graphs and tables - critisising the solitary mobile subject
TRANSCRIPT
Criticising the solitary mobile subject: researching relational mobilities and reflecting on mobile methods
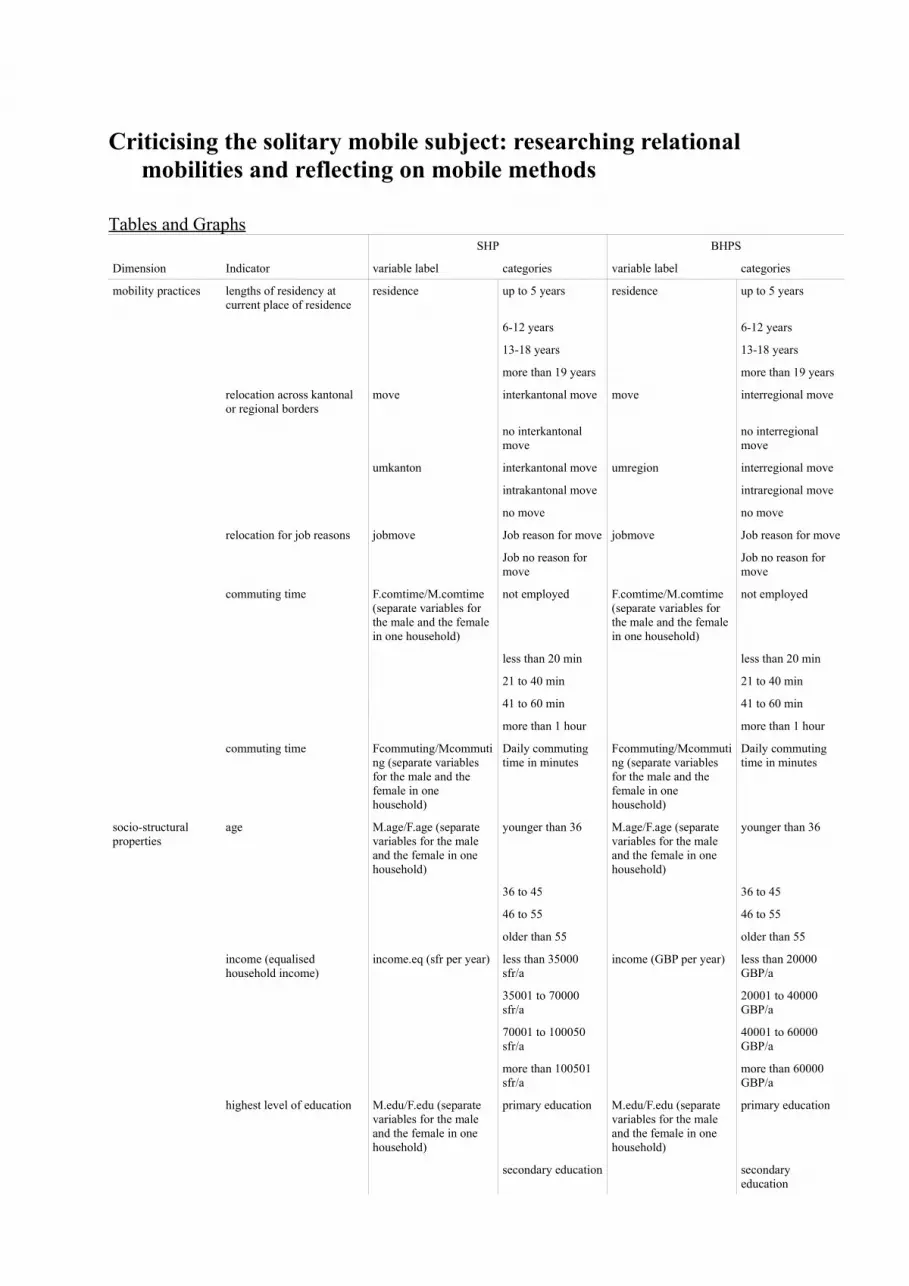
Tables and GraphsSHP BHPS
Dimension Indicator variable label categories variable label categories
mobility practices lengths of residency at current place of residence
residence up to 5 years residence up to 5 years
6-12 years 6-12 years
13-18 years 13-18 years
more than 19 years more than 19 years
relocation across kantonal or regional borders
move interkantonal move move interregional move
no interkantonal move
no interregional move
umkanton interkantonal move umregion interregional move
intrakantonal move intraregional move
no move no move
relocation for job reasons jobmove Job reason for move jobmove Job reason for move
Job no reason for move
Job no reason for move
commuting time F.comtime/M.comtime (separate variables for the male and the female in one household)
not employed F.comtime/M.comtime (separate variables for the male and the female in one household)
not employed
less than 20 min less than 20 min
21 to 40 min 21 to 40 min
41 to 60 min 41 to 60 min
more than 1 hour more than 1 hour
commuting time Fcommuting/Mcommuting (separate variables for the male and the female in one household)
Daily commuting time in minutes
Fcommuting/Mcommuting (separate variables for the male and the female in one household)
Daily commuting time in minutes
socio-structural properties
age M.age/F.age (separate variables for the male and the female in one household)
younger than 36 M.age/F.age (separate variables for the male and the female in one household)
younger than 36
36 to 45 36 to 45
46 to 55 46 to 55
older than 55 older than 55
income (equalised household income)
income.eq (sfr per year) less than 35000 sfr/a
income (GBP per year) less than 20000 GBP/a
35001 to 70000 sfr/a
20001 to 40000 GBP/a
70001 to 100050 sfr/a
40001 to 60000 GBP/a
more than 100501 sfr/a
more than 60000 GBP/a
highest level of education M.edu/F.edu (separate variables for the male and the female in one household)
primary education M.edu/F.edu (separate variables for the male and the female in one household)
primary education
secondary education secondary education

tertiary education tertiary education
type of household household couple without children
household couple without children
couple with children couple with children
single household* single household*
single parent* single parent*
infrastructural and geographical context
type of settlement urban urban agglo main Agglomeration
rural not main Agglomeration
availability of a private car car car available car car available
no car available no car available
type of residence house owner house owner
tenant tenant
* not included in the multiple correspondence analyses.
Table 1: Dimensions, indicators, variables and categories used in the analyses
Switzerland England
Male Female Male Female
Cohabiting couple without children 29.3 26.8 31.8 29
Cohabiting couple with children 55.9 51.2 53.6 48.9
Single household 13.1 14.8 12.8 9.5
Single parent 1.8 7.3 1.8 12.6
Sum of individuals n=3246 n=3544 n=2009 n=2201
Sum of households 4027 2495
Table 2: Distribution of households in percent, data: BHPS/SHP 2005
Switzerland England
type of household men women men women
cohabiting couple without children
41.0 (n=594) 36.1(n=644) 44.5 (n=480) 36.4 (n=576)
cohabiting couple with children
46.0 (n=1087) 25.0 (n=1278) 48.6 (n=771) 24.6 (n=947)
single household 39.7(n=368) 38.2 (n=465) 40.4 (n=203) 34.6 (n=180)
single parent 41.7 (n=44) 32.7 (n=217) 43.9 (n=28) 27.3 (n=250)
Sum 2093 2604 1482 1953
Table 3: Average commuting time in minutes by type of houshold, data: BHPS/SHP 2005
Switzerland England
cohabiting couple without
children
cohabiting couple with
children
single household
single parent cohabiting couple without
children
cohabiting couple with
children
single household
single parent
not moved 79.6 80.6 80.5 78.2 51.3 52.9 47.5 52.1
intraregional/ intrakantonal move
19.1 17.6 16.6 19.8 32.4 34.7 35.5 39.6
interregional/i interkantonal move
1.4 1.8 2.9 1.9 16.3 12.3 16.9 8.3
Sum 950 1813 524 257 638 1077 467 313
Table 4: Residential mobility in percent by household type, data: SHP/BHPS 2005

Graph 1: Commuting and residential migration in Switzerland, data: SHP 2005
Graph 2: Social and spatial structuring attributes, data: SHP 2005

Graph 3: Inner space of social and spatial attribute in the Swiss space of movements, data: SHP 2005
Graph 4: Types of mobility patterns, data: SHP 2005
(1) high commuting mobility, no cars, young, highly educated
(2) high residential mobility for job reasons
(3) old, outside the labour force, residentially sedentary
(4) low male education, medium commuting and low residential mobility

Graph 5: Commuting and residential migration in England, data: BHPS 2005
Graph 6: Social and spatial structuring attributes, data: BHPS 2005

Graph 7: Inner space of social and spatial structuring attributes, data: BHPS 2005
Graph 8: groups of mobility patterns, data: BHPS 05
(3) low residential and medium commuting mobility, medium education, family households
(1) highly residentially mobile for job reasons without children
(4) sedentary, poor, low education, outside the labour force, no car
(2) high commuting mobility, high income and high education, young age