global education digest 2003
TRANSCRIPT
global education digest 2003Comparing Education Statistics Across the World
UNESCO Institute for Statistics, Montréal, 2003
UNESCO
The constitution of the United Nations Educational, Scientific and Cultural Organization (UNESCO)was adopted by 20 countries at the London Conference in November 1945 and entered into effect on4 November 1946. The Organization currently has 189 Member States.
The main objective of UNESCO is to contribute to peace and security in the world by promoting collab-oration among nations through education, science, culture and communication in order to fosteruniversal respect for justice, the rule of law, and the human rights and fundamental freedoms thatare affirmed for the peoples of the world, without distinction of race, sex, language or religion, bythe Charter of the United Nations.
To fulfill its mandate, UNESCO performs five principal functions: 1) prospective studies on education,science, culture and communication for tomorrow’s world; 2) the advancement, transfer and sharingof knowledge through research, training and teaching activities; 3) standard-setting actions for thepreparation and adoption of internal instruments and statutory recommendations; 4) expertisethrough technical co-operation to Member States for their development policies and projects; and5) the exchange of specialized information.
UNESCO is headquartered in Paris, France.
The UNESCO Institute for Statistics
The UNESCO Institute for Statistics (UIS) is the statisical office of UNESCO and is the UN depository forglobal statistics in the fields of education, science and technology, culture and communication.
UIS was established in 1999. It was created to improve UNESCO’s statisical programme and to developand deliver the timely, accurate and policy-relevant statistics needed in today’s increasingly complexand rapidly changing social, political and economic environments.
UIS is based in Montréal, Canada.
Published in 2003 by
UNESCO Institute for StatisticsP.O. Box 6128, Succursale Centre-VilleMontreal, Quebec H3C 3J7CanadaTel: (1 514) 343-6880Fax: (1 514) 343-6882Email: [email protected]://www.uis.unesco.org
© UIS 2003
Design: JCNicholls DesignPrinting: St. Joseph Print GroupPhoto credits: ©UNESCO/D.Roger, ©UNESCO/A.AbbéRef: UIS/SD/03-01

3
FOREWORD
The knowledge, skills and capabilities needed to meet the chal-lenges of the 21st century depend upon education systems that dis-tribute learning opportunities equitably and that make efficientuse of human and financial resources. Accurate, reliable and timelyeducation statistics are fundamental to enabling education systemsto achieve these aims.
For many countries still struggling to break out of widespreadpoverty and to achieve universal primary education, statistics providea measure of progress, enabling them to set priorities for usingscarce resources. For more developed countries, education statisticshelp governments to respond to the ever-quickening pace of glob-alisation, technological advance and economic change.
The UNESCO Institute for Statistics (UIS) is the guardian of interna-tional education statistics. At the heart of the Institute’s mandate isassistance to Member States to collect, analyse and disseminateinternationally-comparable education indicators that inform policiesand monitor their outcomes. Since its creation in 1999, the UIS hascarried out far-reaching consultations with both national and inter-national users and producers of education statistics to identify infor-mation needs and to develop a strategy to meet these needs. In addi-tion, the UIS has led a series of technical workshops across the globewhich have raised awareness of data collection methodologies andtools, and provided a common framework for harmonising nationaleducation data.
As a result, response rates to the UNESCO questionnaire haveimproved and, very importantly, the indicators are becoming moretimely and comparable. However, the UIS is still facing many chal-lenges. One of these is to consolidate the quality of existing educa-tion data to ensure that they are better aligned with today’s indi-cators. This is vital for the accurate monitoring of progress. Anotherchallenge is to incorporate education data from different sources to
global education digest 2003
4
achieve better estimates of missing data, whichrepresent a considerable gap in our knowledge.For the first time, as part of the WEI programme,the UIS together with its partners will soon be col-lecting, as a complement to aggregated adminis-trative data, individual- and school-level data thatwill inform national policies based on a compara-tive approach.
This new annual digest is a solid first step in theprocess of making data more useful, bringing to-gether data on education systems throughout theworld on a comparable basis. Data are collected andpresented according to the International StandardClassification of Education (ISCED97). This compar-ative framework allows countries to benchmarktheir progress against neighbouring or similar coun-tries and provides a lens to interpret the outcomesof education reforms from different parts of theworld. The digest reports data for the school years1999/2000 and 2000/2001 and the accompanyingCD-Rom includes data for 1998/1999.
In what will become a regular feature, the digestalso presents analysis of a current topic relevant tothe state of global education statistics. In this issuethe focus is upon measures of primary access, partic-ipation and completion, which comprise the mainindicators used to monitor progress towards inter-national development goals.
The data found here are the product of the coop-eration and commitment of national statisticiansworldwide, whose valuable contributions and com-ments have greatly enhanced our understanding oftheir education systems.
Denise LievesleyDirector, UNESCO Institute for Statistics
5
CONTENTS
Foreword 3
Contents 5
Acknowledgments 6
The State of Global Education Statistics: Measuring Progress 7 Towards Universal Primary Education
Reader’s Guide 21
Statistical Tables 25
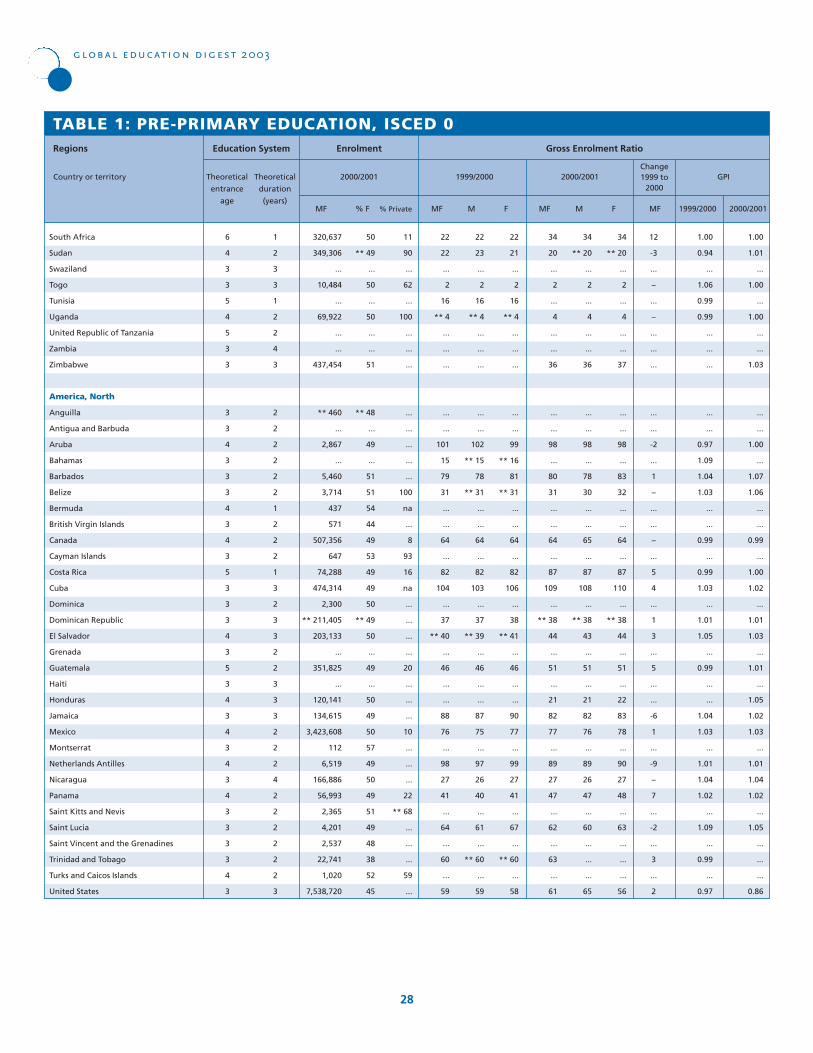
1. Pre-primary education, ISCED 0 26
2. Primary education, ISCED 1 36
3. Secondary education, ISCED 2, ISCED 3 and ISCED 4 62
4. Tertiary education, ISCED 5 and ISCED 6 82
5. Number of foreign student by hosting country and 92continent of origin, 2000/2001
6. Tertiary education, ISCED 5 and 6. Graduates by fields 94of education, 2000/2001
7. Education expenditure 104
Annexes
A. Glossary 115
B. Definitions of Indicators 119
C. International Standard Classification of Education 121(ISCED97)
D. Regions 124
6
ACKNOWLEDGMENTS
This Global Education Digest is based on data provided by the coun-tries or territories covered in this publication. We would like to ex-press our gratitude to all those statisticians, who in each country andterritory took the time to respond to the UIS or UOE questionnairesas well as our requests for clarification, for their participation in re-gional workshops, and for their comments and suggestions con-cerning the content of this publication. We would also like to expressour thanks to the international organizations, in particular theUnited Nations Statistics and Population Divisions, the World Bank,the Organisation for Economic Co-operation and Development(OECD), Eurostat and other specialized institutions, that supplied ad-ditional information and statistics to complement those gathereddirectly by the UIS.
The production of this publication was coordinated by Rosario GarcíaCalderón and Jens Johansen, under the direction of Simon Ellis,Douglas Lynd and Albert Motivans.
Special thanks go to the survey operations team that has worked toimprove the education database since the creation of the Institutein Montreal: Catherine Bélanger, Camilla Gidlöf, Monica Githaiga,Sirina Kerim-Dikeni, Weixin Lu, Patrik Maheux, Lucy Hong Mei, JohnPacifico, Ioulia Sementchouk, Anuja Singh, Pierre Varly and SaïdOuld Voffal.
Other input and contributions were provided by Claude Akpabie,Saïd Belkachla, Michael Bruneforth, Doug Drew, Ernesto FernándezPolcuch, Katja Frostell, Marcela Chiang-Sam Garduño, CésarGuadalupe, Ivan Guentchev, Adriano Miele, José Pessoa, YanhongZhang and all other staff in the UIS.
7
THE STATE OF GLOBAL EDUCATION STATISTICS
By 2015...all children...will have access to and complete free and com-pulsory primary education of good quality.
[Dakar Framework for Action, 2000]
The focus of basic education must, therefore, be on actual learningacquisition and outcome, rather than exclusively upon enrolment,continued participation in organized programmes and completionof certification requirements.
[Article IV, Jomtien Declaration, 1990]
More than a decade ago, the Education for All (EFA) movement wasborn of the notion that access to basic education of good quality isa fundamental human right. Numerous studies have shown thateducational participation can result in improvements in individualliving conditions, such as better health or increased income. At anational level, higher levels of educational attainment among thepopulation have economic and social benefits for both individualsand society as a whole.
It is because education is so important in and of itself that it is recog-nised as a human right, as witnessed not only by the Dakar Frame-work for Action but by internationally binding agreements, such asthe Convention on the Rights of the Child. Measures of this right mustaddress access to quality learning opportunities that lead to theacquisition of knowledge, skills and attitudes.
Measuring Progress Towards Universal Primary Education
global education digest 2003
8
While marking the progress that has been achieved,recent EFA assessments have highlighted the diffi-culties that many countries, particularly those inAfrica and South Asia, have encountered in tryingto reach these goals. Global estimates by theUNESCO Institute for Statistics (UIS) indicate thatsome 104 million children of primary school age arenot enrolled in school. Improving education willrequire new efforts to expand access to primaryeducation and to improve educational quality andlearning outcomes. The types of indicators used tomonitor progress thus must respond to a broadrange of policy questions.
The EFA goals represent a broad and comprehen-sive set of education-related aims, ranging fromearly childhood development through to adultlearning and literacy. One of the flagship goals isthe attainment of Universal Primary Education(UPE) in all countries of the world. It proposes thatall children have the opportunity to participate inprimary education where they should acquire basicskills, such as reading, writing and numeracy. Gov-ernments have committed themselves to ensuringthat all children have access to and complete pri-mary education by 2015 while international agen-cies seek to monitor progress towards UPE.
The World Education Conference in Dakar in 2000 chosesix main goals as the follow-up to the Education for All2000 Assessment. These goals include expanding early-childhood care and education, promoting learningopportunities for young people and adults, raising adultliteracy, and improving all aspects of education qualityso that recognized and measurable learning outcomesare achieved by all.
With respect to Universal Primary Education, there arethree main goals:
Goal 2: Free and compulsory education of good qual-ity. Ensure that by 2015 all children, particularly girls,children in difficult circumstances and those belongingto ethnic minorities, have access to and are able tocomplete primary education that is free, compulsoryand of good quality.
Goal 5: Eliminate gender disparities. Eliminate genderdisparities in primary and secondary education by 2005and achieve gender equality in education by 2015, witha focus on ensuring girls’ full and equal access to andachievement in basic education of good quality.
Goal 6: Enhance educational quality. Improve all as-pects of the quality of education and ensure excellence
of all so that recognized and measurable learning out-comes are achieved by all, especially in literacy, num-eracy and essential life skills.
An assessment of the state of education was conductedin 2000 (the EFA 2000 Assessment) using 18 indicators.Since then efforts have been focused on consolidatingthe original set of indicators into a core set of 15 forwhich all countries should be able to provide the dataon an annual basis. The UNESCO Institute for Statisticsis responsible for monitoring EFA goals based on datacollected from Member States and the provision ofaccurate and timely comparative data for the global EFAMonitoring Report.
The Millennium Development Compact incorporates 8goals and a total of 48 monitoring indicators. The maingoals and indicators related to education focus on Uni-versal Primary Education and draw upon similar EFAgoals:
Goal 2: Achieve Universal Primary Education.
Target 3: Ensure that, by 2015, children everywhere,boys and girls alike will be able to complete a full courseof primary schooling.
BOX 1. EDUCATION FOR ALL AND MILLENNIUM DEVELOPMENT EDUCATION-RELATED GOALS

The State of Global Education Statistics: Measuring Progress Towards Universal Primary Education
9
The need for a wide range of indicators
The 1990 Jomtien Declaration points out that pro-gress must be measured using outcomes ratherthan concentrating exclusively on access to educa-tion and progression through the education system,which assume that learning acquisition is actuallytaking place. Direct measures of learning outcomesshow us that, particularly in some less developedcountries, the quality of education provision is poorand often pupils do not achieve basic literacy, evenafter completing primary education. Thus, moni-
Monitoring indicators: Net enrolment ratio in primaryeducation; proportion of pupils starting grade 1 whoreach grade 5; literacy rates among 15 to 24-year-olds.
Goal 3: Promote gender equality and empower women.
Target 4: Eliminate gender disparity in primary andsecondary education preferably by 2005 and to all levelsof education no later than 2015.
Monitoring indicators: Ratios of girls to boys in primary,secondary and tertiary education; ratio of literate fe-males to literate males aged 15–24 years.
The World Bank’s Fast Track Initiative aims to concen-trate donor efforts on the achievement of Universal Pri-mary Education for a selected group of countries whichhave been judged to be able to achieve universalprimary education and have met the criteria of havingprepared realistic national plans. The World Bank hasused a range of indicators to monitor progress of thisprogramme, which will result in strong partnership toassist these countries in implementing their plansincluding the release of additional funds for educa-tion. The indicative framework consists of the followingindicators:
The attention given to education statistics in theinternational community has increased sharply inthe last few years. In addition to renewed effortsto monitor national progress through the Educationfor All movement (www.unesco.org/education/efa),the Millennium Development Compact of 2000(www.developmentgoals.org) included educationas a key part of a broad set of development goals(see Box 1). The UNESCO Institute for Statisticsprovides education data for both initiatives.
• Average annual teacher salary (as a multiple of percapita GDP);
• Pupil-teacher ratio;• Spending on inputs other than teachers (as a per-
centage of primary education recurrent spending);• Average repetition rate;• Unit construction cost of school/classroom;• Government revenues (as a percentage of GDP);• Education recurrent spending (as a percentage of
government revenues);• Primary education recurrent spending (as a
percentage of total education recurrent spending);and
• Private enrolments (as percentage of total).
The UIS is in discussions with the World Bank to ensurethat, as far as possible, the cross-nationally comparabledata take account of the needs of the Fast Track Initia-tive and that countries are supported to provide theadditional information required for their own nationalpurposes. Of course, the UIS remit extends beyond theaims of this initiative, and as explained above, mustprovide a wider range of indicators to cover all of theEFA goals.

global education digest 2003
10
toring progress in terms of access, progression andcompletion needs to be accompanied by strategiesto better measure learning outcomes in countries.
The development and implementation of new indi-cators require time and national expertise, andthese resources have to be balanced against thosethat support more immediate requirements fordata. Trade-offs are inevitable, especially whenmany countries are still struggling to produce eventhe most basic monitoring information about theiredu-cational systems.
At present, there are great pressures for educationstatistics to monitor current trends, and nationalpolitical mobilisation and high-stakes donor initia-tives hang in the balance. Thus a parallel strategyis needed that improves and exploits educationdata which are more readily available and compa-rable, primarily on participation, progression andcompletion, while at the same time, advances anagenda for the direct assessment of outcomes in lessdeveloped countries.
While measures of access, participation or comple-tion are not measures of achievement, they do pro-vide very valuable information about primaryeducation in a country, and once children are inschool, about some of the characteristics of educa-tion systems that are amenable to policy change.This information can inform policies that createmore effective, equitable and efficient educationalsystems.
Policymakers need a range of robust indicators thatprovide different types of information on access,participation and completion that are comparablebut also sensitive to change in various national con-texts. National education policy presents complex-ities that can only be addressed by a comprehensive‘toolkit’ of indicators which addresses all aspects ofnational policy, while including the agreed inter-nationally-harmonised indicators to allow bench-marking against other countries. It is vital to ensurethat each of the measures best meet the needs for
data quality (e.g. reliability, accuracy, timeliness),whether they refer to enrolment, progression orcompletion.
The principal indicators for monitoring progresstowards Universal Primary Education relate toaccess and participation (net intake and enrolmentrates) and progression or completion (survival ratesor gross intake rate into last year of primary educa-tion). They all provide important perspectives intothe coverage and functioning of education systems.All of these indicators are presented in this reportand can be used to present a rich picture of accessand participation in education, not only at the pri-mary level but from pre-primary to tertiary. Thepolicy vision on progress towards Universal PrimaryEducation should not be limited to one or two indi-cators.
There is a danger in drawing too many conclusionsfrom changes in a single indicator or from its rela-tionship to other variables, whether a net enrol-ment rate or some measure of completion. Theoriginal 18 EFA indicators represented differentaspects of the education process, and all of theseaspects are considered important to the overallvision of EFA. The inter-relationship of differentparts of the education system is also important.Thus, indicators developed to monitor other EFAgoals are relevant for UPE. For example, indicatorson participation in pre-primary education help toestablish whether children have received prepara-tion, which may enable better achievement inprimary education, while indicators related to theliteracy of young adults help to establish whetherthe knowledge of basic skills has been sustainedafter completion of primary education.
In reflecting on the lessons from monitoring EFA inthe 1990s, a general perception was that greaterpolitical attention was paid towards increasing thequantity (i.e. expanding access) rather than thequality of education. As a result, it was felt by somethat indicators based on enrolment rates, eithernet or gross, received disproportionate attention in
The State of Global Education Statistics: Measuring Progress Towards Universal Primary Education
11
terms of measuring progress and that this came atthe expense of results of other key EFA indicators,which included the progression and completion ofschooling, the quality of education and learningoutcomes. The simple lesson is that a single measurewill never appropriately cover progress towardsUPE and a more comprehensive approach is neces-sary. Each indicator has a distinct set of advantagesand limitations that should be carefully weighed.
For example, the welcome emphasis on indicatorsof outcome should not lead us to overlook the useof indicators of access. With over 104 million school-age children not enrolled in school, intake rateshave an immediate significance for policymakers atnational and international level. ‘Out-of-school chil-dren’ are often concentrated in particular socialgroups or remote areas. Low intake for particulargroups should still remain a top national priorityeven where overall national policy is focusing oneducational quality and outcomes. Problems ofgender disparity and discrimination often beginwith access to schooling. Once girls are able toenrol at school, they are often more likely thanboys to remain in education. While issues of educa-tional quality and outcome are high on govern-ment agendas, they must ensure that children getto school in the first place, and this preferably at theright age.
Enrolment rates are among the most commonly-cited participation indicators, although they aremost valuable as a complement to other indica-tors. Enrolment is neither a measure of actualschool attendance nor a measure of learningoutcomes. Data are typically collected at the begin-ning of the school year and compiled by nationalministries of education. There are problems ofquality of these data in many countries.
Gross enrolment rates measure the total volume ofeducation provided by a system. As such, they indi-cate the capacity of educational systems to providethe necessary school facilities for the official school-age population. Gross enrolment rates of above
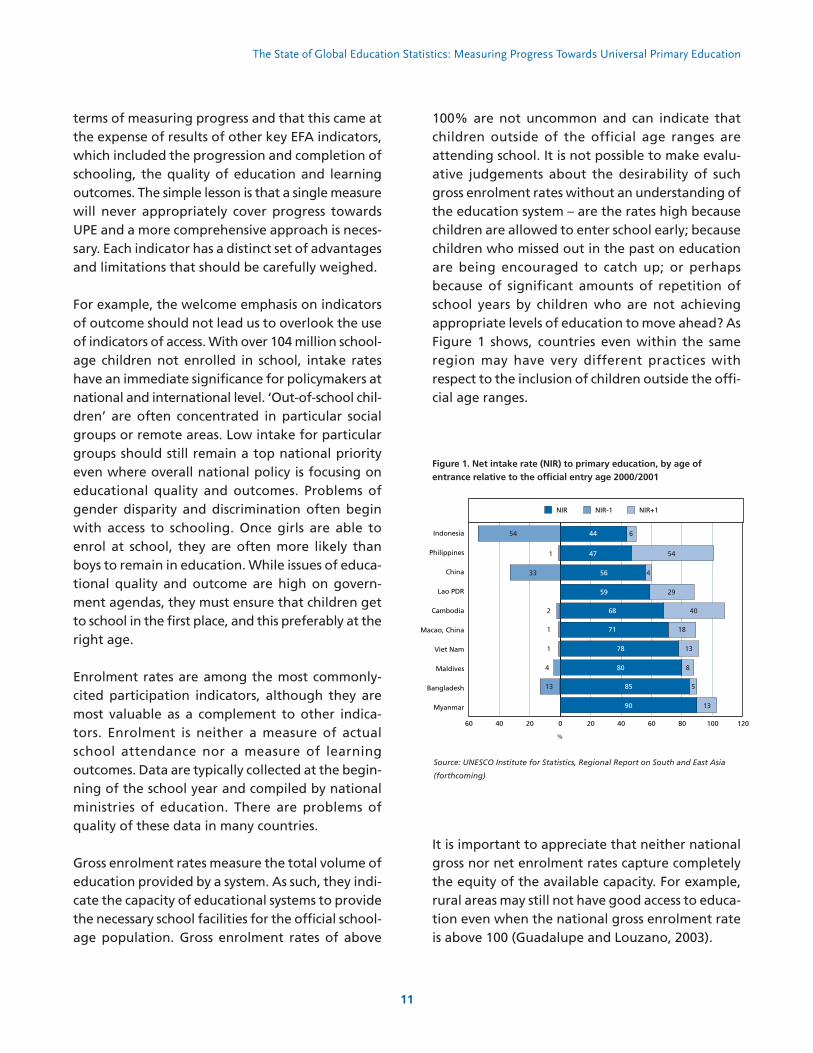
100% are not uncommon and can indicate thatchildren outside of the official age ranges areattending school. It is not possible to make evalu-ative judgements about the desirability of suchgross enrolment rates without an understanding ofthe education system – are the rates high becausechildren are allowed to enter school early; becausechildren who missed out in the past on educationare being encouraged to catch up; or perhapsbecause of significant amounts of repetition ofschool years by children who are not achievingappropriate levels of education to move ahead? AsFigure 1 shows, countries even within the sameregion may have very different practices withrespect to the inclusion of children outside the offi-cial age ranges.
It is important to appreciate that neither nationalgross nor net enrolment rates capture completelythe equity of the available capacity. For example,rural areas may still not have good access to educa-tion even when the national gross enrolment rateis above 100 (Guadalupe and Louzano, 2003).
60 40 20 0 20 40 60 80 100 120
NIR+1NIR-1NIR
Myanmar
Bangladesh
Maldives
Viet Nam
Macao, China
Cambodia
Lao PDR
China
Philippines
Indonesia 54
1
33
2
1
1
4
13
44
47
56
59
68
71
78
80
85
90
6
54
4
29
40
18
13
8
5
13
%
Figure 1. Net intake rate (NIR) to primary education, by age ofentrance relative to the official entry age 2000/2001
Source: UNESCO Institute for Statistics, Regional Report on South and East Asia
(forthcoming)

global education digest 2003
12
Net enrolment rates, which measure the enrolmentof children of the appropriate ages, can currentlybe calculated for about two-thirds of countries inthe world. The lack of available data by grade andage of pupils is the main reason that the indicatorcannot be calculated for other countries. It is ofconcern that the other third are unable to providethe data to calculate the indicator because thebuilding blocks of the indicator (year of age,gender, and grade) represent fundamental infor-mation required to manage education systems. TheUIS is therefore working with countries to improvetheir ability to calculate this indicator or to estimateit. Net enrolment provides the best picture ofwhether children of the appropriate age group areenrolled in the appropriate level of schooling.
Figure 2 provides both net and gross enrolmentrates by region, which can be compared with thenational rates provided in the tables of this publi-cation. Major differences between the two mea-sures can be explained by factors such as late entryinto school or repetition.
A wide range of data sources
The previous section concentrated on the use of arange of data produced by the administrative sys-tems of national education ministries. But it is alsovital to utilise data from a range of other sourcesin order to obtain a fuller, more comprehensivepicture of education trends. In education, as inhealth and other sectors, administrative data can beused alongside data from other sources to helpmonitor and formulate public policy. It is, however,important to stress that the use of other data mustnot be at the expense of administrative data. Flex-ible and sustainable education management infor-mation systems are a critical tool for processingstatistical information, but even more fundamentalfor managing the education system in a country.The great challenge is to improve national capacityso that countries themselves can collect, produce
and interpret indicators within a culture of bettergovernance and accountability.
The important analytical potential of data collectedthrough household- and school-based surveys iswell recognised in some countries and is of specialvalue in the measurement of progress towards UPE(see Box 2). Household survey data are a valuablecomplement to administrative data, since they pre-sent the opportunity to examine more closely indi-vidual-level differences in educational participa-tion – related to gender, location, ethnic group andhousehold characteristics.
As an increasing number of surveys, collecting dataon education participation, have been conductedin developing countries and as co-ordination effortshave been undertaken to try to harmonise some ofthe key variables, an international database of edu-cation indicators reached a critical mass by the late1990s. The number of developing countries coveredby USAID’s Demographic and Health Surveys (DHS),UNICEF Multiple Indicator Cluster Surveys (MICS),
40
60
80
100
120
140Net enrolment rateGross enrolment rate
FMFMFMFMFMFM
OceaniaAfrica Europe Asia N.America S.America
%
Figure 2. Primary net and gross enrolment rates by gender and region,2000/2001
Source: UNESCO Institute for Statistics
The State of Global Education Statistics: Measuring Progress Towards Universal Primary Education
13
and the World Bank’s Living Standards Measure-ment Surveys (LSMS) is large and growing.
Because of the increase in the quantity and cross-national comparability of data, the interest inanalysing these data has intensified. For the mostpart, education indicators are derived from multi-purpose surveys, which are not education surveysper se, but broad surveys including several hundredquestions with only a handful focused on educa-tion. Whereas this gives the advantage that educa-tion data can be related to many other variables, itcan mean that the design of the surveys is notoptimal for the collection of education data. Forexample, this may mean that the survey fieldworkis not timed to coincide with a specific point in theschool year, resulting in inconsistent estimates ofschool participation , e.g. more children attend atthe beginning of the school year than at the end ofthe school year and seasonality effects of childrennot attending school in order to help with harvests.
Indicators of progression andcompletion
Since 2001 there has been a great deal of debateon the appropriate indicators for measuring pro-gression and completion of primary education, andit is worth singling out this area for further discus-sion. Monitoring the progression of primary stu-dents is complicated by the need to take account ofgrade repetition and school dropout. Currentlythere is no cross-national measure of primary schoolcompletion which is accepted by countries andwhich can be measured in a harmonised way acrossa large number of countries. This remains an impor-tant challenge for the future.
This global digest presents two relevant indicators– survival rate to grade 5 and gross enrolment infinal year of primary education (ISCED 1), but fur-ther study of completion is required as subsequentparagraphs will make clear.
Survival rate to grade 5
The UIS calculates a measure of completion of fouryears of education. More explicitly, this is the sur-vival rate to grade five or the proportion of pupilsstarting grade 1 who reach grade 5. This indicatorwas included as part of the EFA2000 assessment andis one of the Millennium Development Goal indi-cators. The survival rate is an indicator of the prob-ability that children who enter the educationalsystem reach a specific grade, typically grade five.Grade five serves as an international benchmark fora minimum duration of primary education. This en-sures that the indicator is as comparable as possibleacross national systems of different duration byfocusing on internationally accepted minimal stan-dards.
The indicator measures progression in the educa-tional system as opposed to access (intake) or partic-ipation (enrolment). However, currently survivalrates can only be calculated for about 40% of coun-tries, as it requires reliable data for two consecutiveyears. Renewed efforts are taking place at the UISto improve the coverage of countries for this indi-cator.
The indicator undoubtedly has drawbacks in that itcan lead to an overestimation of the completionrate because some students that have started agrade may not finish it. In this way it is a moreaccurate estimate of completion of four years ofeducation than of five. Since the indicator refers toenrolled pupils only, it can be weighted by intakeor enrolment rates.
Primary completion rate
Increasingly there is interest in a measure of primaryschool ‘graduation’. However, the concept ofprimary ‘graduation’ is not clear. Across the worldthere are many different concepts of primary grad-uation and an internationally-comparable measure
global education digest 2003
14
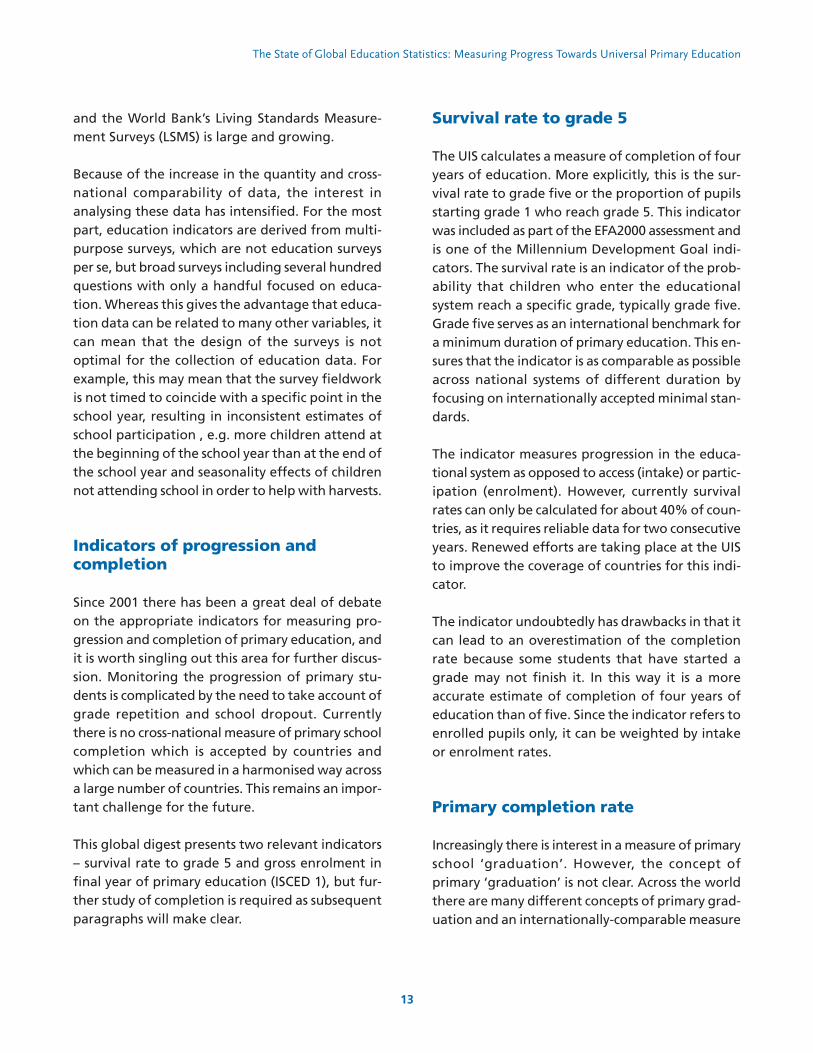
An important advantage of household survey data isthat they provide the characteristics of school-age chil-dren who are not participating in education. Adminis-trative data typically provide data for only those chil-dren who have enrolled in school, and often providelimited information about children who are enrolledbut who are not attending school. As Figure 3 shows,there are often sizable differences in educational partic-ipation depending upon the population subgroup. InGuinea, children who live in rural areas or in householdsthat score low on the household asset index, as well asthose who have a mother with no education, are muchless likely to report having attended school in the lastyear. Moreover there are important interactions withresidence, well-being and gender. One in eight girlsfrom poor households attend school, compared to onein four boys from poor households.
This type of information is helpful in targeting nationalpolicy efforts, although it is important to appreciatethat the survey data may also be weak in relation toseverely disadvantaged groups since these are fre-quently under-represented in household surveys evenin the most developed countries. In less developedcountries, the coverage of disadvantaged groups, suchas migrants, refugees, the homeless, those in orphan-ages and other institutions, or people from ethnicminorities, is even more difficult and thus results mayunderestimate the scope of a problem such as out-of-school children.
As indicated above, a further advantage of surveys is thepossibility to inquire about attendance at school.However, this is not as straightforward as it might ap-pear and often surveys will produce markedly differentestimates of attendance because of differences in themethodology or because of differences in the surveytiming in relation to the school year.
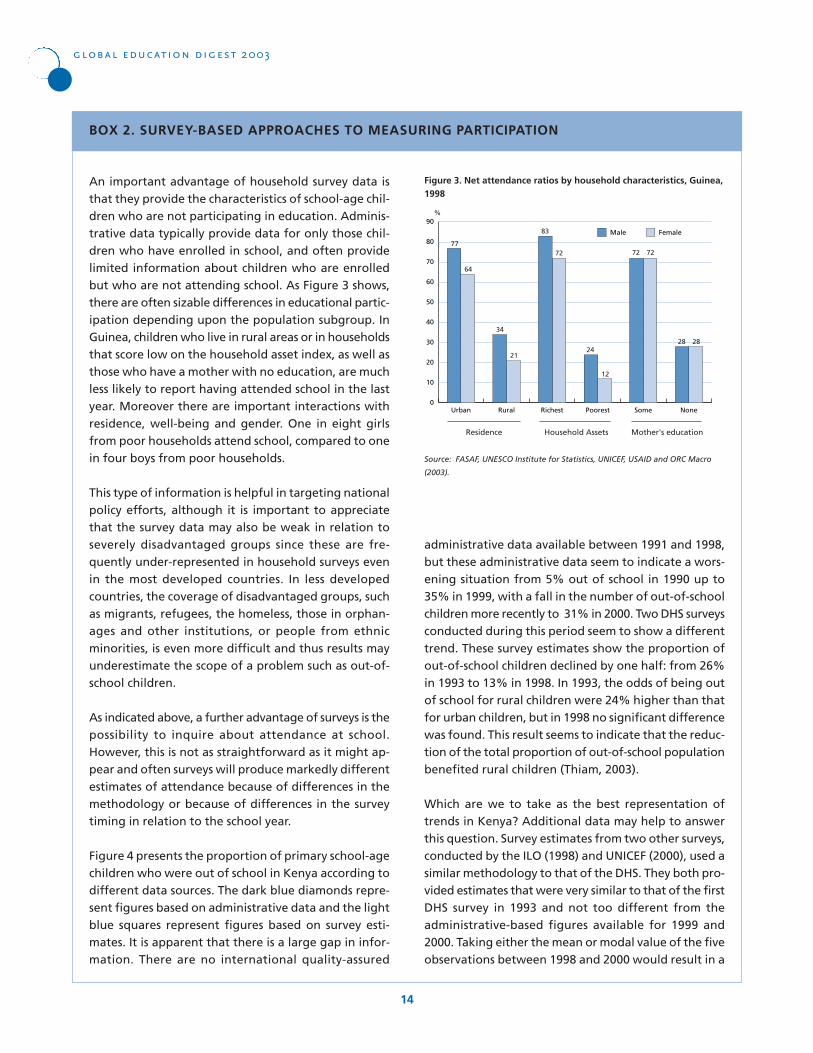
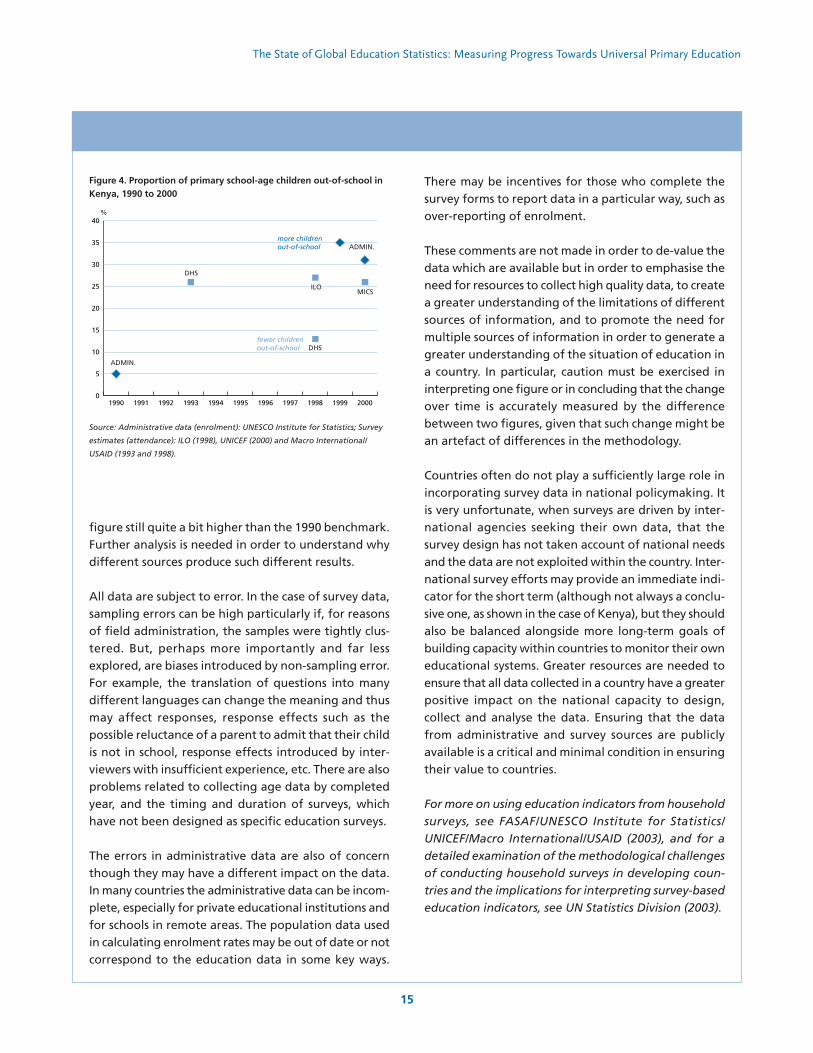
Figure 4 presents the proportion of primary school-agechildren who were out of school in Kenya according todifferent data sources. The dark blue diamonds repre-sent figures based on administrative data and the lightblue squares represent figures based on survey esti-mates. It is apparent that there is a large gap in infor-mation. There are no international quality-assured
administrative data available between 1991 and 1998,but these administrative data seem to indicate a wors-ening situation from 5% out of school in 1990 up to35% in 1999, with a fall in the number of out-of-schoolchildren more recently to 31% in 2000. Two DHS surveysconducted during this period seem to show a differenttrend. These survey estimates show the proportion ofout-of-school children declined by one half: from 26%in 1993 to 13% in 1998. In 1993, the odds of being outof school for rural children were 24% higher than thatfor urban children, but in 1998 no significant differencewas found. This result seems to indicate that the reduc-tion of the total proportion of out-of-school populationbenefited rural children (Thiam, 2003).
Which are we to take as the best representation oftrends in Kenya? Additional data may help to answerthis question. Survey estimates from two other surveys,conducted by the ILO (1998) and UNICEF (2000), used asimilar methodology to that of the DHS. They both pro-vided estimates that were very similar to that of the firstDHS survey in 1993 and not too different from theadministrative-based figures available for 1999 and2000. Taking either the mean or modal value of the fiveobservations between 1998 and 2000 would result in a
0
10
20
30
40
50
60
70
80
90
FemaleMale
NoneSomePoorestRichestRuralUrban
77
64
34
21
83
72
24
12
72 72
28 28
Residence Household Assets Mother's education
%
Figure 3. Net attendance ratios by household characteristics, Guinea,1998
Source: FASAF, UNESCO Institute for Statistics, UNICEF, USAID and ORC Macro
(2003).
BOX 2. SURVEY-BASED APPROACHES TO MEASURING PARTICIPATION
The State of Global Education Statistics: Measuring Progress Towards Universal Primary Education
15
figure still quite a bit higher than the 1990 benchmark.Further analysis is needed in order to understand whydifferent sources produce such different results.
All data are subject to error. In the case of survey data,sampling errors can be high particularly if, for reasonsof field administration, the samples were tightly clus-tered. But, perhaps more importantly and far lessexplored, are biases introduced by non-sampling error.For example, the translation of questions into manydifferent languages can change the meaning and thusmay affect responses, response effects such as thepossible reluctance of a parent to admit that their childis not in school, response effects introduced by inter-viewers with insufficient experience, etc. There are alsoproblems related to collecting age data by completedyear, and the timing and duration of surveys, whichhave not been designed as specific education surveys.
The errors in administrative data are also of concernthough they may have a different impact on the data.In many countries the administrative data can be incom-plete, especially for private educational institutions andfor schools in remote areas. The population data usedin calculating enrolment rates may be out of date or notcorrespond to the education data in some key ways.
There may be incentives for those who complete thesurvey forms to report data in a particular way, such asover-reporting of enrolment.
These comments are not made in order to de-value thedata which are available but in order to emphasise theneed for resources to collect high quality data, to createa greater understanding of the limitations of differentsources of information, and to promote the need formultiple sources of information in order to generate agreater understanding of the situation of education ina country. In particular, caution must be exercised ininterpreting one figure or in concluding that the changeover time is accurately measured by the differencebetween two figures, given that such change might bean artefact of differences in the methodology.
Countries often do not play a sufficiently large role inincorporating survey data in national policymaking. Itis very unfortunate, when surveys are driven by inter-national agencies seeking their own data, that thesurvey design has not taken account of national needsand the data are not exploited within the country. Inter-national survey efforts may provide an immediate indi-cator for the short term (although not always a conclu-sive one, as shown in the case of Kenya), but they shouldalso be balanced alongside more long-term goals ofbuilding capacity within countries to monitor their owneducational systems. Greater resources are needed toensure that all data collected in a country have a greaterpositive impact on the national capacity to design,collect and analyse the data. Ensuring that the datafrom administrative and survey sources are publiclyavailable is a critical and minimal condition in ensuringtheir value to countries.
For more on using education indicators from householdsurveys, see FASAF/UNESCO Institute for Statistics/UNICEF/Macro International/USAID (2003), and for adetailed examination of the methodological challengesof conducting household surveys in developing coun-tries and the implications for interpreting survey-basededucation indicators, see UN Statistics Division (2003).
Figure 4. Proportion of primary school-age children out-of-school inKenya, 1990 to 2000
0
5
10
15
20
25
30
35
40
20001999199819971996199519941993199219911990
ADMIN.
ADMIN.
DHS
DHS
ILOMICS
more childrenout-of-school
fewer childrenout-of-school
%
Source: Administrative data (enrolment): UNESCO Institute for Statistics; Survey
estimates (attendance): ILO (1998), UNICEF (2000) and Macro International/
USAID (1993 and 1998).
global education digest 2003
16
of primary graduation is still far from being areality. Completion of primary is often based onteacher assessment (similar to any other grade)rather than any type of examination. Many coun-tries do hold public examinations, and there maynot be an outcome such as an exam or schoolleavers’ certificate as in secondary education. Insome countries the public examinations are in-tended as placement tests where the number ofplaces in the secondary institutions is limited. Inthose cases the number of graduates is effectivelya measure of the secondary levels capacity and notof the graduates’ capabilities.
An attempt to capture a primary school completionrate has been popularised by the World Bank. It isthe number of pupils of any age completing theprimary cycle as a percentage of the number ofchildren at the theoretical graduation age. This hasbecome known as a graduation rate. Ideally thisapproach aims to assess the proportion of childrenwho have achieved a basic level of skills.
However due to the lack of available data, theWorld Bank has used a proxy indicator for thiswhich is calculated based on the number of childrenenrolled in the last year of primary education, netof repeaters, divided by the number of children inthe official age for primary completion. Depen-dent on data availability, the enrolment data mayrelate to beginning of the year or end of the yeardata.1 This indicator is readily available, but moreoften on the basis of enrolment in the last year ofprimary school rather than on the basis of successfulachievement at the end of primary school.
This indicator has limited value as an internation-ally-comparable indicator of educational progress
since the duration of what countries call a primarycycle ranges from 3 to 10 years. Applying ISCEDlevel 1 makes the duration of primary educationmore similar, but the data are less meaningful fromthe national perspective. The UIS is committed toworking with countries to develop their capacitiesto collect better measures of graduation andcompletion data for their primary education cycleand to explore the possibility of extending theseindicators to reflect the ISCED rather than nationalsystems.
Primary education corresponds generally to thelevel 1 programmes that, according to ISCED97,aim to “give students a sound basic education inreading, writing and mathematics.” An alternativeto using graduation is to set a certain number ofyears as a benchmark, typically 4–6 years, a periodof learning which is generally considered sufficientto ensure that basic literacy skills are attained andretained.
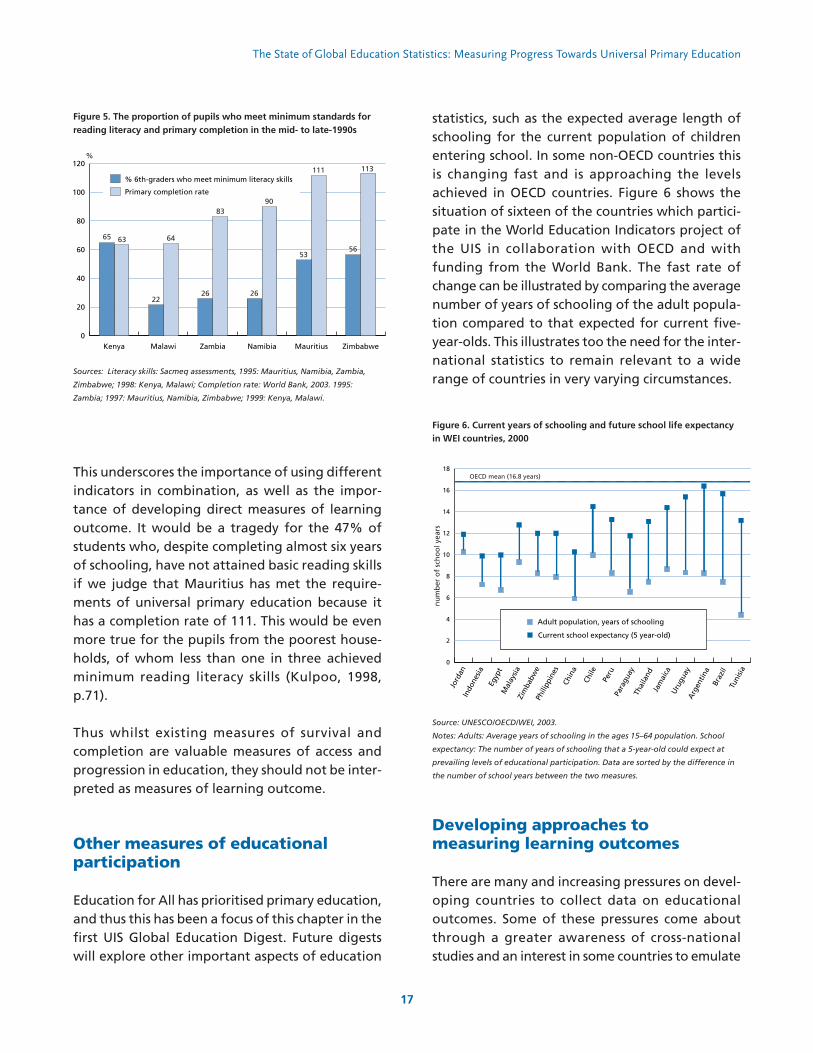
Assessments of reading literacy among pupils inthe last year of primary school in six countries inSouthern Africa show that far too few pupilsachieve minimum literacy skill levels. As shown inFigure 5, direct measures of skills can bear littlerelation to measures of completion (or other partic-ipation measures as well). Thus, Kenya has thelowest rate of completion according to World Bankstaff estimates. In 1999, 63% of pupils were com-pleters, which was the lowest rate among the sixcountries. But, pupils in Kenya were more likely tohave achieved acceptable learning outcomes thanpupils in other countries, even compared to Zim-babwe where the completion rate was almost twiceas high as in Kenya.
1 Some have compared this indicator to the OECD methodology for measuring the secondary graduation rate. However, the OECD approach extends far
beyond the calculation of a simple ratio. The OECD methodology places strong emphasis on the cross-national comparability of education indicators and
would not accept nationally-specific definitions in place of international ones, and would only use actual graduation data not enrolments.
The State of Global Education Statistics: Measuring Progress Towards Universal Primary Education
17
This underscores the importance of using differentindicators in combination, as well as the impor-tance of developing direct measures of learningoutcome. It would be a tragedy for the 47% ofstudents who, despite completing almost six yearsof schooling, have not attained basic reading skillsif we judge that Mauritius has met the require-ments of universal primary education because ithas a completion rate of 111. This would be evenmore true for the pupils from the poorest house-holds, of whom less than one in three achievedminimum reading literacy skills (Kulpoo, 1998,p.71).
Thus whilst existing measures of survival andcompletion are valuable measures of access andprogression in education, they should not be inter-preted as measures of learning outcome.
Other measures of educationalparticipation
Education for All has prioritised primary education,and thus this has been a focus of this chapter in thefirst UIS Global Education Digest. Future digestswill explore other important aspects of education
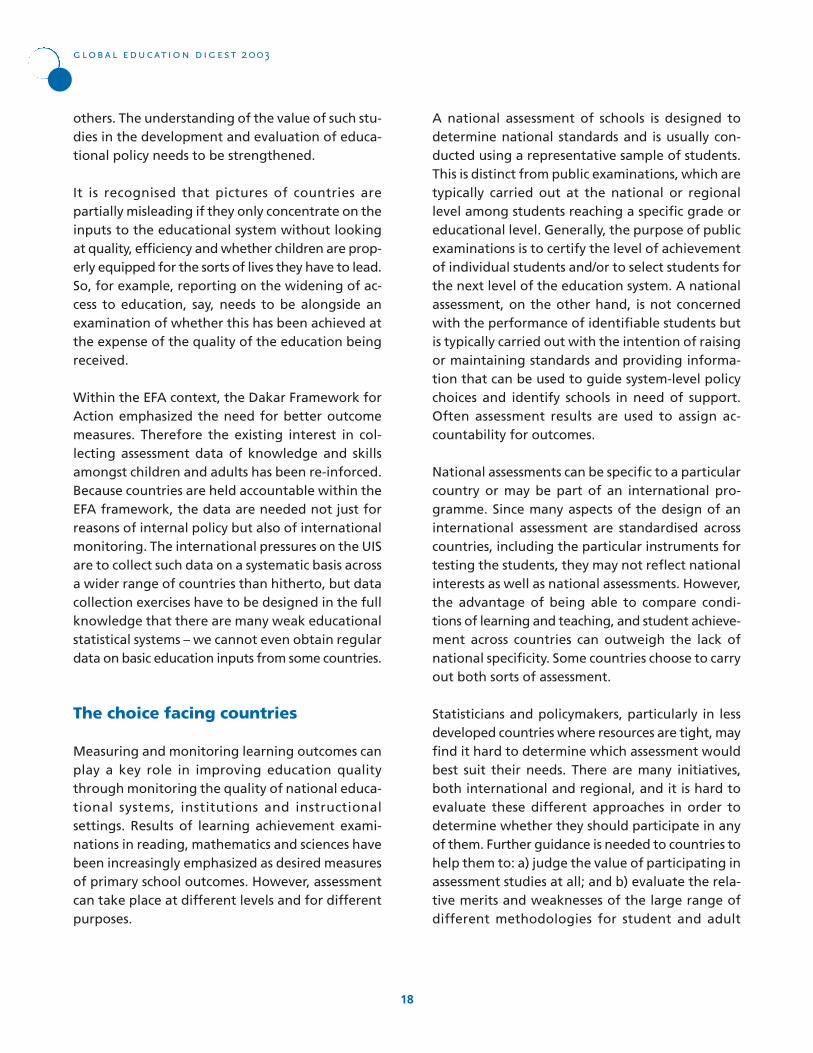
statistics, such as the expected average length ofschooling for the current population of childrenentering school. In some non-OECD countries thisis changing fast and is approaching the levelsachieved in OECD countries. Figure 6 shows thesituation of sixteen of the countries which partici-pate in the World Education Indicators project ofthe UIS in collaboration with OECD and withfunding from the World Bank. The fast rate ofchange can be illustrated by comparing the averagenumber of years of schooling of the adult popula-tion compared to that expected for current five-year-olds. This illustrates too the need for the inter-national statistics to remain relevant to a widerange of countries in very varying circumstances.
Developing approaches tomeasuring learning outcomes
There are many and increasing pressures on devel-oping countries to collect data on educationaloutcomes. Some of these pressures come aboutthrough a greater awareness of cross-nationalstudies and an interest in some countries to emulate
0
20
40
60
80
100
120
ZimbabweMauritiusNamibiaZambiaMalawiKenya
Primary completion rate
% 6th-graders who meet minimum literacy skills
65 63
22
64
26
83
26
90
53
111
56
113
%
Figure 5. The proportion of pupils who meet minimum standards forreading literacy and primary completion in the mid- to late-1990s
Sources: Literacy skills: Sacmeq assessments, 1995: Mauritius, Namibia, Zambia,
Zimbabwe; 1998: Kenya, Malawi; Completion rate: World Bank, 2003. 1995:
Zambia; 1997: Mauritius, Namibia, Zimbabwe; 1999: Kenya, Malawi.
0
2
4
6
8
10
12
14
16
18
Tuni
sia
Braz
il
Arg
entin
a
Uru
guay
Jam
aica
Thai
land
Para
guay
Peru
Chile
Chin
a
Phili
ppin
es
Zim
babw
e
Mal
aysia
Egyp
t
Indo
nesia
Jord
an
OECD mean (16.8 years)
Adult population, years of schooling
Current school expectancy (5 year-old)
nu
mb
er o
f sc
ho
ol y
ears
Figure 6. Current years of schooling and future school life expectancyin WEI countries, 2000
Source: UNESCO/OECD/WEI, 2003.
Notes: Adults: Average years of schooling in the ages 15–64 population. School
expectancy: The number of years of schooling that a 5-year-old could expect at
prevailing levels of educational participation. Data are sorted by the difference in
the number of school years between the two measures.
global education digest 2003
18
others. The understanding of the value of such stu-dies in the development and evaluation of educa-tional policy needs to be strengthened.
It is recognised that pictures of countries arepartially misleading if they only concentrate on theinputs to the educational system without lookingat quality, efficiency and whether children are prop-erly equipped for the sorts of lives they have to lead.So, for example, reporting on the widening of ac-cess to education, say, needs to be alongside anexamination of whether this has been achieved atthe expense of the quality of the education beingreceived.
Within the EFA context, the Dakar Framework forAction emphasized the need for better outcomemeasures. Therefore the existing interest in col-lecting assessment data of knowledge and skillsamongst children and adults has been re-inforced.Because countries are held accountable within theEFA framework, the data are needed not just forreasons of internal policy but also of internationalmonitoring. The international pressures on the UISare to collect such data on a systematic basis acrossa wider range of countries than hitherto, but datacollection exercises have to be designed in the fullknowledge that there are many weak educationalstatistical systems – we cannot even obtain regulardata on basic education inputs from some countries.
The choice facing countries
Measuring and monitoring learning outcomes canplay a key role in improving education qualitythrough monitoring the quality of national educa-tional systems, institutions and instructionalsettings. Results of learning achievement exami-nations in reading, mathematics and sciences havebeen increasingly emphasized as desired measuresof primary school outcomes. However, assessmentcan take place at different levels and for differentpurposes.
A national assessment of schools is designed todetermine national standards and is usually con-ducted using a representative sample of students.This is distinct from public examinations, which aretypically carried out at the national or regionallevel among students reaching a specific grade oreducational level. Generally, the purpose of publicexaminations is to certify the level of achievementof individual students and/or to select students forthe next level of the education system. A nationalassessment, on the other hand, is not concernedwith the performance of identifiable students butis typically carried out with the intention of raisingor maintaining standards and providing informa-tion that can be used to guide system-level policychoices and identify schools in need of support.Often assessment results are used to assign ac-countability for outcomes.
National assessments can be specific to a particularcountry or may be part of an international pro-gramme. Since many aspects of the design of aninternational assessment are standardised acrosscountries, including the particular instruments fortesting the students, they may not reflect nationalinterests as well as national assessments. However,the advantage of being able to compare condi-tions of learning and teaching, and student achieve-ment across countries can outweigh the lack ofnational specificity. Some countries choose to carryout both sorts of assessment.
Statisticians and policymakers, particularly in lessdeveloped countries where resources are tight, mayfind it hard to determine which assessment wouldbest suit their needs. There are many initiatives,both international and regional, and it is hard toevaluate these different approaches in order todetermine whether they should participate in anyof them. Further guidance is needed to countries tohelp them to: a) judge the value of participating inassessment studies at all; and b) evaluate the rela-tive merits and weaknesses of the large range ofdifferent methodologies for student and adult
The State of Global Education Statistics: Measuring Progress Towards Universal Primary Education
19
assessment. It is also important to help them todetermine whether they should focus on one typeof study which might be repeated over time orwhether a better strategy is to use different studiesin combination with one another.
A key question for many countries is what are thebenefits of having cross-nationally comparabledata? The best approach might be to begin with acountry-specific project. Some initiatives have con-centrated on assisting countries to develop studieswhich are designed with their specific needs inmind, and this local relevance is given priority overcross-national harmonisation. How can we helpcountries make such a choice? To what extent is itimportant that assessment closely mirrors curriculaand how should countries determine the relativepriorities of school-based versus home-basedassessment?
An important issue is the extent to which differentcircumstances of countries in some parts of theworld mean that they require different method-ologies. In particular this leads to questions aboutwhether some of the methodologies developed inmore developed countries can be adapted for othercountries (at a very simple level, for example, is itappropriate to test 15-year-olds at school if a lowproportion of 15-year-olds are in school?).
Potential participants in cross-national studies alsohave questions about the resources (human as wellas financial) needed to carry out the different stu-dies, the opportunity costs of doing so, and theways in which such studies might fit into nationaleducational plans (and other plans such as PovertyReduction Strategy Papers). We might considerwhat advice we can give concerning the politicalcommitment needed in order for studies tocontribute to informed decision-making in coun-tries and how the misuse of assessment data can beguarded against.
The UIS exists to support countries, especially thosein the developing world, to build statistical systems
which are appropriate to their policy needs andwhich also meet their international obligations. Animportant aspect of this is helping national statis-ticians and policymakers to identify the ways inwhich student and adult assessment is relevant totheir own education policies and planning and thevalue of such measures in relation to internationalmonitoring. Since some countries have inadequateresources for data collection, it is vital that they areoffered assistance in prioritising their statisticalwork in order to ensure that they use such resourceseffectively.
Conclusion
This introductory chapter has served to contextu-alise the figures presented in the data tables. It hasbeen argued that policymakers require a rich rangeof complementary data rather than a restricted setof indicators. Indeed, different countries mayrequire different sets of indicators depending onpolicy priorities. In the measurement of UPE, theyare likely to choose a set of indicators that addressaccess, participation, progression and outcome.
The data presented are mostly derived from admin-istrative sources, and the potential for using othersources has also been highlighted. Indeed, whereUIS presents its own estimates in the tables below,we have sometimes drawn on such sources to makethese calculations.
Finally the issue of measuring learning outcomehas been discussed. It has been concluded thatcountries need to consider carefully which achieve-ment measure would be most appropriate to them,and the UIS has called for more transparency intesting methods which will enable countries tomake a better decision.
Above all, we would stress that UIS is committed tosupporting countries in deciding what indicatorsthey require and in helping them to collect and usethese effectively. The Institute has recently intro-

global education digest 2003
20
duced a programme of capacity building and isactively seeking more resources so that we are ableto improve the support we give to Member Statesin monitoring education in order to achieve Educa-tion for All.
References
Belkachla, Saïd (2002), “Measuring completion inprimary education,” UIS, mimeo.
Bruns, Barbara, Alain Mingat and RamahatraRakatomalala (2003), Achieving universal primaryeducation by 2015: a chance for every child, Wash-ington DC: The World Bank.
Ellis, Simon (2003), “Achieving the MillenniumDevelopment Goals 2 and 3: Measuring the gapand gaps in measurement of education,” Paperprepared for the Millennium Development GoalsTask Force on Education, July 2003, UIS, mimeo.
FASAF, UNESCO Institute for Statistics, UNICEF,USAID, and ORC Macro (2003), Guide to the analy-sis and use of household survey and census educa-tion data, Montreal: UIS.
Filmer, Deon and Lant Pritchett (1999), “Householdwealth and educational attainment: Evidence from35 countries”, Population and Development Review25(1).
Gardner, Robert (1998), “Education,” Demographicand Health Surveys Comparative Studies, No. 29,Calverton, MD: Macro International.
Guadalupe, César and Paula Louzano (2003),“Measuring universal primary completion in LatinAmerica,” UNESCO OREALC, mimeo.
Huebler Fredrich and Edilberto Loaiza (2003),“Primary education in Africa at the end of themillennium: empirical evidence from recent house-hold surveys,” UNICEF, mimeo.
Langsten and Hassan (forthcoming), “Monitoringeducation for all: an integrated structure to assessprogress and assist policy-making,” Social ResearchCentre, American University in Cairo.
OECD/UNESCO Institute for Statistics (2003a),Financing education – investments and returns,Montreal: UNESCO Institute for Statistics.
OECD/UNESCO Institute for Statistics (2003b),Literacy for the world of tomorrow – further resultsfrom PISA2000, Montreal: UIS.
Thiam, Mamadou (2003), “Trends in out-of-schoolchildren in 16 countries,” UIS, mimeo.
UNESCO (2002), Education for all: is the world ontrack?, Paris: UNESCO.
UNESCO (2000), The Dakar Framework for Action,Education for All: Meeting our Collective Commit-ments, Paris: UNESCO.
UNESCO Institute for Statistics (forthcoming),Regional Report: South and East Asia, Montreal:UIS.
UNESCO Institute for Statistics (2002), Report on themeeting and proposals for the future developmentof EFA indicators, Paris: UNESCO.
UNESCO Institute for Statistics (2001), Educationfor all 2000 assessment: statistical document, Paris:UNESCO.
UN Statistics Division (2003), Technical Guide tohousehold surveys in developing countries, NewYork: UNSD.
21
READER’S GUIDE
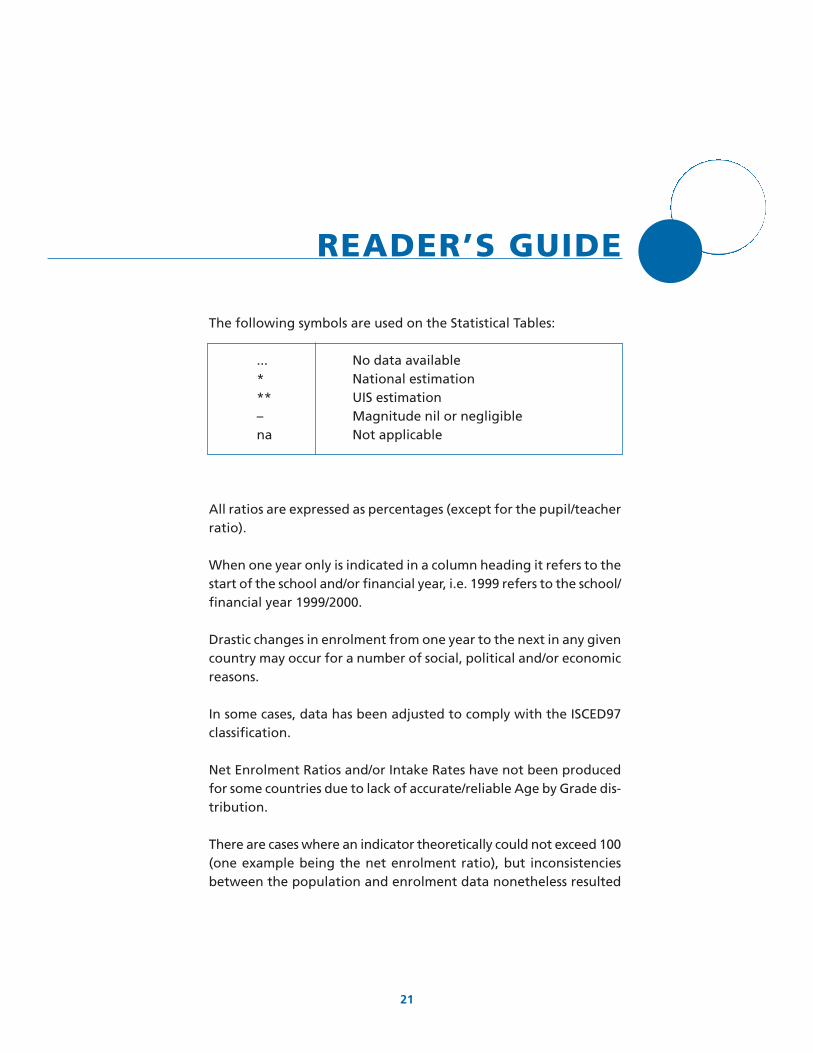
The following symbols are used on the Statistical Tables:
... No data available* National estimation** UIS estimation– Magnitude nil or negligiblena Not applicable
All ratios are expressed as percentages (except for the pupil/teacherratio).
When one year only is indicated in a column heading it refers to thestart of the school and/or financial year, i.e. 1999 refers to the school/financial year 1999/2000.
Drastic changes in enrolment from one year to the next in any givencountry may occur for a number of social, political and/or economicreasons.
In some cases, data has been adjusted to comply with the ISCED97classification.
Net Enrolment Ratios and/or Intake Rates have not been producedfor some countries due to lack of accurate/reliable Age by Grade dis-tribution.
There are cases where an indicator theoretically could not exceed 100(one example being the net enrolment ratio), but inconsistenciesbetween the population and enrolment data nonetheless resulted
global education digest 2003
22
in the indicator exceeding the theoretical limit. Inthose cases capping was applied, while maintainingthe gender balance.
Due to rounding procedures, Gender Parity Index(GPI) and Change numbers cannot be derived fromthe preceding columns. The columns for GPI andchange are based on the data by gender and thedata for the two previous years respectively. Theyare therefore subject to the same reservations asthose underlying data, i.e. if one year is observeddata and the next year is a UIS estimate the re-sulting change will effectively be a UIS estimate.
Percentage of Females (%F) is included to providethe reader information on the number of girls en-rolled with respect to total enrolment in school. Forinformation on gender equality, please refer to theGPI column.
The standard indicator produced by UIS is SurvivalRate to Grade 5, but Survival Rate to Grade 4 hasbeen included as well, since in some countries thisrepresents the end of the primary cycle.
Timor-Leste was recognised as an independent stateon 20 May 2002. Data for previous years were notincluded in the data submissions for Indonesia.
Data do not include data from institutions not re-cognised by the national authorities. This in partic-ular should be considered when interpreting datafor Bangladesh, India and Pakistan.
Data for China do not include data for the twoSpecial Administrative Regions: Hong Kong andMacao.
The data presented in these tables do not includethe following 12 territories: Falkland Islands, Amer-ican Samoa, Faeroe Islands, French Guyana, FrenchPolynesia, Guadeloupe, Guam, Martinique, NewCaledonia, Puerto Rico, Reunion, U.S. Virgin Islands.
Data on GDP are World Bank estimates as of August2002.
Population
Population data are provided by the United NationsPopulation Division (UNPD) 2000 Revision. UNPD donot provide data by single year of age for countrieswith a population of less than 140,000. Where thetotal population is less than 140,000 national datawere used where available.
Education indicators are listed as missing (...) wherethere is no population data available.
Population based indicators have been omitteddue to serious concerns about the population datafor Bhutan and Armenia.
Croatia: The population data do not seem to reflectthe actual population in Croatia reliably. New popu-lation data will be used in future publications. Indi-cators are not internationally comparable andshould be interpreted with caution.
Cyprus: Enrolment data for Cyprus do not includeschools in the area of the island not controlled bythe government. The population data used for thecalculation of indicators was provided by the gov-ernment of Cyprus and only cover the populationliving in the government-controlled area.
Moldova: The enrolment data do not cover Trans-nistria, whereas the population data do. The popu-lation of Transnistria is approx. 16% of the totalpopulation of Moldova. Indicators are not interna-tionally comparable and should be interpreted withcaution.
Serbia & Montenegro: The enrolment data do notcover Kosovo, whereas the population data do.The population of Kosovo is approx. 10% of the to-
Reader’s Guide
23
Tanzania: The enrolment data do not cover Zanz-ibar, whereas the population data do. The popula-tion of Zanzibar is approx. 3% of the total popula-tion of Tanzania. Indicators are not internationallycomparable and should be interpreted withcaution.
tal population of Serbia & Montenegro. Indicatorsare not internationally comparable and should beinterpreted with caution. For data on Kosovo, see“Statistics on education in Kosovo 2001”, Statis-tical Office of Kosovo/UNICEF/TA-DEST, Pristina,2001.

25
TABLES
1. Pre-primary education, ISCED 0
2. Primary education, ISCED 1. Progression and Completion
3. Secondary education, ISCED 2, 3 and 4
4. Tertiary education, ISCED 5 and 6
5. Number of foreign student by hosting country and continent of origin, 2000/2001 (countries having more than1000 students)
6. Tertiary education, ISCED 5 and 6. Graduates by fields ofeducation, 2000/2001
7. Education expenditure

4
3
4
3
4
4
4
3
4
3
3
3
3
3
3
4
3
5
4
3
4
4
3
4
3
3
3
4
3
3
4
3
4
4
3
3
4
3
4
6
4
4
3
3
2
3
2
3
3
3
2
3
2
3
3
3
3
3
3
2
4
2
3
3
3
2
4
3
3
3
3
2
3
3
3
3
2
2
3
3
3
3
3
1
3
2
3
3
46,670
...
25,010
...
13,241
7,616
125,674
19,810
...
...
...
9,636
41,592
40,432
213
383,616
16,654
12,436
109,358
15,568
...
647,126
...
...
1,096,629
30,540
...
17,232
52,751
...
15,106
...
39,232
742,287
...
** 35,318
12,300
...
18,399
4,431
31,650
3,065
17,162
...
Education System
Theoretical
entrance
age
Theoretical
duration
(years)MF
49
...
49
...
51
49
50
51
...
...
...
51
49
49
59
48
63
47
49
** 50
...
49
...
...
49
50
...
49
51
...
49
...
50
35
...
** 53
49
...
50
52
67
48
44
...
3
...
7
...
** 2
* 1
10
...
...
...
2
3
3
...
...
11
30
6
2
...
** 20
62
...
4
45
...
70
...
3
...
1
...
96
58
...
21
1
...
...
...
3
...
4
...
3
...
7
...
** 2
* 1
10
...
...
...
** 2
2
3
...
...
12
29
6
2
...
** 21
63
...
4
45
...
74
...
3
...
1
...
95
74
...
20
1
...
...
...
3
...
4
...
na
...
31
...
...
52
60
...
...
...
...
75
46
...
100
48
...
95
...
68
...
33
...
...
...
100
...
5
94
...
...
...
83
100
...
...
36
...
...
...
73
5
59
...
% F % Private MF M
3
...
7
...
** 2
* 1
11
...
...
...
** 2
3
3
...
...
11
31
5
2
...
** 19
62
...
4
45
...
65
...
3
...
1
...
97
41
...
23
1
...
...
...
3
...
4
...
F
3
...
6
...
1
1
14
56
...
...
...
3
3
1
...
12
29
6
2
14
...
59
...
...
42
18
...
8
3
...
1
...
90
53
...
** 21
1
...
3
...
4
...
4
...
3
...
6
...
1
1
14
55
...
...
...
3
3
1
...
13
21
6
2
** 14
...
60
...
...
42
18
...
8
3
...
1
...
89
68
...
** 20
1
...
3
...
2
...
5
...
MF M
3
...
6
...
1
1
14
58
...
...
...
3
3
1
...
12
37
5
2
** 15
...
59
...
...
41
18
...
8
3
...
1
...
92
38
...
** 23
1
...
3
...
5
...
4
...
1
...
-1
...
-1
–
4
...
...
...
...
–
–
...
...
1
-1
–
–
...
...
-3
...
...
-4
...
...
...
–
...
–
...
-6
-5
...
–
–
...
...
...
1
...
–
...
0.99
...
0.94
...
1.01
0.95
1.13
...
...
...
1.08
1.47
0.97
...
1.25
0.95
1.05
0.93
0.93
...
0.90
0.99
...
1.05
1.00
...
0.89
...
1.02
...
0.96
...
1.02
0.55
...
1.15
1.02
...
...
...
1.06
...
1.07
...
F MF
Change1999 to
2000
Gross Enrolment Ratio
1999/2000 2000/2001
TABLE 1: PRE-PRIMARY EDUCATION, ISCED 0
GPI
Regions
Country or territory
Enrolment
2000/2001
global education digest 2003
26
1999/2000
1.00
...
0.95
...
1.07
0.95
1.01
1.06
...
...
...
1.06
0.98
0.99
1.44
0.95
1.74
0.91
0.97
1.01
...
0.99
...
...
0.98
1.03
...
1.01
1.02
...
0.99
...
1.03
0.57
...
1.15
0.98
...
0.99
...
2.05
...
0.78
...
2000/2001
Africa
Algeria
Angola
Benin
Botswana
Burkina Faso
Burundi
Cameroon
Cape Verde
Central African Republic
Chad
Comoros
Congo
Côte d’Ivoire
Democratic Rep. of the Congo
Djibouti
Egypt
Equatorial Guinea
Eritrea
Ethiopia
Gabon
Gambia
Ghana
Guinea
Guinea-Bissau
Kenya
Lesotho
Liberia
Libyan Arab Jamahiriya
Madagascar
Malawi
Mali
Mauritania
Mauritius
Morocco
Mozambique
Namibia
Niger
Nigeria
Rwanda
Sao Tome and Principe
Senegal
Seychelles
Sierra Leone
Somalia
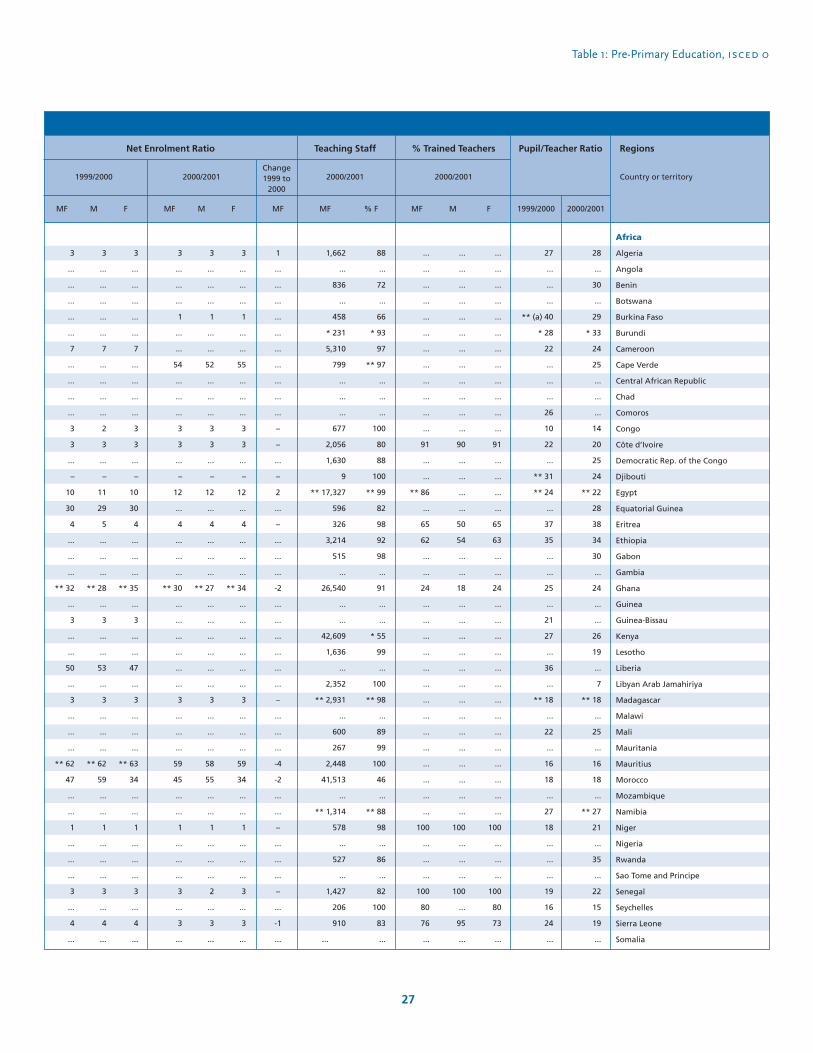
Table 1: Pre-Primary Education, isced 0
27
Regions
Country or territory
% Trained Teachers
2000/2001
Teaching Staff
2000/2001
Pupil/Teacher Ratio
1999/2000 2000/2001
3
...
...
...
...
...
7
...
...
...
...
3
3
...
–
10
30
4
...
...
...
** 32
...
3
...
...
50
...
3
...
...
...
** 62
47
...
...
1
...
...
...
3
...
4
...
MF
3
...
...
...
...
...
7
...
...
...
...
2
3
...
–
11
29
5
...
...
...
** 28
...
3
...
...
53
...
3
...
...
...
** 62
59
...
...
1
...
...
...
3
...
4
...
M
3
...
...
...
...
...
7
...
...
...
...
3
3
...
–
10
30
4
...
...
...
** 35
...
3
...
...
47
...
3
...
...
...
** 63
34
...
...
1
...
...
...
3
...
4
...
F
3
...
...
...
1
...
...
54
...
...
...
3
3
...
–
12
...
4
...
...
...
** 30
...
...
...
...
...
...
3
...
...
...
59
45
...
...
1
...
...
...
3
...
3
...
MF
3
...
...
...
1
...
...
52
...
...
...
3
3
...
–
12
...
4
...
...
...
** 27
...
...
...
...
...
...
3
...
...
...
58
55
...
...
1
...
...
...
2
...
3
...
M
3
...
...
...
1
...
...
55
...
...
...
3
3
...
–
12
...
4
...
...
...
** 34
...
...
...
...
...
...
3
...
...
...
59
34
...
...
1
...
...
...
3
...
3
...
F
...
...
...
...
...
...
...
...
...
...
...
...
91
...
...
** 86
...
65
62
...
...
24
...
...
...
...
...
...
...
...
...
...
...
...
...
...
100
...
...
...
100
80
76
...
MF
...
...
...
...
...
...
...
...
...
...
...
...
90
...
...
...
...
50
54
...
...
18
...
...
...
...
...
...
...
...
...
...
...
...
...
...
100
...
...
...
100
...
95
...
M
...
...
...
...
...
...
...
...
...
...
...
...
91
...
...
...
...
65
63
...
...
24
...
...
...
...
...
...
...
...
...
...
...
...
...
...
100
...
...
...
100
80
73
...
27
...
...
...
** (a) 40
* 28
22
...
...
...
26
10
22
...
** 31
** 24
...
37
35
...
...
25
...
21
27
...
36
...
** 18
...
22
...
16
18
...
27
18
...
...
...
19
16
24
...
28
...
30
...
29
* 33
24
25
...
...
...
14
20
25
24
** 22
28
38
34
30
...
24
...
...
26
19
...
7
** 18
...
25
...
16
18
...
** 27
21
...
35
...
22
15
19
...
Africa
Algeria
Angola
Benin
Botswana
Burkina Faso
Burundi
Cameroon
Cape Verde
Central African Republic
Chad
Comoros
Congo
Côte d’Ivoire
Democratic Rep. of the Congo
Djibouti
Egypt
Equatorial Guinea
Eritrea
Ethiopia
Gabon
Gambia
Ghana
Guinea
Guinea-Bissau
Kenya
Lesotho
Liberia
Libyan Arab Jamahiriya
Madagascar
Malawi
Mali
Mauritania
Mauritius
Morocco
Mozambique
Namibia
Niger
Nigeria
Rwanda
Sao Tome and Principe
Senegal
Seychelles
Sierra Leone
Somalia
F
88
...
72
...
66
* 93
97
** 97
...
...
...
100
80
88
100
** 99
82
98
92
98
...
91
...
...
* 55
99
...
100
** 98
...
89
99
100
46
...
** 88
98
...
86
...
82
100
83
...
% F
1
...
...
...
...
...
...
...
...
...
...
–
–
...
–
2
...
–
...
...
...
-2
...
...
...
...
...
...
–
...
...
...
-4
-2
...
...
–
...
...
...
–
...
-1
...
MF
1,662
...
836
...
458
* 231
5,310
799
...
...
...
677
2,056
1,630
9
** 17,327
596
326
3,214
515
...
26,540
...
...
42,609
1,636
...
2,352
** 2,931
...
600
267
2,448
41,513
...
** 1,314
578
...
527
...
1,427
206
910
...
MF
Change1999 to
2000
1999/2000 2000/2001
Net Enrolment Ratio
6
4
3
3
5
4
5
3
3
3
3
4
3
3
3
4
3
4
3
5
3
3
3
4
3
5
3
4
3
4
3
4
3
4
3
3
3
3
4
3
1
2
3
3
1
2
2
4
3
2
2
2
2
2
2
1
2
2
2
1
3
2
3
3
2
2
3
3
3
2
2
2
4
2
2
2
2
2
2
3
320,637
349,306
...
10,484
...
69,922
...
...
437,454
** 460
...
2,867
...
5,460
3,714
437
571
507,356
647
74,288
474,314
2,300
** 211,405
203,133
...
351,825
...
120,141
134,615
3,423,608
112
6,519
166,886
56,993
2,365
4,201
2,537
22,741
1,020
7,538,720
Education System
Theoretical
entrance
age
Theoretical
duration
(years)MF
50
** 49
...
50
...
50
...
...
51
** 48
...
49
...
51
51
54
44
49
53
49
49
50
** 49
50
...
49
...
50
49
50
57
49
50
49
51
49
48
38
52
45
22
22
...
2
16
** 4
...
...
...
...
...
101
15
79
31
...
...
64
...
82
104
...
37
** 40
...
46
...
...
88
76
...
98
27
41
...
64
...
60
...
59
22
23
...
2
16
** 4
...
...
...
...
...
102
** 15
78
** 31
...
...
64
...
82
103
...
37
** 39
...
46
...
...
87
75
...
97
26
40
...
61
...
** 60
...
59
11
90
...
62
...
100
...
...
...
...
...
...
...
...
100
na
...
8
93
16
na
...
...
...
...
20
...
...
...
10
...
...
...
22
** 68
...
...
...
59
...
% F % Private MF M
22
21
...
2
16
** 4
...
...
...
...
...
99
** 16
81
** 31
...
...
64
...
82
106
...
38
** 41
...
46
...
...
90
77
...
99
27
41
...
67
...
** 60
...
58
F
34
20
...
2
...
4
...
...
36
...
...
98
...
80
31
...
...
64
...
87
109
...
** 38
44
...
51
...
21
82
77
...
89
27
47
...
62
...
63
...
61
34
** 20
...
2
...
4
...
...
36
...
...
98
...
78
30
...
...
65
...
87
108
...
** 38
43
...
51
...
21
82
76
...
89
26
47
...
60
...
...
...
65
MF M
34
** 20
...
2
...
4
...
...
37
...
...
98
...
83
32
...
...
64
...
87
110
...
** 38
44
...
51
...
22
83
78
...
90
27
48
...
63
...
...
...
56
12
-3
...
–
...
–
...
...
...
...
...
-2
...
1
–
...
...
–
...
5
4
...
1
3
...
5
...
...
-6
1
...
-9
–
7
...
-2
...
3
...
2
1.00
0.94
...
1.06
0.99
0.99
...
...
...
...
...
0.97
1.09
1.04
1.03
...
...
0.99
...
0.99
1.03
...
1.01
1.05
...
0.99
...
...
1.04
1.03
...
1.01
1.04
1.02
...
1.09
...
0.99
...
0.97
F MF
Change1999 to
2000
Gross Enrolment Ratio
1999/2000 2000/2001
TABLE 1: PRE-PRIMARY EDUCATION, ISCED 0
GPI
Regions
Country or territory
Enrolment
2000/2001
global education digest 2003
28
1999/2000
1.00
1.01
...
1.00
...
1.00
...
...
1.03
...
...
1.00
...
1.07
1.06
...
...
0.99
...
1.00
1.02
...
1.01
1.03
...
1.01
...
1.05
1.02
1.03
...
1.01
1.04
1.02
...
1.05
...
...
...
0.86
2000/2001
South Africa
Sudan
Swaziland
Togo
Tunisia
Uganda
United Republic of Tanzania
Zambia
Zimbabwe
America, North
Anguilla
Antigua and Barbuda
Aruba
Bahamas
Barbados
Belize
Bermuda
British Virgin Islands
Canada
Cayman Islands
Costa Rica
Cuba
Dominica
Dominican Republic
El Salvador
Grenada
Guatemala
Haiti
Honduras
Jamaica
Mexico
Montserrat
Netherlands Antilles
Nicaragua
Panama
Saint Kitts and Nevis
Saint Lucia
Saint Vincent and the Grenadines
Trinidad and Tobago
Turks and Caicos Islands
United States
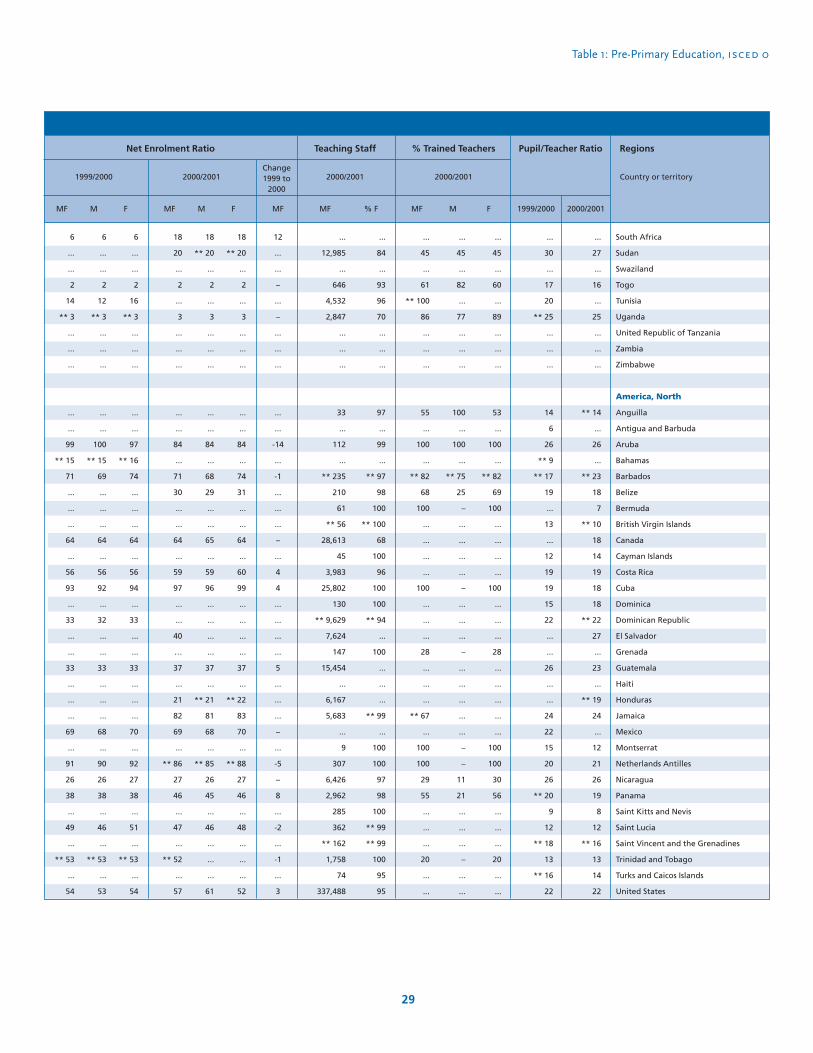
Table 1: Pre-Primary Education, isced 0
29
Net Enrolment Ratio
1999/2000 2000/2001
Regions
Country or territory
% Trained Teachers
2000/2001
Teaching Staff
2000/2001
Pupil/Teacher Ratio
1999/2000 2000/2001
6
...
...
2
14
** 3
...
...
...
...
...
99
** 15
71
...
...
...
64
...
56
93
...
33
...
...
33
...
...
...
69
...
91
26
38
...
49
...
** 53
...
54
MF
6
...
...
2
12
** 3
...
...
...
...
...
100
** 15
69
...
...
...
64
...
56
92
...
32
...
...
33
...
...
...
68
...
90
26
38
...
46
...
** 53
...
53
M
6
...
...
2
16
** 3
...
...
...
...
...
97
** 16
74
...
...
...
64
...
56
94
...
33
...
...
33
...
...
...
70
...
92
27
38
...
51
...
** 53
...
54
F
18
20
...
2
...
3
...
...
...
...
...
84
...
71
30
...
...
64
...
59
97
...
...
40
…
37
...
21
82
69
...
** 86
27
46
...
47
...
** 52
...
57
MF
18
** 20
...
2
...
3
...
...
...
...
...
84
...
68
29
...
...
65
...
59
96
...
...
...
...
37
...
** 21
81
68
...
** 85
26
45
...
46
...
...
...
61
M
18
** 20
...
2
...
3
...
...
...
...
...
84
...
74
31
...
...
64
...
60
99
...
...
...
...
37
...
** 22
83
70
...
** 88
27
46
...
48
...
...
...
52
F
...
45
...
61
** 100
86
...
...
...
55
...
100
...
** 82
68
100
...
...
...
...
100
...
...
...
28
...
...
...
** 67
...
100
100
29
55
...
...
...
20
...
...
MF
...
45
...
82
...
77
...
...
...
100
...
100
...
** 75
25
–
...
...
...
...
–
...
...
...
–
...
...
...
...
...
–
–
11
21
...
...
...
–
...
...
M
...
45
...
60
...
89
...
...
...
53
...
100
...
** 82
69
100
...
...
...
...
100
...
...
...
28
...
...
...
...
...
100
100
30
56
...
...
...
20
...
...
...
30
...
17
20
** 25
...
...
...
14
6
26
** 9
** 17
19
...
13
...
12
19
19
15
22
...
...
26
...
...
24
22
15
20
26
** 20
9
12
** 18
13
** 16
22
...
27
...
16
...
25
...
...
...
** 14
...
26
...
** 23
18
7
** 10
18
14
19
18
18
** 22
27
...
23
...
** 19
24
...
12
21
26
19
8
12
** 16
13
14
22
South Africa
Sudan
Swaziland
Togo
Tunisia
Uganda
United Republic of Tanzania
Zambia
Zimbabwe
America, North
Anguilla
Antigua and Barbuda
Aruba
Bahamas
Barbados
Belize
Bermuda
British Virgin Islands
Canada
Cayman Islands
Costa Rica
Cuba
Dominica
Dominican Republic
El Salvador
Grenada
Guatemala
Haiti
Honduras
Jamaica
Mexico
Montserrat
Netherlands Antilles
Nicaragua
Panama
Saint Kitts and Nevis
Saint Lucia
Saint Vincent and the Grenadines
Trinidad and Tobago
Turks and Caicos Islands
United States
F
...
84
...
93
96
70
...
...
...
97
...
99
...
** 97
98
100
** 100
68
100
96
100
100
** 94
...
100
...
...
...
** 99
...
100
100
97
98
100
** 99
** 99
100
95
95
% F
12
...
...
–
...
–
...
...
...
...
...
-14
...
-1
...
...
...
–
...
4
4
...
...
...
...
5
...
...
...
–
...
-5
–
8
...
-2
...
-1
...
3
MF
...
12,985
...
646
4,532
2,847
...
...
...
33
...
112
...
** 235
210
61
** 56
28,613
45
3,983
25,802
130
** 9,629
7,624
147
15,454
...
6,167
5,683
...
9
307
6,426
2,962
285
362
** 162
1,758
74
337,488
MF
Change1999 to
2000
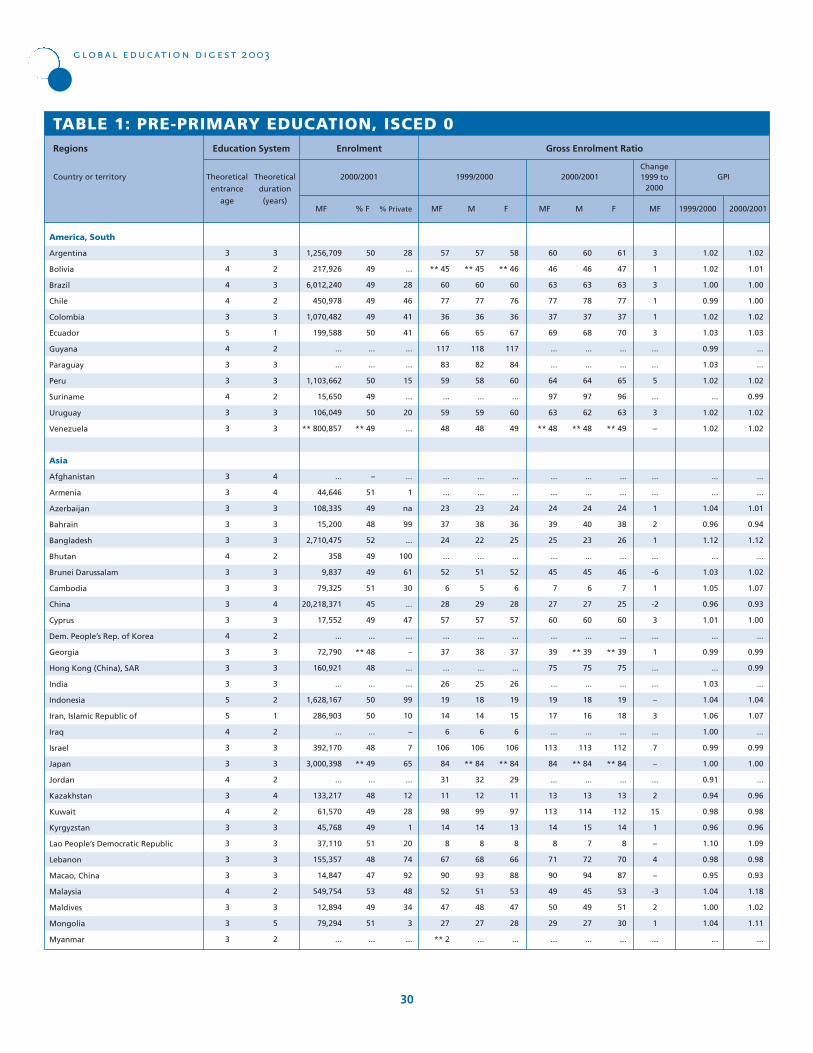
3
4
4
4
3
5
4
3
3
4
3
3
3
3
3
3
3
4
3
3
3
3
4
3
3
3
5
5
4
3
3
4
3
4
3
3
3
3
4
3
3
3
3
2
3
2
3
1
2
3
3
2
3
3
4
4
3
3
3
2
3
3
4
3
2
3
3
3
2
1
2
3
3
2
4
2
3
3
3
3
2
3
5
2
1,256,709
217,926
6,012,240
450,978
1,070,482
199,588
...
...
1,103,662
15,650
106,049
** 800,857
...
44,646
108,335
15,200
2,710,475
358
9,837
79,325
20,218,371
17,552
...
72,790
160,921
...
1,628,167
286,903
...
392,170
3,000,398
...
133,217
61,570
45,768
37,110
155,357
14,847
549,754
12,894
79,294
...
Education System
Theoretical
entrance
age
Theoretical
duration
(years)MF
50
49
49
49
49
50
...
...
50
49
50
** 49
–
51
49
48
52
49
49
51
45
49
...
** 48
48
...
50
50
...
48
** 49
...
48
49
49
51
48
47
53
49
51
...
57
** 45
60
77
36
66
117
83
59
...
59
48
...
...
23
37
24
...
52
6
28
57
...
37
...
26
19
14
6
106
84
31
11
98
14
8
67
90
52
47
27
** 2
57
** 45
60
77
36
65
118
82
58
...
59
48
...
...
23
38
22
...
51
5
29
57
...
38
...
25
18
14
6
106
** 84
32
12
99
14
8
68
93
51
48
27
...
28
...
28
46
41
41
...
...
15
...
20
...
...
1
na
99
...
100
61
30
...
47
...
–
...
...
99
10
–
7
65
...
12
28
1
20
74
92
48
34
3
...
% F % Private MF M
58
** 46
60
76
36
67
117
84
60
...
60
49
...
...
24
36
25
...
52
6
28
57
...
37
...
26
19
15
6
106
** 84
29
11
97
13
8
66
88
53
47
28
...
F
60
46
63
77
37
69
...
...
64
97
63
** 48
...
...
24
39
25
...
45
7
27
60
...
39
75
...
19
17
...
113
84
...
13
113
14
8
71
90
49
50
29
...
60
46
63
78
37
68
...
...
64
97
62
** 48
...
...
24
40
23
...
45
6
27
60
...
** 39
75
...
18
16
...
113
** 84
...
13
114
15
7
72
94
45
49
27
...
MF M
61
47
63
77
37
70
...
...
65
96
63
** 49
...
...
24
38
26
...
46
7
25
60
...
** 39
75
...
19
18
...
112
** 84
...
13
112
14
8
70
87
53
51
30
...
3
1
3
1
1
3
...
...
5
...
3
–
...
...
1
2
1
...
-6
1
-2
3
...
1
...
...
–
3
...
7
–
...
2
15
1
–
4
–
-3
2
1
...
1.02
1.02
1.00
0.99
1.02
1.03
0.99
1.03
1.02
...
1.02
1.02
...
...
1.04
0.96
1.12
...
1.03
1.05
0.96
1.01
...
0.99
...
1.03
1.04
1.06
1.00
0.99
1.00
0.91
0.94
0.98
0.96
1.10
0.98
0.95
1.04
1.00
1.04
...
F MF
Change1999 to
2000
Gross Enrolment Ratio
1999/2000 2000/2001
TABLE 1: PRE-PRIMARY EDUCATION, ISCED 0
GPI
Regions
Country or territory
Enrolment
2000/2001
global education digest 2003
30
1999/2000
1.02
1.01
1.00
1.00
1.02
1.03
...
...
1.02
0.99
1.02
1.02
...
...
1.01
0.94
1.12
...
1.02
1.07
0.93
1.00
...
0.99
0.99
...
1.04
1.07
...
0.99
1.00
...
0.96
0.98
0.96
1.09
0.98
0.93
1.18
1.02
1.11
...
2000/2001
America, South
Argentina
Bolivia
Brazil
Chile
Colombia
Ecuador
Guyana
Paraguay
Peru
Suriname
Uruguay
Venezuela
Asia
Afghanistan
Armenia
Azerbaijan
Bahrain
Bangladesh
Bhutan
Brunei Darussalam
Cambodia
China
Cyprus
Dem. People’s Rep. of Korea
Georgia
Hong Kong (China), SAR
India
Indonesia
Iran, Islamic Republic of
Iraq
Israel
Japan
Jordan
Kazakhstan
Kuwait
Kyrgyzstan
Lao People’s Democratic Republic
Lebanon
Macao, China
Malaysia
Maldives
Mongolia
Myanmar
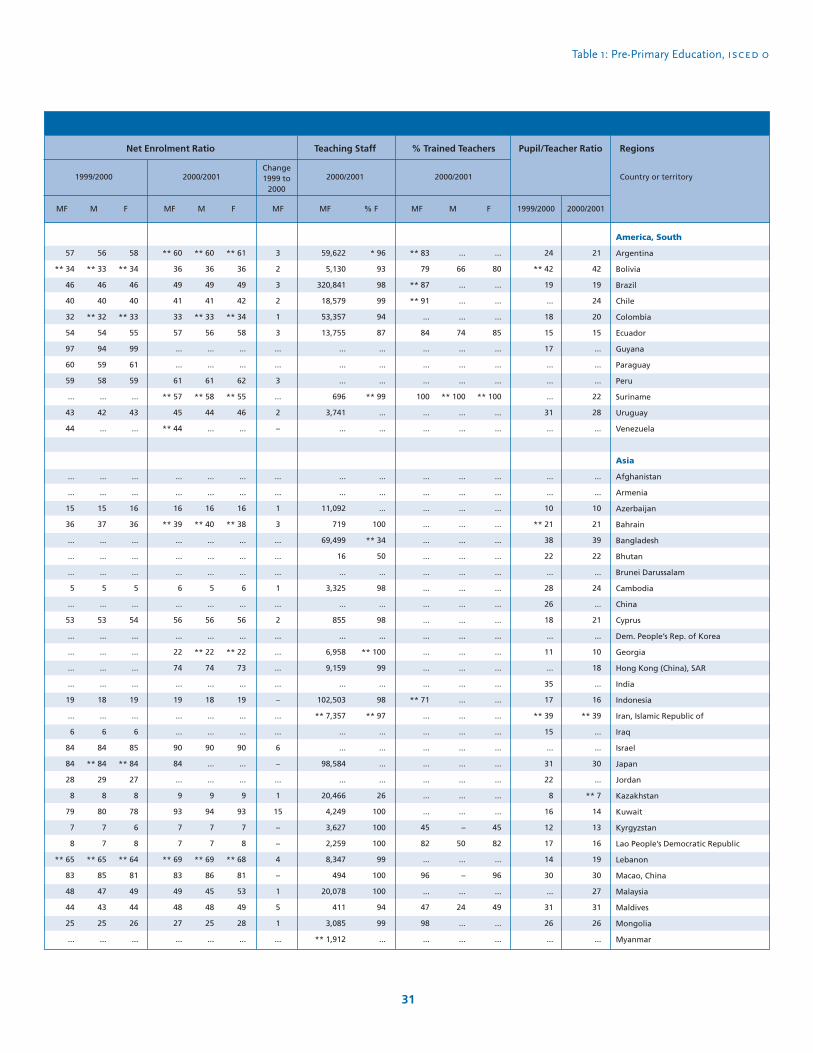
Table 1: Pre-Primary Education, isced 0
31
Regions
Country or territory
% Trained Teachers
2000/2001
Teaching Staff
2000/2001
Pupil/Teacher Ratio
1999/2000 2000/2001
57
** 34
46
40
32
54
97
60
59
...
43
44
...
...
15
36
...
...
...
5
...
53
...
...
...
...
19
...
6
84
84
28
8
79
7
8
** 65
83
48
44
25
...
MF
56
** 33
46
40
** 32
54
94
59
58
...
42
...
...
...
15
37
...
...
...
5
...
53
...
...
...
...
18
...
6
84
** 84
29
8
80
7
7
** 65
85
47
43
25
...
M
58
** 34
46
40
** 33
55
99
61
59
...
43
...
...
...
16
36
...
...
...
5
...
54
...
...
...
...
19
...
6
85
** 84
27
8
78
6
8
** 64
81
49
44
26
...
F
** 60
36
49
41
33
57
...
...
61
** 57
45
** 44
...
...
16
** 39
...
...
...
6
...
56
...
22
74
...
19
...
...
90
84
...
9
93
7
7
** 69
83
49
48
27
...
MF
** 60
36
49
41
** 33
56
...
...
61
** 58
44
...
...
...
16
** 40
...
...
...
5
...
56
...
** 22
74
...
18
...
...
90
...
...
9
94
7
7
** 69
86
45
48
25
...
M
** 61
36
49
42
** 34
58
...
...
62
** 55
46
...
...
...
16
** 38
...
...
...
6
...
56
...
** 22
73
...
19
...
...
90
...
...
9
93
7
8
** 68
81
53
49
28
...
F
** 83
79
** 87
** 91
...
84
...
...
...
100
...
...
...
...
...
...
...
...
...
...
...
...
...
...
...
...
** 71
...
...
...
...
...
...
...
45
82
...
96
...
47
98
...
MF
...
66
...
...
...
74
...
...
...
** 100
...
...
...
...
...
...
...
...
...
...
...
...
...
...
...
...
...
...
...
...
...
...
...
...
–
50
...
–
...
24
...
...
M
...
80
...
...
...
85
...
...
...
** 100
...
...
...
...
...
...
...
...
...
...
...
...
...
...
...
...
...
...
...
...
...
...
...
...
45
82
...
96
...
49
...
...
24
** 42
19
...
18
15
17
...
...
...
31
...
...
...
10
** 21
38
22
...
28
26
18
...
11
...
35
17
** 39
15
...
31
22
8
16
12
17
14
30
...
31
26
...
21
42
19
24
20
15
...
...
...
22
28
...
...
...
10
21
39
22
...
24
...
21
...
10
18
...
16
** 39
...
...
30
...
** 7
14
13
16
19
30
27
31
26
...
America, South
Argentina
Bolivia
Brazil
Chile
Colombia
Ecuador
Guyana
Paraguay
Peru
Suriname
Uruguay
Venezuela
Asia
Afghanistan
Armenia
Azerbaijan
Bahrain
Bangladesh
Bhutan
Brunei Darussalam
Cambodia
China
Cyprus
Dem. People’s Rep. of Korea
Georgia
Hong Kong (China), SAR
India
Indonesia
Iran, Islamic Republic of
Iraq
Israel
Japan
Jordan
Kazakhstan
Kuwait
Kyrgyzstan
Lao People’s Democratic Republic
Lebanon
Macao, China
Malaysia
Maldives
Mongolia
Myanmar
F
* 96
93
98
99
94
87
...
...
...
** 99
...
...
...
...
...
100
** 34
50
...
98
...
98
...
** 100
99
...
98
** 97
...
...
...
...
26
100
100
100
99
100
100
94
99
...
% F
3
2
3
2
1
3
...
...
3
...
2
–
...
...
1
3
...
...
...
1
...
2
...
...
...
...
–
...
...
6
–
...
1
15
–
–
4
–
1
5
1
...
MF
59,622
5,130
320,841
18,579
53,357
13,755
...
...
...
696
3,741
...
...
...
11,092
719
69,499
16
...
3,325
...
855
...
6,958
9,159
...
102,503
** 7,357
...
...
98,584
...
20,466
4,249
3,627
2,259
8,347
494
20,078
411
3,085
** 1,912
MF
Change1999 to
2000
1999/2000 2000/2001
Net Enrolment Ratio
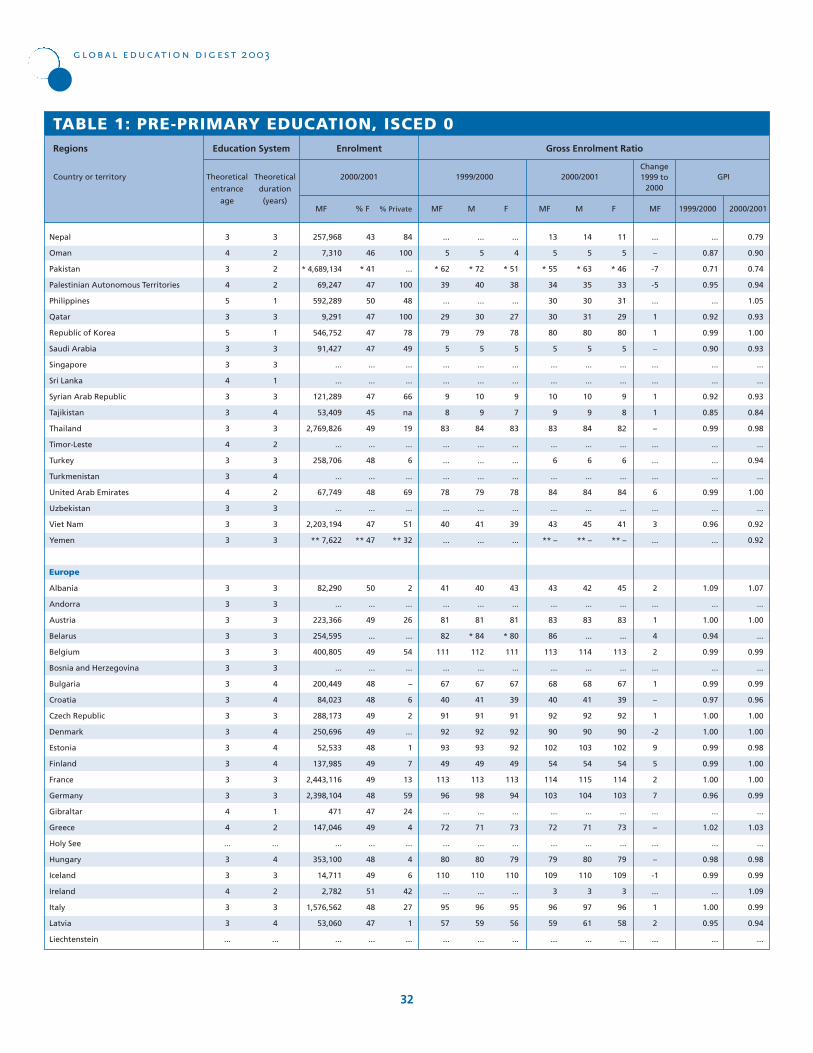
3
4
3
4
5
3
5
3
3
4
3
3
3
4
3
3
4
3
3
3
3
3
3
3
3
3
3
3
3
3
3
3
3
3
4
4
...
3
3
4
3
3
...
3
2
2
2
1
3
1
3
3
1
3
4
3
2
3
4
2
3
3
3
3
3
3
3
3
3
4
4
3
4
4
4
3
3
1
2
...
4
3
2
3
4
...
257,968
7,310
* 4,689,134
69,247
592,289
9,291
546,752
91,427
...
...
121,289
53,409
2,769,826
...
258,706
...
67,749
...
2,203,194
** 7,622
82,290
...
223,366
254,595
400,805
...
200,449
84,023
288,173
250,696
52,533
137,985
2,443,116
2,398,104
471
147,046
...
353,100
14,711
2,782
1,576,562
53,060
...
Education System
Theoretical
entrance
age
Theoretical
duration
(years)MF
43
46
* 41
47
50
47
47
47
...
...
47
45
49
...
48
...
48
...
47
** 47
50
...
49
...
49
...
48
48
49
49
48
49
49
48
47
49
...
48
49
51
48
47
...
...
5
* 62
39
...
29
79
5
...
...
9
8
83
...
...
...
78
...
40
...
41
...
81
82
111
...
67
40
91
92
93
49
113
96
...
72
...
80
110
...
95
57
...
...
5
* 72
40
...
30
79
5
...
...
10
9
84
...
...
...
79
...
41
...
40
...
81
* 84
112
...
67
41
91
92
93
49
113
98
...
71
...
80
110
...
96
59
...
84
100
...
100
48
100
78
49
...
...
66
na
19
...
6
...
69
...
51
** 32
2
...
26
...
54
...
–
6
2
...
1
7
13
59
24
4
...
4
6
42
27
1
...
% F % Private MF M
...
4
* 51
38
...
27
78
5
...
...
9
7
83
...
...
...
78
...
39
...
43
...
81
* 80
111
...
67
39
91
92
92
49
113
94
...
73
...
79
110
...
95
56
...
F
13
5
* 55
34
30
30
80
5
...
...
10
9
83
...
6
...
84
...
43
** –
43
...
83
86
113
...
68
40
92
90
102
54
114
103
...
72
...
79
109
3
96
59
...
14
5
* 63
35
30
31
80
5
...
...
10
9
84
...
6
...
84
...
45
** –
42
...
83
...
114
...
68
41
92
90
103
54
115
104
...
71
...
80
110
3
97
61
...
MF M
11
5
* 46
33
31
29
80
5
...
...
9
8
82
...
6
...
84
...
41
** –
45
...
83
...
113
...
67
39
92
90
102
54
114
103
...
73
...
79
109
3
96
58
...
...
–
-7
-5
...
1
1
–
...
...
1
1
–
...
...
...
6
...
3
...
2
...
1
4
2
...
1
–
1
-2
9
5
2
7
...
–
...
–
-1
...
1
2
...
...
0.87
0.71
0.95
...
0.92
0.99
0.90
...
...
0.92
0.85
0.99
...
...
...
0.99
...
0.96
...
1.09
...
1.00
0.94
0.99
...
0.99
0.97
1.00
1.00
0.99
0.99
1.00
0.96
...
1.02
...
0.98
0.99
...
1.00
0.95
...
F MF
Change1999 to
2000
Gross Enrolment Ratio
1999/2000 2000/2001
TABLE 1: PRE-PRIMARY EDUCATION, ISCED 0
GPI
Regions
Country or territory
Enrolment
2000/2001
global education digest 2003
32
1999/2000
0.79
0.90
0.74
0.94
1.05
0.93
1.00
0.93
...
...
0.93
0.84
0.98
...
0.94
...
1.00
...
0.92
0.92
1.07
...
1.00
...
0.99
...
0.99
0.96
1.00
1.00
0.98
1.00
1.00
0.99
...
1.03
...
0.98
0.99
1.09
0.99
0.94
...
2000/2001
Nepal
Oman
Pakistan
Palestinian Autonomous Territories
Philippines
Qatar
Republic of Korea
Saudi Arabia
Singapore
Sri Lanka
Syrian Arab Republic
Tajikistan
Thailand
Timor-Leste
Turkey
Turkmenistan
United Arab Emirates
Uzbekistan
Viet Nam
Yemen
Europe
Albania
Andorra
Austria
Belarus
Belgium
Bosnia and Herzegovina
Bulgaria
Croatia
Czech Republic
Denmark
Estonia
Finland
France
Germany
Gibraltar
Greece
Holy See
Hungary
Iceland
Ireland
Italy
Latvia
Liechtenstein
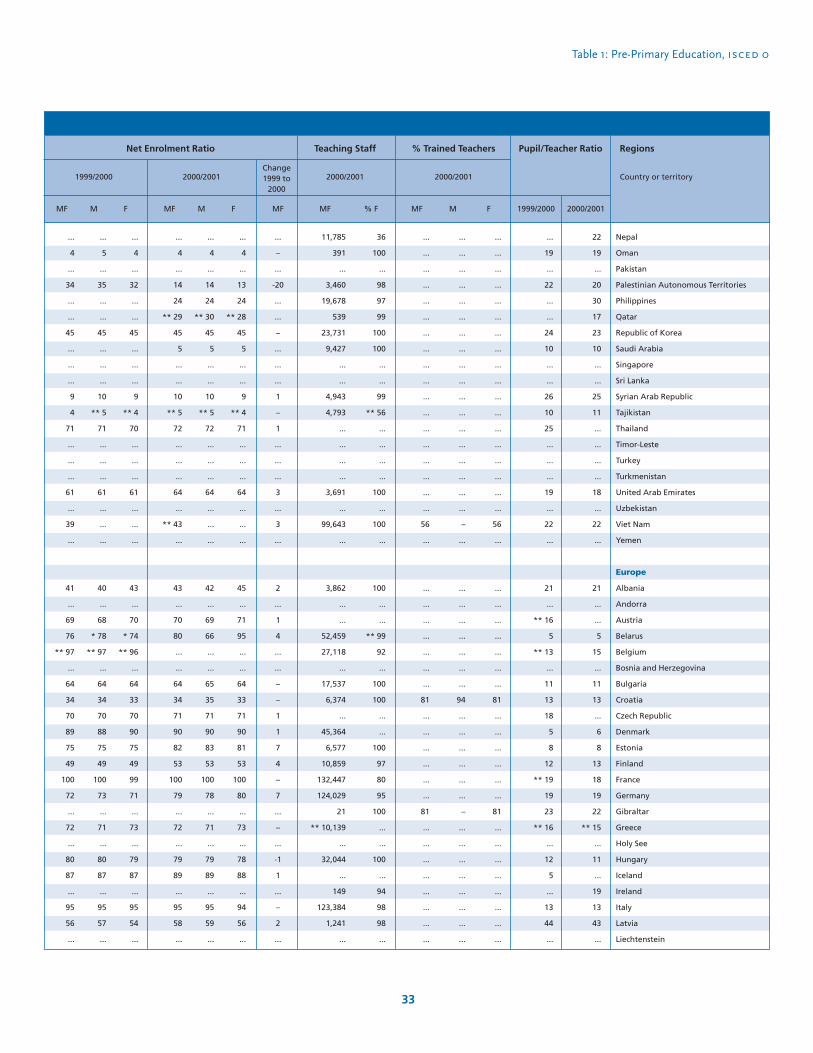
Table 1: Pre-Primary Education, isced 0
33
Regions
Country or territory
% Trained Teachers
2000/2001
Teaching Staff
2000/2001
Pupil/Teacher Ratio
1999/2000 2000/2001
...
4
...
34
...
...
45
...
...
...
9
4
71
...
...
...
61
...
39
...
41
...
69
76
** 97
...
64
34
70
89
75
49
100
72
...
72
...
80
87
...
95
56
...
MF
...
5
...
35
...
...
45
...
...
...
10
** 5
71
...
...
...
61
...
...
...
40
...
68
* 78
** 97
...
64
34
70
88
75
49
100
73
...
71
...
80
87
...
95
57
...
M
...
4
...
32
...
...
45
...
...
...
9
** 4
70
...
...
...
61
...
...
...
43
...
70
* 74
** 96
...
64
33
70
90
75
49
99
71
...
73
...
79
87
...
95
54
...
F
...
4
...
14
24
** 29
45
5
...
...
10
** 5
72
...
...
...
64
...
** 43
...
43
...
70
80
...
...
64
34
71
90
82
53
100
79
...
72
...
79
89
...
95
58
...
MF
...
4
...
14
24
** 30
45
5
...
...
10
** 5
72
...
...
...
64
...
...
...
42
...
69
66
...
...
65
35
71
90
83
53
100
78
...
71
...
79
89
...
95
59
...
M
...
4
...
13
24
** 28
45
5
...
...
9
** 4
71
...
...
...
64
...
...
...
45
...
71
95
...
...
64
33
71
90
81
53
100
80
...
73
...
78
88
...
94
56
...
F
...
...
...
...
...
...
...
...
...
...
...
...
...
...
...
...
...
...
56
...
...
...
...
...
...
...
...
81
...
...
...
...
...
...
81
...
...
...
...
...
...
...
...
MF
...
...
...
...
...
...
...
...
...
...
...
...
...
...
...
...
...
...
–
...
...
...
...
...
...
...
...
94
...
...
...
...
...
...
–
...
...
...
...
...
...
...
...
M
...
...
...
...
...
...
...
...
...
...
...
...
...
...
...
...
...
...
56
...
...
...
...
...
...
...
...
81
...
...
...
...
...
...
81
...
...
...
...
...
...
...
...
...
19
...
22
...
...
24
10
...
...
26
10
25
...
...
...
19
...
22
...
21
...
** 16
5
** 13
...
11
13
18
5
8
12
** 19
19
23
** 16
...
12
5
...
13
44
...
22
19
...
20
30
17
23
10
...
...
25
11
...
...
...
...
18
...
22
...
21
...
...
5
15
...
11
13
...
6
8
13
18
19
22
** 15
...
11
...
19
13
43
...
Nepal
Oman
Pakistan
Palestinian Autonomous Territories
Philippines
Qatar
Republic of Korea
Saudi Arabia
Singapore
Sri Lanka
Syrian Arab Republic
Tajikistan
Thailand
Timor-Leste
Turkey
Turkmenistan
United Arab Emirates
Uzbekistan
Viet Nam
Yemen
Europe
Albania
Andorra
Austria
Belarus
Belgium
Bosnia and Herzegovina
Bulgaria
Croatia
Czech Republic
Denmark
Estonia
Finland
France
Germany
Gibraltar
Greece
Holy See
Hungary
Iceland
Ireland
Italy
Latvia
Liechtenstein
F
36
100
...
98
97
99
100
100
...
...
99
** 56
...
...
...
...
100
...
100
...
100
...
...
** 99
92
...
100
100
...
...
100
97
80
95
100
...
...
100
...
94
98
98
...
% F
...
–
...
-20
...
...
–
...
...
...
1
–
1
...
...
...
3
...
3
...
2
...
1
4
...
...
–
–
1
1
7
4
–
7
...
–
...
-1
1
...
–
2
...
MF
11,785
391
...
3,460
19,678
539
23,731
9,427
...
...
4,943
4,793
...
...
...
...
3,691
...
99,643
...
3,862
...
...
52,459
27,118
...
17,537
6,374
...
45,364
6,577
10,859
132,447
124,029
21
** 10,139
...
32,044
...
149
123,384
1,241
...
MF
Change1999 to
2000
1999/2000 2000/2001
Net Enrolment Ratio
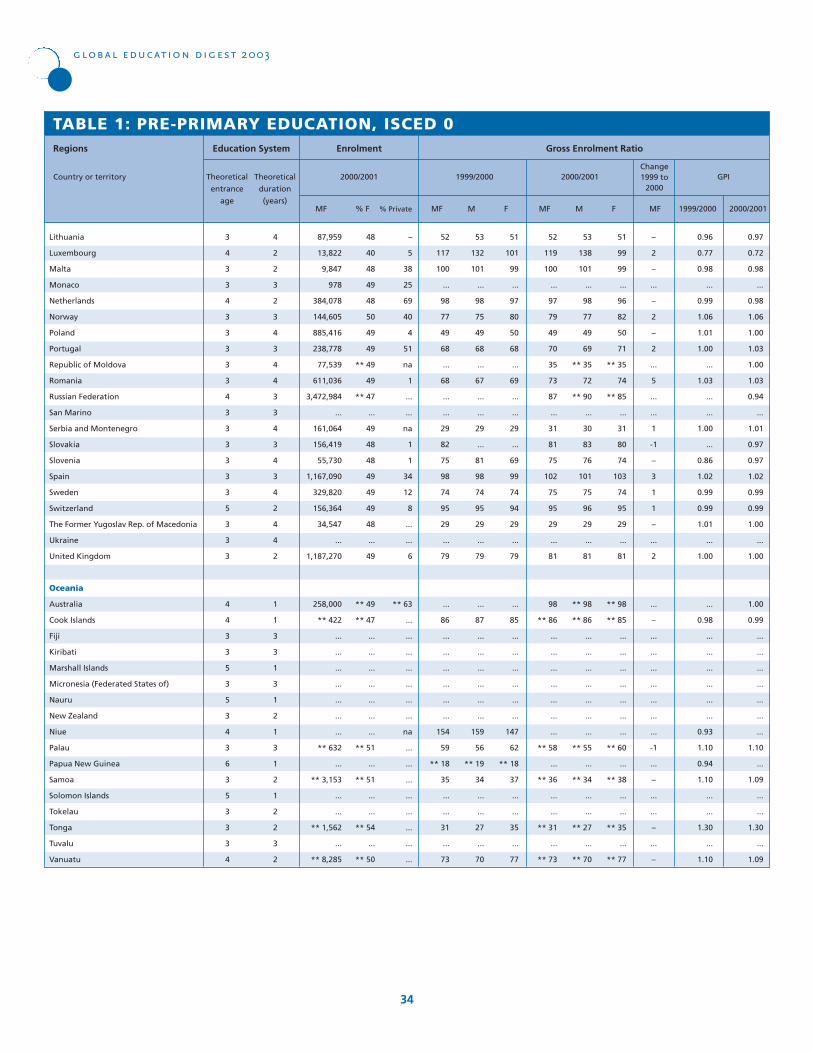
3
4
3
3
4
3
3
3
3
3
4
3
3
3
3
3
3
5
3
3
3
4
4
3
3
5
3
5
3
4
3
6
3
5
3
3
3
4
4
2
2
3
2
3
4
3
4
4
3
3
4
3
4
3
4
2
4
4
2
1
1
3
3
1
3
1
2
1
3
1
2
1
2
2
3
2
87,959
13,822
9,847
978
384,078
144,605
885,416
238,778
77,539
611,036
3,472,984
...
161,064
156,419
55,730
1,167,090
329,820
156,364
34,547
...
1,187,270
258,000
** 422
...
...
...
...
...
...
...
** 632
...
** 3,153
...
...
** 1,562
...
** 8,285
Education System
Theoretical
entrance
age
Theoretical
duration
(years)MF
48
40
48
49
48
50
49
49
** 49
49
** 47
...
49
48
48
49
49
49
48
...
49
** 49
** 47
...
...
...
...
...
...
...
** 51
...
** 51
...
...
** 54
...
** 50
52
117
100
...
98
77
49
68
...
68
...
...
29
82
75
98
74
95
29
...
79
...
86
...
...
...
...
...
...
154
59
** 18
35
...
...
31
...
73
53
132
101
...
98
75
49
68
...
67
...
...
29
...
81
98
74
95
29
...
79
...
87
...
...
...
...
...
...
159
56
** 19
34
...
...
27
...
70
–
5
38
25
69
40
4
51
na
1
...
...
na
1
1
34
12
8
...
...
6
** 63
...
...
...
...
...
...
...
na
...
...
...
...
...
...
...
...
% F % Private MF M
51
101
99
...
97
80
50
68
...
69
...
...
29
...
69
99
74
94
29
...
79
...
85
...
...
...
...
...
...
147
62
** 18
37
...
...
35
...
77
F
52
119
100
...
97
79
49
70
35
73
87
...
31
81
75
102
75
95
29
...
81
98
** 86
...
...
...
...
...
...
...
** 58
...
** 36
...
...
** 31
...
** 73
53
138
101
...
98
77
49
69
** 35
72
** 90
...
30
83
76
101
75
96
29
...
81
** 98
** 86
...
...
...
...
...
...
...
** 55
...
** 34
...
...
** 27
...
** 70
MF M
51
99
99
...
96
82
50
71
** 35
74
** 85
...
31
80
74
103
74
95
29
...
81
** 98
** 85
...
...
...
...
...
...
...
** 60
...
** 38
...
...
** 35
...
** 77
–
2
–
...
–
2
–
2
...
5
...
...
1
-1
–
3
1
1
–
...
2
...
–
...
...
...
...
...
...
...
-1
...
–
...
...
–
...
–
0.96
0.77
0.98
...
0.99
1.06
1.01
1.00
...
1.03
...
...
1.00
...
0.86
1.02
0.99
0.99
1.01
...
1.00
...
0.98
...
...
...
...
...
...
0.93
1.10
0.94
1.10
...
...
1.30
...
1.10
F MF
Change1999 to
2000
Gross Enrolment Ratio
1999/2000 2000/2001
TABLE 1: PRE-PRIMARY EDUCATION, ISCED 0
GPI
Regions
Country or territory
Enrolment
2000/2001
global education digest 2003
34
1999/2000
0.97
0.72
0.98
...
0.98
1.06
1.00
1.03
1.00
1.03
0.94
...
1.01
0.97
0.97
1.02
0.99
0.99
1.00
...
1.00
1.00
0.99
...
...
...
...
...
...
...
1.10
...
1.09
...
...
1.30
...
1.09
2000/2001
Lithuania
Luxembourg
Malta
Monaco
Netherlands
Norway
Poland
Portugal
Republic of Moldova
Romania
Russian Federation
San Marino
Serbia and Montenegro
Slovakia
Slovenia
Spain
Sweden
Switzerland
The Former Yugoslav Rep. of Macedonia
Ukraine
United Kingdom
Oceania
Australia
Cook Islands
Fiji
Kiribati
Marshall Islands
Micronesia (Federated States of)
Nauru
New Zealand
Niue
Palau
Papua New Guinea
Samoa
Solomon Islands
Tokelau
Tonga
Tuvalu
Vanuatu
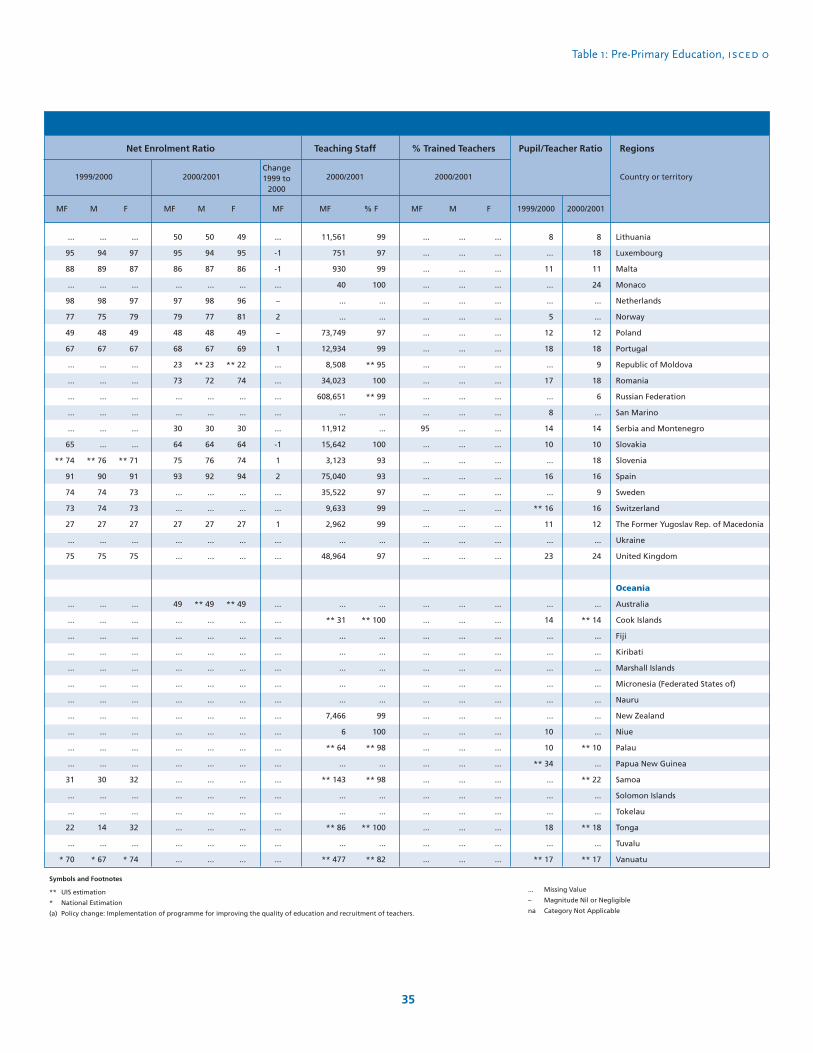
Table 1: Pre-Primary Education, isced 0
35
Net Enrolment Ratio
1999/2000 2000/2001
Regions
Country or territory
% Trained Teachers
2000/2001
Teaching Staff
2000/2001
Pupil/Teacher Ratio
1999/2000 2000/2001
...
95
88
...
98
77
49
67
...
...
...
...
...
65
** 74
91
74
73
27
...
75
...
...
...
...
...
...
...
...
...
...
...
31
...
...
22
...
* 70
MF
...
94
89
...
98
75
48
67
...
...
...
...
...
...
** 76
90
74
74
27
...
75
...
...
...
...
...
...
...
...
...
...
...
30
...
...
14
...
* 67
M
...
97
87
...
97
79
49
67
...
...
...
...
...
...
** 71
91
73
73
27
...
75
...
...
...
...
...
...
...
...
...
...
...
32
...
...
32
...
* 74
F
50
95
86
...
97
79
48
68
23
73
...
...
30
64
75
93
...
...
27
...
...
49
...
...
...
...
...
...
...
...
...
...
...
...
...
...
...
...
MF
50
94
87
...
98
77
48
67
** 23
72
...
...
30
64
76
92
...
...
27
...
...
** 49
...
...
...
...
...
...
...
...
...
...
...
...
...
...
...
...
M
49
95
86
...
96
81
49
69
** 22
74
...
...
30
64
74
94
...
...
27
...
...
** 49
...
...
...
...
...
...
...
...
...
...
...
...
...
...
...
...
F
...
...
...
...
...
...
...
...
...
...
...
...
95
...
...
...
...
...
...
...
...
...
...
...
...
...
...
...
...
...
...
...
...
...
...
...
...
...
MF
...
...
...
...
...
...
...
...
...
...
...
...
...
...
...
...
...
...
...
...
...
...
...
...
...
...
...
...
...
...
...
...
...
...
...
...
...
...
M
...
...
...
...
...
...
...
...
...
...
...
...
...
...
...
...
...
...
...
...
...
...
...
...
...
...
...
...
...
...
...
...
...
...
...
...
...
...
8
...
11
...
...
5
12
18
...
17
...
8
14
10
...
16
...
** 16
11
...
23
...
14
...
...
...
...
...
...
10
10
** 34
...
...
...
18
...
** 17
8
18
11
24
...
...
12
18
9
18
6
...
14
10
18
16
9
16
12
...
24
...
** 14
...
...
...
...
...
...
...
** 10
...
** 22
...
...
** 18
...
** 17
Lithuania
Luxembourg
Malta
Monaco
Netherlands
Norway
Poland
Portugal
Republic of Moldova
Romania
Russian Federation
San Marino
Serbia and Montenegro
Slovakia
Slovenia
Spain
Sweden
Switzerland
The Former Yugoslav Rep. of Macedonia
Ukraine
United Kingdom
Oceania
Australia
Cook Islands
Fiji
Kiribati
Marshall Islands
Micronesia (Federated States of)
Nauru
New Zealand
Niue
Palau
Papua New Guinea
Samoa
Solomon Islands
Tokelau
Tonga
Tuvalu
Vanuatu
F
99
97
99
100
...
...
97
99
** 95
100
** 99
...
...
100
93
93
97
99
99
...
97
...
** 100
...
...
...
...
...
99
100
** 98
...
** 98
...
...
** 100
...
** 82
% F
...
-1
-1
...
–
2
–
1
...
...
...
...
...
-1
1
2
...
...
1
...
...
...
...
...
...
...
...
...
...
...
...
...
...
...
...
...
...
...
MF
11,561
751
930
40
...
...
73,749
12,934
8,508
34,023
608,651
...
11,912
15,642
3,123
75,040
35,522
9,633
2,962
...
48,964
...
** 31
...
...
...
...
...
7,466
6
** 64
...
** 143
...
...
** 86
...
** 477
MF
Change1999 to
2000
Symbols and Footnotes
** UIS estimation
* National Estimation
(a) Policy change: Implementation of programme for improving the quality of education and recruitment of teachers.
... Missing Value
– Magnitude Nil or Negligible
na Category Not Applicable
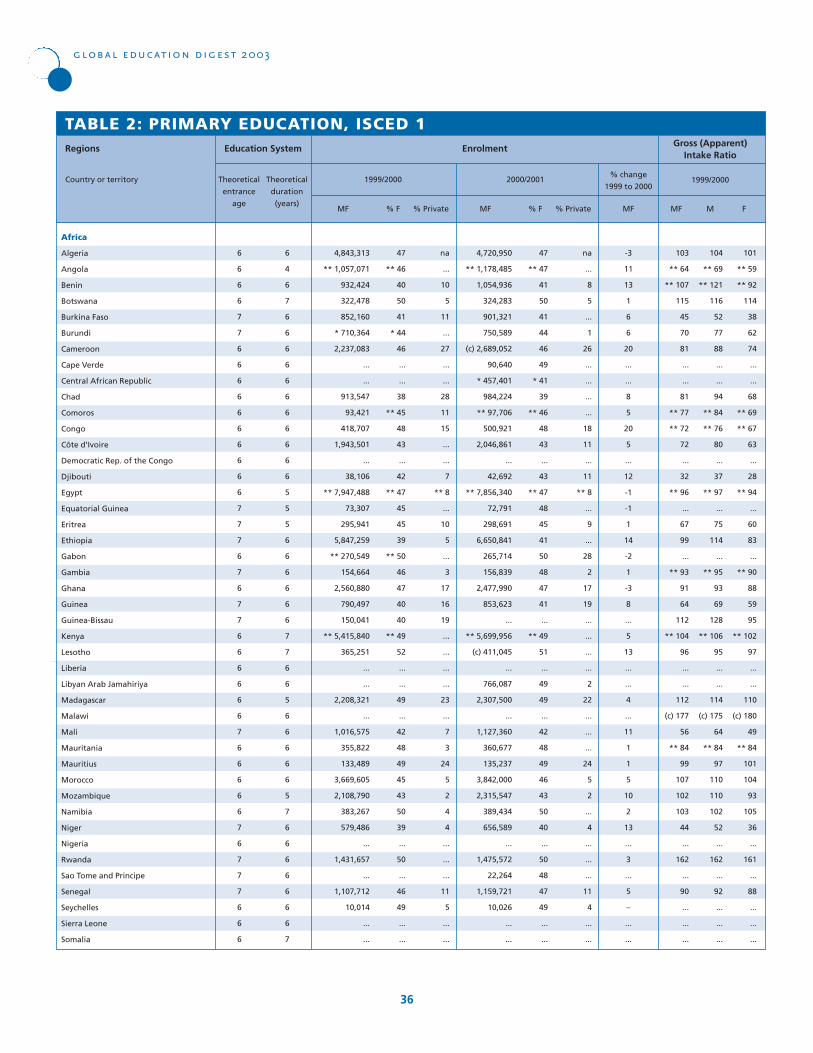
6
6
6
6
7
7
6
6
6
6
6
6
6
6
6
6
7
7
7
6
7
6
7
7
6
6
6
6
6
6
7
6
6
6
6
6
7
6
7
7
7
6
6
6
6
4
6
7
6
6
6
6
6
6
6
6
6
6
6
5
5
5
6
6
6
6
6
6
7
7
6
6
5
6
6
6
6
6
5
7
6
6
6
6
6
6
6
7
Theoretical
entrance
age
Theoretical
duration
(years)MF
47
** 46
40
50
41
* 44
46
...
...
38
** 45
48
43
...
42
** 47
45
45
39
** 50
46
47
40
40
** 49
52
...
...
49
...
42
48
49
45
43
50
39
...
50
...
46
49
...
...
47
** 47
41
50
41
44
46
49
* 41
39
** 46
48
43
...
43
** 47
48
45
41
50
48
47
41
...
** 49
51
...
49
49
...
42
48
49
46
43
50
40
...
50
48
47
49
...
...
na
...
10
5
11
...
27
...
...
28
11
15
...
...
7
** 8
...
10
5
...
3
17
16
19
...
...
...
...
23
...
7
3
24
5
2
4
4
...
...
...
11
5
...
...
% F % Private MF % F % Private
na
...
8
5
...
1
26
...
...
...
...
18
11
...
11
** 8
...
9
...
28
2
17
19
...
...
...
...
2
22
...
...
...
24
5
2
...
4
...
...
...
11
4
...
...
103
** 64
** 107
115
45
70
81
...
...
81
** 77
** 72
72
...
32
** 96
...
67
99
...
** 93
91
64
112
** 104
96
...
...
112
(c) 177
56
** 84
99
107
102
103
44
...
162
...
90
...
...
...
104
** 69
** 121
116
52
77
88
...
...
94
** 84
** 76
80
...
37
** 97
...
75
114
...
** 95
93
69
128
** 106
95
...
...
114
(c) 175
64
** 84
97
110
110
102
52
...
162
...
92
...
...
...
101
** 59
** 92
114
38
62
74
...
...
68
** 69
** 67
63
...
28
** 94
...
60
83
...
** 90
88
59
95
** 102
97
...
...
110
(c) 180
49
** 84
101
104
93
105
36
...
161
...
88
...
...
...
-3
11
13
1
6
6
20
...
...
8
5
20
5
...
12
-1
-1
1
14
-2
1
-3
8
...
5
13
...
...
4
...
11
1
1
5
10
2
13
...
3
...
5
–
...
...
MF M FMF
% change
1999 to 2000
Gross (Apparent)Intake Ratio
TABLE 2: PRIMARY EDUCATION, ISCED 1
Africa
Algeria
Angola
Benin
Botswana
Burkina Faso
Burundi
Cameroon
Cape Verde
Central African Republic
Chad
Comoros
Congo
Côte d’Ivoire
Democratic Rep. of the Congo
Djibouti
Egypt
Equatorial Guinea
Eritrea
Ethiopia
Gabon
Gambia
Ghana
Guinea
Guinea-Bissau
Kenya
Lesotho
Liberia
Libyan Arab Jamahiriya
Madagascar
Malawi
Mali
Mauritania
Mauritius
Morocco
Mozambique
Namibia
Niger
Nigeria
Rwanda
Sao Tome and Principe
Senegal
Seychelles
Sierra Leone
Somalia
Regions
Country or territory 1999/2000 2000/2001 1999/2000
global education digest 2003
36
4,843,313
** 1,057,071
932,424
322,478
852,160
* 710,364
2,237,083
...
...
913,547
93,421
418,707
1,943,501
...
38,106
** 7,947,488
73,307
295,941
5,847,259
** 270,549
154,664
2,560,880
790,497
150,041
** 5,415,840
365,251
...
...
2,208,321
...
1,016,575
355,822
133,489
3,669,605
2,108,790
383,267
579,486
...
1,431,657
...
1,107,712
10,014
...
...
Enrolment
4,720,950
** 1,178,485
1,054,936
324,283
901,321
750,589
(c) 2,689,052
90,640
* 457,401
984,224
** 97,706
500,921
2,046,861
...
42,692
** 7,856,340
72,791
298,691
6,650,841
265,714
156,839
2,477,990
853,623
...
** 5,699,956
(c) 411,045
...
766,087
2,307,500
...
1,127,360
360,677
135,237
3,842,000
2,315,547
389,434
656,589
...
1,475,572
22,264
1,159,721
10,026
...
...
Education System

Table 2: Primary Education, isced 1
37
Change 1999 to 2000 GPI
Regions
Country or territory
-15
10
3
–
2
7
44
...
...
1
1
9
-4
...
9
2
...
-3
-4
...
...
-4
4
...
8
86
...
...
–
...
6
8
-2
-1
8
–
2
...
-37
...
-8
...
...
...
MF
-15
10
4
1
2
7
46
...
...
–
–
8
-5
...
9
1
...
-5
-7
...
...
-5
5
...
6
96
...
...
-1
...
7
10
-1
-2
7
–
2
...
-40
...
-10
...
...
...
M
-15
10
3
-1
2
6
42
...
...
2
3
11
-2
...
9
2
...
-1
–
...
...
-4
3
...
9
77
...
...
–
...
5
6
-4
–
9
–
3
...
-35
...
-7
...
...
...
FF
0.98
0.86
0.76
0.99
0.72
0.81
0.84
...
...
0.72
0.83
0.89
0.79
...
0.77
0.96
...
0.8
0.73
...
0.95
0.95
0.86
0.75
0.97
1.02
...
...
0.96
1.03
0.77
1.01
1.04
0.95
0.84
1.03
0.68
...
0.99
...
0.96
...
...
...
1999/2000
0.98
0.88
0.75
0.98
0.73
0.82
0.86
1.03
...
0.75
0.86
0.93
0.82
...
0.80
0.97
...
0.84
0.78
0.98
...
0.96
0.85
...
1.00
0.91
...
...
0.97
...
0.76
0.96
1.01
0.97
0.86
1.03
0.71
...
1.03
...
0.99
...
...
...
2000/2001
81
...
...
23
21
** 31
...
...
...
28
...
...
** 26
...
** 27
** 86
...
** 26
26
...
...
** 29
...
...
...
(c) 54
...
...
...
...
...
28
25
(b) 66
21
** 58
31
...
** 65
...
...
...
...
...
MF
82
...
...
22
25
** 31
...
...
...
32
...
...
** 29
...
** 30
** 88
...
** 28
27
...
...
** 29
...
...
...
**(c) 62
...
...
...
...
...
28
24
(b) 68
22
** 57
36
...
** 63
...
...
...
...
...
M
80
...
...
25
17
** 30
...
...
...
24
...
...
** 23
...
** 24
** 85
...
** 24
24
...
...
** 29
...
...
...
**(c) 47
...
...
...
...
...
27
25
(b) 65
21
** 60
25
...
** 67
...
...
...
...
...
Africa
Algeria
Angola
Benin
Botswana
Burkina Faso
Burundi
Cameroon
Cape Verde
Central African Republic
Chad
Comoros
Congo
Côte d’Ivoire
Democratic Rep. of the Congo
Djibouti
Egypt
Equatorial Guinea
Eritrea
Ethiopia
Gabon
Gambia
Ghana
Guinea
Guinea-Bissau
Kenya
Lesotho
Liberia
Libyan Arab Jamahiriya
Madagascar
Malawi
Mali
Mauritania
Mauritius
Morocco
Mozambique
Namibia
Niger
Nigeria
Rwanda
Sao Tome and Principe
Senegal
Seychelles
Sierra Leone
Somalia
F
79
** 17
...
23
21
28
...
...
...
27
...
** 43
28
...
23
** 83
...
20
25
...
** 45
** 31
...
** 33
** 30
25
...
...
...
...
...
...
25
58
18
** 59
29
...
...
...
...
...
80
...
MF
81
** 18
...
21
24
29
...
...
...
32
...
** 45
31
...
27
** 85
...
22
27
...
** 46
** 31
...
** 38
** 30
25
...
...
...
...
...
...
25
60
18
** 57
34
...
...
...
...
...
82
...
M
78
** 17
...
25
17
26
...
...
...
23
...
** 40
24
...
20
** 81
...
19
22
...
** 44
** 31
...
** 29
** 31
26
...
...
...
...
...
...
26
57
17
** 61
23
...
...
...
...
...
79
...
F
2000/2001
2
...
...
1
–
3
...
...
...
–
...
...
-2
...
4
3
...
6
1
...
...
-1
...
...
...
29
...
...
...
...
...
...
-1
8
4
–
2
...
...
...
...
...
...
...
MF
1
...
...
1
–
2
...
...
...
–
...
...
-2
...
3
3
...
6
–
...
...
-2
...
...
...
37
...
...
...
...
...
...
–
8
4
–
2
...
...
...
...
...
...
...
M
2
...
...
–
–
4
...
...
...
–
...
...
-1
...
4
4
...
6
2
...
...
-1
...
...
...
21
...
...
...
...
...
...
-1
8
4
–
2
...
...
...
...
...
...
...
F
(b) 87
** 74
110
115
47
76
(c) 125
116
...
82
** 78
81
68
...
** 42
** 98
...
64
95
100
...
86
68
...
** 112
(c) 183
...
...
112
...
** 62
92
97
106
110
103
46
...
125
...
82
...
...
...
(b) 88
** 79
125
116
54
84
(c) 134
114
...
94
** 83
84
75
...
** 46
** 99
...
69
106
100
...
88
74
...
** 112
(c) 191
...
...
114
...
** 71
94
97
108
118
102
54
...
123
...
82
...
...
...
MF M
(b) 86
** 69
94
114
40
69
(c) 116
117
...
70
** 72
78
61
...
** 37
** 96
...
58
83
99
...
85
63
...
** 111
(c) 174
...
...
110
...
** 54
91
97
104
102
105
38
...
126
...
81
...
...
...
2000/2001
Net Intake Ratio
Change 1999 to 2000
Gross (Apparent) Intake Ratio
1999/2000
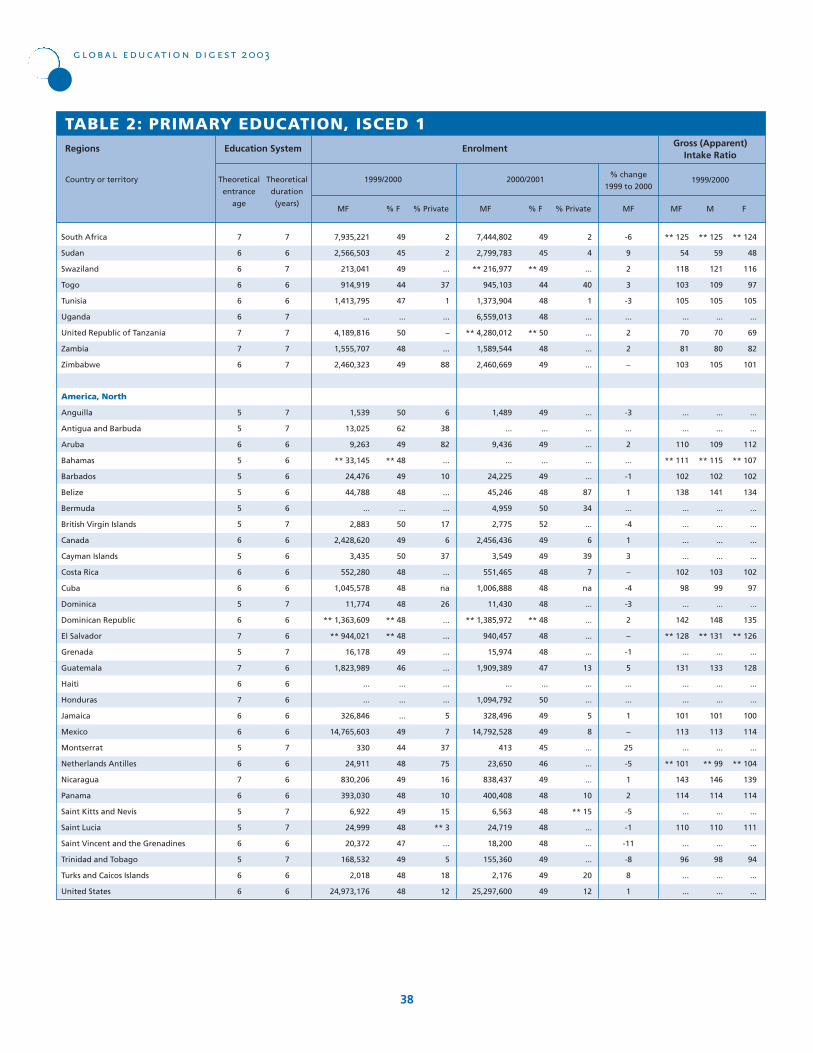
7
6
6
6
6
6
7
7
6
5
5
6
5
5
5
5
5
6
5
6
6
5
6
7
5
7
6
7
6
6
5
6
7
6
5
5
6
5
6
6
7
6
7
6
6
7
7
7
7
7
7
6
6
6
6
6
7
6
6
6
6
7
6
6
7
6
6
6
6
6
7
6
6
6
7
7
6
7
6
6
Theoretical
entrance
age
Theoretical
duration
(years)MF
49
45
49
44
47
...
50
48
49
50
62
49
** 48
49
48
...
50
49
50
48
48
48
** 48
** 48
49
46
...
...
...
49
44
48
49
48
49
48
47
49
48
48
49
45
** 49
44
48
48
** 50
48
49
49
...
49
...
49
48
50
52
49
49
48
48
48
** 48
48
48
47
...
50
49
49
45
46
49
48
48
48
48
49
49
49
2
2
...
37
1
...
–
...
88
6
38
82
...
10
...
...
17
6
37
...
na
26
...
...
...
...
...
...
5
7
37
75
16
10
15
** 3
...
5
18
12
% F % Private MF % F % Private
2
4
...
40
1
...
...
...
...
...
...
...
...
...
87
34
...
6
39
7
na
...
...
...
...
13
...
...
5
8
...
...
...
10
** 15
...
...
...
20
12
** 125
54
118
103
105
...
70
81
103
...
...
110
** 111
102
138
...
...
...
...
102
98
...
142
** 128
...
131
...
...
101
113
...
** 101
143
114
...
110
...
96
...
...
** 125
59
121
109
105
...
70
80
105
...
...
109
** 115
102
141
...
...
...
...
103
99
...
148
** 131
...
133
...
...
101
113
...
** 99
146
114
...
110
...
98
...
...
** 124
48
116
97
105
...
69
82
101
...
...
112
** 107
102
134
...
...
...
...
102
97
...
135
** 126
...
128
...
...
100
114
...
** 104
139
114
...
111
...
94
...
...
-6
9
2
3
-3
...
2
2
–
-3
...
2
...
-1
1
...
-4
1
3
–
-4
-3
2
–
-1
5
...
...
1
–
25
-5
1
2
-5
-1
-11
-8
8
1
MF M FMF
% change
1999 to 2000
Gross (Apparent)Intake Ratio
TABLE 2: PRIMARY EDUCATION, ISCED 1
South Africa
Sudan
Swaziland
Togo
Tunisia
Uganda
United Republic of Tanzania
Zambia
Zimbabwe
America, North
Anguilla
Antigua and Barbuda
Aruba
Bahamas
Barbados
Belize
Bermuda
British Virgin Islands
Canada
Cayman Islands
Costa Rica
Cuba
Dominica
Dominican Republic
El Salvador
Grenada
Guatemala
Haiti
Honduras
Jamaica
Mexico
Montserrat
Netherlands Antilles
Nicaragua
Panama
Saint Kitts and Nevis
Saint Lucia
Saint Vincent and the Grenadines
Trinidad and Tobago
Turks and Caicos Islands
United States
Regions
Country or territory 1999/2000 2000/2001 1999/2000
global education digest 2003
38
7,935,221
2,566,503
213,041
914,919
1,413,795
...
4,189,816
1,555,707
2,460,323
1,539
13,025
9,263
** 33,145
24,476
44,788
...
2,883
2,428,620
3,435
552,280
1,045,578
11,774
** 1,363,609
** 944,021
16,178
1,823,989
...
...
326,846
14,765,603
330
24,911
830,206
393,030
6,922
24,999
20,372
168,532
2,018
24,973,176
Enrolment
7,444,802
2,799,783
** 216,977
945,103
1,373,904
6,559,013
** 4,280,012
1,589,544
2,460,669
1,489
...
9,436
...
24,225
45,246
4,959
2,775
2,456,436
3,549
551,465
1,006,888
11,430
** 1,385,972
940,457
15,974
1,909,389
...
1,094,792
328,496
14,792,528
413
23,650
838,437
400,408
6,563
24,719
18,200
155,360
2,176
25,297,600
Education System
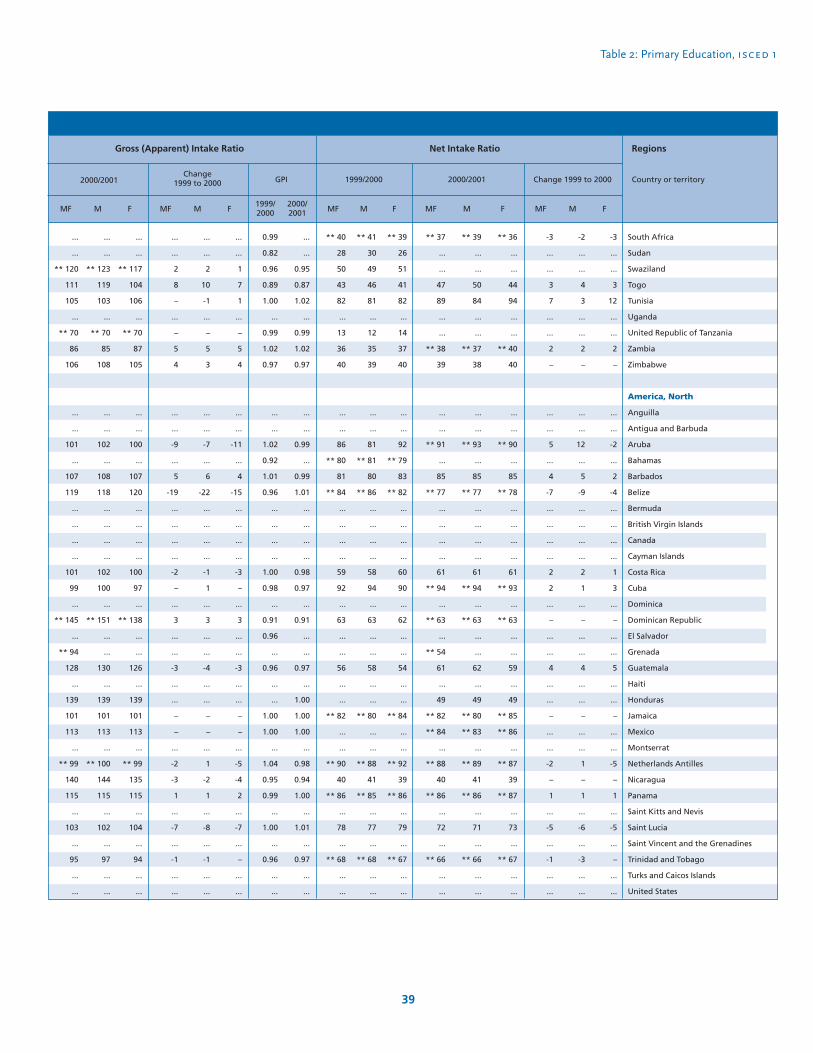
Table 2: Primary Education, isced 1
39
Change 1999 to 2000 GPI
Regions
Country or territory1999/2000
...
...
2
8
–
...
–
5
4
...
...
-9
...
5
-19
...
...
...
...
-2
–
...
3
...
...
-3
...
...
–
–
...
-2
-3
1
...
-7
...
-1
...
...
MF
...
...
2
10
-1
...
–
5
3
...
...
-7
...
6
-22
...
...
...
...
-1
1
...
3
...
...
-4
...
...
–
–
...
1
-2
1
...
-8
...
-1
...
...
M
...
...
1
7
1
...
–
5
4
...
...
-11
...
4
-15
...
...
...
...
-3
–
...
3
...
...
-3
...
...
–
–
...
-5
-4
2
...
-7
...
–
...
...
FF
0.99
0.82
0.96
0.89
1.00
...
0.99
1.02
0.97
...
...
1.02
0.92
1.01
0.96
...
...
...
...
1.00
0.98
...
0.91
0.96
...
0.96
...
...
1.00
1.00
...
1.04
0.95
0.99
...
1.00
...
0.96
...
...
1999/2000
...
...
0.95
0.87
1.02
...
0.99
1.02
0.97
...
...
0.99
...
0.99
1.01
...
...
...
...
0.98
0.97
...
0.91
...
...
0.97
...
1.00
1.00
1.00
...
0.98
0.94
1.00
...
1.01
...
0.97
...
...
2000/2001
** 37
...
...
47
89
...
...
** 38
39
...
...
** 91
...
85
** 77
...
...
...
...
61
** 94
...
** 63
...
** 54
61
...
49
** 82
** 84
...
** 88
40
** 86
...
72
...
** 66
...
...
MF
** 39
...
...
50
84
...
...
** 37
38
...
...
** 93
...
85
** 77
...
...
...
...
61
** 94
...
** 63
...
...
62
...
49
** 80
** 83
...
** 89
41
** 86
...
71
...
** 66
...
...
M
** 36
...
...
44
94
...
...
** 40
40
...
...
** 90
...
85
** 78
...
...
...
...
61
** 93
...
** 63
...
...
59
...
49
** 85
** 86
...
** 87
39
** 87
...
73
...
** 67
...
...
South Africa
Sudan
Swaziland
Togo
Tunisia
Uganda
United Republic of Tanzania
Zambia
Zimbabwe
America, North
Anguilla
Antigua and Barbuda
Aruba
Bahamas
Barbados
Belize
Bermuda
British Virgin Islands
Canada
Cayman Islands
Costa Rica
Cuba
Dominica
Dominican Republic
El Salvador
Grenada
Guatemala
Haiti
Honduras
Jamaica
Mexico
Montserrat
Netherlands Antilles
Nicaragua
Panama
Saint Kitts and Nevis
Saint Lucia
Saint Vincent and the Grenadines
Trinidad and Tobago
Turks and Caicos Islands
United States
F
** 40
28
50
43
82
...
13
36
40
...
...
86
** 80
81
** 84
...
...
...
...
59
92
...
63
...
...
56
...
...
** 82
...
...
** 90
40
** 86
...
78
...
** 68
...
...
MF
** 41
30
49
46
81
...
12
35
39
...
...
81
** 81
80
** 86
...
...
...
...
58
94
...
63
...
...
58
...
...
** 80
...
...
** 88
41
** 85
...
77
...
** 68
...
...
M
** 39
26
51
41
82
...
14
37
40
...
...
92
** 79
83
** 82
...
...
...
...
60
90
...
62
...
...
54
...
...
** 84
...
...
** 92
39
** 86
...
79
...
** 67
...
...
F
2000/2001
-3
...
...
3
7
...
...
2
–
...
...
5
...
4
-7
...
...
...
...
2
2
...
–
...
...
4
...
...
–
...
...
-2
–
1
...
-5
...
-1
...
...
MF
-2
...
...
4
3
...
...
2
–
...
...
12
...
5
-9
...
...
...
...
2
1
...
–
...
...
4
...
...
–
...
...
1
–
1
...
-6
...
-3
...
...
M
-3
...
...
3
12
...
...
2
–
...
...
-2
...
2
-4
...
...
...
...
1
3
...
–
...
...
5
...
...
–
...
...
-5
–
1
...
-5
...
–
...
...
F
...
...
** 120
111
105
...
** 70
86
106
...
...
101
...
107
119
...
...
...
...
101
99
...
** 145
...
** 94
128
...
139
101
113
...
** 99
140
115
...
103
...
95
...
...
...
...
** 123
119
103
...
** 70
85
108
...
...
102
...
108
118
...
...
...
...
102
100
...
** 151
...
...
130
...
139
101
113
...
** 100
144
115
...
102
...
97
...
...
MF M
...
...
** 117
104
106
...
** 70
87
105
...
...
100
...
107
120
...
...
...
...
100
97
...
** 138
...
...
126
...
139
101
113
...
** 99
135
115
...
104
...
94
...
...
2000/2001
Net Intake Ratio
Change 1999 to 2000
Gross (Apparent) Intake Ratio

6
6
7
6
6
6
6
6
6
6
6
6
7
7
6
6
6
6
6
6
7
6
6
6
6
6
7
6
6
6
6
6
7
6
6
6
6
6
6
6
8
5
6
6
4
6
5
6
6
6
6
6
6
6
6
3
4
6
5
7
6
6
5
6
4
4
6
5
6
5
6
6
6
6
4
4
4
5
6
6
6
7
4
5
Theoretical
entrance
age
Theoretical
duration
(years)MF
49
** 49
48
48
49
49
49
** 48
49
...
...
49
...
...
49
49
49
46
47
46
48
49
...
49
...
44
** 48
48
44
49
49
49
49
49
49
45
48
47
48
49
50
49
49
49
48
49
49
49
...
** 48
49
49
49
** 49
–
49
48
49
49
46
47
46
47
49
...
49
48
...
49
48
...
49
49
...
49
49
49
45
48
47
49
49
50
49
20
** 9
8
45
...
...
...
** 15
13
...
...
** 9
...
...
na
19
...
2
36
2
...
4
...
2
...
17
** 7
3
na
–
1
30
...
31
–
2
66
94
6
3
1
na
% F % Private MF % F % Private
20
...
8
45
19
23
...
** 15
13
...
14
...
...
1
na
20
39
2
35
1
...
4
...
2
...
...
16
4
na
...
1
...
1
31
1
2
64
94
3
2
2
na
114
** 130
...
97
134
135
124
** 122
128
...
107
103
...
...
** 100
** 99
112
...
105
122
93
101
...
93
...
131
** 110
79
116
...
...
106
...
102
103
125
87
90
...
99
108
112
114
** 129
...
97
137
136
127
** 125
128
...
107
104
...
...
** 98
** 99
113
...
106
126
...
100
...
94
...
142
** 113
79
123
...
...
105
...
104
104
132
88
93
...
98
107
110
114
** 130
...
96
131
134
121
** 120
128
...
107
102
...
...
** 102
** 99
111
...
104
118
...
101
...
91
...
119
** 106
79
109
...
...
106
...
101
102
117
86
87
...
99
109
114
2
2
-3
–
1
2
...
2
–
...
...
1
-48
...
–
2
–
5
-2
8
-3
–
...
-7
...
...
2
-4
...
1
-2
...
-2
1
-1
–
18
-4
–
-1
-1
-2
MF M FMF
% change
1999 to 2000
Gross (Apparent)Intake Ratio
TABLE 2: PRIMARY EDUCATION, ISCED 1
America, South
Argentina
Bolivia
Brazil
Chile
Colombia
Ecuador
Guyana
Paraguay
Peru
Suriname
Uruguay
Venezuela
Asia
Afghanistan
Armenia
Azerbaijan
Bahrain
Bangladesh
Bhutan
Brunei Darussalam
Cambodia
China
Cyprus
Dem. People’s Rep. of Korea
Georgia
Hong Kong (China), SAR
India
Indonesia
Iran, Islamic Republic of
Iraq
Israel
Japan
Jordan
Kazakhstan
Kuwait
Kyrgyzstan
Lao People’s Democratic Republic
Lebanon
Macao, China
Malaysia
Maldives
Mongolia
Myanmar
Regions
Country or territory 1999/2000 2000/2001 1999/2000
global education digest 2003
40
4,820,908
** 1,457,141
20,939,076
1,804,612
5,162,260
1,925,420
108,909
** 951,481
4,349,594
...
...
3,328,067
959,809
...
696,823
77,720
17,621,731
81,156
45,822
2,248,109
130,132,548
63,952
...
298,352
...
113,612,541
** 28,201,934
8,287,537
3,639,362
738,610
7,528,907
723,508
1,208,320
140,182
466,250
831,521
384,539
47,486
3,032,987
74,050
253,441
4,857,955
Enrolment
4,898,224
1,492,023
20,211,506
1,798,515
5,221,018
1,955,060
...
** 966,476
4,338,080
64,852
360,834
** 3,347,120
500,068
155,423
693,760
79,407
17,667,985
85,097
44,981
(c) 2431142
125,756,891
63,637
...
276,389
493,979
...
28,690,131
7,968,437
...
748,580
7,394,582
...
1,190,069
141,419
459,721
828,113
(e) 453,986
45,816
3,017,902
73,522
250,437
4,781,543
Education System
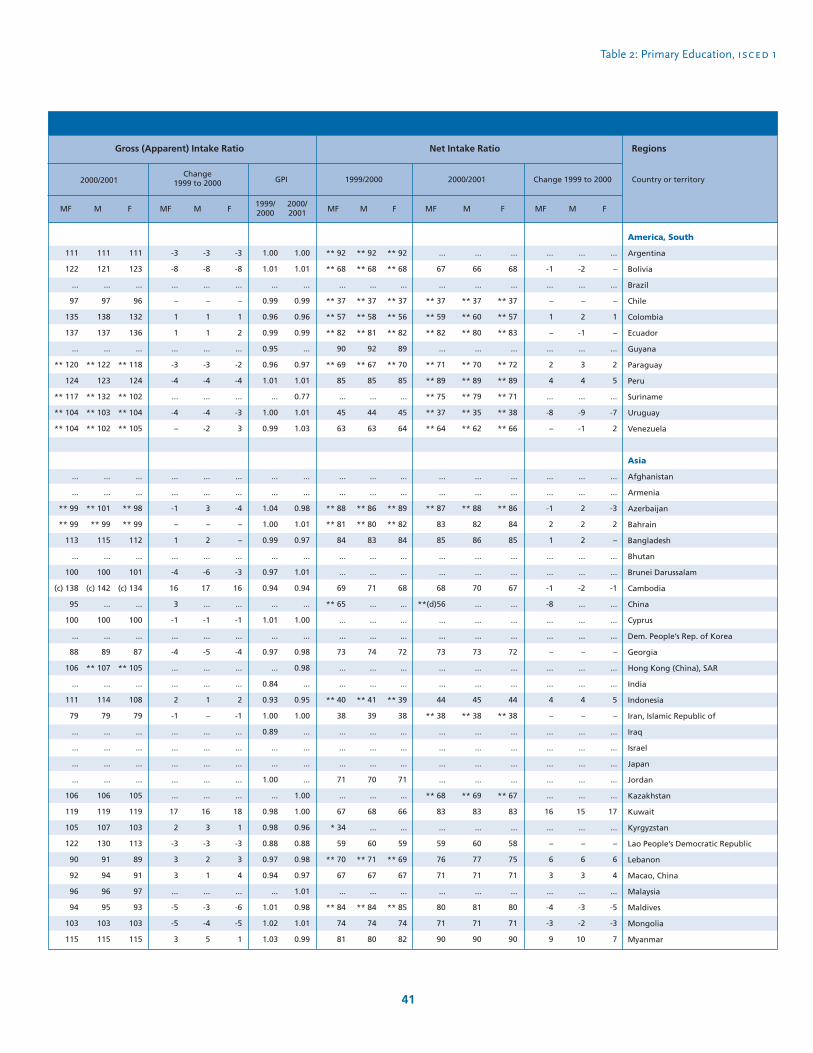
Table 2: Primary Education, isced 1
41
Change 1999 to 2000 GPI
Regions
Country or territory
-3
-8
...
–
1
1
...
-3
-4
...
-4
–
...
...
-1
–
1
...
-4
16
3
-1
...
-4
...
...
2
-1
...
...
...
...
...
17
2
-3
3
3
...
-5
-5
3
MF
-3
-8
...
–
1
1
...
-3
-4
...
-4
-2
...
...
3
–
2
...
-6
17
...
-1
...
-5
...
...
1
–
...
...
...
...
...
16
3
-3
2
1
...
-3
-4
5
M
-3
-8
...
–
1
2
...
-2
-4
...
-3
3
...
...
-4
–
–
...
-3
16
...
-1
...
-4
...
...
2
-1
...
...
...
...
...
18
1
-3
3
4
...
-6
-5
1
FF
1.00
1.01
...
0.99
0.96
0.99
0.95
0.96
1.01
...
1.00
0.99
...
...
1.04
1.00
0.99
...
0.97
0.94
...
1.01
...
0.97
...
0.84
0.93
1.00
0.89
...
...
1.00
...
0.98
0.98
0.88
0.97
0.94
...
1.01
1.02
1.03
1999/2000
1.00
1.01
...
0.99
0.96
0.99
...
0.97
1.01
0.77
1.01
1.03
...
...
0.98
1.01
0.97
...
1.01
0.94
...
1.00
...
0.98
0.98
...
0.95
1.00
...
...
...
...
1.00
1.00
0.96
0.88
0.98
0.97
1.01
0.98
1.01
0.99
2000/2001
...
67
...
** 37
** 59
** 82
...
** 71
** 89
** 75
** 37
** 64
...
...
** 87
83
85
...
...
68
**(d)56
...
...
73
...
...
44
** 38
...
...
...
...
** 68
83
...
59
76
71
...
80
71
90
MF
...
66
...
** 37
** 60
** 80
...
** 70
** 89
** 79
** 35
** 62
...
...
** 88
82
86
...
...
70
...
...
...
73
...
...
45
** 38
...
...
...
...
** 69
83
...
60
77
71
...
81
71
90
M
...
68
...
** 37
** 57
** 83
...
** 72
** 89
** 71
** 38
** 66
...
...
** 86
84
85
...
...
67
...
...
...
72
...
...
44
** 38
...
...
...
...
** 67
83
...
58
75
71
...
80
71
90
America, South
Argentina
Bolivia
Brazil
Chile
Colombia
Ecuador
Guyana
Paraguay
Peru
Suriname
Uruguay
Venezuela
Asia
Afghanistan
Armenia
Azerbaijan
Bahrain
Bangladesh
Bhutan
Brunei Darussalam
Cambodia
China
Cyprus
Dem. People’s Rep. of Korea
Georgia
Hong Kong (China), SAR
India
Indonesia
Iran, Islamic Republic of
Iraq
Israel
Japan
Jordan
Kazakhstan
Kuwait
Kyrgyzstan
Lao People’s Democratic Republic
Lebanon
Macao, China
Malaysia
Maldives
Mongolia
Myanmar
F
** 92
** 68
...
** 37
** 57
** 82
90
** 69
85
...
45
63
...
...
** 88
** 81
84
...
...
69
** 65
...
...
73
...
...
** 40
38
...
...
...
71
...
67
* 34
59
** 70
67
...
** 84
74
81
MF
** 92
** 68
...
** 37
** 58
** 81
92
** 67
85
...
44
63
...
...
** 86
** 80
83
...
...
71
...
...
...
74
...
...
** 41
39
...
...
...
70
...
68
...
60
** 71
67
...
** 84
74
80
M
** 92
** 68
...
** 37
** 56
** 82
89
** 70
85
...
45
64
...
...
** 89
** 82
84
...
...
68
...
...
...
72
...
...
** 39
38
...
...
...
71
...
66
...
59
** 69
67
...
** 85
74
82
F
2000/2001
...
-1
...
–
1
–
...
2
4
...
-8
–
...
...
-1
2
1
...
...
-1
-8
...
...
–
...
...
4
–
...
...
...
...
...
16
...
–
6
3
...
-4
-3
9
MF
...
-2
...
–
2
-1
...
3
4
...
-9
-1
...
...
2
2
2
...
...
-2
...
...
...
–
...
...
4
–
...
...
...
...
...
15
...
–
6
3
...
-3
-2
10
M
...
–
...
–
1
–
...
2
5
...
-7
2
...
...
-3
2
–
...
...
-1
...
...
...
–
...
...
5
–
...
...
...
...
...
17
...
–
6
4
...
-5
-3
7
F
111
122
...
97
135
137
...
** 120
124
** 117
** 104
** 104
...
...
** 99
** 99
113
...
100
(c) 138
95
100
...
88
106
...
111
79
...
...
...
...
106
119
105
122
90
92
96
94
103
115
111
121
...
97
138
137
...
** 122
123
** 132
** 103
** 102
...
...
** 101
** 99
115
...
100
(c) 142
...
100
...
89
** 107
...
114
79
...
...
...
...
106
119
107
130
91
94
96
95
103
115
MF M
111
123
...
96
132
136
...
** 118
124
** 102
** 104
** 105
...
...
** 98
** 99
112
...
101
(c) 134
...
100
...
87
** 105
...
108
79
...
...
...
...
105
119
103
113
89
91
97
93
103
115
2000/2001
Net Intake Ratio
Change 1999 to 2000
Gross (Apparent) Intake Ratio
1999/2000
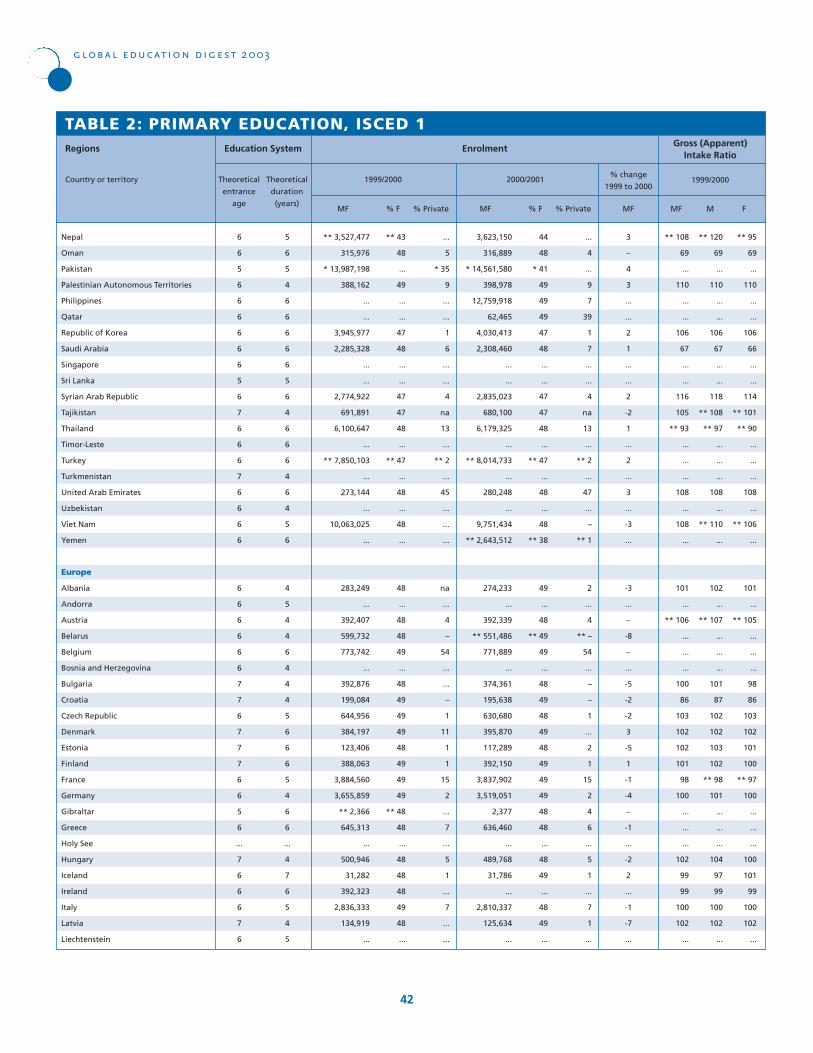
6
6
5
6
6
6
6
6
6
5
6
7
6
6
6
7
6
6
6
6
6
6
6
6
6
6
7
7
6
7
7
7
6
6
5
6
...
7
6
6
6
7
6
5
6
5
4
6
6
6
6
6
5
6
4
6
6
6
4
6
4
5
6
4
5
4
4
6
4
4
4
5
6
6
6
5
4
6
6
...
4
7
6
5
4
5
Theoretical
entrance
age
Theoretical
duration
(years)MF
** 43
48
...
49
...
...
47
48
...
...
47
47
48
...
** 47
...
48
...
48
...
48
...
48
48
49
...
48
49
49
49
48
49
49
49
** 48
48
...
48
48
48
49
48
...
44
48
* 41
49
49
49
47
48
...
...
47
47
48
...
** 47
...
48
...
48
** 38
49
...
48
** 49
49
...
48
49
48
49
48
49
49
49
48
48
...
48
49
...
48
49
...
...
5
* 35
9
...
...
1
6
...
...
4
na
13
...
** 2
...
45
...
...
...
na
...
4
–
54
...
...
–
1
11
1
1
15
2
...
7
...
5
1
...
7
...
...
% F % Private MF % F % Private
...
4
...
9
7
39
1
7
...
...
4
na
13
...
** 2
...
47
...
–
** 1
2
...
4
** –
54
...
–
–
1
...
2
1
15
2
4
6
...
5
1
...
7
1
...
** 108
69
...
110
...
...
106
67
...
...
116
105
** 93
...
...
...
108
...
108
...
101
...
** 106
...
...
...
100
86
103
102
102
101
98
100
...
...
...
102
99
99
100
102
...
** 120
69
...
110
...
...
106
67
...
...
118
** 108
** 97
...
...
...
108
...
** 110
...
102
...
** 107
...
...
...
101
87
102
102
103
102
** 98
101
...
...
...
104
97
99
100
102
...
** 95
69
...
110
...
...
106
66
...
...
114
** 101
** 90
...
...
...
108
...
** 106
...
101
...
** 105
...
...
...
98
86
103
102
101
100
** 97
100
...
...
...
100
101
99
100
102
...
3
–
4
3
...
...
2
1
...
...
2
-2
1
...
2
...
3
...
-3
...
-3
...
–
-8
–
...
-5
-2
-2
3
-5
1
-1
-4
–
-1
...
-2
2
...
-1
-7
...
MF M FMF
% change
1999 to 2000
Gross (Apparent)Intake Ratio
TABLE 2: PRIMARY EDUCATION, ISCED 1
Nepal
Oman
Pakistan
Palestinian Autonomous Territories
Philippines
Qatar
Republic of Korea
Saudi Arabia
Singapore
Sri Lanka
Syrian Arab Republic
Tajikistan
Thailand
Timor-Leste
Turkey
Turkmenistan
United Arab Emirates
Uzbekistan
Viet Nam
Yemen
Europe
Albania
Andorra
Austria
Belarus
Belgium
Bosnia and Herzegovina
Bulgaria
Croatia
Czech Republic
Denmark
Estonia
Finland
France
Germany
Gibraltar
Greece
Holy See
Hungary
Iceland
Ireland
Italy
Latvia
Liechtenstein
Regions
Country or territory 1999/2000 2000/2001 1999/2000
global education digest 2003
42
** 3,527,477
315,976
* 13,987,198
388,162
...
...
3,945,977
2,285,328
...
...
2,774,922
691,891
6,100,647
...
** 7,850,103
...
273,144
...
10,063,025
...
283,249
...
392,407
599,732
773,742
...
392,876
199,084
644,956
384,197
123,406
388,063
3,884,560
3,655,859
** 2,366
645,313
...
500,946
31,282
392,323
2,836,333
134,919
...
Enrolment
3,623,150
316,889
* 14,561,580
398,978
12,759,918
62,465
4,030,413
2,308,460
...
...
2,835,023
680,100
6,179,325
...
** 8,014,733
...
280,248
...
9,751,434
** 2,643,512
274,233
...
392,339
** 551,486
771,889
...
374,361
195,638
630,680
395,870
117,289
392,150
3,837,902
3,519,051
2,377
636,460
...
489,768
31,786
...
2,810,337
125,634
...
Education System
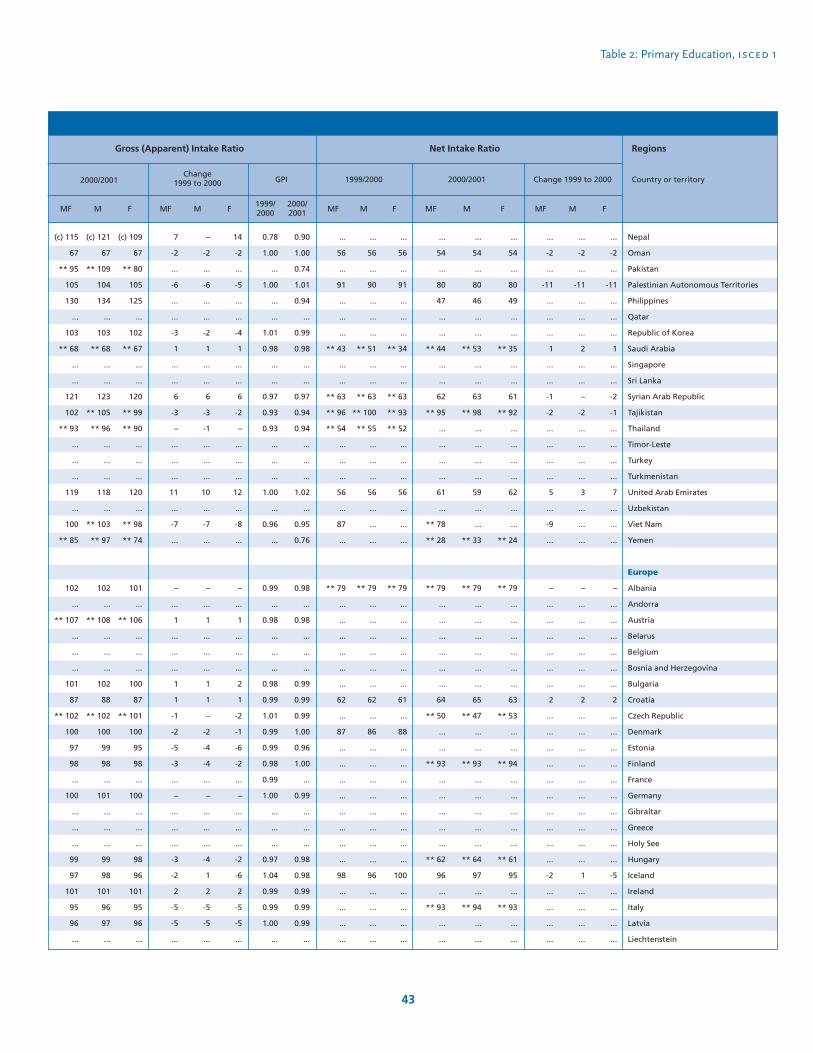
Table 2: Primary Education, isced 1
43
Change 1999 to 2000 GPI
Regions
Country or territory
7
-2
...
-6
...
...
-3
1
...
...
6
-3
–
...
...
...
11
...
-7
...
–
...
1
...
...
...
1
1
-1
-2
-5
-3
...
–
...
...
...
-3
-2
2
-5
-5
...
MF
–
-2
...
-6
...
...
-2
1
...
...
6
-3
-1
...
...
...
10
...
-7
...
–
...
1
...
...
...
1
1
–
-2
-4
-4
...
–
...
...
...
-4
1
2
-5
-5
...
M
14
-2
...
-5
...
...
-4
1
...
...
6
-2
–
...
...
...
12
...
-8
...
–
...
1
...
...
...
2
1
-2
-1
-6
-2
...
–
...
...
...
-2
-6
2
-5
-5
...
FF
0.78
1.00
...
1.00
...
...
1.01
0.98
...
...
0.97
0.93
0.93
...
...
...
1.00
...
0.96
...
0.99
...
0.98
...
...
...
0.98
0.99
1.01
0.99
0.99
0.98
0.99
1.00
...
...
...
0.97
1.04
0.99
0.99
1.00
...
1999/2000
0.90
1.00
0.74
1.01
0.94
...
0.99
0.98
...
...
0.97
0.94
0.94
...
...
...
1.02
...
0.95
0.76
0.98
...
0.98
...
...
...
0.99
0.99
0.99
1.00
0.96
1.00
...
0.99
...
...
...
0.98
0.98
0.99
0.99
0.99
...
2000/2001
...
54
...
80
47
...
...
** 44
...
...
62
** 95
...
...
...
...
61
...
** 78
** 28
** 79
...
...
...
...
...
...
64
** 50
...
...
** 93
...
...
...
...
...
** 62
96
...
** 93
...
...
MF
...
54
...
80
46
...
...
** 53
...
...
63
** 98
...
...
...
...
59
...
...
** 33
** 79
...
...
...
...
...
...
65
** 47
...
...
** 93
...
...
...
...
...
** 64
97
...
** 94
...
...
M
...
54
...
80
49
...
...
** 35
...
...
61
** 92
...
...
...
...
62
...
...
** 24
** 79
...
...
...
...
...
...
63
** 53
...
...
** 94
...
...
...
...
...
** 61
95
...
** 93
...
...
Nepal
Oman
Pakistan
Palestinian Autonomous Territories
Philippines
Qatar
Republic of Korea
Saudi Arabia
Singapore
Sri Lanka
Syrian Arab Republic
Tajikistan
Thailand
Timor-Leste
Turkey
Turkmenistan
United Arab Emirates
Uzbekistan
Viet Nam
Yemen
Europe
Albania
Andorra
Austria
Belarus
Belgium
Bosnia and Herzegovina
Bulgaria
Croatia
Czech Republic
Denmark
Estonia
Finland
France
Germany
Gibraltar
Greece
Holy See
Hungary
Iceland
Ireland
Italy
Latvia
Liechtenstein
F
...
56
...
91
...
...
...
** 43
...
...
** 63
** 96
** 54
...
...
...
56
...
87
...
** 79
...
...
...
...
...
...
62
...
87
...
...
...
...
...
...
...
...
98
...
...
...
...
MF
...
56
...
90
...
...
...
** 51
...
...
** 63
** 100
** 55
...
...
...
56
...
...
...
** 79
...
...
...
...
...
...
62
...
86
...
...
...
...
...
...
...
...
96
...
...
...
...
M
...
56
...
91
...
...
...
** 34
...
...
** 63
** 93
** 52
...
...
...
56
...
...
...
** 79
...
...
...
...
...
...
61
...
88
...
...
...
...
...
...
...
...
100
...
...
...
...
F
2000/2001
...
-2
...
-11
...
...
...
1
...
...
-1
-2
...
...
...
...
5
...
-9
...
–
...
...
...
...
...
...
2
...
...
...
...
...
...
...
...
...
...
-2
...
...
...
...
MF
...
-2
...
-11
...
...
...
2
...
...
–
-2
...
...
...
...
3
...
...
...
–
...
...
...
...
...
...
2
...
...
...
...
...
...
...
...
...
...
1
...
...
...
...
M
...
-2
...
-11
...
...
...
1
...
...
-2
-1
...
...
...
...
7
...
...
...
–
...
...
...
...
...
...
2
...
...
...
...
...
...
...
...
...
...
-5
...
...
...
...
F
(c) 115
67
** 95
105
130
...
103
** 68
...
...
121
102
** 93
...
...
...
119
...
100
** 85
102
...
** 107
...
...
...
101
87
** 102
100
97
98
...
100
...
...
...
99
97
101
95
96
...
(c) 121
67
** 109
104
134
...
103
** 68
...
...
123
** 105
** 96
...
...
...
118
...
** 103
** 97
102
...
** 108
...
...
...
102
88
** 102
100
99
98
...
101
...
...
...
99
98
101
96
97
...
MF M
(c) 109
67
** 80
105
125
...
102
** 67
...
...
120
** 99
** 90
...
...
...
120
...
** 98
** 74
101
...
** 106
...
...
...
100
87
** 101
100
95
98
...
100
...
...
...
98
96
101
95
96
...
2000/2001
Net Intake Ratio
Change 1999 to 2000
Gross (Apparent) Intake Ratio
1999/2000
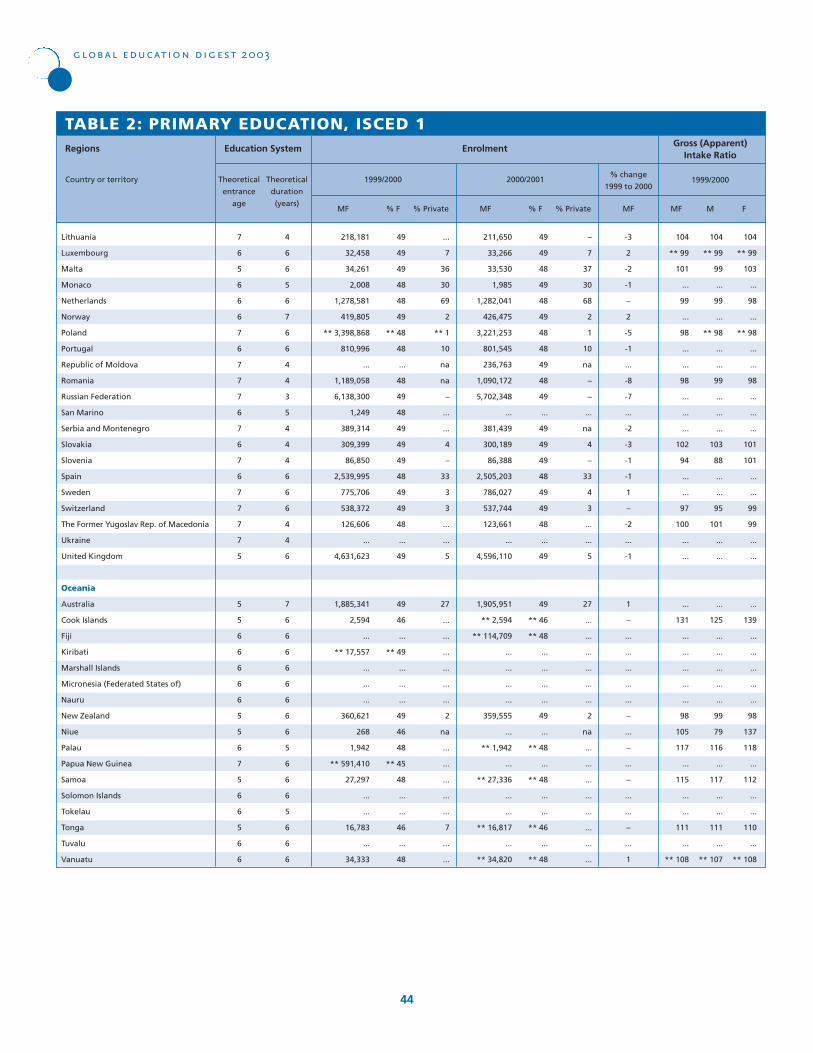
7
6
5
6
6
6
7
6
7
7
7
6
7
6
7
6
7
7
7
7
5
5
5
6
6
6
6
6
5
5
6
7
5
6
6
5
6
6
4
6
6
5
6
7
6
6
4
4
3
5
4
4
4
6
6
6
4
4
6
7
6
6
6
6
6
6
6
6
5
6
6
6
5
6
6
6
Theoretical
entrance
age
Theoretical
duration
(years)MF
49
49
49
48
48
49
** 48
48
...
48
49
48
49
49
49
48
49
49
48
...
49
49
46
...
** 49
...
...
...
49
46
48
** 45
48
...
...
46
...
48
49
49
48
49
48
49
48
48
49
48
49
...
49
49
49
48
49
49
48
...
49
49
** 46
** 48
...
...
...
...
49
...
** 48
...
** 48
...
...
** 46
...
** 48
...
7
36
30
69
2
** 1
10
na
na
–
...
...
4
–
33
3
3
...
...
5
27
...
...
...
...
...
...
2
na
...
...
...
...
...
7
...
...
% F % Private MF % F % Private
–
7
37
30
68
2
1
10
na
–
–
...
na
4
–
33
4
3
...
...
5
27
...
...
...
...
...
...
2
na
...
...
...
...
...
...
...
...
104
** 99
101
...
99
...
98
...
...
98
...
...
...
102
94
...
...
97
100
...
...
...
131
...
...
...
...
...
98
105
117
...
115
...
...
111
...
** 108
104
** 99
99
...
99
...
** 98
...
...
99
...
...
...
103
88
...
...
95
101
...
...
...
125
...
...
...
...
...
99
79
116
...
117
...
...
111
...
** 107
104
** 99
103
...
98
...
** 98
...
...
98
...
...
...
101
101
...
...
99
99
...
...
...
139
...
...
...
...
...
98
137
118
...
112
...
...
110
...
** 108
-3
2
-2
-1
–
2
-5
-1
...
-8
-7
...
-2
-3
-1
-1
1
–
-2
...
-1
1
–
...
...
...
...
...
–
...
–
...
–
...
...
–
...
1
MF M FMF
% change
1999 to 2000
Gross (Apparent)Intake Ratio
TABLE 2: PRIMARY EDUCATION, ISCED 1
Lithuania
Luxembourg
Malta
Monaco
Netherlands
Norway
Poland
Portugal
Republic of Moldova
Romania
Russian Federation
San Marino
Serbia and Montenegro
Slovakia
Slovenia
Spain
Sweden
Switzerland
The Former Yugoslav Rep. of Macedonia
Ukraine
United Kingdom
Oceania
Australia
Cook Islands
Fiji
Kiribati
Marshall Islands
Micronesia (Federated States of)
Nauru
New Zealand
Niue
Palau
Papua New Guinea
Samoa
Solomon Islands
Tokelau
Tonga
Tuvalu
Vanuatu
Regions
Country or territory 1999/2000 2000/2001 1999/2000
global education digest 2003
44
218,181
32,458
34,261
2,008
1,278,581
419,805
** 3,398,868
810,996
...
1,189,058
6,138,300
1,249
389,314
309,399
86,850
2,539,995
775,706
538,372
126,606
...
4,631,623
1,885,341
2,594
...
** 17,557
...
...
...
360,621
268
1,942
** 591,410
27,297
...
...
16,783
...
34,333
Enrolment
211,650
33,266
33,530
1,985
1,282,041
426,475
3,221,253
801,545
236,763
1,090,172
5,702,348
...
381,439
300,189
86,388
2,505,203
786,027
537,744
123,661
...
4,596,110
1,905,951
** 2,594
** 114,709
...
...
...
...
359,555
...
** 1,942
...
** 27,336
...
...
** 16,817
...
** 34,820
Education System
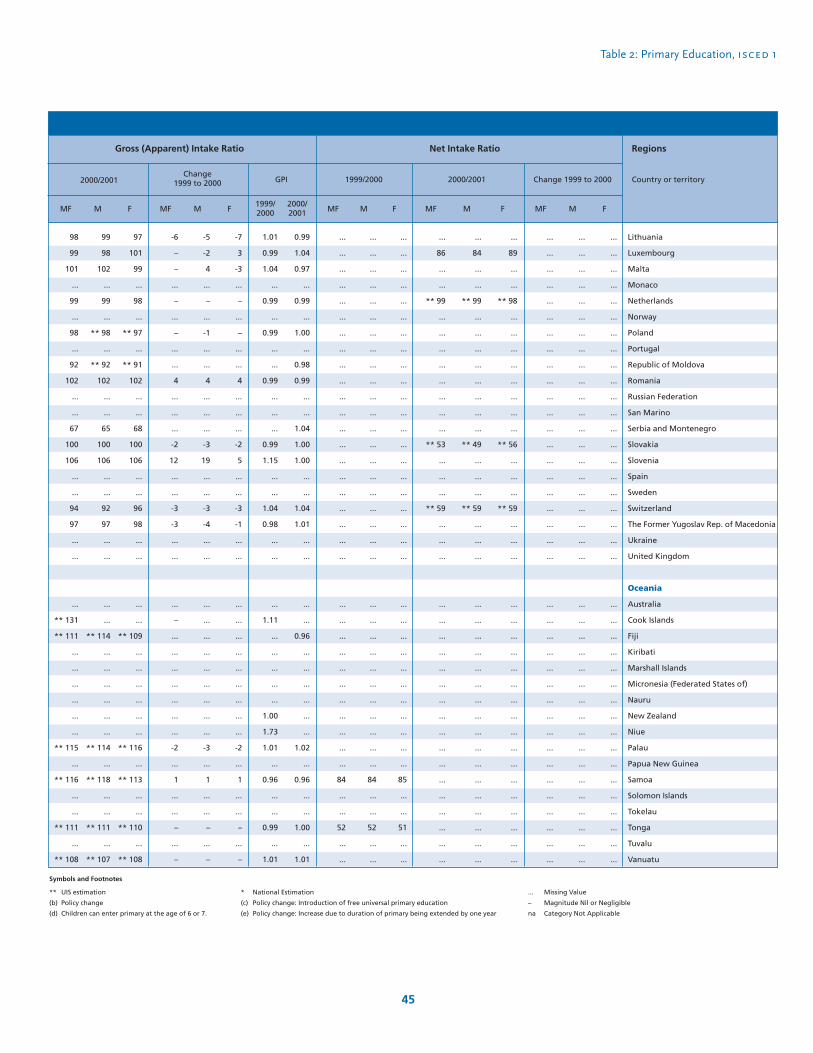
Table 2: Primary Education, isced 1
45
Change 1999 to 2000 GPI
Regions
Country or territory
-6
–
–
...
–
...
–
...
...
4
...
...
...
-2
12
...
...
-3
-3
...
...
...
–
...
...
...
...
...
...
...
-2
...
1
...
...
–
...
–
MF
-5
-2
4
...
–
...
-1
...
...
4
...
...
...
-3
19
...
...
-3
-4
...
...
...
...
...
...
...
...
...
...
...
-3
...
1
...
...
–
...
–
M
-7
3
-3
...
–
...
–
...
...
4
...
...
...
-2
5
...
...
-3
-1
...
...
...
...
...
...
...
...
...
...
...
-2
...
1
...
...
–
...
–
FF
1.01
0.99
1.04
...
0.99
...
0.99
...
...
0.99
...
...
...
0.99
1.15
...
...
1.04
0.98
...
...
...
1.11
...
...
...
...
...
1.00
1.73
1.01
...
0.96
...
...
0.99
...
1.01
1999/2000
0.99
1.04
0.97
...
0.99
...
1.00
...
0.98
0.99
...
...
1.04
1.00
1.00
...
...
1.04
1.01
...
...
...
...
0.96
...
...
...
...
...
...
1.02
...
0.96
...
...
1.00
...
1.01
2000/2001
...
86
...
...
** 99
...
...
...
...
...
...
...
...
** 53
...
...
...
** 59
...
...
...
...
...
...
...
...
...
...
...
...
...
...
...
...
...
...
...
...
MF
...
84
...
...
** 99
...
...
...
...
...
...
...
...
** 49
...
...
...
** 59
...
...
...
...
...
...
...
...
...
...
...
...
...
...
...
...
...
...
...
...
M
...
89
...
...
** 98
...
...
...
...
...
...
...
...
** 56
...
...
...
** 59
...
...
...
...
...
...
...
...
...
...
...
...
...
...
...
...
...
...
...
...
Lithuania
Luxembourg
Malta
Monaco
Netherlands
Norway
Poland
Portugal
Republic of Moldova
Romania
Russian Federation
San Marino
Serbia and Montenegro
Slovakia
Slovenia
Spain
Sweden
Switzerland
The Former Yugoslav Rep. of Macedonia
Ukraine
United Kingdom
Oceania
Australia
Cook Islands
Fiji
Kiribati
Marshall Islands
Micronesia (Federated States of)
Nauru
New Zealand
Niue
Palau
Papua New Guinea
Samoa
Solomon Islands
Tokelau
Tonga
Tuvalu
Vanuatu
F
...
...
...
...
...
...
...
...
...
...
...
...
...
...
...
...
...
...
...
...
...
...
...
...
...
...
...
...
...
...
...
...
84
...
...
52
...
...
MF
...
...
...
...
...
...
...
...
...
...
...
...
...
...
...
...
...
...
...
...
...
...
...
...
...
...
...
...
...
...
...
...
84
...
...
52
...
...
M
...
...
...
...
...
...
...
...
...
...
...
...
...
...
...
...
...
...
...
...
...
...
...
...
...
...
...
...
...
...
...
...
85
...
...
51
...
...
F
2000/2001
...
...
...
...
...
...
...
...
...
...
...
...
...
...
...
...
...
...
...
...
...
...
...
...
...
...
...
...
...
...
...
...
...
...
...
...
...
...
MF
...
...
...
...
...
...
...
...
...
...
...
...
...
...
...
...
...
...
...
...
...
...
...
...
...
...
...
...
...
...
...
...
...
...
...
...
...
...
M
...
...
...
...
...
...
...
...
...
...
...
...
...
...
...
...
...
...
...
...
...
...
...
...
...
...
...
...
...
...
...
...
...
...
...
...
...
...
F
98
99
101
...
99
...
98
...
92
102
...
...
67
100
106
...
...
94
97
...
...
...
** 131
** 111
...
...
...
...
...
...
** 115
...
** 116
...
...
** 111
...
** 108
99
98
102
...
99
...
** 98
...
** 92
102
...
...
65
100
106
...
...
92
97
...
...
...
...
** 114
...
...
...
...
...
...
** 114
...
** 118
...
...
** 111
...
** 107
MF M
97
101
99
...
98
...
** 97
...
** 91
102
...
...
68
100
106
...
...
96
98
...
...
...
...
** 109
...
...
...
...
...
...
** 116
...
** 113
...
...
** 110
...
** 108
2000/2001
Net Intake Ratio
Change 1999 to 2000
Gross (Apparent) Intake Ratio
1999/2000
Symbols and Footnotes
** UIS estimation * National Estimation
(b) Policy change (c) Policy change: Introduction of free universal primary education
(d) Children can enter primary at the age of 6 or 7. (e) Policy change: Increase due to duration of primary being extended by one year
... Missing Value
– Magnitude Nil or Negligible
na Category Not Applicable

82
114
** 68
86
108
43
* 62
91
...
...
70
84
84
75
...
37
** 100
125
61
58
** 151
84
84
63
83
** 89
104
...
...
102
...
57
84
108
90
85
113
32
...
122
...
73
...
...
87
119
** 73
103
108
51
* 69
98
...
...
87
** 91
88
86
...
43
** 104
137
67
71
** 152
91
88
75
99
** 90
99
...
...
104
...
66
87
108
98
98
112
39
...
124
...
78
...
...
77
110
** 63
69
108
35
* 56
84
...
...
53
** 76
79
64
...
31
** 96
112
55
46
** 151
77
79
51
66
** 88
108
...
...
100
...
48
82
109
83
73
114
26
...
121
...
68
...
...
MF M F
Change
1999 to 2000
TABLE 2 / cont’d: PRIMARY EDUCATION, ISCED 1
Africa
Regional average
Algeria
Angola
Benin
Botswana
Burkina Faso
Burundi
Cameroon
Cape Verde
Central African Republic
Chad
Comoros
Congo
Côte d’Ivoire
Democratic Rep. of the Congo
Djibouti
Egypt
Equatorial Guinea
Eritrea
Ethiopia
Gabon
Gambia
Ghana
Guinea
Guinea-Bissau
Kenya
Lesotho
Liberia
Libyan Arab Jamahiriya
Madagascar
Malawi
Mali
Mauritania
Mauritius
Morocco
Mozambique
Namibia
Niger
Nigeria
Rwanda
Sao Tome and Principe
Senegal
Seychelles
Sierra Leone
Regions
Country or territory 1999/2000
84
112
** 74
95
108
44
65
(c) 108
139
* 75
73
** 86
97
79
...
40
** 100
120
59
64
144
82
80
67
...
** 94
(c) 115
...
116
103
...
61
83
109
94
92
112
35
...
119
...
75
...
...
89
116
** 78
113
108
52
73
(c) 115
140
* 89
90
** 92
101
89
...
46
** 103
126
65
76
144
86
84
78
...
** 95
(c) 112
...
115
105
...
71
86
109
101
104
112
42
...
119
...
79
...
...
79
107
** 69
78
108
37
58
(c) 100
137
* 61
57
** 80
93
68
...
35
** 96
115
54
52
143
78
76
56
...
** 93
(c) 118
...
117
101
...
51
80
108
88
79
113
29
...
118
...
70
...
...
MF M F
1
-2
6
10
–
1
3
17
...
...
3
2
13
4
...
3
–
-4
-2
6
-8
-1
-3
4
...
5
11
...
...
1
...
4
-1
–
4
6
-1
3
...
-4
...
2
...
...
1
-3
5
11
–
1
3
17
...
...
2
1
13
4
...
3
-1
-11
-2
6
-8
-4
-4
3
...
4
13
...
...
1
...
6
-1
1
3
6
-1
3
...
-5
...
1
...
...
1
-2
6
8
–
2
2
16
...
...
4
4
13
4
...
4
–
2
-1
7
-8
2
-3
5
...
5
9
...
...
1
...
3
-2
–
5
6
-1
3
...
-3
...
2
...
...
MF M F
2000/2001
global education digest 2003
46
Gross Enrolment Ratio
61
97
** 27
** 70
84
35
** 44
...
...
...
57
** 55
...
56
...
31
** 92
79
40
43
...
70
63
49
54
** 65
58
...
...
66
...
...
** 59
94
74
50
80
27
...
** 97
...
** 62
...
...
64
99
** 29
** 83
82
41
** 49
...
...
...
69
** 60
...
65
...
35
** 95
88
43
49
...
75
65
56
63
** 65
55
...
...
66
...
...
** 61
94
79
55
77
32
...
** 97
...
** 66
...
...
58
96
** 25
** 57
85
28
** 40
...
...
...
45
** 50
...
48
...
26
** 90
70
37
36
...
65
61
41
45
** 66
62
...
...
67
...
...
** 58
94
70
46
82
22
...
** 97
...
** 58
...
...
MF M F
1999/2000
62
98
** 37
...
84
36
54
...
100
** 55
58
** 56
...
62
...
** 33
** 93
72
41
47
** 88
** 69
58
47
...
** 69
(c) 78
...
...
68
...
...
** 64
95
** 78
54
82
30
...
...
...
** 63
...
...
65
100
** 39
...
82
42
59
...
100
** 64
70
** 60
...
71
...
** 37
** 95
76
44
53
** 89
** 71
60
52
...
** 68
(c) 75
...
...
67
...
...
** 66
95
** 82
59
79
36
...
...
...
** 66
...
...
60
97
** 35
...
86
29
49
...
100
** 45
47
** 52
...
54
...
** 28
** 90
68
38
41
** 87
** 66
57
41
...
** 69
(c) 82
...
...
68
...
...
** 62
95
** 74
50
84
24
...
...
...
** 60
...
...
MF M F
2000/2001
Net Enrolment Ratio
GPI
0.88
0.92
0.87
0.67
1.00
0.70
0.80
0.85
...
...
0.61
0.84
0.90
0.75
...
0.73
0.93
0.82
0.82
0.65
0.99
0.85
0.90
0.68
0.67
0.98
1.09
...
...
0.96
...
0.73
0.94
1.00
0.84
0.75
1.02
0.67
...
0.98
...
0.87
...
...
1999/2000
0.89
0.92
0.88
0.68
1.00
0.71
0.80
0.87
0.98
0.69
0.63
0.87
0.92
0.76
...
0.76
0.93
0.91
0.82
0.69
0.99
0.91
0.91
0.72
...
0.99
1.05
...
1.02
0.96
...
0.72
0.93
1.00
0.87
0.76
1.01
0.68
...
0.99
...
0.89
...
...
2000/2001
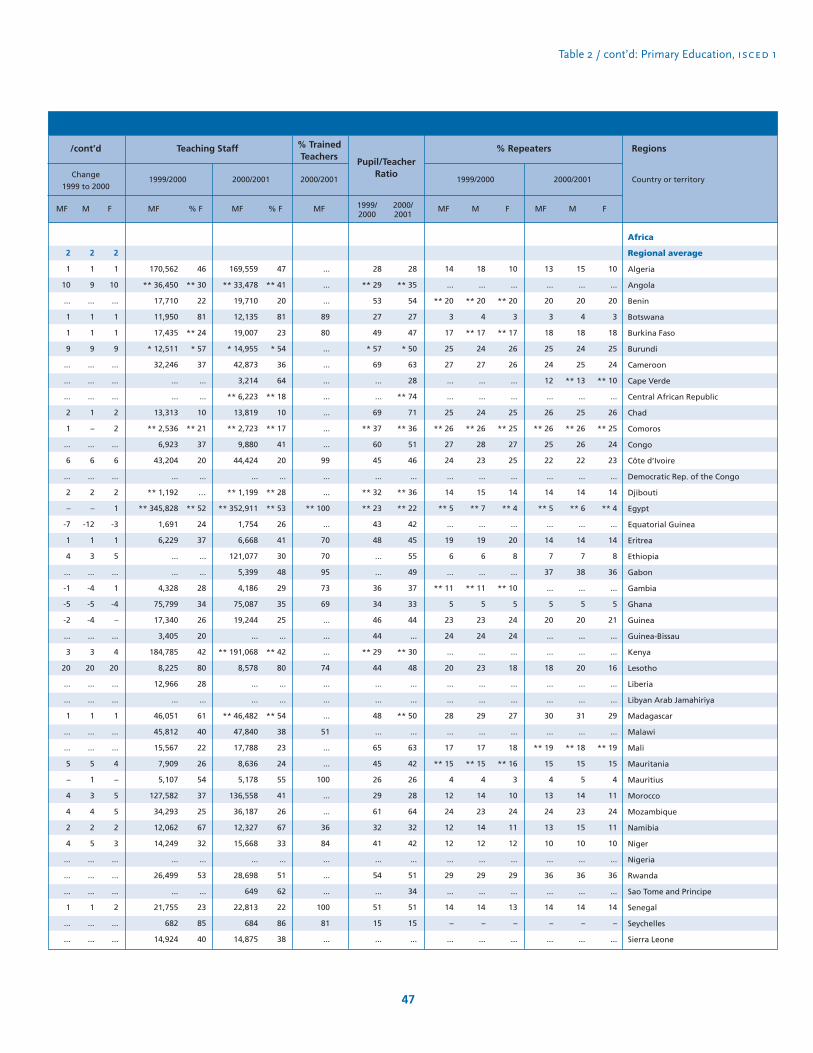
Table 2 / cont’d: Primary Education, isced 1
47
Regions
Country or territory
170,562
** 36,450
17,710
11,950
17,435
* 12,511
32,246
...
...
13,313
** 2,536
6,923
43,204
...
** 1,192
** 345,828
1,691
6,229
...
...
4,328
75,799
17,340
3,405
184,785
8,225
12,966
...
46,051
45,812
15,567
7,909
5,107
127,582
34,293
12,062
14,249
...
26,499
...
21,755
682
14,924
MF
46
** 30
22
81
** 24
* 57
37
...
...
10
** 21
37
20
...
…
** 52
24
37
...
...
28
34
26
20
42
80
28
...
61
40
22
26
54
37
25
67
32
...
53
...
23
85
40
% F MF % F
169,559
** 33,478
19,710
12,135
19,007
* 14,955
42,873
3,214
** 6,223
13,819
** 2,723
9,880
44,424
...
** 1,199
** 352,911
1,754
6,668
121,077
5,399
4,186
75,087
19,244
...
** 191,068
8,578
...
...
** 46,482
47,840
17,788
8,636
5,178
136,558
36,187
12,327
15,668
...
28,698
649
22,813
684
14,875
47
** 41
20
81
23
* 54
36
64
** 18
10
** 17
41
20
...
** 28
** 53
26
41
30
48
29
35
25
...
** 42
80
...
...
** 54
38
23
24
55
41
26
67
33
...
51
62
22
86
38
28
** 29
53
27
49
* 57
69
...
...
69
** 37
60
45
...
** 32
** 23
43
48
...
...
36
34
46
44
** 29
44
...
...
48
...
65
45
26
29
61
32
41
...
54
...
51
15
...
28
** 35
54
27
47
* 50
63
28
** 74
71
** 36
51
46
...
** 36
** 22
42
45
55
49
37
33
44
...
** 30
48
...
...
** 50
...
63
42
26
28
64
32
42
...
51
34
51
15
...
Africa
Regional average
Algeria
Angola
Benin
Botswana
Burkina Faso
Burundi
Cameroon
Cape Verde
Central African Republic
Chad
Comoros
Congo
Côte d’Ivoire
Democratic Rep. of the Congo
Djibouti
Egypt
Equatorial Guinea
Eritrea
Ethiopia
Gabon
Gambia
Ghana
Guinea
Guinea-Bissau
Kenya
Lesotho
Liberia
Libyan Arab Jamahiriya
Madagascar
Malawi
Mali
Mauritania
Mauritius
Morocco
Mozambique
Namibia
Niger
Nigeria
Rwanda
Sao Tome and Principe
Senegal
Seychelles
Sierra Leone
2000/2001
13
...
20
3
18
25
24
12
...
26
** 26
25
22
...
14
** 5
...
14
7
37
...
5
20
...
...
18
...
...
30
...
** 19
15
4
13
24
13
10
...
36
...
14
–
...
MF
15
...
20
4
18
24
25
** 13
...
25
** 26
26
22
...
14
** 6
...
14
7
38
...
5
20
...
...
20
...
...
31
...
** 18
15
5
14
23
15
10
...
36
...
14
–
...
M
10
...
20
3
18
25
24
** 10
...
26
** 25
24
23
...
14
** 4
...
14
8
36
...
5
21
...
...
16
...
...
29
...
** 19
15
4
11
24
11
10
...
36
...
14
–
...
F
% Repeaters
2000/2001
14
...
** 20
3
17
25
27
...
...
25
** 26
27
24
...
14
** 5
...
19
6
...
** 11
5
23
24
...
20
...
...
28
...
17
** 15
4
12
24
12
12
...
29
...
14
–
...
MF
18
...
** 20
4
** 17
24
27
...
...
24
** 26
28
23
...
15
** 7
...
19
6
...
** 11
5
23
24
...
23
...
...
29
...
17
** 15
4
14
23
14
12
...
29
...
14
–
...
M
10
...
** 20
3
** 17
26
26
...
...
25
** 25
27
25
...
14
** 4
...
20
8
...
** 10
5
24
24
...
18
...
...
27
...
18
** 16
3
10
24
11
12
...
29
...
13
–
...
F
1999/20001999/2000Change
1999 to 2000
2
1
10
...
1
1
9
...
...
...
2
1
...
6
...
2
–
-7
1
4
...
-1
-5
-2
...
3
20
...
...
1
...
...
5
–
4
4
2
4
...
...
...
1
...
...
2
1
9
...
1
1
9
...
...
...
1
–
...
6
...
2
–
-12
1
3
...
-4
-5
-4
...
3
20
...
...
1
...
...
5
1
3
4
2
5
...
...
...
1
...
...
2
1
10
...
1
1
9
...
...
...
2
2
...
6
...
2
1
-3
1
5
...
1
-4
–
...
4
20
...
...
1
...
...
4
–
5
5
2
3
...
...
...
2
...
...
MF M F
/cont’d Teaching Staff
...
...
...
89
80
...
...
...
...
...
...
...
99
...
...
** 100
...
70
70
95
73
69
...
...
...
74
...
...
...
51
...
...
100
...
...
36
84
...
...
...
100
81
...
MF
2000/2001
% TrainedTeachers Pupil/Teacher
Ratio
1999/2000
2000/2001
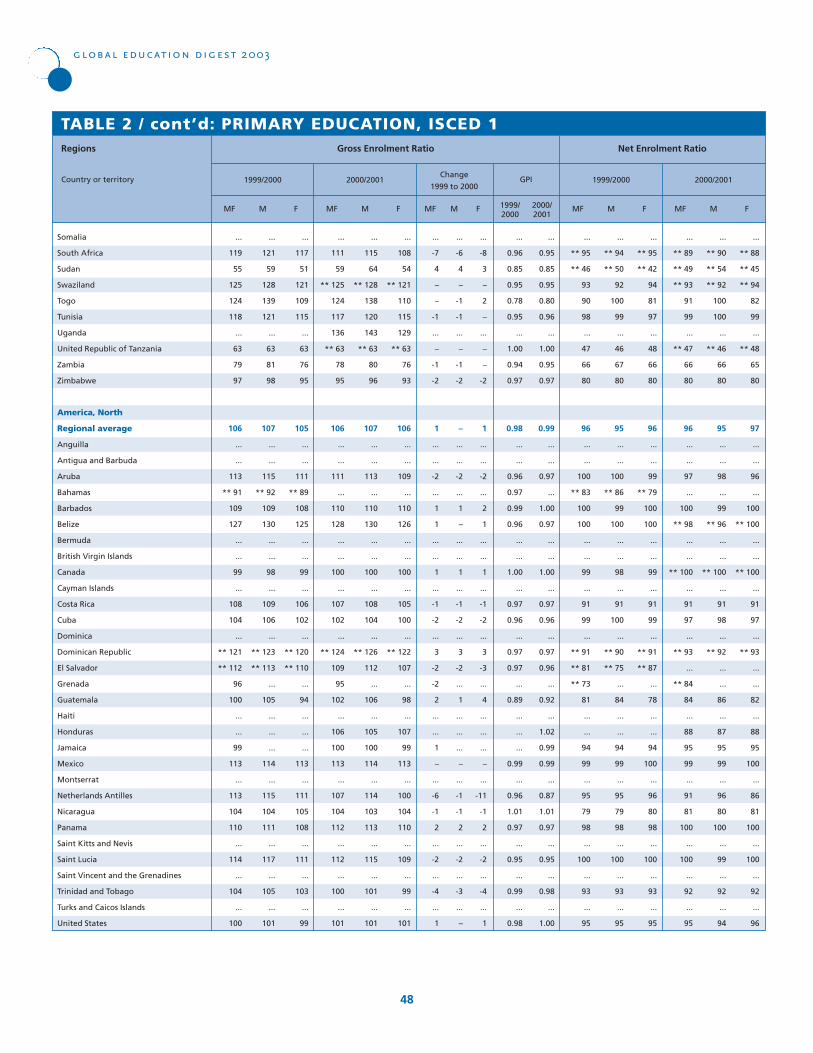
...
119
55
125
124
118
...
63
79
97
106
...
...
113
** 91
109
127
...
...
99
...
108
104
...
** 121
** 112
96
100
...
...
99
113
...
113
104
110
...
114
...
104
...
100
...
121
59
128
139
121
...
63
81
98
107
...
...
115
** 92
109
130
...
...
98
...
109
106
...
** 123
** 113
...
105
...
...
...
114
...
115
104
111
...
117
...
105
...
101
...
117
51
121
109
115
...
63
76
95
105
...
...
111
** 89
108
125
...
...
99
...
106
102
...
** 120
** 110
...
94
...
...
...
113
...
111
105
108
...
111
...
103
...
99
MF M F
Change
1999 to 2000
TABLE 2 / cont’d: PRIMARY EDUCATION, ISCED 1
Somalia
South Africa
Sudan
Swaziland
Togo
Tunisia
Uganda
United Republic of Tanzania
Zambia
Zimbabwe
America, North
Regional average
Anguilla
Antigua and Barbuda
Aruba
Bahamas
Barbados
Belize
Bermuda
British Virgin Islands
Canada
Cayman Islands
Costa Rica
Cuba
Dominica
Dominican Republic
El Salvador
Grenada
Guatemala
Haiti
Honduras
Jamaica
Mexico
Montserrat
Netherlands Antilles
Nicaragua
Panama
Saint Kitts and Nevis
Saint Lucia
Saint Vincent and the Grenadines
Trinidad and Tobago
Turks and Caicos Islands
United States
Regions
Country or territory 1999/2000
...
111
59
** 125
124
117
136
** 63
78
95
106
...
...
111
...
110
128
...
...
100
...
107
102
...
** 124
109
95
102
...
106
100
113
...
107
104
112
...
112
...
100
...
101
...
115
64
** 128
138
120
143
** 63
80
96
107
...
...
113
...
110
130
...
...
100
...
108
104
...
** 126
112
...
106
...
105
100
114
...
114
103
113
...
115
...
101
...
101
...
108
54
** 121
110
115
129
** 63
76
93
106
...
...
109
...
110
126
...
...
100
...
105
100
...
** 122
107
...
98
...
107
99
113
...
100
104
110
...
109
...
99
...
101
MF M F
...
-7
4
–
–
-1
...
–
-1
-2
1
...
...
-2
...
1
1
...
...
1
...
-1
-2
...
3
-2
-2
2
...
...
1
–
...
-6
-1
2
...
-2
...
-4
...
1
...
-6
4
–
-1
-1
...
–
-1
-2
–
...
...
-2
...
1
–
...
...
1
...
-1
-2
...
3
-2
...
1
...
...
...
–
...
-1
-1
2
...
-2
...
-3
...
–
...
-8
3
–
2
–
...
–
–
-2
1
...
...
-2
...
2
1
...
...
1
...
-1
-2
...
3
-3
...
4
...
...
...
–
...
-11
-1
2
...
-2
...
-4
...
1
MF M F
2000/2001
global education digest 2003
48
Gross Enrolment Ratio
...
** 95
** 46
93
90
98
...
47
66
80
96
...
...
100
** 83
100
100
...
...
99
...
91
99
...
** 91
** 81
** 73
81
...
...
94
99
...
95
79
98
...
100
...
93
...
95
...
** 94
** 50
92
100
99
...
46
67
80
95
...
...
100
** 86
99
100
...
...
98
...
91
100
...
** 90
** 75
...
84
...
...
94
99
...
95
79
98
...
100
...
93
...
95
...
** 95
** 42
94
81
97
...
48
66
80
96
...
...
99
** 79
100
100
...
...
99
...
91
99
...
** 91
** 87
...
78
...
...
94
100
...
96
80
98
...
100
...
93
...
95
MF M F
1999/2000
...
** 89
** 49
** 93
91
99
...
** 47
66
80
96
...
...
97
...
100
** 98
...
...
** 100
...
91
97
...
** 93
...
** 84
84
...
88
95
99
...
91
81
100
...
100
...
92
...
95
...
** 90
** 54
** 92
100
100
...
** 46
66
80
95
...
...
98
...
99
** 96
...
...
** 100
...
91
98
...
** 92
...
...
86
...
87
95
99
...
96
80
100
...
99
...
92
...
94
...
** 88
** 45
** 94
82
99
...
** 48
65
80
97
...
...
96
...
100
** 100
...
...
** 100
...
91
97
...
** 93
...
...
82
...
88
95
100
...
86
81
100
...
100
...
92
...
96
MF M F
2000/2001
Net Enrolment Ratio
GPI
...
0.96
0.85
0.95
0.78
0.95
...
1.00
0.94
0.97
0.98
...
...
0.96
0.97
0.99
0.96
...
...
1.00
...
0.97
0.96
...
0.97
0.97
...
0.89
...
...
...
0.99
...
0.96
1.01
0.97
...
0.95
...
0.99
...
0.98
1999/2000
...
0.95
0.85
0.95
0.80
0.96
...
1.00
0.95
0.97
0.99
...
...
0.97
...
1.00
0.97
...
...
1.00
...
0.97
0.96
...
0.97
0.96
...
0.92
...
1.02
0.99
0.99
...
0.87
1.01
0.97
...
0.95
...
0.98
...
1.00
2000/2001
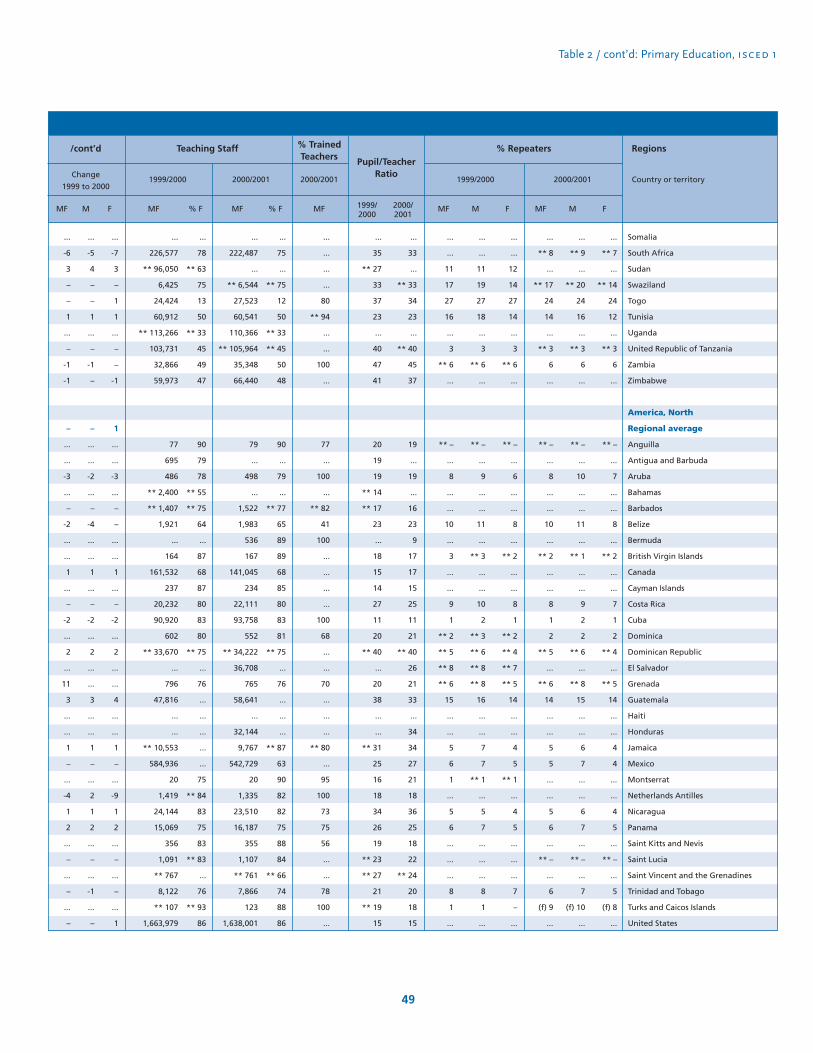
Table 2 / cont’d: Primary Education, isced 1
49
Regions
Country or territory
...
226,577
** 96,050
6,425
24,424
60,912
** 113,266
103,731
32,866
59,973
77
695
486
** 2,400
** 1,407
1,921
...
164
161,532
237
20,232
90,920
602
** 33,670
...
796
47,816
...
...
** 10,553
584,936
20
1,419
24,144
15,069
356
1,091
** 767
8,122
** 107
1,663,979
MF
...
78
** 63
75
13
50
** 33
45
49
47
90
79
78
** 55
** 75
64
...
87
68
87
80
83
80
** 75
...
76
...
...
...
...
...
75
** 84
83
75
83
** 83
...
76
** 93
86
% F MF % F
...
222,487
...
** 6,544
27,523
60,541
110,366
** 105,964
35,348
66,440
79
...
498
...
1,522
1,983
536
167
141,045
234
22,111
93,758
552
** 34,222
36,708
765
58,641
...
32,144
9,767
542,729
20
1,335
23,510
16,187
355
1,107
** 761
7,866
123
1,638,001
...
75
...
** 75
12
50
** 33
** 45
50
48
90
...
79
...
** 77
65
89
89
68
85
80
83
81
** 75
...
76
...
...
...
** 87
63
90
82
82
75
88
84
** 66
74
88
86
...
35
** 27
33
37
23
...
40
47
41
20
19
19
** 14
** 17
23
...
18
15
14
27
11
20
** 40
...
20
38
...
...
** 31
25
16
18
34
26
19
** 23
** 27
21
** 19
15
...
33
...
** 33
34
23
...
** 40
45
37
19
...
19
...
16
23
9
17
17
15
25
11
21
** 40
26
21
33
...
34
34
27
21
18
36
25
18
22
** 24
20
18
15
Somalia
South Africa
Sudan
Swaziland
Togo
Tunisia
Uganda
United Republic of Tanzania
Zambia
Zimbabwe
America, North
Regional average
Anguilla
Antigua and Barbuda
Aruba
Bahamas
Barbados
Belize
Bermuda
British Virgin Islands
Canada
Cayman Islands
Costa Rica
Cuba
Dominica
Dominican Republic
El Salvador
Grenada
Guatemala
Haiti
Honduras
Jamaica
Mexico
Montserrat
Netherlands Antilles
Nicaragua
Panama
Saint Kitts and Nevis
Saint Lucia
Saint Vincent and the Grenadines
Trinidad and Tobago
Turks and Caicos Islands
United States
2000/2001
...
** 8
...
** 17
24
14
...
** 3
6
...
** –
...
8
...
...
10
...
** 2
...
...
8
1
2
** 5
...
** 6
14
...
...
5
5
...
...
5
6
...
** –
...
6
(f) 9
...
MF
...
** 9
...
** 20
24
16
...
** 3
6
...
** –
...
10
...
...
11
...
** 1
...
...
9
2
2
** 6
...
** 8
15
...
...
6
7
...
...
6
7
...
** –
...
7
(f) 10
...
M
...
** 7
...
** 14
24
12
...
** 3
6
...
** –
...
7
...
...
8
...
** 2
...
...
7
1
2
** 4
...
** 5
14
...
...
4
4
...
...
4
5
...
** –
...
5
(f) 8
...
F
% Repeaters
2000/2001
...
...
11
17
27
16
...
3
** 6
...
** –
...
8
...
...
10
...
3
...
...
9
1
** 2
** 5
** 8
** 6
15
...
...
5
6
1
...
5
6
...
...
...
8
1
...
MF
...
...
11
19
27
18
...
3
** 6
...
** –
...
9
...
...
11
...
** 3
...
...
10
2
** 3
** 6
** 8
** 8
16
...
...
7
7
** 1
...
5
7
...
...
...
8
1
...
M
...
...
12
14
27
14
...
3
** 6
...
** –
...
6
...
...
8
...
** 2
...
...
8
1
** 2
** 4
** 7
** 5
14
...
...
4
5
** 1
...
4
5
...
...
...
7
–
...
F
1999/20001999/2000Change
1999 to 2000
...
-6
3
–
–
1
...
–
-1
-1
–
...
...
-3
...
–
-2
...
...
1
...
–
-2
...
2
...
11
3
...
...
1
–
...
-4
1
2
...
–
...
–
...
–
...
-5
4
–
–
1
...
–
-1
–
–
...
...
-2
...
–
-4
...
...
1
...
–
-2
...
2
...
...
3
...
...
1
–
...
2
1
2
...
–
...
-1
...
–
...
-7
3
–
1
1
...
–
–
-1
1
...
...
-3
...
–
–
...
...
1
...
–
-2
...
2
...
...
4
...
...
1
–
...
-9
1
2
...
–
...
–
...
1
MF M F
/cont’d Teaching Staff
...
...
...
...
80
** 94
...
...
100
...
77
...
100
...
** 82
41
100
...
...
...
...
100
68
...
...
70
...
...
...
** 80
...
95
100
73
75
56
...
...
78
100
...
MF
2000/2001
% TrainedTeachers Pupil/Teacher
Ratio
1999/2000
2000/2001
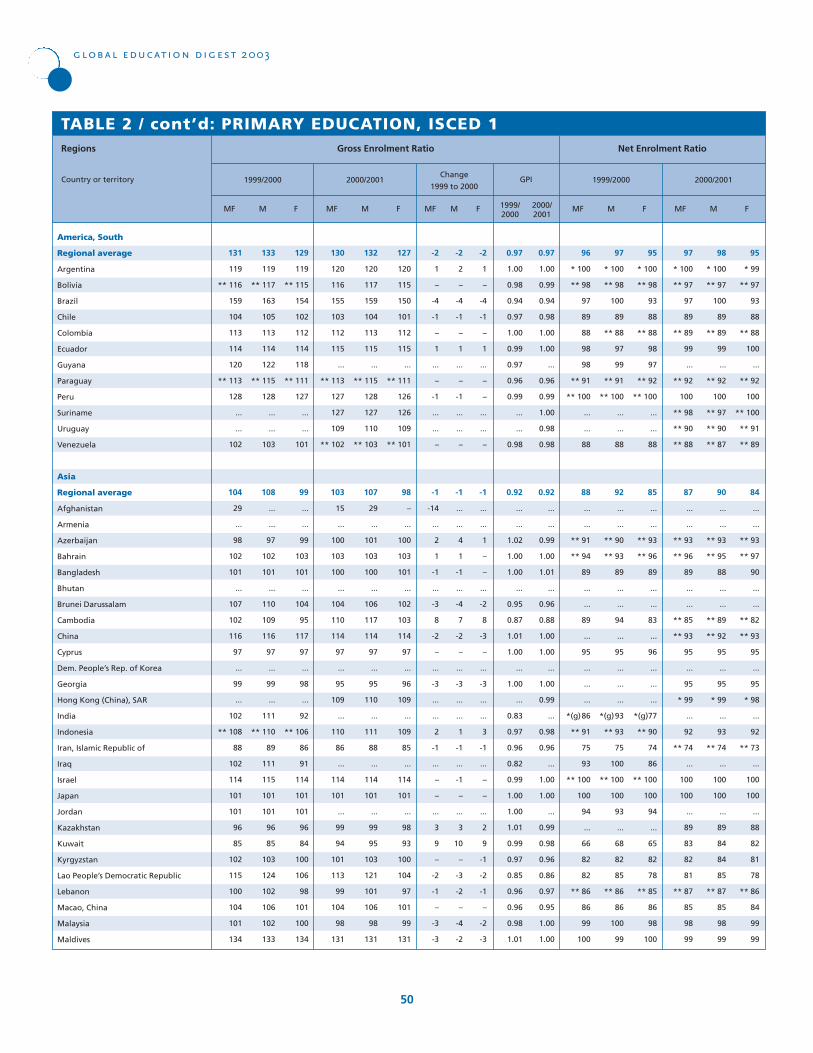
131
119
** 116
159
104
113
114
120
** 113
128
...
...
102
104
29
...
98
102
101
...
107
102
116
97
...
99
...
102
** 108
88
102
114
101
101
96
85
102
115
100
104
101
134
133
119
** 117
163
105
113
114
122
** 115
128
...
...
103
108
...
...
97
102
101
...
110
109
116
97
...
99
...
111
** 110
89
111
115
101
101
96
85
103
124
102
106
102
133
129
119
** 115
154
102
112
114
118
** 111
127
...
...
101
99
...
...
99
103
101
...
104
95
117
97
...
98
...
92
** 106
86
91
114
101
101
96
84
100
106
98
101
100
134
MF M F
Change
1999 to 2000
TABLE 2 / cont’d: PRIMARY EDUCATION, ISCED 1
America, South
Regional average
Argentina
Bolivia
Brazil
Chile
Colombia
Ecuador
Guyana
Paraguay
Peru
Suriname
Uruguay
Venezuela
Asia
Regional average
Afghanistan
Armenia
Azerbaijan
Bahrain
Bangladesh
Bhutan
Brunei Darussalam
Cambodia
China
Cyprus
Dem. People’s Rep. of Korea
Georgia
Hong Kong (China), SAR
India
Indonesia
Iran, Islamic Republic of
Iraq
Israel
Japan
Jordan
Kazakhstan
Kuwait
Kyrgyzstan
Lao People’s Democratic Republic
Lebanon
Macao, China
Malaysia
Maldives
Regions
Country or territory 1999/2000
130
120
116
155
103
112
115
...
** 113
127
127
109
** 102
103
15
...
100
103
100
...
104
110
114
97
...
95
109
...
110
86
...
114
101
...
99
94
101
113
99
104
98
131
132
120
117
159
104
113
115
...
** 115
128
127
110
** 103
107
29
...
101
103
100
...
106
117
114
97
...
95
110
...
111
88
...
114
101
...
99
95
103
121
101
106
98
131
127
120
115
150
101
112
115
...
** 111
126
126
109
** 101
98
–
...
100
103
101
...
102
103
114
97
...
96
109
...
109
85
...
114
101
...
98
93
100
104
97
101
99
131
MF M F
-2
1
–
-4
-1
–
1
...
–
-1
...
...
–
-1
-14
...
2
1
-1
...
-3
8
-2
–
...
-3
...
...
2
-1
...
–
–
...
3
9
–
-2
-1
–
-3
-3
-2
2
–
-4
-1
–
1
...
–
-1
...
...
–
-1
...
...
4
1
-1
...
-4
7
-2
–
...
-3
...
...
1
-1
...
-1
–
...
3
10
–
-3
-2
–
-4
-2
-2
1
–
-4
-1
–
1
...
–
–
...
...
–
-1
...
...
1
–
–
...
-2
8
-3
–
...
-3
...
...
3
-1
...
–
–
...
2
9
-1
-2
-1
–
-2
-3
MF M F
2000/2001
global education digest 2003
50
Gross Enrolment Ratio
96
* 100
** 98
97
89
88
98
98
** 91
** 100
...
...
88
88
...
...
** 91
** 94
89
...
...
89
...
95
...
...
...
*(g)86
** 91
75
93
** 100
100
94
...
66
82
82
** 86
86
99
100
97
* 100
** 98
100
89
** 88
97
99
** 91
** 100
...
...
88
92
...
...
** 90
** 93
89
...
...
94
...
95
...
...
...
*(g)93
** 93
75
100
** 100
100
93
...
68
82
85
** 86
86
100
99
95
* 100
** 98
93
88
** 88
98
97
** 92
** 100
...
...
88
85
...
...
** 93
** 96
89
...
...
83
...
96
...
...
...
*(g)77
** 90
74
86
** 100
100
94
...
65
82
78
** 85
86
98
100
MF M F
1999/2000
97
* 100
** 97
97
89
** 89
99
...
** 92
100
** 98
** 90
** 88
87
...
...
** 93
** 96
89
...
...
** 85
** 93
95
...
95
* 99
...
92
** 74
...
100
100
...
89
83
82
81
** 87
85
98
99
98
* 100
** 97
100
89
** 89
99
...
** 92
100
** 97
** 90
** 87
90
...
...
** 93
** 95
88
...
...
** 89
** 92
95
...
95
* 99
...
93
** 74
...
100
100
...
89
84
84
85
** 87
85
98
99
95
* 99
** 97
93
88
** 88
100
...
** 92
100
** 100
** 91
** 89
84
...
...
** 93
** 97
90
...
...
** 82
** 93
95
...
95
* 98
...
92
** 73
...
100
100
...
88
82
81
78
** 86
84
99
99
MF M F
2000/2001
Net Enrolment Ratio
GPI
0.97
1.00
0.98
0.94
0.97
1.00
0.99
0.97
0.96
0.99
...
...
0.98
0.92
...
...
1.02
1.00
1.00
...
0.95
0.87
1.01
1.00
...
1.00
...
0.83
0.97
0.96
0.82
0.99
1.00
1.00
1.01
0.99
0.97
0.85
0.96
0.96
0.98
1.01
1999/2000
0.97
1.00
0.99
0.94
0.98
1.00
1.00
...
0.96
0.99
1.00
0.98
0.98
0.92
...
...
0.99
1.00
1.01
...
0.96
0.88
1.00
1.00
...
1.00
0.99
...
0.98
0.96
...
1.00
1.00
...
0.99
0.98
0.96
0.86
0.97
0.95
1.00
1.00
2000/2001

Table 2 / cont’d: Primary Education, isced 1
51
Regions
Country or territory
221,495
** 59,036
807,053
56,424
214,911
82,809
4,153
...
...
...
17,929
...
30,202
...
37,469
** 4,363
312,245
1,946
...
44,852
** 6,692,731
4,146
...
17,714
...
* 2,840,314
** 1,256,426
** 322,571
170,141
...
363,880
...
...
10,176
19,284
27,592
20,571
1,578
151,711
3,051
MF
88
** 61
93
77
77
68
85
...
...
...
** 92
...
...
...
83
** 75
33
32
...
39
** 53
59
...
95
...
* 36
** 54
** 54
72
...
...
...
...
74
94
43
81
88
64
60
% F MF % F
244,412
** 61,546
815,079
57,265
197,374
84,758
...
...
149,526
3,253
17,384
...
11,708
...
40,523
** 4,606
309,341
2,068
3,753
45,914
6,430,774
3,701
...
17,732
22,845
...
1,289,720
** 320,975
...
61,294
362,605
...
63,569
9,518
18,783
27,665
26,719
1,613
** 159,375
3,246
* 89
** 61
93
78
77
68
...
...
62
82
...
...
...
...
84
** 74
34
34
69
39
53
75
...
92
77
...
52
** 54
...
83
...
...
97
85
95
44
86
89
** 65
60
22
** 25
26
32
24
23
26
...
...
...
...
...
32
...
19
** 18
56
42
...
50
** 19
15
...
17
...
* 40
** 22
** 26
21
...
21
...
...
14
24
30
19
30
20
24
20
** 24
25
31
26
23
...
...
29
20
21
...
43
...
17
** 17
57
41
12
53
20
17
...
16
22
...
22
** 25
...
12
20
...
19
15
24
30
17
28
** 19
23
America, South
Regional average
Argentina
Bolivia
Brazil
Chile
Colombia
Ecuador
Guyana
Paraguay
Peru
Suriname
Uruguay
Venezuela
Asia
Regional average
Afghanistan
Armenia
Azerbaijan
Bahrain
Bangladesh
Bhutan
Brunei Darussalam
Cambodia
China
Cyprus
Dem. People’s Rep. of Korea
Georgia
Hong Kong (China), SAR
India
Indonesia
Iran, Islamic Republic of
Iraq
Israel
Japan
Jordan
Kazakhstan
Kuwait
Kyrgyzstan
Lao People’s Democratic Republic
Lebanon
Macao, China
Malaysia
Maldives
2000/2001
6
** 4
25
2
5
2
...
8
11
** 11
9
** 7
...
–
...
4
6
13
na
16
1
–
...
–
1
...
6
5
...
...
...
...
–
3
–
20
7
7
na
...
MF
7
** 4
** 25
2
6
2
...
9
11
** 6
10
** 8
...
–
...
5
7
14
na
17
...
–
...
–
** 1
...
6
6
...
...
...
...
–
3
–
21
8
8
na
...
M
5
** 4
** 25
2
5
2
...
7
10
** 17
7
** 5
...
–
...
4
6
13
na
16
...
–
...
–
** 1
...
6
4
...
...
...
...
–
3
–
18
6
5
na
...
F
% Repeaters
2000/2001
6
** 2
24
2
5
2
2
8
10
...
8
** 7
...
...
** –
4
6
12
na
** 19
–
–
...
–
...
4
** 6
5
12
...
...
1
...
3
–
20
9
7
na
...
MF
7
** 2
24
3
6
3
3
9
10
...
9
** 8
...
...
** –
5
7
12
na
** 20
...
–
...
** –
...
4
** 6
7
14
...
...
1
...
3
–
21
10
9
na
...
M
5
** 2
24
2
5
2
2
7
10
...
6
** 5
...
...
** –
4
6
12
na
** 18
...
–
...
** –
...
4
** 6
4
10
...
...
1
...
3
–
18
7
5
na
...
F
1999/20001999/2000Change
1999 to 2000
–
–
-1
–
–
–
2
...
1
–
...
...
–
-1
...
...
2
2
-1
...
...
-3
...
–
...
...
...
...
1
-1
...
–
–
...
...
17
–
–
1
-1
-1
-1
–
–
-1
–
–
1
1
...
1
–
...
...
–
-1
...
...
3
2
-1
...
...
-5
...
–
...
...
...
...
–
-1
...
–
–
...
...
16
1
-1
1
-1
-2
-1
–
–
-1
–
–
–
2
...
1
–
...
...
–
-1
...
...
–
1
–
...
...
-2
...
–
...
...
...
...
2
-1
...
–
–
...
...
18
–
–
1
-1
–
-1
MF M F
/cont’d Teaching Staff
** 67
** 74
** 92
** 92
...
87
...
...
** 78
100
...
...
...
...
...
...
65
95
...
...
** 97
...
...
...
...
...
** 94
** 96
...
...
...
...
...
...
48
76
...
87
...
66
MF
2000/2001
% TrainedTeachers Pupil/Teacher
Ratio
1999/2000
2000/2001

99
91
** 118
73
* 73
109
...
...
99
68
...
...
106
105
94
...
** 101
...
94
...
108
...
102
109
...
103
111
105
...
104
88
104
102
103
101
105
105
...
99
...
103
101
119
97
91
** 131
75
...
108
...
...
98
70
...
...
110
109
96
...
** 106
...
95
...
111
...
103
110
...
104
112
105
...
105
88
104
102
105
101
106
106
...
99
...
104
102
120
100
91
** 104
71
...
109
...
...
99
67
...
...
102
101
91
...
** 96
...
94
...
104
...
102
109
...
103
109
104
...
102
87
104
102
101
100
105
105
...
99
...
103
101
119
MF M F
Change
1999 to 2000
TABLE 2 / cont’d: PRIMARY EDUCATION, ISCED 1
Mongolia
Myanmar
Nepal
Oman
Pakistan
Palestinian Autonomous Territories
Philippines
Qatar
Republic of Korea
Saudi Arabia
Singapore
Sri Lanka
Syrian Arab Republic
Tajikistan
Thailand
Timor-Leste
Turkey
Turkmenistan
United Arab Emirates
Uzbekistan
Viet Nam
Yemen
Europe
Regional average
Albania
Andorra
Austria
Belarus
Belgium
Bosnia and Herzegovina
Bulgaria
Croatia
Czech Republic
Denmark
Estonia
Finland
France
Germany
Gibraltar
Greece
Holy See
Hungary
Iceland
Ireland
Regions
Country or territory 1999/2000
99
89
118
72
* 75
108
113
105
101
68
...
...
109
104
95
...
** 101
...
99
...
106
** 79
102
107
...
104
** 109
105
...
103
88
104
102
103
102
105
104
...
99
...
102
102
...
97
89
128
74
* 85
107
113
105
101
69
...
...
113
108
97
...
** 105
...
99
...
109
** 96
102
107
...
104
** 109
105
...
105
89
105
102
105
102
106
104
...
99
...
103
102
...
101
89
108
71
* 63
109
113
104
101
66
...
...
105
100
93
...
** 96
...
99
...
102
** 61
102
107
...
103
** 108
104
...
102
88
104
102
101
101
104
104
...
99
...
101
102
...
MF M F
–
-2
–
-1
1
-1
...
...
2
-1
...
...
3
–
1
...
–
...
5
...
-2
...
–
-2
...
1
-2
–
...
–
–
–
–
–
1
–
-2
...
–
...
-1
1
...
–
-2
-3
-1
...
-1
...
...
3
-1
...
...
3
–
1
...
-1
...
5
...
-2
...
–
-3
...
–
-2
–
...
–
–
–
–
–
1
–
-2
...
–
...
-1
–
...
–
-2
4
-1
...
–
...
...
2
-1
...
...
4
–
1
...
–
...
5
...
-2
...
–
-2
...
1
-1
–
...
–
–
–
–
–
1
–
-2
...
–
...
-1
2
...
MF M F
2000/2001
global education digest 2003
52
Gross Enrolment Ratio
90
83
* 71
65
...
99
...
...
97
58
...
...
** 95
96
...
...
...
...
78
...
96
...
94
100
...
91
** 99
** 100
...
95
81
90
99
98
100
100
87
...
97
...
90
99
** 90
88
84
* 78
66
...
99
...
...
97
60
...
...
** 98
100
...
...
...
...
78
...
...
...
94
100
...
90
** 100
** 100
...
96
82
90
99
98
100
100
86
...
97
...
90
100
** 90
91
83
* 65
65
...
99
...
...
98
56
...
...
** 91
92
...
...
...
...
79
...
...
...
95
99
...
91
** 98
** 100
...
94
81
90
99
97
99
100
87
...
97
...
90
99
** 90
MF M F
1999/2000
89
83
** 72
65
* 60
97
93
...
99
** 58
...
...
** 96
96
** 85
...
...
...
87
...
95
** 67
95
98
...
91
** 99
100
...
94
82
90
...
98
100
100
...
...
97
...
90
100
...
87
83
** 77
65
* 69
96
92
...
99
** 60
...
...
** 99
100
** 87
...
...
...
86
...
** 98
** 84
94
98
...
90
** 100
100
...
95
82
90
...
98
100
100
...
...
97
...
91
100
...
91
83
** 67
64
* 51
98
93
...
100
** 56
...
...
** 94
92
** 84
...
...
...
87
...
** 92
** 49
95
97
...
92
** 99
100
...
93
81
90
...
97
100
100
...
...
97
...
90
100
...
MF M F
2000/2001
Net Enrolment Ratio
GPI
1.04
0.99
0.80
0.95
...
1.01
...
...
1.01
0.96
...
...
0.92
0.93
0.95
...
0.91
...
1.00
...
0.94
...
0.99
0.99
...
0.99
0.98
0.99
...
0.97
0.99
0.99
1.00
0.96
0.99
0.99
1.00
...
1.00
...
0.98
0.99
0.99
1999/2000
1.04
0.99
0.85
0.96
0.74
1.01
1.00
1.00
1.01
0.96
...
...
0.93
0.93
0.96
...
0.92
...
1.00
...
0.94
0.63
0.99
1.00
...
0.99
0.99
0.99
...
0.97
0.99
0.99
1.00
0.96
1.00
0.99
1.00
...
1.00
...
0.99
1.00
...
2000/2001
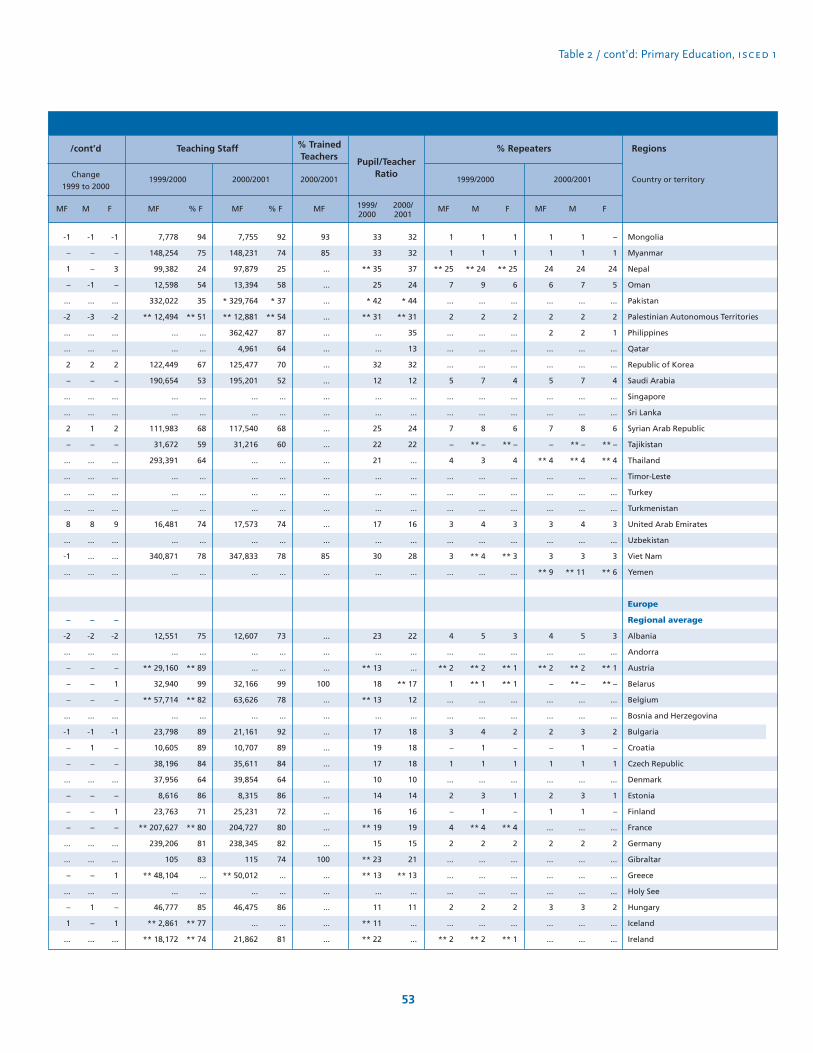
Table 2 / cont’d: Primary Education, isced 1
53
Regions
Country or territory
7,778
148,254
99,382
12,598
332,022
** 12,494
...
...
122,449
190,654
...
...
111,983
31,672
293,391
...
...
...
16,481
...
340,871
...
12,551
...
** 29,160
32,940
** 57,714
...
23,798
10,605
38,196
37,956
8,616
23,763
** 207,627
239,206
105
** 48,104
...
46,777
** 2,861
** 18,172
MF
94
75
24
54
35
** 51
...
...
67
53
...
...
68
59
64
...
...
...
74
...
78
...
75
...
** 89
99
** 82
...
89
89
84
64
86
71
** 80
81
83
...
...
85
** 77
** 74
% F MF % F
7,755
148,231
97,879
13,394
* 329,764
** 12,881
362,427
4,961
125,477
195,201
...
...
117,540
31,216
...
...
...
...
17,573
...
347,833
...
12,607
...
...
32,166
63,626
...
21,161
10,707
35,611
39,854
8,315
25,231
204,727
238,345
115
** 50,012
...
46,475
...
21,862
92
74
25
58
* 37
** 54
87
64
70
52
...
...
68
60
...
...
...
...
74
...
78
...
73
...
...
99
78
...
92
89
84
64
86
72
80
82
74
...
...
86
...
81
33
33
** 35
25
* 42
** 31
...
...
32
12
...
...
25
22
21
...
...
...
17
...
30
...
23
...
** 13
18
** 13
...
17
19
17
10
14
16
** 19
15
** 23
** 13
...
11
** 11
** 22
32
32
37
24
* 44
** 31
35
13
32
12
...
...
24
22
...
...
...
...
16
...
28
...
22
...
...
** 17
12
...
18
18
18
10
14
16
19
15
21
** 13
...
11
...
...
Mongolia
Myanmar
Nepal
Oman
Pakistan
Palestinian Autonomous Territories
Philippines
Qatar
Republic of Korea
Saudi Arabia
Singapore
Sri Lanka
Syrian Arab Republic
Tajikistan
Thailand
Timor-Leste
Turkey
Turkmenistan
United Arab Emirates
Uzbekistan
Viet Nam
Yemen
Europe
Regional average
Albania
Andorra
Austria
Belarus
Belgium
Bosnia and Herzegovina
Bulgaria
Croatia
Czech Republic
Denmark
Estonia
Finland
France
Germany
Gibraltar
Greece
Holy See
Hungary
Iceland
Ireland
2000/2001
1
1
24
6
...
2
2
...
...
5
...
...
7
–
** 4
...
...
...
3
...
3
** 9
4
...
** 2
–
...
...
2
–
1
...
2
1
...
2
...
...
...
3
...
...
MF
1
1
24
7
...
2
2
...
...
7
...
...
8
** –
** 4
...
...
...
4
...
3
** 11
5
...
** 2
** –
...
...
3
1
1
...
3
1
...
2
...
...
...
3
...
...
M
–
1
24
5
...
2
1
...
...
4
...
...
6
** –
** 4
...
...
...
3
...
3
** 6
3
...
** 1
** –
...
...
2
–
1
...
1
–
...
2
...
...
...
2
...
...
F
% Repeaters
2000/2001
1
1
** 25
7
...
2
...
...
...
5
...
...
7
–
4
...
...
...
3
...
3
...
4
...
** 2
1
...
...
3
–
1
...
2
–
4
2
...
...
...
2
...
** 2
MF
1
1
** 24
9
...
2
...
...
...
7
...
...
8
** –
3
...
...
...
4
...
** 4
...
5
...
** 2
** 1
...
...
4
1
1
...
3
1
** 4
2
...
...
...
2
...
** 2
M
1
1
** 25
6
...
2
...
...
...
4
...
...
6
** –
4
...
...
...
3
...
** 3
...
3
...
** 1
** 1
...
...
2
–
1
...
1
–
** 4
2
...
...
...
2
...
** 1
F
1999/20001999/2000Change
1999 to 2000
-1
–
1
–
...
-2
...
...
2
–
...
...
2
–
...
...
...
...
8
...
-1
...
–
-2
...
–
–
–
...
-1
–
–
...
–
–
–
...
...
–
...
–
1
...
-1
–
–
-1
...
-3
...
...
2
–
...
...
1
–
...
...
...
...
8
...
...
...
–
-2
...
–
–
–
...
-1
1
–
...
–
–
–
...
...
–
...
1
–
...
-1
–
3
–
...
-2
...
...
2
–
...
...
2
–
...
...
...
...
9
...
...
...
–
-2
...
–
1
–
...
-1
–
–
...
–
1
–
...
...
1
...
–
1
...
MF M F
/cont’d Teaching Staff
93
85
...
...
...
...
...
...
...
...
...
...
...
...
...
...
...
...
...
...
85
...
...
...
...
100
...
...
...
...
...
...
...
...
...
...
100
...
...
...
...
...
MF
2000/2001
% TrainedTeachers Pupil/Teacher
Ratio
1999/2000
2000/2001

101
101
...
101
100
106
...
108
101
** 101
123
...
102
109
...
66
103
97
105
109
108
100
...
99
96
101
96
...
** 128
...
...
...
101
99
113
** 84
103
...
...
113
...
109
102
102
...
101
99
106
...
109
101
** 102
125
...
103
109
...
65
103
96
105
108
108
101
...
99
97
101
99
...
** 127
...
...
...
101
99
115
** 88
104
...
...
113
...
109
101
100
...
100
101
107
...
107
101
** 99
120
...
101
108
...
67
102
98
105
111
107
100
...
99
95
101
94
...
** 129
...
...
...
101
98
111
** 80
101
...
...
112
...
108
MF M F
Change
1999 to 2000
TABLE 2 / cont’d: PRIMARY EDUCATION, ISCED 1
Italy
Latvia
Liechtenstein
Lithuania
Luxembourg
Malta
Monaco
Netherlands
Norway
Poland
Portugal
Republic of Moldova
Romania
Russian Federation
San Marino
Serbia and Montenegro
Slovakia
Slovenia
Spain
Sweden
Switzerland
The Former Yugoslav Rep. of Macedonia
Ukraine
United Kingdom
Oceania
Regional average
Australia
Cook Islands
Fiji
Kiribati
Marshall Islands
Micronesia (Federated States of)
Nauru
New Zealand
Niue
Palau
Papua New Guinea
Samoa
Solomon Islands
Tokelau
Tonga
Tuvalu
Vanuatu
Regions
Country or territory 1999/2000
101
100
...
101
101
106
...
108
101
100
121
84
99
109
...
66
103
100
105
110
107
99
...
99
97
102
** 96
** 109
...
...
...
...
100
...
** 111
...
** 103
...
...
** 113
...
** 108
101
101
...
102
101
106
...
109
101
100
122
84
100
109
...
66
103
101
105
109
108
99
...
99
98
102
** 98
** 110
...
...
...
...
100
...
** 113
...
** 105
...
...
** 113
...
** 109
100
100
...
101
101
106
...
106
102
99
120
84
98
108
...
67
103
100
105
111
107
99
...
99
96
102
** 93
** 108
...
...
...
...
100
...
** 109
...
** 101
...
...
** 112
...
** 108
MF M F
-1
-1
...
–
1
–
...
–
–
-1
-1
...
-3
–
...
–
–
3
–
1
–
-2
...
–
–
1
–
...
...
...
...
...
-1
...
-2
...
–
...
...
–
...
–
–
-1
...
1
1
–
...
–
–
-2
-3
...
-3
–
...
–
–
5
–
1
–
-2
...
–
1
1
–
...
...
...
...
...
-1
...
-2
...
–
...
...
–
...
–
-1
-1
...
–
–
-1
...
–
–
–
–
...
-3
–
...
–
–
2
–
1
–
-1
...
–
–
1
–
...
...
...
...
...
-1
...
-2
...
–
...
...
–
...
–
MF M F
2000/2001
global education digest 2003
54
Gross Enrolment Ratio
100
93
...
94
96
99
...
100
100
** 97
...
...
93
...
...
** 51
...
93
100
100
99
94
…
99
92
95
85
...
...
...
...
...
100
99
98
** 84
97
...
...
91
...
90
100
93
...
94
95
98
...
100
100
** 97
...
...
93
...
...
** 50
...
92
100
100
100
94
…
99
92
94
87
...
...
...
...
...
100
99
100
** 88
98
...
...
92
...
90
100
93
...
94
97
100
...
99
100
** 97
...
...
93
...
...
** 51
...
94
100
99
99
93
…
99
91
95
83
...
...
...
...
...
100
98
97
** 80
95
...
...
90
...
89
MF M F
1999/2000
100
92
...
95
97
98
...
99
100
98
...
** 78
93
...
...
50
89
93
100
100
99
92
…
99
92
96
** 85
** 99
...
...
...
...
99
...
** 98
...
** 97
...
...
** 91
...
** 89
100
92
...
95
96
98
...
100
100
98
...
** 79
93
...
...
50
89
94
99
100
99
92
…
99
93
95
** 86
** 99
...
...
...
...
99
...
** 100
...
** 98
...
...
** 92
...
** 90
100
92
...
94
97
98
...
99
100
98
...
** 78
93
...
...
51
90
93
100
99
99
92
…
99
91
96
** 83
** 99
...
...
...
...
99
...
** 97
...
** 95
...
...
** 90
...
** 89
MF M F
2000/2001
Net Enrolment Ratio
GPI
1.00
0.98
...
0.99
1.02
1.01
...
0.98
1.00
0.97
0.96
...
0.98
0.99
...
1.02
0.99
1.02
0.99
1.03
0.99
0.99
...
1.00
0.98
1.00
0.95
...
1.02
...
...
...
1.00
1.00
0.97
0.91
0.97
...
...
0.98
...
0.99
1999/2000
0.99
0.99
...
0.99
1.00
1.00
...
0.98
1.00
0.99
0.98
1.00
0.98
0.99
...
1.02
0.99
0.99
0.99
1.02
0.99
1.00
...
1.00
0.98
1.00
0.95
0.98
...
...
...
...
1.00
...
0.97
...
0.97
...
...
0.99
...
0.99
2000/2001
Symbols and Footnotes
** UIS estimation * National Estimation
(c) Policy change: Introduction of free universal primary education (f) Policy change: The pass mark required to transfer to secondary was raised from 40% to 50% in 2000.

Table 2 / cont’d: Primary Education, isced 1
55
Regions
Country or territory
258,827
8,935
...
13,265
...
1,790
...
...
...
...
61,258
...
** 60,524
330,220
233
19,346
17,602
...
174,638
65,528
** 39,506
5,884
...
248,148
...
144
...
** 720
...
...
...
23,446
...
...
** 16,433
** 1,137
...
...
803
...
1,576
MF
95
97
...
98
...
86
...
...
...
...
82
...
...
99
91
82
90
...
69
80
** 72
67
...
81
...
86
...
** 64
...
...
...
78
...
...
** 38
** 72
...
...
67
...
44
% F MF % F
262,675
8,379
...
13,265
2,834
1,783
89
130,974
...
289,113
61,908
11,648
...
330,220
...
19,204
15,419
6,874
175,135
68,949
39,460
5,729
...
252,705
...
** 144
** 3,965
...
...
...
...
22,990
...
...
...
** 1,139
...
...
** 805
...
** 1,598
95
97
...
98
67
86
87
78
...
83
82
95
...
99
...
82
93
95
71
80
73
68
...
82
...
** 86
** 57
...
...
...
...
81
...
...
...
** 72
...
...
** 67
...
** 44
11
15
...
16
...
19
...
...
...
...
13
...
** 20
19
5
20
18
...
15
12
** 14
22
...
19
...
18
...
** 24
...
...
...
15
...
...
** 36
** 24
...
...
21
...
22
11
15
...
16
12
19
22
10
...
11
13
20
...
17
...
20
19
13
14
11
14
22
...
18
...
** 18
** 29
...
...
...
...
16
...
...
...
** 24
...
...
** 21
...
** 22
Italy
Latvia
Liechtenstein
Lithuania
Luxembourg
Malta
Monaco
Netherlands
Norway
Poland
Portugal
Republic of Moldova
Romania
Russian Federation
San Marino
Serbia and Montenegro
Slovakia
Slovenia
Spain
Sweden
Switzerland
The Former Yugoslav Rep. of Macedonia
Ukraine
United Kingdom
Oceania
Regional average
Australia
Cook Islands
Fiji
Kiribati
Marshall Islands
Micronesia (Federated States of)
Nauru
New Zealand
Niue
Palau
Papua New Guinea
Samoa
Solomon Islands
Tokelau
Tonga
Tuvalu
Vanuatu
2000/2001
–
2
...
1
...
2
...
...
...
1
...
** 1
3
...
...
1
2
1
...
...
2
–
...
...
...
** 3
...
...
...
...
...
...
...
...
...
** 1
...
...
** 9
...
** 11
MF
–
3
...
1
...
3
...
...
...
1
...
** 1
4
...
...
...
3
1
...
...
2
–
...
...
...
...
...
...
...
...
...
...
...
...
...
** 1
...
...
** 8
...
** 12
M
–
1
...
–
...
2
...
...
...
–
...
** 1
3
...
...
...
2
1
...
...
2
–
...
...
...
...
...
...
...
...
...
...
...
...
...
** 1
...
...
** 9
...
** 10
F
% Repeaters
2000/2001
–
2
...
1
...
2
...
...
...
1
...
...
3
...
...
...
2
1
...
...
2
–
...
...
...
3
...
...
...
...
...
...
...
...
** 5
1
...
...
9
...
** 11
MF
1
3
...
1
...
2
...
...
...
1
...
...
4
...
...
...
3
1
...
...
2
–
...
...
...
...
...
...
...
...
...
...
...
...
** 5
1
...
...
8
...
** 12
M
–
1
...
1
...
2
...
...
...
–
...
...
3
...
...
...
2
1
...
...
1
–
...
...
...
...
...
...
...
...
...
...
...
...
** 5
1
...
...
9
...
** 10
F
1999/20001999/2000Change
1999 to 2000
–
-1
...
–
1
-1
...
–
–
1
...
...
–
...
...
–
...
–
–
–
–
-1
…
–
–
1
–
...
...
...
...
...
-1
...
–
...
–
...
...
–
...
–
–
-1
...
1
1
–
...
–
–
1
...
...
–
...
...
-1
...
1
–
–
–
-2
…
–
1
1
–
...
...
...
...
...
-1
...
–
...
–
...
...
–
...
–
–
-1
...
–
–
-2
...
–
–
1
...
...
–
...
...
–
...
-1
–
–
–
-1
…
–
–
1
–
...
...
...
...
...
-1
...
–
...
–
...
...
–
...
–
MF M F
/cont’d Teaching Staff
...
...
...
...
...
...
...
...
...
...
...
...
...
...
...
100
...
...
...
...
...
...
...
...
...
...
** 97
...
...
...
...
...
...
...
...
...
...
...
...
...
...
MF
2000/2001
% TrainedTeachers Pupil/Teacher
Ratio
1999/2000
2000/2001
/cont’d
(g) Projected at the National level (593 districts) on the basis of age-wise data collected for ISCED1 level in 193 districts under the
District Information System on Education (DISE).
... Missing Value
– Magnitude Nil or Negligible
na Category Not Applicable
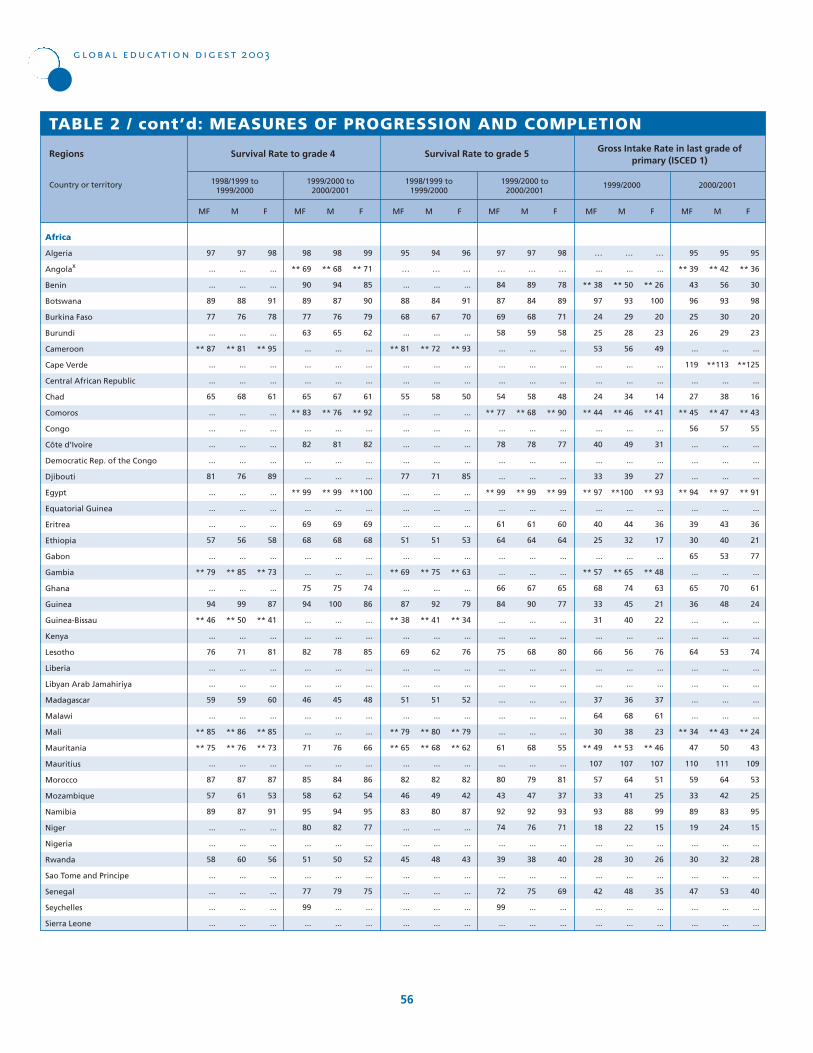
97
...
...
89
77
...
** 87
...
...
65
...
...
...
...
81
...
...
...
57
...
** 79
...
94
** 46
...
76
...
...
59
...
** 85
** 75
...
87
57
89
...
...
58
...
...
...
...
97
...
...
88
76
...
** 81
...
...
68
...
...
...
...
76
...
...
...
56
...
** 85
...
99
** 50
...
71
...
...
59
...
** 86
** 76
...
87
61
87
...
...
60
...
...
...
...
98
...
...
91
78
...
** 95
...
...
61
...
...
...
...
89
...
...
...
58
...
** 73
...
87
** 41
...
81
...
...
60
...
** 85
** 73
...
87
53
91
...
...
56
...
...
...
...
MF M F
TABLE 2 / cont’d: MEASURES OF PROGRESSION AND COMPLETION
Africa
Algeria
Angolax
Benin
Botswana
Burkina Faso
Burundi
Cameroon
Cape Verde
Central African Republic
Chad
Comoros
Congo
Côte d’Ivoire
Democratic Rep. of the Congo
Djibouti
Egypt
Equatorial Guinea
Eritrea
Ethiopia
Gabon
Gambia
Ghana
Guinea
Guinea-Bissau
Kenya
Lesotho
Liberia
Libyan Arab Jamahiriya
Madagascar
Malawi
Mali
Mauritania
Mauritius
Morocco
Mozambique
Namibia
Niger
Nigeria
Rwanda
Sao Tome and Principe
Senegal
Seychelles
Sierra Leone
Regions
Country or territory 1998/1999 to1999/2000
98
** 69
90
89
77
63
...
...
...
65
** 83
...
82
...
...
** 99
...
69
68
...
...
75
94
...
...
82
...
...
46
...
...
71
...
85
58
95
80
...
51
...
77
99
...
98
** 68
94
87
76
65
...
...
...
67
** 76
...
81
...
...
** 99
...
69
68
...
...
75
100
...
...
78
...
...
45
...
...
76
...
84
62
94
82
...
50
...
79
...
...
99
** 71
85
90
79
62
...
...
...
61
** 92
...
82
...
...
**100
...
69
68
...
...
74
86
...
...
85
...
...
48
...
...
66
...
86
54
95
77
...
52
...
75
...
...
MF M F
1999/2000 to2000/2001
global education digest 2003
56
Survival Rate to grade 4
95
…
...
88
68
...
** 81
...
...
55
...
...
...
...
77
...
...
...
51
...
** 69
...
87
** 38
...
69
...
...
51
...
** 79
** 65
...
82
46
83
...
...
45
...
...
...
...
94
…
...
84
67
...
** 72
...
...
58
...
...
...
...
71
...
...
...
51
...
** 75
...
92
** 41
...
62
...
...
51
...
** 80
** 68
...
82
49
80
...
...
48
...
...
...
...
96
…
...
91
70
...
** 93
...
...
50
...
...
...
...
85
...
...
...
53
...
** 63
...
79
** 34
...
76
...
...
52
...
** 79
** 62
...
82
42
87
...
...
43
...
...
...
...
MF M F
1998/1999 to1999/2000
97
…
84
87
69
58
...
...
...
54
** 77
...
78
...
...
** 99
...
61
64
...
...
66
84
...
...
75
...
...
...
...
...
61
...
80
43
92
74
...
39
...
72
99
...
97
…
89
84
68
59
...
...
...
58
** 68
...
78
...
...
** 99
...
61
64
...
...
67
90
...
...
68
...
...
...
...
...
68
...
79
47
92
76
...
38
...
75
...
...
98
…
78
89
71
58
...
...
...
48
** 90
...
77
...
...
** 99
...
60
64
...
...
65
77
...
...
80
...
...
...
...
...
55
...
81
37
93
71
...
40
...
69
...
...
MF M F
1999/2000 to2000/2001
Survival Rate to grade 5
…
...
** 38
97
24
25
53
...
...
24
** 44
...
40
...
33
** 97
...
40
25
...
** 57
68
33
31
...
66
...
...
37
64
30
** 49
107
57
33
93
18
...
28
...
42
...
...
…
...
** 50
93
29
28
56
...
...
34
** 46
...
49
...
39
**100
...
44
32
...
** 65
74
45
40
...
56
...
...
36
68
38
** 53
107
64
41
88
22
...
30
...
48
...
...
…
...
** 26
100
20
23
49
...
...
14
** 41
...
31
...
27
** 93
...
36
17
...
** 48
63
21
22
...
76
...
...
37
61
23
** 46
107
51
25
99
15
...
26
...
35
...
...
MF M F
1999/2000
95
** 39
43
96
25
26
...
119
...
27
** 45
56
...
...
...
** 94
...
39
30
65
...
65
36
...
...
64
...
...
...
...
** 34
47
110
59
33
89
19
...
30
...
47
...
...
95
** 42
56
93
30
29
...
**113
...
38
** 47
57
...
...
...
** 97
...
43
40
53
...
70
48
...
...
53
...
...
...
...
** 43
50
111
64
42
83
24
...
32
...
53
...
...
95
** 36
30
98
20
23
...
**125
...
16
** 43
55
...
...
...
** 91
...
36
21
77
...
61
24
...
...
74
...
...
...
...
** 24
43
109
53
25
95
15
...
28
...
40
...
...
MF M F
2000/2001
Gross Intake Rate in last grade ofprimary (ISCED 1)
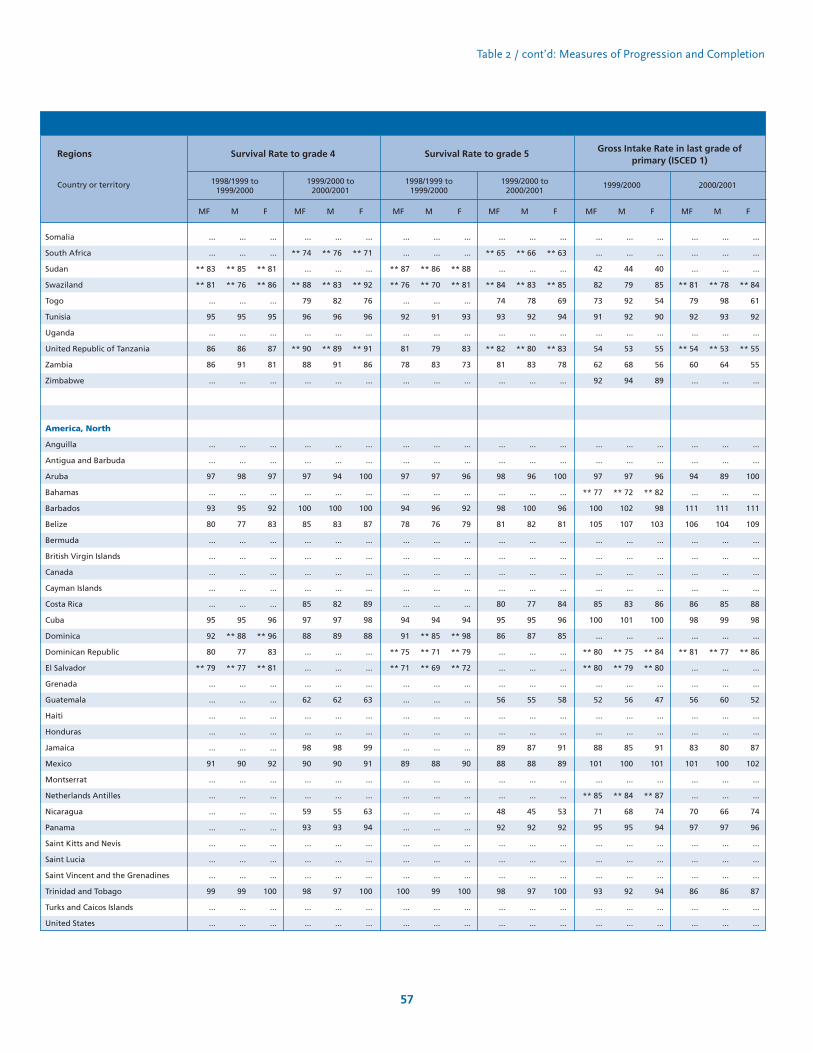
...
...
** 83
** 81
...
95
...
86
86
...
...
...
97
...
93
80
...
...
...
...
...
95
92
80
** 79
...
...
...
...
...
91
...
...
...
...
...
...
...
99
...
...
...
...
** 85
** 76
...
95
...
86
91
...
...
...
98
...
95
77
...
...
...
...
...
95
** 88
77
** 77
...
...
...
...
...
90
...
...
...
...
...
...
...
99
...
...
...
...
** 81
** 86
...
95
...
87
81
...
...
...
97
...
92
83
...
...
...
...
...
96
** 96
83
** 81
...
...
...
...
...
92
...
...
...
...
...
...
...
100
...
...
MF M F
Somalia
South Africa
Sudan
Swaziland
Togo
Tunisia
Uganda
United Republic of Tanzania
Zambia
Zimbabwe
America, North
Anguilla
Antigua and Barbuda
Aruba
Bahamas
Barbados
Belize
Bermuda
British Virgin Islands
Canada
Cayman Islands
Costa Rica
Cuba
Dominica
Dominican Republic
El Salvador
Grenada
Guatemala
Haiti
Honduras
Jamaica
Mexico
Montserrat
Netherlands Antilles
Nicaragua
Panama
Saint Kitts and Nevis
Saint Lucia
Saint Vincent and the Grenadines
Trinidad and Tobago
Turks and Caicos Islands
United States
Regions
Country or territory 1998/1999 to1999/2000
...
** 74
...
** 88
79
96
...
** 90
88
...
...
...
97
...
100
85
...
...
...
...
85
97
88
...
...
...
62
...
...
98
90
...
...
59
93
...
...
...
98
...
...
...
** 76
...
** 83
82
96
...
** 89
91
...
...
...
94
...
100
83
...
...
...
...
82
97
89
...
...
...
62
...
...
98
90
...
...
55
93
...
...
...
97
...
...
...
** 71
...
** 92
76
96
...
** 91
86
...
...
...
100
...
100
87
...
...
...
...
89
98
88
...
...
...
63
...
...
99
91
...
...
63
94
...
...
...
100
...
...
MF M F
1999/2000 to2000/2001
57
Survival Rate to grade 4
...
...
** 87
** 76
...
92
...
81
78
...
...
...
97
...
94
78
...
...
...
...
...
94
91
** 75
** 71
...
...
...
...
...
89
...
...
...
...
...
...
...
100
...
...
...
...
** 86
** 70
...
91
...
79
83
...
...
...
97
...
96
76
...
...
...
...
...
94
** 85
** 71
** 69
...
...
...
...
...
88
...
...
...
...
...
...
...
99
...
...
...
...
** 88
** 81
...
93
...
83
73
...
...
...
96
...
92
79
...
...
...
...
...
94
** 98
** 79
** 72
...
...
...
...
...
90
...
...
...
...
...
...
...
100
...
...
MF M F
1998/1999 to1999/2000
...
** 65
...
** 84
74
93
...
** 82
81
...
...
...
98
...
98
81
...
...
...
...
80
95
86
...
...
...
56
...
...
89
88
...
...
48
92
...
...
...
98
...
...
...
** 66
...
** 83
78
92
...
** 80
83
...
...
...
96
...
100
82
...
...
...
...
77
95
87
...
...
...
55
...
...
87
88
...
...
45
92
...
...
...
97
...
...
...
** 63
...
** 85
69
94
...
** 83
78
...
...
...
100
...
96
81
...
...
...
...
84
96
85
...
...
...
58
...
...
91
89
...
...
53
92
...
...
...
100
...
...
MF M F
1999/2000 to2000/2001
Survival Rate to grade 5
...
...
42
82
73
91
...
54
62
92
...
...
97
** 77
100
105
...
...
...
...
85
100
...
** 80
** 80
...
52
...
...
88
101
...
** 85
71
95
...
...
...
93
...
...
...
...
44
79
92
92
...
53
68
94
...
...
97
** 72
102
107
...
...
...
...
83
101
...
** 75
** 79
...
56
...
...
85
100
...
** 84
68
95
...
...
...
92
...
...
...
...
40
85
54
90
...
55
56
89
...
...
96
** 82
98
103
...
...
...
...
86
100
...
** 84
** 80
...
47
...
...
91
101
...
** 87
74
94
...
...
...
94
...
...
MF M F
1999/2000
...
...
...
** 81
79
92
...
** 54
60
...
...
...
94
...
111
106
...
...
...
...
86
98
...
** 81
...
...
56
...
...
83
101
...
...
70
97
...
...
...
86
...
...
...
...
...
** 78
98
93
...
** 53
64
...
...
...
89
...
111
104
...
...
...
...
85
99
...
** 77
...
...
60
...
...
80
100
...
...
66
97
...
...
...
86
...
...
...
...
...
** 84
61
92
...
** 55
55
...
...
...
100
...
111
109
...
...
...
...
88
98
...
** 86
...
...
52
...
...
87
102
...
...
74
96
...
...
...
87
...
...
MF M F
2000/2001
Gross Intake Rate in last grade ofprimary (ISCED 1)
Table 2 / cont’d: Measures of Progression and Completion
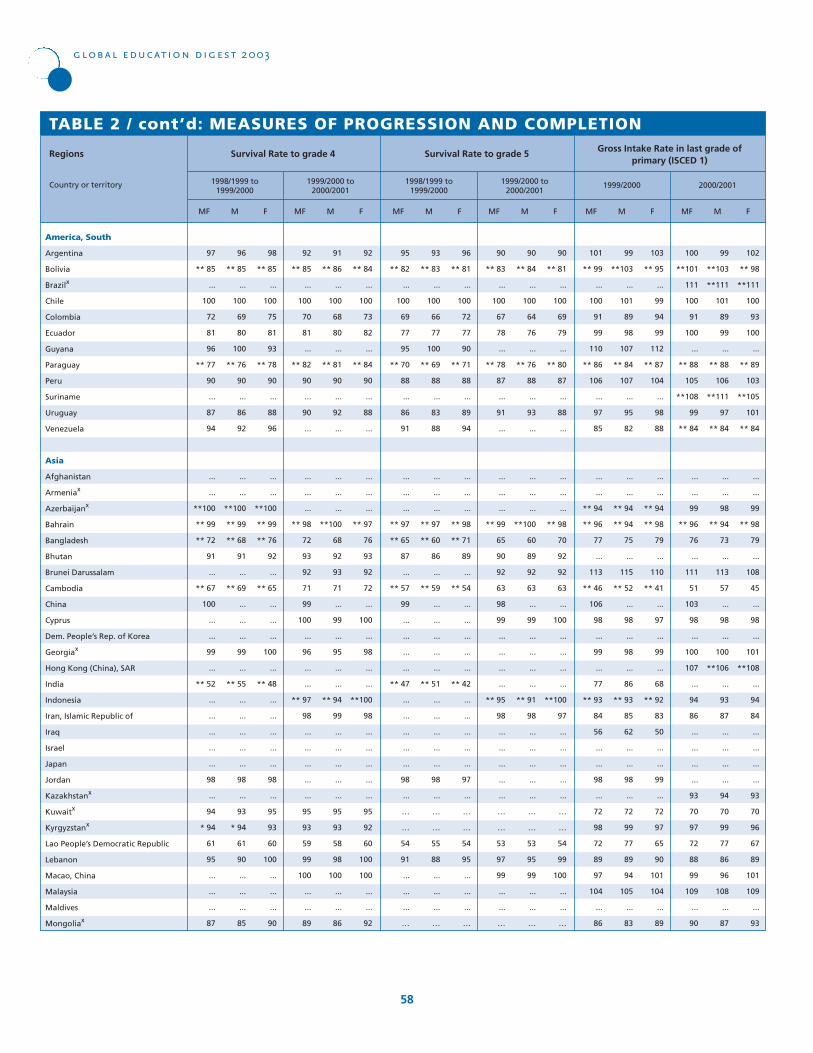
97
** 85
...
100
72
81
96
** 77
90
...
87
94
...
...
**100
** 99
** 72
91
...
** 67
100
...
...
99
...
** 52
...
...
...
...
...
98
...
94
* 94
61
95
...
...
...
87
96
** 85
...
100
69
80
100
** 76
90
...
86
92
...
...
**100
** 99
** 68
91
...
** 69
...
...
...
99
...
** 55
...
...
...
...
...
98
...
93
* 94
61
90
...
...
...
85
98
** 85
...
100
75
81
93
** 78
90
...
88
96
...
...
**100
** 99
** 76
92
...
** 65
...
...
...
100
...
** 48
...
...
...
...
...
98
...
95
93
60
100
...
...
...
90
MF M F
TABLE 2 / cont’d: MEASURES OF PROGRESSION AND COMPLETION
America, South
Argentina
Bolivia
Brazilx
Chile
Colombia
Ecuador
Guyana
Paraguay
Peru
Suriname
Uruguay
Venezuela
Asia
Afghanistan
Armeniax
Azerbaijanx
Bahrain
Bangladesh
Bhutan
Brunei Darussalam
Cambodia
China
Cyprus
Dem. People’s Rep. of Korea
Georgiax
Hong Kong (China), SAR
India
Indonesia
Iran, Islamic Republic of
Iraq
Israel
Japan
Jordan
Kazakhstanx
Kuwaitx
Kyrgyzstanx
Lao People’s Democratic Republic
Lebanon
Macao, China
Malaysia
Maldives
Mongoliax
Regions
Country or territory 1998/1999 to1999/2000
92
** 85
...
100
70
81
...
** 82
90
...
90
...
...
...
...
** 98
72
93
92
71
99
100
...
96
...
...
** 97
98
...
...
...
...
...
95
93
59
99
100
...
...
89
91
** 86
...
100
68
80
...
** 81
90
...
92
...
...
...
...
**100
68
92
93
71
...
99
...
95
...
...
** 94
99
...
...
...
...
...
95
93
58
98
100
...
...
86
92
** 84
...
100
73
82
...
** 84
90
...
88
...
...
...
...
** 97
76
93
92
72
...
100
...
98
...
...
**100
98
...
...
...
...
...
95
92
60
100
100
...
...
92
MF M F
1999/2000 to2000/2001
global education digest 2003
58
Survival Rate to grade 4
95
** 82
...
100
69
77
95
** 70
88
...
86
91
...
...
...
** 97
** 65
87
...
** 57
99
...
...
...
...
** 47
...
...
...
...
...
98
...
…
…
54
91
...
...
...
…
93
** 83
...
100
66
77
100
** 69
88
...
83
88
...
...
...
** 97
** 60
86
...
** 59
...
...
...
...
...
** 51
...
...
...
...
...
98
...
…
…
55
88
...
...
...
…
96
** 81
...
100
72
77
90
** 71
88
...
89
94
...
...
...
** 98
** 71
89
...
** 54
...
...
...
...
...
** 42
...
...
...
...
...
97
...
…
…
54
95
...
...
...
…
MF M F
1998/1999 to1999/2000
90
** 83
...
100
67
78
...
** 78
87
...
91
...
...
...
...
** 99
65
90
92
63
98
99
...
...
...
...
** 95
98
...
...
...
...
...
…
…
53
97
99
...
...
…
90
** 84
...
100
64
76
...
** 76
88
...
93
...
...
...
...
**100
60
89
92
63
...
99
...
...
...
...
** 91
98
...
...
...
...
...
…
…
53
95
99
...
...
…
90
** 81
...
100
69
79
...
** 80
87
...
88
...
...
...
...
** 98
70
92
92
63
...
100
...
...
...
...
**100
97
...
...
...
...
...
…
…
54
99
100
...
...
…
MF M F
1999/2000 to2000/2001
Survival Rate to grade 5
101
** 99
...
100
91
99
110
** 86
106
...
97
85
...
...
** 94
** 96
77
...
113
** 46
106
98
...
99
...
77
** 93
84
56
...
...
98
...
72
98
72
89
97
104
...
86
99
**103
...
101
89
98
107
** 84
107
...
95
82
...
...
** 94
** 94
75
...
115
** 52
...
98
...
98
...
86
** 93
85
62
...
...
98
...
72
99
77
89
94
105
...
83
103
** 95
...
99
94
99
112
** 87
104
...
98
88
...
...
** 94
** 98
79
...
110
** 41
...
97
...
99
...
68
** 92
83
50
...
...
99
...
72
97
65
90
101
104
...
89
MF M F
1999/2000
100
**101
111
100
91
100
...
** 88
105
**108
99
** 84
...
...
99
** 96
76
...
111
51
103
98
...
100
107
...
94
86
...
...
...
...
93
70
97
72
88
99
109
...
90
99
**103
**111
101
89
99
...
** 88
106
**111
97
** 84
...
...
98
** 94
73
...
113
57
...
98
...
100
**106
...
93
87
...
...
...
...
94
70
99
77
86
96
108
...
87
102
** 98
**111
100
93
100
...
** 89
103
**105
101
** 84
...
...
99
** 98
79
...
108
45
...
98
...
101
**108
...
94
84
...
...
...
...
93
70
96
67
89
101
109
...
93
MF M F
2000/2001
Gross Intake Rate in last grade ofprimary (ISCED 1)
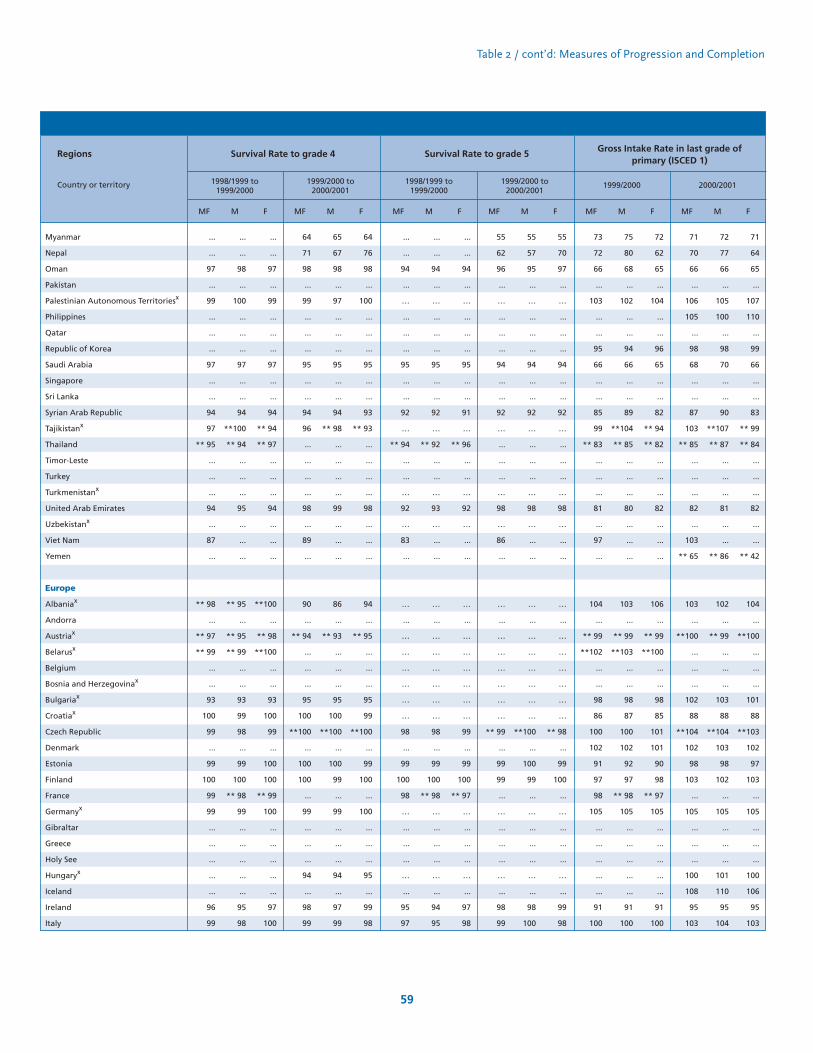
...
...
97
...
99
...
...
...
97
...
...
94
97
** 95
...
...
...
94
...
87
...
** 98
...
** 97
** 99
...
...
93
100
99
...
99
100
99
99
...
...
...
...
...
96
99
...
...
98
...
100
...
...
...
97
...
...
94
**100
** 94
...
...
...
95
...
...
...
** 95
...
** 95
** 99
...
...
93
99
98
...
99
100
** 98
99
...
...
...
...
...
95
98
...
...
97
...
99
...
...
...
97
...
...
94
** 94
** 97
...
...
...
94
...
...
...
**100
...
** 98
**100
...
...
93
100
99
...
100
100
** 99
100
...
...
...
...
...
97
100
MF M F
Myanmar
Nepal
Oman
Pakistan
Palestinian Autonomous Territoriesx
Philippines
Qatar
Republic of Korea
Saudi Arabia
Singapore
Sri Lanka
Syrian Arab Republic
Tajikistanx
Thailand
Timor-Leste
Turkey
Turkmenistanx
United Arab Emirates
Uzbekistanx
Viet Nam
Yemen
Europe
Albaniax
Andorra
Austriax
Belarusx
Belgium
Bosnia and Herzegovinax
Bulgariax
Croatiax
Czech Republic
Denmark
Estonia
Finland
France
Germanyx
Gibraltar
Greece
Holy See
Hungaryx
Iceland
Ireland
Italy
Regions
Country or territory 1998/1999 to1999/2000
64
71
98
...
99
...
...
...
95
...
...
94
96
...
...
...
...
98
...
89
...
90
...
** 94
...
...
...
95
100
**100
...
100
100
...
99
...
...
...
94
...
98
99
65
67
98
...
97
...
...
...
95
...
...
94
** 98
...
...
...
...
99
...
...
...
86
...
** 93
...
...
...
95
100
**100
...
100
99
...
99
...
...
...
94
...
97
99
64
76
98
...
100
...
...
...
95
...
...
93
** 93
...
...
...
...
98
...
...
...
94
...
** 95
...
...
...
95
99
**100
...
99
100
...
100
...
...
...
95
...
99
98
MF M F
1999/2000 to2000/2001
59
Survival Rate to grade 4
...
...
94
...
…
...
...
...
95
...
...
92
…
** 94
...
...
…
92
…
83
...
…
...
…
…
…
…
…
…
98
...
99
100
98
…
...
...
...
…
...
95
97
...
...
94
...
…
...
...
...
95
...
...
92
…
** 92
...
...
…
93
…
...
...
…
...
…
…
…
…
…
…
98
...
99
100
** 98
…
...
...
...
…
...
94
95
...
...
94
...
…
...
...
...
95
...
...
91
…
** 96
...
...
…
92
…
...
...
…
...
…
…
…
…
…
…
99
...
99
100
** 97
…
...
...
...
…
...
97
98
MF M F
1998/1999 to1999/2000
55
62
96
...
…
...
...
...
94
...
...
92
…
...
...
...
…
98
…
86
...
…
...
…
…
…
…
…
…
** 99
...
99
99
...
…
...
...
...
…
...
98
99
55
57
95
...
…
...
...
...
94
...
...
92
…
...
...
...
…
98
…
...
...
…
...
…
…
…
…
…
…
**100
...
100
99
...
…
...
...
...
…
...
98
100
55
70
97
...
…
...
...
...
94
...
...
92
…
...
...
...
…
98
…
...
...
…
...
…
…
…
…
…
…
** 98
...
99
100
...
…
...
...
...
…
...
99
98
MF M F
1999/2000 to2000/2001
Survival Rate to grade 5
73
72
66
...
103
...
...
95
66
...
...
85
99
** 83
...
...
...
81
...
97
...
104
...
** 99
**102
...
...
98
86
100
102
91
97
98
105
...
...
...
...
...
91
100
75
80
68
...
102
...
...
94
66
...
...
89
**104
** 85
...
...
...
80
...
...
...
103
...
** 99
**103
...
...
98
87
100
102
92
97
** 98
105
...
...
...
...
...
91
100
72
62
65
...
104
...
...
96
65
...
...
82
** 94
** 82
...
...
...
82
...
...
...
106
...
** 99
**100
...
...
98
85
101
101
90
98
** 97
105
...
...
...
...
...
91
100
MF M F
1999/2000
71
70
66
...
106
105
...
98
68
...
...
87
103
** 85
...
...
...
82
...
103
** 65
103
...
**100
...
...
...
102
88
**104
102
98
103
...
105
...
...
...
100
108
95
103
72
77
66
...
105
100
...
98
70
...
...
90
**107
** 87
...
...
...
81
...
...
** 86
102
...
** 99
...
...
...
103
88
**104
103
98
102
...
105
...
...
...
101
110
95
104
71
64
65
...
107
110
...
99
66
...
...
83
** 99
** 84
...
...
...
82
...
...
** 42
104
...
**100
...
...
...
101
88
**103
102
97
103
...
105
...
...
...
100
106
95
103
MF M F
2000/2001
Gross Intake Rate in last grade ofprimary (ISCED 1)
Table 2 / cont’d: Measures of Progression and Completion
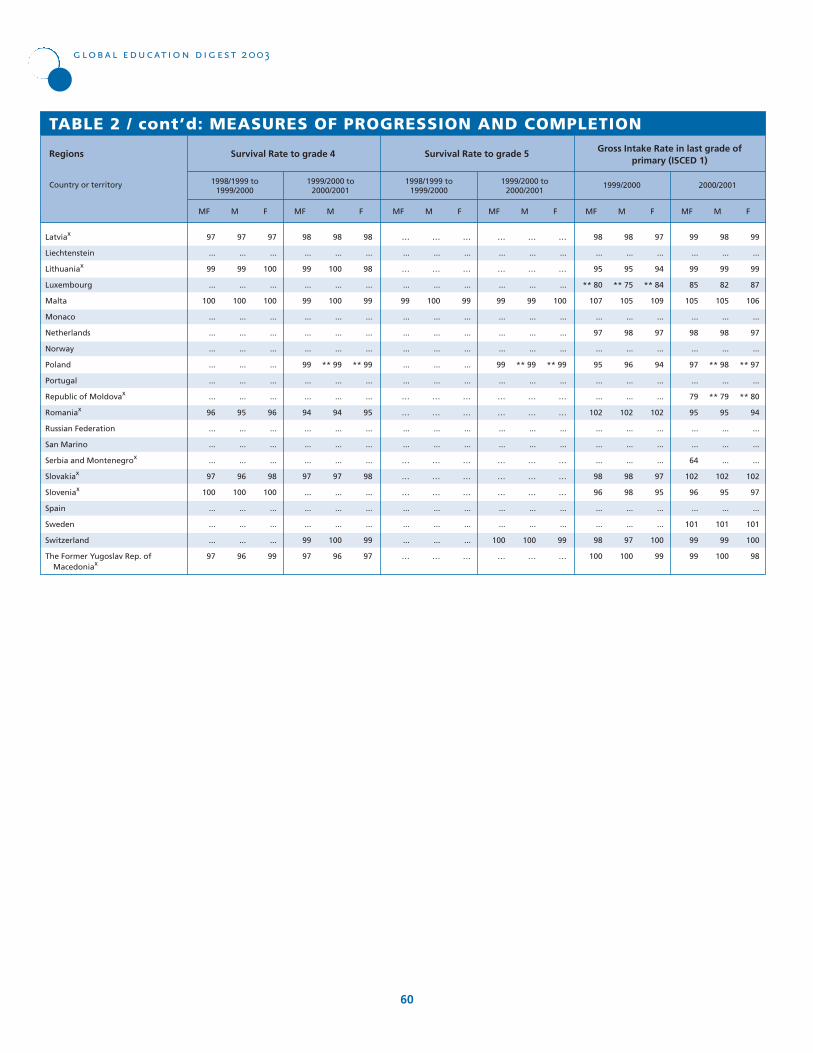
97
...
99
...
100
...
...
...
...
...
...
96
...
...
...
97
100
...
...
...
97
97
...
99
...
100
...
...
...
...
...
...
95
...
...
...
96
100
...
...
...
96
97
...
100
...
100
...
...
...
...
...
...
96
...
...
...
98
100
...
...
...
99
MF M F
TABLE 2 / cont’d: MEASURES OF PROGRESSION AND COMPLETION
Latviax
Liechtenstein
Lithuaniax
Luxembourg
Malta
Monaco
Netherlands
Norway
Poland
Portugal
Republic of Moldovax
Romaniax
Russian Federation
San Marino
Serbia and Montenegrox
Slovakiax
Sloveniax
Spain
Sweden
Switzerland
The Former Yugoslav Rep. of Macedoniax
Regions
Country or territory 1998/1999 to1999/2000
98
...
99
...
99
...
...
...
99
...
...
94
...
...
...
97
...
...
...
99
97
98
...
100
...
100
...
...
...
** 99
...
...
94
...
...
...
97
...
...
...
100
96
98
...
98
...
99
...
...
...
** 99
...
...
95
...
...
...
98
...
...
...
99
97
MF M F
1999/2000 to2000/2001
global education digest 2003
60
Survival Rate to grade 4
…
...
…
...
99
...
...
...
...
...
…
…
...
...
…
…
…
...
...
...
…
…
...
…
...
100
...
...
...
...
...
…
…
...
...
…
…
…
...
...
...
…
…
...
…
...
99
...
...
...
...
...
…
…
...
...
…
…
…
...
...
...
…
MF M F
1998/1999 to1999/2000
…
...
…
...
99
...
...
...
99
...
…
…
...
...
…
…
…
...
...
100
…
…
...
…
...
99
...
...
...
** 99
...
…
…
...
...
…
…
…
...
...
100
…
…
...
…
...
100
...
...
...
** 99
...
…
…
...
...
…
…
…
...
...
99
…
MF M F
1999/2000 to2000/2001
Survival Rate to grade 5
98
...
95
** 80
107
...
97
...
95
...
...
102
...
...
...
98
96
...
...
98
100
98
...
95
** 75
105
...
98
...
96
...
...
102
...
...
...
98
98
...
...
97
100
97
...
94
** 84
109
...
97
...
94
...
...
102
...
...
...
97
95
...
...
100
99
MF M F
1999/2000
99
...
99
85
105
...
98
...
97
...
79
95
...
...
64
102
96
...
101
99
99
98
...
99
82
105
...
98
...
** 98
...
** 79
95
...
...
...
102
95
...
101
99
100
99
...
99
87
106
...
97
...
** 97
...
** 80
94
...
...
...
102
97
...
101
100
98
MF M F
2000/2001
Gross Intake Rate in last grade ofprimary (ISCED 1)
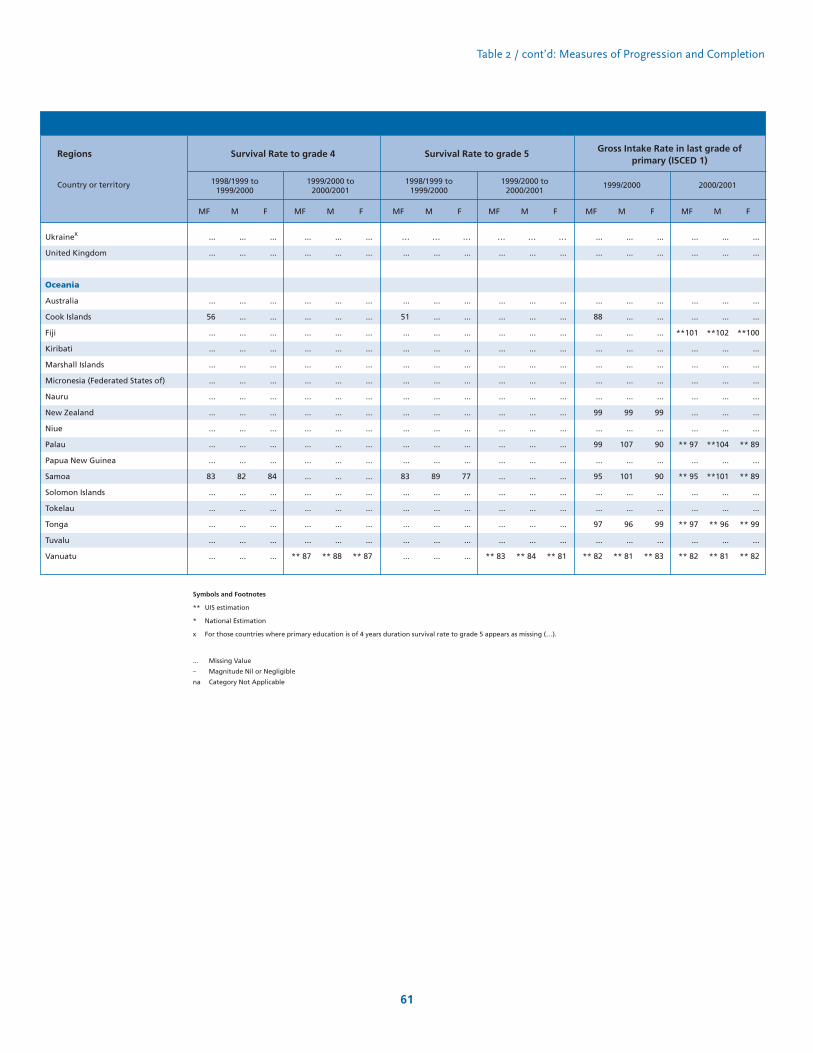
...
...
...
56
...
...
...
...
...
...
...
...
...
83
...
...
...
...
...
...
...
...
...
...
...
...
...
...
...
...
...
...
82
...
...
...
...
...
...
...
...
...
...
...
...
...
...
...
...
...
...
84
...
...
...
...
...
MF M F
Ukrainex
United Kingdom
Oceania
Australia
Cook Islands
Fiji
Kiribati
Marshall Islands
Micronesia (Federated States of)
Nauru
New Zealand
Niue
Palau
Papua New Guinea
Samoa
Solomon Islands
Tokelau
Tonga
Tuvalu
Vanuatu
Regions
Country or territory 1998/1999 to1999/2000
...
...
...
...
...
...
...
...
...
...
...
...
...
...
...
...
...
...
** 87
...
...
...
...
...
...
...
...
...
...
...
...
...
...
...
...
...
...
** 88
...
...
...
...
...
...
...
...
...
...
...
...
...
...
...
...
...
...
** 87
MF M F
1999/2000 to2000/2001
61
Survival Rate to grade 4
…
...
...
51
...
...
...
...
...
...
...
...
...
83
...
...
...
...
...
…
...
...
...
...
...
...
...
...
...
...
...
...
89
...
...
...
...
...
…
...
...
...
...
...
...
...
...
...
...
...
...
77
...
...
...
...
...
MF M F
1998/1999 to1999/2000
…
...
...
...
...
...
...
...
...
...
...
...
...
...
...
...
...
...
** 83
…
...
...
...
...
...
...
...
...
...
...
...
...
...
...
...
...
...
** 84
…
...
...
...
...
...
...
...
...
...
...
...
...
...
...
...
...
...
** 81
MF M F
1999/2000 to2000/2001
Survival Rate to grade 5
...
...
...
88
...
...
...
...
...
99
...
99
...
95
...
...
97
...
** 82
...
...
...
...
...
...
...
...
...
99
...
107
...
101
...
...
96
...
** 81
...
...
...
...
...
...
...
...
...
99
...
90
...
90
...
...
99
...
** 83
MF M F
1999/2000
...
...
...
...
**101
...
...
...
...
...
...
** 97
...
** 95
...
...
** 97
...
** 82
...
...
...
...
**102
...
...
...
...
...
...
**104
...
**101
...
...
** 96
...
** 81
...
...
...
...
**100
...
...
...
...
...
...
** 89
...
** 89
...
...
** 99
...
** 82
MF M F
2000/2001
Gross Intake Rate in last grade ofprimary (ISCED 1)
Table 2 / cont’d: Measures of Progression and Completion
Symbols and Footnotes
** UIS estimation
* National Estimation
x For those countries where primary education is of 4 years duration survival rate to grade 5 appears as missing (…).
... Missing Value
– Magnitude Nil or Negligible
na Category Not Applicable
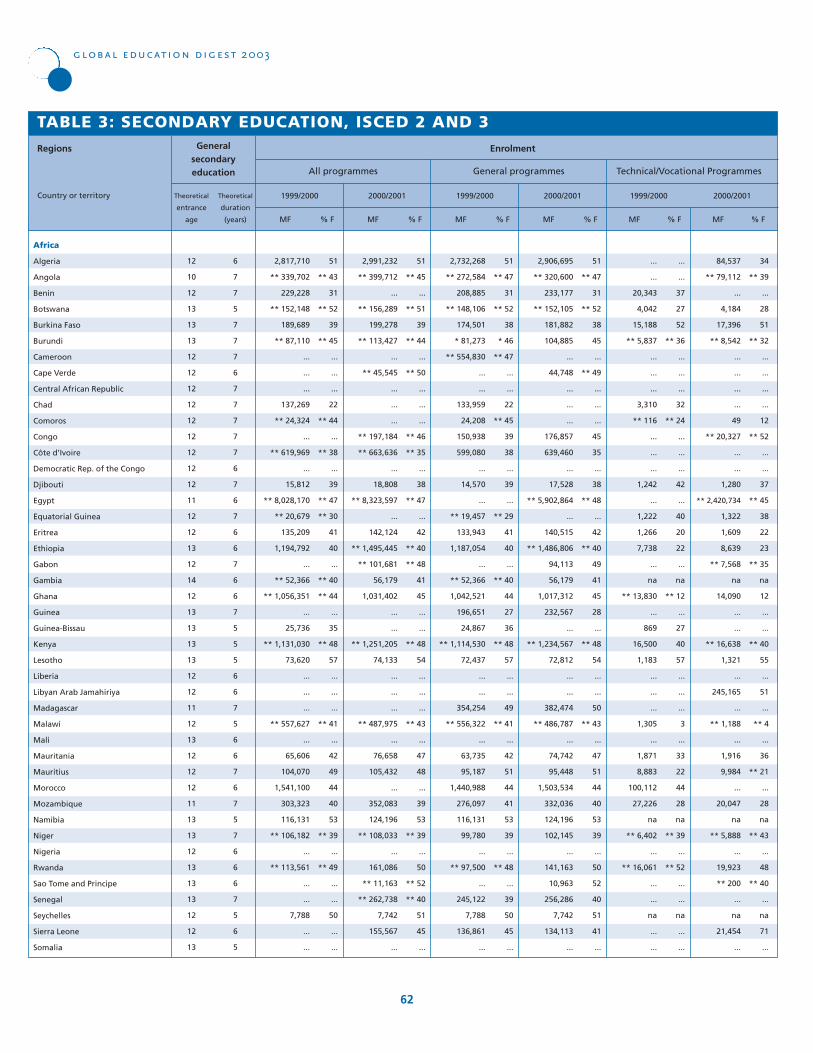
12
10
12
13
13
13
12
12
12
12
12
12
12
12
12
11
12
12
13
12
14
12
13
13
13
13
12
12
11
12
13
12
12
12
11
13
13
12
13
13
13
12
12
13
6
7
7
5
7
7
7
6
7
7
7
7
7
6
7
6
7
6
6
7
6
6
7
5
5
5
6
6
7
5
6
6
7
6
7
5
7
6
6
6
7
5
6
5
Theoretical
entrance
age
Theoretical
duration
(years) MF
51
** 43
31
** 52
39
** 45
...
...
...
22
** 44
...
** 38
...
39
** 47
** 30
41
40
...
** 40
** 44
...
35
** 48
57
...
...
...
** 41
...
42
49
44
40
53
** 39
...
** 49
...
...
50
...
...
% F
TABLE 3: SECONDARY EDUCATION, ISCED 2 AND 3
Africa
Algeria
Angola
Benin
Botswana
Burkina Faso
Burundi
Cameroon
Cape Verde
Central African Republic
Chad
Comoros
Congo
Côte d’Ivoire
Democratic Rep. of the Congo
Djibouti
Egypt
Equatorial Guinea
Eritrea
Ethiopia
Gabon
Gambia
Ghana
Guinea
Guinea-Bissau
Kenya
Lesotho
Liberia
Libyan Arab Jamahiriya
Madagascar
Malawi
Mali
Mauritania
Mauritius
Morocco
Mozambique
Namibia
Niger
Nigeria
Rwanda
Sao Tome and Principe
Senegal
Seychelles
Sierra Leone
Somalia
Regions
Country or territory
All programmes
1999/2000
global education digest 2003
62
2,817,710
** 339,702
229,228
** 152,148
189,689
** 87,110
...
...
...
137,269
** 24,324
...
** 619,969
...
15,812
** 8,028,170
** 20,679
135,209
1,194,792
...
** 52,366
** 1,056,351
...
25,736
** 1,131,030
73,620
...
...
...
** 557,627
...
65,606
104,070
1,541,100
303,323
116,131
** 106,182
...
** 113,561
...
...
7,788
...
...
MF
51
** 45
...
** 51
39
** 44
...
** 50
...
...
...
** 46
** 35
...
38
** 47
...
42
** 40
** 48
41
45
...
...
** 48
54
...
...
...
** 43
...
47
48
...
39
53
** 39
...
50
** 52
** 40
51
45
...
% F
2000/2001
2,991,232
** 399,712
...
** 156,289
199,278
** 113,427
...
** 45,545
...
...
...
** 197,184
** 663,636
...
18,808
** 8,323,597
...
142,124
** 1,495,445
** 101,681
56,179
1,031,402
...
...
** 1,251,205
74,133
...
...
...
** 487,975
...
76,658
105,432
...
352,083
124,196
** 108,033
...
161,086
** 11,163
** 262,738
7,742
155,567
...
MF
51
** 47
31
** 52
38
* 46
** 47
...
...
22
** 45
39
38
...
39
...
** 29
41
40
...
** 40
44
27
36
** 48
57
...
...
49
** 41
...
42
51
44
41
53
39
...
** 48
...
39
50
45
...
% F
General programmes
1999/2000
2,732,268
** 272,584
208,885
** 148,106
174,501
* 81,273
** 554,830
...
...
133,959
24,208
150,938
599,080
...
14,570
...
** 19,457
133,943
1,187,054
...
** 52,366
1,042,521
196,651
24,867
** 1,114,530
72,437
...
...
354,254
** 556,322
...
63,735
95,187
1,440,988
276,097
116,131
99,780
...
** 97,500
...
245,122
7,788
136,861
...
MF
51
** 47
31
** 52
38
45
...
** 49
...
...
...
45
35
...
38
** 48
...
42
** 40
49
41
45
28
...
** 48
54
...
...
50
** 43
...
47
51
44
40
53
39
...
50
52
40
51
41
...
% F
2000/2001
2,906,695
** 320,600
233,177
** 152,105
181,882
104,885
...
44,748
...
...
...
176,857
639,460
...
17,528
** 5,902,864
...
140,515
** 1,486,806
94,113
56,179
1,017,312
232,567
...
** 1,234,567
72,812
...
...
382,474
** 486,787
...
74,742
95,448
1,503,534
332,036
124,196
102,145
...
141,163
10,963
256,286
7,742
134,113
...
MF
...
...
37
27
52
** 36
...
...
...
32
** 24
...
...
...
42
...
40
20
22
...
na
** 12
...
27
40
57
...
...
...
3
...
33
22
44
28
na
** 39
...
** 52
...
...
na
...
...
% F
Technical/Vocational Programmes
1999/2000
...
...
20,343
4,042
15,188
** 5,837
...
...
...
3,310
** 116
...
...
...
1,242
...
1,222
1,266
7,738
...
na
** 13,830
...
869
16,500
1,183
...
...
...
1,305
...
1,871
8,883
100,112
27,226
na
** 6,402
...
** 16,061
...
...
na
...
...
MF
34
** 39
...
28
51
** 32
...
...
...
...
12
** 52
...
...
37
** 45
38
22
23
** 35
na
12
...
...
** 40
55
...
51
...
** 4
...
36
** 21
...
28
na
** 43
...
48
** 40
...
na
71
...
% F
2000/2001
84,537
** 79,112
...
4,184
17,396
** 8,542
...
...
...
...
49
** 20,327
...
...
1,280
** 2,420,734
1,322
1,609
8,639
** 7,568
na
14,090
...
...
** 16,638
1,321
...
245,165
...
** 1,188
...
1,916
9,984
...
20,047
na
** 5,888
...
19,923
** 200
...
na
21,454
...
EnrolmentGeneralsecondaryeducation

Table 3: Secondary Education, isced 2 and 3
63
GPI
Regions
Country or territory
71
** 18
...
** 79
10
** 10
...
** 76
...
...
...
** 42
** 23
...
19
** 86
...
28
** 18
** 60
37
36
...
...
** 31
33
...
...
...
** 36
...
21
77
...
12
62
** 6
...
14
...
** 18
...
26
...
MF
68
** 19
...
** 77
12
** 12
...
** 75
...
...
...
** 46
** 30
...
23
** 88
...
33
** 22
** 61
44
40
...
...
** 32
30
...
...
...
** 40
...
22
79
...
14
58
** 8
...
14
...
** 21
...
29
...
M
73
** 16
...
** 82
8
** 9
...
** 77
...
...
...
** 38
** 17
...
14
** 83
...
24
** 14
** 58
31
32
...
...
** 29
36
...
...
...
** 31
...
20
75
...
9
65
** 5
...
14
...
** 14
...
24
...
FF
1.07
0.77
0.45
1.08
0.64
0.81
...
...
...
0.28
0.82
...
0.61
...
0.65
0.94
0.43
0.70
0.67
...
0.65
0.79
...
0.54
0.91
1.37
...
...
...
0.71
...
0.72
0.98
0.80
0.65
1.12
0.65
...
0.94
...
...
...
...
...
1999/2000
1.08
0.83
...
1.06
0.64
0.77
...
1.02
...
...
...
0.83
0.55
...
0.62
0.94
...
0.71
0.66
0.94
0.70
0.81
...
...
0.91
1.20
...
...
...
0.76
...
0.88
0.94
...
0.64
1.13
0.66
...
0.98
...
0.66
...
0.82
...
2000/2001
** 62
...
...
** 59
** 8
...
...
...
...
...
...
...
...
...
** 17
** 79
...
22
** 13
...
29
** 31
...
...
** 23
21
...
...
...
** 25
...
** 14
64
...
9
38
5
...
...
...
...
...
...
...
MF
** 60
...
...
** 55
** 10
...
...
...
...
...
...
...
...
...
** 20
** 80
...
25
** 15
...
34
** 33
...
...
** 23
16
...
...
...
** 27
...
** 16
63
...
11
32
6
...
...
...
...
...
...
...
MM
** 63
...
...
** 63
** 6
...
...
...
...
...
...
...
...
...
** 13
** 77
...
19
** 10
...
23
** 28
...
...
** 23
26
...
...
...
** 23
...
** 13
65
...
8
44
4
...
...
...
...
...
...
...
Africa
Algeria
Angola
Benin
Botswana
Burkina Faso
Burundi
Cameroon
Cape Verde
Central African Republic
Chad
Comoros
Congo
Côte d’Ivoire
Democratic Rep. of the Congo
Djibouti
Egypt
Equatorial Guinea
Eritrea
Ethiopia
Gabon
Gambia
Ghana
Guinea
Guinea-Bissau
Kenya
Lesotho
Liberia
Libyan Arab Jamahiriya
Madagascar
Malawi
Mali
Mauritania
Mauritius
Morocco
Mozambique
Namibia
Niger
Nigeria
Rwanda
Sao Tome and Principe
Senegal
Seychelles
Sierra Leone
Somalia
F
2000/2001
** 59
...
17
** 59
** 8
...
...
...
...
8
...
...
...
...
...
** 79
** 26
23
** 14
...
...
** 32
...
...
** 21
19
...
...
...
** 29
...
...
** 66
30
8
34
...
...
...
...
...
...
24
...
MF
** 57
...
24
** 54
** 10
...
...
...
...
12
...
...
...
...
...
** 81
** 37
25
** 16
...
...
** 35
...
...
** 22
14
...
...
...
** 33
...
...
** 67
33
10
29
...
...
...
...
...
...
26
...
** 60
...
11
** 63
** 7
...
...
...
...
4
...
...
...
...
...
** 77
** 16
20
** 11
...
...
** 29
...
...
** 21
24
...
...
...
** 26
...
...
** 65
27
7
40
...
...
...
...
...
...
22
...
F
1999/2000
MF
3
...
...
–
–
...
...
...
...
...
...
...
...
...
...
–
...
–
-1
...
...
-1
...
...
2
2
...
...
...
-4
...
...
-2
...
1
4
...
...
...
...
...
...
...
...
67
** 15
22
** 79
10
** 8
...
...
...
11
** 21
...
** 22
...
16
** 84
** 31
28
15
...
** 35
** 38
...
20
** 28
33
...
...
...
** 42
...
18
75
39
10
60
** 7
...
** 11
...
...
...
...
...
65
** 18
30
** 76
12
** 9
...
...
...
18
** 23
...
** 28
...
20
** 86
** 43
33
18
...
** 42
** 42
...
26
** 30
28
...
...
...
** 49
...
21
75
44
13
56
** 8
...
** 11
...
...
...
...
...
MF M
69
** 13
14
** 81
8
** 7
...
...
...
5
** 18
...
** 17
...
13
** 81
** 19
23
12
...
** 28
** 33
...
14
** 27
38
...
...
...
** 35
...
15
74
35
8
63
** 5
...
** 10
...
...
...
...
...
1999/2000
Net Enrolment Ratio
Change 1999to 2000
MF
4
2
...
1
–
2
...
...
...
...
...
...
1
...
2
2
...
–
3
...
3
-2
...
...
2
–
...
...
...
-6
...
3
2
...
1
2
–
...
3
...
...
...
...
...
Change 1999to 2000
Gross Enrolment Ratio
2000/2001
All Programmes All Programmes
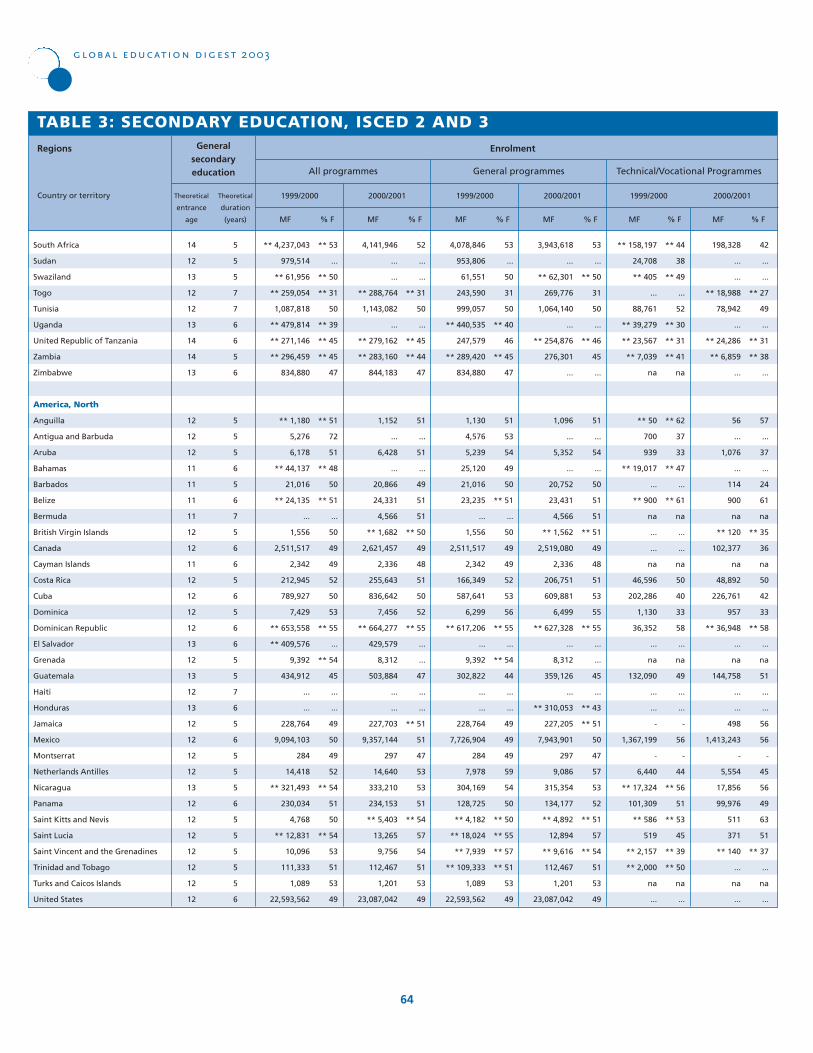
14
12
13
12
12
13
14
14
13
12
12
12
11
11
11
11
12
12
11
12
12
12
12
13
12
13
12
13
12
12
12
12
13
12
12
12
12
12
12
12
5
5
5
7
7
6
6
5
6
5
5
5
6
5
6
7
5
6
6
5
6
5
6
6
5
5
7
6
5
6
5
5
5
6
5
5
5
5
5
6
Theoretical
entrance
age
Theoretical
duration
(years) MF
** 53
...
** 50
** 31
50
** 39
** 45
** 45
47
** 51
72
51
** 48
50
** 51
...
50
49
49
52
50
53
** 55
...
** 54
45
...
...
49
50
49
52
** 54
51
50
** 54
53
51
53
49
% F
TABLE 3: SECONDARY EDUCATION, ISCED 2 AND 3
South Africa
Sudan
Swaziland
Togo
Tunisia
Uganda
United Republic of Tanzania
Zambia
Zimbabwe
America, North
Anguilla
Antigua and Barbuda
Aruba
Bahamas
Barbados
Belize
Bermuda
British Virgin Islands
Canada
Cayman Islands
Costa Rica
Cuba
Dominica
Dominican Republic
El Salvador
Grenada
Guatemala
Haiti
Honduras
Jamaica
Mexico
Montserrat
Netherlands Antilles
Nicaragua
Panama
Saint Kitts and Nevis
Saint Lucia
Saint Vincent and the Grenadines
Trinidad and Tobago
Turks and Caicos Islands
United States
Regions
Country or territory
All programmes
1999/2000
global education digest 2003
64
** 4,237,043
979,514
** 61,956
** 259,054
1,087,818
** 479,814
** 271,146
** 296,459
834,880
** 1,180
5,276
6,178
** 44,137
21,016
** 24,135
...
1,556
2,511,517
2,342
212,945
789,927
7,429
** 653,558
** 409,576
9,392
434,912
...
...
228,764
9,094,103
284
14,418
** 321,493
230,034
4,768
** 12,831
10,096
111,333
1,089
22,593,562
MF
52
...
...
** 31
50
...
** 45
** 44
47
51
...
51
...
49
51
51
** 50
49
48
51
50
52
** 55
...
...
47
...
...
** 51
51
47
53
53
51
** 54
57
54
51
53
49
% F
2000/2001
4,141,946
...
...
** 288,764
1,143,082
...
** 279,162
** 283,160
844,183
1,152
...
6,428
...
20,866
24,331
4,566
** 1,682
2,621,457
2,336
255,643
836,642
7,456
** 664,277
429,579
8,312
503,884
...
...
227,703
9,357,144
297
14,640
333,210
234,153
** 5,403
13,265
9,756
112,467
1,201
23,087,042
MF
53
...
50
31
50
** 40
46
** 45
47
51
53
54
49
50
** 51
...
50
49
49
52
53
56
** 55
...
** 54
44
...
...
49
49
49
59
54
50
** 50
** 55
** 57
** 51
53
49
% F
General programmes
1999/2000
4,078,846
953,806
61,551
243,590
999,057
** 440,535
247,579
** 289,420
834,880
1,130
4,576
5,239
25,120
21,016
23,235
...
1,556
2,511,517
2,342
166,349
587,641
6,299
** 617,206
...
9,392
302,822
...
...
228,764
7,726,904
284
7,978
304,169
128,725
** 4,182
** 18,024
** 7,939
** 109,333
1,089
22,593,562
MF
53
...
** 50
31
50
...
** 46
45
...
51
...
54
...
50
51
51
** 51
49
48
51
53
55
** 55
...
...
45
...
** 43
** 51
50
47
57
53
52
** 51
57
** 54
51
53
49
% F
2000/2001
3,943,618
...
** 62,301
269,776
1,064,140
...
** 254,876
276,301
...
1,096
...
5,352
...
20,752
23,431
4,566
** 1,562
2,519,080
2,336
206,751
609,881
6,499
** 627,328
...
8,312
359,126
...
** 310,053
227,205
7,943,901
297
9,086
315,354
134,177
** 4,892
12,894
** 9,616
112,467
1,201
23,087,042
MF
** 44
38
** 49
...
52
** 30
** 31
** 41
na
** 62
37
33
** 47
...
** 61
na
...
...
na
50
40
33
58
...
na
49
...
...
-
56
-
44
** 56
51
** 53
45
** 39
** 50
na
...
% F
Technical/Vocational Programmes
1999/2000
** 158,197
24,708
** 405
...
88,761
** 39,279
** 23,567
** 7,039
na
** 50
700
939
** 19,017
...
** 900
na
...
...
na
46,596
202,286
1,130
36,352
...
na
132,090
...
...
-
1,367,199
-
6,440
** 17,324
101,309
** 586
519
** 2,157
** 2,000
na
...
MF
42
...
...
** 27
49
...
** 31
** 38
...
57
...
37
...
24
61
na
** 35
36
na
50
42
33
** 58
...
na
51
...
...
56
56
-
45
56
49
63
51
** 37
...
na
...
% F
2000/2001
198,328
...
...
** 18,988
78,942
...
** 24,286
** 6,859
...
56
...
1,076
...
114
900
na
** 120
102,377
na
48,892
226,761
957
** 36,948
...
na
144,758
...
...
498
1,413,243
-
5,554
17,856
99,976
511
371
** 140
...
na
...
EnrolmentGeneralsecondaryeducation
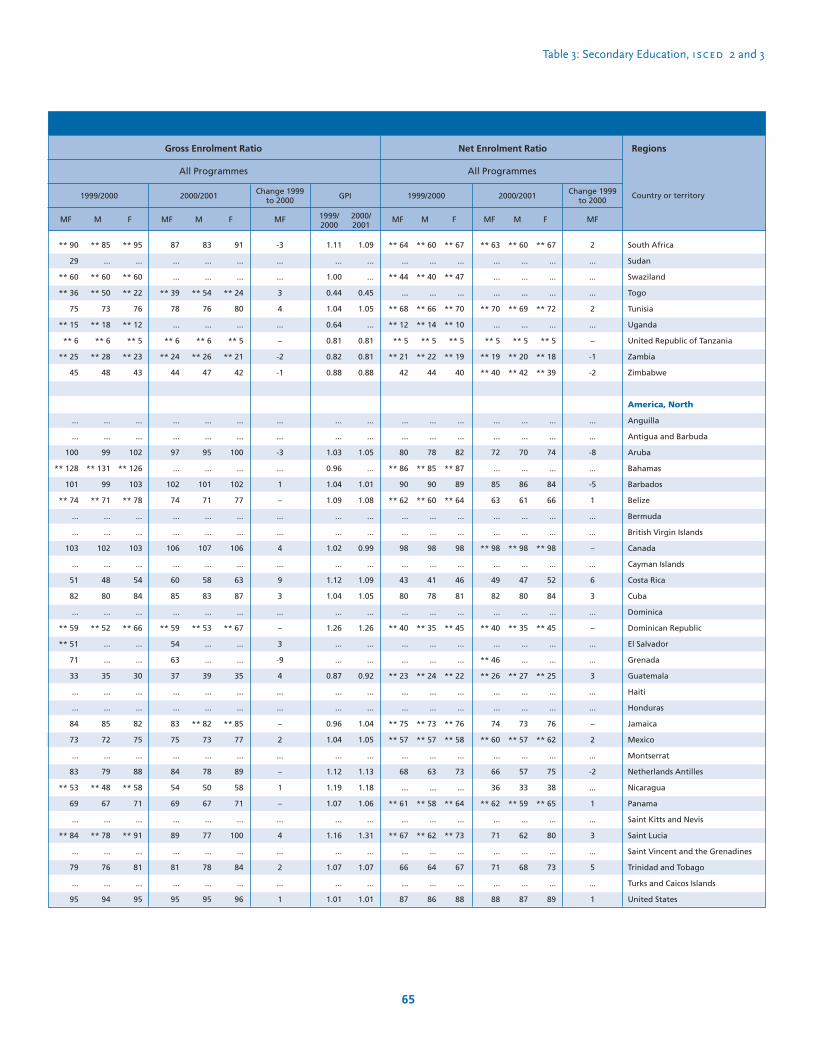
Table 3: Secondary Education, isced 2 and 3
65
GPI
Regions
Country or territory
87
...
...
** 39
78
...
** 6
** 24
44
...
...
97
...
102
74
...
...
106
...
60
85
...
** 59
54
63
37
...
...
83
75
...
84
54
69
...
89
...
81
...
95
MF
83
...
...
** 54
76
...
** 6
** 26
47
...
...
95
...
101
71
...
...
107
...
58
83
...
** 53
...
...
39
...
...
** 82
73
...
78
50
67
...
77
...
78
...
95
M
91
...
...
** 24
80
...
** 5
** 21
42
...
...
100
...
102
77
...
...
106
...
63
87
...
** 67
...
...
35
...
...
** 85
77
...
89
58
71
...
100
...
84
...
96
FF
1.11
...
1.00
0.44
1.04
0.64
0.81
0.82
0.88
...
...
1.03
0.96
1.04
1.09
...
...
1.02
...
1.12
1.04
...
1.26
...
...
0.87
...
...
0.96
1.04
...
1.12
1.19
1.07
...
1.16
...
1.07
...
1.01
1999/2000
1.09
...
...
0.45
1.05
...
0.81
0.81
0.88
...
...
1.05
...
1.01
1.08
...
...
0.99
...
1.09
1.05
...
1.26
...
...
0.92
...
...
1.04
1.05
...
1.13
1.18
1.06
...
1.31
...
1.07
...
1.01
2000/2001
** 63
...
...
...
** 70
...
** 5
** 19
** 40
...
...
72
...
85
63
...
...
** 98
...
49
82
...
** 40
...
** 46
** 26
...
...
74
** 60
...
66
36
** 62
...
71
...
71
...
88
MF
** 60
...
...
...
** 69
...
** 5
** 20
** 42
...
...
70
...
86
61
...
...
** 98
...
47
80
...
** 35
...
...
** 27
...
...
73
** 57
...
57
33
** 59
...
62
...
68
...
87
MM
** 67
...
...
...
** 72
...
** 5
** 18
** 39
...
...
74
...
84
66
...
...
** 98
...
52
84
...
** 45
...
...
** 25
...
...
76
** 62
...
75
38
** 65
...
80
...
73
...
89
South Africa
Sudan
Swaziland
Togo
Tunisia
Uganda
United Republic of Tanzania
Zambia
Zimbabwe
America, North
Anguilla
Antigua and Barbuda
Aruba
Bahamas
Barbados
Belize
Bermuda
British Virgin Islands
Canada
Cayman Islands
Costa Rica
Cuba
Dominica
Dominican Republic
El Salvador
Grenada
Guatemala
Haiti
Honduras
Jamaica
Mexico
Montserrat
Netherlands Antilles
Nicaragua
Panama
Saint Kitts and Nevis
Saint Lucia
Saint Vincent and the Grenadines
Trinidad and Tobago
Turks and Caicos Islands
United States
F
2000/2001
** 64
...
** 44
...
** 68
** 12
** 5
** 21
42
...
...
80
** 86
90
** 62
...
...
98
...
43
80
...
** 40
...
...
** 23
...
...
** 75
** 57
...
68
...
** 61
...
** 67
...
66
...
87
MF
** 60
...
** 40
...
** 66
** 14
** 5
** 22
44
...
...
78
** 85
90
** 60
...
...
98
...
41
78
...
** 35
...
...
** 24
...
...
** 73
** 57
...
63
...
** 58
...
** 62
...
64
...
86
** 67
...
** 47
...
** 70
** 10
** 5
** 19
40
...
...
82
** 87
89
** 64
...
...
98
...
46
81
...
** 45
...
...
** 22
...
...
** 76
** 58
...
73
...
** 64
...
** 73
...
67
...
88
F
1999/2000
MF
2
...
...
...
2
...
–
-1
-2
...
...
-8
...
-5
1
...
...
–
...
6
3
...
–
...
...
3
...
...
–
2
...
-2
...
1
...
3
...
5
...
1
** 90
29
** 60
** 36
75
** 15
** 6
** 25
45
...
...
100
** 128
101
** 74
...
...
103
...
51
82
...
** 59
** 51
71
33
...
...
84
73
...
83
** 53
69
...
** 84
...
79
...
95
** 85
...
** 60
** 50
73
** 18
** 6
** 28
48
...
...
99
** 131
99
** 71
...
...
102
...
48
80
...
** 52
...
...
35
...
...
85
72
...
79
** 48
67
...
** 78
...
76
...
94
MF M
** 95
...
** 60
** 22
76
** 12
** 5
** 23
43
...
...
102
** 126
103
** 78
...
...
103
...
54
84
...
** 66
...
...
30
...
...
82
75
...
88
** 58
71
...
** 91
...
81
...
95
1999/2000
Net Enrolment Ratio
Change 1999to 2000
MF
-3
...
...
3
4
...
–
-2
-1
...
...
-3
...
1
–
...
...
4
...
9
3
...
–
3
-9
4
...
...
–
2
...
–
1
–
...
4
...
2
...
1
Change 1999to 2000
Gross Enrolment Ratio
2000/2001
All Programmes All Programmes

12
12
11
12
11
12
12
12
12
12
12
12
13
10
10
12
11
13
12
12
12
12
10
10
12
11
13
11
12
12
12
12
11
10
10
11
12
12
12
13
12
10
6
6
7
6
6
6
5
6
5
5
6
5
6
7
7
6
7
4
7
6
6
6
6
7
7
7
6
6
6
6
6
6
7
8
7
6
6
6
7
5
6
6
Theoretical
entrance
age
Theoretical
duration
(years) MF
51
** 48
52
50
52
50
49
50
...
...
...
53
...
...
49
50
49
44
51
35
40
49
...
49
...
40
** 48
47
37
49
49
** 50
50
50
...
41
51
51
51
51
55
** 51
% F
TABLE 3: SECONDARY EDUCATION, ISCED 2 AND 3
America, South
Argentina
Bolivia
Brazil
Chile
Colombia
Ecuador
Guyana
Paraguay
Peru
Suriname
Uruguay
Venezuela
Asia
Afghanistan
Armenia
Azerbaijan
Bahrain
Bangladesh
Bhutan
Brunei Darussalam
Cambodia
China
Cyprus
Dem. People’s Rep. of Korea
Georgia
Hong Kong (China), SAR
India
Indonesia
Iran, Islamic Republic of
Iraq
Israel
Japan
Jordan
Kazakhstan
Kuwait
Kyrgyzstan
Lao People’s Democratic Republic
Lebanon
Macao, China
Malaysia
Maldives
Mongolia
Myanmar
Regions
Country or territory
All programmes
1999/2000
global education digest 2003
66
3,722,449
** 842,937
24,982,899
1,396,631
3,589,425
917,245
92,430
425,214
...
...
...
1,522,225
...
...
945,393
65,422
9,912,318
20,123
34,426
351,431
86,516,712
63,677
...
467,249
...
71,030,516
**14,263,912
9,181,276
1,224,353
587,663
8,782,114
583,535
2,002,880
239,997
...
264,586
383,217
35,565
2,176,863
14,988
235,099
** 2,284,224
MF
51
48
52
50
52
50
...
50
** 47
53
52
** 54
...
51
48
50
50
45
50
36
41
49
...
...
...
...
49
47
...
49
49
...
49
** 50
50
41
52
50
51
51
54
** 48
% F
2000/2001
3,832,258
874,669
26,096,870
1,391,283
3,568,889
936,406
...
459,260
** 2,375,796
41,875
303,883
** 1,543,613
...
389,131
1,020,131
66,536
10,329,065
23,390
35,945
396,876
90,722,796
64,065
...
...
477,522
...
14,828,085
9,090,866
...
594,210
8,605,812
...
2,031,675
** 243,757
683,832
288,443
322,136
39,201
2,205,426
20,046
259,888
** 2,317,834
MF
52
** 47
51
51
52
48
52
50
48
...
...
54
...
...
49
52
49
44
52
35
...
52
...
49
...
40
** 49
48
38
51
50
** 51
50
50
51
41
53
51
51
51
55
51
% F
General programmes
1999/2000
2,868,065
** 793,630
23,462,345
1,026,615
3,589,425
741,066
61,695
394,078
2,089,970
...
...
1,481,096
...
...
922,697
55,279
9,806,527
20,123
32,365
343,382
...
59,285
...
426,884
...
70,412,400
**12,210,019
8,493,508
1,148,645
474,326
7,637,639
542,001
1,913,017
235,852
633,863
260,797
343,575
33,375
2,052,047
14,988
216,597
2,268,402
MF
52
** 47
51
51
52
48
...
50
48
58
55
** 54
...
51
48
52
50
45
51
36
...
52
...
50
...
...
...
48
...
51
50
...
49
50
50
41
53
50
52
52
** 55
48
% F
2000/2001
2,844,693
** 800,629
25,094,296
1,013,325
3,568,889
751,240
...
424,621
2,235,524
22,262
244,486
** 1,501,904
...
384,165
997,187
55,144
10,223,908
23,390
33,689
389,020
...
59,568
...
433,156
466,710
...
...
8,332,723
...
478,786
7,480,437
...
1,945,586
239,520
657,291
284,424
282,177
36,723
2,073,915
18,892
** 247,751
2,301,919
MF
47
** 60
61
47
na
56
43
49
...
...
...
48
...
...
35
...
24
-
38
39
...
16
...
47
...
20
** 43
37
17
39
45
37
36
39
...
36
40
45
44
na
...
** 32
% F
Technical/Vocational Programmes
1999/2000
854,384
** 49,307
1,520,554
370,016
na
176,179
30,735
31,136
...
...
...
41,129
...
...
22,696
...
105,791
-
2,061
8,049
...
4,392
...
40,365
...
618,116
**2,053,893
687,768
75,708
113,337
1,144,475
41,534
89,863
4,145
...
3,789
39,642
2,190
124,816
na
...
** 15,822
MF
49
** 58
65
47
na
55
...
49
...
48
42
** 53
...
35
37
40
25
-
32
39
...
16
...
...
11
...
...
35
...
39
45
...
37
** 39
36
33
41
46
41
40
51
** 31
% F
2000/2001
987,509
** 74,040
1,002,574
377,958
na
185,166
...
34,639
...
19,613
59,397
** 41,709
...
4,966
22,944
11,392
105,157
-
2,256
7,856
...
4,497
...
...
10,812
...
...
758,143
...
115,424
1,125,375
...
86,089
** 4,237
26,541
4,019
39,959
2,478
131,511
1,154
12,177
** 15,915
EnrolmentGeneralsecondaryeducation
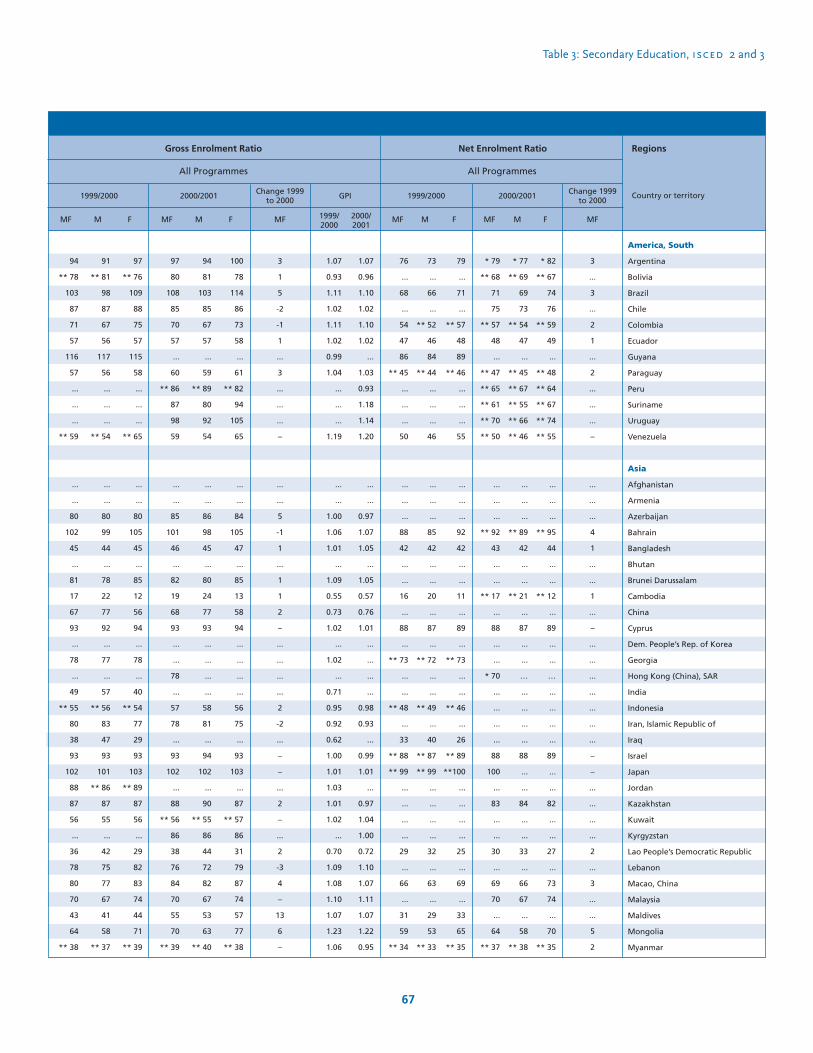
Table 3: Secondary Education, isced 2 and 3
67
GPI
Regions
Country or territory
97
80
108
85
70
57
...
60
** 86
87
98
59
...
...
85
101
46
...
82
19
68
93
...
...
78
...
57
78
...
93
102
...
88
** 56
86
38
76
84
70
55
70
** 39
MF
94
81
103
85
67
57
...
59
** 89
80
92
54
...
...
86
98
45
...
80
24
77
93
...
...
...
...
58
81
...
94
102
...
90
** 55
86
44
72
82
67
53
63
** 40
M
100
78
114
86
73
58
...
61
** 82
94
105
65
...
...
84
105
47
...
85
13
58
94
...
...
...
...
56
75
...
93
103
...
87
** 57
86
31
79
87
74
57
77
** 38
FF
1.07
0.93
1.11
1.02
1.11
1.02
0.99
1.04
...
...
...
1.19
...
...
1.00
1.06
1.01
...
1.09
0.55
0.73
1.02
...
1.02
...
0.71
0.95
0.92
0.62
1.00
1.01
1.03
1.01
1.02
...
0.70
1.09
1.08
1.10
1.07
1.23
1.06
1999/2000
1.07
0.96
1.10
1.02
1.10
1.02
...
1.03
0.93
1.18
1.14
1.20
...
...
0.97
1.07
1.05
...
1.05
0.57
0.76
1.01
...
...
...
...
0.98
0.93
...
0.99
1.01
...
0.97
1.04
1.00
0.72
1.10
1.07
1.11
1.07
1.22
0.95
2000/2001
* 79
** 68
71
75
** 57
48
...
** 47
** 65
** 61
** 70
** 50
...
...
...
** 92
43
...
...
** 17
...
88
...
...
* 70
...
...
...
...
88
100
...
83
...
...
30
...
69
70
...
64
** 37
MF
* 77
** 69
69
73
** 54
47
...
** 45
** 67
** 55
** 66
** 46
...
...
...
** 89
42
...
...
** 21
...
87
...
...
…
...
...
...
...
88
...
...
84
...
...
33
...
66
67
...
58
** 38
MM
* 82
** 67
74
76
** 59
49
...
** 48
** 64
** 67
** 74
** 55
...
...
...
** 95
44
...
...
** 12
...
89
...
...
…
...
...
...
...
89
...
...
82
...
...
27
...
73
74
...
70
** 35
America, South
Argentina
Bolivia
Brazil
Chile
Colombia
Ecuador
Guyana
Paraguay
Peru
Suriname
Uruguay
Venezuela
Asia
Afghanistan
Armenia
Azerbaijan
Bahrain
Bangladesh
Bhutan
Brunei Darussalam
Cambodia
China
Cyprus
Dem. People’s Rep. of Korea
Georgia
Hong Kong (China), SAR
India
Indonesia
Iran, Islamic Republic of
Iraq
Israel
Japan
Jordan
Kazakhstan
Kuwait
Kyrgyzstan
Lao People’s Democratic Republic
Lebanon
Macao, China
Malaysia
Maldives
Mongolia
Myanmar
F
2000/2001
76
...
68
...
54
47
86
** 45
...
...
...
50
...
...
...
88
42
...
...
16
...
88
...
** 73
...
...
** 48
...
33
** 88
** 99
...
...
...
...
29
...
66
...
31
59
** 34
MF
73
...
66
...
** 52
46
84
** 44
...
...
...
46
...
...
...
85
42
...
...
20
...
87
...
** 72
...
...
** 49
...
40
** 87
** 99
...
...
...
...
32
...
63
...
29
53
** 33
79
...
71
...
** 57
48
89
** 46
...
...
...
55
...
...
...
92
42
...
...
11
...
89
...
** 73
...
...
** 46
...
26
** 89
**100
...
...
...
...
25
...
69
...
33
65
** 35
F
1999/2000
MF
3
...
3
...
2
1
...
2
...
...
...
–
...
...
...
4
1
...
...
1
...
–
...
...
...
...
...
...
...
–
–
...
...
...
...
2
...
3
...
...
5
2
94
** 78
103
87
71
57
116
57
...
...
...
** 59
...
...
80
102
45
...
81
17
67
93
...
78
...
49
** 55
80
38
93
102
88
87
56
...
36
78
80
70
43
64
** 38
91
** 81
98
87
67
56
117
56
...
...
...
** 54
...
...
80
99
44
...
78
22
77
92
...
77
...
57
** 56
83
47
93
101
** 86
87
55
...
42
75
77
67
41
58
** 37
MF M
97
** 76
109
88
75
57
115
58
...
...
...
** 65
...
...
80
105
45
...
85
12
56
94
...
78
...
40
** 54
77
29
93
103
** 89
87
56
...
29
82
83
74
44
71
** 39
1999/2000
Net Enrolment Ratio
Change 1999to 2000
MF
3
1
5
-2
-1
1
...
3
...
...
...
–
...
...
5
-1
1
...
1
1
2
–
...
...
...
...
2
-2
...
–
–
...
2
–
...
2
-3
4
–
13
6
–
Change 1999to 2000
Gross Enrolment Ratio
2000/2001
All Programmes All Programmes
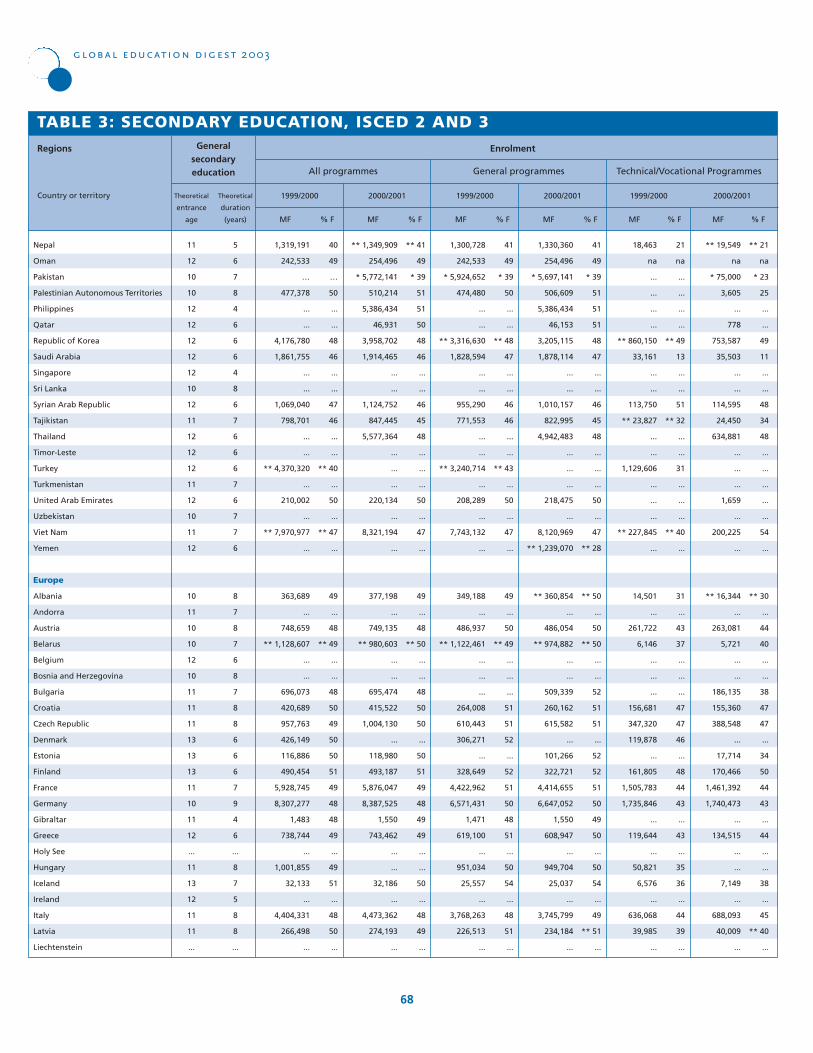
11
12
10
10
12
12
12
12
12
10
12
11
12
12
12
11
12
10
11
12
10
11
10
10
12
10
11
11
11
13
13
13
11
10
11
12
...
11
13
12
11
11
...
5
6
7
8
4
6
6
6
4
8
6
7
6
6
6
7
6
7
7
6
8
7
8
7
6
8
7
8
8
6
6
6
7
9
4
6
...
8
7
5
8
8
...
Theoretical
entrance
age
Theoretical
duration
(years) MF
40
49
…
50
...
...
48
46
...
...
47
46
...
...
** 40
...
50
...
** 47
...
49
...
48
** 49
...
...
48
50
49
50
50
51
49
48
48
49
...
49
51
...
48
50
...
% F
TABLE 3: SECONDARY EDUCATION, ISCED 2 AND 3
Nepal
Oman
Pakistan
Palestinian Autonomous Territories
Philippines
Qatar
Republic of Korea
Saudi Arabia
Singapore
Sri Lanka
Syrian Arab Republic
Tajikistan
Thailand
Timor-Leste
Turkey
Turkmenistan
United Arab Emirates
Uzbekistan
Viet Nam
Yemen
Europe
Albania
Andorra
Austria
Belarus
Belgium
Bosnia and Herzegovina
Bulgaria
Croatia
Czech Republic
Denmark
Estonia
Finland
France
Germany
Gibraltar
Greece
Holy See
Hungary
Iceland
Ireland
Italy
Latvia
Liechtenstein
Regions
Country or territory
All programmes
1999/2000
global education digest 2003
68
1,319,191
242,533
…
477,378
...
...
4,176,780
1,861,755
...
...
1,069,040
798,701
...
...
** 4,370,320
...
210,002
...
** 7,970,977
...
363,689
...
748,659
** 1,128,607
...
...
696,073
420,689
957,763
426,149
116,886
490,454
5,928,745
8,307,277
1,483
738,744
...
1,001,855
32,133
...
4,404,331
266,498
...
MF
** 41
49
* 39
51
51
50
48
46
...
...
46
45
48
...
...
...
50
...
47
...
49
...
48
** 50
...
...
48
50
50
...
50
51
49
48
49
49
...
...
50
...
48
49
...
% F
2000/2001
** 1,349,909
254,496
* 5,772,141
510,214
5,386,434
46,931
3,958,702
1,914,465
...
...
1,124,752
847,445
5,577,364
...
...
...
220,134
...
8,321,194
...
377,198
...
749,135
** 980,603
...
...
695,474
415,522
1,004,130
...
118,980
493,187
5,876,047
8,387,525
1,550
743,462
...
...
32,186
...
4,473,362
274,193
...
MF
41
49
* 39
50
...
...
** 48
47
...
...
46
46
...
...
** 43
...
50
...
47
...
49
...
50
** 49
...
...
...
51
51
52
...
52
51
50
48
51
...
50
54
...
48
51
...
% F
General programmes
1999/2000
1,300,728
242,533
* 5,924,652
474,480
...
...
** 3,316,630
1,828,594
...
...
955,290
771,553
...
...
** 3,240,714
...
208,289
...
7,743,132
...
349,188
...
486,937
** 1,122,461
...
...
...
264,008
610,443
306,271
...
328,649
4,422,962
6,571,431
1,471
619,100
...
951,034
25,557
...
3,768,263
226,513
...
MF
41
49
* 39
51
51
51
48
47
...
...
46
45
48
...
...
...
50
...
47
** 28
** 50
...
50
** 50
...
...
52
51
51
...
52
52
51
50
49
50
...
50
54
...
49
** 51
...
% F
2000/2001
1,330,360
254,496
* 5,697,141
506,609
5,386,434
46,153
3,205,115
1,878,114
...
...
1,010,157
822,995
4,942,483
...
...
...
218,475
...
8,120,969
** 1,239,070
** 360,854
...
486,054
** 974,882
...
...
509,339
260,162
615,582
...
101,266
322,721
4,414,655
6,647,052
1,550
608,947
...
949,704
25,037
...
3,745,799
234,184
...
MF
21
na
...
...
...
...
** 49
13
...
...
51
** 32
...
...
31
...
...
...
** 40
...
31
...
43
37
...
...
...
47
47
46
...
48
44
43
...
43
...
35
36
...
44
39
...
% F
Technical/Vocational Programmes
1999/2000
18,463
na
...
...
...
...
** 860,150
33,161
...
...
113,750
** 23,827
...
...
1,129,606
...
...
...
** 227,845
...
14,501
...
261,722
6,146
...
...
...
156,681
347,320
119,878
...
161,805
1,505,783
1,735,846
...
119,644
...
50,821
6,576
...
636,068
39,985
...
MF
** 21
na
* 23
25
...
...
49
11
...
...
48
34
48
...
...
...
...
...
54
...
** 30
...
44
40
...
...
38
47
47
...
34
50
44
43
...
44
...
...
38
...
45
** 40
...
% F
2000/2001
** 19,549
na
* 75,000
3,605
...
778
753,587
35,503
...
...
114,595
24,450
634,881
...
...
...
1,659
...
200,225
...
** 16,344
...
263,081
5,721
...
...
186,135
155,360
388,548
...
17,714
170,466
1,461,392
1,740,473
...
134,515
...
...
7,149
...
688,093
40,009
...
EnrolmentGeneralsecondaryeducation
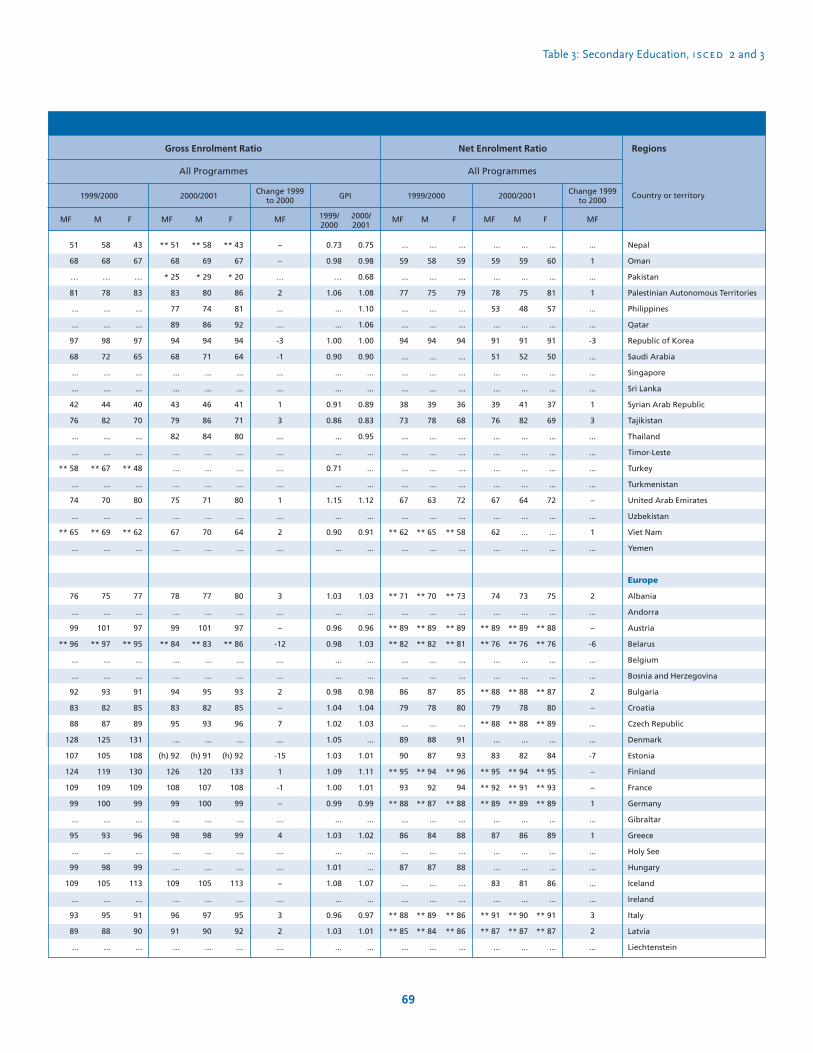
Table 3: Secondary Education, isced 2 and 3
69
GPI
Regions
Country or territory
** 51
68
* 25
83
77
89
94
68
...
...
43
79
82
...
...
...
75
...
67
...
78
...
99
** 84
...
...
94
83
95
...
(h) 92
126
108
99
...
98
...
...
109
...
96
91
...
MF
** 58
69
* 29
80
74
86
94
71
...
...
46
86
84
...
...
...
71
...
70
...
77
...
101
** 83
...
...
95
82
93
...
(h) 91
120
107
100
...
98
...
...
105
...
97
90
...
M
** 43
67
* 20
86
81
92
94
64
...
...
41
71
80
...
...
...
80
...
64
...
80
...
97
** 86
...
...
93
85
96
...
(h) 92
133
108
99
...
99
...
...
113
...
95
92
...
FF
0.73
0.98
…
1.06
...
...
1.00
0.90
...
...
0.91
0.86
...
...
0.71
...
1.15
...
0.90
...
1.03
...
0.96
0.98
...
...
0.98
1.04
1.02
1.05
1.03
1.09
1.00
0.99
...
1.03
...
1.01
1.08
...
0.96
1.03
...
1999/2000
0.75
0.98
0.68
1.08
1.10
1.06
1.00
0.90
...
...
0.89
0.83
0.95
...
...
...
1.12
...
0.91
...
1.03
...
0.96
1.03
...
...
0.98
1.04
1.03
...
1.01
1.11
1.01
0.99
...
1.02
...
...
1.07
...
0.97
1.01
...
2000/2001
...
59
...
78
53
...
91
51
...
...
39
76
...
...
...
...
67
...
62
...
74
...
** 89
** 76
...
...
** 88
79
** 88
...
83
** 95
** 92
** 89
...
87
...
...
83
...
** 91
** 87
...
MF
...
59
...
75
48
...
91
52
...
...
41
82
...
...
...
...
64
...
...
...
73
...
** 89
** 76
...
...
** 88
78
** 88
...
82
** 94
** 91
** 89
...
86
...
...
81
...
** 90
** 87
...
MM
...
60
...
81
57
...
91
50
...
...
37
69
...
...
...
...
72
...
...
...
75
...
** 88
** 76
...
...
** 87
80
** 89
...
84
** 95
** 93
** 89
...
89
...
...
86
...
** 91
** 87
...
Nepal
Oman
Pakistan
Palestinian Autonomous Territories
Philippines
Qatar
Republic of Korea
Saudi Arabia
Singapore
Sri Lanka
Syrian Arab Republic
Tajikistan
Thailand
Timor-Leste
Turkey
Turkmenistan
United Arab Emirates
Uzbekistan
Viet Nam
Yemen
Europe
Albania
Andorra
Austria
Belarus
Belgium
Bosnia and Herzegovina
Bulgaria
Croatia
Czech Republic
Denmark
Estonia
Finland
France
Germany
Gibraltar
Greece
Holy See
Hungary
Iceland
Ireland
Italy
Latvia
Liechtenstein
F
2000/2001
...
59
...
77
...
...
94
...
...
...
38
73
...
...
...
...
67
...
** 62
...
** 71
...
** 89
** 82
...
...
86
79
...
89
90
** 95
93
** 88
...
86
...
87
...
...
** 88
** 85
...
MF
...
58
...
75
...
...
94
...
...
...
39
78
...
...
...
...
63
...
** 65
...
** 70
...
** 89
** 82
...
...
87
78
...
88
87
** 94
92
** 87
...
84
...
87
...
...
** 89
** 84
...
...
59
...
79
...
...
94
...
...
...
36
68
...
...
...
...
72
...
** 58
...
** 73
...
** 89
** 81
...
...
85
80
...
91
93
** 96
94
** 88
...
88
...
88
...
...
** 86
** 86
...
F
1999/2000
MF
...
1
...
1
...
...
-3
...
...
...
1
3
...
...
...
...
–
...
1
...
2
...
–
-6
...
...
2
–
...
...
-7
–
–
1
...
1
...
...
...
...
3
2
...
51
68
…
81
...
...
97
68
...
...
42
76
...
...
** 58
...
74
...
** 65
...
76
...
99
** 96
...
...
92
83
88
128
107
124
109
99
...
95
...
99
109
...
93
89
...
58
68
…
78
...
...
98
72
...
...
44
82
...
...
** 67
...
70
...
** 69
...
75
...
101
** 97
...
...
93
82
87
125
105
119
109
100
...
93
...
98
105
...
95
88
...
MF M
43
67
…
83
...
...
97
65
...
...
40
70
...
...
** 48
...
80
...
** 62
...
77
...
97
** 95
...
...
91
85
89
131
108
130
109
99
...
96
...
99
113
...
91
90
...
1999/2000
Net Enrolment Ratio
Change 1999to 2000
MF
–
–
…
2
...
...
-3
-1
...
...
1
3
...
...
...
...
1
...
2
...
3
...
–
-12
...
...
2
–
7
...
-15
1
-1
–
...
4
...
...
–
...
3
2
...
Change 1999to 2000
Gross Enrolment Ratio
2000/2001
All Programmes All Programmes
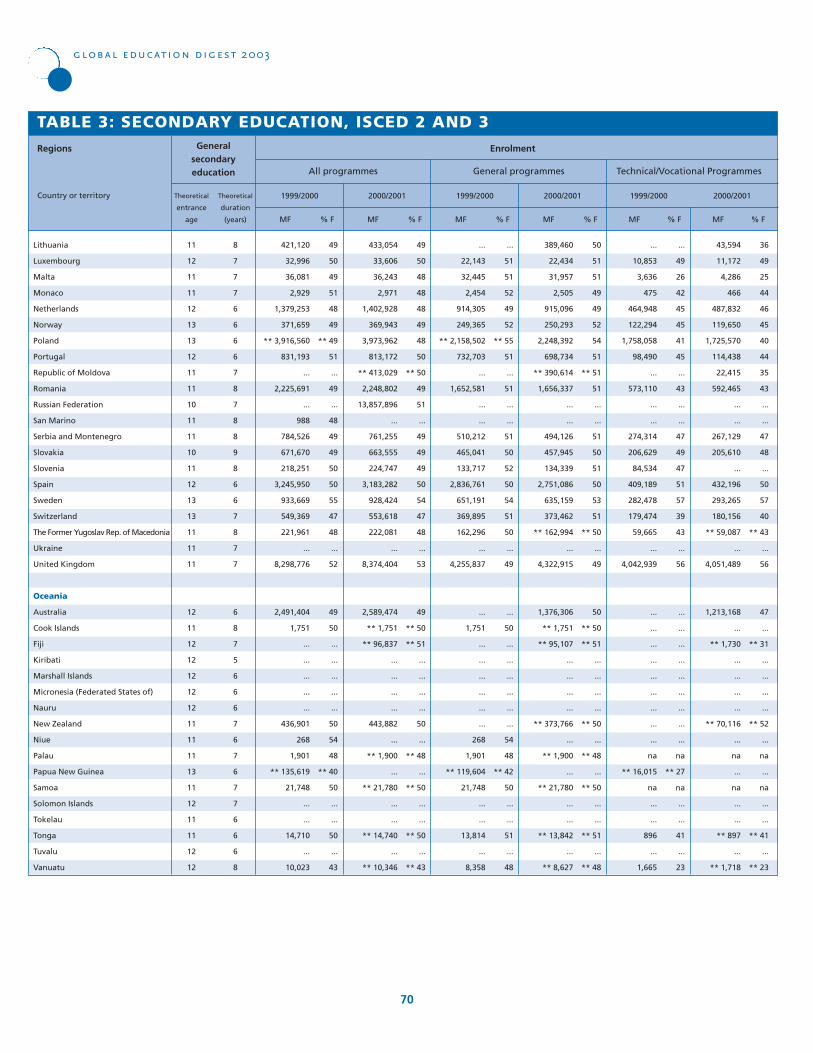
11
12
11
11
12
13
13
12
11
11
10
11
11
10
11
12
13
13
11
11
11
12
11
12
12
12
12
12
11
11
11
13
11
12
11
11
12
12
8
7
7
7
6
6
6
6
7
8
7
8
8
9
8
6
6
7
8
7
7
6
8
7
5
6
6
6
7
6
7
6
7
7
6
6
6
8
Theoretical
entrance
age
Theoretical
duration
(years) MF
49
50
49
51
48
49
** 49
51
...
49
...
48
49
49
50
50
55
47
48
...
52
49
50
...
...
...
...
...
50
54
48
** 40
50
...
...
50
...
43
% F
TABLE 3: SECONDARY EDUCATION, ISCED 2 AND 3
Lithuania
Luxembourg
Malta
Monaco
Netherlands
Norway
Poland
Portugal
Republic of Moldova
Romania
Russian Federation
San Marino
Serbia and Montenegro
Slovakia
Slovenia
Spain
Sweden
Switzerland
The Former Yugoslav Rep. of Macedonia
Ukraine
United Kingdom
Oceania
Australia
Cook Islands
Fiji
Kiribati
Marshall Islands
Micronesia (Federated States of)
Nauru
New Zealand
Niue
Palau
Papua New Guinea
Samoa
Solomon Islands
Tokelau
Tonga
Tuvalu
Vanuatu
Regions
Country or territory
All programmes
1999/2000
global education digest 2003
70
421,120
32,996
36,081
2,929
1,379,253
371,659
** 3,916,560
831,193
...
2,225,691
...
988
784,526
671,670
218,251
3,245,950
933,669
549,369
221,961
...
8,298,776
2,491,404
1,751
...
...
...
...
...
436,901
268
1,901
** 135,619
21,748
...
...
14,710
...
10,023
MF
49
50
48
48
48
49
48
50
** 50
49
51
...
49
49
49
50
54
47
48
...
53
49
** 50
** 51
...
...
...
...
50
...
** 48
...
** 50
...
...
** 50
...
** 43
% F
2000/2001
433,054
33,606
36,243
2,971
1,402,928
369,943
3,973,962
813,172
** 413,029
2,248,802
13,857,896
...
761,255
663,555
224,747
3,183,282
928,424
553,618
222,081
...
8,374,404
2,589,474
** 1,751
** 96,837
...
...
...
...
443,882
...
** 1,900
...
** 21,780
...
...
** 14,740
...
** 10,346
MF
...
51
51
52
49
52
** 55
51
...
51
...
...
51
50
52
50
54
51
50
...
49
...
50
...
...
...
...
...
...
54
48
** 42
50
...
...
51
...
48
% F
General programmes
1999/2000
...
22,143
32,445
2,454
914,305
249,365
** 2,158,502
732,703
...
1,652,581
...
...
510,212
465,041
133,717
2,836,761
651,191
369,895
162,296
...
4,255,837
...
1,751
...
...
...
...
...
...
268
1,901
** 119,604
21,748
...
...
13,814
...
8,358
MF
50
51
51
49
49
52
54
51
** 51
51
...
...
51
50
51
50
53
51
** 50
...
49
50
** 50
** 51
...
...
...
...
** 50
...
** 48
...
** 50
...
...
** 51
...
** 48
% F
2000/2001
389,460
22,434
31,957
2,505
915,096
250,293
2,248,392
698,734
** 390,614
1,656,337
...
...
494,126
457,945
134,339
2,751,086
635,159
373,462
** 162,994
...
4,322,915
1,376,306
** 1,751
** 95,107
...
...
...
...
** 373,766
...
** 1,900
...
** 21,780
...
...
** 13,842
...
** 8,627
MF
...
49
26
42
45
45
41
45
...
43
...
...
47
49
47
51
57
39
43
...
56
...
...
...
...
...
...
...
...
...
na
** 27
na
...
...
41
...
23
% F
Technical/Vocational Programmes
1999/2000
...
10,853
3,636
475
464,948
122,294
1,758,058
98,490
...
573,110
...
...
274,314
206,629
84,534
409,189
282,478
179,474
59,665
...
4,042,939
...
...
...
...
...
...
...
...
...
na
** 16,015
na
...
...
896
...
1,665
MF
36
49
25
44
46
45
40
44
35
43
...
...
47
48
...
50
57
40
** 43
...
56
47
...
** 31
...
...
...
...
** 52
...
na
...
na
...
...
** 41
...
** 23
% F
2000/2001
43,594
11,172
4,286
466
487,832
119,650
1,725,570
114,438
22,415
592,465
...
...
267,129
205,610
...
432,196
293,265
180,156
** 59,087
...
4,051,489
1,213,168
...
** 1,730
...
...
...
...
** 70,116
...
na
...
na
...
...
** 897
...
** 1,718
EnrolmentGeneralsecondaryeducation
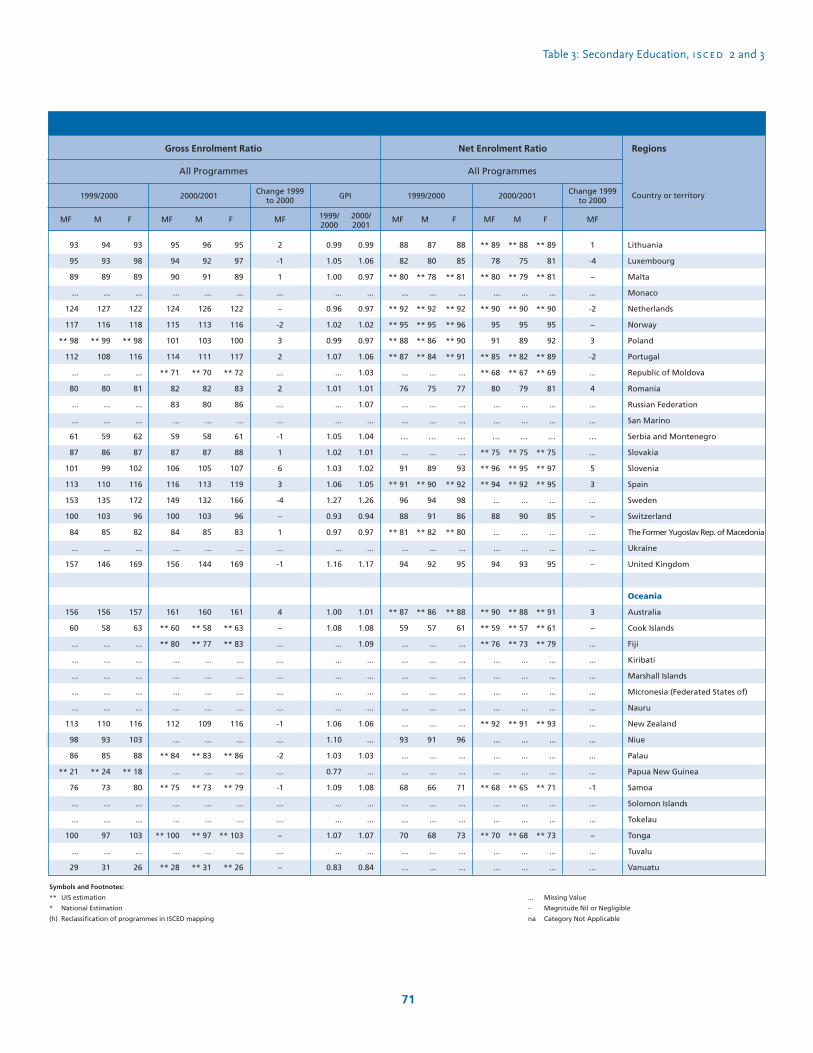
Table 3: Secondary Education, isced 2 and 3
71
GPI
Regions
Country or territory
95
94
90
...
124
115
101
114
** 71
82
83
...
59
87
106
116
149
100
84
...
156
161
** 60
** 80
...
...
...
...
112
...
** 84
...
** 75
...
...
** 100
...
** 28
MF
96
92
91
...
126
113
103
111
** 70
82
80
...
58
87
105
113
132
103
85
...
144
160
** 58
** 77
...
...
...
...
109
...
** 83
...
** 73
...
...
** 97
...
** 31
M
95
97
89
...
122
116
100
117
** 72
83
86
...
61
88
107
119
166
96
83
...
169
161
** 63
** 83
...
...
...
...
116
...
** 86
...
** 79
...
...
** 103
...
** 26
FF
0.99
1.05
1.00
...
0.96
1.02
0.99
1.07
...
1.01
...
...
1.05
1.02
1.03
1.06
1.27
0.93
0.97
...
1.16
1.00
1.08
...
...
...
...
...
1.06
1.10
1.03
0.77
1.09
...
...
1.07
...
0.83
1999/2000
0.99
1.06
0.97
...
0.97
1.02
0.97
1.06
1.03
1.01
1.07
...
1.04
1.01
1.02
1.05
1.26
0.94
0.97
...
1.17
1.01
1.08
1.09
...
...
...
...
1.06
...
1.03
...
1.08
...
...
1.07
...
0.84
2000/2001
** 89
78
** 80
...
** 90
95
91
** 85
** 68
80
...
...
…
** 75
** 96
** 94
...
88
...
...
94
** 90
** 59
** 76
...
...
...
...
** 92
...
...
...
** 68
...
...
** 70
...
...
MF
** 88
75
** 79
...
** 90
95
89
** 82
** 67
79
...
...
…
** 75
** 95
** 92
...
90
...
...
93
** 88
** 57
** 73
...
...
...
...
** 91
...
...
...
** 65
...
...
** 68
...
...
MM
** 89
81
** 81
...
** 90
95
92
** 89
** 69
81
...
...
…
** 75
** 97
** 95
...
85
...
...
95
** 91
** 61
** 79
...
...
...
...
** 93
...
...
...
** 71
...
...
** 73
...
...
Lithuania
Luxembourg
Malta
Monaco
Netherlands
Norway
Poland
Portugal
Republic of Moldova
Romania
Russian Federation
San Marino
Serbia and Montenegro
Slovakia
Slovenia
Spain
Sweden
Switzerland
The Former Yugoslav Rep. of Macedonia
Ukraine
United Kingdom
Oceania
Australia
Cook Islands
Fiji
Kiribati
Marshall Islands
Micronesia (Federated States of)
Nauru
New Zealand
Niue
Palau
Papua New Guinea
Samoa
Solomon Islands
Tokelau
Tonga
Tuvalu
Vanuatu
F
2000/2001
88
82
** 80
...
** 92
** 95
** 88
** 87
...
76
...
...
…
...
91
** 91
96
88
** 81
...
94
** 87
59
...
...
...
...
...
...
93
...
...
68
...
...
70
...
...
MF
87
80
** 78
...
** 92
** 95
** 86
** 84
...
75
...
...
…
...
89
** 90
94
91
** 82
...
92
** 86
57
...
...
...
...
...
...
91
...
...
66
...
...
68
...
...
88
85
** 81
...
** 92
** 96
** 90
** 91
...
77
...
...
…
...
93
** 92
98
86
** 80
...
95
** 88
61
...
...
...
...
...
...
96
...
...
71
...
...
73
...
...
F
1999/2000
MF
1
-4
–
...
-2
–
3
-2
...
4
...
...
…
...
5
3
...
–
...
...
–
3
–
...
...
...
...
...
...
...
...
...
-1
...
...
–
...
...
93
95
89
...
124
117
** 98
112
...
80
...
...
61
87
101
113
153
100
84
...
157
156
60
...
...
...
...
...
113
98
86
** 21
76
...
...
100
...
29
94
93
89
...
127
116
** 99
108
...
80
...
...
59
86
99
110
135
103
85
...
146
156
58
...
...
...
...
...
110
93
85
** 24
73
...
...
97
...
31
MF M
93
98
89
...
122
118
** 98
116
...
81
...
...
62
87
102
116
172
96
82
...
169
157
63
...
...
...
...
...
116
103
88
** 18
80
...
...
103
...
26
1999/2000
Net Enrolment Ratio
Change 1999to 2000
MF
2
-1
1
...
–
-2
3
2
...
2
...
...
-1
1
6
3
-4
–
1
...
-1
4
–
...
...
...
...
...
-1
...
-2
...
-1
...
...
–
...
–
Change 1999to 2000
Gross Enrolment Ratio
2000/2001
All Programmes All Programmes
Symbols and Footnotes:
** UIS estimation
* National Estimation
(h) Reclassification of programmes in ISCED mapping
... Missing Value
– Magnitude Nil or Negligible
na Category Not Applicable
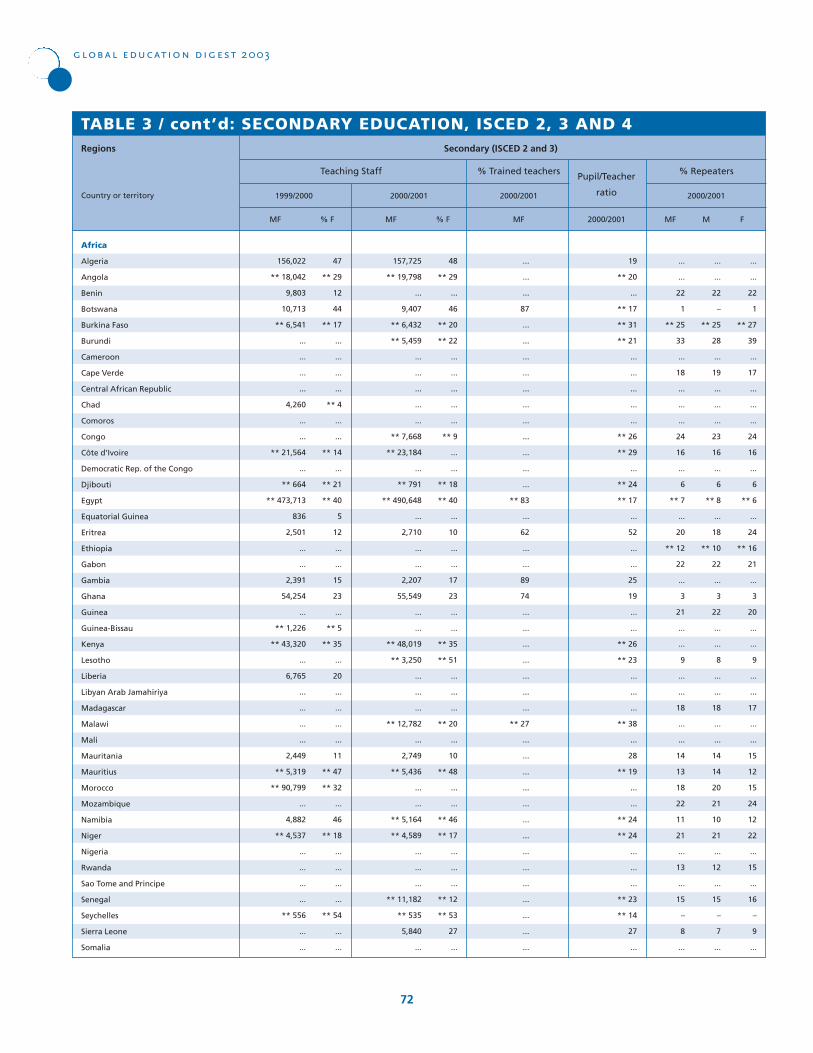
MF
47
** 29
12
44
** 17
...
...
...
...
** 4
...
...
** 14
...
** 21
** 40
5
12
...
...
15
23
...
** 5
** 35
...
20
...
...
...
...
11
** 47
** 32
...
46
** 18
...
...
...
...
** 54
...
...
% F
TABLE 3 / cont’d: SECONDARY EDUCATION, ISCED 2, 3 AND 4
Africa
Algeria
Angola
Benin
Botswana
Burkina Faso
Burundi
Cameroon
Cape Verde
Central African Republic
Chad
Comoros
Congo
Côte d’Ivoire
Democratic Rep. of the Congo
Djibouti
Egypt
Equatorial Guinea
Eritrea
Ethiopia
Gabon
Gambia
Ghana
Guinea
Guinea-Bissau
Kenya
Lesotho
Liberia
Libyan Arab Jamahiriya
Madagascar
Malawi
Mali
Mauritania
Mauritius
Morocco
Mozambique
Namibia
Niger
Nigeria
Rwanda
Sao Tome and Principe
Senegal
Seychelles
Sierra Leone
Somalia
Regions
Country or territory
Teaching Staff
1999/2000
global education digest 2003
72
156,022
** 18,042
9,803
10,713
** 6,541
...
...
...
...
4,260
...
...
** 21,564
...
** 664
** 473,713
836
2,501
...
...
2,391
54,254
...
** 1,226
** 43,320
...
6,765
...
...
...
...
2,449
** 5,319
** 90,799
...
4,882
** 4,537
...
...
...
...
** 556
...
...
MF
48
** 29
...
46
** 20
** 22
...
...
...
...
...
** 9
...
...
** 18
** 40
...
10
...
...
17
23
...
...
** 35
** 51
...
...
...
** 20
...
10
** 48
...
...
** 46
** 17
...
...
...
** 12
** 53
27
...
% F
2000/2001
157,725
** 19,798
...
9,407
** 6,432
** 5,459
...
...
...
...
...
** 7,668
** 23,184
...
** 791
** 490,648
...
2,710
...
...
2,207
55,549
...
...
** 48,019
** 3,250
...
...
...
** 12,782
...
2,749
** 5,436
...
...
** 5,164
** 4,589
...
...
...
** 11,182
** 535
5,840
...
MF
19
** 20
...
** 17
** 31
** 21
...
...
...
...
...
** 26
** 29
...
** 24
** 17
...
52
...
...
25
19
...
...
** 26
** 23
...
...
...
** 38
...
28
** 19
...
...
** 24
** 24
...
...
...
** 23
** 14
27
...
2000/2001
2000/2001
...
...
...
87
...
...
...
...
...
...
...
...
...
...
...
** 83
...
62
...
...
89
74
...
...
...
...
...
...
...
** 27
...
...
...
...
...
...
...
...
...
...
...
...
...
...
Secondary (ISCED 2 and 3)
F
...
...
22
1
** 25
33
...
18
...
...
...
24
16
...
6
** 7
...
20
** 12
22
...
3
21
...
...
9
...
...
18
...
...
14
13
18
22
11
21
...
13
...
15
–
8
...
...
...
22
–
** 25
28
...
19
...
...
...
23
16
...
6
** 8
...
18
** 10
22
...
3
22
...
...
8
...
...
18
...
...
14
14
20
21
10
21
...
12
...
15
–
7
...
MF M
...
...
22
1
** 27
39
...
17
...
...
...
24
16
...
6
** 6
...
24
** 16
21
...
3
20
...
...
9
...
...
17
...
...
15
12
15
24
12
22
...
15
...
16
–
9
...
2000/2001
% Trained teachers Pupil/Teacher
ratio
% Repeaters
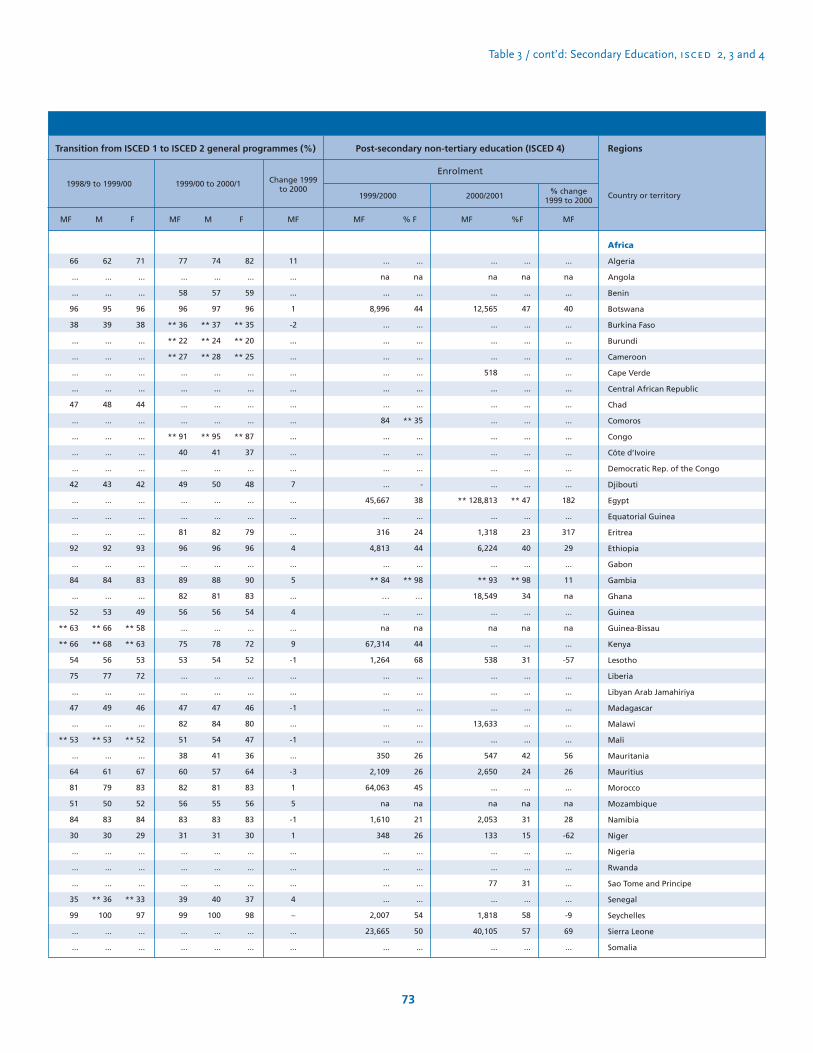
Table 3 / cont’d: Secondary Education, isced 2, 3 and 4
73
Regions
Country or territory
F
Africa
Algeria
Angola
Benin
Botswana
Burkina Faso
Burundi
Cameroon
Cape Verde
Central African Republic
Chad
Comoros
Congo
Côte d’Ivoire
Democratic Rep. of the Congo
Djibouti
Egypt
Equatorial Guinea
Eritrea
Ethiopia
Gabon
Gambia
Ghana
Guinea
Guinea-Bissau
Kenya
Lesotho
Liberia
Libyan Arab Jamahiriya
Madagascar
Malawi
Mali
Mauritania
Mauritius
Morocco
Mozambique
Namibia
Niger
Nigeria
Rwanda
Sao Tome and Principe
Senegal
Seychelles
Sierra Leone
Somalia
66
...
...
96
38
...
...
...
...
47
...
...
...
...
42
...
...
...
92
...
84
...
52
** 63
** 66
54
75
...
47
...
** 53
...
64
81
51
84
30
...
...
...
35
99
...
...
62
...
...
95
39
...
...
...
...
48
...
...
...
...
43
...
...
...
92
...
84
...
53
** 66
** 68
56
77
...
49
...
** 53
...
61
79
50
83
30
...
...
...
** 36
100
...
...
MF M
71
...
...
96
38
...
...
...
...
44
...
...
...
...
42
...
...
...
93
...
83
...
49
** 58
** 63
53
72
...
46
...
** 52
...
67
83
52
84
29
...
...
...
** 33
97
...
...
F
77
...
58
96
** 36
** 22
** 27
...
...
...
...
** 91
40
...
49
...
...
81
96
...
89
82
56
...
75
53
...
...
47
82
51
38
60
82
56
83
31
...
...
...
39
99
...
...
74
...
57
97
** 37
** 24
** 28
...
...
...
...
** 95
41
...
50
...
...
82
96
...
88
81
56
...
78
54
...
...
47
84
54
41
57
81
55
83
31
...
...
...
40
100
...
...
MF M
82
...
59
96
** 35
** 20
** 25
...
...
...
...
** 87
37
...
48
...
...
79
96
...
90
83
54
...
72
52
...
...
46
80
47
36
64
83
56
83
30
...
...
...
37
98
...
...
1998/9 to 1999/00
Post-secondary non-tertiary education (ISCED 4)
MF
11
...
...
1
-2
...
...
...
...
...
...
...
...
...
7
...
...
...
4
...
5
...
4
...
9
-1
...
...
-1
...
-1
...
-3
1
5
-1
1
...
...
...
4
–
...
...
Change 1999to 2000
Transition from ISCED 1 to ISCED 2 general programmes (%)
1999/00 to 2000/1
MF
...
na
...
40
...
...
...
...
...
...
...
...
...
...
...
182
...
317
29
...
11
na
...
na
...
-57
...
...
...
...
...
56
26
...
na
28
-62
...
...
...
...
-9
69
...
% change1999 to 2000
Enrolment
MF
...
na
...
44
...
...
...
...
...
...
** 35
...
...
...
-
38
...
24
44
...
** 98
…
...
na
44
68
...
...
...
...
...
26
26
45
na
21
26
...
...
...
...
54
50
...
% F
1999/2000
...
na
...
8,996
...
...
...
...
...
...
84
...
...
...
...
45,667
...
316
4,813
...
** 84
…
...
na
67,314
1,264
...
...
...
...
...
350
2,109
64,063
na
1,610
348
...
...
...
...
2,007
23,665
...
MF
...
na
...
47
...
...
...
...
...
...
...
...
...
...
...
** 47
...
23
40
...
** 98
34
...
na
...
31
...
...
...
...
...
42
24
...
na
31
15
...
...
31
...
58
57
...
%F
2000/2001
...
na
...
12,565
...
...
...
518
...
...
...
...
...
...
...
** 128,813
...
1,318
6,224
...
** 93
18,549
...
na
...
538
...
...
...
13,633
...
547
2,650
...
na
2,053
133
...
...
77
...
1,818
40,105
...
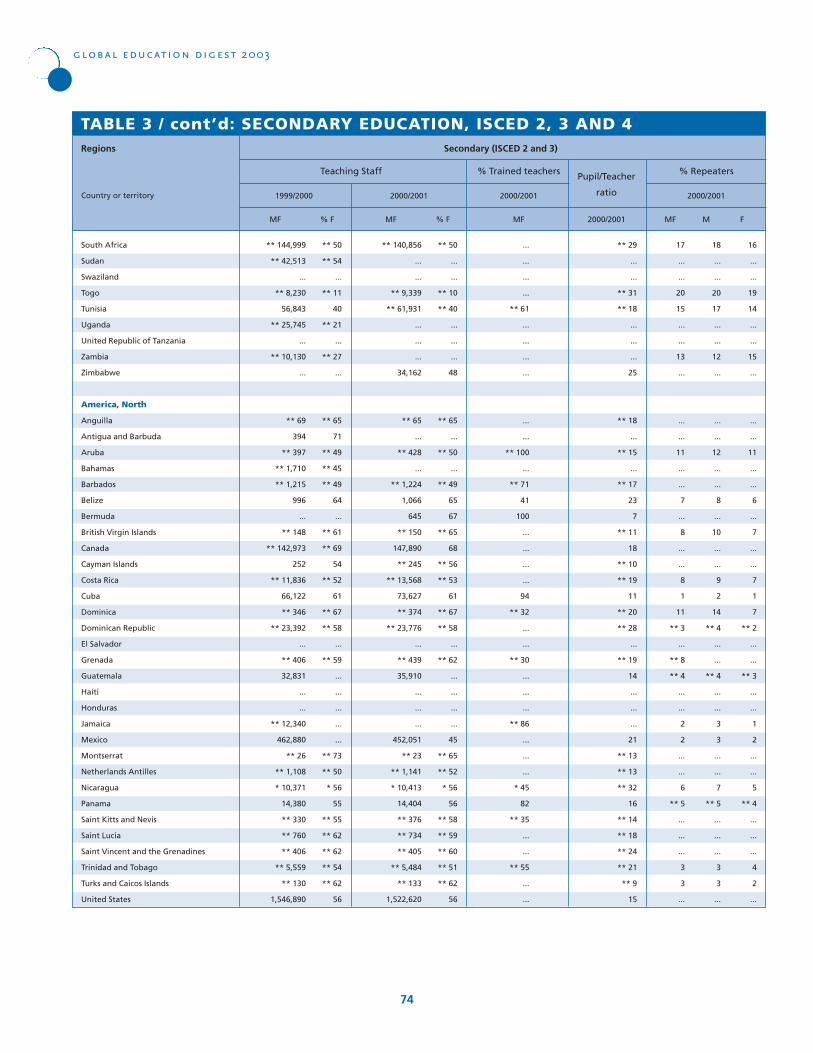
MF
** 50
** 54
...
** 11
40
** 21
...
** 27
...
** 65
71
** 49
** 45
** 49
64
...
** 61
** 69
54
** 52
61
** 67
** 58
...
** 59
...
...
...
...
...
** 73
** 50
* 56
55
** 55
** 62
** 62
** 54
** 62
56
% F
TABLE 3 / cont’d: SECONDARY EDUCATION, ISCED 2, 3 AND 4
South Africa
Sudan
Swaziland
Togo
Tunisia
Uganda
United Republic of Tanzania
Zambia
Zimbabwe
America, North
Anguilla
Antigua and Barbuda
Aruba
Bahamas
Barbados
Belize
Bermuda
British Virgin Islands
Canada
Cayman Islands
Costa Rica
Cuba
Dominica
Dominican Republic
El Salvador
Grenada
Guatemala
Haiti
Honduras
Jamaica
Mexico
Montserrat
Netherlands Antilles
Nicaragua
Panama
Saint Kitts and Nevis
Saint Lucia
Saint Vincent and the Grenadines
Trinidad and Tobago
Turks and Caicos Islands
United States
Regions
Country or territory
Teaching Staff
1999/2000
global education digest 2003
74
** 144,999
** 42,513
...
** 8,230
56,843
** 25,745
...
** 10,130
...
** 69
394
** 397
** 1,710
** 1,215
996
...
** 148
** 142,973
252
** 11,836
66,122
** 346
** 23,392
...
** 406
32,831
...
...
** 12,340
462,880
** 26
** 1,108
* 10,371
14,380
** 330
** 760
** 406
** 5,559
** 130
1,546,890
MF
** 50
...
...
** 10
** 40
...
...
...
48
** 65
...
** 50
...
** 49
65
67
** 65
68
** 56
** 53
61
** 67
** 58
...
** 62
...
...
...
...
45
** 65
** 52
* 56
56
** 58
** 59
** 60
** 51
** 62
56
% F
2000/2001
** 140,856
...
...
** 9,339
** 61,931
...
...
...
34,162
** 65
...
** 428
...
** 1,224
1,066
645
** 150
147,890
** 245
** 13,568
73,627
** 374
** 23,776
...
** 439
35,910
...
...
...
452,051
** 23
** 1,141
* 10,413
14,404
** 376
** 734
** 405
** 5,484
** 133
1,522,620
MF
** 29
...
...
** 31
** 18
...
...
...
25
** 18
...
** 15
...
** 17
23
7
** 11
18
** 10
** 19
11
** 20
** 28
...
** 19
14
...
...
...
21
** 13
** 13
** 32
16
** 14
** 18
** 24
** 21
** 9
15
2000/2001
2000/2001
...
...
...
...
** 61
...
...
...
...
...
...
** 100
...
** 71
41
100
...
...
...
...
94
** 32
...
...
** 30
...
...
...
** 86
...
...
...
* 45
82
** 35
...
...
** 55
...
...
Secondary (ISCED 2 and 3)
F
17
...
...
20
15
...
...
13
...
...
...
11
...
...
7
...
8
...
...
8
1
11
** 3
...
** 8
** 4
...
...
2
2
...
...
6
** 5
...
...
...
3
3
...
18
...
...
20
17
...
...
12
...
...
...
12
...
...
8
...
10
...
...
9
2
14
** 4
...
...
** 4
...
...
3
3
...
...
7
** 5
...
...
...
3
3
...
MF M
16
...
...
19
14
...
...
15
...
...
...
11
...
...
6
...
7
...
...
7
1
7
** 2
...
...
** 3
...
...
1
2
...
...
5
** 4
...
...
...
4
2
...
2000/2001
% Trained teachers Pupil/Teacher
ratio
% Repeaters
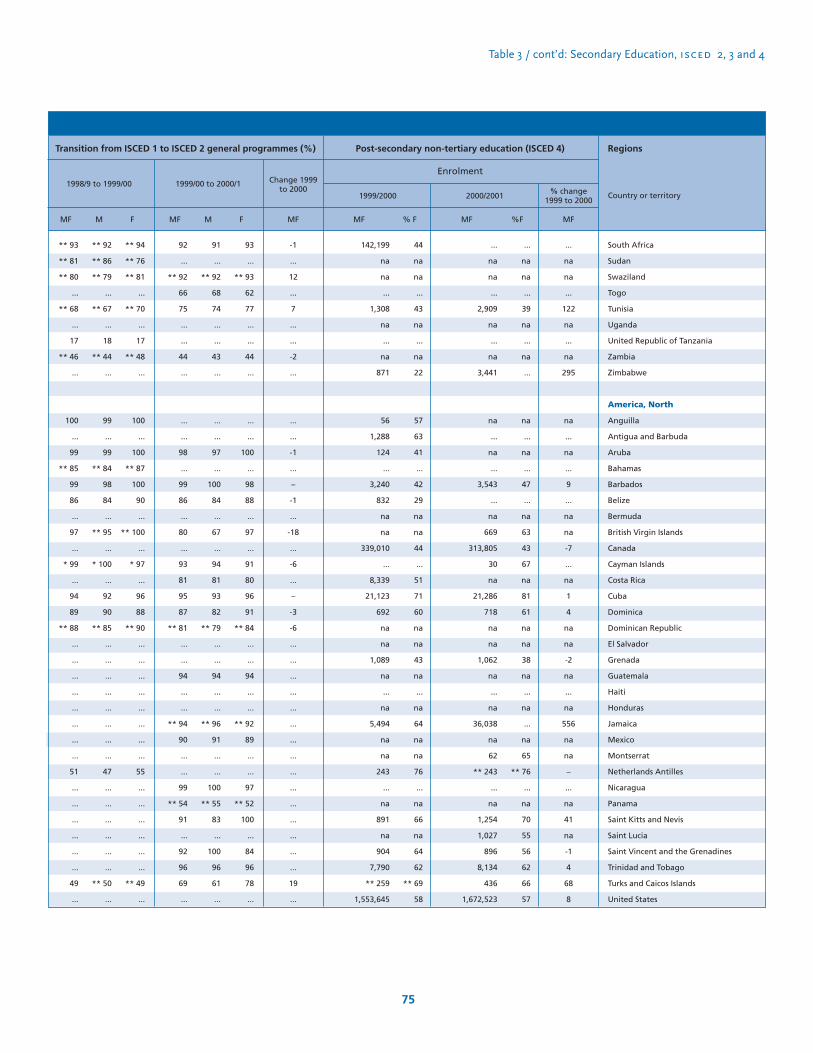
Table 3 / cont’d: Secondary Education, isced 2, 3 and 4
75
Regions
Country or territory
F
South Africa
Sudan
Swaziland
Togo
Tunisia
Uganda
United Republic of Tanzania
Zambia
Zimbabwe
America, North
Anguilla
Antigua and Barbuda
Aruba
Bahamas
Barbados
Belize
Bermuda
British Virgin Islands
Canada
Cayman Islands
Costa Rica
Cuba
Dominica
Dominican Republic
El Salvador
Grenada
Guatemala
Haiti
Honduras
Jamaica
Mexico
Montserrat
Netherlands Antilles
Nicaragua
Panama
Saint Kitts and Nevis
Saint Lucia
Saint Vincent and the Grenadines
Trinidad and Tobago
Turks and Caicos Islands
United States
** 93
** 81
** 80
...
** 68
...
17
** 46
...
100
...
99
** 85
99
86
...
97
...
* 99
...
94
89
** 88
...
...
...
...
...
...
...
...
51
...
...
...
...
...
...
49
...
** 92
** 86
** 79
...
** 67
...
18
** 44
...
99
...
99
** 84
98
84
...
** 95
...
* 100
...
92
90
** 85
...
...
...
...
...
...
...
...
47
...
...
...
...
...
...
** 50
...
MF M
** 94
** 76
** 81
...
** 70
...
17
** 48
...
100
...
100
** 87
100
90
...
** 100
...
* 97
...
96
88
** 90
...
...
...
...
...
...
...
...
55
...
...
...
...
...
...
** 49
...
F
92
...
** 92
66
75
...
...
44
...
...
...
98
...
99
86
...
80
...
93
81
95
87
** 81
...
...
94
...
...
** 94
90
...
...
99
** 54
91
...
92
96
69
...
91
...
** 92
68
74
...
...
43
...
...
...
97
...
100
84
...
67
...
94
81
93
82
** 79
...
...
94
...
...
** 96
91
...
...
100
** 55
83
...
100
96
61
...
MF M
93
...
** 93
62
77
...
...
44
...
...
...
100
...
98
88
...
97
...
91
80
96
91
** 84
...
...
94
...
...
** 92
89
...
...
97
** 52
100
...
84
96
78
...
1998/9 to 1999/00
Post-secondary non-tertiary education (ISCED 4)
MF
-1
...
12
...
7
...
...
-2
...
...
...
-1
...
–
-1
...
-18
...
-6
...
–
-3
-6
...
...
...
...
...
...
...
...
...
...
...
...
...
...
...
19
...
Change 1999to 2000
Transition from ISCED 1 to ISCED 2 general programmes (%)
1999/00 to 2000/1
MF
...
na
na
...
122
na
...
na
295
na
...
na
...
9
...
na
na
-7
...
na
1
4
na
na
-2
na
...
na
556
na
na
–
...
na
41
na
-1
4
68
8
% change1999 to 2000
Enrolment
MF
44
na
na
...
43
na
...
na
22
57
63
41
...
42
29
na
na
44
...
51
71
60
na
na
43
na
...
na
64
na
na
76
...
na
66
na
64
62
** 69
58
% F
1999/2000
142,199
na
na
...
1,308
na
...
na
871
56
1,288
124
...
3,240
832
na
na
339,010
...
8,339
21,123
692
na
na
1,089
na
...
na
5,494
na
na
243
...
na
891
na
904
7,790
** 259
1,553,645
MF
...
na
na
...
39
na
...
na
...
na
...
na
...
47
...
na
63
43
67
na
81
61
na
na
38
na
...
na
...
na
65
** 76
...
na
70
55
56
62
66
57
%F
2000/2001
...
na
na
...
2,909
na
...
na
3,441
na
...
na
...
3,543
...
na
669
313,805
30
na
21,286
718
na
na
1,062
na
...
na
36,038
na
62
** 243
...
na
1,254
1,027
896
8,134
436
1,672,523
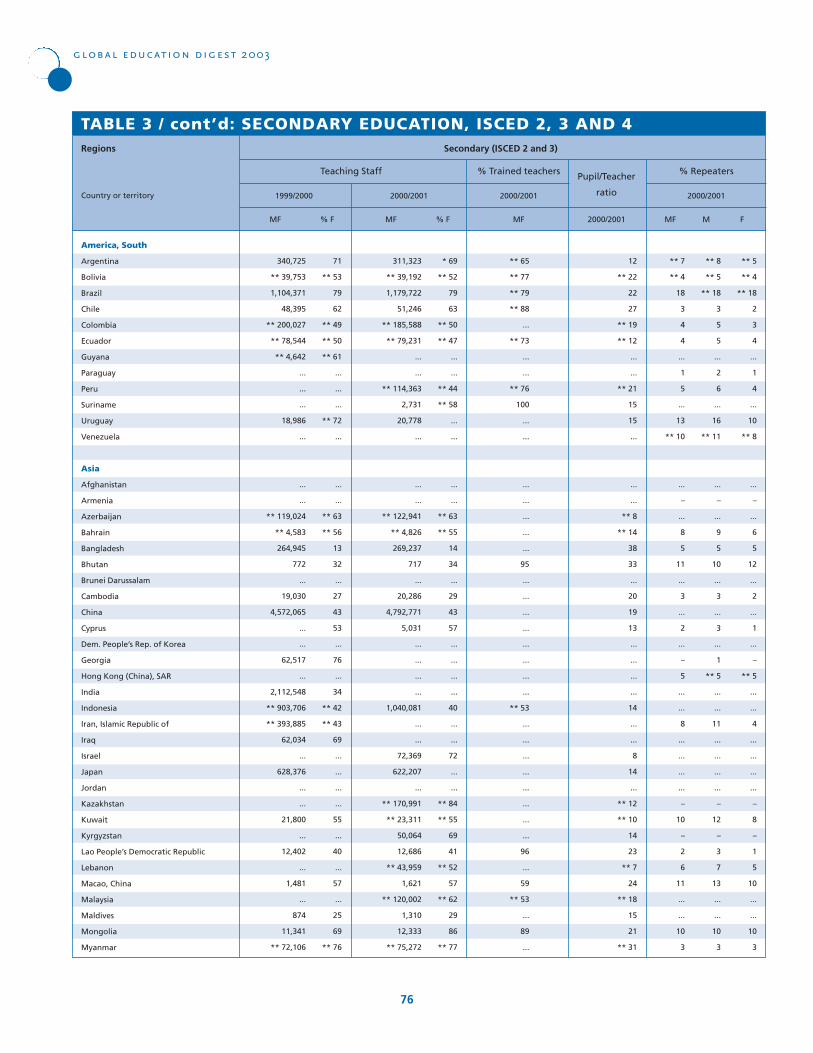
MF
71
** 53
79
62
** 49
** 50
** 61
...
...
...
** 72
...
...
...
** 63
** 56
13
32
...
27
43
53
...
76
...
34
** 42
** 43
69
...
...
...
...
55
...
40
...
57
...
25
69
** 76
% F
TABLE 3 / cont’d: SECONDARY EDUCATION, ISCED 2, 3 AND 4
America, South
Argentina
Bolivia
Brazil
Chile
Colombia
Ecuador
Guyana
Paraguay
Peru
Suriname
Uruguay
Venezuela
Asia
Afghanistan
Armenia
Azerbaijan
Bahrain
Bangladesh
Bhutan
Brunei Darussalam
Cambodia
China
Cyprus
Dem. People’s Rep. of Korea
Georgia
Hong Kong (China), SAR
India
Indonesia
Iran, Islamic Republic of
Iraq
Israel
Japan
Jordan
Kazakhstan
Kuwait
Kyrgyzstan
Lao People’s Democratic Republic
Lebanon
Macao, China
Malaysia
Maldives
Mongolia
Myanmar
Regions
Country or territory
Teaching Staff
1999/2000
global education digest 2003
76
340,725
** 39,753
1,104,371
48,395
** 200,027
** 78,544
** 4,642
...
...
...
18,986
...
...
...
** 119,024
** 4,583
264,945
772
...
19,030
4,572,065
...
...
62,517
...
2,112,548
** 903,706
** 393,885
62,034
...
628,376
...
...
21,800
...
12,402
...
1,481
...
874
11,341
** 72,106
MF
* 69
** 52
79
63
** 50
** 47
...
...
** 44
** 58
...
...
...
...
** 63
** 55
14
34
...
29
43
57
...
...
...
...
40
...
...
72
...
...
** 84
** 55
69
41
** 52
57
** 62
29
86
** 77
% F
2000/2001
311,323
** 39,192
1,179,722
51,246
** 185,588
** 79,231
...
...
** 114,363
2,731
20,778
...
...
...
** 122,941
** 4,826
269,237
717
...
20,286
4,792,771
5,031
...
...
...
...
1,040,081
...
...
72,369
622,207
...
** 170,991
** 23,311
50,064
12,686
** 43,959
1,621
** 120,002
1,310
12,333
** 75,272
MF
12
** 22
22
27
** 19
** 12
...
...
** 21
15
15
...
...
...
** 8
** 14
38
33
...
20
19
13
...
...
...
...
14
...
...
8
14
...
** 12
** 10
14
23
** 7
24
** 18
15
21
** 31
2000/2001
2000/2001
** 65
** 77
** 79
** 88
...
** 73
...
...
** 76
100
...
...
...
...
...
...
...
95
...
...
...
...
...
...
...
...
** 53
...
...
...
...
...
...
...
...
96
...
59
** 53
...
89
...
Secondary (ISCED 2 and 3)
F
** 7
** 4
18
3
4
4
...
1
5
...
13
** 10
...
–
...
8
5
11
...
3
...
2
...
–
5
...
...
8
...
...
...
...
–
10
–
2
6
11
...
...
10
3
** 8
** 5
** 18
3
5
5
...
2
6
...
16
** 11
...
–
...
9
5
10
...
3
...
3
...
1
** 5
...
...
11
...
...
...
...
–
12
–
3
7
13
...
...
10
3
MF M
** 5
** 4
** 18
2
3
4
...
1
4
...
10
** 8
...
–
...
6
5
12
...
2
...
1
...
–
** 5
...
...
4
...
...
...
...
–
8
–
1
5
10
...
...
10
3
2000/2001
% Trained teachers Pupil/Teacher
ratio
% Repeaters
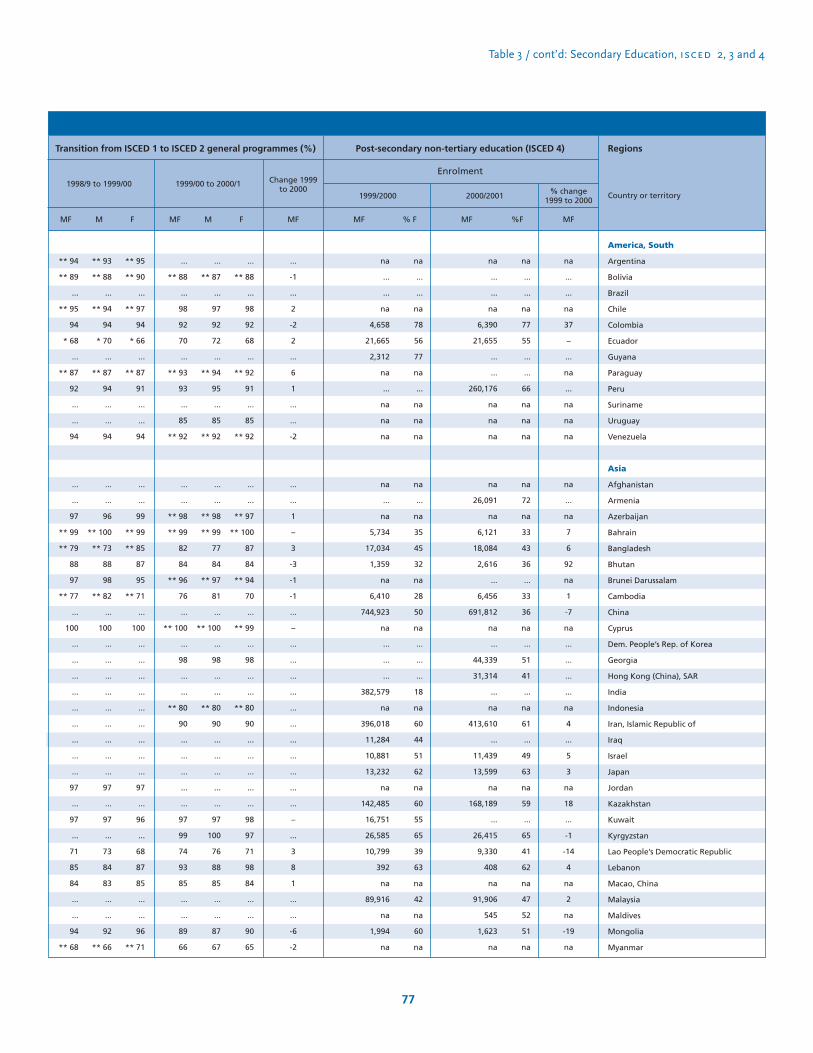
Table 3 / cont’d: Secondary Education, isced 2, 3 and 4
77
Regions
Country or territory
F
America, South
Argentina
Bolivia
Brazil
Chile
Colombia
Ecuador
Guyana
Paraguay
Peru
Suriname
Uruguay
Venezuela
Asia
Afghanistan
Armenia
Azerbaijan
Bahrain
Bangladesh
Bhutan
Brunei Darussalam
Cambodia
China
Cyprus
Dem. People’s Rep. of Korea
Georgia
Hong Kong (China), SAR
India
Indonesia
Iran, Islamic Republic of
Iraq
Israel
Japan
Jordan
Kazakhstan
Kuwait
Kyrgyzstan
Lao People’s Democratic Republic
Lebanon
Macao, China
Malaysia
Maldives
Mongolia
Myanmar
** 94
** 89
...
** 95
94
* 68
...
** 87
92
...
...
94
...
...
97
** 99
** 79
88
97
** 77
...
100
...
...
...
...
...
...
...
...
...
97
...
97
...
71
85
84
...
...
94
** 68
** 93
** 88
...
** 94
94
* 70
...
** 87
94
...
...
94
...
...
96
** 100
** 73
88
98
** 82
...
100
...
...
...
...
...
...
...
...
...
97
...
97
...
73
84
83
...
...
92
** 66
MF M
** 95
** 90
...
** 97
94
* 66
...
** 87
91
...
...
94
...
...
99
** 99
** 85
87
95
** 71
...
100
...
...
...
...
...
...
...
...
...
97
...
96
...
68
87
85
...
...
96
** 71
F
...
** 88
...
98
92
70
...
** 93
93
...
85
** 92
...
...
** 98
** 99
82
84
** 96
76
...
** 100
...
98
...
...
** 80
90
...
...
...
...
...
97
99
74
93
85
...
...
89
66
...
** 87
...
97
92
72
...
** 94
95
...
85
** 92
...
...
** 98
** 99
77
84
** 97
81
...
** 100
...
98
...
...
** 80
90
...
...
...
...
...
97
100
76
88
85
...
...
87
67
MF M
...
** 88
...
98
92
68
...
** 92
91
...
85
** 92
...
...
** 97
** 100
87
84
** 94
70
...
** 99
...
98
...
...
** 80
90
...
...
...
...
...
98
97
71
98
84
...
...
90
65
1998/9 to 1999/00
Post-secondary non-tertiary education (ISCED 4)
MF
...
-1
...
2
-2
2
...
6
1
...
...
-2
...
...
1
–
3
-3
-1
-1
...
–
...
...
...
...
...
...
...
...
...
...
...
–
...
3
8
1
...
...
-6
-2
Change 1999to 2000
Transition from ISCED 1 to ISCED 2 general programmes (%)
1999/00 to 2000/1
MF
na
...
...
na
37
–
...
na
...
na
na
na
na
...
na
7
6
92
na
1
-7
na
...
...
...
...
na
4
...
5
3
na
18
...
-1
-14
4
na
2
na
-19
na
% change1999 to 2000
Enrolment
MF
na
...
...
na
78
56
77
na
...
na
na
na
na
...
na
35
45
32
na
28
50
na
...
...
...
18
na
60
44
51
62
na
60
55
65
39
63
na
42
na
60
na
% F
1999/2000
na
...
...
na
4,658
21,665
2,312
na
...
na
na
na
na
...
na
5,734
17,034
1,359
na
6,410
744,923
na
...
...
...
382,579
na
396,018
11,284
10,881
13,232
na
142,485
16,751
26,585
10,799
392
na
89,916
na
1,994
na
MF
na
...
...
na
77
55
...
...
66
na
na
na
na
72
na
33
43
36
...
33
36
na
...
51
41
...
na
61
...
49
63
na
59
...
65
41
62
na
47
52
51
na
%F
2000/2001
na
...
...
na
6,390
21,655
...
...
260,176
na
na
na
na
26,091
na
6,121
18,084
2,616
...
6,456
691,812
na
...
44,339
31,314
...
na
413,610
...
11,439
13,599
na
168,189
...
26,415
9,330
408
na
91,906
545
1,623
na
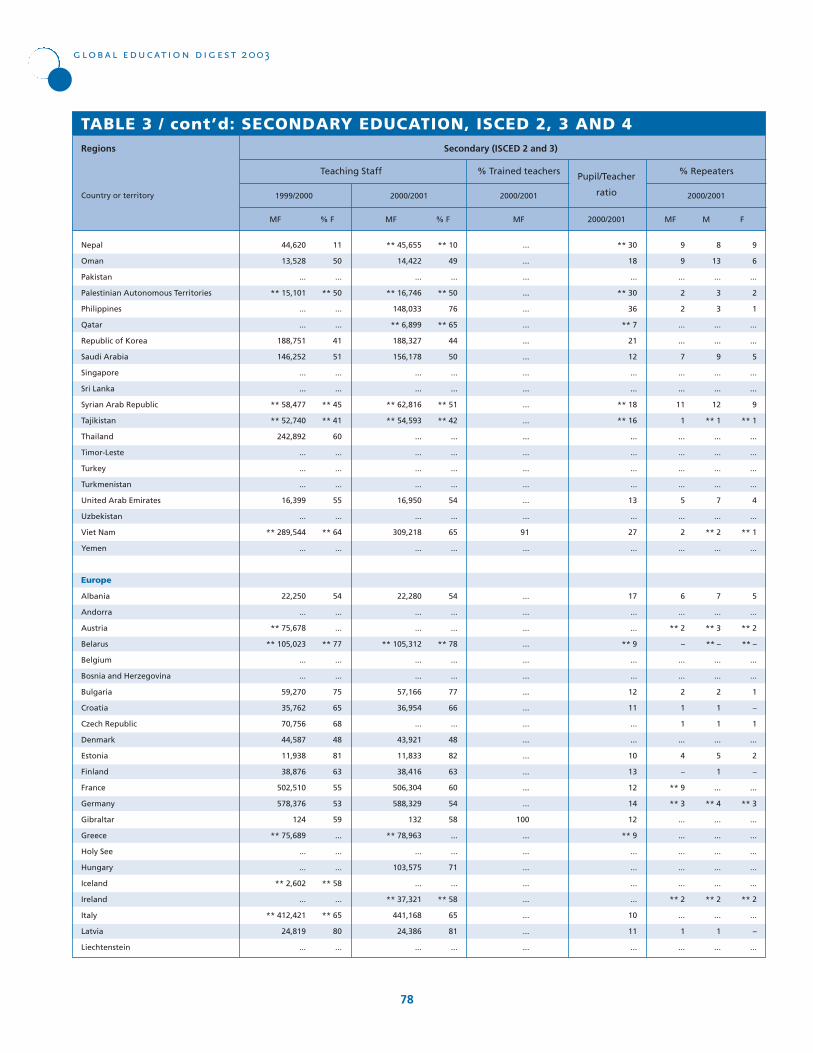
MF
11
50
...
** 50
...
...
41
51
...
...
** 45
** 41
60
...
...
...
55
...
** 64
...
54
...
...
** 77
...
...
75
65
68
48
81
63
55
53
59
...
...
...
** 58
...
** 65
80
...
% F
TABLE 3 / cont’d: SECONDARY EDUCATION, ISCED 2, 3 AND 4
Nepal
Oman
Pakistan
Palestinian Autonomous Territories
Philippines
Qatar
Republic of Korea
Saudi Arabia
Singapore
Sri Lanka
Syrian Arab Republic
Tajikistan
Thailand
Timor-Leste
Turkey
Turkmenistan
United Arab Emirates
Uzbekistan
Viet Nam
Yemen
Europe
Albania
Andorra
Austria
Belarus
Belgium
Bosnia and Herzegovina
Bulgaria
Croatia
Czech Republic
Denmark
Estonia
Finland
France
Germany
Gibraltar
Greece
Holy See
Hungary
Iceland
Ireland
Italy
Latvia
Liechtenstein
Regions
Country or territory
Teaching Staff
1999/2000
global education digest 2003
78
44,620
13,528
...
** 15,101
...
...
188,751
146,252
...
...
** 58,477
** 52,740
242,892
...
...
...
16,399
...
** 289,544
...
22,250
...
** 75,678
** 105,023
...
...
59,270
35,762
70,756
44,587
11,938
38,876
502,510
578,376
124
** 75,689
...
...
** 2,602
...
** 412,421
24,819
...
MF
** 10
49
...
** 50
76
** 65
44
50
...
...
** 51
** 42
...
...
...
...
54
...
65
...
54
...
...
** 78
...
...
77
66
...
48
82
63
60
54
58
...
...
71
...
** 58
65
81
...
% F
2000/2001
** 45,655
14,422
...
** 16,746
148,033
** 6,899
188,327
156,178
...
...
** 62,816
** 54,593
...
...
...
...
16,950
...
309,218
...
22,280
...
...
** 105,312
...
...
57,166
36,954
...
43,921
11,833
38,416
506,304
588,329
132
** 78,963
...
103,575
...
** 37,321
441,168
24,386
...
MF
** 30
18
...
** 30
36
** 7
21
12
...
...
** 18
** 16
...
...
...
...
13
...
27
...
17
...
...
** 9
...
...
12
11
...
...
10
13
12
14
12
** 9
...
...
...
...
10
11
...
2000/2001
2000/2001
...
...
...
...
...
...
...
...
...
...
...
...
...
...
...
...
...
...
91
...
...
...
...
...
...
...
...
...
...
...
...
...
...
...
100
...
...
...
...
...
...
...
...
Secondary (ISCED 2 and 3)
F
9
9
...
2
2
...
...
7
...
...
11
1
...
...
...
...
5
...
2
...
6
...
** 2
–
...
...
2
1
1
...
4
–
** 9
** 3
...
...
...
...
...
** 2
...
1
...
8
13
...
3
3
...
...
9
...
...
12
** 1
...
...
...
...
7
...
** 2
...
7
...
** 3
** –
...
...
2
1
1
...
5
1
...
** 4
...
...
...
...
...
** 2
...
1
...
MF M
9
6
...
2
1
...
...
5
...
...
9
** 1
...
...
...
...
4
...
** 1
...
5
...
** 2
** –
...
...
1
–
1
...
2
–
...
** 3
...
...
...
...
...
** 2
...
–
...
2000/2001
% Trained teachers Pupil/Teacher
ratio
% Repeaters
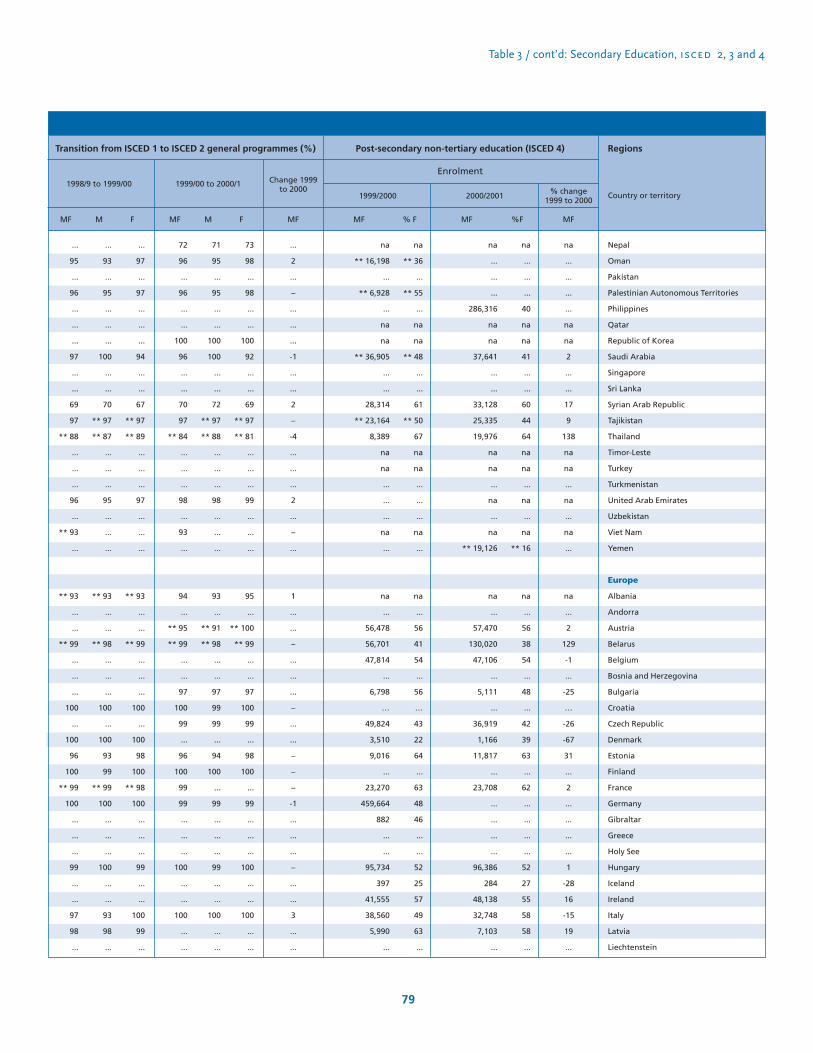
Table 3 / cont’d: Secondary Education, isced 2, 3 and 4
79
Regions
Country or territory
F
Nepal
Oman
Pakistan
Palestinian Autonomous Territories
Philippines
Qatar
Republic of Korea
Saudi Arabia
Singapore
Sri Lanka
Syrian Arab Republic
Tajikistan
Thailand
Timor-Leste
Turkey
Turkmenistan
United Arab Emirates
Uzbekistan
Viet Nam
Yemen
Europe
Albania
Andorra
Austria
Belarus
Belgium
Bosnia and Herzegovina
Bulgaria
Croatia
Czech Republic
Denmark
Estonia
Finland
France
Germany
Gibraltar
Greece
Holy See
Hungary
Iceland
Ireland
Italy
Latvia
Liechtenstein
...
95
...
96
...
...
...
97
...
...
69
97
** 88
...
...
...
96
...
** 93
...
** 93
...
...
** 99
...
...
...
100
...
100
96
100
** 99
100
...
...
...
99
...
...
97
98
...
...
93
...
95
...
...
...
100
...
...
70
** 97
** 87
...
...
...
95
...
...
...
** 93
...
...
** 98
...
...
...
100
...
100
93
99
** 99
100
...
...
...
100
...
...
93
98
...
MF M
...
97
...
97
...
...
...
94
...
...
67
** 97
** 89
...
...
...
97
...
...
...
** 93
...
...
** 99
...
...
...
100
...
100
98
100
** 98
100
...
...
...
99
...
...
100
99
...
F
72
96
...
96
...
...
100
96
...
...
70
97
** 84
...
...
...
98
...
93
...
94
...
** 95
** 99
...
...
97
100
99
...
96
100
99
99
...
...
...
100
...
...
100
...
...
71
95
...
95
...
...
100
100
...
...
72
** 97
** 88
...
...
...
98
...
...
...
93
...
** 91
** 98
...
...
97
99
99
...
94
100
...
99
...
...
...
99
...
...
100
...
...
MF M
73
98
...
98
...
...
100
92
...
...
69
** 97
** 81
...
...
...
99
...
...
...
95
...
** 100
** 99
...
...
97
100
99
...
98
100
...
99
...
...
...
100
...
...
100
...
...
1998/9 to 1999/00
Post-secondary non-tertiary education (ISCED 4)
MF
...
2
...
–
...
...
...
-1
...
...
2
–
-4
...
...
...
2
...
–
...
1
...
...
–
...
...
...
–
...
...
–
–
–
-1
...
...
...
–
...
...
3
...
...
Change 1999to 2000
Transition from ISCED 1 to ISCED 2 general programmes (%)
1999/00 to 2000/1
MF
na
...
...
...
...
na
na
2
...
...
17
9
138
na
na
...
na
...
na
...
na
...
2
129
-1
...
-25
…
-26
-67
31
...
2
...
...
...
...
1
-28
16
-15
19
...
% change1999 to 2000
Enrolment
MF
na
** 36
...
** 55
...
na
na
** 48
...
...
61
** 50
67
na
na
...
...
...
na
...
na
...
56
41
54
...
56
…
43
22
64
...
63
48
46
...
...
52
25
57
49
63
...
% F
1999/2000
na
** 16,198
...
** 6,928
...
na
na
** 36,905
...
...
28,314
** 23,164
8,389
na
na
...
...
...
na
...
na
...
56,478
56,701
47,814
...
6,798
…
49,824
3,510
9,016
...
23,270
459,664
882
...
...
95,734
397
41,555
38,560
5,990
...
MF
na
...
...
...
40
na
na
41
...
...
60
44
64
na
na
...
na
...
na
** 16
na
...
56
38
54
...
48
...
42
39
63
...
62
...
...
...
...
52
27
55
58
58
...
%F
2000/2001
na
...
...
...
286,316
na
na
37,641
...
...
33,128
25,335
19,976
na
na
...
na
...
na
** 19,126
na
...
57,470
130,020
47,106
...
5,111
...
36,919
1,166
11,817
...
23,708
...
...
...
...
96,386
284
48,138
32,748
7,103
...
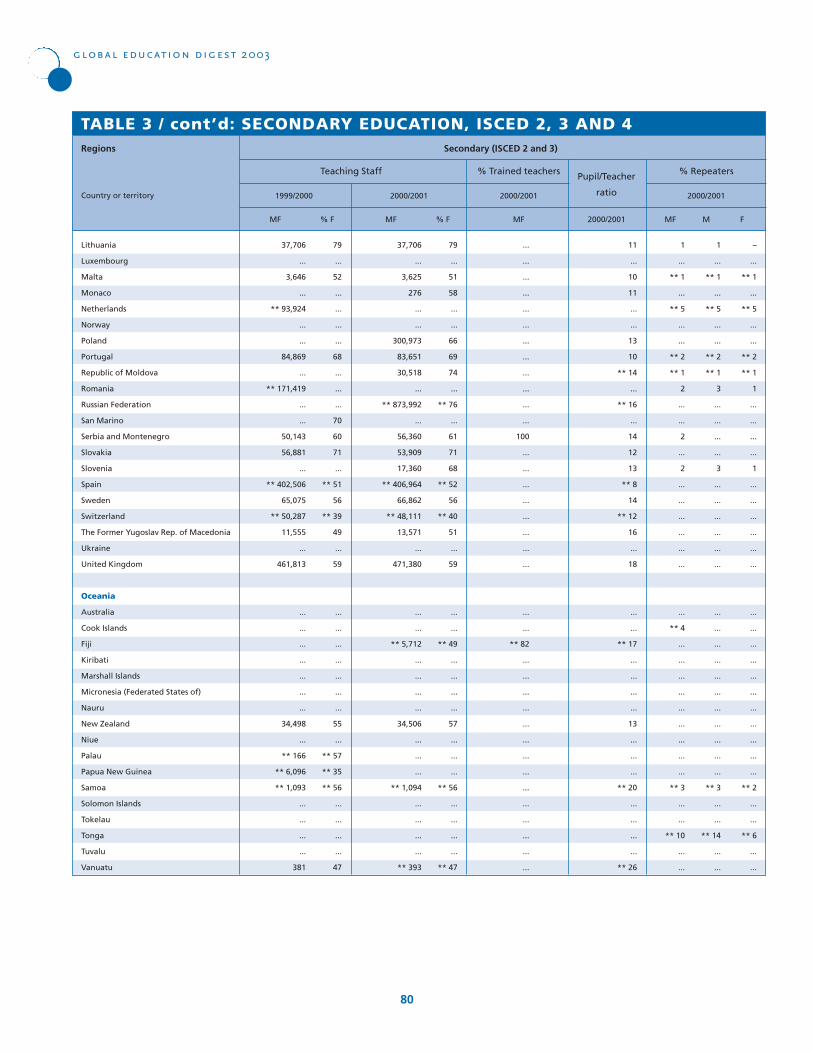
MF
79
...
52
...
...
...
...
68
...
...
...
70
60
71
...
** 51
56
** 39
49
...
59
...
...
...
...
...
...
...
55
...
** 57
** 35
** 56
...
...
...
...
47
% F
TABLE 3 / cont’d: SECONDARY EDUCATION, ISCED 2, 3 AND 4
Lithuania
Luxembourg
Malta
Monaco
Netherlands
Norway
Poland
Portugal
Republic of Moldova
Romania
Russian Federation
San Marino
Serbia and Montenegro
Slovakia
Slovenia
Spain
Sweden
Switzerland
The Former Yugoslav Rep. of Macedonia
Ukraine
United Kingdom
Oceania
Australia
Cook Islands
Fiji
Kiribati
Marshall Islands
Micronesia (Federated States of)
Nauru
New Zealand
Niue
Palau
Papua New Guinea
Samoa
Solomon Islands
Tokelau
Tonga
Tuvalu
Vanuatu
Regions
Country or territory
Teaching Staff
1999/2000
global education digest 2003
80
37,706
...
3,646
...
** 93,924
...
...
84,869
...
** 171,419
...
...
50,143
56,881
...
** 402,506
65,075
** 50,287
11,555
...
461,813
...
...
...
...
...
...
...
34,498
...
** 166
** 6,096
** 1,093
...
...
...
...
381
MF
79
...
51
58
...
...
66
69
74
...
** 76
...
61
71
68
** 52
56
** 40
51
...
59
...
...
** 49
...
...
...
...
57
...
...
...
** 56
...
...
...
...
** 47
% F
2000/2001
37,706
...
3,625
276
...
...
300,973
83,651
30,518
...
** 873,992
...
56,360
53,909
17,360
** 406,964
66,862
** 48,111
13,571
...
471,380
...
...
** 5,712
...
...
...
...
34,506
...
...
...
** 1,094
...
...
...
...
** 393
MF
11
...
10
11
...
...
13
10
** 14
...
** 16
...
14
12
13
** 8
14
** 12
16
...
18
...
...
** 17
...
...
...
...
13
...
...
...
** 20
...
...
...
...
** 26
2000/2001
2000/2001
...
...
...
...
...
...
...
...
...
...
...
...
100
...
...
...
...
...
...
...
...
...
...
** 82
...
...
...
...
...
...
...
...
...
...
...
...
...
...
Secondary (ISCED 2 and 3)
F
1
...
** 1
...
** 5
...
...
** 2
** 1
2
...
...
2
...
2
...
...
...
...
...
...
...
** 4
...
...
...
...
...
...
...
...
...
** 3
...
...
** 10
...
...
1
...
** 1
...
** 5
...
...
** 2
** 1
3
...
...
...
...
3
...
...
...
...
...
...
...
...
...
...
...
...
...
...
...
...
...
** 3
...
...
** 14
...
...
MF M
–
...
** 1
...
** 5
...
...
** 2
** 1
1
...
...
...
...
1
...
...
...
...
...
...
...
...
...
...
...
...
...
...
...
...
...
** 2
...
...
** 6
...
...
2000/2001
% Trained teachers Pupil/Teacher
ratio
% Repeaters
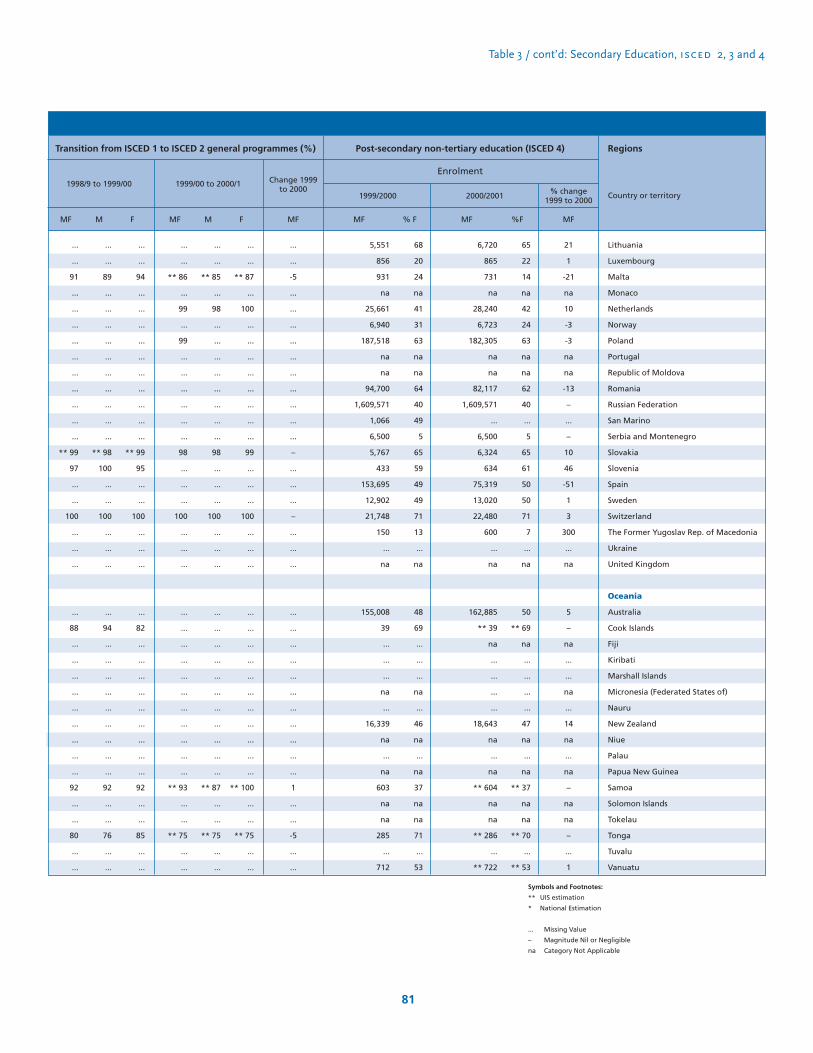
Table 3 / cont’d: Secondary Education, isced 2, 3 and 4
81
Regions
Country or territory
F
Lithuania
Luxembourg
Malta
Monaco
Netherlands
Norway
Poland
Portugal
Republic of Moldova
Romania
Russian Federation
San Marino
Serbia and Montenegro
Slovakia
Slovenia
Spain
Sweden
Switzerland
The Former Yugoslav Rep. of Macedonia
Ukraine
United Kingdom
Oceania
Australia
Cook Islands
Fiji
Kiribati
Marshall Islands
Micronesia (Federated States of)
Nauru
New Zealand
Niue
Palau
Papua New Guinea
Samoa
Solomon Islands
Tokelau
Tonga
Tuvalu
Vanuatu
...
...
91
...
...
...
...
...
...
...
...
...
...
** 99
97
...
...
100
...
...
...
...
88
...
...
...
...
...
...
...
...
...
92
...
...
80
...
...
...
...
89
...
...
...
...
...
...
...
...
...
...
** 98
100
...
...
100
...
...
...
...
94
...
...
...
...
...
...
...
...
...
92
...
...
76
...
...
MF M
...
...
94
...
...
...
...
...
...
...
...
...
...
** 99
95
...
...
100
...
...
...
...
82
...
...
...
...
...
...
...
...
...
92
...
...
85
...
...
F
...
...
** 86
...
99
...
99
...
...
...
...
...
...
98
...
...
...
100
...
...
...
...
...
...
...
...
...
...
...
...
...
...
** 93
...
...
** 75
...
...
...
...
** 85
...
98
...
...
...
...
...
...
...
...
98
...
...
...
100
...
...
...
...
...
...
...
...
...
...
...
...
...
...
** 87
...
...
** 75
...
...
MF M
...
...
** 87
...
100
...
...
...
...
...
...
...
...
99
...
...
...
100
...
...
...
...
...
...
...
...
...
...
...
...
...
...
** 100
...
...
** 75
...
...
1998/9 to 1999/00
Post-secondary non-tertiary education (ISCED 4)
MF
...
...
-5
...
...
...
...
...
...
...
...
...
...
–
...
...
...
–
...
...
...
...
...
...
...
...
...
...
...
...
...
...
1
...
...
-5
...
...
Change 1999to 2000
Transition from ISCED 1 to ISCED 2 general programmes (%)
1999/00 to 2000/1
MF
21
1
-21
na
10
-3
-3
na
na
-13
–
...
–
10
46
-51
1
3
300
...
na
5
–
na
...
...
na
...
14
na
...
na
–
na
na
–
...
1
% change1999 to 2000
Enrolment
MF
68
20
24
na
41
31
63
na
na
64
40
49
5
65
59
49
49
71
13
...
na
48
69
...
...
...
na
...
46
na
...
na
37
na
na
71
...
53
% F
1999/2000
5,551
856
931
na
25,661
6,940
187,518
na
na
94,700
1,609,571
1,066
6,500
5,767
433
153,695
12,902
21,748
150
...
na
155,008
39
...
...
...
na
...
16,339
na
...
na
603
na
na
285
...
712
MF
65
22
14
na
42
24
63
na
na
62
40
...
5
65
61
50
50
71
7
...
na
50
** 69
na
...
...
...
...
47
na
...
na
** 37
na
na
** 70
...
** 53
%F
2000/2001
6,720
865
731
na
28,240
6,723
182,305
na
na
82,117
1,609,571
...
6,500
6,324
634
75,319
13,020
22,480
600
...
na
162,885
** 39
na
...
...
...
...
18,643
na
...
na
** 604
na
na
** 286
...
** 722
Symbols and Footnotes:
** UIS estimation
* National Estimation
... Missing Value
– Magnitude Nil or Negligible
na Category Not Applicable

global education digest 2003
82
MF
...
39
20
42
...
27
...
...
16
15
** 42
24
...
...
** 47
...
30
14
22
...
...
25
...
16
35
** 62
...
49
46
...
...
...
45
42
** 44
55
...
...
...
na
...
na
...
...
% F
...
100
82
73
...
64
...
...
78
89
64
85
...
...
** 31
...
88
100
100
...
...
55
...
...
50
** 79
...
65
84
...
...
...
50
93
...
34
...
...
...
na
...
na
...
...
...
...
18
27
...
35
...
...
10
7
36
15
...
...
** 69
...
12
...
...
...
...
40
...
100
47
** 21
...
33
13
...
...
...
48
2
...
66
...
...
...
na
...
na
...
...
...
...
–
–
...
1
...
...
12
4
...
...
...
...
na
...
na
...
–
...
...
5
...
...
3
...
...
3
3
...
...
...
1
5
...
...
...
...
...
na
...
na
...
...
5A 5B 6
TABLE 4: TERTIARY EDUCATION, ISCED 5 AND 6
Africa
Algeria
Angola
Benin
Botswana
Burkina Faso
Burundi
Cameroon
Cape Verde
Central African Republic
Chad
Comoros
Congo
Côte d’Ivoire
Democratic Rep. of the Congo
Djibouti
Egypt
Equatorial Guinea
Eritrea
Ethiopia
Gabon
Gambia
Ghana
Guinea
Guinea-Bissau
Kenya
Lesotho
Liberia
Libyan Arab Jamahiriya
Madagascar
Malawi
Mali
Mauritania
Mauritius
Morocco
Mozambique
Namibia
Niger
Nigeria
Rwanda
Sao Tome and Principe
Senegal
Seychelles
Sierra Leone
Somalia
Regions
Country or territory Total enrolmentDistribution of students
by ISCED level (%)
...
39
19
41
...
27
...
...
14
14
** 34
25
...
...
** 24
...
33
14
22
...
...
26
...
...
34
** 60
...
51
46
27
...
...
47
43
...
55
...
...
...
na
...
na
...
...
...
...
24
46
...
27
...
...
10
28
** 56
19
...
...
** 57
...
8
...
...
...
...
24
...
16
37
** 68
...
45
48
...
...
...
43
33
...
55
...
...
...
na
...
na
...
...
...
...
23
...
...
11
...
...
35
20
...
...
...
...
na
...
na
...
...
...
...
23
...
...
33
...
...
42
48
...
...
...
44
31
...
...
...
...
...
na
...
na
...
...
5A 5B 6
% female by
ISCED level
...
7,845
18,753
6,332
...
6,132
** 65,697
...
6,323
5,901
714
15,629
...
...
** 190
...
1,003
4,135
67,732
...
...
54,658
...
463
89,016
** 4,470
...
290,060
32,156
...
...
...
8,256
276,375
** 9,303
9,561
...
...
...
na
...
na
...
...
1999/2000
MF
...
...
...
47
...
27
...
...
...
...
...
12
...
...
42
...
...
13
21
...
...
29
...
...
44
63
...
** 48
45
...
...
17
57
44
** 44
...
25
...
34
36
...
na
29
...
% F
...
...
...
89
...
66
...
...
...
...
...
80
...
...
47
...
...
100
100
...
...
58
...
...
47
...
...
** 66
79
...
...
95
38
84
...
...
84
...
...
100
...
na
44
...
...
...
...
10
...
34
...
...
...
...
...
19
...
...
53
...
...
...
...
...
...
37
...
...
50
...
...
** 32
19
...
...
5
59
11
...
...
15
...
...
...
...
na
56
...
...
...
...
–
...
–
...
...
...
...
...
1
...
...
na
...
na
...
...
...
...
5
...
...
3
...
...
** 3
1
...
...
...
2
5
...
...
1
...
...
...
...
na
...
...
5A 5B 6
Total enrolmentDistribution of students
by ISCED level (%)
...
...
...
7,651
...
6,289
68,495
...
...
...
...
13,403
...
...
496
...
...
5,505
87,431
...
...
64,098
...
...
98,583
4,976
...
** 287,172
31,386
...
...
9,033
12,481
310,258
** 9,774
...
13,400
...
12,802
181
...
na
8,795
...
2000/2001
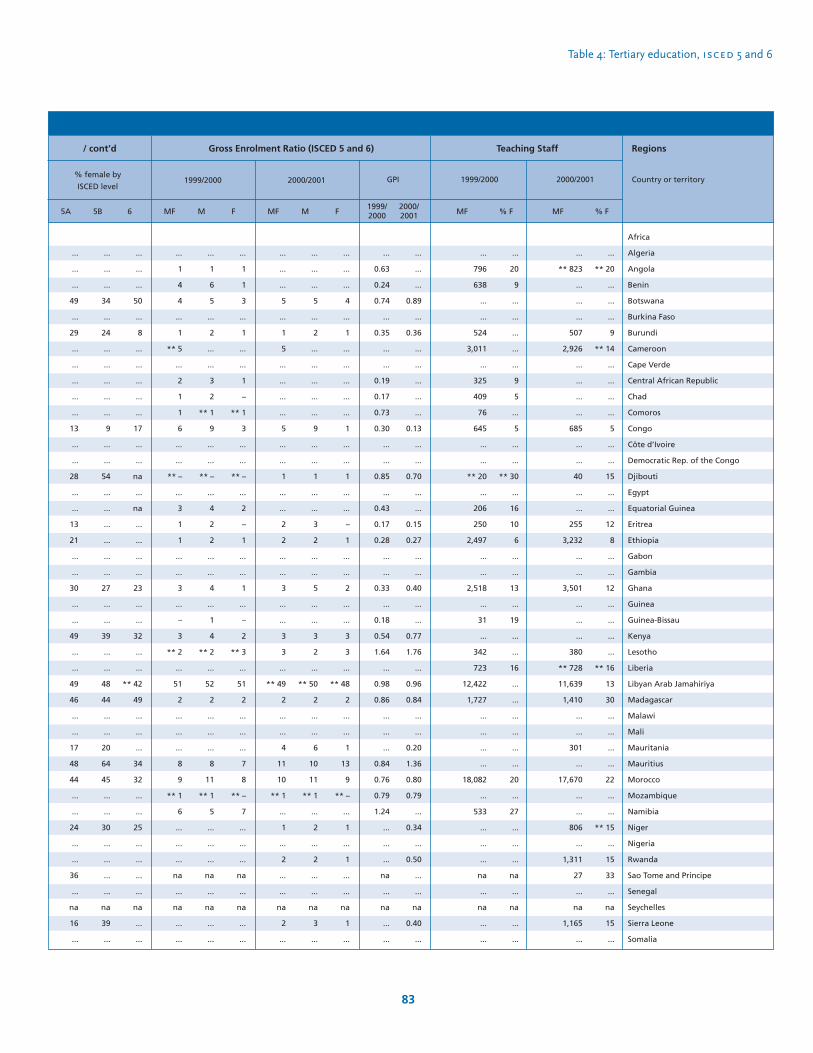
Table 4: Tertiary education, isced 5 and 6
83
GPI
Regions
Country or territory
...
...
...
5
...
1
5
...
...
...
...
5
...
...
1
...
...
2
2
...
...
3
...
...
3
3
...
** 49
2
...
...
4
11
10
** 1
...
1
...
2
...
...
na
2
...
MF
...
...
...
5
...
2
...
...
...
...
...
9
...
...
1
...
...
3
2
...
...
5
...
...
3
2
...
** 50
2
...
...
6
10
11
** 1
...
2
...
2
...
...
na
3
...
M
...
...
...
4
...
1
...
...
...
...
...
1
...
...
1
...
...
–
1
...
...
2
...
...
3
3
...
** 48
2
...
...
1
13
9
** –
...
1
...
1
...
...
na
1
...
FF
...
0.63
0.24
0.74
...
0.35
...
...
0.19
0.17
0.73
0.30
...
...
0.85
...
0.43
0.17
0.28
...
...
0.33
...
0.18
0.54
1.64
...
0.98
0.86
...
...
...
0.84
0.76
0.79
1.24
...
...
...
na
...
na
...
...
1999/2000
...
...
...
0.89
...
0.36
...
...
...
...
...
0.13
...
...
0.70
...
...
0.15
0.27
...
...
0.40
...
...
0.77
1.76
...
0.96
0.84
...
...
0.20
1.36
0.80
0.79
...
0.34
...
0.50
...
...
na
0.40
...
2000/2001
Africa
Algeria
Angola
Benin
Botswana
Burkina Faso
Burundi
Cameroon
Cape Verde
Central African Republic
Chad
Comoros
Congo
Côte d’Ivoire
Democratic Rep. of the Congo
Djibouti
Egypt
Equatorial Guinea
Eritrea
Ethiopia
Gabon
Gambia
Ghana
Guinea
Guinea-Bissau
Kenya
Lesotho
Liberia
Libyan Arab Jamahiriya
Madagascar
Malawi
Mali
Mauritania
Mauritius
Morocco
Mozambique
Namibia
Niger
Nigeria
Rwanda
Sao Tome and Principe
Senegal
Seychelles
Sierra Leone
Somalia
...
1
4
4
...
1
** 5
...
2
1
1
6
...
...
** –
...
3
1
1
...
...
3
...
–
3
** 2
...
51
2
...
...
...
8
9
** 1
6
...
...
...
na
...
na
...
...
...
1
6
5
...
2
...
...
3
2
** 1
9
...
...
** –
...
4
2
2
...
...
4
...
1
4
** 2
...
52
2
...
...
...
8
11
** 1
5
...
...
...
na
...
na
...
...
MF M
...
1
1
3
...
1
...
...
1
–
** 1
3
...
...
** –
...
2
–
1
...
...
1
...
–
2
** 3
...
51
2
...
...
...
7
8
** –
7
...
...
...
na
...
na
...
...
1999/2000 2000/2001
Gross Enrolment Ratio (ISCED 5 and 6)
MF % FMF % F
...
** 823
...
...
...
507
2,926
...
...
...
...
685
...
...
40
...
...
255
3,232
...
...
3,501
...
...
...
380
** 728
11,639
1,410
...
...
301
...
17,670
...
...
806
...
1,311
27
...
na
1,165
...
...
** 20
...
...
...
9
** 14
...
...
...
...
5
...
...
15
...
...
12
8
...
...
12
...
...
...
...
** 16
13
30
...
...
...
...
22
...
...
** 15
...
15
33
...
na
15
...
...
796
638
...
...
524
3,011
...
325
409
76
645
...
...
** 20
...
206
250
2,497
...
...
2,518
...
31
...
342
723
12,422
1,727
...
...
...
...
18,082
...
533
...
...
...
na
...
na
...
...
...
20
9
...
...
...
...
...
9
5
...
5
...
...
** 30
...
16
10
6
...
...
13
...
19
...
...
16
...
...
...
...
...
...
20
...
27
...
...
...
na
...
na
...
...
2000/20011999/2000
Teaching Staff
...
...
...
49
...
29
...
...
...
...
...
13
...
...
28
...
...
13
21
...
...
30
...
...
49
...
...
49
46
...
...
17
48
44
...
...
24
...
...
36
...
na
16
...
...
...
...
34
...
24
...
...
...
...
...
9
...
...
54
...
...
...
...
...
...
27
...
...
39
...
...
48
44
...
...
20
64
45
...
...
30
...
...
...
...
na
39
...
...
...
...
50
...
8
...
...
...
...
...
17
...
...
na
...
na
...
...
...
...
23
...
...
32
...
...
** 42
49
...
...
...
34
32
...
...
25
...
...
...
...
na
...
...
5A 5B 6
% female by
ISCED level
/ cont’d
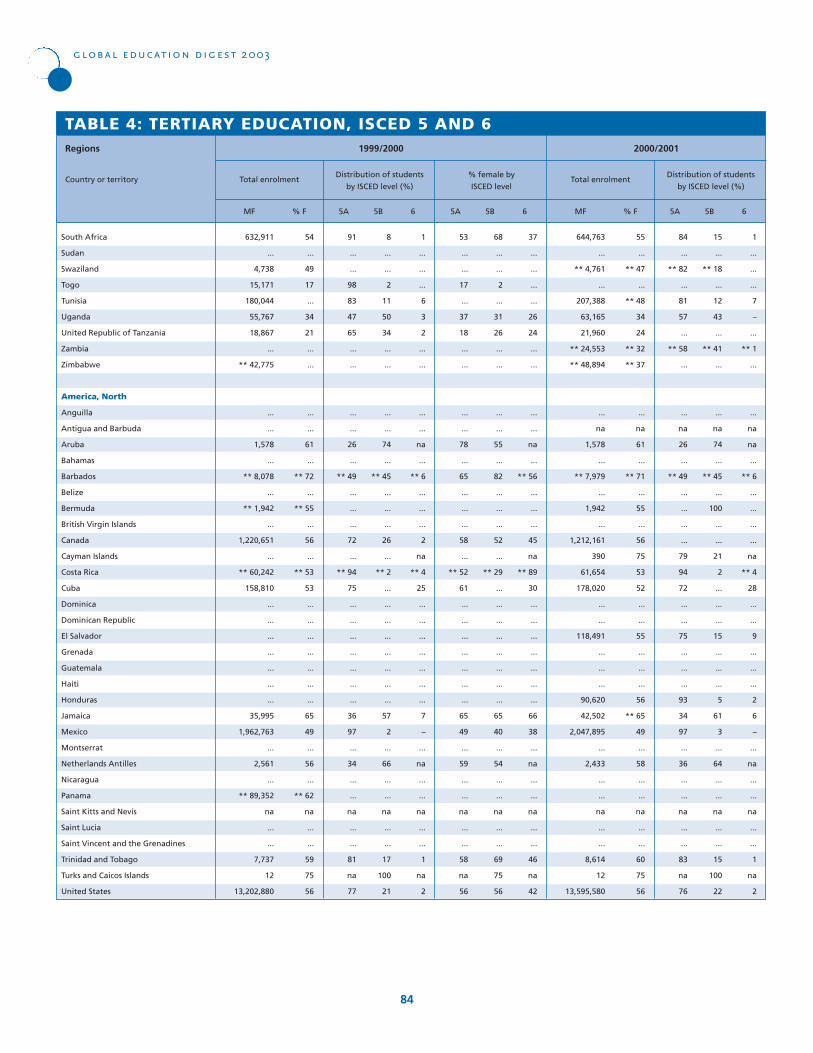
global education digest 2003
84
MF
54
...
49
17
...
34
21
...
...
...
...
61
...
** 72
...
** 55
...
56
...
** 53
53
...
...
...
...
...
...
...
65
49
...
56
...
** 62
na
...
...
59
75
56
% F
91
...
...
98
83
47
65
...
...
...
...
26
...
** 49
...
...
...
72
...
** 94
75
...
...
...
...
...
...
...
36
97
...
34
...
...
na
...
...
81
na
77
8
...
...
2
11
50
34
...
...
...
...
74
...
** 45
...
...
...
26
...
** 2
...
...
...
...
...
...
...
...
57
2
...
66
...
...
na
...
...
17
100
21
1
...
...
...
6
3
2
...
...
...
...
na
...
** 6
...
...
...
2
na
** 4
25
...
...
...
...
...
...
...
7
–
...
na
...
...
na
...
...
1
na
2
5A 5B 6
TABLE 4: TERTIARY EDUCATION, ISCED 5 AND 6
South Africa
Sudan
Swaziland
Togo
Tunisia
Uganda
United Republic of Tanzania
Zambia
Zimbabwe
America, North
Anguilla
Antigua and Barbuda
Aruba
Bahamas
Barbados
Belize
Bermuda
British Virgin Islands
Canada
Cayman Islands
Costa Rica
Cuba
Dominica
Dominican Republic
El Salvador
Grenada
Guatemala
Haiti
Honduras
Jamaica
Mexico
Montserrat
Netherlands Antilles
Nicaragua
Panama
Saint Kitts and Nevis
Saint Lucia
Saint Vincent and the Grenadines
Trinidad and Tobago
Turks and Caicos Islands
United States
Regions
Country or territory Total enrolmentDistribution of students
by ISCED level (%)
53
...
...
17
...
37
18
...
...
...
...
78
...
65
...
...
...
58
...
** 52
61
...
...
...
...
...
...
...
65
49
...
59
...
...
na
...
...
58
na
56
68
...
...
2
...
31
26
...
...
...
...
55
...
82
...
...
...
52
...
** 29
...
...
...
...
...
...
...
...
65
40
...
54
...
...
na
...
...
69
75
56
37
...
...
...
...
26
24
...
...
...
...
na
...
** 56
...
...
...
45
na
** 89
30
...
...
...
...
...
...
...
66
38
...
na
...
...
na
...
...
46
na
42
5A 5B 6
% female by
ISCED level
632,911
...
4,738
15,171
180,044
55,767
18,867
...
** 42,775
...
...
1,578
...
** 8,078
...
** 1,942
...
1,220,651
...
** 60,242
158,810
...
...
...
...
...
...
...
35,995
1,962,763
...
2,561
...
** 89,352
na
...
...
7,737
12
13,202,880
1999/2000
MF
55
...
** 47
...
** 48
34
24
** 32
** 37
...
na
61
...
** 71
...
55
...
56
75
53
52
...
...
55
...
...
...
56
** 65
49
...
58
...
...
na
...
...
60
75
56
% F
84
...
** 82
...
81
57
...
** 58
...
...
na
26
...
** 49
...
...
...
...
79
94
72
...
...
75
...
...
...
93
34
97
...
36
...
...
na
...
...
83
na
76
15
...
** 18
...
12
43
...
** 41
...
...
na
74
...
** 45
...
100
...
...
21
2
...
...
...
15
...
...
...
5
61
3
...
64
...
...
na
...
...
15
100
22
1
...
...
...
7
–
...
** 1
...
...
na
na
...
** 6
...
...
...
...
na
** 4
28
...
...
9
...
...
...
2
6
–
...
na
...
...
na
...
...
1
na
2
5A 5B 6
Total enrolmentDistribution of students
by ISCED level (%)
644,763
...
** 4,761
...
207,388
63,165
21,960
** 24,553
** 48,894
...
na
1,578
...
** 7,979
...
1,942
...
1,212,161
390
61,654
178,020
...
...
118,491
...
...
...
90,620
42,502
2,047,895
...
2,433
...
...
na
...
...
8,614
12
13,595,580
2000/2001
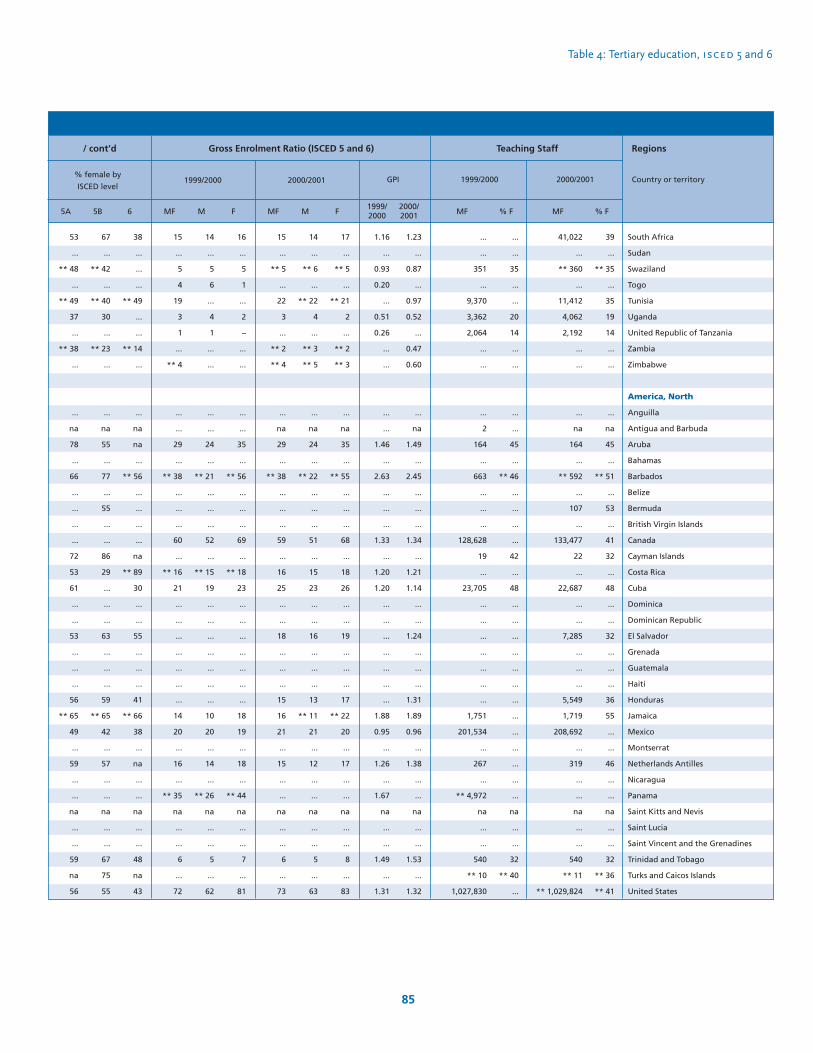
Table 4: Tertiary education, isced 5 and 6
85
GPI
Regions
Country or territory
15
...
** 5
...
22
3
...
** 2
** 4
...
na
29
...
** 38
...
...
...
59
...
16
25
...
...
18
...
...
...
15
16
21
...
15
...
...
na
...
...
6
...
73
MF
14
...
** 6
...
** 22
4
...
** 3
** 5
...
na
24
...
** 22
...
...
...
51
...
15
23
...
...
16
...
...
...
13
** 11
21
...
12
...
...
na
...
...
5
...
63
M
17
...
** 5
...
** 21
2
...
** 2
** 3
...
na
35
...
** 55
...
...
...
68
...
18
26
...
...
19
...
...
...
17
** 22
20
...
17
...
...
na
...
...
8
...
83
FF
1.16
...
0.93
0.20
...
0.51
0.26
...
...
...
...
1.46
...
2.63
...
...
...
1.33
...
1.20
1.20
...
...
...
...
...
...
...
1.88
0.95
...
1.26
...
1.67
na
...
...
1.49
...
1.31
1999/2000
1.23
...
0.87
...
0.97
0.52
...
0.47
0.60
...
na
1.49
...
2.45
...
...
...
1.34
...
1.21
1.14
...
...
1.24
...
...
...
1.31
1.89
0.96
...
1.38
...
...
na
...
...
1.53
...
1.32
2000/2001
South Africa
Sudan
Swaziland
Togo
Tunisia
Uganda
United Republic of Tanzania
Zambia
Zimbabwe
America, North
Anguilla
Antigua and Barbuda
Aruba
Bahamas
Barbados
Belize
Bermuda
British Virgin Islands
Canada
Cayman Islands
Costa Rica
Cuba
Dominica
Dominican Republic
El Salvador
Grenada
Guatemala
Haiti
Honduras
Jamaica
Mexico
Montserrat
Netherlands Antilles
Nicaragua
Panama
Saint Kitts and Nevis
Saint Lucia
Saint Vincent and the Grenadines
Trinidad and Tobago
Turks and Caicos Islands
United States
15
...
5
4
19
3
1
...
** 4
...
...
29
...
** 38
...
...
...
60
...
** 16
21
...
...
...
...
...
...
...
14
20
...
16
...
** 35
na
...
...
6
...
72
14
...
5
6
...
4
1
...
...
...
...
24
...
** 21
...
...
...
52
...
** 15
19
...
...
...
...
...
...
...
10
20
...
14
...
** 26
na
...
...
5
...
62
MF M
16
...
5
1
...
2
–
...
...
...
...
35
...
** 56
...
...
...
69
...
** 18
23
...
...
...
...
...
...
...
18
19
...
18
...
** 44
na
...
...
7
...
81
1999/2000 2000/2001
Gross Enrolment Ratio (ISCED 5 and 6)
MF % FMF % F
41,022
...
** 360
...
11,412
4,062
2,192
...
...
...
na
164
...
** 592
...
107
...
133,477
22
...
22,687
...
...
7,285
...
...
...
5,549
1,719
208,692
...
319
...
...
na
...
...
540
** 11
** 1,029,824
39
...
** 35
...
35
19
14
...
...
...
na
45
...
** 51
...
53
...
41
32
...
48
...
...
32
...
...
...
36
55
...
...
46
...
...
na
...
...
32
** 36
** 41
...
...
351
...
9,370
3,362
2,064
...
...
...
2
164
...
663
...
...
...
128,628
19
...
23,705
...
...
...
...
...
...
...
1,751
201,534
...
267
...
** 4,972
na
...
...
540
** 10
1,027,830
...
...
35
...
...
20
14
...
...
...
...
45
...
** 46
...
...
...
...
42
...
48
...
...
...
...
...
...
...
...
...
...
...
...
...
na
...
...
32
** 40
...
2000/20011999/2000
Teaching Staff
53
...
** 48
...
** 49
37
...
** 38
...
...
na
78
...
66
...
...
...
...
72
53
61
...
...
53
...
...
...
56
** 65
49
...
59
...
...
na
...
...
59
na
56
67
...
** 42
...
** 40
30
...
** 23
...
...
na
55
...
77
...
55
...
...
86
29
...
...
...
63
...
...
...
59
** 65
42
...
57
...
...
na
...
...
67
75
55
38
...
...
...
** 49
...
...
** 14
...
...
na
na
...
** 56
...
...
...
...
na
** 89
30
...
...
55
...
...
...
41
** 66
38
...
na
...
...
na
...
...
48
na
43
5A 5B 6
% female by
ISCED level
/ cont’d
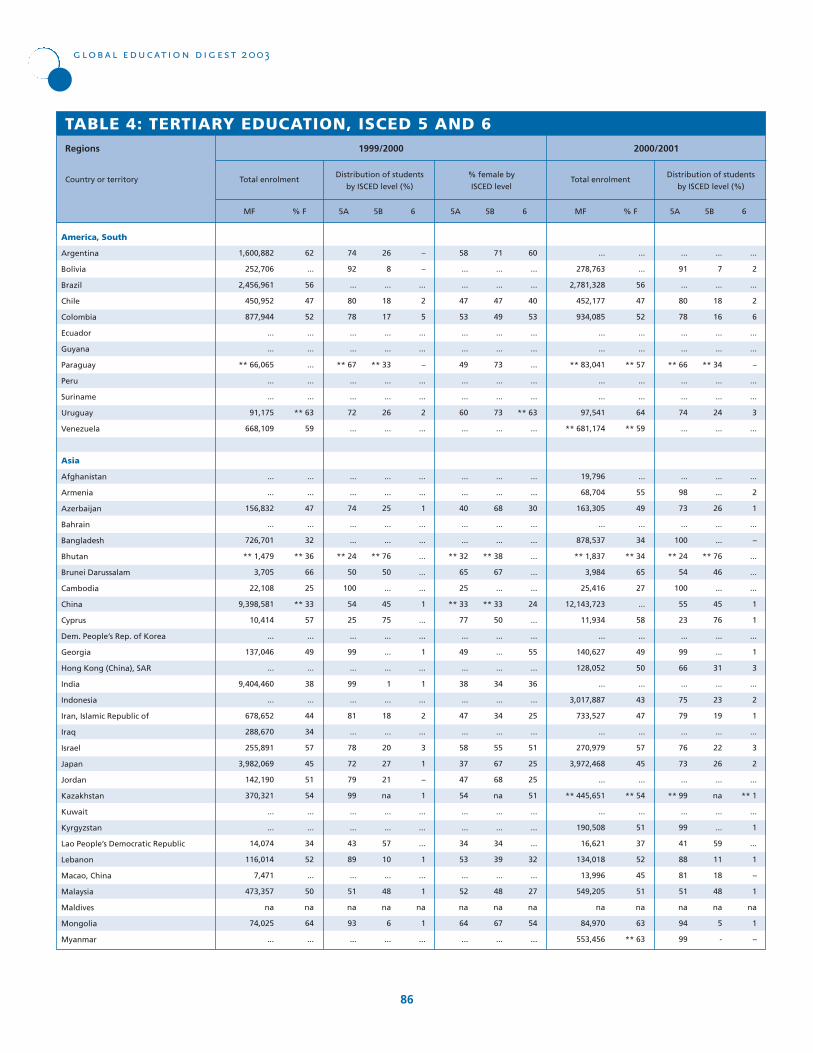
global education digest 2003
86
MF
62
...
56
47
52
...
...
...
...
...
** 63
59
...
...
47
...
32
** 36
66
25
** 33
57
...
49
...
38
...
44
34
57
45
51
54
...
...
34
52
...
50
na
64
...
% F
74
92
...
80
78
...
...
** 67
...
...
72
...
...
...
74
...
...
** 24
50
100
54
25
...
99
...
99
...
81
...
78
72
79
99
...
...
43
89
...
51
na
93
...
26
8
...
18
17
...
...
** 33
...
...
26
...
...
...
25
...
...
** 76
50
...
45
75
...
...
...
1
...
18
...
20
27
21
na
...
...
57
10
...
48
na
6
...
–
–
...
2
5
...
...
–
...
...
2
...
...
...
1
...
...
...
...
...
1
...
...
1
...
1
...
2
...
3
1
–
1
...
...
...
1
...
1
na
1
...
5A 5B 6
TABLE 4: TERTIARY EDUCATION, ISCED 5 AND 6
America, South
Argentina
Bolivia
Brazil
Chile
Colombia
Ecuador
Guyana
Paraguay
Peru
Suriname
Uruguay
Venezuela
Asia
Afghanistan
Armenia
Azerbaijan
Bahrain
Bangladesh
Bhutan
Brunei Darussalam
Cambodia
China
Cyprus
Dem. People’s Rep. of Korea
Georgia
Hong Kong (China), SAR
India
Indonesia
Iran, Islamic Republic of
Iraq
Israel
Japan
Jordan
Kazakhstan
Kuwait
Kyrgyzstan
Lao People’s Democratic Republic
Lebanon
Macao, China
Malaysia
Maldives
Mongolia
Myanmar
Regions
Country or territory Total enrolmentDistribution of students
by ISCED level (%)
58
...
...
47
53
...
...
49
...
...
60
...
...
...
40
...
...
** 32
65
25
** 33
77
...
49
...
38
...
47
...
58
37
47
54
...
...
34
53
...
52
na
64
...
71
...
...
47
49
...
...
73
...
...
73
...
...
...
68
...
...
** 38
67
...
** 33
50
...
...
...
34
...
34
...
55
67
68
na
...
...
34
39
...
48
na
67
...
60
...
...
40
53
...
...
...
...
...
** 63
...
...
...
30
...
...
...
...
...
24
...
...
55
...
36
...
25
...
51
25
25
51
...
...
...
32
...
27
na
54
...
5A 5B 6
% female by
ISCED level
1,600,882
252,706
2,456,961
450,952
877,944
...
...
** 66,065
...
...
91,175
668,109
...
...
156,832
...
726,701
** 1,479
3,705
22,108
9,398,581
10,414
...
137,046
...
9,404,460
...
678,652
288,670
255,891
3,982,069
142,190
370,321
...
...
14,074
116,014
7,471
473,357
na
74,025
...
1999/2000
MF
...
...
56
47
52
...
...
** 57
...
...
64
** 59
...
55
49
...
34
** 34
65
27
...
58
...
49
50
...
43
47
...
57
45
...
** 54
...
51
37
52
45
51
na
63
** 63
% F
...
91
...
80
78
...
...
** 66
...
...
74
...
...
98
73
...
100
** 24
54
100
55
23
...
99
66
...
75
79
...
76
73
...
** 99
...
99
41
88
81
51
na
94
99
...
7
...
18
16
...
...
** 34
...
...
24
...
...
...
26
...
...
** 76
46
...
45
76
...
...
31
...
23
19
...
22
26
...
na
...
...
59
11
18
48
na
5
-
...
2
...
2
6
...
...
–
...
...
3
...
...
2
1
...
–
...
...
...
1
1
...
1
3
...
2
1
...
3
2
...
** 1
...
1
...
1
–
1
na
1
–
5A 5B 6
Total enrolmentDistribution of students
by ISCED level (%)
...
278,763
2,781,328
452,177
934,085
...
...
** 83,041
...
...
97,541
** 681,174
19,796
68,704
163,305
...
878,537
** 1,837
3,984
25,416
12,143,723
11,934
...
140,627
128,052
...
3,017,887
733,527
...
270,979
3,972,468
...
** 445,651
...
190,508
16,621
134,018
13,996
549,205
na
84,970
553,456
2000/2001

Table 4: Tertiary education, isced 5 and 6
87
GPI
Regions
Country or territory
...
36
17
38
23
...
...
** 17
...
...
36
** 29
1
...
23
...
7
...
15
3
13
22
...
35
25
...
15
10
...
53
48
...
** 31
...
41
3
42
52
28
na
33
12
MF
...
...
14
39
22
...
...
** 14
...
...
26
** 24
...
...
23
...
8
...
10
4
...
19
...
35
24
...
16
10
...
44
51
...
** 28
...
40
4
40
56
27
na
24
** 8
M
...
...
19
36
24
...
...
** 19
...
...
47
** 35
...
...
22
...
5
...
20
2
...
25
...
34
25
...
13
10
...
62
44
...
** 34
...
42
2
44
48
29
na
42
** 15
FF
1.64
...
1.26
0.91
1.11
...
...
...
...
...
1.76
1.46
...
...
0.93
...
0.51
...
2.11
0.34
0.52
1.29
...
1.00
...
0.66
...
0.82
0.54
1.42
0.85
1.14
1.19
...
...
0.53
1.08
...
1.03
na
1.79
...
1999/2000
...
...
1.29
0.92
1.09
...
...
1.36
...
...
1.83
1.46
...
...
0.99
...
0.55
...
1.99
0.38
...
1.35
...
0.99
1.06
...
0.77
0.93
...
1.39
0.85
...
1.19
...
1.04
0.59
1.09
0.84
1.08
na
1.74
1.75
2000/2001
America, South
Argentina
Bolivia
Brazil
Chile
Colombia
Ecuador
Guyana
Paraguay
Peru
Suriname
Uruguay
Venezuela
Asia
Afghanistan
Armenia
Azerbaijan
Bahrain
Bangladesh
Bhutan
Brunei Darussalam
Cambodia
China
Cyprus
Dem. People’s Rep. of Korea
Georgia
Hong Kong (China), SAR
India
Indonesia
Iran, Islamic Republic of
Iraq
Israel
Japan
Jordan
Kazakhstan
Kuwait
Kyrgyzstan
Lao People’s Democratic Republic
Lebanon
Macao, China
Malaysia
Maldives
Mongolia
Myanmar
48
33
15
38
22
...
...
** 14
...
...
34
29
...
...
22
...
6
...
15
3
10
20
...
34
...
10
...
10
14
50
46
29
26
...
...
3
37
29
25
na
29
...
36
...
13
39
21
...
...
...
...
...
** 24
24
...
...
23
...
7
...
9
4
** 12
17
...
34
...
13
...
11
17
42
50
27
24
...
...
4
35
...
24
na
21
...
MF M
60
...
17
36
23
...
...
...
...
...
** 43
35
...
...
21
...
4
...
20
1
** 6
22
...
34
...
8
...
9
9
59
42
31
28
...
...
2
38
...
25
na
37
...
1999/2000 2000/2001
Gross Enrolment Ratio (ISCED 5 and 6)
MF % FMF % F
112,721
12,809
183,194
...
85,743
15,271
...
...
...
...
11,245
...
...
11,254
18,598
...
47,137
** 164
483
2,124
679,888
1,134
...
14,470
** 10,063
...
217,403
46,747
...
...
477,161
...
29,577
...
9,960
1,372
9,459
939
20,473
na
6,575
10,522
54
...
41
...
32
...
...
...
...
...
...
...
...
47
47
...
19
** 27
34
18
45
...
...
50
** 18
...
41
18
...
...
...
...
58
...
37
24
30
36
38
na
49
** 70
99,020
13,324
173,836
...
86,166
...
...
1,844
...
...
11,209
53,590
...
...
17,441
...
50,476
** 171
498
1,664
...
1,082
...
13,597
...
399,023
212,823
45,540
12,068
...
472,629
4,755
26,996
...
...
1,152
8,820
835
...
na
6,642
8,232
...
...
...
...
34
...
...
...
...
...
...
38
...
...
45
...
14
...
32
19
...
...
...
49
...
37
...
18
30
...
...
...
56
...
...
...
27
...
...
na
47
80
2000/20011999/2000
Teaching Staff
...
...
...
47
53
...
...
50
...
...
60
...
...
55
42
...
34
** 32
65
27
...
77
...
49
51
...
42
51
...
58
38
...
54
...
51
35
54
39
56
na
63
** 64
70
...
...
46
47
...
...
70
...
...
75
...
...
...
70
...
...
** 35
65
...
...
52
...
...
50
...
47
35
...
53
66
...
na
...
...
38
39
72
46
na
68
33
...
...
...
40
49
...
...
...
...
...
** 64
...
...
37
34
...
24
...
...
...
...
54
...
51
38
...
34
24
...
52
26
...
** 51
...
62
...
32
29
42
na
59
** 64
5A 5B 6
% female by
ISCED level
/ cont’d
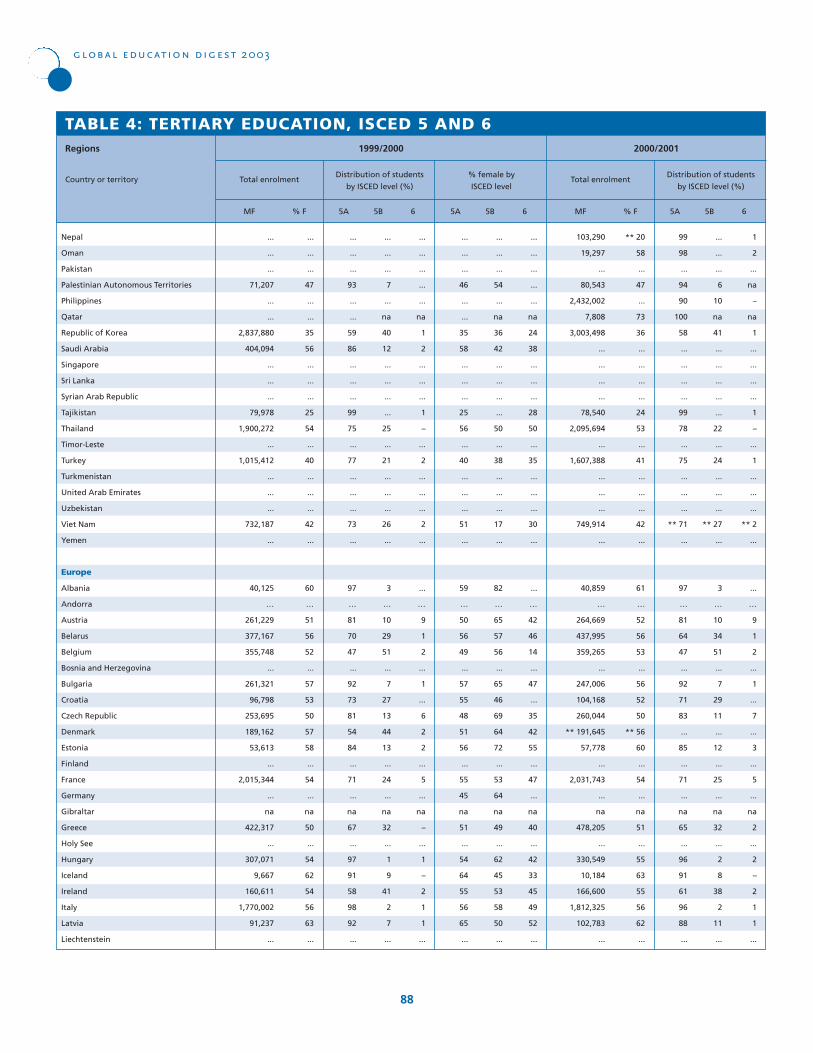
global education digest 2003
88
MF
...
...
...
47
...
...
35
56
...
...
...
25
54
...
40
...
...
...
42
...
60
…
51
56
52
...
57
53
50
57
58
...
54
...
na
50
...
54
62
54
56
63
...
% F
...
...
...
93
...
...
59
86
...
...
...
99
75
...
77
...
...
...
73
...
97
…
81
70
47
...
92
73
81
54
84
...
71
...
na
67
...
97
91
58
98
92
...
...
...
...
7
...
na
40
12
...
...
...
...
25
...
21
...
...
...
26
...
3
…
10
29
51
...
7
27
13
44
13
...
24
...
na
32
...
1
9
41
2
7
...
...
...
...
...
...
na
1
2
...
...
...
1
–
...
2
...
...
...
2
...
...
…
9
1
2
...
1
...
6
2
2
...
5
...
na
–
...
1
–
2
1
1
...
5A 5B 6
TABLE 4: TERTIARY EDUCATION, ISCED 5 AND 6
Nepal
Oman
Pakistan
Palestinian Autonomous Territories
Philippines
Qatar
Republic of Korea
Saudi Arabia
Singapore
Sri Lanka
Syrian Arab Republic
Tajikistan
Thailand
Timor-Leste
Turkey
Turkmenistan
United Arab Emirates
Uzbekistan
Viet Nam
Yemen
Europe
Albania
Andorra
Austria
Belarus
Belgium
Bosnia and Herzegovina
Bulgaria
Croatia
Czech Republic
Denmark
Estonia
Finland
France
Germany
Gibraltar
Greece
Holy See
Hungary
Iceland
Ireland
Italy
Latvia
Liechtenstein
Regions
Country or territory Total enrolmentDistribution of students
by ISCED level (%)
...
...
...
46
...
...
35
58
...
...
...
25
56
...
40
...
...
...
51
...
59
…
50
56
49
...
57
55
48
51
56
...
55
45
na
51
...
54
64
55
56
65
...
...
...
...
54
...
na
36
42
...
...
...
...
50
...
38
...
...
...
17
...
82
…
65
57
56
...
65
46
69
64
72
...
53
64
na
49
...
62
45
53
58
50
...
...
...
...
...
...
na
24
38
...
...
...
28
50
...
35
...
...
...
30
...
...
…
42
46
14
...
47
...
35
42
55
...
47
...
na
40
...
42
33
45
49
52
...
5A 5B 6
% female by
ISCED level
...
...
...
71,207
...
...
2,837,880
404,094
...
...
...
79,978
1,900,272
...
1,015,412
...
...
...
732,187
...
40,125
…
261,229
377,167
355,748
...
261,321
96,798
253,695
189,162
53,613
...
2,015,344
...
na
422,317
...
307,071
9,667
160,611
1,770,002
91,237
...
1999/2000
MF
** 20
58
...
47
...
73
36
...
...
...
...
24
53
...
41
...
...
...
42
...
61
…
52
56
53
...
56
52
50
** 56
60
...
54
...
na
51
...
55
63
55
56
62
...
% F
99
98
...
94
90
100
58
...
...
...
...
99
78
...
75
...
...
...
** 71
...
97
…
81
64
47
...
92
71
83
...
85
...
71
...
na
65
...
96
91
61
96
88
...
...
...
...
6
10
na
41
...
...
...
...
...
22
...
24
...
...
...
** 27
...
3
…
10
34
51
...
7
29
11
...
12
...
25
...
na
32
...
2
8
38
2
11
...
1
2
...
na
–
na
1
...
...
...
...
1
–
...
1
...
...
...
** 2
...
...
…
9
1
2
...
1
...
7
...
3
...
5
...
na
2
...
2
–
2
1
1
...
5A 5B 6
Total enrolmentDistribution of students
by ISCED level (%)
103,290
19,297
...
80,543
2,432,002
7,808
3,003,498
...
...
...
...
78,540
2,095,694
...
1,607,388
...
...
...
749,914
...
40,859
…
264,669
437,995
359,265
...
247,006
104,168
260,044
** 191,645
57,778
...
2,031,743
...
na
478,205
...
330,549
10,184
166,600
1,812,325
102,783
...
2000/2001
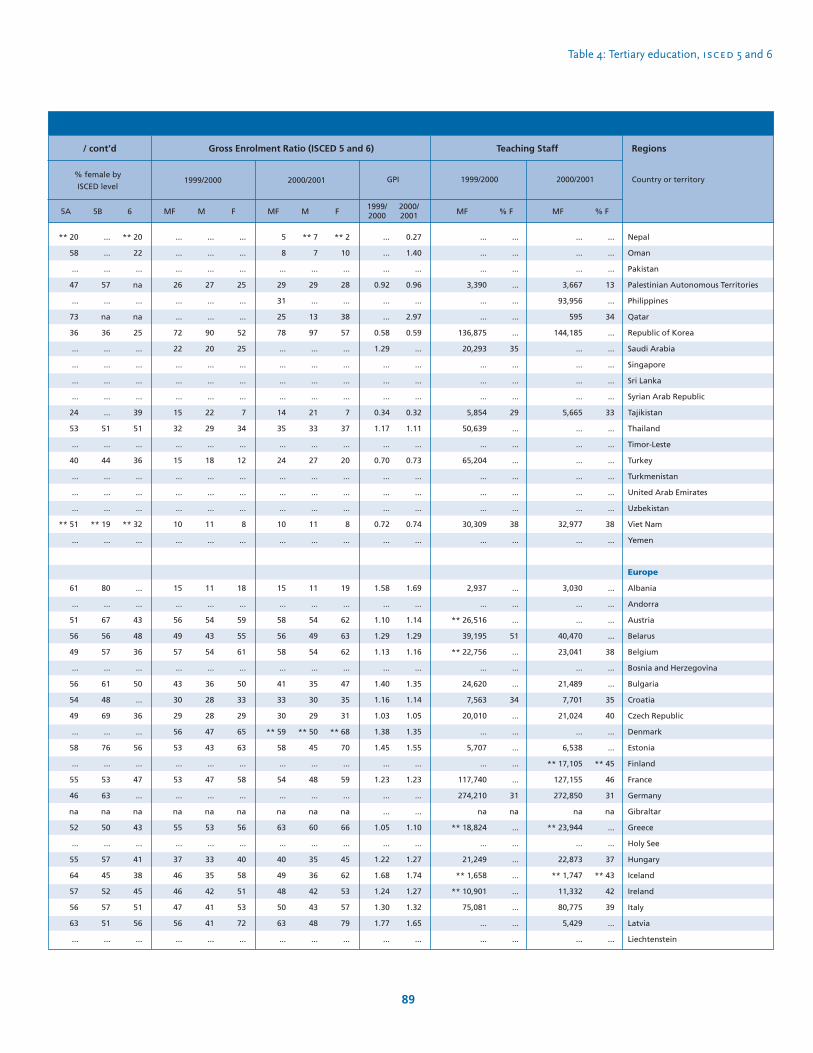
Table 4: Tertiary education, isced 5 and 6
89
GPI
Regions
Country or territory
5
8
...
29
31
25
78
...
...
...
...
14
35
...
24
...
...
...
10
...
15
...
58
56
58
...
41
33
30
** 59
58
...
54
...
na
63
...
40
49
48
50
63
...
MF
** 7
7
...
29
...
13
97
...
...
...
...
21
33
...
27
...
...
...
11
...
11
...
54
49
54
...
35
30
29
** 50
45
...
48
...
na
60
...
35
36
42
43
48
...
M
** 2
10
...
28
...
38
57
...
...
...
...
7
37
...
20
...
...
...
8
...
19
...
62
63
62
...
47
35
31
** 68
70
...
59
...
na
66
...
45
62
53
57
79
...
FF
...
...
...
0.92
...
...
0.58
1.29
...
...
...
0.34
1.17
...
0.70
...
...
...
0.72
...
1.58
...
1.10
1.29
1.13
...
1.40
1.16
1.03
1.38
1.45
...
1.23
...
...
1.05
...
1.22
1.68
1.24
1.30
1.77
...
1999/2000
0.27
1.40
...
0.96
...
2.97
0.59
...
...
...
...
0.32
1.11
...
0.73
...
...
...
0.74
...
1.69
...
1.14
1.29
1.16
...
1.35
1.14
1.05
1.35
1.55
...
1.23
...
...
1.10
...
1.27
1.74
1.27
1.32
1.65
...
2000/2001
Nepal
Oman
Pakistan
Palestinian Autonomous Territories
Philippines
Qatar
Republic of Korea
Saudi Arabia
Singapore
Sri Lanka
Syrian Arab Republic
Tajikistan
Thailand
Timor-Leste
Turkey
Turkmenistan
United Arab Emirates
Uzbekistan
Viet Nam
Yemen
Europe
Albania
Andorra
Austria
Belarus
Belgium
Bosnia and Herzegovina
Bulgaria
Croatia
Czech Republic
Denmark
Estonia
Finland
France
Germany
Gibraltar
Greece
Holy See
Hungary
Iceland
Ireland
Italy
Latvia
Liechtenstein
...
...
...
26
...
...
72
22
...
...
...
15
32
...
15
...
...
...
10
...
15
...
56
49
57
...
43
30
29
56
53
...
53
...
na
55
...
37
46
46
47
56
...
...
...
...
27
...
...
90
20
...
...
...
22
29
...
18
...
...
...
11
...
11
...
54
43
54
...
36
28
28
47
43
...
47
...
na
53
...
33
35
42
41
41
...
MF M
...
...
...
25
...
...
52
25
...
...
...
7
34
...
12
...
...
...
8
...
18
...
59
55
61
...
50
33
29
65
63
...
58
...
na
56
...
40
58
51
53
72
...
1999/2000 2000/2001
Gross Enrolment Ratio (ISCED 5 and 6)
MF % FMF % F
...
...
...
3,667
93,956
595
144,185
...
...
...
...
5,665
...
...
...
...
...
...
32,977
...
3,030
...
...
40,470
23,041
...
21,489
7,701
21,024
...
6,538
** 17,105
127,155
272,850
na
** 23,944
...
22,873
** 1,747
11,332
80,775
5,429
...
...
...
...
13
...
34
...
...
...
...
...
33
...
...
...
...
...
...
38
...
...
...
...
...
38
...
...
35
40
...
...
** 45
46
31
na
...
...
37
** 43
42
39
...
...
...
...
...
3,390
...
...
136,875
20,293
...
...
...
5,854
50,639
...
65,204
...
...
...
30,309
...
2,937
...
** 26,516
39,195
** 22,756
...
24,620
7,563
20,010
...
5,707
...
117,740
274,210
na
** 18,824
...
21,249
** 1,658
** 10,901
75,081
...
...
...
...
...
...
...
...
...
35
...
...
...
29
...
...
...
...
...
...
38
...
...
...
...
51
...
...
...
34
...
...
...
...
...
31
na
...
...
...
...
...
...
...
...
2000/20011999/2000
Teaching Staff
** 20
58
...
47
...
73
36
...
...
...
...
24
53
...
40
...
...
...
** 51
...
61
...
51
56
49
...
56
54
49
...
58
...
55
46
na
52
...
55
64
57
56
63
...
...
...
...
57
...
na
36
...
...
...
...
...
51
...
44
...
...
...
** 19
...
80
...
67
56
57
...
61
48
69
...
76
...
53
63
na
50
...
57
45
52
57
51
...
** 20
22
...
na
...
na
25
...
...
...
...
39
51
...
36
...
...
...
** 32
...
...
...
43
48
36
...
50
...
36
...
56
...
47
...
na
43
...
41
38
45
51
56
...
5A 5B 6
% female by
ISCED level
/ cont’d
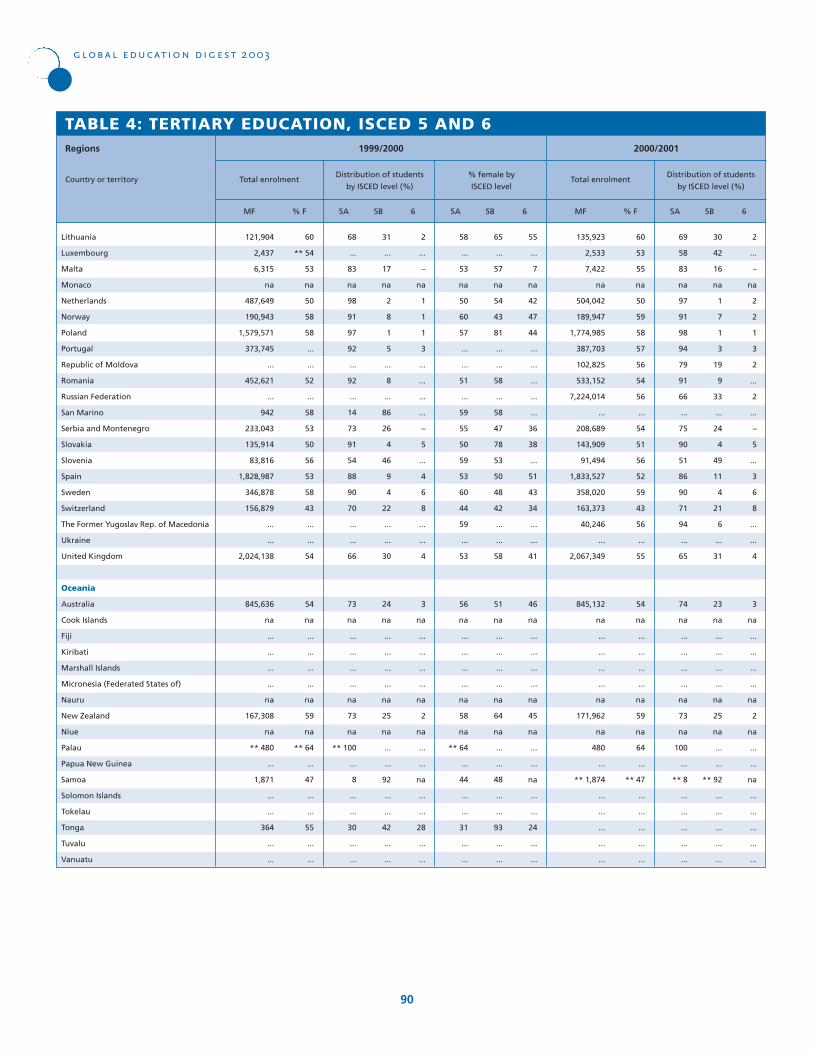
global education digest 2003
90
MF
60
** 54
53
na
50
58
58
...
...
52
...
58
53
50
56
53
58
43
...
...
54
54
na
...
...
...
...
na
59
na
** 64
...
47
...
...
55
...
...
% F
68
...
83
na
98
91
97
92
...
92
...
14
73
91
54
88
90
70
...
...
66
73
na
...
...
...
...
na
73
na
** 100
...
8
...
...
30
...
...
31
...
17
na
2
8
1
5
...
8
...
86
26
4
46
9
4
22
...
...
30
24
na
...
...
...
...
na
25
na
...
...
92
...
...
42
...
...
2
...
–
na
1
1
1
3
...
...
...
...
–
5
...
4
6
8
...
...
4
3
na
...
...
...
...
na
2
na
...
...
na
...
...
28
...
...
5A 5B 6
TABLE 4: TERTIARY EDUCATION, ISCED 5 AND 6
Lithuania
Luxembourg
Malta
Monaco
Netherlands
Norway
Poland
Portugal
Republic of Moldova
Romania
Russian Federation
San Marino
Serbia and Montenegro
Slovakia
Slovenia
Spain
Sweden
Switzerland
The Former Yugoslav Rep. of Macedonia
Ukraine
United Kingdom
Oceania
Australia
Cook Islands
Fiji
Kiribati
Marshall Islands
Micronesia (Federated States of)
Nauru
New Zealand
Niue
Palau
Papua New Guinea
Samoa
Solomon Islands
Tokelau
Tonga
Tuvalu
Vanuatu
Regions
Country or territory Total enrolmentDistribution of students
by ISCED level (%)
58
...
53
na
50
60
57
...
...
51
...
59
55
50
59
53
60
44
59
...
53
56
na
...
...
...
...
na
58
na
** 64
...
44
...
...
31
...
...
65
...
57
na
54
43
81
...
...
58
...
58
47
78
53
50
48
42
...
...
58
51
na
...
...
...
...
na
64
na
...
...
48
...
...
93
...
...
55
...
7
na
42
47
44
...
...
...
...
...
36
38
...
51
43
34
...
...
41
46
na
...
...
...
...
na
45
na
...
...
na
...
...
24
...
...
5A 5B 6
% female by
ISCED level
121,904
2,437
6,315
na
487,649
190,943
1,579,571
373,745
...
452,621
...
942
233,043
135,914
83,816
1,828,987
346,878
156,879
...
...
2,024,138
845,636
na
...
...
...
...
na
167,308
na
** 480
...
1,871
...
...
364
...
...
1999/2000
MF
60
53
55
na
50
59
58
57
56
54
56
...
54
51
56
52
59
43
56
...
55
54
na
...
...
...
...
na
59
na
64
...
** 47
...
...
...
...
...
% F
69
58
83
na
97
91
98
94
79
91
66
...
75
90
51
86
90
71
94
...
65
74
na
...
...
...
...
na
73
na
100
...
** 8
...
...
...
...
...
30
42
16
na
1
7
1
3
19
9
33
...
24
4
49
11
4
21
6
...
31
23
na
...
...
...
...
na
25
na
...
...
** 92
...
...
...
...
...
2
...
–
na
2
2
1
3
2
...
2
...
–
5
...
3
6
8
...
...
4
3
na
...
...
...
...
na
2
na
...
...
na
...
...
...
...
...
5A 5B 6
Total enrolmentDistribution of students
by ISCED level (%)
135,923
2,533
7,422
na
504,042
189,947
1,774,985
387,703
102,825
533,152
7,224,014
...
208,689
143,909
91,494
1,833,527
358,020
163,373
40,246
...
2,067,349
845,132
na
...
...
...
...
na
171,962
na
480
...
** 1,874
...
...
...
...
...
2000/2001
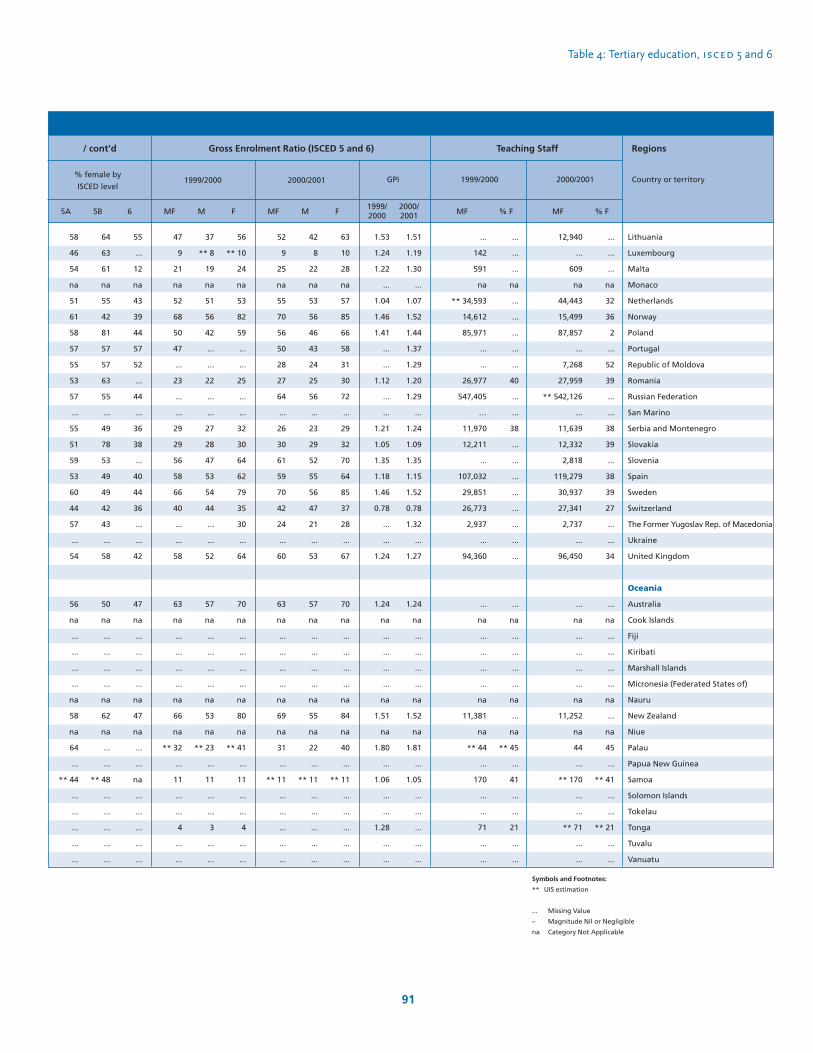
Table 4: Tertiary education, isced 5 and 6
91
GPI
Regions
Country or territory
52
9
25
na
55
70
56
50
28
27
64
...
26
30
61
59
70
42
24
...
60
63
na
...
...
...
...
na
69
na
31
...
** 11
...
...
...
...
...
MF
42
8
22
na
53
56
46
43
24
25
56
...
23
29
52
55
56
47
21
...
53
57
na
...
...
...
...
na
55
na
22
...
** 11
...
...
...
...
...
M
63
10
28
na
57
85
66
58
31
30
72
...
29
32
70
64
85
37
28
...
67
70
na
...
...
...
...
na
84
na
40
...
** 11
...
...
...
...
...
FF
1.53
1.24
1.22
...
1.04
1.46
1.41
...
...
1.12
...
...
1.21
1.05
1.35
1.18
1.46
0.78
...
...
1.24
1.24
na
...
...
...
...
na
1.51
na
1.80
...
1.06
...
...
1.28
...
...
1999/2000
1.51
1.19
1.30
...
1.07
1.52
1.44
1.37
1.29
1.20
1.29
...
1.24
1.09
1.35
1.15
1.52
0.78
1.32
...
1.27
1.24
na
...
...
...
...
na
1.52
na
1.81
...
1.05
...
...
...
...
...
2000/2001
Lithuania
Luxembourg
Malta
Monaco
Netherlands
Norway
Poland
Portugal
Republic of Moldova
Romania
Russian Federation
San Marino
Serbia and Montenegro
Slovakia
Slovenia
Spain
Sweden
Switzerland
The Former Yugoslav Rep. of Macedonia
Ukraine
United Kingdom
Oceania
Australia
Cook Islands
Fiji
Kiribati
Marshall Islands
Micronesia (Federated States of)
Nauru
New Zealand
Niue
Palau
Papua New Guinea
Samoa
Solomon Islands
Tokelau
Tonga
Tuvalu
Vanuatu
47
9
21
na
52
68
50
47
...
23
...
...
29
29
56
58
66
40
...
...
58
63
na
...
...
...
...
na
66
na
** 32
...
11
...
...
4
...
...
37
** 8
19
na
51
56
42
...
...
22
...
...
27
28
47
53
54
44
...
...
52
57
na
...
...
...
...
na
53
na
** 23
...
11
...
...
3
...
...
MF M
56
** 10
24
na
53
82
59
...
...
25
...
...
32
30
64
62
79
35
30
...
64
70
na
...
...
...
...
na
80
na
** 41
...
11
...
...
4
...
...
1999/2000 2000/2001
Gross Enrolment Ratio (ISCED 5 and 6)
MF % FMF % F
12,940
...
609
na
44,443
15,499
87,857
...
7,268
27,959
** 542,126
...
11,639
12,332
2,818
119,279
30,937
27,341
2,737
...
96,450
...
na
...
...
...
...
na
11,252
na
44
...
** 170
...
...
** 71
...
...
...
...
...
na
32
36
2
...
52
39
...
...
38
39
...
38
39
27
...
...
34
...
na
...
...
...
...
na
...
na
45
...
** 41
...
...
** 21
...
...
...
142
591
na
** 34,593
14,612
85,971
...
...
26,977
547,405
…
11,970
12,211
...
107,032
29,851
26,773
2,937
...
94,360
...
na
...
...
...
...
na
11,381
na
** 44
...
170
...
...
71
...
...
...
...
...
na
...
...
...
...
...
40
...
...
38
...
...
...
...
...
...
...
...
...
na
...
...
...
...
na
...
na
** 45
...
41
...
...
21
...
...
2000/20011999/2000
Teaching Staff
58
46
54
na
51
61
58
57
55
53
57
...
55
51
59
53
60
44
57
...
54
56
na
...
...
...
...
na
58
na
64
...
** 44
...
...
...
...
...
64
63
61
na
55
42
81
57
57
63
55
...
49
78
53
49
49
42
43
...
58
50
na
...
...
...
...
na
62
na
...
...
** 48
...
...
...
...
...
55
...
12
na
43
39
44
57
52
...
44
...
36
38
...
40
44
36
...
...
42
47
na
...
...
...
...
na
47
na
...
...
na
...
...
...
...
...
5A 5B 6
% female by
ISCED level
/ cont’d
Symbols and Footnotes:
** UIS estimation
... Missing Value
– Magnitude Nil or Negligible
na Category Not Applicable
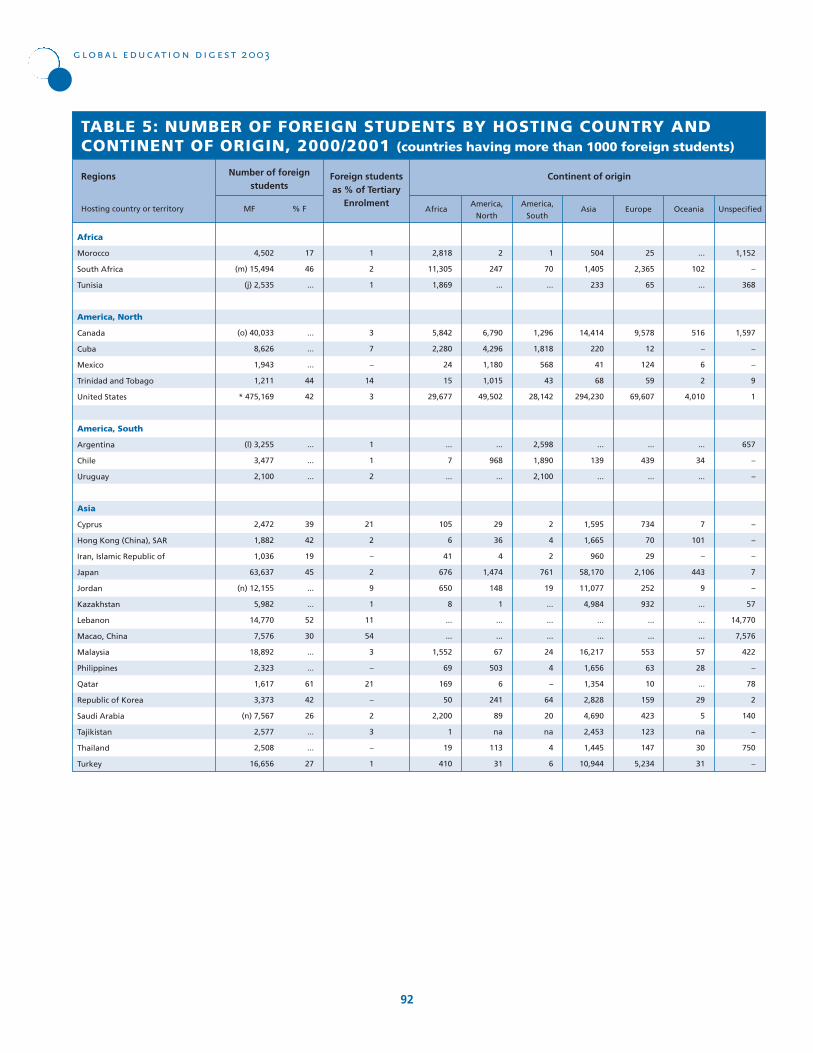
global education digest 2003
92
MF
17
46
...
...
...
...
44
42
...
...
...
39
42
19
45
...
...
52
30
...
...
61
42
26
...
...
27
% F
1
2
1
3
7
–
14
3
1
1
2
21
2
–
2
9
1
11
54
3
–
21
–
2
3
–
1
TABLE 5: NUMBER OF FOREIGN STUDENTS BY HOSTING COUNTRY ANDCONTINENT OF ORIGIN, 2000/2001 (countries having more than 1000 foreign students)
Africa
Morocco
South Africa
Tunisia
America, North
Canada
Cuba
Mexico
Trinidad and Tobago
United States
America, South
Argentina
Chile
Uruguay
Asia
Cyprus
Hong Kong (China), SAR
Iran, Islamic Republic of
Japan
Jordan
Kazakhstan
Lebanon
Macao, China
Malaysia
Philippines
Qatar
Republic of Korea
Saudi Arabia
Tajikistan
Thailand
Turkey
Regions
Hosting country or territory
4,502
(m) 15,494
(j) 2,535
(o) 40,033
8,626
1,943
1,211
* 475,169
(l) 3,255
3,477
2,100
2,472
1,882
1,036
63,637
(n) 12,155
5,982
14,770
7,576
18,892
2,323
1,617
3,373
(n) 7,567
2,577
2,508
16,656
Number of foreignstudents
Foreign studentsas % of Tertiary
EnrolmentAfrica
America,
North
America,
SouthAsia Europe Oceania Unspecified
504
1,405
233
14,414
220
41
68
294,230
...
139
...
1,595
1,665
960
58,170
11,077
4,984
...
...
16,217
1,656
1,354
2,828
4,690
2,453
1,445
10,944
1
70
...
1,296
1,818
568
43
28,142
2,598
1,890
2,100
2
4
2
761
19
...
...
...
24
4
–
64
20
na
4
6
2
247
...
6,790
4,296
1,180
1,015
49,502
...
968
...
29
36
4
1,474
148
1
...
...
67
503
6
241
89
na
113
31
2,818
11,305
1,869
5,842
2,280
24
15
29,677
...
7
...
105
6
41
676
650
8
...
...
1,552
69
169
50
2,200
1
19
410
1,152
–
368
1,597
–
–
9
1
657
–
–
–
–
–
7
–
57
14,770
7,576
422
–
78
2
140
–
750
–
...
102
...
516
–
6
2
4,010
...
34
...
7
101
–
443
9
...
...
...
57
28
...
29
5
na
30
31
25
2,365
65
9,578
12
124
59
69,607
...
439
...
734
70
29
2,106
252
932
...
...
553
63
10
159
423
123
147
5,234
Continent of origin

Table 5: Number of foreign students by hosting country and continent of origin, 2000/2001
MF
51
32
49
41
...
45
55
43
...
48
44
52
55
...
49
46
51
50
26
42
...
39
55
...
44
...
48
47
51
% F
12
–
11
3
3
3
7
2
7
10
3
5
2
8
3
5
–
3
3
2
1
1
2
7
17
1
11
13
5
Europe
Austria
Belarus
Belgium
Bulgaria
Croatia
Czech Republic
Denmark
Finland
France
Germany
Hungary
Ireland
Italy
Latvia
Netherlands
Norway
Poland
Portugal
Republic of Moldova
Romania
Russian Federation
Slovakia
Spain
Sweden
Switzerland
Ukraine
United Kingdom
Oceania
Australia
New Zealand
Regions
Hosting country or territory
31,682
1,794
38,150
8,130
2,720
7,750
12,547
6,288
± 147,402
199,132
(j) 11,242
(k) 8,207
29,228
7,917
16,589
8,834
(i) 6,659
(n) 11,177
2,578
11,669
64,103
1,690
39,944
26,304
27,765
(m) 18,312
* 225,722
105,764
8,210
Number of foreignstudents
Foreign studentsas % of Tertiary
EnrolmentAfrica
America,
North
America,
SouthAsia Europe Oceania Unspecified
3,885
1,497
2,609
1,555
8
727
1,027
1,666
19,828
67,658
1,602
1,399
3,463
7,124
3,308
1,017
1,081
142
1,046
1,681
28,013
390
1,131
2,303
2,175
–
74,400
67,849
5,573
320
20
646
10
1
82
123
69
4,253
4,265
15
21
1,233
4
1,079
149
57
1,846
...
33
...
11
6,604
572
866
–
2,926
819
87
554
2
485
20
7
102
307
294
5,242
5,387
435
2,044
612
24
348
393
451
601
1
155
...
18
2,645
1,387
697
–
18,564
4,409
559
965
136
10,973
146
5
239
382
716
75,465
19,394
175
415
2,186
12
2,559
733
296
6,093
81
691
...
133
4,013
641
1,802
–
18,134
3,102
112
152
–
730
–
107
1,400
4,776
51
1,010
1,746
39
–
851
–
48
1,454
96
156
–
19
20,238
–
22
5,037
1,097
18,312
454
12,306
–
29
na
17
...
2
1
51
27
200
323
1
81
26
...
42
21
9
25
...
4
...
...
39
209
58
–
1,790
6,104
1,121
25,777
139
22,690
6,399
2,590
5,199
5,881
3,465
41,404
100,359
8,975
4,247
20,857
753
9,205
5,067
4,669
2,314
1,450
9,086
15,852
1,138
25,490
16,155
21,070
–
109,454
11,175
758
Continent of origin
93
Symbols and Footnotes:
(i) Data refer to ISCED level 5A only.
(j) Data refer to ISCED 5A and 6 only.
(k) Full-time only.
(l) Data refer to ISCED 5B only
(m) Data refer to 1998/1999 school year
(n) Data for 1999/2000 school year.
(o) Data refer to 1999/2000 school year. Data excludes ISCED 5B.
* National Estimation
± Partial data, covers 82.4% of total number of students.
... Missing Value
– Magnitude Nil or Negligible
na Category Not Applicable
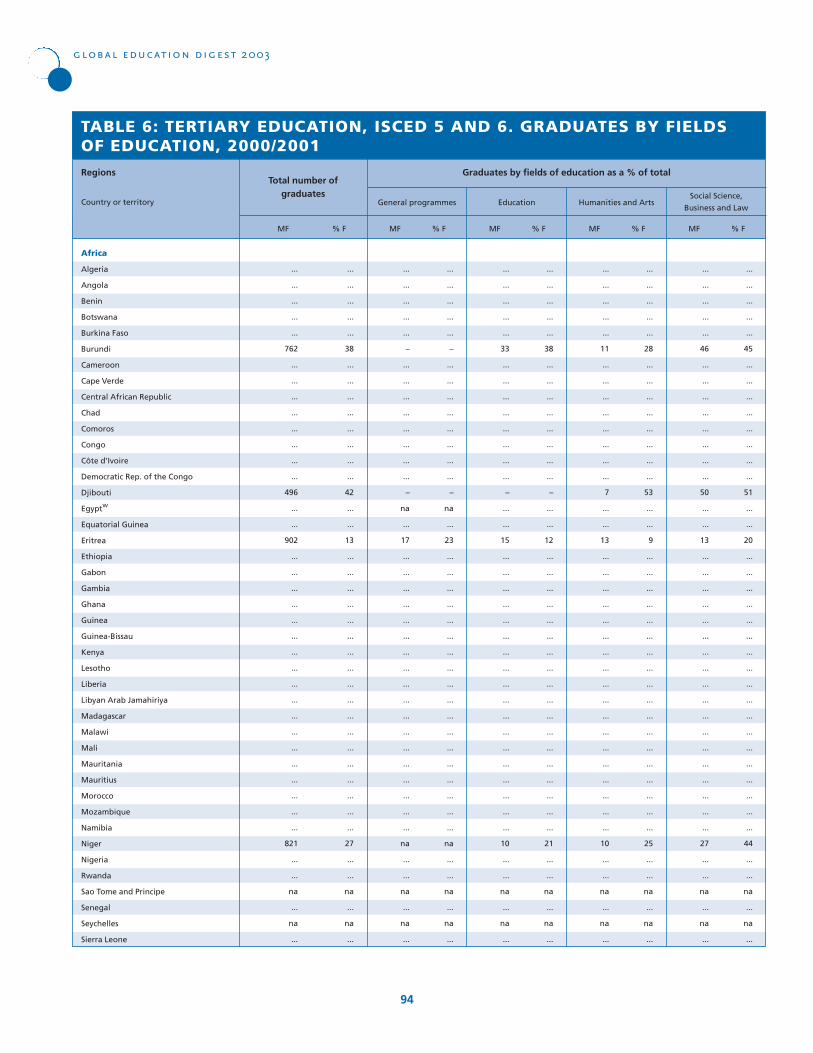
MF
...
...
...
...
...
38
...
...
...
...
...
...
...
...
42
...
...
13
...
...
...
...
...
...
...
...
...
...
...
...
...
...
...
...
...
...
27
...
...
na
...
na
...
% F
TABLE 6: TERTIARY EDUCATION, ISCED 5 AND 6. GRADUATES BY FIELDSOF EDUCATION, 2000/2001
Africa
Algeria
Angola
Benin
Botswana
Burkina Faso
Burundi
Cameroon
Cape Verde
Central African Republic
Chad
Comoros
Congo
Côte d’Ivoire
Democratic Rep. of the Congo
Djibouti
Egyptw
Equatorial Guinea
Eritrea
Ethiopia
Gabon
Gambia
Ghana
Guinea
Guinea-Bissau
Kenya
Lesotho
Liberia
Libyan Arab Jamahiriya
Madagascar
Malawi
Mali
Mauritania
Mauritius
Morocco
Mozambique
Namibia
Niger
Nigeria
Rwanda
Sao Tome and Principe
Senegal
Seychelles
Sierra Leone
Regions
Country or territory
global education digest 2003
94
...
...
...
...
...
762
...
...
...
...
...
...
...
...
496
...
...
902
...
...
...
...
...
...
...
...
...
...
...
...
...
...
...
...
...
...
821
...
...
na
...
na
...
MF
...
...
...
...
...
–
...
...
...
...
...
...
...
...
–
na
...
23
...
...
...
...
...
...
...
...
...
...
...
...
...
...
...
...
...
...
na
...
...
na
...
na
...
% F MF % F MF % F MF % F
General programmes
...
...
...
...
...
–
...
...
...
...
...
...
...
...
–
na
...
17
...
...
...
...
...
...
...
...
...
...
...
...
...
...
...
...
...
...
na
...
...
na
...
na
...
...
...
...
...
...
38
...
...
...
...
...
...
...
...
–
...
...
12
...
...
...
...
...
...
...
...
...
...
...
...
...
...
...
...
...
...
21
...
...
na
...
na
...
...
...
...
...
...
33
...
...
...
...
...
...
...
...
–
...
...
15
...
...
...
...
...
...
...
...
...
...
...
...
...
...
...
...
...
...
10
...
...
na
...
na
...
...
...
...
...
...
28
...
...
...
...
...
...
...
...
53
...
...
9
...
...
...
...
...
...
...
...
...
...
...
...
...
...
...
...
...
...
25
...
...
na
...
na
...
...
...
...
...
...
11
...
...
...
...
...
...
...
...
7
...
...
13
...
...
...
...
...
...
...
...
...
...
...
...
...
...
...
...
...
...
10
...
...
na
...
na
...
...
...
...
...
...
45
...
...
...
...
...
...
...
...
51
...
...
20
...
...
...
...
...
...
...
...
...
...
...
...
...
...
...
...
...
...
44
...
...
na
...
na
...
...
...
...
...
...
46
...
...
...
...
...
...
...
...
50
...
...
13
...
...
...
...
...
...
...
...
...
...
...
...
...
...
...
...
...
...
27
...
...
na
...
na
...
Total number of graduates
Graduates by fields of education as a % of total
Education Humanities and ArtsSocial Science,
Business and Law

95
Table 6: Tertiary education, ISCED 5 and 6. Graduates by fields of education, 2000/2001
Africa
Algeria
Angola
Benin
Botswana
Burkina Faso
Burundi
Cameroon
Cape Verde
Central African Republic
Chad
Comoros
Congo
Côte d’Ivoire
Democratic Rep. of the Congo
Djibouti
Egyptw
Equatorial Guinea
Eritrea
Ethiopia
Gabon
Gambia
Ghana
Guinea
Guinea-Bissau
Kenya
Lesotho
Liberia
Libyan Arab Jamahiriya
Madagascar
Malawi
Mali
Mauritania
Mauritius
Morocco
Mozambique
Namibia
Niger
Nigeria
Rwanda
Sao Tome and Principe
Senegal
Seychelles
Sierra Leone
Regions
Country or territory
MF
...
...
...
...
...
–
...
...
...
...
...
...
...
...
23
...
...
11
...
...
...
...
...
...
...
...
...
...
...
...
...
...
...
...
...
...
8
...
...
na
...
na
...
% F MF % F MF % F MF % F
Science
...
...
...
...
...
–
...
...
...
...
...
...
...
...
25
...
...
13
...
...
...
...
...
...
...
...
...
...
...
...
...
...
...
...
...
...
19
...
...
na
...
na
...
...
...
...
...
...
–
...
...
...
...
...
...
...
...
–
...
...
6
...
...
...
...
...
...
...
...
...
...
...
...
...
...
...
...
...
...
na
...
...
na
...
na
...
...
...
...
...
...
4
...
...
...
...
...
...
...
...
3
...
...
18
...
...
...
...
...
...
...
...
...
...
...
...
...
...
...
...
...
...
na
...
...
na
...
na
...
...
...
...
...
...
–
...
...
...
...
...
...
...
...
–
...
...
14
...
...
...
...
...
...
...
...
...
...
...
...
...
...
...
...
...
...
31
...
...
na
...
na
...
...
...
...
...
...
–
...
...
...
...
...
...
...
...
–
...
...
8
...
...
...
...
...
...
...
...
...
...
...
...
...
...
...
...
...
...
14
...
...
na
...
na
...
...
...
...
...
...
26
...
...
...
...
...
...
...
...
–
...
...
6
...
...
...
...
...
...
...
...
...
...
...
...
...
...
...
...
...
...
35
...
...
na
...
na
...
...
...
...
...
...
6
...
...
...
...
...
...
...
...
–
...
...
4
...
...
...
...
...
...
...
...
...
...
...
...
...
...
...
...
...
...
15
...
...
na
...
na
...
Graduates by fields of education as a % of total
Engineering, Manufacturing
and ConstructionAgriculture
Health and
Welfare
MF % F MF % F
...
...
...
...
...
–
...
...
...
...
...
...
...
...
–
...
...
na
...
...
...
...
...
...
...
...
...
...
...
...
...
...
...
...
...
...
–
...
...
na
...
na
...
...
...
...
...
...
–
...
...
...
...
...
...
...
...
–
...
...
na
...
...
...
...
...
...
...
...
...
...
...
...
...
...
...
...
...
...
6
...
...
na
...
na
...
...
...
...
...
...
–
...
...
...
...
...
...
...
...
44
...
...
–
...
...
...
...
...
...
...
...
...
...
...
...
...
...
...
...
...
...
na
...
...
na
...
na
...
...
...
...
...
...
–
...
...
...
...
...
...
...
...
15
...
...
–
...
...
...
...
...
...
...
...
...
...
...
...
...
...
...
...
...
...
na
...
...
na
...
na
...
ServicesNot Known or
Unspecified
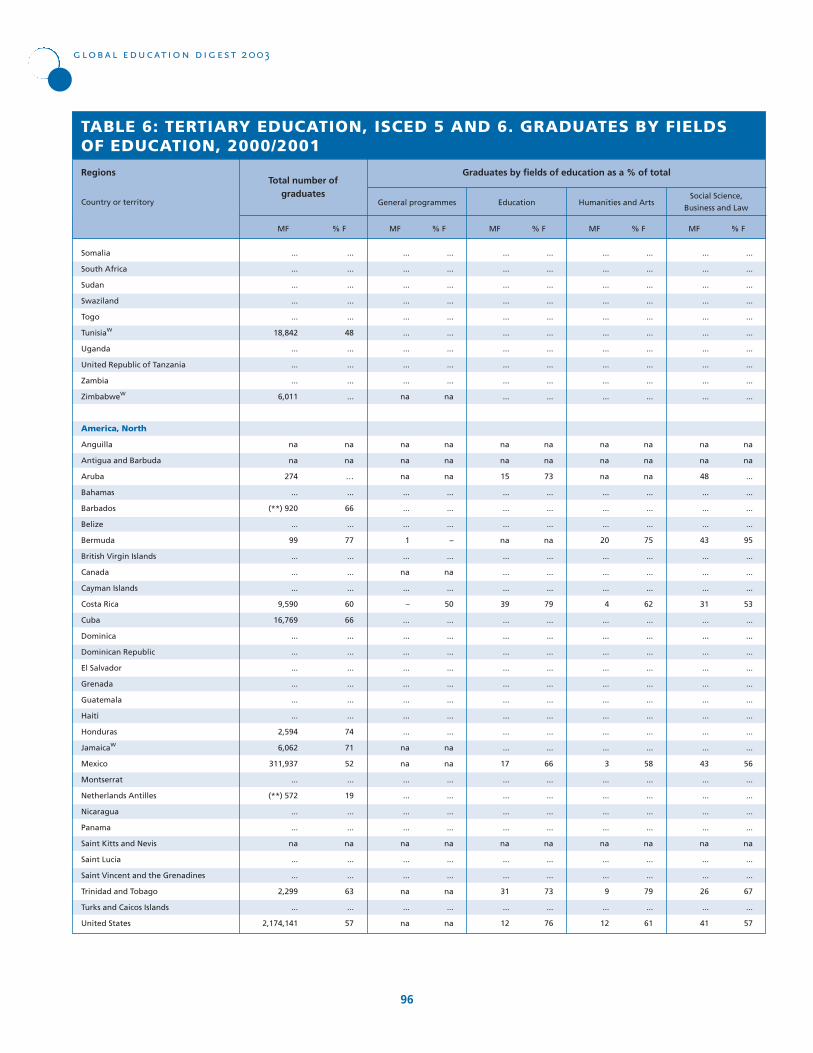
MF
...
...
...
...
...
48
...
...
...
...
na
na
…
...
66
...
77
...
...
...
60
66
...
...
...
...
...
...
74
71
52
...
19
...
...
na
...
...
63
...
57
% F
TABLE 6: TERTIARY EDUCATION, ISCED 5 AND 6. GRADUATES BY FIELDSOF EDUCATION, 2000/2001
Somalia
South Africa
Sudan
Swaziland
Togo
Tunisiaw
Uganda
United Republic of Tanzania
Zambia
Zimbabwew
America, North
Anguilla
Antigua and Barbuda
Aruba
Bahamas
Barbados
Belize
Bermuda
British Virgin Islands
Canada
Cayman Islands
Costa Rica
Cuba
Dominica
Dominican Republic
El Salvador
Grenada
Guatemala
Haiti
Honduras
Jamaicaw
Mexico
Montserrat
Netherlands Antilles
Nicaragua
Panama
Saint Kitts and Nevis
Saint Lucia
Saint Vincent and the Grenadines
Trinidad and Tobago
Turks and Caicos Islands
United States
Regions
Country or territory
global education digest 2003
96
...
...
...
...
...
18,842
...
...
...
6,011
na
na
274
...
(**) 920
...
99
...
...
...
9,590
16,769
...
...
...
...
...
...
2,594
6,062
311,937
...
(**) 572
...
...
na
...
...
2,299
...
2,174,141
MF
...
...
...
...
...
...
...
...
...
na
na
na
na
...
...
...
–
...
na
...
50
...
...
...
...
...
...
...
...
na
na
...
...
...
...
na
...
...
na
...
na
% F MF % F MF % F MF % F
General programmes
...
...
...
...
...
...
...
...
...
na
na
na
na
...
...
...
1
...
na
...
–
...
...
...
...
...
...
...
...
na
na
...
...
...
...
na
...
...
na
...
na
...
...
...
...
...
...
...
...
...
...
na
na
73
...
...
...
na
...
...
...
79
...
...
...
...
...
...
...
...
...
66
...
...
...
...
na
...
...
73
...
76
...
...
...
...
...
...
...
...
...
...
na
na
15
...
...
...
na
...
...
...
39
...
...
...
...
...
...
...
...
...
17
...
...
...
...
na
...
...
31
...
12
...
...
...
...
...
...
...
...
...
...
na
na
na
...
...
...
75
...
...
...
62
...
...
...
...
...
...
...
...
...
58
...
...
...
...
na
...
...
79
...
61
...
...
...
...
...
...
...
...
...
...
na
na
na
...
...
...
20
...
...
...
4
...
...
...
...
...
...
...
...
...
3
...
...
...
...
na
...
...
9
...
12
...
...
...
...
...
...
...
...
...
...
na
na
...
...
...
...
95
...
...
...
53
...
...
...
...
...
...
...
...
...
56
...
...
...
...
na
...
...
67
...
57
...
...
...
...
...
...
...
...
...
...
na
na
48
...
...
...
43
...
...
...
31
...
...
...
...
...
...
...
...
...
43
...
...
...
...
na
...
...
26
...
41
Total number of graduates
Graduates by fields of education as a % of total
Education Humanities and ArtsSocial Science,
Business and Law
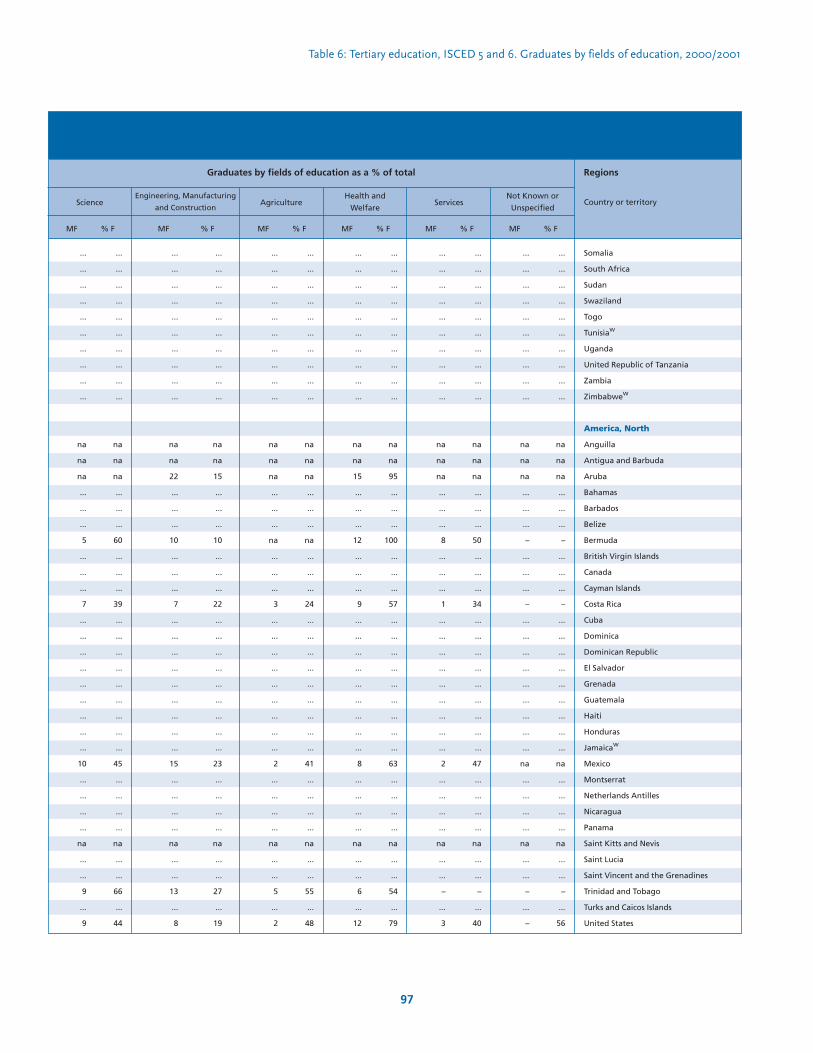
97
Table 6: Tertiary education, ISCED 5 and 6. Graduates by fields of education, 2000/2001
Somalia
South Africa
Sudan
Swaziland
Togo
Tunisiaw
Uganda
United Republic of Tanzania
Zambia
Zimbabwew
America, North
Anguilla
Antigua and Barbuda
Aruba
Bahamas
Barbados
Belize
Bermuda
British Virgin Islands
Canada
Cayman Islands
Costa Rica
Cuba
Dominica
Dominican Republic
El Salvador
Grenada
Guatemala
Haiti
Honduras
Jamaicaw
Mexico
Montserrat
Netherlands Antilles
Nicaragua
Panama
Saint Kitts and Nevis
Saint Lucia
Saint Vincent and the Grenadines
Trinidad and Tobago
Turks and Caicos Islands
United States
Regions
Country or territory
MF
...
...
...
...
...
...
...
...
...
...
na
na
na
...
...
...
60
...
...
...
39
...
...
...
...
...
...
...
...
...
45
...
...
...
...
na
...
...
66
...
44
% F MF % F MF % F MF % F
Science
...
...
...
...
...
...
...
...
...
...
na
na
na
...
...
...
5
...
...
...
7
...
...
...
...
...
...
...
...
...
10
...
...
...
...
na
...
...
9
...
9
...
...
...
...
...
...
...
...
...
...
na
na
15
...
...
...
10
...
...
...
22
...
...
...
...
...
...
...
...
...
23
...
...
...
...
na
...
...
27
...
19
...
...
...
...
...
...
...
...
...
...
na
na
22
...
...
...
10
...
...
...
7
...
...
...
...
...
...
...
...
...
15
...
...
...
...
na
...
...
13
...
8
...
...
...
...
...
...
...
...
...
...
na
na
na
...
...
...
na
...
...
...
24
...
...
...
...
...
...
...
...
...
41
...
...
...
...
na
...
...
55
...
48
...
...
...
...
...
...
...
...
...
...
na
na
na
...
...
...
na
...
...
...
3
...
...
...
...
...
...
...
...
...
2
...
...
...
...
na
...
...
5
...
2
...
...
...
...
...
...
...
...
...
...
na
na
95
...
...
...
100
...
...
...
57
...
...
...
...
...
...
...
...
...
63
...
...
...
...
na
...
...
54
...
79
...
...
...
...
...
...
...
...
...
...
na
na
15
...
...
...
12
...
...
...
9
...
...
...
...
...
...
...
...
...
8
...
...
...
...
na
...
...
6
...
12
Graduates by fields of education as a % of total
Engineering, Manufacturing
and ConstructionAgriculture
Health and
Welfare
MF % F MF % F
...
...
...
...
...
...
...
...
...
...
na
na
na
...
...
...
50
...
...
...
34
...
...
...
...
...
...
...
...
...
47
...
...
...
...
na
...
...
–
...
40
...
...
...
...
...
...
...
...
...
...
na
na
na
...
...
...
8
...
...
...
1
...
...
...
...
...
...
...
...
...
2
...
...
...
...
na
...
...
–
...
3
...
...
...
...
...
...
...
...
...
...
na
na
na
...
...
...
–
...
...
...
–
...
...
...
...
...
...
...
...
...
na
...
...
...
...
na
...
...
–
...
56
...
...
...
...
...
...
...
...
...
...
na
na
na
...
...
...
–
...
...
...
–
...
...
...
...
...
...
...
...
...
na
...
...
...
...
na
...
...
–
...
–
ServicesNot Known or
Unspecified
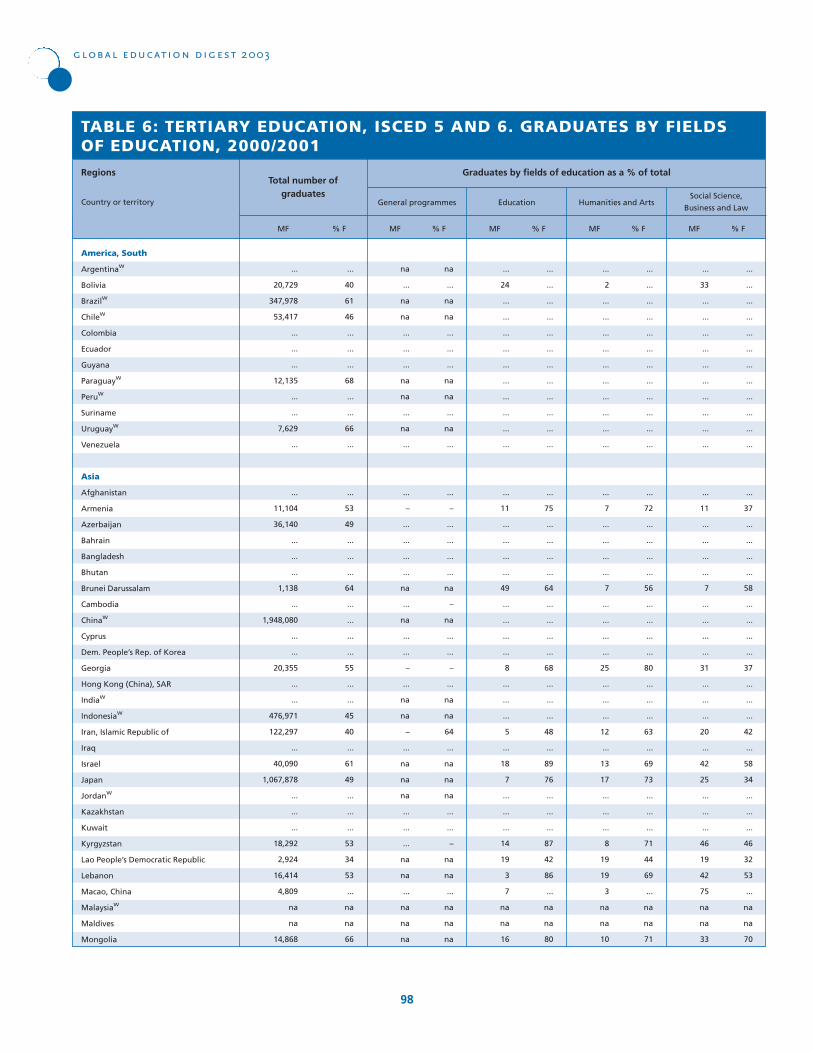
MF
...
40
61
46
...
...
...
68
...
...
66
...
...
53
49
...
...
...
64
...
...
...
...
55
...
...
45
40
...
61
49
...
...
...
53
34
53
...
na
na
66
% F
TABLE 6: TERTIARY EDUCATION, ISCED 5 AND 6. GRADUATES BY FIELDSOF EDUCATION, 2000/2001
America, South
Argentinaw
Bolivia
Brazilw
Chilew
Colombia
Ecuador
Guyana
Paraguayw
Peruw
Suriname
Uruguayw
Venezuela
Asia
Afghanistan
Armenia
Azerbaijan
Bahrain
Bangladesh
Bhutan
Brunei Darussalam
Cambodia
Chinaw
Cyprus
Dem. People’s Rep. of Korea
Georgia
Hong Kong (China), SAR
Indiaw
Indonesiaw
Iran, Islamic Republic of
Iraq
Israel
Japan
Jordanw
Kazakhstan
Kuwait
Kyrgyzstan
Lao People’s Democratic Republic
Lebanon
Macao, China
Malaysiaw
Maldives
Mongolia
Regions
Country or territory
global education digest 2003
98
...
20,729
347,978
53,417
...
...
...
12,135
...
...
7,629
...
...
11,104
36,140
...
...
...
1,138
...
1,948,080
...
...
20,355
...
...
476,971
122,297
...
40,090
1,067,878
...
...
...
18,292
2,924
16,414
4,809
na
na
14,868
MF
na
...
na
na
...
...
...
na
na
...
na
...
...
–
...
...
...
...
na
–
na
...
...
–
...
na
na
64
...
na
na
na
...
...
–
na
na
...
na
na
na
% F MF % F MF % F MF % F
General programmes
na
...
na
na
...
...
...
na
na
...
na
...
...
–
...
...
...
...
na
...
na
...
...
–
...
na
na
–
...
na
na
na
...
...
...
na
na
...
na
na
na
...
...
...
...
...
...
...
...
...
...
...
...
...
75
...
...
...
...
64
...
...
...
...
68
...
...
...
48
...
89
76
...
...
...
87
42
86
...
na
na
80
...
24
...
...
...
...
...
...
...
...
...
...
...
11
...
...
...
...
49
...
...
...
...
8
...
...
...
5
...
18
7
...
...
...
14
19
3
7
na
na
16
...
...
...
...
...
...
...
...
...
...
...
...
...
72
...
...
...
...
56
...
...
...
...
80
...
...
...
63
...
69
73
...
...
...
71
44
69
...
na
na
71
...
2
...
...
...
...
...
...
...
...
...
...
...
7
...
...
...
...
7
...
...
...
...
25
...
...
...
12
...
13
17
...
...
...
8
19
19
3
na
na
10
...
...
...
...
...
...
...
...
...
...
...
...
...
37
...
...
...
...
58
...
...
...
...
37
...
...
...
42
...
58
34
...
...
...
46
32
53
...
na
na
70
...
33
...
...
...
...
...
...
...
...
...
...
...
11
...
...
...
...
7
...
...
...
...
31
...
...
...
20
...
42
25
...
...
...
46
19
42
75
na
na
33
Total number of graduates
Graduates by fields of education as a % of total
Education Humanities and ArtsSocial Science,
Business and Law
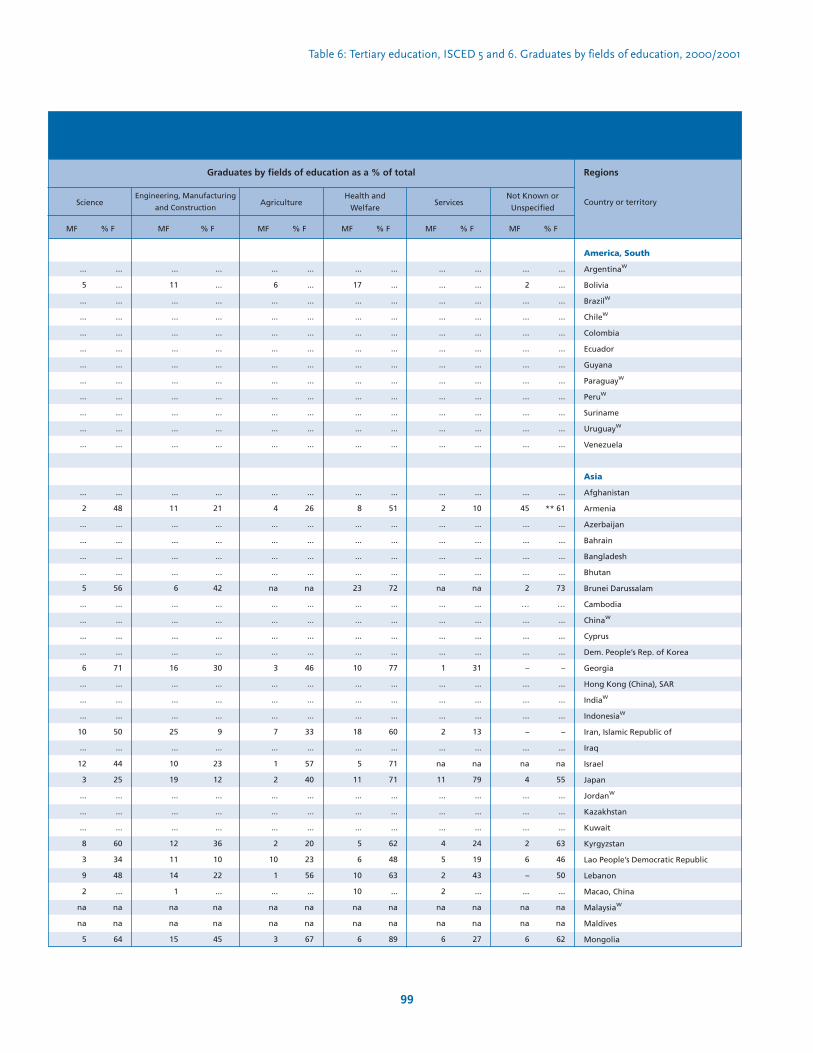
99
Table 6: Tertiary education, ISCED 5 and 6. Graduates by fields of education, 2000/2001
America, South
Argentinaw
Bolivia
Brazilw
Chilew
Colombia
Ecuador
Guyana
Paraguayw
Peruw
Suriname
Uruguayw
Venezuela
Asia
Afghanistan
Armenia
Azerbaijan
Bahrain
Bangladesh
Bhutan
Brunei Darussalam
Cambodia
Chinaw
Cyprus
Dem. People’s Rep. of Korea
Georgia
Hong Kong (China), SAR
Indiaw
Indonesiaw
Iran, Islamic Republic of
Iraq
Israel
Japan
Jordanw
Kazakhstan
Kuwait
Kyrgyzstan
Lao People’s Democratic Republic
Lebanon
Macao, China
Malaysiaw
Maldives
Mongolia
Regions
Country or territory
MF
...
...
...
...
...
...
...
...
...
...
...
...
...
48
...
...
...
...
56
...
...
...
...
71
...
...
...
50
...
44
25
...
...
...
60
34
48
...
na
na
64
% F MF % F MF % F MF % F
Science
...
5
...
...
...
...
...
...
...
...
...
...
...
2
...
...
...
...
5
...
...
...
...
6
...
...
...
10
...
12
3
...
...
...
8
3
9
2
na
na
5
...
...
...
...
...
...
...
...
...
...
...
...
...
21
...
...
...
...
42
...
...
...
...
30
...
...
...
9
...
23
12
...
...
...
36
10
22
...
na
na
45
...
11
...
...
...
...
...
...
...
...
...
...
...
11
...
...
...
...
6
...
...
...
...
16
...
...
...
25
...
10
19
...
...
...
12
11
14
1
na
na
15
...
...
...
...
...
...
...
...
...
...
...
...
...
26
...
...
...
...
na
...
...
...
...
46
...
...
...
33
...
57
40
...
...
...
20
23
56
...
na
na
67
...
6
...
...
...
...
...
...
...
...
...
...
...
4
...
...
...
...
na
...
...
...
...
3
...
...
...
7
...
1
2
...
...
...
2
10
1
...
na
na
3
...
...
...
...
...
...
...
...
...
...
...
...
...
51
...
...
...
...
72
...
...
...
...
77
...
...
...
60
...
71
71
...
...
...
62
48
63
...
na
na
89
...
17
...
...
...
...
...
...
...
...
...
...
...
8
...
...
...
...
23
...
...
...
...
10
...
...
...
18
...
5
11
...
...
...
5
6
10
10
na
na
6
Graduates by fields of education as a % of total
Engineering, Manufacturing
and ConstructionAgriculture
Health and
Welfare
MF % F MF % F
...
...
...
...
...
...
...
...
...
...
...
...
...
10
...
...
...
...
na
...
...
...
...
31
...
...
...
13
...
na
79
...
...
...
24
19
43
...
na
na
27
...
...
...
...
...
...
...
...
...
...
...
...
...
2
...
...
...
...
na
...
...
...
...
1
...
...
...
2
...
na
11
...
...
...
4
5
2
2
na
na
6
...
...
...
...
...
...
...
...
...
...
...
...
...
** 61
...
...
...
...
73
…
...
...
...
–
...
...
...
–
...
na
55
...
...
...
63
46
50
...
na
na
62
...
2
...
...
...
...
...
...
...
...
...
...
...
45
...
...
...
...
2
…
...
...
...
–
...
...
...
–
...
na
4
...
...
...
2
6
–
...
na
na
6
ServicesNot Known or
Unspecified
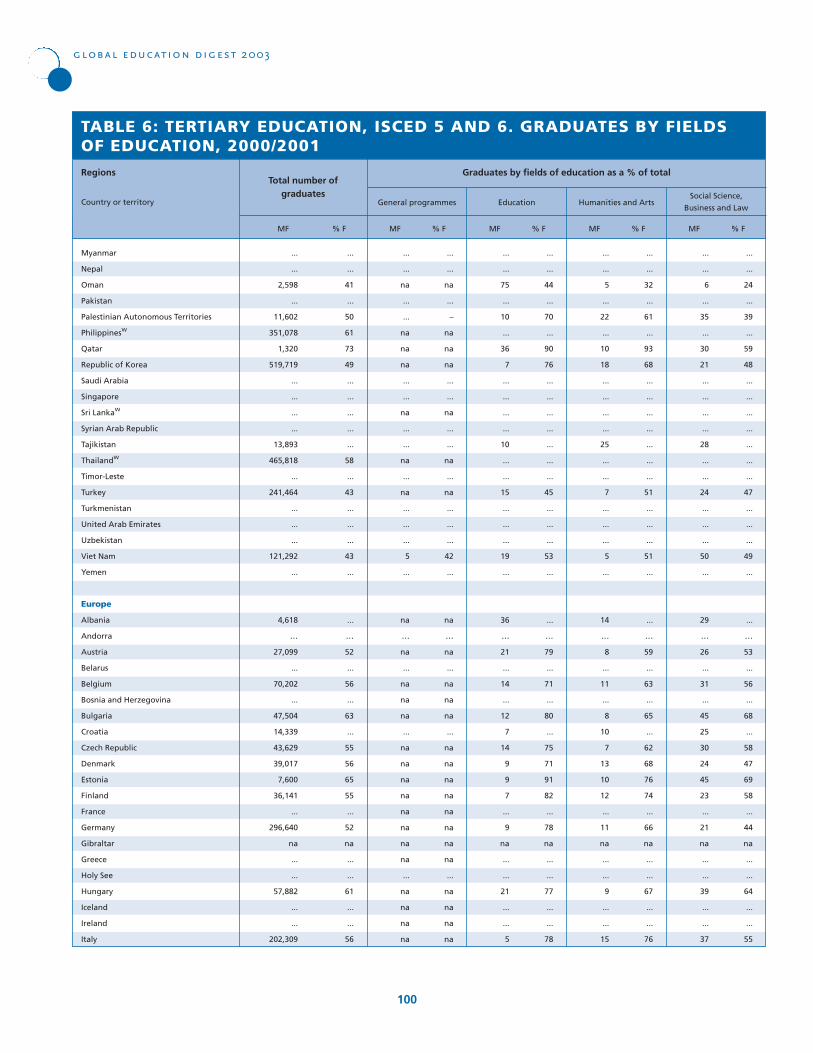
MF
...
...
41
...
50
61
73
49
...
...
...
...
...
58
...
43
...
...
...
43
...
...
…
52
...
56
...
63
...
55
56
65
55
...
52
na
...
...
61
...
...
56
% F
TABLE 6: TERTIARY EDUCATION, ISCED 5 AND 6. GRADUATES BY FIELDSOF EDUCATION, 2000/2001
Myanmar
Nepal
Oman
Pakistan
Palestinian Autonomous Territories
Philippinesw
Qatar
Republic of Korea
Saudi Arabia
Singapore
Sri Lankaw
Syrian Arab Republic
Tajikistan
Thailandw
Timor-Leste
Turkey
Turkmenistan
United Arab Emirates
Uzbekistan
Viet Nam
Yemen
Europe
Albania
Andorra
Austria
Belarus
Belgium
Bosnia and Herzegovina
Bulgaria
Croatia
Czech Republic
Denmark
Estonia
Finland
France
Germany
Gibraltar
Greece
Holy See
Hungary
Iceland
Ireland
Italy
Regions
Country or territory
global education digest 2003
100
...
...
2,598
...
11,602
351,078
1,320
519,719
...
...
...
...
13,893
465,818
...
241,464
...
...
...
121,292
...
4,618
…
27,099
...
70,202
...
47,504
14,339
43,629
39,017
7,600
36,141
...
296,640
na
...
...
57,882
...
...
202,309
MF
...
...
na
...
–
na
na
na
...
...
na
...
...
na
...
na
...
...
...
42
...
na
…
na
...
na
na
na
...
na
na
na
na
na
na
na
na
...
na
na
na
na
% F MF % F MF % F MF % F
General programmes
...
...
na
...
...
na
na
na
...
...
na
...
...
na
...
na
...
...
...
5
...
na
…
na
...
na
na
na
...
na
na
na
na
na
na
na
na
...
na
na
na
na
...
...
44
...
70
...
90
76
...
...
...
...
...
...
...
45
...
...
...
53
...
...
…
79
...
71
...
80
...
75
71
91
82
...
78
na
...
...
77
...
...
78
...
...
75
...
10
...
36
7
...
...
...
...
10
...
...
15
...
...
...
19
...
36
…
21
...
14
...
12
7
14
9
9
7
...
9
na
...
...
21
...
...
5
...
...
32
...
61
...
93
68
...
...
...
...
...
...
...
51
...
...
...
51
...
...
…
59
...
63
...
65
...
62
68
76
74
...
66
na
...
...
67
...
...
76
...
...
5
...
22
...
10
18
...
...
...
...
25
...
...
7
...
...
...
5
...
14
…
8
...
11
...
8
10
7
13
10
12
...
11
na
...
...
9
...
...
15
...
...
24
...
39
...
59
48
...
...
...
...
...
...
...
47
...
...
...
49
...
...
…
53
...
56
...
68
...
58
47
69
58
...
44
na
...
...
64
...
...
55
...
...
6
...
35
...
30
21
...
...
...
...
28
...
...
24
...
...
...
50
...
29
…
26
...
31
...
45
25
30
24
45
23
...
21
na
...
...
39
...
...
37
Total number of graduates
Graduates by fields of education as a % of total
Education Humanities and ArtsSocial Science,
Business and Law
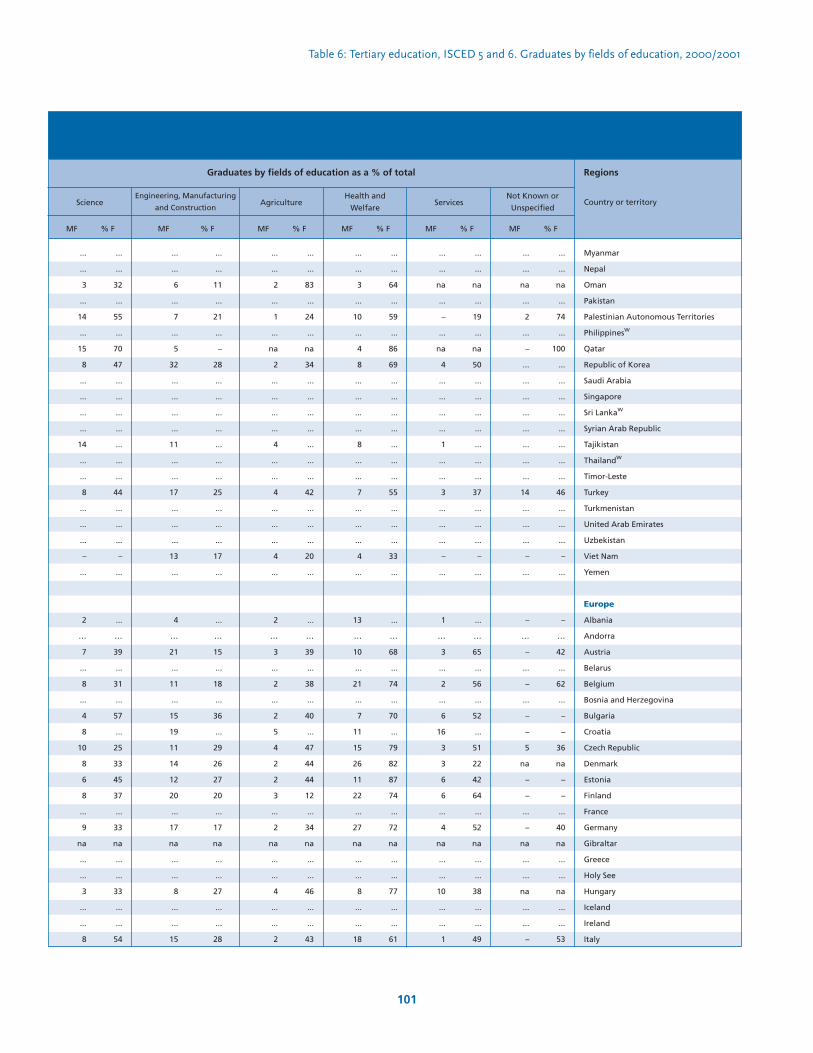
101
Table 6: Tertiary education, ISCED 5 and 6. Graduates by fields of education, 2000/2001
Myanmar
Nepal
Oman
Pakistan
Palestinian Autonomous Territories
Philippinesw
Qatar
Republic of Korea
Saudi Arabia
Singapore
Sri Lankaw
Syrian Arab Republic
Tajikistan
Thailandw
Timor-Leste
Turkey
Turkmenistan
United Arab Emirates
Uzbekistan
Viet Nam
Yemen
Europe
Albania
Andorra
Austria
Belarus
Belgium
Bosnia and Herzegovina
Bulgaria
Croatia
Czech Republic
Denmark
Estonia
Finland
France
Germany
Gibraltar
Greece
Holy See
Hungary
Iceland
Ireland
Italy
Regions
Country or territory
MF
...
...
32
...
55
...
70
47
...
...
...
...
...
...
...
44
...
...
...
–
...
...
…
39
...
31
...
57
...
25
33
45
37
...
33
na
...
...
33
...
...
54
% F MF % F MF % F MF % F
Science
...
...
3
...
14
...
15
8
...
...
...
...
14
...
...
8
...
...
...
–
...
2
…
7
...
8
...
4
8
10
8
6
8
...
9
na
...
...
3
...
...
8
...
...
11
...
21
...
–
28
...
...
...
...
...
...
...
25
...
...
...
17
...
...
…
15
...
18
...
36
...
29
26
27
20
...
17
na
...
...
27
...
...
28
...
...
6
...
7
...
5
32
...
...
...
...
11
...
...
17
...
...
...
13
...
4
…
21
...
11
...
15
19
11
14
12
20
...
17
na
...
...
8
...
...
15
...
...
83
...
24
...
na
34
...
...
...
...
...
...
...
42
...
...
...
20
...
...
…
39
...
38
...
40
...
47
44
44
12
...
34
na
...
...
46
...
...
43
...
...
2
...
1
...
na
2
...
...
...
...
4
...
...
4
...
...
...
4
...
2
…
3
...
2
...
2
5
4
2
2
3
...
2
na
...
...
4
...
...
2
...
...
64
...
59
...
86
69
...
...
...
...
...
...
...
55
...
...
...
33
...
...
…
68
...
74
...
70
...
79
82
87
74
...
72
na
...
...
77
...
...
61
...
...
3
...
10
...
4
8
...
...
...
...
8
...
...
7
...
...
...
4
...
13
…
10
...
21
...
7
11
15
26
11
22
...
27
na
...
...
8
...
...
18
Graduates by fields of education as a % of total
Engineering, Manufacturing
and ConstructionAgriculture
Health and
Welfare
MF % F MF % F
...
...
na
...
19
...
na
50
...
...
...
...
...
...
...
37
...
...
...
–
...
...
…
65
...
56
...
52
...
51
22
42
64
...
52
na
...
...
38
...
...
49
...
...
na
...
–
...
na
4
...
...
...
...
1
...
...
3
...
...
...
–
...
1
…
3
...
2
...
6
16
3
3
6
6
...
4
na
...
...
10
...
...
1
...
...
na
...
74
...
100
...
...
...
...
...
...
...
...
46
...
...
...
–
...
–
…
42
...
62
...
–
–
36
na
–
–
...
40
na
...
...
na
...
...
53
...
...
na
...
2
...
–
...
...
...
...
...
...
...
...
14
...
...
...
–
...
–
…
–
...
–
...
–
–
5
na
–
–
...
–
na
...
...
na
...
...
–
ServicesNot Known or
Unspecified
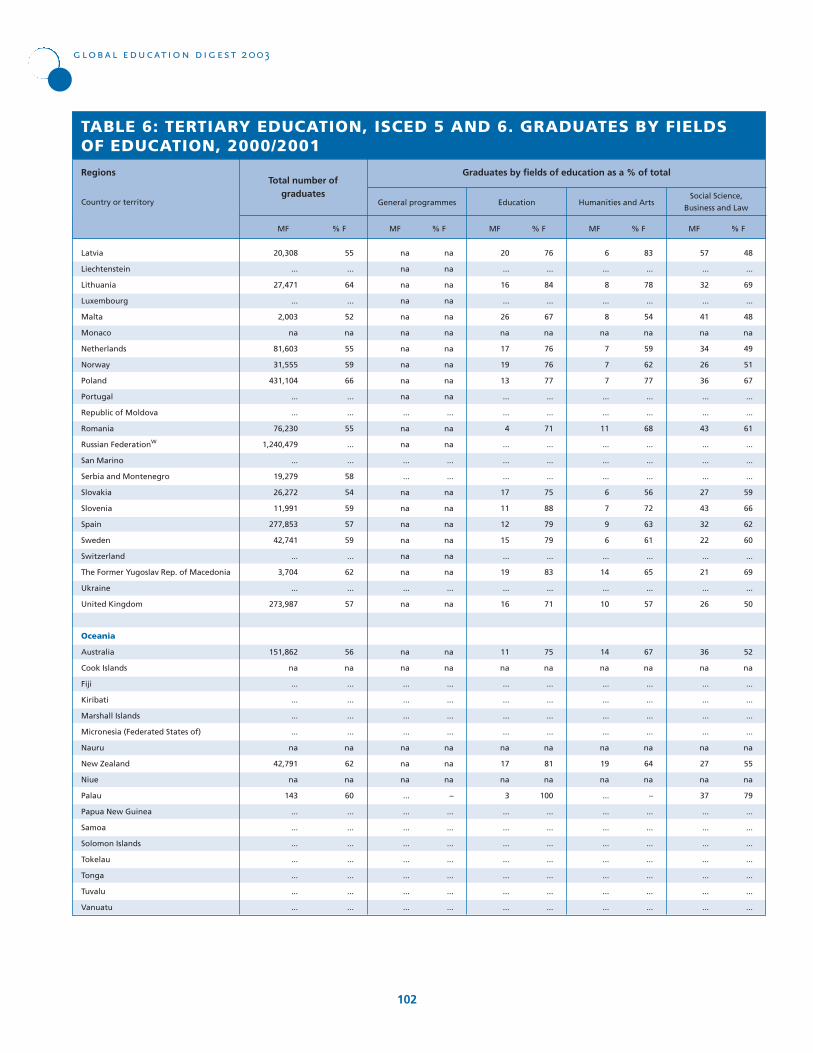
MF
55
...
64
...
52
na
55
59
66
...
...
55
...
...
58
54
59
57
59
...
62
...
57
56
na
...
...
...
...
na
62
na
60
...
...
...
...
...
...
...
% F
TABLE 6: TERTIARY EDUCATION, ISCED 5 AND 6. GRADUATES BY FIELDSOF EDUCATION, 2000/2001
Latvia
Liechtenstein
Lithuania
Luxembourg
Malta
Monaco
Netherlands
Norway
Poland
Portugal
Republic of Moldova
Romania
Russian Federationw
San Marino
Serbia and Montenegro
Slovakia
Slovenia
Spain
Sweden
Switzerland
The Former Yugoslav Rep. of Macedonia
Ukraine
United Kingdom
Oceania
Australia
Cook Islands
Fiji
Kiribati
Marshall Islands
Micronesia (Federated States of)
Nauru
New Zealand
Niue
Palau
Papua New Guinea
Samoa
Solomon Islands
Tokelau
Tonga
Tuvalu
Vanuatu
Regions
Country or territory
global education digest 2003
102
20,308
...
27,471
...
2,003
na
81,603
31,555
431,104
...
...
76,230
1,240,479
...
19,279
26,272
11,991
277,853
42,741
...
3,704
...
273,987
151,862
na
...
...
...
...
na
42,791
na
143
...
...
...
...
...
...
...
MF
na
na
na
na
na
na
na
na
na
na
...
na
na
...
...
na
na
na
na
na
na
...
na
na
na
...
...
...
...
na
na
na
–
...
...
...
...
...
...
...
% F MF % F MF % F MF % F
General programmes
na
na
na
na
na
na
na
na
na
na
...
na
na
...
...
na
na
na
na
na
na
...
na
na
na
...
...
...
...
na
na
na
...
...
...
...
...
...
...
...
76
...
84
...
67
na
76
76
77
...
...
71
...
...
...
75
88
79
79
...
83
...
71
75
na
...
...
...
...
na
81
na
100
...
...
...
...
...
...
...
20
...
16
...
26
na
17
19
13
...
...
4
...
...
...
17
11
12
15
...
19
...
16
11
na
...
...
...
...
na
17
na
3
...
...
...
...
...
...
...
83
...
78
...
54
na
59
62
77
...
...
68
...
...
...
56
72
63
61
...
65
...
57
67
na
...
...
...
...
na
64
na
–
...
...
...
...
...
...
...
6
...
8
...
8
na
7
7
7
...
...
11
...
...
...
6
7
9
6
...
14
...
10
14
na
...
...
...
...
na
19
na
...
...
...
...
...
...
...
...
48
...
69
...
48
na
49
51
67
...
...
61
...
...
...
59
66
62
60
...
69
...
50
52
na
...
...
...
...
na
55
na
79
...
...
...
...
...
...
...
57
...
32
...
41
na
34
26
36
...
...
43
...
...
...
27
43
32
22
...
21
...
26
36
na
...
...
...
...
na
27
na
37
...
...
...
...
...
...
...
Total number of graduates
Graduates by fields of education as a % of total
Education Humanities and ArtsSocial Science,
Business and Law

103
Table 6: Tertiary education, ISCED 5 and 6. Graduates by fields of education, 2000/2001
Latvia
Liechtenstein
Lithuania
Luxembourg
Malta
Monaco
Netherlands
Norway
Poland
Portugal
Republic of Moldova
Romania
Russian Federationw
San Marino
Serbia and Montenegro
Slovakia
Slovenia
Spain
Sweden
Switzerland
The Former Yugoslav Rep. of Macedonia
Ukraine
United Kingdom
Oceania
Australia
Cook Islands
Fiji
Kiribati
Marshall Islands
Micronesia (Federated States of)
Nauru
New Zealand
Niue
Palau
Papua New Guinea
Samoa
Solomon Islands
Tokelau
Tonga
Tuvalu
Vanuatu
Regions
Country or territory
MF
57
...
52
...
30
na
27
30
58
...
...
65
...
...
...
34
36
41
46
...
62
...
37
41
na
...
...
...
...
na
43
na
–
...
...
...
...
...
...
...
% F MF % F MF % F MF % F
Science
5
...
5
...
4
na
5
8
3
...
...
6
...
...
...
9
4
11
10
...
11
...
13
12
na
...
...
...
...
na
10
na
...
...
...
...
...
...
...
...
30
...
32
...
23
na
12
21
24
...
...
27
...
...
...
32
22
25
28
...
28
...
18
21
na
...
...
...
...
na
32
na
4
...
...
...
...
...
...
...
7
...
21
...
5
na
10
8
7
...
...
18
...
...
...
17
17
16
22
...
16
...
10
8
na
...
...
...
...
na
5
na
16
...
...
...
...
...
...
...
50
...
54
...
38
na
40
49
56
...
...
39
...
...
...
37
43
42
57
...
44
...
46
42
na
...
...
...
...
na
39
na
17
...
...
...
...
...
...
...
1
...
2
...
1
na
2
1
2
...
...
3
...
...
...
4
3
2
1
...
5
...
1
2
na
...
...
...
...
na
2
na
4
...
...
...
...
...
...
...
84
...
80
...
53
na
75
82
67
...
...
62
...
...
...
78
79
77
80
...
74
...
82
76
na
...
...
...
...
na
80
na
85
...
...
...
...
...
...
...
2
...
10
...
14
na
22
23
2
...
...
7
...
...
...
14
11
12
21
...
10
...
24
15
na
...
...
...
...
na
11
na
9
...
...
...
...
...
...
...
Graduates by fields of education as a % of total
Engineering, Manufacturing
and ConstructionAgriculture
Health and
Welfare
MF % F MF % F
33
...
53
...
43
na
54
38
49
...
...
57
...
...
...
29
35
58
59
...
40
...
56
51
na
...
...
...
...
na
66
na
50
...
...
...
...
...
...
...
3
...
5
...
–
na
3
3
3
...
...
4
...
...
...
7
5
5
2
...
4
...
1
3
na
...
...
...
...
na
6
na
10
...
...
...
...
...
...
...
–
...
–
...
–
na
41
55
70
...
...
44
...
...
...
na
–
38
na
...
–
...
–
–
na
...
...
...
...
na
54
na
67
...
...
...
...
...
...
...
–
...
–
...
–
na
–
4
27
...
...
3
...
...
...
na
–
–
na
...
–
...
–
–
na
...
...
...
...
na
2
na
21
...
...
...
...
...
...
...
ServicesNot Known or
Unspecified
Symbols and Footnotes
** UIS estimation
w These countries are part of the World Education Indicators programme (WEI), and are not required to provide graduates by field of education
... Missing Value
– Magnitude Nil or Negligible
na Category Not Applicable
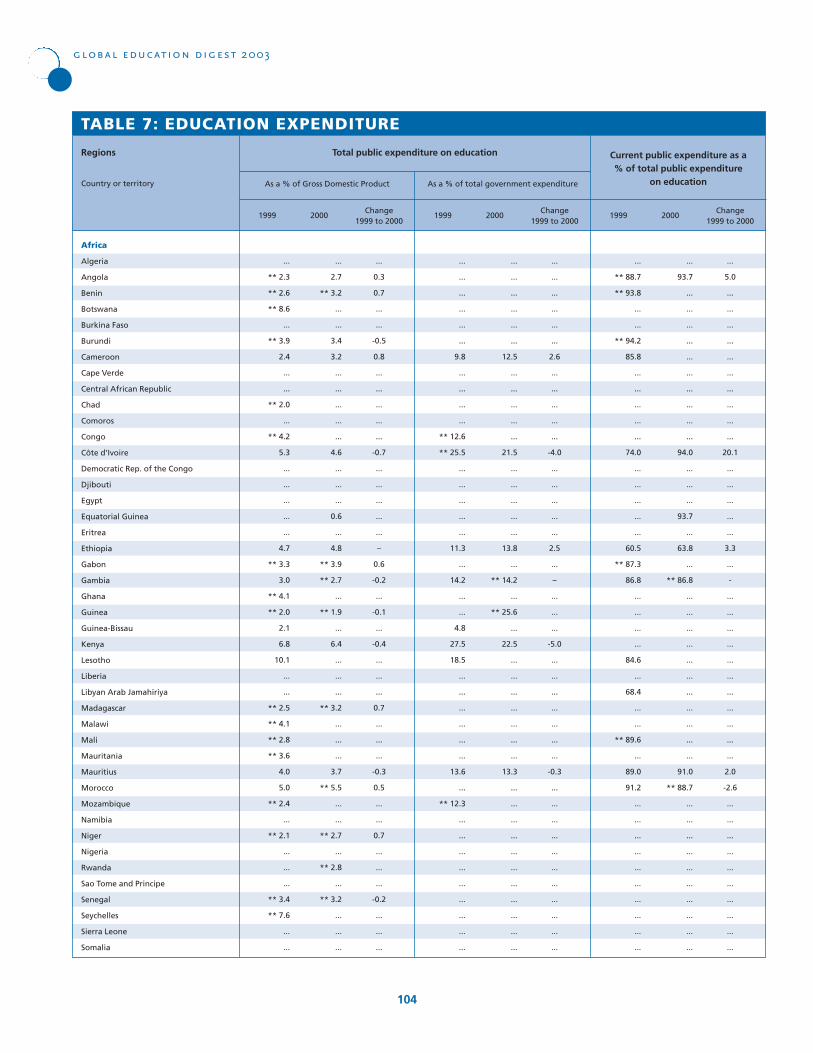
...
2.7
** 3.2
...
...
3.4
3.2
...
...
...
...
...
4.6
...
...
...
0.6
...
4.8
** 3.9
** 2.7
...
** 1.9
...
6.4
...
...
...
** 3.2
...
...
...
3.7
** 5.5
...
...
** 2.7
...
** 2.8
...
** 3.2
...
...
...
...
0.3
0.7
...
...
-0.5
0.8
...
...
...
...
...
-0.7
...
...
...
...
...
–
0.6
-0.2
...
-0.1
...
-0.4
...
...
...
0.7
...
...
...
-0.3
0.5
...
...
0.7
...
...
...
-0.2
...
...
...
TABLE 7: EDUCATION EXPENDITURE
Africa
Algeria
Angola
Benin
Botswana
Burkina Faso
Burundi
Cameroon
Cape Verde
Central African Republic
Chad
Comoros
Congo
Côte d’Ivoire
Democratic Rep. of the Congo
Djibouti
Egypt
Equatorial Guinea
Eritrea
Ethiopia
Gabon
Gambia
Ghana
Guinea
Guinea-Bissau
Kenya
Lesotho
Liberia
Libyan Arab Jamahiriya
Madagascar
Malawi
Mali
Mauritania
Mauritius
Morocco
Mozambique
Namibia
Niger
Nigeria
Rwanda
Sao Tome and Principe
Senegal
Seychelles
Sierra Leone
Somalia
Regions
Country or territory As a % of Gross Domestic Product
global education digest 2003
104
...
** 2.3
** 2.6
** 8.6
...
** 3.9
2.4
...
...
** 2.0
...
** 4.2
5.3
...
...
...
...
...
4.7
** 3.3
3.0
** 4.1
** 2.0
2.1
6.8
10.1
...
...
** 2.5
** 4.1
** 2.8
** 3.6
4.0
5.0
** 2.4
...
** 2.1
...
...
...
** 3.4
** 7.6
...
...
Total public expenditure on education Current public expenditure as a% of total public expenditure
on education
Change 1999 to 2000
1999 2000
...
...
...
...
...
...
12.5
...
...
...
...
...
21.5
...
...
...
...
...
13.8
...
** 14.2
...
** 25.6
...
22.5
...
...
...
...
...
...
...
13.3
...
...
...
...
...
...
...
...
...
...
...
...
...
...
...
...
...
2.6
...
...
...
...
...
-4.0
...
...
...
...
...
2.5
...
–
...
...
...
-5.0
...
...
...
...
...
...
...
-0.3
...
...
...
...
...
...
...
...
...
...
...
As a % of total government expenditure
...
...
...
...
...
...
9.8
...
...
...
...
** 12.6
** 25.5
...
...
...
...
...
11.3
...
14.2
...
...
4.8
27.5
18.5
...
...
...
...
...
...
13.6
...
** 12.3
...
...
...
...
...
...
...
...
...
Change 1999 to 2000
1999 2000
...
93.7
...
...
...
...
...
...
...
...
...
...
94.0
...
...
...
93.7
...
63.8
...
** 86.8
...
...
...
...
...
...
...
...
...
...
...
91.0
** 88.7
...
...
...
...
...
...
...
...
...
...
...
5.0
...
...
...
...
...
...
...
...
...
...
20.1
...
...
...
...
...
3.3
...
-
...
...
...
...
...
...
...
...
...
...
...
2.0
-2.6
...
...
...
...
...
...
...
...
...
...
...
** 88.7
** 93.8
...
...
** 94.2
85.8
...
...
...
...
...
74.0
...
...
...
...
...
60.5
** 87.3
86.8
...
...
...
...
84.6
...
68.4
...
...
** 89.6
...
89.0
91.2
...
...
...
...
...
...
...
...
...
...
Change 1999 to 2000
1999 2000

Table 7: Education Expenditure
105
Regions
Country or territory
Africa
Algeria
Angola
Benin
Botswana
Burkina Faso
Burundi
Cameroon
Cape Verde
Central African Republic
Chad
Comoros
Congo
Côte d’Ivoire
Democratic Rep. of the Congo
Djibouti
Egypt
Equatorial Guinea
Eritrea
Ethiopia
Gabon
Gambia
Ghana
Guinea
Guinea-Bissau
Kenya
Lesotho
Liberia
Libyan Arab Jamahiriya
Madagascar
Malawi
Mali
Mauritania
Mauritius
Morocco
Mozambique
Namibia
Niger
Nigeria
Rwanda
Sao Tome and Principe
Senegal
Seychelles
Sierra Leone
Somalia
...
...
...
...
...
...
...
...
...
...
...
...
...
...
...
...
...
...
...
...
...
...
...
...
...
...
...
...
...
...
...
...
...
na
...
...
...
...
...
...
...
...
...
...
...
...
...
...
...
...
...
...
...
...
...
...
...
...
...
...
...
...
...
...
...
...
...
...
...
...
...
...
...
...
...
...
...
** 48.0
...
...
...
...
...
...
...
...
...
...
...
...
...
...
...
...
...
...
...
...
...
...
...
...
...
...
...
...
...
...
...
...
...
...
...
...
...
...
...
...
...
...
...
** 50.6
...
...
...
...
...
...
...
...
...
...
...
...
...
...
...
...
...
...
...
...
...
...
...
...
...
...
...
...
...
...
...
...
...
...
...
...
...
...
...
...
...
...
...
** 1.0
...
...
...
...
...
...
...
...
...
...
...
...
...
...
...
...
...
...
...
...
...
...
...
...
...
...
...
...
...
...
...
...
...
...
...
...
...
...
...
...
...
...
...
** 0.4
...
...
...
...
...
...
...
...
...
...
...
...
...
...
...
...
...
...
...
...
...
...
...
...
...
...
...
...
...
...
...
...
...
...
...
...
...
...
...
...
...
...
...
–
...
...
...
...
...
...
...
...
...
...
2000/2001
Current public expenditure on education by ISCED levels as a % of total current expenditure on education
ISCED 0 Pre-primary
ISCED 1Primary
ISCED 2 and 3Secondary
ISCED 4 Post-secondary non-tertiary
ISCED 5 and 6Tertiary
NotAllocated
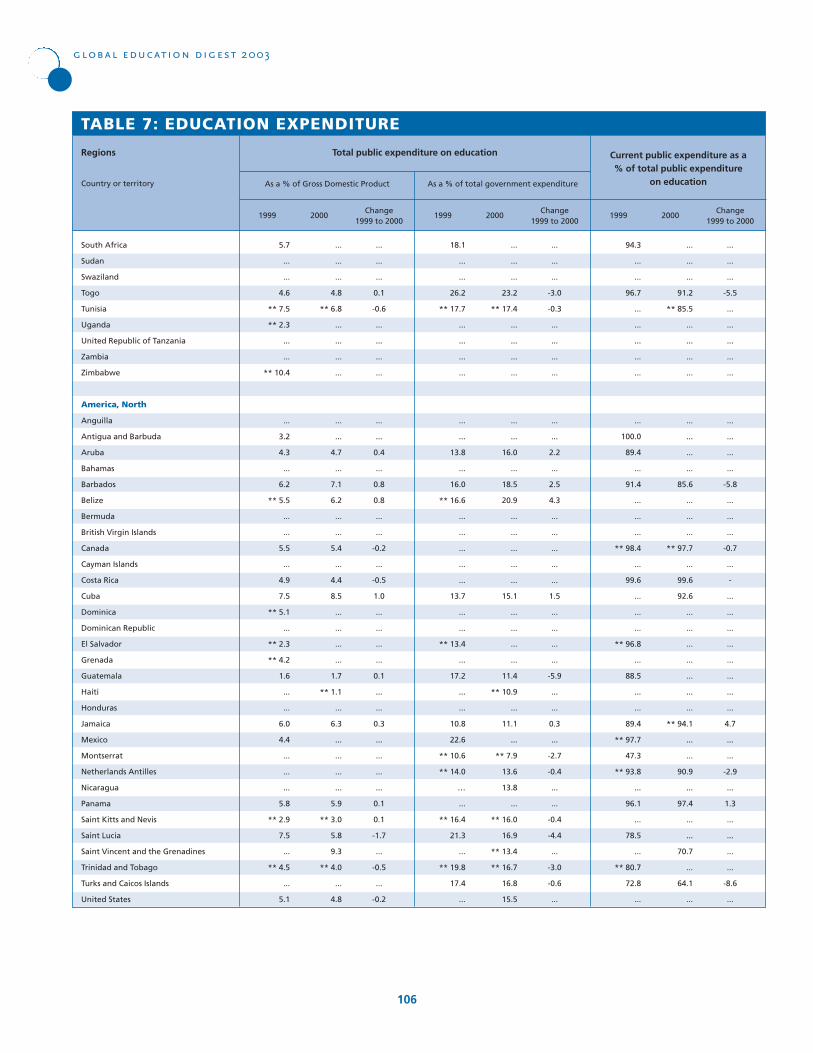
...
...
...
4.8
** 6.8
...
...
...
...
...
...
4.7
...
7.1
6.2
...
...
5.4
...
4.4
8.5
...
...
...
...
1.7
** 1.1
...
6.3
...
...
...
...
5.9
** 3.0
5.8
9.3
** 4.0
...
4.8
...
...
...
0.1
-0.6
...
...
...
...
...
...
0.4
...
0.8
0.8
...
...
-0.2
...
-0.5
1.0
...
...
...
...
0.1
...
...
0.3
...
...
...
...
0.1
0.1
-1.7
...
-0.5
...
-0.2
TABLE 7: EDUCATION EXPENDITURE
South Africa
Sudan
Swaziland
Togo
Tunisia
Uganda
United Republic of Tanzania
Zambia
Zimbabwe
America, North
Anguilla
Antigua and Barbuda
Aruba
Bahamas
Barbados
Belize
Bermuda
British Virgin Islands
Canada
Cayman Islands
Costa Rica
Cuba
Dominica
Dominican Republic
El Salvador
Grenada
Guatemala
Haiti
Honduras
Jamaica
Mexico
Montserrat
Netherlands Antilles
Nicaragua
Panama
Saint Kitts and Nevis
Saint Lucia
Saint Vincent and the Grenadines
Trinidad and Tobago
Turks and Caicos Islands
United States
Regions
Country or territory As a % of Gross Domestic Product
global education digest 2003
106
5.7
...
...
4.6
** 7.5
** 2.3
...
...
** 10.4
...
3.2
4.3
...
6.2
** 5.5
...
...
5.5
...
4.9
7.5
** 5.1
...
** 2.3
** 4.2
1.6
...
...
6.0
4.4
...
...
...
5.8
** 2.9
7.5
...
** 4.5
...
5.1
Total public expenditure on education Current public expenditure as a% of total public expenditure
on education
Change 1999 to 2000
1999 2000
...
...
...
23.2
** 17.4
...
...
...
...
...
...
16.0
...
18.5
20.9
...
...
...
...
...
15.1
...
...
...
...
11.4
** 10.9
...
11.1
...
** 7.9
13.6
13.8
...
** 16.0
16.9
** 13.4
** 16.7
16.8
15.5
...
...
...
-3.0
-0.3
...
...
...
...
...
...
2.2
...
2.5
4.3
...
...
...
...
...
1.5
...
...
...
...
-5.9
...
...
0.3
...
-2.7
-0.4
...
...
-0.4
-4.4
...
-3.0
-0.6
...
As a % of total government expenditure
18.1
...
...
26.2
** 17.7
...
...
...
...
...
...
13.8
...
16.0
** 16.6
...
...
...
...
...
13.7
...
...
** 13.4
...
17.2
...
...
10.8
22.6
** 10.6
** 14.0
…
...
** 16.4
21.3
...
** 19.8
17.4
...
Change 1999 to 2000
1999 2000
...
...
...
91.2
** 85.5
...
...
...
...
...
...
...
...
85.6
...
...
...
** 97.7
...
99.6
92.6
...
...
...
...
...
...
...
** 94.1
...
...
90.9
...
97.4
...
...
70.7
...
64.1
...
...
...
...
-5.5
...
...
...
...
...
...
...
...
...
-5.8
...
...
...
-0.7
...
-
...
...
...
...
...
...
...
...
4.7
...
...
-2.9
...
1.3
...
...
...
...
-8.6
...
94.3
...
...
96.7
...
...
...
...
...
...
100.0
89.4
...
91.4
...
...
...
** 98.4
...
99.6
...
...
...
** 96.8
...
88.5
...
...
89.4
** 97.7
47.3
** 93.8
...
96.1
...
78.5
...
** 80.7
72.8
...
Change 1999 to 2000
1999 2000

Table 7: Education Expenditure
107
Regions
Country or territory
South Africa
Sudan
Swaziland
Togo
Tunisia
Uganda
United Republic of Tanzania
Zambia
Zimbabwe
America, North
Anguilla
Antigua and Barbuda
Aruba
Bahamas
Barbados
Belize
Bermuda
British Virgin Islands
Canada
Cayman Islands
Costa Rica
Cuba
Dominica
Dominican Republic
El Salvador
Grenada
Guatemala
Haiti
Honduras
Jamaica
Mexico
Montserrat
Netherlands Antilles
Nicaragua
Panama
Saint Kitts and Nevis
Saint Lucia
Saint Vincent and the Grenadines
Trinidad and Tobago
Turks and Caicos Islands
United States
...
...
...
** 0.5
...
...
...
...
...
...
...
...
...
...
...
...
...
** 4.0
...
5.3
* 9.9
...
...
...
...
...
...
...
** 5.0
...
...
...
...
** 3.0
...
...
...
...
...
...
...
...
...
** 47.0
** 38.3
...
...
...
...
...
...
...
...
32.0
...
...
...
...
...
46.5
* 35.5
...
...
...
...
...
...
...
** 30.2
...
...
...
...
** 37.1
...
...
...
...
...
...
...
...
...
** 32.5
** 42.9
...
...
...
...
...
...
...
...
31.9
...
...
...
...
...
28.0
* 37.9
...
...
...
...
...
...
...
** 34.5
...
...
...
...
** 33.9
...
...
...
...
...
...
...
...
...
...
...
...
...
...
...
...
...
...
...
2.5
...
...
...
...
...
...
* 0.3
...
...
...
...
...
...
...
** 8.6
...
...
...
...
na
...
...
...
...
...
...
...
...
...
** 19.9
** 18.8
...
...
...
...
...
...
...
...
33.7
...
...
...
** 34.5
...
...
* 16.4
...
...
...
...
...
...
...
** 21.7
...
...
...
...
** 26.0
...
...
...
...
...
...
...
...
...
...
...
...
...
...
...
...
...
...
...
–
...
...
...
...
...
–
...
...
...
...
...
...
...
...
–
...
...
...
...
–
...
...
...
...
...
...
2000/2001
Current public expenditure on education by ISCED levels as a % of total current expenditure on education
ISCED 0 Pre-primary
ISCED 1Primary
ISCED 2 and 3Secondary
ISCED 4 Post-secondary non-tertiary
ISCED 5 and 6Tertiary
NotAllocated
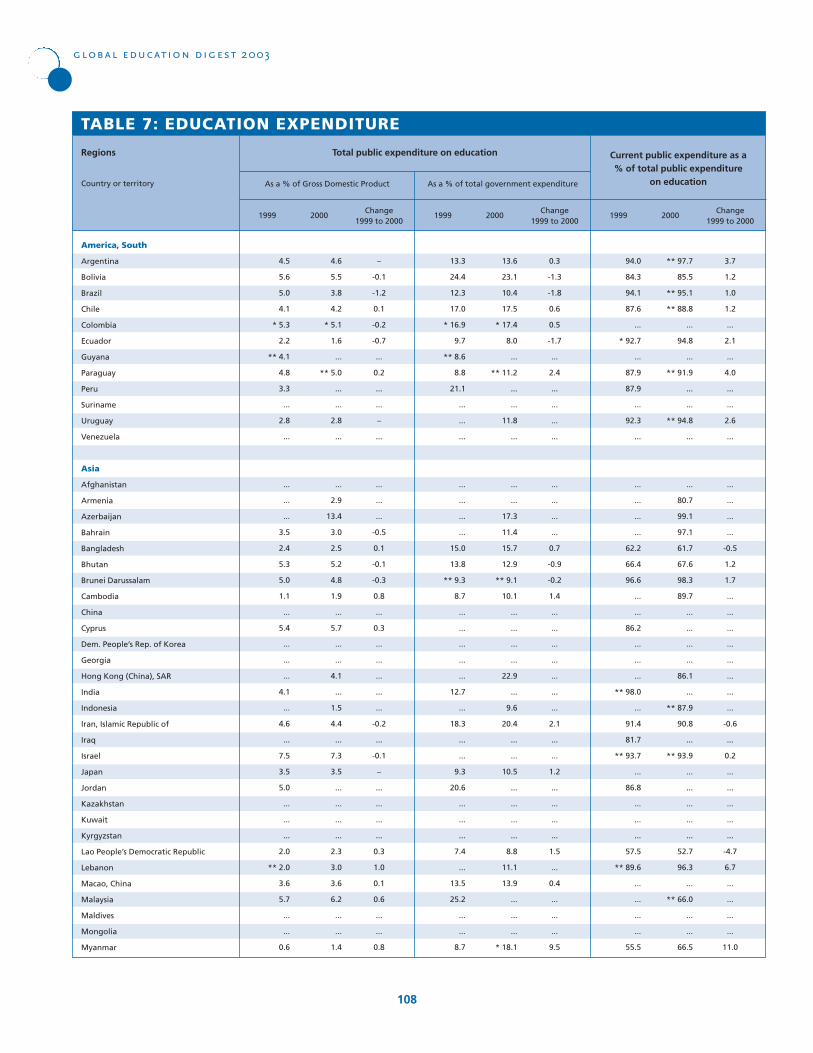
4.6
5.5
3.8
4.2
* 5.1
1.6
...
** 5.0
...
...
2.8
...
...
2.9
13.4
3.0
2.5
5.2
4.8
1.9
...
5.7
...
...
4.1
...
1.5
4.4
...
7.3
3.5
...
...
...
...
2.3
3.0
3.6
6.2
...
...
1.4
–
-0.1
-1.2
0.1
-0.2
-0.7
...
0.2
...
...
–
...
...
...
...
-0.5
0.1
-0.1
-0.3
0.8
...
0.3
...
...
...
...
...
-0.2
...
-0.1
–
...
...
...
...
0.3
1.0
0.1
0.6
...
...
0.8
TABLE 7: EDUCATION EXPENDITURE
America, South
Argentina
Bolivia
Brazil
Chile
Colombia
Ecuador
Guyana
Paraguay
Peru
Suriname
Uruguay
Venezuela
Asia
Afghanistan
Armenia
Azerbaijan
Bahrain
Bangladesh
Bhutan
Brunei Darussalam
Cambodia
China
Cyprus
Dem. People’s Rep. of Korea
Georgia
Hong Kong (China), SAR
India
Indonesia
Iran, Islamic Republic of
Iraq
Israel
Japan
Jordan
Kazakhstan
Kuwait
Kyrgyzstan
Lao People’s Democratic Republic
Lebanon
Macao, China
Malaysia
Maldives
Mongolia
Myanmar
Regions
Country or territory As a % of Gross Domestic Product
global education digest 2003
108
4.5
5.6
5.0
4.1
* 5.3
2.2
** 4.1
4.8
3.3
...
2.8
...
...
...
...
3.5
2.4
5.3
5.0
1.1
...
5.4
...
...
...
4.1
...
4.6
...
7.5
3.5
5.0
...
...
...
2.0
** 2.0
3.6
5.7
...
...
0.6
Total public expenditure on education Current public expenditure as a% of total public expenditure
on education
Change 1999 to 2000
1999 2000
13.6
23.1
10.4
17.5
* 17.4
8.0
...
** 11.2
...
...
11.8
...
...
...
17.3
11.4
15.7
12.9
** 9.1
10.1
...
...
...
...
22.9
...
9.6
20.4
...
...
10.5
...
...
...
...
8.8
11.1
13.9
...
...
...
* 18.1
0.3
-1.3
-1.8
0.6
0.5
-1.7
...
2.4
...
...
...
...
...
...
...
...
0.7
-0.9
-0.2
1.4
...
...
...
...
...
...
...
2.1
...
...
1.2
...
...
...
...
1.5
...
0.4
...
...
...
9.5
As a % of total government expenditure
13.3
24.4
12.3
17.0
* 16.9
9.7
** 8.6
8.8
21.1
...
...
...
...
...
...
...
15.0
13.8
** 9.3
8.7
...
...
...
...
...
12.7
...
18.3
...
...
9.3
20.6
...
...
...
7.4
...
13.5
25.2
...
...
8.7
Change 1999 to 2000
1999 2000
** 97.7
85.5
** 95.1
** 88.8
...
94.8
...
** 91.9
...
...
** 94.8
...
...
80.7
99.1
97.1
61.7
67.6
98.3
89.7
...
...
...
...
86.1
...
** 87.9
90.8
...
** 93.9
...
...
...
...
...
52.7
96.3
...
** 66.0
...
...
66.5
3.7
1.2
1.0
1.2
...
2.1
...
4.0
...
...
2.6
...
...
...
...
...
-0.5
1.2
1.7
...
...
...
...
...
...
...
...
-0.6
...
0.2
...
...
...
...
...
-4.7
6.7
...
...
...
...
11.0
94.0
84.3
94.1
87.6
...
* 92.7
...
87.9
87.9
...
92.3
...
...
...
...
...
62.2
66.4
96.6
...
...
86.2
...
...
...
** 98.0
...
91.4
81.7
** 93.7
...
86.8
...
...
...
57.5
** 89.6
...
...
...
...
55.5
Change 1999 to 2000
1999 2000
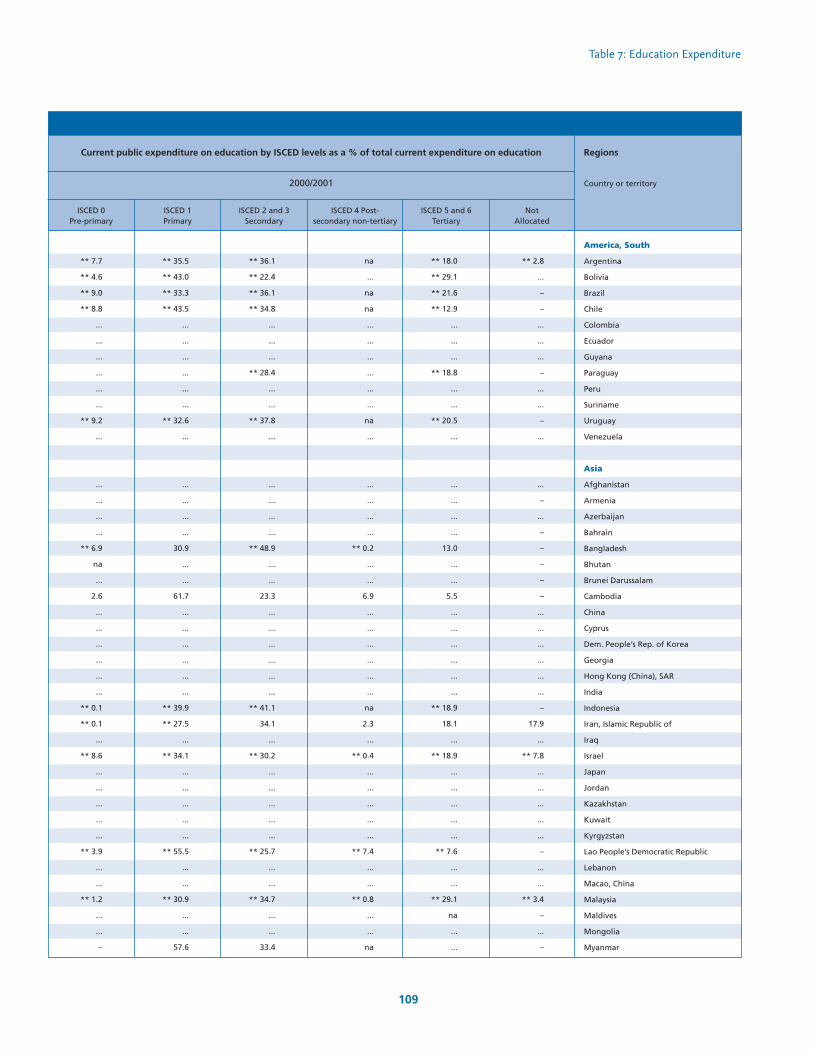
Table 7: Education Expenditure
109
Regions
Country or territory
America, South
Argentina
Bolivia
Brazil
Chile
Colombia
Ecuador
Guyana
Paraguay
Peru
Suriname
Uruguay
Venezuela
Asia
Afghanistan
Armenia
Azerbaijan
Bahrain
Bangladesh
Bhutan
Brunei Darussalam
Cambodia
China
Cyprus
Dem. People’s Rep. of Korea
Georgia
Hong Kong (China), SAR
India
Indonesia
Iran, Islamic Republic of
Iraq
Israel
Japan
Jordan
Kazakhstan
Kuwait
Kyrgyzstan
Lao People’s Democratic Republic
Lebanon
Macao, China
Malaysia
Maldives
Mongolia
Myanmar
** 7.7
** 4.6
** 9.0
** 8.8
...
...
...
...
...
...
** 9.2
...
...
...
...
...
** 6.9
na
...
2.6
...
...
...
...
...
...
** 0.1
** 0.1
...
** 8.6
...
...
...
...
...
** 3.9
...
...
** 1.2
...
...
–
** 35.5
** 43.0
** 33.3
** 43.5
...
...
...
...
...
...
** 32.6
...
...
...
...
...
30.9
...
...
61.7
...
...
...
...
...
...
** 39.9
** 27.5
...
** 34.1
...
...
...
...
...
** 55.5
...
...
** 30.9
...
...
57.6
** 36.1
** 22.4
** 36.1
** 34.8
...
...
...
** 28.4
...
...
** 37.8
...
...
...
...
...
** 48.9
...
...
23.3
...
...
...
...
...
...
** 41.1
34.1
...
** 30.2
...
...
...
...
...
** 25.7
...
...
** 34.7
...
...
33.4
na
...
na
na
...
...
...
...
...
...
na
...
...
...
...
...
** 0.2
...
...
6.9
...
...
...
...
...
...
na
2.3
...
** 0.4
...
...
...
...
...
** 7.4
...
...
** 0.8
...
...
na
** 18.0
** 29.1
** 21.6
** 12.9
...
...
...
** 18.8
...
...
** 20.5
...
...
...
...
...
13.0
...
...
5.5
...
...
...
...
...
...
** 18.9
18.1
...
** 18.9
...
...
...
...
...
** 7.6
...
...
** 29.1
na
...
...
** 2.8
...
–
–
...
...
...
–
...
...
–
...
...
–
...
–
–
–
–
–
...
...
...
...
...
...
–
17.9
...
** 7.8
...
...
...
...
...
–
...
...
** 3.4
–
...
–
2000/2001
Current public expenditure on education by ISCED levels as a % of total current expenditure on education
ISCED 0 Pre-primary
ISCED 1Primary
ISCED 2 and 3Secondary
ISCED 4 Post-secondary non-tertiary
ISCED 5 and 6Tertiary
NotAllocated
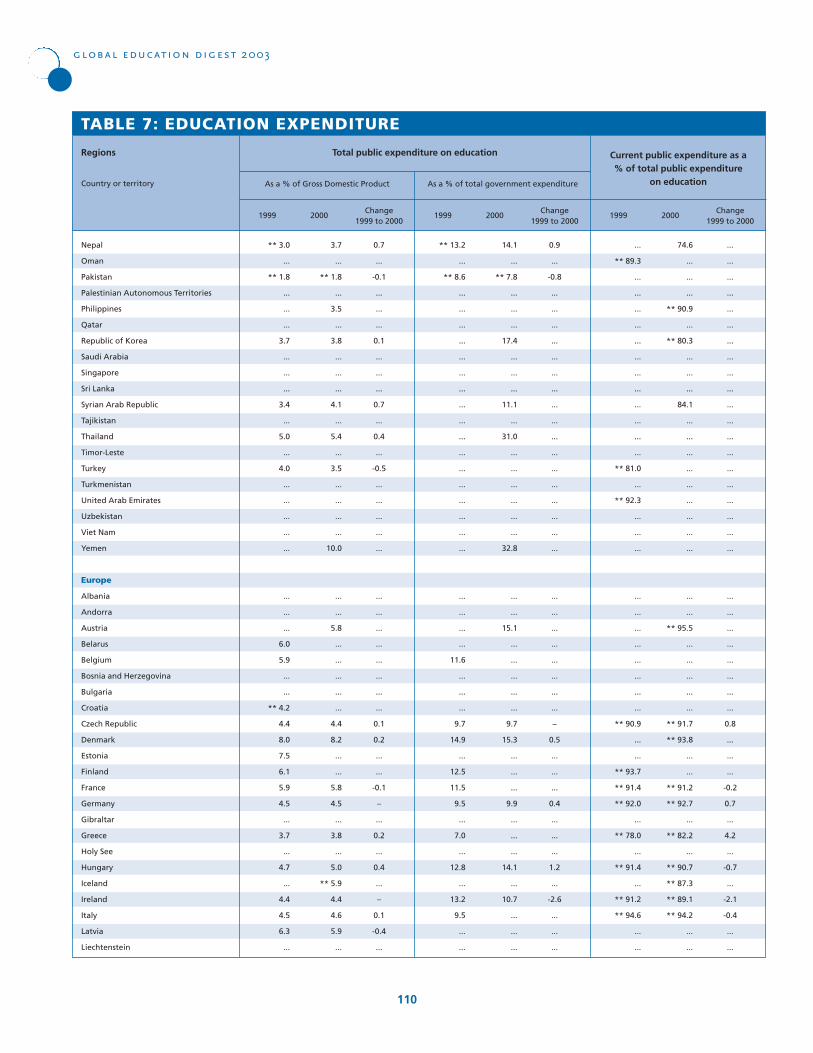
3.7
...
** 1.8
...
3.5
...
3.8
...
...
...
4.1
...
5.4
...
3.5
...
...
...
...
10.0
...
...
5.8
...
...
...
...
...
4.4
8.2
...
...
5.8
4.5
...
3.8
...
5.0
** 5.9
4.4
4.6
5.9
...
0.7
...
-0.1
...
...
...
0.1
...
...
...
0.7
...
0.4
...
-0.5
...
...
...
...
...
...
...
...
...
...
...
...
...
0.1
0.2
...
...
-0.1
–
...
0.2
...
0.4
...
–
0.1
-0.4
...
TABLE 7: EDUCATION EXPENDITURE
Nepal
Oman
Pakistan
Palestinian Autonomous Territories
Philippines
Qatar
Republic of Korea
Saudi Arabia
Singapore
Sri Lanka
Syrian Arab Republic
Tajikistan
Thailand
Timor-Leste
Turkey
Turkmenistan
United Arab Emirates
Uzbekistan
Viet Nam
Yemen
Europe
Albania
Andorra
Austria
Belarus
Belgium
Bosnia and Herzegovina
Bulgaria
Croatia
Czech Republic
Denmark
Estonia
Finland
France
Germany
Gibraltar
Greece
Holy See
Hungary
Iceland
Ireland
Italy
Latvia
Liechtenstein
Regions
Country or territory As a % of Gross Domestic Product
global education digest 2003
110
** 3.0
...
** 1.8
...
...
...
3.7
...
...
...
3.4
...
5.0
...
4.0
...
...
...
...
...
...
...
...
6.0
5.9
...
...
** 4.2
4.4
8.0
7.5
6.1
5.9
4.5
...
3.7
...
4.7
...
4.4
4.5
6.3
...
Total public expenditure on education Current public expenditure as a% of total public expenditure
on education
Change 1999 to 2000
1999 2000
14.1
...
** 7.8
...
...
...
17.4
...
...
...
11.1
...
31.0
...
...
...
...
...
...
32.8
...
...
15.1
...
...
...
...
...
9.7
15.3
...
...
...
9.9
...
...
...
14.1
...
10.7
...
...
...
0.9
...
-0.8
...
...
...
...
...
...
...
...
...
...
...
...
...
...
...
...
...
...
...
...
...
...
...
...
...
–
0.5
...
...
...
0.4
...
...
...
1.2
...
-2.6
...
...
...
As a % of total government expenditure
** 13.2
...
** 8.6
...
...
...
...
...
...
...
...
...
...
...
...
...
...
...
...
...
...
...
...
...
11.6
...
...
...
9.7
14.9
...
12.5
11.5
9.5
...
7.0
...
12.8
...
13.2
9.5
...
...
Change 1999 to 2000
1999 2000
74.6
...
...
...
** 90.9
...
** 80.3
...
...
...
84.1
...
...
...
...
...
...
...
...
...
...
...
** 95.5
...
...
...
...
...
** 91.7
** 93.8
...
...
** 91.2
** 92.7
...
** 82.2
...
** 90.7
** 87.3
** 89.1
** 94.2
...
...
...
...
...
...
...
...
...
...
...
...
...
...
...
...
...
...
...
...
...
...
...
...
...
...
...
...
...
...
0.8
...
...
...
-0.2
0.7
...
4.2
...
-0.7
...
-2.1
-0.4
...
...
...
** 89.3
...
...
...
...
...
...
...
...
...
...
...
...
** 81.0
...
** 92.3
...
...
...
...
...
...
...
...
...
...
...
** 90.9
...
...
** 93.7
** 91.4
** 92.0
...
** 78.0
...
** 91.4
...
** 91.2
** 94.6
...
...
Change 1999 to 2000
1999 2000
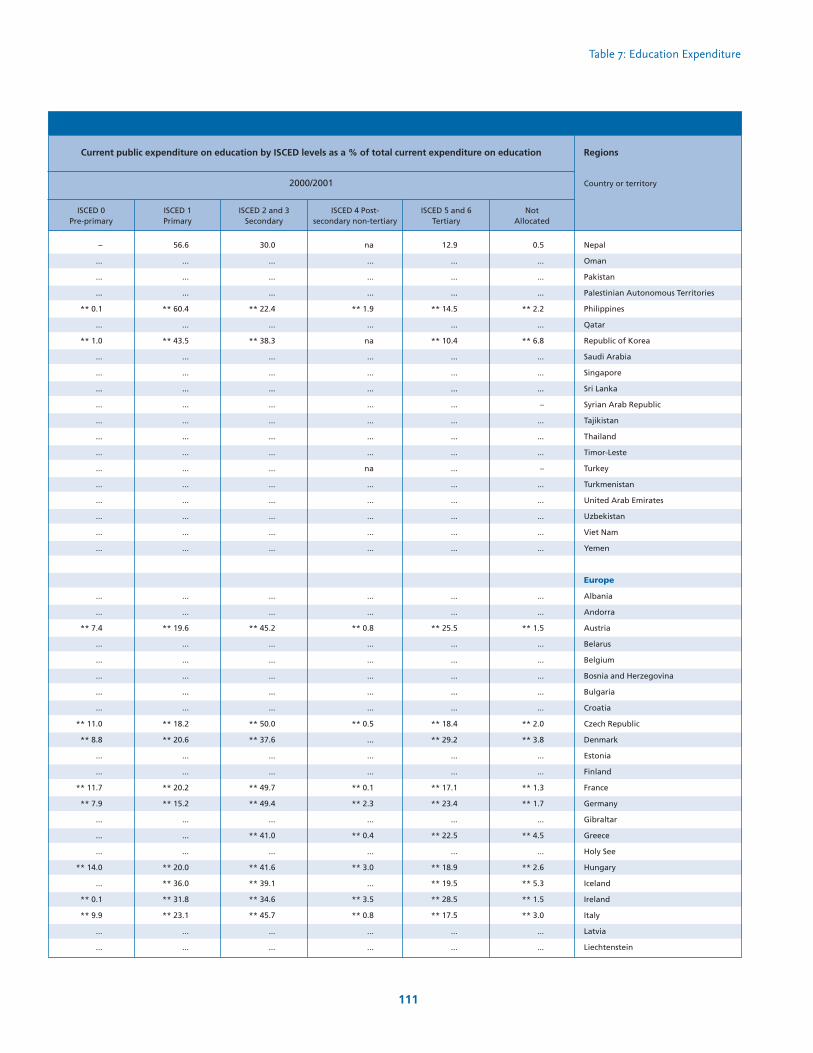
Table 7: Education Expenditure
111
Regions
Country or territory
Nepal
Oman
Pakistan
Palestinian Autonomous Territories
Philippines
Qatar
Republic of Korea
Saudi Arabia
Singapore
Sri Lanka
Syrian Arab Republic
Tajikistan
Thailand
Timor-Leste
Turkey
Turkmenistan
United Arab Emirates
Uzbekistan
Viet Nam
Yemen
Europe
Albania
Andorra
Austria
Belarus
Belgium
Bosnia and Herzegovina
Bulgaria
Croatia
Czech Republic
Denmark
Estonia
Finland
France
Germany
Gibraltar
Greece
Holy See
Hungary
Iceland
Ireland
Italy
Latvia
Liechtenstein
–
...
...
...
** 0.1
...
** 1.0
...
...
...
...
...
...
...
...
...
...
...
...
...
...
...
** 7.4
...
...
...
...
...
** 11.0
** 8.8
...
...
** 11.7
** 7.9
...
...
...
** 14.0
...
** 0.1
** 9.9
...
...
56.6
...
...
...
** 60.4
...
** 43.5
...
...
...
...
...
...
...
...
...
...
...
...
...
...
...
** 19.6
...
...
...
...
...
** 18.2
** 20.6
...
...
** 20.2
** 15.2
...
...
...
** 20.0
** 36.0
** 31.8
** 23.1
...
...
30.0
...
...
...
** 22.4
...
** 38.3
...
...
...
...
...
...
...
...
...
...
...
...
...
...
...
** 45.2
...
...
...
...
...
** 50.0
** 37.6
...
...
** 49.7
** 49.4
...
** 41.0
...
** 41.6
** 39.1
** 34.6
** 45.7
...
...
na
...
...
...
** 1.9
...
na
...
...
...
...
...
...
...
na
...
...
...
...
...
...
...
** 0.8
...
...
...
...
...
** 0.5
...
...
...
** 0.1
** 2.3
...
** 0.4
...
** 3.0
...
** 3.5
** 0.8
...
...
12.9
...
...
...
** 14.5
...
** 10.4
...
...
...
...
...
...
...
...
...
...
...
...
...
...
...
** 25.5
...
...
...
...
...
** 18.4
** 29.2
...
...
** 17.1
** 23.4
...
** 22.5
...
** 18.9
** 19.5
** 28.5
** 17.5
...
...
0.5
...
...
...
** 2.2
...
** 6.8
...
...
...
–
...
...
...
–
...
...
...
...
...
...
...
** 1.5
...
...
...
...
...
** 2.0
** 3.8
...
...
** 1.3
** 1.7
...
** 4.5
...
** 2.6
** 5.3
** 1.5
** 3.0
...
...
2000/2001
Current public expenditure on education by ISCED levels as a % of total current expenditure on education
ISCED 0 Pre-primary
ISCED 1Primary
ISCED 2 and 3Secondary
ISCED 4 Post-secondary non-tertiary
ISCED 5 and 6Tertiary
NotAllocated
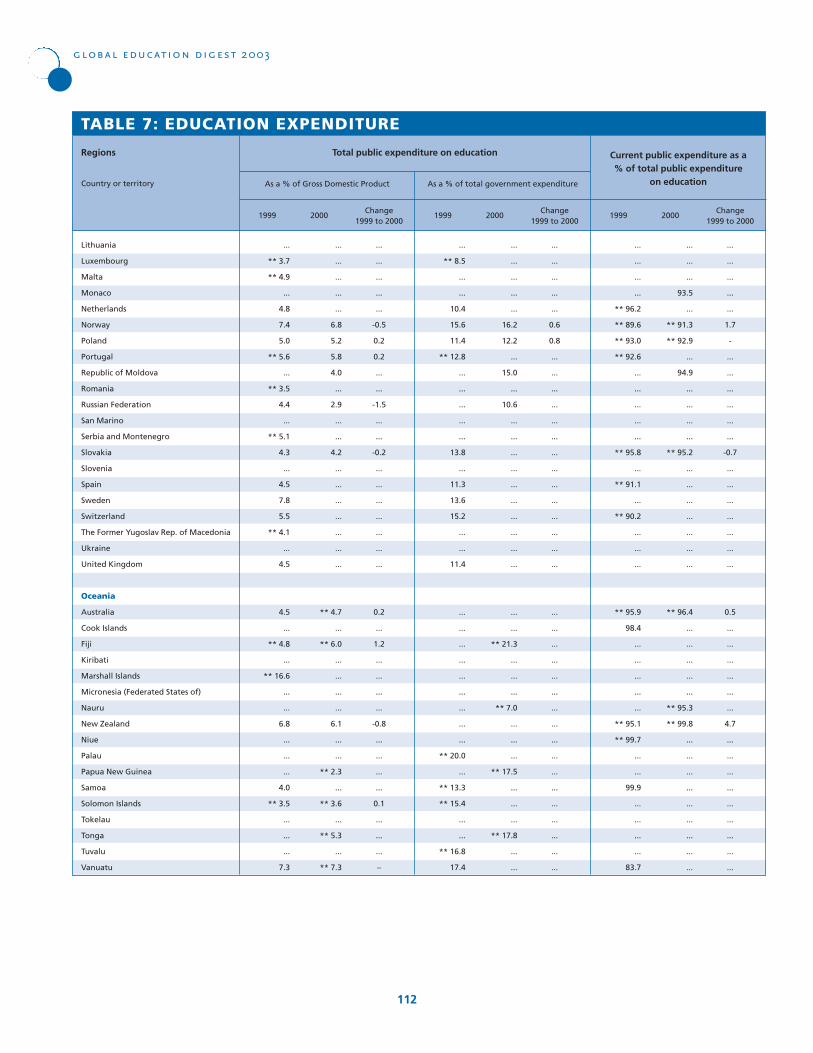
...
...
...
...
...
6.8
5.2
5.8
4.0
...
2.9
...
...
4.2
...
...
...
...
...
...
...
** 4.7
...
** 6.0
...
...
...
...
6.1
...
...
** 2.3
...
** 3.6
...
** 5.3
...
** 7.3
...
...
...
...
...
-0.5
0.2
0.2
...
...
-1.5
...
...
-0.2
...
...
...
...
...
...
...
0.2
...
1.2
...
...
...
...
-0.8
...
...
...
...
0.1
...
...
...
–
TABLE 7: EDUCATION EXPENDITURE
Lithuania
Luxembourg
Malta
Monaco
Netherlands
Norway
Poland
Portugal
Republic of Moldova
Romania
Russian Federation
San Marino
Serbia and Montenegro
Slovakia
Slovenia
Spain
Sweden
Switzerland
The Former Yugoslav Rep. of Macedonia
Ukraine
United Kingdom
Oceania
Australia
Cook Islands
Fiji
Kiribati
Marshall Islands
Micronesia (Federated States of)
Nauru
New Zealand
Niue
Palau
Papua New Guinea
Samoa
Solomon Islands
Tokelau
Tonga
Tuvalu
Vanuatu
Regions
Country or territory As a % of Gross Domestic Product
global education digest 2003
112
...
** 3.7
** 4.9
...
4.8
7.4
5.0
** 5.6
...
** 3.5
4.4
...
** 5.1
4.3
...
4.5
7.8
5.5
** 4.1
...
4.5
4.5
...
** 4.8
...
** 16.6
...
...
6.8
...
...
...
4.0
** 3.5
...
...
...
7.3
Total public expenditure on education Current public expenditure as a% of total public expenditure
on education
Change 1999 to 2000
1999 2000
...
...
...
...
...
16.2
12.2
...
15.0
...
10.6
...
...
...
...
...
...
...
...
...
...
...
...
** 21.3
...
...
...
** 7.0
...
...
...
** 17.5
...
...
...
** 17.8
...
...
...
...
...
...
...
0.6
0.8
...
...
...
...
...
...
...
...
...
...
...
...
...
...
...
...
...
...
...
...
...
...
...
...
...
...
...
...
...
...
...
As a % of total government expenditure
...
** 8.5
...
...
10.4
15.6
11.4
** 12.8
...
...
...
...
...
13.8
...
11.3
13.6
15.2
...
...
11.4
...
...
...
...
...
...
...
...
...
** 20.0
...
** 13.3
** 15.4
...
...
** 16.8
17.4
Change 1999 to 2000
1999 2000
...
...
...
93.5
...
** 91.3
** 92.9
...
94.9
...
...
...
...
** 95.2
...
...
...
...
...
...
...
** 96.4
...
...
...
...
...
** 95.3
** 99.8
...
...
...
...
...
...
...
...
...
...
...
...
...
...
1.7
-
...
...
...
...
...
...
-0.7
...
...
...
...
...
...
...
0.5
...
...
...
...
...
...
4.7
...
...
...
...
...
...
...
...
...
...
...
...
...
** 96.2
** 89.6
** 93.0
** 92.6
...
...
...
...
...
** 95.8
...
** 91.1
...
** 90.2
...
...
...
** 95.9
98.4
...
...
...
...
...
** 95.1
** 99.7
...
...
99.9
...
...
...
...
83.7
Change 1999 to 2000
1999 2000
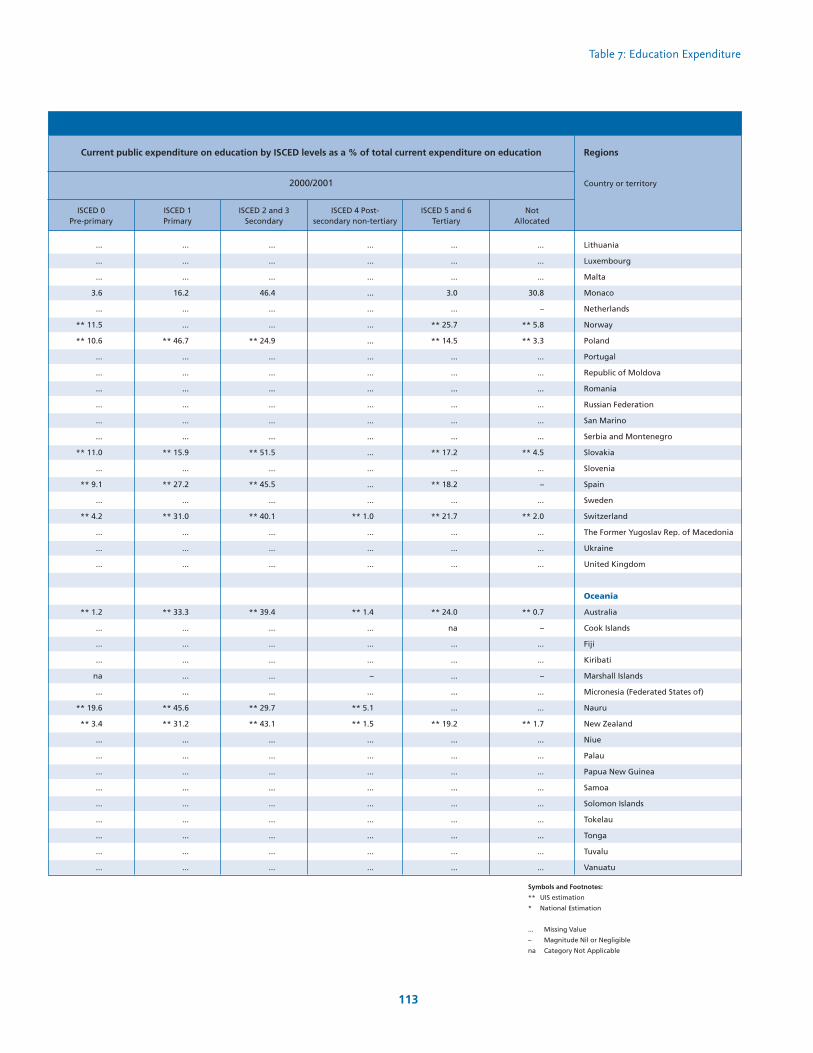
Table 7: Education Expenditure
113
Regions
Country or territory
Lithuania
Luxembourg
Malta
Monaco
Netherlands
Norway
Poland
Portugal
Republic of Moldova
Romania
Russian Federation
San Marino
Serbia and Montenegro
Slovakia
Slovenia
Spain
Sweden
Switzerland
The Former Yugoslav Rep. of Macedonia
Ukraine
United Kingdom
Oceania
Australia
Cook Islands
Fiji
Kiribati
Marshall Islands
Micronesia (Federated States of)
Nauru
New Zealand
Niue
Palau
Papua New Guinea
Samoa
Solomon Islands
Tokelau
Tonga
Tuvalu
Vanuatu
...
...
...
3.6
...
** 11.5
** 10.6
...
...
...
...
...
...
** 11.0
...
** 9.1
...
** 4.2
...
...
...
** 1.2
...
...
...
na
...
** 19.6
** 3.4
...
...
...
...
...
...
...
...
...
...
...
...
16.2
...
...
** 46.7
...
...
...
...
...
...
** 15.9
...
** 27.2
...
** 31.0
...
...
...
** 33.3
...
...
...
...
...
** 45.6
** 31.2
...
...
...
...
...
...
...
...
...
...
...
...
46.4
...
...
** 24.9
...
...
...
...
...
...
** 51.5
...
** 45.5
...
** 40.1
...
...
...
** 39.4
...
...
...
...
...
** 29.7
** 43.1
...
...
...
...
...
...
...
...
...
...
...
...
...
...
...
...
...
...
...
...
...
...
...
...
...
...
** 1.0
...
...
...
** 1.4
...
...
...
–
...
** 5.1
** 1.5
...
...
...
...
...
...
...
...
...
...
...
...
3.0
...
** 25.7
** 14.5
...
...
...
...
...
...
** 17.2
...
** 18.2
...
** 21.7
...
...
...
** 24.0
na
...
...
...
...
...
** 19.2
...
...
...
...
...
...
...
...
...
...
...
...
30.8
–
** 5.8
** 3.3
...
...
...
...
...
...
** 4.5
...
–
...
** 2.0
...
...
...
** 0.7
–
...
...
–
...
...
** 1.7
...
...
...
...
...
...
...
...
...
2000/2001
Current public expenditure on education by ISCED levels as a % of total current expenditure on education
ISCED 0 Pre-primary
ISCED 1Primary
ISCED 2 and 3Secondary
ISCED 4 Post-secondary non-tertiary
ISCED 5 and 6Tertiary
NotAllocated
Symbols and Footnotes:
** UIS estimation
* National Estimation
... Missing Value
– Magnitude Nil or Negligible
na Category Not Applicable


115
ANNEX AGlossary
Compulsory education. Number of years or the age-span duringwhich children and young people are legally obliged to attendschool.
Duration. Number of grades (years) in a given level of education.
Enrolment. Number of pupils or students officially enrolled in agiven grade or level of education, regardless of age. Typically, thesedata are collected at the beginning of the school-year.
Entrance age (Theoretical). The age at which pupils or studentswould enter a given programme or level of education assumingthey had started at the official entrance age for the lowest level ofeducation, had studied full-time throughout and had progressedthrough the system without repeating or skipping a grade. Note thatthe theoretical entrance age to a given programme or level is oftenbut not always the typical or most common entrance age.
Fields of education (Broad):
General programmes: basic programmes; literacy and numeracy;personal development.
Education: teacher training; education science; and educationalassessment.
Humanities and arts: religion and theology; foreign languagesand cultures; native languages; other humanities such as: inter-pretation and translation, linguistics, comparative literature,history, archaeology, philosophy, ethics. Fine arts; performingarts; graphic and audio-visual arts; design; craft skills.
global education digest 2003
116
Social science, business and law: social and be-havioural science; journalism and information;business and administration; law.
Science: life sciences; physical sciences; mathe-matics and statistics; computer sciences.
Engineering, manufacturing and construction:engineering and engineering trades; manufac-turing and processing; architecture and build-ing.
Agriculture: agriculture, forestry and fishery;veterinary.
Health and welfare: medicine; medical services;nursing; dental services; social care; social work.
Services: personal services; transport services;environmental protection; security services.
Other programmes are classified as Not knownor Unspecified.
Foreign student. Students enrolled in an educa-tional programme in a country of which they arenot a permanent resident.
Gross domestic product (GDP). The sum of grossvalue added by all resident producers in the eco-nomy, including distributive trades and transport,plus any product taxes and minus any subsidies notincluded in the value of the products.
Gross national income (GNI). The sum of gross valueadded by all resident producers in the economy, in-cluding distributive trades and transport, plus anyproduct taxes, minus any subsidies not included inthe value of the products plus net receipts of in-come from abroad. Since net receipts from abroadmay be positive or negative, it is possible for GNI tobe greater or smaller than GDP. GNI is also referredto as Gross National Product (GNP).
International Standard Classification of Education(ISCED). A classification system designed as an in-strument suitable for assembling, compiling andpresenting comparable indicators and statistics ofeducation both within individual countries andinternationally. This system was introduced in 1976,and revised in 1997. ISCED classifies educationalprogrammes by their content along two axes: levelsof education and fields of education.
New entrants. Pupils or students entering a pro-gramme at a given level of education for the firsttime.
Orientation of educational programmes.
General education. This type of programme isdesigned mainly to lead pupils to a deeperunderstanding of a subject or group of subjects,especially, but not necessarily, with a view topreparing pupils for further education at thesame or a higher level. These programmes aretypically school-based and may or may not con-tain vocational elements. Successful comple-tion of these programmes may or may not leadto an academic qualification. However, they donot typically allow successful completers to en-ter a particular occupation or trade or class ofoccupations or trades without further training.
Technical and vocational education. This type ofprogramme is designed mainly to lead pupils toacquire the practical skills, know-how andunderstanding necessary for employment in aparticular occupation or trade (or class of occu-pations or trades). Successful completion ofsuch programmes normally leads to a labour-market relevant vocational qualification recog-nized by the competent authorities in thecountry in which it is obtained (e.g. Ministry ofEducation, employers’ associations, etc.).
Annex A: Glossary
117
Public expenditure on education at all educationallevels
Total expenditure on education. The sum ofthe expenditure on education made by local,regional and national/central governments, itexcludes inter-governmental transfers.
Current expenditure on education. Expendi-ture at all educational levels for goods andservices consumed within the current year andwhich would be renewed if needed in the fol-lowing year. It includes expenditure on: staffsalaries, pensions and benefits; contracted orpurchased services; other resources includingbooks and teaching materials; welfare services;and other current expenditure such as subsidiesto students and households, furniture andminor equipment, minor repairs, fuel, telecom-munications, travel, insurance and rents.
Capital expenditure on education. Expenditurefor assets that last longer than one year. It in-cludes expenditure for construction, renova-tion and major repairs of buildings and thepurchase of heavy equipment or vehicles.
Repeaters. Pupils enrolled in the same grade for asecond or further year.
School-age population. Population of the age-group which corresponds to the relevant level ofeducation as indicated by theoretical entrance ageand duration.
Student
Student / pupil. Refers to a person enrolled inan educational programme.
Full-time student. Persons engaged in an educa-tional programme for a number of hours ofstudy statutorily regarded as full-time at theparticular level of education.
Part-time student. Students whose statutorystudying hours are less than those required offull-time students.
Full-time equivalent number of students. Theseare generally calculated in person-years. Theunit for the measurement of full-time equiva-lence is a full-time student. Thus, a full-timestudent equals one full-time equivalent. Thefull-time equivalence of part-time students isdetermined by calculating the ratio of theirhours studied to the statutory hours studiedby a full-time student during the school year.For example, a student who studied one-thirdof the statutory hours of a full-time studentequals one-third of a full-time equivalentstudent.
Survival rates by grade. Percentage of a cohort ofpupils (or students) enrolled in the first grade of agiven level or cycle of education in a given schoolyear who are expected to reach successive grades.These are calculated using the reconstructed cohortmethod that uses data on the number of pupilsenrolled and repeaters for two consecutive years.
Teachers
Teaching staff. Persons employed full-time orpart-time in an official capacity for the purposeof guiding and directing the learning experi-ence of pupils and students, irrespective ofhis/her qualification or the delivery mechanism,i.e. whether face-to-face and/or at a distance.This definition excludes educational personnelwho have no active teaching duties (e.g. head-masters, headmistresses or principals who donot teach) or who work occasionally or in a vol-untary capacity in educational institutions (e.g.parents).
Trained teachers. Teachers who have receivedthe minimum organized teacher-training (pre-service or in-service) required for teaching atthe relevant level in the given country.
global education digest 2003
118
Full-time teachers. Persons engaged in teachingfor a number of hours of work statutorilyregarded as full-time at the particular level ofeducation.
Part-time teachers. Teachers whose statutoryworking hours are less than those required offull-time teachers.
Full-time equivalent number of teachers. Theequivalent is calculated in person-years. Theunit for the measurement of full-time equiva-lence is full-time employment. Thus, a full-timeteacher equals one full-time equivalent. Thefull-time equivalence of part-time teachers is
determined by calculating the ratio of theirhours worked to the statutory hours worked bya full-time teacher during the school year. Forexample, a teacher who works one-third of thestatutory hours of a full-time teacher equalsone-third of a full-time equivalent teacher.
Transition from ISCED 1 to ISCED 2 (%). The transi-tion rate from primary to secondary is based ondata for two consecutive years. New students en-rolled in the first grade of general programmes insecondary are compared to the number of studentsenrolled in the last grade of primary in the previousyear.

119
ANNEX BDefinitions of Indicators
Change. The value of the latest year minus the value of the earlieryear, i.e. change 1999 to 2000 is the value of 2000 minus the valueof 1999.
Education finance
Current public expenditure on education as a % of total publicexpenditure on education. Current public expenditure on educa-tion expressed as a percentage of the total public expenditureon education. The total public expenditure on education is thesum of capital and current expenditure on education.
Current public expenditure on education by ISCED levels as a %of total current expenditure on education. Public current educa-tional expenditure in education by ISCED level expressed as a %of the total public current educational expenditure for all levels,including expenses not allocated by level.
Total public expenditure on education as a % of gross domesticproduct (GDP). Current and capital expenditures on educationby local, regional and national governments, including munici-palities (household contributions are excluded), expressed as apercentage of the gross domestic product.
Total public expenditure on education as a % of total govern-ment expenditure. Current and capital expenditures on educa-tion by local, regional and national governments, includingmunicipalities (household contributions are excluded) expressedas a percentage of total government expenditure on all sectors(including health, education, social services, etc.).

global education digest 2003
120
Gross (Apparent) intake ratio (AIR). Total numberof new entrants in the first grade of primary educa-tion, regardless of age, expressed as a percentageof the population of theoretical entrance age toprimary education.
Gross intake rate in last grade of primary education.Total number of new entrants in the last grade ofprimary education, regardless of age, expressed asa per-centage of the population of the theoreticalentrance age at the last grade.
Gender parity index (GPI). Ratio of the female-to-male value of a given indicator. A GPI of 1 indicatesparity between sexes; a GPI that varies between 0and 1 means a disparity in favour of males; whereasa GPI greater than 1 indicates a disparity in favourof females.
Gross enrolment ratio (GER). Number of pupilsenrolled in a given level of education, regardless ofage, expressed as a percentage of the populationin the theoretical age group for the same level ofeducation.
Net enrolment ratio (NER). Number of pupils in thetheoretical age group for a given grade/level ofeducation enrolled in that level expressed as apercentage of the total population in that agegroup.
Net intake ratio (NIR). Number of new entrants inthe first grade of primary education who are of thetheoretical primary school-entrance age, expressedas a percentage of the population of the same age.
Percent Change. The change from one year toanother is expressed in percent of the earliest year.
Percentage of foreign students. Number of foreignstudents as a percentage of the total number ofstudents enrolled in tertiary education pro-grammes.
Percentage of repeaters. Number of pupils whoare enrolled in the same grade (or level) as theprevious year, expressed as a percentage of thetotal enrolment in the given grade (or level) ofeducation.
Percentage of trained teachers. Number of teacherswho are certified or who otherwise have met theminimum standard pre-service or in-service requiredfor teaching at the relevant level of education,expressed as a percentage of the total number ofteachers at the given level of education.
Pupil-teacher ratio (PTR). Average number of pupilsper teacher at the level of education specified in agiven school year.
Survival rates. Divide the total number of pupilsbelonging to a school-cohort who reached a givengrade of the specified level of education by thenumber of pupils in the school-cohort, i.e. thoseoriginally enrolled in the first grade of primaryeducation, and multiply the result by 100.
Transition rate to secondary education. Number ofpupils admitted, net of repeaters, to the first gradeof secondary education (general programmes only)in a given year, expressed as a percentage of thenumber of pupils enrolled in the final grade of pri-mary education in the previous year.
121
ANNEX CInternational Standard
Classification of Education (ISCED97)
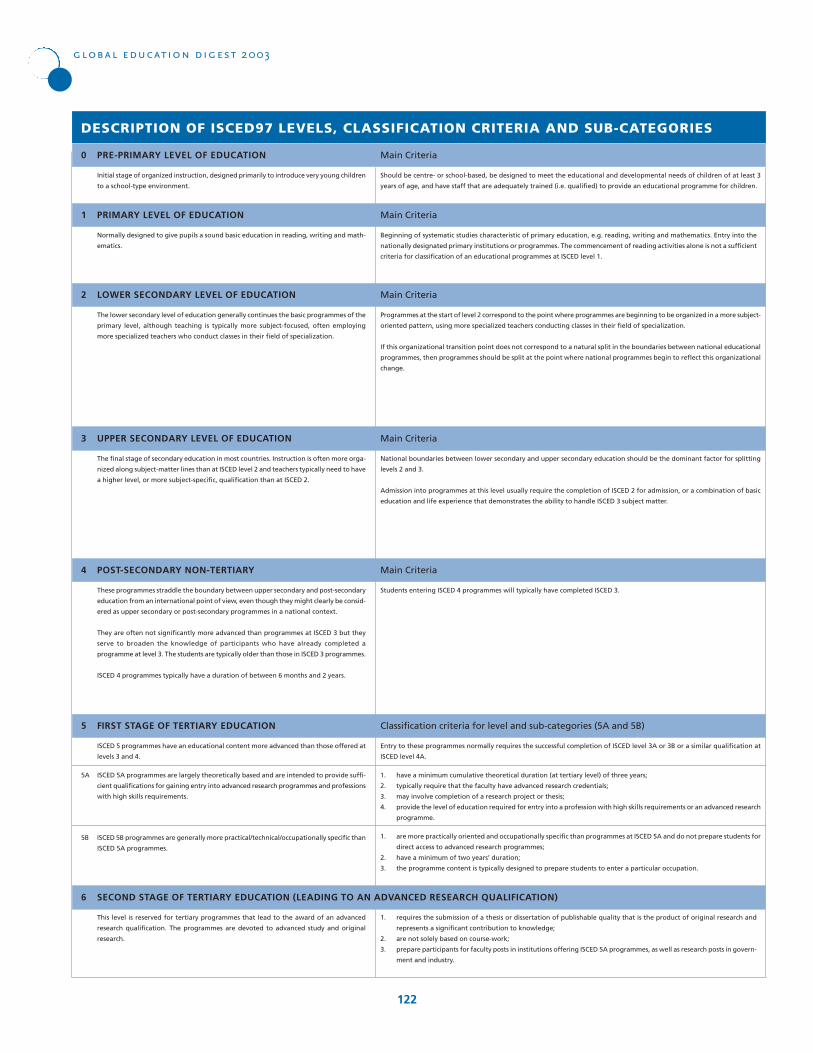
global education digest 2003
122
Entry to these programmes normally requires the successful completion of ISCED level 3A or 3B or a similar qualification at
ISCED level 4A.
1. have a minimum cumulative theoretical duration (at tertiary level) of three years;
2. typically require that the faculty have advanced research credentials;
3. may involve completion of a research project or thesis;
4. provide the level of education required for entry into a profession with high skills requirements or an advanced research
programme.
1. are more practically oriented and occupationally specific than programmes at ISCED 5A and do not prepare students for
direct access to advanced research programmes;
2. have a minimum of two years’ duration;
3. the programme content is typically designed to prepare students to enter a particular occupation.
DESCRIPTION OF ISCED97 LEVELS, CLASSIFICATION CRITERIA AND SUB-CATEGORIES
0 PRE-PRIMARY LEVEL OF EDUCATION
1 PRIMARY LEVEL OF EDUCATION
Main Criteria
Main Criteria
Main Criteria
Main Criteria
Main Criteria
2 LOWER SECONDARY LEVEL OF EDUCATION
1. requires the submission of a thesis or dissertation of publishable quality that is the product of original research and
represents a significant contribution to knowledge;
2. are not solely based on course-work;
3. prepare participants for faculty posts in institutions offering ISCED 5A programmes, as well as research posts in govern-
ment and industry.
This level is reserved for tertiary programmes that lead to the award of an advanced
research qualification. The programmes are devoted to advanced study and original
research.
3 UPPER SECONDARY LEVEL OF EDUCATION
4 POST-SECONDARY NON-TERTIARY
5 FIRST STAGE OF TERTIARY EDUCATION
6 SECOND STAGE OF TERTIARY EDUCATION (LEADING TO AN ADVANCED RESEARCH QUALIFICATION)
Classification criteria for level and sub-categories (5A and 5B)
Initial stage of organized instruction, designed primarily to introduce very young children
to a school-type environment.
Should be centre- or school-based, be designed to meet the educational and developmental needs of children of at least 3
years of age, and have staff that are adequately trained (i.e. qualified) to provide an educational programme for children.
Normally designed to give pupils a sound basic education in reading, writing and math-
ematics.
Beginning of systematic studies characteristic of primary education, e.g. reading, writing and mathematics. Entry into the
nationally designated primary institutions or programmes. The commencement of reading activities alone is not a sufficient
criteria for classification of an educational programmes at ISCED level 1.
The lower secondary level of education generally continues the basic programmes of the
primary level, although teaching is typically more subject-focused, often employing
more specialized teachers who conduct classes in their field of specialization.
Programmes at the start of level 2 correspond to the point where programmes are beginning to be organized in a more subject-
oriented pattern, using more specialized teachers conducting classes in their field of specialization.
If this organizational transition point does not correspond to a natural split in the boundaries between national educational
programmes, then programmes should be split at the point where national programmes begin to reflect this organizational
change.
The final stage of secondary education in most countries. Instruction is often more orga-
nized along subject-matter lines than at ISCED level 2 and teachers typically need to have
a higher level, or more subject-specific, qualification than at ISCED 2.
National boundaries between lower secondary and upper secondary education should be the dominant factor for splitting
levels 2 and 3.
Admission into programmes at this level usually require the completion of ISCED 2 for admission, or a combination of basic
education and life experience that demonstrates the ability to handle ISCED 3 subject matter.
These programmes straddle the boundary between upper secondary and post-secondary
education from an international point of view, even though they might clearly be consid-
ered as upper secondary or post-secondary programmes in a national context.
They are often not significantly more advanced than programmes at ISCED 3 but they
serve to broaden the knowledge of participants who have already completed a
programme at level 3. The students are typically older than those in ISCED 3 programmes.
ISCED 4 programmes typically have a duration of between 6 months and 2 years.
Students entering ISCED 4 programmes will typically have completed ISCED 3.
ISCED 5 programmes have an educational content more advanced than those offered at
levels 3 and 4.
5A ISCED 5A programmes are largely theoretically based and are intended to provide suffi-
cient qualifications for gaining entry into advanced research programmes and professions
with high skills requirements.
5B ISCED 5B programmes are generally more practical/technical/occupationally specific than
ISCED 5A programmes.
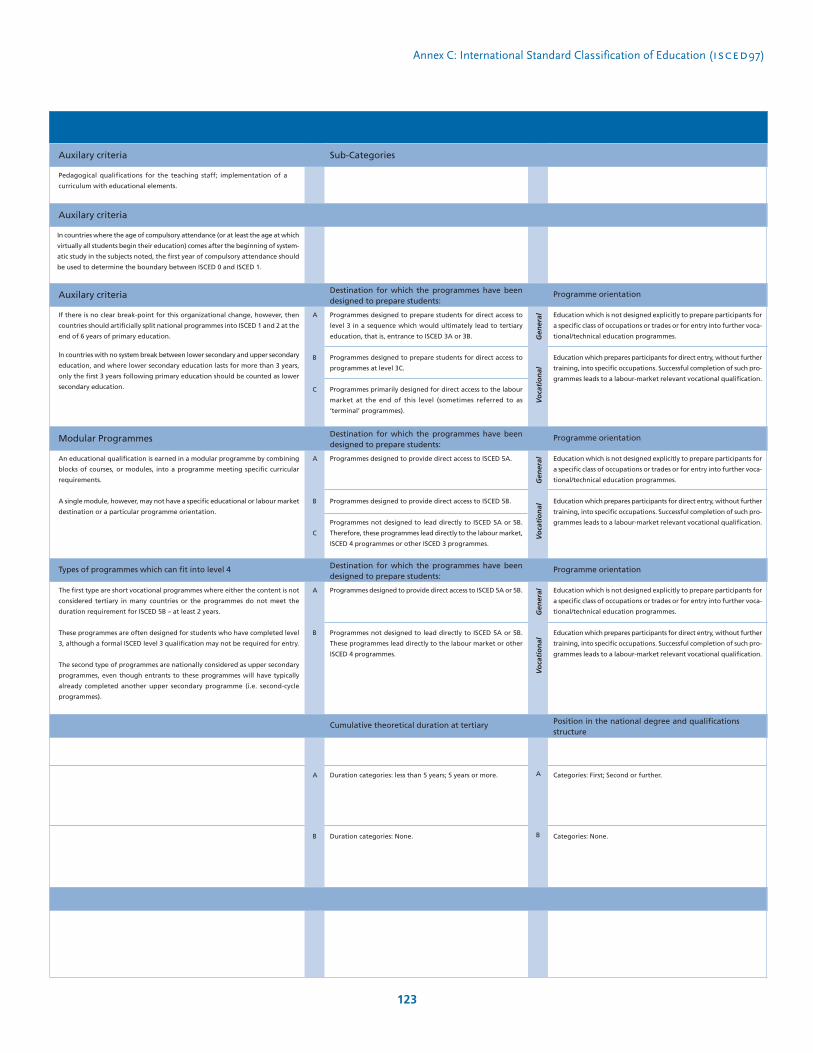
123
Annex C: International Standard Classification of Education (isced97)
Education which is not designed explicitly to prepare participants for
a specific class of occupations or trades or for entry into further voca-
tional/technical education programmes.
Education which prepares participants for direct entry, without further
training, into specific occupations. Successful completion of such pro-
grammes leads to a labour-market relevant vocational qualification.
Duration categories: less than 5 years; 5 years or more.
Duration categories: None.
Categories: First; Second or further.
Categories: None.
Auxilary criteria
Auxilary criteria
Sub-Categories
Auxilary criteria
Modular Programmes
Cumulative theoretical duration at tertiary Position in the national degree and qualificationsstructure
Pedagogical qualifications for the teaching staff; implementation of a
curriculum with educational elements.
In countries where the age of compulsory attendance (or at least the age at which
virtually all students begin their education) comes after the beginning of system-
atic study in the subjects noted, the first year of compulsory attendance should
be used to determine the boundary between ISCED 0 and ISCED 1.
If there is no clear break-point for this organizational change, however, then
countries should artificially split national programmes into ISCED 1 and 2 at the
end of 6 years of primary education.
In countries with no system break between lower secondary and upper secondary
education, and where lower secondary education lasts for more than 3 years,
only the first 3 years following primary education should be counted as lower
secondary education.
Programmes designed to prepare students for direct access to
level 3 in a sequence which would ultimately lead to tertiary
education, that is, entrance to ISCED 3A or 3B.
Programmes designed to prepare students for direct access to
programmes at level 3C.
Programmes primarily designed for direct access to the labour
market at the end of this level (sometimes referred to as
‘terminal’ programmes).
An educational qualification is earned in a modular programme by combining
blocks of courses, or modules, into a programme meeting specific curricular
requirements.
A single module, however, may not have a specific educational or labour market
destination or a particular programme orientation.
Programmes designed to provide direct access to ISCED 5A.
Programmes designed to provide direct access to ISCED 5B.
Programmes not designed to lead directly to ISCED 5A or 5B.
Therefore, these programmes lead directly to the labour market,
ISCED 4 programmes or other ISCED 3 programmes.
The first type are short vocational programmes where either the content is not
considered tertiary in many countries or the programmes do not meet the
duration requirement for ISCED 5B – at least 2 years.
These programmes are often designed for students who have completed level
3, although a formal ISCED level 3 qualification may not be required for entry.
The second type of programmes are nationally considered as upper secondary
programmes, even though entrants to these programmes will have typically
already completed another upper secondary programme (i.e. second-cycle
programmes).
Programmes designed to provide direct access to ISCED 5A or 5B.
Programmes not designed to lead directly to ISCED 5A or 5B.
These programmes lead directly to the labour market or other
ISCED 4 programmes.
Education which is not designed explicitly to prepare participants for
a specific class of occupations or trades or for entry into further voca-
tional/technical education programmes.
Education which prepares participants for direct entry, without further
training, into specific occupations. Successful completion of such pro-
grammes leads to a labour-market relevant vocational qualification.
Types of programmes which can fit into level 4 Programme orientation
Programme orientation
Programme orientation
Destination for which the programmes have beendesigned to prepare students:
Destination for which the programmes have beendesigned to prepare students:
Destination for which the programmes have beendesigned to prepare students:
A
B
C
Gen
eral
Vo
cati
on
alV
oca
tio
nal
Vo
cati
on
alG
ener
alG
ener
al
A
B
C
A
B
A
B
A
B
124
ANNEX DRegions
Africa (53 countries or territories)
Algeria, Angola, Benin, Botswana, Burkina Faso, Burundi, Cameroon,Cape Verde, Central African Republic, Chad, Comoros, Congo, Côted’Ivoire, Democratic Rep. of the Congo, Djibouti, Egypt, EquatorialGuinea, Eritrea, Ethiopia, Gabon, Gambia, Ghana, Guinea, Guinea-Bissau, Kenya, Lesotho, Liberia, Libyan Arab Jamahiriya, Madagascar,Malawi, Mali, Mauritania, Mauritius, Morocco, Mozambique,Namibia, Niger, Nigeria, Rwanda, Sao Tome and Principe, Senegal,Seychelles, Sierra Leone, Somalia, South Africa, Sudan, Swaziland,Togo, Tunisia, Uganda, United Republic of Tanzania, Zambia,Zimbabwe
America, North (31 countries or territories)
Anguilla, Antigua and Barbuda, Aruba, Bahamas, Barbados, Belize,Bermuda, British Virgin Islands, Canada, Cayman Islands, Costa Rica,Cuba, Dominica, Dominican Republic, El Salvador, Grenada,Guatemala, Haiti, Honduras, Jamaica, Mexico, Montserrat, Nether-lands Antilles, Nicaragua, Panama, Saint Kitts and Nevis, Saint Lucia,Saint Vincent and the Grenadines, Trinidad and Tobago, Turks andCaicos Islands, United States
America, South (12 countries or territories)
Argentina, Bolivia, Brazil, Chile, Colombia, Ecuador, Guyana,Paraguay, Peru, Suriname, Uruguay, Venezuela
Annex D: Regions
125
Asia (50 countries or territories)
Afghanistan, Armenia, Azerbaijan, Bahrain,Bangladesh, Bhutan, Brunei Darussalam, Cambodia,China, Cyprus, Dem. People’s Rep. of Korea,Georgia, Hong Kong (SAR of China), India,Indonesia, Iran, Islamic Republic of, Iraq, Israel,Japan, Jordan, Kazakhstan, Kuwait, Kyrgyzstan,Lao People’s Democratic Republic, Lebanon, Macao(China), Malaysia, Maldives, Mongolia, Myanmar,Nepal, Oman, Pakistan, Palestinian AutonomousTerritories, Philippines, Qatar, Republic of Korea,Saudi Arabia, Singapore, Sri Lanka, Syrian ArabRepublic, Tajikistan, Thailand, Timor-Leste, Turkey,Turkmenistan, United Arab Emirates, Uzbekistan,Viet Nam, Yemen
Europe (44 countries or territories)
Albania, Andorra, Austria, Belarus, Belgium, Bosniaand Herzegovina, Bulgaria, Croatia, Czech Republic,Denmark, Estonia, Finland, France, Germany,Gibraltar, Greece, Holy See, Hungary, Iceland,Ireland, Italy, Latvia, Liechtenstein, Lithuania,Luxembourg, Malta, Monaco, Netherlands, Norway,Poland, Portugal, Republic of Moldova, Romania,Russian Federation, San Marino, Serbia andMontenegro, Slovakia, Slovenia, Spain, Sweden,Switzerland, The Former Yugoslav Republic ofMacedonia, Ukraine, United Kingdom of GreatBritain and Northern Ireland
Oceania (17 countries or territories)
Australia, Cook Islands, Fiji, Kiribati, MarshallIslands, Micronesia (Federated States of), Nauru,New Zealand, Niue, Palau, Papua New Guinea,Samoa, Solomon Islands, Tokelau, Tonga, Tuvalu,Vanuatu