digest of technical papers - vehicle displays
TRANSCRIPT

2020 VEHICLE DISPLAYS AND INTERFACES SYMPOSIUM
DIGEST OF TECHNICAL PAPERS
OCTOBER 14–15, 2020
CONFERENCE SPONSORS

2020 VEHICLE DISPLAYS AND INTERFACES SYMPOSIUM
Digest of Technical Papers
Abstracting is permitted with credit to the source. Libraries are permitted to photocopy beyond the limits of the U.S. copyright law for private use of patrons those articles in this volume that carry a code at the bottom of the first page, provided per-copy fee indicated in the code is paid through the Copyright Clearance Center, 21 Congress Street, Salem, MA 01970. Instructors are permitted to photocopy isolated articles for noncommercial classroom use without fee. For other copying, reprint, or republication permission, write to SID Headquarters, 1475 S. Bascom Avenue, Suite 114, Campbell, CA 95008. All rights reserved. Copyright © 2020 Society for Information Display.

Table of ConTenTs
K1: Keynote Address: Future Auto Cockpit Human Experiences ............................................................ 1John Schneider, Director – Electrical, Software, Compute, and AI Technologies,Ford Motor Company, Detroit, MI, US
session 1: automotive Market
1.1: Invited Address: Automotive Display Market and User Interfaces Overview .................................. 3Kyle Davis, IHS Markit, Southfield, MI, US
1.2: Invited Address: Automotive Touch Screen, Touchless Control, Micro and miniLED andSmart Windows Market Forecast .................................................................................................... 5
Jennifer Colegrove, Touch Display Research, Inc., Santa Clara, CA, US
1.3: Invited Address: Display Industry Markets and Technologies – What Auto DisplayProfessionals Need to Know About the Rest of the Industry.......................................................... 7
Bob O’Brien, Display Supply Chain Consultants, Ann Arbor, MI, US
session 2: Display and HMI systems
2.1: Reflection Properties of AR Coated Flat and AG Glass Surfaces ...................................................... 9Dave McLean, MAC Thin Films, Inc., Santa Rosa, CA, US
2.2: IoT Intelligent Display Technology .................................................................................................... 15Liang Zhou, Ling‐ling Zhang, Jiu‐bin Zhou, Jin‐e Liu, Feng Qinin,Shanghai Tianma Microelectronics Co., Ltd., Shanghai, China
2.3: Display Module with Integrated Driver of Multi‐Screen .................................................................... 17Liang Zhou, Lu Yao, Ling‐ling Zhang, Jiu‐bin Zhou, Wan‐chun Du, Jin‐e Liu, Feng Qin, Tianma Micro‐Electronics Group, Shanghai, China
2.4: High Precision Optical Bonding for Free‐Form and Curved Displays .............................................. 19Eugen Bilcai, Henkel KGaA, Madison Heights, MI, US
2.5: Digitized Styling and Safety with Automotive Exterior Displays ...................................................... 21Johnathan Weiser, Richard Nguyen, Kimberly Peiler, OSRAM Opto Semiconductors, Novi, MI, USUlrich Kizak, OSRAM Opto Semiconductors, Regensburg, Germany
2.6: A Novel Approach for High Quality SNR in Sensing Applications.................................................... 25Gerald Morrison, SigmaSense, Austin, TX, US
session 3: Head‐Up Displays
3.1: Diffusive Microlens Array for Head‐Up Display Applications .......................................................... 41Naoki Hanashima, Mitsuo Arima, Yutaka Nakazawa, Dexerials Corporation, Tagajo, Miyagi,
JapanKazuyuki Shibuya, Dexerials Corporation, Tome, Miyagi, JapanJingting Wu, Dexerials America Corporation; San Jose, California, US
i

3.2: Human Perception Studies of Head‐Up Display Ghosting.................................................................. 47Steve Pankratz, William Diepholz, John Vanderlofske, 3M Company, St. Paul, MN, US
3.3: Computational Holographic Displays for 3D AR HUD Using Free‐Form Optics.............................. 53Hakan Urey, CY Vision, San Jose, CA, US
3.4: Holographic Optical Elements and Projector Design Considerations for Automotive Windshield Displays .................................................................................................... 55
Sam Martin, Jason Thompson, Texas Instruments, Inc., Dallas Texas, USIan Redmond, CERES Holographics, Ltd., St. Andrews, Scotland, UK
Tutorial
Holography and Its Automotive Applications...................................................................................... 63Kai‐Han Chang, General Motors Global R&D, Pontiac, MI, US
Keynote address
K2: Keynote Address: Voice of the Consumer | Technology and Mobility Clarity Today and Tomorrow.................................................................................................................................. 65
Kristin Kolodge, Executive Director of Human‐Machine Interface (HMI) andDriver Interaction at J.D. Power
session 4: Display Metrology
4.1: Understanding and Achieving Reproducible Sparkle Measurements for an Automotive Specification ................................................................................................................ 67
Ingo Rotscholl, Julia Brinkmann, Udo Krüger, TechnoTeam Bildverarbeitung GmbH, Ilmenau, Germany
Jens Rasmussen, Elektrobit Automotive GmbH, Ulm, GermanyChristoph Rickers, Volkswagen AG, Wolfsburg, Germany
4.2: Measuring MicroLEDs for Color Non‐Uniformity Correction .......................................................... 73Mike Naldrett, Matt Scholz, Bret Stonebridge, Austin Piehl, Anne Corning,
Shaina Warner, Radiant Vision Systems LLC, Redmond, Washington, US
session 5: new Display solutions
5.1: Supervising (Automotive) Displays to Safeguard Camera Monitor Systems .................................... 85B. Axmann, F. Langner, Mercedes‐Benz AG, Stuttgart, GermanyK. Blankenbach, M. Vogelmann, Pforzheim University, Pforzheim, GermanyM. Conrad, samoconsult GmbH, Berlin, GermanyJ. Bauer, Karlsruhe University, Karlsruhe, Germany
5.2: Customized Local Dimming Algorithm and BLU for Automotive Application towards Low Power Consumption and High Visual Quality........................................................................ 93
Maxim Schmidt, Ramazan Ayasli, Chihao Xu, Saarland University, Saarbrücken, Germany
5.3: Automotive Smart Surfaces: Conformable HDR Displays and Smart Windows to Activate Almost Any Surface ...................................................................................................... 97
J. Huggins, FlexEnable, Ltd., Cambridge, UK
ii

5.4: End‐of‐Line (EOL) Testing of Recent OEM Display Quality Standards............................................ 101Silke R. Kirchner, Benjamin Käsdorf, Cameron R. Hughes, Nadine Götte,
Instrument Systems Optische Messtechnik GmbH, Munich, Germany
5.5: Automotive Dual Cell microZone™ LCD Development.................................................................... 103Paul Weindorf, Qais Sharif, Elijah Auger, David Whitton, Brian Hayden,
Visteon Corporation, Van Buren Twp., MI, US
5.6: A Low‐Power Transflective TFT‐LCD Based on IGZO TFT ............................................................ 107Tenggang Lou, Lei Wang, Xiangjian Kong, Jine Liu, Feng Qin, Tianma Micro‐Electronics Group, Shanghai, China
5.7: A MicroLED Device with 0mm Border .............................................................................................. 111TengGang Lou, Tianma Micro‐Electronics Group, Shanghai, China
5.8: Enabling Features of VueReal MicroLED Technology for Automotive Applications ........................ 113Rexa Chaji, VueReal Inc, Waterloo, Ontario, Canada
5.9: New Challenges and Testing Solutions for Flexible Vehicle Displays & Interfaces .......................... 115Eisuke Tsuyuzaki, Bayflex Solutions, Alameda, CA, US
5.10: New Material Solutions for Automotive Displays. Interfaces, and Applications................................ 127Volker Plehn, SABIC, Wixom, MI, US
5.11: An Alternative to OLED with Full‐Array Local Dimming in Automotive Displays.......................... 129Logan Cummins, Texas Instruments, Dallas, TX, US
Panel DIsCUssIon: Display and Interfaces for autonomous Drive Including aDas
iii

iv

SID VEHICLE DISPLAYS AND INTERFACES 2020 27th ANNUAL SYMPOSIUM & EXPO
PROGRAM October 14–15, 2020
WEDNESDAY, OCTOBER 14, 2020 All technical content will be published at 8:00 AM EDT
EXHIBITS OPEN
Welcoming Remarks
Silviu Pala, Automotive Display, Southfield, MI, US
KEYNOTE ADDRESS
Future Auto Cockpit Human Experiences
John Schneider, Director – Electrical, Software, Compute, and AI Technologies,
Ford Motor Company, Detroit, MI, US
SESSION 1: AUTOMOTIVE MARKET
Co‐Chairs: Silviu Pala, Automotive Display, Southfield, MI, US
Michael Boyd, Yazaki North America, Canton, MI, US
1.1 INVITED ADDRESS:
Automotive Display Market and User Interfaces Overview
Kyle Davis, IHS Markit, Southfield, MI, US
1.2 INVITED ADDRESS:
Automotive Touch Screen, Touchless Control, Micro and miniLED and
Smart Windows Market Forecast
Jennifer Colegrove, Touch Display Research, Inc., Santa Clara, CA, US
1.3 INVITED ADDRESS:
Display Industry Markets and Technologies – What Auto Display
Professionals Need to Know About the Rest of the Industry
Bob O’Brien, Display Supply Chain Consultants, Ann Arbor, MI, US
SESSION 2: DISPLAY AND HMI SYSTEMS
Co‐Chairs: Bruce Banter, Tech‐D‐P Inc., Northville, MI, US
Drew Harbach, Peterbilt Motors Denton, TX, US
2.1 Reflection Properties of AR Coated Flat and AG Glass Surfaces
Dave McLean, MAC Thin Films, Inc., Santa Rosa, CA, US
v

2.2 IoT Intelligent Display Technology
Liang Zhou, Ling‐ling Zhang, Jiu‐bin Zhou, Jin‐e Liu, Feng Qinin,
Shanghai Tianma Microelectronics Co., Ltd., Shanghai, China
2.3 Display Module with Integrated Driver of Multi‐Screen
Liang Zhou, Lu Yao, Ling‐ling Zhang, Jiu‐bin Zhou, Wan‐chun Du, Jin‐e Liu,
Feng Qin, Tianma Micro‐Electronics Group, Shanghai, China
2.4 High Precision Optical Bonding for Free‐Form and Curved Displays
Eugen Bilcai, Henkel KGaA, Madison Heights, MI, US
2.5 Digitized Styling and Safety with Automotive Exterior Displays
Johnathan Weiser, Richard Nguyen, Kimberly Peiler, OSRAM Opto
Semiconductors, Novi, MI, US
Ulrich Kizak, OSRAM Opto Semiconductors, Regensburg, Germany
2.6 A Novel Approach for High Quality SNR in Sensing Applications
Gerald Morrison, SigmaSense, Austin, TX, US
SESSION 3: Head‐Up Displays
Co‐Chairs: Ross Maunders, FCA US LLC, Auburn Hills, MI, US
Dan Cashen, Continental Automotive Group, Auburn Hills, MI, US
3.1 Diffusive Microlens Array for Head‐Up Display Applications
Naoki Hanashima, Mitsuo Arima, Yutaka Nakazawa, Dexerials Corporation,
Tagajo, Miyagi, Japan
Kazuyuki Shibuya, Dexerials Corporation, Tome, Miyagi, Japan
Jingting Wu, Dexerials America Corporation; San Jose, California, US
3.2 Human Perception Studies of Head‐Up Display Ghosting
Steve Pankratz, William Diepholz, John Vanderlofske, 3M Company, St. Paul,
MN, US
3.3 Computational Holographic Displays for 3D AR HUD Using
Free‐Form Optics
Hakan Urey, CY Vision, San Jose, CA, US
3.4 Holographic Optical Elements and Projector Design Considerations for
Automotive Windshield Displays
Sam Martin, Jason Thompson, Texas Instruments, Inc., Dallas Texas, US
Ian Redmond, CERES Holographics, Ltd., St. Andrews, Scotland, UK
vi

TUTORIAL on Holography and Its Automotive Applications
Kai‐Han Chang, General Motors Global R&D, Pontiac, MI, US
EXHIBITOR PRESENTATIONS SESSION
Co‐Chairs: Bruce Banter, Tech‐D‐P Inc., Northville, MI, US
Eric Miciuda, Continental Corporation, Auburn Hills, MI, US
Presentations will be available from the following Exhibitors: ‐ AGC Plasma Technology Solutions
‐ Dexerials Corporation
‐ ELDIM
‐ IHS Market
‐ Incom
‐ Instrument Systems Optische
Messtechnik GmbHIwatani
Corporation of America
‐ Keiwa
‐ Konica Minolta Sensing Americas
‐ Kyocera Display
‐ Lumineq
‐ MAC Thin Films, Inc.
‐ Optics Blazers AG
‐ Optronic Laboratories, Inc.
‐ Panasonic
‐ Radiant Vision Systems
‐ SigmaSense
‐ Tanvavs
‐ TouchNetix Limited
‐ TT Vision USA
‐ Westboro Photonics
vii

THURSDAY, OCTOBER 15, 2020 All technical content will be published at 8:00 AM EDT
EXHIBITS OPEN
Local SID Chapter Awards
Bob O’Brien, Display Supply Chain Consultants, Ann Arbor, MI, US
Silviu Pala, Automotive Display, Southfield, MI, US
KEYNOTE ADDRESS
Voice of the Consumer | Technology and Mobility Clarity Today and Tomorrow
Kristin Kolodge, Executive Director of Human‐Machine Interface (HMI) and
Driver Interaction at J.D. Power
SESSION 4: DISPLAY METROLOGY
Co-Chairs: Kimberly Peiler, OSRAM Opto Semiconductors, Inc., Novi, MI, US
Vyacheslav Birman, Continental Corporation, Auburn Hills, MI, US
4.1 Understanding and Achieving Reproducible Sparkle Measurements
for an Automotive Specification
Ingo Rotscholl, Julia Brinkmann, Udo Krüger, TechnoTeam Bildverarbeitung
GmbH, Ilmenau, Germany
Jens Rasmussen, Elektrobit Automotive GmbH, Ulm, Germany
Christoph Rickers, Volkswagen AG, Wolfsburg, Germany
4.2 Measuring MicroLEDs for Color Non‐Uniformity Correction
Mike Naldrett, Matt Scholz, Bret Stonebridge, Austin Piehl, Anne Corning,
Shaina Warner, Radiant Vision Systems LLC, Redmond, Washington, US
SESSION 5: NEW DISPLAY SOLUTIONS
Co‐Chairs: David Lambert, Panasonic, Farmington Hills, MI, US
Jerzy Kanicki, University of Michigan, Ann Arbor, MI, US
5.1 Supervising (Automotive) Displays to Safeguard Camera Monitor Systems
B. Axmann, F. Langner, Mercedes‐Benz AG, Stuttgart, Germany
K. Blankenbach, M. Vogelmann, Pforzheim University, Pforzheim, Germany
M. Conrad, samoconsult GmbH, Berlin, Germany
J. Bauer, Karlsruhe University, Karlsruhe, Germany
5.2 Customized Local Dimming Algorithm and BLU for
Automotive Application towards Low Power Consumption and
High Visual Quality
Maxim Schmidt, Ramazan Ayasli, Chihao Xu, Saarland University,
Saarbrücken, Germany
viii

5.3 Automotive Smart Surfaces: Conformable HDR Displays and
Smart Windows to Activate Almost Any Surface
J. Huggins, FlexEnable, Ltd., Cambridge, UK
5.4 The Functional Safety Designs of Vehicle Display Driver ICs
Cheng‐Chih Deno Hsu, Himax Technologies, Hsinchu City, Taiwan
5.5 Automotive Dual Cell microZone™ LCD Development
Paul Weindorf, Qais Sharif, Elijah Auger, David Whitton, Brian Hayden,
Visteon Corporation, Van Buren Twp., MI, US
5.6 A Low‐Power Transflective TFT‐LCD Based on IGZO TFT
Tenggang Lou, Lei Wang, Xiangjian Kong, Jine Liu, Feng Qin,
Tianma Micro‐Electronics Group, Shanghai, China
5.7 A MicroLED Device with 0mm Border
TengGang Lou, Tianma Micro‐Electronics Group, Shanghai, China
5.8 Enabling Features of VueReal MicroLED Technology for
Automotive Applications
Rexa Chaji, VueReal Inc, Waterloo, Ontario, Canada
5.9 New Challenges and Testing Solutions for Flexible
Vehicle Displays & Interfaces
Eisuke Tsuyuzaki, Bayflex Solutions, Alameda, CA, US
5.10 New Material Solutions for Automotive Displays. Interfaces, and
Applications
Volker Plehn, SABIC, Wixom, MI, US
5.11 An Alternative to OLED with Full‐Array Local Dimming in
Automotive Displays
Logan Cummins, Texas Instruments, Dallas, TX, US
PANEL DISCUSSION
Moderator: Bob O’Brien, Display Supply Chain Consultants, Ann Arbor, MI, US
Display and Interfaces for Autonomous Drive Including ADAS
Participants: Members of government, academia, industry
Live Q&A with Panelists and Moderator at 11AM EDT
ix

x

Keynote Address
KEYNOTE ADDRESS Future Auto Cockpit Human Experiences
John Schneider, Director – Electrical, Software, Compute, and AI Technologies, Ford Motor Company, Detroit, MI, US
PAPER UNAVAILABLE
PRESENTATION SLIDES SHOULD BE DISTRIBUTED AFTER THE CONFERENCE
1

2

Presentation 1.1
INVITED ADDRESS Automotive Display Market and User Interfaces Overview
Kyle Davis, IHS Markit, Southfield, MI, US
PAPER UNAVAILABLE
PRESENTATION SLIDES SHOULD BE DISTRIBUTED AFTER THE CONFERENCE
3

4

Presentation 1.2
INVITED ADDRESS Automotive Touch Screen, Touchless Control,
Micro and miniLED and Smart Windows Market Forecast Jennifer Colegrove, Touch Display Research, Inc.,
Santa Clara, CA, US
PAPER UNAVAILABLE
PRESENTATION SLIDES SHOULD BE DISTRIBUTED AFTER THE CONFERENCE
5

6

Presentation 1.3
INVITED ADDRESS Display Industry Markets and Technologies –
What Auto Display Professionals Need to Know About the Rest of the Industry
Bob O’Brien, Display Supply Chain Consultants, Ann Arbor, MI, US
PAPER UNAVAILABLE
PRESENTATION SLIDES SHOULD BE DISTRIBUTED AFTER THE CONFERENCE
7

8

Reflection Properties of AR Coated Flat and AG Glass Surfaces
David McLean, MAC Thin Films, Inc.
Information displays are common in modern vehicles and their use, size and form factors continue to
increase. Display visibility in sunlight remains an issue even with the use of anti‐glare glass, which
breaks up the specular reflection, but does not reduce the overall intensity of reflected light. Aircraft
cockpit displays require both anti‐reflection (AR) and anti‐glare (AG) functionality to provide optimum
viewability. The same design considerations apply to the automotive use case. The use of touchscreen
panels requires an effective oleophobic (anti‐fingerprint) treatment to maintain appearance and for
ease of cleaning.
The CIE 1976 L*a*b* color space is commonly used to numerically describe color. Color is expressed as
three numerical values, L* for the lightness and a* and b* for the green–red and blue–yellow color
components.
The difference between two colors is useful for the purposes of
evaluating color match or perceived differences in color. This can be
expressed mathematically as ΔC (or ΔE if lightness is included). It is
generally accepted that the threshold for a noticeable color change is
about deltaC ~ 2.2.
The reflected color and color shift when changing viewing angle are critical considerations when
designing a thin film anti‐reflection coating for avionic or automotive displays. This reflected color is
Figure 1: Graphical Representation of CIE 1976
L*a*b* color in 3‐dimensional space
9

most noticeable most when the display is off. The position of the sun with respect to the observer and
associated viewing angle changes with vehicle position and the time of day, among other factors. It is
critical to maintain a consistent reflected color over a wide range of angles to ensure pleasing display
aesthetics and meet the demands of interior designers.
An optimized AR coating with integrated oleophobic (anti‐fingerprint) properties coated onto AG glass
surfaces provides the optimal solution for reducing glare from touch panel displays. The design
approach is to create a broadband visible anti‐reflection (AR) coating with a nominal blue‐green
reflected color which maintains low color saturation across a wide range of incident angles. The
theoretical reflected color for this coating design is shown in Table 1. ΔC is kept below 2.2 between the
most extreme viewing angles.
Table 1: Nominal Coating Design Color Values
Incident Angle Y a* b* ΔC
10 0.21 ‐0.85 ‐2.89 ref
20 0.20 ‐0.75 ‐1.83 1.06
30 0.26 ‐0.91 ‐0.17 1.67
40 0.54 ‐1.45 1.54 1.79
50 1.38 ‐1.36 1.64 0.13
60 3.84 ‐0.25 0.19 1.83
The coating design proposed in Table 1 was produced by MAC Thin Films, Inc. The measured properties
were found to be in good agreement with theory as shown in Table 2.
Table 2: Actual Measured Values
Incident Angle Y a* b* ΔC
10 deg 0.23 ‐1.70 ‐3.84 ref
20 deg 0.17 ‐0.79 ‐2.99 1.25
30 deg 0.16 ‐0.05 ‐1.53 1.64
40 deg 0.30 ‐0.23 0.27 1.81
50 deg 0.86 ‐0.83 0.50 0.64
60 deg 2.87 ‐0.12 0.08 0.82
10

Thin film AR coatings are comprised of multiple layers of high and low refractive index materials with
each individual layer typically < 150 nm. Critical control of the thickness of each layer is required to
achieve the designed visual functionality. Fingerprints on the
coating can change the AR behavior. A successful design
approach requires an anti‐fingerprint treatment to reduce the
transfer of skin oils to the display and allow for them to be
easily cleaned from the surface.
The measurements of the reflected light scattered from the AR
coating on AG glass were made according to the setup shown
in Figure 2. The nominal angle of incidence is represented by
theta (θ). The collection aperture is moved at “+” and “‐”
angles from primary incident angle to collect the scattered
light. A glass wedge and n=1.52 matching oil were used to
eliminate the second surface reflection and simulates the case
of an optically bonded display.
The degree of scattered light increases as the gloss value of the
AG glass decreases. This is indicated by a reduced peak at 0
deg scatter angle, which represents the specular component of
the reflected light, as shown in Figure 3. A corresponding
increase in the proportion of the reflected light at larger
scatter angles was observed.
The ratio of diffuse (Rde) to total (Rdi = specular + diffuse)
reflectance is a convenient way to describe the degree of light
scattering of an optical surface. Figure 4 summarizes the
behavior of various uncoated AG glasses as well the color
neutral AR coating on 70 gloss AG glass. For uncoated AG
glass, the proportion of scattered light increases with
increasing incident angle in a linear manner. The addition of
the AR coating significantly reduces the specular component, thereby increasing the ratio of scattered to
total reflected light. The visual effect is a significant reduction and glare and an improvement in sunlight
readability.
Figure 3: Scatter behavior by gloss value
Figure 2: Measurement configuration
11

The measured reflected color values for the AR coated samples produced for this study are shown in
Figure 5 below. The results obtained are in good agreement with the design target. The use of AG glass
reduces the visible color change by scattering light at larger and smaller angles to the primary incident
angle, which has the effect of blending the reflected color.
0.40
0.45
0.50
0.55
0.60
0.65
0.70
0.75
0.80
20 30 40 50 60 70
Rde / Rdi
Incident Angle
Rde / Rdi Trajectory
35 Gloss
70 Gloss
70 Gloss ‐ Coated
110 Gloss
Linear (35 Gloss)
Linear (70 Gloss)
Linear (110 Gloss)
Figure 4: Scatter characteristics of AG glasses by incident angle
Figure 5: Reflected Color Measurements of Coated Samples
12

Photographic samples of the reflected color were made for the purpose of making a visual comparison
and are shown in Figure 6. The uncoated glass has a neutral color but a strong reflection with Y = 4.2%
and L* = 24.4. This can make the display hard to read in sunlight. A “Standard AR” coating greatly
reduces the magnitude of the reflected light with Y < 0.3% and L* < 2.7, an order of magnitude reduction
in apparent intensity, as indicated by a comparison of L* values. However, this coating demonstrates a
noticeable red‐shift in the reflected color when the viewing angle changes from 10 degrees to 45
degrees. This color shift is typical of common AR coatings in use today.
The optimized AR coating on standard flat glass maintains a blue‐green reflected color over the range of
viewing angles while still providing a drastic reduction in the magnitude of the reflected light.
Combining this coating with an AG glass reduces the color saturation at all viewing angles.
A comprehensive AR coating design, including an oleophobic optical layer, has been developed and
manufactured. This coating provides minimal color saturation and consistent color over a wide range of
viewing angles. The addition of this AR coating to AG glass significantly reduces reflectance and
increases the ratio of diffuse to total reflected light. Consequently, it drastically reduces glare from the
sun. Like in avionic displays, automotive display viewability is optimized by the addition of an AR coated
AG cover glass with effective anti‐fingerprint treatment.
Figure 6: Reflected Color Measurements of Coated Samples
13

14

IOT intelligent display technology
Liang Zhou, Ling‐ling Zhang, Jiu‐bin Zhou, Jin‐e Liu and Feng Qin
Shanghai Tianma Microelectronics Co., Ltd.
Abstract:
This paper introduces a display technology suitable
for IOT smart home. The panel of the display
technology product integrates the COG display driver
IC and MCU IC. The MCU contains an 8051 or ARM
core and FPC includes FLASH module and Clock
Module. The I2C or SPI instruction interface replaces
the traditional display data interface. MCU controls
other devices of intelligent terminal products
through I/O interface to realize the integration and
intelligentization of terminal products. The display
technology uses I2C or SPI interfaces to interact with
the communication module instructions and is
compatible with all kinds of communication
protocols, such as Wifi, Bluetooth, Zigbee, etc. The
technology can be applied to IOT intelligent display
terminal products with different demands.
Keywords:IOT; smart home; MCU; Intelligent display
1. Introduction
Usually a simple display system consists of a display
module and a driving controller. The DDI(display
driver IC) is bonded on the edge of display panel,
called COG (chip on glass); the MCU IC is bonded on
the driving board. A significant fraction of cost is
associated with the external ICs for small to mid‐size
display modules.
In this paper, we describe the MCU IC is packaged in
COG, bonded on the edge of display panel with DDI.
The technology increases the cost‐competitiveness of
display system, and realizes the integration and
intelligentization of products. The technology can be
applied to IOT intelligent display terminal products
with different demands.
2. Architecture of IOT display module
Figure 1 shows the proposed IOT display architecture.
The DDI drives the screen with source and gate circuit,
and MCU IC drives the DDI with display interface such
as RGB interface. Besides, the MCU IC communicates
with the devices on the FPC, between them
instructions are transmitted through I2C or SPI
interface.
The devices on the FPC include the communication
module such as WIFI, Bluetooth and Zigbee , the input
devices such as sensor、touch controller、microphone
and camera, the output device such as speaker, DAC
and switch. The communication module exchanges
information with cloud and internet net.
Figure1. IOT display architecture
Figure 2 shows the working principle of IOT intelligent
display module. Input devices or communication
modules give instructions to MCU IC, for example, you
can touch the TP KEY or TP panel, or you can operate
with APP. The instructions from touch sensor include
switching UI, displaying time and controlling smart
home. There is no need for main board to transmit UI
images to MCU, only instructions are needed, and
then MCU reads UI images from flash on the FPC
15

according to these instructions. UI images are
beforehand stored in the flash.
Figure2. The working principle of IOT intelligent display module
Figure 3 shows the internal diagram of MCU. Image
data is cached in the display ram through RAM
controller, graphics controller builds in geometry
drawing function, support the functions of drawing
dot, line, curve, ellipse, triangle and rectangle.
Hardware graphics accelerator is also embedded to
realize picture rotation, flipping, mirroring and picture
in picture, transparent display. This architecture
reduces greatly the loading of software of MCU.
This display module is very useful for Household
Electric Appliances, Industrial control, electronics
instruments, Medical equipment, Human interface,
Testing equipment, Lift indicators and so on.
Figure3. Internal diagram of MCU
3. Performance of IOT display module
First, this MCU IC belongs to SOC and its size is much
smaller than discrete COB devices. And it is bonded
on panel, PCB areas can be saved. This will reduce the
cost of the system. Besides, the precision of COG
bonding is much higher than COB SMT process, more
pins are allowed in smaller areas. This will improve
the integration of the system. Furthermore, MCU and
DDI can be combined as one chip, if the process is
feasible.
Secondly, the display interface bus is shorter than
traditional system, because MCU IC bonded on panel
is closer to DDI. The display signal does not need to
pass through PCB and FPC, so it is not susceptible to
interference. The product will have better reliability.
Finally, the development cycle of the terminal system
will be greatly shortened because the complex display
processing is finished by MCU IC of display module
instead of host main board. The development of host
main board just focuses on the power control of
terminal product and simple instruction set with MCU.
MCU will realize the control of equipment through
relays according to responding instructions. For
example, adjust the air conditioner switch,
temperature and air volume through your cell phone
APP or central console screen. Besides, for terminal
product, the product supply chain will be simplified
without external MCU IC. It not only shortens the
development cycle, but also makes the later
maintenance and upgrade easier.
4. Conclusion
The IOT display module uses COG package MCU IC on
panel instead of COB IC on board to realize the
integration of terminal products. The display
technology uses I2C or SPI interfaces to interact with
the peripheral including communication module
instructions and is compatible with all kinds of
communication protocols, such as Wifi, Bluetooth,
Zigbee, etc to realize the intelligentization of terminal
products. The technology can be applied to IOT
intelligent display terminal products with different
demands.
16

Display module with integrated driver of multi-screen
Liang Zhou, Lu Yao, Ling-ling Zhang, Jiu-bin Zhou, Wan-chun Du, Jin-e Liu, Feng Qin
TIANMA MICRO-ELECTRONICS GROUP, Shanghai, China
Abstract
This article introduces a way to integrate the image
segmentation processing function on each display
module without the driver boards of multi‐screen.
For example, the integrated processing chip which
is integrated on the FPC or PCB of each display
module can set the row and column addresses
according to the corresponding module ID.
According to the addresses, the chip can intercept
own display data from the source data bus, and
send the data to cache RAM. Then reducing
frequency, it can refresh the corresponding display
by matching frame rate. As the number of splicing
unit screens increasing, this way can save expensive
costs by removing the driver boards of multi‐screen.
Author Keywords
multi‐screen; Image segmentation; Driver of multi‐screen
1. Introduction
At present, for the splicing screen in the market,
usually each splicing screen will come with a
splicing drive board, where there is a splicing drive
board control chip and image processing chip. With
the increasing number of splicing unit screens,
splicing driver plates cost a lot. This paper
introduces a scheme to integrate processing chip
(such as FPGA) into FPC or PCB of display module.
According to the ID setting of each module, the
responding display data is intercepted on the data
bus by the chip and after processing the cached
data is sent to its own screen.
2. Architecture and principle of integrated driver
of multi‐screen
As shown in Figure 1, each display module's
interface plate is set with the ID (for example, using
a dial switch) and the host terminal passes
configuration parameters (row, column address,
etc.) for modules with different IDs through serial
port, and the FPGA intercepts them according to its
own address. Taking its own pixel data from the
data bus, FPGA sends it to RAM for caching, and
then reduce the PCLK frequency to the normal
refresh rate for display. The FPGA collects all the
pixel data on the bus (the sampling clock is based
on the signal source) and which pixel data will be
stored in RAM depends on the ID setting of the
plate.
Figure 1. Architecture of integrated driver of multi‐screen
For example, there are nine screens in total, and
each unit screen has its own interface plate, using
the dial switch or other ways to set the ID number
(such as 0001, 0010,...1001 in order respectively).
The FPGA on each cell screen will read the ID
number on the responding interface plate to
confirm the pixel data it needs. For example ID
17

number 0110 is read at 6th block, which is in row 2
and column 3, the FPGA displays lines 641‐1280
and columns 2561‐3840 of the source image (e.g.,
resolution 3840*1920) on the bus. The pixel data
(1280*640) is first stored in RAM and then read
from RAM to drive display module in
1280*640@60Hz. The host side can transmit
configuration parameters such as unit screen
resolution and frame frequency to FPGA through
serial port or other low‐speed interface.
3. Performance
This method can save the expensive cost of splicing
drive plates. The ID number is adjustable to make
the replacement of the unit screen more flexible.
FPGA self‐addressing according to parameters
ensures simpler settings on host side.
4. Conclusion
This paper introduces a way to integrate the image
segmentation processing function on each display
module without the driver boards of multi‐screen.
As the number of splicing unit screens increasing,
this way can save expensive costs by removing the
driver boards of multi‐screen.
18

Presentation 2.4
High Precision Optical Bonding for Free-Form and Curved Displays
Eugen Bilcai, Henkel KGaA, Madison Heights, MI, US
PAPER UNAVAILABLE
PRESENTATION SLIDES SHOULD BE DISTRIBUTED AFTER THE CONFERENCE
19

20

Digitized Styling and Safety with Automotive Exterior Displays
Johnathan Weiser*, Richard Nguyen*, Kimberly Peiler*, Ulrich Kizak**
*OSRAM Opto Semiconductors, Novi, MI, USA 48377 **OSRAM Opto Semiconductors, Regensburg, Germany 93055
Abstract
Modern display technologies allow for increasingly
sophisticated animated digitized elements to be
implemented on automotive exteriors. These displays
can allow for both unique signature lighting elements
to a vehicle and can bring increased awareness to
other road occupants to the intentions of the driver. In
the present paper, we discuss future concepts of
automotive exterior displays that allow for increased
safety and styling throughout the vehicle such as in the
taillights and exterior paneling. Future regulation
may be shaped by increased interest in dynamic
lighting aesthetics and displays on vehicle surfaces
including the use of monochromatic and multi-color
amorphous displays.
Keywords
Automotive Exterior Lighting; Signaling Displays;
Dynamic Lighting; Sequential Turn; LED Matrix;
Digitization; Pedestrian Communication
Introduction
Advancements in LED technology have allowed for
smaller, brighter, and more robust parts which has
expanded their flexibility throughout vehicles.
Additionally, new driver modules have expanded the
capability to support large numbers of individually
addressable nodes in more space constrained
environments.
Figure 1. OSRAM TOPLED E1608 LED
Small packaged LEDs with a size such as 1.6 x 0.8 x
0.6mm allow for narrow pixel pitch monochromatic
displays with 2mm pitch. Due to the high brightness
of using individual LEDs for each pixel, high contrast,
and hidden illumination effects behind materials can
be achieved as well.
Figure 2. OSIRE E4633i LEDs from OSRAM in a daisy-
chained architecture with integrated driver IC and pre-
calibrated LED data
Multi-die packages are also available with built in
drivers connected to new communication protocols,
such as ISELED, which allow for individual
addressing of over four thousand mixed Red, Green,
and Blue (RGB) nodes from a single communication
interface. These methods increase the capability to
provide unique, dynamic, and impactful lighting
effects to the exterior of vehicles.
Dynamic Exterior Styling
Unique styling plays a major part in automotive
design. As such, lighting effects have become more
prominent recently in exterior elements of the vehicle.
Dynamic LED lighting is an excellent way to
introduce these effects into a vehicle’s design
language. Sequences for welcome lighting can greet
soon-to-be occupants while accentuating features of
the vehicle.
Figure 3a. Concept door with LED display for messaging
21

Figure 3b. Concept door with customized greeting
Utilizing a matrix of LEDs as a display can add further
personalization in welcome features, Figure 3b,
improving quality for services such as ride share and
delivery by introducing clearly visible, unique
identifiers to the exterior of the vehicle. LED displays
also introduce use cases such as the capability for
advertising, due to the high resolutions they provide to
show text and logos. LEDs are also brighter and more
robust than alternative display technologies, making
them more suitable for exterior environments,
especially with regards to daylight readability and use
behind tinted lenses. Figures 3a and 3b depict a RGB
LED array utilizing a 1mm pitch, exhibiting over
3000cd/m2 enabling direct sunlight readability.
Figure 4. Rinspeed Metrosnap concept shown at CES 2020
Figure 4 shows a concept electric vehicle with a LED
matrix display on the front and rear for both pedestrian
messaging and front or rear functions. It also includes
LED backlit stripes on the sides to indicate the lock
status of doors to pedestrians who approach the
vehicle. This is one such method that LED arrays can
be utilized on a vehicle exterior.
Safety and Visibility
The National Highway Traffic Safety Administration
(NHTSA) has conducted a study[1] finding that a
significant percentage of all car accidents are from
rear-end collisions. Within those collisions, a majority
were due to the preceding car decelerating to a stop.
These collisions also tended to involve driver
distraction. Car manufacturers are increasingly tasked
with designing taillights that are aesthetically pleasing
while also aiding to improve driver safety allowing
stop, turn, tail, and hazard to be recognized as quickly
as possible.
Digital rear combination lamps (RCLs) provide a wide
amount of flexibility in developing patterns of various
size, position, resolution, and animation rate. In a
OSRAM sponsored Lighting Research Center study,
participants rated on-axis patterns to be easier to
perceive, and higher resolution patterns to be smoother
visually [2]. Participants also reacted to larger patterns
more quickly [3]. Because of the flexibility of digital
displays, they can be placed in stylistic locations,
while still placing indicator patterns in visually
relevant locations. For example, a display could wrap
from the rear of a vehicle onto the side panel to include
both legal functions, and stylistic elements in a single
unit. Furthermore, the flexibility of dynamic LED
arrays developed as a platform allow the core design
to be implemented into multiple vehicles across a
lineup with unique styling for each vehicle that can be
easily augmented via software.
According to a research study by UMTRI [4] on
flashing brake light systems, flashing brake systems
and flashing hazard systems reduced drivers brake
response times and crash frequency in each scenario as
compared to traditional brake indicators. Shape
changes, colors, and moving effects or animations are
more examples of dynamic signaling that could impact
brake response times.
Taillights can be designed such that dynamic effects
are possible. There have been instances of animated
signaling on vehicles as early as 1968 on the Ford
Mustang Shelby GT500. Other examples include
vehicles, such as the 2016 Audi Q3. Both these
examples implemented sequential turn, which was
implemented in North America through the use of a
legal turn indicator zone plus redundant additional
zones dynamically sequenced to indicate turning.
There also have been instances of taillights that change
shape from tail function to brake light such as the
European model of the 2014 Volkswagen Passat. The
‘Click-Clack’ effect caused the taillight to visually
shift from a horizontal taillight to a vertical brake light.
Volkswagen claims “this signal change underlines the
recognizability of the brake, and thus increases the
road safety.” [5] to expand on this, some additional
features that can be put into taillights are animated
22

braking signals, reversing signal, and displaying
symbols to warn of driving conditions (heavy rain, ice,
snow, fog, dust, traffic). An emergency signal or SOS
feature could also be added, as well as symbols that
represent an autonomous vehicle. This can all be made
possible into one taillight product if an exterior display
is utilized.
Figure 6. Concept hybrid digital RCL with animation
It is increasingly important for pedestrians to see and
comprehend what vehicles are doing, especially in
dense urban environments. With the rise of pedestrian
distractions, as well as quiet EV vehicles reducing
auditory cues, noticeable reverse lights, animated
signals and messaging on exterior displays along the
side or rear of the vehicle may aid pedestrian
awareness. Figure 3a depicts a door retrofitted with a
LED display which is indicating to pedestrians that the
vehicle is driving in an automated mode. This can also
be used to indicate other intentions such as a vehicle
reversing, or doors being opened. Figure 6 depicts a
RCL with a LED display to show animated stop and
turn functions, as an additional feature to traditional
dedicated indicators, which are intended to more
clearly indicate the driver’s intentions to other road
users.
Manufacturers and consumers are awaiting new
regulations from global committees that will allow for
making these concepts a reality. Development of
requirements to support new signal lighting
technologies is on the agenda of main global standards
and regulation bodies such as GTB, and SAE.
Academia is carrying out independent research studies
to evaluate novel lighting technologies and their
applicability to exterior lighting. Industry proposals
supported by academic findings are then presented to
regulators for their consideration. This is a vital step
toward seeing new functionalities for exterior lighting
and displays on vehicles. They study the safety
benefits of certain technologies, as it pertains to
conveying information to drivers and pedestrians.
Concepts and demonstrators are essential for
supporting these studies.
Digital RCL Concept
The function of a RCL is to have a single light module
that performs multiple tasks. These tasks include tail
function, stop, turn, and a reversing light. Each of
these functions have federal regulations and
requirements that are stated in Federal Motor Vehicle
Safety Standards (FMVSS) 108 [6]. Manufacturers
must pass specific photometry, luminous lit area,
distribution of intensity, color and lamp position
requirements. Stop and turn have the most stringent
requirements. These functions require 5,000 mm2 of
luminous lens area and must satisfy minimum
intensity values at different test points. Intensities are
measured at various test points at angles off-center
horizontally and vertically. The highest minimum
intensity is defined as on-axis to the lamp.
According to a human spatial resolution study [7], fine
pitch is relatable to the viewing distance from the
display. In the study, subjects were tasked to view
displays with LEDs placed at different pixel pitches,
then asked to find the distance from the display that
has the most homogenous image. Results found that at
3mm pixel pitch, a distance of 5.2 meters from the
display was needed in order to see the optimal
homogenous image. smaller pitches would decrease
this distance.
We introduce here a digital RCL concept targeting the
requirements above. This concept uses a fine pitched
matrix of LEDs to create a mono-chromatic display
that can show static and dynamic images using
commercially available automotive grade
components. We realized a slim 1:5 aspect ratio 2mm
pitch display to fulfil luminous lit area requirements of
the FMVSS regulations for a stop lamp at 5,000mm2
with a homogenous image at a distance less than 5m.
Figure 7. RCL concept lamp and matrix array pcb
23

The concept consists of multiple scalable modules
designed in a 2mm pitch 24 x 24 LED array driven by
3 multiplexed 48-channel drivers for independent
LED control. Figure 8 shows a block diagram of the
architecture of this concept.
Figure 8. Example matrix display control scheme
We selected an OSRAM TOPLED E1608 KR
DELMS1.22 for our LED due to its small size and
suitability for exterior use. The average intensity of
this part from the SH brightness group at 20mA and
25C ambient is 225mcd. Available brightness and
LED selection may change over time based on
technological advancement. We target 80cd minimum
from the lamp for the single cavity H-V requirement.
The concept utilizes a 4:1 multiplexing, M, with a total
of 2,880 LEDs, N. We assume a thermal loss of 30%,
𝜂t, with an assumption of LED junction temperature,
Tj, of 60°C and an optical loss of 15%, 𝜂o, from lenses.
The resulting [JJ1]96.4cd, I, meets our target intensity
requirements.
((𝐼𝑣) ∗ 𝑁
𝑀) ∗ 𝜂𝑡 ∗ 𝜂𝑜 = 𝐼
Equation 1. Estimation of lamp intensity
Figure 9. exemplary digital RCL graphics
Each graphical pattern should be verified to meet local
legal requirements prior to implementation. This paper
is only intended to discuss feasibility from a lighting
technology standpoint. Figures 9 show potential
exemplary graphics that could be implemented with a
digital RCL.
Conclusion
Arrayed LEDs allow for a multitude of new designs
and applications to the exterior of a vehicle from
dramatic welcome effects, to innovative ways to
display safety critical information. The digital RCL
concept shows one exemplary way to implement this
solution including achieving this, both meeting size
and brightness requirements allowing for dynamic
new RCL designs. We look forward to seeing what
new designs can become a reality through the use of
these technologies.
References
1. S. Lee, E. Llaneras, S. Klauer, J. Sudweeks,
“Analyses of Rear-End Crashes and Near-Crashes in
the 100-Car Naturalistic Driving Study to Support
Rear-Signaling Countermeasure Development”,
Virginia Tech Transportation Institute, NHTSA
(2007).
2. K. Peiler, J. Weiser, J. Bullough, N. Skinner, M.
Rea, “Responses to Dynamic Peripheral
Communication for Automotive Interior Lighting”,
SID Vehicle and Interfaces (2019).
3. K. Peiler, J. Weiser, J. Bullough, N. Skinner, M.
Rea, “Dynamic Peripheral Communication for
Advanced Automotive Applications”, SID Digest
(2019).
4. G. Li, W. Wang, S. Li, B. Cheng, P. Green,
“Effectiveness of Flashing Brake and Hazard
Systems in Avoiding Rear-End Crashes”, Advances
in Mechanical Engineering (2014).
5. Volkswagen, “Signal lights – Switching signature
tail light”, https://www.volkswagen-
newsroom.com/en/evolution-of-light-4261/signal-
lights-switching-signature-tail-light-4271 (2018).
6. United States Department of Transportation,
“Lamp, Reflective Devices, and Associated
Equipment”, Federal Motor Vehicle Safety Standard
No. 108 (2015).
7. S. Merl, “Physiological investigation of human
resolution on LED pixel grid displays”, OSRAM
(2017).
24

25

26

27

28

29

30

31

32

33

34

35

36

37

38

39

40

Diffusive Microlens Array for Head-Up Display Applications
Naoki Hanashima1, Kazuyuki Shibuya2, Mitsuo Arima1, Yutaka Nakazawa1, Jingting Wu3
1Dexerials Corporation; Tagajo, Miyagi, Japan 2Dexerials Corporation; Tome, Miyagi, Japan
3Dexerials America Corporation; San Jose, California, USA [email protected]; [email protected]; [email protected];
[email protected]; [email protected]
Abstract: The goal of this paper is to present solutions for optimizing image quality in various picture generating units (PGU) for automotive Head-Up Displays (HUDs). HUD units in current production usually have LED-based light sources, while laser-based light sources, such as DMD or MEMS, are on the rise. Since wider field-of-view and better image quality of HUD systems are the design goals of Tier 1 suppliers and original equipment manufacturers (OEMs), diffusive optical components are needed to balance brightness and uniformity of the projected information. Conventional frosted glass and coated diffuser films typically have Gaussian distribution profiles, which leads to sub-optimal brightness uniformity and poor confinement of the LED backlights. Microlens array (MLA) optical components can be engineered to control shape and uniformity profile of the transmitted light. A diffusive MLA (DMLA), with top hat distribution, is compared to conventional diffusers. Dexerials explores novel optical design technology to enhance light efficiency and improve wider field of view (FOV) and image quality of HUDs.
Keywords: Microlens array, Diffuser, Projector, UV resin, UV Imprint, HUD, PGU, TFT-LCD, DMD, MEMS
1. Introduction
Following the design trend and targets of both Tier 1 suppliers and OEMs, automotive HUDs have emerged as an additional source of information that enhances the driver’s experience. Currently, the primary PGU technology is based on thin-film-transistor liquid-crystal display (TFT-LCD) (Figure 1). This paper investigates performance of various diffusers in PGUs.
As shown in Figures 1 and 2, a diffuser component in the PGU is placed between the LED board and TFT substrate to homogenize incoming light from the LED board, and transmit the uniform light to the TFT-LCD, which are important requirements for HUD applications.
A conventional diffuser is an optical component with a Gaussian, or normal, distribution. Microlens array is a class of optical component that is engineered to control the shape and uniformity profile of light passing through. In addition, it can focus and collimate light. MLA is
widely used in microoptics such as sensors, light modulators, and optical interconnects, etc. [1].
Figure 1: Typical HUD optical path; PGU type is TFT-LCD.
Dexerials fabricates a diffusive MLA (DMLA) that is tailored for HUD systems. A detailed comparison of conventional diffusers and DMLA is shown in Table 1.
Like diffusive layer of randomly dispersed microbeads in the coated diffuser film, random microstructure of frosted glass limits control of light distribution. The frosted glass and coated film are useful for achieving a uniform brightness. DMLA, on the other hand, is advantageous for controlling light distribution and can be engineered to have a top-hat profile.
Dexerials’ DMLA, compared to conventional diffusers, can provide greater uniformity of projected image, improve light efficiency, reduce power requirements of PGU, and contribute to heatsink downsizing. DMLA is also easier to scale up in the UV imprinting manufacturing process.
LED
Free‐shapeconcave mirror
Lens
Cold mirror
TFT‐LCD
Cover (Glare trap)
Diffuser
41

Figure 2: Gaussian diffuser and top-hat diffuser light distribution from LED light sources, showing light confinement property.
2. Benefits of DMLA for HUD applications
After thorough HUD system-level evaluations, it was concluded that top-hat diffusers outperform Gaussian diffusers and could lead to power saving.
As visualized in Figure 2, using a Gaussian diffuser in the backlight unit of PGU could result in non-uniformity around individual LEDs in the backlight unit. This is due to the brightness being the greatest at the center of the LED while the surround area would be dimmer. The light map and distribution can be evened out with multiple LEDs in the backlight unit. Although HUD image uniformity can be achieved with conventional diffusers, the luminance required is greater due to light scattering from TFT-LCD substrate.
Unlike conventional diffusers, Dexerials’ DMLA uses surface scattering mechanism and doesn’t have light loss because of internal scattering. Therefore, the DMLA has higher overall transmittance while providing adequate diffusivity. An advantage of using a better confined top-hat diffuser is meeting the image brightness and uniformity specifications with lower leakage of PGU light.
3. Design
A novel design approach was used to create the surface profile of the DMLA component. Considerations include concavity of the single lenses, packing density of the lens group, individual microlens positioning and aperiodicity according to designed statistical distribution. The size of each microlens was also investigated and optimized to minimize unwanted granular and textured image.
Radius of lens curvature and pitch between adjacent lens, referred to as lens size in Figure 3a, are major design parameters for a non-diffusive MLA. While both convex and concave lens arrays (Figure 3b) are applicable for diffusive applications, the arrangement of each lens is more critical for distribution control. Packing density of 100% (defined as the lens area divided by the non-lens spacing area) is necessary in order to avoid transmitting pass-through rays. Suppression of diffraction is also optimized to prevent unwanted colorization and unevenness in brightness.
The following lens parameters were optimized to ensure desired light distribution profile, such as flatness around zero angle and steepness at the cutoff angle (Figure 3c) [2, 3].
Lateral and vertical height
Lateral and vertical arrangement
Radius of curvature
Figure 3a. Major lens parameters.
Top‐hat diffuserGaussian diffuser
Not used for display Minimized loss
Enhanced brightness
and uniformity
Radius
Height
Pitch
Table 1: Comparison of Gaussian coated diffuser, Gaussian frosted glass diffuser, and diffusive MLA.
Diffuser type Structure Feature
Coated Diffuser (Film)
Microbeads dispersed resin
-Lower transmittance by internal scattering -Limited control of microbeads diameter and light distribution
Frosted Diffuser (Glass)
Random corrugated microstructure
-Limited control of wet etched structure and light distribution -High reliability by being made fully of inorganic material
Diffusive Microlens Array (glass, film)
Designed microlens array -High transmittance by surface diffusion -High controllability of designed microstructure and light distribution -Acceptable cost by UV-imprint process
42

Figure 3b. Concave and convex MLA and its diffusive operation.
Figure 3c. Light distribution profile and specific parameters from LED light source.
Dexerials’ DMLA is comprised of identical or unidentical MLA unit cells tiled side-by-side so that each lens across the boundary of the cell is connected continuously, as illustrated in Figure 3d. Designing smaller individual lens sizes while maintaining a larger unit cell size is better for minimizing undesired patterns. Tiled DMLA with different unit cell size is presented in Figure 3e. With a lens size around 30um small and large unit cell sizes, 0.8mm x 0.8mm and 4mm x 4mm, respectively, the latter exhibit no granular or texture-like features.
Figure 3d. Tiling of MLA.
Figure 3e. Texture-like outlook with different unit cell
size and same lens size.
4. Fabrication for Automotive Industry
4.1 Inorganic (Glass) DMLA:
DMLA is fabricated on glass wafer by conventional photolithography process as shown in Figure 4a. Positive photoresist (PR) is coated on borosilicate glass substrate, and patterned by UV exposure with gray scale photomask, followed by a developing step and Reactive Ion Etching (RIE). A concave MLA pattern is then formed on the glass surface. To improve transmittance, both sides of the DMLA are treated with broadband anti-reflection (AR) coating (Figure 4b).
Fabricated DMLA is then evaluated using a beam profiler at wavelength of 450nm and spectrophotometer. The top-hat light distribution profile in circular shape indicating isotropic diffusion is shown in Figure 4c. Full-Width at Half-Maximum (FWHM) angle of 5 degrees and
Concave MLA Convex MLA
Nor
mal
ized
int
ensi
ty
Angle
1.0
0.5Cutoff
Flatness
FWHM angle
43

transmittance of 98% with AR coating are obtained. No apparent noisy diffraction is observed. This is an outcome attributed to the optimized aperiodic lens design. The DMLA with rectangular light distribution has the same fabrication process while using a different MLA pattern. Typical optical properties of Dexerials’ inorganic (glass) DMLA are specified in Table 2. As a result of the top-hat distribution, improved efficiency is verified in various laser projectors in contrast to the frosted diffusers.
Figure 4a. Fabrication process flow of glass DMLA (Inorganic diffuser).
Figure 4b. Cross section of glass DMLA (Inorganic diffuser).
Figure 4c. Light distribution property of circular (top) and rectangular (bottom) DMLA from laser light
source.
Table 2. Optical properties of glass DMLA (Inorganic diffuser)
4.2 Organic DMLA, UV imprinted:
Organic DMLA can be fabricated on various film substrates for backlight unit application in advanced LCD/TFT-type HUD (Figure 1), where top hat distribution can improve light efficiency (Figure 2).
As indicated in Figure 5, the first fabrication step of film MLA is dispensing acrylic UV-curable resin on PET substrate. A glass master mold with concave lens curvature is imprinted onto the uncured resin, thereby forming a convex pattern on the resin. The UV light is used in the next processing step to instantly cure the resin. The polymer itself is engineered to ensure imprinting capability, mechanical hardness, and a good adhesion to
Photomask
Evaluation
Photoresistcoating
UV exposure
RIE
Developing
Glass Substrate
Glass
AR coating
AR coating
Property Circular type Rectangular type
Diffusion angle (FWHM)
2~9 degree 3~9degree
Accuracy < ±0.7 degree < ±0.7 degree
Transmittance >96% >96%
Size (max) 100mm x 100mm 50mm x 50mm
Substrate Quartz glass, Borosilicate glass
Quartz glass, Borosilicate glass
44

the plastic substrate while maintaining its optical properties in various automotive reliability tests. Optical properties of fabricated film DMLA and the result of high temperature (105 degree C) storage test is shown in Figures 6a and 6b, respectively. With stable optical values, the final projected image benefits from decreased MURA.
Figure 5: Process flow of film MLA.
Figure 6a: Optical properties of film DMLA.
Figure 6b: High temperature reliability of film DMLA.
5. Conclusion
In conclusion, Dexerials’ DMLA features top hat light distribution. Dexerials’ inorganic (glass) and organic (UV-imprint) DMLA, which both exhibit good light distribution confinement and uniformity within FWHM angle, are expected to produce better light efficiency in HUD and other projection displays than conventional diffusers.
Glossary of Terms
MLA: microlens array
DMLA: diffusive microlens array
FWHM: full-width at half maximum
HUD: head-up display
PGU: picture generating unit
TFT-LCD: thin film transistor liquid crystal display
DMD: digital micromirror device
Glass master mold
PET
UV curable resinResin
dispense
UV cure
Demold
Evaluation
Film substrate
0
0.2
0.4
0.6
0.8
1
1.2
-10 -8 -6 -4 -2 0 2 4 6 8 10
Inte
nsity
(a.u
)
Angle(deg)
80
85
90
95
100
400 450 500 550 600 650 700
Tota
l tr
ansm
itta
nce
(%)
Wavelength(nm)
Diffusive angle (FWHM) 10.2 degree
Total transmittance (Tt) 89.4%
4
6
8
10
12
14
0 100 200 300 400 500 600
FW
HM
ang
le (
deg)
Time (hours)
80
85
90
95
100
0 100 200 300 400 500 600
Tra
nmitt
ance
* (
%)
Time (hours)
45

References 1. Dan Daly, “Microlens Arrays”, CRC Press,2000,
ISBN 9780748408931
2. M, Arima., et al., “Optical body, diffuser plate, display device, projection device,” Patent website. <http://www.freepatentsonline.com/y2019/0369297. html > Access July 2020.
3. N. Hanashima. et al., “Diffuser plate, display device, projection device,” WIPO, <https://patents.google. com/patent/WO2017010257A1/en>. Access July 2020.
46

Human Perception Studies of Head Up Display Ghosting
Steve Pankratz Ph.D., William Diepholz, John Vanderlofske Ph.D. 3M Company, St. Paul, MN, USA
Contact author email: [email protected]
Abstract To achieve high-quality, legible images in automotive Head Up
Displays (HUDs), ghost images must be mitigated. To date, this
has been accomplished with a wedge-shaped PVB interlayer in
the windshield (WS) that aligns the outer and inner surface
reflections. The metric to determine the degree of ghosting has
been disparity angle (DA, the angular distance between the
image and ghost). A new ghosting mitigation strategy uses P-
pol combiner films, which rely not on geometric compensation
but on ghost luminance reduction. To characterize this
mitigation strategy, another metric—relative ghost luminance
(RGL)—is required. An initial ghost perception survey shows
the relative impact of DA and RGL on perceived image quality.
The data suggest that DA alone fails to adequately characterize
image quality in a WS employing a P-pol combiner film; RGL
must also be considered. Further, for most real-world scenarios,
P-pol combiner film-type ghosting is not noticeable or is deemed
acceptable by most viewers.
Keywords Head Up Displays (HUDs); windshield; ghost images;
perception; disparity angle; relative ghost luminance; ambient
contrast ratio.
1. Introduction Head Up Displays (HUDs) provide safety are becoming more
common in automobiles and their adoption across the
automotive market is expected to increase.[1][2][3] Advances in
optical systems modeling, projector and imager design, and
insert-molding technology have enabled newer HUDs to
produce bright, high-quality images that can offer augmented
reality (AR) functionality.[4] One of the key optical components
in current HUD systems has been the windshield (WS) itself; it
must be designed to effectively mitigate the ghost images that
occur when light is reflected off both its interior (S4) and
exterior (S1) surface. The standard approach is to incorporate a
PVB interlayer with a linearly or nonlinearly varying thickness
across the WS in the vertical direction.[5][6] This small wedge
angle allows the S1 and S4 reflections of the HUD image to
overlap and appear as a single image (Figure 1a). This
technique works well within a small range of viewer positions
and HUD virtual image distances (VIDs). However, if a driver’s
position is above or below the optimized viewer position, the
compensation becomes imperfect (Figure 1b). Additionally,
wedge angle variation due to PVB tolerances and glazing
processes can further degrade ghost image mitigation.
Ghost disparity angle (DA) or ghost displacement is the current
metric for determining the degree of ghosting and for specifying
allowable limits. For a wedge-system WS, with a ghost image
luminance that can be 40%-60% of the primary image
luminance (depending on glass tinting), DA is typically
sufficient to characterize HUD image legibility.
However, if other approaches to ghost mitigation—such as a
reduction in ghost luminance—are used, then DA alone is not
adequate for specifying the impact of ghosting on image quality.
3M™ Windshield Combiner Film is a P-pol combiner film
designed to reflect P-polarized light; when used with a P-pol
HUD, this film enables a central image and two very weak ghost
images with relative ghost luminance (RGL) values often < 5%
(Figure 1c). [7] In this regime, image legibility still depends on
disparity angle but is affected more by relative ghost luminance.
Figure 1: Comparison of geometric (wedge) and
luminance (P-pol combiner film) ghost compensation. Perfect ghost compensation can be achieved with a
wedge WS for one viewer location, virtual image distance (VID) and ray angle (e.g. center of image), as in (a). Compensation degrades for variations in these parameters (b). A P-pol combiner WS (c) produces two very weak ghosts with non-zero disparity angle.
To date, perception studies of HUD ghosting and its impact on
image legibility have not included RGL.[8] Therefore a ghosting
perception study was carried out to determine the relative impact
of DA (defined as the angular displacement between the image
and its ghost), RGL (defined as the ratio of ghost to image
luminance) and Ambient Contrast Ratio (ACR, the ratio of
image luminance to background luminance). A high ACR value
corresponds to low light driving conditions—such as at night or
in a tunnel—while a low ACR occurs when the background is
bright.
The goal of this study was to determine the relationship between
these variables and HUD image legibility and perceived quality.
2. Experimental Setup While it would be possible to create a physical system to vary
key system parameters—such as WS rake angle, HUD
lookdown angle and VID, and glass thickness and tinting—it
would be cumbersome and time consuming to move between all
the parameter combinations needed to map out the ghosting
perception in the 3-variable space outlined above. Therefore, an
all-digital approach was used, in which simulated HUD images
with ghosts were displayed on a 75”, 4K television positioned 3
meters from the viewer (Figure 2).
47

Software was created to simulate ghosting scenarios by
superimposing a base HUD image, its ghost(s) with the specified
RGL and DA, and a uniform, grayscale ambient background,
summing up the luminance values for each pixel to create the
composite image at the specified ACR. A calibration curve for
the television was obtained by measuring its luminance with a
Radiant Imaging Prometric imaging photometer for a series of
images with grayscale values between 0 and 255. This function
was used by the software to output the grayscale values needed
to yield the correct luminance for each image pixel. The
software also ensured that the image was never saturated (peak
sum luminance for any pixel in the image never resulted in a
required grayscale value higher than 255).
Figure 2: Software creation of simulated HUD image with ghost(s)
The font size for the survey was at the small end of what might
be seen in a real HUD, with a vertical angular extent of 0.194°
and line width of ~0.025°; this was chosen because smaller or
thinner image features generally produce the most visible
ghosting. Figure 3 shows two example images with different
ghosting parameters that approximates what would be seen in
the study. Note that the left image has one ghost image while
the right-hand image has two ghost images displaced on
opposite sides of the main image, corresponding to wedge WS
and P-pol combiner film WS ghosting geometries, respectively.
Figure 3: Two example images with ghosts, shown
with the three parameter values.
For this study, the ghost disparity angle was varied from 0°–
0.1° and ACR values of 2, 4, and 10 were used. Single-ghost
For the sake of simplicity, the two ghost images always had
symmetric DA and RGL values. In reality, due to differing glass
images were created with RGL values between 40% and 60%,
simulating wedge WS scenarios, while double-ghost images
with RGL values between 2% and 20% were created to simulate
P-pol combiner film WS ghosting. These parameters were
designed to cover most typical HUD system geometries and
conditions.
Forty survey participants viewed over 100 images spanning this
parameter range and rated the images on legibility (Table 1).
Table 1. Participants rated the images according to the following statement: “The image is: 1) Easy to read
and 2) Pleasing to look at.”
Strongly Disagree
Disagree Neutral Agree Strongly
Agree Image badly
degraded, annoying
Image noticeably degraded
Image OK but
somewhat impacted
Image still
good
Image perfect
The ratings were recorded as values from 1 to 5 (1 = perfect
image, 5 = badly degraded image). Zero-ghost images and
duplicate images were included to determine the degree of intra-
participant variability and an average zero-ghosting baseline
rating, and the image presentation sequence was randomized to
eliminate any order effects. The participants were non-experts
in HUD or display image quality and included people in the <30,
30-50 and >50 age groups. They were given no prior coaching
on how to rate the images; rather, the first five images were
selected to span the range from perfect to badly degraded to
allow the viewer to quickly get a sense of the full range.
3. Results and Analysis The averaged no-ghost, baseline ratings were 1.65, 1.58 and 1.4
for ACR values of 2, 4, and 10, indicating that some participants
rated the images as less than perfect even when there was no
ghosting. (This is likely due to differences in visual acuity
among participants, just as would be the case in the general
population.) The duplicate images, each seen twice in the
survey, had average rating differences of <0.2, which on a rating
scale from 1 to 5 indicates very good repeatability.
The rating for each image, defined according to its 3-parameter
values (DA, RGL, ACR), was averaged across the 40 study
participants, and the results for these averaged image ratings are
shown in Figure 4.
A two-way ANOVA on disparity angle and ghost luminance, in
both the wedge parameter space and P-pol combiner parameter
space, returns p-values < 0.002 for each variable and the
interaction term. This shows a statistically significant difference
in the mean participant responses between varying levels of
disparity angle and ghost luminance. Additionally, the
significance in the interaction term indicates participants’
or PVB thicknesses, glass tinting and other factors, the two
ghosts will have differing DA and RGL values.
48

Figure 4: Average image quality ratings for the 44 participants for ACR values of 2, 4, and 10, plotted vs ghost DA (x-axis) and RGL (y-axis). The top row shows ratings for single-ghost images (as from a wedge-system mitigation) with RGLs from 40% to 60%; the bottom row shows ratings for symmetric double-ghost images (as from P-pol combiner
mitigation) with RGLs from 2% to 20%.
responses are dependent on a combination of the disparity angle
and ghost luminance.**
As can be seen in the upper row of single-ghost plots, simulating
ghosts created by a wedge-system mitigation with RGL values
in the 40%-60% range, the ghosting impact on image quality is
quite insensitive to the RGL, indicating that once the relative
ghost luminance reaches a value of around 40%, increasing it
further causes little additional image quality degradation. These
results support the current use of DA alone as a sufficient metric
for measuring ghosting in a wedge WS HUD system. These data
also show that tinting the glass, while it will lower the RGL to
some degree, does not significantly reduce the adverse impact of
the ghost image on the HUD image quality.
In contrast, looking at the lower row of plots for the double-
ghost, P-pol combiner system image ratings, for RGL values
below about 20%, the image quality becomes increasingly
sensitive to the RGL value. For lower RGL values, ghosts with
relatively higher disparity angles (which would seriously
degrade the image quality in wedge systems) are much less
visible and are rated by participants as good or acceptable. This
is an important finding, indicating that new metrics and
standards need to be developed for low brightness ghosts. Figure
** Taking a closer look at the p-values for the coefficients in the
ordinary least squares [OLS] linear model for the wedge, the
ghost luminance term has a p-value of 0.053 while the other
terms have a p-value of 0. This suggests that in the wedge
parameter space the ghost luminance does not have a significant
impact on the response by itself. However, when looking at the
coefficients of the P-pol combiner OLS linear model, the
independent disparity angle and ghost luminance terms have p-
values of 0.296 and 0.061 respectively, while the interaction
4 also shows the effect of ACR, which has very little impact on
high RGL, wedge-type ghosting; high RGL ghosts are bright
enough that their effect is similar regardless of ACR. However,
for low RGL, P-pol combiner-type ghosts, the ACR value does
affect ghost visibility; lower ACR conditions (ACR=2) produced
a larger region of higher image quality ratings than did the
higher ACR conditions.
To compare ghosting in wedge and P-pol combiner film WS
systems using these survey results, it was necessary to determine
the DA and RGL parameter spaces that correspond to real-world
automotive HUD system geometries. This was achieved
through the development of mathematical tools to calculate the
ghost DA and RGL for a system geometry defined by the WS
rake angle, glass thicknesses and absorptions, HUD lookdown
angle, VID, vertical FOV and S/P polarization mixture, and
relative positions of driver, WS and HUD output mirror.
For a wedge system, the ideal wedge angle was calculated for a
5mm thick WS; this angle perfectly compensates for the ghost
image at the central eye position and central HUD image ray.
(The solid red line in Figure 5 shows the ideal reflection point
term has a p-value of 0. This indicates that it is very likely the
participants’ responses to the P-pol combiner parameter space
are more impacted by the interaction of the disparity angle and
ghost luminance rather than the effect of each variable
independently.
49

for a 27° WS rake angle and 3° lookdown angle). Then the ghost
DA values for the top and bottom of a 4° vertical FOV HUD
image (solid green lines around central red dotted line in Figure
5) were calculated for driver eye positions up to 100mm above
and below the ideal position.
Figure 5. Geometry of model system to calculate wedge and P-pol combiner film DA and RGL. (Rake and lookdown angles were varied; numbers on plot
are shown for example.)
Variations in wedge PVB angle and/or resulting WS wedge
angle due to PVB angle tolerances or glazing process were not
included in this analysis but could potentially increase the worst-
case DA values by an additional 0.01-0.02°. In this model
system, for a VID of 2.5 meters, ghost DA values anywhere
from 0° to 0.05° were possible when considering all driver
heights. This region on the survey ratings plot for ACR=2 is
shown in Figure 6a, and as can be seen, portions of this region
received participant ratings of 3 and any increase in DA (due to,
for example, wedge angle tolerance variations) would create
ghosting that would be rated as noticeably degrading the image.
The mathematical model above was also used to calculate DA
and RGL values for a P-pol combiner film WS in the same
system geometry. A sample set of real-world geometries,
designed to probe the full range of resulting DA and RGL
values, were used to calculate the points shown on the plot in
Figure 6b. It is notable that the region on the plot corresponding
to calculated ghosting produced by a P-pol combiner film WS in
the model system received average participant ratings under 3,
indicating good or acceptable image quality. In other words, for
most real-world scenarios, P-pol combiner film-type ghosting is
not noticeable or is deemed acceptable by most viewers.
Further, this type of low RGL ghosting is less sensitive to
increases in ghost DA. As seen in Figures 6a and 6b, for high
RGL wedge-system ghosting, the ratings increase quickly with
DA, while for the weak ghosts produced by a P-pol combiner
system the image degrades much more slowly with DA. This
means that any WS variations from glass imperfections or
glazing process that increase the DA, either locally or globally,
may more significantly increase detrimental ghosting effects for
a wedge WS than for a P-pol combiner film WS.***
*** In addition, even if the P-pol combiner film WS has some
variation in slope due to the glazing process, for a given slope
change the ghost DA variation will only be half as large as for a
wedge WS, because the distance between the P-pol combiner
Figure 6: Survey image quality rating results with highlighted regions of DA and RGL corresponding to
model system geometry for both a) wedge-system ghosting b) P-pol combiner system ghosting
4. Conclusions As shown by this initial study of human perception of HUD
ghosting, for low-luminance ghosting typical of a P-pol
combiner film WS, the disparity angle metric alone is not
sufficient for characterizing ghosting and its impact on HUD
image quality. In this regime, the ghost RGL also plays a
critical role and must be considered when defining acceptable
levels of ghosting. Further, the ghosting parameters calculated
for a P-pol combiner film WS across a range of physical HUD
geometries were shown to yield favorable image quality ratings
and to be less sensitive to variations in DA than a wedge system.
Future studies will build upon these initial results, which were
based on simulated HUD images on a static grayscale
background. Potential refinements include specifying unequal
DA and RGL values for the front and back ghosts for P-pol
combiner ghosting, using image or video ambient backgrounds
rather than uniform grayscale, probing the effects of transitory
viewing of the image (as occurs in actual HUD viewing), and
the effect of image color and image/background color
differences. Further, the metric of driver fatigue to evaluate the
impact of ghosting may also be considered alongside image
quality ratings.
5. References
[1.] Normile, Brian. Which cars have head-up displays for 2020?
[Internet]. 2020 May 14. Available from:
https://www.cars.com/articles/which-cars-have-head-up-
displays-for-2020-421615/.
[2.] Jarrett DN. Cockpit engineering, Farnham, United
Kingdom: Ashgate Pub.; 2005. p. 189. ISBN 0-7546-1751-3.
ISBN 9780754617518. [Retrieved 2012 Jul 14].
[3.] Harrison AK. Head-up displays for automotive applications.
Ann Arbor: The University of Michigan Transportation
Research Institute; 1994. Report No. UMTRI-94-10.
[4.] Gitlin, Jonathan M. Augmented reality heads-up displays for
cars are finally a real thing [Internet]. Ars Technica. 2020 July
film and the S1 and S4 surfaces is only approximately half the
thickness of the WS.
50

10. Available from
https://arstechnica.com/cars/2020/07/augmented-reality-heads-
up-displays-for-cars-are-finally-a-real-thing/.
[5.] Seder, T, Cashen, D, Ferris, L, Robb, E. Minimizing HUD
ghost images from glare trap lens. 2016 SID Vehicle Displays &
Interfaces Symposium. 2016 Sep.
[6.] Marcus, M. Simultaneous head-up display windshield
wedge-angle and layer-thickness measurements. SPIE News,
2016 Jul.
[7.] VanDerlofske J, Pankratz S, Johnson M, Franey E. New
optical films for next generation AR head up displays (HUDs).
2019 SID Display Week Symposium, Digest of Technical
Papers. 2019.
[8.] Zong Qin, Fang-Cheng Lin, Yi-Pai Huang, Han-Ping D.
Shieh. Maximal acceptable ghost images for designing a legible
windshield-type vehicle head-up display. IEEE Photonics
Journal 9. Dec 2017 (6).
51

52

Presentation 3.3
Computational Holographic Displays for 3D AR HUD Using Free-Form Optics
Hakan Urey, CY Vision, San Jose, CA, US
PAPER UNAVAILABLE
PRESENTATION SLIDES SHOULD BE DISTRIBUTED AFTER THE CONFERENCE
53

54

Holographic Optical Elements and Projector Design Considerations for Automotive Windshield Displays
Sam Martin DLP Products
Texas Instruments Incorporated
Jason Thompson DLP Products
Texas Instruments Incorporated
Ian Redmond Ceres Holographics Ltd
Abstract: Holographic Optical Elements (HOEs) can be used in a range of automotive applications including head-up displays, windshield clusters, and transparent window displays. When paired with TI DLP® Automotive projection technology, HOEs offer a number of advantages including smaller package sizes, large bright displays, and system design flexibility through unique manipulation of light. HOEs can now be produced in a pixel-by-pixel fashion by a digital technique giving great versatility of function. Recorded in novel photopolymer materials, these elements have high efficiency when used with LED/laser sources and simultaneously high transparency to ambient light. This paper will provide a market overview of HOE automotive applications, an update on the key aspects of this technology and performance achieved to date, and cover projector design considerations when illuminating holographic films. Projectors designed for HOE applications have additional requirements on spectral emission to guarantee sufficient image brightness to the viewer. A detailed analysis of spectral efficiency and color point tuning of a DLP light engine will be provided as an example.
Keywords: transparent holographic display, automotive, cluster, DLP, LED, laser, HOE
Introduction
With the increase of sensors and advanced driver assistance systems (ADAS) capabilities, both passenger vehicles and commercial vehicles need to display this information to the driver in a simple and effective way. Many vehicles have adapted traditional head-up display (HUD) to show this information to the driver while allowing the driver to keep their eyes on the road. However, the large mechanical volume and windshield reflection angle requirements of traditional HUDs can cause fundamental challenges with vehicle integration. For example, some car models have very small instrument panels making it impossible to integrate a HUD. Additionally, the steep windshield rake angle of many commercial and off-highway vehicles makes it impractical to use traditional HUDs, since the angle of the HUD optical axis must be between 50 and 60 degrees relative to the windshield for the driver to view the reflected image.
New technologies based on volume holographic optical elements combined with automotive grade projection display systems can solve these integration challenges and enable a transparent display (TD) on the windshield. Ceres Holographics and Texas Instruments collaborated to design, build, and validate a prototype that demonstrates a large, bright transparent window display exceeding the traditional specs of a HUD, while minimizing total mechanical volume in the instrument panel.
1. Display size is 220 mm x 110 mm 2. Image distance ~1 m (i.e. windshield)
3. Greater than 10 000 cd/m2 4. Less than 1 liter of mechanical volume 5. LED illumination source 6. No windshield wedge required
Additionally, this system can demonstrate an image effectively on a window with a steep rake angle and is viewable while using polarized sunglasses, which is a challenge for HUDs based on TFT-LCD technology.
Ceres HOE technology
Ceres develops HOE technologies primarily for automotive applications, based on “volume” holograms (as opposed to thin, or surface relief elements). “Volume” refers to the fact that the hologram is a 3-dimensional structure of refractive index variation, formed by an optically recorded exposure of an interference pattern in a photo-polymerizable material. As a volume structure, it has highly selective Bragg diffraction properties in angle and wavelength, essential to windshield applications.
Volume holograms have key properties essential for windshield displays:
Due to the high angle and wavelength selectivity, they are simultaneously highly efficient at diffracting light from a projector with the appropriate spectrum and incident angle, and yet appear very transparent as they remove very little of the broadband ambient spectrum in transmission.
55

They are in the form of a thin flexible film of photopolymer (15-25 m) on a polymer substrate (e.g. 60 m) which can be laminated within the (curved) windshield sandwich.
Optical quality can be excellent. Specifically, Ceres uses Covestro’s Bayfol™ material which exhibits negligible haze, and negligible residual absorption (in the 1% range), suitable for windshield applications.
The optical function is independent of the final film (or windshield) shape. The film may have the function of a curved mirror or lens which would physically have a much larger depth (i.e. sag). Or it may have the function of a tilted optic, independent of the tilt of the HOE film. It may have these functions independent of the final film shape (e.g. in a windshield).
An engineered diffuser function can be realized for the transparent display function, so light can be efficiently redirected to a uniformly illuminated specified eyebox rectangle (or indeed any other distribution).
The Bayfol™ material is also suitable for mass-production, requiring only simple optical exposure processing, exhibiting very low polymerization shrinkage and very good long-term stability.
For typical automotive HOE applications, HOE bandwidths are in the 4-8 nm FWHM range (15-25 m films) at the design angle, or 2-4 degrees at the design monochromatic wavelength.
Pixel-wise HOE recording
In traditional hologram recording, the hologram is recorded in a single exposure in the interference field between two mutually coherent beams. This requires the wavefronts of these beams to be created by large format typically custom optics on the scale of the final hologram.
Ceres however produces large HOEs by a step and repeat optical exposure of small subholograms, each defined digitally, allowing great flexibility of design without change of hardware, and resulting in high repeatability and uniformity.
For this, a master hologram “printer” has been developed, and optimized for the specific photopolymer materials. This printer is digitally controlled, and the recording beams are settable for each subhologram. Specifically, the RGB exposure values, reference beam angle in 2-dimensions and the entire object beam field may be set exposure by exposure. A diagram of the HOE printer is shown in Figure 1.
Figure 1: Pixel-wise HOE printing
Each subhologram is formed by the exposure of the interference pattern between the simple plane reference beam and the complex object beam, formed by the Fourier transform of the field on a spatial light modulator (SLM), i.e. a microdisplay. Both the reference beam angle and the SLM RGB greyscale pattern are programmed for each subhologram exposure by a master control dataset.
The subholograms are typically 0.25x0.25 mm square, and each is recorded with a simultaneous exposure of red, green and blue laser light designed to match the final illumination source. For example, exposure wavelengths of 633, 532 and 473 nm naturally results in peak diffraction efficiencies (with 6-8 nm FWHM) at 627/527/468 nm at the same geometry, after allowing for an intrinsic typical ~1% polymerization shrinkage. However, due to the digital nature of the printer control, compensations can easily be made in the control data to adjust for different target wavelengths, such as specific peak LED wavelengths.
Note that, in the case of a diffuser/transparent display, the display resolution is not limited by the subhologram size (0.25x0.25 mm). This size only defines the quantization of the angular properties of the film, so if a finer resolution were imaged onto this HOE, it would still effectively resolve it from the viewer’s perspective.
Note also that this printer produces “master” holograms which may take many hours to produce (typically 10 subholograms/second), but in production these holograms are optically mass-copied at a much higher rates on the order of 2000 to 5000x faster, consistent with commercially viable windshield production rates.
Transparent display HOEs
TD HOEs are essentially precision engineered diffractive diffusers. The function is illustrated in Figure 2. The projector is shown emitting two rays; red towards the center of the HOE and black towards a corner. The HOE subhologram function for the red ray is programmed to expect a ray at that incidence angle
SLM Fourier Transform Lens
HOE pixelexposure inphotopolymer
Reference beam(plane)
56

and wavelength, and to diffract it (by a diffuser function) into the uniformly illuminated rectangle of the eyebox at a specific location.
Similarly, the subhologram where the black ray hits the HOE is designed to be optimum for this incidence angle and to diffract the light to the eyebox rectangle. Both conditions are different from those of the red subhologram and are digitally programmed in the (optical) recording process.
Figure 2: Transparent display HOE
Note that the image originates from the HOE (diffuser) plane, and the projector must project a focused image onto this plane, like a traditional projection screen.
Illumination
Since the TD HOE operates as a diffuser, the apparent image location is the plane of the HOE. Therefore, dispersion due to diffraction does not affect image resolution. All light diffracted by the HOE appears to come from the HOE plane. If the illumination wavelength does not match the HOE, it will simply diffract less efficiently resulting in a shift in the color point of the diffracted light.
The best result occurs when the HOE is designed to expect illumination at the actual projector wavelength. In terms of optical efficiency, the best result is when the projector wavelength matches the Bragg diffraction efficiency peak of the HOE. From this point of view, a laser illuminated projector would offer the best system efficiency (lumens/watt). And importantly, the resulting thermal dissipation would be much reduced, a crucial system consideration.
However, consideration should also be given to the associated spectral tolerances. Laser diodes (LDs) have a natural manufacturing peak wavelength spread which is wider than the HOE bandwidth. Laser diode specified peak wavelength spread can easily be ±10 nm, while the HOE has a FWHM of <10 nm. Some lasers will poorly match the HOE, leading to low efficiency, brightness and a poor color point. LEDs on the other hand have relatively wide bandwidths compared to the HOE, and so are inherently more tolerant of variation in their peak wavelength. Choice of LDs versus LEDs thus remains a topic of investigation.
Projector design
HOE technology is not constrained by the symmetrical specular reflection laws of traditional glass surfaces. For example, it is possible to create a system that emits light normal to the glass surface when illuminated from a steep angle, or vice-versa. The following diagram shows two example layouts that can be realized using a DLP projector and Ceres HOE technology:
Figure 3: Configuration A (left) and B (right) showing two different design architectures for transparent displays based on Ceres HOE and DLP projector
technology.
Note that the accessible angles for the HOE has implications for projector distance and achievable eyebox size. Configuration A may be more applicable to an off-highway vehicle with a near-vertical windshield, while configuration B is well suited for standard consumer vehicles. Bear in mind that in this latter case the windshield will be highly raked and the projector will be in the dashboard. In a collaborative R&D program, Ceres Holographics and Texas Instruments designed and built a transparent display prototype using configuration B architecture:
Figure 4: Holographic Windshield Cluster demonstrator built by Ceres Holographics and Texas
Instruments
30° possiblecone
90°cone
57

Luminance contrast ratio
To guarantee image visibility, the optical designer must ensure the projector emits enough light. As with traditional HUDs, this light is spread out over area and solid angle in the eyebox, meaning the size of the image and eyebox influence optical flux requirements from the projector. Luminance contrast ratio (LCR) describes how visible an image is relative to the background. Light from transparent displays is additive to background light, so LCR is given by the following equation:
𝐿𝐶𝑅 𝐿 𝐿
𝐿
Exact LCR requirements are a heavily debated topic. A 1995 study of human factors aspects of automotive HUD technology recommends a minimum of 1.5:1 in bright ambient conditions [1] but it is often desirable to have higher LCR to increase legibility. In this example we will target LCR = 2 to guarantee the information is visible to the driver. Forward-looking scene luminance can exceed 10 000 cd/m2 in bright sunlight [1], so transparent displays must be able to produce at least 10 000 cd/m2 image luminance to ensure LCR > 2. The following sections describe a calculation procedure to estimate projector requirements for a set of system parameters. This method is for initial estimation only and should be followed by a comprehensive optical design to validate performance.
Estimating image brightness
Working backwards from the luminance target of 10 000 cd/m2 in the eyebox, we can estimate the efficiency of each optical component in order to determine required optical flux from the projector. The variables that determine image luminance are image area, eyebox solid angle, HOE efficiency, and projector luminous flux. The eyebox is small relative to its distance from the HOE, so its solid angle can be approximated based on its area:
Ω𝑆𝑟
∗ cos 𝜃
where Ω is solid angle, 𝑆 is eyebox area, 𝑟 is eyebox distance, and 𝜃 is the angle with respect to normal at which the light is diffracted from the HOE.
Using optical throughput concepts, we can convert the required luminance (10 000 cd/m2) to diffracted luminous flux given the following equation:
Φ 𝐿𝐴Ω
where Φ is diffracted luminous flux, 𝐿 is luminance, 𝐴 is image area, and Ω is solid angle.
The final equation is formed by substituting the approximation for solid angle defined above.
Φ𝐿𝐴𝑆𝑟
∗ cos 𝜃
For example, the TI Holographic Windshield Cluster demonstrator has an image size of 220x110 mm (0.0242 m2), an eyebox size of 140x80 mm (0.0112 m2), eyebox distance of 1.2 m, and diffraction angle of 48 degrees. To achieve the luminance target of 10 000 cd/m2, the required diffracted luminous flux is:
Φ𝐿𝐴𝑆𝑟
∗ cos 𝜃
Φ10 000 0.0242 0.0112
1.2∗ cos 48
Φ 1.3 lm
In other words, the luminous flux diffracted by the HOE must be 1.3 lm in order to achieve an image luminance of 10 000 cd/m2. This is valid for the system parameters defined above, but will be different for different image size, eyebox size, eyebox distance, and HOE diffraction angle.
The efficiency of the HOE will determine how much luminous flux the projector must emit in order to achieve this diffracted flux target.
HOE efficiency
HOEs are spectrally selective, so it is important to consider optical efficiency as a function of wavelength. 3-wavelength multiplexed RGB HOEs made by Ceres Holographics have a spectral efficiency curve that can be approximated by 3 gaussians with peak wavelengths around 460, 520, and 620 nm, and FWHM of 6, 7, and 8 nm respectively.
Figure 5: HOE spectral efficiency
Exact peak wavelengths of each color channel can be tuned in the fabrication process within a certain range.
Multiplying the projector spectral emission curves by these spectral efficiency curves will determine optical efficiency of the HOE for a given projector. As such, it is important for the projector spectral emission to align with the HOE spectral efficiency in order to guarantee
58

highest system efficiency. projector spectral emission is determined by the light sources used, so projectors designed for HOE applications may have different requirements than those designed for other applications.
Projector light source considerations
LED light sources offer robust, efficient performance and are common in both consumer and automotive DLP projector systems. It is common to find projection systems on the market today that contain a phosphor converted green LED, which uses a more efficient blue LED under a green phosphor to produce green light, as opposed to a true green LED which emits green light directly. While these converted green LEDs are more efficient (higher lumens/watt), the wide spectral emission of the phosphor results in low system efficiency when coupled with the HOE narrow spectral efficiency bandwidth. For example, Osram produces both converted and true green LEDs in their Q8 product line. The converted green LED, LE CG Q8WP, has a max bin luminous flux of 800 lm and spectral emission FWHM of 100 nm [2]. The true green LED, LE T Q8WP, has a max bin luminous flux of 450 lm and spectral emission FWHM of 33 nm [3]. However, even though the converted green LED produces nearly 2x the total luminous flux, the true green LED results in roughly 40% more energy throughput when multiplied by the HOE spectral efficiency curve.
Figure 6: Spectral emission of Osram LE T Q8WP true green with 450 lm total flux, LE CG Q8WP converted
green with 800 lm total flux, and HOE efficiency curve. Even though the converted green LED produces nearly 2x luminous flux, the energy within the HOE efficiency curve is roughly 40% greater for the true green LED.
For this reason, the TI Holographic Windshield Cluster demonstrator uses the DLP5530PROJTGQ1EVM [4] as its projector, which has been designed with the Osram LE T Q8WP true green LED to maximize efficiency with the Ceres HOE. Blue and red LEDs like the Osram LE B Q8WP and LE A Q8WP are direct emitting diodes (no phosphor conversion) and produce a narrow bandwidth that is well suited for use with HOEs.
Figure 7 shows the measured spectral emission of this projector at various LED power levels compared with the HOE spectral efficiency bands.
Figure 7: Projector spectral emission for various LED forward currents. LED peak wavelength and spectral
shape may change with drive current, temperature, and lifetime of the device.
The product of the HOE spectral efficiency and the LED spectral emission determines the optical efficiency. Here the LEDs are fairly well-matched to the HOE and result in a total optical efficiency of 2.6%.
Osram Q8 LED HOE efficiency
Blue 2.5%
True Green 2.0%
Red 3.5%
Total 2.6%
Table 1: HOE efficiency for Osram Q8 LEDs used in the DLP5530PROJTGQ1EVM.
Therefore, to achieve the target eyebox luminous flux of 1.3 lm, we would need 50 lm emitted by the projector. However, light incident on the HOE must be polarized to avoid a double-image artifact, resulting in roughly 50% loss from unpolarized LEDs. Therefore, the total luminous flux required from the projector in this example is 100 lm.
Eyebox luminance 10 000 cd/m2
Eyebox luminous flux 1.3 lm
Luminous flux incident on HOE 50 lm
Luminous flux emitted by projector (unpolarized)
100 lm
Table 2: Summary of key optical values in system efficiency breakdown used to estimate projector
requirements
Light source spectral shift
It can be seen from the measurements in Figure 7 that the peak wavelengths of the green and red LEDs are shifting with respect to output flux. LED peak
59

wavelength variation can result in increased or decreased efficiency for that color channel if the LED spectral curve moves closer to or away from its corresponding HOE spectral efficiency curve. LED spectrum variation can occur from natural operational variation (drive current, junction temperature, etc.) or minor variations in the manufacturing process resulting in different LED bins. It is important to understand potential shifts of peak wavelength of each LED across the operating temperature range and lifetime of the device. Changing efficiency of one color channel relative to the others will result in a color shift of the diffracted light and must be accounted for in the white point calibration process.
White point calibration
Traditional LED projection systems are designed to project red, green, and blue light onto a scattering surface, such as a projection screen. It is necessary to tune the relative flux of each primary light source such that their combined output appears white at the maximum digital pixel value for all primaries. This process is known as white point calibration. In the case of a white (spectrally neutral) projection screen, the light from each primary color is reflected equally. Therefore, calibrating the light emitted by the projector ensures that light reflected by the screen maintains the same white point calibration. However, in the case of display systems using HOE technology this is not necessarily true. The HOE is not spectrally neutral, and the relative transmission of each primary color is a function of the overlap between source spectral emission and HOE spectral efficiency. Applying a white point calibration to the projector will not necessarily guarantee that light diffracted by the HOE toward the eyebox will maintain that white point. For example, calibrating the DLP5530PROJTGQ1EVM for a D65 white point results in a red shift when that light is diffracted by the HOE, as shown in Figure 8.
Figure 8: HOE technology can induce a color shift in
light from the projector making it necessary to calibrate the system to an offset color point. The spectral flux
plot (left) shows normalized spectra before (projector) and after (eyebox) HOE diffraction.
For this reason, it is important to incorporate the spectral efficiency of the HOE in the calibration process and calibrate the projector for an offset color point to account for the color shift of the HOE. This will ensure light in the eyebox is properly white point calibrated.
By optimizing the white point of the entire system, including the HOE, we can determine the relative flux from the projector to achieve the target white point in the eyebox. Figure 9 shows projector spectral emission calibrated for an offset color point to compensate for the chromatic shift of the HOE, resulting in the target D65 white point in the eyebox.
Figure 9: Pre-correcting projector color point calibration results in well-calibrated D65 white light in
the eyebox.
Laser light sources
While LEDs are a proven and recommended solution today, laser sources offer promising system-level benefits. At the projector level, laser sources can enable higher F/#, improved contrast, smaller package volume, and lower cost optics [5]. However, lasers paired with a HOE can offer significantly higher system efficiency than achievable with LEDs. Additionally, lasers emit polarized light which naturally eliminates the double image reflection and mitigates the need for a polarizer, which is necessary for LEDs.
It can be seen in Figure 7 that the LED spectral emission is wider than the HOE efficiency bandwidth, meaning some of the energy for each LED is lost, resulting in reduced system efficiency. The spectral bandwidth of laser sources is much narrower than that of LEDs and easily fits within the HOE spectral efficiency bands, resulting in a higher percentage of the light from each color being diffracted towards the viewer.
60

Figure 10: Spectral emission of ideal laser sources. The narrow laser bandwidth easily fits within the HOE
spectral efficiency bands.
HOE efficiency Osram Q8 LEDs Ideal laser
Blue 2.5% 12%
Green 2.0% 12%
Red 3.5% 12%
Total 2.6% 12%
Table 3: Comparison of HOE efficiency for LED and laser sources. Differences in efficiency are due to
different overlap between LED spectral emission and HOE spectral efficiency band.
The efficiency benefits are obvious, but there is potential for speckle artifacts to be more visible when using laser illumination. Additionally, there may be added complexity in the system to manage thermal limits for lasers in the automotive environment which is from -40 C to 85 C ambient. This is an ongoing research topic for both Ceres Holographics and Texas Instruments.
Conclusion
In summary, through the combination of a Ceres Holographics HOE and a DLP5530 based projector, a large, bright window display can be implemented in a small package size that is compatible with virtually any size passenger vehicle and can also effectively work with commercial or off-highway vehicle with low rake angles. This solution has the opportunity to enable many vehicles to implement transparent window displays to effectively communicate important driver assistance information.
In future studies, the use of RGB lasers, as well as techniques to increase HOE efficiencies may increase efficiency of this system, dramatically lowering the overall power level or offering increased image and eyebox sizes. However, more evaluation is needed to effectively address the temperature management of the lasers and mitigate the speckle that is inherent to direct lasers.
References
[1] K. Gish and L. Staplin, "Human Factors Aspects of Using Head Up Displays in Automobiles: A Review of the Literature," Office of Crash Avoidance Research, National Highway Traffic Safety Administration, Washington, 1995.
[2] OSRAM Opto Semiconductors, "OSRAM OSTAR® Projection Compact, LE CG Q8WP, " 04 06 2020. [Online]. Available: https://www.osram.com/ecat/OSRAM%20OSTAR%C2%AE%20Projection%20Compact%20LE%20CG%20Q8WP/com/en/class_pim_web_catalog_103489/global/prd_pim_device_2191201/.
[3] OSRAM Opto Semiconductors, "OSRAM OSTAR® Projection Compact, LE T Q8WP, " 04 06 2020. [Online]. Available: https://www.osram.com/ecat/OSRAM%20OSTAR%C2%AE%20Projection%20Compact%20LE%20T%20Q8WP/com/en/class_pim_web_catalog_103489/global/prd_pim_device_2191202/.
[4] Texas Instruments Incorporated, "DLP5530-Q1 Interior projector evaluation module with true green LED," August 2020. [Online]. Available: https://www.ti.com/tool/DLP5530PROJTGQ1EVM.
[5] M. Firth, A. Norris, D. Segler and J. Thompson, "Next Generation Augmented Reality Head-Up Display with DLP Technology," in SID Vehicle Displays and Interfaces Symposium Digest of Technical Papers and Presentation Files, Livonia, 2017.
[6] K. A. Smet, "Tutorial: The LuxPy Python Toolbox for Lighting and Color Science," LEUKOS, vol. 16, no. 3, pp. 179-201, 2020.
61

62

Tutorial
Holography and Its Automotive Applications Kai-Han Chang, General Motors Global R&D, Pontiac, MI, US
PAPER UNAVAILABLE
PRESENTATION SLIDES SHOULD BE DISTRIBUTED AFTER THE CONFERENCE
63

64

Keynote Address
KEYNOTE ADDRESS Voice of the Consumer | Technology and Mobility Clarity
Today and Tomorrow Kristin Kolodge, Executive Director of Human-Machine Interface
(HMI) and Driver Interaction at J.D. Power
PAPER UNAVAILABLE
PRESENTATION SLIDES SHOULD BE DISTRIBUTED AFTER THE CONFERENCE
65

66

Understanding and Achieving Reproducible Sparkle Measurements for an Automotive Specification
Ingo Rotscholl*, Jens Rasmussen**, Christoph Rickers***, Julia Brinkmann*, Udo Krüger* *TechnoTeam Bildverarbeitung GmbH, Werner-von-Siemens Str.5, 98693, Ilmenau, Germany
**Elektrobit Automotive GmbH, Lise-Meitner-Straße 10, 89081, Ulm, Germany
***Volkswagen AG, 38436, Wolfsburg, Germany
Abstract: The reproducible quantification of display
sparkle with Imaging Luminance Measurement Devices is
essential for testing and conformity assessment of high
quality automotive displays. This study systematically
researches relevant setup and system influences of a Fourier
Space based sparkle evaluation by analyzing more than
10000 luminance images. These include 13 different Anti-
Glare-Layers and two displays with different PPI in more
than 70 system setups. The concluded procedure serves as
basis to define a new automotive specification for
reproducible sparkle measurements and may do so for other
applications that need to quantify sparkle in a reproducible
way.
Keywords: sparkle, photometry, display measurement,
display metrology, display characterization, uniformity,
anti-glare layer; AGL; imaging luminance measurement
device; ILMD; 2D-LMD;
Introduction Alongside the quantification of the low frequency
uniformity as for instance BlackMURA [1], the
quantification of high frequency uniformity as Anti-Glare-
Layer (AGL) caused display sparkle, is an important quality
criterion for modern automotive displays. Thus, the
quantification of sparkle has been the focus of several
studies [1-9]. However, in many cases these studies focus
only on the relative comparison of several glass samples, its
correlation to human perception and repeatability. The
reproducibility of absolute sparkle levels within different
settings, remains a large challenge [2].
Figure 1: Luminance image with AGL in the center
region
Another important practical requirement is that each method
works without removing the AGL such that the same method
to quantify sparkle can be used during each development
step of the display. Furthermore, it is advantageous if
existing measurement procedures, setups and equipment as
known from the BlackMURA [10,11] specification can be
used. The main aim of this study is to systematically research
all relevant setup influences and system specifications
during an ILMD (Imaging Luminance Measurement
Device) based sparkle evaluation in order to define a sparkle
measurement procedure, which allows not only reproducible
sparkle measurements but ideally uses already existing
BlackMURA compliant procedures and equipment.
In the next section the fundamentals of sparkle
measurements are described. The main focus is the pixel
separation method Fourier filter approach. After that we will
focus on aspects which enhance the reproducibility in the
suggested approach and which will also be covered in the
upcoming specification.
Fundamentals of Sparkle Measurements Figure 1 visualizes the main problem of a sparkle measure-
ment, which is the separation of the high frequency sparkle
phenomenon from the periodic luminance modulations of
the pixel matrix. The AGL in Figure 1 is only applied to the
center of the luminance image. The sparkle can be seen but
there is a large contribution from the periodic pixel pattern.
Becker summarized four different concepts to perform this
separation [1,2]: Defocussing [4,5], Undersampling [6,7],
Spatial filtering [1,2] and Frequency Filtering [8].
While the first two approaches try to avoid sparkle by
adjusting the capturing condition, the last two methods rely
on image post processing. As both the Undersampling
approach as well as the Spatial filtering require unsuitable or
at least untypical sampling ratios (camera pixels per display
pixels) also called reproduction scale (RPS) for
BlackMURA, we focus our analysis on the remaining two
approaches.
The idea of the defocusing method is to first focus on the
periodic pattern and then defocus the periodic pixel pattern
while trying to keep the sparkle as sharp as possible.
However, this requires a very constraint setup to ensure that
the focusing conditions are identical. Nevertheless
reproducibility issues arise because the initial focus position
reproducibility is limited.
67
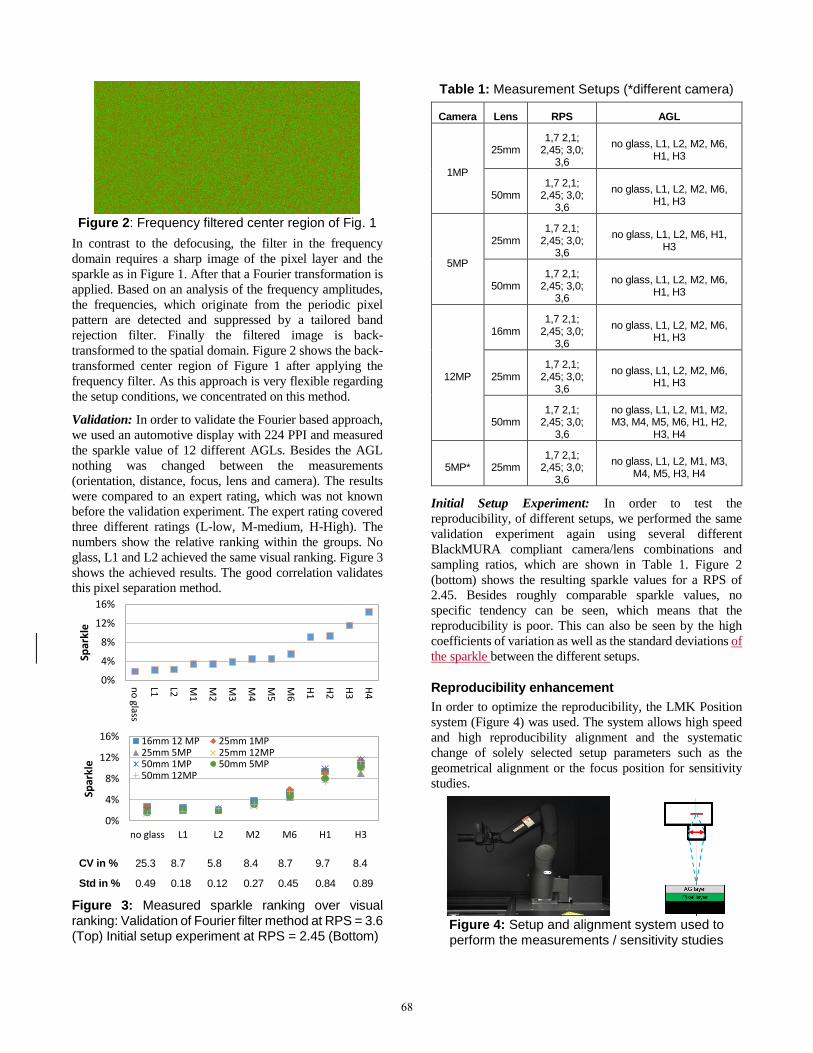
Figure 2: Frequency filtered center region of Fig. 1
In contrast to the defocusing, the filter in the frequency
domain requires a sharp image of the pixel layer and the
sparkle as in Figure 1. After that a Fourier transformation is
applied. Based on an analysis of the frequency amplitudes,
the frequencies, which originate from the periodic pixel
pattern are detected and suppressed by a tailored band
rejection filter. Finally the filtered image is back-
transformed to the spatial domain. Figure 2 shows the back-
transformed center region of Figure 1 after applying the
frequency filter. As this approach is very flexible regarding
the setup conditions, we concentrated on this method.
Validation: In order to validate the Fourier based approach,
we used an automotive display with 224 PPI and measured
the sparkle value of 12 different AGLs. Besides the AGL
nothing was changed between the measurements
(orientation, distance, focus, lens and camera). The results
were compared to an expert rating, which was not known
before the validation experiment. The expert rating covered
three different ratings (L-low, M-medium, H-High). The
numbers show the relative ranking within the groups. No
glass, L1 and L2 achieved the same visual ranking. Figure 3
shows the achieved results. The good correlation validates
this pixel separation method.
CV in % 25.3 8.7 5.8 8.4 8.7 9.7 8.4
Std in % 0.49 0.18 0.12 0.27 0.45 0.84 0.89
Figure 3: Measured sparkle ranking over visual ranking: Validation of Fourier filter method at RPS = 3.6 (Top) Initial setup experiment at RPS = 2.45 (Bottom)
Table 1: Measurement Setups (*different camera)
Camera Lens RPS AGL
1MP
25mm 1,7 2,1;
2,45; 3,0; 3,6
no glass, L1, L2, M2, M6, H1, H3
50mm 1,7 2,1;
2,45; 3,0; 3,6
no glass, L1, L2, M2, M6, H1, H3
5MP
25mm 1,7 2,1;
2,45; 3,0; 3,6
no glass, L1, L2, M6, H1, H3
50mm 1,7 2,1;
2,45; 3,0; 3,6
no glass, L1, L2, M2, M6, H1, H3
12MP
16mm 1,7 2,1;
2,45; 3,0; 3,6
no glass, L1, L2, M2, M6, H1, H3
25mm 1,7 2,1;
2,45; 3,0; 3,6
no glass, L1, L2, M2, M6, H1, H3
50mm 1,7 2,1;
2,45; 3,0; 3,6
no glass, L1, L2, M1, M2, M3, M4, M5, M6, H1, H2,
H3, H4
5MP* 25mm 1,7 2,1;
2,45; 3,0; 3,6
no glass, L1, L2, M1, M3, M4, M5, H3, H4
Initial Setup Experiment: In order to test the
reproducibility, of different setups, we performed the same
validation experiment again using several different
BlackMURA compliant camera/lens combinations and
sampling ratios, which are shown in Table 1. Figure 2
(bottom) shows the resulting sparkle values for a RPS of
2.45. Besides roughly comparable sparkle values, no
specific tendency can be seen, which means that the
reproducibility is poor. This can also be seen by the high
coefficients of variation as well as the standard deviations of
the sparkle between the different setups.
Reproducibility enhancement
In order to optimize the reproducibility, the LMK Position
system (Figure 4) was used. The system allows high speed
and high reproducibility alignment and the systematic
change of solely selected setup parameters such as the
geometrical alignment or the focus position for sensitivity
studies.
Figure 4: Setup and alignment system used to perform the measurements / sensitivity studies
no
glass
L1 L2 M1
M2
M3
M4
M5
M6
H1
H2
H3
H4
0%
4%
8%
12%
16%
Spar
kle
no glass L1 L2 M2 M6 H1 H3
0%
4%
8%
12%
16%
Spar
kle
16mm 12 MP 25mm 1MP25mm 5MP 25mm 12MP50mm 1MP 50mm 5MP50mm 12MP
68

Figure 5: Sparkle/Focus sensitivity: Left: Sparkle of
one AGL in different setups Right: Sparkle of different AGLs in one setup
CV in % 18.9 10.1 8.6 3.3 4.4 5.3 4.3
Std in % 0.38 0.23 0.19 0.11 0.24 0.50 0.49
Figure 6: Reproducibility setup experiment with optimized focus at RPS = 2.45
Optimized Focus: To research the focus sensitivity of the
measured sparkle, an initial setup according to Figure 4 was
used. The focus was adjusted to the pixel layer of the display.
Then a lateral camera movement was performed to slightly
change the relative distance between the camera and the
display, which also changed the relative position of the
focus. Each time a sparkle value was obtained.
Figure 5 (Left) shows the experiment for the different setups
of Table 1 (AGL M6, RPS = 3.6).Three things can be
observed:
There is a high focus sensitivity
There is a “random” lateral shift
There is a similar maximum value.
The high sensitivity is caused by blurred sparkle and was
expected. The lateral shift can be explained by the
reproducibility of the focus position relative to the pixel
layer. Each camera/lens system has a specific depth of focus.
This is a region, in which all rays that originate from one
point are imaged onto the same sensor pixel so that a sharp
image is produced regardless of the exact focus position.
This effect and the general performance of the focus
procedure limit the focus reproducibility. Thus, the sparkle
values at the initial focus position are limited by the focus
reproducibility, while the maximum describes the position
where the sparkle is blurred the least.
Figure 5 (Right) shows the normalized sparkle focus
sensitivity of the different AGL in one setup (50 mm 1MP,
RPS = 2.1). The initial focus position was not changed.
Thus, the focus reproducibility can be neglected. However,
there is still a slight lateral shift within a range of a few
millimeter. It originates from AGL properties such as
structure, thickness and the interaction with the display. This
effect is additionally superimposed to the focus
reproducibility.
In order to overcome the fundamental focus reproducibility
limitation we performed a sparkle focus scan for the
complete measurement series of Table 1. However, instead
of the sparkle value at the reference position, we selected the
maximum value as the representative sparkle value. Figure
5 shows the resulting values as well as the reproducibility. It
can be seen that especially the reproducibility of medium
and high sparkle values improves. This is caused by the
effect that an undetermined blur affects strong sparkle much
more than low sparkle values. We assume that earlier studies
may have been affected by this effect [9].
Local Median Evaluation: Other impact factors besides the
focus position are for instance tiny imperfections such as
scratches, defect pixels, dust and fingerprints or artifacts
from the Fourier filter. These tiny imperfections may change
the sparkle value significantly because they may produce
high outliers. An example is provided in Figure 7. The image
at the top shows a Fourier filtered image with tiny
imperfections. This image has been divided into small local
areas. A local sparkle contrast was calculated in each area.
This is shown in the image at the bottom. We call this result
local sparkle matrix. There are a few high outliers in the
sparkle values. In order to select a statistically robust
representative value from the local sparkle matrix that is not
affected by outliers, we select the median of all local values.
Figure 8 shows the results for the measurement series of
Table 1 using not only an optimized focus position but also
a local median based evaluation. Especially the low
sparkling values improve by applying the local median. This
can be explained by the effect that tiny imperfections such
as dust affect low sparkling values more than high sparkling
values. Note that the absolute values always become smaller.
Figure 7: Local evaluation: filtered image with tiny imperfections (Top), Local sparkle matrix (Bottom)
no glass L1 L2 M2 M6 H1 H3
0%
4%
8%
12%
16%
Spar
kle
16mm 12MP 25mm 5MP*25mm 1MP 25mm 5MP25mm 12MP 50mm 1MP50mm 5MP 50mm 12MP
69

CV in % 4.1 4.1 4.0 4.6 2.8 5.2. 4.2
Std in % 0.06 0.08 0.08 0.14 0.15 0.49 0.47
Figure 8: Reproducibility setup experiment with optimized focus and local evaluation at RPS = 2.45
Boundary Conditions: Other setup conditions that have
been researched are the reproduction scale and the
measurement field angle. They were researched by
performing all measurement series of Table 1. The different
measurement distances each cover an additional
reproduction scale and measurement field angles. Due to the
distance/focus scan, this measurement series covers more
than 10,000 individual luminance images to research the
sensitivities.
Reproduction Scale: The RPS is the ratio between camera
and display pixels. It has a large influence on the absolute
sparkle value. Figure 9 shows an exemplarily distance focus
scan for a glass/camera/lens combinations at different
measurement distances. Two things can be noticed. First, a
higher RPS leads to higher sparkle values. Second, a higher
RPS leads to a higher focus sensitivity. This is again the
effect of the depth of focus, which is smaller for shorter
measurement distances, which correspond to higher RPS
values. Thus, smaller RPS values of Table 1 as for instance
1.7 or 2.45 lead to more reproducible measurement results if
the focus scan is performed.
It should be further noted that for a comparison of absolute
sparkle values between different displays covering different
pixel pitches, the pixel pitch independent magnification (in
camera pixels per mm) of the measurement setup should be
used.
Figure 9: Sparkle/Focus sensitivity for AGL M6 and different RPS (measurement distances)
Measurement Field Angle: Further, it has been found that
the measurement field angle also affects the absolute sparkle
value. Especially oblique angles have led to different results,
which can be seen directly in the exemplarily sparkle matrix
in Figure 10. Although the effect itself can be interesting, it
will affect the reproducibility between different camera/lens
combinations, because they might cover different
measurement field angles. Thus, a limitation of the
maximum field angle during evaluation is recommended to
enhance reproducibility. In our case this limit would be ± 7°.
Figure 10: Sparkle/Field angle sensitivity: Top: Evaluation of sparkle within different field angle regions within the sparkle matrix. Bottom: Effect for different glasses for a short focal length lens setup
CV in % 2.8 4.8 2.4 2.8 2.6 2.7. 1.7 2.7 1.8
Std in % 0.1 0.1 0.1 0.1 0.1 0.1 0.1 0.3 0.3
Figure 10: Reproducibility setup experiment with optimized focus and local evaluation at RPS 2.45
with second test display (183 PPI)
no glass L1 L2 M2 M6 H1 H3
0%
4%
8%
12%
16%Sp
arkl
e16mm_12MP 25mm 5MP*25mm_1MP 25mm,5MP25mm,12MP 50mm_1MP50mm,5MP 50mm,12MP
0,0%
2,0%
4,0%
6,0%
8,0%
10,0%
no glass L1 L2 M2 M6 H1 H3
16mm 12MP RPS=2.1
ϑMax=26° ϑMax=14°
ϑMax=7° ϑMax=3°
No Glass L1 L2 M4 M1 M3 M5 H3 H4
0%
5%
10%
15%
20%
Spar
kle
25mm 1MP 50mm 1MP25mm 5 MP 50mm 5MP16mm 12MP 25mm 12MP50mm 12MP
70

Validation
In order to validate our procedure, we used a second display
with another PPI and repeated all measurements with several
AGLs. We performed the geometrical alignment with LMK
Position, a distance focus scan and a median based
evaluation at approximately constant reproduction scales
and limited the evaluated measurement field angle. The
results are shown in Figure 11. The sparkle values do not
only correlate to the perceived sparkle but are reproducible
among a large variety of BlackMURA compliant setups.
Conclusion
In order to enhance the reproducibility of sparkle
measurements, TechnoTeam, Volkswagen and Elektrobit
systematically researched the influences of different
measurement setups in more than 40 different measurement
setups per display, covering a large variety of BlackMURA
compliant measurement conditions and camera/lens
combinations.
We found that the reproducibility of absolute sparkle values
can be limited by the depth of focus. The depth of focus
should be large enough to provide a sharp image of the
sparkle while still enabling focusing on the “pixel layer”. It
should also be small enough to maximize the focus position
reproducibility. However, it is nearly impossible to find a
compromise for the large variety of existing BlackMURA
compliant setups and AGL/display combinations. Therefore,
the distance focus scan was introduced to find the correct
focus position. It should be noted that depending on the
focus sensitivity of the RPS (Figure 8), the scan is only
necessary if either the setup or the DUT type change. This is
important to save tag time during end-of-line inspection.
Another important reported improvement was achieved by
replacing the global sparkle value evaluation by a local
median based sparkle evaluation. This procedure minimizes
the effect of tiny imperfections such as dust, scratches or
defect pixels as well as artifacts from the Fourier filter and
thus optimizes the reproducibility of low sparkling AGL.
Further a measurement specification should specify the
reproduction scale or the magnification and consider a
boundary for the maximum of the measurement field angle.
The achieved reproducibility in combination with the high
flexibility regarding applicable already existing camera
lens/combinations allows the use of existing BlackMURA
compliant setups. Finally, the derived procedures,
algorithms and concepts are used to define a new automotive
specification for reproducible sparkle measurements at
Volkswagen, which will be distributed in 2020/2021 and
which will allow a large variety of setups regarding camera
pixel pitches, resolution and lenses to measure sparkle of
automotive displays in a reproducible way.
References
1. Becker M. E., Sparkle measurement revisited: A
closerlook at the details, J. Soc Inf. Disp. 23 (10),
(2015)
2. Becker M. E., 8-1: Standardization of Sparkle
Measurement: A Solid Basis, SID Symposium
Digest of Technical Papers, 49, 1, (2018).
3. Gollier, J et. al, 24.4: Display Sparkle Measurement
and Human Response. SID Symposium Digest of
Technical
Papers, 44, (2013).
4. Ferreras Paz V., Kohlenbecker S. and Persidis E., 8‐
2: Sparkle Characterization of Anti‐glare Layers on
Displays with a Grey Value Histogram Analysis,
SID Symposium Digest of Technical Papers, 49, 1
(2018)
5. Scholz M., Standard System Specifications for
Repeatable Sparkle Measurement in AG Displays,
electronic display conference, (2018)
6. Kurashige M. et. al, VHF1-3 Estimation of
Equivalent Conditions for Display Sparkle
Measurement, Proc. International Display Workshop
(2019)
7. Hayashi M., Simplified Method to Quantify
Sparkling of Antiglare. Display without Image
Processing and Its. Application, Proc. International
Display Workshop (2017)
8. Chiang Y.-H., Hsu T.-W.,Lin S.-C., Cheng-Hsien.
L., Su J.-J., Novel Sparkling Quantification Method
on TFT LCD, Proc. International Display Workshop
(2014)
9. Isshiki M., Inouye A., Tamada M., Kobayashi Y, 78‐
3: The Optimized Condition for Display Sparkle
Contrast Measurement of Anti‐Glare Cover Glass
based on the Solid Understandings, SID Symposium
Digest of Technical Papers, 50, 1, (2019)
10. German Automotive OEM Work Group Displays,
“Display Specifications for Automotive Application
V5.1” (2018)
11. German Automotive OEM Work Group Displays,
Uniformity Measurement Standard for Displays
V1.3, (2018)
71

72

Measuring MicroLEDs for Color Non-Uniformity Correction
Mike Naldrett, Matt Scholz, Bret Stonebridge, Austin Piehl, Anne Corning, Shaina Warner Radiant Vision Systems, LLC
18640 NE 67th Court, Redmond, WA 98052 USA [email protected]
Abstract: MicroLEDs continue to demonstrate their
advantages for the display market. They offer many benefits
over other technologies including higher brightness, faster
response, and lower power consumption. These benefits are
driving significant investment in the technology and pushing
market forecast estimates up to 330 million units by 2025.1
However, several challenges remain to achieve efficient,
high-volume production—including ensuring high visual
quality. As individual emitters with their own performance,
microLEDs exhibit luminance and color variation, unlike
traditional LCD displays that use uniform backlights. These
variations require that each microLED be measured and
adjusted individually in order to achieve visual uniformity
across the display. The chosen measurement and correction
system must be capable of providing very low takt times to
correct the high quantity of emitters in a single display, to
support efficient high-volume production processes.
This paper will discuss how these requirements can be
satisfied using imaging colorimeters, applying unique
correction methods and image processing techniques. The
benefits of various color measurement methods, imaging
system resolutions, and correction methods will be
demonstrated.
Keywords: microLED; color uniformity, color accuracy;
automated visual inspection; automotive displays; head-up
displays; HUDs; display measurement; subpixel
measurement; subpixel metrology, display correction;
demura; imaging photometry; imaging colorimetry; optical
metrology; pixel defect; curved displays; flexible displays
Introduction MicroLED technology is ushering in new generation of
illuminated components, particularly within the automotive
segment where displays and lighting are rapidly
diversifying. Commercialization of microLED displays in
automobiles is anticipated within two to three years.2 The
high brightness and contrast, wide color gamut, and high
pixel density of microLEDs offer visibility and legibility in
the various ambient-light conditions of an automobile
(particularly in bright daylight). These qualities make them
especially attractive for head-up display (HUD)
applications—the superior brightness of microLEDs yields
“the contrast necessary to clearly see an image against a
bright sun-lit background (including sun shining right
through the windshield) and wide operation temperatures to
withstand weather swings from bitter cold in winters to
scorching heat in summers.”3
Like other emerging display integrations that use flexible
plastic LCD-TFT backplanes or OLED, microLED displays
can be used for flexible and curved panels that enable more
display integration options within the vehicle interior,
increasing their appeal to automotive designers.
However, a significant challenge to successful microLED
display development, production, and commercialization is
achieving a consistent, uniform appearance. As individual
emissive elements, microLEDs are driven independently
and can exhibit a high degree of variability in luminance
(Figure 1) and color (Figure 2), unlike traditional LCD
displays that use a uniform backlight.
Figure 1. This close-up image of a microLED panel shows wide variation in luminance of different pixels
across the display.
Variability is compounded because each microLED is a
monochromatic subpixel whose output is combined with
other subpixels to produce the overall brightness and color
of a single display pixel. This variability at the subpixel- and
pixel-level manifests as non-uniformity across the display,
resulting in low yield of acceptable displays, rejection of
expensive components, or costly rework (Figure 3).
Measurement of microLED subpixels is necessary to
quantify, evaluate, and potentially correct display output.
However, microLEDs are challenging to measure accurately
(due to subpixel size, density, and quantity per display) and
equally challenging to correct—especially at the high
volumes needed to support commercial production
demands.
73

New solutions to address microLED display quality
challenges combine traditional automated visual inspection
systems with innovative measurement methods. These
solutions have already been proven for identification of
defects like non-uniformity, with quantitative pass-fail
results, fast cycle times, and reduced operational costs
necessary for mass production and commercialization.
For emissive displays, new measurement methods that can
detect and quantify the output of individual pixel and
subpixel emissive elements are enabling display uniformity
correction. It is now possible to measure and correct the
luminance and chromaticity output of each pixel, thereby
producing displays with uniform appearance. This
process—referred to as pixel uniformity correction, or
“demura”—relies on the accuracy of subpixel-level
luminance and color measurement to calculate accurate
correction coefficients for each microLED.
Matching Human Visual Perception of Color In 1931, the Commission Internationale de L’éclairage
(CIE) defined a standard for scientifically quantifying the
physical properties of colors as perceived by a human
observer, enabling accurate mathematical representation
and reproduction of those colors (Figure 4). A color gamut
is the set of all colors available (producible) by a display (a
subset of the entire CIE color space).
One reason microLED technology is attractive to display
manufacturers is because it can produce a wider color gamut,
enhancing the customer’s visual experience. Human viewers
can discern subtle variations in image brightness and color
produced by a microLED display and experience it as higher
quality device. To provide this enhanced viewing
experience, quality inspection of microLED displays
requires a metrology system that can discern color variation
with equivalent sensitivity to the human eye. This
discernment is quantified based on mathematical formula of
the CIE standard to provide chromaticity coordinates within
the CIE color space.4
Figure 2. Illustration of an emissive display with color nonuniformity (far left), with magnification of areas across the display (display pixels) A, B, and C that vary in color (center left); illustration of the example spectral data for A, B,
and C (right).
Figure 3. Input signals for target color gamut of DCP-P3 (D65) (row 1), compared to microLED display output (row 2), where dominant vertical non-uniformity pattern and block-wise stamp marks are clearly seen.5 (Images ©
Samsung Research / Samsung Electronics)
74

Figure 4. A graphical representation of the CIE 1931 color space, showing all colors visible to the human eye. The black numbers give the visible spectrum in wavelengths, while perceived colors are represented
as coordinate points (x and y) within these limits.
Considerations for Measurement Because they are susceptible to color variation, microLED
emitters must be individually measured and corrected to
achieve displays with the highest visual quality possible. At
the same time, the chosen measurement and correction
system must be capable of providing very low takt times to
correct the high quantity of emitters in a single display at
once, to support efficient high-volume production processes.
Different display metrology systems offer benefits and
drawbacks when applied to the various challenges of
microLED color measurement. For example, a
spectroradiometric system can achieve a high degree of
color accuracy, but its slow takt times make it an inefficient
solution to measure the millions of pixels that make up an
entire microLED display.
Additionally, spectroradiometric systems typically have a
spot size that is too large to provide the most accurate
measurement of individual microLED emitters. A typical
microLED is <100 micrometers (µm) square, with <50 µm
quite common, and some as small as 3 µm.6 Thus a
measurement system capable of measuring structures with a
diameter of just 0.075 mm would be insufficient to
differentiate and measure the characteristics of individual
microLED pixels smaller than 75 µm.
To meet production takt time requirements, some automated
visual inspection systems are designed to provide high-speed
measurement—for example, machine vision cameras.
However, these systems do not have the accuracy required
to quantify differences in luminance and chromaticity
values, especially at the pixel level.
As shown in this paper, a color-calibrated, high-resolution
imaging colorimeter provides both the accuracy and speed
to meet production needs, and thus offers an effective
solution for pixel-level measurement of microLEDs in
production. An effective solution to meet commercial
manufacturing demands would include:
• Imaging colorimeter. The advantages of imaging
photometer and colorimeter systems include
efficiency—the ability to detect all meaningful
variations across displays in a single image,
accomplishing multiple measurements at once:
luminance, chromaticity, uniformity, contrast, pixel
defects, etc. Another advantage is scope—the ability to
capture the entire field of view (FOV) in a single image,
just as the device is viewed by a user. An imaging
photometer measures luminance, while chromaticity
measurements require an imaging colorimeter.
• High resolution. A microLED measurement system
must have high-resolution imaging capabilities. High-
resolution imaging provides the precision needed to
distinguish and isolate each pixel and subpixel for
measurement, and the efficiency to capture values for
every pixel across increasingly high-resolution displays
in a single image.
• Low noise. Along with high resolution, low-noise
imaging capability is also needed. Image noise (which
can include read noise, shot noise, or electronic noise),
interferes with the clarity of an image. No matter how
high the resolution of an imaging system (the number of
megapixels (MP) of its sensor), if the system captures
significant noise (yielding low signal-to-noise ratio, or
SNR), then its effective resolution may be much lower.
• Calibration. To perform accurate color measurement
according to CIE standards, a metrology device must be
carefully calibrated. A common method uses reference
data captured by a spectrometer to calibrate the
response of an imaging colorimeter. Alternatively,
Enhanced Color Calibration™ (ECC) is an algorithm-
based calibration method shown to have high accuracy
without requiring a spectrometer device (see the
Enhanced Color Calibration section below).
• Test & Analysis Tools. Image processing software
enables manufacturers to optimize and run tests on a
captured image. Ideally, an analysis package for display
metrology would include tools to detect and quantify
luminance, chromaticity, uniformity, contrast, pixel and
line defects, display mura, and other qualities.
75

Importance of Color Measurement Accuracy Replicating the human eye’s response to light and color
using standard CIE functions is vital for measuring color
accurately. CIE-matched tristimulus (XYZ) color filters on
a rotating filter wheel enable color measurement according
to standard CIE functions and chromaticity values. Light
entering the metrology device is passed through the
respective filters and then captured by a sensor. The filters
adjust the incoming light, blocking certain wavelengths
(such as UV that are invisible to the human eye) so that the
sensors capture an image that is as close as possible to what
the human eye sees.
Tristimulus Systems. A recent study by Jensen, Piehl, and
Renner (2020)7 demonstrates the high degree of accuracy of
a tristimulus system in matching human color perception.
This is discussed in more detail in the section titled Color
Measurement Accuracy Study: Tristimulus System.
Enhanced Color Calibration™. Some imaging systems
require a spectrometer device to supply calibration data to
ensure measurement accuracy. Enhanced Color Calibration
(ECC) from Radiant Vision Systems provides the highest
level of color measurement accuracy via advanced
calibration algorithms. The ECC method creates a 12-
element correction calibration matrix in order to maximize
the ability of the color measurement system to tolerate
variability (provide accurate color measurement over a large
area of the CIE color space) from a calibrated color value
(calibration point; see Figure 5).
Figure 5. Based on the spectral response of the calibrated tristimulus system, it is expected to continue to provide accuracy even as source spectral data deviates further from the calibration point. This chart illustrates an expected accuracy limit (area within the white dotted line circle) for a tristimulus imaging colorimeter with values A,
B, and C plotted from Figure 2.
Color Measurement Accuracy Study: Tristimulus System This study looked at the color measurement accuracy of a
CIE tristimulus filter imaging colorimeter system using ECC
compared to a reference meter (a spectroradiometer). LEDs
of different colors were measured by the reference meter and
by each color measurement system under test. First,
measurement systems were calibrated to a base output for
each LED (using ECC). Then, the systems measured each
LED as its output was varied (LED variability was
introduced by supplying different current levels). The
accuracy of the color measurement system was defined by
its ability to match reference meter measurements as
chromatic distance of the LED output increased from the
system calibration point.
Results. The tabular measurement data shown in Table 1
and plotted in Figures 6 and 7 demonstrate that a tristimulus
system provides accurate luminance and chromaticity values
across introduced LED source variation. The tristimulus
system accurately measures nearly the entire range of
variation exhibited by each LED test source (at each
supplied current) as indicated in Table 1, Parts A and B.
In all but a few measurements, the Δ dominant wavelength
of the tristimulus system measurements compared to the
reference was less than 1 nm, indicating a high degree of
accuracy for a tristimulus imaging colorimeter with ECC.
These results demonstrate that a tristimulus system is
suitable to accurately measure colored LEDs with a high
degree of accuracy in both luminance and chromaticity—
even as sources vary widely from the calibration point. In
this study, the introduced variability of most of the LED test
sources exceeded the expected variability of microLEDs. A
tristimulus system is recommended for ensuring efficient
and accurate display correction where source variation is
high, or tolerance for variation is limited.
Results also demonstrate the robustness of a tristimulus
system for accurately measuring across white LEDs (Table
1, Part C). These results indicate that a tristimulus imaging
colorimeter can be used for wafer-level inspection, to
address pick-and-place applications for microLED displays,
and for general binning operations for both colored LEDs
and white LEDs (Figures 6 and 7).
76

Figure 6. Tristimulus system (ProMetric® I29 (29 MP) Imaging Colorimeter) accuracy range for color variation across
colored and white LED test sources.
Figure 7. Plot showing true LED source variation at each current level (as measured by the reference spectroradiometer) based on ± nm change in dominant wavelength from the calibration point (x-axis). This axis gives
the range of variation observed for each LED. The tristimulus system (ProMetric® I29) measurement accuracy is shown as a ± nm difference from the reference measurement at each current level for each LED source (y-axis).
0.0000
0.0010
0.0020
0.0030
0.0040
0.0050
0.0060
0.0070
0.0000 0.0050 0.0100 0.0150 0.0200 0.0250 0.0300 0.0350 0.0400 0.0450 0.0500 0.0550 0.0600 0.0650 0.0700 0.0750 0.0800 0.0850 0.0900 0.0950 0.1000 0.1050 0.1100 0.1150 0.1200
Syste
m M
ea
su
rem
etn
t A
ccu
racy (
Δxy)
True Color Distance from calibration Point (Δxy)
Tristimulus System - Chromatic Accuracy Range - Colored LEDsDeep Red
Red
Red-Orange
Amber
Green
Cyan
Blue
Royal Blue
-5
-4
-3
-2
-1
0
1
2
3
4
5
-12 -11 -10 -9 -8 -7 -6 -5 -4 -3 -2 -1 1 2 3 4 5 6 7 8 9 10 11 12
Syste
m M
ea
su
rem
etn
t A
ccu
racy (
ΔD
om
. λ
(nm
))
True shift in source dominant wavelength relative to calibration point (ΔDom. λ (nm))
Tristimulus System - Dominant Wavelength - Colored LEDs
Deep Red
Red
Red-Orange
Amber
Green
Cyan
Blue
Royal Blue
77

Table 1, Part A. Test results for a 4-filter tristimulus imaging colorimeter system (ProMetric I29). The tan row of cells indicates the calibration condition for each source. Values measured by the tristimulus system are reported in columns under the Camera header. Values measured by the reference meter (measured at the same time and within the same conditions as the tristimulus system) are reported in columns under the Reference header. The
error between dominant wavelength values measured by the tristimulus system and the reference meter are reported under the Results header in columns ΔDom. Wv (nm), ΔLv (%), Δx, Δy, and Δxy.
Tristimulus System vs. Reference Measurement Agreement (xy)
LED Camera Reference Result
Peak Wv
(nm)
Dom. Wv
(nm)
Lv
x
y
Dom. Wv
(nm)
Lv
x
y
xy from Cal. Point
Dom.
Wv (nm)
Lv (%)
x
y
xy
DEEP RED
658 643.0 3.7 0.7208 0.2785 642.3 3.7 0.7193 0.2792 0.0007 0.7 -0.3 -0.0015 0.0007 0.0017
659 643.1 19.0 0.7212 0.2784 642.2 19.1 0.7198 0.2792 0.0006 0.9 -0.5 -0.0014 0.0008 0.0016
660 642.8 36.9 0.7211 0.2786 642.2 37.0 0.7197 0.2792 0.0006 0.6 -0.5 -0.0014 0.0006 0.0015
662 642.4 68.2 0.7205 0.279 642.1 68.5 0.7198 0.2793 0.0005 0.3 -0.4 -0.0007 0.0003 0.0008
664 641.9 93.8 0.7199 0.2794 641.9 94.2 0.7194 0.2795 0.0004 0.0 -0.4 -0.0005 0.0001 0.0005
666 641.6 113.6 0.7192 0.2797 641.5 114.3 0.7192 0.2798 0.0005 0.1 -0.6 0.0000 0.0001 0.0001
668 641.1 127.5 0.7182 0.2802 641.0 128.1 0.719 0.2802 0.0008 0.2 -0.5 0.0008 0.0000 0.0008
670 640.8 134.7 0.7169 0.2806 640.5 135.3 0.7187 0.2806 0.0013 0.3 -0.5 0.0018 0.0000 0.0018
672 640.8 134.7 0.7162 0.2807 640.5 135.7 0.718 0.2807 0.0019 0.3 -0.7 0.0018 0.0000 0.0018
RED
632 623.7 10.4 0.6983 0.3015 622.7 10.4 0.6961 0.3032 0.0055 0.9 0.0 -0.0022 0.0017 0.0028
632 624.2 55.8 0.6987 0.3006 622.9 56.0 0.6967 0.3029 0.0049 1.4 -0.4 -0.0020 0.0023 0.0030
633 624.0 110.7 0.6989 0.301 623.2 110.9 0.6972 0.3023 0.0041 0.7 -0.2 -0.0017 0.0013 0.0021
635 624.4 209.8 0.6995 0.3003 623.8 210.3 0.6983 0.3013 0.0026 0.6 -0.2 -0.0012 0.0010 0.0016
636 624.7 291.7 0.6999 0.2998 624.5 292.5 0.6993 0.3002 0.0011 0.2 -0.2 -0.0006 0.0004 0.0007
638 624.9 353.0 0.7003 0.2995 625.2 353.6 0.7003 0.2991 0.0004 -0.3 -0.2 0.0000 -0.0004 0.0004
640 625.0 387.7 0.7005 0.2993 625.8 387.6 0.7014 0.2981 0.0019 -0.8 0.0 0.0009 -0.0012 0.0015
643 625.0 391.2 0.7006 0.2993 626.5 388.3 0.7025 0.297 0.0034 -1.5 0.7 0.0019 -0.0023 0.0030
645 625.1 371.3 0.7008 0.2991 626.8 370.7 0.703 0.2965 0.0041 -1.7 0.2 0.0022 -0.0026 0.0034
RED-ORANGE
621 616.4 10.8 0.6832 0.3162 614.7 11.0 0.6788 0.3205 0.0155 1.7 -1.0 -0.0044 0.0043 0.0062
622 615.5 57.8 0.6809 0.3186 615.3 57.8 0.6805 0.3191 0.0133 0.2 -0.1 -0.0004 0.0005 0.0006
623 616.4 110.8 0.6832 0.3163 615.9 111.1 0.682 0.3175 0.0111 0.5 -0.3 -0.0012 0.0012 0.0017
625 617.4 196.9 0.6855 0.314 617.2 197.3 0.6849 0.3145 0.0069 0.2 -0.2 -0.0006 0.0005 0.0008
627 618.4 252.3 0.6877 0.3118 618.4 252.5 0.6877 0.3118 0.0030 0.0 -0.1 0.0000 0.0000 0.0000
630 619.4 273.4 0.6899 0.3096 619.6 274.1 0.6904 0.3091 0.0008 -0.2 -0.2 0.0005 -0.0005 0.0007
633 620.0 266.7 0.6912 0.3084 620.9 264.8 0.693 0.3065 0.0045 -1.0 0.7 0.0018 -0.0019 0.0026
636 620.7 231.8 0.6926 0.307 622.3 228.8 0.6954 0.304 0.0080 -1.6 1.3 0.0028 -0.0030 0.0041
638 621.2 204.7 0.6936 0.306 623.0 202.9 0.6967 0.3028 0.0097 -1.7 0.9 0.0031 -0.0032 0.0045
AMBER
594 591.3 9.2 0.584 0.4171 591.4 9.3 0.5831 0.4159 0.0430 -0.1 -1.5 -0.0009 -0.0012 0.0015
594 592.2 50.1 0.5873 0.4118 592.1 51.4 0.5867 0.4123 0.0379 0.1 -2.5 -0.0006 0.0005 0.0008
595 593.1 93.3 0.5924 0.4063 592.8 95.6 0.5911 0.4081 0.0318 0.3 -2.4 -0.0013 0.0018 0.0022
597 594.2 152.6 0.5986 0.4004 594.4 154.1 0.5996 0.3994 0.0196 -0.2 -0.9 0.0010 -0.0010 0.0014
599 596.3 183.1 0.609 0.3901 596.1 178.2 0.608 0.391 0.0077 0.2 2.7 -0.0010 0.0009 0.0013
602 597.7 178.2 0.6163 0.3833 597.7 178.4 0.6164 0.3829 0.0039 -0.1 -0.1 0.0001 -0.0004 0.0004
604 599.9 163.2 0.6253 0.373 599.6 161.3 0.6248 0.3745 0.0158 0.3 1.2 -0.0005 0.0015 0.0016
607 601.8 138.7 0.6346 0.3645 601.3 139.3 0.6327 0.3666 0.0270 0.5 -0.4 -0.0019 0.0021 0.0028
608 602.8 128.8 0.6388 0.3604 602.2 128.4 0.6364 0.363 0.0321 0.6 0.4 -0.0024 0.0026 0.0035
78

Table 1, Part B. Tristimulus System vs. Reference Measurement Agreement (xy), cont.
LED Camera Reference Result
Peak Wv (nm)
Dom. Wv
(nm)
Lv
x
y
Dom. Wv
(nm)
Lv
x
y
xy from Cal. Point
Dom.
Wv (nm)
Lv (%)
x
y
xy
GREEN
534 541.7 39.2 0.247 0.7209 541.6 42.7 0.2479 0.7171 0.0557 0.1 -0.3 0.0004 -0.0033 0.0033
530 537.8 195.2 0.2233 0.7313 537.7 203.3 0.2227 0.7294 0.0335 0.1 -0.4 0.0000 -0.0023 0.0023
528 535.6 358.3 0.2113 0.7334 535.5 370.1 0.2105 0.7324 0.0239 0.1 -0.3 0.0000 -0.0018 0.0018
526 533.2 619.9 0.1994 0.7307 533.1 638.0 0.1985 0.7308 0.0140 0.0 -0.4 0.0001 -0.0010 0.0010
525 531.7 821.9 0.194 0.7248 531.7 845.6 0.1931 0.7256 0.0067 0.0 -0.3 0.0003 -0.0006 0.0007
524 530.8 981.6 0.1922 0.7172 530.8 1003.8 0.1917 0.7180 0.0013 0.0 -0.1 0.0002 -0.0002 0.0003
524 530.2 1104.7 0.1923 0.7092 530.3 1132.0 0.1917 0.7103 0.0092 -0.1 0.0 0.0005 -0.0003 0.0006
525 530.0 1201.7 0.1942 0.7008 530.0 1228.2 0.1934 0.7019 0.0180 0.0 0.3 0.0004 -0.0005 0.0006
525 529.9 1238.7 0.1958 0.6963 529.9 1263.3 0.1951 0.6971 0.0228 0.0 0.4 0.0003 -0.0006 0.0007
CYAN
510 513.4 37.1 0.0929 0.7005 513.4 38.0 0.0935 0.6991 0.1101 0.0 -0.9 0.0008 -0.0016 0.0018
508 510.4 150.0 0.0839 0.6657 510.5 153.0 0.0839 0.6657 0.0763 0.0 -0.7 0.0005 -0.0002 0.0005
506 508.8 255.4 0.0808 0.6425 508.8 260.3 0.0809 0.6425 0.0535 0.0 -0.6 0.0006 0.0000 0.0006
505 507.1 418.2 0.0804 0.6154 507.2 425.2 0.0804 0.6155 0.0269 -0.1 -0.4 0.0006 0.0004 0.0007
505 506.3 544.8 0.0825 0.5997 506.3 554.2 0.0822 0.5995 0.0110 -0.1 -0.3 0.0005 0.0003 0.0006
505 505.9 649.4 0.0858 0.5898 505.9 659.5 0.0851 0.5892 0.0010 0.0 -0.1 0.0002 -0.0002 0.0003
505 505.8 735.7 0.0898 0.5835 505.7 747.7 0.0888 0.5827 0.0076 0.0 -0.2 -0.0001 -0.0004 0.0004
506 505.8 811.1 0.094 0.5794 505.7 823.1 0.0928 0.5784 0.0135 0.1 -0.1 -0.0004 -0.0007 0.0008
506 505.9 843.0 0.0967 0.5784 505.8 856.1 0.0952 0.5771 0.0160 0.1 -0.2 -0.0007 -0.0009 0.0011
BLUE
473 475.5 12.6 0.116 0.0992 475.4 12.5 0.1163 0.0987 0.0110 0.1 1.2 0.0003 -0.0006 0.0007
471 473.9 56.6 0.1207 0.088 473.8 56.6 0.1208 0.0871 0.0028 0.1 0.6 0.0000 -0.0006 0.0006
470 473.1 102.6 0.123 0.0833 473.1 103.1 0.1230 0.0825 0.0065 0.0 0.1 -0.0001 -0.0003 0.0003
470 472.8 185.2 0.1242 0.082 472.8 186.1 0.1244 0.0809 0.0076 0.0 -0.4 -0.0002 0.0000 0.0002
471 473.2 264.9 0.1237 0.0851 473.2 266.5 0.1239 0.0841 0.0044 0.0 -0.6 -0.0001 0.0001 0.0001
472 474.0 346.4 0.1223 0.0906 474.0 347.9 0.1226 0.0895 0.0012 0.0 -0.3 -0.0001 0.0001 0.0001
473 474.9 427.3 0.1204 0.0976 474.9 429.8 0.1208 0.0965 0.0085 0.0 -0.3 0.0001 0.0001 0.0001
474 475.8 504.3 0.1186 0.1051 475.7 507.6 0.1190 0.1041 0.0159 0.0 0.0 0.0002 -0.0001 0.0002
474 476.2 539.7 0.1177 0.1089 476.2 543.2 0.1181 0.1080 0.0199 0.0 0.0 0.0002 -0.0001 0.0002
ROYAL BLUE
451 454.1 4.1 0.1533 0.0238 454.2 4.2 0.1531 0.0243 0.0006 -0.1 -1.4 -0.0001 0.0003 0.0003
451 453.8 21.6 0.1537 0.0234 453.8 21.8 0.1538 0.0234 0.0013 0.0 -0.6 0.0000 0.0001 0.0001
450 453.6 42.2 0.1539 0.0233 453.6 42.5 0.1540 0.0232 0.0016 0.0 -0.5 0.0000 0.0000 0.0000
450 453.7 81.2 0.1538 0.0235 453.7 81.7 0.1539 0.0234 0.0014 0.0 -0.6 0.0000 0.0000 0.0000
451 454.1 118.4 0.1534 0.0241 454.1 119.1 0.1536 0.0239 0.0007 0.0 -0.6 0.0000 0.0000 0.0000
451 454.6 154.2 0.153 0.0248 454.6 155.1 0.1531 0.0247 0.0002 -0.1 -0.3 -0.0001 0.0000 0.0001
452 455.2 187.9 0.1523 0.0258 455.2 189.1 0.1525 0.0255 0.0014 0.0 -0.3 0.0000 0.0000 0.0000
452 455.9 220.0 0.1516 0.0269 455.9 221.5 0.1517 0.0267 0.0027 0.0 -0.1 0.0000 0.0000 0.0000
453 456.4 235.3 0.1511 0.0276 456.4 237.1 0.1512 0.0275 0.0035 0.0 -0.1 0.0000 0.0000 0.0000
79

Table 1, Part C. Tristimulus System vs. Reference Measurement Agreement (xy), cont.
Camera Reference Result
Lv
x
y
Lv
x
y
xy from Cal. Point
Lv (%)
x
y
xy
WHITE (2700K)
29.4 0.4618 0.411 29.2 0.4601 0.4116 0.0670 0.5 -0.0017 0.0006 0.0018
149.3 0.4615 0.4135 148.5 0.46 0.4139 0.0676 0.6 -0.0015 0.0004 0.0016
287.2 0.4603 0.414 285.7 0.4587 0.4145 0.0666 0.5 -0.0016 0.0005 0.0017
534.0 0.4572 0.4136 530.9 0.4558 0.414 0.0637 0.6 -0.0014 0.0004 0.0015
747.6 0.4542 0.4125 743.0 0.4529 0.4128 0.0606 0.6 -0.0013 0.0003 0.0013
930.9 0.4512 0.4111 924.3 0.4499 0.4114 0.0573 0.7 -0.0013 0.0003 0.0013
1078.6 0.4478 0.4097 1071.0 0.4469 0.4099 0.0540 0.7 -0.0009 0.0002 0.0009
1191.7 0.4446 0.4082 1182.0 0.4437 0.4084 0.0504 0.8 -0.0009 0.0002 0.0009
1230.4 0.4425 0.4074 1220.1 0.4419 0.4074 0.0484 0.8 -0.0006 0.0000 0.0006
1253.6 0.4409 0.4067 1243.1 0.4404 0.4066 0.0467 0.8 -0.0005 -0.0001 0.0005
WHITE (3500K)
33.4 0.4115 0.4042 33.1 0.4103 0.4046 0.0195 1.0 -0.0012 0.0004 0.0013
162.6 0.4096 0.4024 161.1 0.4084 0.4026 0.0168 0.9 -0.0012 0.0002 0.0012
307.7 0.4076 0.4003 304.9 0.4063 0.4006 0.0139 0.9 -0.0013 0.0003 0.0013
562.2 0.4038 0.3968 556.9 0.4027 0.397 0.0088 0.9 -0.0011 0.0002 0.0011
777.1 0.4003 0.3935 769.6 0.3993 0.3936 0.0040 1.0 -0.0010 0.0001 0.0010
955.1 0.3971 0.3903 945.1 0.396 0.3905 0.0006 1.1 -0.0011 0.0002 0.0011
1091.3 0.3934 0.3875 1079.8 0.3927 0.3875 0.0050 1.1 -0.0007 0.0000 0.0007
1185.4 0.3895 0.3845 1172.2 0.389 0.3844 0.0098 1.1 -0.0005 -0.0001 0.0005
1213.8 0.3872 0.3829 1200.1 0.3869 0.3827 0.0125 1.1 -0.0003 -0.0002 0.0004
1228.7 0.3852 0.3816 1214.7 0.3851 0.3814 0.0148 1.2 -0.0001 -0.0002 0.0002
WHITE (5700K)
37.9 0.3362 0.3565 37.3 0.3341 0.3564 0.0712 1.7 -0.0021 -0.0001 0.0021
187.1 0.3349 0.3532 184.2 0.3325 0.353 0.0743 1.6 -0.0024 -0.0002 0.0024
357.8 0.3335 0.3506 352.4 0.331 0.3503 0.0770 1.5 -0.0025 -0.0003 0.0025
664.4 0.3306 0.3468 654.3 0.3281 0.3464 0.0815 1.5 -0.0025 -0.0004 0.0025
930.6 0.3276 0.3436 916.2 0.3252 0.343 0.0858 1.6 -0.0024 -0.0006 0.0025
1158.6 0.3246 0.3404 1139.4 0.3222 0.3399 0.0900 1.7 -0.0024 -0.0005 0.0025
1341.0 0.3208 0.3372 1319.1 0.3187 0.3365 0.0949 1.7 -0.0021 -0.0007 0.0022
1476.7 0.3165 0.3336 1451.7 0.3147 0.3329 0.1002 1.7 -0.0018 -0.0007 0.0019
1523.3 0.3139 0.3316 1497.4 0.3122 0.3308 0.1034 1.7 -0.0017 -0.0008 0.0019
1551.7 0.3117 0.3299 1525.0 0.3101 0.329 0.1062 1.7 -0.0016 -0.0009 0.0018
80

Importance of Resolution As noted previously, microLED size ranges from less than
100 µm to as small as 3 µm—about 1/10th the width of a
human hair.7 Measurement accuracy within the small area of
an individual microLED depends on high imaging
resolution. To increase yields through display correction, it
is essential to be able to isolate and measure each individual
microLED emitter with precision so defects and non-
uniformity specific to a given microLED can be corrected.
A high-resolution imaging system optimizes the number of
photo-sensing elements (sensor pixels) applied across each
microLED and offers sufficient resolution to ensure all
microLEDs in the display can be measured at once to
complete correction processes within adequate takt times.
A microLED panel is composed of millions of pixels in chip
form that are typically grown on 4- to 8-inch wafers. Each
pixel contains some combination of red, green, and/or blue
subpixels. To fabricate a display, each individual microLED
chip (pixel) must be transferred to a substrate or backplane
(panel) that holds the array of units in place. Measurement is
typically performed at two stages of microLED production:
at the wafer level and at the panel level.
General visual performance standards in the display industry
allow for less than 10 dead pixels per display, thus epitaxial
yield must be very high. Each microLED on the wafer must
be measured to determine uniformity, verify individual
distribution of dies, and measure luminance across red,
green, blue, and occasionally white microLEDs. Once
wafers have been deposited onto a backplane, manufacturers
then need to verify overall uniformity of luminance and
color distribution across the entire panel.
The first step in ensuring microLED display quality is
inspection and measurement at the LED, chip, and wafer
stage to reduce the possibility of dead pixels and ensure
luminance and wavelength (chromaticity) uniformity.
Wafer-Level Measurement. For inspection of microLED
wafers, manufacturers must assess performance at the
individual subpixel (microLED) level. A high-resolution,
low-noise imaging colorimeter with a standard lens or
microscope lens option can be used for this process.
A microscope lens provides objective measurement with, for
example, 5X or 10X zoom (5 to 10 times the effective
resolution of the imaging system applied over an area of the
device), allowing detailed measurement of each individual
emissive element (Figure 8). Used with a high-resolution
imaging system, a microscope lens enables every display
pixel to be captured over multiple sensor pixels for increased
measurement precision. This type of system is effective for
evaluation of display subpixels and characterization of
individual microLEDs.
Panel-Level Measurement. Once individual microLED
chips are transferred onto a backplane, an imaging
colorimeter with standard lens can be used to measure
luminance and color uniformity across an entire panel. The
advantage of an imaging colorimeter is its ability to capture
a large area in a single image to detect and measure non-
uniformity quickly and accurately, just as a user would view
a display.
Beyond the visual perception of a user, however, high-
resolution imaging systems can continue to provide pixel-
and subpixel-level measurements at the panel level to enable
correction. To assess color gamut, luminance uniformity, or
color uniformity at this stage, manufacturers need accurate
data at each display pixel’s coordinate position, which can
then be downloaded into a coefficient calculator to
determine and apply factors for display uniformity
correction.
Figure 8. Example of subpixel measurement using a ProMetric I29 Imaging Colorimeter (main image),
magnified by a Radiant Microscope Lens showing 50 µm distance at 10X zoom (inset image).
Correcting Emissive Displays to Improve Yield As display size scales, yields decline drastically, and the cost
of each component is much higher. At a certain point, it
becomes viable for manufacturers to perform correction
(electronic compensation, or calibration) to improve display
image quality. The concept is simple: by modifying the
inputs to individual subpixels of an emissive display,
previously identified dim pixels can be adjusted to a uniform
brightness level resulting in improved luminance uniformity
and correct color across the display.
Display pixel uniformity correction requires, first, having in-
display electronics that can control brightness of the
individual subpixels and make adjustments based on the
calculated correction factors for each subpixel. Second, a
measurement system is required to accurately quantify
individual subpixel brightness and color, and compute
specific correction factors for each of them. This method was
81

originally developed to calibrate LED video screens (e.g.,
outdoor arena displays), and has been adapted for today’s
small, high-resolution emissive displays (OLED and
microLED) using a correction technique known as “demura”
or pixel uniformity correction.
Demura. The demura method employs three distinct steps:
1. Measure each subpixel in the display to calculate
luminance values at each pixel coordinate location
using a high-resolution imaging colorimeter. Accurate
measurement values for each subpixel are essential.
Test images are displayed on-screen to target subpixels
of each color set. These images enable measurements
and correction factors to be computed for each set. For
example, a green test image can be shown to illuminate
all green subpixels. An imaging colorimeter measures
and records the output of each individual green
subpixel. This is repeated for all the primary colors and,
usually, white.
2. Load measurement data from each pixel’s coordinate
position into a coefficient calculator. Correction factors
are calculated to normalize luminance and chromaticity
discrepancies between pixels in the display using test
analysis software.
3. Apply correction factors to the signals of each subpixel
at each pixel location using an external control IC
(integrated circuit) system.
MicroLED Correction Challenges: Registration and Measurement The demura method has been proven effective for ensuring
the visual quality of millions of displays in mass production
worldwide. However, new microLEDs offer the potential to
increase display resolution and pixel pitch exponentially,
requiring new approaches to continue to achieve accurate
measurement (Step 1) and correction (Steps 2 and 3) results.
Accurate pixel-level measurement relies on a measurement
system’s ability to sufficiently isolate each pixel and
precisely quantify its output value. As described, imaging
resolution determines the number of photo-sensing elements
(sensor pixels) available to cover each individual pixel.
Applying more sensor pixels per display pixel increases the
granularity of data acquired by the imaging system for
accurate pixel registration and pixel measurement. As
overall display resolution increases, an imaging system’s
ability to apply sufficient sensor pixels per display pixel—
while continuing to capture measurements for all display
pixels in a single image to ensure efficiency—is reduced.
Radiant has developed two methods that significantly
improve an imaging system’s ability to isolate and measure
subpixels of increasingly high-resolution displays for
correction: a “spaced pixel” method and a “fractional pixel”
method; both are described below.
Spaced Pixel Method. The spaced pixel measurement
method (US Patent 9135851) improves the effective
resolution of a measurement by applying the measurement
system’s total image sensor resolution across only a subset
of display pixels at a time. The method employs a series of
dot-matrix test patterns shown on the display screen as part
of a measurement sequence. Each pattern illuminates a
subset of the display’s subpixels, while the rest are turned
off. An imaging colorimeter measures the output (luminance
or chromaticity) of the “on” pixels for each pattern. A
subsequent test image adjusts the matrix to turn off the first
set of pixels and turn on the next set of pixels for
measurement. This process is repeated until all pixels in the
display are measured.
Figure 9. During spaced pixel measurement, a series of dot-matrix patterns illuminates sets of pixels until values have been acquired for all pixels in the display.
82

This process increases the effective resolution of the
measurement at each display pixel, ensuring the isolation of
each pixel’s output, and thus the accuracy of measurement
calculations across displays of any arbitrary resolution.
Images from the spaced pixel measurement method are
combined into a single, synthetic image for analysis, which
compares values at each of the pixel’s x,y coordinate
locations to determine uniformity. The software calculates
the necessary correction coefficient for each display pixel
and applies the correction at each pixel’s coordinate location
to adjust values until the display is uniform.
The spaced pixel method reduces the requirement for
measurement resolution of an image-based system to
increase measurement accuracy. However, because this
method requires multiple images, takt times are also
increased. The fractional pixel method, by comparison,
improves measurement accuracy without increasing takt
times, for example, only a single image is required to
measure typical smartphone displays. Thus, the fractional
pixel method (explained in the next section) offers
advantages when shorter takt times are required, as in many
production-level test and correction applications.
Fractional Pixel Method. The fractional pixel method can
be optionally combined with the spaced pixel method and
uses fractional image sensor pixels to further improve the
precision of display pixel registration and measurement. As
described, this method addresses measurement scenarios
where imaging sensor resolution per display pixel is limited,
enabling measurement systems with standard resolutions to
continue to accurately measure and correct today’s high-
resolution displays, even in a single-image measurement.
First, the fractional pixel method optimizes pixel
registration. Pixel registration is a method of dynamically
locating and setting a region of interest (ROI) around each
pixel in the measurement image. In traditional methods, ROI
are aligned to the imaging system’s sensor pixel array.
However, as display resolutions continue to increase relative
to measurement system resolutions, it is more likely that the
center of a display pixel will not be aligned with the center
of a sensor pixel, reducing the ability of the ROI to precisely
cover and isolate each display pixel. This misalignment can
result in measurement error.
Second, the fractional pixel method optimizes pixel
measurement. The fractional pixel method calculates pixel
values based on the fractional area of each sensor pixel
contained within the ROI (see Figure 10, right image). This
improves the precision of measured values over traditional
“whole pixel” methods that factor values from the whole
area of sensor pixels contained partially withing the ROI (see
Figure 10, left image). The fractional pixel method ensures
the accuracy of pixel-level measurements for emissive
displays of much higher resolution than was previously
possible using a single-image capture (e.g., when a
measurement system’s sensor resolution is applied to
measure an entire display at once, to increase takt time).
Figure 10. Illustration of a traditional whole pixel measurement method versus the fractional pixel method. In
the traditional method (left), display pixels are measured using 100% of the data from sensor pixels whose area is more than 50% inside the ROI, and 0% of the data from
sensor pixels whose area is less than 50% inside the ROI. Using the fractional pixel method (right), display pixels are
measured using a percentage of data based on the percentage of sensor pixel area inside the ROI.
The accuracy of the fractional pixel method was
demonstrated in a study published by Pedeville, Rouse, and
Kreysar (2020).8 Figure 11 plots single-image measurement
data from this study, comparing the pixel-level measurement
accuracy of fractional pixel measurements, whole pixel
measurements, and extremely high-resolution reference
measurements. The fractional pixel data adheres closely to
the reference data, whereas the whole pixel measurements
diverge from the reference data at multiple points.
Figure 12 shows the before-and-after result of an actual
demura application using a 43MP imaging system
employing both spaced and fractional pixel methods to
correct a microLED microdisplay panel.
Conclusions Use of microLED displays is growing in a highly
competitive automotive marketplace. Developers are racing
to find production solutions that deliver cost-effective
performance that meets industry standards while exceeding
customer expectations.
Defects, variations in color or brightness, and other
irregularities can quickly deflate buyer satisfaction, hurt
brand reputation, and erode market share. If these issues
cannot be addressed and corrected at the component level,
low yields and high production costs will impede the
viability of microLED display technologies for automotive
commercialization.
Image-based color measurement systems provide an
efficient quality control solution to support quality and
efficiency benchmarks for microLED production. These
systems rely on their color filter method, calibrations, and
subpixel measurement capabilities to ensure accurate data is
captured at the pixel and subpixel level, enabling correction
83

that safeguards manufacturing resources. Studies of recent
display metrology systems and methods demonstrate the
effectiveness of tristimulus imaging colorimeters in the 29-
43MP resolution range, combined with sophisticated
algorithms for calibration, measurement, and correction, to
solve microLED display color uniformity challenges and
support the viability of microLED technology for the
automotive industry.
Using imaging colorimeters and novel correction methods,
automotive manufacturers and suppliers can realize a
solution for production efficiency in microLED
manufacturing, ensuring quality, reducing waste, and
enabling cost-effective design of higher-performance
displays in a range of types, shapes, and curvatures.
Figure 11. Normalized luminance (Lv) measured by whole and fractional pixel measurement methods (achieving 3.2 x 3.2 sensor pixels per display pixel) and reference luminance (achieving 30 x 30 sensor pixels per display pixel) for
the same row of pixels on a display.
Figure 12. MicroLED microdisplay panel shown before (left) and after (right) demura correction. The panel shown is 0.7” with full HD, 1920 x 1080, LED size/pitch of 2 µm / 8 µm. Measurement and correction performed using a
ProMetric Y29 imager with microscope objective lens and TrueTest™ Software.
References 1. Yole Développement. MicroLED Displays, February
2017. Retrieved from:
http://www.yole.fr/MicroLEDDisplays_Market.aspx
2. Han, S., Hwang, A, “Automotive micro LED display
commercialization expected in 2-3 years,” DigiTimes,
April 2020. Retrieved from
https://www.digitimes.com/news/a20200423PD210.ht
ml)
3. MicroLED: Total Market for Automotive HUD 2018-
2024, July 2018. N-tech Research. (Retrieved from
https://www.ntechresearch.com/infographic/automotiv
e-heads-up-display/)
4. Carter, E., Schanda, J., Hirschler, R., Jost, S., Luo, M.,
Melgosa, M., … Wold, J., CIE 015:2018 Colorimetry,
4th Edition, 2018. doi: 10.25039/tr.015.2018
5. Kim, K., Lim, T., Kim, C., Park, S., Park, C., et al.,
“High precision color uniformity based on 4D
transformation for micro-LED.” Proceedings of SPIE
Vol. 11302, February 2020
6. Lapedus, M., “MicroLEDs: The Next Revolution in
Displays?” Semiconductor Engineering, May 2019.
Retrieved from
https://semiengineering.com/microleds-the-next-
revolution-in-displays/
7. Jensen, J., Piehl, A., and Renner, W., “Evaluating
tristimulus and Bayer pattern matching system
accuracy for color measurement based on CIE color-
matching functions,” Presented at the 34th annual
electronic displays conference (edC), January 2020.
8. Pedeville, G., Rouse, J., and Kreysar, D., Society for
Information Display (SID) Display Week 2020 Digest.
Book 2, August 2020.
MicroLED display before demura MicroLED display after demura
84

Supervising (Automotive) Displays for Safeguard Camera Monitor Systems
B. Axmann1, F. Langner1, K. Blankenbach2, M. Vogelmann2, M. Conrad3, J. Bauer4 1Mercedes-Benz AG, Stuttgart, Germany; 2Pforzheim University, Display Lab, Pforzheim, Germany;
3samoconsult GmbH, Berlin, Germany; 4Karlsruhe University, Karlsruhe, Germany
ABSTRACT: Modern cars are equipped with Camera Monitor Systems (CMS) such as back-up camera systems or mirror replacement systems. To fulfill the demanding safety requirements for such systems, information that is transmitted and processed within CMS should be monitored and supervised. In today’s CMS however, only the digital
data is being supervised.
This paper introduces new methods for the optical safeguarding of displays using cameras. These methods enable end-to-end or “light-to-light” fault detection within CMS.
Keywords: camera monitor system (CMS); automotive display; functional safety; safety mechanism; ISO 26262
1 INTRODUCTION Modern cars and trucks are equipped with rear-view camera systems. Side-view mirror replacement systems are at the dawn of mass production. Such features are termed camera monitor systems (CMS, see [1] for an overview). CMS provide obvious benefits in terms of safety. A typical rear-view (back-
up) CMS (Figure 1) consists of a camera (transmitter) that is connected via a high-speed video data interface or link (HSVL) to a head unit (processing unit), which enhances and modifies the image data (e.g. overlaying the image with augmented information such as trajectories) and sends it to an
in-vehicle (car) display.
If an autonomous (robot) car without a steering wheel
fails, it will stop and become an obstacle. In such a situation, a remote operator (Figure 1, top right) can log in to the car system and perform remote control (like a drone pilot). As a prerequisite for remote control, the operator needs to see the images captured by the cameras of the vehicle as well as
other vehicle status information (e.g. vehicle speed, activated tell tales, etc.).
For brevity, in Figure 1 these two use cases were superimposed onto one vehicle, such that camera data and other relevant information can be displayed on an in-vehicle display as well as on a workstation of a remote-operator. As in-vehicle CMS and remote operator systems shall be designed as safe as
possible, we investigated and prototyped new approaches to safeguard such systems. In this paper, we report about how display components of such systems could be safeguarded.
Figure 1. In-vehicle CMS and wireless video transmission to a remote operator.
Figure 2 sketches a typical automotive CMS: An input component, usually a camera captures an optical signal from the vehicle’s surrounding environment and transforms it into digital video data. The digital video data is being routed through
the vehicle and might be processed and/or modified by an electronic control unit such as a head unit. Finally the processed / modified video stream is transformed into an optical image that is shown to the driver. The digital video data might also be transmitted to a remote operator workstation where
it is also being transformed into an optical image and displayed to the operator.
To ensure the safety of such a CMS, the optical image shown to the driver or a remote operator should match the optical signal captured by the camera. Any information overlaid to the digital video data should be correctly displayed as well.
Traditional methods to check the correct functioning of a CMS, such as video watermarking [2], safeguard the digital data only (“data-to-data” protection, see Figure 2, left). The transformation of
the optical signal into digital information in the camera and the transformation from digital information into an optical image within the display are usually left out.
Our goal is to extend the coverage of the safeguarding mechanisms to enable a full “light-to-light” protection (see Figure 2, right). A key element is the ASIL Prepared Video Safety System
(APVSS), which was developed and evaluated
85

successfully in our project. The main tasks of APVSS are to compare meta data (obtained by feature extraction of the image) from both camera and output device (digital front-end of a display) and to judge on the optical reproduction quality of the display by
measurement data. This paper focusses on the display component, i.e. how to supervise displays including the transformation from digital information into an optical image.
Figure 2. Block diagram of today´s (left, magenta) and our new concept (right, green) for safety.
This paper is arranged in two main paragraphs: (§2) functional safety framework and (§3) display
supervision using a camera. §2 outlines the conceptual framework to analyze and improve the functional safety of CMS. Here, we aim at providing a set of generic methods to safeguard automotive CMS such that a particular CMS under development with defined safety requirements can pick and
choose from this set.
§3 illustrates the application of this safety framework
by using a video system that involves a remote operator as an example. First, we describe the overall set-up
• To acquire the optical output of the display using a dedicated camera and
• To correlate the camera data with the RGB input data fed into the display.
This enables the application of safety mechanisms that facilitate the verification of the content displayed. These mechanisms can not only be used to verify the content of a remote display, but could also for in-vehicle displays as well. However the
latter may result in high integration effort.
2 FUNCTIONAL SAFETY FRAMEWORK
Safety is one of the key issues in the development of road vehicles [1]. The international standard ISO 26262 [4] provides guidance to achieve functional safety, i.e. to mitigate risks resulting from failures of
electric / electronic in-vehicle systems (E/E systems).
Engineering for functional safety includes
• The systematic identification and analysis of
potential failure modes of the E/E system under consideration as well as
• The design and implementation of safety mechanisms, i.e. technical solutions to detect, mitigate, or tolerate faults or control or avoid failures [4].
In the following, we utilize the generic model of a video data transmission and processing system (see [5] for more details) depicted in Figure 3 as a conceptual framework for discussing functional
safety aspects of automotive CMSs. This model abstracts the physical components of a specific system into logical components of type input (I), modifier (M), output (O), and transmission channel (T). A real system might comprise zero, one or multiple instances of each type. Some components
may be located outside of the actual vehicle, e.g. the monitor of a remote operator.
Figure 3. Video Transmission and Processing Model. Flashes mark sources for failures.
86
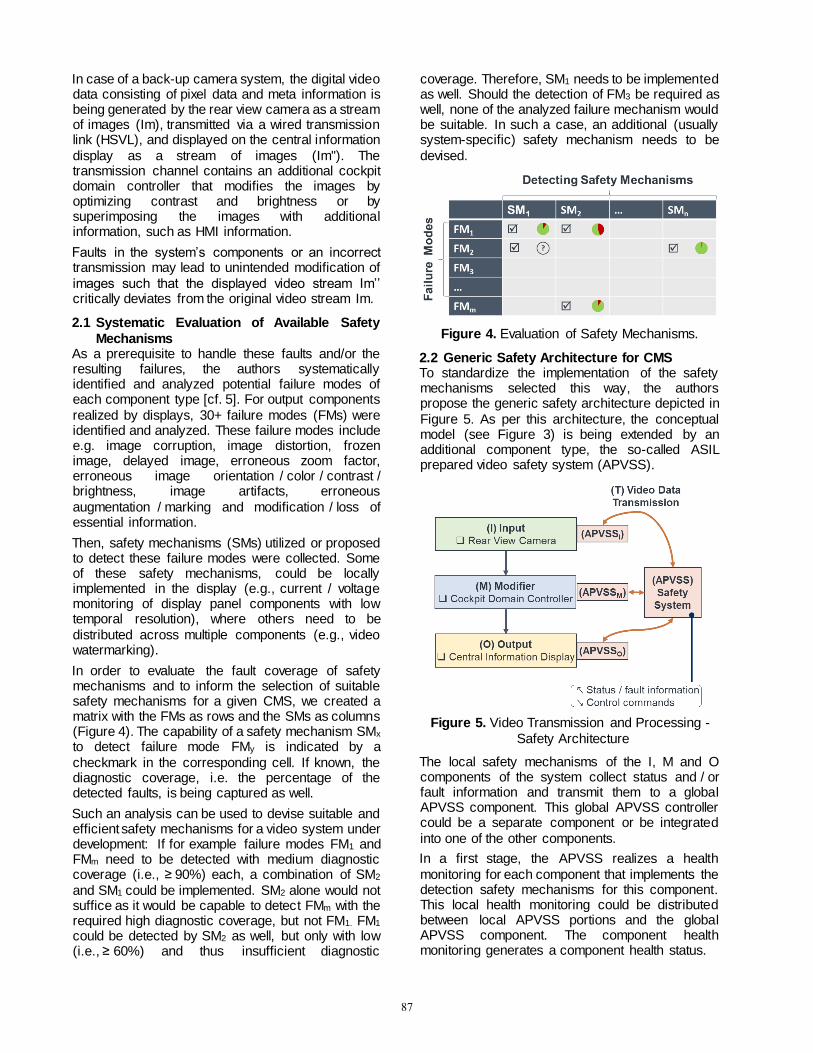
In case of a back-up camera system, the digital video data consisting of pixel data and meta information is being generated by the rear view camera as a stream of images (Im), transmitted via a wired transmission link (HSVL), and displayed on the central information
display as a stream of images (Im''). The transmission channel contains an additional cockpit domain controller that modifies the images by optimizing contrast and brightness or by superimposing the images with additional information, such as HMI information.
Faults in the system’s components or an incorrect transmission may lead to unintended modification of
images such that the displayed video stream Im’’ critically deviates from the original video stream Im.
2.1 Systematic Evaluation of Available Safety
Mechanisms As a prerequisite to handle these faults and/or the resulting failures, the authors systematically identified and analyzed potential failure modes of each component type [cf. 5]. For output components
realized by displays, 30+ failure modes (FMs) were identified and analyzed. These failure modes include e.g. image corruption, image distortion, frozen image, delayed image, erroneous zoom factor, erroneous image orientation / color / contrast / brightness, image artifacts, erroneous
augmentation / marking and modification / loss of essential information.
Then, safety mechanisms (SMs) utilized or proposed to detect these failure modes were collected. Some of these safety mechanisms, could be locally implemented in the display (e.g., current / voltage monitoring of display panel components with low temporal resolution), where others need to be
distributed across multiple components (e.g., video watermarking).
In order to evaluate the fault coverage of safety mechanisms and to inform the selection of suitable safety mechanisms for a given CMS, we created a matrix with the FMs as rows and the SMs as columns (Figure 4). The capability of a safety mechanism SMx to detect failure mode FMy is indicated by a
checkmark in the corresponding cell. If known, the diagnostic coverage, i.e. the percentage of the detected faults, is being captured as well.
Such an analysis can be used to devise suitable and efficient safety mechanisms for a video system under development: If for example failure modes FM1 and FMm need to be detected with medium diagnostic coverage (i.e., ≥ 90%) each, a combination of SM2
and SM1 could be implemented. SM2 alone would not suffice as it would be capable to detect FMm with the required high diagnostic coverage, but not FM1. FM1 could be detected by SM2 as well, but only with low (i.e., ≥ 60%) and thus insufficient diagnostic
coverage. Therefore, SM1 needs to be implemented as well. Should the detection of FM3 be required as well, none of the analyzed failure mechanism would be suitable. In such a case, an additional (usually system-specific) safety mechanism needs to be
devised.
Figure 4. Evaluation of Safety Mechanisms.
2.2 Generic Safety Architecture for CMS To standardize the implementation of the safety mechanisms selected this way, the authors propose the generic safety architecture depicted in
Figure 5. As per this architecture, the conceptual model (see Figure 3) is being extended by an additional component type, the so-called ASIL prepared video safety system (APVSS).
Figure 5. Video Transmission and Processing -
Safety Architecture
The local safety mechanisms of the I, M and O components of the system collect status and / or fault information and transmit them to a global APVSS component. This global APVSS controller could be a separate component or be integrated
into one of the other components.
In a first stage, the APVSS realizes a health
monitoring for each component that implements the detection safety mechanisms for this component. This local health monitoring could be distributed between local APVSS portions and the global APVSS component. The component health monitoring generates a component health status.
87

A second stage combines the component health statuses of all components into an overall health status of the system. If critical faults or failures are detected, this second stage commands counter reactions, e.g. the display of an default / error image
etc. or lastly the shutdown the output component to give clear understanding for the user.
3 DISPLAY SUPERVISION USING A CAMERA This paragraph illustrates the application of the safety framework presented above in order to supervise an in-car video camera system that transmits video data
to the display / monitor of a remote operator. This monitor can be installed, e.g., in the headquarters of a robot car operator. In case of a breakdown or an autonomous driving mode failure, such a remote operator can log into the car, take over control and eventually drive the car remotely. It is obvious that in
the latter case, significant degradation of the video image or faulty vehicle data (for example speed) cannot be tolerated.
3.1 Prototype Approach and Set-up There are various approaches for optical supervision (see [3]) but most methods require modifications to or customization of the display. Supervising a display
or monitor by a camera allows the use of an “unmodified” mass production monitor which is significantly cheaper than a modified display.
The supervision of displays of a remote operator would be an example of a low-volume use case. In such a scenario, the operator’s displays will likely consist of standard consumer electronics (CE) PC monitors (Figure 6 bottom). The block diagram at the
top of Figure 6 visualizes the adaptation of the safety architecture presented in §2 to the camera-based supervision of a monitor.
This approach is relatively easy to implement. It requires just a simple mount of a tiny camera e.g. on top of the monitor (Figure 6 bottom). This camera, which could be a professional or CE grade device as well, captures the actual image reproduced on the
operator’s monitor.
The task of the APVSS (see Figure 2) for the remote
operator use case is to compare the RGB data of the image sent to the monitor with the RGB image data captured by the supervising camera.
This approach allows to use high-resolution optical safeguarding by computer vision algorithms as described in e.g. [6] or toolboxes. The camera image data is being analyzed and the results are transmitted to the “health” monitoring component of the remote
APVSS (see Figure 2). Depending on the required safety level, the APVSS can be implemented as a software solution on the operator’s PC or in an optional external hardware component.
In theory, the same method, i.e., monitoring of the optical emission of the display using a camera, could be used for in-vehicle displays as well. But here it forces some design and technical challenges (e.g., mounting a camera in front of central
information display, interference with touch control and in particular ambient light).
The prototype system was tested using MATLAB [6] and programmed in PHYTHON with the use of OPENCV image processing library.
Figure 6. Safety architecture (top; see §2 for details) and prototype setup (bottom) to evaluate camera-based supervision of a
remote operator´s monitor.
3.2 Pre-Processing When grabbing images from a display by a camera, it is obvious that unwanted effects are very likely to occur. Examples are geometric distortions due to the camera position (cf. prototype setup in Figure 6), mismatching luminance output and camera
input characteristics and reflections of ambient light. These and other effects have to be handled by so-called pre-processing before the RGB input data of the digital display and the data acquired by the supervising camera can be assessed and compared.
Figure 7 (top) illustrates the image pre-processing steps. First, the image has to be checked for
periodic Moiré patterns (interference of display and camera “grid”). This can be reduced via software by a Fourier transform and band filtering or by varying
88

the focal length of the lens and/or the distance between the monitor and the camera, or by slightly defocusing.
As the add-on camera is placed above or beneath the display, the image is geometrically distorted. The perspective correction (warping) can be achieved using the four corner points and the display’s outline
as reference. For calibration purposes, a grid can be used during initialization of the remote operator’s monitor for compensation of geometric distortions of the camera lens such as barrel or pincushion.
The last pre-processing step is to achieve a linear relationship between display output (luminance) and camera RGB gray level data. This can be done once at initial set-up of the system or permanently using
gray level control boxes (see Figure 100 bottom right). If the display’s use case does not allow visualization of such control boxes, pre-defined gray level areas in the GUI can be used. To be able to adapt the transfer function to changing ambient light conditions, the system uses black (RGB = 0) areas
as reference and perpetually determines the gray level reproduction.
Figure 7. Pre-processing of the raw camera data and subsequent monitoring methods
As most displays and cameras have a gray scale resolution of 8 bits, it is obvious that just grabbing
images from the display results in low quality of the supervision. For professional systems we have to respect the dynamic range of the displays and the camera. One approach is to use a high dynamic range camera or to acquire two subsequent images with different exposure times for standard cameras.
Figure 8 visualizes gradation curves for different ex-posure times. Longer exposed images present higher
resolution at lower gray scale range and vice versa. The goal is to get two linear curves of different sensi-tivity to capture and resolve low and high luminance content. As an example (cf. Figure 8), the cyan line (exposure time 1/64 s) is linear up to 0.35 of the relative maximum gray level; saturation is reached at
0.5. The red curve (exposure time 1/512 s) is mostly linear from 0.2 to 1.0 without reaching saturation.
So the fundamental requirements are fulfilled: Reasonable linear RGB gray scale camera data which is mostly linear to the display output. If computational time or acquisition speed is not critical, both images can be analyzed separately
and combined to one image with higher virtual gray level resolution, for example 1/64 s and 1/512 s raises the resolution by 3 bit (i.e. by a factor of 8). The resulting “virtual” image is used for further analysis.
Figure 8. Gradation curves for various exposure times used to expand dynamic range.
An example of the enhanced dynamic range is given in Figure 9: A typical night scene of a rear-view camera is recorded at different exposure times. The luminance of PC monitors of remote
operators at office conditions (e.g., 500 lx) is in the range of 200 cd/m². If such a camera-based optical display supervision would be installed in a car it has to deal with a large dimming range from 10 cd/m² to 1000 cd/m². The left image has a shorter exposure time then the right one. The blue and yellow dotted
boxes mark the significant differences: A shorter exposure time avoids over-exposure (saturation) for bight content (high gray levels) and vice versa. The combination results in a better discrimination of objects with low foreground-background contrast. This can be easily seen for the dashed boxes of
Figure 9 for bright (blue, exposure time 1/512 s) and dark (yellow, exposure time 1/64 s) content.
Figure 9. Visibility of bright and dark objects using short (left) and long (right) exposure time.
3.3 Content-Dependent Safety Mechanisms to
Verify Displayed Content A core requirement of camera-based display
supervision is to detect a “modification or loss of essential information” with high probability to
89

prevent e.g. critical situations for remote car control. As the safety of data transmission is secured by state-of-the-art methods, we have to deal here with modifications or degradations of the optical / visual reproduction by the display / monitor. They can be
caused e.g. by gamma distortions which mainly affect video images but can as well reduce the visibility of vehicle status information.
As the Graphical User Interface (GUI) of such remote operator monitors should be ergonomic, the different types of information on the screen are displayed at fixed positions / in fixed areas. This can be used to divide the captured images into Regions of Interest
(ROI) and applying dedicated and optimized algorithms to analyze the corresponding content.
In-car display GUIs can be modified at some extent by the driver. However, the ROI approach is still applicable here, but requires additional information about the current display layout.
To evaluate and optimize safety mechanisms to verify ROIs based on their specific content, we used the test GUI shown in Figure 10. It consists of 4 regions of interest. The first three are typically for
automotive use, and the last one is used for live calibration and supervision purposes:
• A digital speedometer (top left),
• Text messages and tell tales (bottom left)
• A rear-view camera image (top right) and
• Gray level and colored reference boxes (bottom below video image).
Figure 10. Test image with multiple ROIs.
As stated before, we assume for a remote operator fixed locations of content. So we can apply dedicated
algorithms for each ROI and optimize them in terms of specific safety mechanisms. The goal is to verify that essential information is being properly displayed in these ROIs, minor effort was made for optimizing the speed of the algorithms for prototype evaluation.
To verify whether the vehicle speed is displayed correctly, the angular position of the red speedometer needle is being detected. After color
filtering and binary morphological operations, the ‘canny edge detection algorithm’ is applied to detect the speedometer needle’s outline. Then, a parametric description of the speedometer needle
line is achieved using Hough transformation (plotted as green line speed is also possible when reflections are present (Figure 11 right). The detected position or speed can be compared with the expected position or the value for the vehicle
speed (could be provided as part of the meta data). If a significant deviation is detected by the APVSS, a warning is shown. In case of the remote operator use case, additional failures (like zero speed but moving video image due to a defective speedometer defect) would be detected by the
human.
Figure 11. Acquisition of the displayed speed by
extracting the speedometer needle angle.
Despite some drawbacks, text messages can be used for safety-related error messages additionally to tell tales for remote operators. To verify their correctness, we applied standard optical character recognition (OCR) to compare the captured (actual)
text with the transmitted (target) content. Here, the quality and performance of the OCR algorithm highly depends on the pre-processing of the image.
Figure 12 shows an example sequence to properly pre-process the image in order to extract character information by OCR. After color removal the contrast reproduction is inversed. A subsequent bilateral filter provides uniform blur without
smoothing edges to reduce image artifacts. Faster median filtering is not expedient due to smooth edges. In the last step before OCR, the contrast- and brightness-ratio is adjusted to gain maximum contrast ratio for best OCR performance. This effort has to be performed of the camera resolution in in
the range of the display resolution for the example provided in Figure 10. If the camera resolution and/or the character size are higher, standard OCR provides reasonable results.
Figure 12. Stepwise processing of the text ROI to prepare for best optical character recognition.
90

Tell tales (see Figure 10 bottom left) such as head light status are analyzed by “traditional” methods, which have however some limitations.
The video content is supervised by feature comparison of the camera image and the digital data at the display’s interface. 100 or more segments (see Figure 13 for an example) are correlated for e.g. gray
scale and color, both in terms of mean value and histogram. Reflections of ambient light in typical office environments have a certain impact in correlation of the RGB grey level data from display and camera. This is compensated (as mentioned above) by using black areas of the screen. The
captured “luminance” (from grey level calibration) is then subtracted from the extracted values. Figure 8 is used to explain this procedure: If the gray level of an acquired black area is higher than the measured one under dark room conditions (data are stored in the system), this value is subtracted from the
captured image data.
Figure 13. Segmentation of the video image.
Figure 14 demonstrates that the segmentation is capable of detecting gamma reproduction distortions. They could potentially result in loss of essential details such as potholes or pedestrians with bright
clothes in front of bright background.
Figure 14. Even minor gamma distortions (right) are detected as “faulty reproduction”.
Camera-based monitoring provides a reliable and precise way to capture the optical display output. Those data are then correlated to the intended image base on interface data. We evaluated the
performance to verify speed, text, tell tales (icons) and video content as shown in Figures 11-13 towards “light-to-light” supervision (see Figure 2) with good results. This is beyond today’s state-of-the-art safety methods (supervising only digital data, “data-to-data”). However there is more to be done towards an
implementation in certified safety relevant systems such as monitors of remote operators.
4 SUMMARY
Safe and unaltered reproduction of camera content is essential for modern automotive camera monitor systems (CMS) applications.
In a first step, we developed a generic functional safety framework for possible failures with respect to their levels of criticality and detection methods.
Those methods were proved for the most relevant cases for the camera-based supervision of the monitor of remote operators and basically as well for in-car camera supervision. However the latter was not in focus of this work.
This high resolution optical safeguard method is beyond today’s state-of-the-art. We evaluated our prototype set-up for supervising the speed, text, tell
tales, and video reproduction of an in-car camera. The latter one is the most safety-relevant topic and challenging in correlation of actual and target data.
The method is part of the overall APV (ASIL prepared video) framework to facilitate the functional safety engineering of CMSs. Key pillars of this framework are a systematic evaluation and selection of safety mechanisms to detect
malfunctions of CMSs and a generic safety architecture to structure the implementation of the selected safety mechanisms.
REFERENCES [1] A. Terzis (Ed.): Handbook of Camera Monitor
Systems - The Automotive Mirror-Replace-
ment Technology based on ISO 16505. Springer 2016.
[2] K. Witt, J. Bauer: A Robust Method for Frozen Frame Detection in Safety Relevant Video Streams Based on Digital Watermarking. Electronic Display Conference, Nuremberg, Germany, 2017.
[3] B. Axmann, F. Langner, K. Blankenbach, et al.: Advanced methods for safe visualization on automotive displays. J Soc Inf Display. 2020;
28: 483– 498. https://doi.org/10.1002/jsid.909
[4] ISO 26262:2018, Road Vehicles -- Functional
Safety. International Standard, 2018.
[5] J. Bauer, K. Blankenbach, M. Conrad, et al.:
Neue Ansätze und Methoden für die Fehlermodellierung und -behandlung bei automobilen Videodatenübertragungs-strecken. 16th Workshop on Automotive Software Engineering @ SE19, Stuttgart, Germany, 2019. http://ceur-ws.org/Vol-
2308/ase2019paper01.pdf
[6] C. Solomon, T. Breckon: Fundamentals of
Digital Image Processing: A Practical Approach with Examples in Matlab. Wiley-Blackwell, 2010.
91

92

Customized Local Dimming Algorithm and BLU for Automotive Application
towards Low Power Consumption and High Visual Quality
Maxim Schmidt, Ramazan Ayasli, Chihao Xu Institute of Microelectronics
Saarland University
66123 Saarbrücken, Germany
Abstract: This paper presents a customized local dimming
algorithm for automotive application and introduce the
crucial parameters of a well-designed BLU with proper
LSF. Additionally, features for enhancing and preserving quality will be described which mitigate and overcome
issues like Halo and failures like LED outage and provide a
highly valuable LCD module capable to compete against
other display technologies. The validation by using
automotive HMI proves high power saving rate and high
visual quality, while the algorithm cost in IC is low.
Keywords: Direct-Lit; Local Dimming; BLU design;
Black Level; Boosting; Power Saving; automotive HMI
Motivation and Challenges for Automotive Local Dimming The visual quality requirement on automotive displays is
getting higher than ever before. To be mentioned are an
excellent black level and a very high luminance, while at the
same time the power consumption has to be reduced in order to meet low carbon footprint regulation and to extend the
mileage of electrical cars. LCDs with direct-lit BLUs are
being considered as feasible due to the capability of high
contrast and low power consumption enabled by local
dimming (BLU example in Figure 1 with 319 LEDs). Such
a system can be seen as a competitor against OLED displays,
which provide a perfect black level, but suffers from low
lifetime and aging artifacts like image sticking.
Figure 1. BLU prototype with 319 LEDs [1].
Another specific issue is that automotive HMIs have high
contrast and circular contents. Due to this specific content,
the number of LEDs in a BLU shall be high, consequently
the complexity of the local dimming algorithm will rise.
However, it allows a thinner BLU design.
A very simple algorithm, e.g. by just considering multiple
representative values to derive a LED signal as e.g.
described in [2] results in a not optimal solution and
sometimes degradation of visual quality. Therefore, the next
section will describe a local dimming algorithm considering
specific automotive requirements and contents, which is
based on the well proven SSC (Sorted-Sector-Covering) algorithm with the unique feature of proper consideration of
LED crosstalk [3]. As explained before, the number of LEDs
is increasing and generates new challenges for the real-time
processing, in addition to a higher memory demand. To
ensure safety operation and real-time processing, no
framebuffer will be used by implementing the algorithm
straight on the pixel pipeline with low hardware cost. Due to
the quality requirements, several features are introduced in
the later section. Therefore, an amendment of the previously
published SSC local dimming algorithm is desirable for
automotive applications.
Amended Local Dimming Algorithm For a light spread function (LSF) with high locality, the
luminance behind a certain pixel is mainly contributed by
just a few adjacent LEDs 𝐿𝑐 as introduced in [4]. The
constraint within the optimization is then modified to
min {∑ x(𝑙)
𝐿
𝑙=1
: ∑ A𝑚(𝑖, 𝑗) ∙ x(𝑚)
𝑚
≥ c(𝑖, 𝑗)}
with 𝑚 ∈ ℳ𝑖,𝑗
where ℳ𝑖,𝑗 is the set with these 𝐿𝑐 LEDs defined for each
condensation pixel 𝑐(𝑖, 𝑗). To limit the memory required,
LSF data are stored and processed with a novel model for the sake of accuracy and efficiency. In addition, just a
selected set of the main contributing LEDs is considered
during the LED calculation, so that the algorithmic
complexity remains modest. Beside this customization, the
light contributions of the adjacent LEDs (crosstalk) are
considered and yield power saving results very close to the
mathematical optimum.
Light-Spread-Function (LSF) Local dimming performance depends on the algorithm as
well as on the BLU. The higher the LED number, the better
the result, but at the same time, the higher the cost. However, the BLU design or more specifically, the LSF has strong
influence on the performance [5, 6]. The impact of various
shapes on the local dimming performance was analyzed in
[7]. It was shown, that the Full-Width-Half-Maximum
(FWHM) to LED-pitch ratio (𝑟50) influences the uniformity
and power saving rates substantially.
Figure 2 shows 3 different direct-lit BLUs with their all-on backlights and their cross-sections. The 2 upper LSFs are
93

radial whereas the third shows a more square-like pattern
which promises a higher uniformity at the borders. The
resulting light contributions (influences) of the LED located
in the center are depicted in Figure 3 for four BLUs.
Figure 2. Different BLUs (measured with ELDIM UMaster).
The maximum value of a curve represents a degree of
locality. The purple line results from a fourth LSF (not
shown in Figure 2), which is rather global and yields to a low power saving. A significant difference results from the
yellow line. Here, the LSF is square-like and results in a very
fast descend at the transition to the neighboring cavities.
Such an LSF matches to the amended local dimming as
introduced before.
Figure 3. Light contribution of different LSFs.
On the other hand, the risk of introducing artifacts is
increased at the transition between two neighboring LEDs,
if the two LED values strongly differ from each other. Figure
4 shows the impact of an increasing LSF locality. Clearly the
high locality yields a high efficiency but it is more prone to
Halo, less stable and not robust against variation in production as investigated in [7]. Therefore, the shape of the
LSF affects the performance and the cost of the system. In
case of an optimal LSF, fewer LEDs are needed.
Furthermore, it is worth mentioning that 6V LEDs shall be
used in order to increase the power efficiency of the LED
driver.
Quality Preserving Features In addition to the consideration of the LED crosstalk which
yields to optimum power saving, the demand on high visual
quality remains, especially for the premium OEMs. For this
reason, the algorithm considers several automotive related, quality enhancing and preserving features which are
introduced in the following.
Figure 4. Locality impact on performance.
Halo Suppression
To mitigate the Halo artifact [8], the algorithm contains now
a two-dimensional spatial filter for LEDs, which can
suppress sudden jump in backlight. For an Edge-Lit BLU, a one-dimensional filter was introduced and demonstrated in
[9]. The new introduced method allows a neighbor 𝐿𝐸𝐷𝑥+1
of the 𝐿𝐸𝐷𝑥 to differ by a filter factor 𝑓𝑥 as shown in the
following formula
1
𝑓𝑥
⋅ 𝐿𝐸𝐷𝑥+1 < 𝐿𝐸𝐷𝑥 < 𝑓𝑥
⋅ 𝐿𝐸𝐷𝑥+1
For the y-direction the constraint is defined in the same way. In the optimization process, this constraint must be
considered to ensure an optimal power saving under
fulfillment of this constraint. An example is depicted in
Figure 5. The upper part shows two initial LED values (8
Bit) and after the application of the constraints above. The
lower part shows a cross-section through the resulting
backlight. For lower filter factors, the Halo artifact is
mitigated while the power saving is decreased.
Figure 5. Function of spatial LED value filtering.
Boosting
The capability of boosting LEDs to achieve a more local
backlight is provided by the LED driver and lower the
negative effect of a too wide LSF. The LED current
amplitude has to be increased for the realization by a factor
𝑃𝐵, while the target luminance within the calculation as well
as the final PWM duty-cycle are reduced by 1/𝑃𝐵 to match
the original luminance. This results in a more local solution
of the optimization process so that fewer LEDs are needed to produce a backlight required by the image given. The
bright highlights are illuminated, while the black level in the
surrounding dark areas are enhanced. Overall, the static
contrast is increased. In addition, the average PWM duty
cycle is inherently limited by 1/𝑃𝐵 by algorithm. 94

Improving Black Level at Corners
The black level at the corners of the display has a significant
impact for the perception and thus the visual quality. It is
obvious, that smooth transition from black display corners to
the surrounding dashboard will increase the overall value of
the display and interior design. So, special processing
methods for the corners are adequate. one is the reduction of
the luminance objective with a function 𝑟(𝑑, 𝐴𝑃𝐿), which
depends on the distance 𝑑 to the corner and their APL.
Figure 6 demonstrates the function 𝑟 (left) and the impact on
the condenser content (right). Among others, these methods
result in a significantly improved perception of the display.
Figure 6. Effect of condenser manipulation (right part).
The mentioned methods can be combined to achieve an
excellent performance. Figure 7 shows a measurement with
the default parameter set and the combination of the methods
described above. Finally, these methods result in a
significant improvement of the black level in the corners as
shown in the lower cross section which leverage the display
quality in combination with the interior design to a higher
level and may give the display a visible differentiation
feature.
Figure 7. Backlight default vs. applied methods for
black level improvement.
Safety Mechanisms
To ensure a safe operation and quality, the safety critical
outage of few LEDs can be compensated by the algorithm,
which assure an adapted optimal solution by considering
LED failures. This is done by insertion of an additional constraint to consider this outage. Then the local dimming
process considers the failure in the LED optimization as well
in the pixel compensation step accordingly. Typically, the
LED failure is communicated by the LED driver via a serial
interface like SPI. Finally, our local dimming IP allows
compensation of several LED outages at the costs of slightly
increased power consumption, while the quality degradation
is compensated to a large extent.
Hardware Design Overview
To overcome the emerging challenges for a direct-lit BLU
for automotive applications, the HW implementation differs
substantially from our previous design for Edge-Lit [9] and
includes quality persevering features, introduced in previous
section as well as a novel LSF model to reduce the hardware
cost and fulfill the timing related constraints. The overview
of the hardware design is depicted in Figure 8 as a dataflow block diagram.
The influence of the LSF is modelled and stored in a ROM,
which is accessed by the addressing based on the position of
the LED and the condenser position, calculated in a
pipelined architecture. The blue color marks the read-only
ROMs while the red highlighted parts describe the writable
registers and SRAM. The logic parts are depicted with a
green background. The parts differing from the state-of-the-
art are particularly the new LSF model to properly consider
the crosstalk as well as the integration of the quality
preserving features. This makes the design to a customized
solution for automotive displays.
Condenser
Corner Reducer
Gamma ROM
Degamma ROM
Pixel Compensation
SPI InterfaceCondenser
SRAM
LSF Model
Model address calculation
Model ROM
Sample Point SRAM
LED Optimizer
LED calc
LED Register
Pixelorder ROM
Quality Features
Boosting LED-Factors Defective LEDs
FPGA
RGB to TCON
To LEDDriver
RGB fromSource
Figure 8. Hardware modules overview with colored marking for read-only and read-write memory as well
as logic.
System Performance To overcome the emerging challenges for a direct-lit BLU
for automotive applications, a local dimming processor for
various BLUs, which is placed in the pixel pipeline without
any framebuffer, was implemented on a Xilinx Kintex325T
FPGA. With the absence of any frame buffer, the SRAM
size is low. It substantially differs from TV local dimming
algorithms and includes particular quality persevering features required by automotive application. In addition, the
real-time requirements are fulfilled for the safety critical
usage in an automotive application. For a robust and efficient
BLU, a 𝑟50 of ≥ 1.5 and a maximal influence of ≈ 30 % are
proposed which can suppress and/or mitigate artifacts and
delivers on the other hand excellent local dimming results in
terms of visual quality and power saving. The resulting cost
for an IC implementation e.g. on TCON would lie in few
cents range. 95

A prototype with 240 LEDs and the algorithm presented in
this paper has been validated. The power saving rate for
typical automotive HMI images is about 40 %, while the
overall display quality is significantly increased by the preserving features. Figure 9 shows luminance
measurements captured with an Eldim UMaster colorimeter.
The images show the luminance of the final modulated
images with backlight and TFT transmission. The upper
both are scaled in the full luminance range. The low
luminance (0-2 nits) is magnified in the lower images
proving that the black level is significantly improved and
results in a power saving rate of 40.4%. Such a device may
be perceived as a high value display.
Figure 9. Luminance measurements with dimming.
In this paper a further quality preserving feature was
introduced, namely the handling of the outages of LED
devices. Figure 10 shows a luminance measurement with the
outage of one LED (red circle). On the left, the outage is
ignored, while on the right, specific constraints during the
LED calculation are set to compensate the negative impact of the loss of a light source. The improvement of the quality
is clearly visible in the underneath cross-section (along the
black dotted lines). The resulting luminance with the enabled
preserving feature (magenta) demonstrates a much brighter
luminance around the failed LED (row 0 – 250). In this case
the luminance reaches > 85% of the target value and
substantially compensates the deficit caused by the failed
LED. In case of several failed LEDs, the effect of the safety
mechanism will be even stronger. Therefore, this is a crucial
feature to safeguard the display operation and achieve a high
automotive safety integrity level.
Figure 10. Breakdown of one LED. Left: no quality
preserving. Right: proper handling.
Conclusions
In this paper a local dimming system comprising algorithm
and a direct-lit BLU is presented. The performance or more
specifically, power saving and visual quality, do depend on
the algorithm and BLU design. The algorithm presented considers automotive HMI’s and interior design. Quality
enhancing/preserving methods are included. Safety
mechanism is inserted to cover failures like outage of few
LEDs. Optimum LSF for BLU is proposed which allows a
uniform backlight, robust production and good local
dimming results. It is proposed that the BLU design as well
as the customization of the algorithm shall be jointly
developed. Then such a LC display module can produce
excellent image quality at high power efficiency, while the
high and tough automotive requirement in terms of high
brightness and high lifetime can be met. It will increase the
value of displays and make displays to a differentiation feature in cars. References
[1] C. Xu, M. Schmidt, T. Lahr und M. Weber, „Dynamic Backlights for Automotive LCDs,“ Information
Display, p. 14, July/Aug 2018.
[2] W. Zhang, Min.Chen, W. Niu und D. Huang, „LED
Control signal extraction by using Multiple
Representative Values,“ IDW, pp. 1519-1522, 2009.
[3] C. Xu, A. Karrenbauer and M. Albrecht, "Method,
system and apparatus for power saving backlight".
USA Patent US8421741, 11 September 2009.
[4] M. Schmidt, M. Grüning, D. Schäfer and C. Xu,
"Efficient Modeling of LED Crosstalk of a Matrix
Backlight Unit," Proceedings of IDW'17, pp. 1457-
1460, December 2017.
[5] M. Schmidt, M. Grüning, J. Ritter, A. Hudak and C.
Xu, "Impact of high-resolution matrix backlight on
local-dimming performance and its characterization,"
Journal of Information Display, 2019.
[6] Y. Cheng, Y. Lu, C. Tien and H. Shieh, "Design and
Evaluation of Light Spread Function for Area-Adaptive LCD System," Journal of Display
Technology, vol. 5, no. 2, pp. 66-71, 2009.
[7] M. Schmidt, J. Ritter und C. Xu, „Optimizing LSF
Shape for Robust and Uniform Backlighting of
Automotive Displays with Direct-Lit Local-Dimming,“ Proceedings of IDW, pp. 1554-1557,
November 2019.
[8] H. Ichioka, K. Otoi, K. Fujiwara, K. Hashimoto, H.
Murakami and T. Yamamoto, "Proposal of Evaluation
Method for Local-Dimming Backlights," SID
DIGEST, pp. 750-753, 2010.
[9] M. Grüning, M. Schmidt, D. Schäfer und C. Xu,
„Challenges and Methods for Local Dimming of
Long-Edge LCD TVs,“ IDW, pp. 1339-1341, 2016.
96

Automotive smart surfaces: Conformable HDR displays
and smart windows to activate almost any surface
J. Huggins FlexEnable Ltd.
34 Cambridge Science Park, Cambridge CB4 0FX, UK. [email protected]
Abstract Increased vehicle automation, connectivity and safety require more and larger displays which conform to the curved surfaces of the car. A new glass-free display technology - OLCD - meets these requirements by using the traditional LCD architecture which is proven for automotive-grade reliability and brightness, with an organic TFT backplane built on an ultra-thin plastic substrate. As well as allowing flexibility, the ultra-thin substrate brings performance advantages to dual cell HDR displays with contrast of around 1,000,000:1, whilst retaining the conformability required for automotive. Beyond OLCD, flexible liquid crystal cells allow other surfaces in the car to be activated, including colour-neutral, rapidly switchable smart window films that can be biaxially conformed to the glazing. Keywords: LCD; OLCD; OLED; Flexible Display; Dual Cell, Smart Windows
Introduction As car makers look ahead to a future of increasing automation, so the focus in automotive moves from the exterior to the interior of the vehicle. This change demands greater functionality with an increased density of displays, yet there are few or no flat surfaces on which to integrate flat displays without imposing undesirable deisgn constraints.
Flexible displays offer a solution, with conformability enabling better integration into the curved surfaces in the car interior. Curved displays can be located into tight interior spaces without disrupting interior ergonomics. One flexible display technology that is being increasingly adopted in small area consumer electronics is flexible OLED. However, this has limitations in automotive applications with very high manufacturing costs at large area, and a fundamental trade-off in brightness-lifetime.
Organic LCDs (OLCD) technology is designed to cost effectively meet the area scalability and reliability-brightness requirements for automotive by utilizing the established technology of LCD while enabling conformability of flexible substrate.
FlexEnable has developed a process for OLCD manufacture that uses organic TFTs replacing conventional a-Si. The process steps for these organic OLCD, including the array, CFA and cell assembly, are performed at low temperatures (< 100°C), and can be implemented on existing a:Si TFT LCD production line equipment sets.
Figure 1. An S-shaped, touch-enabled centre unit consisting of twin 12.1” OLCDs. Image source: Novares
The low processing temperatures enable the use of TAC (triacetate cellulose) film to be used as the substrate, which possesses critical optical benefits required for LCD, including low haze and zero birefringence. TAC is already commonly available as the substrate used in automotive polarizers and offers film thicknesses 10x less than glass used for large area displays. Throughout the overall OLCD manufacturing process, many other standard materials and processes that are already qualified for automotive glass-based LCDs are used.
Figure 2. Schematic OLCD cross section using TAC substrate in place of glass
97

Figure 2 shows a schematic cross section of a typical OLCD single cell structure. The OTFT array is built directly onto a 40μm TAC film substrate which is itself mounted onto a glass carrier during fabrication. The stack consists of a top-gate OTFT structure connected to a pixel electrode for a conventional IPS pixel structure. The cell shown in figure 2 has a thickness of <100μm and OLCD modules incorporating this cell have been demonstrated with a bend radius down to R10. Applications utilizing conformable displays have been demonstrated in both curved centre console units and curved digital side mirrors1. OLCD displays and new smart window technology offer the possibility to activate almost any surface in the car interior, providing new design aesthetics for existing use cases (center console), as well as many new use cases (invisible A-Pillar). The concept in Figure 3. shows the range of potential applications using OLCD displays.
Figure 3. FlexEnable concept demonstrating applications for conformable OLCD and smart windows
Ultra-high Contrast HDR via Dual Cell OLCD Dual cell LCDs are in production today for TVs and specialist monitors, and combine a standard LCD display with a second ‘light modulating’ cell2 that allows the backlight to be locally dimmed. Such displays incorporate 4 glass substrsates (2 per cell) instead of 2, and the additional modulation of the backlight illumination provides a performance improvement over conventional LCD resulting in an increase of CR from >1000:1 to >1,000,000:1. Display black levels similar to OLED TVs are achievable, with contrast values within VESA Display HDR 1000 specifications3. Very high contrast displays are strongly desired for automotive (as well as TVs, Monitors), where light leakage reduction particularly for night driving allows displays to be hidden until lit.
Nevertheless, the dual cell approach using conventional glass LCD does introduce some trade-offs; both mechanical (thickness, weight, lack of flexibility) and optical (moiré, wide angle performance). All of these trade-offs are a direct result of the large inter-cell separation caused by the thickness of the display glass. These optical defects can be reduced using optical compensation film diffusion layers between the two cells. However the addition of compensation means that true pixel-level dimming is not possible and an additional polarizer is needed. The additional polarizers and compensation films reduce overall transmission requiring increased backlight brightness. The ultra-thin structure of OLCD provides a breakthrough approach to dual-cell with the opportunity to reduce the inter-cell spacing to less than the pixel pitch. By utilising the TAC substrate at ~40um thickness and a conventional polarizer film inter-cell spacing in the order of 300μm is possible resulting in true pixel level dimming for dual cell. All of this can be achieved while maintaining the flexibility and conformability of OLCD with the whole dual cell stack thickness within the range of a single sheet of FPD glass. By eliminating the need for further optical compensation, OLCD offers the added benefit of improved transmission which reduces the BLU brightness requirements relative to glass dual-cell displays.
Figure 4: (a) Conventional Glass Dual Cell display compared to (b) FlexEnable Dual Cell using TAC substrate – as used in test
98
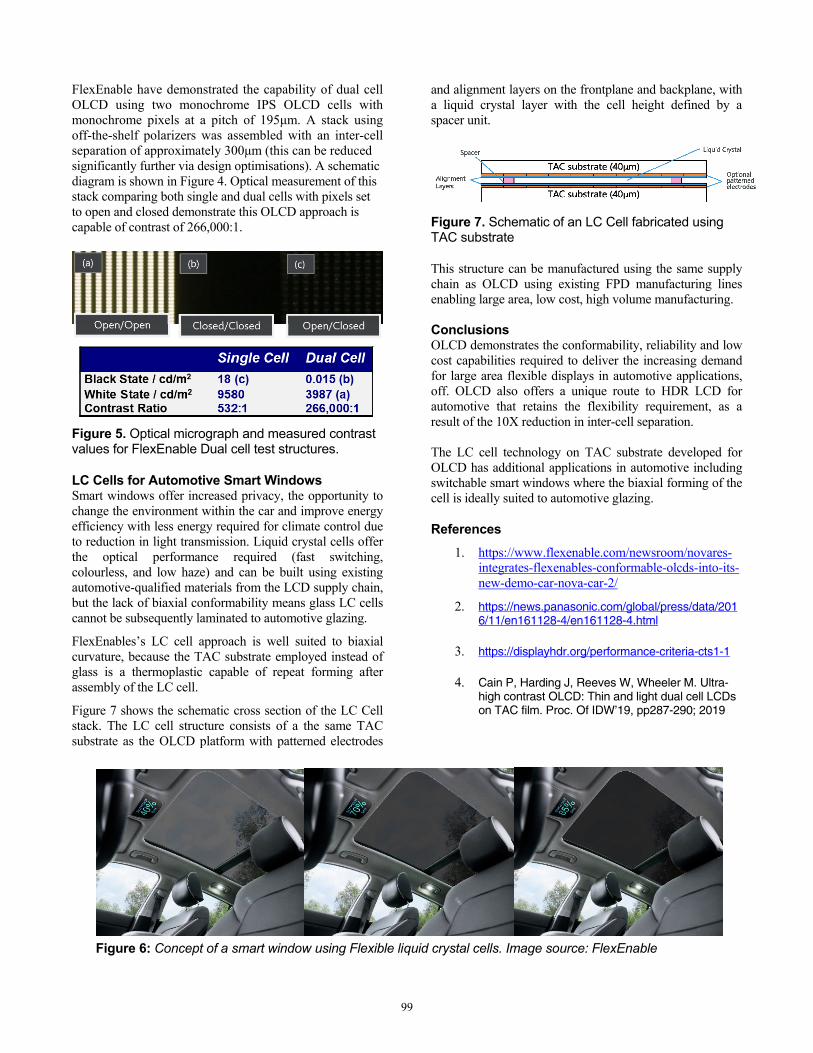
FlexEnable have demonstrated the capability of dual cell OLCD using two monochrome IPS OLCD cells with monochrome pixels at a pitch of 195μm. A stack using off-the-shelf polarizers was assembled with an inter-cell separation of approximately 300μm (this can be reduced significantly further via design optimisations). A schematic diagram is shown in Figure 4. Optical measurement of this stack comparing both single and dual cells with pixels set to open and closed demonstrate this OLCD approach is capable of contrast of 266,000:1.
Figure 5. Optical micrograph and measured contrast values for FlexEnable Dual cell test structures.
LC Cells for Automotive Smart Windows Smart windows offer increased privacy, the opportunity to change the environment within the car and improve energy efficiency with less energy required for climate control due to reduction in light transmission. Liquid crystal cells offer the optical performance required (fast switching, colourless, and low haze) and can be built using existing automotive-qualified materials from the LCD supply chain, but the lack of biaxial conformability means glass LC cells cannot be subsequently laminated to automotive glazing.
FlexEnables’s LC cell approach is well suited to biaxial curvature, because the TAC substrate employed instead of glass is a thermoplastic capable of repeat forming after assembly of the LC cell.
Figure 7 shows the schematic cross section of the LC Cell stack. The LC cell structure consists of a the same TAC substrate as the OLCD platform with patterned electrodes
and alignment layers on the frontplane and backplane, with a liquid crystal layer with the cell height defined by a spacer unit.
Figure 7. Schematic of an LC Cell fabricated using TAC substrate
This structure can be manufactured using the same supply chain as OLCD using existing FPD manufacturing lines enabling large area, low cost, high volume manufacturing. Conclusions OLCD demonstrates the conformability, reliability and low cost capabilities required to deliver the increasing demand for large area flexible displays in automotive applications, off. OLCD also offers a unique route to HDR LCD for automotive that retains the flexibility requirement, as a result of the 10X reduction in inter-cell separation. The LC cell technology on TAC substrate developed for OLCD has additional applications in automotive including switchable smart windows where the biaxial forming of the cell is ideally suited to automotive glazing. References
1. https://www.flexenable.com/newsroom/novares-integrates-flexenables-conformable-olcds-into-its-new-demo-car-nova-car-2/
2. https://news.panasonic.com/global/press/data/2016/11/en161128-4/en161128-4.html
3. https://displayhdr.org/performance-criteria-cts1-1
4. Cain P, Harding J, Reeves W, Wheeler M. Ultra-high contrast OLCD: Thin and light dual cell LCDs on TAC film. Proc. Of IDW’19, pp287-290; 2019
Figure 6: Concept of a smart window using Flexible liquid crystal cells. Image source: FlexEnable
99

100

Presentation 5.4
The Functional Safety Designs of Vehicle Display Driver ICs Cheng‐Chih Deno Hsu, Himax Technologies, Hsinchu City, Taiwan
PAPER UNAVAILABLE
PRESENTATION SLIDES SHOULD BE DISTRIBUTED AFTER THE CONFERENCE
101

102

Automotive Dual Cell microZone™LCD Development Paul Weindorf, Qais Sharif, Elijah Auger, David Whitton, Brian Hayden
Visteon Corporation, Van Buren Twp., MI, USA
Abstract Consumer experience with high performing mobile device displays sets high expectations for the automotive market in contrast, color performance and brightness. OLED based displays have not been able to successfully penetrate the automotive display market primarily due to image burn at high luminance operation. The microZone™ LCD is an alternative display configuration that can meet the desirable properties of OLED displays while providing high luminance at high temperature operation without image burn in.
Author Keywords OLED; dual; cell; high dynamic range; HDR; wide color gamut; high contrast; high brightness
1. Introduction Since the introduction of OLED display technology, the automotive industry has desired the development of automotive grade OLEDs. OLEDs have the desirable property of high contrast ratios on the order of 1M:1 and therefore exhibit a perfectly black background in comparison to typical thin-film transistor (TFT) LCDs with contrast ratios around 1500:1 which exhibit a certain amount of visible black leakage that is visible under night time viewing conditions. OLEDs also exhibit highly saturated colors for a great viewing experience. However since OLEDs are an emissive display technology, image burn-in artifacts will always occur since pixels that are illuminated for long periods of time at elevated temperatures will experience a natural degradation in luminance and color [1,2]. Unlike other disposable commercial display products, the automotive display must be able to display the same image for extended times and not exhibit a permanent burned-in image when an alternative display presentation is selected. In addition, the automotive display must continue to operate satisfactorily for the life of the vehicle (>5000 hours) in order to avoid warranty returns and poor customer perception. Elaborate countermeasures continue to be developed to address the image burn-in problem [3]. These countermeasures can be either at the pixel level or at the macro level with the use of luminance consumption preservation methods [4]. The pixel level compensation techniques generally reduce the luminance of all the pixels to the lowest burned in pixel level, but color compensation has yet to be realized. OEMs are reluctantly relaxing specifications for image burn-in, operational temperature, and luminance requirements in order to allow the use of OLED displays which have high tooling and recurring costs compared to TFT LCD technology.
In comparison, TFT LCDs have been successfully utilized by the millions in automotive applications because a LCD is based on the light valve principle where the selected pixels either transmit light or block light from a uniform backlight. As the LEDs in the backlight degrade over time, all of the LCD pixels decline uniformly, but differential image burn-in does not occur for “on” pixels compared to “off” pixels. Inorganic backlight LEDs are much more resistant to degradation under high temperature operation compared to organic LEDs and therefore LCDs can maintain a higher luminance operation under high temperature conditions. Currently OLEDs are having difficulties obtaining 600-800 cd/m2 for extended periods of operation whereas TFT
LCD displays can easily operate at >1200 cd/m2 since the LCD is simply a light valve to a backlight that can be thermally managed. Although TFT LCD technology has been successfully utilized in the automotive industry, the black background light leakage as depicted in Figure 1 has encouraged the industry for a better looking black background that does not have the problems associated with black mura [5].
Figure 1. Typical LCD Light Leakage Background
In order to address the desire for higher contrast ratios with black backgrounds, LCD suppliers have proposed the use of local dimming zone based backlights. In a local dimming backlight as shown in Figure 2, the LEDs are not turned on in areas where a true black background is desired. The number of backlight LED zones may be on the order of 96-394 for packaged LEDs and extend to the idea of mini-LED zones on the order of millimeter zones.
Figure 2. Local Dimming Backlight
103

Although there has been some adoption of the local dimming backlight in the automotive industry, the problems of driving a large matrix of LEDs with luminance control has discouraged wide adoption of this technology. In addition, local dimming backlights have generally been thicker and the image experiences rather large grayish halos due to the size of the LED zones as shown in Figure 3.
Figure 3. Local Dimming Zone Halo Depiction
The complexity of driving all of the LEDs has led to exotic and costly electronic signage based multiplexing techniques together with a specialized FPGA or ASIC [6] for the zone control as a function of the dynamic video input.
Due to these afore mentioned deficiencies associated with OLEDs and local dimming LCD approaches, an alternative dual cell approach is proposed.
2. Dual Cell microZone™LCD A highly efficient dual cell technology called microZone™LCD (µZLCD™) has been developed. The µZLCD™ display as shown in Figure 4 is based on luminance control at a micro-meter scale by using a monochrome TFT for the rear backlight light valve control. Since TFTs have a highly efficient and mature control method, the small µZones may be easily driven and include gray scale control.
Figure 4. Dual Cell microZone™LCD
Although the concept of using two cells has been purported in the industry for some time, the approach is generally not considered viable for automotive applications due to the low transmission and attending high backlight power associated with the use of two LCD cells. Typically, dual cell approaches require up to 2.5x the
power due to the transmission of the two cells and the inter-cell diffuser. In order to make an automotive viable dual cell display, several efficiency improvements were made:
Modification of the inter-cell diffuser
Use of a proprietary light control method
Backlight efficiency improvements
As discussed in reference [7], a diffuser is generally utilized to eliminate the Moiré effect due to the periodic structure the two LCDs. The diffuser is generally a polarization dependent scattering film (PDSF) that scatters light only in one polarization axis. However the diffuser film has a transmission decrease to 70% and therefore deleteriously decreases the system efficiency. The µZLCD™ approach modifies the diffuser configuration by using a proprietary technique to eliminate Moiré which improves the system efficiency. Although the Moiré effect is eliminated with this proprietary method, the diffuser function of also smoothing the edges of the mono-cell image needs to be considered so that the observer does not focus on the mono-cell image. The µZLCD™ system solves this problem by using the gray scale function of the display to smooth the edges as shown in Figure 5 which requires the use of an FPGA or similar device and a specialized image processing algorithm.
Figure 5. Edge Smoothing Example of Mono-Cell
The monochrome gray scale levels may also be utilized to increase the dynamic range of the system. In particular, the monochrome gray scale level is dynamically controlled as a function of the color display gray shade level which effectively eliminates the color cell leakage component as shown in Figure 6, thus providing high dynamic range (HDR) performance without image artifacts.
Figure 6. Before and After Algorithm Comparison for Lower White Gray Shades
104

3. Color Gamut Improvement In order to better compete with highly color saturated OLED displays, the color performance was improved for the µZLCD™ to obtain 96% NTSC compliance. The color performance was improved by:
Using improved TFT color filters Using LEDs with improved green phosphor performance As is known in the LCD industry, the major problem with improving the color performance is associated with the green-blue overlap of the color filter spectral transmission curves. Figure 7 shows what can be obtained by optimizing the color filter and LED selection. Figure 8 shows that the µZLCD™ is fully compliant to the Digital Cinema Initiatives DCI-P3 color gamut.
Figure 7. NTSC Color Performance
Figure 8. DCI-P3 Color Performance
It is expected that improvements in the color filter and light emitter technologies will improve the color performance beyond what OLEDs are capable of.
Measurements utilizing a Radiant Vision Systems ProMetric I16 imaging colorimeter reveals excellent iso-contrast performance per Figure 9 while Figure 10 shows more numerical results in the x and y axes. In the horizontal viewing directions up to 60° (limit of colorimeter), excellent contrast ratios greater than 10,000:1 are maintained.
Figure 9. Iso-Contrast Performance
Figure 10. Horizontal and Vertical Contrast Ratio Performance
One of the benefits of using dual cell technology is the visual improvement in black mura performance which has historically been a challenge in automotive TFT LCD applications. Figure 11 shows that back area scan uniformity performance of the dual cell display.
Figure 11. Area Scan Black Mura Performance [5]
105

Although the measured uniformity performance is only 59% per the GOEM specification [5], the black luminance range of 0.001 to 0.017 cd/m2 is near the bottom of the mesopic range and is impossible to see under day time lighting conditions. Under nighttime conditions with graphical component image luminances in the 10 cd/m2 range, the black non-uniformity is also not visible. The black non-uniformity is only visible under dark room conditions with an all-black screen with no graphical image.
4. LCD Configuration Power Since power dissipation is the critical parameter for the µZLCD™, it is important to compare the power dissipation for the various color configurations to a commonly used 85% NTSC typical 12.3 inch display. Table 1 outlines the power comparison depending on the desired NTSC level and shows that at the 85% NTSC level there is only a modest increase in power from 7.2W for a typical single cell approach to 8.7W for the µZLCD™ dual cell approach. Various combinations of color filter types and LED types may be utilized to obtain different levels of NTSC performance.
Table 1. Power Comparison Summary
Size Configuration cd/m2 Color
Filter
Type
NTSC Power
12.3” Single Cell 850 Old 85% 7.2W
12.3” µZLCD™ 850 Old 85% 8.7W
12.3” µZLCD™ 850 New 96% 9.3W
12.3” µZLCD™ 850 New 110% 12.9W
5. microZone™LCD Summary The development of a highly efficient dual cell µZLCD™ will enable the next generation of automotive displays. OLED-like performance without an image burn-in may be realized. It is important to note that the µZLCD™ is not limited in luminance whereas OLEDs are limited and exhibit greater image burn-in as the luminance is increased.
Figure 12 shows the working of the first prototype.
Figure 12. Initial microZone™LCD Prototype
In summary, the following attributes have been obtained:
Ultra High Contrast Ratio – 100,000:1
Low Power with High Color Gamut – Proprietary optical stack and backlight configuration provides an 850 cd/m2 at about 9.7 Watts of LED power for a DCI P3 compliant NTSC performance of 96%.
High Brightness – Higher luminance values from 850 to 1300 cd/m2with no image burn-in
Moiré – None
Black Mura Performance – None observable
High Dynamic Range Performance
6. References [1] P. Weindorf, Automotive OLED Life Prediction
Method, Detroit SID 2005 Proceedings.
[2] P. Weindorf, D. Andres, J. Hatfield, Automotive OLED Life Test and Prediction, Detroit SID 2013 Proceedings
[3] Fan R, Zhang X, Tu Z. Influence of ambient temperature on OLED lifetime and uniformity based on modified equivalent lifetime detection. J Soc Inf Display. 2019;27:597-607. https://doi.org/10.1002/jsid.788
[4] P. Weindorf, Automotive OLED Luminance Consumption Control Methods, SID Symposium May 22–27 2016, Paper 36.1, DOI 10.1002/sdtp. 10706
[5] ©German Automotive OEM Work Group Displays, BlackMURA_Display_V115.doc/14.06.2011
[6] Himax HX8880 Data Sheet, TFT LCD Timing controller with LVDS/Display Port input and LVDS/mini-LVDS output
[7] Haiwei Chen et al., High Dynamic Range LCD with Pixel-level Local Dimming, SID 2017 Digest ISSN 0097-996X/17/4702-0890
106

A Low-power Transflective TFT-LCD Based On IGZO TFT
Tenggang Lou, Lei Wang, Xiangjian Kong, Jine Liu, Feng Qin TIANMA MICRO-ELECTRONICS GROUP, Shanghai, China
Abstract We have developed a transflective TFT-LCD device based on IGZO TFT(thin film transistor) using GIP and Demux driving circuit. The average flicker is -62.35dB when in reflective mode driving in 1Hz while -55dB in transmissive mode driving in 60Hz. The flicker and the visual effect still performance well after RA(reliability analysis) test. The flicker after RA test almost unchanged comparing with the LCD without RA test. The average contrast ratio is 24.9 in reflective mode while 33.4 in transmissive mode. The power consumption average reduced by 40% in 1Hz reflective mode contrasting to 60Hz in transmissive mode while in black, white, red, green, blue, grey, flicker, crosstalk, checkpixel image. We proved the power consumption can be reduced by even more if IC is well designed. The transflective LCD device supports 256 grey.
Author Keywords Low power LCD; low frequency driving; reflective LCD; transmissive LCD; Transflective LCD; Gate in panel (GIP); Demux; IGZO;
1. Introduction Low power consumption LCD devices have longer usage time. This attribute is meaningful to those devices with battery powered. Such as sports watch, electronic tag and so on. To achieve the low power consumption target, many methods can be used. On one side, use low resistivity metal materials or increase the metal thickness. On the other side, use low dielectric coefficient insulation layers or thick organic coating to decrease the parasitic capacity. Also we can use special thin film transistor to reduce the TFT’s parasitic capacity or use high mobility semiconductor materials to resize the TFT dimension.
Reduce the driving frequency is also a good method to lower the power consumption. Driving LCD with low frequency has many difficulties. The one is human eyes may be more sensitivities to brightness variations in low frequency which can cause flicker problems. The other is imaging sticking may deterioration. Also TFT reliability can be worsen lead to reliability problems.
IGZO for its insensitivity to temperature, adequate mobility and low leakage current[1] is suitable for low frequency driving devices. We fabricate a transflective TFT-LCD device based on IGZO TFT. It can driving in 1Hz to 60Hz alternatively and has 256 gray scale image.
2. Basic information of the LCD device Figure 1 shows a schematic of the device. With a round active area(AA). GIP circuit is designed on the left and right of AA. The demux circuit is placed on the bottom of AA. The resolution is 240RGB*240 and the AA size is 1.2 inch. The demux is 1:6 designed which is 1 IC output pad corresponding with 6 sources in AA.
Using GIP and demux we can reduce the border of LCD and driving in low frequency can reduce the power consumption, so its meaningful to verify whether the GIP and demux circuit performance well in low frequency, high temperature and high humidity condition.
We use bottom gate IGZO TFT to make the transflective TFT-LCD. In order to enlarge the reflective area, com electrode or pixel electrode was placed right above the IGZO TFT. This can deteriorate the TFT performance especially the reliability performance. So the film forming process is improved to minimize the impact imposed by the electrode above the TFT. We use some methods to improve the GIP performance especially the reliability performance. The source loading was well designed to suitable for the demux driving condition. Also the materials used in LCD cell is carefully choosed.
Figure 1. Schematic drawing of panel design with GIP and demux circuit
3. Performances of the transflective TFT-LCD device
Figure 2. Flicker value in reflective mode and in transmissive mode
Figure 2 shows 8 samples was tested to see the flicker performance. The flicker is tested in flicker image. We use DMS to check the flicker in reflective mode and use CA310 to test the
107

flicker in transmissive mode. The driving frequency is 1Hz in reflective mode while 60Hz in transmissive mode. In reflective mode the backlight is power off and the backlight is power on in transmissive mode. The flicker is smaller than -60dB in reflective mode and smaller than -50dB in transmissve. According to the tested value of flicker we can see the transflective TFT-LCD performance well both in 1Hz mode and in 60Hz mode.
Table 1. Reliability performance of the transflective TFT-LCD with GIP and demux circuit
RA(reliability analysis) test Conditions
Sample quantity
Result Driving
frequency
80°C, 240H,storage 4 Pass /
-40°C, 240H,storage 4 Pass /
70°C, 240H,operation 8 Pass 60Hz
-20°C, 240H,operation 8 Pass 60Hz
60°C 90%RH, 240H,operation 8 Pass 60Hz
70°C, 240H,operaion 8 Pass 1Hz
-20°C, 240H,operation 8 Pass 1Hz
60°C 90%RH, 240H,operation 8 Pass 1Hz
-40°C 30min~80°C 30min 100cycle 4 Pass /
Table 1 shows the reliability analysis results. The reflective mode and the transmissive mode were tested respectively. The total tested time is 240 hours for each RA test condition. In reflective mode the driving frequency is 1Hz and the backlight is power off. In transmissive mode the driving frequency is 60Hz and the backlight is power on. In storage RA test condition and the thermal shock RA test condition, the LCD is power off. The RA test results show that after 240H RA test, the LCD remains performance well.
Table 2. Flicker value after 70°C and 60°C/90RH 240 hours RA test in 1Hz driving frequency
flicker after RA test(dB)
RA test conditon 70°C,240H,
operation,1Hz 60°C /90RH,240H,
operation,1Hz
sample 1&2 -59.27 -47.65
sample 3&4 -47.8 -55.15
sample 5&6 -51.2 -53.14
sample 7&8 -61.89 -52.18
sample 9&10 -58.74 -53.41
sample 11&12 -47.09 -56.55
Sample1 13&14 -51.42 -51.09
sample 15&16 -62.34 -49.79
Table 3. Contrast ratio test
Contrast ratio
test condition Sample
17 Sample
18 Sample
19 Sample
20
reflective mode 1Hz 26.65 23.27 26.47 23.11
transmissive mode 60Hz 29.96 36.68 32.52 34.63
For human eyes are sensitivity to brightness variation in low frequency, also the TFT can be worsen because of longer voltage bias applied on the TFT in 1Hz driving mode. So we tested the 1Hz reflective mode samples after RA test to see if it is deteriation. Table 2 shows the flicker after RA condition “70°C, 240H, operation, 1Hz” and “60°C/90RH, 240H, operation, 1Hz”. We tested 8 samples separately for each condition. We can see that the LCD performance well even after 240 hours RA test for the flicker is below than -47dB after 70°C RA condition and 60°C/90RH RA condition. The flicker is almost the same as the LCD without RA test. This indicates the transflective LCD device we fabricated based on IGZO is reliable enough to long term use.
Table 3 shows the contrast ratio value of the device in reflective mode and the transmissive mode. The value is acquired by DMS in reflective mode and SR-3A in transmissive mode. The contrast ratio is beyond 23 in reflective mode while 29 in transmissive mode. The contrast ratio is enough for human read information on the LCD under sunshine or in the dark environment.
Table 4. Imaging sticking performance after 1, 2, 4, 8, 24 hours
time 1hour 2hour 4hour 8hour 24hour release 30min
Sample 21
Level 0
Level 0
Level 0
Level 0
Level 2.5
Level 0
Sample 22
Level 2.5
Level 2.5
Level 2.5
Level 2.5
Level 2.5
Level 0
(a) (b)
(c) (d)
Figure 3. Screen refresh image problem
108

Table 4 shows the imaging sticking performance in reflective mode. We tested 2 samples and check the imaging sticking performance immediately after 1, 2, 4, 8, 24 hours. Release 30min in the table 4 means we closed the LCD power 30 minutes. The imaging sticking pattern is chess pattern. Level 0 means no imaging sticking can be seen in any viewing angle. Level 1 means no image sticking under vertical viewing angle. Level 2 means slightly image sticking under vertical viewing angle. Level 3 means LCD has image sticking problem and the image sticking boundary is unsharpness. Level 2.5 means the imaging sticking performance is between level 2 and level 3. We checked the imaging sticking after 1 hour, 2 hour, 4 hour, 8 hour and 24 hour. Although in the worst case is the imaging sticking level can reaches level 2.5, but after release 30min the imaging sticking can’t be seen by human eyes in any viewing angle.
Figure 3 shows the screen refresh problem which often occurs in low frequency driving condition such as driving frequency is 1Hz, because the brightness of the positive frame is different from the negative frame for the cause of charge ratio, the hold ratio or the voltage is different form positive frame to negative frame. And in 1Hz frame rate the human is more sensitivity to brightness, so the screen refresh problem occurs. Figure 3(a) shows the positive frame. Figure 3(b) shows the negative frame is refreshed 1/3 image. Figure 3(c) shows the negative frame is refreshed 2/3 image. Figure 3(d) shows the negative frame image. If there are screen refresh problem or not is one of the key factor to evaluate the LCD device while driving in low frequency.
By means of improve the film process, enlarge the capacity and choose the right cell materials, we finally fabricated the transflective TFT-LCD device with no screen refresh problem in all grey images from 0 grey to 255 grey even after RA test.
Table 5. Power consumption in various image in 1Hz, 5Hz, 60Hz
Frequency \Image
Black (mW)
White (mW)
R/G/B (mW)
Grey (mW)
Flicker (mW)
Crosstalk (mW)
1Hz 34.28 33.66 34.64 33.86 34.19 33.85
5Hz 35.51 35.24 36.17 35.73 35.69 35.55
60Hz 54.34 56.18 56.16 60.17 57.37 58.91
Table 5 shows the power consumption of the demo with GIP and demux circuit. The power consumption in 1Hz driving frequency is reduced by 36.9%~42.5% in contrast to 60Hz. The power consumption in 5Hz driving frequency is reduced by 34.7%~39.7% in contrast to 60Hz. Although the absolute power consumption is high, we due this to the IC is not well designed for our panel. Such as the IC’s minimum supported resolution is 720P, but our LCD’s resolution is 240P. We insert dummy black image to let the LCD shows 240P image. Meanwhile the IC is not well designed for low frequency driving condition, we assume that if IC is well designed for low frequency, the power consumption in 1Hz can be reduced 80% in contrast to 60Hz.
In order to confirm our guess, we fabricated a pin to pin designed transflective LCD based on IGZO TFT that is without GIP and demux. Pin to pin design means the gates and sources in LCD were directly connected one by one to the IC. The IC is well designed for low frequency driving. We tested the average power consumption reduced by 87% in 1Hz in contrast to 51Hz.
The absolute power consumption in white image is 2mW in 51Hz mode while 0.26mW in 1Hz mode. Figure 4 shows the Demo that is pin to pin designed based on IGZO TFT.
Figure 5 shows the image of the Transflective TFT-LCD with GIP and demux circuit. For the case of reduce the cost of demo, the CF(color filter) mask is not matching well with the Array mask. So you can see yellow border on the left and right side of the LCD where there is no BM(black matric) and PS(photo spacer). But it has no influence with the conclusion of the evaluation of our transflective TFT-LCD.
Figure 4. Image of the Demo with pin to pin design based on IGZO TFT
Figure 5. Image of the Demo with GIP and demux circuit based on IGZO TFT (transmissive mode)
4. Conclusion We fabricated a transflective TFT-LCD based on IGZO TFT. GIP and Demux were integrated in the LCD. The device can operate in 1Hz or 60Hz alternatively. The tested results prohibit
109

that the device can provide a good quality both in low frequency and in high frequency.
5. References [1] T. Tanabe, K. Kusunoki, Y. Sekine, K. Furutani,
T. Murakawa, T. Nishi, Y. Hirakata, H. Godo, J. Koyama, S. Yamazaki, Proc. AM-FPD ’11 Digest, 109-112(2011).
110

Presentation 5.7
A MicroLED Device with 0mm Border TengGang Lou, Tianma Micro-Electronics Group, Shanghai, China
PAPER UNAVAILABLE
PRESENTATION SLIDES SHOULD BE DISTRIBUTED AFTER THE CONFERENCE
111

112

Presentation 5.8
Enabling Features of VueReal MicroLED Technology for Automotive Applications
Rexa Chaji, VueReal Inc, Waterloo, Ontario, Canada
PAPER UNAVAILABLE
PRESENTATION SLIDES SHOULD BE DISTRIBUTED AFTER THE CONFERENCE
113

114

1
New challenges and testing solutions for flexible vehicle displays & interfaces
Title: New Flexible Display Challenges, New Reliability Solutions
Presenter: Eisuke Tsuyuzaki
Company: Bayflex Solutions
Topic: Reliability
The rapid transition of new vehicle drivetrains has enabled automobile manufacturers to reimagine safety, comfort and entertainment in mobility. More recently, we have already begun to see lightweight flexible devices incorporated into mainstream models such as LED lighting, flexible sensors and heated fabrics for seating. In addition, we are now beginning to see large, rollable flexible displays from concept to realization by OLED based technologies.
From a product design and testing perspective, the challenge is that these new form factors often utilize curved or fully flexible systems that integrate a mixture of different devices, processing techniques, and packaging and assembly approaches. Legacy testing is susceptible to both failure and performance variations under operating conditions, a new testing regime is needed.
Specifically, product designers must integrate and ensure continuous performance for new materials, curved screens, new metal ink compounds, ultra‐thin and flexible connectors, cables, bendable antennas, and other electronic components. Testing of rigid devices only dealt with initial evaluation and conditions under which failure might occur due to breakage.
As these new flexible devices can undergo performance changes under different physical conditions (rolling, flexing, warping) when exposed to different environmental conditions (temperature, humidity), and over periods of time and repetitive motion, testing approaches are needed to characterize performance under real‐world conditions.
Bayflex Solutions, working with equipment partners, has developed several new approaches. First, Bayflex Solutions has integrated a family of interchangeable mechanical endurance testing solutions for both ambient and hostile conditions from Yuasa Systems that simulate the mechanical‐physical motions for flexing of components and cables, reliably and repetitively based upon extensive experience in smartphone, tablets and laptop testing.
Second, Bayflex Solutions has integrated resistance and temperature measurements during endurance testing through electrical data capture, with a real‐time collaboration and analytics platform. Furthermore, as discussed at SID2020, a combined mechano‐optical platform with careful camera position enables for example, real‐time edge strain analysis for early multi‐layer coating delamination detection. This approach enables our customers to observe, monitor, analyze, and even predict component failure.
The combination of mechanical testing equipment, data collection, and analytics and reliability data provides unique insights that can be applied to component research, product design, and volume manufacturing and deployment for new innovative vehicle display device systems & interfaces.
2
BAYFLEX SOLUTIONSNew challenges & testing solutions for flexible displays & interfaces
115

3
About us
• Experts in Mechanical systems manufacturing crankshafts since 1947
• Factory automation for transmission, engine blocks, differential gear assembly since 1995
• Initial large endurance systems for Harnesses and Cables & industrial applications
• Medium size endurance systems for semi-rigid & curved LCD components since 2009
• Awarded “Flexi” for mechanical testing in hostile environment
• Successfully meeting industry transition to flexible, rollable, wearable OLED form factors
incl. Consumer Electronics Display ecosystems for smartphones, tablets, wearables, laptops
4
Problem
• Previously failure analysis was performed on Universal tester units
• Flexible components & products require repeatable real-world mechanical tests
• Use of counterweights leads to imperfect mechanical test results
• Printed traces, films, conductive materials, connectors, display modules
• Front windscreens, Entertainment systems (inc. OLEDs), Human sensors, LED lighting, Soft electronics, antennas, fine cables etc.
116

Scalable Modular Solutions
• Developed modular desktop endurance systems since 2009including many tension-free mechanical jigs designed for basic components
• System options for electronic / optical data analysis & harsh environments
5
3. + Data 4. + Systems
+ +
1. Mechanical Jig (over 120 variations)2. Drive unit
6
Examples
Twisting Rolling Bending
117

7
Reliability challenges
• Standards completed for semi-rigid form factors
• Recent activity for more flexible materials and form factors
• Integration of hostile conditions
• Data capture and Optical inspection systems
• Delamination
• Adjustment of neutral layers
• Scratch detection
8
Transition from FS (folding) to CS (flexing)
• “Butterfly” U-shape motion to simulate gentle warping with a push rod movement
• Requirement by manufacturers to understand motion for rigid samples
• “Clamshell” motion to simulate flexing with a double hinge movement
• Requirement by new materials & manufacturers to develop flexible substrates
118

9
Transition from FS (folding) to CS (flexing)
CS family extension – CS‐M
• Tension-free ™ “Clamshell” type flexing
• Linear or planar objects
• Larger holding plates for bigger samples
• Can be flexed to 0.5 mm radius
• Cartridge for easy examination during testing
• New faster DR medium/small motor
• Can use in ambient & hostile conditions
• Can use with ECP electronic data & system control package
10
119

CS - integration in hostile environments
• Integrate mechanical jig into existing Environmental chamber tests (motor drive is connected thru chamber’s service ports)
• Operating range : Controlled Temperature (-40° to +90° C)and Humidity (30% to 95% RH)
• Simple Tandem operation (chamber and jig work independently) or Custom designed Single programmable automatic operation available
11
ECP – system control & data capture package
• PC based system control software for integrated data capture and analysis
• Includes dedicated Resistance Meter, dedicated expansion board & cables
• Enables programmed control of endurance testing machines by measuring resistance of the test sample continuously
• Can use in ambient & hostile conditions
• Remote collaboration platform extension in development for 2021
12
120

13
CS-CAM developmentRequirement to detect and predict deformation stress exerted at specific location of test sample
• Smooth and steady motor helpful to develop stable platform for continuous image capture
• Optimize (size & usability) of optical camera system at precise motor movements
• Develop software analytics to determine key metrics
14
Optical image capture
40mm 6mm 1.5mm
121

15
Surface strain relationship
16
Visual inspection
122

17
CS “Teardrop” Cartridge
Enables to easily adjust CS Holding Plates to simulate various size & shape of hinge movement
• Optional accessory to CS standard size jig with new medium/small DR drive unit
• Precise adjustment to the bottom supporting element of the U-shape flexing test
• Alternatively can cost effectively adjust neutral layer on standard CS jig
The CS-Teardrop shape is very similar to an actual
tear
U-shape folding without full vertical support
becomes a teardrop shape
The CS-Teardrop shapeduring flexing
Parameters for adjusting CS-Teardrop shape
18
CS- TD Cartridge
123

19
New design concept
PICO Multi-environment chamberPrototype desktop multi-environment for
endurance testing machines
• Designed for integrated CS flexing jig with DR medium/small motor
• New G-shock & vibration mechanism via motor drive unit
• Anticipated release mid 2021
20
New design preview
Next-Gen Modular Systems Prototype desktop mechanical jigs
• Designed for Compound Components
• Self-custom 2-axis mechanical jigs
• Dedicated rotary or linear motion drive units
124

21
Integrated in North America / Europe by
www.bayflextechnologies.com
125

126

Presentation 5.10
New Material Solutions for Automotive Displays, Interfaces, and Applications
Volker Plehn, SABIC, Wixom, MI, US
PAPER UNAVAILABLE
PRESENTATION SLIDES SHOULD BE DISTRIBUTED AFTER THE CONFERENCE
127

128

An alternative to OLED with full-array local dimming in automotive displays
Logan Cummins Automotive Systems Engineering
Texas Instruments Dallas, Texas, United States 75243
Abstract: The automotive display market has historically lagged behind the consumer display industry in contrast ratio, black levels, resolution, curvature, and form-factors due to the automotive specifications and environmental conditions. If you look to the personal electronics market, you might assume that emissive displays, such as organic light emitting diodes (OLEDs) or micro-LEDs are the best way to achieve ideal automotive displays. However, the practicality of OLED displays in automotive has been continuously delayed by numerous design and fabrication challenges, such as lifetime, cost, and peak brightness concerns. Globally dimmed, edge-lit backlight architectures are most common in automotive today, but lack the desired contrast ratio and black levels.
So, how can carmakers meet modern display expectations? Full-array locally dimmed backlight architecture shows potential to improve contrast ratio of LCDs near OLED levels while also providing power savings over traditional backlight methods.
This paper will explain the benefits of local dimming backlight architecture, as well as how to consider and solve the implementation challenges.
Keywords: Local Dimming; Globally dimmed; Edge-Lit; Backlight; HMI; Infotainment; Automotive Displays; OLEDs; LEDs; LCD; Automotive Center Displays (CID); Contrast Ratio; Brightness
Introduction: Even though the automotive display market has typically trailed behind the consumer display industry, automakers must somehow differentiate their infotainment human-machine interface (HMI) displays while catching up to the technological advances now common in smart phone, tablet and television displays.
LCDs now pervade many aspects of modern life and are becoming more prevalent in vehicles, replacing analog and hybrid gauge clusters and becoming standard in the center information display and passenger entertainment areas of the vehicle. However, these displays lack the image quality and contrast ratio that consumers experience with their personal electronics.
The next alternative you might assume would be emissive displays, such as organic LEDs (OLEDs) or micro LEDs to achieve the ideal automotive display. But numerous design and fabrication challenges – including lifetime, cost
and peak brightness concerns – have delayed the implementation of OLED displays in automotive systems.
Lighting LCDs in automotive applications
Automotive displays have traditionally used globally dimmed edge-lit backlight architectures to illuminate through the liquid-crystal and color-filter layers in the thin-field transistor (TFT) LCD panel to generate colored pixels. The liquid crystals allow light to go through or block light from passing to the color filter creating each subpixel. LCD panels with global backlight architectures create light everywhere, regardless of whether the subpixel is on or off, and rely solely on the liquid crystals to block light. The LCD panel’s intrinsic ability to block light will determine the contrast ratio and black levels of the display as shown in Figure 1.
Figure 1: The layers within an LCD panel1
129

OLEDs in automotive applications
OLEDs and micro LEDs are emissive-based displays, a single pixel is formed by three RGB sub-pixel LEDs. In contrast to TFT LCD panels, emissive displays only generate light where pixels are needed. OLED displays have a greater contrast ratio – as much as 1 million-to-1 – compared to 2,000-to-1 in normal TFT LCD displays. They also have lower peak-illuminance capabilities, which are important in automotive displays in order to overcome bright ambient light conditions. The lower contrast ratios and black levels of automotive displays can cause unpleasant night-time viewing, when black cluster and gauge backgrounds and menus produce a gray-hue effect from the LCD light leakage.
While many have expected OLED technology to become more widespread in automotive applications for years, it has yet to proliferate due to lifetime, peak brightness and cost concerns.
The case for local dimming
A local-dimming backlight technology is a direct-lit architecture where the LEDs are directly behind the LCD panel as shown in Figure 2. Each LED or zone of LEDs can dim individually to illuminate only those pixels of the display that are needed by dynamically adapting to the image content on the display.
Figure 2: Switching LEDs individually to achieve a better display
A local-dimming backlight technology can help you achieve greater contrast ratios, maintain high peak illuminance, and remain within automotive environmental and cost limits.
The benefits of using a full-array local dimming architecture include:
The mitigation of light leakage by dimming the backlight zones where the pixels have darker content.
Improved contrast ratios (up to several hundred thousand-to-one) depending on the number of zones, peak brightness and the native contrast ratio of the display.
Lower power consumption compared to globally dimmed backlights, since the LEDs are not lit unless needed.
Table 1 compares the benefits and considerations for automotive display options.
Table 1: A side-by-side comparison of display options
130

Design factors for implementing local dimming
System cost and performance of a local dimming system are directly related to the number of LEDs and zones. If there are too few zones, the resulting zone size will be too large, and a halo effect will occur where light bleeds into pixels that need to be fully dark for the best contrast. Other causes of the halo effect include a light spread function of the particular zone, zone overlap, spatial filters in the dimming algorithm, and the native contrast ratio of the LCD panel.
To achieve the native contrast ratios required for undetectable halo-effect levels comparable to OLEDs, one study2 concluded that an LCD with a 5,000-to-1 contrast ratio requires 200 local dimming zones, while a 2,000-to-1 contrast ratio requires over 3,000 local dimming zones.
Figures 3 and 4 demonstrate the light leakage in globally dimmed and locally dimmed displays, respectively. Figure 4 shows the higher black levels realized by local dimming and the halo artifact introduces immediately surrounding the white circle. Figure 3 shows a traditional edge-lit LCD with no halo effect, but with a lower contrast ratio due to the light leakage of the LCD.
Figures 3 and 4 compare the backlight and resulting light leakage of globally dimmed and locally dimmed displays
Careful consideration needs to be taken during the definition of the local dimming system parameters to ensure that local dimming performance outweighs the added system cost and artifacts introduced. Thickness of the backlight module, halo effect, thermals and system cost are all trade-offs to consider.
The number of dimming zones and LEDs per zone are the main priorities when designing a local dimming system. This combination defines the pitch of the LED array, which impacts the backlight module’s overall thickness to achieve homogenous light distribution across the display.
In addition to optical layers, such as diffusers and polarizers, increasing the air gap between the LEDs and panel glass will better distribute the light evenly through the panel. The number of dimming zones is directly proportional to the amount of halo artifact created by the system, as more zones will better match the display’s pixels and reduce the unwanted illumination of dark pixels.
Components of an automotive display local dimming system
An automotive local dimming backlight module and LCD display system have similar but slightly modified components when compared to a traditional globally dimmed backlight system. The major components include a timing controller (TCON), LED drivers and LED backlight unit, as shown in Figure 5.
Figure 5: The components of a local dimming system for automotive displays
The TCON will convert a video input, such as Open Low-Voltage Differential Signaling (LVDS) interface, LVDS or Red-Green-Blue, into control signals for the source and row drivers in the LCD panel. In a local dimming system, the TCON is specialized to include the internal processing and histogram calculations for the individual zone dimming, with a Serial Peripheral Interface (SPI) output to control the LED drivers.
Traditional edge-lit backlight units contain 20 to 80 LEDs along the edge in conjunction with light guides, diffusers and polarizers. The locally dimmed LED backlight unit will contain anywhere from 96 to as many as 1,000 LEDs or more uniformly dispersed in a grid, directly behind the LCD to be illuminated. The LEDs are individually, or sometimes grouped together as two or four LEDs in series or in parallel, controlled by a single low-side channel from the LED driver.
Instead of the single four-to-six-channel low-side LED driver used in edge-lit architectures, a local dimming architecture uses multiple 16- to 48-channel LED drivers to achieve the higher zone counts. Multiple LED drivers can have the control signals daisy-chained together to provide an easily controlled and scalable approach based on the number of zones needed.
131

Table 2 compares OLED, local dimming and traditional edge-lit globally dimmed backlight implementations.
Table 2: A comparison of display lighting options
Parameter OLED / micro-LED
Full array locally
dimmed
Edge-lit, globally dimmed
Number of zones Millions
100 to 1,000s
4 to 6
LEDs per zone 1 1 to >4 20 to 40
Current per string N/A 10-50 mA 100-200 mA
Full-array local dimming in automotive displays could bridge the gap in performance displays in the consumer market. Local dimming improves the contrast ratio of traditional edge-lit LCD displays that underperform due to their low native contrast ratio and light leakage.
Conclusion Automotive displays are subject to much more environmental variations than their consumer-grade counterparts: whether it’s day, night, hot, cold, or even whether the car bounces up and down as it travels over a rough road. Vehicle displays have strict temperature operating ranges; electromagnetic emission restrictions; and immunity, vibration and lifetime standards. Many of the technology advances in consumer displays fail to overcome these strict environmental requirements, but automotive OEMs must still provide similar performance that users expect from their personal electronics. OLED and globally dimmed displays are either too expensive or do not provide the performance that customers want. Local dimming can provide a balanced trade-off between price and performance while meeting the strict environmental constraints of an automotive system.
The key takeaway for designing a local dimming system for an automotive display is to choose the right number of LEDs spread across the right number of zones. To see more technical information and a demonstration of the local dimming backlight architecture, learn more here: out, Automotive 144-Zone Local Dimming Backlight Reference Design. References 1. Rasmussen, Torben “OLED vs. LCD,” FlatpanelsHD,
https://www.flatpanelshd.com/focus.php?subaction=showfull&id=1474618766 , 23 September 2016.
2. Guanjun Tan, Yuge Huang, Ming-Chun Li, Seok-Lyul Lee, and Shin-Tson Wu, "High dynamic range liquid crystal displays with a mini-LED backlight," Opt. Express 26, 16572–16584 (2018)
132