the vermont energy digest
TRANSCRIPT
An Inventory Of Renewable Energy And Efficiency
Vermont Council On Rural Development
April 2007
The Vermont Energy Digest
Acknowledgements
The Vermont Council on Rural Development deeply appreciates the support of each of the sponsors of this report, which is a component of the Vermont Rural Energy Council (VREC): Casella Waste Systems, Windham Foundation, VT Agency of Transportation, VT Agency of Natural Resources, VT Sustainable Futures Fund, Vermont Department of Public Service, High Meadows Fund, VT Agency of Agriculture, USDA Rural Development and Ben & Jerry’s. Printing for this publication was provided by National Life Insurance Group.
The VCRD would like to thank the many people who generously shared their time and expertise in the development of this report. Special thanks go to the following people for providing technical information and chapter reviews: Lori Barg, Paula Calabrese, Robert DeGeus, Dave DiDomenico, Robert Foster, Kim Greenwood, Blair Hamilton, Frances Huessy, Dave Lamont, Mike McQueeney, Lawrence Mott, Matt Orio, Andrew Perchlik, Diona Roberg, Leigh Seddon, Scott Sawyer, Daniel Scruton, Richard Smith, Netaka White, John Warshow, and Jeffrey Wolfe.
Research on this report began in late 2006. Every effort has been made to present accurate information, but changes are occurring rapidly in this dynamic sector. VCRD encourages readers to use the Resource and Reference Lists in the appendices found online at www.vtrural.org to obtain more detailed and up-to-date information. The author apologizes for any factual errors or outdated information.
Vermont Council on Rural Development
The Vermont Council on Rural Development is a non-profit organization dedicated to helping Vermonters and Vermont communities develop their capacity to create a prosperous and sustainable future through coordination, collaboration, and the effective use of public and private resources. A dynamic partnership of federal, state, local, non-profit, and private partners, VCRD is uniquely positioned to sponsor and coordinate committees concerned with policy questions of rural import.
The Vermont Energy Digest was researched and written by Brenda Hausauer
For additional copies of this report, contact:
Vermont Council on Rural Development89 Main St., PO Box 1384
Montpelier, VT 05602802-828-6022
Design and Layout: Newcomb Studios

An Inventory of Renewable Energy and Efficiency
�
Table of Contents
Introduction . . . . . . . . . . . . . . . . . . . . . . . . . . . . . . . . . . . . . . . . . . . . . . . . . . . . . . . . . . . . . . 2
An Energy Snapshot . . . . . . . . . . . . . . . . . . . . . . . . . . . . . . . . . . . . . . . . . . . . . . . . . . . . . . . . 3
Efficiency and Conservation . . . . . . . . . . . . . . . . . . . . . . . . . . . . . . . . . . . . . . . . . . . . . . . . . 12
Electrical Efficiency and Conservation . . . . . . . . . . . . . . . . . . . . . . . . . . . . . . . . . . . . . . 12
Transportation Efficiency and Conservation . . . . . . . . . . . . . . . . . . . . . . . . . . . . . . . . . . 15
Efficiency and Conservation in Other Sectors . . . . . . . . . . . . . . . . . . . . . . . . . . . . . . . . . 19
Wood Energy . . . . . . . . . . . . . . . . . . . . . . . . . . . . . . . . . . . . . . . . . . . . . . . . . . . . . . . . . . . . 21
Farm Biogas . . . . . . . . . . . . . . . . . . . . . . . . . . . . . . . . . . . . . . . . . . . . . . . . . . . . . . . . . . . . . 27
Landfill Biogas . . . . . . . . . . . . . . . . . . . . . . . . . . . . . . . . . . . . . . . . . . . . . . . . . . . . . . . . . . . 32
Biofuels . . . . . . . . . . . . . . . . . . . . . . . . . . . . . . . . . . . . . . . . . . . . . . . . . . . . . . . . . . . . . . . . 36
Wind Energy . . . . . . . . . . . . . . . . . . . . . . . . . . . . . . . . . . . . . . . . . . . . . . . . . . . . . . . . . . . . .41
Solar Energy . . . . . . . . . . . . . . . . . . . . . . . . . . . . . . . . . . . . . . . . . . . . . . . . . . . . . . . . . . . . . 47
Hydroelectric Energy . . . . . . . . . . . . . . . . . . . . . . . . . . . . . . . . . . . . . . . . . . . . . . . . . . . . . . 51
Geothermal Energy . . . . . . . . . . . . . . . . . . . . . . . . . . . . . . . . . . . . . . . . . . . . . . . . . . . . . . . . 54
Appendices. . . . . . . . . . . . . . . . . . . . . . . . . . . . . . . . . . . . . . . . . . . . . . . . . . . . . . . . . . . . . . 56
The following appendices can be found in the online version of this report, at www.vtrural.org.
• Vermont Incentives for Renewables and Efficiency
• Recent Vermont Laws and Programs
• Resources
• Reference List
The VermonT energy DigesT
�
Vermonters began the year 2007 with a sharpened awareness of a changing climate and a growing interest in a complex array of renewable energy options. Governor Douglas and the Legislature
have stated their commitment to understanding and building this important sector in Vermont. Community groups have formed, technologies are being developed, and opportunities are unfolding that could seed economic growth for Vermont businesses, farmers and entrepreneurs. Renewable energy is a rapidly changing and diverse field. Clearly there is a need for a concise source of information about current developments in renewable energy, Vermont’s potential for growth in each sector, and barriers to consider in forming wise choices in renewable energy development, production and use.
The Vermont Council on Rural Development (VCRD) presents this Digest in response to that need. The Digest is an overview of eight distinct renewable energy sectors: wood, farm biogas, landfill biogas, biofuels, wind, solar, hydroelectric and geothermal, including a survey of interna-tional and national practices in each field, Vermont’s current and potential market, and barriers to progress. The Digest also presents a snapshot of current energy programs and incentives, and an examination of efficiency and conserva-tion practices in electricity, transportation and other specific sectors.
VCRD has developed this document as part of the work of the Vermont Rural Energy Council (VREC), which is in the process of evaluating opportunities in renewable energy generation, fuel development and efficiency in Vermont. In August 2006, VCRD convened the “Local Power” Energy
Introduction
Summit at Lyndon State College, drawing more than 350 participants to share their expertise and ideas about the state’s energy future. In June 2006 VCRD launched VREC, a 26-member council conducting a comprehensive year-long study that will conclude with the July 2007 publication of recommendations for federal, state, and private agencies toward advancing Vermont opportunities for local energy generation, fuel development and expanded efficiencies (the Summit report, VREC membership and Council Charge can be found at www.vtrural.org). Finally, VCRD has commis-sioned economic modeling research designed to analyze the economic risks and opportunities of various energy sectors under diverse scenarios. The results of that project will be released in conjunction with VREC’s final report.
The Vermont Energy Digest serves as a companion to the VREC final report. It brings together information on the existing state of renewable energy development and efficiency in Vermont through a review of all pertinent available sources. Inevitably the Digest contains data and analysis from numerous and, in some cases, conflicting sources. The Digest is not designed to serve as a final statement or to arbitrate among different views, and it makes no recommendations; rather, it provides a baseline from the best available data for VREC and all parties interested in the future development of renewable energy and efficiency in Vermont.
Efficiency and renewable energy development and generation present emerging opportunities to stimulate Vermont’s rural economy, strengthen communities, and protect the state’s environmental integrity. VCRD hopes that you will find this a useful resource in understanding this vital sector.
An Inventory of Renewable Energy and Efficiency
�
WorldWide and U.S. energy USe
The way we use energy rarely has been so much on our minds. Federal, state, and local governments around the world are devoting serious attention to energy initiatives. Oil prices have risen, and there
are security impacts around the world. Global climate change is a concern in most nations, and extreme weather events appear to be increasing. There is discussion about when the world’s oil supply will peak and then start to decline. Meanwhile, population continues to rise; developing countries grow their economies; and the 1.6 billion people who still do not have electricity strive to have a better life – all requiring more energy (International Energy Agency, World Energy Outlook 2006).
Worldwide energy use doubled between 1970 and 2004 to 443 quadrillion BTU, with the U.S. using the highest amount per person (U.S. Energy Information Administration, Annual Energy Review 2005.) The U.S. consumed 343 million BTU per person in 2005, compared with 147 per person in Europe, and 70 per person worldwide (U.S. Energy Information Administration, International Energy Annual 2004.) The United States was the largest consumer of oil in 2005, using nearly one-fourth of the world’s total (Worldwatch Institute, July 2006).
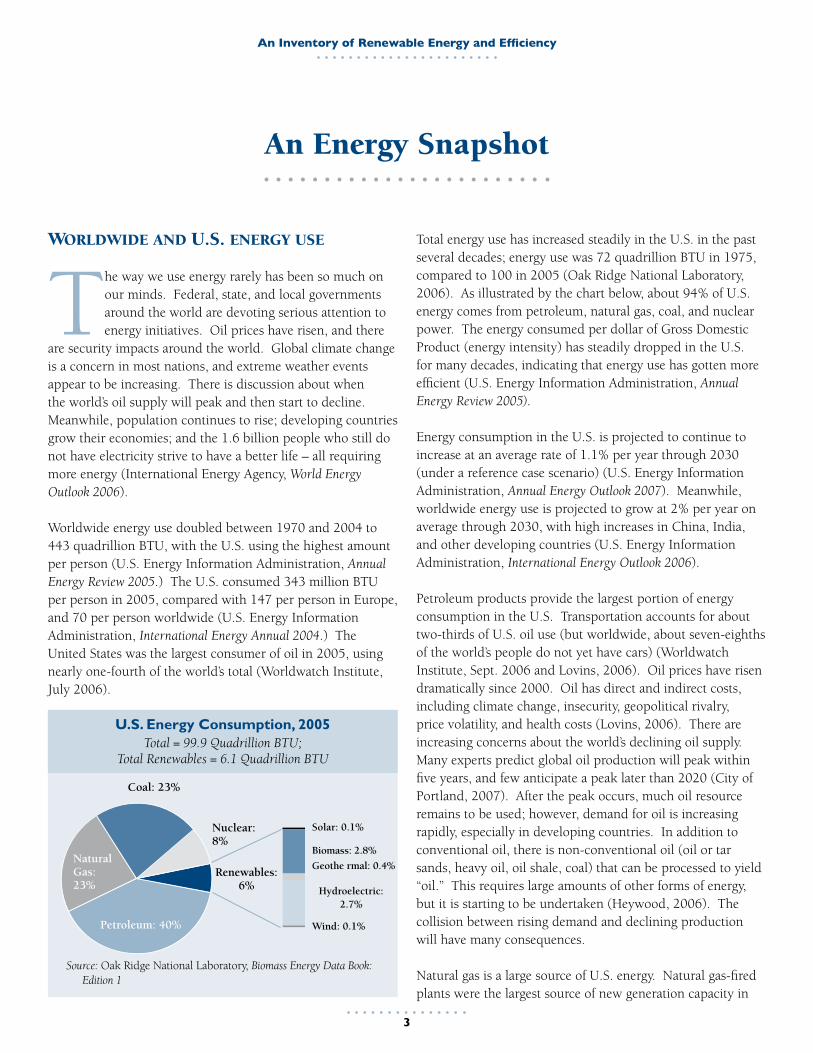
Total energy use has increased steadily in the U.S. in the past several decades; energy use was 72 quadrillion BTU in 1975, compared to 100 in 2005 (Oak Ridge National Laboratory, 2006). As illustrated by the chart below, about 94% of U.S. energy comes from petroleum, natural gas, coal, and nuclear power. The energy consumed per dollar of Gross Domestic Product (energy intensity) has steadily dropped in the U.S. for many decades, indicating that energy use has gotten more efficient (U.S. Energy Information Administration, Annual Energy Review 2005).
Energy consumption in the U.S. is projected to continue to increase at an average rate of 1.1% per year through 2030 (under a reference case scenario) (U.S. Energy Information Administration, Annual Energy Outlook 2007). Meanwhile, worldwide energy use is projected to grow at 2% per year on average through 2030, with high increases in China, India, and other developing countries (U.S. Energy Information Administration, International Energy Outlook 2006).
Petroleum products provide the largest portion of energy consumption in the U.S. Transportation accounts for about two-thirds of U.S. oil use (but worldwide, about seven-eighths of the world’s people do not yet have cars) (Worldwatch Institute, Sept. 2006 and Lovins, 2006). Oil prices have risen dramatically since 2000. Oil has direct and indirect costs, including climate change, insecurity, geopolitical rivalry, price volatility, and health costs (Lovins, 2006). There are increasing concerns about the world’s declining oil supply. Many experts predict global oil production will peak within five years, and few anticipate a peak later than 2020 (City of Portland, 2007). After the peak occurs, much oil resource remains to be used; however, demand for oil is increasing rapidly, especially in developing countries. In addition to conventional oil, there is non-conventional oil (oil or tar sands, heavy oil, oil shale, coal) that can be processed to yield “oil.” This requires large amounts of other forms of energy, but it is starting to be undertaken (Heywood, 2006). The collision between rising demand and declining production will have many consequences.
Natural gas is a large source of U.S. energy. Natural gas-fired plants were the largest source of new generation capacity in
An Energy Snapshot
Source: Oak Ridge National Laboratory, Biomass Energy Data Book: Edition 1
U.S. Energy Consumption, 2005Total = 99.9 Quadrillion BTU;
Total Renewables = 6.1 Quadrillion BTU
Coal: 23%
Nuclear: 8%
Renewables: 6%
Petroleum: 40%
Natural Gas: 23%
Solar: 0.1%
Biomass: 2.8%
Geothe rmal: 0.4%
Wind: 0.1%
Hydroelectric: 2.7%

The VermonT energy DigesT
�
the U.S. in 2005 (Worldwatch Institute, Sept. 2006). Natural gas prices also have risen sharply in recent years, due to a decline in U.S. supply. The worldwide supply of natural gas is projected to peak in the same time frame or shortly after oil production peaks. Natural gas use produces fewer emissions than oil or coal.
Coal will remain abundant long after oil and natural gas have become scarce. More than 100 coal-fired power plants are in the planning stages in the U.S.; other countries, including China, also are building large numbers of them (Worldwatch Institute, Sept. 2006 and Hawkins, 2006). Coal’s market price is low, but the total costs of its extraction, processing, and consumption are high. Impacts from coal mining include dangers to coal miners, landscape and ecosystem destruction, and groundwater and surface water pollution. Coal power plants produce acid rain, fine particulate emissions, smog, ground-level ozone, and mercury emissions, with associated human health costs. Finally, burning coal produces more carbon dioxide per unit of electricity generation than burning either natural gas or oil (Hawkins, 2006).
A technique for addressing carbon dioxide emissions from coal-fired plants is called carbon dioxide capture and storage (CCS). This involves separating out much of the carbon dioxide created when coal is burned, and then storing it underground in depleted oil or gas fields or in saline formations. This technology would require 20% - 30% extra energy to undertake compared to releasing the carbon dioxide. If CCS is required in the future, it would make coal generation more expensive, and cleaner sources more desirable (Hawkins, 2006).
Nuclear power, along with hydroelectric energy, is the largest source of “carbon-free” power today. Growing concerns about global warming are leading governments and power providers to consider building a substantial number of additional nuclear power plants. The U.S. Energy Policy Act of 2005 included a tax credit to encourage new nuclear plants. In the future, if carbon emissions are priced in the U.S., nuclear power could become less expensive than generation from fossil fuels. Issues with nuclear power include high capital costs, the uncertainty of nuclear waste management and disposal, nuclear weapons risks, and security issues (Deutch, 2006).
reneWable energy USe and energy efficiency
Renewable energy – including solar, wind, hydro, biomass, and geothermal – provides about 6% of U.S. energy use,
but that percentage could increase in the years ahead. Most renewable energy sectors have experienced rapid growth and investment in the past several years, because of concerns about higher oil and natural gas prices, global climate change, energy security and dependence on foreign nations. At the same time, renewable energy costs have declined and their technologies have improved. These factors have combined to create an unprecedented level of interest in renewable sources and efficiency. Recent developments worldwide show the potential:
• Global wind energy has more than tripled since 2000.• Production of solar photovoltaics is one of the world’s
fastest-growing industries.• Biodiesel from vegetable oil and waste expanded nearly
four-fold between 2000 and 2005.• Energy efficiency measures have reduced total U.S. energy
use per dollar of gross national product by 49% since the 1970s.
Worldwide investment in renewable energy (excluding large hydropower) was estimated at $38 billion in 2005. Renewable energy investments have nearly doubled during the past three years (Worldwatch Institute, Sept. 2006). In the U.S., venture capitalists and private equity investments in clean energy companies increased from $2.7 billion in 2005 to $7.1 billion in 2006 (U.S. Dept. of Energy, January 24, 2007). By 2009, clean energy is expected to attract more than 10% of venture capital investments (Sulaiman, 2006).
These growth rates are bringing new economic opportuni-ties to people around the world. Today, renewable energy manufacturing, operations, and maintenance provide about 2 million jobs worldwide (Worldwatch Institute, Sept. 2006). Renewable energy creates more jobs per unit of energy produced and per dollar spent than fossil fuel technologies create. Several studies have shown that increased renewable energy use would have large positive impacts on the U.S. economy, including a significant number of new jobs, more capital investment, more stable energy prices, and lower consumer costs. For example, a 2004 Union of Concerned Scientists analysis found that if 20% of our electricity supply came from renewable sources by 2020, 355,000 new U.S. jobs would be created (Worldwatch Institute, 2006). A study for New England showed that the combined effects of energy efficiency and renewable energy between 2000 through 2010 would have net impacts of adding $6.1 billion to the economy and providing 28,000 job-years (Regulatory Assistance Project, 2005).

An Inventory of Renewable Energy and Efficiency
�
Other countries currently lead the world in renewable energy technolo-gies and installations. Germany and Spain are leaders in wind power, Japan and Germany in solar power, and China in small hydropower, all the result of strong and continuing governmental policies adopted years ago. Many U.S. states and the federal government now are developing policies more favorable to renewables. For example, all but four U.S. states had incentives in place to promote renewable energy as of late 2006, and more than a dozen had enacted new renewable energy laws in the past few years (Worldwatch Institute, Sept. 2006).
Renewable energy sources have many benefits in common. They lessen global warming, air pollution, and water pollution. They are reliable, their prices are stable, and they diversify our fuel portfolios. Most renewable energy is or can be more localized, providing income to farmers and landowners, local tax revenue, new local jobs and investment, and energy security at a local level.
Environmental concerns
Because energy efficiency and most renewable sources add little or no carbon dioxide or air emissions to the atmosphere, they offer significant environmental advantages over fossil fuels.
The risk of climate change caused by energy use is attracting attention around the world. Atmospheric carbon dioxide levels have climbed 20% since the measurements began in 1959, and are now higher than at any time in the past 650,000 years. During the past century, the average global temperature has increased by 1.8 degrees Fahrenheit; more than half of this warming has taken place in the past 30 years, meaning that the warming trend is accelerating (Worldwatch Institute, 2006). The five warmest years worldwide since the late 1880s were 2005, 1998, 2002, 2003, and 2006 (NASA, 2007). The Intergovernmental Panel on Climate Change has concluded that it is “very likely,” or 90% probable, that human activity causes global warming (O’Carroll, 2007). The expected impacts of climate change are rising sea levels; flooding in coastal areas; increasing frequency and severity of floods, droughts, storms, and heat waves; reduced agricul-tural production; massive species extinctions; and the spread of vector-borne diseases such as malaria. The World Health Organization estimates that climate change already is
responsible for 150,000 deaths annually (Worldwatch Institute, 2006).
Power plants, motor vehicles, and industries that burn fossil fuels emit many pollutants that harm human health and the environment. Premature deaths, asthma attacks, cancer, develop-mental disorders, and neurological and reproductive problems can be caused by air pollution from energy use. The result is more than $160 billion per year in
medical expenses due to air pollution from just power plants (Worldwatch Institute, 2006). Acid rain, primarily from coal plants, damages buildings, crops, forests, lakes, and rivers. Mercury, arsenic, and lead are released when coal and oil are burned and find their way into drinking water; once in the environment, these toxic metals stay in the fatty tissues of humans and animals. In 2004, the EPA warned that fish in nearly all of the nation’s lakes and streams are contami-nated with mercury. Conventional power plants also create water pollution, while fuel extraction and transport present additional health and environmental problems.
Laws and programs
There are many laws, incentives, subsidies, programs, and lawsuits underway throughout the world and across the country related to renewable energy and climate change. A summary of the federal incentives for renewables and efficiency is provided at www.dsireusa.org.
The federal Energy Policy Act of 2005 is a broad law that created various tax incentives and loan guarantees for renewable energy sources and other fuel sources. The Renewable Electricity Production Credit is a per kilowatt-hour federal tax credit for electricity generated and sold by qualified renewable energy resources, for facilities built before the end of 2008.
The U.S. Congress now is considering a federal renewable portfolio standard, which would require utilities to provide a certain amount of energy from renewable sources by a specific date. Meanwhile, nearly one-half of states have a renewable energy portfolio standard (Ekhart, 2006). For example, California has a requirement that power companies must buy 20% of their electricity from renewable sources by 2010.
Green markets, which provide market-based choices allowing customers to purchase electricity from renewable sources,
Most renewable energy sectors have experienced rapid growth and investment in the
past several years, because of concerns about higher oil and natural gas prices,
global climate change, energy security and dependence on
foreign nations.
The VermonT energy DigesT
�
have grown in the past several years. Electricity is now viewed as having two components: the actual energy, and the way it was produced. When power is produced from a renewable source, the environmental attributes can be sold as a separate commodity.
According to the U.S. Department of Energy, nearly 600 utilities in the U.S. offer some type of green pricing or renewable choice program, which gives customers the option of supporting a greater level of utility investment in renewable sources (Central Vermont Public Service). Participating customers pay a premium on their electric bills to cover the additional cost of renewable energy. Utilities then use the money to purchase renewable power or Renewable Energy Certificates, or invest in renewable power projects.
Green power marketing refers to selling green power in competitive electricity markets, in which multiple suppliers and service offerings exist. Competitive marketers have offered green power to retail or wholesale customers in several states so far.
There also are marketers of Renewable Energy Certificates (RECs) (also known as green tags), which are the environ-mental attributes of the power produced from a renewable energy project. Consumers can purchase RECs from such companies without having to switch electricity suppliers. Carbon dioxide offsets are similar to RECs, but are credits that reduce carbon dioxide emissions through renewable energy projects, energy efficiency, and other methods. For example, Vermont company Native Energy sells RECs and carbon dioxide offsets; customers can calculate the amount of carbon dioxide they produce from their activities, and purchase RECs to offset those emissions and make their activities “carbon neutral.” Vermont companies including Green Mountain Coffee Roasters, Ben and Jerry’s, and Annie’s Homegrown are customers (Native Energy). The number of purchasers of RECs and offsets is growing around the country. For instance, 51 ski resorts nationwide use at least some renewable energy credits. In Vermont, Okemo, Smugglers Notch, Stratton, Sugarbush, and Middlebury Ski Bowl offset some or all of their usage (National Ski Areas Association). Information about green markets is at www.eere.energy.gov/greenpower/index.shtml.
Vermont’s energy use
Many of the concerns that have been growing nationwide are reflected in Vermont. Vermonters are increasingly concerned about global warming. In 2005 and 2006, there were
significant changes to Vermont law, regulatory initiatives, stakeholder engagement efforts, and developments in the market around energy use, and many people in state, private, and non-profit sectors are working on these issues. In 2006, Governor Douglas endorsed the “25 by 25” vision, a national initiative whose goal is that by 2025 America’s farms, forests, and ranches will provide 25 percent of the total energy consumed in the U.S. Governor Douglas, in his 2007 State of the State speech, proposed incentives for purchasing fuel-efficient cars and for using biofuels (Porter, 2007). The 2007 Legislature spent its first few weeks hearing from nationally-known energy experts on strategies for reducing global warming emissions, and is considering energy-related legislation. On the Congressional front, Vermont Senators Bernard Sanders and Patrick Leahy announced in January 2007 they were co-sponsoring a bill to reduce pollution associated with global warming (Audette, 2007).
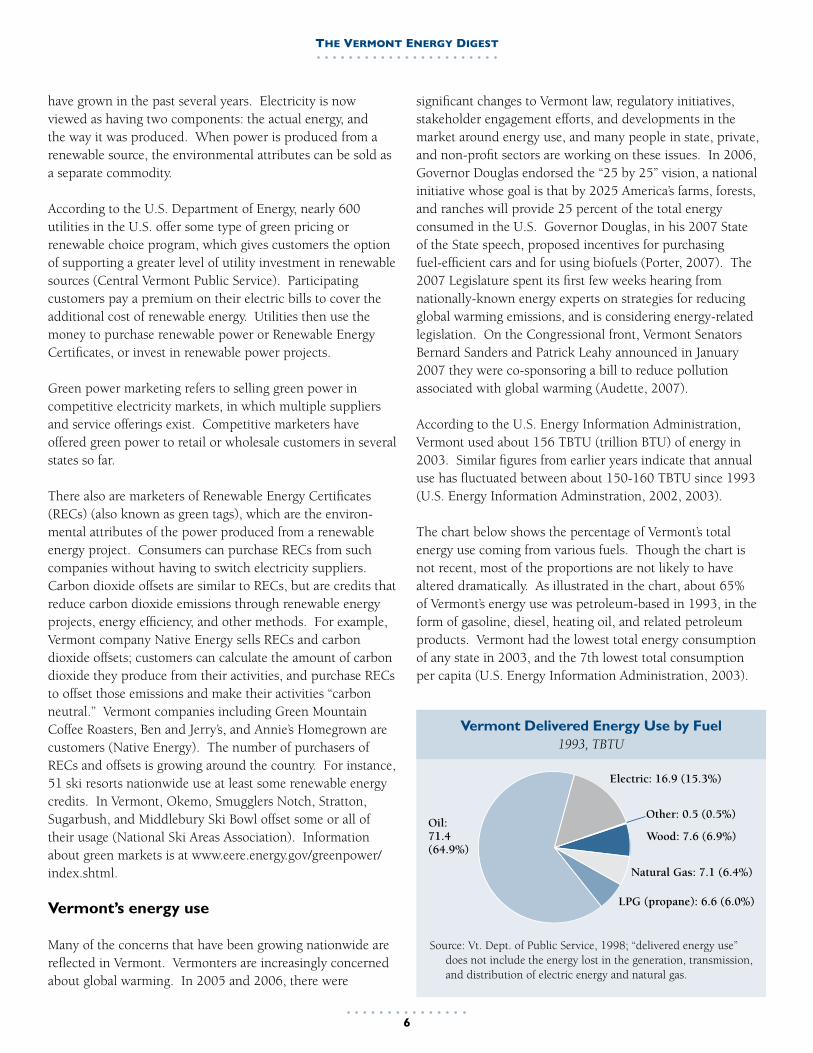
According to the U.S. Energy Information Administration, Vermont used about 156 TBTU (trillion BTU) of energy in 2003. Similar figures from earlier years indicate that annual use has fluctuated between about 150-160 TBTU since 1993 (U.S. Energy Information Adminstration, 2002, 2003).
The chart below shows the percentage of Vermont’s total energy use coming from various fuels. Though the chart is not recent, most of the proportions are not likely to have altered dramatically. As illustrated in the chart, about 65% of Vermont’s energy use was petroleum-based in 1993, in the form of gasoline, diesel, heating oil, and related petroleum products. Vermont had the lowest total energy consumption of any state in 2003, and the 7th lowest total consumption per capita (U.S. Energy Information Administration, 2003).
Vermont Delivered Energy Use by Fuel1993, TBTU
Oil:71.4(64.9%)
Source: Vt. Dept. of Public Service, 1998; “delivered energy use” does not include the energy lost in the generation, transmission, and distribution of electric energy and natural gas.
Electric: 16.9 (15.3%)
Other: 0.5 (0.5%)
Wood: 7.6 (6.9%)
Natural Gas: 7.1 (6.4%)
LPG (propane): 6.6 (6.0%)
An Inventory of Renewable Energy and Efficiency
�
Vermonters now spend more than $2 billion per year on energy, or about $3,000 for every Vermonter (Sachs, 2006).
Electricity use in Vermont
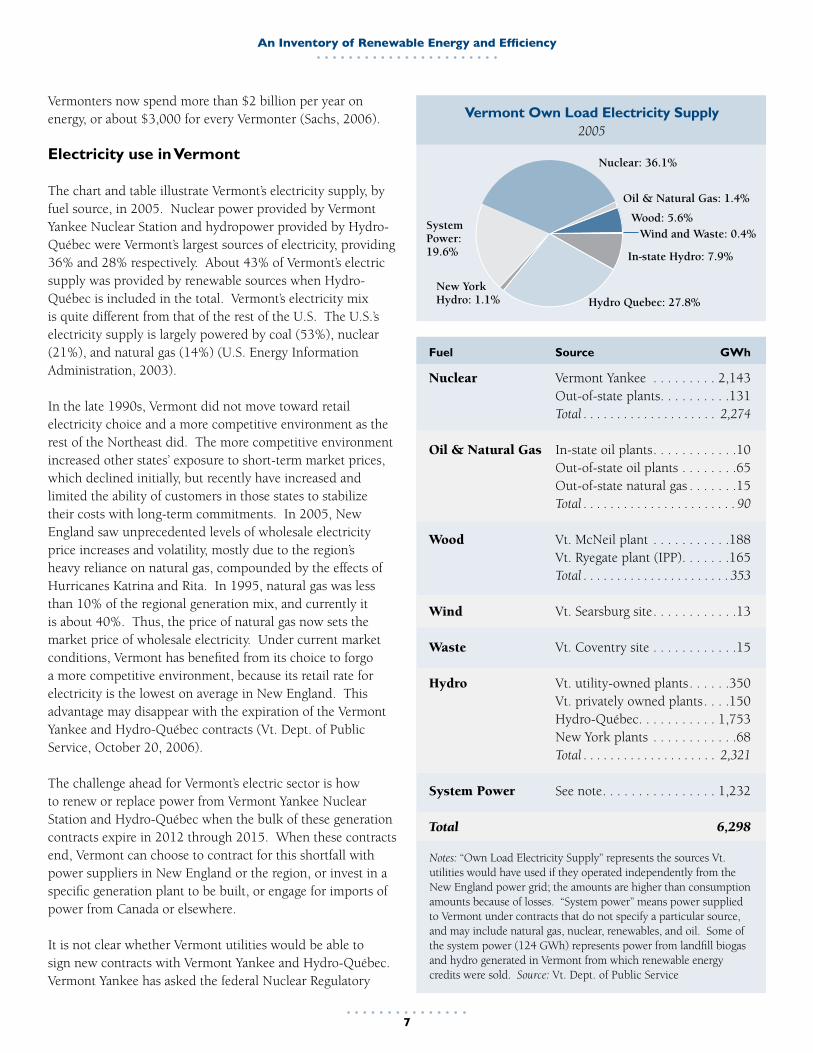
The chart and table illustrate Vermont’s electricity supply, by fuel source, in 2005. Nuclear power provided by Vermont Yankee Nuclear Station and hydropower provided by Hydro-Québec were Vermont’s largest sources of electricity, providing 36% and 28% respectively. About 43% of Vermont’s electric supply was provided by renewable sources when Hydro-Québec is included in the total. Vermont’s electricity mix is quite different from that of the rest of the U.S. The U.S.’s electricity supply is largely powered by coal (53%), nuclear (21%), and natural gas (14%) (U.S. Energy Information Administration, 2003).
In the late 1990s, Vermont did not move toward retail electricity choice and a more competitive environment as the rest of the Northeast did. The more competitive environment increased other states’ exposure to short-term market prices, which declined initially, but recently have increased and limited the ability of customers in those states to stabilize their costs with long-term commitments. In 2005, New England saw unprecedented levels of wholesale electricity price increases and volatility, mostly due to the region’s heavy reliance on natural gas, compounded by the effects of Hurricanes Katrina and Rita. In 1995, natural gas was less than 10% of the regional generation mix, and currently it is about 40%. Thus, the price of natural gas now sets the market price of wholesale electricity. Under current market conditions, Vermont has benefited from its choice to forgo a more competitive environment, because its retail rate for electricity is the lowest on average in New England. This advantage may disappear with the expiration of the Vermont Yankee and Hydro-Québec contracts (Vt. Dept. of Public Service, October 20, 2006).
The challenge ahead for Vermont’s electric sector is how to renew or replace power from Vermont Yankee Nuclear Station and Hydro-Québec when the bulk of these generation contracts expire in 2012 through 2015. When these contracts end, Vermont can choose to contract for this shortfall with power suppliers in New England or the region, or invest in a specific generation plant to be built, or engage for imports of power from Canada or elsewhere.
It is not clear whether Vermont utilities would be able to sign new contracts with Vermont Yankee and Hydro-Québec. Vermont Yankee has asked the federal Nuclear Regulatory
System Power:19.6%
Nuclear: 36.1%
Oil & Natural Gas: 1.4%
Wood: 5.6%Wind and Waste: 0.4%
In-state Hydro: 7.9%
Notes: “Own Load Electricity Supply” represents the sources Vt. utilities would have used if they operated independently from the New England power grid; the amounts are higher than consumption amounts because of losses. “System power” means power supplied to Vermont under contracts that do not specify a particular source, and may include natural gas, nuclear, renewables, and oil. Some of the system power (124 GWh) represents power from landfill biogas and hydro generated in Vermont from which renewable energy credits were sold. Source: Vt. Dept. of Public Service
New York Hydro: 1.1% Hydro Quebec: 27.8%
Fuel Source GWh
Nuclear Vermont Yankee . . . . . . . . . 2,143 Out-of-state plants . . . . . . . . . .131 Total . . . . . . . . . . . . . . . . . . . . 2,274
Oil & Natural Gas In-state oil plants . . . . . . . . . . . .10 Out-of-state oil plants . . . . . . . .65 Out-of-state natural gas . . . . . . .15 Total . . . . . . . . . . . . . . . . . . . . . . . 90
Wood Vt. McNeil plant . . . . . . . . . . .188 Vt. Ryegate plant (IPP) . . . . . . .165 Total . . . . . . . . . . . . . . . . . . . . . . 353
Wind Vt. Searsburg site . . . . . . . . . . . .13
Waste Vt. Coventry site . . . . . . . . . . . .15
Hydro Vt. utility-owned plants . . . . . .350 Vt. privately owned plants . . . .150 Hydro-Québec . . . . . . . . . . . 1,753 New York plants . . . . . . . . . . . .68 Total . . . . . . . . . . . . . . . . . . . . 2,321
System Power See note . . . . . . . . . . . . . . . . 1,232
Total 6,298
Vermont Own Load Electricity Supply2005
The VermonT energy DigesT
�
Commission for a new license extending until 2032, and the plant recently received permission to increase its power output by 20% to about 650 MW. Energy experts say Hydro-Québec is likely to have some power to sell after Vermont’s contracts expire, though likely not at the price Vermont now receives (Porter, 2006).
Under Act 208, a public engagement process will gather ideas about how to address electric supply choices facing the state beginning in 2012. The Vt. Dept. of Public Service initiated a mediated modeling process that has developed an interactive model of energy scenarios to inform the debate. Vermont utilities also are engaged in efforts to examine the feasibility of alternatives (Vt. Dept. of Public Service, October 20, 2006).
ISO – New England, the manager of the regional power grid, estimates that by 2020 New England will need 8,000 more megawatts of new resources. More natural-gas-powered facilities are proposed, but there is a growing consensus that fuel diversity is needed for the region. There has been public opposition to new proposals for natural gas, coal, nuclear, and wind power in the region. Meanwhile, Québec recently released a new energy strategy calling for 4,500 megawatts of new hydro-electric projects and several new wind power projects, some of which could produce power for export to the U.S. Newfoundland and Labrador also want to construct a hydroelectric project and export its power to the U.S. (Kenway, 2006). In an effort to spur the development of power plants that provide power during peak electricity times, ISO – New England has created a forward capacity market in which developers can bid their generation units into a capacity market and, if accepted, receive guaranteed payments for several years. The initial results from this have drawn a large and diverse set of potential generation resources (Lamont, 2007).
Vermont and New England experienced record-breaking peak electricity use in the summer of 2006, placing increased strains on the transmission system regionally and statewide. Transmission system planning is complex, and it is closely tied with electricity reliability, making it crucial for public health and safety. The Vermont Legislature passed Act 61 recently, requiring the Vermont Electric Power Company (VELCO; the entity that owns and manages Vermont’s transmission facilities) to create a long-range transmission system plan and a public engagement process.
Local, renewable, efficient energy use in Vermont
Almost 7% of Vermont’s total energy use came from one renewable source – wood for non-electric uses – in 1993. This percentage may be smaller today. Of Vermont’s electricity supply in 2005, 43% comes from all renewable sources (including Hydro-Québec); 14% from in-state renewables (hydro, wood, and wind).
Renewable electric sources located in Vermont include two wood-fired power plants, many utility-owned and privately owned hydroelectric plants, one large landfill biogas project and a few very small ones, one utility-scale wind project, several farm biogas producers, and grid-connected and off-grid small-scale wind and solar photovoltaic systems. Non-electric renewable sources in Vermont include firewood, wood pellets, and wood chips used for heating in Vermont homes, schools, companies, and other institutions; small uses of farm or landfill biogas for direct heat; biodiesel used in vehicle fleets and heating systems, along with some “grease cars”; solar thermal systems used for water heating; and some geothermal systems.
In addition, efficiency, though not a traditional “source” of fuel, saves significant electricity each year. In 2005, for instance, the statewide energy efficiency utility provided electricity savings equivalent to the power generation of 20 Searsburg wind plants (from efficiency investments made between 2000 – 2005) (Efficiency Vermont, 2006).
Because some sectors of Vermont’s renewable energy use are very small, very new, or difficult to quantify, they do not “show up” on the pie charts provided of Vermont’s total energy and electricity use. The table below is an attempt to combine what we know about usage levels or capacity of all renewable energy in Vermont, and these amounts are discussed in the chapters ahead. Though the table lists sources in different units, it is a starting point toward a statewide efficiency and renewable energy inventory.
A study completed in 2003 estimated there were more than 500 jobs in Vermont’s renewable energy sectors (Swanson, 2003). Today, the number of jobs is estimated to be more than 600 (Perchlik, 2007). Some of the economic impacts of the individual renewable sectors are given in this Digest.

An Inventory of Renewable Energy and Efficiency
�
Vermont’s Estimated Renewable Energy Use / Capacity and Efficiency Savings Fuel Estimated Use / Capacity / Savings
Electric efficiency1 Efficiency Vermont Electricity savings of 3,600 GWh over the lifetime of the efficiency measures installed between 2000 and 2005 Burlington Electric Department Electricity savings of 960 GWh over the lifetime of the efficiency measures installed to date
Wood (total)2 1.5 million tons used in 2006 Residential firewood 680,000 tons used in 2006 (estimate) Residential pellets 24,000 tons (estimate) Wood chips for utilities 700,000 tons used in 2006 McNeil 53 MW capacity; 188 GWh in 2005 (own load supply) Ryegate 20 MW capacity; 165 GWh in 2005 (own load supply) Other wood chips 93,000 tons used in 2006
Farm biogas3 Farms projects in operation 400 kW capacity Farms projects under construction / expected on-line in 2007 700 kW capacity
Landfill biogas4 Washington Electric Cooperative / New England Waste Systems of Vermont 6.4 MW capacity; 30 GWh total in 2005; RECs were sold on 15 of these GWh Other small projects ~1-2 MW capacity
Biofuels5 Ethanol None Biodiesel 275,000 gallons used in 2005; estimated more than 1 million gallons used in 2006 Vehicles using biodiesel 139 vehicles using B20
Wind6 Utility-scale wind (Searsburg plant) 6 MW capacity; 13 GWh in 2005 (own load supply) Wind grid-connected 76 net metered systems approved; 499 kW capacity Wind off-grid ~10-50 systems (estimate)
Solar7 PV grid-connected 240 net metered systems approved; 673 kW capacity PV off-grid ~300 systems (estimate) Solar thermal ~500 operating systems (estimate)
Hydroelectric (total)8 2,430 GWh in 2005 (own load supply; RECs were sold on 109 of these GWh) Vt. utility-owned plants 84 MW capacity; 420 GWh in 2005 (own load supply; RECs were sold on 70 of these GWh) Vt. privately-owned plants (IPPs) 54 MW capacity; 189 GWh in 2005 (own load supply; RECs were sold on 39 of these GWh) Hydro-Québec 1,753 GWh in 2005 (own load supply) New York plants 68 GWh in 2005 (own load supply)
Geothermal9 ~200 systems (estimate)
1 Sources: Efficiency Vermont, 2005 Annual Report; Burlington Electric Dept., 2005 Energy Efficiency Annual Report
2 Sources: Biomass Energy Resource Center; Vt. Dept. of Public Service (McNeil and Ryegate); Charlie Page (wood pellets); “other wood chips” includes schools, the State of Vermont, other businesses and institutions, and the forest products industry.
3 Sources: Central Vermont Public Service, VREC presentation, and Daniel Scruton, Vt. Agency of Agriculture, Food, and Markets
4 Sources: Agency of Natural Resources, Waste Management Division; Vt. Dept. of Public Service
5 Sources: Edward Delhagen, The Vermont Biodiesel Project: Building Demand in the Biofuels Sector (2005 estimate); Netaka White (2006 estimate); Elaine Wang (biodiesel vehicles)
6 Sources: Green Mountain Power; Vt. Dept. of Public Service (Searsburg GWh and grid-connected); Lawrence Mott and Andrew Perchlik (off grid)
7 Sources: Vt. Dept. of Public Service (PV grid-connected); Leigh Seddon, Solar Works (PV off grid and solar thermal)
8 Source: Vt. Dept. of Public Service9 Source: Matt Orio of Water Energy Distributors

The VermonT energy DigesT
�0
In an effort to displace some of the emissions from fossil-fuel generation, some neighboring states have established Renewable Portfolio Standards, and associated markets for renewable energy credits (RECs). Vermont contributes to meeting these requirements by selling RECs from in-state renewable generators. Once these attributes are sold, Vermont can no longer claim them as renewable sources in its portfolio. In a parallel effort, Vermont developed the SPEED program, which encourages power purchase contracts between developers of renewable energy projects and Vermont utilities (Vt. Dept. of Public Service, 2007).
Two Vermont utilities, Central Vermont Public Service and Green Mountain Power, have established “green pricing” programs during the past few years. Under both programs, customers can elect to pay an extra 4 to 5 cents per kWh to support renewable sources. CVPS customers support the utilities’ Cow Power program, described in the Farm Biogas section of this report. GMP customers support various renewable sources through GMP’s purchase of renewable energy credits.
Net metering
Vermont’s legislature passed a law permitting net metering in 1998. Under net metering, homeowners and businesses can install small-scale photovoltaic, wind, farm biogas, biomass gasification, and fuel cells powered by renewable sources to provide their own power. The systems are connected to the electric grid, and excess power they generate is fed back to the utility, running the owners’ electric meters backwards. Equipment purchased to build a net metered system is exempt from the state’s sales tax. Net metered projects must receive a Certificate of Public Good from the Public Service Board. Net metered home and commercial systems cannot have more than 15 kilowatts of generating capacity; farm systems can generate up to 150 kilowatts. In addition, the Public Service Board can approve up to ten residential and commercial net metered systems per year for systems between 15 and 150 kilowatts. Utilities are required to allow net metered systems until the cumulative generating capacity of all the systems in their territory equals one percent of the utility’s peak demand.
The Public Service Board is required by the Legislature to expand the scope of the net metering program. In December 2006, the Board sent a draft rule to expand the program to the Legislature. The draft rule proposes expanding the program in several ways, including allowing for individual and municipal group net metering systems, increasing the number of permitted systems between 15 kW and 150 kW, and other
provisions (Vermont Public Service Board, 2006).
As of March 2007, there were 317 net metered systems in Vermont with 1.2 MW of installed capacity, as detailed in the table below.
Vermont Net Metered SystemsMarch 2007
Source: Vt. Dept. of Public Service; some systems are permitted but not yet built.
Number of systems
Capacity in kilowatts
Average size, kW
Wind 76 499.1 6.6
Solar 240 672.5 2.8
Farm biogas (methane) 1 65.0 --
Total 317 1,236.6 --
Distributed and community-based generation
There is growing interest in establishing local, community-sized and residential-sized energy systems. These can include wind power, solar power, wood-fueled heating systems, micro-hydro generation, local biodiesel production and use for vehicles and heating, farm biogas, geothermal heating, and combined heat and power systems. The Vermont Public Interest Research and Education Fund estimates that by 2015, 4% of our electric needs could be supplied by such customer-sited generation (Vermont Public Interest Research and Education Fund, 2006).
Such systems would contribute to a more distributed electricity system. Because distributed power is generated closer to where it is used, it is more efficient, and can avoid or reduce distribution bottlenecks and long-distancce transmis-sion lines. Distributed sources are better matched to the kilowatt scale of most customers’ needs, or to “microgrid” or “minigrid” scales (smaller electrical power systems not connected to a larger grid.) There may be reliability issues to address with an increased distributed power system, and “distributed pollution” issues if the generation sources are fossil fuels.
Vermont communities are charged by state law to plan for their energy future in a variety of ways: they can establish a conservation commission, appoint an energy coordinator, and undertake other activities. In addition, all Vermont municipalities are required to include an Energy Plan within
An Inventory of Renewable Energy and Efficiency
��
their Comprehensive Plan. Vermont communities have formed energy committees through municipal government, have focused their Conservation Commission on energy issues, and have established energy committees of interested citizens independent from but working with the municipal government.
Numerous Vermont communities are actively involved in a wide range of energy issues. For example, in a well-known 2006 effort, a Manchester group sold more than 40,000 energy efficient light bulbs in six months (McKeever, 2006). Manchester also voted at its March 2007 Town Meeting to appropriate about $12,000 to help the town reduce its carbon emissions (McArdle, 2007). A summary of the activities of 18 Vermont towns is at www.SERG-info.org. In addition, the Vermont Energy and Climate Action Network published the Town Energy and Climate Action Guide in January 2007, at www.vnrc.org/article/view/14458/1/625.
Vermont incentives for renewables and efficiency, and recent Vermont laws and programs
Vermont has numerous incentives and other initiatives that financially support renewable energy and efficiency. A summary of each of these is on the Database of State Incentives for Renewables and Efficiency website, www.dsireusa.org. There also is additional information in the online appendices of this report, at www.vtrural.org. Since 2005, there have been many events related to energy policy in Vermont. An outline of the major legislation and initiatives in Vermont state government is in the online appendices as well.
The VermonT energy DigesT
��
Conserving energy and using energy more efficiently are the fastest and usually the least expensive ways to reduce fossil fuel dependence, affect climate change, improve energy security, and reduce the
health and environmental impacts of energy use. In addition, efficiency usually supports local economic development.
Energy conservation means acting differently in order to use less energy. Turning off the lights when not in use, building a smaller-than-average home, and living close to work are all energy conservation choices. Efficiency means doing the same thing or more while using less energy. Efficiency measures are often technology-based: compact fluorescent light bulbs, hybrid vehicles, and refrigerators that use less electricity.
Because every product we use takes energy to mine or create the materials, to fabricate the product, and to transport it to where we live, purchasing and using fewer products is a significant energy conservation measure. Some people do not consider an ever-growing volume of consumer products and energy services to be worthy ends, and seek to live more simply. Such choices often save even more energy than technical efficiency improvements.
The efficiency of energy use can be improved at any point along the line from energy creation to delivery. About two-thirds of primary energy is lost during the two stages of energy conversion: converting primary energy to final energy in the form of electricity, gasoline, etc., and then converting those to useful energy in engines, appliances, boilers, etc. The energy use of many appliances have improved in recent years, but buildings usually have been designed with the intent of minimizing construction costs rather than minimizing energy costs. Land use also has occurred in such a way during the past several decades to require more transportation energy use. Technical solutions are available to lower these forms of energy use. Efficiency and conservation are highly cost-effective, but they require public policy and money up front.
The three sections ahead detail Vermont’s conservation and efficiency measures for electricity, transportation, and other sectors.
electric efficiency and conServation
Background
Electric energy efficiency is increasingly recognized as our best electricity resource; it is reliable, good for the Vermont economy, and good for the environment. Between 20% and 30% of the electrical energy we use today is less expensive to save than it is to supply, according to a variety of recent studies around the U.S. and Canada (Sachs, 2006).
Electrical efficiency opportunities are wide-ranging and diverse. They include more efficient lighting, appliances, equipment, heating, cooling, ventilation, and refrigeration systems. Building more efficient homes, offices, and industrial facilities, and using more efficient equipment in industrial processes can provide large electrical efficiency gains.
Electrical efficiency efforts are growing in the U.S. and around the world. For example, between 1988 and 2001, worldwide sales of energy-efficient compact fluorescent light bulbs increased more than 13-fold. There are an estimated 1.8 billion CFLs in use today, consuming only one-quarter of the energy incandescent bulbs would consume (Worldwatch Institute, “Compact fluorescents set record,” 2006). Appliance efficiency standards are found in 43 countries today, and the number of nations implementing them has tripled in the past decade (Worldwatch Institute, “Appliance efficiency takes off,” 2006). Technologies available today could increase appliance efficiency by an additional 33 percent during the next decade, and further improvements in dryers, televisions, lighting, and standby power consumption could avoid more than half of the projected growth in demand in the industrial world by 2030 (Worldwatch Institute, Sept. 2006).
The U.S. economy uses one-half the amount of energy to produce a dollar of output today compared to the 1970s, indicating that energy use has gotten more efficient (Prindle, 2007). The shift away from manufacturing toward services during these years has contributed about one-third of the gains in energy intensity, and investment in energy efficiency is responsible for the other two-thirds. If energy demand had continued its earlier growth patterns since 1973, we would
Efficiency and Conservation

An Inventory of Renewable Energy and Efficiency
��
today be using an amazing 75% more energy than we are. Remarkably, energy efficiency contributed almost four times as much to meeting U.S. demand since 1973 as new energy supply (Levine, 2006).
Electric energy efficiency budgets in the U.S. totaled $2.34 billion in 2006, and have increased 13% since 2005. In 2005, members of the Consortium for Energy Efficiency (which are responsible for 90% of electric efficiency program budgets) undertook programs that resulted in electricity savings which were more than 1% of all U.S. energy consumption in 2005. About 34% of this total was in California and Hawaii, and 27% was in New England and the Mid-Atlantic (Consortium for Energy Efficiency, 2007).
California is among the most aggressive states in promoting energy efficiency. A wide range of efficiency measures undertaken in response to 2001 electricity shortages reduced California’s electricity demand by 5,000 MW, averting blackouts and economic disruptions that would have cost billions of dollars. Through strong efficiency policies, California’s energy consumption per person has plateaued, and in 2006 California committed to spending $2 billion on efficiency through 2008 (Canine, 2006). (On a per person basis, however, Vermont spends even more on electric efficiency; see the discussion below.)
The U.S. Green Building Council’s Leadership in Energy and Environmental Design program (LEED) is a voluntary standard for developing high-performance, sustainable buildings. Today, 5% of new commercial construction meets this standard. A number of large cities around the country have laws that require new public buildings be built to LEED standards. Ten percent of new U.S. homes satisfy the federal government’s Energy Star guidelines (E – The Environmental Magazine, 2007).
National home appliance efficiency standards were enacted in 1987, and as a result, appliances are much more efficient today. Refrigerator efficiency nearly tripled between 1972 and 1999, and dishwasher efficiency more than doubled in the last eight years (Worldwatch Institute, Sept. 2006). In 2005, Vermont and other states brought a lawsuit against the U.S. Department of Energy to publish and enforce new appliance efficiency standards, an action already required by the federal government. In November 2006, an agreement with the federal government was reached that will phase in the new standards by 2011. The federal standards are not expected
to conflict with standards Vermont has set on appliances, except possibly furnaces and boilers (Porter, November 15, 2006).
The economic value of energy efficiency is huge. Electric efficiency is a long-term investment with a certain and generally high financial return-on-investment. Every unit of efficiency applied to power generation equals ten units of fuel savings at a typical coal plant. Efficiency gains have far-reaching impacts for the economy: providing
more local jobs, keeping more money local, and allowing businesses to continue operation or expand. More than seventy percent of the dollars we use to purchase energy leave Vermont, while 70% of dollars spent on efficiency stay in state (Sachs, 2006).
Vermont’s current initiatives for electric efficiency and conservation
Vermont in 2006 had the highest per capita budget for electric energy efficiency programs in the country, at $31.25 per person, compared to an average of $8.50 per person (Hamilton, 2007 and Consortium for Energy Efficiency, 2007). Vermont’s per capita budget will be even higher in 2007 and 2008, when its efficiency budget increases. These investments have translated into substantial energy savings for Vermonters.
Between 1992 and 1999, Vermont’s electric utilities were required by state law to help customers save energy. Each utility ran its own Least Cost Integrated Planning efficiency program, and regulators were charged with ensuring that all 22 utility efficiency programs complied with state law.
In 1996, Vermont received a grant to create the Residential Energy Efficiency Program (REEP). This program combined all of Vermont’s utility low-income multi-family residential efficiency programs into a single statewide effort closely coordinated with Vermont’s Weatherization Assistance Program. This program was later incorporated into the energy efficiency utility.
In 1999, the Vermont Legislature and Vermont Public Service Board created the nation’s first statewide energy efficiency utility, providing a single-statewide source for all electric efficiency services. The efficiency utility, called Efficiency Vermont, acts on behalf of Vermont’s utilities and their customers, and is funded through electric rates as part of utilities’ obligation to provide least-cost energy service. The program has become a model around the country and
Some people do not consider an ever-growing
volume of consumer
products and energy services to
be worthy ends, and seek to live
more simply.

The VermonT energy DigesT
��
world, and is being replicated and adapted in other locations (Hamilton, 2005).
Efficiency Vermont is operated by the Vermont Energy Investment Corporation under a contract with the Vt. Public Service Board. Efficiency Vermont designs, markets, and implements energy efficiency services. The contract is performance-based, with a significant hold-back of compensa-tion if energy and demand reduction goals are not met. The Vt. Dept. of Public Service is responsible for carrying out annual reviews and verification of the savings claims made by Efficiency Vermont, for periodic assessment of market potential, and for program evaluations. Efficiency Vermont develops an annual program plan which is reviewed by the Vt. Public Service Board in a public setting.
In 2005, Efficiency Vermont provided efficiency resources for about 3.6 cents per kWh (Hamilton, 2007). The 2007 efficiency surcharge on a residential electric bill for a home using 500 kWh per month is $2.48 per month (for customers other than BED customers). Rates for industrial and commercial customers are different, but are based on usage (Vt. Public Service Board, October 26, 2006).
Statewide efficiency savings have increased steadily during the past several years, as illustrated in the table. Through efficiency investments made since 2000, Vermont used 4.6% less electricity in 2005 than the state would have otherwise used, and 5.2% less in 2006 (Huessy, 2007). From 2000 through 2005, Efficiency Vermont investments had more than 150,000 participants (Hamilton, 2007 and Efficiency Vermont, 2005).
In 2007, Efficiency Vermont will undertake a new project to implement very high levels of efficiency investment in four geographic areas of the state where the electric distribution system is increasingly stressed. The intent of this targeted investment is to reduce the growth of the peak electricity load in these areas, so that upgrades to the transmission and distri-
bution system can be avoided or deferred. The four locations are in the vicinities of: St. Albans; Winooski-Colchester; Newport-Derby; and a loop running across Southern Vermont through Arlington, Manchester, Stratton, and toward Brattleboro (Hamilton, 2007). In 2005, legislation was passed that removed a previous budget cap for the state’s energy efficiency utility spending (of $17.5 million), and requested the Vt. Public Service Board
to revisit the budget. The Board significantly increased budgets for 2006-2008, ramping up to $30.75 million in 2008. The Board also concluded that even higher funding levels may be appropriate and may be established within 15 months of the August 2006 decision. However, in order to address the short-term rate impacts that such increases might have, the Board also began to assess the
feasibility of various ways to finance these investments (Vt. Public Service Board, August 2, 2006).
Efficiency Vermont can cite many inspiring case studies of businesses and homes that achieved large savings through efficiency measures, including:
• Harbor Industries, a maker of cable wire in Shelburne, cut its annual electric bill by about $45,000 through efficiency measures (Associated Press, July 6, 2006).
• Columbia Forest Products in Newport, a producer of hardwood veneer, is saving almost $55,000 per year in energy costs after switching to smaller, more efficient air compressors (The Newport Daily Express).
• The Vermont Campus Energy Group spearheaded an initiative to install thousands of efficient lightbulbs in campus buildings around Vermont (Larkin, 2006).
A statewide Commercial Building Energy Standard for new commercial buildings in Vermont took effect on January 1, 2007. A Residential Building Energy Standard for new homes has been in effect since 1998, with revisions mandated starting in 2005. Efficiency Vermont provides assistance for
2000 $5.6 million 23,540 $17.1 million2001 $8.8 million 37,489 $23.8 million2002 $10.9 million 40,557 $25.8 million2003 $12.9 million 51,216 $44.8 million2004 $13.9 million 51,863 $35.6 million2005 $15.1 million 57,055 $37.1 million2006-2008
Efficiency Vermont’s Costs and Savings
Efficiency Vermont
costs
Incremental annual MWh
savings
Lifetime economic
value
Source: Efficiency Vermont, 2005 Annual Report and Hamilton, 2007
Expected $184 million
(three-year total)
Expected 270,000
(three-year total)
$66.5 million (three-year total)
An Inventory of Renewable Energy and Efficiency
��
new homes to be built to the U.S. Environmen-tal Protection Agency’s Energy Star designation; Energy Star homes provide homeowners with energy bills that are 30% lower than homes built to the minimum state energy code requirements (Efficiency Vermont). In 2006, about one-third of new housing units built in Vermont met Energy Star standards (Hamilton, 2007). Federal tax credits currently are available for efficient improvements to existing homes. Federal tax deductions are available for efficiency improvements in commercial buildings and equipment.
The Vermont Builds Greener (VBG) Program, an initiative of Building for Social Responsibility (BSR), certifies residential buildings that are constructed to sustainable criteria. The VBG Scorecard resulted in the nation’s most comprehensive and respected residential green building rating system; other entities in the Northeast have adopted the VBG Scorecard and show interest in the program.
South Farm Homes is a six-home development under construction on the edge of Hinesburg village. It is one of the first, if not the first, Vermont subdivisions to aim to be “net zero” with respect to energy use. To achieve net zero status, homes have to be 50% - 70% more efficient than Energy Star homes, a difficult goal. The homes, which cost $400,000 and up, use solar PVs, geothermal heat, and super-efficient design measures; wind also is being tested nearby (Page, January 28, 2007). The size of the homes is restricted to 1,600 – 1,900 square feet, and air conditioning is not permitted (Reiss, 2006). A similar subdivision is expected to begin construc-tion in 2007 in Richmond.
Burlington Electric Department, serving more than 19,000 customers in Burlington, implements electric efficiency programs in partnership with Efficiency Vermont. In 2005, the services that BED implemented in partnership with Efficiency Vermont and others saved about 4,900 MWh. Annual electricity consumption in 2005 among BED customers was only 2% higher than it was in 1989, despite substantial economic growth during those years, illustrating that efficiency programs in Burlington have been extremely successful (Burlington Electric Department, 2005). During that same time, Vermont’s electricity consumption grew by nearly 15% (O’Connor, 2007).
Efficiency Vermont and the Burlington Electric Department also coordinate their efficiency work with efficiency programs
offered by Vermont Gas Systems, the Office of Economic Opportunity’s Weatherization Program, and affordable housing programs.
Vermont’s potential for electric efficiency and conservation
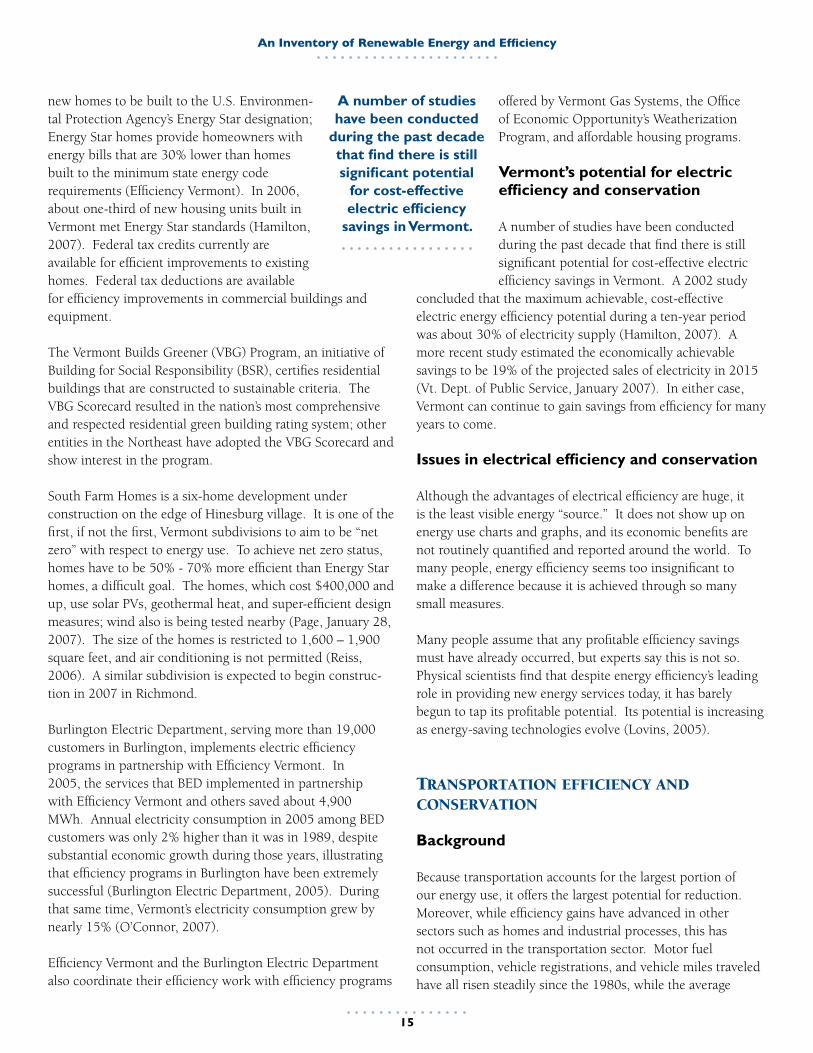
A number of studies have been conducted during the past decade that find there is still significant potential for cost-effective electric efficiency savings in Vermont. A 2002 study
concluded that the maximum achievable, cost-effective electric energy efficiency potential during a ten-year period was about 30% of electricity supply (Hamilton, 2007). A more recent study estimated the economically achievable savings to be 19% of the projected sales of electricity in 2015 (Vt. Dept. of Public Service, January 2007). In either case, Vermont can continue to gain savings from efficiency for many years to come.
Issues in electrical efficiency and conservation
Although the advantages of electrical efficiency are huge, it is the least visible energy “source.” It does not show up on energy use charts and graphs, and its economic benefits are not routinely quantified and reported around the world. To many people, energy efficiency seems too insignificant to make a difference because it is achieved through so many small measures. Many people assume that any profitable efficiency savings must have already occurred, but experts say this is not so. Physical scientists find that despite energy efficiency’s leading role in providing new energy services today, it has barely begun to tap its profitable potential. Its potential is increasing as energy-saving technologies evolve (Lovins, 2005).
tranSportation efficiency and conServation
Background
Because transportation accounts for the largest portion of our energy use, it offers the largest potential for reduction. Moreover, while efficiency gains have advanced in other sectors such as homes and industrial processes, this has not occurred in the transportation sector. Motor fuel consumption, vehicle registrations, and vehicle miles traveled have all risen steadily since the 1980s, while the average
A number of studies have been conducted
during the past decade that find there is still significant potential
for cost-effective electric efficiency
savings in Vermont.
The VermonT energy DigesT
��
efficiency of the passenger vehicle fleet remains about the same.
There are a great many methods for conserving energy and making energy use more efficient in the transportation sector. They range from marketing to promote behavioral changes, pricing vehicles and vehicle fuels to encourage efficient purchases and use, requiring manufacturers to build efficient vehicles, switching fuels, and many, many more. There are varying goals: reducing energy use, reducing emissions, improving fuel efficiency, improving infrastructure, changing behavior. There are complex issues around each goal: costs, environmental impacts, availability and affordability, and others. This chapter does not cover the breadth or depth of these issues; instead it offers a brief sketch of a few issues in the sector. A later chapter covers biofuels in Vermont.
Transportation energy use, as well as transportation efficiency efforts, is increasing worldwide. Global car and light truck production reached 64.1 million in 2005. China and India, which have 2.3 billion people, had only 5% of the total vehicles in the world in 2004 (Worldwatch Institute, “Vehicle production continues to expand”). Many cities and countries outside the U.S. achieve excellent mobility and access for all without many cars. Most forms of public transportation are more developed in countries outside the U.S. For example, most train travel occurs in the former Soviet states, India, China, Western Europe, and Japan, which together account for more than 80% of all passenger-kilometers (Worldwatch Institute, “Passenger rail at crossroads”).
Transportation accounts for about two-thirds of U.S. petroleum use. The U.S. has close to one-quarter of all the cars in the world. Most developed countries have fewer cars per person than the U.S. Western Europe and Canada, for instance, in 2004 had the number of cars per person that the U.S. had in 1972. U.S. car sales have shifted toward pickup trucks, SUVs, and minivans in recent years, with a corresponding drop or plateau in the average fuel efficiency of vehicles on the road. In 2005, 50% of vehicle sales were these “light trucks,” compared to 19% in 1975. From the mid-1970s to the late-1980s, the car / light truck fleet became more fuel-efficient, but since then it has become slightly less efficient or stayed the same. The average fuel economy of cars on the road in 2003 was 22.3 miles per gallon; the average of light trucks was 17.7 (Oak Ridge National Laboratory, 2006). There has been an increase in more efficient cars sold recently due to higher gas prices. In 2006, more than 251,000 hybrid
vehicles were sold, an increase of 22% compared to 2005. Meanwhile, light duty vehicle sales fell by 2.6% between 2005 and 2006 (Green Car Congress, 2007).
There are many ideas and technologies to make vehicles more efficient, including making vehicles that are smaller, lighter, and have less horsepower and performance. Less than 1% of the energy put into a car ultimately moves the driver
(most moves the weight of the car) (Lovins, 2006). Thus, lighter cars provide huge energy savings. In the short term, alternative fuels may displace some petroleum. In 2004, there were an estimated 548,000 vehicles in the U.S. using LPG, compressed and liquefied natural gas, electricity, and blends of 85% ethanol and methanol (Oak Ridge National Laboratory, 2006). There are a large number of other strategies for making vehicles and transportation energy use more efficient.
Vermont’s current initiatives for transportation efficiency and conservation
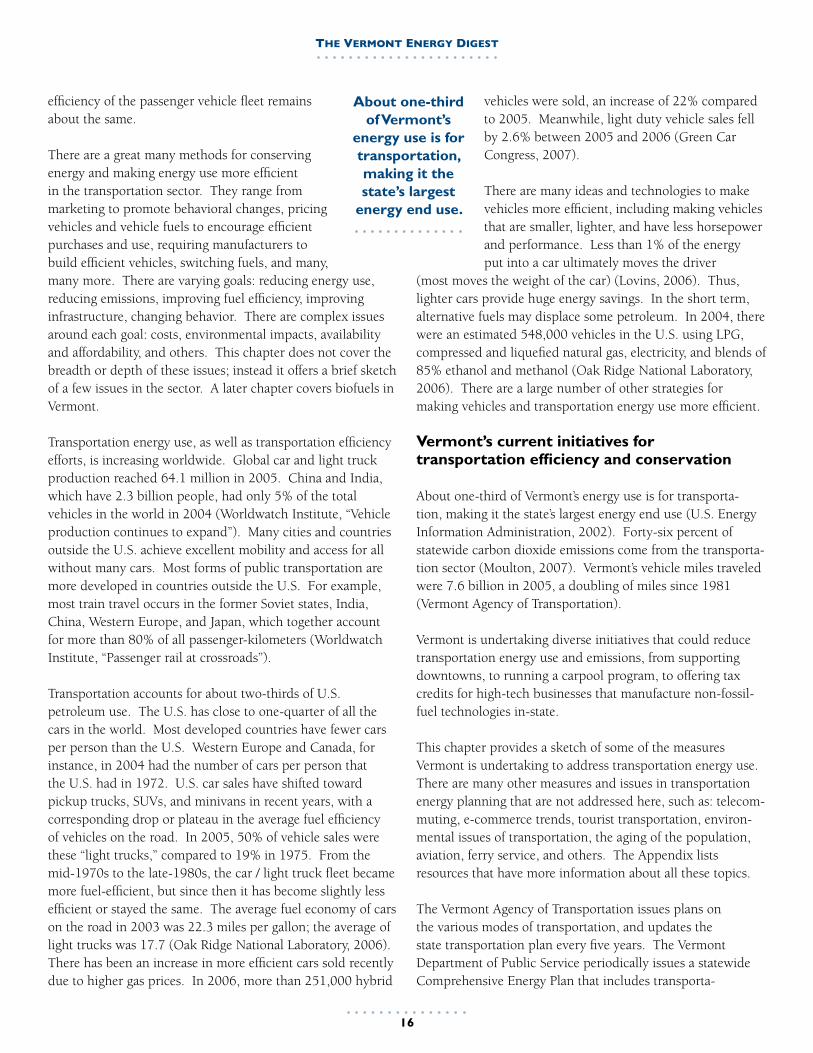
About one-third of Vermont’s energy use is for transporta-tion, making it the state’s largest energy end use (U.S. Energy Information Administration, 2002). Forty-six percent of statewide carbon dioxide emissions come from the transporta-tion sector (Moulton, 2007). Vermont’s vehicle miles traveled were 7.6 billion in 2005, a doubling of miles since 1981 (Vermont Agency of Transportation).
Vermont is undertaking diverse initiatives that could reduce transportation energy use and emissions, from supporting downtowns, to running a carpool program, to offering tax credits for high-tech businesses that manufacture non-fossil-fuel technologies in-state.
This chapter provides a sketch of some of the measures Vermont is undertaking to address transportation energy use. There are many other measures and issues in transportation energy planning that are not addressed here, such as: telecom-muting, e-commerce trends, tourist transportation, environ-mental issues of transportation, the aging of the population, aviation, ferry service, and others. The Appendix lists resources that have more information about all these topics.
The Vermont Agency of Transportation issues plans on the various modes of transportation, and updates the state transportation plan every five years. The Vermont Department of Public Service periodically issues a statewide Comprehensive Energy Plan that includes transporta-
About one-third of Vermont’s
energy use is for transportation, making it the state’s largest
energy end use.

An Inventory of Renewable Energy and Efficiency
��
tion energy policies. And, there are non-profit and private companies that are working on measures or have measures in place to reduce transportation energy use.
Land use
How we use land determines the kinds of transportation options we can use. Sprawling land use patterns and long-distance commutes, initially made possible by low gasoline prices and improved road networks, encourage more driving. By contrast, increased densities, especially near mixed-use town centers and near jobs, make public transit, walking, and biking more viable.
Vermont has a long tradition of efforts to preserve historic land use patterns and encourage compact growth centers, and there are many Vermont organizations, businesses, and institutions working on land use issues that could result in lower energy use. A 2006 survey found that 42% of residents think the Vermont Agency of Transportation should take an active role in limiting urban sprawl (Wilbur Smith Associates, 2006). The state-administered Vermont Downtown Program, for example, provides technical assistance and training to help communities with downtown revitalization efforts. Towns that receive downtown designation through the state are eligible for tax credits, loans, and grants from various state agencies. See the Appendix for more groups who are working in this area.
Vehicles
The average Vermont car travels 17,000 miles per year, emits 7.5 tons of air pollution per year, and costs $2,000 or more per year just for fuel (Moulton, 2007 and Vt. Agency of Natural Resources, 1998). The annual cost of owning and operating a vehicle in Vermont is $6,000 or more (Moulton, 2007). Vermonters spend an average of 70 minutes per day driving, covering about 53 miles per day (Wilbur Smith Associates, 2006). Driving our vehicles is one of the most expensive, time-consuming, energy-consumptive, and polluting activities we do on a daily basis.
Vermonters spend much of their driving time commuting to and from work. On average, Vermonters travel 16 miles to their work; 17% live 26 miles or more from their work. About 75% of Vermonters employed outside their homes drive alone as their primary method for getting to work; twelve percent drive with one or more others at least partway. When asked what would make them drive their vehicle less, 37% of residents said that nothing would make them drive
less, a significant drop from 2000 when 66% said nothing would make them drive less. Improved public transportation and higher gas prices were the most likely reasons Vermonters said they would drive less (Wilbur Smith Associates, 2006).
Vermont has some strategies in place to encourage people to drive less and use non-fuel related modes of travel. Work on land use development is one of these. Biking and walking promotion are others. Gas taxes, if high enough, can help change behavior and decrease driving. Vermont’s 2005 gas tax rate was 20 cents per gallon (compared to a national average of 19.25 cents); our diesel tax rate was 26 cents per gallon (compared to a national average of 20 cents) (U.S. Federal Highway Administration, 2005).
There are strategies in place to make driving more efficient and cleaner. There are 29 Park and Ride parking lots across the state where Vermonters can leave their cars and meet public transit or carpools. About 22% of Vermonters used a Park and Ride lot at least once during the last year, an increase from 2000 when 15% had used them (Wilbur Smith Associates, 2006). There is a Vermont rideshare program, where individuals are matched with others for carpooling, and a vanpool program, where workers can arrange to use a van for daily commuting. Public transit and rail efforts also make travel more efficient and are described below.
There are alternative fuel vehicles and hybrids in use in Vermont, which contribute to cleaner, more efficient driving. In 2006, there were 120 vehicles running on Liquified Petroleum Gas, 14 running on compressed natural gas, 139 running on 20% biodiesel, and 2,389 hybrid electric vehicles (Wang, 2007).
Vermont businesses that design, develop, and manufacture hybrids, alternative fueled vehicles, or electric vehicles, and technology involving fuel sources other than fossil fuels that qualify as “high-tech business” are eligible for tax credits in Vermont.
Governor Douglas in 2007 proposed reducing the purchase and use tax on new vehicles from 6% to 5% for hybrids and other vehicles getting 30 miles per gallon or more. A “gas guzzler tax” also is proposed in the 2007 Legislature. The legislation would assess a $150 surcharge on the purchase price of vehicles that get less than 20 miles per gallon, except work vehicles. The money would be used for supporting public transit.
Work is on-going to establish Clean Cities Vermont / the

The VermonT energy DigesT
��
Vermont Clean Vehicle Coalition, which seeks to support local decisions to reduce petroleum consumption in the transpor-tation sector and work toward increased use of hybrids and alternative fueled vehicles. The UVM University Transpor-tation Center will be managing the project as of July 2007 (Snelling Center for Government and Wang, 2007).
To address emissions from vehicles, Vermont adopted Califor-nia’s Low Emission Vehicle (LEV) program, along with 5 other northeastern states. The standard requires that new vehicles sold in the state meet emissions requirements. The program started implementation in 2000.
Bicycling and walking
Vermont has more than 50 miles of bike lanes, 350 miles of signed bike routes, 100 miles of shared use paths and rail trails, and hundreds of miles of sidewalks (Vermont Agency of Transportation, December 2006).
A 2006 survey found that 28% of Vermonters used bike lanes or road shoulders at least once during the past year, up signifi-cantly from 15% in 2000 (Wilbur Smith Associates, 2006). Four percent of Vermonters working outside the home walk to work most or all of the time, and 8% walk to work some of the time. One percent bike to work most or all of the time, while 6% bike some of the time (Wilbur Smith Associates, 2006).
The Vermont Agency of Transportation issued a draft Pedestrian and Bicycle Policy Plan in December 2006, and works along with other organizations to support walking and biking.
Public transportation
Vermont is blanketed by about 13 transit service providers (Vermont Agency of Transportation, June 2004). Vermont has a large percent of the population living outside of high-density areas, presenting special challenges to public transit (Vermont Agency of Transportation, 2003).
About 12% of Vermonters used a local public transit service during the last year, 11% used bus lines between cities, and 4% used a special dedicated bus or van (for senior citizens or disabled residents). When traveling to work, 1% of Vermonters use public transit as their primary means of transportation, while 3% use it some of the time (Wilbur Smith Associates, 2006). Public transit ridership has been increasing recently; in fiscal year 2006, ridership grew by 9.3% in Vermont, a much higher rate than the 2.9% increase
seen in the U.S. (Moulton, 2007).
Current funding for public transportation is linked to human service needs, especially for rural residents who need services. But according to Gina Campoli of the Vermont Agency of Transportation, there is a need to focus outside the human service needs area, because Vermonters drive the most miles commuting to work (Campoli, 2006).
Specific routes have seen strong growth recently. For example, the commuter bus between Burlington and Montpelier has grown by 25% annually for four years. Public transit routes have been added in some areas. Transit agencies currently need more and newer vehicles to meet the demand for certain routes (Barre-Montpelier Times Argus, 2007).
The number of residents who would like to see a greater share of funding spent on public transportation was 41%, an increase from a similar survey done in 2000 (Wilbur Smith Associates, 2006).
Rail
Vermont’s first railroad was built in 1849, and by 1890 Vermont had nearly 1,000 miles of track. Vermont still is covered by a network of railroads owned by 11 state entities and private companies, with the state now owning more than half the active rail mileage. The Vermont Agency of Transpor-tation’s draft State Rail and Policy Plan, issued in November 2006, gives a summary of changes to Vermont’s rail system, trends in rail use that impact Vermont, and an inventory of the rail system.
Amtrak currently operates two passenger lines in Vermont: one trip per day between St. Albans and Washington, D.C. (the Vermonter), and one trip per day between Rutland and New York City (the Ethan Allen Express). The state is one of a few number of states that subsidizes Amtrak travel, paying Amtrak $3.3 million in 2007 to operate the lines (Vermont Agency of Transportation, November 2006 and Edwards, 2007). The number of passengers on these trips has been declining in recent years; there were 93,600 passengers on the Vermonter and Ethan Allen Express for the year ending June 2005, compared to 122,100 in 2000. According to the state, the decline is partly attributed to a reduction in the number of trains, along with low-priced airline service (Vermont Agency of Transportation, November 2006). A 2006 survey found that 11% of Vermonters used passenger train service at least once during the last year (Wilbur Smith Associates, 2006).
An Inventory of Renewable Energy and Efficiency
��
The Vermont Agency of Transportation projects increasing costs to support passenger train service in Vermont, with little or no gains in ridership. In response, the Vermont Legislature in March 2007 is considering a pilot project to purchase five state-of-the art railcars, adding another trip per day on the eastern side of the state, and modifying the routes. Under the proposal, Amtrak would continue to operate the trips, but the state would own the equipment. If the project goes forward, it could provide a more cost-effective way to preserve passenger rail service in Vermont (Edwards, 2007). The federal government, Massachusetts, New Hampshire, and Vermont also are studying the feasibility of high-speed rail that would connect Boston and Montreal (Vermont Agency of Transportation, November 2006).
Freight rail traffic that either terminated in or originated in Vermont was about 2.2 million tons in 2002, a 21% drop compared to 1992. However, the freight that originated in Vermont actually increased during that time, primarily due to calcium carbonate shipments from Omya, Inc. The overall decline may have resulted from a combination of factors, according to the state, including weight and clearance limitations of the track (Vermont Agency of Transportation, November 2006).
There are many issues to consider with increasing freight rail traffic, too complex to detail here. Vermont’s rail infrastruc-ture, including the tracks, bridges, and tunnels, increas-ingly are not equipped to handle the height and weight of today’s freight cars. Each year between 30,000 and 35,000 shipping containers pass through Vermont by truck because our railroad infrastructure cannot accommodate the freight cars, according to Michael Coates, a member of the Vermont Rail Advisory Council. Freight traffic is often routed around Vermont, or loaded onto trucks to cross Vermont. According to Charlie Moore, retired general manager of the New England Central Railroad, upgrading the Vermont railroad infrastruc-ture to accommodate current standards for freight, would cost an estimated $112 million (Picard, 2007).
Vermont’s potential for transportation efficiency and conservation
Vermont’s potential for transportation efficiency and conserva-tion is large, though difficult to quantify. Sales of hybrids are likely to continue to increase; alternative modes of transporta-tion are receiving more attention; biodiesel use is growing; and many more efforts are underway.
A 1998 report by the Vermont Department of Public Service modeled a collection of transportation policies to quantify their impact on energy use. The policies included:
• Increase federal efficiency standards on vehicles• Adopt a 55 mile-per-hour interstate speed limit• More strictly enforce highway speed limits• Shift vehicle miles traveled to bus, vanpool, and train• Encourage non-motorized transportation• Encourage telecommuting• Encourage land-use planning that uses less energy• Establish pay-at-the-pump auto liability insurance• Continue vapor recovery at gas stations• Adopt Low Emissions Vehicle standards• Shift local roadway construction and maintenance
funding from property tax to gas tax• Shift police and fire transportation funding from
property tax to gas tax• Remove the sales tax exemption on motor fuels• Shift vehicle registration and license fees to gas tax• Support commuter buses with gas tax
The analysis found that compared to a business-as-usual scenario, the policies resulted in 30% less energy used in the transportation sector by 2020 on a cumulative basis. The report illustrated then that the transportation sector offered the greatest opportunity by far for energy use reductions in Vermont (Vt. Dept. of Public Service, 1998).
efficiency and conServation in other SectorS
Background
The previous two sections of this report reviewed efficiency and conservation measures in the electric and transportation sectors. There are many other areas where efficiency and conservation are important: fossil-fueled heating and water heating systems and industrial processes, for example. This section gives a brief view of a few of the measures that can be undertaken in this area.
Like electrical generation and delivery, natural gas delivery also can benefit from efficiency investments. Seventeen U.S. states had natural gas energy efficiency programs in 2006. High-efficiency furnaces now represent almost one-third of national furnace shipments, a 40 percent increase since 1998
The VermonT energy DigesT
�0
(Consortium for Energy Efficiency). More information about efficiency measures for natural gas and other fossil fuels is at www.cee1.org.
One way industrial and commercial facilities can achieve greater efficiency is through combined heat and power systems (CHP), sometimes called co-generation systems. These are on-site electric generation systems that use “waste” heat for heating and cooling applications. The systems are often fueled by natural gas. Generating power at a central plant is only 30% - 35% efficient; by contrast CHP applica-tions have net efficiencies of 75% - 90%. CHP systems save energy and money, reduce emissions, and improve reliability. If CHP systems are located in critical areas, they can help reduce loads on congested distribution networks. California, New York, Connecticut, and New Jersey have good incentive programs for CHP installations (McNamara, 2006).
Vermont’s current initiatives for efficiency and conservation in other sectors
Vermont Gas Systems, which serves 38,000 customers in Chittenden and Franklin counties, has offered residential and commercial efficiency programs since 1992. Through its efficiency programs in 2005, Vermont Gas helped customers save enough natural gas to supply heat and hot water to 740homes for a year. During the last 12 years, efficiency investments have saved enough natural gas to serve almost all of the company’s residential customers for a year (Vermont Gas Systems). Among the seventeen states that had natural gas energy efficiency programs in 2006, the average budget per capita was $2.24; in Vermont, it was slightly more than this (Consortium for Energy Efficiency, 2007).
There is a Weatherization Assistance Program in Vermont that retrofits income-eligible homes to save energy. In the 1998 – 2000 program years, for example, the program retrofitted almost 2,500 homes, resulting in $666,000 in first-year savings for the two-year period and 22% in heating energy use (Vt. State Office of Economic Opportunity, 2001). There is a gross receipts tax on heating fuel that finances the weatheriza-tion program.
Successful combined heat and power (CHP) systems are in
place at Green Mountain Coffee Roasters in Waterbury, North Country Hospital in Newport, Ethan Allen in Beecher Falls, and Cersosimo Lumber in Brattleboro. The Vermont-based company Northern Power Systems designs and builds on-site power systems for industrial and commercial customers worldwide, including CHP systems. Vermont Electric Cooperative (which serves 37,000 member-customers in 90 Vermont towns) promotes and helps manage combined heat and power systems at businesses.
A bill proposed in the Legislature in March 2007 would expand Efficiency Vermont’s work to include not only efficiency investments that lower electricity use, but also those that lower heating and water heating fuel use. The proposal would fund the program through an “efficiency charge” on heating fuels. Vermont has the second oldest housing stock in the country, and there are many homes that could benefit from such a program. The Vt. Dept. of Public Service says there will be $4.00 of benefit for every dollar invested in this program. There are concerns about increasing heating fuel costs for low-income wage-earners and renters who may not benefit from efficiency improvements (Lintilhac, 2007).
Vermont’s potential for efficiency and conservation in other sectors
Under Vermont Legislative Act 208, the Department of Public Service conducted a study of the potential to reduce consumption of oil, propane, kerosene, and wood through energy efficiency measures. The study assumed that a structure similar to Efficiency Vermont would deliver the programs, with homeowners paying 50% of the efficiency improvements. The study found that there is significant cost-effective energy savings potential for each fuel, with reductions in fuel oil use providing most of the savings. Under the program, the total cost-effective energy savings (as a percent of the forecast of fuel consumption) by 2016 is 14% for fuel oil, 8% for propane, 6% for kerosene, and 14% for wood. The program would cost $149 million (in current dollars) during the next 10 years, and participants would spend an additional $92 million on efficiency measures. The cost savings would be $486 million (in net present value; all future dollars converted into the equivalent of today’s dollars) over 10 years (GDS Associates, 2007).
An Inventory of Renewable Energy and Efficiency
��
Background
Burning wood for heat goes back to prehistoric times. The U.S. and Vermont have a long tradition of wood use for energy; wood was the first energy source for Native Americans living in the state, and
wood and water were early settlers’ abundant, basic energy sources. Wood is still the most widely used local, renewable energy source in Vermont. The state’s forests are a significant renewable energy resource, covering about 78% of Vermont’s total land area.
Wood fuel comes in a variety of shapes and sizes: logs, cordwood, wood chips, and wood pellets. Wood is most often used to produce heat, but also can be used to generate electricity. New technologies are making it possible to convert wood to gases and liquids that can be used for transportation and power generation. Wood stoves, furnaces, and boilers provide heating options for homes and small buildings, and district heating systems use large boilers to serve many buildings. Wood chip systems work well for commercial or industrial applications.
One-half of all wood harvested world-wide is used as fuel. In the U.S., all biomass sources together provided about 2.8% of the energy consumed in 2004. Of all the renewable energy used in the U.S. in 2004, the largest share, about 47% came from biomass sources, and wood was the largest portion of this. Between 1989 and 2004, total wood energy use declined in the U.S. (U.S. Energy Information Administration, July 2006). However, certain wood energy markets, such as the residential wood pellet market, have increased rapidly in the past few years.
During the energy crisis in the 1970s, wood-fired electricity plants were built in the Northeast. These plants became more expensive than other sources in the late 1970s and 1980s. Today, wood power plants are operating at full power or coming back online, as competing energy sources have become much more expensive (Kingsley, 2006)
New uses of wood for energy are being considered across the country. Technologies exist to gasify wood to create a biogas
that could be used much like natural gas or propane. This type of gasification would be far more efficient that traditional wood steam systems. Gasifiers for electricity and combined heat and power are currently in use and under development in a range of sizes (Maker, 2004). In the past, facilities have been proposed making ethanol, diesel additives, bio-oil, plastic, and other products with wood as the feedstock. With high oil costs, many of these plans are being looked at again (Kingsley, 2006).
Vermont’s current uses of wood energy
According to the Vt. Department of Public Service, wood provided 5.6% of our electricity supply (own load) in 2005 (Lamont, 2007). Vermont uses an estimated 1.5 million tons of wood per year in all sectors, as detailed in a table below. The Vt. Dept. of Forests, Parks, and Recreation estimates the value of wood energy used in Vermont is about $34 million (Vt. Dept. of Forests, Parks, and Recreation).
The state estimates there are 400 to 500 loggers in the state. A 1994 estimate held that there were 1,870 jobs in the wood energy industry in Vermont, and $85 million in income (High, 1994). Vermont landowners who sold their standing trees received estimated stumpage payments for all forest products of $30 million in 2002 (North East State Foresters Association, 2004).
Current residential uses of wood
Vermont has a long tradition of wood use for home heating. Forty-two percent of Vermont homes used wood as their primary heat source as recently as 25 years ago. But that percentage has been declining; during the 1997-1998 heating season, the last year for which numbers are available, 16% of homes used wood as their primary heat source, represent-ing about 40,000 homes. An additional 15% used wood for supplemental heating. Those residential uses translated to an estimated 250,000 cords (625,000 tons) of wood burned during that heating season (Vt. Dept. of Public Service, 2000).
Those statistics have not been updated with survey data, but the Biomass Energy Resource Center estimates that roughly
Wood Energy
The VermonT energy DigesT
��
680,000 tons of firewood were burned in 2004 (Sherman, 2006). The number of households using firewood as a primary heating source likely has gone down since 1997-98, but those using firewood as a supplemental heating source has increased. The number of firewood dealers also has fallen since the last survey, and during the last two heating seasons there were reports that people who needed firewood could not find it to purchase (DeGeus, 2006).
Meanwhile, wood pellet stoves are becoming increasingly popular, and are likely to continue to see the largest growth in the residential sector. There are an estimated 6,000 wood pellet stoves in use in Vermont, using about 24,000 tons of pellets per year (Page, 2007). Wood pellets are made entirely from wood waste, including sawdust, wood chips, and other residual wood from furniture mills, flooring companies, and sawmills. The majority of wood pellets used in Vermont come from two companies: Energex, with locations in Quebec and Pennsylvania, and New England Wood Pellet in New Hampshire (Kozubek, 2006).
A New Hampshire company sells pellet stoves for $1,600 to $3,500, and the pellets for $268 to $278 per ton. A household with 2,000 square feet will use about 3.5 tons of pellets per winter, making pellet heat one of the cheapest forms of heating available right now (Kozubek, 2006).
Now, spurred partly by high oil, propane, and natural gas prices, demand for wood pellets is high; last winter, supply of wood pellets and pellet stoves could not meet demand. Between 2004 and 2005, the number of pellet stoves and stove inserts shipped in the U.S. increased by 76%, with more than 118,000 shipped during 2005 (Hearth, Patio, and Barbecue Association). To respond to the demand, the wood pellet industry is investing millions of dollars in new plants. For example, New England Wood Pellet, which supplies much of New England with wood pellets, is ramping up to produce 100,000 tons of wood pellets per year and has begun construction on a new plant in Schuyler, NY that will produce another 100,000 tons per year. The company recently started operating a Palmer, MA packaging and reloading center; at this facility, more than 80,000 tons of wood pellets per year are being imported from British Columbia and being bagged and distributed in the northeast (New England Wood Pellet).
Wood pellets can be burned in both stoves and central heating systems, but the vast majority of systems sold in the U.S. are stoves, because there are no wood pellet central heating systems manufactured in the U.S. Central heating systems currently are used much more in Europe, especially Sweden.
There also is a technology under development that would run a generation unit off of a pellet stove. This would allow homeowners to produce combined heat and power from their basement with a wood pellet system. This technology needs about 5 to 10 years to mature, but has potential to boost distributed generation from renewable sources (DeGues, 2006).
Current commercial, industrial, and institutional uses of wood
For many years, state government and others in the private and non-profit sectors have worked to promote wood energy use for commercial, industrial and institutional applications. As a result, Vermont has established some unique wood energy use applications in these sectors.
Vermont has an active wood energy use program in place for Vermont schools (the School Energy Management Program). Currently, 33 Vermont elementary and high schools use wood chip heating systems, serving about 10% of the state’s students. Another 15 schools are considering such a system. During the 2004-2005 school year, the schools with systems saved more than $600,000 by using 16,000 to 18,000 tons of wood chips (Davis, 2006). Wood use in schools has been a big success story, but there are increasing concerns about the wood chip supply. Most schools purchase from sawmills, where the chips are a byproduct from mill operations. There are about a million or so tons of wood chips produced annually in Vermont; most of these are sold to paper and pulp mills or to power plants, and the schools together use only about 2% of the total. Thus, mills are essentially supplying the schools with wood chips as a community service. In the last year, the price of wood chips to schools increased. Special and expensive tractors and trailers are needed to supply the schools. Most schools use the highest quality wood chips, which require more screening at the mill. Declines in the entire wood industry also could ultimately impact schools (Davis, 2006).
In addition to schools, there are other unique wood energy use applications in Vermont. State campuses in Montpelier and Waterbury use district heating systems fueled by wood. (District heating systems use a central boiler with buried piping to provide heat to multiple buildings nearby.) A wood chip district heating system heats 9 buildings in a 50-apartment affordable housing complex in Barre. District heating systems also have been studied for other locations, including downtown Montpelier. These types of systems have
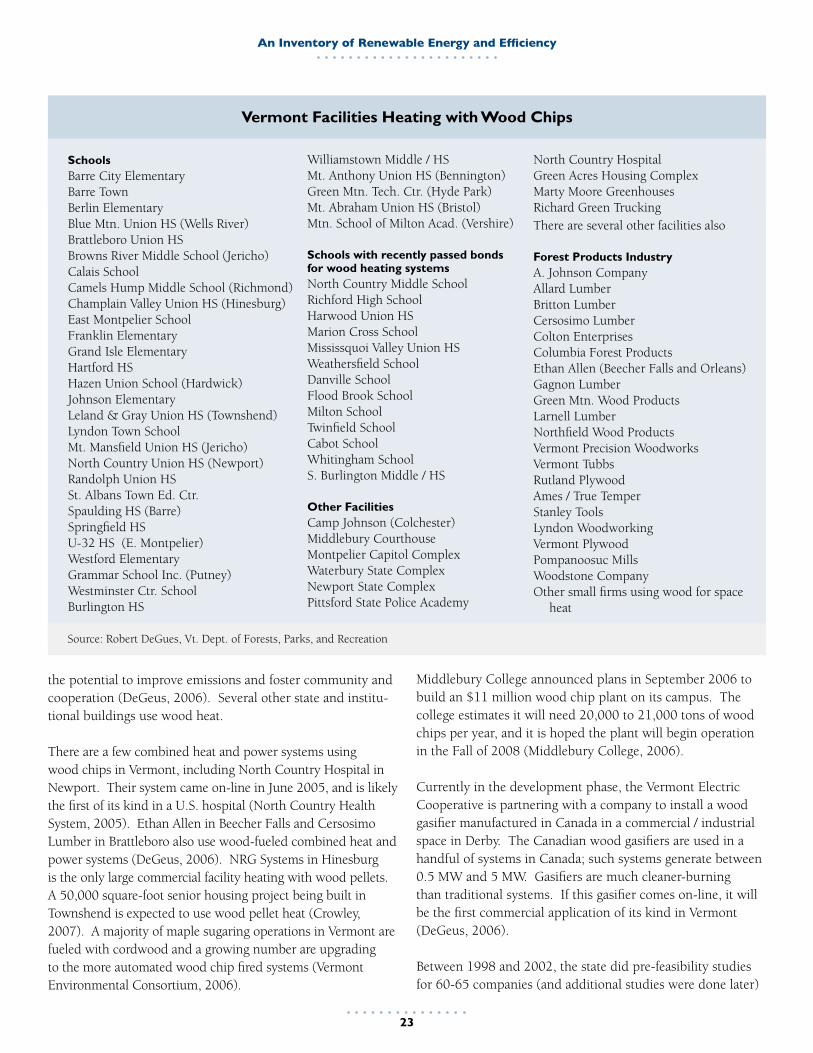
An Inventory of Renewable Energy and Efficiency
��
SchoolsBarre City Elementary Barre Town Berlin Elementary Blue Mtn. Union HS (Wells River) Brattleboro Union HS Browns River Middle School (Jericho)Calais School Camels Hump Middle School (Richmond)Champlain Valley Union HS (Hinesburg)East Montpelier School Franklin Elementary Grand Isle Elementary Hartford HS Hazen Union School (Hardwick)Johnson Elementary Leland & Gray Union HS (Townshend)Lyndon Town SchoolMt. Mansfield Union HS (Jericho) North Country Union HS (Newport)Randolph Union HS St. Albans Town Ed. Ctr. Spaulding HS (Barre)Springfield HS U-32 HS (E. Montpelier) Westford Elementary Grammar School Inc. (Putney)Westminster Ctr. School Burlington HS
Williamstown Middle / HS Mt. Anthony Union HS (Bennington)Green Mtn. Tech. Ctr. (Hyde Park)Mt. Abraham Union HS (Bristol)Mtn. School of Milton Acad. (Vershire)
Schools with recently passed bondsfor wood heating systemsNorth Country Middle SchoolRichford High SchoolHarwood Union HSMarion Cross SchoolMississquoi Valley Union HSWeathersfield SchoolDanville SchoolFlood Brook SchoolMilton SchoolTwinfield SchoolCabot SchoolWhitingham SchoolS. Burlington Middle / HS
Other FacilitiesCamp Johnson (Colchester)Middlebury CourthouseMontpelier Capitol Complex Waterbury State ComplexNewport State Complex Pittsford State Police Academy
Vermont Facilities Heating with Wood Chips
Source: Robert DeGues, Vt. Dept. of Forests, Parks, and Recreation
North Country HospitalGreen Acres Housing ComplexMarty Moore GreenhousesRichard Green TruckingThere are several other facilities also
Forest Products IndustryA. Johnson CompanyAllard LumberBritton LumberCersosimo LumberColton EnterprisesColumbia Forest ProductsEthan Allen (Beecher Falls and Orleans)Gagnon LumberGreen Mtn. Wood ProductsLarnell LumberNorthfield Wood ProductsVermont Precision WoodworksVermont TubbsRutland PlywoodAmes / True TemperStanley ToolsLyndon WoodworkingVermont PlywoodPompanoosuc MillsWoodstone CompanyOther small firms using wood for space
heat
the potential to improve emissions and foster community and cooperation (DeGeus, 2006). Several other state and institu-tional buildings use wood heat.
There are a few combined heat and power systems using wood chips in Vermont, including North Country Hospital in Newport. Their system came on-line in June 2005, and is likely the first of its kind in a U.S. hospital (North Country Health System, 2005). Ethan Allen in Beecher Falls and Cersosimo Lumber in Brattleboro also use wood-fueled combined heat and power systems (DeGeus, 2006). NRG Systems in Hinesburg is the only large commercial facility heating with wood pellets. A 50,000 square-foot senior housing project being built in Townshend is expected to use wood pellet heat (Crowley, 2007). A majority of maple sugaring operations in Vermont are fueled with cordwood and a growing number are upgrading to the more automated wood chip fired systems (Vermont Environmental Consortium, 2006).
Middlebury College announced plans in September 2006 to build an $11 million wood chip plant on its campus. The college estimates it will need 20,000 to 21,000 tons of wood chips per year, and it is hoped the plant will begin operation in the Fall of 2008 (Middlebury College, 2006).
Currently in the development phase, the Vermont Electric Cooperative is partnering with a company to install a wood gasifier manufactured in Canada in a commercial / industrial space in Derby. The Canadian wood gasifiers are used in a handful of systems in Canada; such systems generate between 0.5 MW and 5 MW. Gasifiers are much cleaner-burning than traditional systems. If this gasifier comes on-line, it will be the first commercial application of its kind in Vermont (DeGeus, 2006).
Between 1998 and 2002, the state did pre-feasibility studies for 60-65 companies (and additional studies were done later)
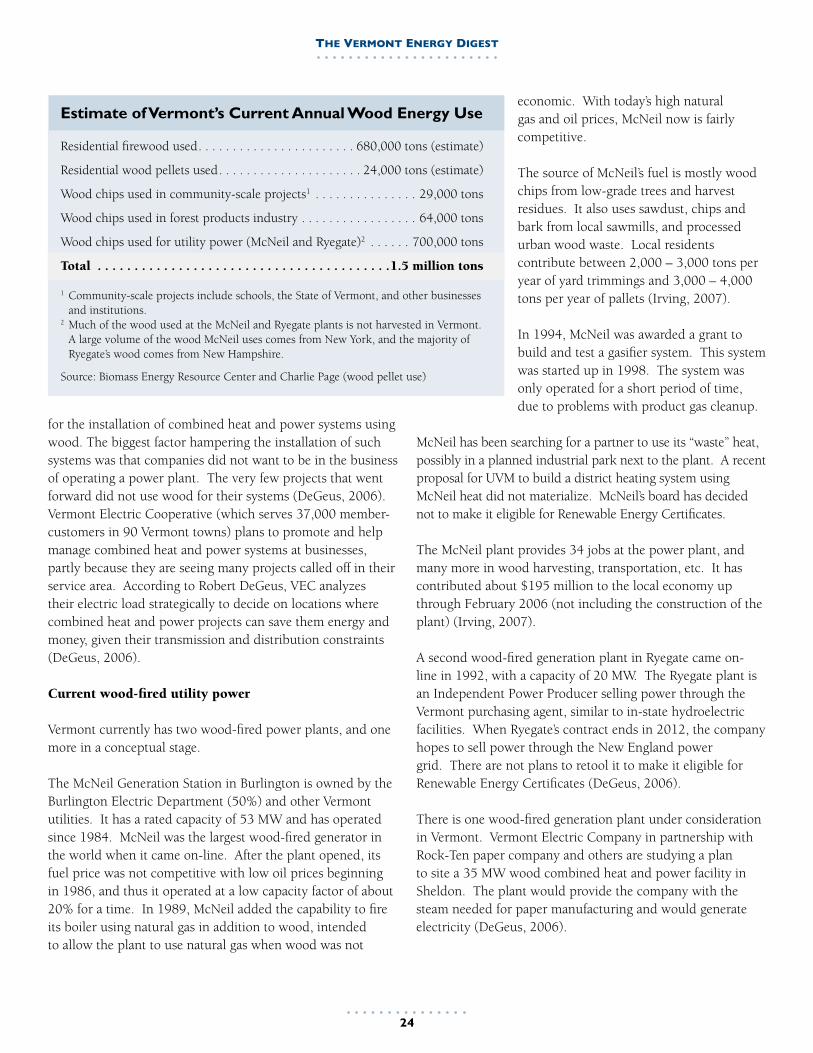
The VermonT energy DigesT
��
economic. With today’s high natural gas and oil prices, McNeil now is fairly competitive.
The source of McNeil’s fuel is mostly wood chips from low-grade trees and harvest residues. It also uses sawdust, chips and bark from local sawmills, and processed urban wood waste. Local residents contribute between 2,000 – 3,000 tons per year of yard trimmings and 3,000 – 4,000 tons per year of pallets (Irving, 2007).
In 1994, McNeil was awarded a grant to build and test a gasifier system. This system was started up in 1998. The system was only operated for a short period of time, due to problems with product gas cleanup.
McNeil has been searching for a partner to use its “waste” heat, possibly in a planned industrial park next to the plant. A recent proposal for UVM to build a district heating system using McNeil heat did not materialize. McNeil’s board has decided not to make it eligible for Renewable Energy Certificates.
The McNeil plant provides 34 jobs at the power plant, and many more in wood harvesting, transportation, etc. It has contributed about $195 million to the local economy up through February 2006 (not including the construction of the plant) (Irving, 2007).
A second wood-fired generation plant in Ryegate came on-line in 1992, with a capacity of 20 MW. The Ryegate plant is an Independent Power Producer selling power through the Vermont purchasing agent, similar to in-state hydroelectric facilities. When Ryegate’s contract ends in 2012, the company hopes to sell power through the New England power grid. There are not plans to retool it to make it eligible for Renewable Energy Certificates (DeGeus, 2006).
There is one wood-fired generation plant under consideration in Vermont. Vermont Electric Company in partnership with Rock-Ten paper company and others are studying a plan to site a 35 MW wood combined heat and power facility in Sheldon. The plant would provide the company with the steam needed for paper manufacturing and would generate electricity (DeGeus, 2006).
for the installation of combined heat and power systems using wood. The biggest factor hampering the installation of such systems was that companies did not want to be in the business of operating a power plant. The very few projects that went forward did not use wood for their systems (DeGeus, 2006). Vermont Electric Cooperative (which serves 37,000 member-customers in 90 Vermont towns) plans to promote and help manage combined heat and power systems at businesses, partly because they are seeing many projects called off in their service area. According to Robert DeGeus, VEC analyzes their electric load strategically to decide on locations where combined heat and power projects can save them energy and money, given their transmission and distribution constraints (DeGeus, 2006).
Current wood-fired utility power
Vermont currently has two wood-fired power plants, and one more in a conceptual stage.
The McNeil Generation Station in Burlington is owned by the Burlington Electric Department (50%) and other Vermont utilities. It has a rated capacity of 53 MW and has operated since 1984. McNeil was the largest wood-fired generator in the world when it came on-line. After the plant opened, its fuel price was not competitive with low oil prices beginning in 1986, and thus it operated at a low capacity factor of about 20% for a time. In 1989, McNeil added the capability to fire its boiler using natural gas in addition to wood, intended to allow the plant to use natural gas when wood was not
Estimate of Vermont’s Current Annual Wood Energy Use
Residential firewood used . . . . . . . . . . . . . . . . . . . . . . . 680,000 tons (estimate)
Residential wood pellets used . . . . . . . . . . . . . . . . . . . . . 24,000 tons (estimate)
Wood chips used in community-scale projects1 . . . . . . . . . . . . . . . 29,000 tons
Wood chips used in forest products industry . . . . . . . . . . . . . . . . . 64,000 tons
Wood chips used for utility power (McNeil and Ryegate)2 . . . . . . 700,000 tons
Total . . . . . . . . . . . . . . . . . . . . . . . . . . . . . . . . . . . . . . . .1.5 million tons
1 Community-scale projects include schools, the State of Vermont, and other businesses and institutions.
2 Much of the wood used at the McNeil and Ryegate plants is not harvested in Vermont. A large volume of the wood McNeil uses comes from New York, and the majority of Ryegate’s wood comes from New Hampshire.
Source: Biomass Energy Resource Center and Charlie Page (wood pellet use)
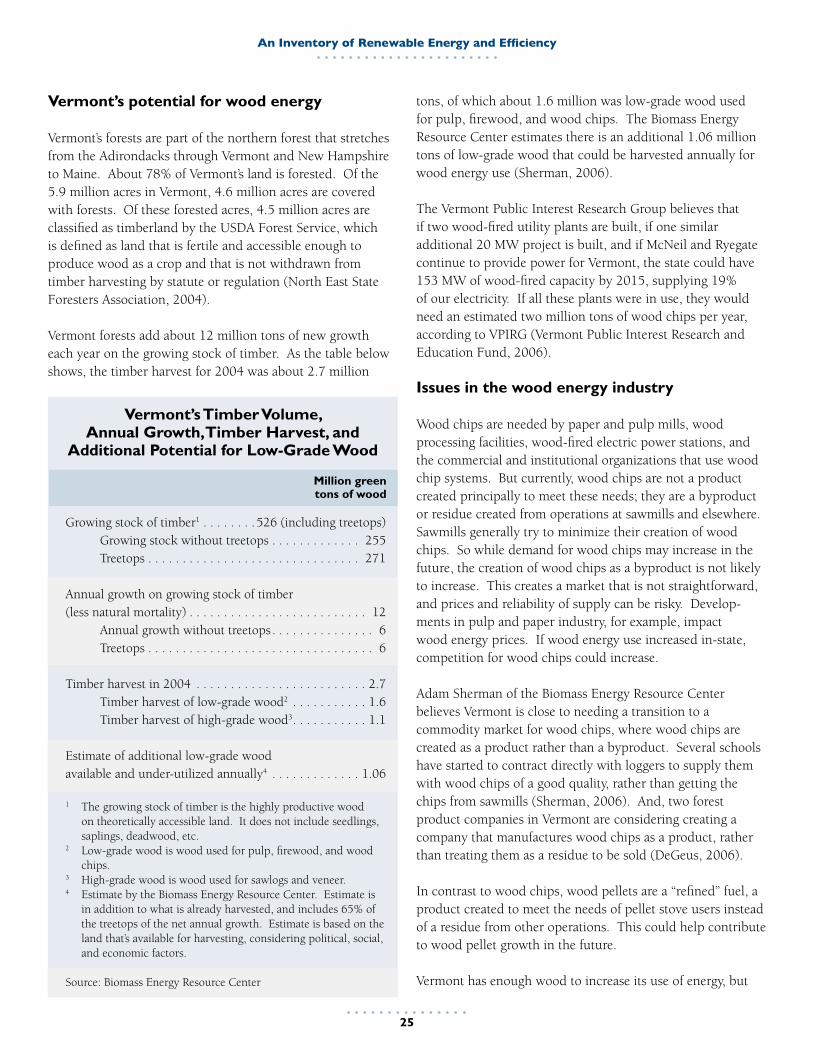
An Inventory of Renewable Energy and Efficiency
��
Vermont’s potential for wood energy
Vermont’s forests are part of the northern forest that stretches from the Adirondacks through Vermont and New Hampshire to Maine. About 78% of Vermont’s land is forested. Of the 5.9 million acres in Vermont, 4.6 million acres are covered with forests. Of these forested acres, 4.5 million acres are classified as timberland by the USDA Forest Service, which is defined as land that is fertile and accessible enough to produce wood as a crop and that is not withdrawn from timber harvesting by statute or regulation (North East State Foresters Association, 2004).
Vermont forests add about 12 million tons of new growth each year on the growing stock of timber. As the table below shows, the timber harvest for 2004 was about 2.7 million
tons, of which about 1.6 million was low-grade wood used for pulp, firewood, and wood chips. The Biomass Energy Resource Center estimates there is an additional 1.06 million tons of low-grade wood that could be harvested annually for wood energy use (Sherman, 2006).
The Vermont Public Interest Research Group believes that if two wood-fired utility plants are built, if one similar additional 20 MW project is built, and if McNeil and Ryegate continue to provide power for Vermont, the state could have 153 MW of wood-fired capacity by 2015, supplying 19% of our electricity. If all these plants were in use, they would need an estimated two million tons of wood chips per year, according to VPIRG (Vermont Public Interest Research and Education Fund, 2006).
Issues in the wood energy industry
Wood chips are needed by paper and pulp mills, wood processing facilities, wood-fired electric power stations, and the commercial and institutional organizations that use wood chip systems. But currently, wood chips are not a product created principally to meet these needs; they are a byproduct or residue created from operations at sawmills and elsewhere. Sawmills generally try to minimize their creation of wood chips. So while demand for wood chips may increase in the future, the creation of wood chips as a byproduct is not likely to increase. This creates a market that is not straightforward, and prices and reliability of supply can be risky. Develop-ments in pulp and paper industry, for example, impact wood energy prices. If wood energy use increased in-state, competition for wood chips could increase.
Adam Sherman of the Biomass Energy Resource Center believes Vermont is close to needing a transition to a commodity market for wood chips, where wood chips are created as a product rather than a byproduct. Several schools have started to contract directly with loggers to supply them with wood chips of a good quality, rather than getting the chips from sawmills (Sherman, 2006). And, two forest product companies in Vermont are considering creating a company that manufactures wood chips as a product, rather than treating them as a residue to be sold (DeGeus, 2006).
In contrast to wood chips, wood pellets are a “refined” fuel, a product created to meet the needs of pellet stove users instead of a residue from other operations. This could help contribute to wood pellet growth in the future.
Vermont has enough wood to increase its use of energy, but
Vermont’s Timber Volume, Annual Growth, Timber Harvest, and
Additional Potential for Low-Grade Wood
Million green tons of wood
Growing stock of timber1 . . . . . . . .526 (including treetops) Growing stock without treetops . . . . . . . . . . . . . 255 Treetops . . . . . . . . . . . . . . . . . . . . . . . . . . . . . . . 271
Annual growth on growing stock of timber (less natural mortality) . . . . . . . . . . . . . . . . . . . . . . . . . . 12 Annual growth without treetops . . . . . . . . . . . . . . . 6 Treetops . . . . . . . . . . . . . . . . . . . . . . . . . . . . . . . . . 6
Timber harvest in 2004 . . . . . . . . . . . . . . . . . . . . . . . . . 2.7 Timber harvest of low-grade wood2 . . . . . . . . . . . 1.6 Timber harvest of high-grade wood3 . . . . . . . . . . . 1.1
Estimate of additional low-grade wood available and under-utilized annually4 . . . . . . . . . . . . . 1.06
1 The growing stock of timber is the highly productive wood on theoretically accessible land. It does not include seedlings, saplings, deadwood, etc.
2 Low-grade wood is wood used for pulp, firewood, and wood chips.
3 High-grade wood is wood used for sawlogs and veneer. 4 Estimate by the Biomass Energy Resource Center. Estimate is
in addition to what is already harvested, and includes 65% of the treetops of the net annual growth. Estimate is based on the land that’s available for harvesting, considering political, social, and economic factors.
Source: Biomass Energy Resource Center

The VermonT energy DigesT
��
according to Robert DeGeus, the state may not have enough loggers and equipment. The number of loggers experienced a decline in the mid-1990s; starting around 2001, some loggers returned to the profession, but many (perhaps the majority) now work seasonally only. In addition, the logger population is aging, and only a small number of younger people are entering the field. The larger wood industry as a whole has impacted loggers; the pulp and paper industry has become unstable, due to aging plants, changes in ownership, and lack of investment. Many plants in the Northeast have closed or will be closing soon. As a result, prices are falling for loggers. Prices for pulp have been much higher than prices for wood energy (DeGeus, 2006). At the same time, input costs for getting the trees out have risen, following gas and oil prices, and now are at their highest level in 20 years nationwide (Kingsley, 2006). As a result, Vermont’s annual timber harvest has been decreasing gradually during the past decade. Because of the falling prices for pulp, loggers tend to harvest more high-grade wood in order to cover their costs, leaving the forests with a larger volume of low-grade material (Sherman, 2006).
Landowner and harvesting issues also exist. The sizes of land parcels are shrinking, and there is a new generation of landowners purchasing properties. Harvesting wood often has no financial advantage to landowners. In the past, landowners were more open to harvesting; but now, many want to preserve their land just the way it is (DeGeus, 2006).
Air emissions from wood-burning appliances have improved dramatically in the recent past. However, there are growing concerns about the
very small particulates emitted when wood is burned. The EPA standard for emissions of fine particulates is very difficult to achieve on small wood-fueled systems. The cost of the most effective controls for fine particulates would make many wood-fired systems financially untenable in schools (DeGues, 2007).
While interest in wood as an energy source is growing, our ability in Vermont to harvest the wood could be a problem. The theory that wood is cheap and plentiful may not be compatible with environmentally sound wood energy use and a livable wage for loggers into the future.
The theory that wood is cheap and plentiful may not
be compatible with environmentally
sound wood energy use and a livable
wage for loggers into the future.

An Inventory of Renewable Energy and Efficiency
��
Background
Anaerobic digesters, a mature technology, are systems that collect and process biodegrad-able waste materials, converting them to energy. Almost any organic material can be processed with
digesters, including animal waste, waste food and paper, grass clippings, sewage, and crops grown specifically for this use. As the materials decompose in the absence of oxygen, bacteria break down the materials and transform them into biogas. The biogas that results can be used to power electric generators or fuel a boiler and provide heat. This biogas consists of methane (40%–80%), carbon dioxide (20%–60%), and small levels of other gases. The percentage of each gas depends on the type of biodegradable materials used, and the way in which the process is managed. After the materials are processed for biogas, the remaining by-products (depending on the original feedstocks) can be used in a variety of ways: as compost, animal bedding, and (with the liquid by-product) as fertilizer. Additionally, the sludge by-product can be used as a cover for landfills or other non-agricultural applications. Most digesters are sited on farms, but centralized digesters that take waste from a number of surrounding farms are gaining more interest.
While electricity is the predominant use of biogas on farms, any direct use of the energy is more efficient. Space heating, water heating, and possibly refrigeration systems can be powered with biogas if the uses are a reasonable distance from the digester.
When used with animal manure, anaerobic digesters’ primary benefits are reducing odor, protecting water quality by destroying disease-causing bacteria, and recycling the nutrients. Using biogas for energy is often considered to be a secondary benefit, except in very large systems. Anaerobic digesters also reduce emissions that contribute to global climate change. Methane is a potent greenhouse gas, with a heat-trapping capacity of about 21 times that of carbon dioxide (U.S. Environmental Protection Agency, “Market Opportunities for Biogas Recovery Systems”). When digesters capture and use biogas for energy, virtually all the methane emissions are eliminated. Digesters also provide an important
distributed generation option.
The types of digesters that currently are most used are:
Covered anaerobic lagoon: This is one of the simplest digesters. A flexible cover is installed over a lagoon that catches the rising biogas and funnels it to pipes leading to the generator. These systems are the least expensive, but are not practical for Vermont because outside temperatures are too low for much of the year, suppressing bacterial activity (Vt. Environmental Consortium, 2006).
Plug-flow digester: This digester has a long, narrow tank with a rigid or flexible cover. The tank is heated and often built partly underground to reduce heat loss. These digesters are used only with dairy manure collected by scraping. These are currently the most effective systems for Vermont’s climate (Vt. Environmental Consortium, 2006).
Complete mix digester: This digester is an enclosed heated tank with a mechanical, hydraulic, or gas mixing system. This digester works best when there is some dilution of the manure with process water (U.S. Environmental Protection Agency, “Market Opportunities for Biogas Recovery Systems”). These digesters can be more expensive to build than plug-flow digesters, but they produce more biogas and retain the manure for shorter times. There are also hybrid systems that combine attributes of complete mix and plug-flow digesters (Vt. Environmental Consortium, 2006). U.S. oil shortages in the 1970s and 1980s earned farm digesters attention. The first farm digester was built in Iowa in 1972, and subsequently, many farm biogas systems were built across the country. Most of those first-generation digesters are no longer in use. By 1998, there were only 28 operating farm digesters in the U.S. (Scruton, 1999). In the past several years, interest in digesters has surged again due to rising energy prices and new interest in renewable energy. The 2002 federal Farm Bill authorized grants to partially fund the installation of digesters, and state programs also provided funding opportunities. As a result, there are now 101 digesters operating or in the construction / start-up phase in the U.S., estimated to produce 248 million kWh per year.
Farm Biogas
The VermonT energy DigesT
��
There are an additional 80 systems in the planning stages (U.S. Environmental Protection Agency, 2006). The U.S. Environmental Protection Agency estimates biogas recovery systems are technically feasible at about 6,900 dairy and swine operations across the U.S., with the potential to generate up to 6 million MWh per year, and to displace about 700 MW of fossil-fuel fired generation (U.S. Environmental Protection Agency, “Market Opportunities for Biogas Recovery Systems”).
New forms of electricity brokering are starting with farm-produced power. In November 2006, grain giant Cargill agreed to partner with Environmental Power, a New Hampshire company that installs digesters on farms, then sells the electricity to utilities and pays the farmers a percentage (Moore, 2006). An approach used by Vermont company Native Energy is to purchase the environmental attributes of farm biogas power. The environmental attributes are purchased up-front by the company for a set number of years (typically 10 or 20), giving farms money to get the project built (Scruton, 2007). A new Vermont company called AgRefresh plans to act as a broker selling electricity produced on farms around the country to businesses seeking to buy power produced from renewable sources (Levesque, 2006).
Vermont’s current uses of farm biogas
Vermont has devoted considerable attention to this energy source. In the early 1980s, pilot programs opened on farms, but most of these digesters are no longer in operation, with the exception of the Foster Brothers Farm in Middlebury. Between 1999 – 2004, the Vermont Methane Pilot Program, using federal funds, was undertaken by the Vermont Department of Public Service and the Vermont Agency of Agriculture, Food, and Markets. The project sought to learn why anaerobic digesters were not in more widespread use in Vermont. The project researched past use of digesters, explored new technologies, made a statewide assessment of potential for digesters, conducted outreach, and provided funds for starting new digester systems. The Agency of Agriculture, Food and Markets continues work in these areas, administering funds for feasibility studies, giving technical assistance for digesters and for farms in start-up operations, and conducting educational outreach (Scruton, 2007).
Currently, Vermont farms can net meter digester systems up to 150 kW in size. In addition, they can sell the power wholesale to utilities or other buyers. There currently are several Vermont farms producing biogas energy, several more in the construction phases, and several in the planning phases.
The Foster Brothers Farm in Middlebury started operating a digester in 1982, and now has one of the oldest anaerobic digester systems in the U.S. The electricity from their biogas provides power directly to the dairy barn and other farm buildings. They created a subsidiary, Vermont Natural Ag Products (Moo Doo), to market the manure compost from their system. They also have conducted research on various digester technologies, in conjunction with the Vt. Agency of Agriculture, Food, and Markets. Their digester system is a plug-flow, in-ground concrete system digester with a flexible top.
Central Vermont Public Service, Vermont’s largest utility with 151,000 customers mostly in southern Vermont, started a “Cow Power” program in 2004. CVPS customers may choose to pay an extra 4 cents per kilowatt-hour to support electricity generated by farm biogas. Customers can choose to pay the extra premium on one-quarter, one-half, or all of their electricity. Participating farm producers are paid 95% of the wholesale market price for the energy sold, plus an additional 4 cents per kilowatt-hour. If enough farm projects are not available, consumers’ premiums purchase renewable energy credits or are deposited into the CVPS Renewable Development Fund. This fund provides grants to farm owners to develop biogas projects (Central Vermont Public Service).
About 3,750 CVPS customers now participate in the Cow Power program, representing about 2.5% of its customers (Costello, 2007). About 95% of the customers are residential. Commercial customers include Green Mountain College (Cow Power’s largest customer), Cas-Cad-Nac Farm (an alpaca farm), Ibex Outdoor Clothing, Newbury Village Store, some buildings at Middlebury College, retail shops, and others (Costello, 2007).
The Blue Spruce Farm in Bridport was the first source of Cow Power for CVPS, coming on-line in January 2005. The project provided 1.3 million kWh in 2006. In addition to being paid for the electricity, Blue Spruce Farm’s owners use the dry solids left over from the digestion process for bedding for the cows (saving $50,000 per year), and use the waste heat from the generator to heat farm buildings (Central Vermont Public Service). The plug-flow digester system features cross-agitation and a “U” shape to allow for manure entrance and exit pits to be at the same end of the concrete digester tank.
Berkshire Cow Power / Pleasant Valley Farm, located in Richford (Vermont Electric Cooperative’s territory), started generating power in November 2006, and is the first farm outside CVPS’s territory under contract with the Cow Power
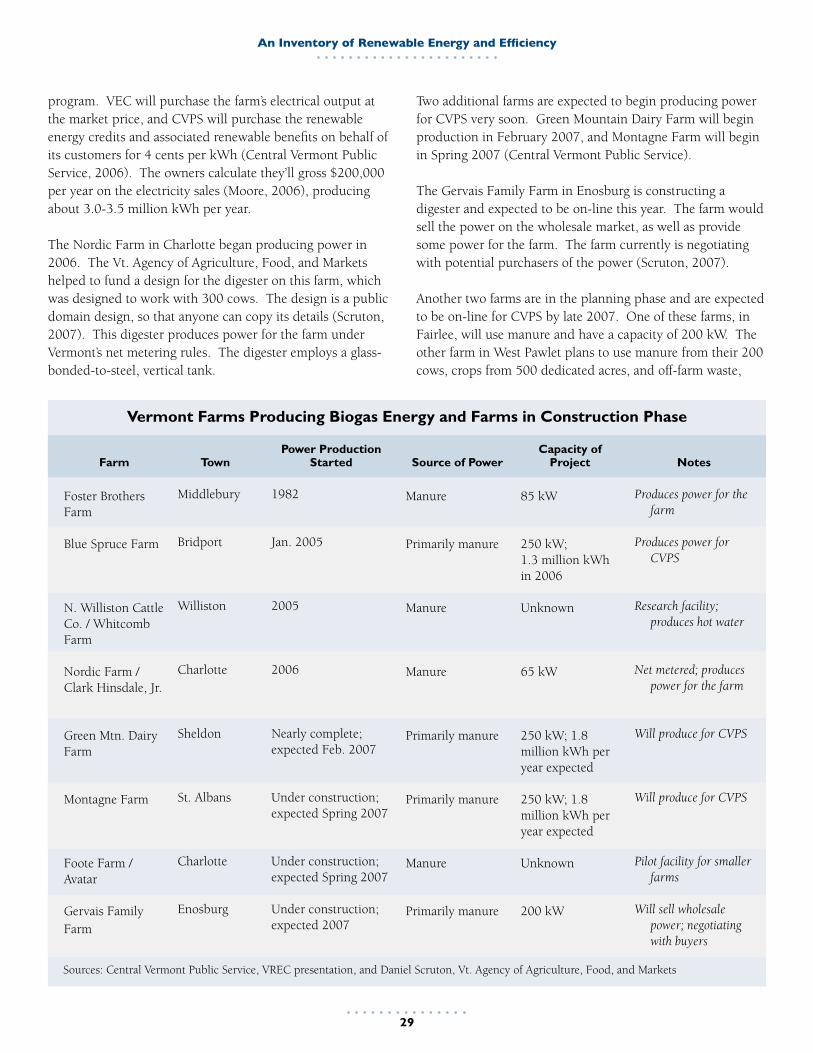
An Inventory of Renewable Energy and Efficiency
��
program. VEC will purchase the farm’s electrical output at the market price, and CVPS will purchase the renewable energy credits and associated renewable benefits on behalf of its customers for 4 cents per kWh (Central Vermont Public Service, 2006). The owners calculate they’ll gross $200,000 per year on the electricity sales (Moore, 2006), producing about 3.0-3.5 million kWh per year.
The Nordic Farm in Charlotte began producing power in 2006. The Vt. Agency of Agriculture, Food, and Markets helped to fund a design for the digester on this farm, which was designed to work with 300 cows. The design is a public domain design, so that anyone can copy its details (Scruton, 2007). This digester produces power for the farm under Vermont’s net metering rules. The digester employs a glass-bonded-to-steel, vertical tank.
Sources: Central Vermont Public Service, VREC presentation, and Daniel Scruton, Vt. Agency of Agriculture, Food, and Markets
Vermont Farms Producing Biogas Energy and Farms in Construction Phase
Two additional farms are expected to begin producing power for CVPS very soon. Green Mountain Dairy Farm will begin production in February 2007, and Montagne Farm will begin in Spring 2007 (Central Vermont Public Service).
The Gervais Family Farm in Enosburg is constructing a digester and expected to be on-line this year. The farm would sell the power on the wholesale market, as well as provide some power for the farm. The farm currently is negotiating with potential purchasers of the power (Scruton, 2007).
Another two farms are in the planning phase and are expected to be on-line for CVPS by late 2007. One of these farms, in Fairlee, will use manure and have a capacity of 200 kW. The other farm in West Pawlet plans to use manure from their 200 cows, crops from 500 dedicated acres, and off-farm waste,
Farm
Foster Brothers Farm
Blue Spruce Farm
N. Williston Cattle Co. / Whitcomb Farm
Nordic Farm / Clark Hinsdale, Jr.
Green Mtn. Dairy Farm
Montagne Farm
Foote Farm / Avatar
Gervais Family Farm
Town
Middlebury
Bridport
Williston
Charlotte
Sheldon
St. Albans
Charlotte
Enosburg
Power Production Started
1982
Jan. 2005
2005
2006
Nearly complete; expected Feb. 2007
Under construction; expected Spring 2007
Under construction; expected Spring 2007
Under construction; expected 2007
Source of Power
Manure
Primarily manure
Manure
Manure
Primarily manure
Primarily manure
Manure
Primarily manure
Capacity of Project
85 kW
250 kW; 1.3 million kWh in 2006
Unknown
65 kW
250 kW; 1.8 million kWh per year expected
250 kW; 1.8 million kWh per year expected
Unknown
200 kW
Notes
Produces power for the farm
Produces power for CVPS
Research facility; produces hot water
Net metered; produces power for the farm
Will produce for CVPS
Will produce for CVPS
Pilot facility for smaller farms
Will sell wholesale power; negotiating with buyers

The VermonT energy DigesT
�0
creating a 500 kW capacity system (Central Vermont Public Service). A third farm in Alburgh also is in the planning phase and expects to construct a digester system in 2007. This farm would use mostly crops, with some manure, and would have a capacity of 1 MW or more; the farm is expected to sell its power on a wholesale basis (Scruton, 2007).
If all the above-mentioned digester systems currently planned for 2007 are completed, Vermont will have about 3 MW of capacity from farm biogas by the end of the year. Vermont has been the site for several pilot or research projects in the past and currently. Foster Brothers Farm has been a site for research. A research project in the past tested a very small digester at the Intervale in Burlington. The North Williston Cattle Company / Whitcomb Farm in Williston currently has a pilot project for an innovative modular system. The Foote Farm in Charlotte is constructing a pilot digester that would work on small farms, those with 60-200 cows. A research project is being considered at a facility with 50 cows that makes cheese; this facility would use both manure and whey from the cheese production in the digester (Scruton, 2007).
Vermont’s potential for farm biogas
According to Daniel Scruton of the Vt. Agency of Agriculture, Food, and Markets, Vermont is poised to be a leader on farm biogas generation in the near future (Scruton, 2007). Six or eight farms currently are seriously considering installing a digester (Scruton, 2007 and Costello, 2007). Vermont Technical College also is interested in building a digester; options discussed include a small digester for educational purposes that would use manure from the College’s 85 cows, or a digester using mostly crops that would provide combined heat and power for the buildings (Scruton, 2007).
There have been a few estimates of the potential for additional biogas generation from Vermont farms.
The Vermont Methane Pilot Project completed a study in 2000 to identify the potential of using anaerobic digestion systems on Vermont farms across the state. The study found that about 30 MW could be generated if all potentially available organic residues and wastes were used. About 94% of this potential would come from dairy manure, the study found, 3% from cheese whey, 2% from other manures, and smaller amounts from food waste, brewery residuals, and food processing residuals. This study analyzed what is theoreti-cally feasible, and did not take into account the technical,
economic, regulatory, environmental, and other factors that would determine whether digesters were feasible on particular farms (Fehrs, 2000).
Steve Costello of Central Vermont Public Service says the utility will continue to expand its Cow Power program. Their goal is, by 2010, to have 10-12 farms participating in the program and 7,500 – 10,000 customers purchasing the power. Six or eight farms currently are exploring participa-tion in the Cow Power program; if developed, the farms would start participation in 2008 or 2009. CVPS currently has about 2.5% of its customers participating in the program, which is a high rate for “green pricing” programs among utilities across the country. The U.S. Department of Energy ranks such programs for participation rates, and CVPS hopes soon to be in the top 10 for highest participation rates. While each system in the Cow Power program now is individually designed, CVPS hopes over time that the systems will become modular and will be feasible for smaller farms. Eventually, CVPS hopes that biogas systems will be common across Vermont and will be available to every farm that wants to participate (Costello, 2007).
The Vt. Agency of Agriculture, Food, and Markets anticipates that if current market trends continue, Vermont could have 15 MW of capacity from manure-based digester systems and 30 MW from crop-based digester systems in 5 to 10 years (Scruton, 2007)
The Vermont Public Interest Research and Education Fund estimates Vermont could have at least 5 MW of capacity from farm biogas by 2015, providing 0.6% of Vermont’s electricity needs (Vermont Public Interest Research and Education Fund, 2006).
Currently, most digesters are only cost-effective at larger farm operations. The farms participating in the Cow Power program have 1,000 or more cows; on paper, farms with 500 or more cows are cost-effective using the Cow Power model. Digesters for medium-sized and small farms currently are being tested, and are hoped to be feasible soon, though they likely will remain less cost-competitive than digesters on larger farms (Scruton, 2007). Experts say a farm should consider a digester only if the payback period is less than seven years, because the equipment is expected to have major maintenance needs every 10 years. Currently, digester systems are profitable only through the use or sale not only of energy, but also of co-products and Renewable Energy Certifi-cates (Vt. Environmental Consortium, 2006).
An Inventory of Renewable Energy and Efficiency
��
On-farm biogas systems are most feasible at larger farms, but with smaller farms, centralized digesters may be viable in the future. With centralized digesters, manure from several surrounding farms can be combined. The system can be owned by a cooperative or a third party. Typically this approach requires manure to be collected fresh with very little process water from farms located within about five miles of the digester. Three such centralized systems are in use today in the U.S. (U.S. Environmental Protection Agency, “Frequently Asked Questions”).
A feasibility study (undertaken by the Vermont Agency of Agriculture, Food, and Markets and the Economic Development Council of Northern Vermont) has explored the potential to create a central digester in the St. Albans / Swanton area that would be used by the high concentra-tion of dairy farms in the area. The study proposed that the electricity and heat could be consumed by the Vermont Northwest State Correctional Facility (Bennett). The concept has been submitted to specific companies for additional ideas. A large challenge is that hauling the manure to the site exceeds the energy value of the electricity the facility would produce. Co-products from the manure or a value-added energy component will need to be identified to make the system economically feasible (Vt. Agency of Agriculture, Food, and Markets)
Another study, commissioned by the Vermont Public Power Supply Authority, looked at the feasibility of installing a central farm manure digester in the Enosburg Falls area. The study concluded that a central digester would be technically and economically feasible, with some government subsidy (Osborne, 2005).
Issues in the farm biogas industry
The passage of the net metering law, CVPS’s Cow Power program, and the state’s work on anaerobic digesters have contributed to Vermont’s current success in this sector. However, anaerobic digesters are expensive, and economics are still a challenge. Digester costs vary based on the design and size of the system, but are in the range of $3,500 to
$6,500 per kilowatt, or $1,000 or more per cow (Vt. Agency of Agriculture, Food, and Markets, 2006; and Vt. Environ-mental Consortium). The typical cost to install a digester at a 1000-cow dairy is $1.2 to $1.5 million. The digester system at Blue Spruce Farm cost $1.2 million, and about one-third of the capital cost was covered by Central Vermont Public Service and state and federal grants (Kelley, 2006). About one-third of the cost of a typical system is for the digester, one-third for the generating system, one-sixth for a separator, and one-sixth for engineering, planning, and administra-tion. Federal and state grants from several sources often cover 40% - 50% of the cost, and farmers are required to provide 50%-60% in debt equity. Lending institutions require farms to provide the land and farm operations for security (Frost, 2006).
In addition to the up-front capital costs, unreliable cash flow when the system is operating can be an issue. After digesters are installed, farmers can get income from several sources including energy generation, bedding substitution, and Renewable Energy Certificate credits; this additional income currently is what makes the projects cost-effective. Research still is necessary for digesters to be cost-effective for smaller farms (Scruton, 2007).
Large power systems often require three-phase power lines in order to connect digester systems with the power grid, and many rural areas lack three-phase power lines. The state’s Clean Energy Fund is expected to provide funds to help offset some of these costs.
Digester systems can be technically demanding and require someone dedicated to oversee the system. It can take one-half hour per day, and one-half day per month to make a digester work successfully (Scruton, 2007). In Europe, mixed systems using both manure and silage have been used with success. In these systems, the corn is grown specifically for use in the digesters. Crop-based systems have higher energy potential, but are more challenging economi-cally (Frost, 2006). See the Biofuels section for more on this topic.

The VermonT energy DigesT
��
Background
In recent years, the solid waste industry has been moving toward conversion technologies, a diverse set of technol-ogies that converts waste into marketable products. One of these marketable products is energy produced by
landfill biogas.
Landfill biogas is created when municipal solid waste decomposes. The gas is about 35% methane (much of the rest is carbon dioxide) and has roughly one-half the energy value of natural gas. This landfill biogas can be captured, converted, and used as an energy source. This not only reduces odors and other local air pollution problems, it also prevents the gas from migrating into the atmosphere and contributing to smog and global warming. (Methane has about 21 times the global warming impact of carbon dioxide.) Most landfill biogas projects extract gas using an active collection system, a series of wells and a blower or vacuum system. This system directs the gas to a central point, where it can be treated and used to generate electricity or used in direct thermal applications. Some landfills have passive collection systems, where landfill biogas slowly migrates into a system of trenches or wells and out of the landfill. (Landfills normally are required to have gas collection systems regardless of whether they host a landfill biogas project.) Active collection systems access the gas more quickly than passive systems. The amount and duration of landfill biogas emissions varies among landfills due to many factors related to the quality and quantity of waste. At a closed landfill, biogas peaks about 10 to 15 years after the waste is deposited, holds the peak for a short time, and then starts to decline (DiDomenico, 2006).
The technologies for landfill biogas projects are already in use. The vast majority of projects use internal combustion engines and gas turbines. Emerging technologies include microtur-bines (now used at smaller landfills and in niche applica-tions), Organic Rankine Cycle engines, and Stirling engines. Traditionally, landfill biogas projects use the gas to create electricity (about two-thirds of projects nationwide produce electricity), but there are a growing number of direct-use projects (e.g., boiler applications, combined heat and power,
direct thermal use for drying applications, greenhouse uses, etc.) There also are emerging technologies that use landfill biogas for vehicle fuels. The U.S. Environmental Protection Agency estimates that every one million tons of municipal solid waste can produce enough landfill biogas to provide about 0.8 MW of electricity (U.S. Environmental Protection Agency, Landfill Methane Outreach Program).
Higher oil and natural gas prices have fueled an increased interest in landfill biogas projects nationwide during the past two years (Goldstein, 2006). The U.S. Energy Information Administration estimates that electricity consumed from landfill biogas has increased 70% between 2000 and 2004 (U.S. Energy Information Administration, 2005). According to the U.S. Environmental Protection Agency, there are currently about 400 operational landfill biogas projects across the country. In 2005, the projects supplied 9 billion kWh of electricity, and 74 billion cubic feet of landfill biogas to direct-use applications (U.S. Environmental Protection Agency, Landfill Methane Outreach Program). The EPA estimates there are at least 600 additional landfills in the U.S. that could economically support a landfill biogas project; these landfills would have a generation capacity of more than 1,400 MW (Goldstein, 2006).
The EPA also estimates that a typical 3 MW landfill biogas project in the U.S. employs more than 70 people, increases employee earnings by more than $3 million, and increases the output of the economy by more than $10 million during the construction year of the project (U.S. Environmental Protection Agency, Landfill Methane Outreach Program).
The federal Energy Policy Act, signed in August 2005, provides a Production Tax Credit of one cent per kWh for electricity produced from landfill biogas and sold.
Vermont’s current uses of landfill biogas
Landfill gas in Vermont provided 15 GWh, about 0.2%, of electricity (own load) in 2005. An additional 15 GWh was generated, but the Renewable Energy Certificates of this power were sold; thus, Vermont cannot count its electricity as part of the state’s renewable portfolio (Lamont, 2007).
Landfill Biogas
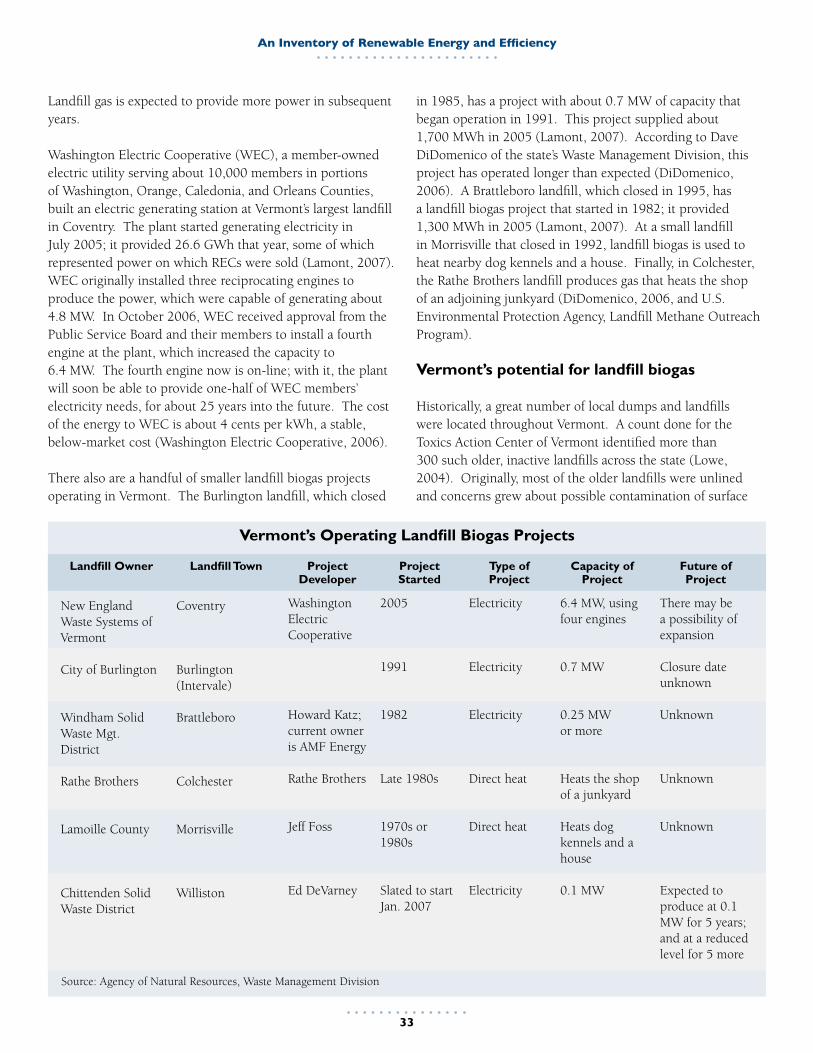
An Inventory of Renewable Energy and Efficiency
��
Landfill gas is expected to provide more power in subsequent years.
Washington Electric Cooperative (WEC), a member-owned electric utility serving about 10,000 members in portions of Washington, Orange, Caledonia, and Orleans Counties, built an electric generating station at Vermont’s largest landfill in Coventry. The plant started generating electricity in July 2005; it provided 26.6 GWh that year, some of which represented power on which RECs were sold (Lamont, 2007). WEC originally installed three reciprocating engines to produce the power, which were capable of generating about 4.8 MW. In October 2006, WEC received approval from the Public Service Board and their members to install a fourth engine at the plant, which increased the capacity to 6.4 MW. The fourth engine now is on-line; with it, the plant will soon be able to provide one-half of WEC members’ electricity needs, for about 25 years into the future. The cost of the energy to WEC is about 4 cents per kWh, a stable, below-market cost (Washington Electric Cooperative, 2006).
There also are a handful of smaller landfill biogas projects operating in Vermont. The Burlington landfill, which closed
in 1985, has a project with about 0.7 MW of capacity that began operation in 1991. This project supplied about 1,700 MWh in 2005 (Lamont, 2007). According to Dave DiDomenico of the state’s Waste Management Division, this project has operated longer than expected (DiDomenico, 2006). A Brattleboro landfill, which closed in 1995, has a landfill biogas project that started in 1982; it provided 1,300 MWh in 2005 (Lamont, 2007). At a small landfill in Morrisville that closed in 1992, landfill biogas is used to heat nearby dog kennels and a house. Finally, in Colchester, the Rathe Brothers landfill produces gas that heats the shop of an adjoining junkyard (DiDomenico, 2006, and U.S. Environmental Protection Agency, Landfill Methane Outreach Program).
Vermont’s potential for landfill biogas
Historically, a great number of local dumps and landfills were located throughout Vermont. A count done for the Toxics Action Center of Vermont identified more than 300 such older, inactive landfills across the state (Lowe, 2004). Originally, most of the older landfills were unlined and concerns grew about possible contamination of surface
Landfill Owner
New England Waste Systems of Vermont
City of Burlington
Windham Solid Waste Mgt. District
Rathe Brothers
Lamoille County
Chittenden Solid Waste District
Landfill Town
Coventry
Burlington (Intervale)
Brattleboro
Colchester
Morrisville
Williston
Project Developer
Washington Electric Cooperative
Howard Katz; current owner is AMF Energy
Rathe Brothers
Jeff Foss
Ed DeVarney
Project Started
2005
1991
1982
Late 1980s
1970s or 1980s
Slated to start Jan. 2007
Type of Project
Electricity
Electricity
Electricity
Direct heat
Direct heat
Electricity
Capacity of Project
6.4 MW, using four engines
0.7 MW
0.25 MW or more
Heats the shop of a junkyard
Heats dog kennels and a house
0.1 MW
Future of Project
There may be a possibility of expansion
Closure date unknown
Unknown
Unknown
Unknown
Expected to produce at 0.1 MW for 5 years; and at a reduced level for 5 more
Vermont’s Operating Landfill Biogas Projects
Source: Agency of Natural Resources, Waste Management Division
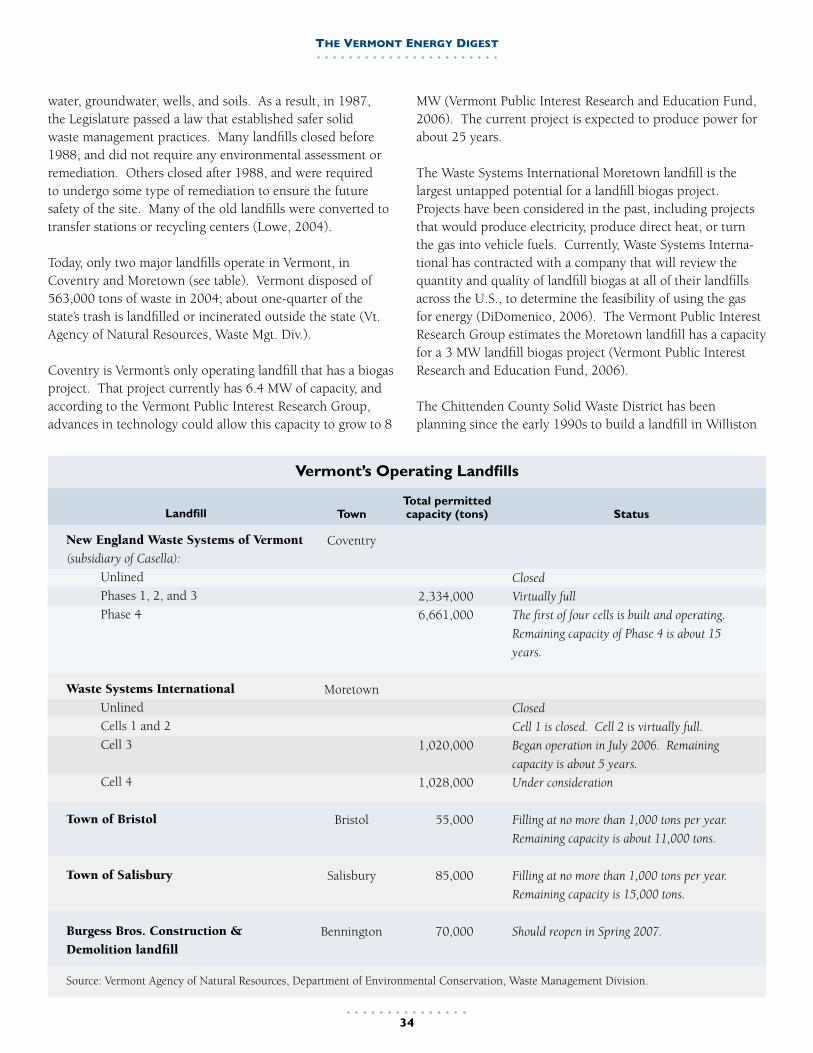
The VermonT energy DigesT
��
water, groundwater, wells, and soils. As a result, in 1987, the Legislature passed a law that established safer solid waste management practices. Many landfills closed before 1988, and did not require any environmental assessment or remediation. Others closed after 1988, and were required to undergo some type of remediation to ensure the future safety of the site. Many of the old landfills were converted to transfer stations or recycling centers (Lowe, 2004).
Today, only two major landfills operate in Vermont, in Coventry and Moretown (see table). Vermont disposed of 563,000 tons of waste in 2004; about one-quarter of the state’s trash is landfilled or incinerated outside the state (Vt. Agency of Natural Resources, Waste Mgt. Div.). Coventry is Vermont’s only operating landfill that has a biogas project. That project currently has 6.4 MW of capacity, and according to the Vermont Public Interest Research Group, advances in technology could allow this capacity to grow to 8
MW (Vermont Public Interest Research and Education Fund, 2006). The current project is expected to produce power for about 25 years.
The Waste Systems International Moretown landfill is the largest untapped potential for a landfill biogas project. Projects have been considered in the past, including projects that would produce electricity, produce direct heat, or turn the gas into vehicle fuels. Currently, Waste Systems Interna-tional has contracted with a company that will review the quantity and quality of landfill biogas at all of their landfills across the U.S., to determine the feasibility of using the gas for energy (DiDomenico, 2006). The Vermont Public Interest Research Group estimates the Moretown landfill has a capacity for a 3 MW landfill biogas project (Vermont Public Interest Research and Education Fund, 2006).
The Chittenden County Solid Waste District has been planning since the early 1990s to build a landfill in Williston
Vermont’s Operating Landfills
Landfill
New England Waste Systems of Vermont
(subsidiary of Casella):
Unlined
Phases 1, 2, and 3
Phase 4
Waste Systems International
Unlined
Cells 1 and 2
Cell 3
Cell 4
Town of Bristol
Town of Salisbury
Burgess Bros. Construction &
Demolition landfill
Town
Coventry
Moretown
Bristol
Salisbury
Bennington
Total permitted capacity (tons)
2,334,000
6,661,000
1,020,000
1,028,000
55,000
85,000
70,000
Status
Closed
Virtually full
The first of four cells is built and operating.
Remaining capacity of Phase 4 is about 15
years.
Closed
Cell 1 is closed. Cell 2 is virtually full.
Began operation in July 2006. Remaining
capacity is about 5 years.
Under consideration
Filling at no more than 1,000 tons per year.
Remaining capacity is about 11,000 tons.
Filling at no more than 1,000 tons per year.
Remaining capacity is 15,000 tons.
Should reopen in Spring 2007.
Source: Vermont Agency of Natural Resources, Department of Environmental Conservation, Waste Management Division.
An Inventory of Renewable Energy and Efficiency
��
to accept waste from the county. If constructed, this would provide another opportunity for a utility-scale landfill biogas project. The landfill is proposed to hold 7.6 million tons of waste and last for about 50 years (or shorter if advancements are not made in reducing the waste stream) (Chittenden Solid Waste District, 2006). The landfill currently is in the preliminary design phase, due to a legal dispute over seizing the land for the landfill. No formal permits have been applied for; meanwhile, a group of residents is raising strong objections to the proposed landfill. When the landfill site was chosen, many of the neighborhoods around it did not exist (Sears, 2006). If this landfill is eventually built, the Vermont Public Interest Rsearch Group estimates it might have 1 MW of capacity by 2015 (Vermont Public Interest Research and Education Fund, 2006).
From these three major landfills, the Vermont Public Interest Research Group believes Vermont could have 12 MW of capacity from landfill biogas by 2015, providing about 1.4% of Vermont’s electricity needs (Vermont Public Interest Research and Education Fund, 2006).
There may be opportunities for projects on a smaller scale also. Ed DeVarney’s company Gas-Watt Energy LLC is installing a project at the Chittenden Solid Waste District’s landfill in Williston that closed in 1995. The landfill has 262,000 tons of waste, and the project is expected to produce 0.09 MW, enough to provide power to 50-75 homes. The plant is expected to begin operation in January 2007; when operational, DeVarney believes it will be the smallest landfill biogas project in the U.S. The power is expected to last at its current level for 5 years, and at a reduced capacity for 5 more years. DeVarney hopes this demonstration project will show that micro-generation can be affordable and profitable (DeVarney, 2006).
According to Ed DeVarney, if the Williston project proves successful, there are a very small number of other landfills in Vermont that could support a similar micro-generation project. Most of Vermont’s closed landfills are too small or too old (and the biogas has already been emitted) (DeVarney, 2006).
The U.S. Environmental Protection Agency’s Landfill Methane Outreach Program lists a few Vermont landfills that could be candidates for a project. The Town of Randolph’s landfill that closed in 1997 has about 190,000 tons of waste in place. The Towns of Bristol and Salisbury still have small operating landfills, with capacities of 55,000 tons and 85,000 tons. All of the landfills closed after 1989 have a gas collection system as part of their design; most of these systems are passive (DiDomenico, 2006).
Issues in the landfill biogas industry
As discussed above, the only larger-scale opportunity for landfill biogas projects in Vermont currently is the landfill in Moretown.
Small scale projects on a few smaller landfills may have some potential. At most of the closed landfills, the peak of their gas emissions has already passed and emissions would be even lower by the time a project was in place. In addition, according to Ed DeVarney who is undertaking the project in Williston (described above), undertaking small-scale projects requires a different business model than that used with large projects. His two-person company has undertaken virtually all aspects of the Williston project, including the legal issues, permitting, working with the utility, construction, etc., which has cut the costs dramatically. In fact, he says the costs for the project are about 40% of the costs of doing the project with the traditional business model that requires experts in several areas (DeVarney, 2006).
The VermonT energy DigesT
��
Background
Biofuels are energy sources derived from biomass, which is renewable organic matter. Biomass sources store sunlight as chemical energy, and they include plant matter, agricultural crops, vegetable oils,
organic agricultural or industrial byproducts, wood, animal manure, and municipal waste. Some biomass sources can be burned directly to create heat or electricity, while others must be converted into a fuel, such as ethanol derived from corn. Biofuels are often liquid, but also can be pellets, chips, biogas, or other forms. Biofuels can be used to run vehicles, heat buildings, or generate electricity. Biofuels emit carbon dioxide when burned, but they are considered carbon neutral because the emissions are absorbed by the regrowth of the plant matter.
Wood, landfill biogas, and farm biogas energy sources are discussed in separate sections of this report. This chapter discusses the remaining energy sources that can be derived from biomass.
Biofuels, especially ethanol and biodiesel, are receiving much attention and funding currently in the U.S., and their production and use are growing rapidly. Major venture capitalists are investing millions in new biofuel production (Tokar, 2006). Federal tax incentives for ethanol were first established in 1978, and subsidies are still in place. Tax incentives for biodiesel were first initiated in 2004. For a list of such incentives, see www.ethanolrfa.org/policy/regulations/federal/standard. In addition to the tax incentives, the Energy Policy Act of 2005 established a nationwide renewable fuels standard that requires ethanol and biodiesel use to nearly double by 2012 (Oak Ridge National Laboratory, 2006). In January 2007, President Bush proposed much higher goals for ethanol and biodiesel use during the next decade, including ethanol use of 35 billion gallons by 2017, a sevenfold increase, and ethanol subsidies of up to $17.8 billion during that time (Hall, 2007).
Ethanol
Ethanol is the most widely used liquid biofuel in the U.S. Ethanol is an alcohol made by fermenting any biomass high in
carbohydrates. In the U.S., most ethanol is made from corn and sorghum (Oak Ridge National Laboratory, 2006). Ethanol is most often used as a fuel additive to gasoline for vehicles to increase octane (anti-knocking quality) and cut carbon monoxide and other pollution. In the past, it was believed that internal combustion engines could use only up to 10% ethanol; however, now cars are being produced that can run on 85% ethanol (Vt. Environmental Consortium).
Ethanol was first used as a vehicle fuel in 1908, but its use did not start to grow significantly until 1980. In 1990, Congress mandated the use of oxygenated fuels such as ethanol in certain areas of the U.S. Several states mandate the use of up to 10% ethanol (E10) in automotive fuels, and there are federal tax incentives to encourage blending ethanol with gasoline. Since 2001, ethanol production in the U.S. has grown dramatically.
The U.S. used 20% of its corn harvest in 2006 to produce 5 billion gallons of ethanol, compared to 6% of its corn harvest in 2000 to produce 1.6 billion gallons of ethanol (Hall, 2007). The U.S. and Brazil together produced about 70% of the world’s ethanol in 2005 with about 4.2 – 4.3 billion gallons each, followed by China with 1 billion gallons (Oak Ridge National Laboratory, 2006). There currently are about 111 ethanol plants in the U.S., with as many as 79 more under construction (Hall, 2007). Twenty-eight states used ethanol-blended fuel in 2004, with California using the most (Oak Ridge National Laboratory, 2006). To meet future demand for ethanol, many believe that cellulosic ethanol will be a prominent fuel in the future. Cellulosic ethanol is chemically identical to corn-based ethanol, but it can be created from a wide range of plant materials such as grasses, corn stalks, woody materials, and some types of wood. The feedstocks for cellulosic ethanol thus could be grown on marginal land or gathered as waste materials from other processes. However, the technology for creating cellulosic ethanol is in the research phase, and there is no commercial-sized facility making it yet. The U.S. Department of Energy announced funding of $160 million in 2006 to be awarded to at least three commercial-scale facilities that would produce cellulosic ethanol (Fialka, 2006). There
Biofuels
An Inventory of Renewable Energy and Efficiency
��
currently is a demonstration plant in Ottawa, Canada, a plant under construction in Georgia, and a test facility to begin construction near Rochester, New York in 2007 (Crenson, 2007 and White, 2007).
Biodiesel
Biodiesel is similar to petroleum-derived diesel fuel, but instead is derived from seed oils (such as canola, soybean, mustard, or sunflower seeds), waste vegetable oil, animal fat, or algae oils. Soybean and canola (rapeseed) oils are the most common vegetable oils used currently, and recycled cooking oil from restaurants also is used. Biodisel production creates a glycerin by-product (used e.g. in soaps after further refinement), and a meal by-product (used e.g. in animal feed). Technology is available to create biodiesel in large central processing facilities, or in small off-the-shelf units, leading to a grassroots orientation of some biodiesel production and use. Fuel-grade biodiesel must be produced to strict industry specifications in order to be sold for on-road use. In the future, biodiesel may be derived more frequently from other materials, such as algae. Some species of algae have high oil content and extremely fast growth rates, and research is on-going in this area (Briggs, 2004). An African bush plant called jathropha now is seen as possible feedstock for biodiesel, and Africa and India may begin growing it on a large scale soon (InsiderAsia, 2007).
Biodiesel has a similar energy content as petroleum-based diesel, and can be blended with conventional diesel fuel (its most common use), used alone, or blended with home heating oil. When used alone, it is called B100; blends of biodiesel range from 2% biodiesel (B2) to 20% (B20). B20 is currently the most widely used biodiesel blend for vehicles, used most frequently in vehicle fleets (Vt. Biofuels Association, October 2006). Farmers can produce biodiesel and use it in their “off-road” diesel farm equipment, or sell it for such use or as an additive for heating oil. Selling biodiesel for on-road use requires complex licenses and permitting. The first diesel engines in the 1890s could run on refined vegetable oils. However, biodiesel did not receive much consideration until the fuel shortages of the 1970s and again during the Gulf War in the 1990s. Biodiesel has been used extensively in Europe for nearly 25 years, but it did not receive general acceptance in the U.S. until the late 1990s (Hansen, 2006).
Europe is the largest producer of biodiesel, but production and use are growing rapidly in the U.S. As of January 2007,
there were 105 biodiesel production plants in the U.S., with 85 more under construction or expanding existing plants. The estimated U.S. biodiesel production in 2005 was 75 million gallons, a three-fold increase over 2004. Production was expected to double or triple again in 2006. Federal tax incentives and other policies have spurred production (National Biodiesel Board, “U.S. Biodiesel Production Capacity”). A study conducted in 2006 found that the U.S. biodiesel industry will add $24 billion to the U.S. economy between 2005 and 2015, assuming annual production reaches 650 million gallons by 2015. The industry will create an estimated 39,000 new jobs and keep $13.6 billion in the U.S. that otherwise have been spent on foreign oil through 2015 (National Biodiesel Board, “Biodiesel’s Contributions to the U.S. Economy).
Companies now are starting to genetically engineer seeds in the hope of producing higher yields of biodiesel and ethanol. Syngenta, DuPont, and Monsanto, large players in the agriculture industry, are experimenting with ways to enhance crops for biofuels (Cook, 2007).
Other biofuels
BioOil, a fuel similar to diesel, can be created through a different process than that used to produce biodiesel, called flash or fast pyrolysis. Additional research and development is needed for this fuel. Biomass also can be gasified to produce a synthesis gas, called syngas or biosyngas. Syngas produced today is used directly to generate heat and electricity (Oak Ridge National Laboratory, 2006).
Grass is another pelletized biofuel that can be burned in special furnaces and stoves, on a residential or commercial scale. Grass is a low-risk perennial crop that captures a high amount of energy in a relatively short time. The infrastructure for pelletizing grass is not yet widely available, but is growing. Switchgrass has been well studied as an energy crop, and giant miscanthus is now grown commercially in Europe for burning in local power stations (Vt. Environmental Consortium).
Corn kernels also can be used for heat, and such combustion systems are readily available. The technology is very similar to wood pellet heating systems. Corn kernel heating systems are starting to be installed more around the country (Vt. Environmental Consortium).
Anaerobic digestion uses bacteria to turn organic waste into biogas. In Vermont, the existing anaerobic digesters use animal manure to produce biogas, but they also are capable
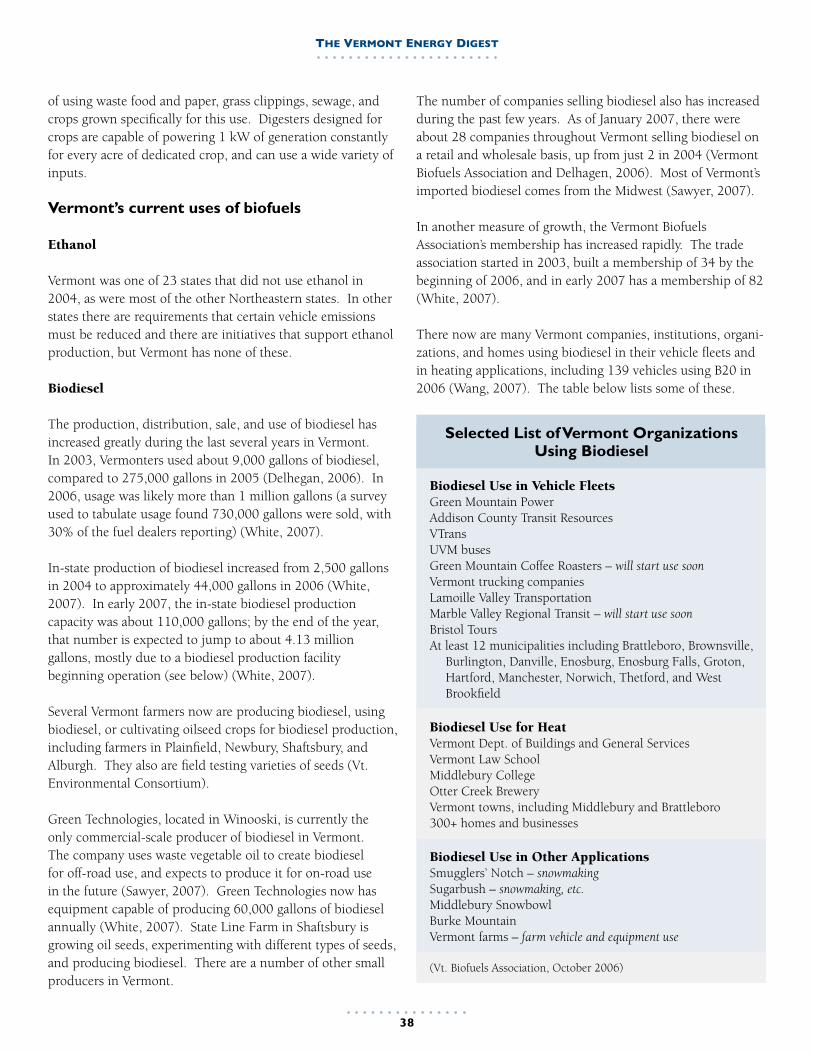
The VermonT energy DigesT
��
of using waste food and paper, grass clippings, sewage, and crops grown specifically for this use. Digesters designed for crops are capable of powering 1 kW of generation constantly for every acre of dedicated crop, and can use a wide variety of inputs.
Vermont’s current uses of biofuels
Ethanol
Vermont was one of 23 states that did not use ethanol in 2004, as were most of the other Northeastern states. In other states there are requirements that certain vehicle emissions must be reduced and there are initiatives that support ethanol production, but Vermont has none of these.
Biodiesel
The production, distribution, sale, and use of biodiesel has increased greatly during the last several years in Vermont. In 2003, Vermonters used about 9,000 gallons of biodiesel, compared to 275,000 gallons in 2005 (Delhegan, 2006). In 2006, usage was likely more than 1 million gallons (a survey used to tabulate usage found 730,000 gallons were sold, with 30% of the fuel dealers reporting) (White, 2007).
In-state production of biodiesel increased from 2,500 gallons in 2004 to approximately 44,000 gallons in 2006 (White, 2007). In early 2007, the in-state biodiesel production capacity was about 110,000 gallons; by the end of the year, that number is expected to jump to about 4.13 million gallons, mostly due to a biodiesel production facility beginning operation (see below) (White, 2007).
Several Vermont farmers now are producing biodiesel, using biodiesel, or cultivating oilseed crops for biodiesel production, including farmers in Plainfield, Newbury, Shaftsbury, and Alburgh. They also are field testing varieties of seeds (Vt. Environmental Consortium).
Green Technologies, located in Winooski, is currently the only commercial-scale producer of biodiesel in Vermont. The company uses waste vegetable oil to create biodiesel for off-road use, and expects to produce it for on-road use in the future (Sawyer, 2007). Green Technologies now has equipment capable of producing 60,000 gallons of biodiesel annually (White, 2007). State Line Farm in Shaftsbury is growing oil seeds, experimenting with different types of seeds, and producing biodiesel. There are a number of other small producers in Vermont.
The number of companies selling biodiesel also has increased during the past few years. As of January 2007, there were about 28 companies throughout Vermont selling biodiesel on a retail and wholesale basis, up from just 2 in 2004 (Vermont Biofuels Association and Delhagen, 2006). Most of Vermont’s imported biodiesel comes from the Midwest (Sawyer, 2007).
In another measure of growth, the Vermont Biofuels Association’s membership has increased rapidly. The trade association started in 2003, built a membership of 34 by the beginning of 2006, and in early 2007 has a membership of 82 (White, 2007).
There now are many Vermont companies, institutions, organi-zations, and homes using biodiesel in their vehicle fleets and in heating applications, including 139 vehicles using B20 in 2006 (Wang, 2007). The table below lists some of these.
Selected List of Vermont Organizations Using Biodiesel
Biodiesel Use in Vehicle FleetsGreen Mountain PowerAddison County Transit ResourcesVTransUVM busesGreen Mountain Coffee Roasters – will start use soonVermont trucking companiesLamoille Valley TransportationMarble Valley Regional Transit – will start use soonBristol ToursAt least 12 municipalities including Brattleboro, Brownsville,
Burlington, Danville, Enosburg, Enosburg Falls, Groton, Hartford, Manchester, Norwich, Thetford, and West Brookfield
Biodiesel Use for HeatVermont Dept. of Buildings and General ServicesVermont Law SchoolMiddlebury CollegeOtter Creek BreweryVermont towns, including Middlebury and Brattleboro300+ homes and businesses
Biodiesel Use in Other ApplicationsSmugglers’ Notch – snowmakingSugarbush – snowmaking, etc.Middlebury SnowbowlBurke MountainVermont farms – farm vehicle and equipment use
(Vt. Biofuels Association, October 2006)
An Inventory of Renewable Energy and Efficiency
��
Many restaurants in Vermont give their waste vegetable oil for biodiesel production or “grease car” use (cars that have been modified to run on straight vegetable oil). An estimated 100 or more grease cars are in use in Vermont (White, 2007). In some areas of Vermont, such as Burlington, Brattleboro, and Montpelier, restaurant waste vegetable oil is in high demand and is difficult to find (White, 2007).
The Vermont Biofuels Initiative, which has run from 2003 to the present, is helping to foster a biofuels industry in Vermont using local resources to supply some of the state’s energy needs. The project partners are the Vermont Sustainable Jobs Fund, the Vermont Biofuels Association, the Vermont Fuel Dealers Association, and the Vermont Department of Public Service. Phase one of the project ran from 2003 – 2006 and established an early stage biodiesel market in Vermont by completing pilot projects and educational activities that introduced biodiesel to large-scale diesel users and residential heating oil customers. Phase two of the project, running from 2006 to 2008, will expand the commercial-scale and small on-farm production of biodiesel by funding additional pilot projects on several farms, providing grants and technical assistance to small-scale biodiesel producers, and coordinat-ing among related organizations. Summaries of the initiative’s activities are at www.vsjf.org and www.vermontbiofuels.org. Some of the initiative’s projects currently in process are:
• Funding the On-Farm Oilseed Study, a research and development project, with the University of Vermont and three Vermont farms.
• Funding the company Green Technologies to increase their production capacity and develop further testing processes.
• With several partners, starting the Fuel and Feed Project, which seeks to increase the amount of biodiesel and livestock feed (as a by-product) that is produced and consumed locally. A number of pilot projects will be funded during the 2007 and 2008 growing seasons (Vermont Sustainable Jobs Fund).
Biocardel Vermont, LLC, a newly formed Canadian company, announced their plans in August 2006 to locate a biodiesel production facility in Swanton, using soy oil from Canada as a feedstock. The facility initially will have a capacity for 4 million gallons per year; the company hopes to produce 8 million gallons after three years of operation, and to hire 30-35 people during that period (Delhagen, October 2006 and WCAX, 2006). The facility is scheduled to start operation in Spring 2007 (White, 2007).
Governor Douglas in January 2007 proposed increasing state government’s use of biofuels in buildings and vehicle fleets
and establishing a rebate system to fuel distributors who sell home heating biofuels. Bills were proposed in the 2007 Legislative Session to accomplish these goals (White, 2007).
Regionally, Hampton Biofuels recently proposed to build a biodiesel plant in Hampton, New York, on a property along the Vermont border near Poultney. If built, the plant could produce up to 50 million gallons of biodiesel per year. A rail line operated by Vermont Rail and extending from Rutland to Whitehall, NY goes through the property (Sutton, 2007).
Other biofuels
There have been several test projects for grass energy crops in Vermont. Shelburne Farms is experimenting with grass pellets as a way to heat some of its buildings (Agriview, 2006). Vermont Technical College is proposing to use a wood pellet boiler for a 5,000 square-foot building, and switch to blended wood/grass pellets when feasible (Vermont Technical College, 2007 and Gill, 2007). Biomass Commodities Corporation, a Vermont company, produced 24 tons of mixed biomass pellet fuel from Vermont-grown and other feedstock sources during the first quarter of 2007. Farm production of grass energy crops on a commercial scale is not yet possible in Vermont, because at this time there is no centralized pellet production (Gill, 2007).
There is no commercial corn kernel system in use in Vermont. The Vermont Superintendents Association’s School Energy Management Program is considering corn’s potential for Vermont’s schools (Vt. Environmental Consortium).
Two Vermont farms have plans to build anaerobic digesters to produce biogas from crops as well as manure. A farm in West Pawlet plans to use manure from their 200 cows, crops from 500 dedicated acres, and off-farm waste, creating a 500 kW capacity system (Central Vermont Public Service). A farm in Alburgh plans to use mostly crops, with some manure, and have a capacity of 1 MW or more (Scruton, 2007).
UVM’s Gund Institute for Ecological Economics is undertaking a technical and economic feasibility study for biodiesel production from algae. The study, with funding from the Vermont Agency of Agriculture, Food, and Markets, is based on an algae production system invented by a Montpelier company, Algepower, Inc. (Scruton, 2007). A pilot project is likely to test the technology this year (White, 2007).Vermont’s potential for biofuels
There are no ethanol facilities located in New England (Sawyer, 2006). Vermont is not likely to be a producer of
The VermonT energy DigesT
�0
grain-based ethanol. Vermont has limited corn production, and companies must produce millions of gallons of ethanol per year to be cost-effective (Vt. Environmental Consortium).
Vermont might, however, provide wood or other biomass feedstock for cellulosic ethanol production in the future. Whether a facility could be sited in Vermont is not clear; unlike biodiesel, there are no decentral-ized models or small-scale production methods. Currently, cellulosic ethanol production requires major investment in large-scale equipment, which only a few players are making in the U.S. (Sawyer, October 2006). In addition, the micro-organisms needed for the process are not in the public domain, but are owned by the companies that developed them (Vt. Environmental Consortium). Despite these challenges, the Vermont Alternative Energy Corporation calculated that a cellulosic ethanol facility producing 10 million gallons per year would be possible based on Vermont’s feedstocks, at a cost of $44 million. Wood, lumber, forest residue, and grass straw would be the most likely feedstocks for such a facility (Vt. Alternative Energy Corporation, 2006).
The Vermont Biodiesel Project anticipates that Vermont will consume five million gallons of biodiesel in 2007 (Delhagen, 2006). In addition to the farmers already involved, about a dozen Vermont farmers are considering using biodiesel or growing feedstocks for it (Sawyer, 2007).
According to Netaka White of the Vermont Biofuels Association, Vermont probably will not be an exporter of biofuels in the near future. However, Vermont could lead in modeling community and regional-scale development and use of biofuels and their by-products (White, 2006).
Issues in the biofuels industry
The cost differential between biodiesel and petroleum-based diesel varies widely depending on location and price volatility of petroleum markets. In Vermont today, the cost of B20 is between 8 cents and 20 cents more per gallon than petroleum diesel. The price per gallon of B100 is historically stable at about $3.00 per gallon (White, 2007).
There can be challenges for fuel dealers around selling biodiesel, including uncertainties about where to purchase biodiesel, where to store it, and whether it will sell (White, 2007).
There are several broader issues about the production of biodiesel and ethanol on a large scale, as follows.
Many worry that large-scale biofuels production will not give enough consideration to the sustainable productive capacity of fields and forests (White, 2006). For example, Brazil uses one-half of its annual sugarcane crop to provide 40% of its auto fuel, while increasing deforestation to grow more fuel feedstock. In
Brazil, 80% of global warming emissions come from deforesta-tion. Much of Europe’s biodiesel has been supplied by Malaysia and Indonesia, where rainforests have been cleared to produce palm oil plantations; there are increasing concerns in Europe about this forest destruction (Tokar, 2006; InsiderAsia, 2007). Other environmental impacts from additional energy crops include pesticide use, nitrate runoff into water supplies, and an increased demand on water.
With the rapid growth in the biofuels industry, there also are concerns about diverting food crops toward energy production, with obvious implications on prices and on the world’s poor. The grain required to make enough ethanol to fill an SUV tank is enough to feed a person for one year (Tokar, 2006). In the past six months, corn prices have doubled in the U.S., and are expected to continue to rise as more ethanol plants come on-line. This alarms cattle ranches, hog farmers, and poultry producers who depend on corn for feed, as well as on many food industries that rely on high-fructose corn syrup. As more farmers plant corn instead of soybeans, the price of soybeans could rise as well (Hall, 2007).
There also have been questions about whether there is a net energy gain in biofuel production (whether the energy it takes to create biofuels is greater than the energy they produce). Studies on this point are contradictory.
These issues raise questions about whether biofuels can contribute a large portion of our future energy needs in a sustainable way. If biofuels are going to be feasible for the long-term on a large scale, it is likely they will have to provide more net energy gain and fewer environmental impacts. In addition, they will have to be undertaken in conjunction with a range of strategies that reduce our fossil fuel energy use. Biofuels may provide strong advantages on a local or regional basis, where the fuels and by-products are produced primarily to meet the needs of the area, and where the communities are invested in the processing infrastructure. Additional efficiencies may be realized when farmers use crop wastes to fuel their own or neighboring farms, or when vehicles and equipment are run on used vegetable oil.
The grain required to make enough ethanol
to fill an SUV tank is enough to feed a person for one year

An Inventory of Renewable Energy and Efficiency
��
Background
In the past, mechanical windmills pumped water and ground grain on many American farms. In 1889, there were 77 windmill factories in the U.S. Windmills began to
disappear from the rural landscape when electricity started to reach rural areas in the 1930s and 1940s. By 1997, there were less than a dozen wind turbine manufac-turers in the U.S., with about half of them dealing only with small-scale turbines (EarthTurbines).
Now, wind energy use is on the rise again. Wind power is the fastest growing energy source in the world. Turbine technology has advanced in the past decade. For example, newly developed utility-scale turbines generate two or three times the power of the turbines used at Searsburg wind farm in Vermont (Vermont Agency of Natural Resources, 2004). A wind turbine can range in size from a 0.5 kW micro-turbine used for a specific application to a 3 MW utility-scale turbine.
Turbines for utility-scale wind farms range in size from 1 MW to 3 MW each. The best locations for wind farms in the U.S. are windy plains in the Midwest and West, rolling farmland upwind of open regions, north-south ridgelines in the eastern U.S., and specific areas where natural topographic features accelerate the wind. Additionally, coastal regions and offshore locations have high winds. At optimum sites, utility-scale wind power is competitive with conventional sources of generation, and is expected to be even lower in the future. One of the significant advantages of wind power is that it is produced at a known and fixed cost; thus, there is no price volatility. The cost of electricity generated by modern wind farms has decreased from about 38 cents per kWh in 1980 to 4.5 cents per kWh today in many locations. The estimated cost for a Vermont wind farm of 15 – 40 MW is about 6 cents per kWh (Mott, December 2006).
Most utility-scale wind farms are developed and owned by an independent merchant, and local or regional utilities purchase the power. In a few special cases, including Vermont, utilities develop and operate the project. Green Mountain Power’s Searsburg wind project was built this way, with financing
from GMP customers and grant money from the U.S. Dept. of Energy and Electric Power Research Institute.
Community wind projects consist of one or more utility-scale wind turbines that are locally owned by municipalities, cooperatives, schools, institu-tions, public/private partnerships, groups of local
landowners or investors, or local businesses. Europe has pioneered the use of community wind projects, but there are a growing number of such projects in the U.S., especially in Iowa and Minnesota where public policy supports community wind. Community wind projects, unlike utility-scale projects, have access to low-cost municipal and non-profit financing. Similar to utility-scale projects, they bring positive economic benefits to rural communities; they also encourage community involvement (Mott, 2007).
Small-scale wind turbines are installed for homes, farms, and small commercial facilities that are on or off the electricity grid, and they range in size from 400 watts to 100 kW (U.S. Department of Energy, 2003). Those used for net metered residential applications usually generate less than 10 kW, and are mounted on towers 80 to 120 feet high. Many small-scale turbines are attached to the electricity grid and take advantage of net metering, in which excess power generated is fed back into the electricity grid. For homes and other facilities that are remote or off the grid, small-scale turbines can avoid the costs of power line extensions. There are several companies working on improved technologies for small-scale turbines. There also are a growing group of companies designing micro-turbines (20 watts to 500 watts) to fit on top of buildings in urban or suburban settings. Micro-turbines currently are used for specific applications such as charging batteries for recreational vehicles and sailboats (U.S. Department of Energy, 2003).
Worldwide wind power installed capacity was about 74,000 MW in 2006, and roughly two-thirds of that capacity was in Europe (Geisler, 2007 and Grotz, 2006). Germany is a leader, with more than 18,000 MW installed by the beginning of 2006. Spain and the U.S. follow Germany, with installations in the 10,000 MW to 12,000 MW range, followed by India
Wind Energy
Wind power is the fastest
growing energy source in the
world.
The VermonT energy DigesT
��
and Denmark in the 3,000 MW to 5,000 MW range (Grotz, 2006). In the U.S., installed wind capacity was 11,603 MW in December 2006, a climb up from just 2,500 MW in 1999 (Geisler, 2007 and U.S. Dept. of Energy, Wind Powering America). Wind farms were expected to generate enough power to serve the equivalent of 2.3 million homes in 2006. Wind was the second largest source of new power generation coming on-line in 2005 and 2006 in the U.S. (after natural gas). Texas and California have the most installed capacity in the U.S. (in the 2,000 to 3,000 MW range). Iowa and Minnesota have specialized in community wind, as well as larger-scale projects, and have the next largest capacities (in the 800 to 900 MW range). More than 150 utilities now use some wind power (American Wind Energy Association).
There are useful wind resources in many areas of the U.S. Wind potential in the U.S. is highest in the windy Great Plains and Western states, and in coastal areas. The wind industry’s goal is to supply 6% of the nation’s electricity by 2020, and to eventually supply 20% (American Wind Energy Association, 2006). All sizes of wind projects are expected to grow signifi-cantly. The small-scale wind sector is poised to grow with grid-connected projects (Mott, 2007).
In the U.S., there is a federal production tax credit equivalent to 1.9 cents per KWh for wind power and other renewables during the first ten years of a project’s operation. The tax credit has helped to boost wind installations, but because it is extended on a year-by-year basis, it also has created uncertainty and slowed the market in the past (Kammen, 2006). Expirations of the credit in certain years caused drastic drops in new wind installations in 2000, 2002, and 2004 (American Wind Energy Association, 2006). The most recent extension of the tax credit was granted in December 2006, which extends the tax credit through December 2008 (American Wind Energy Association, December 2006).
According to a 2004 estimate, the U.S. wind industry directly employs around 2,000 people (American Wind Energy Association). A 2005 estimate found that during construction of wind projects, 1-2 jobs are generated for each megawatt of the project. For on-going operation and maintenance, 2-5 permanent, local jobs are created for each 50-100 MW (The Energy Foundation, 2005). This is approximately double the number of jobs created with other electric generating industries (Mott, 2007). Each 100 MW of wind projects contributes $500,000 - $1 million in annual property tax revenue, and many projects in the eastern U.S. are now paying
more than this in various regional payment programs (The Energy Foundation, 2005 and Mott, 2007). Major companies have a growing interest in wind energy; for example, oil giant BP and investment bank Goldman Sachs have acquired wind energy companies, and General Electric has been boosting its efforts with wind turbine manufacture (Green, 2006)
Vermont’s current uses of wind energy
About 13 GWh, or 0.2% of Vermont’s electricity supply (own load), came from wind in 2005 (Lamont, 2007). Net metered small-scale wind projects provided a small additional amount of energy to Vermont.
Vermont’s one utility-scale wind farm was the largest wind plant in New England until December 2006 (when a 40 MW wind farm came on-line in Mars Hill, Maine). Green Mountain Power’s wind project in Searsburg started providing power in 1997, and has 11 turbines with 6 MW of capacity, enough to power more than 1,600 homes. The average wind speed along the ridgeline is 15 to 17 mph, at which speed the turbines produce power 80% of the time. This project has provided research on the performance of turbines in cold climates, on potential impacts to birds and wildlife, and on the level of public acceptance of wind facilities (Green Mountain Power).
Vermont currently has 76 net metered small-scale wind projects, providing 499 kW of capacity. In addition, experts estimate Vermont has roughly 10-50 wind projects that are not connected to the electricity grid (Mott, 2007 and Perchlik, 2007).
Vermonters are installing more small wind turbines partly due to incentive programs and net metering availability. Net metering requires a Certificate of Public Good from the Vt. Public Service Board, and is available for wind systems up to 15 kW (150 kW for farms); and, up to ten Certificates of Public Good per year may be granted for non-farm renewable systems between 15 kW and 150 kW (Vermont Public Service Board).
Through a series of federal grants, the Vermont Department of Public Service established the Vermont Small-Scale Wind Energy Demonstration Program. Under this program, the state has assisted 19 Vermont schools, agricultural sites, and municipal and state facilities to install wind turbines on their properties, providing a total of up to 200 kilowatts of energy. In addition, seven wind measurement towers are currently operating under a program administered through Vermont
An Inventory of Renewable Energy and Efficiency
��
Technical College to provide wind measurement equipment to Vermont residents who are considering installing small wind systems on their property (Vermont Small-Scale Wind Energy Program).
The Vermont Solar and Small Wind Incentive Program, as described elsewhere in this report, provides $2.50 per watt for small grid-connected wind systems for homes, businesses, and low-income multi-family housing (with additional incentives if Vermont-made equipment is used), up to a $12,500 incentive maximum. The incentive is $4.50 per watt for schools, farms, local/state governments, with an incentive maximum of $20,000 or 50% of the installed cost, whichever is less. Between the program’s inception in 2003 and January 2007, it provided $264,000 for 41 wind projects, supporting 99 kW of installed capacity. Fifteen of the projects are tied to the electricity grid, and 26 are not (funding was available in previous rounds of the program for off-grid projects) (Jenkins, 2007). The latest round of funding was opened in September 2006, with $980,000 available for solar and wind projects (Renewable Energy Resource Center).
In the 1970s and 1980s, the Vermont company Enertech was one of the most popular names in the wind industry, selling thousands of small wind turbines in the U.S. The company went out of business in the late 1980s as market conditions became less favorable for wind power (Renewable Energy Access). Today, there are several world-class wind equipment manufacturers in Vermont including Northern Power Systems, Earth Turbines, and NRG Systems. Earth Turbines, which manufactures and installs complete home wind systems, expects to have products available for sale starting in June 2008 (Shute, 2007). Northern Power Systems designs and installs electric power systems using wind, solar, and fossil fuels for industrial and other applications. NRG systems is a global leader manufacturing wind measurement technolo-gies. Vermont-based Catamount Energy Corporation, a subsidiary of Central Vermont Public Service, develops and owns wind projects around the U.S. and is a world player in the industry. These four companies together employ around 80 people; EarthTurbines may hire as many as 15 more people during the next two years as they ramp up production of their turbine (Mott, March 2007). Vermont Technical College has a partnership with the state and wind industry to train students in the wind industry.
Vermont’s potential for wind energy
Vermont has substantial wind resources. Its strongest winds are on the north-south ridges of the Green Mountains, above
1,800 or 2,500 feet, and below 3,500 feet (due to ice). Statewide maps of wind resources at 50-meter and 30-meter heights exist that were developed from computer models and correlated with some actual data sets (Vermont Small-Scale Wind Energy Program). Small-scale turbines require sites that have wind speeds of at least 9 -11 mph, while community wind projects may be feasible at wind speeds of 13-15 mph (Mott, March 2007 and American Wind Energy Association).
Because smaller turbines require less wind to operate, there are more potential locations for them. According to Lawrence Mott, locations with wind speeds that would support small-scale or community wind projects, that have available land, and that are close enough to power lines and infrastructure include Grand Isle, the tops of rises in the Champlain Valley and elsewhere, and many locations in the Northeast Kingdom and Northwestern and Southwestern Vermont. Such projects will not be feasible in the Montpelier area, White River Valley, or inland areas below 1,400 feet in elevation. Mott believes small and community wind turbines have the theoretical potential to provide about 5% of Vermont’s electricity use (or 75 MW) within the next 15-20 years. While this level of generation is technically feasible and there is enough available land, Mott believes it would not be achievable with today’s rates and with the current level of opposition to wind (Mott, March 2007).
As noted above, the Vt. Solar and Small Wind Incentive Program has provided incentive funding for small wind projects since 2003. The incentive program is expected to continue to be funded by the Vermont Clean Energy Development Fund, but a funding schedule for the program has not yet been set (Jenkins, 2007).
For most utility-scale projects, ridgelines are the only viable location given current technology and economics (Mott, December 2006). Utility-scale projects require a minimum of 16-18 mph wind speeds in Vermont under current market conditions (Mott, March 2007). About 20% of the potential sites for utility-scale wind development are located on state lands under the jurisdiction of the Vermont Agency of Natural Resources. Much of this land cannot be developed due to legal restrictions (Vermont Agency of Natural Resources, 2004).
The Vermont Public Interest Research Group believes Vermont could install 450 MW of utility-scale wind turbine capacity by 2015, supplying 20% of the state’s electric needs. VPIRG’s estimate would require 274 turbines on about 46 miles of Vermont’s ridgelines, less than 10% of the ridgelines above
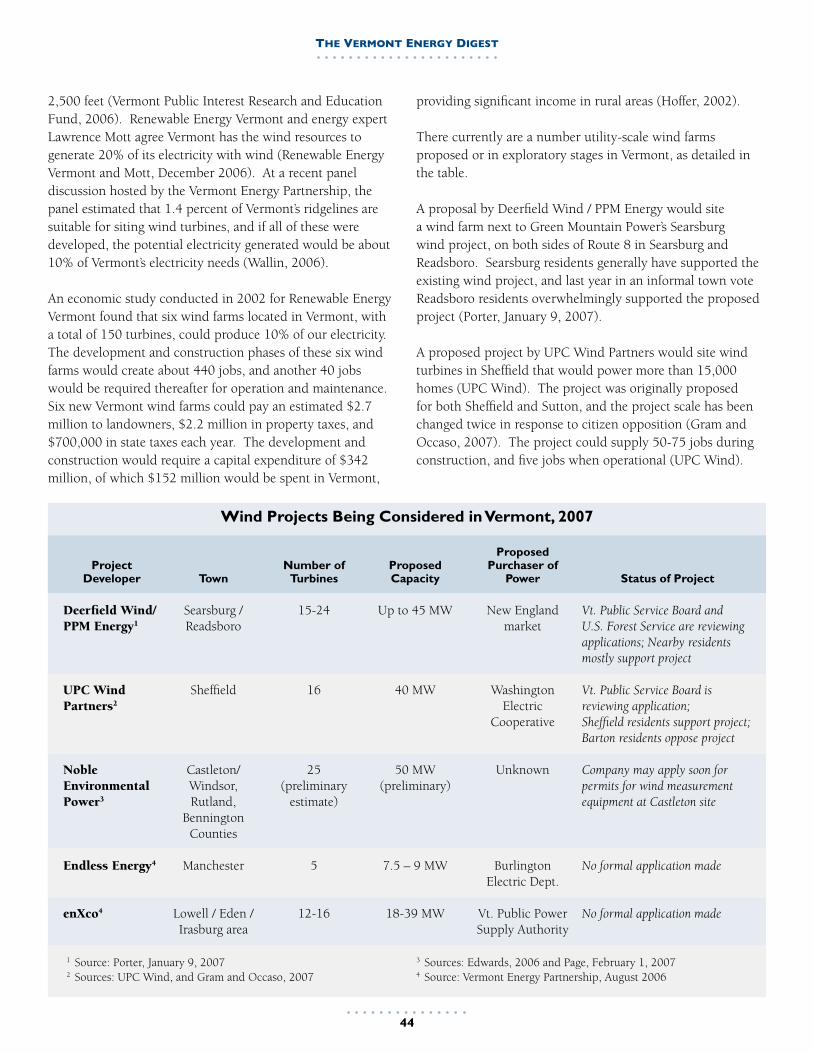
The VermonT energy DigesT
��
2,500 feet (Vermont Public Interest Research and Education Fund, 2006). Renewable Energy Vermont and energy expert Lawrence Mott agree Vermont has the wind resources to generate 20% of its electricity with wind (Renewable Energy Vermont and Mott, December 2006). At a recent panel discussion hosted by the Vermont Energy Partnership, the panel estimated that 1.4 percent of Vermont’s ridgelines are suitable for siting wind turbines, and if all of these were developed, the potential electricity generated would be about 10% of Vermont’s electricity needs (Wallin, 2006).
An economic study conducted in 2002 for Renewable Energy Vermont found that six wind farms located in Vermont, with a total of 150 turbines, could produce 10% of our electricity. The development and construction phases of these six wind farms would create about 440 jobs, and another 40 jobs would be required thereafter for operation and maintenance. Six new Vermont wind farms could pay an estimated $2.7 million to landowners, $2.2 million in property taxes, and $700,000 in state taxes each year. The development and construction would require a capital expenditure of $342 million, of which $152 million would be spent in Vermont,
providing significant income in rural areas (Hoffer, 2002).
There currently are a number utility-scale wind farms proposed or in exploratory stages in Vermont, as detailed in the table. A proposal by Deerfield Wind / PPM Energy would site a wind farm next to Green Mountain Power’s Searsburg wind project, on both sides of Route 8 in Searsburg and Readsboro. Searsburg residents generally have supported the existing wind project, and last year in an informal town vote Readsboro residents overwhelmingly supported the proposed project (Porter, January 9, 2007).
A proposed project by UPC Wind Partners would site wind turbines in Sheffield that would power more than 15,000 homes (UPC Wind). The project was originally proposed for both Sheffield and Sutton, and the project scale has been changed twice in response to citizen opposition (Gram and Occaso, 2007). The project could supply 50-75 jobs during construction, and five jobs when operational (UPC Wind).
Wind Projects Being Considered in Vermont, 2007
Project Developer
Deerfield Wind/ PPM Energy1
UPC Wind Partners2
Noble Environmental Power3
Endless Energy4
enXco4
Town
Searsburg / Readsboro
Sheffield
Castleton/ Windsor, Rutland,
Bennington Counties
Manchester
Lowell / Eden / Irasburg area
Number of Turbines
15-24
16
25 (preliminary
estimate)
5
12-16
Proposed Capacity
Up to 45 MW
40 MW
50 MW (preliminary)
7.5 – 9 MW
18-39 MW
Proposed Purchaser of
Power
New England market
Washington Electric
Cooperative
Unknown
Burlington Electric Dept.
Vt. Public Power Supply Authority
Status of Project
Vt. Public Service Board and U.S. Forest Service are reviewing applications; Nearby residents mostly support project
Vt. Public Service Board is reviewing application;Sheffield residents support project; Barton residents oppose project
Company may apply soon for permits for wind measurement equipment at Castleton site
No formal application made
No formal application made
1 Source: Porter, January 9, 2007 2 Sources: UPC Wind, and Gram and Occaso, 2007
3 Sources: Edwards, 2006 and Page, February 1, 20074 Source: Vermont Energy Partnership, August 2006

An Inventory of Renewable Energy and Efficiency
��
Meanwhile, Connecticut-based Noble Environmental Power, in partnership with the Vermont Environmental Research Associates, is exploring sites for wind farms in Rutland, Bennington, and Windsor Counties (Edwards, 2006). The company is considering a site on Grandpa’s Knob, near the border of Castleton and West Rutland. This site had the nation’s first large wind turbine installed in 1941, and it ran intermittently till 1945 (Page, February 1, 2007). A survey conducted by Noble Environmental in August 2006 found that 87% of respondents in Rutland, Bennington, and Windsor Counties were in favor of expanding the use of wind energy, and 79% said they would approve of placing a wind farm in their area. Noble Environmental said a wind farm of 50-60 turbines would create 10-12 permanent jobs and hundreds of construction workers (Edwards, 2006).
Developer Endless Energy has proposed a wind project on Little Equinox Mountain near Manchester. Developer enXco, in partnership with the Vermont Public Power Supply Authority, is considering the feasibility of a wind development on Lowell Mountain in the Lowell / Eden / Irasburg area (Vermont Energy Partnership, August 2006). No formal applications have been made for these projects.
One proposed wind farm failed to gain a Certificate of Public Good from the Public Service Board in 2006. The East Haven Wind Farm proposed to site four turbines producing 6 MW on East Mountain in East Haven. In July 2006, the Public Service Board rejected the project’s bid for a Certificate of Public Good because the developer did not conduct studies to evaluate the project’s impact on birds and bats. The Board indicated the project would not have had an undue adverse effect on the scenic or natural beauty of the area and on aesthetics (Vermont Energy Partnership, August 2006).
Another proposed wind project was abandoned in 2006. Developer Catamount Energy Corporation / Marubeni Power International proposed siting up to 27 turbines on Glebe Mountain in Londonderry, with up to 50 MW (Vermont Energy Partnership, August 2006). The plan was abandoned in 2006, because according to the company, “a majority of the local community was opposed to the project and Vermont’s governor has stated that he opposes utility-scale wind projects” (Catamount Energy Corporation, 2006).
Issues in the wind energy industry
Although the cost of wind energy has fallen dramatically in recent years and incentives are a considerable help, the cost of small-scale and community wind projects continues to
be prohibitive. A 2.5 kW wind turbine on a 100-foot tower with 14-foot rotors and 10 mph average wind speeds can generate about 3,000 kWh annually, enough to meet half the electricity needs of an average household. Such a turbine might cost $25,000 installed; with incentives and tax credits, the final cost would be $15,000 - $16,000, or 12-16 cents per kWh (Mott, December 2006 and March 2007). According to EarthTurbines, in order for a residential wind project to be feasible in Vermont, the property should be one acre or more, the location should have a 10 mph average wind speed, and the homeowner should pay at least 10 cents per kWh for electricity (EarthTurbines). In addition, zoning regulations must allow for tall towers.
The estimated cost for a Vermont community wind project with 1-3 turbines is 8-12 cents per kWh (Mott, December 2006). A community wind project with one 600 kW turbine would cost an estimated $1.2 million in Vermont. This cost is higher per MW than community wind projects in some other states, due to added costs in Vermont related to land, access, interconnection, permitting, and citizen opposition (Mott, March 2007).
Given current market conditions and Vermont’s terrain, utility-scale projects in Vermont require sites with very high wind speeds. In New York, wind farms are being built at sites with wind speeds less than 16 mph, in areas with easier access, lower development costs, less opposition, and state support (Mott, March 2007). Public opposition to utility-scale projects remains a barrier in Vermont. Every proposed project has faced public opposition, and Governor Douglas has not supported utility-scale wind. In 2004, the Vermont Agency of Natural Resources stated that large-scale renewable energy development on state-owned lands is not allowed (Vermont Agency of Natural Resources, 2004). Given Vermont’s political climate toward wind, many have called for the state to establish clear parameters, policies, and a vision for utility-scale wind projects.
Much of the public’s opposition has been about the aesthetics, land use, and large scale of utility-scale projects. While some people find wind turbines inspiring, others feel a scenic view or a wild area has been compromised. Others object to possible impacts on birds and bats. In a recent development, President John Flicker of the National Audubon Society stated that Audubon strongly supports wind power, noting that coal-fired electricity plants will ultimately kill many more birds than wind farms (enXco).

The VermonT energy DigesT
��
There are other issues to overcome with utility-scale wind as well. Good wind sites are often in remote locations, causing roads, clearing, and development in areas that otherwise would not be developed. Wildlife can be negatively impacted, and physical access to ridgelines can increase, causing positive and negative impacts for recreation. In the winter, ice can sometimes build up on turbine blades and be thrown from the blades, making it necessary to restrict access to the land
around the turbines. Good wind sites usually are not located close to population centers, and access to transmission lines can be an issue. There are noise and light issues associated with turbines. Finally, wind projects are capital intensive. With both utility-scale and smaller-scale turbines, there can be zoning issues and issues with meeting the goals of municipal plans.
An Inventory of Renewable Energy and Efficiency
��
Background
Harnessing the power of the sun for energy can be used for many applications, including space heating, water heating, pool heating, drying applications, and electric generation. Photovol-
taic or “solar cell” technology was discovered in 1954 by Bell Telephone researchers. Subsequently, photovoltaics were used to power U.S. space satellites. The solar industry experienced rapid growth in the 1970s, after which growth slowed. However, growth has been increasing again in recent years.
Passive solar heating is in some ways the simplest use of the sun’s energy. With passive solar systems, buildings are designed to have southern orientations and other features that maximize exposure to the sun’s warmth. Simply orienting a building to the south to use passive solar gain can save 10% to 20% of heating energy, and a whole-system passive design with integrated solar gain, thermal storage, and well-insulated building shell can save more than 75% of heating energy (Rocky Mountain Institute).
Solar thermal systems are “active” systems that use sunlight to generate heat. Such systems have long been used to provide hot water for homes and factories. Domestic hot water systems usually use solar energy to pre-heat the water coming into a conventionally fueled heating tank. The warmer the water from the solar heater, the less conventional fuel will be needed to provide the household’s hot water needs. There are many commercial facilities with high hot water demands that can use solar hot water systems also, such as restaurants, bakeries, beauty salons, health clubs, car washes, hotels, and dairies. Solar thermal systems are an economical way to heat swimming pools. The solar collectors used for pool heating systems are often less expensive than those used for domestic hot water systems, and solar pool heating systems can pay for themselves in four years or less (Renewable Energy Resource Center).
Solar thermal systems also can be used to provide space heating. Hydronic systems provide heat by warming fluid that circulates through a system of pipes; for these systems, a greater solar collection area, greater storage capacity, and
additional controls and heat exchangers are required. Alterna-tively, solar air heating systems provide heat by warming the air and injecting it directly into the space or into an existing forced air system. These systems are less complex than hydronic systems, but they do not provide heat storage (Wolfe, 2007).
Solar thermal systems can also use their heat to produce electricity without the need for photovoltaics. These systems use large troughs or dishes that focus the sun’s energy into high-temperature heat, which is then used to power a generator. These systems are only practical in the U.S. in the Southwest, where there are plans to build such systems (Kammen, 2006).
Photovoltaics (PVs) convert sunlight into electricity, and have many applications. PVs produce electricity any time the sun is shining, but more electricity is produced when the light is more intense and is striking the PV modules directly. Unlike solar thermal systems, PVs do not use the sun’s heat to make energy, but instead produce electricity directly from the electrons freed by the interaction of photons of sunlight with semiconductor materials in the PV cells. When domestic PV systems are installed on homes that are independent of the utility grid, they use battery banks to provide power when the sun is not out; domestic PV systems on homes connected to the grid can use electricity from the utility when the sun is not shining. The market has largely shifted from remote, off-grid, and consumer products, to a majority of grid-connected distributed power (U.S. Department of Energy, “Learning about PV”).
PV systems also are used for specific applications in remote areas where grid power is not available. These applications include electric fences, human or livestock water systems, boats, traffic safety signs, telecommunications, and parking lot lighting (Renewable Energy Resource Center).
Solar PV use provides less than 0.1 percent of worldwide electricity capacity, but PV production and use have been growing rapidly in the last several years (Spencer, 2006). Japan and Germany are leaders in production and installation of PVs. Germany subsidized the installation of 837 MW of PV
Solar Energy
The VermonT energy DigesT
��
systems last year, while Japan installed 292 MW last year. By comparison, 180 MW of PV systems have been installed in California so far (Rose, 2006). Japan gets half the sunshine of California, but it has three times the installed PV capacity of the U.S. (McKibben, 2005).
The global solar equipment industry has grown by 30 percent or more per year during the past five years, and demand is expected to grow rapidly in the next several years as dozens of countries approve new incentives and tax breaks to promote their use (Spencer, 2006). The U.S. manufactured 153 MW of PVs in 2005, compared to 833 MW in Japan. Japan and China have some of the world’s largest producers of PV cells, and a number of smaller Asian firms are experiencing rapid growth (Spencer, 2006).
In the U.S., all renewable energy sources provided about 6% of the nation’s total energy consumption in 2004, and 1% of renewable energy was provided by solar energy. Americans used 63 trillion BTU of solar energy in 2004 (U.S. Energy Information Administration, “Renewable Energy Annual,” 2006). More than 156,000 homes in the U.S. run solely on solar electricity and there are more than 100,000 solar water heater installations in the United States (Rocky Mountain Institute and Solar Works). Southern California is one of the best areas in the world for solar resources, and the rest of the U.S. gets enough sun for effective solar use (Wolfe, 2007).
The U.S. solar industry is now a nearly $1 billion per year industry, providing 25,000 jobs. During the next 20 years, the industry is expected to expand to $10-$15 billion per year, with 300,000 workers by 2025. The industry’s own goal is to meet 10% of the nation’s electricity needs by 2030 (U.S. Department of Energy, “Learning about PV”).
The 2005 Energy Policy Act established a 30% federal tax credit for solar systems purchased for residential and business applications in the U.S. (up to a $2,000 maximum per residential system, uncapped for business systems). In addition, there are large subsidy programs in some states, including California, New Jersey, Connecticut, Massachu-setts, New York, and Pennsylvania (Eckhart, 2006 and Wolfe, 2007). The new California Solar Initiative commits the state to spending more than $3.4 billion to subsidize the installa-tion of 1 million solar roofs, or about 3,000 MW of capacity, by 2017 (Rose, 2006). New Jersey offers large rebates for PV installations. An average homeowner can save 50% off the installation cost, and the payback period is less than 10 years. As of October 2006, almost 1,000 projects have been funded under New Jersey’s program, providing almost 20 MW
in capacity, with rebates totaling $75.5 million (New Jersey’s Clean Energy Program).
Vermont’s current uses of solar energy
Vermont had 240 net metered solar PV systems, providing 673 kW of capacity, as of March 2007 (Lamont, 2007). Leigh Seddon of Solar Works estimates Vermonters have installed about 300 PV systems not connected to the electricity grid. In addition, there an estimated 500 solar water heater systems in the state; many more solar thermal systems were installed in the 1970s and 1980s, before a federal tax credit ended, that are no longer in use (Seddon, 2007). There are a few commercial facilities with solar installations in Vermont, including NRG Systems and groSolar, but this is not a large sector of use or growth currently (Seddon, 2007).
Burlington Electric Department has a Solar on Schools program to help install photovoltaic systems on the roofs of Burlington public schools, mostly for educational purposes. So far there are 1 kW systems on Burlington High School and Champlain Elementary School, and installation at a third school is in progress (Sullivan, 2007). Norm Etkind of the Vermont Superintendents Association’s School Energy Management Program has discussed opportunities for solar thermal system installations with a small number of schools (Etkind, 2007).
Vermont provides incentives for solar installations. The Vermont Solar and Small Wind Incentive Program was established in 2003. The Vt. Department of Public Service oversees the program, and the Renewable Energy Resource Center, a project of the Vermont Energy Investment Corporation, administers it. Under the program, individuals and businesses can receive $1.75 per watt for approved solar PV projects, with a maximum of $8,750 or 5 kW. Multi-family and low-income housing projects can receive $3.50 per watt up to $35,000 or 50% of the total cost, whichever is less. Solar thermal systems receive the same incentive rates, but the rates are per 100 BTUs per day. To qualify for the incentive program, PV systems must be connected to the electricity grid (in previous rounds of the program, off-grid systems were funded). Net metering is available for PV systems up to 15 kW (150 kW for farms), and the Vt. Public Service Board can approve up to ten residential and commercial net metered systems per year for systems between 15 and 150 kilowatts (Vermont Public Service Board). Upgrades to PV systems that include modules with a rated capacity of at least 1 kW are also eligible. Solar
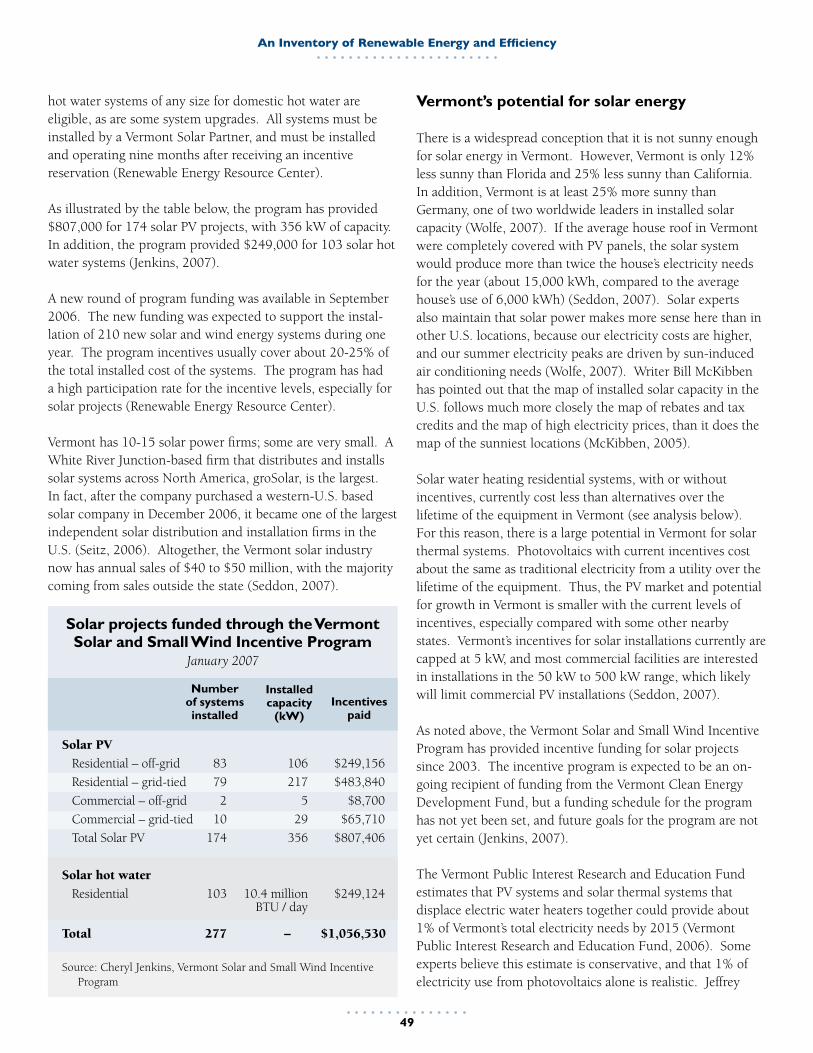
An Inventory of Renewable Energy and Efficiency
��
hot water systems of any size for domestic hot water are eligible, as are some system upgrades. All systems must be installed by a Vermont Solar Partner, and must be installed and operating nine months after receiving an incentive reservation (Renewable Energy Resource Center).
As illustrated by the table below, the program has provided $807,000 for 174 solar PV projects, with 356 kW of capacity. In addition, the program provided $249,000 for 103 solar hot water systems (Jenkins, 2007).
A new round of program funding was available in September 2006. The new funding was expected to support the instal-lation of 210 new solar and wind energy systems during one year. The program incentives usually cover about 20-25% of the total installed cost of the systems. The program has had a high participation rate for the incentive levels, especially for solar projects (Renewable Energy Resource Center).
Vermont has 10-15 solar power firms; some are very small. A White River Junction-based firm that distributes and installs solar systems across North America, groSolar, is the largest. In fact, after the company purchased a western-U.S. based solar company in December 2006, it became one of the largest independent solar distribution and installation firms in the U.S. (Seitz, 2006). Altogether, the Vermont solar industry now has annual sales of $40 to $50 million, with the majority coming from sales outside the state (Seddon, 2007).
Vermont’s potential for solar energy
There is a widespread conception that it is not sunny enough for solar energy in Vermont. However, Vermont is only 12% less sunny than Florida and 25% less sunny than California. In addition, Vermont is at least 25% more sunny than Germany, one of two worldwide leaders in installed solar capacity (Wolfe, 2007). If the average house roof in Vermont were completely covered with PV panels, the solar system would produce more than twice the house’s electricity needs for the year (about 15,000 kWh, compared to the average house’s use of 6,000 kWh) (Seddon, 2007). Solar experts also maintain that solar power makes more sense here than in other U.S. locations, because our electricity costs are higher, and our summer electricity peaks are driven by sun-induced air conditioning needs (Wolfe, 2007). Writer Bill McKibben has pointed out that the map of installed solar capacity in the U.S. follows much more closely the map of rebates and tax credits and the map of high electricity prices, than it does the map of the sunniest locations (McKibben, 2005).
Solar water heating residential systems, with or without incentives, currently cost less than alternatives over the lifetime of the equipment in Vermont (see analysis below). For this reason, there is a large potential in Vermont for solar thermal systems. Photovoltaics with current incentives cost about the same as traditional electricity from a utility over the lifetime of the equipment. Thus, the PV market and potential for growth in Vermont is smaller with the current levels of incentives, especially compared with some other nearby states. Vermont’s incentives for solar installations currently are capped at 5 kW, and most commercial facilities are interested in installations in the 50 kW to 500 kW range, which likely will limit commercial PV installations (Seddon, 2007).
As noted above, the Vermont Solar and Small Wind Incentive Program has provided incentive funding for solar projects since 2003. The incentive program is expected to be an on-going recipient of funding from the Vermont Clean Energy Development Fund, but a funding schedule for the program has not yet been set, and future goals for the program are not yet certain (Jenkins, 2007).
The Vermont Public Interest Research and Education Fund estimates that PV systems and solar thermal systems that displace electric water heaters together could provide about 1% of Vermont’s total electricity needs by 2015 (Vermont Public Interest Research and Education Fund, 2006). Some experts believe this estimate is conservative, and that 1% of electricity use from photovoltaics alone is realistic. Jeffrey
Solar PV
Residential – off-grid 83 106 $249,156
Residential – grid-tied 79 217 $483,840
Commercial – off-grid 2 5 $8,700
Commercial – grid-tied 10 29 $65,710
Total Solar PV 174 356 $807,406
Solar hot water
Residential 103 10.4 million $249,124 BTU / day
Total 277 – $1,056,530
Source: Cheryl Jenkins, Vermont Solar and Small Wind Incentive Program
Solar projects funded through the Vermont Solar and Small Wind Incentive Program
January 2007
Number of systems installed
Installed capacity
(kW)Incentives
paid
The VermonT energy DigesT
�0
Wolfe of groSolar says that PVs could provide much more than 1% of electricity use by 2015 if advantageous incentives and electric rate structures were in place (Wolfe, 2007).
Vermont experts say there is not capacity to produce photovoltaics in Vermont, because the regional market is not large enough to support a plant (Wolfe, 2007). However, solar components such as racking systems, inverters, combiner boxes, and electronic assemblies could be manufactured in Vermont (Wolfe, 2007). There also are no solar thermal manufacturers in the Northeast, and this could be a niche for Vermont; a Brattleboro company used to make solar thermal panels. Vermont has a history of solar industry expertise, and has companies and individuals with worldwide project experience (Seddon, 2007). Additionally, system design engineering, support, and logistical planning for projects around the country already occurs by several Vermont companies (Wolfe, 2007). Thus, the state has some necessary elements to become an industry leader. The solar industry is expected to see large growth in the next several years; one estimate is for 8,000 workers in the industry in the Northeast by 2014 (Wolfe, 2006). Issues in the solar energy industry
While some solar systems are the most economical option over the long run, about 95% of their life-cycle cost is up front, making them difficult to afford for many people. For example, residential solar water heaters, with or without current Vermont incentives, are less expensive than electric or propane water heaters over their 25-year lifetime ($13,500 for solar with incentives on a typical residential system, compared to about $21,000 or more for electric or propane). But, the up-front capital cost is considerably higher (about $6,250 for a solar system with incentives and propane backup, compared to $750 for a propane or electric system) (Seddon, 2006). Most residential solar water heating systems provide 60% - 70% of a household’s annual need, with payback periods of
7-10 years (Seddon, 2007).
Photovoltaics with current levels of incentives cost about the same as traditional electricity from a utility over the lifetime of the equipment. However, the typical Vermont-sized system (3 kW providing 50% - 70% of electricity needs) costs $27,000 and has a 15-20 year payback period. It is difficult to promote a technology with a long payback period; people often do not remain in the same home for 15-20 years. Some states have set incentive levels for PV systems for 10 or more years ahead, at a declining rate, with the assumption that when the incentives are no
longer available, the technology will have advanced and the price decreased (Seddon, 2007). Currently, there is an industry-wide shortage of silicon, the principal material in PV cells. The restricted silicon supply spurred innovation, and manufacturers responded by using new production methods that use less silicon or other materials. Industry watchers forecast the amount of silicon available for solar will quadruple by 2010 (Burger, 2006). Meanwhile, there have been advances in system components during the past two years which help to counterbalance the higher cost of PVs. Emerging inverter technology and new installation techniques are expected to continue to lower the cost of PV systems (Wolfe, 2007).
PV technology is well-established; however, further evolution will occur. Investments in research and development are crucial to maximize opportunities. The U.S. lost the leadership of the PV industry about 5 years ago; it may be able to gain it back again, but Germany, Japan, and China are all moving forward quickly to develop current and next generation technologies (Wolfe, 2007). Germany and Japan are poised to own much of the manufacturing industry (McKibben, 2006). But PV systems need to be installed locally, so jobs will be created in that area if the correct price structures are in place (Wolfe, 2007).
The map of installed solar
capacity in the U.S. follows much more
closely the map of rebates and tax
credits and the map of high electricity
prices, than it does the map of the
sunniest locations

An Inventory of Renewable Energy and Efficiency
��
Background
Hydropower is the most widely used renewable energy source around the world. It was one of the most basic and abundant sources of energy for early U.S. settlers, and much of our early economy was built on it.
There are many sizes of hydroelectric facilities. Large hydroelectric facilities, usually owned by utilities, generally impound water behind a dam. The water is controlled and released to turn turbines and run generators when electricity is needed. Facilities with impounded areas are more econom-ically attractive, but they have greater environmental impacts due to the creation of ponds and fluctuating water levels.
Small hydroelectric projects often refer to facilities with 1-5 MW capacity (Barg). There is no international consensus on the definition of “small hydropower,” but the upper limit is often agreed to be capacity of up to 10 MW (Taylor, 2006). In general, small hydroelectric projects have fewer environmental impacts than large projects due to their use of “run-of-river” design. Run-of-river hydroelectric projects generate power as the water flows through the facilities, requiring little or no impoundment. Small hydropower systems have other benefits as well: they do not displace people; the technology is not complex and can be easily transferred to communities; and the technology can provide power for locations that are not connected to larger grids (Taylor, 2006). Small hydropower is a highly developed technology; however, the equipment and design still has potential to evolve and improve (Laguna, 2006).
“Small hydropower” sometimes includes the classifications of very small projects, including mini-hydro (less than 1 MW), micro-hydro (less than 100 kW), and pico-hydro (less than 5 kW). These smaller projects almost always use run-of-river designs; some can be installed in farm ponds and water supply pipes. The projects can produce enough power for a single home, a block of homes, a school, or municipal building. These turbines are commercially available, ranging in size from a lawnmower engine to much larger.
Worldwide, there is about 730 GW of installed hydropower capacity, providing 17% of electricity needs, with another 100 GW under construction as of early 2006; most of the capacity is large hydro plants. Environmental constraints, the lack of appropriate sites, and difficulties with displacing people when water is impounded have hampered further development of large-scale hydro in many countries.
Small hydropower in 2002 provided about 1% to 2% of total worldwide electrical capacity (Taylor, 2006). Asia has most of the world’s small hydro capacity; China is the leader, due to its long-standing rural electrification programs using small hydropower and preferential policies for small hydro manufacturing. China has about 43,000 small hydropower stations, with 31,200 MW of capacity, and about 80 small hydro turbine manufacturers (Taylor, 2006). Much of the other small hydro capacity is in developing countries. In the last 30 years, Nepal, Vietnam, Pakistan, Sri Lanka, Peru, and other countries have seen the development of a large number of micro-hydro and pico-hydro units which are providing electricity to thousands of households (Taylor, 2006).
Europe has 22% of worldwide small hydro capacity. The European Union small hydropower industry employs about 20,000 people. Australia, New Zealand, and Canada have new focuses on small hydropower (Laguna, 2006).
In the U.S., about 2.7% of total energy use is provided by hydroelectric sources. The U.S. has not had a concerted focus on developing small hydropower sources. The capacity of small U.S. hydro plants in 2002 was 2,750 MW; generation by those plants provided about 4% of total U.S. hydro generation (World Energy Council). In the past 20-30 years, there have been regulatory changes and increased environmental constraints related to developing projects in the U.S. Small hydro projects require numerous licenses and studies, making it cost-prohibitive for smaller projects (Barlow, 2007). Even a 5 kW house-sized system can cost $30,000, for example.
Hydroelectric Energy

The VermonT energy DigesT
��
Vermont’s current uses of hydroelectric energy
In 1898, 1,552 Vermont businesses generated the equivalent of about 55 MW with water wheels, and by 1910, the figure had more than doubled (Vt. Environmental Consortium, 2006). Vermont’s early electric companies generated their electricity from hydro facilities on Vermont rivers. As late as 1939, a state report noted that “practically all the electricity generated and used within the state is produced by water power” (Vt. Department of Public Service, 1998). Around this time, out-of-state companies controlled major hydro stations on the Connecticut and Deerfield rivers, and started to export a large portion of this generation out of state. Vermont utilities began to look for large-scale blocks of inexpensive power outside the state, and to consider new generating plants. In the years following, much of Vermont’s small hydro capacity was lost and replaced by other energy sources (Vt. Environmental Consortium, 2006).
Vermont still has about 1,000 dams, but most are not operating hydropower facilities. In the late 1970s through the early 1990s, many in-state hydro projects were rebuilt, and Vermont doubled its in-state production of hydropower (excluding the Connecticut River dams) (Warshow, 2007). Today, Vermont utilities, municipalities, and independent power producers maintain about 75 working hydro facilities.
About 2,321 GWh, or 37% of Vermont’s electricity supply (own load), came from hydro sources in 2005. About 28% came through contracts with Hydro-Quebec; 8% from Vermont utility-owned and privately-owned Vermont plants; and 1% from New York plants (Lamont, 2007). As discussed in more detail in an earlier chapter, most of Vermont utilities’ contracts with Hydro-Quebec expire in 2015, which will leave the state with a significant portion of its power to replace. In addition, there are a small number of very small hydro sites around Vermont.
In 2005, Vermont had 138 MW of small in-state hydroelec-tric capacity providing electricity. Utilities owned 84 MW, of which 51 MW operate as run-of-river stations, and 32 MW have the ability to store water for use when electricity demand is at its peak. Independent power producers selling power to utilities owned about 20 hydro stations with 54 MW of capacity, ranging in size from 0.11 MW to 26 MW (Vt. Dept. of Public Service, January 19, 2005).
In 2003-2004, the state passed up an opportunity to purchase a network of hydroelectric facilities with 567 MW of capacity on the Connecticut River between Vermont
and New Hampshire, and the Deerfield River in Southern Vermont. Instead, the dams were purchased by TransCanada Corporation for $505 million. The state considered purchasing the dams, but in the end decided against a bid. The Vermont Hydroelectric Power Authority, created by the Legislature to act on these issues, opted instead to work with the town of Rockingham to help them purchase the 49 MW Bellows Falls dam which was part of TransCanada’s purchase. However, that purchase did not occur either (Associated Press, 2005). There has been a new interest in considering whether non-working in-state hydro sites can be redeveloped, whether working hydro sites can be repowered (their output levels increased), and whether more micro-hydro and mini-hydro facilities can be built. Several Vermont communities have expressed interest in small hydro projects, including Barre, Barton, Bennington, Calais, Greensboro, Hardwick, Middlebury, Plainfield, and Putney (Barlow, 2007, Page, 2007, Barg, 2007). A Middlebury resident has drafted plans for a small hydroelectric project on Otter Creek that could generate about 3 MW of capacity. The Selectboard is working with the resident and seeking money from Vermont’s Clean Energy Fund for feasibility studies (Page, 2007). In Greensboro, a 66 kW project below Caspian Lake has been proposed, and preliminary talks with the Agency of Natural Resources have begun (Barg, 2007).
In 2006, the City of Barre received a $16,700 grant from the Vermont Community Development Program and a $15,000 grant from Green Mountain Power to help study potential low-impact hydro sites (Green Mountain Power, 2006). The study will assess several hydroelectric sites that the city owns or controls. One potential site is the 30-inch water main that runs downhill from the Lower Orange Reservoir into the middle of the city. The study will explore whether placing a series of turbines inside the pipe to utilize the power from the flowing water would be feasible (Delcore, 2006). The study had not yet started in early 2007 (Barg, 2007).
New state legislation was proposed in 2007 to simplify the state permitting process for small hydropower projects. Initially, legislation was drafted to create a simpler permitting process for run-of-river projects of 5 MW or less. As of March 2007, the legislation had changed to state that the Public Service Board and Agency of Natural Resources will make a report on a simple, predictable, environmen-tally sound process for issuing their permits for mini-hydroelectric projects, defined as those of 250 kW or smaller. The legislation directs the Board and Agency to

An Inventory of Renewable Energy and Efficiency
��
address several elements in their reports, including (in the Board’s) a recommendation on how to establish and fund an ombudsman to assist individuals seeking permits for mini-hydro projects (Vermont Legislature, March 13, 2007).
The Vermont Small Hydro Association launched a town meeting resolution petition in March 2007 to test the opinions of Vermonters about developing small-hydro projects. The resolution asked state legislators to help simplify the state and federal permitting processes to speed along the development of small-scale, environmentally sound hydro projects. The resolution was on the ballot in about 8 towns, and was approved in each town (Potak, 2007).
Vermont’s potential for hydroelectric energy
The U.S. Department of Energy completed resource assessment reports for hydropower potential in 49 states (Idaho National Laboratory). The Vermont study, completed in 1996, assessed 149 sites for their undeveloped hydropower potential. The sites included developed projects with current power generation that may have more potential, developed sites that have no current power generation, and undeveloped sites. The study found that there were 421 MW of theoretical potential; when environmental factors were included in the model, this figure was lowered to 174 MW. About 83% of the sites had potential capacities of 1 MW or less (Conner, 1996). An earlier study by the Federal Energy Regulatory Commission in 1988 identified 351 MW of undeveloped hydropower potential in the state (Creaser, 2006). A study completed in 2007 gathered the data from these and other inventories. The study concludes, after comparing data from the various inventories and choosing the most conservative estimates for potential sites of 1 MW or more, that there is 93 MW of potential within the state (Barg, 2007).
While these analyses seem large, they did not include economic considerations, or in some cases, environmental considerations. According to John Warshow, a long-time developer and operator of in-state hydroelectric facilities,
most of the economically and environmentally feasible hydro projects were rebuilt between the late 1970s and early 1990s. In Warshow’s estimation, there are about 10 to 15 MW of economically and environmentally feasible projects left to develop in Vermont at existing dams, ranging in size from about 500 kW to 2 MW. There might also be the potential to increase power production (repower) at a small number of older sites currently in use (Warshow, 2007).
The Vermont Public Interest Research Group believes Vermont hydroelectric facilities could provide about 2% more of Vermont’s electric supply by 2015 than they are currently. According to VPIRG, some of the utility-owned dams have been upgraded, which should allow for an increased generating capacity in the future. The hydropower produced by the independent power producers is delivered through contracts set to expire before 2015, but VPIRG believes most of the projects will continue to produce power which can be purchased by Vermont (Vermont Public Interest Research and Education Fund, 2006).
Issues in the hydroelectric energy industry
Costs, permitting issues, and environmental constraints are significant barriers to small hydro development in Vermont.
Hydro projects that use public waters require several permits, including permits from the Vt. Public Service Board, the Agency of Natural Resources, and the Federal Energy Regulatory Commission. Many of the permits are required to mitigate environmental impacts. Projects can take from 3 to 5 years to develop and are expensive, making it prohibitive for small projects (Barg, 2007).
A pico-hydro-sized system (less than 5 kW) in Vermont costs around $20,000 installed (including the grid intercon-nection), without permitting costs. On a project of under 1 MW, permitting costs add about $2,000 per kW to the total cost, bringing the total cost of a 5 kW system up to $30,000, according to Lori Barg of Community Hydro (Barg, 2007).
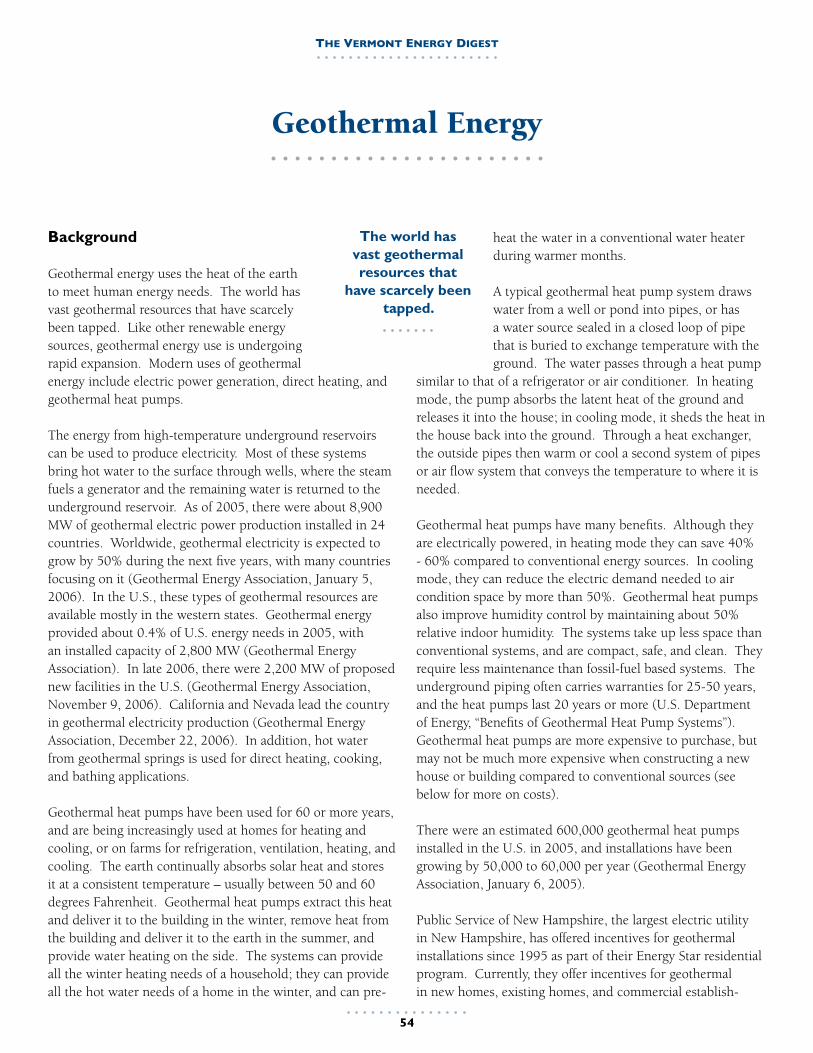
The VermonT energy DigesT
��
Background
Geothermal energy uses the heat of the earth to meet human energy needs. The world has vast geothermal resources that have scarcely been tapped. Like other renewable energy sources, geothermal energy use is undergoing rapid expansion. Modern uses of geothermal energy include electric power generation, direct heating, and geothermal heat pumps.
The energy from high-temperature underground reservoirs can be used to produce electricity. Most of these systems bring hot water to the surface through wells, where the steam fuels a generator and the remaining water is returned to the underground reservoir. As of 2005, there were about 8,900 MW of geothermal electric power production installed in 24 countries. Worldwide, geothermal electricity is expected to grow by 50% during the next five years, with many countries focusing on it (Geothermal Energy Association, January 5, 2006). In the U.S., these types of geothermal resources are available mostly in the western states. Geothermal energy provided about 0.4% of U.S. energy needs in 2005, with an installed capacity of 2,800 MW (Geothermal Energy Association). In late 2006, there were 2,200 MW of proposed new facilities in the U.S. (Geothermal Energy Association, November 9, 2006). California and Nevada lead the country in geothermal electricity production (Geothermal Energy Association, December 22, 2006). In addition, hot water from geothermal springs is used for direct heating, cooking, and bathing applications.
Geothermal heat pumps have been used for 60 or more years, and are being increasingly used at homes for heating and cooling, or on farms for refrigeration, ventilation, heating, and cooling. The earth continually absorbs solar heat and stores it at a consistent temperature – usually between 50 and 60 degrees Fahrenheit. Geothermal heat pumps extract this heat and deliver it to the building in the winter, remove heat from the building and deliver it to the earth in the summer, and provide water heating on the side. The systems can provide all the winter heating needs of a household; they can provide all the hot water needs of a home in the winter, and can pre-
heat the water in a conventional water heater during warmer months.
A typical geothermal heat pump system draws water from a well or pond into pipes, or has a water source sealed in a closed loop of pipe that is buried to exchange temperature with the ground. The water passes through a heat pump
similar to that of a refrigerator or air conditioner. In heating mode, the pump absorbs the latent heat of the ground and releases it into the house; in cooling mode, it sheds the heat in the house back into the ground. Through a heat exchanger, the outside pipes then warm or cool a second system of pipes or air flow system that conveys the temperature to where it is needed.
Geothermal heat pumps have many benefits. Although they are electrically powered, in heating mode they can save 40% - 60% compared to conventional energy sources. In cooling mode, they can reduce the electric demand needed to air condition space by more than 50%. Geothermal heat pumps also improve humidity control by maintaining about 50% relative indoor humidity. The systems take up less space than conventional systems, and are compact, safe, and clean. They require less maintenance than fossil-fuel based systems. The underground piping often carries warranties for 25-50 years, and the heat pumps last 20 years or more (U.S. Department of Energy, “Benefits of Geothermal Heat Pump Systems”). Geothermal heat pumps are more expensive to purchase, but may not be much more expensive when constructing a new house or building compared to conventional sources (see below for more on costs).
There were an estimated 600,000 geothermal heat pumps installed in the U.S. in 2005, and installations have been growing by 50,000 to 60,000 per year (Geothermal Energy Association, January 6, 2005).
Public Service of New Hampshire, the largest electric utility in New Hampshire, has offered incentives for geothermal installations since 1995 as part of their Energy Star residential program. Currently, they offer incentives for geothermal in new homes, existing homes, and commercial establish-
Geothermal Energy
The world has vast geothermal resources that
have scarcely been tapped.

An Inventory of Renewable Energy and Efficiency
��
ments. The residential incentive amounts are based on the incremental cost of the system compared with a conventional system, and on the square footage of the house, up to a maximum of $7,500. Incentives have recently started being offered for commercial facilities also. There are around 200 residences that have installed geothermal heat pumps through this program; residential geothermal heat pumps installed in 2006 saved 722,000 kWh in heating, cooling, and hot water applications. The utility has seen much more interest in the program since fossil fuel prices have risen (McQueeney, 2007). Other utilities in New Hampshire have seen PSNH’s success in this area and now offer incentives for geothermal heat pump installations as well.
Vermont’s current uses of geothermal energy
Water Energy Distributors, a New Hampshire company, has installed most of the residential geothermal heat pumps in Vermont. In the past 10 years, the company has installed around 200 residential systems. In addition, there are a small number of commercial installations (Orio, 2007).
Most geothermal heat pump systems are installed in new homes in Vermont; some are installed as retrofits, but these are more expensive and require more committed homeowners. Most systems in Vermont are not “closed loop” systems, but instead draw water from a well and discharge the water back into the well (Roberg, 2007).
According to Water Energy Distributors, there has been an increase in homeowners interested in geothermal heat pumps in the past three years, and in the number of trained geothermal installers in Vermont. There are about 10 residential geothermal heat pump installers in Vermont currently (Roberg, 2007).
Vermont’s potential for geothermal energy
Geothermal heat pumps can be used virtually anywhere in Vermont, so the state has vast resources available. Because Vermont has a large number of homes that use wells instead of public water systems, the potential market is large.
Issues in the geothermal energy industry
Virtually all the costs of all types of geothermal installations are up-front, which can be cost-prohibitive. Geothermal heat pump systems function for 20 years or more, and the geothermal sources exist indefinitely, so over the systems’ lifetimes they’re very cost-effective. The cost for a standard geothermal heat pump system with ductwork for a new 2,000-foot (non-Energy-Star) home is between $15,000 to $20,000 for the equipment inside the house. This cost is comparable to a conventional efficient heating and cooling system. There also is equipment required outside the house for a geothermal heat pump system. If a domestic well already is planned for the house, the cost for the outside equipment may not add a large amount to the total cost; if a well is not planned, such a system would cost another $6,000 to $8,000 for the outside equipment. Operating costs are much lower compared to conventional systems; a typical home can save 40% to 60% in heating and cooling costs over a conventional system (Water Energy Distributors). The payback time on the system described above is 3 to 5 years (Orio, 2007). More trained geothermal heat pump installers in Vermont would help to promote the technology and meet the need, according to Diona Roberg of Water Energy Distributors (Roberg, 2007).

The VermonT energy DigesT
��
The appendices of this report are:
• Vermont Incentives for Renewables and Efficiency
• Recent Vermont Laws and Programs
• Resources
• Reference List
These appendices can be found in the online version of this
report, at www.vtrural.org.
Appendices


89 Main Street PO Box 1384
Montpelier, VT 05602(802) 828-6024 [email protected]
Printing courtesy of National Life Group
Montpelier, Vermont