geography, endogenous growth, and innovation
TRANSCRIPT

EDITORS
LUC ANSELINAgricultural and Consumer Economics
University of Illinois at Urbana–Champaign, USA
ANDREW ISSERMANAgricultural and Consumer Economics
University of Illinois at Urbana–Champaign, USA
SERGIO J. REYGeography
San Diego State University, USA
EDITORIAL BOARD
INTERNATIONAL REGIONAL SCIENCE REVIEW
HARVEY W. ARMSTRONG, Geography, University ofSheffield, UK
CARLOS R. AZZONI, Economics, University of SaoPaulo, Brazil
TIMOTHY BARTIK, W. E. Upjohn Institute forEmployment Research, USA
PATRICIA BEESON, Economics, University of Pittsburgh,USA
WILLIAM BEYERS, Geography, University ofWashington, USA
ROGER E. BOLTON, Economics, Williams College, USALAWRENCE A. BROWN, Geography, The Ohio State
University, USARICHARD S. CONWAY, Dick Conway & Associates, USARODNEY ERICKSON, Geography, Pennsylvania State
University, USABERNARD FINGLETON, Land Economics, University of
Cambridge, UKRAYMOND FLORAX, Spatial Economics, Free University
of Amsterdam, The NetherlandsSHELBY GERKING, Economics and Finance, University
of Wyoming, USAFRANK GIARRATANI, Economics, University of
Pittsburgh, USAEDWARD GLAESER, Economics, Harvard University,
USAAMY GLASMEIER, Geography, Pennsylvania State
University, USAMICHAEL J. GREENWOOD, Economics, University of
Colorado, USANILES HANSEN, Economics, University of Texas, USAANDREW HAUGHWOUT, Public Affairs, Princeton
University, USASUNG WOONG HONG, Construction and Economy
Research Institute of KoreaGARY HUNT, Economics, University of Maine, USARODNEY C. JENSEN, Economics, University of
Queensland, Australia
JOHN KORT, Bureau of Economic Analysis, U.S.Department of Commerce
EDWARD J. MALECKI, Geography, Ohio StateUniversity, USA
ANN MARKUSEN, Public Affairs, University ofMinnesota, USA
RON MARTIN, Geography, University of Cambridge, UKPHILIP MCCANN, Economics, University of Reading,
UKWILLIAM J. MILNE, Economics, University of New
Brunswick, CanadaMAKOTO NOBUKUNI, Economics, Nagoya City
University, JapanATSUYUKI OKABE, Spatial Information Science,
University of Tokyo, JapanDAVID PLANE, Geography and Regional Development,
University of Arizona, USABORIS PLESKOVIC, Research Advisory Department,
The World Bank, USAHARRY RICHARDSON, Urban and Regional Planning,
University of Southern California, USAPIET RIETVELD, Spatial Economics, Free University of
Amsterdam, The NetherlandsPETER A. ROGERSON, Geography, State University of
New York–Buffalo, USAGERARD RUSHTON, Geography, University of Iowa,
USAPETER V. SCHAEFFER, Agricultural and Resource
Management, West Virginia University, USASHUETSU TAKAHASHI, Economics, Tohoku Gakuin
University, JapanBARNEY WARF, Geography, Florida State University,
USACAROL TAYLOR WEST, Economic and Business
Research, University of Florida, USAANTHONY M. YEZER, Economics, George Washington
University, USA
For Sage Publications: David Neyhart, Russell Goff, Kathryn Journey, and Rose Tylak

Volume 25, Number 1 January 2002
Special Issue: Regional Innovation SystemsGuest Editors: Zoltan J. Acs and Attila Varga
ZOLTAN J. ACS AND ATTILA VARGA
Introduction 3
PHILIP COOKE
Biotechnology Clusters as Regional, Sectoral Innovation Systems 8
SUMA S. ATHREYE AND DAVID KEEBLE
Specialized Markets and the Behavior of Firms: Evidence fromthe United Kingdom’s Regional Economies 38
JAVIER REVILLA DIEZ
Metropolitan Innovation Systems: A Comparsion betweenBarcelona, Stockholm, and Vienna 63
MICHAEL FRITSCH
Measuring the Quality of Regional Innovation Systems:A Knowledge Production Function Approach 86
PÄIVI OINAS AND EDWARD J. MALECKI
The Evolution of Technologies in Time and Space:From National and Regional to Spatial Innovation Systems 102
ZOLTAN J. ACS AND ATTILA VARGA
Geography, Endogenous Growth, and Innovation 132
InternationalRegional ScienceReview
Published in association withthe University of Illinois, Urbana–Champaign,
and San Diego State University

International Regional Science Review serves as an international forum for economists, geographers,planners, and other social scientists to share important research findings and methodological breakthroughs.The journal serves as a catalyst for improving spatial and regional analysis within the social sciences and stimu-lating communication among the disciplines. IRSR deliberately helps define regional science by publishingkey interdisciplinary survey articles that summarize and evaluate previous research and identify fruitfulresearch directions. Focusing on issues of theory, method, and public policy where the spatial or regionaldimension is central, IRSR strives to promote useful scholarly research that is securely tied to the real world.
Submissions: The IRSR editors welcome the submission of suitable, unsolicited material for publication.Submit four (4) copies of the manuscript, typewritten and double spaced, to Sergio Rey, Editor, InternationalRegional Science Review, Department of Geography, San Diego State University, San Diego, CA 92182;e-mail: [email protected].
Subscriptions: Annual subscription rates for institutions and individuals are based on the current fre-quency. Prices quoted are in U.S. dollars and are subject to change without notice. Canadian subscribers add 7%GST (and HST as appropriate). Outside U.S. subscription rates include shipping via air-speeded delivery. Insti-tutions: $200 (within the U.S.) / $216 (outside the U.S.) / single issue: $59 (worldwide). Individuals: $52(within the U.S.) / $68 (outside the U.S.) / single issue: $22 (worldwide). Address inquiries to Sage Publications(address below). Orders with ship-to addresses in the United Kingdom, Europe, the Middle East, and Africashould be sent to the London address (below). Orders with ship-to addresses in India and South Asia should besent to the New Delhi address (below). Noninstitutional orders must be paid by personal check, VISA, Dis-cover, or MasterCard. Special subscription rates are available to members of the Regional Science AssociationInternational (RSAI).
This journal is abstracted or indexed in Avery Index to Architectural Periodicals, CAB Abstracts Data-base, CSA Political Science and Government: A Guide to Periodical Literature, Current Contents:Social & Behavioral Sciences, e-JEL, EconLit, International Bibliography of the Social Sciences, Inter-national Political Science Abstracts, Journal of Economic Literature on CD, Social Sciences CitationIndex, Social Service Abstracts, and Sociological Abstracts, and is available on microfilm from UniversityMicrofilms in Ann Arbor, Michigan.
The International Regional Science Review (ISSN 0160-0176) is published four times per year—in Janu-ary, April, July, and October—by Sage Publications, 2455 Teller Road, Thousand Oaks, CA 91320; telephone:(800) 818-SAGE (7243) and (805) 499-9774; fax/order line: (805) 499-0871. Copyright © 2002 by Sage Publi-cations. All rights reserved. No portion of the contents may be reproduced in any form without written permis-sion of the publisher.
Back Issues: Information about availability and prices of back issues may be obtained from the publisher’sorder department (address below). Single-issue orders for 5 or more copies will receive a special adoption dis-count. Contact the order department for details. Write to the London office for sterling prices.
Inquiries: All subscription inquiries, orders, and renewals with ship-to addresses in North America, SouthAmerica, Australia, China, Indonesia, Japan, Korea, New Zealand, and the Philippines must be addressed toSage Publications, 2455 Teller Road, Thousand Oaks, CA 91320, U.S.A.; telephone: (800) 818-SAGE (7243)and (805) 499-9774, fax: (805) 499-0871. All subscription inquiries, orders, and renewals with ship-toaddresses in the United Kingdom, Europe, the Middle East, and Africa must be addressed to Sage PublicationsLtd, 6 Bonhill Street, London EC2A 4PU, England; telephone: +44 (0)20 7374-0645, fax: +44 (0)207374-8741. All subscription inquiries, orders, and renewals with ship-to addresses in India and South Asiamust be addressed to Sage Publications Private Ltd, P.O. Box 4215, New Delhi 110 048 India; telephone:(91-11) 641-9884, fax: (91-11) 647-2426. Address all permissions requests to the Thousand Oaks office.
Authorization to photocopy items for internal or personal use, or the internal or personal use of specific cli-ents, is granted by Sage Publications for libraries and other users registered with the Copyright Clearance Cen-ter (CCC) Transactional Reporting Service, provided that the base fee of 50¢ per copy, plus 10¢ per copy page, ispaid directly to CCC, 21 Congress St., Salem, MA 01970. 0160-0176/2002 $.50 + .10.
Advertising: Current rates and specifications may be obtained by writing to the Advertising Manager atthe Thousand Oaks office (address above).
Claims: Claims for undelivered copies must be made no later than six months following month of publica-tion. The publisher will supply missing copies when losses have been sustained in transit and when the reservestock will permit.
Change of Address: Six weeks’advance notice must be given when notifying of change of address. Pleasesend old address label along with the new address to ensure proper identification. Please specify name of jour-nal. POSTMASTER: Send address changes to International Regional Science Review, c/o 2455 Teller Road,Thousand Oaks, CA 91320.
Printed on acid-free paper
INTERNATIONAL REGIONAL SCIENCE REVIEW (Vol. 25, No. 1, 2002)Acs, Varga / INTRODUCTION
INTRODUCTION TO THE SPECIAL ISSUE
ON REGIONAL INNOVATION SYSTEMS
ZOLTAN J. ACS
University of Baltimore, Baltimore, MD, [email protected]
ATTILA VARGA
University of Pécs, Hungary, [email protected]
Over the past decade, several issues of this journal (see Pleskovic 1996) haveaddressed questions of regional economic development and policy. These debatesbetween regional scientists, development economists, and policy specialists oftenfocus on macroeconomic and sectoral issues of development or on individual pro-jects. Regional scientists and regional economists concentrate on theoretical mod-eling aspects of regional science and rarely work on policy issues. Approachesoften call for a closer collaboration between regional scientists and policy analystsas a way to improve outcomes. However, this is often exacerbated by lack of data, alack of tools and techniques, and frequently the local nature of the problem.
In this special issue of International Regional Science Review, we would like tobuild on this previous call for a closer collaboration between theory and practice inregional economic development and suggest viewing the question through a newlens: the creation and incubation of new knowledge. While the lens has many fac-ets, there are at least three theoretical fields that can help us focus. First, the newgrowth theory suggests that technology is the key driving force behind economicgrowth and rising standards of living (Romer 1990). At the core of the new growththeory is the concept of technological knowledge as a nonrival and partiallyexcludable good. Second, the new economic geography suggests that regions andnot countries are the real units of economic analysis (Krugman 1991). In this newworld of global capitalism, as economies become less constrained by national fron-tiers, they become geographically more specialized. Third, the new economics ofinnovation requires a systemic understanding of the institutional framework (Nel-son 1993). Innovation is a matter of producing new knowledge or combining exist-ing knowledge in new ways. Many different kinds of actors and agents in the sys-tems of innovation are involved in the process. How the agents fit together in thissystem is an active area of research.
If we are to understand why some regions grow and others stagnate, we need tounderstand the interactions among economic growth, economic geography, and theeconomics of innovation. There are three fundamental questions that need to be
INTERNATIONAL REGIONAL SCIENCE REVIEW 25, 1: 3–7 (January 2002)
© 2002 Sage Publications

answered. First, Why and when does economic activity become concentrated in afew regions leaving others relatively underdeveloped? Second, What role doestechnological change play in regional economic activity? Third, How does techno-logical advance occur, and what are the key processes and institutions involved?Many of these interconnections can be found at the regional level as firms forge net-works, clusters, and specialized markets (Acs 2000).
This special issue presents state-of-the-art research on case studies, empiricalfindings pertaining to regional innovation, and theoretical developments. Most ofthe articles in this special issue were presented at the 1999 meeting of the Interna-tional Regional Science Association in Montreal, Canada, and are published here atthe invitation of Luc Anselin. One cannot proceed with the development of a newarray of policy-relevant tools or statistical indicators pertaining to regional systemsof innovation until a more comprehensive and realistic picture of the real economicdynamics of local and regional systems of innovation has been better developed (dela Mothe and Paquet 1998). Articles in this special issue advance our understandingof regional innovation systems by empirically examining several key concepts andprovide a theoretical discussion to better understand how to model regional devel-opment and, it is hoped, develop better policy. The first four articles present resultsfrom three large innovation surveys.
The first article, by Philip Cooke, draws on the Regional Innovation System pro-ject of the European Union to offer a theoretical framework for why clusters areimportant. In the traditional economy, self-sufficiency by firms was viewed as asign of strength. In the new economy, it is a sign of weakness, with its emphasis onfirms’ interconnections to factor inputs, suppliers, competitors, and customers(Porter 2000). Clusters offer three key competitive advantages over vertical integra-tion in single firms. First, productivity is enhanced by lower transaction costs andnontraded interdependencies. Second, innovation is increased, which is dependenton interactive knowledge exchange between a variety of knowledge actors. Third,new business formation is massively assisted by the mentoring, role-model provi-sion, learning, and communication gains that arise from operating in a cluster set-ting (Armington and Acs 2001).
Using the biotechnology industry as a case study in three countries—the UnitedStates, the United Kingdom, and Germany—Cooke identifies two key issues hin-dering the building of innovative regional clusters in Europe. Probably the key limi-tation on regional initiatives for advanced technology is funding for basic andapplied research, since most regional administrations do not have remotely enoughof such capital. The second limitation is venture capital and other sources of riskcapital for the commercialization stages of biotechnology. He concludes that theregional level becomes the most important for the evolution of clusters includingthe concentration of critical research mass.
The second article, by Suma Athreye and David Keeble, continues to examinethe issue of vertical disintegration, outsourcing, and technological behavior in adetailed study of the development of specialized markets for information and
4 INTERNATIONAL REGIONAL SCIENCE REVIEW (Vol. 25, No. 1, 2002)

communications technologies in the United Kingdom. According to Jorgenson(2001), the development of information technologies is the foundation of theAmerican growth resurgence. The authors compare the Southeast region with theindustrial heartland of the United Kingdom to answer the question, “Does the exis-tence of specialized markets promote innovation and competitive advantage infirms?” To assess the hypothesis, they use firm-level survey data collected by theEconomic & Social Research Council Centre for Business Research at the Univer-sity of Cambridge from a large sample of 998 small and medium-sized enterprisesin the two regions. They find greater buying and selling of technology by firms andthe presence of technological externalities in the Southeast, even when the service-intensive nature of the region’s production is accounted for. Industrial heartlandfirms, in contrast, more frequently collaborate with domestic suppliers, which arealso an important source of technology.
The third article, by Javier Revilla Diez, uses data from the European RegionalInnovation Survey (ERIS) to compare the innovation systems of Barcelona, Stock-holm, and Vienna. His point of departure is the systems of innovation approach inits various forms. Nelson’s (1993) concept of a national innovation system may betoo restrictive to examine the interconnections of a firm. He argues that region-specific conditions and cooperative relationships between different actors influ-ence the regional innovation potential either positively or negatively. He finds thatthe innovative capacity of the three cities differs markedly, reflecting the differ-ences visible in a comparison of national innovation systems. The results documentthat between regions of similar characteristics like the three large metropolitanagglomerations surveyed, profound differences in technological competitivenessexist. Stockholm provides an interesting insight into an innovative and technology-oriented national and regional policy.
The fourth article, by Michael Fritsch, uses the same data as the previous articleto examine the quality of regional innovation systems using a knowledge produc-tion function framework (Grilliches 1979). In this way, the qualitative data in theprevious article can be compared with the quantitative analysis employed here.Using data on all eleven regions in the ERIS, the author takes a center-peripheryapproach to examine whether regional agglomeration affects the productivity ofresearch and development (R&D) in firms. He suggests that the elasticity of R&Doutput with respect to R&D inputs, as well as the value of the constant term in theknowledge production function, can be applied to measure relative differences inproductivity of innovation activities among the regions considered. In fact, there issome support for this hypothesis. In accordance with the literature, output elastici-ties of R&D inputs in manufacturing establishments tended to be relatively higherin the center as compared to the periphery.
The next two articles are theoretical in nature, with the aim of opening new ave-nues for further research. Päivi Oinas and Edward Malecki attempt a new synthesisin the innovation systems literature. They elaborate on the spatial innovation sys-tem (SIS), which highlights the organization of innovation systems in space, as well
Acs, Varga / INTRODUCTION 5

as their evolution in time. The SIS approach shares the view of the emergingmesolevel analysis of technological evolution in that it regards as central both theconcrete interactions through which innovations emerge and diffuse as well as thebroader societal context. It is distinct in the sense that it emphasizes the spatialdimensions so as to pay attention to the evolution of technological trajectories inspace. SISs are also seen as distinct from national innovation systems because theydo not necessarily reside within national boundaries. In regard to regional innova-tion systems (RISs), the SIS approach depicts that the capabilities and results ofseveral RISs might be included in one SIS. In other words, SISs consist of overlap-ping and interlinking national, regional, and sectoral systems of innovation, whichall are manifested in different configurations in space.
The final article, by Zoltan J. Acs and Attila Varga, is an attempt to channel theinnovation system literature into the more general regional economic growth prob-lem. The authors survey three literatures that have been recently reexamined—theNew Economic Geography, the New Growth Theory and the New Economics ofInnovation—to understand why some regions prosper and others decline. The sur-vey suggests that a specific combination of the Krugmanian theory of initial condi-tions for spatial concentration of economic activity with the Romerian theory ofendogenous economic growth complemented with a systematic representation ofinteractions among the actors of Nelson’s (1993) innovation system could be a wayto develop a new model of technology-led regional economic development. Thecentral element of the model could be the “regional knowledge production func-tion” distilled from the predominantly empirical literature of innovation networks.This equation would facilitate the presence of knowledge in the Krugmanian eco-nomic geography model. Here the analytical technique for deriving initial condi-tions of spatial concentration can be adapted to come up with the preconditions forthe emergence of knowledge-induced agglomerations. Together with other param-eters of the model, threshold values of knowledge may be calculated following thetechnique developed by Krugman (1991). Finally, to actually model the equilib-rium path of regional economic growth induced by the threshold values of knowl-edge and other regional parameters, the combined framework of the new economicgeography and the new economics of innovation can be complemented with theRomerian analytics of economic growth.
REFERENCES
Acs, Zoltan J. 2000. Regional innovation, knowledge and global change. London: Pinter.Armington, Catherine, and Zoltan J. Acs. 2002. The determinants of regional variation in new firm for-
mation. Regional Studies. In press.de la Mothe, John, and Gilles Paquet. 1998. Local and regional systems of innovation. Boston: Kluwer.Grilliches, Zvi. 1979. Issues in assessing the contribution of R&D to productivity growth. Bell Journal
of Economics 10: 92-116.
6 INTERNATIONAL REGIONAL SCIENCE REVIEW (Vol. 25, No. 1, 2002)

Jorgenson, Dale W. 2001. Information technology and the U.S. economy. The American EconomicReview 91: 1-32.
Krugman, Paul. 1991. Geography and trade. Cambridge, MA: MIT Press.Nelson, Richard. 1993. National innovation systems. New York: Oxford University Press.Pleskovic, Boris P., ed. 1996. Special issue on regional science and development. International Regional
Science Review 19 (1/2).Porter, Michael. 2000. Can Japan compete? London: MacMilllan.Romer, Paul. 1990. Endogenous technical change. Journal of Political Economy 98: S71-S102.
Acs, Varga / INTRODUCTION 7

INTERNATIONAL REGIONAL SCIENCE REVIEW (Vol. 25, No. 1, 2002)Cooke / BIOTECHNOLOGY CLUSTERS
BIOTECHNOLOGY CLUSTERS AS
REGIONAL, SECTORAL INNOVATION
SYSTEMS
PHILIP COOKE
Centre for Advanced Studies, University of Wales,Cardiff, UK, [email protected]
Today, knowledge economies are a key asset for global competitiveness. Biotechnology is aknowledge-driven sector because it consists of knowledge working on knowledge to createvalue, decoding in genomics and proteomics being paradigmatic knowledge-based economicactivity. Like many other new economy industries such as information and communications tech-nology, new media, and advanced finance, firms cluster in proximity to knowledge sources. In thecase of biotechnology, universities are key magnets. But to transfer science from the laboratorybench to the market involves complex, interactive chains of transactions among scientists, entre-preneurs, and various intermediaries. Chief among the latter are investors and lawyers. Proxim-ity to such services and, in biotechnology, research hospitals for clinical trials creates an innova-tion system. This is best analyzed regionally and locally. This article anatomizes the functioningof regional sectoral innovation systems in Germany, Cambridge, Massachusetts, and Cam-bridge, U.K.
Innovation is a key competitive weapon in an era of globalization. Firms and enter-prise support infrastructures are becoming more knowledge intensive, and policiesare being adjusted accordingly. Among the key general findings of the EuropeanUnion (EU)-Targeted Socio-Economic Research (EU-TSER) project “RegionalInnovation Systems: Designing for the Future” (REGIS) (Cooke, Boekholt, andTödtling 2000) are the following. First, despite globalization and increased foreignownership, most European businesses are rather strongly regional and national inkey business relationships. Significant decision autonomy exists at the regionallevel, not least because of the predominance of small and medium-sized enterprises(SMEs). Second, all firms, large and small, are confronted by twin competitivenesspressures to raise quality and reduce cost. This impulse drives a great deal of inno-vation practice. Third, a majority of firms respond initially by organizational inno-vation, especially quality measures. Fourth, in Europe, many firms rely on the sup-ply chain and their own knowledge sources to innovate products and processes. Butthere is growing recognition of the importance of universities, research institutes,consultants, and technology-transfer agencies in supplying new knowledge.
Smaller firms show some evidence of recognizing the importance of vertical andhorizontal networks for collective learning and innovation. Moreover, at the
INTERNATIONAL REGIONAL SCIENCE REVIEW 25, 1: 8–37 (January 2002)
© 2002 Sage Publications

regional level, particularly where there is a regional governance structure and pres-ence of knowledge centers, finance, and industry clusters, policies are being devel-oped to support clusters by creating economic communities within a multilevelgovernance structure to develop access to global markets. A new, knowledge-intensive industry in which these characteristics are particularly pronounced is bio-technology. Growing from research laboratories, the industry is characterized bymany new start-up firms needing major support from university technology-trans-fer and licensing agencies, venture capitalists, large firms (as corporate partners),and regional governance bodies, both political and industrial. Centered on the twoCambridges (United States and United Kingdom), successful biotechnology clus-ters with a full range of systemic interaction mechanisms exist and, while unique inmany ways, offer lessons for systemic regional innovation in other sectors andregions. These are being followed by German federal government policies that sup-port regional biotechnology clusters, notably the BioRegio contest. This articlereflects on the limitations and capabilities of a strongly public and federal attemptto develop the national innovation system through seeking to build regional innova-tion systems based on a core technological capability.
In doing this, a useful light is cast on all three cases in respect of the strengths butalso limits of regional innovation systems in relation to policies to enhance, sup-port, or build innovative regional clusters. Probably the key limitation on regionalinitiatives for advanced technology is funding for basic and applied research, sincemost regional administrations do not have remotely enough of such capital, espe-cially in biotechnology. The second limitation is venture capital and other sourcesof investment capital for the commercialization stages of biotechnology, althoughthis is less of a limitation in certain cases. Boston and Cambridge (United King-dom) are interesting instances of world-class science attracting critical mass in ven-ture capital and it may be true also, at present, in Munich. Where the national inno-vation system cannot function well without regional innovation systems is inrespect of the enterprise and innovation support infrastructure, specialized humancapital, leading-edge basic and applied research, and the varieties of network rela-tionships that function most effectively in the relatively close proximity of regionalclusters.
Recent work by Porter (1998), Audretsch (1998), Krugman (1998), and Best(1999, 2000) confirms the earlier insights of regional scientists like Scott (1993);Saxenian (1994); Storper (1995); Florida (1995); Amin and Thrift (1994); Asheim(1996); Cooke (1995); Braczyk, Cooke, and Heidenreich (1998); and Cooke andMorgan (1998) that clusters offer key competitive advantages over vertical integra-tion in single firms with respect to three key competitiveness variables. These areproductivity, which is enhanced by lower transaction costs and untraded interde-pendencies; innovation, which is dependent on interactive knowledge exchangebetween a variety of knowledge actors, especially because of the proximity neces-sary for tacit knowledge exchange; and new business formation, which is massively
Cooke / BIOTECHNOLOGY CLUSTERS 9

assisted by the mentoring, role-model provision, learning, communication, andcommercialization gains that arise from operating in a cluster setting.
In this article, the first section will argue the case for regional innovation sys-tems, drawing on theoretical and empirical findings from the REGIS project (seeCooke, Boekholt, and Tödtling 2000). This will draw attention to the concepts ofinteractive innovation, learning, proximity, associational networking, and cluster-ing activities of public and private governance actors, paying respect also to themultilevel governance aspects of innovation systems. The second half of the articleconsists of some detailed case studies of biotechnology clustering in the UnitedStates, the United Kingdom, and Germany, paying attention to the differences andsimilarities in the processes involved despite their origins in different national inno-vation systems and the distinctive role of public policy involvement in the threecases. The article concludes with a review of the strengths and limitations ofregional innovation systems with respect specifically to the development trajecto-ries of the biotechnology clusters under inspection.
THEORIZING THE NEW REGIONALISM
Speaking in theoretical terms and picking up on points made in the introductionto this article concerning regional advantage, a consensus has formed among writ-ers such as Grabher (1993), Maillat (1995), Sabel (1995), Enright (1996), andRosenfeld (1997) that accomplished regional economies tend to display certaincommon features. Among the most important of these are agglomeration econo-mies, institutional learning, associative governance, proximity capital, and interac-tive innovation (see also Malmberg and Maskell 1997; Johnson 1992; Amin andThomas 1996; Crevoisier 1997; Edquist 1997a). These are briefly explained below.
AGGLOMERATION ECONOMIES
Since Marshall, the advantages of colocation by firms in single or complemen-tary industries have been well understood. Krugman (1997) itemized these as fol-lows: first, a concentration of producers supports local suppliers of specializedinputs who thus help generate external economies of scale effects; second, agglom-erations generate localized skills pools benefiting workers’and firms’flexible labormarket opportunities; and third, knowledge spillovers are implied by the existenceof agglomeration. In the sphere of regional innovation, these translate into opportu-nities for lowering transaction costs from uncertainty due to the possibilities forspecialist, tacit-knowledge exchange present in the agglomeration (althoughalways subject to efforts to minimize leakage and maximize equivalence fromtacit-knowledge exchange with others) (Saxenian 1994; Storper and Scott 1995;Malmberg and Maskell 1997).
10 INTERNATIONAL REGIONAL SCIENCE REVIEW (Vol. 25, No. 1, 2002)

INSTITUTIONAL LEARNING
Institutional learning refers to the institutional setting of norms, routines, “rulesof the game,” and conventions (after North 1993), whereby it is widely understoodthat certain practices are acceptable and promote trustful relationships among firmsand organizations (which may also help reduce transaction costs). But among thenorms of growing importance for firms and enterprise support organizations is thepresumption in a globalizing economy, characterized by turbulence and uncer-tainty, that openness to learning good practice from others is of special importance.In Lundvall and Johnson’s (1994) formulation, this is conceived of as the exter-nalized form of the kind of learning more typical of what Argyris and Schon (1978)referred to as the more internalized characteristics of the “learning organization” orfirm. It applies equally to organizations that interact with firms, including gover-nance agencies, that must “learn by monitoring” in respect of the performance ofthe wider economy, their own goals achievement, and that of competitor agencies(Sabel 1995). It goes without saying that such learning is global as well as local.
ASSOCIATIVE GOVERNANCE
Here, reference is made to a networking propensity whereby key regional gover-nance mechanisms, notably the regional administrative bodies, are interactive andinclusive with respect to other bodies of consequence to regional innovation. Thismay lead to an organizational setting in which, let us say, the regional administra-tion animates or facilitates associativeness among representative bodies inside oroutside public governance but does not seek to dominate a process of consensus for-mation with respect to, say, a readjustment of regional economic strategy. It mayinvolve a government agency letting go of, or at least sharing with legitimate privategovernance bodies such as chambers of commerce or business associations, a func-tion it may have been responsible for innovating.
PROXIMITY CAPITAL
Proximity capital can be hard or soft, financial or human, and refers to differentkinds of infrastructure of relevance to regional innovation. According to Smith(1997), there is a strong association between past investments in a variety of infra-structures and economic performance. Thus, the existence of appropriate commu-nication links such as road, rail, airport, and telecommunication services is cru-cially important in proximity to industrial agglomerations. As Krugman (1997) putit, quoting U.S. Federal Reserve chairman Alan Greenspan, “the gross domesticproduct is getting lighter.” Hence, “for businesses which depend on personal con-tact and/or rapid shipment of goods, two locations 500 miles apart but close to
Cooke / BIOTECHNOLOGY CLUSTERS 11

major airports with frequent direct flights are effectively closer to each other thantwo locations on opposite sides of the same large metropolitan area” (Krugman1997, 44-46). This is material capital, but Crevoisier (1997) referred also to theimportance in agglomerations (especially of SMEs) of localized, trustful means ofraising venture capital, maybe through local entrepreneurs or “business angels.”Intellectual capital from previous investments in universities and research institutesin proximity to complementary firms is yet another form of proximity capital.
INTERACTIVE INNOVATION
As is well known, the concept of interactive innovation is very much associatedwith the “national systems of innovation” literature (Lundvall 1992; Nelson 1993;Freeman 1994, 1995; Edquist 1997b), but it is of obvious relevance to the regionallevel, too. Where there is a rich innovation infrastructure—ranging from specialistresearch institutes to universities, colleges, and technology transfer agencies—andinstitutional learning is routine, firms have considerable opportunities to access ortest knowledge, whether internally or externally generated to the region. Clearly, byno means all innovation interactions can or even should occur locally, but the rise ofthe “entrepreneurial university” (Smilor, Dietrich, and Gibson 1993) and promo-tion of the so-called triple helix of interaction between industry, government, anduniversities as a key feature of the knowledge economy (Etkowitz and Leydesdorff1997) testify to the practical evolution of interactive innovation processes.
It is in respect to this new regional science approach to thinking about regionaleconomic development that regional studies and innovation studies in the mannerof Lundvall, Nelson, Freeman, and Edquist themselves begin to interact. The lattertradition is more overtly evolutionary in its theoretical perspective on economics.But all of what has been described in the new regional science approach is compati-ble with evolutionary economics. Summarizing Edquist’s (1997a) presentation ofkey concerns of contemporary innovation research in light of the interests of newregional science, especially where innovation is under the microscope, we find thatboth fields envision innovation and learning processes involving knowledge trans-fer as a key focus, share an interest in systemic interaction within political econo-mies, and are concerned with questions of path dependence, development trajecto-ries, and the role of institutions and ways they evolve over time (see also Cooke,Uranga, and Etxebarria 1998).
CONDITIONS AND CRITERIA
FOR REGIONAL INNOVATION SYSTEMS
In considering the prospects for regional systems of innovation, Cooke, Uranga,and Extebarria (1998) have explored theoretically the key organizational and insti-tutional dimensions providing for strong and weak regional innovation systemspotential. This is a pioneering attempt to specify desirable criteria on which
12 INTERNATIONAL REGIONAL SCIENCE REVIEW (Vol. 25, No. 1, 2002)
systemic innovation at the regional level may occur. These can be divided intoinfrastructural and superstructural characteristics.
INFRASTRUCTURAL ISSUES
The first infrastructural issue concerns the degree to which there is regionalfinancial competence. This includes private and public finance. Where there is aregional stock exchange, firms, especially SMEs, may find opportunity in a localcapital market. Where regional governments have jurisdiction and competence, aregional credit-based system in which the regional administration can be involvedin cofinancing or provision of loan guarantees will be of considerable value, some-thing that is extremely important about the German approach in which the privatesector strongly avoids high risk. In the United States and the United Kingdom, pri-vate venture capital is the proximate source and main lubricant of commercializa-tion activities. Hence, secured proximity capital can clearly be of great importance,especially as lender-borrower interaction and open communication are seen to beincreasingly important features in modern theories of finance. Hence, regional gov-ernance for innovation entails the facilitation of interaction between parties, includ-ing—where appropriate and available—the competencies of public as well as pri-vate resources. Public-private animation of investment can also help build upcapability, reputation, trust, and reliability among regional partners.
However, regional public budgets are also important for mobilizing regionalinnovation potential. We may consider three kinds of budgetary competence forthose situations in which at least some kind of regional administration exists. First,regions may have competence to administer decentralized spending. This is wherethe region is the channel through which central government expenditure flows forcertain items. In Europe, much Italian, Spanish, and French regional expenditure isof this kind, although there are exceptions, such as the Italian Special Statuteregions and some Spanish regions where taxes are raised and spent regionally. Asecond category applies to cases in which regions have autonomous spending com-petence. This occurs when regions determine how to spend a centrally allocatedblock grant (as in Scotland and Wales in the United Kingdom) or where, as in fed-eral systems, they are able to negotiate their expenditure priorities with their centralstate and, where appropriate, the EU. The third category is when regions have taxa-tion authority as well as autonomous spending competence since this allows themextra capacity to design special policies to support, for example, regional innova-tion. The Basque Country in Spain has this competence, as does Scotland. Clearly,the strongest base for the promotion of regional innovation is found when regionshave regionalized credit facilities and administrations with autonomous spendingand/or taxation authority. Of course, in the United States, states have access to theirown sales taxes and powers to vary tax rates on such items as expenditure onresearch and development (R&D).
Cooke / BIOTECHNOLOGY CLUSTERS 13

A further infrastructural issue concerns the competence regional authoritieshave for controlling or influencing investments in hard infrastructures such astransport and telecommunications and softer, knowledge infrastructures such asuniversities, research institutes, science parks, and technology transfer centers.Most regions lack the budgetary capacity for the most strategic of these, but manyhave competencies to design and construct many of them or, if not, to influencedecisions ultimately made elsewhere in respect of them. The range of possibilitiesis enormous in this respect, so we classify broadly into types of infrastructure overwhich regions may have more or less managerial or influence capacity. If we thinkof our three cases, then the federal systems in Germany and the United States havethe most influence over infrastructural decisions, including roads and even airportpolicies. In Germany, basic research funding frequently has a regional (land) com-ponent. In the United States, management and funding of public universities isdevolved. In the United Kingdom case, regions in England (but not Northern Ire-land, Scotland, or Wales) have had only regional development agencies since April1999, so autonomy is low and dependence on discretionary budgets from the centeris still high.
SUPERSTRUCTURAL ISSUES
Three broad categories of conditions and criteria can be advanced in respect tosuperstructural issues. These refer, in general, to mentalities among regional actorsor the culture of the region and can be divided into the institutional level, the organi-zational level for firms, and the organizational level for governance. Together, thesehelp to define the degree of embeddedness of the region, its institutions, and itsorganizations. Embeddedness is here defined in terms of the extent to which asocial community operates in terms of shared norms of cooperation, trustful inter-action, and “untraded interdependencies” (Dosi 1988) as distinct from competitive,individualistic, “arm’s length exchange,” and hierarchical norms. The contentionhere is that the former set of characteristics is more appropriate to systemic innova-tion through network or partnership relationships. It is widely thought that Ameri-can entrepreneurship involves this cultural characteristic, but in biotechnology, asin other cases of high technology, there is cooperation as well as competition, as weshall see. It should also be noted that the work of Saxenian (1994) pointed stronglyto the conclusion that a key reason for Silicon Valley’s better long-term innovationperformance than that of Route 128 Boston was that Silicon Valley was the regionwith the greater embeddedness. But the resurgence of the latter is linked to Massa-chusetts’s adoption of a cluster policy from which biotechnology and biomedicalinstruments, for example, have benefited (Porter 1998; Best 2000).
Therefore, if we look first at the institutional level, the atmosphere of a coopera-tive culture, associative disposition, learning orientation, and quest for consensuswould be expected to be stronger in a region displaying characteristics of systemic
14 INTERNATIONAL REGIONAL SCIENCE REVIEW (Vol. 25, No. 1, 2002)

innovation, whereas a competitive culture, individualism, a “not invented here”mentality, and dissension would be typical of nonsystemic, weakly interactiveinnovation at the regional level. Moving to the organizational level of the firm,those with stronger systemic innovation potential will display trustful labor rela-tions, shopfloor cooperation, and a worker welfare orientation with emphasis onhelping workers improve through a mentoring system and an openness toexternalizing transactions and knowledge exchange with other firms and organiza-tions with respect to innovation. The weakly systemic firm characteristics wouldinclude antagonistic labor relations, workplace division, “sweating,” and a “teachyourself” attitude to worker improvement. Internalization of business functionswould be strongly pronounced, and innovativeness might be limited to adaptation.Regarding the organization of governance, the embedded region will displayinclusivity, monitoring, consultation, delegation, and networking propensitiesamong its policy makers while the disembedded region will have organizations thattend to be exclusive, reactive, authoritarian, and hierarchical. These characteristicsare summarized in Table 1.
Clearly, both sets of conditions are ideal types in the sense that it is unlikely that asingle region would conform to all of one or the other set of characteristics. How-ever, it could be expected that regions might display tendencies toward one or the
Cooke / BIOTECHNOLOGY CLUSTERS 15
TABLE 1. Conditions for Higher and Lower Regional Innovation Systems Potential
Higher Potential Lower Potential
Infrastructural levelAutonomous taxing and spending Decentralized spendingRegional private finance National financial organizationPolicy influence on infrastructure Limited influence on infrastructureRegional university-industry strategy Piecemeal innovation projects
Superstructural levelInstitutional dimension
Cooperative culture Competitive cultureInteractive learning IndividualisticAssociative consensus Institutional dissension
Organizational dimension (firms)Harmonious labor relations Antagonistic labor relationsWorker mentoring Self-acquired skillsExternalization InternalizationInteractive innovation Stand alone research and development
Organizational dimension (policy)Inclusive ExclusiveMonitoring ReactingConsultative AuthoritativeNetworking Hierarchical
other end of the continuum, and in dynamic terms, it might be possible to identifyevolutionary tendencies by regions toward one or the other pole, perhaps signifyingan element of convergence influenced either by globalization processes or the pol-icy effects of governments or (in Europe) EU programs.
OPERATIONALIZING REGIONAL INNOVATION
IN THE CONTEXT OF MULTILEVEL GOVERNANCE
Because, under conditions of globalization and liberal trading, the EU has beenconscious of the relative weakness of the European economy in competing with theUnited States in terms of the commercialization of the fruits of research, a greateffort has been made to support and promote the improvement of innovation amongfirms of all sizes. While the EU’s Science & Technology Framework Programmewas at first strongly influenced by and mainly directed toward Europe’s largestmultinationals, the focus was later extended to encompass the interests of SMEsand regional innovation, as the Green Paper on Innovation (European Commission1995) makes clear. The fact that promoting regional innovation also targets lessfavored regions and thus helps the Commission to meet its cohesion obligationsstrengthens this disposition. Moreover, the emergence of innovation promotion asan element of the EU’s “structural funds” for implementing regional policiesunderlines the commitment to regional innovation policy. Experimentation withregional technology plans, regional innovation strategies, and regional informationsociety initiatives also testified to the growing importance of capacity building forinnovation at the regional level.
However, as has been stated, the absorptive capacity and organizational compe-tencies in a context of multilevel power relations within different member-statesmean that building the capability for regional firms to engage in interactive or evensystemic innovation varies considerably. It is well known, for example, that whilethe wealth disparity within the EU ranges from 1 to 5, that for R&D expenditureranges from 1 to 11, meaning that there is far less basic innovation activity awayfrom the main metropolitan centers in the larger and more northerly member-states.Moreover, the capability of regional administrations in the Southern member-statesin multilevel lobbying and influence to access regional innovation funding can beaffected by decision-making structures that remain centralized for some functionseven when a wide-ranging program of regional decentralization may have beenimplemented.
These points are made because multilevel governance (MLG) relationships dif-fer due to member-state constitutional and practical political traditions and conven-tions. Five key points assist our analysis of the regions studied in the REGIS project.MLG is highly dependent on the presence of strong and established regional gover-nance organizations. MLG for innovation is significantly assisted where the region
16 INTERNATIONAL REGIONAL SCIENCE REVIEW (Vol. 25, No. 1, 2002)
has a substantial number and diversity of regional and local innovation organiza-tions. Regional and external innovation interaction among firms and other innova-tion organizations is important for regional innovation potential. The existence ofregional scientific, technological, and innovation policies and programs, assistedby the EU and nationally, is important. Finally, the ability to access and use fundingfor innovation support for regional firms and organizations is crucial for regionalinnovation promotion.
On this basis, it is clearly necessary to say more about the kinds of organizationsthat can be found to comprise the organizational innovation support infrastructurein a given region. The two key subsystems in any functioning regional innovationsystem are (1) the knowledge application and exploitation subsystem and (2) theknowledge generation and diffusion subsystem (Autio 1998). The first is princi-pally, but not only, concerned with firms while the second is more concerned withpublic organizations like universities, research institutes, technology transfer agen-cies, and regional and local governance bodies responsible for innovation supportpractices and policies. However, private investors can be the most important actorsoutside basic research in highly innovative regions and metropolitan areas. Firmsapplying and exploiting innovation directly can have vertical and horizontal net-work linkages; vertical relationships are mainly supplier linkages, whereas hori-zontal linkages are found typically amongst SMEs who may, on occasion, also becompetitors. Many innovation network policies seek to build horizontal linkages,but some also aim to assist the elaboration of vertical supply-chain relationships.Evidence has emerged that venture capitalists do this as a matter of course to watchtheir investments. Possibly Kleiner, Perkins, Caufield & Byers in Silicon Valley isthe most conscious of this through its keiretsu building practices (Cooke 2001a,2001b). In the knowledge generation and diffusion subsystem are technology-mediating organizations, those that mediate with respect to vocational training andworkforce skill provision, public research institutes, and educational organizations.Each of these subsystem organizations interacts with the others and with nationalinnovation organizations or the National System of Innovation of their mem-ber-state as well as international policy and knowledge-generating organizationssuch as the EU, on one hand, and non-European universities, research institutes,and firms, on the other hand. Figure 1 is an attempt, based on the work of Autio(1998), to present the structure of a regional innovation system in the abstract.
This model captures the main features and relationships of a functioningregional innovation system operating in an MLG environment. But it only indicatesthe linkages in a neutral fashion. Empirical research is necessary to capture the vari-ety of degrees of influence and decision-making authority and the presence orabsence of weaker and stronger relationships among the diverse possible kinds ofapplication, exploitation, generation, and diffusion elements of specific regionsand their degrees of “systemness.”
Cooke / BIOTECHNOLOGY CLUSTERS 17

EXPLORING BIOTECHNOLOGY CLUSTERING
FROM A REGIONAL INNOVATION SYSTEMS VIEWPOINT
We now need to focus in on empirical cases to seek the limitations of regionalinnovation systems as well as their contribution to sector competitiveness in thecontext of MLG. Some of the funding limitations at the regional level have alreadybeen discussed, particularly with respect to the funding of basic and much appliedresearch in universities and specialist research institutes. Another limitation is theregulatory regime, a matter of national or federal responsibility, although the imple-mentation of certain regulations, in terms of speed, can be a subnational matter.Thus, issues concerning taxation, rules about depreciation of investment, and suchissues as the rules governing share options are usually national and affect the gen-eral climate for entrepreneurship and rules of competition. For example, the UnitedStates is widely understood to have the most benign regulatory regime for market-based entrepreneurship. The United Kingdom has a less benign regime; for exam-ple, capital gains tax on the selling of share options by firm founders is set higherthan in the United States and is considered a barrier to growth by the biotechnologyindustry (Department of Trade and Industry 1999). Germany, despite some recent
18 INTERNATIONAL REGIONAL SCIENCE REVIEW (Vol. 25, No. 1, 2002)
FIGURE 1. Schematic Illustration of the Structuring of Regional Systems of Innovation

reforms, has a more rigid regulatory regime in relation to depreciation and shareoptions than either the United States or the United Kingdom (Casper and Kettler2000). Germany also has rules that make it much harder for academics to becomeentrepreneurs because they are classified as civil servants who may not take a sec-ond employment. In Germany, however, the implementation powers of the ländermean that, for example, the federal Genetic Engineering Act (which regulates thisactivity) has been implemented as different speeds— Bavaria being one of the earliestto act—thereby assisting the development of genetic engineering entrepreneurshipthere as compared with other regions.
However, although it is fairly uncontroversial to state that the United States hasthe best business climate for the commercialization of scientific research, this doesnot mean that development of U.S. biotechnology has not been assisted by substan-tial public funding at both federal and state levels. The role of the National Institutesof Health, with a 1999 research budget of $15.6 billion (increased by $2 billion or14 percent since 1998), and the National Science Foundation, which supports bio-logical science research with a 1999 budget of $391 million, along with the U.S.Department of Agriculture ($1.6 billion), NASA ($264 million), and the U.S.Department of Energy, which supports the human genome project ($433 million),constitutes a massive public-funding resource from which biotechnology researchbenefits. Furthermore, the Small Business Innovation Research (SBIR) program,whereby 2.5 percent of the external budget of eleven U.S. federal agencies is avail-able for funding R&D in small firms, is of major importance to new technologycompanies, including biotechnology. Indeed, one possible weakness of SBIR isthat some firms exercise “grantsmanship” and spend much of their time seekingsuch grants in a dependent, “rent-seeking” manner. So this is not proximity capital,although it certainly arrives in proximity to elite research institutes with some regu-larity. In basic science funding, multilevel budget governance is well to the fore.
These funds dwarf even the U.S. venture capital industry for biotechnology,which in 1998 was some $1.4 billion. However, this private investment allied to thegrowth of state-initiated venture funds for biotechnology in California, Massachu-setts, Maryland, North Carolina, and Seattle in Washington State means the impor-tance of proximity for private investment is high as well as regionally variable.States, through their economic development initiatives, also operate tax incentivesand support programs to assist the sector. California exempts biotechnology firmsfrom the 6 percent state sales tax, North Carolina gives tax exemption for equip-ment purchases, and the state of Washington gives credits against business taxes forR&D expenditure. Massachusetts is probably the most interventionist, having a10 percent to 15 percent tax credit on research and a 3 percent investment tax crediton fixed assets, both with lengthy carry-forward periods.
Such is the nature of regional-level support for U.S. biotechnology that a recentmission there by the U.K. Bioindustry Association (BIA) led them to call for a newNational Biotechnology Center: “In no case did U.S. (biotechnology) manufactur-ing plants just spring up. It [sic] was kicked into existence by government bodies,”
Cooke / BIOTECHNOLOGY CLUSTERS 19
said Dr. John Sime (personal communication, August 1999), head of BIA. Mary-land and North Carolina were seen as having especially helped to build successfulbiotechnology clusters. “In both states, biotechnology companies have beenencouraged to undertake manufacturing by a supportive regulatory and planningenvironment, a responsive academic environment and financial incentives,”reported a team member (personal communication, August 1999). North Carolinawas seen as a model due to the establishment of its North Carolina BiotechnologyCenter, having been set up with public funds as an independent organization, beingfinancially self-sufficient, and playing a coordinating role between the industry andgovernment, universities, financial institutions, and the media (Cookson andPilling 1999). It is interesting to note how a key ingredient of North Carolina’sregional cluster building of a biotechnology innovation system acts as a recipe forenhancing the United Kingdom’s national biotechnology innovation system. Thisclearly suggests the tenaciousness of a national and centralizing perspective by sci-ence in the face of manifest evidence of the importance of the regional in clusterbuilding. U.K. Department of Trade & Industry policy up to and including 2001was to make disbursements of special cluster, innovation support, and public ven-ture capital funding to England’s Regional Development Agencies and U.K. sci-ence entrepreneurship funding direct to universities following national contests.Nowadays, the other U.K. countries develop their own distinctive cluster-supportpolicies. So multilevel governance is important for U.K. public innovation funds,acting to offset the large disparities in a U.K. investment system heavily skewed toLondon and away from the regions.
CAMBRIDGE, MASSACHUSETTS
One of the biggest and most dynamic biotechnology clusters is that in Boston.The science base is exceptionally strong in the Massachusetts Institute of Technol-ogy (MIT), Harvard University, Boston University, and Massachusetts GeneralHospital. Each year some $770 million in basic research funding flows through thesystem. Leading scientists and academic entrepreneurs, one of whom has beeninvolved with some 350 patent applications, are present. At MIT, in particular, theTechnology Licensing Office is a major operation, also involved in assisting at leasttwenty start-ups per year to be established. Massachusetts has at least 150 venturecapitalists, most of them in Boston or Cambridge. The Massachusetts Biotechnol-ogy Council is an industry association that organizes common purchasing and otherservices such as promotion, educational placement, and career development for its215 member firms. In 1998, there were 132 member firms in the greater Boston area(59 in Cambridge, 73 elsewhere) and 83 outside Route 128, employing some17,000 people. By 1999, Massachusetts Biotechnology Council’s membership hadreached 245 biotechnology firms.
Because of proximity and common backgrounds from educational institutions,the level of interfirm and firm-agency interaction is high. In these respects, this in-
20 INTERNATIONAL REGIONAL SCIENCE REVIEW (Vol. 25, No. 1, 2002)

dustry constitutes an exemplary case of a cluster, although as with high-technologyclusters in general, global linkages to other clusters and, particularly, “big pharma”partners or customers are also pronounced. The connection to other centers of bio-technology is testified by the presence in the Massachusetts Biotechnology Councilof promotional material from other clusters, including that of the Eastern RegionBiotechnology Initiative (ERBI) based in Cambridge (United Kingdom). Thisassociation is a major factor in the private governance of the metropolitan regionalcluster.
If we look at the biotechnology sector springing mainly from MIT and Harvardin Cambridge, supported by Massachusetts General Hospital and, to a lesser extent,Boston University in Boston, we have to talk of biotechnology nowadays in thegreater Boston area, since many start-ups have moved out to Route 128 and evenbeyond Route 495 to Worcester as the encompassing area. The 1998 geographicalbreakdown, bearing in mind the 59 firms in Cambridge, was as follows: 132 firmswere located east of Route 128 (59 in Cambridge, 16 in Boston, and the remainderbetween there and Route 128), 58 were located between Route 128 and Route 495(including 11 in Bedford and 6 in Wilmington), and 25 were located west ofRoute 495 (including 11 in Worcester). Many of these, especially in the outer loca-tions, were based on science or technology parks, as were many start-ups on thetechnology park campuses of the key universities. The Massachusetts Biotechnol-ogy Park at Worcester has venture capital on site, suggesting that proximity isimportant for some in meeting demand, despite the presence of large numbers ofinvestment firms in downtown Boston.
The market segment breakdown is that 34 percent of firms are in the therapeuticproducts sector (meaning they have grown beyond the early stages, typically inplatform technologies, including diagnostics), 20 percent are in scientific equip-ment or supplies, 15 percent are in scientific services, 14 percent are in human diag-nostics, 10 percent are in environmental and veterinary services, and 7 percent arein agricultural biotechnology (animal, plant, diagnostic, and transgenics). Per-ceived industry growth areas are in medical therapeutics (genetically produced pro-tein, vaccines, gene therapy, and human growth hormones), human diagnostics(monoclonal antibodies, biological imaging, DNA probes, biosensors, and poly-merase chain reaction), agricultural biotechnology (nutraceuticals, rapid diagnos-tic testing, and transgenics), and bioinformatics (biological discovery, patient data-bases, etc.). Seventy-nine firms were founded in the 1980s including Biogen,Genetics Institute, and Genzyme (with more than three hundred employees). A fur-ther eighty-eight firms began between 1990 and 1997; the remainder are morerecent start-ups or inward investments. Employment grew from 7,682 in 1991 to16,872 in 1998. As the industry matures, the number of start-ups is decreasingannually. Between 1996 and 1999, seven mergers and acquisitions occurred.Financing of companies in biotechnology is high risk, and analyses show that pub-lic investment is strongest at the risky process or product development stage.
Cooke / BIOTECHNOLOGY CLUSTERS 21
Of considerable significance as agents in the regional innovation system, withinthe knowledge generation and diffusion subsystem, are the following:
• Massachusetts Department of Economic Development: has a key role in business andtrade development, improving the business climate (R&D tax credits, investment taxcredits), responding to lobbying from industry associations, and providing grants togrowth firms and inward investors.
• MIT: is a leading center for biotechnology research and commercialization, campusincubators, and technology parks. MIT Entrepreneurship Center trains scientists inentrepreneurship. MIT Technology Licensing Office identifies technologies suit-able for start-ups and introduces technology to potential investors (usually venturecapitalists).
• Harvard University: provides Ph.D. programs in biochemistry, biology, biophysics,cell and development biology, genetics, microbiology and molecular genetics, tech-nology, and so on at the Joint Harvard-MIT Division of Health and Technology, theSchool of Medicine, and the School of Public Health.
• Massachusetts General Hospital and Boston University: conducts research and com-mercialization at Boston University, Bio Square Technology Park.
• Whitehead Institute of Biomedical Research: is an independent research and teachinginstitution (affiliated with MIT in teaching) and an international leader in the humangenome project, the source of comprehensive, published genome data, whichconducts world-leading research in genetics and molecular biology and houses a tech-nology-licensing program and start-up scheme.
• Massachusetts Technology Collaborative: is a state-founded, independent body tofoster technology-intensive enterprises and cluster-building strategies.
• Massachusetts Biotechnology Council: is a trade association representing biotech-nology firms (162 full and 83 associate members), which provides educational, ca-reer, and promotional information to the industry and conducts common-purchasingcontracting for biotechnology firm members.
In conclusion, leading exploitation firms such as Genzyme, patenter and inven-tor of the therapeutic product that controls the genetically caused Gaucher’s dis-ease, are closely intertwined with this generation and diffusion system. Moreover,Genzyme, as a founding member of the Partners Healthcare System with Brighamand Women’s and Massachusetts General Hospitals on research funded at $400 mil-lion by the National Institutes of Health, reinforces the system. Along with Biogenand Genetics Institute, and other internationally known firms such as BASF,Corning and Quintiles, and a host of SMEs and start-ups, this means the greaterBoston region is supported by the generation and diffusion organizations and asso-ciations already noted and clearly functions as a well-integrated regional innova-tion system based on a cluster of leading-edge biotechnology businesses. It has amajor proximity capital resource in the 150 or so venture capital firms in and aroundBoston. Lobbying through the Massachusetts Biotechnology Council led the Food
22 INTERNATIONAL REGIONAL SCIENCE REVIEW (Vol. 25, No. 1, 2002)

and Drug Administration to open an office in the city, testimony to the sector’s pow-ers of association.
THE CAMBRIDGE (UNITED KINGDOM) ECONOMY AND BIOTECHNOLOGY
As in Boston, the economy around biotechnology is important but by no meansoverwhelmingly so by comparison with other economic sectors in Cambridge-shire. Thus, Cambridgeshire County Council estimates that in 1998 there were37,000 high-technology jobs in the area and that these comprised 11 percent of theCambridgeshire labor market. South Cambridgeshire had about 66 percent of thesejobs, while Cambridge city accounted for most of the remainder. The mainhigh-tech activity is R&D, supplying 24 percent of total high-tech employment;electronics has 17 percent; computer services have 13 percent; scientific instru-mentation has 8 percent; and biotechnology has 7 percent. Probably the estimate ofsome 2,600 employees in biotechnology (and chemicals) for the county is a not anunreasonable figure. However, if we inspect the ERBI Biotechnology (1998)Sourcebook, the number of core biotechnology firms in Cambridgeshire listed is36. So the discrepancy between that figure and the estimate of 200 biotechnologyfirms by Segal, Quince & Wicksteed (SQW) in 1998 needs some qualification. Thefirst qualification can be offered with some confidence: in ERBI’s list of Cam-bridgeshire biotechnology firms there are venture capitalists, research institutes,management consultants, and lawyers. Together these total 96; thus, the clustersupport firms and agencies exist in an approximate 2:1 ratio with biotechnologyfirms. ERBI considers this a significant underestimate and, in its new survey (1999),estimates numbers, in general, about one-third higher. This would take the Cam-bridgeshire figure to around 50 core biotechnology firms. The second reason for thediscrepancy is that the significant number of very small start-ups in incubators andthe like are underrepresented in the ERBI figures published thus far. Therefore, wemay conclude that Cambridgeshire’s core biotechnology industry consists of noless than 50 firms, and the broader cluster (venture capitalists, patent lawyers, etc.)probably consists of not much more than 200 firms, including the core biotechnol-ogy firms.
It is quite useful, in trying to categorize the biotechnology sector, to follow theGerman custom of referring to “red,” “green,” and “gray” biotechnology. The firstis primarily medical and biopharmaceutical, the second is agro-food biotechnol-ogy, and the third is environmental. It is clear from both ERBI (1998) data and theSQW estimates that Cambridgeshire specializes in red biotechnology. The two cat-egories of biopharmarceuticals including vaccines and pharmaceuticals largelyfrom chemical synthesis register fourteen and nine Cambridgeshire-based firms,respectively. Examples of the former are Actinova, Amgen, and Hexagen and of thelatter, Chiroscience, Napp, and Quadrant. In addition to these two key categories
Cooke / BIOTECHNOLOGY CLUSTERS 23

are direct biotechnology services like clinical trails, diagnostics, and reagent sup-ply. A further eight Cambridgeshire direct-services firms are listed in the ERBISourcebook, which, it will be recalled, probably underestimates the numbers byabout one-third (not counting micro-firms). Cambridgeshire has four green biofirms, but ERBI lists no gray bio firms. It is important to note that Cambridgeshirealso hosts twelve biotechnology equipment and instrumentation firms according toERBI. This is more than two-thirds of such firms in the Eastern region.
The growth in the number of biopharmaceutical firms has been from one totwenty-three over the 1984-97 period, an average of just less than two per year, butthe rate has been more like four per year in the past two years of that period. Equip-ment firms grew from four to twelve in 1984-97 and diagnostics firms from two toeight. Table 2 shows the distribution of technology-based companies in Cam-bridgeshire and the distribution of support services.
Thus, it is clear that Cambridgeshire has a rather diverse biotechnology process-ing and development as well as services support structure, even though the industryis relatively young and small. Some of the service infrastructure and perhaps theequipment sector benefits from the earlier development of information technologybusinesses, many also spinning out from university research in Cambridge. It isnotable that 15 percent of biotechnology support services comprise venture capital.For a small city, Cambridge is well supplied with this commodity even though it isless than an hour away from London. This is a striking case of local demand attract-ing a supply of private investment, something that has been true of Cambridge sincethe earlier development in the 1980s of its thriving information and communica-tions technology (ICT) industry. As in Boston, basic scientific funding is a largelypublic affair, although the Wellcome Trust, the world’s largest medical charity, has
24 INTERNATIONAL REGIONAL SCIENCE REVIEW (Vol. 25, No. 1, 2002)
TABLE 2. Shares of Biotechnology and Services Functions
Distribution %
Biotechnology firmsBiopharmaceuticals 41Instrumentation 20Agro-food bio 17Diagnostics 11Reagents/chemicals 7Energy 4
Biotechnology servicesSales and marketing 29Management consulting 23Corporate accounting 15Venture capital 15Legal and patents 8Business incubation 10
Source: Eastern Region Biotechnology Initiative (1999).

been highly active both independently and in partnership with government in fund-ing bioscience and medical research.
The infrastructure support for biotechnology in and around Cambridge isimpressive, much of it deriving from the university and hospital research facilities.The Laboratory of Molecular Biology at Addenbrookes Hospital, funded by theMedical Research Council; Cambridge University’s Institute of Biotechnology,Department of Genetics and Centre for Protein Engineering; the Babraham Insti-tute and Sanger Institute, with their emphasis on functional genomics research; andthe Babraham and St. John’s incubators for biotechnology start-ups and commer-cialization are all globally recognized facilities, particularly in biopharmaceuticals.However, in the Eastern region are also located important research institutes in thegreen biotechnology field of agricultural and food biotechnology, such as the Insti-tute for Food Research, John Innes Centre, Institute of Arable Crop Research, andNational Institute of Arable Botany. Thus, in research and commercializationterms, Cambridge is well placed in red bio and with respect to basic and appliedresearch but perhaps less so to commercialization and green bio.
Within a 25-mile radius of Cambridgeshire are found many of the big pharma orspecialist biopharmaceutical firms with which commercialization development bysmaller start-ups and R&D by research institutes must be cofinanced. Firms likeGlaxo-SmithKline, Merck, and Aventis in the big pharma category are represented,and in the specialist biopharmaceutical sector, Amgen, Napp, GenzymeYamaguchi, and Bioglan are represented. Thus, on another of the criteria for suc-cessful cluster development—namely, access within reasonable proximity to largecustomer and funding partner firms—Cambridge is, again, fortuitously positioned.
Finally, with respect to agro-food bio, Aventis, Agrevo, Dupont, Unilever, andCiba are situated in reasonably close proximity to Cambridge. Hence, the prospectsfor linkage, although more occluded by public concerns about genetically modifiedorganisms than in the case of health-related biotechnology, are nevertheless propi-tious in locational terms.
Cambridge has a number of science and technology parks, although the demandfor further space is significant. At least eight biopharmaceutical firms are located inCambridge Science Park. St. John’s Innovation Centre, Babraham Bioincubator,Granta Park, the Bioscience Innovation Centre, and Hinxton Science Park are allnewly available or planned. Hinxton is home to the U.K. human genome researchcenter and the Sanger Institute, and commercialization will occur in an integratedscience park. Most of the newer developments are taking place within short com-muting distance of Cambridge itself, on or near main road axes like the M11, A11,A10, and A14. This is evidence of the importance of access for research applica-tions firms to centers of basic research, also reinforcing the point that not every-thing concerning biotechnology must occur “on the head of a pin” in Cambridgecity itself.
The final, important feature of the biotechnology landscape in Cambridge andthe surrounding Eastern Region is the presence of both informal and formal
Cooke / BIOTECHNOLOGY CLUSTERS 25

networking between firms and research or service organizations and among firmsthemselves. Of more direct relevance to the biotechnology community are theactivities of ERBI. This biotechnology association is the main regional networkwith formal responsibilities for creating newsletters; organizing network meetings;running an international conference, Web site, sourcebook, and database on thebioscience industry; providing aftercare services for biobusinesses; makingintranational and international links (e.g., Boston, Oxford, San Diego); and orga-nizing common purchasing, business-planning seminars, and government andgrant-related interactions for firms.
Although substantially smaller than the Boston cluster, Cambridge already hasmost of the generic features of a sectoral innovation system. The presence of ven-ture capital and other support services, mainly private, were noted. The existence ofthe regional biotechnology industry association ERBI compares with the Massa-chusetts Biotechnology Council in Boston, although it is worth noting that its ori-gins lie in a multilevel governance initiative by the U.K. industry ministry (Depart-ment of Trade and Industry) and a local public-private enterprise supportpartnership (CambsTEC Business Link). Clearly, institutional learning from infor-mation technology networks established in the region and practices by interna-tional biotechnology comparators has played a role in the conception of how to gov-ern the agglomeration and give it more cluster consciousness. Clusters like this areclearly cases of localized sectoral innovation systems possessing global reach. Inscientific and commercialization terms, it is Europe’s leading biotechnology clus-ter in a business with expected global turnover of $70 billion in 2000. Because of thesunk costs associated with colocation by venture capitalists, specialist patenting,legal, accountancy and insurance services, the immobility of the key knowledge-driving resource, the university, and the presence of a critical mass of biotechnol-ogy firms and entrepreneurs, Cambridgeshire is likely to remain the key biotech-nology focus it has become.
THE GERMAN BIOREGIO CLUSTERS
We have seen that clustering in biotechnology is perceived as advantageous andsuccessfully practiced in the United States and United Kingdom, something that thefederal BioRegio initiative has sought to emulate. In what follows, we shall see adifferent picture, in which efforts are made by the government to induce learning,stimulate commercialization, and create governance and venture funding to buildclusters through the BioRegio contest. The three key BioRegios are Rhineland,comprising Cologne, Düsseldorf, Wuppertal, and Aachen; Rhine-Neckar, includ-ing Heidelberg, Mannheim, and Ludwigshafen; and Munich. Jena was given a con-solation prize but is least developed as a cluster. The accounts will be provided inthat order.
26 INTERNATIONAL REGIONAL SCIENCE REVIEW (Vol. 25, No. 1, 2002)

Rhineland BioRegio
Given its history as a heavy industrial region undergoing major restructuring incoal, steel, chemicals, and heavy engineering (particularly in the Ruhr) towardnewer growth industries, the land of North Rhine Westphalia has launched numer-ous technology-orientated initiatives, especially from 1984, when a number of newtechnological institutes with near-market research functions, technology parks, andinnovation networks were set up under the Future Technology Program initiative.Among these was the land’s first biotechnology program (Landesinitiative Bio-undGentechnik e.V) to support SMEs. Other sectors receiving support included envi-ronmental technology, energy technology, micro-electronics, measurement, infor-mation technology, and materials. The biotechnology initiative was supersededin 1994 by the establishment of BioGenTec. This agency is a nonprofit organiza-tion with representation from industry, academia, trade unions, and government. Itacts as an intermediary body linking biotechnology start-ups, an expert network of200 members, venture capitalists, and partners from industry. It is seeking tobecome a commercial company and will sell services to the industry on that basis. Awide range of mainly medical biotechnology areas are prioritized under its programof support, but environmental and agro-food technologies are also supported.
Various networks have been established, including a venture capital network oflocal but also internationally operational firms and groups (the BioGenTec Atlas[BioGenTec 1998] lists fifteen), a competence and training network, and a manage-ment and coaching network. BioGenTec is about to establish biocenters at variouslocations and organizes an annual international meeting called the BioGenTecForum. In 2000, an international forum on nanobiotechnology was organized. Theresearch strengths of the land include the Max Planck Institute for Plant BreedingResearch at Cologne, which has become the center of green biotechnology, aroundwhich larger (e.g., Monsanto, DSV, and Agrevo) and smaller firms are clustered. In1998, a letter of intent was signed between the governments of NorthRhine-Westphalia (NRW) and Saskatchewan, Canada, to improve collaboration inthe field of agro-biotechnology. Also in Cologne is the Max Delbrück Laboratory(also part of the Max Planck Society), specializing in plant genetics. The MaxPlanck Institute for Neurological research, specializing in (photo)receptors, signaltransduction, and recombinant proteins, is at Mülheim an der Ruhr. A HelmholtzInstitute exists at Aachen (biomedicine and cryobiology), and a Fraunhofer Insti-tute for Environmental Chemistry and Ecotoxicology is located at Schmallenberg.Altogether, the land has some 167 research institutes, many employing relativelysmall numbers of researchers but with representation across the red, green, and graybiotechnology spectrum.
It is fairly evident that multilevel land and federal programs of support fittogether well, as the transition from the Future Technology Program to BioGenTecsuggests. Dr. Fritschi, head of the latter organization, reported there is no conflict
Cooke / BIOTECHNOLOGY CLUSTERS 27

but rather, on the contrary, they have been complementary sources of funding overthe years (Cooke 1999). He noted a spatial distinction in the stage at which particu-lar kinds of public-venture funding occurred such that “interestingly, mostlyexpanding companies were able to take advantage of federal funding while landfunding went directly into start-ups. We also recognize a steady movement of com-panies into the BioRegio area because of federal and/or land funding” (Dr. E.Fritschi, personal communication, September 1999). BioGenTec has alreadyestablished regional offices outside the BioRegio area (Münster and Bergkamen,north and east of the Ruhr) to seek to seed new clusters, which with land funding it ishoped will also attract start-ups to get established in these more outlying areas.
It is worth noting that, in terms of the sectoral distribution of companies workingin the field of biotechnology, 22 percent are in diagnostics, 12 percent are inpharmarceuticals, 7 percent are in agro-food biotechnology, 18 percent are in envi-ronmental protection, 9 percent are in filtration engineering, and 10 percent are inbioanalysis. The last three are primarily engaged in gray or environmental biotech-nology activities, making it the largest category. Thus, although it is seen as a“Cinderella” part of biotechnology and one in which it is hard to get university-derived start-ups under way, it remains a strength of this region’s biotechnologyprofile. The origins of this commercial expertise are interesting and reflect well onthe restructuring efforts of the NRW government noted earlier. Because of Germanrules on codetermination, involving management and unions in strategic decisionsconcerning, for example, company restructuring, management could not simplydecide to close down redundant plants but were required to explore alternative tra-jectories firms might seek to move along. Because of expertise in the mining andsteel industries of, for example, filtration and ventilation technologies, it was recog-nized that adapting these for environmental cleanup, initially in the Ruhr itself butlater in former East Germany and into Central and Eastern Europe, would meet ahuge potential market need. Moreover, it was known that the EU was set on intro-ducing tougher environmental legislation in 1990, and on advice from NRW politi-cians, the federal government introduced an equivalent German version in anticipa-tion, thus augmenting market demand for environmental clean-up technologies.Between 1984 and 1994, some six hundred firms turned partly or wholly in thisdirection, including a number of new start-ups or spin-offs. More than 100,000 jobswere found in this new industry, which itself has been shown to have a clusterlikecharacter (Cooke and Davies 1993; Rehfeld 1995).
Finally, to what extent can clustering be said to be a feature of the RhinelandBioRegio or areas adjacent to it? From responses elicited from the question, itseems that in place are the key conditions of a strong science base, expanding num-bers of firms, qualified staff, available physical infrastructure (e.g., the Recht-srheinisches Technologie Zentrum in Cologne, a 5,000 meter square biotechnologyincubator with plans for a C4 quality central laboratory), availability of finance,business support services, a skilled workforce, effective networks, and a supportivepolicy environment. However, the number of biotechnology start-ups was at a peak
28 INTERNATIONAL REGIONAL SCIENCE REVIEW (Vol. 25, No. 1, 2002)

of twenty-six in 1990-91 and in decline to a figure of twelve in 1994-95, recoveringover 1996-97 after the announcement and including the first operational year ofBioRegio (BioGenTec 1998). An International Technology Services Expert Mis-sion report (Department of Trade and Industry 1998) stated that there were elevenstart-ups and eight company expansions since 1996 in biotechnology in theRhineland BioRegio area. This is consistent with the head of BioGenTec’s hints ofcaution about funding only quality projects and disappointment in the gray biotech-nology center of Aachen and Jülich, where start-ups had been hard to stimulate. It isalso worth noting that QIAGEN, Germany’s best firm based in this BioRegio, net-works in its “gene alliance” with firms outside it. So, for the present, the RhinelandBioRegio has all the appropriate conditions for stimulating the development of rea-sonably large numbers of new biotechnology firms, but whether a significant clus-ter of growing biotechnology firms will appear swiftly must remain doubtfulbecause of the evidence presently available.
Rhine-Neckar-Dreieck
Heidelberg is Germany’s oldest university and has one of the best sciencebases for biotechnology. Two Max Planck Institutes—Cell Biology and Medi-cal Research—are in the region, as is the German (Helmholtz) Cancer ResearchCenter. The European Molecular Biology Laboratory and the European MolecularBiology Organization are there, along with one of Germany’s four Gene Centers,the Resource Center of the German Human Genome Project, two further medicalgenetics institutes, and two plant genetics centers. Three other universities—Mannheim, Ludwigshafen, and Kaiserslautern—and three polytechnics completethe generation and diffusion subsystem. There are a number of Germany’s leadingbig pharma firms nearby, such as BASF/Knoll (Ludwigshafen), BoehringerMannheim Roche Diagnostics (Mannheim), and Merck (Darmstadt). But the heartof the BioRegio is the Heidelberg-based commercialization organization, the Bio-technology Center Heidelberg (BTH). This is a three-tired organization consistingof a commercial business consultancy, a seed capital fund, and a nonprofit biotech-nology liaison and advisory service. Central to BTH’s functioning is HeidelbergInnovation GmbH (HI), a commercial consultancy that takes company equity inexchange for drawing up market analyses, business, and financing plans; assistingin capital acquisition; and providing early-phase business support for start-ups. It isa network organization, relaying information, partnering with organizations seek-ing contact with local biotechnology companies, and linking to research institutesand local authorities.
The key initial financing element of BTH is BioScience Venture. This was estab-lished by local big pharma and banks, managed by HI, and acts as a seed fund andlead investor in early start-ups. It also seeks international venture capital to financesecond-round developments. Assessments of project viability are made with advicefrom HI and BioRegio Rhine-Neckar e.V., the third element of BTH. The latterseeks out commercial projects and recommends the most promising for BioRegio
Cooke / BIOTECHNOLOGY CLUSTERS 29

public funding support. Business proposals have run at some fifty per year since1996, but between 1996 and 1998 only nine start-ups had been established, a figurethat had risen to seventeen (including biochip and biosoftware firms) by July 1999.The total number of biotechnology SMEs (excluding start-ups) was twenty in July1998. Most are in the health care sector, with some in plant genetics. The main loca-tion for this cluster of some thirty-seven biotechnology firms is the HeidelbergTechnology Park for SMEs and the adjoining Biopark on the university’s sciencecampus. The Biopark has 10,000 square meters of laboratory and office space plusa further 6,000 on the Production Park nearby, where start-ups move to once theyhave grown beyond the research phase. A joint venture by local firms and universi-ties has been to establish the Postgraduate BioBusiness Program. This is designedto provide scientists with hands-on experience of business administration throughthree months’ coursework and nine months of practical training in industry (König1998).
Once more, key ingredients for successful clustering are present, including closeproximity for firms on the technology park to both big pharma in Ludwigshafen andMannheim and leading-edge science in Heidelberg. The land of Baden-Württemberg has a biotechnology initiative but also distributes its funding amongthe Freiburg BioValley (one of Germany’s most dynamic BioRegios), Ulm, andTübingen-Stuttgart as well as the Rhine-Neckar region. As we have seen elsewhere,BioRegio funding is principally used for start-ups, most of which are currently suf-fering losses. But through the networklike character of BTH, lead investor capitalfrom BioScience Venture can be tripled by leveraging both federal BioRegio fund-ing and land/corporate venturing funds. Thus, reasonable sums of start-up capitalcan very easily be raised at low risk to the essentially public lead investor. The landhelped fund Heidelberg Technology Park; subsidizes a patenting support initiative,providing grants to universities for making patent applications; and funds a younginnovators pre-start-up funding program for university and research institute per-sonnel (Clarke 1998).
Munich
The commercial application of biotechnology in Germany is said by König(1998) to have begun in the 1950s when Boehringer Mannheim moved part of itsdiagnostics R&D to Munich. More recently, this company invested DM150 millionin production facilities for therapeutic Reteplase (cardiac infarction treatment) in asouthern part of Munich. But Martinsreid and Grosshadern in the southwestern sub-urbs mark the center of biotechnology in Bavaria. Hoechst Marion Roussel (mergedwith Rhone Poulenc Rorer to form Aventis in 2000) opened its Center for AppliedGenomic Research there, and the Biotechnology Innovation Center (IZB), fundedDM40 million by the Bavarian government, is located nearby with 9,000 squaremeters of laboratory and office space. The organization responsible for managingthe development of biotechnology, BioM, is also located at Martinsried. The areahas become a biomedical research campus with eight thousand researchers
30 INTERNATIONAL REGIONAL SCIENCE REVIEW (Vol. 25, No. 1, 2002)

working in biology, medicine, chemistry, and pharmacy. Unlike Rhine-Neckar’sBTH, BioM AG is a one-stop shop with seed financing, administration of BioRegioawards, and enterprise support under one roof. Seed financing is a partnership fundfrom the Bavarian State government, industry, and banks up to DM300 thousandper company. BioM’s investments are tripled by financing from Bayern Kapital, aspecial Bavarian financing initiative. The latter supplies equity capital as co-invest-ments. The fund has DM80 million for supporting biotechnology activities. BayBG and BV Bank-Corange-ING Barings Bank have special public/privatecofunding pools, and a further eight (from sixteen) Munich venture capitalists inthe private-market sector invest in biotechnology. By 1999, sixteen start-ups hadbeen funded to the tune of DM59 million, with a third of this coming from BioRegiosources. BioM is a network organization, reliant on science, finance, and industryexpertise for its support committees. It also runs young entrepreneur initiatives,including development of business ideas into business plans and financial engi-neering plans. Business plan competitions are also run in biotechnology.
The science base in Munich is broad, and seen as Germany’s number onehigh-technology region (it is especially strong also in ICT, see Sternberg andTamásy 1999), but with special expertise in health-related and agricultural and foodbiotechnology. There are three Max Planck Institutes of relevance, in Biochemistry,Psychiatry, and the MPI Patent Agency. GSF is the Helmholtz Research Center forEnvironment and Health, and the German Research Institute for Food Chemistry isa Leibniz Institute. There are three Fraunhofer Institutes, one of Germany’s fourGene Centers, two universities, and two polytechnics. The main research-orientedbig pharma companies are Roche Diagnostics (formerly Boerhinger Mannheim)and Hoechst Marion Roussel. The work areas of this science community includethree-dimensional structural analysis, biosensors, genomics, proteomics, combina-torial chemistry, gene transfer technologies, vaccines, bioinformatics genetic engi-neering, DNA methods, primary and cell cultures, microorganisms, proteins,enzymes, and gene mapping. The Bavarian commitment to biotechnology (andother new technologies) was realized through its state government decision to pri-vatize parts of its share in power-generation and distribution companies in the1990s, thereby creating a funding pool to subsidize applied technology develop-ments. The commitment was expressed in permission for biotechnology produc-tion facilities being issued with fewer obstacles and delays than in the other Germanländer. Such permissions are land and not federal responsibilities, and Bavariashowed its commitment earliest. The Bavarian Ministry of Economics learned theU.S. model of commercialization on the consultancy advice of the FraunhoferInstitute for Systems Innovation, Karlsruhe: venture capital, management support,and start-ups to transfer research results from laboratory to market. As we have seenelsewhere, however, this is mostly sought through public initiative, as with the IZB,which is a combination of incubator and technology park in proximity to the GeneCenter and two of the Max Planck Institutes conducting biotechnology research. Incommon with the other BioRegio winners, the vertical networks from science
Cooke / BIOTECHNOLOGY CLUSTERS 31

through (public) funding to start-up are in principle strong; however, as elsewhere,given the almost risk-free funding regime, the number of start-ups is not over-whelming, perhaps because of the quest for quality start-ups in which substantialsums may be individually invested. A further explanation for conservatism is thatBioM AG, set up as a corporation, makes investments with its shareholders’ (state,industry, and banks) money. Banks hold most shares, looking for high returns and tolearn about biotechnology’ risks and prospects. Hence, while BioM is the networkface of the biotechnology cluster in Munich, its activities are ultimately orches-trated indirectly and directly by the banks, abetted by a fairly risk-averse, mostlypublicly funded, venture capital industry and the local pharmaceutical and chemi-cal companies (see Giesecke 1999).
With respect to land and federal relationships on funding, Munich BioRegioonce again demonstrates the seamlessness of the fit between programs. This is nosurprise since a great deal of “concertation” proceeds between the two levels ofgovernment on a constant basis and the last thing either wants is a resort to the Con-stitutional Court to rule on intergovernmental conflicts. Hence, this is a goodinstance of the German consensus-oriented mode of policy evolution. Similarly, theconsistency with which public, scientific, and industrial partnership characterizesfunding or technology-transfer mechanisms is illustrative of the ingrained net-working culture that characterizes German governance. As to whether Martinsreidand Munich more widely constitute a cluster, the answer is probably affirmative,although there are conflicting reports as to whether three key firms commercializ-ing biotechnology from Max Planck Institutes are interacting, collaborating com-panies. Dohse (1999; personal communication, September 1999), suggested thatdespite their common origin they are not strongly linked. But Clarke (1998) notedthat two of the firms, MorphoSys and Micromet, are collaborating on the develop-ment of an antibody-based treatment for micrometastatic cancer. MorphoSys wasthe first firm to receive a BioRegio grant and had previously collaborated success-fully with Boeringer-Mannheim on the development of a diagnostic reagent.MorphoSys’ business strategy is to focus on the development of horizontal net-working. They have no plans to develop therapeutics themselves, aiming to remaina science discovery firm, but rather to let partners carry the risk of drug develop-ment. Thus, MorphoSys works with a variety of companies, minimizing its riskprofile but potentially benefiting from substantial injections of capital fromresearch funding, milestone payments, and royalties. MediGene is another Munichcompany that does plan to become a fully integrated biopharmaceutical company. Itwas a spin-off from a Gene Center in 1994 and has raised DM23 million from thetypical German sources: venture capital and state and federal funds. Its expertise isin gene therapy for cancer and cardiovascular diseases. MediGene has alliances withHoechst on gene therapy vectors and a vaccine for malignant melanoma. Academic-clinical partnerships include the Munich Gene Center, the Munich University Hos-pital, German Cancer Center at Heidelberg and, in the United States, the NationalInstitutes of Health and Princeton University. Its cofounder Horst Domdey recently
32 INTERNATIONAL REGIONAL SCIENCE REVIEW (Vol. 25, No. 1, 2002)

gave up a chair at Munich University to become head of BioM. Mondogen spun offfrom the Virus Research Department at the Martinsried Max Planck Institute forBiochemistry. Its founder Peter Hofschneider was director of the department andhad cofounded Biogen, one of Boston’s oldest biotechnology firms, in the late1970s. IZB and BioRegion, plus a McKinsey Business Plan competition, led to thefounding of Mondogen. Martinsreid is said by Hofschneider to be unlike MIT andCambridge as a cluster but to have the “seed crystal” of high-tech firms: the mainobstacles are the different cultures between German scientists and venture capitalspeculators.
Prior to the conclusions, we can see the distinctiveness of the three approaches inTable 3. This takes key dimensions of the sectoral innovation system in the form ofbiotechnology clusters and draws the fairly obvious deduction that private-sectorinteraction with the science base produces more rapid commercialization but notnecessarily invention from which innovation as commercialization subsequentlyflows.
A conclusion of a companion study (Cooke 2001a, 2001b) to this article is thatthe United States was early into the commercialization of discoveries made else-where in biotechnology, notably the United Kingdom because of its superior, pri-vate system of innovation. This compensated at the level of the market for a weakerinvention system based on inadequate use of public resources. Germany has weak-nesses in both; hence, whether its modest performance—causing major public sub-sidy to be injected in order to try to catch up—is successful remains to be seen.
CONCLUSIONS
These biotechnology clusters each have exceptionally strong enterprise supportinfrastructures complementing strong local science bases. Network links amongactors are pronounced, with cooperation on finance and services between nationaland regional, public and private sectors common. In Germany, there are difficultiesin getting large numbers of new businesses up and running despite the apparentlygenerous grant aid available. This seems partly explicable by the risk averseness ofthe lead investors and the conservatism of the banks that are quite closely involved
Cooke / BIOTECHNOLOGY CLUSTERS 33
TABLE 3. Stylized Assessment of Different Sectoral Innovation Systems
United States United Kingdom Germany
Innovation strength Applications Discovery Platform technologyVenture capital Private Mostly private Mostly publicCommercialization Entrepreneurial Liberalizing Highly regulatedGovernance Firm association Public and SME Public and large firmClustering Mature Developing ImmatureCompetitiveness High Medium Low
Note: SME = small and medium-sized enterprise.

behind the scenes in the management of BioRegio economic development. In allcases, land and federal funding regimes coexist happily, and in some cases, initia-tives set up by the lower level of government are easily absorbed into new initia-tives, notably BioRegio, emanating from the federal level. Funding is a challenge inthe United States and United Kingdom, but firms have more abundant venture capi-tal to access than in Germany, especially private funding. Perhaps one of the moststriking features of the government, industry, and science relationship with respectto biotechnology is how interwoven they are into what Etkowitz and Leydesdorff(1997) called “the triple helix,” even down to the individual, sometimes small-citylevel of operations. Communication levels among key actors are thus of a high qual-ity, networks function effectively, and “seed crystals” of well-functioning futureclusters have been sown in numerous regions of the United States, United King-dom, and Germany. The real testing time for these possibly emergent clusters ofbiotechnology firms in Germany will come when large doses of second-roundfunding are needed as firms move toward therapeutic-drug production. This willbegin occurring seriously around the year 2002. This period is over in the UnitedStates, and the industry is maturing, with mergers and acquisitions occurring. In theUnited Kingdom, probably ten years behind the United States, the first-stage firmshave, in some cases, reached take-off and Chrioscience: Celltech placed the UnitedKingdom’s first therapeutic product on the market in 1998.
Clearly, clustering is absolutely central to the growth prospects of biotechnol-ogy firms at present. The cases studied here all have in common exceptionally well-developed scientific research bases, associations that manage collective affairs,local venture capital, infrastructure appropriate to biotechnology commercializa-tion, and much national and some regional public funding of diverse aspects ofcluster activities. While the United States appears to be the most marketized sys-tem, it is clear that behind the scenes major federal funding sustains its leading edgein science. In Germany, the whole cluster system is in general more publiclydependent; without major public funding, even of venture capital, the Germanindustry would not be extensive. Strangely, perhaps, it is the U.K. case of Cam-bridge that has the least subnational innovation support from the public sector, atleast for commercialization, having until a few months ago little by way of regionalgovernance. Venture capital is largely private and relatively abundant. Despite this,it also has the character of a localized regional innovation system based on strongclustering and networking among research and business actors.
Thus, the limitations of regional innovation systems are made particularly clearby this textured analysis of five cases. The funding of basic research is a nationalinnovation system priority and a responsibility that regional innovation systems canonly consider at the margin; even then, they need fairly full devolution. The regula-tory regime, including laws on laboratory practice (e.g., the Genetic EngineeringAct), financial rules, and rates of taxation, are more national than regional but canbe implemented differentially or adjusted regionally. But the local-regional levelbecomes the most important for the evolution of clusters, including the con-
34 INTERNATIONAL REGIONAL SCIENCE REVIEW (Vol. 25, No. 1, 2002)

centration of critical research mass, the formation of networks, development ofcluster interactions, and even the commercialization of products. However, withrespect to commercialization, links to big pharma, customers, and even venturecapital is frequently global as well as national or even regional.
ACKNOWLEDGMENTS
Many people deserve thanks for helping me write this article. The conceptualpart of the article grew in consequence of the EU-TSER Regional Innovation Sys-tems: Designing for the Future project. DG12 of the European Commission arethanked, along with our collaborators, particularly Goio Etxebarria and MikelGomez Uranga who conceived with me key elements of the regional innovationsystem concept. Patries Boekholt and Franz Tödtling also contributed in majorways to the published research findings of the REGIS report. For the biotechnologyresearch, I am grateful to the U.K. Minister of Science, Lord Sainsbury, and theU.K. Department of Trade and Industry for appointing me a member of the Bio-technology Clusters Task Force, from which information on the two Cambridgesarose following intensive study visits. Dr. Monica Darnbrough, head of the DTIBiotechnology Directorate was also instrumental in commissioning the research onGermany. In conducting that research, I was assisted in major ways by Dirk Dohse,Susanne Giesecke, Gerd Krauss, Thomas Stahlecker, Knut Koschatzky, OlafArndt, Edgar Fritschi, and Steffen Reich. All are warmly acknowledged and theusual disclaimer applies.
REFERENCES
Amin, A., and D. Thomas. 1996. The negotiated economy: State and civic institutions in Denmark.Economy and Society 25: 255-81.
Amin, A., and N. Thrift. 1994. Living in the global. In Globalization, institutions and regional develop-ment in Europe, edited by A. Amin and N. Thrift, 1-22. Oxford, UK: Oxford University Press.
Argyris, C., and D. Schon. 1978. Organisational learning: A theory of action perspective. Reading, MA:Addison-Wesley.
Asheim, B. T. 1996. Industrial districts as “learning regions”: A condition for prosperity? EuropeanPlanning Studies 4: 379-400.
Audretsch, D. 1998. Agglomeration and the location of innovative activity. Oxford Review of EconomicPolicy 14: 18-29.
Autio, E. 1998. Evaluation of RTD in regional systems of innovation. European Planning Studies 6:131-40.
Best, M. 1999. Cluster dynamics in theory and practice, with applications to Singapore/Johor andPenang electronics. Report to the Judge Institute of Management Studies, Cambridge University.
———. 2000. Silicon Valley and the resurgence of Route 128: Systems integration and regional innova-tion. In Regions, globalization and the knowledge-based economy, edited by J. Dunning. Oxford,UK: Oxford University Press.
BioGenTec. 1998. BioGenTec atlas. Cologne, Germany: BioGenTec.
Cooke / BIOTECHNOLOGY CLUSTERS 35

Braczyk, H.-J., P. Cooke, and M. Heidenreich, eds. 1998. Regional innovation systems: The role of gov-ernances in a globalized world. London: UCL Press.
Casper, S., and H. Kettler. 2000. The road to sustainability in the UK and German biotechnology indus-tries. London: Office of Health Economics.
Clarke, L. 1998. Setting the pace. Pharmaceutical Forum pp. 2-6.Cooke, P., ed. 1995. The rise of the rustbelt. London: UCL Press.———. 1999. The German biotechnology sector, the public policy impact and regional clustering: An
assessment. London: Department of Trade & Industry.———. 2001a. Biotechnology clusters in the UK: Lessons from localisation in the commercialisation
of science. Small Business Economics 17: 43-59.———. 2001b. Knowledge economies: Clusters, learning and cooperative advantage. London:
Routledge.Cooke, P., P. Boekholt, and F. Tödtling. 2000. The governance of innovation in Europe: Regional per-
spectives on global competitiveness. London: Pinter.Cooke, P., and S. Davies. 1993. An economic profile of North Rhine-Westphalia. Report to the Welsh
Development Agency, Center for Advanced Studies in the Social Sciences, Cardiff University, Car-diff, UK.
Cooke, P., and K. Morgan. 1998. The associational economy: Firms, regions and innovation. Oxford,UK: Oxford University Press.
Cooke, P., M. Uranga, and G. Etxebarria. 1998. Regional systems of innovation: An evolutionary per-spective. Environment & Planning, A 30: 1563-84.
Cookson, C., and D. Pilling. 1999. Biotech trade looks to US to cure confidence crisis. Financial Times,9 September, 11.
Crevoisier, O. 1997. Financing regional endogenous development: The role of proximity capital in theage of globalization. European Planning Studies 5: 407-16.
Department of Trade and Industry. 1998. Our competitive future: Building the knowledge-driven econ-omy. London: Department of Trade and Industry.
———. 1999. Biotechnology clusters. London: Department of Trade and Industry.Dohse, D. 1999. The BioRegio contest: Results of an empirical investigation. Kiel, Institute of World
Economics (mimeo).Dosi, G. 1988. Sources, procedures and microeconomic effects of innovation. Journal of Economic Lit-
erature. 26: 1120-71.Eastern Region Biotechnology Initiative. 1998. Sourcebook ’98. Cambridge, UK: Eastern Region Bio-
technology Initiative.———. 1999. Background information for Cambridge and Eastern Region biotechnology cluster. Cam-
bridge, UK: Eastern Region Biotechnology Initiative (mimeo).Edquist, C. 1997a. Introduction: Systems of innovation approaches—their emergence and characteris-
tics. In Systems of innovation: Technologies, institutions & organizations, edited by C. Edquist,1-35. London: Pinter.
———, ed. 1997b. Systems of innovation: Technologies, institutions and organisations. London: Pinter.Enright, M. 1996. Regional clusters and economic development: A research agenda. In Business net-
works: Prospects for regional development, edited by V. Staber, N. Schaefer, and B. Sharma,190-214. Berlin, Germany: de Gruyter.
Etkowitz, H., and L. Leydesdorff. 1997. Universities and the global knowledge economy. London: Pinter.European Commission. 1995. The green paper on innovation. Luxembourg: Commission of the Euro-
pean Communities.Florida, R. 1995. The industrial transformation of the Great Lakes Region. In The rise of the rustbelt,
edited by P. Cooke, 162-76. London: UCL Press.Freeman, C. 1994. The economics of technical change. Cambridge Journal of Economics 18: 463-514.———. 1995. The “National System of Innovation” in historical perspective. Cambridge Journal of
Economics 19: 5-24.
36 INTERNATIONAL REGIONAL SCIENCE REVIEW (Vol. 25, No. 1, 2002)

Giesecke, S. 1999. Determinants of successful S&T policy in a national system of innovation. Vienna,Economics University (mimeo).
Grabher, G. 1993. The weakness of strong ties: The lock-in of regional development in the Ruhr area. InThe embedded firm: On the socio-economics of industrial networks, edited by G. Grabher, 255-77.London: Routledge.
Johnson, B. 1992. Institutional learning. In National systems of innovation: Towards a theory of innova-tion and interactive learning, edited by B. Lundvall, 23-44. London: Pinter.
König, G. 1998. Nurturing biotech in the regions. Pharmaceutical Forum pp. 9-11.Krugman, P. 1997. Good news from Ireland: A geographical perspective. In International perspectives
on the Irish economy, edited by A. Gray. Dublin, Ireland: Indecon.———. 1998. What’s new about the new economic geography? Oxford Review of Economic Policy 14:
7-17.Lundvall, B., ed. 1992. National systems of innovation: Towards a theory of innovation and interactive
learning. London: Pinter.Lundvall, B., and B. Johnson. 1994. The learning economy. Journal of Industry Studies 1: 23-41.Maillat, D. 1995. Territorial dynamic, innovative milieus and regional policy. Entrepreneurship and
Regional Development 7: 157-65.Malmberg, A., and P. Maskell. 1997. Towards an explanation of regional specialization and industry
agglomeration. European Planning Studies 5: 25-42.Nelson, R., ed. 1993. National innovation systems—A comparative analysis. Oxford, UK: Oxford Uni-
versity Press.North, D. 1993. Institutions and economic performance. In Rationality, institutions and economic meth-
odology, edited by U. Mäki, B. Gustafsson, and C. Knudsen, 242-64. London: Routledge.Porter, M. 1998. On competition. Cambridge, MA: Harvard Business School Press.Rehfeld, D. 1995. Disintegration and reintegration of production clusters in the Ruhr area. In The rise of
the rustbelt, edited by P. Cooke, 85-102. London: UCL Press.Rosenfeld, S. 1997. Bringing business clusters into the mainstream of economic development. Euro-
pean Planning Studies 5: 3-23.Sabel, C. 1995. Experimental regionalism and the dilemmas of regional economic policy in Europe.
Paris: Organization for Economic Cooperation and Development.Sabel, C., H. Kern, and G. Herrigel. 1989. Collaborative manufacturing: New supplier relations in the
automobile industry and the redefinition of the industrial corporation. Cambridge, MA: MIT Press.Saxenian, A. 1994. Regional advantage: Culture and competition in Silicon Valley and Route 128. Cam-
bridge, MA: Harvard University Press.Scott, A. 1993. Technopolis: High technology industry and regional development in Southern Califor-
nia. Oxford: University of California Press.Segal, Quince & Wicksteed. 1998. Cambridge phenomenon update. Cambridge, UK: Segal, Quince &
Wicksteed.Smilor, R., G. Dietrich, and D. Gibson. 1993. The entrepreneurial university: The role of higher educa-
tion in the United States in technology commercialization and economic development. InternationalSocial Science Journal 45: 1-11.
Smith, K. 1997. Economic infrastructures and innovation systems. In Systems of innovation, edited byC. Edquist. London: Pinter.
Sternberg, R., and C. Tamásy. 1999. Munich as Germany’s no.1 high technology region: Empirical evi-dence, theoretical explanations and the role of small firm/large firm relationships. Regional Studies33: 367-77.
Storper, M. 1995. The resurgence of regional economies, ten years after: The region as a nexus ofuntraded interdependencies. European Urban and Regional Studies 2: 191-221.
Storper, M., and A. Scott. 1995. The wealth of regions: Market forces and policy imperatives in local andglobal context. Futures 27: 505-26.
Cooke / BIOTECHNOLOGY CLUSTERS 37

INTERNATIONAL REGIONAL SCIENCE REVIEW (Vol. 25, No. 1, 2002)Athreye, Keeble / UK REGIONAL ECONOMIES
SPECIALIZED MARKETS AND
THE BEHAVIOR OF FIRMS: EVIDENCE
FROM THE UNITED KINGDOM’S
REGIONAL ECONOMIES
SUMA S. ATHREYE
Department of Economics, Faculty of Social Sciences, Open University,Milton Keynes, UK, [email protected]
DAVID KEEBLE
Centre for Business Research and Department of Geography,University of Cambridge, Cambridge, UK, [email protected]
A key feature of the South East regional economy in recent decades has been the development ofseveral intermediate markets in specialized business services. This article investigates whetherthe greater development of specialized markets in the South East is associated with differentcompetitive and technological behaviors of innovative firms in this region when compared withfirms in the Industrial Heartland regions of the West Midlands, North West England, and York-shire and Humberside. We find greater buying and selling of technology by firms and the pres-ence of technological externalities in the South East, even when the services-intensive nature ofthe region’s production is accounted for. Industrial Heartland firms, in contrast, more frequentlycollaborate with domestic suppliers who are also an important source of technology. They alsohave greater collaboration with higher education institutes.
Historically, the industrial economy of the United Kingdom has developed aroundtwo main centers of growth. One center has developed in South East England,focused on London and characterized during this century by the growth of numer-ous service industries. The second developed in the Midlands and north of Britain,focused on the coalfields and industrial areas of the West Midlands, North WestEngland, and Yorkshire, based on a strong manufacturing tradition.1 The evolution
INTERNATIONAL REGIONAL SCIENCE REVIEW 25, 1: 38–62 (January 2002)
We are grateful to Alan Hughes, director of the Centre for Business Research (CBR) at the University ofCambridge, for permission to use the data and for discussing aspects of the data analysis in the earlystages of this article. Collection of the data by the CBR was funded by the UK Economic and SocialResearch Council. Anna Bullock, the CBR’s survey and database manager, kindly provided us with allthe mean values reported in this article, and we are very grateful to her for her timely assistance with thisand several other queries relating to the database. The article benefited from discussion at presentationsin the Science Policy Research Unit, University of Sussex. The usual disclaimer applies.
© 2002 Sage Publications

of the regional economies of the South East and Industrial Heartland has differedsignificantly, and debate on these differences has taken place in the context of theUnited Kingdom’s so-called north-south divide (Martin 1988; Lewis andTownsend 1989; Keeble and Bryson 1996).
The South East’s economy is much larger, faster growing, and more integratedthan that of the Industrial Heartland. Its gross domestic product (GDP) is three tofive times larger than that of the North West, West Midlands, or Yorkshire and theHumber, and rates of growth in the South East economy have been higher than inthe Industrial Heartland for two decades now.2 The existing secondary evidence onregional development strongly suggests that the South East has many features thatmay characterize an economy growing with a greater division of labor, and theemergence since the 1970s of several specialized markets in the services sector ofthe economy may be seen as an example of this tendency.
The development (or underdevelopment) of specialized markets, in our view,constitutes an important structural difference, reflecting previous histories and vol-ume of economic growth between the two regional economies. In this article, weexplore whether this difference in the structure of the two economies is associatedwith differences in the technological behavior and competitive advantages of firmsin the two regions. We examine this conjecture empirically, by using qualitativedata from a unique innovation survey of UK small and medium-sized enterprises(SMEs) conducted by the Centre for Business Research at the University of Cam-bridge, for the period 1992-95.
The remainder of the article is organized in the following way. The first sectionoutlines the arguments linking specialization and innovative behavior. The secondsection summarizes the implication of the arguments in the first section for firmbehavior in the two regional economies and formalizes testable hypotheses aboutthe behavior of firms in the two regions. The third section outlines the data andmethods used in our analysis. The fourth section reports and discusses the empiricalresults, and the last section concludes with some implications of our study.
SPECIALIZED MARKETS AND
THEIR IMPACT ON FIRM BEHAVIORS:CONCEPTUAL ARGUMENTS
THE EMERGENCE OF SPECIALIZED INTERMEDIATE MARKETS
Adam Smith linked the enlargement of demand to increasing division of laborand specialization in 1776. As the exchange market for final goods grows, itbecomes more efficient for firms to specialize both internally and within an indus-trial filiere. Among later economists, both Young (1928) and Stigler (1951) recog-nized the importance of the scale of the market as the one factor that ultimatelydetermined the emergence of new industries through specialized markets and
Athreye, Keeble / UK REGIONAL ECONOMIES 39

vertical disintegration. The industrial history of the past two centuries shows sev-eral instances of the growth of such markets: the emergence of a specialized capitalgoods sector in the late nineteenth century, the emergence of specialized engineer-ing firms for chemical plant designs in the immediate postwar period, and the morerecent emergence of a specialized software and business services sector are somesuch instances.
Specialized intermediate markets emerge due to vertical disintegration andgradually develop into arms-length markets.3 Initially, such markets develop due tooutsourcing of parts of production by large firms, which can happen with a moder-ate growth of exchange markets for final goods. Also known as externalization,outsourcing is the contracting out of services previously performed within a largeintegrated firm to smaller firms that may be independent legal entities. Outsourcingallows the large firm to cut down on overheads and to overcome supervision coststhat may arise due to the managerial complexity created by having to handle manydifferent stages of production at large volumes of production. Such outsourcing isoften characterized by the dominance of a few large buying firms, and the decisionsof the several ancillary firms supplying almost exclusively to these firms are oftenconstrained by the objectives of their large buyers. As a consequence, outsourcingis often accompanied by the dominance of relational contracting between the largefirms and their suppliers.
As the market for outsourcing grows, so do the number of buyers and sellers ofthe outsourced product or service. The market starts developing characteristics ofan arms-length market, namely, more independent and numerous sellers and buyersand a gradual role for prices to signal the costs of supply. However, outputs of suchmarkets retain a degree of heterogeneity, and this prevents such specialized marketsfrom acquiring characteristics of a commodity market, where arms-length marketsdevelop with standardized supply. The broadening of the demand base, however,makes the producers of intermediate goods in such markets more independent enti-ties and less tied to the firms to which they sell their output. In particular, they areindependent with regard to their decisions about how to expand their growth andless constrained about the technological and production decisions they might haveto take to achieve their growth.
VERTICAL DISINTEGRATION, OUTSOURCING, AND
THEIR IMPACT ON TECHNOLOGICAL BEHAVIORS
Intermediate markets usually develop on the basis of narrow demands. This isbecause the demand for any intermediate commodity is a derived demand from thedemand for the final good. If four units of an intermediate good are used to produceten units of the final good, then an increase in final demand to twenty will stillincrease the demand for the intermediate good by only four units and not by ten.However, if the intermediate product could be used in several different sectors, thenthis narrowness of demand can be overcome and a broad-based customer demand is
40 INTERNATIONAL REGIONAL SCIENCE REVIEW (Vol. 25, No. 1, 2002)

possible. Athreye (1998) and Bresnahan and Gambardella (1998) have shown thatthe emergence of specialized intermediate markets is based on several sectors ofuse rather than single sectors of use.
The need to overcome the narrowness of demand thus makes such specializedmarkets develop into general-purpose intermediate markets for a group of indus-trial sectors even though each firm in the specialized market may be quite narrowlyspecialized in its particular application area. Thus, the capital goods sector servedthe textile, iron and steel, and automobile industry and not any one of these indus-tries alone. Within this sector there was a clear difference between firms that madetextile machinery or automobile machinery, but the important feature was that bothsorts of firms benefited from the expertise of each other in aspects of mechanicalengineering and used a common pool of skilled labor.
The emergence of arms-length specialized markets thus creates interdependen-cies and raises the possibility of production and innovation externalities amongproducers in the economy. Three such types of effects have been noted. First, asRosenberg (1963) pointed out, the economy as a whole may benefit from econo-mies of specialization, due to the presence of specialized intermediate sectors.Improvements in one area of mechanical engineering technology were transmittedacross the industrial sector through product improvements to several manufacturedcapital goods that shared a common technological base, thus stimulating techno-logical innovation.4 Second, the specialized intermediate sector draws on a com-mon pool of trained labor that itself acquires expertise through its experience in var-ious kinds of application areas. Groups of industries that draw on the commonintermediate sector may also cluster together to derive the first two advantages.They are thus capable of becoming sources of positive externalities in regional andindustrial growth.
Last, the existence of specialized sectors can make entry easier in some indus-trial sectors of the economy. The emergence of a machine tool sector meant thatproducers had the opportunity to search for the kind of machinery they wantedwithout having to incur all the costs of learning how to make the machinery them-selves. This brings down the set-up cost of entry across a range of machinery-usingsectors, making the economy more competitive. Thus, the broadening of thedemand markets for the specialized product may be associated with a more compet-itive environment in the sectors using that specialized service.
The existence of these externalities and greater competition favors the rapid dif-fusion of technology use. The interdependencies created by the more roundaboutmethods of production also facilitate the flow of technological information acrossfirms in the economy through essentially buying and selling relations.
Where specialized markets are underdeveloped, regional economies tend tobecome dependent on imports of these specialized inputs from other regions. Somebenefits from the development of arms-length specialized markets elsewhere willflow to these regions through trade and through the improvements embodied in thegoods traded. In addition, at the firm level, there could be a marked tendency for
Athreye, Keeble / UK REGIONAL ECONOMIES 41

vertically integrated production and internalization of the missing markets. Thelocus of innovation in vertically integrated markets tends to be contained withinfirms and as a consequence of imitative entry, perhaps within particular industrialsectors. Vertically integrated firms and outsourced production are both associatedwith the market power of a few large firms. Economic environments in such a situa-tion may also be less competitive.
This need not mean a lower rate of innovation. Science and technology are stillharnessed by firms to enhance the productivity of industrial production, but thiseffort may be undertaken more consciously through created and less anonymousinteractions. Institutions for knowledge sharing may be important in spreading newtechnological information. This could take the form of more frequent formal link-ages with higher education institutes and public sector research laboratories.Equally, vertical collaborations between firms, such as suppliers and customers,along the production filiere may substitute for the missing specialized markets.Furthermore, research on innovation has shown that all these arrangements have animportant role to play in explaining innovative behavior in different countries andalso in different industrial sectors.
The extent to which final demands increase can thus influence the organizationof production in the economy. Where the growth of final demands has been rela-tively rapid and the scale of the market is large, arms-length intermediate marketswill characterize the organization of production. Where the growth of finaldemands has been relatively constrained, intermediate markets develop due tooutsourcing, but in such markets a few large firms exert considerable market power.In turn, whether intermediate markets in production emerge as outsourced marketsor become arms-length markets also influences the flow of technological informa-tion and thus the sources of technological change, modes of technology transfer andacquisition used by firms, and the competitive behavior of firms in the economicsystem.
THE DEVELOPMENT OF SPECIALIZED MARKETS
IN THE UNITED KINGDOM
The development of specialized markets is very hard to measure empirically.Particularly difficult is the empirical distinction between outsourced markets andarms-length markets. Furthermore, the development of specialized markets has his-torically been related to groups of industries, making the economy-wide effect ofsuch markets difficult to separate from the sectoral or technology specific effects.Thus, the emergence of the capital goods and machine tools sectors was closelyassociated with the rise of mechanical industries, specialized engineering firmswere closely associated with the rise of chemical industries, and the more recentemergence of software and business services has been associated with the emer-gence of microelectronics and digital industries and the growth of the so-called“new economy.”
42 INTERNATIONAL REGIONAL SCIENCE REVIEW (Vol. 25, No. 1, 2002)
Several studies have indicated that the new economy, based on information andcommunications technology, is strongly concentrated in the South East region.Thus, Huggins (2000) computed an index of relative specialization in knowledge-based industries and found that the South East counties show a relative specializa-tion in these industries. Tether and Howells (2000) found a similar concentration ofinformation and communications technology employment in the South East rela-tive to the North West region.
Since the 1980s, the mushrooming growth of the business services industry(including software and computer services) is seen by many to be an importantsource of productivity improvement in Organization for Economic Cooperationand Development countries and a consequence of increasing specialization(Antonelli 1998). Since business services are measured as a separate industrial cat-egory in the UK standard industrial classification, the relative size of this sector pro-vides a rough (under) estimate of the extent of specialized market development inthe regional economy.
The UK economy shows great regional variation in the distribution of businessand professional services providing intermediate inputs to other firms in the econ-omy. In 1998, advanced business and financial services as a whole (all financial,professional, and business services) accounted for 23.7 percent of total employ-ment in South East England, compared to only 14.8 percent for the Industrial Heart-land.5 The South East economy thus possesses a greater incidence of specializedmarkets as measured by the greater volume of business services available to theregion’s firms than in the Industrial Heartland.
Wood, Bryson, and Keeble (1993) also argued that the South East also offers amuch greater range of specialized intermediate business services than the IndustrialHeartland.
In the North West . . .[with its] smaller and more diffuse market compared with Lon-don and the South East . . .many small business service companies project themselvesas generalists. In contrast, the size and functional diversity of the southern market fa-vour specialisation in the types of clients served and the forms of specialised expertisethat small business service firms offer. (Pp. 691-92)6
Finally, surveys by workers such as O’Farrell, Moffat, and Hitchens (1993, 390)have demonstrated that firms in the smaller regional markets of the United King-dom “are more likely than their counterparts in core regions (such as the South East)to import their service inputs from other regions,” such as the South East, presum-ably because of the underdevelopment of specialized markets in business servicesin these regions.
An important difference between the two regional economies studied here is inthe composition of industrial production. The industries that absorb most of theemployment in the Industrial Heartland regions are manufacturing based, while thenew economy, which is concentrated in the South East region, is predominantly
Athreye, Keeble / UK REGIONAL ECONOMIES 43

service based. Thus, a moot point in discussions of regional difference is whetherwe can isolate the effects of the regional environment from those that could beattributed to differences in industrial composition alone.
SPECIALIZED MARKETS AND THEIR IMPLICATIONS
FOR FIRM BEHAVIOR: TESTABLE HYPOTHESES
In this section, we try and draw out the implication of the arguments presented inthe first section for differences in firm technology acquisition and exploitation andcompetitive advantages of firms in the presence and absence of specialized (inter-mediate) markets. Since the extent of development of specialized services marketsis a key difference between the two regions of the South East and the IndustrialHeartland, these expected differences in behavior carry over as expected differ-ences in the behavior of firms in these two regional economies.
Our conjectures in the previous two sections were based on the distinctionbetween outsourced markets and arms-length markets. To simplify our analysis, weassume that outsourced markets are likely to occur with the underdevelopment ofintermediate markets. That is to say, as markets for intermediate goods becomelarger, firms supplying such products will not need to depend on particular buyersand will begin to behave more like firms in an arms-length market. Available evi-dence suggests that the lesser development of specialized intermediate markets inthe Industrial Heartland coexists with a relatively higher incidence of outsourcing.7
Our hypotheses implicitly assume that South East England and the regions of theIndustrial Heartland represent different and distinct regional markets and that theSMEs in these regions are principally engaged in supplying their own regional mar-ket. The considerable distances between the South East and the Industrial Heart-land regions support these assumptions. In addition, Curran and Blackburn (1994,77) found that small firms in different British localities on average sold almosttwo-thirds of their output locally, within a radius of 10 miles. Treating regions asregional markets may not be so wrong for our data set, which draws on a populationof small and medium-sized firms.
The existence of arms-length, specialized markets should favor a greater reli-ance on market modes in technological transfer by firms in such an economy. Thus,we may expect a higher incidence of purchase and sales of research and develop-ment (R&D) services between firms and a greater reliance on the use of technologytransfer instruments like licenses and patents. Following the greater specializationin the South East economy, we would expect such behavior to be more frequent inthe activities of innovative firms in the South East. We would also expect to see agreater preponderance of activities that coordinate segmented innovations acrossfirms. This would mean the predominance of licensing instruments in technologyacquisition activities.
Collaborative arrangements (such as outsourcing of supply) between firms maybe instituted to overcome the deficiencies caused by underdeveloped arms-length
44 INTERNATIONAL REGIONAL SCIENCE REVIEW (Vol. 25, No. 1, 2002)

markets. Equally, the absence of specialized markets may favor the use of embod-ied forms of technology transfer such as equipment purchases. Firms may alsoresort to the use of consultancy services and bought-in R&D (both of which are akinto outsourcing) to the extent that they are available regionally, or depend on the buy-ing-in of such services, for technology acquisition, perhaps from outside the region.We would expect to observe all these behaviors by firms in the Industrial Heartland.
An important issue is the impact of specialized intermediate markets on theimportance of firm-specific sources of technology, that is, through past learningand experience. It is not clear what we can expect here. On one hand, specializationmakes it possible for firms not to have to learn everything. On the other hand, betterfirm capability may help them exploit expertise available in specialized markets inmuch better ways.
Arms-length intermediate markets, we argued, are capable of generating tech-nological externalities for firms in other sectors. The impact of this on firm behav-ior is less easy to measure, as the meaning of an externality is that it is not attribut-able to any identifiable single source of technology. However, the effect of suchexternalities may show up in the sources of competitive advantage available to allfirms in the regional economy, or a general lack of information on technology facedby innovating firms, in regions where such arms-length specialized markets are lessdeveloped.
Last, we argued that the presence of arms-length markets is likely to be associ-ated with a more competitive environment in the regional economy. The presenceof arms-length, specialized markets may also be associated with particular compet-itive advantages for firms (innovating and non-innovating) in the two regions. Thiscould take the form of the possession of specialized expertise or the presence ofbetter market knowledge and skills among South East firms. Equally, we mightexpect to find the expression of this externality in the barriers faced by firms toinnovation. Information on technology may be less easily and widely available inthe Industrial Heartland.
DATA AND METHOD
To assess our hypotheses empirically, we use firm-level survey data collected bythe Centre for Business Research at the University of Cambridge from a large sam-ple of SMEs in our two regions. Details about the data and how they were collectedare contained in Cosh and Hughes (1996). The appendix also describes some char-acteristics of our sample of firms. Table A2 reports the counties included in theIndustrial Heartland and South East England.
In our analysis of technology acquisition and exploitation by firms, we focusonly on those firms that reported product or process innovations,8 so that we cancompare like with like in the two regions. Innovative firms are also more likely to beactive in technology acquisition and exploitation. Where we expect general differ-ences in behavior we analyzed these differences for all firms, innovators and
Athreye, Keeble / UK REGIONAL ECONOMIES 45
non-innovators alike. This is the case when we compare the incidence of collabora-tive behavior (due to an absence of specialized markets) and differences in thesources of competitive advantage (due to the existence of specialized markets).
The data on qualitative factors that we analyze come from two sorts of questions:
1. Questions in which firms were asked to tick the methods employed to transfer or ac-quire technology or the type of partner with which they have formal or informal col-laborative arrangements. Here the relative frequencies of firms reporting various cate-gories are analyzed, and we employ a test of proportions to assess the greater or lesserincidence. These results are reported in Tables 1 through 3.
2. Questions in which firms were asked to rank a factor on a Likert-type scale from 1 to 5,with 1 indicating not very important and 5 indicating extremely important. Questionsthat employ this format are those that ask firms about the importance of objectives ofinnovation, barriers to innovation, the various sources of innovation, and sources ofcompetitive advantage. To assess the differences in the two groups of firms, we testedfor the statistical significance of a difference in mean scores based on a t test. In addi-tion, we report the results of the nonparametric Kruskal-Wallis test of a difference inthe median ranks for the two regional groups.9 These results are reported in Tables 4through 7.
An important caveat we need to bear in mind in interpreting the results is thedifferent industrial composition, especially the mix of manufacturing and ser-vice activities, in the two regions. As noted earlier, and as is also evident fromthe appendix, the Industrial Heartland has a larger share of manufacturing activ-ity while the South East economy has a larger proportion of service sector firms.The simple univariate methods that we use do not enable us to control for this fac-tor in an easy way.
We have, however, taken explicit account of this factor in our interpretation ofresults by reporting earlier published results in Cosh and Hughes (1996) andHughes and Wood (1999) that have analyzed differences in the same variablespooled by sector (manufacturing versus services). If the regional effect were of anysignificance, we would expect to see an alternative set of factors to show up as sig-nificantly different in the regional grouping of the data when compared to a group-ing of the data by manufacturing or services sector.
EMPIRICAL RESULTS
Many of our hypothesized conjectures about the impact of specialized marketson the technological behavior of firms receive strong empirical support. Further-more, we find that most of the observed differences in technological behaviorsbetween the two regions are not reflections of the differing industrial compositionsof the two regions. Rather, these differences are in line with our conjectures aboutthe effects of developed arms-length markets. However, the objectives of innova-tion are closely determined by technological opportunities and reflect industry-specific opportunities. We find some support for greater new firm formation in the
46 INTERNATIONAL REGIONAL SCIENCE REVIEW (Vol. 25, No. 1, 2002)

South East, but the regional differences in competitive environments and sources ofcompetitive advantage largely reflect their different industrial compositions. In thefollowing discussion, the differences in technological behaviors are reported first,followed by the differences in the competitive environment and sources of competi-tive advantage for SMEs in the two regions.
REGIONAL DIFFERENCES IN TECHNOLOGICAL BEHAVIORS
As hypothesized, the most significant differences in the behavior of innovatingfirms due to the existence or underdevelopment of specialized (technology) mar-kets are in the methods used to buy and sell technology. Innovating firms in theSouth East show a significantly greater reliance on market modes of selling andacquiring technology than do similar firms in the Industrial Heartland. Thus, asTable 1 shows, both product and process innovators in the South East are apprecia-bly more likely to report the selling of technology by using licenses, the provisionof technology or expertise to other firms through consultancy services, and the car-rying out and selling of R&D services to other firms than are their Industrial Heart-land counterparts. In contrast, the most favored method of technology transfer
Athreye, Keeble / UK REGIONAL ECONOMIES 47
TABLE 1. Regional Differences in Modes of Technology Transfer
Mean Proportions (%)
Mode of South East Industrial Heartland z-Test ofTechnology Transfer Firms Firms Proportions
Product innovators (n) 162 91Right to use inventions (includes licenses) 66 40 ***Research and development (R&D)
performed for others 40 34 *Consultancy services for other firms 88 45 ***Through sale of part of firm 8 5.5 **Sales of equipment 35 48 ***
Process innovators (n) 137 93Right to use inventions (includes licenses) 57 40 ***R&D performed for others 55 32 ***Consultancy services for other firms 86 49 ***Through sale of part of firm 6.6 6.5Sales of equipment 29 27
All firms (n) 309 176Right to use inventions (includes licenses) 39 21 ***R&D performed for others 30 18 ***Consultancy services for other firms 59 27 ***Through sale of part of firm 6.5 3.4 ***Sales of equipment 24 26
*p = .10. **p = .05. ***p = .01.

reported in the Industrial Heartland is through the sale of equipment. Moore (1996,69) reported that no strong relationships were found in the Centre for BusinessResearch (CBR) SME data set between modes of transferring technology and sec-toral characteristics. This suggests that all the differences observed can be attrib-uted to a regional effect, perhaps due to the development of arms-length specializedmarkets as we have argued.
Table 2 analyses the most frequently used modes for buying technology. Of thevarious methods considered here, the buying-in of R&D and the use of consultancyservices can be taken as symptomatic of outsourcing behavior by the buying firm.Here again we find important regional differences. The buying of rights to use otherfirms’or organizations’ inventions dominates all other modes of technology acqui-sition for innovating firms in the South East, and the frequency of this method ofacquiring technology is far higher than that for similar firms in the Industrial
48 INTERNATIONAL REGIONAL SCIENCE REVIEW (Vol. 25, No. 1, 2002)
TABLE 2. Regional Differences in Modes of Technology Acquisition
Mean Proportions (%)
Mode of Technology South East Industrial Heartland z-Test ofAcquisition Firms Firms Proportions
Product innovators (n) 162 91Right to use others’ inventions 64 53 ***Results of bought-in research
and development (R&D) 23 37 ***Use of consultancy services 37 40Through purchase of another firm 31 35
Process innovators (n) 137 93Right to use others’ inventions 69 49 ***Results of bought-in R&D 26 31 *Use of consultancy services 44 37 **Through purchase of another firm 30 25 *
All firms (n) 309 176Right to use others’ inventions 45 34 ***Results of bought-in R&D 17 23 ***Use of consultancy services 29 32 *Through purchase of another firm 19 20
Mean Proportions (%) Kruskal-Services Manufacturing Wallis Test
All firms (n) 321 176Right to use others’ inventions 11.5 6.1 *Results of bought-in R&D 7.2 3.9 *Use of consultancy services 16.2 16.5Through purchase of another firm 5.0 6.1
Source: The last five rows of the table are reproduced from Moore (1996), table 7.12.*p = .10. **p = .05. ***p = .01.

Heartland. Product and process innovators in the Industrial Heartland, however,tend to make more use of bought-in R&D and consultancy services than do similarSouth East firms, with the one exception of process innovators’ use ofconsultancies.
A comparison of these differences with those obtained by grouping SMEsaccording to whether they are manufacturing or service firms is also revealing. Ser-vice firms show a somewhat greater propensity to acquire technologies throughlicenses and through the buying-in of R&D. Manufacturing and service firms donot show any significant differences in the use of consultancy services. This sug-gests that while the dominance of licensing in acquiring technology in the SouthEast is possibly a consequence of its services orientation, the greater use ofbought-in R&D services and consultancy services by Industrial Heartland firmscannot be seen to be a consequence of its manufacturing bias. We would suggestthat these results show the relatively greater dependence of the Industrial Heartlandregions on technology imports due to the underdevelopment of these regions’ spe-cialized services markets.
Athreye, Keeble / UK REGIONAL ECONOMIES 49
TABLE 3. Regional Incidence of Collaborative Activity, by Type of Partner (% of firms)
South East Firms Industrial HeartlandType of Partner (n = 308) Firms (n = 174)
No collaborations 58.1 59.2a
With suppliersNone 26.6 21.3UK firms 8.8 15.5Overseas firms 2.9 2.3Both 3.6 1.7
With customersNone 24.7 17.8UK firms 9.8 13.2Overseas firms 3.2 4.6Both 3.2 5.2
With firms in same line of businessNone 16.2 21.8UK firms 14.3 13.8a
Overseas firms 6.8 3.4Both 4.5 1.7
With higher education institutionsNone 37.0 32.2UK firms 3.9 7.5Overseas firms 0.3 0.0Both 0.6 1.1
Note: All differences in proportions are significant at the .05 level except where marked with a super-script.a. The proportions are not significantly different between the two regions.

Table 3 analyses the incidence of collaborative arrangements with differenttypes of partners among all firms in the two regional economies. There is no overalldifference in the extent of collaborative activity (percentage reporting no collabora-tions) between the two regions. In Kitson and Wilkinson (1996), the same data ana-lyzed for overall sector differences revealed that service firms in the United King-dom show a greater propensity for collaboration compared with manufacturingfirms.
In contrast, there are significant regional differences in frequencies of collabora-tive arrangements with different types of partners. Vertical collaborative arrange-ments (with suppliers and customers) are more frequently reported by IndustrialHeartland SMEs. Furthermore, these collaborations are more frequently with otherUK firms than with overseas firms. The same pattern characterizes collaborationswith higher education institutes.
In contrast, South East firms show a greater incidence of horizontal collabora-tions with firms in their own line of business. The difference is particularly great inthe case of the minority of such collaborations that are with overseas firms. Thisfinding probably reflects the greater international orientation of South East firmsnoted earlier.
The relative importance of the different external sources of technology for inno-vators in the two regions (Table 4) does appear to reflect the sectoral composition ofSMEs in the two regions. Thus, Table 4 shows that both product and process inno-vators in the Industrial Heartland rate suppliers of materials and components as amore important source of technology than do similar firms in the South East. Atten-dance at professional conferences is rated as a more important source of innovationby product innovators in the South East. Analyzing the same data, Hughes andWood (1999) found that manufacturing firms rated suppliers of materials and com-ponents and attendance at fairs and exhibitions as more important external sourcesof innovation than did firms engaged in the provision of business services. Businessservice firms, on the other hand, ranked professional conferences, meetings, andprofessional journals as more important external sources of innovation than didmanufacturing firms.
However, put together with the importance of bought-in technology as a mode ofacquisition of technology, the importance of suppliers of materials and componentsas a source of innovation emphasizes the reliance of Industrial Heartland firms onthe purchase of embodied innovation from other firms. Interestingly, local cham-bers of commerce are a significantly more important source of innovation for pro-cess innovators in the Industrial Heartland, a difference that cannot be explained bythe industrial composition of the two regions.
The most interesting results revealed by Table 4, however, are in consideringinternal sources of innovation. Innovation sources within the group of which thefirm is part are rated much more highly by product innovators in the IndustrialHeartland than is the case with their counterparts in the South East. Although the
50 INTERNATIONAL REGIONAL SCIENCE REVIEW (Vol. 25, No. 1, 2002)

number of firms involved is not large, this finding almost certainly reflects the lackof R&D facilities in Industrial Heartland subsidiaries or the presence of associatedcompanies whose main R&D centers are located in other parts of Britain. SouthEast subsidiaries, in contrast, are more likely to possess their own internal R&Dactivity and therefore rate access to group R&D less highly.
Athreye, Keeble / UK REGIONAL ECONOMIES 51
TABLE 4. Regional Differences in the Importance of Sources of Innovation
South East IndustrialIndustrial Heartland Kruskal-
Firms Firms WallisSource of Innovation Mean Scores n Mean Scores n t-Test Test
Product InnovatorsInternal sourcesWithin the firm 4.06 147 3.80 83 *Within the group 2.96 23 4.00 11 ** **
External sourcesMarket/commercial sources 3.44 147 3.53 77Suppliers of materials and components 2.30 141 2.99 76 *** ***Clients or customers 3.69 148 3.86 81Competitors in own line of business 2.97 141 2.84 79Consultancy firms 1.65 136 1.68 74University and higher education 1.43 134 1.52 73Technical institutes 1.43 133 1.59 73Patent disclosures 1.29 134 1.44 73Professional conferences 2.04 141 1.77 75 * **Fairs and exhibitions 2.13 139 2.29 78Trade associations 1.79 137 1.93 75Chambers of commerce 1.28 135 1.51 74 *
Process InnovatorsInternal sourcesWithin the firm 4.08 121 3.81 84 * *Within the group 3.30 20 3.82 11
External sourcesMarket/commercial sources 3.43 120 3.56 81Suppliers of materials and components 2.41 117 3.17 81 *** ***Clients or customers 3.66 122 3.77 84Competitors in own line of business 3.11 120 3.01 81Consultancy firms 1.73 113 1.76 80University and higher education 1.38 113 1.58 77Technical institutes 1.40 112 1.62 77Patent disclosures 1.15 111 1.42 77 **Professional conferences 2.18 116 1.93 81Fairs and exhibitions 2.22 117 2.28 82Trade associations 1.83 115 1.96 79Chambers of commerce 1.26 112 1.47 79 *
(continued)
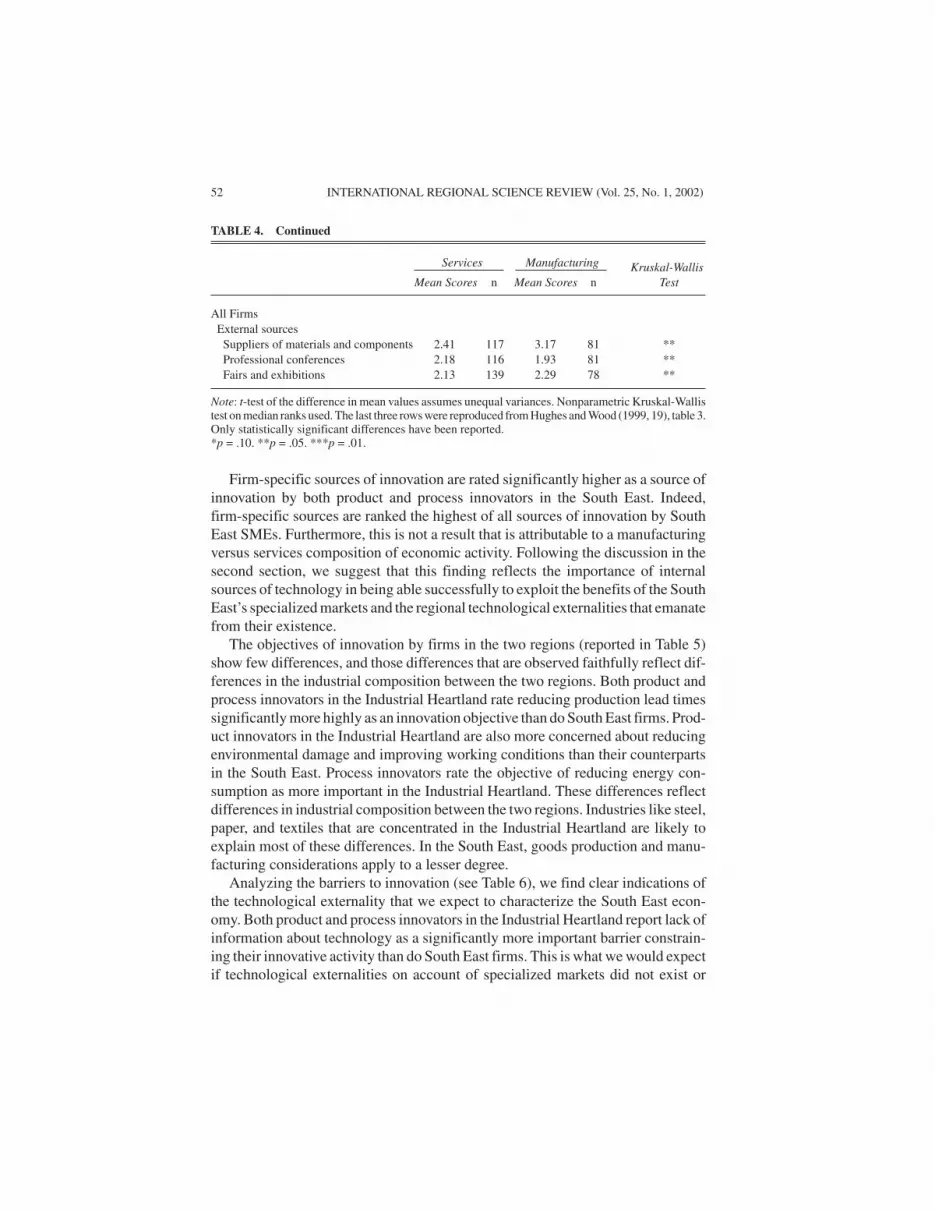
Firm-specific sources of innovation are rated significantly higher as a source ofinnovation by both product and process innovators in the South East. Indeed,firm-specific sources are ranked the highest of all sources of innovation by SouthEast SMEs. Furthermore, this is not a result that is attributable to a manufacturingversus services composition of economic activity. Following the discussion in thesecond section, we suggest that this finding reflects the importance of internalsources of technology in being able successfully to exploit the benefits of the SouthEast’s specialized markets and the regional technological externalities that emanatefrom their existence.
The objectives of innovation by firms in the two regions (reported in Table 5)show few differences, and those differences that are observed faithfully reflect dif-ferences in the industrial composition between the two regions. Both product andprocess innovators in the Industrial Heartland rate reducing production lead timessignificantly more highly as an innovation objective than do South East firms. Prod-uct innovators in the Industrial Heartland are also more concerned about reducingenvironmental damage and improving working conditions than their counterpartsin the South East. Process innovators rate the objective of reducing energy con-sumption as more important in the Industrial Heartland. These differences reflectdifferences in industrial composition between the two regions. Industries like steel,paper, and textiles that are concentrated in the Industrial Heartland are likely toexplain most of these differences. In the South East, goods production and manu-facturing considerations apply to a lesser degree.
Analyzing the barriers to innovation (see Table 6), we find clear indications ofthe technological externality that we expect to characterize the South East econ-omy. Both product and process innovators in the Industrial Heartland report lack ofinformation about technology as a significantly more important barrier constrain-ing their innovative activity than do South East firms. This is what we would expectif technological externalities on account of specialized markets did not exist or
52 INTERNATIONAL REGIONAL SCIENCE REVIEW (Vol. 25, No. 1, 2002)
TABLE 4. Continued
Services Manufacturing Kruskal-WallisMean Scores n Mean Scores n Test
All FirmsExternal sourcesSuppliers of materials and components 2.41 117 3.17 81 **Professional conferences 2.18 116 1.93 81 **Fairs and exhibitions 2.13 139 2.29 78 **
Note: t-test of the difference in mean values assumes unequal variances. Nonparametric Kruskal-Wallistest on median ranks used. The last three rows were reproduced from Hughes and Wood (1999, 19), table 3.Only statistically significant differences have been reported.*p = .10. **p = .05. ***p = .01.

were much less available in the Industrial Heartland regions. In addition, processinnovators in the Industrial Heartland perceive innovation costs to be a greater bar-rier than do similar firms in the South East, possibly reflecting their lack of access tonew forms of technology financing such as venture capital. Indeed, the existence ofthese barriers to innovation among Industrial Heartland firms is exactly the
Athreye, Keeble / UK REGIONAL ECONOMIES 53
TABLE 5. Regional Differences in Objectives of Innovating Firms
IndustrialSouth East Heartland Kruskal-
Firms Firms WallisObjective M n Score n t-Test Test
Product innovatorsTo replace products being phased out 2.65 145 2.89 83To extend product range 3.66 149 3.85 84To create new geographical markets 2.69 143 2.85 86To reduce share of wage costs 2.60 142 2.67 82To reduce materials consumption 2.21 140 2.40 84To reduce energy consumption 1.76 140 1.91 82To reduce product design costs 2.12 138 2.35 81To reduce production lead times 2.69 141 3.12 84 ** **To improve output flexibility 3.06 138 3.16 81To improve flexibility in labor use 3.03 135 2.78 81To improve flexibility in product mix 2.81 137 2.83 81To improve product quality 3.67 141 3.81 84To reduce environmental damage 1.86 136 2.30 82 ** **To improve working conditions 2.13 138 2.45 82 * *To maintain market share 3.95 149 3.85 86
Process innovatorsTo replace products being phased out 2.58 117 2.75 85To extend product range 3.55 120 3.45 85To create new geographical markets 2.76 118 2.67 86To reduce share of wage costs 2.85 121 3.00 85To reduce materials consumption 2.31 115 2.59 86To reduce energy consumption 1.76 115 2.06 85 * *To reduce product design costs 2.15 112 2.46 84 *To reduce production lead times 3.00 117 3.41 86 ** *To improve output flexibility 3.29 119 3.55 85To improve flexibility in labor use 3.10 118 3.13 85To improve flexibility in product mix 2.97 115 2.85 84To improve product quality 3.90 120 3.95 86To reduce environmental damage 1.87 113 2.18 85To improve working conditions 2.27 118 2.54 85To maintain market share 4.01 122 3.88 86
Note: t-test of the difference in mean values assumes unequal variances. Nonparametric Kruskal-Wallistest on median ranks used.*p = .10. **p = .05.

54 INTERNATIONAL REGIONAL SCIENCE REVIEW (Vol. 25, No. 1, 2002)
TABLE 6. Regional Differences in Perceived Barriers to Innovation
IndustrialSouth East Heartland Kruskal-
Firms Firms WallisBarrier to Innovation Mean Scores n Mean Scores n t-Test Test
Product innovatorsExcess perceived risk 2.65 146 2.50 86Lack of sources of finance 2.70 153 2.88 89Innovation costs too high 2.74 152 2.68 88Innovation pay-off period too long 2.45 151 2.38 88Innovation potential too small 2.55 149 2.66 87Lack of skilled personnel 2.53 152 2.50 86Lack of information on technology 1.84 150 2.12 85 * *Lack of information on markets 2.11 152 2.28 86Costs of innovation hard to control 2.24 150 2.41 85Resistance to change 1.82 147 1.65 85Deficit of external technology sources 1.74 144 1.81 84Lack of opportunity for cooperation 1.69 143 1.82 84Lack of technological opportunity 1.54 143 1.62 82No need to innovate 1.52 141 1.48 82Too easy to copy 1.88 145 1.81 81Legislation, norms, and so on 2.02 141 1.95 81Lack of customer response 2.09 141 1.95 82Uncertainty in timing 2.01 141 1.90 79Process innovatorsExcess perceived risk 2.66 122 2.76 87Lack of sources of finance 2.68 125 2.71 92Innovation costs too high 2.75 124 3.02 90 * *Innovation pay-off period too long 2.45 124 2.63 91Innovation potential too small 2.55 122 2.57 88Lack of skilled personnel 2.50 124 2.44 88Lack of information on technology 1.92 124 2.28 87 ** **Lack of information on markets 2.19 124 2.30 87Costs of innovation hard to control 2.33 123 2.47 87Resistance to change 1.88 120 1.79 87Deficit of external technology sources 1.78 117 1.84 86Lack of opportunity for cooperation 1.79 117 1.72 86Lack of technological opportunity 1.54 118 1.61 84No need to innovate 1.49 115 1.52 84Too easy to copy 1.82 117 1.72 83Legislation, norms, and so on 1.89 113 1.84 83Lack of customer response 2.02 113 1.93 84Uncertainty in timing 2.14 113 1.90 81
(continued)

opposite of what we would expect given the higher proportion of larger SMEs in theregion.10
Interestingly, neither of these barriers is related to the industrial composition ofthe two regions. A comparison of barriers to innovation between manufacturingand services firms in Hughes and Wood (1999) revealed that they face similar barri-ers to innovation. Indeed, the only statistically significant difference is that manu-facturing firms rate the lack of skilled personnel significantly more highly than doservice firms.
COMPETITIVE ENVIRONMENT AND
SOURCES OF COMPETITIVE ADVANTAGE
More rapidly growing markets and relatively greater competition are two dis-tinctive characteristics of the South East regional economy. Thus, between 1990and 1997, the South East’s GDP measured in constant prices grew by 15.5 percentcompared with 12.2 percent, 13.3 percent, and 13.6 percent in the North West,Yorkshire and the Humber, and West Midlands, respectively. For most of thisperiod, new firm formation rates were also appreciably higher, with the South Eastrecording a net growth of 19,715 new firms between 1994 and 1997 compared witha decline of 14,035 in the stock of firms in the Industrial Heartland regions (Depart-ment of Trade and Industry 1998). This is not a trend confined to the 1990s. Keebleand Bryson (1996) found that in the 1980s, the South East’s annual firm creationrate averaged 9.2 new enterprises per 1,000 of the labor force, compared with only6.4 in the North West and Yorkshire/Humberside and 6.6 in the West Midlands.
South East SMEs also face more intense competition and are relatively moreoutward looking compared to similar firms in the Industrial Heartland. The formerhas been documented by various studies (Keeble 1996, 1998; O’Farrell, Hitchens,and Moffat 1992, 1993); the 1997 Cambridge CBR survey revealed a mean numberof “serious competitors” for South East SMEs (19.0), approximately double that
Athreye, Keeble / UK REGIONAL ECONOMIES 55
TABLE 6. Continued
Services Manufacturing Kruskal-Mean Scores n Mean Scores n Wallis Test
All firmsLack of skilled personnel 2.13 253 2.42 323 **
Note: t-test refers to the t-test of the difference in mean values assuming unequal variances.Nonparametric Kruskal-Wallis test on median ranks used. The last row is reported from Hughes andWood (1999, 20), table 4. Only statistically significant differences have been reported.*p = .10. **p = .05.

(9.7) for their counterparts in the Industrial Heartland (Keeble 1998). However, theCBR data also reveal that service firms on average face greater numbers of competi-tors compared to manufacturing firms. It is thus likely that at least part of thisregional difference merely reflects the different industrial composition of the tworegions.
56 INTERNATIONAL REGIONAL SCIENCE REVIEW (Vol. 25, No. 1, 2002)
TABLE 7. Regional Differences in the Sources of Competitive Advantage
South East IndustrialFirms Heartland Firms t-Test
Source of CompetitiveAdvantage 1995 1991 1995 1991 1995 1991
All firmsPrice 3.29 3.27 3.52 3.57 ** ***
(297) (302) (172) (173)Marketing and promotion 3.14 3.17 3.13 3.03
(293) (301) (176) (169)Speed of service 3.84 3.94 4.08 4.08 ***
(303) (307) (177) (176)Established reputation 4.14 4.21 4.19 4.12
(302) (309) (176) (174)Cost advantages 2.91 2.99 3.25 3.01 ***
(284) (299) (173) (165)Product design 3.19 3.30 3.31 3.13
(267) (263) (173) (160)Product quality 4.06 4.18 4.22 4.22 *
(282) (290) (172) (172)Specialized product/expertise 4.05 4.22 3.88 3.94 * **
(292) (299) (176) (170)Range of products/expertise 3.63 3.53 3.54 3.62
(287) (289) (174) (170)Flair and creativity 3.44 3.31 3.30 3.20
(290) (293) (173) (165)Attention to client needs 4.40 4.49 4.47 4.45
(306) (311) (178) (177)
Services Manufacturing(n = 302) (n = 352) F Test
All firmsPrice 3.2 3.5 **Established reputation 4.2 4.1 *Cost advantages 2.9 3.1 **Product quality 4.0 4.2 **Specialized product/expertise 4.1 3.8 **
Note: Numbers in parentheses are the total number of valid responses in each region. The t-test reportedassumes unequal variances. The last five rows of the table are reproduced from Kitson and Wilkinson(1996, 26), table 3.5. Only statistically significant differences have been reported.*p = .10. **p = .05. ***p = .01.
Table 7 reports mean scores assigned to various sources of competitive advan-tage by firms in the South East and the Industrial Heartland in 1991 and 1995.11 Themean scores for each of the sources of competitive advantage are remarkably stableover time for both regional groupings. Particularly striking is the fact that in 1991,South East firms rated the possession of specialized products and expertise signifi-cantly more highly as a source of competitive advantage than did Industrial Heart-land firms. In contrast, firms in the Industrial Heartland rated price advantages sig-nificantly more highly than did their South East counterparts. In 1995, South Eastfirms continued to rank possession of specialized expertise more highly. However,in this period, Industrial Heartland firms ascribed significantly higher scores to sev-eral other factors than price. These included cost advantages, speed of service, andproduct quality. It is possible that these changes could reflect changes taking placein the manufacturing sector with the advent of information technology. Overall,however, these regional differences in competitive advantage chiefly reflect the dif-ferent industrial composition of the two regions.
CONCLUSIONS AND IMPLICATIONS
The United Kingdom’s regional economies vary in the extent to which interme-diate markets in business services have developed since the 1970s. Existing second-ary evidence suggests that the South East region is the most advanced in thisrespect, and the most recent trend toward the concentration of business and R&Dservices in the South East can be seen as indicative of the emergence of such spe-cialized intermediate markets. If the existence of specialized markets has an impacton firm behavior, we may observe such differences in the behavior of firms in thetwo regional economies of the South East and the Industrial Heartland.
As they develop into arms-length characteristics, specialized markets increaseinterdependence of markets in an economy, and this in turn can be a source ofexternality in production and innovation. Thus, we expected to see the dominanceof market modes in the technology acquisition and exploitation activities of firms inthe South East economy. We also hoped to see some indication of the presence oftechnological externalities and the economies of specialization. Our results indi-cate that all these are observable for SMEs in the South East economy.
The underdevelopment of specialized markets, we conjectured, would causespecialist suppliers to operate with a narrow demand base. This could result in sig-nificant user producer interactions in innovation and production activities. Theflow of technological information is qualitatively different. User firms in suchregions may depend on technology acquisition through created partnerships. Sucheconomies depend more on the buying-in of these services for technology acquisi-tion, perhaps from other regions. We also expected to find signs of the absence oftechnological externalities in the regional economy. The absence of a technologicalexternality was reflected in the fact that Industrial Heartland firms perceived thelack of information on technology to be an appreciably greater barrier to successful
Athreye, Keeble / UK REGIONAL ECONOMIES 57
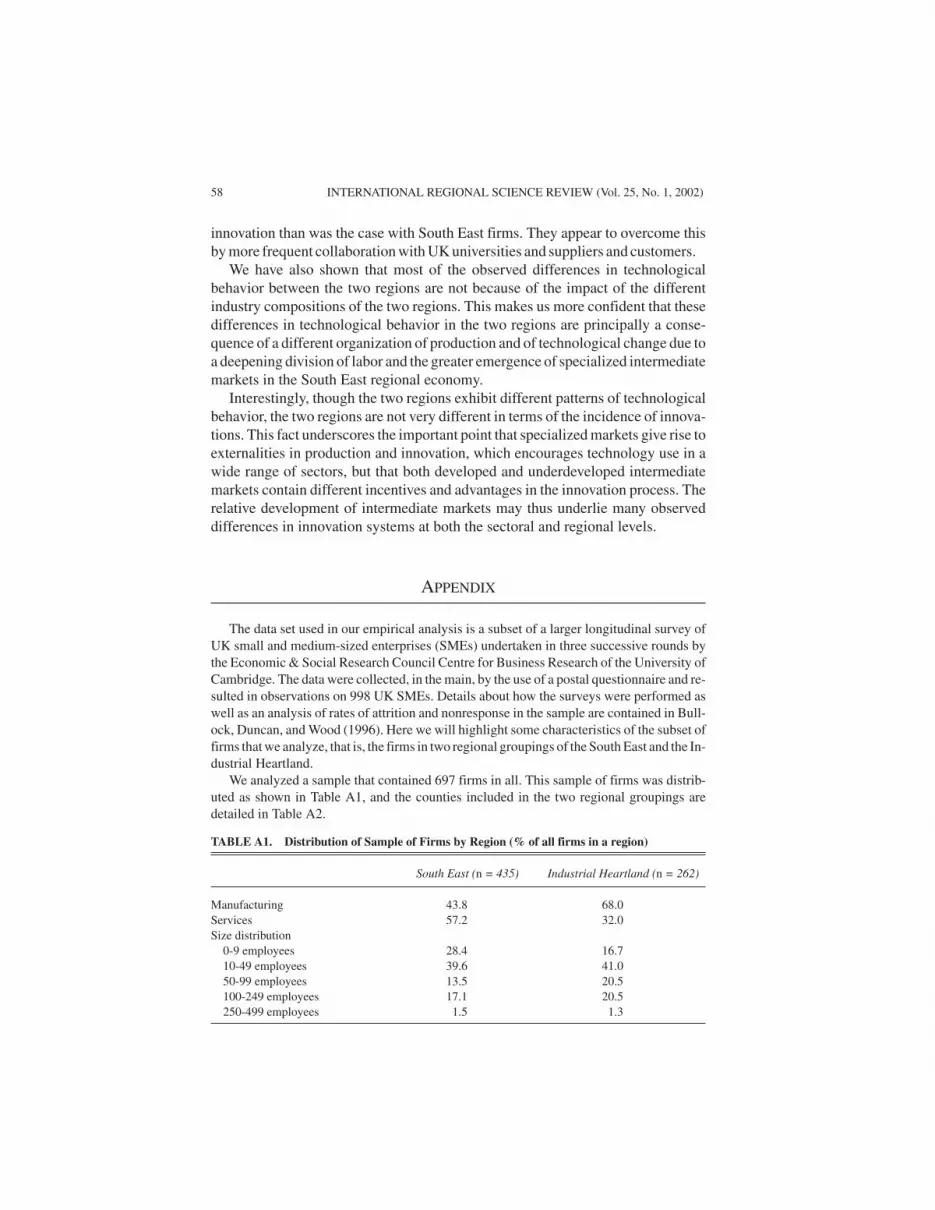
58 INTERNATIONAL REGIONAL SCIENCE REVIEW (Vol. 25, No. 1, 2002)
innovation than was the case with South East firms. They appear to overcome thisby more frequent collaboration with UK universities and suppliers and customers.
We have also shown that most of the observed differences in technologicalbehavior between the two regions are not because of the impact of the differentindustry compositions of the two regions. This makes us more confident that thesedifferences in technological behavior in the two regions are principally a conse-quence of a different organization of production and of technological change due toa deepening division of labor and the greater emergence of specialized intermediatemarkets in the South East regional economy.
Interestingly, though the two regions exhibit different patterns of technologicalbehavior, the two regions are not very different in terms of the incidence of innova-tions. This fact underscores the important point that specialized markets give rise toexternalities in production and innovation, which encourages technology use in awide range of sectors, but that both developed and underdeveloped intermediatemarkets contain different incentives and advantages in the innovation process. Therelative development of intermediate markets may thus underlie many observeddifferences in innovation systems at both the sectoral and regional levels.
APPENDIX
The data set used in our empirical analysis is a subset of a larger longitudinal survey ofUK small and medium-sized enterprises (SMEs) undertaken in three successive rounds bythe Economic & Social Research Council Centre for Business Research of the University ofCambridge. The data were collected, in the main, by the use of a postal questionnaire and re-sulted in observations on 998 UK SMEs. Details about how the surveys were performed aswell as an analysis of rates of attrition and nonresponse in the sample are contained in Bull-ock, Duncan, and Wood (1996). Here we will highlight some characteristics of the subset offirms that we analyze, that is, the firms in two regional groupings of the South East and the In-dustrial Heartland.
We analyzed a sample that contained 697 firms in all. This sample of firms was distrib-uted as shown in Table A1, and the counties included in the two regional groupings aredetailed in Table A2.
TABLE A1. Distribution of Sample of Firms by Region (% of all firms in a region)
South East (n = 435) Industrial Heartland (n = 262)
Manufacturing 43.8 68.0Services 57.2 32.0Size distribution
0-9 employees 28.4 16.710-49 employees 39.6 41.050-99 employees 13.5 20.5100-249 employees 17.1 20.5250-499 employees 1.5 1.3

TABLE A2. Counties Included in the Two Regional Groupings
South East Industrial Heartland
Greater London HumbersideBedfordshire North YorkshireBerkshire South YorkshireBuckinghamshire West YorkshireEast Sussex CheshireEssex Greater ManchesterHampshire LancashireHertfordshire MerseysideIsle of Wight ShropshireKent StaffordshireOxfordshire West MidlandsSurrey WarwickshireWest Sussex Hereford and Worcester
We separated firms into two groups, innovators and non-innovators, depending on afirm’s response to the following question included in the postal questionnaire. We quotefrom the questionnaire, including the original emphasis and preface to the actual question:
In this section we would like you to tell us about your innovative activity. We are inter-ested in innovations in products and processes, which are new to your firm.
In answering your questions, please count innovation as occurring when a new orchanged product is introduced to the market (product innovation) or when a new orsignificantly improved production method is used commercially (process innova-tion), and when changes in knowledge or skills, routines, competence, equipment orengineering practices are required to make the new product or introduce the new pro-cess.
Please do not count as product innovation, changes which are purely aesthetic(such as changes in colour or decoration), or which simply involve product differenti-ation (that is minor design or presentation changes which differentiate the productwhile leaving it technically unchanged in construction or performance).
Has your firm introduced any innovations in products (goods or services) or processesduring the last three years which were new to your firm? (Please tick only one box ineach row.)
Yes No
ProductsProcesses
Firms that answered yes to the first row were classified as product innovators, and firmsthat answered yes to the second row were classified as process innovators.
Athreye, Keeble / UK REGIONAL ECONOMIES 59

NOTES
1. Scotland, northeast England, and Wales represent smaller manufacturing-based regions and arenot included in this analysis. The grouping of the West Midlands, the North West, and Yorkshire andHumberside into a broad “Industrial Heartland” category is employed and justified in Keeble (1997). Inthis article, South East refers to the South East Standard Region used for official statistics until themid-1990s.
2. In 1997, regional gross domestic product at factor cost in the South East (excluding East Anglia)was £246.9 billion, compared with only £51.6 billion in the Humber, £56.8 billion in the West Midlands,and £72.2 billion in the North West (Office for National Statistics 1999, table 12.1). The integration ofthe South East market is evidenced by commuter patterns. By 1971, 10 percent of the local populationwas working in London up to a radius of 50 miles from London (Keeble 1980, 121).
3. The emergence of specialized markets is not a frequently observed economic process. This isbecause such specialized intermediate markets can only emerge when both the separability of a produc-tion process into smaller elementary components is possible (Scazzieri 1993) and the volume of demandbecomes large enough to justify the specialized investment (Stigler 1951). The conjunction of the twofactors happens uncommonly. Thus, specialization due to vertical disintegration tends to be unevenacross both industrial sectors and regions.
4. Furthermore, the commonality of the intermediate good to a wide range of industries, due to whatRosenberg (1963) termed “technological convergence,” meant that the trajectory or direction of techno-logical change in the entire economy was also affected and came to possess a capital-saving bias.
5. See the August 1998 issue of Labour Market Trends. The South East comprises the Eastern, Lon-don, and South East (GOR) regions, while the Industrial Heartland includes the North West (GOR),Merseyside, Yorkshire and the Humber, and West Midlands regions.
6. The Wood, Bryson, and Keeble (1993) study found that 48 percent of a random sample of sixtysmall South East management consultancy and market research companies reported providing special-ized expertise to their clients, compared with only 25 percent of a similar sample of North West firms,most of whom regarded themselves as generalists. See O’Farrell, Moffat, and Hitchens (1993) for a sim-ilar finding comparing South East and Scottish firms.
7. This assumption receives some support from the Centre for Business Research data that are usedin this analysis. The mean value of subcontracted output from other firms was 19.5 percent for SouthEast firms compared to 24.1 percent for Industrial Heartland firms. This difference in mean values wasstatistically significant at the .10 level. About 50 percent of all South East firms and 43 percent of allIndustrial Heartland firms reported no subcontracting from other firms. Nine percent of South East firmsand 13 percent of Industrial Heartland firms reported that all of their output was subcontracted to otherfirms. The incidence of subcontracting is thus somewhat higher in the Industrial Heartland.
8. See the appendix for the definition of product and process innovators.9. Recoding extreme values of 4 and 5 into 1 and the lower scores of 1, 2, and 3 into 0 and then look-
ing at the difference in frequencies is a common method of analyzing Likert-type scale scores. We wereunable to obtain mean values based on a recoding of the data. The nonparametric test, however, analyzessimilar information and is reported here.
10. See Table A1 of the appendix for the size distribution of firms in the two regions.11. Analyzing the sources of competitive advantage for innovating firms alone reveals that Industrial
Heartland firms perceive the speed of service and costs to be a greater source of competitive advantagecompared to innovating firms in the South East. The difference in mean scores is statistically significant.
REFERENCES
Antonelli, C. 1998. The microdynamics of technological change. London: Routledge.Athreye, S. 1998. On markets in knowledge. Journal of Management and Governance 1: 231-53.
60 INTERNATIONAL REGIONAL SCIENCE REVIEW (Vol. 25, No. 1, 2002)

Bresnahan, T., and A. Gambardella. 1998. The division of inventive labour and the extent of the market.In General purpose technologies and economic growth, edited by E. Helpman. Cambridge, MA:MIT Press.
Bullock, A., J. Duncan, and E. Wood. 1996. The survey method, sample attrition and the SME paneldatabase. In The changing state of British enterprise: Growth, innovation and competitive advan-tage in small and medium sized firms, 1986-95, edited by A. Cosh and A. Hughes, 94-101. Cam-bridge, UK: ESRC Centre for Business Research, University of Cambridge.
Cosh, A. D., and A. Hughes 1996. The changing state of British enterprise: Growth, innovation andcomparative advantage in small and medium sized firms, 1986-95. Cambridge, UK: ESRC Centrefor Business Research, University of Cambridge.
Curran, J., and R. A. Blackburn. 1994. Small firms and local economic networks: The death of the localeconomy? London: Chapman.
Department of Trade and Industry. 1998. Business start-ups and closures: VAT registrations and de-registrations in 1997. Statistical press release p/98/645.
Huggins, R. 2000. An index of competitiveness in the UK: Local, regional and global analysis. Mimeo.Centre for Advanced Studies, Cardiff University, UK.
Hughes, A., and E. Wood. 1999. Rethinking innovation comparisons between manufacturing and ser-vices: The experience of CBR SME surveys in the UK. Working Paper 140. ESRC Centre for Busi-ness Research, University of Cambridge, UK.
Keeble, D. 1980. The South East: II Greater London. In Regional development in Britain, edited byG. Manners, D. Keeble, B. Rodgers, and K. Warren. 2d. ed. Chichester, UK: Wiley.
———. 1996. North-south and urban-rural variations in SME performance, innovation and businesscharacteristics. In The changing state of British enterprise: Growth, innovation and competitiveadvantage in small and medium sized firms 1986-95, edited by A. D. Cosh and A. Hughes, 83-93.Cambridge, UK: ESRC Centre for Business Research, University of Cambridge.
———. 1997. Small firms, innovation and regional development in Britain in the 1990s. RegionalStudies 31: 281-93.
———. 1998. North-south and urban-rural variations in SME growth, innovation and networking in the1990s. In Enterprise Britain: Growth, innovation and public policy in the small and medium sizedenterprise sector 1994-1997, edited by A. D. Cosh and A. Hughes, 99-113. Cambridge, UK: ESRCCentre for Business Research, University of Cambridge.
Keeble, D., and J. Bryson. 1996. Small firm creation and growth, regional development and thenorth-south divide in Britain. Environment and Planning A 28: 909-34.
Kitson, M., and F. Wilkinson. 1996. Markets and competition. In The changing state of British enter-prise: Growth, innovation and competitive advantage in small and medium sized firms 1986-95,edited by A. D. Cosh and A. Hughes. Cambridge, UK: ESRC Centre for Business Research, Univer-sity of Cambridge.
Lewis, J., and A. Townsend, eds. 1989. The north-south divide: Regional change in Britain in the 1980s.London: Chapman.
Martin, R. 1988. The political economy of Britain’s north-south divide. Transactions of the Institute ofBritish Geographers, New Series 13: 389-418.
Moore, B. 1996. Sources of innovation, technology transfer and diffusion. In The changing state of Brit-ish enterprise: Growth, innovation and competitive advantage in small and medium sized firms1986-95, edited by A. D. Cosh and A. Hughes. Cambridge, UK: ESRC Centre for BusinessResearch, University of Cambridge.
O’Farrell, P. N., D.M.W.N. Hitchens, and L.A.R. Moffat. 1992. The competitiveness of business servicefirms: A matched comparison between Scotland and the south east of England. Regional Studies 26:519-33.
———. 1993. The competitiveness of business services and regional development: Evidence fromScotland and the south east of England. Urban Studies 30: 1629-52.
Athreye, Keeble / UK REGIONAL ECONOMIES 61

O’Farrell, P. N., L.A.R. Moffat, and D.M.W.N Hitchens. 1993. Manufacturing demand for business ser-vices in a core and peripheral region: Does flexible production imply vertical disintegration of busi-ness services? Regional Studies 27: 385-400.
Office for National Statistics. 1997. Regional trends. London: The Stationery Office.Rosenberg, N. 1963. Technological change in the machine tool industry, 1840-1910. Reprinted in
N. Rosenberg, ed. 1976. Perspectives on technology. Cambridge, UK: Cambridge University Press.Scazzieri, R. 1993. A theory of production. Oxford, UK: Clarendon.Stigler, G. J. 1951. The division of labour is limited by the extent of the market. The Journal of Political
Economy 59: 185-93.Tether, B., and J. Howells. 2000. W(h)ither Manchester? Paper presented at the 8th International
Schumpeter Society Conference, July, Manchester, UK.Wood, P., J. Bryson, and D. Keeble. 1993. Regional patterns of small firm development in the business
services: Evidence from the United Kingdom. Environment and Planning A 25: 677-700.Young, A. 1928. Increasing returns and economic progress. Economic Journal 38: 527-42.
62 INTERNATIONAL REGIONAL SCIENCE REVIEW (Vol. 25, No. 1, 2002)

INTERNATIONAL REGIONAL SCIENCE REVIEW (Vol. 25, No. 1, 2002)Revilla Diez / METROPOLITAN INNOVATION SYSTEMS
METROPOLITAN INNOVATION SYSTEMS:A COMPARISON BETWEEN BARCELONA,STOCKHOLM, AND VIENNA
JAVIER REVILLA DIEZ
Department of Economic Geography, University of Hannover, Germany,[email protected]
This article uses data from the European Regional Innovation Survey to provide insights into theinnovative activity and innovation networking of the most important innovation actors, namelymanufacturing firms, producer service firms, and research institutes. The innovation capacitiesof the metropolitan innovation systems differ markedly. In respect to cooperation partners, verti-cal relationships predominate. Only in Stockholm do research institutes play a significant role inassisting innovation processes in manufacturing firms. Spatial proximity of cooperation partnersis very important, confirming the concept of territorially based systems of innovation. At the sametime, the actors surveyed cooperate intensively with cooperation partners outside the region.
Metropolitan regions are increasingly seen as regional development engines in aglobalizing world (Huggins 1997). On one hand, traditional approaches haveexplained that metropolitan regions are able to facilitate agglomeration economiesin the form of urbanization and localization economies to its actors. On the otherhand, they function as gateways to other regions, thus linking the local actors withnational or international ones. With respect to innovation, these two aspects arebecoming more and more meaningful. The innovative capacity of firms does notonly depend on their own research and development (R&D) capabilities. The possi-bility to cooperate during innovation processes with external partners such as cus-tomers, industrial suppliers, producer service firms, research institutes, and com-petitors becomes an important locational factor that reduces risks and uncertaintiesand leads to collective learning (De Bresson and Amesse 1991; Lakshmanan andOkumura 1995; Malecki and Oinas 1998).
Due to their size, metropolitan regions offer a variety of potential network part-ners to local firms, ensuring synergies, creating further knowledge, and resulting intechnological progress. Besides these agglomeration economies, metropolitanregions are characterized by a high degree of openness. Metropolitan regions are,among others, locations of multinationals, either foreign or domestic, innovativesmall and medium-sized enterprises (SMEs), and research institutes that are linkedto cooperation partners worldwide.
INTERNATIONAL REGIONAL SCIENCE REVIEW 25, 1: 63–85 (January 2002)
© 2002 Sage Publications
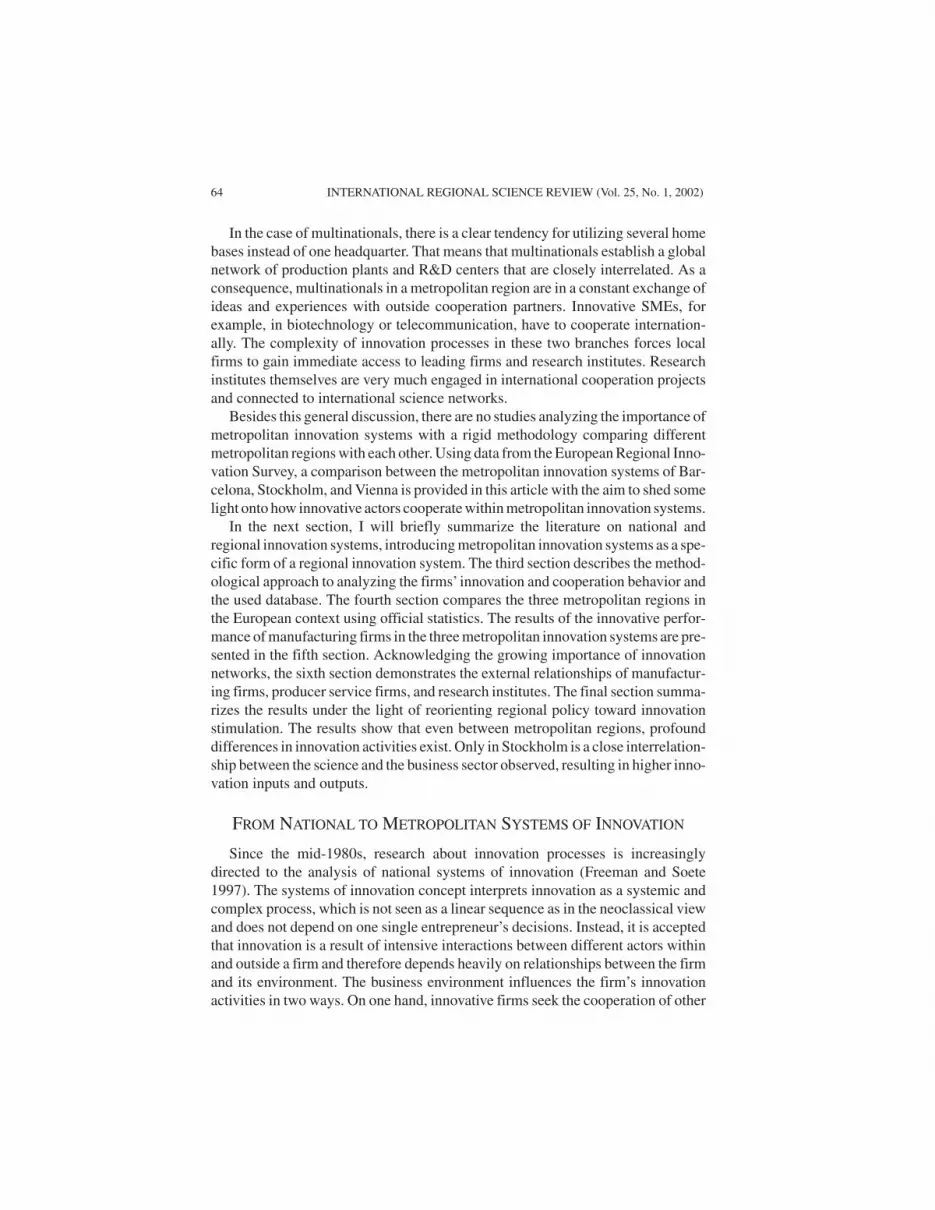
In the case of multinationals, there is a clear tendency for utilizing several homebases instead of one headquarter. That means that multinationals establish a globalnetwork of production plants and R&D centers that are closely interrelated. As aconsequence, multinationals in a metropolitan region are in a constant exchange ofideas and experiences with outside cooperation partners. Innovative SMEs, forexample, in biotechnology or telecommunication, have to cooperate internation-ally. The complexity of innovation processes in these two branches forces localfirms to gain immediate access to leading firms and research institutes. Researchinstitutes themselves are very much engaged in international cooperation projectsand connected to international science networks.
Besides this general discussion, there are no studies analyzing the importance ofmetropolitan innovation systems with a rigid methodology comparing differentmetropolitan regions with each other. Using data from the European Regional Inno-vation Survey, a comparison between the metropolitan innovation systems of Bar-celona, Stockholm, and Vienna is provided in this article with the aim to shed somelight onto how innovative actors cooperate within metropolitan innovation systems.
In the next section, I will briefly summarize the literature on national andregional innovation systems, introducing metropolitan innovation systems as a spe-cific form of a regional innovation system. The third section describes the method-ological approach to analyzing the firms’ innovation and cooperation behavior andthe used database. The fourth section compares the three metropolitan regions inthe European context using official statistics. The results of the innovative perfor-mance of manufacturing firms in the three metropolitan innovation systems are pre-sented in the fifth section. Acknowledging the growing importance of innovationnetworks, the sixth section demonstrates the external relationships of manufactur-ing firms, producer service firms, and research institutes. The final section summa-rizes the results under the light of reorienting regional policy toward innovationstimulation. The results show that even between metropolitan regions, profounddifferences in innovation activities exist. Only in Stockholm is a close interrelation-ship between the science and the business sector observed, resulting in higher inno-vation inputs and outputs.
FROM NATIONAL TO METROPOLITAN SYSTEMS OF INNOVATION
Since the mid-1980s, research about innovation processes is increasinglydirected to the analysis of national systems of innovation (Freeman and Soete1997). The systems of innovation concept interprets innovation as a systemic andcomplex process, which is not seen as a linear sequence as in the neoclassical viewand does not depend on one single entrepreneur’s decisions. Instead, it is acceptedthat innovation is a result of intensive interactions between different actors withinand outside a firm and therefore depends heavily on relationships between the firmand its environment. The business environment influences the firm’s innovationactivities in two ways. On one hand, innovative firms seek the cooperation of other
64 INTERNATIONAL REGIONAL SCIENCE REVIEW (Vol. 25, No. 1, 2002)

actors to access information, knowledge, and other resources; to exchange experi-ences; and to find jointly adequate solutions. Potential cooperation partners areother firms, for example, customers, suppliers, competitors, service providers,and/or research institutes, financial institutions, political decision makers, and soon. On the other hand, the business environment, which can change in the course oftime, determines the firm’s activities. The social and cultural embeddedness, theinstitutional and regulatory framework, and the existing infrastructure influenceentrepreneurial decisions. In this broad sense, innovation is the outcome of an inter-play between different actors, whose actions are determined by their environment(Camagni 1991; Crevoisier 1998; Hudson 1999).
A comprehensive analysis of innovation processes has to include numerous fac-tors. In Edquist’s (1997) opinion, the concept of innovation systems is the onlyframework in which innovation processes can be examined:
If we want to describe, understand, explain—and perhaps influence—processes of in-novation, we must take all important factors shaping and influencing innovations intoaccount. The system of innovation approach—in its various forms—is designed to dothis. Attempts to understand the structure and dynamics of such systems are at thecore of modern thinking about innovation processes. (P. 4)
According to Lundvall (1992), a national innovation system includes “all parts andaspects of the economic structure and the institutional set-up affecting learning aswell as searching and exploring the production system, the marketing system andthe system of finance” (p. 12).
Whereas Lundvall (1992) and Nelson (1993) concentrated their analyses on thenation-state, increasing attention has been paid to the regional level since themid-1990s. The recent discussion stresses two aspects (Fischer et al. 2001):
• Developed countries need, to maintain their international competitiveness, innova-tive and dynamic firms. These firms tend to be concentrated in certain regions wherethey can find a favorable business environment.
• Innovative firms succeed in linking local with national or even global knowledgesources. They are able to generate new ideas by using their own and external expertiseand to transform them into marketable products.
The stronger emphasis on the regional and local level led to a fairly high numberof studies about regional innovation systems (e.g., Cooke and Morgan 1998;Braczyk, Cooke, and Heidenreich 1998; Maskell et al. 1998). Again, their point ofdeparture is the chain-linked innovation model that emphasizes feedback loops andinteractions between different actors during innovation processes. The authorstransferred the systemic elements of a national innovation system to the regionallevel. In short, they argued that region-specific conditions and cooperative relation-ships between different actors influence the regional innovation potential eitherpositively or negatively. They concluded that “regions which possess the full pano-
Revilla Diez / METROPOLITAN INNOVATION SYSTEMS 65

ply of innovation organizations set in an institutional milieu where systemic link-age and interactive communication among the innovation actors is normal, ap-proach the designation of regional innovation systems” (Cooke and Morgan 1998,71). It would be wrong to interpret regional innovation systems as being isolatedfrom the national and/or international context. The national scale continues to becrucial in setting important framework conditions like laws and investment (e.g., inresearch and education). The international scale gives important impulses aboutpotential markets and the development of new products; it also provides knowledgefrom outside the region (Revilla Diez 2000).
Recent studies about the spatial distribution of innovation activities show thatmetropolitan regions have a high innovation potential (e.g., BMBF 2000 and Beiseand Stahl 1999 for Germany; Brouwer, Budil-Nadvornikova, and Kleinknecht1999 for the Netherlands; Varga 1998 and Anselin, Varga, and Acs 1997 for theUnited States). For example, Audretsch and Feldman (1999) proved empiricallythat cities and especially metropolitan regions are the most important locations forinnovations. Ninety-six percent of all registered product innovations were gener-ated in metropolitan regions. Furthermore, Audretsch and Feldman (1999) pre-sented empirical evidence for Jane Jacobs’s (1969) argument that diversity fostersinnovation. They found that sectoral specialization on a small number of brancheshas a negative effect on the regional innovation output level. Metropolitan regionsthat generally are characterized by a diverse economic structure achieve signifi-cantly higher innovation outputs (Audretsch and Feldman 1999). These resultsunderline the fact that metropolitan regions offer favorable conditions for innova-tive firms. Here, these firms find a diversified industrial structure, qualified workforce, capable cooperation partners in business (customers, suppliers, competitors,producer services), and research institutes (Suarez-Villa and Fischer 1995; Howells1983; Ewers and Wettmann 1980). But contrary to this argumentation, Acs,FritzRoy, and Smith (2001) have shown empirical evidence for the benefits of spe-cialization. However, metropolitan regions tend to be the driving forces in nationaland global innovation processes (Shefer and Frenkel 1998).
The uneven spatial distribution of innovations demonstrates that metropolitanregions are very important in respect to the generation of new ideas, further devel-opment of technological progress, and knowledge-based regional and nationaldevelopment. Metropolitan regions offer firms spatial, technological, and institu-tional proximity and specific resources whose exploitation generates significantexternalities (Fischer et al. 2001).
For these reasons, metropolitan regions can be interpreted as metropolitan inno-vation systems. Technology-oriented firms need to find innovative solutions a min-imum of locational advantages that can only be found in metropolitan innovationsystems. Of central importance is the availability of cooperation partners not onlywithin but also outside the metropolitan innovation system (Davelaar and Nijkamp1989; Harrison, Kelley, and Gant 1996). Some examples are industrial suppliersand customers, producer service firms, and research institutes. The full exploitation
66 INTERNATIONAL REGIONAL SCIENCE REVIEW (Vol. 25, No. 1, 2002)

of technological opportunities requires a satisfactory division of labor betweensmall and large enterprises as well as the coexistence of many different kinds ofproducers and service providers. Research institutes fulfill at least two importantroles. The first refers to the training of a qualified work force and the second to thegeneration and diffusion of knowledge (Fischer et al. 2001; Charles and Goddard1997; Fritsch et al. 1998; Acs, Audretsch, and Feldman 1991, 1994).
On the basis of this short theoretical discussion, the empirical analysis is di-rected to the following questions:
1. How does the innovation capacity and performance across the metropolitan innova-tion systems surveyed differ in comparison to other regions in the European Union(EU)?
2. How different is the innovative capacity of the manufacturing firms across the metro-politan innovation systems surveyed?
3. How important is external cooperation for manufacturing firms, producer services,and research institutes and to what extent does spatial proximity matter for coopera-tion networks?
4. What is the role of producer service firms within metropolitan innovation systems?Do they differ in their own R&D capacities and in the way in which they support man-ufacturing firms’ innovation activities across the case study regions?
5. How important are research institutes for businesses within metropolitan innovationsystems?
METHOD: THE EUROPEAN REGIONAL INNOVATION SURVEY
Since the 1970s, numerous innovation and network studies were conducted on anational and regional scale; however, a basic problem is their lacking comparabil-ity. All of these studies present interesting insights into innovation processes, andtheir different focus on product or process innovation on sectors (all sectors vs.high-tech sectors), firm size (small and medium-sized firms vs. large firms), geo-graphic orientation (regional vs. national), theoretical assumptions (linear vs.chain-linked innovation model), and methodology (case study approach vs. postalsurvey) limit their transferabilty. The European Regional Innovation Survey(ERIS) is a comprehensive and integrated attempt to overcome these shortcomings.The database was elaborated within the framework of the extensive research pro-gram “Technological Change and Regional Development in Europe” funded by theGerman Research Association. In a joint project between the University ofHannover, the University of Cologne, the Technical University of Freiberg, and theFraunhofer Institute for System Analysis, postal surveys were conducted in elevenregions across Europe. Written questionnaires were sent to the most importantactors in regional innovation systems—manufacturing firms, producer services,and research institutions—to analyze their innovative and networking activities. Inthe case of the manufacturing survey, firms belonging to manufacturing sectors15-36 according to the EU classification of economic activities (NACE) wereselected. The producer service survey covers producer service firms in computer
Revilla Diez / METROPOLITAN INNOVATION SYSTEMS 67

software (hardware consultancy, software consultancy, and supply, data process-ing, database activities, NACE 72.1-72.4), technical consultancy (architectural,engineering, and related technical consultancy and technical testing and analysis,NACE 74.2, 74.3), business consultancy (business and management consultancy,NACE 74.14), and market research and advertising (market research and publicopinion polling, advertising, activities of trade fairs, exhibitions, and congressorganizers, NACE 74.13, 74.4, 74.8). The research institutes survey was addressedto the science fields of architecture, construction, surveying, biology, chemistry,medicine, mathematics, informatics, physics, electrotechnology, mechanical engi-neering, economics, social and geo-sciences. To obtain a detailed insight into theresearch and network activities of the research institutions (i.e., universities andother research institutions), the questionnaire was sent to the departmental level, or,if these units were too large, to the level of research groups.
Basically, the same actor-specific questionnaires were used in all the regionssurveyed, guaranteeing a high degree of comparability (Fritsch et al. 1998). Thisarticle focuses on the results from three metropolitan regions: Barcelona, Stock-holm, and Vienna. The data were collected jointly with the professors Dr. FolkeSnickars, Royal Institute of Technology in Stockholm; Dr. Manfred Fischer,Vienna University of Economics and Business Administration; and Dr. PereEscorsa, Polytechnical University of Catalonia. The three regions were defined in afunctional perspective. In addition to the city core area, where mainly producer ser-vices and research institutions are located, the industrial hinterland is included. Themetropolitan region of Barcelona comprises the communities of Barcelona, BaixLlobregat, Valles Occidental, Valles Oriental, and Maresme. The metropolitanregion of Stockholm comprises the province of Stockholm, Uppsala, Södermans-lands, Örebro, and Vastmanlands. The metropolitan region of Vienna comprises thecity of Vienna and the districts Baden, Bruck an der Leitha, Gänserndorf,Korneuburg, Mödling, Tulln, and Vienna Umgebung. Table 1 gives an overview on
68 INTERNATIONAL REGIONAL SCIENCE REVIEW (Vol. 25, No. 1, 2002)
TABLE 1. Metropolitan Innovation Survey
Metropolitan Innovation System
Survey Subject Barcelona Stockholm Vienna
Manufacturing firmsResponding firms 394 451 204Representativeness ratio (%) 15 24 23
Producer service firmsResponding firms 105 334 185Representativeness ratio (%) 18 26 29
Research institutesResponding research units 148 173 290Representativeness ratio (%) 35 50 45
Source: European Regional Innovation Survey.
sample sizes and response patterns. Overall, the survey data in the metropolitanregions surveyed are a good representation of the total population.
THE METROPOLITAN INNOVATION SYSTEMS OF BARCELONA,STOCKHOLM, AND VIENNA IN THE EUROPEAN CONTEXT
The three metropolitan innovation systems surveyed vary significantly in theirinnovative capabilities. However, these differences are already clear when onecompares the national innovation systems. Table 2 summarizes the strengths andweaknesses of the three national innovation systems. With respect to innovation,Sweden is the most successful country. Sweden reaches the top position in the EUwith respect to the gross expenditure in R&D and number of researchers per 1,000labor force. The private sector is the driving force within the national R&D system.Nearly 68 percent of all expenses in R&D come from the business sector. As aresult, the Swedish patent applications at the European Patent Office are twice ashigh as the European average. Interestingly, in Sweden foreign ownership ofdomestic inventions is lower than in Austria and Spain, but at the same time Swed-ish ownership of inventions made abroad is markedly higher than in the two othercountries. This shows, on one hand, that the Swedish R&D system has a solid basewithin the country but, on the other hand, that Swedish multinationals are highlycompetitive in an international perspective and able to control inventions outsidethe country.
With respect to innovation indicators, Austria follows second. Although itachieves one of the highest per capita incomes within the EU, its R&D systemshows several weaknesses. Not only is the input in R&D, measured as the share ofgross expenditure in R&D, below the EU average, but the active participation of thebusiness sector in R&D activities is also very limited. Contrary to Sweden, the pub-lic R&D system plays a leading role in the innovation system. The high proportionof foreign ownership of domestic inventions demonstrates the attractiveness ofAustrian research capacities for multinationals. But, at the same time, it illustratesthe heavy dependence of the Austrian innovation system on foreign R&D efforts.Austrian firms are not able to control inventions abroad in a substantial manner. Asa whole, the Austrian R&D system is not able to achieve high innovative outputs.The patent indicator clearly underlines the weak position in international standards.
The Spanish innovation system clearly lags behind the two other countries. TheSpanish economy has been able to achieve high economic growth rates since itsmembership in the European Community (EC). This catching-up process, amongother factors, was heavily based on foreign investment. But Spain is still not reach-ing the EU average in terms of per capita income. In comparison to Sweden, whichcan be labeled as an inventor country, the Spanish economy is much more an applierof new knowledge, whereas Austria lies in between. The Spanish indicators onR&D expenditure lay significantly below the EU average. Like the Austrian case,the participation of businesses in R&D is rather low, resulting in a high proportion
Revilla Diez / METROPOLITAN INNOVATION SYSTEMS 69

TA
BL
E 2
.N
atio
nal I
nnov
atio
n Sy
stem
in C
ompa
riso
n
Gro
ssR
&D
Pate
ntFo
reig
nD
omes
tic
GD
P p
erD
omes
tic
Res
earc
hers
Exp
endi
ture
App
lica
tion
s at
Ow
ners
hip
ofO
wne
rshi
p of
Hea
d of
Exp
endi
ture
per
10,0
00by
Bus
ines
sE
PO
per
Hea
dD
omes
tic
Fore
ign
Popu
lati
on (
%on
R&
D a
sL
abor
Ent
erpr
ises
in %
of P
opul
atio
nIn
vent
ions
aIn
vent
ions
b
Cou
ntry
of U
.S.)
199
7a
% o
f GD
PFo
rce
of A
ll F
unds
199
719
9619
93-9
519
93-9
5
Swed
en70
3.9
86(1
997)
67.7
187
10.0
10.4
Aus
tria
791.
534
(199
3)49
.395
20.9
8.2
Spai
n55
0.9
33(1
997)
44.7
1116
.64.
1G
erm
any
752.
359
(199
5)61
.618
66.
94.
6U
nite
d K
ingd
om70
1.9
51(1
996)
49.5
6923
.011
.3Fr
ance
732.
261
(199
6)48
.595
8.9
5.8
Uni
ted
Stat
es10
02.
774
(199
3)64
.378
5.0
8.8
Japa
n84
2.9
92(1
997)
73.4
103
3.0
1.8
Org
aniz
atio
n fo
r E
cono
mic
Coo
pera
tion
and
Dev
eope
men
t75
2.2
55(1
995)
62.3
8.2
8.1
Eur
opea
n U
nion
701.
850
(199
6)52
.894
6.5
3.5
Sour
ce:
Eur
osta
t (19
99)
and
the
Org
aniz
atio
n fo
r E
cono
mic
Coo
pera
tion
and
Dev
elop
men
t (19
99).
Not
e:G
DP
= g
ross
dom
estic
pro
duct
; R&
D =
res
earc
h an
d de
velo
pmen
t; E
PO =
Eur
opea
n Pa
tent
Off
ice.
a. S
hare
of
pate
nt a
pplic
atio
ns to
the
EPO
ow
ned
by f
orei
gn r
esid
ents
in to
tal p
aten
ts in
vent
ed d
omes
tical
ly.
b. S
hare
of
pate
nt a
pplic
atio
ns to
the
EPO
inve
nted
abr
oad
in to
tal p
aten
ts o
wne
d by
cou
ntry
res
iden
ts.
70
of foreign ownership of domestic inventions. Using patent data, the distance fromthe knowledge- and technology-intensive economies is even bigger.
The differences revealed on the national level continue to be present on theregional level (see Table 3). The metropolitan innovation system of Stockholmseems to be much more innovative than the metropolitan innovation systems inVienna and Barcelona. The strengths of the Stockholm innovation system can beseen in the high number of patent applications at the European Patent Office. Oneexplanation could be the expenses in R&D, which are two times higher than inVienna or Barcelona. Another explanation can be derived from the much higherqualification levels of the population in the metropolitan region of Stockholm.Thirty-eight percent of the population aged twenty-five to sixty-four have com-pleted a university-level education. As a consequence, the business enterprise sci-entists and researchers are relatively much more numerous in Stockholm than inVienna and Barcelona.
The metropolitan system of Vienna follows in term of innovativeness. The percapita income is significantly higher than in the two other metropolises. But theR&D output measured in patent applications demonstrates that the former knowl-edge center in Europe has declined in importance. The weak contribution of the pri-vate business sector to the metropolitan innovation system is expressed in low busi-ness expenditures in R&D. Surprisingly, the proportion of highly qualified workforce is even lower than in the metropolitan region of Barcelona.
The metropolitan system of Barcelona is the leading Spanish region in businessR&D, but in the international perspective this position has to be relativized. Theregion was quite successful in attracting foreign investments and in achieving higheconomic growth after the Spanish entry to the EC in 1986. In only ten years, theregion succeeded in reaching the European average in per capita income. The inno-vative output measured in patents is still far behind the leading European regions,comparable to the output of the Vienna metropolitan system. The greatest factorimpeding a higher innovative performance is the weak business sector. But theefforts toward improving the higher education system seem to be paying off. Theproportion of university-level qualified work force is already higher than in Vienna.
INNOVATION PERFORMANCE OF MANUFACTURING FIRMS
The differences observed so far with the help of official statistics are confirmedby the ERIS. The innovation capacity of the manufacturing firms surveyed differssignificantly between the three metropolitan innovation systems. Differences notonly across industrial branches but also within the branches are notable (seeTable 4). The innovation performance of manufacturing firms was measured byinput and output indicators. When input indicators like the R&D personnel and theR&D expenditure ratio are analyzed, the manufacturing firms in the metropolitanregions of Vienna and Stockholm realize much higher R&D inputs than the firms inthe metropolitan region of Barcelona. The differences become very clear in the case
Revilla Diez / METROPOLITAN INNOVATION SYSTEMS 71

TA
BL
E 3
.M
etro
polit
an I
nnov
atio
n Sy
stem
s in
Com
pari
son
Bar
celo
na-
Île-
de-
Gre
ater
Eur
opea
nC
atal
onia
Stoc
khol
mVi
enna
Obe
rbay
ern
Fra
nce
Lon
don
Uni
on
Gro
ss d
omes
tic p
rodu
ct p
er c
apita
(E
U =
100
) 19
9699
123
167
157
160
140
100
Une
mpl
oym
ent r
ate
(%)
1997
17.4
7.9
5.9
4.8
10.7
9.7
10.7
Edu
catio
nal l
evel
of
the
popu
latio
n ag
ed tw
enty
-fiv
eto
fif
ty-n
ine
(tot
al %
)L
ow63
1722
2034
4541
Med
ium
1745
6352
3824
40H
igh
1938
1527
2931
20N
umbe
r of
pat
ents
, Eur
opea
n Pa
tent
Off
ice
1995
136
522
162
1,33
92,
222
242
33,6
51
Sour
ce:
Eur
osta
t (19
99).
72

of high-tech sectors, reflecting the backwardness of the metropolis in southernEurope. In all three regions, the highest R&D personnel ratio can be found in thesector of electrical and optical equipment. But again, the Barcelonese figure is lessthan half as high as in the two other regions. With respect to R&D expenditure ratio,the picture across the regions is more diffuse. In the metropolitan region of Barce-lona, the food industry is the most R&D-intensive sector. The food sector in Barce-lona is one of the few sectors in which domestic firms reach international competi-tiveness by their own R&D capabilities and strategies. In Stockholm, the industrialsector of machinery and transport equipment—one of the major industrial sectorsof the Stockholm economy—and in Vienna, the sector of electrical and opticalequipment are the most R&D intensive in terms of R&D expenditure. Besides thesebranch differences, the size of the manufacturing firms influences the R&D inputlevels. Whereas in the metropolitan systems of Stockholm and Vienna large firmswith more than five hundred employees reach the highest R&D input levels, in Bar-celona it is the small and medium-sized firm with fewer than one hundred employ-ees. The relatively poor commitment of large firms in Barcelona to R&D is a conse-quence of the low number of domestic multinationals. The number of multinationalheadquarters is distinctly higher in Stockholm and Vienna.
The overall innovation capacity of the manufacturing firms has also to be dis-cussed as well in terms of output indicators such as the innovation rate or the shareof turnover by product innovations (see Table 5). Contrary to the results obtained sofar, the manufacturing firms in Barcelona achieve the highest number of new prod-uct developments, followed by Stockholm and Vienna. With respect to the share ofturnover by product innovations, the metropolitan region of Vienna becomes themost innovative, followed by Barcelona and then Stockholm. The relatively goodresults for Vienna and Barcelona are the consequence of the initiated catching-upprocess. In the past decades, as shown earlier, these two regions did not belong tothe most innovative regions in Europe. The increased competition since their mem-bership in the EU has forced the firms to invest more in R&D to improve productquality and to develop new products.
THE ROLE OF EXTERNAL COOPERATION AND SPATIAL PROXIMITY
MANUFACTURING FIRMS’ COOPERATION NETWORKS
The two most important research goals of the empirical surveys in the three met-ropolitan regions were to detect on a representative level the importance of externalcooperation in innovation processes and the role of spatial proximity for such inno-vation cooperation. The network paradigm postulated by Cooke and Morgan in1993 implies that networks link innovation actors, resources, and activities in andbetween innovation systems, enabling the exchange of information and knowledgeand facilitating learning processes. Overall, manufacturing firms in all the regions
Revilla Diez / METROPOLITAN INNOVATION SYSTEMS 73

TA
BL
E 4
.Se
lect
ed R
esea
rch
and
Dev
elop
men
t (R
&D
) C
hara
cter
isti
cs o
f Su
rvey
ed F
irm
s in
Man
ufac
turi
ng (
1994
-199
6)
Bar
celo
naSt
ockh
olm
Vien
na
R&
DR
&D
R&
DR
&D
R&
DR
&D
Pers
onne
l Rat
ioa
Exp
endi
ture
Rat
ioPe
rson
nel R
atio
aE
xpen
ditu
re R
atio
Pers
onne
l Rat
ioa
Exp
endi
ture
Rat
io
Indu
stri
al s
ecto
rTe
xtile
s an
d cl
othi
ng60
.64.
1252
.610
.019
.85.
79Fo
od in
dust
ry17
.09.
6825
.40.
927
.71.
75W
ood,
pap
er, a
nd p
rint
ing
15.8
0.75
54.1
2.5
9.2
1.55
Che
mic
als
76.1
4.48
70.2
4.3
48.3
6.53
Ele
ctri
cal a
nd o
ptic
al e
quip
men
t10
7.1
4.69
144.
09.
525
5.3
16.0
3B
asic
met
als
and
met
al p
rodu
cts
54.3
4.21
31.8
2.8
29.2
2.37
Mac
hine
ry a
nd tr
ansp
ort
67.5
3.98
117.
114
.130
.55.
52H
igh
tech
nolo
gy74
.04.
211
9.0
9.2
132.
910
.58
Em
ploy
men
t siz
e≤
4970
.95.
8786
.94.
456
.52.
7950
-99
78.1
4.98
85.9
5.9
31.6
3.15
100-
499
33.6
2.24
68.8
3.8
35.3
4.28
≥50
063
.94.
5792
.012
.512
7.2
10.3
0To
tal
61.8
4.3
84.0
7.1
96.0
8.2
Sour
ce:
Eur
opea
n R
egio
nal I
nnov
atio
n Su
rvey
.a.
Per
1,0
00 e
mpl
oyee
s.
74

TA
BL
E 5
.In
nova
tion
Act
ivit
ies
of S
urve
yed
Fir
ms
(199
4-19
96)
Bar
celo
naSt
ockh
olm
Vien
na
Shar
e of
Tur
nove
rSh
are
of T
urno
ver
Shar
e of
Tur
nove
rIn
nova
tion
by P
rodu
ctIn
nova
tion
by P
rodu
ctIn
nova
tion
by P
rodu
ctR
atea
Inno
vati
ons
Rat
eaIn
nova
tion
sR
atea
Inno
vati
ons
Indu
stri
al s
ecto
rTe
xtile
s an
d cl
othi
ng99
.40.
4734
0.9
0.68
65.8
0.13
Food
indu
stry
13.2
0.07
22.9
0.11
33.7
0.28
Woo
d, p
aper
, and
pri
ntin
g12
9.6
0.15
62.6
0.20
19.3
0.04
Che
mic
als
73.4
0.15
37.7
0.06
36.8
0.19
Ele
ctri
cal a
nd o
ptic
al e
quip
men
t13
9.6
0.33
36.3
0.45
6.4
0.51
Bas
ic m
etal
s an
d m
etal
pro
duct
s13
0.9
0.20
28.0
0.13
12.0
0.57
Mac
hine
ry a
nd tr
ansp
ort
6.9
0.47
23.6
0.38
4.3
0.53
Hig
h te
chno
logy
34.1
0.37
29.4
0.26
12.8
0.43
Em
ploy
men
t siz
e≤
4917
6.2
0.22
170.
60.
2413
4.9
0.13
50-9
910
6.4
0.29
54.8
0.31
86.5
0.16
100-
499
77.0
0.22
20.8
0.11
6.5
0.35
≥50
04.
00.
3710
.70.
342.
30.
45To
tal
49.4
0.33
30.0
0.22
15.2
0.43
Sour
ce:
Eur
opea
n R
egio
nal I
nnov
atio
n Su
rvey
.a.
Den
otes
num
ber
of n
ew p
rodu
cts
per
1,00
0 em
ploy
ees.
75

surveyed are strongly engaged in innovation networking. Firms’innovative activityis not solely based on in-house capabilities. The results obtained clearly demon-strate the importance of external cooperation in the innovation process of manufac-turing and producer service firms (see Table 6). Interestingly, the most importantcooperation partners for manufacturing firms are customers, suppliers, and pro-ducer service firms. For the producer service firms surveyed, industrial customersand other producer service firms are the major cooperation partner. Vertical cooper-ation partners along the value chain are much more involved in innovation networksthan horizontal cooperation partners like research institutes and competitors. Thespatial range of networking varies between vertical and horizontal cooperationpartners. Spatial proximity is much more important in horizontal linkages betweenmanufacturing firms and research institutes or competitors, whereas cooperationwith vertical cooperation partners is realized over larger distances. It can be statedthat the network pattern of the manufacturing firms is much more complex thanexpected. Spatial proximity of cooperation partners and cooperation partners atlarger distances are a common picture of the firms surveyed. This reflects the needto make use of local but at the same time national or even international knowledgesources.
But against this general picture, differences depending on the size, industry sec-tor, and innovativeness of firms are significant. Small manufacturing firms tend tobe less engaged in innovation networks than large firms. Manufacturing firmsshowing a high innovative performance are strongly connected to cooperation part-ners than less innovative ones. With respect to branches, the results underline theimportance of external cooperation for technology- and knowledge-intensiveindustries, which also cooperate more often with horizontal cooperation partnersthan the low-tech industries.
Between the three metropolitan innovation systems, differences in the externalcooperation of the manufacturing firms can be distinguished. The metropolitanregion of Barcelona reaches the highest percentage of networking manufacturing
76 INTERNATIONAL REGIONAL SCIENCE REVIEW (Vol. 25, No. 1, 2002)
TABLE 6. Cooperation Partners of Innovating Manufacturing Firms
Barcelona Stockholm Vienna
Cooperating manufacturing firmsa 78 64 63Cooperation partners of manufacturing firmsb
Customer 69 75 52Supplier 56 37 37Producer services 61 45 60Competitors 23 18 23Research institutes 23 34 23
Source: European Regional Innovation Survey.a. In percentage of all firms.b. In percentage of all cooperating manufacturing firms.
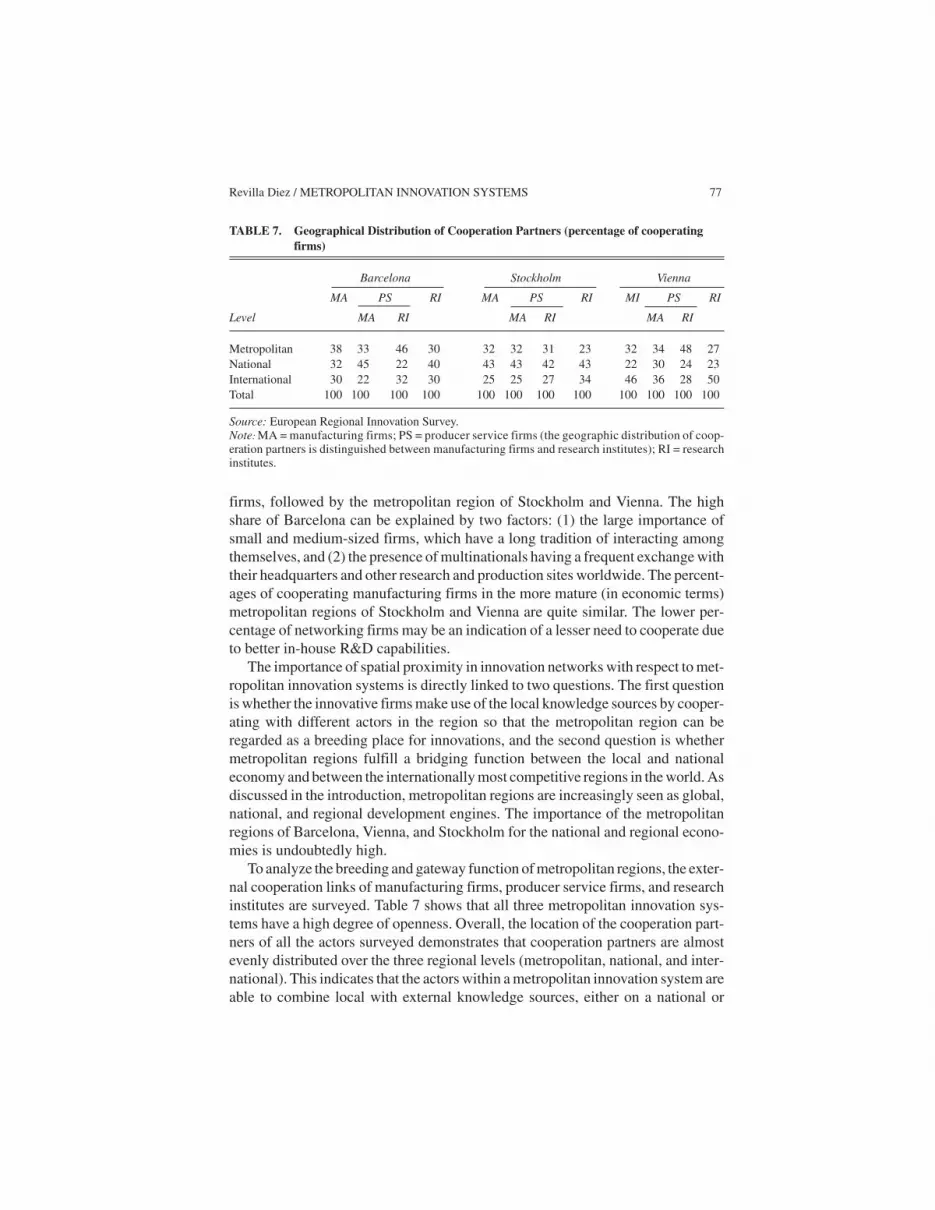
firms, followed by the metropolitan region of Stockholm and Vienna. The highshare of Barcelona can be explained by two factors: (1) the large importance ofsmall and medium-sized firms, which have a long tradition of interacting amongthemselves, and (2) the presence of multinationals having a frequent exchange withtheir headquarters and other research and production sites worldwide. The percent-ages of cooperating manufacturing firms in the more mature (in economic terms)metropolitan regions of Stockholm and Vienna are quite similar. The lower per-centage of networking firms may be an indication of a lesser need to cooperate dueto better in-house R&D capabilities.
The importance of spatial proximity in innovation networks with respect to met-ropolitan innovation systems is directly linked to two questions. The first questionis whether the innovative firms make use of the local knowledge sources by cooper-ating with different actors in the region so that the metropolitan region can beregarded as a breeding place for innovations, and the second question is whethermetropolitan regions fulfill a bridging function between the local and nationaleconomy and between the internationally most competitive regions in the world. Asdiscussed in the introduction, metropolitan regions are increasingly seen as global,national, and regional development engines. The importance of the metropolitanregions of Barcelona, Vienna, and Stockholm for the national and regional econo-mies is undoubtedly high.
To analyze the breeding and gateway function of metropolitan regions, the exter-nal cooperation links of manufacturing firms, producer service firms, and researchinstitutes are surveyed. Table 7 shows that all three metropolitan innovation sys-tems have a high degree of openness. Overall, the location of the cooperation part-ners of all the actors surveyed demonstrates that cooperation partners are almostevenly distributed over the three regional levels (metropolitan, national, and inter-national). This indicates that the actors within a metropolitan innovation system areable to combine local with external knowledge sources, either on a national or
Revilla Diez / METROPOLITAN INNOVATION SYSTEMS 77
TABLE 7. Geographical Distribution of Cooperation Partners (percentage of cooperatingfirms)
Barcelona Stockholm Vienna
MA PS RI MA PS RI MI PS RI
Level MA RI MA RI MA RI
Metropolitan 38 33 46 30 32 32 31 23 32 34 48 27National 32 45 22 40 43 43 42 43 22 30 24 23International 30 22 32 30 25 25 27 34 46 36 28 50Total 100 100 100 100 100 100 100 100 100 100 100 100
Source: European Regional Innovation Survey.Note: MA = manufacturing firms; PS = producer service firms (the geographic distribution of coop-eration partners is distinguished between manufacturing firms and research institutes); RI = researchinstitutes.

international level. In contrast to this general picture, manufacturing firms in Bar-celona tend to cooperate more intensively with local partners; in Stockholm, withpartners at the national level; and in Vienna, with international partners. The stron-gest outward orientation is visible at research institutes that are linked mostly tonational and international knowledge sources. Interestingly, the regional coopera-tion pattern of producer service firms depends heavily on the type of cooperationpartner. If producer service firms cooperate with manufacturing firms, a strongernational or international orientation can be deduced. If the producer service firmscooperate with research institutes, the metropolitan level becomes more important.
THE ROLE OF PRODUCER SERVICE FIRMS
IN MANUFACTURING FIRMS’ INNOVATION PROCESSES
Producer service firms play a very crucial role in supporting innovation activi-ties in industry. In the metropolitan region of Vienna, producer service firms are themost important external cooperation partner for the manufacturing firms surveyed;in the metropolitan regions of Stockholm and Barcelona, they follow second inimportance after customers. This illustrates that producer service firms take a lead-ing position within an innovation system. Their innovative capabilities and capaci-ties are decisive for the functioning of an innovation system, whether it is on thenational, regional, or local scale. As in the case of the manufacturing firms, theinnovative performance of the producer service firms surveyed was analyzed bynumerous indicators (see Table 8). Again, similarities and differences across themetropolitan regions can be distinguished. When input indicators like R&D expen-diture or the R&D personnel ratio are used, common features of the analyzedknowledge-intensive business services prevail. According to the mentioned inputindicators, the two most important service sectors are the sector of computer soft-ware and of technical consultancy. In the metropolitan region of Stockholm, thesector of computer software achieves the highest R&D inputs for both indicators. Inthe metropolitan region of Barcelona, the R&D expenditure ratio is highest in com-puter software, and the personnel ratio is highest in technical consultancy. In themetropolitan region of Vienna, technical consultants are the most R&D-intensiveservice firms. Compared to Stockholm and Barcelona, the Viennese computer soft-ware firms fall behind in terms of R&D inputs. With respect to firm size, it can bestated that in Stockholm and Barcelona, small firms with fewer than 20 employeesreach the highest input indicators. Only in Vienna is the highest personnel ratioreached by firms with 50 to 249 employees.
THE IMPORTANCE OF RESEARCH INSTITUTES’
ASSISTING FIRMS’ INNOVATION ACTIVITIES
Overall, it is necessary to relativize the outstanding importance of research insti-tutes in business innovation processes that is often stated in the literature on the
78 INTERNATIONAL REGIONAL SCIENCE REVIEW (Vol. 25, No. 1, 2002)

TA
BL
E 8
.Se
lect
ed R
esea
rch
and
Dev
elop
men
t (R
&D
) C
hara
cter
isti
cs o
f Su
rvey
ed F
irm
s in
Pro
duce
r Se
rvic
es (
1994
-199
6)
Bar
celo
naSt
ockh
olm
Vien
na
R&
DR
&D
R&
DR
&D
R&
DR
&D
Exp
endi
ture
Pers
onne
lE
xpen
ditu
rePe
rson
nel
Exp
endi
ture
Pers
onne
lR
atio
(%
)R
atio
aR
atio
(%
)R
atio
aR
atio
(%
)R
atio
a
Serv
ice
sect
orC
ompu
ter
soft
war
e9.
715
.05.
723
.74.
311
.2Te
chni
cal c
onsu
ltanc
y4.
217
.24.
96.
15.
425
.4B
usin
ess
cons
ulta
ncy
6.0
12.6
2.5
17.8
3.1
4.0
Mar
ket r
esea
rch
and
adve
rtis
ing
2.5
6.5
4.7
20.4
3.7
8.0
Em
ploy
men
t siz
e≤
1910
.324
.47.
424
.65.
015
.320
-49
6.1
28.0
2.3
16.3
3.1
13.6
50-2
494.
13.
75.
616
.03.
920
.9≥
250
1.7
10.8
4.8
13.0
5.0
3.8
Tota
l7.
710
.84.
715
.43.
612
.3
Sour
ce:
Eur
opea
n R
egio
nal I
nnov
atio
n Su
rvey
.a.
Per
1,0
00 e
mpl
oyee
s.
79

subject (Revilla Diez 2000). The results of the survey clearly showed that verticalcooperation partners, such as buyers and suppliers, and producer service firms holda higher status in the support of business innovation processes than research insti-tutes do. In addition, the survey impressively proves that in contrast to the hypothe-sis, as far as business cooperation partners are concerned, it is above all themedium-size and large firms that are the favored cooperating partners. Small busi-nesses are not reached by the research institutes. If manufacturing firms cooperatewith research institutes, they demonstrate a higher preference for neighboring insti-tutions. Research institutes themselves cooperate intensively on a national andinternational scale. The active participation in international science networksallows them to fulfill the gateway function. Through their contacts, they are able todiffuse internationally available information and knowledge to local firms.
Despite this general picture, differences across the three metropolitan innova-tion systems are profound. In contrast to Vienna and Barcelona, manufacturingfirms in Stockholm make use of research institutes in a significant way (seeTable 9). Large manufacturing firms with more than five hundred employees werethe most important cooperation partners for the Stockholm research institutes. InVienna, the large manufacturers are the preferred cooperation partners of researchinstitutes. Only in Barcelona do research institutes cooperate intensively with smallmanufacturing firms with fewer than one hundred employees. Taking into consid-eration the high number of large multinationals in Barcelona, this result shows thatlocal research units are not able to provide knowledge resources to these globalplayers. In other words, the most important factor for locating in Barcelona is notthe knowledge base found in local research institutes.
One reason for the lower participation of research institutes in innovation net-works could be the mismatch of technology fields. In Table 10, it can be clearly seenthat the specialization patterns of manufacturing firms and research institutes varysignificantly. The research institutes have patterns of specialization that allow oneto expect only few complementary effects for local businesses, and vice versa. Butinterestingly, the mismatch is highest in the Stockholm metropolitan innovation
80 INTERNATIONAL REGIONAL SCIENCE REVIEW (Vol. 25, No. 1, 2002)
TABLE 9. Cooperation of Research Institutes with Firms
Barcelona Stockholm Vienna
Cooperation with firms (%) 71 64 55Employment size of firmsa
≤ 49 28 3 2050-99 27 15 15100-499 20 24 19≥ 500 25 58 46
Total 100 100 100
Source: European Regional Innovation Survey.a. Size distribution of firms cooperating with research institutes in percentages.
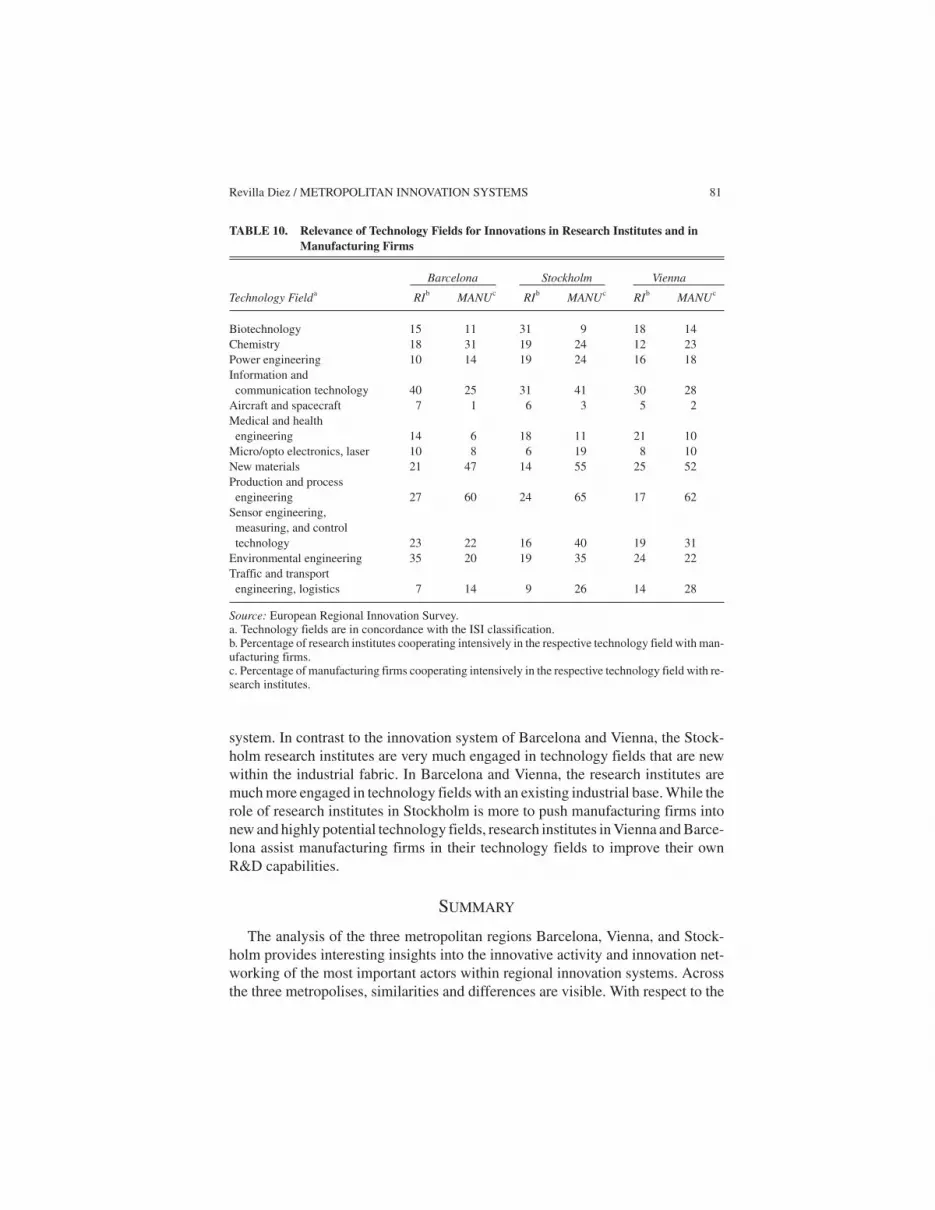
system. In contrast to the innovation system of Barcelona and Vienna, the Stock-holm research institutes are very much engaged in technology fields that are newwithin the industrial fabric. In Barcelona and Vienna, the research institutes aremuch more engaged in technology fields with an existing industrial base. While therole of research institutes in Stockholm is more to push manufacturing firms intonew and highly potential technology fields, research institutes in Vienna and Barce-lona assist manufacturing firms in their technology fields to improve their ownR&D capabilities.
SUMMARY
The analysis of the three metropolitan regions Barcelona, Vienna, and Stock-holm provides interesting insights into the innovative activity and innovation net-working of the most important actors within regional innovation systems. Acrossthe three metropolises, similarities and differences are visible. With respect to the
Revilla Diez / METROPOLITAN INNOVATION SYSTEMS 81
TABLE 10. Relevance of Technology Fields for Innovations in Research Institutes and inManufacturing Firms
Barcelona Stockholm Vienna
Technology Fielda RIb MANUc RIb MANUc RIb MANUc
Biotechnology 15 11 31 9 18 14Chemistry 18 31 19 24 12 23Power engineering 10 14 19 24 16 18Information andcommunication technology 40 25 31 41 30 28
Aircraft and spacecraft 7 1 6 3 5 2Medical and healthengineering 14 6 18 11 21 10
Micro/opto electronics, laser 10 8 6 19 8 10New materials 21 47 14 55 25 52Production and processengineering 27 60 24 65 17 62
Sensor engineering,measuring, and controltechnology 23 22 16 40 19 31
Environmental engineering 35 20 19 35 24 22Traffic and transportengineering, logistics 7 14 9 26 14 28
Source: European Regional Innovation Survey.a. Technology fields are in concordance with the ISI classification.b. Percentage of research institutes cooperating intensively in the respective technology field with man-ufacturing firms.c. Percentage of manufacturing firms cooperating intensively in the respective technology field with re-search institutes.

five research questions raised in the second section of this article, the obtainedresults can be summarized as follows.
First, the innovative capacity of the metropolitan innovation systems differmarkedly, reflecting the differences already visible in a comparison of the nationalinnovation systems. Across Europe, the metropolitan region of Stockholm is one ofthe most innovative regions, basically based on business R&D activities. In Vienna,a former world leader with respect to innovations, the R&D performance is verymuch concentrated in the science sector. Local businesses are relatively weak interms of innovativeness. Barcelona is by far the least innovative metropolitanregion. Like in Vienna, since becoming a member of the EC/EU, the innovation sys-tem is transforming rapidly toward more international competitiveness.
Second, R&D inputs are much higher in Vienna and Stockholm than in Barce-lona, reflecting its backwardness. But the Barcelonese firms are in a catching-upprocess. The innovative output measured in terms of turnover accounted by new orimproved products indicates that Barcelonese firms are changing their products tobetter match the market needs. With respect to firm size, in Vienna and Stockholm,large firms are much more involved in R&D activities than in Barcelona. In thesouthern metropole, the SMEs especially are R&D orientated. External coopera-tion in innovation processes is a common feature of the firms surveyed. But externalcooperation is not the only source for internal innovations. In-house R&D capabili-ties and knowledge gained through internal product and production experience is aprecondition for successful cooperation. It is interesting that across the regions thevertical cooperation partners like customers, industrial suppliers, and producer ser-vice firms predominate the external cooperation network of manufacturing firms.Spatial proximity of cooperation partners is also important, but at the same time themanufacturing firms are having cooperation partners outside the region. Whereasthe firms in Stockholm and Vienna tend to cooperate more with extraregionalcooperation partners, in Barcelona the firms surveyed are much more regionallyorientated.
Third, producer service firms play a crucial role in the metropolitan innovationsystems surveyed. Across the regions, they are very much engaged in supportingmanufacturing innovation activities. Interestingly, they support innovation activi-ties in neighboring firms.
Fourth, in comparison to cooperation partners such as customers, industrial sup-pliers, or producer services, the role of research institutes for firm innovation pro-cesses is relatively weak. The highest importance of research institutes can beobserved in Stockholm. The two other regions still face some difficulties to link thescience sector with the business sector.
Fifth, the gateway function of the metropolitan innovation systems is underlinedby the geographic location of the cooperation partners. Across the regions, cooper-ation partners of manufacturing firms, producer services, and research institutes atthe national and international level predominate. The research institutes especiallyare characterized by a high degree of international cooperation partners.
82 INTERNATIONAL REGIONAL SCIENCE REVIEW (Vol. 25, No. 1, 2002)

More important than the simple repetition of results is the question of what con-clusions can be derived to reorient regional policy toward innovation stimulation,thus improving metropolitan innovation systems. The results demonstrate thatbetween regions of similar characteristics such as the three large metropolitanagglomerations surveyed, profound differences in technological competitivenessexist. It would be too simple to transfer the Stockholm success story to other loca-tions. Regions are equipped with a specific set of production factors and influencedby a region-specific business environment (institutional arrangements, cultural andsocial context) that makes it difficult to derive generally valid policy recommenda-tions. Also, limits of regional policy have to be admitted. Experience has shown thatregional policy is more successful in stimulating existing innovation potentials andnot so much in developing innovative regions from the very beginning (Sternberg1998). However, the Stockholm example provides interesting insights into an inno-vation- and technology-oriented national and regional policy.
The Swedish national and regional R&D promotion policy has shifted from thelinear to the chain-linked innovation model. It stresses the need to improve thein-house R&D capabilities via well-qualified personnel and external cooperation.The higher quality of human resources in Swedish firms, expressed in a higher pro-portion of R&D personnel and personnel with academic training, enlarges thefirms’innovation potential. The higher number of capable “heads” facilitates learn-ing processes within a firm and increases the absorptive capacity for firm-externalknowledge.
To improve innovation capabilities, the Swedish national and regional technol-ogy policy tries to encourage closer links between firms and research institutes.This does not mean the opening of an additional transfer agency as in many othercountries. Here, on one hand, private firms, and on the other hand, public researchinstitutes jointly establish research institutes with the aim to accelerate the processof transferring scientific findings into marketable products. In 1995, thirty industry-related research centers affiliated with universities were established. In these cen-ters of competence, researchers from industry and academia work together. Thepolicy orientation toward business needs becomes also visible in measures againstthe expected labor shortage in the fields of engineering and natural science (reformof curricula to increase their attractiveness, longer financial support to students).
At the metropolitan level, the improvement of the business environment to stim-ulate innovative activities has a high priority. An outstanding example is the Kistascience park, in which industry and public research institutes are linked closelytogether. Kista’s focus is information technology (IT), and in 1998, the science parkwas ranked by the U.S. magazine Wired as the fifth best IT region in the world. Kistasucceeded in establishing a network between public research institutions and smalland large multinational companies (e.g., Ericsson, Nokia, Compaq, Microsoft,IBM, Hewlett-Packard, and Sun Microsystems).
Another positive example is the Business Arena Stockholm (BAS). BAS dem-onstrates that public entities can be flexible and creative. Here, twenty-four
Revilla Diez / METROPOLITAN INNOVATION SYSTEMS 83

municipalities of the provinces Stockholm and Upssala have established jointly aneconomic promotion agency. Besides the attraction of foreign investment, BASactively promotes firm start-ups in IT, medicine, and biotechnology. BAS offers awide spectrum of business services free of charge to create a perfect businessenvironment.
Undoubtedly, the metropolitan innovation system of Stockholm is a positiveexample of the advantages of innovation networking, resulting in an improvedcompetitiveness, higher innovativeness, and dynamic economic performance.Although cooperation between industry and public research institutes cannot beforced, the Stockholm experience might be motivating other firms and regions tofollow with a similar approach.
REFERENCES
Acs, Z., D. Audretsch, and M. Feldman. 1991. Real effects of academic research: A comment. AmericanEconomic Review 81: 363-67.
———. 1994. R&D spillovers and recipient firm size. The Review of Economics and Statistics 76:336-40.
Acs, Z., F. FritzRoy, and I. Smith. 2001. High technology employment and R&D in cities: Heterogeneityvs specialization. Annals of Regional Science. Forthcoming.
Anselin, L., A. Varga, and Z. Acs. 1997. Local geographic spillovers between university research andhigh technology innovations. Journal of Urban Economics 42: 422-48.
Audretsch, D. B., and M. P. Feldman. 1999. Innovation in cities: Science-based diversity, specializationand localized competition. European Economic Review 43: 409-29.
Beise, M., and H. Stahl. 1999. Public research and industrial innovations in Germany. Research Policy28: 397-422.
BMBF. 2000. Zur technologischen Leistungsfähigkeit Deutschlands. Zusammenfassender Endbericht,Bonn, Germany.
Braczyk, H. J., P. Cooke, and M. Heidenreich. 1998. Regional innovation systems. London: UCL Press.Brouwer, E., H. Budil-Nadvornikova, and A. Kleinknecht. 1999. Are urban agglomerations a better
breeding place for product innovation? An analysis of new product announcements. RegionalStudies 33: 541-49.
Camagni, R. 1991. Innovation networks: Spatial perspectives. New York: John Wiley.Charles, D., and J. Goddard. 1997. Higher education and employment—Linking universities with their
regional industrial base. Paper prepared for the thematic seminar on Territorial Employment Pacts,18-19 September, Ostersund, Sweden.
Cooke, P., and K. Morgan. 1993. The network paradigm: New departures in corporate and regionaldevelopment. Environment and Planning D 11: 543-64.
Cooke, P., and K. Morgan. 1998. The associational economy: Firms, regions, and innovation. Oxford,UK: Oxford University Press.
Crevoisier, O. 1998. Innovation and the city. In Making connections—Technological learning andregional economic change, edited by E. J. Malecki and P. Oinas, 61-78. Aldershot, UK: Ashgate.
Davelaar, E. J., and P. Nijkamp. 1989. The role of metropolitan milieu as an incubation center for techno-logical innovation: A Dutch case study. Urban Studies 26: 517-25.
De Bresson, C., and F. Amesse. 1991. Networks of innovators: A review and introduction to the issue.Research Policy 20: 363-79.
Edquist, C. 1997. Systems of innovation. Technologies, institutions and organizations. London: Pinter.
84 INTERNATIONAL REGIONAL SCIENCE REVIEW (Vol. 25, No. 1, 2002)
Eurostat. 1999. Sechster periodischer Bericht über die sozio-ökonomische Lage und Entwicklung derRegionen der Europäischen Union, Amt für amtliche Veröffentlichungen der EuropäischenGemeinschaften, Luxembourg.
Ewers, H. J., and R. Wettmann. 1980. Innovation-oriented regional policy. Regional Studies 14: 161-79.Fischer, M. F., J. Revilla Diez, F. Snickars, and A. Varga. 2001. Metropolitan systems of innova-
tion—Theory and evidence from three metropolitan regions in Europe. Berlin, Germany: Springer.Freeman, C., and L. Soete. 1997. The economics of industrial innovation. 3d ed. London: Pinter.Fritsch, M., K. Koschatzky, L. Schätzl, and R. Sternberg. 1998. Regionale innovationspotentiale und
innovative netzwerke. Raumforschung und Raumordnung 4: 288-98.Harrison, B., M. R. Kelley, and J. Gant. 1996. Innovative firm behaviour and local milieu: Exploring the
intersection of agglomeration, firm effects and technological change. Economic Geography 79:233-58.
Howells, J. 1983. Filter-down theory: Location and technology in the UK pharmaceutical industry. Envi-ronment and Planning A 15: 147-64.
Hudson, R. 1999. “The learning economy, the learning firm and the learning region”: A sympathetic cri-tique of the limits to learning. European Urban and Regional Studies 6: 59-72.
Huggins, R. 1997. Competitiveness and the global region: The role of networking. In Innovation, net-works and learning regions, edited by J. M. Simmie. London: Jessica Kingsley.
Jacobs, J. 1969. The economy of cities. New York: Random House.Lakshmanan, T., and M. Okumura. 1995. The nature and evolution of knowledge networks in Japanese
manufacturing: Papers in regional science. The Journal of the RSAI 74: 63-86.Lundvall, B.-Å. 1992. National systems of innovation: Towards a theory of innovation and interactive
learning. London: Pinter.Malecki, E., and P. Oinas. 1998. Making connections—Technological learning and regional economic
change. Aldershot, UK: Ashgate.Maskell, P., H. Eskelinen, I. Hannibalsson, A. Malmberg, and E. Vatne. 1998. Competitiveness, local-
ised learning and regional development. London: Routledge.Nelson, R. 1993. National innovation systems—A comparative analysis. Oxford, UK: Oxford Univer-
sity Press.Organization for Economic Cooperation and Development. 1999. Benchmarking the knowledge base
economy. Paris: Organization for Economic Cooperation and Development.Revilla Diez, J. 2000. The importance of public research institutes in innovative networks. Empirical
results from the metropolitan innovation systems Barcelona, Stockholm and Vienna. EuropeanPlanning Studies 8: 451-64.
Shefer, D., and A. Frenkel. 1998. Local milieu and innovations: Some empirical results. The Annals ofRegional Science 32: 185-200.
Sternberg, R. 1998. Technologiepolitik und High-Tech Regionen-ein internationaler Vergleich. 2d ed.Hamburg, Germany: Lit-Verlag.
Suarez-Villa, L., and M. M. Fischer. 1995. Technology, organization and export-driven research anddevelopment in Austria’s electronics industry. Regional Studies 29: 19-42.
Varga, A. 1998. University research and regional innovation: A spatial econometric analysis of aca-demic technology transfers. Boston: Kluwer.
Revilla Diez / METROPOLITAN INNOVATION SYSTEMS 85

INTERNATIONAL REGIONAL SCIENCE REVIEW (Vol. 25, No. 1, 2002)Fritsch / KNOWLEDGE PRODUCTION FUNCTION APPROACH
MEASURING THE QUALITY OF REGIONAL
INNOVATION SYSTEMS: A KNOWLEDGE
PRODUCTION FUNCTION APPROACH
MICHAEL FRITSCH
Technical University Bergakademie Freiberg, Faculty of Economicsand Business Administration, Freiberg, Germany, [email protected]
This article deals with applying the knowledge production function approach to the measuringand the comparison of the quality of regional innovation systems. It is argued that anembeddedness in a well-functioning innovation system should result in a relatively high propen-sity to innovate and a high productivity of efforts in research and development (R&D). Based ondata for eleven European regions, the author has found a number of such statistically significantdifferences between the manufacturing firms in these regions. Interregional differences in theproductivity of R&D activities correspond to some degree with a center-periphery paradigm,which can be found in the literature. Obviously, there exist considerable agglomeration econo-mies that are conducive to R&D activities.
LOCATION AND RESEARCH AND DEVELOPMENT ACTIVITIES
The notion of a regional innovation system is based on the assumption that loca-tion and spatial proximity matter for innovation activities (Cooke, Uranga, andEtxebarria 1997; Cooke 1998). There have been a number of approaches to investi-gate the impact of regional conditions on the innovation of research and develop-ment (R&D) activities of private firms empirically. However, most attempts thattried to find significant regional difference with regard to innovation activities havemore or less failed.1 There are several possible reasons that may be responsible forsuch a result. One main obstacle for an empirical investigation into regional differ-ences of R&D activities could be the lack of appropriate data. Another shortcomingis unclear methodology with regard to the assessment of effects of location. Inmany cases, multivariate models for the impact of a number of factors on innova-tion activities are specified more or less ad hoc, with regional dummies included asa measure of regional effects. The test statistics for these regional dummy variablesthen stand for the significance of a locational effect.
In this contribution, an approach to measure the quality of a regional innovationsystem on the basis of knowledge production functions will be discussed. By apply-ing this approach to data for eleven European regions, it will be shown that
INTERNATIONAL REGIONAL SCIENCE REVIEW 25, 1: 86–101 (January 2002)
© 2002 Sage Publications

statistically significant differences in the quality of regional innovation systemsexist that have an impact on the efficiency of R&D activities. In the next section, thebasic hypothesis concerning the impact of the regional innovation system on R&Dis presented in some detail. The third section then deals with the measurement ofthe quality of a regional innovation system by a knowledge production function. Itfollows a brief description of the database of the empirical analysis (fourth section).Estimation results are presented in the fifth section and, finally, some conclusionsare drawn (final section).
DIFFERENCES IN THE WORKABILITY
OF REGIONAL INNOVATION SYSTEMS
In recent years, the system of innovation approach has been increasingly appliedto the analysis of innovation activities in both a national and a regional context(Cooke 1998; Lundvall 1992; Edquist 1997). The system of innovation approachemphasizes the importance of labor division for innovation processes and tries toaccount for the contributions of the different actors or institutions to innovation out-put. Regional systems of innovation may constitute an adequate approach for theanalysis of innovation activities if spatial proximity matters, and the effect of cer-tain influences is limited to a particular region. The main groups of actors in aregion that may have an impact on the innovation activities of a firm are other pri-vate firms, public research institutions, supportive services, and the regionalworkforce. A key hypothesis in the systems of innovation literature states that it isnot the mere presence of such actors or institutions—the elements of the innovationsystem— that has an effect on the division of innovative labor in a region. Rather, itis the interaction, the density, and the quality of the network between these elementsthat is decisive for the impact of location in a certain region on innovation activity.
Relationships with other actors may affect R&D activities of a certain firm orresearch institution in a number of ways. One form of such influences is knowledgespillovers, that is, the flow of relevant knowledge from other actors that may beassociated with all kinds of interaction. One important medium for such spilloversof knowledge may be the labor market, particularly the inflow of workers from edu-cation institutions (e.g., universities) into private firms and the fluctuation ofemployees between different employers. Other possible media for knowledgespillovers are cooperative relationships, publications, and purchased goods and ser-vices. A further important effect of relationships with other actors that may be con-ducive to R&D can be a high level of outsourcing and division of innovative labor.Such a relatively high degree of labor division constitutes an important attribute ofmany so-called industrial districts, a certain kind of regional innovation system thathas been extensively dealt with in the literature.2 Division of innovative labor mayallow those firms that are members of the network to benefit from the advantages ofmarket allocation as compared to the internal provision of the different elements of
Fritsch / KNOWLEDGE PRODUCTION FUNCTION APPROACH 87

an R&D process within a hierarchy.3 Therefore, one can expect relatively high pro-ductivity of R&D activities if they are characterized by a high degree of interactionand specialization.
Because in most cases contracts on R&D activities cannot be completely speci-fied, the respective relationships represent more than just impersonal “spot-market”interaction and may necessitate face-to-face contacts from time to time (see Nohriaand Eccles 1992). Spatial proximity may, therefore, be very conducive to suchforms of interaction. Intensive contacts between the actors involved in a division ofinnovative labor may stimulate a high level of knowledge spillovers between theseactors. Because outsourcing certain tasks of the innovation process necessitates theavailability of suppliers that are able to fulfill these tasks, a rich supply of comple-mentary firms and research institutions in the region may be rather conducive toR&D. Another element of a location that may be highly relevant for innovationactivities is a diversified labor market that provides appropriate qualifications. Forthese reasons, a basic hypothesis in the respective literature suggests that the level,as well as the success or efficiency, of R&D activity is higher in the center than inmore remote areas or in regions characterized by a relatively low degree of agglom-eration, the periphery (for a brief overview, see Fritsch 2000).4
All of these influences can stimulate innovation activities in two ways. Oneeffect may be that the availability of inputs makes certain innovation projects possi-ble that would otherwise not be started or accomplished. Therefore, a well-workinginnovation system should be characterized by a relatively high share of innovatingfirms and a relatively high level of R&D output in these firms. A second possibleeffect of a local environment is that it stimulates a high degree of labor division inthe field of innovation activities resulting in a relatively high efficiency or produc-tivity of innovation processes.
THE KNOWLEDGE PRODUCTION FUNCTION
The concept of a knowledge production function has been introduced byGriliches (1979) for measuring the contribution of R&D and knowledge spilloversto productivity growth. The basic assumption states that the output of the innova-tion process represents a result of R&D capital or investment, that is,
R&D output = f (R&D input). (1)
Taking the Cobb-Douglas production function as a framework, the basic relation-ship is
R&D output = a R&D inputb, (2)
88 INTERNATIONAL REGIONAL SCIENCE REVIEW (Vol. 25, No. 1, 2002)

with the term a representing a constant factor and b giving the elasticity by whichR&D output varies in relation to the input to the R&D process. If the elasticity valueequals 1, a 100 percent increase in R&D expenditure would lead to a doubling of in-novative output. An elasticity value lower than 1 indicates that innovative outputdoes not rise in proportion to R&D input. Taking the natural logarithms of bothsides leads to
ln R&D output = ln a + b ln R&D input. (3)
This equation can be estimated by standard regression methods.The slope of the knowledge production function represents the output elasticity
of R&D input. This elasticity may be interpreted as a measure of the productivity ofthe inputs to the innovation process, indicating the efficiency of R&D activities andthereby the quality of the innovation system in a region. In particular, this elasticityshould increase as the quality of inputs to the R&D process is improving and as thespillovers stemming from the R&D activities of other actors in the region (whetherthey are public research institutions or private sector firms) become more pro-nounced. Differences in output elasticities between regions indicate the effects oflocational conditions not explicitly accounted for in the empirical model on the effi-ciency of R&D processes. For example, if variables for regional spillover pools orfor cooperation with other firms or institutions are included in the model, the outputelasticity measures those influences that are not explained by these variables (seeFritsch and Franke 2000 for examples). Thus, differences of output elasticitiesbetween regions signify diverging locational conditions for R&D, but they tell usnothing about the causes of these effects. All we know in this respect is that the dif-ferences do not result from the variables in the empirical model. However, one caninvestigate the causes for interregional differences by including respective vari-ables. Note that the output elasticity is dimensionless and cannot, therefore, beaffected by a difference of price levels between the regions or by the exchange ratesin case of an international comparison.
The constant term of the knowledge production function has the same dimen-sion as the indicator of R&D output. If the success of R&D activities is measured inreal terms (e.g., number of patents, number of new products), the estimates for theconstant are also unaffected by the exchange rates or the differences in price levelsso that a comparison between regions can neglect such factors. The interpretation ofthe constant term, however, is somewhat delicate. If the number of innovations isused as an indicator for the success of R&D activities, the constant term denoteshow many innovations have been generated without a corresponding R&D inputduring the period in which R&D input was measured. Assuming that the generationof an innovation necessitates some R&D input, there are two possible explanationsfor the existence of a positive constant term. One explanation could be that therespective innovation was completely the result of knowledge spillovers from other
Fritsch / KNOWLEDGE PRODUCTION FUNCTION APPROACH 89

sources, without any R&D effort on the part of the firm that is supposed to have gen-erated it. In this case, the constant term of the knowledge production function repre-sents those innovations that are “falling from heaven” on a certain firm. A secondpossible explanation has to do with the measurement of the input to the innovationprocess. The key input factor to this process, knowledge, is cumulative in character,so that innovation is based on a stock of knowledge capital. In practice, we can mea-sure this knowledge stock only incompletely. The best that we might know is theR&D effort, that is, the investment into the knowledge stock within a certain timeperiod. In many data sets available for an empirical analysis of innovation activities,we cannot be entirely sure if R&D investment is properly defined and relates to thatpart of the knowledge stock that was relevant for the innovation output measured.Moreover, information on an R&D investment that was made long ago is hardlyavailable. Therefore, a positive constant term of the knowledge production functionmay be an indication that the innovation was not based on current R&D investmentbut on the existing stock of “old” knowledge, which could not be measured. In thiscase, the constant term of the knowledge production function represents amisspecification of the input variable.
As long as the data underlying an interregional comparison of knowledge pro-duction functions are comparable and have about the same bias, the differences ofthe absolute term of the knowledge production function may be seen as an indica-tion of how much the innovation output is based on an older stock of knowledge.Therefore, if innovation activities are path dependent, a relatively low value of theconstant term can be expected if the respective technological paradigm is relativelyyoung.5 This is to the extent that not much old knowledge exists that is relevant forinnovation activities along the new path or if the technological path has beenchanged recently. The latter example is the case for the postsocialist countries ofEastern Europe, in the course of their transformation to a market economy (seeFritsch and Werker 1999 for a detailed exposition). These factors may also explaindifferences of the constant term between knowledge production functions for cer-tain industries.
DATABASE AND INDICATORS
The empirical analyses reported here are based on data gathered by sendingquestionnaires to manufacturing enterprises in eleven European regions. Thisinquiry was carried out in two phases between 1995 and 1998 and resulted inapproximately 4,300 usable questionnaires, which constitute the data set. Thequestions concentrated on innovation-related issues but also raised some generalinformation on each enterprise such as the number of employees, the amount ofturnover, characteristics of the product program, and so forth (for a more detaileddescription of the data set, see Sternberg 2000).
Four of the eleven regions (see Figure 1) in which the inquiry was carried out aredominated by large cities of international importance. These regions are Barcelona,
90 INTERNATIONAL REGIONAL SCIENCE REVIEW (Vol. 25, No. 1, 2002)

Rotterdam, Stockholm, and Vienna, with the two latter cities serving as nationalcapitals. Two of the regions in our sample, Saxony and Slovenia, have been undersocialist regime until 1990-91 and are faced with the need to more or less com-pletely reorganize their innovation system. Baden, one of the two West Germanregions in the sample, is said to have a relatively well-functioning innovation sys-tem (Cooke 1996; Heidenreich and Krauss 1998). In Hanover, the other West Ger-man region, there is a relatively high share of large-scale industries (e.g., automo-biles, steel), while the proportion of employment in new innovative industries iscomparatively low. The French border region of Alsace, which is adjacent to theBaden region in Germany, represents a relatively rural area. The second Frenchregion, Gironde, has a significant share of employment in high-tech industries thatare well-integrated into the global division of labor. Finally, South Wales representsan old industrialized region that has experienced a considerable employment shiftfrom old declining industries to new high-tech industries in recent years (cf. Cooke1998). Due to the great variety with regard to economic development and locationalconditions of the regions in our sample, we may expect that if location matters forR&D, we should find corresponding differences in the data.6 Applying a center-periphery paradigm (cf. Differences in the Workability of Regional Innovation Sys-tems section) to this set of regions, Barcelona, Rotterdam, Stockholm, and Viennacan be classified as centers, while Alsace, Gironde, Saxony, Slovenia, and SouthWales may represent the periphery.
Our data set provides two indicators for the output volume of R&D activities: thenumber of new products introduced in the three preceding years and the number ofinventions registered for patenting during the same time period. However, attemptsto estimate models with the number of new products as a dependent variable haveled to rather poor results for most of the regions. In many cases, not only was theshare of explained variance rather low, but also the whole model proved not to bestatistically significant at the .05 level. Apparently, the number of new products isnot a good measure for the volume of R&D output. The analysis has, therefore,been limited to the number of inventions registered for patenting, which serves asthe indicator for the output of R&D activities. R&D expenditures in the precedingthree years7 and the number of R&D personnel at the beginning of this three-yearperiod have been used as alternative measures of R&D input. Because R&D expen-diture includes inputs to the R&D process that are purchased from other firms, itrepresents a more comprehensive measure than the number of R&D personnel.
To avoid the problem of having too many zero values in the model,8 the estima-tions were restricted to those enterprises that had registered at least one inventionfor patenting during the preceding three years. A patent is only granted for a signifi-cant invention that is new on a worldwide scale. For this reason, counting only firmsthat have patent applications in the sample implies that the estimations are basedsolely on information from enterprises that are performing near the technologicalfrontier. This approach has the great advantage that the output of the innovationprocess is somewhat standardized and that innovation processes of about the same
Fritsch / KNOWLEDGE PRODUCTION FUNCTION APPROACH 91

level of novelty are compared. Six dummies control for the influence of the differ-ent industry sectors the firms belong to. Therefore, interregional differences of out-put elasticities found in the analysis should not be a result of diverging industrystructures.
ESTIMATION RESULTS
Interregional differences of knowledge production functions have been investi-gated in two ways. In a first approach, the model was estimated for each of theregions separately. Comparing the estimated coefficients allows for the identifica-tion of differences with regard to innovation activities between the regions. In a sec-ond approach, all regions were included in one model, with dummy variables
92 INTERNATIONAL REGIONAL SCIENCE REVIEW (Vol. 25, No. 1, 2002)
FIGURE 1. The Spatial Framework Analysis

testing for regional deviations. A main difference between these two approachesconcerns the industry dummies that are included to control for sector effects. Whenrunning the model for each of the regions separately, the industry dummies repre-sent the influence of affiliation to a particular industry on innovation activities in acertain region. These industry effects may deviate between the regions. However, ifall regions are included in one model, it is implicitly assumed that the industryeffects are identical in all of the regions. In such an approach, the results for regionaldummy variables may be influenced by diverging effects of affiliation to a certainindustry in the regions under inspection. This could provide an explanation for dif-ferences in the assessment of the regional impact on innovation activities attainedby the two approaches applied. A main practical advantage of an empirical modelthat includes information for more than one region over estimating models for theindividual regions is that fewer cases are needed to attain a statistically significantestimate for the regional impact. The reason is that in a model for more than oneregion, the observations of a certain region are less needed for estimating the indus-try effects compared to assessing these impacts for each region separately. This isdue to the fact that in a multiregion approach, the coefficients for industry dummiescan be estimated using the information from the other regions. Therefore, this typeof test is statistically more efficient than estimating a separate model for eachregion.
Table 1 depicts the constant terms and the coefficients for the output elasticity ofR&D input in the different regions, which was calculated by running the model foreach region separately. Because the dependent variable of the model, the number ofpatents, has the character of a count variable, negative-binomial regression hasbeen applied as the estimation procedure. Using this method implies the hypothesisthat the number of patents is generated by a Poisson-like process. Compared to aPoisson regression, negative binomial regression is based on somewhat more gen-eral assumptions and allows for a greater variance than is assumed for a true Pois-son process (Green 1997, 931-39). As an example of the output of the completemodel, the coefficients for the region of Saxony are given in the table in the appen-dix. Baden serves as the reference region for testing for significance of differencesof the estimated elasticities, as well as of the constants of the regressions. Unfortu-nately, no statistically significant estimates of a region-specific knowledge produc-tion function could be found for Gironde or Slovenia, presumably due to the rela-tively small number of observations that our sample provides for these regions.9
Looking first at the elasticities based on R&D expenditure, the values rangebetween 0.35 and 0.62, indicating that a certain increase in R&D input leads to aless than proportionate rise in R&D output. The lowest value of the output elasticitywith regard to R&D expenditure is found in South Wales. In contrast, three of thefour regions in our sample dominated by large cities (Barcelona, Stockholm, andVienna) have relatively high estimated values of the elasticities. That the estimatefor Baden is in the upper range of values confirms assessments found in the litera-ture that characterize the innovation system in this region as relatively well
Fritsch / KNOWLEDGE PRODUCTION FUNCTION APPROACH 93

TA
BL
E 1
.E
stim
ates
of
the
Con
stan
t T
erm
and
of
Out
put
Ela
stic
ity
of R
esea
rch
and
Dev
elop
men
t (R
&D
) In
put
in t
he D
iffe
rent
Reg
ions
Num
ber
of P
aten
ts w
ith
Reg
ard
to R
&D
Exp
endi
ture
Num
ber
of P
aten
ts w
ith
Reg
ard
to R
&D
Em
ploy
men
t
Con
stan
tt-
valu
eE
last
icit
yt-
valu
eC
onst
ant
t-va
lue
Ela
stic
ity
t-va
lue
Bar
celo
na1.
14*/-
(2.1
1)0.
62**
/-(8
.35)
0.92
*/-(2
.22)
0.58
**/-
(6.2
7)R
otte
rdam
1.45
**/-
(6.4
4)0.
43**
/-(4
.92)
0.46
-/-
(1.8
6)0.
53**
/ *(5
.38)
Stoc
khol
m1.
82**
/-(1
1.06
)0.
52**
/-(9
.98)
0.51
*/-(2
.41)
0.61
**/-
(10.
42)
Vie
nna
2.01
**/-
(6.5
1)0.
59**
/-(5
.19)
0.65
-/-
(1.5
5)0.
57**
/-(3
.62)
Als
ace
1.02
**/ **
(4.4
1)0.
41**
/-(6
.19)
0.57
*/-(2
.17)
0.39
**/ *
(6.0
1)B
aden
1.75
**/-
(11.
45)
0.49
**/-
(7.6
8)0.
66**
/-(3
.21)
0.49
**(8
.96)
Gir
onde
.ns
.ns
Han
over
1.67
**/-
(8.1
1)0.
43**
/-(8
.00)
0.65
**/-
(2.8
4)0.
40**
/ **(7
.56)
Saxo
ny1.
62**
/-(1
0.24
)0.
42**
/-(7
.84)
0.39
*/-(1
.99)
0.44
**/ *
(7.9
0)Sl
oven
ia.n
s.n
sSo
uth
Wal
es1.
80**
/-(5
.15)
0.35
**/-
(5.1
5)0.
60-/
-1.
90)
0.51
**/ *
(3.3
8)
Not
e:T
heas
teri
sk(s
)bef
ore
the
slas
hde
note
(s)i
fthe
coef
fici
enti
ssig
nifi
cant
lydi
ffer
entf
rom
zero
;the
aste
risk
(s)a
fter
the
slas
hin
dica
te(s
)ift
heco
effi
cien
tiss
igni
fi-
cant
lydi
ffer
entf
rom
the
valu
esfo
rBad
en(χ
2te
st).
Asy
mpt
otic
t-va
lues
ofth
eco
effi
cien
tapp
eari
npa
rent
hese
s.ns
=no
stat
istic
ally
sign
ific
ante
stim
ate
ofth
em
odel
coul
d be
atta
ined
.*p
= .0
5. *
*p=
.01.
94

functioning or efficient (see, for example, Heidenreich and Krauss 1998). Appar-ently, the pattern of estimated coefficients for the output elasticities of R&D inputcorresponds to some degree with a center-periphery pattern of R&D productivity,indicating relatively favorable locational conditions for innovation activities in theagglomerations. However, none of the calculated elasticities differ from the valuefor Baden on the .05 level of significance. Yet, if South Wales is taken as a refer-ence, then the elasticities for Barcelona and Vienna prove to be higher at the .05 sig-nificance level.
The estimates of output elasticities based on R&D employment as a measure ofinput fall in about the same range (between 0.39 and 0.61; see Table 1) as the esti-mates based on R&D expenditure. Compared to the elasticities estimated usingR&D expenditures as an indicator for R&D input, some differences in the resultscan be found (particularly for Rotterdam, Stockholm, and South Wales), but formost of the regions, the estimates attained with the two alternative input measureslie relatively close together. Again, the overall pattern of the estimates for the differ-ent regions corresponds to some degree with a center-periphery hypothesis oflocational conditions for R&D activity. For the estimates of output elasticitiesbased on R&D employment, there are a number of statistically significant differ-ences when compared to the value for Baden. While the output elasticity for Rotter-dam is significantly higher than for Baden, the values for Hanover, Alsace, and Sax-ony turn out to be significantly lower.
We also find a number of differences between the regions with regard to the con-stant term of the model (see Table 1). In the estimates based on R&D expenditure asa measure of R&D input, however, these differences may be influenced by theexchange rates that were applied for converting the original values into a commoncurrency. The respective results are, therefore, dubious. Indeed, the regional patternof the estimates for the constant term based on R&D expenditure differs consider-ably from the pattern attained when using R&D employment as a measure of theinput to the innovation process. In the estimations with R&D employment, we findthe by far lowest value of the constant term for Saxony. This indicates a relativelypoor ability of firms to exploit a longer existing knowledge stock. This may beexplained with the more or less complete reorganization of the innovation system inthis former socialist region. Even more important, a considerable part of the knowl-edge stock generated under socialist regime had to be depreciated in the last yearsbecause it proved to be no longer useful in the framework of an open market econ-omy (cf. Fritsch and Werker 1999). Although the highest estimate for the constantterm by far is found for the enterprises in Barcelona when using R&D employmentas input indicator, there is no clear pattern according to a center-periphery para-digm.10 This conclusion also holds for the results based on R&D expenditure as ameasure for innovative input, where we find the highest estimates of the constantterm for Vienna and Stockholm (but also for South Wales and Baden) and a rela-tively low value for Barcelona.
Fritsch / KNOWLEDGE PRODUCTION FUNCTION APPROACH 95
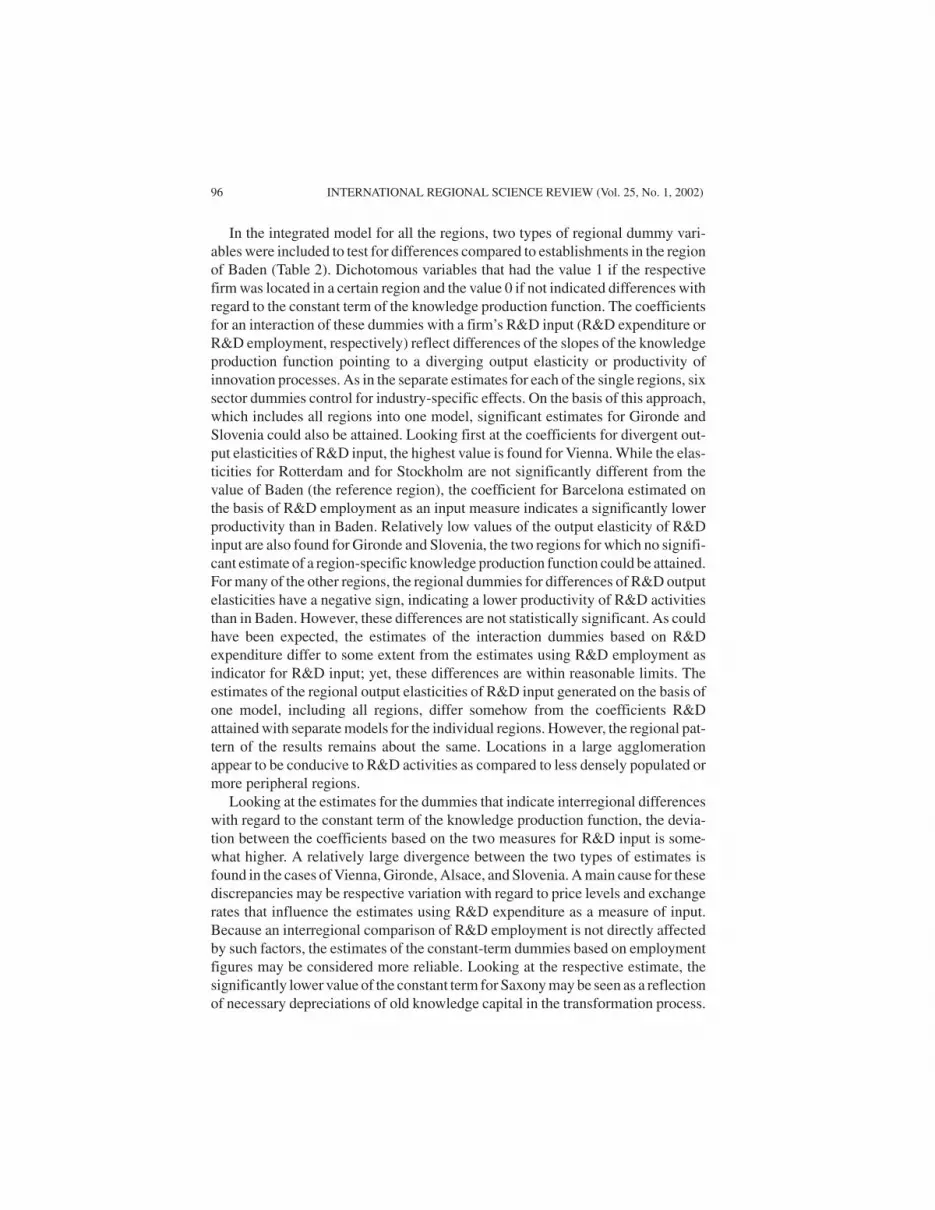
In the integrated model for all the regions, two types of regional dummy vari-ables were included to test for differences compared to establishments in the regionof Baden (Table 2). Dichotomous variables that had the value 1 if the respectivefirm was located in a certain region and the value 0 if not indicated differences withregard to the constant term of the knowledge production function. The coefficientsfor an interaction of these dummies with a firm’s R&D input (R&D expenditure orR&D employment, respectively) reflect differences of the slopes of the knowledgeproduction function pointing to a diverging output elasticity or productivity ofinnovation processes. As in the separate estimates for each of the single regions, sixsector dummies control for industry-specific effects. On the basis of this approach,which includes all regions into one model, significant estimates for Gironde andSlovenia could also be attained. Looking first at the coefficients for divergent out-put elasticities of R&D input, the highest value is found for Vienna. While the elas-ticities for Rotterdam and for Stockholm are not significantly different from thevalue of Baden (the reference region), the coefficient for Barcelona estimated onthe basis of R&D employment as an input measure indicates a significantly lowerproductivity than in Baden. Relatively low values of the output elasticity of R&Dinput are also found for Gironde and Slovenia, the two regions for which no signifi-cant estimate of a region-specific knowledge production function could be attained.For many of the other regions, the regional dummies for differences of R&D outputelasticities have a negative sign, indicating a lower productivity of R&D activitiesthan in Baden. However, these differences are not statistically significant. As couldhave been expected, the estimates of the interaction dummies based on R&Dexpenditure differ to some extent from the estimates using R&D employment asindicator for R&D input; yet, these differences are within reasonable limits. Theestimates of the regional output elasticities of R&D input generated on the basis ofone model, including all regions, differ somehow from the coefficients R&Dattained with separate models for the individual regions. However, the regional pat-tern of the results remains about the same. Locations in a large agglomerationappear to be conducive to R&D activities as compared to less densely populated ormore peripheral regions.
Looking at the estimates for the dummies that indicate interregional differenceswith regard to the constant term of the knowledge production function, the devia-tion between the coefficients based on the two measures for R&D input is some-what higher. A relatively large divergence between the two types of estimates isfound in the cases of Vienna, Gironde, Alsace, and Slovenia. A main cause for thesediscrepancies may be respective variation with regard to price levels and exchangerates that influence the estimates using R&D expenditure as a measure of input.Because an interregional comparison of R&D employment is not directly affectedby such factors, the estimates of the constant-term dummies based on employmentfigures may be considered more reliable. Looking at the respective estimate, thesignificantly lower value of the constant term for Saxony may be seen as a reflectionof necessary depreciations of old knowledge capital in the transformation process.
96 INTERNATIONAL REGIONAL SCIENCE REVIEW (Vol. 25, No. 1, 2002)

However, plausible explanations for the other significant constant-term dummiesappear to be more difficult to find.
Fritsch / KNOWLEDGE PRODUCTION FUNCTION APPROACH 97
TABLE 2. Results of Negbin-Regressions of a Knowledge Production Function with RegionalDummy Variables
Number of Patents with Number of Patents withRespect to R&D Expenditure Respect to R&D Employment
Constant 1.83** (15.78) 0.79** (5.14)R&D expenditure (ln) 0.51** (7.44) —Number of R&D employees (ln) — 0.50** (9.46)Industry dummies
Food, beverages, tobacco 0.59 (1.83) 0.51 (1.46)Textiles, clothing, leather –0.18 (0.045) –0.35 (1.01)Wood, paper, printing, publishing –0.21 (1.33) –0.09 (0.60)Mineral oil, chemicals, rubber,
plastics, stone, and so on 0.16 (1.27) 0.37** (3.12)Metal products, recycling 0.44** (3.15) 0.67** (4.87)Mechanical engineering, vehicles 0.15 (1.38) 0.17 (1.66)
Regional dummies for absolute termBarcelona 0.58** (3.48) 0.56** (2.83)Rotterdam –0.15 (0.71) –0.39 (1.41)Stockholm –0.34* (2.31) –0.66** (2.92)Vienna 0.04 (0.23) –0.57 (1.82)Alsace –0.52* (2.29) –0.06 (0.20)Gironde –0.77* (2.20) 0.49 (1.42)Hanover –0.07 (0.51) –0.03 (0.14)Saxony –0.30* (2.10) –0.61** (2.91)Slovenia –0.82** (3.48) 0.02 (0.06)South Wales 0.03 (0.12) –0.13 (0.37)
Regional dummies for R&D elasticityBarcelona –0.10 (1.11) –0.20* (2.20)Rotterdam –0.07 (0.55) 0.05 (0.36)Stockholm 0.01 (0.18) 0.14 (1.54)Vienna 0.20* (2.10) 0.48** (4.11)Alsace –0.07 (0.50) –0.12 (0.95)Gironde –0.61** (5.77) –0.56** (3.53)Hanover –0.12 (1.41) –0.13 (1.68)Saxony –0.07 (0.74) –0.01 (0.09)Slovenia –0.43** (3.37) –0.40** (2.84)South Wales –0.14 (1.15) 0.02 (0.10)
α .73** (16.71) .73** (16.62)Pseudo R2 .134 .127Probability χ2 0.00 0.00Number of cases 705 707
Note: Asymptotic t values of the coefficient appear in parentheses.*p = .05. **p = .01.

CONCLUSION
This contribution has demonstrated the application of the knowledge productionfunction approach for measuring the quality of regional innovation systems. Themain idea was that the output elasticity of R&D input, the slope of the knowledgeproduction function, can be interpreted as a measure for the productivity of innova-tion activities and that this productivity is affected by region-specific conditions.Output elasticity, as a measure for the productivity of R&D effort, has the advan-tage of being dimensionless. If the analysis is based on monetary figures (e.g., R&Dexpenditure), the estimates for output elasticity should not, therefore, be influencedby interregional differences in price levels or if regions in different currency areasare included by the underlying exchange rate. The estimates based on data foreleven European regions revealed significant differences with regard to R&D pro-ductivity between manufacturing firms in these regions. In accordance with a num-ber of theoretical models and the hypotheses that can be found in the literature, out-put elasticity of R&D input in manufacturing establishments tended to be relativelyhigh in the center as compared to the periphery. Obviously, there exist considerableagglomeration economies, which are conducive to R&D activities. However, rela-tively high values of output elasticity of R&D activities with regard to R&D inputcould also be found for some less urbanized regions, indicating that a certain degreeof agglomeration does not constitute a necessary condition for R&D activity to beconducted productively.
A number of statistically significant differences could also be found with regardto the constant term of the knowledge production function. Assuming that an inno-vation necessitates at least some R&D input, this constant term represents an errorin the measurement of the input to R&D activities. If information on R&D inputincluded in the analysis is restricted to a more recent period of time, then the abso-lute term of the knowledge production function may represent the importance ofolder knowledge for the output of the innovation process. In this case, relativelyhigh depreciations of knowledge capital caused by a change of the technologicalpath, for example, should lead to a relatively low value of the absolute term of theknowledge production function. This is indeed what could be found for the tworegions in the sample that have been under socialist regime until the late 1980s, Sax-ony and Slovenia. These two regions are now faced with the necessity of adjustingtheir innovation system to the demands of a market economy.
In total, we may conclude that the knowledge production function is a quite use-ful approach for comparing the quality of regional innovation systems in providinga simple measure for the productivity of R&D activities. However, innovation pro-cesses are quite complex and cannot be comprehensively assessed with a singleindicator. Therefore, not only one indicator but a whole number of measures shouldbe applied when comparing innovation activities between regions.11 Among such agroup of measures, output elasticity of R&D input can be relatively interesting.
98 INTERNATIONAL REGIONAL SCIENCE REVIEW (Vol. 25, No. 1, 2002)

Because the estimates for this measure are limited to information on innovatingfirms, indicators for the propensity to innovate might be a good complement.
APPENDIX
NEGATIVE BINOMIAL REGRESSIONS FOR THE NUMBER OF
PATENTS IN MANUFACTURING ENTERPRISES LOCATED IN SAXONY
Number of Patents with Number of Patents withRespect to R&D Expenditure Respect to R&D Employment
Constant 1.62** (10.34) 0.39* (1.99)R&D effort (ln) 0.42** (7.84) .—Number of R&D employees at
the beginning of designatedperiod (ln) .— — 0.44** (7.90)
Industry dummiesFood, beverages, tobacco –0.58 (1.11) –0.57 (0.92)Textiles, clothing, leather –0.86 (0.74) –1.03 (1.24)Wood, paper, printing, publishing –0.42 (1.04) –0.44 (1.05)Mineral oil, chemicals, rubber,
plastics, stone, etc. 0.14 (0.63) 0.23 (1.00)Metal products, recycling –0.50 (0.20) 0.22 (0.01)Mechanical engineering, vehicles 0.12 (0.65) 0.22 (1.14)
α .33** (5.02) .32** (4.73)Adjusted R2 .114 .128Probability χ2 0.00 0.00Number of cases 135 118
Note: Asymptotic t-values of the coefficient appear in parentheses.*p = .05. **p = .01.
NOTES
1. See, for example, Alderman and Fischer (1992); Brower, Budil-Nadvornikova, and Kleinknecht(1999); Kleinknecht and Poot (1992); Davelaar (1991); Davelaar and Nijkamp (1989); Meyer-Krahmer(1985); and Pfirrmann (1994). For a brief review of the evidence, see Fritsch (2000).
2. See, for example, Marshall (1920) and the contributions in Pyke, Becattini, and Sengenberger(1990).
3. For a detailed account of the different advantages that may emerge from an increased division ofinnovative labor, see Fritsch (2001).
4. In a broad sense, a region in the center may be defined as an easily accessible location character-ized by a relatively high density of population and economic activity. It has a relatively high rank in thespatial hierarchy. In contrast, regions in the periphery are lacking these properties. They are character-ized by relatively low density, poor accessibility, and rank relatively low in the spatial hierarchy.
Fritsch / KNOWLEDGE PRODUCTION FUNCTION APPROACH 99

5. Accordingly, a relatively low value for the absolute term of the knowledge production functioncan be expected for those industries that follow a relatively new technological path or paradigm, forwhich the relevant stock of older knowledge is relatively small. The conditions for innovation processesin such industries are also characterized as an entrepreneurial regime. See Winter (1984) and Audretsch(1995) for details.
6. For an overview of economic conditions and innovation activities in the different regions, seeFritsch (2000).
7. The original responses have been converted into the European Currency Unit, but as alreadymentioned, this should not affect the comparison of elasticities according to the approach chosen here.
8. A distribution of observations that is characterized by a relatively large number of cases at oneend violates basic assumptions underlying most standard estimation procedures.
9. The estimates for Gironde were based on data for thirteen R&D expenditures and eleven R&Demployment enterprises, respectively, with at least one patent application during the respective timeperiod. The estimates for Slovenia were based on thirty-one and thirty-five cases, respectively.
10. In the estimations based on R&D employment as a measure of innovative input, none of the con-stant terms were significantly different from the value for Baden. However, statistically significant dif-ferences of constant terms can be found if relatively extreme values are compared, for instance, thosefound for Saxony and Barcelona.
11. See Fritsch (2000) for a more detailed comparison of innovation activities in the regions underinspection here.
REFERENCES
Alderman, Neil, and Manfred M. Fischer. 1992. Innovation and technological change: An Austrian-British comparison. Environment and Planning A 24: 273-88.
Audretsch, David B. 1995. Innovation and industry evolution. Cambridge, MA: MIT Press.Brower, Erik, Hana Budil-Nadvornikova, and Alfred Kleinknecht. 1999. Are urban agglomerations a
better breeding place for product innovation? An analysis of new product announcements. RegionalStudies 33: 541-49.
Cooke, Philip. 1996. The new wave of regional innovation networks: Analysis, characteristics and strat-egy. Small Business Economics 8: 159-71.
Cooke, Philip. 1998. Introduction: Origins of the concept. In Regional innovation systems—The role ofgovernances in a globalized world, edited by Hans-Joachim Braczyk, Philip Cooke, and MartinHeidenreich, 2-25. London: UCL Press.
Cooke, Philip, Mikel Gomez Uranga, and Goio Etxebarria. 1997. Regional innovation systems: Institu-tional and organisational dimensions. Research Policy 26: 475-91.
Davelaar, Evert Jan. 1991. Regional economic analysis of innovation and incubation. Aldershot, UK:Avebury.
Davelaar, Evert Jan, and Peter Nijkamp. 1989. Spatial dispersion of technological innovation. A casestudy for the Netherlands by means of partial least squares. Journal of Regional Science 29: 325-46.
Edquist, Charles. 1997. Systems of innovation approaches—Their emergence and characteristics. InSystems of innovation—Technologies, institutions and organizations, edited by Charles Edquist,1-40. London: Pinter.
Fritsch, Michael. 2000. Interregional differences in R&D activities—An empirical investigation. Euro-pean Planning Studies 8: 409-27.
Fritsch, Michael. 2001. Innovation by networking: An economic perspective. In Innovation net-works—Concepts and challenges in the European perspective, edited by Knut Koschatzky,Marianne Kulicke, and Andrea Zenker, 25-34. Heidelberg, Germany: Physica.
100 INTERNATIONAL REGIONAL SCIENCE REVIEW (Vol. 25, No. 1, 2002)

Fritsch, Michael, and Franke Grit. 2000. Innovation, regional knowledge spillovers and R&D. WorkingPaper 2000/25, Faculty of Economics and Business Administration, Technical UniversityBergakademie Freiberg.
Fritsch, Michael, and Claudia Werker. 1999. Systems of innovation in transition. In Innovation and tech-nological change in Eastern Europe—Pathways to industrial recovery, edited by Michael Fritschand Horst Brezinski, 5-22. Cheltenham, UK: Elgar.
Green, William H. 1997. Economic analysis. 3d ed. New York: Prentice Hall.Griliches, Svi. 1979. Issues in assessing the contribution of R&D to productivity growth. Bell Journal of
Economics 10: 92-116.Heidenreich, Martin, and Gerhard Krauss. 1998. The Baden-Württemberg production and innovation
regime: Past successes and new challenges. In Regional innovation systems—The role of govern-ances in a globalised world, edited by Hans-Joachim Braczyk, Philipp Cooke, and MartinHeidenreich, 214-44. London: UCL Press.
Kleinknecht, Alfred, and Tom P. Poot. 1992. Do regions matter for R&D? Regional Studies 26: 221-32.Lundvall, Bengt-Ake. 1992. Introduction. In National systems of innovation: Towards a theory of inno-
vation and interactive learning, edited by Bengt-Ake Lundvall, 1-19. London: Pinter.Marshall, Alfred. 1920. Principles of economics. 8th ed. London: MacMillan.Meyer-Krahmer, Frieder. 1985. Innovation behaviour and regional indigenous potential. Regional
Studies 19: 523-34.Nohria, Nitin, and Robert G. Eccles. 1992. Face-to-face: Making network organizations work. In Net-
works and organizations: Structure, form, and action, edited by Nitin Nohria and Robert G. Eccles,288-308. Boston: Harvard Business School Press.
Pfirrmann, Oliver. 1994. The geography of innovation in small and medium-sized firms in West Ger-many. Small Business Economics 6: 141-54.
Pyke, Frank, Giacomo Becattini, and Werner Sengenberger, eds. 1990. Industrial districts andinter-firm co-operation in Italy. Geneva, Switzerland: International Institute for Labor Studies.
Sternberg, Rolf. 2000. Innovation networks and regional development—Evidence from the EuropeanRegional Innovation Survey (ERIS): Theoretical concepts, methodological approach, empiricalbasis and introduction to the theme issue. European Planning Studies 8: 389-407.
Winter, Sidney G. 1984. Schumpeterian competition in alternative technological regimes. Journal ofEconomic Behavior and Organization 5: 287-320.
Fritsch / KNOWLEDGE PRODUCTION FUNCTION APPROACH 101

INTERNATIONAL REGIONAL SCIENCE REVIEW (Vol. 25, No. 1, 2002)Oinas, Malecki / EVOLUTION OF TECHNOLOGIES
THE EVOLUTION OF TECHNOLOGIES
IN TIME AND SPACE: FROM NATIONAL
AND REGIONAL TO SPATIAL
INNOVATION SYSTEMS
PÄIVI OINAS
Department of Economics, Erasmus University,Rotterdam, the Netherlands, [email protected]
EDWARD J. MALECKI
Department of Geography, The Ohio State University,Columbus, [email protected]
Complementing existing approaches on national innovation systems (NISs) and regional inno-vation systems (RISs), the proposed spatial innovation systems (SISs) approach incorporates afocus on the path-dependent evolution of specific technologies as components of technologicalsystems and the intermingling of their technological paths among various locations throughtime. SISs utilize spatial divisions of labor among several specialized RISs, possibly in more thanone NIS. The SIS concept emphasizes the external relations of actors as key elements that tran-scend all existing systems of innovation. The integrating role of these relations remains inade-quately understood to date. This poses a challenge for future research.
This article aims to understand technological development from a perspective thatboth integrates and transcends contemporary discussions about national innovationsystems (NISs) and regional innovation systems (RISs). It approaches technologi-cal development as path-dependent processes at the level of specific technologiesthat evolve in time and space. These technologies are components, or subsystems,of broader technological systems, which makes them interdependent. Furthermore,technological development is spatially bound; technological paths are shaped bythe social relations involved in their production as well as consumption (in pro-cesses of adoption, adaptation, and rejection) and the interplay between them. Thisprompts us to pay attention to the role of many RISs (and possibly NISs) in shapingthe various components of technological systems: to look at the historical coevolu-tion of interdependent technological paths. Their evolution is inseparable from the
INTERNATIONAL REGIONAL SCIENCE REVIEW 25, 1: 102–131 (January 2002)
The authors wish to thank Stephan Schüller and two anonymous referees for perceptive comments. PäiviOinas is grateful for the financial support of the J&A Wihuri Foundation, Finland, and the Dutch CentralBoard for the Retail Trade.
© 2002 Sage Publications

socioeconomic circumstances in the places in which they take place, as well as thebroader competence endowments in their surrounding regions and nations. Tech-nological frontiers create their specific “time geographies” as they evolve so as totake advantage of such circumstances. This makes us observe both the simulta-neous evolution of technological paths in many RISs or NISs and their occasionalmovements in space. Conjointly, these are viewed as forming spatial innovationsystems (SIS), which consist of “overlapping and interlinked national, regional andsectoral systems of innovation which all are manifested in different configurationsin space” (Oinas and Malecki 1999, 10). Although portions of this argument havebeen made previously, the notion of an SIS has not been elaborated on in muchdetail. This article aims to make some progress in this regard.
Much of the thinking on innovation systems in economic geography andregional science is centered on localities or regions. Different places are viewed asmanifesting systems—industrial, technological, sociocultural, or otherwise. Whatwe wish to suggest in our approach, in contrast, is that innovation systems areworked out differently in space; they exhibit different spatial configurations. Theymay originate in one place, but often they are spread beyond local, regional, andeven national borders. Technological evolution occurs through the interplaybetween elements of national, subnational, and transnational innovation systemsthat produce flows of innovation and are to different degrees able to keep up withstate-of-the-art practices in different technological frontiers. Central in the SISapproach are (1) the external relations of actors and (2) the variability of the relativeweights of different places or regions as center points of particular technologicalpaths in time. With these emphases, the SIS approach offers a complement to muchof the literature on localized learning that emerged toward the end of the 1990s andassumed that proximate relationships are most conducive for learning and innova-tion (see Oinas 1999, 2000). This assumption has largely prevailed even though ithas been observed that production or innovation systems are not necessarily delim-ited to localities or regions (see, e.g., Storper 1996, 787; Storper 1997, 71; Aminand Cohendet 2000). This issue seems to be drawing more attention in most recentscholarship, however (see Bunnell and Coe 2001).
The SIS approach also complements the earlier literature that paid abundantattention to industrial districts, new industrial spaces, and other specialized indus-trial agglomerations. While this literature highlighted the specialization of thoseregions, the SIS approach pays attention to the possibility of various types ofregions being part of SISs, whether diverse or specialized. As a related matter,regions whose economies are associated mainly with technologically mature prod-ucts and processes may also serve a role in SISs in addition to technologically moreadvanced ones.
The problem is that innovation systems are complex entities, and it is difficult tofind clear patterns that would structure our observations on the relative importanceof the local versus translocal elements in them. What this article aims to do, there-fore, is to open up this complexity for further exploration. While the suggested SIS
Oinas, Malecki / EVOLUTION OF TECHNOLOGIES 103

approach could be applied to innovation in various types of economic activities(such as organizational, financial, and design activities), the discussion in this arti-cle is delimited to technological innovations.
The article proceeds as follows. We first discuss briefly why the prevalent litera-tures on NISs and RISs do not provide a full understanding of how technologicalinnovation evolves. We then outline the SIS approach. In subsequent sections there-after, we discuss key elements of SISs: technological paths, types of RISs involved,proximate and distant relations between actors, and firms and individuals as con-nectors in SISs. We conclude by reflecting on the main argument of the article andby outlining major challenges related to further theoretical and empirical researchin the SIS framework.
LIMITATIONS OF THE NIS AND RIS APPROACHES
The SIS view is a complement to the existing concepts of NISs and RISs. TheNIS and RIS approaches largely center on the conditions for innovative activity in aterritory—nation or region—at a particular point in time. We propose instead that ithelps to put these discussions in a broader perspective by providing an approach tolook at the intermingling of technological trajectories among various locationsthrough time.
The NIS approach (Freeman 1987, 1995; Nelson 1993; Edquist 1997) generallyfocuses on institutional characteristics of innovation systems at the national scaleand privileges those at the expense of other scales. The effect of an NIS is seen in theaccumulation of specific types and levels of competences in a country. Besides theprivate sector, this body of research recognizes the involvement of the public sectorin innovation, both directly (via universities and government laboratories) and indi-rectly (by creating incentive structures, education and training systems, and pro-moting exports through fiscal, monetary, and trade policy packages) (Patel andPavitt 1994; Nelson 1993). Other factors also can be seen as influencing the emer-gence of distinct NISs, such as national culture and its effect on policy (Roobeek1990), business management systems (Hampden-Turner and Trompenaars 1993;Hickson 1993), and financial systems, which configure the relative roles of subsi-dies, loans, shares, and other prevailing national financial arrangements(Christensen 1992; Guinet 1995).
There is a parallel stream in the NIS literature that focuses on networks and inter-action. Indeed, Lundvall’s (1992) approach to interfirm networks and interactivelearning (see also Gelsing 1992) may be seen as suggesting a focus on a smallerscale, geographically (subnational spaces) or otherwise (e.g., development blocks;Edquist and Hommen 1999)—i.e., to the concrete contexts of the actual interac-tions where learning and innovation actually occur (Acs, de la Mothe, and Paquet1996). In line with this observation, the NIS (or NSI) approach has been criticizedby, for example, Kumaresan and Miyazaki (1999), whose concern is that
104 INTERNATIONAL REGIONAL SCIENCE REVIEW (Vol. 25, No. 1, 2002)
while the concept of NSI is rich and has a strong foundation, it is too rich, too macroand broad—covering all aspects from institutional set up, interfirm relationships, or-ganization of R&D, educational and training systems, natural resource endowments,financing mechanisms to even culture. Moreover, it is unable to deal with the diversityof industrial situations in one country. In other words it is difficult to analyze NSIwithout going through in-depth studies at the meso-level. At the micro-level, much ofthe work on dynamic capabilities has focused on the issue of corporate competencies.In order to analyze dynamic capabilities at the national level, we need to accumulatestudies in meso-systems, focusing on the internal dynamics of network evolution.(P. 564)
The meso level has been also highlighted in other recent research, which is at-tempting to focus on a scale below the national (macro level) and above that of thefirm (the micro level) (Braczyk, Cooke, and Heidenreich 1998; de la Mothe andPaquet 1998a). To Foss (1996), the meso level is crucially where nonproprietaryand intangible higher order industrial capabilities are developed and maintained bythe interactions among firms (cf. also Nooteboom 1999b, 2000). This implies, cen-trally, that the development of the capabilities crucial for innovation, as well as in-novation itself, is a relation-specific process. We adopt the meso level of analysis asmost appropriate for a focus on the relations and flows within a spatial innovationsystem.
Regions within countries share some of the aspects of the entire nation, but theyalso have different possibilities to “go their own ways” and ultimately end updiverging from a national average (in terms of, e.g., the nature of education andtraining systems, science and technology capabilities, industrial structure, interac-tions within the innovation system, and propensities to absorb from abroad; cf.Archibugi and Michie 1997, 127-28). Indeed, within countries, specific regionstend to bring about a large share of the outcomes which, in the NIS framework,would be regarded as the accomplishments of national systems of innovation(Ohmae 1995; Oinas and Malecki 1999; Scott 1998; Storper 1997, 218). Accord-ingly, an increasing awareness has grown among those sensitive to spatial issuesthat regions might be an appropriate scale for carrying out analysis on systems ofinnovations. A focus on regions does not lead to the denial of the importance of theNIS as a key context and facilitator of the smaller scale innovation systems.
Those smaller scale systems are variously called clusters, territorial productioncomplexes, productive systems, territorial systems, milieus, and local systems (see,e.g., Acs, de la Mothe, and Paquet 1996; Asheim and Dunford 1997; Cooke 1996;de la Mothe and Paquet 1998a, 1998b; Enright 1996; Feser 1998; Porter 1998;Rosenfeld 1997; Steiner 1998), but they can be seen as belonging under the broadumbrella of RISs. Three features of regional and local systems stand out as impor-tant: (1) the collectivity that somehow encompasses—indeed defines—a region inits entirety, (2) the emphasis put on the soft aspects of economic activity, andincreasingly, (3) extralocal connections. It is this third feature that has not received
Oinas, Malecki / EVOLUTION OF TECHNOLOGIES 105

due attention in the literature on RISs and needs to be focused on more centrally.The SIS framework seeks to provide a remedy in this regard.
SISs
A technology is an industry-specific, time-specific, and place-specific way ofdoing things. In clusters of economic activity, developments in several industriesbecome integrated and coordinated through strong links (as, e.g., in industrial clus-ters producing electronic appliances that involve producers in several industriessuch as metals, plastics, telecommunications, and electronics). These clusters ofinterrelated and thus coevolving industry-specific technologies form technologicalsystems (cf. Carlsson and Stankiewicz 1991; Carlsson 1994). Technological systemrefers to sets of technologies in use in specific interlinked industries. Technologicalsystems may be local, regional, or multinational, depending on the nature andextent of the networks involved.
From the standpoint of the dynamics of these technological systems, the evolu-tion of the various technologies in technological systems can be seen as formingtechnological paths. This notion relates closely to Dosi’s (1982) “technological tra-jectory.” Both notions, of course, are metaphorical, but they have slightly differentconnotations. Dosi defined a technological trajectory as “the pattern of ‘normal’problem solving activity (i.e., of ‘progress’) on the ground of a technological para-digm,” where a technological paradigm is a “ ‘model’ and a ‘pattern’ of solution ofselected technological problems, based on selected principles derived from naturalsciences and on selected material technologies” (p. 152). Technological paradigms,in his view, embody “strong prescriptions on the directions of technical change topursue and those to neglect” (p. 152). Thus, paradigms form cognitive limits foractors involved in them. While they give direction to activities, they also delimit theoptions that might actually be available. In addition, institutionalized structures ofrelations around technological trajectories add inertia to them. Dosi’s trajectory,then, appears to be reminiscent of the use of the term in ballistics: a technologydevelops in the direction to which it is set under initial conditions until, for any rea-son, a paradigm changes. We regard the metaphor of a “path” more appropriate, yetwe share Dosi’s idea that broader paradigms give direction to them: technologicalpaths do not move to random directions. Accordingly, the evolution of technologiescan actually sometimes be described as trajectories, due to the relatively stabledirection in which they seem to be moving, sometimes for relatively long periods oftime. Like Dosi, we emphasize that neither trajectories nor paradigms stayunchanged. Paradigms change and new trajectories are set in motion. Thus, techno-logical evolution involves alternating periods of progress along a trajectory (andwithin a paradigm) as well as periods of change, resulting in settling on a new tra-jectory based on a new paradigm. Yet, Dosi (1982, 158) seems to suggest that atechnology progresses along a trajectory, attaining incremental innovations, untilthe paradigm changes, due to a radical innovation, and a new trajectory is set in
106 INTERNATIONAL REGIONAL SCIENCE REVIEW (Vol. 25, No. 1, 2002)

motion. We draw less of a sharp distinction between incremental and radical inno-vations (cf. Tidd, Bessant, and Pavitt 1997), which allows for the idea of a moreevolving technological path. Our emphasis is on the possibility of continuousadjustments. For example, in the case of emerging technologies and in entirely newtechnological systems, no clear directions of trajectories can be seen but rather anapparently randomly winding path, until the new developments settle onto some-thing that could be called a trajectory. How steady and long lasting such trajectoriesare depends on the nature of the technologies and on the competitive environment.
The details related to technological change are being revealed in ongoing re-search, particularly where empirical situations are analyzed with evolutionary con-ceptual frameworks. Yet, there is a relatively broadly shared understanding of theevolution of technologies as having certain, if unpredictable, life-cycle characteris-tics (Nelson 1996). Technological development includes stages during which ideasemerge for new products and processes and subsequently standards and dominantdesigns evolve. We draw on the following in Tushman, Anderson, and O’Reilly’s(1997) account on technology cycles and Nooteboom’s (1999a, 2000) account oncycles of discovery. Both of these accounts, albeit with some differences, highlightsubsequent periods characterized by
• the emergence of variation through technological discontinuity (novel combinations),• consolidation (following a fermentation period including design competition),• selection of dominant design and generalization of its application, and• retention with incremental changes in the dominant design (Tushman, Anderson, and
O’Reilly 1997) as well as differentiation as a result of applications in new contexts(Nooteboom 1999a, 2000).
These cyclical processes in the evolution of technologies keep technological tra-jectories or paths moving in one direction for a period of time, but relatively smalleradjustments in that direction are made in periods of retention and differentiation.More significantly, “turns” in a technological path are made during technologicaldiscontinuities as major technological discoveries are made (or as novel combina-tions are brought about).
What is described above refers to the progress that is made in a technologicalsystem and that takes place by advancing knowledge at the level of specific technol-ogies (or components, subsystems of technological systems). These componentshave their own technology cycles, but their development is influenced by develop-ments in other parts of the technological system. As one technology changes,adjustments have to be made in the rest that belong to the same technological sys-tem. Different subtrajectories have their own frontiers, which give them new direc-tion. Different frontiers may compete with each other even within the same techno-logical system.
In addition, technological frontiers are developed at different levels of techno-logical sophistication, as older and newer technologies are often developed
Oinas, Malecki / EVOLUTION OF TECHNOLOGIES 107

simultaneously to serve the needs of different customer groups. For example, inmobile telephony, the older NMT (nordisk mobiltelefon) technology is continu-ously improved for mobile phones used in remote areas even though most researchand development (R&D) effort in Europe is being put into global system for mobilecommunications (GSM) applications and, increasingly, third-generation technolo-gies. That is, parts of a technology system may make progress by the exploitation ofexisting technologies at different levels of advancement and incremental improve-ments in those, whereas the activities in frontiers are aimed at exploration: thesearch for novel combinations. These parts may be spatially and organizationallyseparate so as to receive support of suitable sets of actors, capabilities, and institu-tional environments in different RISs.
Accordingly, no innovation system is located in one place only. This is why it isnot enough to focus on particular RISs in trying to understand technologicalchange. Instead, the development of a technological system takes place via thecoterminous evolution of its various components in space and time. It is supportedby an interlinked set of social relations in a number of RISs of different levels ofsocioeconomic development, (semi-)integrated by the requirements of a techno-logical system, resulting in a distinct spatial division of labor in that system. Tech-nological systems are not autonomous of the place-specific RISs where they
108 INTERNATIONAL REGIONAL SCIENCE REVIEW (Vol. 25, No. 1, 2002)
FIGURE 1. Hypothetical Evolution of Two Technological Systems (A and B) in the SpatialInnovation Systems Framework

originate or are transferred because local conditions may be decisive for sustainingcreative interaction in making progress in specific technologies.
The SIS framework is illustrated in Figure 1, which depicts the hypotheticalpaths of technological systems A and B. It recognizes the role of multinational cor-porations (MNCs) as actors who transfer technologies through international flows(e.g., the links from C1 to C2) via foreign direct investment (FDI) or strategic alli-ances. In addition, a small region can originate a technology (TB1 in L3in time periodt2), decreasing its dependence on the principal source of technology (L2 in C1).
Summing up the discussion so far, key issues in discussing SISs are (1) thesimultaneous and interdependent development of components of technologicalsystems possibly in many places, utilizing spatial divisions of labor among severalRISs specialized in different aspects of technologies, possibly in more than oneNIS, and (2) the “travels” that technologies make in space and over time as knowl-edge flows take place along with the progress made in the frontiers of those compo-nents. The key elements in the complex spatial innovation systems are the techno-logical paths themselves, the RISs that participate in creating the technologies orparts of them, the actors whose interaction locally and over space ultimately bringstechnologies about, as well as their (proximate or more distant) relations. Theseelements will be discussed in the following sections.
TECHNOLOGICAL PATHS IN TIME AND SPACE
In line with the above, we portray technological evolution at the level of specifictechnologies that coevolve as part of a wider technological system along their spe-cific paths. The directions that technological paths take are influenced, but notentirely determined, by each technology’s frontier. A frontier is advanced by actorswithin sets of social relations, for example, in one (or several) RIS. It is in the idea ofa frontier that it is brought about by unique knowledge and skills: exactly the samefrontier (or a part of it) cannot be in two places at the same time. Thus, the collectiveaction of those sets of interdependent actors at a technology’s frontier is subject tothe basic constraints identified by time geography: movement takes time, and thesame actor cannot be in more than one place at the same time (Hägerstrand 1970).They are subject to situated interdependence (Jackson and Thrift 1996, 214) withothers working with a specific technology. In other words, they are locally depend-ent on the RISs, which are able to support a particular level of and progress within aspecific technology. As a result, the advancement of each particular technology hasits own time- and space-specific developmental path behind (and ahead of) it. Formany innovations, technological development proceeds simultaneously butfocused on different specializations, in several places. Lasers, for example, are theresult of research efforts in Germany, Japan, and the United States (Grupp 2000). Inaircraft, innovation is the fruit of a complex web of producers in many places, asFrenken (2000) showed by tracing 863 aircraft models. Each firm, in its own loca-tion(s), has its unique design specialization (Frenken and Leydesdorff 2000).
Oinas, Malecki / EVOLUTION OF TECHNOLOGIES 109
The cyclical patterns of technological development referred to above also needto be seen as having spatial patterns that are part of their evolution: technologicalfrontiers may change places. Spatial discontinuities, or shifts, in technological tra-jectories or paths do not necessarily (or even often) happen because the sets ofsocial relations advancing them change places but rather due to reasons related tothe dynamics of technological progress, as discussed above. What is different aboutthe time geographies of technological paths compared to the more customary ideaof individuals’ time geographies is that technologies may change form and multi-ply. Even if a frontier moves ahead in space, the path that it leaves behind does notremain entirely unchanged, that is, there is a period of retention (Tushman, Ander-son, and O’Reilly 1997). Besides, new developments are set in motion as adaptersof the technologies created by a frontier remain along the path and may be success-ful in further developing the technology—giving rise to new paths, which either gotheir own way or start competing with the frontier, that is, there is a period of differ-entiation (Nooteboom 2000). As a product moves from R&D to production, firms(and places) that specialize in economies of scale play a more important role, asfirms in Singapore and Taiwan do in semiconductors (O’hUallachain 1997).
Spatial discontinuities may relate to specific phases in technological cycles.Technological frontiers are in operation in the RISs that are involved in creatingnovel combinations and that are able to build local structures around emergingdominant designs and exploit them commercially. If those structures become toorigid in time, they cannot change as new variation emerges, beginning a new cycleof technological change. At this time, the actors at the frontier of technology maymove to areas that fulfill their locational specifications (cf. Storper and Walker1989). Alternatively, new technological frontiers may emerge in new areas as aresult of the previous dominant design having been applied in a new context, possi-bly in a new region, where it becomes differentiated and may give rise to a newsubtrajectory and maybe later to another novel combination beginning a new cyclewith a different set of actors involved.
In sum, technologies have their specific, path-dependent time geographies:technologies emerge somewhere, in a place—or sometimes similar technologicalsolutions are invented in more than one place simultaneously (shown, e.g., by pat-ent applications for similar technical solutions of different origins being receivedone after another by patent authorities)—and the further development of those tech-nologies may take place in a new context and in a new place, where possibly newqualities are added to them. Technological development is the result of the inter-mingling of such technological paths, overlapping in content and possibly also inspace. Each path is part of an industry- or product-specific technological systemand epitomizes its developmental phases. An example is found in the hard diskdrive industry (Christensen 1997), in which customers in different markets placepriority on different types of performance (e.g., size, weight, speed, capacity). Theindustry has evolved to meet new needs, often through the emergence of new firms,taking advantage of skills and networks in new locations, such as Singapore and
110 INTERNATIONAL REGIONAL SCIENCE REVIEW (Vol. 25, No. 1, 2002)

Penang (Malaysia). The production skills in these new locations helped to shape thetrajectories of several producers as new products were introduced (McKendrick,Doner, and Haggard 2000).
TYPES OF RISs
So far, we have aimed at giving a dynamic, albeit metaphorical, account of tech-nological development as paths that the frontiers of specific technologies create asthey evolve in time and as they travel and make connections in space. This sectiondiscusses the different kinds of places: the different, interlinked RISs that areinvolved in producing those paths. The RIS literature usually fails to provide dis-tinctions between types of RISs, which may be top-down and poorly integratedregionally (regionalized NISs) or bottom-up, with considerable regional network-ing (territorially integrated innovation systems; Asheim and Cooke 1999; Hassink2000). For our purposes, such distinctions are important, as SISs consist of variouskinds of activities with different levels of sophistication organized in space (withinand between different RISs) according to a division of labor that is specific to eachSIS (cf. Figure 1). Our typology of RISs evolves out of a discussion on the relativetechnological advancement of regions and on the relative specialization versusdiversity of their economic activities.
We start with a basic tenet of evolutionary accounts on technological develop-ment: that innovation requires diversity (Nelson and Winter 1982). In spatial analy-sis, the need for diversity has been documented in recent research showing thatdiverse locales (i.e., locales with relatively large numbers of different industries)are more important for promoting innovative firm behavior (Feldman andAudretsch 1999; Harrison, Kelley, and Gant 1996; Quigley 1998) than specializedones (of, e.g., the industrial district type, as often assumed in the course of the1990s). Small firms in particular benefit from regional industrial diversity (Kelleyand Helper 1999) because they cannot create it internally.
These are important findings for the spatial analysis of technological change.The SIS perspective, however, prompts us to raise three additional issues.
Diversity and actual (innovative) relationships. As pointed out above, a meso-level approach to innovation pays attention to relations between actors. With regardto that, simple claims made at the level of numbers of industry sectors (whicheverISIC digit level) miss the point about the critical nature of relations within andbetween industries for innovation. This is the case even in regions with a broaddiversity of industries. The mere presence of a variety of industries in a region obvi-ously does not make a region a “territorially integrated innovation system” (Asheimand Cooke 1999); it does not reveal the basis of the relations between firms in any ofthose industries. Rather, this basis has to be seen in the potential relatednessbetween firms’ knowledge and capabilities that may trigger their engagement ininnovative interaction (Oinas and van Gils 2001).
Oinas, Malecki / EVOLUTION OF TECHNOLOGIES 111
Diversified and specialized regions complement each other (via external rela-tions). While diverse regions may be more conducive to regional innovation rela-tive to specialized ones, the SIS approach helps to point out that diversity as food forinnovation is not always locally available in the right form and thus needs to becomplemented by interaction with more distant actors—actors that can bring inspecialized expertise based on their participation in another RIS. Within the SISframework, there is no reason to think, ceteris paribus, that diversity originatinglocally is drastically different in terms of its potential input into innovation as com-pared to diversity originating elsewhere.
In line with our discussion of technological paths above, we regard it as one ofthe key functions of technological frontiers to search for diversity: to direct andredirect technological paths to regions where they can find suitable diversity to sup-port innovation. When actors in one region do not provide enough diversity forinnovativeness, a technological frontier either puts effort into making regionalactors effectively connected to sources of diversity elsewhere, or the technologygradually loses its edge and the frontier moves to another region (yet, as discussedabove, it may be another frontier, with a different set of actors and their specificsocial relations).
This does not exclude the possibility that even narrowly specialized regions mayhave a role in the evolution of technologies, by creating leading-edge specializedknowledge that supports a larger innovation system. Specialized regions do notoperate in isolation but receive impulses for renewal and innovation from interac-tion with other innovative actors who are part of the same system even if they are notlocated in the same place. Thus, even a narrowly specialized region may be a sub-stantial contributor if the part of the technology that it creates happens to be crucialat some point in time (Frenken 2000; Frenken and Leydesdorff 2000). This may bethe result of the (possibly slow and incremental) evolution of specialized knowl-edge through local adjustments in a region that leads to a strong (possibly leading-edge) expertise in a narrow area of knowledge. It is possible that such a small regionwill not stay central for a long time, and the technology may or may not createspillover effects in its regional environment, but it may still be relevant for the his-torical evolution of the technological path.
Within regions, thus, each sector has its specific connections to extraregionalpartners, which enhances the innovative potential of those sectors’ actors. In thecase of diversified regions, external relations are likely to add to the total innovativepotential of the region’s actors by helping to sustain continuously higher and morediversified technological capabilities. In the case of specialized regions with a morenarrow range of economic activities, external relations compensate for the lack ofregional diversity.
Diversity versus specialization and technological advancement in SISs. What isimportant in the SIS framework, accordingly, is the variety of regions involved inwhole innovation systems. Yet, regions differ not only in terms of their relative spe-
112 INTERNATIONAL REGIONAL SCIENCE REVIEW (Vol. 25, No. 1, 2002)

cialization but also in terms of their relative technological sophistication. The RISsthat are involved in SISs range from genuine innovator regions (which may tend tobe more diversified on the average) to regions that merely imitate or adopt innova-tions. Yet, each has a function in the SIS. We make a simple distinction in the fol-lowing between three types of regions in SISs in terms of their ability to bring aboutinnovation: adopters, adapters, and genuine innovators (Oinas and Malecki 1999)(these types still leave outside the large swath of the world which is technologicallyexcluded; Sachs 2000).
1. Genuine innovators. These are the RISs in which genuinely novel combinations(“new to the world” innovations) take place and best practices emerge, in specifictechnologies. Sometimes all stages of innovation cycles (Nooteboom 1999a, 2000;Tushman, Anderson and O’Reilly 1997) may be carried out in them. Or, as innova-tions diffuse from them through imitation, they may host the actors that pick up prob-lem signs or signals of new opportunities from actors in other regions exploiting exist-ing, yet maturing, technologies (incremental innovation) and engage in exploration,to hit yet another novel combination (radical innovation), which might begin a newcycle of innovation. These regions also maintain competitive and/or collaborative re-lations with other leading-edge regions, which further propels their innovativeness.This involves close monitoring of what is going on in other key RISs in a particulartechnology. Many technologies evolve as products incorporating the knowledge con-tributions of firms and people in several places. Computers and peripherals, for exam-ple, are frequently the result of flows back and forth between Silicon Valley in Califor-nia (prominently) and key Asian locations, such as Penang in Malaysia and Singapore(Gourevitch, Bohn, and McKendrick 2000; McKendrick, Doner, and Haggard 2000).
2. Adapters. While the main emphasis and interest of the scientific community has beenin the regions that host actors creating best practices, innovation is not absent fromless-than-best-practice regions. These regions do it by providing an environment forsteady improvements and incremental innovations, possibly leading gradually to highquality. This takes place in RISs that are able to adopt new innovations from externalsources relatively early and gradually improve them. The ability to learn from innova-tive firms in other places (i.e., imitating) is considered the best route for developingand maintaining innovative capability of this sort (Kim 1997; Mody, Suri, andTatikonda 1995). Examples of regions include the newly industrializing countries ofSoutheast Asia, where incremental innovations are becoming common (Kim 1997;Leonard-Barton 1995; Singh 1995). Bangalore in India (Fromhold-Eisebith 1999),parts of Mexico, and the Zhong’guancun area of Beijing, China (Wang 1999), typifythis environment. These areas attract a great deal of foreign direct investment, basedon their productive workers, but they have not yet attained the perception from the out-side as generating a steady flow of more fundamental innovations. Hobday (1994,1995), Porter et al. (1996), and Roessner et al. (1996) include most of East Asia, in-cluding Singapore, as not yet at the stage at which local ability for innovation matchesthat originating from outside, except in production.
3. Adopters. RISs into which innovations diffuse relatively slowly (latecomers) are re-gional “imitator systems.” They are characterized by actors employing an adopterstrategy: they are able to import and use technological solutions (in end products, in-termediaries, machinery, or appliances) from external, technologically more ad-vanced sources. Via adopting technologies as users and through learning by imitating,they are able to adopt the production of mature products. Actors in such imitator sys-
Oinas, Malecki / EVOLUTION OF TECHNOLOGIES 113
tems are not capable of significantly improving those products. Yet, they form parts ofinnovation systems due to their specialization in more routine parts of production, oreven just assembly (McKendrick, Doner, and Haggard 2000).
These different regions may maintain their roles in a rather static manner or theymay upgrade their capabilities and gradually improve. This means that it is difficultto make clear distinctions in the real world, as many regions may host actors at vary-ing levels of technological sophistication and, especially in diverse regions, possi-bly belonging to different technological systems. In a dynamic analysis, this maysometimes be a sign of a relative regional decline, sometimes of a relativeupgradation of the overall regional capabilities, and sometimes even a sign of a re-gional structure that is fit for hosting the various actors involved in the whole inno-vation cycle (i.e., both those who are specialized in exploration and those who arespecialized in exploitation. When progress is made in a region’s innovativeness, thebasis of its knowledge system changes over time, incorporating and diffusing suc-cessively more external technology (Bell and Albu 1999). This is how Kim (1999)described the process by which Korea built technological capability at the na-tional scale. Korea went through three stages: (1) duplicative imitation of maturetechnology, (2) creative imitation of intermediate technology, and (3) innovationor emerging technology. Each stage required changes in Korea’s national system ofinnovation.
Innovation systems do not operate in isolation but are the dynamic parts of pro-duction systems that are geared around getting the right goods for the right markets.Storper and Salais’s (1997; Storper 1997, 116-26) typology of “worlds of produc-tion” is used in the following to elaborate briefly on the kinds of production systemsinnovation systems participate in.
In the “industrial world,” generic and standardized products are produced for amarket with undifferentiated demand. This can be done endlessly once the requiredskills have been learned. Actors belonging to industrial worlds are likely to befound in adopter RISs. Only through external shocks (drop in demand) may regionsof this type start looking around for more sophisticated technologies to adopt them-selves. As parts of innovation systems, they are able to adapt to new standards orrequirements demanded by those more actively involved in innovating. Industrialworlds tend to be in lower labor cost regions or countries and mature industrialregions.
In the “market world,” products are in many ways standardized (they consist ofparts made according to standardized specifications), but they are produced fordedicated customers. Market worlds tend to be specialized production regions withlarge numbers of firms in an industry. Market worlds are likely to be in operation inadapter regions. Producers may be of the adapter type because they may engage inincremental innovation while adjusting their production to the needs of customers.
The “interpersonal world” produces for dedicated customers with specializedneeds. For this purpose, specialized capabilities are needed as well. This world is
114 INTERNATIONAL REGIONAL SCIENCE REVIEW (Vol. 25, No. 1, 2002)
found in technological and industrial districts, and it is the central locus of leading-edge innovation. This world is obviously a genuine innovator RIS. This is the kindof system in which it is usually assumed that proximity among actors is requireddue to the need for frequent interpersonal communication and shared understand-ings to support it.
The “world of intellectual resources” uses scientific methods for developingnew generic products for specialized purposes. The intellectual worlds aredesigned to specialize in the phase of particular innovation cycles that explore newknowledge, and they may comprise those parts of the interpersonal world that aregeared toward innovation (e.g., R&D projects). As part of innovation processes,relations in this world are, indeed, maintained with actors in an interpersonal world.Storper (1997, 124-25) seemed to assume that interaction in innovation takes placein the districts, or RISs, of the interpersonal world. Productive activities may alsotake place over long distance as external transactions may happen over long dis-tances in predictable, formal, contractual governance regimes (Storper 1997,124-25). This world may be the progressive core of a genuine innovator system, andit often works in close connection with the interpersonal world in the same or aclosely connected location.
These worlds may be connected to each other through concrete production rela-tions. They may also become connected via forming key nodes of cycles of innova-tion over time: what is first discovered in the intellectual and interpersonal worlds istransferred to other places after or during a period of consolidation by actors inthem (FDI, licensing, etc.) or imitated by actors in the industrial or market worlds.Sometimes these worlds may operate in the same place, as suggested above, andsometimes they are separated by space so that each type of activity is located inregions (RISs) where they find the best fit with other actors in the local environ-ment. A spatial division of labor reflects the relative advantages of local environ-ments for activities before and after the emergence of a dominant design (Utterbackand Afuah 2000) or as technological clusters as opposed to operational clusters(McKendrick, Doner, and Haggard 2000). Younger technologies are characterizedby a wider, more open-minded perspective, based on many links to sources ofknowledge. By the time production begins, the number of partners and suppliers isreduced to reflect the standardization of production.
The above considerations on the sectoral specialization versus diversity ofregions and the relative maturity versus advancement of their technologies arebrought together in Table 1, which outlines a typology of RISs involved in differenttypes of SISs. Regions that host genuine innovators may be diversified or special-ized, but with specialization may come an inability to connect to other industries orshift to new technological regimes as times change (i.e., to sustain innovativeness inthe region). Adapter regions may acquire a high level of competence, enhanced bydiversity, which enables greater technological sophistication. Adopter regionsexhibit innovativeness only in production, and many are unable to exhibit anyinnovativeness because of specialization in assembly with few local suppliers.
Oinas, Malecki / EVOLUTION OF TECHNOLOGIES 115

As these ideas are at an experimental stage, the names of the various types ofRISs are obviously playful. Among other things, we do not aim to approximate realscales (from stars to candles). The real-world examples we provide are also onlysuggestive as no in-depth analyses of the places are carried out.
• “Stars” are the suns for their surrounding planets: With the leading-edge innovationsthat they keep pushing to the market, they generate the energy that keeps other placesgoing, either via imitation or enhanced innovativeness in other stars. They are keptstrong by the multiple links among diverse industries as, for example, in Silicon Val-ley where the venture capitalists that keep the electronics industry alive also financestart-up biotechnology companies. Actors in their key industries also monitor devel-opments and maintain close links with other centers of excellence on the world scale.
• “Shooting stars” live as long as they are able to live on the strength of an innovation ora set of interrelated innovations, such as those related to technological and organiza-tional innovations in automobile production in Detroit from 1910 to 1960 and in ship-building in Liverpool during the eighteenth century.
• “Living room lamp” regions host actors with relatively high levels of competences ina number of different sectors, each of which maintain close links with nonlocalsources of innovation. They may also be locally connected so as to collaborate in im-proving local production conditions; local cross-sectoral connections may also giverise to occasional technological improvements. It is possible that these regions be-come “rising stars” and later give rise to genuine innovations. Korea, but perhaps par-ticularly the Seoul region, also fits this description.
• “Spotlights” get the stimuli to engage in mainly incremental innovation through theirstrong external connections. Through the high competences, they are able to respondto relatively advanced R&D-related improvements, for example, delegated by head-quarters staff or in collaboration with main contractors, such as Nike’s developedpartners in Taiwan and Korea (Donaghu and Barff 1990).
• “Chandeliers” are regions where many sectors are colocated but where those sectorsare not strongly linked to each other. Rather, they maintain relatively stronger links totheir respective external customers, main contractors, and other sources of knowl-edge. Thus, chandeliers consist of several islands of locally isolated industrial activ-
116 INTERNATIONAL REGIONAL SCIENCE REVIEW (Vol. 25, No. 1, 2002)
TABLE 1. A Typology of Regional Innovation Systems
Characterization of Region Sectoral Diversity Sectoral Specialization
Genuine innovators “Stars” (e.g., Silicon Valley, “Shooting stars” (e.g., Detroit,(best practice places) Cambridge, U.K.) U.S., eighteenth-century
Glasgow)Adapters (relatively high “Living room lamps” “Spotlights” (e.g., Bangalore,
levels of diverse (e.g., Hsinchu, Taiwan) India)competences)
Adopters (production- “Chandeliers” (e.g., “Candles” (e.g., Dongguan,oriented competences) Bangkok, Thailand) China)

ity. Their colocation may be supported, for example, by strong government supportand consequently improved production environment (involving infrastructure, fi-nance, education, etc.).
• “Candles” stay alive as long as their relatively simple production-oriented compe-tences are utilized and supported by externally based customers, main contractors, orcorporate structures. They may become efficient masters in certain production lines.Occasional incremental innovations in production activities may occur, but this ismost likely to happen via imitation or knowledge transfer within corporate networksthan through the initiative of local actors.
LOCAL AND DISTANT CONNECTIONS
It has been postulated in the literature on RISs and localized learning that thecreation of noncosmopolitan (Storper 1997) or unique (Maskell 1999) knowledgethrough learning takes place more easily within proximate relations (e.g., Maskelland Malmberg 1999a, 1999b; Asheim and Cooke 1999). Yet, as the importance oflinks to nonregional networks is also a recurrent finding in recent research on indus-trial districts and technology districts (Amin and Thrift 1992; Tödtling andKaufmann 1999; Maillat 1995; Mueller and Loveridge 1995; Storper 1993), itseems increasingly clear that the connections of regional actors to extraregionalactors stand as momentous in technological progression. Connections to other net-works in other regions provide access to a diversity of ideas and bases for compari-son with local practices that are not internally generated (Amin and Thrift 1992,1993; Camagni 1995; Maillat 1995; Tödtling 1995). An interesting example is seenin the immigrant communities from around the world that converge in and benefitSilicon Valley, partly by maintaining their previous connections (Saxenian 1999).External connections help actors within a regional system to stay in tune with whathappens in the market, what happens among other producers (both competitors andcollaborators), customers, scientists, regulators, support agencies, and othersources of technological knowledge and help them form fruitful relations withthese agents.
It may be the case that the content of learning in nonlocal networks differs fromthe kind of learning that occurs in local relations (Oinas 2000). Overall, however,we do not seem to understand the nature and relative significance of proximate anddistant connections in innovative activity very well to date. It is often assumed thatonly codifiable and hence non-culture-dependent, cosmopolitan-scientific, or pro-fessional languages can be communicated over longer distances (Storper 1997,114). Noncosmopolitan knowledge is usually believed to involve a considerabletacit component that makes it glued to concrete local relationships. Yet, as Storper(1997) pointed out, “Noncosmopolitan knowledge is not necessarily associatedwith proximity or localization. The two are theoretically distinct: noncosmopolitanknowledge can be ‘localized’ in a restricted technological, organizational, or pro-fessional ‘space’, that is, in certain interpretative networks that transcend local
Oinas, Malecki / EVOLUTION OF TECHNOLOGIES 117

geographical space” (p. 71). Due to the complexity of this issue, there is no pretenceof exhausting it here. Let us point out that even if innovation systems were consid-ered as localized (e.g., Asheim and Cooke 1999), it would not mean that they oper-ate in total isolation. Being localized, then, must mean that either most relationshipsor key relationships in production systems or worlds of production take place inproximate relationships. What the SIS framework suggests, in addition, is that thereis the possibility that neither most nor the key relationships are necessarilyproximate.
In local and regional innovative systems, two sets of effects operate simulta-neously (Camagni 1995; cf. Malmberg and Maskell 1997): proximity effects, suchas reductions in costs because of quicker circulation of information, face-to-facecontacts, and lower costs of collecting information or sharing knowledge, andsocialization effects, related to collective learning, cooperation, and socializationof risks. These two processes are collective but not necessarily (explicitly) coopera-tive (meaning concrete, goal-oriented interaction whether in the form of supplier-customer relationship, joint R&D, or informal collaboration); they spread beyondbilateral interfirm relationships. In nonlocal relations, the proximity effect is miss-ing and leaves only socialization effects and the possible forms that they may takeover space.
Shared rationalities, or common frameworks of action (Storper 1997, 45), mustbe seen central in the socialization effect. Such frameworks of action, which arespecific to the different worlds of production, are formed by conventions (Storperand Salais 1997, 15-17), which bring about coordination among actors (Storper1997, 42-43). They “include taken-for-granted mutually coherent expectations,routines, and practices, which are sometimes manifested as formal institutions andrules but often not” (Storper 1997, 38). This implies that conventions are also keycarriers of collectively shared tacit knowledge related to the functioning of the rele-vant innovation system. Following Blanc and Sierra (1999), the more precise con-tent of Camagni’s socialization effect can be interpreted to have four aspects:(1) organizational proximity (including formal relationships with suppliers), (2) rela-tional proximity (which includes noneconomic relationships), (3) institutionalproximity (especially of local informal institutions), and (4) temporal proximity (ashared vision of the future). Geographical proximity does not guarantee the otherproximities, but those can partially substitute for geographical proximity (for arelated discussion in terms of competence relatedness, see Oinas 1999; Oinas andvan Gils 2001). There are complex trade-offs between the various proximities.When the potential involved in each type of proximity is actualized, it is manifestedin shared context-specific conventions, coordinating both local and nonlocalrelations.
The issues related to the question of how and to what degree conventional rela-tions based on the various proximities are maintained over space remains largelyunanswered to date. Exactly how knowledge grows and is shared in an agglomera-tion is beginning to be teased out in detailed studies (Henry, Pinch, and Russell
118 INTERNATIONAL REGIONAL SCIENCE REVIEW (Vol. 25, No. 1, 2002)
1996; Pinch and Henry 1999; Porter 1998). More work needs to be done onnonlocal relations and especially on the distant transferability or exchangeability ofknowledge that involves a considerable share of tacitness.
TYPES OF CONNECTORS
The actors that create and maintain the relations that are emphasized in the SISapproach are centrally individuals (entrepreneurs, managers, employees, individu-als in governmental or semigovernmental bodies, researchers, etc.) with their inter-personal networks (face-to-face, virtual, or a combination of these) and firms(multilocational/multinational) and their networks of various sorts: (advanced)customers, universities, research institutions, support organizations (such as cham-bers of commerce, knowledge centers, government bodies, and consultants). Thereasons for the success of some places and the lack of success of others appear to betwo interrelated things: first, interfirm differences in the degree to which active,extroverted behavior takes place and, second, the technical culture created withinintensively connected communities of professionals, much of which is summed upby the characteristics of technologically successful regions (Malecki 1997; Swee-ney 1991, 1999). This section discusses the nature of the actors creating those con-nections (cf. Oinas and Malecki 1999; Bunnell and Coe 2001). Innovation involv-ing both local and distant relations often center on networks of these actors.
FIRMS AND THEIR NETWORKS
Kelley and Brooks (1992) distinguished between firms with primarily active andsocial external linkages and those with passive and asocial linkages (see alsoAmendola and Bruno 1990; Estimé, Drilhon, and Julien 1993). Indeed, the role ofactive, extroverted firms needs to be acknowledged in their role of making connec-tions (Malecki and Poehling 1999; Patchell, Hayter, and Rees 1999). It is via themultilocational networks of facilities, alliances, and other linkages that such extro-verted corporations and small and medium-sized enterprises alike are able to makeSISs cut through possibly several RISs. These extroverted, active firms utilize writ-ten sources for acquiring information, interact with sales representatives, partici-pate in trade shows, contact with vendors, and create close relationships withspecial-order customers for sharing of technical information (Malecki andPoehling 1999).
Via extroverted behavior, even small firms compensate for their size limitationin the adoption of new technology (Julien 1995; Rothwell 1992). Oerlemans,Meeus, and Boekema (1998) found that access to external resources increases inno-vation in small firms over those using only internal resources. Firms used four dis-tinct types of external information: public knowledge infrastructure, private knowl-edge infrastructure, production column, and intermediaries. The most significant isthe production column, comprised of buyers, suppliers, and other firms, reinforcing
Oinas, Malecki / EVOLUTION OF TECHNOLOGIES 119

the view that links with customers, or producer-user connections, are the most ben-eficial. However, networks alone are not as effective as the combination of internaltechnical ability and effort with external networks (MacPherson 1997). The mostlikely firms to be active in seeking out external information are those with in-houseR&D activity (Tsipouri 1991; Keeble et al. 1998; MacPherson 1992), whichincreases their absorptive capacity (Cohen and Levinthal 1989).
The wider networks of active, extroverted firms tend to encompass both moreconnections within the region and outside it. Extroverted firms are also more likelyto aim at competition in international markets (MacPherson 1995). Externally ori-ented firms are able to overcome the constraints related to a peripheral location(Alderman 1999; Vaessen and Wever 1993). Vaessen and Keeble (1995) found thatgrowth-oriented firms do more R&D and have more external programs for workertraining regardless of their regional environment. Localized technological knowl-edge is highest where both the receptivity to nonlocal information and regional net-work connectivity provide access to and absorption of external information, com-bining it with internal competence (Antonelli 1999; MacPherson 1997). Thecombination of a critical mass and diversity of firms together with a set offast-growing firms at technological frontiers appears to be the key to success at thelevel of a region (Chesbrough 1999).
In sum, the capability to innovate successfully at the firm level appears to bestrongly conditioned by the ability to accumulate specific knowledge internally andto access sources of knowledge via external relations. The ideal case may existwhen the firm’s external networks can learn from strong local knowledge infra-structures, as well as maintain links to global networks of best practice in technolo-gies, products, and services. Jacobs and de Man (1996) suggested that firms’strate-gies toward local and nonlocal clusters have different effects on which activitiesshould be located in which locations. Local clusters allow greater cooperation andintensive user-producer interaction. Nonlocal clusters open possibilities to workwith other clients and suppliers, and to tap—if not to become fully integrated—intodifferent knowledge networks.
Multilocationality/multinationality is a form of extroversion. There is a growingtendency for companies to seek extraregional connections by using several homebases, including R&D and sophisticated production. External knowledge is mosteasily obtained by MNCs, with corporate facilities in various locations exploitingthe relative advantages of their locations (Ferdows 1997), which may be seen astypes of RISs. But such external knowledge must be internalized. To integrateknowledge residing in distant locations, firms must become locals in those places(Blanc and Sierra 1999; Cohendet et al. 1999; Gassmann and von Zedtwitz 1999;Reger 1999). This is evident in the five competencies that Amin and Cohendet(1999) suggested are now critical for globalized firms: (1) integrate the firm inter-nally, (2) exploit advantages of proximity at many locations, (3) integrate frag-mented pieces of localized learning, (4) invest continually in access to knowledge,and (5) focus on a small number of core competencies. This suggests three aspects
120 INTERNATIONAL REGIONAL SCIENCE REVIEW (Vol. 25, No. 1, 2002)

to the information-age organization’s structure: decentralization, information prac-tices that promote both an awareness of external information and information-sharing within the organization, and a network structure for the outsourcing ofnoncore activities (Mendelson and Pillai 1999). For smaller firms, it is more diffi-cult to be all things at once, but an effort to make external connections seems to be aminimal requirement.
Technology-based firms are particularly inclined to diversify their technologysources (Granstrand 1998) even though dispersed corporate networks do not neces-sarily have the result of diversifying firms’ technological capabilities (Zander1999). There is actually only scarce empirical evidence of projects that integrateknowledge across related technologies within MNCs internationally, yet, to somedegree, it does happen (Zander 1998, 19).
INDIVIDUALS AND THEIR NETWORKS
The role of individual entrepreneurial initiative is obviously central in creatingand transferring innovations, whether based on imitation and adaptation of techno-logical solutions elsewhere (e.g., Fujimoto 1998, 23), differentiation (Nooteboom2000), or novel combinations (e.g., palm-size devices and other hybrids of mobiletelephones and portable computers). Competent and mobile individuals are equallyan important group of connectors (e.g., Eliasson 1998). For instance, in a compari-son of twelve U.S. semiconductor regions, Almeida and Kogut (1999) found thehigh level of intraregional mobility of engineers in Northern California unique.
Individuals seldom innovate alone, however. Interpersonal networks areincreasingly seen as a powerful force in learning and maintaining (technological)capabilities. Their role can also be highlighted in making connections within tech-nological systems. Recent research describes innovation networks as technologicalcommunities (Powell, Koput, and Smith-Doerr 1996; Rycroft and Kash 1999), orcommunities of practice (e.g., Aldrich 1998; Brown and Duguid 1994; Lave andWenger 1991; Wenger and Snyder 2000). Through intensive relations, members oftechnological communities share common ways of thinking about work-relatedissues (the collaborative project, perceiving the problems to be solved, gettingabout solving problems, etc.), which enables the sharing of tacit knowledge. More-over, they often share similarities in their educational backgrounds and features oflifestyle (in many cases including a highly international orientation accompaniedby frequent traveling), which facilitates the process of learning to communicatemeanings in a long-standing collaborative situation. While such technologicalcommunities may be locally or regionally based, they need not be. The literature oncommunities of practice usually refers to collective practice-based learning withinbusiness organizations. Amin and Cohendet (2000) observed that such communi-ties of practice may also operate across space in multilocational firms. In addition,there is no reason to think that communities of practice would be limited to organi-zations only: tightly knit networks also consist of communities of professionals
Oinas, Malecki / EVOLUTION OF TECHNOLOGIES 121

who may have an intimate understanding of each others work, whether or not theyare (physically) located in the same (local) community (Oinas 2001). These com-munities also function effectively as connectors between firms and locations butoften within technological systems.
CONCLUSIONS AND CHALLENGES FOR FUTURE RESEARCH
The notion of SIS has been used to refer to the organization of technological sys-tems in space as well as their evolution in time. The SIS approach shares the view ofthe emerging meso-level analyses of technological evolution in that it regards ascentral both the concrete interactions through which innovations emerge and dif-fuse and the broader societal (techno-economico-cultural) context (cf. Green et al.1999). It is distinct, however, in the sense that we emphasize centrally the spatialdimensions so as to pay attention to the evolution of technological trajectories inspace. SISs are also seen as distinct from NISs because they do not necessarilyreside within national boundaries. In regard to RISs, the SIS approach depicts thatthe capabilities and results of several RISs might be included in one SIS, simulta-neously and/or over time. Accordingly, what we call the SIS refers to those (partsof ) region-specific innovation systems that are relevant for the development of par-ticular technological systems, involving the various interconnections of subsys-tems over space. In other words, “spatial innovation systems consist of overlappingand interlinked national, regional and sectoral systems of innovation which all aremanifested in different configurations in space” (Oinas and Malecki 1999, 10).Thus, the SIS approach aims to highlight the “complex and evolving integration atdifferent levels of local, national and global forces” (Archibugi and Michie 1997,122). It seems that this complexity is increasingly recognized but that we are still atthe stage where many basic concepts need to be searched and developed for pinningit down (e.g., Howells and Roberts 2000) and for finding patterns in that complex-ity. It is the aim of the SIS approach to provide some building blocks for analyzingthe complex processes around innovation.
It is especially the connections between regional systems that remain relativelylittle understood. We know that local as well as nonlocal sources of innovativeactivity are decisive for innovations to occur and evolve, but we are just beginningto understand “the details related to the cofunctioning of proximity versus distanceeffects in various sorts of innovation” (Oinas and Malecki 1999, 25; cf. Blanc andSierra 1999; Bunnell and Coe 2001; Gertler 1995; Hudson 1999; Oinas 1999, 2000;Oinas and Virkkala 1997).
This article was aimed at proposing a broad framework for analyzing SISs. In sodoing, we have not penetrated into the details of actual technological systems andtheir evolution in time and space. We conclude by outlining several interrelatedchallenges that remain to be tackled in continued work on identifying and analyzingSISs.
122 INTERNATIONAL REGIONAL SCIENCE REVIEW (Vol. 25, No. 1, 2002)

1. An important issue is understanding dynamics: seeing the need for technological sys-tems to evolve as firms and that their interactive patterns change, that is, as products,strategies, resource bases, and information bases change (Ebers and Grandori 1997;Galli and Teubal 1997). The evolutionary trajectories of firms must be matched ratherclosely by the evolution of their networks and the broader institutional environments.Yet, it is very difficult, for example, for regional support organizations to keep up withgeneral trends as well as the varied and specific needs for firms for support (Braczykand Heidenreich 1998; Cooke 1998).
2. We do not know very much about how successful firms build their local and extralocalnetworks of contacts. As Cantwell and Piscitello (2000) noted, “We need to knowmore . . .about changes in the exact geographical composition of technological activ-ity in each industry” (p. 45). Does it matter whether local relations or linkages to otherregions are the first to be built, as long as the firm can survive until the appropriate net-work is assembled? Does a region’s success depend on a specific degree of globalnessin its firms’ networks? Or are the local relations really relatively most important? Wehave some hints about these matters. For example, the necessary progression by a firmfrom a technological focus to a market focus (Roberts 1990) typically coincides with ashift in linkages from local to national and international markets (Autio 1994;Christensen 1991; Christensen and Lindmark 1993). However, it is not yet clearwhich kinds of processes or activities of innovation are dependent on proximity (i.e.,constrained by the need to establish close personal relations at close distance in spe-cific institutional and conventional set-ups) and which are those that can be carried outover long distances. To start finding out, we assume that the appropriate units of anal-ysis are the interactions related to specific technologies and models of products,which are typically organized within product families (Sanderson and Uzumeri1995).
3. What remains to be further explored in the specific interactions within innovation sys-tems are their “soft” sides. The degree to which the embeddedness of the relevant ac-tors in their possibly different local institutional environments—involving their spe-cific cultural conventions—affects their external relations is a key question. Localpractitioners may remain tied to traditional factors as the basis for local development,and this may impede their ability to interact effectively with external actors. Alterna-tively, their embeddedness in local social relations involving strong interactionswithin professional communities with specific business cultures may provide the ba-sis for finding useful complementarities with externally emerging technology, knowl-edge, and business cultures (cf. Malecki 2000; Wong 1998). Central is the question ofthe transferability of tacit knowledge as part of the operation of various communitiesof practice over space (Oinas 2001). There is very little empirical evidence that we candraw on concerning the travel of tacit knowledge over space, yet we should be re-minded that the distinction between codified and tacit knowledge is not fixed in a “spi-ral of knowledge” (Krogh, Ichijo, and Nonaka 2000; Nonaka and Konno 1998). Com-plex and changing combinations of codified and tacit knowledge are likely to be foundin innovative interactions in different spheres of activity in technological systems.
4. There is indeed a need to gain deeper understanding of the types of networks firms andindividuals and firms create for different strategic purposes. While implementationnetworks (and the regional environments that support them) are highly important forfirms to succeed in their existing competitive contexts, learning networks are morerelevant for the competitive success of firms in the long run (Oinas and Packalén1998). Minimally, differentiating between types of network relations will be helpfulin understanding the types of connections actors create between RISs within SISs andthe kinds of knowledge exchanges that are involved in them.
Oinas, Malecki / EVOLUTION OF TECHNOLOGIES 123

5. There is a need to incorporate conceptual insight into comprehensive empirical stud-ies. Yet, technological systems are not identifiable with simple means. They involveknowledge systems, innovative capability, knowledge transfer, and so on—largely in-tangible objects that are difficult to define and investigate (Smith 1995, 86). The col-lective nature of technological development often has no formal manifestation but in-volves informal, invisible practices. This renders research difficult; data are notreadily available. “ ‘Problem-solving’ networks are what really define (technologi-cal) systems, not buyer-supplier links. Such relationships can only be identified andanalyzed through primary data collection (via interviews, plant visits, etc.), whichalso needs to be oriented toward analyzing infrastructure and institutional arrange-ments” (Braunerhjelm and Carlsson 1999, 290). We are beginning to see the results ofresearch along these lines in a few sectors, such as aircraft (Eriksson 1995; Frenken2000) and hard disk drives (Gourevich, Bohn, and McKendrick 2000), but we do notknow if these are special cases or the tip of a generally applicable iceberg.
REFERENCES
Acs, Z., J. de la Mothe, and G. Paquet. 1996. Local systems of innovation: In search of an enabling strat-egy. In The implications of knowledge-based growth for micro-economic policies, edited byP. Howitt, 339-59. Calgary, Canada: University of Calgary Press.
Alderman, N. 1999. Local product development trajectories: Engineering establishments in three con-trasting regions. In Making connections: Technological learning and regional economic change,edited by E. J. Malecki and P. Oinas, 79-107. Aldershot, UK: Avebury.
Aldrich, H. 1999. Organizations evolving. London: Sage.Almeida, P., and B. Kogut. 1999. Localization of knowledge and the mobility of engineers in regional
networks. Management Science 45: 905-17.Amendola, M., and S. Bruno. 1990. The behaviour of the innovative firm: Relations to the environment.
Research Policy 19: 419-33.Amin, A., and P. Cohendet. 1999. Learning and adaptation in decentralised business networks. Environ-
ment and Planning D: Society and Space 17: 87-104.———. 2000. Organisational learning and governance through embedded practices. Journal of Man-
agement and Governance 4: 93-116.Amin, A. and N. Thrift. 1992. Neo-Marshallian nodes in global networks. International Journal of
Urban and Regional Research 16: 571-87.———. 1993. Globalization, institutional thickness and local prospects. Revue d’Economie Régionale
et Urbaine 3: 405-27.Antonelli, C. 1999. The microdynamics of technological change. London: Routledge.Archibugi, D., and J. Michie. 1997. Technological globalisation or national systems of innovation.
Futures 29: 121-37.Asheim, B., and M. Dunford. 1997. Regional futures. Regional Studies 31: 445-55.Asheim, B. T., and P. Cooke. 1999. Local learning and interactive innovation networks in a global econ-
omy. In Making connections: Technological learning and regional economic change, edited by E. J.Malecki and P. Oinas, 145-78. Aldershot, UK: Ashgate.
Autio, E. 1994. New, technology-based firms as agents of R&D and innovation: An empirical study.Technovation 14: 259-73.
Bell, M., and M. Albu. 1999. Knowledge systems and technological dynamism in industrial clusters indeveloping countries. World Development 27: 1715-34.
124 INTERNATIONAL REGIONAL SCIENCE REVIEW (Vol. 25, No. 1, 2002)

Blanc, H., and C. Sierra. 1999. The internationalisation of R&D by multinationals: A trade-off betweenexternal and internal proximity. Cambridge Journal of Economics 23: 187-206.
Braczyk, H.-J., P. Cooke, and M. Heidenreich, eds. 1998. Regional innovation systems: The role of gov-ernances in a globalized world. London: UCL Press.
Braczyk, H.-J., and M. Heidenreich. 1998. Regional governance structures in a globalized world. InRegional innovation systems: The role of governances in a globalized world, edited by H.-J.Braczyk, P. Cooke, and M. Heidenreich, 414-40. London: UCL Press.
Braunerhjelm, P., and B. Carlsson. 1999. Industry clusters in Ohio and Sweden, 1975-1995. Small Busi-ness Economics 12: 279-93.
Brown, J. S., and P. Duguid. 1994. Organizational learning and communitites-of-practice: Toward a uni-fied view of working, learning and innovation. In New thinking in organizational behaviour, editedby H. Tsoukas, 165-87. Oxford, UK: Butterworth-Heinemann.
Bunnell, T. G., and N. M. Coe. 2001. Spaces and scales of innovation. Progress in Human Geography25. Forthcoming.
Camagni, R. 1995. Global network and local milieu: Towards a theory of economic space. In The indus-trial enterprise and its environment: Spatial perspectives, edited by S. Conti, E. J. Malecki, andP. Oinas, 195-214. Aldershot, UK: Avebury.
Cantwell, J., and L. Piscitello. 2000. Accumulating technological competence: Its changing impact oncorporate diversification and internationalization. Industrial and Corporate Change 9: 21-51.
Carlsson, B. 1994. Technological systems and economic performance. In The handbook of industrialinnovation, edited by M. Dodgson and R. Rothwell, 13-24. Aldershot, UK: Edward Elgar.
Carlsson, B., and R. Stankiewicz. 1991. On the nature, function and composition of technological sys-tems. Journal of Evolutionary Economics 1: 93-118.
Chesbrough, H. 1999. The organizational impact of technological change: A comparative theory ofnational institutional factors. Industrial and Corporate Change 8: 447-85.
Christensen, C. M. 1997. The innovator’s dilemma: When new technologies cause great firms to fail.Boston: Harvard Business School Press.
Christensen, J. L. 1992. The role of finance in national systems of innovation. In National systems ofinnovation: Towards a theory of innovation and interactive learning, edited by B.-Å. Lundvall,146-68. London: Pinter.
Christensen, P. R. 1991. The small and medium-sized exporters’squeeze: Empirical evidence and modelreflections. Entrepreneurship and Regional Development 3: 49-65.
Christensen, P. R., and L. Lindmark. 1993. Location and internationalization of small firms. In Visionsand strategies in European integration, edited by L. Lundqvist and L. O. Persson, 131-51. Berlin:Springer-Verlag.
Cohen, W. M., and D. A. Levinthal. 1989. Innovation and learning: The two faces of R&D. EconomicJournal 99: 569-96.
Cohendet, P., F. Kern, B. Mehmanpazir, and F. Munier. 1999. Knowledge coordination, competence cre-ation and integrated networks in globalised firms. Cambridge Journal of Economics 23: 225-41.
Cooke, P. 1996. The new wave of regional innovation networks: Analysis, characteristics and strategy.Small Business Economics 8: 159-71.
———. 1998. Introduction: Origins of the concept. In Regional innovation systems: The role of govern-ances in a globalized world, edited by H.-J. Braczyk, P. Cooke, and M. Heidenreich, 2-25. London:UCL Press.
de la Mothe, J., and G. Paquet. 1998a. Local and regional systems of innovation as learning socio-economies. In Local and regional systems of innovation, edited by J. de la Mothe and G. Paquet,1-16. Dordrecht, the Netherlands: Kluwer.
de la Mothe, J., and G. Paquet. 1998b. National innovation systems, “real economies” and instituted pro-cesses. Small Business Economics 11: 101-11.
Oinas, Malecki / EVOLUTION OF TECHNOLOGIES 125

Donaghu, M. T., and R. Barff. 1990. Nike just did it: International subcontracting and flexibility in ath-letic footwear production. Regional Studies 24: 537-52.
Dosi, G. 1982. Technological paradigms and technological trajectories. Research Policy 11: 147-62.Ebers, M., and A. Grandori. 1997. The forms, costs, and development dynamics of inter-organizational
networking. In The formation of inter-organizational networks, edited by M. Ebers, 265-86. Oxford,UK: Oxford University Press.
Edquist, C. 1997. Systems of innovation approaches—Their emergence and characteristics. In Systemsof innovation: Technologies, institutions and organizations, edited by C. Edquist, 1-35. London:Pinter.
Edquist, C., and L. Hommen. 1999. Systems of innovation: Theory and policy for the demand side. Tech-nology in Society 21: 63-79.
Eliasson, G. 1998. Competence blocs and industrial policy in the knowledge-based economy. STIReview 22: 209-41.
Enright, M. J. 1996. Regional clusters and economic development: A research agenda. In Business net-works: Prospects for regional development, edited by U. H. Staber, N. V. Schaefer, and B. Sharma,190-213. Berlin: de Gruyter.
Eriksson, S. 1995. Global shift in the aircraft industry: A study of airframe manufacturing with specialreference to the Asian NIEs. Gothenburg, Sweden: University of Gothenburg, Department of Humanand Economic Geography.
Estimé, M.-F., G. Drilhon, and P.-A. Julien. 1993. Small and medium-sized enterprises: Technology andcompetitiveness. Paris: OECD.
Feldman, M. P., and D. B. Audretsch. 1999. Innovation in cities: Science-based diversity, specializationand localized competition. European Economic Review 43: 409-29.
Ferdows, K. 1997. Making the most of foreign factories. Harvard Business Review 75: 73-88.Feser, E. J. 1998. Old and new theories of industry clusters. In Clusters and regional specialisation: On
geography, technology and networks, edited by M. Steiner, 18-40. London: Pion.Foss, N. J. 1996. Higher-order industrial capabilities and competitive advantage. Journal of Industry
Studies 3: 1-20.Freeman, C. 1987. Technology policy and economic performance. London: Pinter.———. 1995. The “national system of innovation” in historical perspective. Cambridge Journal of Eco-
nomics 19: 5-24.Frenken, K. 2000. A complexity approach to innovation networks. The case of the aircraft industry
(1909-1997). Research Policy 29: 257-72.Frenken, K., and L. Leydesdorff. 2000. Scaling trajectories in civil aircraft. Research Policy 29: 331-48.Fromhold-Eisebith, M. 1999. Bangalore: A network model for innovation-oriented regional develop-
ment in NICs? In Making connections: Technological learning and regional economic change,edited by E. J. Malecki and P. Oinas, 231-60. Aldershot, UK: Ashgate.
Fujimoto, T. 1998. Reinterpreting the resource-based capability view of the firm: A case of thedevelopment-production systems of the Japanese auto-makers. In The dynamic firm: The role oftechnology, strategy, organization, and regions, edited by A. D. Chandler, P. Hagström and Ö.Sölvell, 15-44. Oxford, UK: Oxford University Press.
Galli, R., and M. Teubal. 1997. Paradigmatic shifts in national innovation systems. In Systems of innova-tion: Technologies, institutions and organizations, edited by C. Edquist, 342-70. London: Pinter.
Gassmann, O., and M. von Zedtwitz. 1999. New concepts and trends in international R&D organization.Research Policy 28: 231-50.
Gelsing, L. 1992. Innovation and the development of industrial networks. In National systems of innova-tion: Towards a theory of innovation and interactive learning, edited by B.-Å. Lundvall, 116-28.London: Pinter.
Gertler, M. S. 1995. “Being there”: Proximity, organization, and culture in the development and adop-tion of advanced manufacturing technologies. Economic Geography 71: 1-26.
126 INTERNATIONAL REGIONAL SCIENCE REVIEW (Vol. 25, No. 1, 2002)

Gourevitch, P., R. Bohn, and D. McKendrick. 2000. Globalization of production: Insights from the harddisk drive industry. World Development 28: 301-17.
Granstrand, O. 1998. Towards a theory of the technology-based firm. Research Policy 27: 465-89.Green, K., R. Hull, A. McMeekin, and V. Walsh. 1999. The construction of the techno-economic: Net-
works vs. paradigms. Research Policy 28: 777-92.Grupp, H. 2000. Learning in a science-driven market. Industrial and Corporate Change 9: 143-72.Guinet, J. 1995. National systems for financing innovation. Paris: OECD.Hägerstrand, T. 1970. What about people in regional science? Papers of the Regional Science Associa-
tion 24: 7-21.Hampden-Turner, C., and A. Trompenaars. 1993. The seven cultures of capitalism. New York: Currency
Doubleday.Harrison, B., M. R. Kelley, and J. Gant. 1996. Innovative firm behavior and local milieu: Exploring the
intersection of agglomeration, firm effects, and technological change. Economic Geography 72:233-58.
Hassink, R. 2000. Regional innovation support systems in South Korea and Japan compared. Zeitschriftfür Wirtscharftsgeografie 44: 228-45.
Henry, N., S. Pinch, and S. Russell. 1996. In pole position? Untraded interdependencies, new industrialspaces and the British motor sport industry. Area 28: 25-36.
Hickson, D. J., ed. 1993. Management in Western Europe: Society, culture and organization in twelvenations. Berlin: de Gruyter.
Hobday, M. 1994. Technological learning in Singapore: A test case of leapfrogging. Journal of Develop-ment Studies 30: 831-58.
———. 1995. East Asian latecomer firms: Learning the technology of electronics. World Development23: 1171-93.
Howells, J., and J. Roberts. 2000. From innovation systems to knowledge systems. Prometheus 18:17-31.
Hudson, R. 1999. “The learning economy, the learning firm and the learning region”: A sympathetic cri-tique of the limits to learning. European Urban and Regional Studies 6: 59-72.
Jacobs, D., and A.-P. de Man. 1996. Clusters, industrial policy and firm strategy: A menu approach.Technology Analysis and Strategic Management 8: 425-37.
Jackson, P., and N. Thrift. 1996. Geographies of consumption. In Acknowledging consumption, editedby D. Miller, 204-37. London: Routledge.
Julien, P.-A. 1995. Economic theory, entrepreneurship and new economic dynamics. In The industrialenterprise and its environment: Spatial perspectives, edited by S. Conti, E. J. Malecki, and P. Oinas,123-42. Aldershot, UK: Avebury.
Keeble, D., C. Lawson, H. Lawton Smith, B. Moore, and F. Wilkinson. 1998. Internationalisation pro-cesses, networking and local embeddedness in technology-intensive small firms. Small BusinessEconomics 11: 327-42.
Kelley, M. R., and H. Brooks. 1992. Diffusion of NC and CNC machine tool technologies in large andsmall firms. In Computer integrated manufacturing, vol. III. Models, case studies, and forecasts ofdiffusion, edited by R. U. Ayres, W. Haywood, and I. Tchijov, 117-35. London: Chapman and Hall.
Kelley, M. R., and S. Helper. 1999. Firm size and capabilities, regional agglomeration, and the adoptionof new technology. Economics of Innovation and New Technology 8: 79-103.
Kim, L. 1997. Imitation to innovation: The dynamics of Korea’s technological learning. Boston: Har-vard University Press.
Kim, L. 1999. Building technological capability for industrialization: Analytical frameworks andKorea’s experience. Industrial and Corporate Change 8: 111-36.
Krogh, G. von, K. Ichijo, and I. Nonaka. 2000. Enabling knowledge creation: How to unlock the mysteryof tacit knowledge and release the power of innovation. Oxford, UK: Oxford University Press.
Kumaresan, N., and K. Miyazaki. 1999. An integrated network approach to systems of innovation—Thecase of robotics in Japan. Research Policy 28: 563-85.
Oinas, Malecki / EVOLUTION OF TECHNOLOGIES 127

Lave, J., and E. Wenger. 1991. Situated learning: Legitimate peripheral participation. Cambridge, UK:Cambridge University Press.
Leonard-Barton, D. 1995. Wellsprings of knowledge. Boston: Harvard Business School Press.Lundvall, B.-Å., ed. 1992. National systems of innovation: Towards a theory of innovation and interac-
tive learning. London: Pinter.MacPherson, A. 1992. Innovation, external technical linkages and small-firm commercial performance:
An empirical analysis from western New York. Entrepreneurship and Regional Development 4:165-83.
———. 1995. Product design strategies amongst small- and medium-sized manufacturing firms: Impli-cations for export planning and regional economic development. Entrepreneurship and RegionalDevelopment 7: 329-48.
———. 1997. A comparison of within-firm and external sources of product innovation. Growth andChange 28: 289-308.
Maillat, D. 1995. Territorial dynamic, innovative milieus and regional policy. Entrepreneurship andRegional Development 7: 157-65.
Malecki, E. J. 1997. Technology and economic development: The dynamics of local, regional andnational competitiveness. 2d ed. London: Addison Wesley Longman.
———. 2000. Soft variables in regional science. Review of Regional Studies 30: 60-69.Malecki, E. J., and R. M. Poehling. 1999. Extroverts and introverts: Small manufacturers and their infor-
mation sources. Entrepreneurship and Regional Development 11: 247-68.Malmberg, A., and P. Maskell. 1997. Towards an explanation of regional specialisation and industry
agglomeration. European Planning Studies 5: 25-41.Maskell, P. 1999. Globalisation and industrial competitiveness: The process and consequences of
ubiquitification. In Making connections: Technological learning and regional economic change,edited by E. J. Malecki and P. Oinas, 35-59. Aldershot, UK: Ashgate.
Maskell, P., and A. Malmberg. 1999a. The competitiveness of firms and regions: “Ubiquitification” andthe importance of localized learning. European Urban and Regional Studies 6: 9-26.
———. 1999b. Localised learning and industrial competitiveness. Cambridge Journal of Economics23: 167-85.
McKendrick, D. G., R. F. Doner, and S. Haggard. 2000. From Silicon Valley to Singapore: Location andcompetitive advantage in the hard disk drive industry. Stanford, CA: Stanford University Press.
Mendelson, H., and R. R. Pillai. 1999. Information age organizations, dynamics and performance. Jour-nal of Economic Behavior and Organization 38: 253-81.
Mody, A., R. Suri, and M. Tatikonda. 1995. Keeping pace with change: International competition inprinted circuit board assembly. Industrial and Corporate Change 4: 583-613.
Mueller, F., and R. Loveridge. 1995. The “second industrial divide”? The role of the large firm in theBaden-Württemberg model. Industrial and Corporate Change 4: 555-82.
Nelson, R. R., ed. 1993. National innovation systems: A comparative analysis. New York: Oxford Uni-versity Press.
———. 1996. The evolution of comparative or competitive advantage: A preliminary report on a study.Industrial and Corporate Change 5: 597-617.
Nelson, R. R., and S. G. Winter. 1982. An evolutionary theory of economic change. Cambridge, MA:Harvard University Press.
Nonaka, I., and N. Konno. 1998. The concept of “ba”: Building a foundation for knowledge creation.California Management Review 40: 40-54.
Nooteboom, B. 1999a. Innovation, learning and industrial organisation. Cambridge Journal of Econom-ics 23: 127-50.
———. 1999b. Interfirm alliances. London: Routledge.———. 2000. Learning and innovation in organizations and economies. Oxford, UK: Oxford Univer-
sity Press.
128 INTERNATIONAL REGIONAL SCIENCE REVIEW (Vol. 25, No. 1, 2002)

Oerlemans, L.A.G., M.T.H. Meeus, and F.W.M. Boekema. 1998. Do networks matter for innovation?The usefulness of the economic network approach in analysing innovation. Tijdschrift voorEconomische en Sociale Geografie 89: 298-309.
Ohmae, K. 1995. The end of the nation state. New York: Free Press.O’hUallachain, B. 1997. Restructuring the American semiconductor industry: Vertical integration of
design houses and wafer fabricators. Annals of the Association of American Geographers 87:217-37.
Oinas, P. 1999. Activity-specificity in organizational learning: Implications for analysing the role ofproximity. GeoJournal 49: 363-72.
———. 2000. Distance and learning: Does proximity matter? In Knowledge, innovation and economicgrowth: Theory and practice of the learning region, edited by R. Rutten, S. Bakkers, K. Morgan, andF. Boekema, 57-69. Cheltenham, UK: Edward Elgar.
———. 2001. Dissecting learning: Cognitive units, activity sets, and geography. Paper presented at theMeetings of the Association of American Geographers, New York, 27 February-3 March.
Oinas, P., and E. J. Malecki. 1999. Spatial innovation systems. In Making connections: Technologicallearning and regional economic change, edited by E. J. Malecki and P. Oinas, 7-33. Aldershot, UK:Ashgate.
Oinas, P., and A. Packalén. 1998. Four types of strategic inter-firm networks—An enrichment ofresearch on regional development [in Finnish]. Terra 110: 69-77.
Oinas, P., and H. van Gils. 2001. Identifying contexts of learning in firms and regions. In Promotinglocal growth: Process, practice and policy, edited by D. Felsenstein and M. Taylor, 61-79.Aldershot, UK: Ashgate.
Oinas, P., and S. Virkkala. 1997. Learning, competitiveness and development. Reflections on the con-temporary discourse on “learning regions.” In Regional specialisation and local environ-ment—Learning and competitiveness, edited by H. Eskelinen, 263-77. Copenhagen, Denmark:NordREFO.
Patchell, J., R. Hayter, and K. Rees. 1999. Innovation and local development: The neglected role of largefirms. In Making connections: Technological learning and regional economic change, edited by E. J.Malecki and P. Oinas, 109-42. Aldershot, UK: Ashgate.
Patel, P., and K. Pavitt. 1994. The nature and economic importance of national innovation systems. STIReview 14: 9-32.
Pinch, S., and N. Henry. 1999. Discursive aspects of technological innovation: The case of the Britishmotor-sport industry. Environment and Planning A 31: 665-82.
Porter, A. L., J. D. Roessner, N. Newman, and D. Cauffiel. 1996. Indicators of high technology competi-tiveness of 28 countries. International Journal of Technology Management 12: 1-32.
Porter, M. E. 1998. Clusters and competition: New agendas for companies, governments, and institu-tions. In On competition, edited by M. E. Porter, 197-287. Boston: Harvard Business School Press.
Powell, W. W., K. W. Koput, and L. Smith-Doerr. 1996. Interorganizational collaboration and the locusof innovation: Networks of learning in biotechnology. Administrative Science Quarterly 41: 116-45.
Quigley, J. M. 1998. Urban diversity and economic growth. Journal of Economic Perspectives 12:127-38.
Reger, G. 1999. Changes in the R&D strategies of transnational firms: Challenges for national technol-ogy and innovation policy. STI Review 22: 243-76.
Roberts, E. B. 1990. Evolving toward product and market-orientation: The early years of technology-based firms. Journal of Product Innovation Management 7: 274-87.
Roessner, J. D., A. L. Porter, N. Newman, and D. Cauffiel. 1996. Anticipating the future high-tech com-petitiveness of nations: Indicators for twenty-eight countries. Technological Forecasting and SocialChange 51: 133-49.
Roobeek, A.J.M. 1990. Beyond the technology race: An analysis of technology policy in seven industrialcountries. Amsterdam: Elsevier.
Oinas, Malecki / EVOLUTION OF TECHNOLOGIES 129

Rosenfeld, S. A. 1997. Bringing business clusters into the mainstream of economic development. Euro-pean Planning Studies 5: 3-23.
Rothwell, R. 1992. Successful industrial innovation: Critical factors for the 1990s. R&D Management22: 221-39.
Rycroft, R., and D. E. Kash. 1999. The complexity challenge: Technological innovation for the 21st cen-tury. London: Pinter.
Sachs, J. 2000. A new map of the world. The Economist 24 June, 81-83.Sanderson, S., and M. Uzumeri. 1995. Managing product families: The case of the Sony Walkman.
Research Policy 24: 761-82.Saxenian, A. 1999. Silicon Valley’s new immigrant entrepreneurs. San Francisco: Public Policy Institute
of California.Scott, A. J. 1998. New industrial spaces. London: Pion.Singh, M. S. 1995. Formation of local skills space and skills networking: The experience of the electron-
ics and electrical sector in Penang. In Human resources and industrial spaces, edited by B. van derKnaap and R. Le Heron, 197-226. Chichester, UK: Wiley.
Smith, K. 1995. Interactions in knowledge systems: Foundations, policy implications and empiricalmethods. STI Review 16: 69-102.
Steiner, M. 1998. The discreet charm of clusters: An introduction. In Clusters and regional specialisa-tion: On geography, technology and networks, edited by M. Steiner, 1-17. London: Pion.
Storper, M. 1993. Regional “worlds” of production: Learning and innovation in the technology districtsof France, Italy and the USA. Regional Studies 27: 433-55.
———. 1996. Innovation as collective action: Conventions, products and technologies, Industrial andCorporate Change 5: 761-90.
———. 1997. The regional world. New York: Guilford.Storper, M., and R. Salais. 1997. Worlds of production. Cambridge, MA: Harvard University Press.Storper, M., and R. Walker. 1989. The capitalist imperative: Territory, technology, and industrial
growth. New York: Basil Blackwell.Sweeney, G. P. 1991. Technical culture and the local dimension of entrepreneurial vitality. Entrepre-
neurship and Regional Development 3: 363-78.Sweeney, G. P. 1999. Local and regional innovation: Governance issues in technological, economic and
social change. Report of the Six Countries Programme. Dublin, Ireland: SICA Innovation Associ-ates.
Tidd, J., J. Bessant, and K. Pavitt. 1997. Managing innovation: Integrating technological, market andorganizational change. Chichester, UK: Wiley.
Tödtling, F. 1995. The innovation process and local environment. In The industrial enterprise and itsenvironment: Spatial perspectives, edited by S. Conti, E. J. Malecki, and P. Oinas, 171-93.Aldershot, UK: Avebury.
Tödtling, F., and A. Kaufmann. 1999. Innovation systems in regions of Europe—A comparative per-spective. European Planning Studies 7: 699-717.
Tsipouri, L. J. 1991. The transfer of technology issue revisited: Some evidence from Greece. Entrepre-neurship and Regional Development 3: 145-57.
Tushman, M. L., P. C. Anderson, and C. O’Reilly. 1997. Technology cycles, innovation streams, andambidextrous organizations: Organization renewal through innovation streams and strategicchange. In Managing strategic innovation and change, edited by M. L. Tushman and P. C. Anderson,3-23. New York: Oxford University Press.
Utterback, J. M., and A. Afuah. 2000. Sources of innovative environments: A technological evolutionperspective. In Regional innovation, knowledge and global change, edited by Z. J. Acs, 169-85.London: Pinter.
Vaessen, P., and D. Keeble. 1995. Growth-oriented SMEs in unfavourable regional environments.Regional Studies 29: 489-505.
130 INTERNATIONAL REGIONAL SCIENCE REVIEW (Vol. 25, No. 1, 2002)

Vaessen, P., and E. Wever. 1993. Spatial responsiveness of small firms. Tijdschrift voor Economische enSociale Geografie 84: 119-31.
Wang, J. 1999. In search of innovativeness: The case of Zhong’guancun. In Making connections: Tech-nological learning and regional economic change, edited by E. J. Malecki and P. Oinas, 205-30.Aldershot, UK: Ashgate.
Wenger, E. C., and W. M. Snyder. 2000. Communities of practice: The organizational frontier. HarvardBusiness Review 78: 139-45.
Wong, C. 1998. Determining factors for local economic development: The perception of practitioners inthe North West and Eastern regions of the UK. Regional Studies 32: 707-20.
Zander, I. 1998. The evolution of technological capabilities in the multinational corporation—Disper-sion, duplication, and potential advantages from multinationality. Research Policy 27: 17-35.
———. 1999. How do you mean “global”? An empirical examination of innovation networks in themultinational corporation. Research Policy 28: 195-213.
Oinas, Malecki / EVOLUTION OF TECHNOLOGIES 131
INTERNATIONAL REGIONAL SCIENCE REVIEW (Vol. 25, No. 1, 2002)Acs, Varga / GEOGRAPHY, ENDOGENOUS GROWTH, AND INNOVATION
GEOGRAPHY, ENDOGENOUS GROWTH,
AND INNOVATION
ZOLTAN J. ACS
University of Baltimore, [email protected]
ATTILA VARGA
University of Pécs, Hungary, [email protected]
If one is to understand why some regions grow and others stagnate, there are three fundamentalquestions that need to be answered. First, Why and when does economic activity become concen-trated in a few regions, leaving others relatively underdeveloped? Second, What role does tech-nological change play in regional economic growth? Third, How does technological advanceoccur, and what are the key processes and institutions involved? To answer these three questions,the authors surveyed three separate and distinct literatures that have a long and distinguishedhistory, and all three have been recently reexamined. They include the new economic geography(Krugman), the new growth theory (Romer), and the new economics of innovation (Nelson).
1. INTRODUCTION
For the past two decades, scientists, policy makers, and the general public havebeen fascinated by developments in the Silicon Valley. The developments we havein mind are the ubiquitous creation of new product innovations in this part of theworld. The Valley has had an unprecedented record of success in the introduction ofcomputers, software, semiconductors, biotechnology, and a host of other innova-tions that have come to dominate industry after industry throughout the world. Ofcourse, this is not the only region of the world that has experienced an outflow ofinnovations. But the truth of the matter is that regions that are innovative appear togrow faster than regions that are not (see, e.g., Suarez-Villa 2000).
In other words, there appears to be a growing consensus that innovation is thekey driving force behind economic growth, standards of living, international com-petitiveness, and regional development. Recently, several books have appeared thattry to identify the underlying processes and interconnections that govern regionalinnovation (Braczyk, Cooke, Heidenreich 1998; de la Mothe and Pacquet 1998;
INTERNATIONAL REGIONAL SCIENCE REVIEW 25, 1: 132–148 (January 2002)
The idea of this article originated out of a series of discussions we had during the fall of 1998. The articlewas outlined while Zoltan J. Acs visited at the Vienna University of Economics and Business Adminis-tration in the summer of 1999. We would like to thank seminar participants at the International RegionalScience Association meetings in Montreal, Canada, in November 1999 and two anonymous referees forvaluable suggestions on how to revise the article.
© 2002 Sage Publications

Ratti, Bramanti, and Gordon 1997; De Bresson 1996; Acs 2000). While thesebooks take different approaches, rely on different methodologies, use differentdata, and define the unit of analysis differently, they all suggest that there is some-thing fundamental at work at the regional level. While these works are all interest-ing, illuminating pieces of the regional innovation puzzle, neither singularly nor inconcert answer the bigger question of why some regions are more innovative thanothers.1
If we are to understand why some regions grow and others stagnate, there arethree fundamental questions that need to be answered. First, Why and when doeseconomic activity become concentrated in a few regions, leaving others relativelyunderdeveloped? Second, What role does technological change play in regionaleconomic growth? Third, How does technological advance occur, and what are thekey processes and institutions involved? To answer these three questions, we sur-veyed three separate and distinct literatures that have a long and distinguished his-tory, and all three have been recently reexamined. They include the new economicgeography (Krugman 1991a), the new growth theory (Romer 1990), and the neweconomics of innovation (Nelson 1993).
The purpose of this article is to survey these three literatures to help us betterunderstand the relationship between economic geography, economic growth, andinnovation. Why these three literatures, you might ask? The reason for choosingthese three literatures is that while each one sheds some light on the relevant ques-tion, neither completely answers the larger question of divergent regional growth.The new economic geography answers the question why economic activity concen-trates in certain regions but not others but leaves out innovation and economicgrowth. The new growth theory explains the causes of economic growth but leavesout regional considerations and ignores the key processes and institutions involvedin innovation. The new economics of innovation, while explaining the institutionalarrangements in the innovation process, leaves out regional issues and economicgrowth.
What we are looking for from this new and evolving literature are insights thatwill help us develop a clear analytical framework that integrates economic growth,spatial interdependencies, and the creation of new technology as an explicit pro-duction process to formulate production-oriented regional policies (Nijkamp andPoot 1997). In the next section, we examine the new economic geography; in thethird section, we survey the endogenous growth theory, while the fourth sectionexamines systems of innovation. We finish with an outline for a new model oftechnology-led regional economic development.
2. GEOGRAPHY AND ECONOMIC THEORY
Despite that space-related economic problems such as firm location or externali-ties resulting from agglomeration are of prominent theoretical and practical impor-tance, economic geography has been a neglected field of mainstream economics for
Acs, Varga / GEOGRAPHY, ENDOGENOUS GROWTH, AND INNOVATION 133

a long time. Ignorance of spatial issues is even more astonishing if one considersthat major accomplishments in the history of spatial economics have approachedgeographical issues within generally accepted frameworks of economics (Blaug1979; Greenhut and Norman 1995; Krugman 1991a, 1995). Johann von Thünen,the father of location theory, made constant use of algebra and differential calculuslong before mathematics had become the primary language of economic theory(Blaug 1979, 1992). Alfred Weber (1929) created a location theory within a com-parative static microeconomics environment. Likewise, recent efforts in regionalscience (Isard 1956) and the new urban economics (Beckmann 1969) to bring spa-tial issues into the framework of mainstream economics have also failed despitetheir purely neoclassical framework (Krugman 1991a).
One possible reason for the negligence of geographic issues could be that fromthe very beginning, neoclassical economics has a nonspatial framework for analyz-ing economic problems. Introducing space into microeconomics can result in sub-stantial changes in well-established theorems (Ohta 1988). Of course, reconstruc-tion of such a huge intellectual framework is always very expensive, and those costsare rarely incurred. Krugman (1991a, 1995) provided an alternative explanation.According to this, a major analytical problem with previous work in economicgeography is that issues related to geography were treated within the perfectly com-petitive neoclassical framework. As a consequence, spatial economic problemshave not attracted the attention of mainstream economists until the recent develop-ment of the analytics of imperfect competition.
Instead of an in-depth survey of the extensive works of Paul Krugman (for suchsurveys, see Isserman 1996; Martin and Sunley 1996; and Martin 1999), or thedynamically evolving field of the new economic geography, this section provides aconcise description of Krugman’s basic theory on economic concentration to assessits potential for modeling technology-led economic growth.
Krugman, a prominent international trade theorist, had turned to economicgeography issues after recognizing that regions and not countries are the real unitsof economic analysis (Krugman 1991a, 1993c). Economic activities are not evenlydistributed across space. An issue having central importance in economics is theexplanation of why economic activities concentrate in certain areas while othersremain relatively underdeveloped. In his basic theory (Krugman 1991a, 1991b) andits subsequent extensions to specific issues (Krugman 1993a, 1993b, 1996; Fujita,Krugman, and Venables 1999), a general equilibrium model was developed thatexplains spatial concentration of economic activities with the interrelations of threeparameters: increasing returns, transport cost, and demand for manufacturinggoods. According to the model, each of these parameters should pass certainthreshold values before any kind of geographic concentration emerges. Similar tomodels in the new trade theory and the new (endogenous) growth theory, it buildsextensively on the monopolistic competition model of Dixit and Stiglitz (1977).
An important prerequisite for any kind of spatial concentration to occur is thepresence of some kind of increasing returns to scale in manufacturing production.
134 INTERNATIONAL REGIONAL SCIENCE REVIEW (Vol. 25, No. 1, 2002)

However, without an appropriately low level of transport costs, economies of scalecannot facilitate concentration: production remains dispersed in the proximity oftheir markets. When suitable levels of transport costs and increasing returns areattained, manufacturing producers start concentrating in areas where the initialdemand for their goods is relatively high to save at least on a portion of transporta-tion expenditures. Demand and supply externalities (“backward and forward link-ages” in Hirschman 1958) have important roles in facilitating further concentra-tion: manufacturers locate where demand is high and the supply of their inputs isavailable. However, demand and supply externalities induce a “cumulative causa-tion” (Myrdal 1957) process: location of new firms reinforces these externalitiesand will attract further manufacturers to the region.
The following briefly summarize the basic two-region model in Krugman(1991a, 1991b).
Individuals share the Cobb-Douglas type utility function of
U C CM A= −π π1 , (2.1)
where CM is consumption of aggregate manufacturing goods, CA is agriculturalconsumption, and π is the share of expenditures spent on manufacturing goods.
The aggregate of manufacturing consumption is determined by the constantelasticity of substitution function of
[ ]C CM ii= −
−
∑ ( ) // ( )
σ σσ σ
11
, (2.2)
where σ > 1 is the elasticity of substitution among manufacturing products. When iis sufficiently large, σ represents demand elasticity for manufacturing good i(Krugman 1980).
Agricultural production is assumed to have constant returns to scale technol-ogy, whereas manufacturing follows increasing returns. Costs in labor are deter-mined by
LMi = α + βxMi , (2.3)
where i stands for individual firms, α is the fixed cost parameter, β is the parameterof marginal costs, and xi is the good’s output.
In equilibrium, price of good i is determined in monopolistic competition as
Pi = [σ/(σ – 1)] βw, (2.4)
which implies that (since Pi = ACi and βw is marginal cost) AC/MC (as a measure offirm size) is represented by σ/(σ – 1). It follows that σ is an inverse index of theimportance of increasing returns in the model.
After defining two of the crucial parameters (i.e., π and σ) of the model, trans-port cost is defined in the manner of Samuelson’s iceberg cost formulation: as dis-tance increases, the portion of the good delivered gets smaller. The fraction thatarrives is denoted τ.
Acs, Varga / GEOGRAPHY, ENDOGENOUS GROWTH, AND INNOVATION 135

The basic model assumes that there are two regions: East, dominated by manu-facturing, and West, a perfectly agricultural area. π is the portion of manufacturingworkers in East, whereas agricultural workers are evenly distributed in space with(1 – π)/2 in each region.
Instead of modeling the emergence of the two regions within some complicateddynamic settings, prerequisites for a representative manufacturing firm to relocatefrom East to West are searched for. This approach is based on the assumption thatparameter conditions for leaving an established manufacturing region are the sameas the conditions for locating there. K stands for the ratio of shares from a West loca-tion of a representative firm to that from an East location. When K > 1, the firm willrelocate. It is represented in the model as follows in (2.5).
[ ]K S Sw E= + + −− − − −τ τ π τ π τπ πσ σ σ/ / ( ) ( ) ( )1 2 1 11 1 , (2.5)
with SW and SE representing the value of sales in West and East and τ–π being theprice index. Partial derivatives of K evaluated in the vicinity of K = 1 in (2.5) indi-cates the effects of parameter values on the representative firm’s decisions.∂ ∂ <K / π 0 shows that higher shares of expenditures on manufacturing goods urgefirms to concentrate in space, whereas ∂ ∂ >K / σ 0 indicates that economies of scalehas a positive effect on geographical concentration (i.e., the less important increas-ing returns are, the less strong is the incentive of firms to agglomerate). Also,∂ ∂ <K / τ 0 at the boundary between concentration and nonconcentration.
Evaluated at K = 1, equation 2.5 makes simulations of any combination of thethree parameters possible as illustrated in Figure 1. The two curves associated withσ1 and σ2(σ1 < σ2) illustrate two boundaries between spatial concentration and dis-persion of manufacturing activities. Any specific combination of π and τ repre-sented by a point above a curve will induce concentration of manufacturing
136 INTERNATIONAL REGIONAL SCIENCE REVIEW (Vol. 25, No. 1, 2002)
FIGURE 1. The Combination of Parameters Leading to Geographical Concentration
Source: Krugman (1991b, 498).

production in space. It is shown in the figure that agglomeration emerges at a certaincombination of large economies of scale, low transportation cost, and a large shareof manufacturing in expenditure.
The model described above can be extended to cases of more than two locationsas exemplified in Krugman (1993a, 1993b) to model the emergence of city hierar-chies. Novelties of Krugman’s theory on economic concentration are not in its ele-ments but in the way the system was put together. It has already been well known ineconomic geography and regional economics that decreasing transportation costs,economies of scale, or increasing demand favor agglomeration. Also, demand andsupply externalities (Hirschman 1958) and economic growth resulting from “circu-lar causation” (Myrdal 1957) have been standard tools in spatial sciences for a longtime. However, the way Krugman put these elements together in a general equilib-rium model is novel. The model provides a case for the treatment of spatial issues ina way economists are accustomed to (Fujita, Krugman, and Venables 1999): notonly in that it makes simulations to study the interrelations of parameters possiblebut also in that it opens the way for empirical testing of the theory.
The model provides a technique to analyze geographical concentration of eco-nomic activities as being induced by some initial combinations of basic parameters.However, the model in its current form does not seem to be suitable for modelingtechnology-led regional economic growth at least for two reasons. First, Krugman’sdefinite insistence of avoiding modeling the role of technological externalities inregional economic growth prevents the model from being applicable in modelinginnovation-led regional development since spillovers and innovation networks arein the core of this type of development, as exemplified by the literature of innova-tion systems.
Second, while the model is very strong in working out the characterization ofspecific initial combinations of the three parameters favoring geographical concen-tration, it is weak in actually modeling the growth process. Cumulative causationeffects of Myrdal (1957) induced by forward and backward linkages of Hirschman(1958) seem not to be sufficient enough to trace economic growth of individualregions.
3. ENDOGENOUS TECHNICAL CHANGE
This section is not considered a detailed survey of the endogenous economicgrowth literature (for such surveys see, for example, Grossman and Helpman 1991;Helpman 1992; Romer 1994; Barro and Sala-i-Martin 1995; Nijkamp and Poot1997; Aghion and Howitt 1998); it focuses instead on certain aspects having crucialimportance for the subject of this article. The distinguishing feature of endogenouseconomic growth theory as compared to the neoclassical growth model is in itsmodeling of technological change as a result of profit-motivated investments inknowledge creation by private economic agents. The novel formulation of techno-logical knowledge in economic theory in Romer (1990) is the key in establishing
Acs, Varga / GEOGRAPHY, ENDOGENOUS GROWTH, AND INNOVATION 137

this new and fast-evolving field of economic growth theory. According to this for-mulation, technological knowledge is a nonrival, partially excludable good. Suchformulation of technological knowledge as a key factor in the production functionresults in a departure from the constant returns to scale, perfectly competitive worldof the neoclassical growth theory.
Central to the neoclassical theory of economic growth as formulated in Solow(1956) is the production function. Assuming that capital does not depreciate, laborforce does not grow, and technology does not change over time (Helpman 1992),the production function has the form of
Y = F (K, L), (3.1)
where Y represents aggregate production, K the capital stock, and L the labor force.F(•) is the constant returns to scale production function. It is assumed that the capi-tal stock grows without bounds. However, the growth rate of per capita income isbounded. Growth rate of per capita income is
g = s FK (K, L), (3.2)
where g is the growth rate of per capita income, s is the savings rate, and FK is themarginal product of capital. Equation 3.2 says that per capita income grows as longas the marginal product of capital exceeds zero. However, assuming constantgrowth in the capital stock, per capita income approaches zero. Relaxing theassumptions of stable labor force and no depreciation of capital does not changeessentially the main point of the model. The condition for a sustained per capitaincome growth in the long run is that, resulting from continuous capital accumula-tion, the marginal product of capital should not decrease below a positive lowerbound.
Development in the state of technology is an essential force to offset the effect ofcapital accumulation on per capita income to decline in the neoclassical model ofeconomic growth. Introducing technological progress in the production function, ittakes the form
Y = F (A, K, L), (3.3)
where A stands for the state of technology. Assuming that A increases, it willincrease the marginal product of capital, which will lead to a higher per capitaincome. As a result, in steady state the rate of technical development equals the rateof capital accumulation.
The essential role of technological progress in economic growth has beenemphasized above. However, technological development remains unexplained inthe neoclassical theory of economic growth. As a public good, it is consideredexogenously determined, although (as data show in Solow 1957 and Maddison1987) the major portion of economic growth can be attributed to technologicalchange whereas capital accumulation (the main concern in the neoclassical model)explains only a fraction of it.
138 INTERNATIONAL REGIONAL SCIENCE REVIEW (Vol. 25, No. 1, 2002)

Primary attempts in the literature to endogenize technological progress includeArrow (1962) by introducing “learning by doing” in technological development,Lucas (1988) by modeling human capital as the determinant factor in technicalchange and Romer (1986) by explicitly including research in the production func-tion. In Arrow’s (1962) formulation,
Yi = A(K)F(Ki, Li), (3.4)
the state of technology depends on the aggregate capital stock in the economy. Sub-script i denotes individual firms. According to the Lucas’ (1988) model of endoge-nous technological change, spillovers resulting from human capital accumulationinstead of the accumulation of physical capital increase the technological level inthe economy:
Yi = A(H)F(Ki, Li), (3.5)
where H stands for the general level of human capital in the economy. In Romer(1986), it is assumed that spillovers from private research efforts lead to the devel-opment in the public stock of knowledge. It could be written as
Yi = A(R)F(Ri, Ki, Li), (3.6)
where Ri stands for the results of private research and development efforts by firm iand R denotes the aggregate stock of research results in the economy.
As summarized in Romer (1990), the major conceptual problem with the formu-lation of endogenous growth in equations 3.4 through 3.6 is that in those models theentire stock of technological knowledge is considered to be public good. However,as daily evidence suggests, new technological knowledge can become partiallyexcludable (at least for a limited length of time) by means of patenting. Conse-quently, each firm developing a new technological knowledge has some marketpower and earns monopoly profits on its discoveries. The new theory of economicgrowth, which follows from this first in Romer (1990), builds on a more suitableview of the available stock of technological knowledge as well as formulates theeconomy within the framework of imperfect competition.
Not until the formulation of monopolistic competition in Dixit and Stiglitz(1997), applied in the dynamic context by Judd (1985), did modeling economicgrowth within an imperfectly competitive market structure become attainable. InRomer (1990), the approach by Judd (1985) was combined with learning by doingin innovation to create the first model of endogenously determined technicalchange with imperfectly competing firms.
In the core of the new economic growth theory there is a concept of technologi-cal knowledge as being a nonrival and partially excludable good as opposed to theneoclassical view of knowledge as an entirely public good. According to the con-cept of Romer (1990), knowledge is a nonrival good because it can be used by oneagent without limiting its use by others. However, at the same time it is also a
Acs, Varga / GEOGRAPHY, ENDOGENOUS GROWTH, AND INNOVATION 139

partially excludable good given the possibility to prevent its use by others by meansof patenting.
Knowledge enters into production in two ways. For the first one, newly devel-oped technological knowledge is used in production by the firm invested in thedevelopment of this new set of technological knowledge to produce output. In thisrole, knowledge can be protected from being used by others in producing the sametype of output. However, this new set of knowledge increases the total stock of pub-licly available knowledge as being spilled over to other researchers by way ofstudying its patent documentation (Romer 1990). As such, it increases the produc-tivity of creating further inventions in the research sector. This second role ofknowledge in production can be formalized as
dA = G(H, A), (3.7)
where H stands for human capital used in research and development, A is the totalstock of technological knowledge available at a certain point in time, and dA is thechange in technological knowledge resulting in private efforts to invest in researchand development. Human capital creates new knowledge, whereas at the sametime, the productivity of human capital depends on the total stock of already avail-able knowledge (A). The larger A, the higher the productivity of H, and the lessexpensive it is to create new technological knowledge.
A principal assumption in the theory of endogenous growth is that for creatingnew sets of technological knowledge, the total stock of knowledge (A in equa-tion 3.7) is freely accessible for anyone engaged in research. However, this assump-tion is not verified in the growing literature of geographic knowledge spillovers(e.g., Jaffe 1989; Acs, Audretsch, and Feldman 1991,1994; Glaeser et al. 1992;Anselin, Varga, and Acs 1997, 2000; Varga 1998, 2000) and innovation systems(e.g., Saxenian 1994; Braczyk, Cooke, and Heidenreich 1998; Fischer and Varga2001; Oinas and Malecki 1999; Sternberg 1999; Acs 2000). New technologicalknowledge (the most valuable type of knowledge in innovation) is usually in such atacit form that its accessibility is bounded by geographic proximity and/or by thenature and extent of the interactions among actors of an innovation system.
Similar to the case of relaxing the neoclassical assumption of equal availabilityof technological opportunities in all countries of the world (Romer 1994), a relax-ation of the assumption that the term A in equation 3.7 is evenly distributed acrossspace within countries seems also to be necessary. The nonexcludable part of thetotal stock of knowledge seems rather to be correctly classified if it is assumed tohave two portions: a perfectly accessible part consisting of already establishedknowledge elements (obtainable via scientific publications, patent applications,etc.) and a novel, tacit element, accessible by interactions among actors in the inno-vation system. While the first part is available without restrictions, accessibility ofthe second one is bounded by the nature of interactions among actors in a system ofinnovation.
140 INTERNATIONAL REGIONAL SCIENCE REVIEW (Vol. 25, No. 1, 2002)
4. SYSTEMS OF INNOVATION
Models and formal theories characterize the previous two sections of this article.Systems of innovation are a new approach to the study of innovations in the econ-omy that has emerged during the past decade. The systems approach is certainly nota formal theory. It does not provide convincing propositions as regards establishedand stable relations between variables. The most it does in this direction is to pro-vide a basis for the formulation of conjectures that various factors are important fortechnological innovation.
The systems approach, like many other institutionally oriented approaches, is aconceptual framework that many scholars and policy makers consider useful for theanalysis of innovation (Edquist 1997). Although the systems of innovationapproach is not considered a formal and established theory, its development hasbeen influenced by different theories of innovation such as interactive learning the-ories (Arrow 1962) and evolutionary theories (Nelson and Winter 1982).
Much work has been done in the tradition of neo-Schumpeterian evolutionaryeconomics to advance our understanding of the micro foundations of innovation.Perhaps the touchstone volume of this tradition is Nelson and Winter’s (1982) AnEvolutionary Theory of Economic Change. In recent years, efforts have been madeto percolate general theoretical and empirical observations from this literature intoa conceptual framework capable of guiding policy and loosely organized aroundthe idea of a national system.
Despite their different interpretations of innovation, all versions of the systemsof innovation approach place innovation at the very center of focus. Technologicalinnovation is a matter of producing new knowledge or combining existing knowl-edge in new ways and of transforming this into economically significant productsand processes. Many different kinds of actors and agents in the system of innova-tion are involved in these processes. Such activities involve learning by doing,increasing the efficiency of production operations, learning by using, increasing theefficiency of the use of complex systems, and learning by interacting, involvingusers and producers in a interaction resulting in product innovations (Lundvall1992, 9).
In the systems approach, innovation is viewed as a ubiquitous phenomenon. Inall parts of the economy, and at all times, we expect to find ongoing processes oflearning, searching, and exploring, which result in new products, new techniques,new forms of organization, and new markets. The first step in recognizing innova-tion as a ubiquitous phenomenon is to focus on its gradual and cumulative aspects.Such a perspective gives rise to simple hypotheses about the dependence of futureinnovation on the past. In this context, an innovation may be regarded as a new useof preexisting possibilities and components. Almost all innovations reflect existingknowledge combined in new ways.
The systems of innovation approaches can be characterized as holistic in thesense that they have the ambition to encompass a wide array of the determinants of
Acs, Varga / GEOGRAPHY, ENDOGENOUS GROWTH, AND INNOVATION 141

innovation that are important. The systems approach allows for the inclusion notonly of economic factors influencing innovation but also of institutional, organiza-tional, social, and political factors. In this sense, it is an interdisciplinary approach.Elements of the systems approach, such as firms, behave differently concerninginnovation in different contexts. To understand such phenomena, it is important tohave a structural concept. The systems of innovation approach can fruitfully serveas such, because it can be considered to have a structural and actor-orientatedapproach.
The institutional setup is the second important dimension of the systems of inno-vation approach. One of the most striking characteristics the systems of innovationapproaches have in common is their emphasis on the role of institutions. Institu-tions are of crucial importance for innovation processes. However, what is meant byinstitutions varies from author to author. The concept of institutions can be quiteheterogeneous and very complex. It includes normative structures, regimes, andorganizations of various kinds. For others, it includes firms and industrial researchlaboratories involved in innovation. It can also include supporting institutions thatinclude research universities, government laboratories, and technology policies.
The systems of innovation of various countries can be quite different. In addi-tion, the organizations and institutions constituting elements of the systems of inno-vation may be different in various countries, regions, or sectors. In the systems ofinnovation approaches, the differences between the various systems are stressedand focused on rather than abstracted from. This makes it not only natural but alsovital to compare various systems. Without comparisons between existing systems,it is impossible to argue that one national system is specialized in one way or theother. We cannot define an optimal system of innovation because evolutionarylearning processes are important in such systems, and they are thus subject to con-tinuous change. The system never reaches equilibrium.
In the real world, the state and the public sector are rooted in national states, andnational borders define their geographical sphere of influence. The focus onnational systems reflects the fact that national economies differ regarding the struc-ture of the production system and regarding the general institutional setup. Spe-cifically, it is assumed that basic differences in historical experience, language, andculture will reflect in national idiosyncrasies in internal organization of firms,interfirm relationships, role of the public sector, institutional set up of the financialsector, and research and development organizations. The concept of a national sys-tem of innovation was proposed virtually simultaneously by Lundvall (1988), Free-man (1988), and Nelson (1988) and examined in two volumes of Lundvall (1992)and Nelson (1993). These two approaches were different. Lundvall was influencedby theories of interactive learning, and Nelson approached innovation systemsfrom an evolutionary perspective.
One of the central concerns of Nelson’s (1993) fifteen-country study was toestablish “whether, and if so in what ways, the concept of a national system madeany sense today” (p. 1). For Nelson there were two issues. First, unless one draws
142 INTERNATIONAL REGIONAL SCIENCE REVIEW (Vol. 25, No. 1, 2002)

the analysis of innovation very narrowly, it is inevitable that analysis of innovationin a country gets drawn into discussions of labor markets, financial systems, mone-tary policy, and trade policy. Second, the national level may be at the same time toobroad since policies that support industryj might not support industryk, and in someindustries a number of the institutions may act internationally, making the conceptof national systems too narrow. The concept of a national innovation system may beproblematic. Lundvall (1992) recognized that both globalization and regionalizationweaken the nation-state. However, Lundvall suggested that we focus on the nationallevel precisely because of the weakened position of the nation-state.
We are therefore left with the question, “What is the proper unit of analysis forinnovation systems?” In other words, at what level should innovation systems bedefined: nation, industrial sector, technology, region, or global? Of course, thisdepends in part on the size of the nation-state. For small states, the system mightvery well be larger than the nation. For large countries, the nation-state might be toolarge. Nevertheless, there are many reasons for balkanization to proceed as global-ization sets in. For example, the disfunctionality of the nation-state has triggeredthe emergence of a genuine shared community of economic interests at the regionallevel (Acs, de la Mothe, and Paquet 1996).
Krugman (1995) suggested that as economies become less constrained bynational frontiers (as globalization spreads), they become more geographicallyspecialized. Important elements of the process of innovation tend to becomeregional rather than national. The trends are more important in the science-basedand high-technology industries. Some of the largest corporations are weakeningtheir ties to their home country and are spreading their innovation activities tosource different regional systems of innovation. Regional networks of firms are cre-ating new forms of learning and production. These changes are important and chal-lenge the traditional role of national systems of innovation.
EPILOGUE: TOWARD A NEW MODEL
OF REGIONAL ECONOMIC DEVELOPMENT?
As emphasized in the introduction, a spatialized theory of technology-ledregional economic growth needs to reflect three fundamental issues. First, it shouldprovide an explanation of why knowledge-related economic activities start concen-trating in certain regions leaving others relatively underdeveloped; second, it needsto answer the questions of how technological advances occur and what the key pro-cesses and institutions involved are; and third, it has to present an analytical frame-work in which the role of technological change in regional economic growth isclearly explained. To answer these three questions, we surveyed three separate anddistinct literatures: the new economic geography, the new growth theory, and thenew economics of innovation. We suggest that each one of the above threeapproaches has its strengths and weaknesses that can be integrated to develop anappropriate model of technology-led regional economic development.
Acs, Varga / GEOGRAPHY, ENDOGENOUS GROWTH, AND INNOVATION 143

The new economic geography answers the question of why economic activityconcentrates in certain regions but not in others, but it leaves out innovation andeconomic growth. The contribution of Krugman’s theory on economic concentra-tion is not in its elements but in the way the system was put together. It has alreadybeen well known in economic geography and regional economics that decreasingtransportation costs, economies of scale, or increasing demand favor agglomera-tion. However, the way Krugman put these elements together in a general equilib-rium model is novel. The model provides a case for the treatment of spatial issues inthe way economists are accustomed to. The model provides a technique to analyzegeographical concentration of economic activities as being induced by some initialcombinations of basic parameters. However, the model in its current form does notseem to be suitable for modeling technology-led regional economic growth at leastfor two reasons. First, Krugman’s definite insistence of avoiding modeling the roleof technological externalities in regional economic growth prevents the model frombeing applicable in innovation-led regional development since spillovers and inno-vation networks are in the core of this type of development, as exemplified in the lit-erature of innovation systems. Second, while the model is very strong in workingout the characterization of specific initial combinations of parameters favoring geo-graphical concentration, it is weak in actually modeling the growth process.
The new growth theory explains the causes of economic growth but leaves outregional considerations and ignores the key processes and institutions involved ininnovation. A principal assumption in the theory of endogenous growth is that forcreating new sets of technological knowledge, the total stock of knowledge is freelyaccessible for anyone engaged in research. However, this assumption is not verifiedin the growing literature of geographic knowledge spillovers. New knowledge(potentially leading to either product or process innovations) is usually in such atacit form that its accessibility is bounded by geographic proximity and/or by thenature and extent of the interactions among actors of an innovation system (see,e.g., Anselin, Varga, and Acs 1997). Similar to the case of relaxing the neoclassicalassumption of equal availability of technological opportunities in all countries ofthe world, a relaxation of the assumption that knowledge is evenly distributedacross space within countries seems also to be necessary. The nonexcludable part ofthe total stock of knowledge seems rather to be correctly classified if it is assumedto have two portions: a perfectly accessible part consisting of already establishedknowledge elements (obtainable via scientific publications, patent applications,etc.) and a novel, tacit element, accessible by interactions among actors in the inno-vation system. While the first part is available without restrictions, accessibility ofthe second one is bounded by the nature of interactions among actors in a system ofinnovation.
The new economics of innovation, while explaining the institutional arrange-ments in the innovation process, leaves out regional issues and economic growth.
144 INTERNATIONAL REGIONAL SCIENCE REVIEW (Vol. 25, No. 1, 2002)

The systems approach is a conceptual framework that many scholars and policymakers consider useful for the analysis of innovation. Although the systems ofinnovation approach is not considered a formal and established theory, its develop-ment has been influenced by different theories of innovation such as interactivelearning theories and evolutionary theories. In recent years, efforts have been madeto percolate general theoretical and empirical observations from this literature intoa conceptual framework capable of guiding policy and loosely organized aroundthe idea of a national system of innovation. The concept of a national innovationsystem may be problematic. Krugman has suggested that as economies become lessconstrained by national frontiers (as globalization spreads), they become more geo-graphically specialized. Important elements of the process of innovation tend tobecome regional rather than national. Some of the largest corporations are weaken-ing their ties to their home country and are spreading their innovation activities tosource different regional systems of innovation. Regional networks of firms are cre-ating new forms of learning and production. These changes are important and chal-lenge the traditional role of national systems of innovation.
We suggest that a specific combination of the Krugmanian theory of initial con-ditions for spatial concentration of economic activities with the Romerian theory ofendogenous economic growth complemented with a systematic representation ofinteractions among the actors of Nelson’s innovation system could be a way ofdeveloping an appropriate model of technology-led regional economic develop-ment. It is not the purpose of this article to present an explicit solution for this prob-lem; however, a brief outline of a possible synthesis may be provided here. The cen-tral element of the model could be the “regional knowledge production equation”distilled from the predominantly empirical literature of innovation networks as pre-sented in the literature of the new economics of innovation. In the traditional modelof the knowledge production function, firms exogenously exist and then engage inthe pursuit of new economic knowledge as an input into the process of generatinginnovative activity. As suggested by Audretsch (1995), we “propose shifting theunit of observation away from exogenously assumed firms to individuals—agentsconfronted with new knowledge and the decision whether and how to act upon thatnew knowledge” (p. 48). This equation would facilitate the presence of knowledgein the Krugmanian economic geography model. Here the analytical technique forderiving initial conditions of spatial concentration can be adapted to come up withthe preconditions for the emergence of knowledge-induced agglomerations.Together with other parameters of the model, threshold values of knowledge maybe calculated following the technique developed by Krugman. Finally, to actuallymodel the equilibrium path of regional economic growth induced by the thresholdvalues of knowledge and other regional parameters, the combined framework of thenew economic geography and the new economics of innovation can be comple-mented with the Romerian analytics of economic growth.
Acs, Varga / GEOGRAPHY, ENDOGENOUS GROWTH, AND INNOVATION 145

NOTE
1. For an alternative view of the economic development, see Webber (1996).
REFERENCES
Acs, Z., ed. 2000. Regional innovation, knowledge and global change. London: Pinter.Acs, Z., D. Audretsch, and M. Feldman. 1991. Real effects of academic research: Comment. American
Economic Review 81: 363-67.———. 1994. R&D spillovers and recipient firm size. The Review of Economics and Statistics 76:
336-40.Acs, Z., J. de la Mothe, and G. Paquet. 1996. Regional innovation: In search of an enabling strategy. In
The implications of knowledge-based growth for micro-economic policies, edited by P. Howitt. Cal-gary, Alberta, Canada: Calgary Press, 339-58.
Aghion, P., and P. Howitt. 1998. Endogenous growth theory. Cambridge, MA: MIT Press.Anselin, L., A. Varga, and Z. Acs. 1997. Local geographic spillovers between university research and
high technology innovations. Journal of Urban Economics 42: 422-48.———. 2000. Geographic spillovers and university research: A spatial econometric approach. Growth
and Change 31: 501-15.Arrow, K. 1962. The economic implications of learning by doing. Review of Economic Studies 29:
155-73.Audretsch, D. B. 1995. Innovation and industry evolution. Cambridge, MA: MIT Press.Barro, R., and Sala-i-Martin. 1995. Economic growth. New York: McGraw-Hill.Blaug, M. 1979. The German hegemony of location theory: A puzzle in the history of economic thought.
History of Political Economy 11: 3-11.———, ed. 1992. Johann von Thünen (1783-1850). In Pioneers in economics (an Elgar reference col-
lection). Aldershot, UK: Elgar.Beckmann, M. 1969. On the distribution of urban rent and residential density. Journal of Economic The-
ory 1: 60-67.Braczyk, H.-J., P. Cooke, and M. Heidenreich, eds. 1998. Regional innovation systems. The role of gov-
ernances in a globalized world. London: UCL Press.De Bresson, C. 1996. Economic interdependence and innovative activity. Cheltenham, UK: Edward
Elgar.de la Mothe, J., and G. Paquet, eds. 1998. Local and regional systems of innovation. Boston: Kluwer.Dixit, A., and J. Stiglitz. 1997. Monopolistic competition and optimum product diversity. American
Economic Review 67: 297-308.Edquist, C. 1997. Systems of innovation. London: Cassel.Fischer, M., and A. Varga. 2001. Technological innovation and interfirm cooperation. An exploratory
analysis using survey data from manufacturing firms in the metropolitan region of Vienna. Interna-tional Journal of Technology Management. Forthcoming.
Freeman, C. 1988. Japan, a new system of innovation. In Technical change and economic theory, editedby G. Dosi, C. Freeman, R. Nelson, G. Silverberg, and L. Soete. London: Pinter.
Fujita, M., P. Krugman, and A. Venables. 1999. The spatial economy. Cambridge, MA: MIT Press.Glaeser, E., H. Kallal, J. Sheinkman, and A. Shleifer. 1992. Growth in cities. Journal of Political Econ-
omy 100: 1126-52.Greenhut, M., and G. Norman. 1995. Introduction. In The economics of location. Aldershot, UK:
Ashgate.Grossman, M., and E. Helpman. 1991. Innovation and growth in the global economy. Cambridge, MA:
MIT Press.
146 INTERNATIONAL REGIONAL SCIENCE REVIEW (Vol. 25, No. 1, 2002)

Helpman, E. 1992. Endogenous macroeconomic growth theory. European Economic Review 36:237-67.
Hirschman, A. 1958. The strategy for economic development. New Haven, CT: Yale University Press.Isard, W. 1956. Location and space-economy. Cambridge, MA: MIT Press.Isserman, A. 1996. “It’s obvious, it’s wrong, and anyway they said it years ago”? Paul Krugman on large
cities. International Regional Science Review 19: 37-48.Jaffe, A. 1989. Real effects of academic research. American Economic Review 79: 957-70.Judd, K. 1985. On the performance of patents. Econometrica 53: 567-86.Krugman, P. 1980. Scale economies, product differentiation, and the pattern of trade. American Eco-
nomic Review 70: 950-59.———. 1991a. Geography and trade. Cambridge, MA: MIT Press.———. 1991b. Increasing returns and economic geography. Journal of Political Economy 99: 483-99.———. 1993a. First nature, second nature, and metropolitan location. Journal of Regional Science 33:
129-44.———. 1993b. On the number and location of cities. European Economic Review 37: 293-98.———. 1993c. On the relationship between trade theory and location theory. Review of International
Economics 1: 10-122.———. 1995. Development, geography and economic theory. Cambridge, MA: MIT Press.———. 1996. Urban concentration: The role of increasing returns and transport costs. International
Regional Science Review 19: 5-30.Lucas, R. 1988. On the mechanics of economic development. Journal of Monetary Economics 22: 3-42.Lundvall, B. 1988. Innovation as an interactive process: From user-producer interaction to the national
system of innovation. In Technical change and economic theory, edited by G. Dosi, C. Freman, R.Nelson, G. Silverberg, and L. Soete. London: Pinter.
———, ed. 1992. National systems of innovation. London: Pinter.Maddison, A. 1987. Growth and slowdown in advanced capitalist economies. Journal of Economic Lit-
erature 25: 649-98.Martin, R. 1999. The new “geographical turn” in economics: Some critical reflections. Cambridge Jour-
nal of Economics 23: 65-91.Martin, R., and P. Sunley. 1996. Paul Krugman’s geographical economics and its implications for
regional development theory: A critical assessment. Economic Geography 72: 259-92.Myrdal, G. 1957. Economic theory and under-developed nations. London: Duckworth.Nelson, R. 1988. Institutions supporting technical change in the United States. In Technical change and
economic theory, edited by G. Dosi, C. Freeman, R. Nelson, G. Silverberg, and L. Soete. London:Pinter.
———, ed. 1993. National innovation systems. New York: Oxford.Nelson, R., and S. Winter. 1982. An evolutionary theory of economic change. Cambridge, MA: Harvard
University Press.Nijkamp, P., and J. Poot. 1997. Endogenous technological change, long run growth and spatial interde-
pendence: A survey. In Innovative Behavior in Time and Space, edited by C. Bertuglia, S. Lombardo,and P. Nijamp. Heidelberg, Germany: Springer.
Ohta, H. 1988. Spatial price theory of imperfect competition. College Station: Texas A&M UniversityPress.
Oinas, P., and E. J. Malecki. 1999. Spatial innovation systems. In Making connections. Technologicallearning and regional economic change, edited by E. J. Malecki and P. Oinas, 261-75. Aldershot,UK: Ashgate.
Ratti, R., A. Bramanti, and R. Gordon. 1997. The dynamics of innovative regions. Aldershot, UK:Ashgate.
Romer, P. 1986. Increasing returns and long-run growth. Journal of Political Economy 94: 1002-37———. 1990. Endogenous technological change. Journal of Political Economy 98: S71-S102.———. 1994. The origins of endogenous growth. Journal of Economic Perspectives 8: 3-22.
Acs, Varga / GEOGRAPHY, ENDOGENOUS GROWTH, AND INNOVATION 147

Saxenian, A. 1994. Regional advantage: Culture and competition in Silicon Valley and Route 128. Cam-bridge, MA: Harvard University Press.
Solow, R. 1956. A contribution to the theory of economic growth. Quarterly Journal of Economics 70:65-94.
———. 1957. Technical change in an aggregative model of economic growth. International EconomicReview 6: 18-31.
Sternberg, R. 1999. Innovative linkages and proximity: Empirical results from recent surveys of smalland medium sized firms in German regions. Regional Studies 33: 529-40.
Suarez-Villa, L. 2000. Invention and the rise of technocapitalism. New York: Rowman & Littlefield.Varga, A. 1998. University research and regional innovation: A spatial econometric analysis of aca-
demic knowledge transfer. Boston: Kluwer.———. 2000. Local academic knowledge spillovers and the concentration of economic activity. Jour-
nal of Regional Science 40: 289-309.Weber, A. 1929. The theory of the location of industries. Chicago: University of Chicago Press.Webber, W. J. 1996. The golden age illusion. London: Guilford.
148 INTERNATIONAL REGIONAL SCIENCE REVIEW (Vol. 25, No. 1, 2002)

GUIDELINES FOR SUBMISSION OF MANUSCRIPTSINTERNATIONAL REGIONAL SCIENCE REVIEW
International Regional Science Review serves as an international forum for economists, geogra-phers, planners, and other social scientists to share important research findings and methodologicalbreakthroughs. The journal serves as a catalyst for improving spatial and regional analysis within thesocial sciences and stimulating communication among the disciplines. IRSR deliberately helps defineregional science by publishing key interdisciplinary survey articles that summarize and evaluate previ-ous research and identify fruitful research directions. Focusing on issues of theory, method, and publicpolicy where the spatial or regional dimension is central, IRSR strives to promote useful scholarlyresearch that is securely tied to the real world.
MANUSCRIPT PREPARATIONManuscripts should be typed double-spaced, including references. Do not use single spacing any-
where. Page numbers are to be placed in the upper-right-hand corner of every page. A tab indent shouldbegin each paragraph.
Submit four (4) copies of each manuscript. Authors with access to e-mail who would like immediateconfirmation of receipt of manuscript(s) should include their e-mail addresses in their cover letters.Authors’ names should not appear anywhere except on the cover page. An author should keep an extra,exact copy for future reference.
For details of manuscript preparation not covered in the following sections, see The Chicago Manualof Style, 14th edition, Chicago and London: University of Chicago Press, 1993.1. WHAT GOES WHERE?
First page. Name of author(s) and title; author’s note, including present position, complete address,telephone/fax numbers, e-mail address, and any acknowledgment of financial or technical assistance.(This page will be removed prior to sending the manuscript to reviewers.)
Second page. Title of paper (without author’s name) and a brief abstract of no more than 150 wordssummarizing the purpose, contribution, method, and findings of the article for an international, multi-disciplinary audience. This should be informative, giving the reader a “taste” of the article.
Body. The text, with major headings centered on the page and subheadings flush with the left margin.Major headings should use all uppercase letters; side subheadings should be typed in upper- and lower-case letters.
Tables and figures. Each table or figure should be prepared on a separate page and grouped togetherat the end of the manuscript. The data in tables should be arranged so that columns of like materials readdown, not across. Nonsignificant decimal places in tabular data should be omitted. The tables and fig-ures should be numbered in Arabic numerals, followed by brief descriptive titles.
Additional details should be footnoted under the table not in the title. In the text, all illustrations andcharts should be referred to as figures.
Figures must be clean, crisp, and black-and-white. Please avoid the use of gray-scale shading; usehatchmarks, dots, or lines. Please send a camera-ready copy as well as a .tif file.
References. References should be typed double-spaced in alphabetical order by author’s last name(see section 3, below).2. REFERENCE CITATIONS WITHIN TEXT
Citations in the text should include the author’s last name and year of publication enclosed in paren-theses without punctuation, for example, (Isard 1956). If practical, the citation should be placed immedi-ately before a punctuation mark. Otherwise, insert it in a logical sentence break.
If a particular page, section, or equation is cited, it should be placed within the parentheses, for exam-ple, (Alonso 1964, 112). For multiple authors, use the full, formal citation for up to three authors, but forfour or more use the first author’s name with “et al.” For example, use (Plane and Rogerson 1994) and(Fujita, Hansen, and Paelink 1999). For more than three authors, use (Markusen et al. 1991) unlessanother work published in that year would also be identified as (Markusen et al. 1991); in that case, listall authors, for example, (Markusen, Hall, Campbell, and Dietrick 1991).3. REFERENCE LIST STYLE
List references alphabetically, principal author’s surname first, followed by publication date. Thereference list should be typed double-spaced, with a hanging indent, on a separate page. Do not numberreferences. Please examine reference lists in recent issues for specific examples. Do not include journalissue numbers. Be sure that all titles cited in the text appear in the reference list and vice versa.
MANUSCRIPT SUBMISSIONPlease send all manuscripts to Sergio Rey, Editor, International Regional Science Review, Depart-
ment of Geography, San Diego State University, San Diego, CA 92182; e-mail: [email protected] published material is copyrighted by Sage Publications. Every author and coauthor must sign a
contract before an article can be published.SUBMISSION OF FINAL MANUSCRIPTS
Authors of final manuscripts accepted for publication should provide both a hard copy of the finalversion of their articles and a matching version on a 3.5-inch computer disk. Please group all sections ofthe article in one file; do not use separate files for tables, references, and so forth.