genetic studies of serum transferrins of free-ranging rhesus macaques of cayo santiago, macaca...
TRANSCRIPT

Genetic Studies of Serum Transferrins of Free-ranging Rhesus Macaques of Cay0 Santiago, Macaca mulatta (Zimmerman 1780)
JOHN BUETTNER-JANUSCH,' GEORGE A. MASON, LAUREN DAME, VINA BUETTNER-JANUSCH AND DONALD S. SADE Depar tmen t s of A n a t o m y n n d Zoology, D u k e Un iver s i t y , D u r h a m , N o r t h Carol ina; Caribbean Pr ima te Research Cen ter , Puerto Rico, a n d D e p a r t m e n t of Anthropology, Northwesterlz Un iver s i t y , Evnns ton , Illinois
KEY WORDS Demography . Genetic polymorphism . Macaca mulatta . Population genetics . Transferrin.
ABSTRACT Transferrin phenotypes of plasma from 687 semi-free-ranging Macaca mulatta living on Cay0 Santiago, Puerto Rico, were determined by starch-gel electrophoresis and autoradiography. Fifteen phenotypes, homozy- gous or heterozygous products of six codominant autosomal alleles, were present in the population. The 687 animals, prior to March 1973, were divided into eight troops plus peripheral males, By March 1 , 1973 the size of the population was reduced to 333 animals, consisting of four troops plus periph- eral males. The distributions of transferrin phenotypes and allele frequencies were determined for the population of 687 animals and for 287 of the March 1973 population of 333 animals. Gametic ratios of 382 offspring of 126 females were enumerated. Statistical tests of homogeneity and equilibrium were applied to the data. The results of these tests suggest that, with only a few exceptions, the Cayo Santiago macaques, although divided into social groups, form a single population, and the results are in accord with behavioral obser- vations. The authors suggest that the data on transferrins provide a good baseline for future genetic and ethological studies of evolutionary processes in a population of nonhuman primates.
During the period from May 1971 to March 1973 we obtained blood samples from the rhesus macaques, Macaca mu- latta, in the semi-free-ranging population of Cayo Santiago, Puerto Rico, in order to describe partially the genetics of a group of primates under intensive ethological investigation. We have reported previously on the population genetics of two red cell enzymes in the Cay0 Santiago macaques (Buettner-Janusch et al., '74). In the present report we shall provide genetic data, both biochemical and population, on the transferrins of the animals. We shall also discuss briefly the demography of this group of macaques. The population of ma- caques on Cayo Santiago is an excellent one for a study of population genetics of transferrin variants, because it is relative- ly easy to survey for variants, and data about the present constitution and history of the population are adequate.
AM. J . PHYS. ANTHROP., 41: 217-232.
Transferrin, an iron-binding molecule, is the major transporter of stored iron to biologically active iron-containing mole- cules such as hemoglobin, myoglobin, and cytochromes. Human transferrin, molec- ular weight about 80,000, is a glycopro- tein, a polypeptide chain with two bifur- cate carbohydrate chains (Greene and Feeney, '68; Mann et al., '70). Five per- cent of the molecule by weight is car- hydrate, and the carbohydrate chains contain sialic acid, the number of which affect the electrophoretic mobility of the molecule (Parker and Bearn, '61 ; Jamie- son et al., '71).
The protein component of serum trans- ferrin is inherited in man and other pri- mates as the product of codominant au- tosomal alleles (Lai and Kirk, '60; Nute
I Present address: Department of Anthropology, New York University, New York, New York 10003; all c o m e spondence to th is address.
217
218 BUETTNER-JANUSCH E T AL
and Buettner-Janusch, '69). Nonhuman primates exhibit marked polymorphism for transferrin, and in some genera, e.g., M a c a c a and Lemur, a large number of transferrin alleles are present (Buetmer- Janusch et al., '61; Goodman et al., '65; Nute and Buettner-Janusch, '69). It is likely that some of the polymorphisms are balanced, although the mechanisms involved in maintaining these polymor- phisms are poorly understood.
Macaques are among the most variable or polymorphic at the transferrin locus. About 4000 macaques of various species have been tested for transferrin pheno- types in a total of at least 14 investiga- tions (Blumberg, '60; Lai and Kirk, '60; Beckman et al., '61a; Beckman et al., '61b; Parker and Bearn, '61; Goodman et al., '65; Ishimoto et al., '65, '67; Jolly and Barnicot, '66; Annenkov and Kotri- kadze, '69; Toyomasu and Ishimoto, '69; Coppenhaver and Buettner-Janusch, '70; Prychodko et al., '71; Annenkov et al., '72; Lai, '72). A t least 15 alleles have been reported. In M a c a c a mulatta, at least 13 alleles and 46 phenotypes have been re- corded (Goodman et al., '65; Annenkov and Kotrikadze, '69; Prychodko et al., '71; Annenkov et al., '72).
Cay0 Santiago lies off the southeastern coast of Puerto Rico and is about 37 acres in area. The founding population of rhe- sus macaques ( M a c a c a mulatta) was in- troduced between December 2, 1938 and January 2, 1939 when approximately 400 animals were released on the island. The animals were brought from several parts of India by C. R. Carpenter in order to establish a breeding colony under rela- tively free-ranging conditions (Carpenter, '72). The initial population consisted of 40 males of breeding age (14 young adults, 16 mature animals, and 10 very old ani- mals, estimated age 15-20 years); 276 females (93 young animals, 105 adults without infants, and 78 adults with in- fants); and 79 infants, sex undetermined (presumed offspring of the 78 females with infants). A few more animals came from laboratory colonies, and eight pig-tailed macaques ( M . nemestrina) were also re- leased. Unfortunately, a number of ani- mals were killed in fights soon after they settled on the island, so the exact number of animals that founded the colony is not
known. The colony was trapped during January and February 1940, and the ani- mals were tested for tuberculosis. Positive reactions were found in about 48 animals, and these were removed for examination by autopsy. The colony was kept under intensive observation by Carpenter from February 29, 1940 through May 10, 1940. Carpenter kept good records of sociosex- ual behavior, and these records remain in his unpublished chronological field notes (Carpenter, '72).
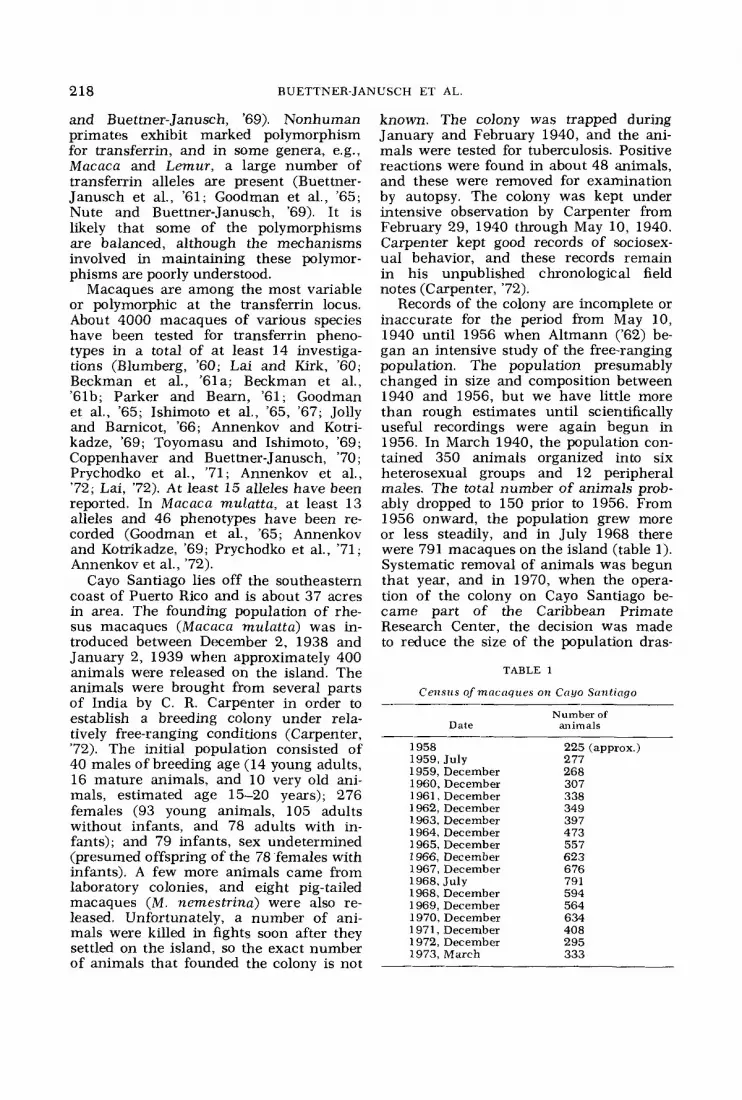
Records of the colony are incomplete or inaccurate for the period from May 10, 1940 until 1956 when Altmann ('62) be- gan an intensive study of the free-ranging population. The population presumably changed in size and composition between 1940 and 1956, but we have little more than rough estimates until scientifically useful recordings were again begun in 1956. In March 1940, the population con- tained 350 animals organized into six heterosexual groups and 12 peripheral males. The total number of animals prob- ably dropped to 150 prior to 1956. From 1956 onward, the population grew more or less steadily, and in July 1968 there were 791 macaques on the island (table 1). Systematic removal of animals was begun that year, and in 1970, when the opera- tion of the colony on Cayo Santiago be- came part of the Caribbean Primate Research Center, the decision was made to reduce the size of the population dras-
TABLE 1
Census of mncnques on Cnyo Sant ingo
Date Nu in ber of
animals
1958 1959, July 1959, December 1960, December 1961, December 1962, December 1963, December 1964, December 1965, December 1966, December 1967, December 1968, July 1968, December 1969, December 1970, December 1 971, December 1972, December 1973, March
225 (approx.) 277 268 307 338 349 397 473 557 623 6 76 791 594 564 634 408 295 333

MACAQUE TRANSFERRINS 219
tically with minimum interference to the program of ethological research. By March 1, 1973 the population was 333 animals organized into four social groups and 18 peripheral males. Since mid-1959 the population has increased at an an- nual rate of about 16% (Koford, '65). The deviations from this rate, apparent in the census figures (table l), are due to re- moval of animals for experimental pur- poses. The history of the groups on the island, significant for our work on trans-
ferrins and other proteins, is briefly re- viewed here.
Cay0 Santiago consists of two hills con- nected by a low-lying narrow bridge of land (fig. 1). The larger segment is referred to as Big Cay and the smaller as Small Cay. When Altmann ('62) began his work on the island in 1956, the population of macaques was divided into two large so- cial groups, Troop A, which usually occu- pied Small Cay, and Troop B, which usu- ally occupied Big Cay. Part of Troop A
N
Fig. 1 Map of Cay0 Santiago. The center of the large cay (Big Cay) lies at approximately 18"IO'N and 65O44'W. The approximate range of each troop, F, I , J, and L, in the current population is indicated by broken or dotted lines. The hexagon-shaped symbols denote the locations of traps; the shaded areas indicate steep slopes.

220 BUETTNER-JANUSCH ET AL.
split primarily along genealogical lines to form Troops J, K, and L; that is, a group of females and their offspring formed a new troop. In 1964 Troop J split off and originally consisted of only two family groups; Troops K and L separated later. The remaining members of Troop A were removed from the island between June 1971 and March 1973. Troop B split to form Troops C and D in 1959. Troop D split immediately to form Troops E, F, and G. The last separated into Troops H and I in 1960 (Koford, '63). Troop C was removed by mid-1969, As of March 1973 only Troops F, I, J, and L remain on the island, the other four troops having been removed completely. Troop L inhabits Small Cay primarily, and the other three troops in- habit Big Cay (fig. 1). There is now and always has been movement of animals be- tween the two cays.
We began to study the transferrin phenotypes in 1971 as animals were being trapped prior to removal of about 400 ani- mals from the island. A blood sample was taken from almost every animal trapped between May 1, 1971 and March 15, 1973. The troop to which an animal is assigned in this study is the troop to which it be- longed at the time at which the blood sam- ple was taken. After the size of the ma- caque population was reduced by removing animals (effective March 1,1973), the troop to which an animal belonged as of March 1, 1973 is the troop to which it is assigned in what we call the current population. The populations we report here do not
include a few adult animals that could not be trapped conveniently and a num- ber of animals born between May 1971 and March 1973 to females that had been trapped prior to the birth of their progeny. The composition of the population before and after March 1, 1973 is shown in ta- ble 2. These data are not censuses; they are counts of animals sampled for the in- vestigation of the genetics of the popula- tion.
The sex ratios (number of ma1es:num- ber of females) for this set of troops and for the populations cover a wide range of values (table 2). There does not seem to be any relationship between size of troop and magnitude of sex ratio. Troop A is the largest, N = 151, and its sex ratio is 0.47; Troop H is the smallest, N = 34, and its sex ratio is 1.27. This is no more signifi- cant than the observation that the sex ratio of Troop F, N = 125, is 1.08 or that of Troop L, N = 45, is 0.45. More signifi- cance may be found by examining geno- typic ratios, but, as we shall indicate later, there does not appear to be any statisti- cally significant association between al- leles and sex of animal.
MATERIALS AND METHODS
Blood samples of 687 animals (table 2) were drawn in ACD (citric acid, sodium citrate, dextrose) on Cay0 Santiago, kept refrigerated, and shipped by air under re- frigeration to our laboratory at Duke Uni- versity. Samples generally arrived in the laboratory within 48 hours after they were
TABLE 2
Cornposittoit of' pop uln tioii
Prior to March 1, 1973 After March 1 , 1973
Troop Sex Sex rat10 ratio
dl? ? Total d : P d $ 0 P Total d : 9
A 48 103 151 0.47 E 47 53 100 0.89 F 65 60 125 1.08 64 60 124 1.07 H 19 15 34 1.27
54 0.86 21 27 48 0.78 I 25 29
K 51 55 106 0.93 L 14 31 45 0.45 All troops I 297 373 670 0.80 125
Total population 1
J 28 27 55 1.04 29 26 55 1.12
11 31 42 0.35 144 269 0.87
18 314 373 687 0.84 143 144 287 0.99
PM 2 17 - 17 - 18 - -
I Total population = all troops plus peripheral males. P M = peripheral males.

MACAQUE TRANSFERRINS 22 1
drawn. Plasma was separated from red cells for determination of transferrin phenotypes.
Transferrin phenotypes of plasmas la- beled with Fe;" were determined by starch- gel electrophoresis in tris-borate buffers, pH 8.6 to pH 9.0, followed by autoradiog- raphy of the gels (Buettner- Janusch, '63; Nute and Buettner-Janusch, '69). Sialic acid content of transferrins was deter- mined after treatment of plasma with neuraminidase (Parker and Bearn, '61 ; Coppenhaver and Buettner-Janusch, '70).
There are two problems that we must deal with when typing macaque plasmas for transferrins. First, are the transferrins we find in a new batch of macaque sam- ples the same or different from those re- ported by other laboratories? Second, can every transferrin be resolved by electro- phoretic methods? The first question is relatively easy to answer by using as con- trols previously identified macaque serum or plasma. We obtained such controls from Goodman's laboratory. The second question can never be answered categorically in the affirmative.
We accept the hypothesis that each transferrin band determined by starch- gel electrophoresis and autoradiography corresponds to a single codominant auto- soma1 allele at the transferrin locus. We use the transferrin nomenclature of Good- man et al. ('65) except that we utilize numerical subscripts rather than prime marks (') to label transferrin bands that migrate between two bands already given labels in alphabetical sequence, for we cannot enter prime marks into our com- puter records or programs. In naming transferrins, no distinctions have been made among species of macaques (Good- man et al., '65); e.g., TF C of M . mulatta has the same mobility in starch gels as TF C of M . nemestrina. Nevertheless, we subscribe to the necessity of clearly and correctly naming the species studied,
We obtained data on mother-progeny groups from the genealogies of the Cayo Santiago macaque population and from the monthly census reports of the popu- lation.
Most of the computations, except sim- ple arithmetical calculations, were made on a Monroe 1860 programmable calcu- lator. In order to obtain expected values
of at least five for x2 tests of Hardy-Wein- berg equilibrium and of homogeneity we combined numbers in certain cells. Al- though we undoubtedly lost some infor- mation, we doubt that the significance of the results would be materially affected if we could have slightly increased the sensitivity of the test.
+ I
-I-- I ---- I l -
A B C D z D I D E F ~ F I F G I D ' ) I D " ) I F " I (F '1
Fig. 2 Relative electrophoretic mobilities of macaque transferrins. The letters in parentheses are alternative symbols used by Goodman et al. ('65) and Prychodko et al. ('72).
Fig. 3 Photograph of an autoradiograph show- ing patterns produced by Cay0 Santiago macaque transferrins; from left to right, Tf CG, Tf D2G, Tf DIG, Tf CC, Tf DIG, and Tf CC. The origin is at the bottom and the anode is a t the top.

222 BUETTNER-JANUSCH ET AL
RESULTS In the population of 687 Macaca mu-
latta, we found 15 transferrin phenotypes. In the current population, we find 12 of these phenotypes. These are the result of various combinations of the products of six codominant autosomal alleles. Nine of the possible 21 phenotypes are not present in the current population. The relative electrophoretic mobilities of the transfer- rins found in the Cay0 Santiago macaques and in macaques studied by Goodman and his colleagues are shown in figure 2. A photograph of a typical autoradiograph
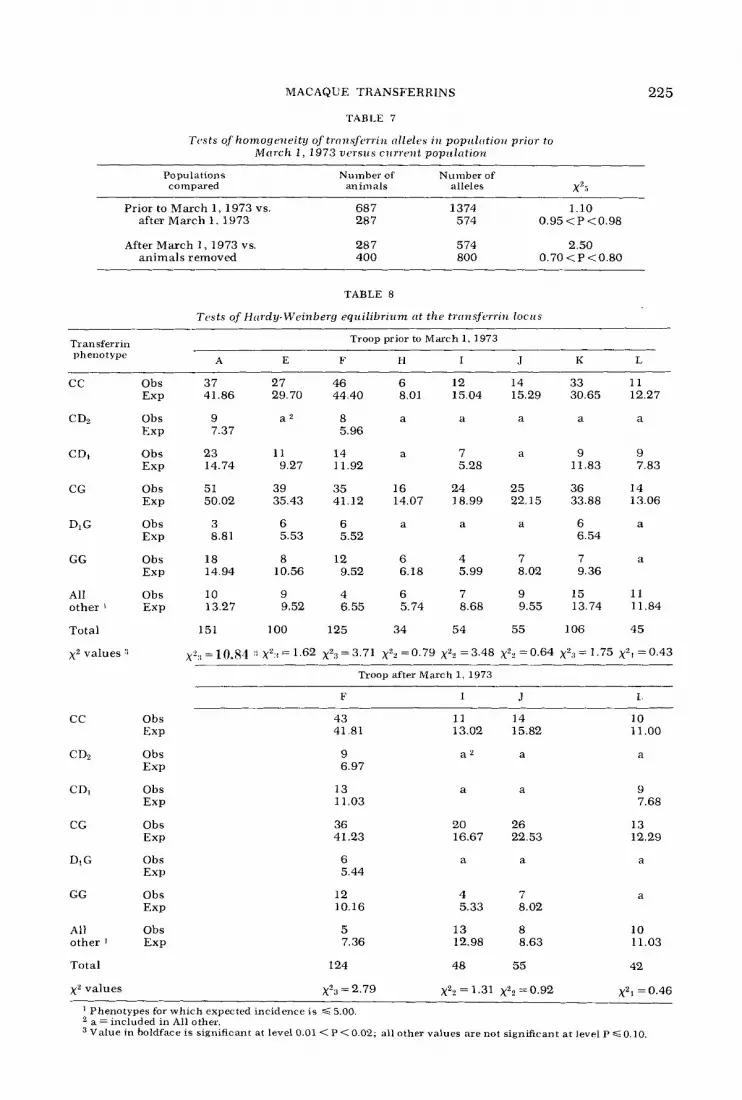
is shown in figure 3. The distribution of phenotypes in the population of eight troops plus a group of peripheral males (PM) and in the current population of four troops plus PM are presented in tables 3 and 4; the distributions of alleles are given in tables 5 and 6. There is no significant difference between the allele frequencies in the population before March 1973 and the current population (table 7).
We determined the number of sialic acid residues per transferrin for at least one plasma of each phenotype; a total of 27 animals was tested. Each macaque
TABLE 3
Dis t r ibu t ion of t rans f e r r in p h e n o t y p e s prior to M a r c h 1 , 1973
Troop Trans-
phenotype ferrin A E F H I J
dd 9p Total d d 9 9 Total d d 9 9 Total d d 99 Total d d 99 Total d d 9 9 Total
cc 9 28 37 14 13 27 24 22 46 4 2 6 5 7 12 7 7 14 C Dz 4 5 9 2 3 5 2 6 8 0 0 0 0 0 0 1 0 1 CDi 1 1 1 2 2 3 6 5 1 1 8 6 1 4 3 1 4 3 4 7 1 2 3 CD 0 0 0 0 0 0 0 0 0 1 0 1 0 0 0 0 1 1 CF 0 2 2 0 0 0 0 0 0 0 0 0 2 0 2 0 0 0 CG 14 37 51 21 18 39 21 14 35 8 8 16 13 11 24 12 13 25 DzDz 0 1 1 0 0 0 0 0 0 0 0 0 0 0 0 0 0 0 D2D1 0 0 0 0 0 0 0 0 0 0 0 0 0 0 0 0 0 0 Dz G 1 2 3 0 4 4 0 2 2 0 0 0 0 0 0 1 0 1 D, Di 0 1 1 0 0 0 0 0 0 0 0 0 0 1 1 1 0 1 Di G 3 0 3 2 4 6 1 5 6 0 1 1 0 1 1 2 0 2 DF 1 0 1 0 0 0 0 0 0 0 0 0 0 0 0 0 0 0 DG 0 0 0 0 0 0 1 0 1 0 0 0 0 0 0 0 0 0 FG 0 2 2 0 0 0 1 0 1 0 0 0 0 3 3 0 0 0 GG 5 1 3 1 8 2 6 8 7 5 1 2 3 3 6 2 2 4 3 4 7 Tot a1 48 103 151 47 53 100 65 60 125 19 15 34 25 29 54 28 27 55
Troop Trans- Tot a1 ferrin K L A11 t L < ) O p s I population 1
phenotype dd ? o Total d ? ? ? Total dd ? ? Total P M 2 dd 99 Total
cc 17 16 33 6 5 11 86 100 186 4 90 100 190 C DZ 1 1 2 0 1 1 10 16 26 0 10 16 26 CDI 3 6 9 1 8 9 36 44 80 4 40 44 84 CD 1 0 1 1 0 1 3 1 4 0 3 1 4 CF 0 0 0 0 0 0 2 2 4 0 2 2 4
D2 Dz 1 0 1 0 0 0 1 1 2 0 1 1 2 DzDi 1 0 1 0 0 0 1 0 1 0 1 0 1 D2 G 0 3 3 0 1 1 2 12 14 0 2 12 14 DiDi 3 0 3 0 1 1 4 3 7 0 4 3 7
1 16 14 30 DiG 5 1 6 2 2 4 15 14 29 DF 0 0 0 0 0 0 1 0 1 0 1 0 1 DG 0 2 2 0 0 0 1 2 3 0 1 2 3
0 0 0 1 7 8 0 1 7 8 FG 0 2 2 GG 4 3 7 1 2 3 27 38 65 0 27 38 65 Tot a1 51 55 106 14 31 45 297 373 670 17 314 373 687
CG 15 21 36 3 11 14 107 133 240 8 115 133 248
1 Total population = all Voops plus peripheral males. 2 PM = peripheral males.

MACAQUE TRANSFERRINS 223
Fig. 4 Photograph of an autoradiograph showing macaque transferrins after digestion with neuraminidase; from left to right, Tf DF after digestion with 0, 5, 10, 20, and 30 units of neuraminidase, respectively; Tf FG after digestion with 0, 5, 10, 20, and 30 units of neur- aminidase, respectively. The origin is at the bottom and the anode is at the top.
TABLE 4
Distribution of trtrnsferriii phe i io t ypes nfter Mtrrch 1 , 1973
Trans- ferrin
phenotype
Troop
F I J L Al l troops I
0 0 0 0 0 0
20 16 36 0 0 0 0 0 0
dd ? ? T o t a l _____ 5 6 11 0 0 0 2 4 6 0 0 0 2 0 2
10 10 20 0 0 0 0 0 0
dd 9 p Total
8 6 14 0 0 0 2 2 4 0 1 1 0 0 0
13 13 26 0 0 0 0 0 0
d d 9 9 Total P M 2
Total population I
dd 99 Total
5 5 10 0 1 1 1 8 9 0 0 0 0 0 0 2 11 13 0 0 0 0 0 0
D ~ G - 1 2 3 0 0 0 0 0 0 0 1 1 ~~- .~ I~
DID1 0 0 0 0 1 1 1 0 1 0 1 DIG 1 5 6 0 1 1 2 0 2 2 2 DF 0 0 0 0 0 0 0 0 0 0 0
1 4 0
DG 1 0 1 0 0 0 0 0 0 0 0 0 FG 1 0 1 0 3 3 0 0 0 0 0 0 GG 7 5 1 2 2 2 4 3 4 7 1 2 3 Total 64 60 124 21 27 48 29 26 55 11 31 42
41 37 78 4 3 7 1 0 0
12 20 32 3 0 1 1 1 2 0 2 0
45 50 95 9 0 0 0 0 0 0 0 0 1 3 4 0 1 2 3 0 5 8 1 3 1 0 0 0 0 1 0 1 0 1 3 4 0
13 13 26 0 125 144 269 18
45 37 82 3 7 10
15 20 35 1 1 2 2 0 2
54 50 104 0 0 0 0 0 0 1 3 4 1 2 3 6 8 14 0 0 0 1 0 1 1 3 4
13 13 26 143 144 287
' Total population = all troops plus peripheral males 2 PM = peripheral males.

TA
BL
E
5
Fre
quen
cies
of
tran
sfer
rin
all
eles
pri
or to
Mar
ch I
, 197
3
Tro
op
Tra
ns-
A
E
F
H
I
J fe
rrin
al
lele
dd
Tot
al
dd
99
T
otal
do^
99
Tot
al
dd
OP
Tot
al
dd
99
T
otal
dd
99
T
otal
Tfc
T
f D1
Tf D
l
0.49
0 0.
052
0.14
6
0.54
4 0.
526
0.60
7 0.
491
0.54
5 0.
608
0.58
3 0.
596
0.52
6 0.
433
0.48
5 0.
560
0.50
0 0.
528
0.50
0 0.
556
0.52
7 0.
044
0.04
6 0.
021
0.06
6 0.
045
0.01
5 0.
067
0.04
0 0
0 0
0
0 0
0.03
6 0
0.01
8 0.
068
0.09
3 0.
085
0.08
5 0.
085
0.06
9 0.
092
0.08
0 0.
079
0.06
7 0.
074
0.06
0 0.
121
0.09
3 0.
089
0.03
7 0.
064
TfD
0.
010
0 0.
003
0 0
0 0.
008
0 0.
004
0.02
6 0
0.01
5 0
0 0
0 0.
018
0.00
9
TfG
0.
292
0.32
5 0.
315
0.28
7 0.
358
0.32
5 0.
292
0.25
8 0.
276
0.36
9 0.
500
0.42
6 0.
340
0.32
7 0.
333
0.37
5 0.
389
0.38
2 T
otal
1.
000
1.00
0 1.
000
1.00
0 1.
000
1.00
0 1.000
1.00
0 1.
000
1.00
0 1.
000
1.00
0 1.
000
1.00
0 1.
000
1.00
0 1.
000
1.00
0
TfF
0.
010
0.01
9 0.
017
0 0
0 0.
008
0 0.
004
0 0
0 0.
040
0.05
2 0.
046
0 0
0
Tro
op
Tra
ns-
K
L
A
ll t
roop
s *
Tot
al p
opu
lati
on 1
ferr
in
alle
le
$0“
PP
T
otal
dd
PP
T
otal
d
d
PP
T
otal
P
M2
d
d
QP
Tot
al
~~~
~ ~~
~
0.52
9 0.
546
0.53
8 0.
607
0.48
4 0.
522
0.55
6 0.
531
0.54
2 0.
588
0.55
7 0.
531
0.54
3 0.
039
0.03
6 0.
038
0 0.
032
0.02
2 0.
025
0.04
0 0.
034
0 0.
024
0.04
0 0.
033
Tf
Tf D
2
Tf
Dl
0.14
7 0.
064
0.10
4 0.
107
0.19
4 0.
167
0.10
1 0.
086
0.09
2 0.
147
0.10
4 0.
086
0.09
4 5.
0.01
0 0.
018
0.01
4 0.
036
0 0.
01 1
0.00
8 0.
004
0.00
6 0
0.00
8 0.
004
0.00
6 0
0.018
0.00
9 0
0 0
0.00
7 0.
012
0.01
0 0
0.00
6 0.
012
0.00
9 0.
275
0.31
8 0.
297
0.25
0 0.
290
0.27
8 0.
303
0.32
7 0.
316
0.26
5 0.
301
0.32
7 0.
315
Tf Tf
Tot
al
1.00
0 1.
000
1.000
1.00
0 1.
000
1.00
0 1.
000
1.00
0 1.
000
1.00
0 1.
000
1.00
0 1.
000
1 T
otal
pop
ula
tion
= a
ll t
roop
s p
lus
per
iph
eral
mal
es.
2 P
M =
per
iph
eral
mal
es.
TA
BL
E G
Fre
quei
zcie
s of
trnn
sfer
rin
crlle
les
afte
r M
arch
1, I
97
3
Tro
op
Tra
ns
ferr
in _
_
alle
le dd
Tfc
0
594
TfD
0
03
1
Tf D
l 0
062
TID
0
00
8
T/F
0
00
8
TfG
0.
297
Tot
al
10
00
F I
J 9
9
0.56
6 0.
067
0.09
2 0 0
0.27
5 1.
000
Tot
al
0.58
1 0.
048
0.07
7 0.
004
0.00
4 0.
286
1.00
0
dd
0.57
1 0
0.
048
0 0.
048
0.33
3 1.
000
OP
0.48
1 0
0.13
0 0
0.05
6 0.
333
1.00
0
Tot
al
0.52
1 0
0.09
4 0
0.05
2 0.
333
1.0
00
dd
0.53
5 0
0.10
3 0 0
0.36
2 1 .o
oo
99
0.53
9 0
0.03
8 0.
019
0
0.40
4 1.
000
Tot
al
0.53
6 0
0.0
73
0.
009
0 0.
382
1.00
0
dd
0.59
1 0
0.13
6 0 0
0.27
3 1.
000
L
PP
0.48
4 0.
032
0.19
4 0 0
0.29
0 1 .o
oo
All
troo
ps I
Tot
al
0.51
2 0.
024
0.17
8 0 0
0.28
6 1
.00
0
dd
0.57
6 0.
016
0.07
6 0.
004
0.01
2 0.
316
1.0
00
99
0.52
8 0.
035
0.11
1 0.
003
0.01
0 0.
313
1 .ooo
Tot
al
PM
2
0.55
0 0.
026
0.09
5 0.
004
0.01
1 0.
314
1 .ooo
0.58
3 0
0.11
1 0.
028
0 0.
278
1.00
0
Tot
al p
opu
lati
on 1
30
”
90
T
otal
0.57
7 0.
528
0.55
2 0.
014
0.03
5 0.
025
0.08
1 0.
111
0.09
6 0.
007
0.00
3 0.
005
0.01
0 0.
010
0.01
0 0.
311
0.31
3 0.
312
1.00
0 1.
000
1.0
00
1 T
otal
pop
ula
tion
= a
ll t
roop
s p
lus
per
iph
eral
mal
es.
2 P
M =
per
iph
eral
mal
es.
MACAQUE TRANSFERRINS
TABLE 7
Tcsta of homogeiieity of tinnaferriiz alleles i n popiclutioiz prior to Mrirch 1, 1973 w t w i c s cirrrrwt popzclatzon
225
Populations compared
Number of Number of animals alleles xZ-
Prior to March 1, 1973 vs. 687 1374 1.10 after March 1, 1973 287 574 0.95<P<0.98
After March 1, 1973 vs. 287 574 2.50 animals removed 400 800 0.70 < P <0.80
TABLE 8
Tests of Hardy-Weinberg equilibrizcm tit the trtrnsfcrriiz locics
Troop prior to March 1, 1973 Transferrin phenotype A E F n I J K L
cc Obs Exp
C D2 Obs Exp
CDI Obs Exp
CG Obs Exp
DIG Obs Exp
GG Obs E ~ P
All Obs other 1 Exp
Total
x2 values .‘I
37 27 46 6 12 14 33 11 41.86 29.70 44.40 8.01 15.04 15.29 30.65 12.27
9 a2 8 a a a a a 7.37 5.96
23 11 14 a 7 a 9 9 14.74 9.27 11.92 5.28 11.83 7.83
51 39 35 16 24 25 36 14 50.02 35.43 41.12 14.07 18.99 22.15 33.88 13.06
3 6 6 a a a 6 a 8.81 5.53 5.52 6.54
18 8 12 6 4 7 7 a 14.94 10.56 9.52 6.18 5.99 8.02 9.36
10 9 4 6 7 9 15 11 13.27 9.52 6.55 5.74 8.68 9.55 13.74 11.84
151 100 125 34 54 55 106 45
~ ‘ : ~ = 1 0 . 8 4 ::Xz:r=1.62 x2n=3.71 x”=0.79 xZZ=3.48 xz2=0.64 xZs=1.75 ~ 2 ~ = 0 . 4 3
Troop after March 1, 1973
F I J I
cc Obs EXP
CD2 Obs EXP
CDI Obs Exp
CG Obs EXP
Di G Obs EXP
GG Obs EXP
All Obs other 1 EXP
Total
x z values
43 41.81
9 6.97
13 11.03
36 41.23
6 5.44
12 10.16
5 7.36
124
~2~ = 2.79
11 14 13.02 15.82
a e a
a a
20 26 16.67 22.53
a a
4 7 5.33 8.02
13 8 12.98 8.63
48 55
X22 = 1.31 xz2 =0.92
10 11 .oo
a
9 7.68
13 12.29
a
a
10 11.03
42
~ 2 1 ~ 0 . 4 6 Phenotypes for which expected incidence is < 5.00 a = included in All other. Value in boldface is significant at level 0.01 < P < 0.02; all other values are not significant at level P G 0.10,

226 BUETTNER-JANUSCH ET AL.
transferrin has two sialic acid residues (fig. 4). This result is the same as that obtained for another species of the genus Macaca, namely M . nigra (Coppenhaver and Buettner-Janusch, '70). Although the number of M. mulatta we tested for sialic acid forms a relatively small part of the total sample, there is no indication that we should expect any deviation from the result we obtained, because the animals are inbred and the gene pool can be con- sidered closed. It is worth noting here that human transferrins contain four residues of sialic acid (Parker and Bearn, '61). For many species of primates the number of sialic acid residues per molecule of trans- ferrin is constant, either two or four resi- dues, and the number is species-specific (Nute and Buettner-Janusch, '69; Coppen- haver and Buettner-Janusch, '70). The
transferrins of some species of Lemur, however, contain both two and four resi- dues of sialic acid (Nute and Buettner- Janusch, '69; Buettner-Janusch and Ma- son, unpublished observations).
We used x2 tests for Hardy-Weinberg equilibrium of the distribution of trans- ferrin phenotypes in each of the troops, all the troops, and the total population prior to March 1, 1973 and after March 1, 1973 (tables 8, 9). Both the population of all troops and the total population appear to be in genetic equilibrium with respect to transferrin alleles, and all except one of the troops are in equilibrium. Troop A, the only troop that is not in equilibrium (table 8), fissioned to form new troops be- fore we began our study, and this may account for the departure from genetic equilibrium.
~ ~~
Prior to March 1, 1973 After March 1 . 1973
Tran sferrin All Total All Total phenotype troops population ' troops population
cc Obs 186 190 78 82 EXP 196.67 202.52 81.43 87.53
C D2 Obs 26 26 EXP 24.38 24.43
CDI Obs 80 84 EXP 67.18 70.04
CF Obs EXP
4 4 7.04 7.06
CG Obs 240 248 EXP 229.72 235.09
Dz G Obs 14 14 EXP 14.24 14.18
D, D1 Obs EXP
Di G Obs EXP
GG Obs EXP
All Obs other2 Exp
7 5.74
29 39.24
65 67.08
19 18.71
7 6.06
30 40.65
65 68.23
19 18.74
10 10
32 35 28.06 30.38
7.70 7.73
a 3 a
95 104 92.98 98.86
a a
a a
13 14 16.02 17.15
26 26 26.54 27.91
15 16 16.27 17.44
Tot a1 670 687 269 28 7
,y' values p5 = 7.93 x Z 5 = 8.79 p3=2.11 x 2 3 = 2.82 0.10 < P <0.20 0.10 < P <0.20 0.50 < P <0.70 0.30 < P <0.50
Total population = all troops plus peripheral males. Phenotypes for which expected incidence is S 5.00. a = included in All other.

MACAQUE TRANSFERRINS 227
After determining the variance for each allele in the population prior to March 1, 1973 and in the current population, we applied Wahlund’s correction (Wahlund, ’28) to the expected number of pheno- types, and we calculated x 2 values as tests of equilibrium in the two populations (table 10). The x2 tests of genetic equi- librium with the expected numbers of phenotypes adjusted with W ahlund’s vari- ance do not produce statistically signifi- cant results (table 10). Although we do not have the simple two-allele case, Wahl- und’s test was extended to cover the six codominant autosomal alleles at the trans- ferrin locus.
We calculated xz tests of homogeneity for each pair of troops, for all troops, for the two sexes, and for the total population both before and after March 1, 1973 (ta- bles l l , 12). Only one of the x2 values is statistically significant: the comparison between Troop F and Troop L in the cur- rent population, x Z 3 = 8.28, 0.02 < P < 0.05. The results of these tests of homo- geneity (tables 11, 12), with the single ex- ception noted, lead us to conclude that the troops form a single population and that there is no difference in allele frequencies between males and females.
From the available genealogies, census- es, and electrophoretic analyses, we ob-
TABLE 10
Tests of Htrrdy-Wcinberg eqiiilibrium i i i totril p o p d n t i o i z cifter correctioii of tr(iizsferriu phenotypic fre~qucwcies w i t h Wahlund’s uciriuiicc
Prior to March 1 , 1973 After March 1. 1973 Transferrin phenotype Observed Expected Observed Expected
cc 190 203.11 C DZ 26 23.66 CDI 84 69.06 C F 4 6.36 CG 248 233.48 D2 G 14 12.98 DiDi 7 6.45 D I G 30 39.24 GG 65 69.25 All o ther I 19 23.41 Total 687 687.00 x 2 values xza =9.48, 0.05<P<O.lO
82 87.78 10 7.34 35 29.76 a 2 a
104 98.18 a a
14 16.36 26 28.33 16 19.25
28 7 287.00 ~ 2 : ~ = 3.69, 0.20 < P < 0.30
See footnote 2, table 9. See footnote 3, table 9.
TABLE 11
Tests of homogc~izc~ity of trtrnsferrin crllc.les - xZ3 vtrlzres I
Troop A E F H I J K L
- A E 1.14 - F 2.91 1.46 - H 5.08 3.16 6.55 -
3.89 3.67 I 0.61 0.10 1.60 2.53 - J 4.09 1.70 4.46 0.71 1.48 - 6.52 K 0.36 1.16 1.95 5.62 0.69 4.59 - L 5.04 4.46 5.78 5.80 2.83 6.44 3.08
x Z 8 = 16.1 1,0.05 < P t 0 . 1 0
1.22 6.56 8.28 2
-
All troops 3 x 2 2 1 =21.37,0.30<P<0.50
Total populat ion 3 ~2~~ = 24.56, 0.30 < P < 0.50
I Values in light face are for population prior to March 1, 1973; those in boldface are for current popu-
:I Total population = all troops plus peripheral males.
xZl2 = 16.59,0.1O<P<O.20
lation. Significant at the level 0.02 <P<O.O5; for all other values, P > O . O s

228 BUETTNER-JANUSCH E T AL
tained transferrin phenotypes of 126 fe- males and their 388 progeny. Six of the offspring were exclusions; that is, the genotype of the female parent was not that of a possible mother. Reasonable explana- tions for these exclusions are: (1) an in- correct observation may have been made
TABLE 12
Tes tc of h o m o g e n e i t y of traitsferrin trlleles of mtrles versiis f e m a l e s
x 2 values
Troop Prior to After March 1, 1973 M;u.ch 1. 1973
d d v s . O ? O ? vs.o"d
A E F H I J K L All hoops 2 Total population
i None of these values is significant; P>O.lO. * Total population = all troops plus peripheral males.
on Cay0 Santiago; (2) an adult female macaque occasionally adopts an infant; (3) a plasma sample may have been mis- typed. Regardless of which of these rea- sons one accepts, the small proportion of exclusions, 1.5% (6/388), is well within the range of acceptable experimental error.
The mother-progeny data from each of the eight troops prior to March 1, 1973 were combined (table 13) before analyzing the gametic ratios of progeny from incom- plete family data according to the method of Cooper and Rendel ('68). Because of the lack of heterogeneity displayed by this population at the transferrin locus, there is no need to analyze the progeny troop by troop. Without presenting the calcula- tions here suffice it to say that the distri- bution of allele frequencies in the mothers is not statistically significantly different from the distribution in all the females in the population, and the distribution of al- lele frequencies in the offspring are not statistically significantly different from the distribution in the total population prior to March 1 , 1973.
TABLE 13
Observed versus expec ted p h e n o t y p i c ratios of progcjny bused 011 i n c o m p l e t e f a m i l y dntu
Mothers Progeny
Transferrin Number of Number of Expected Observed Expected phenotypes ratio ratio x21 phenotype animals progeny
36
6
13
1
47
1
5
3
2
12
102
22
47
1
148
4
13
5
8
32
cc:cx 1
CDz:CC+DeD2 CX:D*X
C D I : C C + D I D l CX:DIX
CF:CC + F F CX:FX
CG:CC +GG CX:GX
DzDP :D2X
D2G:DzDZ + GG D2X:GX
D,G:DID, +GG DIX:GX
FG:FF + GG FX:GX
GG:GX
49:53
4:3 9:6
11:20 12:4
- 0:l
60:62 16:lO
0:4
0:2 7 :4
1 :o 3:l
1 :2 2:3
7 :25
0.543:0.457
1 :1 1:1
1 : l 1:l
- 1 :1
1:1 1 : l
0.033:0.967
1:l 1 : l
1 : l 1:l
1:l 1 :1
0.315:0.685
1.61
0.14 0.60
2.61 4.00 2
- 1 .oo 0.03 1.38
0.13
2.00 0.82
1.00 1.00
0.33 0.20
1.37
X = any transferrin not present in mother. Significant at the level 0.02 < P < 0.05; for all other values. P > 0.10.

MACAQUE TRANSFERRINS 229
The x2 values obtained for observed versus expected ratios of homozygous and heterozygous progeny of homozygous and heterozygous females are listed in ta- ble 13. Only one of the x' values is sta- tistically significant: one of the values for the offspring of CD1 mothers. This is the only result, at this stage of our investiga- tion, that gives any indication of an excess of T j c alleles in the progeny of TJ'C/Tj'D1 females.
DISCUSSION
The six transferrin alleles in the Cay0 Santiago macaques have all been reported in other groups of Macaca mulatta (Good- man et al., '65; Prychodko et al., '71). A total of 13 distinct alleles have been re- ported in animals from India and East Pakistan (Bangladesh). The absence of seven of these alleles from the Cay0 San- tiago macaques, in light of their history, may be attributed to a founder effect and also may be a result of the marked de- crease in the size of the population be- tween 1940 and 1956. The magnitude of the decrease in number of animals may have been sufficient to have produced a bottleneck for this population. We can offer this only as a speculation until such time as the genetically effective popula- tion number can be determined precisely. The genealogies are not yet adequate for calculation of the effective size of the pop- ulation.
It would be desirable to have more de- finitive biochemical analyses - structural and functional - of macaque and other nonhuman primate transferrins. The sta- tistical approach to the problem of distri- bution of alleles in various populations is only a first step. The chemical differences between transferrins should be character- ized; analysis of the distribution of trans- ferrins will be advanced when these bio- chemical data become available.
The x 2 values obtained for tests of equilibrium and tests of homogeneity of the alleles at the transferrin locus, with two exceptions, support the conclusion that the troops of macaques living on Cay0 Santiago prior to March 1973 and the troops presently living on the island are members of a single population. One ex- ception to this is found in the result of the x' test of equilibrium at the transferrin
locus in Troop A (table 8); x~~ = 10.84, 0.01 < P < 0.02. This result is in accord with what we know about the movement of the animals of Troop A just before blood samples were taken for the studies report- ed here. Troop A, as defined in table 2, was essentially what remained after Troops J, K, and L had split from it. As we noted earlier, Troop A split along gene- alogical lines as each new troop was formed. This result alone reemphasizes the mutual value to ethologists and genet- icists of concurrent genetical and behav- ioral investigations of populations of non- human primates.
The x 2 value for the test of homoge- neity when Troops F and L of the current population are compared is statistically significant (table 11). There is no obvi- ous explanation for this result. However, Troop F, the largest troop in the current population, is fissioning.
Much has been written about the large body of data on mammalian transferrins, especially those of cattle (Robertson, '65; Cooper and Rendel, '68). The apparent heterogeneity of the alleles at the trans- ferrin locus of cattle has led to consider- able analysis. Part of the analysis may be applicable to future studies of the Cay0 Santiago macaques. Some of the reasons for the heterogeneity of cattle transferrin alleles stem from certain characteristics of populations of domestic cattle. First, the breeds may be composed of many sub- populations that are genetically as well as physically subdivided (Wahlund, '28). Second, there may be a relatively small number of dams or sires. Third, there may be significant heterogeneity of alleles be- tween males and females. Fourth, fertility rates may be different for different geno- types. Fifth, there may be significantly different viability rates for different geno- types. Finally, among cattle, artificial se- lection may affect allele frequencies; that is, cattle breeders deliberately decide which matings are desirable, and this may have an effect upon the frequency and distribution of transferrins. It is unlikely that such artificial selection has or will have any effect in the macaque popula- tion of Cay0 Santiago. Therefore, we shall direct our attention to the other charac- teristics as they may apply to the ma- caques.

230 BUETTNER-JANUSCH ET AL
Tests of equilibrium indicate that het- erogeneity due to division of the macaque population into subpopulations has not yet arisen (table 10). If it should happen, we should be able to detect it. The effect of a small number of male or female par- ents cannot at this stage of our investiga- tion be determined, for we do not have sufficient information. There is no hetero- geneity of allele frequencies between the male and female macaques at present; but, should it occur, we shall be able to detect this cause of heterogeneity. If sig- nificant heterogeneity due to differential fertility or viability rates among genotypes should occur, it too should be detectable. Although the available statistical tests are not particularly sensitive or discriminat- ing, we shall be able to work with the to- tally enumerated population, and we shall not have to depend upon samples of the population.
When the genealogies of the Cay0 San- tiago macaques are completed as a result of intensive behavioral observation and verification of records, many important parameters for demographic and genetic analyses will be available. We shall be able to determine, for example, exact mi- gration rates between troops, inbreeding coefficients, effective population sizes, fertility rates, and gametic ratios over rel- atively long periods of time.
Ongoing behavioral observations and data derived from genetic analyses of transferrins and red cell enzymes (Buett- ner-Janusch et al., '74) provide and ade- quate baseline for future studies of the population genetics of these free-ranging macaques living on Cayo Santiago. Fu- ture behavioral and genetic studies will perhaps allow us to determine whether one genotype is more fit than another, whether natural selection or random proc- esses are maintaining the polymorphisms in this population. Thus, the experimen- tal work should enable us to test various models of evolution by natural selection and evolution by stochastic processes.
ACKNOWLEDGMENTS
We wish to thank Drs. M. Goodman, E. Poulik and W. Prychodko, Wayne State University, for their generosity in fur- nishing samples of macaque plasmas that had been typed in their laboratory. We
are grateful to Drs. J. Antonovics and M. O'Fallon, Duke University, for their advice on many genetical and statistical proce- dures. Dr. K. K. Namboodiri, University of North Carolina-Chapel Hill, provided invaluable advice on statistical techniques, and we take this opportunity to thank her.
This work was supported in part by grants to J. B-J. from the USPHS (RCDA GM 16722) and from the National Science Foundation (GS 30657X3, GS 41678X); to D. S. S. from the National Science Founda- tion (GS 3114 and GS 3574413); to G. A. M. from the USPHS (fellowship GM 02007); and to the Caribbean Primate Research Center from the USPHS (Contract NIH DRR 71-2003).
LITERATURE CITED Altmann, S. A. 1962 A field study of the socio-
biology of rhesus monkeys, Mmtrcci mzilritta. Ann. N. Y. Acad. Sci., 102: 338435 .
Annenkov, G. A , , and N. G. Kotrikadze 1969 Further study of transferrin polymorphism in Mncrrcus r h r s i i s . Tsitologia i Genetika, USSR, 3: 449452 .
Annenkov, H. A., A. B. Mirvis and H. G. Kotri- kadze 1972 Geographical transferrin polymor- phism in Mnccico mulnttn. Primates, 13: 235- 242.
Beckman, L., J . Hirschfeld and U. Soderberg 1961a Transferrin variations in sera of Mnrncn i n i s . Acta Pathol. Microbiol. Scand., 51: 132- 140.
Beckman, L., G. Holmgren, 0. Makela and R. Lehtovaara 1961b Serum protein variations in monkeys. Acta Genet., 1 1 : 126-132.
Blumberg, B. S. 1960 Biochemical polymor- phisms in animals: Haptoglobins and transfer- rins. Proc. SOC. Exp. Biol. Med., 104: 25-28.
Buettner-Janusch, J. 1963 Hemoglobins and transferrins of baboons. Folia Primat., 1: 73-87.
Buettner-Janusch, J., L. Dame, G. A. Mason and D. S. Sade 1974 Primate red cell enzymes: glucose-6-phosphate dehydrogenase and 6-phos- phogluconate dehydrogenase. Am. J. Phys. An- throp., 41; 7-14.
Buettner-Janusch, J., J . B. Twichell, B. Y-S. Wong and G. van Wagenen 1961 Multiple haemo- globins and transferrins in a macaque sibship. Nature, 192: 948-950.
Carpenter, C. R. 1972 Breeding colonies of ma- caques and gibbons on Santiago Island, Puerto Rico. In: Breeding Primates. W. I. Beveredge, ed. S. Karger, Basel, pp. 223-230.
Cooper, D. W., and J. Rendel 1968 Incomplete family data, selection and population studies of transferrins and blood groups in cattle. Hered- ity, 23: 4 9 4 6 .
Coppenhaver, D., and J. Buettner-Janusch 1970 Tran sferrin s of Cercopithecinae. Folia Prim at., 13: 23-34.
Goodman, M., A. Kulkarni, E. Poulik and E. Rek- lys 1965 Species and geographic differences in the transferrin polymorphism of macaques. Science, 147: 884-886.

MACAQUE TRANSFERRINS 231
Greene, F. C., and R. E. Feeney 1968 Physical evidence for transferrins as single polypeptide chains. Biochemistry, 7: 1366-1371.
Ishimoto, G., T. Toyomasu and K. Uemura 1965 Electrophoretic study of serum proteins of Japa- nese macaques. Primates, 6: 272-282.
1967 Serum transferrins of Japanese macaques: comparison with other species of monkeys. Primates, 8: 29-34.
Jamieson, G. A,, M. Jett and S. L. DeBernardo 1971 The carbohydrate sequence of the glyco- peptide chains of human transferrin. J. Biol. Chem., 246: 3686-3693.
Jolly, C. J., and N. A. Barnicot 1966 Serum and red-cell protein variations of the Celebes black ape. Folia Primat., 4: 206-220.
Koford, C. B. 1963 Group relations in an island colony of rhesus monkeys. In: Primate Social Behavior. C. H. Southwick, ed. D. Van Nostrand, Princeton, pp. 136-1 52.
1965 Population dynamics of rhesus monkeys on Cay0 Santiago. 1n:Primate Behav- ior. I. DeVore, ed. Holt, Rinehart and Winston, New York, pp. 160-174.
Lai, L. Y. C. 1972 Transferrins in Mclcclcn irus. Folia Primat., 17: 193-201.
Lai, L. Y . C., and R. L. Kirk 1960 &globulin
variants in two species of monkeys. Nature, 188: 673-674.
Mann, K. G., W. W. Fish, A. C. Cox and C. Tan- ford 1970 Single-chain nature of human se- rum transferrin. Biochemistry, 9: 1348-1354.
Nute, P. E., and J. Buettner-Janusch 1969 Genetics of polymorphic transferrins in the genus Lemur. Folia Primat., 10: 181-194.
Parker, W. C., and A. G. Bearn 1961 Altera- tions in sialic acid content of human transferrin. Science, 133: 1014-1016.
Prychodko, W., M. Goodman, B. M. Singal, M. L. Weiss, G. Ishimoto and T. Tanaka 1971 Starch-gel electrophoretic variants of erythro- cyte 6-phosphogluconate dehydrogenase in Asian macaques. Primates, 12: 175-182.
Robertson, A. 1965 The interpretation of geno- typic ratios in domestic animal populations. Animal Production, 7: 319-324.
Toyomasu, T., and G. Ishimoto 1969 Trans- ferrin gene distribution in Muccrcn irus from two different local populations. J. Anthropol. SOC. Nippon, 77: 260-266.
Wahlund, S. 1928 Zusammensetzung von Popu- lationen und Korrelationserscheinungen vom Standpunkt der Vererbungslehre aus betrachtet. Hereditas, 11: 65106.