gender audit 2017-18 to 2019-20
TRANSCRIPT
1
2
Index
Sr. No. Content Page No.
1. Acknowledgements 3
2. Introduction 4-5
3. Objective Of Gender audit 5-6
4. Gender Ratio 6-
5. Gender sensitive features 11-54
6. Prevention of Sexual Harassment 55
7. Salient Features and Recommendation 56-59
8. Our Pride 59-63
9. Conclusion
64
3
ACKNOWLEDGEMENTS
First of all, I sincerely thank the President of Koyana Education
Society, Patan, Hon. Dr. Sopanrao Chavan, General Secretary of Koyana
Education Society Hon. Amarsingh Patankar, and the Members of
Koyna Education Society, Hon. Yadnyasen Patankar and Hon. Sanjeev
Chavan for motivating us and increasing our enthusiasm to perform
different tasks, one of which is Gender Audit.
I thank I/C Principal Hon. Dr S. D. Pawar for his valuable co-
operation in this work.
I also express my sincere gratitude towards the NAAC
coordinator, Dr. P. Y. Phadnis and all the faculty members and
administrative staff of the college for their valuable co-operation in
compiling the data required for Gender Audit.
I express my gratefulness towards Dr. Mahesh Chavan and Dr.
Sou. U .E. Salunkhe Kakasaheb Chavan of Talamavale College,
Talmawale for their special support and guidance in concern with
conducting gender audit of our college.
Last but not the least, I would like to express my sincere gratitude
towards all the members the Gender Audit Committee and announce that
the work of Gender Audit has been successfully completed.
Coordinator, I/C Principal,
Dr. Hemlata Kate Dr. S. D. Pawar
Gender Audit Committee Balasaheb Desai College, Patan
Balasaheb Desai College, Patan
4
1. Introductory Koyana Education Society’s Balasaheb Desai College, Patan was
established in 1969 to open the doors of higher education for rural youth
of Patan Tahasil. This college is affiliated to Shivaji University,
Kolhapur. Balasaheb Desai College, Patan is the only major college in
the taluka. Most of the villages in the vicinity of Patan tahasil are
situated in the hilly area where transportation facility is hardly available.
From such places the students come to this college for education. The
aim of the institution is to give education to all. We take care of the fact
that not a single student should be deprived of education. With that view
in mind, the goals and objectives of the college have been set. They are
as follows:
Vision:
Transforming the life of rural, hilly, earthquake prone population
through quality higher education with new vistas of knowledge
inculcating the spirit of self-reliance and scientific temper.
Mission:
1. To impart higher education to the students from rural, hilly,
earthquake prone region and channelize youth energy to undertake the
task of upliftment of the society.
2. To acquaint the students with modern technology and trends, research
and informatics to enable them to confront the challenges of competitive
world.
3. To inculcate the awareness of Physical and Mental Fitness among
students, faculties and society.
5
4. To empower the students through modern learning techniques and
participation in curricular, co-curricular, extracurricular, extension
activities and disaster management.
5. To create awareness among the students and society to conserve
natural resources and wild life.
In October, 2016, our college has gone through NAAC
accreditation process and obtained B+ grade with CGP 2.68. Gender
inequality in society has created a need for gender audit. Gender audit is
being done to emphasize the male-female equality & its importance
among student. Gender Audit has two words, one is gender and the other
is audit. In fact, the term audit refers to investigating financial
transactions. The word Gender Audit means investigating gender
transactions. The main purpose of gender audit is to empower women.
Unless gender equality is achieved, women empowerment in society is
impossible. If children get the right education, change can happen. That
is why gender audit is done at the college level. The environment in the
college is conducive for the overall development of the students.
Students feel safe in the college.
The Gender Audit also attempts to study the gender balance.
Similarly, it studies whether college follows all the University rules,
policies & action. This Gender Audit tries to check the impact of its
current & proposed policies on Gender equality.
2. Gender Audit Objectives
1. Checking the gender ratio at different levels of the college
2. To check the level of gender equality in the college.
6
3. To check whether men and women are given equal opportunity in
various programs implemented in the college.
4. To see what facilities are available in the college from the point of
view of women's safety
5. To see what activities are implemented in the college from the
perspective of gender equality
6. To strive for gender equality in college
7. To Suggest solutions to reduce gender inequality
8. To look after the capacity for prevention and prohibition of sexual
harassment at work place
The college has three components: 1) teachers 2) teaching staff 3)
students. The study of the ratio of men to women on these three different
levels is discussed here.
1 . Last three years’ gender ratio of the teaching staff:
Year wise summary of teaching and non-teaching staff during the
last three years: (2017-18 to 2019-20) is given in the following table no.
1
Number of full time teaching staff in the senior college and the ratio of
male & female faculty are given in Table No. 1
3.1. Table No. 1: Senior College Regular full time Teachers
(Grantable) Ratio:
Year Male Female Total Ratio M Ratio F
2017-18 28 5 33 84.85% 15.15%
2018-19 27 4 31 87.09% 12.90%
2019-20 25 3 28 89.28% 10.71%
7
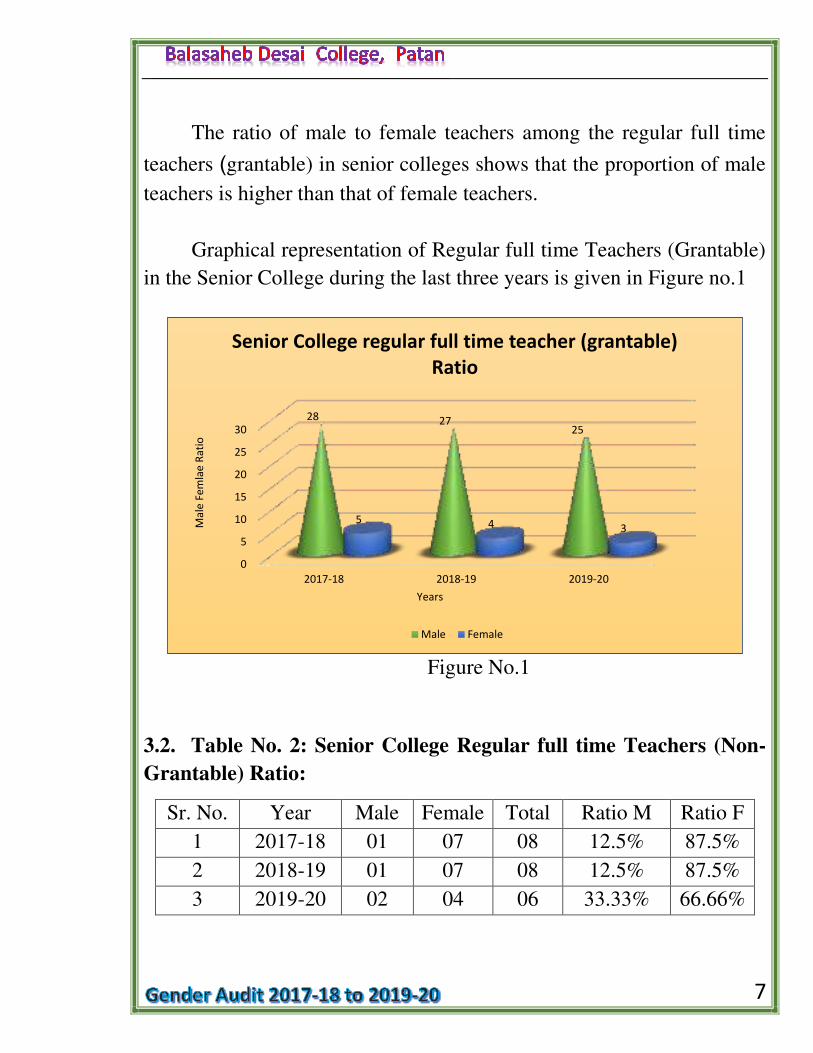
The ratio of male to female teachers among the regular full time
teachers (grantable) in senior colleges shows that the proportion of male
teachers is higher than that of female teachers.
Graphical representation of Regular full time Teachers (Grantable)
in the Senior College during the last three years is given in Figure no.1
Figure No.1
3.2. Table No. 2: Senior College Regular full time Teachers (Non-
Grantable) Ratio:
Sr. No. Year Male Female Total Ratio M Ratio F
1 2017-18 01 07 08 12.5% 87.5%
2 2018-19 01 07 08 12.5% 87.5%
3 2019-20 02 04 06 33.33% 66.66%
0
5
10
15
20
25
30
2017-18 2018-19 2019-20
28 27 25
5 4 3 Ma
le F
em
lae
Ra
tio
Years
Senior College regular full time teacher (grantable)
Ratio
Male Female
8
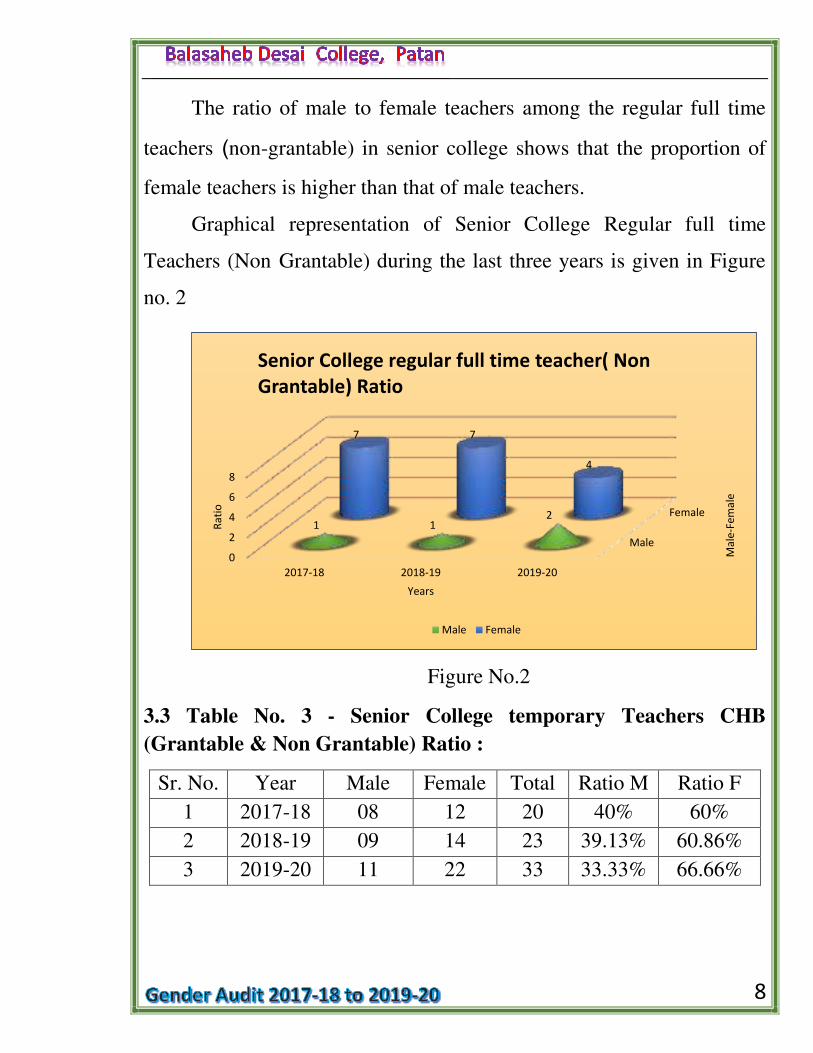
The ratio of male to female teachers among the regular full time
teachers (non-grantable) in senior college shows that the proportion of
female teachers is higher than that of male teachers.
Graphical representation of Senior College Regular full time
Teachers (Non Grantable) during the last three years is given in Figure
no. 2
Figure No.2
3.3 Table No. 3 - Senior College temporary Teachers CHB
(Grantable & Non Grantable) Ratio :
Sr. No. Year Male Female Total Ratio M Ratio F
1 2017-18 08 12 20 40% 60%
2 2018-19 09 14 23 39.13% 60.86%
3 2019-20 11 22 33 33.33% 66.66%
Male
Female
0
2
4
6
8
2017-18 2018-19 2019-20
1 1 2
7 7
4
Ma
le-F
em
ale
Ra
tio
Years
Senior College regular full time teacher( Non
Grantable) Ratio
Male Female
9
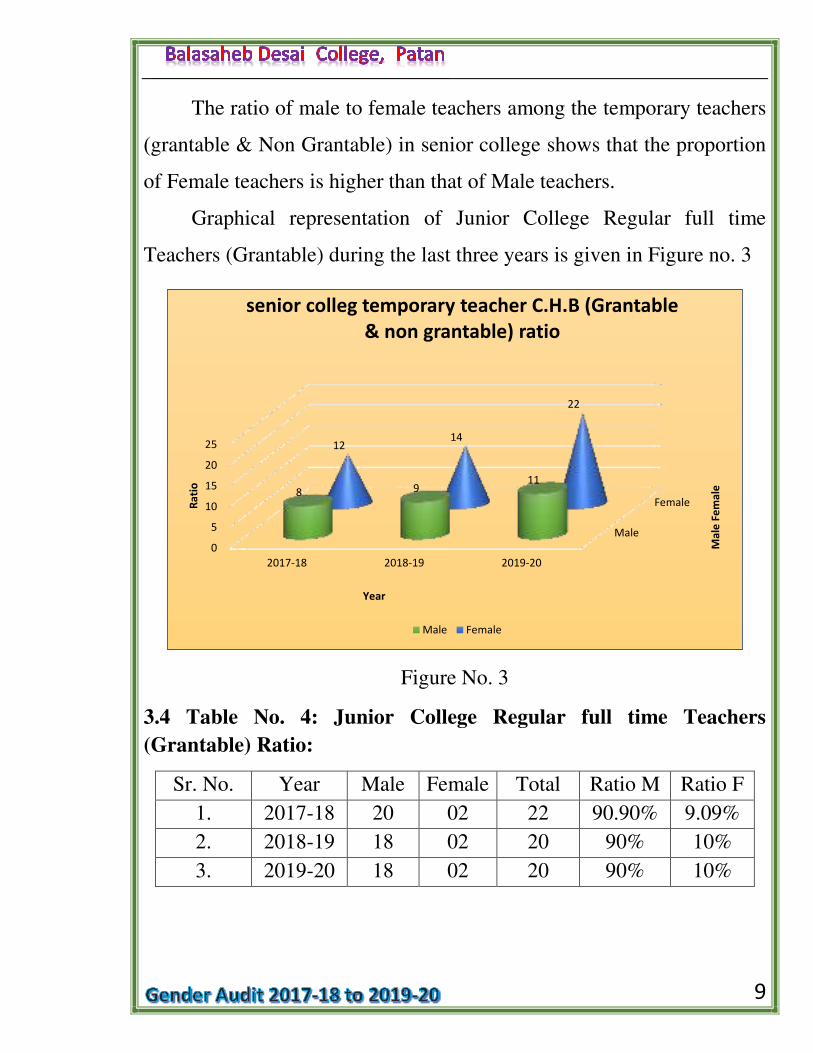
The ratio of male to female teachers among the temporary teachers
(grantable & Non Grantable) in senior college shows that the proportion
of Female teachers is higher than that of Male teachers.
Graphical representation of Junior College Regular full time
Teachers (Grantable) during the last three years is given in Figure no. 3
Figure No. 3
3.4 Table No. 4: Junior College Regular full time Teachers
(Grantable) Ratio:
Sr. No. Year Male Female Total Ratio M Ratio F
1. 2017-18 20 02 22 90.90% 9.09%
2. 2018-19 18 02 20 90% 10%
3. 2019-20 18 02 20 90% 10%
Male
Female
0
5
10
15
20
25
2017-18 2018-19 2019-20
8 9 11
12 14
22
Ma
le F
em
ale
Ra
tio
Year
senior colleg temporary teacher C.H.B (Grantable
& non grantable) ratio
Male Female
10
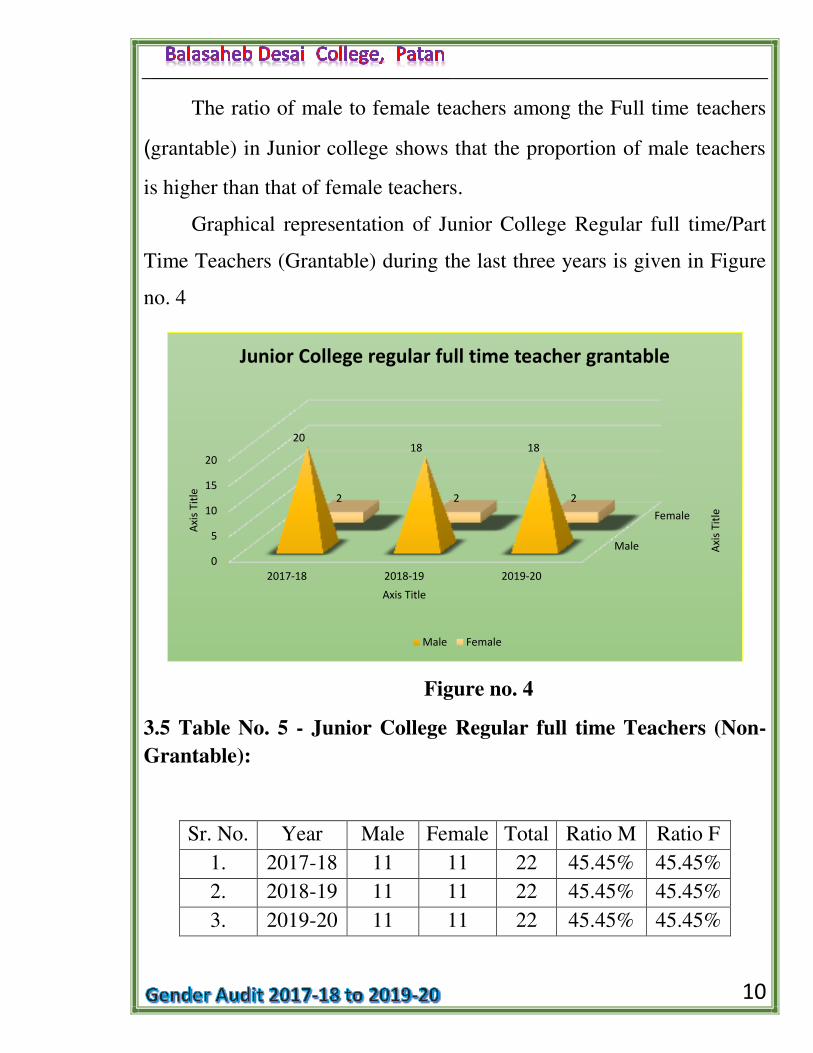
The ratio of male to female teachers among the Full time teachers
(grantable) in Junior college shows that the proportion of male teachers
is higher than that of female teachers.
Graphical representation of Junior College Regular full time/Part
Time Teachers (Grantable) during the last three years is given in Figure
no. 4
Figure no. 4
3.5 Table No. 5 - Junior College Regular full time Teachers (Non-
Grantable):
Sr. No. Year Male Female Total Ratio M Ratio F
1. 2017-18 11 11 22 45.45% 45.45%
2. 2018-19 11 11 22 45.45% 45.45%
3. 2019-20 11 11 22 45.45% 45.45%
Male
Female
0
5
10
15
20
2017-18 2018-19 2019-20
20 18 18
2 2 2
Axi
s T
itle
Axi
s T
itle
Axis Title
Junior College regular full time teacher grantable
Male Female
11
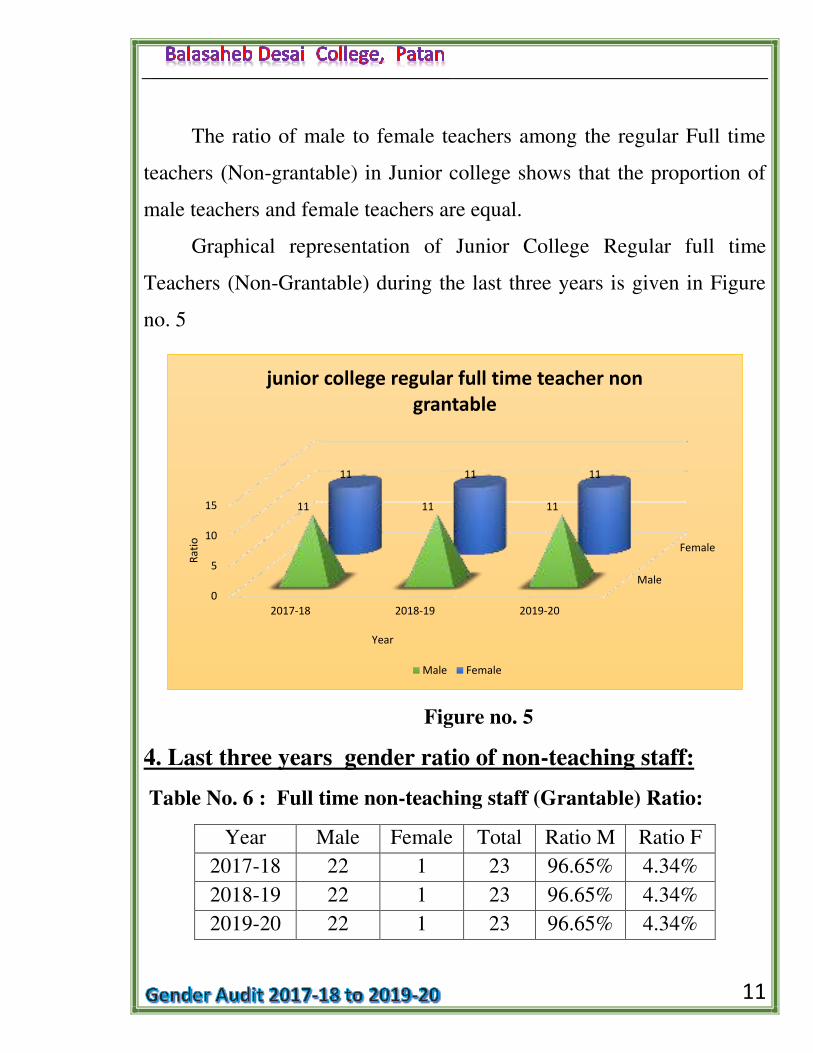
The ratio of male to female teachers among the regular Full time
teachers (Non-grantable) in Junior college shows that the proportion of
male teachers and female teachers are equal.
Graphical representation of Junior College Regular full time
Teachers (Non-Grantable) during the last three years is given in Figure
no. 5
Figure no. 5
4. Last three years gender ratio of non-teaching staff:
Table No. 6 : Full time non-teaching staff (Grantable) Ratio:
Year Male Female Total Ratio M Ratio F
2017-18 22 1 23 96.65% 4.34%
2018-19 22 1 23 96.65% 4.34%
2019-20 22 1 23 96.65% 4.34%
Male
Female
0
5
10
15
2017-18 2018-19 2019-20
11 11 11
11 11 11
Ra
tio
Year
junior college regular full time teacher non
grantable
Male Female
12
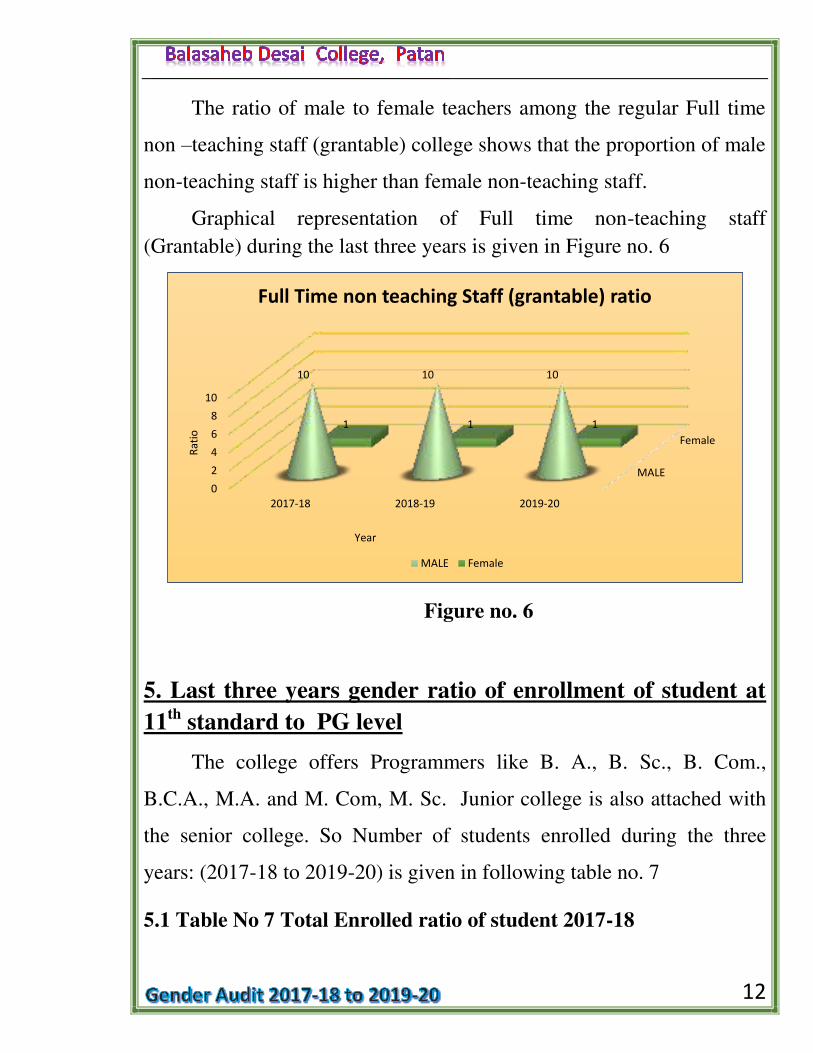
The ratio of male to female teachers among the regular Full time
non –teaching staff (grantable) college shows that the proportion of male
non-teaching staff is higher than female non-teaching staff.
Graphical representation of Full time non-teaching staff
(Grantable) during the last three years is given in Figure no. 6
Figure no. 6
5. Last three years gender ratio of enrollment of student at
11th standard to PG level
The college offers Programmers like B. A., B. Sc., B. Com.,
B.C.A., M.A. and M. Com, M. Sc. Junior college is also attached with
the senior college. So Number of students enrolled during the three
years: (2017-18 to 2019-20) is given in following table no. 7
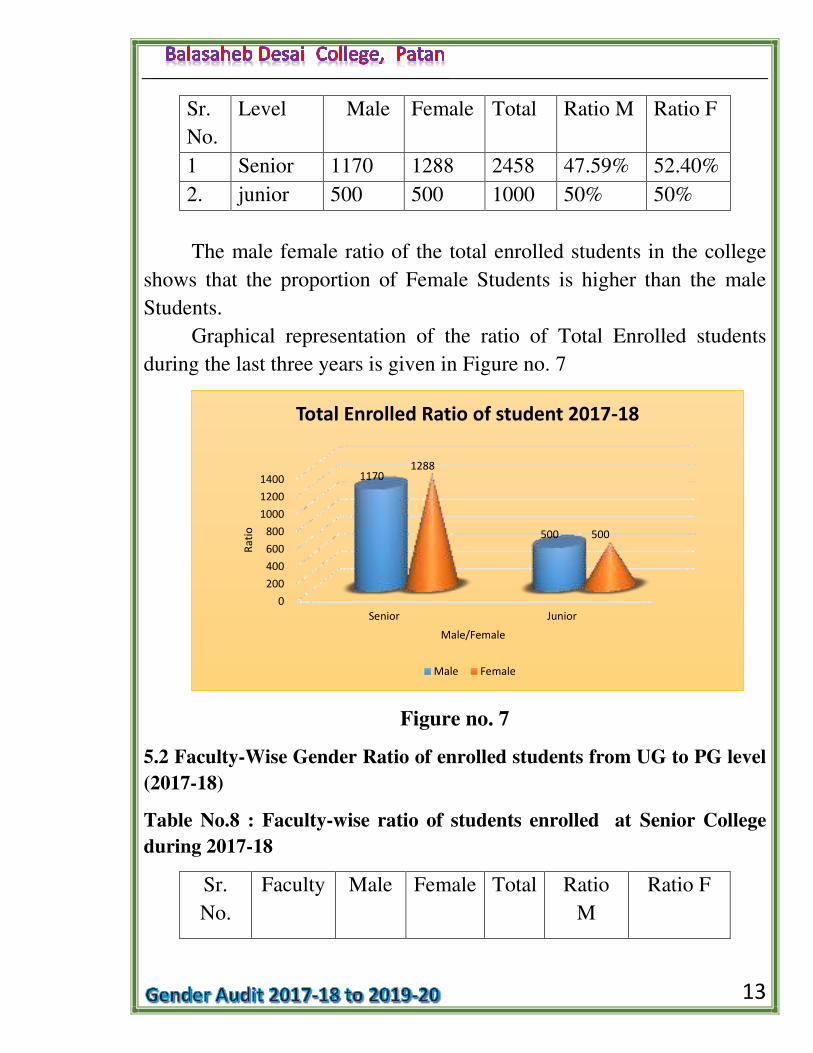
5.1 Table No 7 Total Enrolled ratio of student 2017-18
MALE
Female
0
2
4
6
8
10
2017-18 2018-19 2019-20
10 10 10
1 1 1
Ra
tio
Year
Full Time non teaching Staff (grantable) ratio
MALE Female
13
Sr.
No.
Level Male Female Total Ratio M Ratio F
1 Senior 1170 1288 2458 47.59% 52.40%
2. junior 500 500 1000 50% 50%
The male female ratio of the total enrolled students in the college
shows that the proportion of Female Students is higher than the male
Students.
Graphical representation of the ratio of Total Enrolled students
during the last three years is given in Figure no. 7
Figure no. 7
5.2 Faculty-Wise Gender Ratio of enrolled students from UG to PG level
(2017-18)
Table No.8 : Faculty-wise ratio of students enrolled at Senior College
during 2017-18
Sr.
No.
Faculty Male Female Total Ratio
M
Ratio F
0
200
400
600
800
1000
1200
1400
Senior Junior
1170
500
1288
500
Ra
tio
Male/Female
Total Enrolled Ratio of student 2017-18
Male Female
14
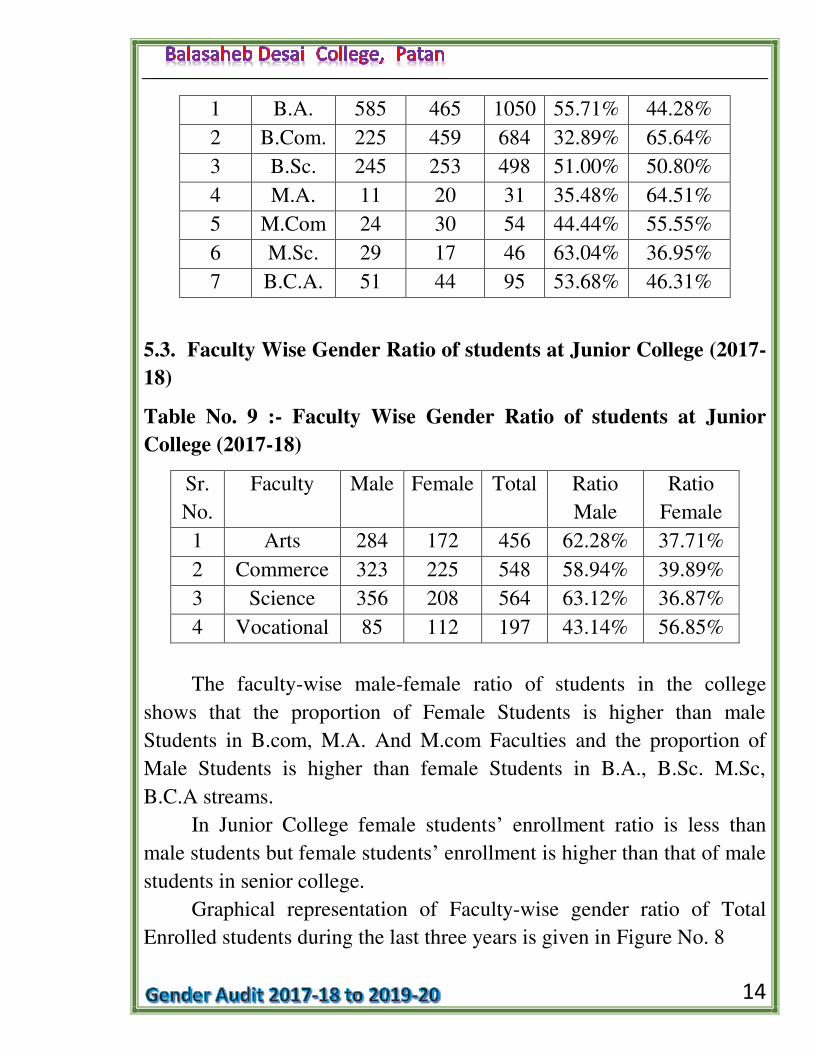
1 B.A. 585 465 1050 55.71% 44.28%
2 B.Com. 225 459 684 32.89% 65.64%
3 B.Sc. 245 253 498 51.00% 50.80%
4 M.A. 11 20 31 35.48% 64.51%
5 M.Com 24 30 54 44.44% 55.55%
6 M.Sc. 29 17 46 63.04% 36.95%
7 B.C.A. 51 44 95 53.68% 46.31%
5.3. Faculty Wise Gender Ratio of students at Junior College (2017-
18)
Table No. 9 :- Faculty Wise Gender Ratio of students at Junior
College (2017-18)
Sr.
No.
Faculty Male Female Total Ratio
Male
Ratio
Female
1 Arts 284 172 456 62.28% 37.71%
2 Commerce 323 225 548 58.94% 39.89%
3 Science 356 208 564 63.12% 36.87%
4 Vocational 85 112 197 43.14% 56.85%
The faculty-wise male-female ratio of students in the college
shows that the proportion of Female Students is higher than male
Students in B.com, M.A. And M.com Faculties and the proportion of
Male Students is higher than female Students in B.A., B.Sc. M.Sc,
B.C.A streams.
In Junior College female students’ enrollment ratio is less than
male students but female students’ enrollment is higher than that of male
students in senior college.
Graphical representation of Faculty-wise gender ratio of Total
Enrolled students during the last three years is given in Figure No. 8
15
Figure No. 8
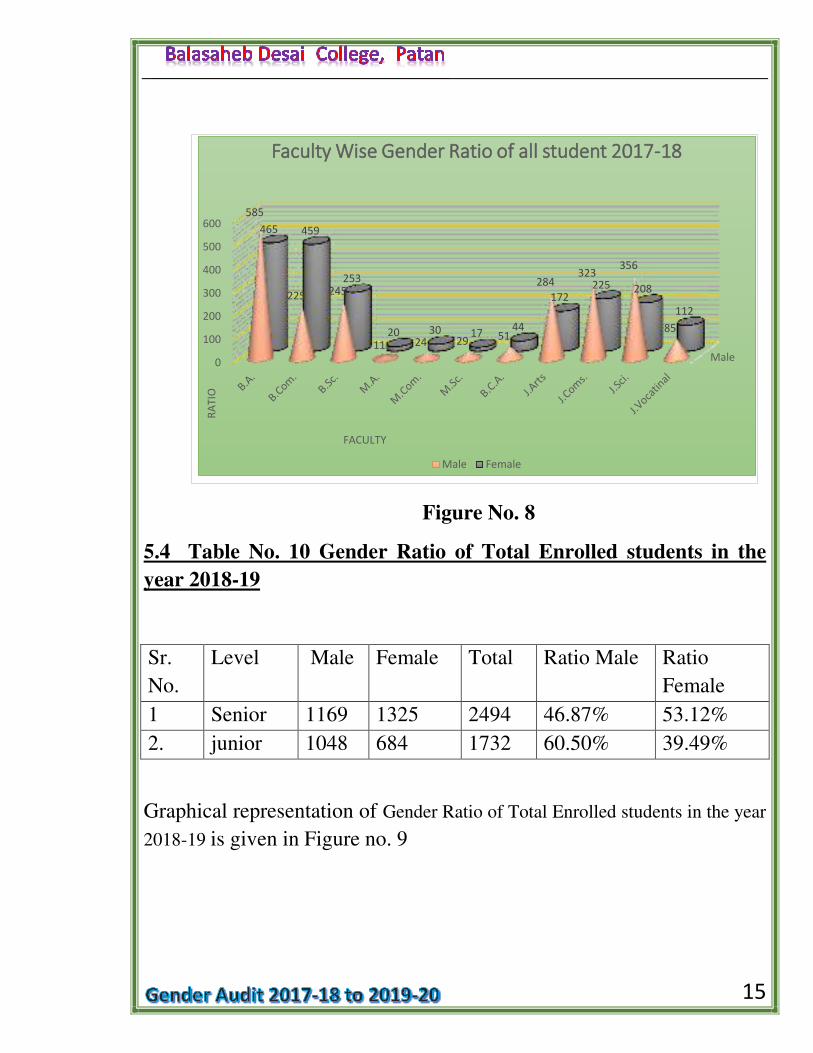
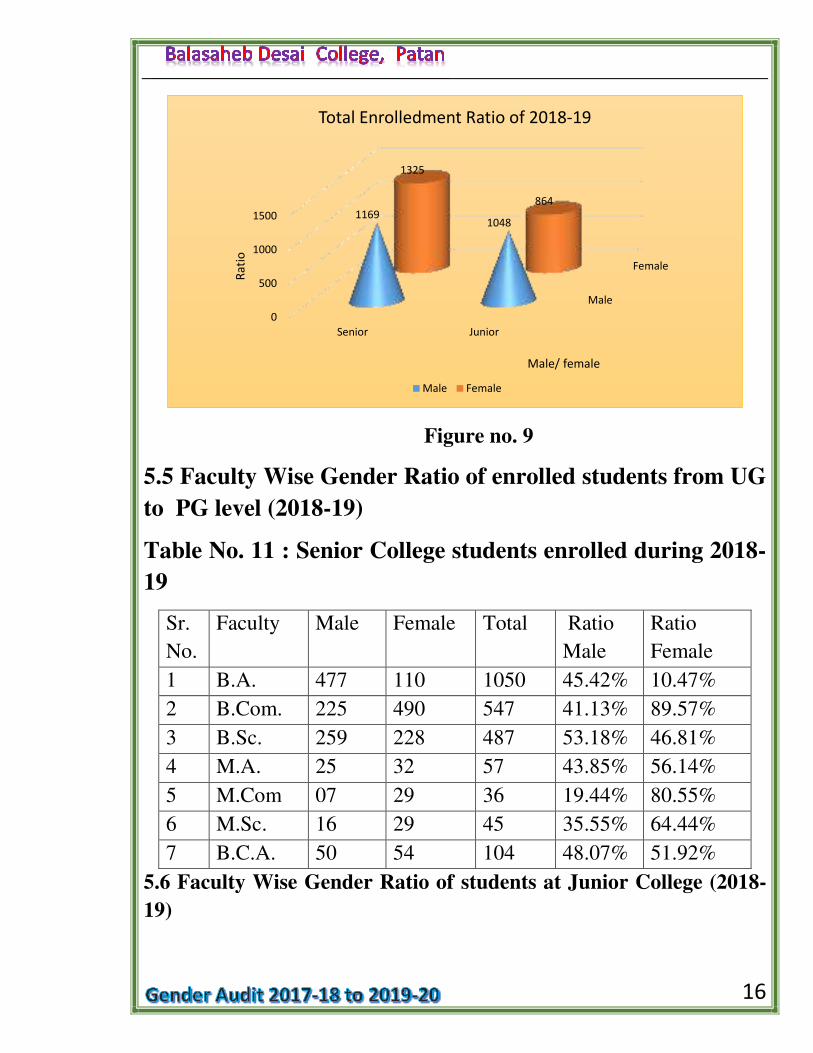
5.4 Table No. 10 Gender Ratio of Total Enrolled students in the
year 2018-19
Sr.
No.
Level Male Female Total Ratio Male Ratio
Female
1 Senior 1169 1325 2494 46.87% 53.12%
2. junior 1048 684 1732 60.50% 39.49%
Graphical representation of Gender Ratio of Total Enrolled students in the year
2018-19 is given in Figure no. 9
Male0
100
200
300
400
500
600585
225 245
11 24 29 51
284 323
356
85
465 459
253
20 30 17 44
172 225 208
112
RA
TIO
FACULTY
Faculty Wise Gender Ratio of all student 2017-18
Male Female
16
Figure no. 9
5.5 Faculty Wise Gender Ratio of enrolled students from UG
to PG level (2018-19)
Table No. 11 : Senior College students enrolled during 2018-
19
Sr.
No.
Faculty Male Female Total Ratio
Male
Ratio
Female
1 B.A. 477 110 1050 45.42% 10.47%
2 B.Com. 225 490 547 41.13% 89.57%
3 B.Sc. 259 228 487 53.18% 46.81%
4 M.A. 25 32 57 43.85% 56.14%
5 M.Com 07 29 36 19.44% 80.55%
6 M.Sc. 16 29 45 35.55% 64.44%
7 B.C.A. 50 54 104 48.07% 51.92%
5.6 Faculty Wise Gender Ratio of students at Junior College (2018-
19)
Male
Female
0
500
1000
1500
Senior Junior
1169 1048
1325
864
Ra
tio
Male/ female
Total Enrolledment Ratio of 2018-19
Male Female
17
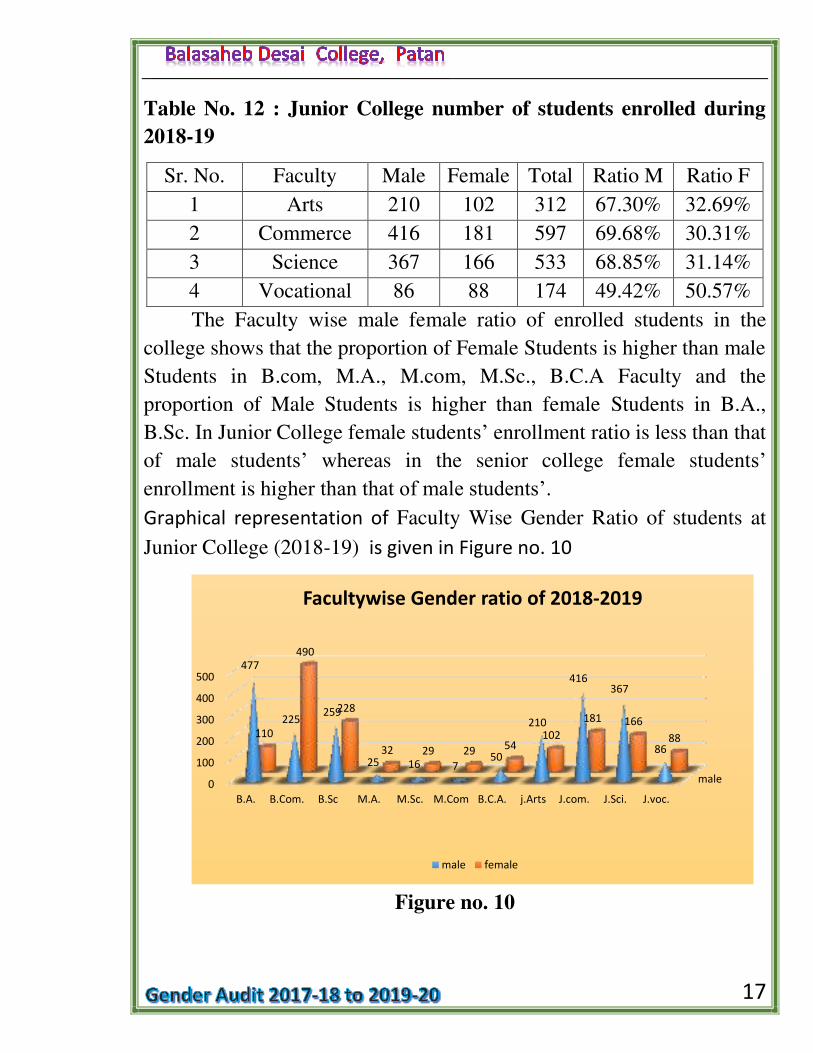
Table No. 12 : Junior College number of students enrolled during
2018-19
Sr. No. Faculty Male Female Total Ratio M Ratio F
1 Arts 210 102 312 67.30% 32.69%
2 Commerce 416 181 597 69.68% 30.31%
3 Science 367 166 533 68.85% 31.14%
4 Vocational 86 88 174 49.42% 50.57%
The Faculty wise male female ratio of enrolled students in the
college shows that the proportion of Female Students is higher than male
Students in B.com, M.A., M.com, M.Sc., B.C.A Faculty and the
proportion of Male Students is higher than female Students in B.A.,
B.Sc. In Junior College female students’ enrollment ratio is less than that
of male students’ whereas in the senior college female students’ enrollment is higher than that of male students’. Graphical representation of Faculty Wise Gender Ratio of students at
Junior College (2018-19) is given in Figure no. 10
Figure no. 10
male0
100
200
300
400
500
B.A. B.Com. B.Sc M.A. M.Sc. M.Com B.C.A. j.Arts J.com. J.Sci. J.voc.
477
225 259
25 16 7 50
210
416 367
86
110
490
228
32 29 29 54
102
181 166
88
Facultywise Gender ratio of 2018-2019
male female
18
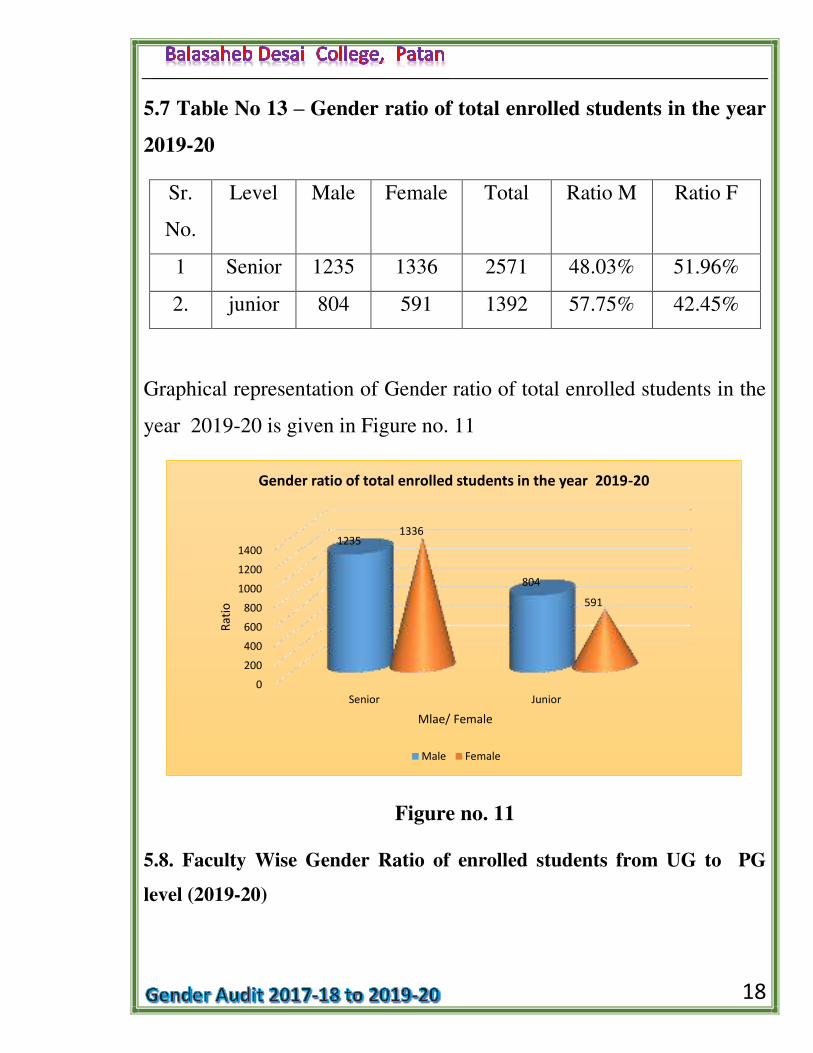
5.7 Table No 13 – Gender ratio of total enrolled students in the year
2019-20
Sr.
No.
Level Male Female Total Ratio M Ratio F
1 Senior 1235 1336 2571 48.03% 51.96%
2. junior 804 591 1392 57.75% 42.45%
Graphical representation of Gender ratio of total enrolled students in the
year 2019-20 is given in Figure no. 11
Figure no. 11
5.8. Faculty Wise Gender Ratio of enrolled students from UG to PG
level (2019-20)
0
200
400
600
800
1000
1200
1400
Senior Junior
1235
804
1336
591
Ra
tio
Mlae/ Female
Gender ratio of total enrolled students in the year 2019-20
Male Female
19
Table No. 14 : Faculty Wise Gender Ratio of enrolled students at the
Senior College during 2019-20
Sr.
No.
Faculty Male Female Total Ratio
Male
Ratio
Female
1 B.A. 644 422 866 74.36% 48.72%
2 B.Com. 260 516 776 33.50% 66.49%
3 B.Sc. 239 225 464 51.50% 48.49%
4 M.A. 16 38 54 29.62% 70.37%
5 M.Com 07 33 40 17.5% 82.5%
6 M.Sc. 17 26 43 39.53% 60.46%
7 B.C.A. 33 76 128 25.78% 59.37%
5.9 Faculty Wise Gender Ratio of enrolled students at the Junior
College during 2019-20
Table No. 15 - Faculty Wise Gender Ratio of enrolled students at the
Junior College during 2019-20
Sr.
No.
Faculty Male Female Total Ratio
Male
Ratio
Female
1 Arts 249 131 380 65.52% 34.47%
2 Commers 264 287 551 47.91% 52.08%
3 Science 291 173 464 62.71% 37.28%
4 Vocational 78 101 179 43.57% 56.42%
20
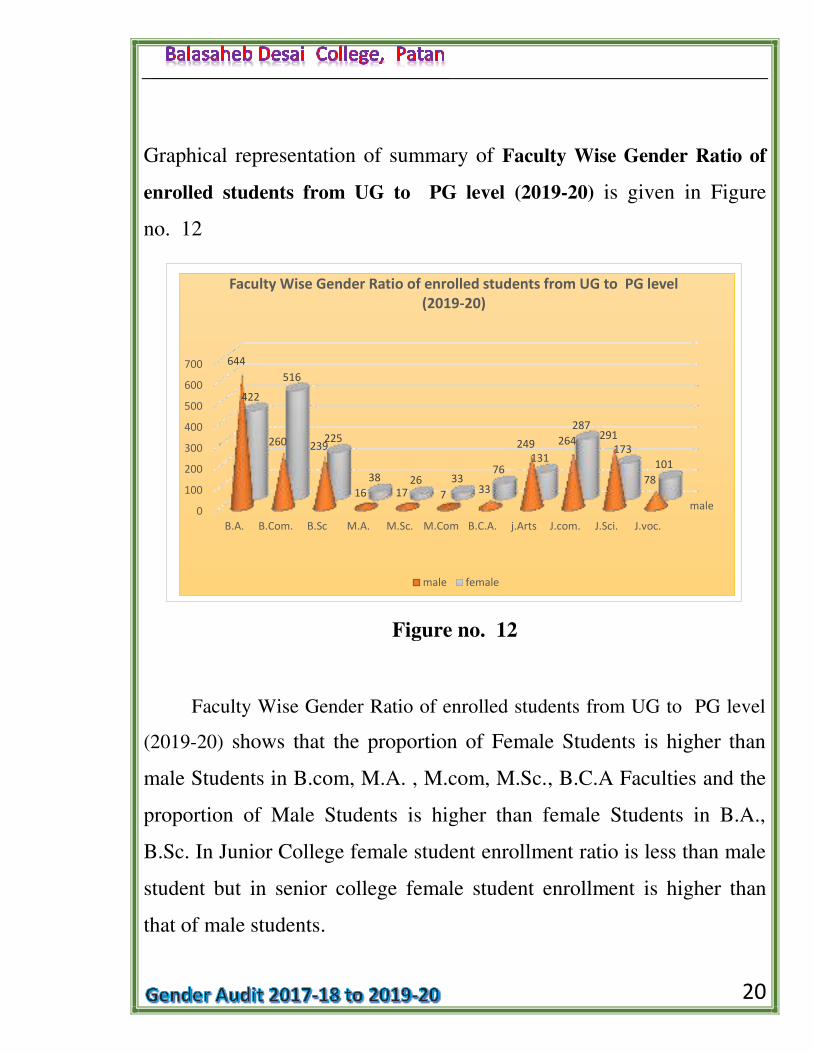
Graphical representation of summary of Faculty Wise Gender Ratio of
enrolled students from UG to PG level (2019-20) is given in Figure
no. 12
Figure no. 12
Faculty Wise Gender Ratio of enrolled students from UG to PG level
(2019-20) shows that the proportion of Female Students is higher than
male Students in B.com, M.A. , M.com, M.Sc., B.C.A Faculties and the
proportion of Male Students is higher than female Students in B.A.,
B.Sc. In Junior College female student enrollment ratio is less than male
student but in senior college female student enrollment is higher than
that of male students.
male0
100
200
300
400
500
600
700
B.A. B.Com. B.Sc M.A. M.Sc. M.Com B.C.A. j.Arts J.com. J.Sci. J.voc.
644
260 239
16 17 7 33
249 264 291
78
422
516
225
38 26 33 76
131
287
173
101
Faculty Wise Gender Ratio of enrolled students from UG to PG level
(2019-20)
male female
21
6. Last Three years Gender Ratio in Various Social Categories:
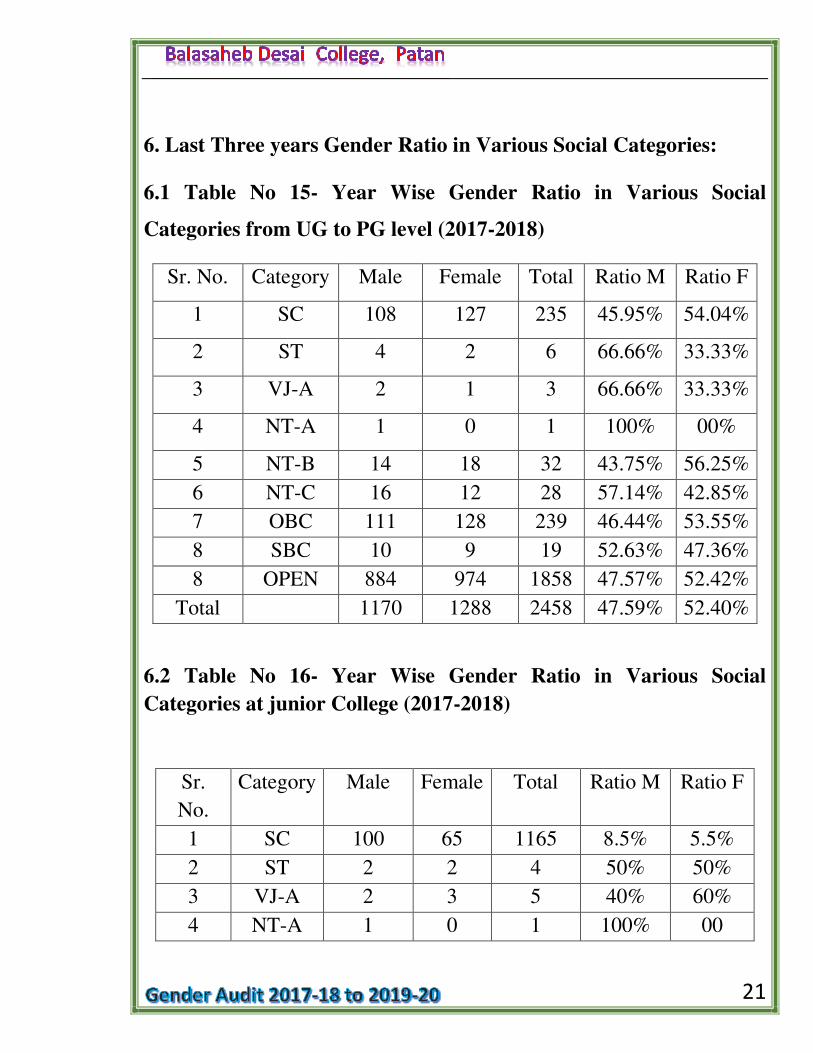
6.1 Table No 15- Year Wise Gender Ratio in Various Social
Categories from UG to PG level (2017-2018)
Sr. No. Category Male Female Total Ratio M Ratio F
1 SC 108 127 235 45.95% 54.04%
2 ST 4 2 6 66.66% 33.33%
3 VJ-A 2 1 3 66.66% 33.33%
4 NT-A 1 0 1 100% 00%
5 NT-B 14 18 32 43.75% 56.25%
6 NT-C 16 12 28 57.14% 42.85%
7 OBC 111 128 239 46.44% 53.55%
8 SBC 10 9 19 52.63% 47.36%
8 OPEN 884 974 1858 47.57% 52.42%
Total 1170 1288 2458 47.59% 52.40%
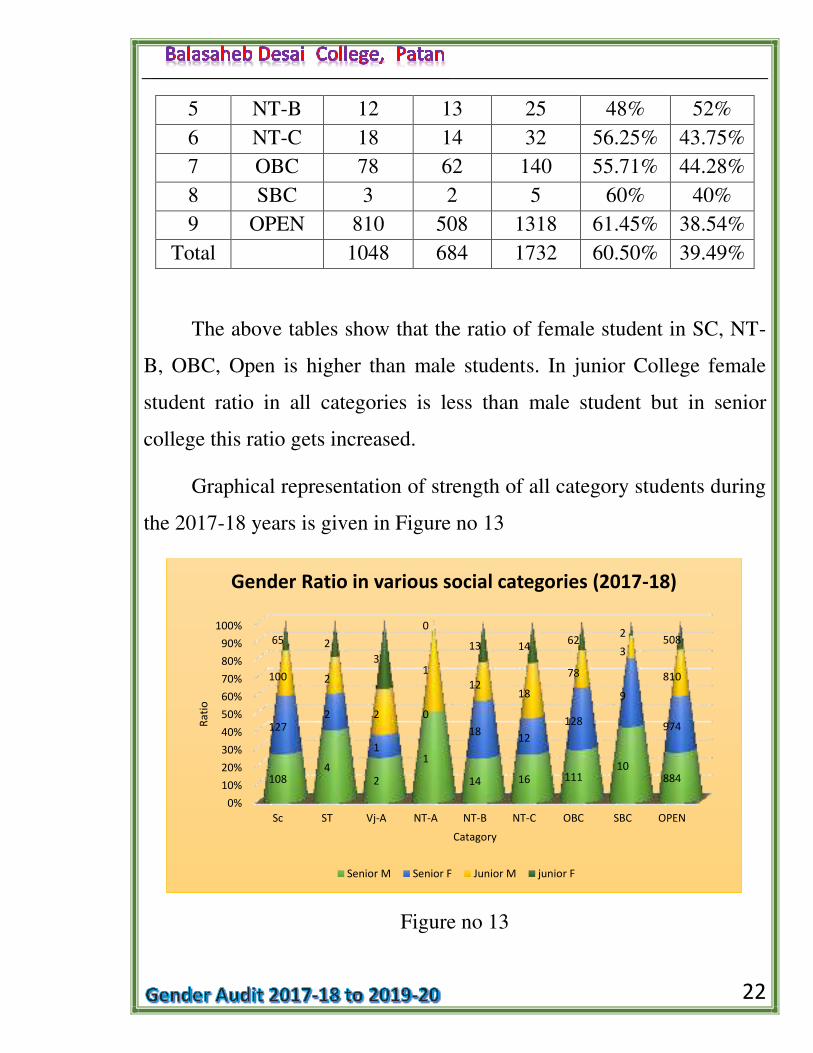
6.2 Table No 16- Year Wise Gender Ratio in Various Social
Categories at junior College (2017-2018)
Sr.
No.
Category Male Female Total Ratio M Ratio F
1 SC 100 65 1165 8.5% 5.5%
2 ST 2 2 4 50% 50%
3 VJ-A 2 3 5 40% 60%
4 NT-A 1 0 1 100% 00
22
5 NT-B 12 13 25 48% 52%
6 NT-C 18 14 32 56.25% 43.75%
7 OBC 78 62 140 55.71% 44.28%
8 SBC 3 2 5 60% 40%
9 OPEN 810 508 1318 61.45% 38.54%
Total 1048 684 1732 60.50% 39.49%
The above tables show that the ratio of female student in SC, NT-
B, OBC, Open is higher than male students. In junior College female
student ratio in all categories is less than male student but in senior
college this ratio gets increased.
Graphical representation of strength of all category students during
the 2017-18 years is given in Figure no 13
Figure no 13
0%
10%
20%
30%
40%
50%
60%
70%
80%
90%
100%
Sc ST Vj-A NT-A NT-B NT-C OBC SBC OPEN
108 4
2
1
14 16 111 10
884
127 2
1
0
18 12
128
9
974
100 2
2
1
12 18
78
3
810
65 2
3
0
13 14 62
2 508
Ra
tio
Catagory
Gender Ratio in various social categories (2017-18)
Senior M Senior F Junior M junior F
23
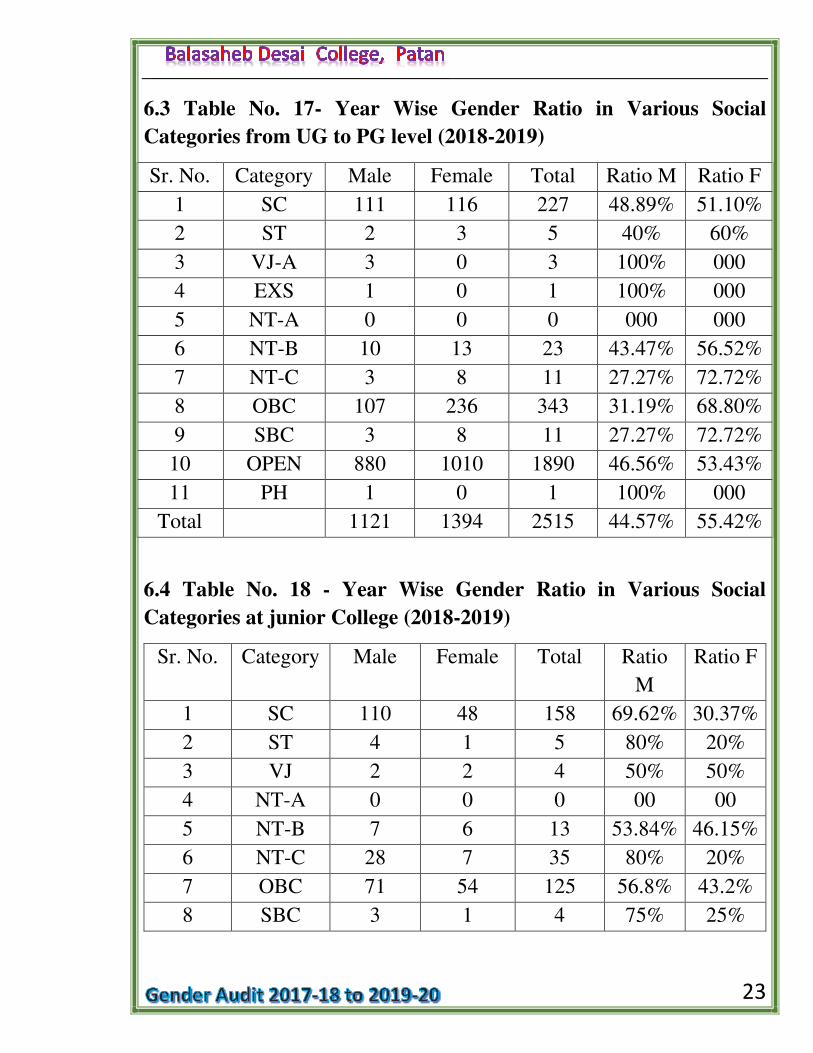
6.3 Table No. 17- Year Wise Gender Ratio in Various Social
Categories from UG to PG level (2018-2019)
Sr. No. Category Male Female Total Ratio M Ratio F
1 SC 111 116 227 48.89% 51.10%
2 ST 2 3 5 40% 60%
3 VJ-A 3 0 3 100% 000
4 EXS 1 0 1 100% 000
5 NT-A 0 0 0 000 000
6 NT-B 10 13 23 43.47% 56.52%
7 NT-C 3 8 11 27.27% 72.72%
8 OBC 107 236 343 31.19% 68.80%
9 SBC 3 8 11 27.27% 72.72%
10 OPEN 880 1010 1890 46.56% 53.43%
11 PH 1 0 1 100% 000
Total 1121 1394 2515 44.57% 55.42%
6.4 Table No. 18 - Year Wise Gender Ratio in Various Social
Categories at junior College (2018-2019)
Sr. No. Category Male Female Total Ratio
M
Ratio F
1 SC 110 48 158 69.62% 30.37%
2 ST 4 1 5 80% 20%
3 VJ 2 2 4 50% 50%
4 NT-A 0 0 0 00 00
5 NT-B 7 6 13 53.84% 46.15%
6 NT-C 28 7 35 80% 20%
7 OBC 71 54 125 56.8% 43.2%
8 SBC 3 1 4 75% 25%
24
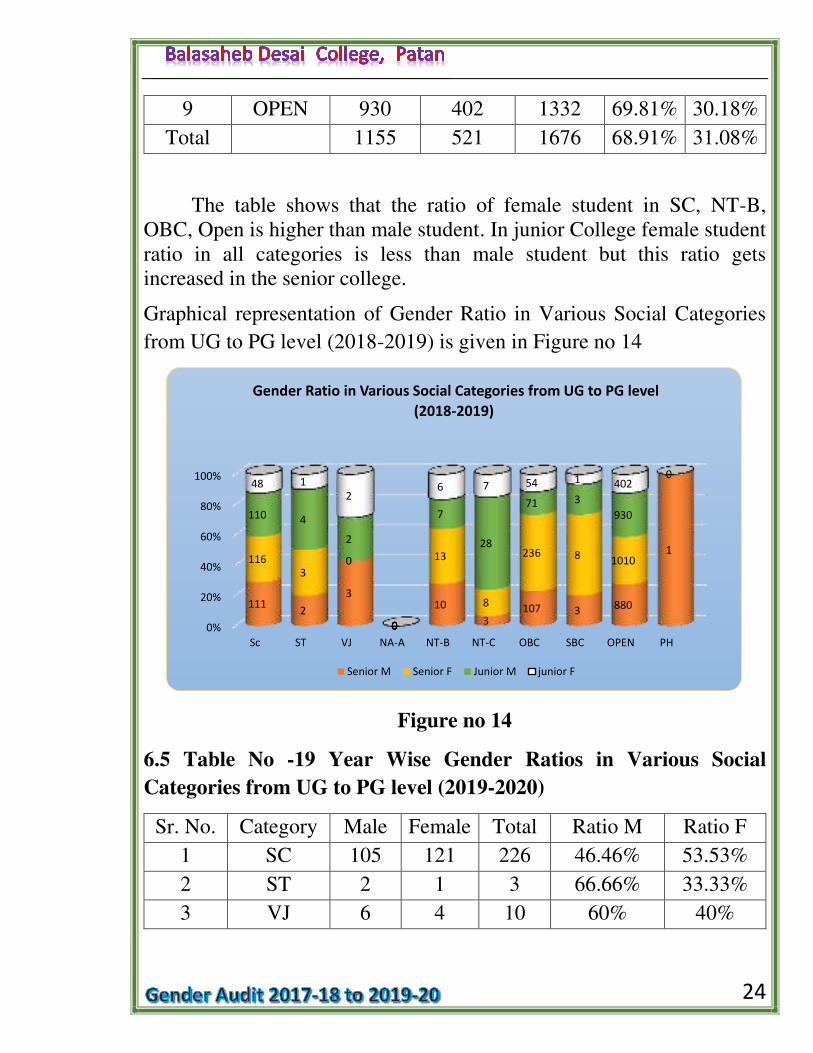
9 OPEN 930 402 1332 69.81% 30.18%
Total 1155 521 1676 68.91% 31.08%
The table shows that the ratio of female student in SC, NT-B,
OBC, Open is higher than male student. In junior College female student
ratio in all categories is less than male student but this ratio gets
increased in the senior college.
Graphical representation of Gender Ratio in Various Social Categories
from UG to PG level (2018-2019) is given in Figure no 14
Figure no 14
6.5 Table No -19 Year Wise Gender Ratios in Various Social
Categories from UG to PG level (2019-2020)
Sr. No. Category Male Female Total Ratio M Ratio F
1 SC 105 121 226 46.46% 53.53%
2 ST 2 1 3 66.66% 33.33%
3 VJ 6 4 10 60% 40%
0%
20%
40%
60%
80%
100%
Sc ST VJ NA-A NT-B NT-C OBC SBC OPEN PH
111 2
3
0
10
3 107 3
880
1 116
3 0
0
13
8
236 8 1010
0
110 4
2
0
7
28
71 3
930
48 1
2
0
6 7 54 1 402
Gender Ratio in Various Social Categories from UG to PG level
(2018-2019)
Senior M Senior F Junior M junior F
25
4 NT-A 24 22 46 52.17% 47.82%
5 NT-B 16 28 44 36.36% 63.63%
6 NT-C 27 19 46 58.69% 41.30%
7 OBC 133 123 256 51.95% 48.04%
8 SBC 3 7 10 30% 70%
9 OPEN 917 1007 1924 47.66% 52.33%
10 SEBC 2 1 3 66.66% 33.33%
Total 1235 1334 2569 48.07% 51.92%
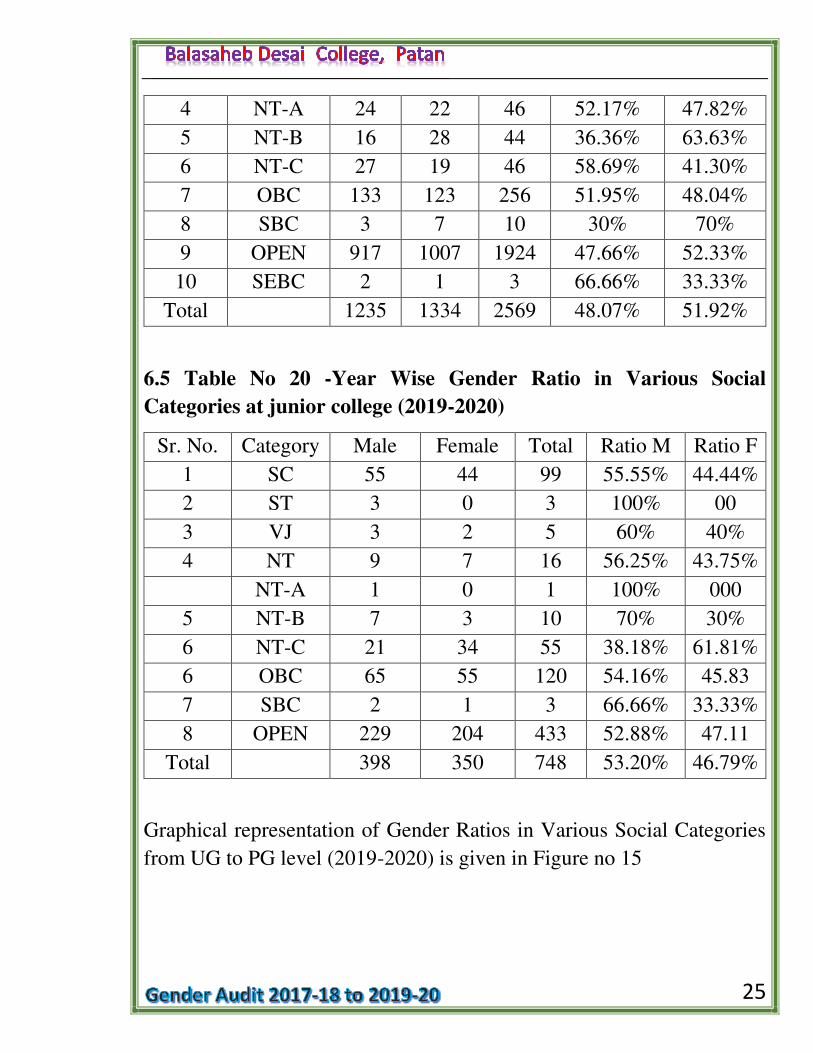
6.5 Table No 20 -Year Wise Gender Ratio in Various Social
Categories at junior college (2019-2020)
Sr. No. Category Male Female Total Ratio M Ratio F
1 SC 55 44 99 55.55% 44.44%
2 ST 3 0 3 100% 00
3 VJ 3 2 5 60% 40%
4 NT 9 7 16 56.25% 43.75%
NT-A 1 0 1 100% 000
5 NT-B 7 3 10 70% 30%
6 NT-C 21 34 55 38.18% 61.81%
6 OBC 65 55 120 54.16% 45.83
7 SBC 2 1 3 66.66% 33.33%
8 OPEN 229 204 433 52.88% 47.11
Total 398 350 748 53.20% 46.79%
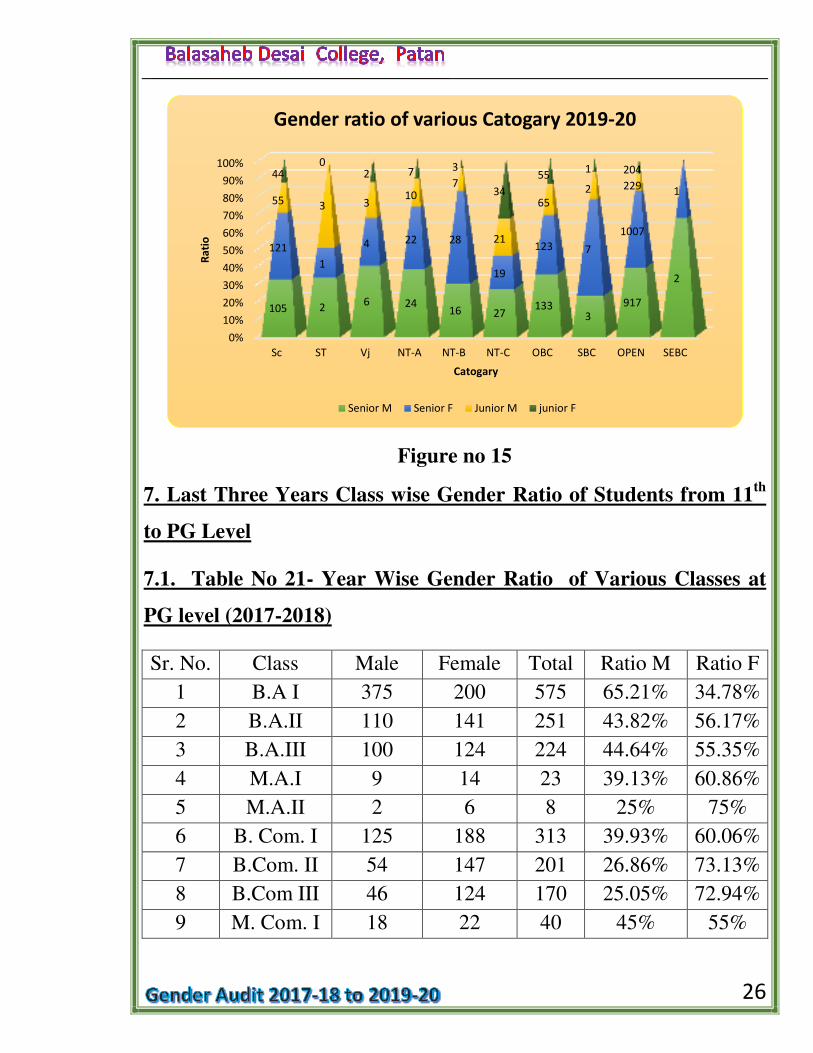
Graphical representation of Gender Ratios in Various Social Categories
from UG to PG level (2019-2020) is given in Figure no 15
26
Figure no 15
7. Last Three Years Class wise Gender Ratio of Students from 11th
to PG Level
7.1. Table No 21- Year Wise Gender Ratio of Various Classes at
PG level (2017-2018)
Sr. No. Class Male Female Total Ratio M Ratio F
1 B.A I 375 200 575 65.21% 34.78%
2 B.A.II 110 141 251 43.82% 56.17%
3 B.A.III 100 124 224 44.64% 55.35%
4 M.A.I 9 14 23 39.13% 60.86%
5 M.A.II 2 6 8 25% 75%
6 B. Com. I 125 188 313 39.93% 60.06%
7 B.Com. II 54 147 201 26.86% 73.13%
8 B.Com III 46 124 170 25.05% 72.94%
9 M. Com. I 18 22 40 45% 55%
0%
10%
20%
30%
40%
50%
60%
70%
80%
90%
100%
Sc ST Vj NT-A NT-B NT-C OBC SBC OPEN SEBC
105 2 6 24
16 27 133
3
917
2
121
1
4 22 28
19
123 7
1007
1 55 3 3
10 7
21
65
2 229 44
0 2 7 3
34
55 1 204
Ra
tio
Catogary
Gender ratio of various Catogary 2019-20
Senior M Senior F Junior M junior F
27
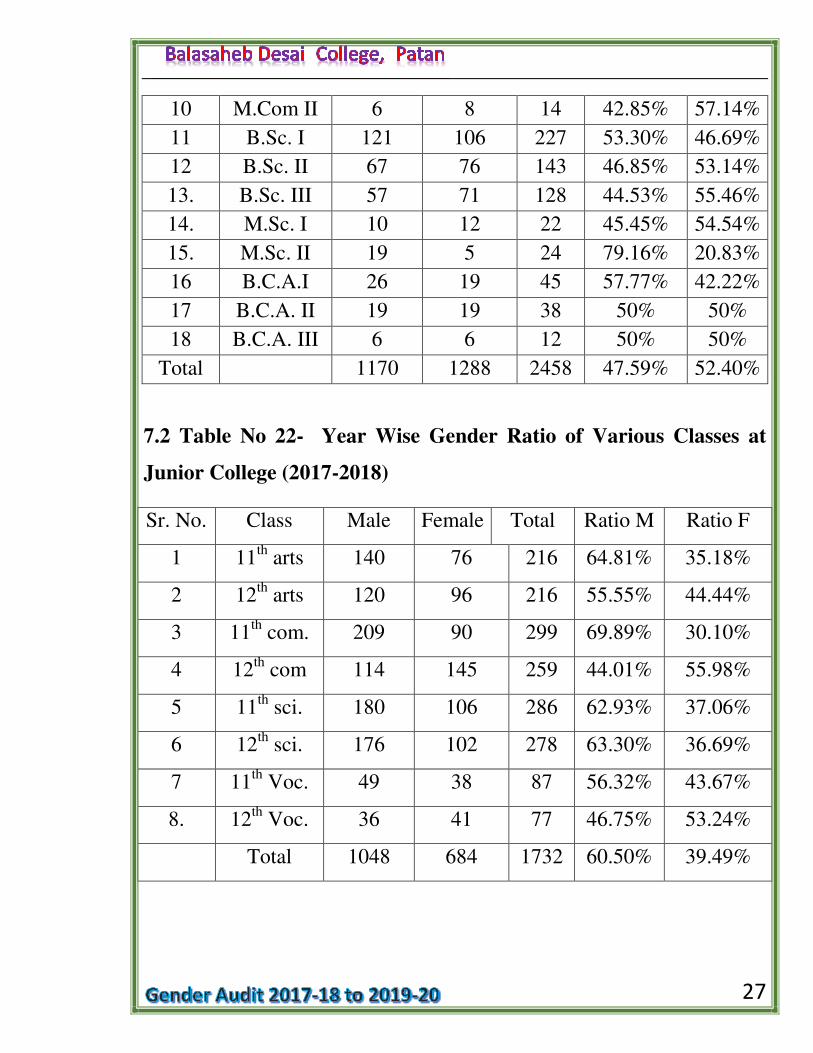
10 M.Com II 6 8 14 42.85% 57.14%
11 B.Sc. I 121 106 227 53.30% 46.69%
12 B.Sc. II 67 76 143 46.85% 53.14%
13. B.Sc. III 57 71 128 44.53% 55.46%
14. M.Sc. I 10 12 22 45.45% 54.54%
15. M.Sc. II 19 5 24 79.16% 20.83%
16 B.C.A.I 26 19 45 57.77% 42.22%
17 B.C.A. II 19 19 38 50% 50%
18 B.C.A. III 6 6 12 50% 50%
Total 1170 1288 2458 47.59% 52.40%
7.2 Table No 22- Year Wise Gender Ratio of Various Classes at
Junior College (2017-2018)
Sr. No. Class Male Female Total Ratio M Ratio F
1 11th
arts 140 76 216 64.81% 35.18%
2 12th
arts 120 96 216 55.55% 44.44%
3 11th
com. 209 90 299 69.89% 30.10%
4 12th
com 114 145 259 44.01% 55.98%
5 11th
sci. 180 106 286 62.93% 37.06%
6 12th
sci. 176 102 278 63.30% 36.69%
7 11th
Voc. 49 38 87 56.32% 43.67%
8. 12th
Voc. 36 41 77 46.75% 53.24%
Total 1048 684 1732 60.50% 39.49%
28
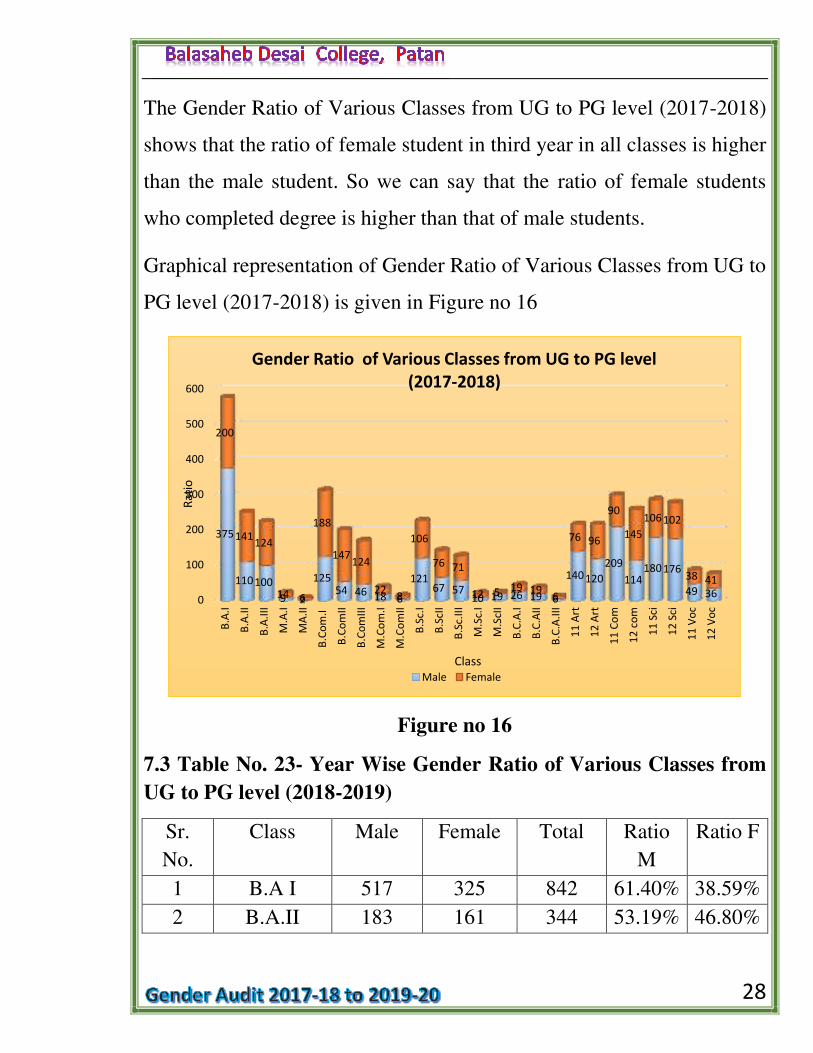
The Gender Ratio of Various Classes from UG to PG level (2017-2018)
shows that the ratio of female student in third year in all classes is higher
than the male student. So we can say that the ratio of female students
who completed degree is higher than that of male students.
Graphical representation of Gender Ratio of Various Classes from UG to
PG level (2017-2018) is given in Figure no 16
Figure no 16
7.3 Table No. 23- Year Wise Gender Ratio of Various Classes from
UG to PG level (2018-2019)
Sr.
No.
Class Male Female Total Ratio
M
Ratio F
1 B.A I 517 325 842 61.40% 38.59%
2 B.A.II 183 161 344 53.19% 46.80%
0
100
200
300
400
500
600
B.A
.I
B.A
.II
B.A
.III
M.A
.I
MA
.II
B.C
om
.I
B.C
om
II
B.C
om
III
M.C
om
.I
M.C
om
II
B.S
c.I
B.S
cII
B.S
c.II
I
M.S
c.I
M.S
cII
B.C
.A.I
B.C
.AII
B.C
.A.I
II
11
Art
12
Art
11
Co
m
12
co
m
11
Sci
12
Sci
11
Vo
c
12
Vo
c
375
110 100
9 2
125 54 46 18 6
121 67 57
10 19 26 19 6
140 120
209
114 180 176
49 36
200
141 124
14 6
188
147 124
22 8
106
76 71
12 5 19 19 6
76 96
90
145
106 102
38 41
Ra
tio
Class
Gender Ratio of Various Classes from UG to PG level
(2017-2018)
Male Female
29
3 B.A.III 79 110 189 41.79% 58.20%
4 M.A.I 18 21 39 46.15% 53.84%
5 M.A.II 7 11 18 38.88% 61.11%
6 B. Com. I 111 193 304 36.51% 63.48%
7 B.Com. II 78 165 243 32.09% 67.90%
8 B.Com III 36 132 168 21.42% 78.57%
9 M. Com. I 6 15 21 28.57% 71.42%
10 M.Com II 1 14 15 6.66% 93.33%
11 B.Sc. I 135 87 195 69.23% 54.37%
12 B.Sc. II 71 89 160 44.37% 55.62%
13. B.Sc. III 53 59 112 47.32% 52.67%
14. M.Sc. I 6 16 22 27.27% 72.72%
15. M.Sc. II 10 13 23 43.47% 56.52%
16 B.C.A.I 23 18 41 56.09% 43.90%
17 B.C.A. II 16 18 34 47.05% 52.94%
18 B.C.A. III 11 18 29 37.93% 62.06%
Total 1343 1465 2808 47.82% 52.17%
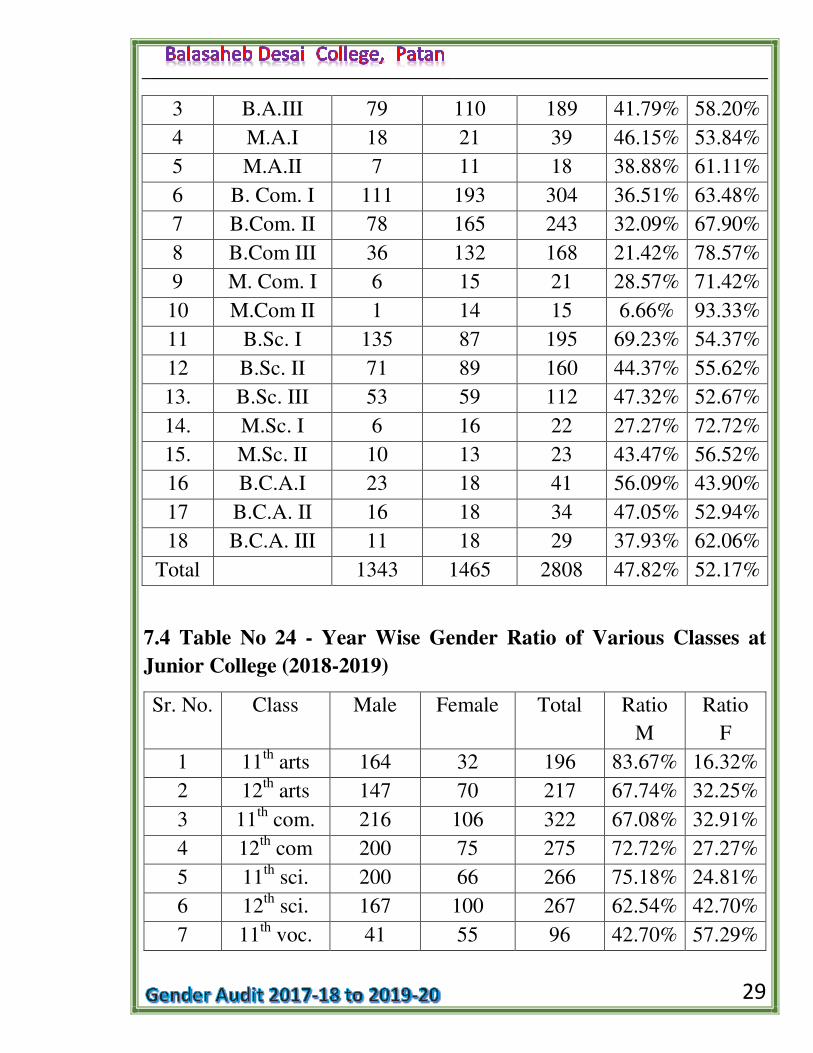
7.4 Table No 24 - Year Wise Gender Ratio of Various Classes at
Junior College (2018-2019)
Sr. No. Class Male Female Total Ratio
M
Ratio
F
1 11th
arts 164 32 196 83.67% 16.32%
2 12th
arts 147 70 217 67.74% 32.25%
3 11th
com. 216 106 322 67.08% 32.91%
4 12th
com 200 75 275 72.72% 27.27%
5 11th
sci. 200 66 266 75.18% 24.81%
6 12th
sci. 167 100 267 62.54% 42.70%
7 11th
voc. 41 55 96 42.70% 57.29%
30
8 12th
voc. 45 33 78 57.69% 42.30%
Total 1180 537 1717 68.72% 31.27%
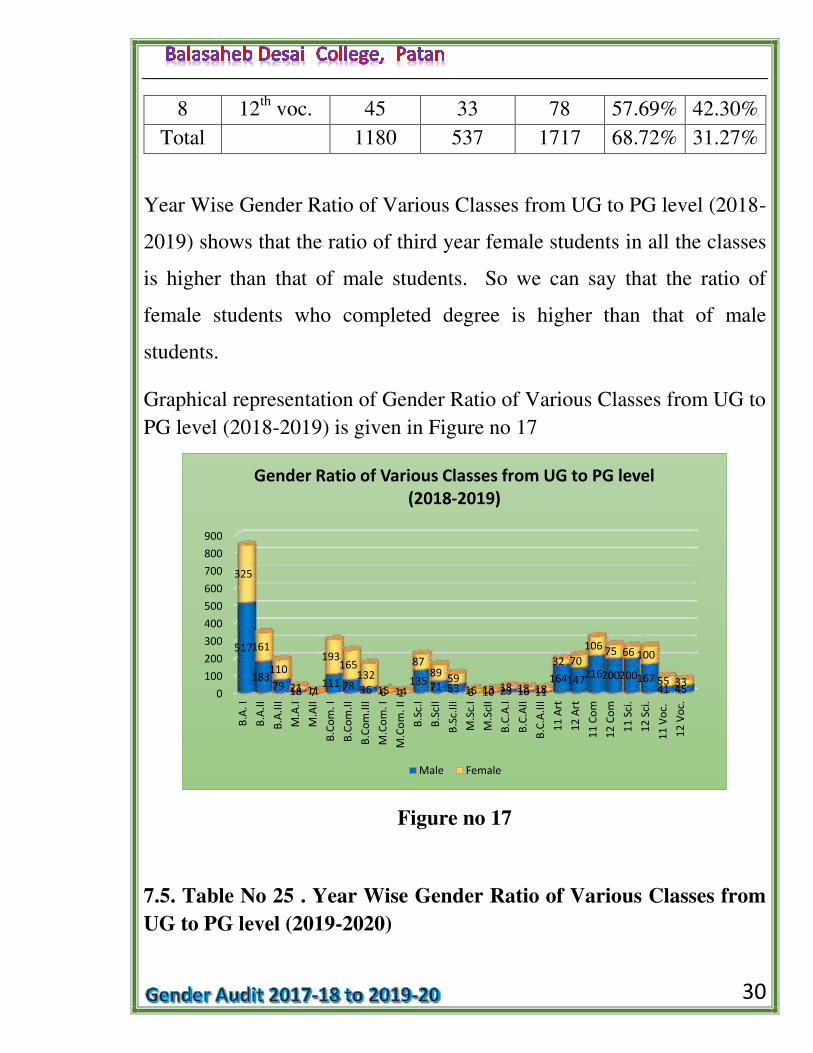
Year Wise Gender Ratio of Various Classes from UG to PG level (2018-
2019) shows that the ratio of third year female students in all the classes
is higher than that of male students. So we can say that the ratio of
female students who completed degree is higher than that of male
students.
Graphical representation of Gender Ratio of Various Classes from UG to
PG level (2018-2019) is given in Figure no 17
Figure no 17
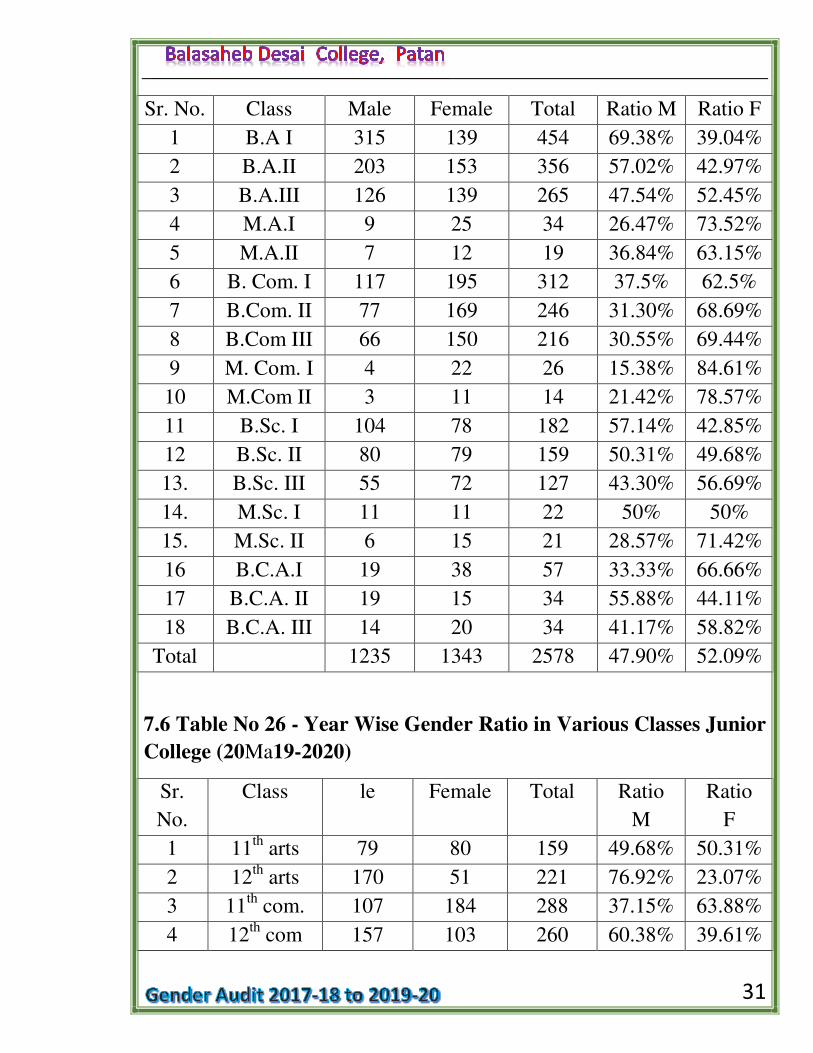
7.5. Table No 25 . Year Wise Gender Ratio of Various Classes from
UG to PG level (2019-2020)
0
100
200
300
400
500
600
700
800
900
B.A
. I
B.A
.II
B.A
.III
M.A
.I
M.A
II
B.C
om
. I
B.C
om
.II
B.C
om
.III
M.C
om
. I
M.C
om
. II
B.S
c.I
B.S
cII
B.S
c.II
I
M.S
c.I
M.S
cII
B.C
.A.I
B.C
.AII
B.C
.A.I
II
11
Art
12
Art
11
Co
m
12
Co
m
11
Sci
.
12
Sci
.
11
Vo
c.
12
Vo
c.
517
183 79 18 7
111 78 36 6 1 135
71 53 6 10 23 16 11
164 147 216 200 200 167
41 45
325
161
110
21 11
193 165
132
15 14
87 89
59 16 13 18 18 18
32 70
106 75 66 100
55 33
Gender Ratio of Various Classes from UG to PG level
(2018-2019)
Male Female
31
Sr. No. Class Male Female Total Ratio M Ratio F
1 B.A I 315 139 454 69.38% 39.04%
2 B.A.II 203 153 356 57.02% 42.97%
3 B.A.III 126 139 265 47.54% 52.45%
4 M.A.I 9 25 34 26.47% 73.52%
5 M.A.II 7 12 19 36.84% 63.15%
6 B. Com. I 117 195 312 37.5% 62.5%
7 B.Com. II 77 169 246 31.30% 68.69%
8 B.Com III 66 150 216 30.55% 69.44%
9 M. Com. I 4 22 26 15.38% 84.61%
10 M.Com II 3 11 14 21.42% 78.57%
11 B.Sc. I 104 78 182 57.14% 42.85%
12 B.Sc. II 80 79 159 50.31% 49.68%
13. B.Sc. III 55 72 127 43.30% 56.69%
14. M.Sc. I 11 11 22 50% 50%
15. M.Sc. II 6 15 21 28.57% 71.42%
16 B.C.A.I 19 38 57 33.33% 66.66%
17 B.C.A. II 19 15 34 55.88% 44.11%
18 B.C.A. III 14 20 34 41.17% 58.82%
Total 1235 1343 2578 47.90% 52.09%
7.6 Table No 26 - Year Wise Gender Ratio in Various Classes Junior
College (20Ma19-2020)
Sr.
No.
Class le Female Total Ratio
M
Ratio
F
1 11th
arts 79 80 159 49.68% 50.31%
2 12th
arts 170 51 221 76.92% 23.07%
3 11th
com. 107 184 288 37.15% 63.88%
4 12th
com 157 103 260 60.38% 39.61%
32
5 11th
sci. 129 94 223 57.84% 42.15%
6 12th
sci. 162 79 241 67.21% 32.78%
7 11th
voc. 42 55 97 43.29% 56.70%
8 12th
voc. 36 33 69 52.17% 47.82%
Total 882 679 1561 56.50% 43.49%
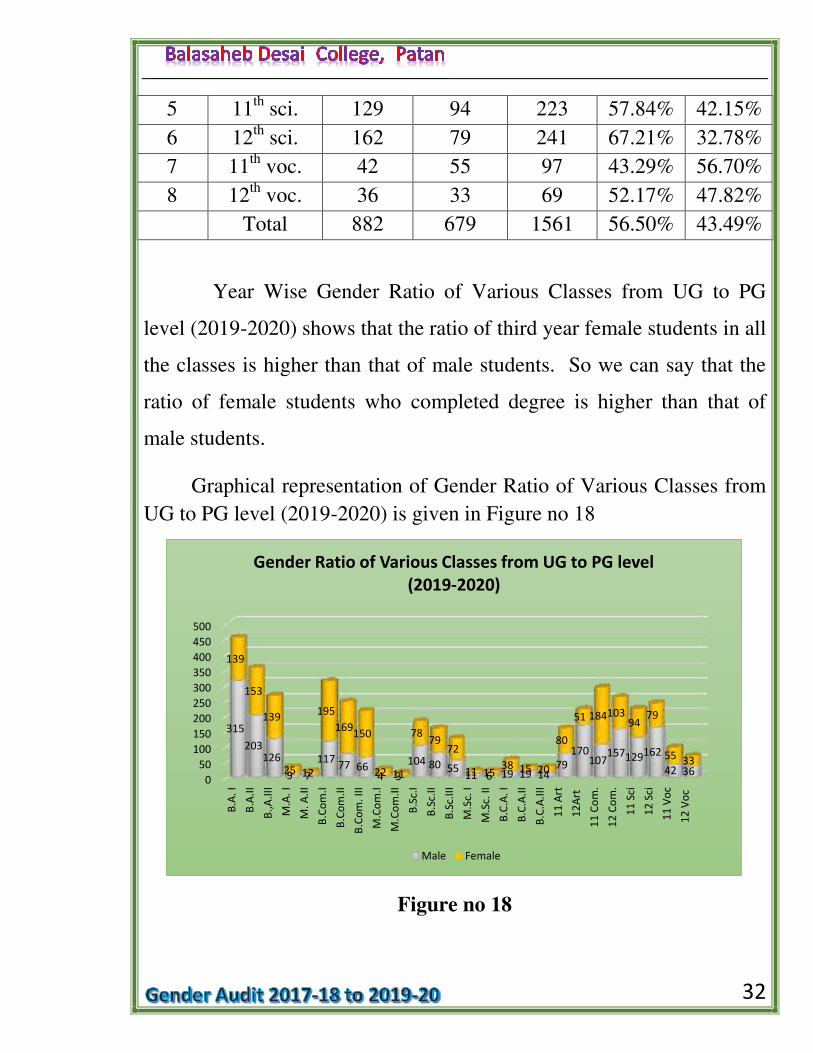
Year Wise Gender Ratio of Various Classes from UG to PG
level (2019-2020) shows that the ratio of third year female students in all
the classes is higher than that of male students. So we can say that the
ratio of female students who completed degree is higher than that of
male students.
Graphical representation of Gender Ratio of Various Classes from
UG to PG level (2019-2020) is given in Figure no 18
Figure no 18
0
50
100
150
200
250
300
350
400
450
500
B.A
. I
B.A
.II
B.,
A.I
II
M.A
. I
M.
A.I
I
B.C
om
.I
B.C
om
.II
B.C
om
. II
I
M.C
om
.I
M.C
om
.II
B.S
c.I
B.S
c.II
B.S
c.II
I
M.S
c. I
M.S
c. I
I
B.C
.A.
I
B.C
.A.I
I
B.C
.A.I
II
11
Art
12
Art
11
Co
m.
12
Co
m.
11
Sci
12
Sci
11
Vo
c
12
Vo
c
315
203 126
9 7
117 77 66
4 3
104 80 55 11 6 19 19 14
79
170 107
157 129 162
42 36
139
153
139
25 12
195
169 150
22 11
78 79
72
11 15 38 15 20
80
51 184 103 94
79
55 33
Gender Ratio of Various Classes from UG to PG level
(2019-2020)
Male Female
33
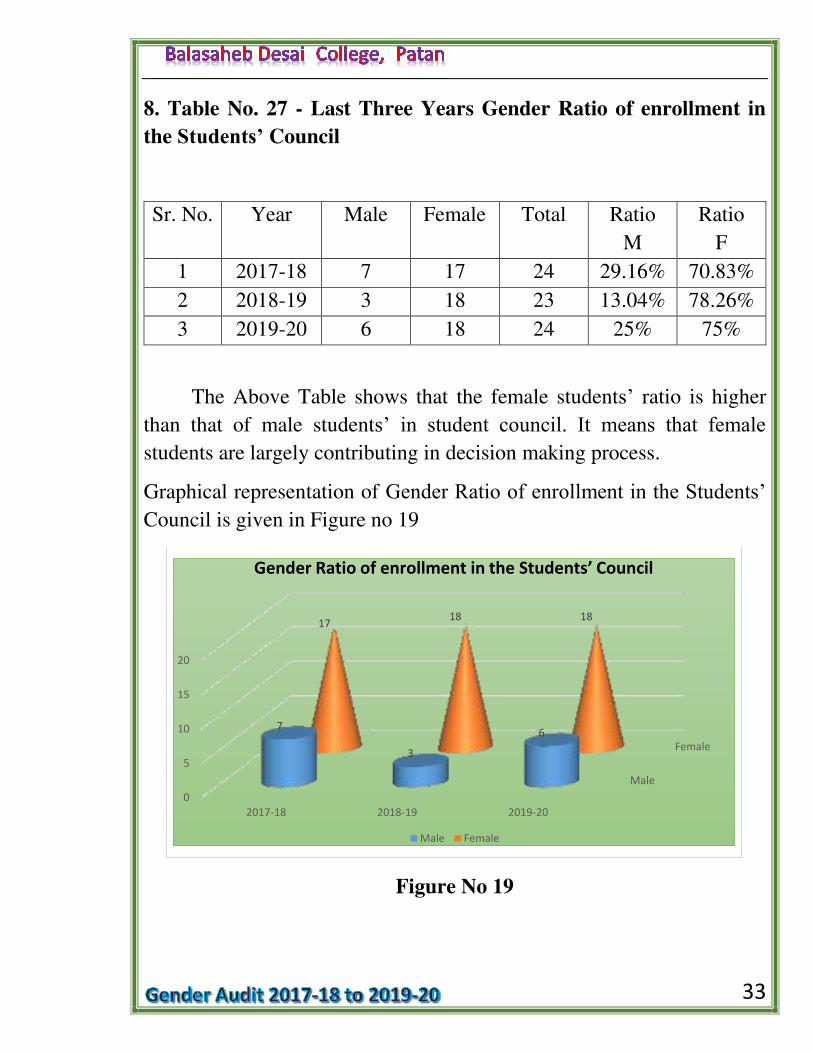
8. Table No. 27 - Last Three Years Gender Ratio of enrollment in
the Students’ Council
Sr. No. Year Male Female Total Ratio
M
Ratio
F
1 2017-18 7 17 24 29.16% 70.83%
2 2018-19 3 18 23 13.04% 78.26%
3 2019-20 6 18 24 25% 75%
The Above Table shows that the female students’ ratio is higher
than that of male students’ in student council. It means that female students are largely contributing in decision making process.
Graphical representation of Gender Ratio of enrollment in the Students’ Council is given in Figure no 19
Figure No 19
Male
Female
0
5
10
15
20
2017-18 2018-19 2019-20
7
3
6
17 18 18
Gender Ratio of enrollment in the Students’ Council
Male Female
34
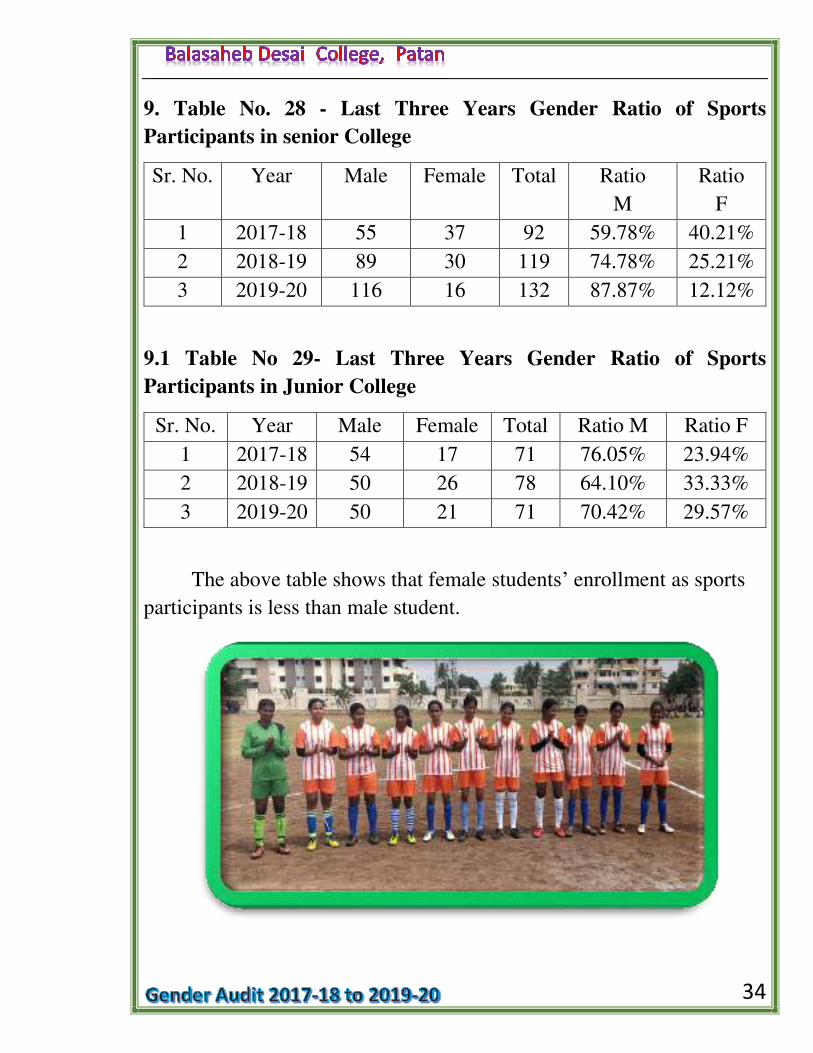
9. Table No. 28 - Last Three Years Gender Ratio of Sports
Participants in senior College
Sr. No. Year Male Female Total Ratio
M
Ratio
F
1 2017-18 55 37 92 59.78% 40.21%
2 2018-19 89 30 119 74.78% 25.21%
3 2019-20 116 16 132 87.87% 12.12%
9.1 Table No 29- Last Three Years Gender Ratio of Sports
Participants in Junior College
Sr. No. Year Male Female Total Ratio M Ratio F
1 2017-18 54 17 71 76.05% 23.94%
2 2018-19 50 26 78 64.10% 33.33%
3 2019-20 50 21 71 70.42% 29.57%
The above table shows that female students’ enrollment as sports
participants is less than male student.
35
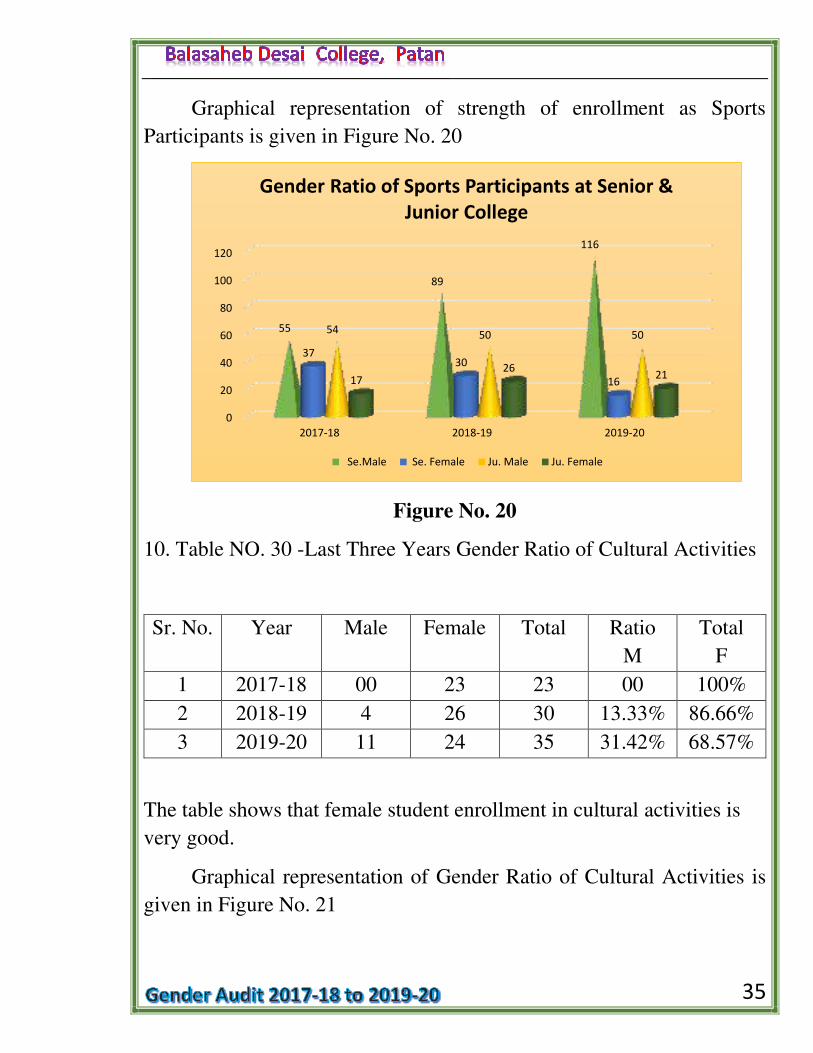
Graphical representation of strength of enrollment as Sports
Participants is given in Figure No. 20
Figure No. 20
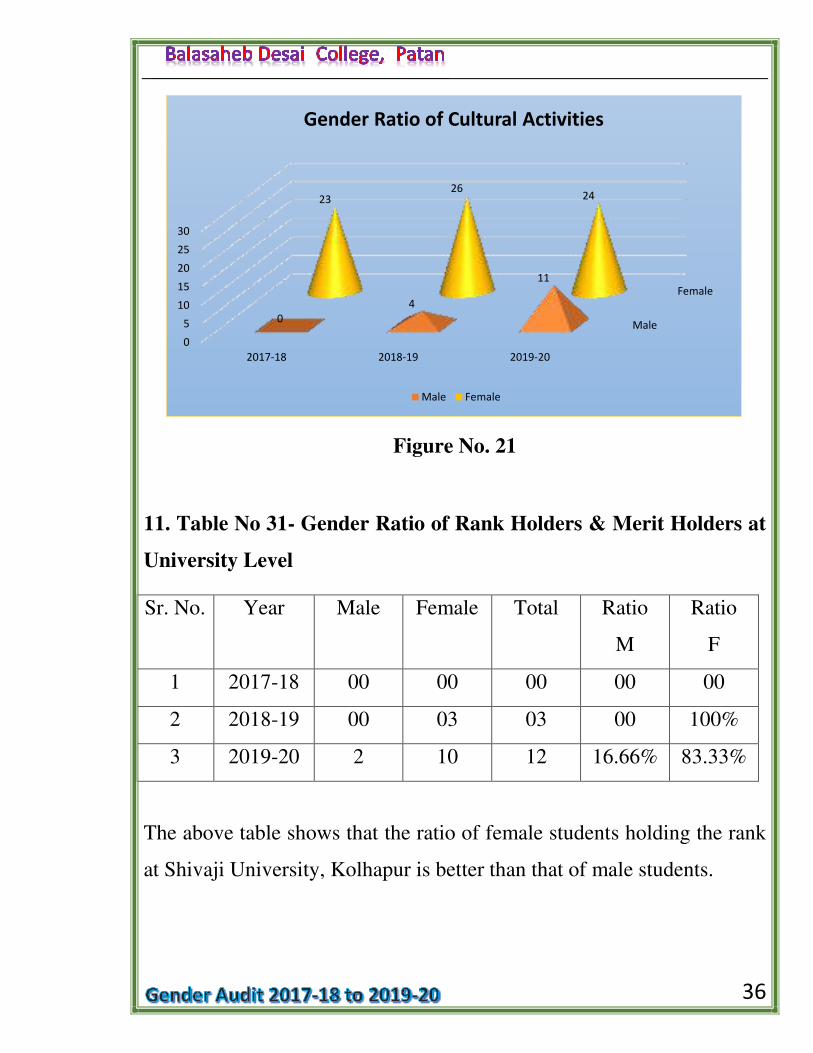
10. Table NO. 30 -Last Three Years Gender Ratio of Cultural Activities
Sr. No. Year Male Female Total Ratio
M
Total
F
1 2017-18 00 23 23 00 100%
2 2018-19 4 26 30 13.33% 86.66%
3 2019-20 11 24 35 31.42% 68.57%
The table shows that female student enrollment in cultural activities is
very good.
Graphical representation of Gender Ratio of Cultural Activities is
given in Figure No. 21
0
20
40
60
80
100
120
2017-18 2018-19 2019-20
55
89
116
37 30
16
54 50 50
17 26
21
Gender Ratio of Sports Participants at Senior &
Junior College
Se.Male Se. Female Ju. Male Ju. Female
36
Figure No. 21
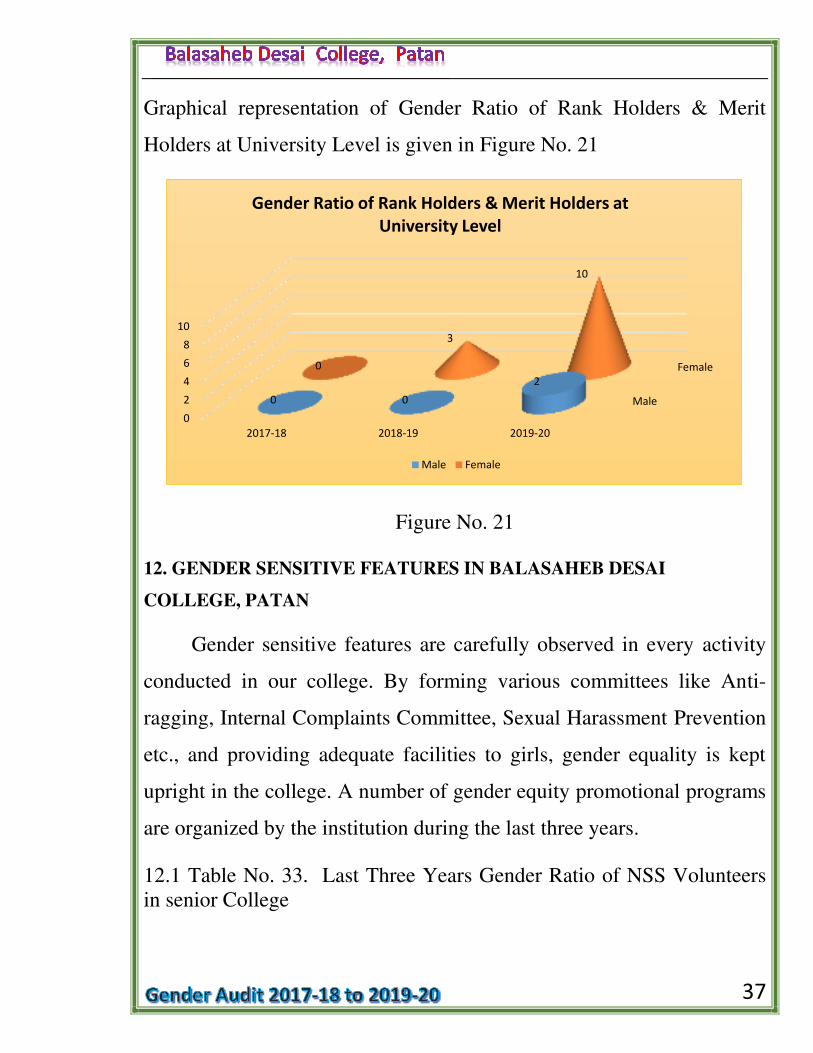
11. Table No 31- Gender Ratio of Rank Holders & Merit Holders at
University Level
Sr. No. Year Male Female Total Ratio
M
Ratio
F
1 2017-18 00 00 00 00 00
2 2018-19 00 03 03 00 100%
3 2019-20 2 10 12 16.66% 83.33%
The above table shows that the ratio of female students holding the rank
at Shivaji University, Kolhapur is better than that of male students.
Male
Female
0
5
10
15
20
25
30
2017-18 2018-19 2019-20
0
4
11
23 26
24
Gender Ratio of Cultural Activities
Male Female
37
Graphical representation of Gender Ratio of Rank Holders & Merit
Holders at University Level is given in Figure No. 21
Figure No. 21
12. GENDER SENSITIVE FEATURES IN BALASAHEB DESAI
COLLEGE, PATAN
Gender sensitive features are carefully observed in every activity
conducted in our college. By forming various committees like Anti-
ragging, Internal Complaints Committee, Sexual Harassment Prevention
etc., and providing adequate facilities to girls, gender equality is kept
upright in the college. A number of gender equity promotional programs
are organized by the institution during the last three years.
12.1 Table No. 33. Last Three Years Gender Ratio of NSS Volunteers
in senior College
Male
Female
0
2
4
6
8
10
2017-18 2018-19 2019-20
0 0
2
0
3
10
Gender Ratio of Rank Holders & Merit Holders at
University Level
Male Female
38
The college has two units of NSS. Admission is given to both boys
and girls with the norms of Shivaji University. A seven-day camp is
conducted. There, both girls and boys, work at the same level. Gender
equality is maintained in the college through this unit.
Sr. No. Year Male Female Ratio M Ratio F Total
1 2017-18 60 140 200 30% 70%
2 2018-19 124 76 200 62% 38%
3 2019-20 42 158 200 21% 79%
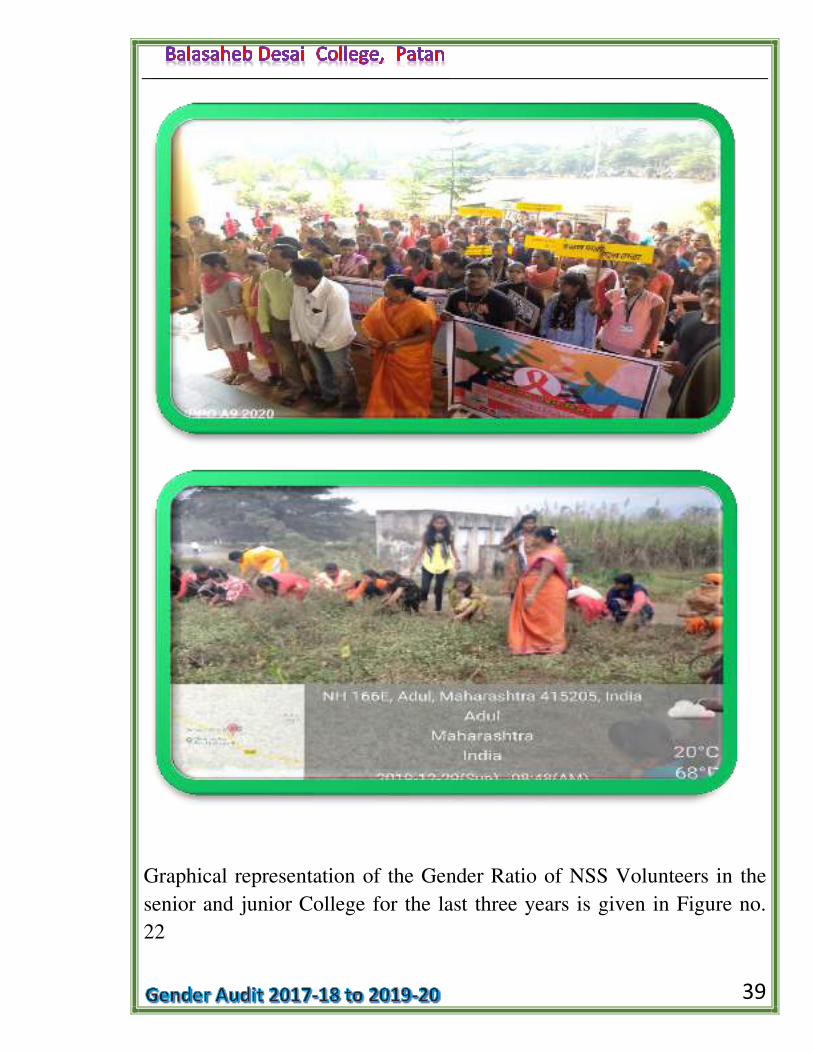
12.2 Table No 34. Last Three Years Gender Ratio of NSS Volunteers
in junior College
Sr. No. Year Male Female Ratio
M
Ratio
F
Total
1 2017-18 23 27 50 46% 54%
2 2018-19 15 35 50 30% 70%
3 2019-20 14 36 50 28% 72%
39
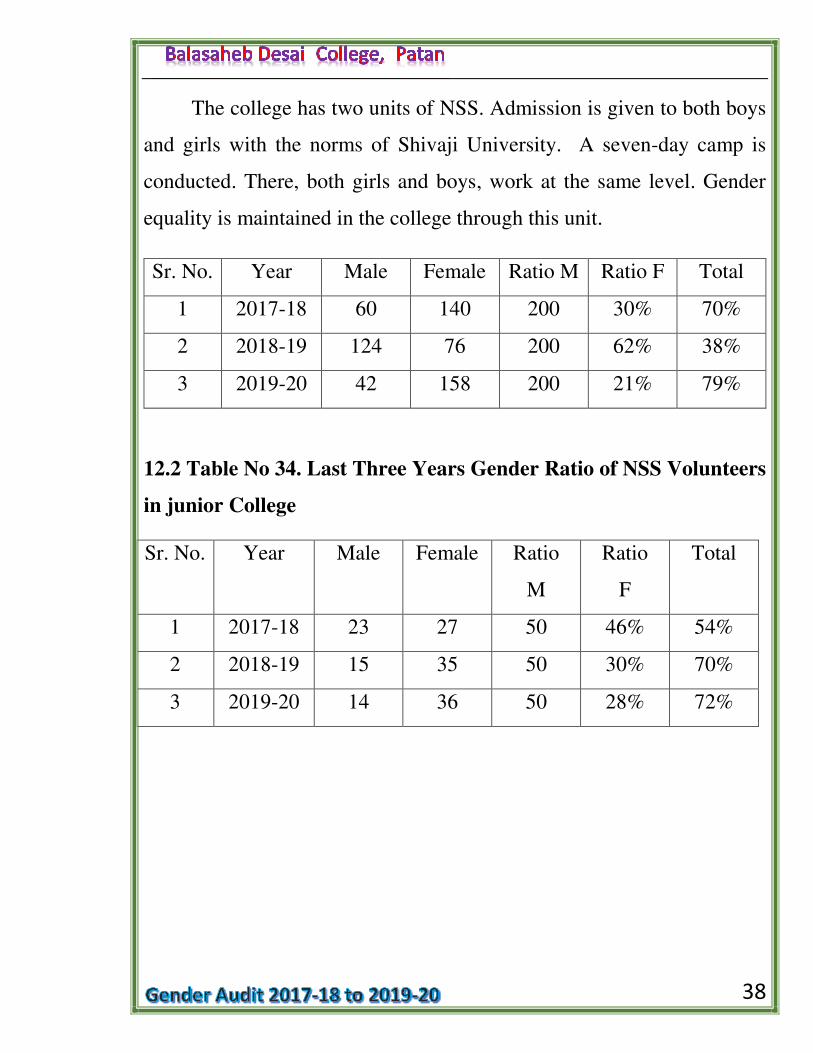
Graphical representation of the Gender Ratio of NSS Volunteers in the
senior and junior College for the last three years is given in Figure no.
22
40
Figure no. 22
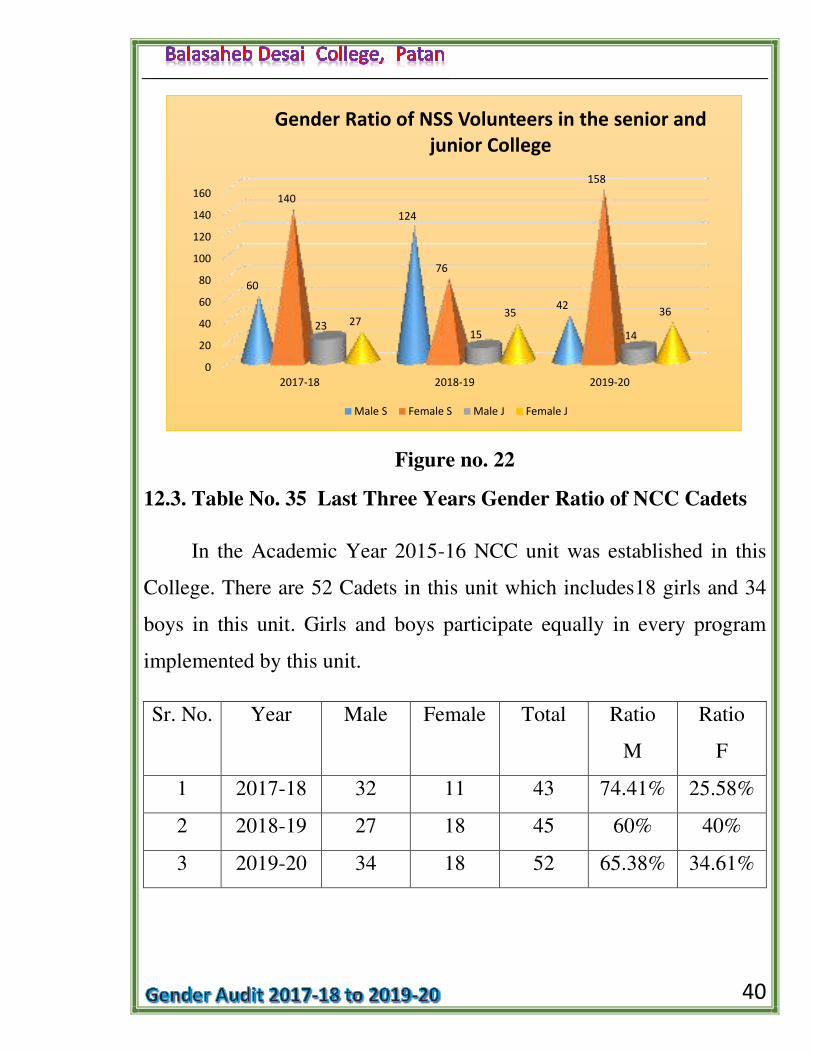
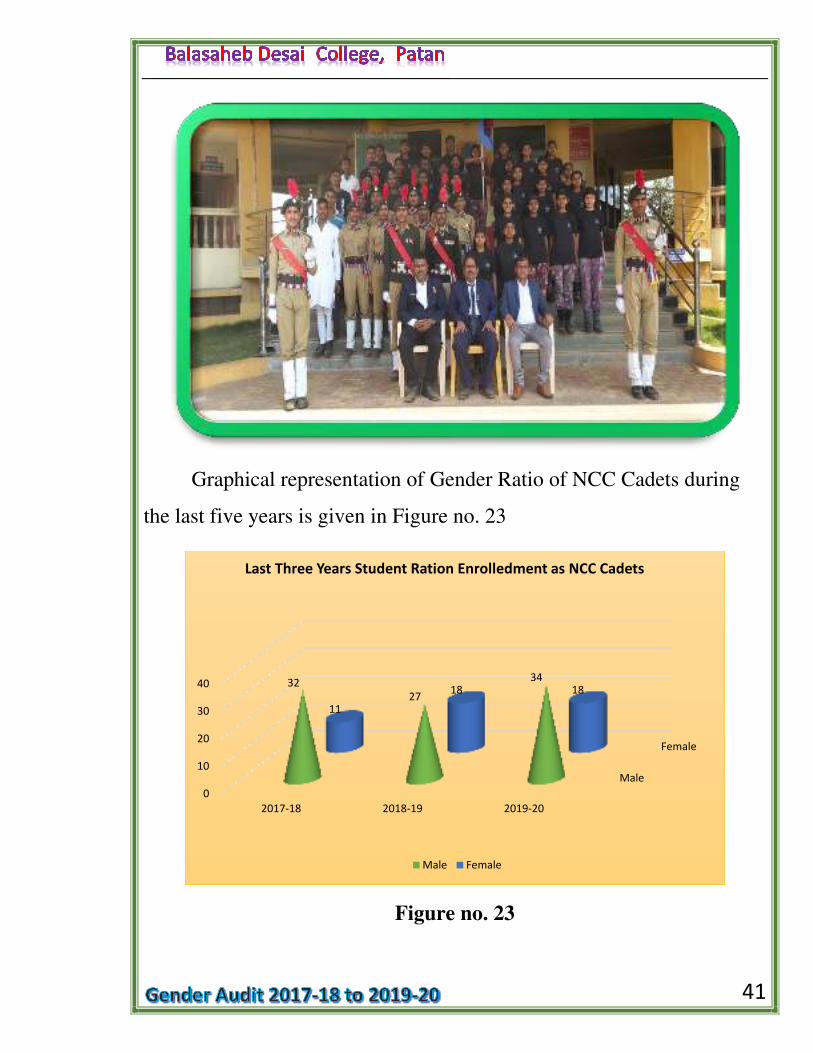
12.3. Table No. 35 Last Three Years Gender Ratio of NCC Cadets
In the Academic Year 2015-16 NCC unit was established in this
College. There are 52 Cadets in this unit which includes18 girls and 34
boys in this unit. Girls and boys participate equally in every program
implemented by this unit.
Sr. No. Year Male Female Total
Ratio
M
Ratio
F
1 2017-18 32 11 43 74.41% 25.58%
2 2018-19 27 18 45 60% 40%
3 2019-20 34 18 52 65.38% 34.61%
0
20
40
60
80
100
120
140
160
2017-18 2018-19 2019-20
60
124
42
140
76
158
23 15 14
27 35 36
Gender Ratio of NSS Volunteers in the senior and
junior College
Male S Female S Male J Female J
41
Graphical representation of Gender Ratio of NCC Cadets during
the last five years is given in Figure no. 23
Figure no. 23
Male
Female
0
10
20
30
40
2017-18 2018-19 2019-20
32
27
34
11
18 18
Last Three Years Student Ration Enrolledment as NCC Cadets
Male Female
42
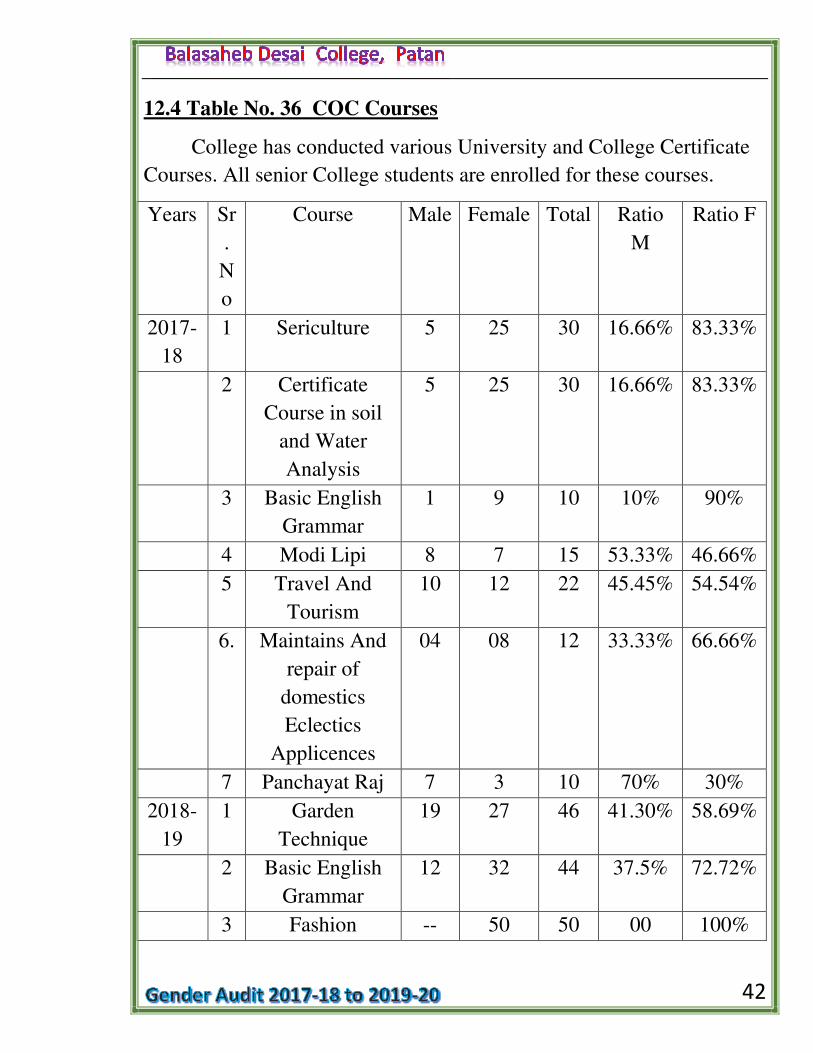
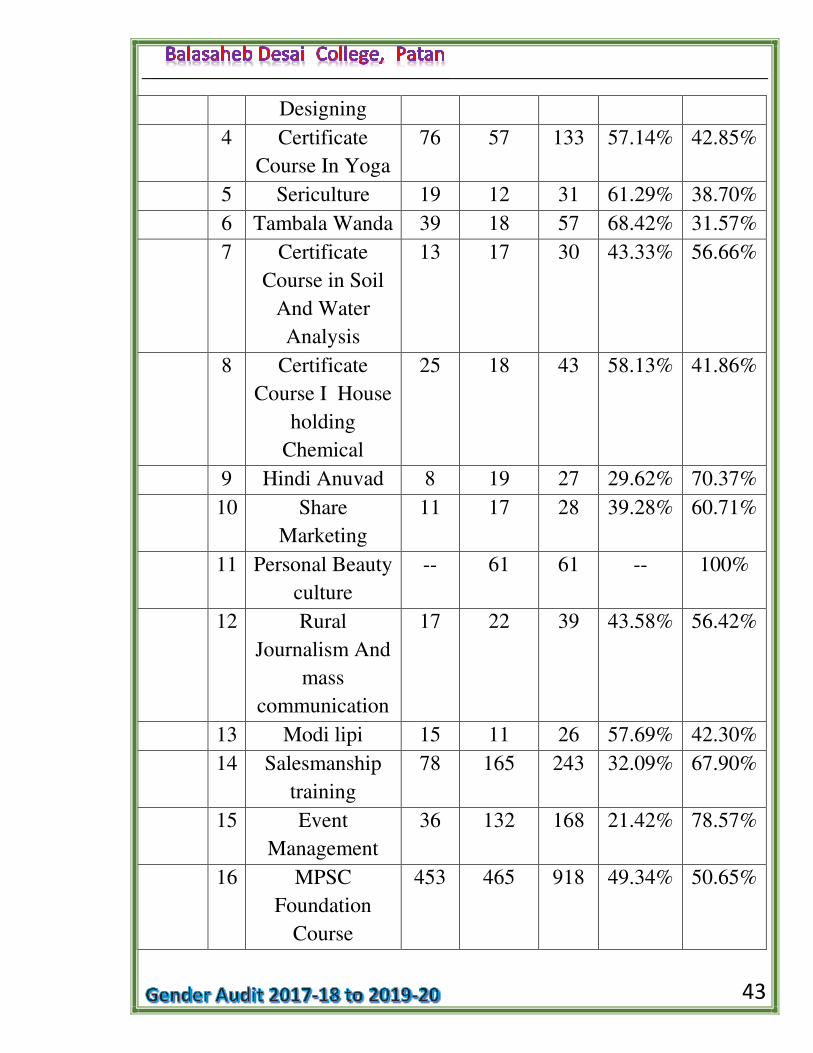
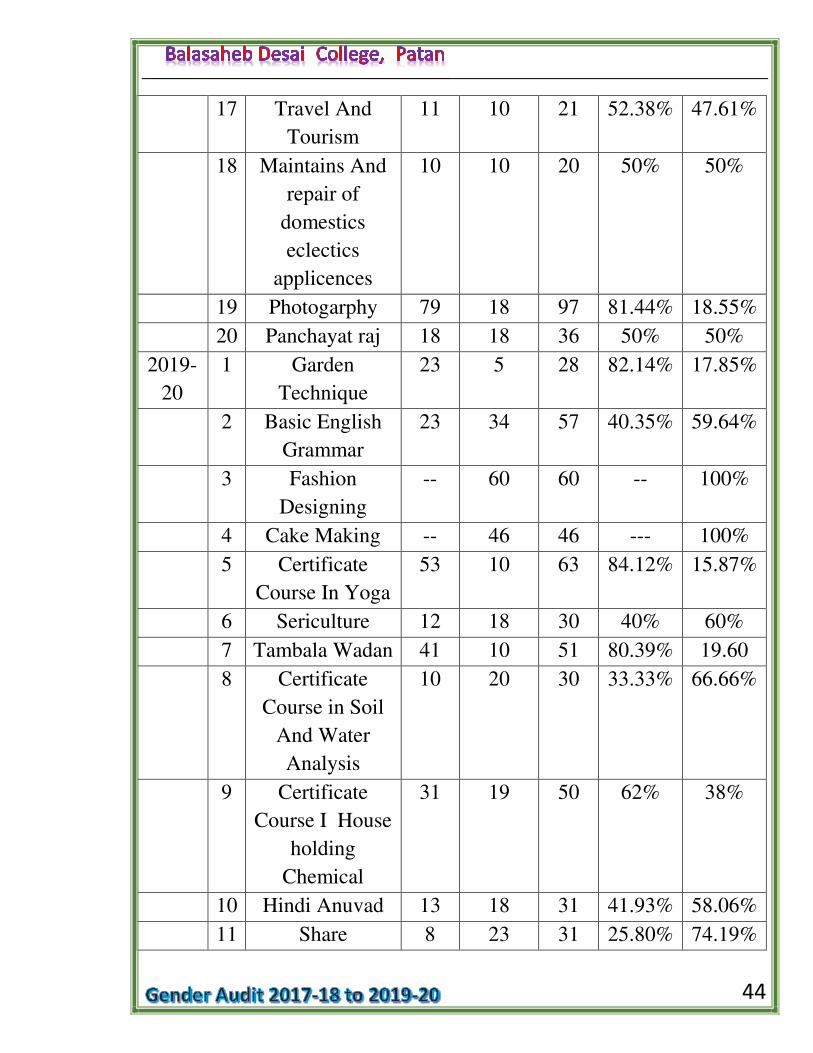
12.4 Table No. 36 COC Courses
College has conducted various University and College Certificate
Courses. All senior College students are enrolled for these courses.
Years Sr
.
N
o
Course Male Female Total Ratio
M
Ratio F
2017-
18
1 Sericulture 5 25 30 16.66% 83.33%
2 Certificate
Course in soil
and Water
Analysis
5 25 30 16.66% 83.33%
3 Basic English
Grammar
1 9 10 10% 90%
4 Modi Lipi 8 7 15 53.33% 46.66%
5 Travel And
Tourism
10 12 22 45.45% 54.54%
6. Maintains And
repair of
domestics
Eclectics
Applicences
04 08 12 33.33% 66.66%
7 Panchayat Raj 7 3 10 70% 30%
2018-
19
1 Garden
Technique
19 27 46 41.30% 58.69%
2 Basic English
Grammar
12 32 44 37.5% 72.72%
3 Fashion -- 50 50 00 100%
43
Designing
4 Certificate
Course In Yoga
76 57 133 57.14% 42.85%
5 Sericulture 19 12 31 61.29% 38.70%
6 Tambala Wanda 39 18 57 68.42% 31.57%
7 Certificate
Course in Soil
And Water
Analysis
13 17 30 43.33% 56.66%
8 Certificate
Course I House
holding
Chemical
25 18 43 58.13% 41.86%
9 Hindi Anuvad 8 19 27 29.62% 70.37%
10 Share
Marketing
11 17 28 39.28% 60.71%
11 Personal Beauty
culture
-- 61 61 -- 100%
12 Rural
Journalism And
mass
communication
17 22 39 43.58% 56.42%
13 Modi lipi 15 11 26 57.69% 42.30%
14 Salesmanship
training
78 165 243 32.09% 67.90%
15 Event
Management
36 132 168 21.42% 78.57%
16 MPSC
Foundation
Course
453 465 918 49.34% 50.65%
44
17 Travel And
Tourism
11 10 21 52.38% 47.61%
18 Maintains And
repair of
domestics
eclectics
applicences
10 10 20 50% 50%
19 Photogarphy 79 18 97 81.44% 18.55%
20 Panchayat raj 18 18 36 50% 50%
2019-
20
1 Garden
Technique
23 5 28 82.14% 17.85%
2 Basic English
Grammar
23 34 57 40.35% 59.64%
3 Fashion
Designing
-- 60 60 -- 100%
4 Cake Making -- 46 46 --- 100%
5 Certificate
Course In Yoga
53 10 63 84.12% 15.87%
6 Sericulture 12 18 30 40% 60%
7 Tambala Wadan 41 10 51 80.39% 19.60
8 Certificate
Course in Soil
And Water
Analysis
10 20 30 33.33% 66.66%
9 Certificate
Course I House
holding
Chemical
31 19 50 62% 38%
10 Hindi Anuvad 13 18 31 41.93% 58.06%
11 Share 8 23 31 25.80% 74.19%
45
Marketing
12 Personal Beauty
culture
-- 59 59 -- 100%
13 Rural
Journalism And
mass
communication
17 21 38 44.73% 55.26%
14 Modilipi 28 18 46 60.86% 39.13%
15 Salesmanship
training
66 147 213 30.98% 69.01%
16 Event
Management
55 128 183 30.5% 69.94%
17 MPSC
Foundation
Course
391 312 703 55.61% 44.38%
18 Travel And
Tourism
25 15 40 62.5% 37.5%
19 Maintains And
repair of
domestics
eclectics
applicences
02 07 09 22.22% 77.77%
20 Photography 61 11 71 84.72% 15.27
21 Panchayat raj 31 29 60 51.66% 48.33%
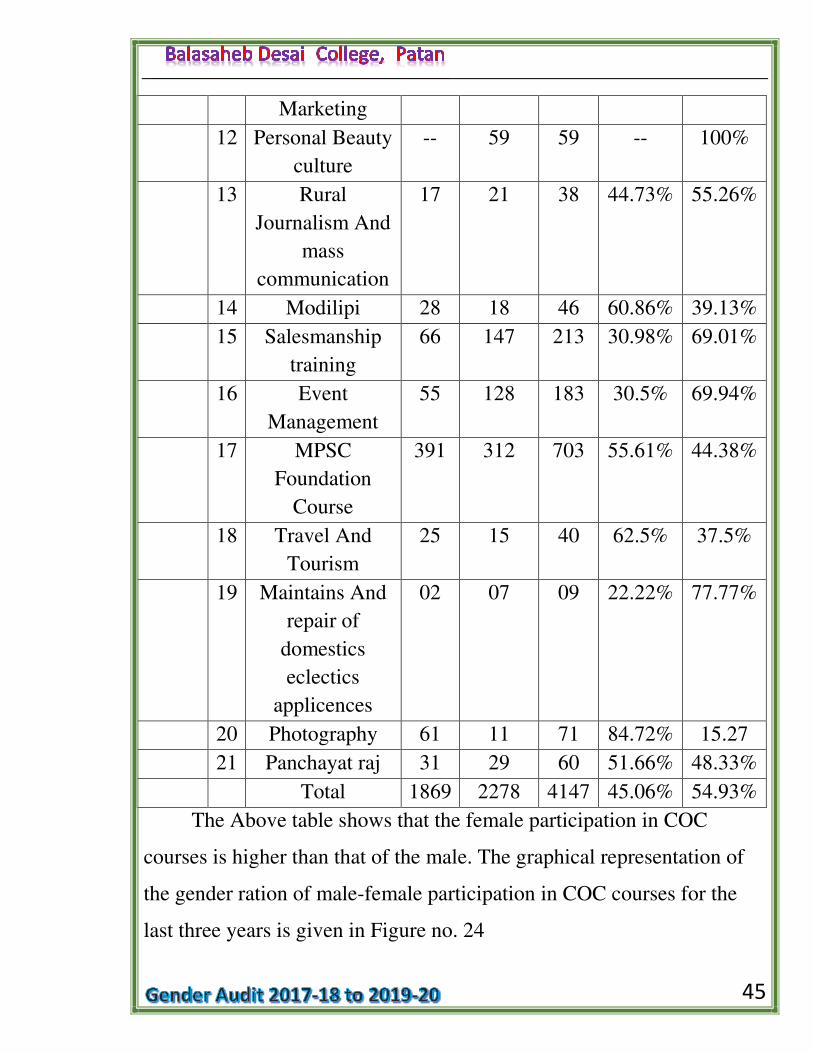
Total 1869 2278 4147 45.06% 54.93%
The Above table shows that the female participation in COC
courses is higher than that of the male. The graphical representation of
the gender ration of male-female participation in COC courses for the
last three years is given in Figure no. 24
46
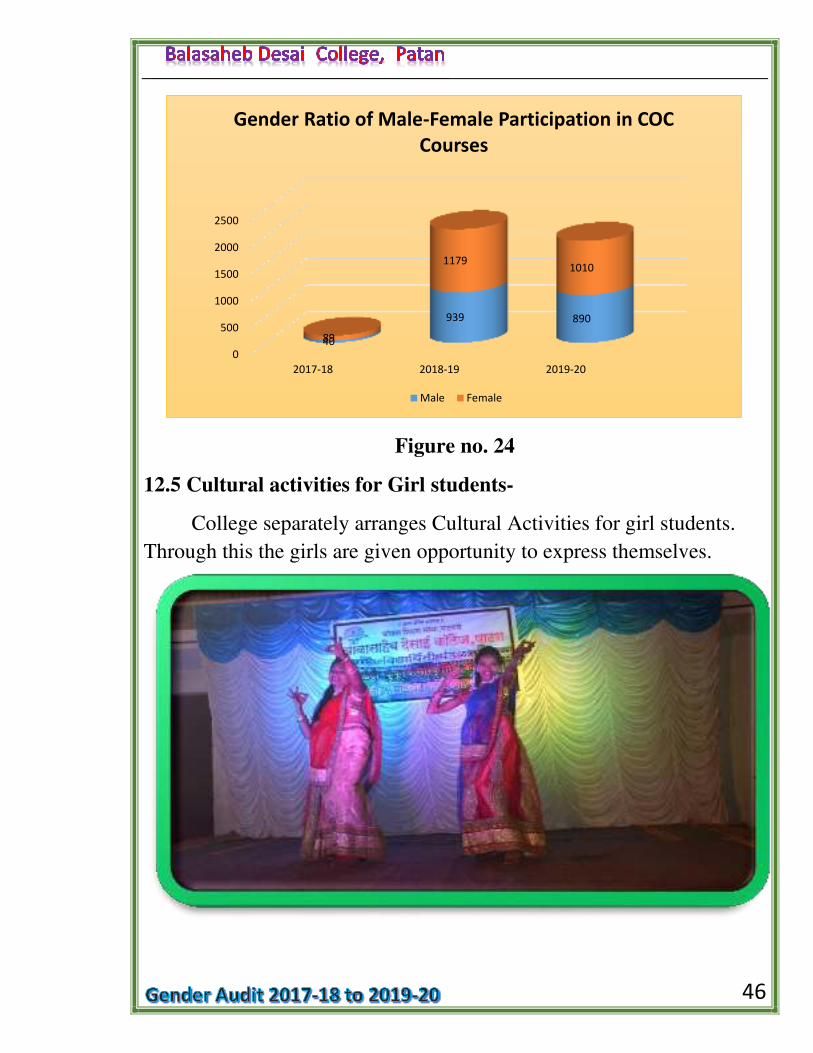
Figure no. 24
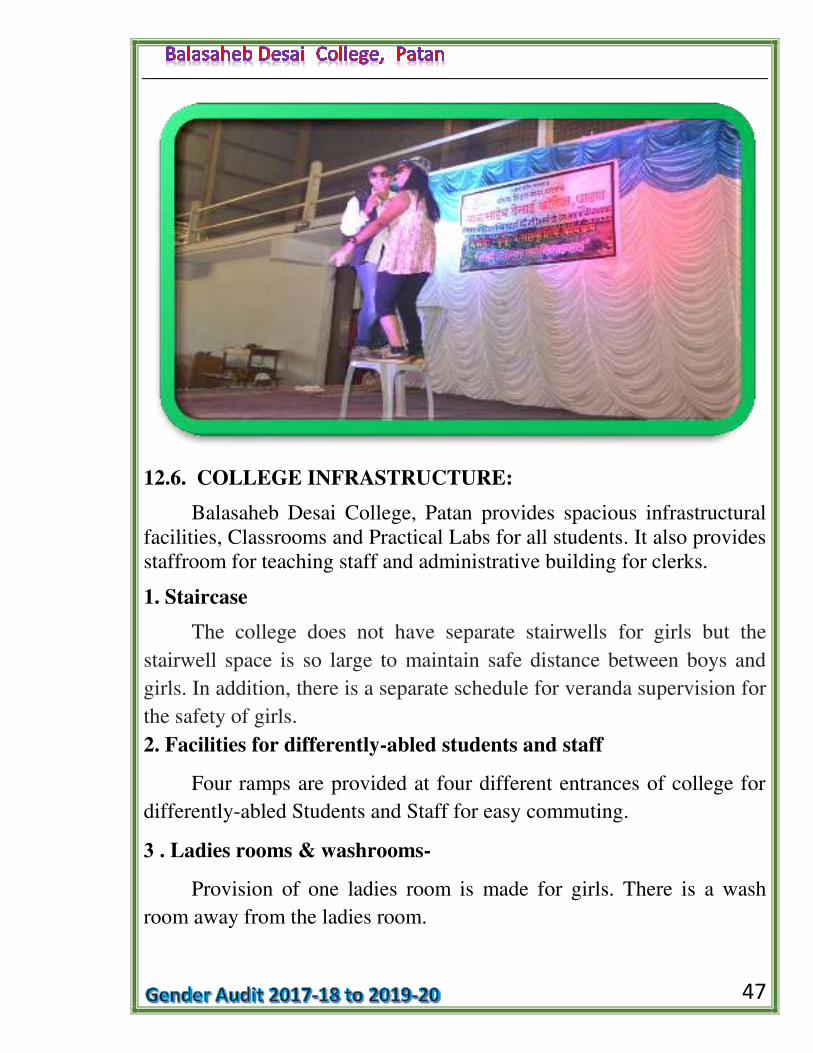
12.5 Cultural activities for Girl students-
College separately arranges Cultural Activities for girl students.
Through this the girls are given opportunity to express themselves.
0
500
1000
1500
2000
2500
2017-18 2018-19 2019-20
40
939 890
89
1179 1010
Gender Ratio of Male-Female Participation in COC
Courses
Male Female
47
12.6. COLLEGE INFRASTRUCTURE:
Balasaheb Desai College, Patan provides spacious infrastructural
facilities, Classrooms and Practical Labs for all students. It also provides
staffroom for teaching staff and administrative building for clerks.
1. Staircase
The college does not have separate stairwells for girls but the
stairwell space is so large to maintain safe distance between boys and
girls. In addition, there is a separate schedule for veranda supervision for
the safety of girls.
2. Facilities for differently-abled students and staff
Four ramps are provided at four different entrances of college for
differently-abled Students and Staff for easy commuting.
3 . Ladies rooms & washrooms-
Provision of one ladies room is made for girls. There is a wash
room away from the ladies room.
48
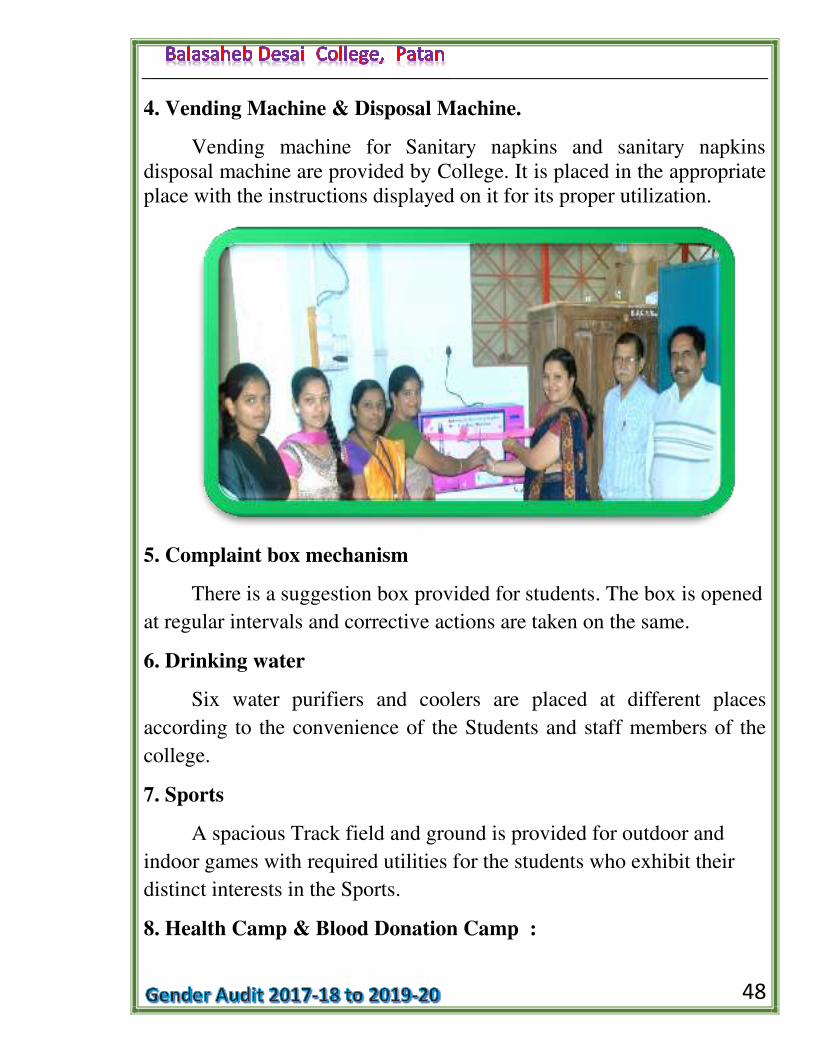
4. Vending Machine & Disposal Machine.
Vending machine for Sanitary napkins and sanitary napkins
disposal machine are provided by College. It is placed in the appropriate
place with the instructions displayed on it for its proper utilization.
5. Complaint box mechanism
There is a suggestion box provided for students. The box is opened
at regular intervals and corrective actions are taken on the same.
6. Drinking water
Six water purifiers and coolers are placed at different places
according to the convenience of the Students and staff members of the
college.
7. Sports
A spacious Track field and ground is provided for outdoor and
indoor games with required utilities for the students who exhibit their
distinct interests in the Sports.
8. Health Camp & Blood Donation Camp :
49
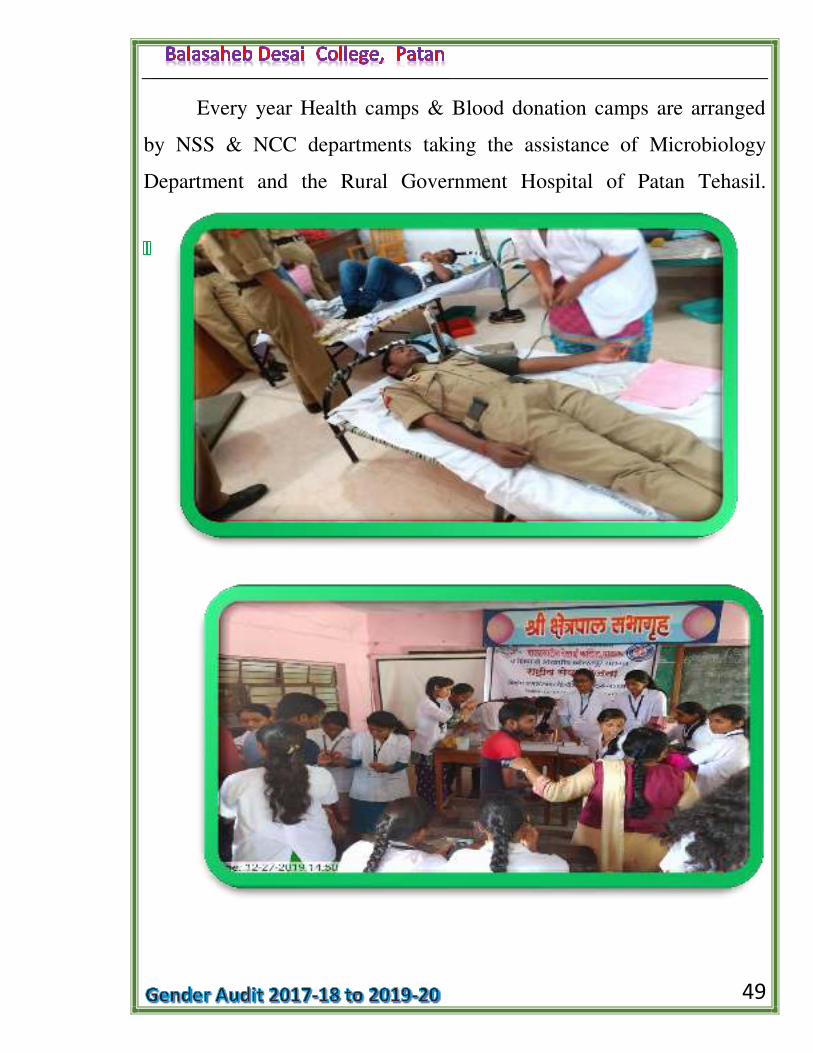
Every year Health camps & Blood donation camps are arranged
by NSS & NCC departments taking the assistance of Microbiology
Department and the Rural Government Hospital of Patan Tehasil.
50
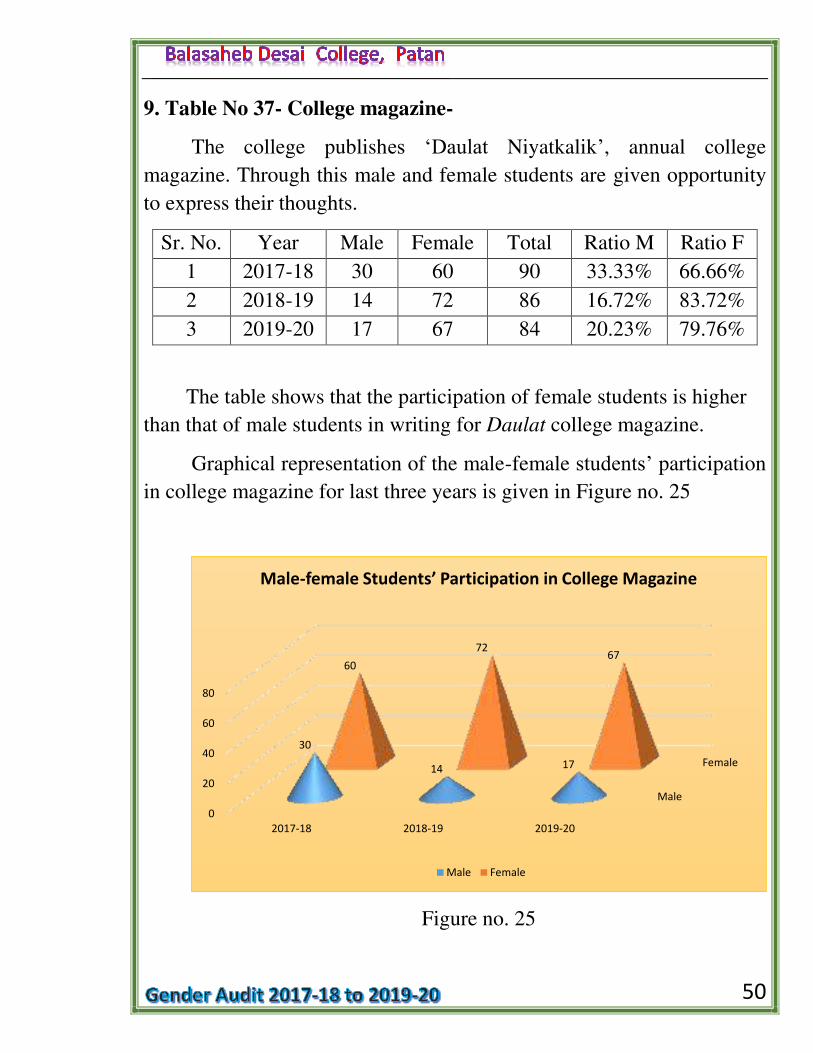
9. Table No 37- College magazine-
The college publishes ‘Daulat Niyatkalik’, annual college
magazine. Through this male and female students are given opportunity
to express their thoughts.
Sr. No. Year Male Female Total Ratio M Ratio F
1 2017-18 30 60 90 33.33% 66.66%
2 2018-19 14 72 86 16.72% 83.72%
3 2019-20 17 67 84 20.23% 79.76%
The table shows that the participation of female students is higher
than that of male students in writing for Daulat college magazine.
Graphical representation of the male-female students’ participation
in college magazine for last three years is given in Figure no. 25
Figure no. 25
Male
Female
0
20
40
60
80
2017-18 2018-19 2019-20
30
14 17
60
72 67
Male-female Students’ Participation in College Magazine
Male Female
51
10. Study Room
The central library has separate sitting arrangements for boys and
girls.
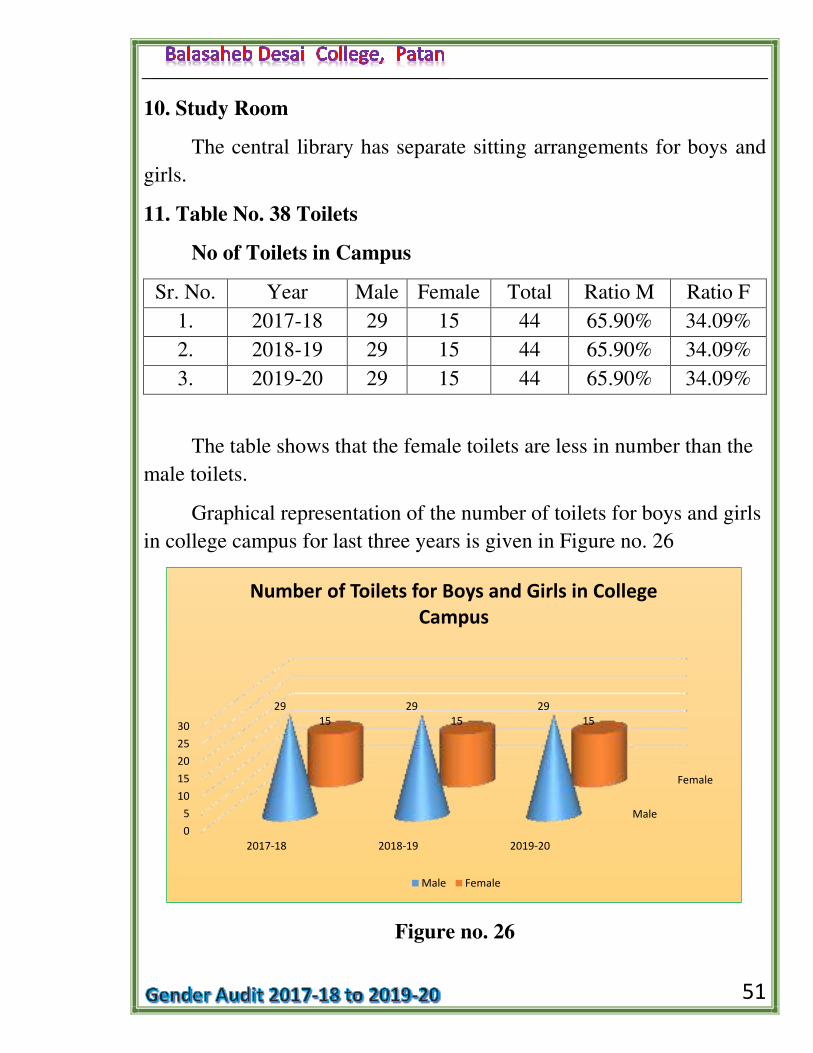
11. Table No. 38 Toilets
No of Toilets in Campus
Sr. No. Year Male Female Total Ratio M Ratio F
1. 2017-18 29 15 44 65.90% 34.09%
2. 2018-19 29 15 44 65.90% 34.09%
3. 2019-20 29 15 44 65.90% 34.09%
The table shows that the female toilets are less in number than the
male toilets.
Graphical representation of the number of toilets for boys and girls
in college campus for last three years is given in Figure no. 26
Figure no. 26
Male
Female
0
5
10
15
20
25
30
2017-18 2018-19 2019-20
29 29 29
15 15 15
Number of Toilets for Boys and Girls in College
Campus
Male Female
52
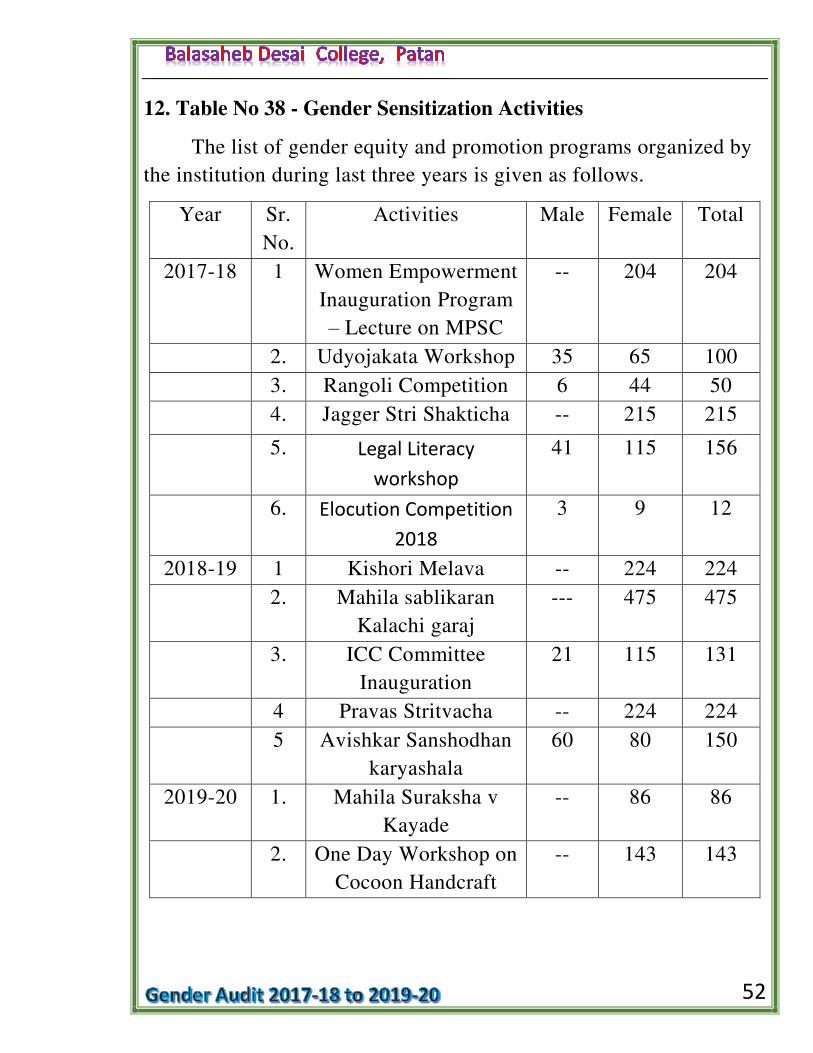
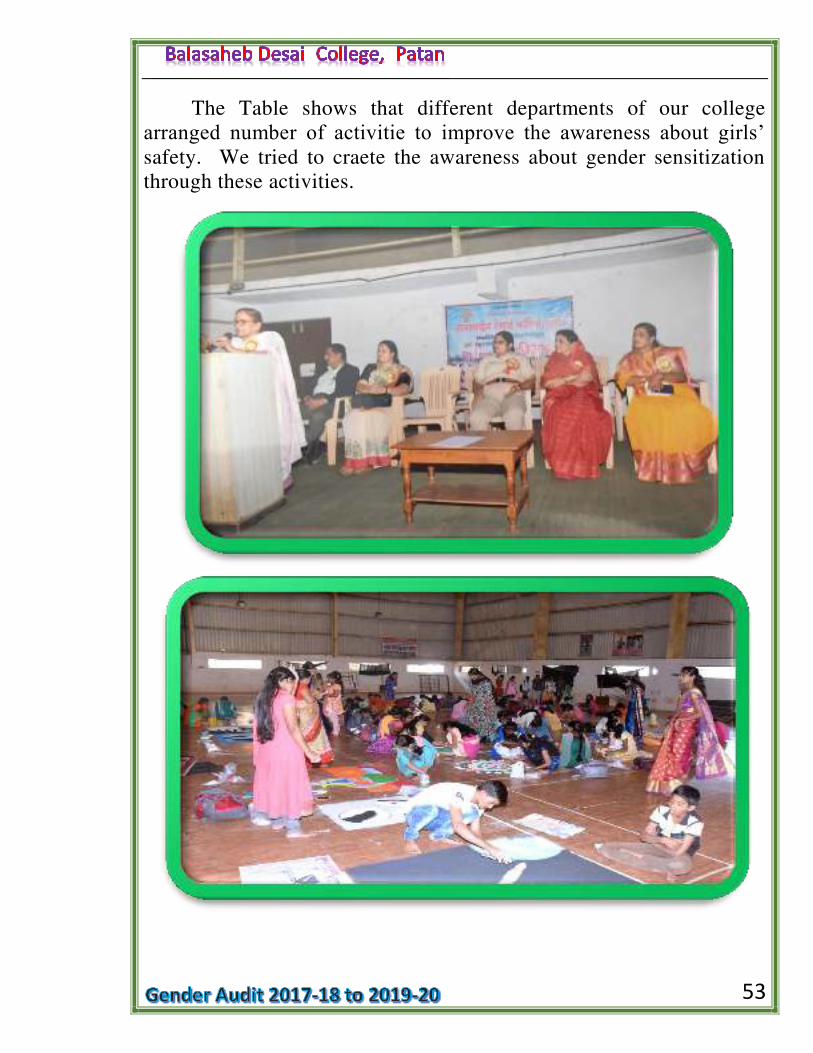
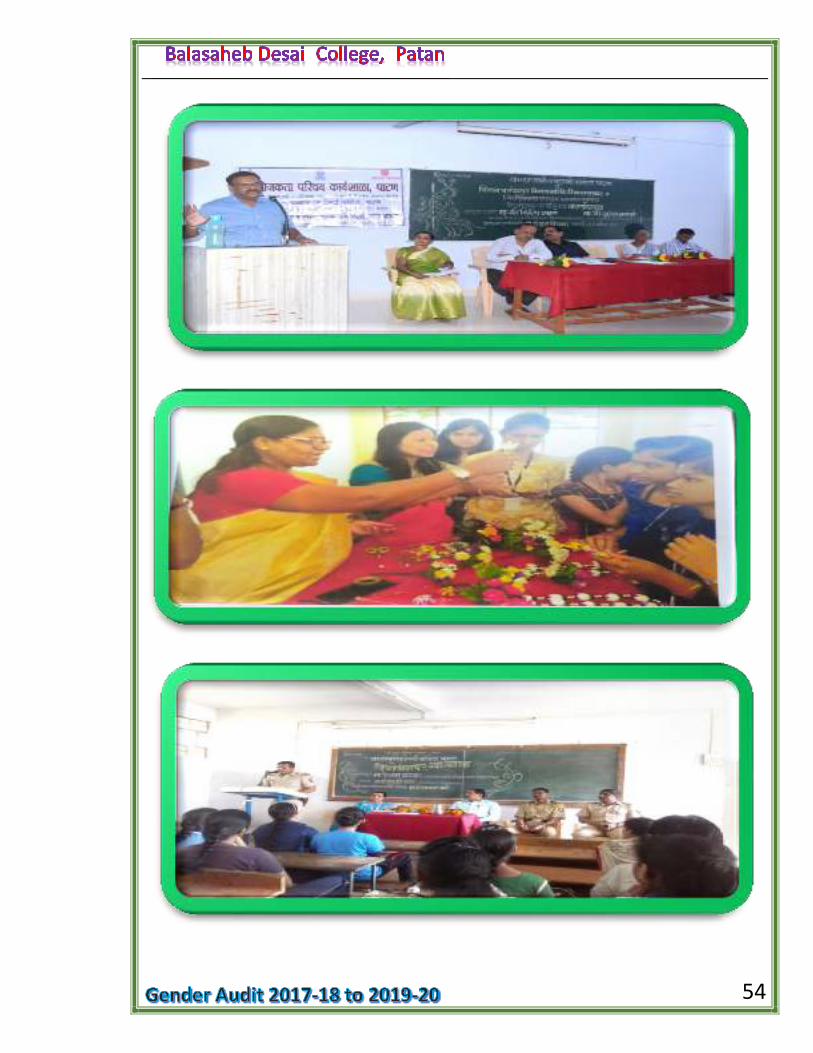
12. Table No 38 - Gender Sensitization Activities
The list of gender equity and promotion programs organized by
the institution during last three years is given as follows.
Year Sr.
No.
Activities Male Female Total
2017-18 1 Women Empowerment
Inauguration Program
– Lecture on MPSC
-- 204 204
2. Udyojakata Workshop 35 65 100
3. Rangoli Competition 6 44 50
4. Jagger Stri Shakticha -- 215 215
5. Legal Literacy
workshop
41 115 156
6. Elocution Competition
2018
3 9 12
2018-19 1 Kishori Melava -- 224 224
2. Mahila sablikaran
Kalachi garaj
--- 475 475
3. ICC Committee
Inauguration
21 115 131
4 Pravas Stritvacha -- 224 224
5 Avishkar Sanshodhan
karyashala
60 80 150
2019-20 1. Mahila Suraksha v
Kayade
-- 86 86
2. One Day Workshop on
Cocoon Handcraft
-- 143
143
53
The Table shows that different departments of our college
arranged number of activitie to improve the awareness about girls’ safety. We tried to craete the awareness about gender sensitization
through these activities.
54
55
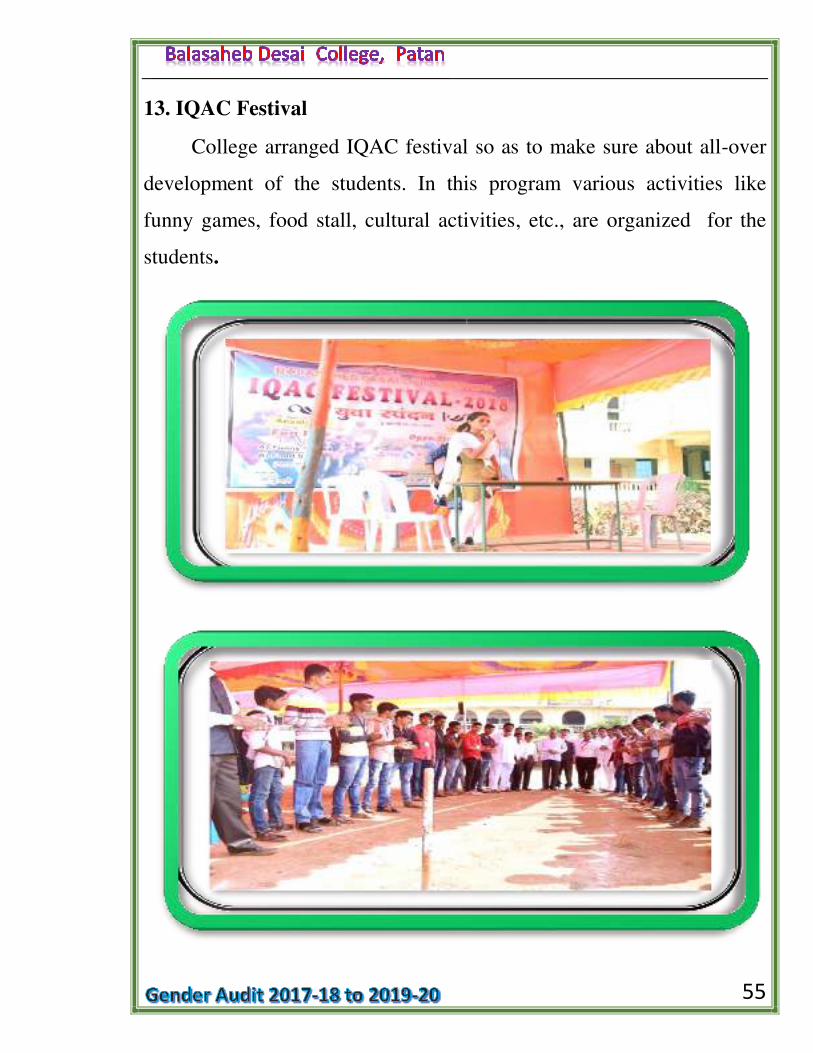
13. IQAC Festival
College arranged IQAC festival so as to make sure about all-over
development of the students. In this program various activities like
funny games, food stall, cultural activities, etc., are organized for the
students.
56
14. Prevention of Sexual Harassment:
It is an act to provide protection against sexual harassment of women at
workplace and for the prevention and redressal of complaints of sexual
harassment and for matters connected therewith or incidental thereto.
Whereas sexual harassment results in violation of the fundamental rights
of a woman to equality under articles 14 and 15 of the constitution of
India and her right to life and to live with dignity under article 21 of the
constitution and right to practice any profession or to carry any
occupation, trade or business which includes a right to a safe
environment free from sexual harassment. Whereas the protection
against sexual harassment and the right to work with dignity are
universally recognized human rights by international conventions and
instruments such as Convention on the Elimination of all forms of
discrimination against Women, which has been ratified on the 25th June
1993 by the Government of India. The same act of parliament received
the assent of the President on 22nd April, 2013 and is hereby published
for general information ―THE SEXUAL HARASSMENT OF WOMEN AT WORK PLACE (PREVENTION, PROHIBITION
ANDREDRESSAL)ACT, 2013 (No.140f 2013) As per rules and
regulations the ―Internal complaint committee‖ is formed to solve the
problems of girl student and women at work place under the title ―The Sexual Harassment of women at work place(prevention, prohibition and
redressal) under the guidance of Principal Dr. S.D. Pawar, President Dr.
Hemlata Kate, and legal advisor Advt. Pratibha Kalugade. The work of
committee involves counseling, research and extension. The committee
conducts various programs such as counseling on self-defense, yoga,
health conscious, women empowerment, gender sensation etc. The
committee received some complaints but resolved on counseling. So no
any police complain raised during the period. The committee without
disclosing names, address has kept the information confidential. The
57
process of inquiry follows the rules and regulations of violation of the
article 5(d) of the Sexual Harassment of Women at Work place
(prevention, prohibition and redressal) Act 2013
15. SALIENT FEATURES AND RECOMMENDATIONS
15.1 Salient features
It is found that Balasaheb Desai College, Patan attained gender
balance in its system. Strengths and weaknesses are as follows -
1. The Gender Ratio of full time faculties show that female faculties are
less in number than that of male faculties. But the female faculties are
more in number as compared to male faculties when we check the
gender ratio is of non-Grantable and C.H.B. Teachers.
2. The gender ratio of non-teaching faculties also shows that the female
employees are less in number than their counterparts.
3. The female Students’ enrollment in junior college is less than that of
male students’. But in senior college, the ratio of the enrollment of female students is higher than that of their counterparts.
4. Gender balance in students’ enrollment is exhibited.
5. Overall female students’ enrollment is satisfactory.
6. The female students’ enrollment ratio is seen increasing across
different faculties.
7. Gender balance in students’ enrollment is maintained in SC, OBC,
NT-B categories but it is very poor when we look at ST, VJ, NT-A,
categories. There is a need to increase the enrollment of these categories.
8. Gender balance is maintained in the scholarships by state government
for BC category
9. In First Year, female students are less in number than that of male
students. But in the third year, female student’s enrollment is
satisfactory. It shows that more female students complete their
graduation degree than that of male students.
58
10. Most of the members in Students’ Council are female students
because students are selected on the basis of their merit.
11. Female Students have consistently performed well in department-
wise ranking/merit list of the college.
12. Gender balance is not maintained in the sports department. It needs
to be maintained.
13. Gender balance is maintained in cultural programs.
14. Gender Balance is maintained by NSS and NCC units.
15. Female students have given good contribution in Daulat, the annual
college magazine.
16. College Maintains the Gender equity by conducting various
activities like COC Course, AQAC Festival etc.
17. All the college committees conduct non–academic activities for
students on gender neutral basis.
18. The college fosters an atmosphere where intolerance on gender
ground is unacceptable.
19. The college committee has taken care of health of girl students by
arranging health checkup camps.
20. Internal Complaints Committee aims to foster an environment in
which unlawful discrimination and harassment are not encouraged.
21. Responses of students, faculty, staff, parent and visitors are
regularly sought in formal and informal ways. Such responses are
audited for gender balance and issues raised in the areas are reported to
the administration and are solved immediately.
22. Gender balance is not maintained in the recruitment of the
administrative staff.
15.2 Recommendations for making Balasaheb Desai College as a
gender sensitive college.
1. It is necessary to start Carrier Development Center in the college
especially for girls.
59
2. It is necessary to make available more number of Ladies Rooms,
Toilets and Study Rooms taking into consideration the large number of
girl students.
3. It is necessary to improve female participation in sports.
4. It is necessary to make available cultural room especially for girls.
5. It is necessary to provide separate suggestion box in ladies room.
6. The Sufficient facilities should be provided to female staff and
students like Drinking water, Separate Book Issue counter in library, etc.
7. The college should ensure the inclusion of women in decision making
practices.
8. It is necessary to start Women Study Centre in the college to convey
information about distinct and eminent women in India and abroad.
7. Daily Newspaper facility must be available in the Reading Room.
8. Female staff in the non-teaching faculty should be increased.
9. Every year Health checkup Camps should be arranged for female staff
and students in the college campus.
10. The equality between men and women in college should always be
promoted and maintained.
16. Our Pride
16.1 Faculty
2017-18
1. Dr. G. S. Pattebahadur, Department of Economics awarded PH.D. of
BAMU University Aurangabad.
2. Dr. S.P. Harare CHB Assistant Professor Department of economics
Passed set exam (2017-18)
2018-19
60
1. Shri. Somnath Nayakavadi CHB Assistant Professor Department of
Physics passed set exam ( 2018 -19)
2. Shri. Anil Patil Labrarian passed SET- exam (2018-19)
2019-20
1. Shri .Prashant Phdanis Assistant Professor Department of Economics
awarded PH.D. of Shivaji University
2. Shri. D. R. Phadatare Assistant Professor Department of Mathmatics
awarded PH.D. of Shivaji University
3. Shri. Abhijeet Pawar Assistant Professor Department of Physics
passed Set Exam (2019-20)
4. Dr. Hemlata Kate Assistant Professor Department of Hindi got
M.phil. Ph.D. Guideship of Shivaji University.
5. Dr. P.J. Aiwale got S. V. Lalit sahity pursakar.
6. Junior College Professor Shri. Sunilrao Pansakar got Rastriya Nisarg
Mitra Pursakar.
7. Junior College Professor Smt. Pournima More got Idial English
Teacher Pursakar.
16.2 STUDENTS:
1) Educational Pride
2018-19
UNIVERSITY RANK HOLDERS& SCHOLARS:
1. Sapakal Amruta Vishnu B.A. I Rank and Scholarship Holder.
2. Kumbhar Arti Yashavan B.A. I Rank and Scholarship Holder.
3. Kambale Jyoti Prakash B.A. I Rank and Scholarship Holder.
61
2019-20
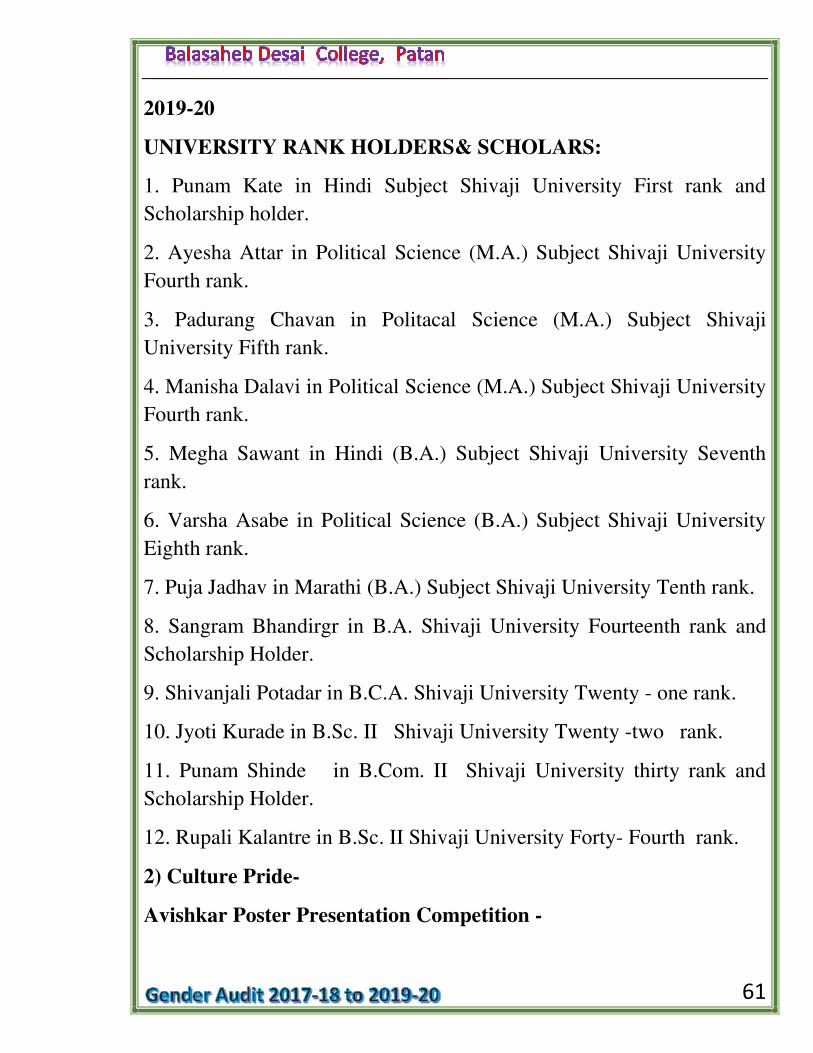
UNIVERSITY RANK HOLDERS& SCHOLARS:
1. Punam Kate in Hindi Subject Shivaji University First rank and
Scholarship holder.
2. Ayesha Attar in Political Science (M.A.) Subject Shivaji University
Fourth rank.
3. Padurang Chavan in Politacal Science (M.A.) Subject Shivaji
University Fifth rank.
4. Manisha Dalavi in Political Science (M.A.) Subject Shivaji University
Fourth rank.
5. Megha Sawant in Hindi (B.A.) Subject Shivaji University Seventh
rank.
6. Varsha Asabe in Political Science (B.A.) Subject Shivaji University
Eighth rank.
7. Puja Jadhav in Marathi (B.A.) Subject Shivaji University Tenth rank.
8. Sangram Bhandirgr in B.A. Shivaji University Fourteenth rank and
Scholarship Holder.
9. Shivanjali Potadar in B.C.A. Shivaji University Twenty - one rank.
10. Jyoti Kurade in B.Sc. II Shivaji University Twenty -two rank.
11. Punam Shinde in B.Com. II Shivaji University thirty rank and
Scholarship Holder.
12. Rupali Kalantre in B.Sc. II Shivaji University Forty- Fourth rank.
2) Culture Pride-
Avishkar Poster Presentation Competition -
62
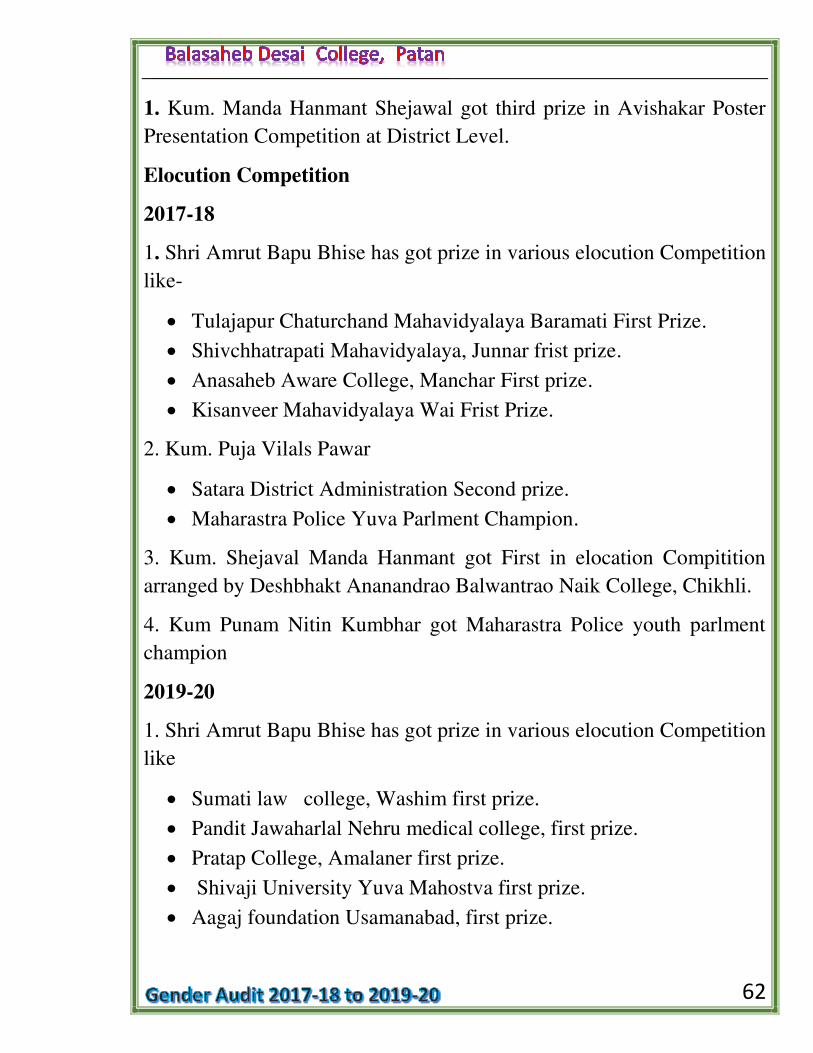
1. Kum. Manda Hanmant Shejawal got third prize in Avishakar Poster
Presentation Competition at District Level.
Elocution Competition
2017-18
1. Shri Amrut Bapu Bhise has got prize in various elocution Competition
like-
Tulajapur Chaturchand Mahavidyalaya Baramati First Prize.
Shivchhatrapati Mahavidyalaya, Junnar frist prize.
Anasaheb Aware College, Manchar First prize.
Kisanveer Mahavidyalaya Wai Frist Prize.
2. Kum. Puja Vilals Pawar
Satara District Administration Second prize.
Maharastra Police Yuva Parlment Champion.
3. Kum. Shejaval Manda Hanmant got First in elocation Compitition
arranged by Deshbhakt Ananandrao Balwantrao Naik College, Chikhli.
4. Kum Punam Nitin Kumbhar got Maharastra Police youth parlment
champion
2019-20
1. Shri Amrut Bapu Bhise has got prize in various elocution Competition
like
Sumati law college, Washim first prize.
Pandit Jawaharlal Nehru medical college, first prize.
Pratap College, Amalaner first prize.
Shivaji University Yuva Mahostva first prize.
Aagaj foundation Usamanabad, first prize.
63
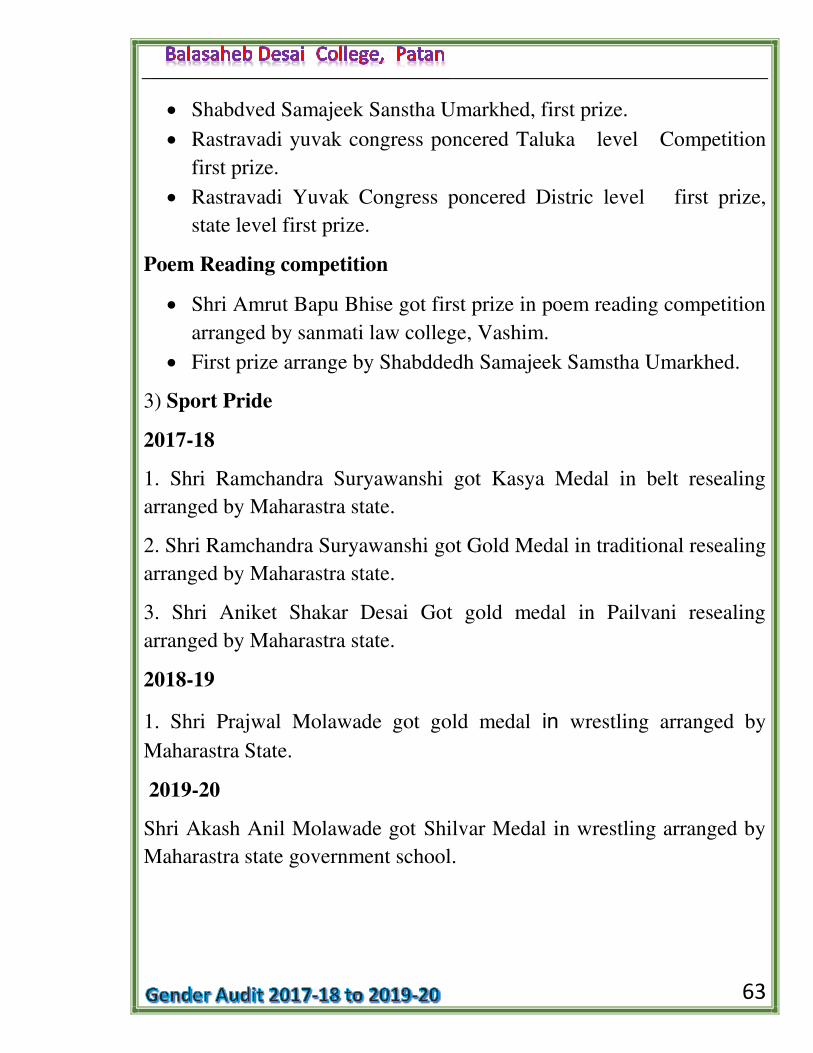
Shabdved Samajeek Sanstha Umarkhed, first prize.
Rastravadi yuvak congress poncered Taluka level Competition
first prize.
Rastravadi Yuvak Congress poncered Distric level first prize,
state level first prize.
Poem Reading competition
Shri Amrut Bapu Bhise got first prize in poem reading competition
arranged by sanmati law college, Vashim.
First prize arrange by Shabddedh Samajeek Samstha Umarkhed.
3) Sport Pride
2017-18
1. Shri Ramchandra Suryawanshi got Kasya Medal in belt resealing
arranged by Maharastra state.
2. Shri Ramchandra Suryawanshi got Gold Medal in traditional resealing
arranged by Maharastra state.
3. Shri Aniket Shakar Desai Got gold medal in Pailvani resealing
arranged by Maharastra state.
2018-19
1. Shri Prajwal Molawade got gold medal in wrestling arranged by
Maharastra State.
2019-20
Shri Akash Anil Molawade got Shilvar Medal in wrestling arranged by
Maharastra state government school.
64
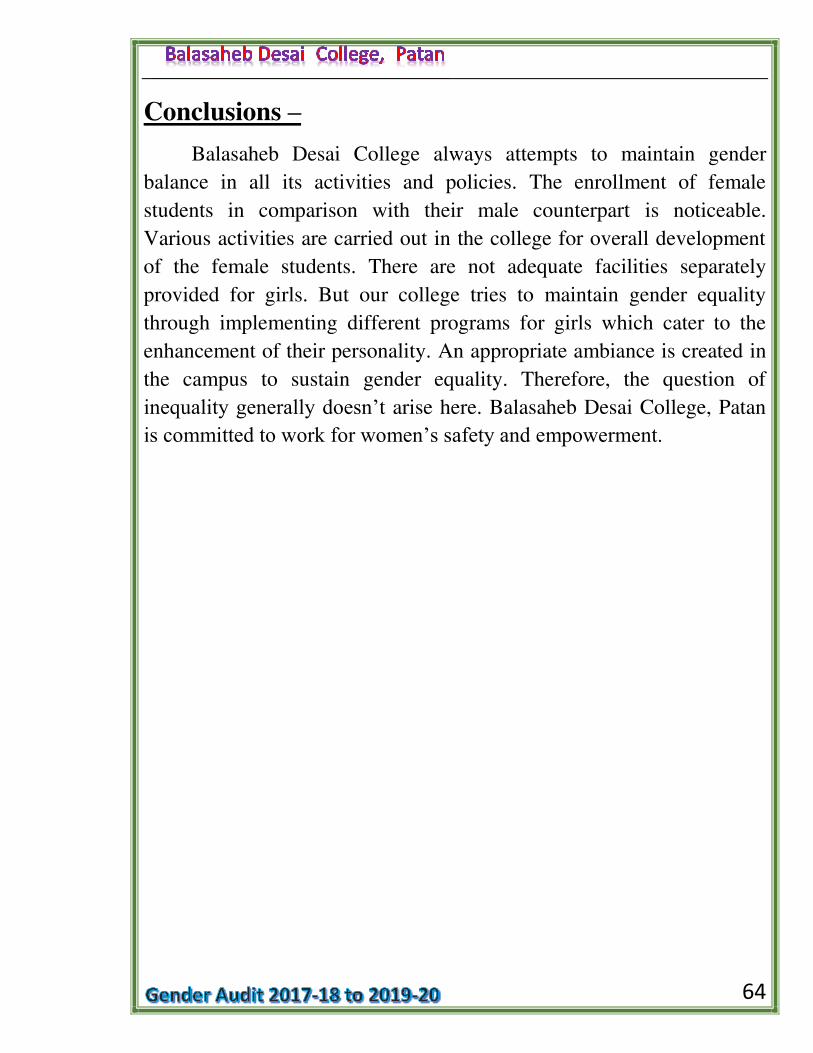
Conclusions – Balasaheb Desai College always attempts to maintain gender
balance in all its activities and policies. The enrollment of female
students in comparison with their male counterpart is noticeable.
Various activities are carried out in the college for overall development
of the female students. There are not adequate facilities separately
provided for girls. But our college tries to maintain gender equality
through implementing different programs for girls which cater to the
enhancement of their personality. An appropriate ambiance is created in
the campus to sustain gender equality. Therefore, the question of
inequality generally doesn’t arise here. Balasaheb Desai College, Patan
is committed to work for women’s safety and empowerment.
65
66