galectin-3 drives glycosphingolipid-dependent biogenesis of clathrin-independent carriers
TRANSCRIPT
ART ICLES
Galectin-3 drives glycosphingolipid-dependentbiogenesis of clathrin-independent carriersRamya Lakshminarayan1,2,3,9,10, Christian Wunder1,2,3,9,10, Ulrike Becken1,2,3,9,10, Mark T. Howes4, Carola Benzing5,Senthil Arumugam1,2,3, Susanne Sales6, Nicholas Ariotti4, Valérie Chambon1,2,3,10, Christophe Lamaze2,3,7,10,Damarys Loew8, Andrej Shevchenko6, Katharina Gaus5, Robert G. Parton4,11 and Ludger Johannes1,2,3,10,11
Several cell surface molecules including signalling receptors are internalized by clathrin-independent endocytosis. How thisprocess is initiated, how cargo proteins are sorted and membranes are bent remains unknown. Here, we found that acarbohydrate-binding protein, galectin-3 (Gal3), triggered the glycosphingolipid (GSL)-dependent biogenesis of a morphologicallydistinct class of endocytic structures, termed clathrin-independent carriers (CLICs). Super-resolution and reconstitution studiesshowed that Gal3 required GSLs for clustering and membrane bending. Gal3 interacted with a defined set of cargo proteins.Cellular uptake of the CLIC cargo CD44 was dependent on Gal3, GSLs and branched N-glycosylation. Endocytosis of β1-integrinwas also reliant on Gal3. Analysis of different galectins revealed a distinct profile of cargoes and uptake structures, suggesting theexistence of different CLIC populations. We conclude that Gal3 functionally integrates carbohydrate specificity on cargo proteinswith the capacity of GSLs to drive clathrin-independent plasma membrane bending as a first step of CLIC biogenesis.
The endocytic pathway consists of distinct vesicular compartments,which merge in the early endosome. Mechanistically, endocyticevents can be subdivided into clathrin-dependent and clathrin-independent processes1–6. Cargoes that are efficiently internalizedin the absence of clathrin include endogenous surface moleculessuch as glycosylphosphatidylinositol (GPI)-anchored proteins7,CD44 (refs 8,9), major histocompatibility complex (MHC) class Imolecules10, interleukin 2 (IL-2) receptor11, and exogenous ligandssuch as the bacterial Shiga12 and cholera toxins13,14 and simian virus 40(ref. 15). A large fraction of fluid phase is also internalized by clathrin-independent endocytosis (reviewed in refs 2,4). CD44, choleratoxin and fluid-phase markers were mapped to early internalizationstructures with a distinct morphology, termed clathrin-independentcarriers14 (CLICs). CLICs arise directly from the plasma membrane,mature into the GPI-enriched early endosomal compartments7, andsubsequently merge with early endosomes.
Highly organized electron dense coat structures could not bedetected at sites of membrane invagination in clathrin (and caveolin)-independent uptake processes. How cargo proteins are sorted andmembranes are bent to build endocytic pits in these cases has thereforebeen one of the challenging questions in the field of endocytosis.
In mammals, the 15 members of the galectin family of N -glycan-binding proteins have functions in cancer, immunity, inflammationand development16–19. Within this family, galectin-3 (Gal3) is uniquein that it combines a carbohydrate recognition domain in its carboxyterminus with an amino-terminal non-lectin domain that favoursthe formation of Gal3 oligomers including pentamers20,21. BranchedN -acetylglucosamine saccharides that result from the activity of theGolgi-localized β-1,6-N -acetylglycosaminyltransferase V (Mgat5) arepreferred binding determinants for Gal3 in the formation of anextracellular galectin–glycoprotein lattice, which regulates receptortyrosine kinase signalling, cell migration and fibronectin fibrilformation22,23. The availability of Gal3 in tissues is controlled throughexpression and atypical secretion (reviewed in ref. 24). Gal3 expressionis deregulated in human cancers, and it has been suggested that Gal3could be a tumourmarker25,26. Binding toGSLs has been demonstratedfor galectin-4 (Gal4; ref. 27) and galectin-9 (ref. 28), and suggested forGal3 (refs 29,30). The biological functions of these GSL interactionshave remained elusive.
GSLs are present in all mammalian cell types, throughout theanimal kingdom, in bacteria, fungi and plants. Apart from beingcellular receptors for pathogens and pathogenic molecules31 they are
1Institut Curie—Centre de Recherche, Endocytic Trafficking and Therapeutic Delivery group, 26 rue d’Ulm, 75248 Paris Cedex 05, France. 2CNRS UMR3666, 75005Paris, France. 3INSERM U1143, 75005 Paris, France. 4Institute for Molecular Bioscience, University of Queensland, St Lucia, Queensland 4072, Australia. 5Centrefor Vascular Research, Australian Centre for Nanomedicine and ARC Centre of Excellence in Advanced Molecular Imaging, University of New South Wales, Sydney, NewSouth Wales 2052, Australia. 6Max Planck Institute of Molecular Cell Biology and Genetics, Pfotenhauerstr. 108, 01307 Dresden, Germany. 7Institut Curie—Centre deRecherche, Membrane Dynamics and Mechanics of Intracellular Signaling group, 26 rue d’Ulm, 75248 Paris Cedex 05, France. 8Institut Curie—Centre de Recherche,Proteomics and Mass Spectrometry Laboratory, 26 rue d’Ulm, 75248 Paris Cedex 05, France. 9These authors contributed equally to this work. 10Authors werepreviously members of UMR144 CNRS.11Correspondence should be addressed to R.G.P. or L.J. (e-mail: [email protected] or [email protected])
Received 18 December 2013; accepted 15 April 2014; published online 18 May 2014; DOI: 10.1038/ncb2970
NATURE CELL BIOLOGY ADVANCE ONLINE PUBLICATION 1
© 2014 Macmillan Publishers Limited. All rights reserved.

ART ICLES
c Anti-CD44 versus Tf uptake
Control PPMP
Fluo
resc
ence
inte
nsity
(per
cent
age
of c
argo
at
2 m
in)
2 min 10 min
400
300
200
100
∗∗
∗∗
∗∗
∗∗ ∗∗
a
Con
trol
PP
MP
PM
PM
PMPM
PM
g hGal3 clustering
b
Tubules, rings(CLICs)
Vesicles 80–120 nm
HRP-labelled carriers
Car
riers
per
cel
l sec
tion
Control PPMP
∗∗20
15
10
5
Vesicles 40–60 nm
Anti–CD44 uptaked e
Gal3–HRP-labelled carriers
f
Fluo
resc
ence
inte
nsity
(per
cent
age
of M
EB
4)
80
20
40
60
120
100
MEB4
GM95
CG1
ControlPPMP99% CI
r (nm)
800600400200 1,000
60
40
20
80
0
L(r)
– r
–20
Gal3 clustering
Tubules, rings (CLICs)
Vesicles 80–120 nmVesicles 40–60 nm
Control PPMP
∗∗∗∗
60
30
120
90
Max
of L
(r) –
r
0
10
6
2
14
18
Control PPMP
Car
riers
per
cel
l sec
tion
Tf-555CD44Tf-555 CD44
Figure 1 The biogenesis of Gal3-CLICs is GSL dependent. (a) Fluid-phase HRP uptake. MEFs were incubated for 2min at 37 ◦C with HRP(10mgml−1) and processed for electron microscopy. Arrowheads point tovesicular structures of different diameters, and arrows to tubular and ring-shaped CLICs. PM: plasma membrane. (b) Quantification of data as ina on 21–24 cells per condition (n= 3 independent experiments, means± s.e.m.). CLIC numbers were significantly reduced on GSL-depleted(PPMP) cells. (c) CD44 endocytosis in GSL-depleted cells. Quantification ofinternalized anti-CD44 antibodies and transferrin (Tf) on control or PPMP-treated MEFs after incubation for 2 or 10min (15–20 cells per condition,n=3 independent experiments, means ± s.e.m.). CD44 uptake was stronglyinhibited in PPMP-treated cells. (d) Experiment as in c (2min uptake) onGSL-deficient GM95 cells, maternal MEB4 cells, and a rescue clone (CG1).CD44 uptake was strongly inhibited in the absence of GSLs (81–90 cellsassessed from 9 fields per condition, means, n=2 independent experiments).(e) Electron microscope tomography. MEFs were incubated for 2min at37 ◦C with Gal3–HRP, and processed for electron microscope tomographyin the presence of ascorbic acid to quench plasma membrane accessibleHRP. Intracellular Gal3–HRP localized in structures with CLIC morphology.
The boxed region in the left panel signifies the part of the image that isrepresented in the tomographic reconstructions (green). The top middle panelshows a tomographic reconstruction of the CLIC structure (green) superposedonto the image from the left panel. The middle and right columns showtomographic reconstructions of the CLIC structure represented from differentangles. (f) GSL dependency of Gal3-CLIC formation. Experiment as in e oncontrol or PPMP-treated TECs (18–20 cells per condition, n=3 independentexperiments, means ± s.e.m.). Gal3-CLIC (tubules/rings) formation wasstrongly inhibited on PPMP-treated cells. (g,h) Clustering of Gal3–Alexa647in control and PPMP-treated HeLa cells. Mean Ripley’s K-function curves,L(r)− r , derived from single-molecule localizations obtained with dSTORMimaging, plotted against radius, r , of concentric circles centred on eachmolecule relative to random distributions (99% confidence interval (CI)of simulated data) (g), and maxima of Ripley’s K-function curves (h).In g, data are averages of 10–20 cells, n= 3 independent experiments.In h, each symbol represents one image region; small horizontal linesindicate mean (± s.e.m., n = 3 independent experiments). Statisticalanalysis in this figure: Student’s unpaired t-test, ∗∗P<0.01, ∗∗∗∗P<0.0001.Scale bars, 200nm.
critical for cell adhesion, migration and signalling32–34. Identifyingmechanism(s) by which GSLs regulate these cellular functions is oneof the major challenges in membrane biology research.
Here, we found thatGal3 binds to theCLIC cargo proteinCD44 andcontrols its GSL-dependent endocytosis, as well as that of β1-integrin.On the basis of cell and model membrane work, we propose anintegrated model for the function of galectins and GSLs in cargo
recruitment and the construction of endocytic pits in the biogenesisof CLICs.
RESULTSGal3 is localized to CLICsTo analyse the contribution of GSLs to endocytic uptake in mam-malian cells, we incubated mouse embryonic fibroblasts (MEFs) for
2 NATURE CELL BIOLOGY ADVANCE ONLINE PUBLICATION
© 2014 Macmillan Publishers Limited. All rights reserved.

ART ICLES
aGal3–HRP-labelled carriers
Tubules, rings (CLICs)
Vesicles 80–120 nm
Vesicles 40–60 nm
Car
riers
per
cel
l sec
tion
∗∗
20
15
10
5
DMSO Lat ADynol siRNA clathrin
Cav1–/–No. 1 No. 231-2 34-2
b
Gal3 endocytosis
ControlLatrunculin A
10080604020Fluorescence intensity(percentage of control)
∗∗∗
Gal
3P
hallo
idin
Mer
ge
Control Latrunculin A
c
Figure 2 Gal3 uptake shows hallmarks of clathrin-independent endocytosis.(a) Gal3–HRP CLIC formation. MEFs were incubated for 2min at 37 ◦Cwith Gal3–HRP, and processed for electron microscopy (presence ofascorbic acid) in the following conditions: 0.1% dimethylsulphoxide(DMSO), 1 µgml−1 latrunculin A (Lat A), 10 µM dynoles 31-2 or 34-2,or depletion of clathrin heavy chain using siRNAs. Cav1−/− MEFs werefrom caveolin 1 knock out mice. 18–21 cells per condition were analysed.Gal3-CLIC formation was significantly inhibited only in the presence of
latrunculin A (means ± s.e.m., n=3 independent experiments). (b,c) Gal3endocytosis under conditions of perturbed actin polymerization. Gal3was incubated for 15min at 37 ◦C with TECs that were treated (rightpanel) or not (left panel) with 1 µM latrunculin A. Gal3 endocytosiswas significantly inhibited on latrunculin A treatment. 25–30 cells percondition (means ± s.d., n = 3 independent experiments). Statisticalanalysis in this figure: Student’s unpaired t-test, ∗∗P<0.01, ∗∗∗P<0.001.Scale bars, 10 µm.
2minwith a fluid-phasemarker, horseradish peroxidase (HRP). Basedon electron microscopy analysis, three classes of uptake structurescould be distinguished in control cells8: 40–60 nm and 80–120 nmvesicles corresponding to caveolar or clathrin-mediated endocyto-sis, respectively (Fig. 1a, arrowheads) and tubular and ring-shapedCLIC structures (Fig. 1a, arrows). When GSLs were depleted us-ing an inhibitor of glycosylceramide synthase (D,L-threo-1-phenyl-2-palmitoylamino-3-morpholino-1-propanol, PPMP), only the occur-rence of tubular and ring-shaped CLIC structures was significantlyreduced (Fig. 1a,b), strongly suggesting that CLIC processes wereexquisitely sensitive to GSL levels. Consistent with this, the uptakeof the CLIC cargo protein CD44 (ref. 8) was almost completely abol-ished in GSL-depleted cells, whereas transferrin (Tf) uptake throughthe clathrin pathway was not affected (Fig. 1c and SupplementaryFig. 1a,e). To rule out potential off-target effects of pharmacologicalGSL depletion, we repeated these experiments onGSL-deficientGM95cells35. CD44 uptake was also strongly diminished on these cells,when compared with parental GSL-containing MEB4 cells (Fig. 1dand Supplementary Fig. 1b,e). Stable overexpression of the ceramideglucosyltransferase-1 gene (CG1 cells) in GM95 cells partially rescuedthe CD44 uptake phenotype. CD44 surface levels were not alteredin these different conditions (Supplementary Fig. 1c,d), most likelybecause CD44 is predominately localized at the plasma membrane atsteady state. Thus, uptake inhibition under conditions of pharmaco-logically or genetically induced GSL deficiency clearly pointed to afunctional role for GSLs in CD44 internalization and CLIC biogenesis.
To establish a molecular link between GSLs and CLICs, wesearched the CLIC proteomics list8 for proteins with a clearlyestablished capacity to bind carbohydrates. Gal3 was one of thebest candidates24. We expressed recombinant Gal3, which for someexperiments was tagged with HRP or fluorophores. In MEFs (Fig. 1eand Supplementary Video 1) or mouse mammary tumour epithelialcells (TECs; Supplementary Video 2), HRP-coupled Gal3 decoratedsmall crescent-shaped cisternae with invaginations, exhibiting thecharacteristic hallmarks of CLICmorphology14. These structures wereformed with as little as 10 ngml−1 of Gal3–HRP (SupplementaryFig. 1f), a concentration that is within the range of Gal3 levels inhuman serum36,37. Depletion of GSLs caused a pronounced loss ofthese Gal3-CLIC structures (Fig. 1f and Supplementary Fig. 1g). Takentogether, the data established a link between GSL expression, Gal3endocytosis and CLIC formation.
To address the contribution of GSLs to Gal3 organization beforeuptake, we determined Gal3 distribution at the plasma membrane bydSTORM super-resolution localization microscopy. PPMP treatmentrevealed that Gal3 clustering at the cell surface was GSL dependent(Fig. 1g,h and Supplementary Fig. 2a–k andNote 1). Gal3 clusters were75 ± 2 nm in diameter, and became smaller and more abundant inGSL-depleted cells.
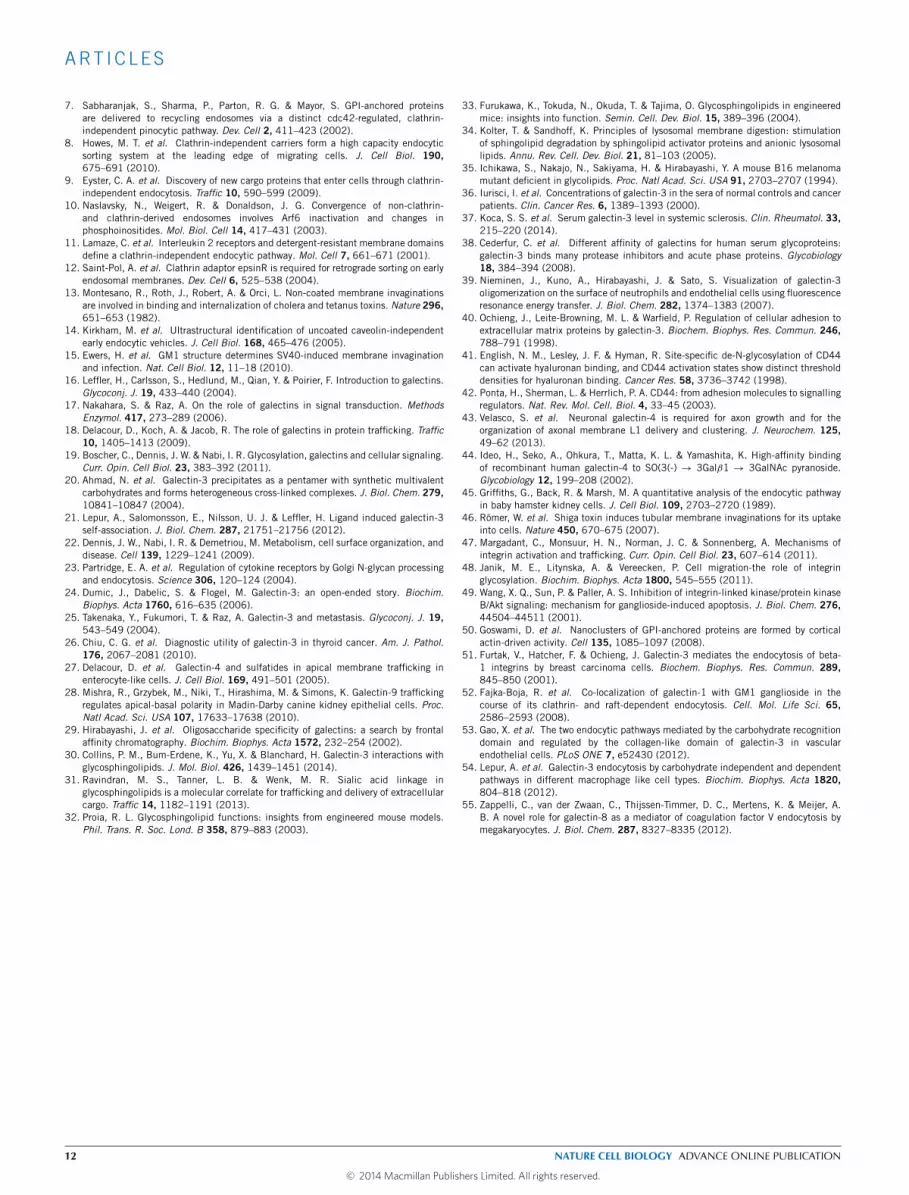
Apart from being clathrin independent, CLIC processes are alsolittle reliant on the scission GTPase dynamin, but strongly sensitiveto actin perturbation14. We found here that Gal3 uptake was largelyunaffected by inhibition of clathrin and dynamin activities, both
NATURE CELL BIOLOGY ADVANCE ONLINE PUBLICATION 3
© 2014 Macmillan Publishers Limited. All rights reserved.

ART ICLES
in TECs and HeLa cells (Supplementary Fig. 3a–d). The genesis ofGal3-CLICs in MEFs was also not altered under these perturbationconditions (Fig. 2a). In contrast, a marked reduction of Gal3uptake (Fig. 2b,c) and Gal3-CLIC formation (Fig. 2a) was observedwhen actin polymerization was inhibited with latrunculin A. Thesefindings further confirmed that Gal3 was internalized in a clathrin-independent manner through CLICs.
In conclusion, Gal3 clustering, CD44 uptake and Gal3-CLICformation required GSL expression.
Gal3 needs glycosylated proteins for binding to cellsGal3 binding to TECs was not affected by GSL depletion(Supplementary Fig. 4a), suggesting that proteins were the primarybinding determinants. Indeed, removal of the extracellular domainsof glycosylated and non-glycosylated plasma membrane proteinswith proteinase K resulted in strongly decreased Gal3 binding,whereas binding of the B-subunit of cholera toxin (CTxB) to theGSL GM1 was not affected (Supplementary Fig. 4b). A similarconclusion was reached when TECs were treated with tunicamycinor 1-deoxymannojirimycin to inhibit protein N -glycosylation.Again, Gal3 binding to the surface of cells was strongly reduced,whereas binding of CTxB to its lipid receptor GM1 was not affected(Supplementary Fig. 4c). Thus,N -glycosylated proteins were requiredfor Gal3 recruitment to the plasma membrane.
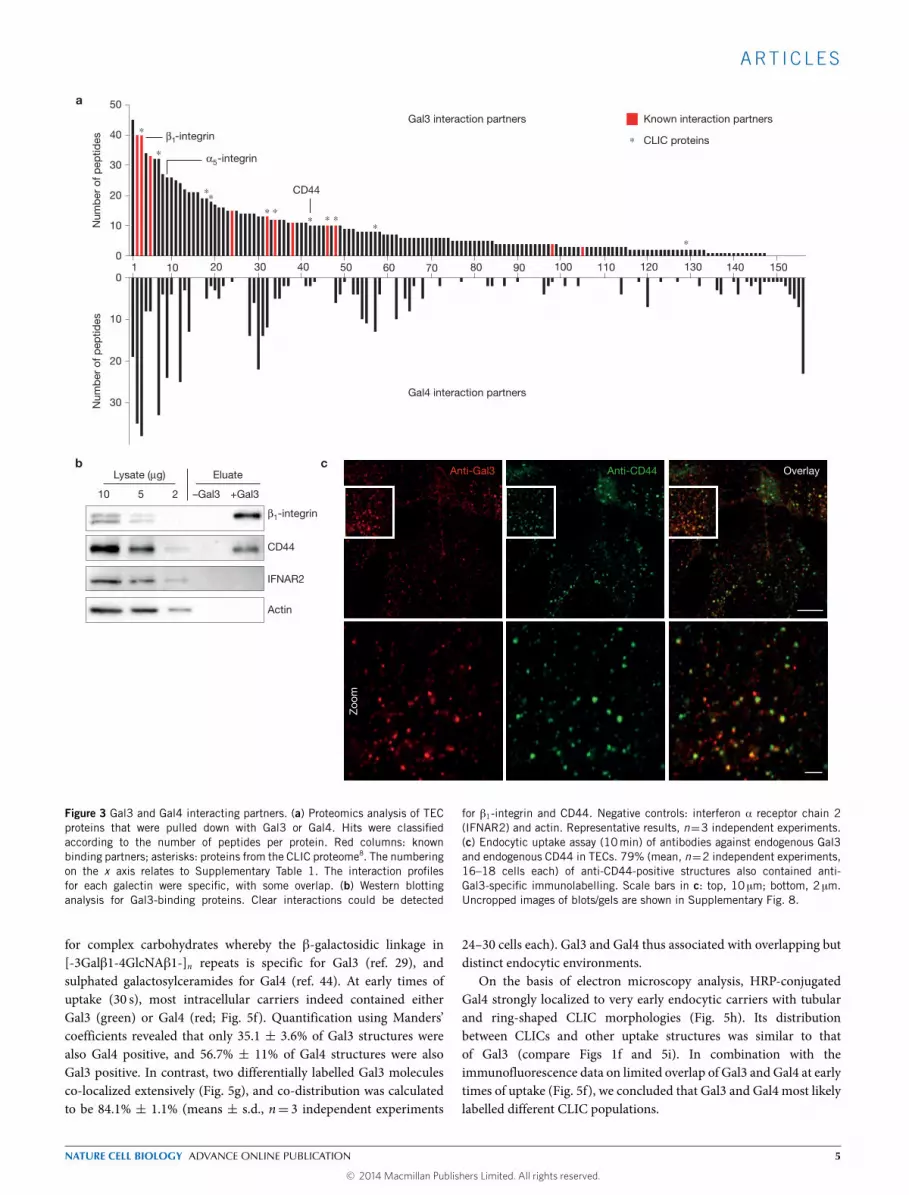
Gal3 interacting proteins at the cell surface were identified by Gal3pulldown followed by mass spectrometry. The list of Gal3 binderscontainedmostly proteins from plasmamembrane, extracellular spaceor intracellular compartments (cytosol, lysosomes, Golgi apparatus)that communicate with the plasmamembrane (Supplementary Fig. 4dand Table 1), and included several known Gal3 interactors (Fig. 3a,red bars). Strikingly, putative and established CLIC cargoes, includingCD44, were also found on the list of Gal3 binders (Fig. 3a,asterisks). The interaction between Gal3 and CD44 was confirmedby western blotting (Fig. 3b). Furthermore, we showed that 79%(means, n= 2 independent experiments, with 16–18 cells assessedfrom 6 fields) of antibody-labelled endogenous Gal3 co-localizedwith endocytic structures that were positive for endogenous CD44(Fig. 3c). Likewise, exogenous Gal3 co-localized with endogenousCD44 at early times of uptake (Fig. 4a,b). Both experiments stronglysuggested that Gal3 and CD44 were internalized by the sameendocytic carriers.
Gal3 is required for CLIC formationTo test the functional implication of Gal3 in CLIC formation, thelectin was depleted from TECs using distinct short interfering RNAs(siRNAs; Supplementary Fig. 5a,d). Although CD44 cell surface levelswere not affected in Gal3-depleted cells (Supplementary Fig. 5b),CD44 uptake was strongly inhibited (Fig. 4c,d and SupplementaryFig. 5c). Addition of exogenous Gal3 rescued CD44 uptake (Fig. 4c) ina dose-dependent manner (Fig. 4d). Significant rescue was obtainedwith the serum-level Gal3 concentration of 10 ngml−1, and maximalrescue at 1 µgml−1, which is at the lower end of Gal3 binding affinitiesfor carbohydrates with optimal branching29, or for serum proteins38.Back-addition of 0.8 µgml−1 of exogenous Gal3 to Gal3-depleted cellsyielded endogenous labelling intensities (Fig. 4e,f), indicating that thisconcentration indeed restored natural Gal3 levels in cells. When Gal3
was added back at 10 µgml−1 to Gal3-depleted MEFs, CD44 uptakewas not rescued any more (Fig. 4d). It is likely that at such highconcentrations, glycoproteinswere crosslinked into an extended latticethereby preventing uptake.
AnN-terminal deletionmutant of Gal3 that lacks critical clusteringdeterminants (termed Gal31Nter; ref. 39) was much less efficientat rescuing CD44 uptake (Fig. 4d), strongly suggesting that Gal3oligomerization was of critical importance for its endocytic function.Interestingly, Gal3 failed to rescue CD44 uptake on GSL-depleted cells(Fig. 4c). These findings established a functional link between Gal3and GSLs in CD44 endocytosis.β1-integrin is one of the most predominant interacting partners
of Gal3 (ref. 40; Fig. 3a,b), and the protein was identified as a tophit of CLIC-associated proteins by mass spectrometry8. Here wefound that its endocytic uptake was inhibited in Gal3-depleted MEFs(Fig. 4g and Supplementary Fig. 5d,e). The uptake of β1-integrinwas also sensitive to clathrin depletion (Fig. 4g and SupplementaryFig. 5d,e), suggesting the existence of multiple uptake routes thatmay be selected on the basis of extra- and intracellular conditions.β1-integrin surface levels were similar in all conditions, except for aslight reduction in the clathrin and Gal3 double depletion condition(Supplementary Fig. 5f).
Depletion of Gal3 also reduced the formation of fluid-phaseHRP-labelled CLICs (Fig. 4h and Supplementary Fig. 5g). As theimpairment was only partial, we concluded that many but notall CLICs required Gal3 for their biogenesis. Similar conclusionswere reached when lactose was used as a competitive inhibitor ofgalectin function: the inhibitory effect on CD44 uptake was verystrong (Supplementary Fig. 6a–c), whereas fluid-phase HRP CLICformation (Supplementary Fig. 6d,e) and dextran fluid-phase uptake(Supplementary Fig. 6f,g) were only partly reduced.
In summary, Gal3 was recruited to N -glycosylated proteins, wasrequired for uptake of CD44 and β1-integrin, and for CLIC formation.
N-glycosylation of CD44 required for uptakeCD44 is a glycoprotein with 5 N - and at least 7 O-glycosylationsites41,42. Inhibition of N -glycosylation using 1-deoxymannojirimycinreduced the average density of CD44 molecules in clusters, and CD44cluster size (Fig. 5a,b and Supplementary Fig.7a,b). CD44 uptakewas strongly perturbed in MEFs treated with the N -glycosylationinhibitors 1-deoxymannojirimycin, kifunensin or swainsonine(Fig. 5c and Supplementary Fig. 7c; see Supplementary Fig. 7d,e forunchanged CD44 surface levels). In addition, we generated a CD44mutant for which all 5 N -glycosylation sites were eliminated. ThisCD44-5xN-Glyc mutant failed to be taken up into cells (Fig. 5d,e; seeSupplementary Fig. 7f,g for unchanged CD44 surface levels). Thesefindings clearly established the importance of N -glycosylation onCD44 clustering and uptake.
Gal4 also localizes to CLICsGal4 binds to GSLs (ref. 27) and forms cluster at the plasmamembrane43. We therefore investigated whether Gal4 could alsobe linked to the CLIC pathway. A proteomics analysis of Gal4interacting partners yielded a markedly different profile comparedwith that of Gal3 (Fig. 3a, bottom part, and Supplementary Fig. 4dand Table 1). This reflects the distinct preference of Gal3 and Gal4
4 NATURE CELL BIOLOGY ADVANCE ONLINE PUBLICATION
© 2014 Macmillan Publishers Limited. All rights reserved.
ART ICLES
a
β1-integrin
CD44
IFNAR2
Actin
10 5 2 –Gal3 +Gal3
Lysate (μg) Eluateb c
Overlay
Zoo
m
Anti-CD44Anti-Gal3
40
0
10
30
20
β1 -integrin
CD44
Known interaction partners
CLIC proteins
Num
ber
of p
eptid
esN
umb
er o
f pep
tides
1 10 20 30 40 50 60 70 80 90 100 110 120 130 140 150
Gal4 interaction partners
α5 -integrin
Gal3 interaction partners
0
10
30
20
50
∗
∗
∗∗∗ ∗
∗ ∗ ∗∗
∗
∗
Figure 3 Gal3 and Gal4 interacting partners. (a) Proteomics analysis of TECproteins that were pulled down with Gal3 or Gal4. Hits were classifiedaccording to the number of peptides per protein. Red columns: knownbinding partners; asterisks: proteins from the CLIC proteome8. The numberingon the x axis relates to Supplementary Table 1. The interaction profilesfor each galectin were specific, with some overlap. (b) Western blottinganalysis for Gal3-binding proteins. Clear interactions could be detected
for β1-integrin and CD44. Negative controls: interferon α receptor chain 2(IFNAR2) and actin. Representative results, n=3 independent experiments.(c) Endocytic uptake assay (10min) of antibodies against endogenous Gal3and endogenous CD44 in TECs. 79% (mean, n=2 independent experiments,16–18 cells each) of anti-CD44-positive structures also contained anti-Gal3-specific immunolabelling. Scale bars in c: top, 10 µm; bottom, 2 µm.Uncropped images of blots/gels are shown in Supplementary Fig. 8.
for complex carbohydrates whereby the β-galactosidic linkage in[-3Galβ1-4GlcNAβ1-]n repeats is specific for Gal3 (ref. 29), andsulphated galactosylceramides for Gal4 (ref. 44). At early times ofuptake (30 s), most intracellular carriers indeed contained eitherGal3 (green) or Gal4 (red; Fig. 5f). Quantification using Manders’coefficients revealed that only 35.1 ± 3.6% of Gal3 structures werealso Gal4 positive, and 56.7% ± 11% of Gal4 structures were alsoGal3 positive. In contrast, two differentially labelled Gal3 moleculesco-localized extensively (Fig. 5g), and co-distribution was calculatedto be 84.1% ± 1.1% (means ± s.d., n= 3 independent experiments
24–30 cells each). Gal3 and Gal4 thus associated with overlapping butdistinct endocytic environments.
On the basis of electron microscopy analysis, HRP-conjugatedGal4 strongly localized to very early endocytic carriers with tubularand ring-shaped CLIC morphologies (Fig. 5h). Its distributionbetween CLICs and other uptake structures was similar to thatof Gal3 (compare Figs 1f and 5i). In combination with theimmunofluorescence data on limited overlap of Gal3 and Gal4 at earlytimes of uptake (Fig. 5f), we concluded that Gal3 and Gal4 most likelylabelled different CLIC populations.
NATURE CELL BIOLOGY ADVANCE ONLINE PUBLICATION 5
© 2014 Macmillan Publishers Limited. All rights reserved.
ART ICLES
g
Fluo
resc
ence
inte
nsity
(per
cent
age
of s
cram
ble
d)
40
80
60
20
100
Scrambled
Anti-β1-integrin uptake h
Car
riers
per
cel
l sec
tion
20
15
10
5
Scrambled Gal3siRNA1
Gal3siRNA2
–
Tubules, rings(CLICs)Vesicles 80–120 nmVesicles 40–60 nm
HRP-labelled carriers
Fluo
resc
ence
inte
nsity
(per
cent
age
of M
EF
WT
)
40
80
60
20
100
0 0.8
MEF Gal3–/–
120
140
e
0.2
Gal3 labelling
MEF Gal3–/–
+0 μg ml–1 Gal3
MEF WT
Endogenous Gal3
MEF Gal3–/–
+0.8 μg ml–1 Gal3
f
Control
d
Fluo
resc
ence
inte
nsity
(per
cent
age
of c
ontr
ol)
80
20
40
60
Gal3 WTGal3ΔNter
120
100
∗∗
∗∗
∗∗∗∗
∗∗∗∗∗
∗
∗∗
∗∗
Anti-CD44 uptake
Gal3 siRNA3Gal3 (μg ml–1)
+ + + + +– – 0.01 0.1 1 10
Gal3 co-labelling
Anti-CD44
Percentage of co-localization
2
8070605040302010
Tf–Alexa488
10
40Tim
e (m
in)
b
+
+
+
+
+
Gal
3
––
––
–
c
Fluorescence intensity(percentage of control)
200100
Anti-CD44 Tf–647
300
Scrambled
Scrambled
Gal3siRNA1
Gal3siRNA1
Gal3siRNA2
Gal3siRNA2
∗∗∗∗
Gal3siRNA1
Gal3siRNA2
PP
MP
Anti-CD44 versus Tf–647 uptake
∗∗∗∗
Control
Control
a2 min
CD
44/G
al3–
Cy3
CD44 Gal3
Tf–4
88/G
al3–
Cy3
10 min
CD44 Gal3 CD44 Gal3
40 min
Tf–488 Gal3 Gal3Tf–488 Gal3Tf–488
+Gal3(μg ml–1)
Gal3siRNA3
ClathrinsiRNA2
Gal3/clathrinsiRNA
MEFWT
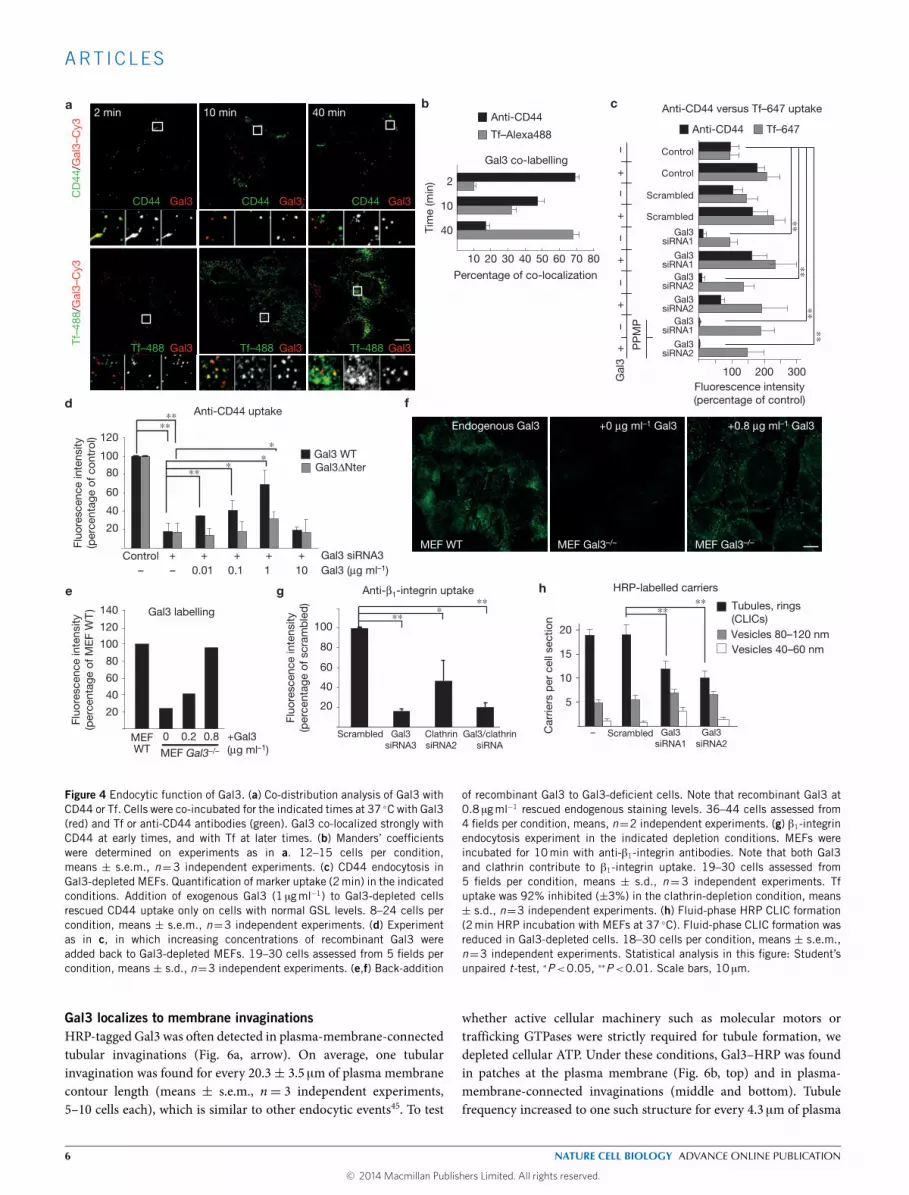
Figure 4 Endocytic function of Gal3. (a) Co-distribution analysis of Gal3 withCD44 or Tf. Cells were co-incubated for the indicated times at 37 ◦C with Gal3(red) and Tf or anti-CD44 antibodies (green). Gal3 co-localized strongly withCD44 at early times, and with Tf at later times. (b) Manders’ coefficientswere determined on experiments as in a. 12–15 cells per condition,means ± s.e.m., n=3 independent experiments. (c) CD44 endocytosis inGal3-depleted MEFs. Quantification of marker uptake (2min) in the indicatedconditions. Addition of exogenous Gal3 (1 µgml−1) to Gal3-depleted cellsrescued CD44 uptake only on cells with normal GSL levels. 8–24 cells percondition, means ± s.e.m., n=3 independent experiments. (d) Experimentas in c, in which increasing concentrations of recombinant Gal3 wereadded back to Gal3-depleted MEFs. 19–30 cells assessed from 5 fields percondition, means ± s.d., n=3 independent experiments. (e,f) Back-addition
of recombinant Gal3 to Gal3-deficient cells. Note that recombinant Gal3 at0.8 µgml−1 rescued endogenous staining levels. 36–44 cells assessed from4 fields per condition, means, n=2 independent experiments. (g) β1-integrinendocytosis experiment in the indicated depletion conditions. MEFs wereincubated for 10min with anti-β1-integrin antibodies. Note that both Gal3and clathrin contribute to β1-integrin uptake. 19–30 cells assessed from5 fields per condition, means ± s.d., n=3 independent experiments. Tfuptake was 92% inhibited (±3%) in the clathrin-depletion condition, means± s.d., n=3 independent experiments. (h) Fluid-phase HRP CLIC formation(2min HRP incubation with MEFs at 37 ◦C). Fluid-phase CLIC formation wasreduced in Gal3-depleted cells. 18–30 cells per condition, means ± s.e.m.,n=3 independent experiments. Statistical analysis in this figure: Student’sunpaired t-test, ∗P<0.05, ∗∗P<0.01. Scale bars, 10 µm.
Gal3 localizes to membrane invaginationsHRP-tagged Gal3 was often detected in plasma-membrane-connectedtubular invaginations (Fig. 6a, arrow). On average, one tubularinvagination was found for every 20.3± 3.5 µm of plasma membranecontour length (means ± s.e.m., n= 3 independent experiments,5–10 cells each), which is similar to other endocytic events45. To test
whether active cellular machinery such as molecular motors ortrafficking GTPases were strictly required for tubule formation, wedepleted cellular ATP. Under these conditions, Gal3–HRP was foundin patches at the plasma membrane (Fig. 6b, top) and in plasma-membrane-connected invaginations (middle and bottom). Tubulefrequency increased to one such structure for every 4.3 µm of plasma
6 NATURE CELL BIOLOGY ADVANCE ONLINE PUBLICATION
© 2014 Macmillan Publishers Limited. All rights reserved.

ART ICLES
100
c Anti-CD44 uptakeFluorescence intensity(percentage of DMSO)
DMSO
Kifunensine
80604020
Deoxymanno-jirimycin
Swainsonine
∗∗
f Gal3Gal3
30 s30 s
Gal4Gal3 gh Gal4–HRPPM
Anti-HA
Anti-CD44 uptake
HA–CD44 WT HA–CD44 5xN-Glyc mt
Anti-HA
Anti-CD44 uptake
d
e Anti-CD44 uptakeFluorescence intensity
(percentage of HA–CD44 WT)
∗∗
20 100806040
HA–CD44WT
HA–CD445xN-Glyc mt
Carriers per cell section20151050
Tubules, rings (CLICs)Vesicles 80–120 nmVesicles 40–60 nm
i Gal4–HRP
Level of clustering L(r )0 ≥200100 15050
Deo
xym
anno
jirim
ycin
aC
ontr
ol
Control Deoxymanno-jirimycin
600
400
200
1,000
800
Mol
ecul
es (μ
m–2
)
CD44 molecule density
∗∗∗∗
Control Deoxymanno-jirimycin
0.015
0.010
0.005
Clu
ster
siz
e (μ
m–2
) ∗∗CD44 cluster size
b
0 0
Figure 5 Role of N-glycosylation in CD44 uptake. (a) Clustering analysisof CD44 in MEFs derived from single-molecule localizations obtainedwith dSTORM imaging. (b) The average density of CD44 molecules andCD44 cluster size decreased on treatment with 1-deoxymannojirimycin,demonstrating that complex type N-linked glycans were required for efficientCD44 clustering. Each symbol represents one image region; horizontallines indicate mean ± s.e.m., n=3 independent experiments. (c) CD44uptake was strongly inhibited in MEFs in which the biogenesis of complextype N-glycosylation was perturbed with the indicated inhibitors. 19–20cells per condition, means ± s.d., n=3 independent experiments. (d) CD44N-glycosylation site mutant. A human CD44 variant in which all 5N-glycosylation sites were mutated failed to be taken up into MEFs.(e) 17–19 cells assessed from 8 fields per condition in experiments asin d, means ± s.d., n=3 independent experiments. (f) Co-incubation of
TECs for 30 s with Gal3 (green) and Gal4 (red), followed by lactose washon ice to remove cell surface accessible material. Both proteins localizedto mostly separate very early uptake structures (see text for quantification).(g) Two differently labelled Gal3 molecules extensively co-localized underthe same conditions as in f, proving the specificity of the observations.(h) MEFs were incubated for 2min at 37 ◦C with Gal4–HRP,as described for Gal3–HRP in Fig. 1e. Arrowheads point tovesicular structures of different diameters, and arrows to tubularand ring-shaped CLICs. PM: plasma membrane. (i) Quantificationof experiments as in h showed that Gal4 was mostly localized to CLICs.Means ± s.e.m., n = 15 cells analysed in 1 experiment. Statisticalanalysis in this figure: Student’s unpaired t-test, ∗∗P<0.01, ∗∗∗∗P<0.0001.Scale bars: a (left), 6 µm; a (middle, right), 500nm; d,f,g, 10 µm;h, 200nm.
membrane contour length (means, n= 2 independent experiments5 cells each). Hence, scission of Gal3-containing tubules seemed to bean active process.
Electron microscope tomography revealed that these tubules hadbasket- and ring-shaped profiles (Fig. 6c, plasma membrane inred; Supplementary Video 3), demonstrating that invaginations withcharacteristic CLIC-likemorphology could formdirectly at the plasma
membrane. Actin cytoskeleton could clearly be seen in the vicinity ofthe invaginated Gal3 domains (Fig. 6c, blue), in agreement with itsrole in Gal3 endocytosis (Fig. 2b,c) and the formation of Gal3-CLICs(Fig. 2a). After GSL depletion, fewer tubular Gal3–HRP structureswere found on ATP-depleted cells (Fig. 6d), and quantificationshowed that tubule frequency had dropped to one such structurefor every 43.3 µm of plasma membrane contour length (means, n=2
NATURE CELL BIOLOGY ADVANCE ONLINE PUBLICATION 7
© 2014 Macmillan Publishers Limited. All rights reserved.
ART ICLES
Gal3
2 min
Gal3
–ATP / +PPMP
Gal3
Gal3
α5 -integrin
β1 -integrin
e f
TfR
g h i
a
c
b
STxB
Gal3
Gal3
–ATP
d
Gal3
Gal3
CD
44
–ATP
Gal3
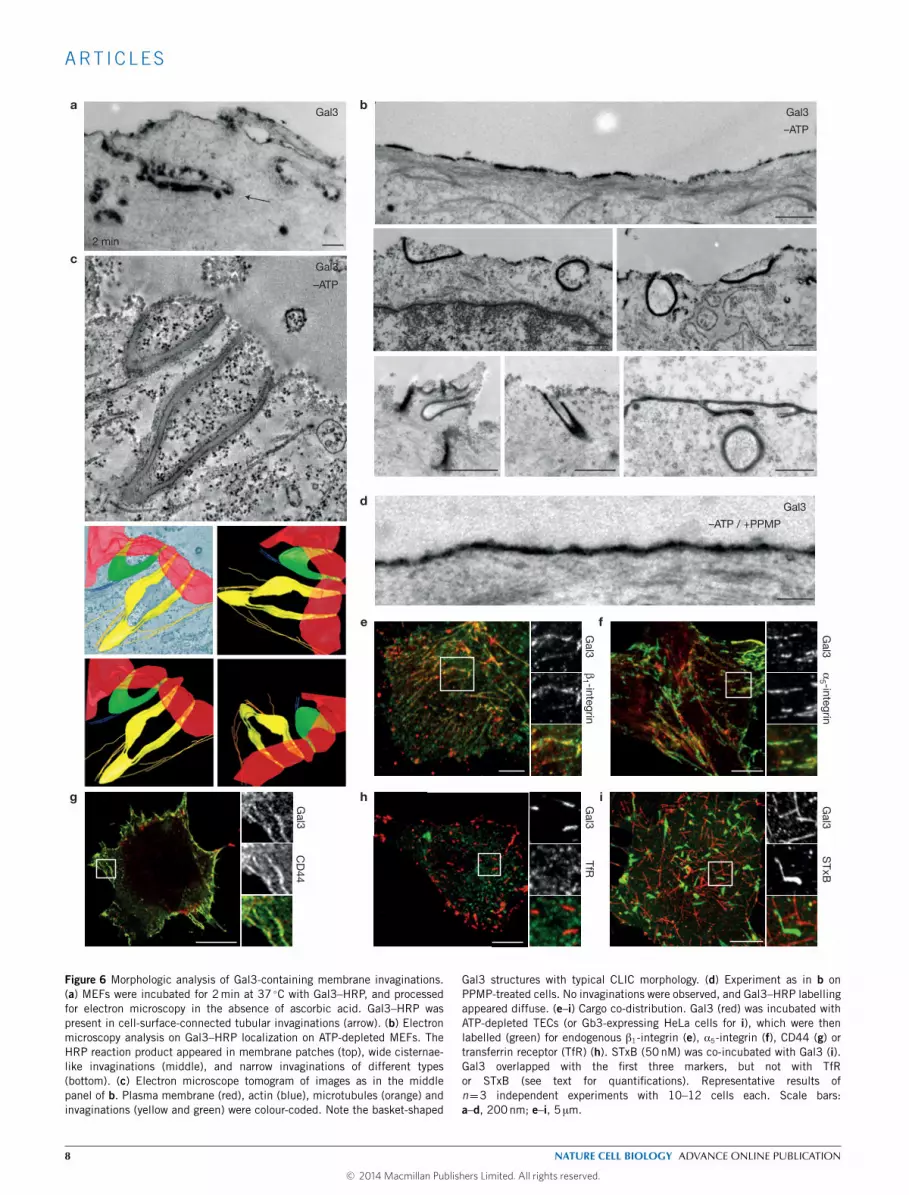
Figure 6 Morphologic analysis of Gal3-containing membrane invaginations.(a) MEFs were incubated for 2min at 37 ◦C with Gal3–HRP, and processedfor electron microscopy in the absence of ascorbic acid. Gal3–HRP waspresent in cell-surface-connected tubular invaginations (arrow). (b) Electronmicroscopy analysis on Gal3–HRP localization on ATP-depleted MEFs. TheHRP reaction product appeared in membrane patches (top), wide cisternae-like invaginations (middle), and narrow invaginations of different types(bottom). (c) Electron microscope tomogram of images as in the middlepanel of b. Plasma membrane (red), actin (blue), microtubules (orange) andinvaginations (yellow and green) were colour-coded. Note the basket-shaped
Gal3 structures with typical CLIC morphology. (d) Experiment as in b onPPMP-treated cells. No invaginations were observed, and Gal3–HRP labellingappeared diffuse. (e–i) Cargo co-distribution. Gal3 (red) was incubated withATP-depleted TECs (or Gb3-expressing HeLa cells for i), which were thenlabelled (green) for endogenous β1-integrin (e), α5-integrin (f), CD44 (g) ortransferrin receptor (TfR) (h). STxB (50nM) was co-incubated with Gal3 (i).Gal3 overlapped with the first three markers, but not with TfRor STxB (see text for quantifications). Representative results ofn=3 independent experiments with 10–12 cells each. Scale bars:a–d, 200nm; e–i, 5 µm.
8 NATURE CELL BIOLOGY ADVANCE ONLINE PUBLICATION
© 2014 Macmillan Publishers Limited. All rights reserved.

ART ICLES
independent experiments 5 cells each). This result mirrored theinhibition of CD44 endocytosis (Fig. 1c) and Gal3-CLIC formation(Fig. 1f) under GSL-depletion conditions.
We next examined Gal3-CLIC cargoes on Gal3 tubular uptakestructures. As expected from Gal3 binding (Fig. 3a,b) and Gal3-mediated uptake (Fig. 4c,d,g), 65.6% (means, 196 tubules pooled from2 independent experiments), 61.3% (means, n= 191 tubules pooledfrom 2 independent experiments), and 53.6% (means, n=140 tubulespooled from 2 independent experiments) of tubular Gal3 structures(red) co-labelled with β1-integrin (Fig. 6e, green), α5-integrin(Fig. 6f, green), or CD44 (Fig. 6g, green), respectively. In contrast,only 4.4% (means, n = 216 tubules pooled from 2 independentexperiments) of Gal3 tubules (red) also labelled for Tf receptor(TfR; Fig. 6h, green). Gal3 tubules thus contained a specificcomplement of Gal3 binders and CLIC cargo proteins.
The B-subunit of the bacterial Shiga toxin (STxB) interacts with α-but not with β-galactosidic linkages to which Gal3 binds. STxB waspreviously shown to induce tubular uptake structures after bindingto the GSL globotriaosylceramide (Gb3; ref. 46). Here, we found thatSTxB (green) and Gal3 (red) localized to different tubule populationson the same cells (Fig. 6i). This finding demonstrated that distinctcurvature-generating environments were obtained when endocytosiswas driven by lectins with differential glycan-binding characteristics.
In conclusion, these experiments showed that Gal3 favouredthe GSL-dependent formation of plasma membrane invaginationscontaining specific Gal3 interacting proteins, whose processing byscission required active cellular machinery.
Membrane-bound Gal3 drives membrane bendingTo directly address the role of Gal3 in membrane bending, we turnedto a liposome reconstitution system. Giant unilamellar vesicles(GUVs) were prepared with a plasma-membrane-like lipid composi-tion containing cholesterol (20mol%), sphingomyelin (12mol%),1-palmitoyl-2-oleoylphosphatidyl choline (POPC, 59.9mol%),1-palmitoyl-2-oleoylphosphatidyl serine (POPS, 3mol%), a GSLmixture (5mol%, see Experimental Procedures), and 0.1mol%lissamine-rhodamine-B-PE for visualization. The GSL mixturecontained lipid species that were also found in the cells that wereused in the present study (Supplementary Tables 2 and 3). Gal3did not directly bind to these GSL-containing GUVs, in agreementwith the notion that Gal3 has low affinity for GSLs (ref. 29) andneeds glycosylated proteins for its recruitment onto membranes(Supplementary Figs 4b,c and 7d,e). Therefore, we His-tagged Gal3(Gal3–His) to force its binding to nickel-chelating lipid (3mol%)-containing GUV membranes, thus mimicking the binding of Gal3to cargo proteins at the plasma membrane. At early time points,Gal3–His was evenly distributed on NTA-containing GUVs (Fig. 7a,5min). At 15min, Gal3 was enriched locally (arrows and inset), andafter 30min 65.3% of GUVs showed tubular membrane invaginations(see Supplementary Table 4 for a summary of observations andquantification for all GUV experiments shown in this figure). 3.0± 1.6invaginations (n= 38 GUVs) were counted per equatorial plane ofGUVs to which Gal3 had bound, with an average length of1.9 ± 1 µm (n = 113 invaginations). Gal3 was enriched 2.5-fold(±0.9, n= 113) in these invaginations, when compared with thelimiting membrane.
Membrane tubules were at background levels when Gal3–His wasincubated with GUVs that did not contain GSLs (Fig. 7b), thatcontained 5mol% glucosylceramide, lactosylceramide, or Gb3, orwhen GSL-mixture-containing GUVs were incubated with a His-tagged GST–GFP control protein (Fig. 7c).
To disrupt carbohydrate-mediated interactions of Gal3 withGSLs, we incubated GUVs with Gal3–His in the presence oflactose as a competitive inhibitor. Under these conditions, Gal3–Hisfailed to cluster and form tubules on GSL-containing GUVs(Fig. 7d), demonstrating that Gal3 required direct interaction withthe carbohydrate part of GSLs to deform membranes. This importantconclusion was confirmed with a carbohydrate-binding-deficient His-tagged Gal3 mutant, Gal3-R186S, which did not induce invaginationson GSL-containing GUVs either (Fig. 7e).
Gal3 interacts with β-but not with α-galactosidic linkages. Tocharacterize the involvement of specific carbohydrate structures inthe tubulation process further, we treated GSL-containing GUVs withdifferent galactosidases. Incubation with β-galactosidase abolishedthe tubule-forming potential of Gal3–His, whereas α-galactosidasehad no effect (Fig. 7f and Supplementary Video 4), again pointingto a requirement of Gal3-carbohydrate interaction with GSLs formembrane bending. Taken together, membrane-bound Gal3 inducedinward-oriented tubulation on GUVs in a GSL-dependent manner.
Gal3 oligomerizes on membranesThe His-tagged Gal31Nter mutant is lacking the oligomerizationdomain and failed on cells to rescue CD44 uptake as efficiently as wild-type Gal3 (Fig. 4d). To analyse the contribution of oligomerization totubule formation, we used thismutant in ourGUV system. Gal31Nterhad a strongly reduced capacity to induce tubules (Fig. 7g), indicatingthat Gal3 clustering was important for membrane bending.
Direct evidence for Gal3 clustering came from experiments inwhich non-His-tagged Gal3 (which did not bind to GUVs on itsown) was recruited by Gal3–His onto GUVs (Fig. 7h). These dataclearly demonstrated the ability of Gal3 to interact with membrane-bound Gal3–His and consequently the propensity of Gal3 to undergooligomerization20,21. In contrast, non-His-tagged Gal31Nter failedto be recruited by Gal3–His (Fig. 7i), in complete agreement withthe notion that this protein has a reduced clustering capacity.The carbohydrate-binding mutant Gal3-R186S without a His-tagwas bound to GUVs by Gal3–His (Fig. 7j), indicating that sugarinteractions were not strictly required for oligomerization. On cells,this mutant failed to bind (Fig. 7k), but was internalized when co-incubated with wild-type Gal3 (Fig. 7l). Thus, we demonstratedthe propensity of Gal3 to undergo oligomerization on cell andmodel membranes.
DISCUSSIONOn the basis of the findings of this study, we propose a modelto explain the initiation of CLIC biogenesis (Fig. 8). MonomericGal3 is recruited to membranes by binding to glycosylated cargoproteins, such as CD44 and β1-integrin. Membrane-bound Gal3oligomerizes and acquires functional GSL interaction capacity. This islikely to involve an avidity effect based on multiple bond interactionsof binding sites on oligomeric lectins with several GSL molecules,and/or the creation of GSL-binding sites at interfaces between Gal3
NATURE CELL BIOLOGY ADVANCE ONLINE PUBLICATION 9
© 2014 Macmillan Publishers Limited. All rights reserved.

ART ICLES
c 30 min
GS
T–G
FP–H
isb
d
+Lactose
30 minG
al3
–His
a 5 minG
al3
–His
15 min Zoom
200 nM 200 nM
f 30 min
Gal
3–H
is
+ β-galacto-sidase
30 min
Gal
3–H
is
+ α-galacto-sidase
Zoom
i
l Gal3 Gal3-R186S Merge
No GSL
30 min
Gal
3–H
is
j
Gal
3–H
is +
Gal
3 w
/o H
is
Gal3–His Gal3 w/o His ZoomMerge
g 30 min
Gal
3ΔN
ter–
His
200 nM
30 m
in
h
Gal
3–H
is +
Gal
3 w
/o H
is
Gal3–His Gal3 w/o His Merge
15 m
in
100 nM 100 nM 100 nM 100 nM
e
Gal
3-R
186S
–His
30 min
200 nM
Gal
3–H
is +
Gal
3-R
186S
w/o
His
ZoomMergeGal3–His Gal3-R186S
100 nM 100 nM
Gal3–His ΔNter w/o His
Gal
3–H
is +
ΔNte
r w
/o H
is
30 m
in
100 nM 100 nM
200 nM
k EEA1 Gal3-R186S
30 min Zoom
200 nM
40 nM 200 nM
Zoom
40 nM
Gal
3–H
is
Gal
3–H
is
Zoom
Figure 7 Gal3-driven membrane bending. (a–g) GUVs were prepared witha plasma-membrane-like lipid composition containing Ni-lipids and a mixof GSLs (except if indicated otherwise), incubated with Gal3–His (wild-type or mutants at 200nM, except if indicated otherwise) at 21 ◦C, andimaged at the equatorial plane by confocal microscopy. See SupplementaryTable 4 for quantifications of results. Gal3–His clustered (15min) andinduced invaginations (30min) (a). No invaginations formed with Gal3–Hisin the absence of GSLs (b), 200nM His-tagged GST–GFP (c), Gal3–Hisin the presence of 100mM lactose (d), the His-tagged Gal3 mutantR186S (e), Gal3–His on GSL-containing GUVs that were treated
with β-galactosidase (invaginations formed on GUVs treated withα-galactosidase as a control) (f), or His-tagged Gal31Nter mutant (g).(h–j) Non-His-tagged Gal3 (h), or Gal3-R186S (j) were recruited toGUVs only on co-incubation with Gal3–His, demonstrating that theseproteins oligomerized. In contrast, Gal31Nter was not co-recruited (i).(k) Gal3-R186S (red) did not associate with cells, labelled with the earlyendosomal marker protein EEA1 (green). (l) Co-incubation of Gal3-R186S(red) with wild-type Gal3 (green) led to the internalization of the mutant,strongly suggesting that Gal3 also oligomerized on cells. Scale bars: a–j, 3 µm;k,l, 5 µm.
monomers. Co-clustering of cargo proteins and GSLs then generatesmechanical strain to which the membrane responds by formingendocytic invaginations.
This model provides an integrative hypothesis of how cargoproteins are recruited and membranes bent in a process of clathrin-independent endocytosis. For CD44, endocytic uptake reliesextensively on the mechanism presented here. For β1-integrin,clathrin-dependent and -independent endocytic contributionshave previously been identified47, and our mechanism probablyexplains the clathrin-independent uptake. Indeed, β1-integrinfunctions have also been described to be reliant on N -glycosylation48
and GSL expression49, as one would expect from our model. An‘endocytic balance’ may thereby be set through an intricate interplaybetween different clustering mechanisms driven from the cytosolic(that is, coat-dependent) and extracellular (that is, galectin andglycosylation-dependent) sides of the plasma membrane.
In addition to CD44 and β1-integrin, a number of otherproteins are at the same time Gal3 binders and CLIC proteomicshits, including lysosomal-associated membrane protein-2 (Lamp-2),nicastrin subunit of γ-secretase, 4F2 heavy chain (CD98), the GPI-anchored protein CD109, mannose 6-phosphate receptor, collectin-12 and prosaposin. As these determinations were carried out on
10 NATURE CELL BIOLOGY ADVANCE ONLINE PUBLICATION
© 2014 Macmillan Publishers Limited. All rights reserved.

ART ICLES
Gal-3–cargo complex Gal3 oligomerization and
GSL recruitment
CGal3Glycosylated
cargoGSL
N
C
Membrane bending andendocytic pit formation
Figure 8 Model for Gal3-driven biogenesis of CLICs. We propose thefollowing model to explain the Gal3-driven initiation of CLIC biogenesis.Monomeric Gal3 is recruited to membranes by binding to glycosylatedcargo proteins, such as CD44 and β1-integrin. Membrane-bound Gal3
oligomerizes and gains functional GSL binding capacity. Co-clusteringof cargo proteins and GSLs generates mechanical stress to which themembrane responds by forming endocytic invaginations. See discussion forfurther details.
different cell types (TECs versus MEFs, respectively), this overlap listmay represent an underestimation of candidate proteins whose uptakemight be mediated by Gal3.
On the basis of the fluid-phase uptake results, we concludethat Gal3 directly drives the biogenesis of a fraction of CLICs.At the same time, these experiments indicate that not all CLICformation is dependent on Gal3. Other galectins could be alternativebiochemical drivers, as exemplified here for Gal4. Whether additionalclasses of lectins or sphingolipid-interacting proteins also contributeremains to be addressed. Furthermore, actin-driven mechanisms ofglycolipid clustering, as described for GPI-anchored proteins50, couldin principle also generate endocytic nanoenvironments similar to theones described here.
Various studies have reported on stimulatory and inhibitory effectsof galectins on endocytosis23,51–55. Our finding that CD44 uptake isstimulated at serum-level concentrations of Gal3, but inhibited withGal3 concentrations that are several orders of magnitude above serumlevels provides an explanation for these apparently contradictory re-ports. Our model predicts that protein glycosylation and GSL expres-sion contribute to setting the domain boundary between regimes ofendocytic nanocluster formation (as described here), and the forma-tion of extended lattices leading to inhibition of internalization23.
In conclusion, we here propose a mechanism in which Gal3functions like an endocytic adaptor that drives the clathrin-independent biogenesis of endocytic pits by linking glycosylated cargoproteins and GSLs into compositionally defined nanoenvironments atthe plasma membrane. �
METHODSMethods and any associated references are available in the onlineversion of the paper.
Note: Supplementary Information is available in the online version of the paper
ACKNOWLEDGEMENTSWe would like to thank the following people for help in experiments, providingmaterials or expertise: P. Bassereau, L. Cabanié, P. Chavrier, B. Hofmann, H. Ideo,
A. Raz, W. Römer, C. Schiff and T. Wollert. The facilities as well as scientific andtechnical assistance from staff in the Australian Microscopy and MicroanalysisFacility (AMMRF) at the Centre for Microscopy and Microanalysis at TheUniversity of Queensland, the Australian Cancer Research Foundation (ACRF)-Institute for Molecular Bioscience Dynamic Imaging Facility for Cancer Biology,the Biomedical Imaging Facility at UNSW and the PICT-IBiSA-Nikon ImagingCentre of Institut Curie with support from FRM (AAP ‘Grand Equipement’ 2011number DGE20111123020), Inca (Number 2011-1-Label-SALAMERO IC 4) andthe ‘CanNoli project’ supported by the DIM Canceropole-IdF (number 2012-2-EML-04) are acknowledged. This work was supported by grants from the NationalHealth and Medical Research Council of Australia (1037320, R.G.P. and K.G.;1045092, R.G.P., N.A. and M.T.H.), the Agence Nationale pour la Recherche (ANR-09-BLAN-283 and ANR-11 BSV2 014 03, L.J.), the Indo-French Centre for thePromotion of Advanced Science (project number 3803, L.J.), Marie Curie Actions—Networks for Initial Training (FP7-PEOPLE-2010-ITN, L.J.), European ResearchCouncil (project 340485, L.J.), fellowships from Association pour la Recherche surle Cancer (R.L.), Marie Curie International Reintegration Grant (FP7-RG-277078,C.W.), and Deutsche Forschungsgemeinschaft (U.B.). The L.J. team is a member ofLabex CelTisPhyBio.
AUTHOR CONTRIBUTIONSR.L., C.W. and U.B.: experimental design, method development and acquisition ofmajor data sets; U.B. and D.L.: protein MS; C.W.: guidance, and participated inmanuscript writing; M.T.H. and S.A.: electron microscopy—acquisition and dataanalysis; C.B. and K.G.: super-resolution microscopy; S.S. and A.S.: lipid analysis;N.A.: data analysis for electron microscope tomography; C.L.: technical supportand conceptual advice; V.C.: experimental support; R.G.P.: electron microscopy—study design, provided direction and guidance; L.J.: original conception of thestudy, provided direction and guidance, and wrote initial draft. All authors revisedthe manuscript.
COMPETING FINANCIAL INTERESTSThe authors declare no competing financial interests.
Published online at www.nature.com/doifinder/10.1038/ncb2970Reprints and permissions information is available online at www.nature.com/reprints
1. Mayor, S. & Pagano, R. E. Pathways of clathrin-independent endocytosis. Nat. Rev.Mol. Cell. Biol. 8, 603–612 (2007).
2. Howes, M. T., Mayor, S. & Parton, R. G. Molecules, mechanisms, and cellular rolesof clathrin-independent endocytosis. Curr. Opin. Cell Biol. 22, 519–527 (2010).
3. Hansen, C. G. & Nichols, B. J. Molecular mechanisms of clathrin-independentendocytosis. J. Cell Sci. 122, 1713–1721 (2009).
4. Donaldson, J. G., Porat-Shliom, N. & Cohen, L. A. Clathrin-independent endocytosis:a unique platform for cell signaling and PM remodeling. Cell. Signal. 21, 1–6 (2009).
5. Sandvig, K., Pust, S., Skotland, T. & van Deurs, B. Clathrin-independent endocytosis:mechanisms and function. Curr. Opin. Cell Biol. 23, 413–420 (2011).
6. Lajoie, P. & Nabi, I. R. Lipid rafts, caveolae, and their endocytosis. Int. Rev. Cell.Mol. Biol. 282, 135–163 (2010).
NATURE CELL BIOLOGY ADVANCE ONLINE PUBLICATION 11
© 2014 Macmillan Publishers Limited. All rights reserved.
ART ICLES
7. Sabharanjak, S., Sharma, P., Parton, R. G. & Mayor, S. GPI-anchored proteinsare delivered to recycling endosomes via a distinct cdc42-regulated, clathrin-independent pinocytic pathway. Dev. Cell 2, 411–423 (2002).
8. Howes, M. T. et al. Clathrin-independent carriers form a high capacity endocyticsorting system at the leading edge of migrating cells. J. Cell Biol. 190,675–691 (2010).
9. Eyster, C. A. et al. Discovery of new cargo proteins that enter cells through clathrin-independent endocytosis. Traffic 10, 590–599 (2009).
10. Naslavsky, N., Weigert, R. & Donaldson, J. G. Convergence of non-clathrin-and clathrin-derived endosomes involves Arf6 inactivation and changes inphosphoinositides. Mol. Biol. Cell 14, 417–431 (2003).
11. Lamaze, C. et al. Interleukin 2 receptors and detergent-resistant membrane domainsdefine a clathrin-independent endocytic pathway. Mol. Cell 7, 661–671 (2001).
12. Saint-Pol, A. et al. Clathrin adaptor epsinR is required for retrograde sorting on earlyendosomal membranes. Dev. Cell 6, 525–538 (2004).
13. Montesano, R., Roth, J., Robert, A. & Orci, L. Non-coated membrane invaginationsare involved in binding and internalization of cholera and tetanus toxins. Nature 296,651–653 (1982).
14. Kirkham, M. et al. Ultrastructural identification of uncoated caveolin-independentearly endocytic vehicles. J. Cell Biol. 168, 465–476 (2005).
15. Ewers, H. et al. GM1 structure determines SV40-induced membrane invaginationand infection. Nat. Cell Biol. 12, 11–18 (2010).
16. Leffler, H., Carlsson, S., Hedlund, M., Qian, Y. & Poirier, F. Introduction to galectins.Glycoconj. J. 19, 433–440 (2004).
17. Nakahara, S. & Raz, A. On the role of galectins in signal transduction. MethodsEnzymol. 417, 273–289 (2006).
18. Delacour, D., Koch, A. & Jacob, R. The role of galectins in protein trafficking. Traffic10, 1405–1413 (2009).
19. Boscher, C., Dennis, J. W. & Nabi, I. R. Glycosylation, galectins and cellular signaling.Curr. Opin. Cell Biol. 23, 383–392 (2011).
20. Ahmad, N. et al. Galectin-3 precipitates as a pentamer with synthetic multivalentcarbohydrates and forms heterogeneous cross-linked complexes. J. Biol. Chem. 279,10841–10847 (2004).
21. Lepur, A., Salomonsson, E., Nilsson, U. J. & Leffler, H. Ligand induced galectin-3self-association. J. Biol. Chem. 287, 21751–21756 (2012).
22. Dennis, J. W., Nabi, I. R. & Demetriou, M. Metabolism, cell surface organization, anddisease. Cell 139, 1229–1241 (2009).
23. Partridge, E. A. et al. Regulation of cytokine receptors by Golgi N-glycan processingand endocytosis. Science 306, 120–124 (2004).
24. Dumic, J., Dabelic, S. & Flogel, M. Galectin-3: an open-ended story. Biochim.Biophys. Acta 1760, 616–635 (2006).
25. Takenaka, Y., Fukumori, T. & Raz, A. Galectin-3 and metastasis. Glycoconj. J. 19,543–549 (2004).
26. Chiu, C. G. et al. Diagnostic utility of galectin-3 in thyroid cancer. Am. J. Pathol.176, 2067–2081 (2010).
27. Delacour, D. et al. Galectin-4 and sulfatides in apical membrane trafficking inenterocyte-like cells. J. Cell Biol. 169, 491–501 (2005).
28. Mishra, R., Grzybek, M., Niki, T., Hirashima, M. & Simons, K. Galectin-9 traffickingregulates apical-basal polarity in Madin-Darby canine kidney epithelial cells. Proc.Natl Acad. Sci. USA 107, 17633–17638 (2010).
29. Hirabayashi, J. et al. Oligosaccharide specificity of galectins: a search by frontalaffinity chromatography. Biochim. Biophys. Acta 1572, 232–254 (2002).
30. Collins, P. M., Bum-Erdene, K., Yu, X. & Blanchard, H. Galectin-3 interactions withglycosphingolipids. J. Mol. Biol. 426, 1439–1451 (2014).
31. Ravindran, M. S., Tanner, L. B. & Wenk, M. R. Sialic acid linkage inglycosphingolipids is a molecular correlate for trafficking and delivery of extracellularcargo. Traffic 14, 1182–1191 (2013).
32. Proia, R. L. Glycosphingolipid functions: insights from engineered mouse models.Phil. Trans. R. Soc. Lond. B 358, 879–883 (2003).
33. Furukawa, K., Tokuda, N., Okuda, T. & Tajima, O. Glycosphingolipids in engineeredmice: insights into function. Semin. Cell. Dev. Biol. 15, 389–396 (2004).
34. Kolter, T. & Sandhoff, K. Principles of lysosomal membrane digestion: stimulationof sphingolipid degradation by sphingolipid activator proteins and anionic lysosomallipids. Annu. Rev. Cell. Dev. Biol. 21, 81–103 (2005).
35. Ichikawa, S., Nakajo, N., Sakiyama, H. & Hirabayashi, Y. A mouse B16 melanomamutant deficient in glycolipids. Proc. Natl Acad. Sci. USA 91, 2703–2707 (1994).
36. Iurisci, I. et al. Concentrations of galectin-3 in the sera of normal controls and cancerpatients. Clin. Cancer Res. 6, 1389–1393 (2000).
37. Koca, S. S. et al. Serum galectin-3 level in systemic sclerosis. Clin. Rheumatol. 33,215–220 (2014).
38. Cederfur, C. et al. Different affinity of galectins for human serum glycoproteins:galectin-3 binds many protease inhibitors and acute phase proteins. Glycobiology18, 384–394 (2008).
39. Nieminen, J., Kuno, A., Hirabayashi, J. & Sato, S. Visualization of galectin-3oligomerization on the surface of neutrophils and endothelial cells using fluorescenceresonance energy transfer. J. Biol. Chem. 282, 1374–1383 (2007).
40. Ochieng, J., Leite-Browning, M. L. & Warfield, P. Regulation of cellular adhesion toextracellular matrix proteins by galectin-3. Biochem. Biophys. Res. Commun. 246,788–791 (1998).
41. English, N. M., Lesley, J. F. & Hyman, R. Site-specific de-N-glycosylation of CD44can activate hyaluronan binding, and CD44 activation states show distinct thresholddensities for hyaluronan binding. Cancer Res. 58, 3736–3742 (1998).
42. Ponta, H., Sherman, L. & Herrlich, P. A. CD44: from adhesion molecules to signallingregulators. Nat. Rev. Mol. Cell. Biol. 4, 33–45 (2003).
43. Velasco, S. et al. Neuronal galectin-4 is required for axon growth and for theorganization of axonal membrane L1 delivery and clustering. J. Neurochem. 125,49–62 (2013).
44. Ideo, H., Seko, A., Ohkura, T., Matta, K. L. & Yamashita, K. High-affinity bindingof recombinant human galectin-4 to SO(3(-) → 3Galβ1 → 3GalNAc pyranoside.Glycobiology 12, 199–208 (2002).
45. Griffiths, G., Back, R. & Marsh, M. A quantitative analysis of the endocytic pathwayin baby hamster kidney cells. J. Cell Biol. 109, 2703–2720 (1989).
46. Römer, W. et al. Shiga toxin induces tubular membrane invaginations for its uptakeinto cells. Nature 450, 670–675 (2007).
47. Margadant, C., Monsuur, H. N., Norman, J. C. & Sonnenberg, A. Mechanisms ofintegrin activation and trafficking. Curr. Opin. Cell Biol. 23, 607–614 (2011).
48. Janik, M. E., Litynska, A. & Vereecken, P. Cell migration-the role of integringlycosylation. Biochim. Biophys. Acta 1800, 545–555 (2011).
49. Wang, X. Q., Sun, P. & Paller, A. S. Inhibition of integrin-linked kinase/protein kinaseB/Akt signaling: mechanism for ganglioside-induced apoptosis. J. Biol. Chem. 276,44504–44511 (2001).
50. Goswami, D. et al. Nanoclusters of GPI-anchored proteins are formed by corticalactin-driven activity. Cell 135, 1085–1097 (2008).
51. Furtak, V., Hatcher, F. & Ochieng, J. Galectin-3 mediates the endocytosis of beta-1 integrins by breast carcinoma cells. Biochem. Biophys. Res. Commun. 289,845–850 (2001).
52. Fajka-Boja, R. et al. Co-localization of galectin-1 with GM1 ganglioside in thecourse of its clathrin- and raft-dependent endocytosis. Cell. Mol. Life Sci. 65,2586–2593 (2008).
53. Gao, X. et al. The two endocytic pathways mediated by the carbohydrate recognitiondomain and regulated by the collagen-like domain of galectin-3 in vascularendothelial cells. PLoS ONE 7, e52430 (2012).
54. Lepur, A. et al. Galectin-3 endocytosis by carbohydrate independent and dependentpathways in different macrophage like cell types. Biochim. Biophys. Acta 1820,804–818 (2012).
55. Zappelli, C., van der Zwaan, C., Thijssen-Timmer, D. C., Mertens, K. & Meijer, A.B. A novel role for galectin-8 as a mediator of coagulation factor V endocytosis bymegakaryocytes. J. Biol. Chem. 287, 8327–8335 (2012).
12 NATURE CELL BIOLOGY ADVANCE ONLINE PUBLICATION
© 2014 Macmillan Publishers Limited. All rights reserved.

DOI: 10.1038/ncb2970 METHODS
METHODSMaterials. DNA constructs were verified by sequencing. The human Gal3construct (pGEX–6p–Gal3) was obtained from A. Raz56 (Detroit, USA). Alist of DNA constructs, primers and siRNAs is provided in SupplementaryTable 5. Antibodies: Gal3 (BD Pharmingen, number 556904, 1:500 and SantaCruz, sc-20157, 1:200), EEA1 (Santa Cruz Biotechnology, sc-6415, 1:100), TfR(Zymed Laboratories, clone H68.4, number 13-6890, 1:200), mouse CD44(Novus Biological, clone 5035-41.1D, NB100-65905 and Abcam, ab119863,10 µgml−1 (immunofluorescence), 0.2 µgml−1 for western blotting), humanCD44 (Novus Biological, clone Hermes-1, NBP2-22530, 1:500), α5-integrin(Millipore AB1928, 1:2,000 on methanol-fixed cells), β1-integrin (for westernblot: gift from P. Chavrier, Institute Curie, France; for immunofluorescence: BDPharmingen, clone 9EG7, #550531, 1:30), dynamin (Upstate, clone Hudy1, number05-319, 1:100), actin (Sigma-Aldrich, clone AC-74, A5316, 1:5000). Recombinantproteins (final concentration): CTxB–Alexa488 (0.5 µgml−1), CTxB–Alexa555(10 µgml−1, Invitrogen), Gal3–Cy3, Gal3–Alexa647, Gal3–Alexa488–His, Gal3-R186S–Cy3His (1–5 µgml−1), Gal3–HRP (10 µgml−1), Gal4–Cy3 (5 µgml−1),STxB–Cy3 (2 µgml−1, ref. 57), Tf–Alexa488/555/647 (10 µgml−1 Invitrogen).All lipids were purchased from Avanti Polar Lipids (Alabaster), except lipidstandards for shotgun lipidomics from Matreya LLC (Pleasant Gap). Otherchemicals were purchased from Sigma-Aldrich and were of ACS or LC-MS gradefor lipidomics.
Recombinant expression, purification and labelling. Gal3 and Gal4 proteinswere found by size-exclusion chromatography to be monomeric. Gal3–GST-containing plasmid (pGEX-6p-Gal3) was grown in Escherichia coli BL21 using 2xYTmedium. Protein expression was induced at D600 nm = 0.8 with 0.5mM IPTG at21 ◦C overnight. The cell pellet was resuspended in ice-cold PBS containing proteaseinhibitor cocktail and 5mM lactose. Bacteria were sonicated and adjusted to 1%Triton X-100 for further gentle agitation (30min, 4 ◦C). The supernatant (15,000g ,10min, 4 ◦C) was incubated with glutathione Sepharose (GE Healthcare) for 1 hat 4 ◦C. Beads were washed twice with PBS and PreScission cleavage buffer andincubated with PreScission protease (GE Healthcare) at 4 ◦C overnight (30 µl ofprotease and 470 µl of cleavage buffer per millilitre of beads). The supernatantcontaining Gal3 was dialysed against PBS twice to remove glutathione and lactose.SDS–PAGE and Coomassie staining showed purity above 90%.
For Cy3 labelling, Gal3 (2mgml−1) was dialysed against 5mM lactose in PBS.Amine-reactive (NHS-ester) Cy3 (GE Healthcare) or Alexa488/647 (Invitrogen)was added to the protein in a molar ratio of 9:1, and the reaction was incubatedfor 1 h at 21 ◦C with agitation. The mixture was purified using PD-10 columns(GE Healthcare).
His-tagged Gal3 (pHis2Parallel) and Gal3-R186S were expressed in Rossetta2-pLysS strains (Novagen) in LB media, supplemented with 60 µM IPTG at 20 ◦Covernight. 95% purity by Coomassie staining was achieved using Cobalt-resin(Pierce) affinity chromatography and gel filtration (Superdex75 16x60). Purificationbuffers were PBS at pH 7.4, or 0.2M bicarbonate buffer at pH 9.4 with 10%glycerol if subsequent coupling with HRP was planned. Alexa488 succinimidylester (Invitrogen) coupling to His-tagged Gal3 was performed as recommended byInvitrogen. If required, the 6xHis tag was removed by incubation with TEV protease(1 µg per 100 µg protein) at 4 ◦C overnight, and target proteins were subsequentpurified by FPLC-gel filtration.
Periodate-activated horseradish peroxidase (HRP; Pierce) coupling to His-taggedGal3was performed for 1 h at 21 ◦C in 0.2Mbicarbonate buffer at pH9.4, 10%glycerol at a molar ratio of 1:8. To separate HRP, Gal3 and Gal3–HRP, gel filtrationchromatography was performed using a Superdex75 10×30 column. Gal3–HRP in50% glycerol was snap-frozen for further usage.
Gal4–His (pQE-9, gift from H. Ideo, Tokyo Institute of Technology, Japan) wasgrown in M15 (pREP4) in LB media and precultured at 30 ◦C. Protein expressionwas induced with 10 µMIPTG at 16 ◦C overnight, bacterial pellets were resuspendedin 25mM HEPES at pH 7.4, 300mM NaCl, 10mM imidazole, 10% glycerol (bufferA), and sonicated. The lysate was adjusted to 5% ELUGENT (w/v, Merck), keptagitating for 30min at 4 ◦C, and cleared by centrifugation at 75,000g for 1 h. 95%purity by Coomassie staining was achieved using Cobalt-resin (Pierce) affinitychromatography (wash buffer: buffer A + 1% ELUGENT; elution buffer: 25mMHEPES at pH 7.4, 300mMNaCl, 20mM trehalose, 0.2% (w/v) PEG8000+ 300mMimidazole) and gel filtration (Superdex75 16×60). Fluorescence labelling and snap-freezing were performed in elution buffer without imidazole. Gal4 was coupled at4 ◦C overnight to periodate-activated HRP in 0.2M bicarbonate buffer at pH 9.4,300mMNaCl, 10% glycerol, 10mM lactose, 20mM trehalose, 0.2% (w/v) PEG8000,and purified by gel filtration in the same buffer without lactose.
GST–GFP–His (pGEX4T-1) preferentially exists as a dimer and was expressedovernight at 25 ◦C in Rossetta2-pLysS strains in LBmedia, supplementedwith 10 µMIPTG. 95% purity by Coomassie staining was achieved using Cobalt-resin affinitychromatography and gel filtration (Superdex75 16x60) in PBS.
Cell culture, transfection and treatments. TECs, HeLa cells and MEFs werecultured in Dulbecco’s modified Eagle medium (DMEM), supplemented with 10%fetal bovine serum (FBS), 1mMsodiumpyruvate, and 2mMglutamine (Invitrogen).Wild-type MEFs were immortalized as previously described58. MEB4, GM95 andCG1 cells were cultured in the same media but with 5% FBS. HeLa cells weretransfected 24 h after plating with Fugene6 (Roche). TECs were transfected byelectroporation using the ElectroBuffer kit (Cell Projects) and Gene Pulser-II(BioRad) at 200V and 975mF with 4mm cuvettes (DNA-cell volume: 250 µl)according to the manufacturer’s instructions.
GSL depletion of cells was achieved by incubation with 5 µM D,L-threo-1-phenyl-2-palmitoylamino-3-morpholino-1-propanol (PPMP, Enzo Life Sciences)for 6–14 days (MEFs and HeLa cells: 6 days, TECs: 14 days). ATP depletion wasinitiated 30min before incubation with Gal3. Cells were incubated for 30minat 37 ◦C in ATP-depletion media composed of PBS++ (PBS + 0.5mM CaCl2,0.5mM MgCl2), 10mM 2-deoxy-D-glucose, and 10mM NaN3. Cells were kept inATP-depletion media for subsequent manipulation. For competition experimentswith free sugars, cells were incubated for 30min in serum-free media beforetreatment with 0.1M sucrose or 0.1M lactose for 20min. The sugars were keptthroughout subsequent incubation steps. Cells were pre-treated with latrunculin A(10–20min, 1 µMonMEFs, 2 µMonTECs), 12.5 µgml−1 tunicamycin (24 h), 10 µMdynoles 31-2 or 34-2 (20min), 10 µgml−1 kifunensine (48 h, 2% FBS), 90 µgml−11-deoxymannojirimycin (48 h, 2% FBS), or 2µgml−1 swaionsonine (48 h, 2% FBS)before endocytosis or binding assays. Depletion ofGal3 and/or clathrinwas achievedafter transfection of siRNA using HiPerfect, according to the manufacturer’sinstructions, and incubation for 48 to 72 h (Supplementary Table 3). In the case ofGal3 and GSL depletion, treatment with PPMP was initiated 3 days before siRNAtransfection. Inhibitors were present throughout subsequent manipulation.
Immunofluorescence. MEFs, TECs or HeLa cells were washed with PBS++ twiceand incubated with Gal3–Cy3, CTxB–Alexa488/555, and/or Tf–Alexa647 for theindicated periods of time in serum-freemediumon ice or at 37 ◦C.Unboundproteinswere removed by two washes with PBS++. Where indicated, cell-surface-exposedmarkers were removed by 3× 30 s washes with ice-cold 0.5M glycine at pH 2.2,including in some cases 200mM lactose. Cells were fixed with 4% PFA (or −20 ◦Cmethanol for α5-integrin), permeabilized and labelled with indicated primary andsecondary antibodies. Samples were imaged by confocal microscopy with ×60or ×40 oil immersion objectives. For quantification, images were backgroundsubtracted, cellular regions were marked, and the total fluorescence intensity wasmeasured in these regions using ImageJ. Intensities were normalized separately tothe untreated control sample of each marker. Co-localization between markers wascalculated as Manders’ coefficients using ImageJ’s co-localization plugin (NIH).
Endocytosis assays. For immunofluorescence, MEFs, TECs or HeLa cells wereincubated in fresh growth media for 30min and subsequently with anti-CD44antibodies (10 µgml−1), anti-β1-integrin antibodies (1 µgml−1) and/or Tf–Alexa633(10 µgml−1) for the indicated periods of time in growth medium on ice or at 37 ◦C.Cell-surface-exposed markers were removed by 3× 30 s washes with ice-cold 0.5Mglycine at pH 2.2 (for quantification of endocytosis), or cells were left untreated(for quantification of surface levels). Cells were then washed, fixed (2% PFA for60min), permeabilized (1mgml−1 saponin, 10min), blocked (3× 10min in 0.2%BSA, 0.2% fish skin gelatine in PBS), and labelled with fluorophore-conjugatedsecondary antibodies. Samples were imaged and total fluorescence intensities werequantified as described above. In the case of HA–CD44 WT and HA–CD44 5xN-Glyc mt endocytosis, we expressed the human constructs in MEFs and used thehuman-specific anti-CD44 antibody (clone Hermes-1) for uptake experiments.
For biochemistry, indicated cell lines were plated on coverslips in growth medi-um containing 5% FBS to reach 80% confluence. Cells were placed in fresh growthmedia for 30min. Coverslips were incubated for 10min at 37 ◦C upside-downwith anti-CD44–FITC antibody (10 µgml−1) in growth medium containing 15mMHEPES at pH 7.3. Cell-surface-exposed antibodies were removed by 3× 30 s washeswith ice-cold 0.5M glycine at pH 2.2. Cells were washed, collected using trypsin–EDTA, and kept on ice after addition of protease inhibitors. The cell pellet was re-suspended in non-reducing sample buffer, boiled and analysed by SDS–PAGE. Anti-CD44–FITC antibody was detected using the ChemiDoc Gel imaging system (Bio-Rad). Fluorescent bands were background subtracted and quantified using ImageJ.
dSTORM imaging and data processing. See Supplementary Note 1.
Electronmicroscopy.Cells were pulsed for 2min at 37 ◦Cwith 10mgml−1 HRP or10 µgml−1 Gal3–HRP, cooled in ice-cold CO2-independentmedia before incubationwith ice-cold 10mgml−1 3,3′-diaminobenzidine (DAB) with or without 50mMascorbic acid for 10min, followed by a second wash in DAB, 0.012% H2O2 withor without ascorbic acid for 20min. Cells were washed 3× in CO2-independentmedia before fixation in 2.5% glutaraldehyde (ProSciTech). For ATP depletion
NATURE CELL BIOLOGY
© 2014 Macmillan Publishers Limited. All rights reserved.

METHODS DOI: 10.1038/ncb2970
experiments, cells were fixed before DAB reaction. Fixed samples were contrastedwith 1% osmium tetroxide (ProSciTech), 2% uranyl acetate (ProSciTech) and weredehydrated in ethanol before embedding in LX-112 epoxide resin (ProSciTech).For quantification of HRP-positive carriers per cell, samples were sectioned inan ultramicrotome (Leica), and 20–25 cells per condition analysed across twoindependent experiments. HRP-positive carriers were grouped into tubular/ring-shaped elements (CLICs), clathrin-coated vesicles (80–120 nm diameter), andcaveolae (40–60 nm diameter).
For electron microscope tomography, 280 nm sections were cut and dual-axistilt-series captured from ± 60◦ at 2 ◦ increments on a Tecnai F30 microscope(FEI Company) with an accelerating voltage of 300 keV. Tilt-series were imagedusing a Direct Electron LC-1100 4K by 4K camera at a binning of 2, usingthe microscope control program serialEM. Reconstructions were completed usingweighted back-projection in the software program IMOD. Segmentation analysiswas performed as described previously59, with the exception that membranes andcytoskeleton were manually segmented for each 5–10 slices and auto-interpolatedbetween manually inserted contours, using the interpolator function in IMOD.
Proteinase K treatment. TECs were washed with 20mM HEPES at pH 7.4,150mM NaCl, 5mM CaCl2 and incubated for 5min at 37 ◦C in the same buffersupplemented with 50 µgml−1 proteinase K (Ambion). Proteinase digestion wasquenched by one wash with ice-cold PBS and twice with PBS containing 2mMphenylmethylsulphonyl fluoride and 2mMEGTA. Protease inhibitors were removedby two washes with 20mM HEPES at pH 7.3, 75mM NaCl, 5mM KCl, 0.5mMMgCl2, 0.5mM CaCl2, 0.45mgml−1 glucose, 0.45mgml−1 albumin. Cells were kepton ice for 20min for plasmamembrane binding ofGal3 andCTxB in the same buffer,washed with ice-cold PBS, fixed in 4% PFA, 0.2% glutaraldehyde for 10min on ice,and for 20min at 21 ◦C.
Mass spectrometry and pulldown. TECs were washed with PBS++ and incubatedin lactose buffer (20mM HEPES at pH 7.2, 200mM lactose, 45mM NaCl, 5mMKCl, 1mMMgCl2, 1mM CaCl2) for 10min at 4 ◦C to remove endogenous, surface-bound Gal3. Cells were extensively washed with PBS++ and subsequently incubatedin PBS++ (negative control) or in PBS++ containing 2 µgml−1 Gal3–His (45min,4 ◦C). After rinsing twice with PBS, cells were lysed in PBS supplemented with20mM imidazole, 0.5% Triton X-100, 0.5% NP-40 and protease inhibitor cocktail(lysis buffer). Cleared lysates (16,100g , 10min, 4 ◦C) were incubated with NiNTA-Sepharose (Qiagen) (1 h, 4 ◦C) and washed with lysis buffer (without proteaseinhibitors). Gal3 binding partners were eluted with PBS + 200mM lactose andfurther processed for analysis by mass spectrometry or SDS–PAGE. For proteindeglycosylation, eluates were adjusted to 10mM βmercaptoethanol and 0.02% SDS,denatured at 95 ◦C for 5min and after cooling incubated with 42Uml−1 PNGase Ffor 2 h at 37 ◦C.
Proteins precipitated from 10mg total proteinweremigrated on SDS–PAGE gels.Excised gel slices were washed and proteins were reduced with 10mM dithiothreitolbefore alkylation with 55mM iodoacetamide. After washing and shrinking of thegel pieces with 100% acetonitrile, in-gel digestion was performed using trypsin(Sequencing GradeModified) overnight in 25mMammonium bicarbonate at 30 ◦C.We achieved peptide concentration and separation using an actively split capillaryhigh-performance liquid chromatography (HPCL) system (Ultimate 3000 system)connected to an LTQ Orbitrap XL mass spectrometer (Thermo Scientific). Themass spectrometer was set to acquire a single MS scan followed by up to five data-dependent scans (dynamic exclusion repeat count of 1, repeat duration of 30 s,exclusion duration of 300 s and lock-mass optionwas enabled). The resulting spectrawere analysed using theMascot Software createdwith ProteomeDiscoverer (version:1.2.0.92, Thermo Scientific) using the NCBInrMusmusculus (housemouse) ProteinDatabase (2012 04 02, 144149 sequences). The resulting Mascot result files werefurther processed using myProMS (ref. 60). The estimated false discovery rate ofall peptide and protein identifications was less than 1%, by automatically filtering onpeptide length, mass error and Mascot score of all peptide identifications.
Shotgun lipidomics. For lipid extraction, to 1ml cell suspension (equivalent to6.5mgml−1 and 6.9mgml−1 of the total protein content for TECs and MEF cells,respectively) 10ml of chloroform/methanol/water (4:8:3, v/v/v; ref. 61) was added.The mixture was extracted for 30min at 21 ◦C, centrifuged, and the supernatanttransferred to a glass vial. The pellet was re-extracted with another 5ml of thechloroform/methanol/water mixture. The combined supernatants were dried in avacuum centrifuge (Jouan RC1022, Thermo Fisher Scientific).
Two-phase partitioning was performed as described previously62 withminormodifications. Four millilitres of di-isopropyl ether/1-butanol (6:4, v/v) was addedto the dried extract, vortexed and sonicated, followed by adding 2ml 50mM NaCl(aq.). The mixture was again vortexed and sonicated for several minutes and thencentrifuged to separate the phases. The upper organic phase was transferred to aglass vial and saved for subsequent alkaline hydrolysis. The lower aqueous phase was
re-extracted with 4ml of di-isopropyl ether/1-butanol (6:4, v/v), vortexed, sonicatedfor several minutes and centrifuged. The organic phase was removed and saved forsubsequent alkaline hydrolysis. Aqueous phases from both extraction steps werepooled, dried in a vacuum centrifuge, and re-dissolved in 1ml methanol/water(1:1, v/v) with vortexing and sonication.
For recovery of gangliosides by solid phase extraction, aqueous phase collectedafter two-phase partitioning was cleaned-up by solid-phase extraction63. SupelcleanLC-18 SPE columns (Supelco) were successively preconditioned with 10mlmethanol, 20ml chloroform/methanol (2:1, v/v), 10ml methanol, and 20mlmethanol/water (1:1, v/v). The aqueous phase was loaded onto the column. Thecolumn was washed with 40ml H2O, and gangliosides were eluted with 2mlmethanol and 10ml chloroform/methanol (1:1, v/v) mixture. The gangliosidefraction was dried and re-dissolved in 150 µl of chloroform/methanol (1:1, v/v).
For alkaline hydrolysis of the organic phase, 1ml of 0.2M NaOH in methanolwas added to the dried sample, incubated at 30 ◦C for 120min and neutralized byadding 8 µl of acetic acid. Chloroform (1ml) and water (2ml) were added and themixture vortexed for 1 h at 21 ◦C. The lower organic phase was transferred to a glassvial, dried in a vacuum centrifuge and re-dissolved in 150 µl chloroform/methanol(2:1, v/v).
Thin-layer chromatography was performed on Silica gel 60 F254 plates(20×20 cm; Sigma-Aldrich) in chloroform/methanol/CaCl2 (65:35:8) and stainedwith 20% H2SO4.
For lipid analysis by shotgun mass spectrometry, 2 µl aliquots of the cell extractsprepared as described above were 160-fold diluted with 7.5mM ammonium acetatein 2-propanol for positive-mode analyses and 20-fold with 0.05% triethylamine inmethanol for negative-mode analyses. The total ganglioside extract (Avanti PolarLipids) used as a reference was dissolved in chloroform/methanol/water (65:35:8,v/v) at the concentration of 1mgml−1 and diluted 100-fold for analyses in positiveand negative modes.
Shotgun lipidomics analyses were performed on a Q Exactive mass spectrometer(Thermo Fisher Scientific) equipped with a robotic nanoflow ion source TriVersaNanoMate (Advion BioSciences). FT MS spectra were acquired for 1min withinthe range of m/z 450–1750 at the target mass resolution of R= 140,000 (full-width at half-maximum at m/z 200) and automated gain control (AGC) of1×106. Lipid species were identified using LipidXplorer software64 by their m/zdetermined in MS survey scans with better than 3 ppm accuracy and a signal tonoise ratio above the value of 3.0. The molecular fragmentation query language(MFQL) queries required for the lipid identification are available at the LipidXplorerwiki site at https://wiki.mpi-cbg.de/lipidx/Main_Page. Lipid loadings were adjustedaccording to the total protein content determined by the BCA protein assay (Pierce).Species of the following lipid classes were monitored: sphingomyelins, ceramides,hexosylceramides, di-hexosylceramides, GA2, GA1/Gb4 (were not distinguishedbecause they have identical masses), Gb3, GD1, GM3, GM2, GM1, GT1, GD3, GD2,GT3, GT2, GQ1, GP1, sulphatides, Forssman antigen.
To confirm the identity of thin-layer chromatography bands, they were scrapedfrom the unstained plate and extractedwith 500 µl of chloroform/methanol (2:1, v/v)for 20min at room temperature. After centrifugation for 15min at 4 ◦C thesupernatant was carefully collected, transferred into a glass vial and dried under anitrogen stream. The dried sample was re-suspended in 100 µl chloroform/methanol(2:1, v/v) and analysed as described above.
Model membrane studies. GUVs were prepared essentially as describedpreviously65. A thin film of lipid mixtures (2mgml−1) containing POPC(56.9mol%), cholesterol (20mol%), sphingomyelin (12mol%), POPS (3mol%),GSL-mix (5mol%), Ni-NTA-DOGS (3mol%) and lissamine-rhodamine-PE(0.1mol%) was applied to glass slides covered with indium-tin oxide (DeltaTechnologies) and placed into a custom-made Teflon chamber. The GSLmix was atotal ganglioside extract from porcine brain and contained the trisialogangliosideGT1b (44.5%), disialogangliosides GD1a (33%), GD1b (8%) and GD1bL (7%),and monosialogangliosides GM1 (6.5%), GM2 (0.66%) and GM3 (0.33%). Theglass slides were separated by a 2mm thin sucrose solution (600mM). An electrica.c. field (0.389VRMS, 10Hz) was applied for 2.5 h at 65 ◦C following the previouslydescribed GUV electroformation protocol66. Liposomes were collected after coolingto 21 ◦C and used immediately. A 200 µl observation chamber (Lab-Tek chambered#1.0 borosilicate) was coated using 2mgml−1 BSA to avoid distortion of GUVs oncontact with the chamber and rinsed with imaging buffer (10mM HEPES at pH7.2, 590mM glucose). One hundred microlitres of GUVs in 600mM sucrose wasmixed with 100 µl of Gal3–His, Gal3-R186S–His, Gal3-R186S or GFP–GST–Hisin imaging buffer to yield 200 nM (that is, 5 µgml−1 of Gal3–His, respectively)final concentrations in 300mM sucrose. The buffer and proteins added to GUVsmatched the osmolarity of the GUV solution. The solution was stirred to accelerateprotein distribution and binding. A buffer control was performed for eachexperiment. This control was treated exactly the same as the actual experiment;however, only buffer and no recombinant protein was added. Images were taken in
NATURE CELL BIOLOGY
© 2014 Macmillan Publishers Limited. All rights reserved.
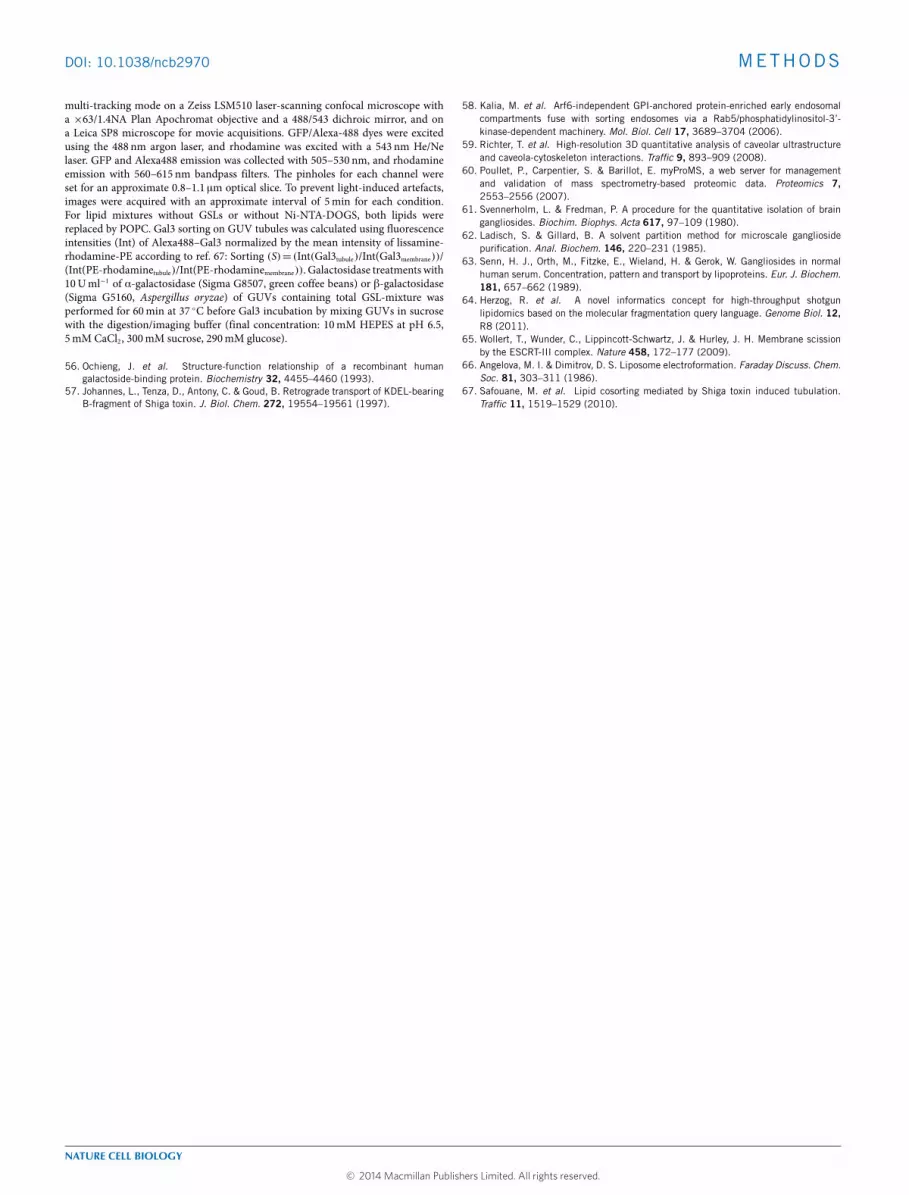
DOI: 10.1038/ncb2970 METHODS
multi-tracking mode on a Zeiss LSM510 laser-scanning confocal microscope witha ×63/1.4NA Plan Apochromat objective and a 488/543 dichroic mirror, and ona Leica SP8 microscope for movie acquisitions. GFP/Alexa-488 dyes were excitedusing the 488 nm argon laser, and rhodamine was excited with a 543 nm He/Nelaser. GFP and Alexa488 emission was collected with 505–530 nm, and rhodamineemission with 560–615 nm bandpass filters. The pinholes for each channel wereset for an approximate 0.8–1.1 µm optical slice. To prevent light-induced artefacts,images were acquired with an approximate interval of 5min for each condition.For lipid mixtures without GSLs or without Ni-NTA-DOGS, both lipids werereplaced by POPC. Gal3 sorting on GUV tubules was calculated using fluorescenceintensities (Int) of Alexa488–Gal3 normalized by the mean intensity of lissamine-rhodamine-PE according to ref. 67: Sorting (S)= (Int(Gal3tubule)/Int(Gal3membrane))/(Int(PE-rhodaminetubule)/Int(PE-rhodaminemembrane)). Galactosidase treatments with10Uml−1 of α-galactosidase (Sigma G8507, green coffee beans) or β-galactosidase(Sigma G5160, Aspergillus oryzae) of GUVs containing total GSL-mixture wasperformed for 60min at 37 ◦C before Gal3 incubation by mixing GUVs in sucrosewith the digestion/imaging buffer (final concentration: 10mM HEPES at pH 6.5,5mM CaCl2, 300mM sucrose, 290mM glucose).
56. Ochieng, J. et al. Structure-function relationship of a recombinant humangalactoside-binding protein. Biochemistry 32, 4455–4460 (1993).
57. Johannes, L., Tenza, D., Antony, C. & Goud, B. Retrograde transport of KDEL-bearingB-fragment of Shiga toxin. J. Biol. Chem. 272, 19554–19561 (1997).
58. Kalia, M. et al. Arf6-independent GPI-anchored protein-enriched early endosomalcompartments fuse with sorting endosomes via a Rab5/phosphatidylinositol-3’-kinase-dependent machinery. Mol. Biol. Cell 17, 3689–3704 (2006).
59. Richter, T. et al. High-resolution 3D quantitative analysis of caveolar ultrastructureand caveola-cytoskeleton interactions. Traffic 9, 893–909 (2008).
60. Poullet, P., Carpentier, S. & Barillot, E. myProMS, a web server for managementand validation of mass spectrometry-based proteomic data. Proteomics 7,2553–2556 (2007).
61. Svennerholm, L. & Fredman, P. A procedure for the quantitative isolation of braingangliosides. Biochim. Biophys. Acta 617, 97–109 (1980).
62. Ladisch, S. & Gillard, B. A solvent partition method for microscale gangliosidepurification. Anal. Biochem. 146, 220–231 (1985).
63. Senn, H. J., Orth, M., Fitzke, E., Wieland, H. & Gerok, W. Gangliosides in normalhuman serum. Concentration, pattern and transport by lipoproteins. Eur. J. Biochem.181, 657–662 (1989).
64. Herzog, R. et al. A novel informatics concept for high-throughput shotgunlipidomics based on the molecular fragmentation query language. Genome Biol. 12,R8 (2011).
65. Wollert, T., Wunder, C., Lippincott-Schwartz, J. & Hurley, J. H. Membrane scissionby the ESCRT-III complex. Nature 458, 172–177 (2009).
66. Angelova, M. I. & Dimitrov, D. S. Liposome electroformation. Faraday Discuss. Chem.Soc. 81, 303–311 (1986).
67. Safouane, M. et al. Lipid cosorting mediated by Shiga toxin induced tubulation.Traffic 11, 1519–1529 (2010).
NATURE CELL BIOLOGY
© 2014 Macmillan Publishers Limited. All rights reserved.

S U P P L E M E N TA RY I N F O R M AT I O N
WWW.NATURE.COM/NATURECELLBIOLOGY 1
DOI: 10.1038/ncb2970
Supplementary Figure 1
2 min
PPMP
Control
10 min
PPMP
Control c
CD44
GM95MEB4 CG1
e
CD44CTxB-555
Fluo
resc
ence
inte
nsity
(% o
f con
trol
)
80
60
40
20
120
100
**Control PPMP
CD44 CTxB
Surface
PPMP
Control
b
f 10 μg/ml 1 μg/ml
500 ng/ml
100 ng/ml 10 ng/ml
1 ng/ml
Gal3
-HRP
g Control PPMP
d
GM95MEB4
Fluo
resc
ence
inte
nsity
(% o
f MEB
4)
80
60
40
20
120
100
GM95
CD44
MEB4
PPMPCtrl.
Fluo
resc
ence
inte
nsity
(%of
con
trol
)
80
60
40
20
120
100
GM95MEB4 CG1
Fluo
resc
ence
inte
nsity
(% o
f MEB
4)
80
60
40
20
120
100
Anti-CD44FITC
** ****
CG1
CD44 surface levels
CG1
Gal3
-HRP
Anti-CD44-FITC uptake
CD44 Tf-555 CD44 Tf-555
CD44 Tf-555 CD44 Tf-555
CD44 CD44
CD44 CD44
a
Control Control
PPMP PPMP
Surface levels
PPMPCtrl.
Supplementary Figure 1 GSLs are required for CD44 uptake. a, Control or PPMP-treated MEFs were incubated at 37°C with anti-CD44 antibodies (green) and Tf (red) (both at 10 µg*ml-1) for 2 or 10 min, and cell surface exposed material was removed by acid washes. CD44 uptake was strongly inhibited in PPMP-treated cells. Quantification is shown in Fig. 1c. b, The indicated types of cells were incubated for 2 min with anti-CD44 antibodies, and cell surface exposed material was removed by acid washes. CD44 uptake was strongly inhibited in GSL-deficient GM95 cells. Quantification is shown in Fig. 1d. c, Control or PPMP-treated MEFs were incubated on ice with anti-CD44 antibodies (green) and CTxB (red). Quantification on 15-20 cells per condition (means ± S.E.M., n=3 independent experiments). PPMP treatment significantly reduced CTxB binding, but not that of anti-CD44 antibody. d, The indicated types of cells were incubated as in (c). Similar CD44 surface levels were observed on all cells. Quantification on 38-49 cells assessed from 4 fields (means, n=2 independent experiments). e, Biochemical CD44 uptake assay. Fluorescently labelled anti-CD44 antibodies at 10 µg/ml were incubated for 10 min at 37°C with MEFs in the indicated conditions (± PPMP), or with MEB4, GM95, or CG1 cells.
After acid washes, the cells were lysed and lysates analysed by SDS-PAGE and fluorescence detection. Means ± S.D are shown, n=4 (upper graph) and n=5 (lower graph) independent experiments. Note that uptake efficiency was strongly dependent on GSL expression. The main GSL, GM3, was 35-fold less expressed in CG1 cells than in MEB4 cells, likely explaining the partial rescue of the CD44 uptake phenotype. A representative gel is shown for the ±PPMP conditions. f, Dose-response of Gal3-HRP CLIC formation. MEFs were incubated for 2 min at 37°C with the indicated concentrations of Gal3-HRP. The diaminobenzidine reaction for imaging HRP was performed on ice in the presence of ascorbic acid, and cells were processed for EM. Gal3-CLIC (tubules/rings) were observed with Gal3-HRP concentrations as low as 10 ng*ml-1. g, Control or PPMP-treated TECs were incubated for 2 min at 37°C with Gal3-HRP. The diaminobenzidine reaction for imaging HRP was performed on ice in the presence of ascorbic acid, and cells were processed for EM. Gal3-CLIC (tubules/rings) formation was significantly inhibited on PPMP-treated cells. Quantification is shown in Fig. 1f. Statistical analysis in this figure: Student, unpaired t-test. ** p<0.01. Scale bars = 10 µm in a-d, and 200 nm in f,g.
© 2014 Macmillan Publishers Limited. All rights reserved.

S U P P L E M E N TA RY I N F O R M AT I O N
2 WWW.NATURE.COM/NATURECELLBIOLOGY
SupplementaryFigure 2
d f
g
Control PPMP
300
200
100
500
400
Mol
ecul
es (p
er μ
m )2
Control PPMP
5
15
10
Clu
ster
s (p
er μ
m )2
Gal3 cluster density
Control PPMP
Gal3 cluster radius
80
70
60
100
90
50C
lust
er ra
dius
(nm
)
Control PPMP
Gal3 cluster size
0.01
0.03
0.02
Clu
ster
siz
e (μ
m )2
Con
trol
a
PPM
P
b c
0 50 100 150 >200Level of clustering L(r )
i j kControl cells
+ Gal3-Alexa647 PPMP-cells + Gal3-Alexa647 Gal3-Alexa647 only
Off-Gap (frames)0
Num
ber o
f mol
ecul
es
10 20 4030 50 7060 9080 100Off-Gap (frames)
10 20 4030 50 7060 9080 100
Num
ber o
f mol
ecul
es
Off-Gap (frames)
0
Num
ber o
f mol
ecul
es
10 20 4030 50 7060 9080 1000
0
00
e Average Gal3 molecule density
1.5*106
1.0*106
0.5*106
6*105
4*105
2*105
1.5*106
1.0*106
0.5*106
Gal3 clustering and control
60
30
0
90
Max
of L
(r) —
r
h
120
Control PPMP Clustercontrol
****
Supplementary Figure 2 dSTORM imaging and cluster analysis of Gal3-Alexa647 in control and PPMP-treated HeLa cells. a, dSTORM images of Gal3-Alexa647 in HeLa cells. Cells were pre-treated or not with PPMP, and incubated with 4 µg*ml-1 of Gal3-Alexa647 for 20 min, fixed and imaged under total internal reflection fluorescence (TIRF) illumination. b, Color-coded cluster maps retrieved from local point pattern analysis of regions (red squares in (a)). Colour indicates level of clustering, L(r), with low to high clustering coloured blue to red. c, Maps of Gal3-Alexa647 clusters and molecules inside clusters after applying a threshold to color-coded maps shown in (b). d-g, Density of Gal3-Alexa647 molecules (d), density of Gal3-Alexa647 clusters (e), radii of Gal3-Alexa647 clusters in nm (f), area covered by Gal3-Alexa647 clusters (g) were obtained from threshold cluster maps. Means ± S.E.M from 10-20 cells, n=3 independent experiments
for each panel. h-k, Analysis for the effects of photoblinking. Max of L(r)-r values (h) of Gal3-Alexa647 molecules adhered to coverslips under cell-free conditions compared to corresponding data of Gal3-Alexa647 on control and PPMP-treated HeLa cells, shown in Fig. 1g,h. To correct for repeated excitation of the same fluorophores, the number of localized Galectin3-Alexa647 molecules in control (i) and PPMP-treated (j) HeLa cells as well as Alexa647-Gal3 molecules adhered to coverslips (k) was plotted versus the off-gap. Data (round symbols) was fitted (solid line) to equation 4 (see Supplementary Note 1). The off-gap threshold was at 40 frames, illustrating that in three examples, >97.5% of over-counted molecules were removed. i-k are representative experiments, n=3 independent experiments with 10-20 cells examined per experiment. Scale bars: a = 6 µm, b,c = 500 nm. Student, unpaired t-test, ** p<0.01; *** p<0.001; **** p<0.0001.
© 2014 Macmillan Publishers Limited. All rights reserved.
S U P P L E M E N TA RY I N F O R M AT I O N
WWW.NATURE.COM/NATURECELLBIOLOGY 3
Control DynK44A-GFP
Fluorescence intensity(% of control)
Tf
Gal3
***
10080604020
Control EH2-1-GFP
Tf
Gal3
***
10080604020
*
Fluorescence intensity(% of control)
c (HeLa)
d (TEC)
b (TEC)
Supplementary Figure 3
a (HeLa)
Tf Gal3
***Fl
uore
scen
ce in
tens
ity(%
of c
ontro
l) 100
604020
140120
80
Control EH2-1-GFP
Tf Gal3
Fluo
resc
ence
inte
nsity
(% o
f con
trol)
***
Control DynK44A-GFP
100
604020
140120
80
EH2-1-GFP Gal3 Tf
15 min
TfDyn2K44A-GFP
Dyn2K44A-GFP Gal3
15 min
15 min
TfDyn2K44A-GFP Gal3
15 min
TfEH2-1-GFP
15 minGal3EH2-1-GFP
15 min
Supplementary Figure 3 Gal3 endocytosis under perturbation conditions. a,b, Gal3 uptake in cells with perturbed clathrin function. Incubation of Gal3 and Tf for 15 min at 37°C with HeLa cells (a) or TECs (b) that expressed dominant negative GFP-tagged mutant of Eps15 (EH2-1). Cells were lactose and acid washed to remove plasma membrane accessible material. Tf endocytosis was strongly inhibited in mutant expressing HeLa cells and TECs, in contrast to Gal3. c,d, Gal3 uptake in cells with perturbed dynamin function. Incubation
of Gal3 and Tf for 15 min at 37°C with HeLa cells (c) or TECs (d) that expressed dominant negative GFP-tagged mutant dynamin (K44A). Cells were lactose and acid washed to remove plasma membrane accessible material. Gal3 endocytosis was not significantly perturbed in K44A expressing cells, while Tf endocytosis was strongly inhibited. Statistical analysis in this figure: Means ± S.D., n=3 independent experiments, 25-30 cells each. Student, unpaired t-test, * p<0.05, *** p<0.001. Scale bars = 10 µm.
© 2014 Macmillan Publishers Limited. All rights reserved.
S U P P L E M E N TA RY I N F O R M AT I O N
4 WWW.NATURE.COM/NATURECELLBIOLOGY
a
b
Control
CTx
B-A
488
/ Gal
3-C
y3 PPMP
CTxBGal3
Surface fluorescence intensity(% of control)
On ice On ice
Gal3
Con
trol
Prot
eina
se K
Gal3 CTxBCTxB
On ice On ice On ice On ice
d
Gal
ectin
-4in
tera
ctio
n pa
rtner
s
Golgi
Supplementary Figure 4
Plasma membrane
Unknown
Cytosol
Extracell. space
LysosomesMito.
Nucleus
Plasma membrane
Extracell. space
Cytosol Unknown
Lysosomes
Gal
ectin
-3in
tera
ctio
n pa
rtner
s
c Surface fluorescence intensity(% of control)
Control Tunicamycin Deoxymannojirimycin
CTx
B-A
488
/ Gal
3-C
y3
On ice On ice On ice
CTxB
10080604020
Gal3
Tunicamycin
Control
*120 140
Deoxymanno-jirimycin
***
***
PPMP
Control
10080604020 120
Supplementary Figure 4 Analysis of Gal3 uptake determinants. a, Gal3 surface binding on GSL-depleted cells. Control or PPMP-treated TECs were incubated on ice with Gal3 (red) and CTxB (green). On PPMP-treated cells, the binding of CTxB was strongly reduced, while Gal3 binding was not affected. Quantification of data on 12-15 cells per condition (means ± S.E.M; n=3 independent experiments). b, Protein determinants are required for Gal3 binding to cells. TECs were treated with proteinase K (right panel) or not (left panel) and incubated with Gal3 (red) and CTxB (green). Gal3 did not bind to proteinase K-treated cells, as opposed to CTxB. A representative result is
shown, n=3. c, Gal3 needs N-glycans for binding to cells. TECs were incubated or not for 24 hours with 6 µM tunicamycin or 48 hours with 90 μg*ml-1 1-deoxymannojirimycin, put on ice and incubated for 20 min with Gal3 (red) and CTxB (green). Gal3 binding was strongly impaired, but not that of CTxB. Quantification of data on 19-26 cells assessed from 4 fields per condition (means ± S.D., n=3 independent experiments). d, Sampling of Gal3 and Gal4 interacting partners according to intra and extracellular localizations. Protein identities are given in Supplementary Table 1. Statistical analysis in this figure: Students, unpaired t-test. *p<0.5, *** p<0.001. Scale bars = 10 µm.
© 2014 Macmillan Publishers Limited. All rights reserved.

S U P P L E M E N TA RY I N F O R M AT I O N
WWW.NATURE.COM/NATURECELLBIOLOGY 5
a
Gal3 siRNA#1 Gal3 siRNA#2
PM
Scrambled siRNAPM
Untransfected
PM
g
Scrambled Gal3 Clathrin Gal3/Clathrin siRNA#3 siRNA#2 siRNA
Fluo
resc
ence
inte
nsity
(% o
f scr
ambl
ed)
**
40
80
60
20
100
120
e
Clathrin siRNA#2 Gal3/Clathrin siRNA
Supplementary Figure 5
Scrambled
Gal3-siRNA
Control
b
Gal3
Tubulin
c
β1 integrin surface levels
Scrambled Gal3 Clathrin Gal3/Clathrin 20 nM 10 nM siRNA#3 siRNA#2 siRNA
Clathrin
Gal3
Actin
d
CD44 surface levels
40 8060 20 100 120
Fluorescence intensity(% of control)
Scra
mbl
ed s
iRN
AG
al3
siR
NA
#2
CD44 Tf CD44 Tf Gal3
Gal
3 si
RN
A#1
Unt
rans
fect
ed
CD44, Tf-Alexa647 : 2 minCD44, Tf-Alexa647 : 2 min
Gal3-Cy3 : 30 min
PPM
PG
al3
siR
NA
#1
Scrambled Gal3
-
siRNA–
β1 integrin
Scrambled Gal3 siRNA#3
f
Supplementary Figure 5 CD44, b1-integrin, and fluid phase uptake in Gal3-depleted cells. a, Depletion of Gal3 on TECs using siRNA sequence #3. Western blot analysis in which tubulin served as a loading control. A representative result is shown. Corresponding cells were used for uptake experiments of Fig. 4d. Cells were tested for efficient knockdown in each experiment. b, CD44 cell surface levels on MEFs were not significantly altered upon Gal3 depletion. Untreated, scrambled siRNA transfected, or Gal3 depleted MEFs were incubated on ice with anti-CD44 antibodies, and after fixation with fluorescently labelled secondary antibodies. Means ± S.D., n=3 independent experiments, 15-35 cells assessed from 5 fields each. Corresponding cells were used for uptake experiments of Fig. 4d. c, Gal3 is required for CD44 uptake. Tf (blue) and anti-CD44 antibodies (green) were concomitantly incubated for the indicated times and in the indicated conditions with MEFs that were complemented or not with exogenous Gal3 (red). Cells were acid washed to remove plasma membrane accessible material. CD44 uptake was specifically reduced in Gal3-depleted MEFs, and exogenous Gal3 rescued this phenotype. Quantification is shown in Fig. 4c. d, Western blotting analysis of proteins expression in the indicated depletion
conditions. A representative result is shown. Corresponding cells were used for uptake experiments of Fig. 4g. Cells were tested for efficient knockdowns in each experiment. e, Examples of cells from the internalization analysis of Fig. 4g, using 9EG7 antibody against the active form of b1-integrin. f, b1-integrin cell surface levels in the indicated conditions, as determined by antibody binding on ice. Means ± S.D., n=3 independent experiments, 15-35 cells assessed from 5 fields each. Corresponds to experiments shown in Fig. 4g. g, EM analysis of HRP uptake in Gal3-depleted cells. Untransfected, scrambled siRNA, or Gal3 siRNA transfected MEFs were pulsed for 2 min with HRP (10 mg*ml-1) and processed for EM. In control conditions (untransfected or scrambled siRNA transfected cells), HRP-labeled tubular and ring-shaped structures were observed at early times of uptake (2 min, arrows). Some vesicular structures of different diameters were also labelled (arrowheads), likely representing clathrin-coated vesicles (80-120 nm) or detached caveolae (40-60 nm). On Gal3 siRNA transfected cells, the tubular and ring-shaped structures were strongly reduced, and mostly vesicular profiles were visualized. Quantification is shown in Fig. 4h. Statistical analysis: Student, unpaired t-test. ** p<0.01. Scale bars (c,e) = 10 µm, (g) = 200 nm.
© 2014 Macmillan Publishers Limited. All rights reserved.

S U P P L E M E N TA RY I N F O R M AT I O N
6 WWW.NATURE.COM/NATURECELLBIOLOGY
d
Supplementary Figure 6
g
Fluo
resc
ence
inte
nsity
(% o
f con
trol
)
40
80
60
20
100
**
LactoseControl Sucrose
FITC-Dextran uptake
e HRP-labeled carriers
Tubules, Rings (CLICs)Vesicles 80-120 nmVesicles40-60 nm
Sucr
ose
Lact
ose
Carriers / section - cell2015105
**
CLIC vs. Tf uptake
700
600
500
400
300
200
100
Fluo
resc
ence
inte
nsity
(% o
f suc
rose
2 m
in)
Tf-555
**
**
b
2 min 40 minSucroseLactose Sucrose Lactose
Anti-CD44
CD44 surface levels
SucroseLactose
Fluo
resc
ence
inte
nsity
(% o
f con
trol
)
Control
40
80
60
20
100
c
f
Control
5 m
in
Lactose
CD44 MergeTf-555
Suc
rose
Lac
tose
2 min
2 min
40 min
40 min
Suc
rose
Lac
tose
a
Sucrose
FITC-Dextran
Sucrose
Lactose
PM
PM
PM
PM
PM
PM
PM
PM
Supplementary Figure 6 CD44 uptake and fluid phase CLIC formation on cells incubated in the presence of lactose. a, Galectin function is required for CD44 uptake. MEFs were incubated with Tf (red) and anti-CD44 antibodies (green) for the indicated times in the presence of 100 mM sucrose or lactose. Cells were acid washed to remove plasma membrane accessible material. b, Labelling intensities of experiments as in (a) were quantified on 10 to 12 cells per condition (Means ± S.E.M., n=3 independent experiments) and normalized to the ‘Sucrose 2 min’ sample average for each marker, separately. Note that lactose specifically inhibited CD44 uptake. c, CD44 cell surface levels on MEFs were not significantly altered upon lactose incubation. MEFs in conditions as in (a) were incubated on ice with anti-CD44 antibodies, and after fixation with fluorescently labelled secondary antibodies. Means ± S.D. of 15 to 25 cells assessed from 5 fields per experiment, n=3 independent experiments. d, Fluid phase uptake is sensitive to galectin function. Lactose or sucrose-treated MEFs were pulsed for 2 min with HRP (10 mg*ml-1) and processed for EM. In control conditions (sucrose), HRP labelled tubular and
ring-shaped CLIC structures at early times of uptake (arrows). Some vesicular structures of different diameters were also labelled (arrowheads), likely representing clathrin-coated vesicles (80-120 nm) and detached caveolae (40-60 nm). In the presence of lactose, the occurrence of tubular and ring-shaped CLIC structures was largely reduced, and mostly vesicular profiles were visualized. e, Quantification of experiments as in (d) on 20-24 cells per condition (means ± S.E.M, n=3 independent experiments) confirmed a significant decrease of tubular and ring-shaped structures upon lactose treatment, while vesicles were not significantly affected. f, Fluid phase dextran uptake experiment. MEFs were incubated for 5 min with 1 mg*ml-1 of FITC-labelled dextran in the presence of the indicated sugars, fixed, and analysed for labelling intensity. Lactose significantly inhibited fluid phase endocytosis. g, Quantification of experiments as in (f). Means ± S.D. of 17 to 27 cells per experiment, n=3 independent experiments. Scale bars (a,f) = 10 µm, (d) = 200 nm. Statistical analysis in this figure: Student, unpaired t-test. ** p<0.01
© 2014 Macmillan Publishers Limited. All rights reserved.
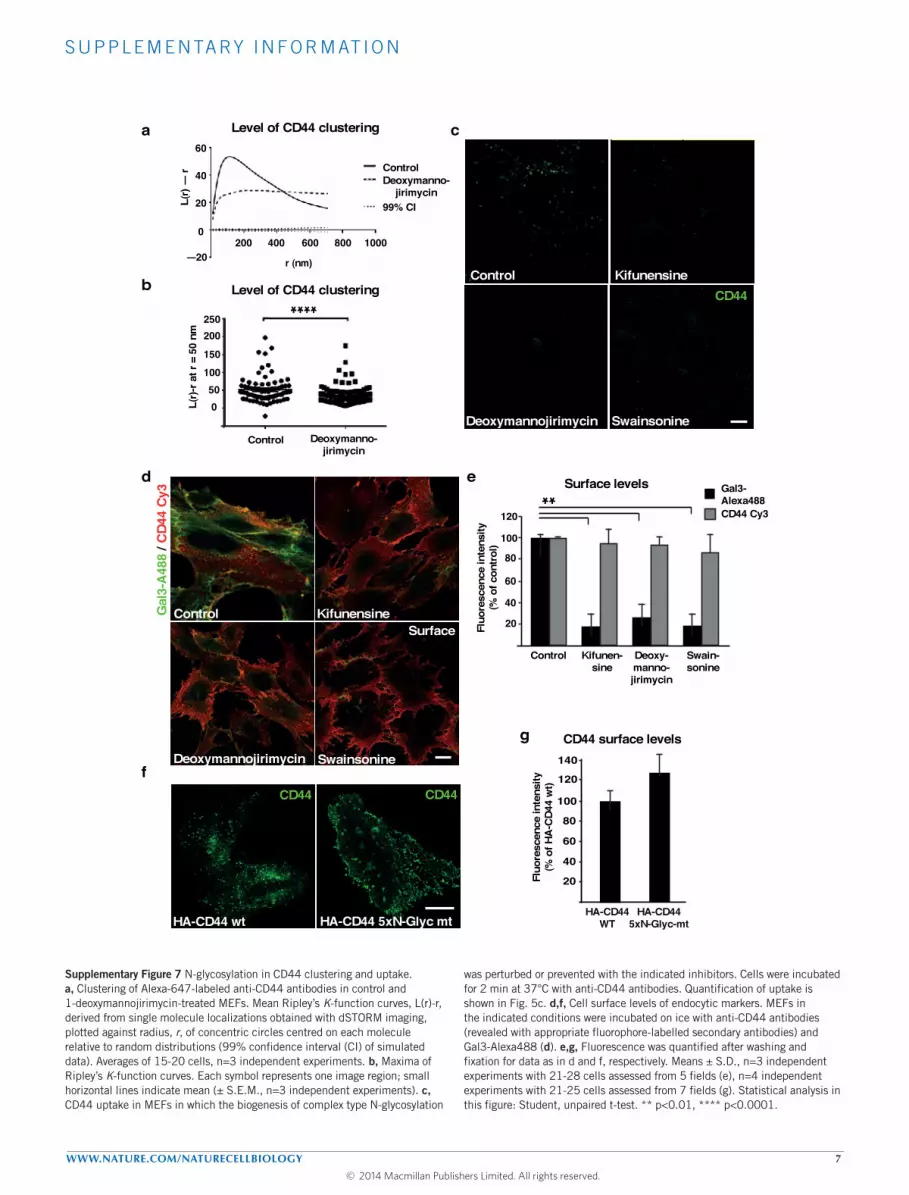
S U P P L E M E N TA RY I N F O R M AT I O N
WWW.NATURE.COM/NATURECELLBIOLOGY 7
Control
99% CI
Deoxymanno-jirimycin
Level of CD44 clustering
800600400200 1000
r (nm)KifunensineControl
Deoxymannojirimycin Swainsonine
CD44 ****
Control Deoxymanno-jirimycin
L(r)
-r a
t r =
50
nm
10050
250
150
0
200
Level of CD44 clusteringb
f
d
Supplementary Figure 7
60
40
20
0
L(r)
— r
—20
HA-CD44 wt HA-CD44 5xN-Glyc mtHA-CD44
WT
Fluo
resc
ence
inte
nsity
(% o
f HA
-CD
44 w
t)
60
80
100
120
40
20
CD44 surface levels
HA-CD445xN-Glyc-mt
Surface levels
CD44 CD44
140
Control Kifunensine
Deoxymannojirimycin
Gal
3-A
488
/ CD
44 C
y3
Fluo
resc
ence
inte
nsity
(% o
f con
trol
)
80
20
40
60
Gal3-Alexa488CD44 Cy3120
100
Control Deoxy-manno-jirimycin
Kifunen-sine
Swain-sonine
**
Swainsonine
ca
e
g
Surface
Supplementary Figure 7 N-glycosylation in CD44 clustering and uptake. a, Clustering of Alexa-647-labeled anti-CD44 antibodies in control and 1-deoxymannojirimycin-treated MEFs. Mean Ripley’s K-function curves, L(r)-r, derived from single molecule localizations obtained with dSTORM imaging, plotted against radius, r, of concentric circles centred on each molecule relative to random distributions (99% confidence interval (CI) of simulated data). Averages of 15-20 cells, n=3 independent experiments. b, Maxima of Ripley’s K-function curves. Each symbol represents one image region; small horizontal lines indicate mean (± S.E.M., n=3 independent experiments). c, CD44 uptake in MEFs in which the biogenesis of complex type N-glycosylation
was perturbed or prevented with the indicated inhibitors. Cells were incubated for 2 min at 37°C with anti-CD44 antibodies. Quantification of uptake is shown in Fig. 5c. d,f, Cell surface levels of endocytic markers. MEFs in the indicated conditions were incubated on ice with anti-CD44 antibodies (revealed with appropriate fluorophore-labelled secondary antibodies) and Gal3-Alexa488 (d). e,g, Fluorescence was quantified after washing and fixation for data as in d and f, respectively. Means ± S.D., n=3 independent experiments with 21-28 cells assessed from 5 fields (e), n=4 independent experiments with 21-25 cells assessed from 7 fields (g). Statistical analysis in this figure: Student, unpaired t-test. ** p<0.01, **** p<0.0001.
© 2014 Macmillan Publishers Limited. All rights reserved.
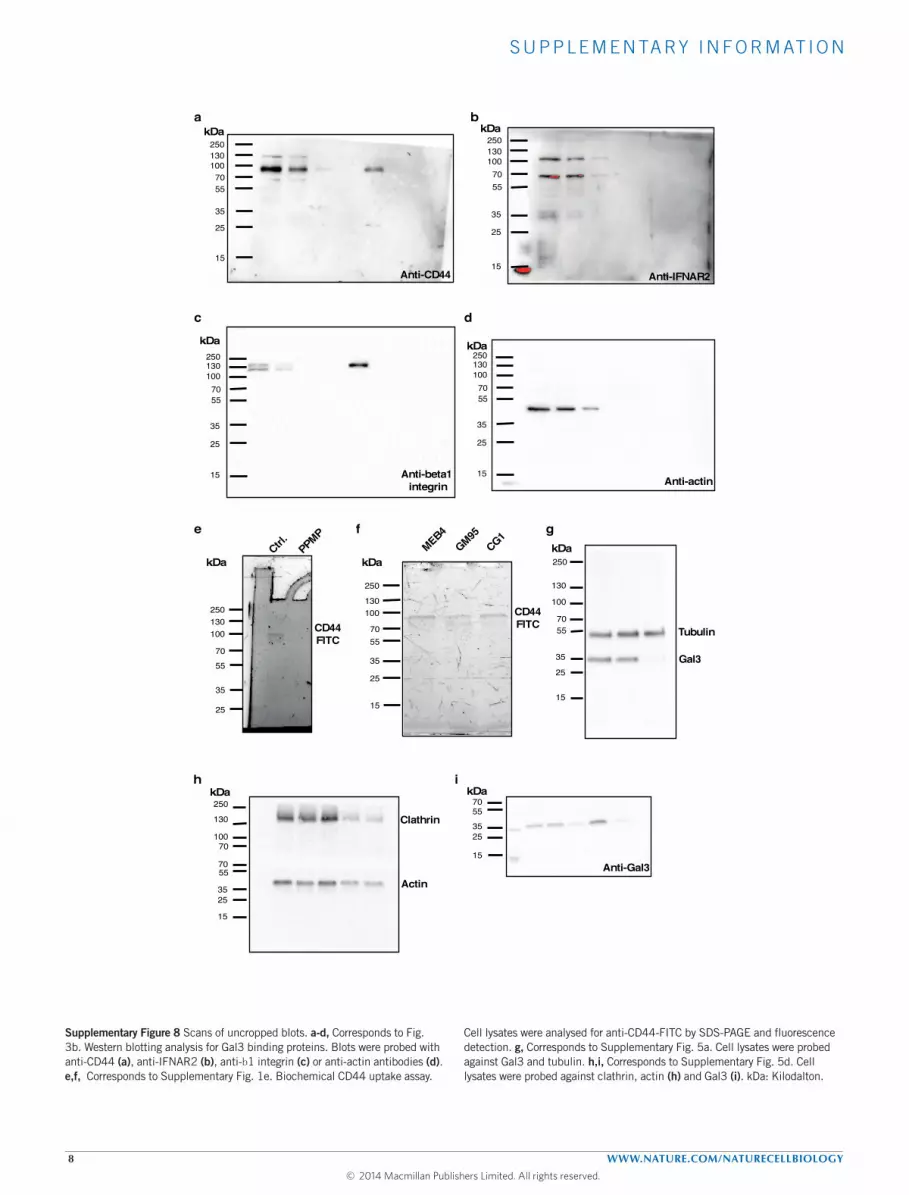
S U P P L E M E N TA RY I N F O R M AT I O N
8 WWW.NATURE.COM/NATURECELLBIOLOGY
25
35
5570
100130250
15Anti-IFNAR2
25
35
5570
100130250
15 Anti-beta1 integrin
25
35
5570
100130250
15Anti-actin
25
35
5570
100130250
15
Anti-CD44
Tubulin
Gal325
35
5570
100
130
250
15
Anti-Gal3
25355570
15
Clathrin
Actin2535
55
70100
130
250
15
70
kDa
kDa kDa
kDa
kDa
kDa
kDa
Supplementary Figure 8
PPMPCtrl. GM95
MEB4CG1
CD44FITC
CD44FITC
25
35
5570
100130250
kDa
25
35
5570
100130
250
15
kDa
a
e
dc
b
i
gf
h
Supplementary Figure 8 Scans of uncropped blots. a-d, Corresponds to Fig. 3b. Western blotting analysis for Gal3 binding proteins. Blots were probed with anti-CD44 (a), anti-IFNAR2 (b), anti-b1 integrin (c) or anti-actin antibodies (d). e,f, Corresponds to Supplementary Fig. 1e. Biochemical CD44 uptake assay.
Cell lysates were analysed for anti-CD44-FITC by SDS-PAGE and fluorescence detection. g, Corresponds to Supplementary Fig. 5a. Cell lysates were probed against Gal3 and tubulin. h,i, Corresponds to Supplementary Fig. 5d. Cell lysates were probed against clathrin, actin (h) and Gal3 (i). kDa: Kilodalton.
© 2014 Macmillan Publishers Limited. All rights reserved.

S U P P L E M E N TA RY I N F O R M AT I O N
WWW.NATURE.COM/NATURECELLBIOLOGY 9
Supplementary Table Legends
Supplementary Table 1: Listing of Gal3 and Gal4 interacting partners. Complete proteomics list of TEC proteins that were pulled down with Gal3 or Gal4. Hits were classified according to the number of peptides per protein bound to Gal3. Corresponds to Fig. 3a.
Supplementary Table 2: GSL expression in different cell lines. Thin layer chromatography (TLC), mass spectrometry (MS), and cholera toxin binding (biological assay, BA) were used to analyse GSL expression on TECs and MEFs. *isomeric molecules distinguished by TLC.
Supplementary Table 3: Listing of GSL species. Major molecular species of glycosphingolipids extracted from TEC and MEF cells were identified by shotgun mass spectrometry.
Supplementary Table 4: GUV summary table. Observed events within different GUV experiments are summarized. Corresponds to Fig. 7a-j.
Supplementary Table 5: Description of plasmids, primer and siRNAs used in this study.
Supplementary Video Legends
Supplementary Video 1: Gal3 is localized to CLICs in unperturbed MEFs. MEFs were incubated with Gal3-HRP for 2 minutes at 37°C, cooled on ice, labelled with DAB in the presence of ascorbic acid, fixed and processed for electron tomography. Movie displays the captured tilt series before highlighting the segmented Gal3-HRP positive carrier (green). Note the presence of invaginations in the Gal3-HRP carrier, as well as connected tubular extensions, similar to that previously described for CLICs. Image series was captured in IMOD and processed with ImageJ to 10 frames per second. Corresponds to Fig. 1e.
Supplementary Video 2: Gal3 is localized to CLICs in unperturbed TECs. TECs were incubated with Gal3-HRP for 2 minutes at 37°C, cooled on ice, labelled with DAB in the presence of ascorbic acid, fixed and processed for electron tomography. Movie displays the captured tilt series before highlighting the segmented Gal3-HRP positive carrier (green). Image series was captured in IMOD and processed with ImageJ to 10 frames per second.
Supplementary Video 3: Gal3 induces cisternal CLIC-like invaginations in ATP-depleted MEFs. ATP-depleted MEFs were incubated with Gal3-HRP and processed for electron tomography. Movie displays the captured tilt series before highlighting the segmented Gal3-HRP positive carriers (green and yellow), microtubules (orange) and actin microfilaments (blue). Complex, basket and ring shaped structures were observed with morphologies that were strikingly similar to previously captured tomography data of CLICs in unperturbed cells. Note the close proximity of actin and microtubules to Gal3-HRP positive invaginations. Image series was captured in IMOD and processed with ImageJ to 10 frames per second. Corresponds to Fig. 6c.
Supplementary Video 4: Gal3 induces tubular invaginations on GSL-containing GUVs, even in the presence of a-galactosidase. GUVs were prepared with a plasma membrane-like lipid composition containing Ni-lipids and a mix of GSLs, were treated with a-galactosidase for 30 min, subsequently incubated with 200 nM Gal3-His at 21°C, and imaged at the equatorial plane by confocal microscopy. Gal3-His induced invaginations after 30 min. Note: No invaginations formed on GUVs treated with b-galactosidase. Corresponds to Fig. 7f.
© 2014 Macmillan Publishers Limited. All rights reserved.

Supplementary Note 1:
dSTORM imaging and data processing
Sample preparation: Cells were incubated for 20 min at 37˚C with Gal3-Alexa647 at a
concentration of 4 µg*ml-1 in serum-free DMEM supplemented or not with PPMP,
and then fixed in 4% paraformaldehyde for 10 min at 37˚C. For Gal3-dependent
CD44 clustering in cells treated with 1-deoxymannojirimycin, cells were incubated
for 20 min at 37˚C with Gal3 at a concentration of 4 µg*ml-1 in the presence of 1-
deoxymannojirimycin. Subsequently, cells were fixed in 4% paraformaldehyde for 10
min at 37˚C and stained for CD44 using an Alexa-647 labelled antibodies directed
against CD44.
Reversible photoswitching of Alexa-647 fluorophores in dSTORM
experiments was performed in a redox buffer composed of 25 mM Hepes and 5%
glycerol in PBS, pH 8, using an oxygen scavenger system made of 0.05 mg*ml-1
glucose oxidase, 0.025 mg*ml-1 horseradish peroxidase, 75 mM cysteamine, and 25
mM glucose1. dSTORM images were acquired on a TIRF microscope (ELYRA;
Zeiss) with a 100x, NA=1.46 oil-immersion objective. For imaging, a 633 nm laser
was used for excitation and a 488 nm laser for conversion from the dark state. 15,000-
20,000 images were acquired per sample using an electron-multiplying CCD
(EMCCD) camera (iXon DU-897D, Andor) with an exposure time of 40 ms.
For data processing, point spread function (PSF) fitting and localization was
performed in Zen 2010D (Zeiss Microscopy). Single molecules were identified as
areas with an intensity-to-noise ratio greater than 6. The centre of each PSF was
calculated by fitting to a 2-dimensional Gaussian distribution. Sample drift was
corrected by tracking immobile gold fiducial markers. To prevent over-counting due
© 2014 Macmillan Publishers Limited. All rights reserved.

to fluorophore blinking, localizations that were dark for less than 1,200 ms before re-
exciting were grouped into a single localization.
From each dSTORM image, 4 µm x 4 µm non-overlapping regions were
selected for analysis. Events with localization precision worse than 50 nm were
discarded. For each analysed region, Ripley’s K-function was calculated as:
K r = A (!!"!!
!!!!
!!!! ) where δ!" = 1 if δ!" < r, else 0 Equation 1
Here, n is the number of points contained in an analysed region of area A (4 µm x 4
µm). dij is the distance between two points i and j and r is the analysed spatial scale.
Localizations at the edge of the analysed region were weighted to negate edge effects.
The K-function is a measure of the number of points encircled within concentric
circles of radius r centred on each point and scales with circle area. It is therefore
transformed into the L-function to obtain linear scaling with radius, r via Equation 2:
! ! = !(!)!
Equation 2
Random distributions have L(r)=r at all r. We therefore plot L(r)-r versus r. Positive
values of L(r)-r at a given r indicate clustering at that spatial scale. 99% confidence
intervals (CI) were generated by simulating 100 spatially random distributions.
To generate cluster heat maps, L(r) values at a spatial scale of 50 nm, L(50),
were computed for each point individually (Equation 3).
!! 50 =! (
!!"!
!!!! )
! where δ!" = 1 !" δ!" < 50, !"#! 0 Equation 3
© 2014 Macmillan Publishers Limited. All rights reserved.

Values of L(50) were interpolated to form a cluster heat map (MATLAB, The
Mathworks). By applying a threshold of L(50)=78 to this map, a binary cluster map
was created from which cluster statistics (number, size, shape, molecules/cluster) was
extracted. This method has previously been demonstrated to extract clustering
parameters from PALM and dSTORM data at the plasma membrane1-3. Statistical
significance of the means of two data sets was assessed with Student t-tests (Prism,
GraphPad Software).
Crucial to PALM and dSTORM data analysis is the correct identification of
single molecules and avoidance of over-counting molecules whose fluorescence has
ceased and re-appeared. To correct for this effect we used an accepted method of
analysis first published by Annibale et al.4, and later modified by Rossy et al.1 to
include two different time-scales of blinking. We fitted Gal3-Alexa647 data to the
following equation (4):
! t! = N 1+ !!"#$%!!( !!!!!!""!
) + !!"#$%!!
( !!!!!!""!)
Equation 4
Here N(td) is the number of molecular counts at different off gaps (td) where off-gap
is the maximum time period a molecule is dark before being identified as a different
molecule when its fluorescence resumes; N is the number of fluorescent molecules;
nblink1 and nblink2 are the average number of counts a molecule converts to a dark
state; toff1 and toff2 is the average lifetime of the fluorophore. We corrected for the
factors described above using clustering data of HeLa cells treated with PPMP and
untreated control cells. As an additional control, we have performed dSTORM
experiments with Gal3-Alexa647 molecules adhered to clean coverslips imaged under
© 2014 Macmillan Publishers Limited. All rights reserved.
the identical parameters as the cell samples. For all samples the duration of the
acquisition was 20,000 frames at 30 ms per frame. We plotted the number of localized
Gal3-Alexa647 molecules in representative images versus the off-gap and fitted the
data to equation 4 (Supplementary Figure 2i-k).
Alexa647-Gal3 exhibited 0.25 blinks for 0.26 frames (7.8 ms) and 0.77
blinks for 6.2 frames (186 ms) in HeLa control cells, and 0.16 blinks for 0.25 frames
(7.5 ms) and 0.44 blinks for 7.7 frames (231 ms) in PPMP treated cells. Alexa647-
Gal3 molecules adhered to coverslips displayed 0.19 blinks per molecule for 0.5
frames (15 ms) and 0.2 blinks for 22 frames (660 ms). Based on this analysis, an off-
gap threshold of 40 frames was applied.
With this threshold, and the exclusion of molecules with localisation
precisions >50 nm, Alexa647-Gal3 molecules adhered to clean coverslips was not
completely random (probably due to Gal3 aggregation in solution and aggregation of
denatured Gal3 on the surface), but was 6-fold lower than Galectin3-Alexa647
molecules in HeLa (Supplementary Figure 2h).
1. Rossy, J., Owen, D.M., Williamson, D., Yang, Z. & Gaus, K. Conformational states of Lck regulate clustering in early T cell signalling. Nat. Immunol. 14, 82-‐89 (2013).
2. Owen, D.M. et al. PALM imaging and cluster analysis of protein heterogeneity at the cell surface. J. Biophotonics 3, 446-‐454 (2010).
3. Williamson, D.J. et al. Pre-‐existing clusters of the adaptor Lat do not participate in early T cell signaling events. Nat. Immunol. 12, 655-‐662 (2011).
4. Annibale, P., Vanni, S., Scarselli, M., Rothlisberger, U. & Radenovic, A. Quantitative photo activated localization microscopy: unraveling the effects of photoblinking. PLoS ONE 6, e22678 (2011).
© 2014 Macmillan Publishers Limited. All rights reserved.