from distress to exit: determinants of the time to exit
TRANSCRIPT

D/2009/6482/12
Vlerick Leuven Gent Working Paper Series 2009/12
FROM DISTRESS TO EXIT: DETERMINANTS OF THE TIME TO EXIT
SOFIE BALCAEN
SOPHIE MANIGART
HUBERT OOGHE

2
FROM DISTRESS TO EXIT: DETERMINANTS OF THE TIME TO EXIT
SOFIE BALCAEN
Faculty of Economics and Business Administration, Ghent University
SOPHIE MANIGART
Vlerick Leuven Gent Management School
HUBERT OOGHE
Vlerick Leuven Gent Management School
The authors would like to thank Antoon Lenaert (National Bank of Belgium), Cécile Buydens and Guy Delvaux
(National Bank of Belgium) for their helpful cooperation with Sofie Balcaen’s doctoral research and provision
of the requisite data. The authors also recognize the indispensable contributions of Wouter De Maeseneire,
Charles Van Wymeersch and Didier Van Caillie and gratefully acknowledge the financial assistance of the
Ghent University Special Research Fund.
Contact:
Sophie Manigart
Vlerick Leuven Gent Management School
Tel: +32 09 210 97 87
Fax: +32 09 210 97 00
Email: [email protected]

3
ABSTRACT
This paper analyses the duration of the time to exit of distressed firms, differentiating
between involuntary exits (mainly bankruptcies) and voluntary liquidations. It examines how
long firms survive after initial signs of economic distress. The study is conducted on an
extensive dataset of 5,233 Belgian distress-related exits of non-starting firms, the majority
being privately held. The results highlight that slack resources have an opposite effect on the
timing of involuntary exits and voluntary liquidations. On the one hand, high levels of
available and potential slack increase the time to involuntary exit, as they allow distressed
firms to postpone an impending involuntary exit. On the other hand, high available slack
resources shorten the time to voluntary liquidation as they make voluntary liquidation easier.
Further, a high level of stakeholder dependence increases the time to exit after distress,
whether the firm exits through a voluntary or through an involuntary procedure. This is
explained by the fact that stakeholder dependence increases the complexity of the exit
decision and the exit procedure.

4
1 INTRODUCTION
After having experienced a situation of economic distress, some companies exit
quickly, while others survive over a longer period. An intriguing question is hence why some
firms exit quickly after the first signs of distress, while other firms survive longer. Given that
the time from distress to exit may have important implications for a distressed firm’s
stakeholders, including shareholders, lenders, employees, customers, suppliers, related firms,
government, and the economy as a whole, this research question is important. For example,
the duration of the exit path preceding a bankruptcy may impact the possibilities of the
stakeholders to reduce their losses. In case of an early bankruptcy, stakeholders may be too
late to recuperate the amounts due by the firm. Alternatively, an early voluntary liquidation
that occurs shortly after the first signs of distress may allow the shareholders to cash-in and
collect their accounts, hence, preventing losses. The length of the time period between first
signs of economic distress and exit is hence important, but it has not received much attention
in the literature, however. We argue that the time to exit is explained by different factors
compared to those explaining firm exit or exit type.
Up to now, studies on business failure strongly focus on the determinants of exit
versus survival: they try to predict or explain bankruptcy, ignoring the dynamic nature of the
business failure process. Although research on failure paths – another main stream of
business failure research – goes along with the need for a dynamic approach of business
failure, existing failure path studies do not explicitly analyze the determinants of the duration
of the exit process. Some duration studies explain the time that distressed firms spend in
Chapter 11 reorganization procedures (eg. Bandopadhyaya 1994; Li 1999; Orbe et al. 2001;
Denis and Rodgers 2007). To the best of our knowledge, there are no studies explicitly
investigating the length of the exit path after distress. Moreover, most prior empirical studies
on business exits tend to neglect alternative forms of exit. However, a distressed firm has
various exit options. Instead of being forced into an involuntary exit procedure in the form of
a bankruptcy or a juridical winding-up, a distressed firm may choose to exit in a more
efficient and orderly way through a voluntary liquidation (Harhoff et al. 1998; Prantl 2003).
Alternatively, it may opt for a merger or an acquisition by another firm (Bulow and Shoven
1978; Shrieves and Stevens 1979; Pastena and Ruland 1986; Peel and Wilson 1989; Astebro
and Winter 2001). Schary (1991) pioneered research on different exit types, stressing that
bankruptcies and liquidations reduce an economy’s productive capacity, while the productive
capacity remains largely unaffected by mergers or acquisitions.

5
More recently, Buehler et al. (2006), Cefis and Marsili (2007) and Jones and Hensher
(2007) have emphasized the need for distinguishing between different types of exit.
Nevertheless, most business failure studies still ignore the fact that a distressed firm has
various exit options.
With this study, we attempt to fill these gaps in the literature. We investigate the
determinants of the time period between the first signs of economic distress and firm exit. We
hereby differentiate between involuntary exits (mainly bankruptcies) and voluntary
liquidations, since there are strong indications that these two types of exits have distinct
underlying dynamics and processes (Harhoff et al. 1998, Prantl 2003; Balcaen et al. 2008)1.
Voluntary liquidations result from ‘entrepreneurial self-selection’, while involuntary exits are
driven by an ‘external selection’ exit mechanism (Prantl 2003) and forced on the firm by
outsiders. A voluntary liquidation can only occur if all stakeholders are duly compensated;
only shareholders may suffer losses. Unlike a voluntary liquidation, stakeholders are not fully
compensated in involuntary exits (Leyman and Schoors 2008).
We argue that a firm’s slack resources that are available at the first signs of economic
distress and the degree of stakeholder dependence determine how long it takes before the firm
exits either through an involuntary exit or through a voluntary liquidation. Guided by
organization theory, we propose that more slack resources increase the time period preceding
an involuntary exit, as firms usually attempt to avoid or delay involuntary exit. Higher levels
of slack resources at the time of distress allow a firm to survive longer. On the contrary, as
slack resources may facilitate a voluntary liquidation procedure, a high level of slack will
accelerate voluntary liquidation after distress and, hence, will decrease the time period
preceding a voluntary liquidation. Further, as suggested by stakeholder theory, the degree of
stakeholder dependence may influence the exit path length, especially for voluntary
liquidations. Various stakeholders, such as employees, creditors, banks, suppliers and related
firms influence a firm’s freedom of action. As stakeholders often have incentives for the firm
to continue operations, high stakeholder dependence will make it more difficult to exit and
will increase the time to exit for both voluntary and involuntary exits.
1 We exclude firms that exit through a merger or acquisition due to the low incidence of M&A’s of distressed firms (Balcaen et al. 2008).

6
The research questions are empirically analyzed on a Belgian sample of 5,233
distress-related firm exits, including bankruptcies and voluntary liquidations. The sample
mainly includes small and medium-size privately held firms. All firms are more mature, i.e.
we exclude starting firms whose exit dynamics may be very different from those of mature
firms. We show that both the available and potential slack resources and the degree of
stakeholder dependence explain the duration of the exit path. As expected, a high level of
available or potential slack increases the duration of the exit path preceding involuntary exits,
but it shortens the time to voluntary liquidation. Furthermore, a high level of stakeholder
dependence increases the time to exit after distress, whether the firm exits via a voluntary or
an involuntary procedure. Overall, firms have a higher probability of going bankrupt quickly
when they are smaller or when they have lower levels of slack resources at the first signs of
economic distress. Early voluntary liquidations, on the other hand, are characterized by high
available slack resources and low stakeholder dependence at the first signs of economic
distress.
By providing clear empirical evidence on determinants of the time period between a
firm’s first signs of economic distress and its exit, distinguishing between involuntary exits
and voluntary liquidations, this paper contributes to the literature on the process of business
failure and firm exit. Until now, the determinants of the time to exit have not been explicitly
studied. Moreover, the differentiation between two types of exit as an outcome of distress —
involuntary exit and voluntary liquidation — fills a gap in the literature on firm exits, which
mainly focuses on bankruptcies, and hence allows new insights into distress-related exits. For
example, this study shows that the time preceding involuntary exits and voluntary liquidations
is explained by different factors. Additional contributions of this paper to the literature are
fourfold. First, the richness of our dataset allows analysis of the effects of available and
potential slack resources and stakeholder dependence, as proposed by the organization theory
of the firm and stakeholder theory, on the duration of the time to exit. Second, the analysis of
a large and unbiased sample of distress-related exits in Belgium makes it possible to draw
conclusions that can be more readily generalized. Third, the focus on exits of more mature
firms and smaller, privately owned firms allows conclusions to be generated for categories of
firm exits that have until now remained largely unexplored. Finally, by considering historical
firm information from a broad pre-exit window up to 10 years prior to exit, this study adds
significantly to the existing business failure studies, which are often limited to the analysis of
firm information close to exit.

7
The remainder of the paper is structured as follows. Section 2 gives an overview of
the literature on distress-related exit and the timing of firm exit after distress. Section 3
formulates hypotheses about the effect of slack resources and stakeholder dependence on the
length of the exit path. Section 4 elaborates on the sample of distress-related exits and method
of analysis. Section 5 reports the results, while section 6 summarizes the most important
conclusions and provides suggestions for further research.
2 DISTRESS-RELATED EXIT AND TIME TO EXIT
Most academic studies on business failure and failure paths focus on involuntary exits
in the form of bankruptcies. In the present study, we extend this narrow concept of business
exit. We take a broader view and we consider two types of distress-related exit: involuntary
exit and voluntary liquidation. A first exit type is the involuntary exit, which may involve a
bankruptcy procedure (comparable to Chapter 11 in the U.S.), or a winding-up enforced by
court, also known as compulsory liquidation. Worldwide, bankruptcy procedures are usually
part of insolvency regulation for financially distressed firms. This allows an appropriate
person (i.e., the manager/owner or a creditor) to file for bankruptcy. In the case of a judicial
winding-up, the court makes an order for the firm to be liquidated on the petition of an
appropriate person. The second exit type considered in this study is the voluntary liquidation.
With this procedure, which is not forced by either the creditors or the court, the firm’s
shareholders sell assets in order to pay off any outstanding liabilities. All creditors are paid in
full, the firm is dissolved and the remaining liquidation proceeds—if any—return to the
shareholders. Involuntary exit is the most unfavorable exit type for many stakeholders of the
firm. It involves destruction of economic value. Not all creditors are fully compensated and
most incur considerable losses (Leyman and Schoors 2008). Bankruptcies may therefore
harm the reputation of the managers and directors. For this reason, firms usually attempt to
avoid involuntary exit. Conversely, with a voluntary liquidation, all external stakeholders are
compensated and only shareholders may suffer losses. A voluntary liquidation is hence only
feasible if the market value of the assets exceeds all liabilities. This makes that voluntary
liquidation is the result of ‘entrepreneurial self-selection’, while involuntary exit involves a
juridical procedure that is often initiated or stimulated by external parties (financial
institutions, companies, individuals and/or government) and therefore is an ‘external
selection’ exit mechanism (Prantl 2003).

8
In this study on distress-related exits, we analyze the length of the period between the
first sign of distress and the firm exit. Until now, surprisingly little is known on the
determinants of the time to exit. Existing studies about business failure mainly explore the
determinants of exit versus survival (Laitinen 1991; Van Wymeersch and Wolfs 1996), while
empirical studies on distress-related exits are mainly focused on a comparison of exit types
(Pastena and Ruland 1986; Peel and Wilson 1989; Kanatas and Qi 2004; Balcaen et al. 2008).
Duration studies, on the other hand, mainly focus on the time that firms spend in a
Chapter 11 reorganization procedure (eg. Bandopadhyaya 1994; Li 1999; Orbe et al. 2001;
Denis and Rodgers 2007). To the best of our knowledge, there are no studies explicitly
investigating the length of the time period from first sign of economic distress to firm exit.
However, the time to exit is an important characteristic of the exit process that warrants
separate analysis. The exit path length may be explained by specific factors, distinct from the
factors explaining firm exit or exit type. It is therefore relevant to gain insight in the driving
forces of the exit timing or the length of the exit path.
3 DETERMINANTS OF THE TIME TO EXIT AFTER DISTRESS
First, we will explore how available and potential slack resources at the first sign of
economic distress affect the time to exit. Guided by organization theory, we argue that slack
resources will lead to a longer time until involuntary exit. As firms usually attempt to avoid or
delay involuntary exit, slack resources will increase the time to involuntary exit. On the
contrary, we argue that a high level of slack will accelerate voluntary liquidation, because it
facilitates liquidation. Second, we use stakeholder theory to further explain the time to exit,
especially for voluntary liquidations. We argue that firms with more stakeholders have a
lower freedom of action. This, in turn, will make liquidation and involuntary exit more
difficult and will increase the time to voluntary liquidation and involuntary exit.
3.1 Slack resources and time to exit
Organization theory sees a firm as an entity that seeks survival as its ultimate goal. In
order to survive, a firm should be able to adapt to its environment and protect its core
(Hannan and Freeman 1984). Therefore, firms accumulate slack resources, because
organizational slack acts as a buffer to protect its core from environmental pressures and
random fluctuations in the environment (Cyert and March 1963; Thompson 1967; Pfeffer and
Salancik 1978; Bromily 1991; Cheng and Kesner 1997).

9
In uncertain environments, the presence of slack resources mitigates risks and may
allow the firm to survive (Sharfman et al. 1988; Tan and Peng 2003). Generally,
organizations are able to survive at least until their buffers of accumulated resources are
depleted (Gimeno et al. 1991). It is hence relevant to study the impact of slack resources on
the time to exit.
Bourgeois (1981, p. 30) defines “organizational slack” as “that cushion of actual or
potential resources which allow an organization to adapt successfully to internal pressures for
adjustment or to external pressures for change in policy as well as to initiate changes in
strategy with respect to the external environment”. Besides absorbing changes in the
environment (Thompson 1967), organizational slack serves also as a resource to tackle
problems (Sharfman et al. 1988). Although the role of slack resources is especially prominent
in economically adverse times (Cheng and Kesner 1997; Latham and Braun 2008), holding
slack resources may also benefit healthy firms (Galbraith 1973). Within certain limits,
organizational slack may be a source of sustainable competitive advantage over other firms.
When other firms experience restrictions on the development of slack or when the firm can
use slack as a complementary asset (e.g., along with superior insight or innovative ability),
slack resources may lead to a higher performance (Pfeffer and Salancik 1978; Hambrick and
D’Aveni 1988; Singh 1986; Barney 1991; Bromiley 1991; Miller and Leiblein 1996; Reuer
and Leiblein 2000).
In a situation of environmental uncertainty and distress, the need for high-discretion
slack resources increases (Sharfmann et al. 1988; Latham & Braun 2008). These are currently
uncommitted resources that are relatively liquid and easily redeployable in a wide variety of
situations (Singh 1986; Sharfman et al. 1988; Hambrick and D’Aveni 1988; Voss et al. 2008).
Firms may have different forms of high-discretion slack resources, such as cash holdings,
marketable securities, credit lines and raw materials. Bourgeois and Singh (1983), Bromiley
(1991) and Cheng and Kesner (1997) further distinguish between “available slack” and
“potential slack”. While available slack is immediately available, potential slack has not yet
entered the firm, but is accessible within a short time frame. Potential slack resources are
hence resources that can be generated from the environment in the future, for example
currently unused credit lines.
In a situation where a firm experiences distress and where involuntary exit poses a
threat, slack resources may be especially valuable. As involuntary exit is the most
unfavorable exit type for a distressed firm and many of its stakeholders, firms usually try to
avoid or postpone this type of exit and try to continue operations as long as possible.

10
Then, the primordial short-run goal of the firm is not to maximize efficiency, but to
survive (Bourgeois 1981; Sharfman et al. 1988). We expect that the available and potential
slack resources will increase the time period during which a distressed firm is able to avoid or
delay involuntary exit and, hence, will increase the duration of the exit path preceding
involuntary exit. In other words, distressed firms with large levels of available and potential
slack are expected to survive longer after economic distress. Firms with high levels of
available slack are able to delay involuntary exit, because available slack resources allow
absorbing changes, resisting to environmental pressures and tackling problems that may
threaten survival. Similarly, high levels of potential slack resources increase the capabilities
to postpone an involuntary exit. Conversely, distressed firms with a low level of available
slack are expected to have a shorter exit path preceding involuntary exit, because they may be
unable to absorb even small shocks, which in turn may accelerate deterioration of the
distressed situation, causing even lower levels of slack resources2. As a result, for firms with
low available slack, an involuntary exit may become inevitable in an early stage after the first
sign of economic distress. Moreover, the finding that a high level of slack decreases the
probability of involuntary exit compared to voluntary exit (Balcaen et al. 2008) feeds our
expectation that slack resources will affect the duration of the exit path leading to involuntary
exit. This leads to:
Hypothesis 1: Available slack resources have a positive effect on the length of the
time period from economic distress to involuntary exit
Hypothesis 2: Potential slack resources have a positive effect on the length of the
time period from economic distress to involuntary exit.
An opposite effect is expected for voluntary liquidations, as a high level of slack
resources facilitates a voluntary liquidation. Firms with high levels of available or potential
slack resources have a high probability to successfully complete the liquidation procedure.
High levels of slack resources may hence motivate shareholders to cash-in early to prevent
further loss of resources. On the contrary, distressed firms with a low level of available slack
are expected to be restrained from starting a liquidation procedure, because of the low success
probability. These firms are hence more likely to postpone the decision to voluntarily
liquidate and await the evolution of the firm.
2 This argument assumes rational behaviour.

11
In other words, economically distressed firms with high levels of available and
potential slack are expected to have a shorter exit path preceding voluntary liquidation. As a
result, we propose the following hypotheses:
Hypothesis 3: Available slack resources have a negative effect on the length of the
time period from economic distress to voluntary liquidation.
Hypothesis 4: Potential slack resources have a negative effect on the length of the
time period from economic distress to voluntary liquidation.
The level of high-discretion available slack is reflected by cash holdings, while the
level of potential slack resources is determined by the future accessibility of additional slack.
An indicator of potential slack is current leverage.
Cash holdings
Cash holdings are available slack resources because they involve currently
uncommitted resources that can easily be deployed for various purposes (Sharfman et al.
1988). Firms may maintain large cash holdings, far in excess of their transactions needs, as a
buffer to meet unexpected contingencies so as to ensure survival (Baum et al. 2004, 2006).
For this reason, high levels of cash holdings may be viewed as “options purchased by the
firm’s managers that may be exercised in adverse times in order to ensure firm survival”
(Baum et al. 2004, p. 4). In case of distress, cash hence provides a firm with a pool of
financial resources that allow to absorb financial problems and to offset potential difficulties
in its access to credit or other external financing and/or to initiate strategic changes so as to
adapt to the pressures from the external environment. Therefore, large cash holdings may
allow a distressed firm to continue operations and postpone involuntary exit.
Current leverage
Firms with a higher borrowing capacity have a higher probability to raise additional
cash in the future through new debt issues. An important indicator of the future borrowing
capacity of a firm is its current leverage. Contrary to firms with more equity and more unused
debt capacity, a firm with a high leverage may experience difficulties in accessing additional
financial resources. As a result, a high current leverage is an indicator of a low level of
potential slack (Singh 1986), which leads to a higher vulnerability to external pressures.
Therefore, current leverage is a negative indicator of potential slack.

12
3.2 Stakeholder dependence and time to exit
Stakeholder theory argues that a firm can be seen as “a vehicle for coordinating
stakeholder interests” (Evan and Freeman 1993, p. 102-103). A modern corporation is the
centre of a network of interdependent interests of various stakeholders. Besides shareholders
and lenders, employees, suppliers, customers, governmental bodies, regulatory authorities,
trade unions, trade associations, related and associated firms including joint venture partners
have an interest in the company. Organizational morality implies that managers acknowledge
stakeholder interests and pay attention to these interests (Hill and Jones 1992; Donaldson and
Preston 1995; Berman et al. 1999; Post et al. 2002). In most countries, the interests of some
types of stakeholders – for example, the shareholders, customers and employees – are
explicitly protected by law (Post et al. 2002).
The term “stakeholder” was introduced by Freeman (1984), who considers each party
with interests in the firm as a stakeholder. All individuals or companies that contribute to the
wealth-creating capacity and performance of a firm by providing resources – and therefore
anticipate benefits (possibly in the form of monetary returns) and/or bear risks – can be
considered as stakeholders (Post et al. 2002). Besides funds, capital, labor (including
knowledge and capabilities) and revenue, the resources that stakeholders supply may include
social acceptance or a “license to operate”3 (Blair 1995; Post et al. 2002). Through the
resources that are provided by the stakeholders, corporations are able to create new wealth in
many different forms: returns for investors, compensation for the employees, income for the
suppliers, benefits in excess of costs for customers, interest payments for creditors, taxes for
the government, and so forth (Post et al. 2002).
In this context, we propose that the level of stakeholder dependence will influence the
period between economic distress and voluntary liquidation. In case of distress, the firm is
voluntarily liquidated if this appears to be the best option. When management believes that
liquidation will prevent future losses or that liquidation will allow redeploying the assets in a
more profitable way, management may choose to voluntarily liquidate the firm. However, as
management is expected to advance the interests of all stakeholders, the freedom of choice for
voluntary liquidation is more complex for corporations operating within an extensive network
of stakeholders (Post et al. 2002).
3 The legitimacy or “license to operate” depends on the firm’s ability to meet the expectations of diverse stakeholders.

13
If a firm has a lot of stakeholders to account for, the decision on a liquidation of the
firm will involve a lot of consideration and, possibly, negotiation with diverse stakeholders,
which will in turn increase the time to exit. For example, internal non-owner stakeholders,
such as employees, may exercise their voice and attempt to obstruct the liquidation by efforts
to influence the decision-making processes (Gimeno et al. 1997). If these efforts turn out
effective, the voluntary liquidation may eventually be postponed, despite a preference of the
owners for liquidation (Meyer and Zucker 1989). Further, external stakeholders, such as debt
holders, customers, suppliers and governmental institutions may persuade a distressed firm to
continue operations by applying direct co-optation or by exercising institutional pressures
(Gimeno et al. 1997). On the contrary, low stakeholder dependence may facilitate the
decision to voluntarily liquidate the firm. For example, in case of distress, a small firm with
few employees, no group relations and few obligations towards suppliers, may decide rather
quickly to voluntarily liquidate, because it is highly independent and has only few
stakeholders to take account of.
Besides the decision to liquidate, the degree of stakeholder dependence will also
influence the length of the liquidation process. High stakeholder dependence is likely to
increase the number of steps in the liquidation process and the duration of these steps, which
will in turn result in a long exit path. In firms with many stakeholders, the liquidation process
is more complex because it requires the settlement of multiple agreements with various
stakeholders, negotiations with various contracting parties concerning the termination of
contracts, the settlement of possible disputes and lawsuits and the settlement of a considerable
amount of accounts payable and debt obligations. For example, due to a more complex
liquidation process, the duration of the liquidation process will be longer in firms with a large
workforce, many related firms and strong supplier relationships. Conversely, low stakeholder
dependence will simplify and, hence, shorten the liquidation process. In independent, small
firms with only few employees and few obligations towards suppliers, a liquidation process
can be rapidly completed, as only few stakeholders are involved. In this kind of firms, the
liquidation process is simpler and shorter. For these reasons, inspired by stakeholder theory,
we propose following hypothesis:
Hypothesis 5: Stakeholder dependence has a positive effect on the length of the time
period from economic distress to voluntary liquidation.

14
A similar effect of stakeholder dependence may be at work when a distressed firm is
facing an involuntary exit. We propose that, in case of distress, the degree of stakeholder
dependence may play an important role in the timing of the involuntary exit. The decision to
file for an involuntary exit procedure – a bankruptcy or a winding-up by court – is likely to be
more complex when a lot of stakeholders are involved. In a firm with a broad network of
stakeholders, the filing for an involuntary exit procedure will involve a lot of consideration,
as it may cause losses for many stakeholders, and it will involve negotiations with diverse
stakeholders. For example, employees are informed about the situation and the firm will
initiate negotiations with the bank about the outstanding debts. As a result, the presence of
stakeholders will increase the time to exit. Conversely, low stakeholder dependence may
facilitate the decision to file for an involuntary exit procedure. For example, for a small firm
with few employees and no group relations it may be much easier to decide on a bankruptcy
in case of distress and this independence from stakeholders may accelerate the decision to file
for a bankruptcy.
Besides the effect on the decision to exit, the degree of stakeholder dependence will
also influence the time between the decision to file for an involuntary exit and the eventual
declaration of exit by court (i.e. bankruptcy declaration). High stakeholder dependence is
likely to increase time between the filing and the declaration, which will, in turn, prolong the
exit path. For example, in firms with a large workforce and many related firms, the official
declaration of bankruptcy by court is likely to require more time than in stand-alone firms
with few employees. As a result, guided by stakeholder theory, hypothesis 6 suggests:
Hypothesis 6: Stakeholder dependence has a positive effect on the length of the time
period from economic distress to involuntary exit
We use different indicators of stakeholder dependence, reflecting the degree of
dependence from different stakeholder categories. The level of stakeholder dependence is
observed through firm size, business group membership, employee representation and trade
debts.

15
Firm size
The level of stakeholder dependence is reflected by firm size. Small firms generally
have fewer stakeholders. They have fewer employees, a smaller network of suppliers, fewer
shareholders (often, the manager is the sole owner of the firm), a smaller customer base, a
more limited number of banks with whom they have contracted loans, and so forth. It is
obvious that these firms have more freedom of action. Radical strategic changes concerning
the firm can be taken rather easily with few stakeholders to negotiate with. In this context,
small firms may be more capable to quickly decide on a voluntary liquidation or an
involuntary exit. On the other hand, larger firms generally have a larger network of
stakeholders. In these firms, fundamental strategic decisions are more likely to involve
extensive and time-consuming negotiations with various internal and external stakeholders.
Business group membership
All firms that are part of a larger group structure around the firm, such as and
associated corporations, firms that are part of a conglomerate or a consortium and parent
corporations, have another category of stakeholders to take account of: the related firms. This
category of stakeholders may be important, especially for firms that operate within a broad
network of related firms, involving participations and intra-group financial flows with respect
to financing activities and operating activities. Firms with group relations clearly have a
lower level of freedom in their actions, as compared to totally independent firms without
group relations. For example, being a supplier or customer of the products of other firms from
the group, is likely to increase the complexity to opt for a voluntary liquidation or a
bankruptcy and, hence, may delay the exit decision. Moreover, the presence of a network of
related firms is likely to increase the complexity and the duration of the liquidation or
bankruptcy process itself, because of the involved negotiations with all related firms.
Conversely, the level of stakeholder dependence is lower in independent firms.

16
Employee representation
Employees are an important stakeholder category. Especially in larger firms where
employee representation is often compulsory4, it will be less obvious to opt for voluntary
liquidation. Employee representatives may have considerable power in the decision making
process within the firm. They are able to give advice, to pass criticism or to raise objections
before important decisions are taken. They may further have an impact on the decisions on a
voluntary liquidation planned by management. For example, they may try to postpone the
liquidation, negotiate about a possible turnaround of the firm or about layoff payments and
premiums for employees with a long length of service. Employee representatives will always
steer upon decisions that are most favorable for the employees and try to avoid choices that
may put them at a disadvantage. It is clear that this may, in turn, be a factor opposing a
prompt settlement of a voluntary liquidation. In a similar way, employee representation may
delay an impending involuntary exit.
Trade debt
Suppliers are another category of stakeholders. With a view to optimize efficiency and
profitability, firms generally aim to develop strong and stable buyer/seller relationships with
one or multiple suppliers. Advantages of strong supplier relationships result from the firm’s
commitment to the supplier, the possibilities of advanced planning, simplified contract
negotiations and the way in which both parties consider each other as partners. Generally,
strong supplier relationships with a high frequency of transactions encourage the use of trade
credit with a view to fill temporary gaps in the cash flow 5 (Stiglitz and Weiss 1981). This is
particularly true for small firms, which are more likely to suffer from information problems in
capital markets and which have a restricted access to external financing (Beger and Udell
1995).
4 In most EU countries, employee representation, which allows for employee participation, is compulsory. This may involve board-level representation of employees or employee representation in the form of works councils. Although board-level representation is a widespread form of employee participation across Europe (a majority of the EU states have board members representing employees), in Belgium, the UK, Bulgaria, Cyprus, Estonia, Italy, Latvia, Lithuania, Romania there is no general legislation or widely applicable collective agreements providing for board-level representation. However, in Belgium, employee representation in the form of a works council is compulsory for larger firms. For example, each Belgian firm with at least a hundred employees needs to establish a “work council”, which mainly has an advisory task. The employee representatives need to be timely informed about important events or decisions that may have a considerable impact on the firm and its work force. For example, decisions about an acquisition by another firm or a merger, about collective lay-offs, about the termination or downscaling of certain activities, about large additional loans need to be timely communicated. 5 This is partly due to the information advantage and monitoring advantage of suppliers over banks (Schwartz and Whitcomb 1979).

17
At the same time, strong relationships with suppliers cause a lower freedom of action
concerning radical strategic changes, such as firm exit. Especially when a large amount of
trade debts is involved, it is less obvious for a distressed firm to decide on a voluntary
liquidation or a bankruptcy. Moreover, large amounts of trade debts are likely to increase the
complexity and the duration of the liquidation or bankruptcy process itself. Conversely, small
amounts of trade debts, reflecting a lower level of dependence from suppliers, may facilitate
and accelerate voluntary liquidation or bankruptcy.
4 RESEARCH METHOD
4.1 Sample composition
The analyses are based on a large Belgian sample of 5,233 distress-related exits of
mature firms. This sample of distress-related exits is drawn from a comprehensive dataset of
all involuntary exits and voluntary liquidations in the period 1998–2000 and is provided by
the National Bank of Belgium (NBB). For each Belgian firm and on a yearly basis, the NBB
registers the annual accounts6 and all juridical information. From this dataset of 19,052 exits,
firms less than five years old at the time of exit are excluded, because confronted with
distress, new firms act differently compared to more established, mature firms. New firms
have a specific exit path, in which personal characteristics of the owner/manager play a major
role and in which there is no gradual evolution toward exit (Pompe and Bilderbeek 2005).
Sole proprietorships, not-for-profit firms, public organizations, companies with a social aim,
and firms with a special main business activity7 are also excluded. These firms have a specific
nature and are likely to have specific exit paths with distinct determinants.
We further restrict our sample to firms that showed economic distress before exiting.
The first sign of distress is viewed as the starting point of the exit path. In the literature, there
is no consensus yet on the most appropriate distress criterion.
6 In Belgium, all firms, even small companies, deposit their annual accounts with the NBB in a standardized format, including balance sheets, profit-and-loss accounts and additional disclosures. 7 More specifically, firms active in financial intermediation and insurance, portfolio companies and management activities of holdings, extra-territorial organizations, real estate firms and enterprises whose activities are totally located in a foreign country are excluded from the sample.

18
Potential indicators of economic distress include several years of negative net
operating income, bottom-line and accumulated losses, negative working capital, retained
earnings deficits, share sales to private investors, capital restructuring or reorganization,
negative shareholder’s funds, suspension of dividend payments, and major restructurings or
layoffs (McKeown et al. 1991; McLeay and Omar 2000; Platt and Platt 2002; Rosner 2003).
In our study, economic distress is defined as a firm year with negative recurring profit
after taxes. We hence define economic distress as a situation where operating revenues are
insufficient to cover (1) operating expenses, such as the expenses for goods and services
needed for production (commodities, accessories, raw materials and services), personnel
costs, write-offs and depreciations of fixed and current assets (land, plant and equipment,
licenses, inventories, orders in progress and accounts receivable); (2) the financial costs of
debt; and (3) taxes. Table A.1 in the Appendix provides details on the calculation of recurring
profit after taxes. In contrast to net profit after taxes, recurring profit after taxes does not
include exceptional revenues and expenses, or financial revenues8. It has an operational
content because it reflects the excess (or deficit) of revenues over expenses derived from
normal business activities. As the exceptional revenues and expenses are not included in the
calculation of recurring profit, this indicator of distress is also less influenced by earnings
management practices. Our measure is closely related to the concept of ‘economic value
added’ (Van Caillie and Arnould 2001; Van Caillie and Dighaye 2002) and ‘revenue
productivity’ (Becchetti and Sierra 2002). It can hence be seen as an indicator of firm
efficiency and firm success.
This definition of distress allows for the study of a broad spectrum of distress-related
exits, including ‘impulsive firm’ exits as an outcome of an excessive fast-growth strategy
(Argenti 1976). It should be noted that the “rapid, unexpected exits”, a heterogeneous
category of exits which have little to do with a situation of economic distress, are excluded
from the sample. Examples are cases of “sudden bankruptcy” reflecting a strategic decision,
where it is likely that the firms have idiosyncratic reasons for the bankruptcy filing, which are
not related to financial distress and are likely to be driven by strategic issues or even
management fraud (Hill et al. 1996) and cases of “accidental bankruptcy”, resulting from an
unexpected event, such as a natural disaster (Davis and Huang 2004).
8 In contrast to a negative recurring profit after taxes, a net loss does not necessarily point to real distress. It could simply be the result of low financial revenues (for example, low revenues from participations in other firms), or high extraordinary expenses (for example, exceptional write-offs or losses from the disposal of assets or business segments). It should be noted that firms often attempt to report negative extraordinary results to decrease net profit in an attempt to avoid taxes.

19
The large dataset of 5,233 distress-related exits used in this study is unique and offers
considerable contributions to the existing literature on firm exit and business failure. First, the
dataset allows analyzing different exit paths: involuntary exits as well as voluntary
liquidations. In addition, it does not suffer from sample selection biases. Second, it contains a
large number of small and medium-sized privately owned enterprises (SMEs).
These have been largely neglected in previous empirical work on business failure,
where the vast majority of research has dealt with large listed firms because of data
availability issues. However, SMEs have been one of the major driving forces of worldwide
economic growth, employment and prosperity during the last decades. At the same time,
during the past decade many European (privately owned) SMEs are threatened by increased
competition and the number of SMEs exiting because of distress is substantial. As it appears
essential to gain insights into the exit-path dynamics of SMEs, the strong presence of
privately owned SMEs in our dataset is interesting. A third contribution of the dataset is its
focus on established and more mature firms. During the past decade, an increasing number of
failures of mature, non-starting firms have been observed in most European countries due to
the fierce competitive situation. Nevertheless, numerous firm exit studies have focused on
new firm exits and largely ignored the exit path of more mature firms. This study will only
analyze firms that have survived the first five years following their foundation.
Table 1 shows the type of exit of our sample firms. The sample contains 2,533 firms
with involuntary exits (48.40%) and 2,700 firms that were voluntarily liquidated (51.60%).
The involuntary exits mainly involve cases of bankruptcy (N=2,518) but also a few cases of
judicial winding-up and compulsory liquidation (N=15). In addition, we also consider firms
operating under a juridical reorganization procedure known as a ‘moratorium on payments’9,
where (1) firms have stopped depositing annual accounts after filing for a reorganization
procedure or (2) their restructuring plan has not been successfully completed and the
moratorium on payments has been recalled. The 2,700 cases of voluntary liquidation include
cases filed at the Court of Commerce as an ‘early dissolution/liquidation’ or ‘closure of
liquidation’.
9 Similar to reorganization procedures in other countries—‘Chapter 11’ in the U.S., ‘administrative receivership’ in the U.K., ‘collective procedure’ in France (Kaiser 1996; Couwenberg 2001)—the Belgian procedure of moratorium on payments permits a firm with (impending) payment problems to take legal shelter from its creditors for a certain period during which it can implement a reorganization plan. It is important to note that although the basic intention of the Belgian reorganization procedure is to help firms recover from a situation of distress, it is strongly oriented toward bankruptcy. It is rarely used, but is usually unsuccessful and followed by bankruptcy (Research Reports of Graydon NV). As outsiders and employees generally interpret a filing as a signal of a forthcoming bankruptcy, only firms with serious problems with payments and

20
Of the firms in our sample, 48.25% are active in the trade industry, including
wholesale, retail, and hotel, restaurant and catering activities, 32.20% in manufacturing,
agriculture or construction, and 19.55% in the service industry, including personal, business
and transport services. Except for one case, all firms in our sample are privately owned.
Insert Table 1 About Here
For the 5,233 firms in our sample, the closure date of the first annual account with a
negative recurring profit after taxes is defined as the starting point of the exit path (time t=1).
The potential determinants of time to exit are observed at t=1. The official date of the legal
exit (i.e. the date when the exit is officially declared by the Court of Commerce) is considered
as the end of the exit path. The duration of the exit path of each firm is then calculated as the
time between the first sign of distress and the legal exit. It should be stressed that the
maximum duration of the exit paths in our sample is 10.9 years, because of the limitation of
the pre-exit window up to fiscal year 1990 – due to data availability issues. The mean
(median) exit-path length of the 5,233 firms in our sample is 6.17 (6.51) years. Table 2 gives
descriptive statistics on the exit path duration, distinguishing between involuntary exits and
voluntary liquidations and for separate subsamples of early exits, that occur within a five-year
period after the first sign of distress, and late exits, that occur passed this five-year limit. On
average, the voluntary liquidations have longer exit paths than involuntary exits (Mann–
Whitney p = 0.000). However, there is a distinction between early exits and late exits. The
separate analysis of early exits indicates that early voluntary liquidations have on average
shorter exit paths than early involuntary exits. In other words, early exits happen more
frequently in the form of a voluntary liquidation and less frequently in the form of an
involuntary exit. Conversely, in the subsample of late exits, voluntary liquidations are
preceded by somewhat longer exit paths. Mann–Whitney tests confirm these findings. The
survival curves in figure 1 reflect the distribution of the exit-path length since the first sign of
distress for the involuntary exits and voluntary liquidations.
continuing operations will file for a moratorium on payments. We note the similarly low popularity and success rate of reorganization procedures in many other European countries (Couwenberg 2001).

21
These survival curves are based on the survival rates for each exit alternative or the
percentage of firms that exit after time t conditional on having survived up to time t, starting
with 100% (all firms enter the dataset) and ending with 0% (all firms have exited and left the
dataset after t = 11).
Insert Table 2 and Figure 1 About Here
4.2 Method of analysis
Multivariate tobit regression is used to identify the determinants of the time to exit. As
the dependent variable LENGTH, measuring the exit path length, is continuous but truncated
below 0 and above 11, tobit is a better suited model. For truncated dependent variables tobit
will produce coefficients and standard errors that are less biased than those obtained from
OLS regression. Moreover, compared to OLS, tobit may explain a higher proportion of the
variance in the dependent variable. (Tobin 1958; Amemiya 1973; Long 1997; Greene 2003).
Survival models are not appropriate in our setting as all the firms in the dataset eventually
exit: no firms survive. We estimate tobit models for the subsamples of involuntary exits and
voluntary liquidations separately, as the fundamental differences between involuntary exit
and voluntary liquidation (Balcaen et al. 2008) require a separate analysis of these two types
of exit.
4.3 Variables
All explanatory and control variables are measured at the first sign of economic
distress. The level of cash holdings (CASH) is measured by the amount of cash and cash
equivalents divided by total assets. Current leverage (LEVERAGE) is measured by the ratio
of the book value of long-term and short-term debt on total assets. Firm size (SIZE) is
measured by the natural log of the book value of total assets (in €1,000), which is a common
size proxy. We use the natural logarithm of total assets, because it is reasonable to assume
that the marginal effect of size is stronger for small firms. Business group membership is
reflected by a dummy variable D_GROUP, which takes the value of 1 (zero) in case of
presence (absence) of financial interactions with related firms and firms with holding
interests. Financial interactions include (1) investments in participations and in claims (i.e.
financial fixed assets), (2) claims, (3) monetary deposits and (4) debts.

22
It is important to note that the group relations observed are not restricted to parent-
subsidiary relations, but also involve financial interactions with other subsidiaries from the
same group and with companies in which the firm holds participations. The presence of
employee representation is reflected by a dummy variable D_REPRESENTATION, which
takes the value of 1 if the firm has at least 100 employees or staff members and, hence, is
obliged to establish employee representation. In Belgium, employee representation in the
form of a works council is compulsory for firms with at least a hundred employees. The
variable trade debts (TRADEDEBT) is measured by the ratio of the amount of trade debts,
including long term and short term trade debts towards suppliers, on total assets.
Besides these indicators of slack resources and stakeholder dependence, a number of
control variables are included: firm age, presence and level of secured debt, productivity,
profitability, investments, tangibles, receivables, level of stocks and industry type. All control
variables are measures at t=1. Firm age (AGE) is a variable that appears in many studies as an
important predictor of business failure. Firm age is expected to affect exit timing, because
more mature firms generally (1) are more efficient and more competent (Levinthal 1991) as a
result of learning effects, decreasing production costs, accumulation of skills and knowledge,
more developed production technologies, and reputation building, (2) have more stable social
relations (Stinchcombe 1965) and (3) have more experience concerning the most appropriate
size and composition of organizational slack (Sharfman et al. 1988)10. Firm age is measured
as the number of years of operational activity.
The secured debt level (SECURED) is included as a control variable because different
studies have suggested that the presence of secured debt may have an impact on firm exit.
Because of their guaranteed position in the liquidation process, secured creditors may push
for an involuntary exit or voluntary liquidation – even shortly after the first sign of distress –
so as to collect their accounts as soon as possible (Campbell 1996; Schwarts 1997; Franks and
Sussman 2005; Leyman et al. 2008). The secured debt level is measured by the percentage of
total debts that are guaranteed by business securities on the firm’s assets. Secured debts
involve guaranteed financial debts, trade debts, received advance payments on orders, debts
related to taxes, remunerations, social security premiums and other guaranteed debts.
Together with the secured debt level, we include a variable reflecting the absence of secured
debts (D_NOSECURED). This allows to separately asses the impact of having secured debts
and of the importance of secured debt.

23
Also, in view of the high frequency (more than 75%) of zero-observations for the
secured debt level, this reduces possible biases in the estimation of the models. The dummy
variable D_NOSECURED takes the value of 1 in cases where no debts are guaranteed by
business securities on the firm’s assets (i.e. there are no secured creditors).
Furthermore, productivity and profitability are included as control variables.
Productivity or overall firm efficiency is a frequently mentioned determinant of business exit
and profitability is an important predictor of failure and exit (Fazzari et al. 1988; Siegfried
and Evans 1994; Klepper 1996; Dimitras et al. 1996; Caves 1998; Cooley and Quadrini 2001;
Daubie and Meskens 2002; Delli Gatti et al. 2003). Productivity (PRODUCTIVITY) is
measured by the ratio of gross value added to total assets. Profitability (PROFITABILITY) is
measured by EBIT on total assets11.
The investments in tangibles and intangibles (INVESTMENTS) are included as a
control variable, because literature on business failure and on corporate restructuring suggests
that investment behavior may impact firm exit. First, as the failure literature suggests that
investments are likely to increase competitive strength and survival chances, we may expect
that investments allow postponing an impending exit. Moreover, several studies on corporate
restructuring and turnaround have indicated that investments in the form of an acquisition of
additional plants or equipment, or an acquisition of another company that fits into the core
business may allow a distressed firm to recover (Schendel et al. 1976; Hofer 1980). In
response to distress and declining performance, firms may adopt a growth strategy, as an
alternative to organizational retrenchment12 (D'Aveni 1989; Chowdhury and Lang 1996;
Rasheed 2005). As a result, we may expect that the investment behavior of a firm confronted
with distress will affect the exit timing. Investments are measured by the total amount of
investments in tangibles and intangibles – including R&D, patents, licenses, franchises and
goodwill, land and plant, equipment and machines, furniture and rolling stock – on total
assets.
10 Note that all firms in our population have survived the critical starting phase of 5 years. 11 Productivity and profitability can also be measured by using operational assets instead of total assets as the denominator. Sensitivity analyses for these alternative measures reveal no changes in the conclusions. 12 Severely declining organizations and distressed firms facing internal resource constraints rather apply asset reductions (D'Aveni 1989; Robbins and Pearce 1992; Rasheed 2005).

24
Another control factor is the level of tangible assets (TANGIBLES). The level of
tangible assets determines the possibility of asset divestment – divestments of lines of
businesses or business units in the context of a refocusing on core business or sales of land,
plant and equipment in the context of an attempt to increase productivity (Gibbs 1993;
Sudarsanam and Lai 2001) – which may be necessary in order to postpone an impending
exit. Consequently, the asset composition may affect the timing of exit after distress. On the
other hand, as tangible assets have a higher liquidation value compared to intangibles, we
may expect that a high degree of asset tangibility may increase the motivation initiate a
voluntary liquidation procedure. The degree of tangibles is measured by the book value of
tangible assets on total assets.
Another control variable is trade receivables (RECEIVABLES). On the one hand,
trade receivables may positively impact exit timing, because the reduction of receivables (i.e.
collection of payments) is a frequently applied restructuring activity in an attempt to postpone
exit. On the other hand, business failure studies have shown that a high amount of receivables
may be detrimental for a firm in distress, especially when they concern questionable debtors.
Therefore, large volume of trade receivables may accelerate involuntary exit. Trade
receivables are measured as the ratio of the amount of long and short term trade receivables
on total assets.
Similarly, the inventory level (INVENTORY) may impact exit timing. Literature on
corporate restructuring has shown that inventory downsizing is a restructuring activity for
firms in distress (Sudarsanam and Lai 2001). As firms with a large inventory – especially
when inventory mainly consists of raw materials and finished goods that can be sold easily –
have more possibilities to optimize working capital by reducing inventories, they may be
expected to be better able to postpone exit. For this reason, inventory may be expected to
have a positive effect on the exit path duration. However, at the same time, a (too) high
inventory, especially when it concerns work in progress and finished goods for which there is
no demand, may accelerate an impending bankruptcy. Inventory is measured by inventory
(including raw materials, finished goods and work in progress) on total assets.
Finally, as the industry may also influence the exit timing, an industry variable is
included as an additional control variable. We distinguish three main industry types:
manufacturing (i.e., manufacturing, agriculture and construction), trade (i.e., wholesale, retail
and hotel, restaurant and catering activities) and services (i.e., personal, business and
transport services).

25
We include two binary variables: D_TRADE takes a value of one if the exiting firm is
active in trade and D_MANUFACTURING takes a value of one if the exiting firm is active
in manufacturing.
Tables A.2 and A.3 in appendix show that the correlation between the independent
and the control variables is low. The highest correlation is found between tangibles and
investments (0.562). Hence, multicollinearity problems in the multivariate analyses are
limited.
4.4 Sample description
Table 3 provides summary statistics of the key variables measured at the first sign of
distress (t = 1) for the entire sample of distress-related exits (N=5,233), and for the
subsamples of involuntary exits (N=2,533) and voluntary liquidations (N=2,700). The results
indicate that most firm characteristics differ significantly. On average, compared to voluntary
liquidations, firms with involuntary exits have lower cash holdings, a higher leverage, a
smaller size and more trade debts. Average leverage is as high as 96.0%, with trade debts
accounting for 31.7% of total assets. Further, they are younger, have more secured debts and
are less profitable than firms that voluntarily liquidate. They have a higher investment
activity, more tangible assets, larger trade receivables and higher inventory levels. Finally,
they are more likely to be a stand-alone firm, to have a main activity in manufacturing and to
have secured debts. Cases of voluntary liquidation, on the contrary, typically have larger cash
holdings (12.7% compared to 7.3% for involuntary exits), a lower leverage (66.7% compared
to 96.0% for involuntary exits), a larger firm size, lower trade debts, a higher maturity, less
secured debts, a higher profitability, a lower investment activity, less tangibles, fewer
receivables and a smaller inventory. Also, they are more likely to be part of a business group,
showing financial interactions with related firms and firms with holding interests, to have no
secured debts and to be active in the trade or service industry. Note that the firms are small:
average total assets equal €1.5 million and median total assets equal only €228.830. The huge
difference between average and median size is due to some very large firms in the sample.
5 Results
Insert Table 3 About Here

26
5 RESULTS
Involuntary and voluntary exits are modeled separately, given the differing dynamics
of their exit paths (Balcaen et al. 2008). For both exit types, the first model includes only the
control variables. The variables proxying for slack resources are added in the second model.
The third model is the full model, including control variables, slack resource variables and
stakeholder dependence variables. Adding stakeholder dependence variables before slack
resource variables does not alter the conclusions. Models 1 are compared to the constant only
model, models 2 are compared to models 1 and the complete models (model 3) are compared
to models 2. The chi-square tests for models 2 and models 3 indicate that the variables on
slack resources and on stakeholder dependence significantly add to explaining both the time
to involuntary exit and the time to voluntary exit (significant at 1% level). Both groups of
explanatory variables hence significantly explain the duration of the exit path of distressed
firms.
5.1 Involuntary exits
The results of the multivariate tobit model explaining the exit duration of involuntary
exits are reported in table 4 (N = 2,531). Model 1, which only contains the control variables,
shows that firm age and investments have a significant effect on the time to involuntary exit.
Older firms and firms with high investments have longer exit paths before they exit
involuntarily. Additionally, firms with a large inventory have a longer time to exit. The
coefficient of this variable is significant in the full models.
Model 2 shows that firms with large cash holdings, reflecting a higher level of
available slack resources, have significantly longer exit paths, supporting Hypothesis 1. The
coefficient of the variable indicating potential slack is significant and in the hypothesized
direction, supporting Hypothesis 2. A high leverage, reflecting lower potential slack,
decreases the time to involuntary exit.
The complete model (model 3) confirms the impact of slack resources and
additionally provides support for hypothesis 6. A large firm – reflecting higher stakeholder
dependence – has a significantly longer time to exit. The other indicators of stakeholder
dependence – business group membership, employee representation, and amount of trade
debts – do not significantly explain the time to involuntary exit however.

27
Overall, we find that early involuntary exits are driven by a low level of available and
potential slack resources. A small firm size, reflecting low stakeholder dependence, also
contributes to an early bankruptcy.
Insert Table 4 About Here
5.2 Voluntary liquidations
Table 5 reports the results of the multivariate models for voluntary liquidations (N =
2,644). Model 1 indicates that productivity, profitability, investments, tangibles, receivables
and inventory significantly explain the duration of the exit path preceding voluntary
liquidation. A stronger economic performance – higher productivity and profitability – high
investments, high asset tangibility, large trade receivables, and a large inventory significantly
increase the survival time and postpone voluntary liquidation. These relationships remain
significant when adding the slack resource and stakeholder dependence variables.
In model 2, the variables reflecting the available and potential slack resources are
added. Supporting hypothesis 3, firms with large cash holdings exit significantly sooner after
the first sign of distress: the available slack has a negative influence on the exit path duration
and, hence, shortens the exit path. A high leverage, indicating lower potential slack,
significantly increases the time to exit in model 2, which is consistent with hypothesis 4.
However, leverage is no longer significant in the complete model (model 3). Current
leverage, as an indicator of low future borrowing capabilities and low potential slack, hence
does not significantly impact the time to voluntary liquidation. Therefore, hypothesis 4 is not
supported.
Finally, the variables reflecting stakeholder dependence are included in the complete
model (model 3). Supporting hypothesis 5, firms with higher stakeholder dependence,
measured by firm size, group membership, and volume of trade debts, take significantly
longer to voluntarily liquidate. The presence of employee representation does not affect the
duration of the exit paths, however.

28
Overall, early voluntary liquidations are determined by high available slack resources
and by low stakeholder dependence, as reflected by a small firm size, a stand-alone status,
and low volume of trade debts. High levels of potential slack resources do not impact the time
to exit, however. This might reflect the fact that firms wishing to voluntarily liquidate do not
attempt to raise additional debt, as additional debt makes a voluntary liquidation more
difficult.
Insert Table 5 About Here
5.3 Robustness checks
Several robustness tests are conducted so as to test the general validity of the results.
First, we correct the tobit models for specification errors (Huber 1967) and for
heteroscedasticity (White 1980), using the Huber-White standard errors13 instead of the
traditional standard errors. The results (reported in Table A.4 in the Appendix) remain
qualitatively unchanged. Second, as the influence of outliers can be important, the tobit
models are re-estimated in a reduced sample. All independent variables are trimmed at the 1st
and the 99th percentile and all observations above and below three standard deviations from
the mean are deleted. The outlier-corrected models are consistent with the original models.
Third, additional model regressions are conducted for alternative measures of employee
representation (number of employees), productivity (gross value added per employee) and
profitability (net return on total assets). The conclusions are consistent with the ones reported
previously. Fourth, re-estimation of the models using OLS instead of tobit does not alter the
conclusions. Finally, a sensitivity analysis is conducted on a sample of ‘complete failure’
exits, of which the exit path is initiated by a sign of serious distress. A sign of serious distress
is defined as three consecutive firm years with a negative recurring profit after taxes. The
samples of complete failure exits as an outcome of serious distress include 1,314 involuntary
exits and 1,458 voluntary liquidations. Again, the results of the additional tobit models are in
line with the original models.

29
6 CONCLUSIONS
This study provides new insights on the determinants of the exit path duration
preceding distress-related involuntary exits and voluntary liquidations. It examines how long
a firm survives after an initial sign of distress and identifies determinants of the ‘time-to-exit’.
We focus on the level of available and potential slack resources and stakeholder
dependence at the time of the first signs of distress as determinants of the time to exit. Based
on a unique sample of 5,233 distress-related firm exits in Belgium, we show that available
and potential slack resources and stakeholder dependence explain the duration of the exit
path.
Particularly, we find that slack resources have an opposite effect on the timing of
involuntary exits and voluntary liquidations. On the one hand, a high level of available and
potential slack resources (reflected by large cash holdings, and a low current leverage)
increases the duration of the exit paths preceding involuntary exits. Slack resources hence
allow distressed firms to postpone an impending involuntary exit. This finding reinforces the
importance of available and potential slack resources in extending the exit path with a view to
delay involuntary exit. On the contrary, we find that high available slack resources decrease
the time to voluntary liquidation. This may be explained by the fact that the owners may have
a stronger motivation to cash-in and prevent the further loss of resources and that the
likelihood of success for the liquidation procedure is greater with high levels of available
slack. Both effects may accelerate the decision to voluntarily liquidate the distressed firm.
High potential slack resources, however, do not affect the time to voluntary liquidation. This
may be explained by the fact that a voluntary liquidation is a planned strategy, in which
potential slack and future borrowing capacity are of minor concern to the distressed firm. In
view of a planned voluntary exit, a distressed firm is unlikely to resort to additional lending.
Further, this study provides evidence that a high level of stakeholder dependence
generally extends the time to exit after distress. This is consistent with stakeholder theory,
suggesting that a firm’s stakeholders determine the firm’s fate and its decisions concerning
(the timing of) firm exit. First, high stakeholder dependence – reflected by a large firm size,
business group membership and large amounts of trade debts towards suppliers – is found to
increase the length of the exit paths preceding voluntary liquidations. This may be explained
13 The Huber-White standard errors are robust and heteroscedasticity-consistent standard errors. These errors are adjusted for correlations of error terms across observations and allow estimating the variance of the parameter estimates when the underlying model is incorrect (Huber 1967; White 1980; Greene 2003).

30
by the fact that in firms with an extensive network of stakeholders and
with multiple potentially diverging stakeholder interests to account for, the decision to
voluntary liquidate the firm is more complex. Also, the liquidation procedure itself will be
more complicated and time-consuming, which will in turn increase the exit path duration.
Second, we find that high stakeholder dependence, reflected by a large firm size, extends the
exit path preceding involuntary exit. The decision to file for a bankruptcy or other involuntary
exit procedure is likely to be more complex and involve negotiations with more diverse
stakeholders in large firms. Moreover, the declaration of exit by court may require more time,
which may lengthen the exit path.
Besides slack resources and stakeholder dependence, other factors are found to
determine the time-to-exit. First, older firms take longer before they involuntarily exit. This
may be explained by the fact that more mature firms generally are more efficient and more
competent, have more stable social relations and have more skills.
Second, firms with higher levels of productivity and profitability take longer to
voluntarily liquidate. This can be explained by the fact that, in case of distress, better
performing firms are more likely to await the evolution of the firm before deciding on a
liquidation. Third, high levels of investments increase the time to both involuntary exit and
voluntary liquidation. A possible explanation for this effect may be that investments, which
are made in the context of a growth strategy aimed at corporate recovery, may allow a
distressed firm to survive a fierce decline and postpone an impending exit. Fourth, high asset
tangibility is found to increase the time to voluntary liquidation. Possibly, distressed firms
with many tangible assets resort to a strategy of asset divestment so as to postpone exit, which
explains their longer exit path. Further, trade receivables have a positive effect on the time to
voluntary liquidation. This may be explained by the fact that firms with large receivables
attempt to collect all payments before initiating a procedure of voluntary liquidation. Finally,
the amount of inventory positively affects exit timing of both involuntary and voluntary exits.
Possibly, firms with a large inventory resort to inventory downsizing in an attempt to survive,
especially when inventory includes a lot of raw materials and finished goods that can be sold
easily. By reducing inventories and, hereby optimizing working capital, they try to postpone
exit.
We recognize that the models estimated in this study are not fully complete. Possibly,
we have ignored other explanatory factors of the length of the exit path, such as human
factors (for example, the experience or age of the manager/owner and the education of the
directors), strategic factors and organizational factors (such as board members, outside

31
directors, number of divisions, plant location). However, this does not limit the value of this
study in understanding the impact of available and potential slack and stakeholder
dependence on the time to exit. Finally, by not considering human, strategic and
organizational factors, the analyses are only based on objective, accurate and publicly
available information.
A potential route for expanding the insights of this study is to consider distressed
firms that continue to operate and the probability of firm survival. However, we claim there
are benefits to be gained from this in-depth study of distress-related exits. The most important
benefit is that a detailed analysis of distress-related exits, including the careful analysis of the
timing of bankruptcy and voluntary liquidation, allows for learning from firms that have
experienced an early exit. This contributes in turn to the eventual success of firms that learn
from the experiences of others and may even allow the development of better models of value
creation (McGrath 1999).
The main findings of this study, concerning (1) the existence of a specific exit path
profile for involuntary exits and voluntary liquidations and (2) the importance of slack
resources and stakeholder dependence for the timing of involuntary exits and voluntary
liquidations, may help to guide future empirical research on distress-related exit paths. For
example, one could conduct a more dynamic analysis of exit paths and investigate sequences
of events related to the available and potential resources and the level of stakeholder
dependence with a view to identify a number of common exit paths leading to involuntary
exit and voluntary liquidation.
Another interesting finding of this study that may call for further investigation, is that
secured debts do not impact the duration of the exit path preceding involuntary exit. This
contrasts with the behavior of secured creditors in court-supervised reorganization procedures
(e.g. Chapter 7), where secured creditors are found to push for early bankruptcy (Leyman et
al. 2008). Our analysis also shows that secured creditors have a different behavior in the pre-
bankruptcy process and in the pre-liquidation process. This calls for more attention to the pre-
liquidation and pre-bankruptcy process.

32
REFERENCES
Amemiya T (1973) Regression analysis when the dependent variable is truncated normal.
Econometrica 41(6):997-1016
Argenti J (976) Corporate collapse: the causes and symptoms. McGraw-Hill, London
Astebro T, Winter JK (2001) More than a dummy: The probability of failure, survival and
acquisition of firms in financial distress. Working paper Series, Joseph L. Rotman School of
Management, University of Toronto
Balcaen S, Buyze J, Ooghe H (2008) Financial distress and firm exit: Nested logit models of
the determinants of voluntary and involuntary exit. Working Paper Series, Faculty of
Economics and Business Administration, Ghent University
Bandopadhyaya A (1994) An estimation of the hazard rate of firms under Chapter 11
protection. Review of Economics and Statistics 76(2):346–350
Barney JB (1991) Firm resources and sustained competitive advantage. Journal of
Management 17(1):99-120
Baum CF, Caglayan M, Ozkan N, Talavera O (2004) The Impact of Macroeconomic
Uncertainty on Non-Financial Firms' Demand for Liquidity Boston College Working Papers
in Economics 552, Boston College
Baum CF, Schäfer D, Talavera O (2006) The effects of industry-level uncertainty on cash
holdings: the case of Germany. Boston College Working Papers in Economics 637, Boston
College
Becchetti L, Sierra J (2002) Bankruptcy risk and productive efficiency in manufacturing
firms. Journal of Banking and Finance 27(11):2099-2120
Berger AN, Udell GF (1995) Relationship lending and lines of credit in small firm finance.
Journal of Business 68(3):351-381
Berman SL, Wicks AC, Kotha S, Jones TM (1999) Does stakeholder orientation matter? The
relationship between stakeholder management models and firm financial performance.
Academy of Management Journal 42(5):488-506

33
Blair MM (1995) Ownership and control: rethinking corporate governance of the twenty- first
century. Brookings Institution, Washington
Bourgeois L (1981) On the measurement of organizational slack. Academy of Management
Review 6:29-39
Bourgeois L, Singh V (1983) Organizational slack and political behavior within top
management teams. Academy of Management Journal 2(2):43–47
Buehler S, Kaiser C, Jaeger F (2006) Merge or fail? The determinants of mergers and
bankruptcies in Switzerland, 1995-2000. Economics Letters 90(1):88-95
Bulow J, Shoven J (1978) The bankruptcy decision. Bell Journal of Economics 9(2):437-456
Bromily P (1991) Testing a causal model of corporate risk-taking and performance. Academy
of Management Journal 34: 37–59.
Campbell SV (1996) Predicting bankruptcy reorganization for closely held firms. Accounting
Horizons 10:12-25
Caves RE (1998) Industrial organization and new findings on the turnover and mobility of
firms. Journal of Economic Literature 36:1947-1982
Cefis E, Marsili O (2007) Going, going, gone: Innovation and exit in manufacturing firms.
Erasmus Research Institute of Management Report Series ERS-2007-015-ORG, Erasmus
University.
Cheng JLC, Kesner IF (1997) Organizational slack and response to environmental shifts: The
impact of resource allocation patterns. Journal of Management 23(1):1-18
Chowdhury SD, Lang JR (1996) Turnaround in small firms: An assessment of efficiency
strategies. Journal of Business Research 36(2):169-179
Cooley TF, Quadrini V (2001) Financial markets and firm dynamics. American Economic
Review 91(5):1286-1310
Couwenberg O (2001) Survival rates in bankruptcy systems: overlooking the evidence.
European Journal of Law and Economics 12(3):253-273.

34
Cyert RM, March JG (1963) A behavioral theory of the firm. Blackwell Publishers Inc,
Massachusetts.
Daubie M, Meskens N (2002) Business failure prediction: a review and analysis of the
literature. In: Zopounidis C (ed) New Trends in Banking Management, Physica-Verlag
Springer, Heidelberg, pp. 71-86
D'Aveni R (1989) The aftermath of organizational decline: A longitudinal study of the
strategic and managerial characteristics of declining firms. Academy of Management Journal
32:577-605
Davis AHR, Huang X (2004) The stock performance of firms emerging from Chapter 11 and
accidental bankruptcy. Paper presented at the 2004 FMA Meeting, New Orleans, USA.
Delli Gatti D, Gallegati M, Giulioni G, Palestrini A (2003) Financial fragility, patterns of
firms' entry and exit and aggregate dynamics. Journal of Economic Behavior and
Organization 51(1):79-97
Deloof M, Jegers M (1996) Trade credit, product quality, and intragroup sales: some
European evidence. Financial management 25(3):33-43
Denis DK, Rodgers KJ (2007) Chapter 11: Duration, outcome, and post-reorganization
performance. Journal of Financial and Quantitative Analysis 42(1):101-118
Dewaelheyns N, Van Hulle C (2006) Corporate failure prediction modelling: distorted by
business groups’ internal capital markets? Journal of Business Finance and Accounting
33(5&6):909-931
Dimitras A, Zanakis S, Zopudinis C (1996) A survey of business failures with an emphasis on
failure prediction methods and industrial applications. European Journal of Operational
Research 90(3):487-513
Donaldson T, Preston LE (1995) The stakeholder theory of the corporation: Concepts,
evidence and implications. Academy of Management Review 20:65-91
Evan WM, Freeman RE (1993) A stakeholder theory of the modern corporation: Kantian
capitalism. In: Beauchamp T, Bowie N (ed) Ethical theory and business, Prentice Hall, New
York

35
Fazzari SM, Hubbard GR, Petersen BC (1988) Financing constraints and corporate
investment. Brookings Papers on Economic Activity 1988(1):141–195
Franks J, Sussman O (2005) Financial distress and bank restructuring of small to medium size
UK companies. Review of Finance 9(1):65-96
Freeman RE (1984) Strategic management: A stakeholder approach. Pitman, Boston
Galbraith J (1973) Designing complex organizations. Addison-Wesley Publishing Co,
Reading MA
Gibbs P (1993) Determinants of corporate restructuring: The relative importance of corporate
governance, takeover threat, and free cash flow. Strategic Management Journal 14(1):51-68
Gimeno J, Folta TB, Cooper AC, Woo CY (1997) Survival of the fittest? Entrepreneurial
human capital and the persistence of underperforming firms. Administrative Science
Quarterly 42:750-783
Greene WH (2003) Econometric Analysis, 5th ed. Prentice-Hall, New Jersey
Harhoff D, Stahl K, Woywode M (1998) Legal form, growth and exit of West German firms -
Empirical results for manufacturing, construction, trade and service industries. Journal of
Industrial Economics 46(4):453-488
Hambrick DC, D'Aveni RA (1988) Large corporate failures as downward spirals.
Administrative Science Quarterly 33:1-23
Hannan MT, Freeman J (1984) Structural inertia and organizational change. American
Sociological Review 49(2):149-164
Hill NT, Perry SE, Andes S (1996) Evaluating firms in financial distress: An event history
analysis. Journal of Applied Business Research 12(3):60-71
Hill CWL, Jones TH (1992) Stakeholder – agency theory. Journal of Management Studies
29(2):131-154
Hofer CW (1980) Turnaround strategies. Journal of Business Strategy 1(1):19–31
36
Huber PJ (1967) The behavior of maximum likelihood estimates under nonstandard
conditions. Proceedings of Fifth Berkeley Symposium on Mathematical Statistics and
Probability, University of California Press, Berkeley, pp. 221–233
Jones S, Hensher DA (2007) Modelling corporate failure: A multinomial nested logit analysis
for unordered outcomes. British Accounting Review 39(1):89-107
Kaiser KMJ (1996) European bankruptcy laws: implications for corporations facing financial
distress. Financial Management 25(3):67-85
Kanatas G, Qi J (2004) Imperfect competition, debt, and exit. Financial Management
33(2):29-49
Klepper S (1996) Entry, exit, growth, and innovation over the product life cycle. American
Economic Review 86(3):562-583
Laitinen EK (1991) Financial ratios and different failure processes. Journal of Business
Finance and Accounting 18(5):649-673
Latham SF, Braun MR (2008) The performance implications of financial slack during
economic recession and recovery. Journal of Managerial Issues 2008(Spring)
Levinthal DA (1991) Random walks and organizational mortality. Administrative Science
Quarterly 36(3):397-420
Leyman B, Schoors K (2008) Bank debt restructuring under Belgian court-supervised
reorganization. Working Paper Series 08/508, Faculty of Economics and Business
Administration, Ghent University
Leyman B, Schoors K, Coussement P (2008) The role of firm viability, creditor behavior and
judicial discretion in the failure of distressed firms under court-supervised restructuring:
evidence from Belgium. Working Paper Series 08/509, Faculty of Economics and Business
Administration, Ghent University
Li K (1998) An empirical examination of U.S. firms in Chapter 11 bankruptcy. University of
British Columbia Working Paper Series UBCFIN 97–7, University of British Columbia

37
Long JS (1997) Regression models for categorical and limited dependent variables. Sage,
California
McGrath RG (1999) Falling forward: Real options reasoning and entrepreneurial failure.
Academy of Management Review 24(1):13–30
McKeown JC, Mutchler JF, Hopwood WS (1991) Towards an explanation of auditor failure
to qualify the opinions of bankrupt companies. Auditing: A Journal of Practice and Theory,
Suppl.:1-13
McLeay S, Omar A (2000) The sensitivity of prediction models tot the non-normality of
bounded an unbounded financial ratios. British Accounting Review 32:213-230
Miller K, Leiblein M (1996) Corporate risk–return relations: returns variability versus
downside risk. Academy of Management Journal 39:91–122
Meyer MW, Zucker LG (1989) Permanently failing organizations. Sage, California
Orbe J, Ferreira E, Núñez-Antón V (2001) Modelling the duration of firms in Chapter 11
bankruptcy using a flexible model. Economics Letters 71(1):35-42
Pastena V, Ruland W (1986) The merger/bankruptcy alternative. Accounting Review
61(2):288–301
Pearce J, Robbins DK (1994) Retrenchment remains the foundation of business turnaround.
Strategic Management Journal 15(5):407-417
Peel MJ, Wilson N (1989) The liquidation/merger alternative: some results for the UK
corporate sector. Managerial and Decision Economics 10:209-220
Pfeffer J, Salancik GR (1978) The external control of organizations: A resource dependence
perspective. Harper & Row, New York
Pompe PPM, Bilderbeek J (2005) The prediction of bankruptcy of small- and medium-sized
industrial firms. Journal of Business Venturing 20:847-868
Post JE, Preston LE, Sachs S (2002) Redefining the corporation. Stakeholder management
and organizational wealth. Stanford University Press, Stanford

38
Platt HD, Platt MB (2002) Predicting corporate financial distress: reflections on choice-based
sample bias. Journal of Economics and Finance 26(2):184-199
Prantl S (2003) Bankruptcy and voluntary liquidation: evidence for new firms in East and
West Germany after unification. ZEW Discussion Paper 03-72, Centre of European
Economic Research, Mannheim
Rasheed HS (2005) Turnaround strategies for declining small business: the effects of
performance and resources. Journal of Developmental Entrepreneurship 10(3):239-252
Reuer J, Lieblein MJ (2000) Downside risk implications of multinationality and international
joint ventures. Academy of Management Journal 43:203-214
Ringlstetter M (1995) Konzernentwicklung - Rahmenkonzepte zu Strategien, Strukturen und
Systemen. Verlag Barbara Kirsch, München
Robbins DK, Pearce JA (1992) Turnaround: Retrenchment and recovery. Strategic
Management Journal 13(4):287-330
Rosner RL (2003) Earnings manipulation in failing firms. Contemporary Accounting
Research 20(2):361–408
Schary MA (1991) The probability of exit. RAND Journal of Economics 22:339-353
Schendel D, Patton G, Riggs J (1976) Corporate turnaround strategies: A study of profit
decline and recovery. Journal of General Management 3:3-11
Schwartz RA, Whitcomb D (1979) The trade credit decision. In: Bicksler JL (ed) Handbook
of Financial Economics, North-Holland, Amsterdam
Sharfman M, Wolf G, Chase R, Tansik D (1988) Antecedents of organizational slack.
Academy of Management Review 13(4):601–614
Shin HH, Stulz R (1998) Are internal capital markets efficient? Quarterly Journal of
Economics 113(2):531-553
Shrieves RE, Stevens DL (1979) Bankruptcy avoidance as a motive for merger. Journal of
Financial and Quantitative Analysis 14(3):501-515

39
Singh J (1986) Performance, slack, and risk taking in organizational decision making.
Academy of Management Journal 29:562–585
Siegfried JJ, Evans LB (1994) Empirical studies of entry and exit: a survey of the evidence.
Review of Industrial Organization 9:121-155
Stiglitz J, Weiss A (1981) Credit rationing in markets with imperfect information. American
Economic Review 71:393-410
Stinchcombe AL (1965) Organizations and social structure. In: March J (ed) Handbook of
organizations, Rand McNally, Chicago, pp. 142-193
Sudarsanam S, Lai J (2001) Corporate financial distress and turnaround strategies: An
empirical analysis. British Journal of Management 12(3):183–199
Tan J, Peng MW (2003) Organizational slack and firm performance during economic
transitions: Two studies from an emerging economy. Strategic Management Journal 24:1249-
1263
Thompson JD (1967) Organizations in action. McGraw Hill, New York
Tobin J (1958) Estimation of relationships for limited dependent variables. Econometrica
26(1):24-36
Van Caillie D, Arnould S (2001) The follow-up of financial value creation indicators to
prevent bankruptcy in Belgian SMEs: an empirical multivariate approach. Proceedings of the
21st Babson College Research Conference on Entrepreneurship, Jonköping, Sweden
Van Caillie D, Dighaye A (2002) The concept of « economic added result », a new tool to
prevent bankruptcy? Proceedings of the 25st EAA Congress, Copenhagen, Denmark
Van Wymeersch Ch, Wolfs A (1996) La trajectoire de faillite des entreprises: une analyse
chronologique sur base des comptes annuels. Working Paper 172, Université Notre-Dame de
la Paix.
Voss GB, Sirdeshmukh D, Voss ZG (2008) The effects of slack resources and environmental
threat on product exploration and exploitation. Academy of Management Journal 51(1):147–
164

40
White H (1980) A heteroskedasticity-consistent covariance matrix estimator and a direct test
for heteroskedasticity. Econometrica 48:817–38

41
APPENDIX
Table A.1 Calculation of the recurring profit/loss after taxes
Abbreviated scheme annual accounts Complete scheme annual accounts Annual account
section number Description Annual account
section number Description OPERATING REVENUES
• Value of production (excl. subsidies)
│70│a
Turnover
(│70/74│ – │740│)
Turnover less subsidies
OPERATING EXPENSES
• Intermediary consumption │60/61│ Commodities, accessories, raw materials and various goods and services
│60│ │61│
Commodities, raw materials and accessories Various goods and services
• Costs of personnel <62> Remunerations, social contributions and pensions
<62> + <635>
Remunerations, social contributions, pensions Pension provisions
• Write-offs and depreciations of fixed assets
│630│
Write-offs and depreciations on fixed assets: land, plant and equipment, establishment costs and intangible assets
│630│
Write-offs and depreciations on fixed assets: land, plant and equipment, establishment costs and intangible assets
NON-OPERATING EXPENSES
• Financial costs of debts (excluding interest subsidies)
– <65> + <656>
Financial costs, excluding financial provisions
│650│ │653│
Financial cost of debts Discount on receivables
• Depreciations on current non-financial assets
+ <631/4>
Depreciations on inventories, orders in progress and accounts receivable
+ <631/4>
Depreciations on inventories, orders in progress and accounts receivable
• Provisions for operational risks and costs
+ <635/7> Provisions + <635/7> – <635> Provisions, excluding provisions for pensions
TAXES
• Taxes on profits – <67/77> Taxes on the result │9134│ + │640│
Taxes on the result of the fiscal year Taxes on operations (i.e. real estate taxes, taxes on cars and trucks, …)
RECURRING PROFIT AFTER TAXES
[│70/61│ – │61/70│] – [ <62> + │630│ – <65> + <656> + <631/4> + <635/7> – <67/77>]
[(│70/74│ – │740│) – (│60│ + │61│)] – [<62> + <635> + │630│ + │650│ + │653│ + <631/4> + <635/7> – <635> + │9134│ + │640│]
a Most firms with an abbreviated annual account do not report sales, as this is not compulsory, and instead report their gross margin as │70/61│or│61/70│.

42
Table A.2 Spearman correlations between the continuous explanatory and control variables for the subsample of involuntary exits
CASH LEVER-
AGE SIZE TRADE DEBT AGE SECURED
PRODUC- TIVITY
PROFITA- BILITY
INVEST-MENTS
TANGI-BLES
RECEIV-ABLES
INVEN- TORY
CASH 1.000 -0.158** -0.212** 0.050* 0.001 -0.151** 0.150** -0.081** -0.053** -0.126** -0.100** -0.050*
2532 2532 2532 2532 2531 2532 2532 2532 2532 2532 2532 2532
LEVERAGE -0.158** 1.000 0.024 0.307** -0.248** 0.051* -0.102** -0.224** 0.145** 0.140** -0.026 -0.017
2532 2532 2532 2532 2531 2532 2532 2532 2532 2532 2532 2532
SIZE -0.212** 0.024 1.000 0.173** 0.324** 0.248** -0.284** 0.373** -0.033 -0.088** 0.283** 0.217**
2532 2532 2532 2532 2531 2532 2532 2532 2532 2532 2532 2532
TRADE DEBT 0.050* 0.307** 0.173** 1.000 0.022 -0.066** -0.047* 0.000 -0.074** -0.295** 0.371** 0.200**
2532 2532 2532 2532 2531 2532 2532 2532 2532 2532 2532 2532
AGE 0.001 -0.248** 0.324** 0.022 1.000 0.073** 0.074** 0.197** -0.392** -0.184** 0.182** 0.196**
2531 2531 2531 2531 2532 2531 2531 2531 2531 2531 2531 2531
SECURED -0.151** 0.051* 0.248** -0.066** 0.073** 1.000 -0.088** 0.149** 0.058** 0.175** -0.045* 0.084**
2532 2532 2532 2532 2531 2532 2532 2532 2532 2532 2532 2532
PRODUCTIVITY 0.150** -0.102** -0.284** -0.047* 0.074** -0.088** 1.000 0.012 0.014 0.133** 0.087** -0.134**
2532 2532 2532 2532 2531 2532 2532 2532 2532 2532 2532 2532
PROFITABILITY -0.081** -0.224** 0.373** 0.000 0.197** 0.149** 0.012 1.000 -0.116** -0.097** 0.097** 0.157**
2532 2532 2532 2532 2531 2532 2532 2532 2532 2532 2532 2532
INVESTMENTS -0.053** 0.145** -0.033 -0.074** -0.392** 0.058** 0.014 -0.116** 1.000 0.540** -0.141** -0.192**
2532 2532 2532 2532 2531 2532 2532 2532 2532 2532 2532 2532
TANGIBLES -0.126** 0.140** -0.088** -0.295** -0.184** 0.175** 0.133** -0.097** 0.540** 1.000 -0.324** -0.272**
2532 2532 2532 2532 2531 2532 2532 2532 2532 2532 2532 2532
RECEIVABLES -0.100** -0.026 0.283** 0.371** 0.182** -0.045* 0.087** 0.097** -0.141** -0.324** 1.000 -0.131**
2532 2532 2532 2532 2531 2532 2532 2532 2532 2532 2532 2532
INVENTORY -0.050* -0.017 0.217** 0.200** 0.196** 0.084** -0.134** 0.157** -0.192** -0.272** -0.131** 1.000
2532 2532 2532 2532 2531 2532 2532 2532 2532 2532 2532 2532
Correlations are based on the observations of involuntary exits (t=1), that are used in the regression analysis (N=2,533). Significance levels: ** Significant at 1%; * Significant at 5%

43
Table A.3 Spearman correlations between the continuous explanatory and control variables for the subsample of voluntary liquidations
CASH LEVER-
AGE SIZE TRADE DEBT AGE SECURED
PRODUC- TIVITY
PROFITA- BILITY
INVEST-MENTS TANGIBLES
RECEIV-ABLES
INVEN-TORY
CASH 1.000 -0.266** -0.208** -0.040* 0.103** -0.161** 0.122** -0.051** -0.100** -0.157** -0.049* -0.123**
2700 2700 2700 2700 2644 2700 2700 2700 2700 2700 2700 2700
LEVERAGE -0.266** 1.000 0.069** 0.485** -0.390** 0.175** -0.024 -0.151** 0.272** 0.206** 0.096** 0.168**
2700 2700 2700 2700 2644 2700 2700 2700 2700 2700 2700 2700
SIZE -0.208** 0.069** 1.000 0.142** 0.137** 0.107** -0.369** 0.269** 0.046* -0.101** 0.183** 0.086**
2700 2700 2700 2700 2644 2700 2700 2700 2700 2700 2700 2700
TRADEDEBT -0.040* 0.485** 0.142** 1.000 -0.093** 0.069** 0.025 -0.121** 0.141** -0.030 0.384** 0.269**
2700 2700 2700 2700 2644 2700 2700 2700 2700 2700 2700 2700
AGE 0.103** -0.390** 0.137** -0.093** 1.000 0.000 0.012 0.108** -0.325** -0.149** 0.094** 0.132**
2644 2644 2644 2644 2644 2644 2644 2644 2644 2644 2644 2644
SECURED -0.161** 0.175** 0.107** 0.069** 0.000 1.000 0.026 0.085** 0.149** 0.246** 0.002 0.070**
2700 2700 2700 2700 2644 2700 2700 2700 2700 2700 2700 2700
PROFITABILITY -0.051** -0.151** 0.269** 0.025 0.108** 0.085** 0.045* 1.000 0.120** 0.234** 0.072** 0.011
2700 2700 2700 2700 2644 2700 2700 2700 2700 2700 2700 2700
PRODUCTIVITY 0.122** -0.024 -0.369** -0.121** 0.012 0.026 1.000 0.045* -0.066** -0.082** -0.025 -0.021
2700 2700 2700 2700 2644 2700 2700 2700 2700 2700 2700 2700
INVESTMENTS -0.100** 0.272** 0.046* 0.141** -0.325** 0.149** 0.120** -0.066** 1.000 0.562** 0.011 -0.006
2700 2700 2700 2700 2644 2700 2700 2700 2700 2700 2700 2700
TANGIBLES -0.157** 0.206** -0.101** -0.030 -0.149** 0.246** 0.234** -0.082** 0.562** 1.000 -0.171** -0.033
2700 2700 2700 2700 2644 2700 2700 2700 2700 2700 2700 2700
RECEIVABLES -0.049* 0.096** 0.183** 0.384** 0.094** 0.002 0.072** -0.025 0.011 -0.171** 1.000 -0.091**
2700 2700 2700 2700 2644 2700 2700 2700 2700 2700 2700 2700
INVENTORY -0.123** 0.168** 0.086** 0.269** 0.132** 0.070** 0.011 -0.021 -0.006 -0.033 -0.091** 1.000
2700 2700 2700 2700 2644 2700 2700 2700 2700 2700 2700 2700
Correlations are based on the observations of voluntary liquidations (t=1), that are used in the regression analysis (N=2,700). Significance levels: ** Significant at 1%; * Significant at 5%

44
Table A.4 Results of the tobit models for the involuntary exits (N= 2,531) and the voluntary liquidations (2,644), using Huber/White robust standard errors
Involuntary exits Voluntary liquidations b H/W SE p-value b H/W SE p-value
C 5.4149** 0.3268 0.0000 4.1245** 0.3432 0.0000 Available slack
CASH 0.9663* 0.3797 0.0109 -1.0172** 0.3470 0.0034 Potential slack
LEVERAGE -0.2753** 0.1004 0.0061 -0.0106 0.0683 0.8768 Stakeholder dependence
SIZE 0.1292** 0.0391 0.0010 0.0875* 0.0360 0.0152 D_GROUP -0.4680 0.2746 0.0883 1.2577** 0.2299 0.0000 D_REPRESENTATION 0.1501 0.4657 0.7473 0.3845 0.3927 0.3275 TRADEDEBT 0.1797 0.2398 0.4538 0.5846** 0.1887 0.0020
Control variables AGE 0.0095 0.0052 0.0695 0.0024 0.0046 0.6108 SECURED 0.3163 0.3362 0.3467 0.4361 0.3924 0.2664 D_NOSECURED -0.0662 0.1541 0.6676 -0.1136 0.1793 0.5266 PRODUCTIVITY 0.0123** 0.0041 0.0026 0.1602** 0.0508 0.0016 PROFITABILITY -0.0390* 0.0155 0.0117 0.1062 0.0791 0.1790 INVESTMEN TS 0.5505** 0.1490 0.0002 0.5858** 0.1708 0.0006 TANGIBLES 0.1517 0.2640 0.5655 1.2151** 0.2762 0.0000 RECEIVABLES -0.0748 0.2896 0.7962 0.5474 0.2817 0.0519 INVENTORY 0.5324* 0.2749 0.0428 1.4913** 0.2538 0.0000 D_TRADE 0.2307 0.1323 0.0813 0.2483 0.1325 0.0609 D_MANUFACTURING -0.0163 0.1349 0.9036 -0.0213 0.1373 0.8765
Log likelihood -5,509.301 -5,959.057 χ² test (p-value) < 0.005 < 0.005 Squared multiple corr 0.0382 0 .1300
The dependent variable LENGTH, measuring the duration of the exit path (in number of years) is treated as a
truncated variable (truncated below 0 and above 11) by using the TOBIT estimation model. For each model,
table A.4 reports the coefficients (b), the robust Huber/White standard errors (H/W SE) and the significance
levels (p-value). Goodness-of-fit measures include the log-likelihood of the model, the squared multiple
correlation (based on correlation between estimated or fitted values and observed values), and the p-value of the
χ² test (based on the log-likelihood of the model, the log-likelihood of a restricted model only including the
control variables, and the number of explanatory variables). With the χ² test, a p-value below 0.05 indicates that
the model is significant.

45
TABLE 1
Composition of the sample: exit type and legal exit procedure
Exit type Legal procedure Number of firms
Percentage
Involuntary exit 2,533 48.40% Bankruptcy 2,518 48.11% Compulsory liquidation 4 0.08% Moratorium on payments 11 0.21% Voluntary liquidation
2,700 51.60%
Early dissolution/liquidation 465 8.89% Closure of liquidation 2,235 42.71% TOTAL 5,233 100.00%

46
0,0000
0,2000
0,4000
0,6000
0,8000
1,0000
1 2 3 4 5 6 7 8 9 10 11
t (years)
% fi
rms
that
exi
t afte
r t
Involuntary exit
Voluntary liquidation
Table 2 Descriptive statistics of time to exit of (early and late) involuntary exits, voluntary liquidations and full sample
All exits (N=5,233) Early exits (N=1,593) Late exits (N=3,640) Full
sample Involuntary
exit Voluntary liquidation
Mann-Whitney p-value
Early involuntary
exit
Early voluntary liquidation
Mann- Whitney p-value
Late involuntary
exit
Late voluntary liquidation
Mann-Whitney p-value
Mean 6.174 6.107 6.238 0.000 3.476 3.054 0.000 7.308 7.577 0.000 Median 6.507 6.326 6.762 3.715 3.249 7.329 7.726 Standard deviation 2.344 2.174 2.4922 1.086 1.497 1.321 1.352
Minimum 0.000 0.482 0.000 0.482 0.000 5.003 5.003 Maximum 10.896 10.707 10.896 4.995 5.000 10.707 10.896 N 5,233 2,533 2,700 794 799 1,739 1,901
Early exits occur within a five-year period after the first sign of distress, while late exits occur passed this five-year limit.
P-value of Mann–Whitney U-test below 0.05 indicates a significant difference between the subsamples of involuntary and voluntary exits.
Fig 1 Survival curves for the involuntary exits (N=2,533) and voluntary liquidations (N=2,700). This figure shows the percentage of firms that exit after time t conditional on
having survived up to time t

47
Table 3 Mean and median of the explanatory and control variables, observed at t=1
Panel A Total sample Subsamples
N Mean (median) full sample
Standard deviation
N zero values
Mean (median) involuntary exit
Mean (median) voluntary liquidation
p-value Mann-Whitney
Explanatory variables CASH 5,232 0.101 (0.041) 0.154 277 0.073 (0.027) 0.127 (0.062) 0.000
LEVERAGE 5,232 0.807 (0.774) 2.924 12 0.960 (0.853) 0.667 (0.653) 0.000 SIZE (in €1,000) 5,233 1504.736 (228.830) 12721.175 0 977.722 (252.095) 1999.515 (207.536) 0.000 TRADEDEBT 5,232 0.262 (0.198) 0.287 179 0.317 (0.265) 0.210 (0.126) 0.000
Control variables AGE (years) 5,176 10.075 (6.663) 10.350 0 8.748 (5.230) 11.347 (8.059) 0.000 SECURED 5,232 0.093 (0.000) 0.205 3,916 0.112 (0.000) 0.075 (0.000) 0.000 PRODUCTIVITY 5,232 0.565 (0.369) 3.175 154 0.575 (0.379) 0.556 (0.363) 0.136 PROFITABILITY 5,232 -0.326 (-0.003) 18.300 8 –0.601 (–0.008) –0.069 (0.001) 0.000 INVESTMENTS 5,232 0.178 (0.054) 0.293 895 0.210 (0.082) 0.148 (0.032) 0.000 TANGIBLES 5,232 0.261 (0.186) 0.240 280 0.292 (0.227) 0.232 (0.149) 0.000 RECEIVABLES 5,232 0.229 (0.170) 0.224 721 0.241 (0.200) 0.217 (0.150) 0.000 INVENTORY 5,232 0.190 (0.090) 0.229 1437 0.199 (0.118) 0.182 (0.063) 0.000
Panel B Total sample Subsamples
N
N (%) non-zero full sample
N (%) non-zero involuntary exit
N (%) non-zero voluntary liquidation
p-value χ²-test
Explanatory variables D_REPRESENTATION 5,233 68 (1.30%) 32 (1.26%) 36 (1.33%) 0.823
D_GROUP 5,233 455 (8.69%) 161 (6.36%) 294 (10.89%) 0.000 Control variables
D_NOSECURED 5,233 3,916 (74.83%) 1738 (68.61%) 2178 (80.67%) 0.000 D_TRADE 5,233 2,525 (48.25%) 1249 (49.31%) 1276 (47.26%) 0.138 D_MANUFACTURING 5,233 1,685 (32.2%) 864 (34.11%) 821 (30.41%) 0.004
In panel A, summary statistics of continuous variables are reported, while panel B reports summary statistics of binary variables. Descriptives for the full sample of distress–
related exits (N=5,233), and for the subsamples of involuntary exits (N=2,533) and of voluntary liquidations (N=2,700) are included. The Mann-Whitney U-tests (continuous
variables) and the Chi-square tests (binary variables) test for differences between the subsamples of involuntary exits and voluntary liquidations.

48
Table 4 Results of the tobit models for the involuntary exits (N=2,531)
Model 1: control variables Model 2: control variables + slack resources
Model 3: control variables + slack resources + stakeholder dependence
b SE p-value b SE p-value b SE p-value C 5.7681** 0.2304 0.0000 5.7978** 0.2499 0.0000 5.4149** 0.3251 0.0000
Available slack CASH 0.8702* 0.3894 0.0254 0.9663* 0.3970 0.0149
Potential slack
LEVERAGE
-0.2966** 0.0579 0.0000 -0.2752** 0.0654 0.0000
Stakeholder dependence SIZE 0.1292** 0.0384 0.0008 D_GROUP -0.4680 0.2665 0.0791 D_REPRESENTATION 0.1501 0.4122 0.7158 TRADEDEBT
0.1797 0.1876 0.3381
Control variables AGE 0.0175** 0.0047 0.0002 0.0162** 0.0047 0.0005 0.0095 0.0051 0.0606 SECURED 0.2920 0.3269 0.3717 0.2830 0.3250 0.3839 0.3163 0.3268 0.3331 D_NOSECURED -0.1045 0.1491 0.4833 -0.1351 0.1483 0.3624 -0.0662 0.1499 0.6589 PRODUCTIVITY 0.0101 0.0102 0.3218 0.0111 0.0101 0.2709 0.0123 0.0101 0.2237 PROFITABILITY 0.0033 0.0017 0.0520 -0.0420** 0.0090 0.0000 -0.0390** 0.0102 0.0001 INVESTMENTS 0.5050** 0.1559 0.0012 0.5583** 0.1555 0.0003 0.5505** 0.1557 0.0004 TANGIBLES -0.1372 0.2398 0.5674 0.1097 0.2575 0.6699 0.1517 0.2606 0.5604 RECEIVABLES -0.2092 0.2442 0.3917 0.0834 0.2587 0.7472 -0.0748 0.2730 0.7841 INVENTORY 0.3928 0.2428 0.1057 0.6113* 0.2573 0.0175 0.5324* 0.2636 0.0434 D_TRADE 0.2236 0.1318 0.0897 0.2371 0.1310 0.0703 0.2307 0.1310 0.0782 D_MANUFACTURING 0.0506 0.1319 0.7013 0.0297 0.1311 0.8208 -0.0163 0.1318 0.9014
Log likelihood -5,532.489 -5,516.526 -5,509.301 χ² test (p-value) <0.005 <0.005 <0.010 Squared multiple corr 0.0193 0.0331 0.0382

49
The dependent variable LENGTH, measuring the duration of the exit path (in number of years) is treated as a truncated variable (truncated below 0 and above 11) by using the
TOBIT estimation model. Model 1 only contains the control variables, model 2 contains the control variables and the variables on slack resources and model 3 includes the
control variables, the variables on slack resources and the variables on stakeholder dependence. For each model, table 4 reports the coefficients (b), the standard errors (SE)
and the significance levels (p-value). Goodness-of-fit measures include the log-likelihood of the model, the squared multiple correlation (based on correlation between
estimated or fitted values and observed values), and the p-value of the χ² test (based on the log-likelihood of the model, the log-likelihood of a restricted model, and the
number of additional variables in the model). With the χ² test, a p-value below 0.05 indicates that the model is significant compared to the restricted model. Model 1 is
compared to the constant only model, model 2 is compared to model 1 and model 3 is compared to model 2.
Significance levels: ** Significant at 1%; * Significant at 5%
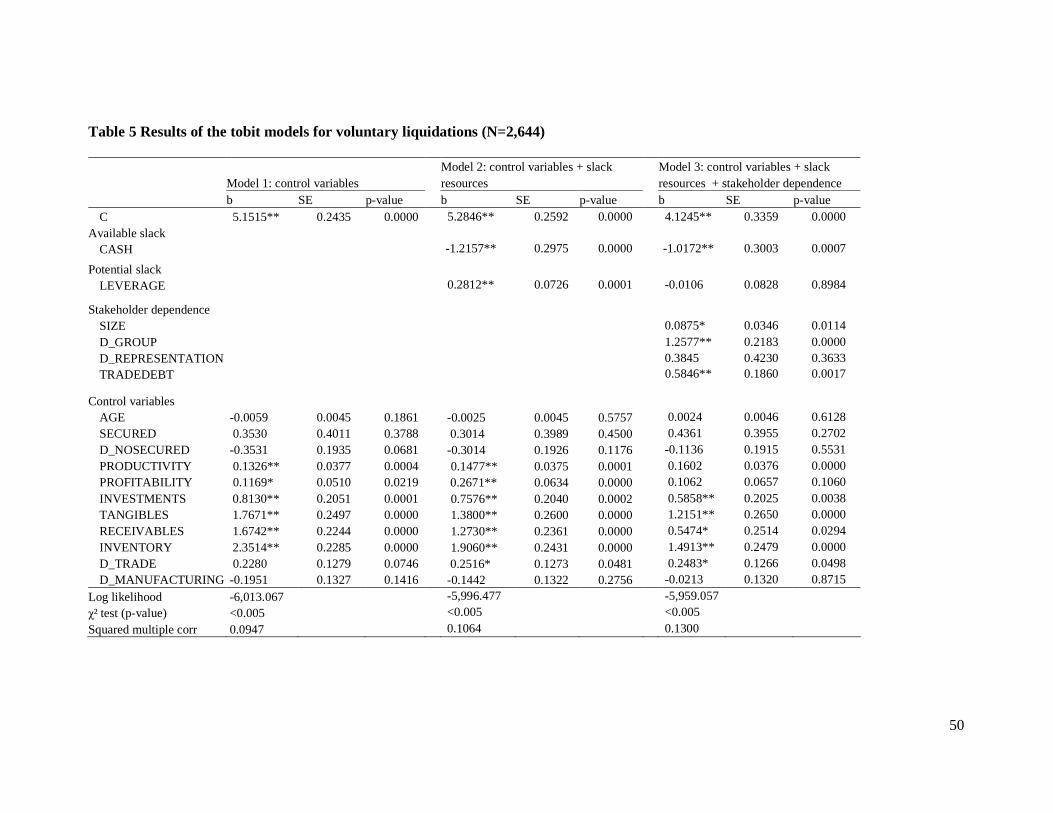
50
Table 5 Results of the tobit models for voluntary liquidations (N=2,644)
Model 1: control variables Model 2: control variables + slack resources
Model 3: control variables + slack resources + stakeholder dependence
b SE p-value b SE p-value b SE p-value C 5.1515** 0.2435 0.0000 5.2846** 0.2592 0.0000 4.1245** 0.3359 0.0000
Available slack CASH -1.2157** 0.2975 0.0000 -1.0172** 0.3003 0.0007
Potential slack LEVERAGE 0.2812** 0.0726 0.0001 -0.0106 0.0828 0.8984
Stakeholder dependence SIZE 0.0875* 0.0346 0.0114 D_GROUP 1.2577** 0.2183 0.0000 D_REPRESENTATION 0.3845 0.4230 0.3633 TRADEDEBT
0.5846** 0.1860 0.0017
Control variables AGE -0.0059 0.0045 0.1861 -0.0025 0.0045 0.5757 0.0024 0.0046 0.6128 SECURED 0.3530 0.4011 0.3788 0.3014 0.3989 0.4500 0.4361 0.3955 0.2702 D_NOSECURED -0.3531 0.1935 0.0681 -0.3014 0.1926 0.1176 -0.1136 0.1915 0.5531 PRODUCTIVITY 0.1326** 0.0377 0.0004 0.1477** 0.0375 0.0001 0.1602 0.0376 0.0000 PROFITABILITY 0.1169* 0.0510 0.0219 0.2671** 0.0634 0.0000 0.1062 0.0657 0.1060 INVESTMENTS 0.8130** 0.2051 0.0001 0.7576** 0.2040 0.0002 0.5858** 0.2025 0.0038 TANGIBLES 1.7671** 0.2497 0.0000 1.3800** 0.2600 0.0000 1.2151** 0.2650 0.0000 RECEIVABLES 1.6742** 0.2244 0.0000 1.2730** 0.2361 0.0000 0.5474* 0.2514 0.0294 INVENTORY 2.3514** 0.2285 0.0000 1.9060** 0.2431 0.0000 1.4913** 0.2479 0.0000 D_TRADE 0.2280 0.1279 0.0746 0.2516* 0.1273 0.0481 0.2483* 0.1266 0.0498 D_MANUFACTURING -0.1951 0.1327 0.1416 -0.1442 0.1322 0.2756 -0.0213 0.1320 0.8715
Log likelihood -6,013.067 -5,996.477 -5,959.057 χ² test (p-value) <0.005 <0.005 <0.005 Squared multiple corr 0.0947 0.1064 0.1300

51
The dependent variable LENGTH, measuring the duration of the exit path (in number of years) is treated as a truncated variable (truncated below 0 and above 11) by using the
TOBIT estimation model. Model 1 only contains the control variables, model 2 contains the control variables and the variables on slack resources and model 3 includes the
control variables, the variables on slack resources and the variables on stakeholder dependence. For each model, table 5 reports the coefficients (b), the standard errors (SE)
and the significance levels (p-value). Goodness-of-fit measures include the log-likelihood of the model, the squared multiple correlation (based on correlation between
estimated or fitted values and observed values), and the p-value of the χ² test (based on the log-likelihood of the model, the log-likelihood of a restricted model, and the
number of additional variables in the model). With the χ² test, a p-value below 0.05 indicates that the model is significant compared to the restricted model. Model 1 is
compared to the constant only model, model 2 is compared to model 1 and model 3 is compared to model 2.
Significance levels: ** Significant at 1%; * Significant at 5%