from financial structure to financial distress
TRANSCRIPT
CHAPTER 1. FROM FINANCIAL STRUCTURE TO FINANCIAL DISTRESS
10
CHAPTER 1
FROM FINANCIAL STRUCTURE TO FINANCIAL
DISTRESS
1.1. THE FINANCIAL STRUCTURE: THE
SOURCES OF FUNDING
Financial structure refers to the combination of debt and equity that
a company uses to finance its operations. It is the structure of the
company’s finances. To finance its assets, a firm can raise funds in order
to obtain the necessary capital borrowing from investors or financial
institutions and promising them a fixed claim (interest payments) on
the revenues generated by the assets (Damodaran, 2015). The creditors
or lenders have a limited (or no) role in the day-to-day management of
the business. This type of financing is categorized as debt. This financial
instrument has a predetermined amount, temporal distribution and
may have some guarantees on the expected economic return.
Alternatively, the company could offer a residual claim on the cash
flows, which means that investors might get a fraction of future profits
once that interests to lenders are paid. The financial instruments held
by shareholders represent some portion of ownership (Brealey, Myers,
& Allen, 2018), so they have a much greater role in the operation of the
business. This type of financing is called equity. Equity does not
contractually guarantee certain revenue and is subordinated to the
reimbursement of debt, however, it allows for greater returns because
of the risk involved.
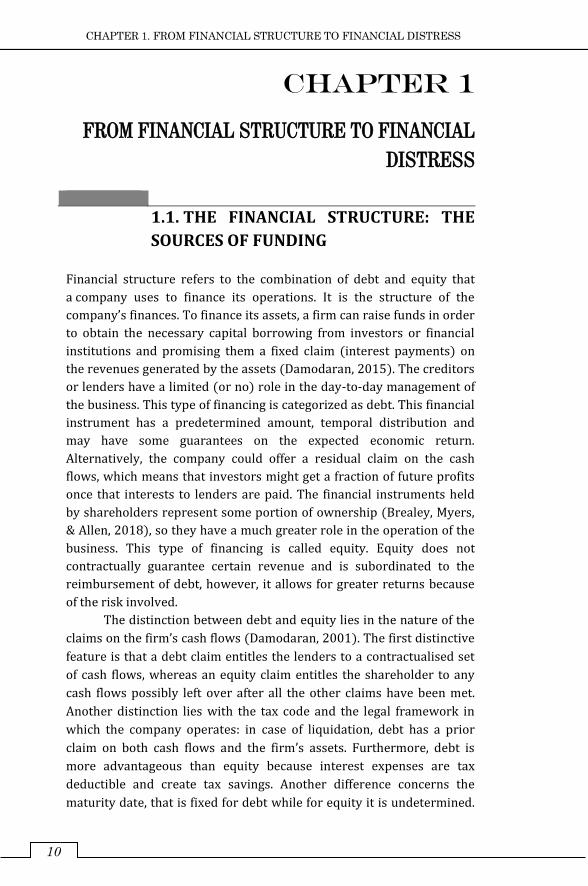
The distinction between debt and equity lies in the nature of the
claims on the firm’s cash flows (Damodaran, 2001). The first distinctive
feature is that a debt claim entitles the lenders to a contractualised set
of cash flows, whereas an equity claim entitles the shareholder to any
cash flows possibly left over after all the other claims have been met.
Another distinction lies with the tax code and the legal framework in
which the company operates: in case of liquidation, debt has a prior
claim on both cash flows and the firm’s assets. Furthermore, debt is
more advantageous than equity because interest expenses are tax
deductible and create tax savings. Another difference concerns the
maturity date, that is fixed for debt while for equity it is undetermined.
CHAPTER 1. FROM FINANCIAL STRUCTURE TO FINANCIAL DISTRESS
11
One last distinction regards the merit of the claim held by equity
investors, who have complete control over the firm’s management
while, on the other hand, debt investors play a passive role in
management, even though through the covenants in loan agreements
they may exercise veto power over significant financial decisions.
The distinction between debt and equity is not always clear, as
there are forms of intermediate capital represented by “hybrid financial
instruments” which share some characteristics of debt and some of
equity. Mezzanine financing refers to a group of financial instruments
that features two components: subordinated debt, that provides a
remuneration scheme similar to the reimbursement of debt capital and
an equity kicker that links the instrument to the economic performance
of the company and allows benefiting from extra-revenues (Forestieri &
Tasca, 1994). The two components can be incorporated into one
instrument that could be an equity or a debt instrument: convertible
subordinated bonds or preferred stocks. These forms of financing play
a crucial role in corporate restructuring.
Investors make their transactions with the expectation of
a financial return (Damodaran, 2001). The expected return for equity
investors will include a premium for the equity risk of the investment.
This expected return is named “cost of equity”. Likewise, the return
expected by lenders includes a premium for the default risk, labelled
“cost of debt”. When all the forms of financing are considered, the cost
of financing is a weighted average of the cost of equity and debt, i.e., “the
cost of capital”.
Many models have been developed to identify the specific
benefits and costs of using debt (i.e., the tax effects and the costs of
financial distress) and equity, however, the greatest contribution has
been by the trade-off theory by Modigliani-Miller and their followers.
A company decides on the amount of debt and equity that should
finance its investments by balancing the relevant costs and benefits.
Over the last 10-15 years, the proportion of debt to equity (D/E, the so-
called “leverage”) has been significantly increasing, especially in
companies subject to takeovers by institutional investors, like
investment funds.
CHAPTER 1. FROM FINANCIAL STRUCTURE TO FINANCIAL DISTRESS
12
FIGURE 1. Main categories of debt
1.1.1. Shareholder equity: characteristics and
structure
Equity is represented by all the shares of the risk capital of a company:
it is what remains of the assets once liabilities have been subtracted
(Annibaletti, 2014). It is the most junior class of financing in terms of
seniority: in case of bankruptcy, all the capital invested in the company
is lost, if the assets are not sufficient to cover all creditors. An equity
investment is a direct participation in the business risk.
This risk is reflected in the return expected by shareholders and,
therefore, in the cost of this type of financing. There are two types of
risk: income risk (when capital remuneration may be insufficient or
even missing) and capital risk (management can cause economic
imbalances and, consequently, lead to the erosion of the shareholders’
contribution).
Shares can be classified into 2 main categories:
1. Common shares (or ordinary shares). The main rights that
ordinary shares attribute to the holder relate to: participation in the
distribution of net profits of the period, participation in the subdivision
of the net capital resulting from the liquidation of the company,
participation and voting in ordinary and extraordinary shareholders'
meetings, the right to participate to capital increases against payment,
free assignment of shares in proportion to those held following
the capitalization of reserves, examination of the financial statement
documentation.
CHAPTER 1. FROM FINANCIAL STRUCTURE TO FINANCIAL DISTRESS
13
2. Preference shares (or preferred stocks), that represent
a mezzanine financing because they incorporate some of the
characteristics of debt and some of the equity (Damodaran, 2001).
Similarly with debt, they require a fixed payment however, if the firm
has no cash to pay, the dividends are cumulated and later paid when
there will be sufficient earnings. Like debt, these instruments do not
confer any form of control and voting privileges are restricted. Instead,
as with equity, payments to preferred stock do not have a maturity date
and are not tax deductible. In terms of seniority in case of liquidation,
preferred stockholders are paid after debt holders’ claims.
1.1.2. Financial debt: characteristics and structure
Debt is another form of financing made available to the company by
third parties that provide money in the form of credit.
The lenders, in this case, do not participate in the business risk
and obtain periodic returns, even if typically, lower than the equity.
Moreover, they do not have the right to directly influence the choices of
the company through voting in the assembly.
It represents a very versatile form of financing, as it is more
modular than equity: in fact, there are many types based on the
frequency of payments, entities, hybridization with other instruments,
risk, etc.
Debt is the most convenient form of capital for two reasons.
Firstly, debtors are privileged over shareholders, if the company goes
bankrupt. For this reason, debt, being “safer” than shares, guarantees
a lower return to the investors and, at the same time, a lower interest
rate compared to the profitability expected by the shareholders.
Secondly, because of financial charges that are tax deductible, as
opposed to dividends.
Debt can be divided into 5 main categories (Ranciaro, 2015)
according to the degree of seniority:
1. Secured debt is a debt backed by some sort of security, which
will be used to repay first lien creditors before and second lien creditors
thereafter (and to the extent that first lien creditors are satisfied).
Securities can be either in the form of assets, cash collateral or other
sorts of guarantees. It includes mortgage loans and credit lines backed
by a guarantee.
2. Unsecured debt is a senior debt not assisted by any form of
security and includes all non-mortgage loans, overdrafts, unsecured
credit lines, non-convertible bonds (except for those classified as
high-yield).
CHAPTER 1. FROM FINANCIAL STRUCTURE TO FINANCIAL DISTRESS
14
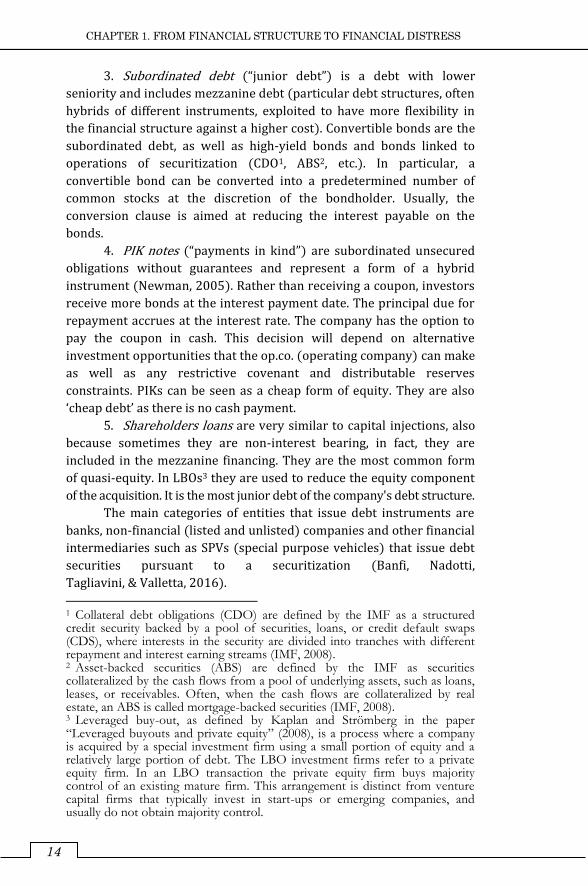
3. Subordinated debt (“junior debt”) is a debt with lower
seniority and includes mezzanine debt (particular debt structures, often
hybrids of different instruments, exploited to have more flexibility in
the financial structure against a higher cost). Convertible bonds are the
subordinated debt, as well as high-yield bonds and bonds linked to
operations of securitization (CDO1, ABS2, etc.). In particular, a
convertible bond can be converted into a predetermined number of
common stocks at the discretion of the bondholder. Usually, the
conversion clause is aimed at reducing the interest payable on the
bonds.
4. PIK notes (“payments in kind”) are subordinated unsecured
obligations without guarantees and represent a form of a hybrid
instrument (Newman, 2005). Rather than receiving a coupon, investors
receive more bonds at the interest payment date. The principal due for
repayment accrues at the interest rate. The company has the option to
pay the coupon in cash. This decision will depend on alternative
investment opportunities that the op.co. (operating company) can make
as well as any restrictive covenant and distributable reserves
constraints. PIKs can be seen as a cheap form of equity. They are also
‘cheap debt’ as there is no cash payment.
5. Shareholders loans are very similar to capital injections, also
because sometimes they are non-interest bearing, in fact, they are
included in the mezzanine financing. They are the most common form
of quasi-equity. In LBOs3 they are used to reduce the equity component
of the acquisition. It is the most junior debt of the company's debt structure.
The main categories of entities that issue debt instruments are
banks, non-financial (listed and unlisted) companies and other financial
intermediaries such as SPVs (special purpose vehicles) that issue debt
securities pursuant to a securitization (Banfi, Nadotti,
Tagliavini, & Valletta, 2016).
1 Collateral debt obligations (CDO) are defined by the IMF as a structured credit security backed by a pool of securities, loans, or credit default swaps (CDS), where interests in the security are divided into tranches with different repayment and interest earning streams (IMF, 2008). 2 Asset-backed securities (ABS) are defined by the IMF as securities collateralized by the cash flows from a pool of underlying assets, such as loans, leases, or receivables. Often, when the cash flows are collateralized by real estate, an ABS is called mortgage-backed securities (IMF, 2008). 3 Leveraged buy-out, as defined by Kaplan and Strömberg in the paper “Leveraged buyouts and private equity” (2008), is a process where a company is acquired by a special investment firm using a small portion of equity and a relatively large portion of debt. The LBO investment firms refer to a private equity firm. In an LBO transaction the private equity firm buys majority control of an existing mature firm. This arrangement is distinct from venture capital firms that typically invest in start-ups or emerging companies, and usually do not obtain majority control.
CHAPTER 1. FROM FINANCIAL STRUCTURE TO FINANCIAL DISTRESS
15
Financial managers have the possibility to access a vast choice of
forms of debt, in fact – beyond the aforementioned classification of debt
based on the degree of seniority of the right to reimbursement – they
can choose between the following types of debt according to the specific
needs of the business:
1. Short-term or long-term debt.
If the company only needs to finance a temporary increase in
stocks to prepare for a particular season, then it may be advisable to
contract a short-term bank loan, supposing that financial resources are
needed to pay for an expansion project for an oil refinery. The
equipment of a refinery can operate more or less continuously for 15 or
20 years. In this case, it is more appropriate to issue a long-term bond.
2. Amortizing vs bullet or balloon.
An amortizing loan (or amortized loan) is one with scheduled
regular payments of both principal and interest. The principal of a loan
is the amount the borrower borrowed originally. The interest,
on the other hand, is what the lender adds on top. The principal balance
of the amortizing bond is reduced with each payment such that it
becomes zero at maturity. A bullet bond (or loan) is a bond (or loan)
that pays interest through periodic payments and the principal amount
at maturity through a single payment. As far as the lender is concerned,
an amortizing loan is less risky. With loans where the borrower pays
the principal at the end, the lender has longer credit risk. The lender’s
risk in such cases is for the full principal during most of the term. By
paying off the principal over time, the risk is lower for the lender.
A balloon payment is a large payment due at the end of a balloon loan,
such as a mortgage, a commercial loan, or another type of amortized
loan. A balloon loan is typical for a relatively short term, and only
a portion of the loan's principal balance is amortized over that period.
The remaining balance is due as a final payment at the end of the term.
The term “balloon” indicates that the final payment is significantly large.
Balloon payments tend to be at least twice the amount of the loan's
previous payments.
3. Fixed or floating rate.
The interest rate of a bank loan, or the coupon of a bond, is
generally set at the time of signing the contract. Fixed interest rate loans
are loans in which the interest rate charged on the loan will remain
fixed for that loan's entire term, no matter what market interest rates
do. This will result in your payments being the same over the entire
term. Many bank loans and some bonds include a floating interest rate
(the interest rate charged on the outstanding balance varies as market
interest rates change). For example, the interest rate in each period can
CHAPTER 1. FROM FINANCIAL STRUCTURE TO FINANCIAL DISTRESS
16
be set at a level equal to the LIBOR (London Interbank Offered Rate)
that represents the rate at which the major international banks lend
each other money, plus a spread expressed in percentage points. When
the LIBOR changes, the interest rate on the debt will also change, thus
payments will vary as well.
4. Simple or convertible bonds.
A company may issue securities that give their holders the option
to convert them into other securities. These options can have
a significant effect on value. A convertible bond gives its holder the
option to exchange the bond for a certain number of shares. The holder
of a convertible bond usually expects the share price of the issuing
company to increase so that he/she can convert the bond and make
a substantial gain. Conversely, if the price of the shares decreases, there
is no obligation to convert; the holder of the convertible bond will
remain a bondholder.
1.1.3. Focus on benefits: the impact of financial
debt
Corporations must pay taxes on the income that they earn. Interest
payments are considered as costs and are deducted from taxable
income; companies pay taxes on their profits after interest payments
are deducted, therefore interest expenses reduce the amount of
corporate taxes that firms must pay. Interests are paid on a pre-tax
income, while dividends of shares are paid on an after-tax income.
Governments provide a tax advantage to the use of debt, an advantage
that equity does not have.
Debt financing has a very important advantage in the fiscal policy
of corporations because interests paid to bondholders are exempt from
corporate taxation.
To gain a better understanding of the above, an example
formulated by Berk De Marzo (Berk & DeMarzo, 2010) is worth
mentioning.
Let us consider the impact of interest expenses on the taxes paid
by Macy’s, Inc., a retail department store. Macy’s had earnings before
interest and taxes of approximately USD 2.5 bln in 2012, and interest
expenses of about USD 430 mln. Given Macy’s marginal corporate tax
rate of 35%, the effect of leverage on Macy’s earnings is presented in
the Table 1.
CHAPTER 1. FROM FINANCIAL STRUCTURE TO FINANCIAL DISTRESS
17
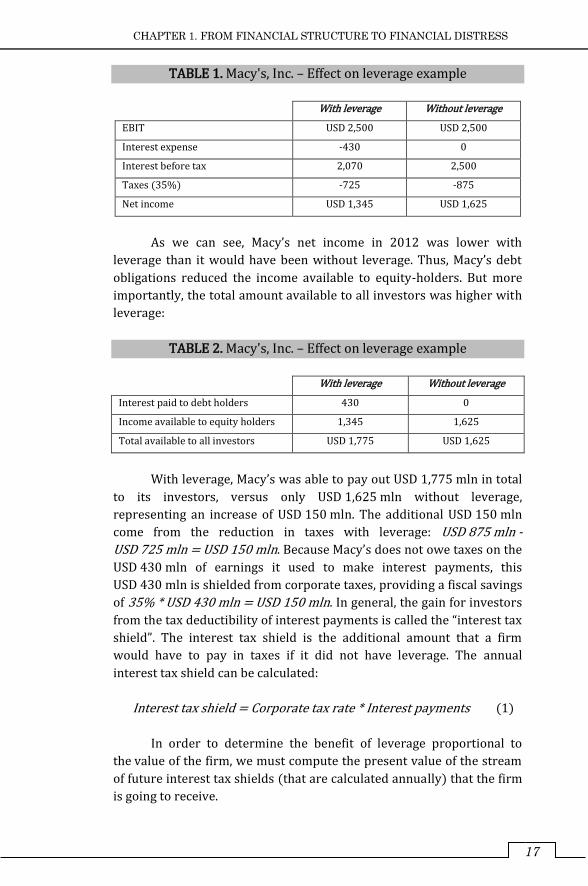
TABLE 1. Macy's, Inc. – Effect on leverage example
With leverage Without leverage
EBIT USD 2,500 USD 2,500
Interest expense -430 0
Interest before tax 2,070 2,500
Taxes (35%) -725 -875
Net income USD 1,345 USD 1,625
As we can see, Macy’s net income in 2012 was lower with
leverage than it would have been without leverage. Thus, Macy’s debt
obligations reduced the income available to equity-holders. But more
importantly, the total amount available to all investors was higher with
leverage:
TABLE 2. Macy's, Inc. – Effect on leverage example
With leverage Without leverage
Interest paid to debt holders 430 0
Income available to equity holders 1,345 1,625
Total available to all investors USD 1,775 USD 1,625
With leverage, Macy’s was able to pay out USD 1,775 mln in total
to its investors, versus only USD 1,625 mln without leverage,
representing an increase of USD 150 mln. The additional USD 150 mln
come from the reduction in taxes with leverage: USD 875 mln -
USD 725 mln = USD 150 mln. Because Macy’s does not owe taxes on the
USD 430 mln of earnings it used to make interest payments, this
USD 430 mln is shielded from corporate taxes, providing a fiscal savings
of 35% * USD 430 mln = USD 150 mln. In general, the gain for investors
from the tax deductibility of interest payments is called the “interest tax
shield”. The interest tax shield is the additional amount that a firm
would have to pay in taxes if it did not have leverage. The annual
interest tax shield can be calculated:
Interest tax shield = Corporate tax rate * Interest payments (1)
In order to determine the benefit of leverage proportional to
the value of the firm, we must compute the present value of the stream
of future interest tax shields (that are calculated annually) that the firm
is going to receive.
CHAPTER 1. FROM FINANCIAL STRUCTURE TO FINANCIAL DISTRESS
18
As shown in the previous example, the cash flows paid to
investors are greater than they would be without leverage.
CF to investor with leverage = CF to investor without
leverage + Interest tax shield (2)
The firm uses a fraction of the available cash flows to pay taxes
and pays the rest to investors. By increasing the amount paid to debt
holders through interest payments, the amount of the pre-tax cash
flows that must be paid as taxes decreases. The gain in total cash flows
to investors is the interest tax shield. This feature of the tax code creates
an incentive to use debt.
1.2. THE COST OF FINANCIAL
STRUCTURE: THE COST OF CAPITAL
Today, most of the companies estimate the rate of return required by
investors for their securities and use this cost of corporate capital to
streamline the cash flows of new projects. The cost of corporate capital
is the opportunity cost of capital for investments that have the same
risk as other business activities. In the case of riskier projects, the
opportunity cost of capital is greater than the cost of corporate capital.
In the case of less risky projects, it is smaller. The cost of corporate
capital is usually calculated as a weighted average cost of capital, or as
the average rate of return required by those who invest in the
company's bonds and equity securities. We will see later in this
paragraph that the cost of corporate capital is equal to the discount rate
when projects have the same risk as other business activities. If
a project is riskier than the company as a whole, the cost of capital for
the project should be adjusted upwards. On the contrary, the cost of
capital for a safer project should be corrected downwards.
The most difficult part in estimating the cost of corporate capital
concerns the calculation of the rate of return expected by investors who
choose to hold shares in the company. The risk-return model that has
been in use the longest period and is still the standard in the most real-world
analysis is the capital asset pricing model (CAPM). The CAPM establishes that
the expected return is equal to the risk-free interest rate plus a premium for
the risk that depends on the beta4 and the market risk premium.
4 The beta of a security is the expected percentage change in its return given a 1% change in the return of the market portfolio, as defined by Berk and DeMarzo (2010). It measures the systematic risk to market-wide risk factors.
CHAPTER 1. FROM FINANCIAL STRUCTURE TO FINANCIAL DISTRESS
19
1.2.1. Pricing the financial structure: the capital
asset pricing model theory
The CAPM (capital asset pricing model) is a mathematical model of
the portfolio theory published in 1964 by Nobel prizewinner William
Sharpe, who determines the relationship between the expected return
from an asset and its riskiness, measured by a single risk factor, called
beta (Hull, 2012). The key assumption is that the risk portion of
a security’s expected return is a function of that security’s market risk.
The CAPM requires a number of strong assumptions (Vulpiani, 2014).
In particular:
1. Investors only care about the expected return and standard
deviation of the return from an asset.
2. The returns from two assets are correlated with each other
only because of their correlation with the return from the market. This
is equivalent to assuming that there is only one factor driving returns.
3. Investors focus on returns over a single period and that
period is the same for all investors.
4. Investors can borrow and lend at the same risk-free rate.
5. Taxes do not influence investment decisions.
6. All investors make the same estimates of expected returns,
standard deviations of returns, and correlations between returns.
Because some of these assumptions do not fully describe
investors’ behavior, some of the model’s conclusions are not completely
accurate.
Considering a simplified market in which there are no taxes and
transaction costs and in which investors have both the same time
horizon for investments and the same identical opinions on expected
returns and risk, the market portfolio will be the efficient one. In that
market the risks related to an investment in a financial asset are limited
to the “systematic risk”, that is related to the return from the market as
a whole (it is an implicit risk in the investment of a specific financial
asset and cannot be diversified away), and the “diversifiable risk” or
“nonsystematic risk”, that is unique to the asset and can be diversified
by choosing a large portfolio of different assets. The CAPM argues that
the return for individual security, the cost of equity capital, is calculated
by adding the equity risk premium to the risk-free rate. The CAPM
formula is:
𝐸𝑥𝑝𝑒𝑐𝑡𝑒𝑑 𝑟𝑒𝑡𝑢𝑟𝑛 = 𝑅𝐹 + 𝛽(𝑅𝑀 − 𝑅𝐹) (3)
where RM is the return on the portfolio of all available investments, RF is
CHAPTER 1. FROM FINANCIAL STRUCTURE TO FINANCIAL DISTRESS
20
the return on a risk-free investment, β (the Greek letter beta) is
a parameter measuring systematic risk.
The return from the portfolio of all available investments, RM, is
referred to as the return on the market and is usually approximated as
the return on a well diversified stock index such as the S&P 500.
The beta of an asset is a measure of the sensitivity of its returns to
returns from the market. It can be estimated from historical data as
the slope obtained when the excess return on the asset over the risk-
free rate is regressed against the excess return on the market over the
risk-free rate. The beta of security measures its volatility due to market
risk relative to the market as a whole, and thus captures the security’s
sensitivity to market risk. In other words, the CAPM focuses on the
systematic risk expressed by the beta; in fact, the cost of equity
estimation is a linear function of the security beta. Empirical literature
shows that the relationship between beta and cost of equity is flatter
than predicted. As a consequence, the CAPM estimates of the cost of
equity for high beta stocks are too high and estimates for low beta
stocks are too low.
1.2.2. Assessing the financial structure: the
Modigliani–Miller theory perspective
Before introducing the cost of corporate capital, it is worth mentioning
the Modigliani-Miller theory, which showed that financing decisions are
irrelevant in a perfect market (Brealey et al., 2018). Whether the
company finances itself by using a combination of debt and equity, or it
is financed exclusively through equity, its total value will be the same. In
practice the financial structure is relevant; nevertheless, it is important
to fully understand the conditions under which the M&M theory is valid,
as to understand why a certain financial structure is better than another
(Berk & DeMarzo, 2010). The financial manager needs to know which
imperfections of the market he/she has to be aware of. The
requirements for the model are the conditions for the “perfect capital
market”: 1) financial markets are perfect, that is, competitive, without
friction, taxes and exempt from information asymmetries; 2) the
bankruptcy of the company does not involve any real cost of liquidation
or any reputational costs for its directors; 3) a firm’s financing decisions
do not change the cash flows generated by its investments, nor do they
reveal new information about them.
CHAPTER 1. FROM FINANCIAL STRUCTURE TO FINANCIAL DISTRESS
21
The first and the second proposition state that:
1. The market value of any firm is independent of its capital
structure and is given by capitalizing its expected return at the rate
appropriate to its class or the average cost of capital to any firm is
completely independent of its capital structure and is equal to
the capitalization rate of a pure equity stream of its class.
2. The expected yield of a share of stock is equal to
the appropriate capitalization rate for a pure equity stream in the class,
plus a premium related to financial risk equal to the debt to equity ratio
times the spread (Modigliani & Miller, 1958).
The first proposition of their theory states that the value of a
company is independent of its capital structure, so it implies that the
value of an all-equity firm (an unlevered firm) is equal to an all-debt
firm (a levered firm). The leverage has no effect on shareholders’
wealth (Brealey et al., 2018). Consequently, the financial structure is
irrelevant, without prejudice to the company's investment decisions.
The second proposition argues that the rate of return that shareholders
can expect from their shares increases with the company's
debt-to-equity ratio. Can shareholders remain indifferent to the
increase in leverage, if this contributes to increasing expected returns?
The answer is negative because any increase in expected returns is
entirely offset by an increase in risk, indeed a reduction in debt reduces
the risk for shareholders and leads to a lower rate of return than the
required one. Hence, the proportions of M&M tell us that greater debts
increase both the expected returns and the risk of equity. They do not
increase shareholder value.
The arguments of M&M hold up if applied to perfect financial
markets, but in reality, the markets are imperfect. Market imperfections
can put debt-using companies in a position to provide their investors
with a valuable service. In this case, the shares of indebted companies
could be traded at prices higher than the theoretical values they would
have in a perfect market. Supposing companies can contract debts at
a lower cost than investors, then investors would agree to contract
debts indirectly, holding shares in indebted companies. They would be
willing to accept an expected rate of return that does not completely
compensate them for the financial and operational risk they run.
The total cost of capital is usually called the cost of corporate
capital or the weighted average cost of capital, WACC, which will be
discussed in the following paragraph. M&M argues that the WACC does
not depend on the financial structure, but this position does not
consider several possible complications. The first complication
concerns taxes. When the interest on the debt is tax deductible, and we
CHAPTER 1. FROM FINANCIAL STRUCTURE TO FINANCIAL DISTRESS
22
calculate the WACC after tax, it decreases as the debt ratio increases.
Paradoxically, the theorem of the irrelevance of M&M, although
obtained in a rather aseptic theoretical context characterized by
hypotheses such as the absence of taxes and perfection of the capital
market, seems almost provocative as it contradicts the behavior
practices of most companies in financial strategies (Scarpa & Ziliotti,
1986). In the famous interview with Merton Miller (Tanous, 1997), he
describes the M&M proposition by saying:
“People often ask: Can you summarize your theory quickly? Well,
I say, you understand the M&M theorem if you know why this is a joke:
The pizza delivery man comes to Yogi Berra after the game and says,
“Yogi, how do you want this pizza cut, into quarters or eighths?” And
Yogi says, “Cut it in eight pieces. I’m feeling hungry tonight.” Everyone
recognizes that’s a joke because obviously the number and shape of the
pieces don’t affect the size of the pizza. And similarly, the stocks, bonds,
warrants, et cetera, issued don’t affect the aggregate value of the firm.
They just slice up the underlying earnings in different ways“.
We can conclude that debt policy is rarely important in
an efficient financial market. Few financial managers would accept this
conclusion as a practical guide. If the debt policy is not relevant, it
should not be dealt with and financing decisions could become routine
decisions. Instead, they worry about debt policy. If debt policy was
totally irrelevant, real debt ratios should vary randomly from company
to company and from sector to sector.
1.2.3. The weighted average cost of capital (WACC)
Nowadays most companies estimate the rate of return required by
investors for their securities and use this cost of corporate capital to
discount the cash flows of new projects. The cost of corporate capital is
the opportunity cost of capital for investments that have the same risk
as other business activities. In the case of riskier projects, the
opportunity cost of capital is greater than the cost of corporate capital,
while in the case of less risky projects it is smaller. The cost of corporate
capital is usually calculated as a weighted average cost of capital, or as
the average rate of return required by those who invest in the
company's bonds and equity securities. The theory of the CAPM
encourages investments in any project that offers a return that can
compensate the β of the project. In order to evaluate the asset cost of
capital or the unlevered cost of capital, we have to consider it as
an expected return of a portfolio composed by debt and equity, simply
evaluating an average mean of the expected return of debt and equity.
CHAPTER 1. FROM FINANCIAL STRUCTURE TO FINANCIAL DISTRESS
23
𝑟𝑈 = 𝑟𝐷 ×𝐷
𝑉 + 𝑟𝐸 ×
𝐸
𝑉 (4)
The unlevered cost of capital (or pre-tax WACC) is the expected
return investors will earn holding the firm’s assets. In a world with
taxes, it can be used to evaluate an all-equity financed project that has
the same risk as the firm.
As previously seen, a tax shield benefits the debt and we must
take it into account when evaluating the cost of capital; the firm’s actual
after-tax cost of capital is:
𝑟𝑊𝐴𝐶𝐶 =𝐸
𝑉 × 𝑟𝐸 +
𝐷
𝑉× 𝑟𝐷 × (1 − 𝜏𝐶) (5)
where τC is the interest tax shield.
The weighted average cost of capital (or WACC) is the effective
after-tax cost of capital to the firm. Since interest expense is tax
deductible, the WACC is less than the expected return of the firm’s
assets. In a world with taxes, the WACC can be used to evaluate
a project bearing the same risk and the same financing as the firm itself.
Via some simple mathematical steps, we can rewrite the WACC as
a function of the unlevered cost of capital:
𝑟𝑊𝐴𝐶𝐶 = 𝑟𝑈 − 𝐷
𝑉 × 𝜏𝐶 × 𝑟𝐷 (6)
This version of the formula clearly highlights the advantages of
debt.
The trade-off theory states that the value of a levered firm is
equal to the value of an unlevered firm plus associated side effects.
These side effects include the debt tax shield and the expected costs of
financial distress. Bradley, Jarrell, and Kim (1984), Graham and Harvey
(2001), Harris and Raviv (1991), Kraus and Litzenberger (1973)
further describe this theory when they state: “The trade-off theory is
centered on the idea that firms have an ‘optimal’ capital structure that
presupposes a target debt ratio and explains this target debt ratio as
a trade-off between tax and other benefits against financial distress and
other costs that are consequences of the use of debt” (Canarella,
Nourayi, & Sullivan, 2014, p. 365). The regulation permits companies to
deduct interest payments on their debt, which benefits corporations as
the reduction in net income lowers tax costs. Therefore, the tax shield is
equal to the cost of debt X (1 - marginal tax rate). All else being equal,
CHAPTER 1. FROM FINANCIAL STRUCTURE TO FINANCIAL DISTRESS
24
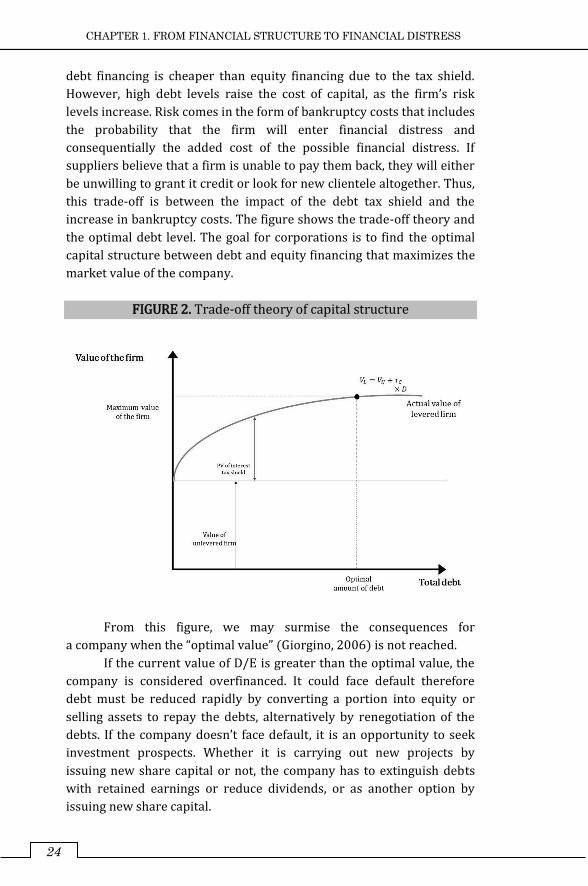
debt financing is cheaper than equity financing due to the tax shield.
However, high debt levels raise the cost of capital, as the firm’s risk
levels increase. Risk comes in the form of bankruptcy costs that includes
the probability that the firm will enter financial distress and
consequentially the added cost of the possible financial distress. If
suppliers believe that a firm is unable to pay them back, they will either
be unwilling to grant it credit or look for new clientele altogether. Thus,
this trade-off is between the impact of the debt tax shield and the
increase in bankruptcy costs. The figure shows the trade-off theory and
the optimal debt level. The goal for corporations is to find the optimal
capital structure between debt and equity financing that maximizes the
market value of the company.
FIGURE 2. Trade-off theory of capital structure
From this figure, we may surmise the consequences for
a company when the “optimal value” (Giorgino, 2006) is not reached.
If the current value of D/E is greater than the optimal value, the
company is considered overfinanced. It could face default therefore
debt must be reduced rapidly by converting a portion into equity or
selling assets to repay the debts, alternatively by renegotiation of the
debts. If the company doesn’t face default, it is an opportunity to seek
investment prospects. Whether it is carrying out new projects by
issuing new share capital or not, the company has to extinguish debts
with retained earnings or reduce dividends, or as another option by
issuing new share capital.
CHAPTER 1. FROM FINANCIAL STRUCTURE TO FINANCIAL DISTRESS
25
In the opposite situation, when the current value is lower than
the optimal value, the company is underfinanced. It could face
graduated risk, and in this situation, the debt must be increased rapidly
by equity swapping or taking out loans, or possibly, by buying back
shares. If the company doesn’t have a graduated risk problem, it is
a favourable time to seek investment opportunities. Whether it is
carrying out new projects with new debt financing or not, it must pay
dividends and buyback shares.
Clearly, the two situations are different; indeed, a rapid debt
increase is more problematic because the company could be perceived
at a very high default risk by the market. The best option is to increase
capital and repay loans although the market may be unfavourable to
an operation of this kind, therefore it is feasible to renegotiate debts or
sell assets and liquidate some creditors.
1.3. THE FINANCIAL DISTRESS
In literature, a variety of terms are used to characterize an economic
problem that affects distressed firms (Altman, Hotchkiss, & Wang,
2019). Failure, insolvency, default, bankruptcy are commonly found and
sometimes they are used interchangeably despite their different
meanings. When the rate of return on invested capital, considering the
risk premium, is significantly lower than the prevailing rates, the
distressed company is classified as “in failure”. A different scenario is
a company being unable to meet its debts as they come due; this means
that the company is insolvent. Default is another term to depict
a negative state; it consists of a borrower violating an agreement with
a creditor as specified in the contract with the lender. Finally, the
economic meaning of “bankruptcy” is reflected in the excess of liabilities
of involved assets.
1.3.1. The signals of financial distress: reasons for
corporate failures
Distress occurs when the promises made to the creditors are not kept,
or they are met with great difficulty: when a firm fails to make
a required payment to debt holders, it is in default (Brealey et al., 2018).
Before examining the costs of financial distress, it is possible to outline
the reason why firms fail. A distortion of the capital structure of
a company (Ranciaro, 2015), leading to its financial crisis, can be
CHAPTER 1. FROM FINANCIAL STRUCTURE TO FINANCIAL DISTRESS
26
originated by many factors that could result from financial and/or
economic distress. Financial distress is caused by a shortfall in cash
flow needed to meet debt obligations but does not necessarily require
fundamental problems in the business model; conversely, business
distress is caused by unsuitable business models. In reality, many
distressed firms suffer from a combination of both business and
economic distress. Common reasons that contribute to corporate failure
are demonstrated below:
• poor operating performance (that may result from factors
such as poorly executed acquisitions, the inability of the
company to react to its competitors, or increase in the
number of competitors in the same market) that could be
exacerbated by high financial leverage on the likelihood of
corporate performance;
• lack of innovation, especially technological (the arrival of
technological innovation creates negative shocks to firms
focusing on older technologies that may result in firms being
driven out of the business);
• liquidity and funding shock (as during the 2008-2009
financial crisis when some firms were unable to roll over
maturing debt because of the markets’ illiquidity);
• lack of programming/planning;
• pursuing excessively aggressive growth strategies;
• deregulation of key industries (removes the “cover” of
a regulated industry and fosters larger numbers of entering
existing firms, so it greatly increases competition);
• unexpected liabilities (firms could fail because off-balance
sheet contingent liabilities suddenly become material
on-balance sheet liabilities).
In practice, there are multiple reasons why a company has
solvency problems (Carbone, 2013). Sometimes it is due to poor
managerial decisions, often because the company has borrowed far
more than its revenue can sustain (overleveraged), especially in the
current financial climate. A company needs cash flows to generate profit
to pay back its debts, if a business takes on more debt, the company
needs to generate higher profits in the income statement to service the
debt and a firm must be able to consistently generate profits to carry
a high debt load. A company’s crisis is often generated by exceedingly
aggressive growth strategies which are mainly financed with short term
debt. Such scenarios can expose the company to the risk of not being
able to service the debt repayment, especially in case of an unforeseen
event in the implementation of the growth process, or of a change in the
economic context.
CHAPTER 1. FROM FINANCIAL STRUCTURE TO FINANCIAL DISTRESS
27
Generally, it is possible to conclude that corporate failure occurs
when the following performance patterns exist:
• a firm’s performance never rises above a poor level;
• a firm shoots up very high levels of performance before
crashing down;
• a firm’s performance partially collapses, followed by
a relatively longer “plateau” period of poor performance, and
then a rapid decline into insolvency (Khaled & Sherif, 2006).
It is interesting to understand the likelihood of financial distress.
There are some indicators that help to predict the crisis of a company
(Foster, 1986). One source is cash flow analysis that focuses directly on
the notion of financial distress in a specific period. Clearly, this
information source critically depends on the assumptions of the
underlying preparation of the budget. The second indicator of distress
is corporate strategy analysis that considers a firm’s potential
competitors, cost structure, plant expansions in the industry, the ability
of the firms to pass along cost increases, the quality of management and
so on. The focus on strategy issues can highlight the consequences of
changes occurring in the industry. The third source of information is
an analysis of the financial statements of a set of firms. Finally, external
variables such as security returns and bond ratings are considered as
they could hold future information about cash flows and corporate
strategy.
1.3.2. The costs of financial distress
A failure occurs when the shareholders exercise their right to default. It
is a right of the utmost importance: when a company experiences
a problem, limited liability allows shareholders to abandon it, leaving its
troubles to the creditors. Creditors become the new shareholders, while
the previous ones are left empty-handed. A bankruptcy is considered to
be “the funeral of a company”. Those who follow the funeral (creditors
and especially the shareholders) observe the sad state in which their
company finds itself. They can reflect on the past value of their titles
and how little is left of them. They also believe that lost value is one of
the costs associated with bankruptcy. Herein lies the mistake.
The decrease in the value of assets, the cause of desperation, is not
necessarily related to the failure. Bankruptcy is simply a legal
mechanism that allows creditors to take over from shareholders when
the diminishing value of the assets gives rise to default. Failure is not
the cause of the decrease in this value, but the consequence. It is
CHAPTER 1. FROM FINANCIAL STRUCTURE TO FINANCIAL DISTRESS
28
imperative to be careful not to mistake the cause for the effect.
The bankruptcy code is designed to provide an orderly process
for settling a firm’s debts. However, the process is still complex,
time-consuming, and costly. From the time perspective, the World Bank
report “Doing business 2013” (The World Bank, 2012) tells us that the
average duration of a commercial dispute in Italy is 1210 days, while
the average period of OECD countries is 510 days. Among the
185 countries studied by the World Bank, Italy ranks 160th. Germany is
in 50th place, the United States is the 6th and the United Kingdom is
the 21st.
If all the actors that are related to the company are considered, it
is possible to distinguish costs associated to each of them with a state of
distress (Ranciaro, 2015):
• for the bank providing the financing because they will face
losses in case of debt non-collection or in case of restructuring
with a reduction of the value of the borrower’s assets;
• for the community, in terms of social consequences that are
proportional to the size of the company;
• for the creditors, who lose a portion of the whole amount
they’re owed;
• for the other company that asks for debt, the bank’s losses
have negative influences on the banking sector and are likely
to deteriorate the conditions to tap the market.
In addition to the money spent by the firm, even the creditors
may incur costs during the bankruptcy process. To ensure that their
rights and interests are respected, and to assist in valuing their claims
in a proposed reorganization, creditors may seek separate legal
representation and professional advice.
Typically, costs of financial distress are classified as either direct
(focus almost entirely on costs on bankruptcy proceedings) or indirect
(all the unobservable opportunity costs).
Direct costs including lawyers, accountants, restructuring
advisors, turnaround specialists and other professionals are the so
called “out of pocket” expenses (Altman et al., 2019). These costs are
easy to identify. There is an evidence of the most expensive failures in
the World Bank report “Doing business 2013” (The World Bank, 2012).
Between 2003 and 2005, United Airlines paid a team of over
30 consultancy firms an average of USD 8.6 mln per month for legal and
professional services related to its reorganization. Enron spent a then-
record USD 30 mln per month on legal and accounting fees in
bankruptcy, with the total cost exceeding USD 750 mln. WorldCom paid
its advisors USD 620 mln as part of its reorganization to become MCI,
CHAPTER 1. FROM FINANCIAL STRUCTURE TO FINANCIAL DISTRESS
29
and the Lehman Brothers bankruptcy, the largest in history, has
reportedly entailed fees of USD 1.6 bln.
Whether paid by the firm or its creditors, these direct costs of
bankruptcy reduce the value of the assets that the firm’s investors will
ultimately receive. Studies typically report that the average direct costs
of bankruptcy are approximately 3% to 4% of the pre-bankruptcy
market value of total assets. The costs are likely to be higher for firms
with more complicated business operations and for firms with larger
numbers of creditors, because it may be more difficult to reach
an agreement among many creditors regarding the final disposition of
the firm’s assets. Since many aspects of the bankruptcy process are
independent of the size of the firm, the costs are typically higher, in
percentage terms, for smaller firms.
Aside from the direct legal and administrative costs of
bankruptcy, many other indirect costs are associated with financial
distress (Berk & DeMarzo, 2010). While these costs are difficult to
measure accurately, they are often much larger than the direct costs of
bankruptcy:
1. Loss of customers. Since bankruptcy may enable or encourage
firms to walk away from commitments to their customers, customers
may be unwilling to purchase products whose value depends on future
support or service from the firm.
2. Loss of suppliers. Customers are not the only ones who
retreat from a firm in financial distress. Suppliers may also be unwilling
to provide a firm with inventory if they fear they will not be paid. This
type of disruption is an important financial distress cost for firms that
rely heavily on trade credit. In many cases, the bankruptcy filing itself
can alleviate these problems through debtor-in-possession (DIP)
financing. DIP financing is a special form of financing meant for
companies in financial distress (typically during restructuring under
corporate bankruptcy law, such as Chapter 11 bankruptcy in the US or
CCAA in Canada). Because this kind of debt is senior to all existing
creditors, it allows a firm that has filed for bankruptcy renewed access
to financing in order to keep operating.
3. Loss of employees. Since firms in distress cannot offer job
security with long-term employment contracts, they may have difficulty
hiring new employees, and existing employees may quit or be hired
away. Retaining key employees may be costly. This type of financial
distress cost is likely to be high for firms whose value is derived largely
from their human resources.
4. Loss of receivables. Firms in financial distress tend to have
difficulty in collecting money that is owed to them. Knowing that the
firm might go out of business or at least experience significant
CHAPTER 1. FROM FINANCIAL STRUCTURE TO FINANCIAL DISTRESS
30
management turnover reduces the incentive of customers to maintain
a reputation for timely payment.
5. Fire sales of assets. In an effort to avoid bankruptcy and its
associated costs, companies in distress may attempt to sell assets
quickly to raise cash. To do so, the firm may accept a lower price than
would be optimal if it were financially healthy. Discounts are also
observed when distressed firms attempt to sell subsidiaries. The costs
of selling assets below their value are greatest for firms with assets that
lack competitive, liquid markets.
6. Inefficient liquidation. Bankruptcy protection can be used by
management to delay the liquidation of a firm that should be shut down.
On the other hand, companies in bankruptcy may be forced to liquidate
assets that would be more valuable if held.
7. Costs to creditors. Aside from the direct legal costs that
creditors may incur when a firm defaults, there may be other indirect
costs to creditors. If the loan to the firm was a significant asset for the
creditor, the default of the firm may lead to costly financial distress for
the creditor.
In contrast with direct costs, they are difficult to empirically
measure. The first to provide a methodology was Altman in 1984 who
defines indirect costs as “those lost sales and profits caused by
customers choosing not to deal with a firm that has high likelihood of
bankruptcy as well as the increased costs of doing business (e.g., higher
debt costs and poorer terms with suppliers) while in a financially
vulnerable condition”.
1.3.3. The trade-off theory
With perfect capital markets, recalling Modigliani-Miller (M&M)
proposition 1 applies the following: “The total value to all investors
does not depend on the firm’s capital structure. Investors as a group are
not worse off because a firm has leverage. While it is true that
bankruptcy results from a firm having leverage, bankruptcy alone does
not lead to a greater reduction in the total value to investors. Thus,
there is no disadvantage to debt financing, and a firm will have the same
total value and will be able to raise the same amount initially from
investors with either choice of capital structure” (Berk & DeMarzo,
2010, p. 187). Investors know that an indebted company can get into
trouble and worry about it. The concern is reflected in the current
market value of the debt of the indebted company.
CHAPTER 1. FROM FINANCIAL STRUCTURE TO FINANCIAL DISTRESS
31
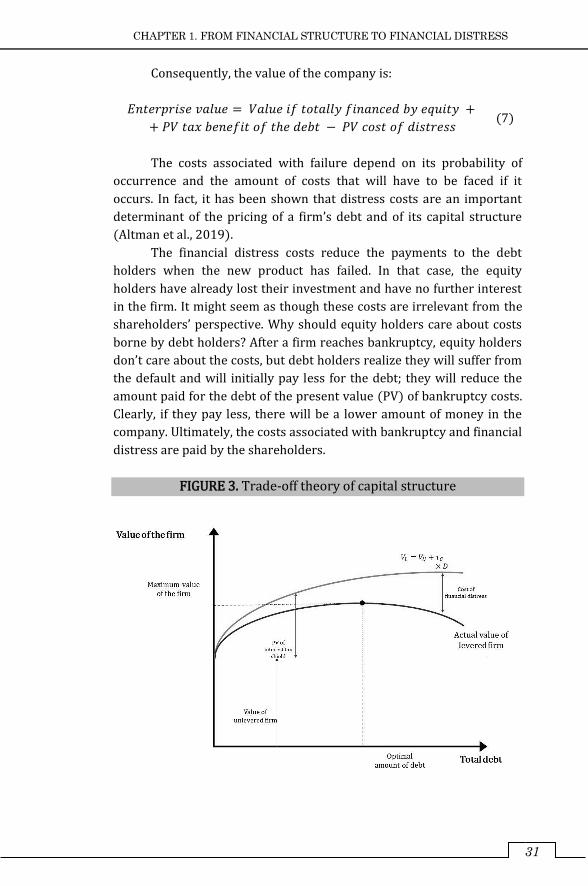
Consequently, the value of the company is:
𝐸𝑛𝑡𝑒𝑟𝑝𝑟𝑖𝑠𝑒 𝑣𝑎𝑙𝑢𝑒 = 𝑉𝑎𝑙𝑢𝑒 𝑖𝑓 𝑡𝑜𝑡𝑎𝑙𝑙𝑦 𝑓𝑖𝑛𝑎𝑛𝑐𝑒𝑑 𝑏𝑦 𝑒𝑞𝑢𝑖𝑡𝑦 +
+ 𝑃𝑉 𝑡𝑎𝑥 𝑏𝑒𝑛𝑒𝑓𝑖𝑡 𝑜𝑓 𝑡ℎ𝑒 𝑑𝑒𝑏𝑡 − 𝑃𝑉 𝑐𝑜𝑠𝑡 𝑜𝑓 𝑑𝑖𝑠𝑡𝑟𝑒𝑠𝑠 (7)
The costs associated with failure depend on its probability of
occurrence and the amount of costs that will have to be faced if it
occurs. In fact, it has been shown that distress costs are an important
determinant of the pricing of a firm’s debt and of its capital structure
(Altman et al., 2019).
The financial distress costs reduce the payments to the debt
holders when the new product has failed. In that case, the equity
holders have already lost their investment and have no further interest
in the firm. It might seem as though these costs are irrelevant from the
shareholders’ perspective. Why should equity holders care about costs
borne by debt holders? After a firm reaches bankruptcy, equity holders
don’t care about the costs, but debt holders realize they will suffer from
the default and will initially pay less for the debt; they will reduce the
amount paid for the debt of the present value (PV) of bankruptcy costs.
Clearly, if they pay less, there will be a lower amount of money in the
company. Ultimately, the costs associated with bankruptcy and financial
distress are paid by the shareholders.
FIGURE 3. Trade-off theory of capital structure
CHAPTER 1. FROM FINANCIAL STRUCTURE TO FINANCIAL DISTRESS
32
In accordance with the benefits of debt and the cost of distress,
the optimal capital structure should be reformulated following the
trade-off theory, indeed if the distress costs are significant the optimal
leverage for a company may be lower. According to this theory, the total
value of a levered firm equals the value of the firm without leverage
plus the present value of the tax savings from debt, minus the present
value of financial distress costs. In the end, the tax benefit of the debt is
balanced with the increased cost linked to a greater probability of
default or possible financial distress. It is evident that the trade-off
between tax benefits and the costs of instability leads to the optimal
financial structure. Initially, the PV of the tax benefit increases with the
increase in debt. At moderate levels of debt, the probability of failure is
insignificant, so the PV of the related costs will be minimal, and the tax
advantages will dominate instead. But at some point, by contracting
even more debt, the probability of collapse increases rapidly, and the
relative costs begin to affect the value of the company. Moreover, if the
company cannot be sure of exploiting the tax benefit of the interest, it is
likely that the tax advantage of the debt will start to decline until it
disappears altogether. The theoretical optimum is achieved when the
current value of tax savings due to greater debt is offset by the increase
in the current value of the costs associated with the collapse. This is, in
summary, what the theory of the trade-off of the financial structure
states.
The discount rate applied to the distress costs will depend on the
firm’s market risk, this is crucial. Since the distress costs are high when
the firm does poorly, the beta of distress costs will have an opposite
sign to that of the firm. More negative beta leads to a lower cost of
capital. Other things being equal, the present value of distress costs will
be higher for high firm betas.
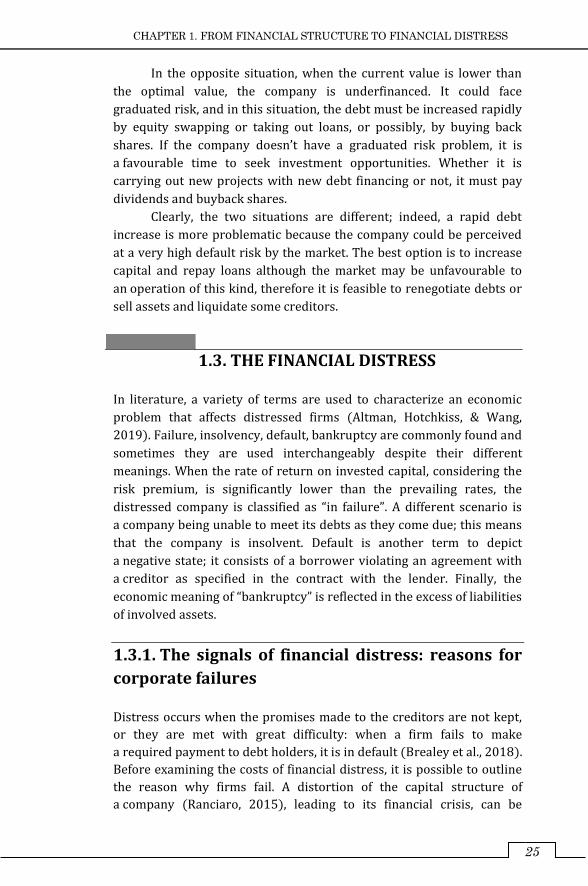
FIGURE 4. Trade-off theory of capital structure with distress costs
CHAPTER 1. FROM FINANCIAL STRUCTURE TO FINANCIAL DISTRESS
33
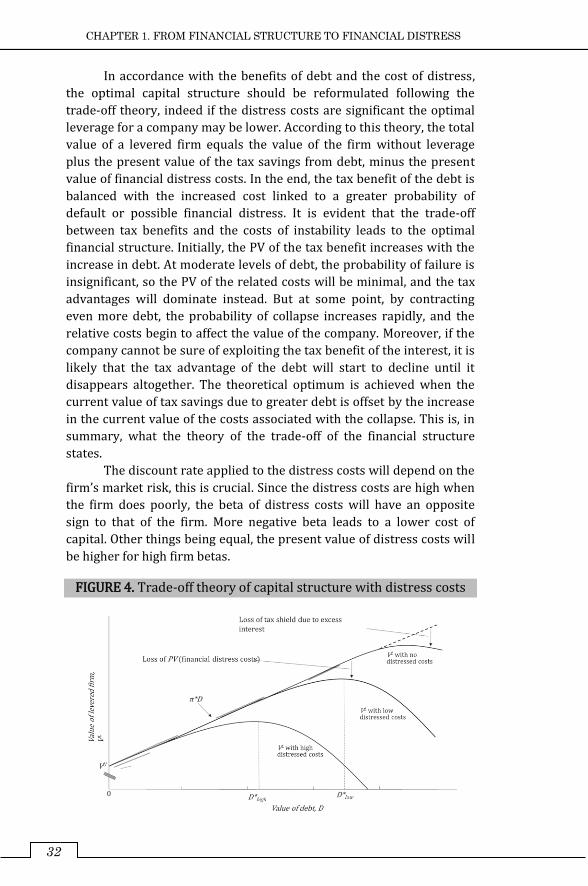
The figure shows the relation between the value of the debt and
the value of the levered firm starting from the value of the firm financed
only by equity. It highlights the fact that for low levels of debt the risk of
default remains low, while an increase in leverage leads to an increase
in the interest tax shield. With no costs of distress, the debt continues to
increase until the interest on the debt exceeds the firms' earnings
before interest and taxes and the tax shield is exhausted. The costs of
financial distress reduce the value of the levered firm, VL. The amount of
the reduction increases with the probability of default, which in turn
increases with the level of the debt D. The trade-off theory states that
firms should increase their leverage until it reaches the level D* for
which VL is maximized. At this point, the tax savings that result from
increasing leverage are just offset by the increased probability of
incurring the costs of financial distress. The figure shows the optimal
debt choices both for a firm with low costs of financial distress,
indicated by D*low and for a firm with high costs of financial distress,
indicated by D*high. Unsurprisingly, with higher costs of financial
distress, it is optimal for the firm to choose lower leverage.