private equity exit report - pwc
TRANSCRIPT
www.pwc.de
Private Equity Exit Report
January 2004 to April 2017
PwC
Management summary
2
The private equity market is undergoing transformation. Portfolio companies are held longer by private equity firms, which have sinceestablished themselves in the market as active owners and operational partners. This report analyses the exit activities of German andinternational private equity firms and their German portfolio companies.
The combination of the low interest rate environment and the substantial liquidity currently available to private equity firms creates anideal fundament for investments and exits alike. As operational improvements have increasingly become the top focus of private equityinvestors, holding periods of portfolio companies have been creeping up steadily. Despite the seemingly ideal conditions, the timing of asale is therefore a crucial factor in maximising the value of the investment.
However, multiple arbitrage no longer exists: it is no longer easily possible for private equity firms to buy companies low and sell themhigh at a profit after a holding period of two to three years. Many exit processes fail due to the discrepancy between seller and buyer priceexpectations. This is primarily true for assets acquired at a relatively high price before the financial crisis. At the same time, the pressureon private equity firms to decrease their management fee, usually 2% of the fund volume, is rising. The pressure to make successfultransactions is therefore also on the rise.
German deal market
Overview and breakdown
PwC
Deals with German targets have been constantly on the rise since 2009
4
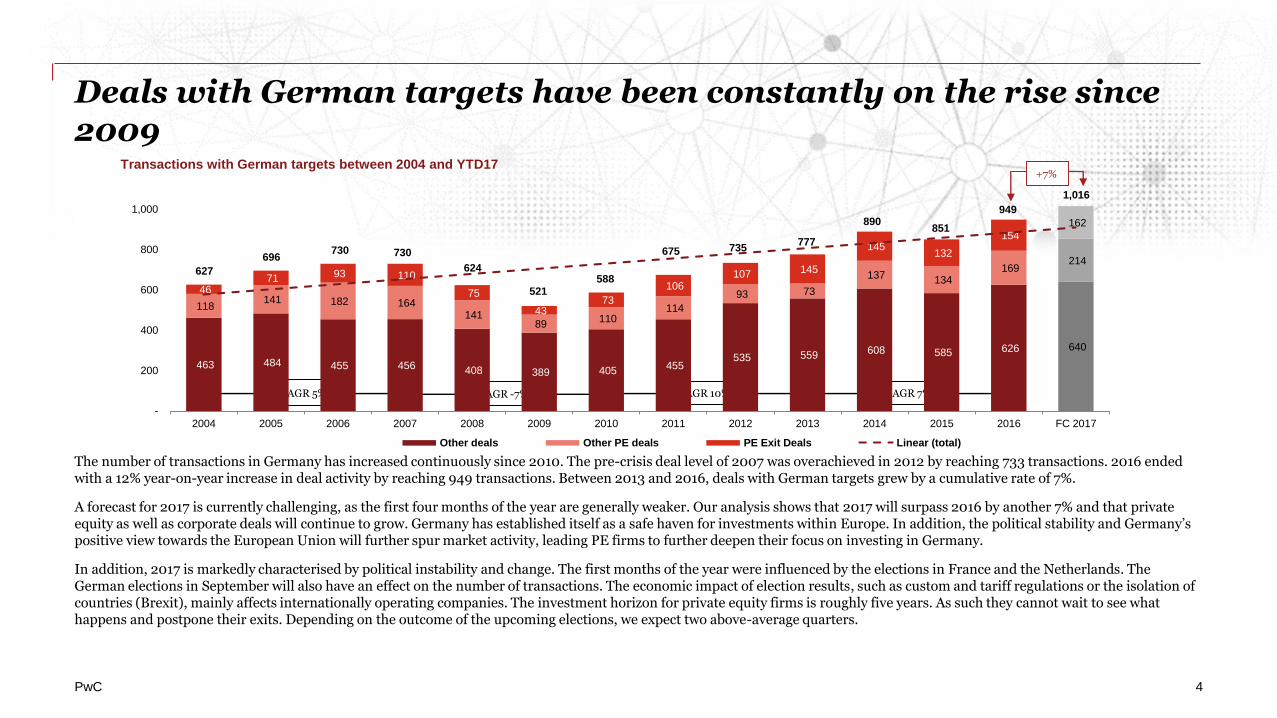
The number of transactions in Germany has increased continuously since 2010. The pre-crisis deal level of 2007 was overachieved in 2012 by reaching 733 transactions. 2016 ended with a 12% year-on-year increase in deal activity by reaching 949 transactions. Between 2013 and 2016, deals with German targets grew by a cumulative rate of 7%.
A forecast for 2017 is currently challenging, as the first four months of the year are generally weaker. Our analysis shows that 2017 will surpass 2016 by another 7% and that private equity as well as corporate deals will continue to grow. Germany has established itself as a safe haven for investments within Europe. In addition, the political stability and Germany’s positive view towards the European Union will further spur market activity, leading PE firms to further deepen their focus on investing in Germany.
In addition, 2017 is markedly characterised by political instability and change. The first months of the year were influenced by the elections in France and the Netherlands. The German elections in September will also have an effect on the number of transactions. The economic impact of election results, such as custom and tariff regulations or the isolation of countries (Brexit), mainly affects internationally operating companies. The investment horizon for private equity firms is roughly five years. As such they cannot wait to see what happens and postpone their exits. Depending on the outcome of the upcoming elections, we expect two above-average quarters.
+7%
CAGR 5% CAGR -7% CAGR 10% CAGR 7%
463 484 455 456 408 389 405 455
535 559 608 585 626 640
118 141 182 164
141 89
110 114
93 73
137 134 169
214
46 71 93 110
75
43 73
106 107 145
145 132
154
162
627
696 730 730
624
521 588
675 735 777
890 851
949
1,016
-
200
400
600
800
1,000
2004 2005 2006 2007 2008 2009 2010 2011 2012 2013 2014 2015 2016 FC 2017
Transactions with German targets between 2004 and YTD17
Other deals Other PE deals PE Exit Deals Linear (total)
PwC
German private equity exits
5
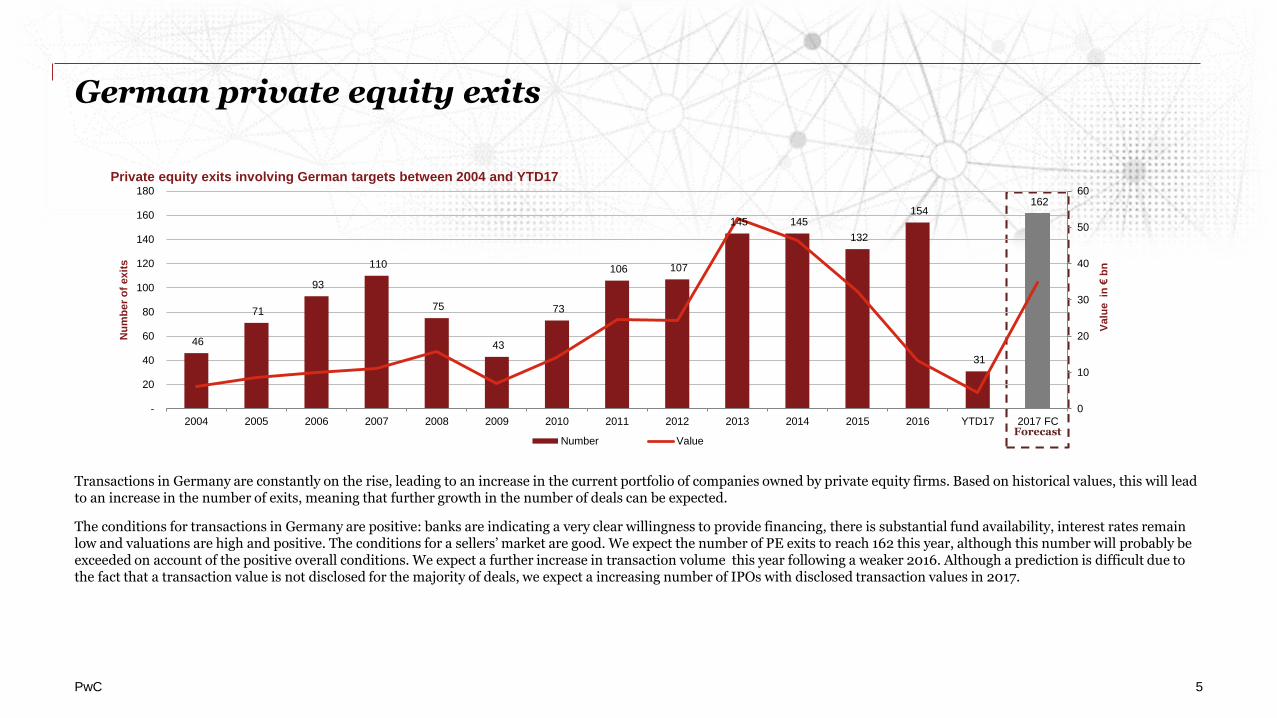
Transactions in Germany are constantly on the rise, leading to an increase in the current portfolio of companies owned by private equity firms. Based on historical values, this will lead to an increase in the number of exits, meaning that further growth in the number of deals can be expected.
The conditions for transactions in Germany are positive: banks are indicating a very clear willingness to provide financing, there is substantial fund availability, interest rates remain low and valuations are high and positive. The conditions for a sellers’ market are good. We expect the number of PE exits to reach 162 this year, although this number will probably be exceeded on account of the positive overall conditions. We expect a further increase in transaction volume this year following a weaker 2016. Although a prediction is difficult due to the fact that a transaction value is not disclosed for the majority of deals, we expect a increasing number of IPOs with disclosed transaction values in 2017.
Forecast
46
71
93
110
75
43
73
106 107
145 145
132
154
31
162
0
10
20
30
40
50
60
-
20
40
60
80
100
120
140
160
180
2004 2005 2006 2007 2008 2009 2010 2011 2012 2013 2014 2015 2016 YTD17 2017 FC
Valu
e in
€b
n
Nu
mb
er
of
exit
s
Private equity exits involving German targets between 2004 and YTD17
Number Value
PwC 6
Exit deals in GermanyTotal value and number of transactions since 2014
2014 2015 2016 2017
Q1 Q2 Q3 Q4 Total Q1 Q2 Q3 Q4 Total Q1 Q2 Q3 Q4 Total Q1 Q2 YTD FC
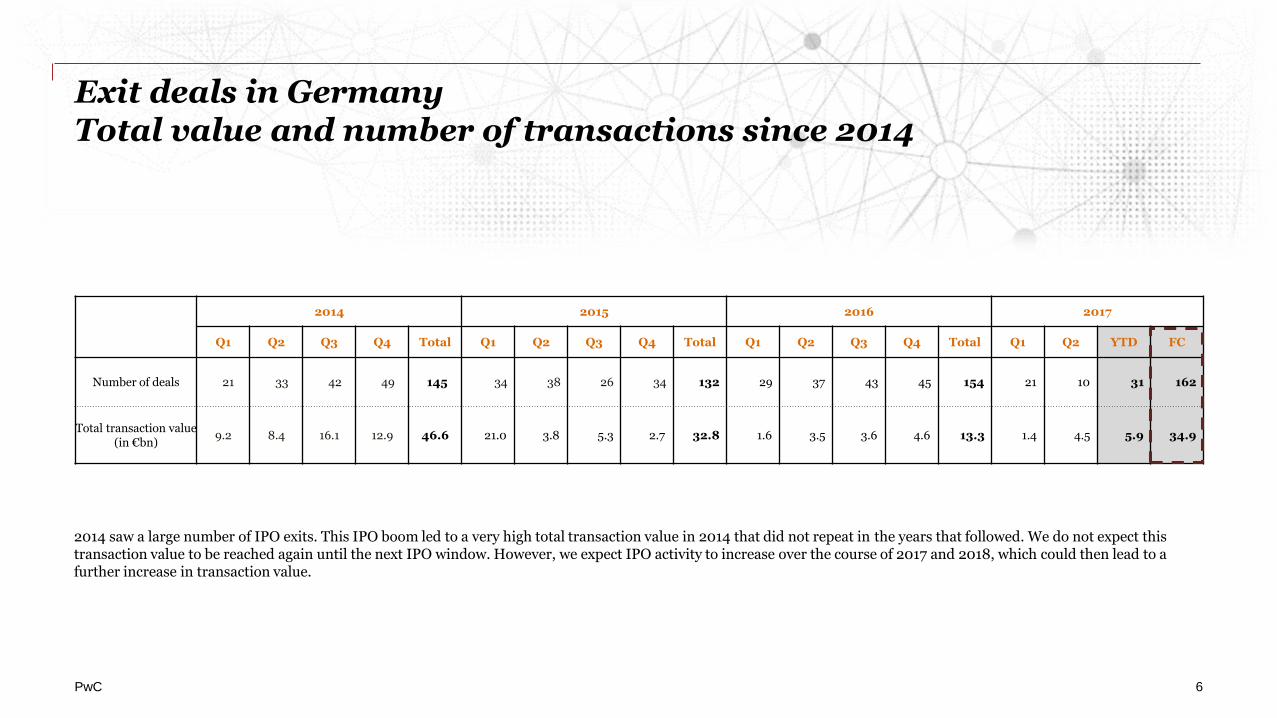
Number of deals 21 33 42 49 145 34 38 26 34 132 29 37 43 45 154 21 10 31 162
Total transaction value (in €bn)
9.2 8.4 16.1 12.9 46.6 21.0 3.8 5.3 2.7 32.8 1.6 3.5 3.6 4.6 13.3 1.4 4.5 5.9 34.9
2014 saw a large number of IPO exits. This IPO boom led to a very high total transaction value in 2014 that did not repeat in the years that followed. We do not expect this transaction value to be reached again until the next IPO window. However, we expect IPO activity to increase over the course of 2017 and 2018, which could then lead to a further increase in transaction value.
PwC 7
Top 10 exit deals between 2014 and 2017*The 10 largest exit deals by volume
Investment date Exit date Target name Seller name Exit type Holding period Buyer nameDeal value in
€bnPrimary industry
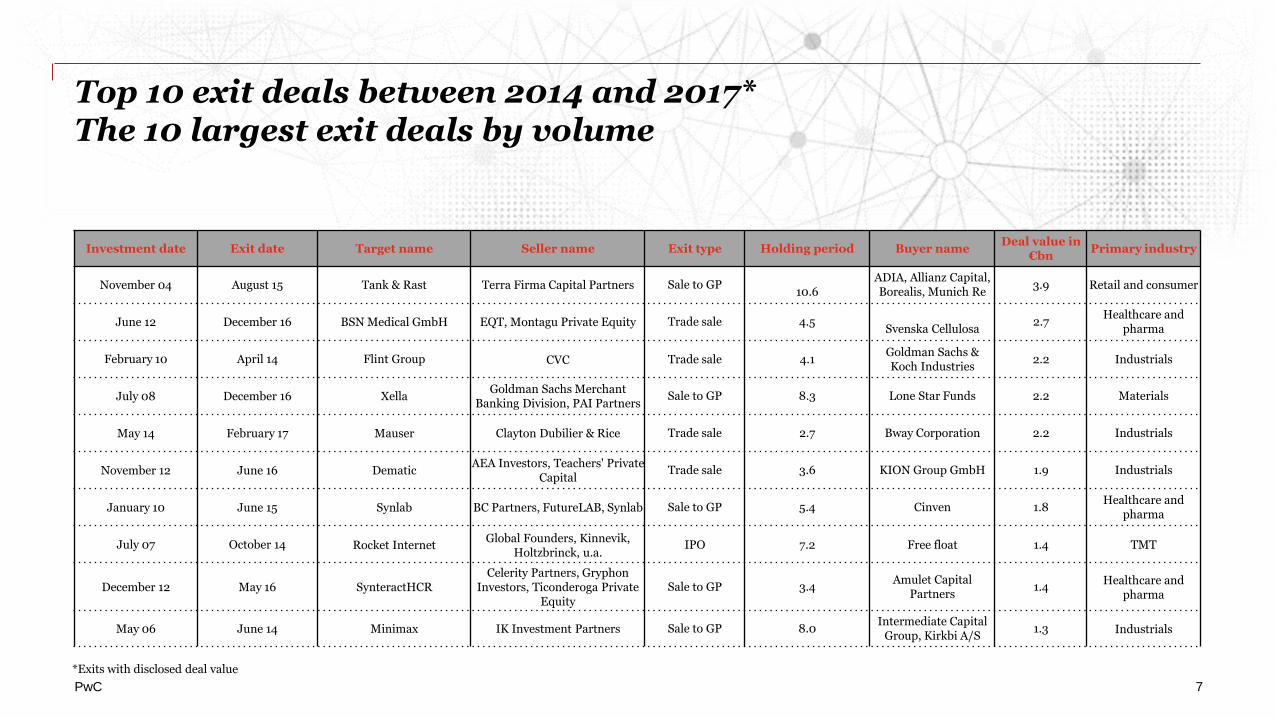
November 04 August 15 Tank & Rast Terra Firma Capital Partners Sale to GP10.6
ADIA, Allianz Capital, Borealis, Munich Re
3.9 Retail and consumer
June 12 December 16 BSN Medical GmbH EQT, Montagu Private Equity Trade sale 4.5Svenska Cellulosa
2.7 Healthcare and
pharma
February 10 April 14 Flint Group CVC Trade sale 4.1Goldman Sachs & Koch Industries
2.2 Industrials
July 08 December 16 XellaGoldman Sachs Merchant
Banking Division, PAI Partners Sale to GP 8.3 Lone Star Funds 2.2 Materials
May 14 February 17 Mauser Clayton Dubilier & Rice Trade sale 2.7 Bway Corporation 2.2 Industrials
November 12 June 16 DematicAEA Investors, Teachers' Private
Capital Trade sale 3.6 KION Group GmbH 1.9 Industrials
January 10 June 15 Synlab BC Partners, FutureLAB, Synlab Sale to GP 5.4 Cinven 1.8 Healthcare and
pharma
July 07 October 14 Rocket InternetGlobal Founders, Kinnevik,
Holtzbrinck, u.a.IPO 7.2 Free float 1.4 TMT
December 12 May 16 SynteractHCRCelerity Partners, Gryphon
Investors, Ticonderoga Private Equity
Sale to GP 3.4Amulet Capital
Partners 1.4
Healthcare and pharma
May 06 June 14 Minimax IK Investment Partners Sale to GP 8.0Intermediate Capital
Group, Kirkbi A/S 1.3 Industrials
*Exits with disclosed deal value
Exit strategies since 2004
PwC 9
Exit strategies since 2004
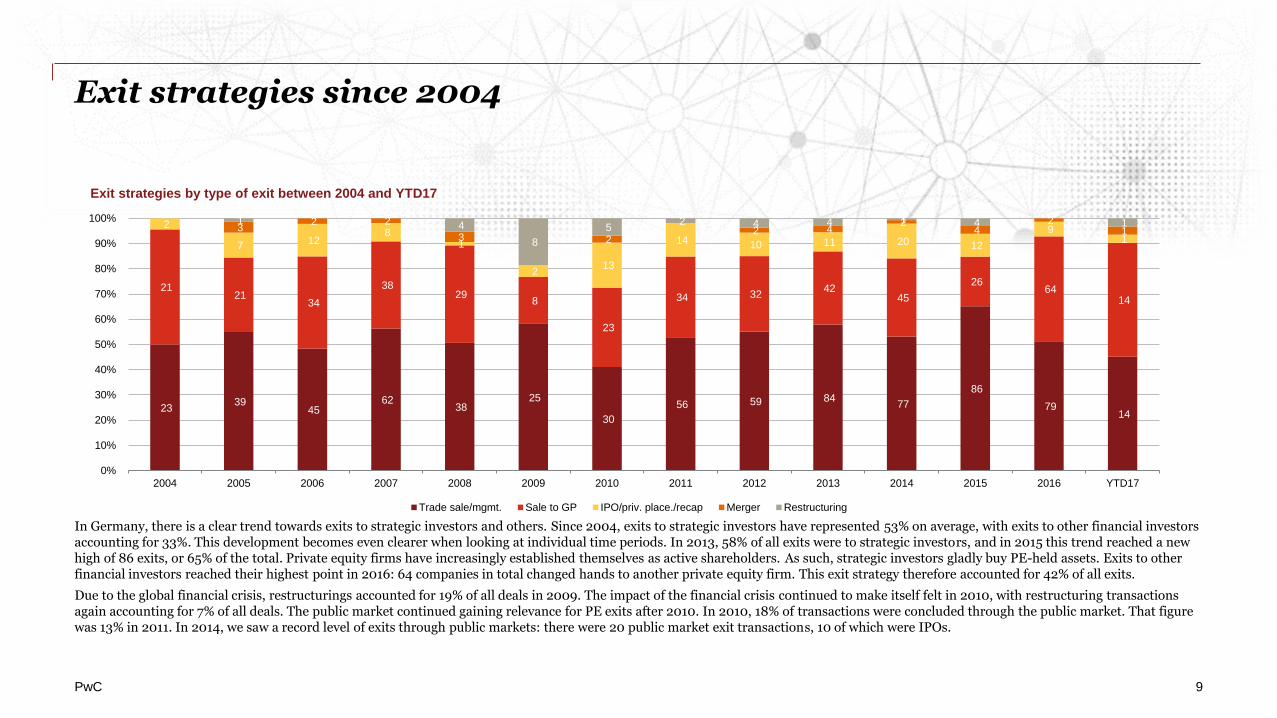
In Germany, there is a clear trend towards exits to strategic investors and others. Since 2004, exits to strategic investors have represented 53% on average, with exits to other financial investors accounting for 33%. This development becomes even clearer when looking at individual time periods. In 2013, 58% of all exits were to strategic investors, and in 2015 this trend reached a new high of 86 exits, or 65% of the total. Private equity firms have increasingly established themselves as active shareholders. As such, strategic investors gladly buy PE-held assets. Exits to other financial investors reached their highest point in 2016: 64 companies in total changed hands to another private equity firm. This exit strategy therefore accounted for 42% of all exits.
Due to the global financial crisis, restructurings accounted for 19% of all deals in 2009. The impact of the financial crisis continued to make itself felt in 2010, with restructuring transactions again accounting for 7% of all deals. The public market continued gaining relevance for PE exits after 2010. In 2010, 18% of transactions were concluded through the public market. That figure was 13% in 2011. In 2014, we saw a record level of exits through public markets: there were 20 public market exit transactions, 10 of which were IPOs.
23 39
45 62
38 25
30
56 59 84 77
86
79 14
21 21
34
38 29
8
23
34 32 42
45
26 64
14
2
7 12 8
1
2 13
14 10 11 20 12
9 1
3 2 2
3 2 2 4
2 4
2 1
1 4
8
5 2 4 4 1 4 1
0%
10%
20%
30%
40%
50%
60%
70%
80%
90%
100%
2004 2005 2006 2007 2008 2009 2010 2011 2012 2013 2014 2015 2016 YTD17
Exit strategies by type of exit between 2004 and YTD17
Trade sale/mgmt. Sale to GP IPO/priv. place./recap Merger Restructuring
PwC 10
Exit strategies since 2004
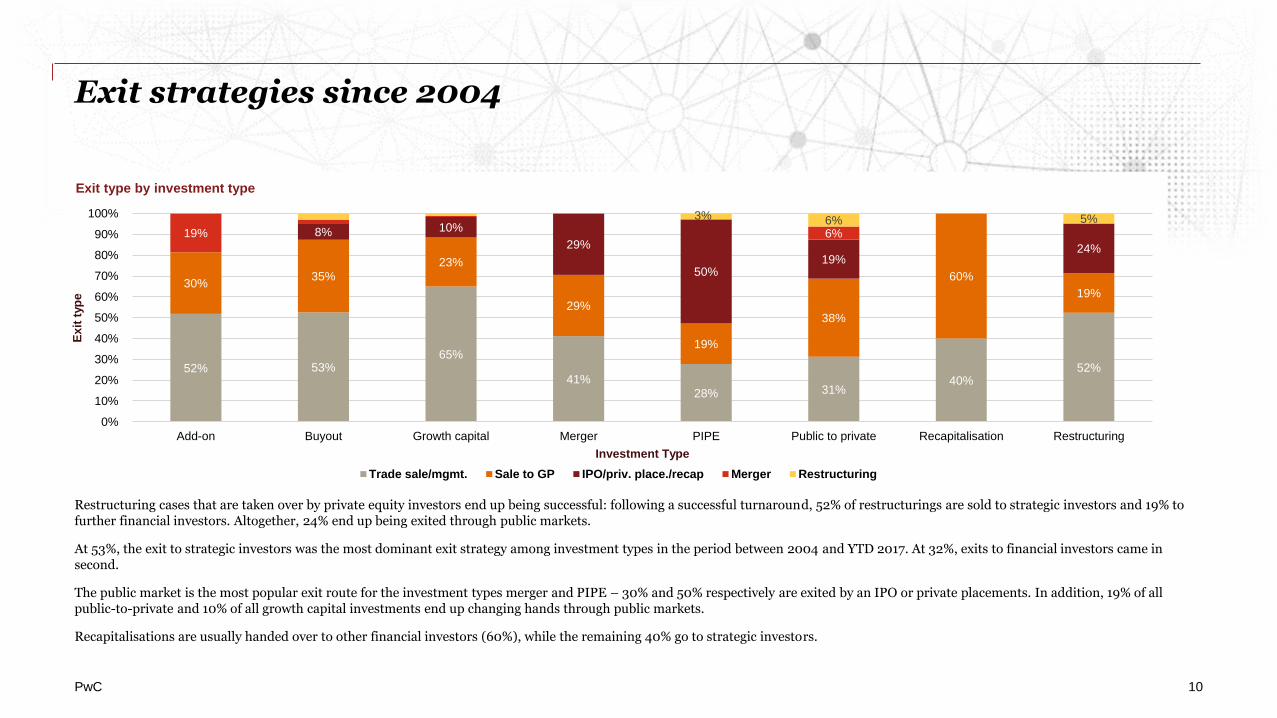
Restructuring cases that are taken over by private equity investors end up being successful: following a successful turnaround, 52% of restructurings are sold to strategic investors and 19% to further financial investors. Altogether, 24% end up being exited through public markets.
At 53%, the exit to strategic investors was the most dominant exit strategy among investment types in the period between 2004 and YTD 2017. At 32%, exits to financial investors came in second.
The public market is the most popular exit route for the investment types merger and PIPE – 30% and 50% respectively are exited by an IPO or private placements. In addition, 19% of all public-to-private and 10% of all growth capital investments end up changing hands through public markets.
Recapitalisations are usually handed over to other financial investors (60%), while the remaining 40% go to strategic investors.
52% 53% 65%
41% 28% 31%
40% 52%
30% 35%
23%
29%
19%
38%
60%
19%
8% 10%
29%
50% 19%
24%
19% 6%
3% 6% 5%
0%
10%
20%
30%
40%
50%
60%
70%
80%
90%
100%
Add-on Buyout Growth capital Merger PIPE Public to private Recapitalisation Restructuring
Ex
it t
yp
e
Investment Type
Exit type by investment type
Trade sale/mgmt. Sale to GP IPO/priv. place./recap Merger Restructuring
Development of historical holding periods by industry and forecast
PwC 12
Holding periods between 2007 and YTD 2017
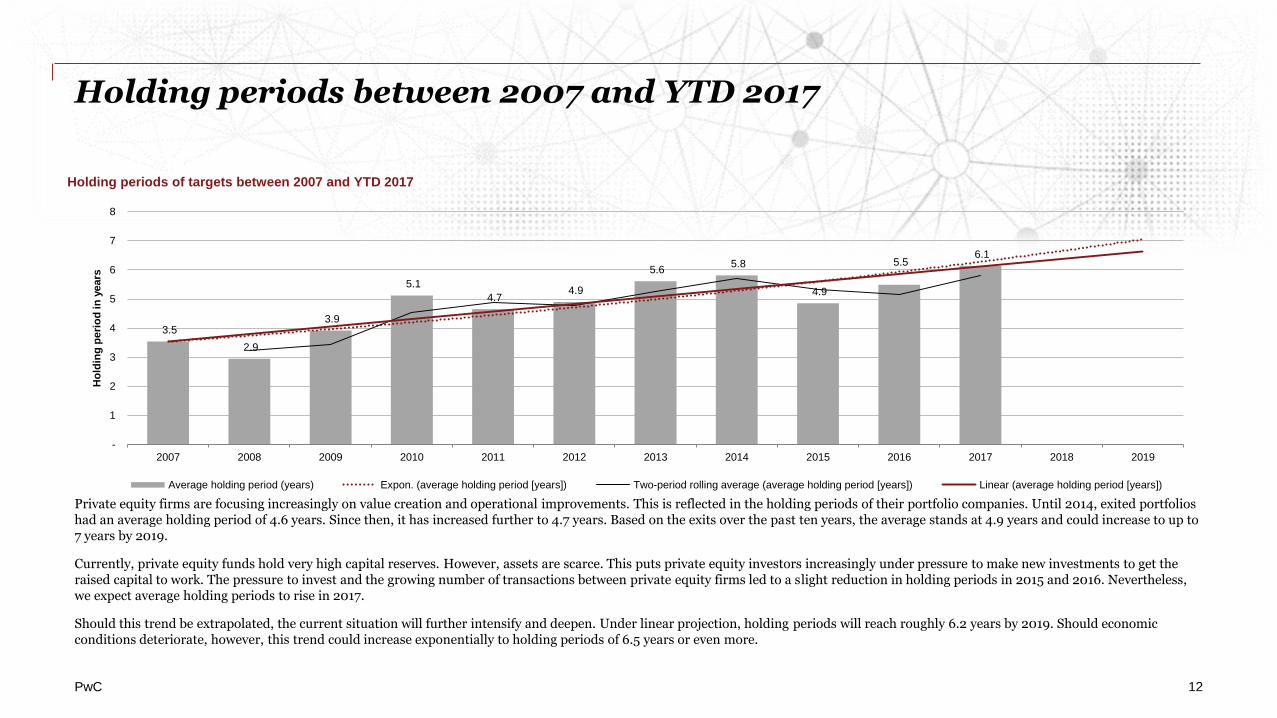
Private equity firms are focusing increasingly on value creation and operational improvements. This is reflected in the holding periods of their portfolio companies. Until 2014, exited portfolios had an average holding period of 4.6 years. Since then, it has increased further to 4.7 years. Based on the exits over the past ten years, the average stands at 4.9 years and could increase to up to 7 years by 2019.
Currently, private equity funds hold very high capital reserves. However, assets are scarce. This puts private equity investors increasingly under pressure to make new investments to get the raised capital to work. The pressure to invest and the growing number of transactions between private equity firms led to a slight reduction in holding periods in 2015 and 2016. Nevertheless, we expect average holding periods to rise in 2017.
Should this trend be extrapolated, the current situation will further intensify and deepen. Under linear projection, holding periods will reach roughly 6.2 years by 2019. Should economic conditions deteriorate, however, this trend could increase exponentially to holding periods of 6.5 years or even more.
3.5
2.9
3.9
5.1
4.7 4.9
5.6 5.8
4.9
5.5 6.1
-
1
2
3
4
5
6
7
8
2007 2008 2009 2010 2011 2012 2013 2014 2015 2016 2017 2018 2019
Ho
ldin
g p
eri
od
in
years
Holding periods of targets between 2007 and YTD 2017
Average holding period (years) Expon. (average holding period [years]) Two-period rolling average (average holding period [years]) Linear (average holding period [years])
PwC
5.1 5.0 4.9 4.8 4.7 4.7 4.5 4.5 4.4 4.3 4.2 4.1
3.2
2.2
-
1
2
3
4
5
6
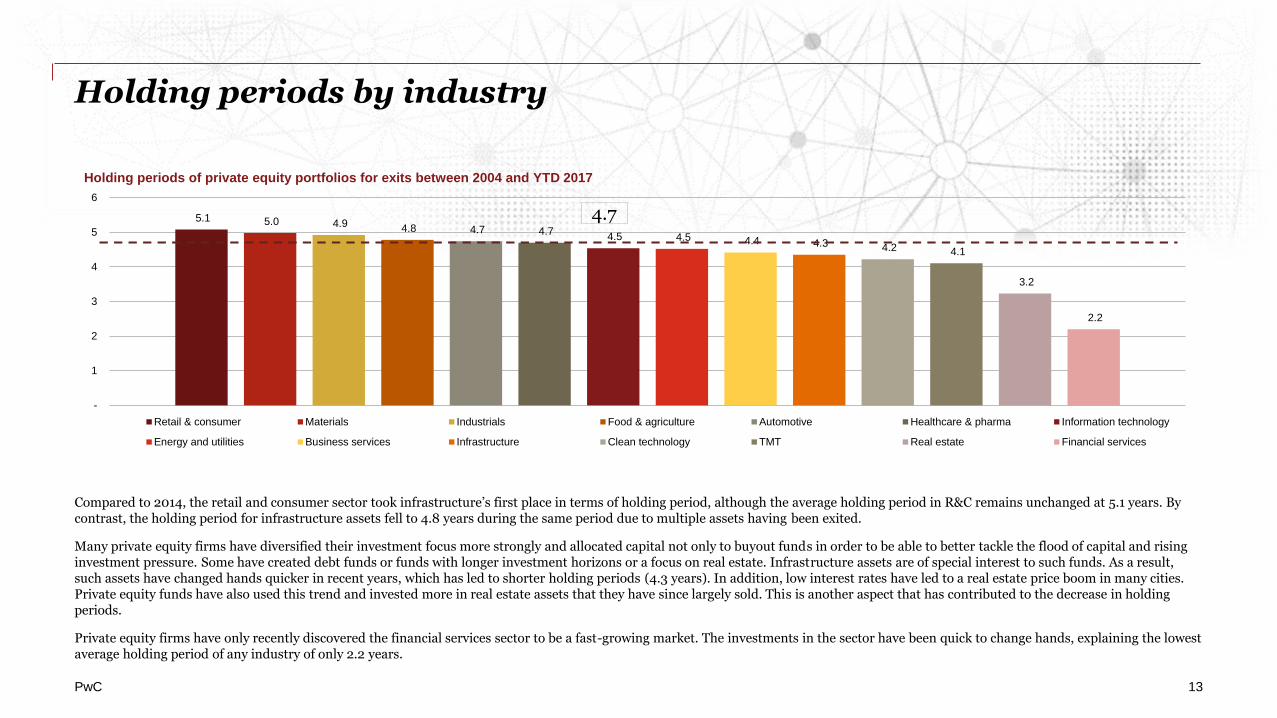
Holding periods of private equity portfolios for exits between 2004 and YTD 2017
Retail & consumer Materials Industrials Food & agriculture Automotive Healthcare & pharma Information technology
Energy and utilities Business services Infrastructure Clean technology TMT Real estate Financial services
13
Holding periods by industry
4.7
Compared to 2014, the retail and consumer sector took infrastructure’s first place in terms of holding period, although the average holding period in R&C remains unchanged at 5.1 years. By contrast, the holding period for infrastructure assets fell to 4.8 years during the same period due to multiple assets having been exited.
Many private equity firms have diversified their investment focus more strongly and allocated capital not only to buyout funds in order to be able to better tackle the flood of capital and rising investment pressure. Some have created debt funds or funds with longer investment horizons or a focus on real estate. Infrastructure assets are of special interest to such funds. As a result, such assets have changed hands quicker in recent years, which has led to shorter holding periods (4.3 years). In addition, low interest rates have led to a real estate price boom in many cities. Private equity funds have also used this trend and invested more in real estate assets that they have since largely sold. This is another aspect that has contributed to the decrease in holding periods.
Private equity firms have only recently discovered the financial services sector to be a fast-growing market. The investments in the sector have been quick to change hands, explaining the lowest average holding period of any industry of only 2.2 years.
PwC
5.1 4.8
4.4 4.1 4.1 4.0 4.0 3.9 3.9 3.8
3.5
3.0
2.2 2.2
-
1
2
3
4
5
6
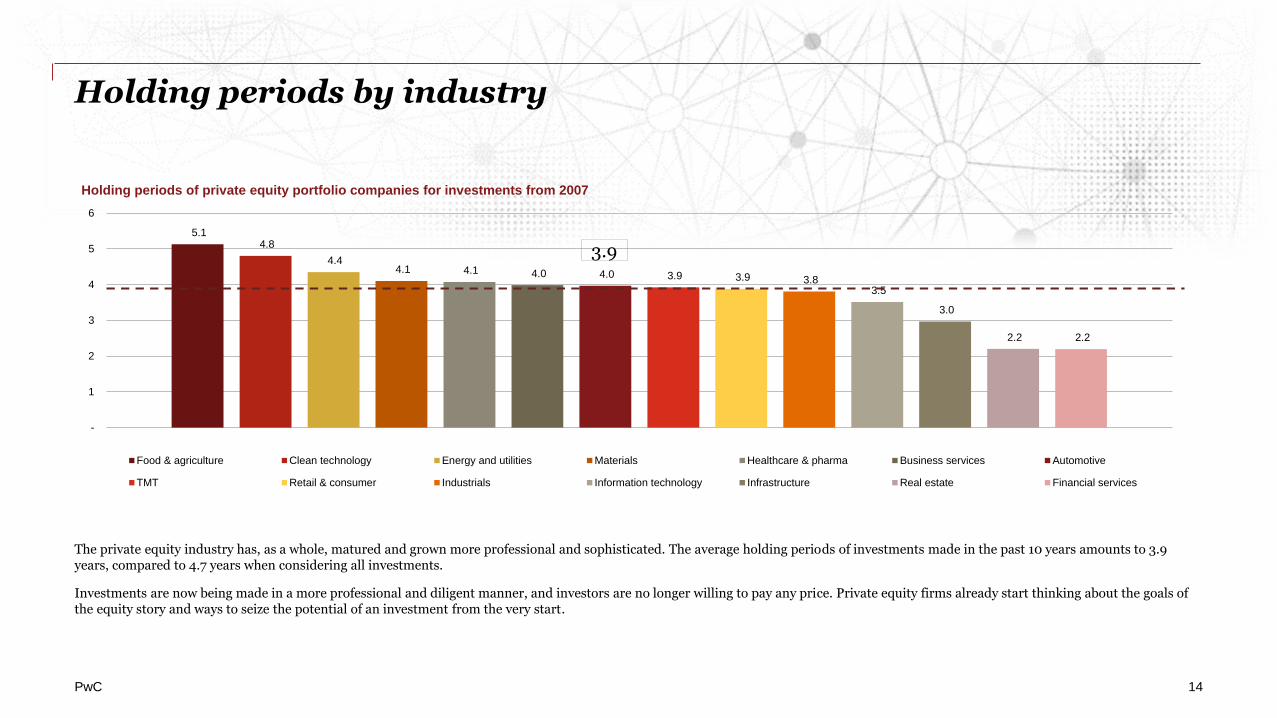
Holding periods of private equity portfolio companies for investments from 2007
Food & agriculture Clean technology Energy and utilities Materials Healthcare & pharma Business services Automotive
TMT Retail & consumer Industrials Information technology Infrastructure Real estate Financial services
14
Holding periods by industry
The private equity industry has, as a whole, matured and grown more professional and sophisticated. The average holding periods of investments made in the past 10 years amounts to 3.9 years, compared to 4.7 years when considering all investments.
Investments are now being made in a more professional and diligent manner, and investors are no longer willing to pay any price. Private equity firms already start thinking about the goals of the equity story and ways to seize the potential of an investment from the very start.
3.9
PwC 15
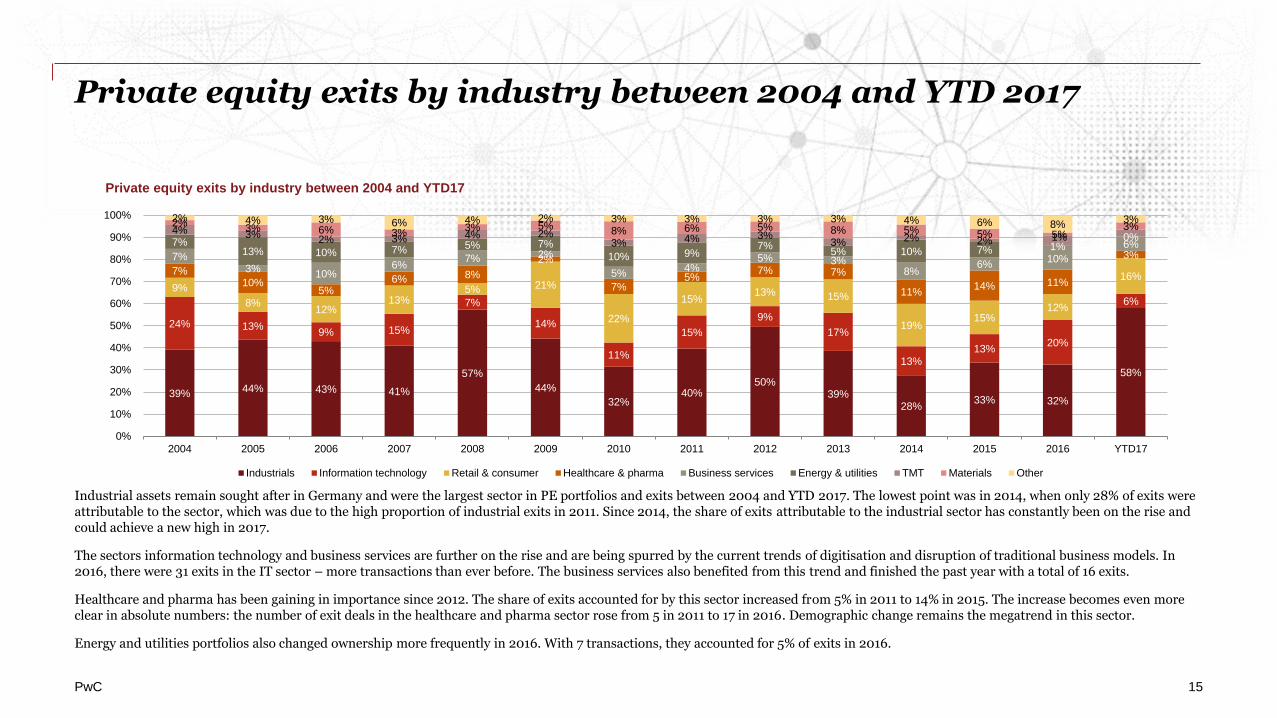
Private equity exits by industry between 2004 and YTD 2017
Industrial assets remain sought after in Germany and were the largest sector in PE portfolios and exits between 2004 and YTD 2017. The lowest point was in 2014, when only 28% of exits were attributable to the sector, which was due to the high proportion of industrial exits in 2011. Since 2014, the share of exits attributable to the industrial sector has constantly been on the rise and could achieve a new high in 2017.
The sectors information technology and business services are further on the rise and are being spurred by the current trends of digitisation and disruption of traditional business models. In 2016, there were 31 exits in the IT sector – more transactions than ever before. The business services also benefited from this trend and finished the past year with a total of 16 exits.
Healthcare and pharma has been gaining in importance since 2012. The share of exits accounted for by this sector increased from 5% in 2011 to 14% in 2015. The increase becomes even more clear in absolute numbers: the number of exit deals in the healthcare and pharma sector rose from 5 in 2011 to 17 in 2016. Demographic change remains the megatrend in this sector.
Energy and utilities portfolios also changed ownership more frequently in 2016. With 7 transactions, they accounted for 5% of exits in 2016.
39% 44% 43% 41%
57%
44%
32% 40%
50% 39%
28% 33% 32%
58%
24% 13% 9% 15%
7%
14%
11%
15%
9%
17%
13% 13%
20%
6%
9%
8% 12%
13% 5% 21%
22%
15% 13% 15%
19% 15%
12%
16% 7%
10% 5%
6% 8%
2%
7% 5%
7% 7%
11% 14% 11%
3% 7% 3%
10% 6%
7% 2%
5% 4%
5% 3% 8%
6% 10%
6% 7% 13% 10% 7% 5% 7%
10% 9% 7%
5% 10% 7% 1% 0%
4% 3% 2% 3% 4% 2%
3% 4% 3% 3% 2% 2%
5% 2%
3% 6% 3% 3% 5% 8% 6% 5% 8% 5% 5% 1%
3% 2% 4% 3% 6% 4% 2% 3% 3% 3% 3% 4% 6% 8%
3%
0%
10%
20%
30%
40%
50%
60%
70%
80%
90%
100%
2004 2005 2006 2007 2008 2009 2010 2011 2012 2013 2014 2015 2016 YTD17
Private equity exits by industry between 2004 and YTD17
Industrials Information technology Retail & consumer Healthcare & pharma Business services Energy & utilities TMT Materials Other
PwC 16
Private equity exits by industry: high/low by investment date
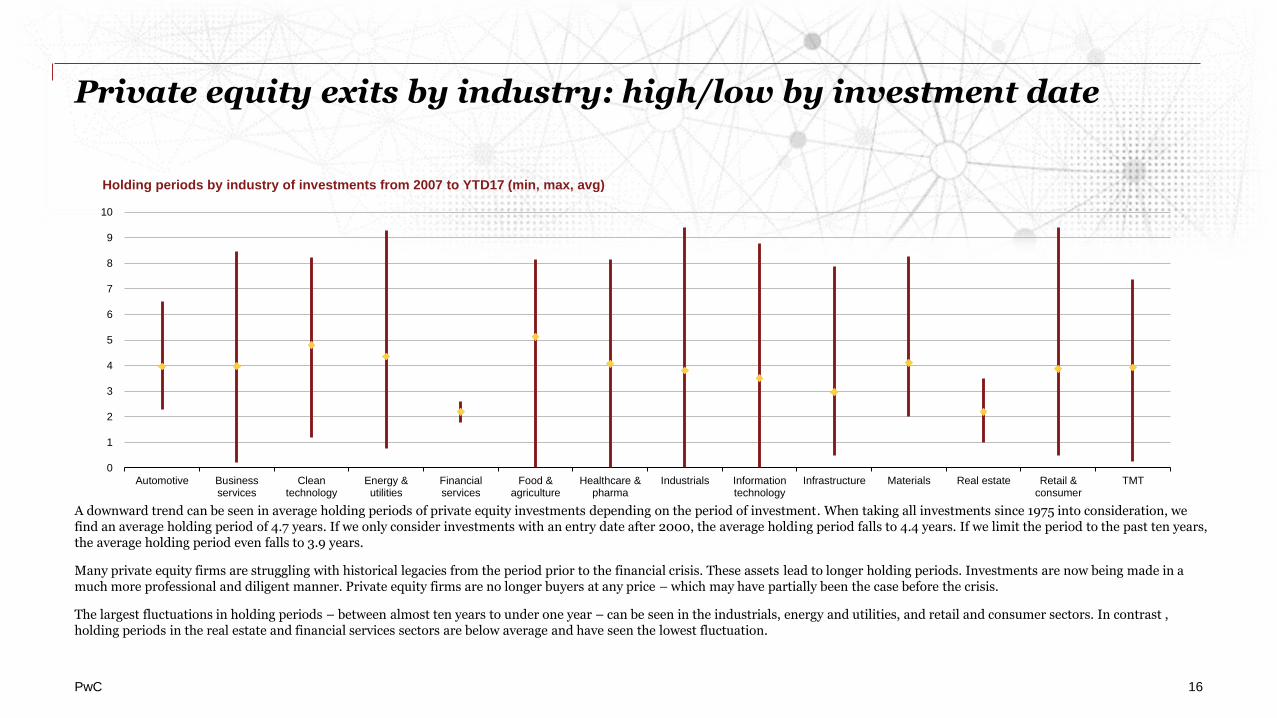
A downward trend can be seen in average holding periods of private equity investments depending on the period of investment. When taking all investments since 1975 into consideration, we find an average holding period of 4.7 years. If we only consider investments with an entry date after 2000, the average holding period falls to 4.4 years. If we limit the period to the past ten years, the average holding period even falls to 3.9 years.
Many private equity firms are struggling with historical legacies from the period prior to the financial crisis. These assets lead to longer holding periods. Investments are now being made in a much more professional and diligent manner. Private equity firms are no longer buyers at any price – which may have partially been the case before the crisis.
The largest fluctuations in holding periods – between almost ten years to under one year – can be seen in the industrials, energy and utilities, and retail and consumer sectors. In contrast , holding periods in the real estate and financial services sectors are below average and have seen the lowest fluctuation.
0
1
2
3
4
5
6
7
8
9
10
Automotive Businessservices
Cleantechnology
Energy &utilities
Financialservices
Food &agriculture
Healthcare &pharma
Industrials Informationtechnology
Infrastructure Materials Real estate Retail &consumer
TMT
Holding periods by industry of investments from 2007 to YTD17 (min, max, avg)
PwC 17
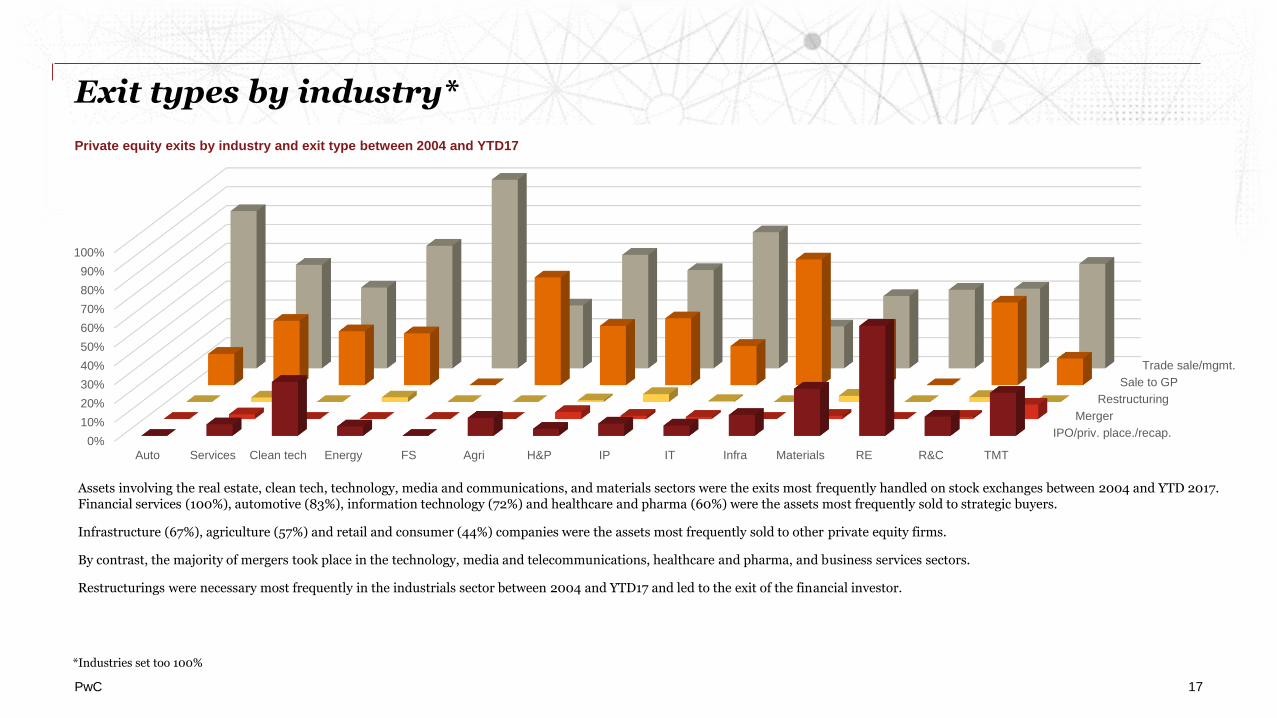
Exit types by industry*
*Industries set too 100%
Assets involving the real estate, clean tech, technology, media and communications, and materials sectors were the exits most frequently handled on stock exchanges between 2004 and YTD 2017. Financial services (100%), automotive (83%), information technology (72%) and healthcare and pharma (60%) were the assets most frequently sold to strategic buyers.
Infrastructure (67%), agriculture (57%) and retail and consumer (44%) companies were the assets most frequently sold to other private equity firms.
By contrast, the majority of mergers took place in the technology, media and telecommunications, healthcare and pharma, and business services sectors.
Restructurings were necessary most frequently in the industrials sector between 2004 and YTD17 and led to the exit of the financial investor.
IPO/priv. place./recap.
Merger
Restructuring
Sale to GP
Trade sale/mgmt.
0%
10%
20%
30%
40%
50%
60%
70%
80%
90%
100%
Auto Services Clean tech Energy FS Agri H&P IP IT Infra Materials RE R&C TMT
Private equity exits by industry and exit type between 2004 and YTD17
PwC 18
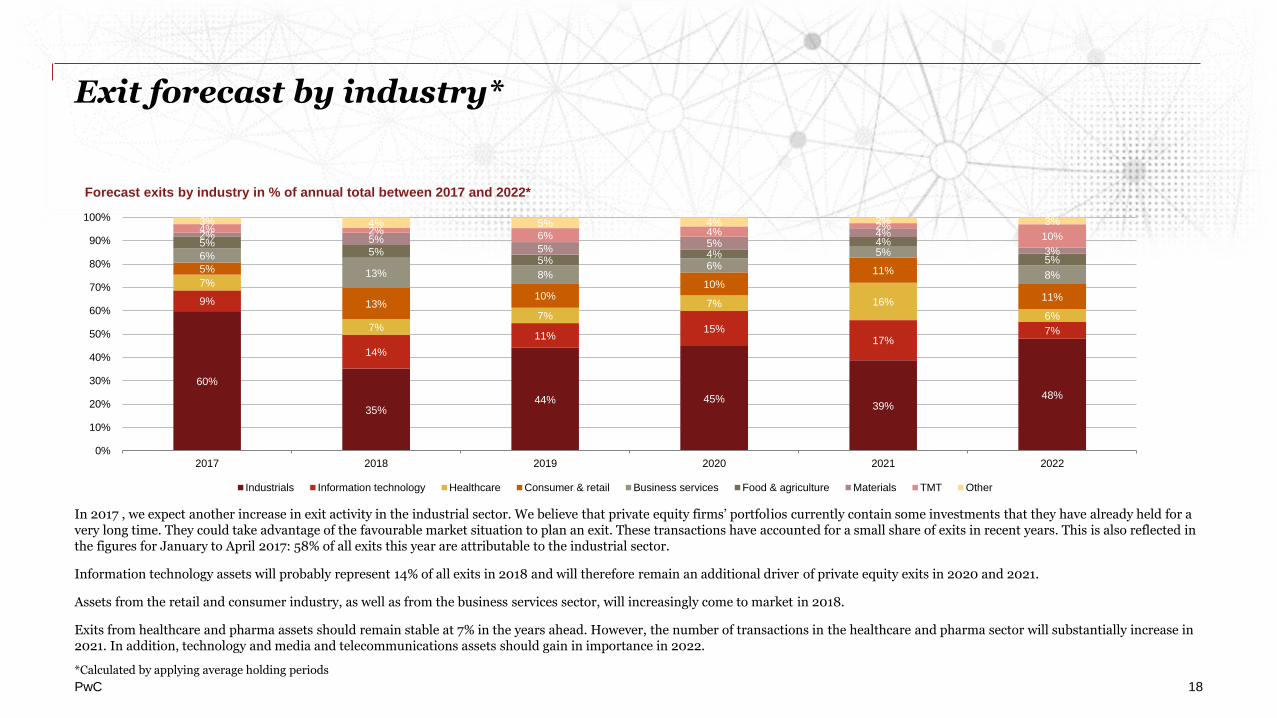
Exit forecast by industry*
In 2017 , we expect another increase in exit activity in the industrial sector. We believe that private equity firms’ portfolios currently contain some investments that they have already held for a very long time. They could take advantage of the favourable market situation to plan an exit. These transactions have accounted for a small share of exits in recent years. This is also reflected in the figures for January to April 2017: 58% of all exits this year are attributable to the industrial sector.
Information technology assets will probably represent 14% of all exits in 2018 and will therefore remain an additional driver of private equity exits in 2020 and 2021.
Assets from the retail and consumer industry, as well as from the business services sector, will increasingly come to market in 2018.
Exits from healthcare and pharma assets should remain stable at 7% in the years ahead. However, the number of transactions in the healthcare and pharma sector will substantially increase in 2021. In addition, technology and media and telecommunications assets should gain in importance in 2022.
*Calculated by applying average holding periods
60%
35% 44% 45%
39% 48%
9%
14%
11% 15%
17% 7%
7%
7% 7%
7% 16%
6%
5%
13% 10%
10%
11%
11%
6%
13% 8% 6%
5%
8%
5% 5%
5% 4%
4%
5%
2% 5% 5%
5% 4%
3%
4% 2% 6% 4% 2%
10%
3% 4% 5% 4% 2% 3%
0%
10%
20%
30%
40%
50%
60%
70%
80%
90%
100%
2017 2018 2019 2020 2021 2022
Forecast exits by industry in % of annual total between 2017 and 2022*
Industrials Information technology Healthcare Consumer & retail Business services Food & agriculture Materials TMT Other
PwC 19
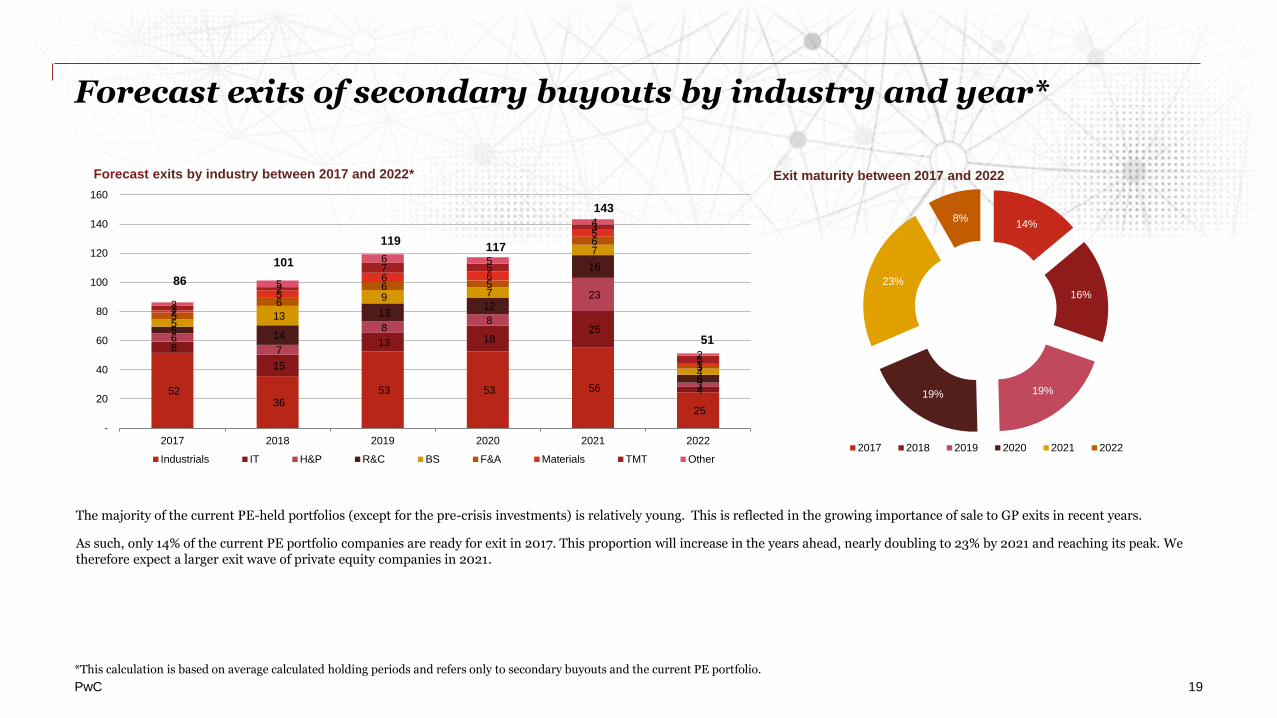
Forecast exits of secondary buyouts by industry and year*
52 36
53 53 56
25
8
15
13 18 25
4
6 7
8 8
23
3
5 14
13 12
16
6
5 13
9 7
7
4
5
6
6 5
6
3
1
5
6 6
5
1
3
2
7 5
3
5
3
5
6 5
4
2
86
101
119 117
143
51
-
20
40
60
80
100
120
140
160
2017 2018 2019 2020 2021 2022
Forecast exits by industry between 2017 and 2022*
Industrials IT H&P R&C BS F&A Materials TMT Other
14%
16%
19% 19%
23%
8%
Exit maturity between 2017 and 2022
2017 2018 2019 2020 2021 2022
*This calculation is based on average calculated holding periods and refers only to secondary buyouts and the current PE portfolio.
The majority of the current PE-held portfolios (except for the pre-crisis investments) is relatively young. This is reflected in the growing importance of sale to GP exits in recent years.
As such, only 14% of the current PE portfolio companies are ready for exit in 2017. This proportion will increase in the years ahead, nearly doubling to 23% by 2021 and reaching its peak. We therefore expect a larger exit wave of private equity companies in 2021.
IPO exits
PwC 21
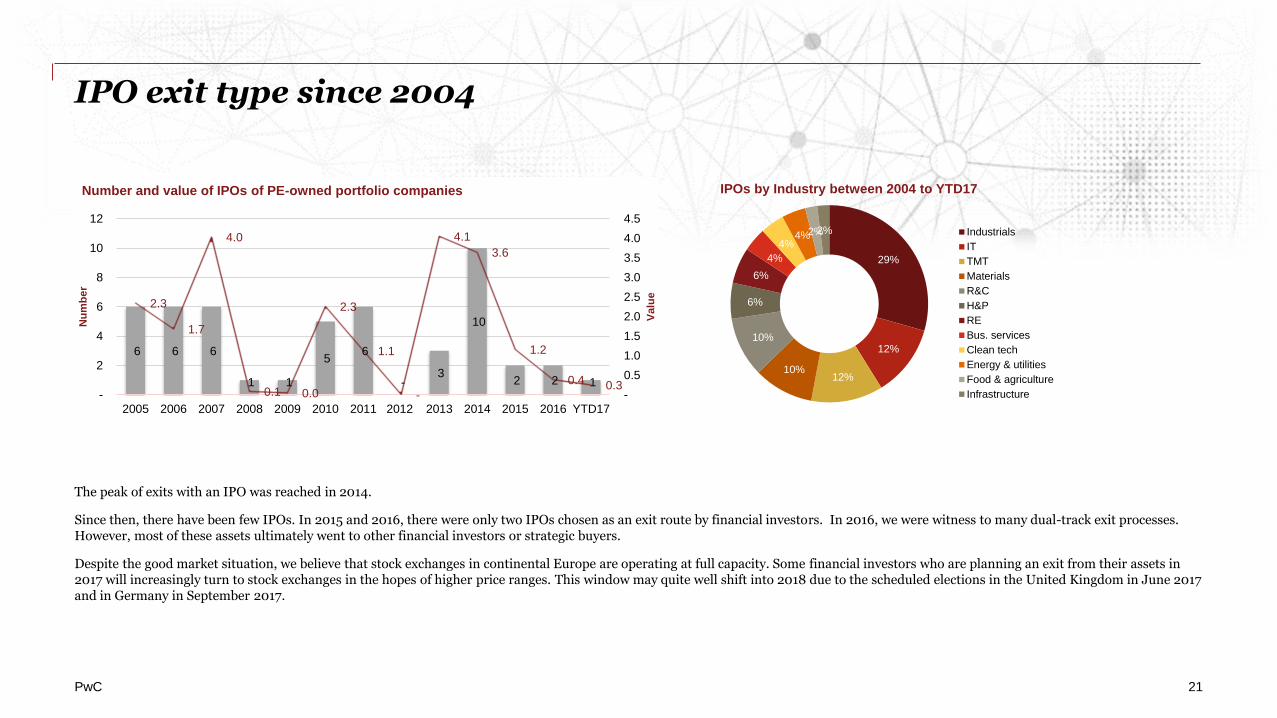
IPO exit type since 2004
The peak of exits with an IPO was reached in 2014.
Since then, there have been few IPOs. In 2015 and 2016, there were only two IPOs chosen as an exit route by financial investors. In 2016, we were witness to many dual-track exit processes. However, most of these assets ultimately went to other financial investors or strategic buyers.
Despite the good market situation, we believe that stock exchanges in continental Europe are operating at full capacity. Some financial investors who are planning an exit from their assets in 2017 will increasingly turn to stock exchanges in the hopes of higher price ranges. This window may quite well shift into 2018 due to the scheduled elections in the United Kingdom in June 2017 and in Germany in September 2017.
6 6 6
1 1
5 6
-3
10
2 2 1
2.3
1.7
4.0
0.1 0.0
2.3
1.1
-
4.1
3.6
1.2
0.4 0.3 -
0.5
1.0
1.5
2.0
2.5
3.0
3.5
4.0
4.5
-
2
4
6
8
10
12
2005 2006 2007 2008 2009 2010 2011 2012 2013 2014 2015 2016 YTD17
Valu
e
Nu
mb
er
Number and value of IPOs of PE-owned portfolio companies
29%
12%
12% 10%
10%
6%
6%
4%
4% 4% 2% 2%
IPOs by Industry between 2004 to YTD17
Industrials
IT
TMT
Materials
R&C
H&P
RE
Bus. services
Clean tech
Energy & utilities
Food & agriculture
Infrastructure
PwC 22
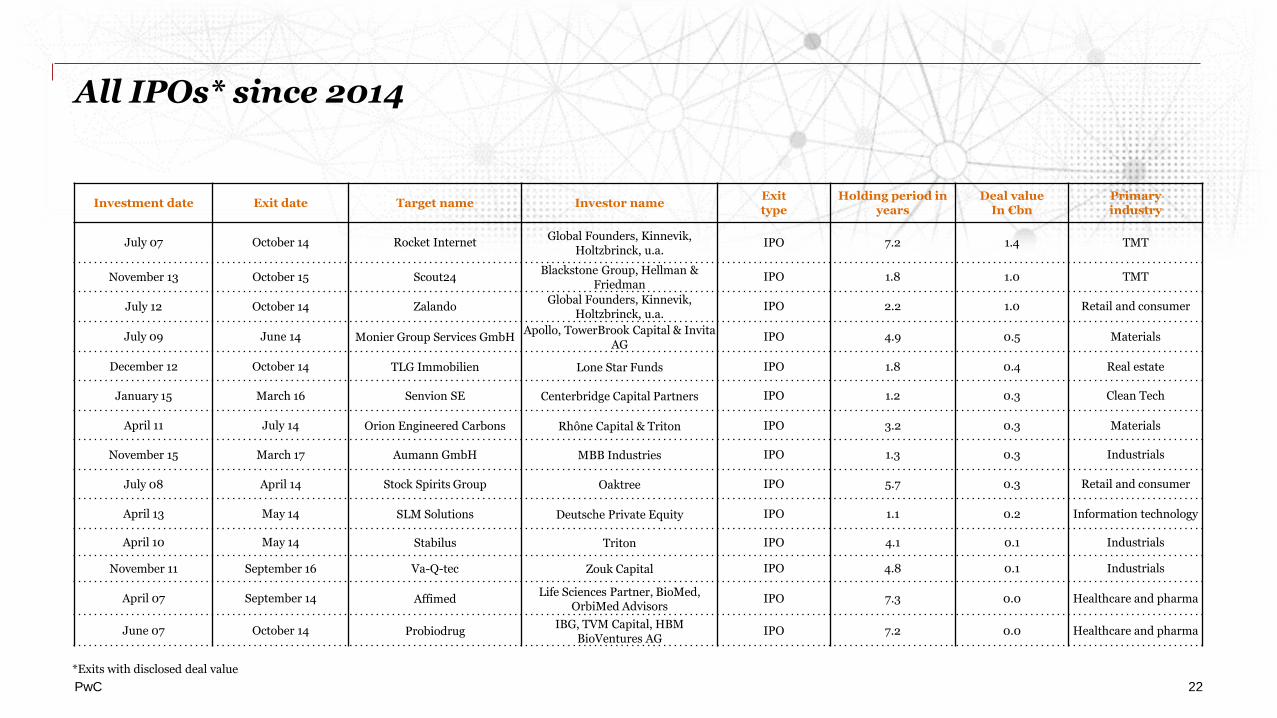
All IPOs* since 2014
Investment date Exit date Target name Investor nameExit type
Holding period in years
Deal valueIn €bn
Primaryindustry
July 07 October 14 Rocket Internet Global Founders, Kinnevik,
Holtzbrinck, u.a.IPO 7.2 1.4 TMT
November 13 October 15 Scout24 Blackstone Group, Hellman &
Friedman IPO 1.8 1.0 TMT
July 12 October 14 ZalandoGlobal Founders, Kinnevik,
Holtzbrinck, u.a. IPO 2.2 1.0 Retail and consumer
July 09 June 14 Monier Group Services GmbHApollo, TowerBrook Capital & Invita
AGIPO 4.9 0.5 Materials
December 12 October 14 TLG Immobilien Lone Star Funds IPO 1.8 0.4 Real estate
January 15 March 16 Senvion SE Centerbridge Capital Partners IPO 1.2 0.3 Clean Tech
April 11 July 14 Orion Engineered Carbons Rhône Capital & Triton IPO 3.2 0.3 Materials
November 15 March 17 Aumann GmbH MBB Industries IPO 1.3 0.3 Industrials
July 08 April 14 Stock Spirits Group Oaktree IPO 5.7 0.3 Retail and consumer
April 13 May 14 SLM Solutions Deutsche Private Equity IPO 1.1 0.2 Information technology
April 10 May 14 Stabilus Triton IPO 4.1 0.1 Industrials
November 11 September 16 Va-Q-tec Zouk Capital IPO 4.8 0.1 Industrials
April 07 September 14 AffimedLife Sciences Partner, BioMed,
OrbiMed AdvisorsIPO 7.3 0.0 Healthcare and pharma
June 07 October 14 ProbiodrugIBG, TVM Capital, HBM
BioVentures AGIPO 7.2 0.0 Healthcare and pharma
*Exits with disclosed deal value
Methodology
PwC 24
Methodology
This report is an analysis of the exit activities of German and international private equity firms and their German portfolio companies.
The analysis is based on information from the Preqin and Mergermarket databases. This data encompasses all private equity deals announced during the period and involving portfolio companies that are based in Germany.
The analysis includes all announced exits, including trade sales, sales to general partners, IPOs, mergers, management and leveraged buyouts (MBO/LBO), restructurings (sales from insolvencies) and private placements in the period between 1 January 2004 and 30 April 2017. The dates of the individual investments range back to 1975. Private equity deals are deals in which a private equity firm or fund was the direct seller and/or part of a consortium of sellers, as well as deals that are processed through a special purpose vehicle (SPV), where a private equity firm was the parent company.
This publication includes information obtained or derived from a variety of publicly available sources. PwC has not sought to establish the reliability of these sources or verified such information. PwC does not give any representation or warranty of any kind (whether express or implied) as to the accuracy or completeness of this publication. The publication is for general guidance only and does not constitute investment or any other advice. Accordingly, it is not intended to form the basis of any investment decisions and does not absolve any third party from conducting its own due diligence in order to verify its contents. Before making any decision or taking any action, you should consult a professional advisor.
© 2017 PricewaterhouseCoopers GmbH Wirtschaftsprüfungsgesellschaft.All rights reserved. In this document, “PwC” refers to PricewaterhouseCoopers GmbH Wirtschaftsprüfungsgesellschaft, which is a member firm of PricewaterhouseCoopers International Limited (PwCIL). Each member firm of PwCIL is a separate and independent legal entity.
Contact
PwC 26
Contact partner
Steve Roberts
Partner, Private Equity Leader PwC Germany
Tel.: +49 69 9585-1950
E-mail: [email protected]