four-stroke hydrogen internal combustion engine - open
TRANSCRIPT
UTAS
Performance appraisal of a • four-stroke Hydrogen
internal combustion engine
Patrick Hugh Burke
BE(Hons) Mech
Submitted in fulfillment of the requirements for the degree of Master of Engineering Science (MEngSc)
January 2005

Declaration and Authority of Access
Declaration and Authority of Access
This thesis contains no material that has been accepted for a degree or diploma by the
University of Tasmania or any other institution, except by way of background
information and has been duly acknowledged in this thesis, and to the best of the author's
knowledge and belief no material has previously been published or written by another
person except where due acknowledgment is made in the text of this thesis.
This thesis contains confidential information and is not to be disclosed or made available
for loan or copy without the expressed permission of the University of Tasmania. Once
released the thesis may be made available for loan and limited copying in accordance
with the Copyright Act 1968.
Signed: r
Date: /Y(
Patrick Burke

Acknowledgements ii
Acknowledgements
Firstly, I would like to thank my supervisors Associate Professor Vishy Karri and Dr.
Yasir Al-Abdeli for their guidance, encouragement, support and friendship throughout
the duration of this project. Their complementing teaching styles have made the process a
thorough and enjoyable learning experience.
I thank Bernadette, Tom, Katharine and Prof. Frank Bullen for their assistance in proof
reading the thesis. Their help has made this document a more pleasurable reading
experience.
I would like to extend my gratitude the workshop staff, Peter Seward, Nathan Smith, Ray
LeFevre, Steven Avery, Bernard Chenery and Nick Embrey for their patience, assistance
and advise throughout the project.
Thanks also to my post graduate colleagues for their assistance and friendship over the
past year. In particular Phuong Nguyen, David Butler, Dr. Hafez Hafez, Justin Sewart
and Todd Houstein deserve special mention for their help.
I wish to thank Australia Post for their generous donation of the subject of this project,
'the posite bike'. In addition, staff at the Australia Post workshop were more than willing
to share their technical knowledge for which I am thankful.
Finally, I would like to thank my family and friends for their endless care, support,
encouragement and distraction during the past year. They have been a source of much
motivation. I am greatly appreciative.
Abstract iii
Abstract
Fossil fuel depletion and environmental factors had lead the search for alternative
transportation fuels. One such alternative is hydrogen. Of the potential transportation
fuels of the future hydrogen is the only one which is both sustainable and
environmentally friendly.
A good understanding of the quantitative and qualitative trends are available in the
literature, for petrol driven vehicles, as established knowledge. However, understanding
of the near zero emissions and associated conversion technology, using hydrogen as fuel,
has been in the domain of few automotive applications around the world.
This work is aimed at converting a commercially available vehicle to operate on
hydrogen as a design and manufacturing exercise to showcase the use of alternative fuel.
The chosen vehicle is the Honda CT110 motor bike or better known as the Australia Post
`postie bike'.
In this thesis, a rigorous design process for conversion to hydrogen is proposed and
implemented from first principles. The test rig development associated with the
calculations for fuel flow rates and associated engine management systems are an integral
part of this overall systematic design. As part of the investigation an innovative fuel
injection system together with fuel-air-intake system is designed and incorporated.
Traditional problems with pre-ignition in hydrogen engines are found to be minimized by
developed systematic design techniques.
As part of this investigation a comprehensive range of engine operating conditions are
investigated using both petrol and hydrogen as fuel. The comparisons have shown that for
the same operating conditions, hydrogen powered vehicles suffer losses in power and
thermal efficiency. With the performance requirements of the vehicle in mind the
reductions in performance are not seen as a major compromise. Exhaust emission
performance showed significant reduction in oxides of nitrogen and no significant
emissions of hydrocarbons, carbon dioxide and carbon monoxide. Future potential
developments suggested by this work is expected to improve performance outputs
further.
Contents iv
Contents
Declaration and Authority of Access Acknowledgements ii
Abstract iii
Contents iv
CHAPTER 1 Introduction 2
CHAPTER 2 Literature Survey 6 2.1 Internal Combustion Engines 7
2.1.1 Introduction 7
2.1.2 History 7
2.1.3 The Automobile 8
2.1.4 Types of combustion engines 8
2.1.5 Internal combustion engine operation and function 9
2.1.6 Two Wheeled Vehicles 11
2.2 Alternative Powering of Vehicles 12 2.2.1 Rationale of Alternately Powered Vehicles 12 2.2.2 Compressed Natural Gas 14 2.2.3 Liquefied Natural Gas 15 2.2.4 Liquefied Petroleum Gas 16 2.2.5 Electric 17 2.2.6 Bio-Diesel 20 2.2.7 Ethanol 21 2.2.8 Hydrogen 22
2.3 Hydrogen Uses 24 2.3.1 Fuel Cells 24 2.3.2 Hydrogen Internal Combustion Engines 27
2.4 Hydrogen Properties 28
2.5 Hydrogen as an Internal Combustion Engine fuel 30 2.5.1 Sustainability 31 2.5.2 Emissions 32 2.5.3 Ignition Limits 33 2.5.4 Pre-ignition, Backfiring and Flashback 33 2.5.5 Engine Performance 35 2.5.6 Storage limitations 36 2.5.7 Other Limitations 36
2.6 Hydrogen Storage 37
2.6.1 Storage based on needs 37
2.6.2 Compressed Hydrogen Gas 37
2.6.3 Liquid Hydrogen Storage 38
2.6.4 Metal and Complex Hydrides 39
CHAPTER 3 Experimental Design 41 3.1 Testing Equipment 42
3.1.1 Honda CT110 42
3.1.2 Dyno Dynamics 450M Dynamometer 44
3.1.3 Gasoline Flow Board 45
Contents
3.1.4 Hydrogen Flow Board 46
3.1.5 RPM Counter 46
3.1.6 Gas Analyzer 47
3.1.7 Throttle Position Sensor 47
3.1.8 Engine Temperature Sensor 48
3.1.9 Atmospheric Temperature and Humidity probe 49
3.2 Testing guidelines 50
3.2.1 Introduction 50
3.2.2 Accuracy of equipment 51
3.2.3 Test Conditions 51
3.3 Testing calculations and relevant background 53
3.3.1 Thermal Efficiency 53
3.3.2 Emissions 53
3.4 Gasoline Testing 54
3.4.1 Power Output vs. Air-Fuel Ratio (AFR) 55
3.4.2 Thermal Efficiency vs. Air Fuel Ratio (AFR) 57
3.4.3 Emissions vs. Air Fuel Ratio (AFR) 59
3.5 Hydrogen Testing 61
3.5.1 Power Output vs. Throttle Position (TP) 62
3.5.2 Thermal Efficiency vs. Throttle Position (TP) 64
3.5.3 Emissions vs. Throttle Position (TP) 66
CHAPTER 4 Vehicle Conversion to Hydrogen 68 4.1 Introduction 69
4.2 Fuel Delivery Method 70
4.2.1 Fuel Lines 72
4.2.2 Fuel Injectors 73
4.2.3 Ignition System 76
4.2.4 Inlet Manifold Design 79
4.3 Fuel Injection and Spark Ignition Control 83
4.3.1 Engine Management System 83
4.3.2 EMS Set up and Programming 86
4.3.3 Sensors 87
4.4 Fuel Storage 92 .
4.4.1 Laboratory Testing 92
4.4.2 Dynamometer tuning operation 93
4.4.3 Dynamometer testing operation 96
4.4.4 Road operation 96
4.4.5 Safety Issues 99
CHAPTER 5 Performance of Gasoline and Hydrogen internal combustion engines 102
5.1 Testing accuracy 103
5.1.1 Compliance with testing guidelines 103
5.2 Gasoline Engine Qualitative Analysis 104
5.2.1 General comments about engine and equipment performance 104
5.2.2 Qualitative trends of the effects of major process variables on power 106
5.2.3 Qualitative trends of the effects of major process variables on thermal efficiency 107
5.2.4 Qualitative trends of the effects of major process variables on exhaust emissions 108
Contents vi
5.3 Qualitative Analysis of the Hydrogen IC engine 112
5.3.1 General comments about the engine and equipment performance 112
5.3.2 Qualitative trends of the effects of major process variables on power 114
5.3.3 Qualitative trends of the effects of major process variables on thermal efficiency 115
5.3.4 Qualitative trends of the effects of major process variables on exhaust emissions 116
5.4 Quantitative Comparison of Performance 118
5.4.1 Power as a means to compare gasoline to Hydrogen Engines 119
5.4.2 Thermal efficiency as a means to compare gasoline to Hydrogen Engines 122
5.4.3 Emissions 124
5.5 Testing and Data Analysis Conclusions 128
CHAPTER 6 Final Concluding Remarks and Proposed Future Work 129 6.1 Final Concluding Remarks 130
6.1.1 Literature Study 130
6.1.2 Power and Thermal Efficiency Comparison 130
6.1.3 Emissions 131
6.1.4 Social Acceptance 131
6.2 Proposed Future Work 131
6.2.1 EMS Development 131
6.2.2 Compression Ratio 132
6.2.3 Valve Timing 132
6.2.4 Fuel Pressure 133
6.2.5 Sensor Accuracy and Repeatability 133
6.2.6 Storage Development 133
6.2.7 Solenoid Valve 134
6.2.8 Control of Air Flow 134
6.2.9 Further Emission Development and Study 134
References 136
APPENDIX A: Experimental Data 140 APPENDIX Al: Hydrogen Testing Data 140
APPENDIX A2: Gasoline Testing Data 141
APPENDIX B: Experimental Equipment 143 APPENDIX Bl: Dyno Dynamics 450M Dynamometer 143
APPENDIX B2: Hydrogen Flowmeter 145
APPENDIX B3: RPM Counter 147
APPENDIX B4: Atmospheric Temperature and Humidity Probe 148
APPENDIX C: Conversion Equipment 150 APPENDIX Cl: Gaseous Fuel Injectors 150
APPENDIX C2: Ignition Coil 152
APPENDIX C3: Ignition Module 153
APPENDIX C4: MoTec M4 Engine Management System Specifications 154
APPENDIX C5: Reference Sensor 159
APPENDIX C6: Throttle Position Sensor 161
Contents vii
APPENDIX D: Determination of Net Power 162
APPENDIX E: Calculated flow rate from flowmeter data 164
APPENDIX F: Manifold Temperature Distribution for Honda CT110 under gasoline
operation 165
APPENDIX G: Cam sensor Design 166 APPENDIX Cl: Toothed Gear 166
APPENDIX G2: Cam Housing 167
APPENDIX G3: Cam Housing Mounting Flange 168
APPENDIX H: Inlet Manifold Layout Design 169
APPENDIX I: EMS Programming Setup 170
APPENDIX J: Costing 179

Chapter One - Introduction 2
CHAPTER 1 Introduction
Chapter One - Introduction 3
The depletion of natural non-renewable resources has necessitated the development of
alternative energy sources. Many countries around the world are channeling research
efforts to both identify a alternative energy sources and build working prototypes to
demonstrate the technology. It is estimated that in 2025 the demand for all forms of
energy is projected to be 54 percent more than total consumption in 2001. On the other
hand, Kyoto protocol has emphasized the need for reduced emissions and several
countries joining the consortium have initiated efforts to reduce the environmental effects
of fossil fuel usage in both stationary and mobile applications. World energy outlooks
predict that third world energy use will increase by 91 percent over the next two decades,
while rising 33 percent in industrialized nations. Furthermore, the carbon dioxide
emissions is projected to rise from 23.9 billion tons in 2001 to 37.1 billion tons in 2025,
whereas the developing world will account for 61 percent of the increase because of
reliance on coal and other fossil fuels.
It has been established that the use of fossil fuels has led to climate changes and
contributes towards the green house effect. The majority of fossil fuel combustion
processes produce carbon monoxide, carbon dioxide, nitrous oxides, sulfur oxides and
other harmful emissions. These pollutants have numerous health and environmental
impacts, including urban smog and global environmental problems. In order to minimize
the environmental damage, it is necessary to make the transition to a cleaner and
renewable energy source. With limited fossil fuel resources and their depletion in the near
future, the selection and use of renewable energy even more imperative.
Hydrogen is the most abundant element in the universe and unlike most other energy
carriers is carbon free. Hydrogen can assume a key role covering the growing energy
demand and lessen dependence on non-renewable energy sources. Hydrogen assisted fuel
cell systems can produce electricity without harmful emissions. It is also demonstrated in
the last century that hydrogen has the potential for automotive applications and stationary
applications such as powering generators and motors. Extensive research and
Chapter One - Introduction 4
development needs to be done before hydrogen use in fuel cells before the technology
can compete with conventional methods in economical terms.
Using of hydrogen in internal combustion engines can achieve the key benefits of fuel
cell vehicles at a much reduced lower cost. While the combustion 'know how' of a
gasoline engine is an established science, little or no information, in the public domain, is
available that comprehensively explains the hydrogen powered internal combustion
engines. Any matured knowledge related to hydrogen internal combustion engines is in
the domain of major automotive companies such as BMW, Mazda, Toyota and more
recently Ford.
The economic justification for building a fully-fledged hydrogen internal combustion
engine plant for automotive applications is questionable, with current prices associated
with hydrogen production and engine production relatively high. Nevertheless, a good
understanding and parallel progress of the hydrogen internal combustion engine
technology is essential when the unit cost of hydrogen production is affordable.
Converting existing gasoline engines to operate on hydrogen as a fuel is currently seen as
the most near term hydrogen transport technology. This creates a transition time where
the current internal combustion engines are ready for 'conversion' to run on hydrogen
rather than having to buy a brand new hydrogen engine. This will also alleviate large
infrastructure changes to the internal combustion engine production. The need to
understand and establish a 'modular approach' to converting gasoline internal
combustion engines to run on hydrogen is essential. In this thesis, a Honda CT110
gasoline engine is converted to run on hydrogen. A methodology and systematic
approach to modular changes to the engine to accommodate hydrogen as fuel is proposed.
The innovative design proposed is built as a working prototype with 'tailor made' air-fuel
intake systems, fuel injection, fuel ignition and state of the art engine management
systems. The effect of the major process variables on the engine performance for power,
thermal efficiency and exhaust emissions will be established for both gasoline and
hydrogen running conditions. This work, as a routine, compares the power and thermal
efficiencies of the gasoline and hydrogen powered engines for parallel running
Chapter One - Introduction 5
conditions. The unique fuel intake systems built in this work are seen as having generic
applications to similar engines of higher capacity. While every effort is made to minimize
required conversion changes and associated costs, it is shown in this work that the
majority of the costs involved are with the engine management system. This work argues
that a significant loss of power compared to the gasoline engine and associated thermal
efficiencies do not justify the exclusion of this adaption with zero carbon based emissions
and reduced nitrous of oxides of hydrogen engine. It is also argued that the socio-
environmental benefits that these emerging technologies can bring have lot more
significance in the long range.
University of Tasmania (UTAS), School of Engineering, has a growing research team in
this emerging field. With an established new research laboratory for applied hydrogen
research in 2004, the automotive applications of hydrogen can now be readily
investigated. The new research facility has been build as a part of the HART (Hydrogen
Allied Renewable Technology) program, which is joint research program between
University of Tasmania and Hydro Tasmania. The thesis presents an important
collaborative work between Australia Post and UTAS in order to design, build and
appraise the performance of a Honda CT 110 ('postie bike') engine converted to run from
gasoline to hydrogen.

Chapter Two - Literature Survey 6
CHAPTER 2 Literature Survey
"I believe that water will one day be employed as a fuel,
that hydrogen and oxygen will constitute it, used singly or together,
will furnish an inexhaustible source of heat and light..."
Jules Verne
Chapter Two - Literature Survey 7
2.1 Internal Combustion Engines
2.1.1 Introduction
Heat engines convert chemical energy into mechanical energy by the process of
combustion. Internal combustion engines are a special type of heat engine wherein the
process of heat addition (combustion) is achieved inside the engine. Conversely, other
heat engines such as Stirling engines and steam engines can be categorized as external
combustion engines since the process heat addition into the working fluid occurs outside
the engine.
One of the most prevalent places combustion engines are used is in the transport sector,
namely automobiles, trucks and aeroplanes. Small internal combustion engines are also
used in more diversified applications such as motorbikes, outboard engines, lawnmowers,
chainsaws and generators to name only a few.
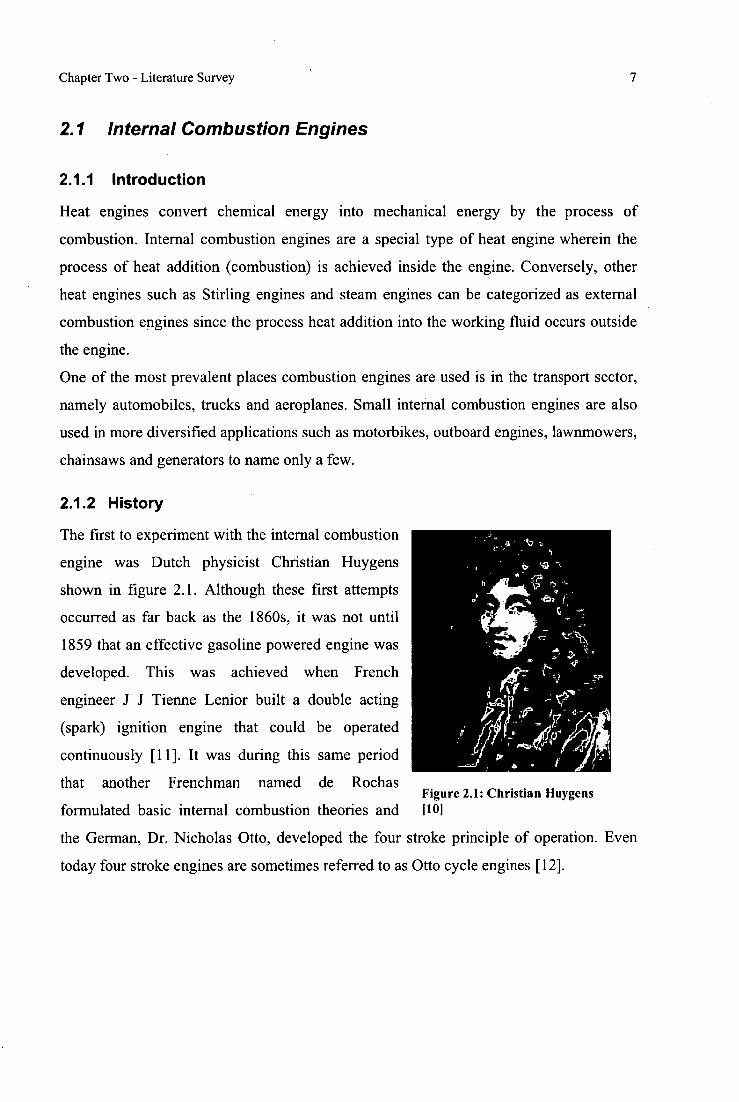
2.1.2 History
The first to experiment with the internal combustion
engine was Dutch physicist Christian Huygens
shown in figure 2.1. Although these first attempts
occurred as far back as the 1860s, it was not until
1859 that an effective gasoline powered engine was
developed. This was achieved when French
engineer J J Tienne Lenior built a double acting
(spark) ignition engine that could be operated
continuously [11]. It was during this same period
that another Frenchman named de Rochas
formulated basic internal combustion theories and Figure 2.1: Christian Huygens 1101
the German, Dr. Nicholas Otto, developed the four stroke principle of operation. Even
today four stroke engines are sometimes referred to as Otto cycle engines [12].
Chapter Two - Literature Survey 8
2.1.3 The Automobile
The main components of an automobile are:
1. the basic structure including the frame, suspension system, axles and wheels;
2. the engine;
3. the transmission systems;
4. auxiliaries such as starter motors, lights and electronics;
5. controls such as steering and brakes [13].
The automobile as we know it was not invented in a single day by a single inventor. The
history of the automobile reflects an evolution which took place over time. It is estimated
that over 100,000 patents created the modern automobile [3].
In 1769, the very first self powered road vehicle was a military tractor invented by French
engineer and mechanic, Nicolas Joseph Cugnot (1725 - 1804). Cugnot's vehicle was
powered by a steam engine built at the Paris Arsenal (by mechanic Brezin). By the early
1900s, gasoline cars started to outsell all other types of motor vehicles. The market was
growing for economical automobiles and the need for industrial (scale) production was
pressing [14].
Manufacturers became more common and the production line, which revolutionized the
industry, came into place. Even today, developments in the automobile are ongoing with
new structural materials, more efficient engine designs and electronics and intelligent
systems are acting today to develop the market.
Automobiles can be classified as:
1. Auto cycles;
2. Motor cycles and scooters;
3. Cars, jeeps;
4. Buses and Trucks [13].
2.1.4 Types of combustion engines
Internal combustion engines are classified according to the cycle of operation and the
mode of combustion [15]. There are two cycles of operation, namely the two stroke cycle
and the four stroke cycle. The cycle of operation refers to how many strokes are required
for the completion of one power stroke. Cycle of operations can be subdivided into the
Chapter Two - Literature Survey 9
gas exchange process, where the products of combustion are exhausted and replaced by
fresh gasses and the power process in which the charge is compressed, ignited and the hot
gas is expanded for useful work.
The two modes of combustion, spark ignition (SI) and compression ignition (CI) are also
commonly used as a means of classification. Each of these is characterized by differing
forms of ignition.
SI and CI engines use fuels with differing combustion characteristics. More commonly in
Australia we see the use of petrol (commonly referred to as gasoline) as the fuel source.
Petrol fuels are designed to resist autoignition during the compression stroke and should
normally ignite only under the presence of an initiating source (electric spark).
The common fuel in CI engines is Diesel. Diesel fuels are produced so they autoignite in
the high pressure and temperature conditions associated with the compression stroke.
2.1.5 Internal combustion engine operation and function
A reciprocating engine, also often known as a piston engine, is an engine that utilizes one
or more pistons in order to convert pressure into a rotating motion [16]. The movement of
the piston occurs in a space called the engine cylinder. The periodic linear movement of
the piston inside the engine cylinder generates an enclosed region of space with
constantly moving volume. This region of space is called the combustion chamber and is
where the air fuel mixture is ignited and combustion takes place.
The four stroke engine has four major phases which are shown in figure 2.2 and
classified as:
• Intake stroke
• Compression Stroke
• Power Stroke
• Exhaust Stroke

Chapter Two - Literature Survey 10
TC
Intake Compression Expansion
Exhaust
Figure 2.2: The four stroke cycle 131
These four phases (in whole) describe the stages of a single power (thermodynamic)
cycle and are controlled by the positions of the intake and exhaust valves as well as the
piston inside the cylinder. The intake valve allows a new charge of air-fuel-mix to enter
the cylinder, whilst the exhaust valve allows burnt gases to leave the cylinder. The timing
of the closure and opening of these valves is governed by the camshaft. Both the
camshaft and the piston are driven by the crankshaft. In this way, the rates of motion for
both the piston and the camshaft (valves) are governed by the rate of rotation of the
crankshaft. It is this rate of rotation that is also displayed in the Rev/Min counter in a
vehicle.
Variations in the timing of the closure and opening of valves as well as the point at which
ignition (sparking) occur have a great effect on the performance of internal combustion
engines.
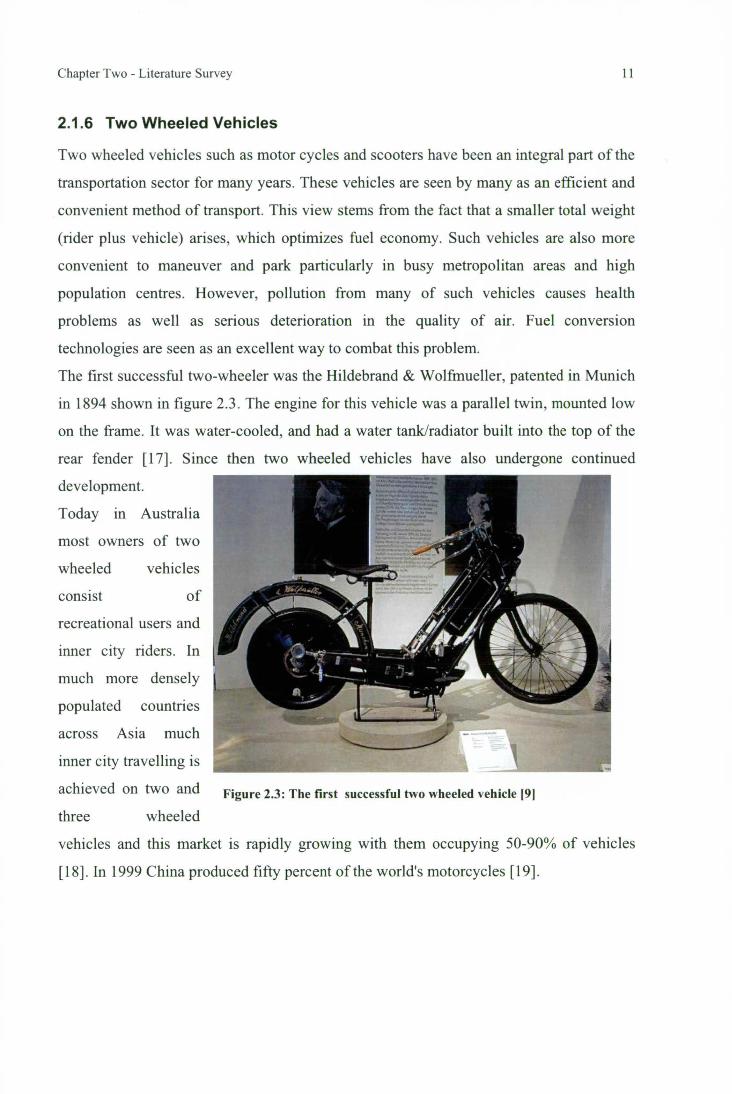
Figure 2.3: The first successful two wheeled vehicle 191
Chapter Two - Literature Survey 11
2.1.6 Two Wheeled Vehicles
Two wheeled vehicles such as motor cycles and scooters have been an integral part of the
transportation sector for many years. These vehicles are seen by many as an efficient and
convenient method of transport. This view stems from the fact that a smaller total weight
(rider plus vehicle) arises, which optimizes fuel economy. Such vehicles are also more
convenient to maneuver and park particularly in busy metropolitan areas and high
population centres. However, pollution from many of such vehicles causes health
problems as well as serious deterioration in the quality of air. Fuel conversion
technologies are seen as an excellent way to combat this problem.
The first successful two-wheeler was the Hildebrand & Wolfmueller, patented in Munich
in 1894 shown in figure 2.3. The engine for this vehicle was a parallel twin, mounted low
on the frame. It was water-cooled, and had a water tank/radiator built into the top of the
rear fender [17]. Since then two wheeled vehicles have also undergone continued
development.
Today in Australia
most owners of two
wheeled vehicles
consist of
recreational users and
inner city riders. In
much more densely
populated countries
across Asia much
inner city travelling is
achieved on two and
three wheeled
vehicles and this market is rapidly growing with them occupying 50-90% of vehicles
[18]. In 1999 China produced fifty percent of the world's motorcycles [19].
Chapter Two - Literature Survey 12
2.2 Alternative Powering of Vehicles
2.2.1 Rationale of Alternately Powered Vehicles
In 2003-2004 Australia imported 23511 ML' of crude oil and other refinery feedstock
valued at over 6500 million dollars [20]. Of this amount more than half came from the
Middle East and Indonesia. Much of this import market was used by the automotive
industry which increased automotive fuel sales by 1% across the sector in 2004 [20].
From a consumer perspective there are 1000 cars to each 675 people in Australia and this
number has been increasing steadily over the past 33 years [21]. This continual growth
and reliance on foreign strategic energy resources threatens national and economic
security and is a non-sustainable practice [22]. The fact that these imports occur from
highly turbulent areas of the globe can also make this supply prone to instability.
One way of alleviating (and gradually phasing out) the reliance on imported fossil based
fuels destined for the automobile market is through the development of vehicles which
run on alternative sources of fuel. Environmental awareness and the application of more
stringent pollution standards from vehicle emissions is another impetus behind the
rationale for the use of alternative fuels and methods of powering vehicles. This is true
whether the (fossil based) fuels are locally or externally sourced. Indeed, it is believed
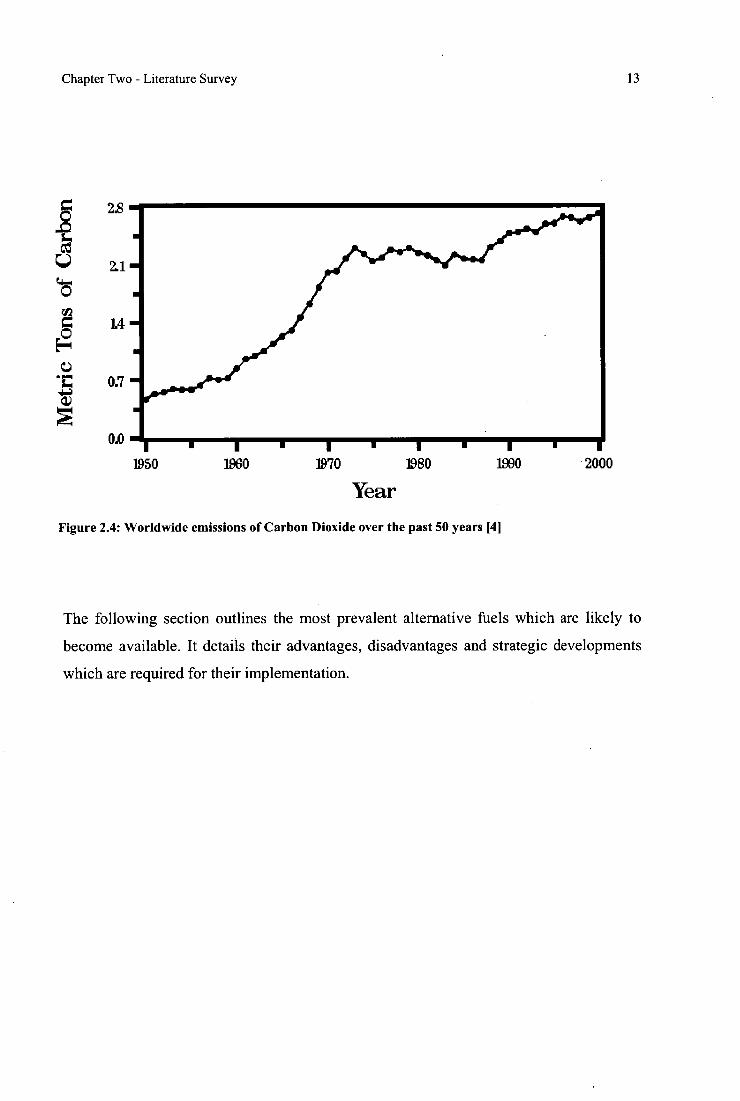
that the surface temperature of the earth has risen by 0.6°C since the late 19th century.
This rise could be a result of increased fossil fuel usage over this period [23]. CO2
emissions have also increased by 33% since 1987 in the Oceania region alone. On a
national scale, Australia is in the top 20 CO2 emitting countries worldwide and along
with Japan, contributes to 97% of the CO2 emissions from the region [24]. The steady
rise in CO2 emissions is shown in figure 2.4. Replacing gasoline in vehicles with alternate
(renewably sourced) fuels is expected to significantly reduce CO2 emissions from the
transportation sector. Additionally, alternate fuels offer reduced emissions of ozone-
forming pollutants such as carbon monoxide (CO) and nitrogen oxides (NO) [22].
megalitres
Chapter Two - Literature Survey 13 M
etri
c To
ns o
f C
arbo
n 2.8
2.1
1.4
0.7
OA n
1950 • 1 • 1 • 1 t
1960 1970 1980
1990
2000
Year Figure 2.4: Worldwide emissions of Carbon Dioxide over the past 50 years 141
The following section outlines the most prevalent alternative fuels which are likely to
become available. It details their advantages, disadvantages and strategic developments
which are required for their implementation.
1. 1'4 "-I-4k 14
Figure 2.5: Natural Gas capture
Chapter Two - Literature Survey 14
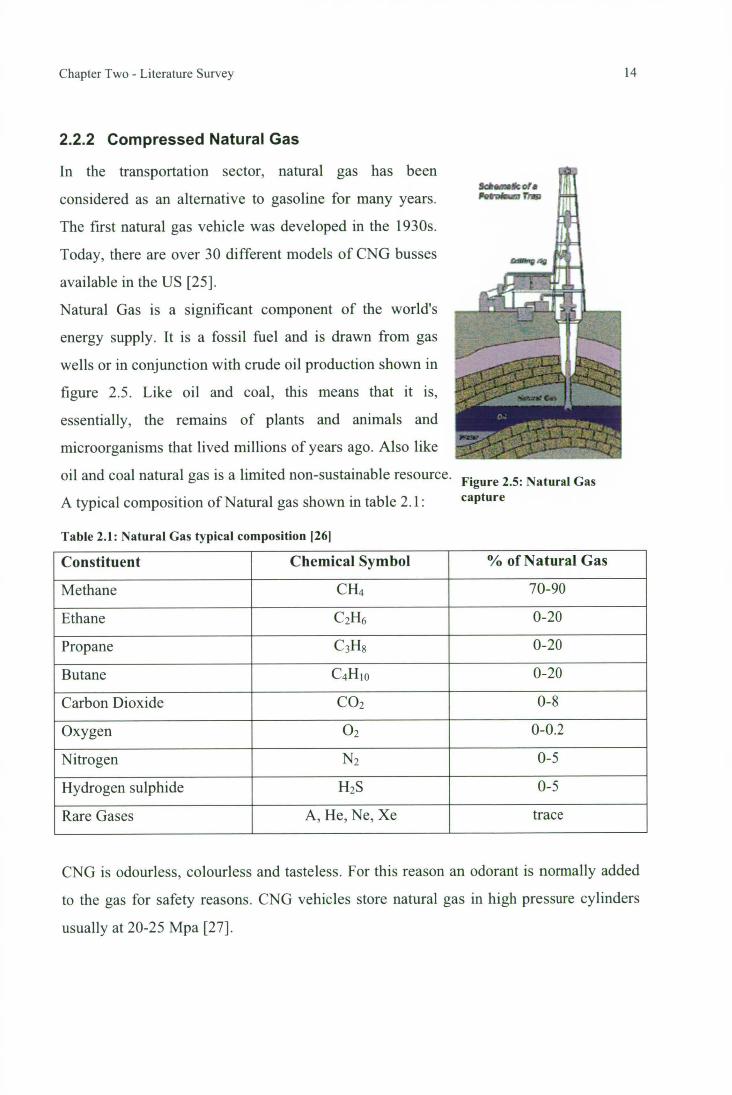
2.2.2 Compressed Natural Gas
In the transportation sector, natural gas has been
considered as an alternative to gasoline for many years.
The first natural gas vehicle was developed in the 1930s.
Today, there are over 30 different models of CNG busses
available in the US [25].
Natural Gas is a significant component of the world's
energy supply. It is a fossil fuel and is drawn from gas
wells or in conjunction with crude oil production shown in
figure 2.5. Like oil and coal, this means that it is,
essentially, the remains of plants and animals and
microorganisms that lived millions of years ago. Also like
oil and coal natural gas is a limited non-sustainable resource.
A typical composition of Natural gas shown in table 2.1:
Table 2.1: Natural Gas typical composition 1261
Constituent Chemical Symbol % of Natural Gas
Methane CH4 70-90
Ethane C2H6 0-20
Propane C3H8 0-20
Butane C411 1 o 0-20
Carbon Dioxide CO2 0-8
Oxygen 02 0-0.2
Nitrogen N2 0-5
Hydrogen sulphide H2 S 0-5
Rare Gases A, He, Ne, Xe trace
CNG is odourless, colourless and tasteless. For this reason an odorant is normally added
to the gas for safety reasons. CNG vehicles store natural gas in high pressure cylinders
usually at 20-25 Mpa [27].
Chapter Two - Literature Survey 15
Because natural gas is mostly methane, natural gas vehicles have much lower non-
methane hydrocarbon emissions than gasoline vehicles, but higher emissions of methane
[28]. Reductions of carbon monoxide has been shown to be 90-97%, carbon dioxide by
25% and nitrous oxide emissions by 35-60% due to the combustion of natural gas
compared to gasoline. [27].
CNG will most likely be seen in heavy-medium duty fleet vehicles initially before
commercially viable vehicles are available due mainly to costing.
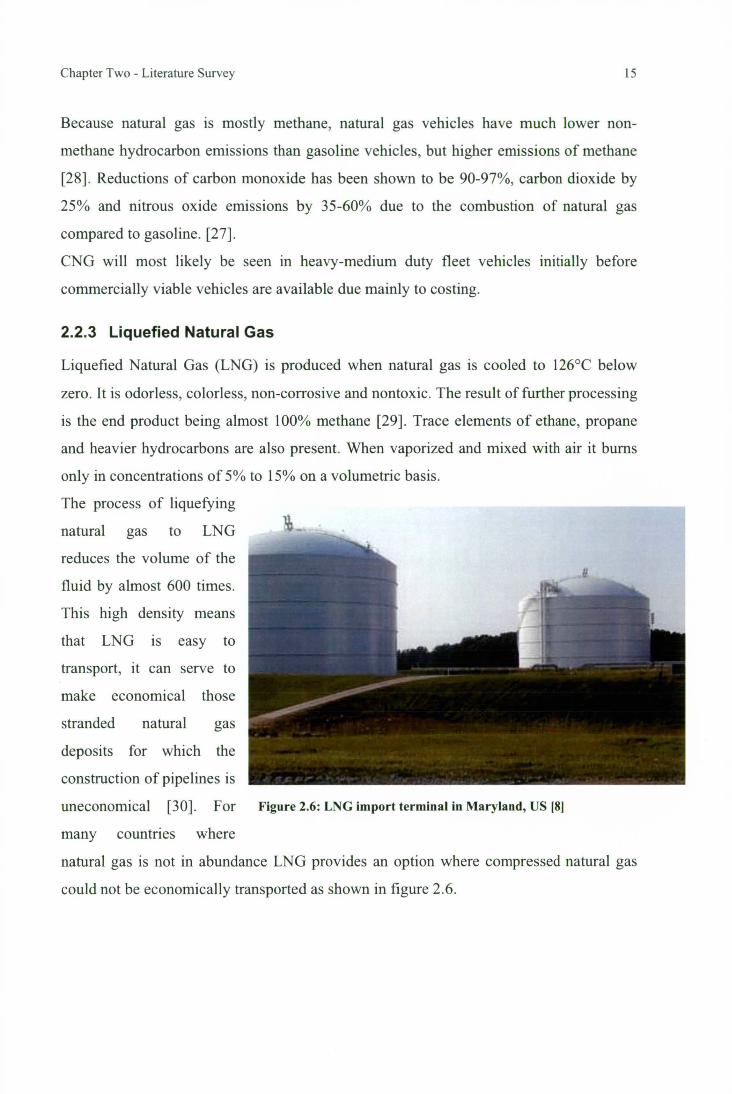
2.2.3 Liquefied Natural Gas
Liquefied Natural Gas (LNG) is produced when natural gas is cooled to 126°C below
zero. It is odorless, colorless, non-corrosive and nontoxic. The result of further processing
is the end product being almost 100% methane [29]. Trace elements of ethane, propane
and heavier hydrocarbons are also present. When vaporized and mixed with air it burns
only in concentrations of 5% to 15% on a volumetric basis.
The process of liquefying
natural gas to LNG
reduces the volume of the
fluid by almost 600 times.
This high density means
that LNG is easy to
transport, it can serve to
make economical those
stranded natural gas
deposits for which the
construction of pipelines is
uneconomical [30]. For Figure 2.6: LNG import terminal in Maryland, US 181
many countries where
natural gas is not in abundance LNG provides an option where compressed natural gas
could not be economically transported as shown in figure 2.6.
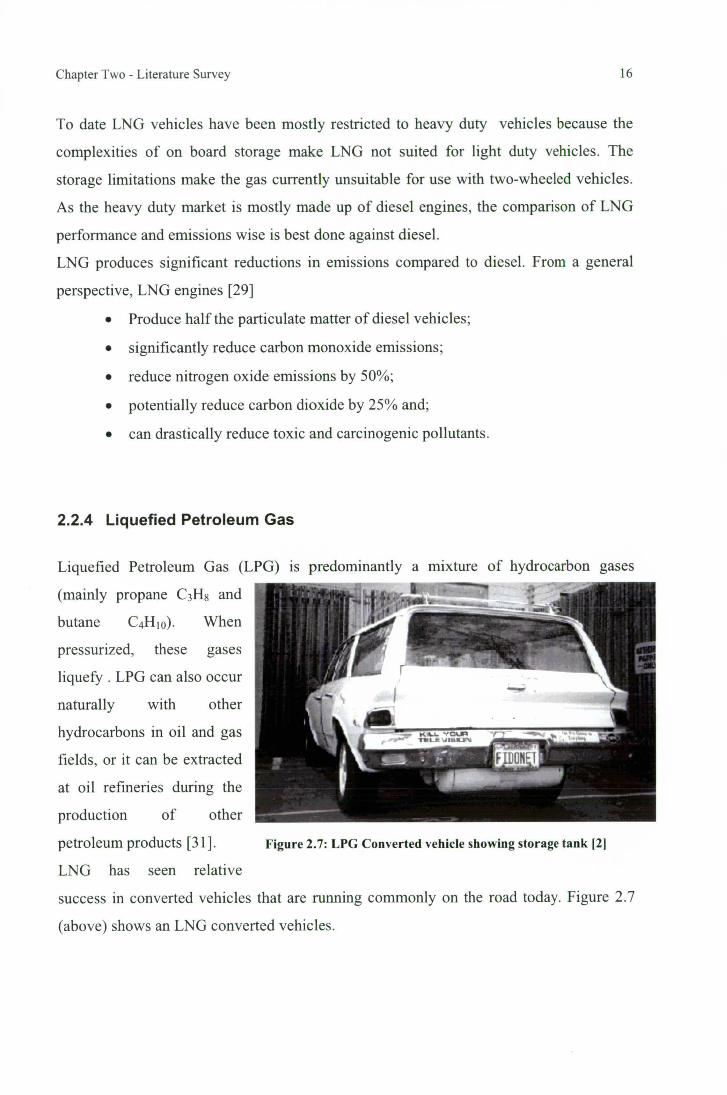
Figure 2.7: LPG Converted vehicle showing storage tank 121
Chapter Two - Literature Survey 16
To date LNG vehicles have been mostly restricted to heavy duty vehicles because the
complexities of on board storage make LNG not suited for light duty vehicles. The
storage limitations make the gas currently unsuitable for use with two-wheeled vehicles.
As the heavy duty market is mostly made up of diesel engines, the comparison of LNG
performance and emissions wise is best done against diesel.
LNG produces significant reductions in emissions compared to diesel. From a general
perspective, LNG engines [29]
• Produce half the particulate matter of diesel vehicles;
• significantly reduce carbon monoxide emissions;
• reduce nitrogen oxide emissions by 50%;
• potentially reduce carbon dioxide by 25% and;
• can drastically reduce toxic and carcinogenic pollutants.
2.2.4 Liquefied Petroleum Gas
Liquefied Petroleum Gas (LPG) is predominantly a mixture of hydrocarbon gases
(mainly propane C 3 H8 and
butane C4H10). When
pressurized, these gases
liquefy. LPG can also occur
naturally with other
hydrocarbons in oil and gas
fields, or it can be extracted
at oil refineries during the
production of other
petroleum products [31].
LNG has seen relative
success in converted vehicles that are running commonly on the road today. Figure 2.7
(above) shows an LNG converted vehicles.
Chapter Two - Literature Survey 17
The main component gases of LPG are :
• Propane (C3H8)
• Propylene (C3H6)
• Butane (C4H10)
In 1999-2000, Australia produced 4,367 ML of naturally occurring LPG and 1,674.4 ML
of refinery produced LPG. In the period, Australia exported 2,858.9 ML of LPG and
imported 518.9 ML of this fuel[31].
Combustion of LPG is a more environmentally friendly solution for transportation
applications than petrol and diesel [32].
However, LPG (like gasoline and diesel) is a finite resource which will inevitably run
out. Tests have shown that LPG engines produce approximately 15 per cent less
greenhouse emissions than their petrol powered counterpart.
Comparisons of the levels of noxious gas emissions from LPG and petrol vehicles are
inconclusive, with test results indicating both higher and lower levels than petrol
vehicles. [33]
2.2.5 Electric
Electric vehicles are propelled by electric motors powered through batteries. Such
vehicles do not produce any tailpipe emissions, although the elegant image of George
Jetson driving his electric vehicle to work without polluting the environment is
ambiguous to say the least. Batteries (in electric vehicles) need to be constantly charged .
If this electric (battery charging) power is sourced from a non-renewable some level of
pollution must also occur. Despite this, electric motors possess greater efficiency than
their internal combustion engine counterpart and, if charged from a renewable energy
source can reduce environmental damage. The Electric Auto Association claims that even
with the effect of electricity generation, electric vehicles are 95% cleaner than the
average 2002 vehicle [34].
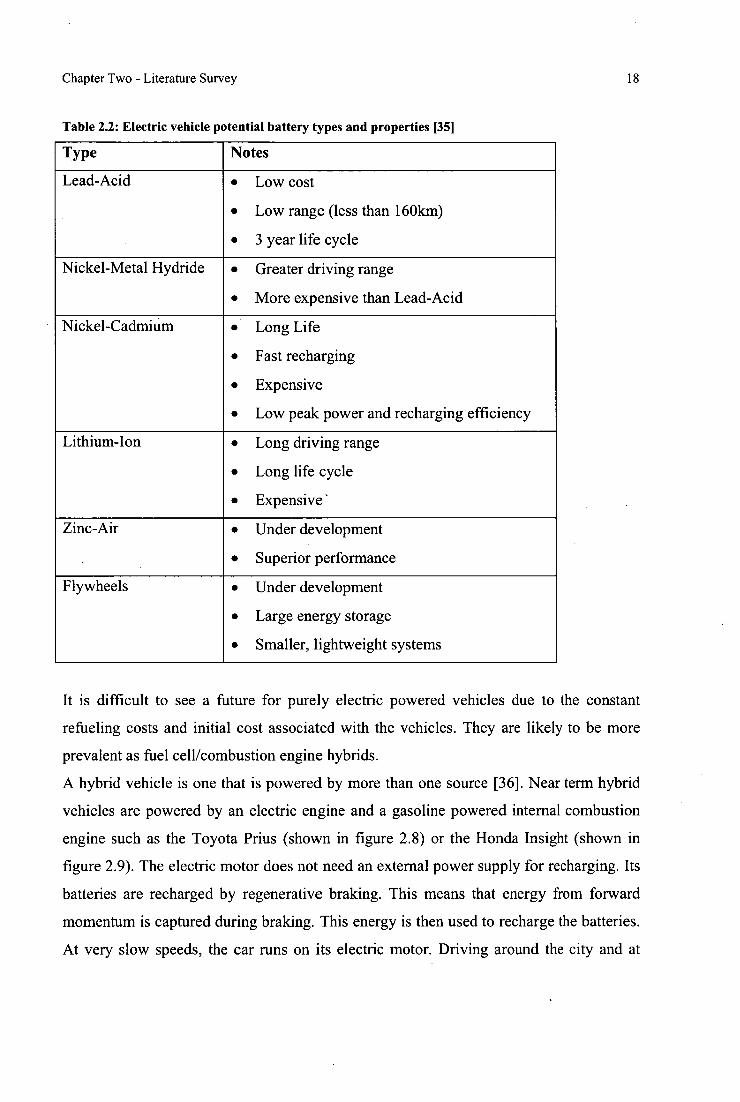
There are several sources of batteries that can be utilized in battery powered electric
vehicles. Table 2.2 shows the various types of potential batteries for electric vehicles:
Chapter Two - Literature Survey 18
Table 2.2: Electric vehicle potential battery types and properties [351
Type Notes
Lead-Acid • Low cost
• Low range (less than 160km)
• 3 year life cycle
Nickel-Metal Hydride • Greater driving range
• More expensive than Lead-Acid
Nickel-Cadmium • Long Life
• Fast recharging
• Expensive
• Low peak power and recharging efficiency
Lithium-Ion • Long driving range
• Long life cycle
• Expensive'
Zinc-Air • Under development
• Superior performance
Flywheels • Under development
• Large energy storage
• Smaller, lightweight systems
It is difficult to see a future for purely electric powered vehicles due to the constant
refueling costs and initial cost associated with the vehicles. They are likely to be more
prevalent as fuel cell/combustion engine hybrids.
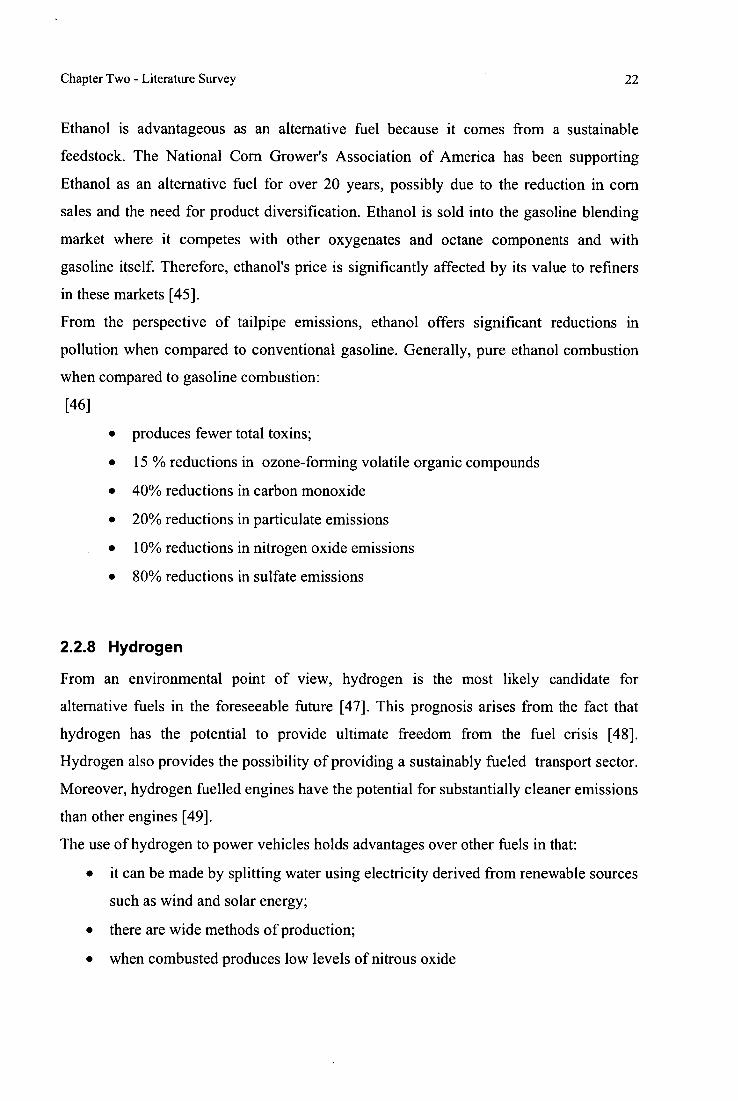
A hybrid vehicle is one that is powered by more than one source [36]. Near term hybrid
vehicles are powered by an electric engine and a gasoline powered internal combustion
engine such as the Toyota Prius (shown in figure 2.8) or the Honda Insight (shown in
figure 2.9). The electric motor does not need an external power supply for recharging. Its
batteries are recharged by regenerative braking. This means that energy from forward
momentum is captured during braking. This energy is then used to recharge the batteries.
At very slow speeds, the car runs on its electric motor. Driving around the city and at
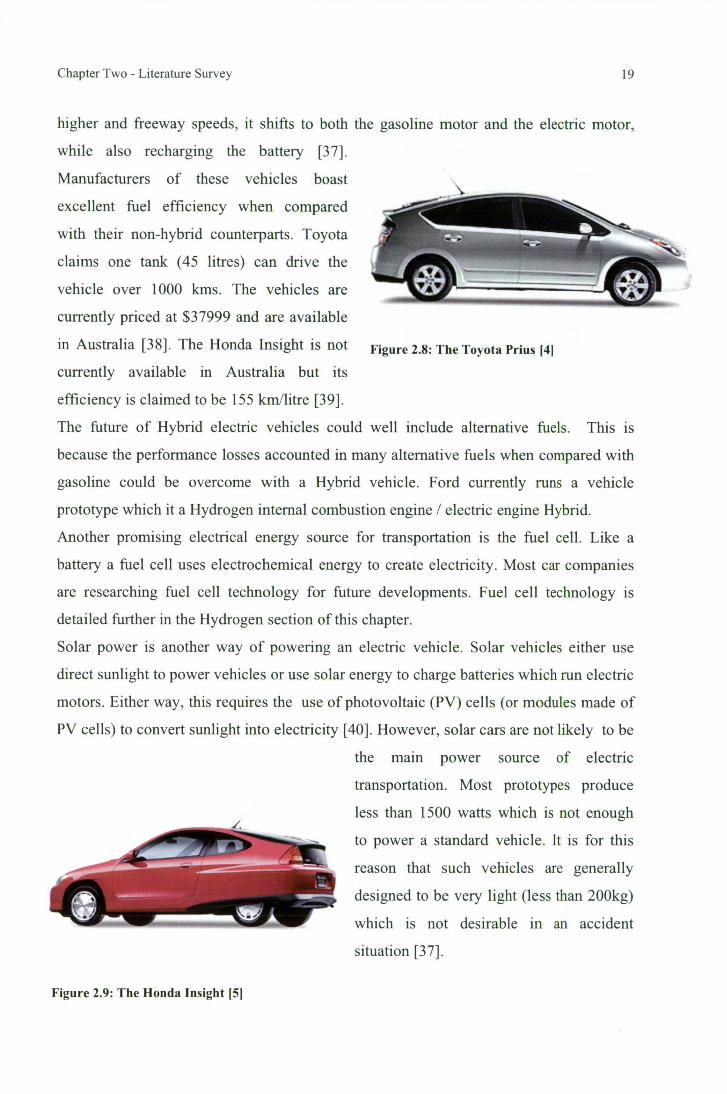
Chapter Two - Literature Survey 19
higher and freeway speeds, it shifts to both the gasoline motor and the electric motor,
while also recharging the battery [37].
Manufacturers of these vehicles boast
excellent fuel efficiency when compared
with their non-hybrid counterparts. Toyota
claims one tank (45 litres) can drive the
vehicle over 1000 kms. The vehicles are
currently priced at $37999 and are available
in Australia [38]. The Honda Insight is not Figure 2.8: The Toyota Prius 141
currently available in Australia but its
efficiency is claimed to be 155 km/litre [39].
The future of Hybrid electric vehicles could well include alternative fuels. This is
because the performance losses accounted in many alternative fuels when compared with
gasoline could be overcome with a Hybrid vehicle. Ford currently runs a vehicle
prototype which it a Hydrogen internal combustion engine / electric engine Hybrid.
Another promising electrical energy source for transportation is the fuel cell. Like a
battery a fuel cell uses electrochemical energy to create electricity. Most car companies
are researching fuel cell technology for future developments. Fuel cell technology is
detailed further in the Hydrogen section of this chapter.
Solar power is another way of powering an electric vehicle. Solar vehicles either use
direct sunlight to power vehicles or use solar energy to charge batteries which run electric
motors. Either way, this requires the use of photovoltaic (PV) cells (or modules made of
PV cells) to convert sunlight into electricity [40]. However, solar cars are not likely to be
the main power source of electric
transportation. Most prototypes produce
less than 1500 watts which is not enough
to power a standard vehicle. It is for this
reason that such vehicles are generally
designed to be very light (less than 200kg)
which is not desirable in an accident
situation [37].
Figure 2.9: The Honda Insight 1 5 1
Chapter Two - Literature Survey 20
2.2.6 Bio-Diesel
Bio-diesel is a diesel replacement fuel made from natural, renewable sources such as
soybean oil, canola oil, sunflower oil, cottonseed oil and animal fats. Up to 20% bio-
diesel blends (mixed with petroleum diesel) can be used in most diesel engines without
any design modifications. Higher blends are attainable with small engine modifications
but storage of the fuel becomes more complicated [41].
Bio-diesel provides similar horsepower, torque and fuel economy as petro-diesel. It has a
higher cetane number which increases engine performance. It also has high quality
lubricant properties which can extend the life of heavy duty engines [35].
The most common blends in use today are B20 and B100. B20 is 20% biodiesel mixed
with 80% gasoline diesel. B100 is 100% biodiesel.
Bio-diesel shows excellent environmental performance when compared with regular
diesel. Reductions in carbon monoxide, particulate emissions, hydrocarbon emissions and
sulfate emissions have all been observed [35].
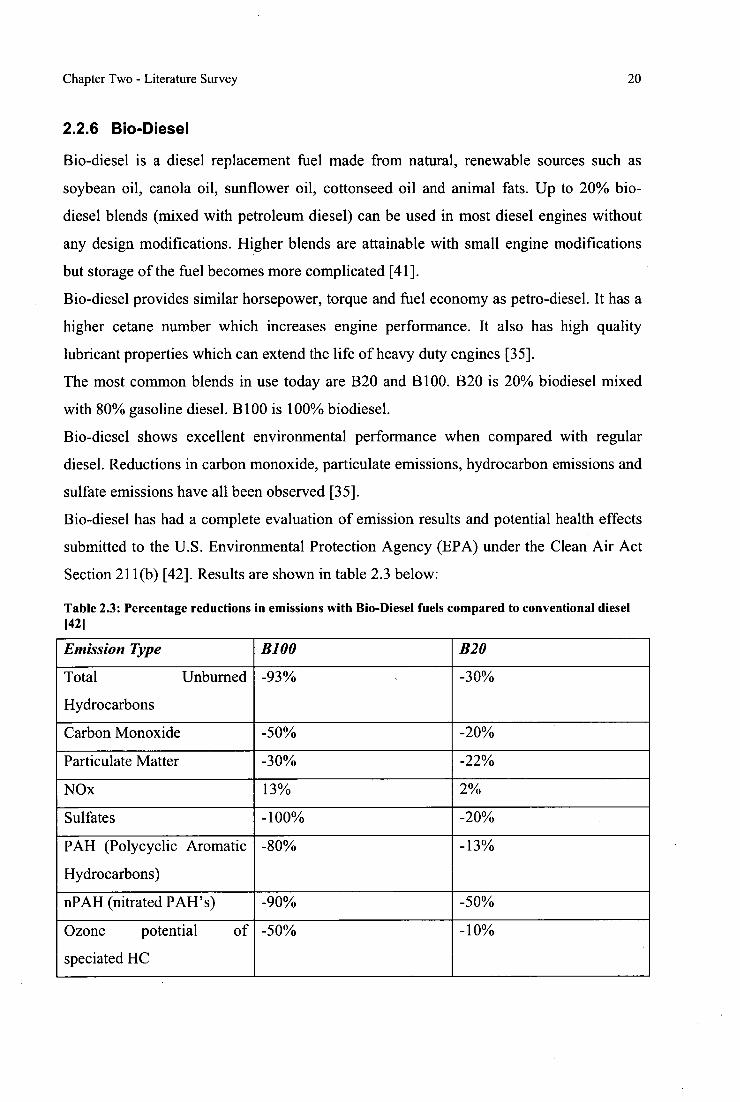
Bio-diesel has had a complete evaluation of emission results and potential health effects
submitted to the U.S. Environmental Protection Agency (EPA) under the Clean Air Act
Section 211(b) [42]. Results are shown in table 2.3 below:
Table 2.3: Percentage reductions in emissions with Bio-Diesel fuels compared to conventional diesel 1421
Emission Type B100 B20
Total Unburned
Hydrocarbons
-93% -30%
Carbon Monoxide -50% -20%
Particulate Matter -30% -22%
NOx 13% 2%
Sulfates -100% -20%
PAH (Polycyclic Aromatic
Hydrocarbons)
-80% -13%
nPAH (nitrated PAH' s) -90% -50%
Ozone potential of
speciated HC
-50% -10%
Chapter Two - Literature Survey 21
Bio-diesel is a near term alternative fuel source. Technology barriers are not as great as
with many of the other (alternative) transportation fuels. The fuel can be used in existing
vehicles without expensive modifications. In general B20 costs less than 10 cents more
per litre than conventional diesel [43]. Barriers exist in feedstock supply whereby there
is not a sustainable industry to support the supply of oil. It is possible that bio-diesel has
the opportunity to be integrated into the market slowly with mixture strength.
2.2.7 Ethanol
Ethanol (CH3CH2OH) is made up of a group of chemical compounds whose molecules
contain a hydroxyl group, -OH, bonded to a carbon atom [44]. Ethanol is mostly derived
from crops which contain sugar (e.g. sugar cane or sugar beet), or by pretreatment of
starchy crops (e.g. corn or wheat) or cellulose to produce sugars [33]. In fact anything
containing sugar, starch or cellulose can be fermented and distilled into ethanol. Despite
this, the need for huge land (plantation) areas to produce significant amounts of ethanol
is a serious consideration from an environmental perspective. Additionally many believe
that food itself is too precious to burn.
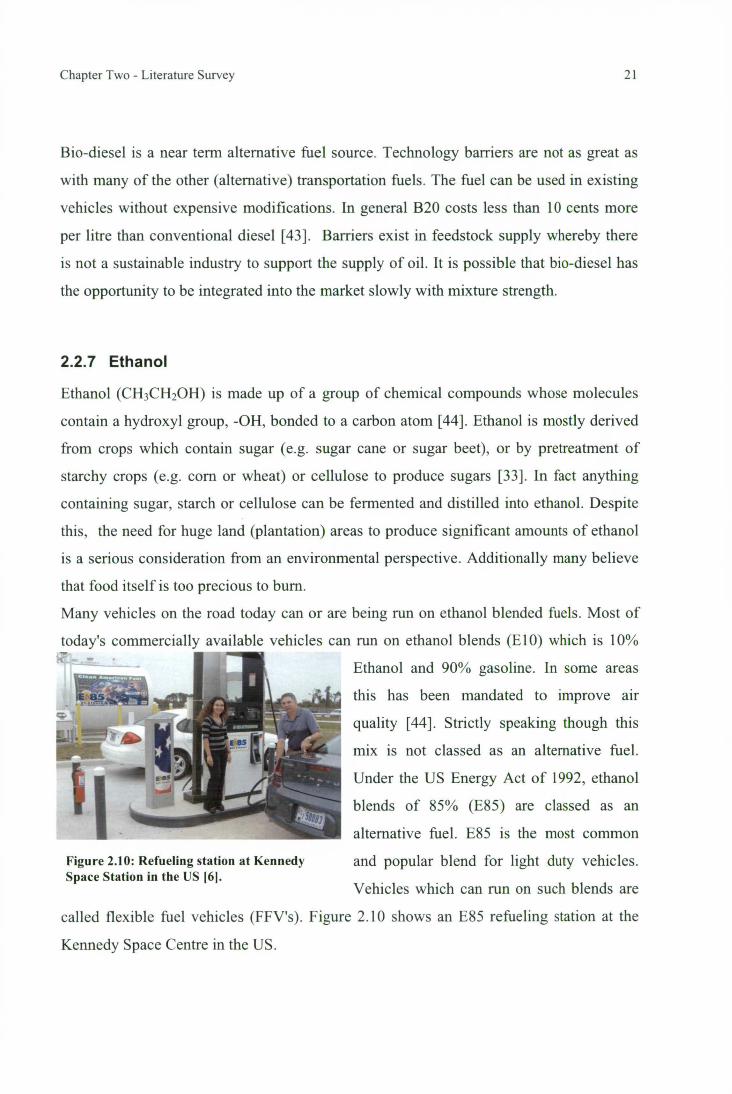
Many vehicles on the road today can or are being run on ethanol blended fuels. Most of
today's commercially available vehicles can run on ethanol blends (E10) which is 10%
Figure 2.10: Refueling station at Kennedy Space Station in the US 161.
Ethanol and 90% gasoline. In some areas
this has been mandated to improve air
quality [44]. Strictly speaking though this
mix is not classed as an alternative fuel.
Under the US Energy Act of 1992, ethanol
blends of 85% (E85) are classed as an
alternative fuel. E85 is the most common
and popular blend for light duty vehicles.
Vehicles which can run on such blends are
called flexible fuel vehicles (FFV's). Figure 2.10 shows an E85 refueling station at the
Kennedy Space Centre in the US.
Chapter Two - Literature Survey 22
Ethanol is advantageous as an alternative fuel because it comes from a sustainable
feedstock. The National Corn Grower's Association of America has been supporting
Ethanol as an alternative fuel for over 20 years, possibly due to the reduction in corn
sales and the need for product diversification. Ethanol is sold into the gasoline blending
market where it competes with other oxygenates and octane components and with
gasoline itself. Therefore, ethanol's price is significantly affected by its value to refiners
in these markets [45].
From the perspective of tailpipe emissions, ethanol offers significant reductions in
pollution when compared to conventional gasoline. Generally, pure ethanol combustion
when compared to gasoline combustion:
[46]
• produces fewer total toxins;
• 15 % reductions in ozone-forming volatile organic compounds
• 40% reductions in carbon monoxide
• 20% reductions in particulate emissions
• 10% reductions in nitrogen oxide emissions
• 80% reductions in sulfate emissions
2.2.8 Hydrogen
From an environmental point of view, hydrogen is the most likely candidate for
alternative fuels in the foreseeable future [47]. This prognosis arises from the fact that
hydrogen has the potential to provide ultimate freedom from the fuel crisis [48].
Hydrogen also provides the possibility of providing a sustainably fueled transport sector.
Moreover, hydrogen fuelled engines have the potential for substantially cleaner emissions
than other engines [49].
The use of hydrogen to power vehicles holds advantages over other fuels in that:
• it can be made by splitting water using electricity derived from renewable sources
such as wind and solar energy;
• there are wide methods of production;
• when combusted produces low levels of nitrous oxide
Chapter Two - Literature Survey 23
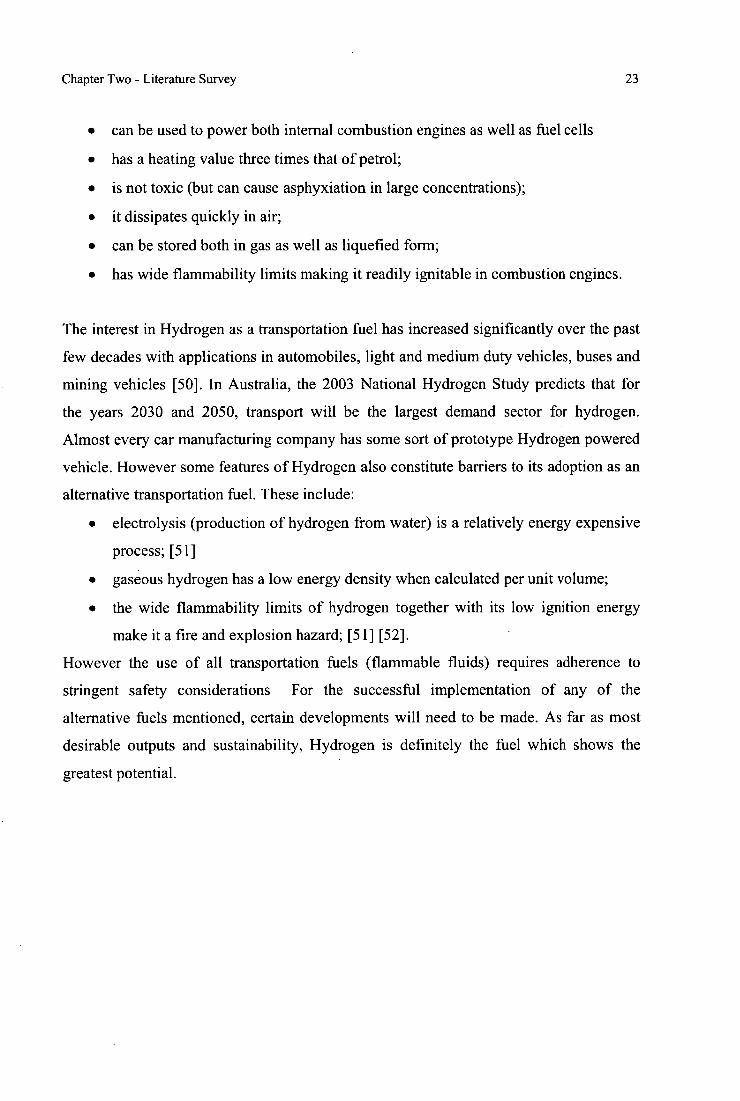
• can be used to power both internal combustion engines as well as fuel cells
• has a heating value three times that of petrol;
• is not toxic (but can cause asphyxiation in large concentrations);
• it dissipates quickly in air;
• can be stored both in gas as well as liquefied form;
• has wide flammability limits making it readily ignitable in combustion engines.
The interest in Hydrogen as a transportation fuel has increased significantly over the past
few decades with applications in automobiles, light and medium duty vehicles, buses and
mining vehicles [50]. In Australia, the 2003 National Hydrogen Study predicts that for
the years 2030 and 2050, transport will be the largest demand sector for hydrogen.
Almost every car manufacturing company has some sort of prototype Hydrogen powered
vehicle. However some features of Hydrogen also constitute barriers to its adoption as an
alternative transportation fuel. These include:
• electrolysis (production of hydrogen from water) is a relatively energy expensive
process; [51]
• gaseous hydrogen has a low energy density when calculated per unit volume;
• the wide flammability limits of hydrogen together with its low ignition energy
make it a fire and explosion hazard; [51] [52].
However the use of all transportation fuels (flammable fluids) requires adherence to
stringent safety considerations For the successful implementation of any of the
alternative fuels mentioned, certain developments will need to be made. As far as most
desirable outputs and sustainability, Hydrogen is definitely the fuel which shows the
greatest potential.
Chapter Two - Literature Survey 24
2.3 Hydrogen Uses
Hydrogen can be utilized to power two different types of vehicles: fuel cells and internal
combustion engines.
2.3.1 Fuel Cells
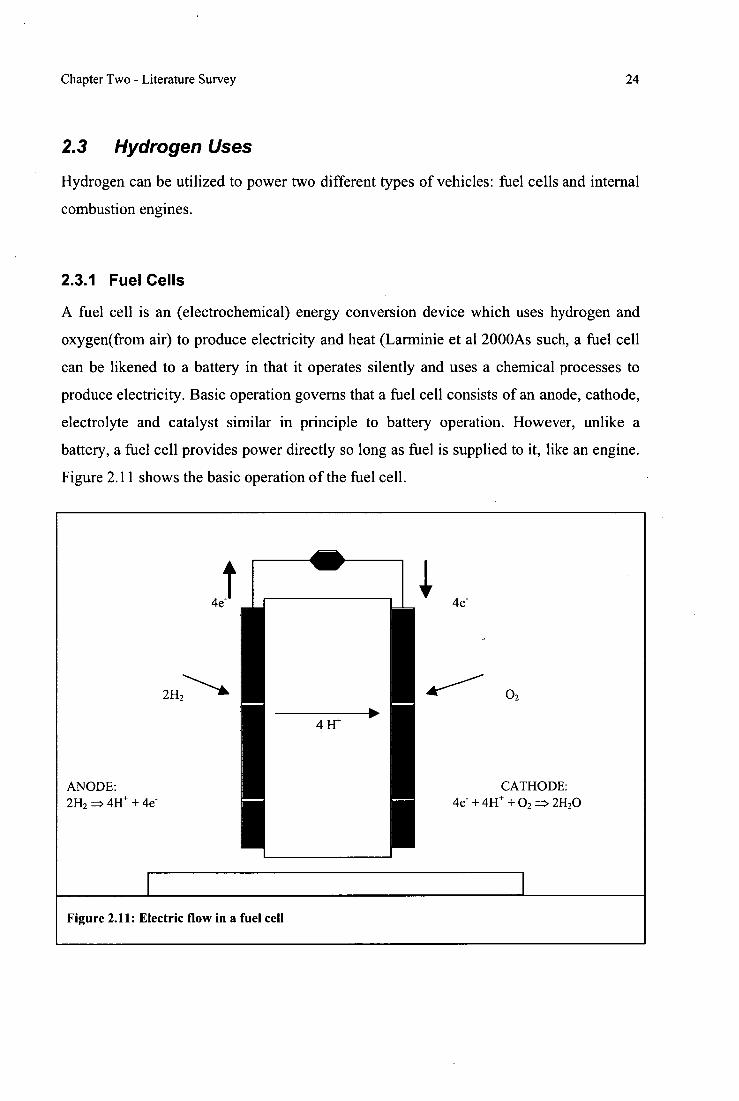
A fuel cell is an (electrochemical) energy conversion device which uses hydrogen and
oxygen(from air) to produce electricity and heat (Larminie et al 2000As such, a fuel cell
can be likened to a battery in that it operates silently and uses a chemical processes to
produce electricity. Basic operation governs that a fuel cell consists of an anode, cathode,
electrolyte and catalyst similar in principle to battery operation. However, unlike a
battery, a fuel cell provides power directly so long as fuel is supplied to it, like an engine.
Figure 2.11 shows the basic operation of the fuel cell.
4e- 4e-
2H2
02
ANODE: 2H2 = 4H+ + 4e
CATHODE: 4e + 4H+ +0 2 = 211 20
Figure 2.11: Electric flow in a fuel cell
Chapter Two - Literature Survey 25
The elegance and simplicity of fuel cells has ensured a steady rate of development since
its invention. At the same time the development has been retarded somewhat by the
highly competitive energy market.
In 1800, scientists William Nicholson and Anthony Carlisle described the process of
using electricity to decompose water into hydrogen and oxygen. William Robert Grove,
however took this idea one step further or, more accurately, one step in reverse in 1838.
Grove discovered that by arranging two platinum electrodes with one end of each
immersed in a container of sulphuric acid and the other end separately sealed in
containers of oxygen and hydrogen, a constant current would flow between the electrodes
(Cahan D et al 2000).
In 1977 the International Energy Agency launched the 'Production and Utilization of
Hydrogen Program' to accelerate the acceptance and widespread use of hydrogen
technology (Elam et al, 1999). The agency identified that fuel cell and hydrogen
technology has potential for locations where energy supply infrastructure does not exist.
It followed on that applications were developed in submarines and space crafts (Wilder
2001).
Recent developments in fuel cells have been driven more so by the commercial sector
than in early development. This has led to a plethora of companies becoming involved in
fuel cell development and sales. Several of the large car companies have released
prototype vehicles powered by fuel cell and hydrogen power. The marketing of these
'clean vehicles' has become an integral part of promoting companies as environmentally
friendly rather than manufacturing the cars for commercial use.
There are at least five unique fuel cell types, each with differing strengths providing
advantages and disadvantages in certain applications. These are mainly known by the
type of electrolyte material used (Wilder 2001).
Table 2.4 shows the five current fuel cell types distinguished by their electrolyte.
Chapter Two - Literature Survey 26
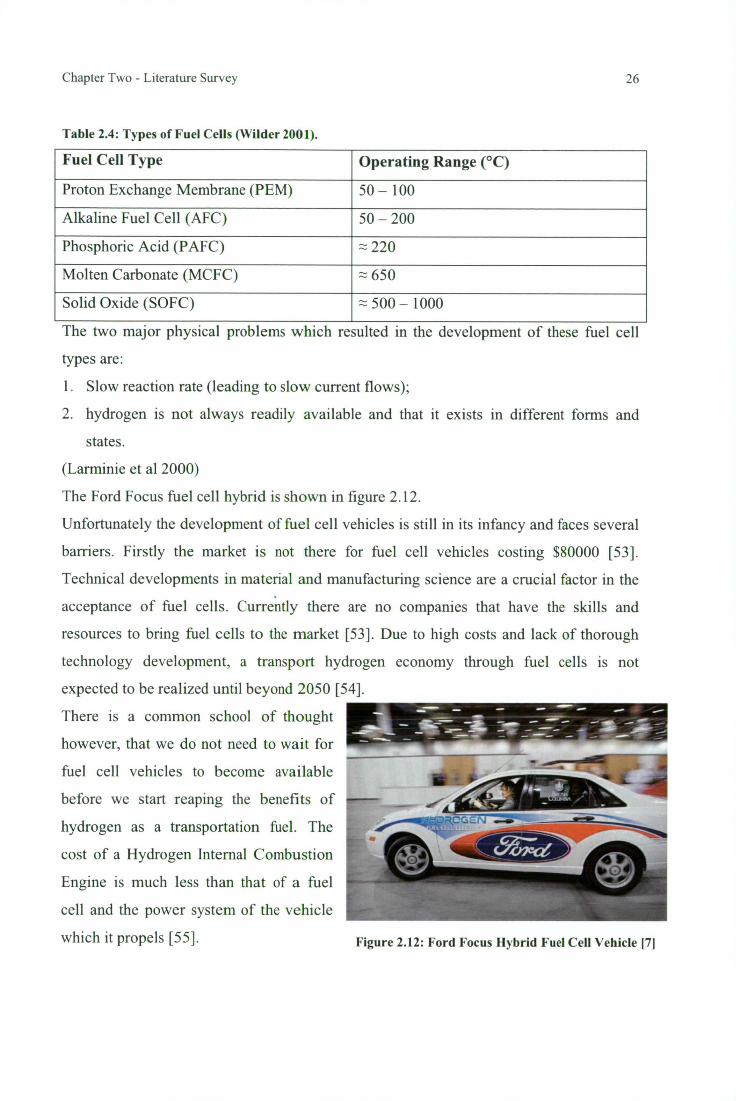
Table 2.4: Types of Fuel Cells (Wilder 2001).
Fuel Cell Type Operating Range (°C)
Proton Exchange Membrane (PEM) 50 — 100
Alkaline Fuel Cell (AFC) 50 — 200
Phosphoric Acid (PAFC) z 220
Molten Carbonate (MCFC) z 650
Solid Oxide (SOFC) z 500 — 1000
The two major physical problems which resulted in the development of these fuel cell
types are:
1. Slow reaction rate (leading to slow current flows);
2. hydrogen is not always readily available and that it exists in different forms and
states.
(Larminie et al 2000)
The Ford Focus fuel cell hybrid is shown in figure 2.12.
Unfortunately the development of fuel cell vehicles is still in its infancy and faces several
barriers. Firstly the market is not there for fuel cell vehicles costing $80000 [53].
Technical developments in material and manufacturing science are a crucial factor in the
acceptance of fuel cells. Currently there are no companies that have the skills and
resources to bring fuel cells to the market [53]. Due to high costs and lack of thorough
technology development, a transport hydrogen economy through fuel cells is not
expected to be realized until beyond 2050 [54].
There is a common school of thought
however, that we do not need to wait for
fuel cell vehicles to become available
before we start reaping the benefits of
hydrogen as a transportation fuel. The
cost of a Hydrogen Internal Combustion
Engine is much less than that of a fuel
cell and the power system of the vehicle
which it propels [55]. Figure 2.12: Ford Focus Hybrid Fuel Cell Vehicle 171
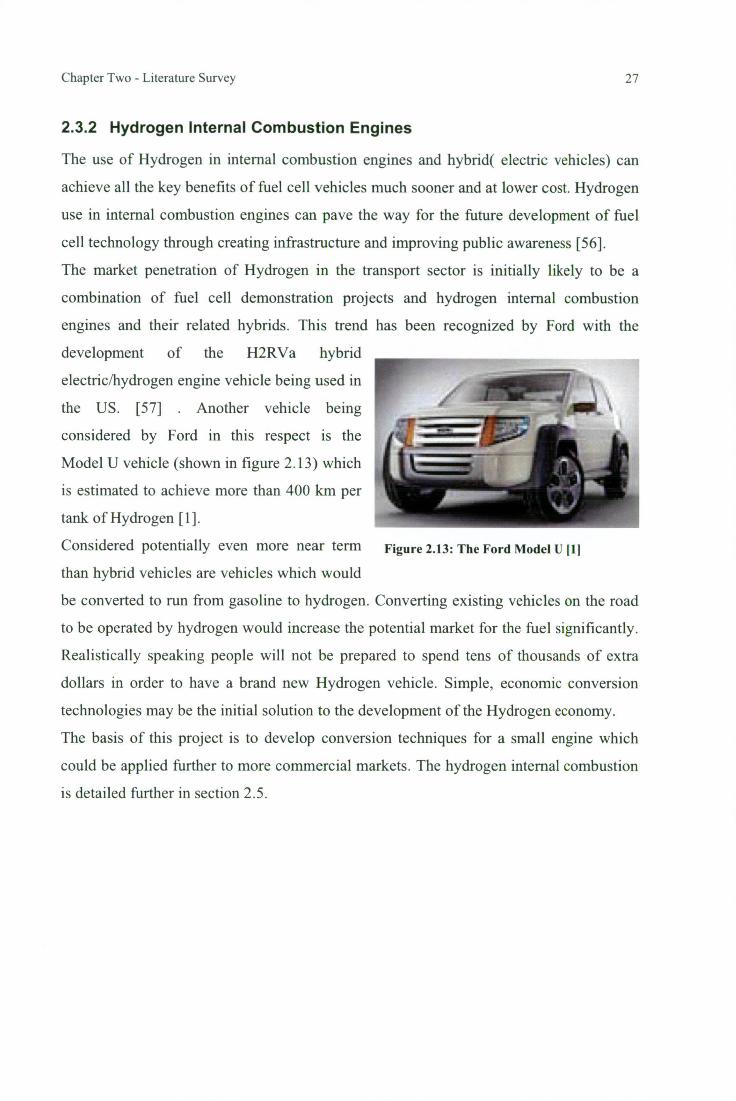
Figure 2.13: The Ford Model U Ill
Chapter Two - Literature Survey 27
2.3.2 Hydrogen Internal Combustion Engines
The use of Hydrogen in internal combustion engines and hybrid( electric vehicles) can
achieve all the key benefits of fuel cell vehicles much sooner and at lower cost. Hydrogen
use in internal combustion engines can pave the way for the future development of fuel
cell technology through creating infrastructure and improving public awareness [56].
The market penetration of Hydrogen in the transport sector is initially likely to be a
combination of fuel cell demonstration projects and hydrogen internal combustion
engines and their related hybrids. This trend has been recognized by Ford with the
development of the H2RVa hybrid
electric/hydrogen engine vehicle being used in
the US. [57] . Another vehicle being
considered by Ford in this respect is the
Model U vehicle (shown in figure 2.13) which
is estimated to achieve more than 400 km per
tank of Hydrogen [1].
Considered potentially even more near term
than hybrid vehicles are vehicles which would
be converted to run from gasoline to hydrogen. Converting existing vehicles on the road
to be operated by hydrogen would increase the potential market for the fuel significantly.
Realistically speaking people will not be prepared to spend tens of thousands of extra
dollars in order to have a brand new Hydrogen vehicle. Simple, economic conversion
technologies may be the initial solution to the development of the Hydrogen economy.
The basis of this project is to develop conversion techniques for a small engine which
could be applied further to more commercial markets. The hydrogen internal combustion
is detailed further in section 2.5.
Chapter Two - Literature Survey 28
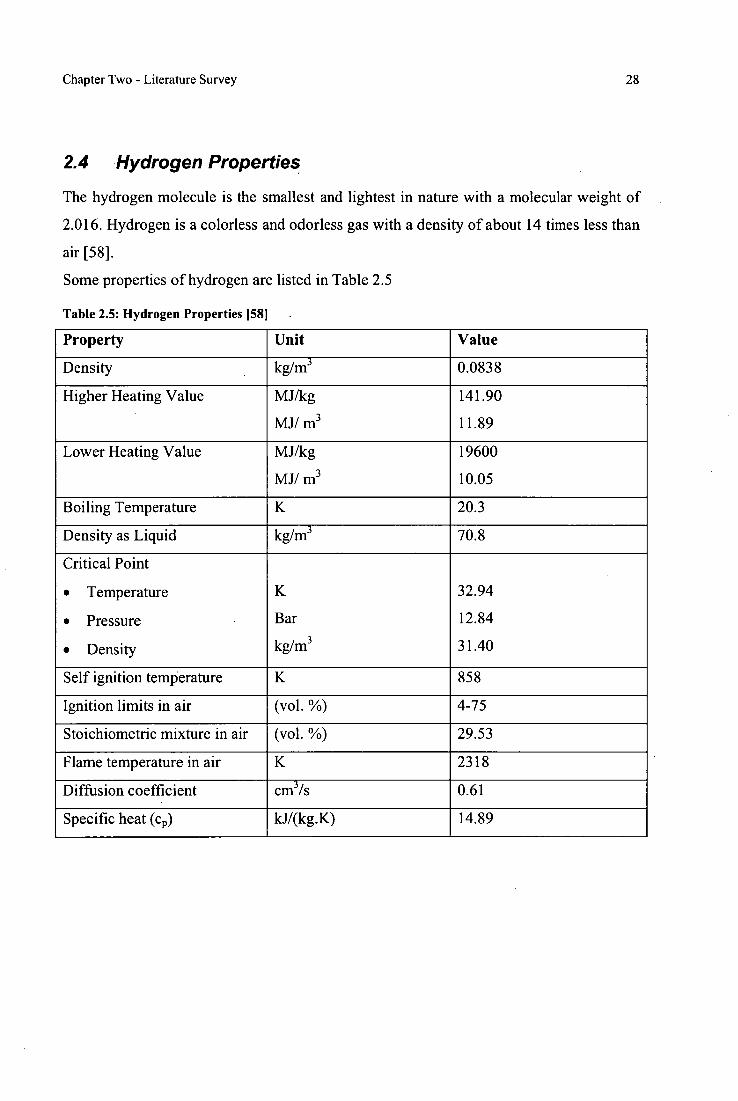
2.4 Hydrogen Properties
The hydrogen molecule is the smallest and lightest in nature with a molecular weight of
2.016. Hydrogen is a colorless and odorless gas with a density of about 14 times less than
air [58].
Some properties of hydrogen are listed in Table 2.5
Table 2.5: Hydrogen Properties 158 .
Property Unit Value
Density kg/m3 0.0838
Higher Heating Value MJ/kg 141.90
MJ/ m3 11.89
Lower Heating Value MJ/kg 19600
MJ/ m3 10.05
Boiling Temperature K 20.3
Density as Liquid kg/m3 70.8
Critical Point
• Temperature K 32.94
• Pressure Bar 12.84
• Density kg/m3 31.40
Self ignition temperature K 858
Ignition limits in air (vol. %) 4-75
Stoichiometric mixture in air (vol. %) 29.53
Flame temperature in air K 2318
Diffusion coefficient cm3/s 0.61
Specific heat (cp) kJ/(kg.K) 14.89
Chapter Two - Literature Survey 29
In its natural (room temperature) state hydrogen exists as a gas. It has the second lowest
boiling and melting point of all substances, second only to helium. It is a liquid below its
boiling point of 20K (-253°C) and solid below its melting point of 14K (-259 °C)
(atmospheric pressure). [59]. These properties become important in design when storage
technologies are being decided upon. The BMW 7i series is powered by liquid hydrogen
which requires the fuel to be kept between 14 and 20K.
Pure hydrogen is clear in appearance. In daylight a stream of leaking hydrogen is
invisible which is a major safety issue [59]. Scent compounds are often added to other
gases to increase the chance of leak recognition. These gases include Mercaptan and
Thiophane [60]. Gases of this type are not commonly added to hydrogen because a pure
strain of the gas is usually preferred. Developments in this field may make hydrogen a
safer gas, especially in combustion engine hydrogen use where purity is not of such great
importance.
The difference between the volume occupied by liquid and gaseous hydrogen can be
appreciated by considering its expansion ratio. Expansion ratio between liquid and gas is
1:848 at atmospheric conditions. From this it can be seen why we require pressurized
vessels to store hydrogen, as to store a useful amount of gas at atmospheric conditions
would be worthless. When hydrogen is stored in a high pressure vessel (3600psig) the
expansion ratio changes to 1:240 [59]. Releasing such a gas into the environment around
it must be done in a controlled manner. The use of regulators, both single and duel stage
is an important part of the design of a gaseous system. (The advantage of duel stage
regulators is that the outlet pressure remains constant even as the inlet pressure changes).
Chapter Two - Literature Survey 30
2.5 Hydrogen as an Internal Combustion Engine fuel
Hydrogen has many properties that make it an advantageous fuel for combustion engines.
The byproducts of hydrogen with air consist of water, oxygen and nitrogen. This has
obvious positive implications in the ongoing journey to reduce damaging tail pipe
emissions [61].
Hydrogen is not a newly conceived transportation fuel. The earliest recorded attempt to
operate an engine on Hydrogen was Rev. W. Cecil in 1820. The attempt was not
considered successful but Cecil pointed out some special features for the potential of
Hydrogen as fuel [62]. In the 1920s German engineer Rudolf Erren converted the
internal combustion engines of trucks, buses and submarines to use hydrogen or
hydrogen mixtures. British scientist and Marxist writer J.B.S. Haldane introduced the
concept of renewable hydrogen in his paper, Science and the Future, by proposing that
"there will be great power stations where during windy weather the surplus power will be
used for the electrolytic decomposition of water into oxygen and hydrogen." [63]. It is
reported that over 100 vehicles were converted to hydrogen and gasoline/hydrogen
mixtures operation in England and Germany in the 1930s. These conversions were more
out of laboratory curiosity than necessity. During the World Wars it was discovered that
there may be shortage of petroleum fuels and some more investigations were undertaken.
The third phase of Hydrogen internal combustion engine development began in the 1970s
when scientists and environmentalists realized that there was going to be a fuel crisis and
that vehicles were having an effect on the environment [62].
The research that continues today is still based on the final phase of Hydrogen
development: to find a fuel that is both sustainable and environmentally friendly. Much
work has been world wide to advance the Hydrogen engine as a possible replacement for
its petroleum engine. Most of the work has considered ways of reducing phenomena such
as backfire, pre-ignition and knocking which have previously troubled the Hydrogen
engine.
Today the Hydrogen engine stands stronger than ever before with rising instability in fuel
sources and increasing environmental problems due to vehicles. This coupled with the
expense and technical developmental flaws of fuel cell technology has seen Hydrogen
70
60
0
30
20
10
0 .1-
• Consumption
• Product ion
13 Reserves
Chapter Two - Literature Survey 31
powered internal combustion vehicles built by car manufacturers, with the vision of
making them available for trial on the road. The intrinsic advantages of Hydrogen over its
alternative fuel counterparts have generated great excitement in the vehicle
manufacturing market, with greater coverage and support given to the concept.
North Far East Western Eastern Latin kiddie East Africa America and Europe Europe and America
Oceania FS U
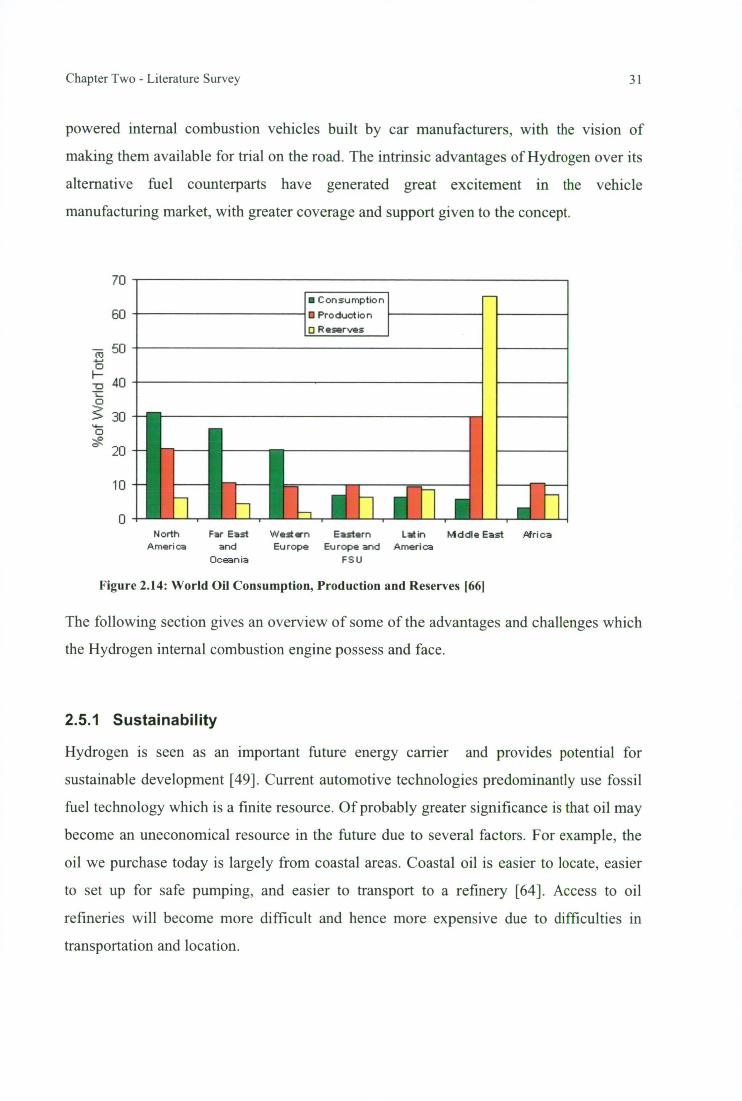
Figure 2.14: World Oil Consumption, Production and Reserves 1661
The following section gives an overview of some of the advantages and challenges which
the Hydrogen internal combustion engine possess and face.
2.5.1 Sustainability
Hydrogen is seen as an important future energy carrier and provides potential for
sustainable development [49]. Current automotive technologies predominantly use fossil
fuel technology which is a finite resource. Of probably greater significance is that oil may
become an uneconomical resource in the future due to several factors. For example, the
oil we purchase today is largely from coastal areas. Coastal oil is easier to locate, easier
to set up for safe pumping, and easier to transport to a refinery [64]. Access to oil
refineries will become more difficult and hence more expensive due to difficulties in
transportation and location.
Chapter Two - Literature Survey 32
Of similar importance to oil sustainability could be political issues. Oil is more likely to
become unavailable before it runs out. 56% of world oil reserves exist in the politically
unstable Middle East with Saudi Arabia possessing 39% of this figure. Figure 2.14 shows
the distribution of world oil supplies and the consumption of the product between
countries. Recent unstability in the Middle East region has meant a spike in oil prices
[65]. From a political point of view to have a sustainable fuel source which is not reliant
on imports would advantageous.
Hydrogen has the potential to be derived from a variety of different sources, many
renewable and readily available. Given economics of scale, hydrogen could become
economically and environmentally sustainable.
Perhaps instability in the Middle East would not exist if oil was not a valued commodity.
2.5.2 Emissions
When used as a combustion fuel Hydrogen bums 'cleaner' than its industry counterparts
such as petroleum. The combustion process emits low levels of pollutants in the form of
nitrous oxide, but these can be virtually eliminated by various combustion control
methods [52]. In the context of current transportation fuels, Hydrogen is classed as
exceptionally clean. Emissions from a Hydrogen operated engine are free of noxious
pollutants such as carbon monoxide, carbon dioxide and other greenhouse gases,
hydrocarbons, sulfur oxides, smoke, lead or other toxic metals, sulfuric acid, ozone and
other oxidants, formaldehydes and benzene and other organic compounds [48].
The road vehicle has traditionally been one of the major sources of harmful gasses in our
environment. Motor vehicles currently on the road emit large quantities of carbon
monoxide, hydrocarbons, nitrogen oxides and such toxic substances like fine particulates.
Because of the rapid growth of Third World countries and vehicle population, the effect
is having serious air pollution problems in both built up city areas and even lakes, streams
and remote forests [66].
Chapter Two - Literature Survey 33
2.5.3 Ignition Limits
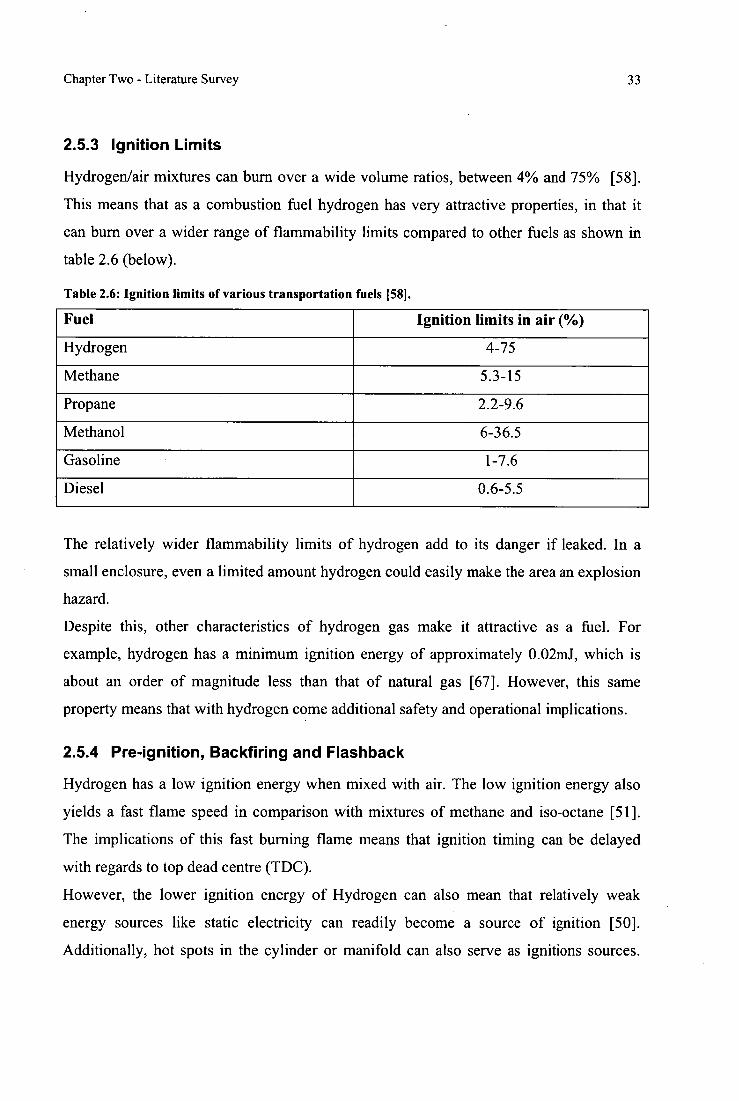
Hydrogen/air mixtures can burn over a wide volume ratios, between 4% and 75% [58].
This means that as a combustion fuel hydrogen has very attractive properties, in that it
can burn over a wider range of flammability limits compared to other fuels as shown in
table 2.6 (below).
Table 2.6: Ignition limits of various transportation fuels 1581.
Fuel Ignition limits in air (%)
Hydrogen 4-75
Methane 5.3-15
Propane 2.2-9.6
Methanol 6-36.5
Gasoline 1-7.6
Diesel 0.6-5.5
The relatively wider flammability limits of hydrogen add to its danger if leaked. In a
small enclosure, even a limited amount hydrogen could easily make the area an explosion
hazard.
Despite this, other characteristics of hydrogen gas make it attractive as a fuel. For
example, hydrogen has a minimum ignition energy of approximately 0.02mJ, which is
about an order of magnitude less than that of natural gas [67]. However, this same
property means that with hydrogen come additional safety and operational implications.
2.5.4 Pre -ignition, Backfiring and Flashback
Hydrogen has a low ignition energy when mixed with air. The low ignition energy also
yields a fast flame speed in comparison with mixtures of methane and iso-octane [51].
The implications of this fast burning flame means that ignition timing can be delayed
with regards to top dead centre (TDC).
However, the lower ignition energy of Hydrogen can also mean that relatively weak
energy sources like static electricity can readily become a source of ignition [50].
Additionally, hot spots in the cylinder or manifold can also serve as ignitions sources.
Chapter Two - Literature Survey 34
This latter situation creates problems with premature ignition (pre-ignition), flashback
and backfiring. Preventing this type of erratic operation is one of the challenges in
running a hydrogen engine [68].
Pre-ignition, defined as the early ignition of the fuel-air charge due to hot spots present in
the cylinder chamber. It can cause power loss and piston damage [69].
Backfires occur in the intake or exhaust system and take the form of a loud explosion. It
can be a result of engine pre-ignition in the inlet or excessive fuel in the exhaust.
Flashback occurs when the flame in a gas torch burns back (upstream) into a fuel supply
line [70]. Most serious fire accidents with gaseous fuel systems are caused by flashbacks.
A flashback can travel through a supply system at speeds of up to 13 metres per second
.[60].
To avoid the occurrence of such behavior, a number of design features can be included in
hydrogen powered internal combustion engines and include:
• Timed injection either into the inlet manifold or directly into the cylinder. Such
injection of Hydrogen means that fuels mixtures are less likely to pre-ignite
which results in better engine performance [51]. It should also be noted that
optimum fuel injection should start at, or before, top dead centre and be advanced
with engine speed [71].
• Variable spark ignition timing facilitates the control of the burning mixture. The
variation in spark timing with Hydrogen is more effective in controlling the
combustion process than with other fuels due to the ease of flammability that the
hydrogen fuel possess.
• Greater attention to heat transfer off the design of Hydrogen engines can lead to
the elimination of potential pre-ignition points which results in reduced
backfiring [51].
• Leaner engine mixtures can be employed to reduce backfiring. Air to fuel ratios
(A) of 2 have resulted in backfire safe operation. However with such lean
mixtures power output decreases [71].
• Flashbacks can be eliminated by using fuel injectors in combination with
flashback arrestors. Gas specific fuel injectors facilitate one way through flow
and so the potential for flashbacks is virtually eliminated. The use of flashback
Chapter Two - Literature Survey 35
arrestors in tandem with these fuel injectors only serves to further avoid the
hydrogen storage vessel from igniting. Such flashback arrestors are fitted with a
sintered flame trap which quenches the flame. Additionally, an integral non-
return valve closes off the gas supply in the event of a pressure wave entering the
flashback arrestor [60].
2.5.5 Engine Performance
Hydrogen fuelled engines suffer from reduced power output due mainly to the lower
heating value of hydrogen gas (on a volume basis) and the lean mixtures which are
usually employed [51]. At a stoichiometric air-to-fuel ratio, hydrogen displaces only 29%
of the combustion chamber. As a result the energy content of the mixture will be less than
it would be if a denser fuel such as gasoline was used [68].
Comparisons between the power output of hydrogen engines with the their gasoline
fuelled counterparts have varied with (theoretically) as little 15% loss for earburetted and
port injected engines and up to a 15% increase in power for direct (cylinder) injected
engines [68]. In this context, several methods can be used to improve the performance of
hydrogen engines.
• Using accurate fuel metering (e.g., via solenoid controlled fuel injectors) to control
the air-to-fuel ratio and enable hydrogen engines to run at wide open throttle. This
type of unthrottled operation leads to increased power output. However, a throttle
body or choke may still be required during start-up and idling [72]. The wider
flammability limits of hydrogen allow the omittance of the throttle valve, the greatest
benefit being better engine efficiency due to reduced suction losses[71]
• Higher compression ratios can be applied satisfactorily to increase the power and
efficiency. This is due to the fast burning characteristics of the lean burning
hydrogen-air mixtures [51]. The increase of compression ratio results in a sharp
increase of the cylinder's top pressure [55]. From a conversion point of view it is
important to consider an engine's physical strength before drastically altering the
compression ratio.
• Variable valve timing is a feature which enhances higher volumetric efficiency [51].
Gasoline engines are usually designed with large overlaps in valve timing. This is not
Chapter Two - Literature Survey 36
a highly desirable feature of a Hydrogen engine. Overlap can increase the chances of
pre-ignition hence increased power losses and erratic engine operation.
• Injector or fuel pressure can also have an effect on the power output of a Hydrogen
engine [71]. Having said this however, the pressure of the fuel only affects the
amount of fuel entering the cylinder, which in turn affects the air to fuel ratio. Injector
opening time, fuel pressure and air flow should all be considered in the overall
systematic design of air-to-fuel mixture control.
• The variation of spark timing can have a significant effect on the performance of a
Hydrogen engine. Variable spark timing allows for greater control at differing engine
speeds. There is need with Hydrogen as a fuel for uniquely optimized variations in
the spark timing throughout so as to improve performance whilst also avoiding
knock.
• Hydrogen engines are usually built 40-60% larger than their gasoline engine
counterparts to compensate for the power losses [51].
2.5.6 Storage limitations
Compressed hydrogen gas (at 200 bar) has about 5% the energy content to that of
gasoline (of the same volume) [51]. Consequently, from a transport application
perspective this is a major shortcoming. Additionally, the energy required to compress
this gas is relatively large which further reduces the efficiency from a (whole) systems
perspective. Realistically for hydrogen to become a major transportation fuel, further
development must occur in the storage technologies. Some of these technologies and
developments are discussed below in the section Hydrogen Storage Techniques
2.5.7 Other Limitations
• High exhaust temperatures involved with lean operation of Hydrogen has the
potential to cause engine damage and high exhaust emissions of oxides of nitrogen
[55].
• The wide flammability limits and low ignition energy of Hydrogen mean extra safety
measures must be adhered to.
Chapter Two - Literature Survey 37
• Care must be taken to ensure material compatibility. Hydrogen embrittlement is a
well known phenomena and could potentially destroy engine parts over time.
• Water in the exhaust system must be managed to avoid undesirable corrosion and
lubricating oil contamination [51].
2.6 Hydrogen Storage
2.6.1 Storage based on needs
Despite the possibility of more than one way in which hydrogen can be used to propel
vehicles, through internal combustion engines, fuel cells or hybrid vehicles, one common
challenge remains, that of storage [73].
There are six major storage methods currently being investigated with hydrogen [74].
Hydrogen can be stored using compressed gas, liquid, metal hydride systems, complex
hydride systems, physisorption and in carbon nanostructures. Some of these methods are
still in their developmental phases while others are more established and common.
However, each storage method has its own advantages and disadvantages . Factors such
as economics, volume of gas required, release rate, storage space, atmospheric conditions
and volatility of space are some of the critical parameters governing the selection of
storage method.
Of the six methods listed above, there are only three which are currently commercially.
viable and which are candidates for this project. These methods are compressed gas
cylinders, liquefied hydrogen cylinders and metal hydride containers
2.6.2 Compressed Hydrogen Gas
Compressed Hydrogen Gas (CHG) storage is one of the simplest methods of hydrogen
storage [75]. It is simple in that the only equipment required is a compressor and a
pressure vessel. The main problem with the method is the low storage density of
compressed CHG, which is dependant on the pressure at which the gas is stored [76].
Because of the low density of CHG, the gas must usually be compressed to 2000 to 2800
psi [77] for useful amounts of the gas to be available.
Chapter Two - Literature Survey 38
Low pressure tanks can hold as much as 1300 kg of Hydrogen at 1.2-1.6 MPa but these
tanks by nature are physically large [76]. Traditionally high pressure vessels have been
operated at a maximum pressure of 20-30 Mpa but recent research has advanced high
pressure storage capabilities. Tensile strength of materials varies widely from 50Mpa for
Aluminum to 1100 MPa for steel. New lightweight cylinders have been developed to
withstand pressures of up to 80 Mpa, giving Hydrogen at a volumetric density of 36
kg / m 3 . It is envisaged that future vessels will consist of three layers: an inner polymer
liner over wrapped carbon fiber composite and an outer layer of aramid material [74].
These tri-shield containers are becoming commercially available.
Quantum Technologies have developed a composite TriShield hydrogen storage cylinder
as an alternative that will be compatible with the cost expectations of the automotive
industry [78].
Conventional tanks are usually made from common grade steel and over time Hydrogen
can migrate into the metal. This makes the metal brittle to a point where Hydrogen can
leak from the vessel. This process is called embrittlement and can be overcome by using
high-quality steel [78]. This high quality steel makes the storage option expensive.
2.6.3 Liquid Hydrogen Storage
Hydrogen can be stored as a liquid in cryogenic tanks at 21.2K (at ambient pressure)
[74]. Liquid Hydrogen Storage is seen as advantageous due to the higher volumetric
density when stored in its compressed form. However the process itself is energy
expensive and much energy is expended in the liquefaction process and continual energy
required to keep the material at low temperatures. Liquefaction is achieved by cooling a
gas to form a liquid. The process uses a combination of compressors, heat exchangers,
expansion engines, and throttle valves to achieve desired cooling [76].
The simplest method of liquefying hydrogen is the Joule-Thomson or Linde cycle. In
this method the gas is compressed and then cooled in a heat exchanger, before passing
through a throttle valve where it undergoes isenthalpic Joule-Thomson expansion
producing liquid [74].
The large amount of energy required to produce liquid Hydrogen (15.2 kW/kg) limits the
potential for its application. Air and space applications where the cost of Hydrogen is not
DErellarje at higher r awl kEattet alma
Chart:Um
at Bow preanco .nil law tem-prawlara
Chapter Two - Literature Survey 39
an issue and the gas is consumed quickly are the most ideal candidates for this storage
option [74].
Liquefied Hydrogen has long been used in the space shuttle and more recently BMW
produced a vehicle powered by liquid Hydrogen [79]. More modern Hydrogen transport
technology supports either metal hydride or compressed gas storage of the liquid option.
2.6.4 Metal and Complex Hydrides
Metal Hydrides store Hydrogen by chemically bonding the hydrogen to metal or
mettalloid elements and alloys. This storage method is unique because some can absorb
5
0%
20% 40% 40% 00% 100%
% ETA-anon Carrie!
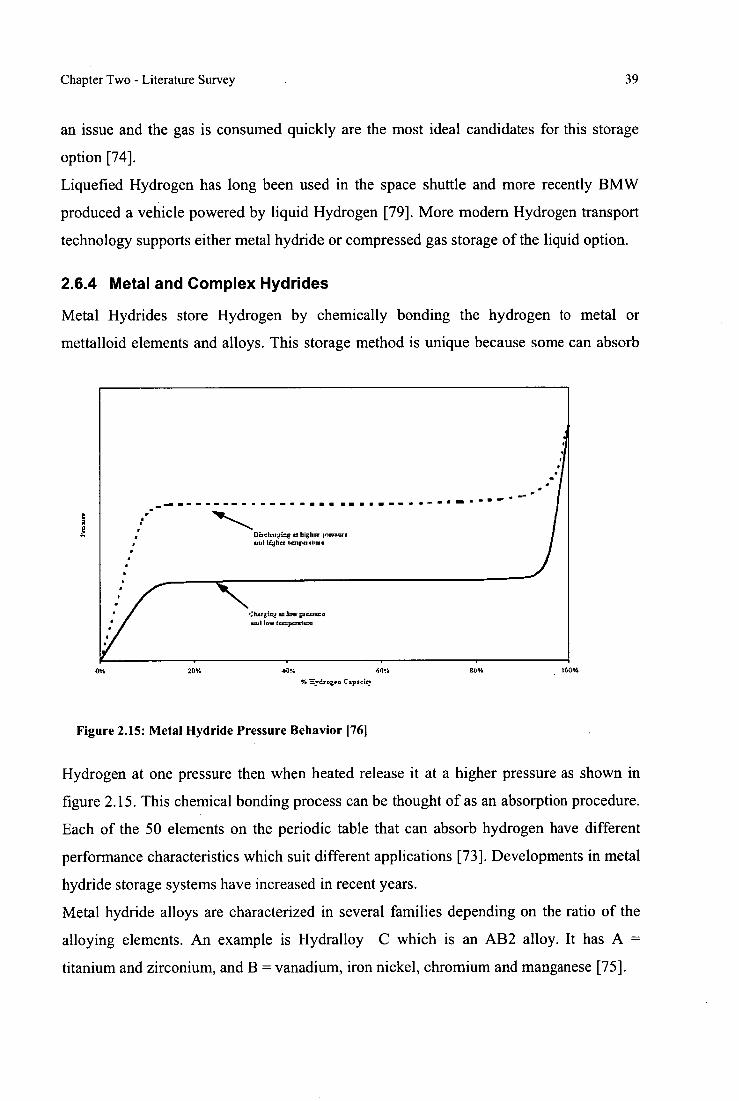
Figure 2.15: Metal Hydride Pressure Behavior 1761
Hydrogen at one pressure then when heated release it at a higher pressure as shown in
figure 2.15. This chemical bonding process can be thought of as an absorption procedure.
Each of the 50 elements on the periodic table that can absorb hydrogen have different
performance characteristics which suit different applications [73]. Developments in metal
hydride storage systems have increased in recent years.
Metal hydride alloys are characterized in several families depending on the ratio of the
alloying elements. An example is Hydralloy C which is an AB2 alloy. It has A =
titanium and zirconium, and B = vanadium, iron nickel, chromium and manganese [75].
Chapter Two - Literature Survey 40
Charging and discharging of metal hydride cylinders is achieved at different
temperatures. Recent developments have found hydrides that operate at atmospheric
temperatures, such that auxiliary heating and cooling systems are not required in
conjunction with the cylinder.
Metal Hydride storage containers are heavy in comparison with some of the other storage
options. For example the above mentioned alloy stores 2% hydrogen by weight [75]. This
weight is of greatest concern to the transport industry. Nonetheless metal hydrides
possess one of the largest volumetric energy density of all the storage techniques
currently being researched which is making it its biggest advantage.
Another developing hydride storage technique is complex hydrides. The main difference
between metallic hydrides and complex hydrides is the transition to an ionic or covalent
compound upon hydrogen absorption [74]. The method could be more conducive to
mobile hydrogen storage due to the or relative light weight. Compounds can store up to
18% mass of Hydrogen giving the complex hydrides a huge advantage where weight is
an issue. While complex hydrides have been investigated for more than six years there is
a whole field of new compounds ready to be explored as an option for Hydrogen storage
[74].

Chapter Three - Experimental Design 41
CHAPTER 3 Experimental Design
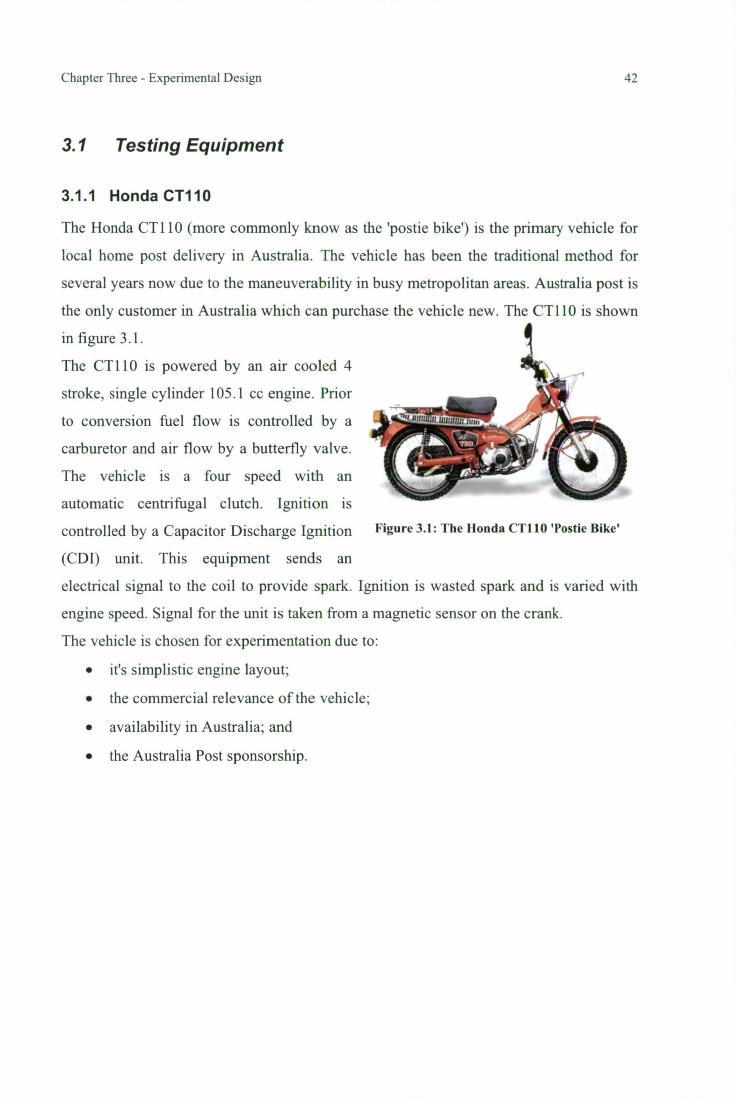
Figure 3.1: The Honda CT110 'Postie Bike'
Chapter Three - Experimental Design 42
3.1 Testing Equipment
3.1.1 Honda CT110
The Honda CT 110 (more commonly know as the 'postie bike') is the primary vehicle for
local home post delivery in Australia. The vehicle has been the traditional method for
several years now due to the maneuverability in busy metropolitan areas. Australia post is
the only customer in Australia which can purchase the vehicle new. The CT110 is shown
in figure 3.1.
The CT110 is powered by an air cooled 4
stroke, single cylinder 105.1 cc engine. Prior
to conversion fuel flow is controlled by a
carburetor and air flow by a butterfly valve.
The vehicle is a four speed with an
automatic centrifugal clutch. Ignition is
controlled by a Capacitor Discharge Ignition
(CD I) unit. This equipment sends an
electrical signal to the coil to provide spark. Ignition is wasted spark and is varied with
engine speed. Signal for the unit is taken from a magnetic sensor on the crank.
The vehicle is chosen for experimentation due to:
• it's simplistic engine layout;
• the commercial relevance of the vehicle;
• availability in Australia; and
• the Australia Post sponsorship.
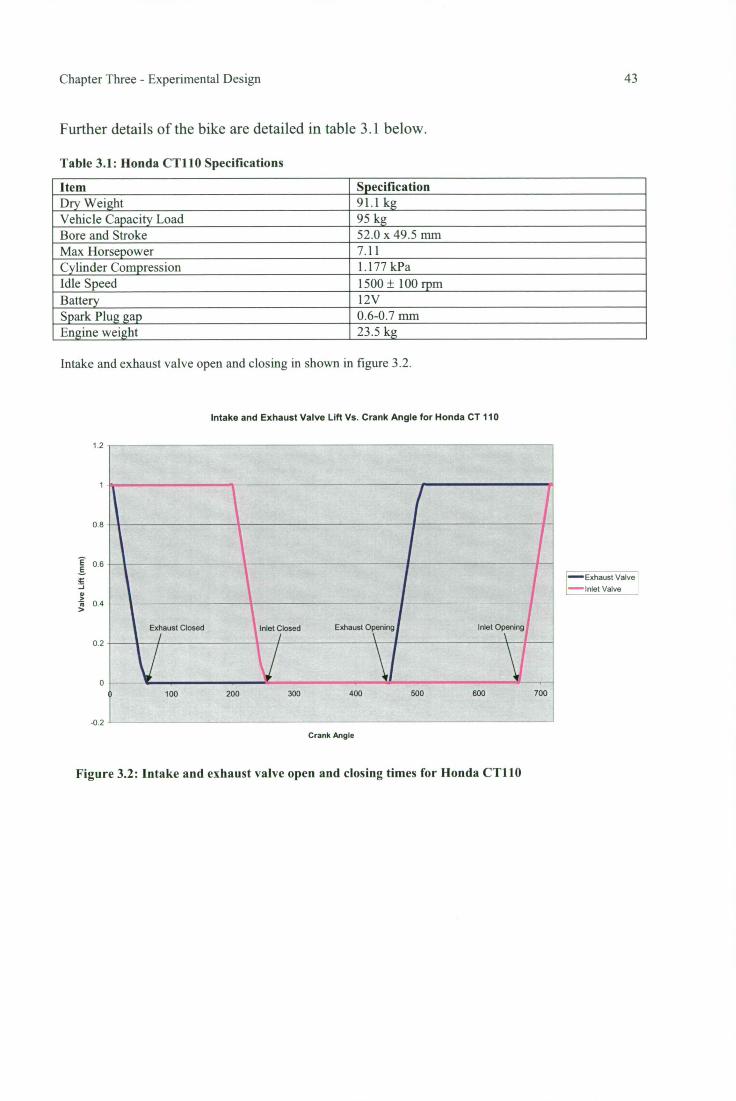
i 1
li Exhaust Closed inlet Closed Exhaust Opening Inlet Opening
II VlMr 100 200 300 400 500 600 700
1.2
0.8
06
_s
0.4
0.2
-0.2
•Exhaust Valve
—Inlet Valve
Chapter Three - Experimental Design 43
Further details of the bike are detailed in table 3.1 below.
Table 3.1: Honda CT110 Specifications
Item Specification Dry Weight 91.1 kg Vehicle Capacity Load 95 kg Bore and Stroke 52.0 x 49.5 mm Max Horsepower 7.11 Cylinder Compression 1.177 kPa Idle Speed 1500 ± 100 rpm Battery 12V Spark Plug gap 0.6-0.7 mm Engine weight 23.5 kg
Intake and exhaust valve open and closing in shown in figure 3.2.
Intake and Exhaust Valve Lift Vs. Crank Angle for Honda CT 110
Crank Angle
Figure 3.2: Intake and exhaust valve open and closing times for Honda CT110
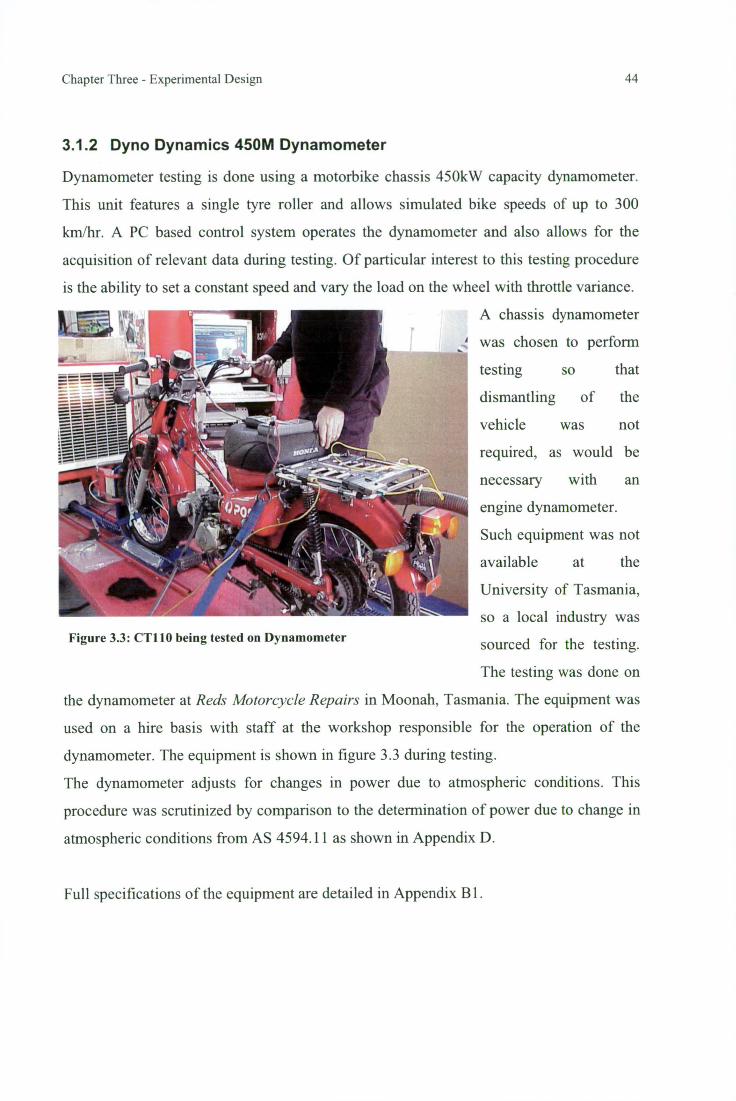
Chapter Three - Experimental Design 44
3.1.2 Dyno Dynamics 450M Dynamometer
Dynamometer testing is done using a motorbike chassis 450kW capacity dynamometer.
This unit features a single tyre roller and allows simulated bike speeds of up to 300
km/hr. A PC based control system operates the dynamometer and also allows for the
acquisition of relevant data during testing. Of particular interest to this testing procedure
is the ability to set a constant speed and vary the load on the wheel with throttle variance.
A chassis dynamometer
was chosen to perform
testing so that
dismantling of the
vehicle was not
required, as would be
necessary with an
engine dynamometer.
Such equipment was not
available at the
University of Tasmania,
so a local industry was
sourced for the testing.
The testing was done on
Figure 3.3: CT110 being tested on Dynamometer
the dynamometer at Reds Motorcycle Repairs in Moonah, Tasmania. The equipment was
used on a hire basis with staff at the workshop responsible for the operation of the
dynamometer. The equipment is shown in figure 3.3 during testing.
The dynamometer adjusts for changes in power due to atmospheric conditions. This
procedure was scrutinized by comparison to the determination of power due to change in
atmospheric conditions from AS 4594.11 as shown in Appendix D.
Full specifications of the equipment are detailed in Appendix B 1.
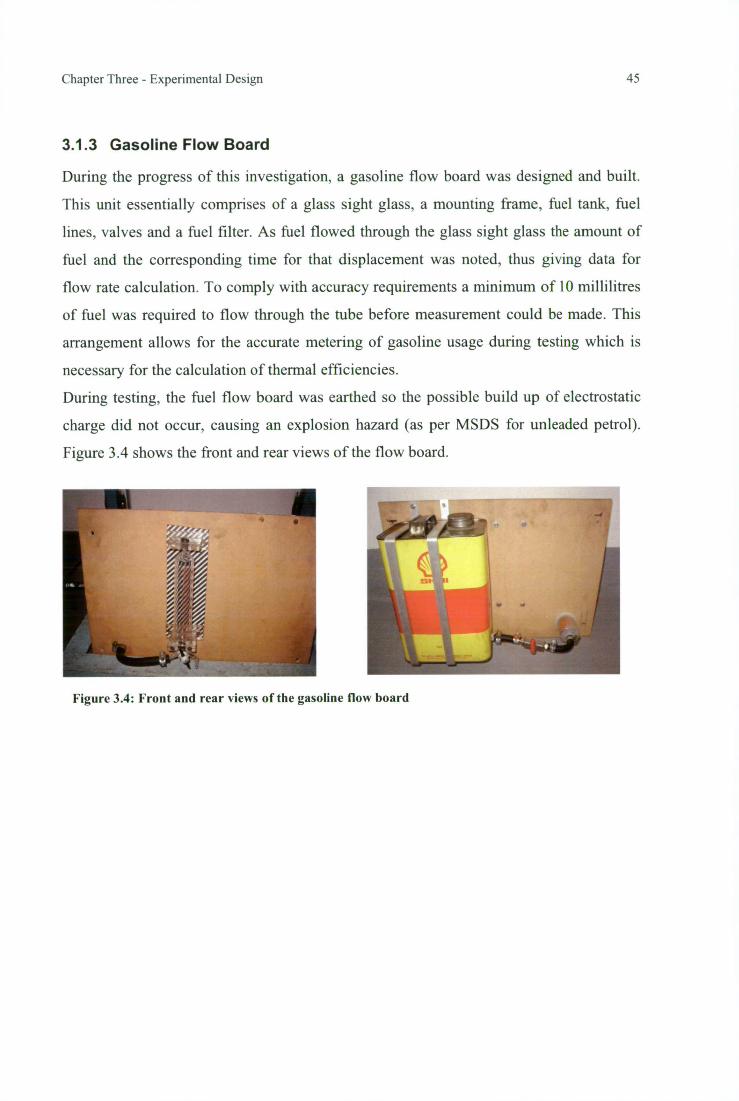
Chapter Three - Experimental Design 45
3.1.3 Gasoline Flow Board
During the progress of this investigation, a gasoline flow board was designed and built.
This unit essentially comprises of a glass sight glass, a mounting frame, fuel tank, fuel
lines, valves and a fuel filter. As fuel flowed through the glass sight glass the amount of
fuel and the corresponding time for that displacement was noted, thus giving data for
flow rate calculation. To comply with accuracy requirements a minimum of 10 millilitres
of fuel was required to flow through the tube before measurement could be made. This
arrangement allows for the accurate metering of gasoline usage during testing which is
necessary for the calculation of thermal efficiencies.
During testing, the fuel flow board was earthed so the possible build up of electrostatic
charge did not occur, causing an explosion hazard (as per MSDS for unleaded petrol).
Figure 3.4 shows the front and rear views of the flow board.
Figure 3.4: Front and rear views of the gasoline flow board
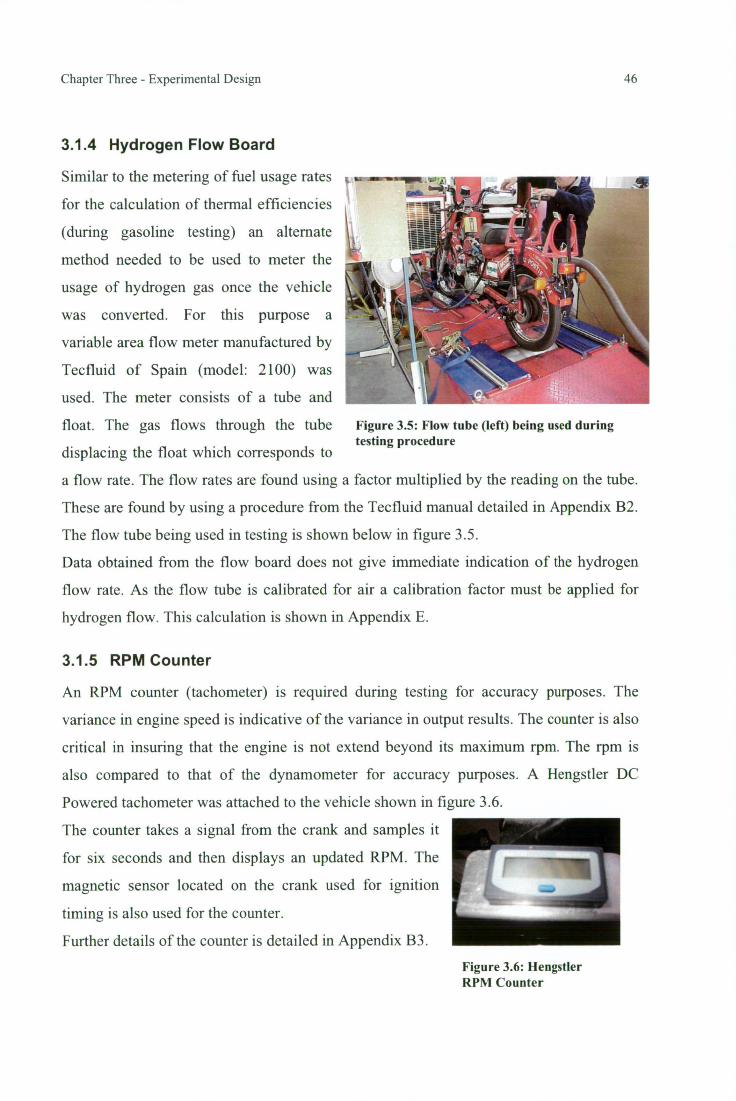
Figure 3.5: Flow tube (left) being used during testing procedure
Chapter Three - Experimental Design 46
3.1.4 Hydrogen Flow Board
Similar to the metering of fuel usage rates
for the calculation of thermal efficiencies
(during gasoline testing) an alternate
method needed to be used to meter the
usage of hydrogen gas once the vehicle
was converted. For this purpose a
variable area flow meter manufactured by
Tecfluid of Spain (model: 2100) was
used. The meter consists of a tube and
float. The gas flows through the tube
displacing the float which corresponds to
a flow rate. The flow rates are found using a factor multiplied by the reading on the tube.
These are found by using a procedure from the Tecfluid manual detailed in Appendix B2.
The flow tube being used in testing is shown below in figure 3.5.
Data obtained from the flow board does not give immediate indication of the hydrogen
flow rate. As the flow tube is calibrated for air a calibration factor must be applied for
hydrogen flow. This calculation is shown in Appendix E.
3.1.5 RPM Counter
An RPM counter (tachometer) is required during testing for accuracy purposes. The
variance in engine speed is indicative of the variance in output results. The counter is also
critical in insuring that the engine is not extend beyond its maximum rpm. The rpm is
also compared to that of the dynamometer for accuracy purposes. A Hengstler DC
Powered tachometer was attached to the vehicle shown in figure 3.6.
The counter takes a signal from the crank and samples it
for six seconds and then displays an updated RPM. The
magnetic sensor located on the crank used for ignition
timing is also used for the counter.
Further details of the counter is detailed in Appendix B3. Figure 3.6: Hengstler RPM Counter
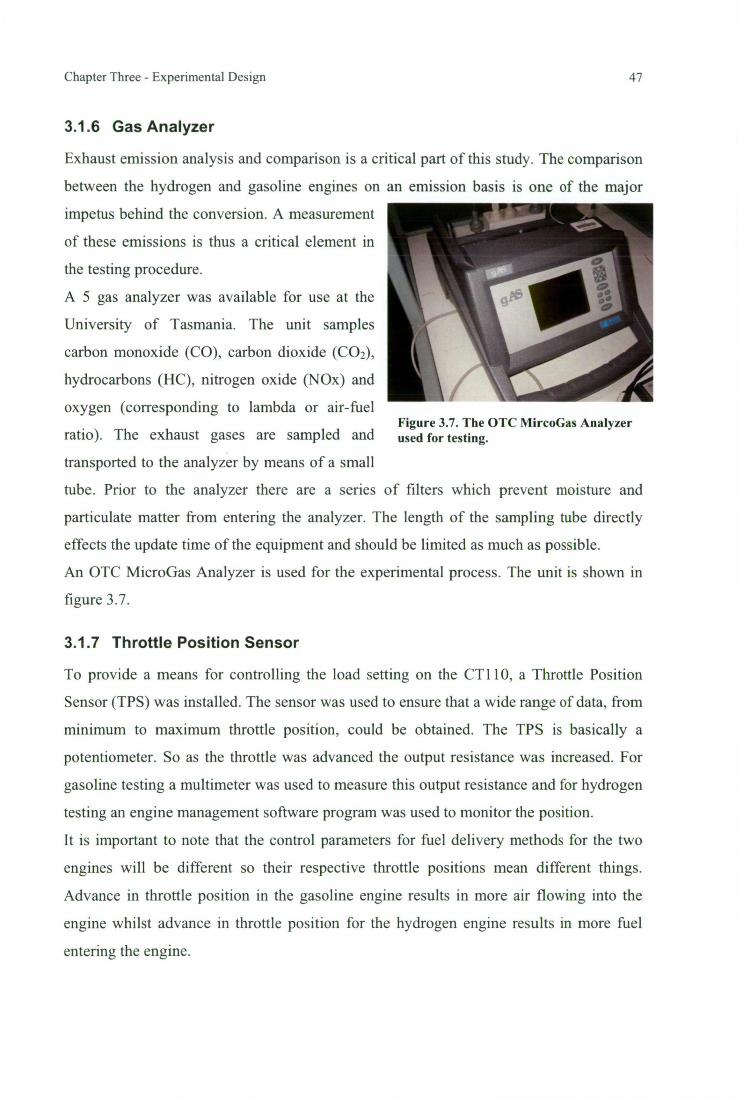
Figure 3.7. The OTC MircoGas Analyzer used for testing.
Chapter Three - Experimental Design 47
3.1.6 Gas Analyzer
Exhaust emission analysis and comparison is a critical part of this study. The comparison
between the hydrogen and gasoline engines on an emission basis is one of the major
impetus behind the conversion. A measurement
of these emissions is thus a critical element in
the testing procedure.
A 5 gas analyzer was available for use at the
University of Tasmania. The unit samples
carbon monoxide (CO), carbon dioxide (CO2),
hydrocarbons (HC), nitrogen oxide (N0x) and
oxygen (corresponding to lambda or air-fuel
ratio). The exhaust gases are sampled and
transported to the analyzer by means of a small
tube. Prior to the analyzer there are a series of filters which prevent moisture and
particulate matter from entering the analyzer. The length of the sampling tube directly
effects the update time of the equipment and should be limited as much as possible.
An OTC MicroGas Analyzer is used for the experimental process. The unit is shown in
figure 3.7.
3.1.7 Throttle Position Sensor
To provide a means for controlling the load setting on the CT 110, a Throttle Position
Sensor (TPS) was installed. The sensor was used to ensure that a wide range of data, from
minimum to maximum throttle position, could be obtained. The TPS is basically a
potentiometer. So as the throttle was advanced the output resistance was increased. For
gasoline testing a multimeter was used to measure this output resistance and for hydrogen
testing an engine management software program was used to monitor the position.
It is important to note that the control parameters for fuel delivery methods for the two
engines will be different so their respective throttle positions mean different things.
Advance in throttle position in the gasoline engine results in more air flowing into the
engine whilst advance in throttle position for the hydrogen engine results in more fuel
entering the engine.
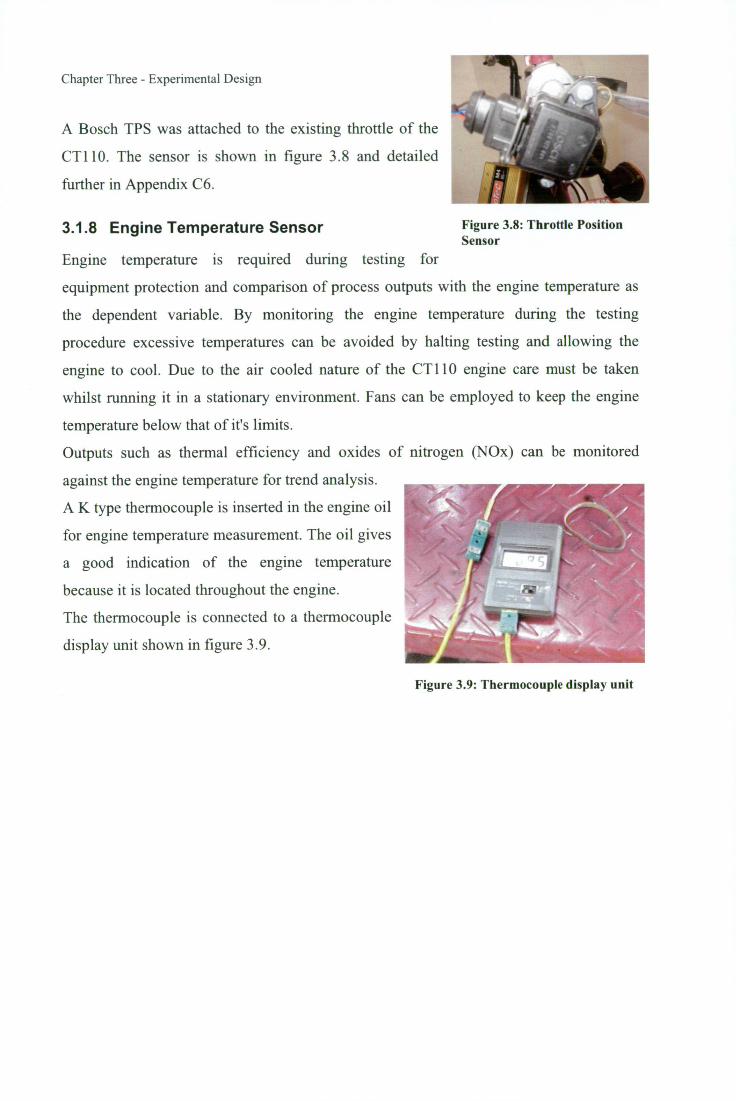
Figure 3.9: Thermocouple display unit
Chapter Three - Experimental Design
A Bosch TPS was attached to the existing throttle of the
CT110. The sensor is shown in figure 3.8 and detailed
further in Appendix C6.
3.1.8 Engine Temperature Sensor
Engine temperature is required during testing for
equipment protection and comparison of process outputs with the engine temperature as
the dependent variable. By monitoring the engine temperature during the testing
procedure excessive temperatures can be avoided by halting testing and allowing the
engine to cool. Due to the air cooled nature of the CT! 10 engine care must be taken
whilst running it in a stationary environment. Fans can be employed to keep the engine
temperature below that of it's limits.
Outputs such as thermal efficiency and oxides of nitrogen (N0x) can be monitored
against the engine temperature for trend analysis.
A K type thermocouple is inserted in the engine oil
for engine temperature measurement. The oil gives
a good indication of the engine temperature
because it is located throughout the engine.
The thermocouple is connected to a thermocouple
display unit shown in figure 3.9.
Figure 3.8: Throttle Position Sensor
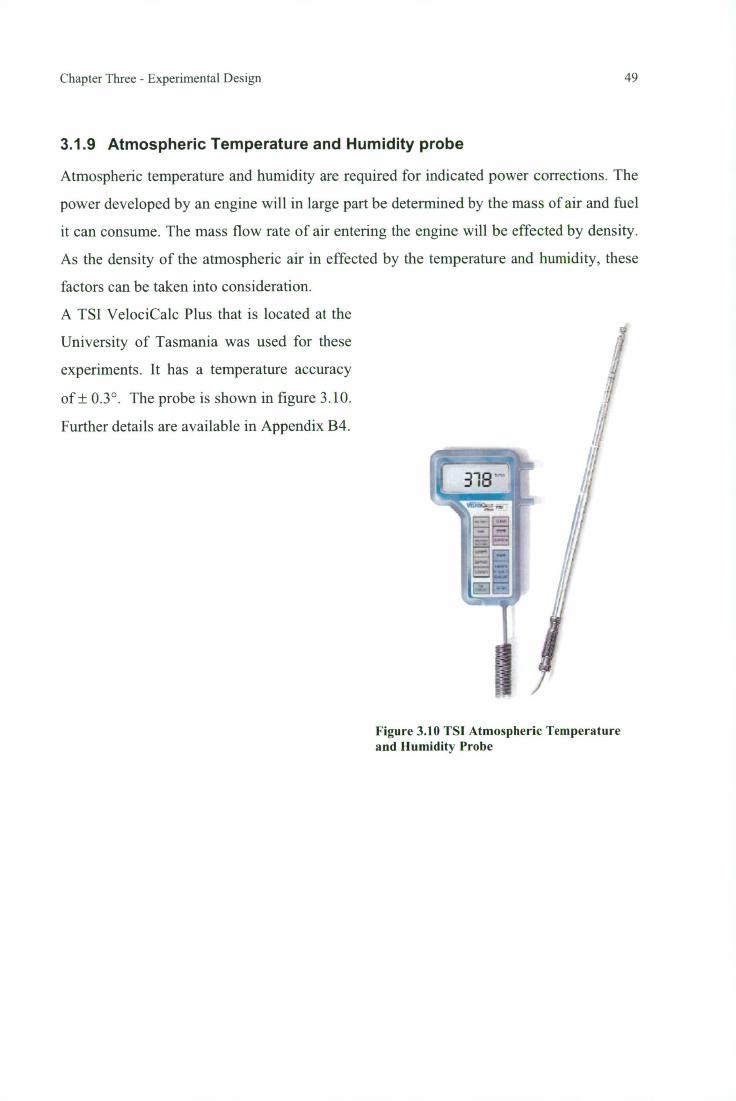
Chapter Three - Experimental Design 49
3.1.9 Atmospheric Temperature and Humidity probe
Atmospheric temperature and humidity are required for indicated power corrections. The
power developed by an engine will in large part be determined by the mass of air and fuel
it can consume. The mass flow rate of air entering the engine will be effected by density.
As the density of the atmospheric air in effected by the temperature and humidity, these
factors can be taken into consideration.
A TSI VelociCalc Plus that is located at the
University of Tasmania was used for these
experiments. It has a temperature accuracy
of ± 0.3°. The probe is shown in figure 3.10.
Further details are available in Appendix B4.
Figure 3.10 TS1 Atmospheric Temperature and Humidity Probe
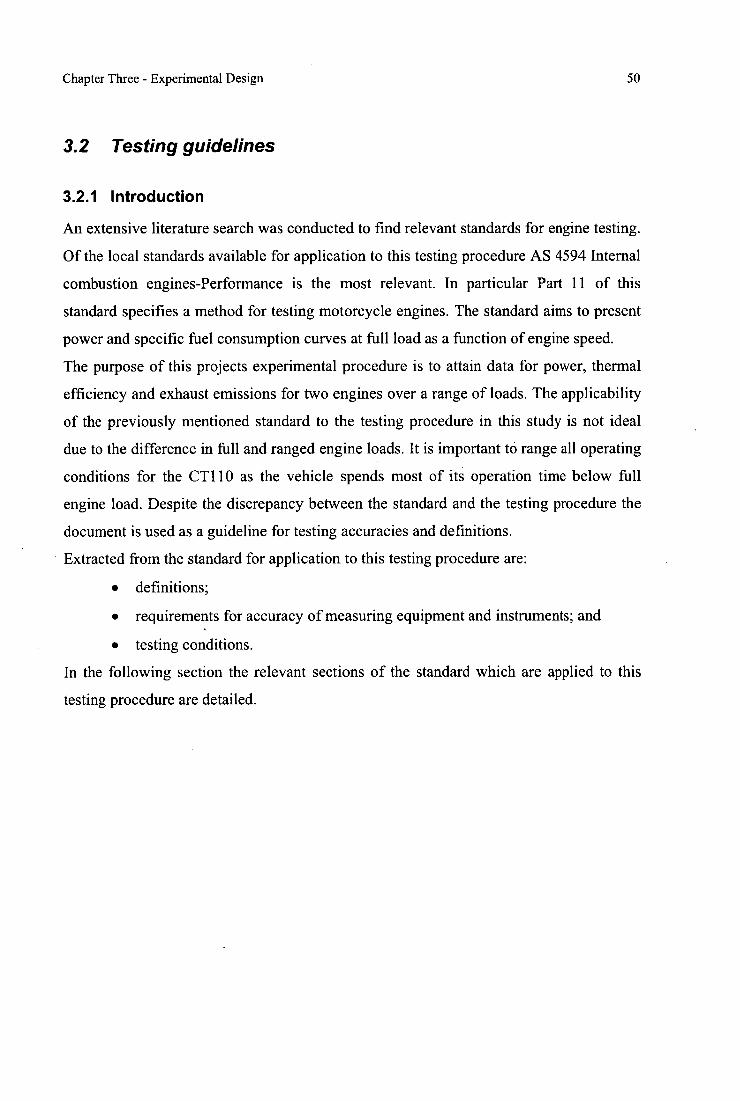
Chapter Three - Experimental Design 50
3.2 Testing guidelines
3.2.1 Introduction
An extensive literature search was conducted to find relevant standards for engine testing.
Of the local standards available for application to this testing procedure AS 4594 Internal
combustion engines-Performance is the most relevant. In particular Part 11 of this
standard specifies a method for testing motorcycle engines. The standard aims to present
power and specific fuel consumption curves at full load as a function of engine speed.
The purpose of this projects experimental procedure is to attain data for power, thermal
efficiency and exhaust emissions for two engines over a range of loads. The applicability
of the previously mentioned standard to the testing procedure in this study is not ideal
due to the difference in full and ranged engine loads. It is important to range all operating
conditions for the CT110 as the vehicle spends most of its operation time below full
engine load. Despite the discrepancy between the standard and the testing procedure the
document is used as a guideline for testing accuracies and definitions.
Extracted from the standard for application to this testing procedure are:
• definitions;
• requirements for accuracy of measuring equipment and instruments; and
• testing conditions.
In the following section the relevant sections of the standard which are applied to this
testing procedure are detailed.
Chapter Three - Experimental Design 51
3.2.2 Accuracy of equipment
Table 3.2 shows the accuracy of measurements required by AS4594.11 and the accuracy
of testing equipment used in this study.
Table 3.2: Accuracy of measuring equipment both required and produced
Variable Measured Accuracy Required of equipment AS4594.11
Accuracy of testing
equipment in this study
Torque ± 1% <1% Engine Speed ± 1% Fuel Consumption ± 1% <1% Engine inlet air temp + 1C 0.3°C Barometric Pressure ± 70Pa N/A Back Pressure in Exhaust System
± 25Kpa N/A
3.2.3 Test Conditions
• Net power test will consist of run at full throttle (AS4594.11-5.3.1, Annex A: A.1);
• Vehicle is to be tested with standard production equipment, such as air filters, inlet
manifold, inlet silencer (AS4594.11-5.1)
• Performance data obtained under stabilized normal conditions (AS4594.11-5.3.2);
• Air Inlet Temp measured within 0.15m of entry to air cleaner. (AS4594.11-5.3.3,
Annex A: A.3);
• Torque, engine speed and temperature must be stabilized for at least 30 seconds
before measurements are taken. (AS4594.11-5.3.4);
• Engine speed shall not deviate by more than ± 1% during a run (AS4594.11-5.3.5,
Annex A: A.4);
• Observed brake load, fuel consumption and inlet air temp shall be taken virtually
simultaneously (AS4594.11-5.3.6);
• For automatic measurement, no less than 10 seconds will be the duration of the
measurement time for engine speed and fuel consumption and 20 seconds for hand
held measurements. (AS4594.11-5.3.7);

Chapter Three - Experimental Design 52
• Air temperature, fuel temperature and lubricating oil temperatures should all be kept
within manufacturer limits. (AS4594.11-5.3.8-5.3.11).
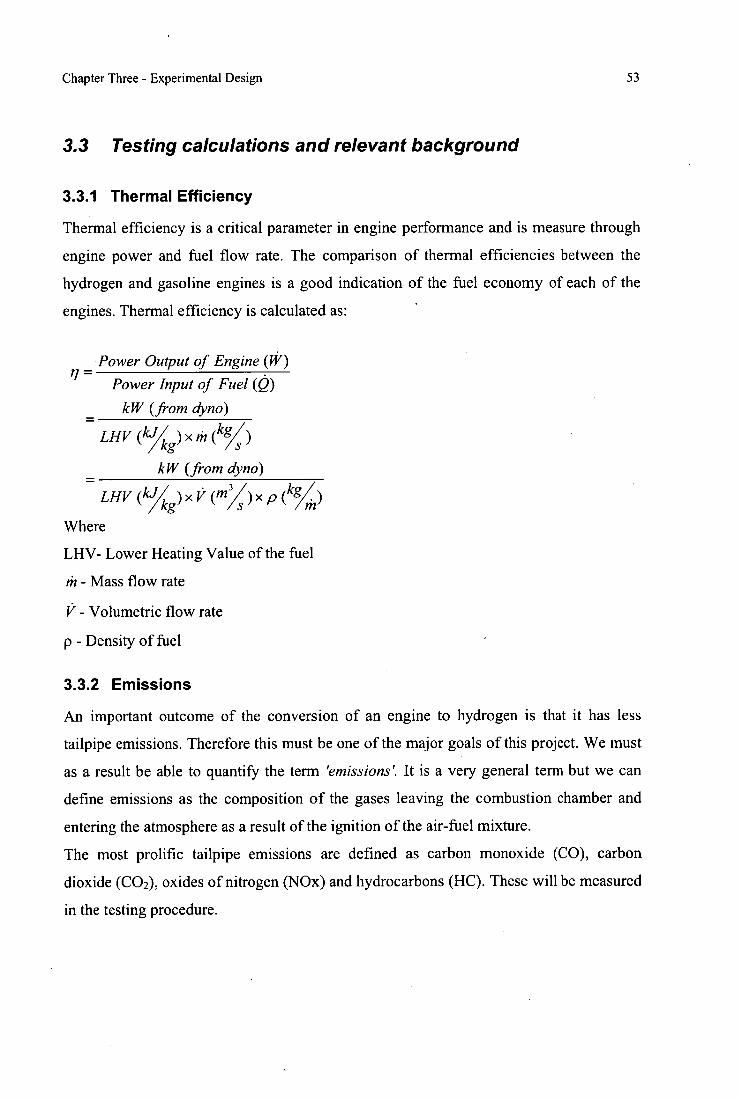
Chapter Three - Experimental Design 53
3.3 Testing calculations and relevant background
3.3.1 Thermal Efficiency
Thermal efficiency is a critical parameter in engine performance and is measure through
engine power and fuel flow rate. The comparison of thermal efficiencies between the
hydrogen and gasoline engines is a good indication of the fuel economy of each of the
engines. Thermal efficiency is calculated as:
Power Output of Engine (W) = Power Input of Fuel (0)
kW (from dyno)
LHV (Id kg) x (kg/s )
kW (from dyno)
LHV (kJ kg)x (m/)x p (kg/th)
Where
LHV- Lower Heating Value of the fuel
- Mass flow rate
- Volumetric flow rate
p - Density of fuel
3.3.2 Emissions
An important outcome of the conversion of an engine to hydrogen is that it has less
tailpipe emissions. Therefore this must be one of the major goals of this project. We must
as a result be able to quantify the term 'emissions'. It is a very general term but we can
define emissions as the composition of the gases leaving the combustion chamber and
entering the atmosphere as a result of the ignition of the air-fuel mixture.
The most prolific tailpipe emissions are defined as carbon monoxide (CO), carbon
dioxide (CO2), oxides of nitrogen (N0x) and hydrocarbons (HC). These will be measured
in the testing procedure.
Chapter Three - Experimental Design 54
3.4 Gasoline Testing
The purpose of testing the bike in its original (unconverted) state is to attain baseline data
which will be used to compare the original bike with the engine once it is converted to
hydrogen. The acquisition of baseline data also serves to validate the testing procedure
prior to investigation on the converted engine. In its original state, the CT100 has a
gasoline powered (carburetted engine) with CDI ignition control. Further details of the
engine are detailed in section 3.1.1 (above).
In drawing up the testing plan in this investigation, parts of Australian Standard 4594
(Internal combustion engines-Performance) have been consulted and used to make
inferences. Testing conditions detailed in section 3.2.3 (above) have been adhered to by
the procedure itself and experimental technique.
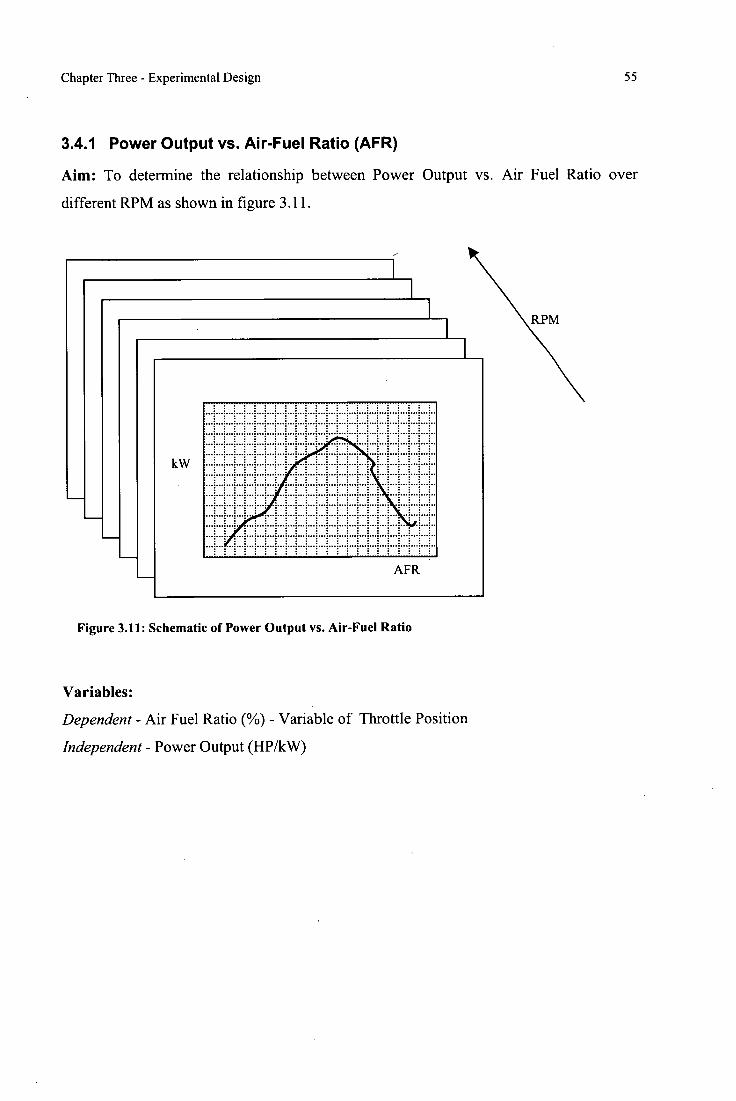
kW
AFR .
Chapter Three - Experimental Design 55
3.4.1 Power Output vs. Air-Fuel Ratio (AFR)
Aim: To determine the relationship between Power Output vs. Air Fuel Ratio over
different RPM as shown in figure 3.11.
RPM
Figure 3.11: Schematic of Power Output vs. Air-Fuel Ratio
Variables:
Dependent - Air Fuel Ratio (%) - Variable of Throttle Position
Independent - Power Output (HP/kW)
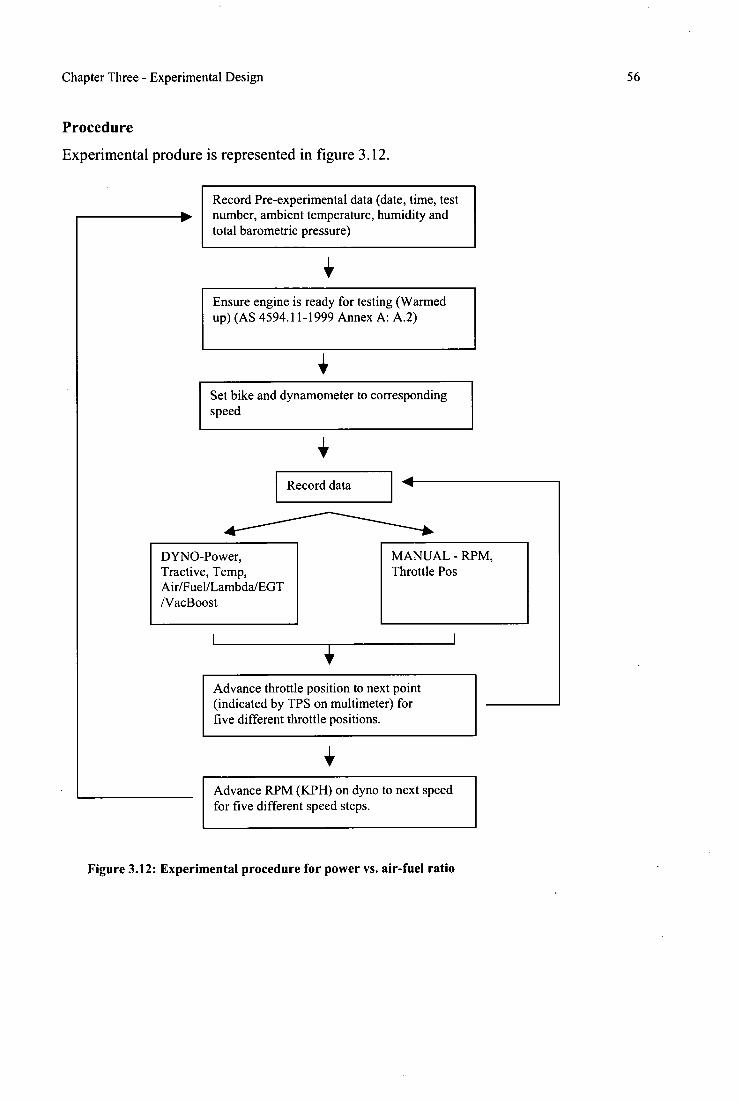
Chapter Three - Experimental Design 56
Procedure
Experimental produre is represented in figure 3.12.
Record Pre-experimental data (date, time, test number, ambient temperature, humidity and total barometric pressure)
4, Ensure engine is ready for testing (Warmed up) (AS 4594.11-1999 Annex A: A.2)
4, Set bike and dynamometer to corresponding speed
Record data •
■
DYNO-Power, Tractive, Temp, Air/Fuel/Lambda/EGT NacBoost
MANUAL - RPM, Throttle Pos
I
I 4
Advance throttle position to next point (indicated by TPS on multimeter) for five different throttle positions.
4 Advance RPM (KPH) on dyno to next speed for five different speed steps.
Figure 3.12: Experimental procedure for power vs. air-fuel ratio
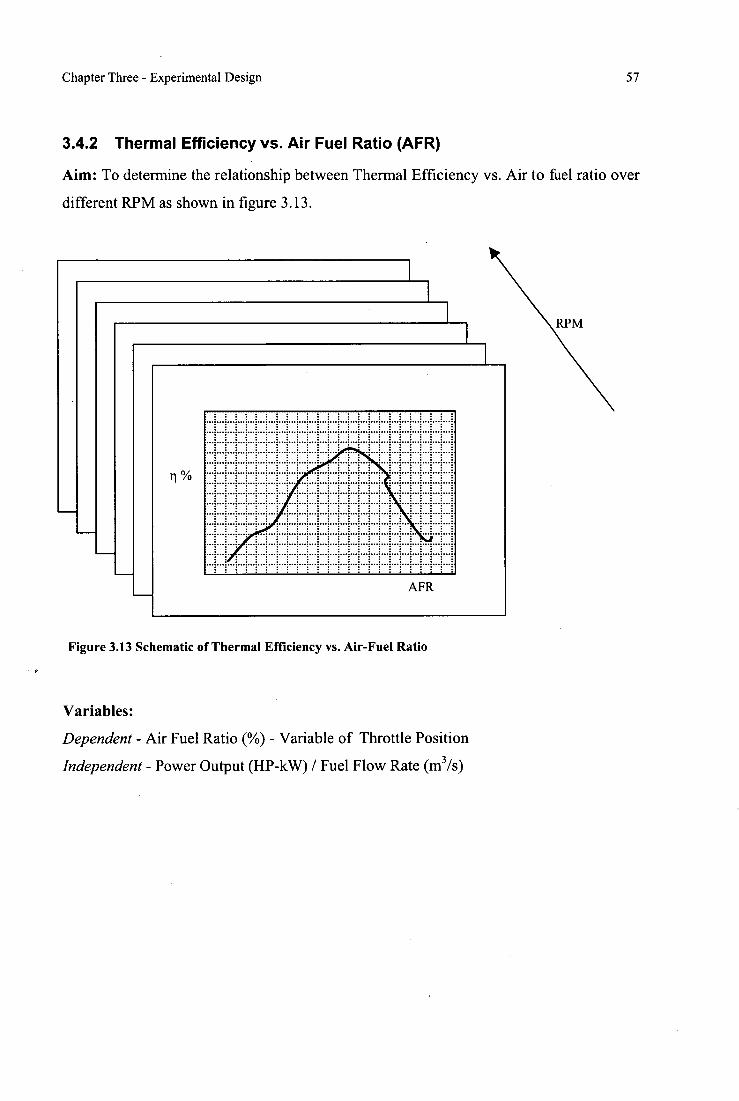
AFR
Chapter Three - Experimental Design 57
3.4.2 Thermal Efficiency vs. Air Fuel Ratio (AFR)
Aim: To determine the relationship between Thermal Efficiency vs. Air to fuel ratio over
different RPM as shown in figure 3.13.
RPM
Figure 3.13 Schematic of Thermal Efficiency vs. Air-Fuel Ratio
Variables:
Dependent - Air Fuel Ratio (%) - Variable of Throttle Position
Independent - Power Output (HP-kW) / Fuel Flow Rate (m3/s)
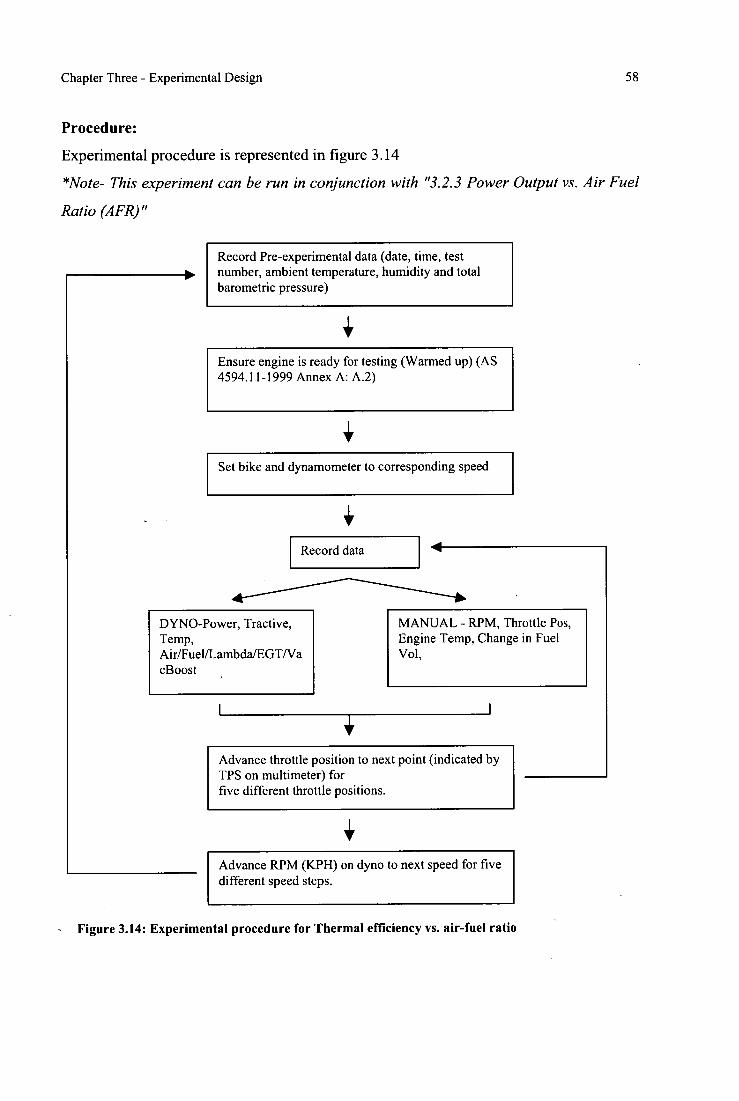
Record Pre-experimental data (date, time, test number, ambient temperature, humidity and total barometric pressure)
Ensure engine is ready for testing (Warmed up) (AS 4594.11-1999 Annex A: A.2)
Set bike and dynamometer to corresponding speed
Record data
l■
DYNO-Power, Tractive, Temp, Air/FueULambda/EGTNa cBoost
MANUAL - RPM, Throttle Pos, Engine Temp, Change in Fuel Vol,
I
I + Advance throttle position to next point (indicated by TPS on multimeter) for five different throttle positions.
Advance RPM (KPH) on dyno to next speed for five different speed steps.
Chapter Three - Experimental Design 58
Procedure:
Experimental procedure is represented in figure 3.14
*Note- This experiment can be run in conjunction with "3.2.3 Power Output vs. Air Fuel
Ratio (AFR)"
- Figure 3.14: Experimental procedure for Thermal efficiency vs. air-fuel ratio
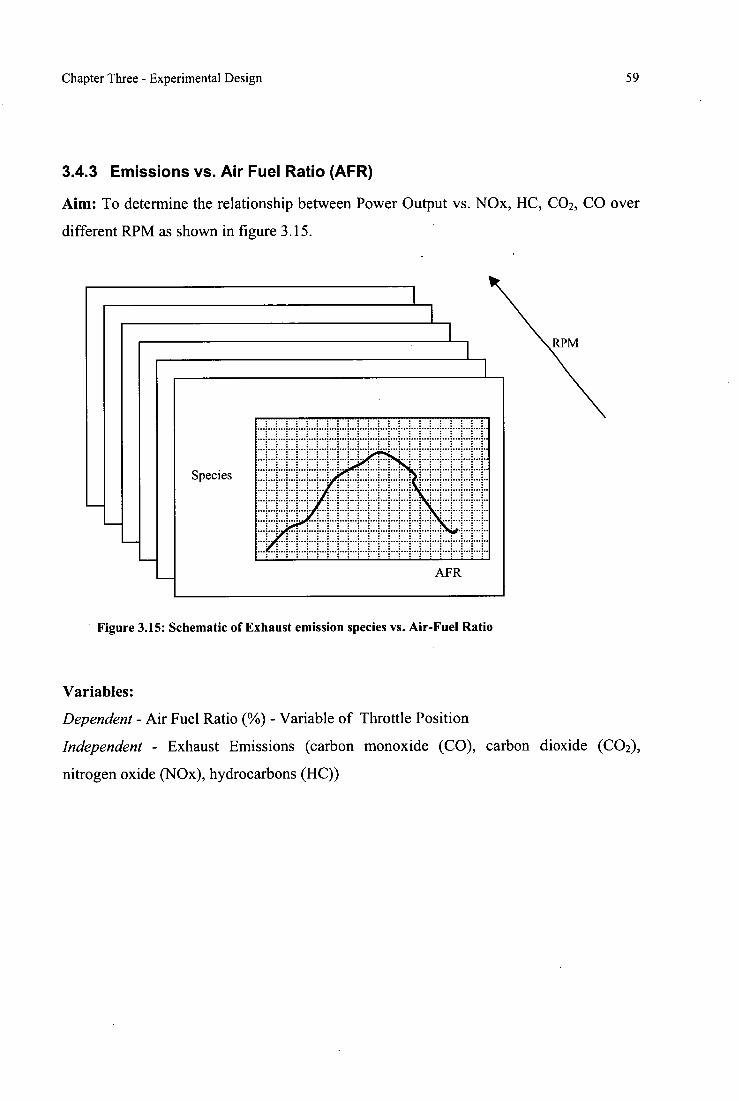
Species
AFR
Chapter Three - Experimental Design 59
3.4.3 Emissions vs. Air Fuel Ratio (AFR)
Aim: To determine the relationship between Power Output vs. NOx, HC, CO2, CO over
different RPM as shown in figure 3.15.
RPM
Figure 3.15: Schematic of Exhaust emission species vs. Air-Fuel Ratio
Variables:
Dependent - Air Fuel Ratio (%) - Variable of Throttle Position
Independent - Exhaust Emissions (carbon monoxide (CO), carbon dioxide (CO2),
nitrogen oxide (N0x), hydrocarbons (HC))
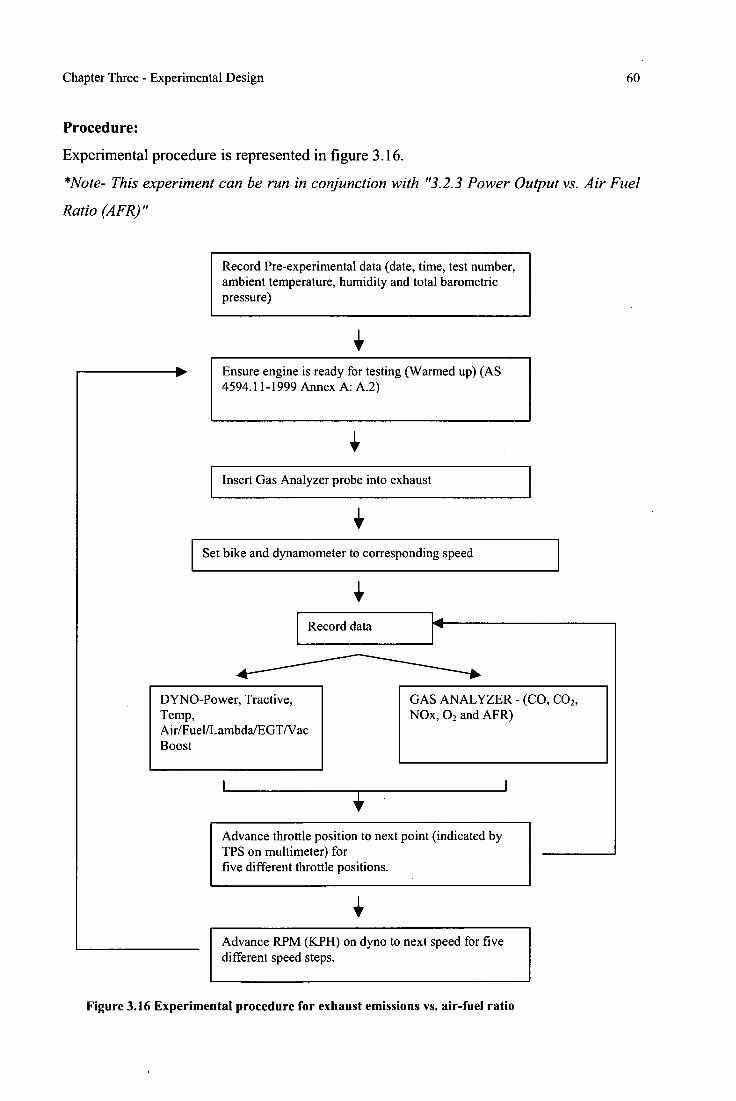
■ Ensure engine is ready for testing (Warmed up) (AS 4594.11-1999 Annex A: A.2)
Insert Gas Analyzer probe into exhaust
Set bike and dynamometer to corresponding speed
Record data
DYNO-Power, Tractive, Temp, Air/FuelfLambda/EGTNac Boost
GAS ANALYZER - (CO, CO2, NOx, 02 and AFR)
Advance throttle position to next point (indicated by TPS on multimeter) for five different throttle positions.
47 Advance RPM (KPH) on dyno to next speed for five different speed steps.
Chapter Three - Experimental Design 60
Procedure:
Experimental procedure is represented in figure 3.16.
*Note- This experiment can be run in conjunction with "3.2.3 Power Output vs. Air Fuel
Ratio (AFR)"
Record Pre-experimental data (date, time, test number, ambient temperature, humidity and total barometric pressure)
Figure 3.16 Experimental procedure for exhaust emissions vs. air-fuel ratio
Chapter Three - Experimental Design 61
3.5 Hydrogen Testing
Dynamometer testing of the converted CT110 allows for a comparison of performance
with the (original) gasoline powered engine. Such a comparison needs to be made bearing
in mind the design modifications implemented to the CT110. The hydrogen powered
CT 110 is different from the gasoline powered engine mostly in the method in which the
fuel is delivered to the engine. The vehicle as it stands for the following testing
procedures is electronically duel fuel injected with controlled variable spark timing. The
air-fuel mixture in the hydrogen engine is controlled by the amount of fuel delivered
whilst the gasoline engine controls by means of air flow.
The dependent variable in the Hydrogen testing is the throttle position rather than the air
fuel ratio. This is due to the lack of accuracy in the narrow band lambda sensor which
was used for testing. As the throttle position essentially controls the air-fuel ratio it can be
used as the dependent variable.
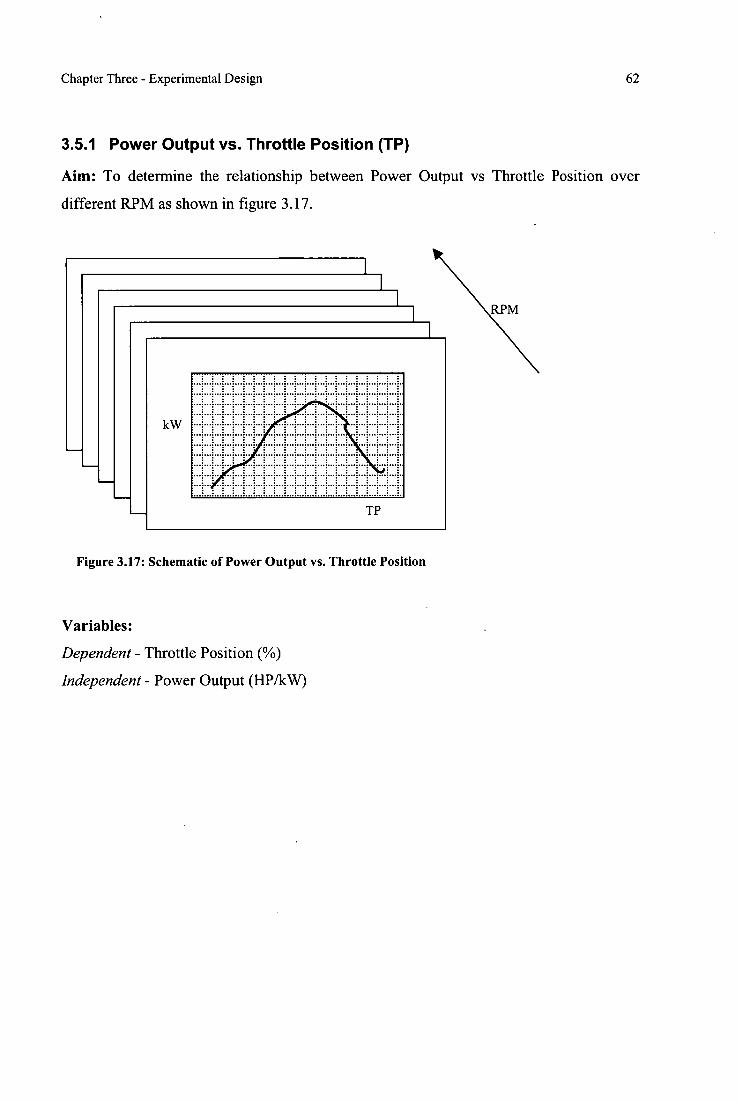
kW
TP
Chapter Three - Experimental Design 62
3.5.1 Power Output vs. Throttle Position (TP)
Aim: To determine the relationship between Power Output vs Throttle Position over
different RPM as shown in figure 3.17.
1 1
1 RPM
Figure 3.17: Schematic of Power Output vs. Throttle Position
Variables:
Dependent - Throttle Position (%)
Independent - Power Output (HP/kW)
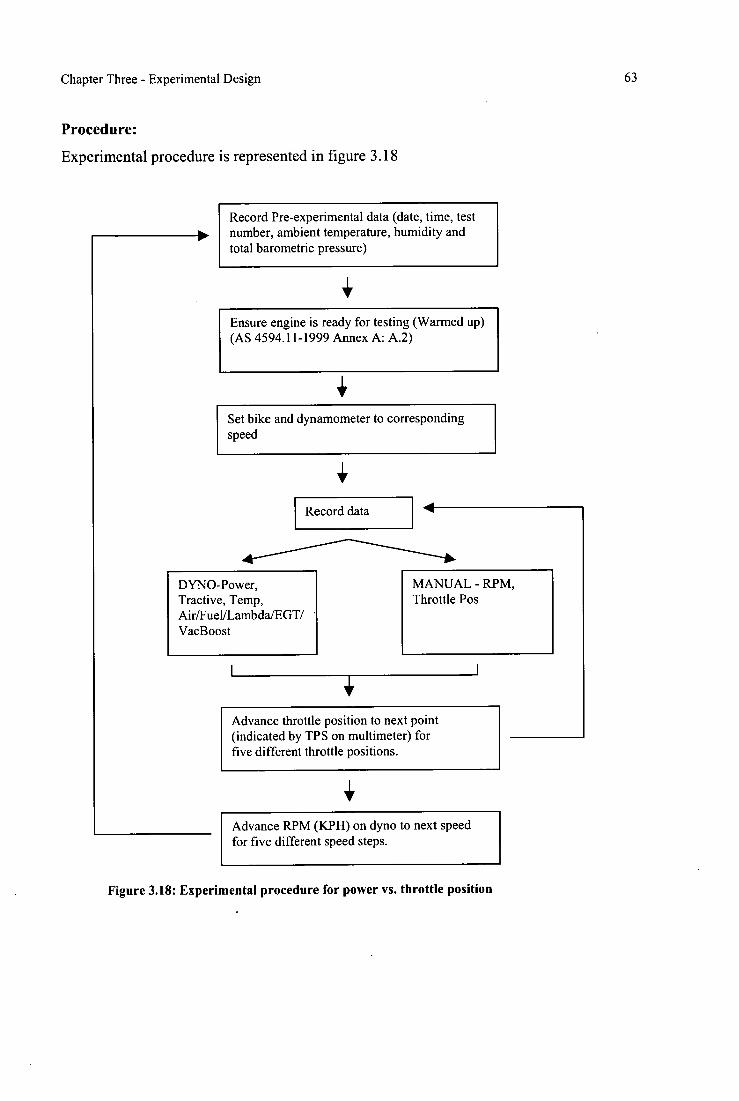
Record Pre-experimental data (date, time, test number, ambient temperature, humidity and total barometric pressure)
Ensure engine is ready for testing (Warmed up) (AS 4594.11-1999 Annex A: A.2)
Set bike and dynamometer to corresponding speed
Record data •
DYNO-Power, Tractive, Temp, Air/Fuel/Lambda/EGT/ VacBoost
MANUAL - RPM, Throttle Pos
Advance throttle position to next point (indicated by TPS on multimeter) for five different throttle positions.
Advance RPM (KPH) on dyno to next speed for five different speed steps.
Chapter Three - Experimental Design 63
Procedure:
Experimental procedure is represented in figure 3.18
Figure 3.18: Experimental procedure for power vs. throttle position
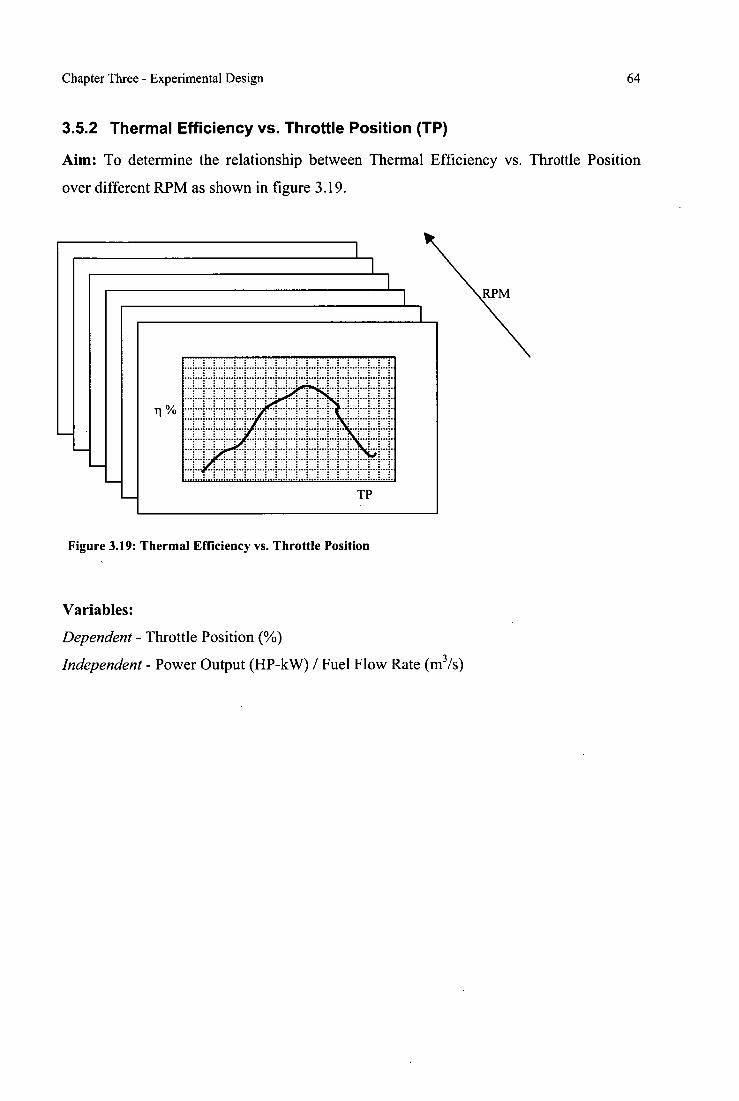
TP
1 1
1
Chapter Three - Experimental Design 64
3.5.2 Thermal Efficiency vs. Throttle Position (TP)
Aim: To determine the relationship between Thermal Efficiency vs. Throttle Position
over different RPM as shown in figure 3.19.
Figure 3.19: Thermal Efficiency vs. Throttle Position
Variables:
Dependent - Throttle Position (%)
Independent - Power Output (HP-kW) / Fuel Flow Rate (m 3/s)
RPM
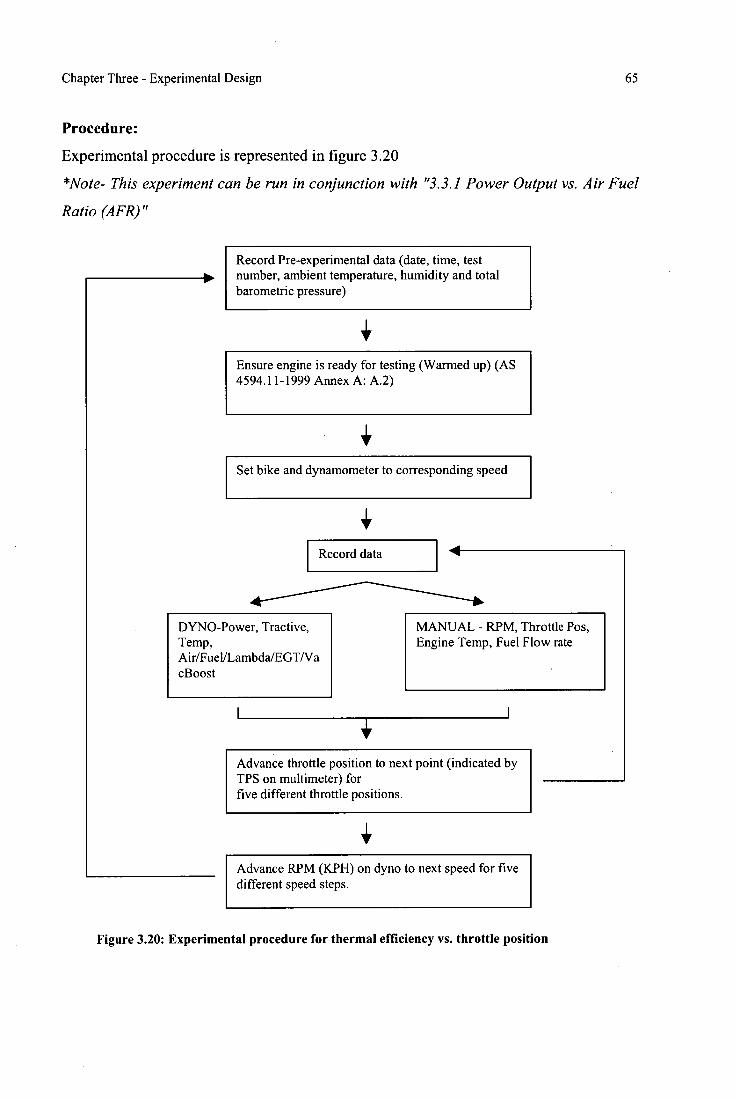
Record Pre-experimental data (date, time, test ■ number, ambient temperature, humidity and total
barometric pressure)
4, Ensure engine is ready for testing (Warmed up) (AS 4594.11-1999 Annex A: A.2)
Set bike and dynamometer to corresponding speed
Record data
DYNO-Power, Tractive, Temp, A ir/Fuel/Lambda/EGTNa cBoost
MANUAL - RPM, Throttle Pos, Engine Temp, Fuel Flow rate
1 4,
I
Advance throttle position to next point (indicated by TPS on multimeter) for five different throttle positions.
Advance RPM (KPH) on dyno to next speed for five different speed steps.
Chapter Three - Experimental Design 65
Procedure:
Experimental procedure is represented in figure 3.20
*Note- This experiment can be run in conjunction with "3.3.1 Power Output vs. Air Fuel
Ratio (AFR)"
Figure 3.20: Experimental procedure for thermal efficiency vs. throttle position
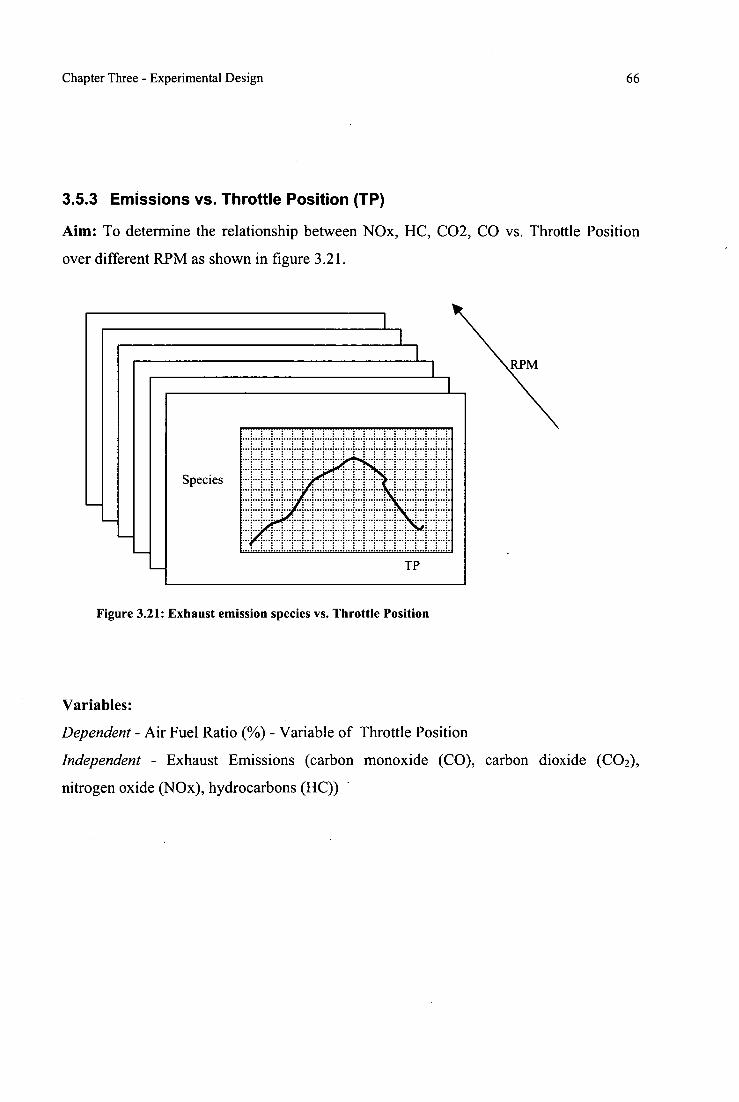
Species
TP
Chapter Three - Experimental Design 66
3.5.3 Emissions vs. Throttle Position (TP)
Aim: To determine the relationship between NOx, HC, CO2, CO vs. Throttle Position
over different RPM as shown in figure 3.21.
Figure 3.21: Exhaust emission species vs. Throttle Position
Variables:
Dependent - Air Fuel Ratio (%) - Variable of Throttle Position
Independent - Exhaust Emissions (carbon monoxide (CO), carbon dioxide (CO2),
nitrogen oxide (N0x), hydrocarbons (HC))
RPM
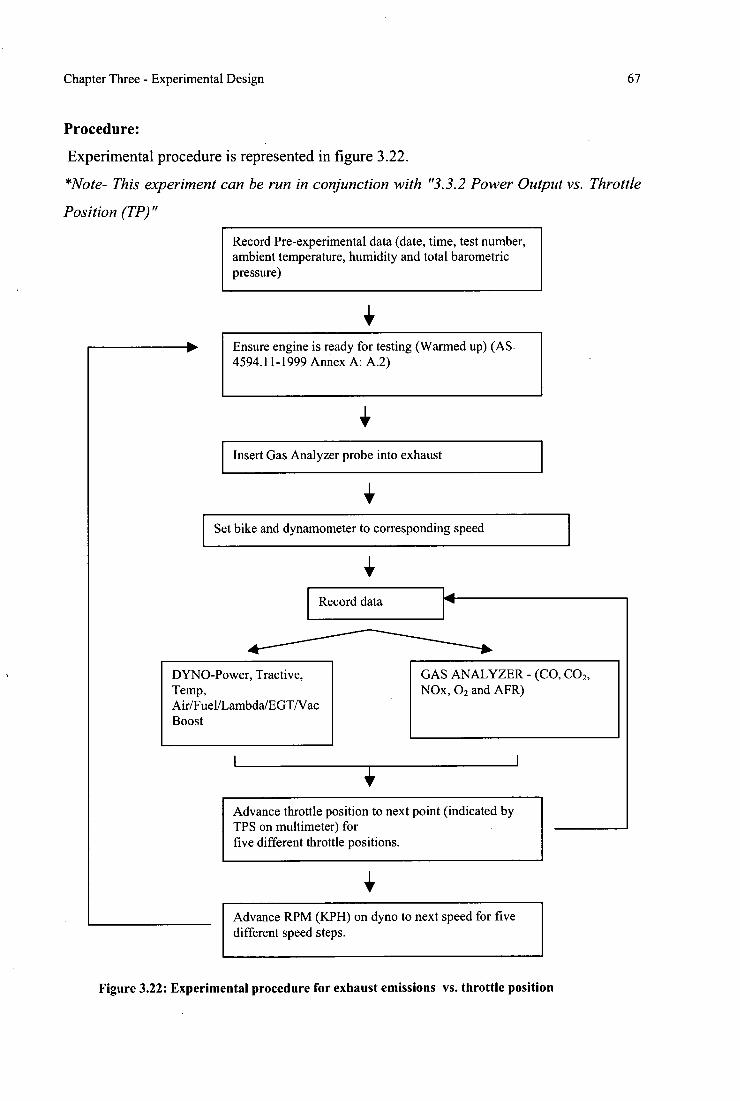
Ensure engine is ready for testing (Warmed up) (AS. 4594.11-1999 Annex A: A.2)
Insert Gas Analyzer probe into exhaust
Set bike and dynamometer to corresponding speed
Record data
DYNO-Power, Tractive, Temp, Air/Fuel/Lambda/EGTNac Boost
GAS ANALYZER - (CO, CO2, NOx, 02 and AFR)
Advance throttle position to next point (indicated by TPS on multimeter) for five different throttle positions.
Advance RPM (KPH) on dyno to next speed for five different speed steps.
Chapter Three - Experimental Design 67
Procedure:
Experimental procedure is represented in figure 3.22. *No te This experiment can be run in conjunction with "3.3.2 Power Output vs. Throttle
Position (TP)"
Record Pre-experimental data (date, time, test number, ambient temperature, humidity and total barometric pressure)
Figure 3.22: Experimental procedure for exhaust emissions vs. throttle position
Chapter Four - Vehicle conversion to Hydrogen 68
CHAPTER 4 Vehicle Conversion to Hydrogen
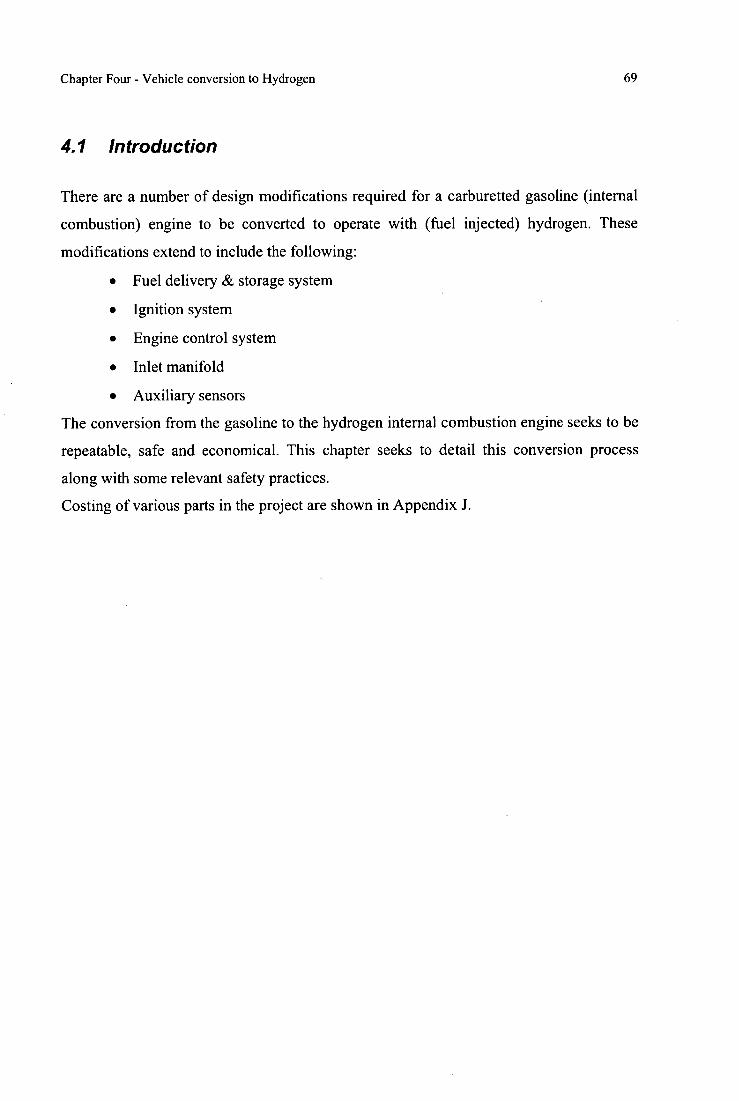
Chapter Four - Vehicle conversion to Hydrogen 69
4.1 Introduction
There are a number of design modifications required for a carburetted gasoline (internal
combustion) engine to be converted to operate with (fuel injected) hydrogen. These
modifications extend to include the following:
• Fuel delivery & storage system
• Ignition system
• Engine control system
• Inlet manifold
• Auxiliary sensors
The conversion from the gasoline to the hydrogen internal combustion engine seeks to be
repeatable, safe and economical. This chapter seeks to detail this conversion process
along with some relevant safety practices.
Costing of various parts in the project are shown in Appendix J.
Figure 4.1: Needle valve inside the carburetor
Chapter Four - Vehicle conversion to Hydrogen 70
4.2 Fuel Delivery Method
Fuel delivery methods for internal combustion engines is a well established topic [13].
The development of electronic fuel injection has meant greater control and user interface
for the fuel delivery system of a vehicle. By converting the original fuel system delivery
on the CT! 10 (carburetted) to a fuel injected one, timed delivery of the fuel can be
achieved. Additionally, the prevalence of pre-ignition can be minimized. Pre-ignition
occurs when the cylinder charge becomes ignited before the ignition by the spark plug.
Pre-ignition is considered one of the primary problems encountered in the development
of operational hydrogen engines [72].
There are 3 basic methods of fuel delivery available for an internal combustion engine.
These are carburetted port (fuel)injection or direct (fuel)-injection. These methods are
briefly discussed here along with their applicability to hydrogen internal combustion
engines.
With a carburetted fuel delivery system, a device called a carburetor mixes fuel vapor
into the (intake) air as it flows into the engine. The unconverted CT 110 uses a carburetor
to deliver gasoline to the engine. A needle valve (shown in figure 4.1) controls the
amount of fuel entering the engine.
The main functions of a carburetor are:
• to keep a small reserve of fuel;
• to vaporize the fuel and prepare a homogeneous air-
fuel mixture and
• to supply an air fuel mixture that is of suitable
stoichiometry under various load and speed
conditions.
[69]
The carburetor is seen as simple and economical option for the internal combustion
engine operation. The device requires no electronic control like other (fuel injected) fuel
delivery systems. The use of hydrogen in carburetor type systems has previously resulted
in pre-ignition due to the low ignition energy of the air fuel mixture in the inlet manifold
[72]. This rules out the use of the existing or a modified carburetor.
Chapter Four - Vehicle conversion to Hydrogen 71
In a fuel-injected engine, the fuel is injected either within the intake manifold (before the
intake valve), known as port fuel injection, or directly into the cylinder chamber, known
as direct fuel injection)
Direct fuel injection is seen as the most efficient method of delivering fuel to the engine.
With the introduction of the first commercially successful direct-injection gasoline
powered vehicle in 1996, the level of research and development into direct injection
engines has intensified [80]. From a conversion point of view the development of a direct
fuel injected hydrogen internal combustion engine would be challenging. Such a system
would require major changes to the engine block, and for successful application most
likely a redesigned engine. This is not seen to be an economically viable nor a practical
outcome.
The other and most appropriate option for fuel delivery and control in a converted
hydrogen engine is port injection. Port injection systems which tend to have less
(residual) fuel in the manifold at any one time, can minimize the effect of pre-ignition
[72].
For port injected engines, hydrogen is injected into a custom designed inlet manifold to
reduce pre-ignition and increase control. Using a control system for injection means that
hydrogen can be injected into the cylinder with more accurate timing. Injecting only
whilst the inlet valve is open will mean that little unburnt fuels can escape the chamber
prior to ignition.
A method of controlling engine power also needs to be considered. Essentially the power
can be controlled by fuel regulation, air regulation or a combination of the two. As in the
carburetted engine, power is controlled by the mass of air entering the engine. Quality
regulation was chosen as the method of control for this engine. In this method the mixture
is controlled by the amount of fuel entering the engine. Controlling engine power in this
manner allows for the removal of the air throttle valve which is a source of efficiency loss
and thus running the engine in a wide open throttle manner. Quality regulation also takes
advantage of hydrogen's wide flammability limits by giving the engine the ability to be
operated at a wide range of air-fuel mixtures. Literature on hydrogen engines tends to
support quality control as the best method of fuel control over air throttle control.
Chapter Four - Vehicle conversion to Hydrogen 72
To convert the fuel delivery system to port injected (hydrogen), the following
components are needed.
4.2.1 Fuel Lines
Selected fuel lines have to have the following properties:
• be able to withstand pressures (between 100-500kPa);
• have the ability to withstand temperatures of that of the engine and exhaust
system (engine temperatures up to 165°C and above 200°C for exhaust as
seen in Appendix G);
• durability (have the ability to withstand knocks without puncturing or
leaking);
• be able to withstand the effects of Hydrogen embrittlement.;
• be readily available and replaceable.
There were two types of fuel lines used in this investigation. For hosing to the inlet
manifold and other engine hosing stainless steel braided hose was used. This hose is
particularly resistant to engine temperatures, leakage, physical damage and hydrogen
embrittlement. For testing Teflon rubber hose was used to connect between the cylinders,
flow boar. and the engine. The hose was rated to withstand 10 bar of pressure; five times
that of the operating conditions. This hose is also resistant to environmental temperatures,
possible physical damage and hydrogen embrittlement.
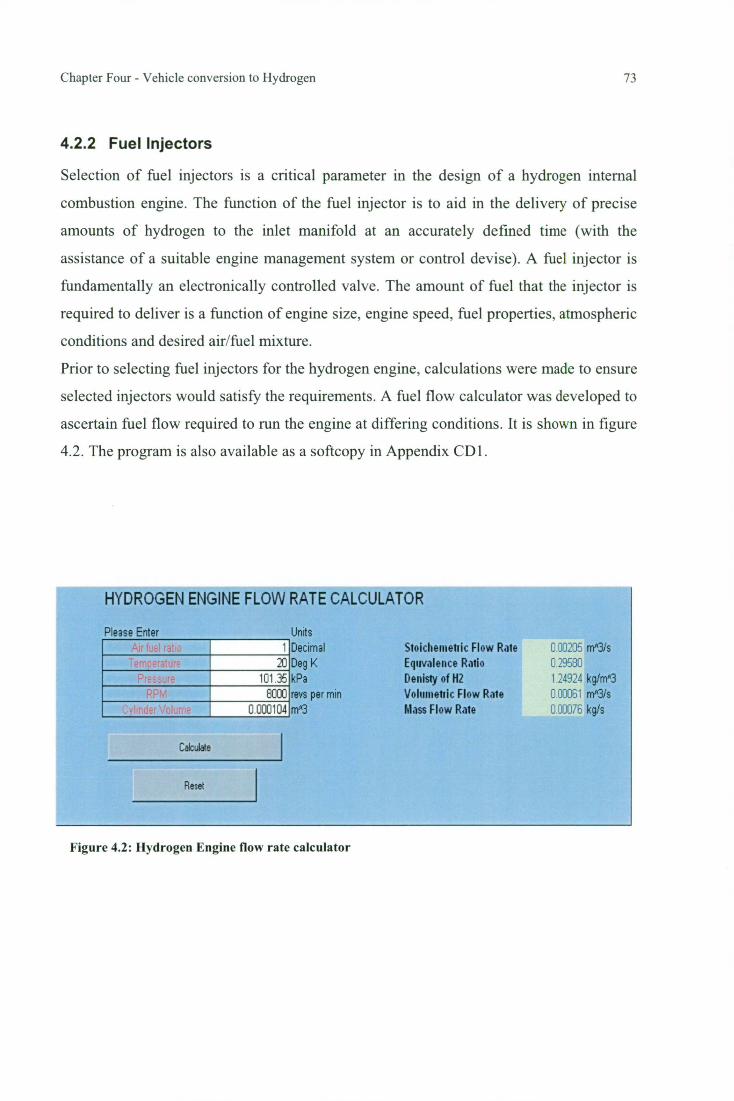
Chapter Four - Vehicle conversion to Hydrogen 73
4.2.2 Fuel Injectors
Selection of fuel injectors is a critical parameter in the design of a hydrogen internal
combustion engine. The function of the fuel injector is to aid in the delivery of precise
amounts of hydrogen to the inlet manifold at an accurately defined time (with the
assistance of a suitable engine management system or control devise). A fuel injector is
fundamentally an electronically controlled valve. The amount of fuel that the injector is
required to deliver is a function of engine size, engine speed, fuel properties, atmospheric
conditions and desired air/fuel mixture.
Prior to selecting fuel injectors for the hydrogen engine, calculations were made to ensure
selected injectors would satisfy the requirements. A fuel flow calculator was developed to
ascertain fuel flow required to run the engine at differing conditions. It is shown in figure
4.2. The program is also available as a softcopy in Appendix CD1.
HYDROGEN ENGINE FLOW RATE CALCULATOR
Please Enter Units Decimal Stoichenienic Flow Rate mA3Is
20 Deg K Eqiivalence Ratio 0.29E61_ 101.35 kPa Deivisty of H2 1.24924 k gi rnA3
0000 revs per min Volanietlic Flow Rate 0.00061 mA3/s 1:100 104 mA3 lvlass Flow Rate 0 00076 kg/s
Calculae
Rv;et
Figure 4.2: Hydrogen Engine flow rate calculator
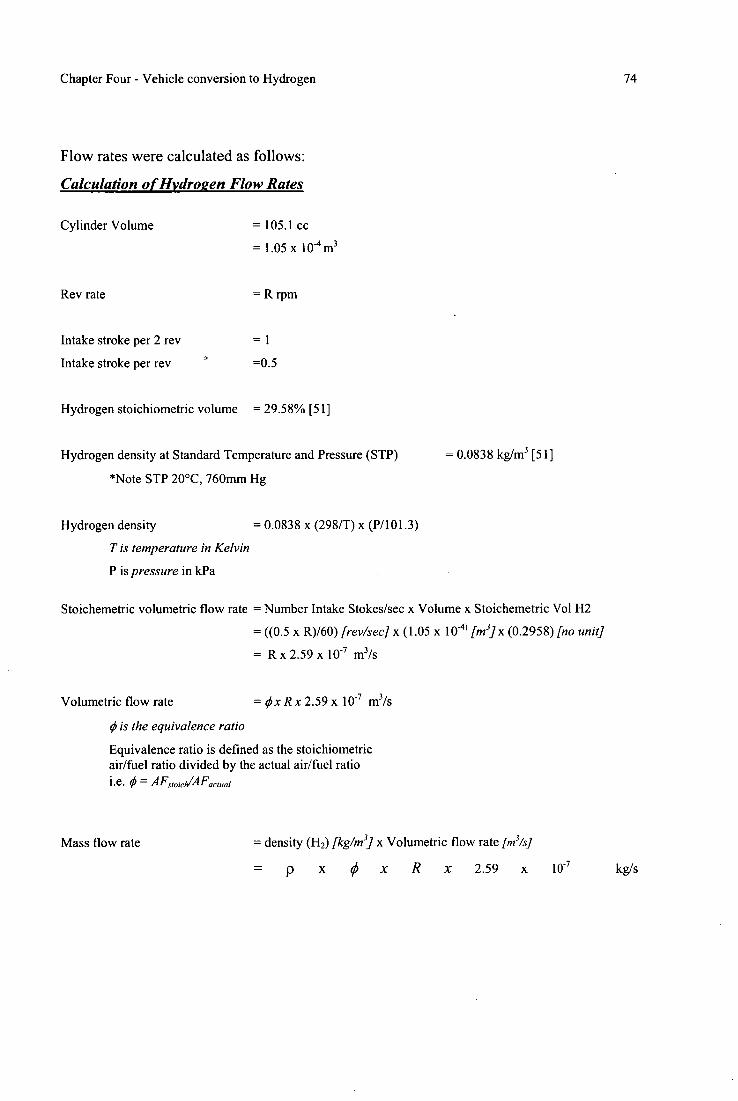
Chapter Four - Vehicle conversion to Hydrogen 74
Flow rates were calculated as follows:
Calculation of Hydro2en Flow Rates
Cylinder Volume = 105.1 cc
= 1.05 x 10⁴ m3
Rev rate = R rpm
Intake stroke per 2 rev = 1
Intake stroke per rev =0.5
Hydrogen stoichiometric volume = 29.58% [51]
Hydrogen density at Standard Temperature and Pressure (STP) = 0.0838 kg/m3 [51]
*Note STP 20°C, 760mm Hg
Hydrogen density = 0.0838 x (298/T) x (P/101.3)
T is temperature in Kelvin
P is pressure in kPa
Stoichemetric volumetric flow rate = Number Intake Stokes/sec x Volume x Stoichemetric Vol H2
= ((0.5 x R)/60) [rev/sec] x (1.05 x le [m3] x (0.2958) [no unit]
= R x 2.59 x le m 3/s
Volumetric flow rate = Ox R x 2.59 x 10 -7 m3/s
0 is the equivalence ratio
Equivalence ratio is defined as the stoichiometric air/fuel ratio divided by the actual air/fuel ratio i.e. 0 = AFstoo/AFacwai
Mass flow rate = density (H2) [kg/m 3] x Volumetric flow rate [m3/4
= p x 0 x R x 2.59 x iø4 kg/s
Chapter Four - Vehicle conversion to Hydrogen 75
From these calculations it can be seen that there are a number of factors affecting the
flow rate of fuel. These include engine parameters and atmospheric conditions which are
essentially uncontrollable. There are also a number of engine parameters which can be
controlled such as air fuel ratio and RPM. To initially determine the number of fuel
injectors, the extreme case of the highest engine RPM and richest engine mix (within the
flammability limits of hydrogen) were used. This approach gives the operational
flexibility of running the engine at over all possible conditions within the RPM range
allowed and also provides for future research and development to be undertaken.
Due to the low density of hydrogen, compared to liquid transport fuels, a relatively high
flow injector must be utilized. Liquid (fuel) injectors can suffer from premature failure
and orifice contamination if used with gaseous fuels. Additionally, injectors designed for
liquid are not capable of delivering the appropriate flow rates if gases are used. Gaseous
fuel injectors are generally designed to work with natural gas, propane and hydrogen in
internal combustion engines.
A limited number of manufacturers supply gaseous fuel injectors, one of which is
Quantum Technologies. This company can supply high flow gaseous injectors used with
hydrogen (model 100078 shown in Appendix Cl). However, it should be noted that
whilst these injectors have been used with hydrogen, they are not specifically designed
for this gas but have nevertheless been applied to many hydrogen vehicles such as the
Ford Model U SUV [1].
The Quantum 100078 injector selected is advantageous in that:
• it utilizes standard injector electrical connector and control;
• is easily adapted to port injection;
• it offers flexibility of both high and low flow rates;
The Quantum fuel injector claims Hydrogen flow rates of 0.8 g/s at 70-80 psi. It was
calculated for these to work that at 8000 rpm (which was determined to be maximum
RPM during baseline testing) a short injection of 1.25 g/s of hydrogen gas would be
required. From these calculations the best solution was to install two injectors.
Furthermore, it is more desirable to have small pulse width (amount of time injector is
open for) in large injectors rather than having small injectors open for longer periods of
Chapter Four - Vehicle conversion to Hydrogen 76
time. With smaller pulse widths the amount of fuel entering the cylinder can be more
precisely controlled.
4.2.3 Ignition System
The ignition system of an engine has three main purposes. Firstly, it must generate an
electric spark that has enough energy to ignite the air-fuel mixture in the chamber.
Secondly, it must maintain that spark long enough to allow all air/fuel to ignite. Thirdly,
it must deliver the spark in a timely manner to the cylinder, so combustion can occur at
the precisly correct time with regards to piston position. This is to optimize the thermal
efficiency of the engine and ensure smooth operation.
All ignition systems consist of a primary (low voltage) and secondary circuit (high
voltage).
Depending on the type of ignition required, components of the primary circuit include
• Battery
• Ignition Switch
• Ignition Coil (primary winding)
• Triggering Device
The secondary circuit includes these components
• Ignition coil (secondary winding)
• Ignition (spark plug) cables
• Spark Plugs
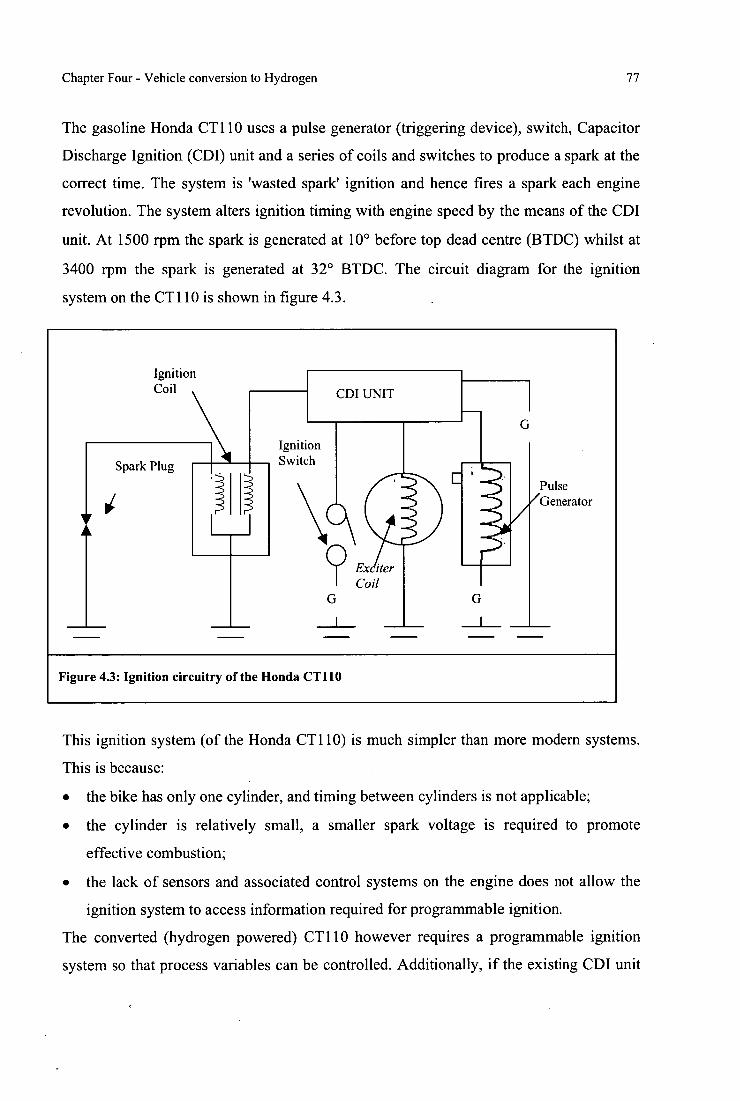
Chapter Four - Vehicle conversion to Hydrogen 77
The gasoline Honda CT 110 uses a pulse generator (triggering device), switch, Capacitor
Discharge Ignition (CDI) unit and a series of coils and switches to produce a spark at the
correct time. The system is 'wasted spark' ignition and hence fires a spark each engine
revolution. The system alters ignition timing with engine speed by the means of the CDI
unit. At 1500 rpm the spark is generated at 10° before top dead centre (BTDC) whilst at
3400 rpm the spark is generated at 32° BTDC. The circuit diagram for the ignition
system on the CT 110 is shown in figure 4.3.
Ignition
Coil
CDI UNIT
G
Ignition Switch
Spark Plug
)
Pulse Generator
G
G
Figure 4.3: Ignition circuitry of the Honda CT110
This ignition system (of the Honda CT110) is much simpler than more modern systems.
This is because:
• the bike has only one cylinder, and timing between cylinders is not applicable;
• the cylinder is relatively small, a smaller spark voltage is required to promote
effective combustion;
• the lack of sensors and associated control systems on the engine does not allow the
ignition system to access information required for programmable ignition.
The converted (hydrogen powered) CT 110 however requires a programmable ignition
system so that process variables can be controlled. Additionally, if the existing CDT unit
Chapter Four - Vehicle conversion to Hydrogen 78
was used wasted spark ignition would be employed. This would be a source of pre-
ignition as the engine would be sparking during the exhaust stoke as well as the prior to
the power stroke. Due to this the system needs to be replaced with a more complex
system that avoids unwanted sparking.
The chosen replacement is a high-energy inductive ignition system. Commercially
available (replacement) CDI units are not generally designed for single cylinder engines.
The use of a Bosch ignition module (model number 1 227 022 008 shown in Appendix
C3) and Bosch ignition coil (MEC 717 shown in Appendix C2)) was therefore necessary
a more compatible, replaceable, cost effective and available method of ignition. The
compatibility of the new ignition system with the MoTec engine management system
(detailed below) was also one of the major advantages of the Bosch ignition module and
coil configuration.
High energy inductive ignition systems are common on most modern road vehicles. Their
spark energy is similar to that of CDI but they offer a longer spark duration, which may
promote better combustion at low engine speeds.
Due to the single cylinder ignition distributorless (direct fire) ignition can be employed.
The existing spark plug (NGK DR8ES-L) was used with a new ignition lead installed
along with the system. The existing lead was attached to the coil from the original CT 110
coil and hence a new lead was required. The spark plug gap was reduced slightly (0.7mm
to 0.5mm), as the energy required to ignite a hydrogen mixture is less than that of the
gasoline charge.
Chapter Four - Vehicle conversion to Hydrogen 79
4.2.4 Inlet Manifold Design
Pre ignition and backfiring of fuel in hydrogen engines is a well known problem. Pre-
ignition can be minimized with several design techniques. The low ignition energy of
hydrogen means that care must be taken to avoid the air-fuel mixture contacting sources
of ignition such as hot spots prior to entering the cylinder.
Assisting the design of the inlet manifold was data attained in the baseline testing.
Surface temperatures of the gasoline inlet manifold was recorded at full load and engine
speed so effective heat transfer design could be applied to the new design. The
temperature distribution is shown in Appendix F.
Flow patterns of gas in the manifold must ensure that hydrogen does not gather in any
area of the inlet. To combat this problem manifold design includes proximity, angular
and flow considerations. Also the design must fit into the limited space available and
combat the harsh atmospheric and environmental factors. The design was first established
using plastacine-modeling clay to ensure the final design would fit into the required area.
The current design incorporates the duel injectors and air intake into a single piece.
Design views are shown in figures 4.4-4.7.
Injectors are orientated so as to spray hydrogen directly towards the inlet valves at the top
of the cylinder. The injectors are positioned as close to the cylinder as possible to
minimize unnecessary contact with potential hot spots prior to reaching the cylinder. This
is the most critical parameter in inlet manifold design. The further the gas has to travel to
the cylinder the longer its potential be affected by conditions (such as high temperatures)
and pre-ignite.
Due to availability, compatibility with hydrogen [78] and heat transfer characteristics
Aluminum was used as the material for the fabrication.
Attached to the air intake is a butterfly valve which is used during start up and idling
shown in figure 4.11.
Between the engine block and the manifold and between the manifold and the choke
plastic gaskets were used to minimize heat transfer between the individual parts.
Significant heat transfer to the manifold from the engine block could cause frequent pre-
ignition through the air inlet.
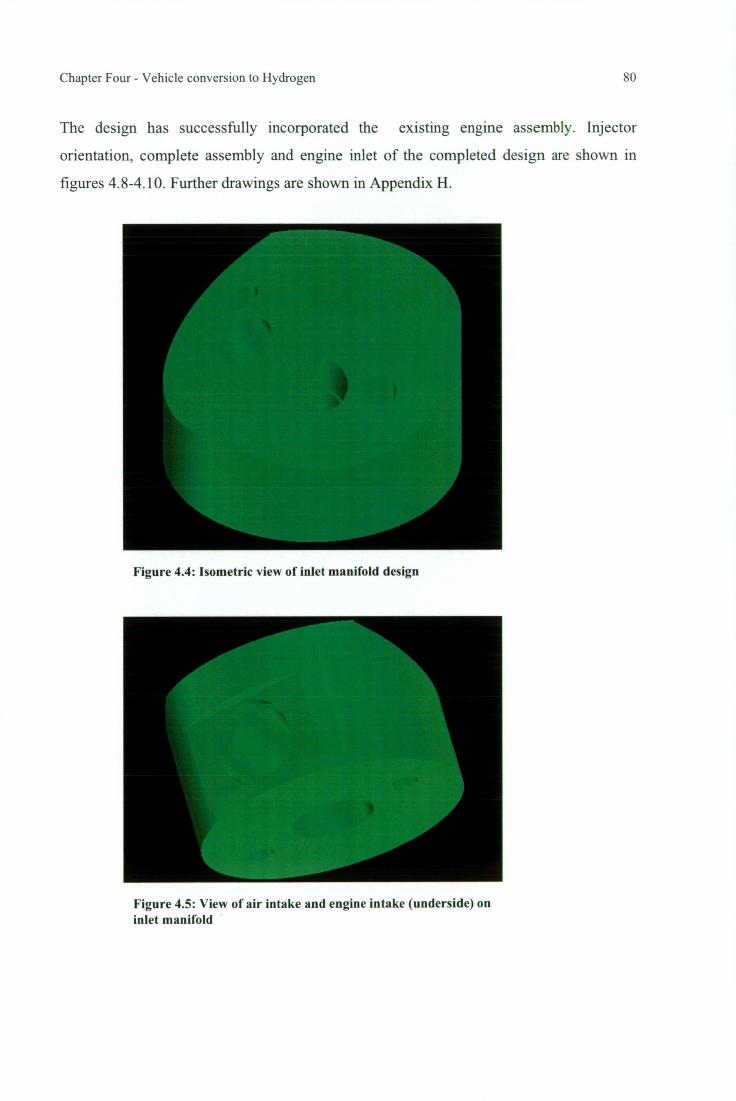
Chapter Four - Vehicle conversion to Hydrogen 80
The design has successfully incorporated the existing engine assembly. Injector
orientation, complete assembly and engine inlet of the completed design are shown in
figures 4.8-4.10. Further drawings are shown in Appendix H.
Figure 4.4: Isometric view of inlet manifold design
Figure 4.5: View of air intake and engine intake (underside) on inlet manifold
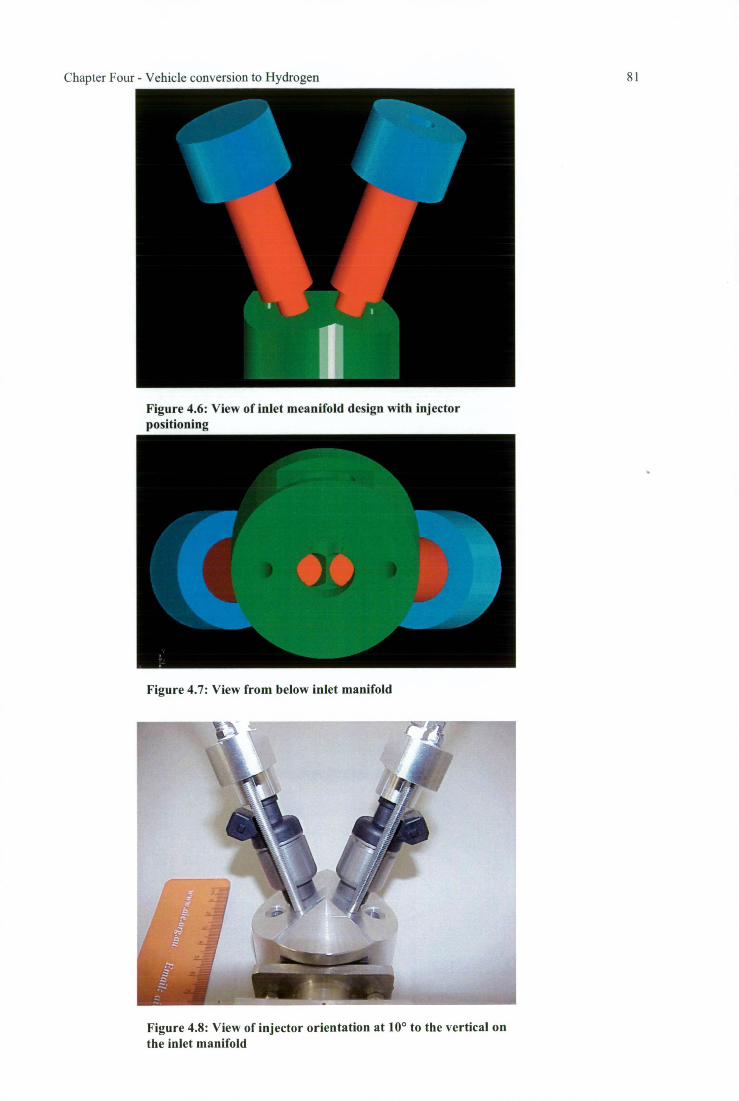
Figure 4.7: View from below inlet manifold
611.11. 1111111 imommosii
Chapter Four - Vehicle conversion to Hydrogen 81
Figure 4.6: View of inlet meanifold design with injector positioning
Figure 4.8: View of injector orientation at 10 0 to the vertical on the inlet manifold
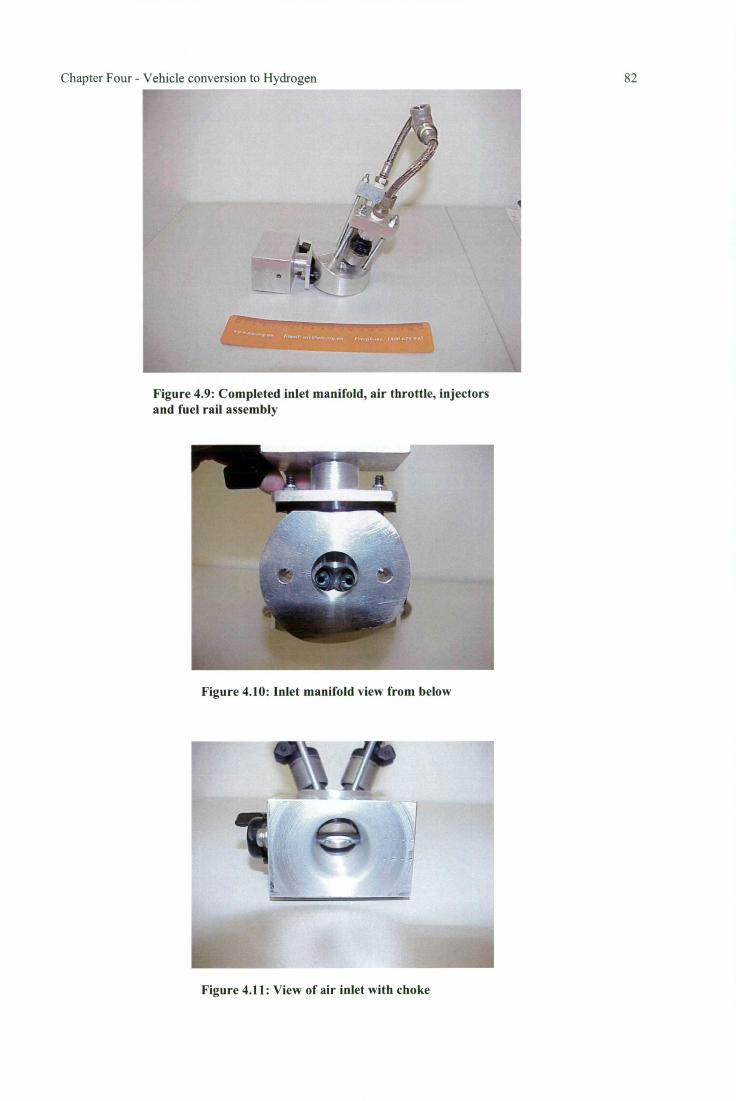
Chapter Four - Vehicle conversion to Hydrogen 82
Figure 4.9: Completed inlet manifold, air throttle, injectors and fuel rail assembly
Figure 4.10: Inlet manifold view from below
Figure 4.11: View of air inlet with choke
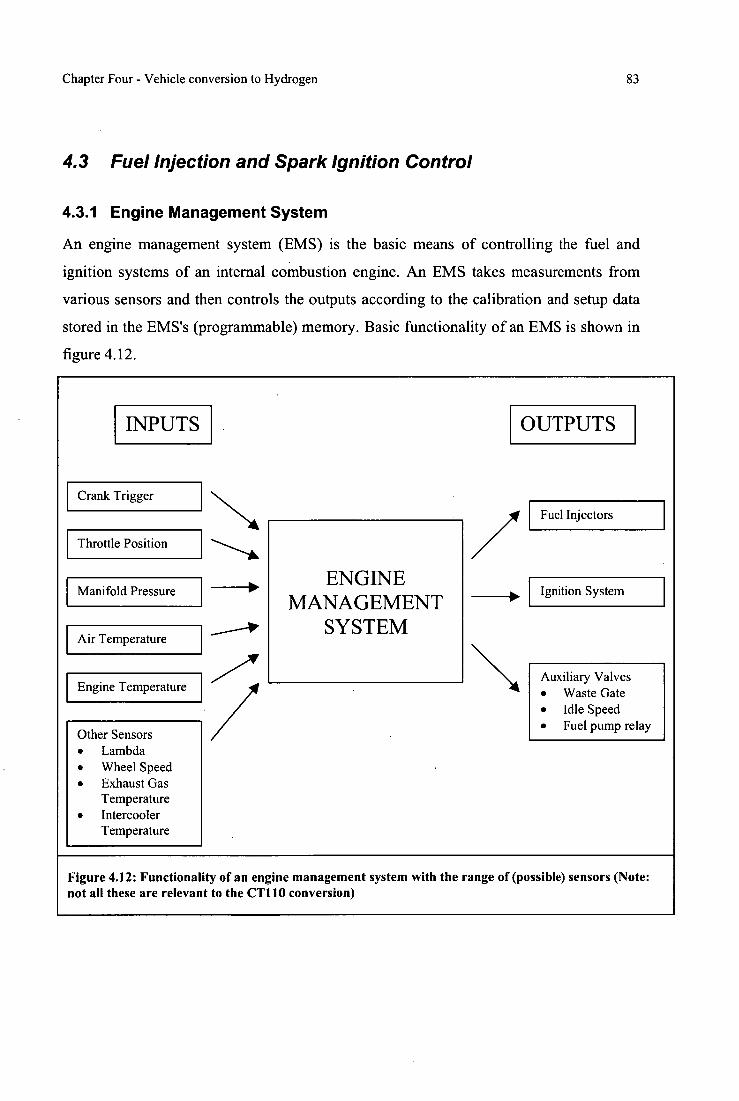
-■
\ Auxiliary Valves • Waste Gate • Idle Speed • Fuel pump relay
Fuel Injectors
Ignition System ENGINE
MANAGEMENT SYSTEM
Other Sensors • Lambda • Wheel Speed • Exhaust Gas
Temperature • Intercooler
Temperature
Engine Temperature
Air Temperature
Manifold Pressure
Crank Trigger
Throttle Position
Chapter Four - Vehicle conversion to Hydrogen 83
4.3 Fuel Injection and Spark Ignition Control
4.3.1 Engine Management System
An engine management system (EMS) is the basic means of controlling the fuel and
ignition systems of an internal combustion engine. An EMS takes measurements from
various sensors and then controls the outputs according to the calibration and setup data
stored in the EMS's (programmable) memory. Basic functionality of an EMS is shown in
figure 4.12.
INPUTS
OUTPUTS
Figure 4.12: Functionality of an engine management system with the range of (possible) sensors (Note: not all these are relevant to the CT110 conversion)
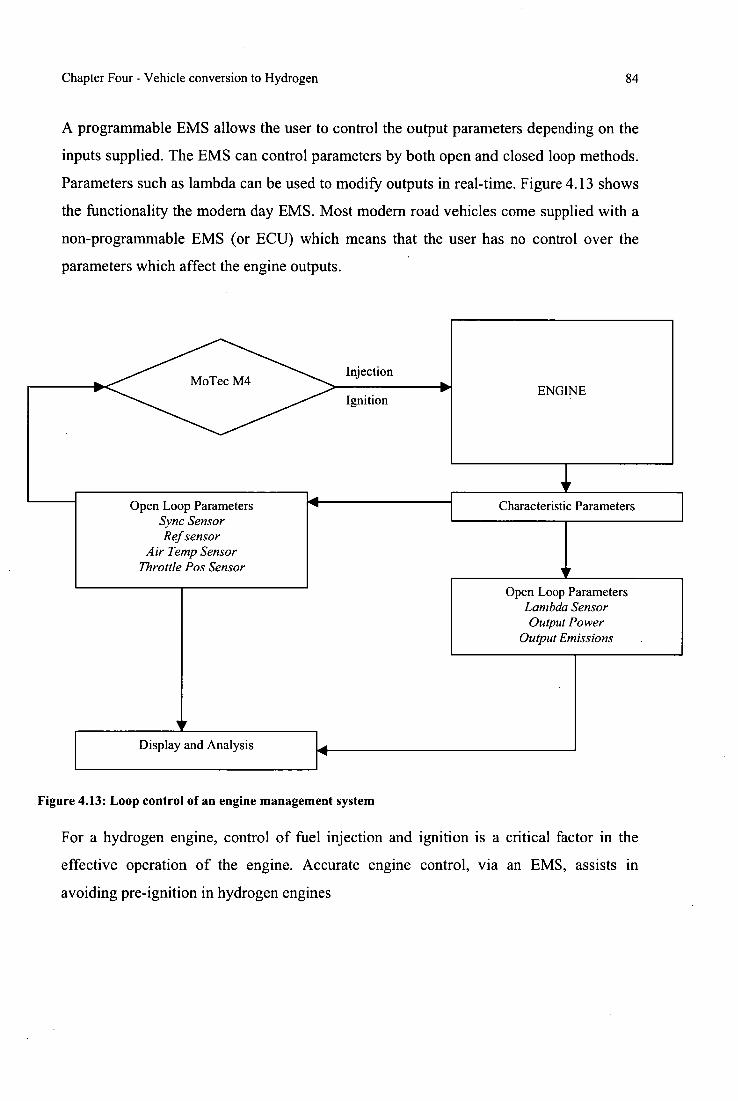
Characteristic Parameters Open Loop Parameters Sync Sensor Ref sensor
Air Temp Sensor Throttle Pos Sensor
ENGINE
Open Loop Parameters Lambda Sensor Output Power
Output Emissions
V Display and Analysis
Chapter Four - Vehicle conversion to Hydrogen 84
A programmable EMS allows the user to control the output parameters depending on the
inputs supplied. The EMS can control parameters by both open and closed loop methods.
Parameters such as lambda can be used to modify outputs in real-time. Figure 4.13 shows
the functionality the modern day EMS. Most modern road vehicles come supplied with a
non-programmable EMS (or ECU) which means that the user has no control over the
parameters which affect the engine outputs.
Figure 4.13: Loop control of an engine management system
For a hydrogen engine, control of fuel injection and ignition is a critical factor in the
effective operation of the engine. Accurate engine control, via an EMS, assists in
avoiding pre-ignition in hydrogen engines
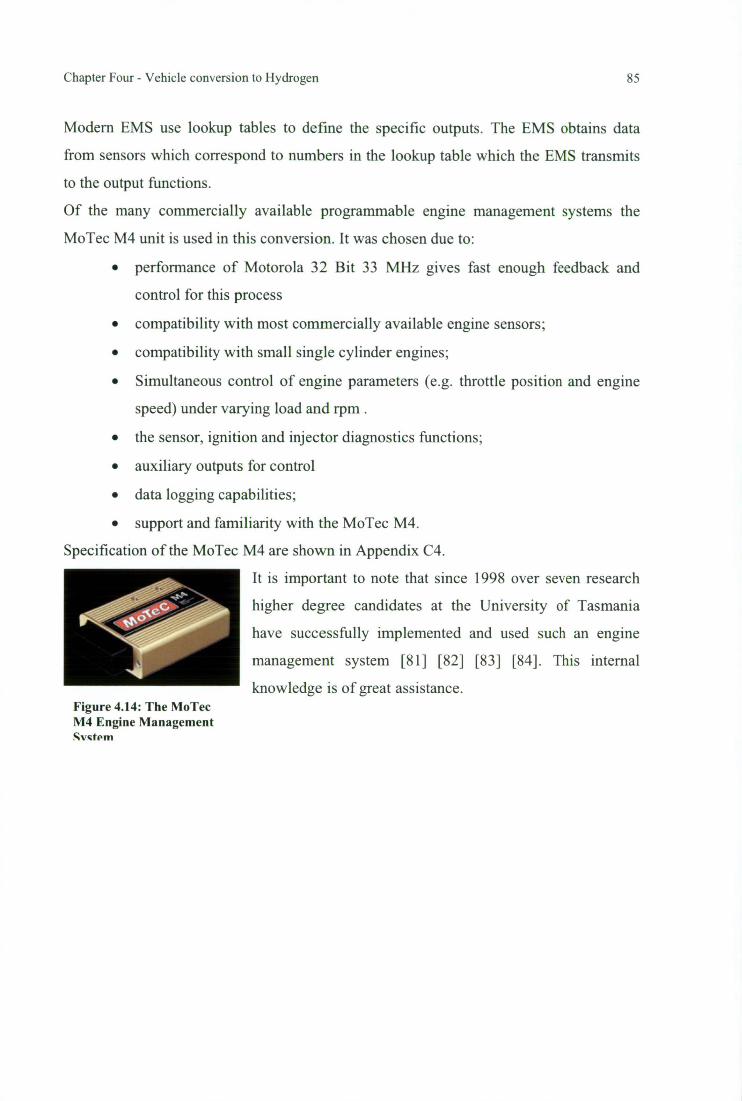
Chapter Four - Vehicle conversion to Hydrogen 85
Modern EMS use lookup tables to define the specific outputs. The EMS obtains data
from sensors which correspond to numbers in the lookup table which the EMS transmits
to the output functions.
Of the many commercially available programmable engine management systems the
MoTec M4 unit is used in this conversion. It was chosen due to:
• performance of Motorola 32 Bit 33 MHz gives fast enough feedback and
control for this process
• compatibility with most commercially available engine sensors;
• compatibility with small single cylinder engines;
• Simultaneous control of engine parameters (e.g. throttle position and engine
speed) under varying load and rpm.
• the sensor, ignition and injector diagnostics functions;
• auxiliary outputs for control
• data logging capabilities;
• support and familiarity with the MoTec M4.
Specification of the MoTec M4 are shown in Appendix C4.
It is important to note that since 1998 over seven research
higher degree candidates at the University of Tasmania
have successfully implemented and used such an engine
management system [81] [82] [83] [84]. This internal
knowledge is of great assistance. Figure 4.14: The MoTec M4 Engine Management Svctem
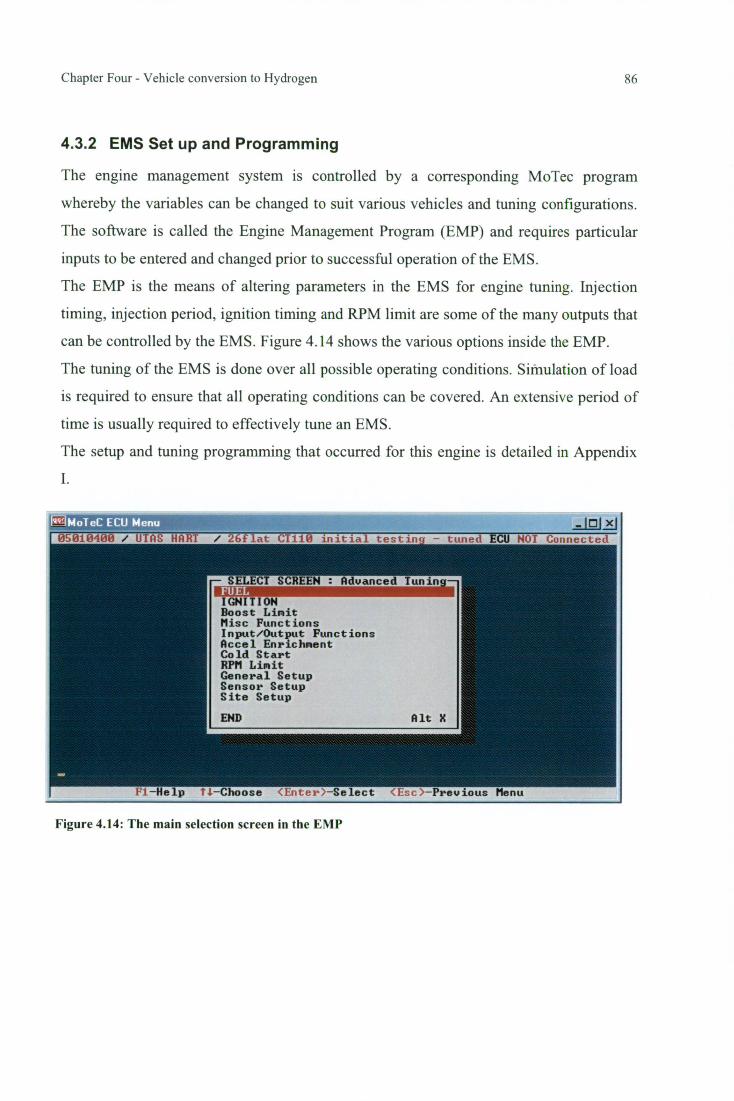
Chapter Four - Vehicle conversion to Hydrogen 86
4.3.2 EMS Set up and Programming
The engine management system is controlled by a corresponding MoTec program
whereby the variables can be changed to suit various vehicles and tuning configurations.
The software is called the Engine Management Program (EMP) and requires particular
inputs to be entered and changed prior to successful operation of the EMS.
The EMP is the means of altering parameters in the EMS for engine tuning. Injection
timing, injection period, ignition timing and RPM limit are some of the many outputs that
can be controlled by the EMS. Figure 4.14 shows the various options inside the EMP.
The tuning of the EMS is done over all possible operating conditions. Simulation of load
is required to ensure that all operating conditions can be covered. An extensive period of
time is usually required to effectively tune an EMS.
The setup and tuning programming that occurred for this engine is detailed in Appendix
I.
..„111:1 0501040s / UTAS HART / 26flat CT110 initial testin – tuned
NOT Connected
— S ELECT EIXCT S n —
IGNITION Boost Limit Misc Functions Input/Output Functions Accel Enrichment Cold Start RPM Limit General Setup Sensor Setup Site Setup
END Alt X
p 11– , osee <Ent >–. sc>–Previous Menu
Figure 4.14: The main selection screen in the EMP
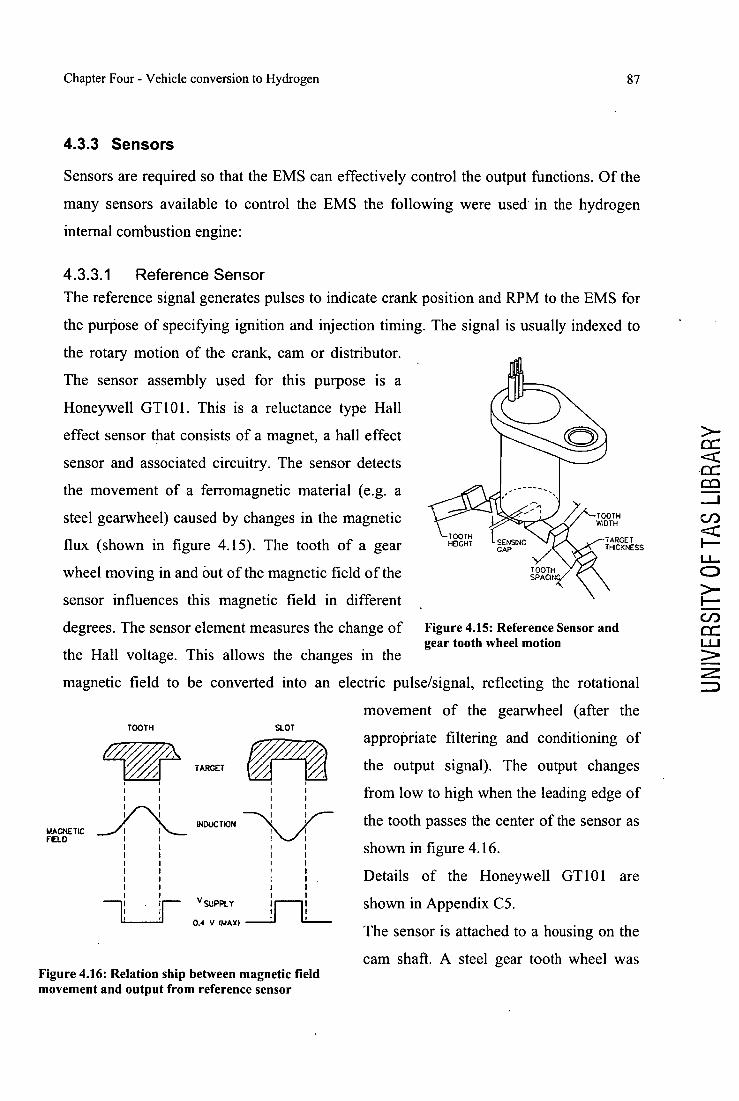
A-TOOTH / WIDTH
TOOTH HEIGHT SENSING
GAP TARGET TI-IICKNESS
TOOTH SPACIN
TARGET
INDUCTION
Chapter Four - Vehicle conversion to Hydrogen 87
4.3.3 Sensors
Sensors are required so that the EMS can effectively control the output functions. Of the
many sensors available to control the EMS the following were used in the hydrogen
internal combustion engine:
4.3.3.1 Reference Sensor
The reference signal generates pulses to indicate crank position and RPM to the EMS for
the purpose of specifying ignition and injection timing. The signal is usually indexed to
the rotary motion of the crank, cam or distributor.
The sensor assembly used for this purpose is a
Honeywell GT101. This is a reluctance type Hall
effect sensor that consists of a magnet, a hall effect
sensor and associated circuitry. The sensor detects
the movement of a ferromagnetic material (e.g. a
steel gearwheel) caused by changes in the magnetic
flux (shown in figure 4.15). The tooth of a gear
wheel moving in and Out of the magnetic field of the
sensor influences this magnetic field in different
degrees. The sensor element measures the change of Figure 4.15: Reference Sensor and gear tooth wheel motion
the Hall voltage. This allows the changes in the
magnetic field to be converted into an electric pulse/signal, reflecting the rotational
movement of the gearwheel (after the TOOTH
SLOT appropriate filtering and conditioning of
the output signal). The output changes
from low to high when the leading edge of
the tooth passes the center of the sensor as
shown in figure 4.16.
Details of the Honeywell GT101 are
L_ shown in Appendix C5.
The sensor is attached to a housing on the
cam shaft. A steel gear tooth wheel was Figure 4.16: Relation ship between magnetic field movement and output from reference sensor
MAGNE TIC FIELD
v SUPPL Y I 0.0 V WAY/
UNIV
ERSIT
Y OF
TAS L
IBRA
RY
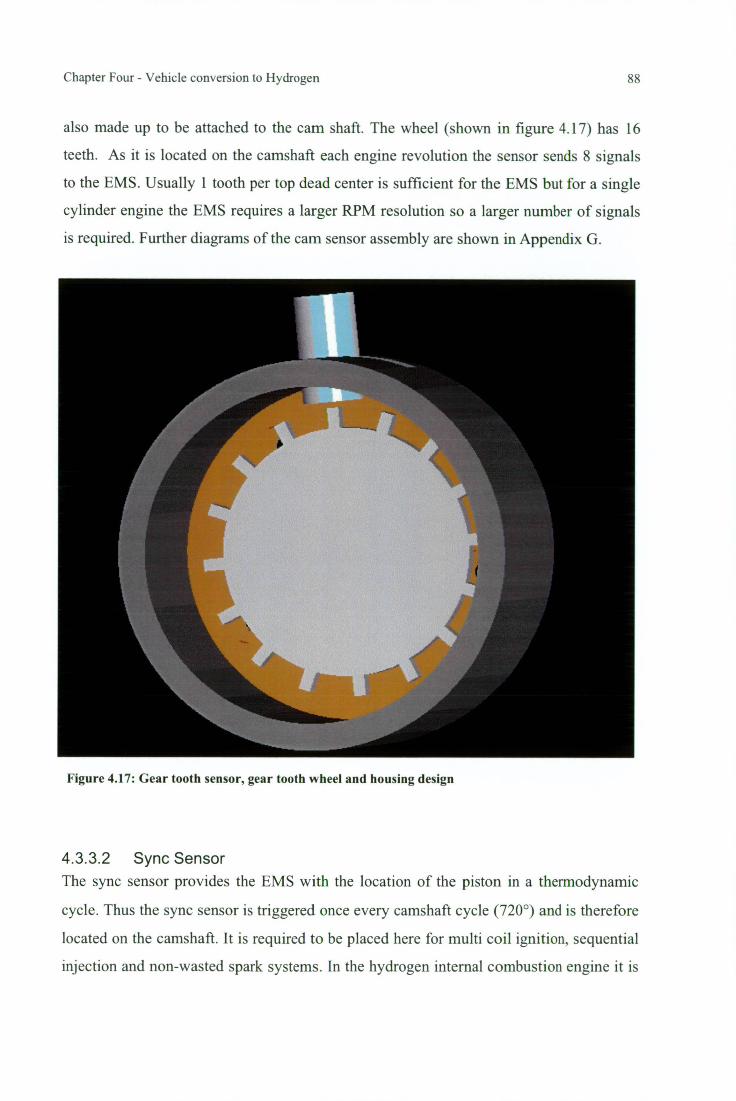
Chapter Four - Vehicle conversion to Hydrogen 88
also made up to be attached to the cam shaft. The wheel (shown in figure 4.17) has 16
teeth. As it is located on the camshaft each engine revolution the sensor sends 8 signals
to the EMS. Usually 1 tooth per top dead center is sufficient for the EMS but for a single
cylinder engine the EMS requires a larger RPM resolution so a larger number of signals
is required. Further diagrams of the cam sensor assembly are shown in Appendix G.
Figure 4.17: Gear tooth sensor, gear tooth wheel and housing design
4.3.3.2 Sync Sensor The sync sensor provides the EMS with the location of the piston in a thermodynamic
cycle. Thus the sync sensor is triggered once every camshaft cycle (720°) and is therefore
located on the camshaft. It is required to be placed here for multi coil ignition, sequential
injection and non-wasted spark systems. In the hydrogen internal combustion engine it is
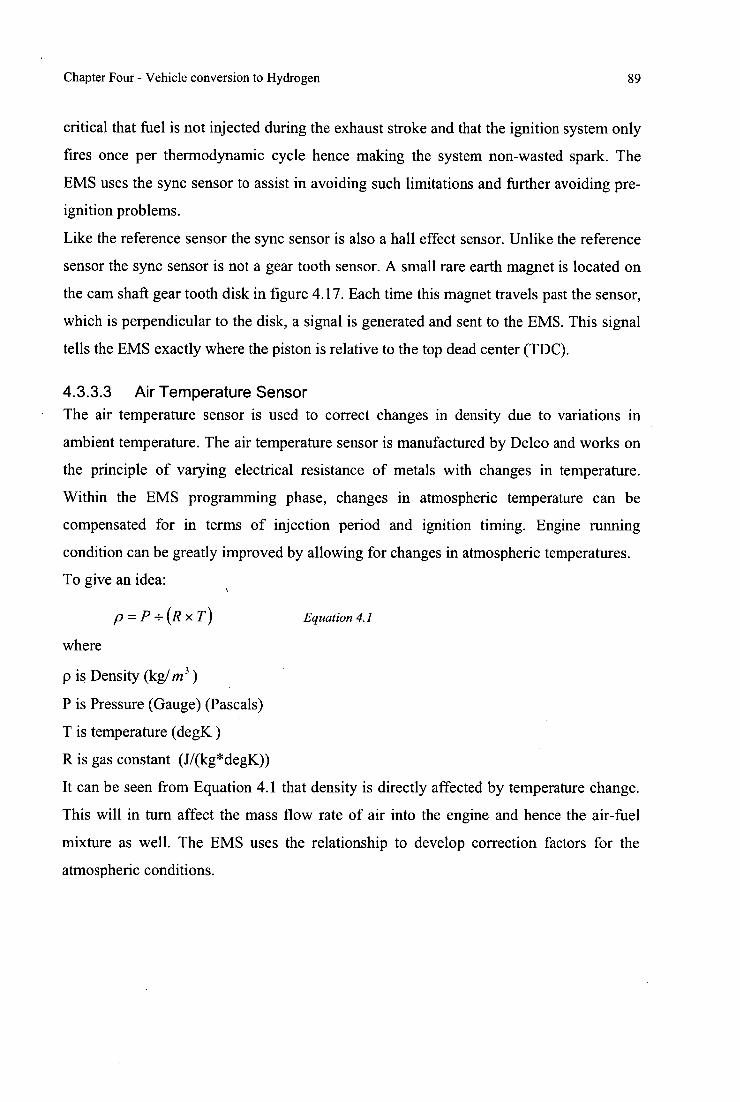
Chapter Four - Vehicle conversion to Hydrogen 89
critical that fuel is not injected during the exhaust stroke and that the ignition system only
fires once per thermodynamic cycle hence making the system non-wasted spark. The
EMS uses the sync sensor to assist in avoiding such limitations and further avoiding pre-
ignition problems.
Like the reference sensor the sync sensor is also a hall effect sensor. Unlike the reference
sensor the sync sensor is not a gear tooth sensor. A small rare earth magnet is located on
the cam shaft gear tooth disk in figure 4.17. Each time this magnet travels past the sensor,
which is perpendicular to the disk, a signal is generated and sent to the EMS. This signal
tells the EMS exactly where the piston is relative to the top dead center (TDC).
4.3.3.3 Air Temperature Sensor The air temperature sensor is used to correct changes in density due to variations in
ambient temperature. The air temperature sensor is manufactured by Delco and works on
the principle of varying electrical resistance of metals with changes in temperature.
Within the EMS programming phase, changes in atmospheric temperature can be
compensated for in terms of injection period and ignition timing. Engine running
condition can be greatly improved by allowing for changes in atmospheric temperatures.
To give an idea:
p =P x T) Equation 4.1
where
p is Density (kg/ m 3 )
P is Pressure (Gauge) (Pascals)
T is temperature (degK )
R is gas constant (J/(kg*degK))
It can be seen from Equation 4.1 that density is directly affected by temperature change.
This will in turn affect the mass flow rate of air into the engine and hence the air-fuel
mixture as well. The EMS uses the relationship to develop correction factors for the
atmospheric conditions.
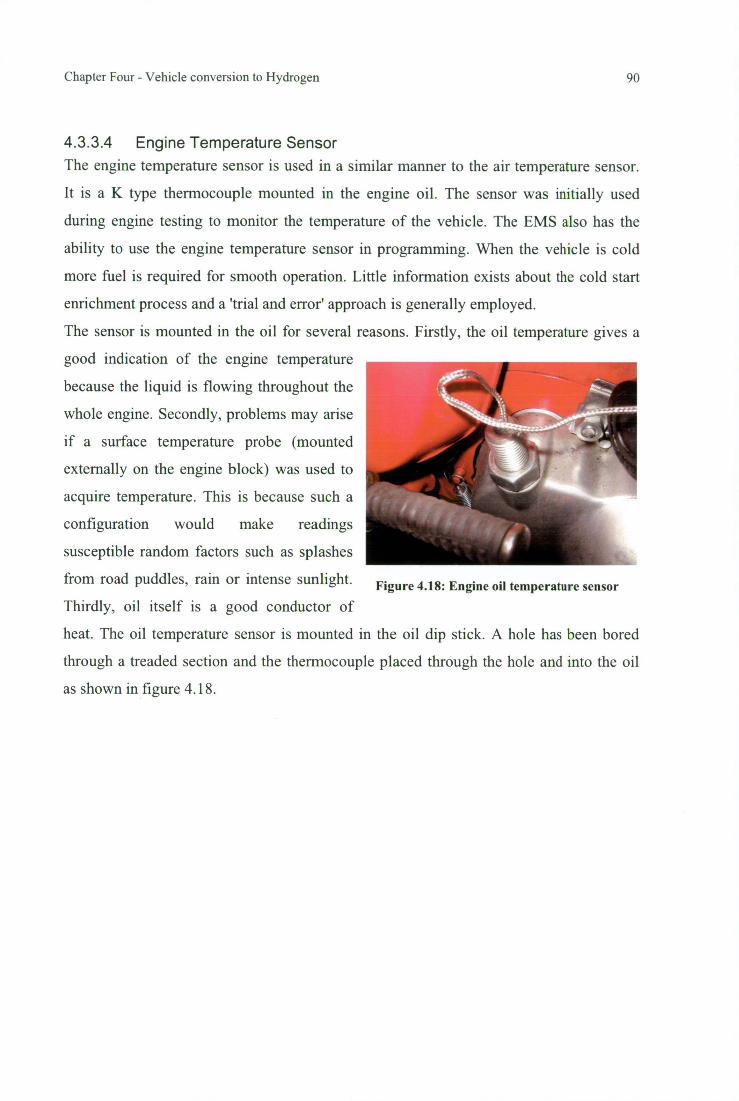
Figure 4.18: Engine oil temperature sensor
Chapter Four - Vehicle conversion to Hydrogen 90
4.3.3.4 Engine Temperature Sensor The engine temperature sensor is used in a similar manner to the air temperature sensor.
It is a K type thermocouple mounted in the engine oil. The sensor was initially used
during engine testing to monitor the temperature of the vehicle. The EMS also has the
ability to use the engine temperature sensor in programming. When the vehicle is cold
more fuel is required for smooth operation. Little information exists about the cold start
enrichment process and a 'trial and error' approach is generally employed.
The sensor is mounted in the oil for several reasons. Firstly, the oil temperature gives a
good indication of the engine temperature
because the liquid is flowing throughout the
whole engine. Secondly, problems may arise
if a surface temperature probe (mounted
externally on the engine block) was used to
acquire temperature. This is because such a
configuration would make readings
susceptible random factors such as splashes
from road puddles, rain or intense sunlight.
Thirdly, oil itself is a good conductor of
heat. The oil temperature sensor is mounted in the oil dip stick. A hole has been bored
through a treaded section and the thermocouple placed through the hole and into the oil
as shown in figure 4.18.
Chapter Four - Vehicle conversion to Hydrogen 91
4.3.3.5 Throttle Position Sensor The Throttle Position Sensor (TPS) indicates to the EMS the load being applied to the
engine. The TPS is a potentiometer with a linear characteristic curve. It generates a
voltage ratio, which is proportional to the throttle's angle of rotation. The sensor consists
of a wiper arm and resistor, each of which are constantly touching. As the throttle
position changes, this resistance changes which influences the output voltage. The output
voltage is proportional to the throttle position inputted by the driver unit (e.g., a
multimeter or an EMS). This data is calibrated in the EMS as a major parameter in fuel
ignition and ignition timing. A full (load) throttle setting in the EMS corresponds to
0.942 whilst a low throttle setting corresponds to 2.35a
The sensor used is a Bosch TPS (0 280 122 001) which is attached to the throttle on the
handlebar. In most applications the TPS is attached to the butterfly valve on the throttle
body. This usually gives an accurate reading of how much the throttle as the sensor does
not need to allow for possible slack in the throttle cable. As the H2 CT110 had no throttle
cable, the best indication point for the throttle position was the handlebar.
The inner sleeve of the sensor was fixed to the inner part of the handle bar which remains
still, whilst the outside of the sensor was mounted to the handle which moved anti-
clockwise as the operator desires more throttle. The throttle position sensor is shown
below in figure 4.19 and detailed in Appendix C6.
Figure 4.19: Throttle of unconverted bike (left) and throttle of converted bike (right) showing attachment of throttle position sensor
Chapter Four - Vehicle conversion to Hydrogen 92
4.4 Fuel Storage
A number of options exist for the issue of fuel storage medium on the converted CT110.
Considerations in this regard were operational conditions and the requirements for each
storage medium. The bike was set up on four different fuel delivery configurations:
1. Laboratory operation;
2. Dynamometer tuning operation;
3. Dynamometer testing operation;
4. Road operation.
Each system had different equipment and varied safety features.
4.4.1 Laboratory Testing
Initial testing of the CT 110 occurred at the Hydro Tasmania Hydrogen Research Facility
located at the School of Engineering at the University of Tasmania. The laboratory is set
up with piped (compressed) hydrogen being supplied from G size cylinders. The
hydrogen is transported through an on/off valve through a regulator, a flashback arrestor,
solenoid valve, through copper lines to the test rig location. Prior to the test rig there is a
pressure regulator and two on/off valves. From here stainless steel braided hose runs
hydrogen to the fuel rail to the fuel injectors. The engine exhaust is ejected to the
environment through flexible hose to the exhaust system of the laboratory.
The solenoid valve is controlled by the laboratory safety system which detects the
amount of hydrogen in the laboratory environment. If the environment becomes unstable
(greater than 0.4% hydrogen in air) the solenoid valve is activated, and flow of hydrogen
halts.
This system was used initially to test the bike and operate it under idling conditions. The
hydrogen was supplied to the injectors at a pressure of two bars (gauge). Some load
tuning was achieved by running the bike in gear and simulating the bike brake as a load.
The laboratory provided the safest environment for the operation of hydrogen in the bike.
It was an important step to operate several hours of running in this environment to ensure
that safety issues on the bike could be covered.
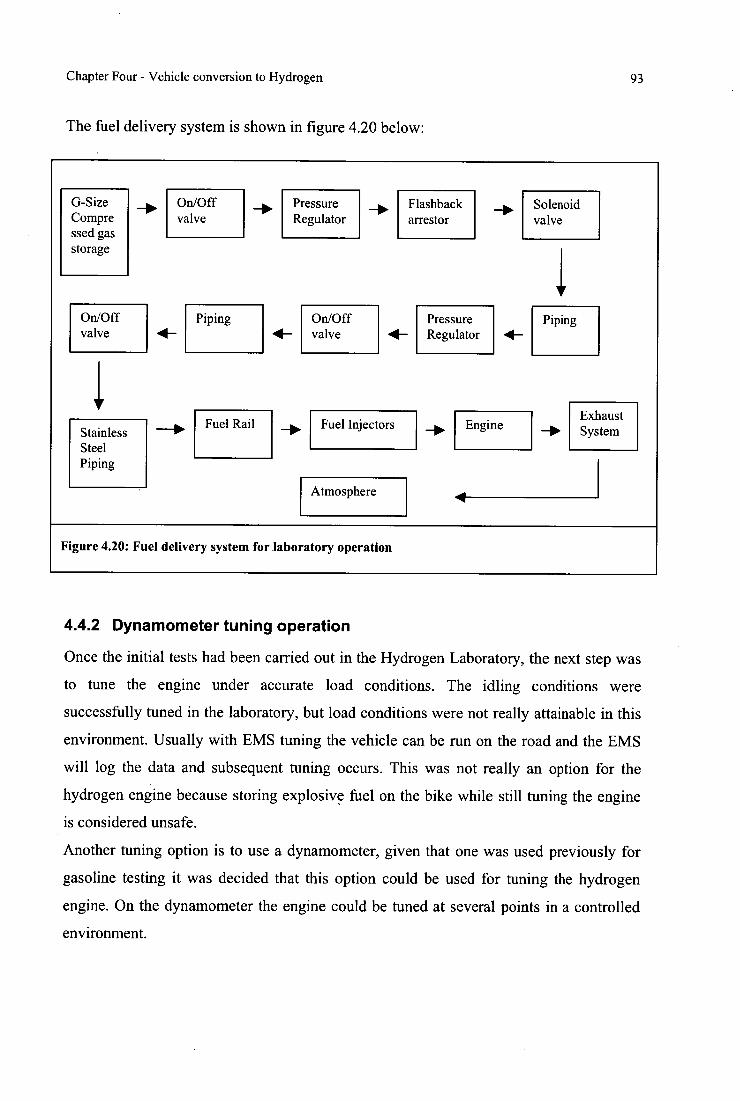
Fuel Injectors
Atmosphere
Stainless Steel Piping
Fuel Rail
Engine
Exhaust System
Chapter Four - Vehicle conversion to Hydrogen 93
The fuel delivery system is shown in figure 4.20 below:
G-Size On/Off Pressure Flashback Solenoid Compre ssed gas storage
valve Regulator arrestor valve
On/Off valve
Piping
On/Off valve
Pressure Regulator
Piping
Figure 4.20: Fuel delivery system for laboratory operation
4.4.2 Dynamometer tuning operation
Once the initial tests had been carried out in the Hydrogen Laboratory, the next step was
to tune the engine under accurate load conditions. The idling conditions were
successfully tuned in the laboratory, but load conditions were not really attainable in this
environment. Usually with EMS tuning the vehicle can be run on the road and the EMS
will log the data and subsequent tuning occurs. This was not really an option for the
hydrogen engine because storing explosive fuel on the bike while still tuning the engine
is considered unsafe.
Another tuning option is to use a dynamometer, given that one was used previously for
gasoline testing it was decided that this option could be used for tuning the hydrogen
engine. On the dynamometer the engine could be tuned at several points in a controlled
environment.
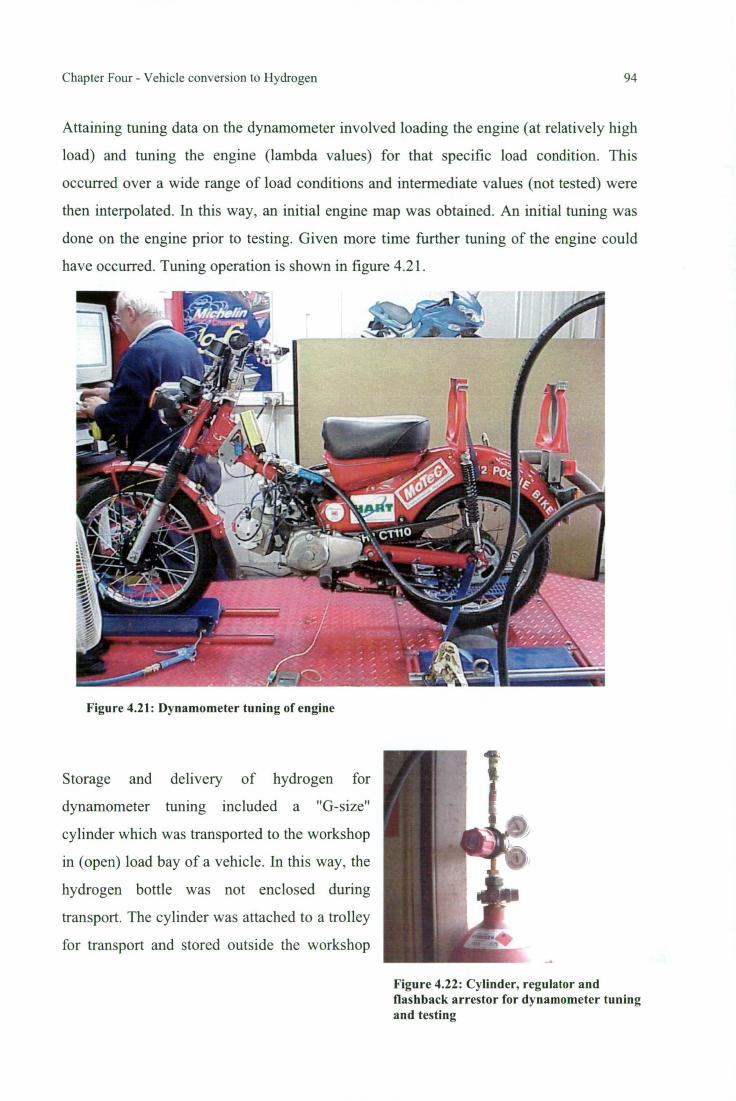
Chapter Four - Vehicle conversion to Hydrogen 94
Attaining tuning data on the dynamometer involved loading the engine (at relatively high
load) and tuning the engine (lambda values) for that specific load condition. This
occurred over a wide range of load conditions and intermediate values (not tested) were
then interpolated. In this way, an initial engine map was obtained. An initial tuning was
done on the engine prior to testing. Given more time further tuning of the engine could
have occurred. Tuning operation is shown in figure 4.21.
Figure 4.21: Dynamometer tuning of engine
Storage and delivery of hydrogen for
dynamometer tuning included a "G-size"
cylinder which was transported to the workshop
in (open) load bay of a vehicle. In this way, the
hydrogen bottle was not enclosed during
transport. The cylinder was attached to a trolley
for transport and stored outside the workshop
Figure 4.22: Cylinder, regulator and flashback arrestor for dynamometer tuning and testing
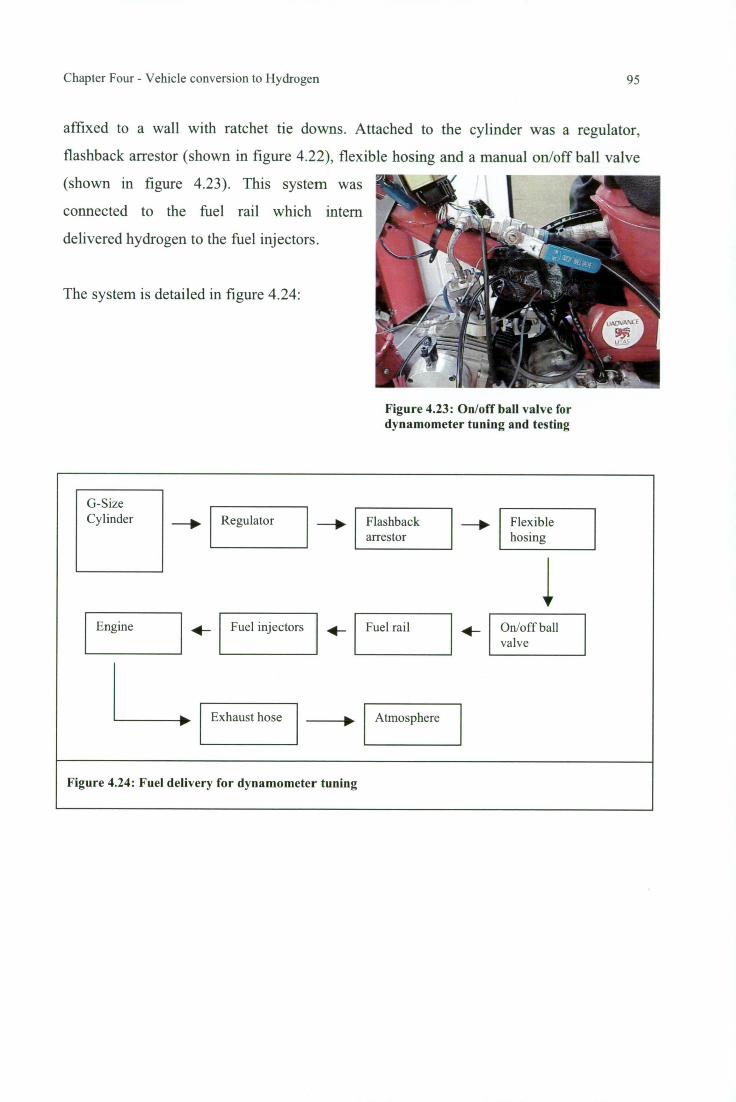
Chapter Four - Vehicle conversion to Hydrogen 95
affixed to a wall with ratchet tie downs. Attached to the cylinder was a regulator,
flashback arrestor (shown in figure 4.22), flexible hosing and a manual on/off ball valve
(shown in figure 4.23). This system was
connected to the fuel rail which intern
delivered hydrogen to the fuel injectors.
The system is detailed in figure 4.24:
Figure 4.23: On/off ball valve for dynamometer tuning and testing
G-Size Cylinder
—•
Regulator --• Flashback arrestor
--• Flexible hosing
Engine
Fuel injectors
4— Fuel rail
4—
On/off ball valve
• Exhaust hose
Atmosphere
Figure 4.24: Fuel delivery for dynamometer tuning
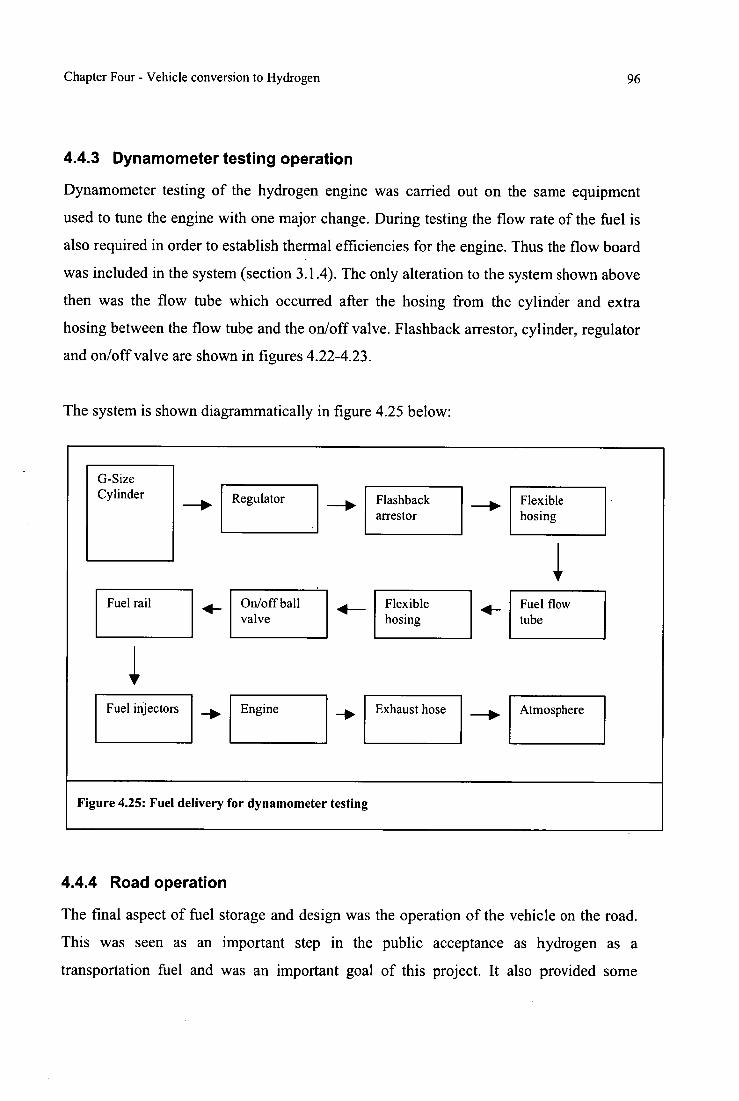
G-Size Cylinder
Fuel rail
Regulator
On/off ball valve
Flashback arrestor
Flexible hosing
Flexible hosing
Fuel flow tube
4—
Fuel injectors
Engine
Exhaust hose
Atmosphere
Figure 4.25: Fuel delivery for dynamometer testing
Chapter Four - Vehicle conversion to Hydrogen 96
4.4.3 Dynamometer testing operation
Dynamometer testing of the hydrogen engine was carried out on the same equipment
used to tune the engine with one major change. During testing the flow rate of the fuel is
also required in order to establish thermal efficiencies for the engine. Thus the flow board
was included in the system (section 3.1.4). The only alteration to the system shown above
then was the flow tube which occurred after the hosing from the cylinder and extra
hosing between the flow tube and the on/off valve. Flashback arrestor, cylinder, regulator
and on/off valve are shown in figures 4.22-4.23.
The system is shown diagrammatically in figure 4.25 below:
4.4.4 Road operation
The final aspect of fuel storage and design was the operation of the vehicle on the road.
This was seen as an important step in the public acceptance as hydrogen as a
transportation fuel and was an important goal of this project. It also provided some
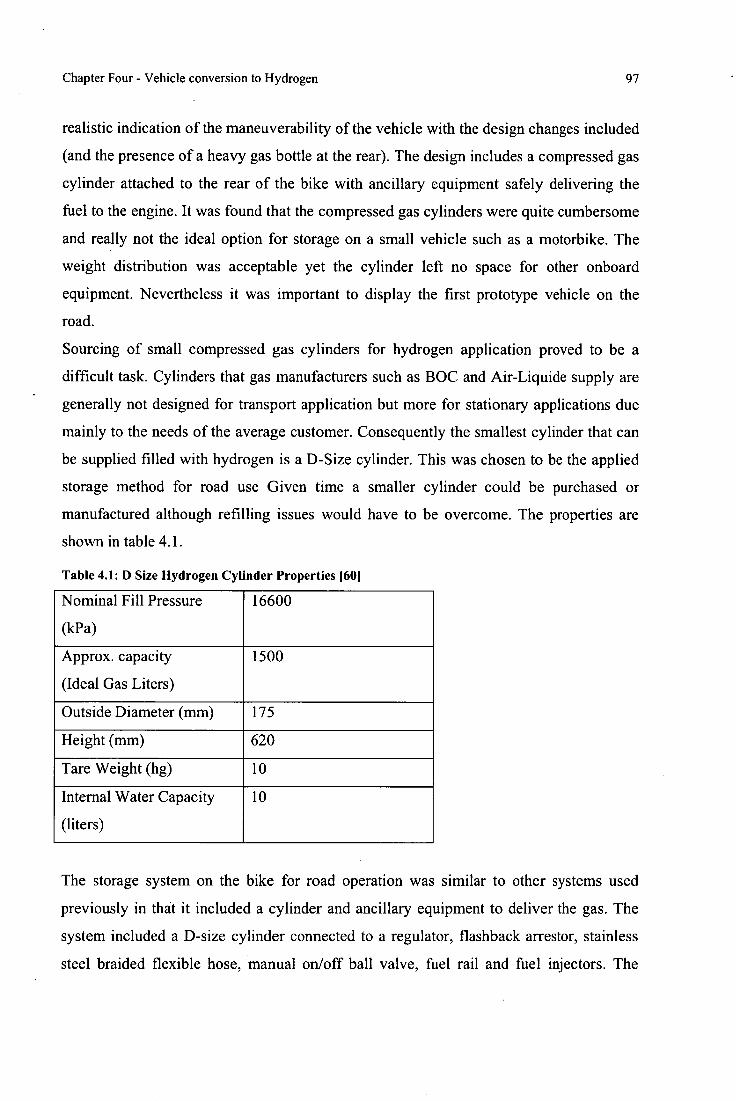
Chapter Four - Vehicle conversion to Hydrogen 97
realistic indication of the maneuverability of the vehicle with the design changes included
(and the presence of a heavy gas bottle at the rear). The design includes a compressed gas
cylinder attached to the rear of the bike with ancillary equipment safely delivering the
fuel to the engine. It was found that the compressed gas cylinders were quite cumbersome
and really not the ideal option for storage on a small vehicle such as a motorbike. The
weight distribution was acceptable yet the cylinder left no space for other onboard
equipment. Nevertheless it was important to display the first prototype vehicle on the
road.
Sourcing of small compressed gas cylinders for hydrogen application proved to be a
difficult task. Cylinders that gas manufacturers such as BOC and Air-Liquide supply are
generally not designed for transport application but more for stationary applications due
mainly to the needs of the average customer. Consequently the smallest cylinder that can
be supplied filled with hydrogen is a D-Size cylinder. This was chosen to be the applied
storage method for road use Given time a smaller cylinder could be purchased or
manufactured although refilling issues would have to be overcome. The properties are
shown in table 4.1.
Table 4.1: D Size Hydrogen Cylinder Properties 1601
Nominal Fill Pressure
(kPa)
16600
Approx. capacity
(Ideal Gas Liters)
1500
Outside Diameter (mm) 175
Height (mm) 620
Tare Weight (hg) 10
Internal Water Capacity
(liters)
10
The storage system on the bike for road operation was similar to other systems used
previously in that it included a cylinder and ancillary equipment to deliver the gas. The
system included a D-size cylinder connected to a regulator, flashback arrestor, stainless
steel braided flexible hose, manual on/off ball valve, fuel rail and fuel injectors. The
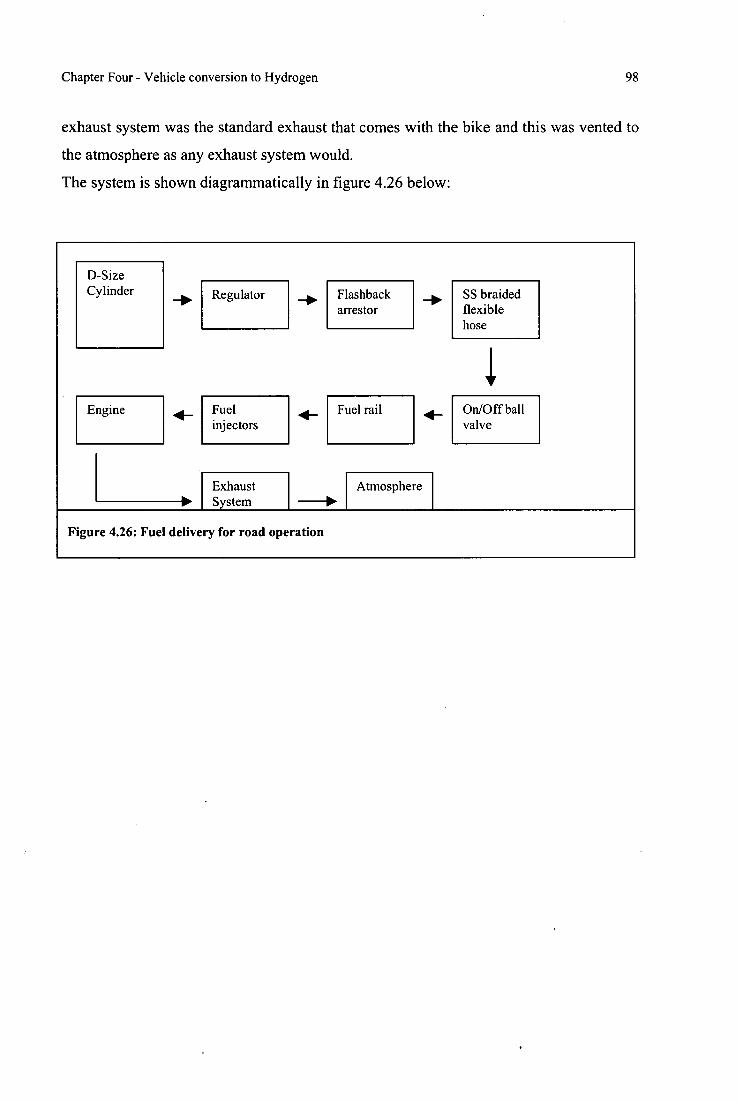
Chapter Four - Vehicle conversion to Hydrogen 98
exhaust system was the standard exhaust that comes with the bike and this was vented to
the atmosphere as any exhaust system would.
The system is shown diagrammatically in figure 4.26 below:
D-Size Cylinder —■ Regulator —• Flashback —• SS braided
arrestor flexible hose
4— 4— 4— Engine Fuel injectors
Fuel rail On/Off ball valve
Exhaust Atmosphere System ■
Figure 4.26: Fuel delivery for road operation
Chapter Four - Vehicle conversion to Hydrogen 99
4.4.5 Safety Issues
Various safety features needed to be included in each of the fuel storage systems to
ensure the safety of operators, onlookers and equipment. These features included both
design aspects as well as procedures. The low ignition energy of hydrogen and it's wide
flammability limit means that a wide variety of safety issue need to be considered and
appropriate precautions are taken.
The hydrogen engine itself had some safety features specific to the hydrogen engine. All
piping used in the storage systems were selected to be able to withstand:
• maximum pressures that the equipment would be subjected to (100-500kPa
gauge);
• maximum temperatures that may occur (up to 165°C on engine, above 200°C on
the exhaust);
• the effects of hydrogen embrittlement;
• the effects of hydrogen leakage;
• the effects of any impacts that may occur;
The piping was located so that regular testing and possible replacement could occur.
Pressure and temperature requirements were adhered to with at least a factor of safety of
two. Sealant tape was used in every joint where there was metal to metal contact. Tape
used was specifically designed for gas applications with a compatibility to hydrogen.
When switched off, the engine cut off the operation of the fuel through the EMS setup.
This meant that once the engine stopped running no fuel was delivered. Beyond 8000
rpm the engine was programmed not to work also by means of the EMS. This meant the
engine could not be damaged which could lead to a hydrogen leak. Regulators, flashback
arrestors, piping and valve on the bike were all hydrogen compatible. Baseline testing on
gasoline provided information that the maximum rpm of the engine was 8000 and thus
this value was taken on for the hydrogen engine.
The engine uses crankcase ventilation to remove residual gases in the crankcase. A valve
at the top of the crankcase allowed gases that build up in the crankcase to be vented to the
atmosphere. Crankcase ventilation reduces the possibility of explosion within the
crankcase which can possibly cause engine damage leading to possible hydrogen leaks.
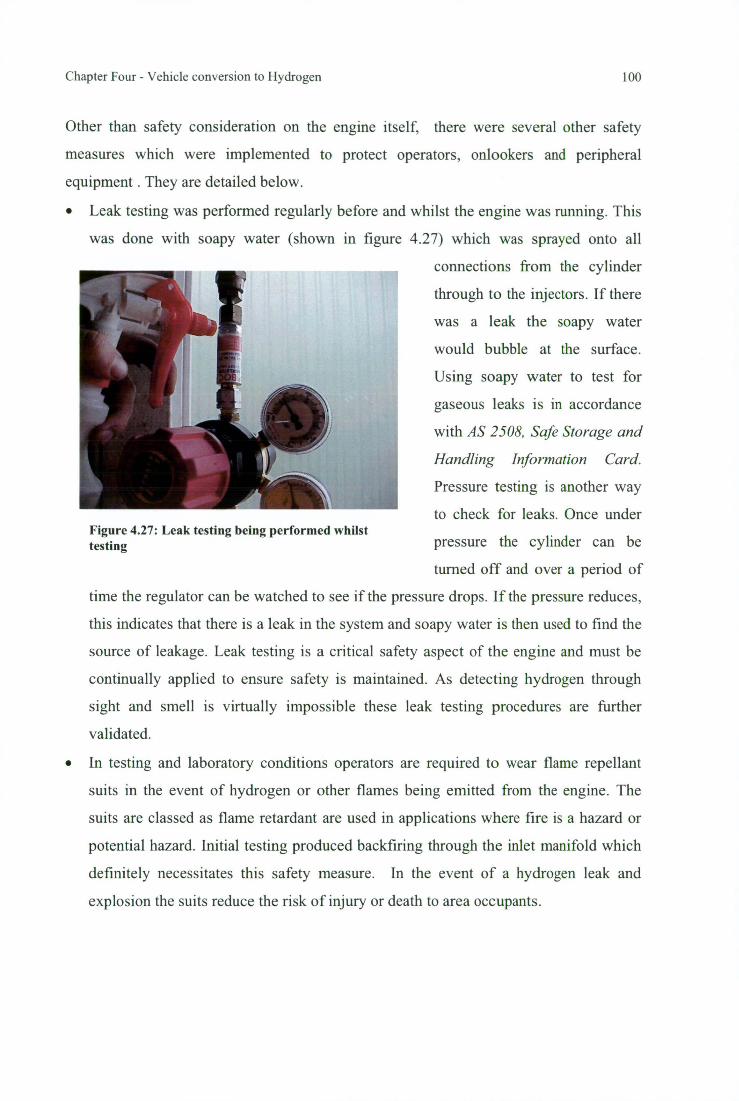
Figure 4.27: Leak testing being performed whilst testing
Chapter Four - Vehicle conversion to Hydrogen 100
Other than safety consideration on the engine itself, there were several other safety
measures which were implemented to protect operators, onlookers and peripheral
equipment. They are detailed below.
• Leak testing was performed regularly before and whilst the engine was running. This
was done with soapy water (shown in figure 4.27) which was sprayed onto all
connections from the cylinder
through to the injectors. If there
was a leak the soapy water
would bubble at the surface.
Using soapy water to test for
gaseous leaks is in accordance
with AS 2508, Safe Storage and
Handling Information Card.
Pressure testing is another way
to check for leaks. Once under
pressure the cylinder can be
turned off and over a period of
time the regulator can be watched to see if the pressure drops. If the pressure reduces,
this indicates that there is a leak in the system and soapy water is then used to find the
source of leakage. Leak testing is a critical safety aspect of the engine and must be
continually applied to ensure safety is maintained. As detecting hydrogen through
sight and smell is virtually impossible these leak testing procedures are further
validated.
• In testing and laboratory conditions operators are required to wear flame repellant
suits in the event of hydrogen or other flames being emitted from the engine. The
suits are classed as flame retardant are used in applications where fire is a hazard or
potential hazard. Initial testing produced backfiring through the inlet manifold which
definitely necessitates this safety measure. In the event of a hydrogen leak and
explosion the suits reduce the risk of injury or death to area occupants.
Chapter Four - Vehicle conversion to Hydrogen 101
• Other personal protection equipment such as eyewear, ear protection and enclosed
footwear are required to be worn at all times when the bike was in an enclosed
environment.
• Whilst in enclosed areas all mobile phones and electrical equipment was switched off.
All laptops and recording equipment was used outside the rigs safety area which is
1.6 meters from the engine. In the event of a leak mobile telephones and electrical
equipment could potentially cause a spark which could ignite leaking hydrogen.
• Whilst in enclosed areas static discharge was performed by personal. In the event of a
hydrogen leak static electricity has enough energy to ignite a leaked hydrogen
mixture. Equipment such as flow boards where also earthed.
• Whilst the bike was being used in a enclosed area gas storage was outside that area.
The most dangerous part of the hydrogen fuel system is the storage itself. This is
because the greatest concentration of hydrogen is in this area. Storing the fuel outside
the occupied area means that in the event of a cylinder explosion the occupants are
safe from the effects of the accident.
• Access and use of the hydrogen storage and delivery system is limited to primary
researchers and supervisor. Reducing contact to critical parts of the system is one of
the best preventative measures in reduction of risk of explosion.
Chapter Five - Performance of Gasoline and Hydrogen internal combustion engines 102
CHAPTER 5 Performance of Gasoline and Hydrogen internal combustion
engines
Chapter Five - Performance of Gasoline and Hydrogen internal combustion engines 103
5.1 Testing accuracy
Prior to presenting experimental results, a basic appraisal of the accuracy obtained is
required for data validation. The accuracy is based upon the testing procedure set out in
Chapter 2, which was under the guidance of AS 4594.11. Testing accuracy is a parameter
of variance in obtained measurement data and adherence to specified guidelines outlined.
5.1.1 Compliance with testing guidelines
• Testing procedures were attained under stabilized normal conditions for all tests.
Power compensations were applied for all tests that varied from standard laboratory
conditions. A period of at least 30 seconds holding the test conditions was attained
prior to any measurements being undertaken.
• Air inlet temperature was measured within 0.15m of the air cleaner (in compliance
with AS 4594.11: Annex A: A.3)
• Variation in engine speed during a test run was averaged at 0.14% for gasoline and
0.99% for hydrogen during the test periods. This is less than the 1% specified by AS
4594.11: Annex A: A.4.
• Brake load was taken three times over the testing period whilst the gasoline fuel
consumption was measured. This served as a simultaneous measurement. For
hydrogen testing the flow tube data allowed for instantaneous fuel flow
measurements. (AS 4594.11: 5.3.6).
• Duration of engine testing period was at least one minute for each teg point. This was
both for automatic and hand held measurements that were taken after the 30 second
stabilization period (AS 4594.11: 5.3.7).
• During testing engine conditions stayed within the manufacturer's limits. As the
engine was stationary and it is air cooled fans were employed to simulate the air
cooling effect to protect the engine and adhere to relevant standards(AS 4594.11:
5.3.8-5.3.11).
• Testing equipment used fell within the limits specified for accuracy in AS 4594.11:
4.1-4.6).
Chapter Five - Performance of Gasoline and Hydrogen internal combustion engines 104
5.2 Gasoline Engine Qualitative Analysis
5.2.1 General comments about engine and equipment performance
The CT 110 exhibited rich burning operation throughout the whole duration of the testing
for varied load and throttle position conditions. It is well known that partial rich burning
improves the power of the engine. Being a small single cylinder engine powering a
motorbike the rich operation may compensate for the loads that it may need to carry. It
has been shown previously that maximum power is often seen in rich mixtures. The
downside to this tuning configuration is that the engine may not be as efficient. It is noted
that the thermal efficiency of the engine was not relatively high, this efficiency is
dependant on the air-fuel ratio. For a small engine using a relatively small amount of fuel
this is not of great importance. However, burning the mixture rich would also increase the
prevalence of unburnt fuel and other emissions in the exhaust.
The range of test data was taken between 30kph to 80kph. It was found that under small
speeds the results were inconsistent and non-repeatable. The reliable quantitative results
were found at higher engine speed; so the testing was focused at these speeds. A
combination of the engine capabilities and the dynamometer size are the most likely
explanations for this discrepancy at low speeds. Under low speeds the engine found it
difficult to undertake a full range of throttle positions whilst maintaining speed. The
variation of air entering the cylinder at this speed would be difficult to control as it would
be quite sensitive in the throttle body. Although the dynamometer is rated to be able to
test vehicles with small power ratings, the likelihood is that it is more designed for
engines with higher power capabilities. The equipment is rated at 450 horse power which
is 75 times larger than the maximum capacity of the CT110. It is therefore possible that
the equipment lacks clarity at lower speeds. The tractive effort for the engine to spin the
roller may have been too large under small loads for accurate results to be obtained.
Gas analyzer data was highly reliable throughout however, adequate care was taken of
filters and water traps. It was observed that moisture in the exhaust would build up in the
water trap in the line between the exhaust and gas analyzer. Excessive moisture and
particulate matter build up in the analyzer line at times caused blockages which would
stop the equipment from working. Once a more efficient water trap was used in

Chapter Five - Performance of Gasoline and Hydrogen internal combustion engines 105
conjunction with a filter to stop particulate matter, the analyzer worked without
interruption.
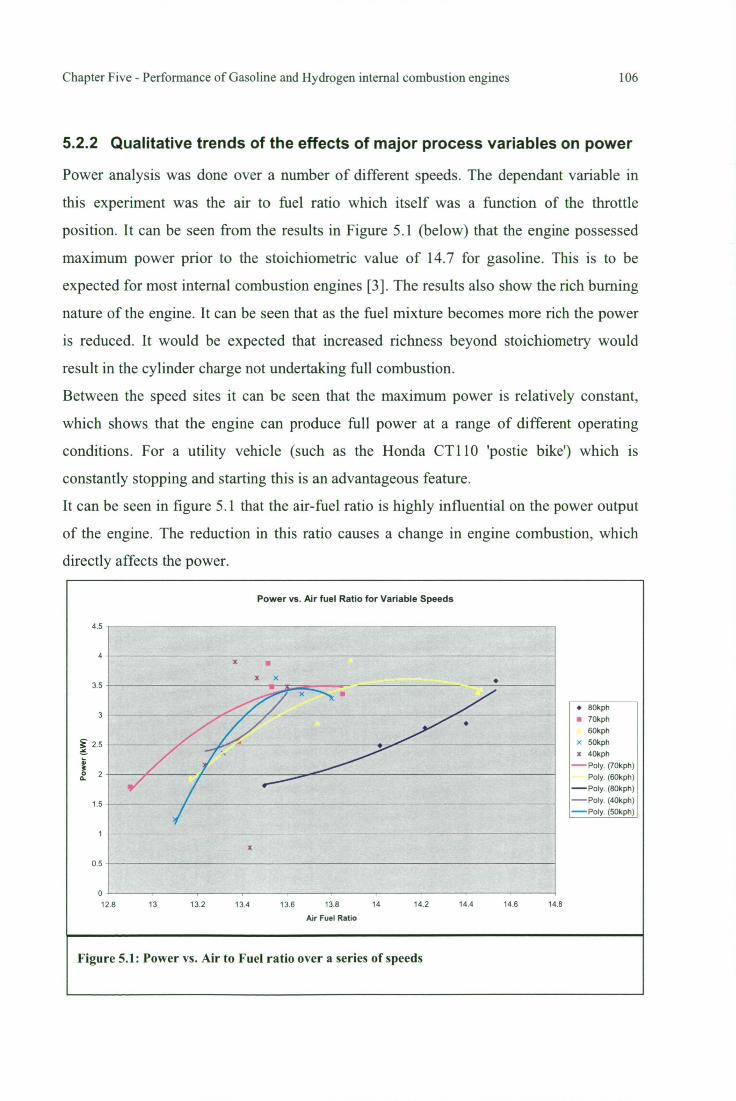
3.5
3
F 2.5
0 2 a.
1.5
0.5
Chapter Five - Performance of Gasoline and Hydrogen internal combustion engines 106
5.2.2 Qualitative trends of the effects of major process variables on power
Power analysis was done over a number of different speeds. The dependant variable in
this experiment was the air to fuel ratio which itself was a function of the throttle
position. It can be seen from the results in Figure 5.1 (below) that the engine possessed
maximum power prior to the stoichiometric value of 14.7 for gasoline. This is to be
expected for most internal combustion engines [3]. The results also show the rich burning
nature of the engine. It can be seen that as the fuel mixture becomes more rich the power
is reduced. It would be expected that increased richness beyond stoichiometry would
result in the cylinder charge not undertaking full combustion.
Between the speed sites it can be seen that the maximum power is relatively constant,
which shows that the engine can produce full power at a range of different operating
conditions. For a utility vehicle (such as the Honda CT110 'postie bike') which is
constantly stopping and starting this is an advantageous feature.
It can be seen in figure 5.1 that the air-fuel ratio is highly influential on the power output
of the engine. The reduction in this ratio causes a change in engine combustion, which
directly affects the power.
Power vs. Air fuel Ratio for Variable Speeds
4.5
0
12.8 13 13.2 13.4 13.6 13.8 14 14.2 14.4 14.6 14.8
Air Fuel Ratio
X X •
• 80kph
• 70kph 60kph
x 50kph x 40kph
— Poly. (70kph) Poly. (60kph)
— Poly. (80kph) — Poly. (40kph) — Poly. (50kph)
Figure 5.1: Power vs. Air to Fuel ratio over a series of speeds
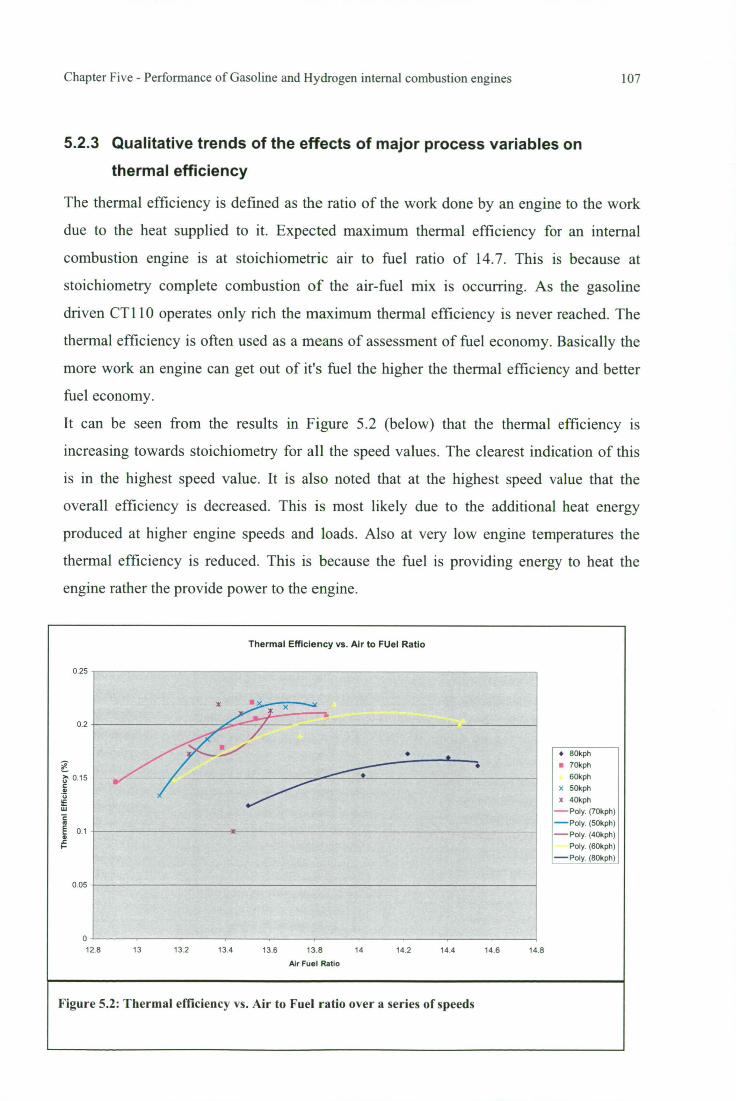
x
• a-----1 •
0 25
0.05
• 80411
• 70kph
60kph
x 50kph
• 40kph
- (lOkPI1 ) — Poly. (5040) — Poly. (40Itph)
Poly. (60kph)
— Poly. (80kph)
0.2
Chapter Five - Performance of Gasoline and Hydrogen internal combustion engines 107
5.2.3 Qualitative trends of the effects of major process variables on
thermal efficiency
The thermal efficiency is defined as the ratio of the work done by an engine to the work
due to the heat supplied to it. Expected maximum thermal efficiency for an internal
combustion engine is at stoichiometric air to fuel ratio of 14.7. This is because at
stoichiometry complete combustion of the air-fuel mix is occurring. As the gasoline
driven CT 110 operates only rich the maximum thermal efficiency is never reached. The
thermal efficiency is often used as a means of assessment of fuel economy. Basically the
more work an engine can get out of it's fuel the higher the thermal efficiency and better
fuel economy.
It can be seen from the results in Figure 5.2 (below) that the thermal efficiency is
increasing towards stoichiometry for all the speed values. The clearest indication of this
is in the highest speed value. It is also noted that at the highest speed value that the
overall efficiency is decreased. This is most likely due to the additional heat energy
produced at higher engine speeds and loads. Also at very low engine temperatures the
thermal efficiency is reduced. This is because the fuel is providing energy to heat the
engine rather the provide power to the engine.
Thermal Efficiency vs. Air to FUel Ratio
12.8 13 13.2 13.4 13.6 13.8 14
14.2
14.4
14.6
14.8
Air Fuel Ratio
Figure 5.2: Thermal efficiency vs. Air to Fuel ratio over a series of speeds
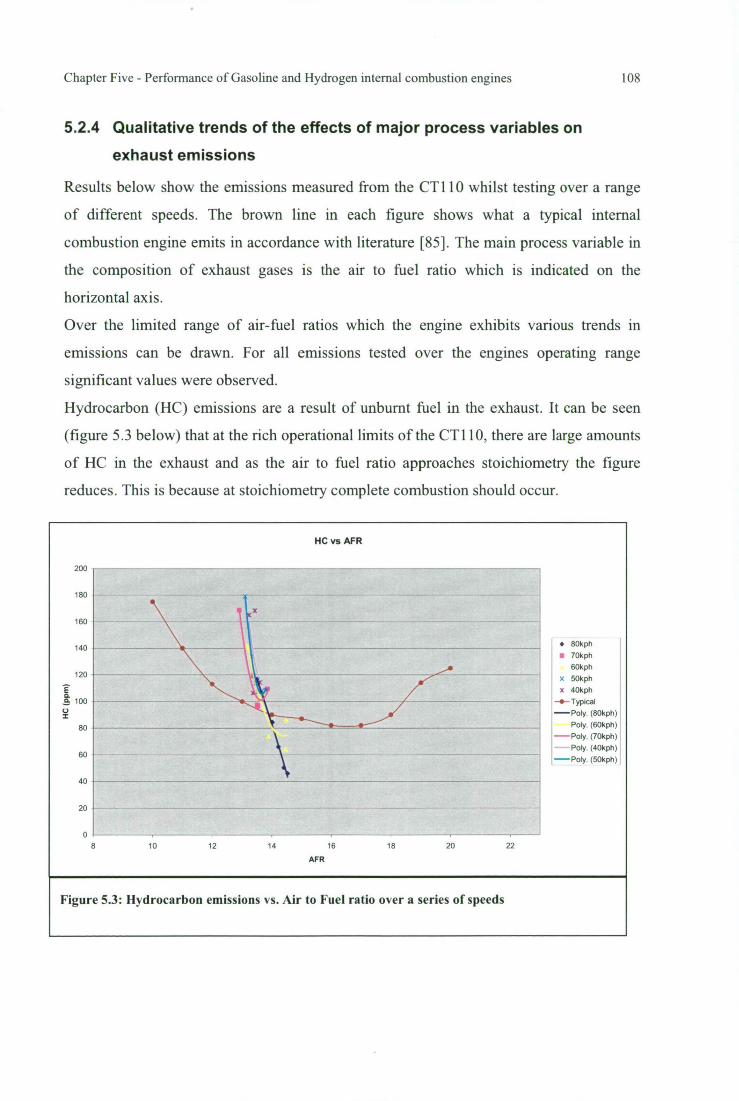
Chapter Five - Performance of Gasoline and Hydrogen internal combustion engines 108
5.2.4 Qualitative trends of the effects of major process variables on
exhaust emissions
Results below show the emissions measured from the CT 110 whilst testing over a range
of different speeds. The brown line in each figure shows what a typical internal
combustion engine emits in accordance with literature [85]. The main process variable in
the composition of exhaust gases is the air to fuel ratio which is indicated on the
horizontal axis.
Over the limited range of air-fuel ratios which the engine exhibits various trends in
emissions can be drawn. For all emissions tested over the engines operating range
significant values were observed.
Hydrocarbon (HC) emissions are a result of unbumt fuel in the exhaust. It can be seen
(figure 5.3 below) that at the rich operational limits of the CT110, there are large amounts
of HC in the exhaust and as the air to fuel ratio approaches stoichiometry the figure
reduces. This is because at stoichiometry complete combustion should occur.
HC vs AFR
200
180
160
140
120
a a. 100
80
60
• 80kph • 70k ph
60k ph x 50k ph • 40k ph
—•— Typical — Poly. (80kph)
Poly. (60kph) — Poly. (70kph)
Poly. (40kph) — Poly. (50kph)
40
20
0
8 10 12 14 16
18 20 22
AFR
Figure 5.3: Hydrocarbon emissions vs. Air to Fuel ratio over a series of speeds
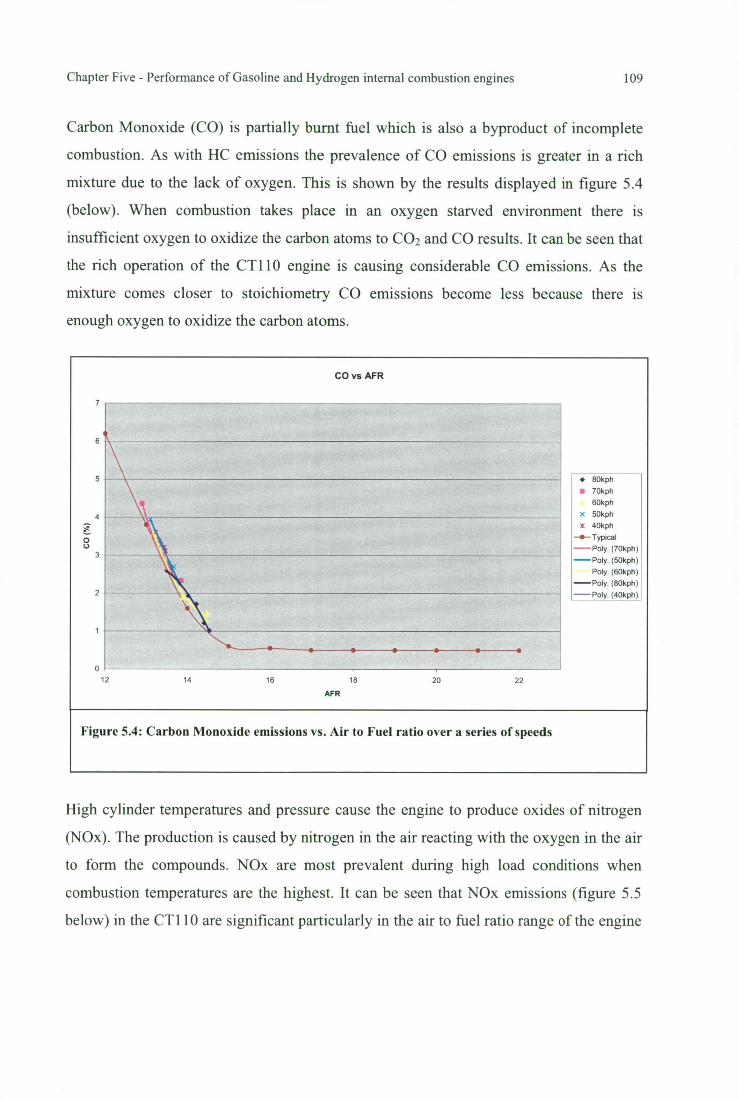
CO vs AFR
• 80kph • 70kph
60kph x 50kph x 40kph —•— Typical
— Poly. (70kph) — Poly. (50kph)
Poly. (60kph) — Poly. (80kph)
Poly. (40kph)
Figure 5.4: Carbon Monoxide emissions vs. Air to Fuel ratio over a series of speeds
F
3
0 12
4
2
7
6
5
14 16 18
AFR
20 22
Chapter Five - Performance of Gasoline and Hydrogen internal combustion engines 109
Carbon Monoxide (CO) is partially burnt fuel which is also a byproduct of incomplete
combustion. As with HC emissions the prevalence of CO emissions is greater in a rich
mixture due to the lack of oxygen. This is shown by the results displayed in figure 5.4
(below). When combustion takes place in an oxygen starved environment there is
insufficient oxygen to oxidize the carbon atoms to CO2 and CO results. It can be seen that
the rich operation of the CT110 engine is causing considerable CO emissions. As the
mixture comes closer to stoichiometry CO emissions become less because there is
enough oxygen to oxidize the carbon atoms.
High cylinder temperatures and pressure cause the engine to produce oxides of nitrogen
(N0x). The production is caused by nitrogen in the air reacting with the oxygen in the air
to form the compounds. NOx are most prevalent during high load conditions when
combustion temperatures are the highest. It can be seen that NOx emissions (figure 5.5
below) in the CT110 are significant particularly in the air to fuel ratio range of the engine
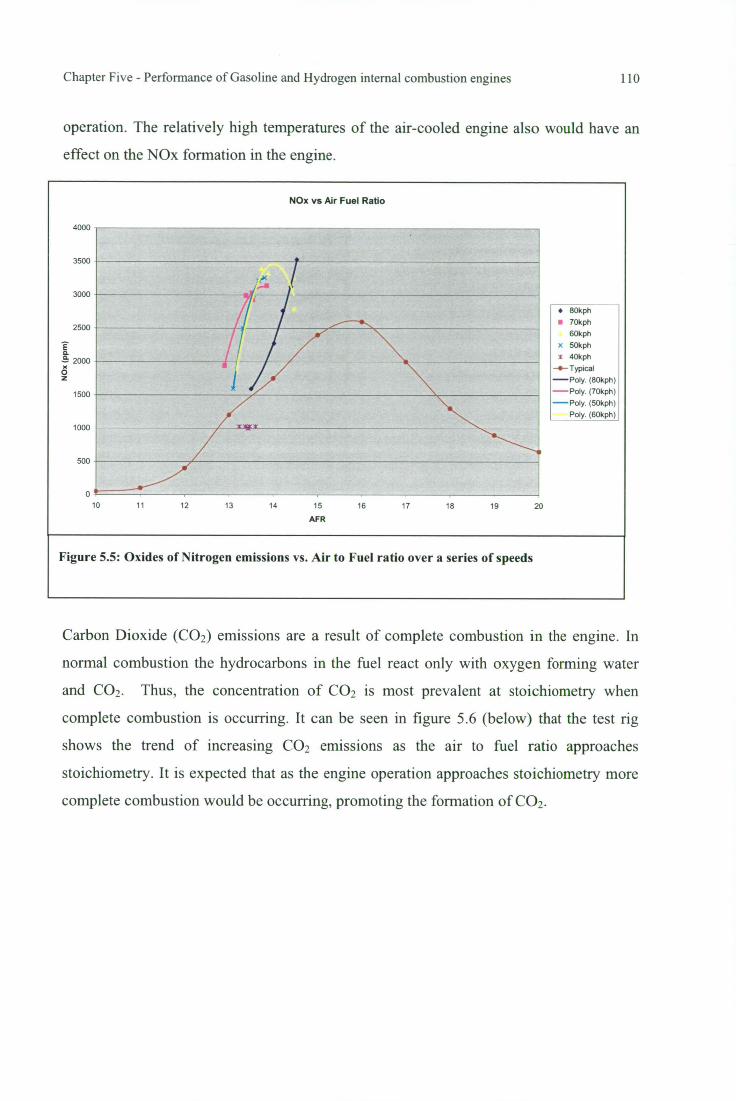
10 1 1 12 13 14 15
AFR
16 17 18 19 20
NOx vs Air Fuel Ratio
4000
3500
3000
2500
2000
1500
1000
500
0
Figure 5.5: Oxides of Nitrogen emissions vs. Air to Fuel ratio over a series of speeds
• 80kph • 70kph
60kph x 50kph x 40kph
--•— Typical — Poly. (80kph) — Poly. (70kph) — Poly. (50kph)
Poly. (60kph)
Chapter Five - Performance of Gasoline and Hydrogen internal combustion engines 110
operation. The relatively high temperatures of the air-cooled engine also would have an
effect on the NOx formation in the engine.
Carbon Dioxide (CO 2) emissions are a result of complete combustion in the engine. In
normal combustion the hydrocarbons in the fuel react only with oxygen forming water
and CO2 . Thus, the concentration of CO 2 is most prevalent at stoichiometry when
complete combustion is occurring. It can be seen in figure 5.6 (below) that the test rig
shows the trend of increasing CO 2 emissions as the air to fuel ratio approaches
stoichiometry. It is expected that as the engine operation approaches stoichiometry more
complete combustion would be occurring, promoting the formation of CO2.
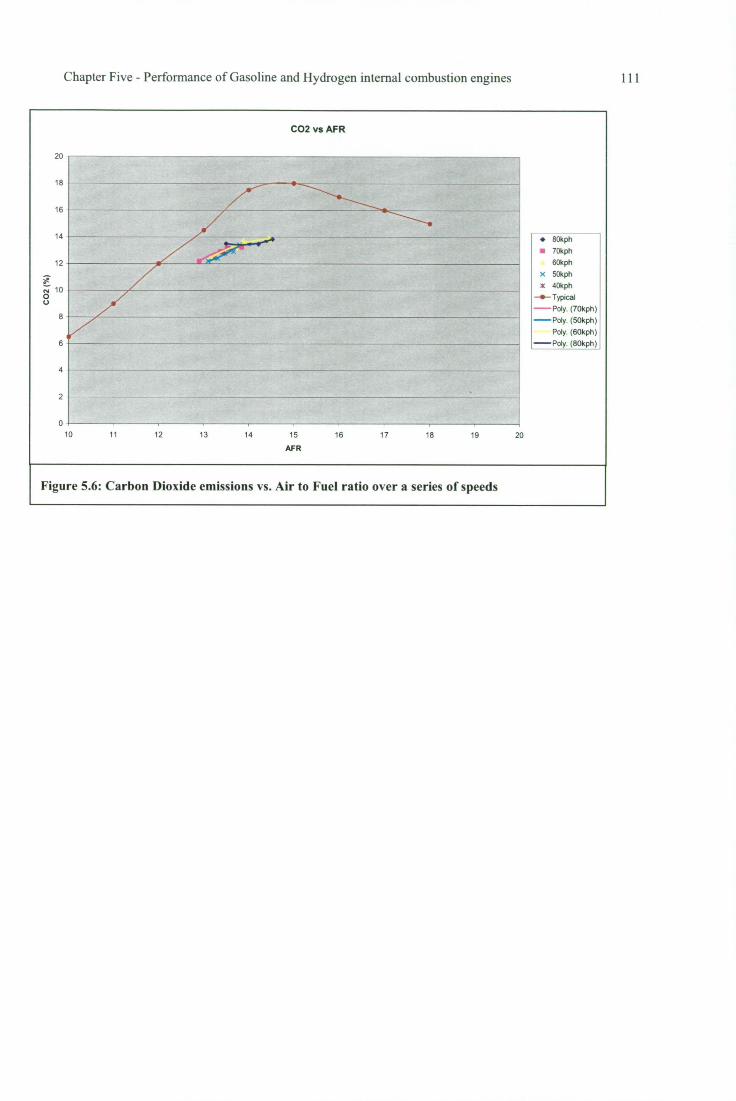
11 12 14 19 15 16 17 18 20 10 13
CO2 vs AFR
AFR
Figure 5.6: Carbon Dioxide emissions vs. Air to Fuel ratio over a series of speeds
20
18
16
14
12
F 10
0
8
4
2
• 80kph • 70k ph
60kph X 50kph X 40kph
—0— TypIcal — Poly. (70kph) — Poly. (50kph)
Poly. (60kph)
— Poly. (80kph)
Chapter Five - Performance of Gasoline and Hydrogen internal combustion engines 11 1
Chapter Five - Performance of Gasoline and Hydrogen internal combustion engines 112
5.3 Qualitative Analysis of the Hydrogen IC engine
5.3.1 General comments about the engine and equipment performance
The purpose of testing the engine operating on hydrogen was to get an initial idea on the
performance of the prototype hydrogen CT 110 engine. The performance features include
the analysis of power, thermal efficiency and exhaust emissions. The testing procedure
closely emulated the gasoline testing procedure for effective comparative analysis.
Backfiring and pre-ignition problems were mostly ironed out during the tuning process.
However, infrequent backfiring through the inlet manifold still existed during the testing
procedure. Engine pre-ignition caused an instantaneous loss in engine power. This meant
that in the observed occurrence of pre-ignition, measured data was not indicative of the
intended data point and the test had to be repeated. The phenomenon is caused by a build
up of combustion gases in the inlet manifold. Due to the buoyancy of hydrogen gas, any
fuel that is not pulled into the cylinder is likely to rise to the top of the inlet manifold.
Once the temperature is hot enough to excite the low ignition energy and the gases in the
area accumulate to a combustible level combustion occurs and backfire occurs. Another
explanation for the phenomenon is that the valve overlap is causing ignition of not only
the charge but also gases in the manifold. Loss of power suggests that the ignition is not
only combusting excess fuel but also the charge intended for the cylinder. Effective
engine design parameters suggested earlier in the thesis could further reduce the existence
of pre-ignition.
Effective measurement of the air to fuel ratio of the engine was mostly unsuccessful for
hydrogen operation. The lambda sensor used was a narrow band sensor and did not have
adequate range. Rather than using the air to fuel ratio as the process variable for analysis
it has been decided to use the throttle position as the dependant. As the throttle of the
engine controlled the amount of fuel entering the cylinder (wide open throttle operation),
the throttle position is a good indication of the mixture of the fuel in the charge. As the
throttle position is advanced the amount of fuel entering will be increased, as shown in
the MoTec engine management system fuel maps. This increase will make the mixture
richer. The limited data obtained from the lambda sensor analysis agrees with this point.
For lower throttle positions in most of the tests the sensor indicated that the mixture was
Chapter Five - Performance of Gasoline and Hydrogen internal combustion engines 113
lean and as the throttle was advanced it indicated a rich mixture. As the throttle is
advanced more fuel is being injected into the engine, the result being an increase in
lambda. The use of a wide band lambda sensor and calibration of that sensor for
hydrogen use would give a more accurate way of measuring the air to fuel ratio.
Care was taken with the use of the gas analyzer during the testing period. The additional
moisture content in the exhaust of the hydrogen engine was resolved by continual
emptying the water trap and cleaning of the test lines to ensure flow was not restricted.
During the testing period hydrogen was delivered to the engine at a pressure of two bar.
This pressure was chosen because two bar (gauge) was found to be an appropriate fuel
pressure during the tuning operation. A duel stage regulator was used to keep this
pressure stable as the pressure inside the cylinder dropped whilst emptying. This is an
extremely important design feature of the test rig. The use of a single stage regulator
would have meant that the pressure would have changed as the cylinder pressure
changed. This would change the flow rate at the injectors which would intern effect the
engine operation. As tuning was undertaken at that pressure it is critical that constant fuel
pressure is maintained for the entire duration of engine running conditions.
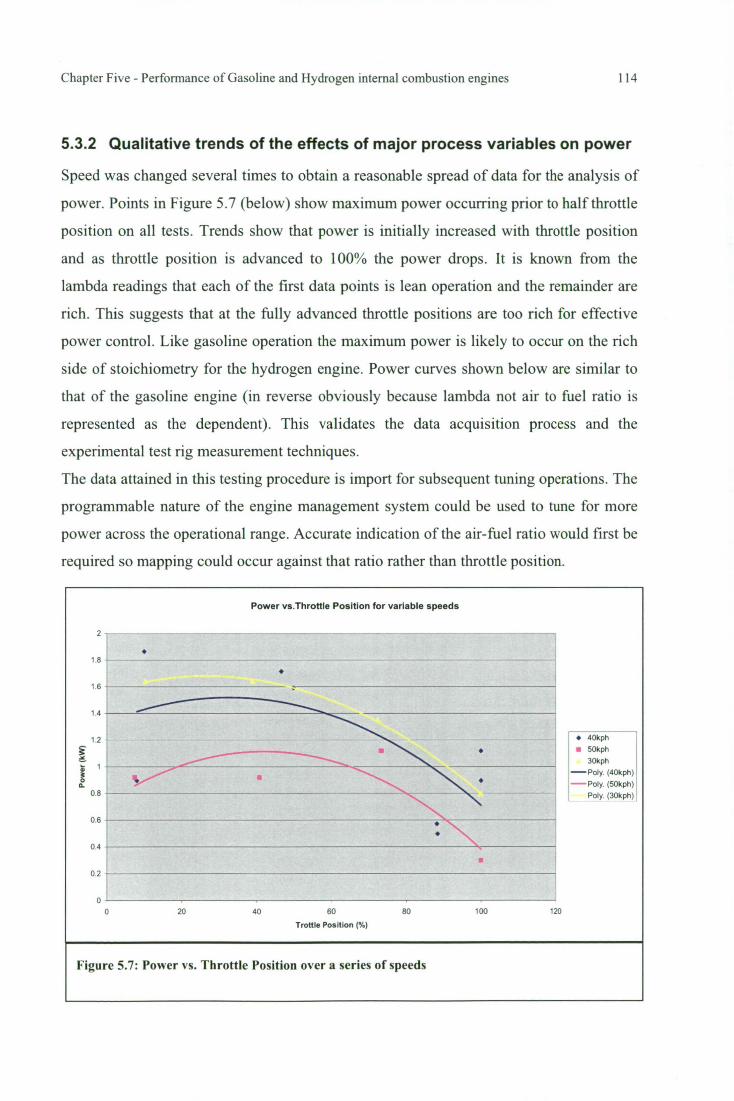
Chapter Five - Performance of Gasoline and Hydrogen internal combustion engines 114
5.3.2 Qualitative trends of the effects of major process variables on power
Speed was changed several times to obtain a reasonable spread of data for the analysis of
power. Points in Figure 5.7 (below) show maximum power occurring prior to half throttle
position on all tests. Trends show that power is initially increased with throttle position
and as throttle position is advanced to 100% the power drops. It is known from the
lambda readings that each of the first data points is lean operation and the remainder are
rich. This suggests that at the fully advanced throttle positions are too rich for effective
power control. Like gasoline operation the maximum power is likely to occur on the rich
side of stoichiometry for the hydrogen engine. Power curves shown below are similar to
that of the gasoline engine (in reverse obviously because lambda not air to fuel ratio is
represented as the dependent). This validates the data acquisition process and the
experimental test rig measurement techniques.
The data attained in this testing procedure is import for subsequent tuning operations. The
programmable nature of the engine management system could be used to tune for more
power across the operational range. Accurate indication of the air-fuel ratio would first be
required so mapping could occur against that ratio rather than throttle position.
Power vs.Throttle Position for variable speeds
1.8
1.6
1.4
12
t 1
et. 0.8
0.6
• •
• 40kph • 50kph
30kph —Poly. (40kph) —Poly. (50kph)
Poly. (30kph)
• •
0.4
•
0.2
0
20 40 60
80 100 120
Trottle Position (%)
Figure 5.7: Power vs. Throttle Position over a series of speeds
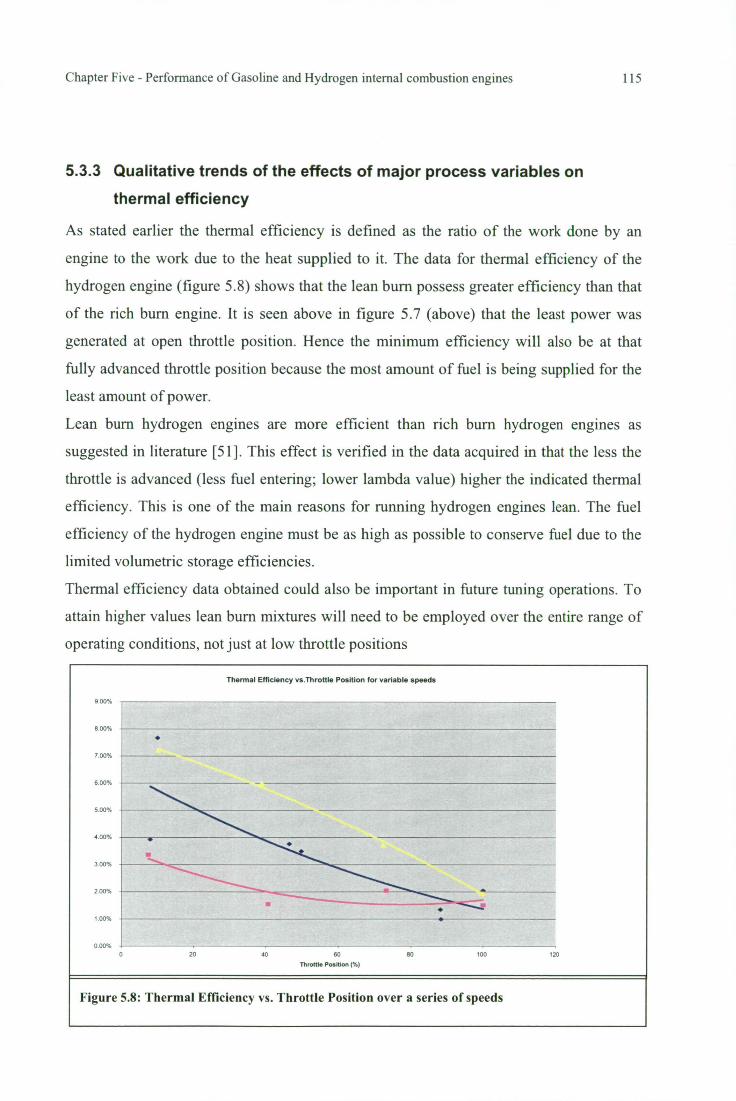
•
Chapter Five - Performance of Gasoline and Hydrogen internal combustion engines 115
5.3.3 Qualitative trends of the effects of major process variables on
thermal efficiency
As stated earlier the thermal efficiency is defined as the ratio of the work done by an
engine to the work due to the heat supplied to it. The data for thermal efficiency of the
hydrogen engine (figure 5.8) shows that the lean burn possess greater efficiency than that
of the rich burn engine. It is seen above in figure 5.7 (above) that the least power was
generated at open throttle position. Hence the minimum efficiency will also be at that
fully advanced throttle position because the most amount of fuel is being supplied for the
least amount of power.
Lean burn hydrogen engines are more efficient than rich burn hydrogen engines as
suggested in literature [51]. This effect is verified in the data acquired in that the less the
throttle is advanced (less fuel entering; lower lambda value) higher the indicated thermal
efficiency. This is one of the main reasons for running hydrogen engines lean. The fuel
efficiency of the hydrogen engine must be as high as possible to conserve fuel due to the
limited volumetric storage efficiencies.
Thermal efficiency data obtained could also be important in future tuning operations. To
attain higher values lean burn mixtures will need to be employed over the entire range of
operating conditions, not just at low throttle positions
Thermal Efficiency vs.Throttle Position for variable speeds
20
40 60 ao 100 120
Throttle Position (%)
Figure 5.8: Thermal Efficiency vs. Throttle Position over a series of speeds
9.00%
8.00%
7.00%
6.00%
5.00%
4.00%
3.00%
2.00%
1.00%
0.00%
Chapter Five - Performance of Gasoline and Hydrogen internal combustion engines 116
5.3.4 Qualitative trends of the effects of major process variables on
exhaust emissions
The major contributing process variable on the exhaust emissions was found to be the
engine temperature rather than the throttle position or air to fuel ratio. The amount of fuel
in the engine does affect the temperature significantly but it is not the only contributing
factor so we cannot analyze it with throttle position as the process variable.
Chemistry of hydrogen combustion produces very little harmful exhaust emissions.
Combustion of hydrogen with oxygen produces only water as shown in equation 5.1:
2H2 + 02 = 2H 2 0 Equation 5.1
Since air is not purely oxygen there oxides of nitrogen (N0x) can also be formed as
shown in equation 5.2:
H 2 ± 02 ± N2 = H2 0 ± N2 + N0, Equation 5.2
As can be seen no hydrocarbons, carbon dioxide or carbon monoxide are yielded in the
combustion of hydrogen. However burning of engine oil can result in trace elements of
hydrocarbons in the exhaust. During testing trace elements of hydrocarbons were
observed but in such small and irregular amounts they were not considered as part of this
analysis.
Figure 5.9 below shows the emissions of the oxides of nitrogen (N0x) with engine
temperature. Literature suggests that high temperature combustion is the cause of NOx in
exhaust emissions [85]. Of the NOx produced by combustion (NO, NO2, N20, N205),
NO is the most prevalent as shown in the equation 4.3. It can be formed in the following
mechanisms each of which is only prevalent with the existence of heat:
N2 + 0 = NO + N N +02 = NO +0 Equations 4.3 N2 + 02 = 2N0
Results obtained for the hydrogen engine confer the expected trends of NOx in the
exhaust. It is noted that as engine temperature increases the concentration of NOx also
increases. Design techniques to reduce engine temperature are a possible solution to
reducing NOx in the exhaust of hydrogen engines. Alternatively, catalytic converter
technology could treat NOx exhaust emissions.
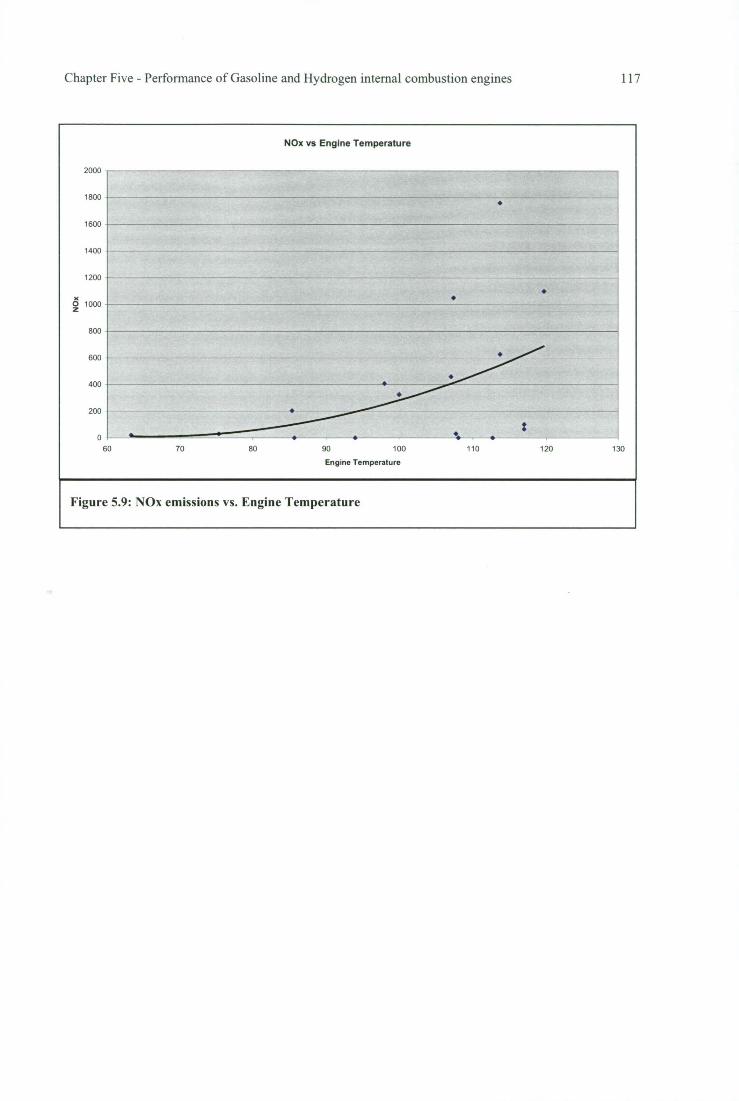
Chapter Five - Performance of Gasoline and Hydrogen internal combustion engines 1 17
2000
1800
1600
1400
1200
C 0 1000 z
800
600
400
0 60
NOx vs Engine Temperature
• - - -
• •
• •
•
• : 70 80 90 100
Engine Temperature
110 120 130
Figure 5.9: NOx emissions vs. Engine Temperature
Chapter Five - Performance of Gasoline and Hydrogen internal combustion engines 118
5.4 Quantitative Comparison of Performance
Due to the differing air to fuel ratio control mechanisms between the two engines, a direct
quantitative comparison cannot be undertaken. The control mechanism being the throttle
variance. The difference in the two being that the gasoline engine used the throttle to
control the amount of air entering the cylinder whilst the hydrogen engine used the
throttle to control the amount of fuel entering the engine.
Ideal comparison between the two engines would be completed with the air-fuel ratio as
the dependent variable. As previously discussed, however, this is not possible due to the
inadequate lambda measuring equipment for the hydrogen engine. This should be a future
consideration in test rig improvements. Despite this useful analysis can still be
undertaken.
It is noted that the trends for power and thermal efficiency vs. their respective dependent
variables are quite similar. From the quantitative analysis performed above, it is observed
that maximum power occurs prior to stoichiometry and as the mixture becomes richer the
power decreases for both fuels. For thermal efficiency we can ascertain information about
differing maxima and where they occur in respect to stoichiometry. Thermal efficiency
for both applications reduces with richness beyond stoichiometry. As the trends are
comparable, a comparison of their respective maximum values is a useful initial
assessment in the evaluation of overall comparative engine performance.
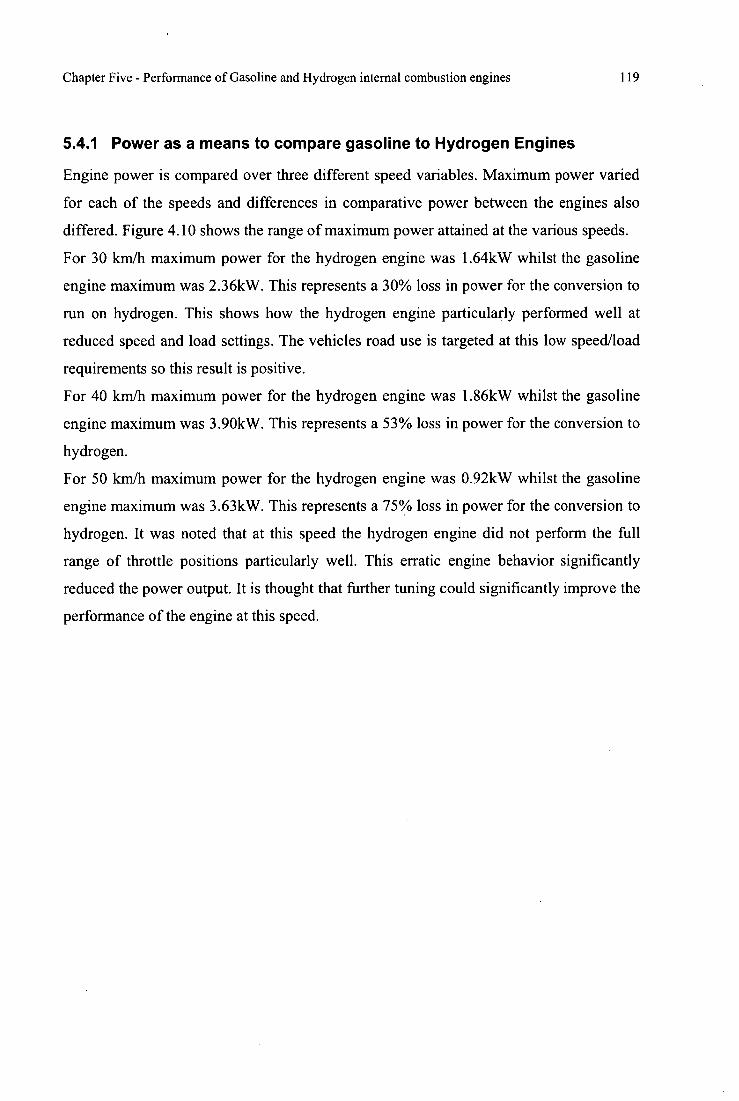
Chapter Five - Performance of Gasoline and Hydrogen internal combustion engines 119
5.4.1 Power as a means to compare gasoline to Hydrogen Engines
Engine power is compared over three different speed variables. Maximum power varied
for each of the speeds and differences in comparative power between the engines also
differed. Figure 4.10 shows the range of maximum power attained at the various speeds.
For 30 km/h maximum power for the hydrogen engine was 1.64kW whilst the gasoline
engine maximum was 2.36kW. This represents a 30% loss in power for the conversion to
run on hydrogen. This shows how the hydrogen engine particularly performed well at
reduced speed and load settings. The vehicles road use is targeted at this low speed/load
requirements so this result is positive.
For 40 km/h maximum power for the hydrogen engine was 1.86kW whilst the gasoline
engine maximum was 3.90kW. This represents a 53% loss in power for the conversion to
hydrogen.
For 50 km/h maximum power for the hydrogen engine was 0.92kW whilst the gasoline
engine maximum was 3.63kW. This represents a 75% loss in power for the conversion to
hydrogen. It was noted that at this speed the hydrogen engine did not perform the full
range of throttle positions particularly well. This erratic engine behavior significantly
reduced the power output. It is thought that further tuning could significantly improve the
performance of the engine at this speed.
Chapter Five - Performance of Gasoline and Hydrogen internal combustion engines 120
Maximum Power comparison between Hydrogen and Petrol Engines at varied speed
4.5
4
3.5
§- 2.5
• Hydrogen Engine
• Petrol Engine 02 a.
1.5
0.5 -
0
30
50
Figure 5.10: Maximum Power comparison between Hydrogen and Gasoline Engines over varied speeds.
There are several explanations for the loss in power exhibited by the hydrogen engine
indicated in figure 5.10.
Firstly, the energy density of a hydrogen-air mixture is significantly less than that of the
gasoline. For stoichiometric operation the air to fuel ratio for hydrogen is 34:1. At this
ratio the fuel only displaces 29% of the combustion chamber. As a result the energy
content of the mixture is reduced.
Secondly, the method of fuel delivery effects the potential power that the engine can
produce. The College of the Desert's document "Hydrogen Use In Internal Combustion
Engines" suggests that for port injected fuel delivery (as is used in this engine) maximum
theoretical power attainable is limited to 85% to that of gasoline engines. This is
calculated at the maximum power load site also which this engine was not designed to
run at.
Thirdly, improvement in the tuning of the hydrogen engine would substantially improve
power output. It was noted that during testing the 50 km/h data was effected by tuning
problems. At this speed the engine struggled the full array of throttle positions at the

Chapter Five - Performance of Gasoline and Hydrogen internal combustion engines 121
given speed. It is though that ignition and injection timing could be further tuned to
encompass smooth operation at all operating conditions.
Finally, further physical modifications could be made to the engine to increase its power
output. To range power that the initial engine gained changes could be made to the valve
timing to optimize injection timing. Injection position changed to below the engine block
may reduce the effects of the buoyancy of the hydrogen fuel. Increase in compression
ratio would significantly effect the pressure within the cylinder which may increase
power. Also the cylinder size could be altered to better suit the application required.
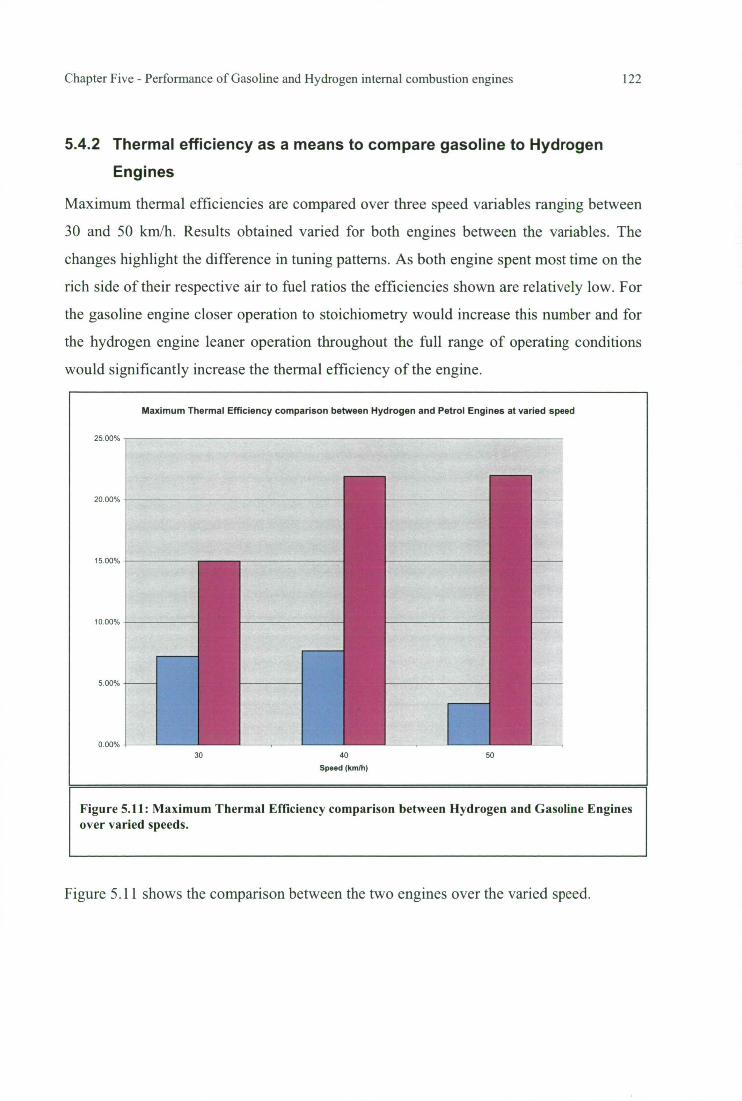
Maximum Thermal Efficiency comparison between Hydrogen and Petrol Engines at varied speed
30 40
Speed (km/h)
50
25.00%
20.00%
15.00%
10.00%
5.00% -
0.00%
Chapter Five - Performance of Gasoline and Hydrogen internal combustion engines 122
5.4.2 Thermal efficiency as a means to compare gasoline to Hydrogen
Engines
Maximum thermal efficiencies are compared over three speed variables ranging between
30 and 50 km/h. Results obtained varied for both engines between the variables. The
changes highlight the difference in tuning patterns. As both engine spent most time on the
rich side of their respective air to fuel ratios the efficiencies shown are relatively low. For
the gasoline engine closer operation to stoichiometry would increase this number and for
the hydrogen engine leaner operation throughout the full range of operating conditions
would significantly increase the thermal efficiency of the engine.
Figure 5.11: Maximum Thermal Efficiency comparison between Hydrogen and Gasoline Engines over varied speeds.
Figure 5.11 shows the comparison between the two engines over the varied speed.
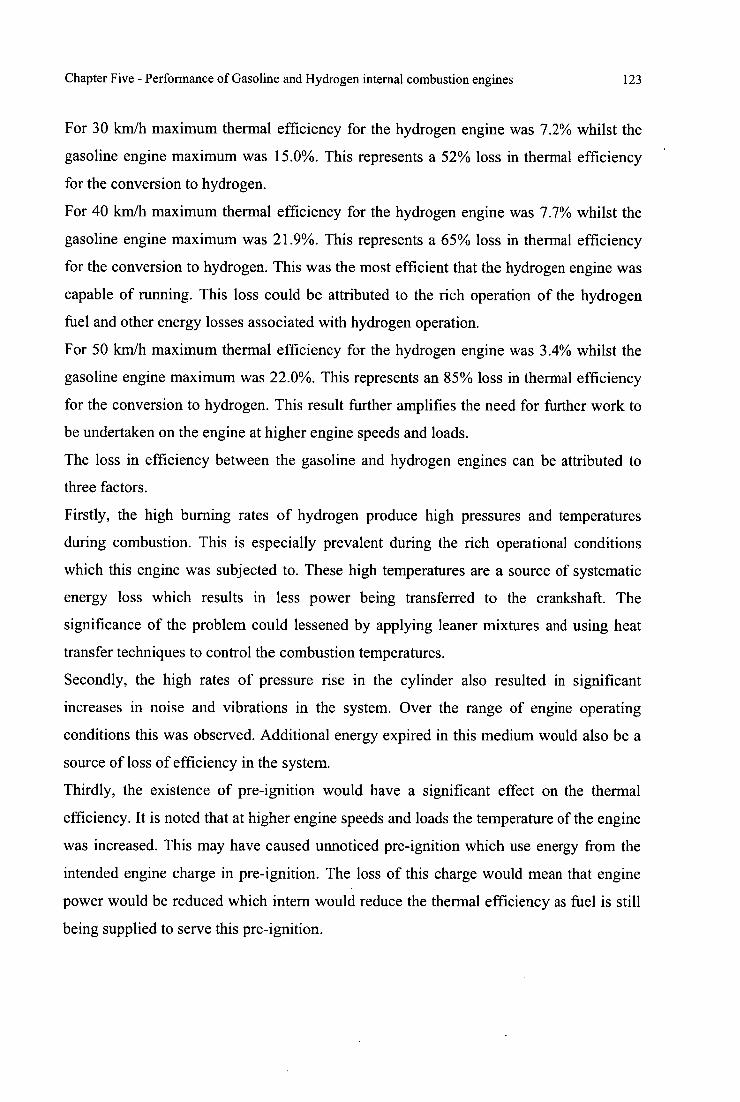
Chapter Five - Performance of Gasoline and Hydrogen internal combustion engines 123
For 30 km/h maximum thermal efficiency for the hydrogen engine was 7.2% whilst the
gasoline engine maximum was 15.0%. This represents a 52% loss in thermal efficiency
for the conversion to hydrogen.
For 40 km/h maximum thermal efficiency for the hydrogen engine was 7.7% whilst the
gasoline engine maximum was 21.9%. This represents a 65% loss in thermal efficiency
for the conversion to hydrogen. This was the most efficient that the hydrogen engine was
capable of running. This loss could be attributed to the rich operation of the hydrogen
fuel and other energy losses associated with hydrogen operation.
For 50 km/h maximum thermal efficiency for the hydrogen engine was 3.4% whilst the
gasoline engine maximum was 22.0%. This represents an 85% loss in thermal efficiency
for the conversion to hydrogen. This result further amplifies the need for further work to
be undertaken on the engine at higher engine speeds and loads.
The loss in efficiency between the gasoline and hydrogen engines can be attributed to
three factors.
Firstly, the high burning rates of hydrogen produce high pressures and temperatures
during combustion. This is especially prevalent during the rich operational conditions
which this engine was subjected to. These high temperatures are a source of systematic
energy loss which results in less power being transferred to the crankshaft. The
significance of the problem could lessened by applying leaner mixtures and using heat
transfer techniques to control the combustion temperatures.
Secondly, the high rates of pressure rise in the cylinder also resulted in significant
increases in noise and vibrations in the system. Over the range of engine operating
conditions this was observed. Additional energy expired in this medium would also be a
source of loss of efficiency in the system.
Thirdly, the existence of pre-ignition would have a significant effect on the thermal
efficiency. It is noted that at higher engine speeds and loads the temperature of the engine
was increased. This may have caused unnoticed pre-ignition which use energy from the
intended engine charge in pre-ignition. The loss of this charge would mean that engine
power would be reduced which intern would reduce the thermal efficiency as fuel is still
being supplied to serve this pre-ignition.
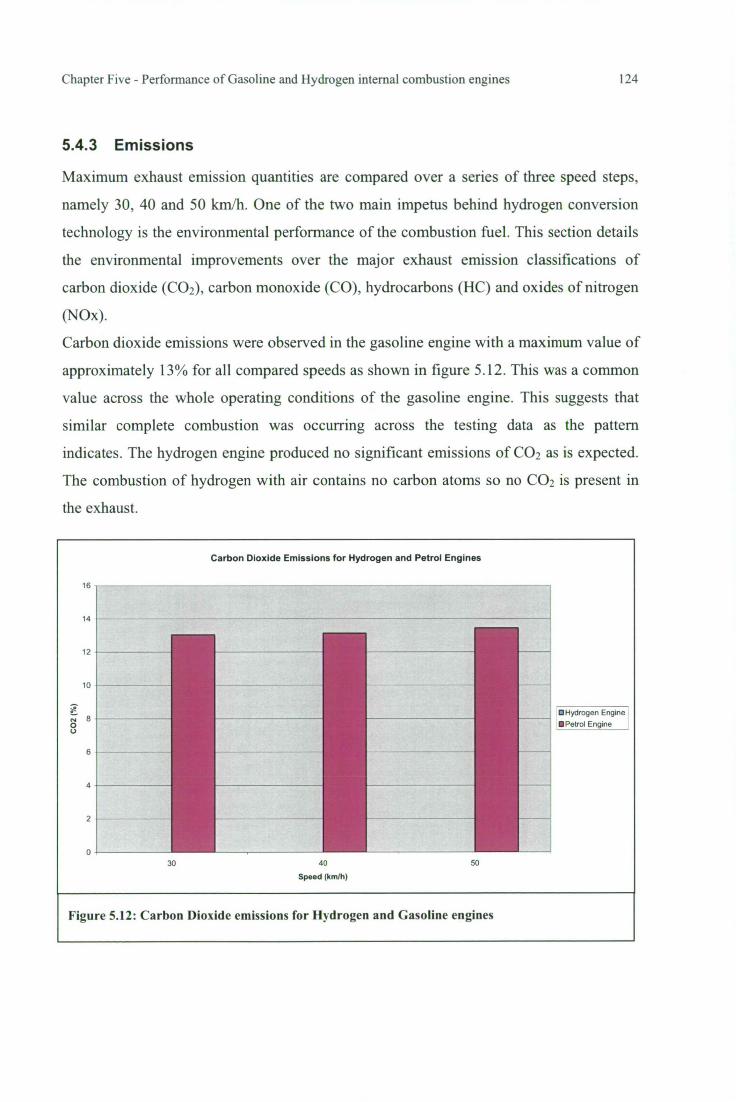
16
14
12
10
6
4
2
o
• Hydrogen Engine
• Petrol Engine
Chapter Five - Performance of Gasoline and Hydrogen internal combustion engines 124
5.4.3 Emissions
Maximum exhaust emission quantities are compared over a series of three speed steps,
namely 30, 40 and 50 km/h. One of the two main impetus behind hydrogen conversion
technology is the environmental performance of the combustion fuel. This section details
the environmental improvements over the major exhaust emission classifications of
carbon dioxide (CO2), carbon monoxide (CO), hydrocarbons (HC) and oxides of nitrogen
(N0x).
Carbon dioxide emissions were observed in the gasoline engine with a maximum value of
approximately 13% for all compared speeds as shown in figure 5.12. This was a common
value across the whole operating conditions of the gasoline engine. This suggests that
similar complete combustion was occurring across the testing data as the pattern
indicates. The hydrogen engine produced no significant emissions of CO 2 as is expected.
The combustion of hydrogen with air contains no carbon atoms so no CO2 is present in
the exhaust.
Carbon Dioxide Emissions for Hydrogen and Petrol Engines
30
40 50
Speed (km/h)
Figure 5.12: Carbon Dioxide emissions for Hydrogen and Gasoline engines
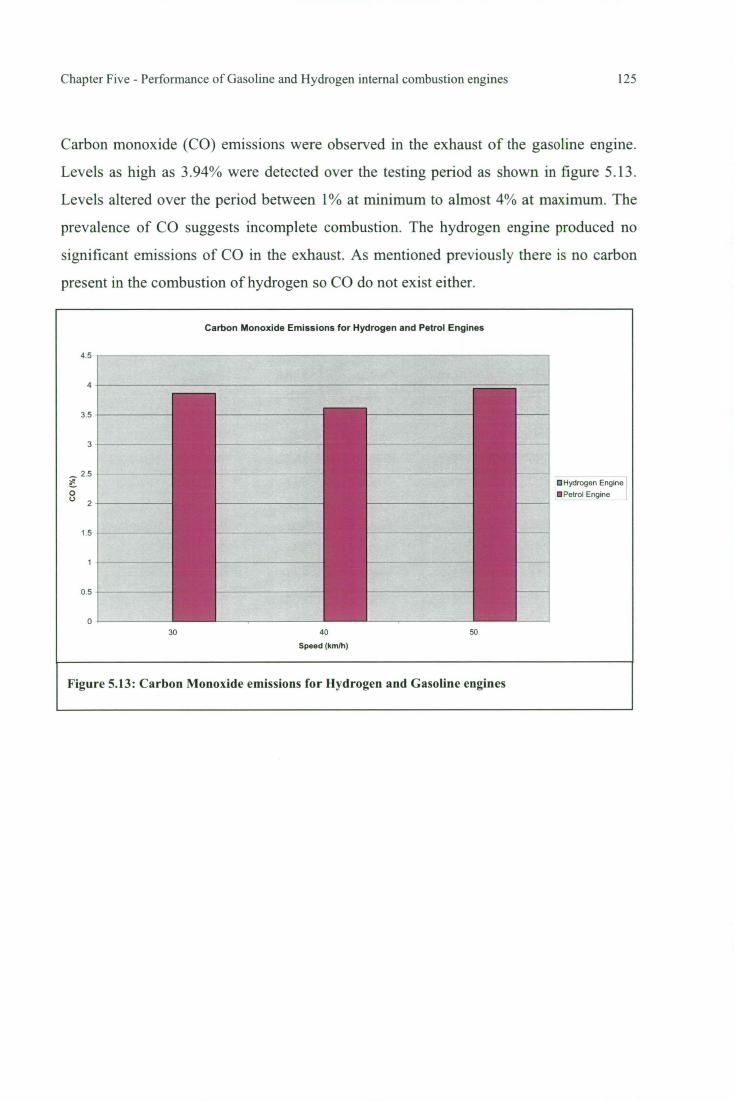
Chapter Five - Performance of Gasoline and Hydrogen internal combustion engines 125
Carbon monoxide (CO) emissions were observed in the exhaust of the gasoline engine.
Levels as high as 3.94% were detected over the testing period as shown in figure 5.13.
Levels altered over the period between 1% at minimum to almost 4% at maximum. The
prevalence of CO suggests incomplete combustion. The hydrogen engine produced no
significant emissions of CO in the exhaust. As mentioned previously there is no carbon
present in the combustion of hydrogen so CO do not exist either.
Carbon Monoxide Emissions for Hydrogen and Petrol Engines
4.5
4
3.5
3
25
• Hydrogen Engine
• Petrol Engine
1 5
30
40
Speed (km/h)
50
Figure 5.13: Carbon Monoxide emissions for Hydrogen and Gasoline engines
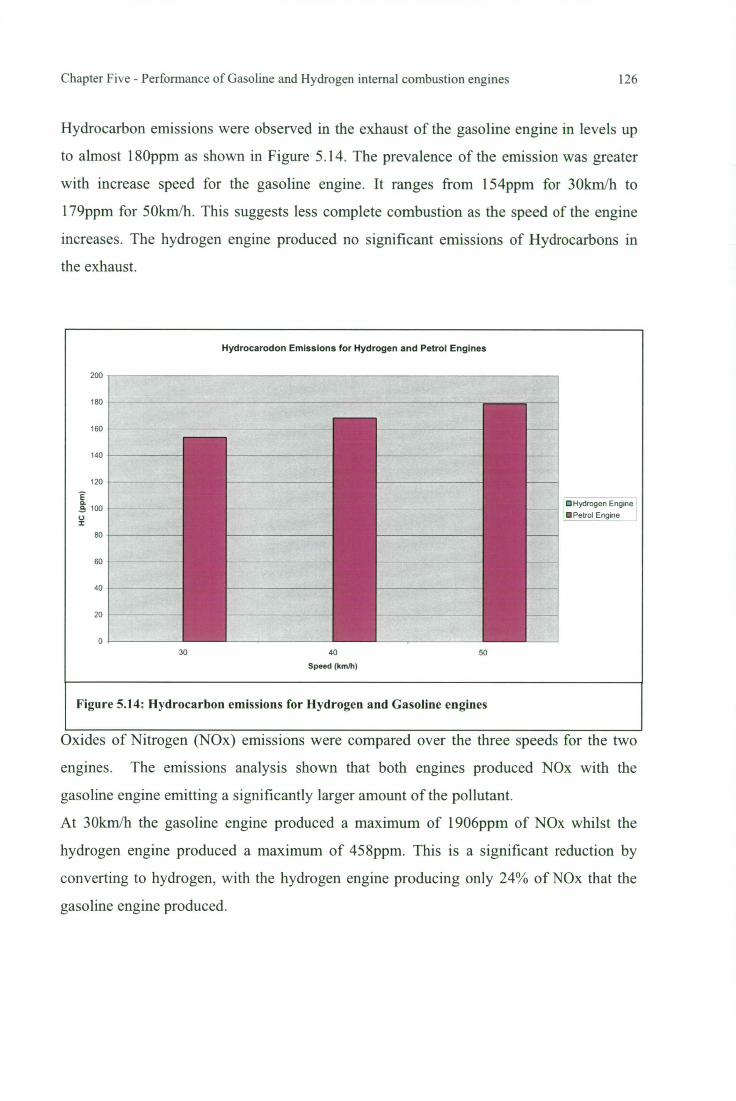
Hydrocarodon Emissions for Hydrogen and Petrol Engines
200
180
160
140
-
I
NM
120 -
S ta. a. 100 0 I
80
60
40
20
0
CI Hydrogen Engine 0 Petrol Engine
30
40
50
Speed (km/h)
Figure 5.14: Hydrocarbon emissions for Hydrogen and Gasoline engines
Chapter Five - Performance of Gasoline and Hydrogen internal combustion engines 126
Hydrocarbon emissions were observed in the exhaust of the gasoline engine in levels up
to almost 180ppm as shown in Figure 5.14. The prevalence of the emission was greater
with increase speed for the gasoline engine. It ranges from 154ppm for 30km/h to
179ppm for 501cm/h. This suggests less complete combustion as the speed of the engine
increases. The hydrogen engine produced no significant emissions of Hydrocarbons in
the exhaust.
Oxides of Nitrogen (N0x) emissions were compared over the three speeds for the two
engines. The emissions analysis shown that both engines produced NOx with the
gasoline engine emitting a significantly larger amount of the pollutant.
At 30km/h the gasoline engine produced a maximum of 1906ppm of NOx whilst the
hydrogen engine produced a maximum of 458ppm. This is a significant reduction by
converting to hydrogen, with the hydrogen engine producing only 24% of NOx that the
gasoline engine produced.
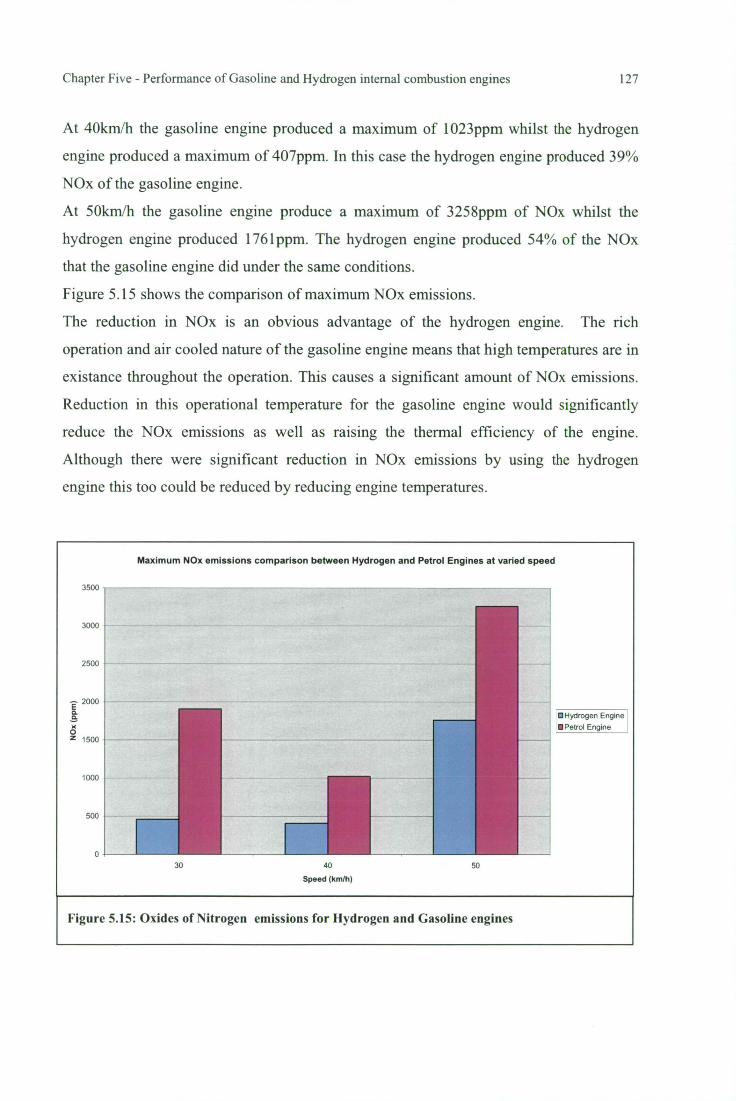
Chapter Five - Performance of Gasoline and Hydrogen internal combustion engines 127
At 401(m/h the gasoline engine produced a maximum of 1023ppm whilst the hydrogen
engine produced a maximum of 407ppm. In this case the hydrogen engine produced 39%
NOx of the gasoline engine.
At 50Icm/h the gasoline engine produce a maximum of 3258ppm of NOx whilst the
hydrogen engine produced 1761ppm. The hydrogen engine produced 54% of the NOx
that the gasoline engine did under the same conditions.
Figure 5.15 shows the comparison of maximum NOx emissions.
The reduction in NOx is an obvious advantage of the hydrogen engine. The rich
operation and air cooled nature of the gasoline engine means that high temperatures are in
existance throughout the operation. This causes a significant amount of NOx emissions.
Reduction in this operational temperature for the gasoline engine would significantly
reduce the NOx emissions as well as raising the thermal efficiency of the engine.
Although there were significant reduction in NOx emissions by using the hydrogen
engine this too could be reduced by reducing engine temperatures.
Maximum NOx emissions comparison between Hydrogen and Petrol Engines at varied speed
3500
3000
2500
i 2000 o. o. x 0 Z 1500
1000
500
0
[
-i
• Hydrogen Engine • Petrol Engine
30
40 50
Speed (km/h)
Figure 5.15: Oxides of Nitrogen emissions for Hydrogen and Gasoline engines
Chapter Five - Performance of Gasoline and Hydrogen internal combustion engines 128
5.5 Testing and Data Analysis Conclusions
The baseline testing by acquiring performance data on the CT110 yielded positive results.
Testing procedures were adhered to and the guidelines extracted from AS 4594.11 were
followed, further validating results. It is important to note that the qualitative trends for
power, thermal efficiency and emissions are comparable to the established trends.
Incomplete combustion explains the trends in increased HC and CO.
The testing of the hydrogen engine yielded results for the comparison to the previously
acquired baseline data. Power and thermal efficiency trends obtained were consistent
with internal combustion engine trends observed in literature [3]. The emission trends
yielded are consistent with the associated combustion chemistry. The results obtained
will also serve as a means of future design assistance in the development of the engine.
Comparison of the two engines generated consistent results between the speed variables.
The gasoline engine produced better power and significantly better thermal efficiency
over all compared values. At lower speed values the hydrogen engine performed better
than at higher speeds. The hydrogen engine produced no significant emissions of carbon
dioxide, carbon monoxide and hydrocarbons and reduced emissions of oxides of nitrogen
when compared to the gasoline engine. The gasoline engine produces considerable
amounts of all measured emissions.

Chapter Six - Final Concluding Remarks and Proposed Future Work 129
CHAPTER 6 Final Concluding Remarks and Proposed Future
Work
Chapter Six - Final Concluding Remarks and Proposed Future Work 130
6.1 Final Concluding Remarks
6.1.1 Literature Study
From an extensive literature survey carried out on hydrogen engines, it is shown that
much of the technology and conversion methods are within the realms of some
automotive companies. It is shown that little extensive literature is available on the
performance of hydrogen engines. This project demonstrated a careful design and
prototype development of working Honda CT 110 hydrogen engine to power a common
commercial fleet vehicle, the 'postie bike'. From a design point of view, the intricate air
intake system and innovative fuel injection systems were built from first principles. The
test rig development predominantly covered conversion intricacies and a systematic
approach to experimental data acquisition and analysis. MoTec as an established engine
management system was used for advanced tuning and to acquire data for post
processing.
The qualitative trends of the effect of major process variables on power, thermal
efficiency and exhaust emissions were established for both gasoline and hydrogen
engines. It is noted that the qualitative trends are comparable with the established trends
in the literature for gasoline engines. This is a reassurance that the experimental test rig
performed well along with associated measuring equipment. The design, development
and installation of the hydrogen storage is well described in this work.
6.1.2 Power and Thermal Efficiency Comparison
The qualitative trends of the hydrogen engine for power, thermal efficiency are
comparable to that of the gasoline engine. From a quantitative comparison both
maximum power and maximum thermal efficiency are taken as bench marks for various
engine speeds. Across various speeds power reductions between 30-85% were observed
for the converted hydrogen engine when compared to its gasoline counterpart. The
maximum speed of the hydrogen CT110 ('postie bike') for normal road running
conditions was shown to be 50km/h. It is also argued that for normal Australian driving
conditions in built-up regions, a maximum speed of 50km/h is adequate.
Chapter Six - Final Concluding Remarks and Proposed Future Work 131
6.1.3 Emissions
The hydrogen engine produced no exhaust emissions of carbon monoxide, carbon dioxide
or hydrocarbons whilst the gasoline engine produced significant emissions of all these
pollutants. Nitrogen oxide emissions'were reduced by between 46-76% by converting the
engine to hydrogen. This is seen as a major success in the conversion process and is a
major validation for the process itself.
6.1.4 Social Acceptance
Another aspect to the conversion of the CT 110 to hydrogen was to increase the
community acceptance and knowledge of the hydrogen fuel as an alternative to
traditional fossil based fuels. Introducing a new technology such as a new fuel requires
two basic necessities: consumer acceptance and working infrastructure. One of the best
methods of increasing consumer acceptance is by means of exposure to the associated
technology. Such exposure reduces the risk perception of the public and also familiarizes
potential users the technology. On completion of the conversion the hydrogen CT 110 was
exposed to the public through various media sources such as print, television, internet and
radio. The project was covered locally, nationally and internationally.
6.2 Proposed Future Work
From a future development point of view there are several research areas of interest that
will enhance the performance of the CT110. The Hydrogen CT110 that has been
developed to this point is still in its infancy as a first generation prototype. The
performance of the bike could be enhanced to make the vehicle more comparable with its
gasoline counterpart. Additionally the bike can be developed to include greater safety
features and become more aesthetically pleasing. Potential developments have been
detailed in order to assist future research goals. An essential part of this investigation are
these proposed works.
6.2.1 EMS Development
The current hydrogen engine has a basic engine management system tuning maps
installed in it. They are the result of about four hours of dynamometer tuning, which is
sufficient for basic operation. However, the current fuel injection map in the engine could
Chapter Six - Final Concluding Remarks and Proposed Future Work 132
be further improved. The map was the result of a series of test point and interpolation.
Injection timing was altered quite substantially over the tuning process in this study. It
was found that by adjusting this parameter backfiring could be reduced and the engine
would produce more power. In the event of valve timing changing this parameter may
have greater effect on engine performance.
An extensive study on the effect of ignition timing on the combustion was not carried out
in this process. A study on the development of this parameter will better control the
combustion process and produce better power results.
6.2.2 Compression Ratio
Compression ratio has a strong influence on the pressure inside the cylinder of the
engine. Increase in compression ratio usually results in a sharp increase in the cylinders
top pressure. Hydrogen engines can run higher compression ratios due to the high flame
speed and high specific-heat ratio. The compression ratio has a strong influence on the
thermodynamic efficiency of the engine. A lean hydrogen mixture is expected to be less
susceptible to knock (the critical parameter in maximum compression ratio) than
conventional gasoline mixtures and therefore can be run at higher compression ratios.
The higher the compression ratio the higher the indicted thermal efficiency of the engine.
A future research in this area should take the compression ratio into consideration.
6.2.3 Valve Timing
It is important to note that valve timing in the CT 110 engine is a fixed parameter. Due to
this fact, the tuning had to be adapted around the valve timing of the engine. Improved
valve timing configuration could be employed to better suit the hydrogen application.
Injecting hot gases into the manifold onto a hot inlet valve is thought to be one of the
sources of backfiring in the engine. In an ideal situation the inlet gases should spend as
little time as possible in the inlet manifold. Once injected the fuel should travel directly
into the cylinder. Fixed valve timing meant that this was not entirely possible as there
was to be no injection during valve overlap. By reducing the valve overlap and
introducing variable valve timing would increase the volumetric efficiency of the engine
whilst also better controlling backfiring and pre-ignition in the inlet manifold. Control
over the variance of the valve timing would also open options of further testing on the
Chapter Six - Final Concluding Remarks and Proposed Future Work 133
effect of valve timing on the hydrogen engine. Very little study has been done on the
effect of valve timing on the hydrogen engine and further investigation could enhance the
understanding of the effect of this important parameter.
6.2.4 Fuel Pressure
Alteration of fuel pressure and the subsequent amount of fuel entering the cylinder can be
readily measured and changed. By increasing the fuel pressure the fuel injectors would
not need to be open for such long periods and greater precision could be attained. Fuel
injectors have a minimum speed at which they can open and shut. The fuel pressure
should be a function of this and engine speed so that the correct amount of fuel can be
administered to the engine at the correct time. By increasing fuel flow it is thought that
perhaps the valve overlap would not need to be so small. Parameters such as cylinder
pressure and volumetric efficiency must also be considered when studying the effect of
fuel pressure.
6.2.5 Sensor Accuracy and Repeatability
Sensors used in the study are 'off the shelf' type sensors from a range of manufacturers.
The accuracy of the test rig and sensors are taken from a combination of manufacturers
specifications and relevant standards. Further work could consider the accuracy of the
equipment in a repeatability study.
6.2.6 Storage Development
The current storage system on the hydrogen CT110 is not suitable for road usage. As a
demonstration prototype the compressed gas cylinder serves as good alternative but for
greater acceptance the volumetric storage efficiency will need to be improved. Due to the
lack of storage space on the vehicle metal hydride storage would be the best storage
option. Metal hydride cylinders are commercially available and their technology has been
proven to work. An ancillary temperature control system would be required to keep to
hydride cylinder at is optimum release temperature. This system would not be overly
complicated but study into release rates would be essential to ensure that the engine could
operate at all required conditions.
Chapter Six - Final Concluding Remarks and Proposed Future Work 134
6.2.7 Solenoid Valve
The current method for stopping fuel flow from the delivery system to the engine is two
fold; a manual on/off ball valve and the operation of the fuel injectors being closed. With
miniscule rates of leakage through the injectors the system is considered safe. Given
injector failure however the situation could be different. If the engine was stopped and
the injectors were leaking into the inlet manifold then there could be potential for
explosion. Furthermore, if the injectors were not to seal properly a flash back could occur
along the fuel delivery line. To compensate for this possibility a solenoid valve put in the
fuel delivery system in place of the manual ball valve would serve as an automatic fuel
shut off once the engine was stopped. The MoTec EMS has the facility to produce
auxiliary voltages for such equipment as turbo chargers and waste gate valves in
performance automobiles. This feature could be used to operate a solenoid valve. Once
the engine stopped the signal could close the solenoid valve and hence stop the flow of
fuel to the injectors. The valve could be beneficial also in that the injectors would not be
constantly under fuel pressure which may cause eventual wear.
6.2.8 Control of Air Flow
As it stands now the hydrogen CT 110 engine is run at wide-open throttle. This method is
thought to take advantage of hydrogen's wide flammability limits and increase engine
efficiency by removing the throttle body. However, the inclusion of a modified air
throttling operation on this bike would give the operator and researcher more control over
the engine parameters. Wide-open throttle operation means the bike idles at a very high
rpm. Attempts to reduce this rpm results in extremely lean operation, backfiring and
eventually engine stall. For an engine specifically designed to run on hydrogen this could
be overcome with inlet design allowing the exactly correct amount of air to enter the
manifold. The introduction of a air throttle would mean the engine could idle much lower
and the control over air-fuel ratios would be much greater. Under greater load and rpm
the throttle could be wide open again increasing the efficiency as desired.
6.2.9 Further Emission Development and Study
The hydrogen engine exhibited in this project produced some nitrous oxides. This amount
was significantly less than the petrol engine but to totally reduce emissions undesirable

Chapter Six - Final Concluding Remarks and Proposed Future Work 135
fuel mixtures would need to be used. Lean mixture invariably in this engine produced
less power than it's richer counterpart. With the use of a catalytic converter NOx
emissions in the exhaust could be captured and high concentrations of hydrogen could be
employed.
References 136
References
1. Ford Motor Company, Model U. 2004. 2. Jennings, T., 5.gif (GIF Image, 400x240 pixels):. 1998. 3. Brear, M., Chapter 6 - IC engines. 2001. 4. Toyota, Toyota Australia: Prius - Colours and trims:. 2004. 5. Honda, Electric Hybrid Car Pictures - Photos of Honda Insight Cars:. 2004. 6. National Ethanol Vehicle Coalition, National Ethanol Vehicle Coalition:. 2004. 7. Sutcliffe, J., Ford Focus Hybrid Fuel Cell Vehicle. 2003. 8. California Energy Commission, cove_pointing_2_500x400,jpg (JPEG Image,
500x400 pixels). 2003. 9. VitageBike, VintageBike.co.uk - Picture of 1894 Hildebrand und Wolfmueller:.
2004. 10. Bellis, M., Christian Huygens. 2004. 11. Encyclopedia.com, Evolution of the Internal Combustion Engine. 2004. 12. Weathers, T. and C. Hunter, Fundamentals of Small Gas Engines. 1983: Reston
Publishing Company Inc. 13. Singh, K., Automobile Engineering Volume 1,. Vol. 1. 2000: A.K. JAIN. 14. Bellis, M., The First Mass Production of Cars - The Assembly Line:. 2004. 15. Benson, S., The Thermodynamics and Gas Dynamics of Internal Combustion
Engines. Vol. 1. 1982: Clarendon Press. 16. Wikipedia, Internal combustion engine. 2004. 17. automibeindia.com, History of Two Wheelers, Motorcycles - Growth and
Development, Motorcyles in India:. 2004. 18. Iyer, N. Reducing Pollution from -3 wheelers. in Synthesis of Hanoi Workshop.
2002. Manila. 19. ABD. 2-3 Wheelers in Asia and their Impact on the Environment. in Action Plans
for Reducing Vehicle Emissions Regional Workshop. 2001. Hanoi, Viet Nam. 20. Australian Bureau of Agricultural and Resource Economics, Australian Mineral
Statistics- June Quarter 2004. 2004. 21. Australian Bureau of Statistics, Motor Vehicle Census, Australia. 2004,
Australian Government. 22. Cao, X., THE FUTURE DEMAND FOR ALTERNATIVE FUEL PASSENGER
VEHICLES: A PRELIMINARY LITERATURE REVIEW. 2003, The California Department of Transportation.
23. Intergovernmental Panel on Climate Change (IPCC), The Scientific Basis: Summary for Policymakers. A Report of Working Group I of the Intergovernmental Panel, in Climate Change 2001:. 2001.
24. Carbon Dioxide Information Analysis Center, Global, Regional, and National CO2 Emissions: OCEANIA. 2004.
25. NaturalGas.org, Natural Gas in the Transportation Sector. 2003. 26. NaturalGas.org, Background. 2003.
References 137
27. United States Environmental Protection Agency, Clean Alternative Fuels: Compressed Natural Gas. 2002, Transportation and Air Quality.
28. ABD.org, Compressed Natural Gas. 2004. 29. United States Environmental Protection Agency, Clean Alternative Fuels:
Liquefied Natural Gas. 2002, Transportation and Air Quality. 30. NaturalGas.org , Liquefied Natural Gas (LNG). 2003. 31. Department of the Parliamentary Library, Liquified Petroleum Gas (LPG). 2002. 32. BP, BP Australia LPG - bp autogas. 2004. 33. Australian Institute of Petroleum, FACT SHEET Alternative Transport Fuels.
2004. 34. Electric Auto Association, Electric Vehicles Today. 2003. 35. United States Environmental Protection Agency, Clean Alternative Fuels:
Electric Vehicles. 2002. 36. Howstuffworks, How Hybrid Cars Work. 2004. 37. California Energy Commission, Energy Quest-Energy Education. 2002. 38. Toyota, Toyota Australia: Prius03 homepage: . 2003, Toyota. 39. Honda, 2004 Honda Insight Hybrid - Specs and Pictures of Hybrid Cars:. 2004. 40. Energy, U.D.o., Energy Savers: Solar-Powered Vehicles:. 2004. 41. US Department of Energy, Biodiesel. 2004. 42. Biodiesel Association of Australia, Biodiesel Fact Sheet. 2003. 43. United States Environmental Protection Agency, Clean Alternative Fuels:
Biodiesel. 2002. 44. US Department of Energy, What is Ethanol. 2004. 45. National Corn Growers Association, Ethanol, America's Clean Renewable Fuel.
2004. 46. United States Environmental Protection Agency, Clean Alternative Fuels:
Ethanol. 2004. 47. Bohacik, T., S.D. Maria, and W. Sman, Constant Volume Adiabatic Combustion
of Stoichiometric Hydrogen-Oxygen Mixtures. Renewable Energy, 1996. 9(1-4): p. 1254-1257.
48. Das, L.M., Near-Term introduction of hydrogen engines for automotive and agricultural applications. Int. J. of Hydrogen Energy, 2002. 27: p. 479-487.
49. Verhelst, S. and R. Sierens, Hydrogen engine-specific properties. International Journal of Hydrogen Energy, 2001. 26(9): p. 987-990.
50. Hansel, J.G., G.W. Mattern, and R.N. Miller, Safety considerations in the design of hydrogen-powered vehicles. International Journal of Hydrogen Energy, 1993. 18(9): p. 783-790.
51. Karim, G.A., Hydrogen as a spark ignition engine fuel. International Journal of Hydrogen Energy, 2003. 28(5): p. 569-577.
52. Peavey, M.a., Fuel From Water. 7 ed. 1998, Louisville, KY: Merit Inc. 251. 53. Wilkie, J., A Fuel Cell Supply Chain in the UK, Johnson Matthey Fuel Cells,
Editor. 2004. 54. ACIL Tasman, a.P.B., National Hydrogen Study. 2003: Australian Government,
Department of Industry, Tourism and Resources.
References 138
55. Ma, J., et al., Simulation and prediction on the performance of a vehicle's hydrogen engine. International Journal of Hydrogen Energy, 2003. 28(1): p. 77- 83.
56. Thomas, C.E. Hydrogen-Fueled Vehicles: Hybrids vs. Fuel Cells. in International Vehicle Technology Symposium On Climate Change. 2003. Sacramento California,.
57. focaljet, Hydrogen Hybrid Focus. 2004. 58. Barbir, F., Safety issues of hydrogen in vehicles. 2002. 59. College of the Desert, Module 1: Hydrogen Properties, in Hydrogen Fuel Cell
Engines and Related Technologies. 2001. 60. BOC Australia, Fuel Flashback Arrestors. 2004. 61. Demirbas, A., Fuel Properties of Hydrogen, Liquified Petroleum Gas (LPG), and
Compressed Natural Gas (CNG) for Transport. Energy Sources, 2002. 24: p. 601- 610.
62. Das, L.M., Hydrogen Engines: A view of the past and a look to the future. Int. J. of Hydrogen Energy, 1990. 15(6): p. 425-443.
63. hydrogenus.com, The History of Hydrogen, F.S. Series, Editor. 2004. 64. carlist.com, OPEC, oil reserves, world demand, alternative fuels:. 2004. 65. U.S. DOE Energy Information Administration, Annual Energy Outlook 2004 with
Projections to 2025. 2004. 66. Yamin, J., et al., Effect of combustion duration on the performance and emission
characteristics of a spark ignition engine using hydrogen as a fueL Int. J. of Hydrogen Energy, 2000. 25: p. 581-589.
67. Swgal, L., S. Wallace, and J. Keffer, Safety considerations in the design of a gaseous hydrogen fuel supply for engine testing. International Journal of Hydrogen Energy, 1986. 11(11).
68. College of the Desert, Module 3: Hydrogen Use In Internal Combustion Engines, in Hydrogen Fuel Cell Engines and Related Technologies. 2001.
69. Singh, K., Automobile Engineering Volume 2. Vol. 2. 2000: A.K. JAIN. 70. Cartwright, H.M., Glossary Definition - Flashback:. 2003. 71. Verhelst, S. and R. Sierens, Aspects concerning the optimisation of a hydrogen
fueled engine. International Journal of Hydrogen Energy, 2001. 26(9): p. 981-985. 72. Heffel, J.W., D.C. Johnson, and C. Shelby, Hydrogen Powered Shelby Cobra:
Vehicle Conversion. 2003, University of California. 73. Jonsson, H., et al., Light Metal Alloys for Hydrogen Storage, University of
Iceland. 74. Zuttel, A., Materials for Hydrogen Storage, in Materials Today. 2003. 75. Pyle, W., Hydrogen Storage. Home Power, 1997. 59(June/July): p. 14-21. 76. Amos, W.A., Costs of Storing and Transporting Hydrogen, N.R.E. Laboratory,
Editor. 1998. 77. Eagles, S.R. and J.A. Mosovsky, Safety recommendations for liquid and gas bulk
hydrogen systems. Professional Safety, 1990. 35(7): p. 32-38. 78. Valenti, M., Fill'er up-with hydrogen, in Mechanical Engineering. 2002. p. 44-48. 79. Hanada, T., M. Nagatomo, and Y. Naruo. Liquid Hydrogen Industry: A Key for
Space Tourism. in 19th International Symposium on Space Technology and Science. 1994. Yokohama Japan.

References 139
80. Solomon, A.S., Direct Fuel Injection for Gasoline Engines. 2000. 81. Bulter, D., Traction Control Using Artificial Neural Networks, in School of
Engineering. 2002, University of Tasmania. 82. Jones, N., SI Engines Port Air Mass Flow Prediction Uning ANN'S, in School of
Engineering. 2003, University of Tasmania. 83. Heron, G., Estimation of Brake Force on an Open Wheel Racing Car Uning
Artificial Neural Networks, in School of Engineering. 2002, University of Tasmania.
84. Cunningham, H., Roll Over Parameters Prediction Using Neural Networks, in School of Engineering. 2002, University of Tasmania.
85. Toyota Motor Sales U.S.A, Emissions #1-Combustion Chemistry. 2002.
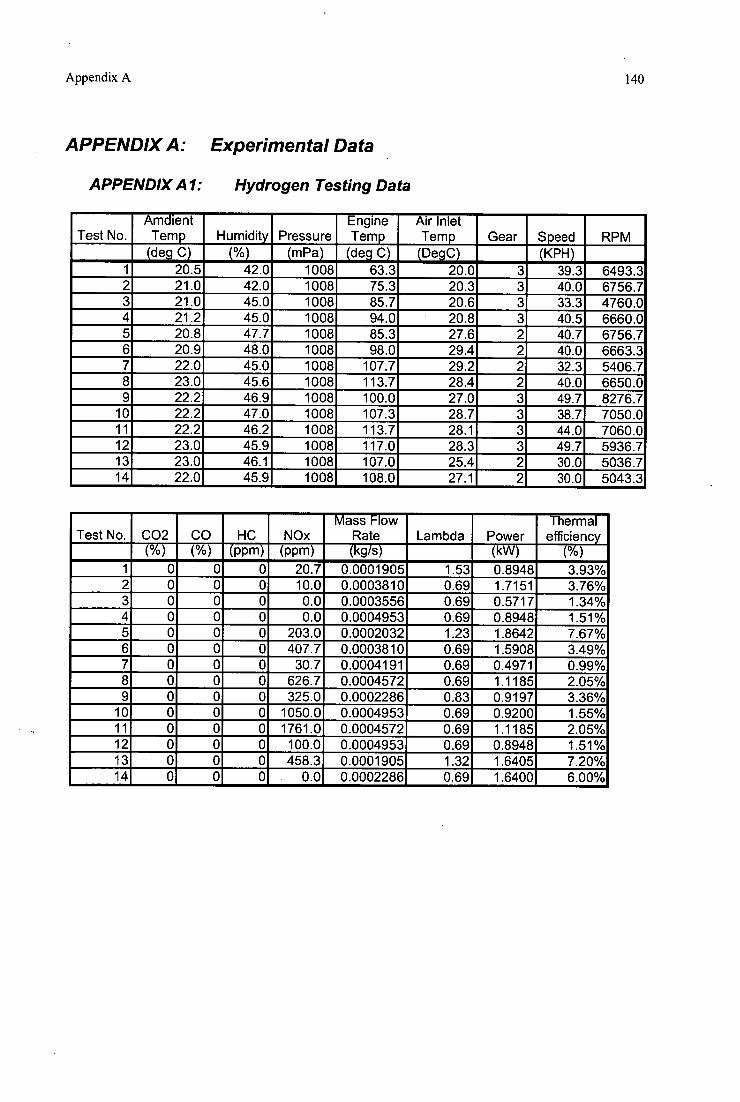
Appendix A 140
APPENDIX A: Experimental Data
APPENDIX Al: Hydrogen Testing Data
Test No. Amdient
Temp Humidity Pressure Engine Temp
Air Inlet Temp Gear Speed RPM
(deg C) (%) (mPa) (deg C) (DegC) (KPH) 1 20.5 42.0 1008 63.3 20.0 3 39.3 6493.3 2 21.0 42.0 1008 75.3 20.3 3 40.0 6756.7 3 21.0 45.0 1008 85.7 20.6 3 33.3 4760.0 4 21.2 45.0 1008 94.0 20.8 3 40.5 6660.0 5 20.8 47.7 1008 85.3 27.6 2 40.7 6756.7 6 20.9 48.0 1008 98.0 29.4 2 40.0 6663.3 7 22.0 45.0 1008 107.7 29.2 2 32.3 5406.7 8 23.0 45.6 1008 113.7 28.4 2 40.0 6650.0 9 22.2 46.9 1008 100.0 27.0 3 49.7 8276.7
10 22.2 47.0 1008 107.3 28.7 3 38.7 7050.0 11 22.2 46.2 1008 113.7 28.1 3 44.0 7060.0 12 23.0 45.9 1008 117.0 28.3 3 49.7 5936.7 13 23.0 46.1 1008 107.0 25.4 2 30.0 5036.7 14 22.0 45.9 1008 108.0 27.1 2 30.0 5043.3
Test No. CO2 CO HC NOx Mass Flow
Rate Lambda Power Thermal efficiency
(%) (%) (ppm) (ppm) (kg/s) (kW) (0/0)
1 0 0 0 20.7 0.0001905 1.53 0.8948 3.93% 2 0 0 0 10.0 0.0003810 0.69 1.7151 3.76% 3 0 0 0 0.0 0.0003556 0.69 0.5717 1.34% 4 0 0 0 0.0 0.0004953 0.69 0.8948 1.51% 5 0 0 0 203.0 0.0002032 1.23 1.8642 7.67% 6 0 0 0 407.7 0.0003810 0.69 1.5908 3.49% 7 0 0 0 30.7 0.0004191 0.69 0.4971 0.99% 8 0 0 0 626.7 0.0004572 0.69 1.1185 2.05% 9 0 0 0 325.0 0.0002286 0.83 0.9197 3.36%
10 0 0 0 1050.0 0.0004953 0.69 0.9200 1.55% 11 0 0 0 1761.0 0.0004572 0.69 1.1185 2.05% 12 0 0 0 100.0 0.0004953 0.69 0.8948 1.51% 13 0 0 0 458.3 0.0001905 1.32 1.6405 7.20% 14 0 0 0 0.0 0.0002286 0.69 1.6400 6.00%
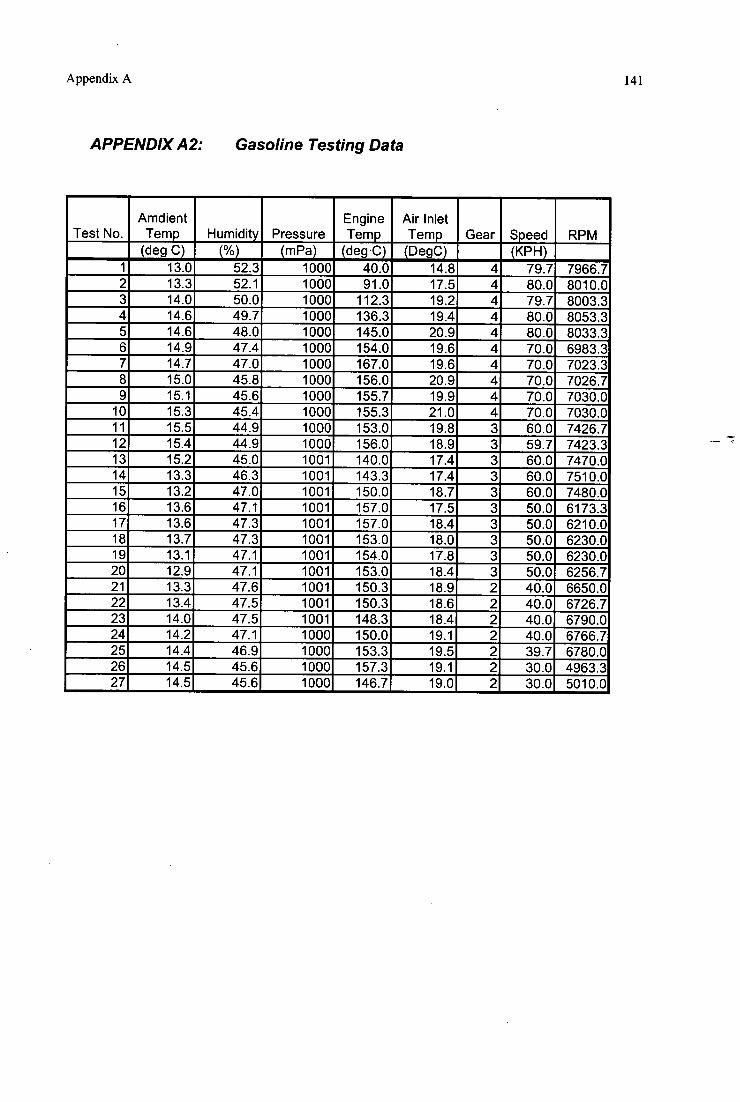
Appendix A 141
APPENDIX A2: Gasoline Testing Data
Test No. Amdient
Temp Humidity Pressure Engine Temp
Air Inlet Temp Gear Speed RPM
(deg C) (%) (mPa) (deg C) (DegC) (KPH) 1 13.0 52.3 1000 40.0 14.8 4 79.7 7966.7 2 13.3 52.1 1000 91.0 17.5 4 80.0 8010.0 3 14.0 50.0 1000 112.3 19.2 4 79.7 8003.3 4 14.6 49.7 1000 136.3 19.4 4 80.0 8053.3 5 14.6 48.0 1000 145.0 20.9 4 80.0 8033.3 6 14.9 47.4 1000 154.0 19.6 4 70.0 6983.3 7 14.7 47.0 1000 167.0 19.6 4 70.0 7023.3 8 15.0 45.8 1000 156.0 20.9 4 70.0 7026.7 9 15.1 45.6 1000 155.7 19.9 4 70.0 7030.0
10 15.3 45.4 1000 155.3 21.0 4 70.0 7030.0 11 15.5 44.9 1000 153.0 19.8 3 60.0 7426.7 12 15.4 44.9 1000 156.0 18.9 3 59.7 7423.3 13 15.2 45.0 1001 140.0 17.4 3 60.0 7470.0 14 13.3 46.3 1001 143.3 17.4 3 60.0 7510.0 15 13.2 47.0 1001 150.0 18.7 3 60.0 7480.0 16 13.6 47.1 1001 157.0 17.5 3 50.0 6173.3 17 13.6 47.3 1001 157.0 18.4 3 50.0 6210.0 18 13.7 47.3 1001 153.0 18.0 3 50.0 6230.0 19 13.1 47.1 1001 154.0 17.8 3 50.0 6230.0 20 12.9 47.1 1001 153.0 18.4 3 50.0 6256.7 21 13.3 47.6 1001 150.3 18.9 2 40.0 6650.0 22 13.4 47.5 1001 150.3 18.6 2 40.0 6726.7 23 14.0 47.5 1001 148.3 18.4 2 40.0 6790.0 24 14.2 47.1 1000 150.0 19.1 2 40.0 6766.7 25 14.4 46.9 1000 153.3 19.5 2 39.7 6780.0 26 14.5 45.6 1000 157.3 19.1 2 30.0 4963.3 27 14.5 45.6 1000 146.7 19.0 2 30.0 5010.0
Appendix A 142
Test No. CO2 CO HC NOx Volmetric Flow Rate Lambda Power
Thermal efficiency
(%) (%) (PPrn) (PPrn) (mA3/s) (kW) (%) 1 13.5 2.59 116.7 1593.3 0.0004585 0.90 1.8145 12.44% 2 13.5 1.93 84.3 2276.3 0.0005111 0.95 2.4857 15.28% 3 13.5 1.71 66.0 2763.3 0.0005054 0.95 2.7839 17.31% 4 13.7 1.21 50.3 3122.7 0.0005298 0.97 2.8585 16.96% 5 13.8 1.01 46.0 3531.3 0.0006944 0.98 3.5794 16.20% 6 12.2 4.36 168.7 1940.3 0.0003840 0.87 1.7897 14.65% 7 12.9 2.97 119.3 2991.3 0.0004499 0.89 2.5602 17.88% 8 13.2 2.33 109.3 3140.3 0.0005076 0.94 3.3556 20.78% 9 13.2 2.64 96.3 2930.3 0.0005313 0.91 3.4799 20.58%
10 13.1 2.66 97.3 3032.7 0.0005505 0.91 3.8776 22.14% 11 12.5 3.55 141.3 1857.7 0.0004112 0.89 1.9388 14.82% 12 13.2 2.38 105.7 3392.3 0.0004733 0.92 2.8585 18.98%
• 13 13.8 1.49 86.0 2789.3 0.0005281 0.98 3.4302 20.41% 14 13.9 1.30 64.0 3262.0 0.0005298 0.98 3.3805 20.05% 15 13.7 1.88 73.7 3321.7 0.0005629 0.94 3.9274 21.93% 16 12.2 3.94 179.0 1597.3 0.0002927 0.88 1.2428 'ii3.34% 17 12.4 3.39 134.0 2497.0 0.0003988 0.89 2.3614 18.61% 18 13.4 2.23 108.3 3258.3 0.0004713 0.93 3.2811 21.88% 19 12.9 2.70 108.0 3217.3 0.0004870 0.91 3.3556 21.65% 20 13.0 2.78 107.3 3007.3 0.0005182 0.91 3.6291 22.01% 21 12.9 3.21 168.3 999.7 0.0002415 0.90 0.7706 10.03% 22 12.4 3.61 165.0 1023.0 0.0003940 0.89 2.1625 17.25% 23 13.1 2.60 114.3 1023.0 0.0005129 0.92 3.4799 21.32% 24 12.8 3.12 113.7 1023.0 0.0005416 0.90 3.6291 21.06% 25 12.9 3.28 106.3 1023.0 0.0005597 0.89 3.9025 21.91% 26 13.0 1.76 94.7 991.0 0.0001575 0.00 0.6115 12.20% 27 11.9 3.86 153.7 1906.3 0.0002796 0.00 0.7606 8.55%
Appendix B 143
APPENDIX B: Experimental Equipment
APPENDIX BI: Dyno Dynamics 450M Dynamometer
ADIAVAMM, 45o m
As used by Mobil Honda race team • 450 kW (600Hp) Capacity • Wide Run Up Ramp and Platform • Phase 3 Computerised Control System • 300 kph Speed Rated • Electromagnetic Eddy Current Retarder • Single (lightweight) 405mm Roller • Unique Square Cut Knurled Roller
Bike Max 450 Features: Electronically controlled load:
Constant Speed Mode - Dial in the speed you want and vary the load with a twist of the throttle.
Constant Load Mode -
Dial in the load you want and vary the speed with a twist of the throttle.
Light Weight Roller: Able to run comfortably 50cc right through to the largest race bikes.
la which will give you more sensitivity and feel of what the bike is really doing; especially at light and partial throttle openings without the problems on over-run. More accurate (no power losses due to tyre slippage) It will handle all bike capacities Simple, Easy & Safe Set up.
Appendix B 144
Unique Square Cut Knurl : More traction than bitumen Cooler tyre temps (saving tyres)
450 kW (600 HP): Power to spare (never pushing it to the limit)
Wide Run up Ramp & Platform:
Instrumentation and Control System
i Phase 3 Computerised Control System Hand held Command Module Full colour computerised display Auto Temperature Compensation Snapshot and Detail Module, Ability to Edit Snap Shot File Plot "live to screen", Store & Print, Graphs:
High Resolution, fme line graphing Step Ramp graphing Speed Step graphing Snap graphing
Ability to Edit graphs, add comments Scan and insert customer logo Computer Colour Monitor Keyboard Mouse High Quality Ink Jet Colour Printer Registered version of Neopaint Odometer Module
Full (Atmospheric) Correction Enables entry of atmospheric pressure, relative humidity, and room temperature. The Dynamometer compensates for these (in addition to inlet air temperature). Optionally prompts operator for entry of these at start-up. Optionally prints all correction factors in the header for each set of snapshot records.

j; T©1DIiIE Instrumentation for fluids
Variable Area Flowmeter
Series 2100/2150 2300/2340
Appendix B 145
APPENDIX B2: Hydrogen Flowmeter
Measurement of Low GAS & Liquid Flows
The Measurement Measurement with a float in a tapered borosilicate glass tube. • Series 2100 with a 100 mm flow tube • Series 2150 with a 150 mm flow tube • Series 2300 arid 2340 with a 300 mm flow tube • Regulating vaNe with a tapered plug and flne thread
for precise flow adjustment • Compact construction with reduced dimensions
to facilitate easy installation and mounting on control panels
• Scales calibrated in flow units of M. %, Ihrin or cUmin • High & Low flow alarms (Optical, inductive or
hail sensor) • Constant flow regulators RCA or RCD • A large numter of applications in a wide range of
manufacturing and laboratory processes, such as - Control panels - Pilot plants
- Measurement & control on machinery - 'Water purification (OSMOSIS) - Control in research laboratories - Control of gas burners - Chemical / pharmaceutical / cosmetic industry - Flow control for industrial refrigeration - Heat treatment - Level control with the RCD regulator
Benefits • Easy installation • Short mounting length • No straight pipe required before or after the flow meter • Vertical mounting for rising fluid flow • Horizontal inlet & outlet connections • Low pressure loss • Temperatures up to 100.0 • Compact construction
Ac = Area of tube At = Area of float Al = Ac-AT = Free area E = Force Pt = Weight of float
Appendix B 146
Operation A fluid flowing vertically through a tapered tube will provide a lifting force on a weighted float, holding it in a fixed position for a fixed flow The floats resting position is a function of: the free area of flow Al (annulus between the float and the measuring tube), the weight of the float Pt and the force E of the fluid flow Each position of float height corresponds to a different flow, which is shown by the equivalent scale engraved on the metering tube
Model 2150 with inductive sensor
Technical Data • Connections
-2100/2150/2300 Rqe, (Female) BSP or NPT
- 2300
R ./ e, (Female) BSP or NPT
- 2340
RV: (male only) BSP or MDT (BSP parallel according to standard ISO 228-1) (NPT according to ANSI B2 1968)
• Length: Flow Tube Body -2100 100 mm 165 mm -2150 150 mm 215 mm -2300 300 mm 365 mm - 2340 300 mm 390 mm
• Accuracy, according to VDE / VD1 3513 standards -2100 ± 3 5% -2150 ±3% -2300/2340 ±16%
• Scales calibrated directly in - Uh for water - Uh up to 700 NVh for air - NmVh from 1-17NriV/h for air - Us, cc/min, %, or others on request
• Materials: Ends:
AlS1-316L (1.4404) Body:
AlS1-316L (1.4404) Valve
AlS1-316L (1.4404) Valve Seat
PTFE 0-Rings/gaskets NBR
(Won or EPDM on request) • Temperature:
Fluid 0...4-100•C Ambient 0.. -.80°C
• Alarm Options: • 20-AMD (1.2): Inductive sensor
(relay amplifier on request) • 20-AMO (1...4:Optical detector
(relay infrared in Aluminium case) - 20-AMH (1 ..2):HALL effect sensor
(relay in Aluminium case) • Constant Flow Regulators:
- Series RCA. For gases Mien the inlet pressure vanes and the outlet pressure is constant. For all liquid applicati3ns.
- Series RCD: For gases when the outlet pressure fluctuates and the inlet pressure is constant.
• Regulator Materials: Body AlS1-316 Membrane NBR (Viton or PTFE on request) Spring: AlS1-316
• The minimum allowable pressure difference between The inlet and outlet of the regulator is 200 mbar
Float AC Float ECG reading point v reacrg doer
2
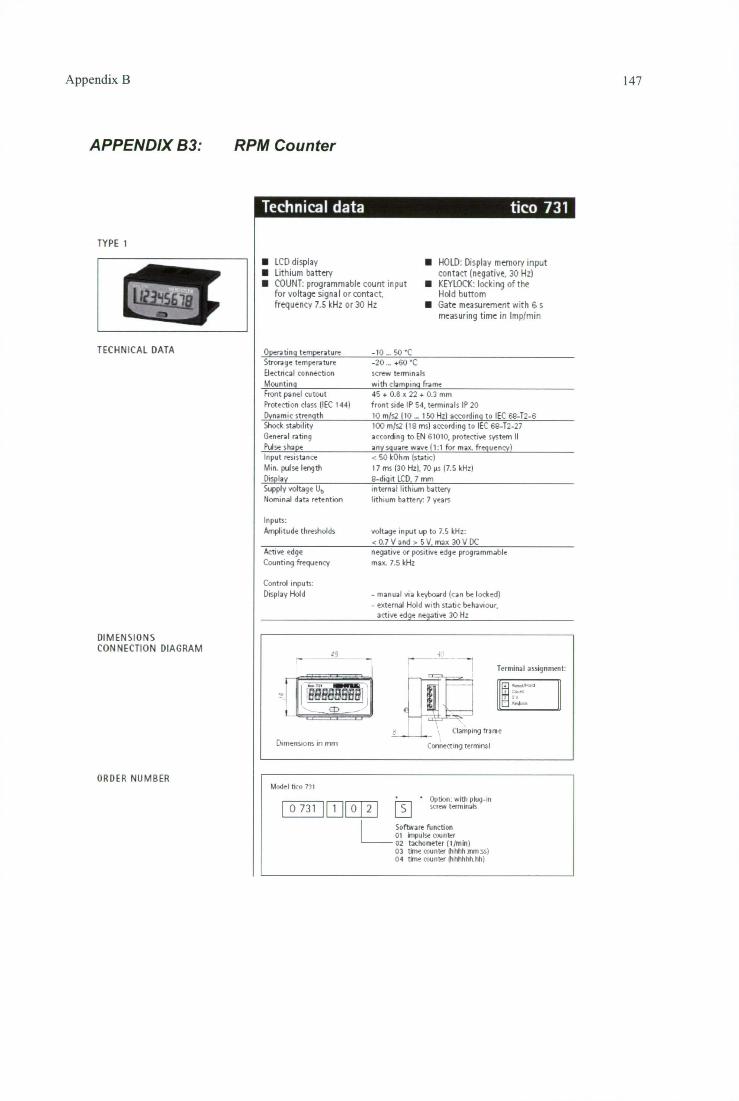
tico 731
• HOLD: Display memory input contact (negative, 30 Hz)
• KEYLOCK: locking of the Hold buttom
• Gate measurement with 6 s measuring time in Imp/min
TYPE I
TECHNICAL DATA
Dimensions in nun Connecting terminal
1 2 0
Model tico 73t
0 731 • Option with plug-in
stirt* terminals
Teirninal assignment:
utiaadria Clamp ng frame
Software function 0! impulse o.unter 02 tachometer 'loin) 03 time ouster i1ihhhmmsi 04 me ownter fhhhhhh hhi
Appendix B 147
APPENDIX B3: RPM Counter
Technical data
• LCD display • Lithium battery • COUNT: programmable count input
for voltage signal or contact, frequency 7.5 kHz or 30 Hz
Operating temperature Strorage temperature Electrical connection Mounting Front panel cutout Protection class IIEC 1441 Dynamic strength Shock stability General rating Pulse shape Input resistance Min. pulse length Display Supply voltage lib
Nominal data retention
Inputs: Amplitude thresholds
Active edge Counting frequency
Control inputs: Display Hold
- 10 _. 50 •C -20._ +60C screw terminals with clamping frame 45 + 0.6 x 22 + 0.3 mm front side IP 54, terminals IP 20 10 mis2 110 ... 150 Hz) according to IEC 6842-6 11)) mjs2 116 msl according to IEC 68-T2-27 according to EN 61010, protective system II any square wave 11:1 for rflaM- frequency) < 50 kOhm !static) 17 ms 130 Hzl, 70 p.s 17.5 kHz)
LCD. 7 mm internal lithium battery lithium batter/. 7 years
voltage input up to 7.5 kHz: < 0.7 V and 5 V. max 30V DC negative or positive edge programmable max_ 7.5 kHz
- manual via keyboard rcan be locked) - external Hold with static behaviour,
active edge negative 30 Hz
DIMENSIONS CONNECTION DIAGRAM
ORDER NUMBER
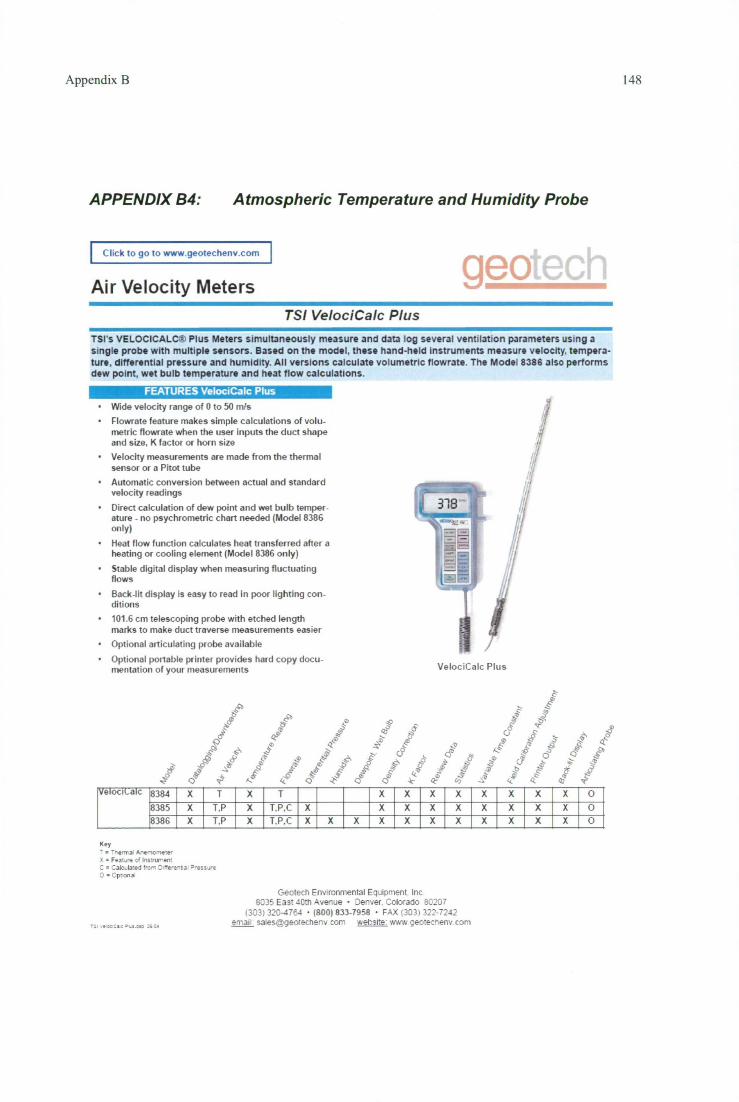
VelociCalc Plus
Appendix B 148
APPENDIX B4: Atmospheric Temperature and Humidity Probe
I Click to go to www.geotechenv.com
geotech Air Velocity Meters
TSI VelociCalc Plus
TSI's VELOCICALCM Plus Meters simultaneously measure and data log several ventilation parameters using a single probe with multiple sensors. Based on the model, these hand-held instruments measure velocity, tempera-ture, differential pressure and humidity. All versions calculate volumetric flowrate. The Model 8386 also performs dew point, wet bulb temperature and heat flow calculations.
FEATURES VelociCalc Plus • Wide velocity range of 0 to 50 m/s
• Flowrate feature makes simple calculations of volu-metric flowrate when the user inputs the duct shape and size. K factor or horn size
• Velocity measurements are made from the thermal sensor or a Pitot tube
• Automatic conversion between actual and standard velocity readings
• Direct calculation of dew point and wet bulb temper-ature - no psychroinetric chart needed (Model 8386 only)
• Heat flow function calculates heat transferred after a heating or cooling element (Model 8386 only)
• Stable digital display when measuring fluctuating flows
• Back-lit display is easy to read in poor lighting con-ditions
• 101.6 cm telescoping probe with etched length marks to make duct traverse measurements easier
• Optional articulating probe available
• Optional portable printer provides hard copy docu-mentation of your measurements
z- e> 1 ,i-- 4, e ,-.., 4 ,• : ..
Q 3 ) S e? e e ... .., 0 ,..-- :5- P 44° t e 4, f iv ,S
Iei, dr, , -.'1" q 4* ir i 4, k .c <> 4' A.. k 0". -2' 0 0' 42- c;3-
VelociLalc8384 X T X T X X X X X X X X 0 8385 X T.P X T.P.0 X X X X X X X X X 0 8386 X Tip X T.P.0 XX X X X X X X X X X 0
Key -= Are-te-wer
Fe3t., c` C f•:"= t'ers-t 3 . 'ess,r4
= Crona
Gectech EnvIonmental EqJipment. Inc. 8035 East 40th .kvenue • Denver. Colorado 80207
1303: 320-4764 • (800) 833 -7958 • FAX (303) 322-7242 emaiI salesiggeotechenv corn odetsite: 'ewer geotechenv.com
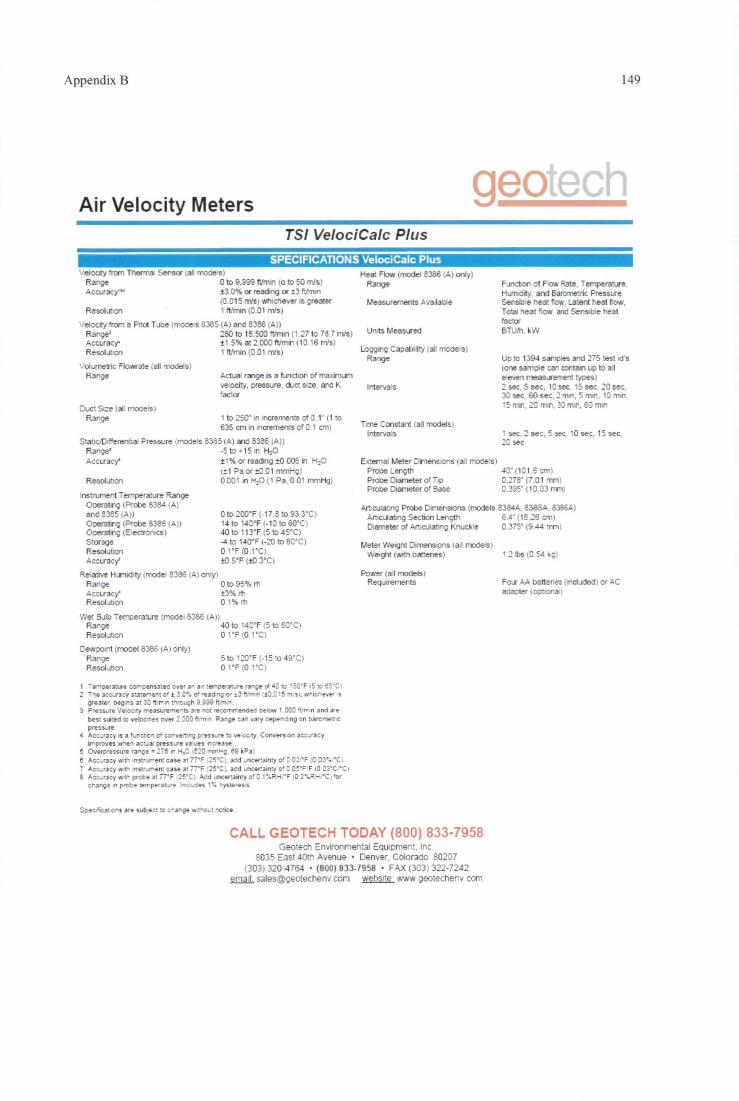
Appendix B
149
Air Velocity Meters geotech
TSI VelociCalc Plus SPECIFICATIONS VelociCalc Plus
Velocity from Thermal Sensor (all models) Range 0 to 9,99911trnM (o to 50 nVs) Accuracy" 23.0% or readng or 23 ft/min
(0.015 nYs) whichever is greater Resolution 1 fVmin (0.01 infs)
Velocity from a Pita Tube (mode s 8365 (A) and 8386 (A)) Range' 250 to 15,500 ft/min (1.27 to 78.7 m/s) Accuracy 21.5% at 2.000 ft/min (10 16 m(s) Resolution 1 IVmin (0.01 nYs)
Volumetric 7-1c..vrate oil mcdeis: Range Actign range is a function of maximum
veocity. pressure cluct size and K Interva s 'actor
Duct Size (all modes)
band or of Flow Rate. 7eripera*.ure FILm4ity. and EarDn-e.ric Pressure Sersib e heat `ow. _a:ent heat tow. Total lee low anc Sersioe heat fac:or STUth kW
Up to 1394 samples and 275 test ICI'S (one samole :tar contain up to all eleven meassement types) 2 sec. sec. 1: set. 15 sec, 20 sec, X sec 60 sec. 2 min, 5 min, 10 man, 15 Tr T r 33 min, 60 men
Heat Flow (model 8386 (A) only) Range
MeasLrer)ents Available
Unts Measured
Loggirg Dacabrity lal; modes) Range
Range Ito 250' in increments of 0.1' (1 to
635 cm in increments of 0 1 cm)
Static/Differentia Pressure (models 8385 (A) and 8386 (A)) Range' -5 to *15 in. F120 Accuracy' it% or readeg 20 005 in )120
(21 Pa or 20.01 rmitig) ResolAoi 0 001 in 41,0(1 Pa, 001 mmHg)
nst.i...mert Temperature Range 0 ratirg (Probe 8384 (A) and e2fE (A))
0 to 200'F (-17.8 to 93.3'C) Coeratrg (Probe 8386 (A))
14 to 1401' (-1010 60'C)
Operating (Electronics)
4010 113'F (5 to 45T) Storage -4 to 140'F (-20 to 60*C) Resolution 0.11' (0.1'C) Accuracy' 10.5'F (tarC)
Relative Hanidty (mode 8336 (A) only) Range Oto 95%rh AccLracy' ±3% rh Resold:Jon 0 I% rh
Wet Bulb Ternoeral ■re ',model 8366 (A)) Range 40 to 140'F (5 to 60T) Resolution 011' (0.1T)
Dewoomt (model 8366 (Al onlyi Range 5 to 120°F (-1510 49°C) Resolution 0 IT (0 1'C)
1 Tr, perawre corhransated over an a • terrperature range of 4C to 150•F 15 to et '2 Tne accuracy stater-ant ef t 3.0% or heating or .t3 fLYnm ;S2.215 whic - eve, s grease' beg on at 33 %leen through tt009 ftimm
3 Press,. Veleory measurements are not recommended term 1 OCC tn,n and are best suited Ic veloc t es over 2.000 febsn Range Call vary sepe^s ng on oarcmcr c presswre
4 Ac: _racy is a f ureter e6 acevertng pressure to veocty. Conssrs on accuracy ir- proves when actual pressure waves menus
5 Overpressure range .275 in (4,0 (520 mmbi. eo kPa: I Acc.racy St, ■nstrurrent ease at 77•F (25•C). add uncer.airry o' C2 °F C or. , c 7 Acc - racy orth os-trarrent case at 77F 125'C(. add -ncer.airry c` Cl" F 0 .1:5°C °C 8 Acc-racy Arr. prote at 77'F ;25°C). Add uncerairry o' 2. I 0 °C `or
change in pre:: e sen- pehature. Inewdes 1% ^yste"ess
Speoicatons are sub.est to change wthout mice
Time Constant a I models) Intervas 1 sec 2 sec, 5 sec 10 sec, 15 sec
22 sec
E ,.:erhe Meter Dimensions .3 models) Pre: _ergth 40' (101.6 con) Prooe Diameter cf Tip 0.276 (7.01 rnm) Probe Diameter o' Base 0.395' (10.03 rnm)
Art culat rig Probe Dimensions (models 8384A, 8385A. 8386A) Art culahrg Section Length 6.4* (16.26 cm) D arreter of Arhculating Knuckle 0.375' (9.44 rflrn)
Meter Weight Dimensions (al/ mode(s) .Neight (with batteries) 1.2 lbs (0.54 kg)
Power (a I models) Reg JI rentents Four AA batteries (ind,ided) a AC
adapter (=bona)
CALL GEOTECH TODAY (800) 833 -7958 Geotech Environmental Equipment, Inc
8035 East 40th Avenue • Denver, Colorado 80207 (303) 320-4764 • (800) 833-7958 • FAX (303)322-7242
emal: salesttgectechenv.ccm wehstte ore,e.geotechenv corn
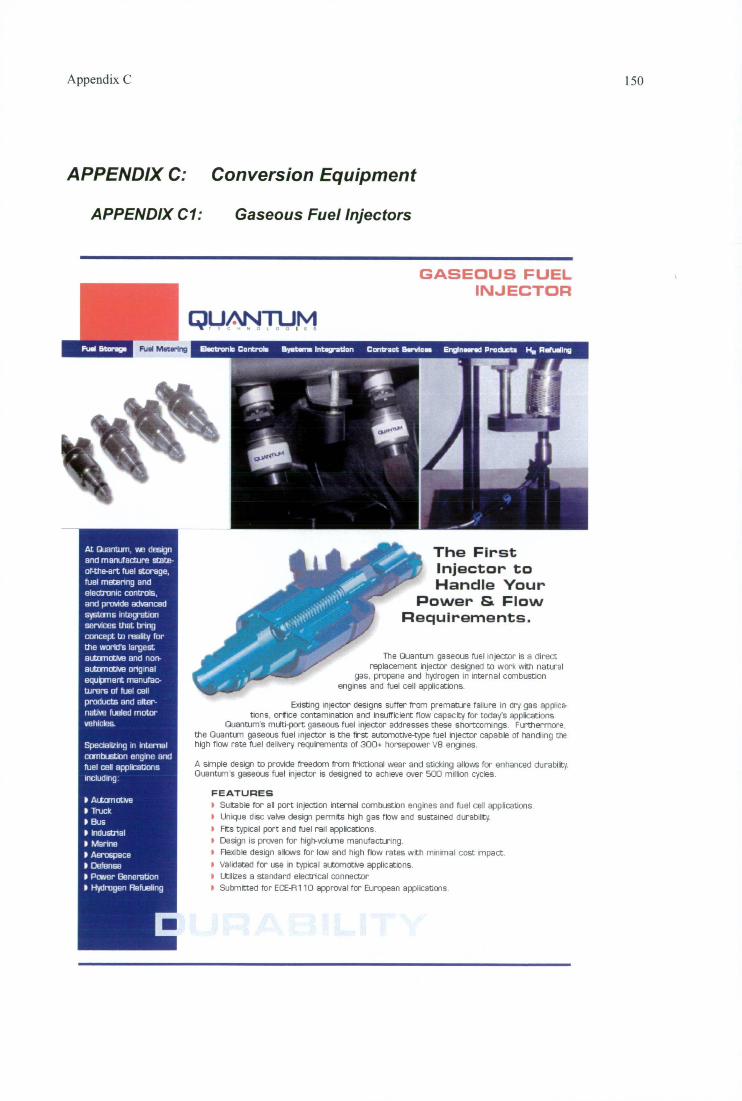
Appendix C 150
APPENDIX C: Conversion Equipment
APPENDIX Cl: Gaseous Fuel Injectors
GASEOUS FUEL INJECTOR
QUANTUM
The First Injector to Handle Your
Power & Flow Requirements.
The Quantum gaseous fuel injector is a direct replacement injector designed to work with natural
gas, propane and hydrogen in internal combustion engines and fuel cell applications.
Existing injector designs suffer from premabire failure in dry gas applica- tions, orifice contamination and insufficient flow capacit y' for today's applications.
Quantum's multi-port gaseous fuel injector addresses these shortcomings Furthermore. the Quantum gaseous fuel injector is the first automotive-type fuel injector capable of handling the high flow rate fuel delNery requirements of 300+ horsepower Ve engines.
A simple design to provide freedom from frictional wear and sticking allows for enhanced durabilq Ouantum s gaseous fuel injector is designed to achieve over 500 million cycles.
FEATURES I Suitable for all port injection internal combustion engines and fuel cell applications 0 Unique disc valve design permits high gas flow and sustained durability
o Fits typical port and fuel rail applications Design is proven for high-volume manufacturing. Flexible design allows for law and high flow rates with minimal cost impact
11 Validated for use in typical automoMe applications. I Utiles a standard electrical connector
Submitted for ECE-R110 approval for European applications.
At Quantum, use design and manufacture slmite-of-the-art fuel storage, fuel metering and electronic controls, and provide advanced Systems integration services that bring conceit to reality for the world's largest automotive and non-automotive original equipment manufac-turers of fuel cell pn:xlucts and alter-native fueled motor vehicles,
Specielying in internal combustion engine and fuel cell applications including
• Autconotive Truck
0 Bus Industnal Marine
0 Aerospace P Defense • Power Generation • Hydrogen Refueling
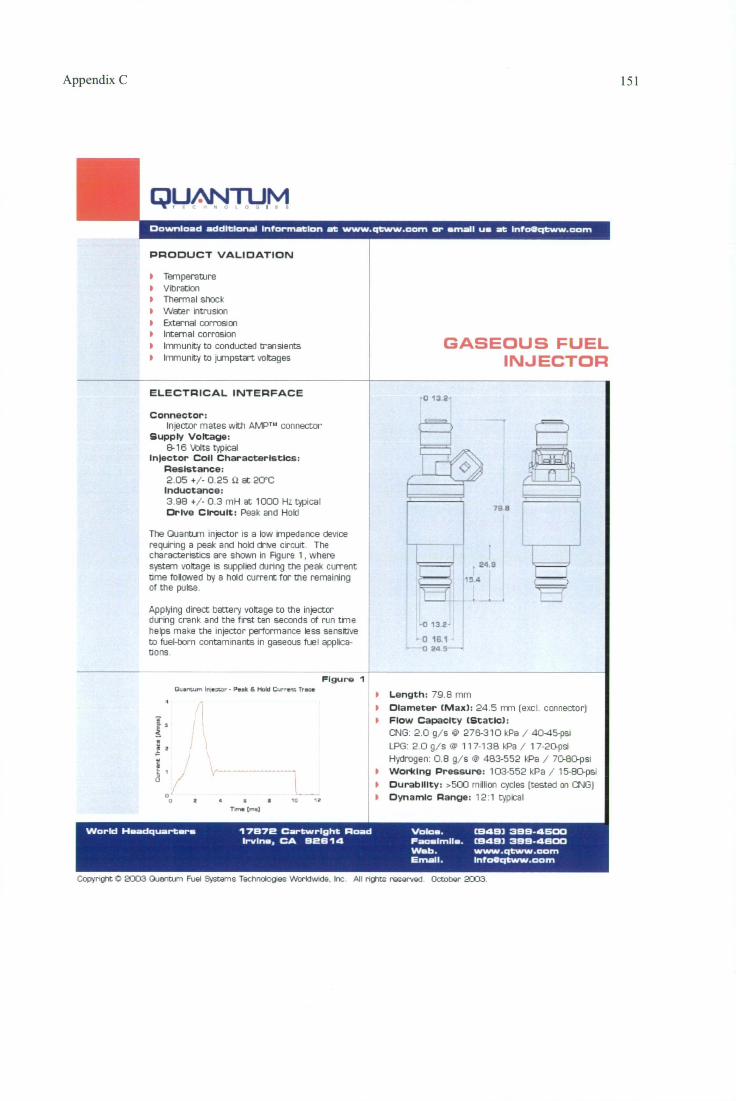
Appendix C 151
QUANTUM Download additional information at wuns.qtww.00m or email us at infoeqtww.com
PRODUCT VALIDATION
o Temperature Vibration Thermal shock
1 Water intrusion 1 External cormsion I Internal corrosion o Immunity to conducted transients
Iiiiinunity tojumpstart voltages GASEOUS FUEL
INJECTOR
ELECTRICAL INTERFACE
Connector: Injector mates wrth AMP" connector
Supply Voltage: 0-16 Npical
Inlector Coll Characteristics: Resistance: 2.05 +/- 0.25 it at 20'C Inductance: 3.98 +/- 0.3 mH at 1000 Hi:typical Drive Circuit: Peak and Hold
The Quantum injector is a low impedance device requiring a peak and hold drive circuit. The characteristics are shown in Figure 1. where system voltage is supplied during the peak current time followed by a hold current for the remaining of the pulse.
•013.2-
15.4
Applying direct battery voltage to the injector during crank and the first ten seconds of run time helps make the injector performance less sensibve to fuel-born contaminants in gaseous fuel applica-tions
-0 13 2-
- 0 16 1 - n 245 ^
o..ks Hid
4 8
Tons (ms)
Figure *I Tress
8
I
I
0
1
Length: 79.8 mm Diameter (Max): 24.5 rnrn (excl. connector) Flow Capacity (Static): CNG: 2.0 g/s 4 276-310 kPa / 40-45-psi LPG: 2.0 g/s @ 117-138 kPa / 17-20-psi Hydrogen: 0.8 g/s @ 483-552 liPa / 70-80-psi Working Pressure: 103-552 kPa / 15-80-ps, Durability: :.51X1 million cycles (tested on CNG1 Dynamic Range: 12:1 Pipical
World Headquarters 17872 Cartwright Road Voles. (9483 388-4600 Irvine, CA 8E814 Facsimile. (9483 388-4800
Web. www.qtww.00m Email. infoOqtww.00m
Copyright C. 2003 Quantu^i Fui SAug-Is Technologies ',Nor1.1%4 ,09. Inc 411rIghts r,-orved October 20:13
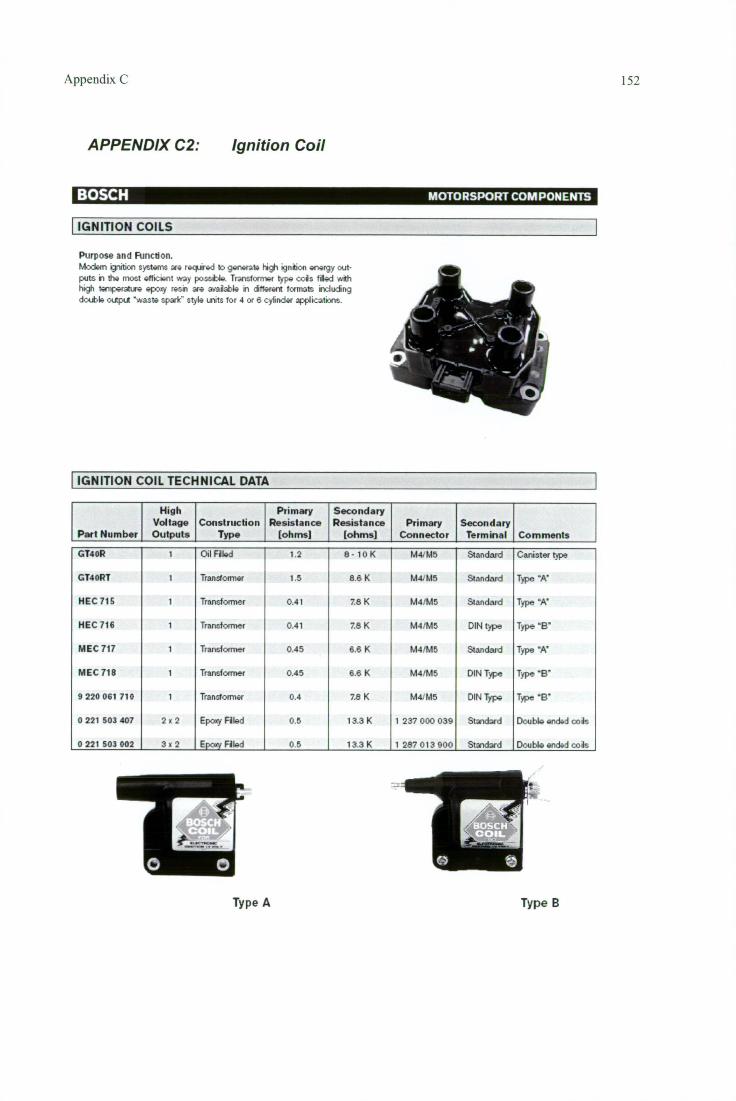
Appendix C 152
APPENDIX C2: Ignition Coil
BOSCH MOTO RSPORT COMPONENTS
IGNITION COILS
Purpose and Function. ignition .t...,ms are required to generate high ignition energy out-
puts in the niost 4tri..-.int way passible. Transformer ty pe coils filed with high temperature ep:.ty resin are ayailable in different forntats including double output 'Nast:. spark" Styid units for 4 or 6 cylinder applications.
IGNITION COIL TECHNICAL DATA
Part Number
High Voltage Outputs
Construction Type
Primary Resistance
[ohms]
Secondary Resistance
[ohms) Primary
Connector Secondary
Terminal Comments
GT4oR 1 Oil Filled 1.2 8 - 10 K M4: M5 Standard Canister type
GT-toRT 1 Tranloiner 1.5 8.6 K M4: M5 Standard Type "A'
HEC 715 1 Tran.sfoirner 0.41 7.8 K 1,14:M5 Standard Type "A'
HEC 716 1 Transformer 0.41 7.8 K M4lt.15 DIN type Type "13'
MEC 717 1 Transfoimer 0.45 6.6 K 1..14.'F.15 Standard Type "A'
MEC 718 1 Transformer 0.45 6.6 K M4it.15 DIN Type Type "E.
9 220 061 710 1 Transfomier 0.4 7.8 K M4: M5 DIN Type Type "Er
0 221 503 407 2 x 2 Epory Filled 0.5 13.3 K 1 237 000 039 Standard Double ended coils
0 221 503 002 3 t 2 Epori Filled 0.5 13.3 K 1 287 013 900 Standard a:..uble ended coils
Type A
Type B

Type A Type B
Type D Type C
Appendix C 153
APPENDIX C3: Ignition Module
MOTORSPORT COMPONENTS
BOSCH
IGNITION MODULES
Purpose and Function. Modern ignrbon systems are required to generate high ignition energy outputs tithe most efficient way possble. Transformer type coils filed with high temperature epoxy resin are available in different formats includ-ing double output 'waste spark" style units for 4 or 6 cylinder applica-tions.
IGNITION MODULE TECHNICAL DATA
Part Number
Number of Output Stages
Maximum Primary
Current [A]
Number of
Pins
Type of
Trigger Connector Type Comment
0 227 100 123 [ BIM 123 ] 1 8- 10 6 Inductive 1 287 013 005 A
0 227 100 124 [ BIM 027 ] 1 8- 10 6 Hall Effect 1 287 013 005 A
0 227 100 137 [ BIM 137 ] 1 8- 10 7 Hl Effect 1 287 013 005 A
0 227 100 200 [ RIM 200 ] 2 8 - 10 7 ECU Control 1 287 013 005 A 2 channel pwr transistor
0 227 100 203 3 8- 10 7 ECU Control 1 287 013 005 A 3 channel pwr transistor
0 227 100 209 3 8 - 10 3 & 4 ECU Control 1 287 000 039 & B 3 channel pwr transistor 1 287 013 900
0 227 100 211 4 B- 10 4 & 5 ECU Control 1 287 013 900 & B 4 channel pwr tra.nsistor 1 287 013 006
9 222 067 024 [ BIM 024 ] 1 8- 10 4 Inductive NIA C
9 222 067 027 [ RIM 027 ] 1 8- 10 6 Hall Effect 1 287 013 005 A
9 222 067 034 [ BIM 034 ] 1 8- 10 3 ECU Control 1 237 000 039 D 1 channel per tnnsistor
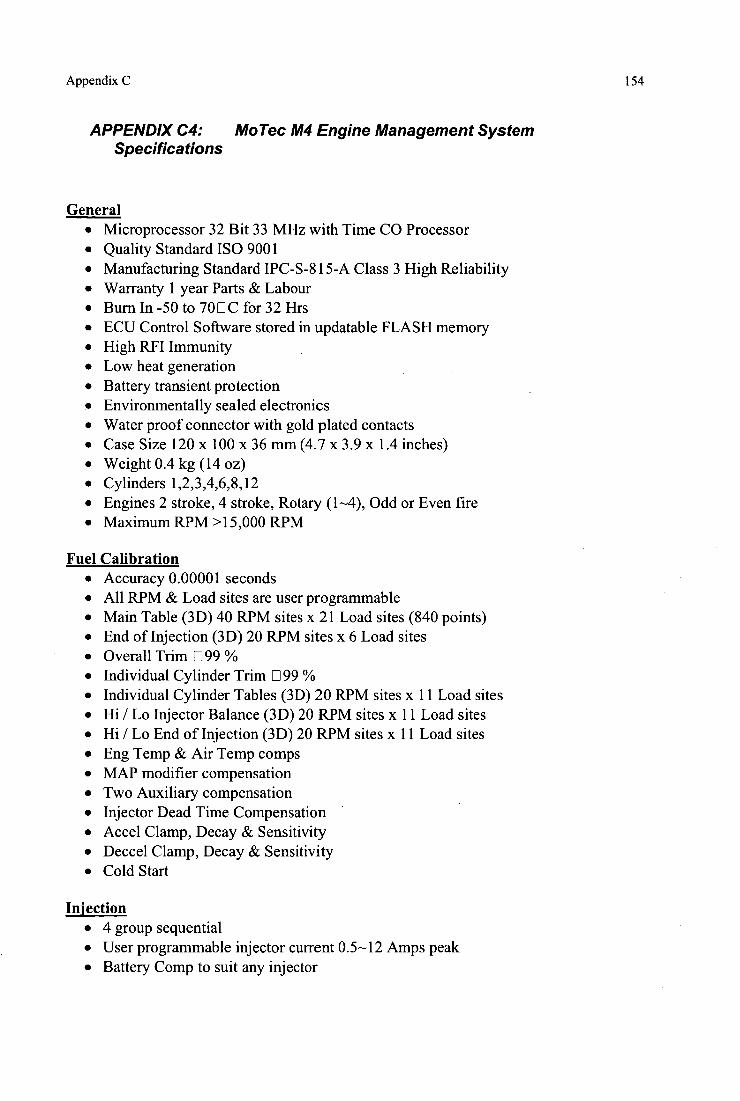
Appendix C 154
APPENDIX C4: MoTec M4 Engine Management System Specifications
General • Microprocessor 32 Bit 33 MHz with Time CO Processor • Quality Standard ISO 9001 • Manufacturing Standard IPC-S-815-A Class 3 High Reliability • Warranty 1 year Parts & Labour • Burn In-SO to 700C for 32 Hrs • ECU Control Software stored in updatable FLASH memory • High RFI Immunity • Low heat generation • Battery transient protection • Environmentally sealed electronics • Water proof connector with gold plated contacts • Case Size 120 x 100 x 36 mm (4.7 x 3.9 x 1.4 inches) • Weight 0.4 kg (14 oz) • Cylinders 1,2,3,4,6,8,12 • Engines 2 stroke, 4 stroke, Rotary (1-4), Odd or Even fire • Maximum RPM >15,000 RPM
Fuel Calibration • Accuracy 0.00001 seconds • All RPM & Load sites are user programmable • Main Table (3D) 40 RPM sites x 21 Load sites (840 points) • End of Injection (3D) 20 RPM sites x 6 Load sites • Overall Trim 099 % • Individual Cylinder Trim 099 % • Individual Cylinder Tables (3D) 20 RPM sites x 11 Load sites • Hi / Lo Injector Balance (3D) 20 RPM sites x 11 Load sites • Hi / Lo End of Injection (3D) 20 RPM sites x 11 Load sites • Eng Temp & Air Temp comps • MAP modifier compensation • Two Auxiliary compensation • Injector Dead Time Compensation • Accel Clamp, Decay & Sensitivity • Deccel Clamp, Decay & Sensitivity • Cold Start
Injection • 4 group sequential • User programmable injector current 0.5-12 Amps peak • Battery Comp to suit any injector
Appendix C 155
Boost Control Calibration • Main Table (3D) 20 RPM sites x 10 Throttle sites or 10 Gear sites • Overall Trim • Engine Temp & Air Temp comps • One Auxiliary compensation
Ignition Outputs • Up to 4 Ignition Outputs • One output may drive up to 8 coils using the MoTeC Ignition Expander • Versatile Ignition Interface allows connection to most OEM ignition systems
including: • Nissan Multi Coil modules • GM EST DFI systems • FORD EDIS DFI systems • Mazda Rotary DFI modules • Many Others

Appendix C 156
Ignition Calibration • Accuracy 0.25 degrees • All RPM & Load sites are user programmable • Main Table (3D) 40 RPM sites x 21 Load sites (840 points) • Overall Trim 099 % • Individual Cylinder Trim 0 99 % • Individual Cylinder Tables (3D) 20 RPM sites x 11 Load sites • Rotary Split 20 RPM x 11 Load • Eng Temp & Air Temp comps • MAP compensation • Two Auxiliary compensations • Dwell Time 20 RPM x11 Battery • Odd fire engine capability Each Top Dead Centre angle may be specified
Resolution 0.5 degree
Trigger Sensors • Directly compatible with most OEM trigger systems including :
• HALL, Magnetic and Optical types • Multi Tooth (eg Mazda and Toyota) • 1 or 2 Missing Teeth (eg Porsche) • Many other special types, eg. Ford Narrow Tooth, Nissan Optical, Harley
Davidson
Data Logging • Optional Logging memory allows logging of all ECU parameters • Memory Size 512 KByte • Logging Rate 1-20 sets / sec • Logging Time 38 minutes at 5 sets / sec (28 Parameters+Diags) PC Software is
available for analysis of the logged data.
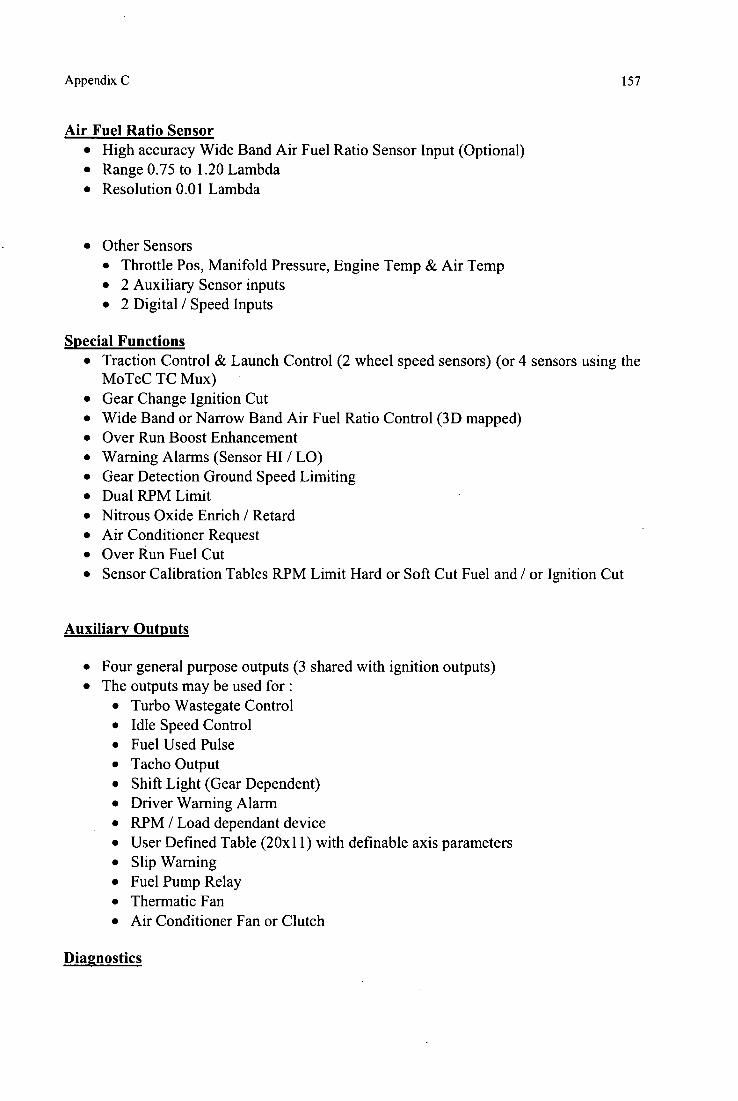
Appendix C 157
Air Fuel Ratio Sensor • High accuracy Wide Band Air Fuel Ratio Sensor Input (Optional) • Range 0.75 to 1.20 Lambda • Resolution 0.01 Lambda
• Other Sensors • Throttle Pos, Manifold Pressure, Engine Temp & Air Temp • 2 Auxiliary Sensor inputs • 2 Digital / Speed Inputs
Special Functions • Traction Control & Launch Control (2 wheel speed sensors) (or 4 sensors using the
MoTeC TC Mux) • Gear Change Ignition Cut • Wide Band or Narrow Band Air Fuel Ratio Control (3D mapped) • Over Run Boost Enhancement • Warning Alarms (Sensor HI / LO) • Gear Detection Ground Speed Limiting • Dual RPM Limit • Nitrous Oxide Enrich / Retard • Air Conditioner Request • Over Run Fuel Cut • Sensor Calibration Tables RPM Limit Hard or Soft Cut Fuel and / or Ignition Cut
Auxiliary Outputs
• Four general purpose outputs (3 shared with ignition outputs) • The outputs may be used for :
• Turbo Wastegate Control • Idle Speed Control • Fuel Used Pulse • Tacho Output • Shift Light (Gear Dependent) • Driver Warning Alarm • RPM / Load dependant device • User Defined Table (20x11) with definable axis parameters • Slip Warning • Fuel Pump Relay • Thermatic Fan • Air Conditioner Fan or Clutch
Diagnostics
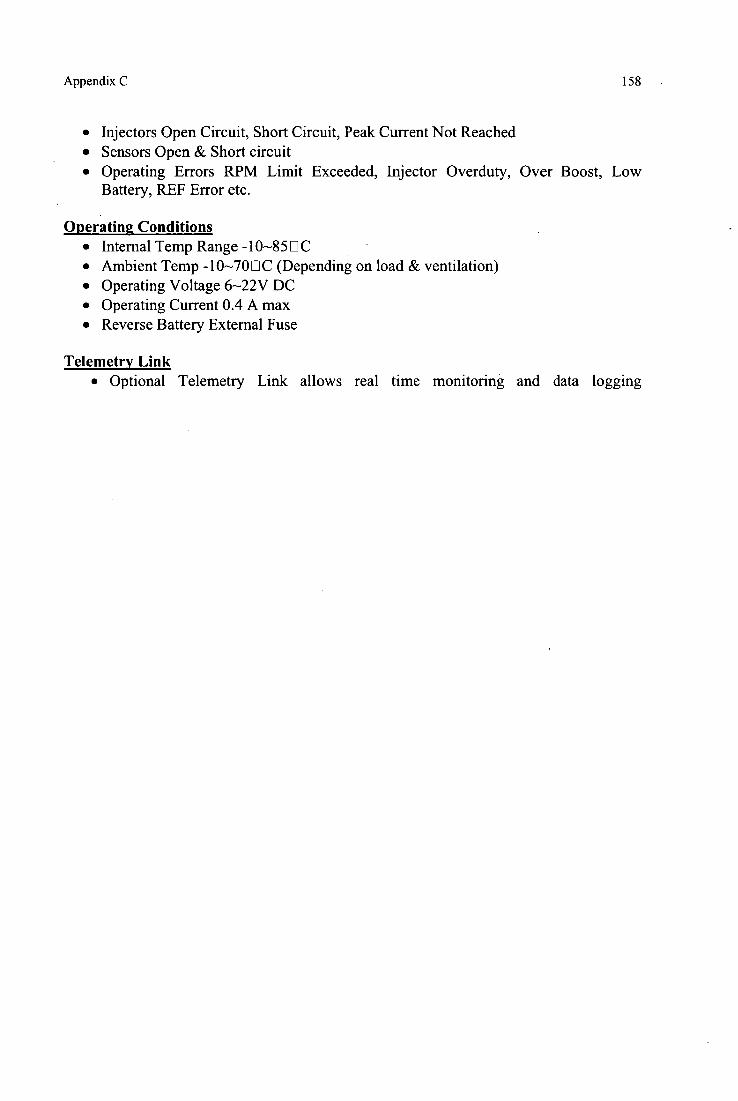
Appendix C 158
• Injectors Open Circuit, Short Circuit, Peak Current Not Reached • Sensors Open & Short circuit • Operating Errors RPM Limit Exceeded, Injector Overduty, Over Boost, Low
Battery, REF Error etc.
Operating Conditions • Internal Temp Range -10-850C • Ambient Temp -10-700C (Depending on load & ventilation) • Operating Voltage 6-22V DC • Operating Current 0.4 A max • Reverse Battery External Fuse
Telemetry Link • Optional Telemetry Link allows real time monitoring and data logging

22.0 •a
Appendix C 159
APPENDIX C5: Reference Sensor
Solid State Sensors
Gil Series Hall Effect Gear Tooth Sensors
TYPICAL APPLICATIONS Automotive and Heavy Duty Vehicles: • Camshaft and crankshaft speed;
position • Transmission speed • Tachometers • Anti-skiditraction control Industrial: • Sprocket speed • Chain link conveyor speed and
distance • Stop motion detector • High speed low cost proximity • Tachometers, Counters
Gil ORDER GUIDE
Catalog Uniting
Description
tGTICrl DC
Gear Tooth Sensor
FEATURES • Senses ferrous metal targets • Digital current sinking output (open
collector) • Better signal-to-noise ratio than
variable reluctance sensors. excellent low speed performance, output amplitude not dependent on RPM
• Sensor electronically seff-adjusts to slight variations in runout and variations in temperature, simplifying installation and maintenance
• Fast operating speed - over 100 kHz • EMI resistant • Reverse polarity protection and
transient protection (integrated into Hall
• Wide continuous operating temperature range (-40r to 15O 'C), short term to 160'C
GENERAL INFORMATION tart Series Gear Tooth Sensors use a magnetically biased Hall effect integrated circuit to accurately sense movement of ferrous metal targets. This specially de-signed I.C., with discrete capacitor and bias magnet, is sealed in a probe type package, for physical protection and cost effective installation.
Units will function from a 4.5 to 24 VDC power supply. Output is digital. current sinking (open collector). Reverse polarity protection is standard. If power is inad-vertently wired backwards, the sensor will not be damaged. Built-in protection against pulsed transients to +60V, -40V is also included.
Optimum sensor performance is depend-ent on the following variables which must be considered in combination:
• Target material, geometry, and speed • Sensorlarget gap • Ambient temperature • Magnetic material in close proximity _ _
MOUNTING DIMENSIONS (For reference only)
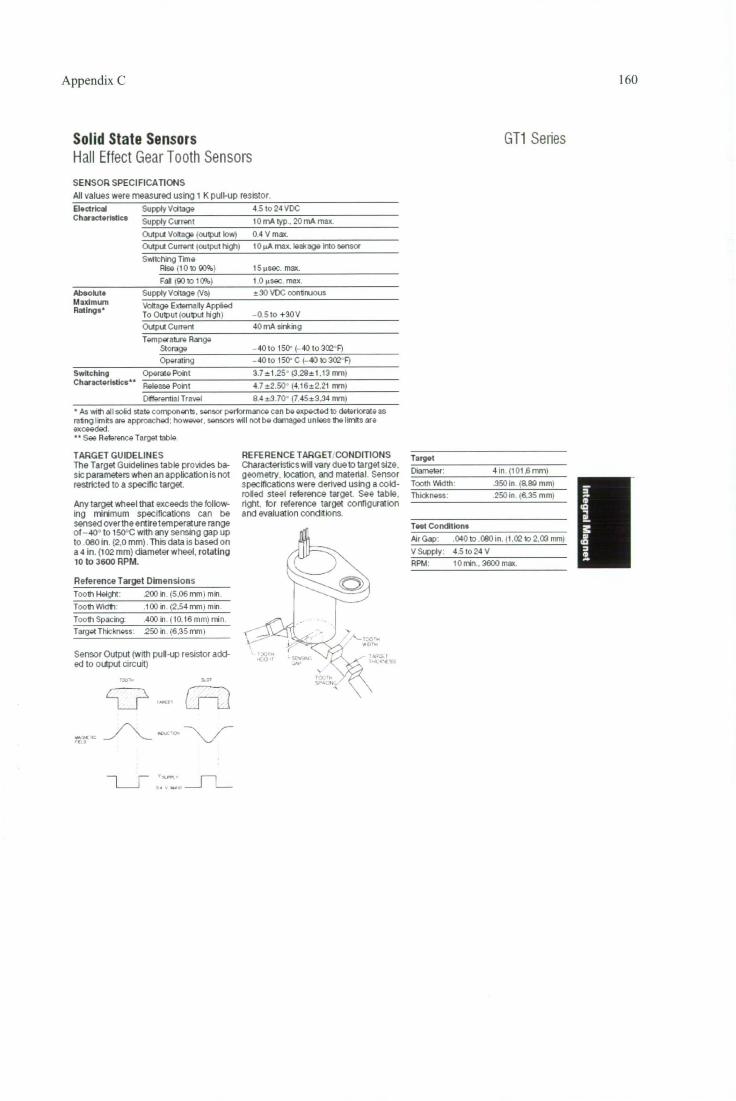
Supply Current 10 mA typ . 20 rnA max Electrical Supply Voltage 4.5 to 24VDC Characteristics
Output Current 40 rnA sinking
Tem riwature Range Storage - 40 to 150° (-40 to 302-F) Operating - 40to 150C (-40 to 302-F)
3.7±1.25 (3.29i-1.13 inmi 4.7±2.50 (4.16.4-2.21 win
Switching Operate Point Characteristics" Release Point
Differential Travel 114 -.L-3.70° (7.45t3.34 mmi
Appendix C 160
Solid State Sensors GT1 Series Hall Effect Gear Tooth Sensors SENSOR SPECIFICATIONS All values were measured using 1 K pull-up resistor .
Clutput Volta ioutput low' 04 V max
i:iutput Current !output highi 10 u.it max leakage into sensor
Snitching Time Rise I 0 to cr:14: I5 se:. max.
Fall 19) to 1 CPo 1 0 use: max
Absolute Supply Vcitage iVsi ± 30 VDC continuous Maximum Ratings. Voltage Externally Applied
To Output (output high -0.5 to +30V
• As with all state componicts, sensor performance can be expected to deteriorate as rating limits are approac het : however, sensors will not be damaged unless tie limits are exceedel. •• See Reference Target table
TARGET GUIDELINES The Target Guidelines table provides ba-sic parameters when an application is not restricted to a specific target.
Any target wheel that exceeds the follow-ing minimum specifications can be sensed over the entire temperat ure range 01 -40 to 150'C with any sensing gap up to 060in >2.0 mm) This data is based on a 4 in. (102 mini) diameter wheel, rotating 10 to 3600 RPM.
Reference Target Dimensions Tooth Height . 203 in. (5,06 min min
Tooth Width. .100 in. (2.54 inn min.
Tooth Spacing: .40) in. (10.16 mmi min
Target Thickness: .25011. (6,35 trim,
Sensor Output (with pul-up resistor add-ed to output circuit)
.250 in. (6.35 mm)
REFERENCE TARGET CONDITIONS Characteristics will vary due to target size, geometry. location, arid material. Sensor specifications were derived using a cold-rolled steel reference target. See table. Th ick ness right for reference target configuration and evaluation conditions.
Target
4 in. (101.6 mm) Diameter:
.350 in 03.130 mm) Tooth Width
Test Conditions
Air Gap: .040 to .090 in. (1.CC to 2.33 mrm
V Supply: 4.5 to 24 V RPM: 10 min.. 3600 max
1=711=

Characteristic cixtes 2 and 3. A internal esxo.
Charactaisec curve 1. A lougnal escp. L Popicall 1.:JorocK• •1 the
*pm « hen fried, N N.nunal clwra,t4.14K.
cur.. T Tol.ance
Elecimall, usabls. anjular
Technical data / Range Part number Diagram Useful electrical angular range Degree _ foi Useful mechank:al angular range Degree _ 96. Angie betaexn fie intQmal stops
imam nc4 be contacted ..hen sensor installedi Degree to 95
Direction of rotation Optional Total resistance jinn.. 1-2'■ un 2 :20
per prpteotte resistor reiper in zero uaning Terms. 2-3i
Operating vcttage Electrical loading Permr.iuble ei•ar current pA •A4tage ratio from stop to skip
Chase_ curve 1 •A:ltage ratio in aria 0...88 - C.
Chara...xece 2 Ohara. awe 3
'Ape ol the nominal charade rise,: curve de-' 0.00927 :Terming temperature Guide -ialue frrerntis4b6 vibratke
aCCOI•irnt. m • ,Terat•g otcles• Mc 2
0 280 122 201
_ _
0.051i t)1.2: :JA.9135 005 s
0. X0 1.2
0 280 122 001 I 2
enter , ' lcd'
710...1380 5 5 Ohmic resistatt Ohmic resistance s". 18 20
0.970
Appendix C 161
APPENDIX C6: Throttle Position Sensor
8 Angular-position sensors
BOSCH
Throttle-valve angular-position sensor Measurement of angles up to 88'
• Potentiometic angular-position sensor with linear characteristic curie. • Sturdy construction for extreme loading. • Very compact.
Application These sensors are used n autornotroe appicati.:nr, for measuring the an of rotation of the throttle /aloe. Since these sensors are directly attached to the throttle-vali.? hcusing at the end of the throttle-shaft extension. they are subiect to ex-tremely hostile undethood operating con-diticns. To remain fully operational, they nlust be resistant to fuels. 4s, same fcg. and industrial climate.
Design and function The throttle. Ave angular-position sensor is a potentiornetric sensor with a linear characteristic canoe. In electronic fuel ireection i.EFI) engines it generates a voltage ratio which is proportional to the throttle s anglo of rotation. The sensor *c rotor is attached to the throttle-gabs shaft, and when the thrcttle vahe mOrie.S, the sensor's special *ipar, MN«
Weir their resistance tracks so that the thrcttle's angular position is trarnformed into a voltage ratio. The throttle- calve angulir-position sensor's are not pro,ided cith return springs.
Design The potion sensor 0 280 122 001 has one linear characteristic curve. The position sensor 0 280 122 201 has Lid::: linear characteristic curves. This permits particularly good resolution in the angular range
Explanation of symbols Output voltage
L:, Supply voltage Angle of rotation
Tio Outpn ooltage, characteristic curve 2 s. Output ooltage, characteriMt: curve .3
Accessories for 0 280 122 001 C onnect:4 1 237 000 039
Accessories for 0 280 122 201 Plug housing 1 284 485 118 Receptack4, 5 per pack. ON. required: 4 1 284 477 121 Pro441tite cap, 5 per pack. (It.. required: 1 1 280 703 023
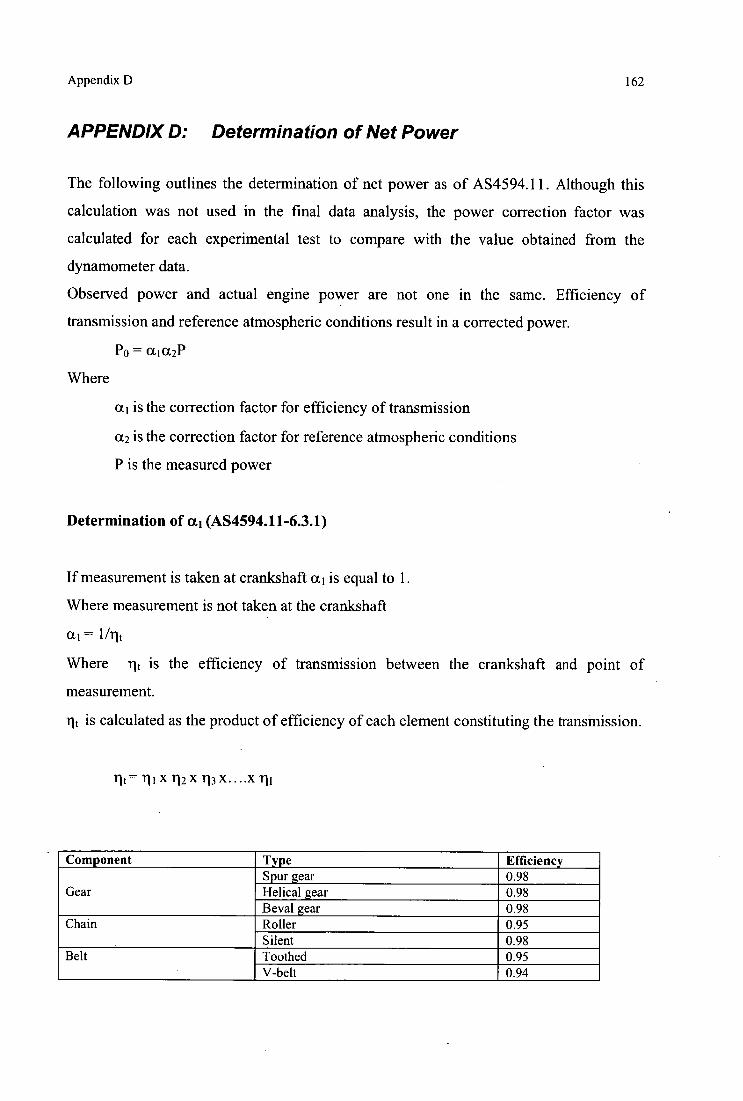
Appendix D 162
APPENDIX D: Determination of Net Power
The following outlines the determination of net power as of AS4594.11. Although this
calculation was not used in the final data analysis, the power correction factor was
calculated for each experimental test to compare with the value obtained from the
dynamometer data.
Observed power and actual engine power are not one in the same. Efficiency of
transmission and reference atmospheric conditions result in a corrected power.
Po = ol1ct2P
Where
a l is the correction factor for efficiency of transmission
a2 is the correction factor for reference atmospheric conditions
P is the measured power
Determination of oc 1 (AS4594.11-6.3.1)
If measurement is taken at crankshaft a i is equal to 1.
Where measurement is not taken at the crankshaft
a 1 = 1/rit
Where Ti t is the efficiency of transmission between the crankshaft and point of
measurement.
it is calculated as the product of efficiency of each element constituting the transmission.
Ilt = 111 x 112 x 113 x....x Ili
Component Type Efficiency
Gear Spur gear 0.98 Helical gear 0.98 Beval gear 0.98
Chain Roller 0.95 Silent 0.98
Belt Toothed 0.95 V-belt 0.94
Appendix D 163
Hydraulic coupler or Hydraulic coupler 0.92 converter Non-locked Hydraulic converter 0.92
Determination of a2 (AS4594.11-5.3.2)
Atmospheric Conditions
Reference Temperature — 298K (25°C) (AS4594.11-6.2.1.1)
Dry Pressure — 99kPa (AS4594.11-6.2.1.2)
For testing temperature will fall between 283K and 318K (10°C and 45°C) (AS4594.11-
6.2.2)
Four Stroke Engine: (AS4594.11-6.3.2.2)
a2 = (99/pd) 12 (17298)°6
Where
T is absolute temp in Kelvin at air inlet
Pd is dry atmospheric pressure in kPa
Formula only true for 0.95,2 1.05
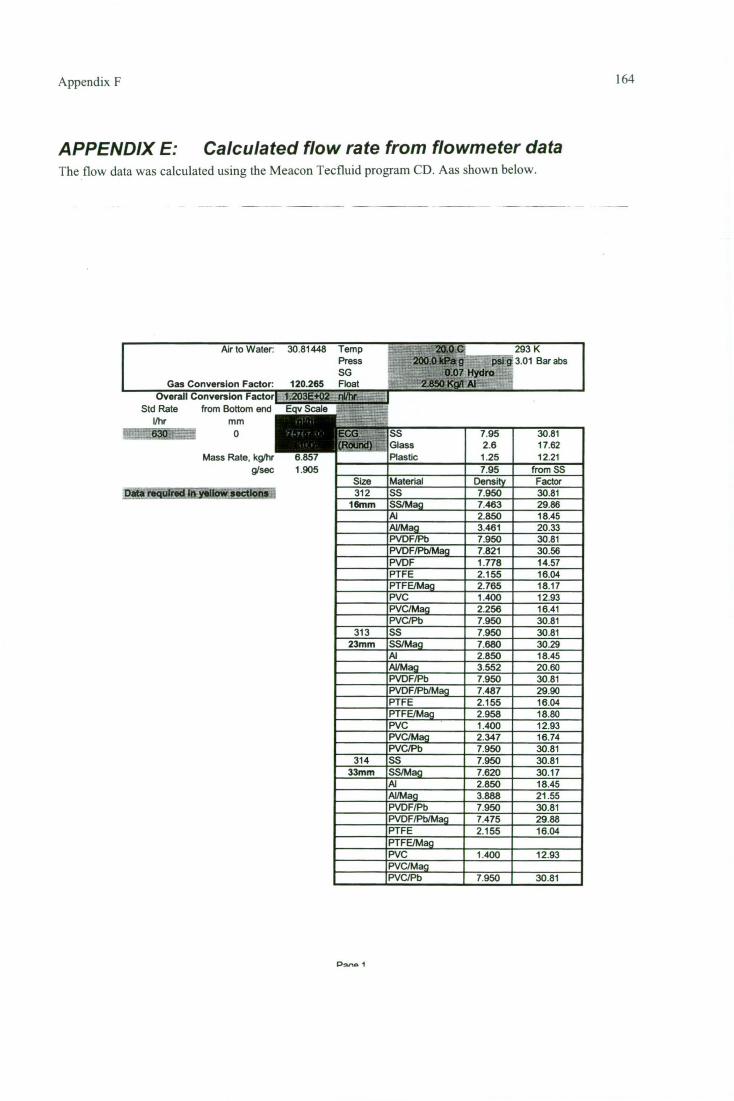
IECG (Round)
SS Glass Plastic
7.95 2.6 1.25
30.81 17.62 12.21
7.95 from SS Size Material Density Factor 312 SS 7.950 30.81
16mm SS/Mag 7.463 29.86 Al 2.850 18.45 Al/Mag 3.461 20.33 PVDF/Pb 7.950 30.81 PVDF/Pb/Mag 7.821 30.56 PVDF 1.778 14.57 PTFE 2.155 16.04 PTFE/Mag 2.765 18.17 PVC 1.400 12.93 PVC/Mag 2.256 16.41 PVC/Pb 7.950 30.81
313 SS 7.950 30.81 23mm SS/Mag 7.680 30.29
Al 2.850 18.45 Al/Mag 3.552 20.60 PVDF/Pb 7.950 30.81 PVDF/Pb/Mag 7.487 29.90 PTFE 2.155 16.04 PTFE/Mag 2.958 18.80 PVC 1.400 12.93 PVC/Mag 2.347 16.74 PVC/Pb 7.950 30.81
314 SS 7.950 30.81 33mm SS/Mag 7.620 30.17
Al 2.850 18.45 Al/Mag 3.888 21.55 PVDF/Pb 7.950 30.81 PVDF/Pb/Mag 7.475 29.88 PTFE 2.155 16.04 PTFE/Mag PVC 1.400 12.93 PVC/Mag PVC/Pb 7.950 30.81
630 0
Mass Rate, kg/hr
6.857
9/sec
1 905
Data required in yellow sections
\ppcndl \ F I ()4
APPENDIX E: Calculated flow rate from flowmeter data Ile flow data was calculated using the Meacon Tecfluid program CD. Aas shown below.
Air to Water: 30.81448 Temp 20.0 C 293K Press 200.0 kPa g psi g 3.01 Bar abs SG 0.07 Hydro
Gas Conversion Factor: 120.265 Float 2.850 Kgli Al Overall Conversion Factori 1.203E+02 nifty
Std Rate from Bottom end l/hr mm
Eqv Scale
P.mno 1
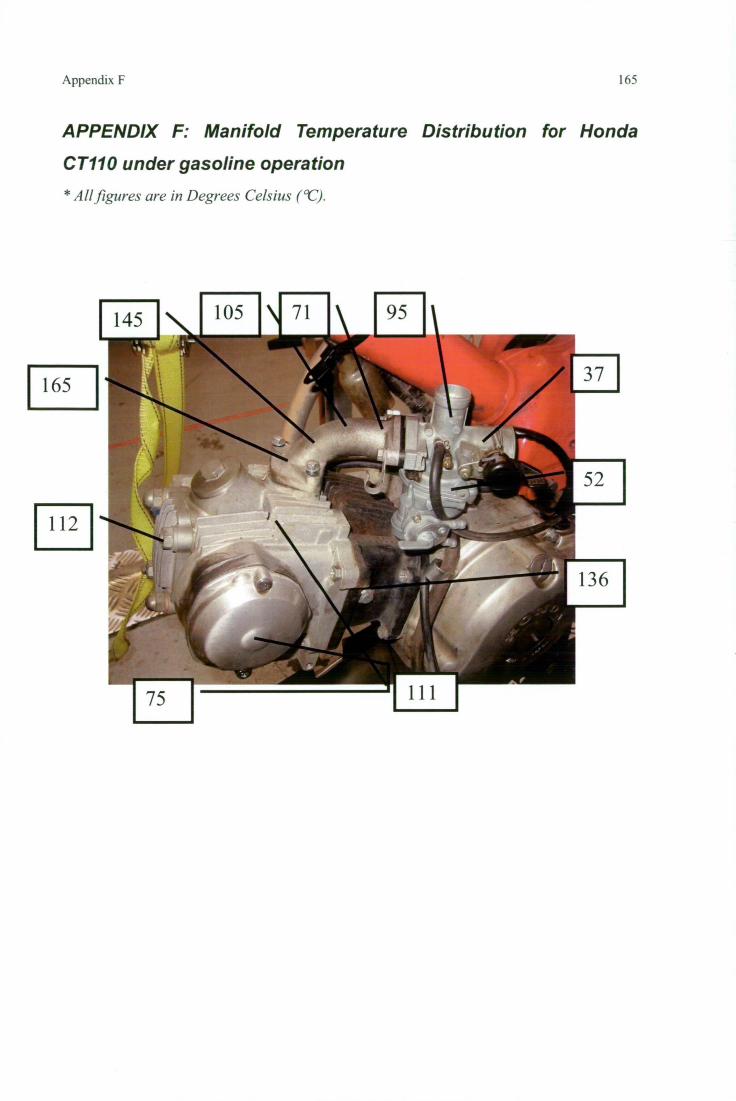
I 165
112
Appendix F
1 65
APPENDIX F: Manifold Temperature Distribution for Honda
CT110 under gasoline operation * All figures are in Degrees Celsius ('C).
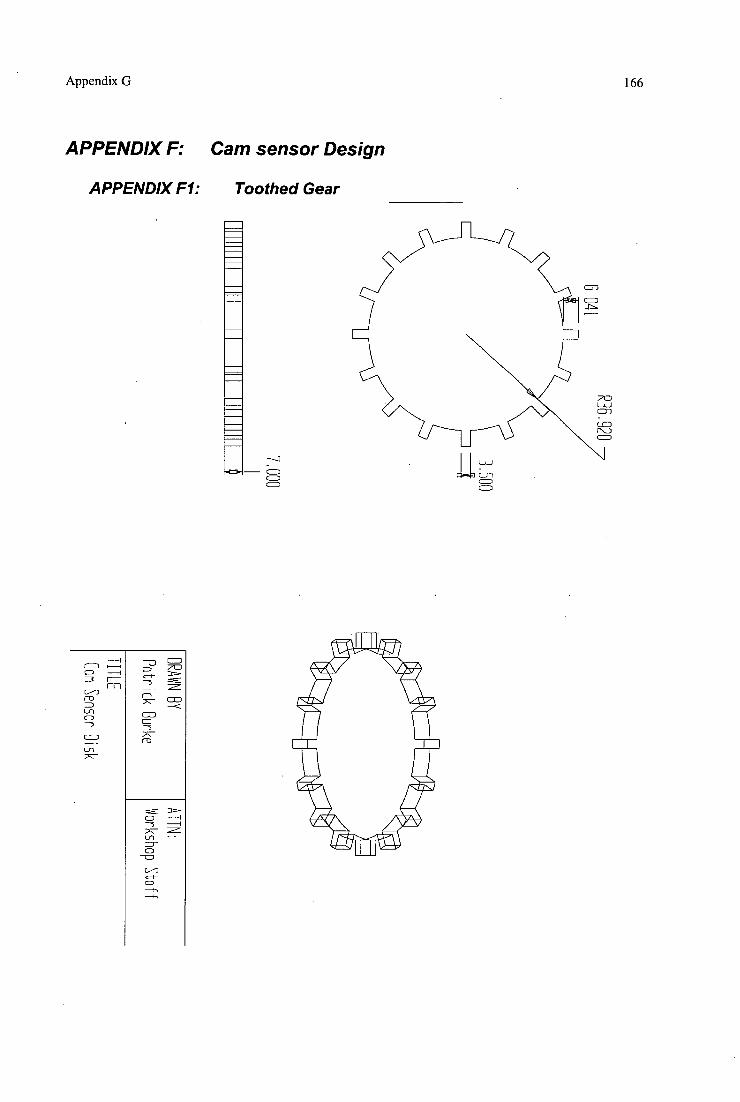
Appendix G 166
APPENDIX F: Cam sensor Design
APPENDIX Fl: Toothed Gear
DRAWN BY ATTN :
Patrick Burke Workshop
Stuff
TITLE [on Sensor Disk
■
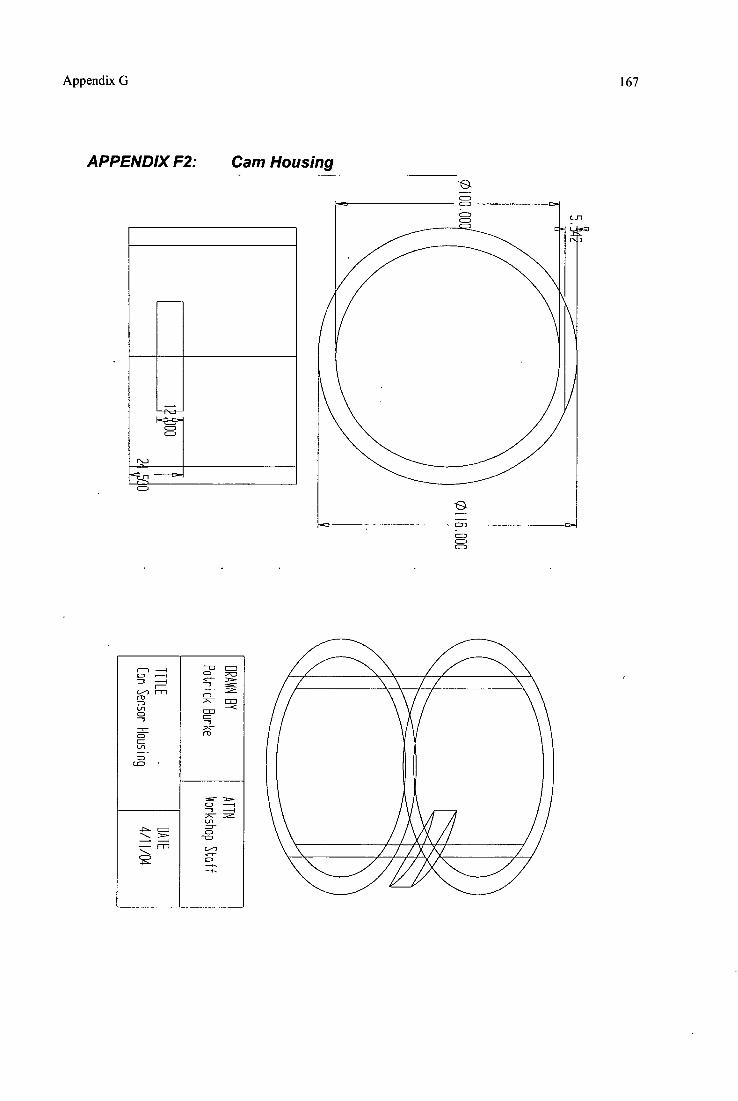
p.
-C_n ----5-1
0
Appendix G 167
APPENDIX F2: Cam Housing
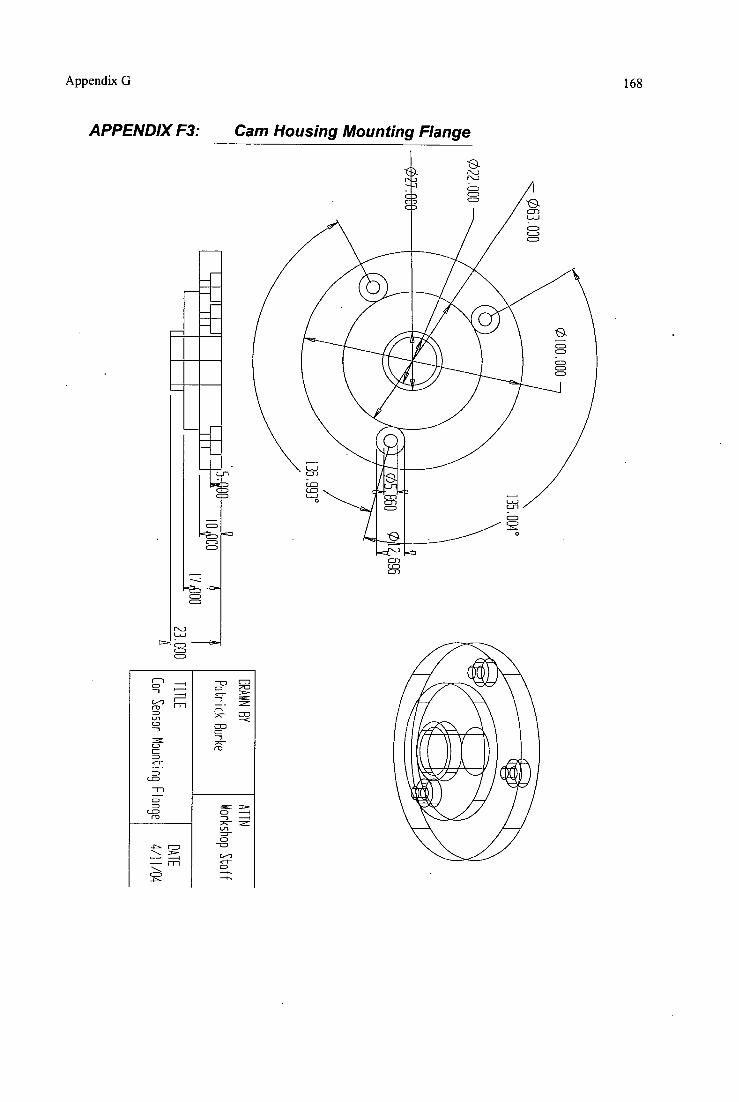
APPENDIX F3: Cam Housing Mounting Flange
Cr1
-o <-t-
co
CID
70
CO
S- O -1 -3 -1
Appendix G 168
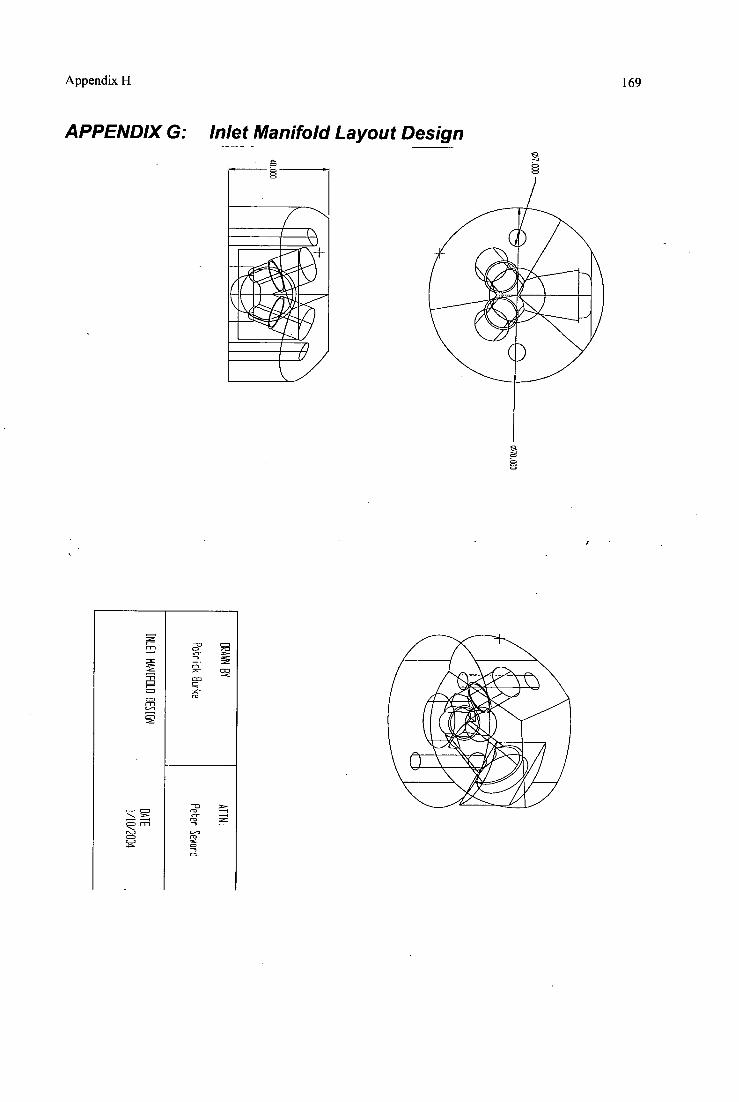
Appendix H 169
APPENDIX G: Inlet Manifold Layout Design
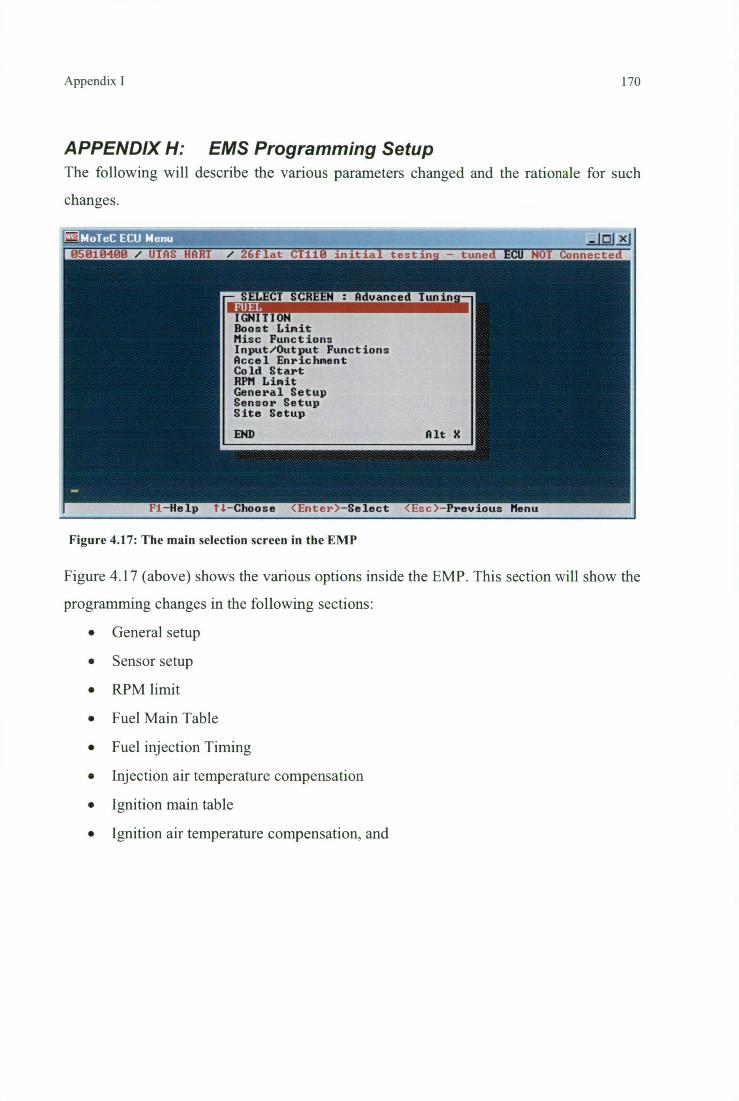
Appendix I
170
APPENDIX H: EMS Programming Setup The following will describe the various parameters changed and the rationale for such
changes.
RMoTeC ECU Menu ,jojal 05010400 / HAS T A / 6flat CT110 initial testin - tuned ECU NOT Connected
- SELECT SCIMOI ced T unin —
IGNITION Boost Limit Misc Functions Input/Output Functions Accel Enrichment Cold Start RPM Limit General Setup Sensor Setup Site Setup
END Alt X
Fl-He p tl booze <Enter>-S sc>-Previous Menu
Figure 4.17: The main selection screen in the EMP
Figure 4.17 (above) shows the various options inside the EMP. This section will show the
programming changes in the following sections:
• General setup
• Sensor setup
• RPM limit
• Fuel Main Table
• Fuel injection Timing
• Injection air temperature compensation
• Ignition main table
• Ignition air temperature compensation, and
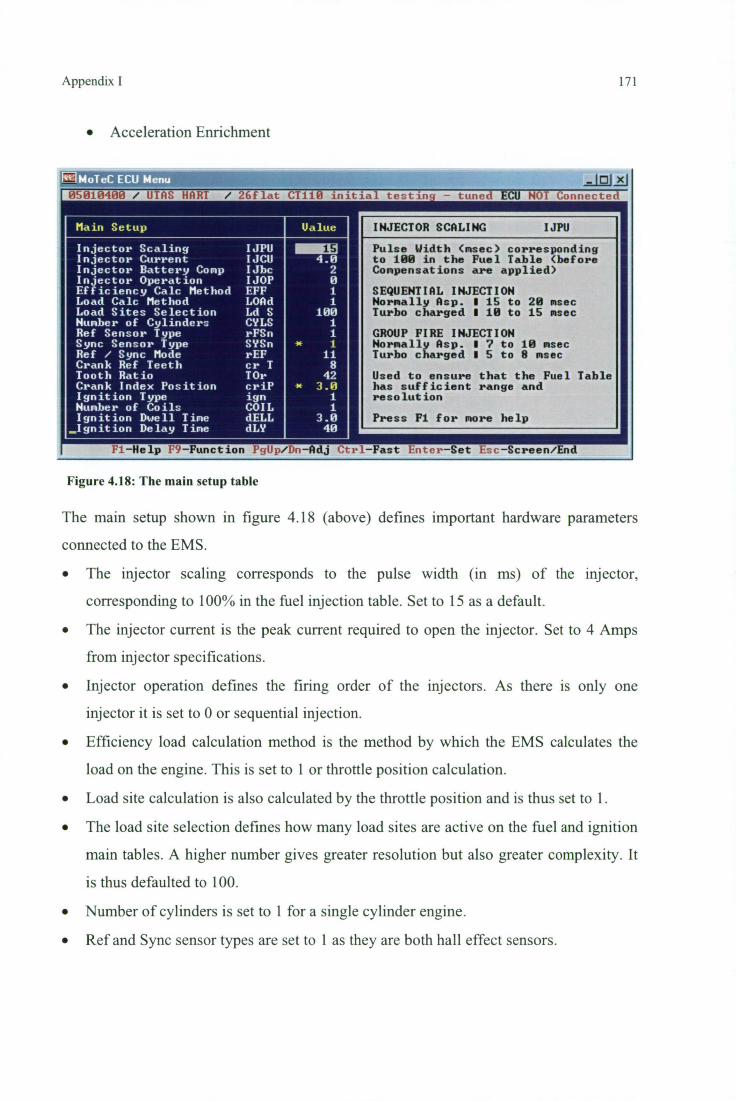
AppendixI
• Acceleration Enrichment
FilMoTeC ECU Menu initial testin — tuned ECU NOT Connected
171
Main Setup
Injector Scaling IJPU Injector Current IJCU Injector Battery Comp lJbc Injector Operation IJOP Efficiency Calc Method EFF Load Calc Method LOAd Load Sites Selection Ld S Number of Cylinders CYLS Ref Sensor Type rFSn Sync Sensor Type SYSn Ref / Sync Mode rEF Crank Ref Teeth cr T Tooth Ratio TOr Crank Index Position criP Ignition Type ign Number of Coils COIL Ignition Dwell Time dELL
_Ignition Delay Time dLY
Ualue
INJECTOR SCALING
IJPU
15 4.0
2
100
1
11
42 3.0
1 1
3.0 40
Pulse Width (msec) corresponding to 100 in the Fuel Table (before Compensations are applied)
SEQUENTIAL INJECTION Normally Asp. I 15 to 20 msec Turbo charged I 10 to 15 msec
GROUP FIRE INJECTION Normally Asp. I 7 to 10 msec Turbo charged I 5 to 8 msec
Used to ensure that the Fuel Table has sufficient range and resolution
Press F1 for more help
F1—Help F9—Function PgUp/Dn—Adj Ctrl—Fast Enter—Set Esc—Screen/End
Figure 4.18: The main setup table
The main setup shown in figure 4.18 (above) defines important hardware parameters
connected to the EMS.
• The injector scaling corresponds to the pulse width (in ms) of the injector,
corresponding to 100% in the fuel injection table. Set to 15 as a default.
• The injector current is the peak current required to open the injector. Set to 4 Amps
from injector specifications.
• Injector operation defines the firing order of the injectors. As there is only one
injector it is set to 0 or sequential injection.
• Efficiency load calculation method is the method by which the EMS calculates the
load on the engine. This is set to 1 or throttle position calculation.
• Load site calculation is also calculated by the throttle position and is thus set to 1.
• The load site selection defines how many load sites are active on the fuel and ignition
main tables. A higher number gives greater resolution but also greater complexity. It
is thus defaulted to 100.
• Number of cylinders is set to 1 for a single cylinder engine.
• Ref and Sync sensor types are set to 1 as they are both hall effect sensors.
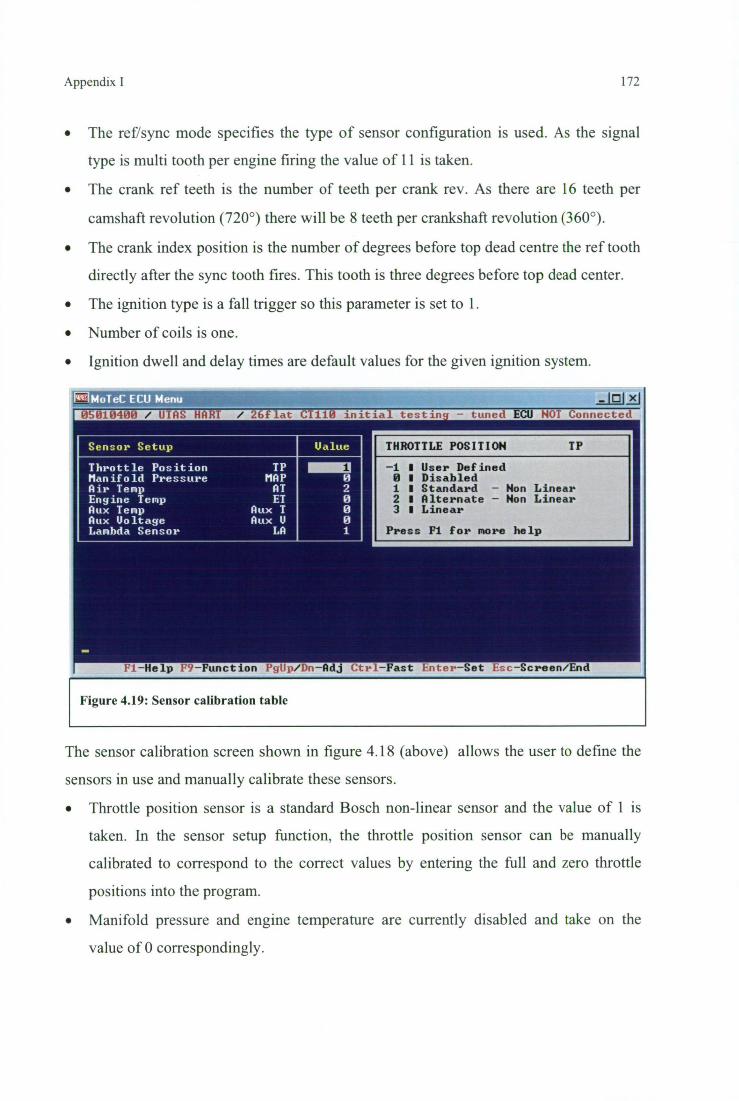
.11:112<_I MoTeC ECU Menu
TP THROTTLE POSITION THROTTLE
nter-Set Esc-Screen/End Fl-Help F9-Function PgUp/Dn-Adj Ctrl- t 1-
05510400 / IT'S HA'T / • at C 110 initia testin. - tuned t. NOT Connected
Sensor Setup
Throttle Position TP Manifold Pressure MAP Air Temp AT Engine Temp ET Aux Temp Aux T Aux Uoltage Aux U Lambda Sensor LA
-1 1 User Defined 0 1 Disabled 1 1 Standard - Non Linear 2 1 Alternate - Non Linear 3 1 Linear
Press Fl for more help
Ualue
0 2
Figure 4.19: Sensor calibration table
Appendix I
172
• The ref/sync mode specifies the type of sensor configuration is used. As the signal
type is multi tooth per engine firing the value of 11 is taken.
• The crank ref teeth is the number of teeth per crank rev. As there are 16 teeth per
camshaft revolution (720 0) there will be 8 teeth per crankshaft revolution (360 0 ).
• The crank index position is the number of degrees before top dead centre the ref tooth
directly after the sync tooth fires. This tooth is three degrees before top dead center.
• The ignition type is a fall trigger so this parameter is set to 1.
• Number of coils is one.
• Ignition dwell and delay times are default values for the given ignition system.
The sensor calibration screen shown in figure 4.18 (above) allows the user to define the
sensors in use and manually calibrate these sensors.
• Throttle position sensor is a standard Bosch non-linear sensor and the value of 1 is
taken. In the sensor setup function, the throttle position sensor can be manually
calibrated to correspond to the correct values by entering the full and zero throttle
positions into the program.
• Manifold pressure and engine temperature are currently disabled and take on the
value of 0 correspondingly.
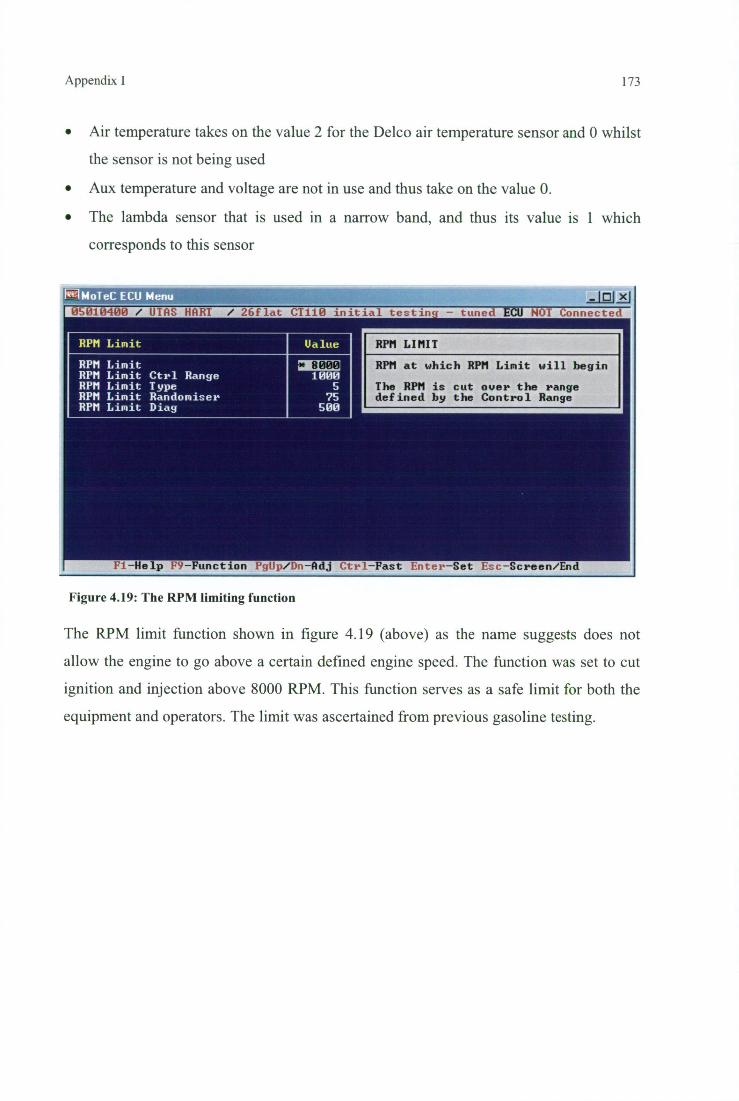
Ualue
11300 5
75 500
RPM Limit RPM Limit Ctrl Range RPM Limit Type RPM Limit Randomiser RPM Limit Diag
RPM Limit
Enter et Esc-Screen/End Fl-Help F9-Function PgU /Dn-Adj Ct 1-F
MoTeC ECU Menu
RPM LIMIT
RPM at which RPM Limit will begin
The RPM is cut over the range defined by the Control Range
05010400 / UTAS HART / 26flat CT110 initial testin. - tuned 01 NOT Connected
Appendix I 173
• Air temperature takes on the value 2 for the Delco air temperature sensor and 0 whilst
the sensor is not being used
• Aux temperature and voltage are not in use and thus take on the value 0.
• The lambda sensor that is used in a narrow band, and thus its value is 1 which
corresponds to this sensor
Figure 4.19: The RPM limiting function
The RPM limit function shown in figure 4.19 (above) as the name suggests does not
allow the engine to go above a certain defined engine speed. The function was set to cut
ignition and injection above 8000 RPM. This function serves as a safe limit for both the
equipment and operators. The limit was ascertained from previous gasoline testing.
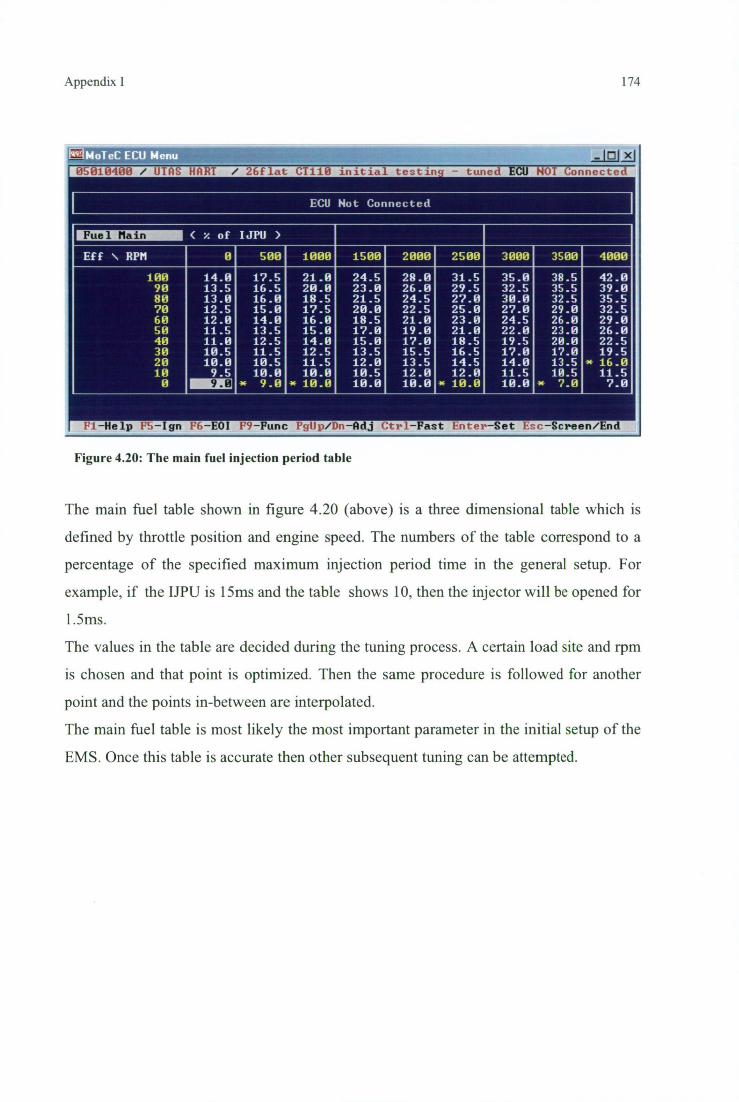
Appendix I
174
MMoTeC ECU Menu
,121211
5010400 / UTAS HART / 26flat CT110 initial testin - tuned ECU NOT Connected
ECU Not Connected
Fuel Main x of IJPU )
Eff \ RPM 500 1000 1500 2000 2500 3000 3500 4000
100 14.0 17.5 21.0 24.5 28.0 31.5 35.0 38.5 42.0 90 13.5 16.5 20.0 23.0 26.0 29.5 32.5 35.5 39.0 80 13.0 16.0 18.5 21.5 24.5 27.0 30.0 32.5 35.5 70 12.5 15.0 17.5 20.0 22.5 25.0 27.0 29.0 32.5 60 12.0 14.0 16.0 18.5 21.0 23.0 24.5 26.0 29.0 50 11.5 13.5 15.0 17.0 19.0 21.0 22.0 23.0 26.0 40 11.0 12.5 14.0 15.0 17.0 18.5 19.5 20.0 22.5 30 10.5 11.5 12.5 13.5 15.5 16.5 17.0 17.0 19.5 20 10.0 10.5 11.5 12.0 13.5 14.5 14.0 13.5 * 16.0 10 9.5 10.0 10.0 10.5 12.0 12.0 11.5 10.5 11.5
9.0 * 9.0 * 10.0 10.0 10.0 10.0 10.0 4*- 7.0 7.0
F1-Help F5-Ign F6-E0I F9-Func PgUp/D -Ad C est Enter-Set Esc-Screen/End
Figure 4.20: The main fuel injection period table
The main fuel table shown in figure 4.20 (above) is a three dimensional table which is
defined by throttle position and engine speed. The numbers of the table correspond to a
percentage of the specified maximum injection period time in the general setup. For
example, if the IJPU is 15ms and the table shows 10, then the injector will be opened for
1.5ms.
The values in the table are decided during the tuning process. A certain load site and rpm
is chosen and that point is optimized. Then the same procedure is followed for another
point and the points in-between are interpolated.
The main fuel table is most likely the most important parameter in the initial setup of the
EMS. Once this table is accurate then other subsequent tuning can be attempted.
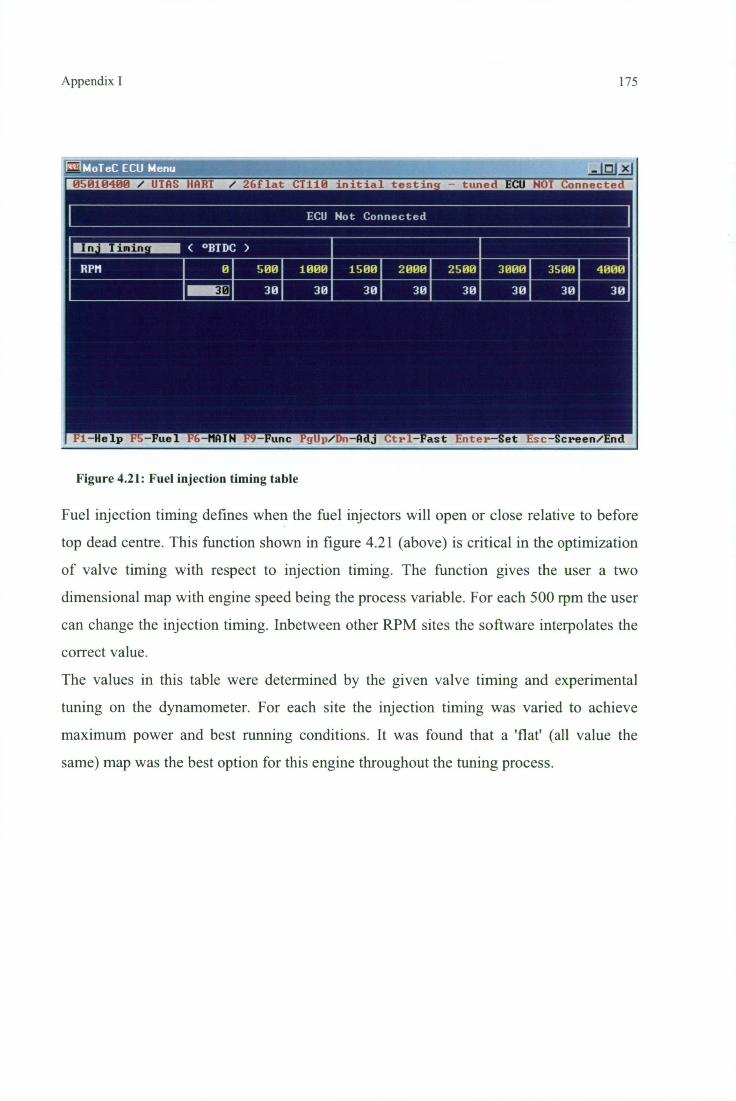
Appendix I
175
Fi.MoTeC ECU Menu
:104s: /
SA
at 110 untie ten tin - tuned ECU NOT Connected
ECU Not Connected
111711dOMUMIIIIM( °BTDC ) RPM
500 1000 1500 2000 2500 3000 3500 4000
30 30 30
30
30
30
30
30
30
F1- e p FS- . ue F6-". F9-'unc PgUp/D est Enter- et Esc-Screen/End
Figure 4.21: Fuel injection timing table
Fuel injection timing defines when the fuel injectors will open or close relative to before
top dead centre. This function shown in figure 4.21 (above) is critical in the optimization
of valve timing with respect to injection timing. The function gives the user a two
dimensional map with engine speed being the process variable. For each 500 rpm the user
can change the injection timing. Inbetween other RPM sites the software interpolates the
correct value.
The values in this table were determined by the given valve timing and experimental
tuning on the dynamometer. For each site the injection timing was varied to achieve
maximum power and best running conditions. It was found that a 'flat' (all value the
same) map was the best option for this engine throughout the tuning process.
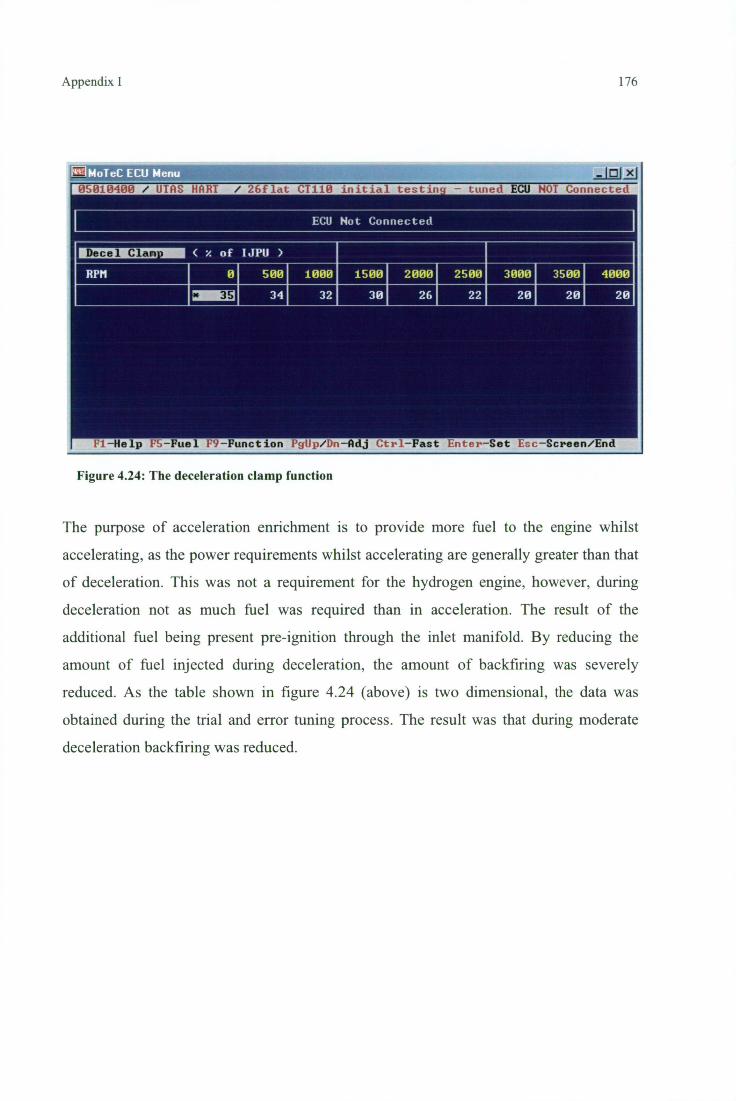
( > of IJPU )
500 1000
34 32
3000 3500 2500 1500 4000 2000
20 20 22 30 20 26
05010400 / UIAS HART / 26f Tat CIllO ini la
in - tuned ECU NOT Connected
ECU Not Connected
Decel Clam.
RPM
176
Fl-Help FS -Fue 1 F9 -Fun c t ion PgUp/D -AdCtrl-Fast Enter-Set Esc-Screen/End
Figure 4.24: The deceleration clamp function
The purpose of acceleration enrichment is to provide more fuel to the engine whilst
accelerating, as the power requirements whilst accelerating are generally greater than that
of deceleration. This was not a requirement for the hydrogen engine, however, during
deceleration not as much fuel was required than in acceleration. The result of the
additional fuel being present pre-ignition through the inlet manifold. By reducing the
amount of fuel injected during deceleration, the amount of backfiring was severely
reduced. As the table shown in figure 4.24 (above) is two dimensional, the data was
obtained during the trial and error tuning process. The result was that during moderate
deceleration backfiring was reduced.
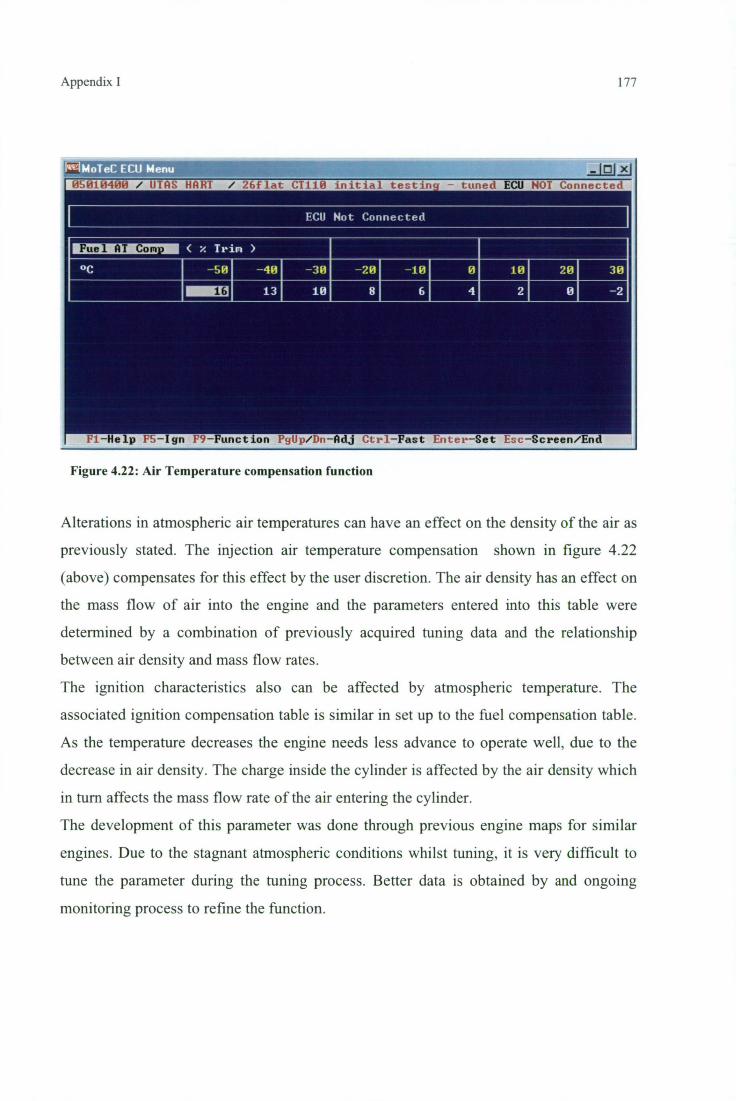
05010400 / UTAS HART / at 1 in tie test - tune T Connected
ECU Not Connected
10 20 301
Fuel AT Com. ( % Trim )
°C -40 -30
-20 -10
16
13 10
6
4 2 0 -2
Appendix I
177
MoTeC ECU Menu
F1-'e p FS- gn F9-'unct on PgUp/Dn-A.j Ct rl- est Enter- et Esc-Screen/End
Figure 4.22: Air Temperature compensation function
Alterations in atmospheric air temperatures can have an effect on the density of the air as
previously stated. The injection air temperature compensation shown in figure 4.22
(above) compensates for this effect by the user discretion. The air density has an effect on
the mass flow of air into the engine and the parameters entered into this table were
determined by a combination of previously acquired tuning data and the relationship
between air density and mass flow rates.
The ignition characteristics also can be affected by atmospheric temperature. The
associated ignition compensation table is similar in set up to the fuel compensation table.
As the temperature decreases the engine needs less advance to operate well, due to the
decrease in air density. The charge inside the cylinder is affected by the air density which
in turn affects the mass flow rate of the air entering the cylinder.
The development of this parameter was done through previous engine maps for similar
engines. Due to the stagnant atmospheric conditions whilst tuning, it is very difficult to
tune the parameter during the tuning process. Better data is obtained by and ongoing
monitoring process to refine the function.
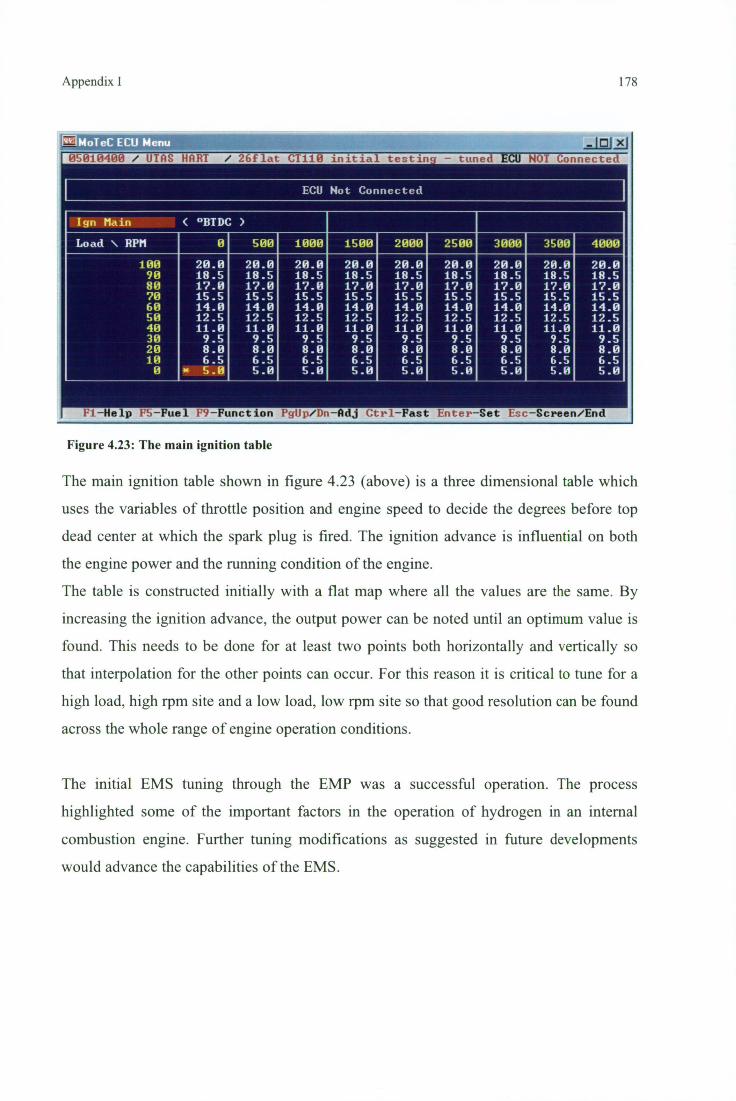
Appendix I
178
WilioTeC ECU Menu 05010400 / UTAS HART / 26flat CT110 initial testin - tuned ECU NOT Connected
ECU Not Connected
Ign Main ( °BTDC )
Load \ RPM 500 1000 1500 2000 2500 3000 3500 4000
100 20.0 20.0 20.0 20.0 20.0 20.0 20.0 20.0 20.0 90 18.5 18.5 18.5 18.5 18.5 18.5 18.5 18.5 18.5 80 17.0 17.0 17.0 17.0 17.0 17.0 17.0 17.0 17.0 70 15.5 15.5 15.5 15.5 15.5 15.5 15.5 15.5 15.5 60 14.0 14.0 14.0 14.0 14.0 14.0 14.0 14.0 14.0 50 12.5 12.5 12.5 12.5 12.5 12.5 12.5 12.5 12.5 40 11.0 11.0 11.0 11.0 11.0 11.0 11.0 11.0 11.0 30 9.5 9.5 9.5 9.5 9.5 9.5 9.5 9.5 9.5 20 8.0 8.0 8.0 8.0 8.0 8.0 8.0 8.0 8.0 10 6.5 6.5 6.5 6.5 6.5 6.5 6.5 6.5 6.5 0 5.0 5.0 5.0 5.0 5.0 5.0 5.0 5.0 5.0
Fl-Help F5-*uel F9-Function PgUp/Dn-Adj C et Enter-Set Esc-Screen/
Figure 4.23: The main ignition table
The main ignition table shown in figure 4.23 (above) is a three dimensional table which
uses the variables of throttle position and engine speed to decide the degrees before top
dead center at which the spark plug is fired. The ignition advance is influential on both
the engine power and the running condition of the engine.
The table is constructed initially with a flat map where all the values are the same. By
increasing the ignition advance, the output power can be noted until an optimum value is
found. This needs to be done for at least two points both horizontally and vertically so
that interpolation for the other points can occur. For this reason it is critical to tune for a
high load, high rpm site and a low load, low rpm site so that good resolution can be found
across the whole range of engine operation conditions.
The initial EMS tuning through the EMP was a successful operation. The process
highlighted some of the important factors in the operation of hydrogen in an internal
combustion engine. Further tuning modifications as suggested in future developments
would advance the capabilities of the EMS.
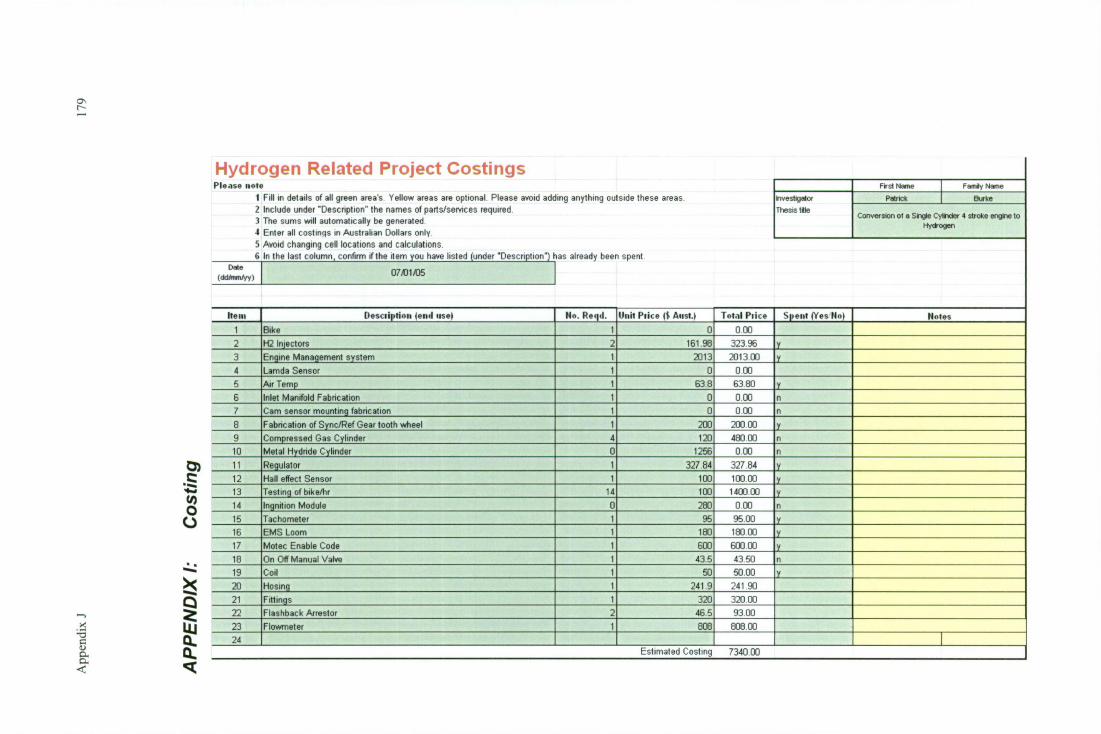
APP
END
IX I:
Hydrogen Related Project Costings Please note
i Fill in details of all green area's Yellow areas are optional. Please avoid adding anything outside these areas. 2 Include under "Description" the names of parts/seivices required. 3 The sums will automatically be generated 4 Enter all costings in Australian Dollars only
First Name Family Name
Investigator
Thesis tile
Petrick Burke
Conversion of a Single Cylinder 4 stroke engine to HYdrogen
5 Avoid changing cell locations and calculations. 6 In the last column, confirm if the item you have listed (under "Description") has already been spent.
Date (cicihrin/yy) 07/01/05
Item Elescliptioli lend 1150 No. Reriil. 11114 Nice l* Alist.1 Total Nice Spent IYes No Notes
1 Bike 1 0 0 00
2 H2 Injectors 2 161.98 323.96 y 3 Engine Management system 1 21313 2013111 y 4 Lamda Sensor 1 0 0 00
5 Air Temp 1 63.8 63 80 y 6 Inlet Manifold Fabrication 1 0 0.00 n 7 Cam sensor mounting fabrication 1 0 0111 n 8 Fabrication of Sync/Ref Gear tooth wheel 1 200 200 00 y 9 Compressed Gas Cylinder 4 120 480 03 n 10 Metal Hydride Cylinder o 1256 0.00 n 11 Regulator 1 327 84 327 84 y 12 Hall effect Sensor 1 100 100 00 y 13 Testing of bike/hr 14 1 oo 1400 00 y 14 Ingnition Module 0 280 0 00 n 15 Tachometer 1 95 95.00 y 16 EMS Loom 1 180 180 00 y 17 Motec Enable Code 1 600 600 00 y
18 On Off Manual Valve 1 43.5 43.50 n 19 Coil 1 50 50.00 y 20 Hosing 1 241.9 241 11I
21 Fittings 1 3213 320 00
22 Flashback Arrestor 2 465 93.00
23 F I owm et er 1 808 808.03
24 i Estimated Costing 7340.00

Appendix J 180