fostering competition in the philippines
TRANSCRIPT
NOVEMBER 2018
Fostering Competition in the Philippines: The Challenge of Restrictive Regulations
Pub
lic D
iscl
osur
e A
utho
rized
Pub
lic D
iscl
osur
e A
utho
rized
Pub
lic D
iscl
osur
e A
utho
rized
Pub
lic D
iscl
osur
e A
utho
rized
© 2018 International Bank for Reconstruction and Development / The World Bank
1818 H Street NWWashington DC 20433Telephone: 202-473-1000Internet: www.worldbank.org
This work is a product of the staff of The World Bank Group with external contributions. The findings, interpretations, and conclusions expressed in this work do not necessarily reflect the view of the Australian Government, the Canadian Government, the World Bank Group, its Board of Executive Directors, or the governments they represent.
The World Bank does not guarantee the accuracy of the data included in this work. The boundaries, colors, denominations, and other information shown on any map in this work do not imply any judgment on the part of The World Bank concerning the legal status of any territory or the endorsement or acceptance of such boundaries.
Rights and Permissions
The material in this work is subject to copyright. Because The World Bank encourages dissemination of its knowledge, this work may be reproduced, in whole or in part, for noncommercial purposes as long as full attribution to this work is given.
Any queries on rights and licenses, including subsidiary rights, should be addressed to World Bank Publications, The World Bank Group, 1818 H Street NW, Washington, DC 20433, USA; fax: 202-522-2625; e-mail: [email protected].
i
Fostering Competition in the Philippines: The Challenge of Restrictive Regulations
A project of the World Bank Group, with the support of the Australian Government through the Australia-World Bank Philippines Development Trust Fund, and the Canadian Government.
NOVEMBER 2018
ii
This report was prepared by a World Bank Group team led by Graciela Miralles Murciego (Senior Economist, GTCTC) and Roberto Martin Nolan Galang (Private Sector Specialist, GTCEA) that included Sara Nyman (Economist, GTCTC), Tilsa Ore (Consultant, GTCTC) and Leandro Zipitria (Consultant, GTCTC). Key inputs were provided by Georgiana Pop (Senior Economist, GTCTC), Tanja Goodwin (Economist, GTC04), Seidu Douda (Analyst, GTCTC), Karen Annette Lazaro (Consultant, GTCEA), Beatrice Tanjangco (Consultant, GTCEA) and Camila Ringeling (Consultant, GTCTC). Gretchen Aquino (Consultant, GTCEA) contributed to the data collection process using the OECD Product Market Regulation (PMR) Questionnaire. Osongo Lenga (GTCTC), Yvette Villostas (Program Assistant, CEAOH), and other team members in the Philippine Country Office provided valuable logistics and administrative support.
Martha Martinez Licetti (Lead Economist and Competition Policy Global Lead, GTCTC), Javier Suarez (Lead Economist, GTC03), and Paul Phumpiu (Senior Consultant, GTCTC, and former Chairman of the Competition Commission of the Peruvian Competition Authority INDECOPI) peer reviewed the report. The team thanks the World Bank Group experts for their comments.
The Philippine Competition Commission (PCC) provided valuable inputs, comments and feedback. The team thanks Chairman Arsenio M. Balisacan, Commissioner Stella Luz A. Quimbo, Commissioner Atty. Johannes Benjamin R. Bernabe, Commissioner Atty. El Cid R. Butuyan and Commissioner Atty. Amabelle C. Asuncion.
Additional departmental units and agencies that participated in the process of data collection and validation include the Philippine Statistical Authority (PSA), the Energy Regulatory Commission (ERC), the National Telecommunications Commission (NTC), the Philippine Postal Corporation (PHLPost), the Philippine National Railways (PNR), the Philippine Ports Authority (PPA), the Maritime Industry Authority (MARINA), the Land Transportation Franchising and Regulatory Board (LTFRB), the Civil Aviation Authority of the Philippines, the National Water Resources Board, the Department of Trade and Industry (DTI), the Professional Regulation Commission (PRC), the Governance Commission for GOCCs (GCG) and the National Economic and Development Authority (NEDA).
The team worked under the overall supervision and guidance of Mona E. Haddad (Practice Manager, GTC02), Jose Guilherme Reis, Practice Manager for Trade and Competition (Trade & Competitiveness Global Practice), Birgit Hansl (Program Leader, EACPF) and Mara K. Warwick, (Country Director for the Philippines).
The findings, interpretations, and conclusions expressed in this Report are those of World Bank staff and do not necessarily reflect the views of the Australian Government, the Canadian Government, and the World Bank or its management, Executive Board, or the governments they represent.
For questions and comments on the content of this publication, please contact Graciela Miralles Murciego ([email protected]). Questions from the media can be addressed to David Llorito ([email protected]).
For information on the work of the World Bank Group on Competition Policy, please visit www.worldbank.org/en/topic/competitiveness/brief/competition-policy
For information about the World Bank and its activities in the Philippines, please visit www.worldbank.org/ph
iii
Contents
List of Figures iv List of Tables viList of Boxes iviiList of Acronyms viii
Executive Summary 1
I. Developing an effective competition policy framework in the Philippines 18
II. Identifying regulatory obstacles to competition in the Philippines’ markets 38
1. State Participation and Control of Economic Activities 45 1.1 Public Ownership 45 1.2 State involvement in business operations 56
2. Barriers to market entry and rivalry 63 2.1 Administrative burdens on startups 65 2.2 Complexity of regulatory procedures 66 2.3 Regulatory protection of incumbents 66
3. Barriers to trade and investment 70 3.1 Explicit barriers to trade and investment 71 3.2 Other barriers to trade and investment 75
III. Designing a road map for pro-competition reform for the Philippines 80
1. Sector-specific competition snapshots 82 1.1 Electricity 82 1.2 Telecommunications 84 1.3 Transport 92 1.4 Professional Services 94
2. Making markets work more efficiently 96
IV. Quantifying potential benefits of increased competition 97
Annex 1: OECD-WBG PMR values for the Philippines 101
References 102
iv
List of Figures
Figure 1: GDP growth of the Philippines as compared to selected regional and non-regional peers 19Figure 2: Market concentration in manufacturing in the Philippines and selected EAP countries 21Figure 3: Evolution of market concentration in manufacturing in the Philippines 21Figure 4: Distribution of manufacturing markets by level of concentration based on standard HHI
thresholds 21Figure 5: Distribution of agriculture markets by level of concentration based on standard HHI thresholds 21Figure 6: Distribution of wholesale/retail markets by level of concentration based on standard HHI
thresholds 21Figure 7: Distribution of transport/storage markets by level of concentration based on standard HHI thresholds 21Figure 8: Extent of Market Dominance for selected countries (7 least) 22Figure 9: Extent of Market Dominance and GDP 22Figure 10: Extent of Market Dominance and GDP per capita 22Figure 11: Business risks related to weak competition policies in the EAP region 23Figure 12: Distribution of average market-level price cost margins (PCMs) for the Philippine manufacturing sector 24Figure 13: Distribution of average market-level price cost margins (PCMs) for the Philippine agriculture sector 24Figure 14: Distribution of average market-level price cost margins (PCMs) for the Philippine wholesale/retail sector 24Figure 15: Distribution of average market-level price cost margins (PCMs) for the Philippine transport/storage sector 24Figure 16: Manufacturing markets in the top deciles of HHI and PCM distributions 27Figure 17: Agriculture markets in the top deciles of HHI and PCM distributions 27Figure 18: Wholesale/retail markets in the top deciles of HHI and PCM distributions 27Figure 19: Transport/storage markets in the top deciles of HHI and PCM distributions 27Figure 20: A Comprehensive Competition Policy Framework 30Figure 21: Years since enactment of competition law and years since the competition authority became functional (selected countries in EAP and SA) 31Figure 22: Scope of the competition laws (selected countries in EAP and SA) 32Figure 23: Elements of effective implementation of competition law and policy 34Figure 24: Economy-wide PMR Methodology 39Figure 25: Economy-wide PMR Score (2017) 40Figure 26: Decomposition of PMR sub-indicators for the Philippines and selected regional comparators included in the PMR database 41Figure 27: Decomposition of PMR Score for the Philippines 42Figure 28: High-level overview of the MCPAT approach 43Figure 29: MCPAT Typology of competition restrictions 44Figure 30: State Control PMR Score (higher score indicates a greater degree of restrictiveness 46Figure 31: Decomposition of state control 46Figure 32: Number of Subsectors with SOEs 49Figure 33: Building Blocks of Competitive Neutrality 53Figure 34: Dispersion of subsidies 55Figure 35: Barriers to market entry and rivalry PMR Score 63Figure 36: Decomposition of barriers to market entry and rivalry 65
v
Figure 37: Barriers to Trade & Investment PMR Score 70Figure 38: Decomposition of restrictiveness through barriers to trade and investment 71Figure 39: Share of PMR countries (OECD and non-OECD) with quota restrictions in professional services 72Figure 40: Proportion of markets with some foreign capitalization by sector 73Figure 41: Share of countries that discriminate against foreign firms in procurement in PMR sample 76Figure 42: Distribution of specific restrictions by MCPAT category and PMR pillar classification 80Figure 43: MCPAT methodology 81Figure 44: Share of vertical separation in generation (left) and distribution (right) in PMR countries 83Figure 45: Electricity prices and installed capacity 84Figure 46: Evolution of density of telecommunications services (2000-2015) 85Figure 47: Average HHI in the mobile services industry in the East Asia and Pacific region and market structure across countries 86Figure 48: Number of Mobile Operators (2005 vs 2015) 87Figure 49: Mobile phone market concentration: HHI index (2005 vs. 2015) 88Figure 50: Mobile phone market: entry and exit (2005-2015) (East Asia and Pacific region) 89Figure 51: Market concentration, regulatory quality and GDP pc ppp - EAP region 90Figure 52: Market concentration, number of companies and market size - EAP region 90Figure 53: Access to telecommunications (left) and price of telecommunications services (right) 91Figure 54: WBG Logistic performance index (5 best) 92Figure 55: PMR for Professional Services by sub indicators 94Figure 56: PMR for professional services – international benchmark 94Figure 57: Number of tasks with exclusive or shared exclusive rights 95Figure 58: PMR score (pre and post reform), cross-country comparison 98Figure 59: Share of 99 identified restrictions according to MCPAT classification 98Figure 60: Share of 99 identified restrictions according to PMR classification 98Figure 61: PMR score (pre and post reform) 99
vi
List of Tables
Table 1: Number of national markets with only one firm operating by sector 3Table 2: Markets with only one firm in operation in the Philippines and PCMs in those markets 26Table 3: Markets in the top 20% of the HHI and PCM distributions that are affected by specific restrictions identified by the PMR methodology 28Table 4: Competition laws and competition authorities in selected countries in EAP and SA 31Table 5: Presence of SOEs in Selected Sectors Covered by PMR Methodology 50Table 6: Degree of Government participation in network industries 51Table 7: Economic considerations to minimize negative effects of price controls 57Table 8: Effect-based classification of PMR restrictions related to state control according to MCPAT typologies/sub-typologies 61Table 9: Doing Business Rankings for the Philippines in 2017 (out of 190 economies) 65Table 10: Effect-based classification of PMR restrictions related to barriers to market entry and rivalry according to MCPAT typologies/sub-typologies 68Table 11: Maximum share of FDI by sector (in percentage) 72Table 12: Effect based classification of PMR restrictions related to barriers to Trade & Investment according to MCPAT typologies/sub-typologies 77Table 13: Ownership structure in the telecommunications market 85Table 14: Expected Impact of reforms of key sectors on GDP 99
vii
List of Boxes
Box 1: The Philippine Competition Act 33Box 2: PMR Methodology: Economy-wide score 38Box 3: The World Bank’s Market and Competition Policy Assessment Tool (MCPAT) 43Box 4: SOEs in the Philippines 48Box 5: Elements for an effective Competitive Neutrality Framework in the Philippines 53Box 6: Subsidies granted by the state in the Philippines 55Box 7: Price controls in the Philippines 59Box 8: Patterns of foreign capitalization in the Philippines 73Box 9: Quantifying the impact of anticompetitive restrictions in the Filipino construction sector 74Box 10: Mobile phone industry in the East Asia Pacific (EAP) Region 86
viii
List of Acronyms
APT Asset Privatization TrustASEAN Association of Southeast Asian NationsBIR Bureau of Internal RevenueBOT Build-Operate-and-TransferCAB Civil Aeronautics BoardCBPI Census of Philippine Business and IndustryCOP Committee on PrivatizationDOTr Department of TransportationDTI Department of Trade and IndustryEPIRA Electric Power Industry Reform Act of 2001EAP East Asia PacificERC Energy Regulatory CommissionEU European UnionFDI Foreign Direct InvestmentGCG Governance Commission for GOCCsGDP Gross Domestic ProductGOCC Government-Owned and Controlled CorporationsHHI Herfindahl – Hirschman IndexIFC International Finance CorporationILO International Labor OrganizationLGU Local Government UnitsLTFRB Land Transportation Franchising and Regulatory BoardNAIA Ninoy Aquino International AirportMRAs Mutual Recognition AgreementsNEDA National Economic and Development AuthorityNFA National Food AuthorityNGA National Grains AuthorityNHA National Housing AuthorityNPC National Power CorporationNTC National Telecommunications CommissionOECD Organisation for Economic Co-operation and DevelopmentPBR Philippine Business RegistrationPC Privatization CouncilPCAB Philippine Contractors Accreditation BoardPCC Philippine Competition CommissionPHIC Philippine Health Insurance CorporationPhilHealth Philippine Health Insurance CorporationPHP Philippines PesosPLDT Philippine Long Distance Telephone CompanyPMO Privatization and Management OfficePMR Product Market RegulationPNR Philippine National RailwaysPPA Philippine Ports Authority
ix
PPP Public-Private PartnershipsPRC Professional Regulation CommissionPSALM Corp. Power Sector Assets and Liabilities Management CorporationRA Republic ActSA South AsiaSEC Securities and Exchange CommissionSOE State Owned EnterpriseSSS Social Security SystemTransCo National Transmission CorporationUS United StatesWBG World Bank GroupWEF World Economic Forum
x
1
Executive Summary
The objective of this report is to identify existing regulatory restraints to competition in key sectors and the economy as a whole and use them to design an effective competition policy for the Philippines.
The report builds on Product Market Regulation (PMR) indicators and the WBG’s Markets and Competition Policy Assessment Tool (MCPAT) applied to the Philippine markets to (i) develop the main aspects of the advocacy role of the Philippine Competition Commission (PCC) against current market features; (ii) map regulatory restrictions to competition and classify them according to their effects; (iv) contextualize competition restraints within each sector to offer a set of policy recommendations; and (v) quantify the potential impact of a more pro-competitive regulatory environment for the Philippines’ economy.
As the country did not have a competition law until 2015, the recently created PCC faces a challenging environment in which to implement its mandate. The two-year transitory period to start enforcement, as well as the potential to grant broad exemptions from the law under the forbearance clause, have hindered the ability of the PCC to prevent anticompetitive conduct of market players, either public or private.
In this context, the advocacy role of the PCC offers a critical mechanism to address those regulatory conditions that may be enabling anticompetitive behavior. Limited market competition can stem from restrictive regulations or discretionary application of the regulatory framework that render entry and operation of new firms difficult. Ensuring government policies and regulations do not generate barriers to entry or distort the level playing field is necessary to enhance private sector participation and unlock investment opportunities.
Developing an effective competition policy framework in the Philippines will be critical to unleash the country’s growth potential
Although the Philippines’ economic outlook appears strong, limited competition in key economic sectors has been consistently identified as a constraint for inclusive structural transformation and is therefore a crucial area for implementing reforms that generate inclusive growth and encourage job creation. Despite the overall positive impact of impressive GDP growth rates of around 6 percent,1 the fact that better economic performance has failed to generate enough jobs2 and has not translated to better
1 See press release “World Bank upgrades growth projections for the Philippines” from December 15, 2016. Available at http://www.worldbank.org/en/news/press-release/2016/12/15/world-bank-upgrades-growth-projections-for-the-philippines
2 PDR (2013) estimated that 10 million jobs need to be created every year from 2013 to 2016. In 2016, actual data from PSA show that there are 2.8 million unemployed persons and 6.4 million underemployed persons, and from PDR (2013), there are 1.15 potential entrants to labor force. Thus, the total needed jobs in 2016 is around 10.35 million, confirming PDR’s projection. However, there were only 1.4 million jobs created in 2016, as reported in PEU (2017), despite the unemployment rate falling to a historic low of 4.7 percent and underemployment remaining at 18 percent. Sources: World Bank (2013), “Philippine Development Report: Creating More and Better Jobs”, at p. 5. Available at: http://documents.worldbank.org/curated/en/895661468092965770/pdf/ACS58420WP0P120Box0382112B00PUBLIC0.pdfWorld Bank. 2017. “Philippines Economic Update: Advancing the Investment Agenda. Philippines economic monitor.” at p.31 Available at: http://docu-ments.worldbank.org/curated/en/746271491832911953/Philippines-Economic-Update-Advancing-the-Investment-AgendaPhilippine Statistics Authority (PSA)
2
services3 can be partially linked to limited competition in key markets.4
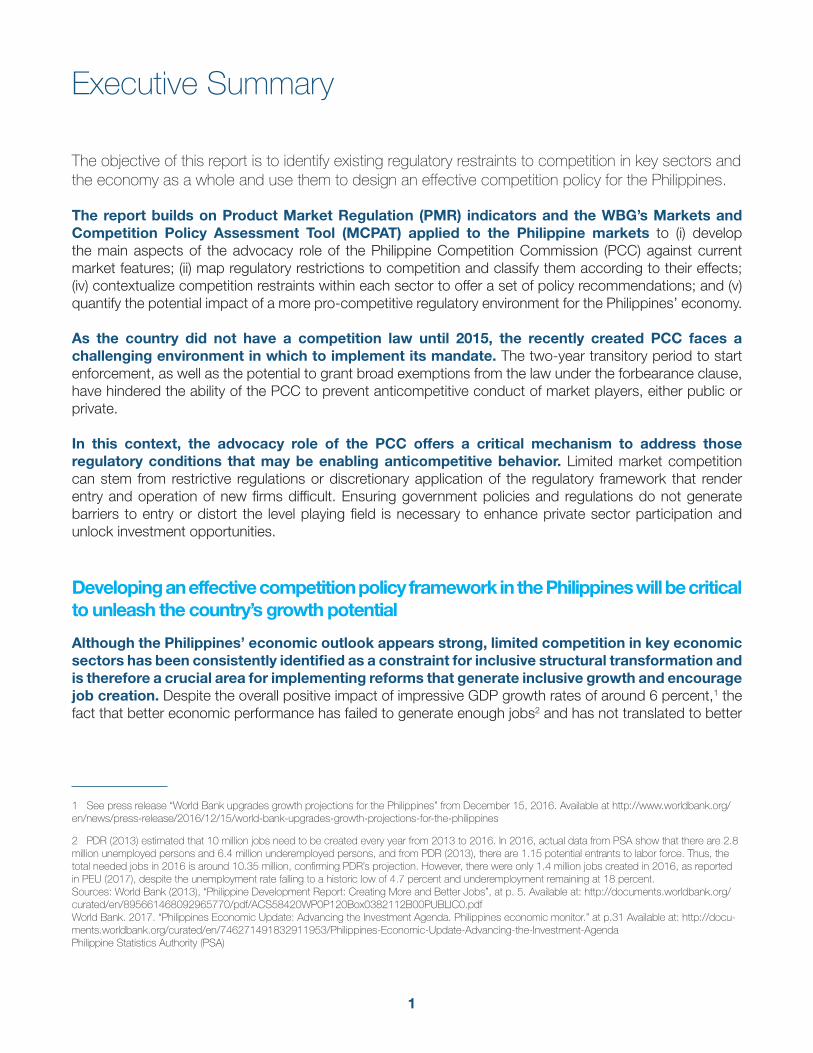
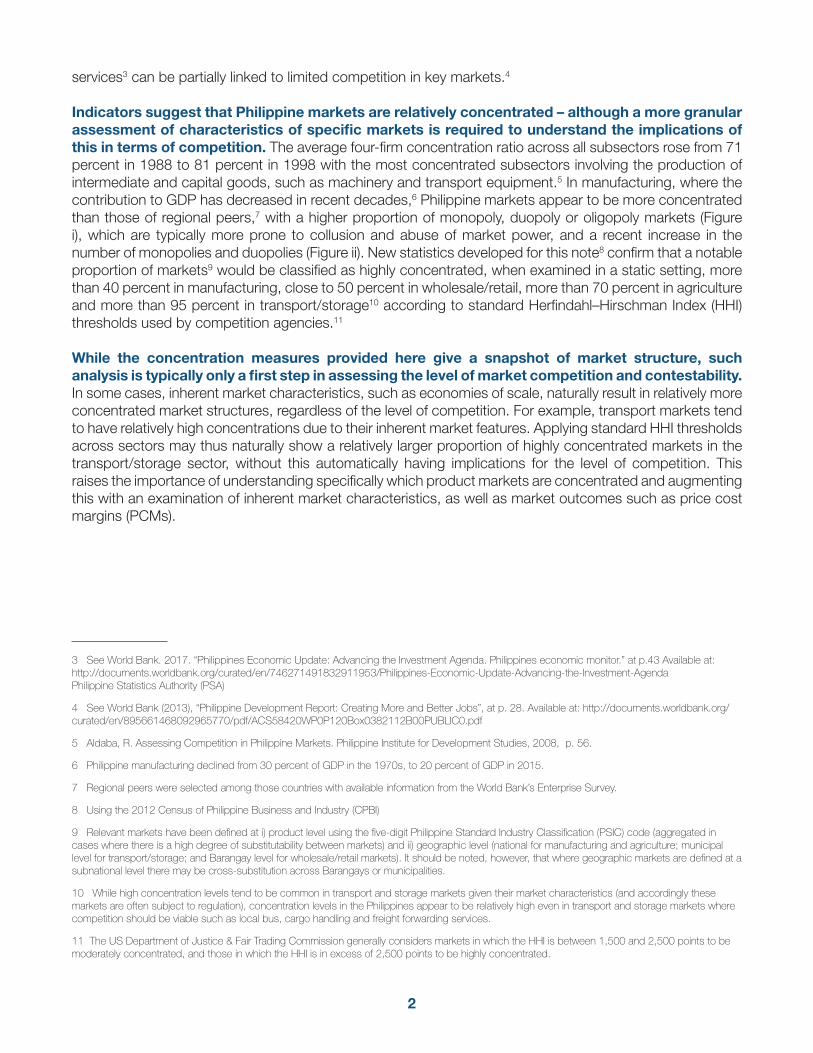
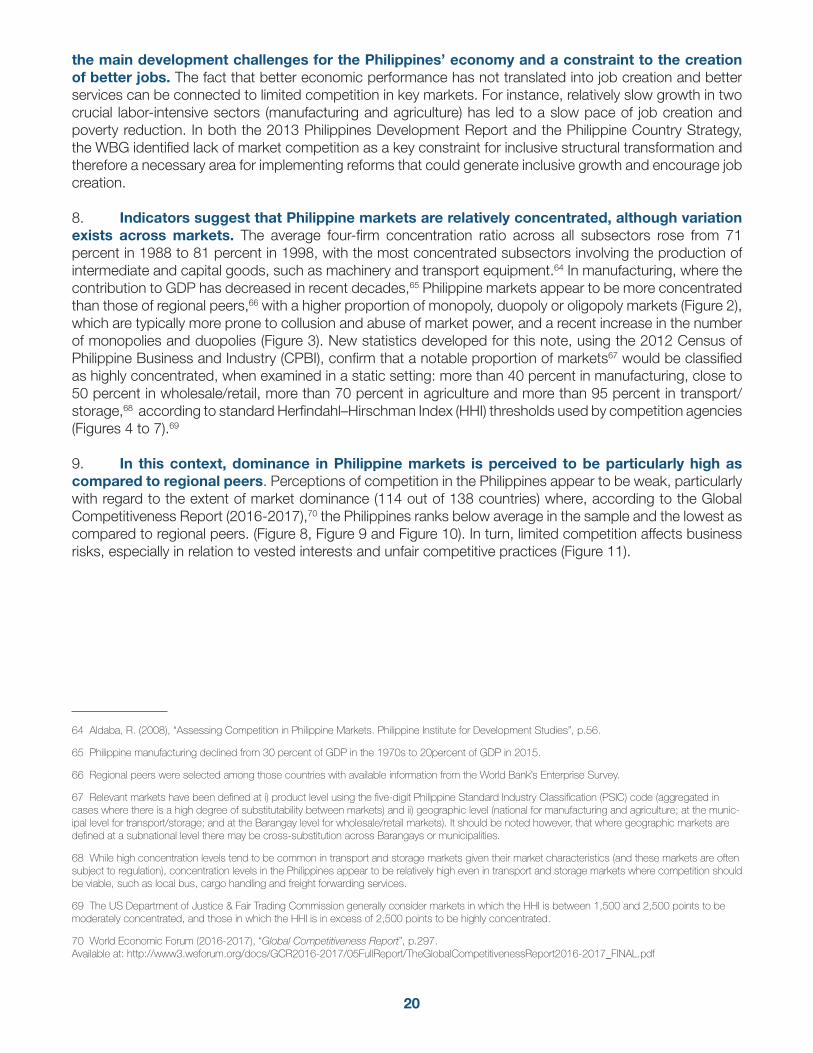
Indicators suggest that Philippine markets are relatively concentrated – although a more granular assessment of characteristics of specific markets is required to understand the implications of this in terms of competition. The average four-firm concentration ratio across all subsectors rose from 71 percent in 1988 to 81 percent in 1998 with the most concentrated subsectors involving the production of intermediate and capital goods, such as machinery and transport equipment.5 In manufacturing, where the contribution to GDP has decreased in recent decades,6 Philippine markets appear to be more concentrated than those of regional peers,7 with a higher proportion of monopoly, duopoly or oligopoly markets (Figure i), which are typically more prone to collusion and abuse of market power, and a recent increase in the number of monopolies and duopolies (Figure ii). New statistics developed for this note8 confirm that a notable proportion of markets9 would be classified as highly concentrated, when examined in a static setting, more than 40 percent in manufacturing, close to 50 percent in wholesale/retail, more than 70 percent in agriculture and more than 95 percent in transport/storage10 according to standard Herfindahl–Hirschman Index (HHI) thresholds used by competition agencies.11
While the concentration measures provided here give a snapshot of market structure, such analysis is typically only a first step in assessing the level of market competition and contestability. In some cases, inherent market characteristics, such as economies of scale, naturally result in relatively more concentrated market structures, regardless of the level of competition. For example, transport markets tend to have relatively high concentrations due to their inherent market features. Applying standard HHI thresholds across sectors may thus naturally show a relatively larger proportion of highly concentrated markets in the transport/storage sector, without this automatically having implications for the level of competition. This raises the importance of understanding specifically which product markets are concentrated and augmenting this with an examination of inherent market characteristics, as well as market outcomes such as price cost margins (PCMs).
3 See World Bank. 2017. “Philippines Economic Update: Advancing the Investment Agenda. Philippines economic monitor.” at p.43 Available at: http://documents.worldbank.org/curated/en/746271491832911953/Philippines-Economic-Update-Advancing-the-Investment-AgendaPhilippine Statistics Authority (PSA)
4 See World Bank (2013), “Philippine Development Report: Creating More and Better Jobs”, at p. 28. Available at: http://documents.worldbank.org/curated/en/895661468092965770/pdf/ACS58420WP0P120Box0382112B00PUBLIC0.pdf
5 Aldaba, R. Assessing Competition in Philippine Markets. Philippine Institute for Development Studies, 2008, p. 56.
6 Philippine manufacturing declined from 30 percent of GDP in the 1970s, to 20 percent of GDP in 2015.
7 Regional peers were selected among those countries with available information from the World Bank’s Enterprise Survey.
8 Using the 2012 Census of Philippine Business and Industry (CPBI)
9 Relevant markets have been defined at i) product level using the five-digit Philippine Standard Industry Classification (PSIC) code (aggregated in cases where there is a high degree of substitutability between markets) and ii) geographic level (national for manufacturing and agriculture; municipal level for transport/storage; and Barangay level for wholesale/retail markets). It should be noted, however, that where geographic markets are defined at a subnational level there may be cross-substitution across Barangays or municipalities.
10 While high concentration levels tend to be common in transport and storage markets given their market characteristics (and accordingly these markets are often subject to regulation), concentration levels in the Philippines appear to be relatively high even in transport and storage markets where competition should be viable such as local bus, cargo handling and freight forwarding services.
11 The US Department of Justice & Fair Trading Commission generally considers markets in which the HHI is between 1,500 and 2,500 points to be moderately concentrated, and those in which the HHI is in excess of 2,500 points to be highly concentrated.
3
Source: World Bank’s Enterprise Survey, 2015 Source: World Bank’s Enterprise Survey, 2009 and 2015
PCMs provide another measure of competition as a proxy of the ability of firms to raise prices above marginal costs. According to statistics generated from the 2012 CPBI, more than 70 percent of agriculture markets, 60 percent of manufacturing markets, 80 percent of wholesale/retail, and 90 percent of transport/storage markets have an average PCM12 of more than 40 percent. For the manufacturing and wholesale/retail sectors, the data show a significant positive correlation between market concentration, as measured by the HHI, and PCMs.13 The ability to charge prices above marginal costs is a potential indicator of the exercise of market power by firms. In some cases, such outcomes can be facilitated by market rules and regulations such as price controls, as this note explores in section II.1.2.
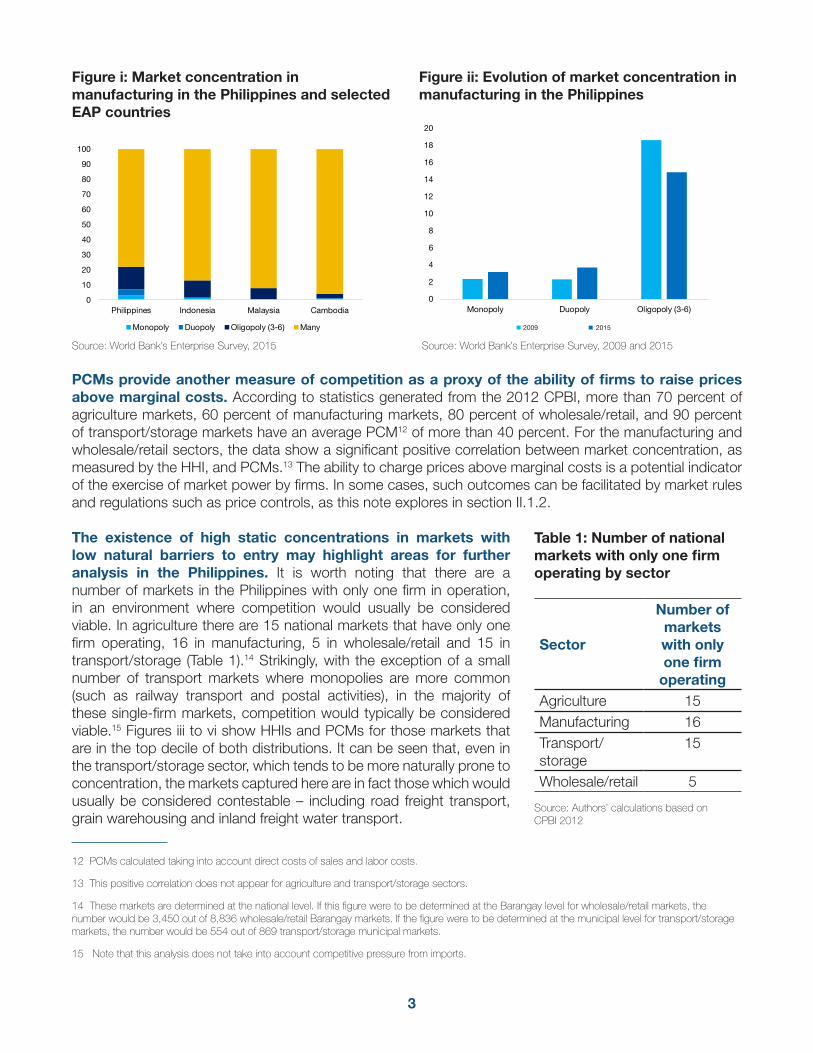
The existence of high static concentrations in markets with low natural barriers to entry may highlight areas for further analysis in the Philippines. It is worth noting that there are a number of markets in the Philippines with only one firm in operation, in an environment where competition would usually be considered viable. In agriculture there are 15 national markets that have only one firm operating, 16 in manufacturing, 5 in wholesale/retail and 15 in transport/storage (Table 1).14 Strikingly, with the exception of a small number of transport markets where monopolies are more common (such as railway transport and postal activities), in the majority of these single-firm markets, competition would typically be considered viable.15 Figures iii to vi show HHIs and PCMs for those markets that are in the top decile of both distributions. It can be seen that, even in the transport/storage sector, which tends to be more naturally prone to concentration, the markets captured here are in fact those which would usually be considered contestable – including road freight transport, grain warehousing and inland freight water transport.
12 PCMs calculated taking into account direct costs of sales and labor costs.
13 This positive correlation does not appear for agriculture and transport/storage sectors.
14 These markets are determined at the national level. If this figure were to be determined at the Barangay level for wholesale/retail markets, the number would be 3,450 out of 8,836 wholesale/retail Barangay markets. If the figure were to be determined at the municipal level for transport/storage markets, the number would be 554 out of 869 transport/storage municipal markets.
15 Note that this analysis does not take into account competitive pressure from imports.
Figure i: Market concentration in manufacturing in the Philippines and selected EAP countries
Figure ii: Evolution of market concentration in manufacturing in the Philippines
Sector
Number of markets with only one firm
operatingAgriculture 15Manufacturing 16Transport/storage
15
Wholesale/retail 5
Table 1: Number of national markets with only one firm operating by sector
Source: Authors’ calculations based on CPBI 2012
0
10
20
30
40
50
60
70
80
90
100
Philippines Indonesia Malaysia Cambodia
Market concentration in manufacturing in the Philippines and selected EAP countries (in percent)
Monopoly Duopoly Oligopoly (3-6) Many
0
2
4
6
8
10
12
14
16
18
20
Monopoly Duopoly Oligopoly (3-6)
Evolution of market concentration in manufacturing in the Philippines (in percent)
2009 2015
4
The fact that the markets highlighted in this analysis as having high concentrations and PCMs would usually be considered contestable may be a first indication that market rules and regulations hinder competition.
New available data on the status of market regulations suggest that significant regulatory restrictions might be limiting competition in key sectors of the Philippine economy
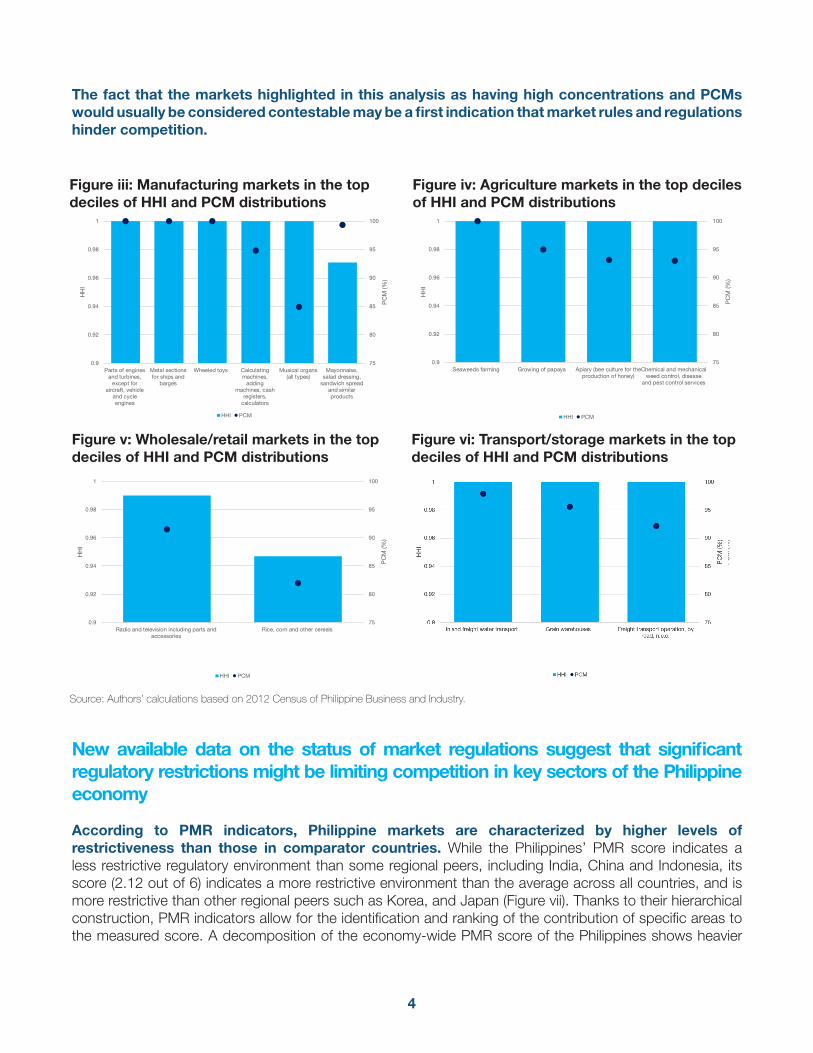
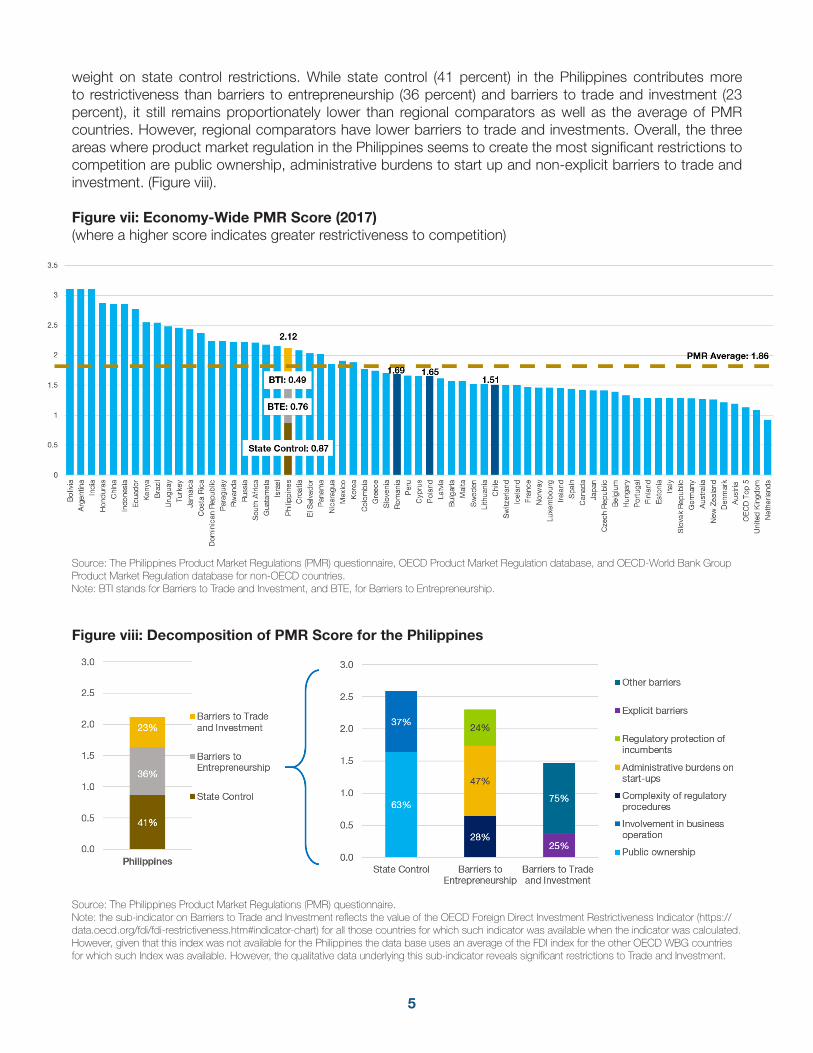
According to PMR indicators, Philippine markets are characterized by higher levels of restrictiveness than those in comparator countries. While the Philippines’ PMR score indicates a less restrictive regulatory environment than some regional peers, including India, China and Indonesia, its score (2.12 out of 6) indicates a more restrictive environment than the average across all countries, and is more restrictive than other regional peers such as Korea, and Japan (Figure vii). Thanks to their hierarchical construction, PMR indicators allow for the identification and ranking of the contribution of specific areas to the measured score. A decomposition of the economy-wide PMR score of the Philippines shows heavier
Figure iii: Manufacturing markets in the top deciles of HHI and PCM distributions
Figure iv: Agriculture markets in the top deciles of HHI and PCM distributions
Figure v: Wholesale/retail markets in the top deciles of HHI and PCM distributions
Figure vi: Transport/storage markets in the top deciles of HHI and PCM distributions
Source: Authors’ calculations based on 2012 Census of Philippine Business and Industry.
75
80
85
90
95
100
0.9
0.92
0.94
0.96
0.98
1
Parts of enginesand turbines,
except foraircraft, vehicle
and cycleengines
Metal sectionsfor ships and
barges
Wheeled toys Calculatingmachines,
addingmachines, cash
registers,calculators
Musical organs(all types)
Mayonnaise,salad dressing,
sandwich spreadand similarproducts
PC
M (%
)
HH
I
HHI PCM
75
80
85
90
95
100
0.9
0.92
0.94
0.96
0.98
1
Seaweeds farming Growing of papaya Apiary (bee culture for theproduction of honey)
Chemical and mechanicalweed control, disease
and pest control services
PC
M (%
)
HH
IHHI PCM
75
80
85
90
95
100
0.9
0.92
0.94
0.96
0.98
1
Radio and television including parts andaccessories
Rice, corn and other cereals
PC
M (%
)
HH
I
HHI PCM
75
80
85
90
95
100
0.9
0.92
0.94
0.96
0.98
1
Inland freight water transport Grain warehouses Freight transport operation, byroad, n.e.c.
PC
M (%
)
HH
I
HHI PCM
5
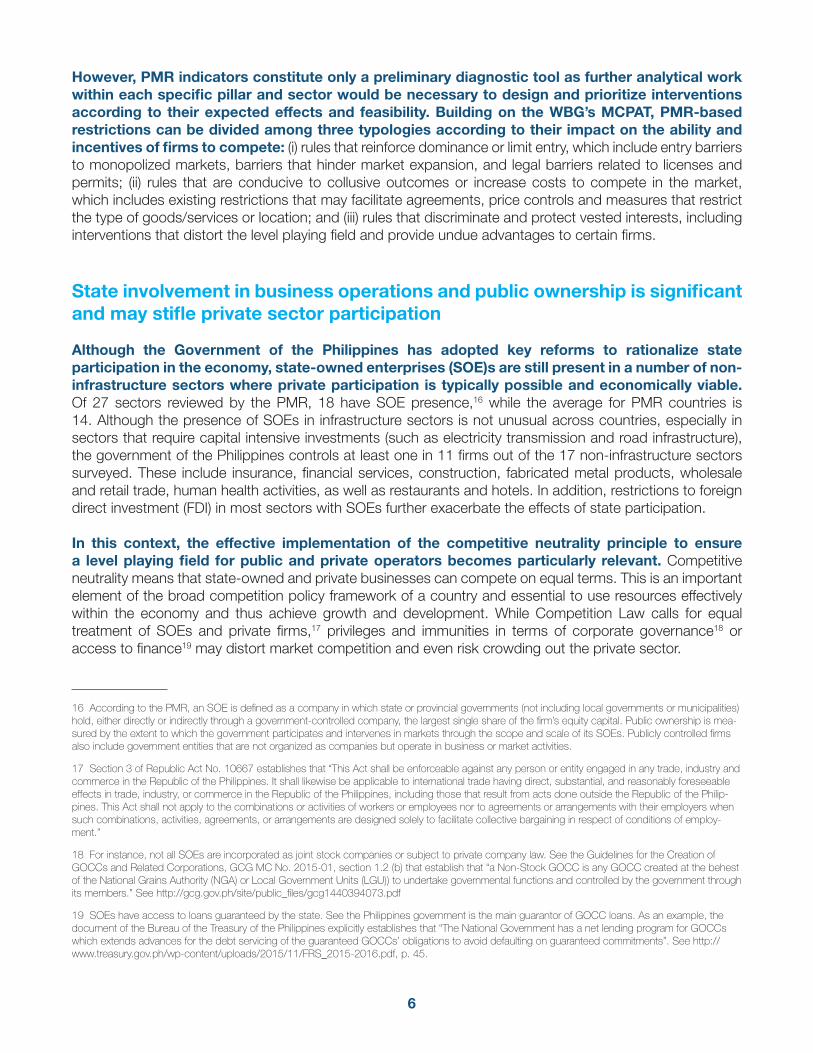
weight on state control restrictions. While state control (41 percent) in the Philippines contributes more to restrictiveness than barriers to entrepreneurship (36 percent) and barriers to trade and investment (23 percent), it still remains proportionately lower than regional comparators as well as the average of PMR countries. However, regional comparators have lower barriers to trade and investments. Overall, the three areas where product market regulation in the Philippines seems to create the most significant restrictions to competition are public ownership, administrative burdens to start up and non-explicit barriers to trade and investment. (Figure viii).
Figure vii: Economy-Wide PMR Score (2017)(where a higher score indicates greater restrictiveness to competition)
0
0.5
1
1.5
2
2.5
3
3.5
Bo
livia
Arg
entin
a
Indi
a
Hon
dur
as
Chi
na
Indo
nesi
a
Egy
pt
Ecu
ador
Ken
ya
Bra
zil
Uru
guay
Turk
ey
Jam
aica
Cos
ta R
ica
Dom
inic
an R
epub
lic
Par
agua
y
Rw
anda
Rus
sia
Sou
th A
fric
a
Gua
tam
ela
Isra
el
Phi
lipp
ines
Cro
atia
El S
alva
dor
Pan
ama
Nic
arag
ua
Mex
ico
Kor
ea
Col
om
bia
Gre
ece
Slo
veni
a
Ro
man
ia
Per
u
Cyp
rus
Pol
and
Latv
ia
Bul
gar
ia
Mal
ta
Sw
eden
Lith
uani
a
Chi
le
Sw
itzer
land
Icel
and
Fran
ce
Nor
way
Luxe
mb
ourg
Irel
and
Spa
in
Can
ada
Jap
an
Cze
ch R
epub
lic
Bel
gium
Hun
gary
Por
tuga
l
Finl
and
Est
onia
Italy
Slo
vak
Rep
ublic
Ger
man
y
Aus
tral
ia
New
Zea
land
Den
mar
k
Aus
tria
OE
CD
Top
5
Uni
ted
Kin
gdom
Net
herla
nds
BTI: 0.49
BTE: 0.76
State Control: 2.60
Source: The Philippines Product Market Regulations (PMR) questionnaire, OECD Product Market Regulation database, and OECD-World Bank Group Product Market Regulation database for non-OECD countries. Note: BTI stands for Barriers to Trade and Investment, and BTE, for Barriers to Entrepreneurship.
Figure viii: Decomposition of PMR Score for the Philippines
41%
36%
23%
0.0
0.5
1.0
1.5
2.0
2.5
3.0
Philippines
Barriers to Tradeand Investment
Barriers toEntrepreneurship
State Control63%
37%
28%
47%
24%
25%
75%
0.0
0.5
1.0
1.5
2.0
2.5
3.0
State Control Barriers toEntrepreneurship
Barriers to Tradeand Investment
Other barriers
Explicit barriers
Regulatory protection ofincumbents
Administrative burdens onstart-ups
Complexity of regulatoryprocedures
Involvement in businessoperation
Public ownership
Source: The Philippines Product Market Regulations (PMR) questionnaire.Note: the sub-indicator on Barriers to Trade and Investment reflects the value of the OECD Foreign Direct Investment Restrictiveness Indicator (https://data.oecd.org/fdi/fdi-restrictiveness.htm#indicator-chart) for all those countries for which such indicator was available when the indicator was calculated. However, given that this index was not available for the Philippines the data base uses an average of the FDI index for the other OECD WBG countries for which such Index was available. However, the qualitative data underlying this sub-indicator reveals significant restrictions to Trade and Investment.
6
However, PMR indicators constitute only a preliminary diagnostic tool as further analytical work within each specific pillar and sector would be necessary to design and prioritize interventions according to their expected effects and feasibility. Building on the WBG’s MCPAT, PMR-based restrictions can be divided among three typologies according to their impact on the ability and incentives of firms to compete: (i) rules that reinforce dominance or limit entry, which include entry barriers to monopolized markets, barriers that hinder market expansion, and legal barriers related to licenses and permits; (ii) rules that are conducive to collusive outcomes or increase costs to compete in the market, which includes existing restrictions that may facilitate agreements, price controls and measures that restrict the type of goods/services or location; and (iii) rules that discriminate and protect vested interests, including interventions that distort the level playing field and provide undue advantages to certain firms.
State involvement in business operations and public ownership is significant and may stifle private sector participation
Although the Government of the Philippines has adopted key reforms to rationalize state participation in the economy, state-owned enterprises (SOE)s are still present in a number of non-infrastructure sectors where private participation is typically possible and economically viable. Of 27 sectors reviewed by the PMR, 18 have SOE presence,16 while the average for PMR countries is 14. Although the presence of SOEs in infrastructure sectors is not unusual across countries, especially in sectors that require capital intensive investments (such as electricity transmission and road infrastructure), the government of the Philippines controls at least one in 11 firms out of the 17 non-infrastructure sectors surveyed. These include insurance, financial services, construction, fabricated metal products, wholesale and retail trade, human health activities, as well as restaurants and hotels. In addition, restrictions to foreign direct investment (FDI) in most sectors with SOEs further exacerbate the effects of state participation.
In this context, the effective implementation of the competitive neutrality principle to ensure a level playing field for public and private operators becomes particularly relevant. Competitive neutrality means that state-owned and private businesses can compete on equal terms. This is an important element of the broad competition policy framework of a country and essential to use resources effectively within the economy and thus achieve growth and development. While Competition Law calls for equal treatment of SOEs and private firms,17 privileges and immunities in terms of corporate governance18 or access to finance19 may distort market competition and even risk crowding out the private sector.
16 According to the PMR, an SOE is defined as a company in which state or provincial governments (not including local governments or municipalities) hold, either directly or indirectly through a government-controlled company, the largest single share of the firm’s equity capital. Public ownership is mea-sured by the extent to which the government participates and intervenes in markets through the scope and scale of its SOEs. Publicly controlled firms also include government entities that are not organized as companies but operate in business or market activities.
17 Section 3 of Republic Act No. 10667 establishes that “This Act shall be enforceable against any person or entity engaged in any trade, industry and commerce in the Republic of the Philippines. It shall likewise be applicable to international trade having direct, substantial, and reasonably foreseeable effects in trade, industry, or commerce in the Republic of the Philippines, including those that result from acts done outside the Republic of the Philip-pines. This Act shall not apply to the combinations or activities of workers or employees nor to agreements or arrangements with their employers when such combinations, activities, agreements, or arrangements are designed solely to facilitate collective bargaining in respect of conditions of employ-ment.”
18 For instance, not all SOEs are incorporated as joint stock companies or subject to private company law. See the Guidelines for the Creation of GOCCs and Related Corporations, GCG MC No. 2015-01, section 1.2 (b) that establish that “a Non-Stock GOCC is any GOCC created at the behest of the National Grains Authority (NGA) or Local Government Units (LGU)) to undertake governmental functions and controlled by the government through its members.” See http://gcg.gov.ph/site/public_files/gcg1440394073.pdf
19 SOEs have access to loans guaranteed by the state. See the Philippines government is the main guarantor of GOCC loans. As an example, the document of the Bureau of the Treasury of the Philippines explicitly establishes that “The National Government has a net lending program for GOCCs which extends advances for the debt servicing of the guaranteed GOCCs’ obligations to avoid defaulting on guaranteed commitments”. See http://www.treasury.gov.ph/wp-content/uploads/2015/11/FRS_2015-2016.pdf, p. 45.
7
In addition, the lack of a regulatory framework to control state support measures may result in market distortions favoring SOEs vis-a-vis private competitors as well as specific private firms. Statistics from the 2012 CPBI show that 56 product markets across sectors, including manufacturing, agriculture, wholesale/retail, and transport/storage, reported at least one firm receiving a subsidy (equivalent to 9 percent of all markets in those sectors). However, in many cases, subsidies do not appear to have been granted equally to all firms within the market. In 22 industries, only one firm received subsidy while more than one firm operated in the market.
Moreover, the existence of undue price controls for certain products may distort the incentives of market operators and affect their ability to compete and provide better quality goods and services.20 Building on the 1991 Price Act, the Government of the Philippines has enacted broad price controls across sectors. The law enables the Department of Trade and Industry (DTI) to issue guidelines for suggested retail prices covering 22 products.21 Moreover, recommended prices exist for some regulated professional services such as architects and engineers, and domestic airfares can be fixed by the Civil Aviation Board (CAB).
At the same time, important price mechanisms to foster competition through ex ante price regulation are not being applied in network industries. For instance, in telecommunications, the power of the National Telecommunication Commission (NTC) to issue efficiency-based pricing mechanisms in segments where price regulation is typically desirable for competition has been challenged, resulting in a lack of regulation22 of international wholesale/retail roaming rates.23
Barriers to market entry and rivalry in services and network sectors, and excessive burdens to start-up businesses, hinder private sector development
High administrative burdens on start-ups make it costly for firms to enter the market.24 In 2017, the Philippines ranked 171 out of 190 economies in Starting a Business, falling seven places in relation to 2016 (ranked 164). According to the PMR indicators, the absence of key simplifying tools in the system of licenses and permits, such as the “silence is consent rule,” increases the complexity of regulatory procedures.25 Barriers in service sectors also contribute to the high administrative burden on firms operating in the Philippines. These include entry and behavioral restrictions on regulated services (accountants, lawyers, architects and engineers),26 road freight transport27 and retail distribution. The forthcoming implementation of the Philippine Business Registry28 (PBR) one-stop shop will be key to ease doing business in the country, reducing incidental expenses and increasing cost savings by cutting red tape.
20 See Nicoletti, Giuseppe and Scarpetta, Stefano, Product Market Reforms: Macro Linkages and Effects on Growth (A Partial Survey), 2004.
21 See DTI suggested retail prices at http://www.dti.gov.ph/consumers/e-presyo#price-reports
22 The NTC does not set prices for local loop unbundling.
23 Although retail prices of international roaming are required to be approved by the NTC (section 17 of Republic Act No 7925, year 1995), in practice the regulator does not impose price ceiling on retail and wholesale access charges.
24 Data source: PMR for Philippines and World Bank Doing Business Indicators, available at http://www.doingbusiness.org/.
25 The general rule is that a written approval/license must be issued. There is no specific law allowing implicit consent by the administration in case of legal deadlines expire.
26 Section 3 will develop restrictions in professional services in detail.
27 In order to establish a national road freight business all trucks require a franchise from the Land Transport and Road Franchising Board (more infor-mation at http://www.ltfrb.gov.ph/media/Truck_FAQs.pdf)
28 The one-stop shop under the PBR is at http://www.business.gov.ph. This includes information about the different requirements for registration (see http://www.business.gov.ph/web/guest/faqs) and the online registration procedure (see http://www.business.gov.ph/web/guest/pbr-registration).
8
Moreover, incumbent firms are protected by high barriers in network sectors at the expense of new entrants. In telecommunications, unbundling of the local loop is not required although it is relevant for broadband access;29 entry is franchised to a single firm in the railway sector, and there is no vertical separation between operation of railroad infrastructure and the provision of railway services;30 and in electricity, there is no legal restriction to ensure the separation in generation, distribution and supply.31 In addition, legal barriers restricting the number of competitors allowed in the market are pervasive across transport sub-sectors including road freight,32 maritime transport,33 operation of air transport infrastructure34 and railways.
While the Competition Act applies to all firms across sectors, including SOEs, the potential to grant broad exclusions may be used to favor market incumbents. The competition law should apply to all sectors and firms engaged in economic activity. The absence of exemptions in the Philippines’ Competition Act is a key element to avoid regulatory insulation of incumbents.35 However, a forbearance clause that enables the PCC to exempt specific practices or even sectors from the law for a given period of time may pose a risk.36
While the Act and its implementing rules and regulations establish limitations to the use of the forbearance clause, notably the need to substantiate the granting of exemptions on the basis of economic analysis and their limitation to a one-year term,37 the mere existence of this clause may increase the risk of anticompetitive behavior and economic distortions.38 Therefore, the drafting of secondary legislation to clarify the procedures and analytical steps to be followed for its implementation would be key to minimizing potential market distortions.
29 Unbundling of the local loop is not required in the Philippines. See Broadband Policy Brief Number 4: “Philippine Broadband: A Policy Brief”, table 3, p. 10 at http://www.investphilippines.info/arangkada/wp-content/uploads/2016/02/BROADBAND-POLICY-BRIEF-as-printed.pdf
30 In the railways market, ownership and operation is restricted to the government due to Section 1 of Republic Act No. 4156 (year 1964), and re-cently was extended by 50 years by Republic Act No. 10638 (2014). See http://www.gov.ph/1964/06/20/republic-act-no-4156/ and http://www.gov.ph/2014/06/16/republic-act-no-10638/
31 Meralco is the Philippines’ largest distributor of electrical power and engaged in electricity generation and supply. See http://www.meralco.com.ph/about-us/corporate-profile
32 The number of franchises allowed by the government are limited due to road capacity.
33 Port operation is under the authority of the Philippine Ports Authority, as established in Presidential Decree No. 505 of year 1994 (amended by Presidential Decree No. 857, year 1975). See http://www.lawphil.net/statutes/presdecs/pd1974/pd_505_1974.html
34 As an example, the Manila International Airport Authority oversees the operation of air transport and infrastructure of Manila Airport as established by Executive Order No 778 (year 1982).
35 Section 3 of Philippine Competition Act (Republic Act No. 10667, year 2015) establishes that “This Act shall be enforceable against any person or entity engaged in any trade, industry and commerce in the Republic of the Philippines. It shall likewise be applicable to international trade having direct, substantial, and reasonably foreseeable effects in trade, industry, or commerce in the Republic of the Philippines, including those that result from acts done outside the Republic of the Philippines.”
36 Established by Section 28 of the Competition Act. The Section establishes that “The Commission may forbear from applying the provisions of this Act, for a limited time, in whole or in part, in all or specific cases, on an entity or group of entities, if in its determination: (a) Enforcement is not necessary to the attainment of the policy objectives of this Act; (b) Forbearance will neither impede competition in the market where the entity or group of entitiesseeking exemption operates nor in related markets; and (c) Forbearance is consistent with public interest and the benefit and welfare of the consumers.A public hearing shall be held to assist the Commission in making this determination. The Commission’s order exempting the relevant entity or group of entities under this section shall be made public. Conditions may be attached to the forbearance if the Commission deems it appropriate to ensure the long-term interest of consumers. In the event that the basis for the issuance of the exemption order ceases to be valid, the order may be withdrawn by the Commission.”
37 See Rule 9 Section 1 of the Rules and Regulations To Implement The Provisions OfRepublic Act No. 10667. Available at http://phcc.gov.ph/wp-content/uploads/2016/04/RA-10667-Implementing-Rules-and-Regulations.pdf
38 OECD, Competition Assessment Toolkit, Version 2.0, Volume I: Principles, p. 65
9
Broad limitations on foreign participation in key sectors of the economy, including utilities and regulated services, thwart trade and investment
The qualitative data underlaying the PMR indicators reveals Barriers to FDI due to constitutional and legislative limitations on foreign participation in key sectors and economic activities that limit competition and could raise input costs for Philippine firms. Entry to all four regulated professions reviewed by the PMR - accountants, architects, engineers and lawyers - is restricted for non-Filipino nationals. The Philippines Foreign Investment Act also limits foreign investment in several industries typically open to FDI, including utilities, retail, restaurants and hotels.39 These restrictions, based on the Constitution itself,40 have affected the capacity of key sectors to attract necessary capital, especially for large infrastructure projects, and triggered SOE presence in many of these sectors, thus making their development dependent on the government’s resources.
Differential treatment of foreign suppliers in public tenders also results from constitutional provisions.41 Allowing national and foreign firms to compete only on the merits—without favoring one over the other—typically has a positive impact on public expenses through lower costs or improved quality. Therefore, a number of countries have implemented reforms that reduce discrimination. However, in the Philippines, the public procurement regulatory framework42 not only restricts tenders in public utilities to Philippine companies with at least 60 percent of national capital but, in those markets where foreign companies are allowed to participate, it favors local bidders with a bidding price up to 15 percent higher.43
Removing key regulatory restraints to competition may have a significant impact on the overall economy
An effect-based analysis following the MCPAT categorization shows that almost half of the restrictions identified by the PMR are related to regulations that discriminate and protect vested interests. More specifically, 45 percent of the restrictions belong to the category rules that discriminate and protect vested interests, 34 percent are related to the rules that are conducive to collusive outcomes or increase costs to compete in the market, and 21 percent relate to the rules that reinforce dominance or limit entry.44 However, the long list of restrictions needs to be contextualized within the market dynamics of each industry in order to map potential pro-competition reforms according to their impact as well as their feasibility.
39 Foreign Investment Act (Republic Act No. 7042, year 1991)
40 See Section 1 of Article XII of the Constitution establishing that “the State shall protect Filipino enterprises against unfair foreign competition and trade practices.” This restriction informs the prohibition for non-Filipino companies to participate in certain sectors or provide regulated professional services. The latter is developed by Section 14 of Article XII of the Constitution of the Philippines stating that “The practice of all professions in the Philip-pines shall be limited to Filipino citizens, save in cases prescribed by law.”
41 See Section 12 of Article XII of the Constitution of the Philippines stating that “The State shall promote the preferential use of Filipino labor, domestic materials and locally produced goods, and adopt measures that help make them competitive”.
42 Section 43 of Government Procurement Reform Act (Republic Act No. 9184, year 2002) states “Consistent with the country’s obligations under international treaties or agreements, Goods may be obtained from domestic or foreign sources and the procurement thereof shall be open to all eligible suppliers, manufacturers and distributors. However, in the interest of availability, efficiency and timely delivery of Goods, the Procuring Entity may give preference to the purchase of domestically-produced and manufactured goods, supplies and materials that meet the specified or desired quality.”
43 See The 2016 Revised Implementing Rules and Regulations of the Republic Act No. 9184 at Section 43.1.2. The Procuring Entity shall give prefer-ence to materials and supplies produced, made and manufactured in the Philippines, subject to the conditions herein below specified. The award shall be made to the lowest Domestic Bidder, provided his bid is not more than fifteen percent (15 percent) in excess of the lowest Foreign Bid.”
44 These percentages reflect the restrictions highlighted in Tables 8, 10 and 12, not the simulation proposed in Section IV as the latter uses a selected subset of restrictions building on Barone and Cingano 2011.
10
While the electricity sector has undergone significant changes in recent years following the entry into force of a new regulatory framework, the implementation of key reforms is still pending. The Electric Power Industry Reform Act (EPIRA) of 2001 fully restructured the legal and institutional framework of the sector. However, there are concerns regarding the speed of implementing the reforms mandated by EPIRA, notably on the need for compliance of the Energy Regulatory Commission (ERC) with the implementation of open access provisions and competition in retail, as well as the separation between different market segments. The Energy Regulatory Commission recently ordered separation between operators in the distribution and supply markets to foster competition in retail45 but this decision was appealed before the Supreme Court. Unbundling concerns and the overall limitations for FDI in utilities, which prevent the development of much needed electricity infrastructure, has resulted in limited capacity and high prices compared with regional peers.
In the telecommunications sector, the NTC’s lack of regulatory power to foster competitive market conditions has resulted in suboptimal market outcomes. The price of mobile phone services is among the highest in the region and four times higher than average OECD countries. Limited regulatory capacity of the NTC has prevented important pro-competition reforms, such as allowing for number portability and unbundling of the local loop. Ownership is highly concentrated between two companies, which is largely due to FDI restrictions. Such restrictions have not only insulated Philippine telecoms from foreign competition but also restricted investment in infrastructure, which is likely to have perpetuated market concentration.
Restrictions in transport sectors appear to impair logistics in the Philippines compared to peers, which creates a key bottleneck in an archipelagic country.
• Road transport accounts for 58 percent of cargo traffic in the Philippines.46 While road cargo is characterized by a large number of small firms providing basic transportation services, PMR data indicate several regulatory restrictions mainly due to entry barriers. Trucks require a license to operate in the market which requires interaction with eight government agencies.47 Philippine citizenship and hauling contracts are also required to establish a business in national road freight services.48 Moreover, participation of foreign firms in tenders for government transport is restricted to cases where (1) a treaty or executive agreement allows them; (2) reciprocity rights exist; and (3) goods are not available locally.49
• In the air transport sector, while there are regional agreements in place (e.g., ASEAN Multilateral Agreement on Air Services 2009), there are a few areas that could foster more competitive market outcomes. While the Philippines does not have an open skies agreement with the United States,50 regional agreements, such as the one signed with ASEAN, have been critical in limiting government interference in the commercial decisions of air carriers regarding routes, capacity and pricing, freeing them to provide a more affordable, convenient and efficient air service for
45 The Retail Competition and Open Access was established by the Department of Energy Circular DC 2015-06-0010 and Resolutions 10 and 11 (year 2016).
46 Asian Development Bank 2012, Philippines: Transport Sector Assessment, Strategy, and Road Map, Mandaluyong City, Philippines, p. 1.
47 License involves applications to: the Land Transportation Franchising and Regulatory Board (LTFRB), the Department of Transportation (DOTr), the Department of Trade and Industry (DTI), the Land Transportation Office (LTO), the Bureau of Internal Revenue (BIR), the Local Government Unit of Princi-pal Address of the Corporation or Partnership, the SEC, and the Barangay of the Principal Address of the Corporation or Partnership.
48 See the information on the Land Transportation Franchising and Regulatory Board, available at http://www.ltfrb.gov.ph/media/Truck_FAQs.pdf
49 See Section 5.2 of Procurement of Goods, http://www.dotc.gov.ph/images/Public_Bidding/Goods/2015/road/LTODriversLicenseCards/BidDocs_LTO-DLC_Final.pdf
50 The PMR methodology uses the existence of an open skies agreement with the US as a benchmark indicator. Open skies agreements with other countries are not included in this methodology. This does not imply that a country should have open skies agreements only with the US.

11
consumers.51 However, cabotage rights for foreign carriers are not included in these agreements and price regulation in the sector persists, as the Civil Aeronautics Board (CAB) can regulate domestic airfares.52
• In terms of maritime transport infrastructure, a lack of separation between the commercial interests and the regulatory functions of the Philippine Ports Authority (PPA) may result in a discriminatory application of rules. The multiple roles of the PPA as the main developer, operator and regulator of ports, which develops, owns, maintains and regulates its own ports while being responsible for awarding contracts to private terminal and cargo handling operators means that there is limited competition in port operations.
• Domestic shipping in the country is generally more expensive than in Malaysia or Indonesia and exhibits concentrated market structures. The average port-to-port cost per nautical mile in the Philippines is $1.47, which is higher than Indonesia’s $0.77 and Malaysia’s $1.36. Constraints on market competition appear to be among the causes of the poor state of the domestic shipping industry. Few operators serve most shipping routes, with more than 40 percent of routes served by a single operator. While some market concentration is likely due to market factors, such as economies of scale in shipping operations, the threat of potential entry of competitors is often the major force driving market behavior in the industry. Moreover, prior to 2015, incumbents had to give their consent for new entry in the routes they were serving.53
• In the railway sector, the presence of a monopolistic SOE, paired with a lack of separation between the operation of infrastructure and the provision of services (actual transport of passengers or freight in inter-urban rail) remain key constraints for further development.
Finally, professional services providers in the Philippines face restrictions that may limit their incentives to offer the highest quality at competitive prices. Burdensome accreditation requirements apply across regulated professions. Advertising is restricted for accountants, architects and engineers, even though the ability of firms to advertise can help improve the quality of professional services and overcome the information asymmetries inherent in these industries. Finally, pricing guidelines exist for lawyers, engineers and architects, and since the market effects of these practices are similar to cartel agreements, competition policy reforms in the professional services sectors across countries have been consistently identified to yield large economic benefits by boosting productivity without affecting quality or professional standards.
Reducing regulatory restrictiveness in key markets would require a number of reforms aimed at:
• Tackling unclear or restrictive regulation in the infrastructure sectors and professional services to create more competitive conditions, with positive effects for downstream markets.
• Eliminating restrictions on foreign investors as well as among domestic investors in sectors where such regulatory restrictions create an uneven playing field.
51 See, generally Lim, Alberto (2010), “Air Transport Policy Reforms”.
52 Section 10(C)(2) of the Civil Aeronautics Act of the Philippines (RA No. 776, as amended). Available at: http://www.cab.gov.ph/mandates/item/republic-act-no-776?category_id=82
53 See the WBG Trade & Competitiveness Project Brief “Paving the Way for Competitive Domestic Shipping in the Philippines.”
12
• Minimizing the scope of controlled prices to create the right incentives for firms to compete.
• Reducing the involvement of the state through SOEs and other operations in typically competitive markets and ensuring competitive neutrality among public and private operators, which will promote a more effective use of public funds.
• Streamlining burdensome administrative procedures for businesses to facilitate easy market entry.
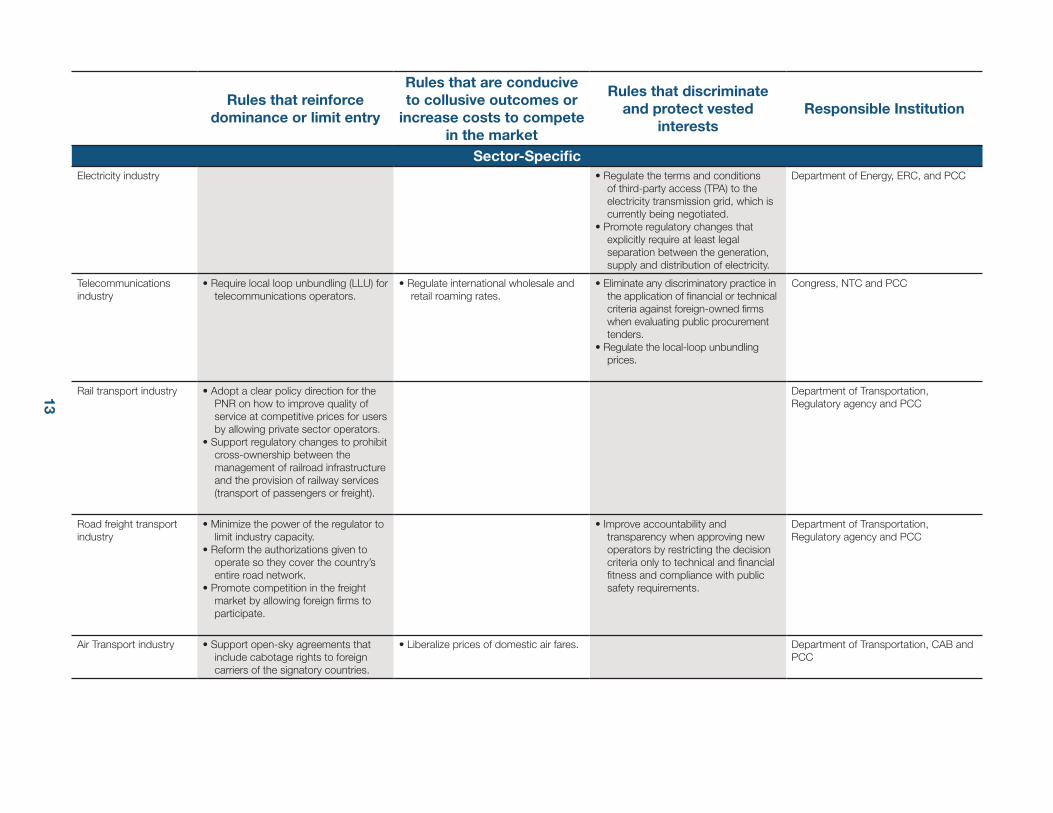
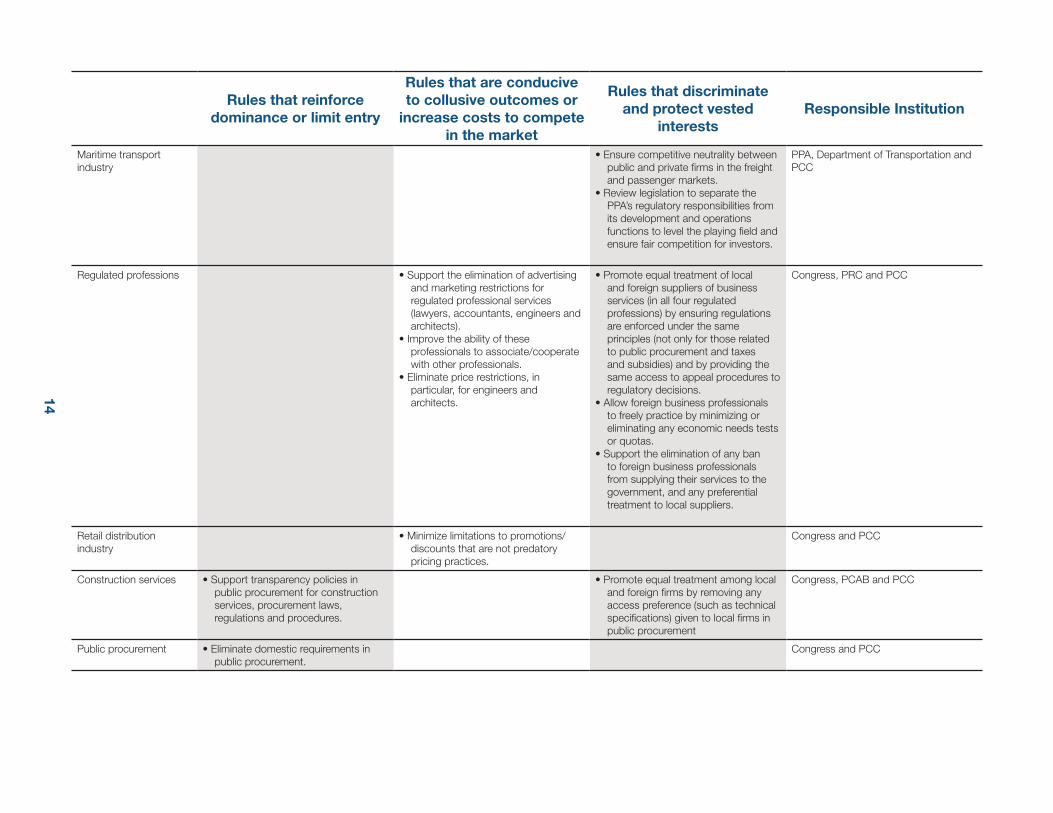
The table next page presents a summary of potential policy options for reducing regulatory restrictions in key markets. The next step in this analysis would be to sequence a package of these reforms according to their impact and feasibility.54
54 This will be a key component of forthcoming work that will involve applying the WBG Markets and Competition Policy Assessment Tool to markets in the Philippines.
13
Rules that reinforce dominance or limit entry
Rules that are conducive to collusive outcomes or
increase costs to compete in the market
Rules that discriminate and protect vested
interestsResponsible Institution
Sector-SpecificElectricity industry • Regulate the terms and conditions
of third-party access (TPA) to the electricity transmission grid, which is currently being negotiated.
• Promote regulatory changes that explicitly require at least legal separation between the generation, supply and distribution of electricity.
Department of Energy, ERC, and PCC
Telecommunications industry
• Require local loop unbundling (LLU) for telecommunications operators.
• Regulate international wholesale and retail roaming rates.
• Eliminate any discriminatory practice in the application of financial or technical criteria against foreign-owned firms when evaluating public procurement tenders.
• Regulate the local-loop unbundling prices.
Congress, NTC and PCC
Rail transport industry • Adopt a clear policy direction for the PNR on how to improve quality of service at competitive prices for users by allowing private sector operators.
• Support regulatory changes to prohibit cross-ownership between the management of railroad infrastructure and the provision of railway services (transport of passengers or freight).
Department of Transportation, Regulatory agency and PCC
Road freight transport industry
• Minimize the power of the regulator to limit industry capacity.
• Reform the authorizations given to operate so they cover the country’s entire road network.
• Promote competition in the freight market by allowing foreign firms to participate.
• Improve accountability and transparency when approving new operators by restricting the decision criteria only to technical and financial fitness and compliance with public safety requirements.
Department of Transportation, Regulatory agency and PCC
Air Transport industry • Support open-sky agreements that include cabotage rights to foreign carriers of the signatory countries.
• Liberalize prices of domestic air fares. Department of Transportation, CAB and PCC
14
15
Rules that reinforce dominance or limit entry
Rules that are conducive to collusive outcomes or
increase costs to compete in the market
Rules that discriminate and protect vested
interestsResponsible Institution
Maritime transport industry
• Ensure competitive neutrality between public and private firms in the freight and passenger markets.
• Review legislation to separate the PPA’s regulatory responsibilities from its development and operations functions to level the playing field and ensure fair competition for investors.
PPA, Department of Transportation and PCC
Regulated professions • Support the elimination of advertising and marketing restrictions for regulated professional services (lawyers, accountants, engineers and architects).
• Improve the ability of these professionals to associate/cooperate with other professionals.
• Eliminate price restrictions, in particular, for engineers and architects.
• Promote equal treatment of local and foreign suppliers of business services (in all four regulated professions) by ensuring regulations are enforced under the same principles (not only for those related to public procurement and taxes and subsidies) and by providing the same access to appeal procedures to regulatory decisions.
• Allow foreign business professionals to freely practice by minimizing or eliminating any economic needs tests or quotas.
• Support the elimination of any ban to foreign business professionals from supplying their services to the government, and any preferential treatment to local suppliers.
Congress, PRC and PCC
Retail distribution industry
• Minimize limitations to promotions/discounts that are not predatory pricing practices.
Congress and PCC
Construction services • Support transparency policies in public procurement for construction services, procurement laws, regulations and procedures.
• Promote equal treatment among local and foreign firms by removing any access preference (such as technical specifications) given to local firms in public procurement
Congress, PCAB and PCC
Public procurement • Eliminate domestic requirements in public procurement.
Congress and PCC
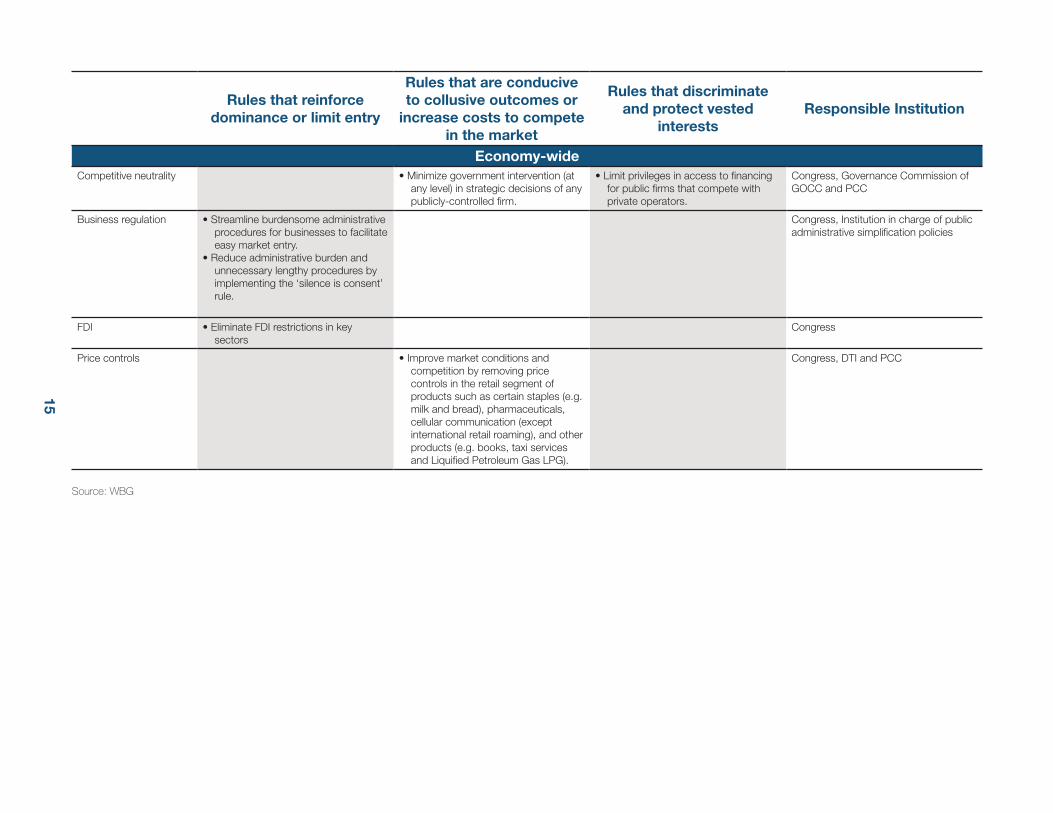
15
Rules that reinforce dominance or limit entry
Rules that are conducive to collusive outcomes or
increase costs to compete in the market
Rules that discriminate and protect vested
interestsResponsible Institution
Economy-wideCompetitive neutrality • Minimize government intervention (at
any level) in strategic decisions of any publicly-controlled firm.
• Limit privileges in access to financing for public firms that compete with private operators.
Congress, Governance Commission of GOCC and PCC
Business regulation • Streamline burdensome administrative procedures for businesses to facilitate easy market entry.
• Reduce administrative burden and unnecessary lengthy procedures by implementing the ‘silence is consent’ rule.
Congress, Institution in charge of public administrative simplification policies
FDI • Eliminate FDI restrictions in key sectors
Congress
Price controls • Improve market conditions and competition by removing price controls in the retail segment of products such as certain staples (e.g. milk and bread), pharmaceuticals, cellular communication (except international retail roaming), and other products (e.g. books, taxi services and Liquified Petroleum Gas LPG).
Congress, DTI and PCC
Source: WBG
16
Empirical evidence confirms a significant relationship between the degree of regulation in the service sector and growth in productivity and value added. A study of OECD countries based on PMR data (Barone and Cingano, 2011) shows that lowering the restrictiveness of service sector regulation has significant positive effects on value added, productivity and export growth of service-intensive sectors. A significant reduction55 in the restrictiveness of regulation across professional services, energy, transport and telecommunications sectors can lead to an increase of 0.75 percentage points in annual value added growth in service-intensive sectors.
In the case of the Philippines, the removal of restrictive PMRs in the professional services, energy, transport and telecommunications sectors could lead to an additional growth of US$0.6 billion in sectors that use those services intensively, which is equivalent to an increase in the annual GDP growth rate of 0.2 percentage points.56
55 A significant decrease in relative regulatory restrictiveness is defined as an improvement of at least two quartiles in the distribution of countries according to their restrictiveness (i.e. a country that moves from the 75th percentile to the 25th percentile in the respective sectoral or lower level indica-tors).
56 Further details of the quantification of these estimates are provided in Section IV, and a summary of results is presented in Table 11.
17
18
I. Developing an effective competition policy framework in the Philippines
1. After more than 15 years in the making, the Competition Act was adopted by the Philippine Congress in June 2015. This legislation provides the country with a great opportunity to internalize the lessons learnt on successful implementation from regional and international peers. The Competition Act57 - which took into account a significant number of WBG recommendations, such as the limitation of exclusions from the scope of the law, the per se illegality of hard core cartels, the establishment of objective merger notification thresholds and the obligation to publish decisions - called for the setup of an enforcing body, the Philippine Competition Commission (PCC).
2. Since its appointment in early 2016, the Board of the PCC has started to implement an ambitious agenda that has already yielded interesting results. The Chairman and four Commissioners of the PCC have designed and approved Implementing Rules and Regulations for the Competition Act, started the hiring process of PCC personnel, with the goal of recruiting 200 officials before the end of 2016, made a filing with the Solicitor General to comment on a foreign investment restriction in the construction industry, and challenged a major economic concentration in the telecommunications sector.
3. However, as the prohibition of anticompetitive practices, i.e. cartels, and abuses of dominance is relatively new, and enforcement was scheduled to begin in June 2017 under the transitory period, the potential for pervasive anticompetitive practices across the economy remains high. The two-year moratorium on the implementation of antitrust enforcement constitutes a key concern of the Competition Act, because it not only enables market players to continue to act anti-competitively and remain unpunished, but also misaligns their incentives to provide cost-efficient goods and services. Moreover, even after the end of this moratorium, the existence of ample grounds to exclude certain practices and even sectors from the law could hinder effective implementation and therefore lower consumer welfare through higher prices and fewer options.58
4. In this context, an analysis of whether the current regulatory conditions inhibit market competition could offer critical and timely inputs for the PCC to develop priorities in the design of a National Competition Policy for the Philippines, identify priorities for competition advocacy and ultimately improve market dynamics. Limited market competition can stem from restrictive regulations or discretionary application of the regulatory framework that render entry and operation of new firms difficult, as well as from ineffective enforcement of competition policy. Addressing government regulations and practices that restrict competition or weaken the enforcement of competition policies is necessary to generate an enabling business environment. The mandate included in the Competition Act to develop a National Competition Policy59 constitutes a unique feature of the Philippine regulatory framework and offers a great opportunity for the PCC to design an instrument applicable to all economic operators - public or private - across sectors, institutions and administrative layers - national and subnational - which would introduce a competition lens in economic policies and embed competition principles in the Philippine markets.
57 The Philippine Competition Act, Republic Act No. 10667, year 2015.
58 See, Section 28 of the Competition Act on the so-called forbearance.
59 Section 12 paragraph O of the Competition Act requires the PCC to assist the National Economic Development Authority (NEDA), in consultation with relevant agencies and sectors, in the preparation and formulation of a National Competition Policy.
19
Limited competition in the Philippines may affect the country’s ability to maximize its growth potential
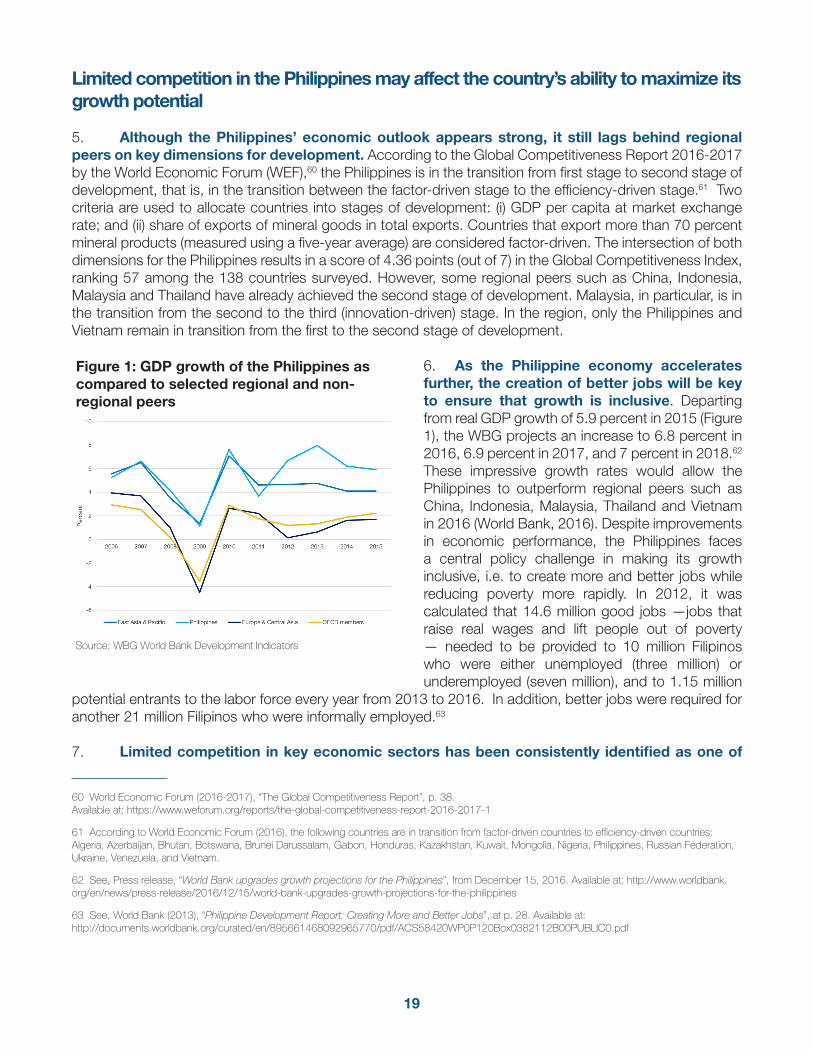
5. Although the Philippines’ economic outlook appears strong, it still lags behind regional peers on key dimensions for development. According to the Global Competitiveness Report 2016-2017 by the World Economic Forum (WEF),60 the Philippines is in the transition from first stage to second stage of development, that is, in the transition between the factor-driven stage to the efficiency-driven stage.61 Two criteria are used to allocate countries into stages of development: (i) GDP per capita at market exchange rate; and (ii) share of exports of mineral goods in total exports. Countries that export more than 70 percent mineral products (measured using a five-year average) are considered factor-driven. The intersection of both dimensions for the Philippines results in a score of 4.36 points (out of 7) in the Global Competitiveness Index, ranking 57 among the 138 countries surveyed. However, some regional peers such as China, Indonesia, Malaysia and Thailand have already achieved the second stage of development. Malaysia, in particular, is in the transition from the second to the third (innovation-driven) stage. In the region, only the Philippines and Vietnam remain in transition from the first to the second stage of development.
6. As the Philippine economy accelerates further, the creation of better jobs will be key to ensure that growth is inclusive. Departing from real GDP growth of 5.9 percent in 2015 (Figure 1), the WBG projects an increase to 6.8 percent in 2016, 6.9 percent in 2017, and 7 percent in 2018.62 These impressive growth rates would allow the Philippines to outperform regional peers such as China, Indonesia, Malaysia, Thailand and Vietnam in 2016 (World Bank, 2016). Despite improvements in economic performance, the Philippines faces a central policy challenge in making its growth inclusive, i.e. to create more and better jobs while reducing poverty more rapidly. In 2012, it was calculated that 14.6 million good jobs —jobs that raise real wages and lift people out of poverty — needed to be provided to 10 million Filipinos who were either unemployed (three million) or underemployed (seven million), and to 1.15 million
potential entrants to the labor force every year from 2013 to 2016. In addition, better jobs were required for another 21 million Filipinos who were informally employed.63
7. Limited competition in key economic sectors has been consistently identified as one of
60 World Economic Forum (2016-2017), “The Global Competitiveness Report”, p. 38. Available at: https://www.weforum.org/reports/the-global-competitiveness-report-2016-2017-1
61 According to World Economic Forum (2016), the following countries are in transition from factor-driven countries to efficiency-driven countries: Algeria, Azerbaijan, Bhutan, Botswana, Brunei Darussalam, Gabon, Honduras, Kazakhstan, Kuwait, Mongolia, Nigeria, Philippines, Russian Federation, Ukraine, Venezuela, and Vietnam.
62 See, Press release, “World Bank upgrades growth projections for the Philippines”, from December 15, 2016. Available at: http://www.worldbank.org/en/news/press-release/2016/12/15/world-bank-upgrades-growth-projections-for-the-philippines
63 See, World Bank (2013), “Philippine Development Report: Creating More and Better Jobs”, at p. 28. Available at:http://documents.worldbank.org/curated/en/895661468092965770/pdf/ACS58420WP0P120Box0382112B00PUBLIC0.pdf
Figure 1: GDP growth of the Philippines as compared to selected regional and non-regional peers
Source: WBG World Bank Development Indicators
-6
-4
-2
0
2
4
6
8
10
2006 2007 2008 2009 2010 2011 2012 2013 2014 2015
East Asia & Pacific Philippines
Europe & Central Asia OECD members
20
the main development challenges for the Philippines’ economy and a constraint to the creation of better jobs. The fact that better economic performance has not translated into job creation and better services can be connected to limited competition in key markets. For instance, relatively slow growth in two crucial labor-intensive sectors (manufacturing and agriculture) has led to a slow pace of job creation and poverty reduction. In both the 2013 Philippines Development Report and the Philippine Country Strategy, the WBG identified lack of market competition as a key constraint for inclusive structural transformation and therefore a necessary area for implementing reforms that could generate inclusive growth and encourage job creation.
8. Indicators suggest that Philippine markets are relatively concentrated, although variation exists across markets. The average four-firm concentration ratio across all subsectors rose from 71 percent in 1988 to 81 percent in 1998, with the most concentrated subsectors involving the production of intermediate and capital goods, such as machinery and transport equipment.64 In manufacturing, where the contribution to GDP has decreased in recent decades,65 Philippine markets appear to be more concentrated than those of regional peers,66 with a higher proportion of monopoly, duopoly or oligopoly markets (Figure 2), which are typically more prone to collusion and abuse of market power, and a recent increase in the number of monopolies and duopolies (Figure 3). New statistics developed for this note, using the 2012 Census of Philippine Business and Industry (CPBI), confirm that a notable proportion of markets67 would be classified as highly concentrated, when examined in a static setting: more than 40 percent in manufacturing, close to 50 percent in wholesale/retail, more than 70 percent in agriculture and more than 95 percent in transport/storage,68 according to standard Herfindahl–Hirschman Index (HHI) thresholds used by competition agencies (Figures 4 to 7).69
9. In this context, dominance in Philippine markets is perceived to be particularly high as compared to regional peers. Perceptions of competition in the Philippines appear to be weak, particularly with regard to the extent of market dominance (114 out of 138 countries) where, according to the Global Competitiveness Report (2016-2017),70 the Philippines ranks below average in the sample and the lowest as compared to regional peers. (Figure 8, Figure 9 and Figure 10). In turn, limited competition affects business risks, especially in relation to vested interests and unfair competitive practices (Figure 11).
64 Aldaba, R. (2008), “Assessing Competition in Philippine Markets. Philippine Institute for Development Studies”, p.56.
65 Philippine manufacturing declined from 30 percent of GDP in the 1970s to 20percent of GDP in 2015.
66 Regional peers were selected among those countries with available information from the World Bank’s Enterprise Survey.
67 Relevant markets have been defined at i) product level using the five-digit Philippine Standard Industry Classification (PSIC) code (aggregated in cases where there is a high degree of substitutability between markets) and ii) geographic level (national for manufacturing and agriculture; at the munic-ipal level for transport/storage; and at the Barangay level for wholesale/retail markets). It should be noted however, that where geographic markets are defined at a subnational level there may be cross-substitution across Barangays or municipalities.
68 While high concentration levels tend to be common in transport and storage markets given their market characteristics (and these markets are often subject to regulation), concentration levels in the Philippines appear to be relatively high even in transport and storage markets where competition should be viable, such as local bus, cargo handling and freight forwarding services.
69 The US Department of Justice & Fair Trading Commission generally consider markets in which the HHI is between 1,500 and 2,500 points to be moderately concentrated, and those in which the HHI is in excess of 2,500 points to be highly concentrated.
70 World Economic Forum (2016-2017), “Global Competitiveness Report”, p.297. Available at: http://www3.weforum.org/docs/GCR2016-2017/05FullReport/TheGlobalCompetitivenessReport2016-2017_FINAL.pdf
21
Figure 4: Distribution of manufacturing markets by level of concentration based on standard HHI thresholds
Figure 5: Distribution of agriculture markets by level of concentration based on standard HHI thresholds
Figure 6: Distribution of wholesale/retail markets by level of concentration based on standard HHI thresholds
Figure 7: Distribution of transport/storage markets by level of concentration based on standard HHI thresholds
Source: Authors’ calculations based on 2012 Census of Philippine Business and Industry.
Figure 2: Market concentration in manufacturing in the Philippines and selected EAP countries
Figure 3: Evolution of market concentration in manufacturing in the Philippines
Source: World Bank’s Enterprise Survey, 2015 Source: World Bank’s Enterprise Survey, 2009 and 2015
0
10
20
30
40
50
60
70
80
90
100
Philippines Indonesia Malaysia Cambodia
Market concentration in manufacturing in the Philippines and selected EAP countries (in percent)
Monopoly Duopoly Oligopoly (3-6) Many
0
2
4
6
8
10
12
14
16
18
20
Monopoly Duopoly Oligopoly (3-6)
Evolution of market concentration in manufacturing in the Philippines (in percent)
0
10
20
30
40
50
60
70
80
90
100
Low Moderate High
Per
cent
age
of 5
-dig
it P
SIC
0
10
20
30
40
50
60
70
80
90
100
Low Moderate High
Per
cent
of
5-d
igit
PS
IC
-
10
20
30
40
50
60
70
80
90
100
Low Moderate High
Per
cent
of
5-d
igit
PS
IC
0
10
20
30
40
50
60
70
80
90
100
Low Moderate High
Per
cent
of
5-d
igit
PS
IC
2009 2015
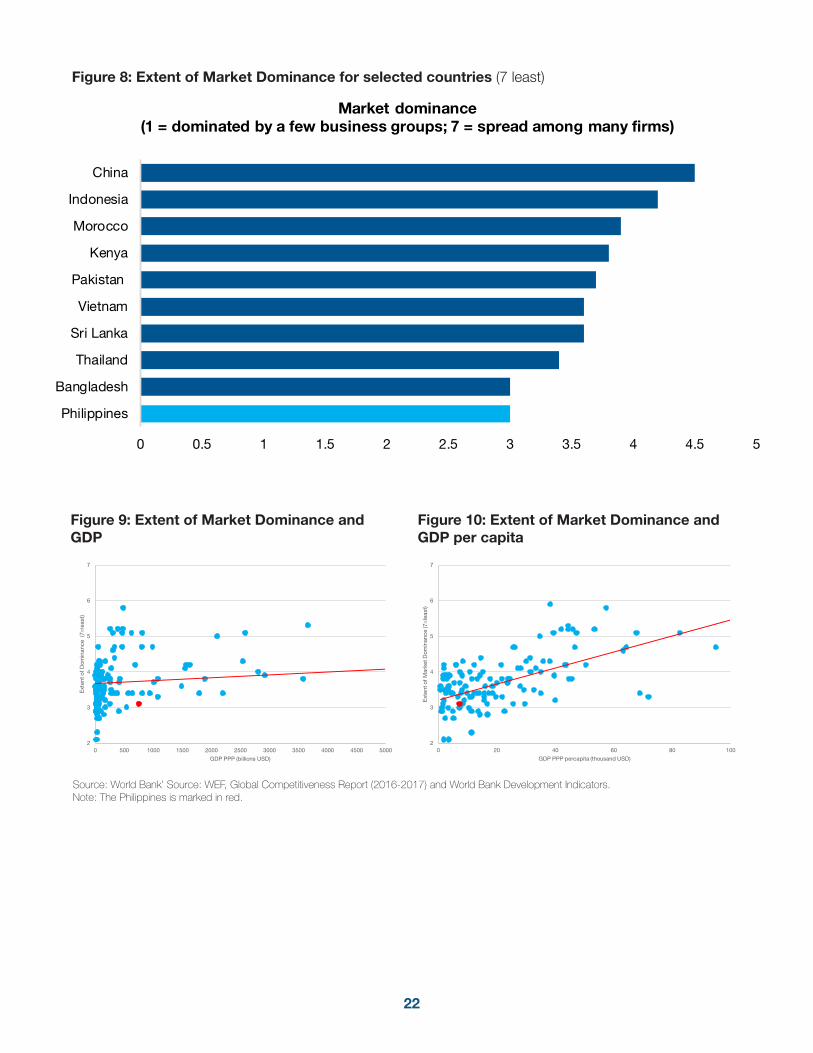
22
Figure 8: Extent of Market Dominance for selected countries (7 least)
0 0.5 1 1.5 2 2.5 3 3.5 4 4.5 5
Philippines
Bangladesh
Thailand
Sri Lanka
Vietnam
Pakistan
Kenya
Morocco
Indonesia
China
Market dominance(1 = dominated by a few business groups; 7 = spread among many firms)
Figure 9: Extent of Market Dominance and GDP
Figure 10: Extent of Market Dominance and GDP per capita
Source: World Bank’ Source: WEF, Global Competitiveness Report (2016-2017) and World Bank Development Indicators. Note: The Philippines is marked in red.
2
3
4
5
6
7
0 500 1000 1500 2000 2500 3000 3500 4000 4500 5000
Ext
ent o
f D
omin
ance
(7=
leas
t)
GDP PPP (billions USD)
2
3
4
5
6
7
0 20 40 60 80 100
Ext
ent o
f M
arke
t Dom
inan
ce (7
=le
ast)
GDP PPP percapita (thousand USD)
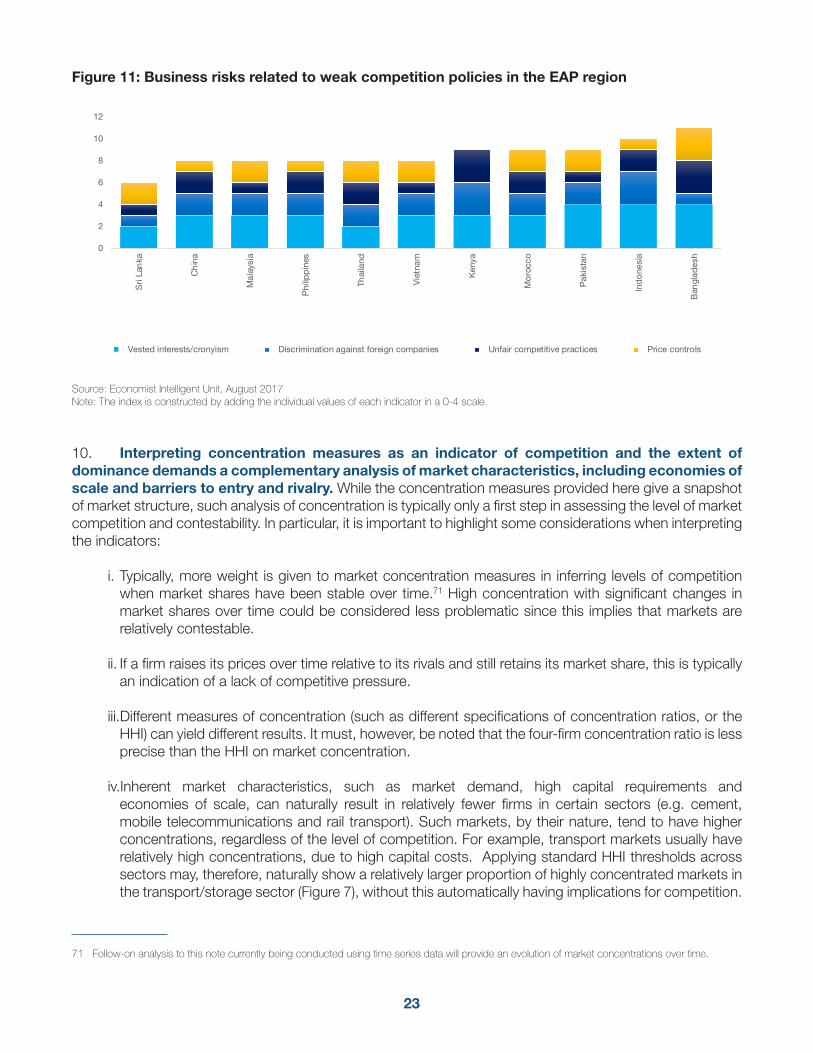
23
Figure 11: Business risks related to weak competition policies in the EAP region
0
2
4
6
8
10
12
Sri
Lan
ka
Ch
ina
Mal
aysi
a
Phi
lipp
ines
Thai
land
Vie
tnam
Ken
ya
Mo
rocc
o
Pak
ista
n
Ind
one
sia
Ban
glad
esh
Vested interests/cronyism Discrimination against foreign companies Unfair competitive practices Price controls
Source: Economist Intelligent Unit, August 2017Note: The index is constructed by adding the individual values of each indicator in a 0-4 scale.
10. Interpreting concentration measures as an indicator of competition and the extent of dominance demands a complementary analysis of market characteristics, including economies of scale and barriers to entry and rivalry. While the concentration measures provided here give a snapshot of market structure, such analysis of concentration is typically only a first step in assessing the level of market competition and contestability. In particular, it is important to highlight some considerations when interpreting the indicators:
i. Typically, more weight is given to market concentration measures in inferring levels of competition when market shares have been stable over time.71 High concentration with significant changes in market shares over time could be considered less problematic since this implies that markets are relatively contestable.
ii. If a firm raises its prices over time relative to its rivals and still retains its market share, this is typically an indication of a lack of competitive pressure.
iii.Different measures of concentration (such as different specifications of concentration ratios, or the HHI) can yield different results. It must, however, be noted that the four-firm concentration ratio is less precise than the HHI on market concentration.
iv.Inherent market characteristics, such as market demand, high capital requirements and economies of scale, can naturally result in relatively fewer firms in certain sectors (e.g. cement, mobile telecommunications and rail transport). Such markets, by their nature, tend to have higher concentrations, regardless of the level of competition. For example, transport markets usually have relatively high concentrations, due to high capital costs. Applying standard HHI thresholds across sectors may, therefore, naturally show a relatively larger proportion of highly concentrated markets in the transport/storage sector (Figure 7), without this automatically having implications for competition.
71 Follow-on analysis to this note currently being conducted using time series data will provide an evolution of market concentrations over time.
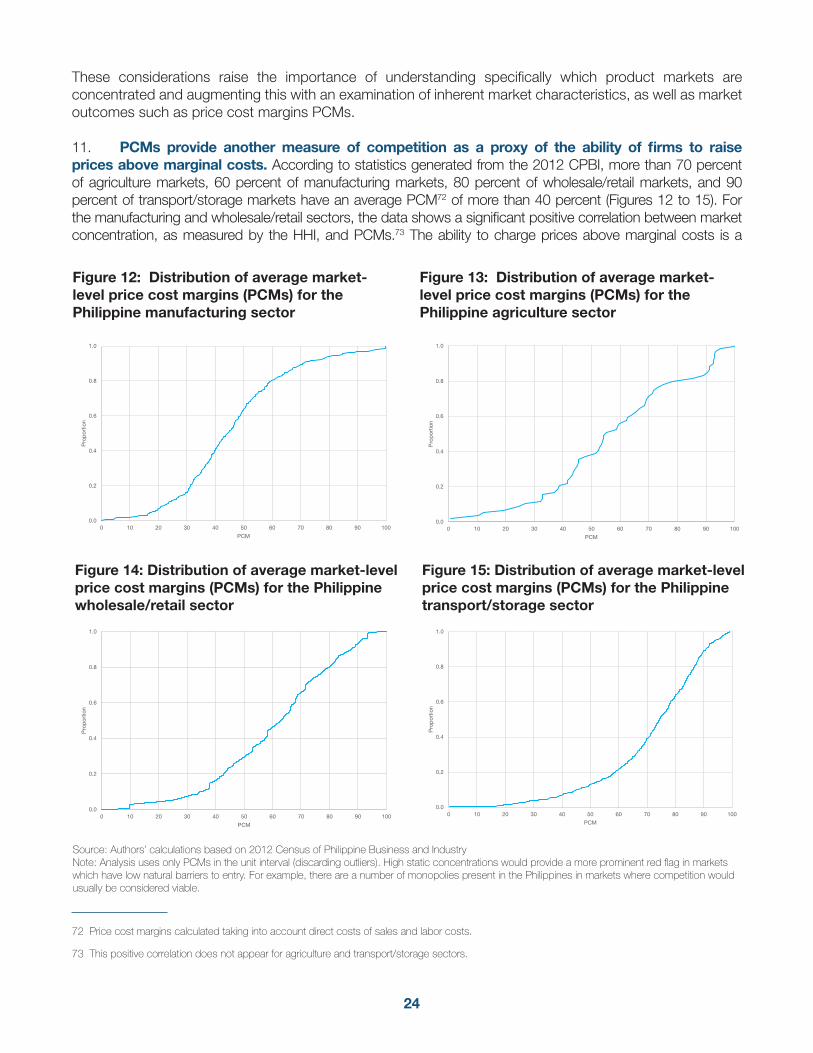
24
These considerations raise the importance of understanding specifically which product markets are concentrated and augmenting this with an examination of inherent market characteristics, as well as market outcomes such as price cost margins PCMs.
11. PCMs provide another measure of competition as a proxy of the ability of firms to raise prices above marginal costs. According to statistics generated from the 2012 CPBI, more than 70 percent of agriculture markets, 60 percent of manufacturing markets, 80 percent of wholesale/retail markets, and 90 percent of transport/storage markets have an average PCM72 of more than 40 percent (Figures 12 to 15). For the manufacturing and wholesale/retail sectors, the data shows a significant positive correlation between market concentration, as measured by the HHI, and PCMs.73 The ability to charge prices above marginal costs is a
72 Price cost margins calculated taking into account direct costs of sales and labor costs.
73 This positive correlation does not appear for agriculture and transport/storage sectors.
Figure 12: Distribution of average market-level price cost margins (PCMs) for the Philippine manufacturing sector
Figure 13: Distribution of average market-level price cost margins (PCMs) for the Philippine agriculture sector
Figure 14: Distribution of average market-level price cost margins (PCMs) for the Philippine wholesale/retail sector
Figure 15: Distribution of average market-level price cost margins (PCMs) for the Philippine transport/storage sector
Source: Authors’ calculations based on 2012 Census of Philippine Business and Industry Note: Analysis uses only PCMs in the unit interval (discarding outliers). High static concentrations would provide a more prominent red flag in markets which have low natural barriers to entry. For example, there are a number of monopolies present in the Philippines in markets where competition would usually be considered viable.
0.0
0.2
0.4
0.6
0.8
1.0
0 10 20 30 40 50 60 70 80 90 100
Pro
por
tion
PCM
0.0
0.2
0.4
0.6
0.8
1.0
0 10 20 30 40 50 60 70 80 90 100
Pro
por
tion
PCM
0.0
0.2
0.4
0.6
0.8
1.0
0 10 20 30 40 50 60 70 80 90 100
Pro
por
tion
PCM
0.0
0.2
0.4
0.6
0.8
1.0
0 10 20 30 40 50 60 70 80 90 100
Pro
por
tion
PCM
25
potential indicator of the exercise of market power by firms. In some cases, such outcomes can be facilitated by market rules and regulations such as price controls, as this note explores in section 1.2. The rising costs and stifling productivity of high PCMs can be particularly detrimental to growth and job creation in input markets. For example, in manufacturing, markets in the top decile of the PCM distribution include key inputs, such as sugar, engine parts, concrete and cement items, and asphalt parts, among others. In agriculture, markets in the top decile include fertilizer applications and weed, disease and pest control services - services that are important for productivity in the agriculture sector overall. In the transport/storage sector, freight truck operations, logistics services, cargo handling and cold storage are the markets that appear most frequently in the top decile of the PCM distribution across geographic markets.
12. High static concentrations would provide more prominent red flags in markets which have low natural barriers to entry. For example, there are several monopolies in the Philippines in markets where competition would usually be considered viable. Table 2 summarizes markets where there is only one firm operating and their associated price cost margin (PCM).74 In agriculture there are 15 markets of this kind, with 16 in manufacturing, 5 in wholesale/retail, and 15 in transport/storage. With the exception of a small number of transport markets where monopolies are more common (such as railway transport and postal service), in the majority of these markets, competition would typically be considered viable.75
13. Even among those markets that have only one firm in operation, there is a high degree of variation in the PCMs (Table 2). This further illustrates the need to take into account a range of indicators beyond market structure to fully understand market dynamics. Figures 16 to 19 show how HHIs and PCMs appear in those markets which are in the top decile of both distributions. Once again it is clear that, even in the transport/storage sector, which tends to be more naturally prone to concentration, the markets captured here are, in fact, markets which would usually be considered contestable – including road freight transport, grain warehousing and inland freight water transport.
74 Transport/storage and retail markets are divided at the geographic level.
75 Note that this analysis does not take into account competitive pressure from imports.
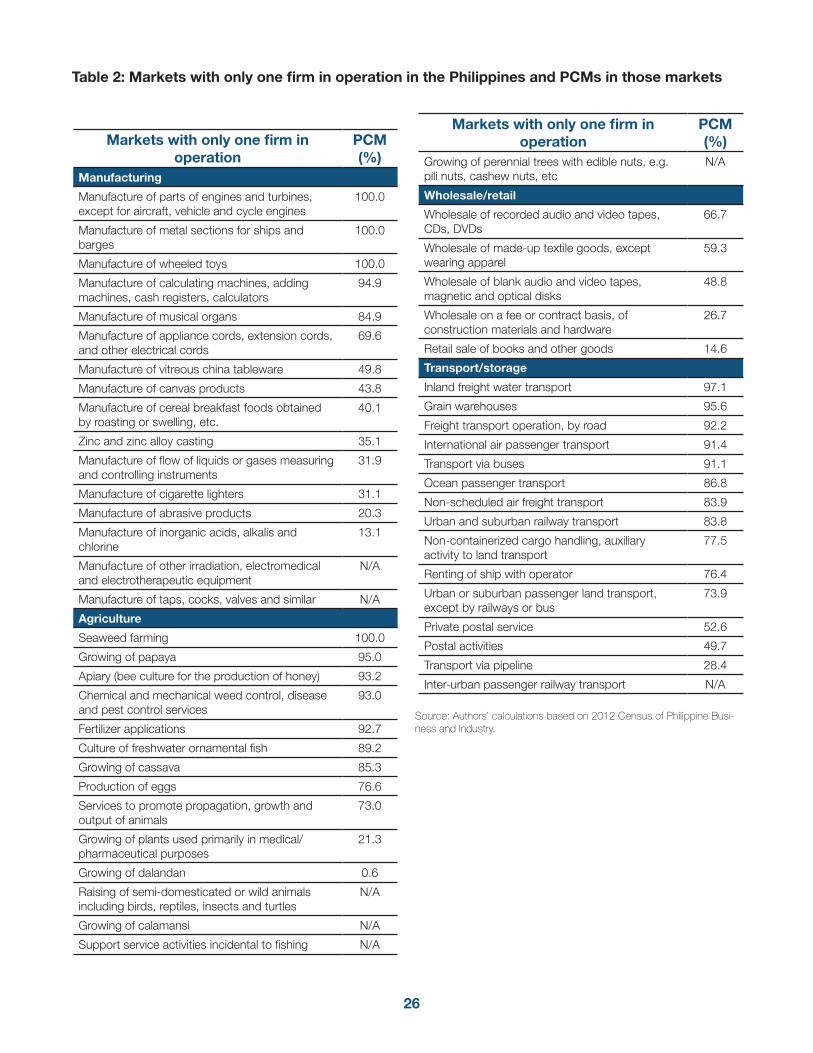
26
Markets with only one firm in operation
PCM (%)
Manufacturing
Manufacture of parts of engines and turbines, except for aircraft, vehicle and cycle engines
100.0
Manufacture of metal sections for ships and barges
100.0
Manufacture of wheeled toys 100.0
Manufacture of calculating machines, adding machines, cash registers, calculators
94.9
Manufacture of musical organs 84.9
Manufacture of appliance cords, extension cords, and other electrical cords
69.6
Manufacture of vitreous china tableware 49.8
Manufacture of canvas products 43.8
Manufacture of cereal breakfast foods obtained by roasting or swelling, etc.
40.1
Zinc and zinc alloy casting 35.1
Manufacture of flow of liquids or gases measuring and controlling instruments
31.9
Manufacture of cigarette lighters 31.1
Manufacture of abrasive products 20.3
Manufacture of inorganic acids, alkalis and chlorine
13.1
Manufacture of other irradiation, electromedical and electrotherapeutic equipment
N/A
Manufacture of taps, cocks, valves and similar N/A
Agriculture
Seaweed farming 100.0
Growing of papaya 95.0
Apiary (bee culture for the production of honey) 93.2
Chemical and mechanical weed control, disease and pest control services
93.0
Fertilizer applications 92.7
Culture of freshwater ornamental fish 89.2
Growing of cassava 85.3
Production of eggs 76.6
Services to promote propagation, growth and output of animals
73.0
Growing of plants used primarily in medical/ pharmaceutical purposes
21.3
Growing of dalandan 0.6
Raising of semi-domesticated or wild animals including birds, reptiles, insects and turtles
N/A
Growing of calamansi N/A
Support service activities incidental to fishing N/A
Markets with only one firm in operation
PCM (%)
Growing of perennial trees with edible nuts, e.g. pili nuts, cashew nuts, etc
N/A
Wholesale/retail
Wholesale of recorded audio and video tapes, CDs, DVDs
66.7
Wholesale of made-up textile goods, except wearing apparel
59.3
Wholesale of blank audio and video tapes, magnetic and optical disks
48.8
Wholesale on a fee or contract basis, of construction materials and hardware
26.7
Retail sale of books and other goods 14.6
Transport/storage
Inland freight water transport 97.1
Grain warehouses 95.6
Freight transport operation, by road 92.2
International air passenger transport 91.4
Transport via buses 91.1
Ocean passenger transport 86.8
Non-scheduled air freight transport 83.9
Urban and suburban railway transport 83.8
Non-containerized cargo handling, auxiliary activity to land transport
77.5
Renting of ship with operator 76.4
Urban or suburban passenger land transport, except by railways or bus
73.9
Private postal service 52.6
Postal activities 49.7
Transport via pipeline 28.4
Inter-urban passenger railway transport N/A
Source: Authors’ calculations based on 2012 Census of Philippine Busi-ness and Industry.
Table 2: Markets with only one firm in operation in the Philippines and PCMs in those markets
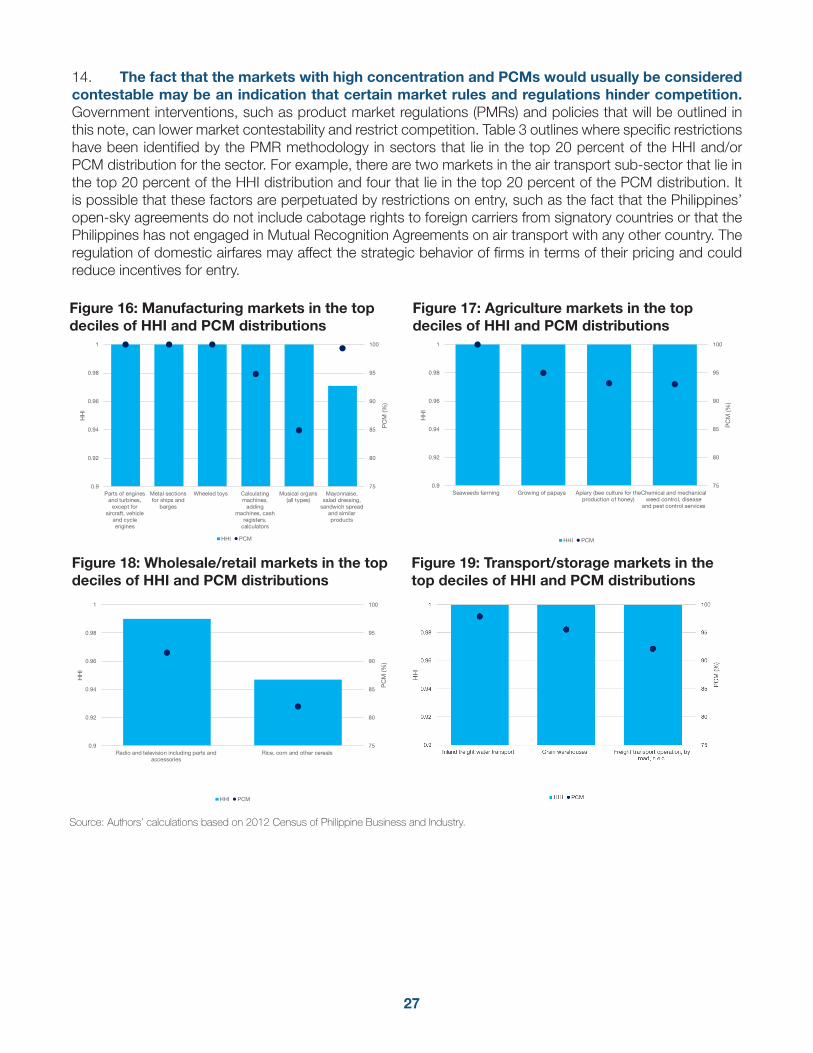
27
14. The fact that the markets with high concentration and PCMs would usually be considered contestable may be an indication that certain market rules and regulations hinder competition. Government interventions, such as product market regulations (PMRs) and policies that will be outlined in this note, can lower market contestability and restrict competition. Table 3 outlines where specific restrictions have been identified by the PMR methodology in sectors that lie in the top 20 percent of the HHI and/or PCM distribution for the sector. For example, there are two markets in the air transport sub-sector that lie in the top 20 percent of the HHI distribution and four that lie in the top 20 percent of the PCM distribution. It is possible that these factors are perpetuated by restrictions on entry, such as the fact that the Philippines’ open-sky agreements do not include cabotage rights to foreign carriers from signatory countries or that the Philippines has not engaged in Mutual Recognition Agreements on air transport with any other country. The regulation of domestic airfares may affect the strategic behavior of firms in terms of their pricing and could reduce incentives for entry.
Figure 16: Manufacturing markets in the top deciles of HHI and PCM distributions
Figure 17: Agriculture markets in the top deciles of HHI and PCM distributions
Figure 18: Wholesale/retail markets in the top deciles of HHI and PCM distributions
Figure 19: Transport/storage markets in the top deciles of HHI and PCM distributions
Source: Authors’ calculations based on 2012 Census of Philippine Business and Industry.
75
80
85
90
95
100
0.9
0.92
0.94
0.96
0.98
1
Parts of enginesand turbines,
except foraircraft, vehicle
and cycleengines
Metal sectionsfor ships and
barges
Wheeled toys Calculatingmachines,
addingmachines, cash
registers,calculators
Musical organs(all types)
Mayonnaise,salad dressing,
sandwich spreadand similarproducts
PC
M (%
)
HH
I
HHI PCM
75
80
85
90
95
100
0.9
0.92
0.94
0.96
0.98
1
Seaweeds farming Growing of papaya Apiary (bee culture for theproduction of honey)
Chemical and mechanicalweed control, disease
and pest control services
PC
M (%
)
HH
I
HHI PCM
75
80
85
90
95
100
0.9
0.92
0.94
0.96
0.98
1
Radio and television including parts andaccessories
Rice, corn and other cereals
PC
M (%
)
HH
I
HHI PCM
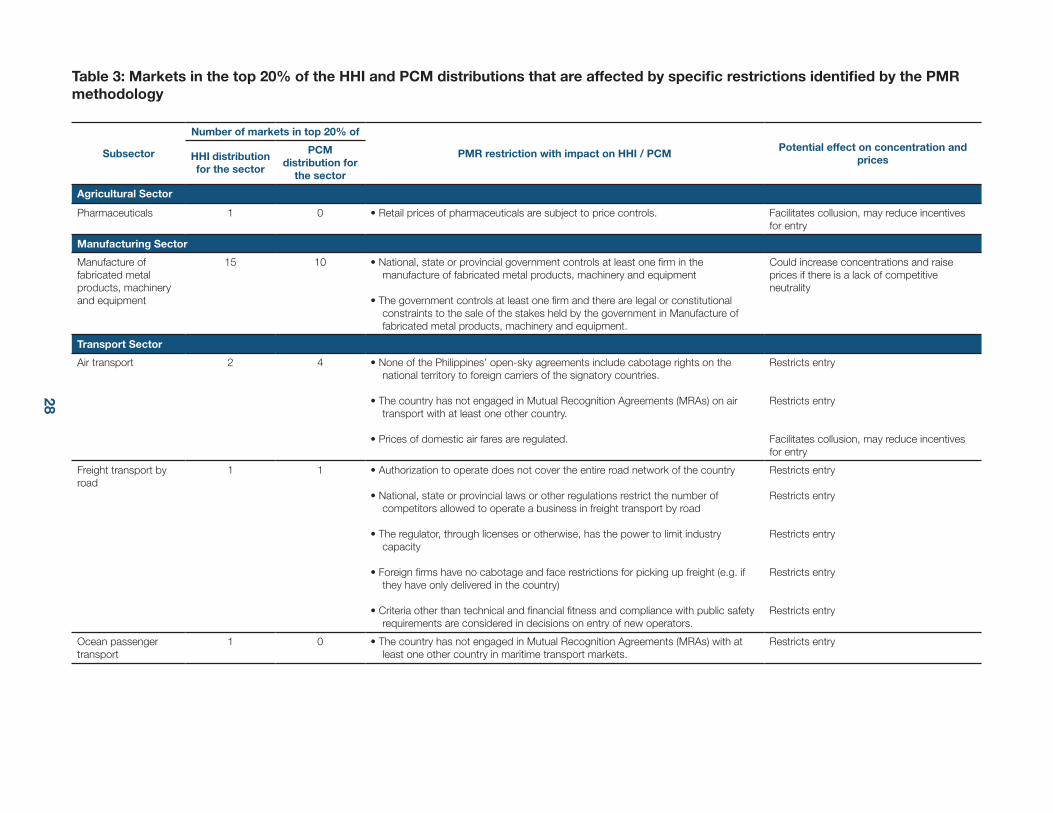
28 29
Table 3: Markets in the top 20% of the HHI and PCM distributions that are affected by specific restrictions identified by the PMR methodology
Subsector
Number of markets in top 20% of
PMR restriction with impact on HHI / PCMPotential effect on concentration and
pricesHHI distribution for the sector
PCM distribution for
the sector
Agricultural Sector
Pharmaceuticals 1 0 • Retail prices of pharmaceuticals are subject to price controls. Facilitates collusion, may reduce incentives for entry
Manufacturing Sector
Manufacture of fabricated metal products, machinery and equipment
15 10 • National, state or provincial government controls at least one firm in the manufacture of fabricated metal products, machinery and equipment
• The government controls at least one firm and there are legal or constitutional constraints to the sale of the stakes held by the government in Manufacture of fabricated metal products, machinery and equipment.
Could increase concentrations and raise prices if there is a lack of competitive neutrality
Transport Sector
Air transport 2 4 • None of the Philippines’ open-sky agreements include cabotage rights on the national territory to foreign carriers of the signatory countries.
• The country has not engaged in Mutual Recognition Agreements (MRAs) on air transport with at least one other country.
• Prices of domestic air fares are regulated.
Restricts entry
Restricts entry
Facilitates collusion, may reduce incentives for entry
Freight transport by road
1 1 • Authorization to operate does not cover the entire road network of the country
• National, state or provincial laws or other regulations restrict the number of competitors allowed to operate a business in freight transport by road
• The regulator, through licenses or otherwise, has the power to limit industry capacity
• Foreign firms have no cabotage and face restrictions for picking up freight (e.g. if they have only delivered in the country)
• Criteria other than technical and financial fitness and compliance with public safety requirements are considered in decisions on entry of new operators.
Restricts entry
Restricts entry
Restricts entry
Restricts entry
Restricts entry
Ocean passenger transport
1 0 • The country has not engaged in Mutual Recognition Agreements (MRAs) with at least one other country in maritime transport markets.
Restricts entry
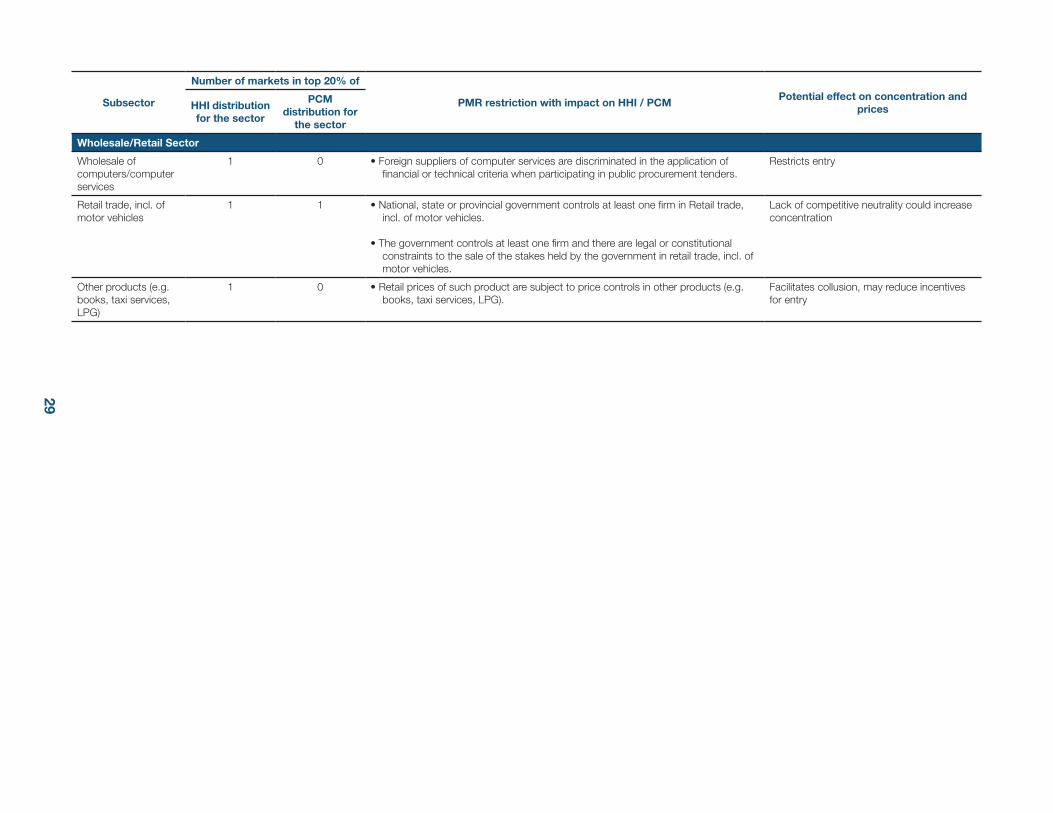
29
Subsector
Number of markets in top 20% of
PMR restriction with impact on HHI / PCMPotential effect on concentration and
pricesHHI distribution for the sector
PCM distribution for
the sector
Wholesale/Retail Sector
Wholesale of computers/computer services
1 0 • Foreign suppliers of computer services are discriminated in the application of financial or technical criteria when participating in public procurement tenders.
Restricts entry
Retail trade, incl. of motor vehicles
1 1 • National, state or provincial government controls at least one firm in Retail trade, incl. of motor vehicles.
• The government controls at least one firm and there are legal or constitutional constraints to the sale of the stakes held by the government in retail trade, incl. of motor vehicles.
Lack of competitive neutrality could increase concentration
Other products (e.g. books, taxi services, LPG)
1 0 • Retail prices of such product are subject to price controls in other products (e.g. books, taxi services, LPG).
Facilitates collusion, may reduce incentives for entry
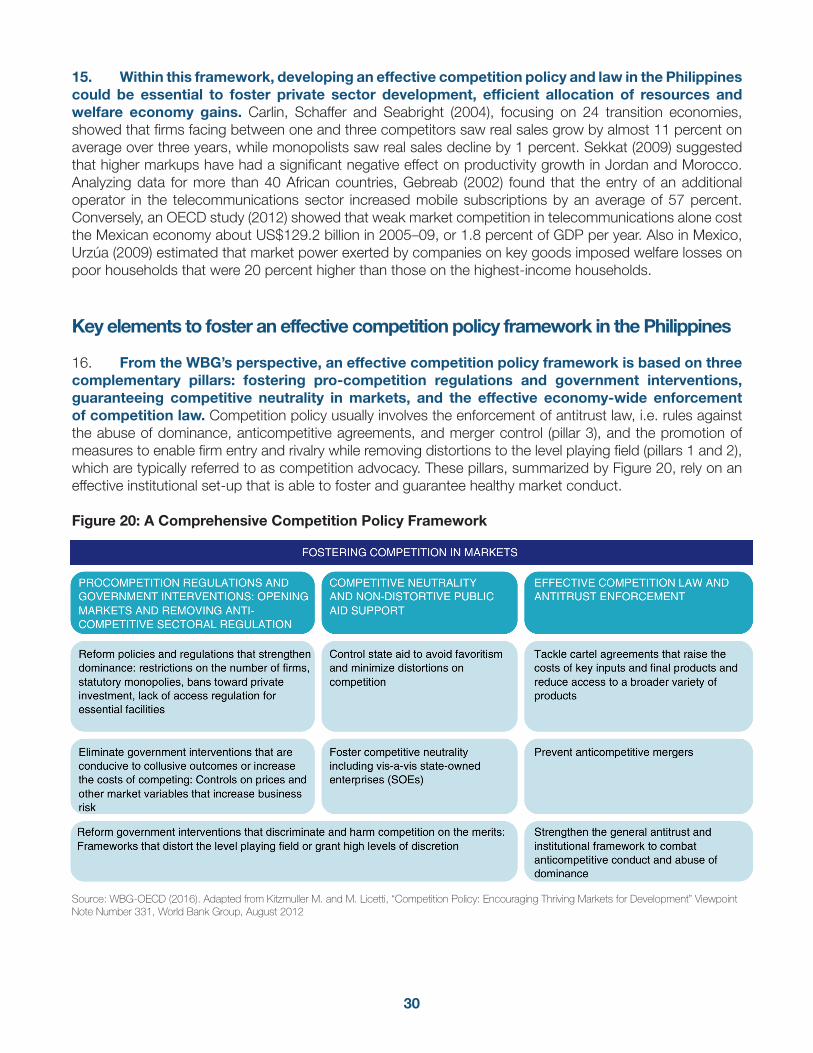
30
15. Within this framework, developing an effective competition policy and law in the Philippines could be essential to foster private sector development, efficient allocation of resources and welfare economy gains. Carlin, Schaffer and Seabright (2004), focusing on 24 transition economies, showed that firms facing between one and three competitors saw real sales grow by almost 11 percent on average over three years, while monopolists saw real sales decline by 1 percent. Sekkat (2009) suggested that higher markups have had a significant negative effect on productivity growth in Jordan and Morocco. Analyzing data for more than 40 African countries, Gebreab (2002) found that the entry of an additional operator in the telecommunications sector increased mobile subscriptions by an average of 57 percent. Conversely, an OECD study (2012) showed that weak market competition in telecommunications alone cost the Mexican economy about US$129.2 billion in 2005–09, or 1.8 percent of GDP per year. Also in Mexico, Urzúa (2009) estimated that market power exerted by companies on key goods imposed welfare losses on poor households that were 20 percent higher than those on the highest-income households.
Key elements to foster an effective competition policy framework in the Philippines
16. From the WBG’s perspective, an effective competition policy framework is based on three complementary pillars: fostering pro-competition regulations and government interventions, guaranteeing competitive neutrality in markets, and the effective economy-wide enforcement of competition law. Competition policy usually involves the enforcement of antitrust law, i.e. rules against the abuse of dominance, anticompetitive agreements, and merger control (pillar 3), and the promotion of measures to enable firm entry and rivalry while removing distortions to the level playing field (pillars 1 and 2), which are typically referred to as competition advocacy. These pillars, summarized by Figure 20, rely on an effective institutional set-up that is able to foster and guarantee healthy market conduct.
Figure 20: A Comprehensive Competition Policy Framework
Fostering Competition in MarketsPillar 1.
Precompetition regulations and government interventions: opening
markets and removing anticompetitive sectoral regulation
Pillar 2.Competitive neutrality and non-distortive
public and support
Pillar 3.Effective competition law and antitrust
enforcement
Reform policies and regulations that strengthen dominance: restriction to the number of firms, statutory monopolies, bans towards private investment, and lack of access regulation for essential
facilities
Control state aid to avoid favoritism and minimize distoritions on competition
Tackle cartel agreements that raise the costs of key inputs and final products
and reduce access to a broader variety of products
Eliminate government interventions that are conducive to collusive outcomes or
increase the costs of competing: controls on prices and other market variables that
increase business risk
Ensure competitive neutrality including vis-a-vis SOEs
Prevent anticompetitive mergers
Reform government interventions that discriminate and harm competition on the merits: frameworks that distort the level playing field or grant high levels of discretion
Strengthen the general antitrust and institutional framework to combat
anticompetitive conduct and abuse of dominance
Source: WBG-OECD (2016). Adapted from Kitzmuller M. and M. Licetti, “Competition Policy: Encouraging Thriving Markets for Development” Viewpoint Note Number 331, World Bank Group, August 2012
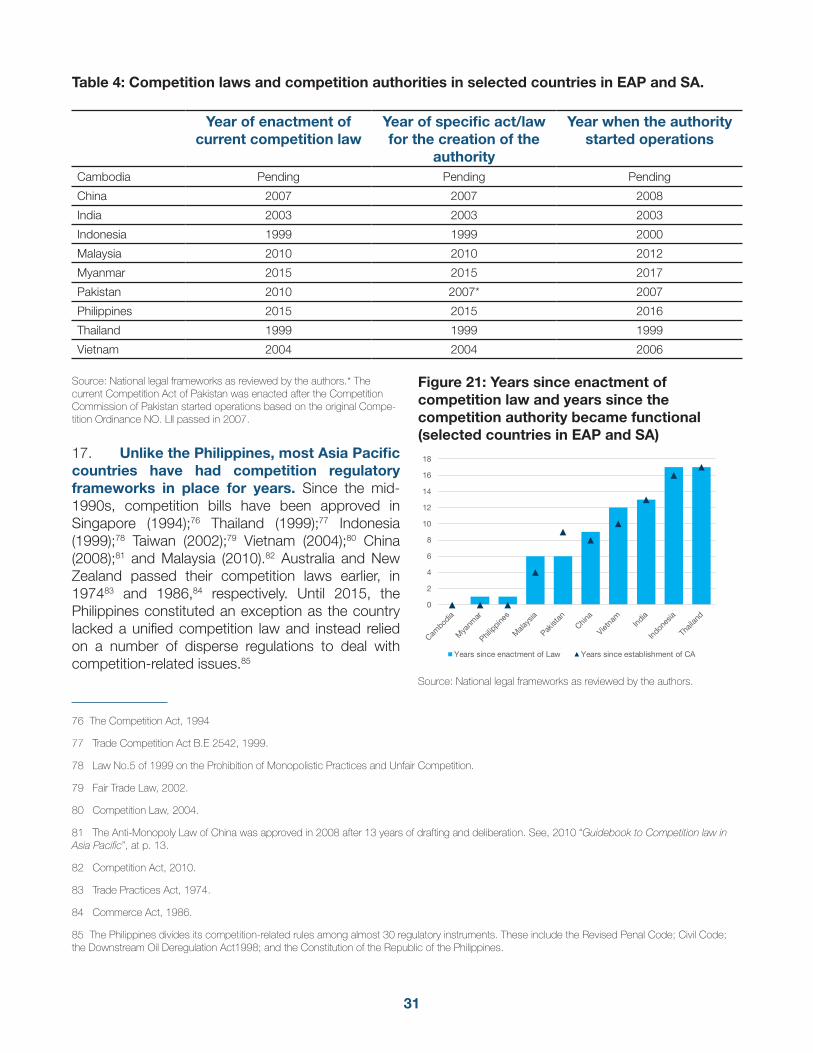
31
Table 4: Competition laws and competition authorities in selected countries in EAP and SA.
Year of enactment of current competition law
Year of specific act/law for the creation of the
authority
Year when the authority started operations
Cambodia Pending Pending Pending
China 2007 2007 2008
India 2003 2003 2003
Indonesia 1999 1999 2000
Malaysia 2010 2010 2012
Myanmar 2015 2015 2017
Pakistan 2010 2007* 2007
Philippines 2015 2015 2016
Thailand 1999 1999 1999
Vietnam 2004 2004 2006
Source: National legal frameworks as reviewed by the authors.* The current Competition Act of Pakistan was enacted after the Competition Commission of Pakistan started operations based on the original Compe-tition Ordinance NO. LII passed in 2007.
17. Unlike the Philippines, most Asia Pacific countries have had competition regulatory frameworks in place for years. Since the mid-1990s, competition bills have been approved in Singapore (1994);76 Thailand (1999);77 Indonesia (1999);78 Taiwan (2002);79 Vietnam (2004);80 China (2008);81 and Malaysia (2010).82 Australia and New Zealand passed their competition laws earlier, in 197483 and 1986,84 respectively. Until 2015, the Philippines constituted an exception as the country lacked a unified competition law and instead relied on a number of disperse regulations to deal with competition-related issues.85
76 The Competition Act, 1994
77 Trade Competition Act B.E 2542, 1999.
78 Law No.5 of 1999 on the Prohibition of Monopolistic Practices and Unfair Competition.
79 Fair Trade Law, 2002.
80 Competition Law, 2004.
81 The Anti-Monopoly Law of China was approved in 2008 after 13 years of drafting and deliberation. See, 2010 “Guidebook to Competition law in Asia Pacific”, at p. 13.
82 Competition Act, 2010.
83 Trade Practices Act, 1974.
84 Commerce Act, 1986.
85 The Philippines divides its competition-related rules among almost 30 regulatory instruments. These include the Revised Penal Code; Civil Code; the Downstream Oil Deregulation Act1998; and the Constitution of the Republic of the Philippines.
Figure 21: Years since enactment of competition law and years since the competition authority became functional (selected countries in EAP and SA)
Source: National legal frameworks as reviewed by the authors.
0
2
4
6
8
10
12
14
16
18
Years since enactment of Law Years since establishment of CA
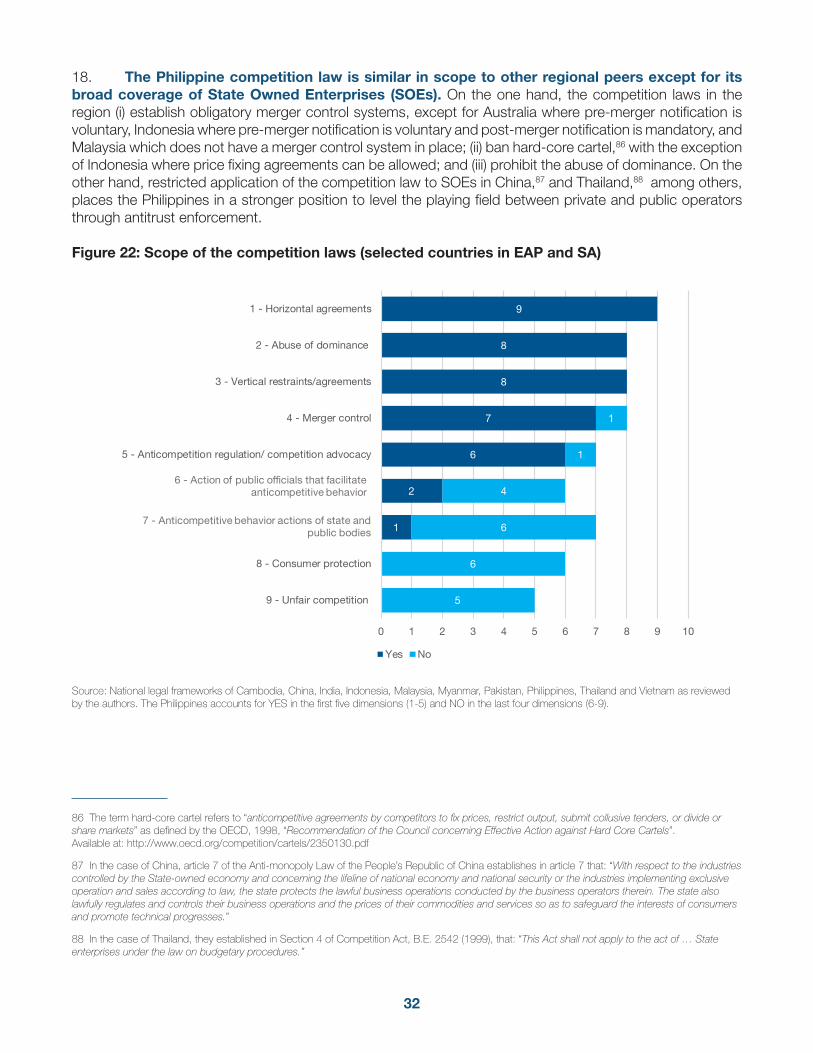
32
18. The Philippine competition law is similar in scope to other regional peers except for its broad coverage of State Owned Enterprises (SOEs). On the one hand, the competition laws in the region (i) establish obligatory merger control systems, except for Australia where pre-merger notification is voluntary, Indonesia where pre-merger notification is voluntary and post-merger notification is mandatory, and Malaysia which does not have a merger control system in place; (ii) ban hard-core cartel,86 with the exception of Indonesia where price fixing agreements can be allowed; and (iii) prohibit the abuse of dominance. On the other hand, restricted application of the competition law to SOEs in China,87 and Thailand,88 among others, places the Philippines in a stronger position to level the playing field between private and public operators through antitrust enforcement.
Figure 22: Scope of the competition laws (selected countries in EAP and SA)
1
2
6
7
8
8
9
5
6
6
4
1
1
0 1 2 3 4 5 6 7 8 9 10
9 - Unfair competition
8 - Consumer protection
7 - Anticompetitive behavior actions of state and publicbodies
6 - Action of public officials that facilitate anticompetitivebehavior
5 - Anticompetition regulation/ competition advocacy
4 - Merger control
3 - Vertical restraints/agreements
2 - Abuse of dominance
1 - Horizontal agreements
Yes No
6 - Action of public officials that facilitate anticompetitive behavior
7 - Anticompetitive behavior actions of state and public bodies
Source: National legal frameworks of Cambodia, China, India, Indonesia, Malaysia, Myanmar, Pakistan, Philippines, Thailand and Vietnam as reviewed by the authors. The Philippines accounts for YES in the first five dimensions (1-5) and NO in the last four dimensions (6-9).
86 The term hard-core cartel refers to “anticompetitive agreements by competitors to fix prices, restrict output, submit collusive tenders, or divide or share markets” as defined by the OECD, 1998, “Recommendation of the Council concerning Effective Action against Hard Core Cartels”.Available at: http://www.oecd.org/competition/cartels/2350130.pdf
87 In the case of China, article 7 of the Anti-monopoly Law of the People’s Republic of China establishes in article 7 that: “With respect to the industries controlled by the State-owned economy and concerning the lifeline of national economy and national security or the industries implementing exclusive operation and sales according to law, the state protects the lawful business operations conducted by the business operators therein. The state also lawfully regulates and controls their business operations and the prices of their commodities and services so as to safeguard the interests of consumers and promote technical progresses.”
88 In the case of Thailand, they established in Section 4 of Competition Act, B.E. 2542 (1999), that: “This Act shall not apply to the act of … State enterprises under the law on budgetary procedures.”
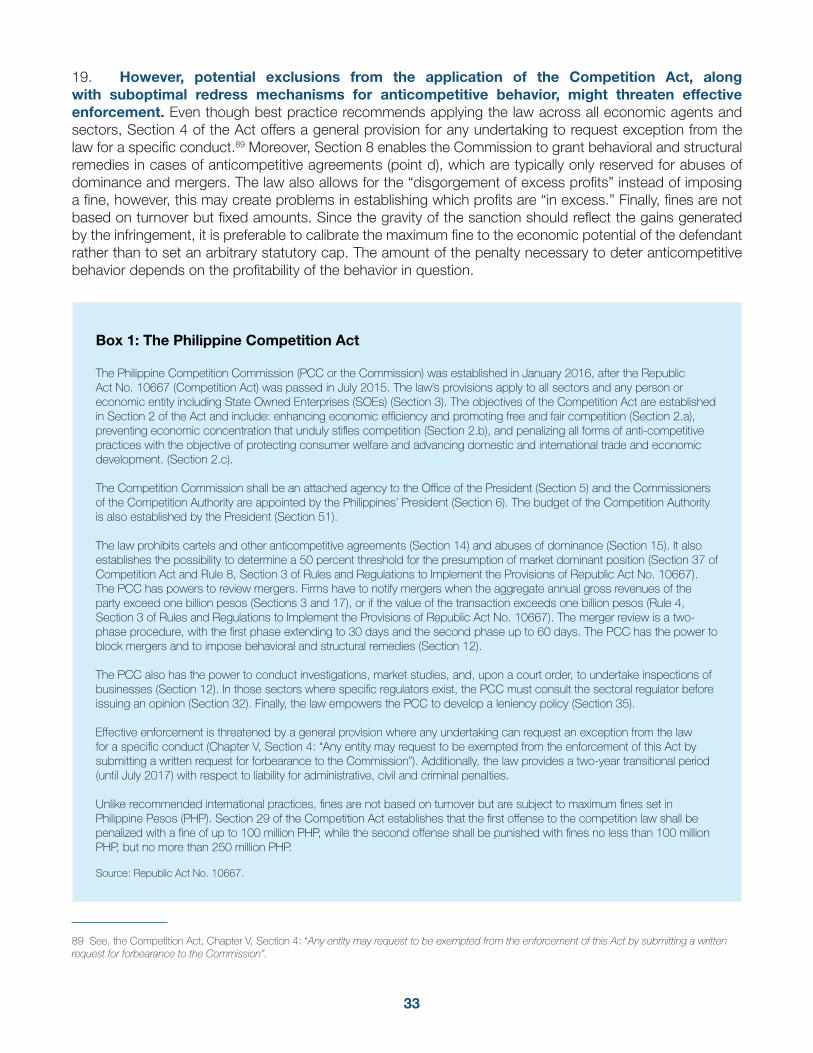
33
19. However, potential exclusions from the application of the Competition Act, along with suboptimal redress mechanisms for anticompetitive behavior, might threaten effective enforcement. Even though best practice recommends applying the law across all economic agents and sectors, Section 4 of the Act offers a general provision for any undertaking to request exception from the law for a specific conduct.89 Moreover, Section 8 enables the Commission to grant behavioral and structural remedies in cases of anticompetitive agreements (point d), which are typically only reserved for abuses of dominance and mergers. The law also allows for the “disgorgement of excess profits” instead of imposing a fine, however, this may create problems in establishing which profits are “in excess.” Finally, fines are not based on turnover but fixed amounts. Since the gravity of the sanction should reflect the gains generated by the infringement, it is preferable to calibrate the maximum fine to the economic potential of the defendant rather than to set an arbitrary statutory cap. The amount of the penalty necessary to deter anticompetitive behavior depends on the profitability of the behavior in question.
Box 1: The Philippine Competition Act
The Philippine Competition Commission (PCC or the Commission) was established in January 2016, after the Republic Act No. 10667 (Competition Act) was passed in July 2015. The law’s provisions apply to all sectors and any person or economic entity including State Owned Enterprises (SOEs) (Section 3). The objectives of the Competition Act are established in Section 2 of the Act and include: enhancing economic efficiency and promoting free and fair competition (Section 2.a), preventing economic concentration that unduly stifles competition (Section 2.b), and penalizing all forms of anti-competitive practices with the objective of protecting consumer welfare and advancing domestic and international trade and economic development. (Section 2.c).
The Competition Commission shall be an attached agency to the Office of the President (Section 5) and the Commissioners of the Competition Authority are appointed by the Philippines’ President (Section 6). The budget of the Competition Authority is also established by the President (Section 51).
The law prohibits cartels and other anticompetitive agreements (Section 14) and abuses of dominance (Section 15). It also establishes the possibility to determine a 50 percent threshold for the presumption of market dominant position (Section 37 of Competition Act and Rule 8, Section 3 of Rules and Regulations to Implement the Provisions of Republic Act No. 10667). The PCC has powers to review mergers. Firms have to notify mergers when the aggregate annual gross revenues of the party exceed one billion pesos (Sections 3 and 17), or if the value of the transaction exceeds one billion pesos (Rule 4, Section 3 of Rules and Regulations to Implement the Provisions of Republic Act No. 10667). The merger review is a two-phase procedure, with the first phase extending to 30 days and the second phase up to 60 days. The PCC has the power to block mergers and to impose behavioral and structural remedies (Section 12).
The PCC also has the power to conduct investigations, market studies, and, upon a court order, to undertake inspections of businesses (Section 12). In those sectors where specific regulators exist, the PCC must consult the sectoral regulator before issuing an opinion (Section 32). Finally, the law empowers the PCC to develop a leniency policy (Section 35).
Effective enforcement is threatened by a general provision where any undertaking can request an exception from the law for a specific conduct (Chapter V, Section 4: “Any entity may request to be exempted from the enforcement of this Act by submitting a written request for forbearance to the Commission”). Additionally, the law provides a two-year transitional period (until July 2017) with respect to liability for administrative, civil and criminal penalties.
Unlike recommended international practices, fines are not based on turnover but are subject to maximum fines set in Philippine Pesos (PHP). Section 29 of the Competition Act establishes that the first offense to the competition law shall be penalized with a fine of up to 100 million PHP, while the second offense shall be punished with fines no less than 100 million PHP, but no more than 250 million PHP.
Source: Republic Act No. 10667.
89 See, the Competition Act, Chapter V, Section 4: “Any entity may request to be exempted from the enforcement of this Act by submitting a written request for forbearance to the Commission”.
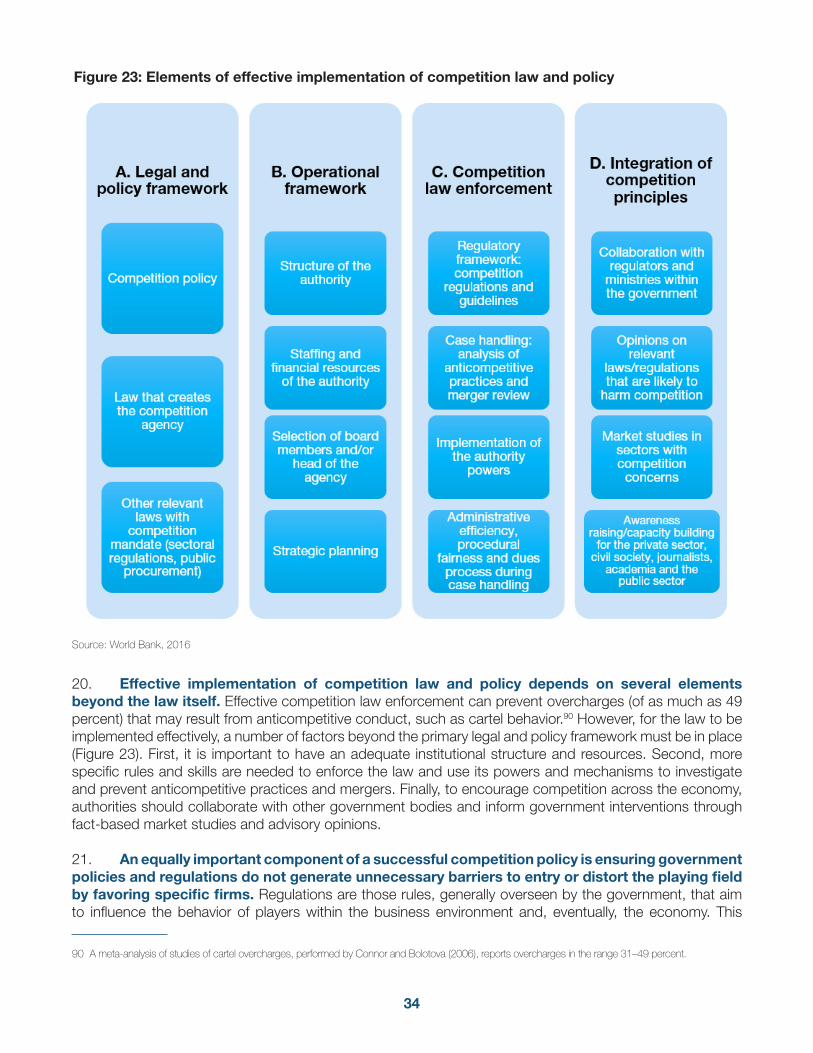
34
20. Effective implementation of competition law and policy depends on several elements beyond the law itself. Effective competition law enforcement can prevent overcharges (of as much as 49 percent) that may result from anticompetitive conduct, such as cartel behavior.90 However, for the law to be implemented effectively, a number of factors beyond the primary legal and policy framework must be in place (Figure 23). First, it is important to have an adequate institutional structure and resources. Second, more specific rules and skills are needed to enforce the law and use its powers and mechanisms to investigate and prevent anticompetitive practices and mergers. Finally, to encourage competition across the economy, authorities should collaborate with other government bodies and inform government interventions through fact-based market studies and advisory opinions.
21. An equally important component of a successful competition policy is ensuring government policies and regulations do not generate unnecessary barriers to entry or distort the playing field by favoring specific firms. Regulations are those rules, generally overseen by the government, that aim to influence the behavior of players within the business environment and, eventually, the economy. This
90 A meta-analysis of studies of cartel overcharges, performed by Connor and Bolotova (2006), reports overcharges in the range 31–49 percent.
Figure 23: Elements of effective implementation of competition law and policy
Source: World Bank, 2016
35
definition includes regulations enacted by governments, standards set by sector regulators and limitations imposed by professional organizations.
22. Regulations can often be justified on social or economic grounds and are important to achieve relevant policy objectives. Such rules are usually driven by legitimate social and economic objectives. Government intervention may be justified by equity goals, such as poverty reduction, or by economic considerations, such as efficiency. The latter may be required when market forces alone cannot deliver the socially optimal outcome, for example in the case of market failures such as natural monopolies, or the presence of externalities.
23. There are circumstances where policy interventions distort competition and, in turn, harm welfare. In some cases, existing regulations (or lack thereof) may be the result of historical processes which have not taken into account their distortive effects on markets. In other circumstances, the main market participants may exercise their lobbying power to influence rule setters (a phenomenon that the literature calls regulatory capture).91 One of their goals usually is to obtain rules that reduce the degree of competitive pressure they face. However, reducing the level of competition is a very important cost that affects the private sector, consumers and the whole economy. It is thus fundamental for policymakers to evaluate that the costs of regulatory interventions will not outweigh the benefits, and to seek alternative options that achieve the ultimate policy objective and minimize distortions to market functioning. In this way, policymakers can maximize the positive impact of regulations on the economy.
24. The risk that regulation may hinder the development of well-functioning markets may be mitigated by considering competition principles when designing regulations and state interventions. One of the most important components of a successful competition policy is to ensure government policies and regulations do not unnecessarily restrict entry, facilitate collusion, increase the cost of competing or distort the level playing field by providing an undue advantage to specific firms. The WBG Markets and Competition Policy Assessment Toolkit, described in the next section and applied within this assessment, provides a structured framework to analyze the effects of government interventions on market competition.
25. By embedding competition principles in policy making, potential distortions from direct state intervention, state aid and investment incentives may be minimized. State support can take various forms, including tax exemptions, loan guarantees, provision of resources at below market prices, subsidies and capital injections. While offering government support to the private sector or SOEs may help to achieve specific goals, it may have a negative impact on competition. If not properly designed, state aid may provide an undue advantage to specific firms and reinforce a dominant position, thus facilitating anticompetitive behaviors, or it may reduce a firm’s incentive to make investments, thus generating market inefficiencies.
26. Price controls are another type of policy intervention where the negative effects should be carefully assessed. Governments may seek different objectives by controlling prices. They may want to protect consumers from increasing prices or to protect the incomes of small producers. Price controls may be necessary in the regulation of natural monopolies, yet they can have distortive effects in markets with more players, including facilitating collusion or dampening incentives to invest. To guard against this, regulations that require consultation with the competition authority before introducing price controls could be implemented. The authority could assess the impact of competitive restrictions in the concerned market and explore the use of a less distortive intervention.
27. Building on its advocacy mandate, the PCC, in cooperation with sector regulators, can play a key role in integrating competition principles in policy making. To achieve an effective competition policy,
91 Chicago School pioneered the notion and theory of ‘regulatory capture’ (Stigler, 1971), which was further developed by the Toulouse School (Laffont and Tirole, 1991).
36
collaboration between the Competition Authority and sector regulators is necessary to prevent conflicts and to ensure a stable environment for regulated firms. In the Philippines, the position granted to the PCC within the regulatory system can be critical to achieve these objectives; in addition to the enforcement of the Competition Act, the PCC has the power to assist the National Economic and Development Authority, in consultation with relevant agencies and sectors, to formulate competition policies in the Philippines.92 This complements the PCC’s role as pro-competition advocate (Section 12(r) of the law) as well as its ability to intervene in administrative and regulatory proceedings initiated by government agencies, such as the Securities and Exchange Commission (SEC), the Energy Regulatory Commission (ERC) and the National Telecommunications Commission (NTC) (Section 12(n) of the law). The contribution of the Competition Authority in formulating pro-competitive regulations can have a substantial impact, particularly on regulated sectors, state involvement in commercial activities and price controls. Mapping existing regulatory restrictions that may inhibit market competition constitutes a critical tool to inform the advocacy agenda of the PCC and shape its overall institutional strategy.
92 Established by section 12 of Competition Act.

37
38
II. Identifying regulatory obstacles to competition in the Philippines’ markets
28. New available data on the status of market regulations in the Philippines suggest that regulatory restrictions might be limiting competition in key sectors of the economy thus affecting the country’s ability to maximize its growth potential. PMR indicators assess the extent to which public policies promote or inhibit market forces.93 Each of the areas addressed within the PMR methodology sheds light on specific restrictions of the regulatory framework, both economy-wide and in key sectors of the economy, on 12 topics: electricity, gas, telecom, postal service, transport, water, retail distribution, professional services, other sectors, administrative requirements for business start-ups, treatment of foreign parties; and others, such as governance of public-controlled enterprises or antitrust exclusions and exemptions. The information for the Philippines was first collected in 2013 as part of International Finance Corporation (IFC) advisory services and was later revised in 2016-2017 to build in PMR indicators. The economy-wide PMR methodology (see Box 2) is a useful instrument for pinpointing rules that are likely to exercise restrictive pressure on competition. However, it should be kept in mind that PMR analysis is not an end in itself; once scores are calculated, these must be used as a screening device to identify the aspects of the regulatory framework that are more likely to have a negative impact on competition.
Box 2: PMR Methodology: Economy-wide score
Product Market Regulation (PMR) indicators form a comprehensive and internationally-comparable set of indicators that measure the degree to which policies promote or inhibit competition in areas of the product market where competition is viable. PMR indicators are useful to monitor the regulatory achievements of monitored countries and to evaluate the effectiveness of policies introduced over the years. Moreover, they have been widely used to help policymakers create a clear picture of regulations in different countries, with the objective of identifying gaps in regulations and/or room for improvements.
The indicators rely on information collected through the OECD’s regulatory indicators questionnaires. Figure 24 summarizes how the economy-wide score is calculated (number in parentheses represent weights). First, the answers are coded into objective information (scores range from 0 to 6, with 6 being the worst). Second, scores of individual regulations are aggregated into subsequently broader regulatory areas from “Lower-level indicators” (18 areas) to “Intermediate indicators” (7 areas), and finally the three “Sub-indicator”. The three sub-indicators are averaged to calculate the overall PMR score.
93 The methodology and key findings of the PMR for OECD countries are presented in Nicoletti et al. (1999), Conway et al. (2005) and Wolf et al. (2009). The current PMR database used for this study includes Australia, Austria, Argentina, Belgium, Bolivia, Brazil, Bulgaria, Canada, Chile, China, Czech Republic, Colombia, Costa Rica, Croatia, Cyprus, Denmark, Dominican Republic, Ecuador, Egypt, El Salvador, Estonia, Finland, France, Germa-ny, Greece, Guatemala, Honduras, Hungary, Iceland, India, Ireland, Israel, Italy, Jamaica, Japan, Kenya, Korea, Latvia, Lithuania, Luxembourg, Malta, Mexico, Netherlands, New Zealand, Nicaragua, Norway, Panama, Paraguay, Peru, Philippines, Poland, Portugal, Romania, Russia, Rwanda, Slovak Republic, Slovenia, South Africa, Spain, Sweden, Switzerland, Turkey, Uruguay, and United Kingdom.
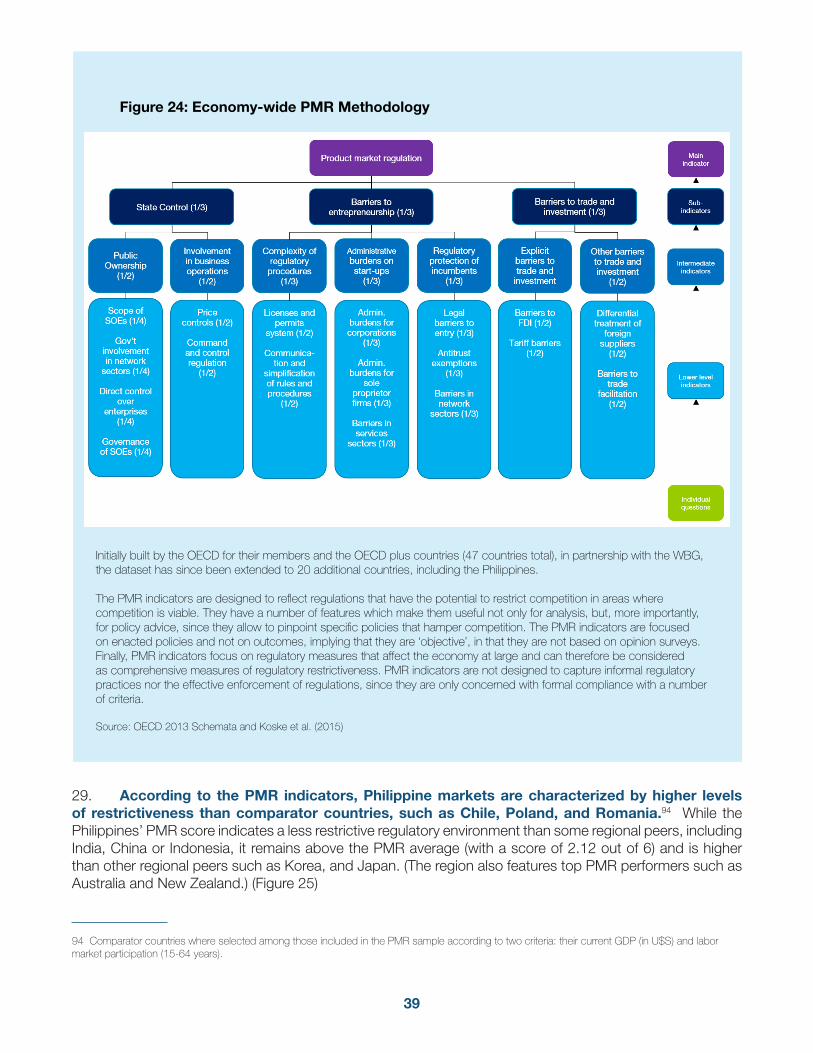
39
Figure 24: Economy-wide PMR Methodology
Initially built by the OECD for their members and the OECD plus countries (47 countries total), in partnership with the WBG, the dataset has since been extended to 20 additional countries, including the Philippines.
The PMR indicators are designed to reflect regulations that have the potential to restrict competition in areas where competition is viable. They have a number of features which make them useful not only for analysis, but, more importantly, for policy advice, since they allow to pinpoint specific policies that hamper competition. The PMR indicators are focused on enacted policies and not on outcomes, implying that they are ‘objective’, in that they are not based on opinion surveys. Finally, PMR indicators focus on regulatory measures that affect the economy at large and can therefore be considered as comprehensive measures of regulatory restrictiveness. PMR indicators are not designed to capture informal regulatory practices nor the effective enforcement of regulations, since they are only concerned with formal compliance with a number of criteria.
Source: OECD 2013 Schemata and Koske et al. (2015)
29. According to the PMR indicators, Philippine markets are characterized by higher levels of restrictiveness than comparator countries, such as Chile, Poland, and Romania.94 While the Philippines’ PMR score indicates a less restrictive regulatory environment than some regional peers, including India, China or Indonesia, it remains above the PMR average (with a score of 2.12 out of 6) and is higher than other regional peers such as Korea, and Japan. (The region also features top PMR performers such as Australia and New Zealand.) (Figure 25)
94 Comparator countries where selected among those included in the PMR sample according to two criteria: their current GDP (in U$S) and labor market participation (15-64 years).
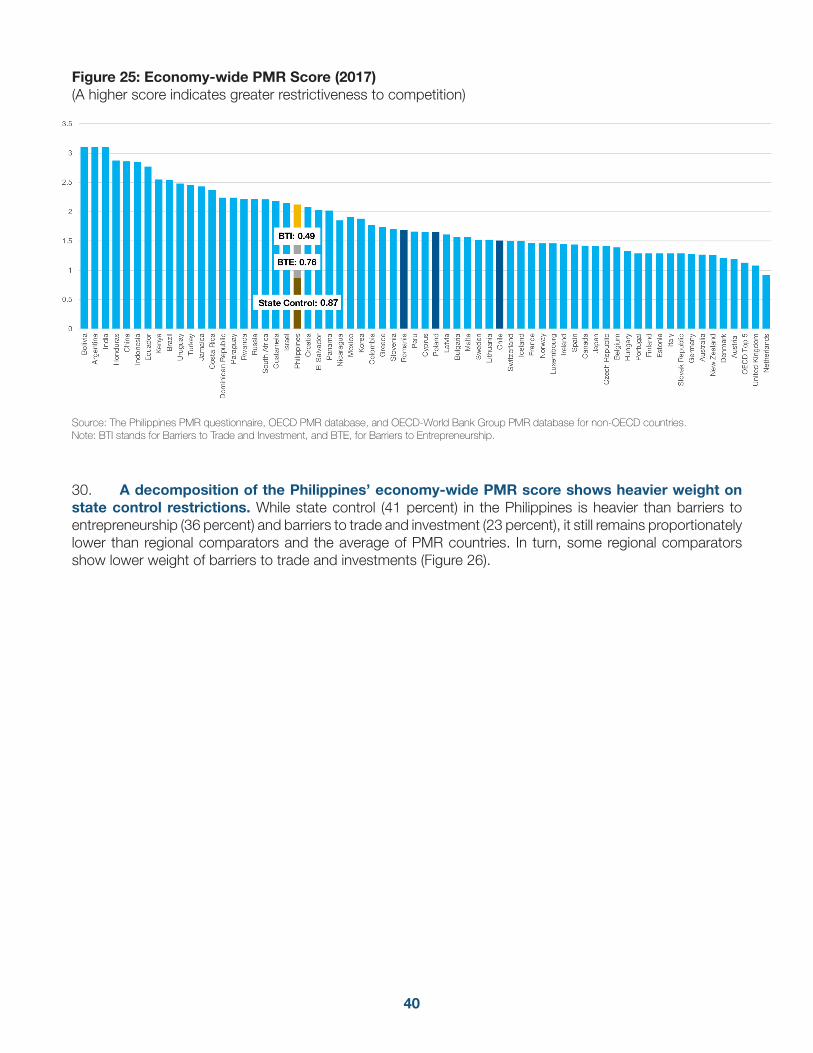
40
Figure 25: Economy-wide PMR Score (2017) (A higher score indicates greater restrictiveness to competition)
Source: The Philippines PMR questionnaire, OECD PMR database, and OECD-World Bank Group PMR database for non-OECD countries. Note: BTI stands for Barriers to Trade and Investment, and BTE, for Barriers to Entrepreneurship.
30. A decomposition of the Philippines’ economy-wide PMR score shows heavier weight on state control restrictions. While state control (41 percent) in the Philippines is heavier than barriers to entrepreneurship (36 percent) and barriers to trade and investment (23 percent), it still remains proportionately lower than regional comparators and the average of PMR countries. In turn, some regional comparators show lower weight of barriers to trade and investments (Figure 26).
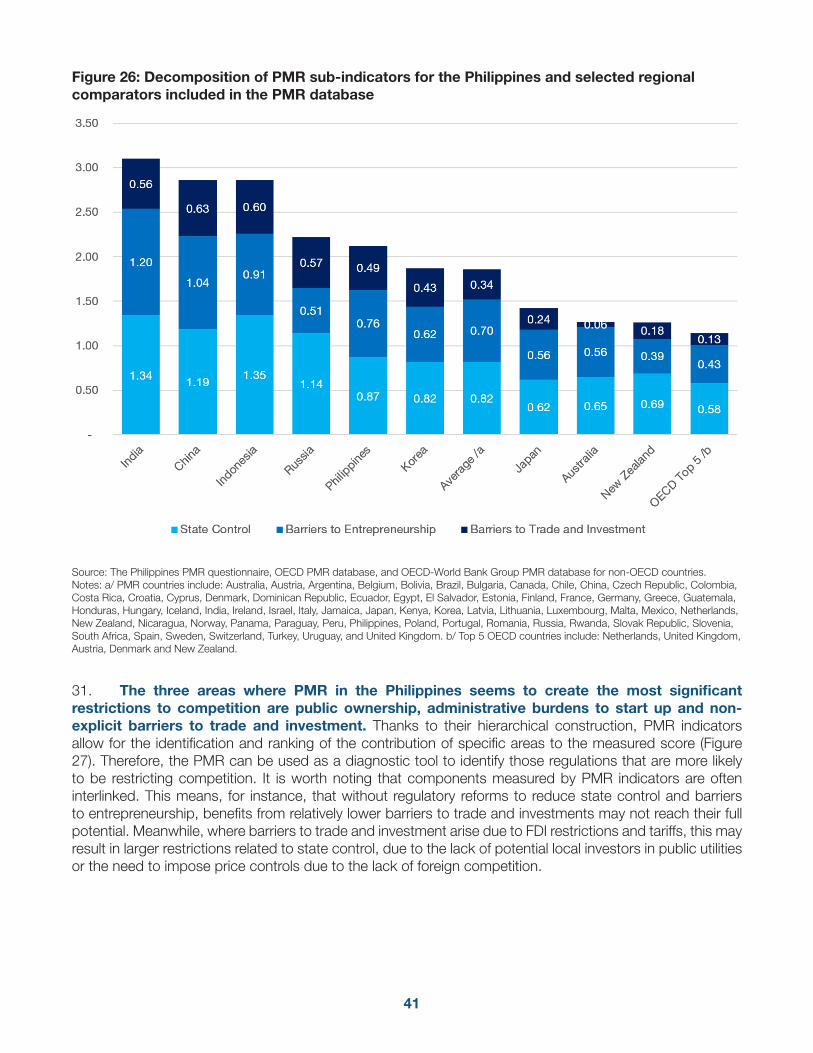
41
Figure 26: Decomposition of PMR sub-indicators for the Philippines and selected regional comparators included in the PMR database
134% 119%135%
114%87% 82% 82%
62% 65% 69% 58%
120%
104%91%
51%76%
62% 70%
56% 56% 39%43%
56%
63% 60%
57% 49%
43% 34%
24% 6% 18%13%
-
0.50
1.00
1.50
2.00
2.50
3.00
3.50
State Control Barriers to Entrepreneurship Barriers to Trade and Investment
Source: The Philippines PMR questionnaire, OECD PMR database, and OECD-World Bank Group PMR database for non-OECD countries. Notes: a/ PMR countries include: Australia, Austria, Argentina, Belgium, Bolivia, Brazil, Bulgaria, Canada, Chile, China, Czech Republic, Colombia, Costa Rica, Croatia, Cyprus, Denmark, Dominican Republic, Ecuador, Egypt, El Salvador, Estonia, Finland, France, Germany, Greece, Guatemala, Honduras, Hungary, Iceland, India, Ireland, Israel, Italy, Jamaica, Japan, Kenya, Korea, Latvia, Lithuania, Luxembourg, Malta, Mexico, Netherlands, New Zealand, Nicaragua, Norway, Panama, Paraguay, Peru, Philippines, Poland, Portugal, Romania, Russia, Rwanda, Slovak Republic, Slovenia, South Africa, Spain, Sweden, Switzerland, Turkey, Uruguay, and United Kingdom. b/ Top 5 OECD countries include: Netherlands, United Kingdom, Austria, Denmark and New Zealand.
31. The three areas where PMR in the Philippines seems to create the most significant restrictions to competition are public ownership, administrative burdens to start up and non-explicit barriers to trade and investment. Thanks to their hierarchical construction, PMR indicators allow for the identification and ranking of the contribution of specific areas to the measured score (Figure 27). Therefore, the PMR can be used as a diagnostic tool to identify those regulations that are more likely to be restricting competition. It is worth noting that components measured by PMR indicators are often interlinked. This means, for instance, that without regulatory reforms to reduce state control and barriers to entrepreneurship, benefits from relatively lower barriers to trade and investments may not reach their full potential. Meanwhile, where barriers to trade and investment arise due to FDI restrictions and tariffs, this may result in larger restrictions related to state control, due to the lack of potential local investors in public utilities or the need to impose price controls due to the lack of foreign competition.
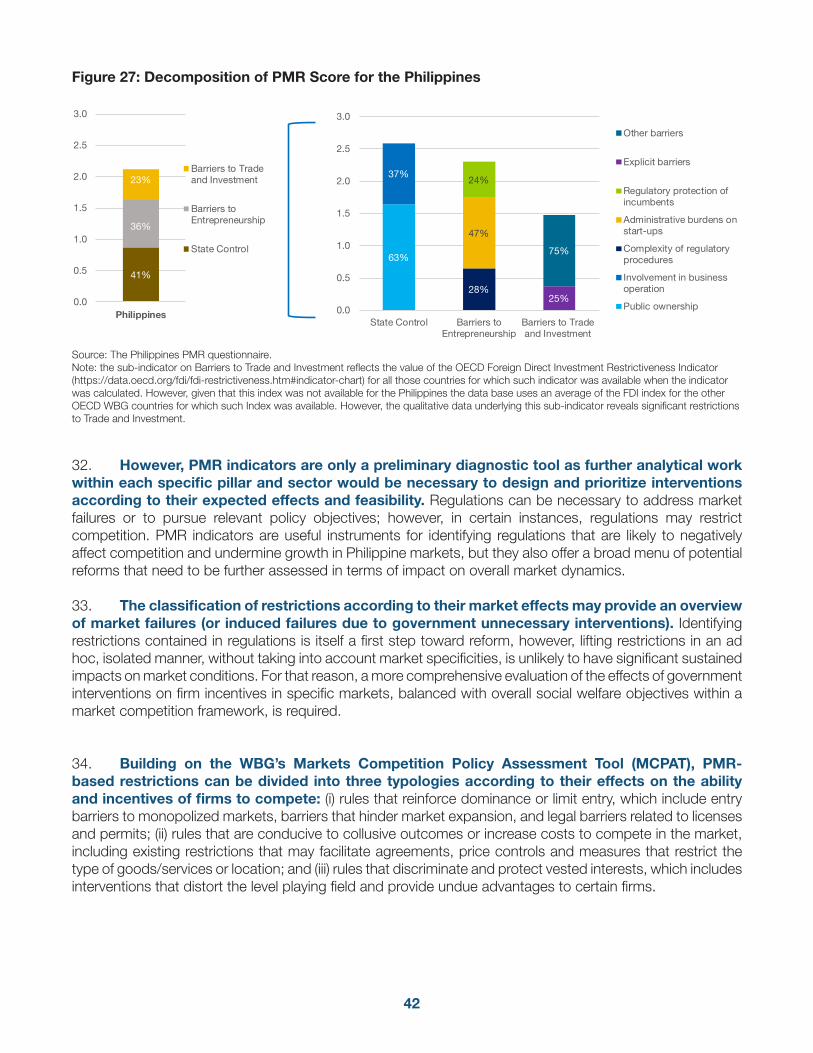
42
Figure 27: Decomposition of PMR Score for the Philippines
41%
36%
23%
0.0
0.5
1.0
1.5
2.0
2.5
3.0
Philippines
Barriers to Tradeand Investment
Barriers toEntrepreneurship
State Control63%
37%
28%
47%
24%
25%
75%
0.0
0.5
1.0
1.5
2.0
2.5
3.0
State Control Barriers toEntrepreneurship
Barriers to Tradeand Investment
Other barriers
Explicit barriers
Regulatory protection ofincumbents
Administrative burdens onstart-ups
Complexity of regulatoryprocedures
Involvement in businessoperation
Public ownership
Source: The Philippines PMR questionnaire.Note: the sub-indicator on Barriers to Trade and Investment reflects the value of the OECD Foreign Direct Investment Restrictiveness Indicator (https://data.oecd.org/fdi/fdi-restrictiveness.htm#indicator-chart) for all those countries for which such indicator was available when the indicator was calculated. However, given that this index was not available for the Philippines the data base uses an average of the FDI index for the other OECD WBG countries for which such Index was available. However, the qualitative data underlying this sub-indicator reveals significant restrictions to Trade and Investment.
32. However, PMR indicators are only a preliminary diagnostic tool as further analytical work within each specific pillar and sector would be necessary to design and prioritize interventions according to their expected effects and feasibility. Regulations can be necessary to address market failures or to pursue relevant policy objectives; however, in certain instances, regulations may restrict competition. PMR indicators are useful instruments for identifying regulations that are likely to negatively affect competition and undermine growth in Philippine markets, but they also offer a broad menu of potential reforms that need to be further assessed in terms of impact on overall market dynamics.
33. The classification of restrictions according to their market effects may provide an overview of market failures (or induced failures due to government unnecessary interventions). Identifying restrictions contained in regulations is itself a first step toward reform, however, lifting restrictions in an ad hoc, isolated manner, without taking into account market specificities, is unlikely to have significant sustained impacts on market conditions. For that reason, a more comprehensive evaluation of the effects of government interventions on firm incentives in specific markets, balanced with overall social welfare objectives within a market competition framework, is required.
34. Building on the WBG’s Markets Competition Policy Assessment Tool (MCPAT), PMR-based restrictions can be divided into three typologies according to their effects on the ability and incentives of firms to compete: (i) rules that reinforce dominance or limit entry, which include entry barriers to monopolized markets, barriers that hinder market expansion, and legal barriers related to licenses and permits; (ii) rules that are conducive to collusive outcomes or increase costs to compete in the market, including existing restrictions that may facilitate agreements, price controls and measures that restrict the type of goods/services or location; and (iii) rules that discriminate and protect vested interests, which includes interventions that distort the level playing field and provide undue advantages to certain firms.
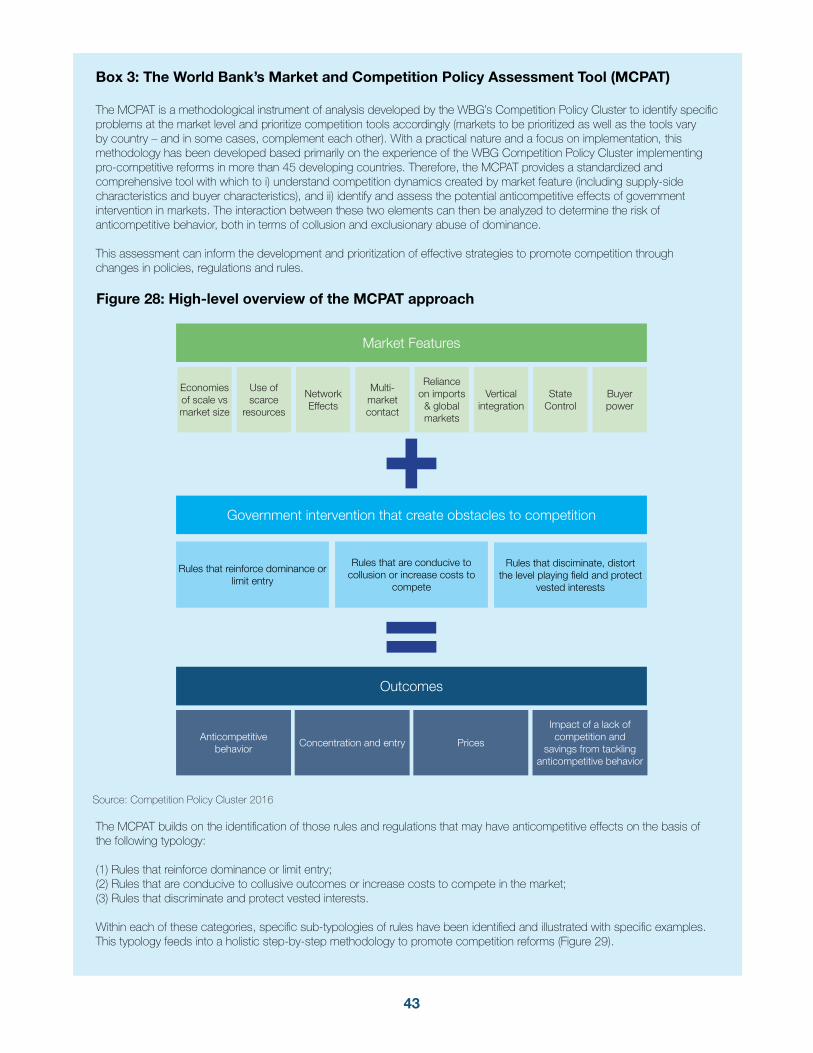
43
Box 3: The World Bank’s Market and Competition Policy Assessment Tool (MCPAT)
The MCPAT is a methodological instrument of analysis developed by the WBG’s Competition Policy Cluster to identify specific problems at the market level and prioritize competition tools accordingly (markets to be prioritized as well as the tools vary by country – and in some cases, complement each other). With a practical nature and a focus on implementation, this methodology has been developed based primarily on the experience of the WBG Competition Policy Cluster implementing pro-competitive reforms in more than 45 developing countries. Therefore, the MCPAT provides a standardized and comprehensive tool with which to i) understand competition dynamics created by market feature (including supply-side characteristics and buyer characteristics), and ii) identify and assess the potential anticompetitive effects of government intervention in markets. The interaction between these two elements can then be analyzed to determine the risk of anticompetitive behavior, both in terms of collusion and exclusionary abuse of dominance.
This assessment can inform the development and prioritization of effective strategies to promote competition through changes in policies, regulations and rules.
Figure 28: High-level overview of the MCPAT approach
Source: Competition Policy Cluster 2016
The MCPAT builds on the identification of those rules and regulations that may have anticompetitive effects on the basis of the following typology:
(1) Rules that reinforce dominance or limit entry; (2) Rules that are conducive to collusive outcomes or increase costs to compete in the market; (3) Rules that discriminate and protect vested interests.
Within each of these categories, specific sub-typologies of rules have been identified and illustrated with specific examples. This typology feeds into a holistic step-by-step methodology to promote competition reforms (Figure 29).
Market Features
Economies of scale vs market size
Use of scarce
resources
Network Effects
Multi-market contact
Reliance on imports
& global markets
Vertical integration
State Control
Buyer power
Government intervention that create obstacles to competition
Rules that reinforce dominance or limit entry
Rules that disciminate, distort the level playing field and protect
vested interests
Rules that are conducive to collusion or increase costs to
compete
Outcomes
Anticompetitive behavior
Concentration and entry Prices
Impact of a lack of competition and
savings from tackling anticompetitive behavior
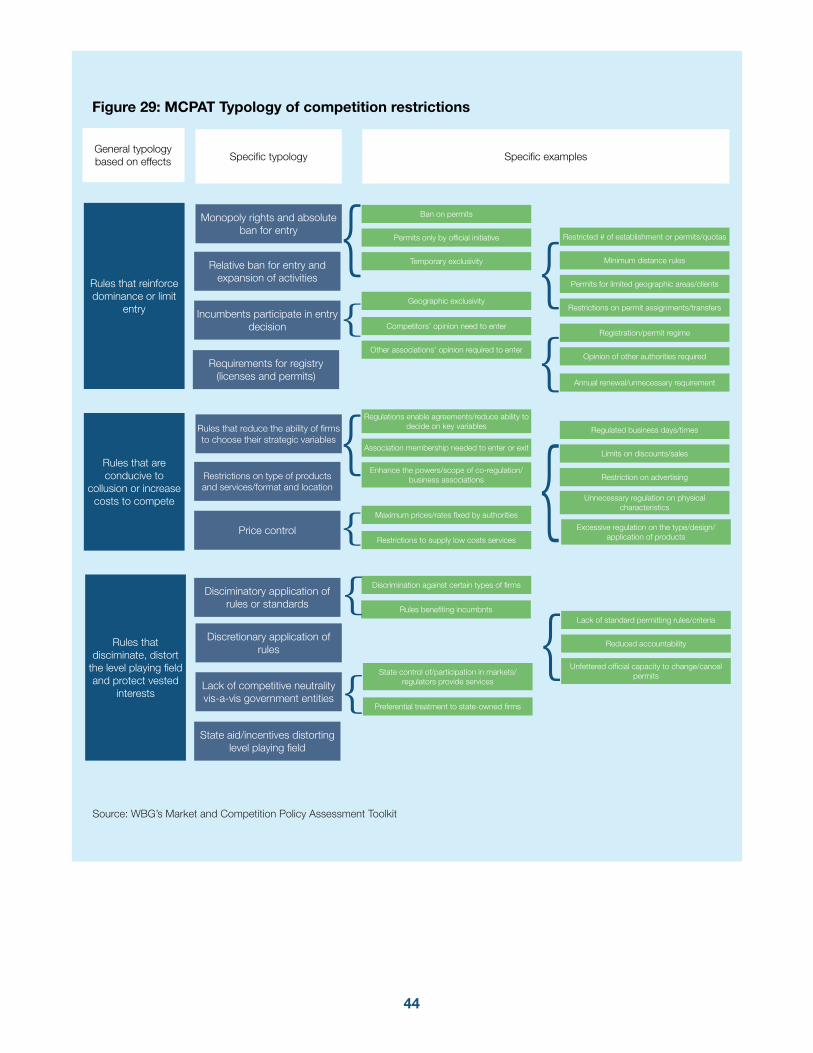
44
Figure 29: MCPAT Typology of competition restrictions
Source: WBG’s Market and Competition Policy Assessment Toolkit
State aid/incentives distorting level playing field
General typology based on effects Specific typology
Rules that reinforce dominance or limit
entry
Monopoly rights and absolute ban for entry
Relative ban for entry and expansion of activities
Incumbents participate in entry decision
Requirements for registry (licenses and permits)
Specific examples
Ban on permits
Discrimination against certain types of firms
Rules benefiting incumbnts
Permits only by official initiative
Temporary exclusivity
Geographic exclusivity
{Competitors’ opinion need to enter
Other associations’ opinion required to enter
{
Restricted # of establishment or permits/quotas
Minimum distance rules
Permits for limited geographic areas/clients
Restrictions on permit assignments/transfers
{Registration/permit regime
Opinion of other authorities required{ Annual renewal/unnecessary requirement
Rules that are conducive to
collusion or increase costs to compete
Rules that reduce the ability of firms to choose their strategic variables
Restrictions on type of products and services/format and location
Price control
Regulations enable agreements/reduce ability to decide on key variables
Association membership needed to enter or exit
Enhance the powers/scope of co-regulation/business associations
Maximum prices/rates fixed by authorities
{Restrictions to supply low costs services{
Regulated business days/times
Limits on discounts/sales
Restriction on advertising
Unnecessary regulation on physical characteristics{
Excessive regulation on the type/design/application of products
Rules that disciminate, distort
the level playing field and protect vested
interests
Discretionary application of rules
Lack of competitive neutrality vis-a-vis government entities
State control of/participation in markets/regulators provide services
{
Preferential treatment to state-owned firms{
Lack of standard permitting rules/criteria
Reduced accountability
Unfettered official capacity to change/cancel permits
{Disciminatory application of
rules or standards
45
1. State Participation and Control of Economic Activities
35. While the Philippines remains close to the PMR average in terms of the state control sub-indicator, some of its components point toward the existence of critical restrictions to competition (Figure 30). The score of state control is mainly driven by the extent of public ownership, which becomes particularly concerning given that the key contributors to restrictiveness in this area are the terms of corporate governance and the scope of SOEs. These dimensions are closely connected: where the scope of SOEs is higher, i.e. SOEs are present in more sectors, having sound corporate governance provisions in place will have a stronger impact on minimizing potential market distortions. To a lesser extent, price controls and suboptimal use of command and control regulations are also responsible for the restrictions related to the involvement of the state in business operations.
1.1 Public Ownership
36. Governments justify their direct participation in the economy through a mixture of social and economic goals. Governments generally invoke the control of strategic resources and the improvement of distribution of wealth and power as justifications to participate in economic activities through SOEs.95 Employment and industrial policies may also be major drivers for developing a large presence of SOEs in the economy.96 In times of crisis, state ownership is often used to rescue private businesses affected by systemic economic and financial problems.97 Such government bailouts of private firms are carried out for a variety of reasons, including the protection of employment, industrial policy considerations, and other strategic and political motivations.98
37. The Government of the Philippines first adopted key reforms to rationalize state participation in the economy in the late 1980s.99 Structural reforms in the public sector began in 1986 under Proclamation No. 50 of December 8, 1986.100 This program, which was implemented by the Asset Privatization Trust (APT) under the guidance of the Committee on Privatization (COP), was directed at substantially reducing the size of the government’s corporate sector. Later, these institutions were replaced by the Privatization Council (PC) and the Privatization and Management Office (PMO) created by Order No. 322 of December 6, 2000.101 The PC is now the central government agency responsible for overseeing
95 According to the PMR, an SOE is defined as a company where state or provincial governments (not including local governments or municipalities) hold, either directly or indirectly through a government-controlled company, the largest single share of the firm’s equity capital. Public ownership is mea-sured by the extent to which the government participates and intervenes in markets through the scope and scale of its SOEs. Publicly-controlled firms include also government entities not organized as companies, but operating in business or market activities.
96 Giorgio Monti (2007), “EC Competition Law”, CUP pp. 441-442; Karel van Miert (2000), “Liberalization of the Economy of the European Union: The Game is not (yet) over”, in Damien Geradin (Ed.) Liberalization of state monopolies, Kluwer Law International, pp.1-2; OECD (2005), “OECD Guidelines on Corporate Governance of State-Owned Enterprises”, pp. 9-10.
97 OECD (2009), “Competition and the Financial Crisis”, pp.14-15. For example, in response to the latest financial crisis the European Commission has adopted a number of communications loosening the state aid rules applicable to restructuring aid given by Member States to banks. Available at: http://ec.europa.eu/competition/state_aid/legislation/temporary.html
98 OECD (2009), “State Owned Enterprises and the Principle of Competitive Neutrality”, OECD Policy Roundtables, p.26
99 The World Bank (2000), “Public-Private Infrastructure Advisory Facility and the World Bank Group, Private Solutions for Infrastructure: Opportunities for the Philippines, A Country Framework Report.” Available at: http://documents.worldbank.org/curated/pt/482921468776415807/pdf/multi-page.pdf
100 Proclamation No. 50 of December 8, 1986, “Proclaiming and launching a program for the expeditious disposition and privatization of certain gov-ernment corporations and/or the assets thereof, and creating the committee on privatization and the asset privatization trust”. Available at: http://www.pmo.gov.ph/p50.pdf
101 Executive Order No. 322 of December 6, 2000, “Constituting an inter-agency privatization council (pc) and creating a privatization and manage-ment office (pmo) under the department of finance for the continuing privatization of government assets and corporations.” Available at: http://www.pmo.gov.ph/eo323.pdf
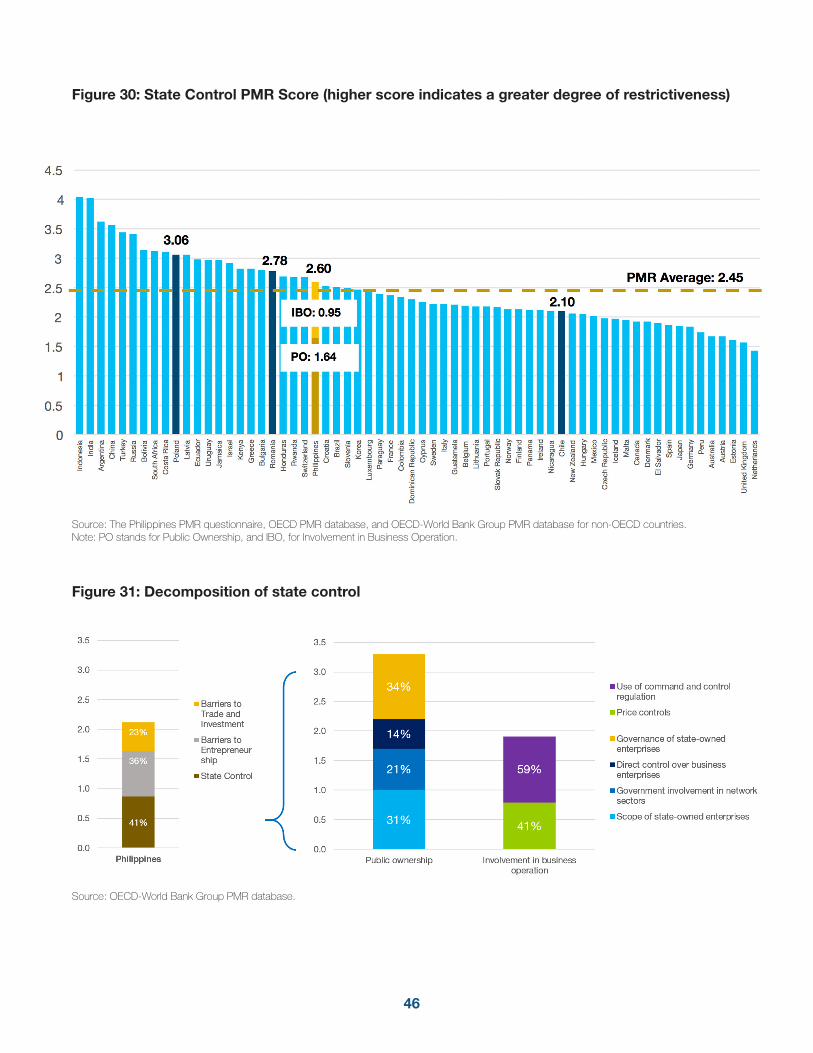
46
Figure 30: State Control PMR Score (higher score indicates a greater degree of restrictiveness)
0
0.5
1
1.5
2
2.5
3
3.5
4
4.5
Indo
nesi
a
Egy
pt
Chi
na
Rus
sia
Sou
th A
fric
a
Pol
and
Ecu
ador
Jam
aica
Ken
ya
Bul
gar
ia
Hon
dur
as
Sw
itzer
land
Cro
atia
Slo
veni
a
Luxe
mb
ourg
Fran
ce
Dom
inic
an R
epub
lic
Sw
eden
Gua
tam
ela
Lith
uani
a
Slo
vak
Rep
ublic
Finl
and
Irel
and
Chi
le
Hun
gary
Cze
ch R
epub
lic
Mal
ta
Den
mar
k
Spa
in
Ger
man
y
Aus
tral
ia
Est
onia
Net
herla
nds
IBO: 0.95
PO: 1.64
Source: The Philippines PMR questionnaire, OECD PMR database, and OECD-World Bank Group PMR database for non-OECD countries.Note: PO stands for Public Ownership, and IBO, for Involvement in Business Operation.
Figure 31: Decomposition of state control
41%
36%
23%
0.0
0.5
1.0
1.5
2.0
2.5
3.0
3.5
Philippines
Barriers toTrade andInvestment
Barriers toEntrepreneurship
State Control
31%
21%
14%
34%
41%
59%
0.0
0.5
1.0
1.5
2.0
2.5
3.0
3.5
Public ownership Involvement in businessoperation
Use of command and controlregulation
Price controls
Governance of state-ownedenterprises
Direct control over businessenterprises
Government involvement in networksectors
Scope of state-owned enterprises
Source: OECD-World Bank Group PMR database.
2.60
47
the government’s privatization program. Its main responsibilities include formulating policies and general guidelines on privatization issues, identifying disposable assets, monitoring the progress of privatization activities and approving the sale or divestment of assets with respect to their price and buyers. The PMO, on the other hand, acts as the marketing agent for those assets.
38. This process was further complemented by transparent Public-Private Partnerships (PPP) regulatory frameworks to foster private entry in infrastructure sectors. Private engagement in infrastructure was first based on the 1990 Build-Own-Transfer (BOT) Law (Republic Act No. 6957), which was later replaced with Republic Act 7718102 and complemented by Administrative Order No. 67 of 1999.103 By establishing a transparent and competitive process for BOT schemes,104 this instrument greatly increased private investment in infrastructure, especially in sectors other than power. Key features of the framework included (i) relaxing the requirement for 60 percent of Filipino ownership for operating infrastructure projects not classified as public utilities;105 (ii) limiting to 50 percent the amount of project costs that government financial institutions could cover; (iii) delegating Congress’ approval to the executive branch; and (iv) allowing implementing agencies to consider unsolicited project proposals and to negotiate proposals directly with the private sector under certain conditions.106 Finally, on September 9, 2010, Executive Order No. 8107 was signed, reorganizing and renaming the BOT Center as the Public-Private Partnership Center. The PPP Center’s mandate is to facilitate and coordinate the PPP program. It manages a revolving fund called the Project Development and Monitoring Facility, provides technical advisory support to implementing agencies, and monitors the implementation of PPP priority projects.108 In 2016, it was estimated that PPP projects would contribute about 0.8 percent of GDP in additional investment spending.
102 Republic Act No. 7718 of 1993 (The Philippine Bot Law) and its Implementing Rules & Regulations. Available at: https://ppp.gov.ph/wp-content/uploads/2015/01/Republic-Act-7718.pdf
103 Administrative Order No. 67 of 1999, “Reorganizing the Coordinating Council of The Philippine Assistance Program and Converting it into the Co-ordinating Council for Private Sector Participation”. This Order expanded the coverage of the BOT program to other forms of private sector participation. Available at: http://www.gov.ph/1999/05/11/administrative-order-no-67-s-1999/
104 The World Bank (2000), “Public-Private Infrastructure Advisory Facility and the World Bank Group, Private Solutions for Infrastructure: Opportunities for the Philippines, A Country Framework Report.” Available at: http://documents.worldbank.org/curated/pt/482921468776415807/pdf/multi-page.pdf
105 See infra at para. 0 for a detailed discussion on restrictions for foreign capital in public utilities in the Philippines.
106 op. cit 119.
107 Executive Order No. 8, of 2010, “Reorganizing and Renaming the Build-Operate and Transfer (BOT) Center to the Public-Private Partnership (PPP) Center of The Philippines and Transferring its Attachment from the Department of Trade and Industry to the National Economic and Development Author-ity and for Other Purposes”. Available at: http://www.gov.ph/2010/09/09/executive-order-no-8-s-2010/
108 Executive Order No. 8 of 2010, as amended by Executive Order No. 136 of 2013, in Section 2, “On the Functions of the PPP center”. Available at: http://www.gov.ph/2010/09/09/executive-order-no-8-s-2010/
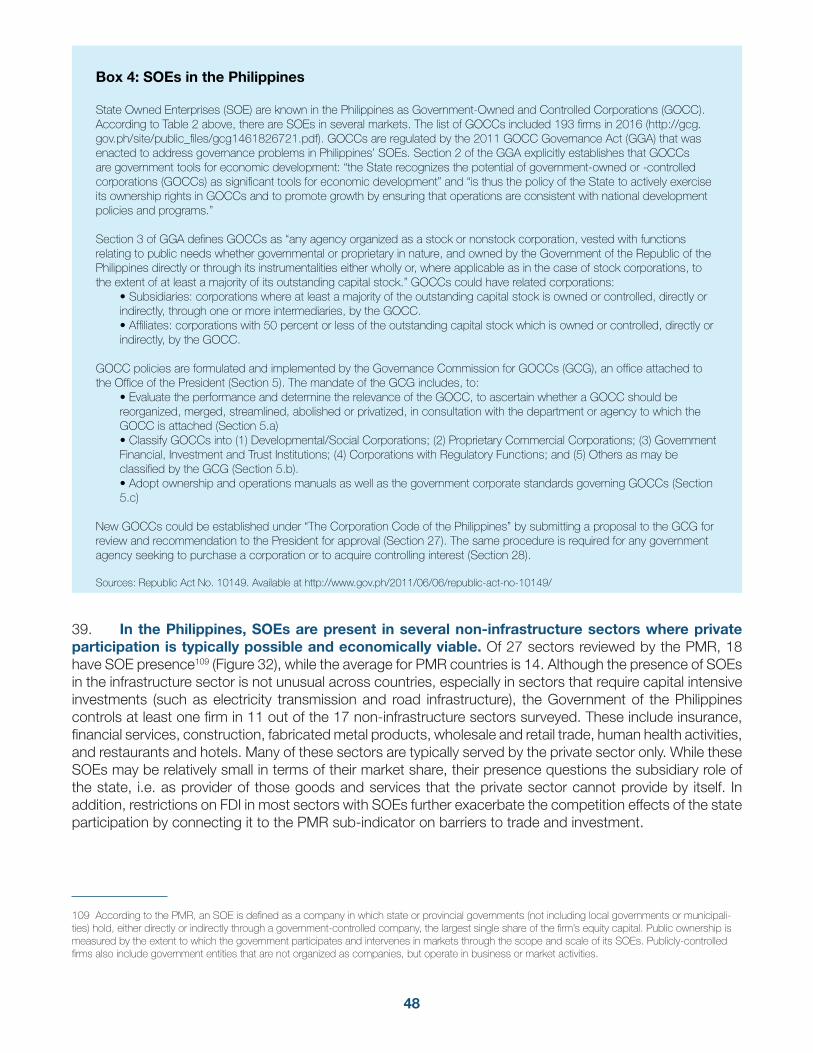
48
Box 4: SOEs in the Philippines
State Owned Enterprises (SOE) are known in the Philippines as Government-Owned and Controlled Corporations (GOCC). According to Table 2 above, there are SOEs in several markets. The list of GOCCs included 193 firms in 2016 (http://gcg.gov.ph/site/public_files/gcg1461826721.pdf). GOCCs are regulated by the 2011 GOCC Governance Act (GGA) that was enacted to address governance problems in Philippines’ SOEs. Section 2 of the GGA explicitly establishes that GOCCs are government tools for economic development: “the State recognizes the potential of government-owned or -controlled corporations (GOCCs) as significant tools for economic development” and “is thus the policy of the State to actively exercise its ownership rights in GOCCs and to promote growth by ensuring that operations are consistent with national development policies and programs.”
Section 3 of GGA defines GOCCs as “any agency organized as a stock or nonstock corporation, vested with functions relating to public needs whether governmental or proprietary in nature, and owned by the Government of the Republic of the Philippines directly or through its instrumentalities either wholly or, where applicable as in the case of stock corporations, to the extent of at least a majority of its outstanding capital stock.” GOCCs could have related corporations:
• Subsidiaries: corporations where at least a majority of the outstanding capital stock is owned or controlled, directly or indirectly, through one or more intermediaries, by the GOCC.• Affiliates: corporations with 50 percent or less of the outstanding capital stock which is owned or controlled, directly or indirectly, by the GOCC.
GOCC policies are formulated and implemented by the Governance Commission for GOCCs (GCG), an office attached to the Office of the President (Section 5). The mandate of the GCG includes, to:
• Evaluate the performance and determine the relevance of the GOCC, to ascertain whether a GOCC should be reorganized, merged, streamlined, abolished or privatized, in consultation with the department or agency to which the GOCC is attached (Section 5.a)• Classify GOCCs into (1) Developmental/Social Corporations; (2) Proprietary Commercial Corporations; (3) Government Financial, Investment and Trust Institutions; (4) Corporations with Regulatory Functions; and (5) Others as may be classified by the GCG (Section 5.b). • Adopt ownership and operations manuals as well as the government corporate standards governing GOCCs (Section 5.c)
New GOCCs could be established under “The Corporation Code of the Philippines” by submitting a proposal to the GCG for review and recommendation to the President for approval (Section 27). The same procedure is required for any government agency seeking to purchase a corporation or to acquire controlling interest (Section 28).
Sources: Republic Act No. 10149. Available at http://www.gov.ph/2011/06/06/republic-act-no-10149/
39. In the Philippines, SOEs are present in several non-infrastructure sectors where private participation is typically possible and economically viable. Of 27 sectors reviewed by the PMR, 18 have SOE presence109 (Figure 32), while the average for PMR countries is 14. Although the presence of SOEs in the infrastructure sector is not unusual across countries, especially in sectors that require capital intensive investments (such as electricity transmission and road infrastructure), the Government of the Philippines controls at least one firm in 11 out of the 17 non-infrastructure sectors surveyed. These include insurance, financial services, construction, fabricated metal products, wholesale and retail trade, human health activities, and restaurants and hotels. Many of these sectors are typically served by the private sector only. While these SOEs may be relatively small in terms of their market share, their presence questions the subsidiary role of the state, i.e. as provider of those goods and services that the private sector cannot provide by itself. In addition, restrictions on FDI in most sectors with SOEs further exacerbate the competition effects of the state participation by connecting it to the PMR sub-indicator on barriers to trade and investment.
109 According to the PMR, an SOE is defined as a company in which state or provincial governments (not including local governments or municipali-ties) hold, either directly or indirectly through a government-controlled company, the largest single share of the firm’s equity capital. Public ownership is measured by the extent to which the government participates and intervenes in markets through the scope and scale of its SOEs. Publicly-controlled firms also include government entities that are not organized as companies, but operate in business or market activities.
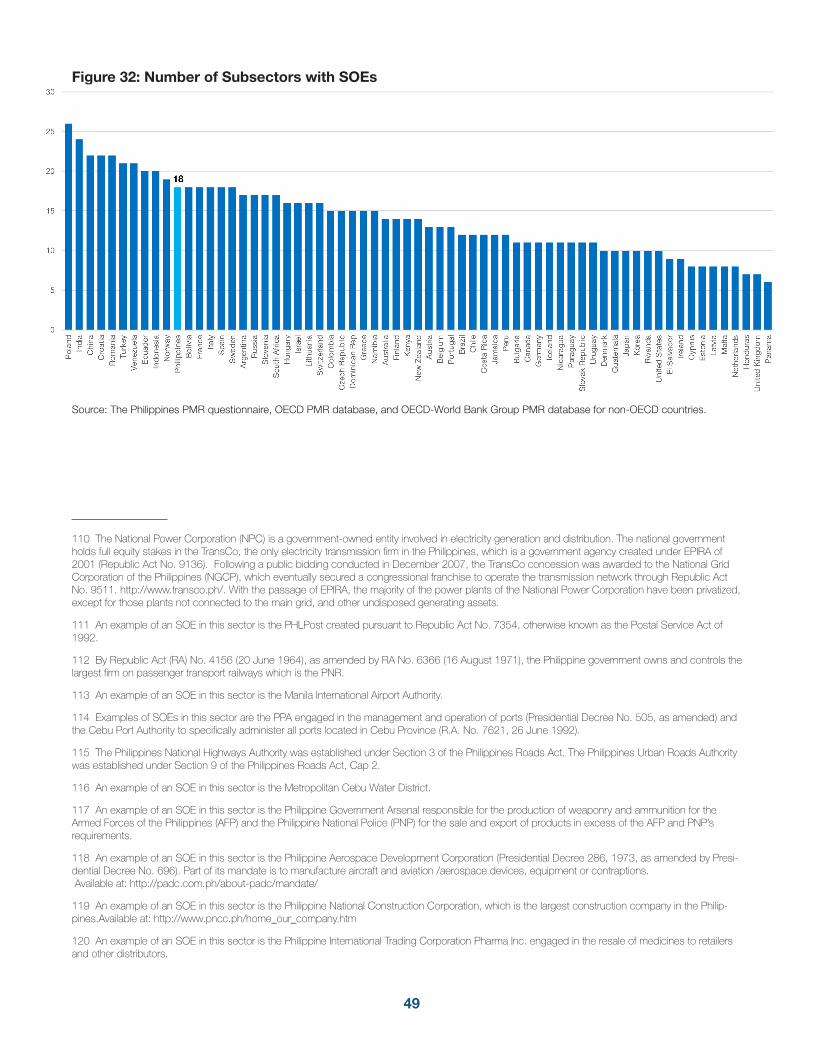
49
Figure 32: Number of Subsectors with SOEs
Source: The Philippines PMR questionnaire, OECD PMR database, and OECD-World Bank Group PMR database for non-OECD countries.
110111112113114115116117118119120
110 The National Power Corporation (NPC) is a government-owned entity involved in electricity generation and distribution. The national government holds full equity stakes in the TransCo, the only electricity transmission firm in the Philippines, which is a government agency created under EPIRA of 2001 (Republic Act No. 9136). Following a public bidding conducted in December 2007, the TransCo concession was awarded to the National Grid Corporation of the Philippines (NGCP), which eventually secured a congressional franchise to operate the transmission network through Republic Act No. 9511. http://www.transco.ph/. With the passage of EPIRA, the majority of the power plants of the National Power Corporation have been privatized, except for those plants not connected to the main grid, and other undisposed generating assets.
111 An example of an SOE in this sector is the PHLPost created pursuant to Republic Act No. 7354, otherwise known as the Postal Service Act of 1992.
112 By Republic Act (RA) No. 4156 (20 June 1964), as amended by RA No. 6366 (16 August 1971), the Philippine government owns and controls the largest firm on passenger transport railways which is the PNR.
113 An example of an SOE in this sector is the Manila International Airport Authority.
114 Examples of SOEs in this sector are the PPA engaged in the management and operation of ports (Presidential Decree No. 505, as amended) and the Cebu Port Authority to specifically administer all ports located in Cebu Province (R.A. No. 7621, 26 June 1992).
115 The Philippines National Highways Authority was established under Section 3 of the Philippines Roads Act. The Philippines Urban Roads Authority was established under Section 9 of the Philippines Roads Act, Cap 2.
116 An example of an SOE in this sector is the Metropolitan Cebu Water District.
117 An example of an SOE in this sector is the Philippine Government Arsenal responsible for the production of weaponry and ammunition for the Armed Forces of the Philippines (AFP) and the Philippine National Police (PNP) for the sale and export of products in excess of the AFP and PNP’s requirements.
118 An example of an SOE in this sector is the Philippine Aerospace Development Corporation (Presidential Decree 286, 1973, as amended by Presi-dential Decree No. 696). Part of its mandate is to manufacture aircraft and aviation /aerospace devices, equipment or contraptions. Available at: http://padc.com.ph/about-padc/mandate/
119 An example of an SOE in this sector is the Philippine National Construction Corporation, which is the largest construction company in the Philip-pines.Available at: http://www.pncc.ph/home_our_company.htm
120 An example of an SOE in this sector is the Philippine International Trading Corporation Pharma Inc. engaged in the resale of medicines to retailers and other distributors.
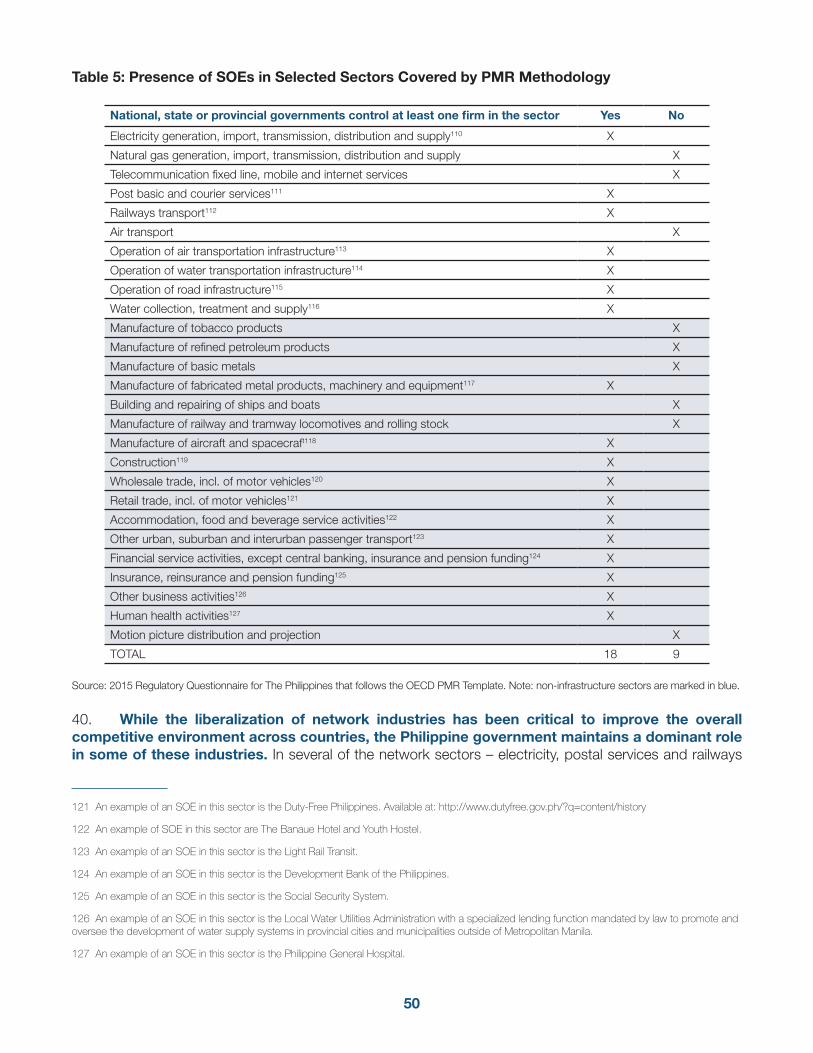
50
Table 5: Presence of SOEs in Selected Sectors Covered by PMR Methodology
National, state or provincial governments control at least one firm in the sector Yes No
Electricity generation, import, transmission, distribution and supply110 X
Natural gas generation, import, transmission, distribution and supply X
Telecommunication fixed line, mobile and internet services X
Post basic and courier services111 X
Railways transport112 X
Air transport X
Operation of air transportation infrastructure113 X
Operation of water transportation infrastructure114 X
Operation of road infrastructure115 X
Water collection, treatment and supply116 X
Manufacture of tobacco products X
Manufacture of refined petroleum products X
Manufacture of basic metals X
Manufacture of fabricated metal products, machinery and equipment117 X
Building and repairing of ships and boats X
Manufacture of railway and tramway locomotives and rolling stock X
Manufacture of aircraft and spacecraft118 X
Construction119 X
Wholesale trade, incl. of motor vehicles120 X
Retail trade, incl. of motor vehicles121 X
Accommodation, food and beverage service activities122 X
Other urban, suburban and interurban passenger transport123 X
Financial service activities, except central banking, insurance and pension funding124 X
Insurance, reinsurance and pension funding125 X
Other business activities126 X
Human health activities127 X
Motion picture distribution and projection X
TOTAL 18 9121122123124125126127
Source: 2015 Regulatory Questionnaire for The Philippines that follows the OECD PMR Template. Note: non-infrastructure sectors are marked in blue.
40. While the liberalization of network industries has been critical to improve the overall competitive environment across countries, the Philippine government maintains a dominant role in some of these industries. In several of the network sectors – electricity, postal services and railways
121 An example of an SOE in this sector is the Duty-Free Philippines. Available at: http://www.dutyfree.gov.ph/?q=content/history
122 An example of SOE in this sector are The Banaue Hotel and Youth Hostel.
123 An example of an SOE in this sector is the Light Rail Transit.
124 An example of an SOE in this sector is the Development Bank of the Philippines.
125 An example of an SOE in this sector is the Social Security System.
126 An example of an SOE in this sector is the Local Water Utilities Administration with a specialized lending function mandated by law to promote and oversee the development of water supply systems in provincial cities and municipalities outside of Metropolitan Manila.
127 An example of an SOE in this sector is the Philippine General Hospital.
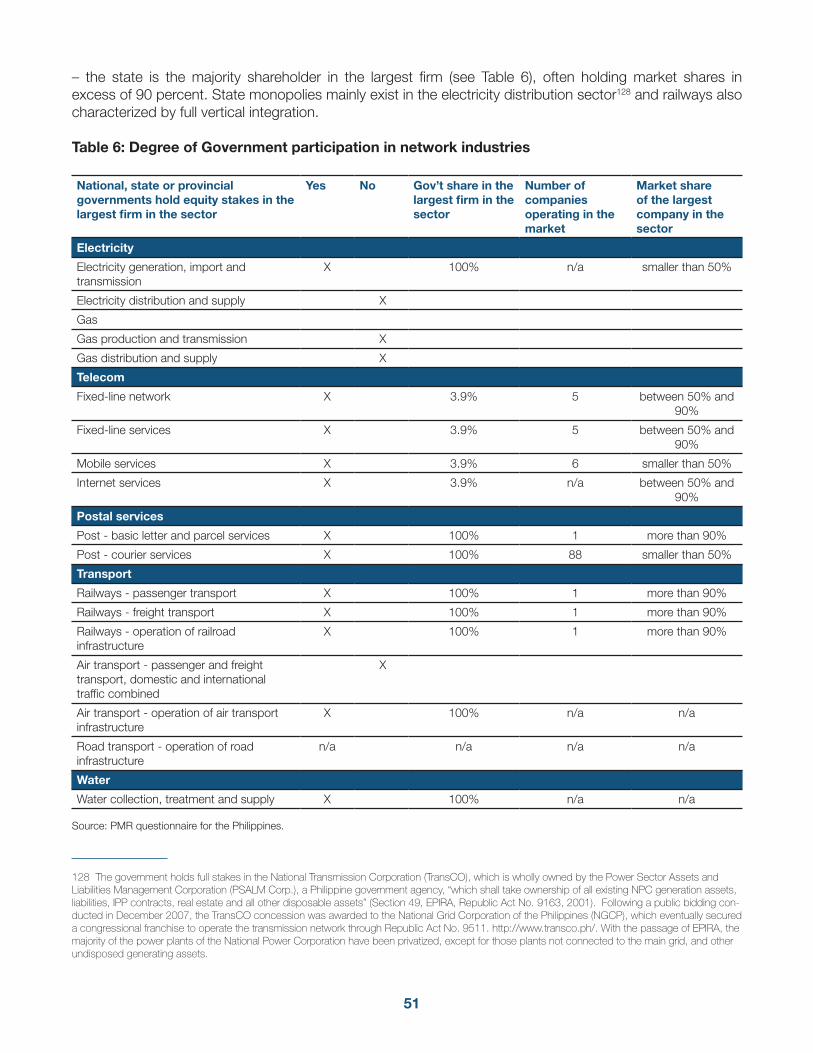
51
– the state is the majority shareholder in the largest firm (see Table 6), often holding market shares in excess of 90 percent. State monopolies mainly exist in the electricity distribution sector128 and railways also characterized by full vertical integration.
Table 6: Degree of Government participation in network industries
National, state or provincial governments hold equity stakes in the largest firm in the sector
Yes No Gov’t share in the largest firm in the sector
Number of companies operating in the market
Market share of the largest company in the sector
Electricity
Electricity generation, import and transmission
X 100% n/a smaller than 50%
Electricity distribution and supply X
Gas
Gas production and transmission X
Gas distribution and supply X
Telecom
Fixed-line network X 3.9% 5 between 50% and 90%
Fixed-line services X 3.9% 5 between 50% and 90%
Mobile services X 3.9% 6 smaller than 50%
Internet services X 3.9% n/a between 50% and 90%
Postal services
Post - basic letter and parcel services X 100% 1 more than 90%
Post - courier services X 100% 88 smaller than 50%
Transport
Railways - passenger transport X 100% 1 more than 90%
Railways - freight transport X 100% 1 more than 90%
Railways - operation of railroad infrastructure
X 100% 1 more than 90%
Air transport - passenger and freight transport, domestic and international traffic combined
X
Air transport - operation of air transport infrastructure
X 100% n/a n/a
Road transport - operation of road infrastructure
n/a n/a n/a n/a
Water
Water collection, treatment and supply X 100% n/a n/a
Source: PMR questionnaire for the Philippines.
128 The government holds full stakes in the National Transmission Corporation (TransCO), which is wholly owned by the Power Sector Assets and Liabilities Management Corporation (PSALM Corp.), a Philippine government agency, “which shall take ownership of all existing NPC generation assets, liabilities, IPP contracts, real estate and all other disposable assets” (Section 49, EPIRA, Republic Act No. 9163, 2001). Following a public bidding con-ducted in December 2007, the TransCO concession was awarded to the National Grid Corporation of the Philippines (NGCP), which eventually secured a congressional franchise to operate the transmission network through Republic Act No. 9511. http://www.transco.ph/. With the passage of EPIRA, the majority of the power plants of the National Power Corporation have been privatized, except for those plants not connected to the main grid, and other undisposed generating assets.
52
41. Some aspects of SOE governance may amplify the restrictions related to public ownership. On the one hand, not all SOEs are incorporated as joint stock companies or subject to private company law.129 Additionally, some strategic choices of SOEs, including mergers, equity decisions and restructuring plans must be reviewed and/or cleared in advance by the government through the GCG.130 On the other hand, key positive features counterbalance such restrictions: first, the Philippine government does not hold special voting rights, such as golden shares, in any SOE. Moreover, the Governance Commission, in charge of monitoring and managing SOEs,131 is an independent public holding.132 Direct governmental influence in the management and business decisions of SOEs is often a sub-optimal means of pursuing policy objectives and tends to negatively affect efficiency, as it can result in conflict of interest or weakened incentives. Entrusting the management of state equity holdings to independent bodies typically results in superior market outcomes.
42. In addition, a number of SOEs in the Philippines appear to enjoy benefits related to access to credit. SOEs sometimes enjoy certain advantages in terms of regulatory enforcement (for instance, regarding licenses, regulatory fees and taxes) or access to financial resources and subsidies that make it difficult for the private sector to compete, and which may end up crowding out efficient private investment.133 This is true in the Philippines, where SOEs have access to loans guaranteed by the state.134
43. In this context, the effective implementation of the competitive neutrality principle to ensure a level playing field for public and private operators becomes particularly relevant. This is an important element of the broad competition policy framework of a country and essential to use resources effectively within the economy and thus achieve growth and development. While the Competition Law calls for the equal treatment of SOEs and private firms,135 privileges and immunities in terms of corporate governance or access to finance may distort competition in the market and even risk crowding out the private sector.
129 “Guidelines for the Creation of GOCCs and Related Corporations, GCG MC No. 2015-01”, Section 1.2 (b) which establishes that: “a Non-Stock GOCC is any GOCC created at the behest of the National Government Agencies (NGA) or Local Government Units (LGU)) to undertake governmental functions and controlled by the government through its members.” Available at: http://gcg.gov.ph/site/public_files/gcg1440394073.pdf
130 Section 5 of Republic Act No. 10149 create the Governance Commission for Government-Owned or Controlled Corporation (GCG), a central advisory, monitoring and oversight body with the authority to formulate, implement and coordinate policies for GOCCs. In particular, literal (a) established that the GCG have the power to: “Evaluate the performance and determine the relevance of the GOCC, to ascertain whether such GOCC should be reorganized, merged, streamlined, abolished or privatized, in consultation with the department or agency to which a GOCC is attached.”
131 Established by Section 5 of Republic Act No. 10149. Available at: http://gcg.gov.ph/site/aboutus
132 The Commission is an office under the President of the Philippines created by Section 5 of Republic Act No. 10149. The website is: http://phcc.gov.ph/
133 For empirical evidence on performance of SOEs, see for example, Kikeri, Sunita et al., (2014), “Corporate Governance of State-Owned Enterpris-es: A Toolkit”, Washington, DC: World Bank Group.
134 The Philippines’ government is the main guarantor of GOCC loans. As an example, the document of the Bureau of the Treasury of the Philippines explicitly establishes that: “The National Government has a net lending program for GOCCs which extends advances for the debt servicing of the guar-anteed GOCCs’ obligations to avoid defaulting on guaranteed commitments”. Available at: http://www.treasury.gov.ph/wp-content/uploads/2015/11/FRS_2015-2016.pdf, p. 45.
135 Section 3 of Republic Act No. 10667 establishes that: “This Act shall be enforceable against any person or entity engaged in any trade, industry and commerce in the Republic of the Philippines. It shall likewise be applicable to international trade having direct, substantial, and reasonably foresee-able effects in trade, industry, or commerce in the Republic of the Philippines, including those that result from acts done outside the Republic of the Philippines. This Act shall not apply to the combinations or activities of workers or employees nor to agreements or arrangements with their employers when such combinations, activities, agreements, or arrangements are designed solely to facilitate collective bargaining in respect of conditions of em-ployment.”
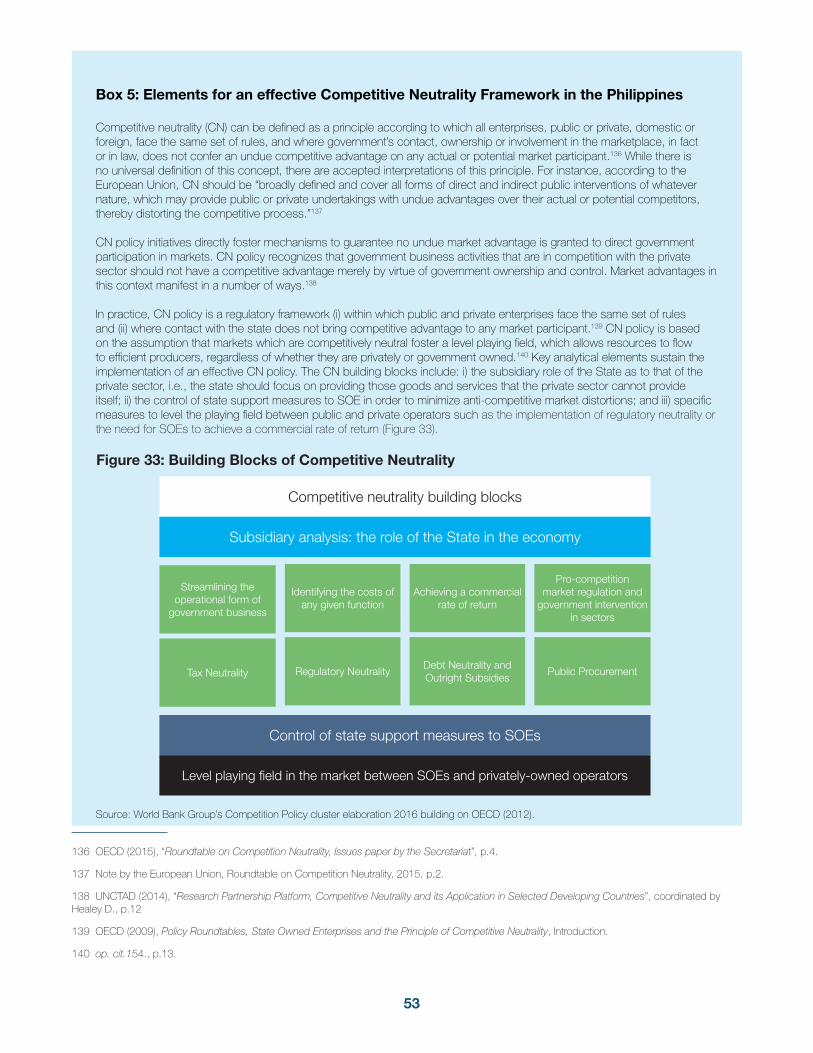
53
Box 5: Elements for an effective Competitive Neutrality Framework in the Philippines
Competitive neutrality (CN) can be defined as a principle according to which all enterprises, public or private, domestic or foreign, face the same set of rules, and where government’s contact, ownership or involvement in the marketplace, in fact or in law, does not confer an undue competitive advantage on any actual or potential market participant.136 While there is no universal definition of this concept, there are accepted interpretations of this principle. For instance, according to the European Union, CN should be “broadly defined and cover all forms of direct and indirect public interventions of whatever nature, which may provide public or private undertakings with undue advantages over their actual or potential competitors, thereby distorting the competitive process.”137
CN policy initiatives directly foster mechanisms to guarantee no undue market advantage is granted to direct government participation in markets. CN policy recognizes that government business activities that are in competition with the private sector should not have a competitive advantage merely by virtue of government ownership and control. Market advantages in this context manifest in a number of ways.138
In practice, CN policy is a regulatory framework (i) within which public and private enterprises face the same set of rules and (ii) where contact with the state does not bring competitive advantage to any market participant.139 CN policy is based on the assumption that markets which are competitively neutral foster a level playing field, which allows resources to flow to efficient producers, regardless of whether they are privately or government owned.140 Key analytical elements sustain the implementation of an effective CN policy. The CN building blocks include: i) the subsidiary role of the State as to that of the private sector, i.e., the state should focus on providing those goods and services that the private sector cannot provide itself; ii) the control of state support measures to SOE in order to minimize anti-competitive market distortions; and iii) specific measures to level the playing field between public and private operators such as the implementation of regulatory neutrality or the need for SOEs to achieve a commercial rate of return (Figure 33).
Figure 33: Building Blocks of Competitive Neutrality
Source: World Bank Group’s Competition Policy cluster elaboration 2016 building on OECD (2012).
136 OECD (2015), “Roundtable on Competition Neutrality, Issues paper by the Secretariat”, p.4.
137 Note by the European Union, Roundtable on Competition Neutrality, 2015, p.2.
138 UNCTAD (2014), “Research Partnership Platform, Competitive Neutrality and its Application in Selected Developing Countries”, coordinated by Healey D., p.12
139 OECD (2009), Policy Roundtables, State Owned Enterprises and the Principle of Competitive Neutrality, Introduction.
140 op. cit.154., p.13.
Competitive neutrality building blocks
Streamlining the operational form of
government business
Subsidiary analysis: the role of the State in the economy
Identifying the costs of any given function
Achieving a commercial rate of return
Pro-competition market regulation and
government intervention in sectors
Tax Neutrality Regulatory NeutralityDebt Neutrality and Outright Subsidies
Public Procurement
Control of state support measures to SOEs
Level playing field in the market between SOEs and privately-owned operators
54
While a general strategy to promote a level playing field between government-controlled and private enterprises exists in the Philippines, a number of crucial elements to implement such policy are still lacking. These include the need to define commercial and non-commercial services conducted by SOEs to be able to differentiate them from an accounting and operational perspective and adjudicate costs and revenues accordingly; as well as the existence of an overlapping mandate of certain SOEs that also act as regulators in key sectors where they compete with private operators (e.g. in maritime ports). Moreover, significant differences exist among sectors in terms of regulation and implementation of CN elements with positive experiences in some (notably electricity and banking) that could potentially be leveraged across other sectors. Finally, the lack of a framework to control subsidies and other state support measures creates a significant potential for market distortion.
Source: Forthcoming World Bank Group (2017) The Philippines: Embedding Competitive Neutrality Principles in State
44. Although controlling state support measures to SOEs is critical to minimize competition distortion, the Philippines lacks a predetermined framework to allocate state aid. Beneficiaries that receive state support, either public or private, enjoy a comparative advantage over their competitors that is not necessarily associated with their efficiency. Control of state support measures is a necessary safeguard for effective competition, free trade, and efficient management of fiscal resources. In particular, state support measures can be used to privilege SOEs, which can damage long-term private sector development.
45. In this context, an increase in the amount of subsidies that seem to benefit selected firms may threaten private sector development. While still limited as a share of overall government expenditures, the amount of subsidies received by GOCCs has consistently increased in recent years. Subsidies to GOCCs from the government are divided into two types: operating subsidies, which are funds released to the GOCC to cover operational expenses; and program or project subsidies, which are funds released to GOCCs to implement specific policies.141 Operating subsidies amounted to 2 billion PHP in 2014, while the main source of subsidies were program funds that amounted to 77 billion PHP.142 The total amount of subsidies increased in 2016 to 103 billion PHP, or 4 percent of Philippines’ national government expenditures.143 Statistics generated from the 2012 CPBI show that 56 product markets across sectors, including manufacturing, agriculture, wholesale/retail, and transport/storage, reported at least one firm receiving a subsidy (equivalent to 9 percent of all markets in those sectors). However, the subsidies did not appear to have always been granted equally to all firms within the market (Box 6, Figure 34). Indeed, in 22 of those industries only one firm received a subsidy while more than one firm operated in the market.
141 GCG The Legacy Report, 2016, p.42, available at: http://gcg.gov.ph/site/public_files/gcg1468227890.pdf
142 Information taken from the GCG report “Operating Subsidies, Dividends, Program Funds Allocated to the GOCC Sector” for 2014. Report available at: http://gcg.gov.ph/ckfinder/userfiles/files/2014%20Operational%20Subsidy%20and%20Program%20Funds.pdf
143 Information from the Bureau of the Treasury, available at: http://www.treasury.gov.ph/wp-content/uploads/2017/03/yr_cor_expenditures3.pdf
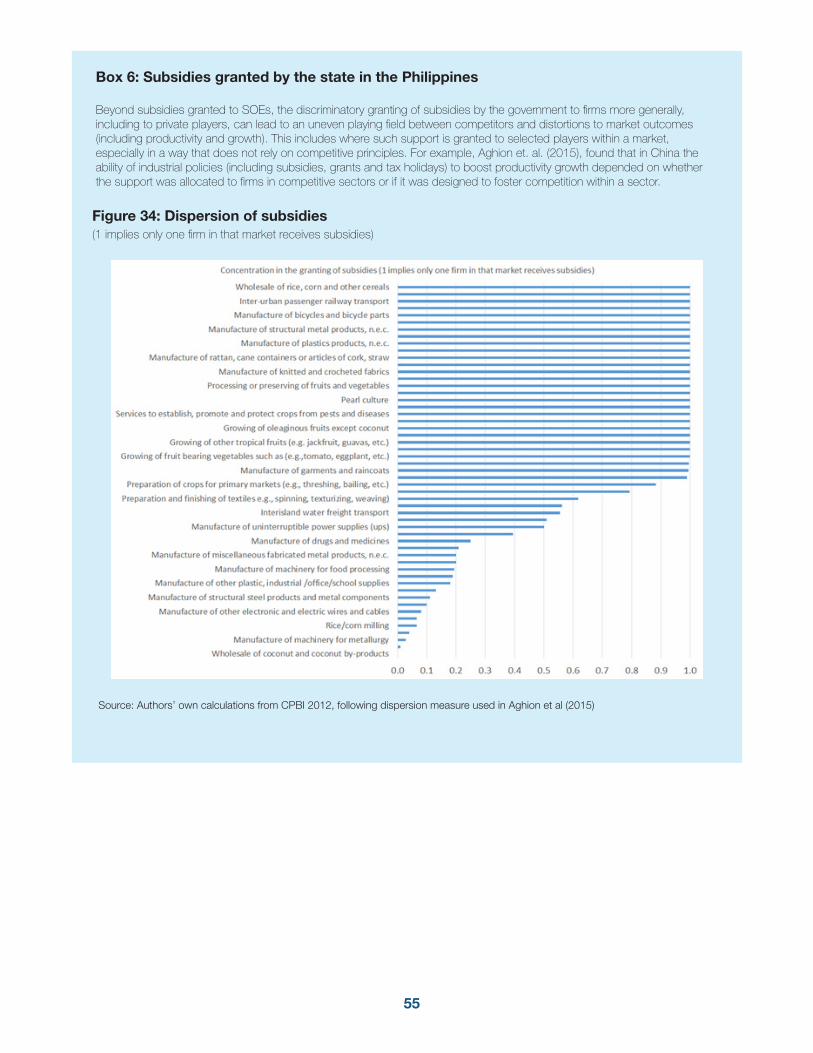
55
Box 6: Subsidies granted by the state in the Philippines
Beyond subsidies granted to SOEs, the discriminatory granting of subsidies by the government to firms more generally, including to private players, can lead to an uneven playing field between competitors and distortions to market outcomes (including productivity and growth). This includes where such support is granted to selected players within a market, especially in a way that does not rely on competitive principles. For example, Aghion et. al. (2015), found that in China the ability of industrial policies (including subsidies, grants and tax holidays) to boost productivity growth depended on whether the support was allocated to firms in competitive sectors or if it was designed to foster competition within a sector.
Figure 34: Dispersion of subsidies (1 implies only one firm in that market receives subsidies)
Source: Authors’ own calculations from CPBI 2012, following dispersion measure used in Aghion et al (2015)
56
1.2 State involvement in business operations
46. While the government aims to reduce direct participation in markets, state involvement in business operations remains significant. This intermediate indicator is calculated as a weighted average of command and control regulations (use of coercive, as opposed to incentive-based regulations) and price controls, which are both lower level indicators on the PMR index. State involvement may dampen the ability of market players to compete, restraining the range of market strategies available to participants. Examples include: entry regulations, mandatory standards, quality regulations and prior approvals.144 From a competition policy perspective, market- or incentive-based regulations are preferable to command and control regulations, as they allow market players to adjust their behavior to market circumstances and are less detrimental to market signals.145
47. In the Philippines, coercive regulations are more common than incentive-based regulations, particularly in regulated services. Filipino regulators are only recently required to assess alternative regulatory and non-regulatory approaches due to the passage of the Ease of Doing Business and Efficient Government Service Delivery Act of 2018.146 Furthermore, the government has not issued guidance on the use of alternative instruments to traditional regulation. In practical terms, for example, all regulated services surveyed by the PMR questionnaire, i.e. accountants, lawyers, architects and engineers, are restricted in their ability to enter into inter-professional cooperation147 as well as to advertise.148 Accountants149 and engineers150 also face specific business limitations.151
48. Moreover, the existence of undue price controls for certain products paired with the absence of necessary pricing mechanisms in regulated sectors may distort the incentives of market operators and affect their ability to compete and provide better quality goods and services.152 Price control rules are among the regulatory tools instituted by governments, often with the aim of protecting consumers from excessively high prices or protecting the incomes of small producers. While regulating prices in natural
144 Examples captured by the PMR questionnaire include provisions concerning opening hours of shops, maximum number of hours, minimum number of shut-down days per year, restrictions on inter-professional co-operation (e.g. partnerships, associations, joint ventures), and restrictions on advertising and marketing by professionals.
145 Examples include allocation of rights and liabilities, competitive public franchising, co-regulation and information disclosure.
146 Llanto, Gilberto (2015), “Towards an Effective Regulatory Management System: Philippines”, Philippine Institute for Development Studies, Discus-sion Paper Series No. 2015-32 at p. 25: “The most common tools used in assessing the effect of regulatory changes are the usual descriptive analysis and standard cost-benefit analysis. Regulators will typically undertake a cost-benefit exercise to determine the efficiency and perhaps, distributional effects of regulatory changes. However, the results of such exercises are neither published nor made available to the wider public and not even to academics or policy analysts, for scrutiny. The public and affected parties could only assume that such an exercise has been done prior to issuance of a regulation.”
147 In the legal profession co-operation of any form is forbidden, as established at Rule 9.02 of the Code of Professional Responsibility. In the Accoun-tancy (Code of Ethics for Professional Accountants in the Philippines, Section 290.14), Engineering (Section 24, Republic Act No. 544, as amended by Republic Act No. 1582, 1950), and Architecture professions (Section 37 of Republic Act No. 9266, 2003) co-operation is only allowed between comparable licensed professionals.
148 In the accountant profession, advertising is restricted by the Section 14 of the Code of Ethics for Professional Accountants in the Philippines. Available at: http://www.picpammr.com/membership/docs/codeofethics2.pdfIn the legal profession is prohibited by Rule 3.04 of the Integrated Bar of the Philippines. Available at:http://www.chanrobles.com/codeofprofessionalresponsibility.html#CODE%20OF%20PROFESSIONAL%20RESPONSIBILITYIn the engineering profession, advertising is prohibited by Section 5 (5.7) of the Code of Ethics of Chemical Engineers (approved by the Professional Regulation Commission (PRC), and published on 8 August 2009). In the architecture profession is prohibited by Section 3 (3.4) of the Profession-al Regulatory Board of Architecture (Resolution No. 2 of 2006. Available at: http://www.architectureboard.ph/1%20LAWS%20(&Regns)ON%20ARCH3/103%202006_CodeofEthics/ok2006_codethics.pdf).
149 Established by the Code of Ethics for Professional Accountants in the Philippines. Available at: http://boa.com.ph/about-the-boa/code-of-ethics/
150 Established by Section 24 of the Republic Act No. 544, as amended by Republic Act No. 1582, 1950.
151 This restriction applies mainly to corporates, private companies or public limited companies.
152 Nicoletti, Giuseppe and Scarpetta, Stefano (2004), “Product Market Reforms: Macro Linkages and Effects on Growth (A Partial Survey)”.
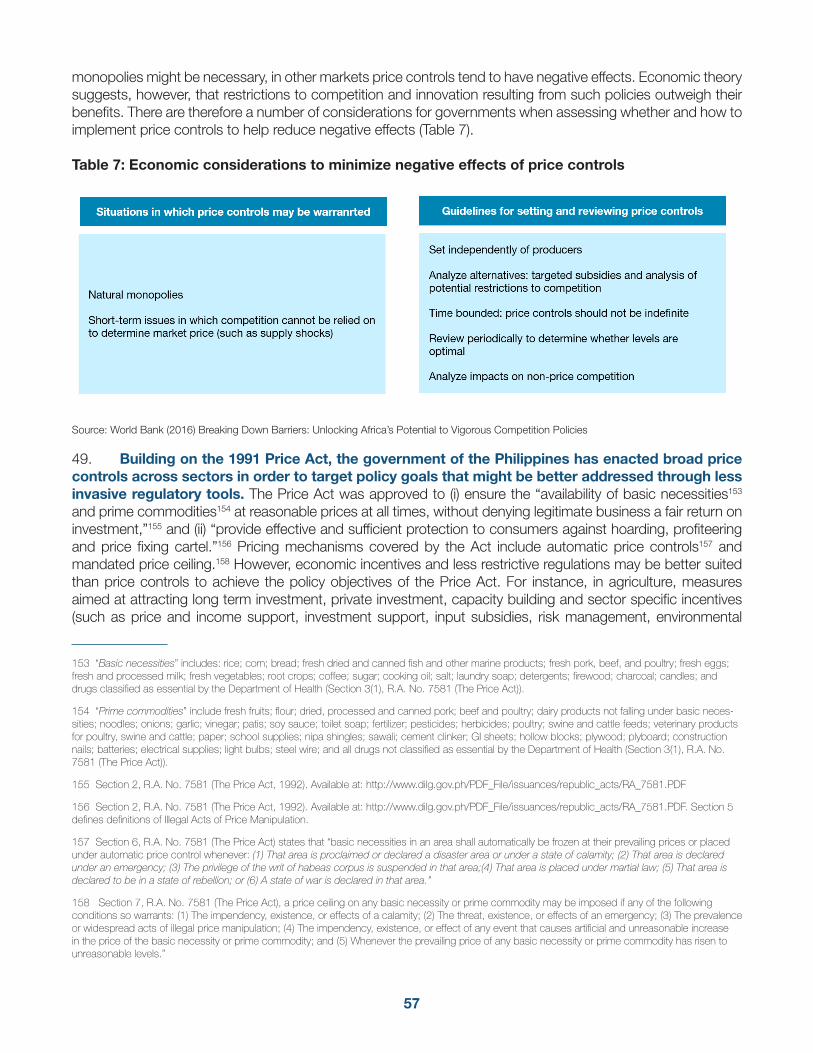
57
monopolies might be necessary, in other markets price controls tend to have negative effects. Economic theory suggests, however, that restrictions to competition and innovation resulting from such policies outweigh their benefits. There are therefore a number of considerations for governments when assessing whether and how to implement price controls to help reduce negative effects (Table 7).
Table 7: Economic considerations to minimize negative effects of price controls
Source: World Bank (2016) Breaking Down Barriers: Unlocking Africa’s Potential to Vigorous Competition Policies
49. Building on the 1991 Price Act, the government of the Philippines has enacted broad price controls across sectors in order to target policy goals that might be better addressed through less invasive regulatory tools. The Price Act was approved to (i) ensure the “availability of basic necessities153 and prime commodities154 at reasonable prices at all times, without denying legitimate business a fair return on investment,”155 and (ii) “provide effective and sufficient protection to consumers against hoarding, profiteering and price fixing cartel.”156 Pricing mechanisms covered by the Act include automatic price controls157 and mandated price ceiling.158 However, economic incentives and less restrictive regulations may be better suited than price controls to achieve the policy objectives of the Price Act. For instance, in agriculture, measures aimed at attracting long term investment, private investment, capacity building and sector specific incentives (such as price and income support, investment support, input subsidies, risk management, environmental
153 “Basic necessities” includes: rice; corn; bread; fresh dried and canned fish and other marine products; fresh pork, beef, and poultry; fresh eggs; fresh and processed milk; fresh vegetables; root crops; coffee; sugar; cooking oil; salt; laundry soap; detergents; firewood; charcoal; candles; and drugs classified as essential by the Department of Health (Section 3(1), R.A. No. 7581 (The Price Act)).
154 “Prime commodities” include fresh fruits; flour; dried, processed and canned pork; beef and poultry; dairy products not falling under basic neces-sities; noodles; onions; garlic; vinegar; patis; soy sauce; toilet soap; fertilizer; pesticides; herbicides; poultry; swine and cattle feeds; veterinary products for poultry, swine and cattle; paper; school supplies; nipa shingles; sawali; cement clinker; GI sheets; hollow blocks; plywood; plyboard; construction nails; batteries; electrical supplies; light bulbs; steel wire; and all drugs not classified as essential by the Department of Health (Section 3(1), R.A. No. 7581 (The Price Act)).
155 Section 2, R.A. No. 7581 (The Price Act, 1992). Available at: http://www.dilg.gov.ph/PDF_File/issuances/republic_acts/RA_7581.PDF
156 Section 2, R.A. No. 7581 (The Price Act, 1992). Available at: http://www.dilg.gov.ph/PDF_File/issuances/republic_acts/RA_7581.PDF. Section 5 defines definitions of Illegal Acts of Price Manipulation.
157 Section 6, R.A. No. 7581 (The Price Act) states that “basic necessities in an area shall automatically be frozen at their prevailing prices or placed under automatic price control whenever: (1) That area is proclaimed or declared a disaster area or under a state of calamity; (2) That area is declared under an emergency; (3) The privilege of the writ of habeas corpus is suspended in that area;(4) That area is placed under martial law; (5) That area is declared to be in a state of rebellion; or (6) A state of war is declared in that area.”
158 Section 7, R.A. No. 7581 (The Price Act), a price ceiling on any basic necessity or prime commodity may be imposed if any of the following conditions so warrants: (1) The impendency, existence, or effects of a calamity; (2) The threat, existence, or effects of an emergency; (3) The prevalence or widespread acts of illegal price manipulation; (4) The impendency, existence, or effect of any event that causes artificial and unreasonable increase in the price of the basic necessity or prime commodity; and (5) Whenever the prevailing price of any basic necessity or prime commodity has risen to unreasonable levels.”
58
and agriculture-specific trade measures, agricultural innovation policies, etc.) typically yield better results to foster productivity, growth and sustainability.159 As per the Price Act and other sector-specific regulations, price controls exist in a number of markets:
Staples: While price controls are mandated only in exceptional circumstances, the Philippines’ Department of Trade and Industry regularly enforces the Suggested Retail Prices on Basic Necessities and Prime Commodities based on the Implementing Rules and Regulations of the Price Act stating that “whenever necessary,” the implementing agency may “issue suggested retail prices”160 and that “The implementing agency may (...) determine, recommend and enforce price ceilings.”
Domestic airfares: The Civil Aeronautics Act enables the Civil Aeronautics Board to regulate domestic airfares.161 The Board can “fix and determine reasonable individual, joint or special rates, charges or fares, which an air carrier may demand, collect or receive for any service in connection with air commerce.”
Regulated professions: Price controls are self-imposed by several professional bodies, thus hindering competition in services, since the market effects of these practices are similar to cartel agreements.162 This is the case for architects and engineers that set non-binding recommended prices.163
50. However, network sectors with natural monopoly market segments, such as telecommunications, lack critical price mechanisms to foster competition through ex ante regulation. The ability of the telecommunications regulator, the NTC, to fix rates has been challenged by the industry operators, in the framework of the NTC’s attempt to regulate SMS prices,164 arguing that the Telecommunications Act precludes the NTC from intervening if a service has “sufficient competition to ensure fair and reasonable rates or tariffs.”165 An over-inclusive interpretation of this provision has limited the NTC’s ability to provide much needed efficiency-based pricing mechanisms in segments where price regulation is typically desirable for competition, such as for local loop unbundling prices166 and international wholesale/retail roaming rates.167
159 OECD (2015), “Analysing Policies to Improve Agricultural Productivity Growth, Sustainably” Available at: http://www.oecd.org/tad/agricultural-poli-cies/Analysing-policies-improve-agricultural-productivity-growth-sustainably-december-2014.pdf
160 Sections 4 and 5, Implementing Rules and Regulations of the Price Act.
161 Section 10(C)(2) of the Civil Aeronautics Act of the Philippines (RA No. 776, as amended). Available at: http://www.cab.gov.ph/mandates/item/republic-act-no-776?category_id=82
162 Harrington, Joseph (2016), “Heterogeneous Firms Can Always Collude on a Minimum Price”, Economics Letters (136), pp.46-49, January.
163 In the case of engineering, the section 3.0 of the Manual of Professional Practice for Electronics Engineers established different compensation methods which are pegged to the consumer price index and a minimum wage Available at: https://jrcanedo2.files.wordpress.com/2007/11/manu-al-of-professional-practice-for-electronics-engineers.pdf, While for the architecture profession, fees are established in the Standards of Professional Practice numbers 201, 203, 204-A, 204-B, 205, 206, 207 and 208. Available at: http://www.architectureboard.ph/uploads/1280328107-2010%20SPP%20for%20RLAs.doc
164 NTC Memorandum Circular no. 02-10-2011 ordering telecommunications firms to reduce Short Messaging Services (SMS) interconnection charges to P0.15 from P0.35
165 Section 17, Republic Act No. 7925, otherwise known as the “Public Telecommunications Policy Act of the Philippines,” provides: “The Com-mission shall establish rates and tariffs which are fair and reasonable and which provide for the economic viability of telecommunications entities and a fair return on their investments considering the prevailing cost of capital in the domestic and international markets. The Commission shall exempt any specific telecommunications service from its rate or tariff regulations if the service has sufficient competition to ensure fair and reasonable rates or tariffs. The Commission shall, however, retain its residual powers to regulate rates or tariffs when ruinous competition results or when a monopoly or a cartel or combination in restraint of free competition exists and the rates or tariffs are distorted or unable to function freely and the public is adversely affected. In such cases, the Commission shall either establish a floor or ceiling on the rates or tariffs.”
166 The NTC does not set prices for local loop unbundling.
167 Although retail prices of international roaming are required to be approved by the NTC (section 17 of Republic Act No 7925, 1995), in practice the regulator does not impose price ceiling on retail and wholesale access charges.
59
Box 7: Price controls in the Philippines
Among the possible regulatory tools instituted by governments, price control rules are often adopted in traditional monopoly sectors such as utilities (e.g., water and electricity distribution), with the aim of protecting consumers from excessively high prices. Nevertheless, governments also establish price controls in other sectors of the economy, which are potentially competitive. Economic theory suggests, however, that in most cases the negative effects of such policies outweigh the benefits. In general terms, there will be an inefficient allocation of resources and high costs for governments to sustain the policy and to tackle the economic consequences. There are two types of price control: price ceilings and price floors.
Price ceilings
In the Philippines, Section 7 of the Price Act (Republic Act No. 7581, 1991) declares that: The President, upon the recommendation of the implementation agency, or the price Coordinating Council, may impose a price ceiling on any basic necessity or prime commodity if any of the following conditions so warrants:
1) the impendency, existence, or effects of a calamity;2) the threat, existence, or effects of an emergency;3) the prevalence or widespread acts of illegal price manipulation;4) the impendency, existence, or effect of any event that causes artificial and unreasonable increase in the price of the
basic necessity or prime commodity; and5) whenever the prevailing price of any basic necessity or prime commodity has risen to unreasonable levels.
This provision entails what economic theory calls price ceilings. The government may be willing to set price ceilings, which prevent prices from exceeding a certain maximum for those goods and services that are believed to be sold at an excessive price. However, the policy might generate counterproductive effects. Indeed, when the ceiling is placed below the price that would otherwise arise under normal competitive market conditions, then there would be a lack of supply or excess demand. That is, producers will not produce enough at the lower price, while consumers will demand more because the goods are cheaper. Therefore, this type of price policy, which is very common in the agriculture sector as well as in utilities, might lead to reduced production that would harm consumers rather than be beneficial to them. Moreover, those producers who are willing to differentiate their products, offering higher quality or more innovative goods, are discouraged as they will not be able to charge higher prices to cover for the higher costs. In addition, price ceilings present a further drawback: The price set as a ceiling by the government is likely to become the focal price. Therefore, low-cost producers that would be willing to charge a lower price and serve the most price-sensitive part of the demand will nevertheless charge the price at the ceiling level, thereby harming consumers as well as competition in the market.
Although the price ceiling provision specifies some emergency situations when the Act should be applied (for instance, during crisis situations, major imbalances between demand and supply, and obvious market malfunctioning), it also allows discretion to the government to apply price ceilings, such as when the prevailing price of any basic necessity or prime commodity has risen to an unreasonable level. Also, the law does not state a maximum period for the applications and re-evaluation of the need for price controls. In practice, the Philippines’ Department of Trade and Industry (DTI) regularly enforces the Suggested Retail Prices on Basic Necessities and Prime Commodities that set the price across a variety of products. However, the PCC is not asked to provide its opinion regarding market conditions that could merit temporary price controls. In other countries, such as Romania, the competition law requires the government to seek the competition authority’s advisory opinion before instituting price-control measures. This requirement ensures government interventions do not run counter to competition policy objectives, and that the selected policy option is the ‘least restrictive’ for competition in the market. Nevertheless, the PCC has started to review suggested retail prices in coordination with the DTI.
It is also important to highlight that the participation of the industry in determining maximum prices creates platforms that encourage price and cost information exchange among competitors, facilitating the creation of instruments that can later inform cartels.
Price floors
Price floors are the lowest legal price at which goods or services can be sold and are used to prevent prices from being too low. For example, in the agriculture sector, price floors could be justified on the grounds of protecting farmers from unfavorable harvesting conditions in special situations. Minimum prices are also introduced in professional services. For example, minimum price limitations are often justified by professional associations as a way of maintaining quality standards that would be impaired with extremely vigorous price competition. In the Philippines, architects and engineers set non-binding recommended prices.
Price floors have drawbacks and the impact of such price regulations should be carefully evaluated. Imposing minimum prices above the market-equilibrium price is likely to translate into higher prices for consumers and to generate demand that
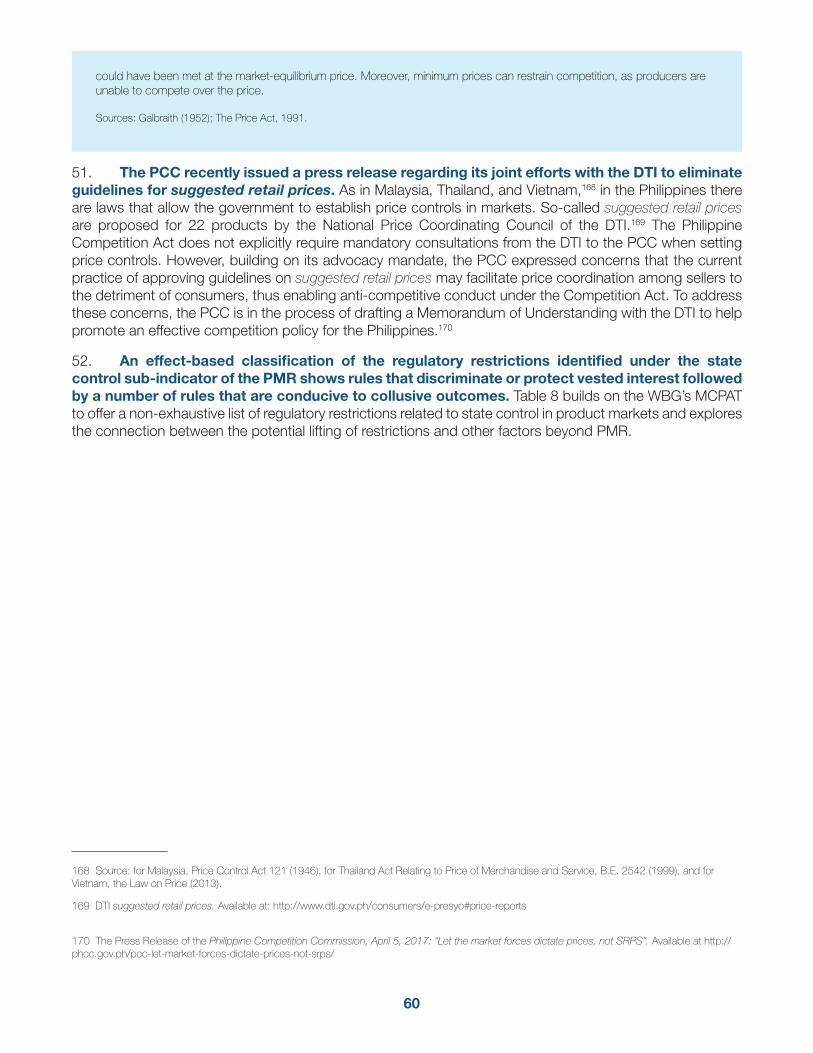
60
could have been met at the market-equilibrium price. Moreover, minimum prices can restrain competition, as producers are unable to compete over the price.
Sources: Galbraith (1952); The Price Act, 1991.
51. The PCC recently issued a press release regarding its joint efforts with the DTI to eliminate guidelines for suggested retail prices. As in Malaysia, Thailand, and Vietnam,168 in the Philippines there are laws that allow the government to establish price controls in markets. So-called suggested retail prices are proposed for 22 products by the National Price Coordinating Council of the DTI.169 The Philippine Competition Act does not explicitly require mandatory consultations from the DTI to the PCC when setting price controls. However, building on its advocacy mandate, the PCC expressed concerns that the current practice of approving guidelines on suggested retail prices may facilitate price coordination among sellers to the detriment of consumers, thus enabling anti-competitive conduct under the Competition Act. To address these concerns, the PCC is in the process of drafting a Memorandum of Understanding with the DTI to help promote an effective competition policy for the Philippines.170
52. An effect-based classification of the regulatory restrictions identified under the state control sub-indicator of the PMR shows rules that discriminate or protect vested interest followed by a number of rules that are conducive to collusive outcomes. Table 8 builds on the WBG’s MCPAT to offer a non-exhaustive list of regulatory restrictions related to state control in product markets and explores the connection between the potential lifting of restrictions and other factors beyond PMR.
168 Source: for Malaysia, Price Control Act 121 (1946), for Thailand Act Relating to Price of Merchandise and Service, B.E. 2542 (1999), and for Vietnam, the Law on Price (2013).
169 DTI suggested retail prices. Available at: http://www.dti.gov.ph/consumers/e-presyo#price-reports
170 The Press Release of the Philippine Competition Commission, April 5, 2017: “Let the market forces dictate prices, not SRPS”. Available at http://phcc.gov.ph/pcc-let-market-forces-dictate-prices-not-srps/
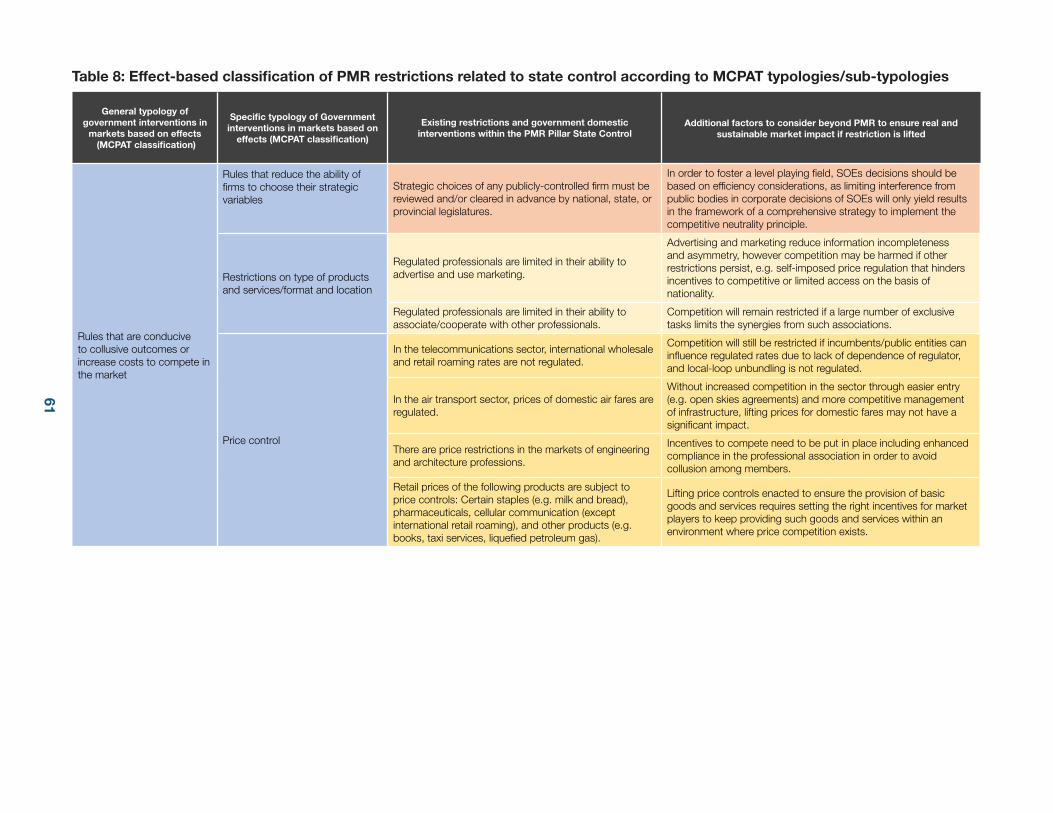
61
Table 8: Effect-based classification of PMR restrictions related to state control according to MCPAT typologies/sub-typologies
General typology of government interventions in
markets based on effects (MCPAT classification)
Specific typology of Government interventions in markets based on
effects (MCPAT classification)
Existing restrictions and government domestic interventions within the PMR Pillar State Control
Additional factors to consider beyond PMR to ensure real and sustainable market impact if restriction is lifted
Rules that are conducive to collusive outcomes or increase costs to compete in the market
Rules that reduce the ability of firms to choose their strategic variables
Strategic choices of any publicly-controlled firm must be reviewed and/or cleared in advance by national, state, or provincial legislatures.
In order to foster a level playing field, SOEs decisions should be based on efficiency considerations, as limiting interference from public bodies in corporate decisions of SOEs will only yield results in the framework of a comprehensive strategy to implement the competitive neutrality principle.
Restrictions on type of products and services/format and location
Regulated professionals are limited in their ability to advertise and use marketing.
Advertising and marketing reduce information incompleteness and asymmetry, however competition may be harmed if other restrictions persist, e.g. self-imposed price regulation that hinders incentives to competitive or limited access on the basis of nationality.
Regulated professionals are limited in their ability to associate/cooperate with other professionals.
Competition will remain restricted if a large number of exclusive tasks limits the synergies from such associations.
Price control
In the telecommunications sector, international wholesale and retail roaming rates are not regulated.
Competition will still be restricted if incumbents/public entities can influence regulated rates due to lack of dependence of regulator, and local-loop unbundling is not regulated.
In the air transport sector, prices of domestic air fares are regulated.
Without increased competition in the sector through easier entry (e.g. open skies agreements) and more competitive management of infrastructure, lifting prices for domestic fares may not have a significant impact.
There are price restrictions in the markets of engineering and architecture professions.
Incentives to compete need to be put in place including enhanced compliance in the professional association in order to avoid collusion among members.
Retail prices of the following products are subject to price controls: Certain staples (e.g. milk and bread), pharmaceuticals, cellular communication (except international retail roaming), and other products (e.g. books, taxi services, liquefied petroleum gas).
Lifting price controls enacted to ensure the provision of basic goods and services requires setting the right incentives for market players to keep providing such goods and services within an environment where price competition exists.
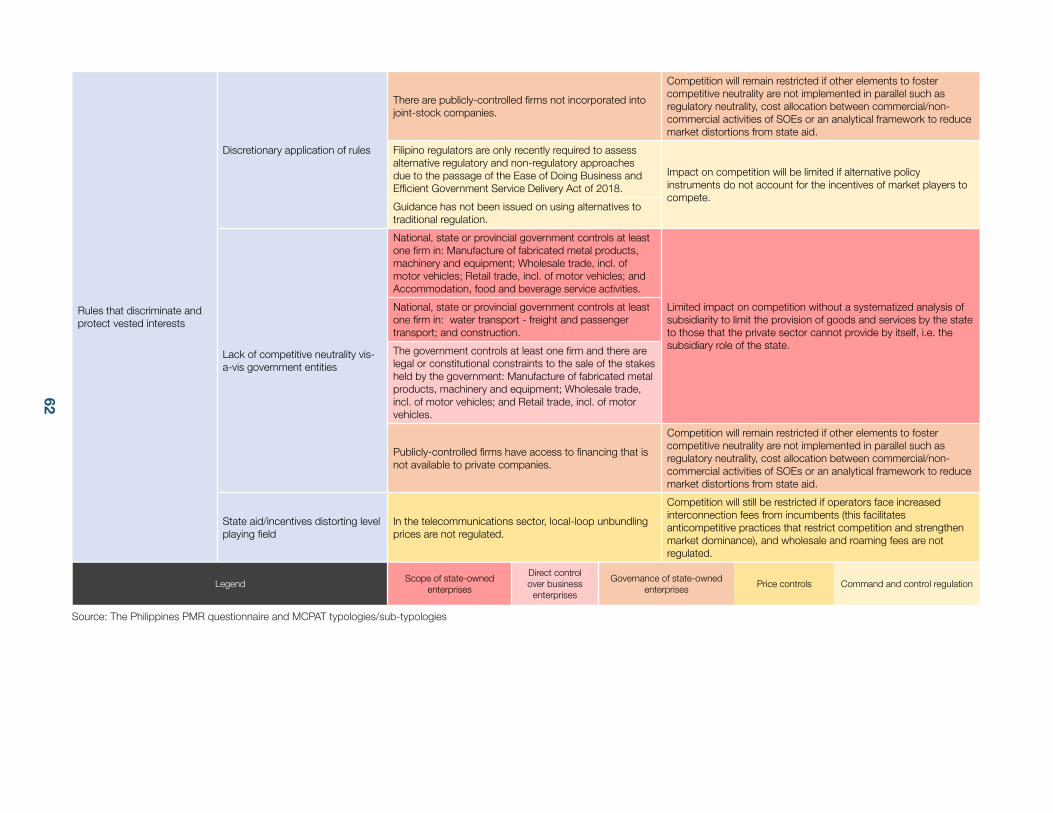
62
Rules that discriminate and protect vested interests
Discretionary application of rules
There are publicly-controlled firms not incorporated into joint-stock companies.
Competition will remain restricted if other elements to foster competitive neutrality are not implemented in parallel such as regulatory neutrality, cost allocation between commercial/non-commercial activities of SOEs or an analytical framework to reduce market distortions from state aid.
Filipino regulators are only recently required to assess alternative regulatory and non-regulatory approaches due to the passage of the Ease of Doing Business and Efficient Government Service Delivery Act of 2018.
Impact on competition will be limited if alternative policy instruments do not account for the incentives of market players to compete.
Guidance has not been issued on using alternatives to traditional regulation.
Lack of competitive neutrality vis-a-vis government entities
National, state or provincial government controls at least one firm in: Manufacture of fabricated metal products, machinery and equipment; Wholesale trade, incl. of motor vehicles; Retail trade, incl. of motor vehicles; and Accommodation, food and beverage service activities.
Limited impact on competition without a systematized analysis of subsidiarity to limit the provision of goods and services by the state to those that the private sector cannot provide by itself, i.e. the subsidiary role of the state.
National, state or provincial government controls at least one firm in: water transport - freight and passenger transport; and construction.
The government controls at least one firm and there are legal or constitutional constraints to the sale of the stakes held by the government: Manufacture of fabricated metal products, machinery and equipment; Wholesale trade, incl. of motor vehicles; and Retail trade, incl. of motor vehicles.
Publicly-controlled firms have access to financing that is not available to private companies.
Competition will remain restricted if other elements to foster competitive neutrality are not implemented in parallel such as regulatory neutrality, cost allocation between commercial/non-commercial activities of SOEs or an analytical framework to reduce market distortions from state aid.
State aid/incentives distorting level playing field
In the telecommunications sector, local-loop unbundling prices are not regulated.
Competition will still be restricted if operators face increased interconnection fees from incumbents (this facilitates anticompetitive practices that restrict competition and strengthen market dominance), and wholesale and roaming fees are not regulated.
Source: The Philippines PMR questionnaire and MCPAT typologies/sub-typologies
LegendScope of state-owned
enterprises
Direct control over business
enterprises
Governance of state-owned enterprises
Price controls Command and control regulation
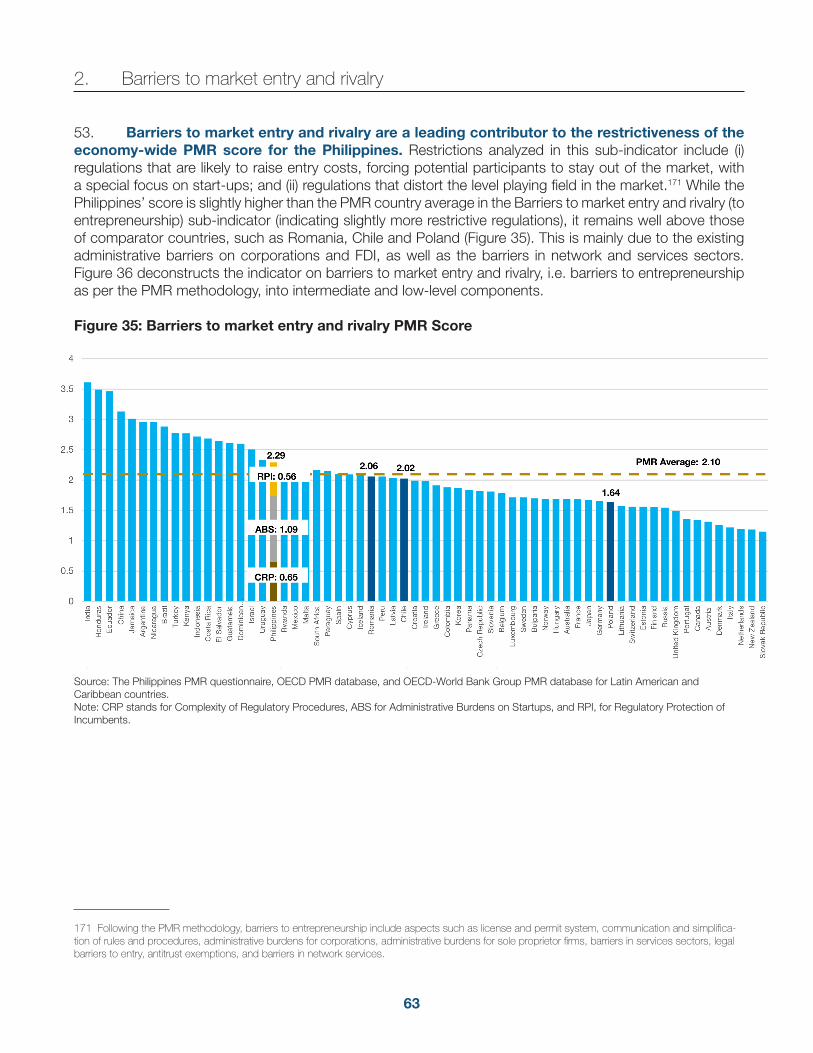
63
2. Barriers to market entry and rivalry
53. Barriers to market entry and rivalry are a leading contributor to the restrictiveness of the economy-wide PMR score for the Philippines. Restrictions analyzed in this sub-indicator include (i) regulations that are likely to raise entry costs, forcing potential participants to stay out of the market, with a special focus on start-ups; and (ii) regulations that distort the level playing field in the market.171 While the Philippines’ score is slightly higher than the PMR country average in the Barriers to market entry and rivalry (to entrepreneurship) sub-indicator (indicating slightly more restrictive regulations), it remains well above those of comparator countries, such as Romania, Chile and Poland (Figure 35). This is mainly due to the existing administrative barriers on corporations and FDI, as well as the barriers in network and services sectors. Figure 36 deconstructs the indicator on barriers to market entry and rivalry, i.e. barriers to entrepreneurship as per the PMR methodology, into intermediate and low-level components.
Figure 35: Barriers to market entry and rivalry PMR Score
Source: The Philippines PMR questionnaire, OECD PMR database, and OECD-World Bank Group PMR database for Latin American and Caribbean countries.Note: CRP stands for Complexity of Regulatory Procedures, ABS for Administrative Burdens on Startups, and RPI, for Regulatory Protection of Incumbents.
171 Following the PMR methodology, barriers to entrepreneurship include aspects such as license and permit system, communication and simplifica-tion of rules and procedures, administrative burdens for corporations, administrative burdens for sole proprietor firms, barriers in services sectors, legal barriers to entry, antitrust exemptions, and barriers in network services.
64
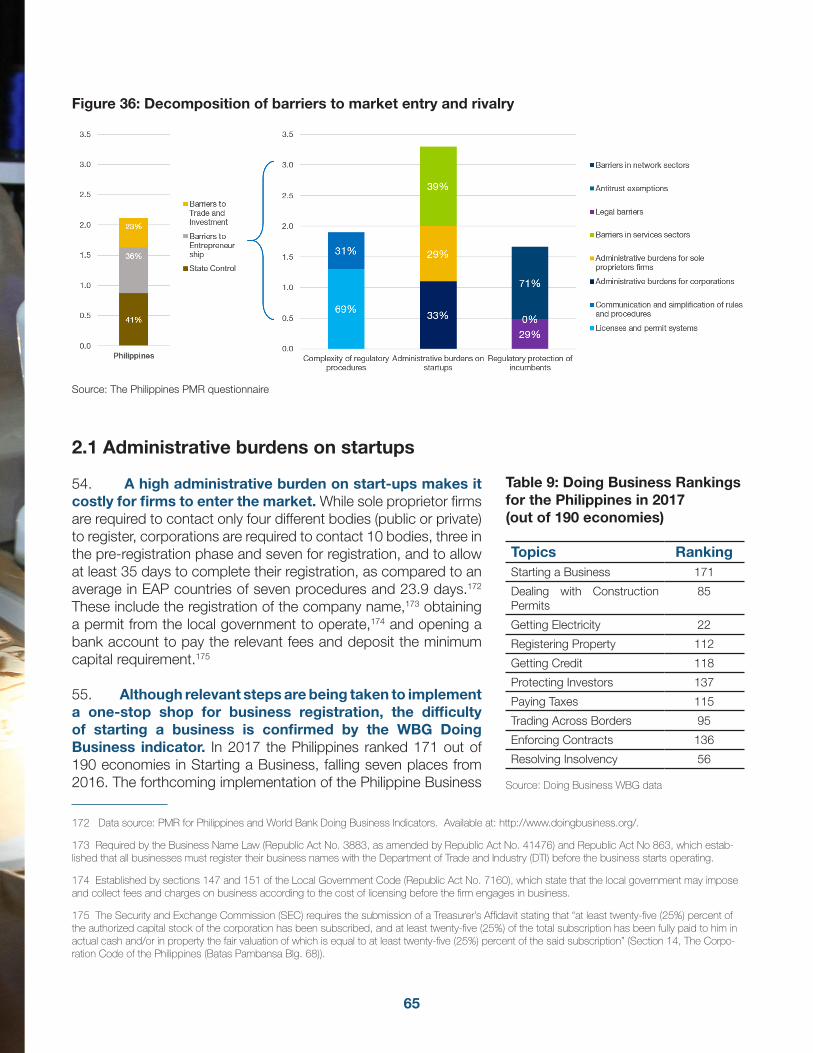
65
Figure 36: Decomposition of barriers to market entry and rivalry
41%
36%
23%
0.0
0.5
1.0
1.5
2.0
2.5
3.0
3.5
Philippines
Barriers toTrade andInvestment
Barriers toEntrepreneurship
State Control
69%
31%
33%
29%
39%
29%0%
71%
0.0
0.5
1.0
1.5
2.0
2.5
3.0
3.5
Complexity of regulatoryprocedures
Administrative burdens onstartups
Regulatory protection ofincumbents
Barriers in network sectors
Antitrust exemptions
Legal barriers
Barriers in services sectors
Administrative burdens for soleproprietors firms
Administrative burdens for corporations
Communication and simplification of rulesand procedures
Licenses and permint systems
Source: The Philippines PMR questionnaire
2.1 Administrative burdens on startups
54. A high administrative burden on start-ups makes it costly for firms to enter the market. While sole proprietor firms are required to contact only four different bodies (public or private) to register, corporations are required to contact 10 bodies, three in the pre-registration phase and seven for registration, and to allow at least 35 days to complete their registration, as compared to an average in EAP countries of seven procedures and 23.9 days.172 These include the registration of the company name,173 obtaining a permit from the local government to operate,174 and opening a bank account to pay the relevant fees and deposit the minimum capital requirement.175
55. Although relevant steps are being taken to implement a one-stop shop for business registration, the difficulty of starting a business is confirmed by the WBG Doing Business indicator. In 2017 the Philippines ranked 171 out of 190 economies in Starting a Business, falling seven places from 2016. The forthcoming implementation of the Philippine Business
172 Data source: PMR for Philippines and World Bank Doing Business Indicators. Available at: http://www.doingbusiness.org/.
173 Required by the Business Name Law (Republic Act No. 3883, as amended by Republic Act No. 41476) and Republic Act No 863, which estab-lished that all businesses must register their business names with the Department of Trade and Industry (DTI) before the business starts operating.
174 Established by sections 147 and 151 of the Local Government Code (Republic Act No. 7160), which state that the local government may impose and collect fees and charges on business according to the cost of licensing before the firm engages in business.
175 The Security and Exchange Commission (SEC) requires the submission of a Treasurer’s Affidavit stating that “at least twenty-five (25%) percent of the authorized capital stock of the corporation has been subscribed, and at least twenty-five (25%) of the total subscription has been fully paid to him in actual cash and/or in property the fair valuation of which is equal to at least twenty-five (25%) percent of the said subscription” (Section 14, The Corpo-ration Code of the Philippines (Batas Pambansa Blg. 68)).
Table 9: Doing Business Rankings for the Philippines in 2017 (out of 190 economies)
Source: Doing Business WBG data
Topics RankingStarting a Business 171
Dealing with Construction Permits
85
Getting Electricity 22
Registering Property 112
Getting Credit 118
Protecting Investors 137
Paying Taxes 115
Trading Across Borders 95
Enforcing Contracts 136
Resolving Insolvency 56
66
Registry176 (PBR) will be key to integrate the business registration processes of five national government line agencies, namely the Department of Trade and Industry (DTI), the Bureau of Internal Revenue (BIR), the Home Development Mutual Fund (Pag-IBIG), the Philippine Health Insurance Corporation (PhilHealth), and the Social Security System (SSS). The PBR program is expected to ease doing business in the Philippines as applicants will no longer need to register their businesses in all five agencies, thereby reducing incidental expenses and increasing cost savings by cutting red tape.
56. Finally, barriers in service sectors, a key input for doing business, also contribute to the high administrative burden on firms to operate in the Philippines. These include entry and behavioral restrictions on regulated services (accountants, lawyers, architects and engineers),177 road freight transport178 and retail distribution. The latter captures restrictions on starting certain activities, especially regarding the sale of food and clothing, opening large outlets of more than 3,000m2,179 or offering below cost prices.180 Moreover, only Filipino citizens may own retail outlets with up to US$ 2.5 million in capital.181
2.2 Complexity of regulatory procedures
57. The absence of key simplifying tools in the system of licenses and permits triggers restrictions related to the complexity of regulatory procedures. For instance, the “silence is consent” rule, a key element to foster administrative efficiency, does not exist in the Philippines.182 This mechanism is crucial for speeding up resolutions for the benefit of firms and citizens. For firms, mainly those intending to enter the market, having a silence is consent rule allows for a reduction in uncertainty during administrative delays issuing licenses and permits. In turn, this rule reduces the protection of incumbents as they will be exposed to more competition.
2.3 Regulatory protection of incumbents
58. The lack of a regulatory framework to enable access in network sectors appears to insulate incumbents from competition. For instance, in the telecommunications sector, unbundling of the local loop is not required although it is relevant for broadband access;183 in the railways sector, entry is franchised to a single firm and there is no vertical separation between the operation of railroad infrastructure and the
176 The one-stop shop under the PBR is available online at: http://www.business.gov.ph. The website includes information about the different require-ments for registration (http://www.business.gov.ph/web/guest/faqs) and, by registering on the website, the online registration procedure (http://www.business.gov.ph/web/guest/pbr-registration).
177 Section 3 will develop restrictions in professional services in detail.
178 In order to establish a national road freight business all trucks require a franchise from the Land Transport and Road Franchising Board (more information at http://www.ltfrb.gov.ph/media/Truck_FAQs.pdf)
179 Retail Trade with paid-up capital of US$ 2.5 million or less is limited to Filipinos, or juridical entities wholly owned by Filipino citizens (Section 5, Republic Act No. 8762, otherwise known as the Retail Trade Liberalization Act).
180 Consumer Act (Republic Act No. 7394) requires the registration of sales that are advertised. Pricing below cost is prohibited only if it is predatory, by the Philippine Competition Act.
181 Section 5, Republic Act No. 8762, otherwise known as the Retail Trade Liberalization Act.
182 The general rule is that a written approval/license must be issued. There is no specific law allowing implicit consent by the administration in case of legal deadlines expiring.
183 Unbundling of the local loop is not required in the Philippines. USAID (2016), “Philippine Broadband: A Policy Brief”, Broadband Policy Brief Num-ber 4, table 3, p.10. Available at:http://www.investphilippines.info/arangkada/wp-content/uploads/2016/02/BROADBAND-POLICY-BRIEF-as-printed.pdf
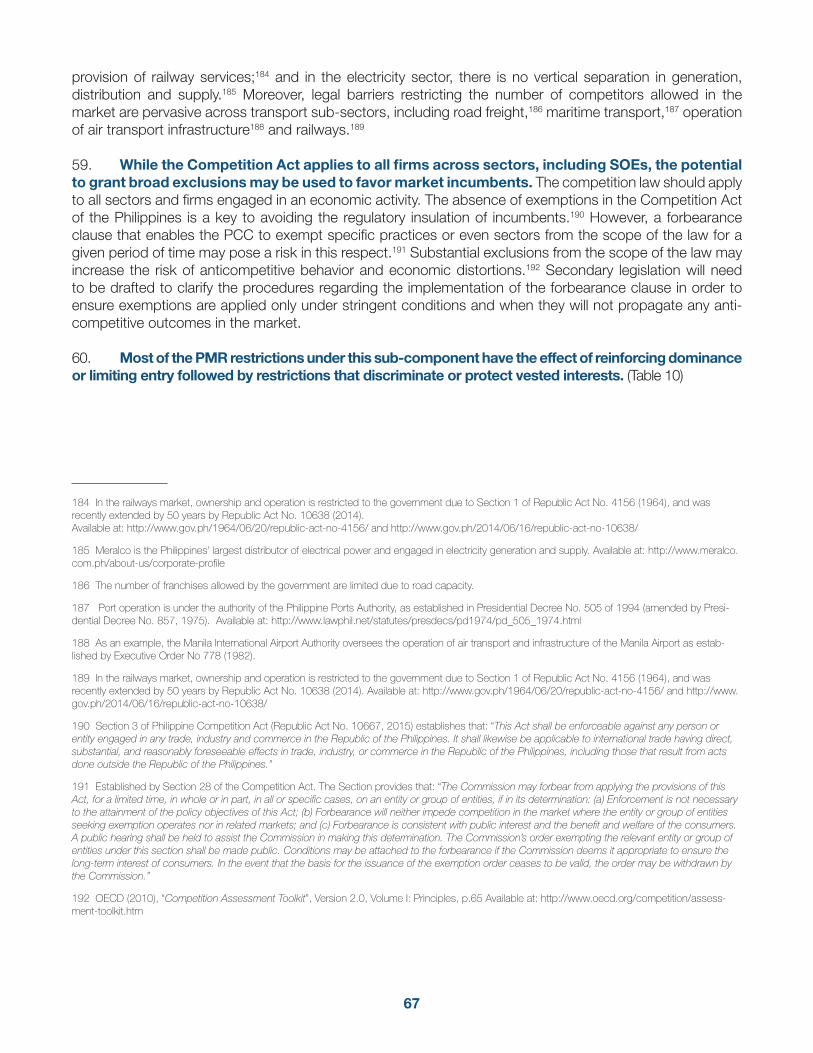
67
provision of railway services;184 and in the electricity sector, there is no vertical separation in generation, distribution and supply.185 Moreover, legal barriers restricting the number of competitors allowed in the market are pervasive across transport sub-sectors, including road freight,186 maritime transport,187 operation of air transport infrastructure188 and railways.189
59. While the Competition Act applies to all firms across sectors, including SOEs, the potential to grant broad exclusions may be used to favor market incumbents. The competition law should apply to all sectors and firms engaged in an economic activity. The absence of exemptions in the Competition Act of the Philippines is a key to avoiding the regulatory insulation of incumbents.190 However, a forbearance clause that enables the PCC to exempt specific practices or even sectors from the scope of the law for a given period of time may pose a risk in this respect.191 Substantial exclusions from the scope of the law may increase the risk of anticompetitive behavior and economic distortions.192 Secondary legislation will need to be drafted to clarify the procedures regarding the implementation of the forbearance clause in order to ensure exemptions are applied only under stringent conditions and when they will not propagate any anti-competitive outcomes in the market.
60. Most of the PMR restrictions under this sub-component have the effect of reinforcing dominance or limiting entry followed by restrictions that discriminate or protect vested interests. (Table 10)
184 In the railways market, ownership and operation is restricted to the government due to Section 1 of Republic Act No. 4156 (1964), and was recently extended by 50 years by Republic Act No. 10638 (2014). Available at: http://www.gov.ph/1964/06/20/republic-act-no-4156/ and http://www.gov.ph/2014/06/16/republic-act-no-10638/
185 Meralco is the Philippines’ largest distributor of electrical power and engaged in electricity generation and supply. Available at: http://www.meralco.com.ph/about-us/corporate-profile
186 The number of franchises allowed by the government are limited due to road capacity.
187 Port operation is under the authority of the Philippine Ports Authority, as established in Presidential Decree No. 505 of 1994 (amended by Presi-dential Decree No. 857, 1975). Available at: http://www.lawphil.net/statutes/presdecs/pd1974/pd_505_1974.html
188 As an example, the Manila International Airport Authority oversees the operation of air transport and infrastructure of the Manila Airport as estab-lished by Executive Order No 778 (1982).
189 In the railways market, ownership and operation is restricted to the government due to Section 1 of Republic Act No. 4156 (1964), and was recently extended by 50 years by Republic Act No. 10638 (2014). Available at: http://www.gov.ph/1964/06/20/republic-act-no-4156/ and http://www.gov.ph/2014/06/16/republic-act-no-10638/
190 Section 3 of Philippine Competition Act (Republic Act No. 10667, 2015) establishes that: “This Act shall be enforceable against any person or entity engaged in any trade, industry and commerce in the Republic of the Philippines. It shall likewise be applicable to international trade having direct, substantial, and reasonably foreseeable effects in trade, industry, or commerce in the Republic of the Philippines, including those that result from acts done outside the Republic of the Philippines.”
191 Established by Section 28 of the Competition Act. The Section provides that: “The Commission may forbear from applying the provisions of this Act, for a limited time, in whole or in part, in all or specific cases, on an entity or group of entities, if in its determination: (a) Enforcement is not necessary to the attainment of the policy objectives of this Act; (b) Forbearance will neither impede competition in the market where the entity or group of entities seeking exemption operates nor in related markets; and (c) Forbearance is consistent with public interest and the benefit and welfare of the consumers.A public hearing shall be held to assist the Commission in making this determination. The Commission’s order exempting the relevant entity or group of entities under this section shall be made public. Conditions may be attached to the forbearance if the Commission deems it appropriate to ensure the long-term interest of consumers. In the event that the basis for the issuance of the exemption order ceases to be valid, the order may be withdrawn by the Commission.”
192 OECD (2010), “Competition Assessment Toolkit”, Version 2.0, Volume I: Principles, p.65 Available at: http://www.oecd.org/competition/assess-ment-toolkit.htm
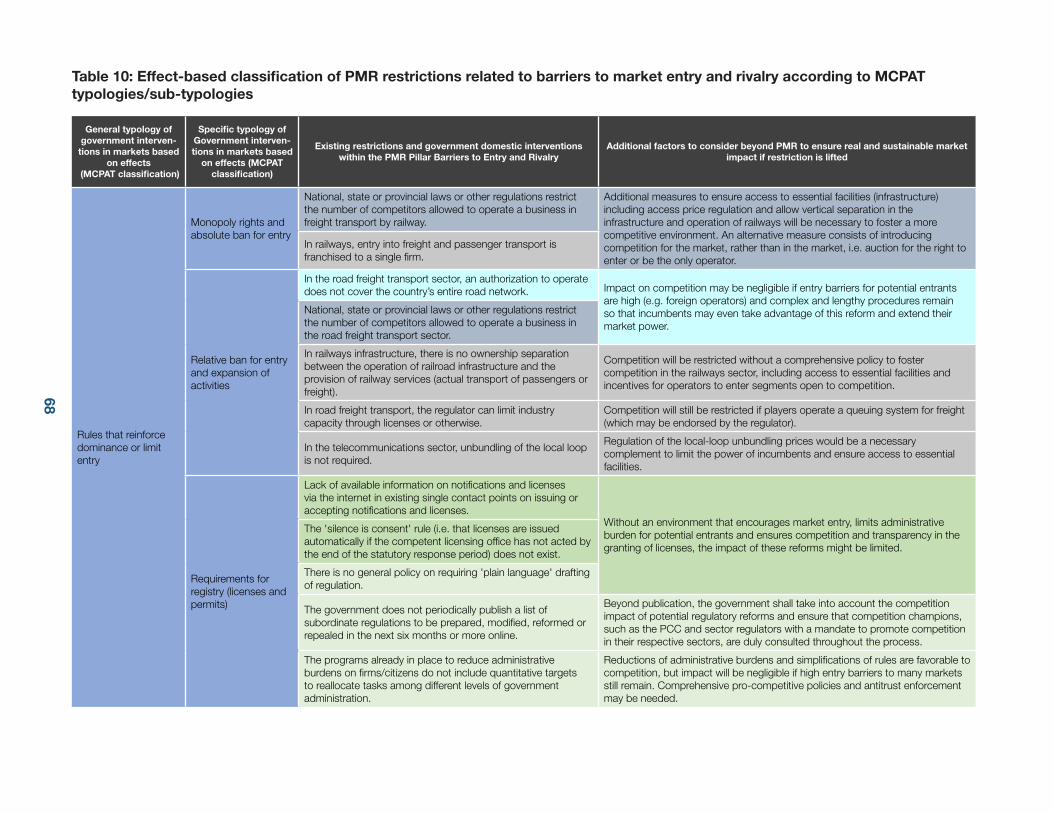
68 69
Table 10: Effect-based classification of PMR restrictions related to barriers to market entry and rivalry according to MCPAT typologies/sub-typologies
General typology of government interven-
tions in markets based on effects
(MCPAT classification)
Specific typology of Government interven-tions in markets based
on effects (MCPAT classification)
Existing restrictions and government domestic interventions within the PMR Pillar Barriers to Entry and Rivalry
Additional factors to consider beyond PMR to ensure real and sustainable market impact if restriction is lifted
Rules that reinforce dominance or limit entry
Monopoly rights and absolute ban for entry
National, state or provincial laws or other regulations restrict the number of competitors allowed to operate a business in freight transport by railway.
Additional measures to ensure access to essential facilities (infrastructure) including access price regulation and allow vertical separation in the infrastructure and operation of railways will be necessary to foster a more competitive environment. An alternative measure consists of introducing competition for the market, rather than in the market, i.e. auction for the right to enter or be the only operator.
In railways, entry into freight and passenger transport is franchised to a single firm.
Relative ban for entry and expansion of activities
In the road freight transport sector, an authorization to operate does not cover the country’s entire road network. Impact on competition may be negligible if entry barriers for potential entrants
are high (e.g. foreign operators) and complex and lengthy procedures remain so that incumbents may even take advantage of this reform and extend their market power.
National, state or provincial laws or other regulations restrict the number of competitors allowed to operate a business in the road freight transport sector.
In railways infrastructure, there is no ownership separation between the operation of railroad infrastructure and the provision of railway services (actual transport of passengers or freight).
Competition will be restricted without a comprehensive policy to foster competition in the railways sector, including access to essential facilities and incentives for operators to enter segments open to competition.
In road freight transport, the regulator can limit industry capacity through licenses or otherwise.
Competition will still be restricted if players operate a queuing system for freight (which may be endorsed by the regulator).
In the telecommunications sector, unbundling of the local loop is not required.
Regulation of the local-loop unbundling prices would be a necessary complement to limit the power of incumbents and ensure access to essential facilities.
Requirements for registry (licenses and permits)
Lack of available information on notifications and licenses via the internet in existing single contact points on issuing or accepting notifications and licenses.
Without an environment that encourages market entry, limits administrative burden for potential entrants and ensures competition and transparency in the granting of licenses, the impact of these reforms might be limited.
The 'silence is consent' rule (i.e. that licenses are issued automatically if the competent licensing office has not acted by the end of the statutory response period) does not exist.
There is no general policy on requiring 'plain language' drafting of regulation.
The government does not periodically publish a list of subordinate regulations to be prepared, modified, reformed or repealed in the next six months or more online.
Beyond publication, the government shall take into account the competition impact of potential regulatory reforms and ensure that competition champions, such as the PCC and sector regulators with a mandate to promote competition in their respective sectors, are duly consulted throughout the process.
The programs already in place to reduce administrative burdens on firms/citizens do not include quantitative targets to reallocate tasks among different levels of government administration.
Reductions of administrative burdens and simplifications of rules are favorable to competition, but impact will be negligible if high entry barriers to many markets still remain. Comprehensive pro-competitive policies and antitrust enforcement may be needed.
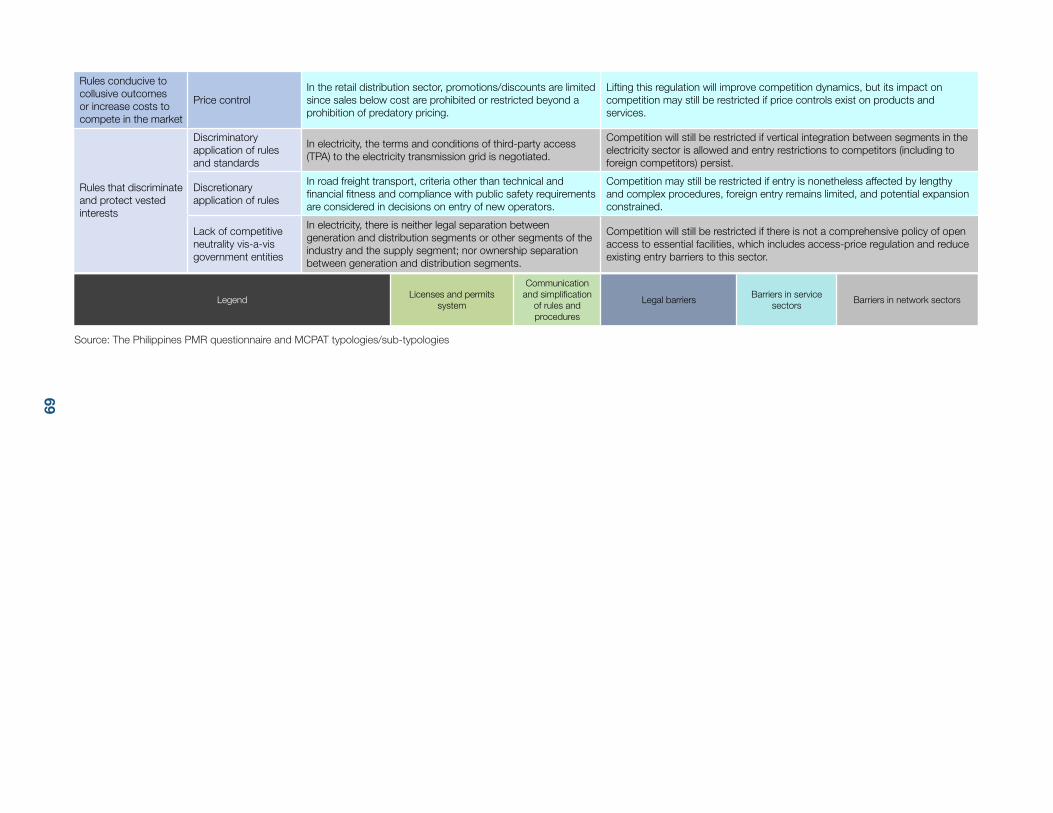
69
Source: The Philippines PMR questionnaire and MCPAT typologies/sub-typologies
Rules conducive to collusive outcomes or increase costs to compete in the market
Price controlIn the retail distribution sector, promotions/discounts are limited since sales below cost are prohibited or restricted beyond a prohibition of predatory pricing.
Lifting this regulation will improve competition dynamics, but its impact on competition may still be restricted if price controls exist on products and services.
Rules that discriminate and protect vested interests
Discriminatory application of rules and standards
In electricity, the terms and conditions of third-party access (TPA) to the electricity transmission grid is negotiated.
Competition will still be restricted if vertical integration between segments in the electricity sector is allowed and entry restrictions to competitors (including to foreign competitors) persist.
Discretionary application of rules
In road freight transport, criteria other than technical and financial fitness and compliance with public safety requirements are considered in decisions on entry of new operators.
Competition may still be restricted if entry is nonetheless affected by lengthy and complex procedures, foreign entry remains limited, and potential expansion constrained.
Lack of competitive neutrality vis-a-vis government entities
In electricity, there is neither legal separation between generation and distribution segments or other segments of the industry and the supply segment; nor ownership separation between generation and distribution segments.
Competition will still be restricted if there is not a comprehensive policy of open access to essential facilities, which includes access-price regulation and reduce existing entry barriers to this sector.
LegendLicenses and permits
system
Communication and simplification
of rules and procedures
Legal barriersBarriers in service
sectorsBarriers in network sectors
70
3. Barriers to trade and investment
61. Barriers to trade and investment limit foreign participation in key sectors of the economy, including utilities and regulated services. The qualitative data underlying the PMR indicators identify key restrictions for the Philippines which are discussed in this section. However, the value of this sub-indicator, generally based on the OECD FDI Index, remains low due to the use of a proxy for the Philippines for whom this index is not available.193 Although barriers to trade and investment carry the smallest weight in the overall PMR score for the Philippines, this sub-indicator captures significant barriers to FDI and differential treatment of foreign suppliers. In contrast, other restrictions captured by this sub-indicator, such as tariff barriers and barriers to trade facilitation, appear to be relatively low.
Figure 37: Barriers to Trade & Investment PMR Score
Source: The Philippines PMR questionnaire, OECD PMR database, and OECD-World Bank Group PMR database for Latin American and Caribbean countries.Note: EBTI stands for Explicit Barriers to Trade and Investment, and OBTI, for Other Barriers to Trade and Investment.
193 The proxy is based on an average of the OECD FDI index of those non-OECD countries included in the PMR dataset for which this index is avail-able. This average is 0.49.
BTI: 1.48
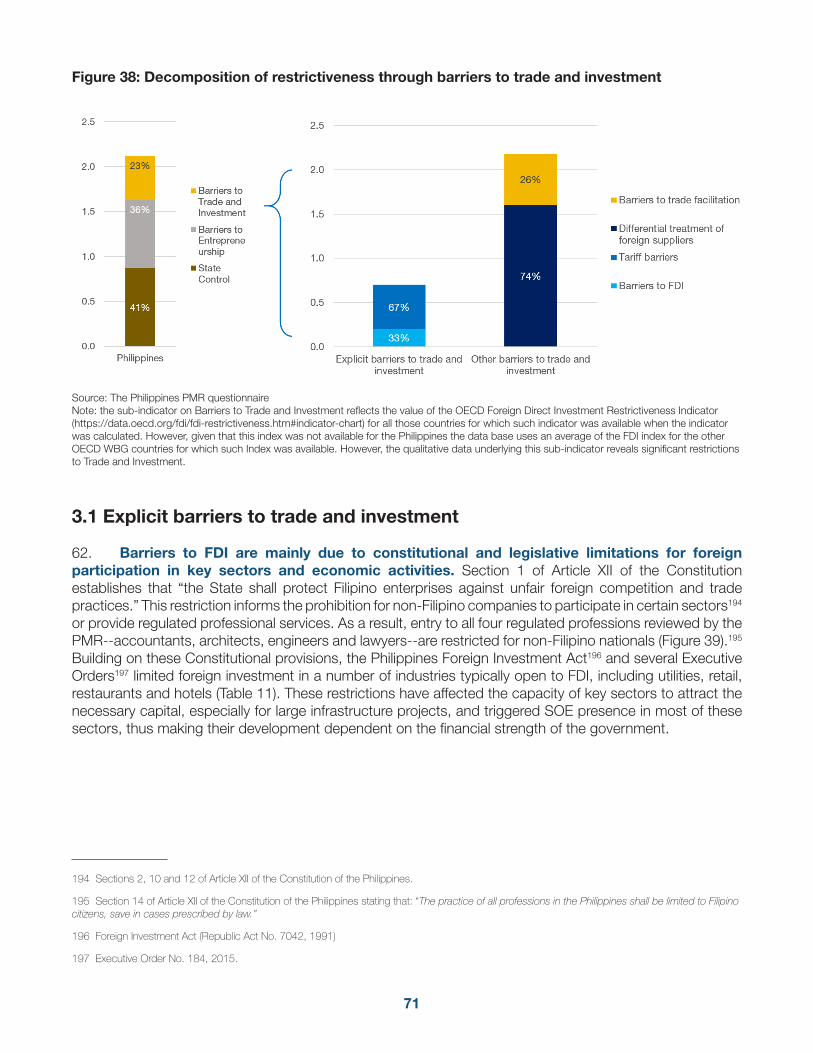
71
Figure 38: Decomposition of restrictiveness through barriers to trade and investment
41%
36%
23%
0.0
0.5
1.0
1.5
2.0
2.5
Philippines
Barriers toTrade andInvestment
Barriers toEntrepreneurship
StateControl
33%
67%
74%
26%
0.0
0.5
1.0
1.5
2.0
2.5
Explicit barriers to trade andinvestment
Other barriers to trade andinvestment
Barriers to trade facilitation
Differential treatment offoreign suppliers
Tariff barriers
Barriers to FDI
Source: The Philippines PMR questionnaireNote: the sub-indicator on Barriers to Trade and Investment reflects the value of the OECD Foreign Direct Investment Restrictiveness Indicator (https://data.oecd.org/fdi/fdi-restrictiveness.htm#indicator-chart) for all those countries for which such indicator was available when the indicator was calculated. However, given that this index was not available for the Philippines the data base uses an average of the FDI index for the other OECD WBG countries for which such Index was available. However, the qualitative data underlying this sub-indicator reveals significant restrictions to Trade and Investment.
3.1 Explicit barriers to trade and investment
62. Barriers to FDI are mainly due to constitutional and legislative limitations for foreign participation in key sectors and economic activities. Section 1 of Article XII of the Constitution establishes that “the State shall protect Filipino enterprises against unfair foreign competition and trade practices.” This restriction informs the prohibition for non-Filipino companies to participate in certain sectors194 or provide regulated professional services. As a result, entry to all four regulated professions reviewed by the PMR--accountants, architects, engineers and lawyers--are restricted for non-Filipino nationals (Figure 39).195 Building on these Constitutional provisions, the Philippines Foreign Investment Act196 and several Executive Orders197 limited foreign investment in a number of industries typically open to FDI, including utilities, retail, restaurants and hotels (Table 11). These restrictions have affected the capacity of key sectors to attract the necessary capital, especially for large infrastructure projects, and triggered SOE presence in most of these sectors, thus making their development dependent on the financial strength of the government.
194 Sections 2, 10 and 12 of Article XII of the Constitution of the Philippines.
195 Section 14 of Article XII of the Constitution of the Philippines stating that: “The practice of all professions in the Philippines shall be limited to Filipino citizens, save in cases prescribed by law.”
196 Foreign Investment Act (Republic Act No. 7042, 1991)
197 Executive Order No. 184, 2015.
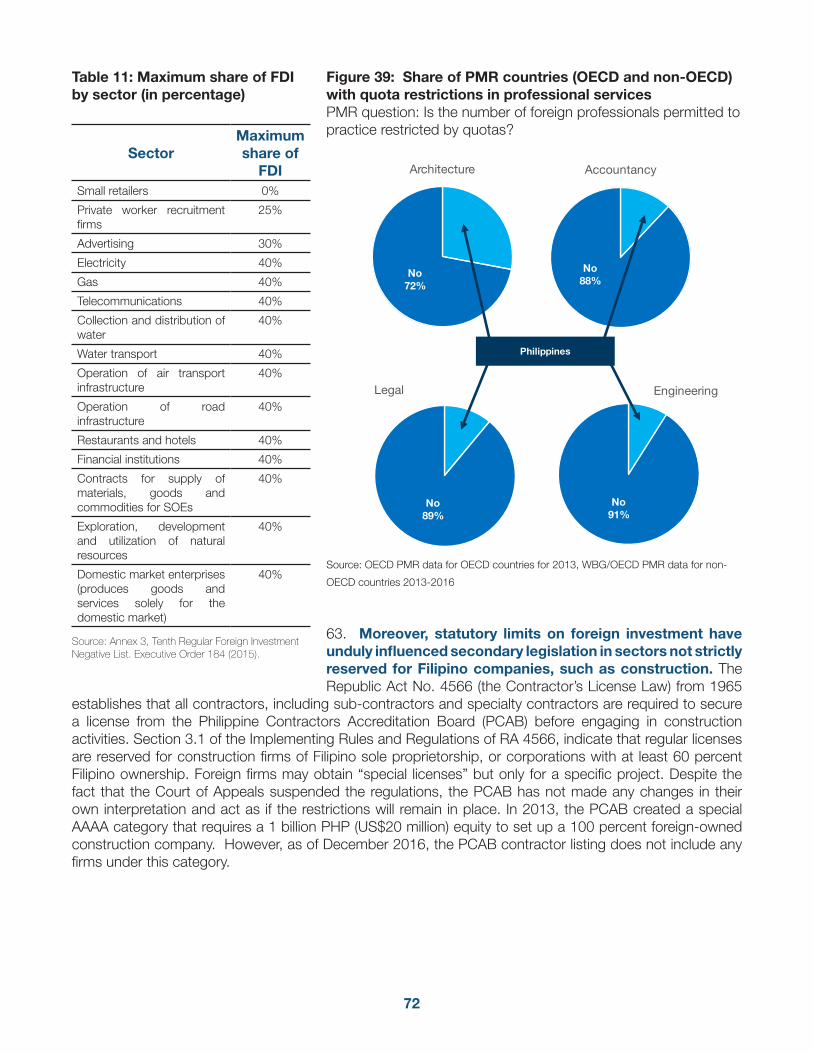
72
Table 11: Maximum share of FDI by sector (in percentage)
Source: Annex 3, Tenth Regular Foreign Investment Negative List. Executive Order 184 (2015).
SectorMaximum share of
FDISmall retailers 0%
Private worker recruitment firms
25%
Advertising 30%
Electricity 40%
Gas 40%
Telecommunications 40%
Collection and distribution of water
40%
Water transport 40%
Operation of air transport infrastructure
40%
Operation of road infrastructure
40%
Restaurants and hotels 40%
Financial institutions 40%
Contracts for supply of materials, goods and commodities for SOEs
40%
Exploration, development and utilization of natural resources
40%
Domestic market enterprises (produces goods and services solely for the domestic market)
40%
Figure 39: Share of PMR countries (OECD and non-OECD) with quota restrictions in professional servicesPMR question: Is the number of foreign professionals permitted to practice restricted by quotas?
No 72%
Architecture
No 88%
Accountancy
No 89%
Legal
No 91%
Engineering
Philippines
Source: OECD PMR data for OECD countries for 2013, WBG/OECD PMR data for non-
OECD countries 2013-2016
63. Moreover, statutory limits on foreign investment have unduly influenced secondary legislation in sectors not strictly reserved for Filipino companies, such as construction. The Republic Act No. 4566 (the Contractor’s License Law) from 1965
establishes that all contractors, including sub-contractors and specialty contractors are required to secure a license from the Philippine Contractors Accreditation Board (PCAB) before engaging in construction activities. Section 3.1 of the Implementing Rules and Regulations of RA 4566, indicate that regular licenses are reserved for construction firms of Filipino sole proprietorship, or corporations with at least 60 percent Filipino ownership. Foreign firms may obtain “special licenses” but only for a specific project. Despite the fact that the Court of Appeals suspended the regulations, the PCAB has not made any changes in their own interpretation and act as if the restrictions will remain in place. In 2013, the PCAB created a special AAAA category that requires a 1 billion PHP (US$20 million) equity to set up a 100 percent foreign-owned construction company. However, as of December 2016, the PCAB contractor listing does not include any firms under this category.
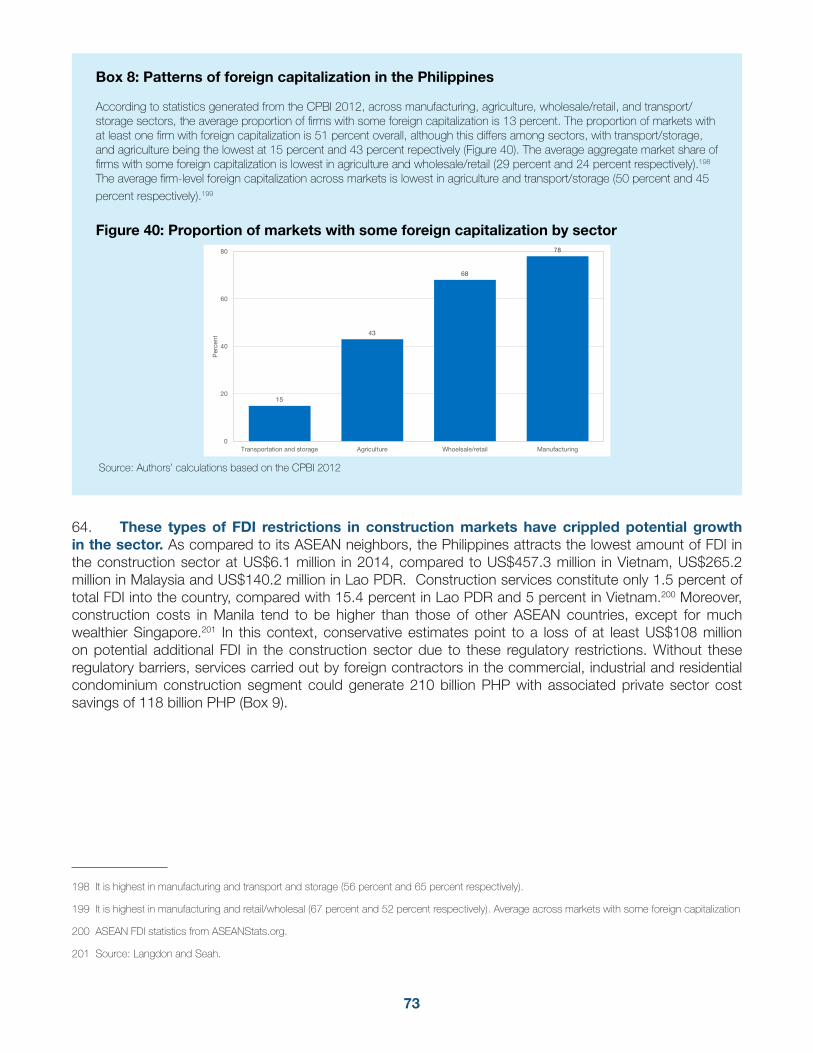
73
Box 8: Patterns of foreign capitalization in the Philippines
According to statistics generated from the CPBI 2012, across manufacturing, agriculture, wholesale/retail, and transport/storage sectors, the average proportion of firms with some foreign capitalization is 13 percent. The proportion of markets with at least one firm with foreign capitalization is 51 percent overall, although this differs among sectors, with transport/storage, and agriculture being the lowest at 15 percent and 43 percent repectively (Figure 40). The average aggregate market share of firms with some foreign capitalization is lowest in agriculture and wholesale/retail (29 percent and 24 percent respectively).198 The average firm-level foreign capitalization across markets is lowest in agriculture and transport/storage (50 percent and 45
percent respectively).199
Figure 40: Proportion of markets with some foreign capitalization by sector
Source: Authors’ calculations based on the CPBI 2012
64. These types of FDI restrictions in construction markets have crippled potential growth in the sector. As compared to its ASEAN neighbors, the Philippines attracts the lowest amount of FDI in the construction sector at US$6.1 million in 2014, compared to US$457.3 million in Vietnam, US$265.2 million in Malaysia and US$140.2 million in Lao PDR. Construction services constitute only 1.5 percent of total FDI into the country, compared with 15.4 percent in Lao PDR and 5 percent in Vietnam.200 Moreover, construction costs in Manila tend to be higher than those of other ASEAN countries, except for much wealthier Singapore.201 In this context, conservative estimates point to a loss of at least US$108 million on potential additional FDI in the construction sector due to these regulatory restrictions. Without these regulatory barriers, services carried out by foreign contractors in the commercial, industrial and residential condominium construction segment could generate 210 billion PHP with associated private sector cost savings of 118 billion PHP (Box 9).
198 It is highest in manufacturing and transport and storage (56 percent and 65 percent respectively).
199 It is highest in manufacturing and retail/wholesal (67 percent and 52 percent respectively). Average across markets with some foreign capitalization
200 ASEAN FDI statistics from ASEANStats.org.
201 Source: Langdon and Seah.
15
43
68
78
0
20
40
60
80
Transportation and storage Agriculture Whoelsale/retail Manufacturing
Per
cent
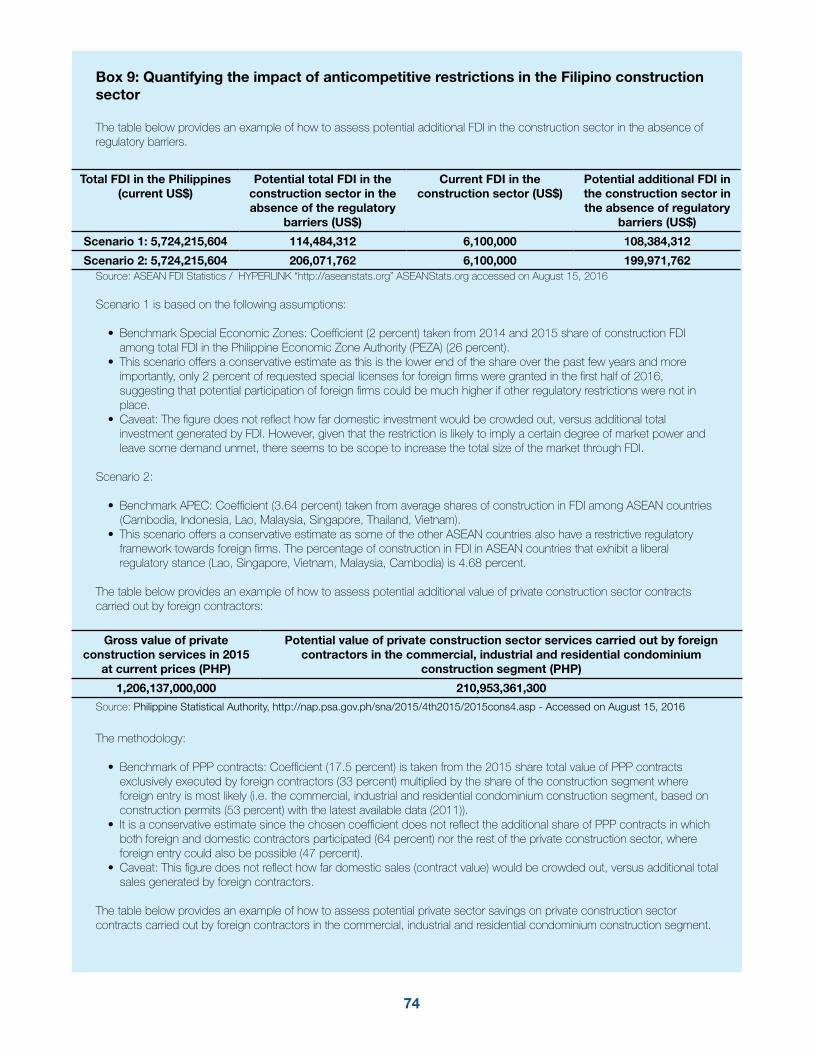
74
Box 9: Quantifying the impact of anticompetitive restrictions in the Filipino construction sector
The table below provides an example of how to assess potential additional FDI in the construction sector in the absence of regulatory barriers.
Total FDI in the Philippines (current US$)
Potential total FDI in the construction sector in the absence of the regulatory
barriers (US$)
Current FDI in the construction sector (US$)
Potential additional FDI in the construction sector in the absence of regulatory
barriers (US$)
Scenario 1: 5,724,215,604 114,484,312 6,100,000 108,384,312
Scenario 2: 5,724,215,604 206,071,762 6,100,000 199,971,762Source: ASEAN FDI Statistics / HYPERLINK “http://aseanstats.org” ASEANStats.org accessed on August 15, 2016
Scenario 1 is based on the following assumptions:
• Benchmark Special Economic Zones: Coefficient (2 percent) taken from 2014 and 2015 share of construction FDI among total FDI in the Philippine Economic Zone Authority (PEZA) (26 percent).
• This scenario offers a conservative estimate as this is the lower end of the share over the past few years and more importantly, only 2 percent of requested special licenses for foreign firms were granted in the first half of 2016, suggesting that potential participation of foreign firms could be much higher if other regulatory restrictions were not in place.
• Caveat: The figure does not reflect how far domestic investment would be crowded out, versus additional total investment generated by FDI. However, given that the restriction is likely to imply a certain degree of market power and leave some demand unmet, there seems to be scope to increase the total size of the market through FDI.
Scenario 2:
• Benchmark APEC: Coefficient (3.64 percent) taken from average shares of construction in FDI among ASEAN countries (Cambodia, Indonesia, Lao, Malaysia, Singapore, Thailand, Vietnam).
• This scenario offers a conservative estimate as some of the other ASEAN countries also have a restrictive regulatory framework towards foreign firms. The percentage of construction in FDI in ASEAN countries that exhibit a liberal regulatory stance (Lao, Singapore, Vietnam, Malaysia, Cambodia) is 4.68 percent.
The table below provides an example of how to assess potential additional value of private construction sector contracts carried out by foreign contractors:
Gross value of private construction services in 2015
at current prices (PHP)
Potential value of private construction sector services carried out by foreign contractors in the commercial, industrial and residential condominium
construction segment (PHP)
1,206,137,000,000 210,953,361,300
Source: Philippine Statistical Authority, http://nap.psa.gov.ph/sna/2015/4th2015/2015cons4.asp - Accessed on August 15, 2016
The methodology:
• Benchmark of PPP contracts: Coefficient (17.5 percent) is taken from the 2015 share total value of PPP contracts exclusively executed by foreign contractors (33 percent) multiplied by the share of the construction segment where foreign entry is most likely (i.e. the commercial, industrial and residential condominium construction segment, based on construction permits (53 percent) with the latest available data (2011)).
• It is a conservative estimate since the chosen coefficient does not reflect the additional share of PPP contracts in which both foreign and domestic contractors participated (64 percent) nor the rest of the private construction sector, where foreign entry could also be possible (47 percent).
• Caveat: This figure does not reflect how far domestic sales (contract value) would be crowded out, versus additional total sales generated by foreign contractors.
The table below provides an example of how to assess potential private sector savings on private construction sector contracts carried out by foreign contractors in the commercial, industrial and residential condominium construction segment.
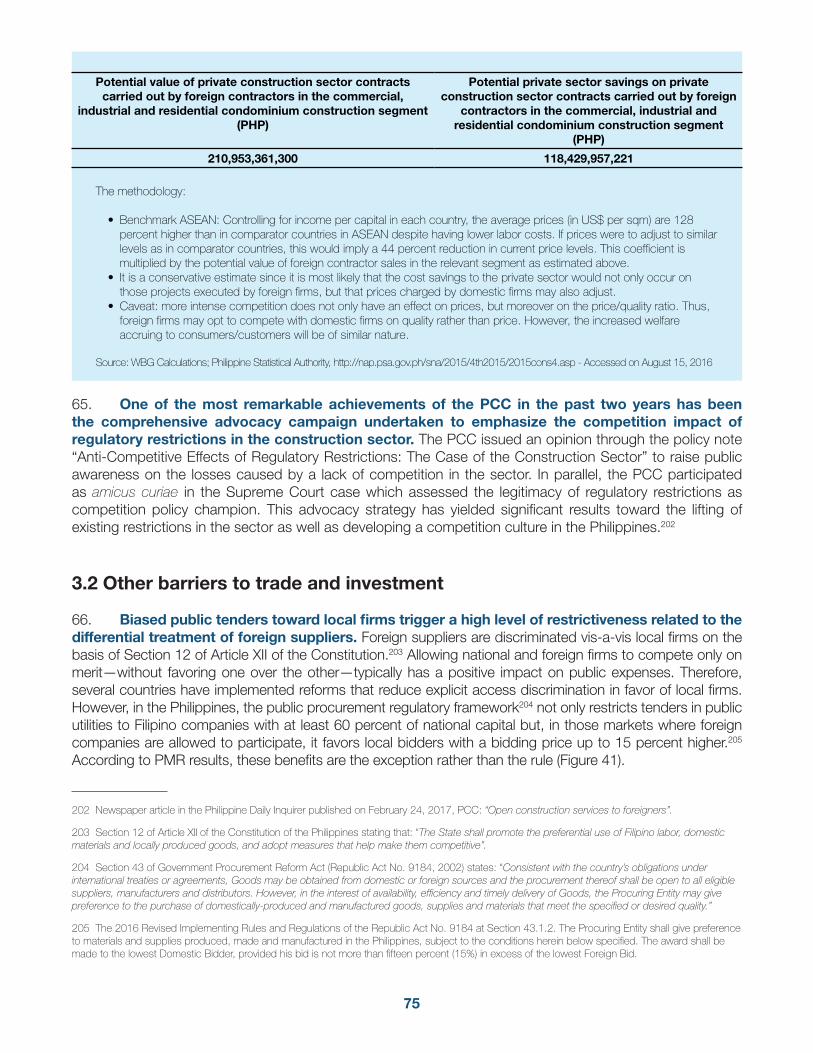
75
Potential value of private construction sector contracts carried out by foreign contractors in the commercial,
industrial and residential condominium construction segment (PHP)
Potential private sector savings on private construction sector contracts carried out by foreign
contractors in the commercial, industrial and residential condominium construction segment
(PHP)
210,953,361,300 118,429,957,221
The methodology:
• Benchmark ASEAN: Controlling for income per capital in each country, the average prices (in US$ per sqm) are 128 percent higher than in comparator countries in ASEAN despite having lower labor costs. If prices were to adjust to similar levels as in comparator countries, this would imply a 44 percent reduction in current price levels. This coefficient is multiplied by the potential value of foreign contractor sales in the relevant segment as estimated above.
• It is a conservative estimate since it is most likely that the cost savings to the private sector would not only occur on those projects executed by foreign firms, but that prices charged by domestic firms may also adjust.
• Caveat: more intense competition does not only have an effect on prices, but moreover on the price/quality ratio. Thus, foreign firms may opt to compete with domestic firms on quality rather than price. However, the increased welfare accruing to consumers/customers will be of similar nature.
Source: WBG Calculations; Philippine Statistical Authority, http://nap.psa.gov.ph/sna/2015/4th2015/2015cons4.asp - Accessed on August 15, 2016
65. One of the most remarkable achievements of the PCC in the past two years has been the comprehensive advocacy campaign undertaken to emphasize the competition impact of regulatory restrictions in the construction sector. The PCC issued an opinion through the policy note “Anti-Competitive Effects of Regulatory Restrictions: The Case of the Construction Sector” to raise public awareness on the losses caused by a lack of competition in the sector. In parallel, the PCC participated as amicus curiae in the Supreme Court case which assessed the legitimacy of regulatory restrictions as competition policy champion. This advocacy strategy has yielded significant results toward the lifting of existing restrictions in the sector as well as developing a competition culture in the Philippines.202
3.2 Other barriers to trade and investment
66. Biased public tenders toward local firms trigger a high level of restrictiveness related to the differential treatment of foreign suppliers. Foreign suppliers are discriminated vis-a-vis local firms on the basis of Section 12 of Article XII of the Constitution.203 Allowing national and foreign firms to compete only on merit—without favoring one over the other—typically has a positive impact on public expenses. Therefore, several countries have implemented reforms that reduce explicit access discrimination in favor of local firms. However, in the Philippines, the public procurement regulatory framework204 not only restricts tenders in public utilities to Filipino companies with at least 60 percent of national capital but, in those markets where foreign companies are allowed to participate, it favors local bidders with a bidding price up to 15 percent higher.205 According to PMR results, these benefits are the exception rather than the rule (Figure 41).
202 Newspaper article in the Philippine Daily Inquirer published on February 24, 2017, PCC: “Open construction services to foreigners”.
203 Section 12 of Article XII of the Constitution of the Philippines stating that: “The State shall promote the preferential use of Filipino labor, domestic materials and locally produced goods, and adopt measures that help make them competitive”.
204 Section 43 of Government Procurement Reform Act (Republic Act No. 9184, 2002) states: “Consistent with the country’s obligations under international treaties or agreements, Goods may be obtained from domestic or foreign sources and the procurement thereof shall be open to all eligible suppliers, manufacturers and distributors. However, in the interest of availability, efficiency and timely delivery of Goods, the Procuring Entity may give preference to the purchase of domestically-produced and manufactured goods, supplies and materials that meet the specified or desired quality.”
205 The 2016 Revised Implementing Rules and Regulations of the Republic Act No. 9184 at Section 43.1.2. The Procuring Entity shall give preference to materials and supplies produced, made and manufactured in the Philippines, subject to the conditions herein below specified. The award shall be made to the lowest Domestic Bidder, provided his bid is not more than fifteen percent (15%) in excess of the lowest Foreign Bid.
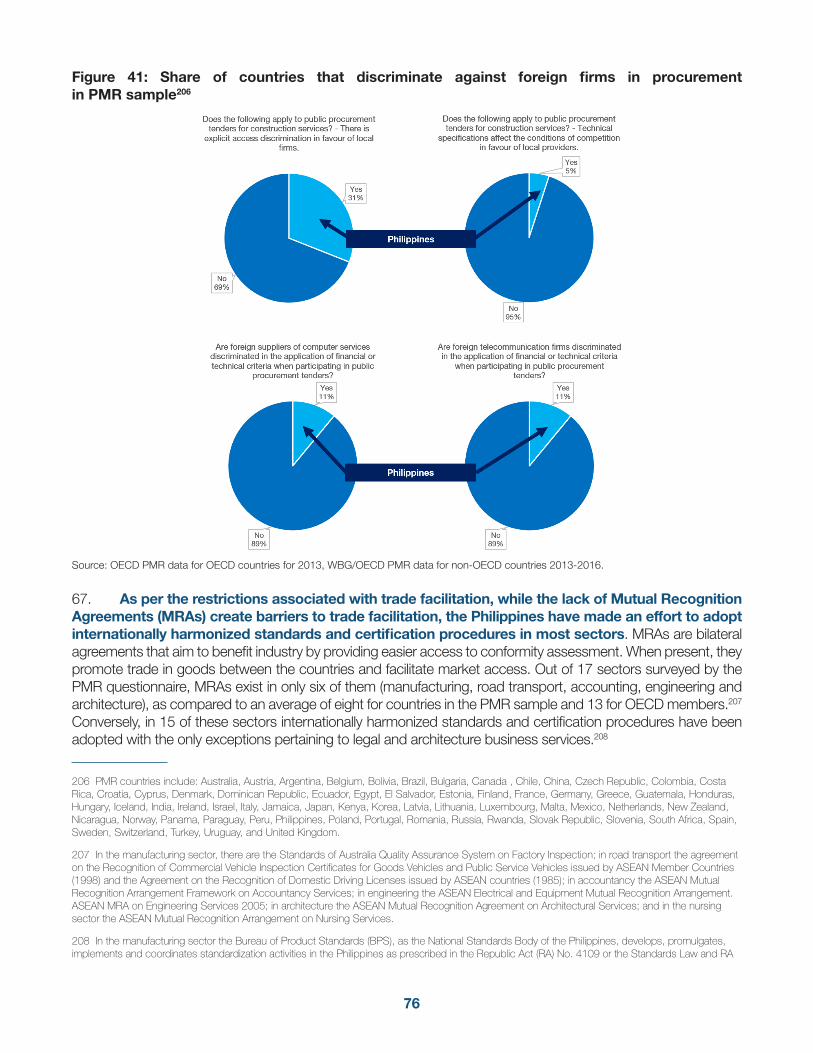
76
Figure 41: Share of countries that discriminate against foreign firms in procurement in PMR sample206
Source: OECD PMR data for OECD countries for 2013, WBG/OECD PMR data for non-OECD countries 2013-2016.
67. As per the restrictions associated with trade facilitation, while the lack of Mutual Recognition Agreements (MRAs) create barriers to trade facilitation, the Philippines have made an effort to adopt internationally harmonized standards and certification procedures in most sectors. MRAs are bilateral agreements that aim to benefit industry by providing easier access to conformity assessment. When present, they promote trade in goods between the countries and facilitate market access. Out of 17 sectors surveyed by the PMR questionnaire, MRAs exist in only six of them (manufacturing, road transport, accounting, engineering and architecture), as compared to an average of eight for countries in the PMR sample and 13 for OECD members.207 Conversely, in 15 of these sectors internationally harmonized standards and certification procedures have been adopted with the only exceptions pertaining to legal and architecture business services.208
206 PMR countries include: Australia, Austria, Argentina, Belgium, Bolivia, Brazil, Bulgaria, Canada , Chile, China, Czech Republic, Colombia, Costa Rica, Croatia, Cyprus, Denmark, Dominican Republic, Ecuador, Egypt, El Salvador, Estonia, Finland, France, Germany, Greece, Guatemala, Honduras, Hungary, Iceland, India, Ireland, Israel, Italy, Jamaica, Japan, Kenya, Korea, Latvia, Lithuania, Luxembourg, Malta, Mexico, Netherlands, New Zealand, Nicaragua, Norway, Panama, Paraguay, Peru, Philippines, Poland, Portugal, Romania, Russia, Rwanda, Slovak Republic, Slovenia, South Africa, Spain, Sweden, Switzerland, Turkey, Uruguay, and United Kingdom.
207 In the manufacturing sector, there are the Standards of Australia Quality Assurance System on Factory Inspection; in road transport the agreement on the Recognition of Commercial Vehicle Inspection Certificates for Goods Vehicles and Public Service Vehicles issued by ASEAN Member Countries (1998) and the Agreement on the Recognition of Domestic Driving Licenses issued by ASEAN countries (1985); in accountancy the ASEAN Mutual Recognition Arrangement Framework on Accountancy Services; in engineering the ASEAN Electrical and Equipment Mutual Recognition Arrangement. ASEAN MRA on Engineering Services 2005; in architecture the ASEAN Mutual Recognition Agreement on Architectural Services; and in the nursing sector the ASEAN Mutual Recognition Arrangement on Nursing Services.
208 In the manufacturing sector the Bureau of Product Standards (BPS), as the National Standards Body of the Philippines, develops, promulgates, implements and coordinates standardization activities in the Philippines as prescribed in the Republic Act (RA) No. 4109 or the Standards Law and RA
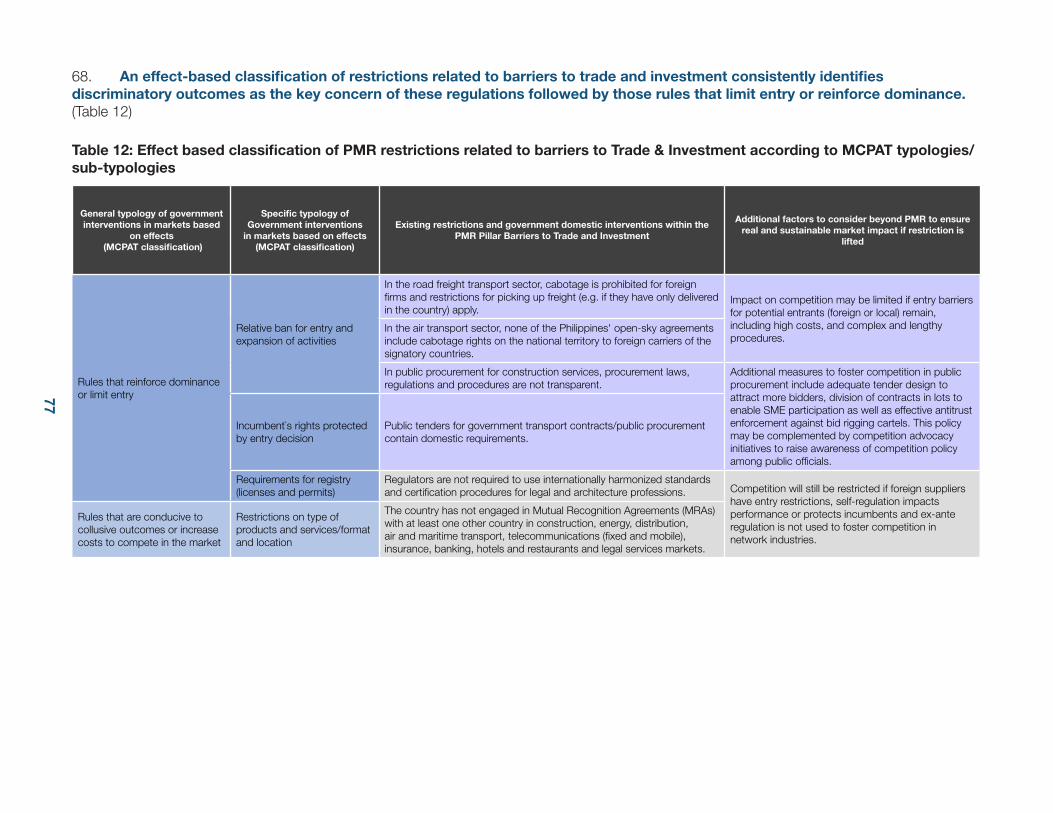
77
Table 12: Effect based classification of PMR restrictions related to barriers to Trade & Investment according to MCPAT typologies/sub-typologies
68. An effect-based classification of restrictions related to barriers to trade and investment consistently identifies discriminatory outcomes as the key concern of these regulations followed by those rules that limit entry or reinforce dominance. (Table 12)
General typology of government interventions in markets based
on effects (MCPAT classification)
Specific typology of Government interventions
in markets based on effects (MCPAT classification)
Existing restrictions and government domestic interventions within the PMR Pillar Barriers to Trade and Investment
Additional factors to consider beyond PMR to ensure real and sustainable market impact if restriction is
lifted
Rules that reinforce dominance or limit entry
Relative ban for entry and expansion of activities
In the road freight transport sector, cabotage is prohibited for foreign firms and restrictions for picking up freight (e.g. if they have only delivered in the country) apply.
Impact on competition may be limited if entry barriers for potential entrants (foreign or local) remain, including high costs, and complex and lengthy procedures.
In the air transport sector, none of the Philippines' open-sky agreements include cabotage rights on the national territory to foreign carriers of the signatory countries.
In public procurement for construction services, procurement laws, regulations and procedures are not transparent.
Additional measures to foster competition in public procurement include adequate tender design to attract more bidders, division of contracts in lots to enable SME participation as well as effective antitrust enforcement against bid rigging cartels. This policy may be complemented by competition advocacy initiatives to raise awareness of competition policy among public officials.
Incumbent`s rights protected by entry decision
Public tenders for government transport contracts/public procurement contain domestic requirements.
Requirements for registry (licenses and permits)
Regulators are not required to use internationally harmonized standards and certification procedures for legal and architecture professions. Competition will still be restricted if foreign suppliers
have entry restrictions, self-regulation impacts performance or protects incumbents and ex-ante regulation is not used to foster competition in network industries.
Rules that are conducive to collusive outcomes or increase costs to compete in the market
Restrictions on type of products and services/format and location
The country has not engaged in Mutual Recognition Agreements (MRAs) with at least one other country in construction, energy, distribution, air and maritime transport, telecommunications (fixed and mobile), insurance, banking, hotels and restaurants and legal services markets.
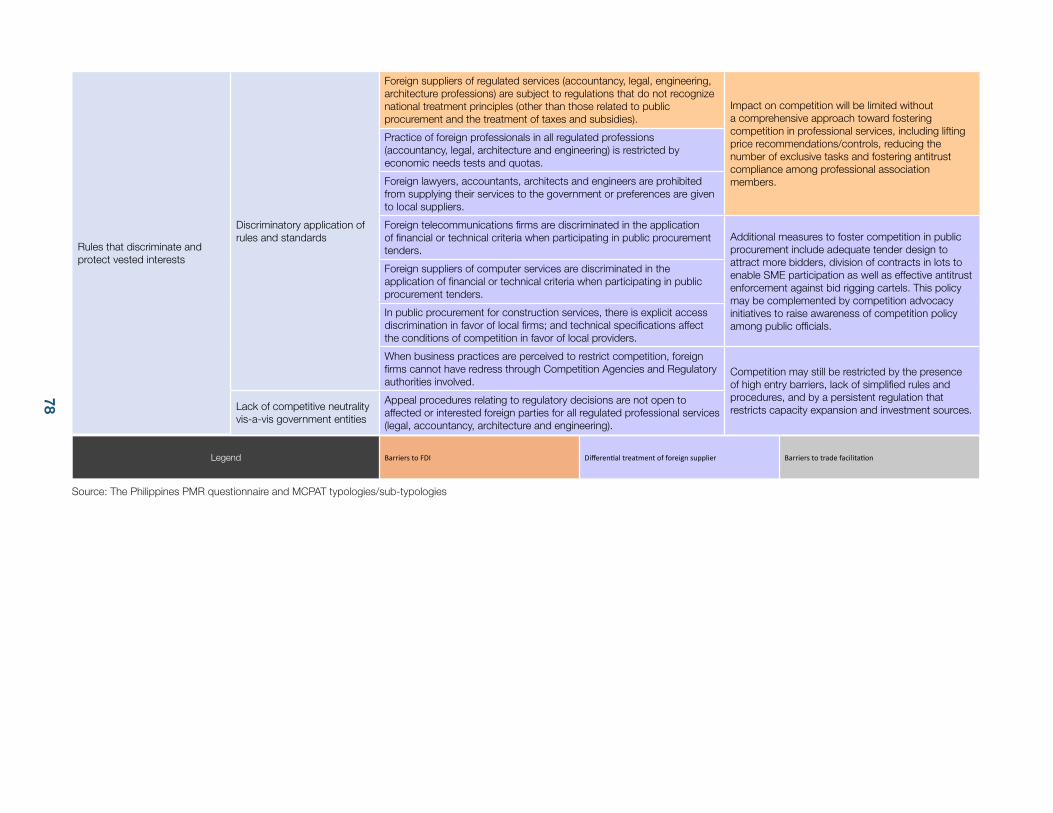
78
Source: The Philippines PMR questionnaire and MCPAT typologies/sub-typologies
Rules that discriminate and protect vested interests
Discriminatory application of rules and standards
Foreign suppliers of regulated services (accountancy, legal, engineering, architecture professions) are subject to regulations that do not recognize national treatment principles (other than those related to public procurement and the treatment of taxes and subsidies).
Impact on competition will be limited without a comprehensive approach toward fostering competition in professional services, including lifting price recommendations/controls, reducing the number of exclusive tasks and fostering antitrust compliance among professional association members.
Practice of foreign professionals in all regulated professions (accountancy, legal, architecture and engineering) is restricted by economic needs tests and quotas.
Foreign lawyers, accountants, architects and engineers are prohibited from supplying their services to the government or preferences are given to local suppliers.
Foreign telecommunications firms are discriminated in the application of financial or technical criteria when participating in public procurement tenders.
Additional measures to foster competition in public procurement include adequate tender design to attract more bidders, division of contracts in lots to enable SME participation as well as effective antitrust enforcement against bid rigging cartels. This policy may be complemented by competition advocacy initiatives to raise awareness of competition policy among public officials.
Foreign suppliers of computer services are discriminated in the application of financial or technical criteria when participating in public procurement tenders.
In public procurement for construction services, there is explicit access discrimination in favor of local firms; and technical specifications affect the conditions of competition in favor of local providers.
When business practices are perceived to restrict competition, foreign firms cannot have redress through Competition Agencies and Regulatory authorities involved.
Competition may still be restricted by the presence of high entry barriers, lack of simplified rules and procedures, and by a persistent regulation that restricts capacity expansion and investment sources.Lack of competitive neutrality
vis-a-vis government entities
Appeal procedures relating to regulatory decisions are not open to affected or interested foreign parties for all regulated professional services (legal, accountancy, architecture and engineering).
Legend Barriers to FDI Differential treatment of foreign supplier Barriers to trade facilitation
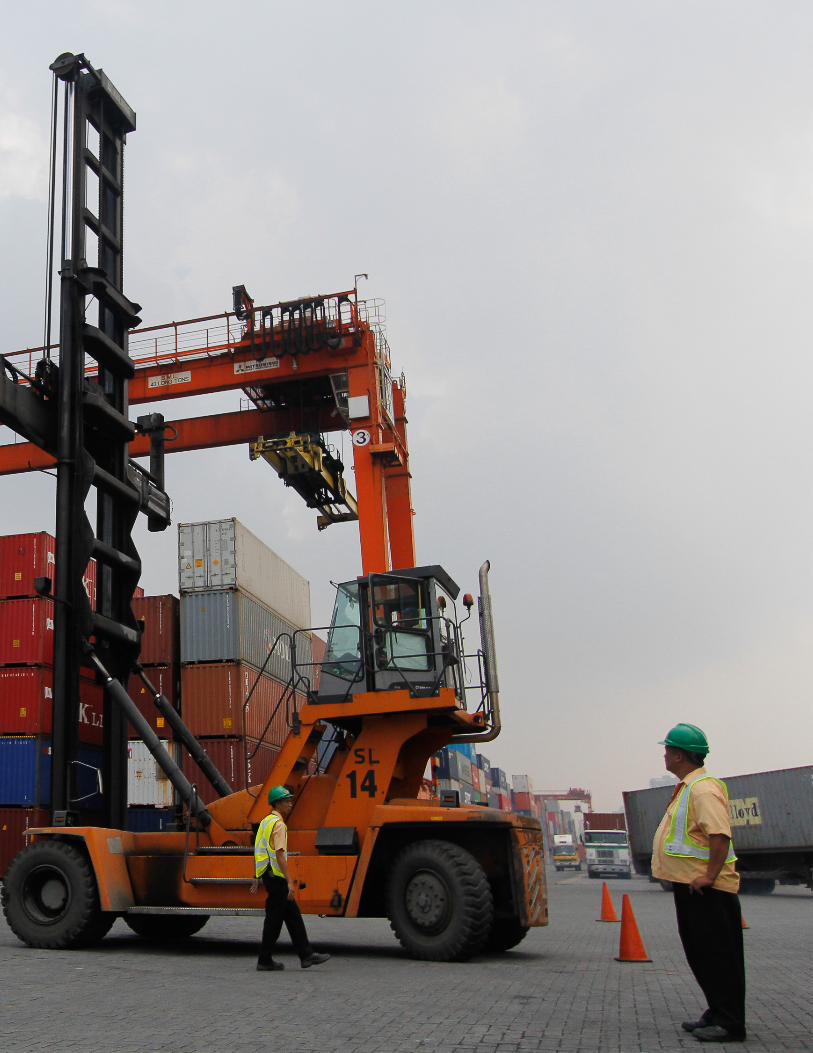
79
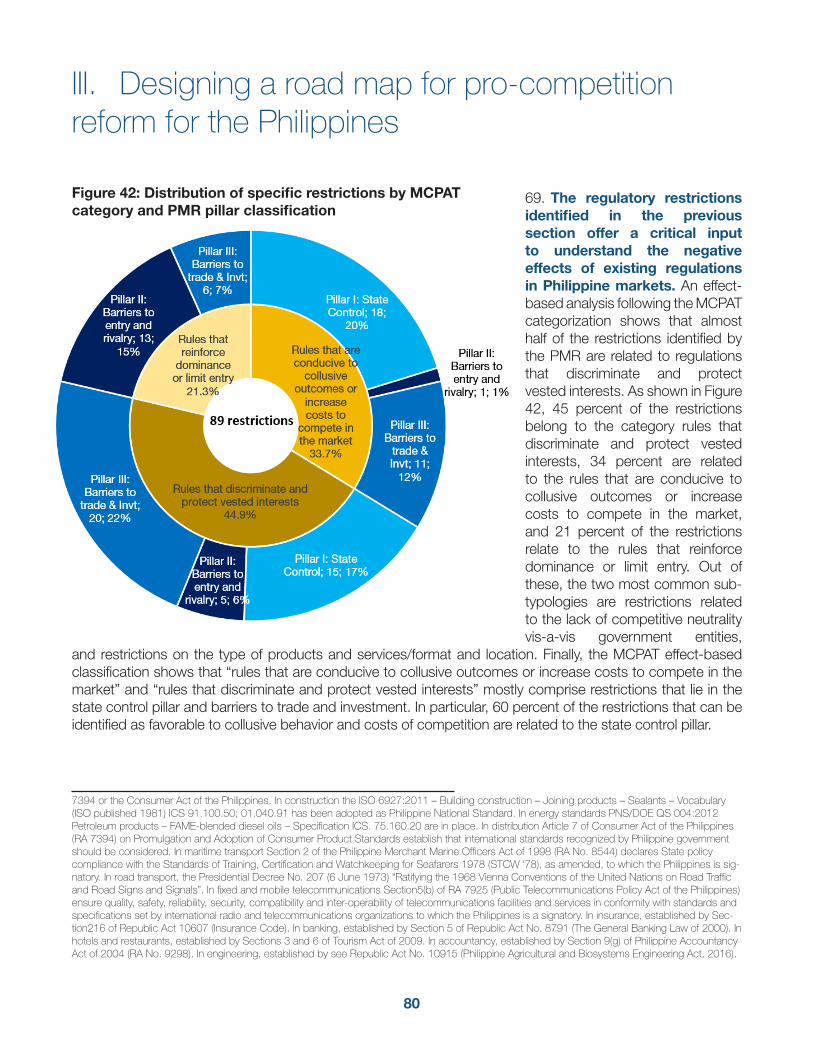
80
III. Designing a road map for pro-competition reform for the Philippines
69. The regulatory restrictions identified in the previous section offer a critical input to understand the negative effects of existing regulations in Philippine markets. An effect- based analysis following the MCPAT categorization shows that almost half of the restrictions identified by the PMR are related to regulations that discriminate and protect vested interests. As shown in Figure 42, 45 percent of the restrictions belong to the category rules that discriminate and protect vested interests, 34 percent are related to the rules that are conducive to collusive outcomes or increase costs to compete in the market, and 21 percent of the restrictions relate to the rules that reinforce dominance or limit entry. Out of these, the two most common sub-typologies are restrictions related to the lack of competitive neutrality vis-a-vis government entities,
and restrictions on the type of products and services/format and location. Finally, the MCPAT effect-based classification shows that “rules that are conducive to collusive outcomes or increase costs to compete in the market” and “rules that discriminate and protect vested interests” mostly comprise restrictions that lie in the state control pillar and barriers to trade and investment. In particular, 60 percent of the restrictions that can be identified as favorable to collusive behavior and costs of competition are related to the state control pillar.
7394 or the Consumer Act of the Philippines. In construction the ISO 6927:2011 – Building construction – Joining products – Sealants – Vocabulary (ISO published 1981) ICS 91.100.50; 01.040.91 has been adopted as Philippine National Standard. In energy standards PNS/DOE QS 004:2012 Petroleum products – FAME-blended diesel oils – Specification ICS. 75.160.20 are in place. In distribution Article 7 of Consumer Act of the Philippines (RA 7394) on Promulgation and Adoption of Consumer Product Standards establish that international standards recognized by Philippine government should be considered. In maritime transport Section 2 of the Philippine Merchant Marine Officers Act of 1998 (RA No. 8544) declares State policy compliance with the Standards of Training, Certification and Watchkeeping for Seafarers 1978 (STCW ‘78), as amended, to which the Philippines is sig-natory. In road transport, the Presidential Decree No. 207 (6 June 1973) “Ratifying the 1968 Vienna Conventions of the United Nations on Road Traffic and Road Signs and Signals”. In fixed and mobile telecommunications Section5(b) of RA 7925 (Public Telecommunications Policy Act of the Philippines) ensure quality, safety, reliability, security, compatibility and inter-operability of telecommunications facilities and services in conformity with standards and specifications set by international radio and telecommunications organizations to which the Philippines is a signatory. In insurance, established by Sec-tion216 of Republic Act 10607 (Insurance Code). In banking, established by Section 5 of Republic Act No. 8791 (The General Banking Law of 2000). In hotels and restaurants, established by Sections 3 and 6 of Tourism Act of 2009. In accountancy, established by Section 9(g) of Philippine Accountancy Act of 2004 (RA No. 9298). In engineering, established by see Republic Act No. 10915 (Philippine Agricultural and Biosystems Engineering Act, 2016).
Figure 42: Distribution of specific restrictions by MCPAT category and PMR pillar classification
Rules that are conducive to
collusive outcomes or
increase costs to compete in the
market33.7%
Rules that discriminate and protect vested interests
44.9%
Rules that reinforce
dominance or limit entry
21.3%
Pillar I: State Control; 18; 20%
Pillar II: Barriers to entry and rivalry; 1;
1%
Pillar III: Barriers to trade & Invt;
11; 12%
Pillar I: State Control; 15; 17%Pillar II: Barriers to entry and
rivalry; 5; 6%
Pillar III: Barriers to trade & Invt; 20; 22%
Pillar II: Barriers to entry and rivalry; 13; 15%
Pillar III: Barriers to trade & Invt; 6; 7%
89 restrictions
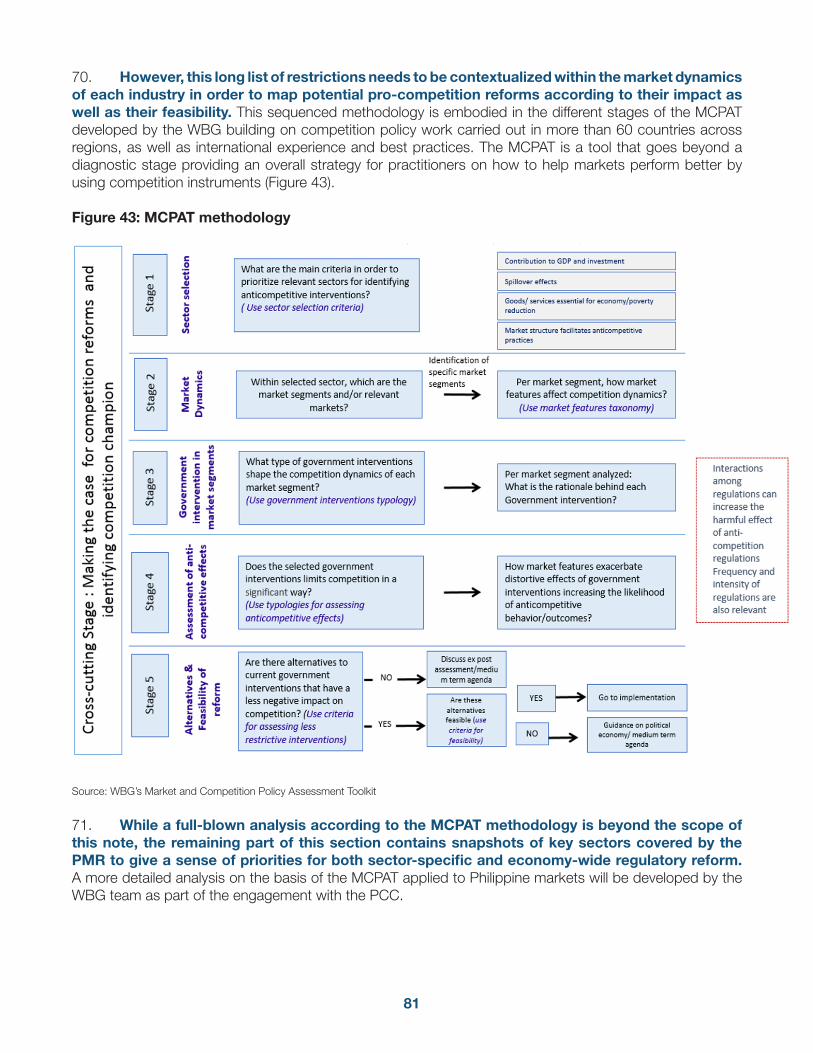
81
70. However, this long list of restrictions needs to be contextualized within the market dynamics of each industry in order to map potential pro-competition reforms according to their impact as well as their feasibility. This sequenced methodology is embodied in the different stages of the MCPAT developed by the WBG building on competition policy work carried out in more than 60 countries across regions, as well as international experience and best practices. The MCPAT is a tool that goes beyond a diagnostic stage providing an overall strategy for practitioners on how to help markets perform better by using competition instruments (Figure 43).
Figure 43: MCPAT methodology
Source: WBG’s Market and Competition Policy Assessment Toolkit
71. While a full-blown analysis according to the MCPAT methodology is beyond the scope of this note, the remaining part of this section contains snapshots of key sectors covered by the PMR to give a sense of priorities for both sector-specific and economy-wide regulatory reform. A more detailed analysis on the basis of the MCPAT applied to Philippine markets will be developed by the WBG team as part of the engagement with the PCC.
82
1. Sector-specific competition snapshots
1.1 Electricity
72. While the electricity sector has undergone significant changes in recent years following the entry into force of a new regulatory framework, the implementation of key reforms is still pending. The Electric Power Industry Reform Act (EPIRA) of 2001 fully restructured the legal and institutional framework of the electricity sector. Specifically, the law provided for:
• the privatization of the state-owned generation and transmission entity, the National Power Corporation (NPC);
• the creation of the transmission company TransCo to assume the transmission assets and functions of the NPC;
• the creation of the Power Sector Asset and Liabilities Management Corporation to own TransCo and other NPC assets;
• the creation of a Wholesale Electricity Spot Market; • the establishment of Open Access for competitive consumers.
However, concerns remain regarding the speed of implementation for the reforms mandated by EPIRA, notably on the need of compliance of the Energy Regulatory Commission (ERC) with the implementation of open access provisions and competition in retail.
73. Following the reforms promoted by the EPIRA, the structure of the different market segments evolved under the supervision of an independent sector regulator. The electricity sector of the Philippines comprises three separate sub-sectors, each with its own industry structure. First, the opening of the generation sector to competition resulted in 116 power generation plants that sell to distributors through the main national transmission grid. In generation, the EPIRA limits the market shares of a single entity to a maximum of 30 percent of each of the island grids, and/or a 25 percent market share of the national grid.209 The ERC has actively monitored the implementation of these limitations.210 Second, the transmission sector is run by the National Transmission Corporation, whose management has been awarded to a private firm, the National Grid Corporation of the Philippines.211 Finally, the distribution segment contains a hybrid of different corporations that have each been awarded monopoly licenses to distribute electricity to a specific franchise area. Currently, the distribution sector includes a large private utility operator (Manila Electric Company), 16 smaller privately-owned utilities, 7 municipal systems and 119 member-owned electric cooperatives.212
74. The separation between different market segments has not yet been fully achieved. The EPIRA forbids cross-ownership between the segments of transmission and generation as well as transmission and distribution. However, implementation remains unclear.213 While the operation of the transmission
209 Established by Rule 11, Section 4, “Limits on Concentration of Ownership, Operation or Control of Installed Generating Capacity” of Republic Act No. 9136 (EPIRA).
210 The last resolution of The Energy Regulatory Commission is Resolution 19, Series of 2016 (2016). Available at: http://www.erc.gov.ph/Files/Ren-der/issuance/1755
211 Concession granted by Republic Act No. 9511 (December 2008). Available at: http://www.lawphil.net/statutes/repacts/ra2008/ra_9511_2008.html Also, the company website for further information: https://www.ngcp.ph/corporate-profile.asp
212 Data included in the PMR questionnaire for the Philippines as of May 2017.
213 Section 45, EPIRA provides: “No generation company, distribution utility, or its respective subsidiary or affiliate or stockholder or official of a generation company or distribution utility, or other entity engaged in generating and supplying electricity specified by ERC within the fourth civil degree of
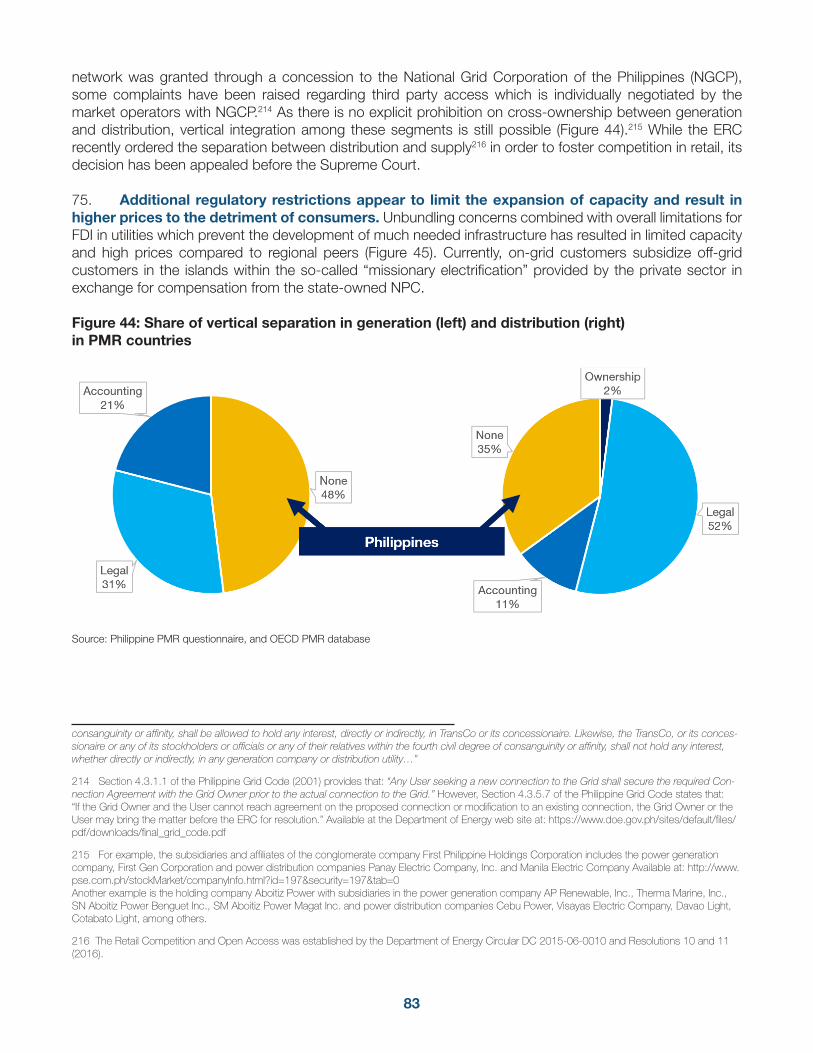
83
network was granted through a concession to the National Grid Corporation of the Philippines (NGCP), some complaints have been raised regarding third party access which is individually negotiated by the market operators with NGCP.214 As there is no explicit prohibition on cross-ownership between generation and distribution, vertical integration among these segments is still possible (Figure 44).215 While the ERC recently ordered the separation between distribution and supply216 in order to foster competition in retail, its decision has been appealed before the Supreme Court.
75. Additional regulatory restrictions appear to limit the expansion of capacity and result in higher prices to the detriment of consumers. Unbundling concerns combined with overall limitations for FDI in utilities which prevent the development of much needed infrastructure has resulted in limited capacity and high prices compared to regional peers (Figure 45). Currently, on-grid customers subsidize off-grid customers in the islands within the so-called “missionary electrification” provided by the private sector in exchange for compensation from the state-owned NPC.
Figure 44: Share of vertical separation in generation (left) and distribution (right) in PMR countries
Source: Philippine PMR questionnaire, and OECD PMR database
consanguinity or affinity, shall be allowed to hold any interest, directly or indirectly, in TransCo or its concessionaire. Likewise, the TransCo, or its conces-sionaire or any of its stockholders or officials or any of their relatives within the fourth civil degree of consanguinity or affinity, shall not hold any interest, whether directly or indirectly, in any generation company or distribution utility…”
214 Section 4.3.1.1 of the Philippine Grid Code (2001) provides that: “Any User seeking a new connection to the Grid shall secure the required Con-nection Agreement with the Grid Owner prior to the actual connection to the Grid.” However, Section 4.3.5.7 of the Philippine Grid Code states that: “If the Grid Owner and the User cannot reach agreement on the proposed connection or modification to an existing connection, the Grid Owner or the User may bring the matter before the ERC for resolution.” Available at the Department of Energy web site at: https://www.doe.gov.ph/sites/default/files/pdf/downloads/final_grid_code.pdf
215 For example, the subsidiaries and affiliates of the conglomerate company First Philippine Holdings Corporation includes the power generation company, First Gen Corporation and power distribution companies Panay Electric Company, Inc. and Manila Electric Company Available at: http://www.pse.com.ph/stockMarket/companyInfo.html?id=197&security=197&tab=0Another example is the holding company Aboitiz Power with subsidiaries in the power generation company AP Renewable, Inc., Therma Marine, Inc., SN Aboitiz Power Benguet Inc., SM Aboitiz Power Magat Inc. and power distribution companies Cebu Power, Visayas Electric Company, Davao Light, Cotabato Light, among others.
216 The Retail Competition and Open Access was established by the Department of Energy Circular DC 2015-06-0010 and Resolutions 10 and 11 (2016).
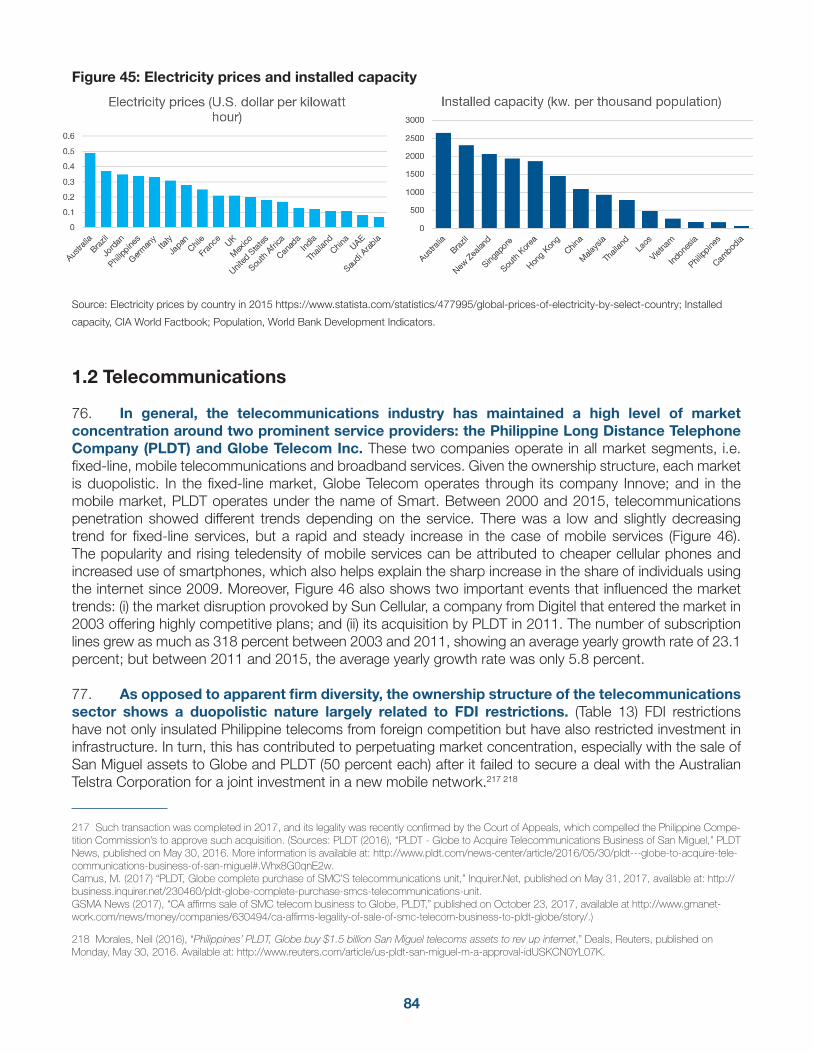
84
Figure 45: Electricity prices and installed capacity
Source: Electricity prices by country in 2015 https://www.statista.com/statistics/477995/global-prices-of-electricity-by-select-country; Installed
capacity, CIA World Factbook; Population, World Bank Development Indicators.
1.2 Telecommunications
76. In general, the telecommunications industry has maintained a high level of market concentration around two prominent service providers: the Philippine Long Distance Telephone Company (PLDT) and Globe Telecom Inc. These two companies operate in all market segments, i.e. fixed-line, mobile telecommunications and broadband services. Given the ownership structure, each market is duopolistic. In the fixed-line market, Globe Telecom operates through its company Innove; and in the mobile market, PLDT operates under the name of Smart. Between 2000 and 2015, telecommunications penetration showed different trends depending on the service. There was a low and slightly decreasing trend for fixed-line services, but a rapid and steady increase in the case of mobile services (Figure 46). The popularity and rising teledensity of mobile services can be attributed to cheaper cellular phones and increased use of smartphones, which also helps explain the sharp increase in the share of individuals using the internet since 2009. Moreover, Figure 46 also shows two important events that influenced the market trends: (i) the market disruption provoked by Sun Cellular, a company from Digitel that entered the market in 2003 offering highly competitive plans; and (ii) its acquisition by PLDT in 2011. The number of subscription lines grew as much as 318 percent between 2003 and 2011, showing an average yearly growth rate of 23.1 percent; but between 2011 and 2015, the average yearly growth rate was only 5.8 percent.
77. As opposed to apparent firm diversity, the ownership structure of the telecommunications sector shows a duopolistic nature largely related to FDI restrictions. (Table 13) FDI restrictions have not only insulated Philippine telecoms from foreign competition but have also restricted investment in infrastructure. In turn, this has contributed to perpetuating market concentration, especially with the sale of San Miguel assets to Globe and PLDT (50 percent each) after it failed to secure a deal with the Australian Telstra Corporation for a joint investment in a new mobile network.217 218
217 Such transaction was completed in 2017, and its legality was recently confirmed by the Court of Appeals, which compelled the Philippine Compe-tition Commission’s to approve such acquisition. (Sources: PLDT (2016), “PLDT - Globe to Acquire Telecommunications Business of San Miguel,” PLDT News, published on May 30, 2016. More information is available at: http://www.pldt.com/news-center/article/2016/05/30/pldt---globe-to-acquire-tele-communications-business-of-san-miguel#.Whx8G0qnE2w. Camus, M. (2017) “PLDT, Globe complete purchase of SMC’S telecommunications unit,” Inquirer.Net, published on May 31, 2017, available at: http://business.inquirer.net/230460/pldt-globe-complete-purchase-smcs-telecommunications-unit.GSMA News (2017), “CA affirms sale of SMC telecom business to Globe, PLDT,” published on October 23, 2017, available at http://www.gmanet-work.com/news/money/companies/630494/ca-affirms-legality-of-sale-of-smc-telecom-business-to-pldt-globe/story/.)
218 Morales, Neil (2016), “Philippines’ PLDT, Globe buy $1.5 billion San Miguel telecoms assets to rev up internet,” Deals, Reuters, published on Monday, May 30, 2016. Available at: http://www.reuters.com/article/us-pldt-san-miguel-m-a-approval-idUSKCN0YL07K.
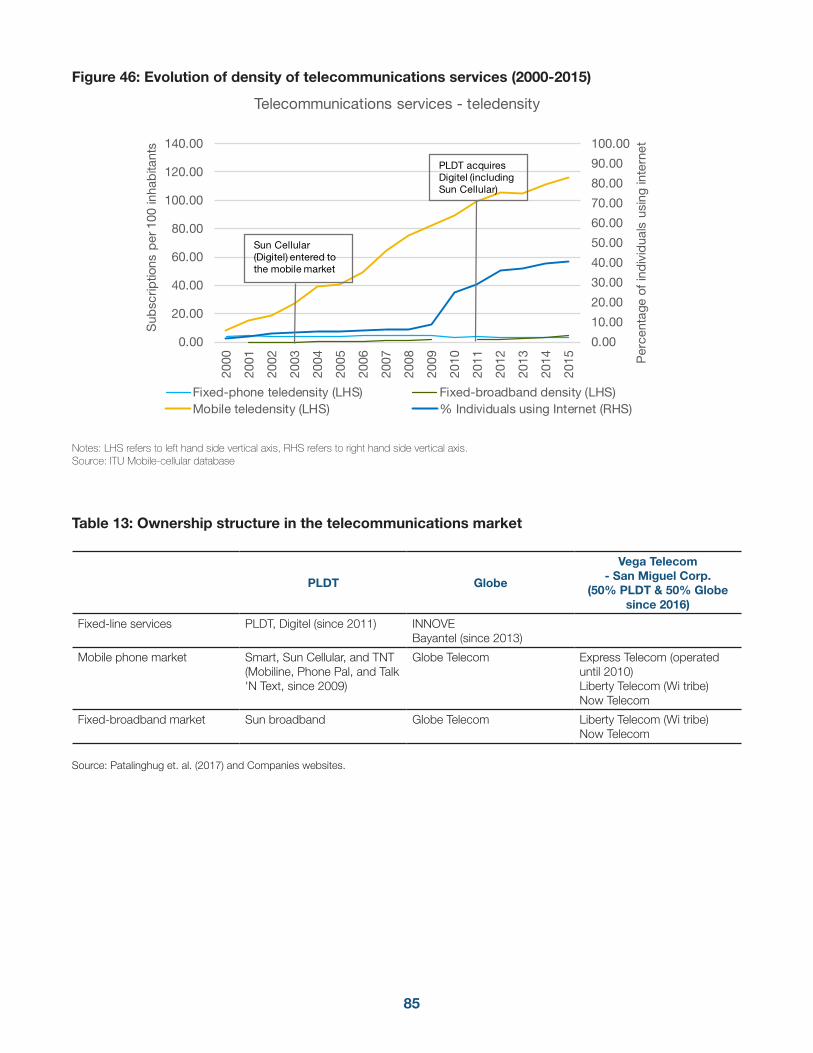
85
Table 13: Ownership structure in the telecommunications market
PLDT Globe
Vega Telecom - San Miguel Corp.
(50% PLDT & 50% Globe since 2016)
Fixed-line services PLDT, Digitel (since 2011) INNOVEBayantel (since 2013)
Mobile phone market Smart, Sun Cellular, and TNT (Mobiline, Phone Pal, and Talk 'N Text, since 2009)
Globe Telecom Express Telecom (operated until 2010)Liberty Telecom (Wi tribe)Now Telecom
Fixed-broadband market Sun broadband Globe Telecom Liberty Telecom (Wi tribe)Now Telecom
Source: Patalinghug et. al. (2017) and Companies websites.
Figure 46: Evolution of density of telecommunications services (2000-2015)
Notes: LHS refers to left hand side vertical axis, RHS refers to right hand side vertical axis. Source: ITU Mobile-cellular database
0.00
10.00
20.00
30.00
40.00
50.00
60.00
70.00
80.00
90.00
100.00
0.00
20.00
40.00
60.00
80.00
100.00
120.00
140.00
2000
2001
2002
2003
2004
2005
2006
2007
2008
2009
2010
2011
2012
2013
2014
2015 P
erce
ntag
e of
ind
ivid
uals
usi
ng in
tern
et
Sub
scrip
tions
per
100
inha
bita
nts
Telecommunications services - teledensity
Fixed-phone teledensity (LHS) Fixed-broadband density (LHS)Mobile teledensity (LHS) % Individuals using Internet (RHS)
PLDT acquires Digitel (including Sun Cellular)
Sun Cellular (Digitel) entered to the mobile market
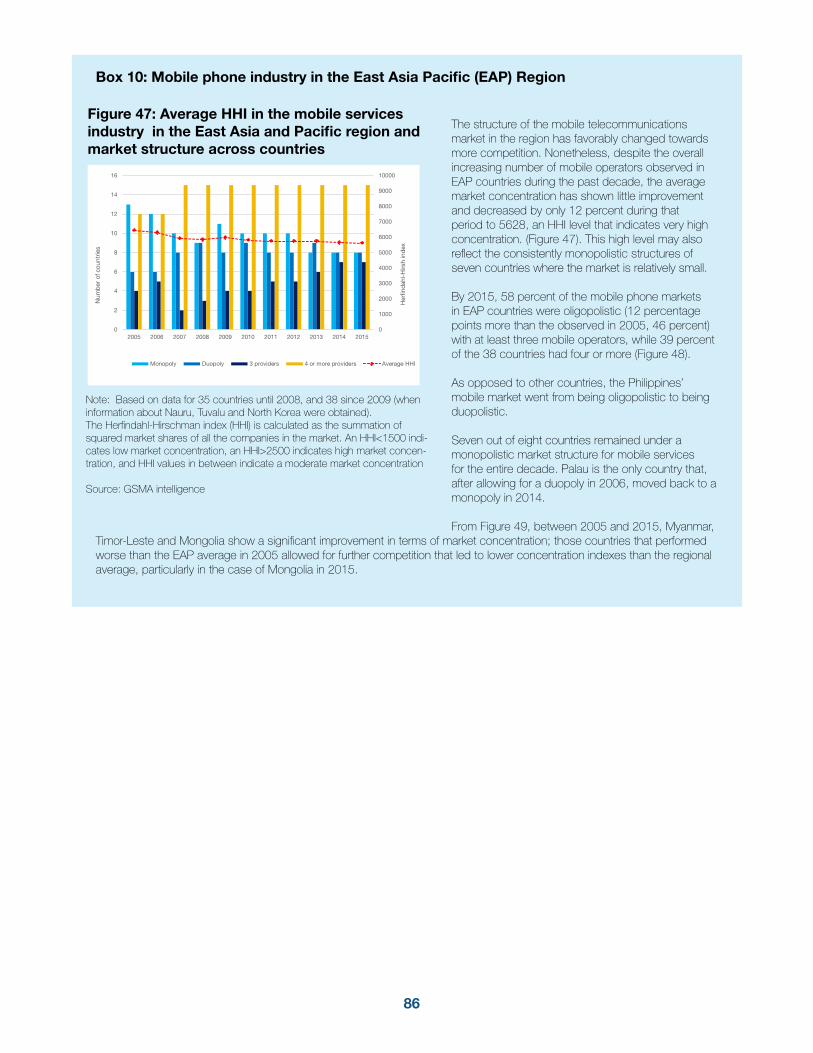
86
Box 10: Mobile phone industry in the East Asia Pacific (EAP) Region
The structure of the mobile telecommunications market in the region has favorably changed towards more competition. Nonetheless, despite the overall increasing number of mobile operators observed in EAP countries during the past decade, the average market concentration has shown little improvement and decreased by only 12 percent during that period to 5628, an HHI level that indicates very high concentration. (Figure 47). This high level may also reflect the consistently monopolistic structures of seven countries where the market is relatively small.
By 2015, 58 percent of the mobile phone markets in EAP countries were oligopolistic (12 percentage points more than the observed in 2005, 46 percent) with at least three mobile operators, while 39 percent of the 38 countries had four or more (Figure 48).
As opposed to other countries, the Philippines’ mobile market went from being oligopolistic to being duopolistic.
Seven out of eight countries remained under a monopolistic market structure for mobile services for the entire decade. Palau is the only country that, after allowing for a duopoly in 2006, moved back to a monopoly in 2014.
From Figure 49, between 2005 and 2015, Myanmar, Timor-Leste and Mongolia show a significant improvement in terms of market concentration; those countries that performed worse than the EAP average in 2005 allowed for further competition that led to lower concentration indexes than the regional average, particularly in the case of Mongolia in 2015.
Figure 47: Average HHI in the mobile services industry in the East Asia and Pacific region and market structure across countries
Note: Based on data for 35 countries until 2008, and 38 since 2009 (when information about Nauru, Tuvalu and North Korea were obtained).The Herfindahl-Hirschman index (HHI) is calculated as the summation of squared market shares of all the companies in the market. An HHI<1500 indi-cates low market concentration, an HHI>2500 indicates high market concen-tration, and HHI values in between indicate a moderate market concentration
Source: GSMA intelligence
0
1000
2000
3000
4000
5000
6000
7000
8000
9000
10000
0
2
4
6
8
10
12
14
16
2005 2006 2007 2008 2009 2010 2011 2012 2013 2014 2015
Monopoly Duopoly 3 providers 4 or more providers Average HHI
Num
ber
of c
ount
ries
Her
finda
hl-H
irsh
inde
x
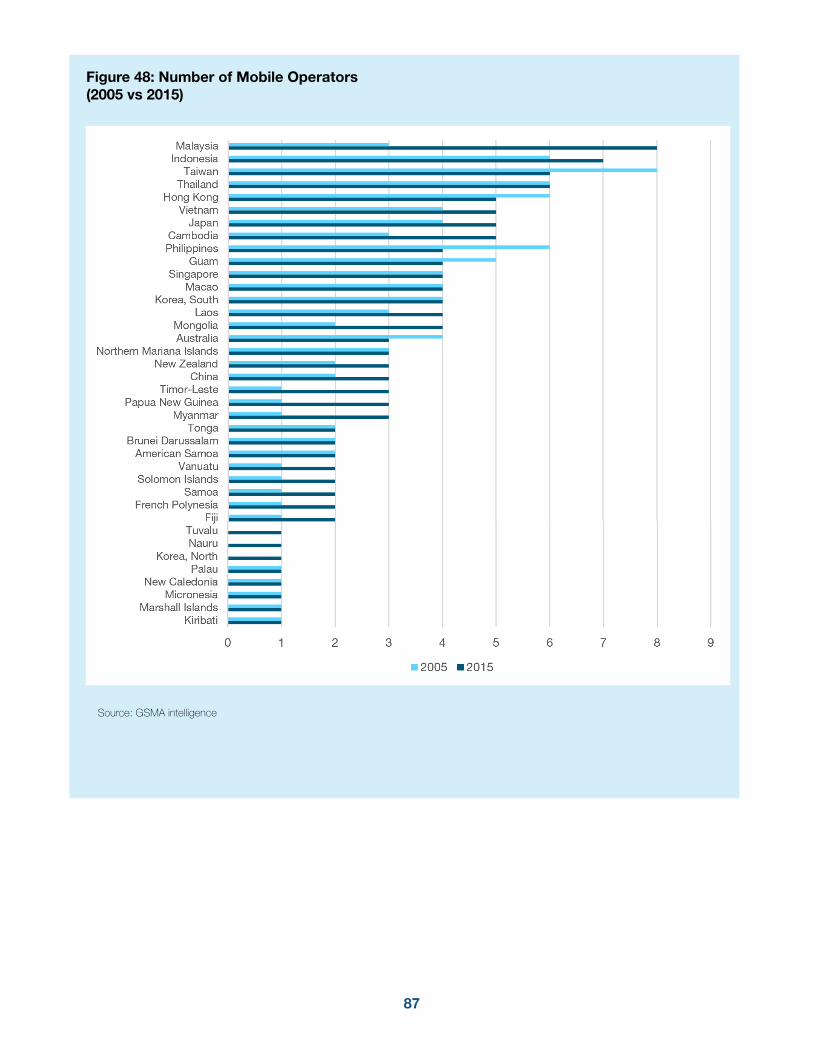
87
Figure 48: Number of Mobile Operators (2005 vs 2015)
Source: GSMA intelligence
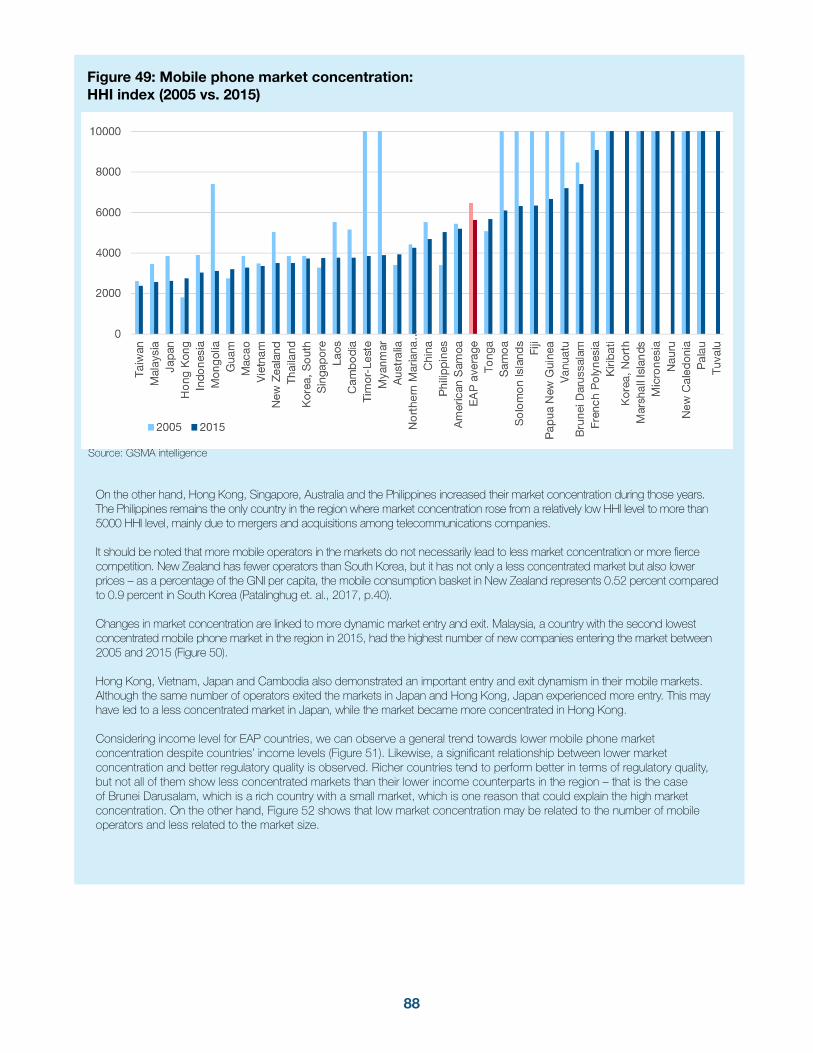
88
Figure 49: Mobile phone market concentration: HHI index (2005 vs. 2015)
Source: GSMA intelligence
On the other hand, Hong Kong, Singapore, Australia and the Philippines increased their market concentration during those years. The Philippines remains the only country in the region where market concentration rose from a relatively low HHI level to more than 5000 HHI level, mainly due to mergers and acquisitions among telecommunications companies.
It should be noted that more mobile operators in the markets do not necessarily lead to less market concentration or more fierce competition. New Zealand has fewer operators than South Korea, but it has not only a less concentrated market but also lower prices – as a percentage of the GNI per capita, the mobile consumption basket in New Zealand represents 0.52 percent compared to 0.9 percent in South Korea (Patalinghug et. al., 2017, p.40).
Changes in market concentration are linked to more dynamic market entry and exit. Malaysia, a country with the second lowest concentrated mobile phone market in the region in 2015, had the highest number of new companies entering the market between 2005 and 2015 (Figure 50).
Hong Kong, Vietnam, Japan and Cambodia also demonstrated an important entry and exit dynamism in their mobile markets. Although the same number of operators exited the markets in Japan and Hong Kong, Japan experienced more entry. This may have led to a less concentrated market in Japan, while the market became more concentrated in Hong Kong.
Considering income level for EAP countries, we can observe a general trend towards lower mobile phone market concentration despite countries’ income levels (Figure 51). Likewise, a significant relationship between lower market concentration and better regulatory quality is observed. Richer countries tend to perform better in terms of regulatory quality, but not all of them show less concentrated markets than their lower income counterparts in the region – that is the case of Brunei Darusalam, which is a rich country with a small market, which is one reason that could explain the high market concentration. On the other hand, Figure 52 shows that low market concentration may be related to the number of mobile operators and less related to the market size.
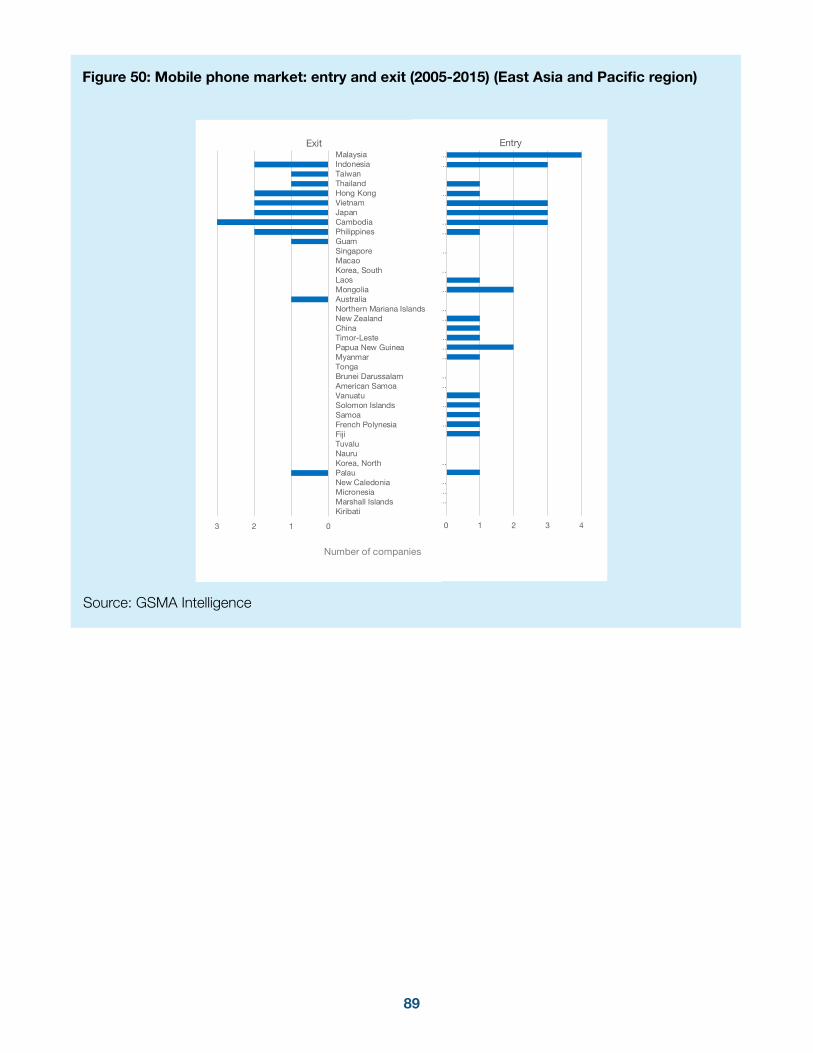
89
0 1 2 3 4
KiribatiMarsh…Micro…New…
PalauKorea…NauruTuvalu
FijiFrenc…
SamoaSolom…
VanuatuAmeri…
Brunei…TongaMyan…
Papua…Timor…China
New…North…
AustraliaMong…Laos
Korea…MacaoSinga…GuamPhilip…Camb…Japan
VietnamHong…
ThailandTaiwan
Indon…Malay…
Entry
0123
KiribatiMarshall IslandsMicronesiaNew CaledoniaPalauKorea, NorthNauruTuvaluFijiFrench PolynesiaSamoaSolomon IslandsVanuatuAmerican SamoaBrunei DarussalamTongaMyanmarPapua New GuineaTimor-LesteChinaNew ZealandNorthern Mariana IslandsAustraliaMongoliaLaosKorea, SouthMacaoSingaporeGuamPhilippinesCambodiaJapanVietnamHong KongThailandTaiwanIndonesiaMalaysia
Exit
Number of companies
Figure 50: Mobile phone market: entry and exit (2005-2015) (East Asia and Pacific region)
Source: GSMA Intelligence
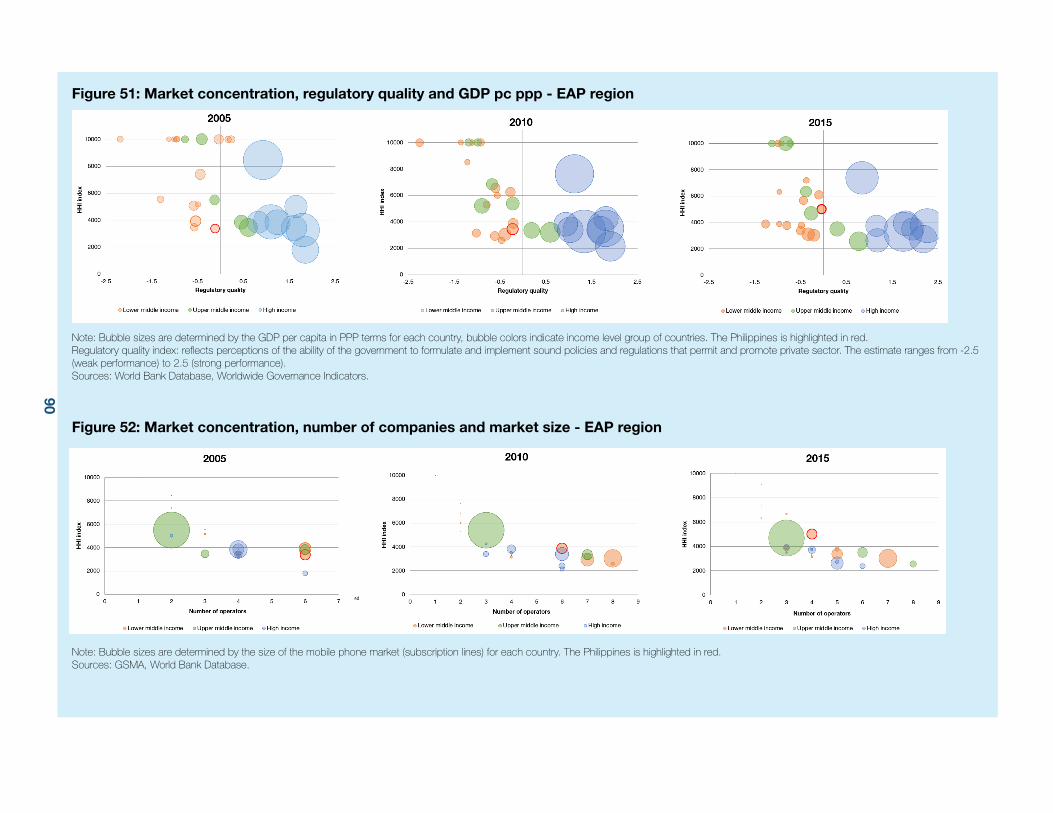
90
Figure 51: Market concentration, regulatory quality and GDP pc ppp - EAP region
Note: Bubble sizes are determined by the GDP per capita in PPP terms for each country, bubble colors indicate income level group of countries. The Philippines is highlighted in red.Regulatory quality index: reflects perceptions of the ability of the government to formulate and implement sound policies and regulations that permit and promote private sector. The estimate ranges from -2.5 (weak performance) to 2.5 (strong performance).Sources: World Bank Database, Worldwide Governance Indicators.
Figure 52: Market concentration, number of companies and market size - EAP region
Note: Bubble sizes are determined by the size of the mobile phone market (subscription lines) for each country. The Philippines is highlighted in red.Sources: GSMA, World Bank Database.
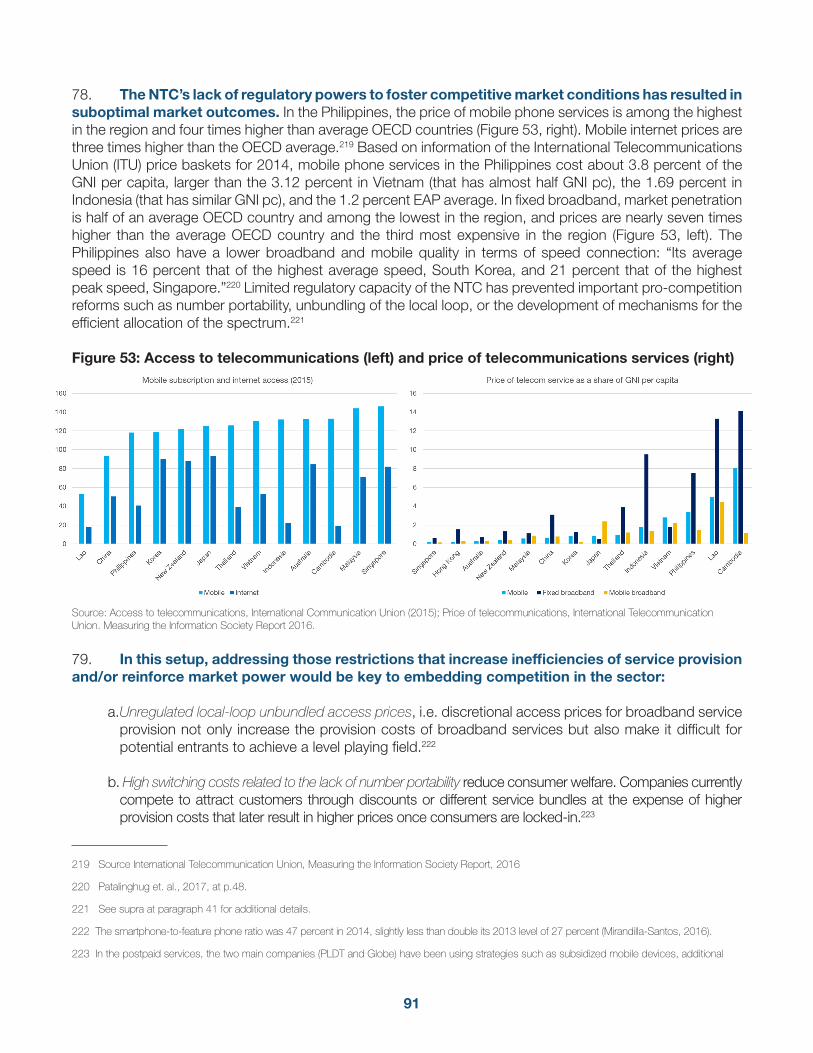
91
78. The NTC’s lack of regulatory powers to foster competitive market conditions has resulted in suboptimal market outcomes. In the Philippines, the price of mobile phone services is among the highest in the region and four times higher than average OECD countries (Figure 53, right). Mobile internet prices are three times higher than the OECD average.219 Based on information of the International Telecommunications Union (ITU) price baskets for 2014, mobile phone services in the Philippines cost about 3.8 percent of the GNI per capita, larger than the 3.12 percent in Vietnam (that has almost half GNI pc), the 1.69 percent in Indonesia (that has similar GNI pc), and the 1.2 percent EAP average. In fixed broadband, market penetration is half of an average OECD country and among the lowest in the region, and prices are nearly seven times higher than the average OECD country and the third most expensive in the region (Figure 53, left). The Philippines also have a lower broadband and mobile quality in terms of speed connection: “Its average speed is 16 percent that of the highest average speed, South Korea, and 21 percent that of the highest peak speed, Singapore.”220 Limited regulatory capacity of the NTC has prevented important pro-competition reforms such as number portability, unbundling of the local loop, or the development of mechanisms for the efficient allocation of the spectrum.221
Figure 53: Access to telecommunications (left) and price of telecommunications services (right)
Source: Access to telecommunications, International Communication Union (2015); Price of telecommunications, International Telecommunication Union. Measuring the Information Society Report 2016.
79. In this setup, addressing those restrictions that increase inefficiencies of service provision and/or reinforce market power would be key to embedding competition in the sector:
a. Unregulated local-loop unbundled access prices, i.e. discretional access prices for broadband service provision not only increase the provision costs of broadband services but also make it difficult for potential entrants to achieve a level playing field.222
b. High switching costs related to the lack of number portability reduce consumer welfare. Companies currently compete to attract customers through discounts or different service bundles at the expense of higher provision costs that later result in higher prices once consumers are locked-in.223
219 Source International Telecommunication Union, Measuring the Information Society Report, 2016
220 Patalinghug et. al., 2017, at p.48.
221 See supra at paragraph 41 for additional details.
222 The smartphone-to-feature phone ratio was 47 percent in 2014, slightly less than double its 2013 level of 27 percent (Mirandilla-Santos, 2016).
223 In the postpaid services, the two main companies (PLDT and Globe) have been using strategies such as subsidized mobile devices, additional
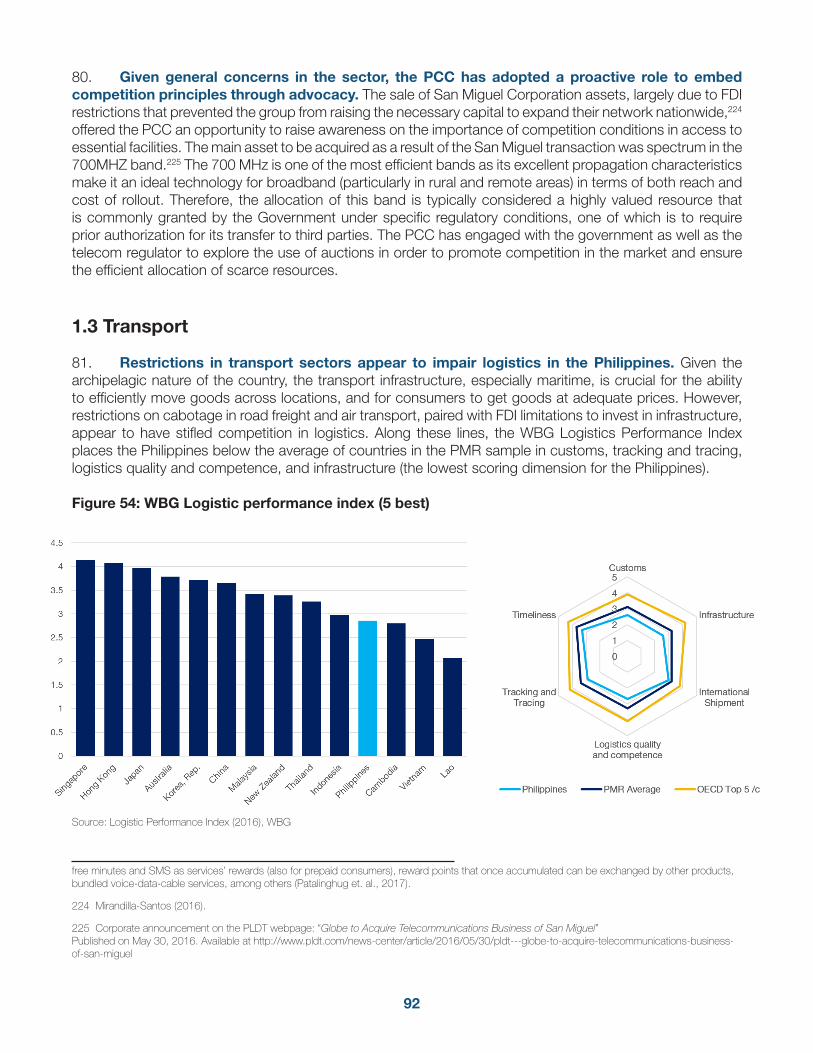
92
80. Given general concerns in the sector, the PCC has adopted a proactive role to embed competition principles through advocacy. The sale of San Miguel Corporation assets, largely due to FDI restrictions that prevented the group from raising the necessary capital to expand their network nationwide,224 offered the PCC an opportunity to raise awareness on the importance of competition conditions in access to essential facilities. The main asset to be acquired as a result of the San Miguel transaction was spectrum in the 700MHZ band.225 The 700 MHz is one of the most efficient bands as its excellent propagation characteristics make it an ideal technology for broadband (particularly in rural and remote areas) in terms of both reach and cost of rollout. Therefore, the allocation of this band is typically considered a highly valued resource that is commonly granted by the Government under specific regulatory conditions, one of which is to require prior authorization for its transfer to third parties. The PCC has engaged with the government as well as the telecom regulator to explore the use of auctions in order to promote competition in the market and ensure the efficient allocation of scarce resources.
1.3 Transport
81. Restrictions in transport sectors appear to impair logistics in the Philippines. Given the archipelagic nature of the country, the transport infrastructure, especially maritime, is crucial for the ability to efficiently move goods across locations, and for consumers to get goods at adequate prices. However, restrictions on cabotage in road freight and air transport, paired with FDI limitations to invest in infrastructure, appear to have stifled competition in logistics. Along these lines, the WBG Logistics Performance Index places the Philippines below the average of countries in the PMR sample in customs, tracking and tracing, logistics quality and competence, and infrastructure (the lowest scoring dimension for the Philippines).
Figure 54: WBG Logistic performance index (5 best)
Source: Logistic Performance Index (2016), WBG
free minutes and SMS as services’ rewards (also for prepaid consumers), reward points that once accumulated can be exchanged by other products, bundled voice-data-cable services, among others (Patalinghug et. al., 2017).
224 Mirandilla-Santos (2016).
225 Corporate announcement on the PLDT webpage: “Globe to Acquire Telecommunications Business of San Miguel” Published on May 30, 2016. Available at http://www.pldt.com/news-center/article/2016/05/30/pldt---globe-to-acquire-telecommunications-business-of-san-miguel
93
82. In the air transport industry, regional agreements (e.g. ASEAN Multilateral Agreement on Air Services 2009) have not fully eliminated regulatory restraints. In the mid-1990s, the liberalization of the sector started with Executive Order No. 219.226 This instrument allowed for new entrants to challenge the monopolistic position of Philippine Airlines, the national flag carrier and sole airline for domestic and international routes under the one-airline policy.227 Executive Order No. 29, issued on 14 March 2011, unilaterally provided an open skies policy to all airports outside the capital, Manila.228 In addition, the Philippines has bilateral air transport agreements with at least 36 countries and territories229 and the government continues to negotiate agreements with other countries to increase capacities for foreign airlines to offer flights into Philippine airports, as well as to promote greater access by Filipino carriers into other countries. While the Philippines does not have an open skies agreement with the United States230 regional agreements such as the one signed with ASEAN have been critical to limit government interference in the commercial decisions of air carriers regarding routes, capacity and pricing, freeing them to provide a more affordable, convenient and efficient air service for consumers.231 However, cabotage rights for foreign carriers are not included in these agreements and price regulation in the sector persists, as the Civil Aeronautics Board can regulate domestic airfares.232
83. In the maritime transport infrastructure, the lack of separation between commercial interests and regulatory functions of the port regulator, the Philippine Ports Authority’s (PPA), may result in a discriminatory application of rules that puts private operators at a disadvantage. Cumulative roles of the PPA as the main developer, operator and regulator of ports, which develops, owns, maintains and regulates its own ports, while being responsible for awarding contracts to private terminal and cargo handling operators, have led to limited competition in port operations.
84. Domestic shipping in the Philippines is generally more expensive than in Malaysia or Indonesia and exhibits concentrated market structures. The average port-to-port cost per nautical mile is $1.47, which is higher than Indonesia’s $0.77 and Malaysia’s $1.36. Constraints on market competition appear to be among the causes of the poor state of the domestic shipping industry. Few operators serve most shipping routes, with more than 40 percent of routes served by a single operator. While some market concentration is likely due to market factors such as economies of scale in shipping operations, the threat of the potential entry of competitors is often the major force driving market behavior in the industry. Moreover, prior to 2015, incumbents had to give their consent for new entry in the routes they were serving.233
85. In the railway sector, the presence of a monopolistic SOE, paired with a lack of separation between the operation of infrastructure and the provision of railway services (actual transport
226 Executive Order No. 217 (January 1995) established the domestic and international civil aviation liberalization policy. Available at: http://www.cab.gov.ph/mandates?task=callelement&format=raw&item_id=417&element=f85c494b-2b32-4109-b8c1-083cca2b7db6&method=download&args[0]=b-0c046f0159676142b23ad5a8f16c4fa
227 Philippine Airlines became a monopoly in domestic air travel in 1974 under the Marcos administration.
228 It provides that: “the Philippine Air Panels may offer and promote third, fourth, and fifth freedom rights to the country’s airports other than the Ninoy Aquino International Airport (NAIA) without restriction as to frequency, capacity and type of aircraft, and other arrangements that will serve the national interest as may be determined by the CAB.”
229 The Philippines has agreements with the following countries: Australia, Ethiopia, India, Oman, Russia, South Korea, Turkey, and US. It also has agreements with the EU (Austria, Belgium, Bulgaria, Croatia, Cyprus, Czech Republic, Denmark, Estonia, Finland, France, Germany, Greece, Hungary, Ireland, Italy, Latvia, Lithuania, Luxembourg, Malta, Netherlands, Poland, Portugal, Romania, Slovakia, Slovenia, Spain, Sweden, and the UK) and ASE-AN countries (Brunei Darussalam, Cambodia, Indonesia, Lao PDR, Malaysia, Myanmar, Singapore, Thailand, and Vietnam).
230 The PMR methodology uses the existence of an open skies agreement with the US as a benchmark indicator. Open skies agreements with other countries are not included in this methodology. This does not imply that a country should only have open skies agreements with the US.
231 Lim, Alberto (2010), “Air Transport Policy Reforms”.
232 Section 10(C)(2) of the Civil Aeronautics Act of the Philippines (RA No. 776, as amended). Available at: http://www.cab.gov.ph/mandates/item/republic-act-no-776?category_id=82
233 WBG Trade & Competitiveness Project Brief “Paving the Way for Competitive Domestic Shipping in the Philippines.”
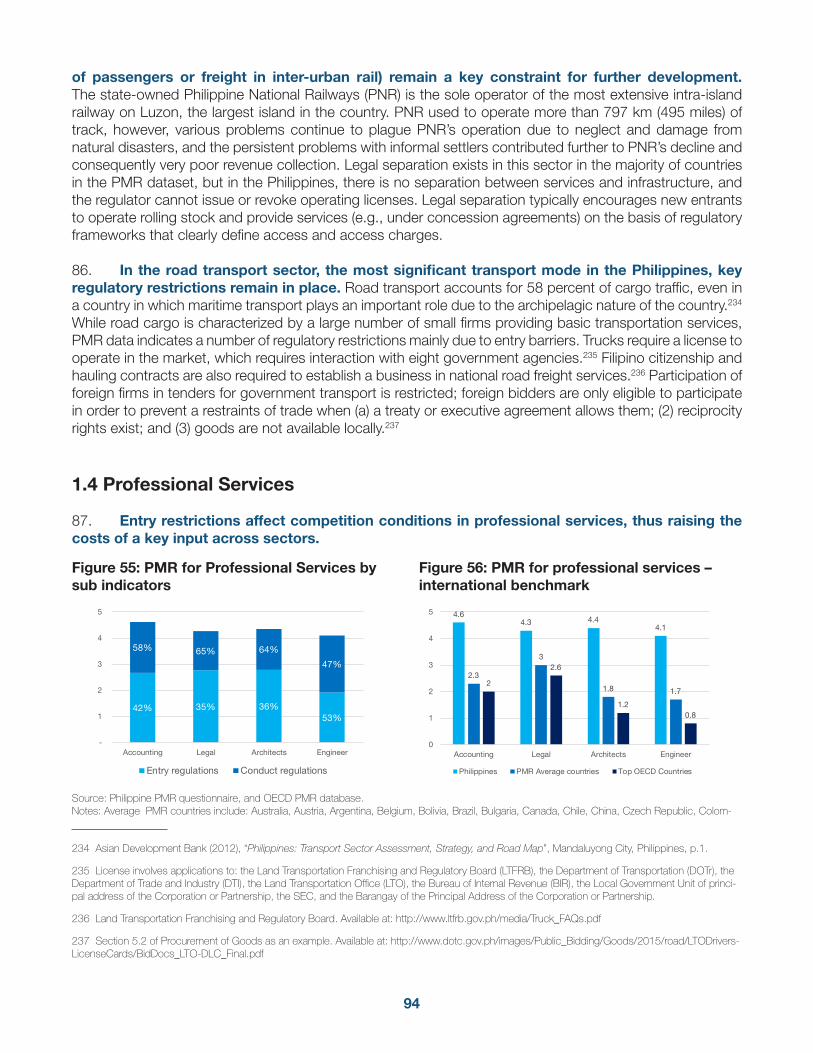
94
of passengers or freight in inter-urban rail) remain a key constraint for further development. The state-owned Philippine National Railways (PNR) is the sole operator of the most extensive intra-island railway on Luzon, the largest island in the country. PNR used to operate more than 797 km (495 miles) of track, however, various problems continue to plague PNR’s operation due to neglect and damage from natural disasters, and the persistent problems with informal settlers contributed further to PNR’s decline and consequently very poor revenue collection. Legal separation exists in this sector in the majority of countries in the PMR dataset, but in the Philippines, there is no separation between services and infrastructure, and the regulator cannot issue or revoke operating licenses. Legal separation typically encourages new entrants to operate rolling stock and provide services (e.g., under concession agreements) on the basis of regulatory frameworks that clearly define access and access charges.
86. In the road transport sector, the most significant transport mode in the Philippines, key regulatory restrictions remain in place. Road transport accounts for 58 percent of cargo traffic, even in a country in which maritime transport plays an important role due to the archipelagic nature of the country.234 While road cargo is characterized by a large number of small firms providing basic transportation services, PMR data indicates a number of regulatory restrictions mainly due to entry barriers. Trucks require a license to operate in the market, which requires interaction with eight government agencies.235 Filipino citizenship and hauling contracts are also required to establish a business in national road freight services.236 Participation of foreign firms in tenders for government transport is restricted; foreign bidders are only eligible to participate in order to prevent a restraints of trade when (a) a treaty or executive agreement allows them; (2) reciprocity rights exist; and (3) goods are not available locally.237
1.4 Professional Services
87. Entry restrictions affect competition conditions in professional services, thus raising the costs of a key input across sectors.
Source: Philippine PMR questionnaire, and OECD PMR database. Notes: Average PMR countries include: Australia, Austria, Argentina, Belgium, Bolivia, Brazil, Bulgaria, Canada, Chile, China, Czech Republic, Colom-
234 Asian Development Bank (2012), “Philippines: Transport Sector Assessment, Strategy, and Road Map”, Mandaluyong City, Philippines, p.1.
235 License involves applications to: the Land Transportation Franchising and Regulatory Board (LTFRB), the Department of Transportation (DOTr), the Department of Trade and Industry (DTI), the Land Transportation Office (LTO), the Bureau of Internal Revenue (BIR), the Local Government Unit of princi-pal address of the Corporation or Partnership, the SEC, and the Barangay of the Principal Address of the Corporation or Partnership.
236 Land Transportation Franchising and Regulatory Board. Available at: http://www.ltfrb.gov.ph/media/Truck_FAQs.pdf
237 Section 5.2 of Procurement of Goods as an example. Available at: http://www.dotc.gov.ph/images/Public_Bidding/Goods/2015/road/LTODrivers-LicenseCards/BidDocs_LTO-DLC_Final.pdf
Figure 55: PMR for Professional Services by sub indicators
Figure 56: PMR for professional services – international benchmark
42% 35% 36%53%
58% 65% 64%
47%
-
1
2
3
4
5
Accounting Legal Architects Engineer
Entry regulations Conduct regulations
4.64.3 4.4
4.1
2.3
3
1.8 1.72
2.6
1.20.8
0
1
2
3
4
5
Accounting Legal Architects Engineer
Philippines PMR Average countries Top OECD Countries
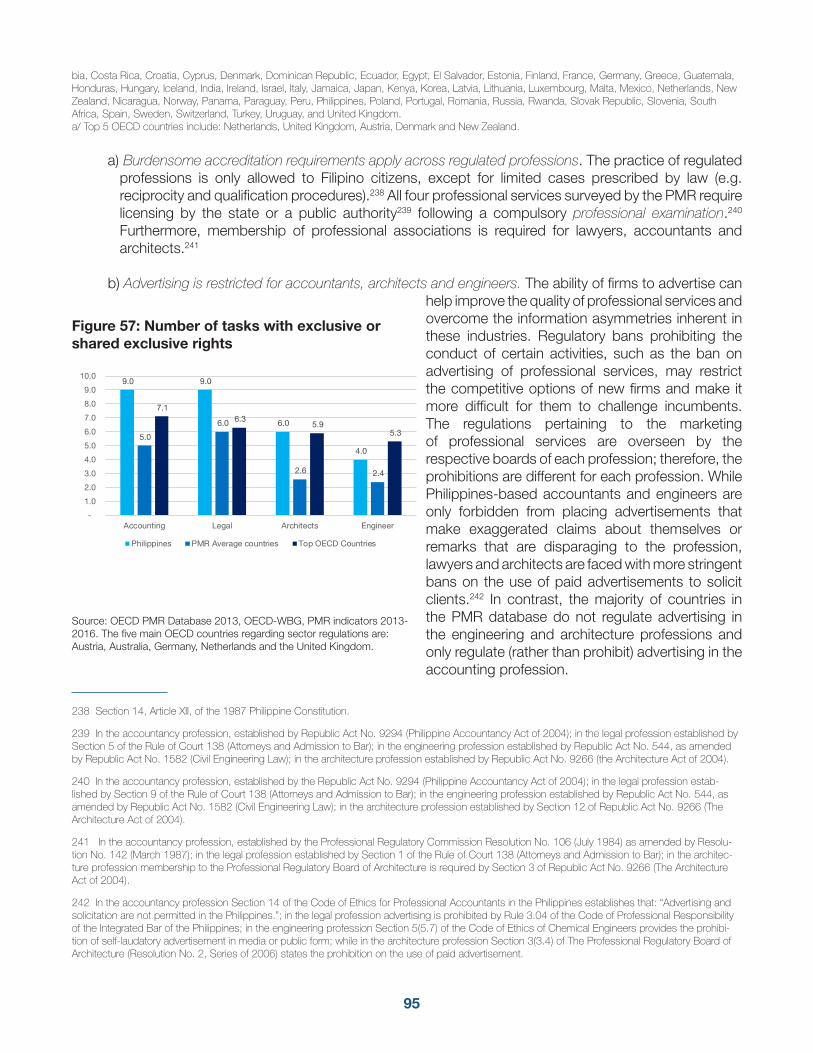
95
bia, Costa Rica, Croatia, Cyprus, Denmark, Dominican Republic, Ecuador, Egypt, El Salvador, Estonia, Finland, France, Germany, Greece, Guatemala, Honduras, Hungary, Iceland, India, Ireland, Israel, Italy, Jamaica, Japan, Kenya, Korea, Latvia, Lithuania, Luxembourg, Malta, Mexico, Netherlands, New Zealand, Nicaragua, Norway, Panama, Paraguay, Peru, Philippines, Poland, Portugal, Romania, Russia, Rwanda, Slovak Republic, Slovenia, South Africa, Spain, Sweden, Switzerland, Turkey, Uruguay, and United Kingdom.a/ Top 5 OECD countries include: Netherlands, United Kingdom, Austria, Denmark and New Zealand.
a) Burdensome accreditation requirements apply across regulated professions. The practice of regulated professions is only allowed to Filipino citizens, except for limited cases prescribed by law (e.g. reciprocity and qualification procedures).238 All four professional services surveyed by the PMR require licensing by the state or a public authority239 following a compulsory professional examination.240 Furthermore, membership of professional associations is required for lawyers, accountants and architects.241
b) Advertising is restricted for accountants, architects and engineers. The ability of firms to advertise can help improve the quality of professional services and overcome the information asymmetries inherent in these industries. Regulatory bans prohibiting the conduct of certain activities, such as the ban on advertising of professional services, may restrict the competitive options of new firms and make it more difficult for them to challenge incumbents. The regulations pertaining to the marketing of professional services are overseen by the respective boards of each profession; therefore, the prohibitions are different for each profession. While Philippines-based accountants and engineers are only forbidden from placing advertisements that make exaggerated claims about themselves or remarks that are disparaging to the profession, lawyers and architects are faced with more stringent bans on the use of paid advertisements to solicit clients.242 In contrast, the majority of countries in the PMR database do not regulate advertising in the engineering and architecture professions and only regulate (rather than prohibit) advertising in the accounting profession.
238 Section 14, Article XII, of the 1987 Philippine Constitution.
239 In the accountancy profession, established by Republic Act No. 9294 (Philippine Accountancy Act of 2004); in the legal profession established by Section 5 of the Rule of Court 138 (Attorneys and Admission to Bar); in the engineering profession established by Republic Act No. 544, as amended by Republic Act No. 1582 (Civil Engineering Law); in the architecture profession established by Republic Act No. 9266 (the Architecture Act of 2004).
240 In the accountancy profession, established by the Republic Act No. 9294 (Philippine Accountancy Act of 2004); in the legal profession estab-lished by Section 9 of the Rule of Court 138 (Attorneys and Admission to Bar); in the engineering profession established by Republic Act No. 544, as amended by Republic Act No. 1582 (Civil Engineering Law); in the architecture profession established by Section 12 of Republic Act No. 9266 (The Architecture Act of 2004).
241 In the accountancy profession, established by the Professional Regulatory Commission Resolution No. 106 (July 1984) as amended by Resolu-tion No. 142 (March 1987); in the legal profession established by Section 1 of the Rule of Court 138 (Attorneys and Admission to Bar); in the architec-ture profession membership to the Professional Regulatory Board of Architecture is required by Section 3 of Republic Act No. 9266 (The Architecture Act of 2004).
242 In the accountancy profession Section 14 of the Code of Ethics for Professional Accountants in the Philippines establishes that: “Advertising and solicitation are not permitted in the Philippines.”; in the legal profession advertising is prohibited by Rule 3.04 of the Code of Professional Responsibility of the Integrated Bar of the Philippines; in the engineering profession Section 5(5.7) of the Code of Ethics of Chemical Engineers provides the prohibi-tion of self-laudatory advertisement in media or public form; while in the architecture profession Section 3(3.4) of The Professional Regulatory Board of Architecture (Resolution No. 2, Series of 2006) states the prohibition on the use of paid advertisement.
9.0 9.0
6.0
4.0
5.0
6.0
2.6 2.4
7.1 6.3
5.9 5.3
-
1.0
2.0
3.0
4.0
5.0
6.0
7.0
8.0
9.0
10.0
Accounting Legal Architects Engineer
Philippines PMR Average countries Top OECD Countries
Figure 57: Number of tasks with exclusive or shared exclusive rights
Source: OECD PMR Database 2013, OECD-WBG, PMR indicators 2013-2016. The five main OECD countries regarding sector regulations are: Austria, Australia, Germany, Netherlands and the United Kingdom.
96
c) Lawyers and accountants are granted a number of exclusive or shared exclusive rights above the average of the PMR dataset. (Figure 57)
d) Pricing guidelines exist for lawyers, engineers and architects. The legal profession has regulated minimum prices, while non-binding pricing guidelines exist for engineers and architects.243 Since the market effects of these practices are similar to cartel agreements, competition policy reforms in the professional service sector across countries have been consistently identified to yield large economic benefits by boosting productivity while not affecting quality or professional standards. Wider use of professional services implies higher productivity across sectors, and the average labor productivity of firms that use accounting and legal professional services is 10 to 45 percent higher than those who do not.244
2. Making markets work more efficiently
88. Reducing regulatory restrictiveness in key markets would require a number of reforms aimed at:
• tackling unclear or restrictive regulation in the infrastructure sectors and professional services to create more competitive conditions, with positive effects for downstream markets.
• eliminating restrictions on foreign investors vis-à-vis domestic investors, as well as among domestic investors in sectors where such restrictions create an uneven playing field.
• minimizing the scope of controlled prices to create the right incentives for firms to compete. • reducing the involvement of the state through SOEs and other operations, particularly in typically
competitive markets and ensuring competitive neutrality among public and private operators; this will also promote a more effective use of public funds.
• streamlining burdensome administrative procedures for businesses to facilitate easy market entry.
243 In the engineering profession, Republic Act No. 5981 for the standardization of the salaries of government civil engineering; in the architecture profession established by the Standards of Professional Practices (2010) Numbers 201, 203, 204-A, 204-B, 205, 206, 207 and 208 that indicate the different methods of compensating architects depending on the services.
244 International Monetary Fund (2013), “Selected Issues. Country Reports” 13/297, Botswana, p.39.
97
IV. Quantifying potential benefits of increased competition
89. Pro-competition reforms in services sectors are critical for GDP growth as they are generally large in size and constitute an input in the supply chain of various other industries. Reducing competitive restrictions in services (telecommunications, energy, transport, and professional services) not only improves the performance within each sector, but also has positive spillovers on the entire economy. In contrast, restrictive regulation may affect economic performance by protecting inefficient incumbents (network industries) or sustaining high prices (professional services). Low quality and high prices in services are likely to reduce the productivity of the downstream sectors that heavily rely on these services as inputs.
90. Empirical evidence confirms a significant relationship between the degree of regulation in the service sector and growth in productivity and value added. A study of OECD countries based on PMR data (Barone and Cingano, 2011) shows that lower service regulation has significant positive effects on the value added, productivity and export growth rates of service-intensive sectors. Additionally, they find that a significant reduction245 in the restrictiveness of regulation leads to an increase between 0.7 and 1.0 percentage points in annual value added growth in service-intensive sectors. Pro-competition reforms in professional services have also been found to increase productivity within sectors. For instance, removal of price floors and advertising restrictions is associated with an increase in productivity and a higher likelihood for high-productivity lawyers to stay in the legal profession (Pellizzari et al., 2011).
91. By concentrating on key reforms in service sectors, the Philippines could move from the third to the first quartile in terms of PMR restrictiveness among the countries in the dataset. A simulation based on enhancing the regulatory environment across all sectors (mostly focused on service sectors) would imply lifting 99 restrictions mapped by the PMR indicators.246 247 In network industries, this would include limiting SOE presence (electricity generation, parcel and courier postal services, railways and water transport of freight and passengers and operation of road, railways and maritime infrastructure) and reducing barriers to entry (implementing some vertical separation in rail transport and electricity, regulating third party access in electricity, promoting Mutual Recognition Agreements in all network industries but road and rail transport, and requiring the unbundling of the local loop in telecommunications); eliminating price regulation for domestic air transport; developing efficient pricing mechanisms in the telecommunications sector (regulating local loop unbundling prices and international wholesale/retail roaming rates); and eliminating FDI restrictions in key service sectors such as business professions. In professional services, market improvements include allowing inter-professional cooperation as well as advertising; facilitating entry for domestic and foreign providers, reducing the number of exclusive tasks and eliminating price regulation.
245 A significant decrease in relative regulatory restrictiveness is defined as an improvement of at least two quartiles in the distribution of countries according to their restrictiveness (i.e. a country that moves from the 75th percentile to the 25th percentile in the respective sectoral or lower level indica-tors).
246 The identified restrictions correspond to 24 markets, from which 20 (83 percent) can be classified within the services sector (including those related to network industries, which ultimately provide services).
247 The simulation is performed lifting 99 restrictions on key service and network sectors; we based our restrictions selection on the findings of Barone and Cingano (2011). These restrictions lifted are not identical to the restrictions identified and extensively discussed in the previous two sections.
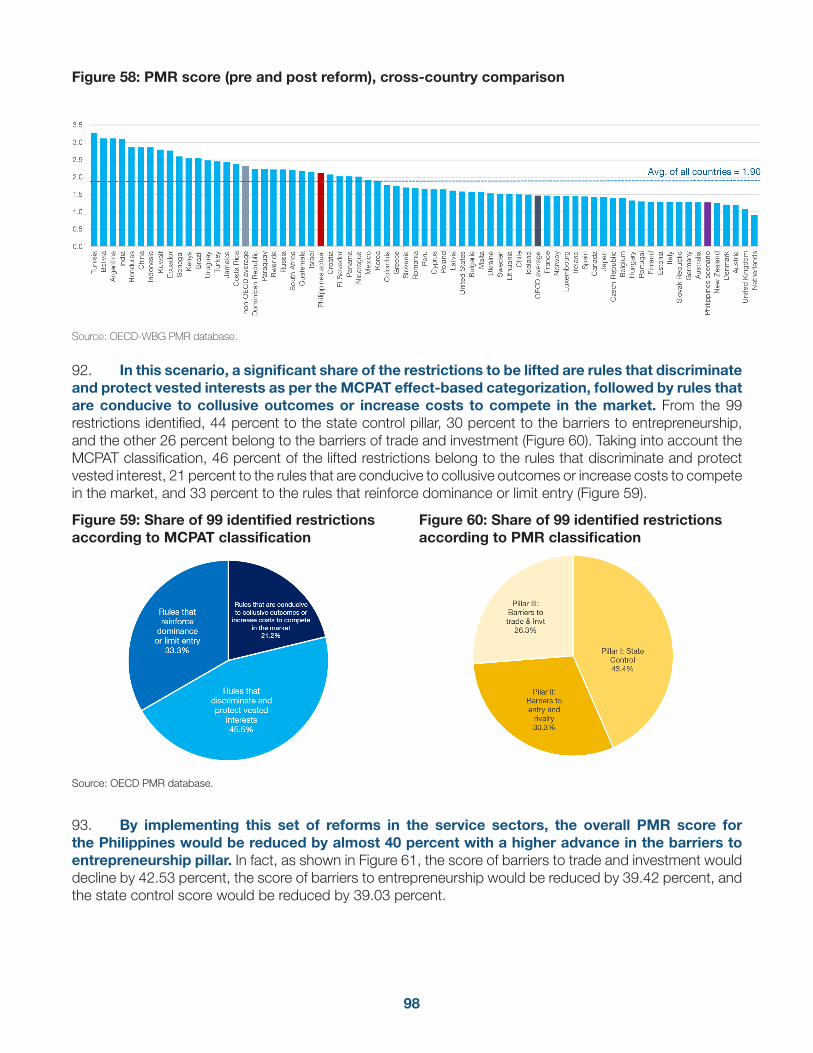
98
Figure 58: PMR score (pre and post reform), cross-country comparison
Source: OECD-WBG PMR database.
92. In this scenario, a significant share of the restrictions to be lifted are rules that discriminate and protect vested interests as per the MCPAT effect-based categorization, followed by rules that are conducive to collusive outcomes or increase costs to compete in the market. From the 99 restrictions identified, 44 percent to the state control pillar, 30 percent to the barriers to entrepreneurship, and the other 26 percent belong to the barriers of trade and investment (Figure 60). Taking into account the MCPAT classification, 46 percent of the lifted restrictions belong to the rules that discriminate and protect vested interest, 21 percent to the rules that are conducive to collusive outcomes or increase costs to compete in the market, and 33 percent to the rules that reinforce dominance or limit entry (Figure 59).
Source: OECD PMR database.
93. By implementing this set of reforms in the service sectors, the overall PMR score for the Philippines would be reduced by almost 40 percent with a higher advance in the barriers to entrepreneurship pillar. In fact, as shown in Figure 61, the score of barriers to trade and investment would decline by 42.53 percent, the score of barriers to entrepreneurship would be reduced by 39.42 percent, and the state control score would be reduced by 39.03 percent.
Figure 59: Share of 99 identified restrictions according to MCPAT classification
Figure 60: Share of 99 identified restrictions according to PMR classification
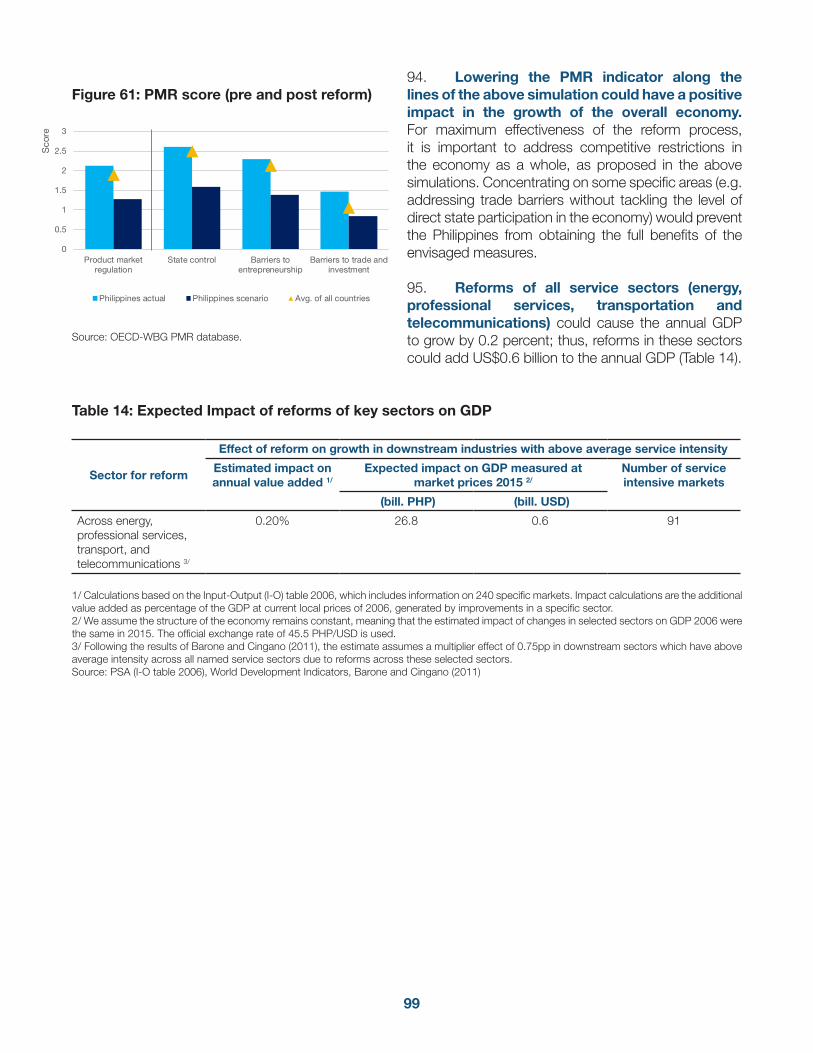
99
94. Lowering the PMR indicator along the lines of the above simulation could have a positive impact in the growth of the overall economy. For maximum effectiveness of the reform process, it is important to address competitive restrictions in the economy as a whole, as proposed in the above simulations. Concentrating on some specific areas (e.g. addressing trade barriers without tackling the level of direct state participation in the economy) would prevent the Philippines from obtaining the full benefits of the envisaged measures.
95. Reforms of all service sectors (energy, professional services, transportation and telecommunications) could cause the annual GDP to grow by 0.2 percent; thus, reforms in these sectors could add US$0.6 billion to the annual GDP (Table 14).
Table 14: Expected Impact of reforms of key sectors on GDP
Sector for reform
Effect of reform on growth in downstream industries with above average service intensity
Estimated impact on annual value added 1/
Expected impact on GDP measured at market prices 2015 2/
Number of service intensive markets
(bill. PHP) (bill. USD)
Across energy, professional services, transport, and telecommunications 3/
0.20% 26.8 0.6 91
1/ Calculations based on the Input-Output (I-O) table 2006, which includes information on 240 specific markets. Impact calculations are the additional value added as percentage of the GDP at current local prices of 2006, generated by improvements in a specific sector. 2/ We assume the structure of the economy remains constant, meaning that the estimated impact of changes in selected sectors on GDP 2006 were the same in 2015. The official exchange rate of 45.5 PHP/USD is used.3/ Following the results of Barone and Cingano (2011), the estimate assumes a multiplier effect of 0.75pp in downstream sectors which have above average intensity across all named service sectors due to reforms across these selected sectors. Source: PSA (I-O table 2006), World Development Indicators, Barone and Cingano (2011)
0
0.5
1
1.5
2
2.5
3
Product marketregulation
State control Barriers toentrepreneurship
Barriers to trade andinvestment
Sco
re
Philippines actual Philippines scenario Avg. of all countries
Figure 61: PMR score (pre and post reform)
Source: OECD-WBG PMR database.
100
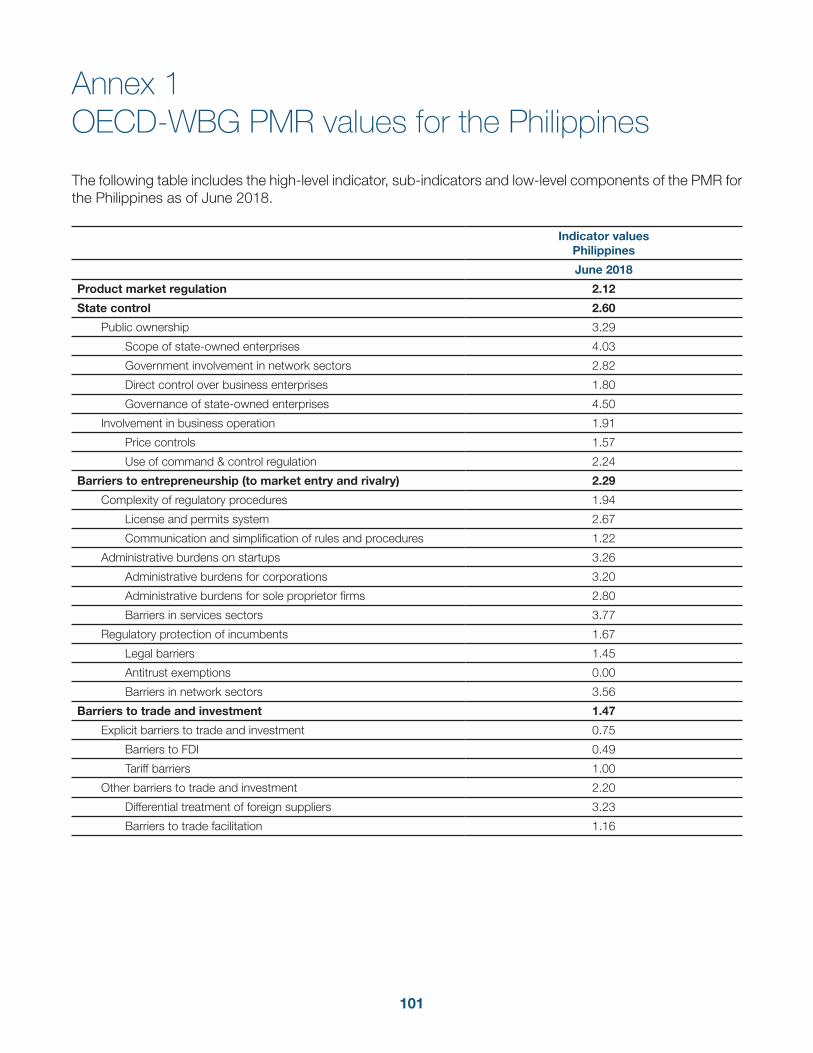
101
Annex 1 OECD-WBG PMR values for the Philippines
The following table includes the high-level indicator, sub-indicators and low-level components of the PMR for the Philippines as of June 2018.
Indicator valuesPhilippines
June 2018
Product market regulation 2.12
State control 2.60
Public ownership 3.29
Scope of state-owned enterprises 4.03
Government involvement in network sectors 2.82
Direct control over business enterprises 1.80
Governance of state-owned enterprises 4.50
Involvement in business operation 1.91
Price controls 1.57
Use of command & control regulation 2.24
Barriers to entrepreneurship (to market entry and rivalry) 2.29
Complexity of regulatory procedures 1.94
License and permits system 2.67
Communication and simplification of rules and procedures 1.22
Administrative burdens on startups 3.26
Administrative burdens for corporations 3.20
Administrative burdens for sole proprietor firms 2.80
Barriers in services sectors 3.77
Regulatory protection of incumbents 1.67
Legal barriers 1.45
Antitrust exemptions 0.00
Barriers in network sectors 3.56
Barriers to trade and investment 1.47
Explicit barriers to trade and investment 0.75
Barriers to FDI 0.49
Tariff barriers 1.00
Other barriers to trade and investment 2.20
Differential treatment of foreign suppliers 3.23
Barriers to trade facilitation 1.16
102
References
Acemoglu, D., Antràs, P. and Helpman, E., 2007. “Contracts and Technology Adoption.” American Economic Review, 97(3), pp.916–943.
Aghion P., Dewatripont M., Du L., Harrison A. and Legros P., 2011. “Industrial Policy and Competition”, GRASP Working Paper 17.
Aghion, P., and Griffith, R., 2008. Competition and Growth: Reconciling Theory and Evidence, Cambridge, US: MIT Press.
Alampay, E. A., 2008. Telecom Regulatory and Policy Environment in the Philippines: Results and Analysis of the 2088 TRE Survey. Retrieved from https://papers.ssrn.com/sol3/papers.cfm?abstract_id=1554783
Aldaba, R., 2008. “Assessing Competition in Philippine markets,” Philippine Institute for Development Studies, Discussion paper series No. 2008-23.
Argent, J., and Begazo, T., 2015. Competition in The Philippinesn Markets and its Impact on Income and Poverty: A Case Study on Sugar and Maize. Policy Research Working Paper No. WPS 7179. Washington, DC: World Bank Group.
Asian Development Bank 2012. Philippines: Transport Sector Assessment, Strategy, and Road Map, Mandaluyong City, Philippines.
Bassanini, A., and Ernst, E., 2002. “Labour Market Institutions, Product Market Regulation, and Innovation,” Paris: Organisation for Economic Co-operation and Development.
Buccirossi P., Ciari L., Duso T., Spagnolo G. and Vitale C., 2009. “Competition policy and productivity Growth: An Empirical Assessment”, Centre for Economic Policy Research Discussion Paper No. 7470.
Cayanan, A., & Suan, I., 2014. Pricing in Regulated Industries: The Telecommunications Sector. Philippine Management Review 2, 53-68.
Cole, H. L., Ohanian, L. E., Riascos, A., and Schmitz Jr, J. A., 2005. “Latin America in the Rearview Mirror.” Journal of Monetary Economics, 52(1), pp.69–107.
Connor, J., and Bolotova, Y., 2006. “Cartel overcharges: Survey and meta-analysis” International Journal of Industrial Organization, 24(6), pp.1109-1137.
Conway, P., and Nicoletti, G., 2007. “Product Market Regulation and Productivity Convergence: OECD Evidence and Implications for Canada.” International Productivity Monitor, 15, pp.3–24.
Galbraith, J. K., 1952. A Theory of Price Control, Cambridge, US: Harvard University press.
103
Goodwin, T; Pierola, M. D., 2015. “Export Competitiveness. Why Domestic Market Competition Matters”. Viewpoint, Public Policy for the Private Sector. The World Bank Group, Trade and Competitiveness Global Practice, Note n. 348.
GSMA., 2014. Country Overview: Philippines Growth Through Innovation. GSMA Intelligence.
Harrington, J., 2016: Heterogeneous Firms Can Always Collude on a Minimum Price, Economics Letters (136), pp 46-49, January.
Hollweg, C. and Wong, M., 2009. Measuring Regulatory Restrictions in Logistics Services, ERIA Discussion Paper Series, Economic Research Institute for ASEAN and East Asia, ERIA-DP-2009-14.
Hu, J.-L., & Chu, W.-K., 2008. Efficiency and Productivity of Major Asia-Pacific Telecom Firms. Chang Gung Journal of Humanities and Social Sciences, 1(2), 223-245.
IEA, 2012. “Tax Incentives and Exemption Regime in The Philippines: Is it working?” Nairobi: Institute of Economic Affairs.IFC, 2013. “Public-Private Partnership Stories- The Philippines: Telkom The Philippines,” Washington, DC: International Finance Corporation.
InfoDev & ITU, n.d . ICT Regulation Toolkit. Information for Development Program and International Telecommunication Union.
ITU, 2015. “Data Source: ICT EYE Statistics,” Geneva: International Telecommunication Union
ITU, 2016. Measuring the Information Society Report. Geneva: International Telecommunication Union
Jayne, T. S., Myers, R. J., and Nyoro, J., 2008. “The Effects of NCPB Marketing Policies on Maize Market Prices in The Philippines.” Agricultural Economics, 38(3), pp.313–325.
Kikeri, S. et al., 2014. Corporate Governance of State-Owned Enterprises: A Toolkit. Washington, DC: World Bank Group.
Kitzmuller, M.; Martinez Licetti, M., 2012. Competition policy: encouraging thriving markets for development. Financial and private sector development; note no. 331. Washington, DC: World Bank.
Koske, I., Wanner, I., Bitetti, R., Barbiero, O., 2015. “The 2013 Update of the OECD’s Database on Product Market Regulation: Policy Insights for OECD and non-OECD countries.” OECD Economics Department Working Papers, No. 1200, OECD Publishing, Paris.
Laffont, J.-J. and Tirole, J., 1991. “The Politics of Government Decision-Making: A Theory of Regulatory Capture.” The Quarterly Journal of Economics, 106(4), pp.1089–1127.
Llanto, G., Navarro, A., Detros, K. and Ortiz, K., 2013. Toward Informed Regulatory Conversations and Improved Regulatory Regime in the Philippines: Logistics Sector and Trade Facilitation, PIDS Discussion Paper Series, Philippine Institute for Development Studies, No. 2013-47.
Llanto, G., 2015. Towards an Effective Regulatory Management System: Philippines; Philippine Institute
104
for Development Studies, Discussion Paper Series No. 2015-32
Mather, D., and Jayne, T. S., 2011. “The Impact of State Marketing Board Operations on Smallholder Behavior and Incomes: The Case of The Philippines.” MSU International Development Working Paper.
Maurer, L. T. A., and Barroso, L. A., 2011. Electricity Auctions - An Overview of Efficient Practices, Washington DC: The World Bank Group.
Mazer, Rafael and Philip Rowan, “Competition in mobile financial services”, forthcoming.
Mendoza, R., Barcenas, L. and P. Mahurkar, 2013. “Balancing Industrial Concentration and Competition for Economic Development in Asia: Insights from South Korea, China, India, Indonesia and the Philippines,” Journal of Reviews on Global Economics, 2013, 2, 248-277.
Mirandilla-Santos, M. G., 2016. Philippine Broadband: A Policy Review. American Chamber of Commerce of the Philippines. Makati: The Arangkada Philippines Project (TAPP).
Monti, G., 2007. EC Competition Law, CUP.
Nicoletti, G., Scarpetta, S., 2004. Product Market Reforms: Macro Linkages and Effects on Growth (A Partial Survey).
OECD, 1998. Competition and Related Regulation Issues in the Insurance Industry, Paris.
OECD, 2000. Hard Core Cartels, Paris.
OECD, 2008. Building an Institutional Framework for Regulatory Impact Analysis (RIA): Guidance for Policy Makers, Version 1.1.
OECD, 2009. Competition and the Financial Crisis. Paris.
OECD, 2009. ‘Policy Roundtables, State Owned Enterprises and the Principle of Competitive Neutrality’ Paris.
OECD, 2013. Mexico. Towards a Whole-of-Government Perspective to Regulatory Improvement. Available at http://www.oecd.org/gov/regulatory-policy/Mexico-review-of-regulatory-reform-2013-executive%20summary.pdf
OECD, 2014. “Background Paper on Airline Competition,” Paris.
OECD, 2015. Guidelines on Corporate Governance of State-Owned Enterprises. Paris. OECD, 2016. Competition policy in the Philippines, in OECD Investment Policy Reviews: Philippines
2016, OECD Publishing, Paris.
OFT, 2009. Government in markets. Why competition matters - a guide for policymakers. Office of Fair Trading.
Oetzel, J. M., & Banerjee, S. G., 2008. A case of the tortoise versus the hare? Deregulation process,
105
timing, and firm performance in emerging markets. International Business Review, 17(1), 54-77.
Outreville, J. F., 1996. Life insurance markets in developing countries. Journal of Risk and Insurance, 263-278.
Patalinghug, E., Manuela, W., Lizares, R., & Patalinghug, J., (2017. Assessment of the Structure, Conduct, and Performance of the Philippine Telecommunications Industry. Retrieved from https://papers.ssrn.com/sol3/papers.cfm?abstract_id=2912238
PCC, 2017. “Anti-competitive effects of regulatory restrictions: the case of the construction sector,” Philippine Competition Commission - PCC, Policy Note No. 1, Series 2017.
PCC, 2016. “PES Panel discussion on the National Competition Policy,” Philippine Competition Commission - PCC, presentation by Arsenio Balisacan for the 54th Annual Meeting of the Philippine Economic Society, Session on Competition Policy, November 6, 2016.
PSA, 2006. “The 2006-based consumer price index” Special Release No. 621, Office of the Administrator, National Statistics Office (now Philippines Statistic Authority PSA). Available at https://psa.gov.ph/sites/default/files/attachments/itsd/cpi/2006-based%20CPI%20full%20report_revised%20as%20of%20sep%20%202011_34.pdf.
PSA – Philippine Statistics Authority, National accounting data.
Pavcnik, N., 2002. “Trade Liberalization, Exit, and Productivity Improvements: Evidence from Chilean Plants.” The Review of Economic Studies, 69(1), pp.245–276.
Petersen, N., 2013. “Antitrust Law and the Promotion of Democracy and Economic Growth.” Journal of Competition Law and Economics, p.nht003.Reuters, 2014. “Safaricom Launches The Philippines’s First 4G Internet Services.” December 4.
Schiffbauer, M., and Ospina, S., 2010. “Competition and Firm Productivity: Evidence from Firm-Level Data,” Washington DC: International Monetary Fund.
Schlumberger, Charles E., and Nora Weisskopf, 2014. Ready for Takeoff? The Potential for Low-Cost Carriers in Developing Countries. Directions in Development. Washington, DC: World Bank.
Seini, W., Jones, M., Tambi, E., and Odularu, G., 2011. Input Market Initiatives that Support Innovation Systems and Agricultural Value Chains in Africa. Accra, Ghana: Forum for Agricultural Research in Africa (FARA).
Short, C., Mulinge, W., and Witwer, M., 2012. Analysis of Incentives and Disincentives for Maize in The Philippines. Rome: FAO.
Standard Digital, 2014. “Maize farmers demand prompt payment for delivered produce.” December 24.
Stigler, G. J., 1971. “The Theory of Economic Regulation.” The Bell Journal of Economics and Management Science, 2(1), p.3.
106
Stiglitz, J. E., and Newbery, D. M. G., 1979. “The Theory of Commodity Price Stabilization Rules: Welfare Impacts and Supply Responses.” Economic Journal, 89(356), pp.799–817.
Takeshima, H., and Lee, H. L., 2012. “Agricultural Inputs Subsidy and their Developmental Impact: Conventional Wisdom,” Washington, DC: International Food Policy Research Institute (IFPRI).
Techweew, 2011. “Mobile Number Portability (MNP) Now a Reality.” April 1.
Techzim, 2014. “Breaking: Reserve Bank issues directive on mobile money agents. Telecash wins.” February 24.
van Miert, K., 2000. Liberalization of the Economy of the European Union: The Game is not (yet) over, in Damien Geradin (Ed.) Liberalization of state monopolies, Kluwer Law International.
Wodon, Q., Coulombe, H., Tsimpo, C., Backiny-Yetna, P., Adoho, F., and Joseph, G., 2008. “Potential Impact of Higher Food Prices on Poverty: Summary Estimates for a Dozen West and Central African Countries,” Washington DC: The World Bank.
Wodon, Q., and Zaman, H., 2008. “Higher Food Prices in Sub-Saharan Africa: Poverty Impact and Policy Responses,” Washington DC: World Bank.
Wölfl, A., Wanner, I., Roehn, O., and Nicoletti, G., 2010. “Product Market Regulation: Extending the Analysis Beyond OECD Countries,” Rochester, NY: Social Science Research Network.
World Bank, 2000. Private Solutions for Infrastructure: Opportunities for the Philippines. A Country Framework Report. Public-Private Infrastructure Advisory Facility and the World Bank Group
World Bank, 2004. World Development Report 2004: A Better Investment Climate for Everyone, Washington DC: The World Bank Group.
World Bank, 2016. Philippines Economic Update. Outperforming the region and managing the transition, East Asia and Pacific Region World Bank. Report No. 108607-PH, October.
World Bank, 2015. “Doing Business: Measuring Business Regulations,” Washington, DC: World Bank Group.
World Bank, 2015. “Enterprise Surveys: What Businesses Experience,” Washington, DC: World Bank Group.
World Economic Forum, 2016. The Global Competitiveness Report 2016- 2017.

107
© 2018 International Bank for Reconstruction and Development / The World Bank
1818 H Street NWWashington DC 20433Telephone: 202-473-1000Internet: www.worldbank.org