fostering software developer productivity through awareness
TRANSCRIPT
Zurich Open Repository andArchiveUniversity of ZurichMain LibraryStrickhofstrasse 39CH-8057 Zurichwww.zora.uzh.ch
Year: 2019
Fostering Software Developer Productivity through Awareness Increase andGoal-Setting
Meyer, André <javascript:contributorCitation( ’Meyer, André’ );>
Abstract: Software development organizations strive to enhance the productivity of their developers. Alltoo often, efforts aimed at improving developer productivity are undertaken without knowledge abouthow developers spend their time at work and how it influences their own productivity. In our research, wefocus on two aspects for improving developers’ productivity: better understanding developer productivityand using these findings to foster productivity at work. To better understand developer productivity, wetook a bottom-up approach by investigating developers’ perceptions of productivity in the field, and byexamining the individual differences in each developer’s work. We found that developers spend their timeon a wide variety of activities and tasks that they regularly switch between, resulting in highly fragmentedwork. Extending our understanding of developers’ work and the factors that impact their productivitythen allowed us to develop models of developers’ work and productivity, and build approaches thatsupport developers with productive behavior changes. To support the identification of self-improvementopportunities that motivate productive behavior changes, we studied how we can increase developers’awareness about work and productivity by combining our models with three persuasive strategies: self-monitoring, self-reflection, and an external indicator. Based on successful applications in the health andphysical activity domain and from examining developers’ expectations, we developed PersonalAnalytics, aworkplace self-monitoring tool that collects a broad variety of computer interaction data and summarizesthe data in a daily and weekly retrospection. A multi-week field-study showed that PersonalAnalyticsoffered meaningful insights to 82% of the participants, but the insights were not actionable enough tomotivate behavior change for 41% of our participants. In a follow-up study, we found that continuousand purposeful self-reflection can motivate productive self-improvements in the workplace, since 83% ofour participants stated that it supported the identification of goals and actionable strategies, and 80%reported productivity increasing behavior changes. We further studied how we can increase developers’awareness about their co-workers’ availability for interruptions, by sensing and externally indicatinginterruptibility to developers based on their computer interaction. Our large-scale field study with theFlowLight showed that we can effectively reduce 46% of external interruptions, participants felt moreproductive, and 86% of them remained active users even after the two-month study period ended. Overall,our research showed that we can successfully foster productivity at developers’ work, by increasing theirawareness about productive and unproductive work habits, and by encouraging work habit improvementsbased on the gained insights. In addition, our research can be extended and opens new opportunities tofoster productive work for development teams.
Posted at the Zurich Open Repository and Archive, University of ZurichZORA URL: https://doi.org/10.5167/uzh-174312DissertationPublished Version

Originally published at:Meyer, André. Fostering Software Developer Productivity through Awareness Increase and Goal-Setting.2019, University of Zurich, Faculty of Economics.
2
Department of Informatics
Fostering Software Developer Productivity
through Awareness Increase and Goal-Setting
Dissertation submitted to the Faculty of Business,
Economics and Informatics
of the University of Zurich
to obtain the degree of
Doktor der Wissenschaften, Dr. sc.
(corresponds to Doctor of Science, PhD)
presented by
André N. Meyer
from Blumenstein, BE, Switzerland
approved in July 2019
at the request of
Prof. Thomas Fritz, Ph.D.
Prof. Margaret-Anne Storey, Ph.D.
Prof. Harald Gall, Ph.D.

The Faculty of Business, Economics and Informatics of the University of Zurich
hereby authorizes the printing of this dissertation, without indicating an opinion of
the views expressed in the work.
Zurich, July 17, 2019
Chairman of the Doctoral Board: Prof. Thomas Fritz, Ph.D.
Acknowledgments
First and foremost, I would like to thank my great advisor and mentor ThomasFritz, who supported me throughout my studies and gifted me with the op-portunity to pursue my doctoral studies. I very much appreciate the manyopportunities he provided me with, to work on amazing research projects, hisintroductions to researchers that opened the door for some fantastic years-longcollaborations, and him constantly motivating (and challenging) me to pushmyself further, to consider new perspectives and to find simpler solutions tocomplicated things. Although we were not always living and working on thesame continent, he always found the time to offer precious advice, feedback andsupport.
I also want to thank Tom Zimmermann for inviting me several times towork with him at Microsoft, everything he taught me, and all the fun timeswe had besides doing research, be it by exploring new burger places or at themovies. I thank Gail Murphy for her precious advice and support during myPhD, helping me with participant recruitment, and always making time for adiscussion regardless of her full calendar. I thank Peggy Storey for spending hervaluable time to examine my thesis and giving precious feedback, for serving onmy PhD committee, and for all the valuable discussions we had throughout myPhD. I thank Harald Gall for giving me the opportunity to be part of the SEALgroup, serving on my PhD committee, and the interesting discussions we had.
During the time of my PhD, I had the great pleasure to collaborate with re-searchers from academia and industry, including Christian Bird, Nachi Nagappan,Andy Begel, Rob DeLine, Mary Czerwinski, Daniel McDuff and Spencer Buja
ii
from Microsoft; David Shepherd, Boyang Li, Vinay Augustine, Patrick Francis,Nicholas Kraft and Will Snipes from ABB Corporate Research; Earl Barr fromthe University College London; Reid Holmes, Nick Bradley, Chris Satterfield, JanPilzer from the University of British Columbia; and Chat Wacharamonatham,Alberto Bacchelli, Elaine Huang, Manuela Züger, Sebastian Müller, Katja Kevic,Helen Ai He, Christian Remy and Chia-Kai Yuang from the University of Zurich.I thank them for the interesting projects, valuable discussions, and everythingthey taught me.
My research would not have been possible without the almost 7’000 studyparticipants and their employers. Thank you for your trust, interest and takingthe time to participate in our studies.
Special thanks go to the current and past members of the Software Evolutionand Architecture Lab, who made the time of my PhD fun and memorable: CarolAlexandru, Jürgen Cito, Adelina Ciurumelea, Giovanni Grano, Katja Kevic,Christoph Laaber, Philipp Leitner, Sebastian Müller, Sebastiano Panichella,Sebastian Proksch, Gerald Schermann, and Carmine Vassallo. Thank you foryour support and valuable feedback on my work, being my guinea pigs for studytest-runs, for the restorative Exploding Kittens game-breaks, and the fun timeswe had at the office, at conferences and retreats. I also thank our university’sadministration and technicians for always helping us when we need support.
Last but not least, I thank my fiancée, Larissa, for her boundless and uncon-ditional support and encouragement, her understanding when I was abroad torun studies or attend conferences or worked late or on weekends, and joining meon many of my research stays. I thank my family, Dida, Peter and Stephaniefor laying a fantastic foundation to work systematically and successfully, alwaysbelieving in me, and supporting my drive to constantly learn more and grow. Fi-nally, I want to thank Yves, Daniel and Philipp for their precious friendship, theirkind support and providing me with positive energy and motivation throughoutmy PhD.
Abstract
Software development organizations strive to enhance the productivity of theirdevelopers. All too often, efforts aimed at improving developer productivity areundertaken without knowledge about how developers spend their time at workand how it influences their own productivity. In our research, we focus on twoaspects for improving developers’ productivity: better understanding developerproductivity and using these findings to foster productivity at work.
To better understand developer productivity, we took a bottom-up approachby investigating developers’ perceptions of productivity in the field, and byexamining the individual differences in each developer’s work. We found thatdevelopers spend their time on a wide variety of activities and tasks that theyregularly switch between, resulting in highly fragmented work. Our findingsfurther showed that while productivity is very personal, there are observablepatterns across developers’ productivity perceptions.
Extending our understanding of developers’ work and the factors that impacttheir productivity then allowed us to develop models of developers’ work andproductivity, and build approaches that support developers with productivebehavior changes. To support the identification of self-improvement opportunitiesthat motivate productive behavior changes, we studied how we can increasedevelopers’ awareness about work and productivity by combining our modelswith three persuasive strategies: self-monitoring, self-reflection, and an externalindicator. In several areas of life, especially the health and physical activitydomains, studies have demonstrated that self-monitoring and self-reflection canincrease a user’s awareness, and can motivate positive behavior change.
iv
In our work, we investigated how we can map the success of these approachesto software developers’ work, by examining their expectations of and experiencewith self-monitoring tools in the workplace. We implemented the findings asa technology probe into PersonalAnalytics, a workplace self-monitoring toolthat collects a broad variety of computer interaction data and summarizes thedata in a daily and weekly retrospection. A multi-week field-study showed thatPersonalAnalytics offered meaningful insights to 82% of the participants, butthe insights were not actionable enough to motivate behavior change for 41% ofour participants. In a follow-up study, we found that continuous and purposefulself-reflection can be an important step towards productive self-improvementsin the workplace, since 83% of our participants stated that it supported theidentification of goals and actionable strategies, and 80% reported productivityincreasing behavior changes. We further studied how we can increase developers’awareness about their co-workers’ availability for interruptions, by sensing andexternally indicating interruptibility to developers based on their computerinteraction. Our large-scale field study with the FlowLight showed that we caneffectively reduce 46% of external interruptions, participants felt more productive,and 86% of them remained active users even after the two-month study periodended.
Overall, our research showed that we can successfully foster productivity atdevelopers’ work, by increasing their awareness about productive and unpro-ductive work habits, and by encouraging work habit improvements based onthe gained insights. In addition, our research can be extended and opens newopportunities to foster productive work for development teams. For example, wecould aim to gain a better understanding of the interplay between individualand team productivity, to coordinate team collaboration better and improve thescheduling of meetings to be less intrusive.
Zusammenfassung
Softwareentwicklungsunternehmen sind bestrebt, die Produktivität ihrer Soft-wareentwickler zu steigern. Allerdings werden oft Bemühungen zur Verbesse-rung der Entwicklerproduktivität unternommen, ohne zu wissen, wie Entwicklerihre Arbeitszeit organisieren und nutzen, und wie ihre eigene Produktivitätdadurch beeinflusst wird. Unsere Forschung konzentriert sich auf zwei Aspektezur Verbesserung der Produktivität von Entwicklern: ein besseres Verständnisder Entwicklerproduktivität und die Nutzung der Erkenntnisse zur Verbesserungder Produktivität am Arbeitsplatz.
Um Einflussfaktoren auf die Entwicklerproduktivität besser zu verstehen,haben wir Produktivität aus der Entwicklerperspektive untersucht. Dafür habenwir die eigene Produktivitätswahrnehmung und individuelle Unterschiede in derArbeit von Entwicklern untersucht. Unsere Resultate zeigten, dass Entwickler ihreArbeit mit einer Vielzahl von Aktivitäten und Aufgaben verbringen und regel-mässig zwischen ihnen wechseln, was ihre Arbeit in kleine Fragmente aufsplittet.Unsere Ergebnisse zeigten ferner, dass Produktivität zwar sehr individuell ist, esaber beobachtbare Muster in der Produktivitätswahrnehmung von Entwicklerngibt.
Ein besseres Verständnis über die Entwicklerarbeit und die Faktoren, welcheProduktivität beeinflussen, erlaubte es uns daraufhin, Modelle zu der Arbeitund Produktivität von Entwicklern zu bauen, um sie bei produktiven Verhal-tensänderungen zu unterstützen. Um die Identifizierung der Möglichkeiten vonproduktiven Verhaltensänderungen zu verbessern, haben wir untersucht, wiewir die Wahrnehmung von Entwicklern zu ihrer eigenen Arbeit und Produk-
vi
tivität erhöhen können. Dafür haben wir unsere Modelle mit drei Persuasi-ve Strategies kombiniert: Selbstüberwachung (Self-Monitoring), Selbstreflektion(Self-Reflection), und einem externen Indikator. Studien in verschiedenen Lebens-bereichen, insbesondere im Gesundheitswesen und im Sport, haben gezeigt, dassSelbstbeobachtung und Selbstreflexion die Wahrnehmung eines Nutzers in diesenBereichen erhöhen und positive Verhaltensänderungen motivieren und auslösenkönnen.
In unserer Arbeit haben wir untersucht, wie wir diese erfolgreichen Ansätzeauf die Arbeit von Softwareentwicklern übertragen können. Hierfür haben wirsie zu ihren Erwartungen an und Erfahrungen mit bestehenden Selbstbeobach-tungssystemen am Arbeitsplatz befragt. Die daraus resultierenden Erkenntnissehaben wir als Technologiestudie in PersonalAnalytics integriert, einem Systemzur Selbstbeobachtung am Arbeitsplatz. PersonalAnalytics sammelt eine Vielzahlvon Daten zur Interaktion mit dem Computer und fasst die Daten in einer tägli-chen und wöchentlichen Retrospektive zusammen. Eine mehrwöchige Feldstudiehat gezeigt, dass PersonalAnalytics für 82% der Teilnehmer wertvolle Einblickein die eigene Arbeit und Produktivität bietet. Allerdings waren diese Einblickefür 41% der Teilnehmer nicht konkret genug, um daraus Verhaltensänderun-gen zu motivieren. Eine Folgestudie hat gezeigt, dass eine kontinuierliche undzielgerichtete Selbstreflektion ein wichtiger Schritt zu produktiven Verhaltens-änderungen am Arbeitsplatz sein kann: 83% unserer Teilnehmer haben mit derzielgerichteten Selbstreflektion Ziele und konkrete Strategien zur Selbstverbes-serung identifiziert. 80% der Teilnehmer konnten diese daraufhin erfolgreich inproduktivitätssteigernde Verhaltensänderungen umsetzen.
Schlussendlich haben wir untersucht, wie wir die Wahrnehmung von Entwick-lern über die Kosten von Unterbrechungen bei Arbeitskollegen erhöhen können.Dazu haben wir die Unterbrechbarkeit von Entwicklern basierend auf ihren Com-puterinteraktionen gemessen und mit einem externen Indikatoren angezeigt. Einegrosse Feldstudie mit FlowLight hat gezeigt, dass die Anzahl der persönlichenUnterbrechungen nach der Einführung von FlowLight um 46% gesunken ist.Ausserdem fühlten sich die Teilnehmer produktiver. 86% der Teilnehmer nutztenFlowLight auch nach Ablauf der zweimonatigen Studienzeit weiterhin aktiv.
vii
Zusammenfassend zeigten unsere Erkenntnisse, dass sich die Produktivitätvon Softwareentwicklern erfolgreich steigern lässt, indem man ihr Bewusstsein fürproduktive und unproduktive Arbeitsgewohnheiten erhöht und sie ermutigt, ihreeigenen Arbeitsgewohnheiten basierend auf den gewonnenen Erkenntnissen zuverbessern. Darüber hinaus zeigen wir auf, wie unsere Forschung erweitert werdenkann, und welche neuen Möglichkeiten sich eröffnen, um die Produktivität vonEntwicklerteams zu erhöhen. Beispielsweise könnten wir ein besseres Verständnisüber das Zusammenspiel von individueller Produktivität und Team-Produktivitätanstreben, das zu einer verbesserten Koordination von Teamarbeit oder derPlanung von Meetings während weniger störenden Zeiten beiträgt.

Contents
1 Synopsis 31.1 Research Questions . . . . . . . . . . . . . . . . . . . . . . . . . 61.2 Research Approach and Main Findings . . . . . . . . . . . . . . 9
1.2.1 RQ1: Examining Developer Work and Productivity . . . . 111.2.2 RQ2: Increasing Self-Awareness to Foster Productivity . 151.2.3 RQ3: Increasing External Awareness to Foster Productivity 18
1.3 Threats to Validity . . . . . . . . . . . . . . . . . . . . . . . . . 201.4 Challenges & Limitations . . . . . . . . . . . . . . . . . . . . . . 231.5 Opportunities for Future Work . . . . . . . . . . . . . . . . . . 261.6 Related Work . . . . . . . . . . . . . . . . . . . . . . . . . . . . 30
1.6.1 Software Developer Workdays and Work Habits . . . . . 301.6.2 Fragmentation of Development Work . . . . . . . . . . . . 311.6.3 Software Developer Productivity . . . . . . . . . . . . . . 321.6.4 Characteristics and Habits of Successful Developers . . . 331.6.5 Fostering Behavior Change with Goal-Setting . . . . . . 341.6.6 Self-Monitoring in the Workplace . . . . . . . . . . . . . 351.6.7 Self-Reflection in the Workplace . . . . . . . . . . . . . . 361.6.8 External Indicators in the Workplace . . . . . . . . . . . 38
1.7 Summary of Contributions . . . . . . . . . . . . . . . . . . . . . 391.8 Thesis Roadmap . . . . . . . . . . . . . . . . . . . . . . . . . . 40
x Contents
2 The Work Life of Developers:Activities, Switches and Perceived Productivity 432.1 Introduction . . . . . . . . . . . . . . . . . . . . . . . . . . . . . 442.2 Related Work . . . . . . . . . . . . . . . . . . . . . . . . . . . . 482.3 Study Method . . . . . . . . . . . . . . . . . . . . . . . . . . . . 48
2.3.1 Participants . . . . . . . . . . . . . . . . . . . . . . . . . 482.3.2 Procedure and Monitoring Application . . . . . . . . . . 49
2.4 Data Collection and Analysis . . . . . . . . . . . . . . . . . . . 532.4.1 User Input Data . . . . . . . . . . . . . . . . . . . . . . 542.4.2 Preparing Program Data and Mapping to Activities . . . 55
2.5 Results . . . . . . . . . . . . . . . . . . . . . . . . . . . . . . . . 562.5.1 What Does a Developer Do? . . . . . . . . . . . . . . . . 562.5.2 How Fragmented is the Work? . . . . . . . . . . . . . . . 622.5.3 Perceived Productivity Changes? . . . . . . . . . . . . . 642.5.4 What are Productive Activities? . . . . . . . . . . . . . . 652.5.5 Summary of Results . . . . . . . . . . . . . . . . . . . . 68
2.6 Threats to Validity . . . . . . . . . . . . . . . . . . . . . . . . . 692.6.1 Construct Validity . . . . . . . . . . . . . . . . . . . . . 692.6.2 Internal Validity . . . . . . . . . . . . . . . . . . . . . . 702.6.3 External Validity . . . . . . . . . . . . . . . . . . . . . . . 71
2.7 Discussion . . . . . . . . . . . . . . . . . . . . . . . . . . . . . . 722.7.1 Individuality of Productivity . . . . . . . . . . . . . . . . 722.7.2 Supporting Flow and Retrospection . . . . . . . . . . . . 732.7.3 Scheduling a Productive Work Day . . . . . . . . . . . . 742.7.4 Predicting High & Low Productivity . . . . . . . . . . . 742.7.5 Privacy Concerns . . . . . . . . . . . . . . . . . . . . . . 76
2.8 Summary . . . . . . . . . . . . . . . . . . . . . . . . . . . . . . . 772.9 Acknowledgments . . . . . . . . . . . . . . . . . . . . . . . . . . 78
3 Characterizing Software Developers by Perceptions of Produc-tivity 793.1 Introduction . . . . . . . . . . . . . . . . . . . . . . . . . . . . . 80
Contents xi
3.2 Related Work . . . . . . . . . . . . . . . . . . . . . . . . . . . . . 813.3 Methodology . . . . . . . . . . . . . . . . . . . . . . . . . . . . . 81
3.3.1 Data Collection . . . . . . . . . . . . . . . . . . . . . . . . 813.3.2 Data Analysis . . . . . . . . . . . . . . . . . . . . . . . . 83
3.4 Results . . . . . . . . . . . . . . . . . . . . . . . . . . . . . . . . 843.5 Discussion . . . . . . . . . . . . . . . . . . . . . . . . . . . . . . 893.6 Threats to Validity . . . . . . . . . . . . . . . . . . . . . . . . . 903.7 Conclusion . . . . . . . . . . . . . . . . . . . . . . . . . . . . . . . 913.8 Acknowledgements . . . . . . . . . . . . . . . . . . . . . . . . . . 91
4 Today was a Good Day: The Daily Life of Software Developers 934.1 Introduction . . . . . . . . . . . . . . . . . . . . . . . . . . . . . 944.2 Research Questions . . . . . . . . . . . . . . . . . . . . . . . . . . 974.3 Related Work . . . . . . . . . . . . . . . . . . . . . . . . . . . . 98
4.3.1 Influence of Job Satisfaction on Developers’ Workdays . 984.4 Study Design . . . . . . . . . . . . . . . . . . . . . . . . . . . . 99
4.4.1 Survey Development Using Preliminary Interviews . . . . 1004.4.2 Final Survey Design and Participants . . . . . . . . . . . 1004.4.3 The Validity of Self-Reported Data . . . . . . . . . . . . 103
4.5 Conceptual Frameworks . . . . . . . . . . . . . . . . . . . . . . 1044.5.1 Developers’ Good Workdays . . . . . . . . . . . . . . . . 1044.5.2 Developers’ Typical Workdays . . . . . . . . . . . . . . . 1104.5.3 Interrelationship Between Good and Typical Days . . . . 116
4.6 Quantitative Analysis . . . . . . . . . . . . . . . . . . . . . . . . . 1174.6.1 Correlation Between Typical and Good Workdays . . . . 1194.6.2 Time Spent on Activities at Work . . . . . . . . . . . . . 1194.6.3 Workday Types . . . . . . . . . . . . . . . . . . . . . . . . 1214.6.4 Collaboration . . . . . . . . . . . . . . . . . . . . . . . . 124
4.7 Making Good Days Typical . . . . . . . . . . . . . . . . . . . . . 1274.7.1 Optimizing Developer Workdays . . . . . . . . . . . . . . 1284.7.2 Agency: Manage Competition for Attention & Time . . . 1304.7.3 Evaluation of Contributions at Work . . . . . . . . . . . . 131
xii Contents
4.8 Threats to Validity . . . . . . . . . . . . . . . . . . . . . . . . . 1324.8.1 External Validity . . . . . . . . . . . . . . . . . . . . . . 1324.8.2 Construct Validity . . . . . . . . . . . . . . . . . . . . . 1334.8.3 Internal Validity . . . . . . . . . . . . . . . . . . . . . . 133
4.9 Conclusion . . . . . . . . . . . . . . . . . . . . . . . . . . . . . . 1354.10 Acknowledgements . . . . . . . . . . . . . . . . . . . . . . . . . 136
5 Detecting Developers’ Task Switches and Types 1375.1 Introduction . . . . . . . . . . . . . . . . . . . . . . . . . . . . . 1385.2 Related Work . . . . . . . . . . . . . . . . . . . . . . . . . . . . . 141
5.2.1 Task Switch Detection . . . . . . . . . . . . . . . . . . . . 1415.2.2 Task Type Detection . . . . . . . . . . . . . . . . . . . . 1435.2.3 Task Support . . . . . . . . . . . . . . . . . . . . . . . . 144
5.3 Study Design . . . . . . . . . . . . . . . . . . . . . . . . . . . . 1455.3.1 Study 1 – Observations . . . . . . . . . . . . . . . . . . . 1465.3.2 Study 2 – Self-Reports . . . . . . . . . . . . . . . . . . . 148
5.4 Data and Analysis . . . . . . . . . . . . . . . . . . . . . . . . . 1525.4.1 Collected Data . . . . . . . . . . . . . . . . . . . . . . . 1525.4.2 Time Window Segmentation . . . . . . . . . . . . . . . . 1525.4.3 Task Switch Features Extracted . . . . . . . . . . . . . . 1535.4.4 Task Type Features Extracted . . . . . . . . . . . . . . . 1565.4.5 Outcome Measures . . . . . . . . . . . . . . . . . . . . . . 1575.4.6 Machine Learning Approach . . . . . . . . . . . . . . . . . 157
5.5 Results: Detecting Task Switches . . . . . . . . . . . . . . . . . 1585.5.1 Task Switch Detection Accuracy . . . . . . . . . . . . . . 1585.5.2 Task Switch Feature Evaluation . . . . . . . . . . . . . . 1595.5.3 Descriptive Statistics of the Dataset . . . . . . . . . . . . 160
5.6 Results: Detecting Task Types . . . . . . . . . . . . . . . . . . . 1605.6.1 Identified Task Type Categories . . . . . . . . . . . . . . 1605.6.2 Task Type Detection Accuracy . . . . . . . . . . . . . . . 1615.6.3 Task Type Feature Evaluation . . . . . . . . . . . . . . . 1635.6.4 Descriptive Statistics of the Dataset . . . . . . . . . . . . 164
Contents xiii
5.7 Discussion . . . . . . . . . . . . . . . . . . . . . . . . . . . . . . 1645.7.1 Improving Task Switch and Type Detection . . . . . . . 1645.7.2 Applications for Automated Task Detection . . . . . . . 165
5.8 Threats to Validity . . . . . . . . . . . . . . . . . . . . . . . . . 1685.9 Conclusion . . . . . . . . . . . . . . . . . . . . . . . . . . . . . . 1705.10 Acknowledgements . . . . . . . . . . . . . . . . . . . . . . . . . 170
6 Design Recommendations for Self-Monitoring in the Workplace:Studies in Software Development 1716.1 Introduction . . . . . . . . . . . . . . . . . . . . . . . . . . . . . 1726.2 Related Work . . . . . . . . . . . . . . . . . . . . . . . . . . . . 176
6.2.1 Designing and Evaluating Self-Monitoring Tools for Work 1766.3 Phase 1 Method: Identifying Design Elements . . . . . . . . . . 179
6.3.1 Pilots . . . . . . . . . . . . . . . . . . . . . . . . . . . . 1806.3.2 Initial Survey . . . . . . . . . . . . . . . . . . . . . . . . . 181
6.4 Phase 1 Results: Identified Design Elements . . . . . . . . . . . 1826.4.1 A: Supporting Various Individual Needs . . . . . . . . . 1836.4.2 B: Active User Engagement . . . . . . . . . . . . . . . . 1856.4.3 C: Enabling More Multi-Faceted Insights . . . . . . . . . 186
6.5 Phase 2 Method: Evaluating Design Elements . . . . . . . . . . 1896.5.1 Participants . . . . . . . . . . . . . . . . . . . . . . . . . 1896.5.2 Procedure . . . . . . . . . . . . . . . . . . . . . . . . . . 1906.5.3 Data Collection and Analysis . . . . . . . . . . . . . . . . 191
6.6 Phase 2 Results: Design Recommendations Based on EvaluatingDesign Elements . . . . . . . . . . . . . . . . . . . . . . . . . . 1926.6.1 Different Granularity of Visualizations . . . . . . . . . . 1926.6.2 Interest in Diverse Set of Measurements . . . . . . . . . 1936.6.3 Increasing Self-Awareness with Experience Sampling . . . 1946.6.4 Increasing Self-Awareness with a Retrospection . . . . . 1956.6.5 Personalized Insights . . . . . . . . . . . . . . . . . . . . 1986.6.6 Potential Impact on Behavior at Work . . . . . . . . . . 199
6.7 Discussion . . . . . . . . . . . . . . . . . . . . . . . . . . . . . . . 201
xiv Contents
6.7.1 Design for Personalization . . . . . . . . . . . . . . . . . . 2016.7.2 Increased Engagement through Experience Sampling . . 2026.7.3 Actionability for Behavior Change . . . . . . . . . . . . . 2036.7.4 Benchmarking . . . . . . . . . . . . . . . . . . . . . . . . 2046.7.5 Team-Awareness . . . . . . . . . . . . . . . . . . . . . . 205
6.8 Generalizability and Limitations . . . . . . . . . . . . . . . . . . 2066.9 Conclusion . . . . . . . . . . . . . . . . . . . . . . . . . . . . . . . 2076.10 Acknowledgements . . . . . . . . . . . . . . . . . . . . . . . . . 208
7 Enabling Good Work Habits in Software Developersthrough Reflective Goal-Setting 2097.1 Introduction . . . . . . . . . . . . . . . . . . . . . . . . . . . . . 2107.2 Related Work and Background . . . . . . . . . . . . . . . . . . . 2137.3 Study Design . . . . . . . . . . . . . . . . . . . . . . . . . . . . 2137.4 Developers’ Work Habit Goals and Strategies (RQ1, RQ2) . . . 218
7.4.1 Improve time management (G1) . . . . . . . . . . . . . . 2197.4.2 Avoid (self-induced/external) deviation from planned work
(G2) . . . . . . . . . . . . . . . . . . . . . . . . . . . . . 2207.4.3 Improve impact on the team (G3) . . . . . . . . . . . . . 2227.4.4 Maintain work-life balance (G4) . . . . . . . . . . . . . . 2247.4.5 Learn (G5) . . . . . . . . . . . . . . . . . . . . . . . . . 225
7.5 Potential Impact of Reflective Goal-Setting (RQ3) . . . . . . . . . 2277.5.1 Self-Reflections can Help to Identify Concrete Goals and
Actionable Strategies . . . . . . . . . . . . . . . . . . . . . 2277.5.2 Self-Reflection can Increase Awareness on Goal Achieve-
ment and Productive Habits . . . . . . . . . . . . . . . . 2297.5.3 Reflective Goal-Setting can Increase Productivity and Well-
Being . . . . . . . . . . . . . . . . . . . . . . . . . . . . 2297.5.4 Help Developers to Help Themselves . . . . . . . . . . . 230
7.6 Summary of Results . . . . . . . . . . . . . . . . . . . . . . . . 2327.7 Discussion . . . . . . . . . . . . . . . . . . . . . . . . . . . . . . 2327.8 Threats to Validity . . . . . . . . . . . . . . . . . . . . . . . . . . 237
Contents xv
7.9 Conclusion . . . . . . . . . . . . . . . . . . . . . . . . . . . . . . 2397.10 Acknowledgements . . . . . . . . . . . . . . . . . . . . . . . . . 239
8 Reducing Interruptions at Work:A Large-Scale Field Study of FlowLight 2418.1 Introduction . . . . . . . . . . . . . . . . . . . . . . . . . . . . . 2428.2 Related Work . . . . . . . . . . . . . . . . . . . . . . . . . . . . 244
8.2.1 Measuring Interruptibility . . . . . . . . . . . . . . . . . 2448.3 Approach and Implementation . . . . . . . . . . . . . . . . . . . 2468.4 Evaluation . . . . . . . . . . . . . . . . . . . . . . . . . . . . . . 249
8.4.1 Study Procedure . . . . . . . . . . . . . . . . . . . . . . 2498.4.2 Participants . . . . . . . . . . . . . . . . . . . . . . . . . . 2518.4.3 Data Collection and Analysis . . . . . . . . . . . . . . . 252
8.5 Results . . . . . . . . . . . . . . . . . . . . . . . . . . . . . . . . 2548.5.1 Reduced Cost of Interruptions . . . . . . . . . . . . . . . 2548.5.2 Increased Awareness of Interruption Cost . . . . . . . . . 2568.5.3 Feeling of Increased Productivity and Self-Motivation . . . 2578.5.4 Costs of Using the FlowLight . . . . . . . . . . . . . . . 2588.5.5 Automatic State Changes and Accuracy . . . . . . . . . 2598.5.6 Continued Usage of FlowLight . . . . . . . . . . . . . . 2628.5.7 Professional Differences in Using the FlowLight . . . . . 262
8.6 Discussion . . . . . . . . . . . . . . . . . . . . . . . . . . . . . . 2638.6.1 Reasons for FlowLight’s Positive Effects . . . . . . . . . 2638.6.2 Accuracy of Automatic Interruptibility Measure . . . . . 2648.6.3 Cost of Not Interrupting . . . . . . . . . . . . . . . . . . 2658.6.4 Threats and Limitations . . . . . . . . . . . . . . . . . . 265
8.7 Conclusion . . . . . . . . . . . . . . . . . . . . . . . . . . . . . . 2668.8 Acknowledgments . . . . . . . . . . . . . . . . . . . . . . . . . . . 267
xvi Contents
List of Figures
1.1 Overview of our research questions. . . . . . . . . . . . . . . . . 81.2 Overview of the components used in PersonalAnalytics. . . . . . 101.3 Screenshot of the daily retrospection in PersonalAnalytics. . . . . 171.4 FlowLights mounted on study participants’ cubicle walls. . . . . 191.5 Thesis roadmap. . . . . . . . . . . . . . . . . . . . . . . . . . . . 42
2.1 Notification to Prompt Participants to Respond to the ExperienceSampling Survey. . . . . . . . . . . . . . . . . . . . . . . . . . . . 51
2.2 Screenshot of the Experience Sampling Survey (Pop-Up). . . . . . 512.3 Total Hours of Work versus Hours Active. . . . . . . . . . . . . . 572.4 3 Types of Developers and their Perceptions of Productivity over
the Course of a Work Day. . . . . . . . . . . . . . . . . . . . . . 62
3.1 Comparing the clusters with respect to words that developersassociate with productive workdays. . . . . . . . . . . . . . . . . 85
3.2 Comparing the clusters with respect to words that developersassociate with unproductive workdays. . . . . . . . . . . . . . . 86
4.1 Conceptual framework for good workdays. . . . . . . . . . . . . . 1074.2 Conceptual framework characterizing typical workdays. . . . . . 112
5.1 Overview of study design and outcomes. . . . . . . . . . . . . . 1465.2 Screenshot of the second page of the experience sampling pop-up
that asked participants to self-report their task types. . . . . . . . 151
6.1 Summary of the Two-Phase Study Describing the Process. . . . 1726.2 Screenshot of the Daily Retrospection in PersonalAnalytics. . . 1836.3 Screenshot of the Self-Reporting Pop-Up to Collect Perceived
Productivity Data and Engage Users. . . . . . . . . . . . . . . . 186
7.1 Participants’ Self-Reports on the Value and Impact of Self-Reflection228
8.1 Evolution of the Physical Indicator of the FlowLight Over Time 245
Contents xvii
8.2 FlowLight Users Over Time . . . . . . . . . . . . . . . . . . . . 2468.3 Timeline of Study Procedure . . . . . . . . . . . . . . . . . . . . 2508.4 Logged Interruptions and State Changes Before and After In-
stalling the FlowLight. . . . . . . . . . . . . . . . . . . . . . . . 2558.5 Results of a Subset of the Survey Questions. . . . . . . . . . . . 2558.6 Time Spent in each State Before (Pre) and After (Post) Installation.260
List of Tables
1.1 Overview of the studies we conducted to answer our researchquestions. . . . . . . . . . . . . . . . . . . . . . . . . . . . . . . 9
2.1 Study Participants . . . . . . . . . . . . . . . . . . . . . . . . . 502.2 Data Collected by the Monitoring Application. . . . . . . . . . . 532.3 Top 10 Used Applications (Sorted by Usage). . . . . . . . . . . . 592.4 Developers’ Fragmented Work: Activities Performed. . . . . . . 602.5 Explanatory Productivity Models for Participants . . . . . . . . . 672.6 Summary of Some of the Study Key Findings. . . . . . . . . . . 682.7 Models to Predict High / Low Productivity Sessions. . . . . . . 75
3.1 The Six Clusters/Personas from the Survey . . . . . . . . . . . . 88
4.1 Top 5 activities where respondents reported spending more or lessthan usual time in on atypical workdays. . . . . . . . . . . . . . . 117
4.2 Contingency table for the relationship between good and typicalworkdays. . . . . . . . . . . . . . . . . . . . . . . . . . . . . . . . 117
4.3 Mean and relative time spent on activities on developers’ previousworkdays. . . . . . . . . . . . . . . . . . . . . . . . . . . . . . . 118
4.4 The six workday type clusters. . . . . . . . . . . . . . . . . . . . 1254.5 How meetings and interruptions influence good and typical workdays.127
5.1 Self-reports from study 2. . . . . . . . . . . . . . . . . . . . . . 1535.2 Features analyzed in our study and their importance for predicting
task switches and task types. . . . . . . . . . . . . . . . . . . . . 154
xviii Contents
5.3 Overview of the performance of the task switch detection, for bothindividual and general models. . . . . . . . . . . . . . . . . . . . 159
5.4 Overview of the task type categories . . . . . . . . . . . . . . . 162
6.1 Overview of the Two-Phase Study Describing the Method, Partic-ipants, their Employer and Study-Durations. . . . . . . . . . . . 180
6.2 Survey Responses on Awareness Change. . . . . . . . . . . . . . . 1976.3 Participants’ Ratings on the Novelty and Potential for Behavior
Change of Personalized Insights. . . . . . . . . . . . . . . . . . . 199
7.1 Daily Self-Reflection Questions. . . . . . . . . . . . . . . . . . . 2147.2 Stages of Reflective Goal-Setting [Travers et al., 2015]. . . . . . 2147.3 Developers’ Work Habit Goals and Strategies. . . . . . . . . . . 2267.4 Summary of the Study Key Findings. . . . . . . . . . . . . . . . 232
Acronyms and Definitions
Activity is an action undertaken by the developer during his or her work, e.g.,navigating code or reading an email.
API application programming interface
Context or task context, refers to the mental model the developer builds atwork; consisting of information, resources and artifacts about one or severaltasks.
DnD do not disturb
Goal or work habit goal, describes a target or outcome habit that developersset for themselves to improve their productivity.
h hour(s)
IDE integrated development environment
IM instant messaging
Interruptibility is a person’s availability for interruptions.
min minute(s) or minimum
max maximum
PI is short for personal informatics, and describes tools and methods to self-quantify oneself and identify opportunities for self-improvements. Otherrelated terms are self-tracking, self-monitoring, and self-surveilling.
2 Contents
RQ research question
s second(s)
Self-Monitoring refers to the process where a user continuously tracks certainbehaviors, either automatically using a self-monitoring tool or manually.
Self-Reflection refers to the process where a user purposefully reviews andthinks about his or her behaviors.
Stdev or std. dev. standard deviation
Strategy is the system developers employ to make progress towards and even-tually reach their (work habit) goals.
Task is a work assignment with a specific objective that developers divide theirwork into, e.g., fixing a bug or preparing for a team meeting.
TTM is short for Transtheoretical Model of behavior change, invented by Prochaskaand Velicer [1997]. TTM models behavior change as a sequence of stageswhich the person advances through until a behavior change can be main-tained.
1Synopsis
There is a common refrain that repeats itself in similar forms every couple of years:our inability to produce enough software to satisfy the needs of the world. Forexample, in 1968, attendees at the first NATO software engineering conferencecoined the term software crisis [Naur and Randell, 1969] and Andreessen [2011]wrote about software eating the world, expressing that the need for softwarekeeps outstripping our ability to produce it.
There are a couple of ways of addressing the gap between software demandand supply. We could try to reduce the demand, which seems unlikely to succeed.Or, we could try to increase the supply, namely our ability to produce software.Our research targets the latter, specifically to increase the supply of softwareby improving software developers’ productivity. In particular, we focus on twoaspects for improving developers’ productivity: better understanding developerproductivity and using these findings to foster productivity at work.
4 Chapter 1. Synopsis
Examining Productivity. A substantial amount of research on developer pro-ductivity has been undertaken over the past four decades. The majority ofthis research focused on defining and measuring productivity from a top-downperspective, formally defined as the ratio between output and input in the Oxford-Dictionary [2019]. In particular, this research aimed at quantifying productivitysolely in terms of output measures, i.e., the artifacts and code created perunit of time, for example the lines of source code modified per hour [Devanbuet al., 1996], the number of function points created per day [Jones, 1994], orthe tasks completed per month [Zhou and Mockus, 2010]. Another body of re-search considered technical factors associated with productivity, such as softwaresize [Albrecht, 1979] and complexity [Brooks Jr, 1995], and soft factors, such asthe effect of workplace settings, meetings and interruptions, with the latter onesshown to be one of the biggest impediments to productivity (e.g., [Czerwinskiet al., 2004; DeMarco and Lister, 1985; Mark et al., 2005; Parnin and Rugaber,2011; Perry et al., 1994b]). However, these studies generally do not consider thespecifics of developers’ workdays, and the individual differences in developers’work that might affect productivity [Gonçalves et al., 2011; Singer et al., 2010].As a result, only very little is known about how developers themselves perceivetheir own productivity and how these insights could be used to foster productivework [Rooksby et al., 2016; Treude and Storey, 2010]. In our research, we aimedto get a deeper understanding of software developers’ work from a bottom-upperspective, i.e., the individual developer perspective, by investigating whendevelopers perceive themselves as productive, how they organize their workdays,what factors impact their productivity, and how their perceived productivityrelates to their work activities.
Fostering Productivity. An improved understanding of the factors that impactdevelopers’ work and productivity allows to better support developers at theirwork. However, most developers are not aware of how these factors impacttheir own productivity, even though they are generally interested in betterunderstanding and improving themselves [Li et al., 2015; Perry et al., 1994b]. Ina second step of our research, we aimed to increase developers’ awareness about
5
their productive and unproductive habits and to motivate self-improvements,by supporting them through three persuasive technologies: self-monitoring,self-reflection, and an external indicator. Persuasive technology, as coined byFogg [2003], refers to technology that is designed to change users’ attitudes orbehaviors through persuasion and social influence, but not coercion. In severalareas of life, especially the health and physical activity domains, these persuasivetechnologies have been shown to provide users with meaningful insights intotheir behavior, which motivate positive behavior changes, such as becoming moreactive or losing weight (e.g., [Consolvo et al., 2008b; Fogg, 2003; Gasser et al.,2006; Kersten-van Dijk et al., 2017; Lee et al., 2017; Munson and Consolvo,2012]). More recently, researchers have looked into using automation to assistwith workplace self-monitoring, by logging users’ computer interaction data.Approaches such as RescueTime [2019], TimeAware [Kim et al., 2016] andCodealike [2019] have largely focused on top-down approaches using pre-definedmeasures of productivity that are visualized to the user. In software development,however, little is known about developers’ expectations of, requirements for, andimpact of these approaches on their behavior [Rooksby et al., 2014; Treude andStorey, 2010]. The Personal Software Process (PSP) by Humphrey [1996] hastaken a first step towards workplace self-monitoring and -reflection for developers.PSP allows the monitoring of and reflecting on a set of basic metrics, such astime estimates and quality. While the method showed great potential to improvedevelopers’ performance and quality of software, applying it in practice wasshown to be time consuming and error prone, since PSP requires to collect thedata manually [Johnson and Disney, 1998]. In our work, we aimed to extendPSP by developing and evaluating a self-monitoring approach that combinesself-reports with automatically collected data. We used our insights on developers’work and productivity, and the automatically captured computer interactiondata, to develop models. Finally, we explored how to best communicate thesemodels as insights to developers to motivate productive self-improvements atwork, for example through dashboards within the self-monitoring system or eventhrough an external indicator.
6 Chapter 1. Synopsis
In summary, we aimed to foster developer productivity at the workplace. Toachieve this objective, we first developed models of work and productivity bystudying developers work and productivity, and then integrated these modelsinto tool support that we evaluated through various field studies.
This leads to the following hypothesis:
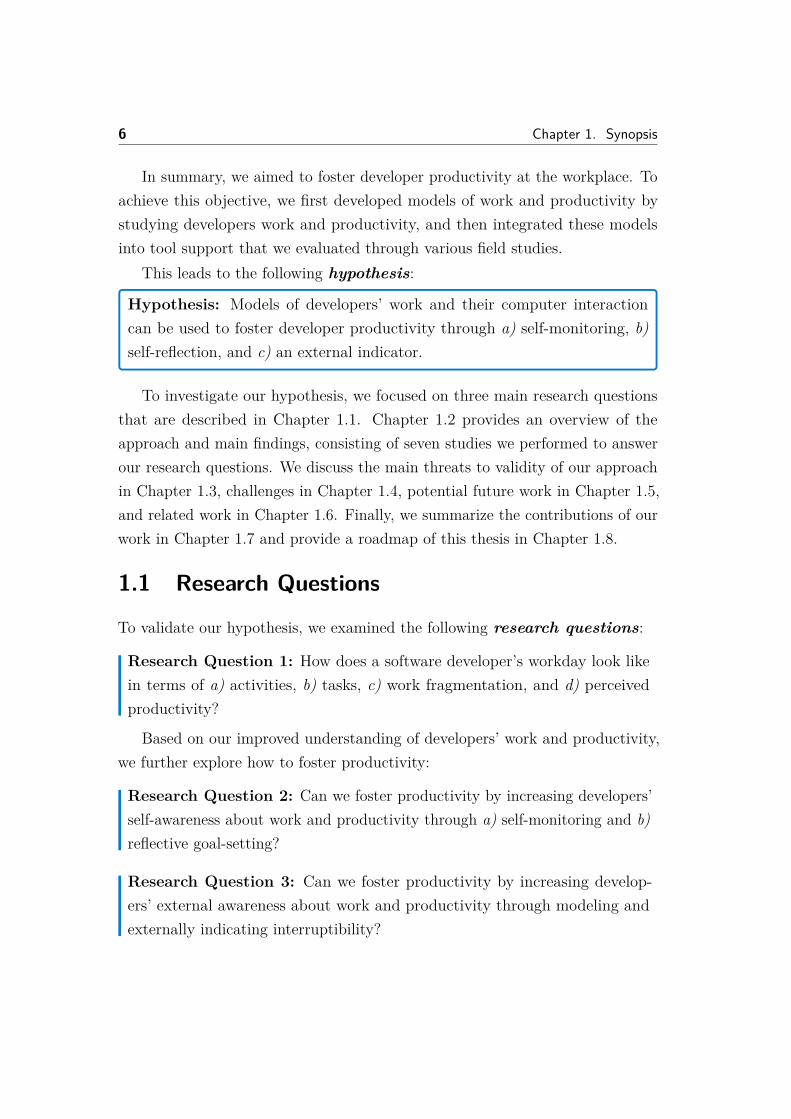
Hypothesis: Models of developers’ work and their computer interactioncan be used to foster developer productivity through a) self-monitoring, b)self-reflection, and c) an external indicator.
To investigate our hypothesis, we focused on three main research questionsthat are described in Chapter 1.1. Chapter 1.2 provides an overview of theapproach and main findings, consisting of seven studies we performed to answerour research questions. We discuss the main threats to validity of our approachin Chapter 1.3, challenges in Chapter 1.4, potential future work in Chapter 1.5,and related work in Chapter 1.6. Finally, we summarize the contributions of ourwork in Chapter 1.7 and provide a roadmap of this thesis in Chapter 1.8.
1.1 Research Questions
To validate our hypothesis, we examined the following research questions:
Research Question 1: How does a software developer’s workday look likein terms of a) activities, b) tasks, c) work fragmentation, and d) perceivedproductivity?
Based on our improved understanding of developers’ work and productivity,we further explore how to foster productivity:
Research Question 2: Can we foster productivity by increasing developers’self-awareness about work and productivity through a) self-monitoring and b)reflective goal-setting?
Research Question 3: Can we foster productivity by increasing develop-ers’ external awareness about work and productivity through modeling andexternally indicating interruptibility?
1.1 Research Questions 7
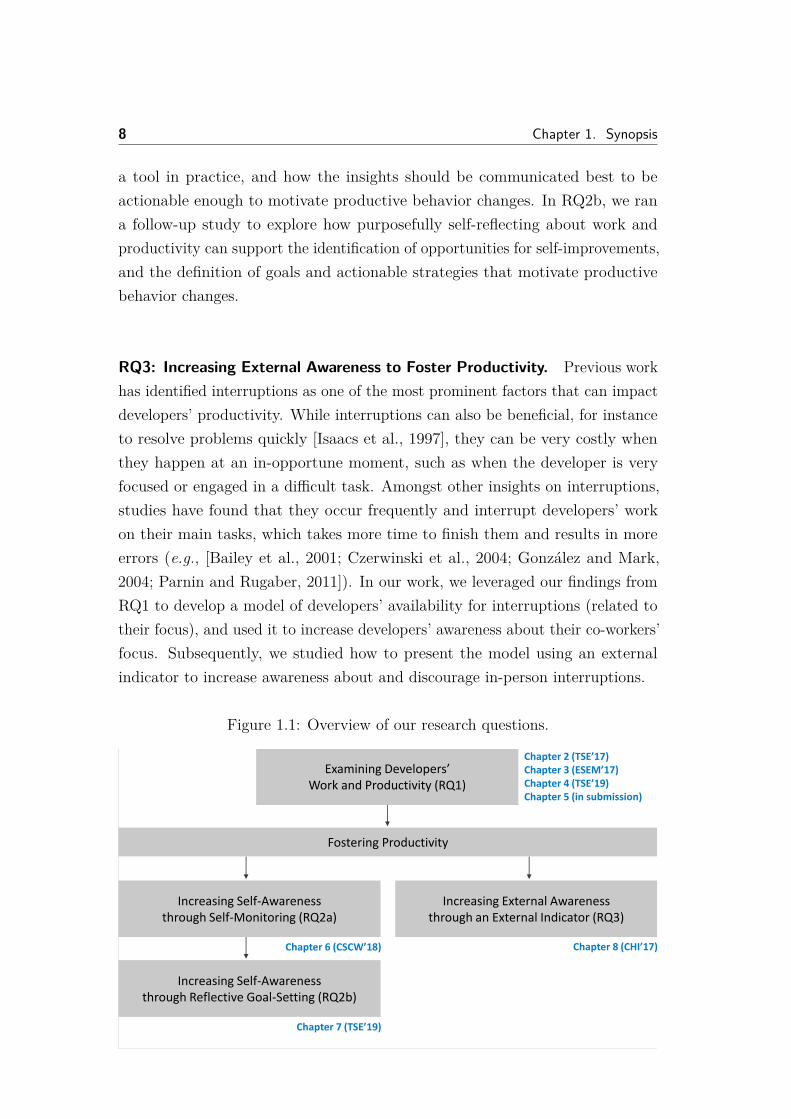
Figure 1.1 gives an overview of the relationship between the research questions.
RQ1: Examining Developer Work and Productivity. Several studies havelooked into developers’ work and productivity. Most have generally focused onspecific factors, such as meetings, emails or interruptions, which were shownto impact developers’ work, decrease productivity, and negatively impact thequality of output (e.g., [Boehm, 1987; DeMarco and Lister, 1985; Meyer et al.,2014; Murphy-Hill et al., 2019]). Yet, little is known about how developers’structure and organize their workdays, and how developers perceive their produc-tivity throughout these days. In RQ1, we examined developers’ workdays moreholistically, and investigated individual differences between developers’ work.This includes gaining a better understanding of the time they spend at work indifferent activities and tasks, their habits at work, and how their work influencestheir perceptions of productivity.
RQ2: Increasing Self-Awareness to Foster Productivity. In other areas oflife, especially the physical activity and health domain, self-monitoring andself-reflection have been shown to increase users’ awareness about positive andproblematic behaviors (e.g., [Bentley et al., 2013; Consolvo et al., 2008a,b; Fritzet al., 2014]). The gained insights then motivated users to define self-improvementgoals, which fostered positive behavior changes (e.g., [Gasser et al., 2006; Lockeand Latham, 2002; Monkaresi et al., 2013; Munson and Consolvo, 2012]). Whileseveral related approaches for the workplace already exist (e.g., [Kim et al., 2016;RescueTime, 2019; Whittaker et al., 2016]), little is known about developers’expectations of and experience with these tools, and how they eventually impactdevelopers’ work and productivity. In our research, we want to map the positiveimpact of self-monitoring and self-reflection to the software engineering domain.With RQ2a, we studied how to leverage self-monitoring to increase developers’self-awareness about work and productivity, by allowing them to self-monitora broad variety of aspects relevant to their work that we identified in RQ1.In particular, we first examined developers’ requirements for a workplace self-monitoring tool. We then evaluated how they are using and engaging with such
8 Chapter 1. Synopsis
a tool in practice, and how the insights should be communicated best to beactionable enough to motivate productive behavior changes. In RQ2b, we rana follow-up study to explore how purposefully self-reflecting about work andproductivity can support the identification of opportunities for self-improvements,and the definition of goals and actionable strategies that motivate productivebehavior changes.
RQ3: Increasing External Awareness to Foster Productivity. Previous workhas identified interruptions as one of the most prominent factors that can impactdevelopers’ productivity. While interruptions can also be beneficial, for instanceto resolve problems quickly [Isaacs et al., 1997], they can be very costly whenthey happen at an in-opportune moment, such as when the developer is veryfocused or engaged in a difficult task. Amongst other insights on interruptions,studies have found that they occur frequently and interrupt developers’ workon their main tasks, which takes more time to finish them and results in moreerrors (e.g., [Bailey et al., 2001; Czerwinski et al., 2004; González and Mark,2004; Parnin and Rugaber, 2011]). In our work, we leveraged our findings fromRQ1 to develop a model of developers’ availability for interruptions (related totheir focus), and used it to increase developers’ awareness about their co-workers’focus. Subsequently, we studied how to present the model using an externalindicator to increase awareness about and discourage in-person interruptions.
Figure 1.1: Overview of our research questions.
Examining Developers’ Work and Productivity (RQ1)
Chapter 2 (TSE’17)Chapter 3 (ESEM’17)Chapter 4 (TSE’19)Chapter 5 (in submission)
Chapter 8 (CHI’17)
Increasing Self-Awareness through Self-Monitoring (RQ2a)
Increasing External Awareness through an External Indicator (RQ3)
Increasing Self-Awareness through Reflective Goal-Setting (RQ2b)
Fostering Productivity
Chapter 7 (TSE’19)
Chapter 6 (CSCW’18)
1.2 Research Approach and Main Findings 9
1.2 Research Approach and Main Findings
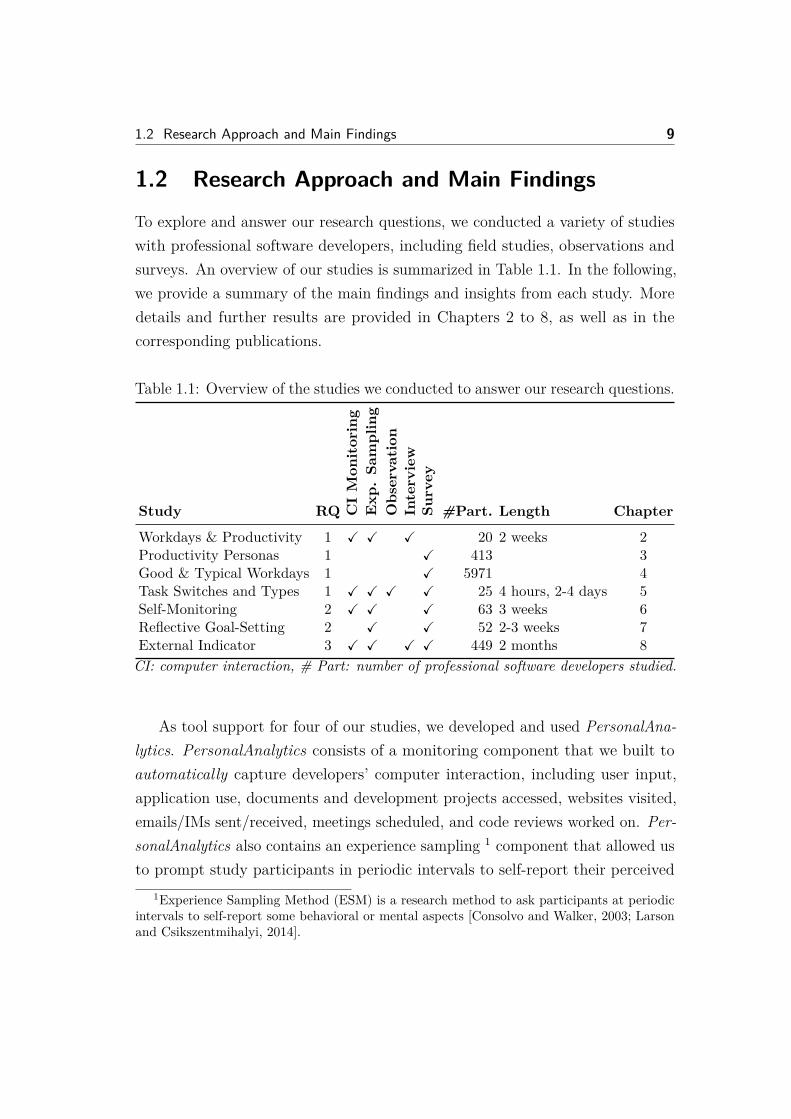
To explore and answer our research questions, we conducted a variety of studieswith professional software developers, including field studies, observations andsurveys. An overview of our studies is summarized in Table 1.1. In the following,we provide a summary of the main findings and insights from each study. Moredetails and further results are provided in Chapters 2 to 8, as well as in thecorresponding publications.
Table 1.1: Overview of the studies we conducted to answer our research questions.
Study RQ CIMon
itoring
Exp
.Sa
mpling
Observation
Interview
Survey
#Part. Length Chapter
Workdays & Productivity 1 X X X 20 2 weeks 2Productivity Personas 1 X 413 3Good & Typical Workdays 1 X 5971 4Task Switches and Types 1 X X X X 25 4 hours, 2-4 days 5Self-Monitoring 2 X X X 63 3 weeks 6Reflective Goal-Setting 2 X X 52 2-3 weeks 7External Indicator 3 X X X X 449 2 months 8CI: computer interaction, # Part: number of professional software developers studied.
As tool support for four of our studies, we developed and used PersonalAna-lytics. PersonalAnalytics consists of a monitoring component that we built toautomatically capture developers’ computer interaction, including user input,application use, documents and development projects accessed, websites visited,emails/IMs sent/received, meetings scheduled, and code reviews worked on. Per-sonalAnalytics also contains an experience sampling 1 component that allowed usto prompt study participants in periodic intervals to self-report their perceived
1Experience Sampling Method (ESM) is a research method to ask participants at periodicintervals to self-report some behavioral or mental aspects [Consolvo and Walker, 2003; Larsonand Csikszentmihalyi, 2014].
10 Chapter 1. Synopsis
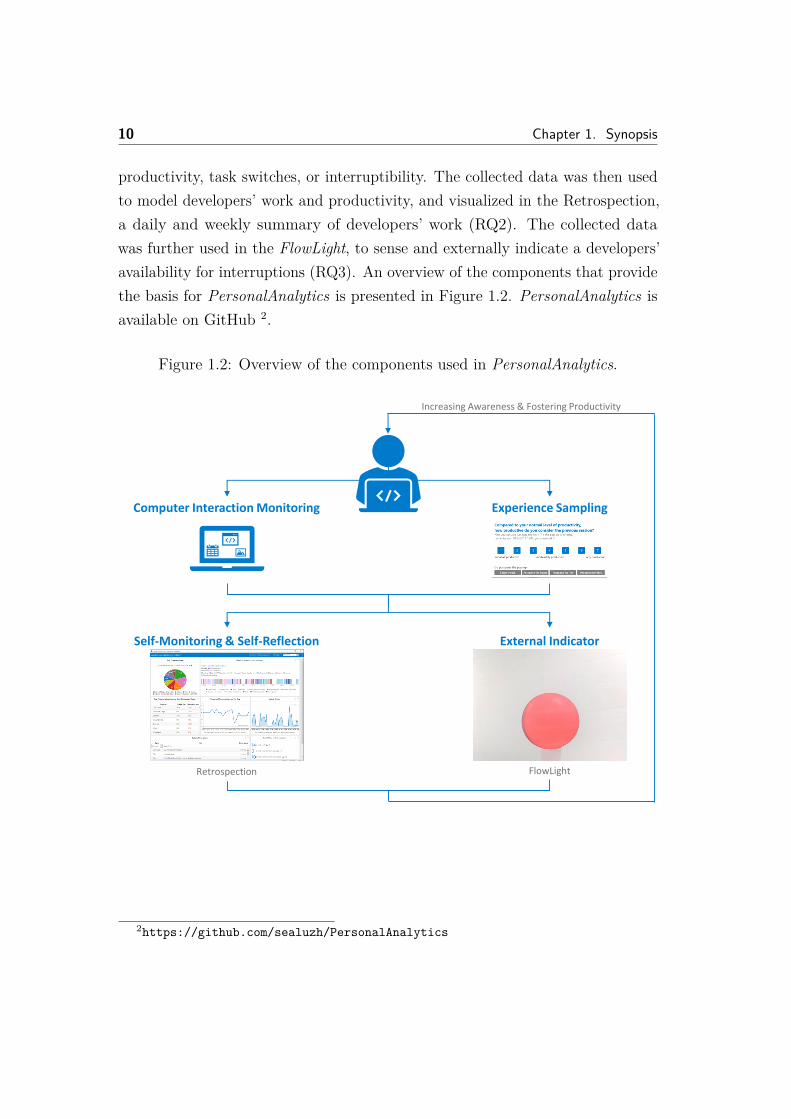
productivity, task switches, or interruptibility. The collected data was then usedto model developers’ work and productivity, and visualized in the Retrospection,a daily and weekly summary of developers’ work (RQ2). The collected datawas further used in the FlowLight, to sense and externally indicate a developers’availability for interruptions (RQ3). An overview of the components that providethe basis for PersonalAnalytics is presented in Figure 1.2. PersonalAnalytics isavailable on GitHub 2.
Figure 1.2: Overview of the components used in PersonalAnalytics.
External Indicator
Experience Sampling
Self-Monitoring & Self-Reflection
Increasing Awareness & Fostering Productivity
Retrospection FlowLight
Computer Interaction Monitoring
2https://github.com/sealuzh/PersonalAnalytics
1.2 Research Approach and Main Findings 11
1.2.1 RQ1: Examining Developer Work and Productivity
The objective of RQ1 is to increase our understanding of developers’ work habitsand how they influence productivity. To gain a broader understanding and bettergeneralize the results, we performed a series of four studies using a variety ofmethods that ranged from observations to multi-week field studies with Person-alAnalytics deployed, and studying professional software developers working forseven different companies. Based on our analysis of the gathered data, our mainobservation is that developers spend their time on a wide variety of activities andtasks that they regularly switch between, resulting in highly fragmented work.Our findings further showed that while productivity is very personal, there areobservable patterns across developers’ productivity perceptions.
Workdays & Productivity. [RQ1 a) activities, b) tasks, d) perceived productivity]
In our first study, we aimed at investigating the activities developers pursue atwork, what fragments their work, and how their work habits related to theirperceptions of productivity. To that purpose, we conducted a two-week field studywith 20 professional software developers from various companies. We deployed themonitoring component of PersonalAnalytics, and employed experience samplingin the form of periodic self-reports on developers’ perceived productivity. Withthe study, we collected a dataset of 220 workdays from the 20 participants,resulting in a total of 2197 hours of computer usage data and self-reports. To geta higher-level view on developers’ work, we developed an automated mapping ofthe applications that participants used into activities.
The analysis of the data we collected with the monitoring component revealedthat developers spend their time on a wide variety of activities and switchregularly between them, which results in highly fragmented work. On average,developers remain in an activity only between 20 seconds and 2.0 minutes. Overall,a typical workday is on average 8-9 hours long, with one fourth of it spent withcoding related activities, and another fourth spent with collaborative activitiessuch as meetings, emails and IM. There are, however, notable differences betweenteams and companies, such as the time spent on emails ranged from less thanone minute to more than an hour a day for developers in different companies.
12 Chapter 1. Synopsis
Investigating developers’ self-reported productivity ratings revealed largevariations amongst developers and that productivity is a highly personal matter.A closer investigation revealed that there are observable patterns across developers’productivity perceptions. For example, we found that developers’ productivityperceptions follow the same habitual patterns each day as each can be roughlyclustered into either morning-person (20%), low-at-lunch person (35%), andafternoon-person (40%). We also built explanatory models to study whichfactors contribute most to developers’ perceptions of productivity. None ofthe explanatory models that we built relating actions and activity to perceivedproductivity was able to explain the productivity perceptions of a large numberof developers. However, many developers consider email, planned meetingsand work unrelated browsing as less productive activities, and usually perceivethemselves as more productive when they have a higher user input and spendtheir time with coding.
Productivity Personas. [RQ1d) perceived productivity] The individual differencesin developers’ productivity perceptions will make it more challenging to determinemeaningful, universal behavior change plans to foster productivity for RQ2and RQ3. To explore whether we can determine further groups of developerswith similar perceptions of productivity, and better understand how variousproductivity factors influence them differently, we conducted an online surveyat one large software organization with 413 professional software developers.First, participants rated a list of previously identified productivity factors basedon importance, including the coding time, email workload, interruptions andworkplace setting. After normalizing participants’ responses, we used a clusteringalgorithm, called Partitioning Around Medoids (PAM) [Kaufman and Rousseeuw,1987], to identify groups of developers with similar productivity perceptions.
Overall, we identified six personas describing developers’ productivity per-ceptions: social, lone, focused, balanced, leading and goal-oriented developers.Focused developers, for example, feel most productive when they are working ona single task at a time, with few interruptions. Contrary, social developers feelmost productive when they are helping others and collaborate frequently. These
1.2 Research Approach and Main Findings 13
personas are a first step towards a set of developer productivity traits, such asgoal-orientation, single-task focus, or socialness. These traits can then help tobetter understand and compare developers’ individual productivity perceptions,and to tailor approaches for improving work and productivity to these personas.More details can be found in Chapter 3.
Good & Typical Workdays. [RQ1a activities] While our first study revealedearly insights into typical developer workdays, we were interested in betterunderstanding which factors influence typical and atypical workdays, and whatmakes them good or bad. We were further interested in investigating similaritiesin developers’ workday structures and in studying how developer workdays areimpacted by meetings and interruptions. We conducted a large-scale surveycollecting 5971 responses at a multi-national software development organization.In our qualitative analysis of the survey, we applied a coding strategy, consistingof Open Coding, Axial Coding and Selective Coding iterations, as definedby Strauss and Corbin [1998]’s Grounded Theory. We then also quantitativelyanalyzed the collected data, by comparing the time developers spend on activitieson workdays they considered good and typical, clustering their workdays intoworkday types, and investigating the effect that various collaborative activitieshave on developers’ perceptions of good and typical workdays.
Extensive team discussions of the categories that resulted from the codingstrategy allowed us to understand their relationships and develop two concep-tual frameworks that characterize developers’ good and typical workdays (seeChapters 4.5.1 and 4.5.2). Our investigation into the factors that influence howgood and typical developers perceive their workdays highlighted the importanceof agency, i.e., developers’ ability to control how they organize their work andreduce factors that randomize work, including infrastructure issues, administra-tive tasks, interruptions or unplanned meetings. While previous work uniformlyconcludes that meetings and interruptions are unproductive overall, the scale ofour survey allowed us to uncover nuances, such as that their impact depends onthe development phase: during specification, planning and release phases, theyare common, but productive.
14 Chapter 1. Synopsis
Task Switches and Types. [RQ1b) tasks] Since we found that task work andtask switches are an important factor for fragmenting developers’ work andimpacting their productivity, we were further interested in better understandinghow developers organize work on the granularity of tasks, and how they switchbetween tasks. To that purpose, we developed a model to automatically detectdevelopers’ task switches and task types, based on their computer interactiondata and the semantic information of the artifacts they work with. In two fieldstudies, one 4-hour observational study and a multi-day study using experiencesampling, we collected task data from 25 professional software developers usingthe monitoring component of PersonalAnalytics. After combining and cleaningthe data from the two studies, we extracted a total of 42 temporal and semanticfeatures that we used to train a machine learning classifier and evaluated theresulting models’ ability to predict task switches and task types in the field.We built both, individual models, to train and test with data solely from oneparticipant, and general models to train with data from all participants exceptone and to test on the remaining one.
From the various classification algorithms that we trained and tested; RandomForest resulted in the highest accuracy. Our analysis revealed that it is possibleto use temporal and semantic features from developers’ computer interactiondata to automatically detect task switches and task types in the field with highaccuracy of 87% and 61% respectively. On average, participants switched tasks6.0 times per hour and spent 13.2 minutes on a task before switching, thus,confirming the high fragmentation of developers’ work that we identified before.Besides improving our understanding of developers’ tasks and how switchingbetween them fragments developers’ work, our automated task detection makesit possible to better support existing approaches that capture task context,reduce task switching and support task resumption, which previously requiredmanual interaction of the developer, e.g., by self-reporting the task boundaries(e.g., [Dragunov et al., 2005; Fogarty et al., 2005; Kersten and Murphy, 2006;Züger et al., 2017]).
1.2 Research Approach and Main Findings 15
1.2.2 RQ2: Increasing Self-Awareness to Foster Productivity
We conducted two field studies to answer RQ2. In the first study, we evaluatedthe potential of workplace self-monitoring to increase developers’ awareness aboutwork and productivity (RQ2a). In a follow-up study, we explored how purposefullyself-reflecting about work and productivity can support the identification ofopportunities for self-improvement, and the definition of goals and actionablestrategies that motivate productive behavior changes (RQ2b).
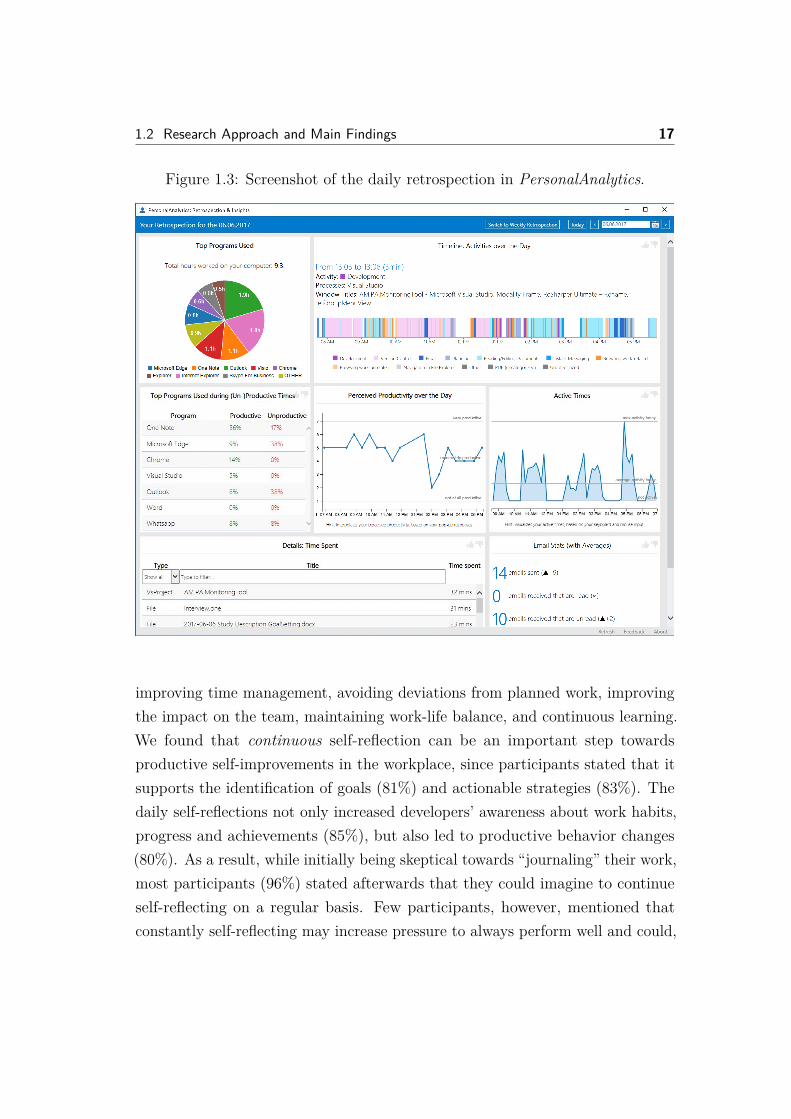
Self-Monitoring (RQ2a). To examine how self-monitoring can increase devel-opers’ self-awareness about productivity and work, we followed a mixed-methodsapproach. First, we used iterative, user-feedback driven development (N=20)and a survey (N=413, survey from above) to infer design elements for workplaceself-monitoring. We then included the inferred design elements into Person-alAnalytics, by adding a self-monitoring component, and by simplifying ourexperience sampling component prompting users to self-report productivity to beless intrusive and quicker to respond to. To enable multi-faceted insights in theself-monitoring component, the captured data is aggregated and visualized in adaily retrospection (see Figure 1.3), and a weekly summary. Next, we conducteda field study with 43 professional software developers during three work weeksto evaluate the experience with and the impact of PersonalAnalytics. Through-out the study, we collected qualitative and quantitative data from participantsthrough multiple surveys, email feedback, and usage logs of PersonalAnalyticsthat we analyzed again using a coding strategy informed by Strauss and Corbin[1998]’s Grounded Theory approach.
Our analysis showed that the retrospection increases developers’ self-awarenessabout work and productivity. 82% said that the retrospections’ visualizations ofthe personalized list of measures increased their awareness and provided novelinsights. For example, developers learned about the time they spent collaboratingor making progress on tasks, how their productivity changes over the courseof a workday, or the extent of their work fragmentation. The retrospectionfurther helped to rectify misconceptions users had about their work, such ashow much time they actually spend with emails or work-unrelated web browsing
16 Chapter 1. Synopsis
(e.g., on Facebook). While we initially used the experience sampling method tocollect data about developers’ productivity perceptions, the final questionnairerevealed that the periodic self-reports increased the awareness about work for59.2% of all participants. PersonalAnalytics’ ability to let users self-report theirproductivity instead of automatically measuring it, was highly appreciated, sincemany participants do not think an automated measure can accurately capturean individual’s productivity. It further helped them to assess whether they spenttheir past work hour efficiently, whether they worked on something of value, andwhether they made progress on their current task.
We further investigated if the insights gained from PersonalAnalytics canfoster productive self-improvements. We learned that slightly less than halfof the participants (41%) changed a few of their habits, including trying tobetter plan their work (6%), trying to optimize how they spend their timewith emails (13%), or trying to focus more and avoiding distractions (19%).41% of our participants reported not having changed any behaviors. Severalparticipants stated that the visualizations and insights were not concrete andactionable enough to know what or how to change, and they suggested to addrecommendations to PersonalAnalytics that suggest self-improvements at work.These recommendations ranged from pop-ups to recommend a break from work,all the way to intervening or blocking specific applications or websites for acertain time.
Reflective Goal-Setting (RQ2b). To explore how we can provide developerswith more actionable insights that allow them to define self-improvement goalsand foster productive behavior changes, we ran another field study. Inspired byHumphrey [1996]’s Personal Software Process (PSP) and diary studies in otherareas of research, we combined self-reflection with goal-setting, and designed areflective goal-setting study. In this study, we asked 52 professional softwaredevelopers to reflect about work on a daily basis for several weeks, as well asdefine and refine goals and actionable strategies to improve their work habits.
Our reflective goal-setting study resulted in a rich set of work habit goalsand strategies that we analyzed. The goals can be broadly categorized into
1.2 Research Approach and Main Findings 17
Figure 1.3: Screenshot of the daily retrospection in PersonalAnalytics.
improving time management, avoiding deviations from planned work, improvingthe impact on the team, maintaining work-life balance, and continuous learning.We found that continuous self-reflection can be an important step towardsproductive self-improvements in the workplace, since participants stated that itsupports the identification of goals (81%) and actionable strategies (83%). Thedaily self-reflections not only increased developers’ awareness about work habits,progress and achievements (85%), but also led to productive behavior changes(80%). As a result, while initially being skeptical towards “journaling” their work,most participants (96%) stated afterwards that they could imagine to continueself-reflecting on a regular basis. Few participants, however, mentioned thatconstantly self-reflecting may increase pressure to always perform well and could,
18 Chapter 1. Synopsis
thus, turn into a burden without tool support that would make self-reportingmore convenient. We conclude that continuous reflective goal-setting enablesdevelopers to improve and maintain good work habits. In Chapter 7, we discussthese results with regards to prior work on self-reflection with other types ofknowledge workers, and how tools could support developers with their reflectivegoal-setting and how they might foster long-term self-reflection.
1.2.3 RQ3: Increasing External Awareness to Foster Produc-tivity
External Indicator. To increase developers’ awareness of their co-workers’ in-terruptibility at work and discourage interruptions at in-opportune moments, wedeveloped and studied the FlowLight. The FlowLight is based on the monitoringcomponent of PersonalAnalytics and combines a physical interruptibility indi-cator in the form of a traffic-light like LED with an automated interruptibilitymeasurement (see Figure 1.4). Our interruptibility is based on a developer’scomputer interaction and approximates how interruptible (or focused) the devel-oper is. Inspired by traffic-lights, the FlowLight changes its color to indicate auser’s interruptibility: available for interruptions as green, busy as red, do notdisturb as pulsating red, and away as yellow. The user’s interruptibility state iscalculated in real-time, based on mouse and keyboard input 3, the user’s historicalinteraction data, and a smoothing function. Whenever a user’s interruptibilitystate changes, the FlowLight updates the color of the LED light. It furtherchanges the user’s Skype for Business presence status to additionally reduceinterruptions over IM. We evaluated the accuracy of our interruptibility measureand FlowLight’s ability to increase the external awareness and reduce in-personinterruptions. To that purpose, we conducted a large-scale field study with 449participants working for one multi-national company in 12 different countries. Weasked participants to self-report in-person interruptions during one week beforeinstalling the FlowLight, and again a week after they familiarized themselveswith the FlowLight for another week (i.e., to reduce Hawthorne-type or novelty
3These data sources were selected since they can be measured non-invasively and to limitprivacy concerns.
1.2 Research Approach and Main Findings 19
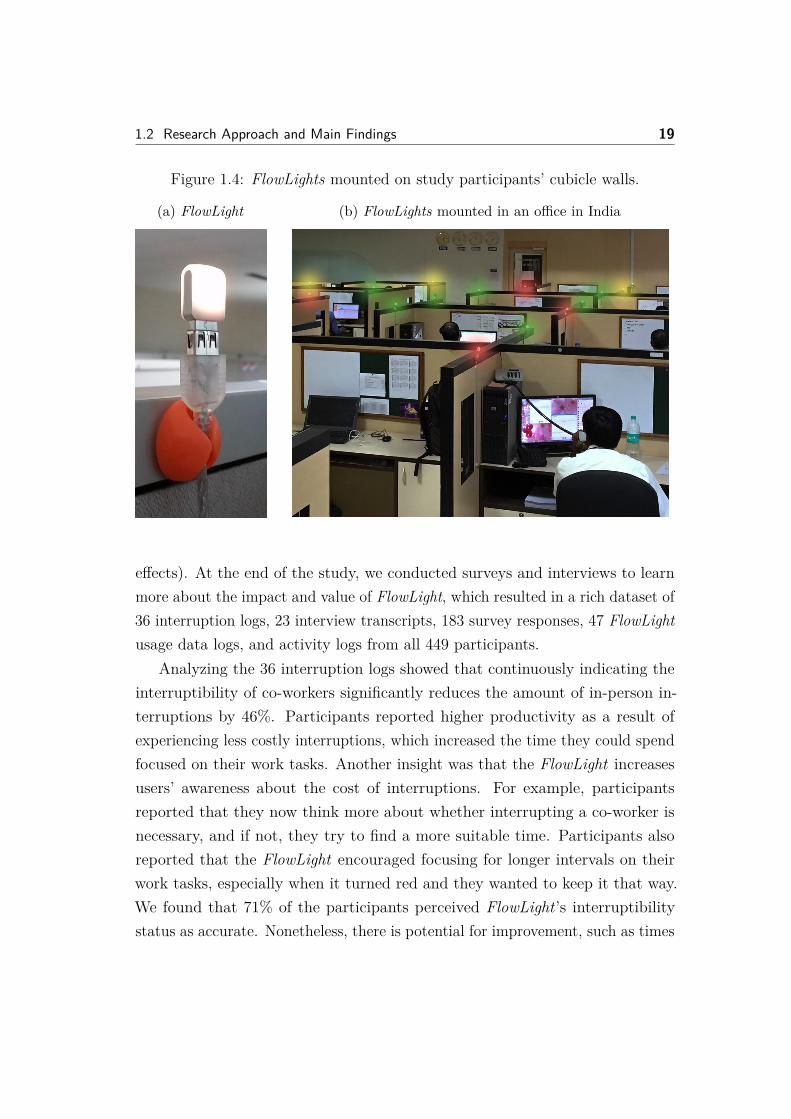
Figure 1.4: FlowLights mounted on study participants’ cubicle walls.
(a) FlowLight (b) FlowLights mounted in an office in India
effects). At the end of the study, we conducted surveys and interviews to learnmore about the impact and value of FlowLight, which resulted in a rich dataset of36 interruption logs, 23 interview transcripts, 183 survey responses, 47 FlowLightusage data logs, and activity logs from all 449 participants.
Analyzing the 36 interruption logs showed that continuously indicating theinterruptibility of co-workers significantly reduces the amount of in-person in-terruptions by 46%. Participants reported higher productivity as a result ofexperiencing less costly interruptions, which increased the time they could spendfocused on their work tasks. Another insight was that the FlowLight increasesusers’ awareness about the cost of interruptions. For example, participantsreported that they now think more about whether interrupting a co-worker isnecessary, and if not, they try to find a more suitable time. Participants alsoreported that the FlowLight encouraged focusing for longer intervals on theirwork tasks, especially when it turned red and they wanted to keep it that way.We found that 71% of the participants perceived FlowLight’s interruptibilitystatus as accurate. Nonetheless, there is potential for improvement, such as times
20 Chapter 1. Synopsis
they are not actively working on the computer (e.g., doing paper work) or whenthey are thinking or reading. For example, webcams or biometric sensors wornby the users might help to better understand their activities and might help toincrease the accuracy of the interruptibility classifier (e.g., [McDuff et al., 2012;Samara et al., 2017; Züger et al., 2018]). Even two months after the installation,86% of participants continued using the FlowLight. The FlowLight’s successfulapplication over multiple months demonstrates that combining an external indi-cator with an automated interruptibility measurement that is based on computerinteraction data is effective to reduce costly in-person interruptions and increaseproductivity. More details about our findings can be found in Chapter 8.
1.3 Threats to Validity
In the following, we present our main threats to the validity of our research, anddiscuss how we addressed and mitigated them.
External Validity. A common challenge of field studies, limiting the general-izability of the results, is having access to only a small set of participants andcompanies over a limited time span. In our studies, we took a number of steps tomitigate threats to generalizability, including studying only professional softwaredevelopers (no students) with a broad range of experience (0.5 to 40 years), andworking for 17 different companies (startups to multi-national corporations) in 12different countries (including Canada, US, India, Brazil, Korea and Switzerland).
In three studies, the external validity of our evaluation of PersonalAnalyticsand the FlowLight might be threatened by only having participants from a single(multi-national) corporation each. To mitigate the risks, we ran the studiesat many separate teams within each corporation, in different subsidiaries ofthe corporation, working on different projects and with different developmentprocesses. Previously, empirical studies performed on a single case (i.e., onecompany) were shown to contribute to scientific discovery [Flyvbjerg, 2006].
The voluntary participation in our studies may also result in a certain self-selection bias towards participants who are more willing to quantify various
1.3 Threats to Validity 21
aspects of their life and use the collected data to improve themselves, whichis a common threat of studies applying or evaluating personal informatics sys-tems [Kersten-van Dijk et al., 2017]. To reduce this risk, we openly advertisedthe studies to encourage any professional software developer to join, were verytransparent and upfront about the study objectives, pro-actively answered pri-vacy concerns, and let participants continue their regular work to minimize thestudies’ intrusiveness.
Since developers’ work and activities vary greatly depending on the currentproject stage and daily discrepancies, another limitation might be that our fieldstudies only capture a small excerpt of developers’ work, especially for the ones weconducted over only a few days. To mitigate these risks, we recruited participantsfrom various companies, working in different teams and at different stages oftheir project, and we asked them about the representativeness of their workto make sure the studied timeframe was representative of their regular work(i.e., not particularly busy or quiet). We further plan to replicate our studies byconsidering additional variables, such as company culture, size and processes, aswell as developers’ personality or gender (Chapter 1.5).
Internal Validity. Running a monitoring application on participants’ computersmight pose privacy concerns to participants or their companies, e.g., they mightfeel observed or fear their managers will get access to the data. To reduce theseconcerns, we were as transparent and explicit as possible about the data wecollected, the people who have access, and how we planned to analyze the data.In all studies, participants could access the raw data logs and were given theopportunity to obfuscate them. Additionally, we logged the data only locally onthe participants’ machines, and never automatically uploaded the data withoutparticipants’ prior consent and option to manually check the data packagebefore sharing it with us. We further never made the logged data available toparticipants’ co-workers or managers.
While our reliance on experience sampling (ESM) allowed us to gain detailedinsights into developers’ individual productivity perceptions, tasks worked onand interruptions at scale, the method also poses threats to validity. First, we
22 Chapter 1. Synopsis
rely on the accuracy of participants’ self-reports who may not always have beenable to recall everything accurately, or filling out the pop-ups regularly mightbe burdensome after a while. To address these concerns, we minimized thenumber of experience sampling surveys and allowed participants to postponethem in case they appeared at an in-opportune or intrusive moment, as suggestedby Csikszentmihalyi and Larson [2014], the inventors of ESM. Furthermore,our various test-runs and studies helped to optimize the experience samplingsurveys and make them easier to respond to, such as limiting the number ofrequired clicks and visualizing cues that are helpful to respond accurately. Inthe surveys and interviews that we performed after the studies to learn aboutparticipants’ experience and potential issues with the self-reports, we generallygot positive feedback about the method. In one study, participants even reportedthat the periodic self-reports were valuable as they increased their awarenessabout productivity and work (Chapter 6.6.3).
Construct Validity. The main threat to construct validity stems from the datathat we collected automatically using PersonalAnalytics, since our monitoringcomponent is limited to data trackers that we build prior to the studies. Wetried to mitigate this risk by capturing a broad range of data on developers’work, including logging application usage, user input, emails, meetings, webbrowsing and more. In most cases, we added experience sampling and furthercollected qualitative data from subjects from surveys or interviews to validate ourapproach and observations, triangulate the data, and get even deeper insightsinto their work. Nonetheless, we cannot exclude that there are other factors thatinfluence developers’ work, productivity and interruptions.
Furthermore, our quantitative data is limited to developers’ work on theircomputer only. Time they spent away from the computer, e.g., at a break or in ameeting, is not captured. In Chapter 1.5, we discuss how future work could studyhow taking advantage of other tracking technologies, such as webcams or biometricsensors worn by the users would allow us to capture an even more holistic pictureof developers’ work. Running a computer monitoring application in real-worldscenarios might capture inaccurate data, due to bugs in the logging application
1.4 Challenges & Limitations 23
or different infrastructure set-ups. To mitigate these risks, we extensively testedand constantly improved the monitoring application; no major problems wereidentified during the studies.
Understanding, categorizing and analyzing the collected data poses anotherthreat to the construct validity of our results, since it is not always straightforwardto identify or extract all activities or tasks developers perform from the collecteddata. For example, an email discussion with co-workers on a code componentcould be categorized as a specific developer task of solving a bug, or to the moregeneral task of answering emails. To mitigate this risk, we observed participantsfor extended periods of time, asked them to validate the collected data wherepossible, and carefully discussed our assumptions within the research team, alsobased on related work.
Another threat to the construct validity of our results is that the first OpenCoding step of the analysis was usually performed by one researcher only (i.e.,the author of this PhD thesis). To reduce bias and increase construct validity,we usually performed the subsequent steps of Axial and Selective Coding in ateam, discussing responses that could not distinctively be mapped, representativequotes, and the relationships between the categories.
1.4 Challenges & Limitations
There are multiple challenges we faced throughout our research. In particular,there are difficulties to generalize the measurement of productivity, and challengesthat are inherent to field studies, such as demonstrating long-term behaviorchange, recruiting participants for long-term studies, and privacy concerns fromcollecting sensitive data.
Productivity is Individual. A recurring theme in all our studies was thatdeveloper productivity is a highly personal matter, due to the many factors thatimpact developers’ work and productivity differently. It is, thus, challenging todevelop a single model of productivity that is generalizable to all developers.Some of the productivity themes we identified, such as developers’ productivity
24 Chapter 1. Synopsis
personas and how productivity changes over the day (morning-, low-at-lunch,and afternoon-person), are a first step towards identifying groups of developerswith similar perceptions of productivity (Chapter 1.5).
Measuring Productivity. One implication of the varying impact that the pro-ductivity factors can have on developers is that actually measuring productivityposes two main risks and unintended consequences. First, measuring productivitycan negatively influence developers’ behaviors, either because it pressures themto perform in a certain way to have a high measured “productivity”, or it distortsincentives and developers might start to “game” the system, especially if themeasure is inaccurate or unfair [Muller, 2018; Treude et al., 2015]. Second,good management requires qualitative insights into team behavior, instead ofa quantitative measure [Sadowski and Zimmermann, 2019]. If managers relyon a productivity measurement only, they could make wrong conclusions andbad decisions, instead of understanding how their developers are working andlearning what makes them more productive. One simple example is the previouslysuggested use of lines of code to quantify productivity: developers would justwrite more code to appear more “productive”, but still solve the same problemonly. For these two reasons, our work did not aim to quantify productivity. In-stead, we focused on understanding productivity from the bottom-up, to supportindividual developers with insights into what happens during productive or un-productive times, and to allow the identification of productive self-improvementopportunities that are tailored to the individual.
Demonstrating Behavior Change. Behavior change is a complex, long-termprocess, progressing over stages and with a high chance of relapse [Klasnja et al.,2011]. Prochaska and Velicer [1997] found that in the field of health sciencesa person has to maintain a behavior change for several years to truly stick.Hence, to demonstrate that a system successfully fosters long-term behaviorchange requires large-scale studies, ideally by performing a Randomized ControlTrial (RCT) [Chalmers et al., 1981] over multiple years, which is often notfeasible with early-stage systems. It is also almost impossible to control for
1.4 Challenges & Limitations 25
all the factors that could influence the outcomes of such a field study, andmany studies had difficulties to exactly show why the behavior changed [Klasnjaet al., 2011]. As a result, more recent studies that evaluated the impact of earlystage personal informatics (PI) systems, ran Efficacy Trials and studied specificoutcome measures to test whether the technology accomplishes what it intendsto do. In our work, we were careful to not over-claim the effect of our approaches,e.g., PersonalAnalytics and FlowLight, by stating explicitly that we primarilystudied the effect on participants’ awareness, and that we observed short-termbehavior changes only, which might have been reversed after ending the study.
Recruiting Study Participants. Another challenge of our field studies was torecruit study participants who were willing, able and allowed to install Personal-Analytics on their computers and participate in studies over several days or weeks.First, we were limited by companies that allowed us to study their employees andcollect data about their work, and their IT infrastructure, which sometimes madeit impossible to install third-party applications. In many cases, approaching themanagement and allowing the review and analysis of PersonalAnalytics prior tothe study and applying code signing often reduced concerns. PersonalAnalyticswas initially only available on the Windows operating system, which furtherlimited the number of candidates for participation. Additionally, monitoringparts of one’s work limits our pool of participants to people who are generallyopen to and interested to learn more about and improve themselves, resulting ina certain self-selection bias that we discuss in Chapter 1.3. Besides extensivelytesting each version of PersonalAnalytics, we therefore spent a substantial amountof time with the recruitment of participants. We approached them via personalcontacts, at developer events, and via social media initially, and later cultivatedconnections with companies to run follow-up studies. We further observed thatproviding participants with easy access to the collected data and presentingvisualizations that can provide insights into their work, were a strong motivatorfor participation. In many cases, participants showed these insights to theirco-workers, who in turn approached us to participate in the study as well.
26 Chapter 1. Synopsis
Collecting Sensitive Data. Monitoring developers’ computer interaction attheir real-world work poses the risk of collecting sensitive data, which maycause privacy concerns. While more fine-grained data, such as the applicationcontent or the text developers type on their keyboards would provide valuableinformation to even better model developers’ work and create more accurateinsights, it also might reveal details about the company’s products or developers’work and personal life that they are not comfortable sharing. Reducing privacyconcerns, thus, required a careful reconciliation of capturing only a minimum setof data that is required by the study, but also tracking as much as possible toget a broad view and understanding of development work. We also made sureto be very transparent and specific about what data is captured, and how it iscollected, processed, and analyzed. During the study, participants were alwaysin full control of their data, since they could investigate and modify the locallystored data, disable data trackers they felt uncomfortable with, and review thedata before sharing it with us. Surprisingly, after gaining participants’ trust, theywere often willing to collect even more data, and regularly suggested additionaldata sources we could implement trackers for.
1.5 Opportunities for Future Work
Our research opens several opportunities for future research, ranging from evenfurther extending our understanding of developers’ work and productivity, allthe way to addressing productivity of development teams. Chapters 2 to 8also discuss further opportunities for future work that are more specific to therespective research projects.
Interplay between Individual and Team Productivity. In our work, we fo-cused on modeling and fostering work and productivity of individual developers.One drawback of giving developers insights into only their own productivity isthat their behavior changes might have a negative impact on the overall teamproductivity. As an example, a developer who blocks out interruptions at in-opportune times to focus better could be blocking a co-worker who needs to aska question or clarify things. Hence, and since collaboration accounts for about
1.5 Opportunities for Future Work 27
one fourth of developers’ workdays (Section 2.5.1), a better understanding ofthe interplay between individual and team productivity is important. We couldimagine integrating and aggregating the individual models to come up with teammodels that provide insights into how the team coordinates and communicatesat work, and that foster productive work on a team level. For example, beingaware of co-workers’ most and least productive times in a workday could helpto schedule meetings during times where everybody is the least productive andwhere interrupting one’s work for a meeting has the least negative effect.
Being more aware of the tasks each member of the team is currently workingon and how much progress they are making could also be useful for managers orteam leads to identify problems early, e.g., a developer who is blocked on a taskor uses communication tools inefficiently, and take appropriate action. However,providing teams and managers with relevant and accurate measures is challenging,as this could raise privacy concerns from sharing and aggregating the data, and asa large and ever-growing amount of information and artifacts has to be processed.One way to identify relevant measures of team collaboration is the Model ofRegulation by Arciniegas-Mendez et al. [2017], which helps to compare andanalyze collaboration practices and tools in software engineering. Furthermore,previous work on team dashboards (e.g., [Brath and Peters, 2004; Jakobsen et al.,2009; Treude et al., 2015]) suggests that aggregating and summarizing the datahelps to effectively solve the privacy and information overflow challenges.
More Holistic Picture on Developers’ Work and Productivity. Our studiesrevealed several opportunities to further extend our understanding and gainan even more holistic picture of developers’ work and productivity. At thesame time, our studies mostly focused on understanding developers’ work attheir computer. Yet, even the time developers spend away from the computermight have a substantial impact on their productivity, especially since we foundthat developers spend a significant part of their workday not actively usingtheir computer (up to 49%, Chapter 2.5.1), for example during discussions withcolleagues or when interacting with other devices such as their smartphone.Therefore, there is potential to further examine and better support work away
28 Chapter 1. Synopsis
from the computer. One way to capture more about the time developers spendaway from the computer is through webcams (e.g., [McDuff et al., 2012; Samaraet al., 2017]), mobile activity trackers (e.g., [Consolvo et al., 2008b]), or biometricsensors. In one of our own studies [Züger et al., 2018], we used biometric sensors,such as the Fitbit, to capture data that is not directly linked to computer usage.
In multiple studies, participants also stated interest in better understandinghow non-work time and private aspects, such as their sleep, exercise or nutrition,impact their productivity. Wearable or biometric sensors could make it possibleto capture this, and we might be able to answer devise better support thatimproves the worklife and productivity of developers.
In addition, we could study the distinctness of the factors that influencedevelopers’ work and productivity. Since the identified factors impact developersdifferently, future work could investigate how pronounced they are, by consideringadditional variables, such as the company culture and development processes, ordevelopers’ gender (e.g., GenderMag [Burnett et al., 2016]) and personality (byusing standardized questionnaires from psychology such as BFI-2 [Soto and John,2016] and UPPS [Whiteside and Lynam, 2001]). Murphy-Hill et al. [2019] recentlymade a first step towards better understanding the distinctness of productivityfactors, by correlating a list of 48 productivity factors with developers’ self-ratedproductivity at three different software companies. They found that the topten productivity factors are non-technical, and that technical factors, includingcode reuse and the accuracy of incoming information, had the highest variancebetween the three companies.
Digital Developer Assistant. A re-occurring feedback by participants in severalfield studies was that they were interested in receiving personalized recommen-dations with opportunities for self-improvement. In the future, we plan to studyif we can leverage the discovered work habit goals and strategies (Chapter 7),and compare them with developers’ current work habits, to identify personalizedrecommendations for self-improvements. For example, depending on whether adeveloper is a morning or evening person (see [Taillard et al., 1999]), a personalrecommendation could suggest to work on the most difficult tasks during times
1.5 Opportunities for Future Work 29
of the day when the developer is usually most productive and can focus best.Another example is to leverage our task detection model (Chapter 5) to identifyand build up task contexts, consisting of work artifacts (e.g., websites or files)and applications the developer used for the task. Upon returning to a suspendedor interrupted task, the system could recommend the task context as cues, whichprevious work has shown to considerably reduce resumption lag and increaseproductivity [Altmann and Trafton, 2004; Bailey et al., 2001; Rule et al., 2015].
To increase the chance of positive behavior change, these personalized recom-mendations would also need to be tailored to developers’ preferences, for exampleby altering the timing and content of their interactions with the user. Recentwork has suggested that conversational interfaces, such as bots and voice assis-tants, can successfully adapt to the user’s needs by prompting for feedback andintegrating into existing work flows [Bradley et al., 2018; Kocielnik et al., 2018;Storey and Zagalsky, 2016; Williams et al., 2018]. We can imagine that such a‘Digital Developer Assistant’ could non-intrusively collect data on the developer’scurrent context and work habits, identify personalized recommendations, andthen either suggest them through the conversational interface (e.g., recommendto take a work-break when the developer is stuck on a task), or even take certainactions automatically depending on the developer’s preferences (e.g., to disablenotifications at times of low interruptibility).
Generalization to other Knowledge Workers. Our work focused on under-standing and fostering productive work of software developers. We can imaginethat many of the findings that we gained and models that we built can begeneralized and transferred to the broader range of knowledge workers. With theFlowLight, we made a first attempt to explore how our models, in this case ondevelopers’ availability for interruptions, generalize to other knowledge workers.The results suggested great potential in targeting the measures and featurestowards a specific knowledge worker type. While many of the measures andfeatures we included in our models were specific to software development (e.g.,debugging time, code reviews) future work could investigate useful features forother knowledge work areas, such as architects, accountants, or other engineers.
30 Chapter 1. Synopsis
1.6 Related Work
Work related to our research can be broadly grouped into research on understand-ing and quantifying developers’ work and productivity, background informationon behavior change and goal-setting, and the three persuasive strategies, self-monitoring, self-reflection and external indicators. We provide a comprehensivesummary of the related work sections from Chapters 2 to 8 here, and removedthem in the respective chapters to reduce repetition.
1.6.1 Software Developer Workdays and Work Habits
Recent work on how developers spend their time at work has focused on specificactivities performed in the IDE, the execution of test cases, usage of refac-toring features, and time spent on understanding code versus actually editingcode [Amann et al., 2016; Beller et al., 2017; LaToza et al., 2006; Minelli et al.,2015]. Other work has investigated developer workdays more holistically, exam-ining how they spend their time on different activities overall, and by employingdifferent methods: observations and interviews [Gonçalves et al., 2011; Meyeret al., 2014; Perry et al., 1994b; Singer et al., 2010; Xia et al., 2017], self-reportingdiaries [Perry et al., 1994b], and computer usage tracking [Astromskis et al., 2017].These studies commonly found that developers spend surprisingly little timeworking on their main coding tasks, and that the times reported on developmentand other activities varies greatly. For example, Perry et al. [1994b] found thatdevelopers spend about 50% of their time writing code, while Gonçalves et al.[2011] found that it is only about 9%, and the rest is spent with collaboration(45%) and information seeking (32%). Recently, Astromskis et al. [2017] reportedthe highest fraction of time spent coding (61%) compared to other activities.Reasons for these varying amounts of time spent coding could be differences inhow teams organize their work, the processes they follow, and the complexity ofthe software they develop. Other explanations could be the shift to agile devel-opment, which might be why more recent studies generally report higher timesspent with collaborative activities, or that the timing of the studies captured anatypical working phase, e.g., when developers were extraordinarily busy before a
1.6 Related Work 31
deadline or wrapping up a project.In our work, we further explored developers’ workdays by performing sev-
eral studies, including running a computer interaction monitoring tool at theworkplace for several weeks, and using a large-scale survey. Our work confirmedsome of these prior findings, such as the little time developers spend on actualcoding related activities, and the many collaborative activities they perform. Atthe same time, it provided a more holistic and more complete picture of howdevelopers’ workdays are structured across many companies, and with detailedinsights into how they spend their work time on the computer (also outside theIDE), the activities they pursue on typical/atypical and good/bad workdays,and the tasks they work on.
1.6.2 Fragmentation of Development Work
One aspect of developers’ work that has drawn much attention is the highfragmentation of their work, which, for instance, is caused by planned meet-ings, unexpected requests from co-workers, unplanned or blocking tasks, or evenjust background noise in the office. A large body of research has investigatedinterruptions—a major reason for fragmentation—in great detail, e.g., the lengthand types of interruptions, the frequency of self-interruptions versus externally ini-tiated ones, resumption strategies, and their impact on work performance [Cutrellet al., 2000; Czerwinski et al., 2004; Iqbal and Horvitz, 2007; Parnin and DeLine,2010a; Perlow, 1999; Van Solingen et al., 1998]. For example, Mark et al. [2005]found that 57% of all tasks are interrupted and, thus, are often fragmented intosmall work sessions, and Chong and Siino [2006] found that most interruptions,including self-initiated ones, lasted around 2 to 3 minutes. While many of theseinterruptions can be beneficial, for instance to resolve problems quickly [Isaacset al., 1997], they are especially costly when they happen at an in-opportunemoment, such as when the developer is very focused or engaged in a difficult task.Interruptions can further lead to a higher error rate, slow task resumption, higheranxiety, and an overall lower work performance [Bailey et al., 2001; Czerwinskiet al., 2000, 2004; Mark et al., 2008a; Parnin and Rugaber, 2011]. Resuming aninterrupted task can be challenging, as Parnin and Rugaber [2011] found that
32 Chapter 1. Synopsis
only one out of ten interrupted programming tasks is being continued within aminute after the interruption, and resuming an interruption takes developers onaverage about 15 minutes. Emails and meetings are two further major sources ofdistraction and frustration that fragment developers’ work. Emails were shown toextend workdays [Mazmanian, 2013] and add stress, especially when developersreceive high amounts of emails [Dabbish and Kraut, 2006] or spend a lot oftime on them [Barley et al., 2011]. Meetings were also related to a decrease inproductivity, especially when they have no clear objective, are not well prepared,or attendees are getting side-tracked [Meyer et al., 2014; Niemantsverdriet andErickson, 2017].
Supporting previous research, we found that one main reason for work frag-mentation is that developers switch frequently between activities and tasks. Onaverage, they spend less than two minutes in an activity (except for meetings),and spend about 13 minutes on a task, before switching to another. Our studiesfurther allowed us to uncover nuances and sort out misconceptions about howvarious factors impact developers’ fragmentation of work and productivity dif-ferently. For example, when we looked more closely into when developers aremost vocal about meetings and interruptions being one of the main detrimentsto productive work, we found that their impact on productivity depends on theproject phase: during non-development phases, they are better accepted andmore productive. Finally, we presented an approach, FlowLight, to reduce costlyexternal interruptions at the workplace, and thereby reducing work fragmentationand increasing productivity at work.
1.6.3 Software Developer Productivity
Starting in the 1970s, researchers and practitioners explored multiple ways toquantify developer productivity. Most of these productivity measures calculatethe rate of output per unit of input, with the output being based on a singleartifact or deliverable and input being time-based. Examples are the numberof lines of source code (SLOC) written per day [Devanbu et al., 1996], thenumber of function points per month [Albrecht, 1979], or the tasks completedper month [Zhou and Mockus, 2010]. Most of these measures only capture a
1.6 Related Work 33
small part of a developer’s work, also impeding the provision of a more holisticpicture of developers’ work and productivity [Treude et al., 2015]. A morecomplete list of approaches to quantify productivity using technical factors canbe found in our previous work [Meyer et al., 2014]. Researchers have also lookedmore broadly into the factors affecting the productivity of software developers.Wagner and Ruhe [2008] categorized these factors into technical, such as theprogramming language [Albrecht, 1979], software tools [Chatzoglou and Macaulay,1997], software size and complexity [Boehm et al., 2000; Brooks Jr, 1995] andproduct quality [DeMarco and Lister, 2013]; and social factors, such as teamand turnover [Blackburn et al., 1996; Boehm et al., 2000; Melo et al., 2011;Murphy-Hill et al., 2019], experience and skills [Boehm et al., 2000; Chatzoglouand Macaulay, 1997], and workplace environment [DeMarco and Lister, 2013].
These studies on productivity are generally separate from studies on devel-opers’ workdays, and do not consider the individual differences in developmentwork that might affect productivity as well [Humphrey, 1996; Johnson et al.,2003; Meyer et al., 2014; Vasilescu et al., 2016b]. Thus, we studied developers’work practices and their relationship to developers’ perceptions of productivitymore holistically, while also examining individual differences and commonalities,and how perceived productivity changes over the day.
1.6.4 Characteristics and Habits of Successful Developers
Generally, most software developers are interested in optimizing their own habitsand behaviors to improve their productivity and well-being at work [Li et al.,2015; Sharp et al., 2009]. However, we have not been able to find prior work thatlooked into the goals developers set to improve their work habits and productivity.Previous work also suggests that it is often the managers who set goals for theirdevelopers, even though developers would like to have more involvement withsetting their own goals [Couger et al., 1990; Enns et al., 2006; Kalliamvakouet al., 2019]. Goals that managers set include usually either concrete featuresor development tasks, such as shipping a feature on time with minimal bugs;or growth goals, such as increasing expertise, improving team-work or workingmore independently.
34 Chapter 1. Synopsis
A related area of research looked into characteristics and work habits ofsuccessful developers, some of which developers might consider relevant andimportant to pursue as goals. Amongst other characteristics, successful developersoften share similar attributes, such as striving for productivity and efficiency,being self-aware, asking for and offering help and feedback, constantly learning andself-improving, doing data-driven decisions, and setting challenging goals [Baltesand Diehl, 2018; Couger et al., 1990; Graziotin et al., 2015b; Li et al., 2015;Sharp et al., 2009]. Successful developers also manage to find a good balancebetween focused work and helping others [Baltes and Diehl, 2018; Li et al., 2015].
In our work, we aim to better understand what productive work habits are,as well as what goals and strategies developers employ, to motivate productivebehavior changes that increase productivity and well-being.
1.6.5 Fostering Behavior Change with Goal-Setting
Behavior change is a complex and long-term process [Zimmerman, 2006] that wasmodeled and formalized in multiple theories, such as the Transtheoretical Modelof behavior change (TTM) by Prochaska and Velicer [1997], and more specificallyto personal informatics, the Stage-Based Model of Behavior Change by Li et al.[2010] and the Lived Informatics Model by Epstein et al. [2015]. TTM modelsbehavior change as a sequence of stages which the person advances through untila behavior change happens and can be maintained. Awareness increase, alsoreferred to as consciousness, is one of the processes that lets people advancebetween stages. In particular, it helps people to advance from being unaware ofthe problem behavior (TTM’s precontemplation stage) to acknowledging thatthe behavior is a problem, and the intention to improve it (contemplation stage).There are two ways to identify a problem behavior, either by increasing people’sself-awareness or external awareness. Internal, or self-awareness can be increasedthrough self-monitoring or self-reflection, and was shown to be valuable to identifyopportunities for positive behavior change, and usually allows people to alsomeasure their progress towards their goals [Consolvo et al., 2009; Kersten-vanDijk et al., 2017]. External awareness can be increased through social incentives,competitions or an external indicator, and was shown to motivate people to not
1.6 Related Work 35
only reach, but also maintain their goals over prolonged periods of time [Edelsonet al., 2011; Fogg, 2003; Fritz et al., 2014; Lin et al., 2006; Rooksby et al.,2014]. The three concepts to increase awareness that we applied in our work,self-monitoring, self-reflection and external indicators, are discussed in detail inthe following three sections.
Once people are ready to take action and change their behavior (TTM’spreparation stage), they define the target behavior or outcome as a goal thatthey work towards (action stage) and maintain once it is reached (maintenancestage). Latham and Locke, who pioneered goal-setting research, identified keyprinciples that improve chances of successful goal-achievement: defining clear andchallenging goals, committing and actively working towards them, and measuringprogress or getting feedback on goal achievement [Locke and Latham, 1990,2002] These principles are closely related to Doran’s SMART goals approach,describing that goals must be specific, measurable, achievable, relevant andtime-bound [Doran, 1981].
1.6.6 Self-Monitoring in the Workplace
An increasing amount of people are using applications and wearable devices totrack certain aspects of their lives, in particular related to physical activity [Con-solvo et al., 2008b; Lin et al., 2006], emotional states [McDuff et al., 2012],stress [Mark et al., 2016a,b], and sleep [Kay et al., 2012]. This self-monitoringleads to increased self-awareness, which helps to realize bad habits in behav-ior [Bentley et al., 2013; Choe et al., 2014; Lin et al., 2006] and helps to setpersonal goals that often promote deliberate or unconscious behavior change(e.g., [Calvo and Peters, 2014; Fogg, 2003; Hollis et al., 2015; Munson and Con-solvo, 2012]). For example, physical activity trackers, such as the Fitbit, motivateusers to pursue a more active and healthier life-style [Fritz et al., 2014; Lin et al.,2006]. In addition to work on quantifying many aspects of a person’s life, thereis a growing body of research that focuses on quantifying work and promotingmore productive work habits with automated self-monitoring techniques. Manyof these approaches focus on the time spent in computer applications [Kimet al., 2016; Manictime, 2019; RescueTime, 2019; Slife, 2019; Whittaker et al.,
36 Chapter 1. Synopsis
2016], work rhythms [Begole et al., 2002], or tasks worked on [Dragunov et al.,2005]. Some approaches specifically target the activities of software developers inIDEs, e.g., Codealike [2019], Wakatime [2019] and WatchDog [Beller et al., 2017].Few of these tools have been evaluated (e.g., [Huang et al., 2016; Kim et al.,2016; Rooksby et al., 2016; Whittaker et al., 2016]), limiting our knowledge ofthe overall user value of these tools and if they can affect developers’ behavior.Previous research also discovered that users rarely engage with the captureddata, resulting in a lower awareness and reducing chances of a positive behaviorchange when using a self-monitoring tool [Collins et al., 2014; Huang et al., 2016;Kim et al., 2016].
In our work, we investigated how we can map the success of self-monitoringsystems from the physical activity and health domain to the workplace, and learnmore about developers’ expectations of and experience with such tools. Specifi-cally, our objectives were to learn how developers use a workplace self-monitoringtool, PersonalAnalytics, in practice, and study its impact on developers’ self-awareness and behavior.
1.6.7 Self-Reflection in the Workplace
In contrast to self-monitoring, where users continuously track certain behaviors,self-reflection describes the process of purposefully reviewing and thinking aboutone’s behaviors. Prior research on self-reflection has mostly focused on under-standing how particular approaches, such as just-in-time interventions or mobileapps, support goal-monitoring and -achievement, by providing participants withpre-determined goals that they could further personalize and adapt (e.g., defin-ing a specific exercise plan). This research mostly focuses on non-work relatedareas of life, such as health [Gasser et al., 2006; Monkaresi et al., 2013], foodintake [Cordeiro et al., 2015], students’ learning behavior [Johnson and White,1971; Morisano et al., 2010; Travers et al., 2015], and physical activity [Her-rmanny et al., 2016; Klasnja et al., 2009; Munson and Consolvo, 2012]. However,there are cases, including sleep and work, where pre-determined goals are notsuitable for everyone, or they would have varying impacts on different people.In these cases, researchers have looked more specifically into how purposeful
1.6 Related Work 37
self-reflection aids individuals to identify and refine personal growth goals thatare relevant and important to them. One example is Lee et al.’s work on howto design a self-experimentation approach that allows individuals to identifybehavior change goals for improving sleep quality [Lee et al., 2014, 2015, 2017].The researchers provided participants with an open-ended journal to self-reflecton their sleep, a structured approach to define self-improvement goals, andjust-in-time interventions to remind them about their goals. They found that thestructured self-reflection allows users to self-experiment with goals and identifybetter behavior change strategies.
There is also research that investigated the value of workplace self-reflectionon task completion [Amabile and Kramer, 2011; Claessens et al., 2010], timemanagement [Pammer et al., 2015; Rooksby et al., 2016; Whittaker et al., 2016],and detachment from work [Kocielnik et al., 2018; Williams et al., 2018]. Theresearch has shown that successful self-reflection approaches are often structured,since they guide users’ reflection with a predefined set of questions [Kersten-vanDijk et al., 2017; Schwarz and Oyserman, 2001].
In software development, Humphrey has taken a first step towards workplaceself-reflection for developers with the Personal Software Process (PSP). PSPfocuses on a set of basic metrics that developers reflect on (e.g., time, size,quality, schedule data), to better understand and improve their performance,quality, time estimations and skills [Humphrey, 1996]. Baltes et al. recentlyfound that many developers already self-monitor their work, by using tools suchas RescueTime [2019], Codealike [2019] or Wakatime [2019], but only very fewactively and regularly reflect on work (3 out of 204 survey participants) [Baltesand Diehl, 2018].
Therefore, we were interested in learning how open developers are towardsactively self-reflecting on their work on a daily basis during several weeks. We werefurther interested in learning how self-reflection and goal-setting can be combinedto identify personal work habit goals and strategies that foster productive behaviorchange for developers.
38 Chapter 1. Synopsis
1.6.8 External Indicators in the Workplace
Since interruptions have been shown to be one of the biggest impediments todevelopers’ productive work, we investigated how we can quantify interruptibilityusing computer interaction data, and how to display interruptibility using anexternal indicator. Several approaches have been proposed to increase awarenessabout interruptions and reduce their costs, ranging from simple manual strategiesto more advanced automated systems.
One strategy is to postpone interruptions at moments when the interrupteeis in the middle of a task to naturally occurring breakpoints—aka. defer-to-breakpoint strategy. This idea is based on studies suggesting that the cognitiveload drops at task boundaries, and that interruptions at lower cognitive load areless harmful [Bailey and Iqbal, 2008; Borst et al., 2015]. While several approachesthat implement this strategy (e.g., Ho and Intille [2005]; Iqbal and Bailey [2008])are successful at mitigating interruptions from the computer and mobile devices,they do not address the frequent and costly in-person interruptions in workplaces.
A second strategy that builds upon the idea of deferring interruptions tomore opportune moments is to continuously indicate a person’s interruptibilityto potential interrupters, and thereby implicitly help negotiating the timingof the interruption. While knowledge workers were shown to already employsimple manual indicators, such as headphones or closing the office door [Sykes,2011], researchers have also developed approaches that indicate interruptibilitybased on automated measurements. Most prior work focused on contact-list-styletools, such as ConExus [Tang et al., 2001] and Lilsys [Begole et al., 2004] thatare installed on the user’s computer and vary mostly in which data they useto quantify interruptibility. MyTeam, an approach by Lai et al. [2003], usesdata on presence, network connection and user input to indicate availability ina contact list. Overall, study results for these computer-based interruptibilityindicators suggest that they increase the awareness about the disruptiveness ofinterruptions, but do not reduce in-person interruptions.
Only few researchers examined external indicators so far, the most similar tothe FlowLight being work by Bjelica et al. [2011]. In their work, they developedan automated indicator visualizing interruptibility through ambient lighting
1.7 Summary of Contributions 39
effects based on detected activities (e.g., low interruptibility during meetings).In our work, we developed an automated interruptibility measure that is basedon computer interaction data and combined it with a physical indicator in theform of a traffic-light like LED that we placed on participants’ desks. Thereby,our approach is more direct and prominent than subtle ambient lighting. Weconducted a large-scale and long-term user study to investigate the impact andvalue of FlowLight to foster productive work by reducing intrusive in-personinterruptions.
1.7 Summary of Contributions
The objective of this research was to foster software developer productivity.A first step towards the objective was to gain a better understanding of de-velopers’ work and productivity from a bottom-up perspective (RQ1). Thefindings from the performed studies informed the development of several modelsdescribing developers’ work and productivity, which we integrated into toolsupport. We evaluated these models through various long-term field studies withprofessional software developers, who used our tools in the field and reportedself-improvements in work habits, experiencing fewer costly interruptions, andincreased productivity, amongst other benefits. These results support our Hy-pothesis and provide evidence that it is possible to apply models that are basedon computer interaction at the workplace, to foster productive work throughthe provision of self-monitoring (RQ2a), reflective goal-setting (RQ2b), and anexternal indicator (RQ3).
The contributions of this work are as follows:
• we present empirical findings from a series of studies on software developers’workdays and the factors that influence them, activities and tasks thatfragment development work, developers’ perceptions of productivity, andthe relationship between activities at work and productivity;
• we present PersonalAnalytics, a system to capture developers’ work andproductivity in the field, and to support self-monitoring. Our multi-week
40 Chapter 1. Synopsis
field study showed that PersonalAnalytics can foster productive behaviorchanges, and revealed design recommendations for self-monitoring systems;
• we present the results of a field-study in which our reflective goal-settingapproach allowed developers to identify individual work habit goals, andmotivated productive self-improvements at work;
• we present and evaluate a model based on computer interaction data toautomatically detect developers’ task switches and types, and show thatwe can achieve high accuracy and only a short delay;
• and, we present the FlowLight, an approach to sense and externally indicateinterruptibility based on computer interaction. Our large-scale field studyshows that the FlowLight successfully increases external awareness aboutinterruption cost and reduces interruptions at in-opportune moments.
Finally, we open-sourced PersonalAnalytics for reproducibility and futureresearch, and licensed the FlowLight to be released as a commercial product.
1.8 Thesis Roadmap
The remainder of this thesis consists of 7 chapters, each based on a publicationpublished at an internationally renowned, peer-reviewed conference or journal.An overview of all publications, including publications that were outside of thescope of the thesis, is given in Figure 1.5.
Chapter 2 addresses RQ1a, RQ1c and RQ1d, and investigates the activitiesdevelopers pursue during their workdays, how they fragment their work, andtheir relationship with perceived productivity. My contributions to this chapterare the design and execution of the field study, participant recruitment, tooldevelopment, partial data analysis, and paper writing.
Chapter 3 addresses RQ1d, explores differences and commonalities in devel-opers’ productivity perceptions, and describes groups of developers with similarperceptions as developer personas. My contributions to this chapter comprise the
1.8 Thesis Roadmap 41
design and execution of the study, participant recruitment, partial data analysis,and paper writing.
Chapter 4 addresses RQ1a, and extends our understanding of developerworkdays, in particular the factors that influence what makes workdays goodand typical, workday types, and how collaboration impacts these days. Mycontributions to this chapter are the analysis of the collected data, and paperwriting.
Chapter 5 addresses RQ1b, and allows us to automatically detect devel-opers’ task switches and task types based on their computer interaction. Mycontributions in this chapter are the study design and execution, participantrecruitment, tool development, partial data analysis, and paper writing.
Chapter 6 addresses RQ2a and presents a workplace self-monitoring ap-proach, PersonalAnalytics, that increases developers’ awareness about work andproductivity through retrospection and experience sampling. My contributionsto this chapter comprise the design and execution of the field study, participantrecruitment, self-monitoring tool development, data analysis, and paper writing.
Chapter 7 addresses RQ2b and provides a framework for reflective goal-setting that supports the identification of work habit goals and actionablestrategies for productive self-improvements. My contributions to this chapterare the design and execution of the field study, participant recruitment, dataanalysis, and paper writing.
Chapter 8 addresses RQ3, introduces an approach to automatically measurethe interruptibility based on computer interaction, and presents the FlowLight toincrease external awareness about co-workers’ interruptibility using an externalindicator. The approach reduces costly interruptions at inopportune moments,and thus, improves productivity. My contributions to this chapter compriseinvolvement in all main parts of this large team project, including the tooldevelopment, execution of the field study, data analysis, and paper writing.
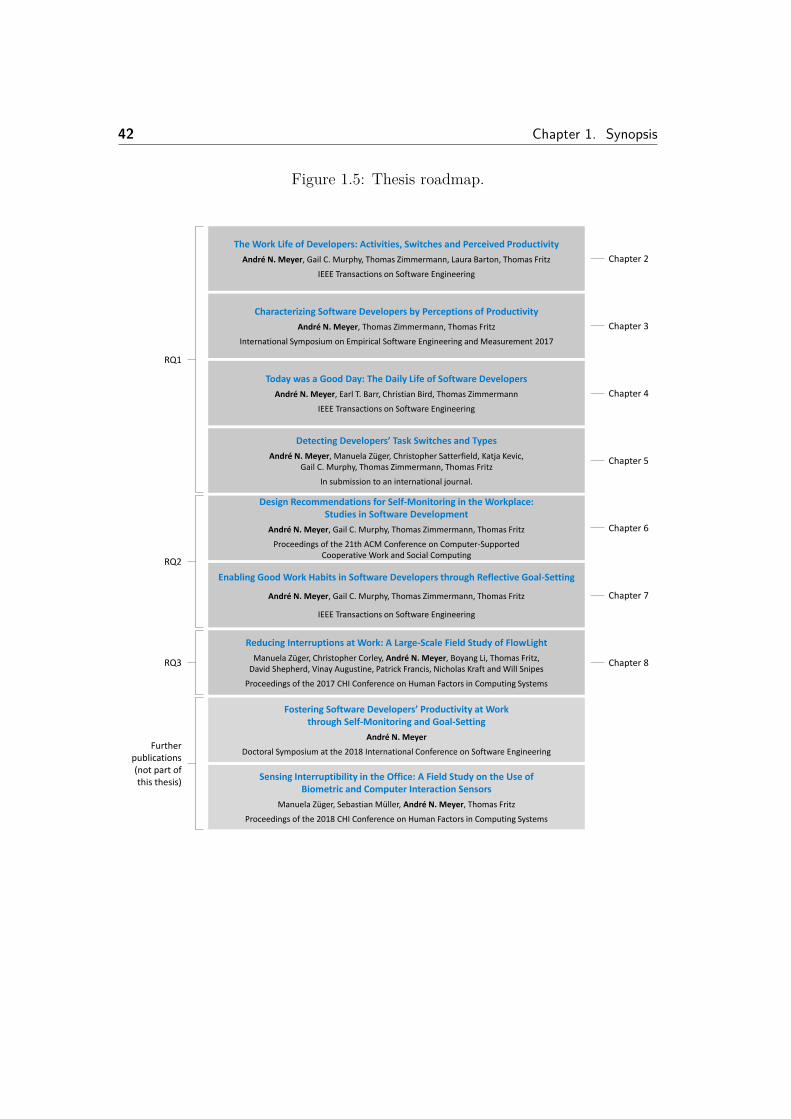
42 Chapter 1. Synopsis
Figure 1.5: Thesis roadmap.
The Work Life of Developers: Activities, Switches and Perceived Productivity
André N. Meyer, Gail C. Murphy, Thomas Zimmermann, Laura Barton, Thomas Fritz
IEEE Transactions on Software Engineering
Characterizing Software Developers by Perceptions of Productivity
André N. Meyer, Thomas Zimmermann, Thomas Fritz
International Symposium on Empirical Software Engineering and Measurement 2017
Today was a Good Day: The Daily Life of Software Developers
André N. Meyer, Earl T. Barr, Christian Bird, Thomas Zimmermann
IEEE Transactions on Software Engineering
Detecting Developers’ Task Switches and Types
André N. Meyer, Manuela Züger, Christopher Satterfield, Katja Kevic, Gail C. Murphy, Thomas Zimmermann, Thomas Fritz
In submission to an international journal.
Design Recommendations for Self-Monitoring in the Workplace: Studies in Software Development
André N. Meyer, Gail C. Murphy, Thomas Zimmermann, Thomas Fritz
Proceedings of the 21th ACM Conference on Computer-Supported Cooperative Work and Social Computing
Enabling Good Work Habits in Software Developers through Reflective Goal-Setting
André N. Meyer, Gail C. Murphy, Thomas Zimmermann, Thomas Fritz
IEEE Transactions on Software Engineering
Reducing Interruptions at Work: A Large-Scale Field Study of FlowLight
Manuela Züger, Christopher Corley, André N. Meyer, Boyang Li, Thomas Fritz, David Shepherd, Vinay Augustine, Patrick Francis, Nicholas Kraft and Will Snipes
Proceedings of the 2017 CHI Conference on Human Factors in Computing Systems
Fostering Software Developers’ Productivity at Work through Self-Monitoring and Goal-Setting
André N. Meyer
Doctoral Symposium at the 2018 International Conference on Software Engineering
Sensing Interruptibility in the Office: A Field Study on the Use of Biometric and Computer Interaction Sensors
Manuela Züger, Sebastian Müller, André N. Meyer, Thomas Fritz
Proceedings of the 2018 CHI Conference on Human Factors in Computing Systems
RQ1
RQ2
RQ3
Further publications (not part of this thesis)
Chapter 2
Chapter 3
Chapter 4
Chapter 5
Chapter 6
Chapter 7
Chapter 8
2The Work Life of Developers:
Activities, Switches andPerceived Productivity
André N. Meyer, Laura E. Barton, Gail C. Murphy,Thomas Zimmermann, Thomas Fritz
Published in the 2017 IEEE Transactions on Software Engineering JournalContribution: Study design and execution, participant recruitment, tooldevelopment, data collection, partial data analysis, and paper writing
AbstractMany software development organizations strive to enhance the productivity oftheir developers. All too often, efforts aimed at improving developer productivityare undertaken without knowledge about how developers spend their time atwork and how it influences their own perception of productivity. To fill in
44Chapter 2. The Work Life of Developers:
Activities, Switches and Perceived Productivity
this gap, we deployed a monitoring application at 20 computers of professionalsoftware developers from four companies for an average of 11 full workdays insitu. Corroborating earlier findings, we found that developers spend their timeon a wide variety of activities and switch regularly between them, resulting inhighly fragmented work. Our findings extend beyond existing research in thatwe correlate developers’ work habits with perceived productivity and also showproductivity is a personal matter. Although productivity is personal, developerscan be roughly grouped into morning, low-at-lunch and afternoon people. Astepwise linear regression per participant revealed that more user input is mostoften associated with a positive, and emails, planned meetings and work unrelatedwebsites with a negative perception of productivity. We discuss opportunitiesof our findings, the potential to predict high and low productivity and suggestdesign approaches to create better tool support for planning developers’ workdaysand improving their personal productivity.
2.1 Introduction
A software developer’s work day might be influenced by a wide variety of factorssuch as the tasks being performed, meetings, interruptions from co-workers, theinfrastructure or the office environment (e.g., [DeMarco and Lister, 1985; Perryet al., 1994b; Singer et al., 2010]). Some of these factors result in activity andcontext switches that can cause fragmented work and that can have a negativeimpact on the developer’s perceived productivity, progress on tasks, and qualityof output (e.g., [Boehm, 1987; Meyer et al., 2014]). As a result, researchersand practitioners have both had a long interest in better understanding howdevelopers work and how their work could be quantified to optimize productivityand efficiency.
Researchers have investigated work practices and work fragmentation in detailfrom various perspectives, specifically the effect of interruptions on fragmentation(e.g., [Czerwinski et al., 2004; Iqbal and Horvitz, 2007; Parnin and Rugaber,2011; Van Solingen et al., 1998]) and how developers organize their work interms of tasks and working spheres (e.g., [González and Mark, 2004; Meyer et al.,
2.1 Introduction 45
2014]). Using both a diary and an observational study format to understandsoftware developer work practices, Perry et al. [1994b] gained several insights,including that most time was spent coding, and that there was a substantialamount of unplanned interaction with colleagues. Singer et al. [2010], usingseveral study methods including tool usage statistics, found that developersspent most of their time reading documentation and that search tools were themost heavily used. Since the time these earlier studies on developers’ workpractices were conducted, empirical studies of software development have focusedmore on particular aspects of a developer’s work day. For example, Ko et al.[2007] observed software developers to determine what information was neededto perform their work and how they found that information. Other studies havefocused on how developers spend their time inside the Integrated DevelopmentEnvironment (IDE) (e.g., [Amann et al., 2016; Minelli et al., 2015]). The industryhas also seen an increasing trend with self-monitoring tools to track activity andwork habits, with applications such as RescueTime [2019] or Codealike [2019].
Starting in the 1970s, researchers have also been exploring various differentways to quantify a developer’s productivity. Most of these identified productivitymeasures capture a small part or single aspect of a developer’s work, such asthe number of tasks per month [Zhou and Mockus, 2010], the number of lines ofcode written [Blackburn et al., 1996], or the resolution time for a modificationrequest [Cataldo et al., 2008]. However, these studies on productivity aregenerally separate from studies of work fragmentation and of how developerswork. Furthermore, these measures do not take into account the individualdifferences in development work that might affect productivity as pointed outby previous work [Humphrey, 1996; Johnson et al., 2003; Meyer et al., 2014;Vasilescu et al., 2016b].
In this paper, we study developers’ work practices and the relationship to thedevelopers’ perceptions of productivity more holistically, while also examiningindividual differences. In particular, our study seeks to answer the followingresearch questions:
46Chapter 2. The Work Life of Developers:
Activities, Switches and Perceived Productivity
RQ1: What does a developer’s work day look like?
RQ2: How fragmented is a developer’s work?
RQ3: Are there observable trends in how developers perceivetheir productivity?
RQ4: What is the relationship between developers’ activity andperceived productivity at work?
To investigate these questions, we designed and conducted a study involvingthe monitoring of 20 developers’ interactions with their computer over a two weektime period. From this monitoring, we were able to gather logs describing how adeveloper was interacting with the computer (i.e., through the keyboard or themouse) and in what applications the interaction was occurring. Our monitoringalso gathered self-reports from the developers about their current task(s) at 60minutes time intervals, and a self-rating of their perceived productivity. The20 developers from whom we gathered data worked for 4 different companiesof varying size, with varying projects, project stages and customers, providingmore diversity in our results than has been available in previous holistic studies.This approach also allows us to see whether earlier research findings, such as howmuch time developers actually spend coding [Perry et al., 1994b] and typicalcoding related activities [LaToza et al., 2006], hold in contemporary development,and to enhance emerging theories about fragmented knowledge work [Gonzálezand Mark, 2004].
Based on our analysis of the gathered data, we observed that productivity is ahighly personal matter and perceptions of what is considered to be productive aredifferent across developers. No one model we built relating actions and activity toperceived productivity was able to explain a large number of developers. However,we did find that many developers consider email, planned meetings and workunrelated browsing as less productive activities, and usually perceive themselvesas more productive when they have a higher user input rate as measured bymouse clicks and keystrokes. Further, developers’ work is highly fragmented, asdevelopers are spending only very short amounts of time (0.3 to 2 minutes) in
2.1 Introduction 47
one activity before switching to another one. Even though we observed that someaspects of a developer’s work habits are highly individual we found consistenttrends across multiple people. For example, some developers parcel their workout over a longer time span, while others choose to contain their work time andstay off of the computer during the evening. Some seem to be morning people,with higher productivity ratings in the morning hours, others are afternoonpeople. Finally, we discuss implications and opportunities of our findings to helpimprove and predict developer productivity.
This paper provides the following contributions:
• it provides insights into software developers’ work habits, including thefrequency and duration of performing particularly activities and applicationuse;
• it provides data about the rhythms in developers’ perceived productivity,which opens opportunities for retrospective tools and recommender systemsfor when developers might best perform particular activities;
• it demonstrates that productivity patterns for individuals are consistent,but vary when comparing across groups of software developers; and,
• it shows that perceived productivity and the factors that influence it, suchas emails, meetings, or activity switches, are highly individual.
Section 2.2 presents relevant related work on developers’ work practices,the high fragmentation of their work, approaches on quantifying developmentactivities and on measuring productivity. Sections 2.3 and 2.4 describe the studymethod employed and the data collected. Section 2.5 presents the results of ourstudy in terms of what a developer does, the fragmentation of a developers’ work,the rhythms of a developer’s perceived productivity and which activities andactions a developer perceives as productive. Section 2.6 outlines the threats toour results. Section 2.7 discusses implications and opportunities of the findingsof our study for future tool support and presents results of a preliminary analysison predicting two levels of productivity. Section 2.8 summarizes the paper.
48Chapter 2. The Work Life of Developers:
Activities, Switches and Perceived Productivity
2.2 Related Work
Related work can broadly be classified into four categories: developers’ workpractices, work fragmentation, the quantification of development activities andproductivity. To avoid repetitions in this thesis, we present and summarize therelated work in Section 1.6 of the synopsis.
2.3 Study Method
To answer our research questions, we conducted an in situ study at four interna-tional software development companies of varying size. We collected data from 24professional software developers using a combination of experience sampling (di-ary study) and a background monitoring application. The monitoring applicationlogged a wide range of digital activities over several weeks with detailed precision.Experience sampling was used to collect participants’ perceptions of productivity,as well as self-reported tasks and activities they performed throughout their workday.
2.3.1 Participants
We used personal contacts, emails and sometimes a short presentation at thecompany to recruit participants. Of the total 24 participants, we discarded thedata of 4 participants as they did not respond to a sufficient amount of experiencesamples. Two participants responded to less than 5 experience samples over thecourse of the study, as they thought it was too intrusive for their work. The othertwo participants responded to very few samples since they were either workingon a different machine as the one initially indicated or did not use their machinefor more than an hour per work day.
Of the remaining 20 participants, 1 was female and 19 were male. Allparticipants are professional software developers, with varying roles betweenindividual contributors1 and lead. At the time of the study, our participants
1We defined an individual contributor as an individual who does not manage other employees.
2.3 Study Method 49
had an average of 14.2 years (±9.6, ranging from 0.5 to 40 years) of professionalsoftware development experience and an average of 18.9 years (± 9.2, ranging from1.5 to 40 years) of total software development experience, including education.An overview of our participants can be found in Table 2.1.
To capture various kinds of software development practices, we sampleddevelopers from 4 different companies of varying size, in different locations andproject stages, using different kinds of programming languages, and with differentkinds of products and customers. Companies resided either in the USA (companyA), Canada (company B and C) or Switzerland (company D). The company sizesvaried from less than 10 developers (company D), to a few hundred (companyC), and thousands of developers (company A and B). The project stages variedfrom working on initial releases (company D), over working on a next big release(company D and B) to being in a project maintenance cycle (company A and C).The developers in company A were mainly programming in C++ and C#, incompany B in Java and C#, in company C in JavaScript, C# and SQL, and incompany D in JavaScript, Java, C# and SQL. The products developed by thecompanies range from developer support tools, to power monitoring and roboticssoftware, all the way to cloud-solutions for B2B and B2C customers.
2.3.2 Procedure and Monitoring Application
The monitoring application was developed and tested to run on the Windows 7,8 and 10 operating system. To make sure it works properly, the collected datais accurate and to optimize the performance, we deployed the tool in multiplesteps. After an initial phase of extended testing on 3 researchers’ machines, wedeployed it to three developers in company B and one developer in company Cover several weeks, to ensure correct functionality in many different computerset-ups and use cases and to ensure the tool is stable and reliable enough fordaily use.
We then installed the monitoring application on the first day of the studyafter a presentation that included an introduction to the study and details on thedata that was being collected with the monitoring application. Participants wereassured of the anonymity and privacy of their data and were shown the location
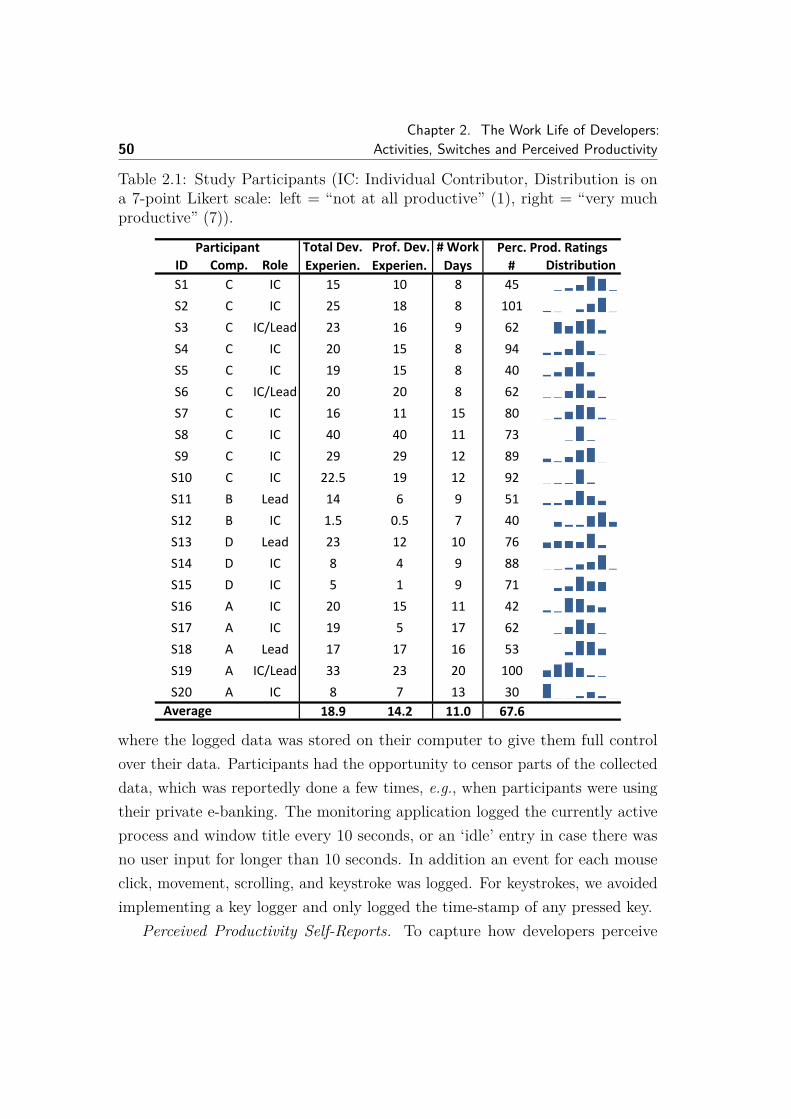
50Chapter 2. The Work Life of Developers:
Activities, Switches and Perceived Productivity
Table 2.1: Study Participants (IC: Individual Contributor, Distribution is ona 7-point Likert scale: left = “not at all productive” (1), right = “very muchproductive” (7)).
ID Comp. Role # Distribution
S1 C IC 15 10 8 45
S2 C IC 25 18 8 101
S3 C IC/Lead 23 16 9 62
S4 C IC 20 15 8 94
S5 C IC 19 15 8 40
S6 C IC/Lead 20 20 8 62
S7 C IC 16 11 15 80
S8 C IC 40 40 11 73
S9 C IC 29 29 12 89
S10 C IC 22.5 19 12 92
S11 B Lead 14 6 9 51
S12 B IC 1.5 0.5 7 40
S13 D Lead 23 12 10 76
S14 D IC 8 4 9 88
S15 D IC 5 1 9 71
S16 A IC 20 15 11 42
S17 A IC 19 5 17 62
S18 A Lead 17 17 16 53
S19 A IC/Lead 33 23 20 100
S20 A IC 8 7 13 30
18.9 14.2 11.0 67.6
Participant Total Dev.
Experien.
# Work
Days
Perc. Prod. Ratings Prof. Dev.
Experien.
Average
where the logged data was stored on their computer to give them full controlover their data. Participants had the opportunity to censor parts of the collecteddata, which was reportedly done a few times, e.g., when participants were usingtheir private e-banking. The monitoring application logged the currently activeprocess and window title every 10 seconds, or an ‘idle’ entry in case there wasno user input for longer than 10 seconds. In addition an event for each mouseclick, movement, scrolling, and keystroke was logged. For keystrokes, we avoidedimplementing a key logger and only logged the time-stamp of any pressed key.
Perceived Productivity Self-Reports. To capture how developers perceive
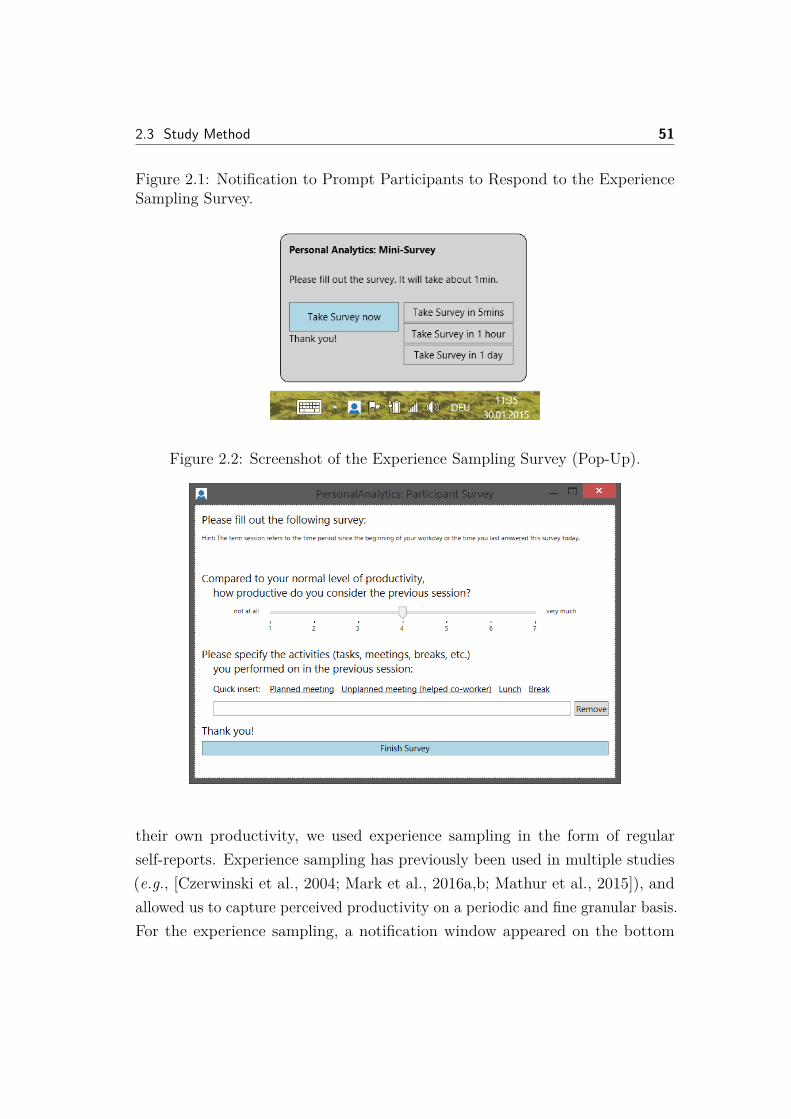
2.3 Study Method 51
Figure 2.1: Notification to Prompt Participants to Respond to the ExperienceSampling Survey.
Figure 2.2: Screenshot of the Experience Sampling Survey (Pop-Up).
their own productivity, we used experience sampling in the form of regularself-reports. Experience sampling has previously been used in multiple studies(e.g., [Czerwinski et al., 2004; Mark et al., 2016a,b; Mathur et al., 2015]), andallowed us to capture perceived productivity on a periodic and fine granular basis.For the experience sampling, a notification window appeared on the bottom
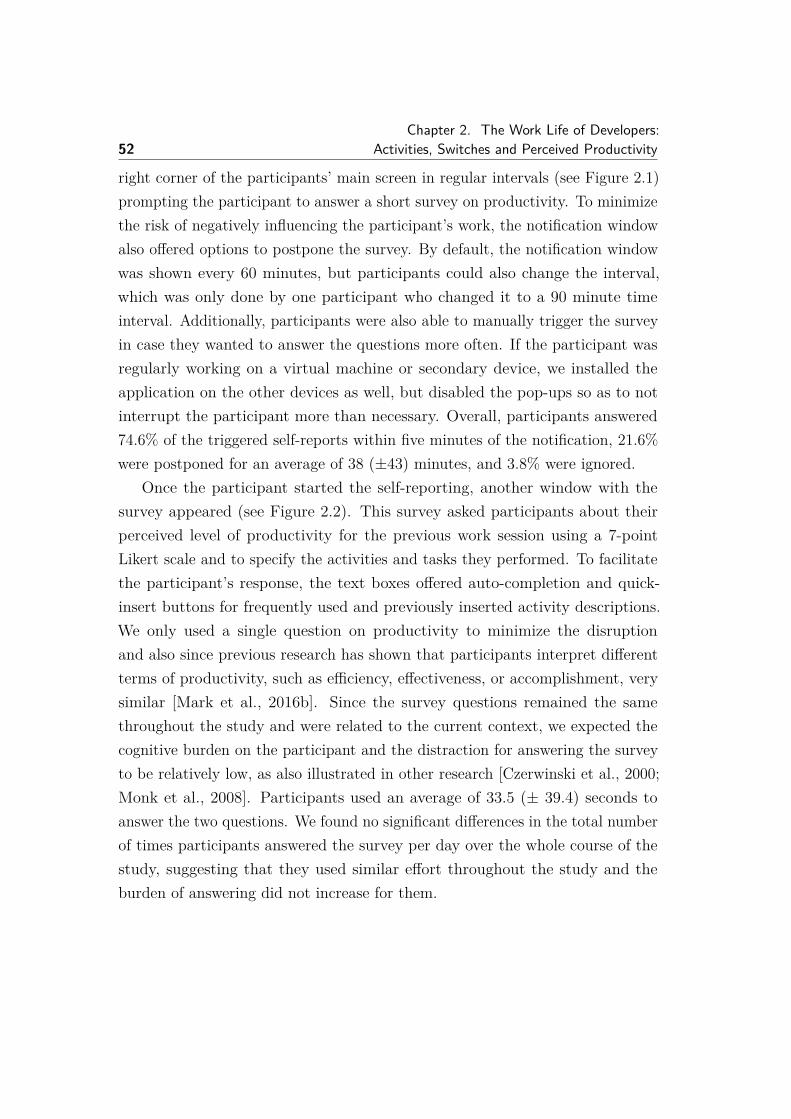
52Chapter 2. The Work Life of Developers:
Activities, Switches and Perceived Productivity
right corner of the participants’ main screen in regular intervals (see Figure 2.1)prompting the participant to answer a short survey on productivity. To minimizethe risk of negatively influencing the participant’s work, the notification windowalso offered options to postpone the survey. By default, the notification windowwas shown every 60 minutes, but participants could also change the interval,which was only done by one participant who changed it to a 90 minute timeinterval. Additionally, participants were also able to manually trigger the surveyin case they wanted to answer the questions more often. If the participant wasregularly working on a virtual machine or secondary device, we installed theapplication on the other devices as well, but disabled the pop-ups so as to notinterrupt the participant more than necessary. Overall, participants answered74.6% of the triggered self-reports within five minutes of the notification, 21.6%were postponed for an average of 38 (±43) minutes, and 3.8% were ignored.
Once the participant started the self-reporting, another window with thesurvey appeared (see Figure 2.2). This survey asked participants about theirperceived level of productivity for the previous work session using a 7-pointLikert scale and to specify the activities and tasks they performed. To facilitatethe participant’s response, the text boxes offered auto-completion and quick-insert buttons for frequently used and previously inserted activity descriptions.We only used a single question on productivity to minimize the disruptionand also since previous research has shown that participants interpret differentterms of productivity, such as efficiency, effectiveness, or accomplishment, verysimilar [Mark et al., 2016b]. Since the survey questions remained the samethroughout the study and were related to the current context, we expected thecognitive burden on the participant and the distraction for answering the surveyto be relatively low, as also illustrated in other research [Czerwinski et al., 2000;Monk et al., 2008]. Participants used an average of 33.5 (± 39.4) seconds toanswer the two questions. We found no significant differences in the total numberof times participants answered the survey per day over the whole course of thestudy, suggesting that they used similar effort throughout the study and theburden of answering did not increase for them.
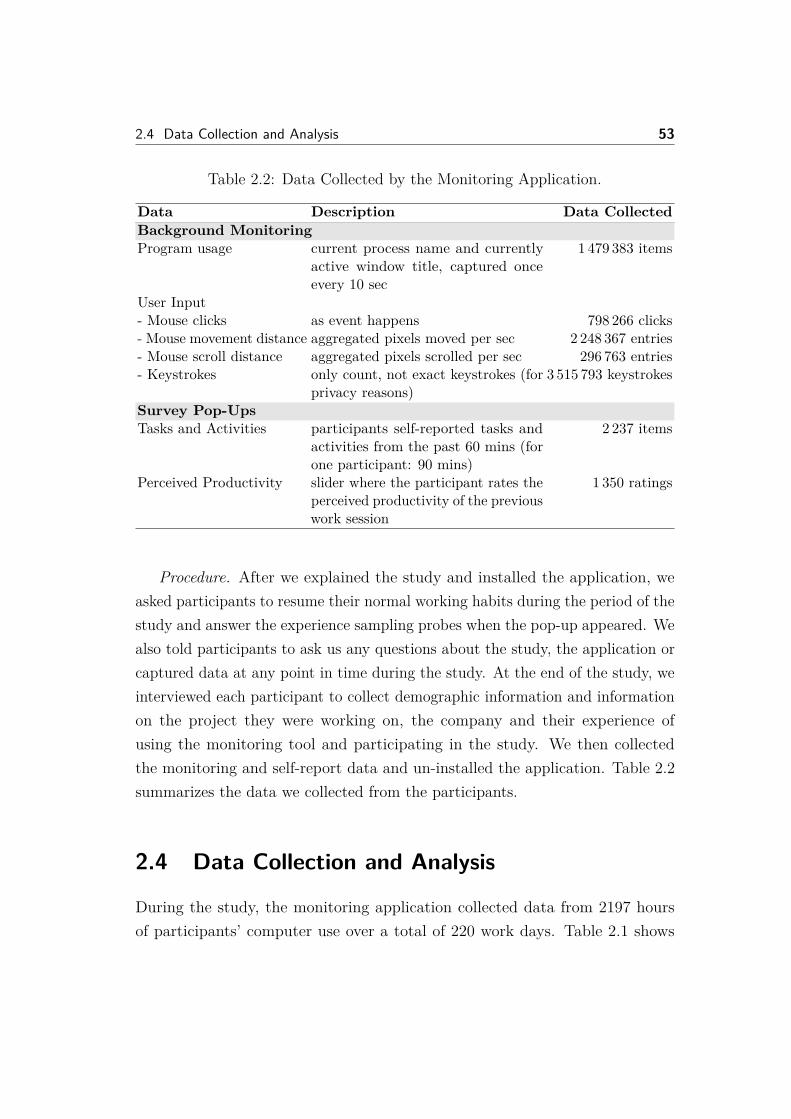
2.4 Data Collection and Analysis 53
Table 2.2: Data Collected by the Monitoring Application.
Data Description Data CollectedBackground MonitoringProgram usage current process name and currently
active window title, captured onceevery 10 sec
1 479 383 items
User Input- Mouse clicks as event happens 798 266 clicks- Mouse movement distance aggregated pixels moved per sec 2 248 367 entries- Mouse scroll distance aggregated pixels scrolled per sec 296 763 entries- Keystrokes only count, not exact keystrokes (for
privacy reasons)3 515 793 keystrokes
Survey Pop-UpsTasks and Activities participants self-reported tasks and
activities from the past 60 mins (forone participant: 90 mins)
2 237 items
Perceived Productivity slider where the participant rates theperceived productivity of the previouswork session
1 350 ratings
Procedure. After we explained the study and installed the application, weasked participants to resume their normal working habits during the period of thestudy and answer the experience sampling probes when the pop-up appeared. Wealso told participants to ask us any questions about the study, the application orcaptured data at any point in time during the study. At the end of the study, weinterviewed each participant to collect demographic information and informationon the project they were working on, the company and their experience ofusing the monitoring tool and participating in the study. We then collectedthe monitoring and self-report data and un-installed the application. Table 2.2summarizes the data we collected from the participants.
2.4 Data Collection and Analysis
During the study, the monitoring application collected data from 2197 hoursof participants’ computer use over a total of 220 work days. Table 2.1 shows
54Chapter 2. The Work Life of Developers:
Activities, Switches and Perceived Productivity
that each participant was part of the study for between 7 and 20 work days(mean: 11.0 days, ±3.6). Table 2.2 shows how much of each type of informationwe collected. This section describes how we prepared the collected data for theanalysis.
2.4.1 User Input Data
Whenever a study participant pressed a key, or clicked, scrolled or moved theirmouse, the event-type and its timestamp were recorded by the monitoringapplication. We divided the events into work days, where a day spanned from04:00:00 A.M. to 03:59:59 A.M. the following morning, very similar to Amannet al. [2016]. This division was chosen as some participants stayed up late andlogged input continuously before and slightly after midnight, suggesting thattheir ’work day’ was not yet over at that time. With respect to time usage, butnot application usage, we removed weekends, as we wanted to examine trendsand based on initial inspection the weekend data was highly irregular. If a dayhad less than 10 minutes of recorded active input for a given developer, that daywas not included when considering keyboard and mouse input.
Within a day, we determined inactive and active periods of computer use. Aninactive period is a lapse in any type of input for 2 minutes or longer; conversely,an active period is 2 minutes or longer during which there is no inactivity. This2 minute mark was chosen as a reasonable boundary based on previous researchthat found an average time of 2 min 11 sec being spent on any device or paperbefore switching [González and Mark, 2004], as well as research by Chong andSiino [2006] who found that a typical interruption for one work team lasted 1min 55 sec, and 2 min 45 sec for another team. We further defined inactiveperiods by sorting them into two categories: short and long breaks away from thecomputer. A short break from the computer is defined as a period of inactivitythat lasts at least 2 minutes but less than 15 minutes and that is often spentwith answering a co-workers question or as a coffee break. A long break fromthe computer is defined as a period of inactivity equal to or longer than the15 minute threshold, and is often used for meetings and longer breaks fromwork, such as a lunch [Epstein et al., 2016b; Sanchez et al., 2015]. We used a 15
2.4 Data Collection and Analysis 55
minutes threshold based on previous work by Sanchez et al. [2015] that describeda typical developer’s coffee break to be 12 minutes on average and factored in a3 minute deviation.
2.4.2 Preparing Program Data and Mapping to Activities
Our monitoring application recorded the current process and window titles ofparticipants’ program usage during their work day, once every 10 seconds. Toprovide a higher-level, aggregated view on participants’ work, we mapped eachentry of a program’s use to activity categories, also taking into account the windowtitles for clarification. These activity categories group actions undertaken by adeveloper, for example the category Coding denotes any developer action that isrelated to reading, editing or navigating code. We reused the activity categories weidentified with an open-coding approach in our previous study [Meyer et al., 2014].This mapping process was a semi-automated open-coding process; automated,where an action fit into an obvious category (e.g., SourceTree belonging tothe activity category Version Control) and manual, where actions could notautomatically be classified distinctively using the program and window titlenames (e.g., website names to the activity categories Work Related Browsingor Work Unrelated Browsing). When a participant did not switch programs orhave any mouse or keyboard interaction for the past 10 seconds, the applicationlogged it as ‘idle’.
In order to complete the coding, we first defined a set of keywords for eachactivity that distinctly map a program to an activity. For instance, we mappedMicrosoft Word to Reading or Writing Documents and Microsoft Outlook eitherto Email or Planning, depending on the details in the window title. We createda script using these keywords to produce the initial mapping, then inspected theresults and iteratively refined the keywords until most programs were mapped. Incases where a program could be mapped to two or more activities, we performeda manual mapping. For example, as work in a text editor could be mapped toseveral activities (e.g., Coding, Reading or Writing Documents, or Planning),we manually mapped all editor use. Similarly, we mapped most website usemanually, either to Work Related Browsing or Work Unrelated Browsing. In both
56Chapter 2. The Work Life of Developers:
Activities, Switches and Perceived Productivity
cases, the window title held valuable information about the activity a developerwas performing. We further manually checked all automated mappings for thefollowing activities: Debugger Use, Code Reviews, and Version Control. Allentries, related to coding, which could not distinctively be mapped to one ofthese categories, were mapped to Coding.
To better understand what participants were doing when they were notactively working on their computer (‘idle’ events), we combined the data loggedby the monitoring tool with participants’ self-reports. As most participantsnot only reported the tasks they worked on in the past work session, but alsoplanned and informal meetings, and lunch and coffee breaks, we could in manycases infer if a period of ‘idle’ time belongs to one of these categories. In caseswhere the participant did not report a meeting or break, we had no way ofidentifying the reason for the ‘idle’ time, which is why the amount of time spentwith planned and informal meetings might be higher than reported in this paper.The self-reports were not only used to map ‘idle’ time, i.e. time not activelyspent on the computer, to breaks and meetings, but also to analyze developers’self-reported tasks.
2.5 Results
This section presents the results of our study on developers’ work practices andtheir relation to the perceived productivity by investigating our four researchquestions.
2.5.1 What Does a Developer Do?
To answer our first research question, “What does a developer’s work day looklike?”, we analyzed the span of a developer’s work, the amount of time during thespan the developer was active, the nature of the breaks taken, the applicationsused, and the activities pursued.
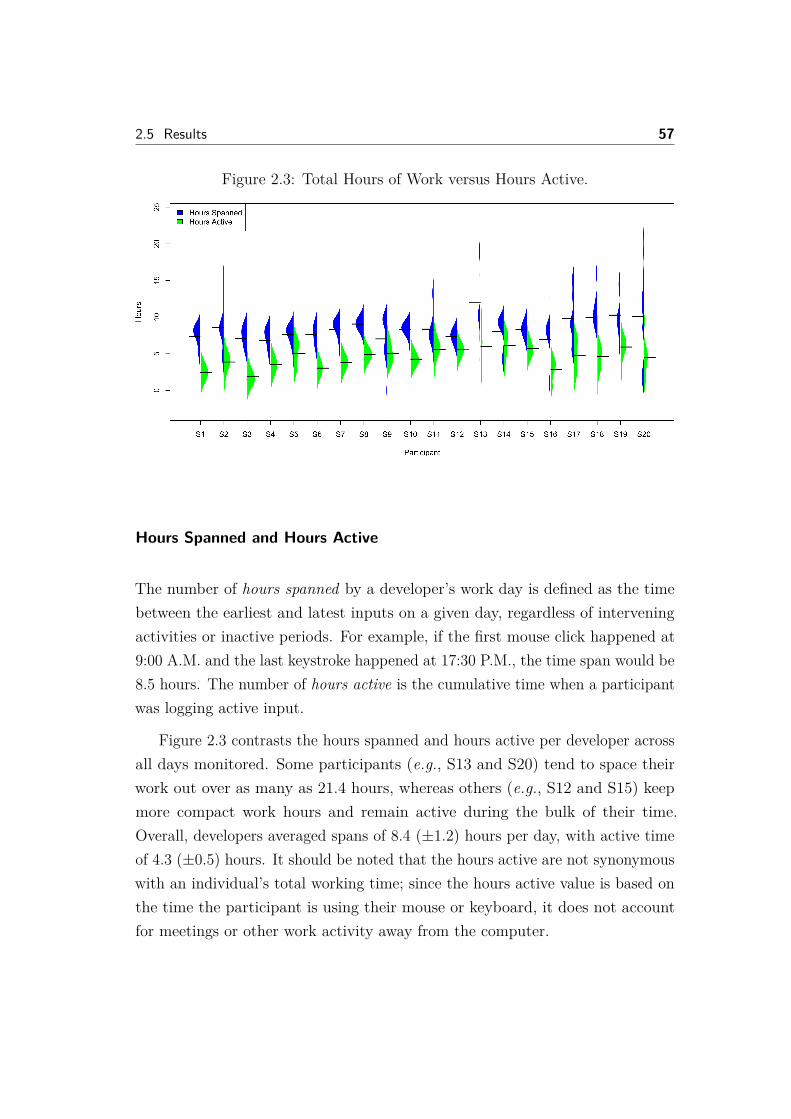
2.5 Results 57
Figure 2.3: Total Hours of Work versus Hours Active.
Hours Spanned and Hours Active
The number of hours spanned by a developer’s work day is defined as the timebetween the earliest and latest inputs on a given day, regardless of interveningactivities or inactive periods. For example, if the first mouse click happened at9:00 A.M. and the last keystroke happened at 17:30 P.M., the time span would be8.5 hours. The number of hours active is the cumulative time when a participantwas logging active input.
Figure 2.3 contrasts the hours spanned and hours active per developer acrossall days monitored. Some participants (e.g., S13 and S20) tend to space theirwork out over as many as 21.4 hours, whereas others (e.g., S12 and S15) keepmore compact work hours and remain active during the bulk of their time.Overall, developers averaged spans of 8.4 (±1.2) hours per day, with active timeof 4.3 (±0.5) hours. It should be noted that the hours active are not synonymouswith an individual’s total working time; since the hours active value is based onthe time the participant is using their mouse or keyboard, it does not accountfor meetings or other work activity away from the computer.
58Chapter 2. The Work Life of Developers:
Activities, Switches and Perceived Productivity
Short and Long Inactive Periods
Every hour, developers take an average of 2.5 (±0.8) short breaks that are about4.2 (±0.6) minutes long each and in which the developers are not interactingwith their computer. This results in a total of 10.5 minutes of inactive time everyhour of work, which we assumed to be likely unplanned interruptions, such asco-workers asking a question or a quick coffee break. According to Minelli et al.[2015], who analyzed how developers spend their time inside the IDE, inactivetimes are often spent with program comprehension. This notion of taking afew minutes to understand, think about or read the current artifact, such ascode, a website or document, is likely another reason for these short inactivities.There was no obvious trend towards taking more or fewer short breaks duringa particular part of the day; rather, short breaks appear to be fairly evenlydistributed for all participants.
The number of long breaks in which developers did not interact with theircomputer for longer than 15 minutes averaged 3.3 (±1.4) per day, with a totallength of 54.7 (±28.2) minutes; this corresponds to an expectation of two longercoffee breaks, a lunch, and perhaps a meeting. The participants with a highnumber of long breaks appear to be those who have a tendency towards longerhours spanned, with additional long breaks happening in the late afternoon orevening before these individuals returned to work. Since these long breaks werelikely planned by the developers, they were also more likely to be self-reportedas a distinct activity in the pop-up surveys.
Applications Used and Frequency of Use
Participants used a total of 331 different applications, with each participantusing an average of 42.8 (±13.9) different applications over the study durationand 15.8 (±4.1) applications per day.
Table 2.3 shows the ten most popular applications across all participants(all were using Windows operating systems). There is a notable amount of timespent using File Explorer, although this may be due to the fact that it is the onlyapplication, other than Internet Explorer, that was used by all 20 participants.
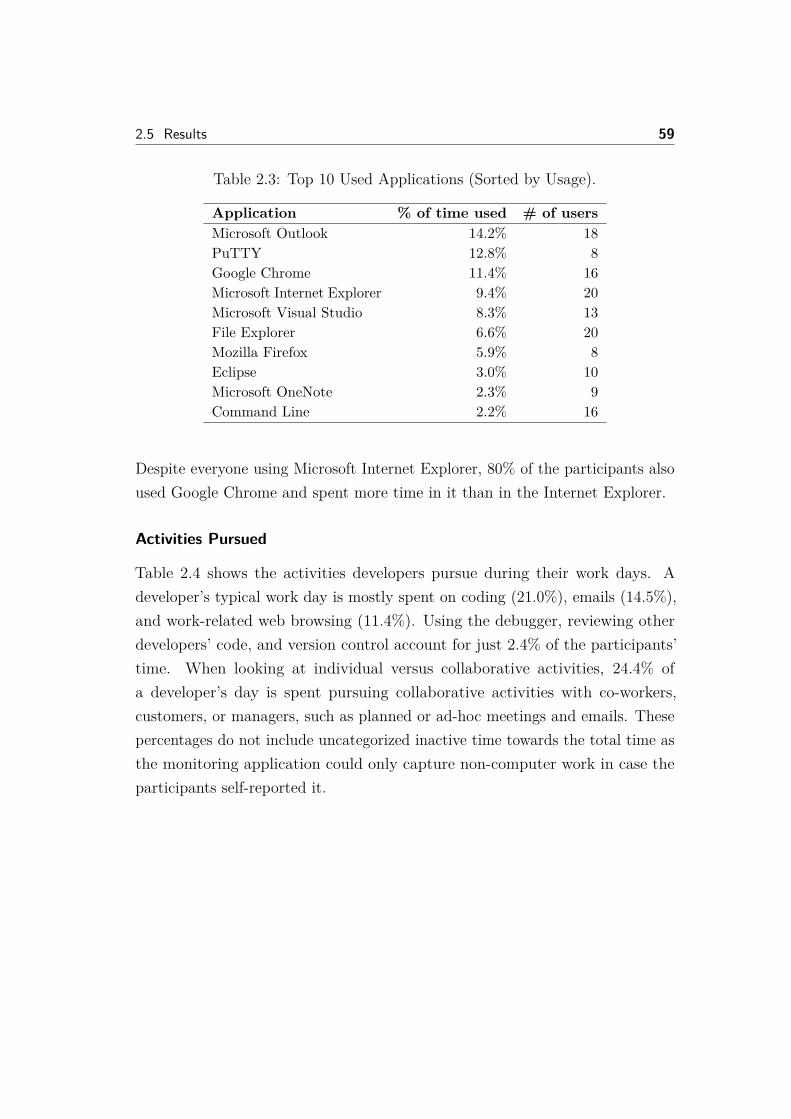
2.5 Results 59
Table 2.3: Top 10 Used Applications (Sorted by Usage).
Application % of time used # of usersMicrosoft Outlook 14.2% 18PuTTY 12.8% 8Google Chrome 11.4% 16Microsoft Internet Explorer 9.4% 20Microsoft Visual Studio 8.3% 13File Explorer 6.6% 20Mozilla Firefox 5.9% 8Eclipse 3.0% 10Microsoft OneNote 2.3% 9Command Line 2.2% 16
Despite everyone using Microsoft Internet Explorer, 80% of the participants alsoused Google Chrome and spent more time in it than in the Internet Explorer.
Activities Pursued
Table 2.4 shows the activities developers pursue during their work days. Adeveloper’s typical work day is mostly spent on coding (21.0%), emails (14.5%),and work-related web browsing (11.4%). Using the debugger, reviewing otherdevelopers’ code, and version control account for just 2.4% of the participants’time. When looking at individual versus collaborative activities, 24.4% ofa developer’s day is spent pursuing collaborative activities with co-workers,customers, or managers, such as planned or ad-hoc meetings and emails. Thesepercentages do not include uncategorized inactive time towards the total time asthe monitoring application could only capture non-computer work in case theparticipants self-reported it.
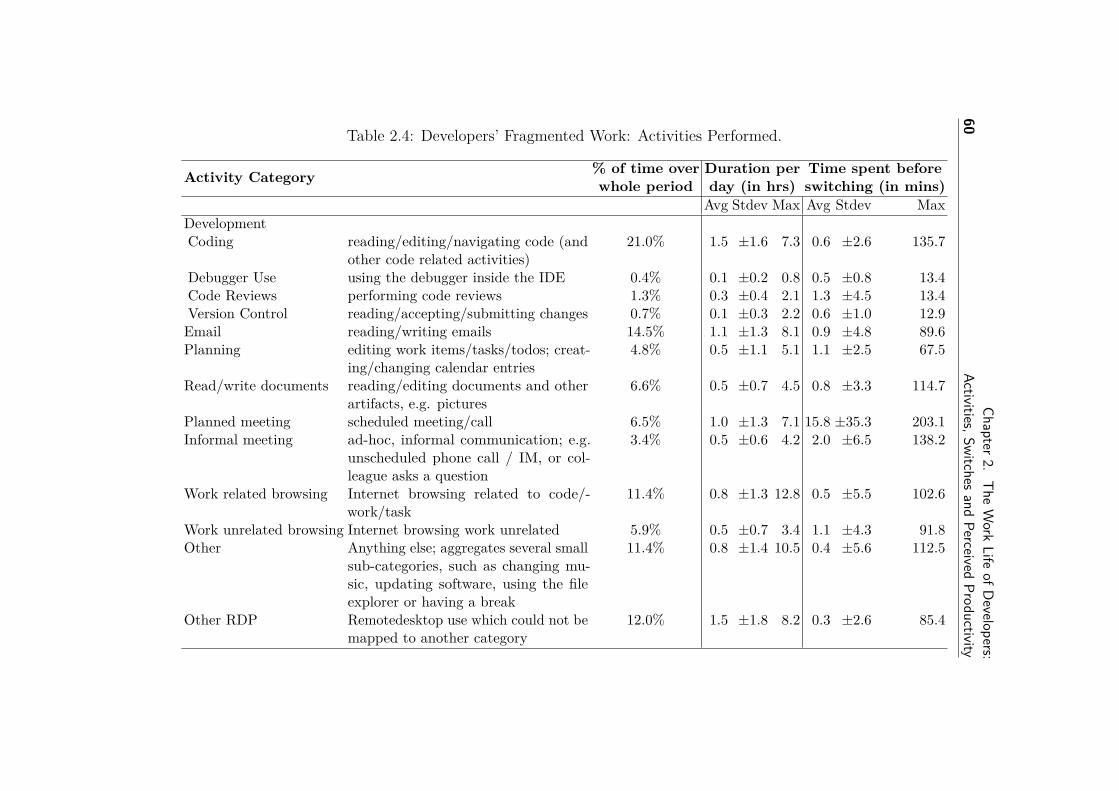
60Chapter2.
TheWork
LifeofD
evelopers:Activities,Switches
andPerceived
ProductivityTable 2.4: Developers’ Fragmented Work: Activities Performed.
Activity Category % of time over Duration per Time spent beforewhole period day (in hrs) switching (in mins)
Avg Stdev Max Avg Stdev MaxDevelopmentCoding reading/editing/navigating code (and
other code related activities)21.0% 1.5 ±1.6 7.3 0.6 ±2.6 135.7
Debugger Use using the debugger inside the IDE 0.4% 0.1 ±0.2 0.8 0.5 ±0.8 13.4Code Reviews performing code reviews 1.3% 0.3 ±0.4 2.1 1.3 ±4.5 13.4Version Control reading/accepting/submitting changes 0.7% 0.1 ±0.3 2.2 0.6 ±1.0 12.9Email reading/writing emails 14.5% 1.1 ±1.3 8.1 0.9 ±4.8 89.6Planning editing work items/tasks/todos; creat-
ing/changing calendar entries4.8% 0.5 ±1.1 5.1 1.1 ±2.5 67.5
Read/write documents reading/editing documents and otherartifacts, e.g. pictures
6.6% 0.5 ±0.7 4.5 0.8 ±3.3 114.7
Planned meeting scheduled meeting/call 6.5% 1.0 ±1.3 7.1 15.8 ±35.3 203.1Informal meeting ad-hoc, informal communication; e.g.
unscheduled phone call / IM, or col-league asks a question
3.4% 0.5 ±0.6 4.2 2.0 ±6.5 138.2
Work related browsing Internet browsing related to code/-work/task
11.4% 0.8 ±1.3 12.8 0.5 ±5.5 102.6
Work unrelated browsing Internet browsing work unrelated 5.9% 0.5 ±0.7 3.4 1.1 ±4.3 91.8Other Anything else; aggregates several small
sub-categories, such as changing mu-sic, updating software, using the fileexplorer or having a break
11.4% 0.8 ±1.4 10.5 0.4 ±5.6 112.5
Other RDP Remotedesktop use which could not bemapped to another category
12.0% 1.5 ±1.8 8.2 0.3 ±2.6 85.4
2.5 Results 61
When we inspected the data, we observed a notable range between theminimum and maximum time developers spent on each activity per day. Theminimum time was virtually 0, or only a few seconds per day. The maximumtime a participant spent on a single activity was 12.8 hours on one day: S13, whowas evaluating various continuous integration and build systems. It is clear thatthe duration and type of activities vary greatly depending on the individualsand their current goals. We also observed differences in the distribution of theactivities between companies. For example, developers S11 and S12, both fromthe same company, spent significantly less time on emails, on average just 0.7minutes (±0.5) per day, compared to the other participants, who spent an average74.3 minutes (±74.8) on emails.
The amount of time spent in coding or debugging might be higher thanreported, as it was not possible to map all activities from the category RemoteDesktop (OtherRdp), as there was not enough context available for an accuratemapping either automatically or manually. Similarly, the amount of time spentin planned and informal meetings might be higher than reported, as participantslikely did not self-report all meetings they attended via the pop-up survey. Thismade it impossible to map all ‘idle’ time to an activity.
Developers’ Self-Reported Tasks
An analysis of developers’ self-reported tasks shows that there is a wide varietyin what developers work on, but in particular also, in what developers denoteas a task. In many cases, participants reported activities they were performing,such as “coding”, working on “emails” or performing a “web search”, ratherthan the intention of the activity, such as the change task or the bug they weretrying to fix. Only in very few cases, did participants mention a bug ID on whichthey were working. Furthermore, reported and worked on tasks varied in theirgranularity. While some participants were working on a task only a single timefor a part of the 60 to 90 minutes time window, others reported to work on thesame task for several days.
Overall, due to this variance in task definition and granularity, the self-reported tasks did not provide much further insights into developers’ work days
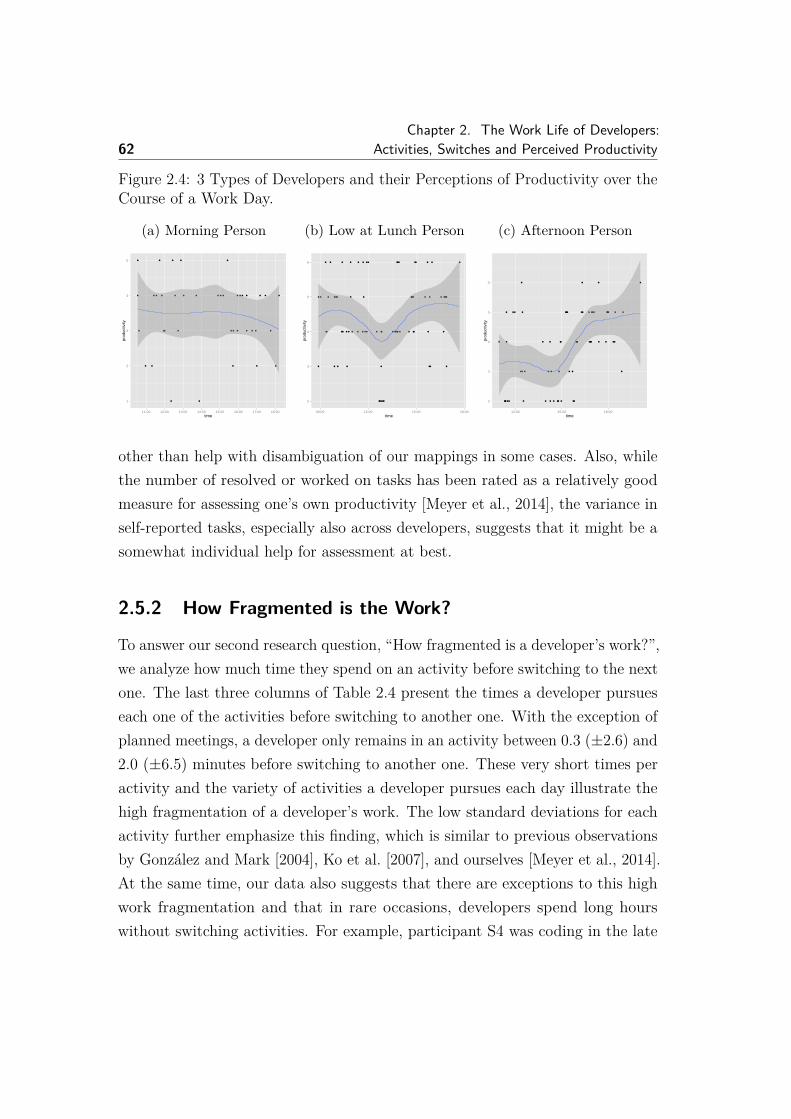
62Chapter 2. The Work Life of Developers:
Activities, Switches and Perceived Productivity
Figure 2.4: 3 Types of Developers and their Perceptions of Productivity over theCourse of a Work Day.
(a) Morning Person
●
● ● ●
●
●
● ●
● ●
● ● ● ● ● ● ●
●
● ●
●
●
●
●
●
●
● ●●
●
● ●
● ● ● ● ●
● ●
●
1
2
3
4
5
11:00 12:00 13:00 14:00 15:00 16:00 17:00 18:00time
prod
uctiv
ity
(b) Low at Lunch Person
● ●
● ●
●
●
●
●
●
●
● ●
●
●
● ●
●
● ●
●
●
● ●
●
● ●
● ● ●
● ●●
● ●
●
●
●
●
● ●
● ●
●
●
●
●
●
●
●
●●
● ●
●
● ●
● ●
● ●
●
●
●
●
●
●
●
● ● ● ●
2
3
4
5
6
09:00 12:00 15:00 18:00time
prod
uctiv
ity
(c) Afternoon Person
●
●●
●
●
●●
●
●
●● ●
●
●
●
●
●
●
●
●
●
●
●
●
●
●
●
●
●
●
●
●
●
●
● ●
●
●
●
●
●
●
● ●
● ● ●
●
● ●
●
●
●
●
● ●
● ●
●
●
●
●
2
3
4
5
6
12:00 15:00 18:00time
prod
uctiv
ity
other than help with disambiguation of our mappings in some cases. Also, whilethe number of resolved or worked on tasks has been rated as a relatively goodmeasure for assessing one’s own productivity [Meyer et al., 2014], the variance inself-reported tasks, especially also across developers, suggests that it might be asomewhat individual help for assessment at best.
2.5.2 How Fragmented is the Work?
To answer our second research question, “How fragmented is a developer’s work?”,we analyze how much time they spend on an activity before switching to the nextone. The last three columns of Table 2.4 present the times a developer pursueseach one of the activities before switching to another one. With the exception ofplanned meetings, a developer only remains in an activity between 0.3 (±2.6) and2.0 (±6.5) minutes before switching to another one. These very short times peractivity and the variety of activities a developer pursues each day illustrate thehigh fragmentation of a developer’s work. The low standard deviations for eachactivity further emphasize this finding, which is similar to previous observationsby González and Mark [2004], Ko et al. [2007], and ourselves [Meyer et al., 2014].At the same time, our data also suggests that there are exceptions to this highwork fragmentation and that in rare occasions, developers spend long hourswithout switching activities. For example, participant S4 was coding in the late
2.5 Results 63
afternoon for 135.7 minutes, without any break longer than 2 minutes. PlannedMeetings are the only exception to the short time periods spent on a singleactivity with an average duration of 15.8 minutes (±35.3) before switching. Ouranalysis of the data also suggests that developers are not using their computer inmost of these planned meetings. The opposite is true for informal meetings, forwhich our monitoring tool recorded user input every few minutes. It is importantto note that an activity switch, while contributing to work fragmentation, is notnecessarily a task switch. A developer might switch activities several times whileworking on the same task, e.g. switching from coding in the IDE to the webbrowser to search for API documentation or code snippets.
To better understand the high number of activity switches, we performed ann-gram analysis to identify the activities which developers often perform in asequence together. The activity pattern, which occurred most often, was a quickswitch to emails during coding tasks. This finding is supported by our results ina previous observational study, where we learnt that developers often performvery quick and short context switches during waiting times, which increases theirperceived productivity [Meyer et al., 2014]. Similarly, Amann et al. [2016] foundthat developers continue working while builds run in the background. Developersalso regularly switch away from coding to work related web browsing (22.1%),reading or writing documents (14.3%) or planning (14.2%). These switches canbe explained with the search for additional information necessary to completea task, such as a task description from an email, a quick research on the web(e.g., for a code snippet or tutorial), or reading a documentation-file. After thesequick switches, developers usually switch back to their main coding task.
We were also interested in better understanding what activities developerswere performing before they were interrupted by a co-worker, to learn where tofocus for building task resumption tools. When developers switched their activityto an informal meeting, they were emailing in 40.1% of the cases, coding in 18.1%of the cases, and browsing the web (work related) in 13.5% of the cases beforethe switch. Switches to work unrelated web browsing were most often causedduring coding tasks (35.5%) and during work related web searches (26.7%), likelyto get a quick break from work.
64Chapter 2. The Work Life of Developers:
Activities, Switches and Perceived Productivity
2.5.3 Perceived Productivity Changes?
Our third research question asks “Are there observable trends in how developersperceive productivity?”. We use the developers’ self-ratings of their productivityvia the pop-up survey to investigate this question. For each participant, weplot the perceived productivity ratings against the time of day the rating wascollected; thus, all ratings from an individual are condensed across the hours ofthe day in one plot.
From an analysis of these plots, we found that although there was a lotof variation between individuals, the plots can be categorized into three broadgroups: morning people, afternoon people, and those whose perceived productivitydipped around lunch. Figure 2.4 shows examples of these three types. The curvedregression line in the figures shows the overall pattern of what part of the dayan individual developer typically felt more or less productive with the shadedarea showing the confidence range. Morning people were rare in our sampleset (20% of all participants); Figure 2.4(a) shows S5’s perceived productivitypattern, which is our clearest example of the trend but is not very pronounced.Afternoon people (8 out of 20, 40%) may be those who are industrious later inthe day, or that feel more productive as a result of having the majority of theirwork day behind them (Figure 2.4(c)). The greater number of afternoon peoplein our sample reflected previous research that showed that information workersperceive themselves as most productive in mid-afternoon, peaking around 2-3P.M. [Mark et al., 2014]. The low-at-lunch group (35%) may see long breaks asunproductive, or they may simply lag in effectiveness as their physical processesdraw focus away from work (Figure 2.4(b)).
These graphs and numbers suggest that while information workers in generalhave diverse perceived productivity patterns, individuals do appear to followtheir own habitual patterns each day. Only for one of the twenty participants itwas not possible to determine a dominant category.
2.5 Results 65
2.5.4 What are Productive Activities?
To answer our fourth research question, “What is the relationship betweendevelopers’ activity and perceived productivity at work?”, we built explanatorymodels relating the action and activity data to the productivity ratings.
The purpose of the explanatory models is to describe which factors con-tribute to the productivity ratings reported by the study participants. For eachparticipant, we built one stepwise linear regression model for a total of 20 models.We chose linear regression because it is a simple and intuitive way to model data.The dependent variable is the reported productivity rating and the independentexplaining variables are: (1) session duration, (2) number of certain events suchas activity switches, (3) keystrokes per minute, (4) mouse clicks per minute, (5)amount of time spent in activities normalized by session length, and (6) howmuch of a session was before mid-day (noon) in percentage2. By choosing linearregression, we assume that the productivity ratings are interval data meaningthat the distance between the productivity ratings 1 and 2 is the same as thedistance between the ratings 2 and 3, and so on. To facilitate comparison acrossmodels, we specified the intercept value for all models as 4, which correspondsto an average perceived productivity.
Table 2.5 shows the results of the explanatory modeling. Each columncorresponds to the perceived productivity model of a participant and each rowcorresponds to a factor in the model. To reduce the complexity of the table,we only report the sign of the coefficients; the full coefficients are availableas supplemental material 3. A plus sign (+) in a cell indicates that a factorhas positive influence in a model; for instance, S1 reported higher productivityratings with a higher number of self-reported tasks. Similarly, a minus sign (–)indicates negative influence; for instance, S3 reported lower productivity ratingsfor higher session durations. Empty cells correspond to variables that either wereremoved as part of the stepwise regression, or were not statistically significant.An NA value indicates that an event or activity did not occur for a participant
2We chose mid-day, since a previous study found differences in knowledge workers’ activitiesbefore and after mid-day [Mark et al., 2014].
3https://www.ifi.uzh.ch/en/seal/people/meyer/personal-analytics.html
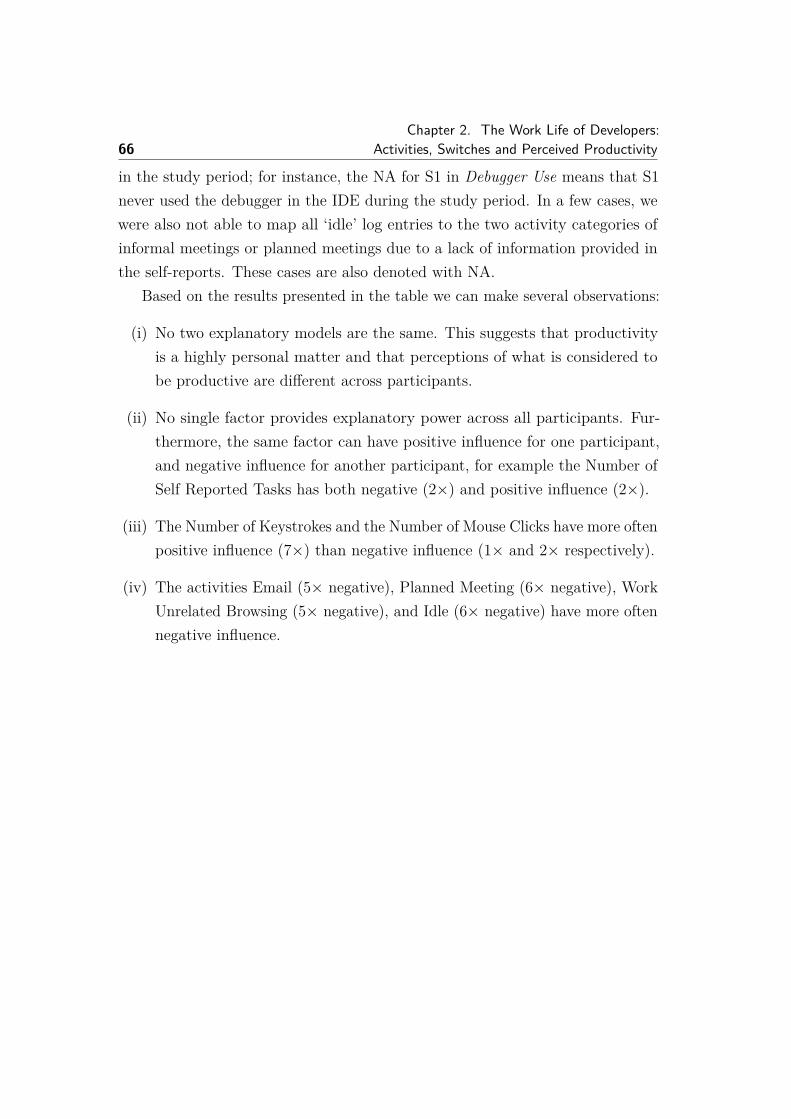
66Chapter 2. The Work Life of Developers:
Activities, Switches and Perceived Productivity
in the study period; for instance, the NA for S1 in Debugger Use means that S1never used the debugger in the IDE during the study period. In a few cases, wewere also not able to map all ‘idle’ log entries to the two activity categories ofinformal meetings or planned meetings due to a lack of information provided inthe self-reports. These cases are also denoted with NA.
Based on the results presented in the table we can make several observations:
(i) No two explanatory models are the same. This suggests that productivityis a highly personal matter and that perceptions of what is considered tobe productive are different across participants.
(ii) No single factor provides explanatory power across all participants. Fur-thermore, the same factor can have positive influence for one participant,and negative influence for another participant, for example the Number ofSelf Reported Tasks has both negative (2×) and positive influence (2×).
(iii) The Number of Keystrokes and the Number of Mouse Clicks have more oftenpositive influence (7×) than negative influence (1× and 2× respectively).
(iv) The activities Email (5× negative), Planned Meeting (6× negative), WorkUnrelated Browsing (5× negative), and Idle (6× negative) have more oftennegative influence.
2.5Results
67Table 2.5: Explanatory Productivity Models for Participants (‘+’ indicates positive, ‘-’ negative influence; ‘NA’indicates a never performed activity. Columns ‘Neg’ / ‘Pos’ count the number of times a variable had negative /positive influence. The ratings are distributed on a 7-point Likert scale: left = “not at all productive” (1), right =“very much productive” (7)).
Participant S1 S2 S3 S4 S5 S6 S7 S8 S9 S10 S11 S12 S13 S14 S15 S16 S17 S18 S19 S20Ratings(total) 45 101 62 94 40 62 80 73 89 92 51 40 76 88 71 42 62 53 100 30Ratings(discarded) 0 29 3 4 0 0 0 7 10 10 1 0 7 0 0 0 4 8 11 4Ratings(includedinmodel) 45 72 59 90 40 62 80 66 79 82 50 40 69 88 71 42 58 45 89 26
Neg Pos NA Ratings(distribution)3 3 0 SessionDuration(inhours) + − − + − +2 1 0 PercentofSessionBeforeNoon − − +
PerMinute2 2 0 #self-reportedtasks + − − +2 4 0 #activityswitches + − + + − +1 1 4 #meetings NA NA + NA NA −2 1 7 #instantmessagingswitches NA NA NA NA + NA NA NA + −1 7 0 #keystrokes + + + − + + + +2 7 0 #mouseclicks + + + + + + − + −
PercentActivity4 1 0 Dev.Coding − − − + −0 1 9 Dev.DebuggerUse NA NA NA NA NA NA NA + NA NA2 1 12 Dev.CodeReviews NA NA NA NA NA NA NA NA NA NA − NA NA − +2 0 3 Dev.VersionControl NA − NA − NA5 0 0 Email − − − − −2 3 0 Planning + + ➖ + ➖4 3 0 Read/writedocuments + + − − + − −6 0 5 Plannedmeeting NA NA − − − − NA NA − NA −3 2 9 Informalmeeting NA + NA NA NA − NA NA − NA NA NA + −2 0 8 Instantmessaging NA NA NA NA NA − NA NA NA −1 2 0 Workrelatedbrowsing ➖ + +5 0 2 Workunrelatedbrowsing − NA − − − − NA2 1 0 Other + − −2 1 4 OtherRDP NA NA − + NA − NA6 2 2 Idle − − − − + − NA − + NA
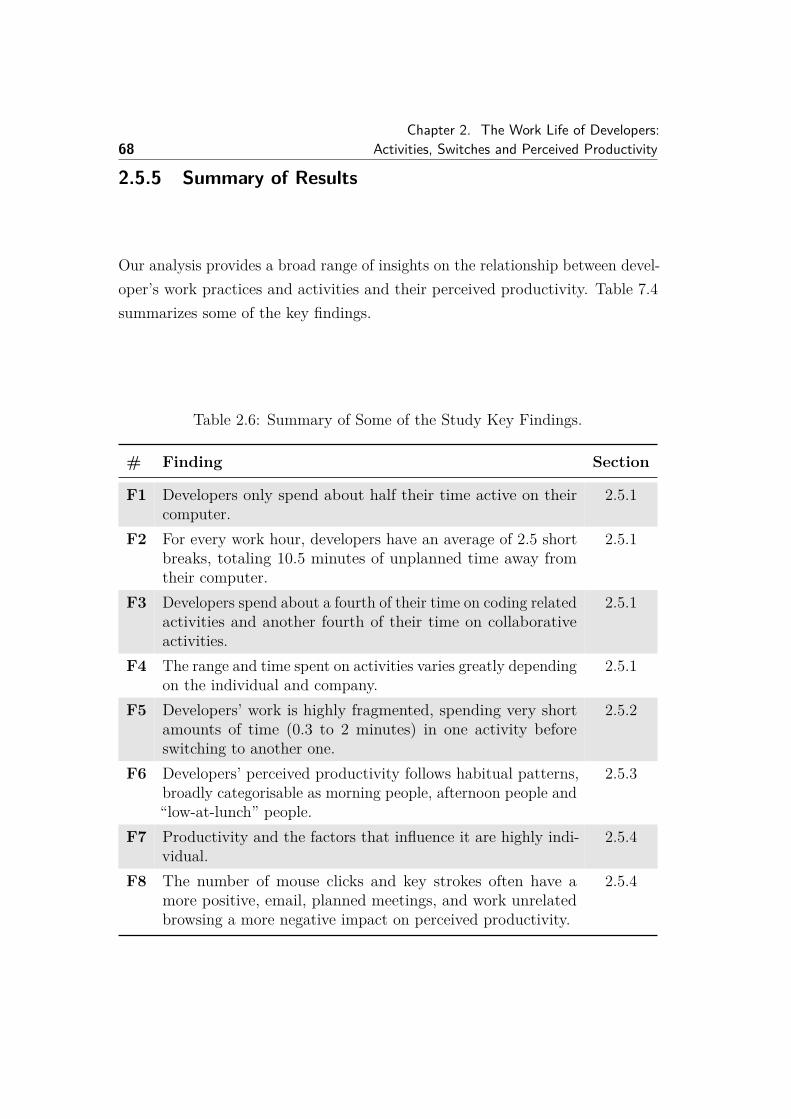
68Chapter 2. The Work Life of Developers:
Activities, Switches and Perceived Productivity
2.5.5 Summary of Results
Our analysis provides a broad range of insights on the relationship between devel-oper’s work practices and activities and their perceived productivity. Table 7.4summarizes some of the key findings.
Table 2.6: Summary of Some of the Study Key Findings.
# Finding Section
F1 Developers only spend about half their time active on theircomputer.
2.5.1
F2 For every work hour, developers have an average of 2.5 shortbreaks, totaling 10.5 minutes of unplanned time away fromtheir computer.
2.5.1
F3 Developers spend about a fourth of their time on coding relatedactivities and another fourth of their time on collaborativeactivities.
2.5.1
F4 The range and time spent on activities varies greatly dependingon the individual and company.
2.5.1
F5 Developers’ work is highly fragmented, spending very shortamounts of time (0.3 to 2 minutes) in one activity beforeswitching to another one.
2.5.2
F6 Developers’ perceived productivity follows habitual patterns,broadly categorisable as morning people, afternoon people and“low-at-lunch” people.
2.5.3
F7 Productivity and the factors that influence it are highly indi-vidual.
2.5.4
F8 The number of mouse clicks and key strokes often have amore positive, email, planned meetings, and work unrelatedbrowsing a more negative impact on perceived productivity.
2.5.4
2.6 Threats to Validity 69
2.6 Threats to Validity
The main threats to our study are construct validity threats due to the monitoringapplication we used to collect data. These, and the threats to internal and externalvalidity, are described in this section.
2.6.1 Construct Validity
The main threat comes with the metrics we base our analysis on, as it is limitedto the data we collected with our monitoring application. We believe that achronological record of application use, user inputs, and the addition of self-reported productivity, tasks, and activities provide a reasonable basis to analyzea developer’s work. Though, we cannot exclude the possibility that any otherfactors influence a developer’s work day and productivity.
Running a monitoring application in a real-world scenario might captureinaccurate data, due to bugs in the logging application or stability issues. Tomitigate this risk, we ran several test-runs in different scenarios prior to thestudy, and observed a user for several hours to compare the logged with theobserved data. No major problems with the tracker were reported during thetests or at the time of the study.
Even though the monitoring tool is able to capture a broad range of activitieson a participants’ computer, it does not capture activities away from the computer.Therefore, we asked participants to record their activities/tasks for their timeaway from the computer in the periodic self-reports. Furthermore, to captureactivities performed on secondary computers or remote desktops, we askedparticipants to install the monitoring application without the self-reportingfeature on these machines as well.
Understanding, categorizing and analyzing the data poses another threat tovalidity, especially since it is not straightforward to identify all activities fromthe collected data. For instance, mapping ‘idle’ times to self-reported breaks,planned meetings and informal meetings could not be automated. We also neededto discard outliers, such as very short work in the middle of the night or onweekends. To mitigate this risk, we did a manual mapping of activities we were
70Chapter 2. The Work Life of Developers:
Activities, Switches and Perceived Productivity
uncertain about and checked random samples of the semi-automated mapping.Assumptions made and thresholds defined were carefully discussed, based onprevious related work, and described in the paper in detail. The short interviewsat the end of the study further helped us to interpret each participants’ data andwork behavior.
2.6.2 Internal Validity
Running a monitoring application on participants’ computers might pose pri-vacy concerns to participants. To address these concerns, we tried to be verytransparent about the data we collected. The participant was shown the locationwhere the logs were saved and given the opportunity to censor them. We did notcollect information about what was being typed or clicked on, merely that theseevents were occurring. We also assured the participant that all collected datawill be anonymized and saved on password-protected devices or in locked filingcabinets.
Monitoring participants’ during their work bears the risk of changing theirbehavior. To mitigate these risks, we tried to collect as much data as possible inthe background and optimized the performance of the data collection to avoidlags, creating a non-intrusive experience for participants. Several participantsexplicitly mentioned that they usually forgot about the monitoring applicationand were only reminded when they were prompted about the self-reports.
Interrupting participants with a short survey once an hour might have influ-enced their work behavior and habits. To address these concerns, we tried to onlyshow the pop-ups when necessary and reduce the effort needed to fill them out byshowing previous responses, having quick response buttons, and auto-completionboxes. Additionally, the participant had the chance to postpone the survey incase it interrupted at an inopportune moment. The continuously very short butstable amount of time used to answer the periodic survey throughout the studyand the small variation in the number of responses per participant and day alsosuggests that participants’ behavior was not affected much and that they didnot get annoyed by the survey.
2.6 Threats to Validity 71
2.6.3 External Validity
The number of participants or the selection of participants might limit thegeneralizability of the results of this study. In particular, our participants wereall using Windows as their operating system due to our monitoring applicationbeing built for Windows. Overall though, we tried to mitigate the threats toexternal validity and generalizability by selecting participants from four differentsoftware companies of varying size, with more and less well-established products,different kinds of customers, and different stages of product development. Studieswere spread to three different countries, Canada, US, and Switzerland, and acrosshalf a year. Additionally, all participants are professionals who were studied intheir everyday, real-world work environment and not in an experimental exercise.The external validity is further strengthened by the broad range of developmentexperience of our participants, ranging from junior to senior developers withan average professional development experience of 14.2 years (±9.6, rangingfrom 0.5 to 40 years). Finally, our participants worked on projects using 7 ofthe top 10 most used programming languages according to a recent large-scalestudy [StackOverflow, 2017]. While the large-scale study also showed that 55%of all developers use Windows as an operating system and our focus on Windowsthus maps to a majority of developers, further studies with a broader participantpool are needed to assess the generalizability of our results.
Another limitation might be the study running for roughly two weeks perparticipant, as developers’ activities might vary greatly at different stages anditerations of their projects. We tried to mitigate this risk by having participantsfrom different teams at different stages of their project and iterations, and bystaggering the monitoring period between participants so that varying times ofthe year were covered. In the final interview, most participants also agreed thatthe study took part in fairly usual, and not extraordinary, work weeks.
72Chapter 2. The Work Life of Developers:
Activities, Switches and Perceived Productivity
2.7 Discussion
The results of our study shed new light on the work practices, fragmentation andperceptions of productivity of individual software developers. In the following,we discuss implications and opportunities of our findings, in particular theindividuality of productivity and its use for designing better tool support, and wereport on an exploratory analysis to predict high and low productivity sessions.
2.7.1 Individuality of Productivity
To quantify a developer’s productivity, related work predominantly focused on asingle or a small set of outcome measures, such as the lines of code or functionpoints. While these measures can be used across developers, they neglect tocapture the individual differences in the way that developers’ work as well asthe differences in their work and their perceived productivity. The results of ourstudy show that perceived productivity is in fact a very personal matter and theinfluence and impact of the factors used for our explanatory productivity modelsvaried greatly. This suggests that measures or models of productivity shouldtake into account the individual differences in what is perceived as productive ornot and capture a developer’s work more holistically rather than just by a singleoutcome measure. Such individual models could then be used to provide betterand more tailored support to developers, for instance, to foster focus and flow atwork.
At the same time, our results also show that while there are individualdifferences, there are tendencies amongst groups of software developers, forinstance, with the number of key strokes and mouse clicks having a positiveinfluence on productivity perception for 7 of the 20 participants. Similarly, weidentified types of developers with similar trends of perceived productivity overthe course of the day, including morning and afternoon people, which resemblethe morningness and eveningness types that Taillard et al. [1999] identified intheir large-scale study on people’s sleeping habits. These results suggest that itmight be possible to identify clusters of software developers with fairly similarproductivity models despite individual differences, which could then be used
2.7 Discussion 73
to provide tool support tailored to these clusters, for instance, for scheduling aproductive work day.
2.7.2 Supporting Flow and Retrospection
In our previous study, we found that developers feel particularly productivewhen they get into “the flow” without having many switches [Meyer et al., 2014].Results from this and other studies suggest that getting into the flow duringwork might not be very easy, given the high fragmentation of work and the manyshort breaks and interruptions.
At the same time, our analysis of the collected data suggests that it mightbe possible to identify individualized proxies for developer productivity, such asusing the number of mouse clicks or key strokes per minute or the time spentin work-unrelated browsing for certain developers. Knowing if a developer isproductive or unproductive at the moment by using such proxies could be usedto support getting and staying in a highly productive “flow” state. In particular,one could use this to indicate the availability of a developer for interruptionsby changing the availability status in instant messaging tools, or with a visualexternal cue to avoid external interruptions at particularly inopportune moments,similar to what Züger and Fritz [2015] suggested. Or, one could also use this toprovide awareness to the developers themselves on their flow and productivity,by indicating them when they are stuck and it might be time to ask a co-workerfor help or to take a break, or even blocking work-unrelated websites for 25minutes—similar to the PomodoroTechnique [2019]—and helping them to focuswhen they are procrastinating.
Being able to predict, to some extent, a developer’s productivity on anindividual basis could also be used to provide developers with individualizedretrospection support, in the form of daily or weekly summaries of their work.With the Quantified Self movement, more and more people are using applicationsand devices to track themselves—mostly with a focus on the non-work relatedactivities, such as sports. These persuasive technologies provide users an oppor-tunity to reflect upon their own activities and support desired improvements,such as a more active lifestyle (e.g., [Bravata et al., 2007; Consolvo et al., 2008b;
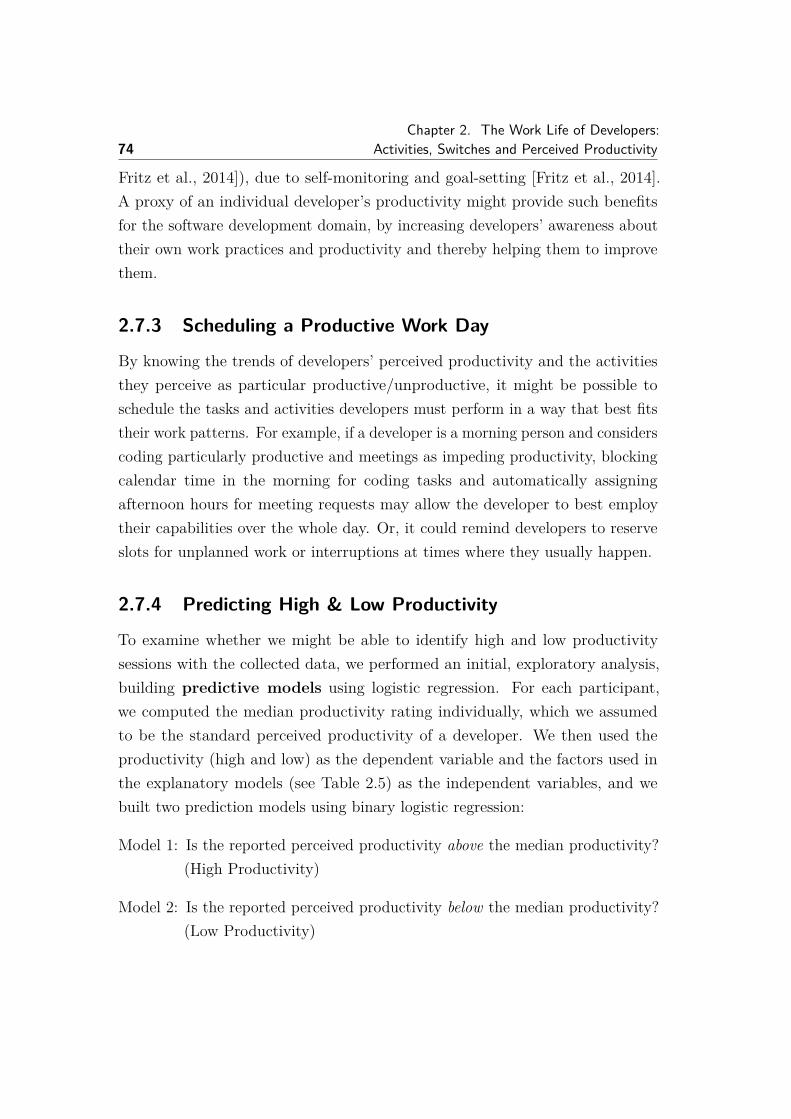
74Chapter 2. The Work Life of Developers:
Activities, Switches and Perceived Productivity
Fritz et al., 2014]), due to self-monitoring and goal-setting [Fritz et al., 2014].A proxy of an individual developer’s productivity might provide such benefitsfor the software development domain, by increasing developers’ awareness abouttheir own work practices and productivity and thereby helping them to improvethem.
2.7.3 Scheduling a Productive Work Day
By knowing the trends of developers’ perceived productivity and the activitiesthey perceive as particular productive/unproductive, it might be possible toschedule the tasks and activities developers must perform in a way that best fitstheir work patterns. For example, if a developer is a morning person and considerscoding particularly productive and meetings as impeding productivity, blockingcalendar time in the morning for coding tasks and automatically assigningafternoon hours for meeting requests may allow the developer to best employtheir capabilities over the whole day. Or, it could remind developers to reserveslots for unplanned work or interruptions at times where they usually happen.
2.7.4 Predicting High & Low Productivity
To examine whether we might be able to identify high and low productivitysessions with the collected data, we performed an initial, exploratory analysis,building predictive models using logistic regression. For each participant,we computed the median productivity rating individually, which we assumedto be the standard perceived productivity of a developer. We then used theproductivity (high and low) as the dependent variable and the factors used inthe explanatory models (see Table 2.5) as the independent variables, and webuilt two prediction models using binary logistic regression:
Model 1: Is the reported perceived productivity above the median productivity?(High Productivity)
Model 2: Is the reported perceived productivity below the median productivity?(Low Productivity)
2.7 Discussion 75
Table 2.7: Models to Predict High / Low Productivity Sessions.
We built and evaluated the models for each participant using 50 randomsplit experiments: 2/3 of the participant’s data was used for training and theremaining 1/3 of the data was used for testing the model. In total, we ran 50 ×2 × 20 + 50 = 2 050 experiments. For each experiment, we measured the successof the predictions with precision and recall. Precision represents how many ofthe returned results are relevant (correct), and recall represents how many ofthe relevant results were returned. We then averaged the precision ratings overthe 50 experiments for each model and participant to receive a single precisionrating. We did the same for recall.
76Chapter 2. The Work Life of Developers:
Activities, Switches and Perceived Productivity
Table 2.7 shows the results. In addition to the precision and recall values,we report in the Ratio columns the percentage of High productivity and Lowproductivity sessions for each participant. On average, the models have aprecision of 0.57 (High Productivity) and 0.56 (Low) and recall of 0.48 (High)and 0.43 (Low). For some participants, the precision and recall values are above0.70. The results are promising and suggest that even with a relatively smallnumber of reported productivity ratings, it is possible to build personalized,predictive productivity models. To build the models we used the session lengthand information about events (keystrokes, mouse clicks), and activities. Weexpect that with more context and data, such as active task information, windowcontents, calendar information, development experience, time of day, or possiblybiometrics, the quality of the predictions can be improved further.
2.7.5 Privacy Concerns
As with all approaches that collect personalized data on people, collectinginformation on a developer’s activities on the computer potentially raises manyprivacy concerns. Especially given the focus of our study on productivity, somepeople were skeptical and declined to participate. This indicates the sensitivityof the data and the need for further research on the privacy concerns of suchbroad, work-related data. We believe that integrating potential users early onin the design process of building such a tool is crucial to increase acceptance ofand engagement with the tool. Furthermore, we expect that the voluntary useof such applications and its ability to tailor to the individual is important forits success since it focuses on the intrinsic motivation of developers to improveor better understand themselves. Requiring the use of such tools by uppermanagement on the other hand will lead to a ‘gaming’ as previous research foundand suggested (e.g., [Treude et al., 2015]), since developers might fear that thegathered information could influence their employment and increase pressure.
2.8 Summary 77
2.8 Summary
Related work has proposed a wide variety of approaches to quantify the produc-tivity of software developers, mostly only taking a single aspect of a developers’work into account. In our paper, we present a more holistic approach to examinedevelopers’ work practices and their relation to perceived productivity. Weconducted a study with 20 professional software developers in four differentcompanies in situ, to investigate how developers spend their work days and whatactivities they perform. We applied a combination of computer logging andexperience sampling by using a background monitoring application and by lettingdevelopers answer pop-up questions every 60 minutes. The results show thatdevelopers spend their time on a wide variety of activities, about a fourth of iton collaborative activities, such as meetings or emails. On average, participantsspend only between 0.3 and 2 minutes on each activity, before switching tothe next one. They also have 2.5 short per hour and 3.3 breaks per day. Thisdemonstrates how fragmented a developer’s normal work day is.
Based on developers’ self-reports, we analyzed how their perceived produc-tivity changes throughout a work day. We found a lot of variation betweenindividuals, but that they can roughly be grouped into morning people, low-at-lunch people and afternoon people. We also correlated perceived productivitywith activities and user input using a stepwise linear regression model per par-ticipant. The data suggested that productivity is a personal matter and thatperceptions vary greatly as different factors in a developer’s work day can in-fluence productivity either positively or negatively. More user input was oftenassociated with a positive, while emails, planned meetings and work unrelatedwebsites were most often associated with a negative perception of productivity.Based on our findings, we propose a number of design approaches and tools tohelp increase developer productivity. For instance, by supporting developersto get into and stay in “the flow”, by reducing interruptions at inopportunemoments and by helping them to focus when they are procrastinating. Finally,we ran an exploratory analysis of predicting productivity for individuals, basedon their computer usage. The results are promising and suggest that even with
78Chapter 2. The Work Life of Developers:
Activities, Switches and Perceived Productivity
a relatively small number of reported productivity ratings, it is possible to buildpersonalized, predictive productivity models. In the future, we plan to work onimproving the quality of these predictions by including more context and data,such as active task information, experience, time of the day, and biometrics.
2.9 AcknowledgmentsThe authors would like to thank the study participants and all of our reviewersfor their insightful remarks. This work was funded in part by ABB, SNF andNSERC.
3Characterizing Software
Developers by Perceptions ofProductivity
André N. Meyer, Thomas Zimmermann, Thomas FritzPublished at the 2017 ESEM Conference on Empirical Software Engineering and
Measurement,Contribution: Study design and execution, participant recruitment, data
collection, partial data analysis, and paper writing
Abstract
Understanding developer productivity is important to deliver software on timeand at reasonable cost. Yet, there are numerous definitions of productivityand, as previous research found, productivity means different things to different
80 Chapter 3. Characterizing Software Developers by Perceptions of Productivity
developers. In this paper, we analyze the variation in productivity perceptionsbased on an online survey with 413 professional software developers at Microsoft.Through a cluster analysis, we identify and describe six groups of developerswith similar perceptions of productivity: social, lone, focused, balanced, leading,and goal-oriented developers. We argue why personalized recommendations forimproving software developers’ work is important and discuss design implicationsof these clusters for tools to support developers’ productivity.
3.1 Introduction
Understanding, measuring and optimizing software developers’ productivity isimportant to deliver software on time and at reasonable cost and quality. Previouswork introduced numerous measures of productivity that vary by their focuson specific outputs of development work, such as lines of code [Devanbu et al.,1996; Walston and Felix, 1977], function points [Jones, 1994], or completedtasks [Zhou and Mockus, 2010], over time. Other researchers have looked atorganizational factors and their impact on developer productivity, such as theteam [Blackburn et al., 1996; Boehm et al., 2000; Melo et al., 2011] and workplacecharacteristics [DeMarco and Lister, 2013]. While these measures and factors canbe valuable to compare certain aspects of productivity, they neglect to capturethe many differences in perceptions of productivity as well as the differencesin developers’ work, roles and habits. By investigating developers’ perceptionsof productivity, several researchers concluded that developers are different inwhat they consider as productive or unproductive [Johnson et al., 2003; Meloet al., 2011; Meyer et al., 2014; Vasilescu et al., 2016b]. Yet, little is knownabout the characteristics, the variation, and the commonalities in developers’productivity perceptions. A better understanding of these aspects of developers’productivity perceptions can help to provide better and more tailored support todevelopers. In this paper, we explore the characteristics of developers’ perceptionsof productivity and the clusters of developers with similar perceptions. We reporton the results from an online survey with 413 professional software developers atMicrosoft. We show that developers can roughly be clustered into six groups with
3.2 Related Work 81
similar perceptions—social, lone, focused, balanced, leading, and goal-orienteddeveloper—thus allowing to abstract and simplify the variety of individualproductivity perceptions. We characterize these groups based on the aspects thatdevelopers perceive to influence their productivity positively or negatively, andby the measures developers are interested in to reflect about their productivity.We discuss the implications of our clusters on software development and theirpotential in optimizing developers’ productivity and support tools.
3.2 Related Work
To avoid repetitions in this thesis, we present and summarize related work ondeveloper productivity and factors that influence it in Section 1.6 of the synopsis.
3.3 Methodology
To explore developers’ productivity perceptions, in particular the variationsand similarities amongst developers, we designed and conducted a survey andanalyzed the collected answers from 413 participants.
3.3.1 Data Collection
We conducted an online survey, consisting of four main questions about produc-tivity perceptions, at Microsoft.
Survey Design. The first two questions Q1 and Q2 asked the participants todescribe a productive and an unproductive work day in two words each (“Pleasedescribe what a productive work day is to you in two words.”, “Please describe whatan unproductive work day is to you in two words.”). We prompted users for twokeywords each to foster more than one precise definition of productivity, similarto what we applied in a previous study [Meyer et al., 2014]. The third questionQ3 asked the agreement with statements on factors that might affect productivity.The last question Q4 asked about the interestingness of productivity measures
82 Chapter 3. Characterizing Software Developers by Perceptions of Productivity
at work. The order of the questions was chosen to not bias the participants whenthey described productive and unproductive work days (Q1 and Q2), beforeshowing them the list of statements and measures (Q3 and Q4). The completesurvey can be found as supplementary material . None of the questions wererequired to be answered and participants could stop the survey at any point intime.
Productivity perceptions (Q3). For question Q3, “Please rate your agreementwith each of the following statements”, we used a symmetric, five-point Likert scalefrom strongly agree (5) to strongly disagree (1) to ask about the agreement with 20statements on when people feel productive, for example, “I feel productive whenI write code.” The statements were selected from related work that analyzed theimpact of various work patterns on productivity. We focused on statements aboutactivities software developers pursue during a work day and the fragmentationof their work. Specifically, we asked participants about the perceived relationbetween productivity and coding related activities (that is, their main workactivity) [Albrecht, 1979; Meyer et al., 2014]; social activities such as emails [Market al., 2016b], meetings [Meyer et al., 2014], and helping co-workers [Chong andSiino, 2006; Meyer et al., 2014]; work unrelated activities such as breaks [Epsteinet al., 2016a]; the fragmentation of their work such as the impact of distractionsand multi-tasking [DeMarco and Lister, 2013; González and Mark, 2004; Market al., 2016b]; the time of the day [Mark et al., 2014; Sach et al., 2011; Spira andFeintuch, 2005]; and their happiness at work [Graziotin et al., 2014a; Khan et al.,2011].
Productivity measures (Q4). For question Q4, “Please rate how interestingeach of the following items would be for you to reflect on your work day or workweek”, we used a symmetric, five-point Likert scale from extremely interesting(5) to not at all interesting (1) to ask about the interestingness of 30 potentialmeasures of productivity to reflect about work, such as “The time I spent coding.”or “The number of emails I sent.” The measures were selected as follows: for thecategories, which we identified for Q3 from related work, we selected measures
3.3 Methodology 83
related to how much time was spent on an activity/event and the total numberof times an activity/event occurred. We further added measures related to theoverall time spent on the computer and within various applications, and thetasks worked on, which developers in another study on productivity consideredto be most relevant [Meyer et al., 2014].
Participants. We advertised the survey by sending personalized invitationemails to 1600 professional software developers within Microsoft. To incentivizeparticipation, we held a raffle for two US$ 50 gift certificates. In total, 413 peopleparticipated in the survey (response rate of 25.8%); 91.5% of the participantsreported their role to be individual contributor, 6.8% team lead or manager, and1.7% stated they are neither. Participants had an average of 9.6 years (±7.5,ranging from 0.3 to 36) of professional software development experience.
3.3.2 Data Analysis
We used the responses to Q3 to group participants with similar perceptions ofproductivity together. First, we normalized the responses. When respondingto surveys, some participants are more positive than others, which can leadto biases in the responses. For example, Alice might center her responses tothe question Q3 around the response to “agree”, while Bob tends to center hisresponses around the response “neutral”. To correct for such personal tendencies,we normalized responses to Q3 and Q4 as follows. We treated the scale as numericand for each survey participant we computed the median response for Q3 andQ4 respectively: medianQ3 and medianQ4. We then subtracted the median fromthe responses and computed the sign. More formally, for the response rq,I to aquestion q and item I, we normalize with sign(rq,I – medianq). As a result, we endup with three categories: A value of +1 indicates that a participant respondedmore positively about an item than for most of the other items (HIGHER).A value of –1 indicates that a participant was more negative about an item(LOWER). A value of 0 indicates that a participant was neutral towards anitem. We used medians instead of means because they more effectively captureneutral responses as zero. Next, we clustered participants into groups using
84 Chapter 3. Characterizing Software Developers by Perceptions of Productivity
the pamk function from the fpc package in R. The input was the normalizedresponses to Q3. The pamk function is a wrapper function to the commonlyused pam clustering function. The wrapper computes the optimal number ofclusters. In our case, the optimal number of clusters was six. The resultingclusters — social, lone, focused, balanced, leading, and goal-oriented developers—are discussed in the next section. Finally, to describe the inferred groups, weused the responses to questions Q1, Q2, and Q3. We created comparison wordclouds for the responses to Q1 and Q2 using the wordcloud package in R. Theseword clouds depict the relative frequency of the most frequently used words foreach cluster, with more frequently used words being displayed in a bigger fontsize. Furthermore, we used the responses to Q4 to identify the measures thatdevelopers of a cluster are interested in.
3.4 Results
We identified the following six clusters based on our analysis of Q3. We furtherdescribe them based on the responses from Q1 (see the word clouds in Figure 3.1,one color per cluster), Q2 (Figure 3.2) and Q4:
1. The social developers (C1) feel productive when helping coworkers, collab-orating and doing code reviews. To get things done, they come early towork or work late and try to focus on a single task.
2. The lone developers (C2) avoid disruptions such as noise, email, meetings,and code reviews. They feel most productive when they have little to nosocial interactions and when they can work on solving problems, fixingbugs or coding features in quiet and without interruptions. To reflect aboutwork, they are mostly interested in knowing the frequency and duration ofinterruptions they encountered.
3. The focused developers (C3) feel most productive when they are workingefficiently and concentrated on a single task at a time. They are feelingunproductive when they are wasting time and spend too much time on
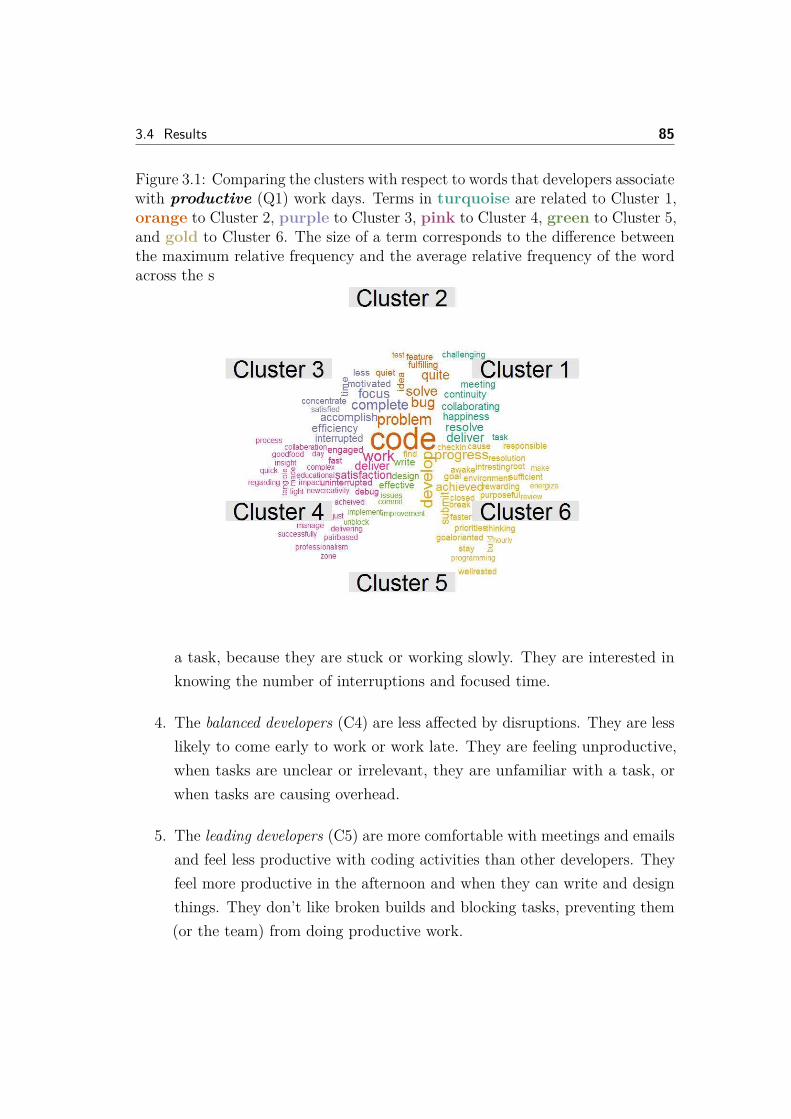
3.4 Results 85
Figure 3.1: Comparing the clusters with respect to words that developers associatewith productive (Q1) work days. Terms in turquoise are related to Cluster 1,orange to Cluster 2, purple to Cluster 3, pink to Cluster 4, green to Cluster 5,and gold to Cluster 6. The size of a term corresponds to the difference betweenthe maximum relative frequency and the average relative frequency of the wordacross the six clusters.
a task, because they are stuck or working slowly. They are interested inknowing the number of interruptions and focused time.
4. The balanced developers (C4) are less affected by disruptions. They are lesslikely to come early to work or work late. They are feeling unproductive,when tasks are unclear or irrelevant, they are unfamiliar with a task, orwhen tasks are causing overhead.
5. The leading developers (C5) are more comfortable with meetings and emailsand feel less productive with coding activities than other developers. Theyfeel more productive in the afternoon and when they can write and designthings. They don’t like broken builds and blocking tasks, preventing them(or the team) from doing productive work.
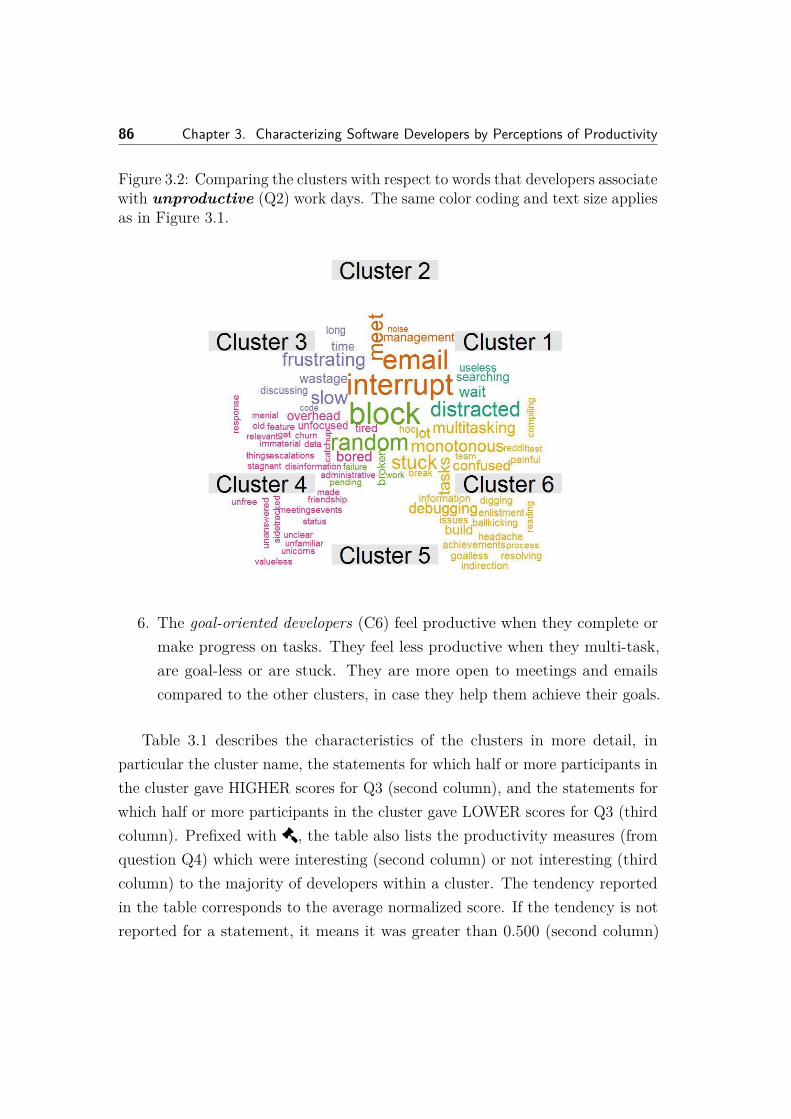
86 Chapter 3. Characterizing Software Developers by Perceptions of Productivity
Figure 3.2: Comparing the clusters with respect to words that developers associatewith unproductive (Q2) work days. The same color coding and text size appliesas in Figure 3.1.
6. The goal-oriented developers (C6) feel productive when they complete ormake progress on tasks. They feel less productive when they multi-task,are goal-less or are stuck. They are more open to meetings and emailscompared to the other clusters, in case they help them achieve their goals.
Table 3.1 describes the characteristics of the clusters in more detail, inparticular the cluster name, the statements for which half or more participants inthe cluster gave HIGHER scores for Q3 (second column), and the statements forwhich half or more participants in the cluster gave LOWER scores for Q3 (thirdcolumn). Prefixed with ©, the table also lists the productivity measures (fromquestion Q4) which were interesting (second column) or not interesting (thirdcolumn) to the majority of developers within a cluster. The tendency reportedin the table corresponds to the average normalized score. If the tendency is notreported for a statement, it means it was greater than 0.500 (second column)
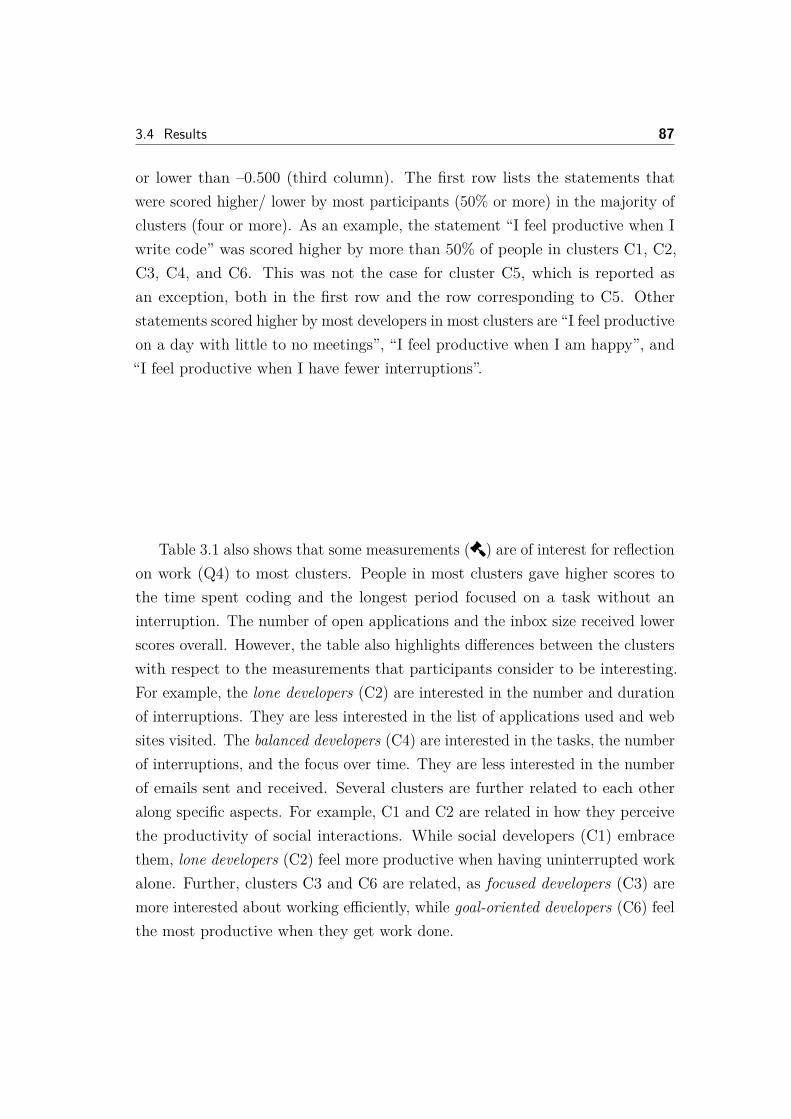
3.4 Results 87
or lower than –0.500 (third column). The first row lists the statements thatwere scored higher/ lower by most participants (50% or more) in the majority ofclusters (four or more). As an example, the statement “I feel productive when Iwrite code” was scored higher by more than 50% of people in clusters C1, C2,C3, C4, and C6. This was not the case for cluster C5, which is reported asan exception, both in the first row and the row corresponding to C5. Otherstatements scored higher by most developers in most clusters are “I feel productiveon a day with little to no meetings”, “I feel productive when I am happy”, and“I feel productive when I have fewer interruptions”.
Table 3.1 also shows that some measurements (©) are of interest for reflectionon work (Q4) to most clusters. People in most clusters gave higher scores tothe time spent coding and the longest period focused on a task without aninterruption. The number of open applications and the inbox size received lowerscores overall. However, the table also highlights differences between the clusterswith respect to the measurements that participants consider to be interesting.For example, the lone developers (C2) are interested in the number and durationof interruptions. They are less interested in the list of applications used and websites visited. The balanced developers (C4) are interested in the tasks, the numberof interruptions, and the focus over time. They are less interested in the numberof emails sent and received. Several clusters are further related to each otheralong specific aspects. For example, C1 and C2 are related in how they perceivethe productivity of social interactions. While social developers (C1) embracethem, lone developers (C2) feel more productive when having uninterrupted workalone. Further, clusters C3 and C6 are related, as focused developers (C3) aremore interested about working efficiently, while goal-oriented developers (C6) feelthe most productive when they get work done.
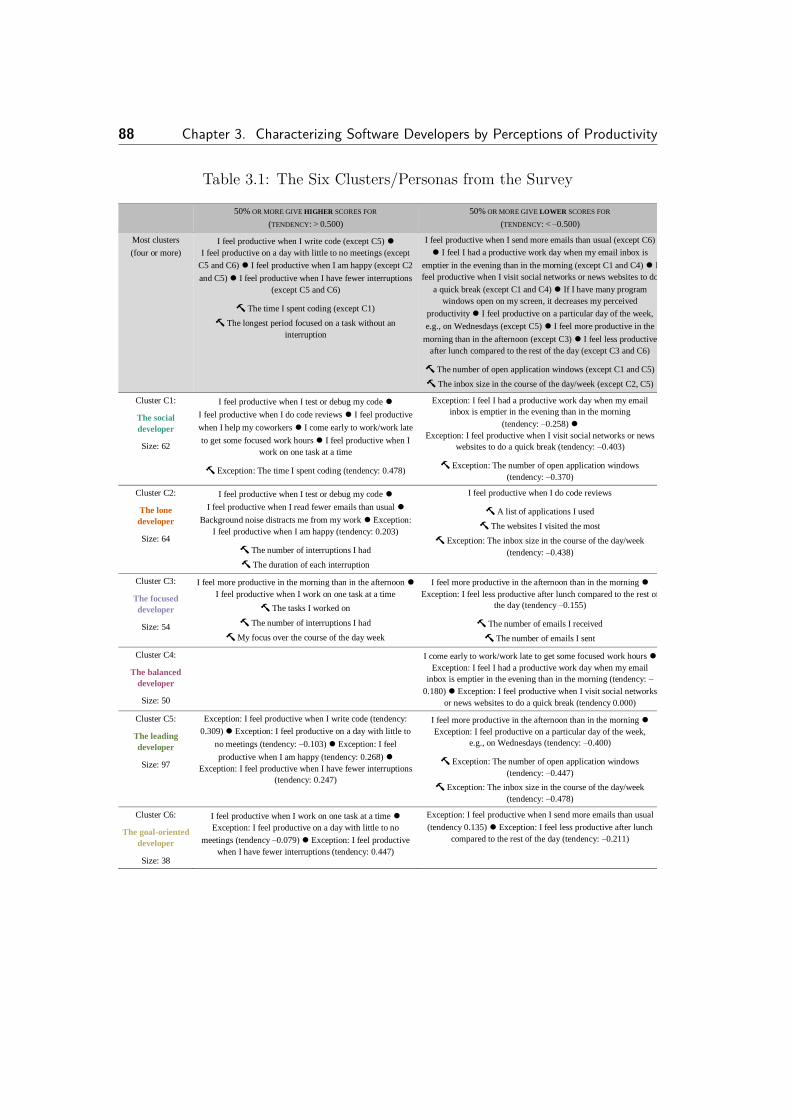
88 Chapter 3. Characterizing Software Developers by Perceptions of Productivity
Table 3.1: The Six Clusters/Personas from the Survey
50% OR MORE GIVE HIGHER SCORES FOR
(TENDENCY: > 0.500)
50% OR MORE GIVE LOWER SCORES FOR
(TENDENCY: < –0.500)
Most clusters
(four or more)
I feel productive when I write code (except C5) ⚫
I feel productive on a day with little to no meetings (except
C5 and C6) ⚫ I feel productive when I am happy (except C2
and C5) ⚫ I feel productive when I have fewer interruptions
(except C5 and C6)
🔨 The time I spent coding (except C1)
🔨 The longest period focused on a task without an
interruption
I feel productive when I send more emails than usual (except C6)
⚫ I feel I had a productive work day when my email inbox is
emptier in the evening than in the morning (except C1 and C4) ⚫ I
feel productive when I visit social networks or news websites to do
a quick break (except C1 and C4) ⚫ If I have many program
windows open on my screen, it decreases my perceived
productivity ⚫ I feel productive on a particular day of the week,
e.g., on Wednesdays (except C5) ⚫ I feel more productive in the
morning than in the afternoon (except C3) ⚫ I feel less productive
after lunch compared to the rest of the day (except C3 and C6)
🔨 The number of open application windows (except C1 and C5)
🔨 The inbox size in the course of the day/week (except C2, C5)
Cluster C1:
The social
developer
Size: 62
I feel productive when I test or debug my code ⚫
I feel productive when I do code reviews ⚫ I feel productive
when I help my coworkers ⚫ I come early to work/work late
to get some focused work hours ⚫ I feel productive when I
work on one task at a time
🔨 Exception: The time I spent coding (tendency: 0.478)
Exception: I feel I had a productive work day when my email
inbox is emptier in the evening than in the morning
(tendency: –0.258) ⚫
Exception: I feel productive when I visit social networks or news
websites to do a quick break (tendency: –0.403)
🔨 Exception: The number of open application windows
(tendency: –0.370)
Cluster C2:
The lone
developer
Size: 64
I feel productive when I test or debug my code ⚫
I feel productive when I read fewer emails than usual ⚫
Background noise distracts me from my work ⚫ Exception:
I feel productive when I am happy (tendency: 0.203)
🔨 The number of interruptions I had
🔨 The duration of each interruption
I feel productive when I do code reviews
🔨 A list of applications I used
🔨 The websites I visited the most
🔨 Exception: The inbox size in the course of the day/week
(tendency: –0.438)
Cluster C3:
The focused
developer
Size: 54
I feel more productive in the morning than in the afternoon ⚫
I feel productive when I work on one task at a time
🔨 The tasks I worked on
🔨 The number of interruptions I had
🔨 My focus over the course of the day week
I feel more productive in the afternoon than in the morning ⚫
Exception: I feel less productive after lunch compared to the rest of
the day (tendency –0.155)
🔨 The number of emails I received
🔨 The number of emails I sent
Cluster C4:
The balanced
developer
Size: 50
I come early to work/work late to get some focused work hours ⚫
Exception: I feel I had a productive work day when my email
inbox is emptier in the evening than in the morning (tendency: –
0.180) ⚫ Exception: I feel productive when I visit social networks
or news websites to do a quick break (tendency 0.000)
Cluster C5:
The leading
developer
Size: 97
Exception: I feel productive when I write code (tendency:
0.309) ⚫ Exception: I feel productive on a day with little to
no meetings (tendency: –0.103) ⚫ Exception: I feel
productive when I am happy (tendency: 0.268) ⚫
Exception: I feel productive when I have fewer interruptions
(tendency: 0.247)
I feel more productive in the afternoon than in the morning ⚫
Exception: I feel productive on a particular day of the week,
e.g., on Wednesdays (tendency: –0.400)
🔨 Exception: The number of open application windows
(tendency: –0.447)
🔨 Exception: The inbox size in the course of the day/week
(tendency: –0.478)
Cluster C6:
The goal-oriented
developer
Size: 38
I feel productive when I work on one task at a time ⚫
Exception: I feel productive on a day with little to no
meetings (tendency –0.079) ⚫ Exception: I feel productive
when I have fewer interruptions (tendency: 0.447)
Exception: I feel productive when I send more emails than usual
(tendency 0.135) ⚫ Exception: I feel less productive after lunch
compared to the rest of the day (tendency: –0.211)
3.5 Discussion 89
3.5 Discussion
Understanding how developers perceive productivity is important to bettersupport them and foster productivity. The six clusters and their characteristicsprovide relevant insights into groups of developers with similar productivityperceptions that can be used to optimize the work and flow on the team andthe individual level. The differences between software developers’ preferredcollaboration and work styles show that not all developers are alike, and thatthe cluster an individual or team belongs to could be a basis for tailoring actionsfor improving their work and productivity.
On the team level, it might, for instance, be most beneficial to provide aquiet, less interruption-prone office space to lone and focused developers (C2and C3) and seat social developers (C1) in open offices. Similarly, a teammight benefit from an increased awareness about each members’ communicationpreferences, to reduce ad-hoc meetings for lone and focused developers (C2 andC3) or use more asynchronous communication where they can choose when torespond to an inquiry. The group of developers can be further beneficial fortask assignment. For example, an exploration task for a new product that israther open without clear goals and that requires a lot of discussion might beless suitable for a goal-oriented (C6), a lone (C2) or a balanced developer (C4).
On the individual level, developers might benefit from tailored user experi-ences and feature sets for software development tools. For instance, a tool to fosterproductive work and avoid interruptions could block emails and instant messagingnotifications for the lone developer (C2) while they are coding, but allow themfor the social developer (C1), similar to what was previously suggested [Agapieet al., 2016]. Similarly, the code review or build experience could be adjustedbased on different productivity perceptions. In addition, the clusters could beused for advice tailored to specific groups of developers, e.g.,, recommend thefocused developer (C3) to come to work early to have uninterrupted work time,or suggest the balanced developer (C4) to take a break to avoid boredom andtiredness [Epstein et al., 2016a]. The clusters can help to quantify the individualproductivity of developers more accurately, by considering what matters most to
90 Chapter 3. Characterizing Software Developers by Perceptions of Productivity
them and depending on their perceptions of productivity. For example, a leadingdeveloper (C5) is likely feeling much more productive after a day with multiplemeetings spread over the day, compared to the focused developer (C3), who onlyhas little time to focus on the tasks in-between these meetings.
Overall, the identified clusters and the aspects that differentiate these clusters,such as goal-orientation, single-task focus or socialness, are a first step towards aset of “productivity traits” of developers. Similar to the big five personality traits(OCEAN) [John and Srivastava, 1999] that help to understand other people’spersonality, the self-assessment along such productivity traits can provide usefulinformation for understanding oneself or other developers and for optimizing thework individually as well as in teams.
3.6 Threats to Validity
External validity. Due to the selection of participants, as all work for the samecompany, the results might not generalize to other software development contexts.We tried to mitigate this threat by advertising the survey to professional softwaredevelopers in different product teams within Microsoft, at different stages intheir projects, and with varying amounts of experience; resulting in a morediverse set of participants. By providing the survey questions, we encourageother researchers and practitioners to replicate the study in other companies.
Construct validity. The selection of questions that we asked in the surveyalso impacts the results. For example, questions about different dimensions ofproductivity, might lead to a different clustering. We created the questions basedon factors that we identified in related work and from our previous experience withsurveying and interviewing developers about their perceptions and measuringof productivity [Meyer et al., 2014]. The choice of clustering algorithm andapproach of using questions Q1 to Q3 to describe the inferred clusters might alsohave influenced the results. Future work is needed to analyze the robustness andcompleteness of the productivity statements and clusters.
3.7 Conclusion 91
3.7 ConclusionDifferent to previous work that suggested numerous productivity measures andfound that perceptions of productivity can vary greatly between developers, ourresearch provides an exploratory first step into identifying commonalities andunderlying categories of developers’ productivity perceptions. Based on theclustering of developers’ answers to productivity statements mentioned in relatedwork, we identified and characterized an initial set of six such categories anddiscussed their potential to improve the work and flow of software developersand their teams.
3.8 AcknowledgementsThe authors would like to thank the study participants.

4Today was a Good Day: The
Daily Life of SoftwareDevelopers
André N. Meyer, Earl T. Barr, Christian Bird, Thomas ZimmermannAccepted in the 2019 IEEE Transactions on Software Engineering Journal,
Contribution: Data analysis and paper writing
AbstractWhat is a good workday for a software developer? What is a typical workday?We seek to answer these two questions to learn how to make good days typical.Concretely, answering these questions will help to optimize development processesand select tools that increase job satisfaction and productivity. Our work adds toa large body of research on how software developers spend their time. We reportthe results from 5971 responses of professional developers at Microsoft, who
94 Chapter 4. Today was a Good Day: The Daily Life of Software Developers
reflected about what made their workdays good and typical, and self-reportedabout how they spent their time on various activities at work. We developedconceptual frameworks to help define and characterize developer workdays fromtwo new perspectives: good and typical. Our analysis confirms some findingsin previous work, including the fact that developers actually spend little timeon development and developers’ aversion for meetings and interruptions. It alsodiscovered new findings, such as that only 1.7% of survey responses mentionedemails as a reason for a bad workday, and that meetings and interruptions are onlyunproductive during development phases; during phases of planning, specificationand release, they are common and constructive. One key finding is the importanceof agency, developers’ control over their workday and whether it goes as plannedor is disrupted by external factors. We present actionable recommendations forresearchers and managers to prioritize process and tool improvements that makegood workdays typical. For instance, in light of our finding on the importance ofagency, we recommend that, where possible, managers empower developers tochoose their tools and tasks.
4.1 Introduction
Satisfied developers are more productive and write better code [Amabile andKramer, 2011; Graziotin et al., 2014a,b, 2015a]. Good workdays increase developerjob satisfaction [Sheldon et al., 1996]. Understanding what differentiates goodworkdays from other days, especially atypical days, will help us make gooddays typical. This work seeks just this understanding. Understanding typicaland atypical workdays will enable us to establish a baseline for comparisonwith other developer workdays and make more informed decisions about processimprovements.
Development is a multistage process with complicated interactions across thestages. These interactions mean that we cannot consider each stage in isolation,but need consider the process as a whole. We need a holistic understanding of howsoftware developers spend their time at work. Without a holistic understanding,one might think that developers, because they “develop”, spend most of theirtime writing code. However, developers spend surprisingly little time with coding,
4.1 Introduction 95
9% to 61% depending on the study [Astromskis et al., 2017; Gonçalves et al.,2011; Meyer et al., 2017a, 2014; Perry et al., 1994b; Singer et al., 2010; Xiaet al., 2017]. Instead, they spend most of their time collecting the informationthey need to fulfill development tasks through meetings, reading documentationor web searches, helping co-workers, and fulfilling administrative duties. Theconventional wisdom is that email is a big source of distraction and frustration.We show that, to the contrary, email activity has little effect on a workday’sperceived goodness (Section 4.5.1). Hence, focusing just on one developmentactivity can miss important opportunities for productivity improvements.
We have therefore set out to better understand how to make good days typicalto increase developer job satisfaction and productivity. Since a review of existingresearch revealed no work that attempted to define or quantify what a good andtypical developer workday is, we studied developers’ workdays from these twonew perspectives 1. We conducted a large-scale survey at Microsoft and askedprofessional software developers whether they consider their previous workday tobe good and typical, and related their answers and reflections to their self-reportsof the time spent on different activities at work. From now on, when we describegood and typical developer workdays, we refer to developers’ self-reports; wediscuss the validity of this method in Section 4.4.3.
We received 5971 responses from professional software developers acrossa four month period. From these responses, we developed two conceptualframeworks to characterize developers’ good and typical workdays. When wequantitatively analyzed the collected data, we found that two main activitiescompete for developers’ attention and time at work: their main coding tasksand collaborative activities. On workdays that developers consider good (60.6%)and typical (64.2%), they manage to find a balance between these two activities.This highlights the importance of agency, one of our key findings that describesdevelopers’ ability to control their workdays, and how much they are randomizedby external factors such as unplanned bugs, inefficient meetings, infrastructureissues.
1We intentionally do not list our own definitions of good and typical workdays since oneaim of this work is to understand the characteristics of these workdays, and how developersassess and define them.
96 Chapter 4. Today was a Good Day: The Daily Life of Software Developers
Our work provides researchers and practitioners with a holistic perspectiveon factors that influence developers’ workdays, job satisfaction and productivity.In the paper, we discuss five main recommendations for managers to makegood workdays typical. Overall, it is important to remove and reduce obstaclesthat block developers from creating value and making progress. Our findingsconfirm and extend recent related work (e.g., [Graziotin et al., 2017; Mark et al.,2008b; Meyer et al., 2014]), including that the most important impediments thatrequire attention are inefficient meetings, constant interruptions, unstable andslow systems and tools, and administrative workloads. Conversely, some factorsbelieved anecdotally to be a problem, such as email, in fact have little effecton how good or typical a workday is perceived to be. Since we found evidencethat meetings and interruptions are not bad overall as their impact dependson the project phase, we conclude that they do not have to be minimized atall times. For instance, we can better support the scheduling of meetings andhelp find more optimal slots depending on the project phase or current workdaytype. Also, improving developers’ perceptions of the importance and value ofcollaborative work can reduce their aversion against activities that take timeaway from coding. For example, managers can include developers’ contributionsto other teams or (open-source) projects when they evaluate them in performancereviews. Finally, giving developers enough control over how they manage theirwork time is important to foster job satisfaction at work. This can, for instance,be achieved by allowing flexibility in selecting appropriate work hours, locationsof work, and tasks to work on.
The main contributions of this paper are:• Two conceptual frameworks that characterize developers’ workdaysfrom two new perspectives: what makes developers consider workdays goodand typical.
• Results from 5971 self-reports from professional software developersabout how they spend their time at work. The number of responsesis an order of magnitude bigger than previous work and allows us toreplicate results from previous work at scale, and to uncover nuances andmisconceptions in developers’ work.
4.2 Research Questions 97
• Quantitative evidence identifying factors that impact good and typicalworkdays for software developers and the relationships between these factors,workday types, and time per activity.
• Recommendations that help researchers and practitioners to prioritizeprocess and tool improvements that make good workdays typical.
4.2 Research Questions
Our research is guided by the following main research question: What is agood and typical workday for developers? We formulated subquestions toapproach the main research question from different perspectives. First, we wantto find out qualitatively what factors impact what developers consider as goodand typical in a workday:
RQ1: What factors influence good and typical developer workdays and howdo they interrelate?While much related work has looked into how much time developers spend
on various work activities (Section 4.3), we want to investigate how developersspend their time differently on days they consider good and typical:
RQ2: How do developers spend their time on a good and typical workday?The large dataset of 5971 survey responses allows us to compare the time
a developer spends on different activities with other developers. We want togroup developers with similar workdays together and use other responses fromthe survey to describe and characterize these groups as workday types:
RQ3: What are the different types of workdays and which ones are moreoften good and typical?As described in the related work section, developers spend a lot of time at
work in development unrelated activities, such as meetings and interruptions.We want to further investigate the impact of these collaborative aspects on goodand typical workdays:
RQ4: How does collaboration impact good and typical workdays?
98 Chapter 4. Today was a Good Day: The Daily Life of Software Developers
4.3 Related Work
Related work can broadly be classified into research on developers’ workdaysand factors that impact these workdays. To avoid repetitions in this thesis, wepresent and summarize the related work in Section 1.6 of the synopsis. Specific tothis publication is previous work on how job satisfaction and happiness influencedevelopers’ work, which is why it is presented below.
4.3.1 Influence of Job Satisfaction on Developers’ Workdays
What is often left out from research about factors influencing workdays are humanaspects, such as developers’ job satisfaction and happiness. Job satisfaction isa developer’s attitude towards the general fulfillment of his/her expectations,wishes and needs from the work that he/she is performing. One importantfactor that influences job satisfaction is the sum of good and bad workdays,which we define as the degree to which a developer is happy about his/herimmediate work situation on the granularity of a single day. The developer’saffective states, such as subjective well-being, feelings, emotions and mood, allimpact the assessment of a good or bad workday. Positive affective states areproxies of happiness and were previously shown to have a positive effect ondevelopers’ problem solving skills and productivity [Amabile and Kramer, 2011;Graziotin et al., 2014a,b; Müller and Fritz, 2015]. Similarly, aspects of the jobthat motivate developers or tasks that bring them enjoyment were also shownto lead to higher job satisfaction and productivity [Beecham et al., 2008; Kimand Choe, 2019]. Self-reported satisfaction levels of knowledge workers [Market al., 2016b], and more specifically, self-reported affective states of softwaredevelopers [Graziotin et al., 2015a], have further been shown to be stronglycorrelated with productivity and efficiency. Similarly, developers’ moods havebeen shown to influence developers’ performance on performing programmingtasks, such as debugging [Khan et al., 2011]. However, it is unclear how these andother factors influencing developers’ workdays affect their assessment of whethera workday is good or bad. Ideally, we would use this knowledge to increase thenumber of good, positive workdays and reduce the negative ones.
4.4 Study Design 99
Previous psychological research connected positive emotions with good work-days [Amabile and Kramer, 2011] and satisfaction [Fisher, 2000]. When studyingthe relationship between positive emotions and well-being, hope was found to bea mediator [Fredrickson et al., 2008; Ouweneel et al., 2012]. Positive emotions atwork were further shown to increase workers’ openness to new experiences [Kahnand Isen, 1993], to broaden their attention and thinking [Fredrickson, 1998; Ouwe-neel et al., 2012], and to increase their level of vigor and dedication [Ouweneelet al., 2012], yielding higher work engagement and better outcomes. Sheldonet al. [1996] have further shown that on good days, students feel they have higherlevels of autonomy and competence, which also results in better outcomes. Onegoal of the reported study is to learn how developers assess good workdays andwhat factors influence their assessment. Amongst other results, we found that ongood workdays, developers succeed at balancing development and collaborativework, and feel having spent their time efficiently and worked on something ofvalue (Section 4.5.1).
There is also research indicating that good and typical workdays are related.For example, knowledge workers were shown to be more satisfied when performingroutine work [Mark et al., 2014; Melamed et al., 1995]. Contrarily, a literaturereview on what motivates developers at work, conducted by Beecham et al.[2008], found that the variety of work (differences in skills needed and tasks towork on) are an important source of motivation at work. Similarly, recent workby Graziotin et al. [2017] found that one of the main sources of unhappiness arerepetitive and mundane tasks. In this paper, we also investigate the factors thatmake developers perceive their workdays as typical (Section 4.5.2), and explorethe relationship between good and typical workdays (Section 4.6).
4.4 Study Design
To answer our research questions, we studied professional software developers atMicrosoft. Microsoft employs over thirty thousand developers around the globewith more than a dozen development centers worldwide. The teams follow abroad variety of software development processes, develop software for several
100 Chapter 4. Today was a Good Day: The Daily Life of Software Developers
platforms, develop both applications and services, and target private consumersand enterprise customers.
4.4.1 Survey Development Using Preliminary Interviews
To study developer workdays in a subsequent survey, we needed a taxonomy ofactivities they pursue. We started with the taxonomy of activities by LaTozaet al. [2006] in their study of developer work habits. To validate and potentiallyenrich this taxonomy, we contacted a random sample of developers at variouslevels of seniority across many teams and scheduled half an hour to interviewthem about their activities at work, conducting ten interviews in total. In eachinterview, we first asked the developer to self-report and describe all of theactivities that they engaged in during the previous workday, including the typeof activity, the reasons for the activity, the time spent in the activity, and whattime of day the activity occurred. We encouraged them to use email, calendars,diaries etc. as these act as “cues” [Tourangeau et al., 2000] and have been shownto reduce interview and survey measurement error [Bellezza and Hartwell, 1981;Bradburn, 2010; Hudson and Davis, 1972; Schwarz and Oyserman, 2001; Tulvingand Pearlstone, 1966]. We then asked interview participants to list additionalactivities that they engage in, regardless of frequency or duration.
After gaining the approval of Microsoft’s internal privacy and ethics board,we conducted interviews with developers until the data saturation point wasreached [Babbie, 2015]. That is, once new interviews yield no additional informa-tion, further interviews will yield only marginal (if any) value [Guest et al., 2006].The set of activities saturated after seven interviews, but we conducted ten toincrease our confidence that we had captured all relevant activities. Once wehad collected all of the activities, two of the authors grouped them into activitycategories using a card sorting approach [Spencer, 2009].
4.4.2 Final Survey Design and Participants
To increase our understanding of developers’ workdays and what makes themgood and typical, we broadly deployed a survey to developers at Microsoft. Wefollowed guidelines by Kitchenham and Pfleeger [2008] for surveys in software
4.4 Study Design 101
engineering and based the questions on our insights from the interviews. Oursurvey comprised four main sections: (1) We first asked about demographics,including team, seniority, and development experience. (2) Next we presentedrespondents a list of activities (those we developed in the interviews) and askedthem to indicate how much time they spent in each activity on their previousworkday. We allowed respondents to write in additional activities if they hadan activity that was not covered by our taxonomy. (3) Third, we asked if theprevious workday was a typical day or not and if they considered it to be a goodday. In both cases, we asked them to explain why as an open response. (4)Finally, we asked a number of additional questions about their day, includinghow many times they were interrupted, and how many impromptu meetingsoccurred. In an effort to minimize the time required to complete the survey andavoid participant fatigue, only a random subset of the questions in the fourthcategory were shown to each respondent. In total, each question in the fourthcategory was answered by a random 10% subset of respondents. Our goal forthe survey was to take only five to ten minutes to complete. After the study wascompleted, the online survey tool indicated that the median time to completethe survey was just over seven minutes.
First, Microsoft’s ethics and privacy board reviewed our survey. To pilotthe survey and identify any potential problems, we then sent the survey to 800developers over the course of one week with an additional question asking if anyaspect of the survey was difficult or confusing and soliciting general feedback.After examining the responses, we made small wording changes for clarity andalso confirmed that our activity list was complete. Since the changes were veryminor, we also included the pilot responses in our analysis. In an effort to makeour study replicable, we provide the full survey in the supplementary material 2.
We then sent out 37,792 invitations to complete the survey by sendingapproximately 500 invitations on a daily basis over the course of roughly 4months. Developers were selected randomly with replacement, meaning thatit was possible that a developer would receive the survey multiple times overthe course of the study (though never more than once on a given day). Each
2Supplementary material: https://doi.org/10.5281/zenodo.1319812
102 Chapter 4. Today was a Good Day: The Daily Life of Software Developers
developer received a personalized invitation via email that explained who wewere and the purpose of the survey. To encourage honest responses and improveparticipation rate, survey responses were anonymous. In the invitation email andsurvey description, we explicitly stated that participation is voluntary, the surveyis completely anonymous, all questions are optional, and that only aggregated andno individual data will be shared with collaborators at Microsoft. Participantscould also contact us in case they had any questions or concerns. Even thoughthe survey was anonymous, 43.8% of respondents choose to reveal their identity.Among them, only 6.6% responded twice and none repeated more than once. InSection 4.8, we discuss potential threats of this study design choice. We analyzedthe responses in the unit of a workday, not a developer.
We used a one sample continuous outcome confidence interval power analysisto determine our required sample size [Daniel and Cross, 2018]. To achieve aconfidence level of 95% for a 5% confidence interval, the power analysis indicatedthat we needed 385 responses. Since we were not sure ahead of time the exactways that we would be partitioning and comparing the responses, we aimedfor ten times that amount. In total, we sent 37,792 survey invitations andreceived 5,971 responses. This is a response rate of 15.5%, which is in line withresponse rates reported by other surveys in software engineering literature [Punteret al., 2003]. From the 5,971 responses we collected in the survey, 59.1% of thedevelopers stated they are junior and 40.5% senior developers. 0.4% or 26 didnot specify their seniority level. Respondents reported an average of 10.0 years(±7.48, ranging from 0.5 to 44) of experience working in software development.
4.4 Study Design 103
4.4.3 The Validity of Self-Reported Data
Collecting time-use data can be achieved through various methods, includingobservations, automated tracking, and self-reporting. We decided to ask develop-ers for self-reports, for the following reasons: self-reports (1) scale better thanobservations to have a representative sample, (2) they collect a more holisticview compared to using time tracking software that misses time away from thecomputer (which was shown to be on average about half of a workday for devel-opers [Meyer et al., 2017a]), and (3) since we investigate developers’ individualperceptions of good and typical workdays, it makes sense to compare those percep-tions with their own estimations of how they spend time. Further, self-reporteddata is also common in large-scale time-use surveys, such as the American TimeUse Survey [Stinson, 1999]. However, self-reports on behaviors and time spentare profoundly influenced by the question wording, format and context, andcan, thus, be unreliable [Schwarz and Oyserman, 2001]. To overcome these risks,we carefully designed the self-report questions based on recommendations fromrelated work, especially Menon [1994]; Schwarz and Oyserman [2001], and wetest-run our questions first with ten interviewees before running the actual surveystudy.
We intentionally asked respondents to self-report about the activities ofthe previous workday instead of asking more generally. This was a consciousmethodological design decision based on the following reasons. First, the previousday is recent, thereby increasing recollection accuracy. This holds true even ifthe self-report is about the Friday the week before in case respondents answer ona Monday. According to Tourangeau et al. [2000], by far the best-attested factabout autobiographical memory is that the longer the interval between the timeof the event and the time of the interview or survey, the less likely that a personwill remember it. Second, a day is a short period of time to recall, and a largebody of research on surveying and recollection has found that when the referenceperiod is long, respondents tend to use heuristics and estimation of frequenciesrather than concrete occurrences [Blair and Burton, 1987; Bradburn et al., 1987;Menon, 1994; Schwarz and Oyserman, 2001]. This can decrease validity, asMenon [1994] found that “to the extent that behavioral frequencies are reported
104 Chapter 4. Today was a Good Day: The Daily Life of Software Developers
based on inferential heuristics, they are judgements and are subjective”. Beingasked how many times one went out to eat last week, most people will likelycount concrete instances, whereas if the reference period is last year, they willalmost certainly estimate based on heuristics. Lastly, even if a respondent doesrecount concrete events, larger reference periods can fall prey to a phenomenonknown as “telescoping” whereby a notable event is remembered as occurring morerecently than it actually did [Neter and Waksberg, 1964; Sudman and Bradburn,1973]. By using the period of a single day, events are less likely to cross a “nightboundary” and be attributed to the wrong day [Bradburn et al., 1987].
We encouraged participants in the interviews and survey to use their emailclients, calendars, task lists, diaries etc. as “cues” [Tourangeau et al., 2000]to improve their recall of their previous workday and reduce measurementerrors [Bellezza and Hartwell, 1981; Bradburn, 2010; Hudson and Davis, 1972;Schwarz and Oyserman, 2001; Tulving and Pearlstone, 1966]. Finally, we askedrespondents to self-report the times spent in minutes rather than hours so thatthey were forced to recall the events in more detail, as the unit of time in responsehas shown to have an impact on recollection accuracy [LeBoeuf and Shafir, 2009;Schwarz and Oyserman, 2001].
4.5 Conceptual Frameworks
In this section, we answer RQ1 and present the results from investigatingsurvey respondents’ self-reports of what made their previous workday good andtypical. We organized the factors influencing developers’ workdays as conceptualframeworks and describe them using representative quotes and examples.
4.5.1 Developers’ Good Workdays
To identify factors that influence what a good workday is to developers, howthey relate to each other, and how important each factor is, we asked surveyrespondents the following question: “Would you consider yesterday a good day?Why or why not?”.
4.5 Conceptual Frameworks 105
Data Analysis
We coded the responses to the question to a binary rating of either good ornot good. Due to the formulation of the question, not good workdays couldeither refer to an average or a bad workday. From now on, we describe not goodworkdays as bad for better readibility. 5013 participants answered the question;60.6% (N=3039) stated their previous workday was good and 39.4% (N=1974)stated it was bad.
We qualitatively analyzed the cleaned responses from participants who pro-vided an explanation for what made their workdays good or bad (21.1% didnot provide an explanation). We developed a coding strategy, applying OpenCoding, Axial Coding, and Selective Coding as defined by Corbin and Strauss’Grounded Theory, as follows [Strauss and Corbin, 1998] 3. The first author OpenCoded the entire set of 4005 responses on what made participants’ previousworkday good or bad, using a quote-by-quote strategy where multiple categoriescould be assigned to each quote. Responses that could not distinctively bemapped to a category were discussed with the other authors. Before starting thefirst Axial and Selective Coding iteration, the authors familiarized themselveswith the categories that resulted from the Open Coding step, by looking at 10-30representative responses (i.e., quotes) per category and the number of responsesthat the first author Open Coded to each category. We then discussed therelationships between these categories in the team (usually with three or all fourauthors present). This included drawing out the factors and their relationshipson a whiteboard, which we collected as memos. During that process, we heavilyrelied on the quotes and regularly consulted them for additional context anddetails about the identified relationships. The process was iterative, meaningthat whenever the Axial and Selective Coding steps resulted in updates to theOpen Coding categories, the first author re-coded participants’ responses, and wedid another iteration of Axial and Selective coding. After five iterations, we usedthe memos, factors that resulted from the Axial Coding and high-level factors
3Since we applied all components of Straussian’s Grounded Theory approach in our analysisbut the outcome of this analysis was a conceptual framework instead of a theory, the mostaccurate description of our analysis is that we used Grounded Theory as a “methodologicalrationale” [Charmaz, 2014] or “à la carte” [Stol et al., 2016].
106 Chapter 4. Today was a Good Day: The Daily Life of Software Developers
(that resulted from the Selective Coding) to create a conceptual framework tocharacterize developers’ good workdays.
Conceptual Framework
From applying our coding strategy, we identified 11 factors impacting developers’assessment of a good workday. We organized these factors into three high-levelfactors, (1) value creation, (2) efficient use of time, and (3) sentiment. The firsttwo high-level factors were fairly obvious since respondents usually describedgood workdays when they considered their work as meaningful and/or did notwaste their time on meaningless activities. A few important factors, however,did not fit into these two high-level factors. They are related to respondents’personal feelings and perceptions of their overall work, which we grouped as thethird high-level factor. Initially, we thought that quality is another importantfactor, since some respondents described good workdays as days they improvedthe quality of the software or did not break something. However, we realizedthat these statements on quality were very rare (0.3% of responses) and thatrespondents described them as one form of working on something of value.
In Figure 4.1, we visualize the conceptual framework for good workdays.Each of the 11 factors (light gray) influences one of the three high-level factors(dark gray), and they in turn influence whether developers perceive a workday asgood. The numbers in parentheses are counts for the number of responses thatwe categorized into each high-level factor (total N=4005). Since the identifiedfactors are based on responses to an open question, the reported numbers andpercentages in this section should only serve to give a feeling about how prevalenteach factor is in respondents’ assessment of good workdays, rather than exactmeasures (reality might be higher).
Now, we provide representative examples and quotes to describe the factorsand explain how we derived the conceptual framework based on survey responses.
Value Creation To decide whether their workday was good, respondents mostoften evaluated if they were effective and if they created something of value(68.0%, N=2725 of the 4005 responses to the question). Creating value, however,
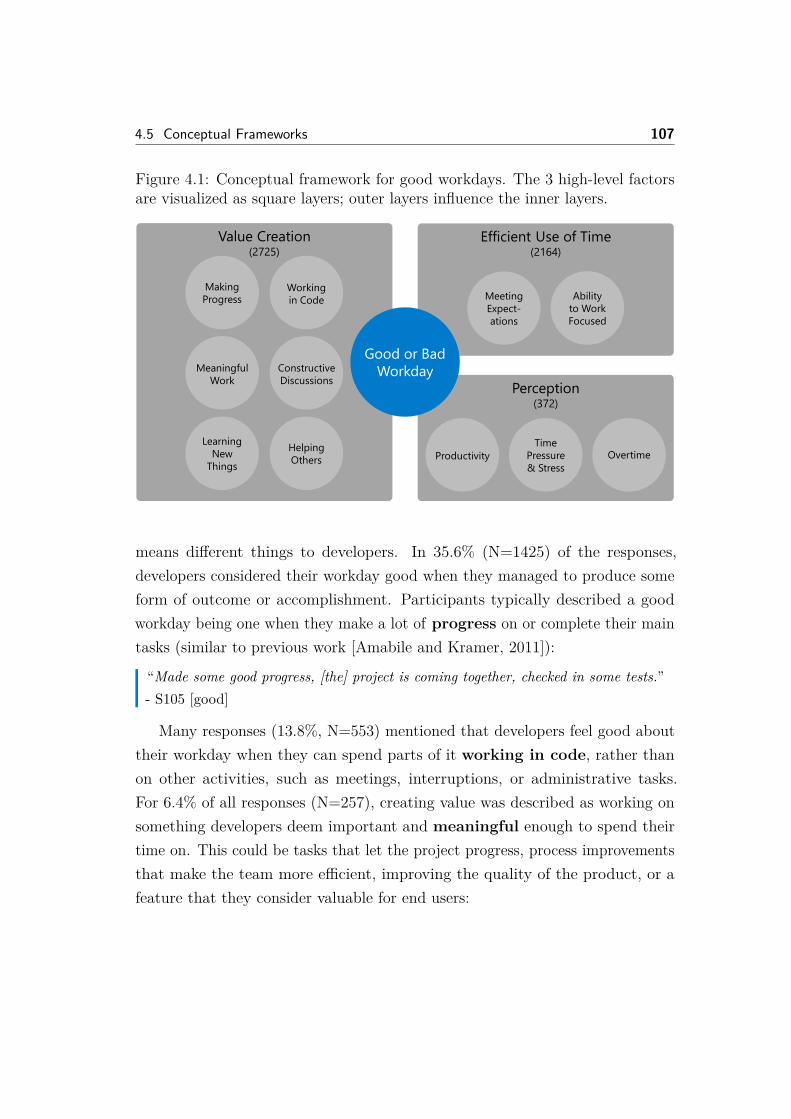
4.5 Conceptual Frameworks 107
Figure 4.1: Conceptual framework for good workdays. The 3 high-level factorsare visualized as square layers; outer layers influence the inner layers.
Value Creation(2725)
Perception(372)
Efficient Use of Time(2164)
Making
Progress
Learning
New
Things
Helping
Others
Constructive
Discussions
Meaningful
Work
Working
in Code Ability
to Work
Focused
Meeting
Expect-
ations
Time
Pressure
& StressProductivity Overtime
Good or Bad
Workday
means different things to developers. In 35.6% (N=1425) of the responses,developers considered their workday good when they managed to produce someform of outcome or accomplishment. Participants typically described a goodworkday being one when they make a lot of progress on or complete their maintasks (similar to previous work [Amabile and Kramer, 2011]):
“Made some good progress, [the] project is coming together, checked in some tests.”- S105 [good]
Many responses (13.8%, N=553) mentioned that developers feel good abouttheir workday when they can spend parts of it working in code, rather thanon other activities, such as meetings, interruptions, or administrative tasks.For 6.4% of all responses (N=257), creating value was described as working onsomething developers deem important and meaningful enough to spend theirtime on. This could be tasks that let the project progress, process improvementsthat make the team more efficient, improving the quality of the product, or afeature that they consider valuable for end users:
108 Chapter 4. Today was a Good Day: The Daily Life of Software Developers
“I was able to help influence a decision that I thought was important.” - S1658[good]
While meetings were often not considered a good use of their time (as discussedin more detail in Section 4.5.1), 189 responses (4.7%) described a good workdayto be when developers participated in good, constructive discussions, whenimportant decisions on the project were made, or when connections could bemade that are valuable in the future:
“Meetings were productive, and we made some new connections with partners thatseem promising. I also had a good chat with a former manager/mentor.” - S483[good]
Workdays where developers learned something new or that increased theirunderstanding of the project or codebase were also considered good, as 4.7%(N=188) of the responses described learning a valuable investment into thedevelopers’ or project’s future. Similarly, days when developers could help aco-worker to learn something new or unblock someone from a problem theyare stuck with was generally considered positive and rewarding (4.7%, N=188).However, spending too much time helping others reduces the time they can spendon making progress on their own tasks:
“I spent too much time helping team members and not enough on my scheduledtasks.” - S1880 [bad]
Efficient Use of Time A second high-level factor for considering what a goodworkday is, is how efficiently developers manage to spend their time (54.0%,N=2164). A developer’s workday can be organized in various ways, and thereare numerous external and personal aspects that compete with each other forthe developer’s attention and time. This impacts whether a workday goes asexpected and influences the developer’s ability to focus on the main codingtasks. Respondents mentioned that changes to their planned work or deviationsfrom their usual workday are often negatively perceived. Especially, unexpected,urgent issues in a deployed system puts pressure on developers to resolve themquickly (11.6%, N=464):
4.5 Conceptual Frameworks 109
“Started off with a live-site issue (still unresolved), then went to a [different]live-site issue (still unresolved), then I actually got a few minutes to work on the[main] task.” - S3158 [bad]
Interruptions from co-workers and distractions such as background noise inopen-plan offices were described in 13.8% (N=552) of the responses to negativelyinfluence developers’ ability to focus or work as planned:
“Too many interruptions/context switches. I need a continuous block of time to bereally productive as a coder, but I find I get distracted/interrupted more than I’dlike.” - S1066 [bad]
Similarly, long meetings or meetings spreading over the whole day, with verylittle time in-between to work focused, were another regularly mentioned reason(12.2%, N=491).
10.3% (N=411) of the remaining responses mentioned further reasons for badworkdays that were not numerous enough to be coded into a new category. Thisincludes time lost due to infrastructure issues, outdated documentation, spendingtoo much time to figure out how something works and being blocked or waitingfor others (similar to [Graziotin et al., 2017]). Unlike what one might expectfrom previous work [Barley et al., 2011; Dabbish and Kraut, 2006; Mazmanian,2013], emails were surprisingly only rarely mentioned as a reason for not being agood workday (1.7%, N=69).
Perception 9.3% (N=372) of all responses about good workdays were relatedto developers’ positive or negative perceptions of their overall work; their produc-tivity, time pressure, and working hours. For example, in 4.7% (N=187) of theresponses developers mentioned that they felt productive or unproductive on aparticular workday, and not specifying what factors contributed to their feeling.
“Yes, I was productive and felt good about what I’d done.” - S322 [good]
In 102 (2.5%) responses, developers considered workdays to be better whenthey had a good balance of handling stress. This includes not trying to meeta tight deadline and not having a too high time pressure:
110 Chapter 4. Today was a Good Day: The Daily Life of Software Developers
“Considering we are not [on] a tight deadline, working in a relaxed fashion andcoding were quite enjoyable.” - S1654 [good]
Time pressure was recently also shown as a major cause of unhappiness ofdevelopers [Graziotin et al., 2017]. 2.2% (N=87) of the responses describedworkdays requiring to work overtime as bad. Reasons for what causes overtimework are tight deadlines and having full task lists.
In Section 4.7, we make recommendations about how to leverage these resultsto make good workdays typical.
4.5.2 Developers’ Typical Workdays
To learn how different factors impact developers’ assessment of typical workdays,we asked survey respondents the following question: “Was yesterday typical?”.To answer the question, they could either select yes or no. Respondents whopicked no were asked to provide a reason for their assessment in a free-formtextbox.
Data Analysis
5876 participants responded to the question; 64.2% (N=3770) considered theirworkday as typical and 35.8% (N=2106) as atypical. 2008 of these 2106 partici-pants (95.3%) then explained what made their workdays atypical. To qualitativelyanalyze these factors and their relationships, we used the same coding strategythat we described in Section 4.5.1 to characterize good workdays.
Conceptual Framework
Here, we describe how we developed the conceptual framework that characterizestypical workdays. As respondents were very vocal about meetings and interrup-tions to describe main reasons for atypical workdays, we initially thought that akey component for the assessment is whether the developer has control over thefactor. However, from our discussions and after coding all responses, we realizedthat the key component is the match between a developer’s expectation of howa workday will be and how it actually was in reality. Externally influenced
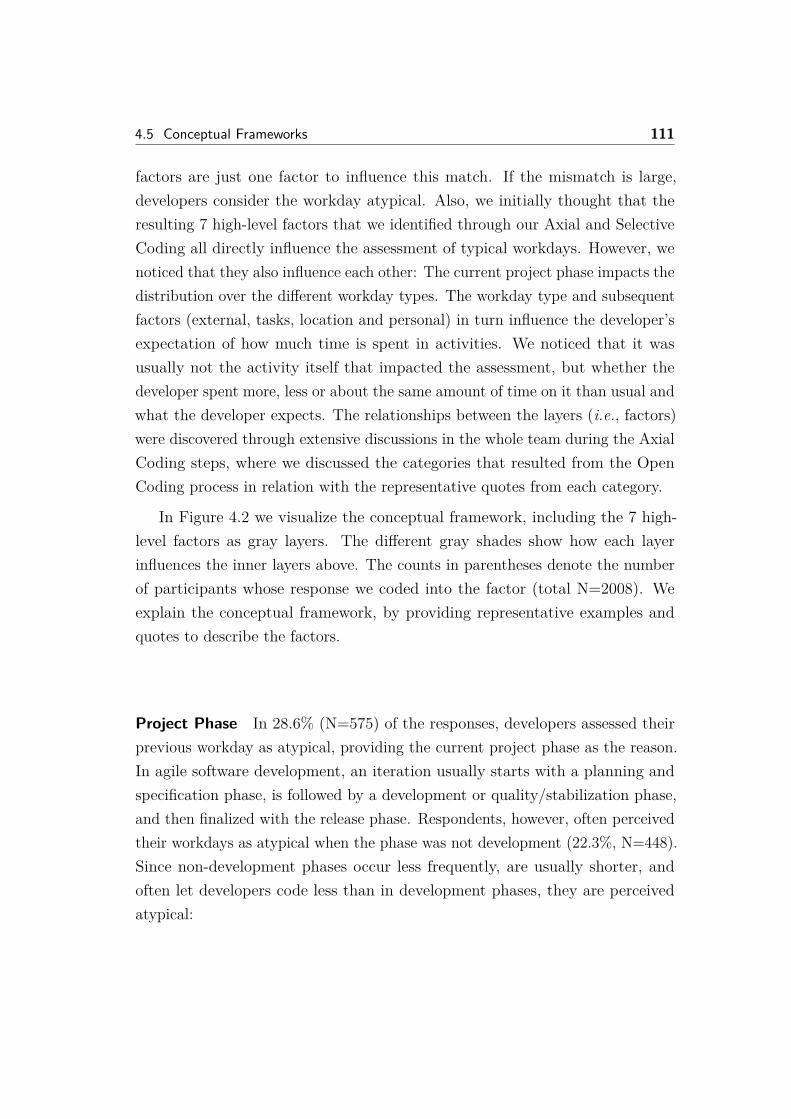
4.5 Conceptual Frameworks 111
factors are just one factor to influence this match. If the mismatch is large,developers consider the workday atypical. Also, we initially thought that theresulting 7 high-level factors that we identified through our Axial and SelectiveCoding all directly influence the assessment of typical workdays. However, wenoticed that they also influence each other: The current project phase impacts thedistribution over the different workday types. The workday type and subsequentfactors (external, tasks, location and personal) in turn influence the developer’sexpectation of how much time is spent in activities. We noticed that it wasusually not the activity itself that impacted the assessment, but whether thedeveloper spent more, less or about the same amount of time on it than usual andwhat the developer expects. The relationships between the layers (i.e., factors)were discovered through extensive discussions in the whole team during the AxialCoding steps, where we discussed the categories that resulted from the OpenCoding process in relation with the representative quotes from each category.
In Figure 4.2 we visualize the conceptual framework, including the 7 high-level factors as gray layers. The different gray shades show how each layerinfluences the inner layers above. The counts in parentheses denote the numberof participants whose response we coded into the factor (total N=2008). Weexplain the conceptual framework, by providing representative examples andquotes to describe the factors.
Project Phase In 28.6% (N=575) of the responses, developers assessed theirprevious workday as atypical, providing the current project phase as the reason.In agile software development, an iteration usually starts with a planning andspecification phase, is followed by a development or quality/stabilization phase,and then finalized with the release phase. Respondents, however, often perceivedtheir workdays as atypical when the phase was not development (22.3%, N=448).Since non-development phases occur less frequently, are usually shorter, andoften let developers code less than in development phases, they are perceivedatypical:
112 Chapter 4. Today was a Good Day: The Daily Life of Software Developers
Figure 4.2: Conceptual framework characterizing typical workdays. The mainfactors are visualized as layers; the outer layers influence all inner layers.
Project Phase (575)
Type of Workday (83)
Main Work Tasks (145) Personal (43)
Location (116)External (678)
Time Spent on Activities (1040)
≈Typical or Atypical
Workday
Expectation
Reality
“We are in the planning phase now and each day is different: There is a lot morefocus on evaluations, specs, meetings during this phase. This would significantlydiffer from our workday during coding milestones.” - S2243
These non-development phases are perceived as “slower”, which is why devel-opers spend more time on activities that usually fall short during developmentphases, such as training, evaluating frameworks, writing documentation, orworking on low-priority tasks.
Since developers often describe meetings and interruptions as unproductive,prior work concluded that they are bad overall [Bailey et al., 2001; Czerwinskiet al., 2004; González and Mark, 2004; Mark et al., 2008b; Meyer et al., 2014;Parnin and Rugaber, 2011]. We are refining these earlier findings with our resultsthat suggest the impact of meetings and interruptions on productivity dependson the project phase. Respondents described that during phases of specification,planning and releases, they are common, but constructive:
4.5 Conceptual Frameworks 113
“In planning stage, not development stage. Spent way more time in meetings thannormal, but they were productive meetings.” - S1762
As some teams at the studied organization do not employ separate teamsdedicated to operations, developers also have to take part in a servicing phase,usually for about one week every couple of weeks. During that week, they areon-call for urgent and unexpected issues, which respondents often also regardedas atypical:
“I am currently on-call as [an] incident manager. It was typical for on-call rotation,but that happens only once every 12 weeks.” - S2447
While many respondents described the current phase to be atypical, fewmentioned that the amount of time they spent on certain activities was unusualfor the phase they are currently in. For example, spending an unusual highamount of time with coding during a planning phase felt atypical.
Type of Workday The workday type is another factor that influences whethera developer considers a workday as typical. While this factor is not as prominentas the project phase that influences it, the workday type was emphasized in 4.1%(N=83) of the responses. Certain teams or individuals organize their work intodays where they mainly focus on a single activity, such as coding, bug-fixing,planning or training. During these days, developers avoid pursuing activitiesthat distract them from their main activity, such as emails or meetings. Specificdays where the team would not schedule any meetings were mentioned mostprominently:
“We’re not allowed to schedule meetings on Thursdays.” - S419“On Mondays I have a late night coding night.” - S159
These well-appreciated “no-meeting days” were often scheduled during de-velopment phases to allow developers to focus primarily on making progress ontheir coding tasks.
External In 33.8% (N=678) of the responses, developers mentioned externalfactors they have little control over to contribute to an atypical workday, as theyoften divert developers from making progress on their main tasks towards other
114 Chapter 4. Today was a Good Day: The Daily Life of Software Developers
responsibilities. Among these, meetings were most often mentioned (20.5%,N=411), especially when they are unplanned, very long or concerning an unusualtopic:
“I had literally no meetings and spent the entire day refactoring legacy code. Thatis unusual.” - S2394
Lack of knowledge, e.g., when having to work on a task in an unfamiliarcodebase or with a new framework, is another factor that can make workdaysatypical (3.9%, N=78), as developers have to stop working on their tasks andspend time learning or attending trainings about a topic:
“I was working in a very unfamiliar system; so I spent a lot of time strugglingwith how to do basic things like building. Normally, I work in a system that I’mfamiliar with.” - S1490
Fixing infrastructure problems or performing maintenance (e.g., internetissues, installing updates) were described as the reason for an atypical workdayby 3.9% (N=78) of the responses:
“Hardware maintenance/setup is not part of my typical responsibilities. I don’tthink that I am typically randomized to this extent.” - S1306
Similar to our finding on what makes a good workday, emails were onlyrarely mentioned as a reason for an atypical workday (1.4%, N=28). Finally,respondents mentioned other factors that make their work more fragmented anddivert them away from their main work tasks, including long or topic unrelatedinterruptions (3.6%, N=72), and being blocked on a task and having to wait forothers (0.5%, N=11).
Location As developers typically work at the organization’s location on-campus,any other location they work on is often considered atypical (5.8%, N=116):
“I worked from home and was able to make much better progress than normal.” -S4679
When developers are not working in their usual location, they either workfrom home, at a client’s or partner’s office, or they are traveling to their team’sremote location in case it is distributed. Working from home was uniformly
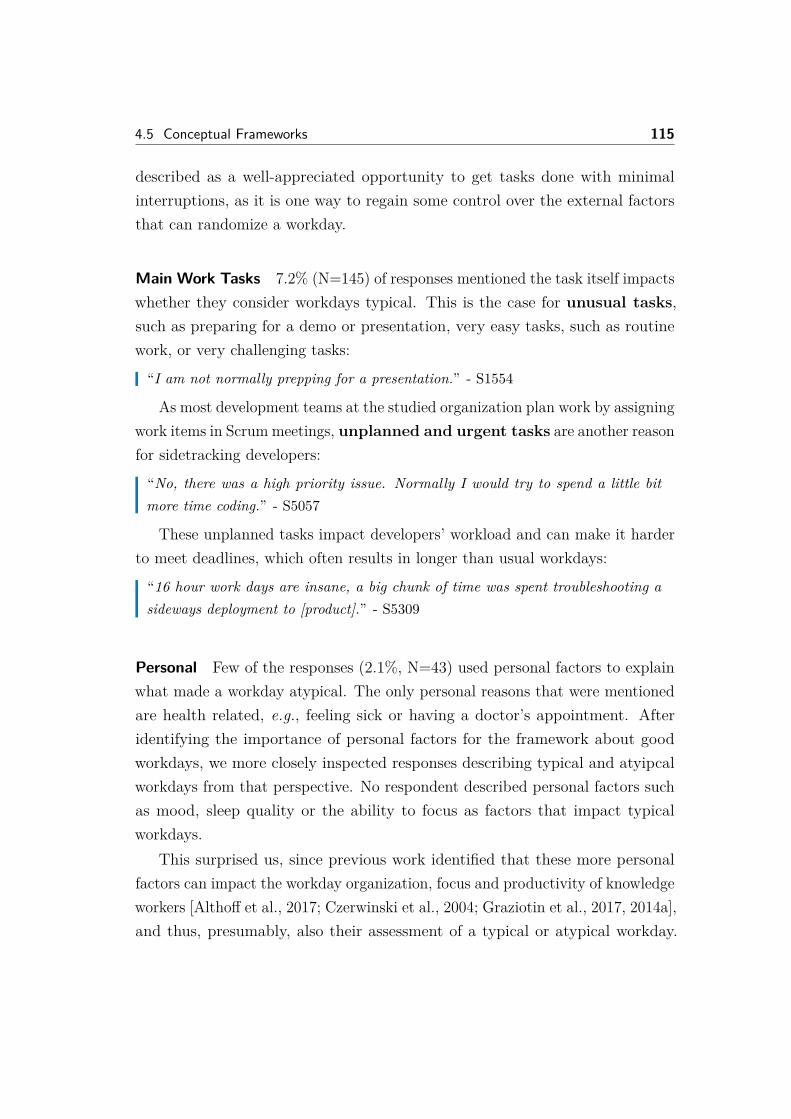
4.5 Conceptual Frameworks 115
described as a well-appreciated opportunity to get tasks done with minimalinterruptions, as it is one way to regain some control over the external factorsthat can randomize a workday.
Main Work Tasks 7.2% (N=145) of responses mentioned the task itself impactswhether they consider workdays typical. This is the case for unusual tasks,such as preparing for a demo or presentation, very easy tasks, such as routinework, or very challenging tasks:
“I am not normally prepping for a presentation.” - S1554
As most development teams at the studied organization plan work by assigningwork items in Scrum meetings, unplanned and urgent tasks are another reasonfor sidetracking developers:
“No, there was a high priority issue. Normally I would try to spend a little bitmore time coding.” - S5057
These unplanned tasks impact developers’ workload and can make it harderto meet deadlines, which often results in longer than usual workdays:
“16 hour work days are insane, a big chunk of time was spent troubleshooting asideways deployment to [product].” - S5309
Personal Few of the responses (2.1%, N=43) used personal factors to explainwhat made a workday atypical. The only personal reasons that were mentionedare health related, e.g., feeling sick or having a doctor’s appointment. Afteridentifying the importance of personal factors for the framework about goodworkdays, we more closely inspected responses describing typical and atyipcalworkdays from that perspective. No respondent described personal factors suchas mood, sleep quality or the ability to focus as factors that impact typicalworkdays.
This surprised us, since previous work identified that these more personalfactors can impact the workday organization, focus and productivity of knowledgeworkers [Althoff et al., 2017; Czerwinski et al., 2004; Graziotin et al., 2017, 2014a],and thus, presumably, also their assessment of a typical or atypical workday.
116 Chapter 4. Today was a Good Day: The Daily Life of Software Developers
As respondents did reveal personal factors when characterizing good and badworkdays, and as we ensured respondents anonymity (see Section 4.4.2), reasonsfor the lack of personal details in this question might be that the survey settingdid not prompt them explicitly enough to reflect about personal factors or theother identified factors are more prevalent and have a bigger influence on theirassessment of a typical workday.
Time Spent on Activities Finally, the high-level factors described above influ-ence how much time developers spend on different activities. For example, duringthe development phase, developers typically spend more time writing code, dayswith many unplanned meetings reduce the time spent on main coding tasks, andunplanned urgent tasks could force a developer to work overtime. We catego-rized all cases where 51.8% (N=1040) of the responses contained descriptions ofspending more or less time than usual on a certain activity and visualized thetop 5 in Table 4.1. On atypical workdays, respondents mostly reported spendingmore than usual time in meetings and debugging or fixing bugs.
4.5.3 Interrelationship Between Good and Typical Days
In our analysis of related work, we found an interconnection between job sat-isfaction, goodness, routine, typicality and productivity. First, we developedconceptual frameworks to better understand these factors in isolation. Now, wedescribe our main qualitative observations on the interrelationship between goodand typical workdays, and present quantitative results in Section 4.6.
One key finding is the importance of control, i.e., developers’ ability tocontrol their workday and whether it goes as planned/expected or is disruptedby external factors, such as unplanned bugs, inefficient meetings, or infrastructureissues. While our findings replicate some results from previous work, they help tobetter understand nuances in developers’ work and sort out misconceptions. Forexample, when we looked more closely at why developers are very vocal aboutmeetings and interruptions being one of the main detriments to productivework, we found that during non-development phases, they are better acceptedand more productive. Another insight from studying factors that influence good
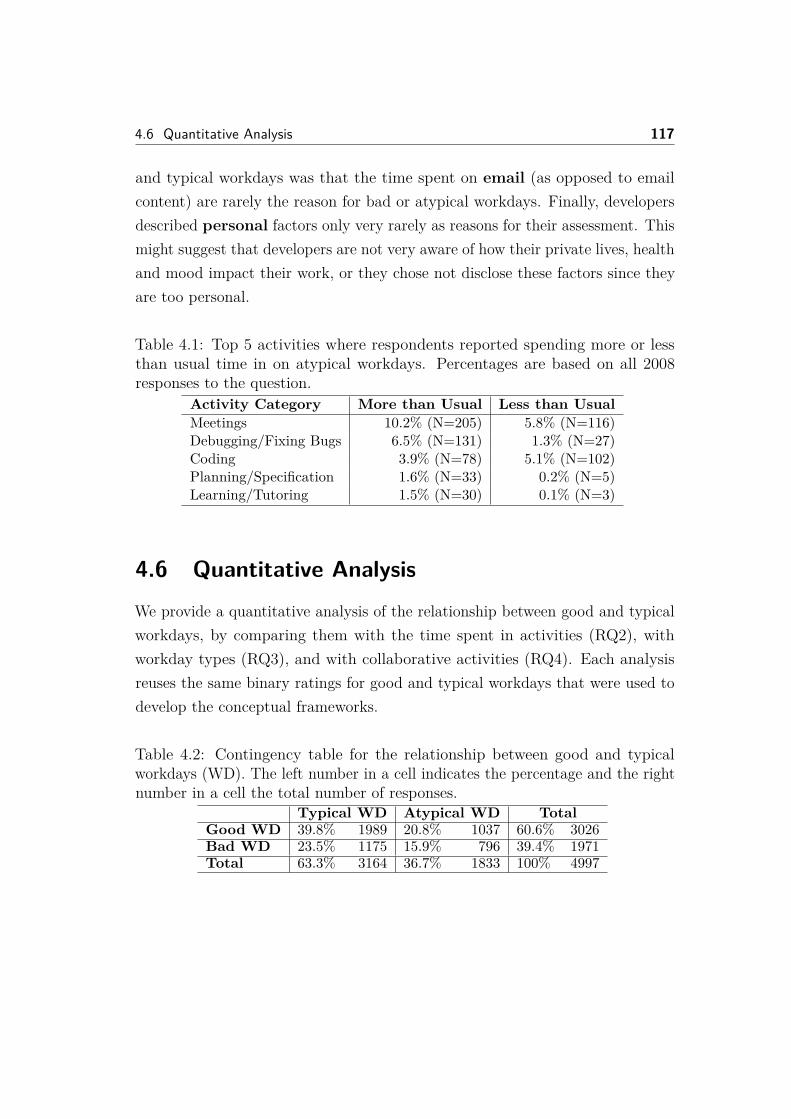
4.6 Quantitative Analysis 117
and typical workdays was that the time spent on email (as opposed to emailcontent) are rarely the reason for bad or atypical workdays. Finally, developersdescribed personal factors only very rarely as reasons for their assessment. Thismight suggest that developers are not very aware of how their private lives, healthand mood impact their work, or they chose not disclose these factors since theyare too personal.
Table 4.1: Top 5 activities where respondents reported spending more or lessthan usual time in on atypical workdays. Percentages are based on all 2008responses to the question.
Activity Category More than Usual Less than UsualMeetings 10.2% (N=205) 5.8% (N=116)Debugging/Fixing Bugs 6.5% (N=131) 1.3% (N=27)Coding 3.9% (N=78) 5.1% (N=102)Planning/Specification 1.6% (N=33) 0.2% (N=5)Learning/Tutoring 1.5% (N=30) 0.1% (N=3)
4.6 Quantitative AnalysisWe provide a quantitative analysis of the relationship between good and typicalworkdays, by comparing them with the time spent in activities (RQ2), withworkday types (RQ3), and with collaborative activities (RQ4). Each analysisreuses the same binary ratings for good and typical workdays that were used todevelop the conceptual frameworks.
Table 4.2: Contingency table for the relationship between good and typicalworkdays (WD). The left number in a cell indicates the percentage and the rightnumber in a cell the total number of responses.
Typical WD Atypical WD TotalGood WD 39.8% 1989 20.8% 1037 60.6% 3026Bad WD 23.5% 1175 15.9% 796 39.4% 1971Total 63.3% 3164 36.7% 1833 100% 4997
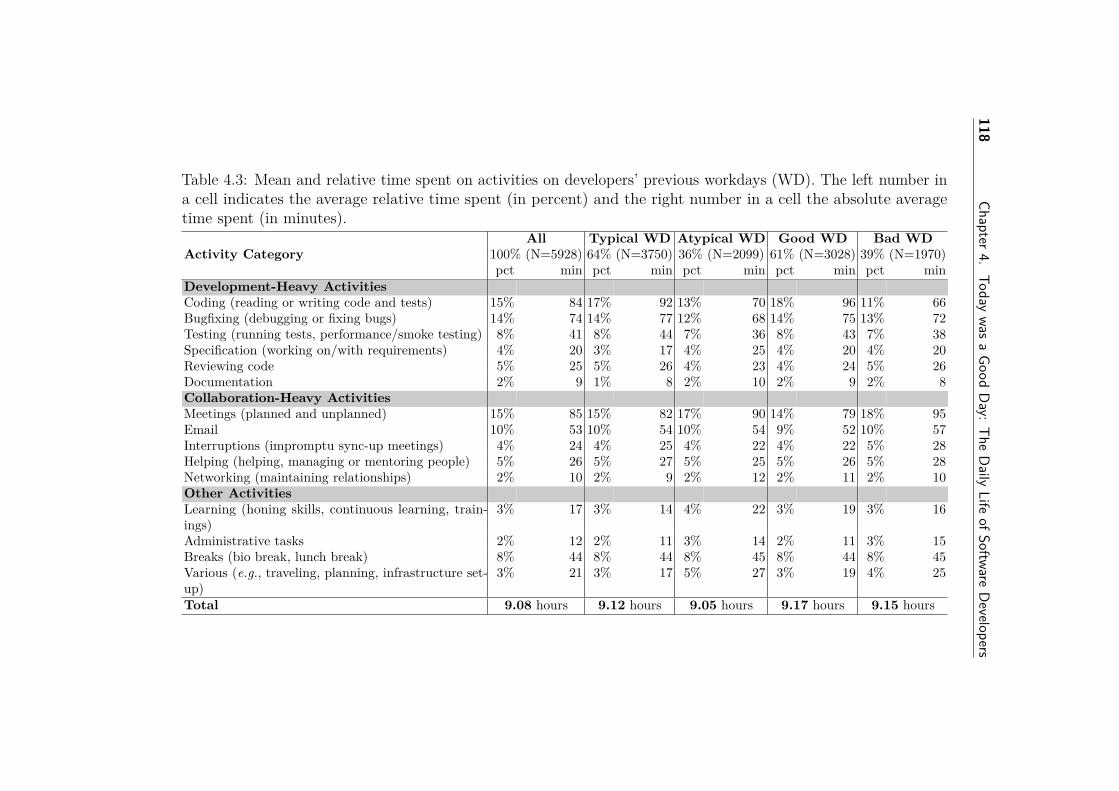
118Chapter4.
Todaywas
aGood
Day:
TheDaily
LifeofSoftware
Developers
Table 4.3: Mean and relative time spent on activities on developers’ previous workdays (WD). The left number ina cell indicates the average relative time spent (in percent) and the right number in a cell the absolute averagetime spent (in minutes).
Activity CategoryAll Typical WD Atypical WD Good WD Bad WD
100% (N=5928) 64% (N=3750) 36% (N=2099) 61% (N=3028) 39% (N=1970)pct min pct min pct min pct min pct min
Development-Heavy ActivitiesCoding (reading or writing code and tests) 15% 84 17% 92 13% 70 18% 96 11% 66Bugfixing (debugging or fixing bugs) 14% 74 14% 77 12% 68 14% 75 13% 72Testing (running tests, performance/smoke testing) 8% 41 8% 44 7% 36 8% 43 7% 38Specification (working on/with requirements) 4% 20 3% 17 4% 25 4% 20 4% 20Reviewing code 5% 25 5% 26 4% 23 4% 24 5% 26Documentation 2% 9 1% 8 2% 10 2% 9 2% 8Collaboration-Heavy ActivitiesMeetings (planned and unplanned) 15% 85 15% 82 17% 90 14% 79 18% 95Email 10% 53 10% 54 10% 54 9% 52 10% 57Interruptions (impromptu sync-up meetings) 4% 24 4% 25 4% 22 4% 22 5% 28Helping (helping, managing or mentoring people) 5% 26 5% 27 5% 25 5% 26 5% 28Networking (maintaining relationships) 2% 10 2% 9 2% 12 2% 11 2% 10Other ActivitiesLearning (honing skills, continuous learning, train-ings)
3% 17 3% 14 4% 22 3% 19 3% 16
Administrative tasks 2% 12 2% 11 3% 14 2% 11 3% 15Breaks (bio break, lunch break) 8% 44 8% 44 8% 45 8% 44 8% 45Various (e.g., traveling, planning, infrastructure set-up)
3% 21 3% 17 5% 27 3% 19 4% 25
Total 9.08 hours 9.12 hours 9.05 hours 9.17 hours 9.15 hours
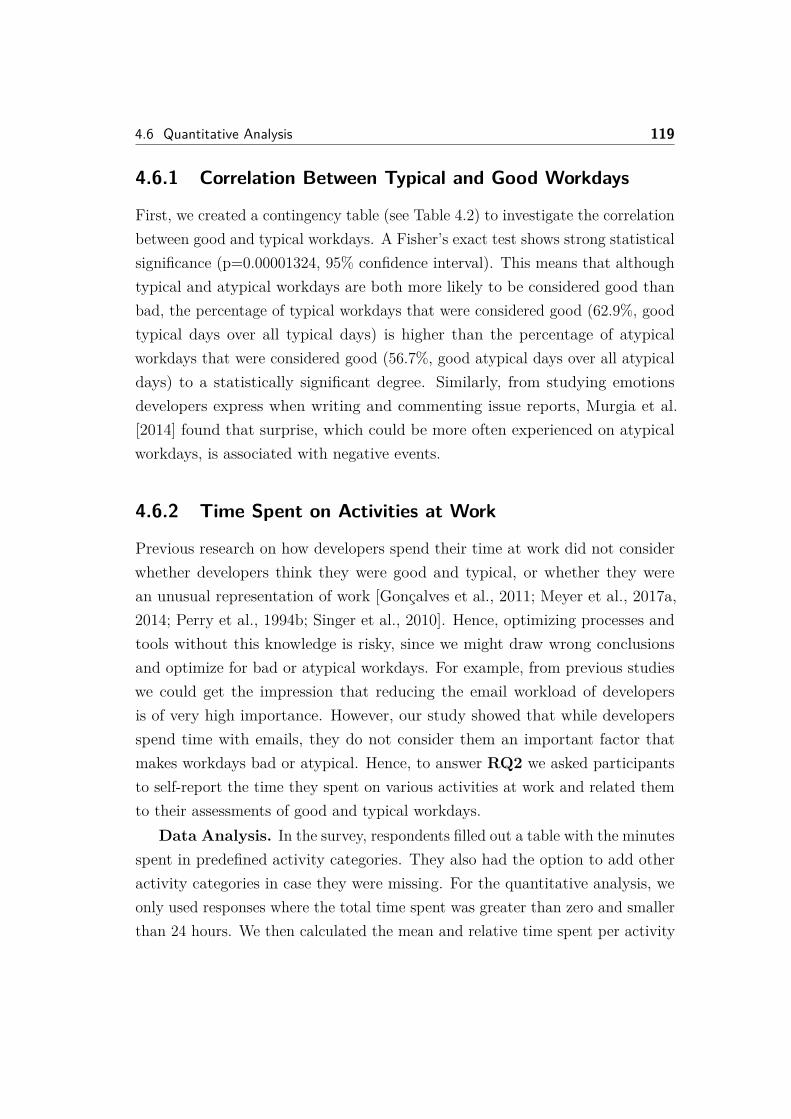
4.6 Quantitative Analysis 119
4.6.1 Correlation Between Typical and Good Workdays
First, we created a contingency table (see Table 4.2) to investigate the correlationbetween good and typical workdays. A Fisher’s exact test shows strong statisticalsignificance (p=0.00001324, 95% confidence interval). This means that althoughtypical and atypical workdays are both more likely to be considered good thanbad, the percentage of typical workdays that were considered good (62.9%, goodtypical days over all typical days) is higher than the percentage of atypicalworkdays that were considered good (56.7%, good atypical days over all atypicaldays) to a statistically significant degree. Similarly, from studying emotionsdevelopers express when writing and commenting issue reports, Murgia et al.[2014] found that surprise, which could be more often experienced on atypicalworkdays, is associated with negative events.
4.6.2 Time Spent on Activities at Work
Previous research on how developers spend their time at work did not considerwhether developers think they were good and typical, or whether they werean unusual representation of work [Gonçalves et al., 2011; Meyer et al., 2017a,2014; Perry et al., 1994b; Singer et al., 2010]. Hence, optimizing processes andtools without this knowledge is risky, since we might draw wrong conclusionsand optimize for bad or atypical workdays. For example, from previous studieswe could get the impression that reducing the email workload of developersis of very high importance. However, our study showed that while developersspend time with emails, they do not consider them an important factor thatmakes workdays bad or atypical. Hence, to answer RQ2 we asked participantsto self-report the time they spent on various activities at work and related themto their assessments of good and typical workdays.
Data Analysis. In the survey, respondents filled out a table with the minutesspent in predefined activity categories. They also had the option to add otheractivity categories in case they were missing. For the quantitative analysis, weonly used responses where the total time spent was greater than zero and smallerthan 24 hours. We then calculated the mean and relative time spent per activity
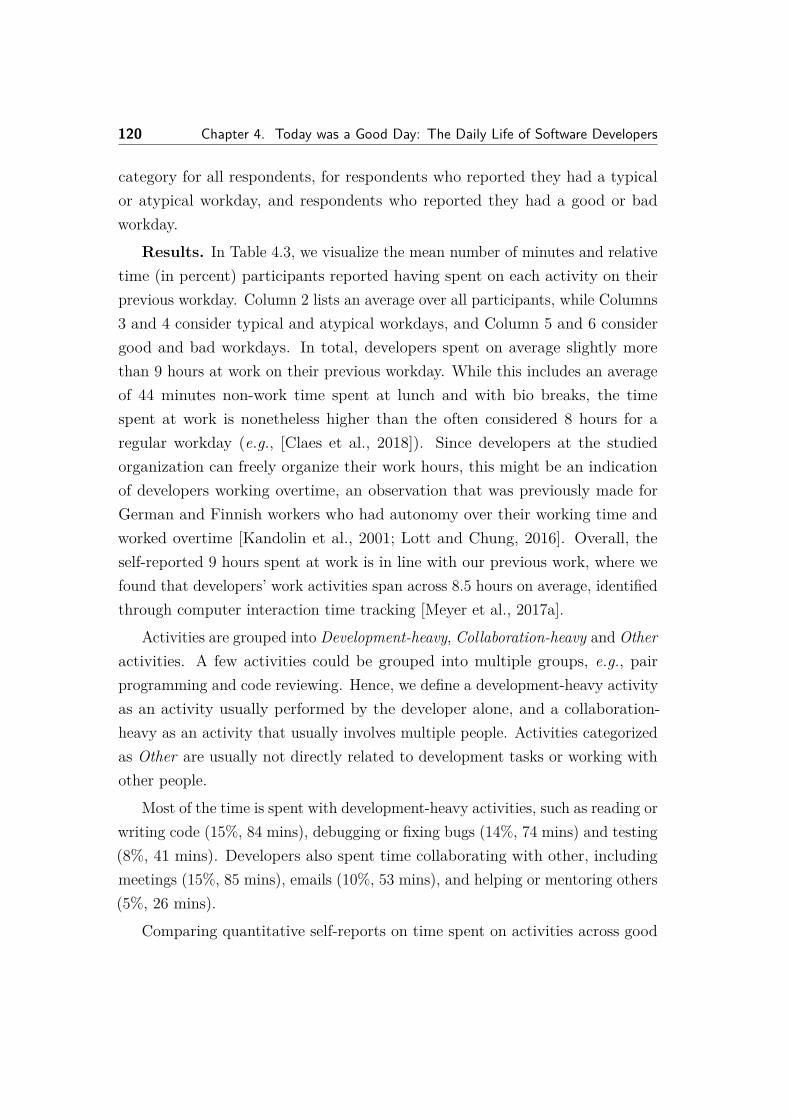
120 Chapter 4. Today was a Good Day: The Daily Life of Software Developers
category for all respondents, for respondents who reported they had a typicalor atypical workday, and respondents who reported they had a good or badworkday.
Results. In Table 4.3, we visualize the mean number of minutes and relativetime (in percent) participants reported having spent on each activity on theirprevious workday. Column 2 lists an average over all participants, while Columns3 and 4 consider typical and atypical workdays, and Column 5 and 6 considergood and bad workdays. In total, developers spent on average slightly morethan 9 hours at work on their previous workday. While this includes an averageof 44 minutes non-work time spent at lunch and with bio breaks, the timespent at work is nonetheless higher than the often considered 8 hours for aregular workday (e.g., [Claes et al., 2018]). Since developers at the studiedorganization can freely organize their work hours, this might be an indicationof developers working overtime, an observation that was previously made forGerman and Finnish workers who had autonomy over their working time andworked overtime [Kandolin et al., 2001; Lott and Chung, 2016]. Overall, theself-reported 9 hours spent at work is in line with our previous work, where wefound that developers’ work activities span across 8.5 hours on average, identifiedthrough computer interaction time tracking [Meyer et al., 2017a].
Activities are grouped into Development-heavy, Collaboration-heavy and Otheractivities. A few activities could be grouped into multiple groups, e.g., pairprogramming and code reviewing. Hence, we define a development-heavy activityas an activity usually performed by the developer alone, and a collaboration-heavy as an activity that usually involves multiple people. Activities categorizedas Other are usually not directly related to development tasks or working withother people.
Most of the time is spent with development-heavy activities, such as reading orwriting code (15%, 84 mins), debugging or fixing bugs (14%, 74 mins) and testing(8%, 41 mins). Developers also spent time collaborating with other, includingmeetings (15%, 85 mins), emails (10%, 53 mins), and helping or mentoring others(5%, 26 mins).
Comparing quantitative self-reports on time spent on activities across good
4.6 Quantitative Analysis 121
and typical workdays confirms the previously established qualitative characteris-tics of good and typical workdays (see Sections 4.5.1 and 4.5.2). Both, on goodand typical workdays, developers spend considerably more time withdevelopment related activities. For example, the time spent with reading andwriting code is 22 minutes higher on typical (compared to atypical) workdays and30 minutes higher on good (compared to bad) workdays. On typical workdays,developers also spend slightly less time in meetings, with planning or working onrequirements, and with learning or in trainings. And on good workdays, theyspend about half an hour less in collaborative activities, than on bad workdays.
4.6.3 Workday Types
Looking at average relative time spent in activities for all responses results inthe impression that good/bad and typical/atypical workdays are very similaroverall. However, respondents described that not all workdays look the same, e.g.,when they have no-meeting days, and that this type of workday often influenceswhether they consider a workday as typical or atypical. Since we did not promptthem to discuss workday types, only 4.1% (N=83) of respondents mentioned it.To evaluate similarities and trends in developers’ workdays and to answer RQ3,we reused our dataset (see Section 4.6.2) to group responses together whererespondents reported spending their time at work with similar activities. Wethen used responses to other questions to characterize these groups as workdaytypes.
Data Analysis. To identify groups of developers with similar workdays, werun a cluster analysis following steps:
1. For the clustering, we used respondents’ self-reports of the relative timespent in each activity category. The data cleaning process is the same asdescribed before in Section 4.6.2. To group the respondents, we used thePartitioning Around Medoids (PAM) clustering algorithm by [Kaufmanand Rousseeuw, 1987] in the pamk implementation from the fpc package4
in R. We varied the number of clusters (k) from one to twenty. The pamk4https://cran.r-project.org/web/packages/fpc
122 Chapter 4. Today was a Good Day: The Daily Life of Software Developers
function is a wrapper that computes a clustering for each k in the specifiedrange and then returns the clustering with the optimum average silhouette.In our case, the optimal number of clusters was k = 6.
2. To describe the inferred six clusters, we used responses to other questionsfrom the survey, including developers’ assessments of good and typicalworkdays, their experience (senior versus junior developer (as defined bythe organization position) and number of years of development experience)and their office environment (private versus open-plan office).
3. Finally, we used the cluster descriptions to develop workday types.
Results. In Table 4.4, we present the resulting six clusters, the amountof time developers in each cluster spend on different activities, and additionalfactors to describe the clusters. Clusters 1 to 3 (C1-C3) are development heavyworkdays, while clusters 4 and 5 (C4-C5) include more collaborative aspects. Inthe following, we describe the clusters as workday types and characterize themconsidering the factors mentioned above. We also name each workday type tomake referencing them easier in the paper.
On a “Testing Day” (C1), developers overall spend considerably more timewith testing compared to the other days. As testing often requires to also debugand fix code, they also spend more time with coding and debugging comparedto other not development heavy days (C4-C6). On “Testing Days”, developersspend more time learning new things than the other days. The majority of thedevelopers in this cluster (in our sample, 71%) are junior developers, with 66%considering it a typical workday and 63% a good workday respectively. On a“Bugfixing Day” (C2) developers spend significantly more time debugging orfixing bugs (almost 3 hours on average). Similar to the “Testing Day”, mostlyjunior developers are experiencing this workday type (69%), and the developersin this cluster generally thought it was fairly typical (65%) and good (60%). A“Coding Day” (C3) is a workday where developers spend a lot of their timereading and writing code, on average about 2.3 hours, and is perceived as good bymore developers than the other workdays (74%). This workday type has a higherchance to be perceived as typical, with 72% considering their previous coding
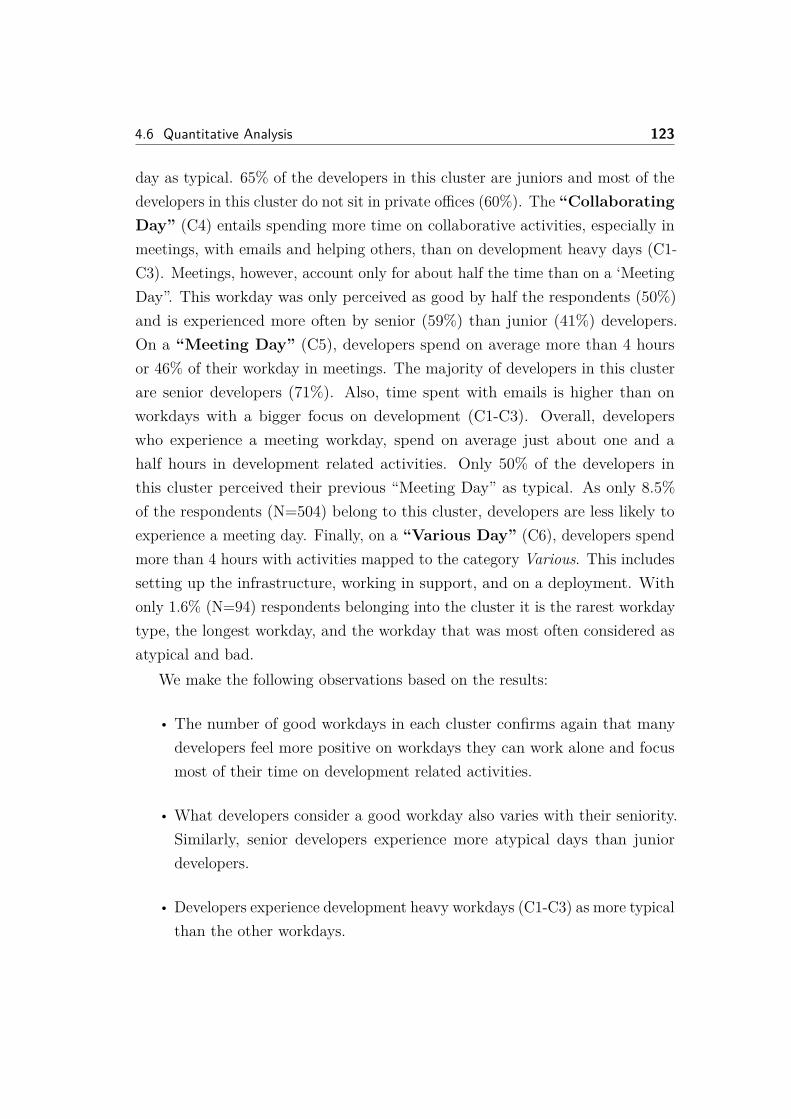
4.6 Quantitative Analysis 123
day as typical. 65% of the developers in this cluster are juniors and most of thedevelopers in this cluster do not sit in private offices (60%). The “CollaboratingDay” (C4) entails spending more time on collaborative activities, especially inmeetings, with emails and helping others, than on development heavy days (C1-C3). Meetings, however, account only for about half the time than on a ‘MeetingDay”. This workday was only perceived as good by half the respondents (50%)and is experienced more often by senior (59%) than junior (41%) developers.On a “Meeting Day” (C5), developers spend on average more than 4 hoursor 46% of their workday in meetings. The majority of developers in this clusterare senior developers (71%). Also, time spent with emails is higher than onworkdays with a bigger focus on development (C1-C3). Overall, developerswho experience a meeting workday, spend on average just about one and ahalf hours in development related activities. Only 50% of the developers inthis cluster perceived their previous “Meeting Day” as typical. As only 8.5%of the respondents (N=504) belong to this cluster, developers are less likely toexperience a meeting day. Finally, on a “Various Day” (C6), developers spendmore than 4 hours with activities mapped to the category Various. This includessetting up the infrastructure, working in support, and on a deployment. Withonly 1.6% (N=94) respondents belonging into the cluster it is the rarest workdaytype, the longest workday, and the workday that was most often considered asatypical and bad.
We make the following observations based on the results:
• The number of good workdays in each cluster confirms again that manydevelopers feel more positive on workdays they can work alone and focusmost of their time on development related activities.
• What developers consider a good workday also varies with their seniority.Similarly, senior developers experience more atypical days than juniordevelopers.
• Developers experience development heavy workdays (C1-C3) as more typicalthan the other workdays.
124 Chapter 4. Today was a Good Day: The Daily Life of Software Developers
• Senior developers have more days that include collaboration, such asmeetings, planning and specification and are less likely to have development-heavy workdays (C1-C3).
• Overall, average workday lengths are very similar, differing only up to halfan hour.
• On average, respondents who experienced a development heavy workday(C1-C3) have about 3 years less development experience.
4.6.4 Collaboration
Previous work has described interruptions as one of the biggest impediments toproductive work [Bailey et al., 2001; Czerwinski et al., 2004]. Also, meetingshave been shown to account for a big chunk of a developer’s workday, but theirusefulness and value is often questioned [Meyer et al., 2014]. Since most of thetime developers spend in development-unrelated activities is of a collaborativenature, we wanted to better understand how the two most frequent collaborativeaspects, meetings and interruptions, impact good and typical workdays (RQ4).Note that we did not include the project phase in this analysis, as respondentswere not specificly asked to report it in the survey.
Data Analysis. To study how collaboration impacts developers assessmentsof good and typical workdays, we selected 8 aspects related to interruptions andmeetings. For each aspect, we asked a random 10% subset of respondents toself-report the time needed, total number, or percentage. After cleaning the dataand removing a few outliers (<1% per aspect), we correlated the aspect withrespondents’ assessments of good and typical workdays. To test whether there isa significant statistical difference between each, good and typical workdays, andthe aspect, we use non-parametric Wilcoxon signed-rank tests (95% confidenceinterval). We corrected all p-values for multiple hypothesis testing, using theBenjamini-Hochberg correction [Benjamini and Hochberg, 1995]. In the resultsthat follow, we describe the relationship as significant if the p-value is less than0.05. In these cases, we include the p-value of the Wilcoxon test inline.
4.6Quantitative
Analysis125
Table 4.4: The six workday type clusters. Each column corresponds to a cluster and each row either to the timespent in activities or factors considered to describe the clusters. The left number in a cell indicates the averagerelative time spent and the right number in a cell the average absolute time spent.
Cluster 1 Cluster 2 Cluster 3 Cluster 4 Cluster 5 Cluster 6Testing Day Bugfixing Day Coding Day Collaborating Day Meeting Day Various Day24% (N=1451) 23% (N=1344) 22% (N=1319) 21% (N=1216) 8% (N=504) 2% (N=94)pct min pct min pct min pct min pct min pct min
Time Spent in ActivitiesDevelopment-Heavy ActivitiesCoding 11% 63 11% 61 37% 137 7% 37 6% 32 6% 35Bugfixing 11% 59 32% 170 10% 56 6% 31 4% 20 6% 36Testing 16% 87 7% 36 6% 35 2% 13 2% 11 4% 25Specification 4% 19 1% 6 2% 10 9% 47 3% 18 1% 4Reviewing code 5% 25 4% 23 4% 23 6% 33 3% 14 3% 19Documentation 3% 16 1% 4 1% 6 2% 9 1% 8 1% 3Collaboration-Heavy ActivitiesMeetings 12% 65 9% 50 9% 50 22% 121 46% 248 7% 41Email 8% 45 10% 52 8% 42 13% 73 12% 66 8% 44Interruptions 4% 24 4% 21 4% 19 6% 33 3% 19 3% 20Helping 4% 24 4% 21 4% 20 8% 44 5% 26 2% 14Networking 3% 14 1% 8 1% 7 2% 12 2% 12 1% 7Other ActivitiesLearning 7% 36 2% 10 2% 13 2% 11 2% 10 2% 9Administrative tasks 2% 12 2% 10 1% 7 4% 22 2% 11 2% 8Breaks 8% 44 9% 50 8% 43 8% 44 7% 37 7% 40Various 2% 19 3% 14 3% 14 3% 20 2% 15 47% 262Factors Describing the ClustersWorkday was good 63% 60% 74% 50% 48% 40%Workday was typical 66% 65% 72% 61% 50% 40%Works in a private office 46% 47% 40% 60% 57% 75%Is a junior developer 71% 69% 65% 41% 29% 56%Years of Experience 8.9 8.8 9.4 12.0 13.0 12.0Total time spent (in hrs) 9.2 8.9 9.0 9.1 9.0 9.4
126 Chapter 4. Today was a Good Day: The Daily Life of Software Developers
Results. The mean values for each aspect, presented for good, typical andcombined workdays, are shown in Table 4.5. We present some key observations:
(4.5a) Overall, developers had on average 4.66 interruptions on their pastworkday. Surprisingly, on typical workdays, the number of interruptions aresignificantly higher than on atypical workdays (p < 0.001). There is alsostrong evidence (i.e., a significance correlation) that interruptions are lower ongood workdays (p < 0.001). Developers who perceived their workday as goodexperienced about one interruption less than developers on a bad workday.
(4.5b) Previous work has found that developers typically take around 15minutes to resume after an interruption [Van Solingen et al., 1998]. In oursurvey, respondents self-reported it took them on average less than ten minutes.Overall, the time needed to resume an interruption is similar, independent ofwhether it is perceived as good and typical.
(4.5c) The longest period developers could work on code without aninterruption was 47.3 minutes, on average. On good (p < 0.001) and typical(p = 0.002) workdays, developers get significantly longer chunks of uninterruptedcoding time. On atypical and bad workdays, it is on average around 40 minutes.
(4.5d) Developers see meetings often as an inefficient use of time. While theresults presented above indicate developers are preferring coding over meetings,they still consider the majority of meetings as useful, independently of whetherit was a good and typical day. The percentage of useful meetings has a significantimpact on if a workday is considered good (p = 0.035), but not on if it wastypical. On atypical workdays, meetings are generally seen as a bit more valuable,probably because they are more irregular and less routine meetings.
(4.5e) Impromptu sync-up meetings are short interruptions from co-workers in the developers’ office to answer a question. Respondents experiencedon average about two impromptu sync-up meetings on their previous workday.
(4.5f) Unplanned meetings are more formal and less ad-hoc than im-promptu sync-ups, but are not stored as calendar appointments like plannedmeetings. Developers rarely have unplanned meetings, overall less than one aday. On good workdays, the number of unplanned meetings is significantly lowerthan on bad days (p = 0.002).
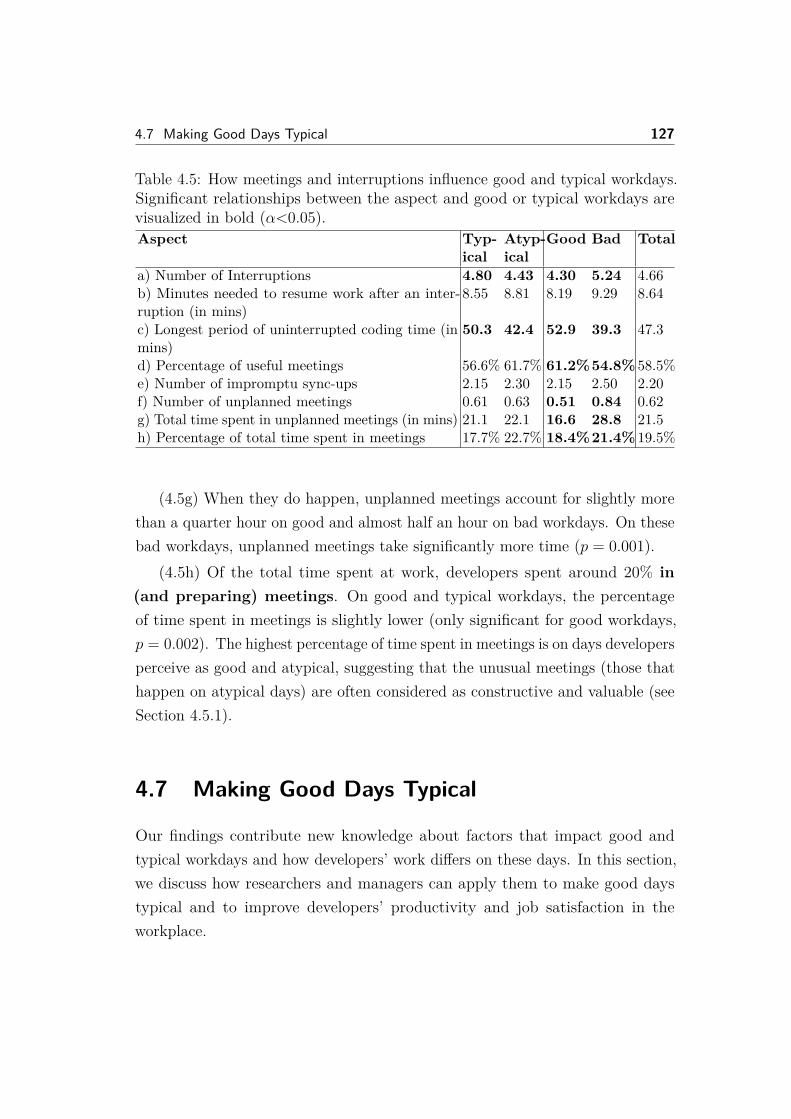
4.7 Making Good Days Typical 127
Table 4.5: How meetings and interruptions influence good and typical workdays.Significant relationships between the aspect and good or typical workdays arevisualized in bold (α<0.05).Aspect Typ-
icalAtyp-ical
Good Bad Total
a) Number of Interruptions 4.80 4.43 4.30 5.24 4.66b) Minutes needed to resume work after an inter-ruption (in mins)
8.55 8.81 8.19 9.29 8.64
c) Longest period of uninterrupted coding time (inmins)
50.3 42.4 52.9 39.3 47.3
d) Percentage of useful meetings 56.6% 61.7% 61.2%54.8% 58.5%e) Number of impromptu sync-ups 2.15 2.30 2.15 2.50 2.20f) Number of unplanned meetings 0.61 0.63 0.51 0.84 0.62g) Total time spent in unplanned meetings (in mins) 21.1 22.1 16.6 28.8 21.5h) Percentage of total time spent in meetings 17.7% 22.7% 18.4%21.4% 19.5%
(4.5g) When they do happen, unplanned meetings account for slightly morethan a quarter hour on good and almost half an hour on bad workdays. On thesebad workdays, unplanned meetings take significantly more time (p = 0.001).
(4.5h) Of the total time spent at work, developers spent around 20% in(and preparing) meetings. On good and typical workdays, the percentageof time spent in meetings is slightly lower (only significant for good workdays,p = 0.002). The highest percentage of time spent in meetings is on days developersperceive as good and atypical, suggesting that the unusual meetings (those thathappen on atypical days) are often considered as constructive and valuable (seeSection 4.5.1).
4.7 Making Good Days Typical
Our findings contribute new knowledge about factors that impact good andtypical workdays and how developers’ work differs on these days. In this section,we discuss how researchers and managers can apply them to make good daystypical and to improve developers’ productivity and job satisfaction in theworkplace.
128 Chapter 4. Today was a Good Day: The Daily Life of Software Developers
4.7.1 Optimizing Developer Workdays
Our results provide insights into factors that impact how developers’ good andtypical workdays are perceived and how they define them. This allows individuals,team leads and managers to prioritize and target actions that improveprocesses and tools, and ultimately productivity. For example, many develop-ers are unhappy when they work on mundane or repetitive tasks [Graziotin et al.,2017]. On the contrary, time pressure and deadlines were found to be majorcauses for stress [Mark et al., 2014; Melamed et al., 1995] and unhappiness [Grazi-otin et al., 2017]. Our results suggest ways to reduce these bad days and makegood days typical (i.e. more routine). Generally, it is advisable to minimizeadministrative tasks and infrastructure issues, and reduce interruptions andmeetings. Developers gain back time they can spend on their coding tasks andincrease their job satisfaction. This is especially important for junior developers,who tend to spend most of their time with development-heavy activities suchas coding, testing and bugfixing. During these tasks, they need to be able tofocus for long chunks of time, without interruptions. Uninterrupted work mightbe easier to achieve in smaller offices shared with only a few colleagues, ratherthan the currently omnipresent open-plan offices. During phases or days thatrequire a lot of collaboration, coordination and many meetings (e.g., planning,specification and release phase), the team could move to an open-plan office. Toaccommodate these changing needs for office space, teams could switch withanother team that is working with reversed phases.
Our results further suggest ways to make atypical days good, e.g., byworking from home on tasks that require a lot of attention and focus, by schedulingno-meeting days, by planning to do little coding during planning phases, or byusing slow times (e.g., project wrap-up) for side-projects. Working from home waspreviously shown to increase knowledge worker job satisfaction, since it increasesflexibility of working at one’s own pace, allows planning active working hours attimes of higher focus and motivation, and in quieter work environments [Rožmanet al., 2017; Ruostela et al., 2015; Van Der Voordt, 2004]. Days on which meetingsare grouped together allow teams to collaborate, discuss and plan intensively,and days when no meetings are scheduled allow teams to work more focused,
4.7 Making Good Days Typical 129
reducing context-switching and interruptions [Donohue, 2018; Lange, 2008].Common in these examples is that individuals and teams organize their work tobe atypical on purpose, which made these days more positive and productive. Inour analysis of workday types (see Section 4.6.3), we found that senior developersexperience more atypical workdays than junior developers. This is likely thecase because they experience more “collaborating days” and “meeting days”,making it more difficult to plan out and control one’s workday. Besides thebeforementioned approaches on making meetings more efficient, other researchfocused on approaches that reduce the amount of time senior developers needto spend with randomization and helping out, leaving more time to work ontheir main coding tasks. This includes expert-finding systems to interrupt fewerpeople with inquiries (e.g., [Balog et al., 2006; Mockus and Herbsleb, 2002]),more efficiently exchanging knowledge and learnings (e.g., [Fritz and Murphy,2010; Robillard et al., 2010]), increasing team awareness (e.g., [Biehl et al., 2007;Jakobsen et al., 2009; Sarma et al., 2003]), and more efficiently dealing withemails (e.g., [Mark et al., 2016a; Sappelli et al., 2016]). Finally, spending morequality time on activities most described as good days (e.g., coding and learning)could further make senior developers’ often randomized, atypical workdays good.
From our work, it remains unclear how much consistency over days devel-opers expect and how often they appreciate non-routine atypical workdays. Wecould imagine that occasionally breaking the routine will also avoid boredomand will make work more exciting overall. However, the ever-changing projectphases and various activities pursued at work might already be sufficient toavoid routine. Having now a better understanding of the factors that influencedevelopers’ assessments of good and typical workdays, future work could ex-plore how the company culture, development processes, developers’ gender (e.g.,GenderMag [Burnett et al., 2016]) and personas (e.g., Developers’ ProductivityPerception Personas [Meyer et al., 2017c]) influence how pronounced thesefactors are. For example, standardized questionnaires from psychology could beleveraged to include perspectives on developers’ personality (e.g., BFI-2 [Sotoand John, 2016]), impulsivity (e.g., UPPS [Whiteside and Lynam, 2001]) orability to self-control (Cognitive Absorption Scale [Agarwal and Karahanna,
130 Chapter 4. Today was a Good Day: The Daily Life of Software Developers
2000]). Getting more insights into the distinctness of these factors could helpindividuals, teams and managers to prioritize improvements at the workplacebetter.
4.7.2 Agency: Manage Competition for Attention & Time
Our results highlight that developers face a constant competition for attentionand time between their main coding tasks (i.e., individual productivity)and collaborating with their team (i.e., team productivity). Whilethey generally understand the importance of team collaboration, not everydeveloper perceived it as an efficient and productive use of their time. Developers’workdays are often disrupted by activities they have little control and autonomyover (e.g., meetings scattered over the day, interruptions from co-workers askingfor help). These disruptions fragment developers’ workdays, allowing them toonly spend little time focused on their coding tasks before switching to thenext topic [González and Mark, 2004; Meyer et al., 2017a]. This increasesfrustration and tensions in the team. Thus, being able to freely control howto best organize one’s workday and whether it goes as planned/expected oris disrupted by external factors is important. For example, allowing developersto “veto” meeting requests can help avoid scattering meetings across the workdaythat leave very little time to make progres in-between them. In Sociology, thisnotion is known as agency, and describes “the capacity of individuals to actindependently and to make their own free choices” [Barker, 2003]. The findingof the importance of agency is in line with previous work in psychology, in whichincreased autonomy in a high-variety task led to increased satisfaction [Doddand Ganster, 1996]. Similarly, a study with students showed that higher levels ofautonomy are related to higher well-being and better outcomes [Sheldon et al.,1996]. Agency is related to the concept of daily job crafting, the self-inducedchanges that employees make in their job demands and resources to meet and/oroptimize their work goals [Tims et al., 2012]. These changes can have positiveimpacts on motivation [Petrou et al., 2012] and performance [Tims et al., 2012].
Previous work has suggested a plurality of approaches that allow knowledgeworkers to better manage their own workdays and improve collaboration. This
4.7 Making Good Days Typical 131
includes avoiding interruptions from co-workers at in-opportune moments [Zügeret al., 2017], reducing distractions from communication channels [Mark et al., 2018;Storey et al., 2017], having flexible work hours [Origo and Pagani, 2008], improvingthe scheduling of meetings between timezones [Tang et al., 2011; Whittaker andSchwarz, 1999], and making distributed meetings more efficient [Babar et al., 2008;Sutherland et al., 2007]. Since these examples are founded in other knowledgework settings, future work could study how to adapt them to the softwareengineering domain and allow developers to better control and optimize theirtime.
Our work refines previous work that found developers consider most meetingsand interruptions as unproductive. We found that during non-developmentphases, they are common and (usually) productive. We should activelywork on reducing interruptions and meetings during the development phase (andon development-heavy days), and encourage them at times when collaborationis most crucial, such as phases of planning/specification, testing and release.Finally, we learnt that senior developers appreciate collaboration generally morethan junior developers, suggesting the value of collaboration changes withexperience. This finding is in line with recent work that found motivation andjob satisfaction at work is changing as individuals age [Rožman et al., 2017].
4.7.3 Evaluation of Contributions at Work
The competing interests between individual productivity and team productivityalso highlight potential issues in how we evaluate success and measureproductivity at work. Our findings indicate that developers who reflect aboutsuccessful work mostly consider the produced output, and value collaborativework much lower. This is why on good and typical days, the majority of developersreported making a lot of progress on their coding tasks and producing a lot ofoutput (49.4%), rather than focussing on contributing something meaningful(6.4%), learning something new (4.7%), or helping a team-mate to make progress(4.7%). Initial discussions with a few project managers at the corporationconfirmed this interpretation. According to them, many teams are starting toconsider developers’ support to other team-members, and contributions to other
132 Chapter 4. Today was a Good Day: The Daily Life of Software Developers
teams and even external (open-source) projects when evaluating the performancein job reviews and salary discussions. This is similar to reports from industry,where developers are not only evaluated by their managers but also their peers, orwhere developers can recommend a small monetary bonus to another developerfor great work done [Goler et al., 2019].
While our study with software developers showed that learning something newwas rarely (4.7%) mentioned as a reason for a successful day, a study focusingon Korean knowledge workers found that career satisfaction is predicted byan organization’s learning culture and goal orientation [Joo and Park, 2010].According to Hofstede and Arrindell [1998]’s dimension of masculinity/femininity,masculine cultures focus more on competition and success, while more feminineones on doing what one likes. These examples suggest that reflecting about(successful) work needs to be considered as a separate variable in future work, tobetter understand how differences in company culture, job profile, goal orientationand gender could impact how developers reflect about their work.
4.8 Threats to Validity
4.8.1 External Validity
The main threat to the generalizability and validity of our results is the externalvalidity. Since our survey was conducted at only one large organization, it isunclear how representative our results are of the views of all software developers,especially from smaller companies or open-source projects. Microsoft employsover thirty thousand developers, who are working on various projects targetingprivate and commercial users, and at different stages of their projects. Surveyrespondents work in teams of different sizes, at various locations, using varyingtechnology and processes. Many teams in the organization have come fromacquisitions of smaller companies or startups, and their development processesand tools have remained largely untouched. According to Microsoft’s yearlydiversity report 5, the distribution of developers in the United States (US) was the
5https://www.microsoft.com/en-us/diversity/inside-microsoft/default.aspx
4.8 Threats to Validity 133
following in 2018: 50.9% Caucasian, 39.2% Asian, 4.5% Hispanic, 2.8% African-American, and 2.6% other. 19.9% identify as female, 80% male, and 0.1% as other.At the time of taking our survey, all participants resided in the greater Seattle areain Washington state, US. Thus, while all of the developers we studied are part ofa single organization, we are confident to achieve some level of external validityand generalizability, based on the variation in paricipants’ context, environment,culture, and experience, as well as the large sample size. Finally, single-caseempirical studies have been shown to contribute to scientific discovery [Flyvbjerg,2006]. Nonetheless, future work could consider additional variables, such asthe company culture and size, and developers’ gender, personality, and goalorientation.
4.8.2 Construct Validity
In Section 4.5.1, we described how we analyzed the survey responses usingmethods common in the Grounded Theory approach by Strauss and Corbin[1998]. One potential threat could be that the Open Coding step was performedby one author only. To reduce bias, we discussed 10-30 representative quotes foreach coded category as a team, and collectively mapped all responses that couldnot distincitvely be mapped to a category. All subsequent steps, including Axialand Selective Coding and the development of the conceptual frameworks, wereperformed iteratively with three or all four authors present.
4.8.3 Internal Validity
Selecting developers randomly with replacement when sending out the surveyinvitations via email might pose a risk to internal validity. Since all responseswere anonymous, we cannot know the exact number of people who took thesurvey more than once and how much time was between the two responses. We,however, expect the number to be low, since from the 43.8% of participantswho voluntarily revealed their identity, only 6.6% responded twice, and no onerepeated more than once. Since the survey invitations were sent out over thecourse of 4 months, we further also expect the number of responses from the
134 Chapter 4. Today was a Good Day: The Daily Life of Software Developers
same participant within subsequent days to be very low. Thus, we believe thatthe large amount of participants (N=5971) reporting at random workdays andvarying stages of their projects is a fairly representative sample of how developerworkdays look like. Future work could consider how developers’ decision toparticipate in the survey and more importantly, their answers are affected bytheir experiences of the previous workday and their personality. For example,previous work showed that well-being on the preceding day can affect the well-being on the subsequent day [Sheldon et al., 1996] and, hence, could have affectedour respondents’ self-reports of how good their previous workday was. Similarlyand with respect to personality, people who are generally more likely to respondto surveys are conscientious, agreeable and open to new experiences [Marcusand Schütz, 2005; Rogelberg et al., 2004; Tuten and Bosnjak, 2001]. Our samplemight not accurately represent developers who do not fit into these personalitygroups.
Another limitation of our study could be that we studied developers’ workdaysbased on their self-reports and only on one day (and in a few cases two days)per developer. We discuss our rationale behind the study design in detail inSection 4.4. We are confident of the soundness of our design, also because ourresults replicate comparable findings (e.g., time spent on activities and the highcost of interruptions and meetings) from previous work that applied differingmethods (e.g., observations, tracking).
The survey structure and formulation might be source of further risks tointernal validity. For example, asking developers whether they consider theirworkday as good and typical after asking them to self-report their time spent atwork might have framed participants. Another potential framing threat is thepositioning of the demographic questions in the beginning of the survey, whichmight have caused a Stereotype Threat [Steele and Aronson, 1995]. For example,a developer working in an open-plan office and not liking this might have beenreminded of the fact when answering the survey. Future work should redress thisthreat by placing the demographic questions at the end of the survey [Danaherand Crandall, 2008; Stricker and Ward, 2004].
We also acknowledge that typicality and goodness of workdays are not binary
4.9 Conclusion 135
ratings in reality, as several factors could influence the assessment of a workdayto be rather typical or rather atypical, for example. However, for the sakeof first identifying the factors that influence what contributes to a good andtypical workday, we decided that using a dichotomous variable makes moresense. Dichotomization was also described as a standard practice in empiricalresearch, to avoid nominal scale violations [Kitchenham and Pfleeger, 2008]. Inthe interviews, we noticed that there is no consensus between whether writingcode and debugging is the same activity. Hence, in the survey, we asked developersto distinguish between writing code and debugging when reporting the timespent. An additional control question revealed that 58% distinguish betweenwriting code and debugging, while 42% do not.
4.9 Conclusion
We extend previous work on understanding developer workdays by adding twonew perspectives: what makes a workday good and typical. We report onaspects that characterize what makes developers consider workdays good andtypical, and how managers can leverage them to make good workdays typical.On good workdays, developers make progress and create value on projects theyconsider meaningful, and spend their time efficiently, with little randomization,administrative work and infrastructure issues. What makes a workday typical isprimarily assessed by the match between developers’ expectations and the reality.Amongst other aspects, this match is heavily influenced by the time they spend ondifferent activities, external factors they have little control over, and the currentdevelopment phase. Since developers often complain meetings and interruptionsare unproductive, prior work concludes that they are bad overall. Surprisingly,we find that their impact on productivity and job satisfaction depends on thedevelopment phase: during specification/planning and release phases, they arecommon, but constructive. Another key finding is the importance of agency,control over one’s workday and whether it goes as planned and expected, oris disrupted by external factors. Our work provides a holistic perspective onhow developers think these aspects influence their workdays and helps prioritize
136 Chapter 4. Today was a Good Day: The Daily Life of Software Developers
process and tool improvements. For example, one unexpected finding is tode-emphasize email, contrary to what was suggested by related work.
Our results stem from a large-scale survey with 5971 responses, where profes-sional software developers reflected about what made their workdays good andtypical, and where they self-reported how they spent their time on the previousworkday. In contrast to related work using primarily automated tracking, byusing self-reports we capture unanticipated events in each developer’s own classi-fication at scale. Our scale also gives us the resolution to uncover nuances, e.g.,what makes developers happy and satisfied varies with their seniority.
4.10 AcknowledgementsWe thank our study participants for their participation. We also thank theanonymous reviewers and our editor for their valuable feedback.
5Detecting Developers’ Task
Switches and Types
André N. Meyer, Manuela Züger, Chris Satterfield, Katja Kevic,Gail C. Murphy, Thomas Zimmermann, Thomas Fritz
In submission at FSE 2019,Contribution: Study design and execution, participant recruitment, tooldevelopment, data collection, partial data analysis, and paper writing
Abstract
Developers work on a broad variety of tasks during their workdays and constantlyswitch between them. While these task switches can be beneficial, they can alsoincur a high cognitive burden on developers, since they have to continuouslyremember and rebuild the task context–the artifacts and applications relevantto the task. Researchers have therefore proposed to capture task context more
138 Chapter 5. Detecting Developers’ Task Switches and Types
explicitly and use it to provide better task support, such as task switch reductionor task resumption support. Yet, these approaches generally require the developerto manually identify task switches. Automatic approaches for predicting taskswitches have so far been limited in their accuracy, scope, evaluation, and thetime discrepancy between predicted and actual task switches. In our work,we examine the use of automatically collected computer interaction data fordetecting developers’ task switches as well as task types. In two field studies–a 4hobservational study and a multi-day study with experience sampling–we collecteddata from a total of 25 professional developers. Our study results show thatwe are able to use temporal and semantic features from developers’ computerinteraction data to detect task switches and types in the field with high accuracyof 87% and 61% respectively, and within a short time window of less than 1.6minutes on average from the actual task switch. We discuss our findings andtheir practical value for a wide range of applications in real work settings.
5.1 Introduction
To successfully perform their work, software developers are required to constantlyswitch between a broad variety of tasks, such as implementing a new feature,answering an email or attending a meeting, with each task requiring its ownset of artifacts and applications [González and Mark, 2004; Meyer et al., 2017a;Perry et al., 1994a]. These constant task switches result in a high fragmentationof work, requiring developers to continuously interrupt and later resume theirtasks and to relocate the artifacts and applications that are relevant to fulfillthe task at hand. Subsequently, developers face a higher cognitive burden, lowerperformance, and a higher error rate [Bailey et al., 2001; Murphy et al., 2005].
To support developers in their fragmented task work, researchers have pro-posed approaches that explicitly capture task context–artifacts and applicationsrelevant to the task–and that use this information to then support users bypreventing interruptions, easing task resumption, or by recommending relevantartifacts and applications [Bragdon et al., 2010a; Card and Henderson Jr, 1986;Dragunov et al., 2005; Kersten and Murphy, 2006; Sahm and Maalej, 2010; Smith
5.1 Introduction 139
et al., 2003]. While studies have shown that the explicitly captured task contextcan lower the cognitive burden on developers and increase productivity [Bragdonet al., 2010b; Kersten and Murphy, 2006], all of these approaches require someform of manual interaction of the developer to identify task boundaries, some-thing that developers often forget to do in practice after using such an approachfor a few days [Kersten and Murphy, 2006].
To address this issue, few researchers have proposed approaches to auto-matically detect switches between tasks, varying mainly in the features used(e.g., user input or application based), and the method applied (e.g., supervisedversus unsupervised) [Mirza et al., 2011a; Shen et al., 2009, 2007]. Yet, theevaluations performed to study these approaches are often fairly limited in termsof the tasks and number of participants, and the results show that it is verychallenging to achieve high prediction accuracy of task switches without toomany false positives [Mirza et al., 2011a; Nair et al., 2005; Stumpf et al., 2005],or that one has to accept a high deviation in time of 3 to 5 minutes betweenpredicted and actual task switches [Shen et al., 2009, 2007, 2006]. Since theseapproaches focus on detecting task switches within the IDE only, they are notcapturing non-development work, which can account for 39% up to 91% of thetime developers spend at work [Astromskis et al., 2017; Gonçalves et al., 2011;Meyer et al., 2017a; Perry et al., 1994a; Singer et al., 2010].
In our research, we extend this work and investigate (RQ1) whether we canautomatically detect task switches of professional software developers in thefield, based on temporal and semantic features as extracted from their computerinteraction inside and outside the IDE. We were also interested in classifyingthe type of task a developer is working on, since the better we understand thecontext of a task, the better we can support developers. To the best of ourknowledge, there has been only one approach so far that looked at the automaticclassification of developers’ activities on a task level [Bao et al., 2018]. Yet, theirexamination was limited to specific development activities only, and did notconsider the whole range of non-development tasks that developers are workingon, such as administrative or planning tasks. In our work, we investigate thetask types that software developers are working on more holistically, and explore
140 Chapter 5. Detecting Developers’ Task Switches and Types
(RQ2) how accurately we can predict them in the field.To address our research questions, we performed two field studies: one with
12 professional developers in which we observed their work over a 4-hour periodand logged the task switches and types without interrupting their work; andone with 13 professional developers in which we regularly prompted participantsto self-report their task switches and types over a period of about 4 workdaysand conducted a post-study questionnaire. By varying the study methods, wewanted to achieve a higher generalizability of our results and ensure that wetake into account the effects of self-reporting while also capturing the breadthof developers’ tasks over multiple days. For both field studies, we also collectedthe participants’ computer interaction using a monitoring tool that we installedon their machine and that was running in the background. From the computerinteraction data, we extracted a total of 68 temporal and semantic features.Our analysis of the data shows we can use the automatically logged computerinteraction data to train machine learning classifiers and predict task switcheswith a high accuracy of 87%, and within a short time window of less than 1.6minutes of the actual task switch. Our analysis further shows that we are ableto predict task types with an accuracy of 61%, yet that this accuracy varies a lotby task type. The features based on mouse and keyboard interaction generallyhold the highest predictive power, while the lexical features we extracted fromthe application names and window titles have the least predict power in ourapproach.
Overall, our work extends previous work with an approach that uses a broaderrange of features, is evaluated in a field-study with 25 professional developers,and achieves higher accuracy and less delay than previous work. Our resultsprovide evidence for the potential to automatically detect software developers’task switches and types in the field. This opens up opportunities for providingdevelopers with task support tools that lower the burden of fragmented workand constant task switching, by reducing task switching and facilitating taskresumption, and by greatly complementing existing task support by freeing thedeveloper from the laborious manual task boundary identification.
5.2 Related Work 141
The primary contributions of this paper are:
• An approach to automatically detect task switches and types based ondevelopers’ computer interaction that is not limited to the IDE.
• Two field studies with 25 professional developers demonstrating our ap-proach’s potential to detect task switches and types with high accuracyand within a small time window in the field.
• An evaluation of the predictive power of various computer interactionfeatures, including semantic and temporal ones, and a comparison ofindividually trained models versus a general model.
5.2 Related Work
Work related to our research can broadly be grouped into research that examinedthe detection of task switches and task types, and into approaches to support taskfocused work. Based on previous work Bruegge and Dutoit [2004]; González andMark [2004]; Kersten and Murphy [2006]; Meyer et al. [2014]; Mirza et al. [2011b];Vasilescu et al. [2016a], we defined a task as a well-defined work assignment witha specific goal that people divide their work into, such as fixing a bug, or preparingfor a team-meeting. A task switch occurs, when a person switches between twodifferent tasks.
5.2.1 Task Switch Detection
Several researchers have explored the detection of task switches mostly for generalknowledge workers. These approaches mainly differ in the features they usedto identify the task boundaries or switches, ranging from semantic features totemporal features, the method they use, unsupervised versus supervised, andthe way they evaluated their approach. One of the most prominent approachesis by [Shen et al., 2009, 2007, 2006; Stumpf et al., 2005] that is mainly basedon semantic features and supervised learning. They reused an approach, Task-Tracer [Dragunov et al., 2005], that allows users to manually indicate the tasks
142 Chapter 5. Detecting Developers’ Task Switches and Types
they are working on, and additionally tracks their application interactions in thebackground, including window titles. Based on the assumption that windowsof the same task share common words in their titles, they create vectors fromwindow titles and identify task switches based on a textual similarity measureusing the users’ previously declared tasks and supervised learning. After the firstversion, Shen et al. [2006] further improved their approach to reduce the numberof false positives and to be able to predict task switches online [Shen et al., 2009,2007]. Their evaluation is based on a small set of two users and counts a taskswitch as accurate if it falls within a 4 to 5 minute time window of a real switch,which is a very coarse measure, given the frequent task switching in today’senvironment that happen every few minutes [González and Mark, 2004; Meyeret al., 2014]. Based on the assumption that switches between windows of thesame task occur more frequently in temporal proximity than to windows of adifferent task, Oliver et al. [2006] examined a temporal feature of window switcheswithin a 5 minute time window in addition to semantic features and using anunsupervised approach. An evaluation based on 4h of a single participant, theyachieved a precision of 0.49 and recall of 0.72. Researchers have also used othertemporal features, in particular, the frequency of window events, to determinetask switches. Under the assumption that users navigate between windows morefrequently when they switch tasks, as opposed to during a task, Nair et al. [2005]developed a system that calculates window event frequency based on fixed 5minute time windows. An evaluation with 6 participants resulted in an accuracyof 50%. Mirza et al. [2011a] relaxed the constraint of a fixed time window, usedadjusted frequency averages and studied the various approaches with 10 graduatestudents. They found that their approach improved the accuracy and achievedan overall accuracy of 58%. Overall, previous research has shown that detectingtask switches is difficult, even for very short periods of time and in controlledenvironments. In our work, we focus on software development work and extendthese approaches by including and examining both, semantic and temporal fea-tures of window events as well as user input features, and by conducting twostudies with professional software developers.
5.2 Related Work 143
Only little research has been performed on task switch detection in thesoftware development domain and all of this research has focused solely onsoftware development tasks within the IDE. As one of the first, Robillard andMurphy [2004] proposed to use program navigation logs to infer developmenttasks and they built a prototype, however, without evaluating it. In 2008, Comanand Sillitti focused on splitting development sessions into task-related subsectionsbased on temporal features of developers’ access to source code methods andevaluated their approach with 3 participants over 70 minutes each, finding thatthey can get close to detecting the number of task switches, yet the point intime when the task happens is a lot more difficult [Coman and Sillitti, 2008].Zou and Godfrey [2012] replicated Coman and Sillitti’s study in an industrialsetting with six professional developers and found that the algorithm detectsmany more task switches than the ones self-reported by the participants with anerror of more than 70%. Finally, on a more fine-grained level, Kevic and Fritzexamined the detection of activity switches and types within a change task usingsemantic, temporal and structural features. In two studies with 21 participants,they found that activity switches as well as the six self-identified activity typescan be predicted with more than 75% accuracy [Kevic and Fritz, 2017]. Differentto these approaches, we focus on all tasks a developer works on during a day,not just the change tasks within the IDE.
5.2.2 Task Type Detection
Researchers also examined detecting the type of task or activity a person isworking on. Most similar to our approach for task type detection is Koldijk et al.[2012]. They investigated the use of features over a fixed 5 minute time window,using mouse and keyboard input, application (switches) and the time of day. Theytried to predict one of 12 task types that they identified in a survey, e.g., reademail, write email, plan, program, search information, and create visualization.The results of a field study with 11 researchers and an average of 10 hours ofdata per participant shows that the prediction is very individual and that ageneral classifier does not work well. Mirza et al. [2015] focused on classifyingusers’ desktop interactions into six higher level activity types: writing, reading,
144 Chapter 5. Detecting Developers’ Task Switches and Types
communicating, web browsing, system browsing and miscellaneous. They usedtemporal, interaction-based (application window events), and semantic featurescalculated over a 5 minute time window. In a 6 hour field study with fiveparticipants and a controlled lab study, they found that they can predict theactivity category for each of these 5 minute windows with high accuracy (81%)and that interaction-based features work best. Researchers have also exploredbiometric features, such as Hassib et al. [2017] who used Electroencephalographyto classify the task type according to cognitive load, but without looking atspecific task types. In our work, we extend these approaches by not fixatingon fixed time windows of 5 minutes but actually detecting the switches and byevaluating them with professional developers in the field.
We have been able to find only very little research on predicting task typesfor software developers. To the best of our knowledge, the only approach that issimilar to our work is by Bao et al. [2018]. In their work, they automatically tracklow-level computer interaction data (user input and application usage) and use aCondition Random Field (CRF) based approach to segment the data and inferone of six development activities–coding, debugging, testing, navigation, search,or documentation–similar to our task types. An analysis of data collected fromten developers over a week shows that CRF is able to classify the activity with73% accuracy. We extend the approach by focusing on all activities developersperform during their workday, not just development, and by examining whendevelopers switch between different tasks.
5.2.3 Task Support
While there is a vast number of approaches to support specific developmentactivities, such as code search, code review or debugging, only little researchhas looked into supporting developers with understanding and managing theirtasks and the frequent switches between them. Several researchers have thereforeproposed to explicitly model development tasks and to capture task contexts–artifacts and applications relevant to a task–to support developers in their taskwork, in particular by recommending relevant artifacts [Kersten and Murphy,2006; Sahm and Maalej, 2010], identifying related tasks [Maalej et al., 2017],
5.3 Study Design 145
easing the resumption of interrupted tasks and switching between them [Bragdonet al., 2010a,b; Card and Henderson Jr, 1986; Dragunov et al., 2005; Kerstenand Murphy, 2006; Oliver et al., 2008; Rattenbury and Canny, 2007; Robertsonet al., 2000; Smith et al., 2003], or scoping queries and recommending workflowimprovements [Murphy et al., 2005]. Early approaches to support task switching,such as virtual workspaces [Card and Henderson Jr, 1986] or the GroupBar [Smithet al., 2003], provide interfaces that allow the user to manually group artifactsand applications with respect to tasks. The approaches Mylyn by Kersten andMurphy [2006], and TaskTracer by Dragunov et al. [2005], both explicitly capturetask context by automatically recording user interactions within the IDE orthe desktop environment respectively, given the user manually indicates thestart and end of a task. While several of these approaches have great potentialto support developers in their task work, they require some form of manualinteraction to identify the task boundaries, something that developers oftenforget to do after using such a tool for a while [Kersten and Murphy, 2006].Researchers have therefore examined how to best aid developers in identifyingtask boundaries retrospectively [Safer and Murphy, 2007], looked into morelightweight approaches for supporting task resumption through cues and withoutspecific task context [Parnin and DeLine, 2010b], or explored the automaticmining of task contexts to support window switching [Oliver et al., 2008] andgrouping files [Rattenbury and Canny, 2007]. Overall, an automatic and real-timetask switch detection has thereby the potential to complement and significantlyimprove the value of most of these existing approaches for developers.
5.3 Study Design
To investigate the use of computer interaction data for predicting task switchesand types, we conducted two field studies, a 4-hour observational study and amulti-day study with experience sampling, with a total of 31 professional softwaredevelopers initially. The observations and self-reports served as the ground truthof participants’ task switches and types, while we additionally gathered computerinteraction data to extract features for our predictions. In both studies, we used
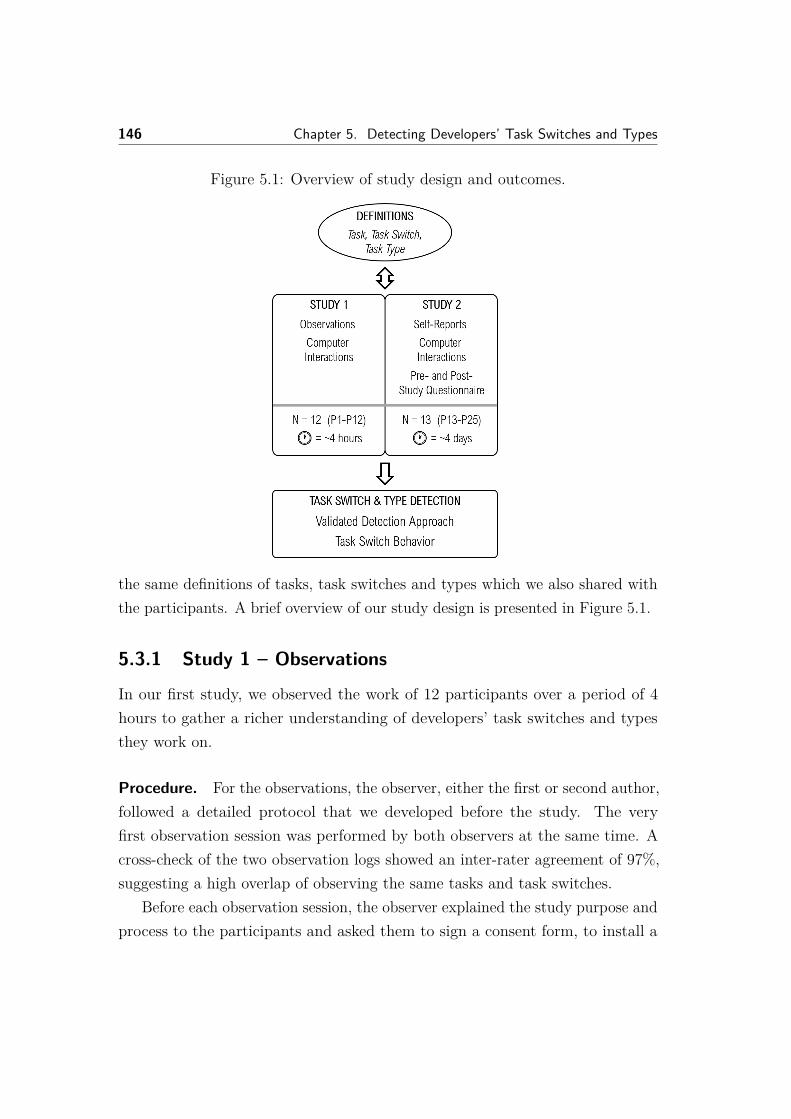
146 Chapter 5. Detecting Developers’ Task Switches and Types
Figure 5.1: Overview of study design and outcomes.
the same definitions of tasks, task switches and types which we also shared withthe participants. A brief overview of our study design is presented in Figure 5.1.
5.3.1 Study 1 – Observations
In our first study, we observed the work of 12 participants over a period of 4hours to gather a richer understanding of developers’ task switches and typesthey work on.
Procedure. For the observations, the observer, either the first or second author,followed a detailed protocol that we developed before the study. The veryfirst observation session was performed by both observers at the same time. Across-check of the two observation logs showed an inter-rater agreement of 97%,suggesting a high overlap of observing the same tasks and task switches.
Before each observation session, the observer explained the study purpose andprocess to the participants and asked them to sign a consent form, to install a
5.3 Study Design 147
monitoring tool that tracks participants’ computer interaction, and to describethe tasks they were planning to work on during the observation. The observeralso introduced herself to nearby colleagues and asked them to ignore her as muchas possible, and collaborate with the observed participant as they would normallydo. After that, the observer placed herself behind the participant to preventdistractions, while still being able to see the screen contents on the participant’scomputer. Finally, the observer started the actual observation session and askedthe participant to continue their work as usual.
We observed participants for a total of four hours each on a single workday:two hours before and two after lunch. For the observations, we followed theprotocol of a structured observation session by Mintzberg [1980]. The observerwrote in an observation log 1 each time the participant switched from one task toanother. Each entry in the observation log consists of a timestamp, a descriptionof the reason for the task switch and a description of the task itself. We inferredtasks and their details from the active programs and their contents on the screen,as well as discussions participants had with co-workers. After each session, theobserver validated the observed tasks and task switches with the participant, bygoing through the list of observed tasks and accompanying notes and modifyingmistakes made during the observation.
Participants. We recruited 14 participants through professional and personalcontacts from two large-sized and one medium-sized software companies. Weexcluded two participants for which we were not able to observe a sufficientamount of task switches (less than 10). Of the remaining 12 participants, 1 wasfemale and 11 were male. Throughout the paper, we refer to these participantsas P1 to P12. Our participants had an average of 10.8 (±7.4, ranging from 1 to20) years of professional software development experience and were working indifferent roles: 8 participants identified themselves as individual contributors and4 as developers in a leading position. All participants resided either in Canadaor the United States.
1We used our own observation logging tool: https://github.com/casaout/ObservationStudyTool
148 Chapter 5. Detecting Developers’ Task Switches and Types
Monitoring Tool. To collect computer interaction data from developers, we de-veloped and used our own monitoring tool, PersonalAnalytics 2, for the Windowsoperating system. The tool tracks participants’ mouse and keyboard interaction,as well as their application usage. For the mouse, the tool tracks the clicks(coordinates and button), the movement (coordinates and moved distance inpixels), and the scrolling (coordinates and scrolled distance in pixels) alongwith the corresponding time-stamp. For the keyboard, the tool records thetype of each keystroke (regular, navigating, or backspace/delete key) along withthe corresponding time-stamp. For privacy reasons, we did not record specifickeystrokes. Our tool further records the currently active application, along withthe process name, window title, and time-stamp whenever the window titlechanged or the user switched to another application.
Task Type Inference. We inferred task type categories by performing a The-matic Analysis [Braun and Clarke, 2006] on the basis of related work and ourobservation logs. The analysis process included first familiarizing ourselves withthe observed task switches, open coding the observed and participant-validatedtasks and accompanying notes, identifying themes, and categorizing the resultingthemes into higher level task types. This process resulted in nine task typecategories: Development, Personal, Awareness & team, Administrative, Plannedmeeting, Unplanned meeting, Planning, Other and Study. The task types aredescribed in more detail in Table 5.4 and discussed in Section 5.6.1.
5.3.2 Study 2 – Self-Reports
To capture a longer time period and more breadth in developers’ work, weconducted a second field study with 13 participants over a period of 4 workdayseach. For this study, we used experience sampling, in particular we regularlyprompted participants to self-report task switches and types. By using experiencesampling, we also wanted to mitigate the risk of a bias in participants’ behavior
2https://github.com/sealuzh/PersonalAnalytics. Details can be found in [Meyeret al., 2017b].
5.3 Study Design 149
due to an observer sitting behind them, which, for example, could lead toparticipants being less likely to browse work unrelated websites.
Procedure. Before the study, we emailed participants a document explainingthe study goal and procedure, asked them to sign a consent form and to answera pre-study questionnaire with questions on demographics, their definition of atask, reasons for switching between tasks, and on the task types they are usuallyworking on. After that, participants were asked to install the same monitoringtool that we described above on their main computer. In case participantsworked on multiple computers (e.g., a desktop and a laptop), we asked them toinstall the monitoring tool on both devices. Participants were further asked toread our definitions of a task, task switch and task type, as well as instructionson how to use the self-reporting component that we added to our monitoringtool. Finally, participants were asked to pursue their work as usual for the nextcouple of workdays while also self-reporting their task switches and types whenthe pop-ups/prompts appeared.
For this study, our tool prompted participants once per hour to self-reporttheir task switches and types for the previous hour. The self-reporting step isexplained in more detail below. We intentionally decided to use an interval of onehour rather than a full day, to balance the intrusiveness of the prompts with theability to accurately remember tasks and task switches over the previous timeinterval [Tourangeau et al., 2000]. To further ensure high quality in the collectedself-report data we further allowed participants to withdraw from the study atany point in time, and to pick the time for their participation themselves. Inaddition, and to avoid boredom or fatigue, we asked participants to respond to atotal of 12 to 15 prompts, assuming an average of four self-reports per day and atotal of three to four workdays for participation. This number was a result ofseveral test-runs over multiple weeks and from qualitative feedback gathered witha pilot participant, a professional developer. Furthermore, we provided supportto postpone self-report prompts for 5 minutes, 15 minutes, or 6 hours, and builtand refined the self-reporting component to require as little effort as possible toanswer, e.g., by letting participants answer the required fields by simply clicking
150 Chapter 5. Detecting Developers’ Task Switches and Types
on elements instead of asking them for textual input. Finally, each pop-up alsoasked participants to report their confidence with their self-reports.
Throughout the study, participants could check the number of completedpop-ups. Once they completed 12 pop-ups, participants could notify us andupload the collected data and self-reports to our server. The upload wizard onceagain described the data collected and allowed participants to obfuscate the databefore sharing it with us. At the end of the study, participants were asked toanswer a post-study questionnaire with questions on the experienced difficultieswhen self-reporting task switches and task types, on further task types they wereworking on, and on how they could imagine using information on task switchesand types. After completing the survey, participants were given two 10 US$ mealcards to compensate for their efforts.
Participants. We recruited 17 participants through professional and personalcontacts from one large-sized software company. We discarded data from threeparticipants that self-reported less than 10 task switches in the days of theirparticipation. We further discarded the data of one participant whose definitionof a task switch was very different to ours and the rest of the participants (i.e.,he considered every application switch a task switch). Of the remaining 13participants that we used for the analysis, 2 were female and 11 were male.Our participants had an average of 12.1 (±8.2, ranging from 1 to 30) yearsof professional software development experience and were working in differentroles: 10 identified themselves as individual contributors and 3 as developers in aleading position (i.e., Lead or Manager). All participants resided in the UnitedStates. In the paper, we refer to these participants as P13 to P25.
Self-Reporting Component. The self-reporting component is part of our mon-itoring tool and includes a pop-up with three pages. The first page askedparticipants to self-report the task switches they experienced in the past hour. Itvisualized participants’ application usage on a timeline using different colors foreach application and allowed them to self-report their task switches by clicking onthe lines denoting applications switches. We restricted the task switch self-reports
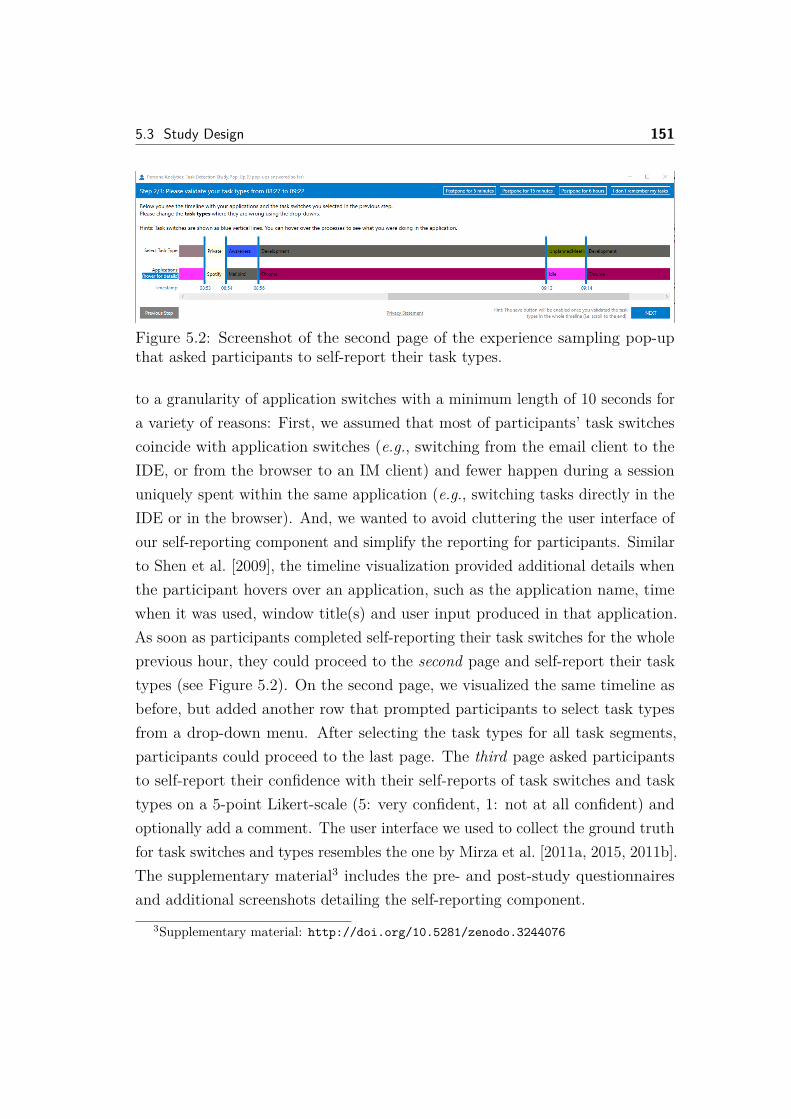
5.3 Study Design 151
Figure 5.2: Screenshot of the second page of the experience sampling pop-upthat asked participants to self-report their task types.
to a granularity of application switches with a minimum length of 10 seconds fora variety of reasons: First, we assumed that most of participants’ task switchescoincide with application switches (e.g., switching from the email client to theIDE, or from the browser to an IM client) and fewer happen during a sessionuniquely spent within the same application (e.g., switching tasks directly in theIDE or in the browser). And, we wanted to avoid cluttering the user interface ofour self-reporting component and simplify the reporting for participants. Similarto Shen et al. [2009], the timeline visualization provided additional details whenthe participant hovers over an application, such as the application name, timewhen it was used, window title(s) and user input produced in that application.As soon as participants completed self-reporting their task switches for the wholeprevious hour, they could proceed to the second page and self-report their tasktypes (see Figure 5.2). On the second page, we visualized the same timeline asbefore, but added another row that prompted participants to select task typesfrom a drop-down menu. After selecting the task types for all task segments,participants could proceed to the last page. The third page asked participantsto self-report their confidence with their self-reports of task switches and tasktypes on a 5-point Likert-scale (5: very confident, 1: not at all confident) andoptionally add a comment. The user interface we used to collect the ground truthfor task switches and types resembles the one by Mirza et al. [2011a, 2015, 2011b].The supplementary material3 includes the pre- and post-study questionnairesand additional screenshots detailing the self-reporting component.
3Supplementary material: http://doi.org/10.5281/zenodo.3244076
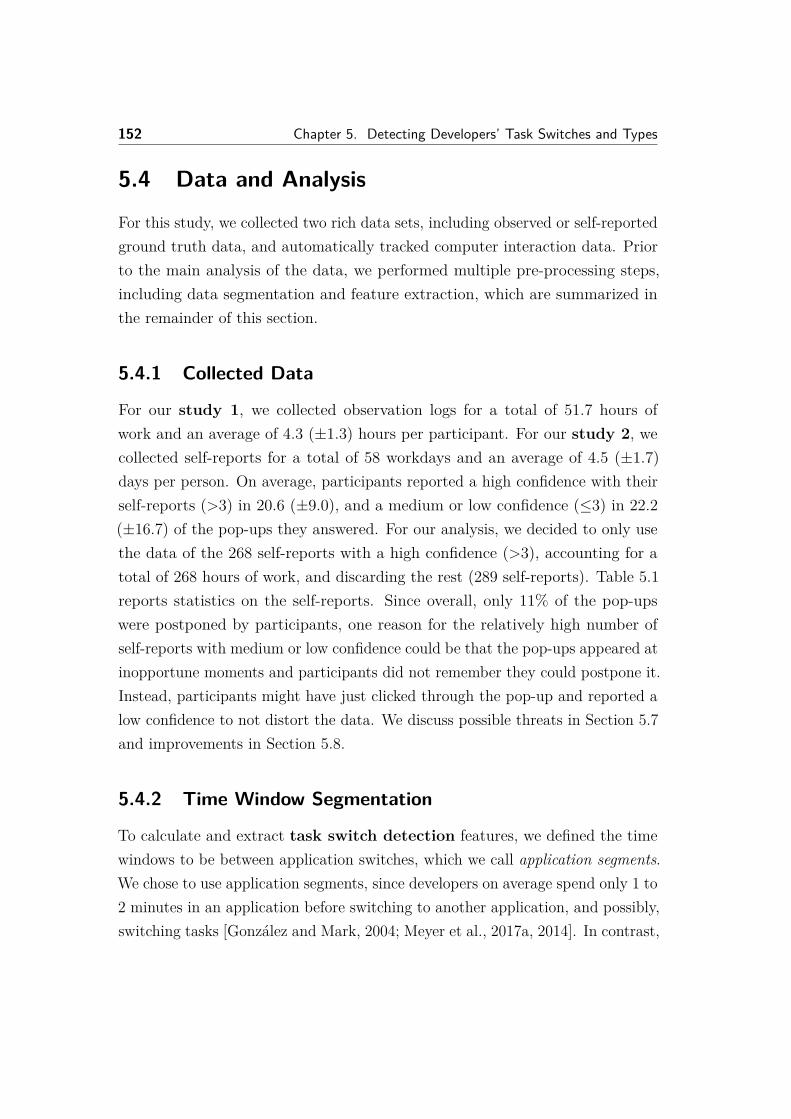
152 Chapter 5. Detecting Developers’ Task Switches and Types
5.4 Data and Analysis
For this study, we collected two rich data sets, including observed or self-reportedground truth data, and automatically tracked computer interaction data. Priorto the main analysis of the data, we performed multiple pre-processing steps,including data segmentation and feature extraction, which are summarized inthe remainder of this section.
5.4.1 Collected Data
For our study 1, we collected observation logs for a total of 51.7 hours ofwork and an average of 4.3 (±1.3) hours per participant. For our study 2, wecollected self-reports for a total of 58 workdays and an average of 4.5 (±1.7)days per person. On average, participants reported a high confidence with theirself-reports (>3) in 20.6 (±9.0), and a medium or low confidence (≤3) in 22.2(±16.7) of the pop-ups they answered. For our analysis, we decided to only usethe data of the 268 self-reports with a high confidence (>3), accounting for atotal of 268 hours of work, and discarding the rest (289 self-reports). Table 5.1reports statistics on the self-reports. Since overall, only 11% of the pop-upswere postponed by participants, one reason for the relatively high number ofself-reports with medium or low confidence could be that the pop-ups appeared atinopportune moments and participants did not remember they could postpone it.Instead, participants might have just clicked through the pop-up and reported alow confidence to not distort the data. We discuss possible threats in Section 5.7and improvements in Section 5.8.
5.4.2 Time Window Segmentation
To calculate and extract task switch detection features, we defined the timewindows to be between application switches, which we call application segments.We chose to use application segments, since developers on average spend only 1 to2 minutes in an application before switching to another application, and possibly,switching tasks [González and Mark, 2004; Meyer et al., 2017a, 2014]. In contrast,
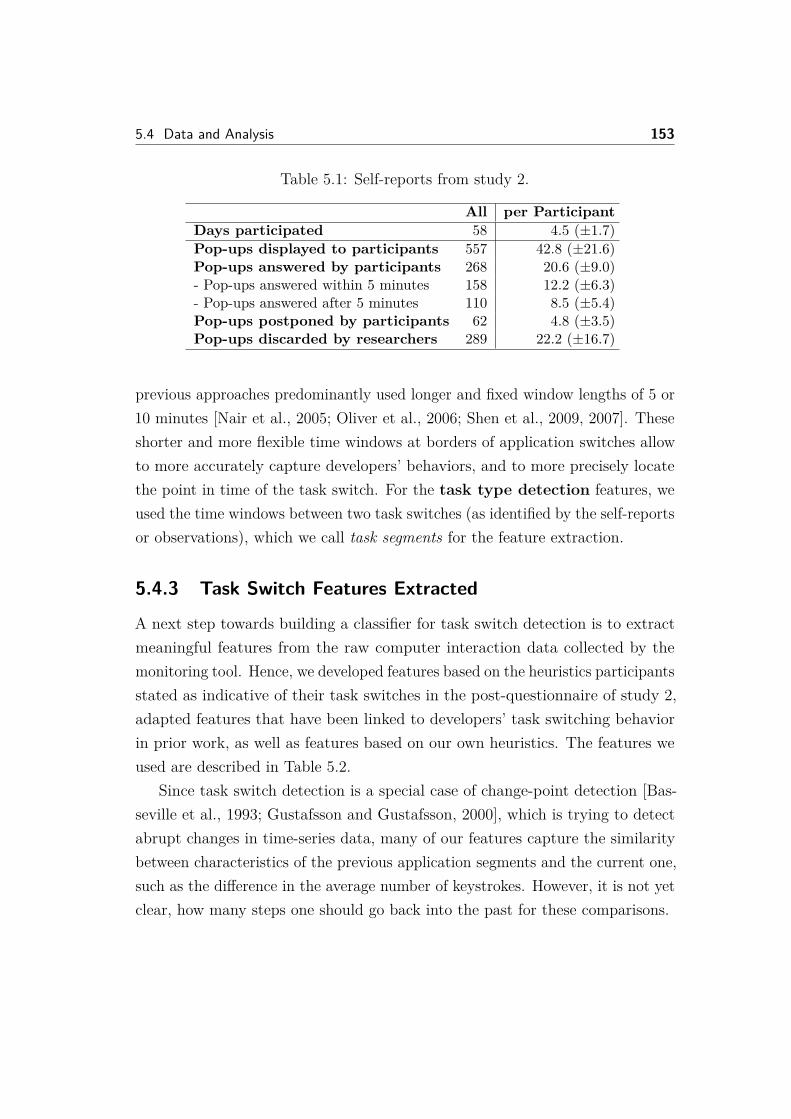
5.4 Data and Analysis 153
Table 5.1: Self-reports from study 2.
All per ParticipantDays participated 58 4.5 (±1.7)Pop-ups displayed to participants 557 42.8 (±21.6)Pop-ups answered by participants 268 20.6 (±9.0)- Pop-ups answered within 5 minutes 158 12.2 (±6.3)- Pop-ups answered after 5 minutes 110 8.5 (±5.4)Pop-ups postponed by participants 62 4.8 (±3.5)Pop-ups discarded by researchers 289 22.2 (±16.7)
previous approaches predominantly used longer and fixed window lengths of 5 or10 minutes [Nair et al., 2005; Oliver et al., 2006; Shen et al., 2009, 2007]. Theseshorter and more flexible time windows at borders of application switches allowto more accurately capture developers’ behaviors, and to more precisely locatethe point in time of the task switch. For the task type detection features, weused the time windows between two task switches (as identified by the self-reportsor observations), which we call task segments for the feature extraction.
5.4.3 Task Switch Features Extracted
A next step towards building a classifier for task switch detection is to extractmeaningful features from the raw computer interaction data collected by themonitoring tool. Hence, we developed features based on the heuristics participantsstated as indicative of their task switches in the post-questionnaire of study 2,adapted features that have been linked to developers’ task switching behaviorin prior work, as well as features based on our own heuristics. The features weused are described in Table 5.2.
Since task switch detection is a special case of change-point detection [Bas-seville et al., 1993; Gustafsson and Gustafsson, 2000], which is trying to detectabrupt changes in time-series data, many of our features capture the similaritybetween characteristics of the previous application segments and the current one,such as the difference in the average number of keystrokes. However, it is not yetclear, how many steps one should go back into the past for these comparisons.
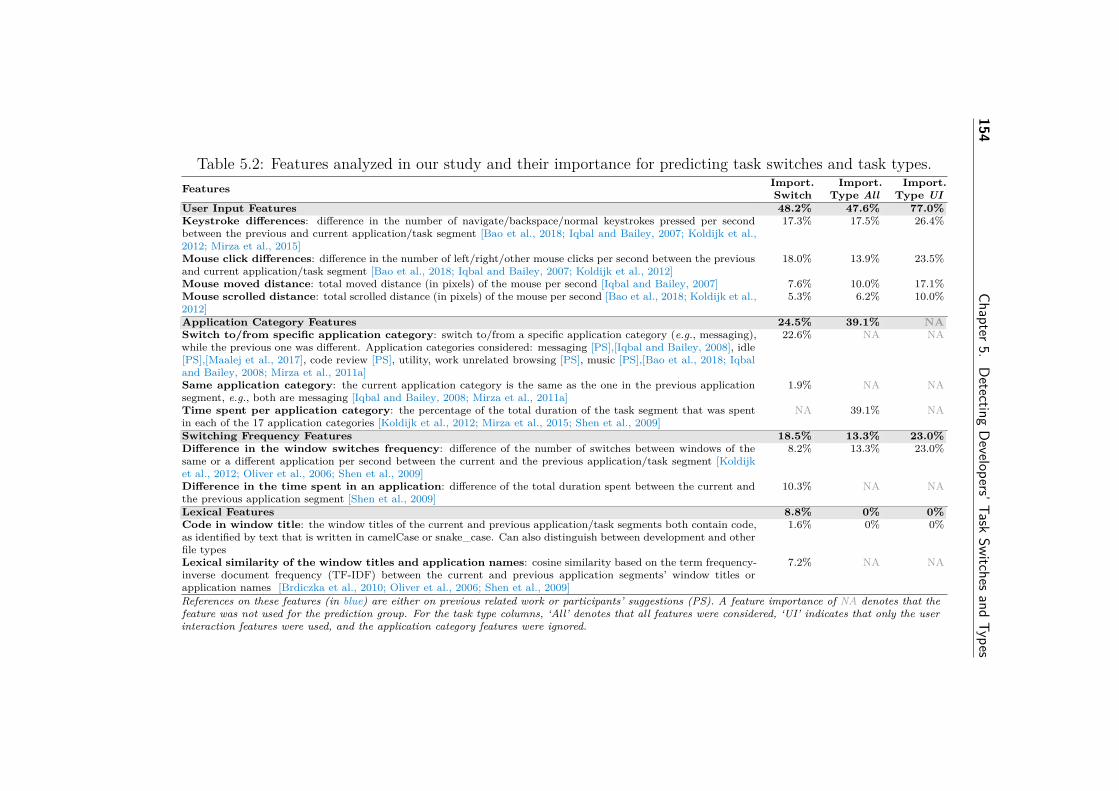
154Chapter5.
Detecting
Developers’Task
Switchesand
Types
Table 5.2: Features analyzed in our study and their importance for predicting task switches and task types.Features Import.
SwitchImport.
Type AllImport.
Type UIUser Input Features 48.2% 47.6% 77.0%Keystroke differences: difference in the number of navigate/backspace/normal keystrokes pressed per secondbetween the previous and current application/task segment [Bao et al., 2018; Iqbal and Bailey, 2007; Koldijk et al.,2012; Mirza et al., 2015]
17.3% 17.5% 26.4%
Mouse click differences: difference in the number of left/right/other mouse clicks per second between the previousand current application/task segment [Bao et al., 2018; Iqbal and Bailey, 2007; Koldijk et al., 2012]
18.0% 13.9% 23.5%
Mouse moved distance: total moved distance (in pixels) of the mouse per second [Iqbal and Bailey, 2007] 7.6% 10.0% 17.1%Mouse scrolled distance: total scrolled distance (in pixels) of the mouse per second [Bao et al., 2018; Koldijk et al.,2012]
5.3% 6.2% 10.0%
Application Category Features 24.5% 39.1% NASwitch to/from specific application category: switch to/from a specific application category (e.g., messaging),while the previous one was different. Application categories considered: messaging [PS],[Iqbal and Bailey, 2008], idle[PS],[Maalej et al., 2017], code review [PS], utility, work unrelated browsing [PS], music [PS],[Bao et al., 2018; Iqbaland Bailey, 2008; Mirza et al., 2011a]
22.6% NA NA
Same application category: the current application category is the same as the one in the previous applicationsegment, e.g., both are messaging [Iqbal and Bailey, 2008; Mirza et al., 2011a]
1.9% NA NA
Time spent per application category: the percentage of the total duration of the task segment that was spentin each of the 17 application categories [Koldijk et al., 2012; Mirza et al., 2015; Shen et al., 2009]
NA 39.1% NA
Switching Frequency Features 18.5% 13.3% 23.0%Difference in the window switches frequency: difference of the number of switches between windows of thesame or a different application per second between the current and the previous application/task segment [Koldijket al., 2012; Oliver et al., 2006; Shen et al., 2009]
8.2% 13.3% 23.0%
Difference in the time spent in an application: difference of the total duration spent between the current andthe previous application segment [Shen et al., 2009]
10.3% NA NA
Lexical Features 8.8% 0% 0%Code in window title: the window titles of the current and previous application/task segments both contain code,as identified by text that is written in camelCase or snake_case. Can also distinguish between development and otherfile types
1.6% 0% 0%
Lexical similarity of the window titles and application names: cosine similarity based on the term frequency-inverse document frequency (TF-IDF) between the current and previous application segments’ window titles orapplication names [Brdiczka et al., 2010; Oliver et al., 2006; Shen et al., 2009]
7.2% NA NA
References on these features (in blue) are either on previous related work or participants’ suggestions (PS). A feature importance of NA denotes that thefeature was not used for the prediction group. For the task type columns, ‘All’ denotes that all features were considered, ‘UI’ indicates that only the userinteraction features were used, and the application category features were ignored.
5.4 Data and Analysis 155
Therefore, we analyzed how many steps (in our case application segments)one should go back for calculating features. In particular, we compared theprecision and recall of the task switch detection taking into account 1 and up to10 steps back into the past. Our analysis of the results indicated that after aninitial increase of the precision for detecting a switch, the precision and recallgradually drop as the number of steps increases. We therefore chose 2 as thenumber of steps to go back in terms of application segments. As a result, thetotal number of features used for the task switch detection is 56, which is doublethe number of unique features used: once calculated for comparing the currentwith the previous application segment, and once to compare the previous twoapplication segments. In the following, we provide an overview over the featuresused:
User Input Features. The first feature group are user input features basedon keyboard and mouse interaction, such as the difference in the number ofkeystrokes the participant pressed per second between this and the previous timewindow segment.
Application Category Features. We categorized commonly used applicationsinto one of 17 predefined application categories (based on our classification inprevious work [Meyer et al., 2017a]). These include categories specific to softwareengineering, such as Development, Code Review or Testing, but also more generalones, such as Read/Write Document, Email and Web Browser. They are leveragedin 12 features that capture switches to or from a specific application category,such as switching to a messaging application or becoming idle. These featureswere selected based on participants’ suggestions of what they consider to be goodindicators for switching to another task. Since switching to another applicationmight be another indication for a task switch [Iqbal and Bailey, 2008; Mirzaet al., 2011a], we added one feature that captures these.
Switching Frequency Features. In the post-study questionnaire, participantsmentioned that they often navigate through several applications to clean-up
156 Chapter 5. Detecting Developers’ Task Switches and Types
their computer right before starting a new task, which is why we added atemporal feature based on the window switching frequency. One feature capturesthe difference in the time spent in an application, since this might be anotherindicator for a task switch, either because a switch is less likely immediately aftera task switch, and the likelihood of a task switch increases as time passes [Shenet al., 2009].
Lexical Features. Inspired by prior work [Brdiczka et al., 2010; Oliver et al.,2006; Shen et al., 2009], we also added three lexical/semantic features that areextracted from application names and their window titles. Since window titlesmight include code snippets, such as a class or method name or development filetype, we added a feature that captures whether the window title contains textwritten in camelCase or underscore_case, and whether this is different to theprevious segment. To determine whether the previous and current applicationsegments have a contextual similarity, two features are calculated based on thecosine similarity of the window titles and application names using the termfrequency-inverse document frequency (TF-IDF). Note that the application nameand window titles were also used to determine the application category features.In addition, and unlike some previous work, we explicitly did not capture filecontents to reduce intrusiveness and avoid privacy concerns [Rattenbury andCanny, 2007; Soules and Ganger, 2005; Wu et al., 2005].
5.4.4 Task Type Features Extracted
For the task type detection, we reused the same features as in the task switchdetection whenever possible. However, some features required adaption or madeno sense in this context. First, as the time window for task type detectionencompasses one or multiple application segments, we replaced the applicationcategory features with a feature that captures the ratio between the time spentin the specific application category and the time spent in the task segment. Thisallowed us to determine the dominant application category in a task segment.Second, we eliminated the lexical similarity features that relied on similaritymeasures between window titles of individual applications. This resulted in atotal of 27 features used for the task type detection.
5.4 Data and Analysis 157
5.4.5 Outcome Measures
For the task switch detection, we labeled the application segments withthe observed (study 1) and self-reported (study 2) task switches. In case theprevious application segment was marked as a task switch, we labeled the currentapplication segment with Switch, otherwise with NoSwitch. Therefore, our taskswitch detection approach is at most the duration of the application segmentaway from the actual task switch, which was an average of 1.6 minutes (±2.2) inour study. For the task type detection, we labeled each task segment with theobserved or self-reported task type. Descriptive statistics regarding participants’task switching behavior and the task types they worked on can be found inSection 5.5.3 and Section 5.6.4, respectively.
5.4.6 Machine Learning Approach
We used scikit-learn by [Pedregosa et al., 2011b], a widely used machine learninglibrary for Python, to predict task switches and task types. We evaluated severalclassifiers by applying them to our feature set and testing different parametervalues. A RandomForest classifier with 500 estimators outperformed all other ap-proaches, including a Gradient Boost-Classifier, Support Vector Machine (SVM),Neural Network and Hidden Naïve Bayes classifier. A RandomForest classifier isone form of ensemble learning that creates multiple decision tree classifiers andaggregates their predictions using a voting mechanism [Breiman, 2001; Liaw et al.,2002]. It does not require a pre-selection of features and can handle a large featurespace that also contains correlated features. Hence, for the remainder of thispaper, the presented results were obtained using a RandomForest classifier.Prior to classification, we impute missing values by replacing them with the meanand apply standardization of the features, which centers the data to 0 and scalesthe standard deviation to 1. These common steps in a machine learning pipelinecan improve a classifier’s performance [Pedregosa et al., 2011a]. For the taskswitch detection, we further apply Lemaître’s implementation of SMOTE,which is a method for oversampling and can considerably boost a classifier’sperformance in the case of an imbalanced dataset such as ours [Lemaître et al.,
158 Chapter 5. Detecting Developers’ Task Switches and Types
2017]. For the task type detection, where as much as 80-90% of the reportedtypes are of the Development class we instead employ penalized classification tocorrect problems caused by class imbalance, as SMOTE has significant drawbackswhen the minority classes have a limited number of samples [Nguyen et al., 2009].
We built both individual and general models, where an individual modelis trained and tested with data solely from one participant and a general modelis trained on data from all participants except one, and tested on the remainingone. Individual models often have a higher accuracy since they are trained ona person’s unique behavioral patterns. On the other hand, general models areusually less accurate but have the advantage of solving the cold-start-problem,which means that no prior training phase is required and the model can beapplied to new users immediately.
To evaluate the individual models, we applied a 10-fold cross-validationapproach, where the model was iteratively tested on 1/10 of the dataset whilebeing trained on the remaining data. We adapted the cross-validation approachto account for the temporal dependency of the samples. In particular, there is adependency between samples in close temporal proximity, since data from thepreceding samples is incorporated in the features. To ensure a valid and realisticevaluation of the model, we therefore deleted h samples on either side of the testset block [Racine, 2000]. In our case, we chose h=10 since we included up to 10preceding samples in the feature calculation.
5.5 Results: Detecting Task Switches
5.5.1 Task Switch Detection Accuracy
Table 5.3 gives an overview of the task switch detection performance of individualand general models. We split the presentation of the data into the two studies,since they were collected with a different method. Overall, our analysis revealedthat we can detect task switches at their exact location with a high averagedaccuracy of 87% (precision: 67% and recall: 37%) when trained with individualmodels. The performance of the classifier drops considerably when we apply the
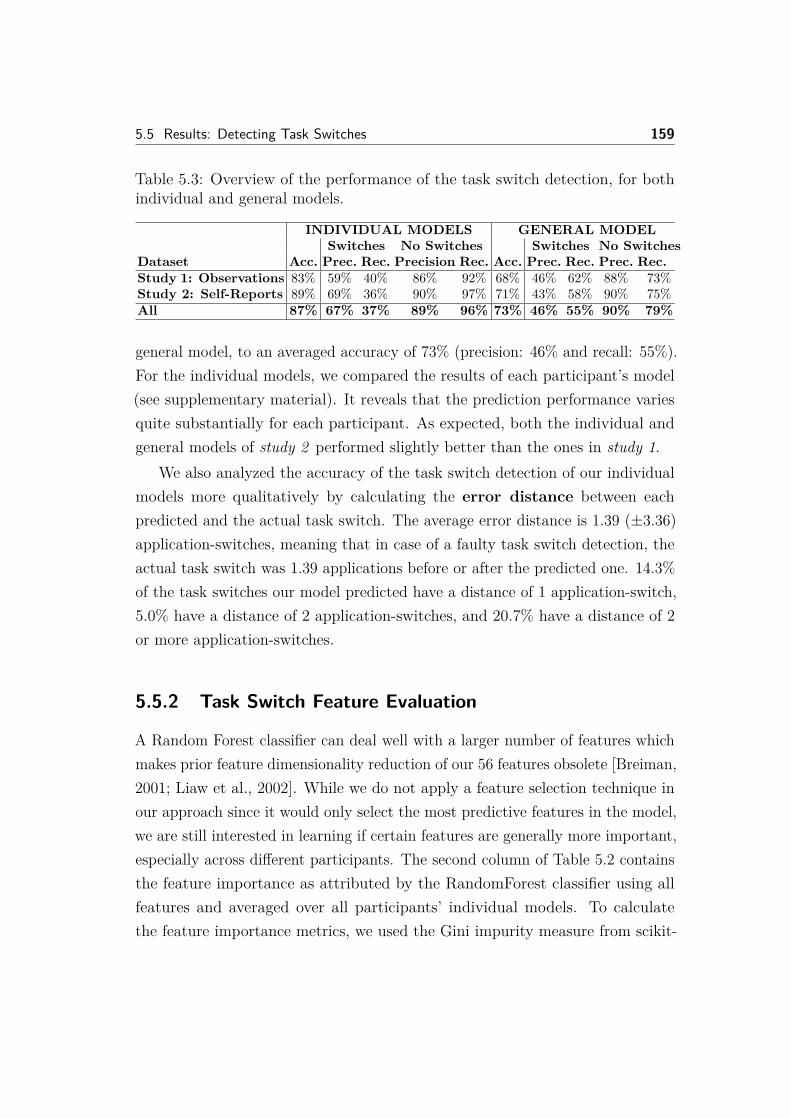
5.5 Results: Detecting Task Switches 159
Table 5.3: Overview of the performance of the task switch detection, for bothindividual and general models.
INDIVIDUAL MODELS GENERAL MODELSwitches No Switches Switches No Switches
Dataset Acc. Prec. Rec. Precision Rec. Acc. Prec. Rec. Prec. Rec.Study 1: Observations 83% 59% 40% 86% 92% 68% 46% 62% 88% 73%Study 2: Self-Reports 89% 69% 36% 90% 97% 71% 43% 58% 90% 75%All 87% 67% 37% 89% 96% 73% 46% 55% 90% 79%
general model, to an averaged accuracy of 73% (precision: 46% and recall: 55%).For the individual models, we compared the results of each participant’s model(see supplementary material). It reveals that the prediction performance variesquite substantially for each participant. As expected, both the individual andgeneral models of study 2 performed slightly better than the ones in study 1.
We also analyzed the accuracy of the task switch detection of our individualmodels more qualitatively by calculating the error distance between eachpredicted and the actual task switch. The average error distance is 1.39 (±3.36)application-switches, meaning that in case of a faulty task switch detection, theactual task switch was 1.39 applications before or after the predicted one. 14.3%of the task switches our model predicted have a distance of 1 application-switch,5.0% have a distance of 2 application-switches, and 20.7% have a distance of 2or more application-switches.
5.5.2 Task Switch Feature Evaluation
A Random Forest classifier can deal well with a larger number of features whichmakes prior feature dimensionality reduction of our 56 features obsolete [Breiman,2001; Liaw et al., 2002]. While we do not apply a feature selection technique inour approach since it would only select the most predictive features in the model,we are still interested in learning if certain features are generally more important,especially across different participants. The second column of Table 5.2 containsthe feature importance as attributed by the RandomForest classifier using allfeatures and averaged over all participants’ individual models. To calculatethe feature importance metrics, we used the Gini impurity measure from scikit-
160 Chapter 5. Detecting Developers’ Task Switches and Types
learn, which captures the feature’s ability to avoid mis-classification [Pedregosaet al., 2011b]. The most predictive feature groups are user input (48.2%) andapplication category (24.5%). The feature group with the least predictive powerare the lexical features (8.8%). The supplementary material includes the featureimportances of each individual feature.
5.5.3 Descriptive Statistics of the Dataset
Participants switched frequently between tasks, with a mean task switch rate of6.0 (±3.7, min: 1.8, max: 18.9) times per hour. The average time spent on eachtask was 13.2 (± 7.3, min: 3.1, max: 30.8) minutes 4. Developers’ task switchbehaviors are similar to previous work [González and Mark, 2004; Meyer et al.,2014].
5.6 Results: Detecting Task Types
5.6.1 Identified Task Type Categories
As described in more detail in Section 5.3, we inferred task type categories aftercollecting task and task switch data from observing 12 developers at work andperforming a Thematic Analysis. This resulted in nine task type categories wedescribed in Table 5.4. In the post-study questionnaires of study 2, participantsreported that they agreed with the identified task types and generally had noissues to assign them. However, two participants mentioned that a task type forSupport duties was missing:
“[Support]-Duties. These are very specific tasks that require a lot of different thingsto do. It’s not Development and it can be a lot of ad-hoc and requires many contextswitches.” - P14
Two participants mentioned that it was sometimes difficult to know if timespent on emails should be assigned to Development or Awareness & team:
4We do not report individual results for the two studies, since the task switch rate (p-value=.056) and time spent on a task (p-value=.215) are not significantly different in the twodatasets.
5.6 Results: Detecting Task Types 161
“I was sometimes unsure of how to classify the time I spent responding to emails.I generally classified it as development since most of the emails were development-related.” - P21Most of our task type categories are consistent with previous work that
investigated knowledge workers’ tasks [Czerwinski et al., 2004; Kim and Choe,2019; Koldijk et al., 2012; Reinhardt et al., 2011]. For example, Meetings, Admin-istrative, Planning and Private were also prevalent in work by both Czerwinskiet al. [2004] and Kim and Choe [2019]. The latter further divided project work(in our case Development tasks) into Documenting and Conceptualizing Ideas,Environment and Development and Design. We did not make these finer-granulardistinctions since we did not want to make the self-reporting of task types in thesecond study too complicated, which would degrade the quality of self-reports.
5.6.2 Task Type Detection Accuracy
Table 5.4 shows the results of our task type detection approach across all 9task type categories. We omit the accuracy metric in this table, as recall is ameasure of individual class accuracy, and since the recall presented in the all rowis weighted by class size it therefore assumes exactly the same value as accuracy.As with the task switch detection analysis, we trained both individual modelsand one general model which was trained on all participants. To save space,precision statistics are not shown for the general model, but they were observedto be lower across the board as compared to those values seen in the individualmodels. The Administrative task type was not predicted a single time by thegeneral classifier, and as thus the precision scores were undefined for this class.In general, the individual models (precision 59%, recall 61%) outperformed thegeneral model by a large margin (precision 44%, recall 50%).
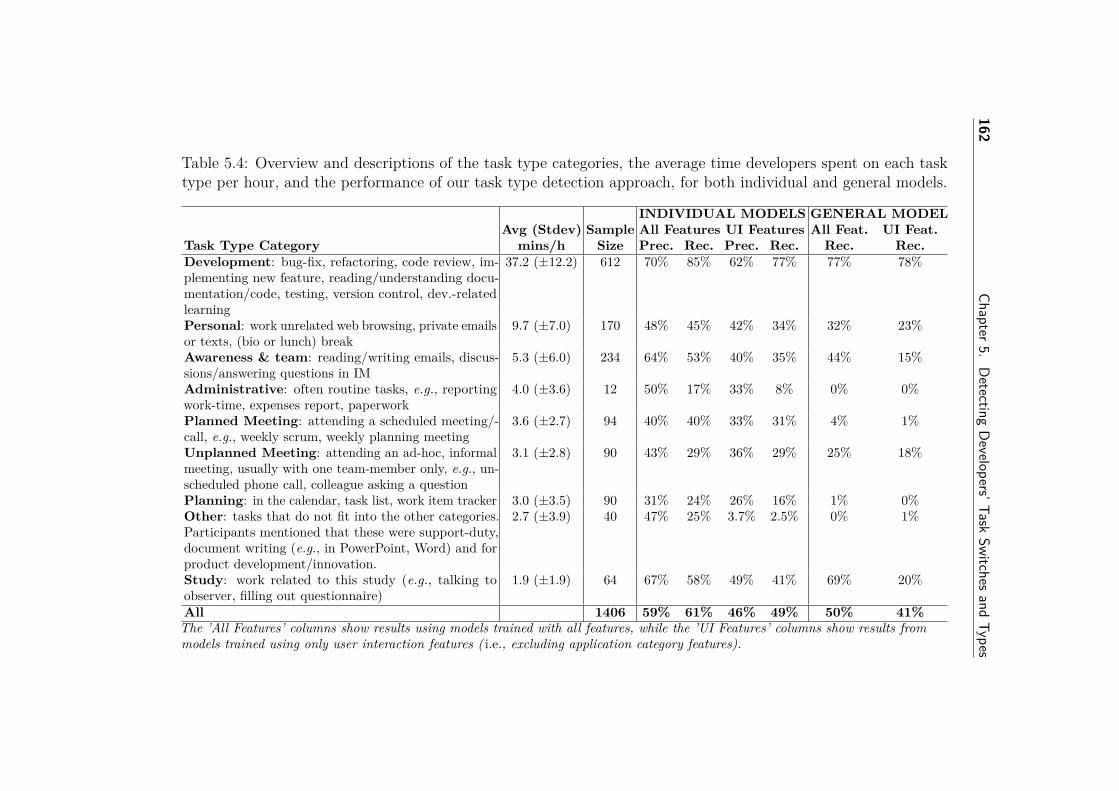
162Chapter5.
Detecting
Developers’Task
Switchesand
Types
Table 5.4: Overview and descriptions of the task type categories, the average time developers spent on each tasktype per hour, and the performance of our task type detection approach, for both individual and general models.
INDIVIDUAL MODELS GENERAL MODELAvg (Stdev) Sample All Features UI Features All Feat. UI Feat.
Task Type Category mins/h Size Prec. Rec. Prec. Rec. Rec. Rec.Development: bug-fix, refactoring, code review, im-plementing new feature, reading/understanding docu-mentation/code, testing, version control, dev.-relatedlearning
37.2 (±12.2) 612 70% 85% 62% 77% 77% 78%
Personal: work unrelated web browsing, private emailsor texts, (bio or lunch) break
9.7 (±7.0) 170 48% 45% 42% 34% 32% 23%
Awareness & team: reading/writing emails, discus-sions/answering questions in IM
5.3 (±6.0) 234 64% 53% 40% 35% 44% 15%
Administrative: often routine tasks, e.g., reportingwork-time, expenses report, paperwork
4.0 (±3.6) 12 50% 17% 33% 8% 0% 0%
Planned Meeting: attending a scheduled meeting/-call, e.g., weekly scrum, weekly planning meeting
3.6 (±2.7) 94 40% 40% 33% 31% 4% 1%
Unplanned Meeting: attending an ad-hoc, informalmeeting, usually with one team-member only, e.g., un-scheduled phone call, colleague asking a question
3.1 (±2.8) 90 43% 29% 36% 29% 25% 18%
Planning: in the calendar, task list, work item tracker 3.0 (±3.5) 90 31% 24% 26% 16% 1% 0%Other: tasks that do not fit into the other categories.Participants mentioned that these were support-duty,document writing (e.g., in PowerPoint, Word) and forproduct development/innovation.
2.7 (±3.9) 40 47% 25% 3.7% 2.5% 0% 1%
Study: work related to this study (e.g., talking toobserver, filling out questionnaire)
1.9 (±1.9) 64 67% 58% 49% 41% 69% 20%
All 1406 59% 61% 46% 49% 50% 41%The ’All Features’ columns show results using models trained with all features, while the ’UI Features’ columns show results frommodels trained using only user interaction features ( i.e., excluding application category features).
5.6 Results: Detecting Task Types 163
One important aspect of our approach that distinguishes it from previous work(e.g., [Bao et al., 2018; Iqbal and Bailey, 2008; Mirza et al., 2011a]) is its abilityto make predictions even on previously unseen applications. To demonstrate this,we split the results into two categories: with the manual application categorymappings (All Features) and without (UI Features). The UI Features include alluser interaction features, but exclude application features. While the combinedapproach proved to be superior, user input features still proved to have highpredictive power on their own. Overall, there was a 28.2% increase in precisionwhen including the application category features, and a 24.5% increase in recall.
We also found there was a substantial difference in performance depending onthe task type category. The Development task type proved to be the easiest topredict, achieving high recall (85%) and precision (70%) scores. Conversely, thePlanning task type saw very poor results, with only 24% recall and 31% precision.These results are somewhat in line with what one might expect. Naturally,some task categories are more difficult to predict than others. For instance,discerning the nature of a meeting (planned or unplanned) based purely on ausers applications used and input activity seems to be nearly impossible. In somecategories, especially in both of the meeting categories and the private category,there was a large amount of idle time recorded for many participants, which alsopartially contributes to the confusion seen in the results.
5.6.3 Task Type Feature Evaluation
The third and fourth column of Table 5.2 show the Gini feature importances wecalculated for our RandomForest classifiers, averaged over all participants. Whenconsidering All Features, we found the time spent per application category featuresto have by far the greatest importance (39.1%), followed by keystroke features(17.5%). However, the combined user input feature group contributed more thanany other feature group (47.6%). The lexical features did not contribute at allto the results of the classifier, which suggests there is room for improvement inthis area as window titles can contain a substantial amount of hints that couldhelp to identify a specific task. The supplementary material includes individualtask type feature importances.
164 Chapter 5. Detecting Developers’ Task Switches and Types
5.6.4 Descriptive Statistics of the Dataset
On average, developers worked on 6.1 (±1.6, min: 3, max: 9) different tasktypes during the studied time periods, indicating that most of the identifiedtask types are relevant to developers. The task type participants self-reportedhaving spent the most time on is Development, with an average of 37 (± 12)minutes spent per hour. Table 5.4 reports details for all task types as well as thenumber of participants who self-reported having worked on the task type. Wealso analyzed if having a higher diversity in work (i.e., working more differenttask types) correlates with developers switching more between tasks. There is aweak positive correlation (Pearson’s r = .0.32, p = .12).
5.7 Discussion
We discuss implications of our results, possible improvements and practicalapplications of automated task detections.
5.7.1 Improving Task Switch and Type Detection
We found that for both task switch and type detection, the individual modelsoutperform the general model, with an overall accuracy of 87% comparedto 73% for switch prediction, 61% to 50% for type prediction. Even thoughwe collected data from a rather large sample of 25 participants (compared tosimilar work), we were not yet able to build reliable general models, which couldsolve the cold-start-problem. The general models’ inability to discover commonpatterns across all participants emphasizes how individual and diverse developers’task switch behaviors are. More research is required to explore reasons for andbetter balance these individual differences. For example, we could imagine toinclude information about a developer’s personality and company culture to traina classifier that works well for developers with similar work habits, instead ofbuilding a general one for everyone. Future work could also study the predictivepower of features extracted from additional data sources, such as emails, meetings,biometrics (e.g., detecting when a user is away from the computer), and moredetailed development related data (e.g., activities inside the IDE).
5.7 Discussion 165
The relatively low feature importances of our lexical features shows furtherpotential to more effectively leverage contextual information. Besides calculatinglexical similarity based on cosine similarity (TF-IDF) of window titles, we alsoexperimented with variations, such as word embeddings or using term-frequencieswithout weights. They led to even less predictive features, which is why wedid not report them separately. One reason could be the little overlap in thewindow title data. While leveraging additional lexical data (e.g.,, file contents)could bear a lot of potential, the privacy concerns for this data were too high forparticipants.
Ideally, a task switch and type detection would be very close to real-time,i.e., close to the exact time a switch occurs. With our approach, there can be aprediction delay of a maximum of one unique application segment, on average1.6 minutes (±2.2), when predicting a task switch. This delay is considerablysmaller compared to previous approaches that applied fixed window lengths of(usually) 5 minutes (e.g., Koldijk et al. [2012]; Mirza et al. [2015]; Nair et al.[2005]; Oliver et al. [2006]; Shen et al. [2009, 2007]). Nonetheless, future workcould further reduce the prediction delay by further shortening the smallestpossible segment size, in our case application switches. This would allow to alsoidentify switches within an application, such as when a developer is switchingtasks inside the web browser.
Our approach extends prior work by combining temporal and semanticfeatures, by developing new features, and by not being limited to capturing taskswitches and types within the IDE only. The evaluation of our approach in afield-study with 25 professional developers, compared to 1 to 11 participants inprevious work, revealed higher accuracy and less delay in the predictions thancomparable prior work.
5.7.2 Applications for Automated Task Detection
An active area of research aims to better support developers’ frequent taskswitching, for example by supporting resuming interrupted tasks or by easingtask switching (see Section 5.2.3). So far, most approaches are limited todevelopers’ manual identification of task switches, and their evaluations have
166 Chapter 5. Detecting Developers’ Task Switches and Types
pointed out challenges this poses for developers. Our approach demonstratesthe feasibility of automatically detecting task switches and types in the field,based on a few hours of training data, which makes it possible to increase thevalue of previous approaches significantly and stimulate new research and toolsupport. In the post-study questionnaire of study 2, participants describedconcrete applications that we qualitatively analyzed and related to prior work,which resulted in the following three main opportunities for applying automatedtask detection:
One application of an almost real-time detection of task switches that 8(out of 13) participants described is to actively reduce task switching. Thisincludes automatically blocking notifications from email, instant messaging orsocial networks when a developer is focused on a (challenging) task, to allowextended times of deep focus:
“What if Windows has a built-in and personalized model about when to give younotifications. I feel like there is a good middle ground between forcing the user toturn off notifications from the OS and having too many notifications interruptingthe user.” - P25
Reducing task switching at times of high focus could greatly reduce multi-tasking, a major source of stress and quality issues [González and Mark, 2004;Mark et al., 2018, 2008b, 2017]. Similarly, an automated task switch detectioncould improve interruptibility classifiers and postpone in-person interruptionsfrom co-workers to task switch borders, times they are less costly [Fogarty et al.,2005; Züger et al., 2017; Züger et al., 2018].
Another application of automated task detection could be to support the re-sumption of suspended or interrupted tasks. Participants did not suggestthis application themselves, but 8 (out of 13) rated it as ’useful’ or ’very useful’ ina follow-up question of the final questionnaire. According to Parnin and Rugaber[2009], a major challenge of task resumption is to rebuild the interrupted task’scontext. Our task detection approach could automatically identify and build uptask contexts, consisting of work artifacts (e.g., websites or files) and applicationsthat the developer used for the task. Applying similar summarization approachesas seen in other areas of software development [Nazar et al., 2016; Treude et al.,
5.7 Discussion 167
2015] could be presented to the user as cues upon returning to the suspended task,which has been shown to considerably reduce the resumption lag [Altmann andTrafton, 2004; Bailey et al., 2001; Rule et al., 2015]. While previous approaches,such as TaskTracer [Dragunov et al., 2005], Scalable Fabric [Robertson et al.,2004], GroupBar [Smith et al., 2003] and Mylyn [Kersten and Murphy, 2006],allow the capturing and presentation of task context, they require the user tomanually group related artifacts or manually state the start and end of a task,thus, reducing chances of long-term adoption. Even tough there is room forimprovement as discussed above, our approach can serve as a starting point toautomate these approaches, since it can already be beneficial to receive help withresuming some tasks, as long as they are detected correctly.
A third opportunity of application that 10 (out of 13) participants suggestedis to use automated task detection to increase their awareness about taskwork and time spent on tasks, which could help to identify opportunities forwork habit and productivity improvements. This is in line with a survey with379 developers that showed the most-often mentioned measurement of interestwhen reflecting about productivity are the tasks developers made progress onand completed in a workday [Meyer et al., 2014]. An aggregated visualizationof the automatically inferred tasks could give developers insights such as howmuch time they spend on different tasks, when they worked on planned versusunplanned tasks, or their multi-tasking behaviors:
“It can help point out different working styles that are also effective and efficient.Not everyone works in the same way.” - P24
Recently, researchers started building retrospective dashboards for develop-ers [Beller et al., 2016; Codealike, 2019; Meyer et al., 2017b; Wakatime, 2019]and other knowledge workers [Kim et al., 2016; RescueTime, 2019; Whittakeret al., 2016], usually by visualizing data on the level of applications or applicationcategories, but suggesting that a per-task level would be more beneficial. Anincreased awareness about one’s task switching behavior could support developersto identify goals that help to maintain and improve good work habits, such asreducing multi-tasking or actively blocking notifications from distracting servicesand websites at times they need to focus. Participants further suggested that the
168 Chapter 5. Detecting Developers’ Task Switches and Types
data could help to reduce administrative workloads that require them to reporttime spent at work:
“We’re often asked to report at the end of the month how much time we spent onsupport requests (...) versus development work. That kind of info is tedious totrack manually, but a tool could generate an automatic report as needed, allowingfor more accurate counts.” - P22
Lu et al. [2018] recently showed that the lack of logs of activities and tasksis often a hindrance to be able to transfer them into time reports. While a fewtime-tracking tools already exist (e.g., DeskTime [2019], TimeDoctor [2019]),they all require users to manually specify the start and end of a task.
5.8 Threats to Validity
Observing Developers in Study 1. The internal validity of our results mightbe threatened by the presence of the observers during the observation sessions,causing developers to diverge from their regular work habits, e.g., having lessbreaks than usual. Observing participants on a single day only might not berepresentative of the participant’s regular workday. We tried to mitigate theserisks by not interacting with participants during the observations, splitting upthe session into two two-hour blocks, sitting as far away from the participantas possible, telling co-workers beforehand that they could still communicateand interrupt as usual, and by allowing the participant to pick an optimaltimeslot that is representative of their usual work. Our observational studyhas the advantage that, rather than performing a lab study or experimentalexercise, participants were observed during their real-world work, thus increasinggeneralizability and realism. However, the above mentioned risks of observingdevelopers at their workplace make it very difficult to scale observational studiesand observe them over many days. Hence, we did not rely only on observations,but also on participants’ self-reports and with that, combining two methods andstrengthening our overall approach.
5.8 Threats to Validity 169
Self-Reporting in Study 2. While collecting participants’ task data using self-reports has proven to be a valuable approach to scale the collection of labeleddata for supervised learning, there are a few limitations. First, we rely on theaccuracy of participants’ self-reports. For example, they might not always havebeen able to accurately remember their tasks, or filling out the pop-up regularlymight be perceived as cumbersome after a while. In Section 5.3.2, we describeour actions to minimize these risks in detail, including the ability to postponea pop-up and collecting confidence ratings. Aiming to make the self-reportingas easy as possible required limiting the segmentation of the self-reports toapplications and excluding application switches shorter than 10 seconds. Futurework could investigate how to give participants good-enough cues that allowthem to accurately self-report switches within applications (e.g., switching froma news website to the work item tracker in the browser) without making theinterface too cluttered. Finally, the reliance on collecting computer interactiondata only, instead of also including other sensors such as heart-rate monitors orcameras, limits our knowledge of what is happening when there is no input tothe computer, e.g., in the case of idle times from using the smartphone, readinga document without scrolling, or a discussion with a co-worker.
Sample Size. A further threat to the external validity of our results could bethe number of participants. A higher number of participants might have led to amore robust general model to predict task switches and task types. Nonetheless,collecting task data from 25 participants is considerably higher than what wasreported in previous work (between 1 and 11 participants). We tried to mitigatethis threat by selecting participants from four different software companies invarious locations.
Task Definitions. The construct validity of our results might be threatenedby our definitions of a task (switch) and our open coding approach to identifytask type categories. To minimize this risk, we based our definitions of task, taskswitch and task type on previous work, and asked participants about their owndefinitions in both studies (Section 5.3).
170 Chapter 5. Detecting Developers’ Task Switches and Types
5.9 ConclusionIn this paper, we explored the potential of automatically detecting task switchesand task types based on developers’ computer interaction data. Based on twofield studies that we conducted with a total of 25 professional software developers,we found that we are able to detect task switches and task types with highaccuracy (81% and 61% respectively) and within a short time frame (average 1.6minutes) from the actual task switch. We thereby examined a broad range ofsemantic and temporal features extracted from the computer interaction dataand found that features based on user input data hold the highest predictivepower. Our work extends previous work with an approach that uses a broaderrange of temporal and semantic features, by evaluating it in a field-study withprofessional developers, and by achieving higher accuracy than previous workwhile achieving a smaller delay in the predictions. The strong evidence on thepotential to automatically predict task switches in the field opens up a widerange of application in real work settings, ranging from complementing existingmanual task support, such as Mylyn, to automating time tracking tools, all theway to new tool support to leverage developers’ workflows.
5.10 AcknowledgementsWe thank our study participants for their participation. We also thank theanonymous reviewers and our editor for their valuable feedback.
6Design Recommendations for
Self-Monitoring in theWorkplace: Studies in
Software Development
André N. Meyer, Gail C. Murphy, Thomas Zimmermann, Thomas FritzPublished at the 2018 CSCW Conference on Computer-Supported Cooperative
Work and Social ComputingContribution: Study design and execution, tool development, data collection,
data analysis, and paper writing
Abstract
One way to improve the productivity of knowledge workers is to increase their self-awareness about productivity at work through self-monitoring. Yet, little is known
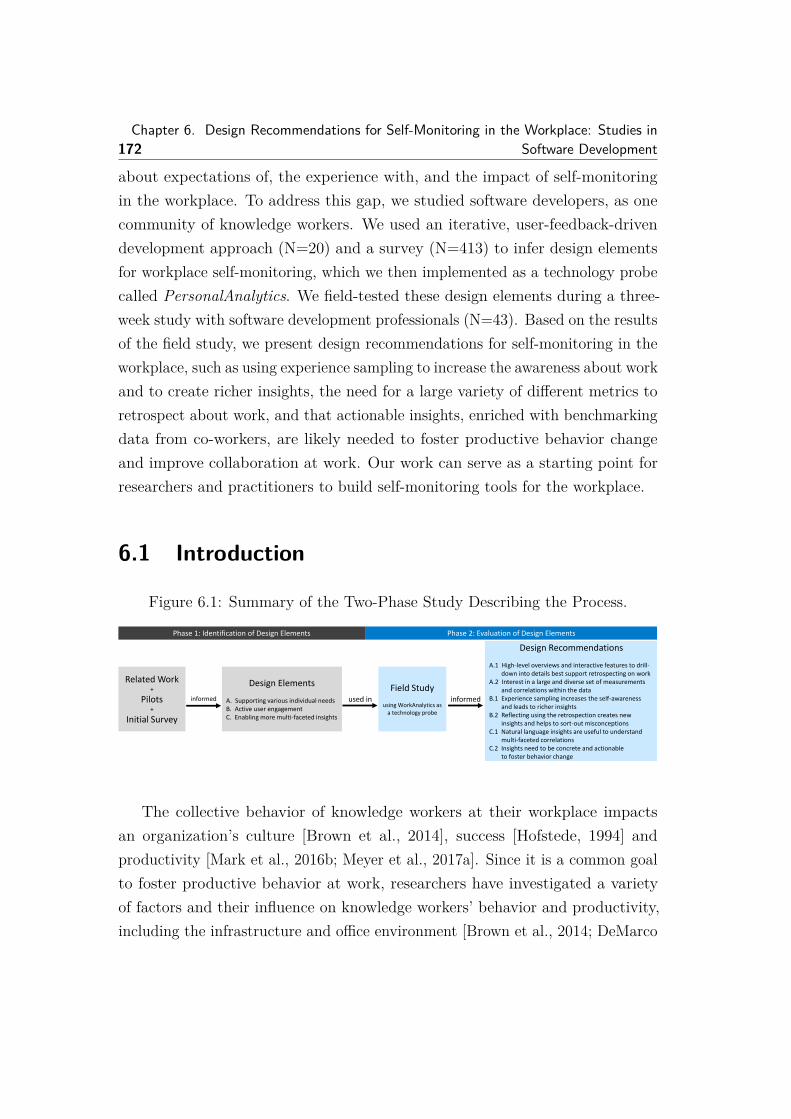
172Chapter 6. Design Recommendations for Self-Monitoring in the Workplace: Studies in
Software Development
about expectations of, the experience with, and the impact of self-monitoringin the workplace. To address this gap, we studied software developers, as onecommunity of knowledge workers. We used an iterative, user-feedback-drivendevelopment approach (N=20) and a survey (N=413) to infer design elementsfor workplace self-monitoring, which we then implemented as a technology probecalled PersonalAnalytics. We field-tested these design elements during a three-week study with software development professionals (N=43). Based on the resultsof the field study, we present design recommendations for self-monitoring in theworkplace, such as using experience sampling to increase the awareness about workand to create richer insights, the need for a large variety of different metrics toretrospect about work, and that actionable insights, enriched with benchmarkingdata from co-workers, are likely needed to foster productive behavior changeand improve collaboration at work. Our work can serve as a starting point forresearchers and practitioners to build self-monitoring tools for the workplace.
6.1 Introduction
Figure 6.1: Summary of the Two-Phase Study Describing the Process.
Phase 2: Evaluation of Design Elements
Design Recommendations
A.1 High-level overviews and interactive features to drill-down into details best support retrospecting on work
A.2 Interest in a large and diverse set of measurements and correlations within the data
B.1 Experience sampling increases the self-awareness and leads to richer insights
B.2 Reflecting using the retrospection creates new insights and helps to sort-out misconceptions
C.1 Natural language insights are useful to understand multi-faceted correlations
C.2 Insights need to be concrete and actionable to foster behavior change
Design Elements
A. Supporting various individual needsB. Active user engagementC. Enabling more multi-faceted insights
Related Work+
Pilots+
Initial Survey
Phase 1: Identification of Design Elements
informed
Field Study
using WorkAnalytics asa technology probe
used in informed
The collective behavior of knowledge workers at their workplace impactsan organization’s culture [Brown et al., 2014], success [Hofstede, 1994] andproductivity [Mark et al., 2016b; Meyer et al., 2017a]. Since it is a common goalto foster productive behavior at work, researchers have investigated a varietyof factors and their influence on knowledge workers’ behavior and productivity,including the infrastructure and office environment [Brown et al., 2014; DeMarco
6.1 Introduction 173
and Lister, 1985], the interruptions from co-workers [Chong and Siino, 2006;Czerwinski et al., 2004], and the teams’ communication behaviors [Mark et al.,2016a; Meyer et al., 2014]. Yet, knowledge workers are often not aware of howtheir actions contribute to these factors and how they impact both their ownproductivity at work and the work of others [Perry et al., 1994b].
One way to improve knowledge workers’ awareness of their own behavior andfoster productive behavior is to provide them with the means to self-monitor andto reflect about their actions, for example through visualizations [Prochaska andVelicer, 1997]. This type of self-monitoring approach has been shown to fosterbehavior change in other areas of life, such as physical activity (e.g., [Consolvoet al., 2008a; Fritz et al., 2014]), health (e.g., [Bentley et al., 2013; Consolvoet al., 2008b]) and nutrition (e.g., [Gasser et al., 2006]). Existing efforts tomap the success of these self-monitoring approaches to the workplace havelargely focused on tracking and visualizing data about computer use [Kim et al.,2016; RescueTime, 2019; Treude and Storey, 2010; Whittaker et al., 2016].Although research has shown that self-monitoring at work can be valuable inincreasing the awareness about a certain aspect of work, such as time spentin applications [Rooksby et al., 2016; Whittaker et al., 2016] or distractingactivities [Kim et al., 2016], little is known about knowledge workers’ expectationsof and experience with these tools [Rooksby et al., 2016; Treude and Storey,2010]. The lack of research about what knowledge workers’ need from these toolsmay be one reason why many existing solutions have a low engagement andonly short-term use overall [Collins et al., 2014; Kim et al., 2016]. Furthermore,most of these approaches did not consider collaborative aspects of work, such asinstant messaging, email or meetings.
We address these gaps by aiming to better understand what informationand features knowledge workers expect in workplace self-monitoring tools. Tomake our investigations tractable, we focus on one community of knowledgeworkers, software developers, before generalizing to a broader range of knowledgeworkers in the future. We study software developers due to their extensive use ofcomputers to support both their individual and collaborative work, includingthe use of issue trackers for collaborative planning [Storey et al., 2014, 2017],
174Chapter 6. Design Recommendations for Self-Monitoring in the Workplace: Studies in
Software Development
code review systems for shared feedback gathering [Bacchelli and Bird, 2013],and version control systems for co-editing artefacts [Vasilescu et al., 2016b].Software developers are also an attractive target given the frequent interest ofthis community to continuously improve their work and productivity [Humphrey,2000; Li et al., 2015]. Furthermore, software developers pursue a variety ofdifferent activities at work [Arciniegas-Mendez et al., 2017; Czerwinski et al.,2004; González and Mark, 2004] that vary considerably across work days andindividuals [Meyer et al., 2017a]. For our investigations, this combination ofdiversity in activity, similarity in domain and extensive use of a computers yieldsan ideal combination for considering self-monitoring in the workplace.
To determine a set of design recommendations for building workplace self-monitoring tools, we followed a mixed-method approach, which is summarized inFigure 6.1. Phase 1 of our approach started with an investigation of software de-velopers’ expectations of and requirements for measures to self-monitor their work.A review of related work indicated barriers that have been identified towardsthe adoption of self-tracking technologies at the workplace, including not fullyunderstanding users’ needs [Li et al., 2010], not knowing in what measures usersare interested in [Meyer et al., 2014; Rooksby et al., 2016; Treude et al., 2015],and not providing users with a holistic understanding of their work behavior [An-cker and Kaufman, 2007; Bartram, 2015; Galesic and Garcia-Retamero, 2011;Huang et al., 2016]. To overcome barriers associated with appropriate measures,we analyzed previous work on measures of software development productivity(e.g., [Meyer et al., 2014]) and designed and developed a prototype, called Per-sonalAnalyticspilot, that captures software development measures, allows softwaredevelopers to self-monitor their work patterns and provides a retrospective viewto a developer of their work day and work week.
We received feedback on the prototype through a pilot study with 20 partici-pants and 5 iterations. Based on what we learned from the pilots, we conducteda study to learn about the design elements, including measures, needed in aself-monitoring tool for software development. We received input from 413 soft-ware development professionals for the survey. An analysis of the pilot andsurvey data indicated three design elements needed to build soft-monitoring
6.1 Introduction 175
tools for a workplace: A) supporting various individual needs for data collectionand representation, B) enabling active user engagement, and C) enabling moreinsights on the multi-faceted nature of work.
In phase 2, we then refined the prototype to accommodate these design ele-ments and conducted a field study involving 43 professional software developersusing the refined prototype for three weeks. The refined prototype, which we referto as PersonalAnalytics, captures information from various individual aspectsof software development work, including application use, documents accessed,development projects worked on, websites visited, as well as collaborative be-haviors from attending meetings, and using email, instant messaging and codereview tools. In addition, PersonalAnalytics prompts a user to reflect on theirwork periodically and to-self report their productivity based on their individualdefinition. To enable more multi-faceted insights, the captured data is visualizedin a daily retrospection (see Figure 6.2), which provides a higher-level overviewin a weekly summary, and allows users to relate various data with each other.
From the field study, we derived six design recommendations, summarizedin Figure 6.1. For instance, we learned that a combination of self-reflectionon productivity using self-reports, and observations made from studying theinsights in the retrospection enhances participants’ awareness about the timespent on various activities at work, about their collaboration with others, andabout the fragmentation of their work. In this paper, we report on these sixdesign recommendations and further requests made by participants for features tohelp them turn retrospective information into action. For instance, participantsrequested recommendation tools to help them better plan their work, improvetheir team-work and coordination with others, block out interruptions, andincrease their productivity.
This paper provides the following main contributions:
• It demonstrates that self-monitoring at work can provide novel insightsand can help to sort out misconceptions about work activities, but alsohighlights the need for information presented to be concrete and actionable,rather than simply descriptive.
176Chapter 6. Design Recommendations for Self-Monitoring in the Workplace: Studies in
Software Development
• It demonstrates the value of brief and periodic self-reports to increaseawareness of work and productivity for software developers.
• It presents a set of measurements specific to software development thatprofessional software developers report to provide the most value to increaseawareness of their work, ranging from the time spent doing code reviewsto the number of emails received in a work day.
This paper is structured as follows: We first discuss related work before wepresent how we identified design elements for self-monitoring in the workplace, andhow we incorporated and evaluated them using PersonalAnalytics as a technologyprobe. Subsequently, the findings and distilled design recommendations arepresented. Finally, we discuss our findings with respect to long-term userengagement, potential impact on individuals and the collaboration with theirteams, and the generalizability of our results.
6.2 Related Work
Previous work on approaches for self-monitoring various aspects of life and work isdiscussed in Section 1.6 of the synopsis to avoid repetitions. Barriers towards theadoption of these self-tracking technologies that are specific to this publicationare presented below.
6.2.1 Designing and Evaluating Self-Monitoring Tools for Work
Only few of the workplace self-monitoring tools we presented in Chapter 1.6.6have been evaluated (e.g., [Huang et al., 2016; Kim et al., 2016; Rooksby et al.,2016; Whittaker et al., 2016]), limiting our knowledge of the overall value ofthese tools to users, particularly limiting our knowledge of which informationis of value to users and if the approaches can affect the behaviour of users. Asdescribed by Klasnja et al. [2011], it is often feasible to evaluate the efficacy of aself-monitoring tool in a qualitative way to identify serious design issues early,while still seeing trends in how behaviour might change in the long-term. In this
6.2 Related Work 177
paper, we follow this recommendation, focusing on facilitating the reasoning andreflection process of a knowledge worker by increasing self-awareness about themonitored aspect of work [Huang et al., 2016; Kim et al., 2016; Prochaska andVelicer, 1997]. We leave an assessment of whether the design recommendationswe provide can be embodied in a tool to change user behaviour to future work.To provide a starting point for building self-monitoring tools targeting softwaredevelopers at work and evaluate their potential impact on behaviors at work,we conducted a three-week user study to investigate the efficacy of the designelements that we identified from related work, five pilots, and a survey, usingWorkAnalytics as a technology probe. To our knowledge, this is also the firstapproach that focuses to raise developers’ awareness about their collaborativeactivities, such as gaining insights about emailing, meeting, and code reviewing.
Previous research has also discovered that users rarely engage with thecaptured data, resulting in a low awareness and reducing chances for a positivebehavior change when using a self-monitoring tool [Collins et al., 2014; Huanget al., 2016; Kim et al., 2016]. We compiled and categorized a list of barriersrelated work has identified towards the adoption of self-monitoring technologiesat the workplace:
Not understanding user needs. Research has shown that knowledgeworkers’ needs for monitoring their computer use vary and that little is actuallyknown about the measures they are interested in [Li et al., 2011; Meyer et al.,2014; Rooksby et al., 2016; Treude et al., 2015]. Users sometimes also have toolittle time for a proper reflection of the data, or an insufficient motivation to usethe tool, which is likely one reason they often stop using it after some time [Liet al., 2010]. This emphasizes the importance of understanding users’ needs andexpectations about how self-monitoring tools should work and what measuresthey should track, to increase the chance people are trying such a tool and usingit over extended periods.
Lack of data context. Most tools we found miss the opportunity to providethe user with a more holistic understanding and context of the multi-facetednature of work, as they only collect data about a single aspect, e.g., the programsused on the computer [Choe et al., 2014; Epstein et al., 2016a]. This makes it
178Chapter 6. Design Recommendations for Self-Monitoring in the Workplace: Studies in
Software Development
difficult for users to find correlations between data sets and, thus, limits theinsights they can get. Behavior change cannot be modelled based on just a fewvariables, as the broader context of the situation is necessary to better understandthe various aspects influencing work behavior and productivity [Bartram, 2015;Huang et al., 2016]. To overcome this, Huang et al. [2016] propose to integratethese self-monitoring approaches into existing processes or tools and place theminto an already existing and well-known context which makes it easier for usersto engage in an ongoing tool use. Choe et al. [2014] further suggest to trackmany things when users first start a self-monitoring initiative, and then let themdecide which measures are necessary for their context to reflect and improvetheir behavior.
Difficulties in interpreting the data. Choe et al. [2014] and Huang et al.[2016] argue how difficulties in making sense of, organizing or interpreting thedata result in a lower adoption of self-monitoring approaches, as users will stopusing them. For example, Galesic and Garcia-Retamero [2011] found that morethan 40% of Americans and Germans lack the ability to understand simplegraphs, such as bar or pie charts, which could be a problem for self-monitoringtools as they often visualize the data. To overcome this issue, Bentley et al. [2013]propose to provide insights from statistically significant correlations betweendifferent data types in natural language, which helped participants in the studyto better understand the data. Another problem to efficiently interpret data inpersonal informatics systems is information overload, as described by Jones andKelly [2017]. They found that users generally have a higher interest in multi-faceted correlations (correlations between two distinct data categories), ratherthan uni-faceted correlations, that reveal “surprising” and “useful” information.Hence, this could help to reduce information overload and provide more relevantinsights to users.
Privacy Concerns. Another potential pitfall of self-monitoring tools is dataprivacy, as many users are afraid the data might have a negative influence ontheir life, such as fearing their managers may know how well they sleep, or thattheir insurance agency can track their activity. Most privacy concerns can bereduced by letting users decide what and how they want to share their data, by
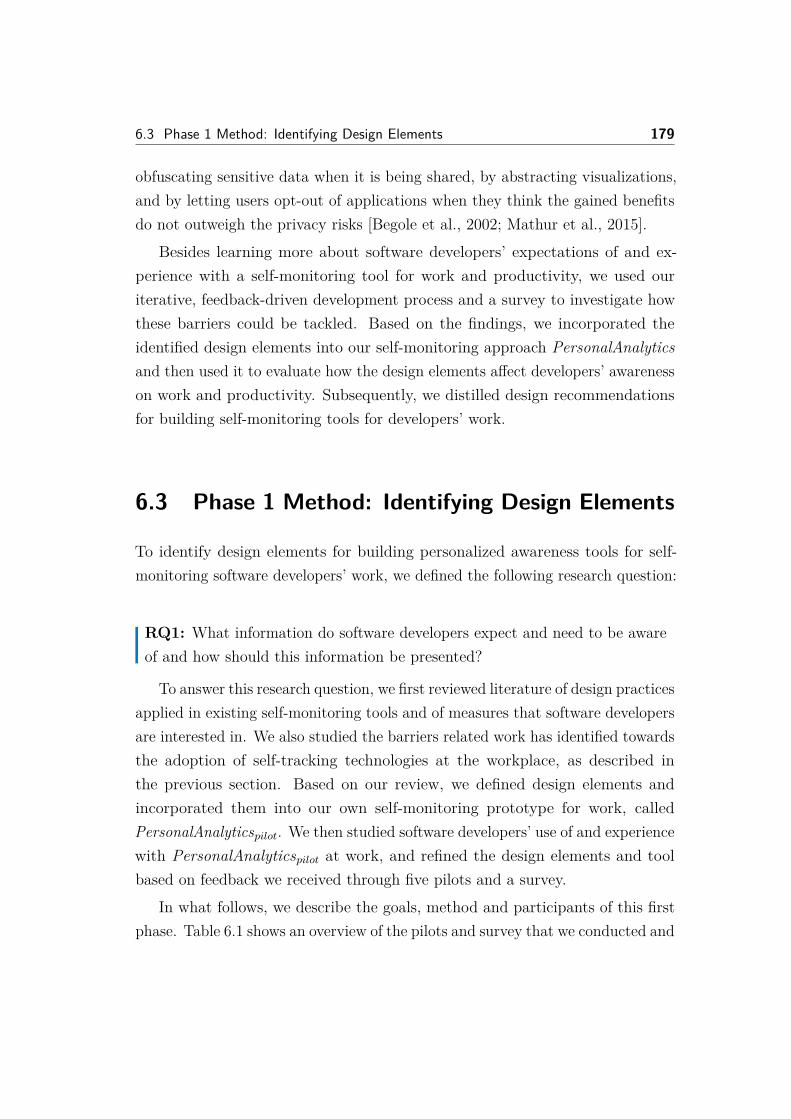
6.3 Phase 1 Method: Identifying Design Elements 179
obfuscating sensitive data when it is being shared, by abstracting visualizations,and by letting users opt-out of applications when they think the gained benefitsdo not outweigh the privacy risks [Begole et al., 2002; Mathur et al., 2015].
Besides learning more about software developers’ expectations of and ex-perience with a self-monitoring tool for work and productivity, we used ouriterative, feedback-driven development process and a survey to investigate howthese barriers could be tackled. Based on the findings, we incorporated theidentified design elements into our self-monitoring approach PersonalAnalyticsand then used it to evaluate how the design elements affect developers’ awarenesson work and productivity. Subsequently, we distilled design recommendationsfor building self-monitoring tools for developers’ work.
6.3 Phase 1 Method: Identifying Design Elements
To identify design elements for building personalized awareness tools for self-monitoring software developers’ work, we defined the following research question:
RQ1: What information do software developers expect and need to be awareof and how should this information be presented?
To answer this research question, we first reviewed literature of design practicesapplied in existing self-monitoring tools and of measures that software developersare interested in. We also studied the barriers related work has identified towardsthe adoption of self-tracking technologies at the workplace, as described inthe previous section. Based on our review, we defined design elements andincorporated them into our own self-monitoring prototype for work, calledPersonalAnalyticspilot. We then studied software developers’ use of and experiencewith PersonalAnalyticspilot at work, and refined the design elements and toolbased on feedback we received through five pilots and a survey.
In what follows, we describe the goals, method and participants of this firstphase. Table 6.1 shows an overview of the pilots and survey that we conducted and
180Chapter 6. Design Recommendations for Self-Monitoring in the Workplace: Studies in
Software Development
Table 6.1: Overview of the Two-Phase Study Describing the Method, Participants,their Employer and Study-Durations.
ID # Developers Location
Pilots 20 2-4 work weeks
Pilot 1 6 A ca. 3000 Canada 2 work weeks
Pilot 2 2 B ca. 150 Canada 2 work weeks
Pilot 3 3 C 4 Switzerland 2 work weeks
Pilot 4 5 D ca. 50000 USA 4 work weeks
Pilot 5 4 A ca. 3000 Canada 3 work weeks
Initial Survey 413 D ca. 50000 USA sent out 1600 invitations
ID # Developers Location
Field Study 43 D ca. 50000 USA 3 work weeks
Email Feedback 34 arbitrarily during the study
Intermed. Feedback Survey 26 after the first week
Data Upload 33 at the end of the study
Final Survey 32 following the data upload
Method # Partic.Company
Duration/Timing
Phase 1: Identification of Design Elements for Self-Monitoring at Work
(iterative, feedback-driven development of WorkAnalytics)
Phase 2: Evaluation of the Design Elements for Self-Monitoring at Work
(using WorkAnalytics as a technology probe)
CompanyMethod Duration# Partic.
situates them within the whole study procedure. The supplementary material 1
contains a list of questions for all surveys and interviews that we conducted aswell as screenshots of how PersonalAnalyticspilot looked like at various stagesuntil the final version.
6.3.1 Pilots
To examine the features and measurements software developers are interestedin and engage with for self-monitoring their work from using them in practice,rather than from doing this hypothetically through an interview or survey, weconducted a set of pilots. Our method has strong similarities to the DesignBased Research process, where the focus is an iterative analysis, design and im-plementation, based on a collaboration between practitioners and researchers in areal-world setting that leads to design principles in the educational sector [Brown,1992]. First, we implemented a self-monitoring prototype, PersonalAnalyticspilot,incorporating visualizations of work-related measures that we identified to be of
1https://doi.org/10.5281/zenodo.884051
6.3 Phase 1 Method: Identifying Design Elements 181
interest to software developers in previous research from running a survey with379 participants [Meyer et al., 2014]. We then conducted a total of five pilots atfour companies (see Phase 1 in Table 6.1 for more details). For each pilot, wehad a small set of software developers use PersonalAnalyticspilot in situ, gathertheir feedback, and use it to refine and improve the prototype before running thenext pilot. Each pilot study ran between 2-4 work weeks. To gather feedback, weconducted interviews with each participant at the end of the pilot period. Theseinterviews were semi-structured, lasted approximately 15 minutes, and focusedon what participants would like to change in the application and what theylearnt from the retrospection. To find and address problems early during thedevelopment, we also conducted daily 5 minute interviews with each participantduring the first three pilots. In these short interviews, we gathered feedback onproblems as well as changes they would like to be made to the application, andfeedback on the visualizations, their representativeness of participants’ work andtheir accuracy. Throughout this phase, we rolled out application updates withbug-fixes, updated visualizations and new features every few days. We prioritizeduser requests based on the feasibility of implementation and the amount ofrequests by participants. After 5 pilots we decided to stop since we did notgather any more new feedback and the application was running stable.
Participants. For the pilots, we used personal contacts and ended up witha total of 20 professional software developers, 1 female and 19 male, from fourdifferent companies of varying size and domains (Table 6.1). 30% reported theirrole to be a team lead and 70% an individual contributor—an individual whodoes not manage other employees. Participants had an average of 14.2 years(±9.6, ranging from 0.5 to 40) of professional software development experience.
6.3.2 Initial Survey
Following the pilot studies, we conducted a survey 1) to examine whether themeasures and features that developers are interested in using for self-monitoringwithin the target company (company D) overlap with what we had implemented,2) to learn how the PersonalAnalyticspilot needed to be adapted to fit into thetarget company’s existing technology set-up and infrastructure, as well as 3) to
182Chapter 6. Design Recommendations for Self-Monitoring in the Workplace: Studies in
Software Development
generate interest in participating in our field study. In the survey, we askedsoftware developers about their expectations and the measurements that theywould be interested in for self-monitoring their work. We advertised the survey atcompany D, sending invitation emails to 1600 professional software developers. Toincentivize participation, we held a raffle for two 50 US$ Amazon gift certificates.The initial survey questions can be found in the supplementary material. Toanalyze the survey, we used methods based on Grounded Theory [Strauss andCorbin, 1998] to analyze the textual data that we collected. This includedOpen Coding to summarize and label the responses, Axial Coding to identifyrelationships among the codes, and Selective Coding to factor out the overallconcepts, related to what measurements and features participants expect andhow their work environment looks like.
Participants. From the 1600 invitation emails, we received responses from413 software developers (response rate: 25.8%), 11% female, 89% male. 91.5% ofthe participants reported their role to be individual contributor, 6.5% team lead,1 manager (0.2%), and 1.8% stated they are neither. Participants had an averageof 9.6 years (±7.5, ranging from 0.3 to 36) of professional software developmentexperience.
6.4 Phase 1 Results: Identified Design Elements
To answer our first research question (RQ1), we analyzed related work, investi-gated developers’ experience with pilots of PersonalAnalyticspilot and analyzedthe initial survey. The analysis showed that a design for a work self-monitoringapproach should: A) support various individual needs, B) foster active userengagement, and C) provide multi-faceted insights into work. We incorporatedthese three design elements into a technology probe, PersonalAnalytics.
PersonalAnalytics was built with Microsoft’s Dot.Net framework in C#and can be used on the Windows 7, 8 and 10 operating system. We createdPersonalAnalytics from the ground up and did not reuse an existing, similarapplication, such as RescueTime [2019], as we wanted to freely extend andmodify all features and measurements according to our participants’ feedback. A
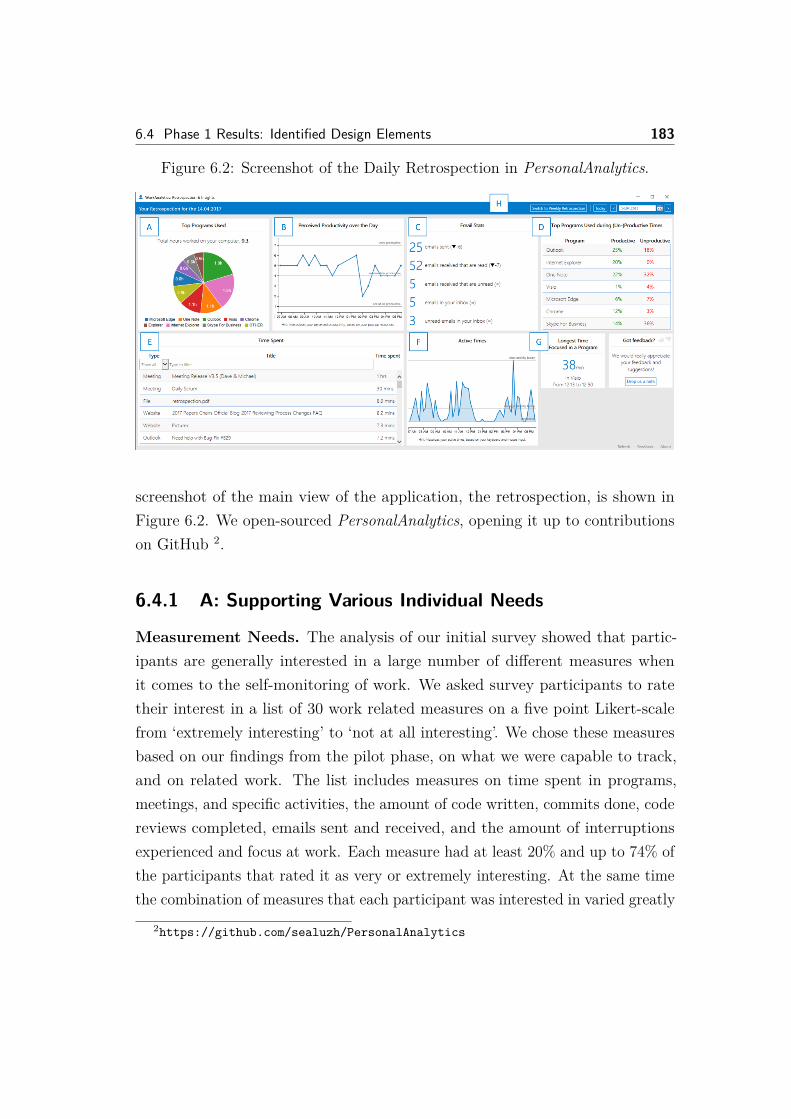
6.4 Phase 1 Results: Identified Design Elements 183
Figure 6.2: Screenshot of the Daily Retrospection in PersonalAnalytics.
screenshot of the main view of the application, the retrospection, is shown inFigure 6.2. We open-sourced PersonalAnalytics, opening it up to contributionson GitHub 2.
6.4.1 A: Supporting Various Individual Needs
Measurement Needs. The analysis of our initial survey showed that partic-ipants are generally interested in a large number of different measures whenit comes to the self-monitoring of work. We asked survey participants to ratetheir interest in a list of 30 work related measures on a five point Likert-scalefrom ‘extremely interesting’ to ‘not at all interesting’. We chose these measuresbased on our findings from the pilot phase, on what we were capable to track,and on related work. The list includes measures on time spent in programs,meetings, and specific activities, the amount of code written, commits done, codereviews completed, emails sent and received, and the amount of interruptionsexperienced and focus at work. Each measure had at least 20% and up to 74% ofthe participants that rated it as very or extremely interesting. At the same timethe combination of measures that each participant was interested in varied greatly
2https://github.com/sealuzh/PersonalAnalytics
184Chapter 6. Design Recommendations for Self-Monitoring in the Workplace: Studies in
Software Development
across participants. For instance, only 6 of the 30 measures were rated as very orextremely interesting by 60% or more, and 52% of participants were interested innearly all measures while 25% only wanted very few measures for self-monitoringat work. Overall, the greatly varying interest and the interest in a large numberof measures for self-monitoring supports earlier findings by Meyer et al. [2014] inthe work domain and Choe et al. [2014] in the activity and health domain. Thecomplete list of the 30 work related measures, including participants’ ratingsabout their interest in the measures, can be found in the supplementary material.
To support these individually varying interests in work measures, we includeda wide variety of measures in our application and allowed users to individuallyselect the measures that were tracked and visualized. To capture the relevantdata for these measures, PersonalAnalytics features multiple data trackers: thePrograms Used tracker that logs the currently active process and window titlesevery time the user switches between programs or logs ‘idle’ in case there was nouser input for more than 2 minutes; the User Input tracker, to collect mouse clicks,movements, scrolling and keystrokes (no key-logging, only time-stamp of anypressed key); and, the Meetings and Email trackers, to collect data on calendarmeetings and emails received, sent and read, using the MicrosoftGraphApi [2019]of the Office 365 Suite.
The initial version only included the Programs Used tracker, similar toRescueTime [2019]. The Programs Used tracker allows the extraction of amultitude of measurements participants wished, including the time spent inspecific programs and activities, such as development related activities (e.g.,coding, testing, debugging, version control, and development projects worked on)and researching the web, as well as specific code files and documents worked onand websites visited. After the first two pilots, the User Input tracker was added,since 3 of the first 8 participants were interested in knowing when they wereproducing (e.g., typing on the keyboard) and consuming (e.g., scrolling throughtext with the mouse) data. Running the initial survey highlighted participants’interest in knowing more concrete details about their collaborative activities,such as planned and unplanned meetings (41%), reading and writing emails(44%), and doing code reviews (47%), which is the reason they were added to
6.4 Phase 1 Results: Identified Design Elements 185
the final version of PersonalAnalytics before running the field study.Privacy Needs. A re-occurring theme during the pilots and initial survey
was participants’ need to keep sensitive workplace data private. Participantsfeared that sharing data with their managers or team members could have severeconsequences on their employment or increase pressure at work. To account forprivacy needs at work, PersonalAnalytics stores all logged data only locally onthe user’s machine in a local database, rather than having a centralized collectionon a server. This enables users to remain in control of the captured data. Tofurther support the individual needs, the application provides actions to enableand disable data trackers manually, pause the data collection and access (andalter) the raw dataset, which was done by two participants during the field study.
6.4.2 B: Active User Engagement
To be able to generate deeper insights on a user’s work and productivity andencourage users to actively reflect upon their work periodically, we decided toinclude a self-reporting component. Several participants of our initial surveystated interest in self-reporting some data about work that cannot be trackedautomatically, in particular more high-level measures on productivity. Further-more, related work found that users rarely engage by themselves with datacaptured in a self-monitoring tool, which reduces awareness and chances of posi-tive change [Collins et al., 2014; Huang et al., 2016; Kim et al., 2016]. To addressthis point, we added a pop-up to our application that appeared periodically,by default once per hour3, and prompted users to self-report their perceivedproductivity, the tasks they worked on, the difficulty of these tasks and a fewother measures. During the first two pilots of our iterative development phase,we found that while the self-reporting might be valuable, it took participantsseveral minutes to answer, and 45% of our participants reported it to be toointrusive, interrupting their work, and decreasing their productivity. As a result,
3This interval was chosen as a way to balance intrusiveness. While the first two pilots hadan interval of 90 minutes which made it harder for participants to remember what exactlyhappened in that period, most participants preferred to reflect on their productivity once anhour.
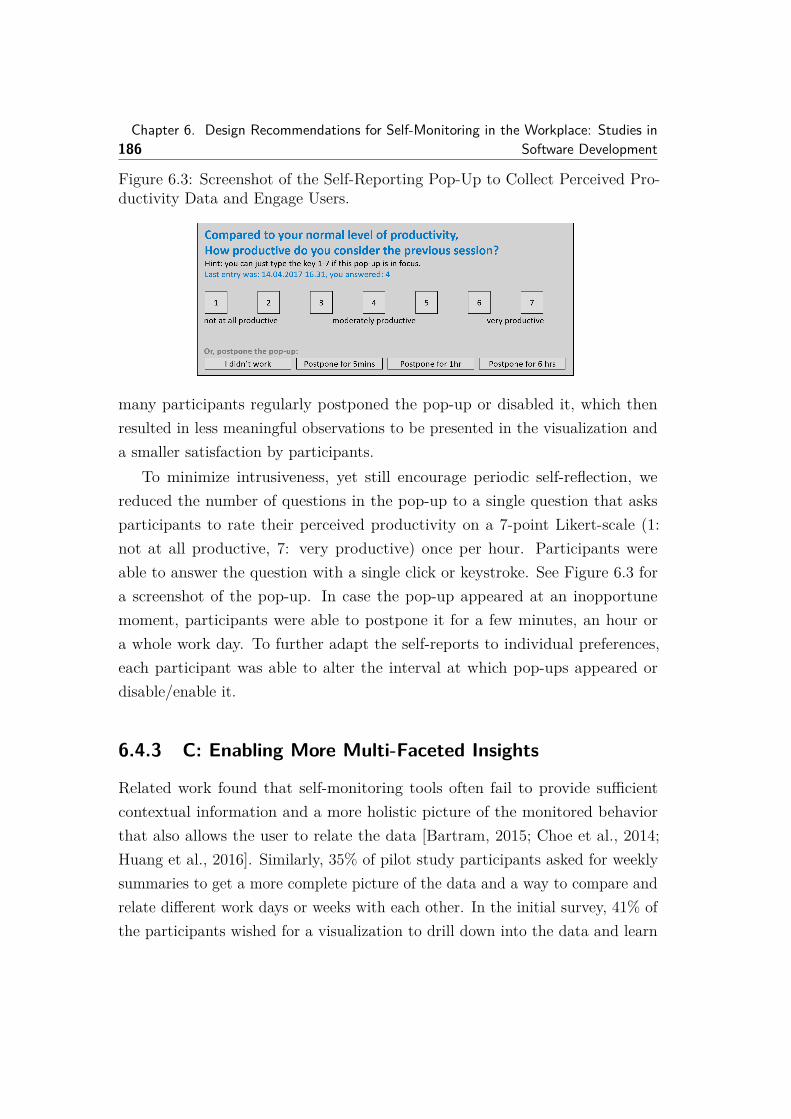
186Chapter 6. Design Recommendations for Self-Monitoring in the Workplace: Studies in
Software Development
Figure 6.3: Screenshot of the Self-Reporting Pop-Up to Collect Perceived Pro-ductivity Data and Engage Users.
many participants regularly postponed the pop-up or disabled it, which thenresulted in less meaningful observations to be presented in the visualization anda smaller satisfaction by participants.
To minimize intrusiveness, yet still encourage periodic self-reflection, wereduced the number of questions in the pop-up to a single question that asksparticipants to rate their perceived productivity on a 7-point Likert-scale (1:not at all productive, 7: very productive) once per hour. Participants wereable to answer the question with a single click or keystroke. See Figure 6.3 fora screenshot of the pop-up. In case the pop-up appeared at an inopportunemoment, participants were able to postpone it for a few minutes, an hour ora whole work day. To further adapt the self-reports to individual preferences,each participant was able to alter the interval at which pop-ups appeared ordisable/enable it.
6.4.3 C: Enabling More Multi-Faceted Insights
Related work found that self-monitoring tools often fail to provide sufficientcontextual information and a more holistic picture of the monitored behaviorthat also allows the user to relate the data [Bartram, 2015; Choe et al., 2014;Huang et al., 2016]. Similarly, 35% of pilot study participants asked for weeklysummaries to get a more complete picture of the data and a way to compare andrelate different work days or weeks with each other. In the initial survey, 41% ofthe participants wished for a visualization to drill down into the data and learn
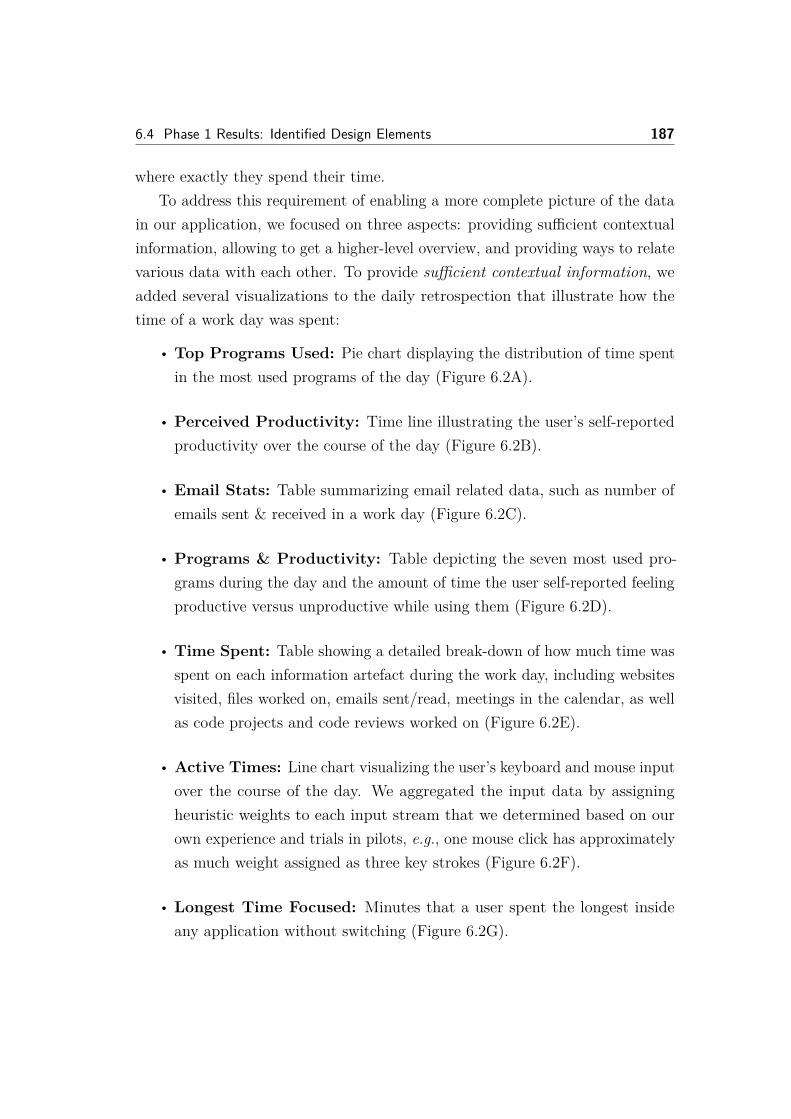
6.4 Phase 1 Results: Identified Design Elements 187
where exactly they spend their time.To address this requirement of enabling a more complete picture of the data
in our application, we focused on three aspects: providing sufficient contextualinformation, allowing to get a higher-level overview, and providing ways to relatevarious data with each other. To provide sufficient contextual information, weadded several visualizations to the daily retrospection that illustrate how thetime of a work day was spent:
• Top Programs Used: Pie chart displaying the distribution of time spentin the most used programs of the day (Figure 6.2A).
• Perceived Productivity: Time line illustrating the user’s self-reportedproductivity over the course of the day (Figure 6.2B).
• Email Stats: Table summarizing email related data, such as number ofemails sent & received in a work day (Figure 6.2C).
• Programs & Productivity: Table depicting the seven most used pro-grams during the day and the amount of time the user self-reported feelingproductive versus unproductive while using them (Figure 6.2D).
• Time Spent: Table showing a detailed break-down of how much time wasspent on each information artefact during the work day, including websitesvisited, files worked on, emails sent/read, meetings in the calendar, as wellas code projects and code reviews worked on (Figure 6.2E).
• Active Times: Line chart visualizing the user’s keyboard and mouse inputover the course of the day. We aggregated the input data by assigningheuristic weights to each input stream that we determined based on ourown experience and trials in pilots, e.g., one mouse click has approximatelyas much weight assigned as three key strokes (Figure 6.2F).
• Longest Time Focused: Minutes that a user spent the longest insideany application without switching (Figure 6.2G).
188Chapter 6. Design Recommendations for Self-Monitoring in the Workplace: Studies in
Software Development
For a higher-level overview, we added a weekly summary of the data, whichshows how often which programs were used on each day of the week, the averageself-reported productivity per day, and the productive versus unproductive timespent on the 7 most used programs during the week (same as Figure 6.2E). Thesupplementary material contains a screenshot of the weekly retrospection.
Finally, to ease the correlation of data, as desired by 19% of the participantsin the initial survey, we implemented a feature that allows users to pick daysor weeks (Figure 6.2H) and compares them with each other side-by-side andwe provide a view that correlates the most used programs during a day withproductivity (Figure 6.2D). In addition to these features, we automatically gen-erated personalized insights. Personalized insights are automatically generatedaggregations and correlations within the captured data and presented in nat-ural language. These personalized insights are similar to the correlation andpresentation of data that Bentley et al. [2013] have shown to increase users’understanding of complex connections in the area of health-monitoring andwell-being. To create the personalized insights, we first created a matrix wherewe correlated each measure with itself (i.e. average per day), with the time of theday (i.e. morning/afternoon), and with the productivity self-reports. To avoidinformation overload, we just selected insights that might be interesting to usersby discarding simple insights from the matrix that were already easily perceptiblein the retrospection (e.g., the number of emails sent per day or user input overthe day) and removed one insight that we could not produce due to the formatof the collected data (number of emails sent/received over the day). For eachpair, we created one or more sentences that correlate the items with each other.For example, from the pair ’self-reported productivity’ and ’time of day’, wecreated the sentence: “You feel more productive in the [morning/afternoon]”(insight 14). Three of these personalized insights address the participants’ focus,which is an abstracted measure for the time spent in a single program beforeswitching to another program. Participants were aware of the definition of focus,as one of the visualizations in the daily retrospection used the same abstractionand included a definition (Figure 6.2G). We created these personalized insightsindividually for each user and filtered the ones that were not feasible, e.g., due to
6.5 Phase 2 Method: Evaluating Design Elements 189
participants disabling certain data trackers. Since we wanted to ensure to collectsufficient data before generating these personalized insights and also ensure thatthey are reasonable, we only included them in the final survey, after users sharedtheir data logs with us. Table 6.3 presents a list of the 15 personal insightsthat resulted from this process. The matrix we created to select these insightsis available and discussed in the supplementary material. Future versions ofPersonalAnalytics will include the automatic generation of such personalizedinsights.
6.5 Phase 2 Method: Evaluating Design Elements
To evaluate the design elements, and learn how software developers are using andappreciating the identified features and measurements in practice, we formulateda second research question:
RQ2: How do software developers use the measurements and features basedon the identified design elements during their work and what is their impact?
To answer the research question, we conducted a field study with Personal-Analytics as a technology probe that implements the previously discussed designelements.
6.5.1 Participants
We recruited participants for this study by contacting the 160 software developersat company D that took our initial survey and indicated their interest in partici-pating. 33 of the 43 participants that signed the consent form were recruitedthrough this follow-up email, and 10 participants were recruited through recom-mendations from other participants. The only requirements for participatingin the study were to be a software developer and to be using a work machinewith the Windows operating system. Participants were given two 10 US$ mealcards at the end of the study for compensating their efforts and were promisedpersonalized insights into their work and productivity. All 43 participants areprofessional software developers working in the same large software company
190Chapter 6. Design Recommendations for Self-Monitoring in the Workplace: Studies in
Software Development
(company D in the pilots), three of them were female and 40 male. The roles,team sizes and projects varied across the participants. 96.7% stated their role tobe an individual contributor and 3.3% team lead. Participants had an averageof 9.8 years (±6.6, ranging from 0.5 to 30) of professional software developmentexperience. To avoid privacy concerns, we identified participants with a subjectid and therefore could not link their responses between the different feedback sur-veys, emails, and collected data from PersonalAnalytics. To get feedback on theusefulness of the different design elements from different perspectives, we pickedparticipants with and without previous experience with other self-monitoringtools, such as Fitbit [2019] or RescueTime [2019].
6.5.2 Procedure
We designed this field study to last three work weeks. At the beginning of theperiod, we provided participants with detailed information on the study procedure,the data we were going to collect, and the features of PersonalAnalytics. Wethen asked participants to install the application on their work machine, continuetheir regular work day and answer the periodic self-reports when they appeared,by default every 60 minutes. We asked them to contact us via email at any pointin time in case they run into an issue, had questions, or suggestions, which 34participants did once or more. At any point throughout the study, participantswere able to change the time period or disable the pop-up completely. Participantscould also enable or disable any trackers that logged data for presentation in theretrospection. After the first week, we sent out a short, intermediate feedbacksurvey to collect early feedback on the usefulness, suggestions for improvement,and participants’ engagement with PersonalAnalytics. 26 participants responded.The timing was chosen to make sure participants had used the application forat least 3 to 5 work days, and the tool had captured enough data to showvisualizations from various work days.
Shortly before the end of the three work weeks of the study, we askedparticipants to share the data that PersonalAnalytics logged on their machine—the reported productivity ratings and the computer interactions—if they werewilling to. We also gave each participant the opportunity to obfuscate any
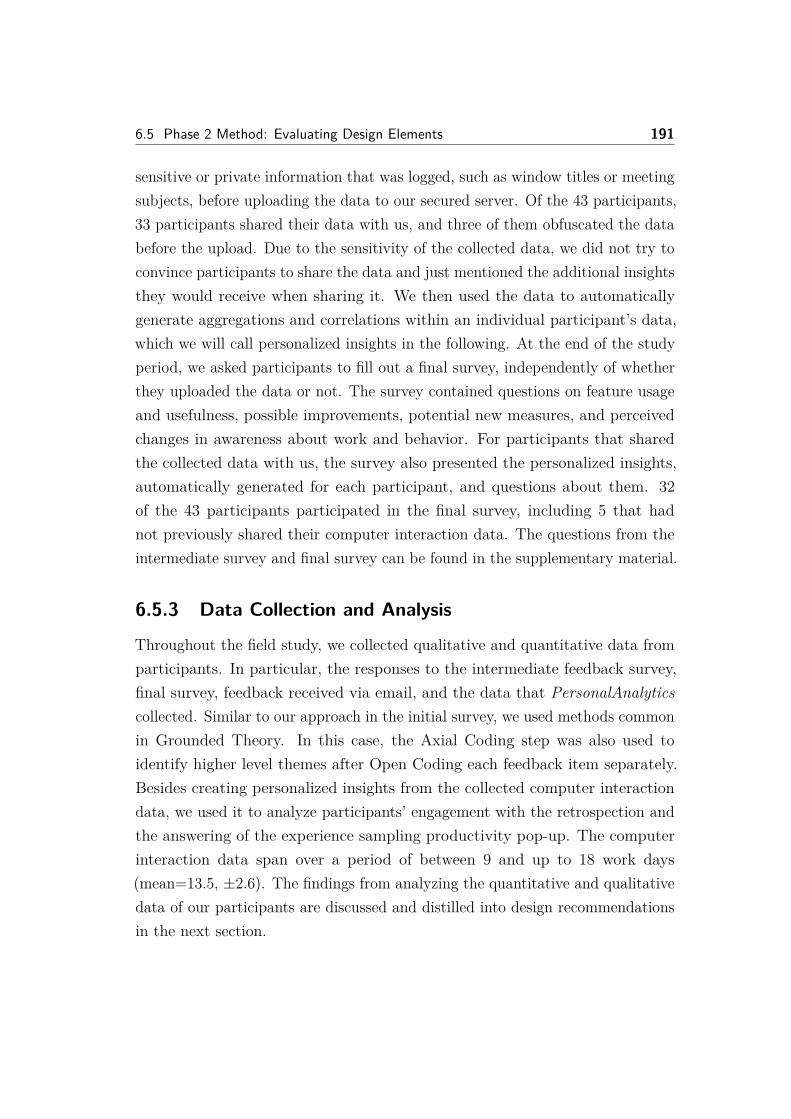
6.5 Phase 2 Method: Evaluating Design Elements 191
sensitive or private information that was logged, such as window titles or meetingsubjects, before uploading the data to our secured server. Of the 43 participants,33 participants shared their data with us, and three of them obfuscated the databefore the upload. Due to the sensitivity of the collected data, we did not try toconvince participants to share the data and just mentioned the additional insightsthey would receive when sharing it. We then used the data to automaticallygenerate aggregations and correlations within an individual participant’s data,which we will call personalized insights in the following. At the end of the studyperiod, we asked participants to fill out a final survey, independently of whetherthey uploaded the data or not. The survey contained questions on feature usageand usefulness, possible improvements, potential new measures, and perceivedchanges in awareness about work and behavior. For participants that sharedthe collected data with us, the survey also presented the personalized insights,automatically generated for each participant, and questions about them. 32of the 43 participants participated in the final survey, including 5 that hadnot previously shared their computer interaction data. The questions from theintermediate survey and final survey can be found in the supplementary material.
6.5.3 Data Collection and Analysis
Throughout the field study, we collected qualitative and quantitative data fromparticipants. In particular, the responses to the intermediate feedback survey,final survey, feedback received via email, and the data that PersonalAnalyticscollected. Similar to our approach in the initial survey, we used methods commonin Grounded Theory. In this case, the Axial Coding step was also used toidentify higher level themes after Open Coding each feedback item separately.Besides creating personalized insights from the collected computer interactiondata, we used it to analyze participants’ engagement with the retrospection andthe answering of the experience sampling productivity pop-up. The computerinteraction data span over a period of between 9 and up to 18 work days(mean=13.5, ±2.6). The findings from analyzing the quantitative and qualitativedata of our participants are discussed and distilled into design recommendationsin the next section.
192Chapter 6. Design Recommendations for Self-Monitoring in the Workplace: Studies in
Software Development
6.6 Phase 2 Results: Design Recommendations Basedon Evaluating Design Elements
To answer the second research question (RQ2), we focus our analysis of the datacollected about the use of PersonalAnalytics. For each part, we first present thefindings before summarizing the design recommendations that we inferred frominterpreting the results. The design recommendations are mapped to one of thethree design elements (A to C) and are presented in blue boxes to distinguishthem from the findings.
6.6.1 Different Granularity of Visualizations
Most participants (70.4%) agreed that the collected data and measures wereinteresting and relevant to them. Participants valued that the retrospectionallowed them to get a high-level overview of the data and also let them drilldown into more detail:
“Sift through all this information and quickly find what’s critical and be able todetermine what is furthering one’s goals and what [is] not (i.e. is a distraction).” -F19
Participants used, for instance, the pie chart on the programs executed(Figure 6.2A) and the active times timeline (Figure 6.2F) to get an aggregatedoverview of the past work day, in particular which activities most time was spenton and the most active and inactive times during the day, respectively. Whenthey wanted to further investigate their day and find out more specific details,participants appreciated the availability of other visualizations:
“I like that [WorkAnalytics] captures who I am talking with in Skype or GoogleHangouts [. . . ]. I like the integration of Outlook in more detail.” - F42
Several participants (F13, F17, F18) reported having used the time spent table(Figure 6.2E) regularly to gain deeper insights on with whom they communicate—through email, instant messaging and meetings—and on which artefacts theyspent time—document, website, code file, or email.
6.6 Phase 2 Results: Design Recommendations Based on Evaluating Design Elements193
Design Recommendation A.1: For self-monitoring at work users are in-terested in a quick as well as deep retrospection on their work that are bestsupported through high-level overviews with interactive features to drill-downinto details.
6.6.2 Interest in Diverse Set of Measurements
Participants had varying interests in the positive, negative or neutral framingof the data. For instance, while some participants (F19, F25) wanted to learnabout what went well, such as the tasks they completed and how much theyhelped their co-workers, others were more interested in understanding what wentwrong:
“[. . . ] focus more on things that prevent someone from being able to add businessvalue, rather than arbitrary metrics like commit count, bug count, task completion,etc. [. . . ] I would prefer [the application] to track things that I felt got in the wayof being productive.” - F17
This framing effect in self-monitoring tools has recently been explored by Kimet al. [2016], where they found out that only participants with a negative framingcondition improved their productivity, while positive framing had little to noimpact.
Most participants (69%) wanted WorkAnalytics to collect even more data onother aspects of their work to further personalize and better fit the retrospectionto their individual needs. For instance, they wanted more detailed insights intocollaborative and communicative behaviors by integrating data from and sharingdata with other team members (6%) and generating insights into the time spenton technical discussions or helping co-workers (6%). Participants were furtherinterested in collecting data from other work devices (13%), capturing even morecoding related data (6%), such as tests and commits, or more high-level measures,such as interruptions or progress on tasks (9%). 80% of the participants werealso interested in biometric data, such as heart rate or stress levels, 70% wereinterested in physical activity data, such as sleep or exercise, and 50% were
194Chapter 6. Design Recommendations for Self-Monitoring in the Workplace: Studies in
Software Development
interested in location based data, such as commute times or visited venues; all incombination with the already collected work data. Similarly, roughly one thirdof the participants suggested to extend the daily and weekly retrospection, byadding additional visualizations and finer-grained aggregations, to better supportthem in making observations based on correlations and combinations of severalmeasurements:
“[The] active times graph would be neat on the weekly retrospection so that I couldget a sense of my most active time of the day without having to navigate througheach day.” - F43
These very diverse requests for extendingWorkAnalytics with further measuresand visualizations emphasize the need for personalizing the experience, to increasesatisfaction and engagement.
Design Recommendation A.2: For self-monitoring one’s work, users areinterested in a large and diverse set of data, even from outside of work, aswell as in correlations within the data.
6.6.3 Increasing Self-Awareness with Experience SamplingParticipants actively engaged in the brief, hourly self-reports on productivitywhen they were working on their computer. Over the course of the study,participants self-reported their productivity regularly, on average 6.6 times a day(±3.8, min = 1, max = 23) and it usually took them just a couple of seconds,without actually interrupting their work. Two (6%) participants even increasedthe frequency to answer the pop-up every 30 minutes, while 3 (9%) of the 33participants, from whom we received data, disabled the self-reports. This showsthat the experience sampling method we applied was not considered as toointrusive for most participants.
Being asked in the final survey about the value of and experience with self-reporting their productivity, 59.2% of the participants agreed or strongly agreedthat the brief self-reports increased their awareness on productivity and work(see Table 6.2 for more detail). The self-reports helped participants to realizehow they have spent their past hour at work and how much progress they havemade on the current task:
6.6 Phase 2 Results: Design Recommendations Based on Evaluating Design Elements195
“It makes me more conscious about where I spent my time and how productive Iam.” - F08
Some participants used the pop-up to briefly reflect on whether they haveused their time efficiently or not, and if they should consider changing something:
“The hourly interrupt helps to do a quick triage of whether you are stuck with sometask/problem and should consider asking for help or taking a different approach.” -F11
The fact that PersonalAnalytics does not automatically measure productivity,but rather lets users self-report their perceptions, was further valued by partici-pants as some do not think an automated measure can accurately capture anindividual’s productivity, similar to what was previously found by Meyer et al.[2017a]:
“One thing I like about [WorkAnalytics] a lot is that it lets me judge if my timewas productive or not. So just because I was in a browser or VisualStudio doesn’tnecessarily mean I was being productive or not.” - F42
“I am much more honest about my productivity levels when I have to self-report,[rather] than if the software simply [. . . ] decided whether or not I was productive.”- F15
These findings suggest that using experience sampling is a feasible method tomanually collect data as long as users have a benefit from their self-reporting.
Design Recommendation B.1: Experience sampling in the form of briefand periodic self-reports are valuable to users as they increase the awarenessof their work and productivity, and lead to richer insights.
6.6.4 Increasing Self-Awareness with a Retrospection
Participants frequently accessed the daily retrospection, yet the patterns ofself-monitoring varied greatly across participants. On average, participantsopened the retrospection 2.5 times per day (±3.5, min=0, max=24) for a totalof 0.85 minutes (±2.95, min=0, max=42.9), but both aspects varied a lot across
196Chapter 6. Design Recommendations for Self-Monitoring in the Workplace: Studies in
Software Development
participants as the standard deviation (±) and the minimum and maximumshow. All participants opened the retrospection more often in the afternoon(mean=1.9) than in the morning (mean=0.6). Yet, 34% of participants openedthe application less than 5 times over the whole study period, while 28% usedthe retrospection at least once a day. Also, while 31% of participants mostlyfocused on the current day, the other 69% looked and compared multiple workdays. Many participants also looked at the weekly retrospection, but access tothis one was less often than to the daily one.
While these results show that most participants were actively reflecting abouttheir work using the retrospection, we also received feedback from 2 participants(6%) that they sometimes forgot the retrospection was available:
“I forgot I could even look at the retrospection! A new pop-up, maybe Fridayafternoon or Monday morning prompting me to review the week’s data would bereally nice.” - F14
Overall, the retrospection increased the awareness of the participating softwaredevelopers and provided valuable and novel insights that they were not aware ofbefore. Overall, participants commented on the retrospection providing novelinsights on a variety of topics, such as how they spend their time at workcollaborating or making progress on tasks, their productivity over the course ofthe day, or the fragmentation and context switches at work:
“Context switches are not the same as program switches, and I do *lots* of programswitches. I still do a lot more context switches than I thought, but it doesn’t hurtmy perceived productivity.” - F36
“[The] tool is awesome! It [. . . ] helped confirm some impression I had about mywork and provided some surprising and very valuable insights I wasn’t aware of. Iam apparently spending most of my time in Outlook.” - F42
Reflecting about the time spent at work further helped participants to sortout misconceptions they had about their work:
“I did not realize I am as productive in the afternoons. I always thought mymornings were more productive but looks like I just think that because I spend moretime on email.” - F14
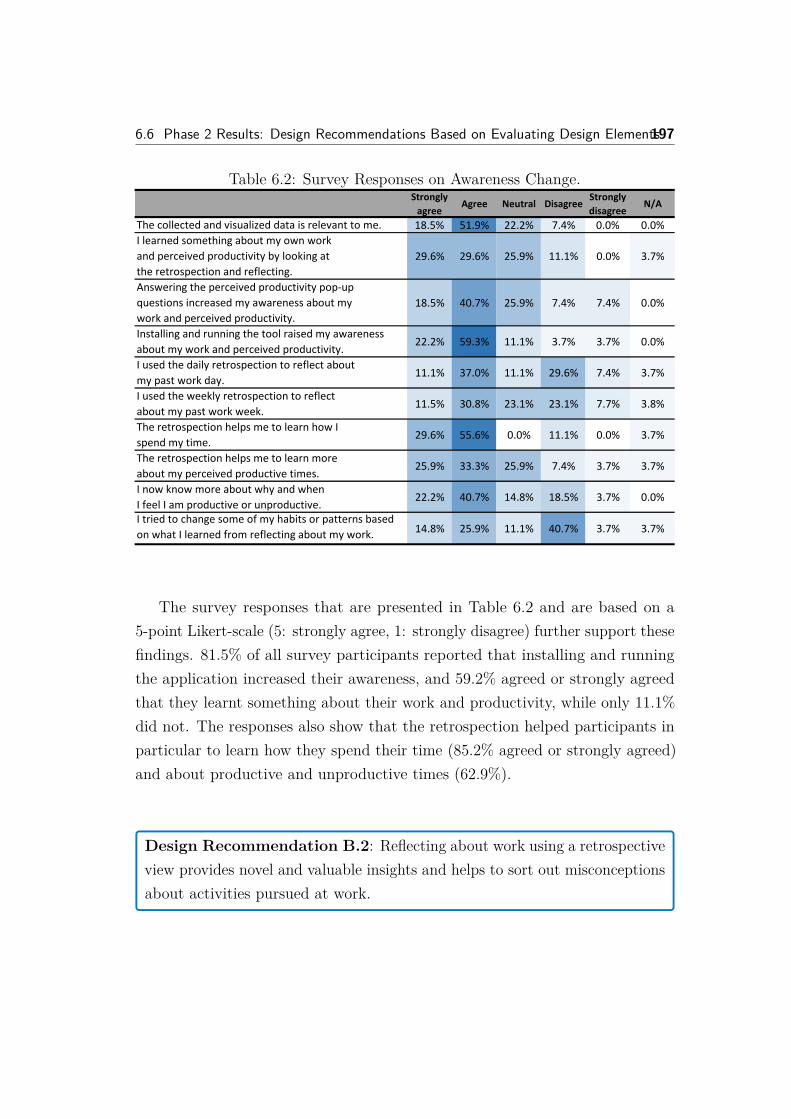
6.6 Phase 2 Results: Design Recommendations Based on Evaluating Design Elements197
Table 6.2: Survey Responses on Awareness Change.Strongly
agreeAgree Neutral Disagree
Strongly
disagreeN/A
The collected and visualized data is relevant to me. 18.5% 51.9% 22.2% 7.4% 0.0% 0.0%
I learned something about my own work
and perceived productivity by looking at
the retrospection and reflecting.
29.6% 29.6% 25.9% 11.1% 0.0% 3.7%
Answering the perceived productivity pop-up
questions increased my awareness about my
work and perceived productivity.
18.5% 40.7% 25.9% 7.4% 7.4% 0.0%
Installing and running the tool raised my awareness
about my work and perceived productivity.22.2% 59.3% 11.1% 3.7% 3.7% 0.0%
I used the daily retrospection to reflect about
my past work day.11.1% 37.0% 11.1% 29.6% 7.4% 3.7%
I used the weekly retrospection to reflect
about my past work week.11.5% 30.8% 23.1% 23.1% 7.7% 3.8%
The retrospection helps me to learn how I
spend my time.29.6% 55.6% 0.0% 11.1% 0.0% 3.7%
The retrospection helps me to learn more
about my perceived productive times.25.9% 33.3% 25.9% 7.4% 3.7% 3.7%
I now know more about why and when
I feel I am productive or unproductive.22.2% 40.7% 14.8% 18.5% 3.7% 0.0%
I tried to change some of my habits or patterns based
on what I learned from reflecting about my work. 14.8% 25.9% 11.1% 40.7% 3.7% 3.7%
The survey responses that are presented in Table 6.2 and are based on a5-point Likert-scale (5: strongly agree, 1: strongly disagree) further support thesefindings. 81.5% of all survey participants reported that installing and runningthe application increased their awareness, and 59.2% agreed or strongly agreedthat they learnt something about their work and productivity, while only 11.1%did not. The responses also show that the retrospection helped participants inparticular to learn how they spend their time (85.2% agreed or strongly agreed)and about productive and unproductive times (62.9%).
Design Recommendation B.2: Reflecting about work using a retrospectiveview provides novel and valuable insights and helps to sort out misconceptionsabout activities pursued at work.
198Chapter 6. Design Recommendations for Self-Monitoring in the Workplace: Studies in
Software Development
6.6.5 Personalized Insights
The personalized insights that we presented to 27 of the 32 participants inthe final survey are based on the same measurements as the ones that arevisualized in the retrospection. These insights were created based on correlationsand aggregations within the collected data and presented as natural languagesentences. The specific insights are presented in Table 6.3 and details on theircreation can be found in Section 6.4.3. To learn more about the value of thevisualizations and the natural language insights, we asked participants to ratethe novelty of each personalized insight. Participants’ responses were mixedwith respect to the novelty of the automatically generated personalized insightsthat presented correlations and aggregates within the data in natural language.When rated on a scale from ‘extremely novel’ to ‘not novel at all’, only 5 of the15 personalized insights (see personalized insights in Table 6.3 marked with anasterisk ‘*’) were rated as ‘very novel’ or ‘extremely novel’ by more than half of theparticipants. This means that participants gained knowledge about most insightseither before or during the study. The five insights that were rated as ‘very novel’or ‘extremely novel’ by more than half of the participants are all correlationsbetween two distinct data categories, so called multi-faceted correlations [Jonesand Kelly, 2017], rather than simple aggregates, called uni-faceted correlations,which are easier to understand from simple visualizations [Bentley et al., 2013;Galesic and Garcia-Retamero, 2011]. One participant also suggested to integratethese novel personalized insights into the retrospection since it was easier todraw connections between two distinct data categories using natural-languagestatements, similar to what Bentley et al. [2013] found. Research by Jonesand Kelly [2017] has shown that multi-faceted correlations presented by self-monitoring tools are of higher interest to users than uni-faceted correlations.Paired with our findings above, this suggests to use visualizations for presentinguni-faceted correlations and to present more complex multi-faceted correlationsusing natural language sentences. Future work could further investigate theeffectiveness of these personalized insights and their impact on behavior at work.
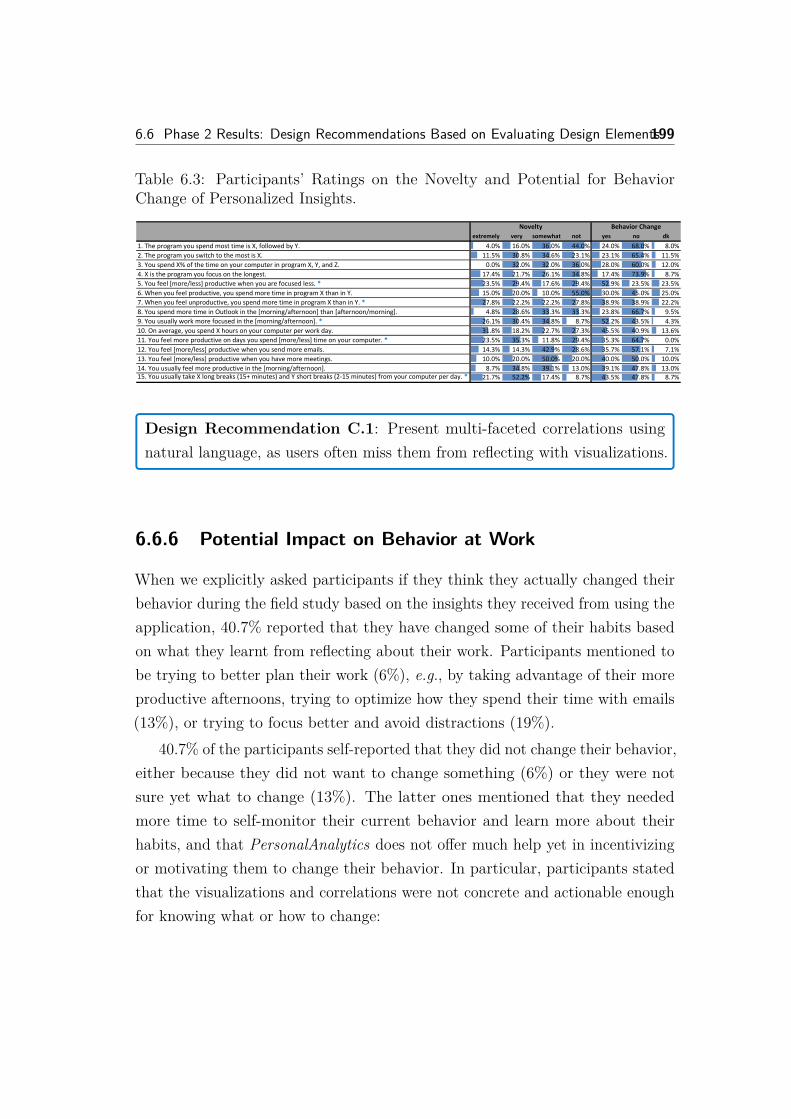
6.6 Phase 2 Results: Design Recommendations Based on Evaluating Design Elements199
Table 6.3: Participants’ Ratings on the Novelty and Potential for BehaviorChange of Personalized Insights.
extremely very somewhat not yes no dk
1. The program you spend most time is X, followed by Y. 4.0% 16.0% 36.0% 44.0% 24.0% 68.0% 8.0%
2. The program you switch to the most is X. 11.5% 30.8% 34.6% 23.1% 23.1% 65.4% 11.5%
3. You spend X% of the time on your computer in program X, Y, and Z. 0.0% 32.0% 32.0% 36.0% 28.0% 60.0% 12.0%
4. X is the program you focus on the longest. 17.4% 21.7% 26.1% 34.8% 17.4% 73.9% 8.7%
5. You feel [more/less] productive when you are focused less. * 23.5% 29.4% 17.6% 29.4% 52.9% 23.5% 23.5%
6. When you feel productive, you spend more time in program X than in Y. 15.0% 20.0% 10.0% 55.0% 30.0% 45.0% 25.0%
7. When you feel unproductive, you spend more time in program X than in Y. * 27.8% 22.2% 22.2% 27.8% 38.9% 38.9% 22.2%
8. You spend more time in Outlook in the [morning/afternoon] than [afternoon/morning]. 4.8% 28.6% 33.3% 33.3% 23.8% 66.7% 9.5%
9. You usually work more focused in the [morning/afternoon]. * 26.1% 30.4% 34.8% 8.7% 52.2% 43.5% 4.3%
10. On average, you spend X hours on your computer per work day. 31.8% 18.2% 22.7% 27.3% 45.5% 40.9% 13.6%
11. You feel more productive on days you spend [more/less] time on your computer. * 23.5% 35.3% 11.8% 29.4% 35.3% 64.7% 0.0%
12. You feel [more/less] productive when you send more emails. 14.3% 14.3% 42.9% 28.6% 35.7% 57.1% 7.1%
13. You feel [more/less] productive when you have more meetings. 10.0% 20.0% 50.0% 20.0% 40.0% 50.0% 10.0%
14. You usually feel more productive in the [morning/afternoon]. 8.7% 34.8% 39.1% 13.0% 39.1% 47.8% 13.0%15. You usually take X long breaks (15+ minutes) and Y short breaks (2-15 minutes) from your computer per day. * 21.7% 52.2% 17.4% 8.7% 43.5% 47.8% 8.7%
Novelty Behavior Change
Design Recommendation C.1: Present multi-faceted correlations usingnatural language, as users often miss them from reflecting with visualizations.
6.6.6 Potential Impact on Behavior at Work
When we explicitly asked participants if they think they actually changed theirbehavior during the field study based on the insights they received from using theapplication, 40.7% reported that they have changed some of their habits basedon what they learnt from reflecting about their work. Participants mentioned tobe trying to better plan their work (6%), e.g., by taking advantage of their moreproductive afternoons, trying to optimize how they spend their time with emails(13%), or trying to focus better and avoid distractions (19%).
40.7% of the participants self-reported that they did not change their behavior,either because they did not want to change something (6%) or they were notsure yet what to change (13%). The latter ones mentioned that they neededmore time to self-monitor their current behavior and learn more about theirhabits, and that PersonalAnalytics does not offer much help yet in incentivizingor motivating them to change their behavior. In particular, participants statedthat the visualizations and correlations were not concrete and actionable enoughfor knowing what or how to change:
200Chapter 6. Design Recommendations for Self-Monitoring in the Workplace: Studies in
Software Development
“While having a retrospection on my time is a great first step, I gained [. . . ]interesting insights and realized some bad assumptions. But ultimately, my behaviordidn’t change much. Neither of them have much in way of a carrot or a stick.” -F42
“It would be nice if the tool could provide productivity tips - ideally tailored to myspecific habits and based on insights about when I’m not productive.” - F15
Several participants went on to make specific recommendations for moreconcrete and actionable support to motivate behavior change. These recommen-dations ranged from pop-ups to encourage more focused work, to recommend abreak from work, all the way to intervening and blocking certain applications orweb sites for a certain time:
“If [the tool] thinks I am having a productive day, it should just leave me aloneand not ask any questions. If I am having an unproductive day and [it] can helpme overcome it ( e.g., go home and get some sleep) the tool should suggest that.” -F10
“Warnings if time on unproductive websites exceeds some amount, and perhapsprovide a way for the user to block those sites (though not forced).” - F29
When we explicitly asked participants to rate whether or not the 15 per-sonalized insights make them think about or plan their work differently, resultsindicated that most of the 15 personalized insights are again not actionable enoughto foster a behavior change (see results on the right sight of Table 6.3). Thefive insights with the highest potential (between 40% and 52.9% of participantsagreed) are mostly related to work fragmentation and focus on work.
Design Recommendation C.2: Self-monitoring insights often need to bevery concrete and actionable to foster behavior change at work.
6.7 Discussion 201
6.7 Discussion
This section discusses implications that emerged from our study with respect tolong-term user engagement, awareness about team-work and collaborations and,ultimately, behavior change.
6.7.1 Design for Personalization
One of our goals was to find out whether the expectations of software developersfor a self-monitoring approach are similar or if they are diverging. While existingcommercial self-monitoring tools to quantify our lives, such as the ?, offer onlyfew options for personalization and are still successful at motivating users tolive a healthier life [Fritz et al., 2014; Mamykina et al., 2008], our results onself-monitoring at work suggest that personalization is crucial.
In the pilot studies and the field study, participants uniformly expecteddifferent measurements to be visualized at different levels of granularity, similarto findings in other areas [Koldijk et al., 2011; McDuff et al., 2012]. Theseindividual expectations might be explained by the very different types of tasksand work that software developers, even with very similar job profiles, have toaccomplish [Meyer et al., 2017a]. The ability to customize the measurementsthat are being captured and how they are visualized is one way to support thepersonalization. This customizability could not only foster interest in long-termusage, as data relevant to the user is available, but could also reduce privacyconcerns that software developers might have.
While many participants were initially skeptical about self-monitoring theirwork, we received no privacy complaints and most participants (33 of 43) evenshared their data with us for the analysis. Almost all participants even wentone step further: after a few days of using PersonalAnalytics and becomingcertain that their data is treated confidentially, they started to comment aboutpossible extensions and additional measures for their self-monitoring at work.This includes more insights about their collaborative activities with other people,as discussed in more detail later in this section, but also adding even moremeasurements specific to their job as software developers, such as the commits
202Chapter 6. Design Recommendations for Self-Monitoring in the Workplace: Studies in
Software Development
they make to the version control tool or insights into their patterns of testingand debugging code.
While it might seem surprising that developers requested many development-unrelated measures for self-monitoring their work, this can be explained bythe amount of time they spend with development related activities, on averagebetween 9% and 21%, versus other activities, such as collaborating (45%) orbrowsing the web (17%) [Gonçalves et al., 2011; Meyer et al., 2017a]. As moststudy participants (84.6%) were interested to continue using PersonalAnalyticsafter the study had ended, we concluded that the initially identified designelements to support various individual needs, actively engage the user, andenable more multi-faceted insights are valuable for self-monitoring at work.
6.7.2 Increased Engagement through Experience Sampling
As noted in previous research, many self-monitoring approaches suffer froman extremely low user engagement with the data [Collins et al., 2014; Huanget al., 2016; Kim et al., 2016]. For example, RescueTime, which visualizes thecaptured data on a dashboard in the browser, was found to be used only afew seconds per day (mean=4.68 ±12.03) [Collins et al., 2014]. Similar to thereports in our field study, participants’ reasons for this low engagement mightbe that users forget about the availability of the data visualizations. A simpleand periodic reminder, e.g., to let users know that there is a new summary onthe work week, might increase the engagement with these visualizations anddashboards. Recently, researchers have explored how adding an ambient widgetand presenting a summary of the captured data always visible on the user’sscreen can increase the engagement with the data (e.g., [Collins et al., 2014; Kimet al., 2016; Whittaker et al., 2016]). For example, the ambient widget by Kimet al. [2016] increased the use of RescueTime to about a minute a day.
In this paper, we assessed another approach, namely a periodic pop-up toself-report productivity. Our findings show that the self-report helped users toquickly reflect on how efficiently they spent their time, which then also resultedin an increased engagement. Our results show that using experience sampling is afeasible method to manually collect data that is difficult to capture automatically
6.7 Discussion 203
and is (mostly) appreciated as long as users have a benefit from self-reporting,e.g., by getting additional or more fine-grained insights. It is up to future work todetermine how long the positive effects of self-reporting or ambient widgets lasts,whether users might at some point loose interest after having learnt ‘enough’about their work, and whether it might be beneficial to only include these featuresin certain time periods. More research is required to understand how this can begeneralized to other domains.
6.7.3 Actionability for Behavior Change
Most health and sports tracking systems have been shown to foster positivebehavior changes due to increased self-awareness. In our study, 40.7% of theparticipants explicitly stated that the increased self-awareness motivated them toadapt their behavior. While motivating changes in behavior was not a primarygoal, the study gave valuable insights into where and how self-monitoring toolsat work could support developers in the process. The very diverse set of insightsin PersonalAnalytics that participants wished for, made it more difficult toobserve a specific problem behavior and define a concrete, actionable goal for abehavior change, which is a basic requirement for starting a change accordingto the theory of behavior change process TTM [Prochaska and Velicer, 1997].Rather than just enabling an increased self-awareness, it might also be importantto provide users with concrete recommendations for active interventions andalerts when certain thresholds are reached. Participants suggested to blockdistracting websites after the user spent a certain amount of time on them, orto suggest a break after a long time without one, similar to what was recentlysuggested [Agapie et al., 2016; Epstein et al., 2016a]. At the same time, not allinsights are actionable as developers sometimes have little power to act on aninsight, similar to what Mathur et al. [2015] found from visualizing noise andair quality at the workplace. As an example, most developers can likely notjust stop reading and responding to emails. Another extension to possibly makeinsights more actionable is to let users formulate concrete behavior change goalsbased on the insights they make from using the retrospection and experiencesampling component. For example, a user could set a goal to regularly take a
204Chapter 6. Design Recommendations for Self-Monitoring in the Workplace: Studies in
Software Development
break to relax or to have an empty email inbox at the end of the day. This goalsetting component could leverage experience sampling further and learn whenand how users are interested and open to receive recommendations of how tobetter reach their goal.
Approaches aiming to foster long-term behavior changes need to offer meansto actively monitor and maintain a behavior change [Prochaska and Velicer,1997] and help avoiding lapses, a frequent reason for abandoning behavior changegoals [Agapie et al., 2016]. In the future we plan to experiment with and evaluatethese different forms of how insights could be improved to make them moreactionable, and then evaluate the longer-term impact of PersonalAnalytics onsoftware developers’ actual behavior at work.
6.7.4 Benchmarking
A re-occurring feedback by participants was the wish for a way to benchmarktheir work behavior and achievements with their team or other developers withsimilar job profiles and to improve their work habits based on the comparisonswith others, similar to what was previously described by Wood [1989]. Giventhe privacy concerns at work, adding such a component to the self-monitoringfor work could, however, severely increase pressure and stress for users who areperforming below average. Also, given our participants’ interest in a high varietyand large set of work related measures indicates that even within one domain—software developers in our case—users might work on fairly different tasks andthat it might be impossible to find a ‘fair’ set of measures for comparing andbenchmarking individuals. More research is needed to examine how and in whichcontexts such a social feature might be beneficial as well as which aggregatedmeasures might be used for some sort of comparison without privacy concerns.For example, one could anonymously collect the data related to developers’work habits, such as fragmentation, time spent on activities, and achievements,combine them with job profile details and then present personalized insights andcomparisons to other developers with a similar job profile. One such insight couldbe to let the developer know that others spend more time reading developmentblogs to educate themselves or that they usually have less meetings in a work
6.7 Discussion 205
week. Besides having anonymous comparisons between developers, it couldfurther be beneficial to let users compare their work habits with their previousself, e.g., from one month ago, and enable them to reflect on how their behaviorschange over time. Although research has shown that benchmarking features inphysical activity trackers foster competition with peers to be more active [Fritzet al., 2014; Rooksby et al., 2014], additional research is needed to determinewhether they also lead to a positive behavior change at the workplace.
6.7.5 Team-Awareness
Even though most insights available within PersonalAnalytics appear to beabout each user’s own work habits, some insights also reveal details about theindividuals’ collaboration and communication patterns with their team andother stakeholders. These are, for example, insights about their meeting, email,instant messaging, social networking, and code review behavior. Nonetheless,participants were interested in even more measures, especially with respect torevealing (hidden) collaboration and communication patterns within their teams.Having detailed insights into how the team coordinates and communicates atwork could help developers make more balanced adjustments with respect tothe impact their behavior change might have on their team. For example, beingaware of co-workers’ most and least productive times could help to schedulemeetings at more optimal times, similar to what Begole et al. [2002] suggested forteams distributed across time zones. Related to an approach suggested by Anviket al. [2006] where work items and bug reports were automatically assigned todevelopers based on previously assigned and resolved work items, it could bebeneficial for improving the coordination and planning of task assignments byalso taking into account each developer’s current capacity and workload. Beingmore aware of the tasks each member of the team is currently working on and howmuch progress they are making could also be useful for managers or team leadsto identify problems early, e.g., a developer who is blocked on a task [Jakobsenet al., 2009] or uses communication tools inefficiently [Storey et al., 2017], andtake appropriate action. A similar approach, WIPDash, has been shown toimprove daily stand-up meetings by providing teams with shared dashboard
206Chapter 6. Design Recommendations for Self-Monitoring in the Workplace: Studies in
Software Development
summaries of work items each developer was assigned to and has completed,as these dashboards increase the awareness about each developer’s progress ontasks [Jakobsen et al., 2009]. Visualizing the current productivity and focus toco-workers could prevent interruptions at inopportune moments, where resumingthe interrupted task might be more costly than at a moment of low focus. Tostreamline inopportune interruptions at work, Züger et al. [2017] suggested tovisualize the current focus to the team by using a “traffic light like lamp”.
As the envisioned additions and extensions to PersonalAnalytics might in-crease an individual’s productivity, they might negatively affect the overall teamproductivity or the collaboration within teams. For example, a developer who isstuck on a task cannot ask a co-worker for help that blocks out interruptions.This is why self-monitoring tools for teams at work could not only motivate acollective improvement of the team-productivity, but also help to monitor thesuccess and impact of these changes on other stakeholders. Future work couldexplore how self-monitoring at work supports team collaboration, by analyzingcollaboration practices within development teams and comparing them to otherteams. This work could be based on the Model of Regulation, recently intro-duced by Arciniegas-Mendez et al. [2017], as it helps to systematically evaluateand understand how teams self-regulate their own tasks and activities, otherteam-members, and how they create a shared understanding of their projectgoals.
6.8 Generalizability and Limitations
We focused our work on one type of knowledge workers, software developers,to gather insights into one work domain before generalizing to a broader rangeof knowledge workers in the future. Software developers have been referred toas the knowledge worker prototype as they are often not only the first ones touse and tweak tools, but also have lower barriers for building and improvingtools themselves [Kelly, 2008]. While software developers experience extensiveinteraction and collaboration with co-workers through their computer use, webelieve that many of the observations made from building and evaluating Per-
6.9 Conclusion 207
sonalAnalytics with developers are also helpful for self-monitoring tools in otherwork domains, especially since the studied features and most tracked measurescan be re-used in or easily ported to other domains.
The main threat to the validity and generalizability of our results is theexternal validity, due to the selection of field study participants that were allfrom the same company and had limited gender diversity. We tried to mitigatethese threats by advertising the study and selecting participants from differentteams in the company, at different stages of their project, and with varyingamounts of experience. Participants tested PersonalAnalytics over a duration ofseveral weeks and were studied in their everyday, real-world work environmentand not in an experimental exercise. Moreover, the development of the applicationwas designed together with participants from three other companies of varyingsize, reducing the chance that we built an application that is just useful forsoftware developers at one company. Although our findings shed light on howawareness and engagement can be increased, it is not clear how PersonalAnalyticsaffects software developers using it over longer than the three-week period studied.We are aware that there is a certain self-selection bias towards participants whoare in general more willing to quantify various aspects of their life, and use thecollected data to increase their awareness.
6.9 Conclusion
One way to improve the productivity and well-being of knowledge workersis to increase their self-awareness about productivity at work through self-monitoring. Yet, little is known about the expectations of and experience withself-monitoring at the workplace and how it impacts software developers, onecommunity of knowledge workers on which we focused. Based on previous work,an iterative development process with 5 pilot studies and a survey with 413developers, we factored out design elements that we implemented and refinedwith PersonalAnalytics as a technology probe for self-monitoring at work. Wethen evaluated the effect of these design elements on self-awareness of patternsof work and productivity and their potential impact on behavior change with 43
208Chapter 6. Design Recommendations for Self-Monitoring in the Workplace: Studies in
Software Development
participants in a field study, resulting in design recommendations.We found that experience sampling, using minimal-intrusive self-reporting,
and the retrospective summary of the data enhances the users’ engagement andincreases their awareness about work and productivity. Participants reportedthat by using our self-monitoring approach, they have made detailed observationsinto how they spend their time at work collaborating or working on tasks, whenthey usually feel more or less productive, and sort out misconceptions they hadabout their activities pursued at work, such as spending a surprisingly highamount of time collaborating with others via email. Our work provides a set ofdesign recommendations for building self-monitoring tools for developers’ workand possibly other types of knowledge workers. We discuss potential futurework to further increase engagement with the data and to enhance the insights’actionability by providing users with recommendations to improve their work,by adding social features to motivate users to compete with their peers, and byincreasing the team awareness to help teams reduce interruptions, improve thescheduling of meetings, and the coordination of task assignments.
6.10 AcknowledgementsThe authors would like to thank the study participants and the anonymousreviewers for their valuable feedback. This work was funded in part by Microsoft,NSERC and SNF.
7Enabling Good Work Habits in
Software Developersthrough Reflective
Goal-Setting
André N. Meyer, Gail C. Murphy, Thomas Zimmermann, Thomas FritzAccepted in the 2019 IEEE Transactions on Software Engineering Journal,
Contribution: Study design and execution, participant recruitment, datacollection, data analysis, and paper writing
Abstract
Software developers are generally interested in developing better habits to increasetheir workplace productivity and well-being, but have difficulties identifying con-crete goals and actionable strategies to do so. In several areas of life, such as
210Chapter 7. Enabling Good Work Habits in Software Developers
through Reflective Goal-Setting
the physical activity and health domain, self-reflection has been shown to besuccessful at increasing people’s awareness about a problematic behavior, moti-vating them to define a self-improvement goal, and fostering goal-achievement.We therefore designed a reflective goal-setting study to learn more about de-velopers’ goals and strategies to improve or maintain good habits at work. Inour study, 52 professional software developers self-reflected about their work ona daily basis during two to three weeks, which resulted in a rich set of workhabit goals and actionable strategies that developers pursue at work. We alsofound that purposeful, continuous self-reflection not only increases developers’awareness about productive and unproductive work habits (84.5%), but alsoleads to positive self-improvements that increase developer productivity andwell-being (79.6%). We discuss how tools could support developers with a bettertrade-off between the cost and value of workplace self-reflection and increaselong-term engagement.
7.1 Introduction
Software developers are motivated to develop better habits to improve theirproductivity and well-being at work [Li et al., 2015; Meyer et al., 2017b; Sharpet al., 2009]. It is therefore desirable to gain a better understanding of whatgood work habits and behaviors are, and how we can support developers with theidentification of self-improvement opportunities to build better and maintain goodhabits at work. Prior research has examined developers’ existing work habits,specifically the time they spend on various activities at work (e.g., [Astromskiset al., 2017; Gonçalves et al., 2011; Meyer et al., 2017a; Singer et al., 2010; Xiaet al., 2017]), their organization of work into tasks (e.g., [González and Mark,2004]), and causes of fragmented work (e.g., [Chong and Siino, 2006; Czerwinskiet al., 2004; Mark et al., 2005; Meyer et al., 2017a; Parnin and Rugaber, 2011]).Recently, researchers have also looked into the attributes and habits of greatsoftware developers [Baltes and Diehl, 2018; Li et al., 2015; Sharp et al., 2009].They found that one key trait of successful developers is growth orientation,which means that they are constantly learning and striving to change theirbehavior to increase efficiency at work.
7.1 Introduction 211
Goal-setting is one way to foster behavior change, since it allows individualsto define a target or outcome, and make progress towards their goal [Locke andLatham, 1990, 2002]. In the context of this work, goals refer to desired targetor outcome habits that developers set for themselves, to improve productivityand well-being at the workplace. Strategies refer to the system they employ tomake progress towards and eventually reach their goals. However, identifyingconcrete and relevant goals can be challenging, which is why an active area ofresearch is investigating how self-reflection can help individuals to get insightsinto positive and negative habits, and support them with the identificationof meaningful goals that motivate positive behavior changes [Brockbank andMcGill, 2007; Kersten-van Dijk et al., 2017,?; Sharot et al., 2011]. This includesmostly personal areas of life, such as health [Gasser et al., 2006; Monkaresiet al., 2013], sleep quality [Daskalova et al., 2016; Lee et al., 2017], students’learning behavior [Johnson and White, 1971; Morisano et al., 2010; Traverset al., 2015], and physical activity [Herrmanny et al., 2016; Klasnja et al., 2009;Munson and Consolvo, 2012]. Research more specific to knowledge workers’ workhabits investigated the effects of self-reflection on task completion [Amabile andKramer, 2011; Claessens et al., 2010], time management [Pammer et al., 2015],and detachment from work [Kocielnik et al., 2018; Williams et al., 2018].
While developers generally want to play an active role in setting their owngoals for work [Couger et al., 1990; Enns et al., 2006; Perry et al., 1994b], wehave not been able to find prior work that investigated goals developers set toimprove work habits and productivity. This is why we wanted to study thegoals that developers set for themselves to improve and maintain good habitsat work, the strategies they pursue to achieve those goals, and the impact theirgoal-setting has on productivity and well-being. Even though self-reflectionhas previously been shown to have great potential to foster goal-identification,developers rarely reflect on or review their work in practice [Baltes and Diehl,2018]. Hence, we further aimed to examine whether encouraging developers toself-reflect continuously on work, results in meaningful insights about work andleads to any work habit goals and -improvements. In particular, our work seeksto answer the following research questions:
212Chapter 7. Enabling Good Work Habits in Software Developers
through Reflective Goal-Setting
RQ1: Which types of goals do developers set for themselves to improve andmaintain good work habits?
RQ2: What are strategies that help developers make progress towards, andachieve their goals?
RQ3: What is the potential impact of reflective goal-setting on developers’goal-identification, goal-achievement monitoring, and work habits?
To investigate these research questions, we combined self-reflection and goal-setting to design a reflective goal-setting study, inspired by the Personal SoftwareProcess (PSP) by Humphrey [1996] and diary studies in other areas of research.Our study prompts participants on a daily basis to reflect on their work, andasks them to set concrete goals and actionable strategies for improving their workhabits. 52 professional software developers completed our study and reflected fortwo to three work weeks.
Our reflective goal-setting study resulted in a rich set of work habit goals andstrategies that we analyzed. They can be broadly categorized into improvingtime management, avoiding deviations from planned work, improving the impacton the team, maintaining work-life balance, and continuous learning. We foundthat continuous self-reflection can be an important step towards productiveself-improvements in the workplace, since participants stated that it supports theidentification of goals (80.8%) and actionable strategies (83.3%). The daily self-reflections not only increased developers’ awareness about work habits, progressand achievements (84.5%), but also led to productive (short-term) behaviorchanges (79.6%). As a result, while initially being skeptical towards “journaling”their work, most participants (96.1%) stated afterwards that they could imagine tocontinue self-reflecting on a regular basis. Few participants, however, mentionedthat constantly self-reflecting may increase pressure to always perform welland thus, could turn into a burden without tool support that would makeself-reporting more convenient. Overall, we conclude that continuous reflectivegoal-setting can enable developers to improve and maintain good work habits.We discuss these results with regards to prior work on self-reflection with othertypes of knowledge workers, and how tools could support developers with their
7.2 Related Work and Background 213
reflective goal-setting and how they might foster long-term self-reflection.Our contributions are (1) a set of developers’ good work habit goals and
strategies to improve productivity based on a field-study, and (2) insights intothe use and value of continuous reflective goal-setting, and its ability to supportdevelopers with the identification, monitoring and maintenance of good workhabits that improve productivity and well-being at work.
7.2 Related Work and Background
Work related to our research can be broadly categorized into research thatexamined developers’ work and productivity, what productive work habits are,and how to foster these with goal-setting and self-reflection. To avoid repetitionsin this thesis, we present and summarize the related work in Section 1.6 of thesynopsis.
7.3 Study Design
To answer our research questions, we conducted an in situ study at 10 softwaredevelopment companies of varying size. We collected data from 52 professionalsoftware developers using a structured reflective goal-setting process, a self-experimentation framework that we developed based on previous work in otherresearch areas.
Reflective Goal-Setting Our reflective goal-setting study is based on successfulself-reflection and goal-setting approaches from other areas of life, in particular thehealth domain where self-experimentation is researched much more extensively.The core of our study are the daily self-reflection questionnaires (Table 7.1),a morning questionnaire participants were asked to answer before they starttheir work, and an afternoon questionnaire they answer at the end of theirworkday. The self-reflection questionnaires are based on the same stages ofreflective goal-setting as identified by Travers et al. [2015] and summarized inTable 7.2.
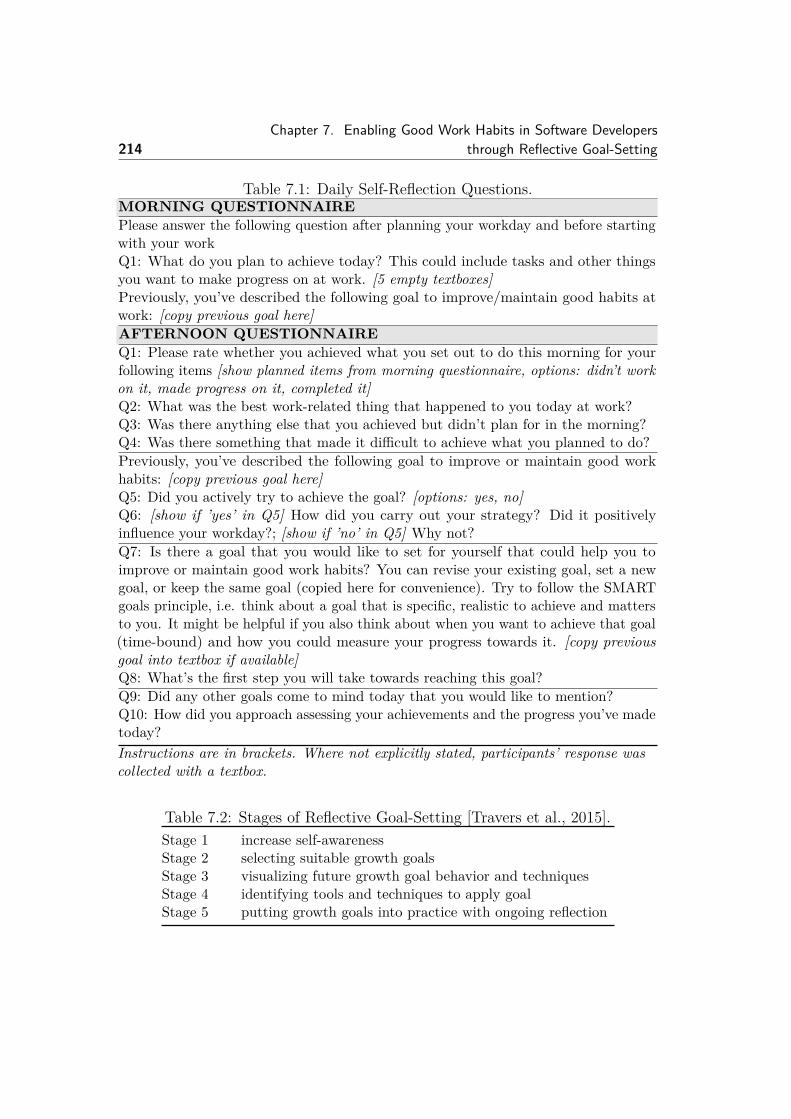
214Chapter 7. Enabling Good Work Habits in Software Developers
through Reflective Goal-Setting
Table 7.1: Daily Self-Reflection Questions.MORNING QUESTIONNAIREPlease answer the following question after planning your workday and before startingwith your workQ1: What do you plan to achieve today? This could include tasks and other thingsyou want to make progress on at work. [5 empty textboxes]Previously, you’ve described the following goal to improve/maintain good habits atwork: [copy previous goal here]AFTERNOON QUESTIONNAIREQ1: Please rate whether you achieved what you set out to do this morning for yourfollowing items [show planned items from morning questionnaire, options: didn’t workon it, made progress on it, completed it]Q2: What was the best work-related thing that happened to you today at work?Q3: Was there anything else that you achieved but didn’t plan for in the morning?Q4: Was there something that made it difficult to achieve what you planned to do?Previously, you’ve described the following goal to improve or maintain good workhabits: [copy previous goal here]Q5: Did you actively try to achieve the goal? [options: yes, no]Q6: [show if ’yes’ in Q5] How did you carry out your strategy? Did it positivelyinfluence your workday?; [show if ’no’ in Q5] Why not?Q7: Is there a goal that you would like to set for yourself that could help you toimprove or maintain good work habits? You can revise your existing goal, set a newgoal, or keep the same goal (copied here for convenience). Try to follow the SMARTgoals principle, i.e. think about a goal that is specific, realistic to achieve and mattersto you. It might be helpful if you also think about when you want to achieve that goal(time-bound) and how you could measure your progress towards it. [copy previousgoal into textbox if available]Q8: What’s the first step you will take towards reaching this goal?Q9: Did any other goals come to mind today that you would like to mention?Q10: How did you approach assessing your achievements and the progress you’ve madetoday?Instructions are in brackets. Where not explicitly stated, participants’ response wascollected with a textbox.
Table 7.2: Stages of Reflective Goal-Setting [Travers et al., 2015].Stage 1 increase self-awarenessStage 2 selecting suitable growth goalsStage 3 visualizing future growth goal behavior and techniquesStage 4 identifying tools and techniques to apply goalStage 5 putting growth goals into practice with ongoing reflection
7.3 Study Design 215
The morning questionnaire asked participants to state the five most im-portant things they want to achieve that day (stages 1 and 5 in Table 7.2). Sincework by Altmann and Trafton [2002] showed that prospective goal-encoding,i.e., the “action of looking ahead mentally to determine how to proceed” isvaluable for successfully achieving goals, the morning questionnaire also showedthe previously set goal to remind participants to pursue it on the workday ahead.
The afternoon questionnaire consisted of three parts: 1) Where am I?(stage 1 in Table 7.2), 2) Where do I want do go? (stage 2), 3) How do I getthere? (stages 3 and 4). Previous work substantially influenced how we promptedparticipants to reflect on work, and define goals and actionable strategies. Forexample, work by Brockbank and McGill [2007] has shown that reflection providesa valuable feedback mechanism that supports people to monitor and measuretheir progress towards a goal. Hence, the first part included a reflection stepwhere participants rated their progress on the five items they stated they wantto achieve in the morning questionnaire. In addition, participants reflected onaspects that were positive or made it difficult to make progress, and any otherunplanned items they made progress on. In case they had defined a goal andstrategy on the previous workday, the questionnaire prompted participants toreflect on their achievement of the goal and whether the strategy worked. Asprevious work has shown that writing down goals and committing on a single goalonly enhances goal achievement [Matthews, 2007; Wiseman, 2007], the secondpart of the questionnaire prompted participants to commit to and write down agoal for their next workday, using the SMART goals approach [Doran, 1981] thatwas shown to result in more specific and more concrete goals [Lee et al., 2014,2015]. Since goals are rarely perfect from the beginning and they can change overtime, participants could alternatively also revise an existing goal. [Locke andLatham, 1990]. In the third part, we asked participants to describe a concretefirst step they plan to take towards reaching the goal, as this was previouslyshown to increase the likelihood of actually changing one’s behavior towardsa goal [Allen, 2015; Clear, 2018; Prochaska and Velicer, 1997]. Note that wedid not provide participants with any examples of goals or strategies, to avoidbiasing them. Every third day, participants were asked how they assessed the
216Chapter 7. Enabling Good Work Habits in Software Developers
through Reflective Goal-Setting
progress they made towards their achievements.
Study Setup Before the study, we emailed participants a document explainingthe study objectives and procedure, explained the SMART goals approach, askedthem to sign a consent form as well as to answer a pre-study survey with questionson demographics, their existing goal-setting and -measuring practice and howthey plan their work. Participants were then asked to pursue their work asusual for the duration of the study, while answering the morning and afternoonquestionnaires timely. We sent two email reminders per workday, one at 8amfor the morning questionnaire, and the other one at 4pm for the afternoonquestionnaire. We asked participants to answer the daily questionnaires for twoto three weeks, to avoid boredom or fatigue and ensure high quality responses.We also logged the time it took participants to answer each daily questionnaire.At the end of the study, participants were asked to answer the final survey, inwhich we asked participants to rate their agreement with statements, or openquestions on their awareness, goal-setting, goal-measuring, and behavior changebefore and during the study. The final survey also asked participants about thevalue and impact of reflective goal-setting, if they could imagine integrating itinto their work routine, and how it could be best assisted with tool support.After completing the final survey, participants received a 50 USD Amazon giftcertificate as a compensation for their efforts.
Study Test-Run To test-run and gather qualitative feedback in advance, weran a pilot study with three computer science graduate students. The feedbackhelped us to fine-tune the survey questions and formulations. For example,participants in the pilot study suggested to show the previous workday’s goalagain in the morning questionnaire, and to introduce the SMART goals approachprior to the daily questionnaires.
Participants We recruited 59 participants through professional and personalcontacts from 10 companies, ranging from startups to large multi-national corpo-rations in the software industry. Developers were invited to join the study either
7.3 Study Design 217
after giving research talks at the respective companies or by spreading the studydescription via our network on social media. Participants could freely decide toparticipate and were not enforced by their employers. We discarded data from 7participants that answered the daily self-reflection surveys for less than one week,or if the time spent on the daily questionnaires was regularly shorter than oneminute each–too short for being a meaningful reflection. Of the remaining 52participants, 7 were female and 45 were male. Our participants had an average of8.2 (±6.7, ranging from 1 to 24) years of professional development experience, andwere working in different roles: 45 identified themselves as individual contributorsand 7 as developers in a leading position (i.e., development lead or manager).Participants resided in the US, Canada, Brazil or Switzerland.Data Analysis In total, we collected 605 self-reflections (i.e., afternoon ques-tionnaires) from 52 participants. On average, they completed 11.6 (± 2.7)self-reflections each, which equals 11.6 days of self-reflection. We qualitativelyanalyzed the collected data, and identified themes by finding commonalities andkey concepts from performing a Thematic Analysis [Braun and Clarke, 2006]. Toanalyze the responses, we first open coded participants’ self-reported goals, usinga quote-by-quote strategy where multiple codes could be assigned to each quote.Responses that could not distinctively be mapped to a code where discussedwith the other authors. To identify high-level goal categories, we discussedthe resulting codes and their relationships in multiple team discussions as wellas one card sort session. During the whole process, we heavily relied on thequotes and consulted them regularly for additional context and details about theidentified relationships. The whole process was iterative, meaning that wheneverthe discussions resulted in updates to the open coding categories, we did anotheriteration.
218Chapter 7. Enabling Good Work Habits in Software Developers
through Reflective Goal-Setting
7.4 Developers’ Work Habit Goals and Strategies(RQ1, RQ2)
An overview of the work habit goals and strategies that developers set forthemselves is presented in Table 7.3. Overall, the identified goals can broadlybe grouped into five categories: (G1) improve time management, (G2) avoid(self-induced/external) deviation from planned work, (G3) improve impact onthe team, (G4) maintain work-life balance, and (G5) learn continuously. Themajority of developers’ goals describe continuous behaviors and desirablehabits they want to develop, rather than momentary goals that have a definedoutcome or result. While many of these goals could apply to any knowledgeworker, several goals are very specific to software development (marked with[SE] in the table). The goal categories are not necessarily disjunct categories: Forexample, improving time management (G1) can impact what developers considerto be a deviation from planned work (G2). The reflective goal-setting studyallowed participants to not only identify work habit goals, but also experimentwith different strategies to reach them. In the evening questionnaires, participantsalso reflected on whether the strategy that they set on their previous workdayworked. After coding developers’ goals, we analyzed developers strategies andsummarized the successful ones in Table 7.3. Most strategies describe concreteand actionable habits and routines that participants usually wanted to performon a daily basis or on multiple occasions each day.
In the following, we discuss each of the five goal categories and participants’strategies to reach them, using participants’ examples and quotes. The numbersin parentheses are counts for the number of developers that set one or multiplegoals of each category. Since the identified goals are based on what participantsidentified themselves, the reported numbers should only serve to give a feelingabout how prevalent each goal is, as actual numbers might be higher. Goalcategories are enumerated with G, strategies with S, and participants with P.
7.4 Developers’ Work Habit Goals and Strategies (RQ1, RQ2) 219
7.4.1 Improve time management (G1)Plan workdays in advance (36) A goal that the majority of the participantsset is to improve their time management by planning their workday in advance,either on a daily or weekly basis:
“I should make a TODO list for today, not a general TODO list for ’at somepoint’.” - P33
Most strategies to reach this goal include common planning methodologies,such as maintaining a personal task list (S1), reserving time to work on importanttasks in the calendar (S2), and planning buffers (S3) for unplanned tasks orissues. To actually apply these strategies, and not forget performing them afterjust a few days, participants tried to develop a daily routine (S4) of planningtheir next workday the evening or morning before work, or by setting an alarmor reminder (S5):
“I scheduled an event in my calendar to remind myself to complete a code review.I prioritized this over other work. It was also easier to start on this since it isschedule right after my team’s daily stand up meeting which means I am not in themiddle of a task.” - P4
“When I think a task takes 2 days to finish, add another day for unforeseen issuesunless I am certain.” - P36
Make progress on most important tasks first (33) Developers also want tocontinuously make progress on their most important tasks. To that purpose,they applied strategies such as constantly reviewing their priorities (S7), andregularly reflecting on the progress (S8) made on their tasks:
“It occurs to me that I need to quick-scan my inbox, and look at my calendar, beforeplanning the day. It will be important that I _scan_ the inbox, and not respond toanything. If I do that, I’ll get stuck into answering mails, and not plan.” - P33
“At the end of the day or beginning of [the] next day, [I want to] reflect why not allgoals could be fully completed, and if so, why and what could be improved.” - P12
These two strategies helped participants to stay aware of their most urgentand most important tasks, which allowed them to plan for an efficient workdayand work more systematically.
220Chapter 7. Enabling Good Work Habits in Software Developers
through Reflective Goal-Setting
Make better use of work item tracking tools (6) For their developmentwork, participants further mentioned they want to better and more actively usetheir work item (WI) tracking tools, by updating their progress (S8), documentingnew findings from investigations in the code (S10), and by defining subtasks foreach work item (S6):
“Every morning, breakdown user stories into at least 2 sub-tasks before starting orcontinuing work on it. If it is an existing story, update the tasks based on any newfindings/discussions.” - P4
7.4.2 Avoid (self-induced/external) deviation from plannedwork (G2)
Developers are also interested in forming habits that make it easier to followthrough with their planned workday (G1) and react better in case things deviatefrom the plan.
Better handle urgent/unplanned issues/bugs (29) Developers want to im-prove how they handle unplanned, urgent issues and bugs, such as a productionissue or a build break, which can occur frequently in software development.Rather than always starting to work on the unplanned issue immediately, theyfirst want to review their priorities (S7) before consciously deciding how to act:
“Before doing anything, I ask myself ’How does this immediately contribute to whatI need to deliver this month?’ and ’Can this be delayed or even avoided?’.” - P19
Deferring unplanned tasks or bugs can effectively help developers to betterbalance and make progress on their planned development tasks, instead of beingconstantly sidetracked. Other strategies are to plan buffers (S3) and to setconcrete upper limits (S11) for working on unplanned issues:
“Spend less than 1 hour a day in activities that are not part of the day’s [plan]” -P25In case participants decided to stop working on the current task and start
working on the unplanned issue, many wanted to update their workday plan (S9)to reschedule their planned tasks.
7.4 Developers’ Work Habit Goals and Strategies (RQ1, RQ2) 221
Improve focus: reduce distractions and interruptions (33) Similar to otherknowledge work domains, developers aim to limit their exposure to aspects thatreduce their focus, to be able to concentrate for longer chunks of time on plannedwork. Specifically, developers’ goals primarily aim to reduce the amount ofexternal interruptions from co-workers and self-distractions:
“Reduce the time spent on checking mails and [IM] channels and restrict it tospecific hours like once in morning and at end of the day.” - P41
Strategies to reduce external interruptions vary, ranging from changing howdevelopers organize their work (e.g., timeboxing work (S12)) to where they work(changing the location (S16)):
“Scheduled daily time block from 8AM to 10AM in my calendar: Stayed at home.Stayed offline until 10AM (not completely offline, but never checked E-Mail orSlack etc. before my time block was over.)” - P8
“Reduce meeting time or club meetings back to back to have bigger focus time blockson my calendar.” - P41
Developers further customized their communication tools, either by disablingnotifications (S13) at certain times, or by reducing the number of communicationchannels (S14)).
“I have [...] notifications turned off completely in Outlook and Slack. I don’t runanything such as Facebook or YouTube in the background or on a second screen.” -P6Reducing self-distractions requires a lot of self-control. To reduce the tempta-
tion to regularly check social media or news websites, few participants installedbrowser extensions to block work unrelated websites (S17). Preparing their en-vironment for focused work (S18), such as hiding the smartphone or filling thewater bottle, further allowed participants to work focused for longer blocks, butalso reduce multi-tasking, which was previously shown as a source of stress andquality issues [González and Mark, 2004; Mark et al., 2008b].
222Chapter 7. Enabling Good Work Habits in Software Developers
through Reflective Goal-Setting
Balance coding time (10) Another reason why developers want to avoiddeviations form work is to ensure they can spend enough time with coding, bybalancing activities and setting limits (S11) or by blocking a specific amount oftime for coding in the calendar (S2). For example, some aim to spend a minimumamount of time on coding each day, want to reduce time spent with bug triaging,or want to better balance the time spent working on new features versus fixingbugs:
“Allocate a reasonable amount of the day for bug triaging of test runs (∼2 hoursmax).” - P14
The importance of finding a good balance between coding and other workwas recently shown to increase developers’ job satisfaction [Meyer et al., 2019].
7.4.3 Improve impact on the team (G3)
Besides making progress on their own tasks, developers are also interested inimproving their team impact and collaboration.
Be a better colleague (12) Participants also wanted to become a bettercolleague. However, both, the goals and strategies were often not concrete, andparticipants had troubles to reach them. For example, participants mentionedthat they wanted to become a better pair programmer, or better understandtheir influence within the team, without being able to clarify what this goalmeant or how they could reach it. Two strategies that developers successfullyapplied to become a better colleague were to delegate important tasks to theirco-workers (S21) instead of always keeping them for themselves, and to activelyshare their knowledge and learnings (S22) with co-workers:
“Stop writing code trying to prove to the others that I can do complex stuff.” - P37
Help co-workers at specific times (5) Even though developers want to reduceexternal interruptions to have longer times of focus, they also want to supportand help their co-workers with questions or in case they are blocked on a task. Toreduce the exposure they have to external interruptions, they ask co-workers to
7.4 Developers’ Work Habit Goals and Strategies (RQ1, RQ2) 223
adapt (S15), e.g., by asking them to schedule time for questions in the calendarin advance, or by changing their location (S16), e.g., by moving to a quiet placein the office or working from home:
“Get people to book time with me when they need my help instead of helping themimmediately.” - P1
Do more code reviews (9) More specific to software development, developersaim to perform code reviews more frequently, to provide continuous feedback totheir team and to help increasing the software quality. To achieve these goals,they want to develop daily or weekly routines (S4) or set reminders (S5):
“Complete one code review every day before lunch.” - P4
Keep documentation updated (8) Developers also set goals to become morediligent at writing documentation and keeping it updated. With this goal, theynot only aim to make their own work easier and more efficient, by rememberingprevious changes and decisions, but also to better support their co-workers. Toachieve their goal, participants either wanted to document consistently (S10), e.g.,immediately after an important change to the code base or infrastructure, or todevelop a routine (S4) of documenting when they had time to spare. This goal isnot specific to development documentation only, but also includes logging progresson tasks, reporting bugs they identify in the coding process, or improvementsthey make to the development process (e.g., release process).
Work more independently (7) Developers also want to work more indepen-dently, to not have to interrupt their co-workers all the time to ask for guidanceor help. Participants who set this goal were often junior developers who triedto approach problems more systematically to reach their goal. However, whenthey reflected about whether the strategy helped, most reported that it was notactionable enough. Few participants reported that they then seeked out to askco-workers for mentorship on how they could become more independent, whosuggested to document the thought process (S10) during the investigation of theproblem, which participants tried and reported that it helped them.
224Chapter 7. Enabling Good Work Habits in Software Developers
through Reflective Goal-Setting
7.4.4 Maintain work-life balance (G4)
Developers further set goals to maintain a good work-life balance.
At work: stay motivated and fresh (11) At work, developers want to havemore regular and productive work hours to stay motivated and fresh. To achievetheir goal, they regularly take short social breaks (S23) and use these breaks tohave meaningful conversations with co-workers or learn from them. Participantsemphasized these breaks must be short, since they otherwise eat into their workor spare time. Participants further optimized their work by reducing their workhours (S24), e.g., leaving earlier and accepting there will always be work leftto do, and by working more regular hours (S25) and avoiding night shifts orweekend work.
Outside of work: better detach from work (7) Outside of work, developerswant to be able to enjoy their spare time more and regenerate for work, by betterdetaching from work and not thinking about it all the time. We summarized theirstrategies to achieve the goal as pursuing a more sustainable lifestyle (S26). Theyinclude exercising more, sleeping longer and better, eating healthier, meditatingand journaling:
“Don’t think about work outside of work. Try to be satisfied with the daily workand come back fully rested.” - P11
Three participants also wanted to compare the data they collected on theirworkplace detachment (e.g., sleep or exercise data) with their perceptionsof productivity or efficiency to spot patterns and gain ideas for further self-improvements, but they had difficulties to follow-through and, hence, asked fortool support.
7.4 Developers’ Work Habit Goals and Strategies (RQ1, RQ2) 225
7.4.5 Learn (G5)
Learn/improve specific development technology/transferable skill (16) De-velopers also set learning goals, either for learning the basics of a specific tech-nology, such as a framework or programming language, or of a transferabledevelopment skill, such as architectural design, design patterns or how to trou-bleshoot issues. In contrast to the other goal categories (G1-G4), learning goalsdo not describe a continuous behavior developers want to develop, but a specificgoal to reach within a concrete timeframe, which is to better understand orimprove their knowledge on a topic:
“I want to know the basics of redux-saga within 7 days.” - P11
To achieve their goal, participants’ strategies included developing a learningroutine (S4) of always seizing opportunities to learn when they had a bit oftime, or reserving re-occurring time blocks for learning in the calendar (S2) .Developers also wanted to better understand the product they were part of andits long-term vision, and attempted to reach the goal by asking more seniorco-workers for help (S27), and by asking more specific questions (S28).
Improve myself (7) Besides learning more about development topics, develop-ers want to continuously improve themselves, for example by learning to workand communicate more efficiently. To achieve their goal, many participantsdeveloped a habit of regularly reflecting about their goals (S8), to consider theprogress they made towards them, and then decide to take specific actions forself-improvements:
“Go over todo list in the evening commute to check which todos were completed. Ifnot, think about why they are not yet done, write down the reason once a week, goover all the reasons to check for patterns.” - P12
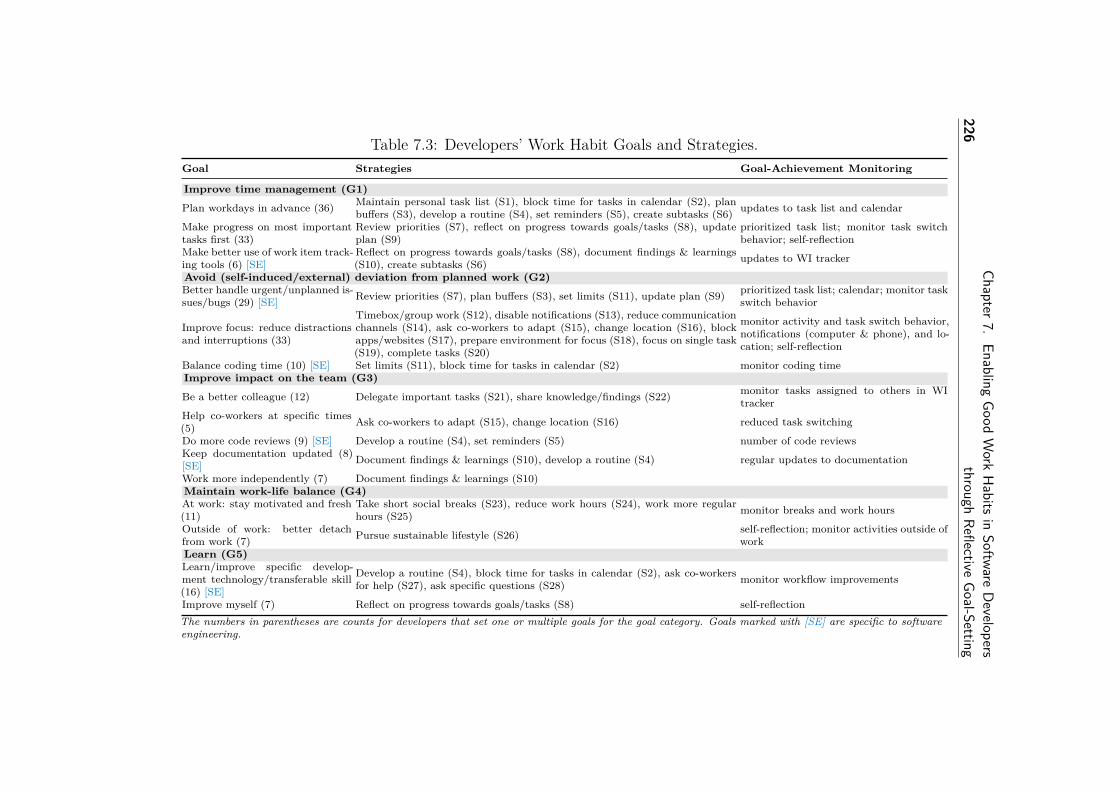
226Chapter7.
EnablingGood
Work
Habits
inSoftware
Developers
throughReflective
Goal-SettingTable 7.3: Developers’ Work Habit Goals and Strategies.
Goal Strategies Goal-Achievement Monitoring
Improve time management (G1)
Plan workdays in advance (36) Maintain personal task list (S1), block time for tasks in calendar (S2), planbuffers (S3), develop a routine (S4), set reminders (S5), create subtasks (S6) updates to task list and calendar
Make progress on most importanttasks first (33)
Review priorities (S7), reflect on progress towards goals/tasks (S8), updateplan (S9)
prioritized task list; monitor task switchbehavior; self-reflection
Make better use of work item track-ing tools (6) [SE]
Reflect on progress towards goals/tasks (S8), document findings & learnings(S10), create subtasks (S6) updates to WI tracker
Avoid (self-induced/external) deviation from planned work (G2)Better handle urgent/unplanned is-sues/bugs (29) [SE] Review priorities (S7), plan buffers (S3), set limits (S11), update plan (S9) prioritized task list; calendar; monitor task
switch behavior
Improve focus: reduce distractionsand interruptions (33)
Timebox/group work (S12), disable notifications (S13), reduce communicationchannels (S14), ask co-workers to adapt (S15), change location (S16), blockapps/websites (S17), prepare environment for focus (S18), focus on single task(S19), complete tasks (S20)
monitor activity and task switch behavior,notifications (computer & phone), and lo-cation; self-reflection
Balance coding time (10) [SE] Set limits (S11), block time for tasks in calendar (S2) monitor coding timeImprove impact on the team (G3)
Be a better colleague (12) Delegate important tasks (S21), share knowledge/findings (S22) monitor tasks assigned to others in WItracker
Help co-workers at specific times(5) Ask co-workers to adapt (S15), change location (S16) reduced task switching
Do more code reviews (9) [SE] Develop a routine (S4), set reminders (S5) number of code reviewsKeep documentation updated (8)[SE] Document findings & learnings (S10), develop a routine (S4) regular updates to documentation
Work more independently (7) Document findings & learnings (S10)Maintain work-life balance (G4)At work: stay motivated and fresh(11)
Take short social breaks (S23), reduce work hours (S24), work more regularhours (S25) monitor breaks and work hours
Outside of work: better detachfrom work (7) Pursue sustainable lifestyle (S26) self-reflection; monitor activities outside of
workLearn (G5)Learn/improve specific develop-ment technology/transferable skill(16) [SE]
Develop a routine (S4), block time for tasks in calendar (S2), ask co-workersfor help (S27), ask specific questions (S28) monitor workflow improvements
Improve myself (7) Reflect on progress towards goals/tasks (S8) self-reflectionThe numbers in parentheses are counts for developers that set one or multiple goals for the goal category. Goals marked with [SE] are specific to softwareengineering.
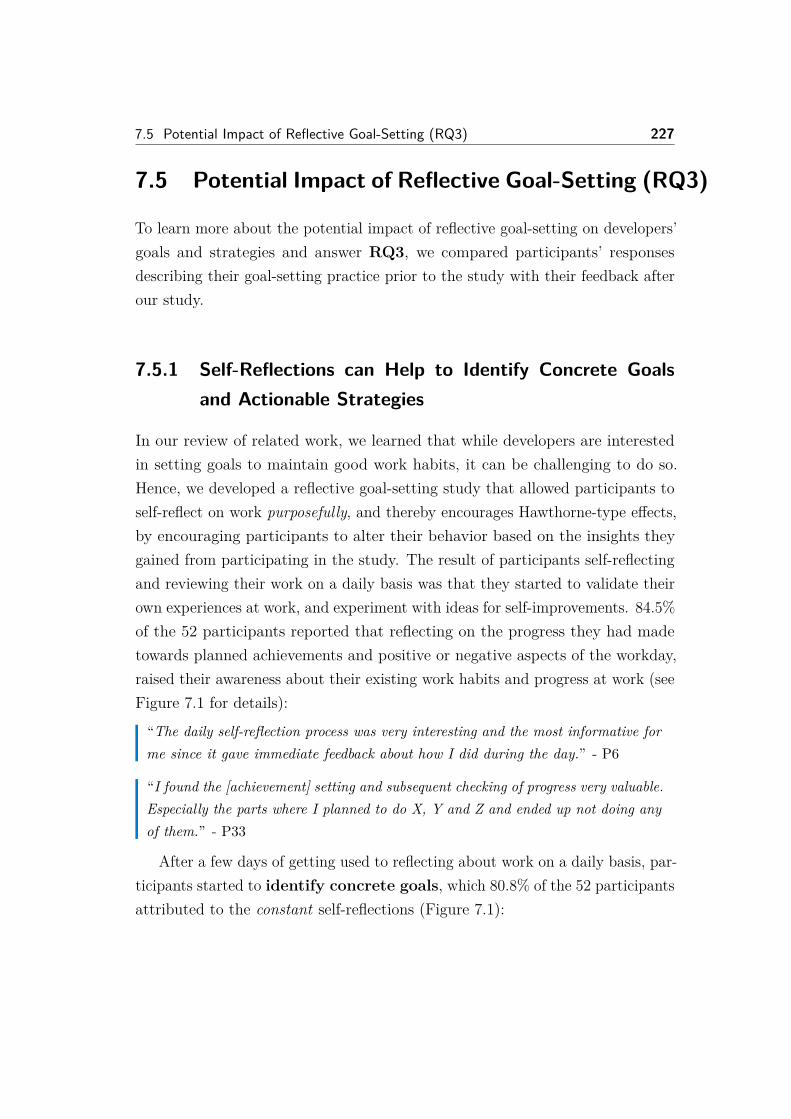
7.5 Potential Impact of Reflective Goal-Setting (RQ3) 227
7.5 Potential Impact of Reflective Goal-Setting (RQ3)
To learn more about the potential impact of reflective goal-setting on developers’goals and strategies and answer RQ3, we compared participants’ responsesdescribing their goal-setting practice prior to the study with their feedback afterour study.
7.5.1 Self-Reflections can Help to Identify Concrete Goalsand Actionable Strategies
In our review of related work, we learned that while developers are interestedin setting goals to maintain good work habits, it can be challenging to do so.Hence, we developed a reflective goal-setting study that allowed participants toself-reflect on work purposefully, and thereby encourages Hawthorne-type effects,by encouraging participants to alter their behavior based on the insights theygained from participating in the study. The result of participants self-reflectingand reviewing their work on a daily basis was that they started to validate theirown experiences at work, and experiment with ideas for self-improvements. 84.5%of the 52 participants reported that reflecting on the progress they had madetowards planned achievements and positive or negative aspects of the workday,raised their awareness about their existing work habits and progress at work (seeFigure 7.1 for details):
“The daily self-reflection process was very interesting and the most informative forme since it gave immediate feedback about how I did during the day.” - P6
“I found the [achievement] setting and subsequent checking of progress very valuable.Especially the parts where I planned to do X, Y and Z and ended up not doing anyof them.” - P33
After a few days of getting used to reflecting about work on a daily basis, par-ticipants started to identify concrete goals, which 80.8% of the 52 participantsattributed to the constant self-reflections (Figure 7.1):
228Chapter 7. Enabling Good Work Habits in Software Developers
through Reflective Goal-Setting
Figure 7.1: Participants’ Self-Reports on the Value and Impact of Self-Reflection
“It was a wonderful exercise. It was not at all painful to start tracking (which Iinitially thought it would). Also, without self-reflection, I was not really seeingwhere I was spending much of my time and in-turn not able to correct/fix thechallenges.” - P48
“[The] study itself was almost a tool!” - P45
On subsequent days, the self-reflections allowed participants to refine thesegoals or identify other opportunities for self-improvement that they transformedinto new goals. These goals and the daily self-reflections allowed 83.3% of the 52participants to experiment with and develop actionable strategies to reachtheir goals (Figure 7.1).
The study fostered participants to engage in deep reflection and self-awarenessactivities to better understand what hindered their ability to work productivelyand make progress, and also led to the identification of a wide variety of concretework habit goals and actionable strategies. Overall, 30.7% (16 of the 52 partici-pants) reported having identified new goals, 53.8% (28 participants) improvedand refined existing goals, and only 15.5% (8 participants) reported that theydid not identify any new goals, since they already had an elaborate goal-settingsystem in place (5 participants), or were happy with their current work habits (3participants). We thus conclude that continuous reflective goal-setting canbe an important step towards improving and maintaining good workhabits.
7.5 Potential Impact of Reflective Goal-Setting (RQ3) 229
7.5.2 Self-Reflection can Increase Awareness on Goal Achieve-ment and Productive Habits
Besides facilitating goal and strategy identification, participants reported thatreflective goal-setting increased their awareness on goal-achievement and pro-ductive work habits. The daily self-reflections allowed participants to evaluatethe progress they made towards their goals and refine them when necessary,effectively providing a feedback mechanism on goal-achievement which previouslywas shown to be an important aspect of lasting behavior change [Humphrey, 1996;Kersten-van Dijk et al., 2017; Sharot et al., 2011]. Besides, the self-reflectionsincreased participants’ awareness about productive work habits, such as theimportance of planning, of reducing interruptions and multi-tasking, and ofclarifying problems before starting to work on them:
“I had long ago forgotten the utility of a short-term TODO list - something focusedon just the next 24 hours. By starting to use a daily list, I could get a tight feedbackloop between my plans and my actual outcomes.” - P33
“I can now make this conscious decision: When someone is coming by I can decide’yes I have time’ or ’no I am going to focus right now’. Whereas before, I was like’okay, I am here, let’s just talk to them’.” - P3
As a result, many participants stated that the motivation to finish the studywas rarely about actually reaching their goals, but about the progress theymade towards them and the productive habit changes and learnings goalsentail:
“Defining goals does not have to be to achieve something. Making progress is agood goal as well.” - P16
7.5.3 Reflective Goal-Setting can Increase Productivity andWell-Being
40 of the 50 participants (80.0%) who answered the question, agreed that thecontinuous self-reflections and goal-setting led to positive behavior change (Fig-ure 7.1). We refrain from repeating the self-reported behavior changes here,
230Chapter 7. Enabling Good Work Habits in Software Developers
through Reflective Goal-Setting
since they are congruent with the identified goals and strategies presented above.12.0% (6 of the 50) who stated that they did not change their behavior, explainedthat they either already had good habits in place (3 participants), had difficultieswith breaking bad habits (2 participants), or were not able to identify goodenough opportunities for self-improvements (1 participant).
37 of the 40 participants (92.5%) who self-reported that they changed theirbehavior stated that they plan to keep their new behavior, mostly because theywere satisfied with their increased progress and (perceived) productivity.Higher well-being was another benefit of the self-reflections, since they allowedparticipants to better detach from work (similar to [Williams et al., 2018]):
“It was a very good opportunity to understand more about myself. When I used towrite it everyday, I realised that I am dissatisfied with myself even though I work tothe best of my ability most of the time. And instead of getting dissatisfied, I shouldthink of what I can do better the next day, and enjoy the rest of my evening withpeace. Also, I learnt to think about my work in a more organised way. That willreally help me in improving my day to day productivity and hence my happiness.” -P32
Note that the duration of our study does not allow to demonstrate anylong-term behavior changes, but it shows the efficacy of our reflective goal-settingapproach to identify concrete and actionable behavior change plans, which shouldbe what is evaluated in early stage personal informatics systems accordingto Klasnja et al. [2011].
7.5.4 Help Developers to Help Themselves
While our reflective goal-setting study was initially met with quite a bit ofskepticism, since we “forced” (P8) participants to “write a diary” about theirwork, many reported that after a few days of getting used to and practicingself-reflecting, it became easier to self-reflect on their work and progress, whichled to many surprising insights into their own work habits, and the identification ofmeaningful goals and strategies. Surprisingly, the approach was also valuable forparticipants who declared that they previously engaged in regular self-reflectionand/or goal setting (Figure 7.1): Of the 63.5% (33 out of 52) who reported they
7.5 Potential Impact of Reflective Goal-Setting (RQ3) 231
previously set goals for themselves, 84.8% (28 out of 33) identified new or revisedexisting goals; and of the 40.4% (21 out of 52) who regularly self-reflected priorto the study, 66.7% (14 out of 21) identified new or revised existing goals in ameaningful way. In the final survey, the majority of participants stated that theywant to continue doing self-reflections voluntarily after the study; 40.4%daily (21 out of 52), 11.5% every two to three days (6 out of 52), and 44.2%weekly (23 out of 52). Several participants stated that they enjoyed participatingin the study:
“Thank you for enforcing me to reflect daily.” - P8
Only 4 out of 52 participants (7.7%) reported that they were happy thestudy was over and they would not want to continue doing self-reflections, eitherbecause the self-reflection caused anxiety (1 participant) or they were burdensomeand tedious (3 participants), especially when performed daily:
“It was tedious. I would not like to do it everyday. I feel like the to do list andhow much did you finish each of them is enough, tracking the tasks that are stillincomplete.” - P34
We conclude that in most cases, encouraging participants to self-reflectregularly can lead them to recognize its value, and the desire to develop aself-reflection routine to foster productive self-improvements.
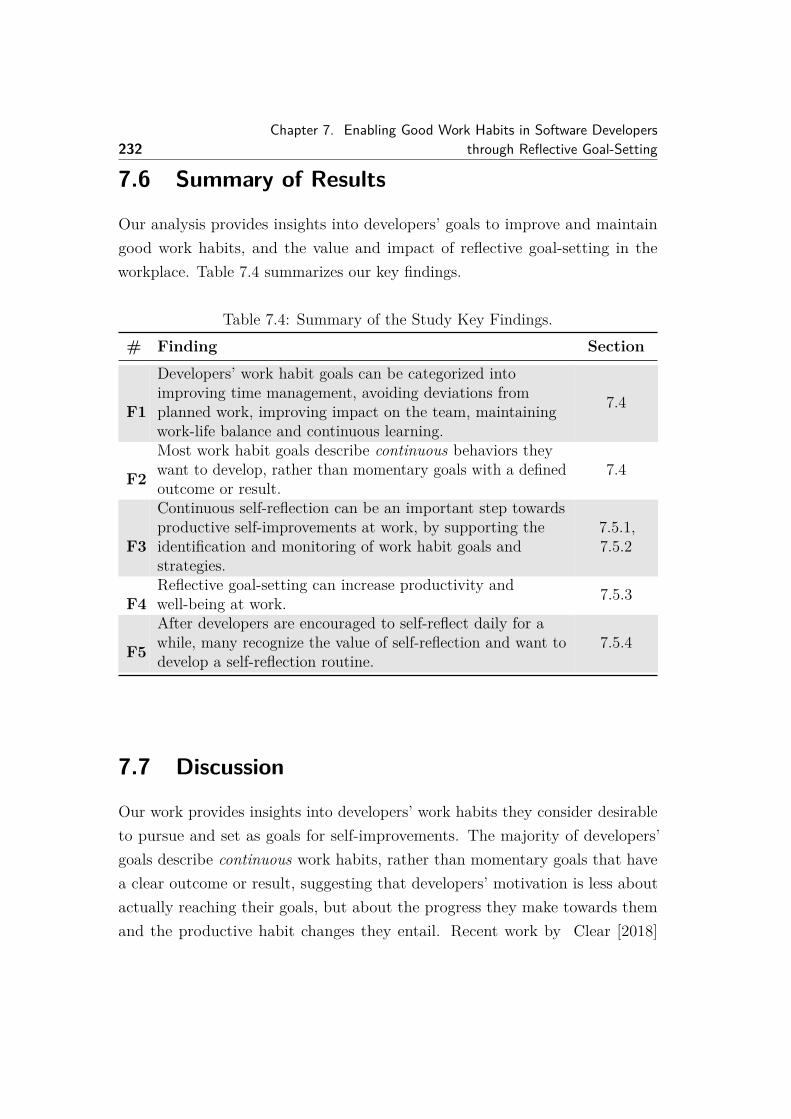
232Chapter 7. Enabling Good Work Habits in Software Developers
through Reflective Goal-Setting
7.6 Summary of Results
Our analysis provides insights into developers’ goals to improve and maintaingood work habits, and the value and impact of reflective goal-setting in theworkplace. Table 7.4 summarizes our key findings.
Table 7.4: Summary of the Study Key Findings.# Finding Section
F1
Developers’ work habit goals can be categorized intoimproving time management, avoiding deviations fromplanned work, improving impact on the team, maintainingwork-life balance and continuous learning.
7.4
F2
Most work habit goals describe continuous behaviors theywant to develop, rather than momentary goals with a definedoutcome or result.
7.4
F3
Continuous self-reflection can be an important step towardsproductive self-improvements at work, by supporting theidentification and monitoring of work habit goals andstrategies.
7.5.1,7.5.2
F4Reflective goal-setting can increase productivity andwell-being at work. 7.5.3
F5
After developers are encouraged to self-reflect daily for awhile, many recognize the value of self-reflection and want todevelop a self-reflection routine.
7.5.4
7.7 Discussion
Our work provides insights into developers’ work habits they consider desirableto pursue and set as goals for self-improvements. The majority of developers’goals describe continuous work habits, rather than momentary goals that havea clear outcome or result, suggesting that developers’ motivation is less aboutactually reaching their goals, but about the progress they make towards themand the productive habit changes they entail. Recent work by Clear [2018]
7.7 Discussion 233
supports this finding, stating that people should focus on changing their habits,rather than working towards a goal, which upon completion becomes irrelevantand causes many to relapse to old or previous habits.
While developers generally had individual differences in their goals and strate-gies to improve their work, we observed that the overarching objective was togain back control of their work to make more progress on their tasks.Extensive studies performed by Amabile and Kramer [2011] support the observa-tion and showed that the single best motivator at work is to empower knowledgeworkers to make progress, which also increases their happiness. Similarly, recentwork suggested that many developers want to gain back control over howthey spend their time at work, since work is often very randomized and frag-mented by interruptions and meetings [Mark et al., 2018; Meyer et al., 2019]. Theremainder of this section discusses how self-reflection and various tool supportmight help developers retain control over their work, make more progress andincrease productivity.
Self-Reflection as the Missing Key to Productivity? Our study showed thatreflective goal-setting provides developers with a framework for identifying goalsand strategies that are relevant to their work, and motivates productive behaviorchanges. These findings are congruent with previous work that demonstrated thevalue of self-reflection for identifying and reaching goals in several areas of life,especially health, sleep and physical activity (e.g., [Gasser et al., 2006; Kocielniket al., 2018; Lee et al., 2017; Williams et al., 2018]).
While it is common for developers to review code, progress (e.g., in scrummeetings) and performance (e.g., reviews with managers), we are curious to learnin the future why they rarely reflect on work habits in practice, given the greatpromise. One reason could be time pressure, which makes it difficult to stepaway from work and take the time to reflect [Di Stefano et al., 2016]. Previouswork has also suggested that self-reflection does not feel natural to some, whichis why they need to be encouraged to try it and learn about the benefits fromself-reflecting regularly themselves, similar to our own observations [Gustafsonand Bennett Jr, 2002; Moon, 2013]. As noted above, many developers were
234Chapter 7. Enabling Good Work Habits in Software Developers
through Reflective Goal-Setting
initially skeptical to participate in a self-reflection study, but encouraging themto try it out for a few weeks let them realize the value and leads to the desireof self-reflecting also outside of the study context. While we did not investigatethe reasons for their initial skepticism, future work could study barriers towardsinitiating and maintaining continuous self-reflection, to better understand how wecan encourage and convince developers. Our study did not look into long-termengagement with reflective goal-setting, but we assume that reflecting dailymight be perceived as too cumbersome or time-consuming after a while. Varyingwith the intervals and frequency at which developers self-reflect might be oneway to find a trade-off between the cost and value of self-reflection andmotivate long-term engagement. For example, developers could initially reflecton a daily basis for a few weeks, to practice self-reflection and learn about thevalue, and then develop a habit of reflecting once or twice a week, or even onlya few times a month. Participants further suggested various opportunities toreduce the cost of self-reflecting by better incorporating it into their daily worklives. These suggestions that participants brought up in the final survey arediscussed in relation to previous work in the area of personal self-improvementand productivity in the remainder of this section.
Supporting Goal-Identification. To support goal-identification, participantssuggested that self-reflection should be integrated into existing systems andworkflows. Instead of creating another separate tool, recent work has exploredhow to integrate self-reflection into existing communication tools, such as Slackor Skype by building conversational bots [Kocielnik et al., 2018; Williams et al.,2018]. Furthermore, our participants and previous work [Baumer et al., 2014;Krogstie et al., 2012] emphasized that supporting self-reflection with computer-ized systems is crucial. For example, through automated monitoring, which canprovide personalized insights and statistics into developers’ work, and ease therecollection part of the reflection and foster goal-identification. Existing auto-mated monitoring systems successfully increased knowledge workers’ awarenessabout specific aspects of work, but the provided insights were often not actionableenough for users to know how and what to change, which is why the engagement
7.7 Discussion 235
with these tools usually decreased after a few days [Collins et al., 2014; Kim et al.,2016; Li et al., 2010; Meyer et al., 2017b]. According to Baumer et al. [2014], theproblem of most automated monitoring research is the implicit assumption thatjust by providing access to “prepared, combined, and transformed” data, in-depthreflection can and will occur. We are, thus, interested in studying how automatedmonitoring can be combined with self-reflection, to reduce the time and effortrequired to participate in active, in-depth reflection, while still providing richand actionable insights. For example, the automated monitoring could providedevelopers with some automatically generated insights and visualizations onhow they spent their time at work, and then still prompt developers to activelyself-reflect about their workday.
Since self-reflection is typically reactive [Johnson and White, 1971], partici-pants suggested that receiving examples and recommendations for self-improvements,that are based on their current behaviors and compared to best practices or devel-opers with similar job profiles, could be valuable for a proactive goal-identification.Such a recommendation system could, for example suggest good moments to takea break when a developer is stuck on an issue [Epstein et al., 2016a]. However,recommending relevant goals to developers is challenging, since there might beprivacy concerns from collecting the data, and since what is a good work habitto one developer is not necessarily a good one for another. For example, onedeveloper might want to reduce interruptions from co-workers to have moreuninterrupted time to focus on coding tasks, while another developer finds valueand satisfaction in the resulting discussions. The advantage of self-reflectionsis that they allow developers to personalize and tailor work habit goals to theirneeds, with a minimum of privacy concerns. Recent work on improving sleep,physical activity or living with diabetes has shown early promise of buildingvirtual “coaches” or “assistants” that provide personalized and tailored recom-mendations, e.g., in the form of conversational bots [Daskalova et al., 2016;Herrmanny et al., 2016; Monkaresi et al., 2013]. However, many open questionsremain as to how to best tailor these systems to users, e.g., by altering the timingand content of their recommendations.
236Chapter 7. Enabling Good Work Habits in Software Developers
through Reflective Goal-Setting
Monitoring Goal-Achievement. Reflective goal-setting allows developers togain self-generated feedback on their goal-achievement, a key pillar of successfulbehavior change [Humphrey, 1996; Kersten-van Dijk et al., 2017; Sharot et al.,2011]. To further improve the trade-off between cost and value of self-reflections,participants suggested how the progress towards their goals could be automaticallymeasured, instead of having to manually self-report them each day. Thesesuggestions include the monitoring of switches between activities and tasks andupdates to the task list, WI tracker, calendar and documentation; they aresummarized in the last column of Table 7.3. Other goals, such as if a developerbecame a better colleague, are more challenging to track automatically.
Supporting Goal-Maintenance. Finally, participants described how tools couldsupport the maintenance of goals once they reached them (i.e., maintaining goodhabits), either passively or actively. One less intrusive way that participantssuggested is to show reminders that help to avoid forgetting to pursue theirgoals. Previous work suggested that reminders need to be context sensitive tobe effective, and that nudging users into performing a behavior might be evenmore successful [Fogg, 2003; Munson and Consolvo, 2012; Prestwich et al., 2009].Similarly, other participants asked for a system that automatically interferes withtheir work if needed. For example, by hiding email or instant messaging notifica-tions at times of high focus, by blocking distracting websites, or by disallowingparticipants to switch to another task when they committed to work on a specificone. However, participants were fairly ambivalent about the value and risks ofsuch systems, suggesting they would require a fair amount of customization andcontextual awareness to work well. The finding is supported by recent workby Mark et al. who found that blocking online distractions increases focus andproductivity, but at the cost of higher stress [Mark et al., 2018].
Related research in the physical activity domain has shown promise in motivat-ing people to maintain their goals by including social challenges and competitions(e.g., [Edelson et al., 2011; Fogg, 2003; Fritz et al., 2014; Lin et al., 2006; Rooksbyet al., 2014]). For example, Chick Clique, a system that allowed teenage girls toshare their health and phyiscal activity related data, showed that data sharingcan be a powerful motivator [Toscos et al., 2006]. However, when we asked our
7.8 Threats to Validity 237
participants about comparing themselves to or competing with co-workers, 62.7%(32 of 51) stated clear disinterest. Reasons were either that work is too individualto be quantified and compared or that some people would start to “game” thesemetrics:
“Everyone works in different ways and such comparative measurements seem togenerally fail to capture that to any satisfactory level. Additionally any suchcomparisons are likely to be gamed by the people who value them the most resultingin workers who strive to increase their metrics rather than being effective andcreative.” - P01
According to Treude et al. [2015] and Muller [2018], users are most likely to“game” a system to receive higher scores when the measure seems inaccurateor unfair. Furthermore, research on including social components with physicalactivity trackers to motivate self-improvements showed similar privacy concerns,increased pressure, and reported that participants felt ”awkward“ when sharingdata with strangers [Fritz et al., 2014; Lin et al., 2006; Prasad et al., 2012;Toscos et al., 2006]. One way to overcome these challenges could be to developsupport groups—an inner circle of people who want to encourage a person toreach self-improvement goals—but it was shown they are challenging and timeconsuming to build and maintain [Munson and Consolvo, 2012].
7.8 Threats to Validity
External Validity. Although we studied 52 software developers at 10 differentcompanies (startups to multi-national companies) from four countries, gen-eralizability to other development companies, to other developers, and otherknowledge workers, might be limited. The positive effect of self-reflection ongoal-identification and -achievement might be threatened by a self-selection biasof participants who are generally more interested in better understanding theirwork and improving their practices, which is a common threat in self-improvementresearch [Kersten-van Dijk et al., 2017]. After a few days of skepticism, mostparticipants started to appreciate the value of self-reflecting and goal-setting,but it is unclear how well this generalizes to other developers. We tried to
238Chapter 7. Enabling Good Work Habits in Software Developers
through Reflective Goal-Setting
mitigate the self-selection risk by being very upfront about the study objectivesand method, by stressing that the collected data is and will remain private, andby allowing participants to continue their regular work and selecting a suitabletime for participation.
Internal Validity. While we relied on methods and findings that were success-fully applied in previous work in other fields (see Section 7.3), the design of thereflective goal-setting study and framing of the daily self-reflection questionsmight have influenced participants. For example, since we prompted participantsto reflect on progress and achievements, the goals they identified might have beenbiased more towards these. Furthermore, the prompts for daily self-reflection andgoal-setting in our study influenced participants’ behaviors (Hawthorne effect),but this was intended to answer RQ3. While most identified goals overlapped withseveral other participants, another threat to the internal validity of our results isbased on our reliance on participants’ self-reports only. For example, the strate-gies we identified to successfully support goal-achievement rely on participants’accurate and non-exaggerated reporting. To mitigate the risk, we first carefullyanalyzed each participants’ self-reports individually, before comparing them totheir study feedback. In case their responses showed decreasing interest (e.g.,missing multiple days of self-reports) or the time spent per self-report was veryshort, we discarded their data. In addition, the positivity towards self-reflectionmight be caused by novelty effects, and might wear off after participating formultiple months. In Section 7.7, we discuss how tool support might motivatelong-term engagement and help to balance the trade-off between cost and valueof self-reflections.
Construct Validity. We performed a Thematic Analysis [Braun and Clarke,2006] to analyze participants’ self-reports and responses to the pre-study andfinal surveys. One potential threat could be that the open coding step wasperformed by one author only. To reduce bias, we discussed themes and quotesof each coded category in the team.
7.9 Conclusion 239
7.9 ConclusionIn this paper, we explored software developers’ goals and strategies to improve ormaintain good habits at work. We identified five main goal categories, and foundthat developers generally want to develop good continuous behaviors, rather thanreaching momentary goals with a defined outcome and result. We show thatcontinuous self-reflection can increase developers’ awareness about work habits,and that it can also lead to productive behavior changes that increase productivityand well-being at work. Our results suggest that purposeful and active self-reflection can provide actionable insights into potential self-improvements atwork, something which has previously been shown to be challenging with existingself-monitoring approaches in the workplace. We discuss approaches to find atrade-off between the cost and value of workplace self-reflection, and how toolscould potentially support goal-identification, goal-achievement monitoring, andsupport the maintenance of goals and good habits.
7.10 AcknowledgementsWe thank our study participants for their participation. We also thank theanonymous reviewers and our editor for their valuable feedback.

8Reducing Interruptions at
Work: A Large-ScaleField Study of FlowLight
Manuela Züger, Christopher Corley, André N. Meyer, Boyang Li,Thomas Fritz, David Shepherd, Vinay Augustine, Patrick Francis,
Nicholas Kraft, Will SnipesPublished at the 2017 CHI Conference on Human Factors in Computing SystemsContribution: Involvement in all main parts of this large team project, includingthe tool development, execution of field study, data analysis, and paper writing.
We licensed the FlowLight in 2018 to be commercially sold by Embrava 1.
1https://embrava.com/pages/flow
242Chapter 8. Reducing Interruptions at Work:
A Large-Scale Field Study of FlowLight
Abstract
Due to the high number and cost of interruptions at work, several approaches havebeen suggested to reduce this cost for knowledge workers. These approaches pre-dominantly focus either on a manual and physical indicator, such as headphonesor a closed office door, or on the automatic measure of a worker’s interruptibilityin combination with a computer-based indicator. Little is known about thecombination of a physical indicator with an automatic interruptibility measureand its long-term impact in the workplace. In our research, we developed theFlowLight, that combines a physical traffic-light like LED with an automaticinterruptibility measure based on computer interaction data. In a large-scale andlong-term field study with 449 participants from 12 countries, we found, amongstother results, that the FlowLight reduced the interruptions of participants by46%, increased their awareness on the potential disruptiveness of interruptionsand most participants never stopped using it.
8.1 Introduction
Knowledge workers are frequently interrupted by their co-workers [Czerwinskiet al., 2004; González and Mark, 2004; Sykes, 2011]. While many of theseinterruptions can be beneficial, for instance to resolve problems quickly [Isaacset al., 1997], they can also incur a high cost on knowledge workers, especiallyif they happen at inopportune moments and cannot be postponed [Bailey andKonstan, 2006; Borst et al., 2015; Mark et al., 2008b; McFarlane, 2002].
Due to the high cost and the high number of interruptions that knowledgeworkers experience every day (e.g., [Czerwinski et al., 2004; González and Mark,2004]), several approaches have been proposed that can roughly be categorizedby the interruptions they address: computer-based and in-person. Studieshave shown that the cost of computer-based interruptions can successfully bemitigated by automatically detecting a knowledge worker’s interruptibility andmediating interruptions by deferring them to more opportune moments (aka.defer-to-breakpoint strategy) [Arroyo and Selker, 2011; Ho and Intille, 2005;
8.1 Introduction 243
Iqbal and Bailey, 2008]. Another strategy to reduce the cost of computer-basedinterruptions is to indicate a person’s interruptibility to co-workers in a contact-list style application on the computer [Begole et al., 2004; Lai et al., 2003; Tanget al., 2001]. While these approaches have also been suggested for addressing in-person interruptions, they did not show to have any effect on them, probably sincethe contact-list style applications can easily be hidden behind other applicationsand thus forgotten at communication initiation [Begole et al., 2004; Fogartyet al., 2004; Hincapié-Ramos et al., 2011a; Lai et al., 2003].
For in-person interruptions—one of the most costly kind of interruptions due totheir high frequency and immediate nature [González and Mark, 2004; McFarlane,2002; Sykes, 2011]—approaches predominantly rely on manual strategies tophysically indicate interruptibility, such as wearing headphones, closing theoffice door, or using busy lights that have to be set manually [Blynclight, 2019;Sykes, 2011]. Since manual approaches are cumbersome to maintain, usersgenerally don’t update them on a regular basis and their accuracy and benefitsare limited [Milewski and Smith, 2000]. Only very few approaches have lookedat a combination of a physical interruptibility indicator with an automaticinterruptibility measure to reduce the cost of in-person interruptions [Bjelicaet al., 2011; Hincapié-Ramos et al., 2011b] and there is no knowledge on thelong-term effects of such approaches.
In our research, we developed the FlowLight approach, an approach toreduce the cost of in-person interruptions by combining a physical interruptibilityindicator in the form of a traffic-light like LED (light emitting diode) with anautomatic interruptibility measurement based on a user’s computer interaction.In a large-scale and long-term field study with 449 knowledge workers from 12countries and 15 sites of a multinational corporation, we evaluated the FlowLightand its effects in the workplace. Over the course of the study, we collected a richset of quantitative and qualitative data, including self-reported interruption logsof 36 participants, survey responses of 183 participants that used the FlowLightfor at least 4 weeks, and in-depth interviews of 23 participants. Our analysis ofthe data shows, amongst other results, that the FlowLight significantly reducedthe number of interruptions of participants by 46%, while having little impact on
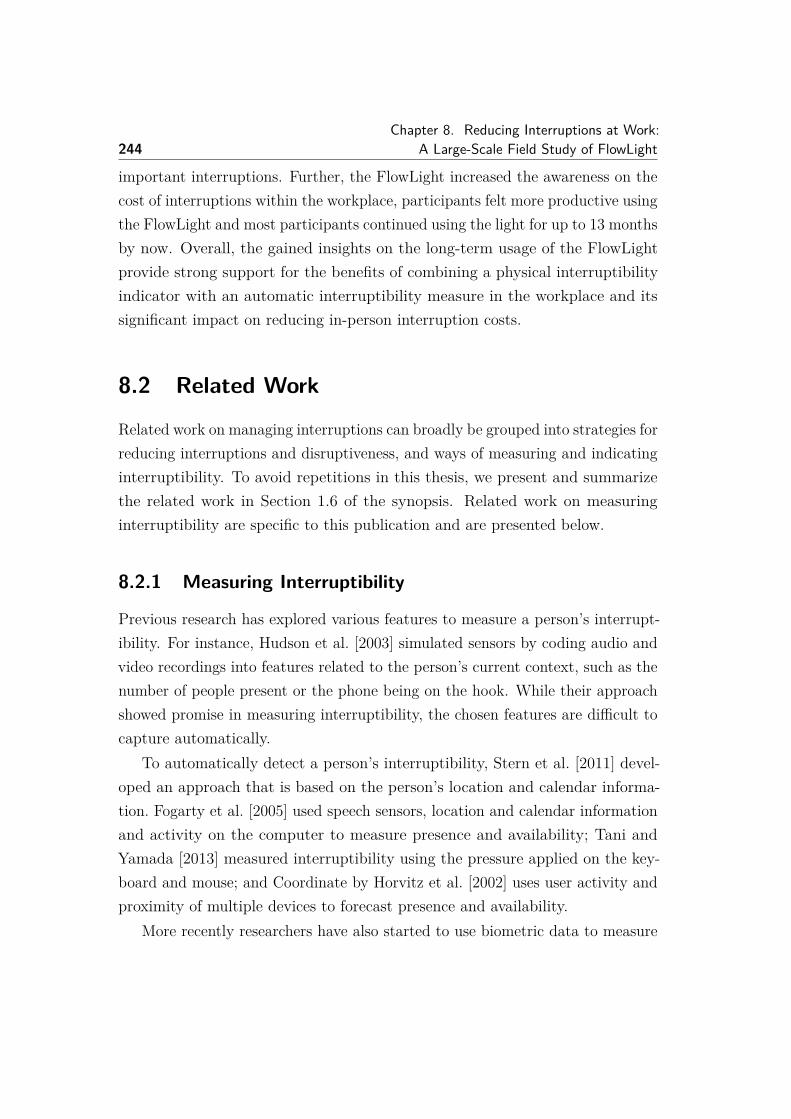
244Chapter 8. Reducing Interruptions at Work:
A Large-Scale Field Study of FlowLight
important interruptions. Further, the FlowLight increased the awareness on thecost of interruptions within the workplace, participants felt more productive usingthe FlowLight and most participants continued using the light for up to 13 monthsby now. Overall, the gained insights on the long-term usage of the FlowLightprovide strong support for the benefits of combining a physical interruptibilityindicator with an automatic interruptibility measure in the workplace and itssignificant impact on reducing in-person interruption costs.
8.2 Related Work
Related work on managing interruptions can broadly be grouped into strategies forreducing interruptions and disruptiveness, and ways of measuring and indicatinginterruptibility. To avoid repetitions in this thesis, we present and summarizethe related work in Section 1.6 of the synopsis. Related work on measuringinterruptibility are specific to this publication and are presented below.
8.2.1 Measuring Interruptibility
Previous research has explored various features to measure a person’s interrupt-ibility. For instance, Hudson et al. [2003] simulated sensors by coding audio andvideo recordings into features related to the person’s current context, such as thenumber of people present or the phone being on the hook. While their approachshowed promise in measuring interruptibility, the chosen features are difficult tocapture automatically.
To automatically detect a person’s interruptibility, Stern et al. [2011] devel-oped an approach that is based on the person’s location and calendar informa-tion. Fogarty et al. [2005] used speech sensors, location and calendar informationand activity on the computer to measure presence and availability; Tani andYamada [2013] measured interruptibility using the pressure applied on the key-board and mouse; and Coordinate by Horvitz et al. [2002] uses user activity andproximity of multiple devices to forecast presence and availability.
More recently researchers have also started to use biometric data to measure
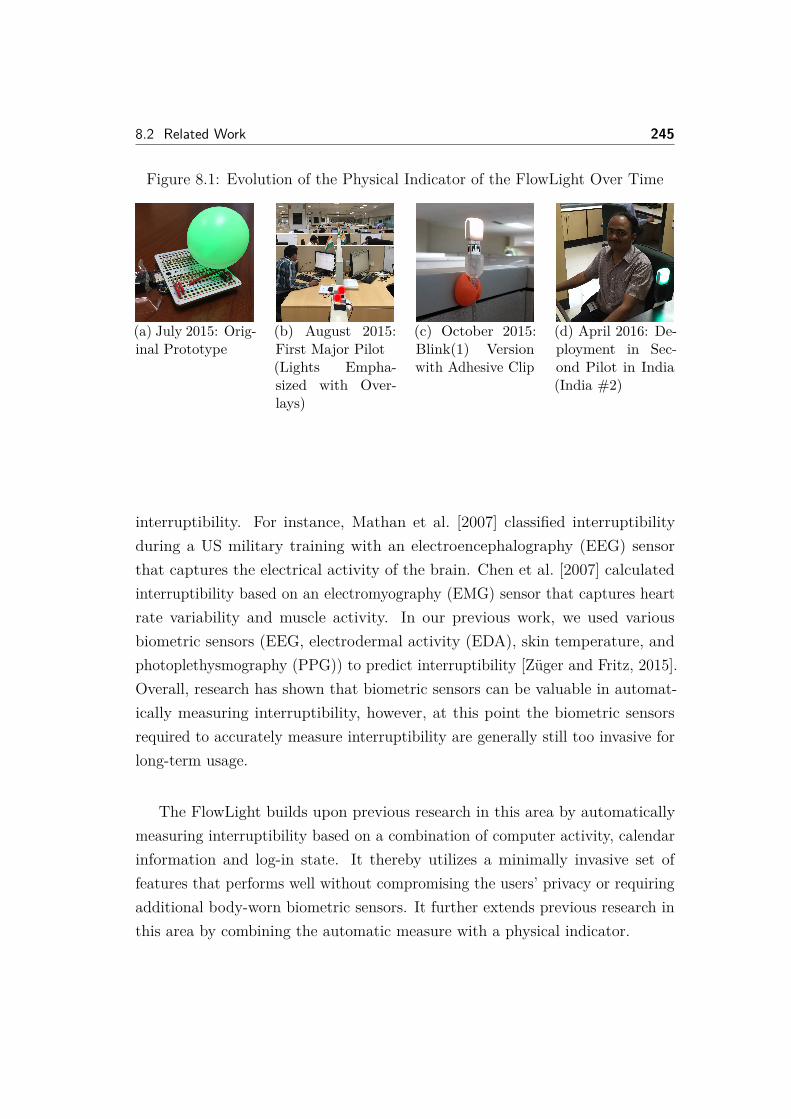
8.2 Related Work 245
Figure 8.1: Evolution of the Physical Indicator of the FlowLight Over Time
(a) July 2015: Orig-inal Prototype
(b) August 2015:First Major Pilot(Lights Empha-sized with Over-lays)
(c) October 2015:Blink(1) Versionwith Adhesive Clip
(d) April 2016: De-ployment in Sec-ond Pilot in India(India #2)
interruptibility. For instance, Mathan et al. [2007] classified interruptibilityduring a US military training with an electroencephalography (EEG) sensorthat captures the electrical activity of the brain. Chen et al. [2007] calculatedinterruptibility based on an electromyography (EMG) sensor that captures heartrate variability and muscle activity. In our previous work, we used variousbiometric sensors (EEG, electrodermal activity (EDA), skin temperature, andphotoplethysmography (PPG)) to predict interruptibility [Züger and Fritz, 2015].Overall, research has shown that biometric sensors can be valuable in automat-ically measuring interruptibility, however, at this point the biometric sensorsrequired to accurately measure interruptibility are generally still too invasive forlong-term usage.
The FlowLight builds upon previous research in this area by automaticallymeasuring interruptibility based on a combination of computer activity, calendarinformation and log-in state. It thereby utilizes a minimally invasive set offeatures that performs well without compromising the users’ privacy or requiringadditional body-worn biometric sensors. It further extends previous research inthis area by combining the automatic measure with a physical indicator.
246Chapter 8. Reducing Interruptions at Work:
A Large-Scale Field Study of FlowLight
Figure 8.2: FlowLight Users Over Time (Size of Orange Circles Indicates theNumber of Participants; Regular Dips in the Number of Pilot Users RepresentWeekends and the Prolonged Dip in December/January 2016 represents theChristmas Break)
8.3 Approach and Implementation
The FlowLight consists of a computer application to automatically determinea user’s interruptibility state and a physical LED light to indicate this state toco-workers. The FlowLight was developed iteratively over more than a year andimproved continuously based on feedback from a small developer team that weused for testing, and later on, also based on feedback from study participants.
Physical LED Light. FlowLight uses a physical traffic-light like LED to indicatethe interruptibility status to co-workers. This light has evolved throughout thepilots2. The first model, which was designed and soldered in-house, is shown inFigure 8.1a. In Figure 8.1b the same model light is shown encased in plastic anddeployed in an open office space. Finally, Figure 8.1c shows the blink(1)3 LEDlight that we adopted to avoid installation issues with certain drivers immediatelyafter the first major pilot, which was also the first of two pilots in India (denotedas India #1 in Figure 8.2). Typically, we mounted the LED light on a user’scubical wall or outside a user’s office.
The light uses different colors to indicate four states: Available as green, Busy
2We use the term pilot to refer to each individual field study trial with a separate team.3https://blink1.thingm.com/
8.3 Approach and Implementation 247
as red, Do Not Disturb (DnD) as pulsating red, and Away as yellow. Note thatthese states and colors mimic the ones used by prominent instant messagingservices, in particular the one used by the company under study.
Application. The application features three main components: a Tracker tocapture events relevant for calculating the interruptibility state, a Status Analyzerto analyze the captured events and calculate the user’s interruptibility state onthe fly, and a Status Manager to manage the user’s current status, propagatingit to the LED light and other applications, in particular instant messaging (IM)clients. The application was implemented to be compatible with the Windowsoperating system, Skype for Business, an IM and video-conferencing system, andOffice 365, a software suite that provides email and calendaring services, amongstothers. We chose to tailor our application to these systems and applications dueto the IT setup at the target company for our study.
The Tracker logs a user’s mouse and keyboard interaction. In particular, itcollects mouse clicks, movements as pixels moved, scrolling as pixels scrolledand keystrokes (without recording the specific key). This component also logscalendar events to determine meetings and the Skype status.
The Status Analyzer uses the tracked keyboard and mouse events to calculatethe user’s interruptibility status on the fly, i.e., whether the user is available, busy,highly busy (DnD) or away. The algorithms used to calculate the interruptibilitystatus are described below.
The Status Manager is notified by the Status Analyzer at every change in theuser’s interruptibility, and then propagates the updated status to the physicalLED light and the user’s presence status in Skype for Business. The presencestatus in Skype for Business can also be changed manually by the user, orautomatically by the Office 365 calendar, in case a meeting is scheduled. Incase the presence status is changed manually, the Status Manager updates theinterruptibility state of the application and the physical LED light.
Algorithms for Status Updates. Over the course of this study, we used threedifferent algorithms to determine and update the interruptibility status automat-
248Chapter 8. Reducing Interruptions at Work:
A Large-Scale Field Study of FlowLight
ically, improving them based on critical user feedback as discussed below.
FlowTracker. This algorithm sums up the computer interaction in the pastthree minutes according to heuristic weights assigned to each type of event,which were tuned based on feedback from early alpha and beta users of theFlowLight. If the value of the sum is in between the top 9% and the top 4%of their activity range—we captured averages over the past days—the user isconsidered busy. If it is within the top 4%, the user is considered highly busy.In our first pilot study in Bangalore, India (India #1 in Figure 8.2), we useddifferent thresholds at first, namely 13% and 5% based on a prior study thatindicated that knowledge workers are not interruptible for approximately 18% oftheir day. However, several technical writers (and others) involved in that pilotgave strong feedback that the light switched to the busy state too easily, whichis why we lowered the thresholds to the mentioned 9% and 4%.
Smoothing. While the FlowTracker showed promise, many early users com-plained that it was too sensitive to certain input. For instance, a twenty secondburst of typing may cause a user to temporarily be shown as busy. Therefore,the Smoothing algorithm marks users as busy if they were active in each of thelast three minutes and exceeded a threshold of 100 combined mouse clicks andkey presses in the recent past (between 4 and 7 minutes ago). This algorithmreduces frequent changes by requiring over three minutes of activity to becomebusy and, once busy, by requiring only one above-threshold minute in the recentpast to remain busy. To achieve the highly busy status, users had to be busy atthe current point in time and had to be above-threshold for fifteen of the lastthirty minutes.
Smoothed FlowTracker. While the Smoothing algorithm leads to fewer statuschanges, since it relied on a static threshold (i.e., 100 combined mouse clicks andkey presses), it did not adapt to individual users’ work patterns. For instance,designers working on drawings tended to use mouse clicks almost exclusively,which makes it difficult to exceed the threshold. Thus, we finally combined theFlowTracker algorithm with the Smoothing algorithm to achieve the advantagesof both approaches. This algorithm, currently in use, operates as the Smoothingalgorithm, but instead of using a static threshold, it utilizes the FlowTracker
8.4 Evaluation 249
algorithm to determine above threshold values. This algorithm eliminated all ofthe most common complaints reported by pilot users. Further refinement of thealgorithm is left for future work.
Although our main intent was to use an algorithm to infer interruptibility,we offered participants a “Manual Only” mode since it was requested by someparticipants, especially those with management roles that needed to be availableto others most of the time, and we noticed (and our study confirmed) that ouralgorithms might not be accurate for everyone or for all activities requiring focus,such as reading or thinking.
8.4 Evaluation
To evaluate the FlowLight, in particular the combination of the physical indicatorand the automatic interruptibility measure as well as its effect on knowledgeworkers, we conducted a long-term and large-scale field study with 449 knowledgeworkers. For this study, we installed the FlowLight at over 15 locations in 12countries of one multinational corporation. Over the course of the study, wecollected a rich set of data using a combination of experience sampling, a survey,an interview and computer interaction monitoring. Figure 8.1 illustrates a fewpictures of the FlowLight in use in different pilots. Figure 8.2 indicates theincreasing and continuous number of participants and the major pilots of thisstudy since its beginning and up to September 2016.
8.4.1 Study Procedure
For each team participating in our field study we conducted the same five-weekpilot procedure as illustrated in Figure 8.3. Prior to the start of a pilot, weasked the participants to install the FlowLight application in ‘data collectiononly’-mode.
InWeek #1 of the pilot, users were instructed to use the FlowLight applicationto manually log the time and severity of each interruption during the five daywork week. Our application allowed participants to log interruptions by a click
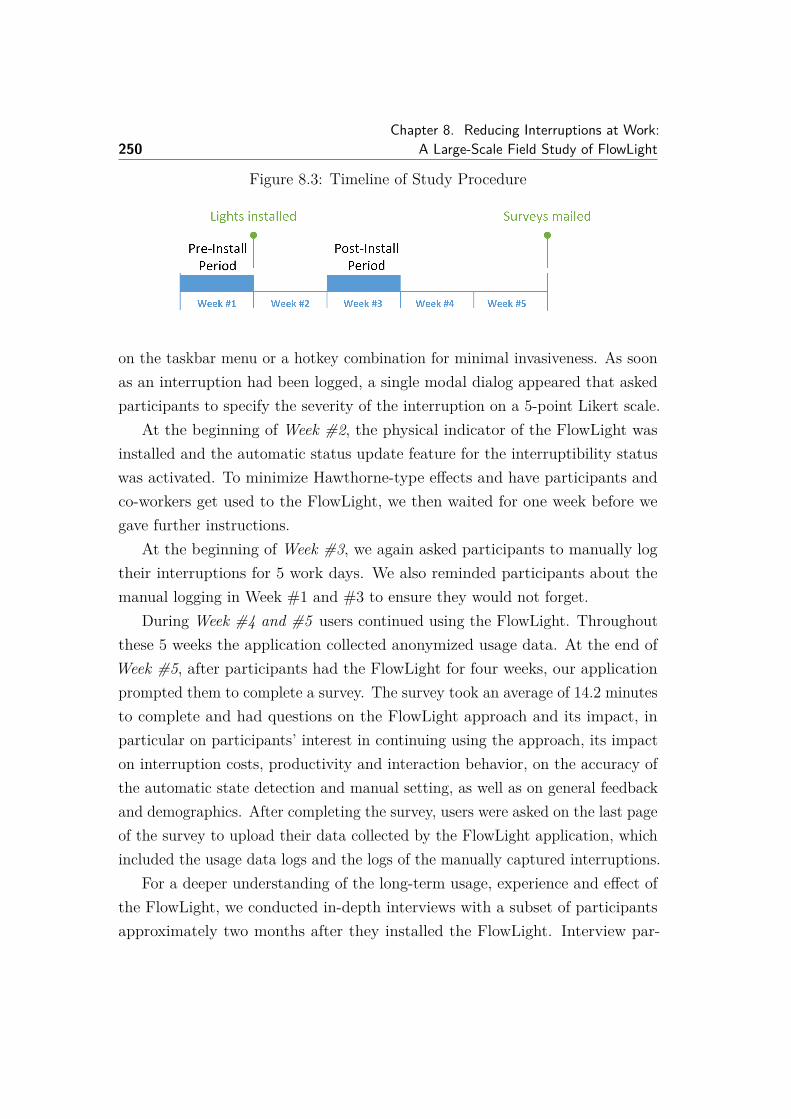
250Chapter 8. Reducing Interruptions at Work:
A Large-Scale Field Study of FlowLight
Figure 8.3: Timeline of Study Procedure
on the taskbar menu or a hotkey combination for minimal invasiveness. As soonas an interruption had been logged, a single modal dialog appeared that askedparticipants to specify the severity of the interruption on a 5-point Likert scale.
At the beginning of Week #2, the physical indicator of the FlowLight wasinstalled and the automatic status update feature for the interruptibility statuswas activated. To minimize Hawthorne-type effects and have participants andco-workers get used to the FlowLight, we then waited for one week before wegave further instructions.
At the beginning of Week #3, we again asked participants to manually logtheir interruptions for 5 work days. We also reminded participants about themanual logging in Week #1 and #3 to ensure they would not forget.
During Week #4 and #5 users continued using the FlowLight. Throughoutthese 5 weeks the application collected anonymized usage data. At the end ofWeek #5, after participants had the FlowLight for four weeks, our applicationprompted them to complete a survey. The survey took an average of 14.2 minutesto complete and had questions on the FlowLight approach and its impact, inparticular on participants’ interest in continuing using the approach, its impacton interruption costs, productivity and interaction behavior, on the accuracy ofthe automatic state detection and manual setting, as well as on general feedbackand demographics. After completing the survey, users were asked on the last pageof the survey to upload their data collected by the FlowLight application, whichincluded the usage data logs and the logs of the manually captured interruptions.
For a deeper understanding of the long-term usage, experience and effect ofthe FlowLight, we conducted in-depth interviews with a subset of participantsapproximately two months after they installed the FlowLight. Interview par-
8.4 Evaluation 251
ticipants were selected semi-randomly, based on accessibility, availability andwillingness to participate in the interview. The interviews were on average 19.5minutes long and the questions focused on the benefits and limitations partici-pants observed with the FlowLight approach, as well as on how it impacted theirown behavior and interactions in the team over the course of the two monthssince the installation. For instance, we asked participants whether they felt thattheir colleagues respected their FlowLight or if they noticed situations in whichthe status was not accurate. Note that the interview and survey questions canbe found on our supplemental materials site 4.
Independent of the timeline of the study procedure, we also started toanonymously log the number of people running the FlowLight application eachday. For privacy reasons, we only keep track of the number of unique activeFlowLight users in the online log.
8.4.2 Participants
Since the beginning of our study 13 months ago, we installed the FlowLightapproach with a total of 449 participants from 15 sites, located in 12 differentcountries, of one multinational corporation. From these 449 participants, wewere able to gather:
Survey responses from 183 participants (IDs: S1-S183), 144 male and 39female, with an average age of 36.0 years (standard deviation, in the followingdenoted with ±, of 8.7), an average professional experience of 12.0 years (± 8.0),from a variety of work areas, including 77 participants in development, 56 inother engineering, 24 in project management, 15 in other non-engineering, and11 in testing, and with various job roles, including 70 individual contributors, 36other, 32 leads, 31 managers, 8 executives, and 6 architects;Interview transcripts (conducted by us) from 23 participants (IDs: I1-I23),22 of which were male, 1 female, average age of 36.9 years (± 5.8), averageexperience of 13.2 years (± 4.7), and with various job roles, including 9 managers,11 software developers, 1 researcher, 1 product owner, and 1 tester;
4https://sites.google.com/site/focuslightonline
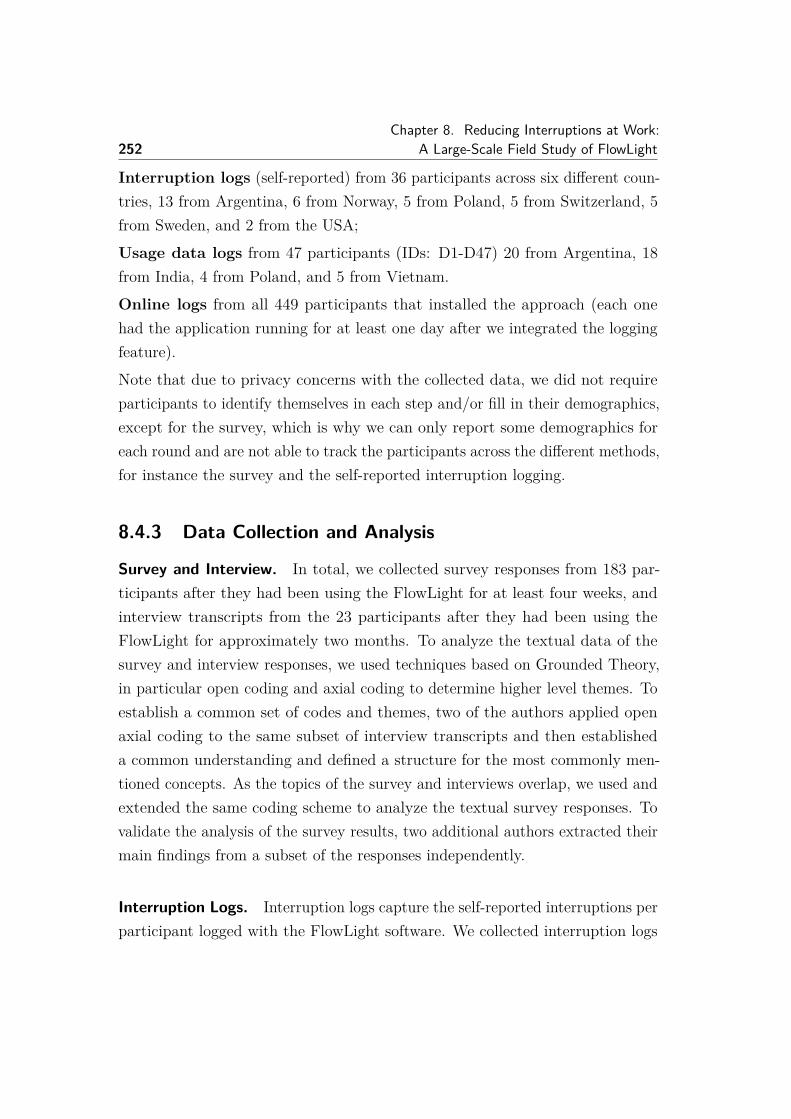
252Chapter 8. Reducing Interruptions at Work:
A Large-Scale Field Study of FlowLight
Interruption logs (self-reported) from 36 participants across six different coun-tries, 13 from Argentina, 6 from Norway, 5 from Poland, 5 from Switzerland, 5from Sweden, and 2 from the USA;Usage data logs from 47 participants (IDs: D1-D47) 20 from Argentina, 18from India, 4 from Poland, and 5 from Vietnam.Online logs from all 449 participants that installed the approach (each onehad the application running for at least one day after we integrated the loggingfeature).Note that due to privacy concerns with the collected data, we did not requireparticipants to identify themselves in each step and/or fill in their demographics,except for the survey, which is why we can only report some demographics foreach round and are not able to track the participants across the different methods,for instance the survey and the self-reported interruption logging.
8.4.3 Data Collection and Analysis
Survey and Interview. In total, we collected survey responses from 183 par-ticipants after they had been using the FlowLight for at least four weeks, andinterview transcripts from the 23 participants after they had been using theFlowLight for approximately two months. To analyze the textual data of thesurvey and interview responses, we used techniques based on Grounded Theory,in particular open coding and axial coding to determine higher level themes. Toestablish a common set of codes and themes, two of the authors applied openaxial coding to the same subset of interview transcripts and then establisheda common understanding and defined a structure for the most commonly men-tioned concepts. As the topics of the survey and interviews overlap, we used andextended the same coding scheme to analyze the textual survey responses. Tovalidate the analysis of the survey results, two additional authors extracted theirmain findings from a subset of the responses independently.
Interruption Logs. Interruption logs capture the self-reported interruptions perparticipant logged with the FlowLight software. We collected interruption logs
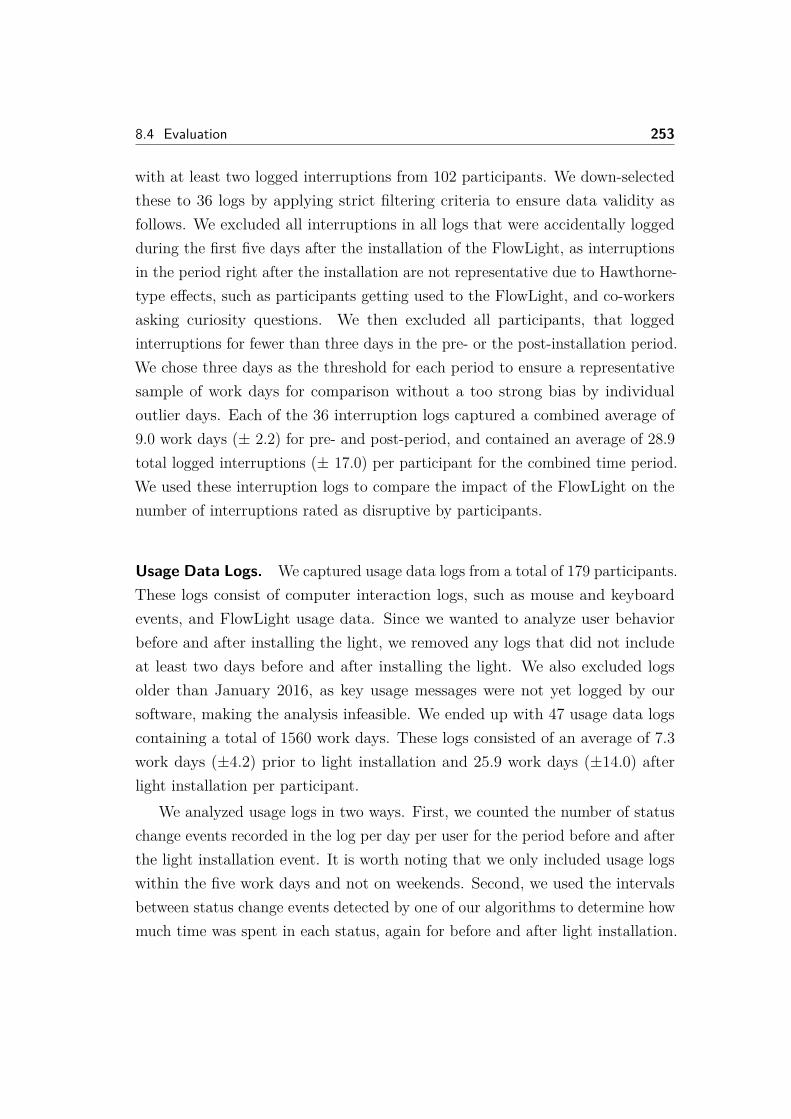
8.4 Evaluation 253
with at least two logged interruptions from 102 participants. We down-selectedthese to 36 logs by applying strict filtering criteria to ensure data validity asfollows. We excluded all interruptions in all logs that were accidentally loggedduring the first five days after the installation of the FlowLight, as interruptionsin the period right after the installation are not representative due to Hawthorne-type effects, such as participants getting used to the FlowLight, and co-workersasking curiosity questions. We then excluded all participants, that loggedinterruptions for fewer than three days in the pre- or the post-installation period.We chose three days as the threshold for each period to ensure a representativesample of work days for comparison without a too strong bias by individualoutlier days. Each of the 36 interruption logs captured a combined average of9.0 work days (± 2.2) for pre- and post-period, and contained an average of 28.9total logged interruptions (± 17.0) per participant for the combined time period.We used these interruption logs to compare the impact of the FlowLight on thenumber of interruptions rated as disruptive by participants.
Usage Data Logs. We captured usage data logs from a total of 179 participants.These logs consist of computer interaction logs, such as mouse and keyboardevents, and FlowLight usage data. Since we wanted to analyze user behaviorbefore and after installing the light, we removed any logs that did not includeat least two days before and after installing the light. We also excluded logsolder than January 2016, as key usage messages were not yet logged by oursoftware, making the analysis infeasible. We ended up with 47 usage data logscontaining a total of 1560 work days. These logs consisted of an average of 7.3work days (±4.2) prior to light installation and 25.9 work days (±14.0) afterlight installation per participant.
We analyzed usage logs in two ways. First, we counted the number of statuschange events recorded in the log per day per user for the period before and afterthe light installation event. It is worth noting that we only included usage logswithin the five work days and not on weekends. Second, we used the intervalsbetween status change events detected by one of our algorithms to determine howmuch time was spent in each status, again for before and after light installation.

254Chapter 8. Reducing Interruptions at Work:
A Large-Scale Field Study of FlowLight
To eliminate inappropriate intervals (e.g.,, a user did not turn off the workstationafter work), we only accumulated the duration within 12 hours per day.
Online Logs. We collected online logs for a total of 305 days from November 2,2015 until September 2, 2016 and from 449 participants. These logs were used todetermine how many users were using the FlowLight on a given day (as shownin Figure 8.2). We analyzed these logs by summing up the number of uniqueidentifiers that appeared in the log on a given day, which represents the numberof active users for that day.
Based on participants’ feedback during the period of the field study, wedeployed the three main variations of the algorithm described earlier to setthe status of the FlowLight. We analyzed differences between the data setsgathered with the three main variations of the algorithms and found no significantdifferences between the data collected with any two variations, neither in thecollected survey items, nor the interruption logs. In the following, we willtherefore present the results aggregated over all variations.
8.5 Results
In this section we present the primary findings of our field study. We first examinethe effect of the FlowLight on the cost of interruptions before we examine howthe FlowLight changed participants’ interruption awareness, their interruption-related behavior, and their perception of productivity. Subsequently, we presentinsights on the costs of the approach, on the influence of its accuracy, on itscontinued usage by participants and on professional differences.
8.5.1 Reduced Cost of Interruptions
Figure 8.4a is based on the 36 collected interruption logs and illustrates thedistribution of the number of interruptions per day and participant in the periodbefore and the period after participants had been using the FlowLight for oneweek.
8.5 Results 255
Figure 8.4: Logged Interruptions and State Changes Before and After Installingthe FlowLight.
9
8
7
6
5
4
3
2
1
lnterruptions per Day
•
Before Installation After Installation
(a) Interruptions per Par-ticipant and Day.
35
30
25
20
15
10
5
0
State Changes per Day
•
•
•
•
•
•
• •
Before Installation After Installation
(b) Number of StateChanges per Participantand Day.
Figure 8.5: Results of a Subset of the Survey Questions.
56.0%
78.0%
57.9%
58.0%
52.6%
70.8%
20.6%
10.0%
24.0%
19.2%
20.6%
17.2%
23.4%
12.0%
18.2%
23.0%
26.8%
12.0%
I would like to continue using the F ight.
I felt more productive when using the F ight.
With the F ight I had less interruptions at inopportune moments than I usually have.
My colleagues respected the state of my F ght.
With the F ight I am interrupted less than usual.
The state as represented by the color of the F ightcaptured my state of availability for interruptions accurately.
40% 20% 0% 20% 40% 60% 80%
Strongly agree
Agree
Somewhat agree
Somewhat disagree
Disagree
Strongly disagree
Overall, the number of interruptions decreased after the installation and oneweek usage of the FlowLight by an average of 1.9 (±1.6) interruptions (46%) perparticipant and day, from 4.1 (±2.1) to 2.2 (±1.1). A Wilcoxon signed-rank testshowed that this reduction is statistically significant (Z =-5.0, p <.000001).
A second Wilcoxon signed-rank test only on the number of severe interruptions(disruptiveness rating of 4 or 5) per day and participant further showed thatthere is also a statistically significant reduction with p <.001 and Z = -3.2.
An analysis of the survey results (see Figure 8.5 for more detail) furthersupports that installing the FlowLight reduced the cost of interruptions. 55.0%
256Chapter 8. Reducing Interruptions at Work:
A Large-Scale Field Study of FlowLight
of the 182 survey participants that answered the question stated that they eitherstrongly agree, agree or agree somewhat that they were interrupted less than usualduring their work, while only 20.3% disagreed with it. Even more participants,59.3%, agreed that they had less interruptions at inopportune moments thanusual, whereas only 19.8% disagreed with this statement.
During interviews participants echoed this quantitative evidence. In interviewexcerpts (full quotes listed in subsequent subsections) participants consistentlymentioned that interruptions were reduced. They claimed that the pilot “..resulted
in less interruptions..” (S126) , eliminated interruptions from colleagues (e.g., “When
[the light]’s red I think they don’t interrupt.” (I11) ), and “..didn’t stop [interruptions]
completely but they surely reduced.” (S16) .Overall, our findings from the interruption logs, survey questions, and in-
terview questions show strong support that the introduction of the FlowLightreduced the cost of interruptions in terms of the overall number as well as theirseverity.
8.5.2 Increased Awareness of Interruption Cost
After using the FlowLight for some time, participants developed a high degree ofawareness for the cost of interruptions:
“It brings more awareness to what people are doing. Sometimes people take itfor granted that people are always interruptible. But there is actually a cost or apenalty when you interrupt someone. So, I think just the concept is good because itreminds people that there is sometimes a good time and a bad time to interruptpeople. So, I think just from an awareness campaign, it’s valuable as well.” - I20
“The pilot increased the sensitivity to interruption. Team members think moreabout whether an interrupt is necessary and try to find a suitable time.” - S45
The FlowLight thereby served as a physical reminder for the interruptibilityof co-workers in the moment and participants generally respect it and its state:
“It’s kind of a like a mood indicator ... so it tells people the state ... of the ownerof the light. And then it helps people be more aware or attentive to what my currentsituation is.” - I18
8.5 Results 257
“I think what really changed is ... a different consciousness about interruptions inour team and also with my colleagues ... I think ... they really respect the light.When it’s red I think they don’t interrupt.” - I11
Overall, 70% of the 23 interview participants explicitly stated that theFlowLight is respected in their offices and 59.6% of 183 survey respondentsagreed that colleagues respected the state of their FlowLight vs. 23.0% that didnot (Figure 8.5).
The increased awareness and respect also triggered participants to changetheir behavior in a variety of ways, ranging from thinking twice before asking, todeferring the interruption, asking before interrupting and changing to a differentcommunication channel, such as email or instant messaging:
“People ask each other if they are available, even when the light is green, even topeople with no light. When I see the colleague I want to ask a question ... has ared light, then I wait a while, or write an email.” - S77
“If it’s red, I’ll send them a message so that when they’re no longer busy orsomething like that, they’ll see the message and they can respond to it then ... soit doesn’t require an immediate response” - I19
Fortunately, participants used common sense when working with FlowLights.If a light was red or red blinking participants would still interrupt if the requestwas urgent:
“Once I go up there [to the person] and I see the light and then I also see thatthey’re pretty intense then I’ll push it off unless I really need to get answered to.” -I17
8.5.3 Feeling of Increased Productivity and Self-Motivation
As a further effect of the FlowLight, 58.5% of the survey respondents felt moreproductive using it, while only 20.1% disagreed with this (Figure 8.5). Thisfeeling of increased productivity often stemmed from the fewer interruptions:
“I definitely think it resulted in less interruptions both in person and via Skype.This resulted in more focus and ability to finish work.” - S126
Another reason for the increased productivity is that the FlowLight serves
258Chapter 8. Reducing Interruptions at Work:
A Large-Scale Field Study of FlowLight
for some participants as a self-monitoring device that motivates them to becomeor stay focused, which, however, can also be distracting at times:
“Mostly it has helped as a personal monitor only for me. If I see the light red, Isense I am in the flow and I keep working.” - I2
“When I notice that my light is turning yellow, and I’ll feel like, ’Oh yeah, I’vebeen idle’ and then I do something ... I think the other way, yeah, there’s someeffect there too. Like, if I see that it’s red, or even flashing red, then I’m like,’Yeah, I’ve been very active, or productive, I should keep that going.’ At the sametime, I think it’s also a little bit distracting too. Sometimes just because the light isthere, I turn around to check it.” - I12
8.5.4 Costs of Using the FlowLight
While people experienced reduced interruption costs and increase in productivity,there are also costs when starting to use the FlowLight. Especially right afterinstalling it the curiosity of co-workers can lead to an increase of interruptions,which, however, diminishes after a few days:
“People walk by, they see it, they ask me questions, ’What’s that? How does itwork? What’s going on?’ like this.” - I19
“Initially there were many people just curious to know what the light is about. Thisincreased the number of interruptions but after few days, people started to respect[it].” - S16
A few participants also experienced situations in which the FlowLight pro-voked interruptions, as the green color of the light might be misunderstood asan invitation (observed by 26% of the interviewed participants):
“What I definitely notice is that green is more inviting. So it actually encouragespeople to come by and say, “Hello” for me at least.” - I20
In some cases, changing the interaction culture might require a mandate fromhigher up or can even be too expensive:
“The more important issue is for it to work, you have to have people committedto following the light rules, which probably requires engagement of some higher
8.5 Results 259
management ... and requires introducing the lights to a wider audience.” - I6
“For us ... the main cost of introducing [it is] that you have to change how youare used to interact with people, that you first have to remember to take a lookat the light. That’s something that’s probably too much for the team. [In] ourenvironment .. it’s easier to look at the people than at lights.” - I8
If colleagues choose to ignore the light, especially for unimportant interrup-tions, it can lead to negative emotions:
“So, for us, what we also heard sometimes is that people have the light red, andothers still interrupt them, and they’re like, ’Oh no, I have this light red, why didthey?’ Like it bothers them, and it creates negative emotions almost more than itcreates positive emotions...” - I17
Finally, the public disclosure of the interruptibility status might make peoplefeel exposed at times (8% of survey participants agree, 6% strongly agree) orlead to negative feelings:
“Oh, do other people see that my light is yellow? And are they thinking that I’mnot working?” - I12
Like any new technology, there is a cost to adopting the FlowLight. However,most of the identified costs diminish quickly or can be mitigated by clear directionfrom management. Overall though participants predominantly stated that thecolors of the light were interpreted appropriately and were mostly not concernedabout being observed.
8.5.5 Automatic State Changes and Accuracy
The algorithm of the FlowLight caused automatic state changes to indicate auser is, for instance, available for interruptions or busy and not interruptible.Figure 8.4b illustrates the change in distribution of the number of state changesper participant per day before and after installation. A Wilcoxon signed-rank testwith Bonferroni-adjusted alpha levels of .01 per test (.05/5) showed a statisticallysignificant change in the number of state changes (Z =-5.5337, p ≤ .01) withan increase in state changes from 1.8 before to 8.4 after. This increase showsthat the automated algorithm is affecting users’ availability status in Skype.
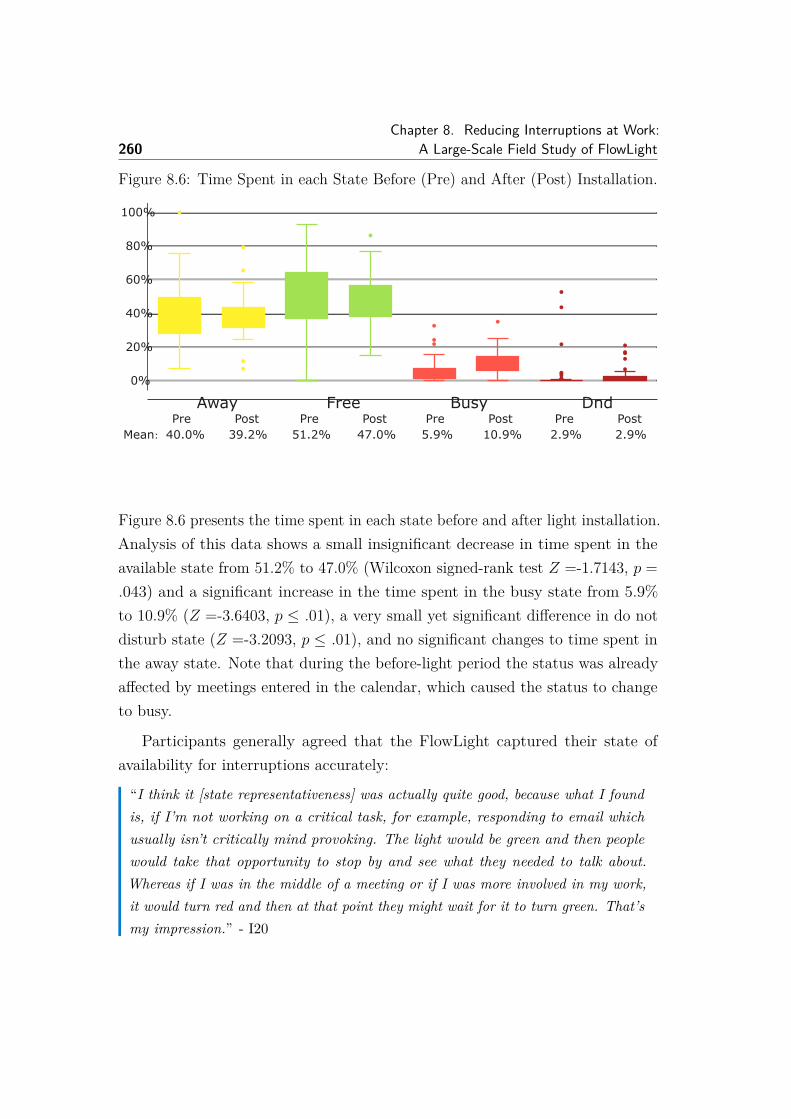
260Chapter 8. Reducing Interruptions at Work:
A Large-Scale Field Study of FlowLight
Figure 8.6: Time Spent in each State Before (Pre) and After (Post) Installation.
Away Free Busy DndPre Post Pre Post Pre Post Pre Post
Mean: 40.0% 39.2% 51.2% 47.0% 5.9% 10.9% 2.9% 2.9%
0%
20%
40%
60%
80%
100%
Figure 8.6 presents the time spent in each state before and after light installation.Analysis of this data shows a small insignificant decrease in time spent in theavailable state from 51.2% to 47.0% (Wilcoxon signed-rank test Z =-1.7143, p =.043) and a significant increase in the time spent in the busy state from 5.9%to 10.9% (Z =-3.6403, p ≤ .01), a very small yet significant difference in do notdisturb state (Z =-3.2093, p ≤ .01), and no significant changes to time spent inthe away state. Note that during the before-light period the status was alreadyaffected by meetings entered in the calendar, which caused the status to changeto busy.
Participants generally agreed that the FlowLight captured their state ofavailability for interruptions accurately:
“I think it [state representativeness] was actually quite good, because what I foundis, if I’m not working on a critical task, for example, responding to email whichusually isn’t critically mind provoking. The light would be green and then peoplewould take that opportunity to stop by and see what they needed to talk about.Whereas if I was in the middle of a meeting or if I was more involved in my work,it would turn red and then at that point they might wait for it to turn green. That’smy impression.” - I20
8.5 Results 261
Overall, 71.0% of survey respondents agreed that the FlowLight capturestheir state accurately while only 15.8% disagreed (Figure 8.5). This shows thateven an interruptibility measure based on a simple algorithm might be accurateenough to be accepted by users and provide value.
At the same time, interview participants and 64% of our survey respondentsmentioned that there are situations where the FlowLight was not representativeand accurate, partly stemming from limitations in measuring interruptibilitysolely with computer interaction data:
“The light was mostly green while debugging code. During debugging, I thinkinterrupts hurt a lot. On the other hand, the light was sometimes red when workingon documents / e-mails that do not require too much focus.” - S45
“[The] light captures the movements of the mouse and keyboard, and actually, thereare times, which I think of a solution separate from the time, which I implement[it] so ... I’m the most occupied when I think something and usually, I write it ona paper or just keep it on my mind.” - I4
In several cases, participants just changed to setting the state manually whenit was not accurate and they wanted to indicate to others that they are availableor do not want to be disturbed:
“There was a case when I was reading an article, and I needed a 100% concentrationon that, so I just manually changed my status to busy. It was helping me a lot. Ithink my colleagues are also doing the same when they are engrossed in an articleand they want free time, they’ll just keep their light busy.” - I4
In fact, 32% of our survey respondents reported to have changed their Skypestatus (which is linked to the FlowLight) more often after the light was installed,23% less often and 45% had no changes. With the FlowLight installed, 17%of participants reported to change their status at least once a day, 37% one toseveral times a week, and 46% rarely or never. The job role can also affect theaccuracy of the FlowLight, especially for managers, administrative assistants,and sales people. For instance, several managers mentioned that interaction wassuch a core part of their role that they felt they should always be available andturned off the automatic feature.
262Chapter 8. Reducing Interruptions at Work:
A Large-Scale Field Study of FlowLight
8.5.6 Continued Usage of FlowLight
Most participants, 82.6% of the 23 interview participants and 79.1% of the 183survey participants, stated their intention to keep using the FlowLight evenafter the pilot period. This sentiment is reflected in actual usage data: twomonths after installing the FlowLight application 85.5% of users remained active(384/449).
Based on online logging of application instances that we started in November2015, Figure 8.2 shows the number of active FlowLight users per day. The Figurealso depicts the start date and relative size for the major pilots (e.g., India #1started in August ’15 and had 80 participants, Norway started in November ’14and had 44).
Note that due to holidays in different locales, vacation, sick days, and travelthe number of active users per day is consistently about 70% of the number ofunique users over the last month (e.g., a measure of 200 active users per dayindicates about 315 number of unique users in the last month).
In spite of most users continuing to use the FlowLight, about 20% of usersdiscontinued usage. There were several reasons that we identified from theinterviews and surveys that decreased the benefit of the FlowLight, includingthe office layout and the visibility of the LED light, the company culture andpeople ignoring the lights, the initial willingness to use such a system, and theaccuracy of the state indicated by the FlowLight. In some cases, the decreasedbenefit also resulted in participants ceasing to use the FlowLight:
“From my perspective that was something I was against from the first day but asI said I decided to join the pilot because I am a team member. ... From time totime I was looking at it but it was a little bit discouraging because the color of thelight didn’t reflect what I was doing and maybe after one week of using it I gave uptotally.” - I9
8.5.7 Professional Differences in Using the FlowLight
An analysis of the survey responses with respect to professional roles shows thatdevelopers (including testers) and project managers stated more frequently than
8.6 Discussion 263
participants from other working areas that they wanted to continue using theFlowLight , even though not significantly (82% vs 70% on average) and perceivedtheir state to be significantly more accurate (77% vs 60%, t =2.51, p =.01). Forproject managers, these differences might be explained by the fact that they alsoreported more often (but not significantly) to manually change their FlowLightstatus on a daily basis than participants from other work areas (24% vs 16%) andby our experiences gathered during the installation phase, in which managersoften asked to disable the automatic mode completely as they wanted to beavailable for most of their work time. For developers, the differences might beexplained by their extensive computer interaction, but future research is neededto confirm this.
8.6 Discussion
The results of our large-scale and long-term study show that the FlowLightcan reduce the interruption costs for knowledge workers and can increase theawareness, amongst other benefits. In the following, we discuss implications of ourfindings, in particular with respect to the combination of the physical indicatorwith the automatic interruptibility measure, the accuracy of the measure, and thecost of not interrupting. Finally, we discuss threats to validity and limitations ofour study.
8.6.1 Reasons for FlowLight’s Positive Effects
The FlowLight uses a combination of a physical LED light with an automaticmeasure based on computer interaction to update the user’s interruptibility status.The findings show that the approach was well adopted and successfully reducedin-person interruption costs. This poses the question if these effects might afterall stem solely either from the automatic interruptibility measure or the physicalLED light. With respect to the sole use of an automatic interruptibility measure,prior related work that used an automatic measure to update computer-basedcontact-list style tools, did not find any or the same level of positive effects
264Chapter 8. Reducing Interruptions at Work:
A Large-Scale Field Study of FlowLight
as our study on both, cost reduction and awareness [Begole et al., 2004; Laiet al., 2003; Tang et al., 2001]. On the other hand, manually maintaining theinterruptibility state incurs a high cost as shown by previous research [Milewskiand Smith, 2000] and only very few of our users switched to the manual optionin cases the algorithm was not accurate enough or they wanted to ensure someundisrupted time. In addition, our findings show that while participants have ahigh tolerance for the accuracy of the automatic interruptibility status updates,when inaccuracies happen too often, participants also stop using the approachaltogether. Overall, this indicates that the combination of the physical LED lightand the automatic interruptibility measure is important to provide significantbenefits to knowledge workers to use it in the long-term and that it led to thepositive impact on awareness and interruption cost found in our study.
8.6.2 Accuracy of Automatic Interruptibility Measure
Participants’ high tolerance for the accuracy of the automatic interruptibilitymeasure of the FlowLight poses the question of how accurate the underlyingmeasure has to be to provide sufficient benefit to the user. Over the course ofour field study, we adapted the automatic measure two times to account forearly user feedback, yet we did not find any significant differences in the effectson interruption cost and behavior. However, we intend to study the relationbetween accuracy and the effects on interruption cost further in the future.
Also, while participants had a high tolerance, they reported numerous situa-tions in which they observed the status to be set incorrectly. The most frequentsituation in which the status is incorrect occurs when participants “think” aboutsomething and experience a high cognitive load, yet do not interact with thecomputer at all. In future work and with the continuously decreasing invasive-ness of biometric sensors, we plan to extend our approach to integrate biometricsensors, to cover these situations more accurately. We further plan to improveour algorithm by integrating application data, which we were not able to collectin this study due to privacy constraints. Knowing the current application mightimprove the algorithm’s accuracy, e.g., one might be less interruptible whileworking in a development related program and more while being in an email
8.6 Discussion 265
client. As the nature of work and interactions vary across work areas and jobroles, tailoring the algorithm accordingly could further improve its accuracy.
8.6.3 Cost of Not Interrupting
As related work has shown, not all interruptions are bad and some are definitelyneeded, for instance, to unblock co-workers. By physically indicating knowledgeworkers as not interruptible (Busy and DnD state), the FlowLight might preventco-workers from interrupting them for important issues, reducing overall teamproductivity. The findings of our study on the FlowLight provides evidencethat this cost is minimal at best for two reasons. First, a data analysis of theusage logs collected for our study shows that the FlowLight ends up having asignificant yet small effect on the time that a knowledge worker is indicated asnot interruptible (+5% per day). Second, while the FlowLight increases theawareness of the cost of interruptions, participants still interrupt their co-workersregardless of the FlowLight state if they have an important concern to discuss, asalso stated by 35% of our interview participants, without being explicitly asked.
8.6.4 Threats and Limitations
A major threat to the validity of our study is the completeness of the collecteddata. For instance, we were not able to identify participants across differentdata sets. While we encouraged participants to share their data and ensuredthem that we only use it for research purposes, we could not demand it due toprivacy concerns. We were also not able to collect geographic data due to privacyconcerns and thus were not able to analyze geographic differences.
Similarly, the accuracy of the interruption logs might be incomplete or notcompletely accurate. Since interruption logs are based on self-reports, participantsmight have forgotten to log some interruptions. Also, the work patterns andhabits of the days on which they logged interruptions before and after theinstallation of the FlowLight might have been significantly different, which makesit more difficult to compare the effect of the FlowLight. We tried to mitigate thisrisk by only including the logs of participants who logged interruptions for more
266Chapter 8. Reducing Interruptions at Work:
A Large-Scale Field Study of FlowLight
than three days before and three days after and by regularly reminding them tolog their interruptions. Furthermore, different participants might have differentcriteria and judgement standards for logging interruptions. We tried to mitigatethis fact by instructing participants to only log external in-person interruptionsat work. In addition, by using a paired test that only compares within subject(Wilcoxon signed rank), we mitigate this effect as long as participants did notchange their definition of an interruption over time.
We limited the validity threats related to generalizability across individualsand teams by collecting data from 449 participants from twelve countries andwith a variety of job roles. As not all participants are native English speakers,there might be a response bias. We tried to mitigate this risk by providingsufficient instructions, opportunity for contacting us if participants had anyquestions, and also by visiting each major pilot site to introduce and explain thestudy. Based on the large number and diversity of participants, we observed thatresponses were not dominantly distributed to extremes, which would indicatethat these knowledge workers were particularly biased based on such difficulties.From our in-person experience we can report that with very few exceptions weperceived similar acceptance, respect and in general a very positive perception ofthe FlowLight across all locations.
Another threat is the influence of the various algorithms on the study results.Since we wanted to ensure that participants are satisfied with the FlowLightand that we take their feedback serious, we evolved the algorithm two times. Tomitigate the risk of a certain bias in the data, we looked for significant differencesbetween populations where we might expect to find them and did not find any.
8.7 Conclusion
In-person interruptions at the workplace can incur a high cost and consume a lotof a knowledge worker’s time, if they happen at inopportune moments. Whilethere are several approaches to possibly reduce the interruption costs, little isknown about the impact of a physical and automatic interruptibility indicator.In this paper, we presented FlowLight—an automatic interruptibility indicator
8.8 Acknowledgments 267
in the form of a physical traffic-light like LED—and reported on results from alarge-scale and long-term field study with 449 participants from 12 countries. Wefound that the FlowLight significantly reduced the number of interruptions by46%. We also observed an increased awareness of the potential disruptiveness ofinterruptions at inopportune moments, which impacts the interaction culture ina positive way, and that our approach can motivate knowledge workers and makethem feel more productive. We discuss the importance of combining the physicalindicator with the automatic interruptibility measure and the high tolerance ofparticipants to the accuracy of the approach. Overall, our study provides deepinsights and strong evidence on the very positive effects of the long-term usageof the FlowLight, and the continued usage of the approach by most participantsindicates the success of the approach.
8.8 AcknowledgmentsThe authors would like to thank all study participants. This work was funded inpart by SNF.

Bibliography
Agapie, E., Avrahami, D., and Marlow, J. (2016). Staying the Course: System-Driven Lapse Management for Supporting Behavior Change. In Proceedingsof the 2016 CHI Conference on Human Factors in Computing Systems.
Agarwal, R. and Karahanna, E. (2000). Time Flies When You’re Having Fun:Cognitive Absorption and Beliefs about Information Technology Usage. MISQuarterly, 24(4):665–694.
Albrecht, A. J. (1979). Measuring application development productivity. In IBMConference on Application Development, pages 83–92.
Allen, D. (2015). Getting things done: The art of stress-free productivity. Penguin.
Althoff, T., Horvitz, E., White, R. W., and Zeitzer, J. (2017). Harnessing theweb for population-scale physiological sensing: A case study of sleep andperformance. In Proceedings of the 26th International Conference on WorldWide Web, pages 113–122. International World Wide Web Conferences SteeringCommittee.
Altmann, E. M. and Trafton, J. G. (2002). Memory for goals: An activation-basedmodel. Cognitive science, 26(1):39–83.
Altmann, E. M. and Trafton, J. G. (2004). Task interruption: Resumption lagand the role of cues.
Amabile, T. and Kramer, S. (2011). The progress principle: Using small wins toignite joy, engagement, and creativity at work. Harvard Business Press.
270 BIBLIOGRAPHY
Amann, S., Proksch, S., Nadi, S., and Mezini, M. (2016). A study of visual studiousage in practice. In Proceedings of the 23rd IEEE International Conferenceon Software Analysis, Evolution, and Reengineering (SANER ’16).
Ancker, J. S. and Kaufman, D. (2007). Rethinking health numeracy: A multi-disciplinary literature review. Journal of the American Medical InformaticsAssociation, 14(6):713–721.
Andreessen, M. (2011). Why software is eating the world. The Wall StreetJournal, August 20, 2011.
Anvik, J., Hiew, L., and Murphy, G. C. (2006). Who should fix this bug? InProceedings of the 28th International Conference on Software Engineering,ICSE ’06, pages 361–370. ACM.
Arciniegas-Mendez, M., Zagalsky, A., Storey, M.-A., and Hadwin, A. F. (2017).Using the model of regulation to understand software development collaborationpractices and tool support. In Proceedings of the 2017 ACM Conference onComputer Supported Cooperative Work and Social Computing, CSCW ’17,pages 1049–1065. ACM.
Arroyo, E. and Selker, T. (2011). Attention and intention goals can mediatedisruption in human-computer interaction. In IFIP Conference on Human-Computer Interaction, pages 454–470. Springer.
Astromskis, S., Bavota, G., Janes, A., Russo, B., and Penta, M. D. (2017).Patterns of developers’ behaviour: A 1000-hour industrial study. Journal ofSystems and Software, 132:85–97.
Babar, M. A., Kitchenham, B., and Jeffery, R. (2008). Comparing distributedand face-to-face meetings for software architecture evaluation: A controlledexperiment. Empirical Software Engineering, 13(1):39–62.
Babbie, E. (2015). The practice of social research. Nelson Education.
BIBLIOGRAPHY 271
Bacchelli, A. and Bird, C. (2013). Expectations, Outcomes, and Challenges ofModern Code Review. In Proceedings of the 2013 International Conference onSoftware Engineering, pages 712–721.
Bailey, B. P. and Iqbal, S. T. (2008). Understanding changes in mental workloadduring execution of goal-directed tasks and its application for interruptionmanagement. ACM Transactions on Computer-Human Interaction (TOCHI),14(4):21.
Bailey, B. P. and Konstan, J. A. (2006). On the need for attention-aware systems:Measuring effects of interruption on task performance, error rate, and affectivestate. Computers in human behavior, 22(4):685–708.
Bailey, B. P., Konstan, J. A., and Carlis, J. V. (2001). The effects of interruptionson task performance, annoyance, and anxiety in the user interface. In Interact,volume 1, pages 593–601.
Balog, K., Azzopardi, L., and de Rijke, M. (2006). Formal models for expert find-ing in enterprise corpora. In Proceedings of the 29th Annual International ACMSIGIR Conference on Research and Development in Information Retrieval,SIGIR ’06, pages 43–50. ACM.
Baltes, S. and Diehl, S. (2018). Towards a theory of software developmentexpertise. In Proceedings of the 2018 26th ACM Joint Meeting on Euro-pean Software Engineering Conference and Symposium on the Foundations ofSoftware Engineering, pages 187–200. ACM.
Bao, L., Xing, Z., Xia, X., Lo, D., and Hassan, A. E. (2018). Inference ofdevelopment activities from interaction with uninstrumented applications.Empirical Software Engineering, 23(3):1313–1351.
Barker, C. (2003). Cultural studies: Theory and practice. Sage.
Barley, S. R., Meyerson, D. E., and Grodal, S. (2011). E-mail as a source andsymbol of stress. Organization Science, 22(4):887–906.
272 BIBLIOGRAPHY
Bartram, L. (2015). Design challenges and opportunities for eco-feedback in thehome. IEEE Computer Graphics and Applications, 35(4).
Basseville, M., Nikiforov, I. V., et al. (1993). Detection of abrupt changes: theoryand application, volume 104. Prentice Hall Englewood Cliffs.
Baumer, E. P., Khovanskaya, V., Matthews, M., Reynolds, L., Schwanda Sosik,V., and Gay, G. (2014). Reviewing reflection: On the use of reflection ininteractive system design. In Proceedings of the 2014 Conference on DesigningInteractive Systems, DIS ’14, pages 93–102. ACM.
Beecham, S., Baddoo, N., Hall, T., Robinson, H., and Sharp, H. (2008). Motiva-tion in software engineering: A systematic literature review. Information andSoftware Technology, 50(9):860 – 878.
Begole, J. B., Matsakis, N. E., and Tang, J. C. (2004). Lilsys: sensing unavail-ability. In Proceedings of the 2004 ACM conference on Computer supportedcooperative work, pages 511–514. ACM.
Begole, J. B., Tang, J. C., Smith, R. B., and Yankelovich, N. (2002). WorkRhythms: Analyzing Visualizations of Awareness Histories of DistributedGroups. 230.
Beller, M., Gousios, G., Panichella, A., Proksch, S., Amann, S., and Zaidman, A.(2017). Developer Testing in The IDE: Patterns, Beliefs, and Behavior. IEEETransactions on Software Engineering, 14(8):1–23.
Beller, M., Levaja, I., Panichella, A., Gousios, G., and Zaidman, A. (2016). Howto catch ’em all: Watchdog, a family of ide plug-ins to assess testing. In 2016IEEE/ACM 3rd International Workshop on Software Engineering Researchand Industrial Practice (SER IP), pages 53–56.
Bellezza, F. S. and Hartwell, T. C. (1981). Cuing subjective units. The Journalof Psychology, 107(2):209–218.
BIBLIOGRAPHY 273
Benjamini, Y. and Hochberg, Y. (1995). Controlling the false discovery rate:a practical and powerful approach to multiple testing. Journal of the royalstatistical society. Series B (Methodological), pages 289–300.
Bentley, F., Tollmar, K., Stephenson, P., and Levy Laura (2013). Health Mashups:Presenting Statistical Patterns between Wellbeing Data and Context in NaturalLanguage to Promote Behavior Change. 20(5):1–27.
Biehl, J. T., Czerwinski, M., Smith, G., and Robertson, G. G. (2007). Fastdash:A visual dashboard for fostering awareness in software teams. In Proceedingsof the SIGCHI Conference on Human Factors in Computing Systems, CHI ’07,pages 1313–1322. ACM.
Bjelica, M. Z., Mrazovac, B., Papp, I., and Teslic, N. (2011). Busy flag just gotbetter: Application of lighting effects in mediating social interruptions. InMIPRO, 2011 Proceedings of the 34th International Convention, pages 975–980.IEEE.
Blackburn, J., Scudder, G., and Van Wassenhove, L. (1996). Improving speed andproductivity of software development: a global survey of software developers.IEEE Transactions on Software Engineering, 22(12):875–885.
Blair, E. and Burton, S. (1987). Cognitive processes used by survey respondentsto answer behavioral frequency questions. Journal of consumer research,14(2):280–288.
Blynclight, E. (2019). http://www.embrava.com/. retrieved March 12, 2019.
Boehm, B. W. (1987). Improving software productivity. In Computer. Citeseer.
Boehm, B. W., Madachy, R., Steece, B., et al. (2000). Software cost estimationwith Cocomo II with Cdrom. Prentice Hall PTR.
Borst, J. P., Taatgen, N. A., and van Rijn, H. (2015). What makes interruptionsdisruptive?: A process-model account of the effects of the problem statebottleneck on task interruption and resumption. In Proceedings of the 33rd
274 BIBLIOGRAPHY
annual ACM conference on human factors in computing systems, pages 2971–2980. ACM.
Bradburn, N. M. (2010). Recall period in consumer expenditure surveys program.
Bradburn, N. M., Rips, L. J., and Shevell, S. K. (1987). Answering autobio-graphical questions: The impact of memory and inference on surveys. Science,236(4798):157–161.
Bradley, N. C., Fritz, T., and Holmes, R. (2018). Context-aware conversationaldeveloper assistants. In Proceedings of the 40th International Conference onSoftware Engineering, ICSE 2018, pages 993–1003.
Bragdon, A., Reiss, S. P., Zeleznik, R., Karumuri, S., Cheung, W., Kaplan, J.,Coleman, C., Adeputra, F., and LaViola, Jr., J. J. (2010a). Code bubbles:Rethinking the user interface paradigm of integrated development environments.In Proceedings of the 32Nd ACM/IEEE International Conference on SoftwareEngineering - Volume 1, ICSE ’10, pages 455–464. ACM.
Bragdon, A., Zeleznik, R., Reiss, S. P., Karumuri, S., Cheung, W., Kaplan, J.,Coleman, C., Adeputra, F., and LaViola, Jr., J. J. (2010b). Code bubbles:A working set-based interface for code understanding and maintenance. InProceedings of the SIGCHI Conference on Human Factors in ComputingSystems, CHI ’10, pages 2503–2512. ACM.
Brath, R. and Peters, M. (2004). Dashboard design: Why design is important.DM Direct, 85.
Braun, V. and Clarke, V. (2006). Using thematic analysis in psychology. Quali-tative research in psychology, 3:77–101.
Bravata, D. M., Smith-Spangler, C., Sundaram, V., Gienger, A. L., Lin, N.,Lewis, R., Stave, C. D., Olkin, I., and Sirard, J. R. (2007). Using pedometersto increase physical activity and improve health: A systematic review. Jama,298(19):2296–2304.
BIBLIOGRAPHY 275
Brdiczka, O., Su, N. M., and Begole, J. B. (2010). Temporal task footprinting:identifying routine tasks by their temporal patterns. In Proceedings of the 15thinternational conference on Intelligent user interfaces, pages 281–284. ACM.
Breiman, L. (2001). Random forests. Machine learning, 45(1):5–32.
Brockbank, A. and McGill, I. (2007). Facilitating reflective learning in highereducation. McGraw-Hill Education (UK).
Brooks Jr, F. P. (1995). The Mythical Man-Month: Essays on Software Engi-neering, Anniversary Edition, 2/E. Pearson Education India.
Brown, A. (1992). Design experiments: Theoretical and methodological challengesin creating complex interventions in classroom settings. Journal of the LearningSciences, 2(2):141–178.
Brown, C., Efstratiou, C., Leontiadis, I., Quercia, D., and Mascolo, C. (2014).Tracking serendipitous interactions: How individual cultures shape the office.pages 1072–1081.
Bruegge, B. and Dutoit, A. H. (2004). Object-Oriented Software EngineeringUsing UML, Patterns and Java-(Required), volume 2004. Prentice Hall.
Burnett, M., Stumpf, S., Macbeth, J., Makri, S., Beckwith, L., Kwan, I., Peters,A., and Jernigan, W. (2016). Gendermag: A method for evaluating software’sgender inclusiveness. Interacting with Computers, 28(6):760–787.
Calvo, R. A. and Peters, D. (2014). Self-Awareness and Self-Compassion, page304. MIT Press.
Card, S. K. and Henderson Jr, A. (1986). A multiple, virtual-workspace interfaceto support user task switching. ACM SIGCHI Bulletin, 17(SI):53–59.
Cataldo, M., Herbsleb, J. D., and Carley, K. M. (2008). Socio-technical congru-ence: A framework for assessing the impact of technical and work dependencieson software development productivity. In Proceedings of the Second ACM-IEEE
276 BIBLIOGRAPHY
International Symposium on Empirical Software Engineering and Measurement,ESEM ’08, pages 2–11. ACM.
Chalmers, T. C., Smith Jr, H., Blackburn, B., Silverman, B., Schroeder, B.,Reitman, D., and Ambroz, A. (1981). A method for assessing the quality of arandomized control trial. Controlled clinical trials, 2(1):31–49.
Charmaz, K. (2014). Constructing grounded theory. Sage.
Chatzoglou, P. D. and Macaulay, L. A. (1997). The importance of human factorsin planning the requirements capture stage of a project. International Journalof Project Management, 15(1):39–53.
Chen, D., Hart, J., and Vertegaal, R. (2007). Towards a physiological model ofuser interruptability. In IFIP Conference on Human-Computer Interaction,pages 439–451. Springer.
Choe, E. K., Lee, N. B., Lee, B., Pratt, W., and Kientz, J. a. (2014). Un-derstanding quantified-selfers’ practices in collecting and exploring personaldata. Proceedings of the 32nd annual ACM conference on Human factors incomputing systems (CHI ’14), pages 1143–1152.
Chong, J. and Siino, R. (2006). Interruptions on software teams: a comparisonof paired and solo programmers. In Proceedings of the 2006 20th anniversaryconference on Computer supported cooperative work, pages 29–38. ACM.
Claes, M., Mäntylä, M. V., Kuutila, M., and Adams, B. (2018). Do programmerswork at night or during the weekend? In Proceedings of the 40th InternationalConference on Software Engineering, pages 705–715. ACM.
Claessens, B., Eerde, W., G. Rutte, C., and Roe, R. (2010). Things to do today...:A daily diary study on task completion at work. Applied Psychology, 59:273 –295.
Clear, J. (2018). Atomic Habits: Tiny Changes, Remarkable Results. PenguinPublishing Group.
BIBLIOGRAPHY 277
Codealike (2019). http://codealike.com. Retrieved March 19, 2019.
Collins, E. I. M., Cox, A. L., Bird, J., and Harrison, D. (2014). Social networkinguse and rescuetime: The issue of engagement. In Proceedings of the 2014ACM International Joint Conference on Pervasive and Ubiquitous Computing:Adjunct Publication, UbiComp ’14 Adjunct, pages 687–690. ACM.
Coman, I. D. and Sillitti, A. (2008). Automated identification of tasks indevelopment sessions. In 2008 16th IEEE International Conference on ProgramComprehension, pages 212–217.
Consolvo, S., Klasnja, P., McDonald, D. W., Avrahami, D., Froehlich, J.,LeGrand, L., Libby, R., Mosher, K., and Landay, J. A. (2008a). Flowersor a robot army?: Encouraging awareness & activity with personal, mobiledisplays. In Proceedings of the 10th International Conference on UbiquitousComputing, UbiComp ’08, pages 54–63. ACM.
Consolvo, S., McDonald, D. W., and Landay, J. A. (2009). Theory-driven designstrategies for technologies that support behavior change in everyday life. InProceedings of the SIGCHI conference on human factors in computing systems,pages 405–414. ACM.
Consolvo, S., McDonald, D. W., Toscos, T., Chen, M. Y., Froehlich, J., Harrison,B., Klasnja, P., LaMarca, A., LeGrand, L., Libby, R., Smith, I., and Landay,J. A. (2008b). Activity sensing in the wild: a field trial of ubifit garden.In Proceedings of the SIGCHI Conference on Human Factors in ComputingSystems, CHI ’08, pages 1797–1806. ACM.
Consolvo, S. and Walker, M. (2003). Using the experience sampling method toevaluate ubicomp applications. IEEE Pervasive Computing, 2(2):24–31.
Cordeiro, F., Bales, E., Cherry, E., and Fogarty, J. (2015). Rethinking the mobilefood journal: Exploring opportunities for lightweight photo-based capture.In Proceedings of the 33rd Annual ACM Conference on Human Factors inComputing Systems, pages 3207–3216. ACM.
278 BIBLIOGRAPHY
Couger, J. D., Adelsberger, H., Borovits, I., Zviran, M., and Motiwalla, J. (1990).Commonalities in motivating environments for programmer/analysts in austria,israel, singapore, and the usa. Information & Management, 18(1):41–46.
Csikszentmihalyi, M. and Larson, R. (2014). Validity and reliability of theexperience-sampling method. In Flow and the foundations of positive psychol-ogy, pages 35–54. Springer.
Cutrell, E., Czerwinksi, M., and Horvitz, E. (2000). Notification, Disruption,and Memory: Effects of Messaging Interruptions on Memory and Performance.(1999).
Czerwinski, M., Cutrell, E., and Horvitz, E. (2000). Instant messaging: Effectsof relevance and timing. In People and Computers XIV: Proceedings of HCI2000, volume 2, pages 71–76.
Czerwinski, M., Horvitz, E., and Wilhite, S. (2004). A diary study of taskswitching and interruptions. In Proceedings of the SIGCHI conference onHuman factors in computing systems, pages 175–182. ACM.
Dabbish, L. A. and Kraut, R. E. (2006). Email overload at work: an analysis offactors associated with email strain. In Proceedings of the 2006 20th anniversaryconference on Computer supported cooperative work, pages 431–440. ACM.
Danaher, K. and Crandall, C. S. (2008). Stereotype threat in applied settingsre-examined. Journal of Applied Social Psychology, 38(6):1639–1655.
Daniel, W. W. and Cross, C. L. (2018). Biostatistics: a foundation for analysisin the health sciences. Wiley.
Daskalova, N., Metaxa-Kakavouli, D., Tran, A., Nugent, N., Boergers, J.,McGeary, J., and Huang, J. (2016). SleepCoacher: A Personalized AutomatedSelf-Experimentation System for Sleep Recommendations. In Proceedings ofthe 29th Annual Symposium on User Interface Software and Technology, pages347–358.
BIBLIOGRAPHY 279
DeMarco, T. and Lister, T. (1985). Programmer performance and the effects ofthe workplace. In Proceedings of the 8th international conference on Softwareengineering, pages 268–272. IEEE Computer Society Press.
DeMarco, T. and Lister, T. (2013). Peopleware: productive projects and teams.Addison-Wesley.
DeskTime (2019). https://desktime.com. Retrieved January 28, 2019.
Devanbu, P., Karstu, S., Melo, W., and Thomas, W. (1996). Analytical andempirical evaluation of software reuse metrics. In Proceedings of the 18thInternational Conference on Software Engineering, ICSE ’96, pages 189–199.IEEE.
Di Stefano, G., Gino, F., Pisano, G. P., and Staats, B. R. (2016). Makingexperience count: The role of reflection in individual learning. HarvardBusiness School NOM Unit Working Paper, (14-093):14–093.
Dodd, N. G. and Ganster, D. C. (1996). The interactive effects of variety, auton-omy, and feedback on attitudes and performance. Journal of OrganizationalBehavior, 17(4):329–347.
Donohue, B. (2018). Three-day no-meeting schedule for en-gineers. https://medium.com/@Pinterest_Engineering/three-day-no-meeting-schedule-for-engineers-fca9f857a567.
Doran, G. T. (1981). There’s a smart way to write management’s goals andobjectives. Management review, 70(11):35–36.
Dragunov, A. N., Dietterich, T. G., Johnsrude, K., McLaughlin, M., Li, L.,and Herlocker, J. L. (2005). Tasktracer: A desktop environment to supportmulti-tasking knowledge workers. In Proceedings of the 10th InternationalConference on Intelligent User Interfaces, IUI ’05, pages 75–82. ACM.
Edelson, M., Sharot, T., Dolan, R. J., and Dudai, Y. (2011). Following the crowd:brain substrates of long-term memory conformity. science, 333(6038):108–111.
280 BIBLIOGRAPHY
Enns, H. G., Ferratt, T. W., and Prasad, J. (2006). Beyond stereotypes of itprofessionals: Implications for it hr practices. Commun. ACM, 49(4).
Epstein, D. A., Avrahami, D., and Biehl, J. T. (2016a). Taking 5: Work-Breaks, Productivity, and Opportunities for Personal Informatics for KnowledgeWorkers. In Proceedings of the 2016 CHI Conference on Human Factors inComputing Systems.
Epstein, D. A., Caraway, M., Johnston, C., Ping, A., Fogarty, J., and Munson,S. A. (2016b). Beyond Abandonment to Next Steps: Understanding andDesigning for Life After Personal Informatics Tool Use. In Proceedings ofthe 2016 CHI Conference on Human Factors in Computing Systems, pages1109–1113.
Epstein, D. A., Ping, A., Fogarty, J., and Munson, S. A. (2015). A livedinformatics model of personal informatics. In Proceedings of the 2015 ACMInternational Joint Conference on Pervasive and Ubiquitous Computing, pages731–742. ACM.
Fisher, C. D. (2000). Mood and emotions while working: missing pieces of jobsatisfaction? Journal of Organizational Behavior, 21(2):185–202.
Fitbit (2019). http://fitbit.com. Retrieved March 19, 2019.
Flyvbjerg, B. (2006). Five misunderstandings about case-study research. Quali-tative inquiry, 12(2):219–245.
Fogarty, J., Ko, A. J., Aung, H. H., Golden, E., Tang, K. P., and Hudson,S. E. (2005). Examining task engagement in sensor-based statistical modelsof human interruptibility. Proceedings of the SIGCHI conference on Humanfactors in computing systems - CHI ’05, page 331.
Fogarty, J., Lai, J., and Christensen, J. (2004). Presence versus availability: thedesign and evaluation of a context-aware communication client. InternationalJournal of Human-Computer Studies, 61(3):299–317.
BIBLIOGRAPHY 281
Fogg, B. J. (2003). Persuasive Technology: Using Computers to Change WhatWe Think and Do. Interactive Technologies. Elsevier Science.
Fredrickson, B. L. (1998). What good are positive emotions? Review of generalpsychology, 2(3):300.
Fredrickson, B. L., Cohn, M. A., Coffey, K. A., Pek, J., and Finkel, S. M. (2008).Open hearts build lives: positive emotions, induced through loving-kindnessmeditation, build consequential personal resources. Journal of personality andsocial psychology, 95(5):1045.
Fritz, T., Huang, E. M., Murphy, G. C., and Zimmermann, T. (2014). Persuasivetechnology in the real world: A study of long-term use of activity sensingdevices for fitness. In Proceedings of the SIGCHI Conference on Human Factorsin Computing Systems, CHI ’14, pages 487–496. ACM.
Fritz, T. and Murphy, G. C. (2010). Using information fragments to answer thequestions developers ask. In Proceedings of the 32nd ACM/IEEE InternationalConference on Software Engineering - Volume 1, volume 1, page 175. ACMPress.
Galesic, M. and Garcia-Retamero, R. (2011). Graph literacy a cross-culturalcomparison. Medical Decision Making, 31(3):444–457.
Gasser, R., Brodbeck, D., Degen, M., Luthiger, J., Wyss, R., and Reichlin, S.(2006). Persuasiveness of a mobile lifestyle coaching application using socialfacilitation. In International Conference on Persuasive Technology, pages27–38. Springer.
Goler, L., Gale, J., and Grant, A. (2019). Let’s not killperformance evaluations yet. https://hbr.org/2016/11/lets-not-kill-performance-evaluations-yet.
Gonçalves, M. K., de Souza, L., and González, V. M. (2011). Collaboration,information seeking and communication: An observational study of software
282 BIBLIOGRAPHY
developers’ work practices. Journal of Universal Computer Science, 17(14):1913–1930.
González, V. M. and Mark, G. (2004). Constant, constant, multi-tasking craziness:Managing multiple working spheres. In Proceedings of the SIGCHI Conferenceon Human Factors in Computing Systems, CHI ’04, pages 113–120. ACM.
Graziotin, D., Fagerholm, F., Wang, X., and Abrahamsson, P. (2017). On theUnhappiness of Software Developers. pages 324–333.
Graziotin, D., Wang, X., and Abrahamsson, P. (2014a). Happy software develop-ers solve problems better: psychological measurements in empirical softwareengineering. PeerJ, 2:e289.
Graziotin, D., Wang, X., and Abrahamsson, P. (2014b). Software developers,moods, emotions, and performance. IEEE Software, 31(4):24–27.
Graziotin, D., Wang, X., and Abrahamsson, P. (2015a). Do feelings matter?on the correlation of affects and the self-assessed productivity in softwareengineering. Journal of Software: Evolution and Process, 27(7):467–487.
Graziotin, D., Wang, X., and Abrahamsson, P. (2015b). How do you feel,developer? an explanatory theory of the impact of affects on programmingperformance. PeerJ Computer Science, 1:e18.
Guest, G., Bunce, A., and Johnson, L. (2006). How many interviews are enough?an experiment with data saturation and variability. Field methods, 18(1):59–82.
Gustafson, K. L. and Bennett Jr, W. (2002). Promoting learner reflection: Issuesand difficulties emerging from a three-year study. Technical report, GeorgiaUniversity Athens, Department of Instructional Technology.
Gustafsson, F. and Gustafsson, F. (2000). Adaptive filtering and change detection,volume 1. Citeseer.
BIBLIOGRAPHY 283
Hassib, M., Khamis, M., Friedl, S., Schneegass, S., and Alt, F. (2017). Brainat-work: Logging cognitive engagement and tasks in the workplace using elec-troencephalography. In Proceedings of the 16th International Conference onMobile and Ubiquitous Multimedia, MUM ’17, pages 305–310. ACM.
Herrmanny, K., Ziegler, J., and Dogangün, A. (2016). Supporting users in settingeffective goals in activity tracking. In Proceedings of the 11th InternationalConference on Persuasive Technology - Volume 9638, Persuasive 2016, pages15–26. Springer-Verlag.
Hincapié-Ramos, J. D., Voida, S., and Mark, G. (2011a). A design spaceanalysis of availability-sharing systems. In Proceedings of the 24th annualACM symposium on User interface software and technology, pages 85–96. ACM.
Hincapié-Ramos, J. D., Voida, S., and Mark, G. (2011b). Sharing availabil-ity information with interruptme. In Proceedings of the 13th internationalconference on Ubiquitous computing, pages 477–478. ACM.
Ho, J. and Intille, S. S. (2005). Using context-aware computing to reduce theperceived burden of interruptions from mobile devices. In Proceedings of theSIGCHI conference on Human factors in computing systems, pages 909–918.ACM.
Hofstede, G. (1994). Cultures and Organizations: Software of the Mind : Inter-cultural Cooperation and Its Importance for Survival. HarperCollins.
Hofstede, G. H. and Arrindell, W. A. (1998). Masculinity and femininity: Thetaboo dimension of national cultures, volume 3 of Cross Cultural Psychology.Sage.
Hollis, V., Konrad, A., and Whittaker, S. (2015). Change of Heart: EmotionTracking to Promote Behavior Change. Proceedings of the 33rd Annual ACMConference on Human Factors in Computing Systems (CHI ’15), pages 2643–2652.
284 BIBLIOGRAPHY
Horvitz, E., Koch, P., Kadie, C. M., and Jacobs, A. (2002). Coordinate: Proba-bilistic forecasting of presence and availability. In Proceedings of the Eighteenthconference on Uncertainty in artificial intelligence, pages 224–233. MorganKaufmann Publishers Inc.
Huang, D., Tory, M., and Bartram, L. (2016). A Field Study of On-CalendarVisualizations. In Proceedings of Graphics Interface 2016, pages 13–20.
Hudson, R. L. and Davis, J. L. (1972). The effects of intralist cues, extralist cues,and category names on categorized recall. Psychonomic Science, 29(2):71–75.
Hudson, S., Fogarty, J., Atkeson, C., Avrahami, D., Forlizzi, J., Kiesler, S., Lee,J., and Yang, J. (2003). Predicting human interruptibility with sensors: awizard of oz feasibility study. In Proceedings of the SIGCHI conference onHuman factors in computing systems, pages 257–264. ACM.
Humphrey, W. S. (1996). Using a defined and measured personal software process.IEEE, 13(3):77–88.
Humphrey, W. S. (2000). The Personal Software Process (PSP). (November).
Iqbal, S. T. and Bailey, B. P. (2007). Understanding and developing modelsfor detecting and differentiating breakpoints during interactive tasks. InProceedings of the SIGCHI Conference on Human Factors in ComputingSystems, CHI ’07, pages 697–706. ACM.
Iqbal, S. T. and Bailey, B. P. (2008). Effects of intelligent notification managementon users and their tasks. In Proceedings of the SIGCHI Conference on HumanFactors in Computing Systems, pages 93–102. ACM.
Iqbal, S. T. and Horvitz, E. (2007). Disruption and recovery of computing tasks:Field study, analysis, and directions. In Proceedings of the SIGCHI Conferenceon Human Factors in Computing Systems, CHI ’07, pages 677–686. ACM.
Isaacs, E., Whittaker, S., Frohlich, D., and O’Conaill, B. (1997). Informal com-munication re-examined: New functions for video in supporting opportunisticencounters. Video-mediated communication, 997:459–485.
BIBLIOGRAPHY 285
Jakobsen, M. R., Fernandez, R., Czerwinski, M., Inkpen, K., Kulyk, O., andRobertson, G. G. (2009). Wipdash: Work item and people dashboard for soft-ware development teams. In IFIP Conference on Human-Computer Interaction,pages 791–804. Springer.
John, O. P. and Srivastava, S. (1999). The big five trait taxonomy: History,measurement, and theoretical perspectives. Handbook of personality: Theoryand research, 2(1999):102–138.
Johnson, P. M. and Disney, A. M. (1998). The personal software process: Acautionary case study. IEEE Software, 15(6):85–88.
Johnson, P. M., Kou, H., Agustin, J., Chan, C., Moore, C., Miglani, J., Zhen, S.,and Doane, W. E. J. (2003). Beyond the personal software process: Metricscollection and analysis for the differently disciplined. In Proceedings of the 25thInternational Conference on Software Engineering, ICSE ’03, pages 641–646.IEEE.
Johnson, S. M. and White, G. (1971). Self-observation as an agent of behavioralchange. Behavior Therapy, 2(4):488–497.
Jones, C. (1994). Software metrics: good, bad and missing. Computer, 27(9):98–100.
Jones, S. L. and Kelly, R. (2017). Dealing With Information Overload inMultifaceted Personal Informatics Systems. Human Computer Interaction,pages 1–48.
Joo, B. K. B. and Park, S. (2010). Career satisfaction, organizational commitment,and turnover intention: The effects of goal orientation, organizational learningculture and developmental feedback. Leadership & Organization DevelopmentJournal, 31(6):482–500.
Kahn, B. E. and Isen, A. M. (1993). The influence of positive affect on varietyseeking among safe, enjoyable products. Journal of Consumer Research,20(2):257–270.
286 BIBLIOGRAPHY
Kalliamvakou, E., Bird, C., Zimmermann, T., Begel, A., DeLine, R., and German,D. M. (2019). What makes a great manager of software engineers? IEEETransactions on Software Engineering, 45(1):87–106.
Kandolin, I., Härmä, M., and Toivanen, M. (2001). Flexible working hours andwell-being in finnland. Journal of Human Ergology, 30(1-2):35–40.
Kaufman, L. and Rousseeuw, P. (1987). Clustering by means of medoids. North-Holland.
Kay, M., Choe, E. K., Shepherd, J., Greenstein, B., Watson, N., Consolvo, S.,and Kientz, J. A. (2012). Lullaby: A capture and access system for under-standing the sleep environment. In Proceedings of the 2012 ACM Conferenceon Ubiquitous Computing, UbiComp ’12, pages 226–234. ACM.
Kelly, A. (2008). Changing Software Development: Learning to Become Agile.Wiley.
Kersten, M. and Murphy, G. C. (2006). Using task context to improve program-mer productivity. In Proceedings of the 14th ACM SIGSOFT InternationalSymposium on Foundations of Software Engineering, SIGSOFT ’06/FSE-14,pages 1–11. ACM.
Kersten-van Dijk, E. T., Westerink, J. H., Beute, F., and IJsselsteijn, W. A.(2017). Personal informatics, self-insight, and behavior change: A criticalreview of current literature. Human–Computer Interaction, 32(5-6):268–296.
Kevic, K. and Fritz, T. (2017). Towards activity-aware tool support for changetasks. In 2017 IEEE International Conference on Software Maintenance andEvolution (ICSME), pages 171–182.
Khan, I. A., Brinkman, W.-P., and Hierons, R. M. (2011). Do moods affectprogrammers’ debug performance? Cognition, Technology & Work, 13(4):245–258.
Kim, Y.-H. and Choe, E. K. (2019). Understanding Personal Productivity: HowKnowledge Workers Define, Evaluate, and Reflect on Their Productivity. In
BIBLIOGRAPHY 287
Proceedings of the 2019 CHI Conference on Human Factors in ComputingSystems - CHI ’19, number May.
Kim, Y.-H., Jeon, J. H., Choe, E. K., Lee, B., Kim, K., and Seo, J. (2016).TimeAware: Leveraging Framing Effects to Enhance Personal Productivity.In Proceedings of the 2016 CHI Conference on Human Factors in ComputingSystems (CHI ’16), pages 272–283.
Kitchenham, B. A. and Pfleeger, S. L. (2008). Personal opinion surveys. InGuide to advanced empirical software engineering, pages 63–92. Springer.
Klasnja, P., Consolvo, S., McDonald, D. W., Landay, J. A., and Pratt, W. (2009).Using mobile & personal sensing technologies to support health behavior changein everyday life: lessons learned. In AMIA Annual Symposium Proceedings,volume 2009, page 338. American Medical Informatics Association.
Klasnja, P., Consolvo, S., and Pratt, W. (2011). How to Evaluate Technologiesfor Health Behavior Change in HCI Research. In Proceedings of the SIGCHIConference on Human Factors in Computing Systems, pages 3063–3072.
Ko, A. J., DeLine, R., and Venolia, G. (2007). Information needs in collocatedsoftware development teams. In Proceedings of the 29th International Con-ference on Software Engineering, ICSE ’07, pages 344–353. IEEE ComputerSociety.
Kocielnik, R., Avrahami, D., Marlow, J., Lu, D., and Hsieh, G. (2018). Designingfor workplace reflection: a chat and voice-based conversational agent. InProceedings of the 2018 on Designing Interactive Systems Conference 2018,pages 881–894. ACM.
Koldijk, S., Staalduinen, M. V., Raaijmakers, S., and Kraaij, W. (2011). Activity-Logging for Self-Coaching of Knowledge Workers. pages 0–3.
Koldijk, S., van Staalduinen, M., Neerincx, M., and Kraaij, W. (2012). Real-time task recognition based on knowledge workers’ computer activities. In
288 BIBLIOGRAPHY
Proceedings of the 30th European Conference on Cognitive Ergonomics, ECCE’12, pages 152–159. ACM.
Krogstie, B., Prilla, M., Wessel, D., Knipfer, K., and Pammer, V. (2012).Computer support for reflective learning in the workplace: A model. pages151–153.
Lai, J., Yoshihama, S., Bridgman, T., Podlaseck, M., Chou, P. B., and Wong,D. C. (2003). Myteam: Availability awareness through the use of sensor data.In INTERACT.
Lange, P. G. (2008). Interruptions and intertasking in distributed knowledgework. NAPA Bulletin, 30(1):128–147.
Larson, R. and Csikszentmihalyi, M. (2014). The experience sampling method.In Flow and the foundations of positive psychology, pages 21–34. Springer.
LaToza, T. D., Venolia, G., and DeLine, R. (2006). Maintaining mental models:a study of developer work habits. In Proceedings of the 28th internationalconference on Software engineering, pages 492–501. ACM.
LeBoeuf, R. A. and Shafir, E. (2009). Anchoring on the" here" and" now" intime and distance judgments. Journal of Experimental Psychology: Learning,Memory, and Cognition, 35(1):81.
Lee, J., Walker, E., Burleson, W., and Hekler, E. B. (2014). Exploring users’creation of personalized behavioral plans. In Proceedings of the 2014 ACM In-ternational Joint Conference on Pervasive and Ubiquitous Computing: AdjunctPublication, pages 703–706. ACM.
Lee, J., Walker, E., Burleson, W., and Hekler, E. B. (2015). Understanding users’creation of behavior change plans with theory-based support. In Proceedingsof the 33rd Annual ACM Conference Extended Abstracts on Human Factors inComputing Systems, pages 2301–2306. ACM.
Lee, J., Walker, E., Burleson, W., Kay, M., Buman, M., and Hekler, E. B.(2017). Self-Experimentation for Behavior Change. In Proceedings of the 2017
BIBLIOGRAPHY 289
CHI Conference on Human Factors in Computing Systems - CHI ’17, pages6837–6849.
Lemaître, G., Nogueira, F., and Aridas, C. K. (2017). Imbalanced-learn: Apython toolbox to tackle the curse of imbalanced datasets in machine learning.Journal of Machine Learning Research, 18(17):1–5.
Li, I., Dey, A., and Forlizzi, J. (2010). A stage-based model of personal informaticssystems. Proceedings of the 28th international conference on Human factorsin computing systems (CHI ’10), page 557.
Li, I., Dey, A., and Forlizzi, J. (2011). Understanding my data, myself: sup-porting self-reflection with Ubicomp technologies. In Proceedings of the 13thinternational conference on Ubiquitous computing (UbiComp ’11), page 405.
Li, P. L., Ko, A. J., and Zhu, J. (2015). What makes a great software engineer?In Proceedings of the 37th International Conference on Software Engineering -Volume 1, ICSE ’15, pages 700–710. IEEE Press.
Liaw, A., Wiener, M., et al. (2002). Classification and regression by randomforest.R news, 2(3):18–22.
Lin, J., Mamykina, L., Lindtner, S., Delajoux, G., and Strub, H. (2006).Fish’n’Steps: Encouraging Physical Activity with an Interactive ComputerGame. In UbiComp 2006: Ubiquitous Computing, volume 4206 of LectureNotes in Computer Science, chapter 16, pages 261–278.
Locke, E. A. and Latham, G. P. (1990). A theory of goal setting & task perfor-mance. Prentice-Hall, Inc.
Locke, E. A. and Latham, G. P. (2002). Building a practically useful theory ofgoal setting and task motivation: A 35-year odyssey. American psychologist,57(9):705.
Lott, Y. and Chung, H. (2016). Gender discrepancies in the outcomes of schedulecontrol on overtime hours and income in germany. European SociologicalReview, 32(6):752–765.
290 BIBLIOGRAPHY
Lu, D., Marlow, J., Kocielnik, R., and Avrahami, D. (2018). Challenges andopportunities for technology-supported activity reporting in the workplace.In Proceedings of the 2018 CHI Conference on Human Factors in ComputingSystems, CHI ’18, pages 170:1–170:12. ACM.
Maalej, W., Ellmann, M., and Robbes, R. (2017). Using contexts similarity topredict relationships between tasks. Journal of Systems and Software, 128:267– 284.
Mamykina, L., Mynatt, E., Davidson, P., and Greenblatt, D. (2008). Mahi:Investigation of social scaffolding for reflective thinking in diabetes management.In Proceedings of the SIGCHI Conference on Human Factors in ComputingSystems, CHI ’08, pages 477–486. ACM.
Manictime (2019). http://manictime.com. Retrieved March 19, 2019.
Marcus, B. and Schütz, A. (2005). Who are the people reluctant to participatein research? personality correlates of four different types of nonresponse asinferred from self- and observer ratings. Journal of Personality, 73(4):959–984.
Mark, G., Czerwinski, M., and Iqbal, S. T. (2018). Effects of Individual Differencesin Blocking Workplace Distractions. In CHI ’18. ACM.
Mark, G., Gonzalez, V. M., and Harris, J. (2005). No task left behind?: examiningthe nature of fragmented work. In Proceedings of the SIGCHI conference onHuman factors in computing systems, pages 321–330. ACM.
Mark, G., Gudith, D., and Klocke, U. (2008a). The cost of interrupted work:more speed and stress. In Proceedings of the SIGCHI conference on HumanFactors in Computing Systems, pages 107–110. ACM.
Mark, G., Gudith, D., and Klocke, U. (2008b). The Cost of Interrupted Work :More Speed and Stress. In CHI 2008: Proceedings of the SIGCHI Conferenceon Human Factors in Computing Systems, pages 107–110.
Mark, G., Iqbal, S., and Czerwinski, M. (2017). How blocking distractionsaffects workplace focus and productivity. In Proceedings of the 2017 ACM
BIBLIOGRAPHY 291
International Joint Conference on Pervasive and Ubiquitous Computing andProceedings of the 2017 ACM International Symposium on Wearable Computerson - UbiComp ’17, pages 928–934.
Mark, G., Iqbal, S. T., Czerwinski, M., and Johns, P. (2014). Bored mondaysand focused afternoons: The rhythm of attention and online activity in theworkplace. In Proceedings of the SIGCHI Conference on Human Factors inComputing Systems, pages 3025–3034. ACM.
Mark, G., Iqbal, S. T., Czerwinski, M., Johns, P., and Sano, A. (2016a). EmailDuration, Batching and Self-interruption: Patterns of Email Use on Productiv-ity and Stress. In Proceedings of the 2016 CHI Conference on Human Factorsin Computing Systems (CHI ’16), volume 21, pages 98–109.
Mark, G., Iqbal, S. T., Czerwinski, M., Johns, P., and Sano, A. (2016b). NeuroticsCan’t Focus: An in situ Study of Online Multitasking in the Workplace. InProceedings of the SIGCHI Conference on Human Factors in ComputingSystems, pages 1739–1744.
Mathan, S., Whitlow, S., Dorneich, M., Ververs, P., and Davis, G. (2007).Neurophysiological estimation of interruptibility: Demonstrating feasibility ina field context. In In Proceedings of the 4th International Conference of theAugmented Cognition Society.
Mathur, A., Broeck, M. V. D., Vanderhulst, G., Mashhadi, A., and Kawsar, F.(2015). Tiny Habits in the Giant Enterprise: Understanding the Dynamics ofa Quantified Workplace. In Proceedings of the Joint International Conferenceon Pervasive and Ubiquitous Computing and the International Symposium onWearable Computers (Ubicomp/ISWC’15), pages 577–588.
Matthews, G. (2007). The impact of commitment, accountability, and writtengoals on goal achievement. In 87th Convention of the Western PsychologicalAssociation.
Mazmanian, M. (2013). Avoiding the trap of constant connectivity: When
292 BIBLIOGRAPHY
congruent frames allow for heterogeneous practices. Academy of ManagementJournal, 56(5):1225–1250.
McDuff, D., Karlson, A., and Kapoor, A. (2012). AffectAura: an IntelligentSystem for Emotional Memory. ACM.
McFarlane, D. (2002). Comparison of four primary methods for coordinatingthe interruption of people in human-computer interaction. Human-ComputerInteraction, 17(1):63–139.
Melamed, S., Ben-Avi, I., Luz, J., and Green, M. S. (1995). Objective andsubjective work monotony: Effects on job satisfaction, psychological distress,and absenteeism in blue-collar workers. Journal of Applied Psychology, 80(1):29.
Melo, C., Cruzes, D. S., Kon, F., and Conradi, R. (2011). Agile team perceptionsof productivity factors. In 2011 Agile Conference, pages 57–66. IEEE.
Menon, G. (1994). Judgments of behavioral frequencies: Memory search andretrieval strategies. In Schwarz, N. and Sudman, S., editors, AutobiographicalMemory and the Validity of Retrospective Reports, pages 161–172. Springer.
Meyer, A., Barr, E. T., Bird, C., and Zimmermann, T. (2019). Today was a goodday: The daily life of software developers. IEEE Transactions on SoftwareEngineering, pages 1–1.
Meyer, A. N., Barton, L. E., Murphy, G. C., Zimmermann, T., and Fritz, T.(2017a). The Work Life of Developers: Activities, Switches and PerceivedProductivity. Transactions of Software Engineering, pages 1–15.
Meyer, A. N., Fritz, T., Murphy, G. C., and Zimmermann, T. (2014). Softwaredevelopers’ perceptions of productivity. In Proceedings of the 22Nd ACMSIGSOFT International Symposium on Foundations of Software Engineering,FSE 2014, pages 19–29. ACM.
Meyer, A. N., Murphy, G. C., Zimmermann, T., and Fritz, T. (2017b). Designrecommendations for self-monitoring in the workplace: Studies in softwaredevelopment. Proc. ACM Hum.-Comput. Interact., 1(CSCW):79:1–79:24.
BIBLIOGRAPHY 293
Meyer, A. N., Zimmermann, T., and Fritz, T. (2017c). Characterizing SoftwareDevelopers by Perceptions of Productivity. In Empirical Software Engineeringand Measurement (ESEM), 2017 International Symposium on.
MicrosoftGraphApi (2019). https://graph.microsoft.io. Retrieved March19, 2019.
Milewski, A. E. and Smith, T. M. (2000). Providing presence cues to telephoneusers. In Proceedings of the 2000 ACM conference on Computer supportedcooperative work, pages 89–96. ACM.
Minelli, R., Mocci, A., and Lanza, M. (2015). I KnowWhat You Did Last Summer– An Investigation of How Developers Spend Their Time. Proceedings of ICPC2015 (23rd IEEE International Conference on Program Comprehension), pages25—-35.
Mintzberg, H. (1980). The nature of managerial work. Theory of managementpolicy series. Prentice-Hall.
Mirza, H. T., Chen, L., Chen, G., Hussain, I., and He, X. (2011a). Switchdetector: an activity spotting system for desktop. In Proceedings of the 20thACM international conference on Information and knowledge management,pages 2285–2288. ACM.
Mirza, H. T., Chen, L., Hussain, I., Majid, A., and Chen, G. (2015). A studyon automatic classification of users’ desktop interactions. Cybernetics andSystems, 46(5):320–341.
Mirza, H. T., Chen, L., Majid, A., and Chen, G. (2011b). Building user task spaceby mining temporally proximate desktop actions. Cybernetics and Systems,42(8):585–604.
Mockus, A. and Herbsleb, J. D. (2002). Expertise browser: a quantitativeapproach to identifying expertise. In Proceedings of the 24th InternationalConference on Software Engineering. ICSE 2002, pages 503–512.
294 BIBLIOGRAPHY
Monk, C. A., Trafton, J. G., and Boehm-Davis, D. A. (2008). The effect ofinterruption duration and demand on resuming suspended goals. Journal ofExperimental Psychology: Applied, 14(4):299–313.
Monkaresi, H., Calvo, R., Pardo, A., Chow, K., Mullan, B., Lam, M., Twigg, S.,and Cook, D. (2013). Intelligent diabetes lifestyle coach. In OzCHI workshopsprogramme.
Moon, J. (2013). Reflection in Learning and Professional Development: Theoryand Practice. Taylor & Francis.
Morisano, D., Hirsh, J. B., Peterson, J. B., Pihl, R. O., and Shore, B. M.(2010). Setting, elaborating, and reflecting on personal goals improves academicperformance. Journal of applied psychology, 95(2):255.
Muller, J. (2018). The Tyranny of Metrics. Princeton University Press.
Müller, S. C. and Fritz, T. (2015). Stuck and frustrated or in flow and happy:Sensing developers’ emotions and progress. In Software Engineering (ICSE),2015 IEEE/ACM 37th IEEE International Conference on, volume 1, pages688–699. IEEE.
Munson, S. and Consolvo, S. (2012). Exploring Goal-setting, Rewards, Self-monitoring, and Sharing to Motivate Physical Activity. Proceedings of the 6thInternational Conference on Pervasive Computing Technologies for Healthcare,pages 25–32.
Murgia, A., Tourani, P., Adams, B., and Ortu, M. (2014). Do developersfeel emotions? an exploratory analysis of emotions in software artifacts. InProceedings of the 11th Working Conference on Mining Software Repositories,MSR 2014, pages 262–271. ACM.
Murphy, G. C., Kersten, M., Robillard, M. P., and Čubranić, D. (2005). Theemergent structure of development tasks. In ECOOP 2005 - Object-OrientedProgramming, pages 33–48. Springer Berlin Heidelberg.
BIBLIOGRAPHY 295
Murphy-Hill, E., Jaspan, C., Sadowski, C., Shepherd, D. C., Phillips, M., Winter,C., Dolan, A. K., Smith, E. K., and Jorde, M. A. (2019). What predictssoftware developers’ productivity? Transactions on Software Engineering.
Nair, R., Voida, S., and Mynatt, E. D. (2005). Frequency-based detection of taskswitches. In Proceedings of the 19th British HCI Group Annual Conference,volume 2, pages 94–99.
Naur, P. and Randell, B. (1969). Software engineering: Report of a conferencesponsored by the nato science committee. Scientific Affairs Division, NATO.
Nazar, N., Hu, Y., and Jiang, H. (2016). Summarizing software artifacts: Aliterature review. Journal of Computer Science and Technology, 31(5):883–909.
Neter, J. and Waksberg, J. (1964). A study of response errors in expenditures datafrom household interviews. Journal of the American Statistical Association,59(305):18–55.
Nguyen, G. H., Bouzerdoum, A., and Phung, S. L. (2009). Learning PatternClassification Tasks with Imbalanced Data Sets. Pattern Recognition.
Niemantsverdriet, K. and Erickson, T. (2017). Recurring meetings: An experien-tial account of repeating meetings in a large organization. Proceedings of theACM on Human-Computer Interaction, 1:1–17.
Oliver, N., Czerwinski, M., Smith, G., and Roomp, K. (2008). Relalttab: assistingusers in switching windows. In IUI.
Oliver, N., Smith, G., Thakkar, C., and Surendran, A. C. (2006). Swish: Semanticanalysis of window titles and switching history. In Proceedings of the 11thInternational Conference on Intelligent User Interfaces, IUI ’06, pages 194–201.ACM.
Origo, F. and Pagani, L. (2008). Workplace flexibility and job satisfaction: Someevidence from europe. 29:539–566.
296 BIBLIOGRAPHY
Ouweneel, E., Le Blanc, P. M., Schaufeli, W. B., and van Wijhe, C. I. (2012).Good morning, good day: A diary study on positive emotions, hope, and workengagement. Human Relations, 65(9):1129–1154.
OxfordDictionary (2019). Oxforddictionary.https://en.oxforddictionaries.com/definition/productivity. RetrievedFebruary 27, 2019.
Pammer, V., Bratic, M., Feyertag, S., and Faltin, N. (2015). The Value ofSelf-tracking and the Added Value of Coaching in the Case of Improving TimeManagement, pages 467–472. Springer International Publishing.
Parnin, C. and DeLine, R. (2010a). Evaluating cues for resuming interruptedprogramming tasks. Proceedings of the 28th international conference on Humanfactors in computing systems - CHI ’10, page 93.
Parnin, C. and DeLine, R. (2010b). Evaluating cues for resuming interruptedprogramming tasks. In Proceedings of the SIGCHI Conference on HumanFactors in Computing Systems, pages 93–102. ACM.
Parnin, C. and Rugaber, S. (2009). Resumption strategies for interruptedprogramming tasks. In 2009 IEEE 17th International Conference on ProgramComprehension, pages 80–89.
Parnin, C. and Rugaber, S. (2011). Resumption strategies for interruptedprogramming tasks. Software Quality Journal, 19(1):5–34.
Pedregosa, F., Varoquaux, G., Gramfort, A., Michel, V., Thirion, B., Grisel, O.,Blondel, M., Prettenhofer, P., Weiss, R., Dubourg, V., et al. (2011a). Scikit-learn: Machine learning in python. Journal of machine learning research,12(Oct):2825–2830.
Pedregosa, F., Varoquaux, G., Gramfort, A., Michel, V., Thirion, B., Grisel,O., Blondel, M., Prettenhofer, P., Weiss, R., Dubourg, V., Vanderplas, J.,Passos, A., Cournapeau, D., Brucher, M., Perrot, M., and Duchesnay, E.
BIBLIOGRAPHY 297
(2011b). Scikit-learn: Machine learning in Python. Journal of MachineLearning Research, 12:2825–2830.
Perlow, L. A. (1999). The time famine: Toward a sociology of work time.Administrative science quarterly, 44(1):57–81.
Perry, D. E., Staudenmayer, N., and Votta, L. G. (1994a). People, organizations,and process improvement. IEEE Softw., 11(4):36–45.
Perry, D. E., Staudenmayer, N. A., and Votta, L. G. (1994b). People, organiza-tions, and process improvement. IEEE Software, 11(4):36–45.
Petrou, P., Demerouti, E., Peeters, M. C., Schaufeli, W. B., and Hetland, J.(2012). Crafting a job on a daily basis: Contextual correlates and the link towork engagement. Journal of Organizational Behavior, 33(8):1120–1141.
PomodoroTechnique (2019). pomodorotechnique.com. Retrieved March 19, 2019.
Prasad, A., Sorber, J., Stablein, T., Anthony, D., and Kotz, D. (2012). Under-standing sharing preferences and behavior for mhealth devices. In Proceedingsof the 2012 ACM workshop on Privacy in the electronic society, pages 117–128.ACM.
Prestwich, A., Perugini, M., and Hurling, R. (2009). Can the effects of implemen-tation intentions on exercise be enhanced using text messages? Psychologyand Health, 24(6):677–687.
Prochaska, J. O. and Velicer, W. F. (1997). The Transtheoretical Change Modelof Health Behavior. American Journal of Health Promotion, 12(1):38–48.
Punter, T., Ciolkowski, M., Freimut, B., and John, I. (2003). Conducting on-linesurveys in software engineering. In International Symposium on EmpiricalSoftware Engineering, 2003. ISESE 2003. Proceedings., pages 80–88. IEEE.
Racine, J. (2000). Consistent cross-validatory model-selection for dependentdata: hv-block cross-validation. Journal of econometrics, 99(1):39–61.
298 BIBLIOGRAPHY
Rattenbury, T. and Canny, J. (2007). Caad: An automatic task support system.In Proceedings of the SIGCHI Conference on Human Factors in ComputingSystems, CHI ’07, pages 687–696. ACM.
Reinhardt, W., Schmidt, B., Sloep, P., and Drachsler, H. (2011). Knowledgeworker roles and actions - results of two empirical studies. Knowledge andProcess Management, 18(3):150–174.
RescueTime (2019). http://rescuetime.com. Retrieved March 19, 2019.
Robertson, G., Horvitz, E., Czerwinski, M., Baudisch, P., Hutchings, D. R.,Meyers, B., Robbins, D., and Smith, G. (2004). Scalable fabric: Flexible taskmanagement. In Proceedings of the Working Conference on Advanced VisualInterfaces, pages 85–89. ACM.
Robertson, G., Van Dantzich, M., Robbins, D., Czerwinski, M., Hinckley, K.,Risden, K., Thiel, D., and Gorokhovsky, V. (2000). The task gallery: a 3dwindow manager. In Proceedings of the SIGCHI conference on Human Factorsin Computing Systems, pages 494–501. ACM.
Robillard, M. and Murphy, G. (2004). Program navigation analysis to supporttask-aware software development environments. pages 83–88.
Robillard, M., Walker, R., and Zimmermann, T. (2010). Recommendationsystems for software engineering. IEEE Software, 27(4):80–86.
Rogelberg, S., Conway, J., E Sederburg, M., Spitzmuller, C., Aziz, S., andE Knight, W. (2004). Profiling active and passive nonrespondents to anorganizational survey. The Journal of applied psychology, 88:1104–14.
Rožman, M., Treven, S., and Čančer, V. (2017). Motivation and satisfaction ofemployees in the workplace. Business Systems Research Journal, 8.
Rooksby, J., Asadzadeh, P., Rost, M., Morrison, A., and Chalmers, M. (2016).Personal Tracking of Screen Time on Digital Devices. In Proceedings of the 2016CHI Conference on Human Factors in Computing Systems, pages 284–296.
BIBLIOGRAPHY 299
Rooksby, J., Rost, M., Morrison, A., and Chalmers, M. (2014). Personal trackingas lived informatics. In Proceedings of the SIGCHI Conference on HumanFactors in Computing Systems, CHI ’14, pages 1163–1172.
Rule, A., Tabard, A., Boyd, K., and Hollan, J. (2015). Restoring the Context ofInterrupted Work with Desktop Thumbnails. In 37th Annual Meeting of theCognitive Science Society, pages 1–6. Cognitive Science Society.
Ruostela, J., Lönnqvist, A., Palvalin, M., Vuolle, M., Patjas, M., and Raij, A.-L.(2015). ‘new ways of working’ as a tool for improving the performance of aknowledge-intensive company. Knowledge Management Research & Practice,13(4):382–390.
Sach, R., Sharp, H., and Petre, M. (2011). What makes software engineers gothat extra mile?
Sadowski, C. and Zimmermann, T. (2019). Rethinking Productivity in SoftwareEngineering. Apress.
Safer, I. and Murphy, G. C. (2007). Comparing episodic and semantic interfacesfor task boundary identification. In Proceedings of the 2007 conference of thecenter for advanced studies on Collaborative research, pages 229–243. IBMCorp.
Sahm, A. and Maalej, W. (2010). Switch! recommending artifacts needed nextbased on personal and shared context. In Software Engineering (Workshops),pages 473–484.
Samara, A., Galway, L., Bond, R., and Wang, H. (2017). Tracking and evaluationof pupil dilation via facial point marker analysis. In 2017 IEEE InternationalConference on Bioinformatics and Biomedicine (BIBM), pages 2037–2043.
Sanchez, H., Robbes, R., and Gonzalez, V. M. (2015). An empirical study of workfragmentation in software evolution tasks. In 2015 IEEE 22nd InternationalConference on Software Analysis, Evolution, and Reengineering, SANER 2015- Proceedings, pages 251–260.
300 BIBLIOGRAPHY
Sappelli, M., Pasi, G., Verberne, S., De Boer, M., and Kraaij, W. (2016).Assessing e-mail intent and tasks in e-mail messages. Information Sciences,358-359:1–17.
Sarma, A., Noroozi, Z., and Van Der Hoek, A. (2003). Palantír: raising awarenessamong configuration management workspaces. In Software Engineering, 2003.Proceedings. 25th International Conference on, pages 444–454. IEEE.
Schwarz, N. and Oyserman, D. (2001). Asking Questions About Behavior: Cog-nition, Communication, and Questionnaire Construction. American Journalof Evaluation, 22(2):127–160.
Sharot, T., Korn, C. W., and Dolan, R. J. (2011). How unrealistic optimism ismaintained in the face of reality. Nature neuroscience, 14(11):1475.
Sharp, H., Baddoo, N., Beecham, S., Hall, T., and Robinson, H. (2009). Modelsof motivation in software engineering. Information and software technology,51(1):219–233.
Sheldon, K. M., Ryan, R., and Reis, H. T. (1996). What makes for a good day?competence and autonomy in the day and in the person. Personality andsocial psychology bulletin, 22(12):1270–1279.
Shen, J., Irvine, J., Bao, X., Goodman, M., Kolibaba, S., Tran, A., Carl, F.,Kirschner, B., Stumpf, S., and Dietterich, T. (2009). Detecting and correctinguser activity switches: Algorithms and interfaces. pages 117–126.
Shen, J., Li, L., and Dietterich, T. G. (2007). Real-time detection of task switchesof desktop users. In IJCAI, volume 7, pages 2868–2873.
Shen, J., Li, L., Dietterich, T. G., and Herlocker, J. L. (2006). A hybrid learningsystem for recognizing user tasks from desktop activities and email messages. InProceedings of the 11th International Conference on Intelligent User Interfaces,IUI ’06, pages 86–92. ACM.
BIBLIOGRAPHY 301
Singer, J., Lethbridge, T., Vinson, N., and Anquetil, N. (2010). An examinationof software engineering work practices. In CASCON First Decade High ImpactPapers, CASCON ’10, pages 174–188. IBM Corporation.
Slife (2019). http://www.slifelabs.com. Retrieved March 19, 2019.
Smith, G., Baudisch, P., Robertson, G., Czerwinski, M., Meyers, B., Robbins,D., and Andrews, D. (2003). Groupbar: The taskbar evolved. In Proceedingsof OZCHI, volume 3, pages 1–10.
Soto, C. J. and John, O. P. (2016). The Next Big Five Inventory (BFI-2):Developing and Assessing a Hierarchical Model With 15 Facets to EnhanceBandwidth. 113(June):117–143.
Soules, C. A. N. and Ganger, G. R. (2005). Connections: Using context toenhance file search. In Proceedings of the Twentieth ACM Symposium onOperating Systems Principles, SOSP ’05, pages 119–132. ACM.
Spencer, D. (2009). Card sorting: Designing usable categories. Rosenfeld Media.
Spira, J. B. and Feintuch, J. B. (2005). The cost of not paying attention: Howinterruptions impact knowledge worker productivity.
StackOverflow (2017). Stackoverflow developer survey 2015. http://stackoverflow.com/research/developer-survey-2015. retrieved January16, 2017.
Steele, C. and Aronson, J. (1995). Stereotype threat and the intellectual test-performance of african-americans. Journal of personality and social psychology,69:797–811.
Stern, H., Pammer, V., and Lindstaedt, S. N. (2011). A preliminary study oninterruptibility detection based on location and calendar information. Proc.CoSDEO, 11.
Stinson, L. L. (1999). Measuring how people spend their time: a time-use surveydesign. Monthly Lab. Rev., 122:12.
302 BIBLIOGRAPHY
Stol, K.-J., Ralph, P., and Fitzgerald, B. (2016). Grounded theory in softwareengineering research. Proceedings of the 38th International Conference onSoftware Engineering - ICSE ’16, (Aug 2015):120–131.
Storey, M.-A., Singer, L., Cleary, B., Figueira Filho, F., and Zagalsky, A. (2014).The (R)Evolution of Social Media in Software Engineering. In FOSE 2014Proceedings of the on Future of Software Engineering, pages 100–116.
Storey, M.-A. and Zagalsky, A. (2016). Disrupting developer productivity onebot at a time. In Proceedings of the 2016 24th ACM SIGSOFT InternationalSymposium on Foundations of Software Engineering, FSE 2016, pages 928–931.ACM.
Storey, M.-A., Zagalsky, A., Figueira Filho, F., Singer, L., and German, D. M.(2017). How social and communication channels shape and challenge a par-ticipatory culture in software development. IEEE Transactions on SoftwareEngineering, 43(2):185–204.
Strauss, A. and Corbin, J. (1998). Basics of Qualitative Research: Techniquesand Procedures for Developing Grounded Theory.
Stricker, L. J. and Ward, W. C. (2004). Stereotype threat, inquiring about testtakers’ ethnicity and gender, and standardized test performance1. Journal ofApplied Social Psychology, 34(4):665–693.
Stumpf, S., Bao, X., Dragunov, A., Dietterich, T. G., Herlocker, J., Johnsrude,K., Li, L., and Shen, J. (2005). Predicting user tasks: I know what you’re doing.In 20th National conference on artificial intelligence (AAAI-05), workshop onhuman comprehensible machine learning.
Sudman, S. and Bradburn, N. M. (1973). Effects of time and memory fac-tors on response in surveys. Journal of the American Statistical Association,68(344):805–815.
Sutherland, J., Viktorov, A., Blount, J., and Puntikov, N. (2007). Distributedscrum: Agile project management with outsourced development teams. In Sys-
BIBLIOGRAPHY 303
tem Sciences, 2007. HICSS 2007. 40th Annual Hawaii International Conferenceon, pages 274a–274a. IEEE.
Sykes, E. R. (2011). Interruptions in the workplace: A case study to reduce theireffects. International Journal of Information Management, 31(4):385–394.
Taillard, J., Philip, P., and Bioulac, B. (1999). Morningness/eveningness andthe need for sleep. Journal of Sleep Research, 8(4):291–295.
Tang, J. C., Yankelovich, N., Begole, J., Van Kleek, M., Li, F., and Bhalodia,J. (2001). Connexus to awarenex: extending awareness to mobile users. InProceedings of the SIGCHI conference on Human factors in computing systems,pages 221–228. ACM.
Tang, J. C., Zhao, C., Cao, X., and Inkpen, K. (2011). Your time zone ormine?: a study of globally time zone-shifted collaboration. In Proceedingsof the ACM 2011 conference on Computer supported cooperative work, pages235–244. ACM.
Tani, T. and Yamada, S. (2013). Estimating user interruptibility by measuringtable-top pressure. In CHI’13 Extended Abstracts on Human Factors inComputing Systems, pages 1707–1712. ACM.
TimeDoctor (2019). https://timedoctor.com. Retrieved January 28, 2019.
Tims, M., Bakker, A. B., and Derks, D. (2012). Development and validation ofthe job crafting scale. Journal of Vocational Behavior, 80(1):173 – 186.
Toscos, T., Faber, A., An, S., and Gandhi, M. P. (2006). Chick Clique :Persuasive Technology to Motivate Teenage Girls to Exercise. In CHI ’06:CHI ’06 extended abstracts on Human factors in computing systems, pages1873–1878.
Tourangeau, R., Rips, L. J., and Rasinski, K. (2000). The psychology of surveyresponse. Cambridge University Press.
304 BIBLIOGRAPHY
Travers, C. J., Morisano, D., and Locke, E. A. (2015). Self-reflection, growth goals,and academic outcomes: A qualitative study. British Journal of EducationalPsychology, 85(2):224–241.
Treude, C., Filho, F. F., and Kulesza, U. (2015). Summarizing and MeasuringDevelopment Activity. In Proceedings of the 2015 10th Joint Meeting onFoundations of Software Engineering, pages 625–636.
Treude, C. and Storey, M.-A. (2010). Awareness 2.0: staying aware of projects,developers and tasks using dashboards and feeds. In Software Engineering,2010 ACM/IEEE 32nd International Conference on, volume 1, pages 365–374.IEEE.
Tulving, E. and Pearlstone, Z. (1966). Availability versus accessibility of infor-mation in memory for words. Journal of Verbal Learning and Verbal Behavior,5(4):381–391.
Tuten, T. L. and Bosnjak, M. (2001). Understanding differences in web usage:The role of need for cognition and the five factor model of personality. SocialBehavior and Personality: an international journal, 29(4):391–398.
Van Der Voordt, T. J. (2004). Productivity and employee satisfaction in flexibleworkplaces. Journal of Corporate Real Estate, 6(2):133–148.
Van Solingen, R., Berghout, E., and Van Latum, F. (1998). Interrupts: just aminute never is. IEEE software, (5):97–103.
Vasilescu, B., Blincoe, K., Xuan, Q., Casalnuovo, C., Damian, D., Devanbu, P.,and Filkov, V. (2016a). The sky is not the limit: Multitasking on GitHubprojects. In International Conference on Software Engineering, ICSE, pages994–1005. ACM.
Vasilescu, B., Blincoe, K., Xuan, Q., Casalnuovo, C., Damian, D., Devanbu, P.,and Filkov, V. (2016b). The Sky is Not the Limit: Multitasking on GitHubProjects. pages 994–1005.
BIBLIOGRAPHY 305
Wagner, S. and Ruhe, M. (2008). A Systematic Review of Productivity Factors inSoftware Development. In Software Productivity Analysis and Cost Estimation(SPACE 2008), pages 1–6.
Wakatime (2019). http://wakatime.com. Retrieved March 19, 2019.
Walston, C. E. and Felix, C. P. (1977). A method of programming measurementand estimation. IBM Systems Journal, 16(1):54–73.
Whiteside, S. P. and Lynam, D. R. (2001). The five factor model and impulsivity:Using a structural model of personality to understand impulsivity. Personalityand Individual Differences, 30(4):669–689.
Whittaker, S., Hollis, V., and Guydish, A. (2016). Don’t Waste My Time: Use ofTime Information Improves Focus. In Proceedings of the 2016 CHI Conferenceon Human Factors in Computing Systems (CHI ’16).
Whittaker, S. and Schwarz, H. (1999). Meetings of the board: The impact ofscheduling medium on long term group coordination in software development.Computer Supported Cooperative Work (CSCW), 8(3):175–205.
Williams, A. C., Kaur, H., Mark, G., Thompson, A. L., Iqbal, S. T., andTeevan, J. (2018). Supporting workplace detachment and reattachment withconversational intelligence. In Proceedings of the 2018 CHI Conference onHuman Factors in Computing Systems, page 88. ACM.
Wiseman, R. (2007). Quirkology: How we discover the big truths in small things.Basic Books.
Wood, J. V. (1989). Theory and research concerning social comparisons ofpersonal attributes. Psychological Bulletin, 106(2):231–248.
Wu, I.-C., Liu, D.-R., and Chen, W.-H. (2005). Task-stage knowledge support:coupling user information needs with stage identification. In IRI -2005 IEEEInternational Conference on Information Reuse and Integration, Conf, 2005.,pages 19–24.
306 BIBLIOGRAPHY
Xia, X., Bao, L., Lo, D., Xing, Z., E. Hassan, A., and Li, S. (2017). MeasuringProgram Comprehension: A Large-Scale Field Study with Professionals. IEEETransactions on Software Engineering, pages 1–26.
Zhou, M. and Mockus, A. (2010). Developer fluency: Achieving true masteryin software projects. In Proceedings of the Eighteenth ACM SIGSOFT Inter-national Symposium on Foundations of Software Engineering, FSE ’10, pages137–146. ACM.
Zimmerman, B. J. (2006). Development and adaptation of expertise: The role ofself-regulatory processes and beliefs.
Zou, L. and Godfrey, M. W. (2012). An industrial case study of coman’sautomated task detection algorithm: What worked, what didn’t, and why. In2012 28th IEEE International Conference on Software Maintenance (ICSM),pages 6–14.
Züger, M., Corley, C., Meyer, A. N., Li, B., Fritz, T., Shepherd, D., Augustine,V., Francis, P., Kraft, N., and Snipes, W. (2017). Reducing Interruptions atWork: A Large-Scale Field Study of FlowLight. In Proceedings of the 2017CHI Conference on Human Factors in Computing Systems (CHI ’17), pages61–72.
Züger, M. and Fritz, T. (2015). Interruptibility of software developers andits prediction using psycho-physiological sensors. In Proceedings of the 33rdAnnual ACM Conference on Human Factors in Computing Systems, pages2981–2990. ACM.
Züger, M., Müller, S. C., Meyer, A. N., and Fritz, T. (2018). Sensing inter-ruptibility in the office: A field study on the use of biometric and computerinteraction sensors. In CHI.
Curriculum Vitae
Personal InformationName André N. MeyerNationality SwissDate of Birth May, 9, 1991Place of Birth Uster, Switzerland
Education2015 – 2019 Doctoral program in Informatics
Department of InformaticsUniversity of Zurich, Switzerland
2013 – 2015 Master of Science in InformaticsDepartment of InformaticsUniversity of Zurich, Switzerland
2009 – 2013 Bachelor of Science in InformaticsDepartment of InformaticsUniversity of Zurich, Switzerland
