foreland propagation of folding and structure of the mountain
TRANSCRIPT

Consejo Superior de Investigaciones Científicas (CSIC) Institut de Ciencies de la Terra “Jaume Almera”
Departament d’ Estructura i Dinàmica de la Terra
Universitat de Barcelona Facultat de Geologia
Departament de Geodinàmica i Geofísica
FORELAND PROPAGATION OF FOLDING AND STRUCTURE OF THE MOUNTAIN FRONT FLEXURE
IN THE PUSHT-E KUH ARC (ZAGROS, IRAN)
Hadi Emami, 2008

CHAPTER 3. Analogue Models
59
Chapter 3
STRUCTURE OF THE MOUNTAIN FRONT FLEXURE ALONG THE ANARAN ANTICLINE IN THE PUSHT-E
KUH ARC (NW ZAGROS, IRAN): INSIGHTS FROM SAND BOX MODELS
Emami, H., J. Vergés, T. Nalpas, P. Gillespie, and E. P. Blanc, in press, Structure of the Mountain Front Flexure along the Anaran anticline in the Pusht-e Kuh Arc (NW Zagros, Iran): Insights from sand box models, in P. Leturmy, and C. Robin, eds., Tectonic and Stratigraphic evolution of Zagros and Makran during the Meso-Cenozoic, Geological Society of London Special Volume.

CHAPTER 3. Analogue Models
60

CHAPTER 3. Analogue Models
61
3. STRUCTURE OF THE MOUNTAIN FRONT FLEXURE ALONG THE ANARAN ANTICLINE IN THE PUSHT-E
KUH ARC (NW ZAGROS, IRAN): INSIGHTS FROM SAND BOX MODELS
3.1 Abstract
The Anaran anticline on top of the Mountain Front Flexure represents the most external fold of the Pusht-e Kuh Arc. This anticline is asymmetric with a long and gently dipping backlimb and a very steep forelimb. However, the most characteristic tectonic feature is the large amount of normal faults that cut the crestal and forelimb domains of the anticline. These normal faults, formed by layer-parallel extension during folding, limit a crestal graben and are not very deep. In addition to these normal faults, the potential tectonic decoupling across the intermediate Gachsaran detachment level and the lack of reflections imaging the Anaran anticline forelimb in newly acquired seismic lines preclude the understanding of the geometry of the fold at depth. This is a key point in HC exploration and is therefore the subject of this work. We propose a geometric and evolution model for the Anaran anticline with the help of sand box models and growth strata ages. We also explore the potential effects of erosion and sedimentation coeval to folding in the development of the Anaran anticline. The characteristic geometry of the Anaran anticline is directly related to its singular position on top of the Mountain Front Flexure. However, the proposed model may be applied to other folds on top of this major basement-related thrust as for example the Siah Kuh and Khaviz anticlines in Pusht-e Kuh Arc and Dezful Embayment domains.
3.2 Introduction
Most foreland fold-and-thrust belts show basement involved structures as in the typical Willow Creek example from the Rocky Mountains (Narr and Suppe, 1994) (Fig.23). These structures are commonly characterized by significant structural and topographic relief and most of the times by folding at the cover levels (Mitra and Mount, 1998). Although there is an extensive literature on these compressive basement structures it is not straightforward to determine their deeper structure: geometry and position of the basement fault, amount of propagation of this fault in the cover, etc. The typical profile of basement-involved structures is characterized by a long gently dipping backlimb (0-20�) that mimics the basement-cover contact and a shorter gently to steep

CHAPTER 3. Analogue Models
62
forelimb (30� to overturned) (Mitra and Mount, 1998). The backlimb of the structures are generally well imaged on seismic profiles whereas the forelimbs are generally poorly imaged, especially the upright ones. Basement-related thrusts have been named in different ways like drape or forced folds (Stearns 1971; 1975 and 1978), upthrust folds (Foose et al., 1961; Berg 1962; Prucha et al., 1965), and fold thrust model (Berg 1962; Brown 1983; Stone 1993). The basement-involved structures can be also associated with a component of the strike slip faulting. Mitra and Mount (1998) developed balanced geometric and kinematic models to interpret a wide variety of foreland basement structures.
Fig. 23. Typical foreland basement-involved thrust fault from Willow Creek locality in (Narr and Suppe, 1994). In most of these structures the backlimb in the cover is subparallel to the basement-cover contact in the upthrown block.
The Zagros Fold Belt (also named Simply Folded Belt) is characterized by a folded 12-14 km thick sedimentary cover deposited on the north-eastern continental border of the Arabian plate (e.g., Falcon, 1974; Colman-Sadd, 1978). Its maximum width is about 280 km in the centre of the Fars Arc and 230 km in the Pusht-e Kuh Arc (Fig. 24). These two arcs are constituted by belts of anticlines and are limited by a major geo-flexure (Falcon, 1961), variously named the Main Front Fault (Berberian, 1995), the Mountain Front Flexure (McQuarrie, 2004), and the Zagros Frontal Fault (Sepehr and Cosgrove, 2004). This structural and topographic front, that we will define as Mountain Front Flexure (Mountain Front Flexure in Fig. 24), has an irregular geometry that defines tectonic salients or arcs and re-entrants or embayments: respectively from

CHAPTER 3. Analogue Models
63
southeast to northwest, the Fars Arc (Fars stratigraphic province), the Dezful Embayment (Khuzestan stratigraphic province), the Pusht-e Kuh Arc (Lurestan stratigraphic province), and the Kirkuk Embayment (Kurdistan in Iraq) (Fig. 24). The Mountain Front Flexure bounding the Pusht-e Kuh Arc has an E-W trending segment along the Balarud Fault, a NW-SE frontal segment along the Anaran anticline and a N-S segment along the Khanaqin Fault. The Balarud Fault, the Anaran anticline and the Khanaqin Fault separate the Pusht-e Kuh Arc from the Dezful Embayment, the foreland, and the Kirkuk Embayment, respectively (Fig. 24).
Fig. 24. Tectonic map of the Zagros Fold Belt showing the position and geometry of the Mountain Front Flexure (MFF in map). Earthquakes of M�5 are displayed by small black dots. Focal mechanisms from Talebian and Jackson (2004) are also displayed in black (Mw � 5.3) and grey (Mw � 5.3). Yellow lines show the position of different morphotectonic transects of Fig. 26. Box shows the extent of the geological map depicting the Anaran anticline (Fig. 27). KH = Khavir anticline; SI = Siah Kuh anticline.

CHAPTER 3. Analogue Models
64
The Anaran anticline is located along the frontal segment of the Mountain Front Flexure in the Pusht-e Kuh Arc and shows excellent and continuous outcrops (Fig. 24). Nevertheless, the geometry of the anticline at depth as well as its relation to the Mountain Front Flexure is mostly unknown at present although new seismic lines have been acquired to image its structure and its prolongation towards the foreland.
The objectives of this work are to determine the potential geometry of the Anaran anticline at depth using a combination of field geology and analogue modelling that helps us to understand the interaction of basement and cover structures, the geometry of normal faults and the role of erosion and syntectonic sedimentation during the evolution of the anticline. The geometry at depth and the evolution of the anticline are important for oil exploration and could be applied to other anticlines located above the Mountain Front Flexure across the entire Zagros Fold Belt.
3.3 The stratigraphy of the Pusht-e Kuh Arc
The stratigraphy of the Lurestan Province consists of a 10 to 12 km thick succession that encompasses the Palaeozoic and Mesozoic Arabian passive margin deposits followed by the sediments corresponding to the long-lived Cenozoic Zagros foreland infilling (Fig. 25). This thick pile of sediments was probably deposited on top of the Proterozoic-Early Cambrian Hormuz evaporites, although this is not directly verified in the Lurestan Province. Most of the stratigraphy described in this section is based on the work of James and Wynd (1965) and Colman-Sadd (1978).
CHAPTER 3. Analogue Models
65
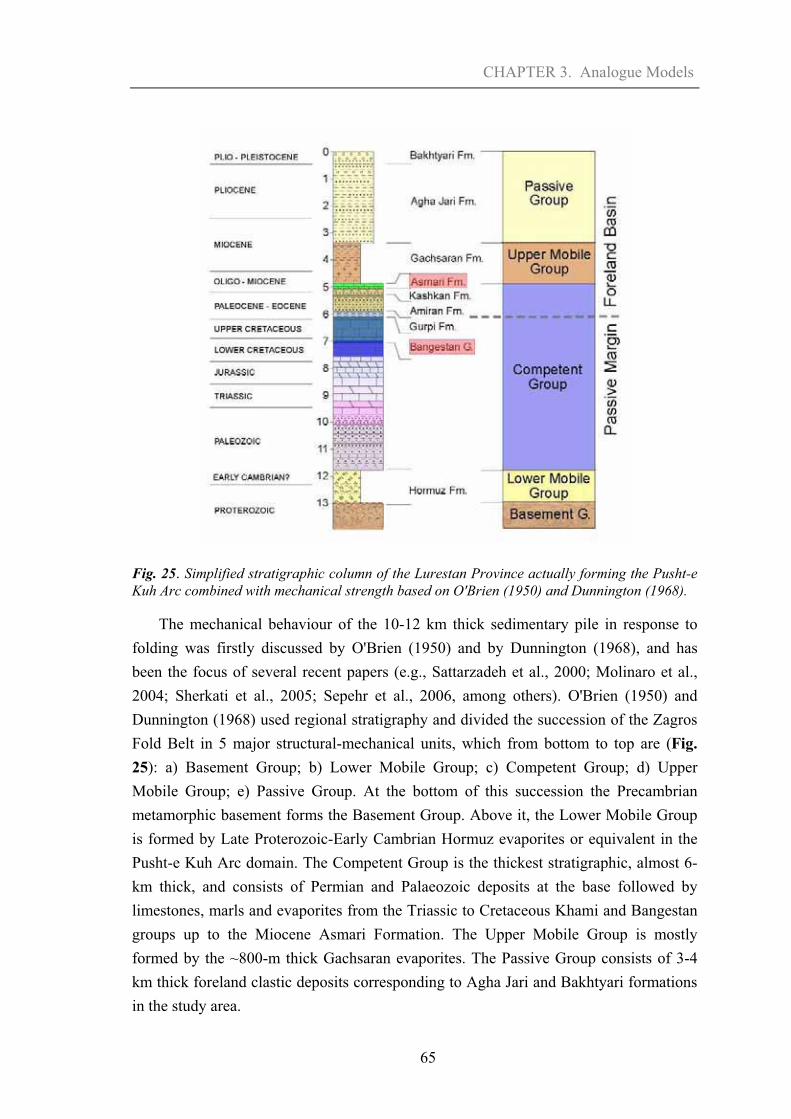
Fig. 25. Simplified stratigraphic column of the Lurestan Province actually forming the Pusht-e Kuh Arc combined with mechanical strength based on O'Brien (1950) and Dunnington (1968).
The mechanical behaviour of the 10-12 km thick sedimentary pile in response to folding was firstly discussed by O'Brien (1950) and by Dunnington (1968), and has been the focus of several recent papers (e.g., Sattarzadeh et al., 2000; Molinaro et al., 2004; Sherkati et al., 2005; Sepehr et al., 2006, among others). O'Brien (1950) and Dunnington (1968) used regional stratigraphy and divided the succession of the Zagros Fold Belt in 5 major structural-mechanical units, which from bottom to top are (Fig. 25): a) Basement Group; b) Lower Mobile Group; c) Competent Group; d) Upper Mobile Group; e) Passive Group. At the bottom of this succession the Precambrian metamorphic basement forms the Basement Group. Above it, the Lower Mobile Group is formed by Late Proterozoic-Early Cambrian Hormuz evaporites or equivalent in the Pusht-e Kuh Arc domain. The Competent Group is the thickest stratigraphic, almost 6-km thick, and consists of Permian and Palaeozoic deposits at the base followed by limestones, marls and evaporites from the Triassic to Cretaceous Khami and Bangestan groups up to the Miocene Asmari Formation. The Upper Mobile Group is mostly formed by the ~800-m thick Gachsaran evaporites. The Passive Group consists of 3-4 km thick foreland clastic deposits corresponding to Agha Jari and Bakhtyari formations in the study area.

CHAPTER 3. Analogue Models
66
3.4 The Mountain Front Flexure and the Anaran anticline
The Mountain Front Flexure is a major bending in the basement characterized by strong variations of topography and structural relief across it (Falcon, 1961). In addition, major seismic events are occurring in the basement somehow related to the Mountain Front Flexure as observed in map view (Fig. 24) (Berberian, 1995). The Mountain Front Flexure is responsible for the main tectonic divisions in the Zagros Fold Belt and their morphotectonic characteristics: low topography in Kirkuk and Dezful embayments, high topography in Pusht-e Kuh Arc and intermediate topography in the Fars Arc.
Falcon (1961) presented an integrated structural and topographic data set from anticlines and synclines across the Mountain Front Flexure, mostly in the Dezful Embayment to quantify the amount of uplift of this basement-involved structure. Here we present 5 sections modified from Falcon (1961) in addition to one section across the Pusht-e Kuh Arc to better define the topographic and structural relief as well as their morphological variations (Fig. 26). In the sections three lines are marked: 1) the green line reflects the Asmari Formation defining folding (based on Falcon, 1961); 2) the red line connects the inflection points of folds (Falcon, 1961); 3) the black dashed line connects the base of the synclines to show the amount of structural relief as well as its geometry across the Mountain Front Flexure.

CHAPTER 3. Analogue Models
67
Fig. 26. Morphotectonic transects across the Dezful Embayment and Pusht-e Kuh Arc domains. Transects B-F are modified from Falcon (1961), whereas transect A is presented in this paper. In each transect green line shows the trace of Asmari limestones defining the geometry of folding, the red line connects the inflexion points of these folds across the Mountain Front Flexure (according to Falcon, 1961), whereas the dashed black line connects the bases of the synclines and thus showing a more accurate determination of the structural relief across the geoflexure.

CHAPTER 3. Analogue Models
68
Along transects A and B the topography increases more than 1000 m in less than 10 km of horizontal distance. The structural relief increase is of 3-4 km between the foreland in Iraq and the Pusht-e Kuh Arc in Iran as determined by the position of the hinges of the synclines in both regions. This structural relief is as high as 6 km if we use the hinges of the synclines in the foreland and the hinges of the anticlines in the Pusht-e Kuh Arc. However, we keep the structural relief only related to the Mountain Front Flexure as the topographic variation between hinges of synclines in both the foreland and Pusht-e Kuh Arc. The horizontal distances for these changes vary from transect to transect being the shorter in the Pusht-e Kuh Arc transect. This shorter distance produces the strongest inclination in both the Pusht-e Kuh Arc and Dezful Embayment domains. This maximum slope of the basement structure also constrains the originality of the Anaran anticline among the Zagros folds (Fig. 26).
The present seismicity of the Zagros fold and thrust belt is largely concentrated along the Mountain Front Fault (Talebian and Jackson, 2004) (Fig. 26). The seismic activity along different segments of the Mountain Front Fault indicates that moderate to large magnitude earthquakes occurred in the basement (Berberian, 1995). The fault plane solution of earthquakes show a nearly pure thrust faulting with nodal planes striking parallel to the trend of the regional structures. The north to northeast ~60º dipping planes of focal mechanisms suggests dominate reverse movements for these faults. The reverse faults could be reactivated Permo-Triassic normal faults formed during the opening of the Neo-Tethys (Jackson et al., 1981; Berberian 1995).
The lack of both surficial thrusting and good quality seismic data crossing the Mountain Front Flexure makes its interpretation difficult. Nevertheless geological cross-sections across this regional structure show different interpretations for it at depth. Berberian (1995) refers to a segmented blind thrust with 15-115 km long segments with a total length of 1350 km along the entire Zagros Fold Belt. Sherkati et al. (2006) interpreted the Mountain Front Flexure as a thrust fault at depth showing typical ramp-flat geometry in Fars Arc and Dezful Embayment domains. McQuarrie (2004), contrarily, attributed the Mountain Front Flexure to the tectonic accumulation of Hormuz Salt beneath the Pusht-e Kuh and Fars arcs, whereas she proposed a thrust fault with ramp and flat geometry in the sedimentary cover beneath the Dezful Embayment.
We also propose a blind thrust fault below the Mountain Front Flexure. The geometry of this thrust has been constructed using geometrical constraints as documented elsewhere. In our section construction we use a more regional approach consisting on relating the amount of topography elevation in the Pusht-e Kuh Arc to the
CHAPTER 3. Analogue Models
69
existence of a single thrust at depth. The regional uplift is concentrated along the Mountain Front Flexure and keeps a widely constant elevation through the Pusht-e Kuh Arc for about 230 km and no apparent additional steps. The best way to simulate this wide uplift is a single fault consisting of low-angle NE-dipping thrust affecting the entire crust similarly in the way proposed by Mouthereau et al. (2007). This blind thrust flattens at the base of 12-14 km thick cover sequence producing a gentle regional monocline so-called the Mountain Front Flexure (geoflexure according to Falcon, 1961). A new subvertical thrust with a displacement of about 700 m is needed to fit both the existence of a thrust along the Central Anaran anticline at surface and the present geometry of the fold.
The Anaran anticline on top of the Mountain Front Flexure is the most external fold of the Pusht-e Kuh Arc. The Anaran anticline is 85 km long and 5.5 km wide with maximum topography of about 1.6 km in its central part. The geometry of the Anaran anticline at shallow levels shows a relatively regular and long backlimb dipping about 30º and a steep forelimb masked by normal faulting. The Anaran anticline is connected to the open Samand anticline to the NE and to the Changuleh anticline that is partially buried beneath the Mesopotamian plains to the SW (Fig. 27). One significant characteristic of this anticline is its irregular geometry in map view (Fig. 27 and Fig.28). The anticline is formed by at least four different segments either independent like the SE Anaran or linked together but showing different orientation (Central Anaran, N-S Anaran and NW Dome) (Fig. 27). Along the Central Anaran segment the anticline only preserves the gently dipping backlimb whereas the forelimb is highly disrupted tectonically and eroded (Fig. 27 and Fig. 28). The most characteristic feature of the Anaran anticline, however, is the large amount of roughly planar normal faults that cut the anticline, especially along the Central and N-S segments of the anticline. On map view the normal faults display sub-parallel trends to the strike of the anticline for the Central Anaran and slightly oblique trends for the N-S Anaran segments (Fig. 28). These normal faults are partially affecting the forelimbs of the SE Anaran and of the Central Anaran segment and both flanks of the N-S Anaran segment (Fig. 27 and Fig. 28). The majority of these faults, however, terminate upwards in the relatively weaker levels of the Gurpi-Pabdeh formations along the north-eastern backlimb of the fold (Fig.27 and Fig. 28). When observed in cross-section, well-stratified marls of the Gurpi-Pabdeh formations are folded above the propagating tip of the normal faults as documented in extensional settings (e.g., Sharp et al., 2000).

CHAPTER 3. Analogue Models
70
Fig. 27. Map view of the Anaran anticline using 1/100000 geological maps of Dehloran (Setudehnia and OB Perry 1967), Kuh-e Anaran (Setudehnia, 1967), Changuleh (Setudehnia, 1967), Kabir Kuh (MacLeod, 1970), Kuh-e Varzarin (MacLeod and Roohi, 1970) and Mehran (MacLeod and Roohi, 1972). In the geological map normal faults have been highlighted. The trace of the thrust along the SW limb of the Central Anaran anticline has been added to the map. Black line across the Central Anaran anticline shows the position of A-A’ cross-section based only on field data.
CHAPTER 3. Analogue Models
71
Normal faults of Central Anaran and N-S Anaran segments form conjugate pairs, dipping around 60º, which define grabens located in the crestal domain of the anticline (Fig. 29A). Along both described segments of the Anaran anticline a second set of faults located towards the forelimb of previous ones define a rotated graben. In this graben the fault closer to the crest of the anticline dips about 90º whereas the fault located towards the forelimb dips only about 30º (Fig. 29B and Fig. 29C). This rotated disposition of graben and bounding faults indicate that the entire extensional structure has been rotated during the evolution of the fold above the Mountain Front Flexure.
Along the forelimb of the Central Anaran anticline the Upper Cretaceous Sarvak Formation is tectonically juxtaposed to the Miocene Gachsaran Formation for along 20 km (Fig. 27 and Fig. 28). This contact shows a rectilinear trace and a reverse displacement of few hundred metres given that Asmari, Pabdeh and Gurpi formations are missing along the inferred thrust fault.
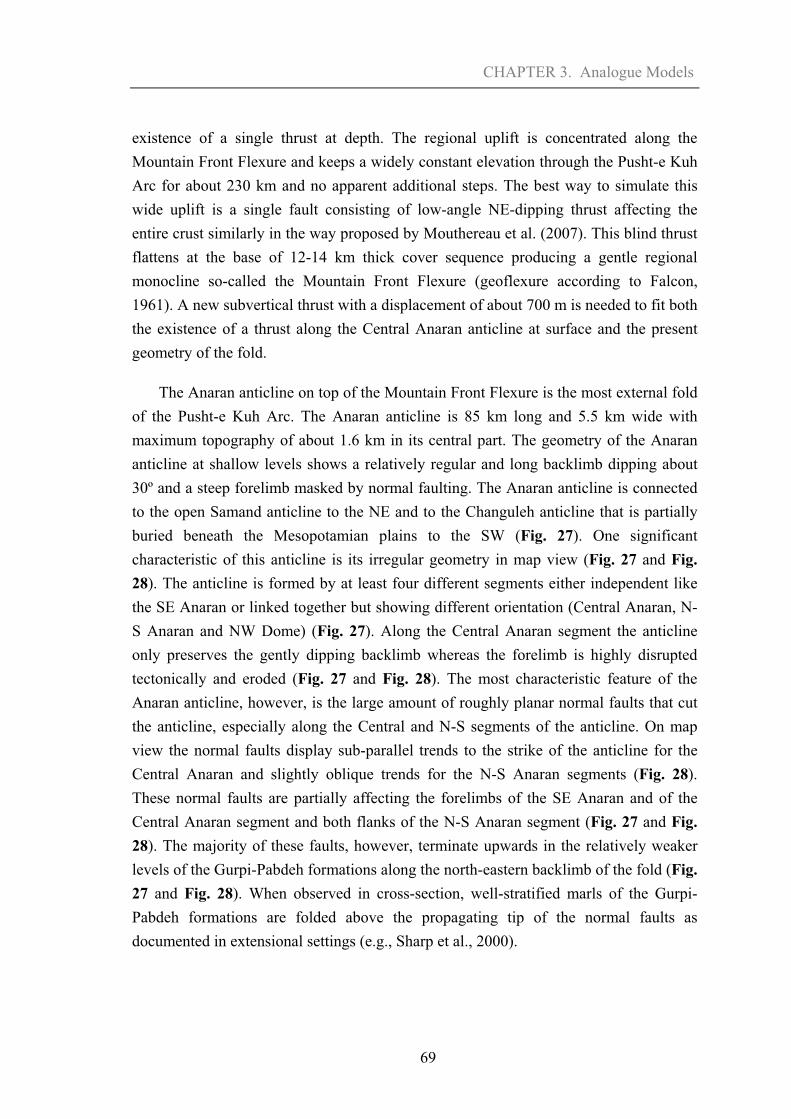
Fig. 28. Two 3-D views of the Anaran anticline from the south (from Google Earth with 1.5 vertical exaggeration) to show the topography of the Anaran anticline mostly controlled by the displacements of normal faults (A) and adding the geological maps Kuh-e Varzarin (MacLeod and Roohi, 1970) and Kuh-e Anaran (Setudehnia, 1967) (B). The boxes show the position of the field and helicopter pictures of normal fault planes which showing dip-slip motion in Fig. 29.
CHAPTER 3. Analogue Models
72
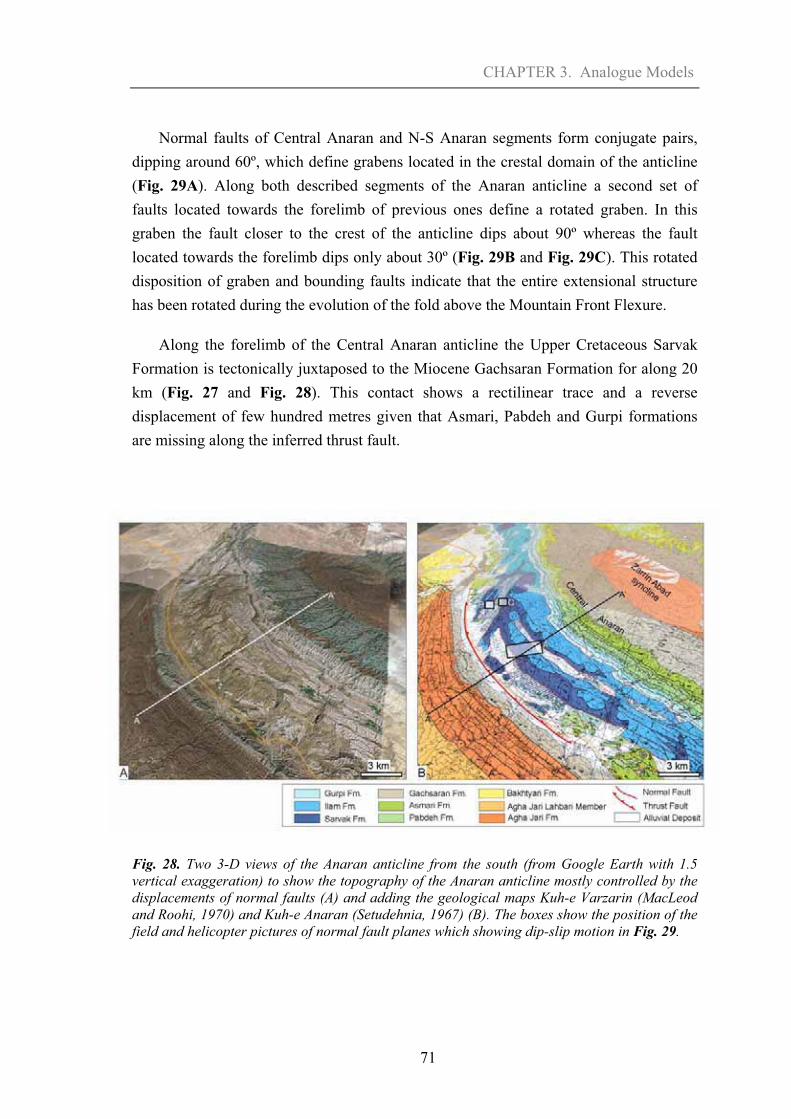
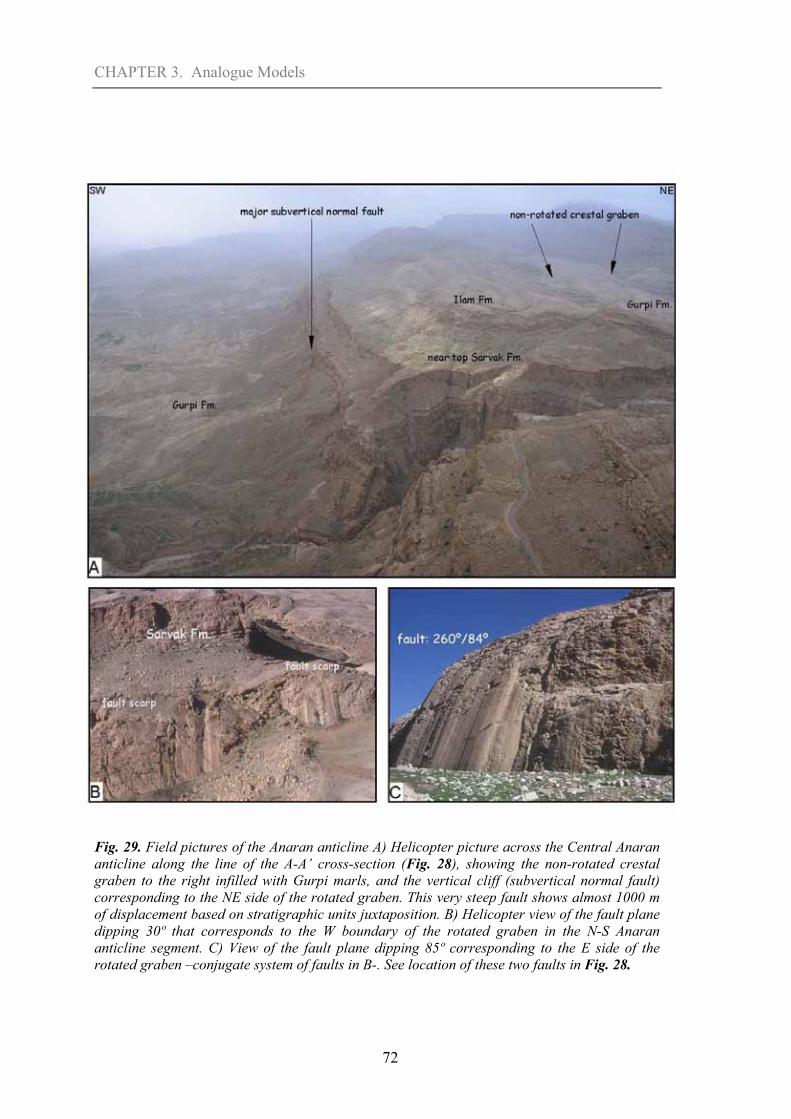
Fig. 29. Field pictures of the Anaran anticline A) Helicopter picture across the Central Anaran anticline along the line of the A-A’ cross-section (Fig. 28), showing the non-rotated crestal graben to the right infilled with Gurpi marls, and the vertical cliff (subvertical normal fault) corresponding to the NE side of the rotated graben. This very steep fault shows almost 1000 m of displacement based on stratigraphic units juxtaposition. B) Helicopter view of the fault plane dipping 30º that corresponds to the W boundary of the rotated graben in the N-S Anaran anticline segment. C) View of the fault plane dipping 85º corresponding to the E side of the rotated graben –conjugate system of faults in B-. See location of these two faults in Fig. 28.

CHAPTER 3. Analogue Models
73
In previous works the Anaran anticline has been interpreted together with the Samand and Kabir Kuh anticlines as formed above thrust ramps directly above basement uplifts (Blanc et al., 2003) or as buckling folds developed above thick Hormuz Salt (McQuarrie, 2004). These folds have been interpreted recently as forming part of a multidetachment fold system as in the same way as for the rest of the Pusht-e Kuh Arc anticlines (Vergés et al., in press). In this paper, we define the Anaran anticline as initially deformed by buckling and then by its uplift above the upper edge of the Mountain Front Flexure although fold amplification could continue above the basement upthrown.
3.5 Experimental procedure
Two sets of analogue models were created to test different options for the development of the Anaran anticline. The first set was designed to reproduce potential geometries of folding and thrusting using two different detachments: one at the base of the basement-cover contact (Hormuz evaporites or equivalent) and a second one at the Gachsaran level (Models 1 and 2). The second set of models was intended to test the proposed sequence of deformation starting with folding and subsequent basement thrusting together with folding assuming a single detachment at the basement-cover contact (Model 3). This second set of models shows in addition syntectonic sedimentation (part of Gachsaran, Agha Jari and Bakhtyari formations) as potential modifiers of the anticline evolution (Model 4).
The modelling techniques are similar to those used for experiments on brittle-ductile systems at the Laboratory of Experimental Tectonics of Géosciences Rennes (Rennes University, France). It has been described in previous studies (e.g., Faugère and Brun 1984; Vendeville et al., 1987; Davy and Cobbold 1991). Basement and brittle sediments (pre and syntectonic) are represented by sand, with an angle of internal friction close to 30° (Krantz, 1991) and a density of � = 1400 Kg/m3. Weak ductile sediments such as shale, clay, marl or salt are represented by silicone putty with a viscosity of μ = 104 Pa.s at 30°C and a density of � = 1400 Kg/m3. The experimental apparatus is composed of a rigid mobile wall pushed at a constant rate with a compression velocity (V = 1 cm/h) (Fig. 30).
Models 1 and 2 are similar in size and initial configuration. The size of the models are 100 x 55 cm limited by fixed and mobile walls in two sides and free from the other two sides. The model is wide enough to achieve a relatively large amount of shortening
CHAPTER 3. Analogue Models
74
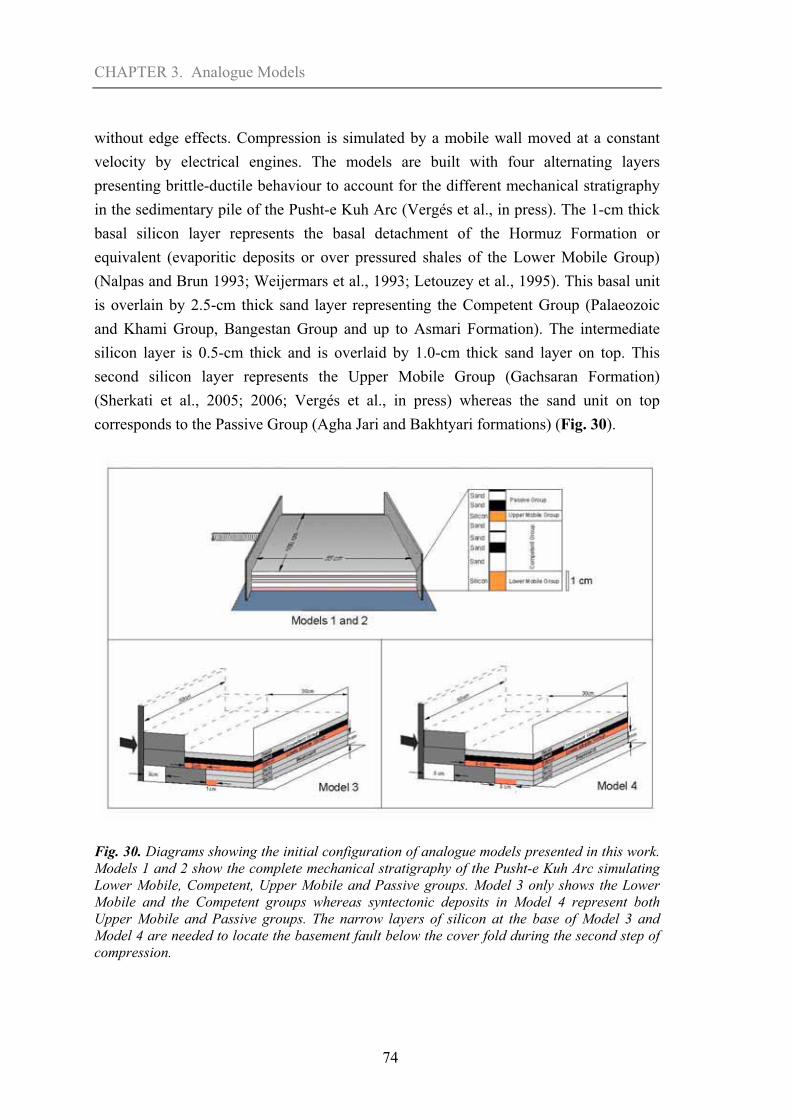
without edge effects. Compression is simulated by a mobile wall moved at a constant velocity by electrical engines. The models are built with four alternating layers presenting brittle-ductile behaviour to account for the different mechanical stratigraphy in the sedimentary pile of the Pusht-e Kuh Arc (Vergés et al., in press). The 1-cm thick basal silicon layer represents the basal detachment of the Hormuz Formation or equivalent (evaporitic deposits or over pressured shales of the Lower Mobile Group) (Nalpas and Brun 1993; Weijermars et al., 1993; Letouzey et al., 1995). This basal unit is overlain by 2.5-cm thick sand layer representing the Competent Group (Palaeozoic and Khami Group, Bangestan Group and up to Asmari Formation). The intermediate silicon layer is 0.5-cm thick and is overlaid by 1.0-cm thick sand layer on top. This second silicon layer represents the Upper Mobile Group (Gachsaran Formation) (Sherkati et al., 2005; 2006; Vergés et al., in press) whereas the sand unit on top corresponds to the Passive Group (Agha Jari and Bakhtyari formations) (Fig. 30).
Fig. 30. Diagrams showing the initial configuration of analogue models presented in this work. Models 1 and 2 show the complete mechanical stratigraphy of the Pusht-e Kuh Arc simulating Lower Mobile, Competent, Upper Mobile and Passive groups. Model 3 only shows the Lower Mobile and the Competent groups whereas syntectonic deposits in Model 4 represent both Upper Mobile and Passive groups. The narrow layers of silicon at the base of Model 3 and Model 4 are needed to locate the basement fault below the cover fold during the second step of compression.

CHAPTER 3. Analogue Models
75
Models 3 and 4 are smaller than models 1 and 2 (50 x 30 cm) and display also a different initial configuration. They are limited in two sides by one fixed and one mobile wall whereas the other two sides are free to eliminate the edge effects during shortening (Fig. 30). The general configuration of these experiments corresponds to three layers of brittle-ductile alternation. The basal layer, used to represent basement, is formed by 1.5-cm thick layer of sand overlaid by a cover composed of 0.5-cm thick silicon layer representing the basal detachment (Lower Mobile Group). The Competent Group (from Palaeozoic to Miocene Asmari Formation) is represented by the upper 1-cm thick sand unit. Syntectonic sedimentation was added in model 4 (see also Nalpas et al., 1999 and Nalpas et al., 2003). Blue and white thin alternations represent the Gachsaran Formation (pre-growth strata in the study area) and Agha Jari and Bakhtyari formations (pre-growth and growth units in the study region) (Homke et al., 2004). Since the second silicon layer is not included in models 3 and 4 the Gachsaran Formation is considered as part of the Passive Group in this model (Fig. 30).
In order to perform the second set of models, fourteen experiments have been done to calibrate the velocity of the compression as well as the position of the basement fault below the early formed anticline. It has been successfully solved by using a different model setup with a thin layer of silicone in front of the mobile wall to initiate thrusting at the base of the model (Fig. 30). In addition, three plastic blocks were used in front of the mobile wall to divide the shortening between the sedimentary cover and the basement. In Model 3, 2-cm of shortening is applied first to the cover (basal silicon and sand) and then 2-cm more were applied to both the basement and the cover. In Model 4, initial 3-cm of shortening was applied to the cover (basal silicon and sand) and then 2-cm more to both the basement and the cover (Fig. 30).
Photographs of the surface of each model were taken at regular time intervals to observe their evolution in map view. After deformation the models were covered with sand to avoid further deformation during subsequently operations. Finally the models were saturated with water to increase their internal cohesion before to cut them in vertical slices parallel to the shortening direction (Fig. 31 to Fig. 33).
CHAPTER 3. Analogue Models
76
3.6 Analogue Model Results
As described earlier, Model 1 and Model 2 simulate the entire stratigraphy of the Pusht-e Kuh Arc with Lower Mobile, Competent, Upper Mobile and Passive groups (Fig. 30 and Fig. 31). Models 1 and 2 share constant velocity of 1 cm/h and final shortening of 7.5 cm (13.6 %). Models 3 and 4 were planned to observe a sequence of deformation in which first we fold cover above a basal detachment and then we develop a basement-involved thrust below one of the already formed anticlines (numbered 2 in Fig. 32 and Fig. 33). These models show different stratigraphy than previous ones given that only Basement, Lower Mobile and Competent groups are displayed in Model 3. Model 4 incorporates growth strata units that might correspond to Upper Mobile and Passive groups in nature.
3.6.1 Model 1
As soon as compression started a major thrust initiated close to the base of the mobile wall cutting through the basal detachment (Lower Mobile Group) and the sedimentary cover (Competent Group). This thrust flattened at the intermediate silicon layer (Upper Mobile Group) and thus defining a large anticline in its hangingwall that shows a significant layer parallel extension along the outer arc of the fold (Fig. 30). The upper brittle unit (Passive Group) deformed differently from the lower brittle unit especially because of the migration of silicon material from the growing anticline to the adjacent synclines but especially towards the one in the foreland. Folding and thrusting in this upper brittle unit (Passive Group) are not directly linked to the structures below and thus showing tectonic decoupling. Further shortening is then transferred to the intermediate detachment layer (Upper Mobile Group) producing several short wavelength detachment folds on top of this intermediate detachment (corresponding to the Passive Group in nature) (Fig. 31). These anticlines show symmetric box folding geometries with very steep and short flanks. Coeval to the folding of the upper brittle unit, a second major thrust cutting the lower stiff unit developed far from the mobile wall developing a monocline in the sedimentary cover. Above the major anticline, upper brittle unit shows thinning in the crest of the anticline that could partly balance the amount of shortening observed towards the foreland and thus indicating that gravity sliding may probably be an additional factor of shortening above the intermediate ductile layer as probably happened in some of the Zagros foldi.ng examples.

CHAPTER 3. Analogue Models
77
Fig. 31. Models 1 and 2 show the final stages of shortening corresponding to 13.6% (7.5 cm). Model 1 was produced with no erosion during shortening whereas coeval erosion was applied to Model 2 during deformation. Erosion has remarkable impact in the propagation of shortening as well as in the geometry of the entire cover succession.
3.6.2 Model 2
This model behaves very similar than Model 1 during initial shortening forming a major thrust and hangingwall anticline for the lower brittle layer (Competent Group) (Fig. 31). The coeval removal of material from the top of the growing anticline to simulate concomitant erosion, however, controls the further development of the fold system. The first significant result is the simplicity of the anticline geometry of the upper brittle unit (Passive Group), with no satellite folds and no thrusting, compared to the one produced in Model 1. The second major difference is that when erosion reaches the intermediate ductile unit it flows out of the anticline producing a similar process as saline extrusions in nature. Geometry of the fold system also varies at the scale of the entire sand box model because coeval erosion inhibits deformation to propagate into the foreland. The foreland deformation in Model 1 needs to be taken by existing structures in Model 2. The geometry of the hangingwall anticline in the lower brittle unit is more complex than in Model 1 especially in the backlimb showing two groups of backthrusts. In the upper brittle unit only a relative increase in the dip of the forelimb is clearly noticeable although backthrusting parallel to the ductile intermediate unit is needed to transfer the displacement of the upper brittle unit towards the back of the model where it is possibly partly eroded.
CHAPTER 3. Analogue Models
78
3.6.3 Model 3
Initial shortening in the cover produced two anticlines (numbers 1 and 2 in Fig. 32). Anticline number 2 represents the Anaran anticline just above the future basement-involved thrust forming the Mountain Front Flexure. Subsequent shortening involved both basement and cover units and thus creating thrusting in the basement and continuous folding in the cover (the position of the basement thrust has been forced with a short strip of silicon at the base of the model) (Fig. 30). The generation of the basement-involved thrust that bends into the main detachment (Lower Ductile Group) propitiated the migration of shortening along this plane producing a new symmetric box fold in the brittle unit (Competent Group) towards the foreland. In cross-section C (Fig.32) the so-called Anaran anticline shows a final asymmetric geometry with a subtle backthrust and crestal extension that seems rotated into the upper part of the forelimb. In the selected cross-sections there is no continuity between the basement-involved thrust and the forethrust displayed by the forelimb of the Anaran anticline in the model and thus showing structural decoupling.
3.6.4 Model 4
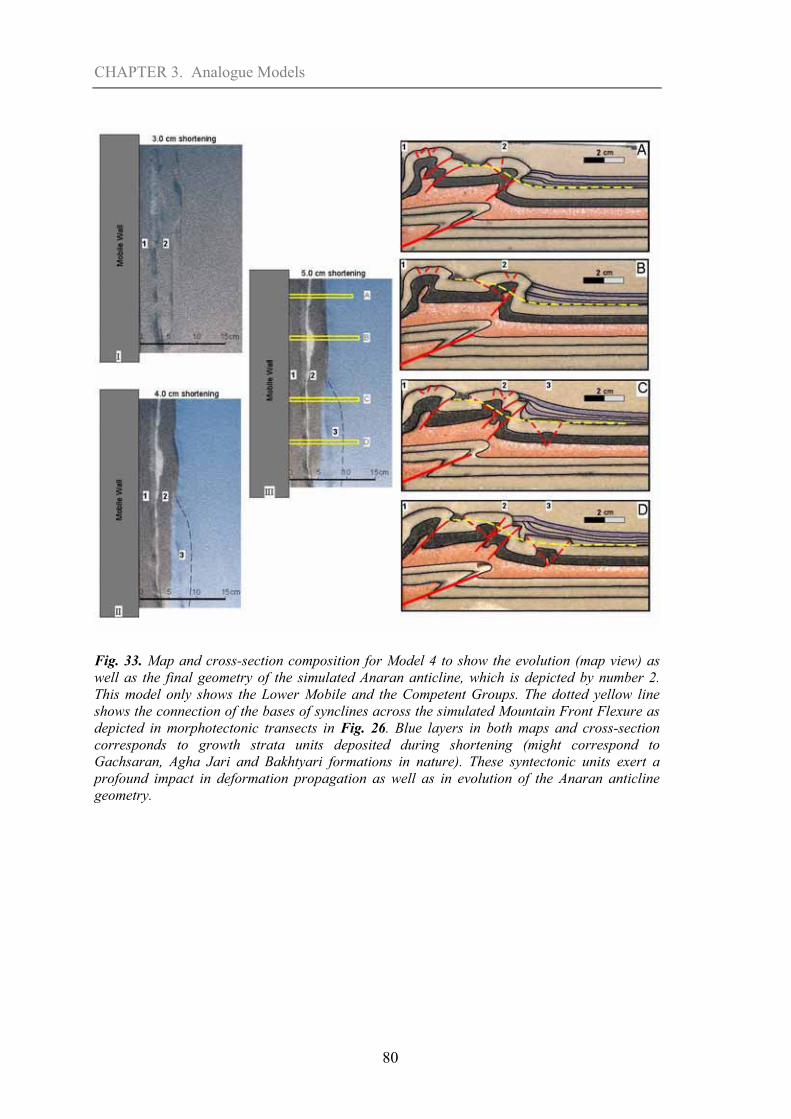
The main difference with previous model consists of the addition of syntectonic sedimentation in the frontal areas of the model after initial shortening (Fig. 33). Initially, Model 4 evolved similarly to Model 3 by forming two different anticlines of which number 2 simulates the Anaran anticline. Syntectonic sands (alternation of white and blue layers) were sprinkled manually every 15 minutes trying to keep the rate of sedimentation comparable to the rate of the frontal fold growth as proposed in Nalpas et al. (2003). These sediments correspond in nature to the growth Agha Jari and Bakhtyari formations in addition to the pre-growth Gachsaran Formation. This last unit acting as overburden rather than as detachment layer as corresponds to the Upper Mobile Group in nature. Development of the anticline number 2 (Anaran anticline in nature) along the strike is variable in this experiment. In cross-sections A and B deformation did not migrate into the foreland, the length of the straight forelimb of the anticline number 2 increased through time and the geometry of the growth strata is simple. The dip of the forelimb in cross-sections A and B is slightly overturned. In cross-sections C and D, however, some shortening is transferred to the foreland initiating a new detached box fold. This fold modified the geometry of the growth strata and also complicated the forelimb geometry of the anticline number 2 but not its subvertical geometry. One significant results of this experiment is the increase in length of the forelimb of the

CHAPTER 3. Analogue Models
79
anticline against which the growth strata impinged. This increase in length, comparable to the length in Model 3 is significant as well as its subvertical to overturned dip that was clearly sustained by the continuous deposition of growth strata. As well as in Model 3, the structures of basement and cover are decoupled across the detachment level. The removal of growth strata units by erosion adjacent to the subvertical and long forelimbs probably triggered the gravitational collapse of many of these unstable geometries formed during growth deposition and especially in the Pusht-e Kuh Arc dominated by deep seated earthquakes.
Fig. 32. Map and cross-section composition for Model 3 to show the evolution (map view) as well as the final geometry of the simulated Anaran anticline, which is depicted by number 2. This model only shows the Lower Mobile and the Competent Groups. The dotted yellow line shows the connection of the bases of synclines across the simulated Mountain Front Flexure as depicted in morphotectonic transects in Fig. 26.
CHAPTER 3. Analogue Models
80
Fig. 33. Map and cross-section composition for Model 4 to show the evolution (map view) as well as the final geometry of the simulated Anaran anticline, which is depicted by number 2. This model only shows the Lower Mobile and the Competent Groups. The dotted yellow line shows the connection of the bases of synclines across the simulated Mountain Front Flexure as depicted in morphotectonic transects in Fig. 26. Blue layers in both maps and cross-section corresponds to growth strata units deposited during shortening (might correspond to Gachsaran, Agha Jari and Bakhtyari formations in nature). These syntectonic units exert a profound impact in deformation propagation as well as in evolution of the Anaran anticline geometry.

CHAPTER 3. Analogue Models
81
3.7 Discussion
In this section the deep geometry of the Anaran anticline is discussed by combining field data and results from sand box models. The geometry of the normal faults is also examined as well as the role of both erosion and syntectonic sedimentation during fold growth. These results are finally combined to propose the evolution of the Anaran anticline through time.
3.7.1 The geometry of the Anaran anticline at surface and depth
A cross-section across the Anaran anticline shows that the geometry of the crestal and backlimb domains can be constructed by using surface data but not the forelimb geometry at depth. That can either be parallel to the base of the Agha Jari Formation dips (parallel to the base of the Passive Group) or can be steeper (Fig. 27). The correct geometry of this forelimb is important for the imaging of the seismic surveys across the area and their potential conversion to depth that is a key point for ongoing HC exploration.
Models 1 and 2 displaying a similar configuration as in the Anaran anticline (Lower Mobile, Competent, Upper Mobile and Passive groups), reproduce the frontal anticline with a relatively steep forelimb at the Competent Group level (Fig. 31). The dip of the forelimb at this level is higher than at the upper brittle level (Passive Group in nature) above the intermediate detachment level. This structural decoupling is partially or even totally controlled by the tectonic thickening of the evaporites migrating from the crestal regions of the anticline to the adjacent syncline to the foreland. This evaporitic tectonic thickening reduces the dip of the overburden (Fig. 31). Model 4 shows, in addition, that the existence of thick growth strata filling up the growth syncline ahead of the anticline increased both the length of the anticline forelimb as well as its dip that is subvertical to slightly overturned (Fig. 33).
Numerical models based on a basement-involved thrust propagating into the cover sequence also result in similar final geometries for the folded cover as concluded by Finch et al. (2003) and Hardy and Finch (2006). These authors indicate that a homogenous weak cover sequence above a propagating basement blind thrust forms a broad anticline with a wide extensional zone whereas a more rigid layered cover succession shows a much narrower anticline with a steeper forelimb and minimum changes of thickness across the anticline (Hardy and Finch, 2006; their Fig. 8).
CHAPTER 3. Analogue Models
82
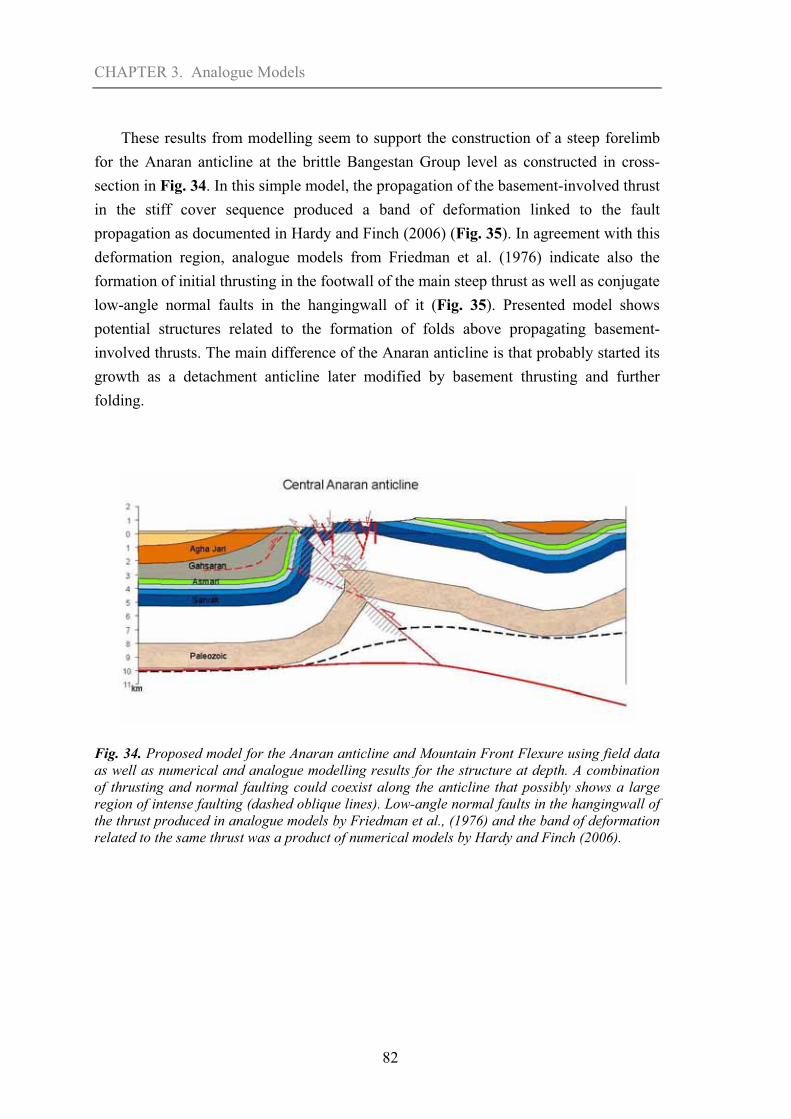
These results from modelling seem to support the construction of a steep forelimb for the Anaran anticline at the brittle Bangestan Group level as constructed in cross-section in Fig. 34. In this simple model, the propagation of the basement-involved thrust in the stiff cover sequence produced a band of deformation linked to the fault propagation as documented in Hardy and Finch (2006) (Fig. 35). In agreement with this deformation region, analogue models from Friedman et al. (1976) indicate also the formation of initial thrusting in the footwall of the main steep thrust as well as conjugate low-angle normal faults in the hangingwall of it (Fig. 35). Presented model shows potential structures related to the formation of folds above propagating basement-involved thrusts. The main difference of the Anaran anticline is that probably started its growth as a detachment anticline later modified by basement thrusting and further folding.
Fig. 34. Proposed model for the Anaran anticline and Mountain Front Flexure using field data as well as numerical and analogue modelling results for the structure at depth. A combination of thrusting and normal faulting could coexist along the anticline that possibly shows a large region of intense faulting (dashed oblique lines). Low-angle normal faults in the hangingwall of the thrust produced in analogue models by Friedman et al., (1976) and the band of deformation related to the same thrust was a product of numerical models by Hardy and Finch (2006).

CHAPTER 3. Analogue Models
83
3.7.2 The geometry of the normal faulting
The Anaran anticline shows numerous normal faults that are mostly subparallel to the fold axis for different segments of the anticline (Fig. 27 to Fig. 29). These spectacular normal faults are an important characteristic of other anticlines located above the Mountain Front Flexure as the Siah Kuh anticline, SE of Anaran anticline, and the Khaviz anticline in Central Zagros (see location in Fig. 24) (Wennberg et al., 2007). Unravelling the relationships between faults and Anaran anticline evolution may help to understand the structure of other anticlines developed above the Mountain Front Flexure elsewhere in Zagros Fold Belt. As discussed earlier the normal faults in the Anaran anticline are divided in two sets: one set dipping ~60º and limiting crestal grabens and one set that shows rotation of about 30º towards the forelimb, possibly formed earlier in ancestral crestal regions and further involved into the forelimb of the anticline.
Some of the results from analogue and numerical models may apply to the Anaran anticline structure. Models 1 and 2 show well developed normal faults in the crestal region of the anticlines (Fig. 31). Similar normal faults also grew in models 3 and 4 although not as well developed as in previous models (Fig. 32 and Fig. 33). Already published numerical and analogue models reproducing basement-involved thrusts propagating through the cover also show interesting results on normal fault formation in the anticline crests (e.g., Friedman et al., 1976; Finch et al., 2003; Hardy and Finch, 2006). Hardy and Finch (2006) results show that uniform strong layered cover bends above the propagating basement thrust produces a narrow anticline with subvertical forelimb with an extensional graben slightly rotated in the transition between crestal and forelimb domains. Their models also show that crestal grabens developed better when the propagation of the thrust fault is efficient through the cover and flattens upwards on top of the footwall developing maximum layer-parallel extension. These results are relevant for the Anaran anticline in which the structure cropping out corresponds to the stiff Competent Group and thus equivalent to the strong layered cover as proposed in the model. Similar conclusions are also provided from analogue models by Friedman et al. (1976). These authors show that crestal grabens developed after 2 to 5% of extension along the outer arc and that displacement along these normal faults is relatively small terminating downwards near the neutral line of the fold.
These results have been integrated in the cross-section across the Anaran anticline in which two successive crestal grabens developed during folding. The faults limiting the present crestal region are thus affecting only the shallow domains of the anticline.
CHAPTER 3. Analogue Models
84
However, the subvertical fault of the rotated graben shows up to about 1000 m of vertical displacement and thus probably needs a different interpretation (Fig. 27 andFig. 34). The large displacement associated to this fault could be associated to reactivations of previous normal faults to accommodate the large structural and topographic variations between the footwall and the hangingwall across the blind propagating basement-involved thrust at depth.
3.7.3 The role of the syntectonic sedimentation and erosion
Other important parameters acting during the growth of an anticline are syntectonic sedimentation and erosion, which have been proved important for constraining the geometry of the fold. These changes in fold geometry associated to growth strata units maybe essential in anticlines like the Anaran anticline in which thick units of pre-growth and growth strata deposits have been identified in front of it in the study region (Homke et al., 2004). More than 800 m of Gachsaran evaporites and about 800 m of Agha Jari fluvial sediments constitute the pre-growth units. Growth units are composed by a total of about 1200 m of fluvial Agha Jari and alluvial Bakhtyari deposits constraining in addition the timing of folding between 7.6 Ma and about 2.5 Ma (Homke et al., 2004).
The effects on fold geometry of growth strata units can be analyzed in light of the results of the analogue modelling. According to sand box models, syntectonic sedimentation and erosion play in a similar way during the growth of a fold and thrust system: inhibiting deformation to propagate into the undeformed foreland (e.g., Storti and McClay, 1995; Barrier et al., 2002; Nalpas et al., 2003). Presented Model 4 with syntectonic sedimentation shows similar effects by keeping the active deformation where it was before syntectonic deposition instead of propagating it towards the foreland (Fig. 33). This prolonged deformation acting along the same structures (anticlines) produced the lengthening of the forelimb against which the growth strata were onlapping. This forelimb with a subvertical shape acted as a buttress for younger growth strata. Coeval erosion with folding also produces a similar effect than syntectonic sedimentation by keeping the deformation at already active structures rather to propagate it. However, its effect on the forelimb geometry is negligible (Model 2 inFig. 31). If intermediate weak units get exposed (like the Gachsaran evaporites) they can flow and create extrusions. One of these potential cases occurs at the northwest termination of the forelimb corresponding to the Central Anaran anticline (Fig. 27 andFig. 28).

CHAPTER 3. Analogue Models
85
Interaction between folding and growth strata deposits from sand box models strengthens the assumption of a very steep forelimb for the Anaran anticline at depth. This interpretation is in agreement with the poor seismic imaging of the forelimb of the Anaran anticline in the newly acquired seismic survey.
3.7.4 Evolution of the Anaran anticline
In this section a sequential restoration is presented to show the potential evolution of the Anaran anticline through time. This reconstruction assumes initial folding and then basement involved thrusting. Although an early phase of folding for the Anaran anticline cannot be disregarded (Homke et al., in press), we refer in this section to the Neogene evolution of the fold in which the timing of the deformation has been determined as starting at 7.65 Ma and possibly ending at about 2.5-1.5 Ma and thus lasting for about 6 My (Homke et al., 2004). This assumed sequence of deformation is supported by the consideration that the Anaran anticline forms part of a system of folds that continues toward both the northeast (hinterland) and southwest (foreland). For this reason it is sensitive to propose firstly folding and then uplift above the Mountain Front Flexure while continuing folding in the Anaran anticline. Although there is no precise timing for folding and uplift, one observation that supports this proposed sequence of deformation is the gently tilt of the anticline towards the foreland above the upper edge of the Mountain Front Flexure.
Initial shortening involving the present Anaran anticline possibly took place above the basement-cover detachment creating a gentle anticline similar to the nearly symmetric Samand anticline to the northeast or the recently analyzed Mand anticline near the Persian Gulf shoreline (Oveisi et al., 2007). A first set of normal faults limiting a crestal graben could form at that time to account for layer-parallel fold extension. Growth strata indicating the inception of folding started at 7.65 Ma after the deposition of 800 m thick Gachsaran and 800 m thick pre-growth Agha Jari formations (Homke et al., 2004) (Fig. 35A). The thickening of the Gachsaran evaporitic units ahead of the forelimb possibly took place during the entire evolution of the Anaran anticline growth as documented in O'Brien (1950), Dunnington (1968) and Vergés et al. (in press).
As commented before there are no clear indications for the age of the uplift of the Pusht-e Kuh Arc in this region. The deposition of the ~800 m thick fine grained deposits of the Lahbari Member starting at 5.5 Ma along the footwall of the Mountain Front Flexure could tentatively be associated to this major event (Homke et al., 2004). This

CHAPTER 3. Analogue Models
86
interpretation is based on the fact that these fine grained sediments, deposited about 2.1 My later than fold growth initiation, could be sourced from the softer Gachsaran and Agha Jari deposits regionally uplifted above the proposed low-angle blind thrust, which generated the Pusht-e Kuh Arc (Vergés, 2007) (Fig. 35B). Above the Lahbari Member the younger alluvial Bakhtyari Formation mostly consists of a coarsening-upwards sequence of conglomerates made of grey carbonatic clasts with a varying amount of interbedded fine brown sandstones. If correct, the initiation of uplift related to basement-involved thrusting would start about 2.1 My later than inception of folding in the Anaran anticline. During this phase, the Anaran anticline would rotate passively on the upper part of the Mountain Front Flexure while continued its amplification.
The end of growth of the Anaran anticline and Mountain Front Flexure occurred during the uppermost part of the Bakhtyari deposition since these subhorizontal conglomeratic depostis, with an extrapolated age of 1.5 Ma, are overlapping the already very steep forelimb of the Anaran anticline (Homke et al., 2004) (Fig. 35C). The steep forethrust that cuts the central part of the Anaran anticline possibly formed during the late stages of folding and Mountain Front Flexure evolution as consequence of fold tightening (Sans and Vergés, 1995) and using fold hinges to propagate as observed in many other examples in the study region (Vergés et al., in press). The displacement of this thrust fault is of about 700-1000 m to account for the stratigraphic separation between Sarvak and Gachsaran formations.
One important point in this fold history is the great topographic difference between the crest of the anticline at Sarvak levels (~1500 m of altitude) and the low position of the topmost Bakhtyari Formation (~610 m) in the Changuleh syncline. Based on discussed relationships we can infer that the conglomerates already deposited when the Anaran anticline was for the most part already created. However, the non-direct contact between the Central Anaran anticline thrust and conglomerates does not inform us about the relative timing for this steep thrust fault to develop that could be relatively young in the history of the fold.
Present deformation along the Mountain Front Flexure is documented by the occurrence of numerous deep basement earthquakes that are aligned along the Mountain Front Flexure (Berberian 1995; Talebian and Jackson, 2004) (Fig. 24). This recent seismic activity could certainly facilitate the reactivation of existing normal faults showing excellent exposures of their undulated fault planes. In addition, earthquakes could easily trigger large mass movements that contribute to the rapid denudation of the
CHAPTER 3. Analogue Models
87
anticlines. These gravitational mass displacements detach above marly layers and are helped by existing strong fracturing.
Large erosive straths located at about 300, 350, and 400 m above sea level, some of them covered by a thin aggradational fluvial or alluvial fill terraces, constitute the most typical landscape along the frontal region of the Mountain Front Flexure along the Anaran anticline. Taking in account that the youngest extrapolated age for the top of the Bakhtyari Formation is of about 1.5 Ma (Homke et al., 2004), post-deposition river incision is calculated by the difference between 610 m of top of Bakhtyari Formation in the Changuleh growth syncline and 250 m of present river course crossing those conglomerates. These numbers give a mean rate of incision since the end of the Bakhtyari deposition of about 0.24 mm/a.
CHAPTER 3. Analogue Models
88
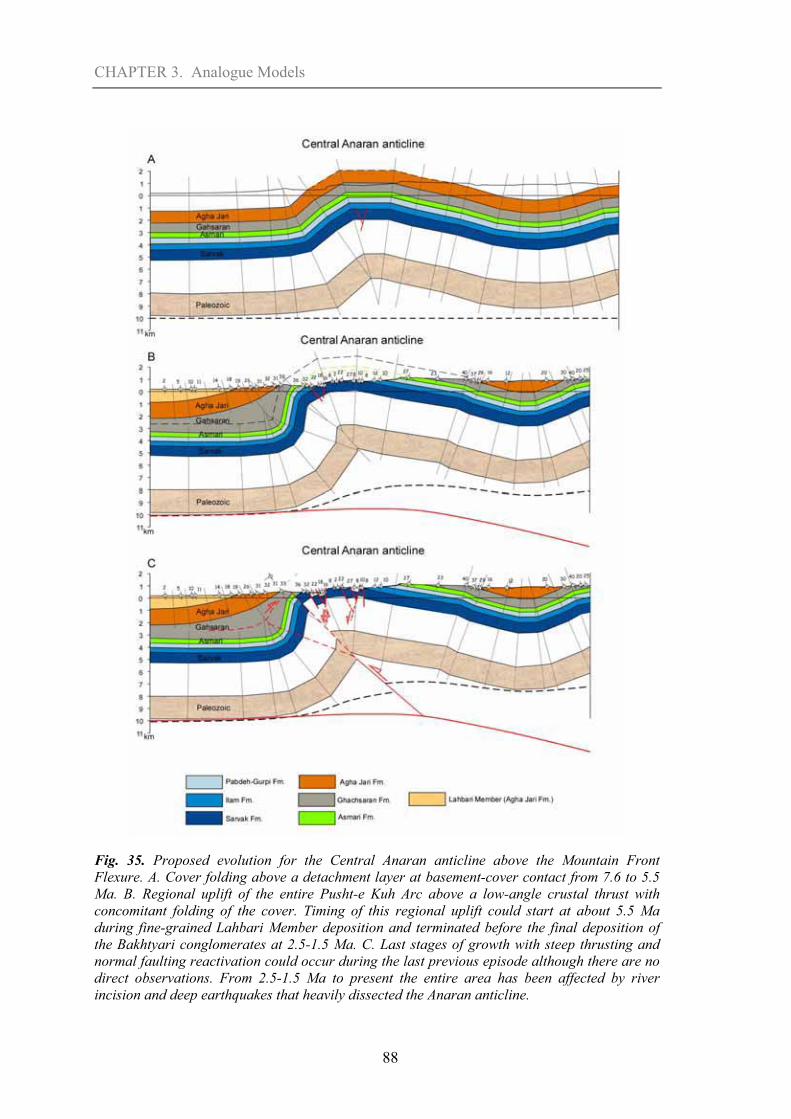
Fig. 35. Proposed evolution for the Central Anaran anticline above the Mountain Front Flexure. A. Cover folding above a detachment layer at basement-cover contact from 7.6 to 5.5 Ma. B. Regional uplift of the entire Pusht-e Kuh Arc above a low-angle crustal thrust with concomitant folding of the cover. Timing of this regional uplift could start at about 5.5 Ma during fine-grained Lahbari Member deposition and terminated before the final deposition of the Bakhtyari conglomerates at 2.5-1.5 Ma. C. Last stages of growth with steep thrusting and normal faulting reactivation could occur during the last previous episode although there are no direct observations. From 2.5-1.5 Ma to present the entire area has been affected by river incision and deep earthquakes that heavily dissected the Anaran anticline.
CHAPTER 3. Analogue Models
89
3.8 Conclusions
Two groups of conclusions can be drawn from this study: one is related to the Anaran anticline above the Mountain Front Flexure based on field observations and the second one is related to the analogue models and how these can provide indications for the deep structure of the Anaran anticline that is not imaged in existing seismic lines.
The Anaran anticline is located above the Mountain Front Flexure along the front of the Pusht-e Kuh Arc. It shows an asymmetric shape in cross-section and an irregular geometry in map view. The principal characteristic of this anticline is the existence of a large group of normal faults that cut its forelimb especially along the N-S Anaran and Central Anaran anticline segments. These normal faults, formed by layer-parallel extension during folding, limit crestal grabens and are not very deep. Older grabens are rotated in the forelimb of the Anaran anticline indicating synchronicity between folding and fracture development. The largest fault shows about 1000 m of subvertical dip-slip displacement and must be interpreted as a reactivation of a previous normal fault during basement upthrown above the Mountain Front Flexure. Linked to this basement-involved thrusting, a 20-km long thrust juxtaposes Late Cretaceous Sarvak Formation on top of Miocene Gachsaran evaporites along the forelimb of the Central Anaran anticline.
The deeper geometry of the Anaran anticline has been reconstructed by using the results from sand box models. These models indicate that the forelimb of brittle units (Competent Group) is mostly subvertical and does not follow the gentler dip of younger stiff units (Passive Group) separated by an intermediate detachment level (Upper Mobile Group). Syntectonic deposition to folding has a strong impact in controlling the geometry of the forelimb against which growth strata are impinged. These variations are the verticalization and lengthening of the growing anticline forelimb.
We therefore propose the evolution of the Anaran anticline as follows: an initial folding episode as detachment anticline linked to the suite of folds cropping out in the present Pusht-e Kuh Arc. Agha Jari growth strata in the Changuleh growth syncline indicate that this folding initiated at 7.65 Ma. Regional uplift of the Pusht-e Kuh Arc above a low-angle crustal thrust probably took place later because of the tilting of the Anaran anticline located at the upper edge of the Mountain Front Flexure. Although no precise temporal constraint, the fine-grained Lahbari Member could be related to this basement blind thrusting since 5.5 Ma to the end of the Bakhtyari deposition at 2.5-1.5 Ma. By then, the formation of the Anaran anticline on top of the Mountain Front

CHAPTER 3. Analogue Models
90
Flexure was already completed. Since the end of Bakhtyari deposition, uplift is recorded by river incision, anticline gravitational collapses and recent basement seismic activity.
The characteristic geometry of the Anaran anticline is closely related to its singular position on top of the Mountain Front Flexure and thus not really applicable to other anticlines in the Pusht-e Kuh Arc. However, a large number of anticlines are located on top of the Mountain Front Flexure along the Pusht-e Kuh Arc, Dezful Embayment and Fars Arc like the Siah Kuh and Khaviz anticlines and thus the Anaran anticline geometry and evolution presented hear can provide clues for their interpretation.

CHAPTER 3. Analogue Models
91