detachment folding in the southwestern tian shan–tarim foreland, china: shortening estimates and...
TRANSCRIPT

Detachment folding in the Southwestern Tian Shan–Tarim foreland,
China: shortening estimates and rates
K.M. Scharera,*, D.W. Burbankb, J. Chenc, R.J. Weldona, C. Rubind, R. Zhaoc, J. Shenc
aDepartment of Geological Sciences, 1272 University of Oregon, Eugene, OR 97403, USAbDepartment of Geological Sciences, University of California, Santa Barbara, CA 93106, USA
cState Key Laboratory of Earthquake Dynamics, Institute of Geology, China Seismological Bureau, P.O. Box 9803, Beijing 100029, P.R. ChinadDepartment of Geological Sciences, Central Washington University, Ellensburg, WA 98926, USA
Received 17 February 2003; received in revised form 15 January 2004; accepted 26 February 2004
Available online 20 July 2004
Abstract
Geologic observations of the Chinese Tian Shan foreland reveal active, contractional deformation along the entire margin. To quantify the
amount of shortening and understand the structural style, we mapped the stratigraphy and structure of four folds expressed at the western end
of the foreland, north of Kashi. In this region, upper Tertiary through Quaternary sediments are conformable, but an abrupt transition from
parallel to unconformable bedding in the uppermost strata suggests a transition from pre-fold strata to strata deposited on a growing fold. The
folds have very steep (60–908) limbs and are box-like to isoclinal, suggestive of detachment folding. Total north–south shortening across the
center of the region is .9 km, of which 5–7 km occurred in the Kashi–Atushi fold system. Shortening estimates determined with excess
area methods for individual folds decrease from a maximum of 6.8 km in the northwest to a minimum of 0.7 km in the southeast. Timing
derived from a paleomagnetic study shows that the transition to syn-folding strata occurred ,1.2 Ma in the middle of the study area, resulting
in an average shortening rate for the Kashi–Atushi fold system of ,5 mm/yr if folding was coeval. The shortening rate is high compared
with foreland deformation east of the study area, suggesting that the regional stresses or response of the foreland stratigraphy are unique to
the Kashi–Atushi fold system kinematics.
q 2004 Elsevier Ltd. All rights reserved.
Keywords: Kashi Depression; Xiyu conglomerate; Lateral propagation; Growth strata; Anticline; Kepingtage
1. Introduction
The Tian Shan (Fig. 1) have been the focus of recent
geologic investigations concerning the timing, sequence,
and geometry of active, intracontinental mountain building
(Sobel and Dumitru, 1997; Yin et al., 1998; Allen et al.,
1999; Burchfiel et al., 1999; Sobel et al., 2000; Abdrakh-
matov et al., 2002; Thompson et al., 2002). These studies
suggest that the onset of deformation in the Tian Shan began
about 20 Ma, or ,35 Myr after the initial Indo-Asian
collision, and that north–south directed shortening con-
tinues to be active across the entire range. Thompson et al.
(2002) demonstrate that at late Pleistocene time scales,
,13 mm/yr of shortening is accommodated on 5–6 discrete
structures distributed across the Kyrgyz Tian Shan.
Geodetic studies indicate that up to 50%, or 20–24 mm/
yr, of the total modern convergence between the Indian and
Eurasian plates is accommodated by shortening in the Tian
Shan (Abdrakhmatov et al., 1996; Holt et al., 2000; Wang
et al., 2000). The geologic and geodetic observations agree
well in the Kyrgyz Tian Shan, which suggests that the
remaining, geodetically calculated shortening of ,7–
10 mm/yr should occur south of the Aksay Basin in the
southern Tian Shan and northern Tarim Basin (Fig. 1).
Studies in the central and eastern Tian Shan foreland
have estimated the Cenozoic shortening, but provided loose
control on the timing of the deformation in the western
foreland (Yin et al., 1998; Allen et al., 1999; Burchfiel et al.,
1999). In the southwestern Chinese Tian Shan foreland, up
to 12 km of Cenozoic strata (Bally et al., 1986) provide a
pristine succession in which the style, age, and rates of
shortening can be investigated. This paper presents
structural, stratigraphic and geomorphic data to define the
style of folding in this region. In combination with a
0191-8141/$ - see front matter q 2004 Elsevier Ltd. All rights reserved.
doi:10.1016/j.jsg.2004.02.016
Journal of Structural Geology 26 (2004) 2119–2137
www.elsevier.com/locate/jsg
* Corresponding author. Tel.: þ1-514-346-4573; fax: þ1-514-346-4692.
E-mail address: [email protected] (K.M. Scharer).

magnetostratigraphic study presented by Chen et al. (2002),
we estimate the timing of initiation of folding and quantify
regional shortening rates. We show that structures in the
northwest Tarim Basin are detachment folds that began
deforming during the Pleistocene and have accommodated
much of the recent shortening predicted geodetically to
occur south of southern Kyrgyzstan.
1.1. Geographic and geologic setting
The Tian Shan extends over 2000 km eastward from
Tajikistan, covers most of Kyrgyzstan, and tapers to the east
in the Xinjiang province of western China At the study
location, the range is ,500 km wide. The Tarim Basin is an
internally draining, trapezoid shaped basin 1500 km long,
pinched between the Tian Shan on the north, the Pamir
Mountains to the west, and the Tibetan Plateau to the south.
The field area is located in the northwest corner of the Tarim
Basin, approximately 250 km from the Alai Valley where
the Tian Shan and the Pamir Mountains meet (Fig. 1). The
arid climate and the paucity of vegetation provide excellent
exposure for structural and stratigraphic mapping.
The Tian Shan and the Tarim Basin blocks have been
proximate since the Devonian, when an intervening ocean
basin separating the two began subducting under the
ancestral Tian Shan (Watson et al., 1987; Carroll et al.,
1995). The two blocks were sutured by the late Permian
(Carroll et al., 1995; Yin and Nie, 1996) and have
subsequently felt the effects of at least three Mesozoic
collisions south of the Tarim craton (Hendrix et al.,
1992). The period between the last Mesozoic collision,
when the Kohistan–Dras arc – forearc complex was
accreted to southern Asia (,70 Ma), and the initiation
of Cenozoic deformation in the Tian Shan (,25 Ma) was
a time of tectonic quiescence. During this ,45 Myr
period, the ancestral Tian Shan was beveled by erosion.
Stratigraphically, this period is represented by a wide-
spread, planar denudation surface in the Tian Shan
(Abdrakhmatov et al., 2002) and by deposition of lower
Tertiary strata along its margins (Bally et al., 1986; Hu,
1992). Within the Tian Shan proper, the Cenozoic
deformation has been quantified by studying the uplift
and faulting of the early Tertiary peneplain (Burbank
et al., 1999; Bullen et al., 2001; Abdrakhmatov et al.,
2002; Thompson et al., 2002). At the southern margin of
the Tian Shan, the peneplain is absent, but deformation of
foreland fold-and-thrust sequences has been used to
understand the timing and style of the outward growth
and uplift of the Tian Shan (Sobel and Dumitru, 1997;
Yin et al., 1998; Allen et al., 1999; Burchfiel et al., 1999;
Chen et al., 2001, 2002).
Geophysical evidence, numerical modeling, and both
geologic and geomorphic evidence suggest that the Tarim
Basin is being coherently thrust under the Tian Shan
(Molnar and Tapponnier, 1975; Burov et al., 1990; Avouac
et al., 1993; Burtman and Molnar, 1993; Neil and House-
Fig. 1. Elevation map of the Tarim Basin, Tian Shan, Pamir Mountains, and Northern Tibetan Plateau. Major rivers designated with dashed lines, lake (Issyk-
kul) in stripes. The study area is located in the western corner of the Tarim Basin, surrounded to the north, west, and south by .4000 m peaks. The box north of
Kashi locates Fig. 2. Number 1 locates the Alai Valley and 2 locates the Aksay Valley described by Thompson et al. (2002). Numbers 3–5 locate the
Kepingtage, Kuche, and Boston Tokar/Kalasu River sections of Allen et al. (1999), Yin et al. (1998), and Burchfiel et al. (1999), respectively.
K.M. Scharer et al. / Journal of Structural Geology 26 (2004) 2119–21372120

man, 1997; Burchfiel et al., 1999; Abdrakhmatov et al.,
2002). Sediments express the convergence in a series of
folds and thrust faults along the northern margin of the
Tarim Basin (Rubin et al., 2000; Scharer et al., 2000; Zhao
et al., 2000; Chen et al., 2001). The topographic front of the
Tian Shan proper is delineated by the South Tian Shan fault,
an oblique reverse fault with unknown displacement
magnitude (Yin et al., 1998). Basinward of the South Tian
Shan fault, two areas with contrasting deformational styles
are clear in Landsat Multispectral Scanner imagery (Fig. 2).
The northern area, called the Kepintage–Yishilakekalawuer
thrust fault (Kepingtage), represents the westernmost
expression of the Kashi–Akesu system as identified by
Yin et al. (1998). It is characterized by south verging thrust
faults that place Paleozoic strata on top of Mesozoic and
Cenozoic sediments (XBGM, 1985; Sobel and Dumitru,
1997; Rubin et al., 2000; Zhao et al., 2000; Chen et al.,
2001, 2002). Fission track dating by Sobel and Dumitru
(1997) suggests that deformation propagated southward
from the Tian Shan, exhuming this part of the Kepingtage
system since ,14 Ma. Total shortening in this part of the
Kepingtage has not been calculated, but folded sediments in
piggyback basins provide evidence for a component of late
Tertiary deformation.
The southern area, the Kashi–Atushi fold system, is
south of the Kepingtage system. It includes the towns of
Kashi (Kashgar) and Atushi (Artush), and is characterized
by two rows of sinuous folds within the Kashi Depression, a
deep Tertiary sub-basin. Major rivers draining the Tian
Shan cross the Kashi–Atushi fold system. Large earth-
quakes have occurred at the perimeter of this area, but none
are recorded within the fold system (Fig. 3). We
differentiate this area from the Kashi–Akesu system of
Yin et al. (1998) due to the striking difference between the
Fig. 2. Landsat image of the southwestern Tian Shan. The study area is located south of the Southern Tian Shan fault (STS), the Muziduke fault (MF), and the
Kepingtage–Yishilakekalawuer Thrust Fault system (Kepingtage). The timing and displacements of these faults are poorly constrained. TFF is the Talas–
Ferghana fault, a right lateral fault with ,10 mm/yr Cenozoic slip rate (Burtman et al., 1996). The Kashi–Atushi fold system covers the lower half of the
image. Upper Tertiary strata (light color) comprise most of the folds, which are rimmed by resistant Quaternary conglomerates (dark color distinct on the
southern limbs). The Talas–Ferghana fault projects into the middle of the fold system, which appears unaffected, suggesting right-lateral strain on the Talas–
Ferghana fault is partitioned into the South Tian Shan fault or the Muziduke fault rather than the Tarim craton.
K.M. Scharer et al. / Journal of Structural Geology 26 (2004) 2119–2137 2121

imbricate thrust stacks of Mesozoic and Paleozoic strata that
form the northern band of deformation in the Tarim Basin
and the simply folded upper Cenozoic strata in the study
area. The Kashi–Atushi fold system includes the Atushi–
Talanghe, Mutule, Mingyaole and Kashi anticlines. We
present fieldwork from the summers of 1999, 2000, and
2003, which includes six structural transects across the folds
(Fig. 2). We incorporate the magnetostratigraphic dating on
the Atushi–Talanghe anticline presented by Chen et al.
(2002) to constrain the timing and rates of this shortening.
The discussion evaluates the mechanisms of detachment
folding and the regional setting that produced this unique
deformation.
2. Stratigraphy
Although not exposed in the study area, we review the
lithology and interpreted depositional setting of the pre-
Tertiary sediments because they are involved in, and to
some extent may control, the modern deformation and
structural behavior of the system. As a depocenter, the field
area shares many attributes with the Southwest Depression
that borders the Kunlun Shan (Fig. 1; Hu, 1982; Sobel and
Dumitru, 1997). The Paleozoic rocks across the western
Tarim Basin comprise ,4000 m of neritic carbonates and
shallow marine carbonates interbedded with mudstone
and shale, recording a series of marine transgressions and
Fig. 3. Geologic map of Kashi–Atushi fold system, modified from Chen et al. (2002). Note that the Xiyu Formation pinches out along strike and is located
closer to the axial trace on the north side of each anticline. The Boguzihe (‘he’ means river in Chinese) has eroded the northern limb of the eastern end of the
Atushi–Talanghe anticline. Focal mechanisms (Harvard CMT, 2003) of major earthquakes show north-directed, low angle reverse faulting; the 1902 ,M 7.7
Artux earthquake is located just east of the map area (Molnar and Ghose, 2000).
K.M. Scharer et al. / Journal of Structural Geology 26 (2004) 2119–21372122

regressions. No Triassic sediments are reported in the Kashi
region, whereas Jurassic coal bearing sediments range in
thickness from 1400 to 3800 m. Lower Cretaceous mud-
stone and sandstone approximately 1000 m thick was
deposited before an eastward transgression of the Tethys
Sea occurred in the late Cretaceous (Hu, 1982; Sobel, 1999).
Isopachs depict Tertiary through modern clastic sedi-
ments exceeding 10,000 m in the Kashi Depression (Bally
et al., 1986); in a different study a lower value of ,8000 m
is cited (Hu, 1992). These strata are subdivided into the
Paleogene Kashi Group, the Neogene Wuqia Group and the
Atushi and Xiyu Formations (Fig. 4; Hu, 1982; Mao and
Norris, 1988). The Paleogene Kashi Group records a series
of alternating shallow marine, hypersaline lagoon, and
fluvial deposits. The thickest members of the Kashi Group
include the 200-m-thick massive gypsum and limestone of
the Aertashi Formation, the red, purple and gray–green
mudstone and siltstone of the Bashibulake Formation
(.268 m) and the Oligocene Kezilouyi Formation, a
brown mudstone and gray–green sandstone with numerous
gypsum interbeds (.280 m; Mao and Norris, 1988; Yang,
1996). The Kashi Group is exposed in the southern edge of
the Kepingtage system (Fig. 3).
Neogene through modern strata are exposed by the
Kashi–Atushi fold system (Fig. 3; Zhou and Chen, 1990;
Chen et al., 2001, 2002). Red mudstone exposed in the core
of the Atushi fold is inferred to correlate with the
multicolored Wuqia Group, dated elsewhere by faunal
assemblage as late Oligocene through Miocene (Hu, 1982).
Conformably above the Wuqia Group, the Atushi Formation
is dominated by yellow–gray to tan mudstone, siltstone, and
fine- to medium-grained sandstone. Thin beds, 5–50 mm
thick, of gypsum and gypsiferous mudstone are preserved
within the lower section; higher the section contains rare
small pebble conglomerate layers. In the field area,
paleocurrent directions in the upper Tertiary clastics are
oriented predominantly southeast.
The top of the Atushi Formation is marked by an abrupt
coarsening and darkening of the lithology that is easily
mapped in the study area and indicates transition into the
Xiyu Formation (Fig. 5). At the base of the Xiyu Formation,
0.3–7-m-thick pebble conglomerate beds alternate with
poorly sorted sand lenses and discontinuous silt and sand
layers with scarce pebbles. Higher in the section, the
conglomerate beds are thicker and comprised of well
rounded, clast supported pebbles and cobbles; less common
are beds with thicknesses of 5–15 m, which are matrix
supported. The Xiyu Formation varies from 0 to 2500 m
thick. Clast composition of the Xiyu Formation is
dominated by limestone and sandstone clasts derived from
Paleozoic to Mesozoic strata in the Kepingtage system and
the southern Tian Shan, and is similar to the modern,
southeast flowing rivers in the study area.
The Xiyu and Atushi Formations appear conformable,
but the stratigraphic level of the contact varies along strike.
The character of the contact can be seen in the Landsat
imagery (Fig. 2) where, for example, west of transect line
F–F0 the contact creeps down section or east of the B–B0
traverse on the Atushi–Talanghe anticline, the dark Xiyu
Formation conglomerate tapers out within the lighter Atushi
sediments. These along-strike variations suggest interdigi-
tation of different depositional systems during systems
during the late Cenozoic.
2.1. Progradation
The stratigraphic height of the Atushi–Xiyu contact also
appears to vary in a north–south direction, but consistently
Fig. 4. Cenozoic stratigraphy exposed by folding includes over 5 km of Neogene through mid-Pleistocene fine-grained sediments capped by lower to middle
Pleistocene conglomerates. The Kashi Group is exposed along parts of the southern edge of the Kepingtage. The combined thickness of the Tertiary sediments
is ,10 km in this region (Bally et al., 1986). According to Sobel (1999) and Chinese geological maps, the oldest exposed sediments are Miocene (XBGM,
1965a,b). Pleistocene ages presented in Chen et al. (2002).
K.M. Scharer et al. / Journal of Structural Geology 26 (2004) 2119–2137 2123

across the region. This variation is shown in the distance
between the axial surface and the Xiyu Formation on the
north versus the south flank of each fold (Figs. 2 and 3).
Despite the essentially identical geometry of the fold limbs
and an absence of major thrust faults, the Atushi–Xiyu
contact on the north side of each fold is consistently 1.5–2
times closer to the core than the contact is on the south side.
Along the Atushi–Talanghe anticline, the contact on the
northern limb is ,1.5 km lower stratigraphically than on
the southern limb. The difference is reduced to ,0.5 km
across the more southerly Mingyaole and Kashi anticlines.
This spatial variation in the thickness of the Xiyu Formation
demands explanation because the conglomerate unit offers
the only potential stratigraphic control with which to
produce cross-sections across the folds (the gradual color
change between the Wuqia Group and Atushi Formation
makes this older contact ambiguous). Two mechanisms,
structural or stratigraphic, could account for the spatial
variation.
A structural model suggests that beds on the northern
limbs have been thinned during folding (Fig. 6A). The
structural model predicts that the Xiyu Formation would be
thinned on the northern side and that the axial traces would
not bisect the neighboring kink panels. Poor preservation
and/or exposure of the conglomerate on the northern side of
the folds make these observations difficult, so we consider
variation in mesoscopic deformation across the fold. The
shear needed to thin the northern limb by ,1.5 km should
require significant penetrative shear across the bedding.
Shear strains of ,15% can be observed in mesoscopic
studies around fault zones (Jamison, 1989), suggesting that
thinning the forelimb by 50% should create obvious shear
and deformation within the attenuated limb. During
structural mapping, we observed no significant difference
in mesoscopic deformation between the limbs. On the
contrary, bedding planes were well maintained in each limb
even where wide panels of the limb were steeply dipping or
overturned.
The stratigraphic model relies on a wedge shaped upper
unit (in cross-section) to cause the difference in the
stratigraphic thickness across the fold (Fig. 6B). Given
both the observed variations in the thickness of the contact
and absence of penetrative shear preferential to either limb,
we interpret that the Xiyu Formation is wedge shaped.
Furthermore, the contact appears to be conformable. A
conformable, wedge shaped unit in this setting can be
created by progradation into a subsiding foreland basin. If
the unit is a progradational wedge, the contact should be
older at the northern limb and younger at the southern limb.
Given these stratigraphic and structural considerations, we
interpret the contact to be progradational and relatively
younger on the southern limb than on the northern limb of
each fold. A similar appearing conglomerate, commonly
called the Xiyu Formation, is widespread across the Tian
Shan foreland and, without quantitative constraints, has
been interpreted to correlate with a ,2.5 Ma climate
change (Avouac et al., 1993; Burchfiel et al., 1999; Zhang
et al., 2001). Our interpretation at the Kashi–Atushi fold
system indicates, however, that the base of the conglomerate
is temporally variable, ranging from 2.8 to 1.9 Ma across the
Talanghe anticline (Chen et al., 2002).
2.2. Growth strata
Bedding is conformable within the folds but not at the
southernmost exposed flanks at each of the transects across
the Atushi –Talanghe and Kashi anticlines At these
transects, field observations show that in the last hundreds
of meters of exposed strata, the bedding inclinations
decrease abruptly up section, and in most places form
Fig. 5. Time-transgressive nature of major lithostratigraphic boundaries
illustrated by interfingering Atushi and Xiyu Formations at the Boguzihe
water gap. View is to the SSW, across a terrace of the Boguzihe on the
southern limb of the Talanghe anticline. Hill at left is ,250 m high.
Fig. 6. Models to account for map trace of Xiyu Formation. (A) Shear
during folding thins units in the forelimb. In this model, the base of the gray
unit in the forelimb is ,2.5 times closer to the fold axis than the base of the
gray unit on the backlimb. (B) When folded, a progradational contact will
be farthest from the axial surface on the distal side (assuming no limb
thinning). In this cartoon, the backlimb contact is twice as far from the core
as the forelimb contact.
K.M. Scharer et al. / Journal of Structural Geology 26 (2004) 2119–21372124

angular unconformities suggestive of off lapping. The
Ganhangou paleomagnetic section was located to capture
this transition (Fig. 7). In contrast, mapping at the
Mingyaole anticline revealed that a few closely spaced
unconformities are located just below the base of the Xiyu
Formation. A transition from conformable beds to off
lapping or angular unconformities is frequently interpreted
to result from the transition from static conditions to active
folding (e.g. Poblet et al., 1997). We argue that the gently
dipping outer beds are syntectonic strata, deposited after the
initiation of folding in the region.
At the Seven Mills and Atushi transects, the southern
flanks show continuous reduction in dips of off lapping
strata; however, the northern flanks revealed dramatic
changes in dip. At the Atushi transect, for example, a
wide, 758 north dipping panel is overlain by a 158 dipping
panel. We infer that, as observed today, rivers eroded the
north side of the folds as they grew, and that growth strata
were not preserved until later in the development of the fold,
when these sections had risen above the grade of the river. It
appears that the southern sides of the folds were sheltered
from this effect, and growth strata were deposited
continuously.
3. Structure
We conducted detailed field mapping on six traverses
across the Atushi–Talanghe, Mutule, Mingyaole and Kashi
anticlines to investigate the variation in shortening and
deformational style across the Kashi–Atushi fold system
(Fig. 2). Transects were located along water gaps or roads
cutting orthogonal to the structures to maximize access to
structures and bedding exposures. Structural and sedimen-
tological data were mapped at ,1:25,000 onto CORONA
satellite photographs, aerial photos, and topographic maps.
Additional structural data were interpreted from Chinese
geologic maps (XBGM, 1965a,b). Field maps were later
transferred onto a geographic information system database
with the Landsat image and CORONA photographs tied to a
90 m digital elevation model (DEM) base. Topographic
profiles oriented perpendicular to the average strike of the
bedding orientation at each traverse were derived from the
DEM and used as bases for our cross-section interpretations.
The cross-sections are constrained by structural measure-
ments, stratigraphic thickness based on field measurements,
progradation of the conglomerate unit, and unpublished
seismic data. Our interpretations suggest most of the folds
would reach 3–4 km above the land surface, yet modern
topography exhibits less than 1 km of relief (Figs. 8 and 9).
Due to the vigorous erosion and lack of distinctive
stratigraphic marker beds, two techniques were used to
quantify the amount of shortening across the region. We
review the general method for creating the cross-sections,
summarize general observations from the seismic reflection
data, discuss the common structural style of the folds, and
then report details of each fold individually.
The basic fold geometry was determined by fitting a form
line to the structural data. Where canyon walls reveal cross-
sectional views, the Kashi–Atushi fold system exhibits
sharp kink axes in the limbs, while sheared zones were
common in the core of tight folds. These features are well-
modeled using kink style fold axes to separate dip panels
(Marshak and Mitra, 1988). Dip panel width and inclination
were determined by converting dip measurements into
apparent dip with respect to the cross-section trend,
grouping the dip measurements into internally consistent
sets (variability #158) and calculating the average angle
(Figs. 8 and 9). Where we were able to measure bedding
thicknesses across a kink axis, the thicknesses did not
change, indicating that the kink axes bisects the kink panels.
In each cross-section, the stratigraphic height of the growth
strata within each fold limb is accurate, but the geometry of
the growth strata package is idealized. For simplicity (and
lacking evidence to the contrary), we assumed that there is
no change in structural height from north to south across the
structures.
3.1. Seismic reflection data
We examined three unpublished, confidential seismic
reflection images from transects across the Atushi–
Talanghe and Kashi anticlines The seismic profiles are
basically co-located with three traverses (Fig. 3): (1) over
the Atushi–Talanghe anticline along the road at A–A0 and
continuing through the Kashi anticline along the Baishiker-
emu River, (2) over the Atushi–Talanghe anticline at B–B0
and crossing the eastern edge of the topographic expression
of the Kashi anticline, and (3) over the Atushi–Talanghe
anticline at C–C0 and continuing ,20 km into the evaporite
deposits ,15 km east of the end of the topographic
expression of the Kashi anticline. These profiles fortuitously
provide this study with a second perspective for interpreting
the structures at depth.
The most valuable information in the seismic lines was
the presence of long, gently dipping (,128) reflectors at the
outermost flanks of the folds, where young alluvial deposits
on the surface prohibited access to the structure. The gently
Fig. 7. Interpreted photograph of growth strata on the southern limb of the
Talanghe anticline at the Ganhangou paleomagnetic transect. View is to the
east. South of a ,3-km-wide panel dipping 508, off lapping dips of siltstone
and small-pebble conglomerates (foreground) are interpreted to record the
initiation of folding. Pale hill under skyline is the eastward continuation of
Talanghe anticline.
K.M. Scharer et al. / Journal of Structural Geology 26 (2004) 2119–2137 2125
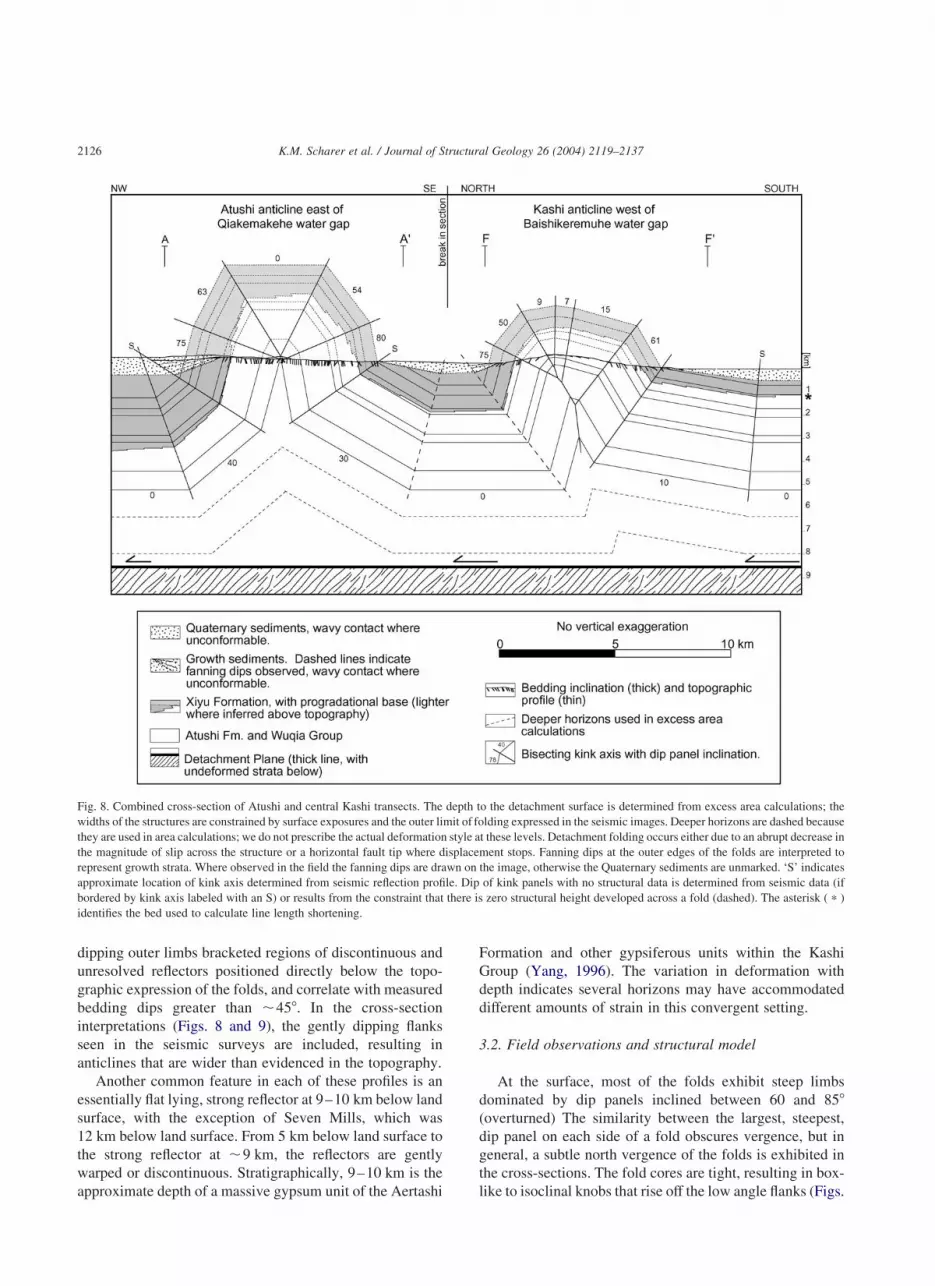
dipping outer limbs bracketed regions of discontinuous and
unresolved reflectors positioned directly below the topo-
graphic expression of the folds, and correlate with measured
bedding dips greater than ,458. In the cross-section
interpretations (Figs. 8 and 9), the gently dipping flanks
seen in the seismic surveys are included, resulting in
anticlines that are wider than evidenced in the topography.
Another common feature in each of these profiles is an
essentially flat lying, strong reflector at 9–10 km below land
surface, with the exception of Seven Mills, which was
12 km below land surface. From 5 km below land surface to
the strong reflector at ,9 km, the reflectors are gently
warped or discontinuous. Stratigraphically, 9–10 km is the
approximate depth of a massive gypsum unit of the Aertashi
Formation and other gypsiferous units within the Kashi
Group (Yang, 1996). The variation in deformation with
depth indicates several horizons may have accommodated
different amounts of strain in this convergent setting.
3.2. Field observations and structural model
At the surface, most of the folds exhibit steep limbs
dominated by dip panels inclined between 60 and 858
(overturned) The similarity between the largest, steepest,
dip panel on each side of a fold obscures vergence, but in
general, a subtle north vergence of the folds is exhibited in
the cross-sections. The fold cores are tight, resulting in box-
like to isoclinal knobs that rise off the low angle flanks (Figs.
Fig. 8. Combined cross-section of Atushi and central Kashi transects. The depth to the detachment surface is determined from excess area calculations; the
widths of the structures are constrained by surface exposures and the outer limit of folding expressed in the seismic images. Deeper horizons are dashed because
they are used in area calculations; we do not prescribe the actual deformation style at these levels. Detachment folding occurs either due to an abrupt decrease in
the magnitude of slip across the structure or a horizontal fault tip where displacement stops. Fanning dips at the outer edges of the folds are interpreted to
represent growth strata. Where observed in the field the fanning dips are drawn on the image, otherwise the Quaternary sediments are unmarked. ‘S’ indicates
approximate location of kink axis determined from seismic reflection profile. Dip of kink panels with no structural data is determined from seismic data (if
bordered by kink axis labeled with an S) or results from the constraint that there is zero structural height developed across a fold (dashed). The asterisk ( p )
identifies the bed used to calculate line length shortening.
K.M. Scharer et al. / Journal of Structural Geology 26 (2004) 2119–21372126

K.M. Scharer et al. / Journal of Structural Geology 26 (2004) 2119–2137 2127

8 and 9). To accommodate the steep bedding dips of the
inner panels, the folds can be modeled as fault propagation
folds with complex, imbricate blind faulting histories (Al
Saffar, 1993) or as detachment folds. Basic observations
suggest the anticlines are not fault propagation folds. (1)
There is no evidence for long thrust ramps above 6 km
below land surface in the seismic images. (2) Along some
transects, fault scarps were observed near the core of the
folds, but never at the base of the forelimb where a thrust
fault is predicted from traditional fault propagation fold
geometry (e.g. Suppe and Medwedeff, 1990). Instead, the
geometry of the anticlines is consistent with models of
disharmonic detachment folds (Mitra and Namson, 1989) or
faulted detachment folds with moderate strain (Figure 3b in
Mitra, 2002). Common to both of these models is a contrast
between relatively competent layers deforming primarily by
flexural slip that overlie incompetent units deforming by
distributed or inhomogeneous deformation. The strati-
graphic units at the Kashi–Atushi fold system exhibit a
similar pattern, best observed at the Boguzihe profile (B–B0,
Fig. 3). At the hinge zone of the fold, the lowest river terrace
risers reveal that Wuqia Group bedding is obliterated,
showing discontinuous blocks of bedded strata floating and
chaotically rotated within a sheared mudstone matrix.
Above this, the older river terrace risers reveal the Atushi
Formation bending unbroken across the axial trace.
The cross-sections (Figs. 8 and 9) were constructed as
detachment folds, constrained by structural measurements
and the low dip panels observed in the seismic sections.
Specific information on each profile is presented in the
sections below. Each cross-section interpretation was drawn
reducibly, meaning that axial planes were located to
minimize the length of steeply dipping panels and maximize
gently dipping panels. Short sections of moderate to gently
dipping beds on the crest of the fold were included, resulting
in rounded folds with minimized shortening.
3.2.1. Atushi–Talanghe anticline
The topographic expression of the Atushi–Talanghe
anticline extends eastward over 100 km from the margin of
the Pamir Mountains. Constrained by our structural
transects and a strike line trace, the axial trace curves up
to the northeast in several gentle arcs, lost finally to a series
of deflected channels that drain southward from the Mutule
anticline (Fig. 2). The fold is oriented approximately N72E.
Previous mapping (Scharer et al., 2000) separated the
western, Atushi fold from the eastern Talanghe fold at an
eastward plunging core visible to the east of the Atushi
transect line (A–A0) in Fig. 2. However, subsequent
structural mapping along the southern limb east transect
A–A0 (Fig. 8) showed that bedding on this limb continues in
a ,808 SE dipping panel and nowhere forms a syncline
required for separate folds. The parallel curvature of the
bedding strike suggests the Atushi and Talanghe anticlines
form over a common, linear structure and are not offset,
linked anticlines (e.g. Sattarzadeh et al., 2000). We
designate the entire anticline as the Atushi–Talanghe
anticline, but refer to the Atushi and Talanghe anticlines
to identify the western and eastern halves, respectively.
At transect A–A0, the Atushi anticline is isoclinal,
dominated by an 808 dip panel on the southern limb and a
758 dip panel on the north (Fig. 8). The characteristic, dark
Xiyu Formation conglomerate is clearly visible on the
northern side but is absent on the southeast side (Fig. 2).
Without the Atushi–Xiyu contact, the southern contact for
the gravel was located by projecting beds in from ,4 km to
the east. In the cross-section, the width of the fold was
determined by the southernmost structural measurements
and the requirement of no net structural relief between the
synclines bounding the fold. The top of the anticline was
modified to have a horizontal dip panel. This alteration
contributes to a conservative shortening estimate, and is
consistent with dip panels observed at the Boguzihe water
gap and Mingyaole sections, and the gentle character of the
anticlines at their tips.
At transect B–B0, the Boguzihe water gap (Fig. 9), the
northernmost dip measurements for the 808 panel were
measured ,1.7 km west of the profile on bedrock islands in
an ephemeral channel. The southern limb contains an
overturned panel that dips 878 to the north, which is
connected to a steeply dipping panel (748) by a long, gently
dipping kink hinge visible in the lowest terrace riser. Where
the Boguzihe enters New Atushi (Fig. 2), a remnant knob of
sediments records the initiation of shortening in an abrupt
set of reducing dips interpreted as syntectonic deposition
(Chen et al., 2002). Paleomagnetic samples along this
profile constrain the age of the strata (Figs. 2 and 4). Two
fault scarps are located ,100 and ,400 m north of the core
of the fold, offsetting several fluvial terraces of the
Boguzihe. The geomorphic expression of the scarps in
CORONA images indicates that the south dipping faults
have been recently active. The location of these faults
within the hinge zone of the anticline suggests that these
faults accommodate deformation in the core, but are not
causal thrusts of a fault propagation fold.
The southern limb of the Ganhangou traverse, located
,10 km west of the Boguzihe, has a uniform strike of N70E
and a ,508 dip for 3 km that ends in off-lapping growth
Fig. 9. Cross-section interpretations for the Kashi–Atushi fold system. Bedding orientations and lithologic data were obtained by field mapping; (D) and (E)
were improved with data from Chinese geologic maps (XBGM, 1965b) and (F) was constructed solely with the information from Chinese geologic maps
(XBGM, 1965a). Conventions as in Fig. 8. The asterisk ( p ) identifies the beds used to calculate line length shortening. Transect C–C0 includes double
detachment planes and low-angle, deep thrust faults interpreted from seismic reflection survey.
K.M. Scharer et al. / Journal of Structural Geology 26 (2004) 2119–21372128

strata (Fig. 7). One of the magnetostratigraphic sections
used in this paper was collected along this transect (Chen
et al., 2002). A cross-section of this transect was not
produced due to the erosion of the northern limb.
Transect C–C0, along the Seven Mills water gap,
provides the most complete record of both limbs of the
Talanghe anticline (Fig. 9). Similar to the Boguzi River
section, the fold is tight, dominated by ,758 dipping limbs.
The seismic reflection profile indicates that the total fold
width is ,13 km, almost twice the size of its topographic
expression (,7 km). Along the canyon walls, the hinge
zone exhibits ,500 m of folded and disrupted bedding,
bound on the southern side by a south dipping fault that is
parallel to bedding in the hanging wall. Without strati-
graphic marker beds, the offset on the fault is not
quantifiable beyond the ,200 m offset provided by the
exposure. Unique to this section, the seismic reflection
profile contained two reverse faults and fault bends between
depths of 9 and 12 km (Fig. 9). Beds translated across the
268, south dipping fault ramp are offset by approximately
2 km.
In the northeast corner of the study area, the opposing
tips of the Mutule and Talanghe anticlines fold the Xiyu
Formation into an open syncline along transect D–D0 (Figs.
3 and 9). The blunt nose of the open Mutule anticline
plunges more steeply than the tight Talanghe anticline. The
Xiyu Formation is folded in the syncline to the east of the
profile, and has been represented in the cross-section by
locating the bottom of the contact just above the remaining
topography along the transect. Growth strata were observed
on the southern limb of the Talanghe anticline, but the
northern limb of the Mutule anticline has been eroded.
3.2.2. Mingyaole anticline
The Mingyaole anticline is the smallest in the study area,
,40 km long and 10 km wide at the widest section. The
fold has an arcuate shape and is impinged upon its southwest
edge by the Kazikeaete thrust system and north verging
Mushi anticline (Fig. 3). A fault associated with the
Kazikeaete thrust ruptured in 1985 during the M 7.2
Wuqia earthquake, creating a 1.3 m dextral and ,1 m
vertical offset (Chen et al., 1997; Molnar and Ghose, 2000).
In cross-section, the Mingyaole anticline exhibits north
vergence. Unlike the Atushi–Talanghe anticline, which
expresses very tight folding at the surface, the Mingyaole
anticline is broad. Also unique to the Mingyaole anticline, a
series of unconformities we have interpreted to indicate the
initiation of folding in this area were found below the base
of the Xiyu Formation. Moving up section at the southern
end of the Mingyaole transect, a .2 km thick, 588 dip panel
ends as bedding dips abruptly decrease to 278, and then are
unconformably replaced by 138 dipping beds over a 50 m
interval (Fig. 9). To produce this cross-section, the growth
strata were modeled to deform progressively by limb
rotation.
3.2.3. Kashi anticline
The axial trace of the Kashi anticline has an orientation
similar to the Mingyaole anticline (N85E) but their tips are
offset by ,5 km. The Kashi anticline is over 60 km long
and is bisected by the Baishikeremuhe. As at the Talanghe
anticline, deflected streams at the eastern end suggest the
fold continues farther into the basin than indicated by its
topographic expression or the Landsat image (Fig. 2). This
interpretation is supported by a gentle fold exhibited in the
seismic reflection profile that crossed ,15 km east of the
topographic end of the fold. The width of the fold is constant
across the fold, ,13 km at transects F–F0 and G–G0, but the
fold amplitude is ,1.5 km lower at transect G–G0. Fanning
strata are observed in the seismic profile on the north and
south sides of the fold.
3.3. Calculated shortening
Slickenlines on bedding planes were observed through-
out the study area, but were not considered pervasive.
Similarly, small-scale accommodation features were scarce.
We did not observe evidence of consistent deformation
domains that suggest the folds formed by tangential
longitudinal strain (e.g. neither tensile cracks in outer arcs
nor reverse faults in deeper arcs). Due to the poorly
indurated stratigraphy and vigorous erosion of the uplifted
structure, we lack observational control on the internal
character of the anticline, and thus on the mechanism(s) of
shortening [e.g. homogeneous strain, second order faulting
or second order folding (Epard and Groshong, 1995)]. The
bulk of each limb, however, maintained broad, planar kink
panels, and the limbs appear to control the largest scale
morphology of the anticlines. We therefore present short-
ening estimates from two methods: excess area calculations
and line length balancing (Table 1). Both methods assume
that flexural slip is the dominant deformation mechanism.
3.3.1. Excess area
Flexural slip is accommodated by layer parallel shear,
which can be displayed graphically in an apparent short-
ening plot (Fig. 10A; Mitra and Namson, 1989). All of the
anticlines show a decrease in apparent shortening profile
with depth, which suggests interbed shear increases in
stratigraphically higher layers. In the case of disharmonic
detachment folds, Mitra and Namson (1989) suggest the
concentricity of the anticline is lost in the lower layers
because space accommodation problems result in penetrat-
ive shortening, which changes the deformed bed length. In
the Kashi–Atushi fold system, erosion limits our ability to
evaluate macroscopic deformation in stratigraphically lower
layers, so we assume that the differential penetrative
shortening in lower layers balances the increase in interbed
shear in higher layers.
Excess area, or the area encompassed by a fold under a
particular stratigraphic level divided by the total shortening
at that level, was first used by Chamberlin (1910) to
K.M. Scharer et al. / Journal of Structural Geology 26 (2004) 2119–2137 2129

Table 1
Summary of shortening and shortening rate estimates for structural transects. The shortening estimates determined by excess area are considered more robust than the line length shortening
Transect Excess area shortening
(km) (preferred)
Line length
shortening (km)
Shortening rate (mm/yr)
using excess area shortening,
assuming uniform initiation
at 1.2 Ma
Slowest/fastest shortening
ratea (mm/yr) using excess
area shortening
Inferred initiation
of foldingb (Ma)
Shortening rate (mm/yr)
assuming lateral propagation
Fig. 12 (H–H0)c 9.3 9.2 7.8 5.3/11.9 – –
Atushi (A–A0) 6.8 5.5 5.7 3.8/8.7 2.0 3.4
Boguzihe (B–B0) 4.3 4.7 3.6 2.4/5.5 1.4 3.1
7 Mills (C–C0) 2.5 4.1 2.1 1.4/3.2 0.9 2.8
Mutule (D–D0) 2.4 1.8 2.0 1.4/3.1 0.8 3.0
Mingyaole (E–E0) 1.5 1.4 1.3 0.8/1.9 . 1.9 ,0.8
Kashi Central (F–F0) 4.1 3.2 3.4 2.3/5.3 1.1 3.7
Kashi East (G–G0) 0.7 0.2 0.6 0.4/0.9 0.7 1.0
a Slowest rate calculated with fold initiation at 1.77 Ma, fastest rate calculated with fold initiation at 0.78 Ma. See text for explanation.b Inferred from lateral propagation rate (50 km/Myr) defined between the Boguzihe and Ganhangou magnetostratigraphic sections (see Section 4).c Includes line length shortening from the southern limb of the Keketamu anticline (4.3 km, Fig. 12).
Fig
.1
0.
Resu
ltso
f(A
)ap
paren
tsh
orten
ing
pro
file
and
(B)
excess
area
meth
od
for
eachtran
sect.F
rom
am
axim
um
atth
eu
pp
ermo
stlay
er,th
e
app
arent
sho
rtenin
gp
rofi
lesred
uce
with
dep
th,
ind
icating
ag
radien
tin
interb
edsh
ear.T
he
true
sho
rtenin
gp
rofi
lesare
un
kn
ow
n,
becau
sein
terbed
shear
canb
eb
alanced
by
pen
etrative
defo
rmatio
n.(B
)E
xcess
aream
etho
ds
of
Ep
ardan
dG
rosh
on
g(1
99
3)
calculate
the
sho
rtenin
g(th
eslo
pe)
and
the
dep
thto
the
detach
men
t(th
ex
intercep
t).D
ashed
lines
sho
wreg
ression
for
the
linear,
up
per
part
of
the
series,so
lidlin
esu
seall
data
from
the
transect.
K.M
.S
cha
reret
al.
/Jo
urn
al
of
Stru
ctura
lG
eolo
gy
26
(20
04
)2
11
9–
21
37
21
30

determine the depth to the detachment horizon. For this
study, we use the excess area method as adapted by Epard
and Groshong (1993). This method compares the excess
area at several stratigraphic levels with the depth from each
level to a constant reference horizon (Fig. 10B). A plot of
the relationship between the excess area and depth to the
reference horizon gives the estimated shortening (the slope)
and the depth to the detachment (the X-intercept). For this
study, at least six excess areas were determined for each
anticline and the land surface at each cross-section was
plotted as the reference horizon. Shortening calculated by
excess area varied from 6.8 km at Atushi to 0.7 km at the
East Kashi transect (Table 1).
Excess area graphs of the Atushi, Boguzihe, Seven Mills,
and Kashi cross-sections show a common feature, in that the
slope (i.e. the shortening) is linear to a depth of 5.5–6.0 km
below land surface at each profile (Fig. 10B). Above this
depth, the slopes have a high correlation coefficient,
suggesting that deformation mechanisms are balanced and
bed lengths remain constant with deformation. Below this
depth, the slope shallows, suggesting reduction in strain.
This pattern is produced if the detachment horizon is raised
over time, or if the detachment occurs over a zone with
differential strain rather than a single detachment plane.
Alternatively, the deformation gradient may change at
lower depths, resulting in an imbalance between interbed
shear and differential penetrative shortening. For this
reason, two detachment horizons are considered. The
upper detachment horizon is ,6 km below land surface,
at the transition from constant bed lengths to imbalanced
deformation mechanisms. Using all data, the maximum
estimated depth to detachment is 8.6 km below land surface
[due to very poor correlation (R 2 ¼ 0.6) and an anom-
alously low depth to detachment estimate (13.4 km), the
Kashi East transect is not included in the average]. We
suggest that between 6 and 9 km, there is a reduction in
north directed shortening and an increase in northward
translation of material under the Tian Shan.
3.3.2. Line length balancing
For comparison with other regional estimates of short-
ening (Yin et al., 1998; Allen et al., 1999; Burchfiel et al.,
1999), we also calculated line length changes for each
profile (Table 1). This method assumes that the folding
process does not alter the bedding from its original length.
To capture the shortening of the youngest pregrowth
deposits, the uppermost reconstructed bedding horizon
was used (Figs. 8 and 9). With the exception of the Seven
Mills and Kashi East transects, the correlation between the
excess area and line length balancing methods is very good
(^20%). Poor correlation at the Seven Mills transect
probably results from the tightness of the fold. Poor
correlation at the Kashi East transect may reflect the
kinematics of the early stages of fold development (Poblet
and McClay, 1996).
4. Discussion
The style and form of these folds, as drawn, result from a
set of interpretations concerning their deposition and
geometry. Described in previous sections, the interpretation
of the nature of the Xiyu–Atushi contact, conventions
followed in reconstructing the anticlines, and the nature of
the growth strata all affect the shortening estimates.
4.1. Structure
A basic assumption that influences the shortening
estimates is the lack of structural height that developed
across the folds Although the cross-sections were developed
to minimize the height of the folds (principally by restricting
the length of steeply dipping panels), not modeling the
imbricate thrusts commonly required that the width of each
fold was broadened from its surface expression by
increasing the distance between the outer kink axes. The
Kashi East transect (G–G0) is the only profile unaltered by
this convention. The seismic lines, however, provide
independent support for this modification, as they show
that in the subsurface the folds are broader than their
topographic expression, and lack clear evidence of thrust
faults in the upper 6 km. Where seismic lines are available,
the location of the outer kink axes in the cross-section
interpretations does not contradict the seismic reflection
data.
Interpretation of the Kashi–Atushi fold system as a set of
detachment folds is supported by the strong competency
contrasts in the deformed beds (Dahlstrom, 1990; Mitra,
2002). The Kashi Group contains a significant proportion of
gypsiferous units, and shows severe small-scale folding and
pervasive faulting where exposed in the southern Keping-
tage system. The Wuqia Group is rich in siltstones, and
shows a ductile behavior in areas of high strain, such as the
core of the Boguzihe transect. The Atushi Formation
exhibits second order faulting at the core of the Mingyaole,
Atushi, and Boguzihe transects and second order folding at
Seven Mills. In the limbs of each anticline, however, the
Atushi Formation forms parallel-bedded kink panels with
scarce to no faults. Finally, the Xiyu Formation appears to
be the most competent, commonly forming the highest
portions of the modern topography. Following the schema
developed by Dahlstrom (1990), we interpret that the
gypsiferous Kashi Group acts as a lower detachment plane,
the upper Kashi and Wuqia Groups behave as a ductile
detachment zone, and the Atushi and Xiyu Formations
constitute a brittle upper layer that deforms by flexural slip
The shortening is linear for all transects to a depth of ,6 km below land
surface, indicating interbed shear and penetrative deformation are balanced.
Below ,6 km, the shortening is reduced, suggesting a gradient in folding
down to the detachment plane, ,9 km below land surface.
K.M. Scharer et al. / Journal of Structural Geology 26 (2004) 2119–2137 2131
in the limbs and second order faulting and folding in the
cores.
This mechanical stratigraphy permits limb rotation as a
mechanism for fold growth (Dahlstrom, 1990), but the
geometric similarity between these folds and symmetric
faulted detachment folds suggests that limb lengthening also
occurs (Mitra, 2002). Additional insight on the method of
fold growth is provided by the anticlinal morphology.
Detachment folding by limb rotation should be
accompanied by a reduction in width and increased limb
dips with advanced shortening. In contrast, shortening by
limb lengthening should be accommodated by an increase in
the height of the fold and a minor increase in fold width
(Poblet and McClay, 1996). For each anticline, the fold
widths remain fairly constant along strike, but the fold
heights and limb dips are correlated with increased short-
ening (Figs. 8 and 9). This suggests that over the life of the
folds, both mechanisms play a role in fold development.
Unfortunately, the growth strata are insufficiently exposed
to more precisely evaluate the kinematics of fold develop-
ment (e.g. Salvini and Storti, 2002). In a future study, we
hope to use deformed fluvial terrace surfaces to illuminate
this question.
4.2. Paleomagnetic constraints
Magnetostratigraphic sampling across the Boguzihe and
Ganhangou sections provides temporal constraints on the
initiation of shortening (Figs 2 and 4; Chen et al., 2002) and
allows an estimation of the shortening rate. The sections are
linked together by tracing bedding along intervening strata
and then matched to the geomagnetic polarity timescale
(GPTS) of Cande and Kent (1995) constrained by the local
Plio-Pleistocene fossil assemblage (Fig. 11). Sampling
strategies and statistics, demagnetization processes, and
correlation to the GPTS are described in detail in Chen et al.
(2002). We apply their results to evaluate the initiation of
shortening across the Kashi–Atushi fold system, and
discuss implications for shortening rates.
The Boguzihe section is a good location to constrain the
age of the base of the Xiyu Formation (,1.9 Ma), but the
cobble conglomerate prevents paleomagnetic sampling
through the syntectonic unconformity. Consequently, the
age of the syntectonic unconformity at Boguzihe (,1.4 Ma)
is calculated both from a linear extrapolation of the
sedimentation rate of the underlying, dated strata and by
strike line correlation to dated strata in the Ganhangou
section (Fig. 11). At the Ganhangou section, finer grained
sediments allow us to sample across the syntectonic
unconformity and capture the age of the growth sediments.
The age of the unconformity at Ganhangou (,1.2 Ma) is
younger than at the Boguzihe section. Ages of the
syntectonic unconformity are maxima; if some pregrowth
strata are missing, the true age of the unconformity could be
younger.
Upper and lower limits on the 1.2 Ma estimate for fold
initiation are determined from the polarity sequence
correlation to the GPTS (Fig. 11). Assuming both sites are
correctly tied at the base of the Olduvai chron, the long
reversed period containing the syntectonic unconformity at
both sites cannot be older than the end of the Olduvai chron
(1.77 Ma) and no younger than the beginning of the Bruhnes
normal chron (0.78 Ma). Therefore, we choose upper and
lower limits of 1.77 and 0.78 Ma, respectively, to bracket
the initiation of folding. Records of small magnitude
earthquakes (USGS Earthquake Hazards Program, 2003),
geomorphic expression of fault scarps, (Zhao et al., 2000),
warping of fluvial terrace surfaces, and geodetic studies
(Wang et al., 2000) indicate that folding continues to the
present.
4.3. Shortening rates
A simplistic approach to quantifying the geologic
shortening rate is to identify a representative location and
apply a regional initiation of folding at 1.2 Ma Expanding
the region to a central profile (H–H0) including shortening
accommodated in the southern limb of the Keketamu
anticline (4.3 km) and the Boguzihe and Kashi East
transects, the total shortening across the Kashi–Atushi
fold system is 9.3 km (Fig. 12). If shortening across the
three structures in this transect initiated contemporaneously,
a mean shortening rate of 7.8 mm/yr has continued for the
past 1.2 Myr (Fig. 13). Extreme minimum (5.3 mm/yr) and
maximum (11.9 mm/yr) rates result from upper and lower
age limits, respectively (Table 1). Shortening rates for each
transect reduce to the east if folding was coeval (Table 1;
Fig. 13).
While synchronous folding provides a reasonable
estimate of the shortening rate, it is an unlikely condition
because the stratigraphic height of the growth strata changes
across the study area. At the Mingyaole profile, the growth
strata are located just below the base of the Xiyu Formation
whereas at the Boguzihe transect and the Ganhangou
section, the growth strata are younger than the Xiyu
Formation. To integrate these observations, we estimate
the geologic shortening rate at each transect using the
difference in growth strata ages at Boguzihe and Ganhangou
(1.4 and 1.2 Ma, respectively). Dividing the distance
between the sites (,10 km) by the difference in initiation
of folding at Boguzihe and Ganhangou (0.2 Myr) results in
an eastward lateral propagation rate of ,50 km/Ma. The
eastern end of the Talanghe anticline shows geomorphic
evidence of eastward lateral propagation (Fig. 14). How-
ever, the geomorphic expression of the anticline is 25 km
shorter than expected if the lateral propagation rate has been
constant for the last 1.2 Ma, suggesting that the extrapolated
rate overestimates the true lateral propagation rate. If the
propagation rate decreased to the east because stress was
accommodated on the Mutule anticline, the lateral propa-
gation rate can be used to estimate the initiation of folding
across the Kashi–Atushi fold system, recognizing that
K.M. Scharer et al. / Journal of Structural Geology 26 (2004) 2119–21372132

interpreting the sequence of fold development across the
folds is speculative given vigorous erosion of the anticlines
and uncertainty in the kinematics of fold growth.
To arrive at local estimates of the shortening rate, we
simply extend the 50 km/Myr lateral propagation rate from
the Ganhangou location back in time to the west and
forward to the east (Table 1; Fig. 13). Under this
assumption, the initiation of folding would occur ,2.0 Ma
at the Atushi transect, ,0.9 Ma at the Seven Mills and
,0.8 Ma at the Mutule transect. Although considerably
more speculative, we estimate the ages along the Mingyaole
and Kashi anticlines using a similar technique and the same
propagation rate. A seismic reflection profile ,20 km east
of the topographic expression of the Kashi anticline shows
low amplitude folding. If folding began at this end recently,
the initiation of folding can be extrapolated westward from
this location, assuming the Mingyaole and Kashi anticlines
formed successively and deformation propagated eastward.
From this construct, folding initiated at ,0.7 Ma at the East
Kashi transect, ,1.1 Ma at the Central Kashi transect, and
at least ,1.9 Ma at the Mingyaole transect (Table 1).
Because the growth strata are older than the Xiyu Formation
at Mingyaole, this scenario suggests that the Xiyu
Formation at Mingyaole is younger than ,1.9 Ma, the
same age as the base of the Xiyu at the Boguzihe transect
(1.9 Ma). A western source for this conglomerate suggests
the Pamir salient had reached this area by ,1.9 Ma,
consistent with estimates for development of the Trans Alai
Range around ,4 Ma (Arrowsmith and Strecker, 1999).
While local shortening rates decrease to the east along the
Atushi–Talanghe anticline, they are variable across the
Mingyaole and Kashi anticlines. Restricted to the Kashi–
Atushi fold system, we consider representative a regional
average rate of ,5 mm/yr (Fig. 13).
Fig. 11. Paleomagnetic results for the Boguzihe and Ganhangou sections compared with the GPTS (Cande and Kent, 1995). See Fig. 4 for location of the
paleomagnetic sections. The sections were linked by tracing distinct beds ,10 km from the Boguzihe to the Ganhangou section (wavy line), and then
correlated to the GPTS. The basal age of growth strata sampled at Ganhangou is inferred to be 1.2 Ma, whereas the age at Boguzihe (1.4 Ma) was calculated by
extrapolating a constant sedimentation rate. At the Boguzihe section, the contact between the Xiyu and Atushi Formations is ,1.95 Ma. The Xiyu Formation is
absent at the Ganhangou transect. Modified from Chen et al. (2002).
K.M. Scharer et al. / Journal of Structural Geology 26 (2004) 2119–2137 2133

Fig. 12. Generalized cross-section across southern Tian Shan (H–H0 on Fig. 2). Total Pleistocene through modern shortening between the Keketamu and Kashi
anticlines is 9.2 km. Due to uncertainties in the geometry of the northern margin of the Keketamu anticline, shortening accommodated by this structure was
calculated by line length balancing. The bed used to measure the shortening is noted with an asterisk ( p ). Shortening calculated for the Boguzihe and Kashi
East anticlines was determined by excess area methods. Arrows above detachment surface show decreasing slip to the north while the Tarim craton is
underthrust below the Tian Shan. The fault geometry of the Kepingtage, South Tian Shan fault, and Muziduke fault, and the angle of the Tarim craton under the
Tian Shan are not known and drawn schematically.
Fig. 13. Simplified maps of shortening rates determined along the Kashi–Atushi fold system assuming (A) uniform initiation (average rates for structure-
perpendicular transects across the entire Kashi–Atushi fold system are presented under the double line) and (B) lateral propagation. We have not mapped the
Mushi anticline, but its size and appearance suggest it has accommodated at least as much deformation as the Mingyaole anticline. These estimates are shown
in parentheses, and added to the cross structure averages. (A) If folding was coeval, shortening rates reduce to the east by a factor of four. (B) If the folds grew
laterally, the Atushi anticline formed first, followed by the Mushi and Mingyaole anticlines, then the Talanghe and Kashi anticlines.
K.M. Scharer et al. / Journal of Structural Geology 26 (2004) 2119–21372134

4.4. Regional kinematics
It is informative to compare timing and rate estimates
presented here with those from other areas at the boundary
between the Tarim Basin and the Tian Shan, beginning near
Wenguri, just north of the study area, and proceeding
clockwise around the Southern Tian Shan. Sobel and
Dumitru (1997) sampled locations within the Kepingtage
system for apatite fission track provenance and exhumation
dates. They infer that thrusting north of Wenguri (Fig. 3)
was active before 14 Ma and has propagated southward
through time. This is consistent with our results and
indicates that there was a ,12 Ma gap between initiation
of activity on the Kepingtage system and the Kashi–Atushi
fold system.
Allen et al. (1999) report on shortening to the east of the
Kashi–Atushi fold system, along the Kepingtage thrust
zone (Fig. 1). At that location, the shortening is expressed as
thin-skinned, imbricate thrusts that have accommodated
,35 km of shortening within a ,100 km long zone. From
the magnetostratigraphic results of Yin et al. (1998), they
estimate that thrusting initiated around 20 Ma, resulting in
an average shortening rate of ,1.8 mm/yr, if shortening
spans the entire interval to the present. Farther east in the
Kuche region (Fig. 1), magnetostratigraphic results by Yin
et al. (1998) are used to date a lacustrine to fluvial transition
inferred to represent regional thrust initiation, between 24
and 21 Ma. When applied to the 20–40 km of total
shortening, the rate (1–1.9 mm/yr) is similar to the results
in Kepingtage, but much lower than the rates at the Kashi–
Atushi fold system.
Burchfiel et al. (1999) present cross-sections from both
the northern and southern perimeters of the eastern Tian
Shan (Fig. 1). These cross-sections show a structural style
that is similar to our interpretation for the Kashi–Atushi
fold system, and contrasts with imbricate thrusting observed
along the Kepingtage and Kuche thrust systems. In
particular, the Boston Tokar and Kalasu transects of
Burchfiel et al. (1999) contain tight, upright folds and
abrupt lithologic changes across the folds. Cross-sections on
these transects yield shortening estimates of ,10–20 km,
1–4 times larger than estimated for the Kashi–Atushi fold
system. To quantify the shortening rates, Burchfiel et al.
(1999) used a range of initiation between 2.5 and 1.0 Ma
(based on a climate inferred Quaternary age of a conglom-
erate), resulting in estimated shortening rates between 3 and
21 mm/yr.
Given uncertainty in the age of fold initiation at the
Boston Tokar and Kalasu sections, the mean shortening rate
(5.1 mm/yr) estimated for the Kashi–Atushi fold system is
high compared with the more proximal Kepingtage and
Kuche regions, and folding probably initiated more
recently. This suggests that the setting of the Kashi–Atushi
fold system may be unique. Indeed, it is located above the
deepest depocenter in the Tarim Basin and shows little
seismicity in comparison with the other systems.
We envision the Kashi–Atushi fold system as part of an
accretionary wedge, formed as the Tarim craton is forced
north and underthrust below the Tian Shan. Approximately
9 km of the Tarim craton has been underthrust below the
Tian Shan in the last 1–3 Myr, which is resolved by the
folding of the top 6 km of Cenozoic strata (Fig. 12).
Structural evidence of parallel folding and geodetic
evidence for northward directed shortening (Holt et al.,
2000), combined with geophysical models of Bouger
gravity anomalies (Burov et al., 1990) support this model.
The two interpretations for initiation of shortening indicate
that either the eastern end has been shortening more slowly
or for less time (Fig. 13). In either case, the patterns of
shortening rates may be facilitated by the Pamir Salient,
which imposes a load on the westernmost Tarim Basin
(Burov et al., 1990). In response to the load, the Tarim
craton would be flexed more in the west, which potentially
facilitates underthrusting of the western Tarim craton below
the Tian Shan. In the eastern portion of the study area, the
reduced effects of the load may inhibit underthrusting of the
Tarim craton, and northward directed convergence would be
taken up within the Tian Shan proper. The higher
concentration of folds in the west may also be controlled
by the geometry of the Kashi Depression, which was
thickest in the west and thinned to the east.
5. Conclusions
The Kashi–Atushi fold system occupies a unique
location in the Indian–Eurasia collision. The folds are
located in an ,808 corner between the north verging frontal
thrust of the Pamir (the Kazikeaete thrust system) and the
Southern Tian Shan fault. We model the Atushi–Talanghe,
Mutule, Mingyaole, and Kashi anticlines as detachment
folds due to very steep limbs (60–908), an absence of
Fig. 14. CORONA satellite photo of confluence of Mutule (M) and
Talanghe (T) anticlines. Light-colored rocks are Atushi Formation and
darkest gray rocks are Xiyu Formation. Most of the folded Xiyu Formation
in the syncline pre-dates the initiation of folding. The series of deflected
drainages across the nose of the Talanghe anticline suggest its eastward
propagation.
K.M. Scharer et al. / Journal of Structural Geology 26 (2004) 2119–2137 2135

emergent, fold bounding fault scarps or faults in proprietary
seismic surveys. The results do not prescribe a kinematic
history for the deformation, but limit the shortening
estimates to the most constrained data, namely the dips of
the beds and the stratigraphic depth of the syngrowth
sediments.
Shortening estimates calculated from the cross-sections
show that total shortening decreases towards the east and
south; the Atushi anticline accommodated the most short-
ening (6.8 km), while the Talanghe anticline transects
exhibit 4.3 and 2.5 km at the Boguzihe and Seven Mills
water gaps, respectively. The transect crossing the eastern
tip of the Talanghe anticline and the western end of the
Mutule anticline yields a total shortening of 2.4 km. The
southern set of folds generally accommodates less than the
northern sets, with the Mingyaole anticline shortened by
1.5 km and the Kashi anticline by 4.1 km in the middle and
0.7 km at the east end. Shortening across the Talanghe
anticline reduces to the east, suggesting that either (1) the
folds are propagating eastward over time, or (2) shortening
across the anticlines began everywhere at the same time, but
the strain rate reduces to the east. In total, at least 6 km of
the Tarim Craton has underplated the southern Tian Shan
in the last 1–2 Myr.
The geometry of the folds, organized like a pleat in a
folded fabric, proximity to the Pamir Mountains, and the
north vergence of the system suggest that the fold system
results from the expected convergence between the Tarim
Basin and the Tian Shan, but is affected by northward
movement of the Pamir Salient as well. The young and
relatively fast deformation of the Kashi–Atushi fold system
appears to be related to the abnormally thick Tertiary
sediments in the Kashi foredeep and regional forces
imparted by the Pamir Salient. Assuming coeval initiation,
the shortening rates across the Kashi Atushi fold system
reduce to the west, from ,9 to 2 mm/yr, with an average of
,5 mm/yr. If deformation at the Keketamu anticline is
included, the shortening of rate (7.8 mm/yr) across the
region plus the previously computed shortening rates in the
Tian Shan (,13 mm/yr; Abdrakhmatov et al., 2002;
Thompson et al., 2002) agrees with the geodetic rates of
,20–24 mm/yr (Abdrakhmatov et al., 1996; Holt et al.,
2000) across the western Tian Shan.
Acknowledgements
This study was greatly improved by the detailed reviews
of Mark Allen and Josep Poblet. Thanks also to Dennis
Fletcher for GIS assistance and Richard Heermance for
fieldwork. This research was supported by the Continental
Dynamics program of the US NSF (EAR 9614765), and by
the National Science Foundation of China grants 49834005
and 40372081.
References
Abdrakhmatov, K.Y., Aldazhanov, S.A., Hager, B.H., Hamburger, M.W.,
Herring, T.A., Kalabaev, K.B., Makarov, V.I., Molnar, P., Panasyuk,
S.V., Prilepin, M.T., Reilinger, R.E., Sadybakasov, I.S., Souter, B.J.,
Trapeznikov, Y.A., Tsurkov, V.Y., Zubovich, A.V., 1996. Relatively
recent construction of the Tien Shan inferred from GPS measurements
of present-day crustal deformation rates. Nature 384(6608), 450–453.
Abdrakhmatov, K.Y., Weldon, R., Thompson, S., Burbank, D., Rubin, C.,
Miller, M., Molnar, P., 2002. Origin, direction, and rate of modern
compression of the Central Tien Shan. Geology and Geophysics
(Russian) 42(10), 1585–1609.
Al Saffar, M., 1993. Geometry of fault-propagation folds; method and
application. Tectonophysics 223(3–4), 363–380.
Allen, M.B., Vincent, S.J., Wheeler, P.J., 1999. Late Cenozoic tectonics of
the Kepingtage thrust zone: interactions of the Tien Shan and Tarim
Basin, northwest China. Tectonics 18, 639–654.
Arrowsmith, J.R., Strecker, M.R., 1999. Seismotectonic range-front
segmentation and mountain-belt growth in the Pamir–Alai region.
Kyrgyzstan (India–Eurasia collision zone). Geological Society of
America Bulletin 111(11), 1665–1683.
Avouac, J.-P., Tapponnier, P., Bai, M., You, H., Wang, G., 1993. Active
thrusting and folding along the northern Tien Shan and late Cenozoic
rotation of the Tarim relative to Dzungaria and Kazakhstan. Journal of
Geophysical Research 98(4), 6755–6804.
Bally, A.W., Chou, I.-M, Clayton, R., Engster, H.P., Kidwell, S.,
Meckel, L.D., Ryder, R.T., Watts, A.B., Wilson, A.A., 1986. Notes on
sedimentary basins in China; report of the American Sedimentary
Basins Delegation to the People’s Republic of China. U.S. Geological
Survey Open-File Report 86-327, pp. 93–95.
Bullen, M.E., Burbank, D.W., Abdrakhmatov, K.Y., Garver, J., 2001. Late
Cenozoic tectonic evolution of the northwestern Tien Shan: constraints
from magnetostratigraphy, detrital fission track, and basin analysis.
Geological Society of America Bulletin 113, 1544–1559.
Burbank, D.W., McLean, J.K., Bullen, M., Abdrakhmatov, K.Y., Miller,
M.M., 1999. Partitioning of intermontane basins by thrust-related
folding, Tien Shan, Kyrgyzstan. Basin Research 11(1), 75–92.
Burchfiel, B.C., Brown, E.T., Qidong, D., Xianyue, F., Jun, L., Molnar, P.,
Jianbang, S., Zhangming, W., Huichuan, Y., 1999. Crustal shortening
on the margins of the Tien Shan, Xinjiang, China. International
Geology Review 41(8), 665–700.
Burov, E.B., Kogan, M.G., Lyon-Caen, H., Molnar, P., 1990. Gravity
anomalies, the deep structure, and dynamic processes beneath the Tien
Shan. Earth and Planetary Science Letters 96, 367–383.
Burtman, V.S., Molnar, P., 1993. Geological and geophysical evidence for
deep subduction of the continental crust beneath the Pamir. Geological
Society of America Special Paper 281, 76.
Burtman, V.S., Skobelev, S.F., Molnar, P., 1996. Late Cenozoic slip on the
Talas–Ferghana fault, the Tien Shan, central Asia. Geological Society
of America Bulletin 108(8), 1004–1021.
Cande, S.C., Kent, D.V., 1995. Revised calibration of the geomagnetic
polarity timescale for the Late Cretaceous and Cenozoic. Journal of
Geophysical Research 100, 6093–6095.
Carroll, A.R., Graham, S.A., Hendrix, M.S., Ying, D., Zhou, D., 1995. Late
Paleozoic tectonic amalgamation of northwestern China; sedimentary
record of the northern Tarim, northwestern Turpan, and southern
Junggar basins. Geological Society of America Bulletin 107(5),
571–594.
Chamberlin, R.T., 1910. The Appalachian folds of central Pennsylvania.
Journal of Geology, 228–251.
Chen, J., Qu, G., Feng, X., Hu, J., 1997. Arcuate thrust tectonics and its
contemporary seismicity in the eastern section of the external zone of
the Pamir. Seismology and Geology (Chinese with English abstract)
19(4), 301–312.
Chen, J., Ding, G.Y., Burbank, D.W., Scharer, K.M., Rubin, C., Sobel, E.,
Qu, G., Shen, J., Yin, J., Zhao, R., 2001. Late Cenozoic tectonics and
K.M. Scharer et al. / Journal of Structural Geology 26 (2004) 2119–21372136

seismicity in the Southwestern Tian Shan, China. Earthquake Research
in China (Chinese with English abstract) 17(2), 134–155.
Chen, J., Burbank, D.W., Scharer, K.M., Sobel, E., Yin, J., Rubin, C., Zhao,
R., 2002. Magnetochronology of the upper Cenozoic strata in the
southwestern Chinese Tian Shan; rates of Pleistocene folding and
thrusting. Earth and Planetary Science Letters 195(1–2), 113–130.
Dahlstrom, C.D., 1990. Geometric constraints derived from the law of
conservation of volume and applied to evolutionary models for
detachment folding. American Association of Petroleum Geologists
Bulletin 74(3), 336–344.
Epard, J.L., Groshong, R.H., 1993. Excess area and depth to detachment.
American Association of Petroleum Geologists Bulletin 77,
1291–1302.
Epard, J.L., Groshong, R.H., 1995. Kinematic model of detachment folding
including limb rotation, fixed hinges and layer-parallel strain.
Tectonophysics 245, 85–103.
Harvard CMT, 2003. Centroid-Moment Tensor Project. http://www.
seismology.harvard.edu/CMTsearch.html.
Hendrix, M.S., Graham, S.A., Carroll, A.R., Sobel, E.R., McKnight, C.L.,
Schulein, B.J., Zuoxun, W., 1992. Sedimentary record and climatic
implications of recurrent deformation in the Tian Shan; evidence from
Mesozoic strata of the north Tarim, south Junggar, and Turpan basins,
Northwest China. Geological Society of America Bulletin 104(1),
53–79.
Holt, W.E., Chamot-Rooke, N., Le Pichon, X., Haines, A.J., Shen-Tu, B.,
Ren, J., 2000. Velocity field in Asia inferred from Quaternary fault slip
rates and Global Positioning System observations. Journal of
Geophysical Research 105(8), 19,185–19,209.
Hu, B., 1992. Petroleum geology and prospects of the Tarim (Talimu)
Basin, China. In: Halbouty, M.T., (Ed.), Giant Oil and Gas Fields of the
Decade 1978–1988, AAPG Memoir, 54, pp. 493–510.
Hu, L.Y., 1982. Late Tertiary foraminifera of Tarim Basin and their
geological significance. Chinese Science Bulletin 15, 938–941.
Jamison, W.R., 1989. Fault–fracture strain in Windgate Sandstone. Journal
of Structural Geology 11, 959–974.
Mao, S., Norris, G., 1988. Late Cretaceous–early Tertiary dinoflagellates
and acritarchs from the Kashi area, Tarim Basin, Xinjiang Province,
China. Life Science Contributions, Royal Ontario Museum 150, 93.
Marshak, S., Mitra, G., 1988. Basic Methods of Structural Geology,
Prentice Hall, Englewood Cliffs, pp. 277–281.
Mitra, S., 2002. Structural models of faulted detachment folds. Association
of Americal Petroleum Geologists Bulletin 86(9), 1673–1694.
Mitra, S., Namson, J.S., 1989. Equal-area balancing. American Journal of
Science 289(5), 563–599.
Molnar, P., Ghose, S., 2000. Seismic movements of major earthquakes and
the rate of shortening across the Tien Shan. Geophysical Research
Letters 27(16), 2377–2380.
Molnar, P., Tapponnier, P., 1975. Cenozoic tectonics of Asia: effects of a
continental collision. Science 189(4201), 419–426.
Neil, E.A., Houseman, G.A., 1997. Geodynamics of the Tarim Basin and
the Tian Shan in Central Asia. Tectonics 16(4), 571–584.
Poblet, J., McClay, K., 1996. Geometry and kinematics of single-layer
detachment folds. American Association of Petroleum Geologists
Bulletin 80, 1085–1109.
Poblet, J., McClay, K., Storti, F., Munoz, J.A., 1997. Geometries of
syntectonic sediments associated with single-layer detachment folds.
Journal of Structural Geology 19(3–4), 369–381.
Rubin, C.M., Chen, J., Burbank, D., Scharer, K.M., Zhao, R., 2000. Late
Cenozoic deformation along the western Kashi–Aksu thrust belt,
Southern Tien Shan, China. Geological Society of America Abstracts
with Programs 32, 1.
Salvini, F., Storti, F., 2002. Three-dimensional architecture of growth strata
associated to fault-bend, fault-propagation, and decollement anticlines
in non-erosional environments. Sedimentary Geology 146(1–2),
57–73.
Sattarzadeh, Y., Cosgrove, J.W., Vita-Finzi, C., 2000. The interplay of
faulting and folding during the evolution of the Zagros deformation
belt. In: Cosgrove, J.W., Ameen, M.S. (Eds.), Forced Folds and
Fractures, Geological Society Special Publications, 169., pp. 187–196.
Scharer, K.M., Chen, J., Burbank, D., Rubin, C.M., Zhao, R., 2000.
Quaternary folding of foreland basin strata at the boundary between the
Northwest Tarim Basin and the Southern Tien Shan, China. Geological
Society of America Abstracts with Programs 32, 1.
Sobel, E.R., 1999. Basin analysis of the Jurassic–Lower Cretaceous
southwest Tarim Basin, northwest China. Geological Society of
America Bulletin 111, 709–724.
Sobel, E.R., Dumitru, T.A., 1997. Thrusting and exhumation around the
margins of the Western Tarim Basin during the India–Asia collision.
Journal of Geophysical Research 102, 5043–5063.
Sobel, E., Mikolaichuk, A., Chen, J., Burbank, D., 2000. Development of
the Late Cenozoic Central Tian Shan in Kyrgyzstan and China
Recorded by Apatite Fission Track Thermochronology. Eos Trans-
actions, AGU 91, 48, Fall Meeting Supplement, Abstract T71D-03.
Suppe, J., Medwedeff, D.A., 1990. Geometry and kinematics of fault-
propagation folding. Eclogae Geologicae Helvetiae 83(3), 409–454.
Thompson, S., Weldon, R.J., Rubin, C.M., Abdrakhmatov, K., Molnar, P.,
Berger, G.W., 2002. Late Quaternary slip rates across the central Tien
Shan, Kyrgyz Republic, central Asia. Journal of Geophysical Research
107(9), 20020910.
USGS Earthquake Hazards Program, 2003. http://neic.usgs.gov/neis/
bulletin/03_EVENTS/eq_030224/neic_qqac_h.html.
Wang, Q., Ding, G., Qiao, X., Wang, X., 2000. Research on present crustal
deformation in the southern Tian Shan (Jiashi) region by GPS geodesy.
Acta Seismologica Sinica (English version) 13(3), 280–287.
Watson, M.P., Hayward, A.B., Parkinson, D.N., Zhang, Z.M., 1987. Plate
tectonic history, basin development and petroleum source rock
deposition onshore China. Marine and Petroleum Geology 4, 205–225.
XBGM, 1965. Xinjiang Bureau of Geology and Mineral Resources.
Geologic Map of Kashi Anticline, scale 1:50,000.
XBGM, 1965. Xinjiang Bureau of Geology and Mineral Resources.
Geologic Map of Mingyaole Anticline, scale 1:50,000.
XBGM, 1985. Xinjiang Bureau of Geology and Mineral Resources.
Geological Map of southwestern Xinjiang. Geological Publishing,
Beijing, scale 1:500,000.
Yang, H., 1996. Tertiary. In: Zhou, Z., Dean, W.T. (Eds.), Phanerozoic
Geology of Northwest China, pp. 274–278.
Yin, A., Nie, S., 1996. Phanerozoic palinspastic reconstruction of China
and its neighboring regions. In: Yin, A., Harrison, M. (Eds.), Tectonic
Evolution of Asia, pp. 442–485.
Yin, A., Nie, S., Craig, P., Harrison, T.M., Ryerson, F.J., Xianglin, Q.,
Geng, Y., 1998. Late Cenozoic tectonic evolution of the southern
Chinese Tien Shan. Tectonics 17(1), 1–27.
Zhang, P., Molnar, P., Downs, W.R., 2001. Increased sedimentation rates
and grain sizes 2–4 Myr ago due to the influence of climate change on
erosion rates. Nature 410, 891–897.
Zhao, R., Jun, L., Jun, S., 2000. The preliminary study on active faults and
paleo-earthquakes in the north fringe of Kashi Depression. Acta
Seismologica Sinica (English version) 13(3), 351–355.
Zhou, Z.Y., Chen, P.J., 1990. Biostratigraphy and Geologic Evolution:
Petroleum Geology of Tarim Basin, Science Press, Beijing, China,
439pp.
K.M. Scharer et al. / Journal of Structural Geology 26 (2004) 2119–2137 2137