foreign operations proposal for entry and operation in south africa:eagle petroleum company ghana...
TRANSCRIPT
1
NINEPENCE ALBERT MCBELL
ASHESI UNIVERSITY COLLEGE
EAGLE PETROLEUM COMPANY GHANA LIMITED
FOREIGN OPERATION PROPOSAL FOR ENTRY AND OPERATION IN SOUTH AFRICA
1
1 | P a g e
Contents EXECUTIVE SUMMARY ............................................................................................................................................................ 2
DESCRIPTION OF COMPANY ................................................................................................................................................... 2
CHOSEN COUNTRY AND JUSTIFICATION ................................................................................................................................. 3
BRIEF DESCIPTION OF FOREIGN OPERATION .......................................................................................................................... 4
REVIEW OF BUSINESS ENVIRONMENT OF TARGET COUNTRY ................................................................................................ 5
ENTRY STRATEGY .................................................................................................................................................................... 7
FINANCING STRATEGY ............................................................................................................................................................ 7
RISK MANAGEMENT STRATEGIES ........................................................................................................................................... 8
CASH FLOW ANALYSIS ........................................................................................................................................................... 8
“Ghana and South Africa Sign Six Agreements” http://www.presidency.gov.gh/press-centre/general-news/ghana-and-
south-africa-sign-six-agreements ...................................................................................................................................... 11
2
2 | P a g e
EXECUTIVE SUMMARY
This written material expands on Eagle Petroleum Company Ghana Limited’s proposal to operate in
South Africa. The major aim is to assess the feasibility of the project. Eagle Petroleum Company Ghana
Limited is a multinational corporation that produces petroleum products. The growth of the corporation has
engendered operations in other countries. At present the corporation is proposing to operate in South Africa
with its existing products. The company expects to catch the interest of regular loyal customers’ base with its
broad variety of petroleum products. The proposed corporation will aim at meeting the demands of low to high
income residents. Upon examination, the cash flows of Eagle Petroleum South Africa Ltd (the proposed
subsidiary) was projected for five years and Net Present value was calculated to appraise cash flows. The net
present value is 167317693.9 which showed that the project is a feasible one. The analysis shows that Eagle
Petroleum South Africa Ltd will go a long way to provide employment and improve the standard of living of
people in South Africa. It is advisable to accept the proposal to implement the project since it is a favorable one.
DESCRIPTION OF COMPANY
Eagle Petroleum Company Ghana Limited is a Multinational Corporation that started operation in 1993.
The company focuses on production of petroleum products with marketing operations in three classes mainly
high end versions for developed economies, standard versions for emerging economies and low versions for
developing economies. In Ghana, it engages in marketing and transportation of petroleum products. Since then,
the company has grown from strength to strength-technologically, operationally and financially. Over the last
five years, Eagle Petroleum Company Ghana Limited has leveraged on its strong brand (ponzo petroleum
products) to expand into foreign markets. Currently, the company operates in Canada, Malaysia, Nigeria, Libya,
US and Australia. We have two thousand employees currently and in the fiscal year of 2012, our net revenue
was GH 90,000,000.The vision of the company is to become the first brand in petroleum products among the
top producers and also have dominant market share of petroleum products in foreign markets. Also, the vision
of the company is to attract customer’s attention while observing beneficiaries rights especially shareholders.
Eagle Petroleum Company Ghana Limited was established under the principles of creative thinking and
personal integrity that are built through knowledge and judgement we derived from our experience. Guided by
these principles, Eagle Petroleum Company Ghana Limited employs talented teams of technical, operational
3
3 | P a g e
and financial professions who utilize the latest technological advancement in the industry to achieve progress
for the firm. We believe we can accomplish this through development of our large petroleum products by
focusing on operational control and cost efficiencies. The company petroleum product trades on the New York
(NYSE)and Ghana Stock Exchange (GSE) under the symbol “EPCGL”. We have a well diversified portfolio of
assets and hold a highly competitive land and resource position through focusing on our four –point strategies.
These include profitable production growth of petroleum products which enable us to strive for high production,
commodity diverse asset base and maintaining capital discipline. Also cost control which has led us to be one of
the lowest-cost operators in the industry. Moreover, management of portfolio is another strategy we use in
every acquisition and divestiture to upgrade our asset quality. Also, financial flexibility enables our asset
portfolio to operate near expected cash flow and grow production. As we move to strengthen our position as one
of the best petroleum producing company and major players in the energy industry, we are mindful of our role
as a responsible entity which is committed to developing programmes to target social and economic
development of countries in Ghana directly impacted by our operations and the nation at large. Our Corporate
Social Responsibility programmes are directed at core areas such as education and training, sport, environment
and community empowerment.
CHOSEN COUNTRY AND JUSTIFICATION
Eagle Petroleum Company Ghana Limited is proposing to operate in South Africa with its existing products.
Mostly foreign companies have had a long and complex history in South Africa. Their presence pre-dates the
discovery of diamond and gold in the late 19th century. Since the 1994 election of South Africa, the economic
policy regime of South Africa has been liberalized to encourage foreign investment. South Arica has a total tax
rate of 33.3% for foreign companies. South Africa recently reduced the time and documents required to export
and import through its ongoing customs modernization program ( Doing Business, 2013). This has made the
cost of doing business much cheaper in South Africa. According to the Ghana Statistical Service, oil and oil
products form the largest export of Ghana which accounts for $2976.06 million. This oil products accounts for
21.89% of total exports. Also, Ghana exports more to South Africa than any of its trading partners from 2007 to
2011. Ghana and South Africa have a long standing trade and investment tradition. In recent years trade
between Ghana and South Africa has grown significantly. In 2008, South Africa exports to Ghana grew from
three billion Rand to one billion Rand. Also in 2011, Ghana signed six trade agreements between Ghana and
South Africa.
4
4 | P a g e
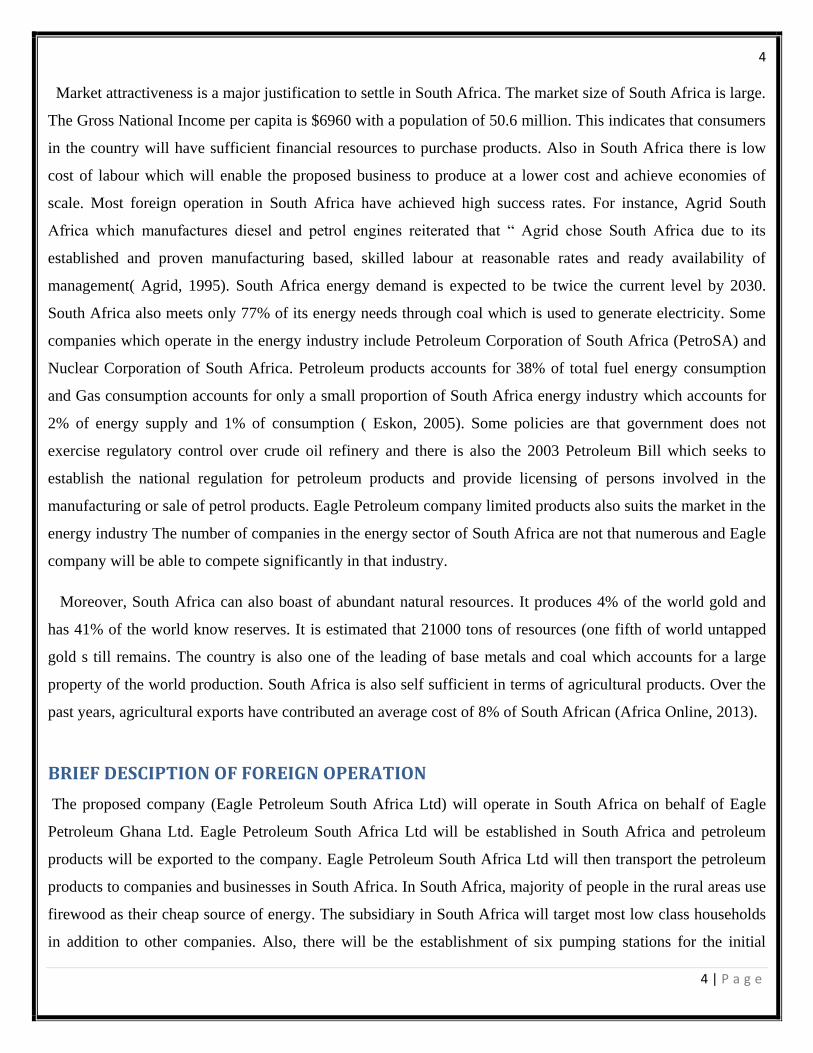
Market attractiveness is a major justification to settle in South Africa. The market size of South Africa is large.
The Gross National Income per capita is $6960 with a population of 50.6 million. This indicates that consumers
in the country will have sufficient financial resources to purchase products. Also in South Africa there is low
cost of labour which will enable the proposed business to produce at a lower cost and achieve economies of
scale. Most foreign operation in South Africa have achieved high success rates. For instance, Agrid South
Africa which manufactures diesel and petrol engines reiterated that “ Agrid chose South Africa due to its
established and proven manufacturing based, skilled labour at reasonable rates and ready availability of
management( Agrid, 1995). South Africa energy demand is expected to be twice the current level by 2030.
South Africa also meets only 77% of its energy needs through coal which is used to generate electricity. Some
companies which operate in the energy industry include Petroleum Corporation of South Africa (PetroSA) and
Nuclear Corporation of South Africa. Petroleum products accounts for 38% of total fuel energy consumption
and Gas consumption accounts for only a small proportion of South Africa energy industry which accounts for
2% of energy supply and 1% of consumption ( Eskon, 2005). Some policies are that government does not
exercise regulatory control over crude oil refinery and there is also the 2003 Petroleum Bill which seeks to
establish the national regulation for petroleum products and provide licensing of persons involved in the
manufacturing or sale of petrol products. Eagle Petroleum company limited products also suits the market in the
energy industry The number of companies in the energy sector of South Africa are not that numerous and Eagle
company will be able to compete significantly in that industry.
Moreover, South Africa can also boast of abundant natural resources. It produces 4% of the world gold and
has 41% of the world know reserves. It is estimated that 21000 tons of resources (one fifth of world untapped
gold s till remains. The country is also one of the leading of base metals and coal which accounts for a large
property of the world production. South Africa is also self sufficient in terms of agricultural products. Over the
past years, agricultural exports have contributed an average cost of 8% of South African (Africa Online, 2013).
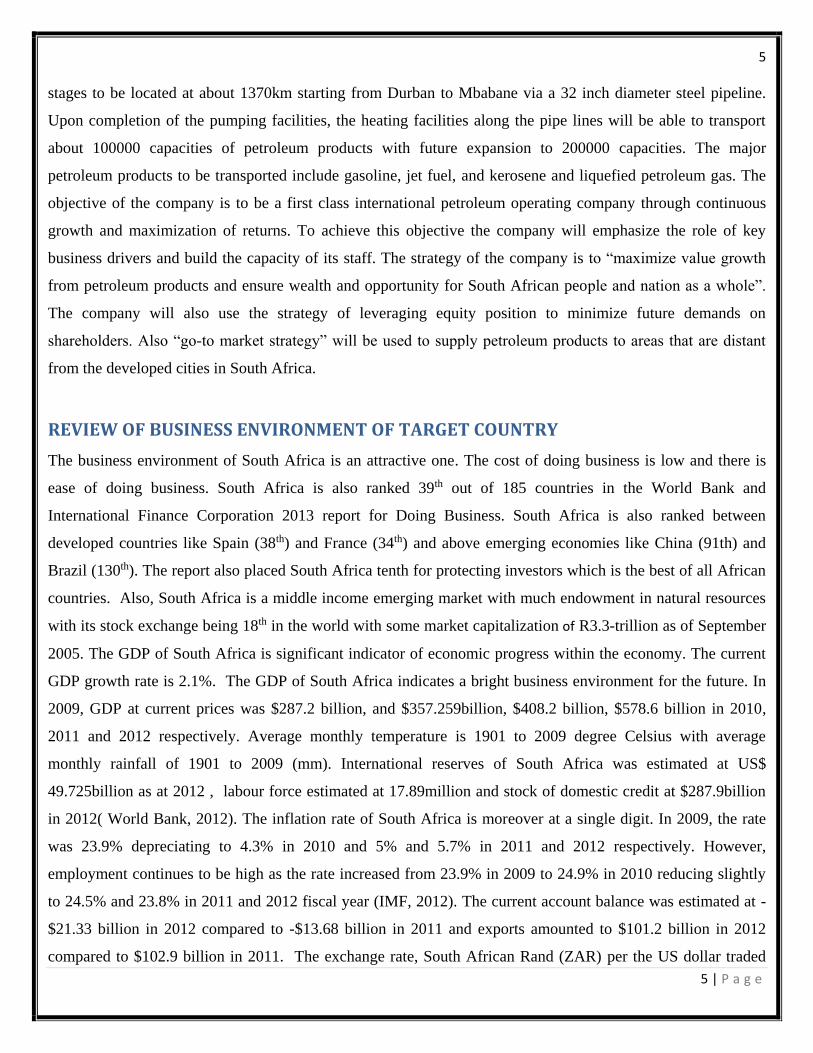
BRIEF DESCIPTION OF FOREIGN OPERATION
The proposed company (Eagle Petroleum South Africa Ltd) will operate in South Africa on behalf of Eagle
Petroleum Ghana Ltd. Eagle Petroleum South Africa Ltd will be established in South Africa and petroleum
products will be exported to the company. Eagle Petroleum South Africa Ltd will then transport the petroleum
products to companies and businesses in South Africa. In South Africa, majority of people in the rural areas use
firewood as their cheap source of energy. The subsidiary in South Africa will target most low class households
in addition to other companies. Also, there will be the establishment of six pumping stations for the initial
5
5 | P a g e
stages to be located at about 1370km starting from Durban to Mbabane via a 32 inch diameter steel pipeline.
Upon completion of the pumping facilities, the heating facilities along the pipe lines will be able to transport
about 100000 capacities of petroleum products with future expansion to 200000 capacities. The major
petroleum products to be transported include gasoline, jet fuel, and kerosene and liquefied petroleum gas. The
objective of the company is to be a first class international petroleum operating company through continuous
growth and maximization of returns. To achieve this objective the company will emphasize the role of key
business drivers and build the capacity of its staff. The strategy of the company is to “maximize value growth
from petroleum products and ensure wealth and opportunity for South African people and nation as a whole”.
The company will also use the strategy of leveraging equity position to minimize future demands on
shareholders. Also “go-to market strategy” will be used to supply petroleum products to areas that are distant
from the developed cities in South Africa.
REVIEW OF BUSINESS ENVIRONMENT OF TARGET COUNTRY
The business environment of South Africa is an attractive one. The cost of doing business is low and there is
ease of doing business. South Africa is also ranked 39th out of 185 countries in the World Bank and
International Finance Corporation 2013 report for Doing Business. South Africa is also ranked between
developed countries like Spain (38th) and France (34th) and above emerging economies like China (91th) and
Brazil (130th). The report also placed South Africa tenth for protecting investors which is the best of all African
countries. Also, South Africa is a middle income emerging market with much endowment in natural resources
with its stock exchange being 18th in the world with some market capitalization of R3.3-trillion as of September
2005. The GDP of South Africa is significant indicator of economic progress within the economy. The current
GDP growth rate is 2.1%. The GDP of South Africa indicates a bright business environment for the future. In
2009, GDP at current prices was $287.2 billion, and $357.259billion, $408.2 billion, $578.6 billion in 2010,
2011 and 2012 respectively. Average monthly temperature is 1901 to 2009 degree Celsius with average
monthly rainfall of 1901 to 2009 (mm). International reserves of South Africa was estimated at US$
49.725billion as at 2012 , labour force estimated at 17.89million and stock of domestic credit at $287.9billion
in 2012( World Bank, 2012). The inflation rate of South Africa is moreover at a single digit. In 2009, the rate
was 23.9% depreciating to 4.3% in 2010 and 5% and 5.7% in 2011 and 2012 respectively. However,
employment continues to be high as the rate increased from 23.9% in 2009 to 24.9% in 2010 reducing slightly
to 24.5% and 23.8% in 2011 and 2012 fiscal year (IMF, 2012). The current account balance was estimated at -
$21.33 billion in 2012 compared to -$13.68 billion in 2011 and exports amounted to $101.2 billion in 2012
compared to $102.9 billion in 2011. The exchange rate, South African Rand (ZAR) per the US dollar traded
6
6 | P a g e
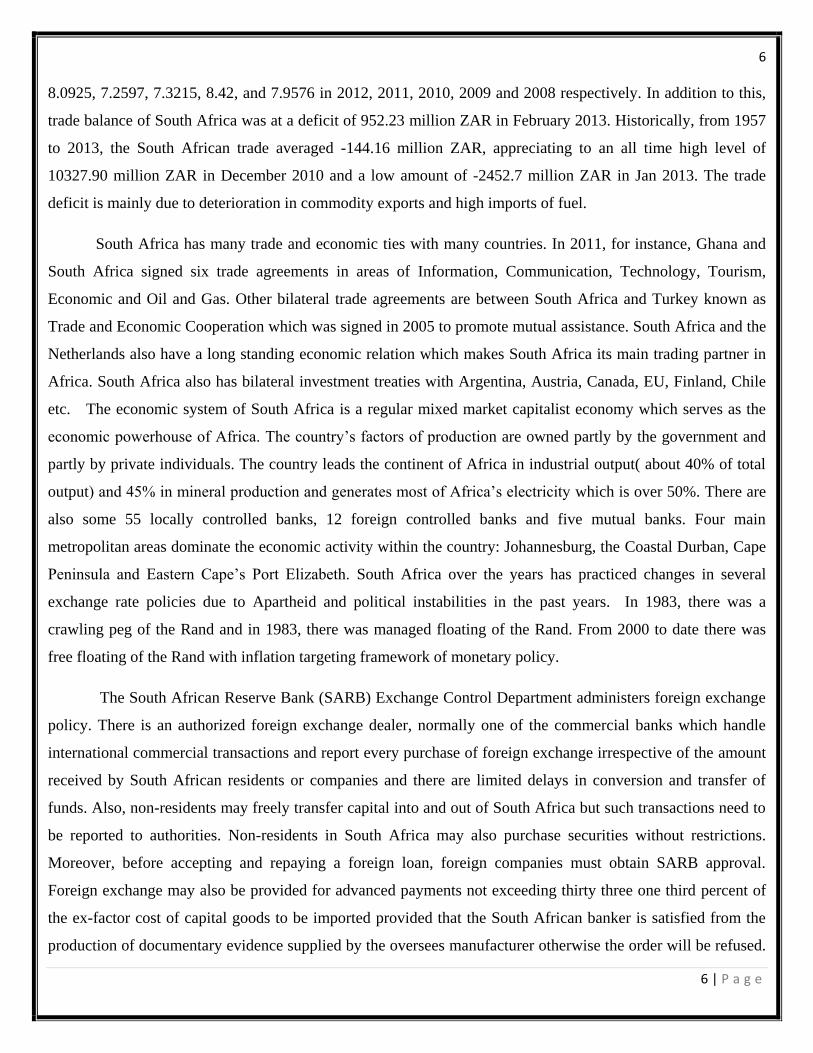
8.0925, 7.2597, 7.3215, 8.42, and 7.9576 in 2012, 2011, 2010, 2009 and 2008 respectively. In addition to this,
trade balance of South Africa was at a deficit of 952.23 million ZAR in February 2013. Historically, from 1957
to 2013, the South African trade averaged -144.16 million ZAR, appreciating to an all time high level of
10327.90 million ZAR in December 2010 and a low amount of -2452.7 million ZAR in Jan 2013. The trade
deficit is mainly due to deterioration in commodity exports and high imports of fuel.
South Africa has many trade and economic ties with many countries. In 2011, for instance, Ghana and
South Africa signed six trade agreements in areas of Information, Communication, Technology, Tourism,
Economic and Oil and Gas. Other bilateral trade agreements are between South Africa and Turkey known as
Trade and Economic Cooperation which was signed in 2005 to promote mutual assistance. South Africa and the
Netherlands also have a long standing economic relation which makes South Africa its main trading partner in
Africa. South Africa also has bilateral investment treaties with Argentina, Austria, Canada, EU, Finland, Chile
etc. The economic system of South Africa is a regular mixed market capitalist economy which serves as the
economic powerhouse of Africa. The country’s factors of production are owned partly by the government and
partly by private individuals. The country leads the continent of Africa in industrial output( about 40% of total
output) and 45% in mineral production and generates most of Africa’s electricity which is over 50%. There are
also some 55 locally controlled banks, 12 foreign controlled banks and five mutual banks. Four main
metropolitan areas dominate the economic activity within the country: Johannesburg, the Coastal Durban, Cape
Peninsula and Eastern Cape’s Port Elizabeth. South Africa over the years has practiced changes in several
exchange rate policies due to Apartheid and political instabilities in the past years. In 1983, there was a
crawling peg of the Rand and in 1983, there was managed floating of the Rand. From 2000 to date there was
free floating of the Rand with inflation targeting framework of monetary policy.
The South African Reserve Bank (SARB) Exchange Control Department administers foreign exchange
policy. There is an authorized foreign exchange dealer, normally one of the commercial banks which handle
international commercial transactions and report every purchase of foreign exchange irrespective of the amount
received by South African residents or companies and there are limited delays in conversion and transfer of
funds. Also, non-residents may freely transfer capital into and out of South Africa but such transactions need to
be reported to authorities. Non-residents in South Africa may also purchase securities without restrictions.
Moreover, before accepting and repaying a foreign loan, foreign companies must obtain SARB approval.
Foreign exchange may also be provided for advanced payments not exceeding thirty three one third percent of
the ex-factor cost of capital goods to be imported provided that the South African banker is satisfied from the
production of documentary evidence supplied by the oversees manufacturer otherwise the order will be refused.
7
7 | P a g e
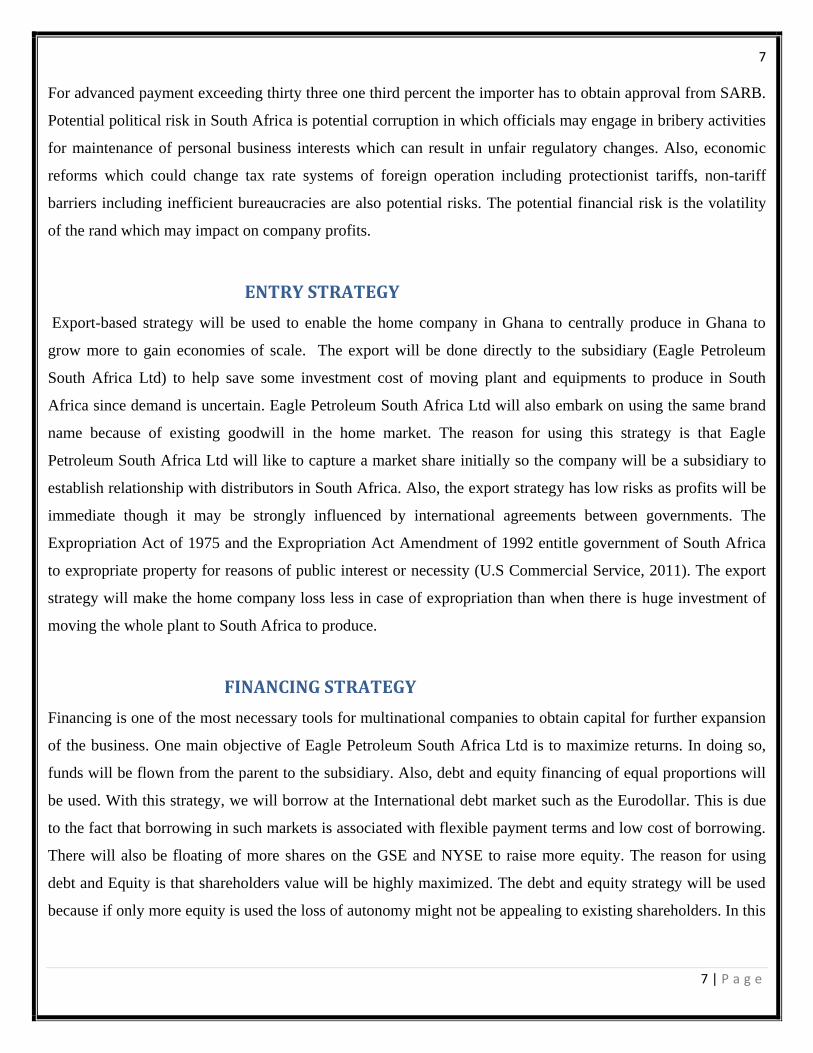
For advanced payment exceeding thirty three one third percent the importer has to obtain approval from SARB.
Potential political risk in South Africa is potential corruption in which officials may engage in bribery activities
for maintenance of personal business interests which can result in unfair regulatory changes. Also, economic
reforms which could change tax rate systems of foreign operation including protectionist tariffs, non-tariff
barriers including inefficient bureaucracies are also potential risks. The potential financial risk is the volatility
of the rand which may impact on company profits.
ENTRY STRATEGY
Export-based strategy will be used to enable the home company in Ghana to centrally produce in Ghana to
grow more to gain economies of scale. The export will be done directly to the subsidiary (Eagle Petroleum
South Africa Ltd) to help save some investment cost of moving plant and equipments to produce in South
Africa since demand is uncertain. Eagle Petroleum South Africa Ltd will also embark on using the same brand
name because of existing goodwill in the home market. The reason for using this strategy is that Eagle
Petroleum South Africa Ltd will like to capture a market share initially so the company will be a subsidiary to
establish relationship with distributors in South Africa. Also, the export strategy has low risks as profits will be
immediate though it may be strongly influenced by international agreements between governments. The
Expropriation Act of 1975 and the Expropriation Act Amendment of 1992 entitle government of South Africa
to expropriate property for reasons of public interest or necessity (U.S Commercial Service, 2011). The export
strategy will make the home company loss less in case of expropriation than when there is huge investment of
moving the whole plant to South Africa to produce.
FINANCING STRATEGY
Financing is one of the most necessary tools for multinational companies to obtain capital for further expansion
of the business. One main objective of Eagle Petroleum South Africa Ltd is to maximize returns. In doing so,
funds will be flown from the parent to the subsidiary. Also, debt and equity financing of equal proportions will
be used. With this strategy, we will borrow at the International debt market such as the Eurodollar. This is due
to the fact that borrowing in such markets is associated with flexible payment terms and low cost of borrowing.
There will also be floating of more shares on the GSE and NYSE to raise more equity. The reason for using
debt and Equity is that shareholders value will be highly maximized. The debt and equity strategy will be used
because if only more equity is used the loss of autonomy might not be appealing to existing shareholders. In this
8
8 | P a g e
case the use of also debt financing will also help owners to have control of the business as long as they are
paying some debt.
RISK MANAGEMENT STRATEGIES
The nature of petroleum products makes it price uncertain as single firm cannot manipulate spot prices as well
as exchange rates and hence the companies operation will be exposed to foreign exchange rate fluctuations.
Hedging all foreign exchange risks will be used as management strategy to address fluctuations in exchange
rates. In this way the company will engage in foreign currency options and forward contracts to hedge against
exposure on forecasted transactions. Also forward contracts will be used to hedge monetary assets and liabilities
that are denominated in the foreign currency. The reason for hedging is that since the firm cannot control price a
alone, and hence the company will be exposed to foreign exchange risks due to demand uncertainty and
inability to forecast sales especially in the short run. Another risk management strategy is that the company will
build relationship with the government of South Africa. This will be done by giving equity stake to the state of
South Africa by giving important officials a seat on board or get the government to buy-in the project. The
reason for this strategy is to avoid sudden expropriation.
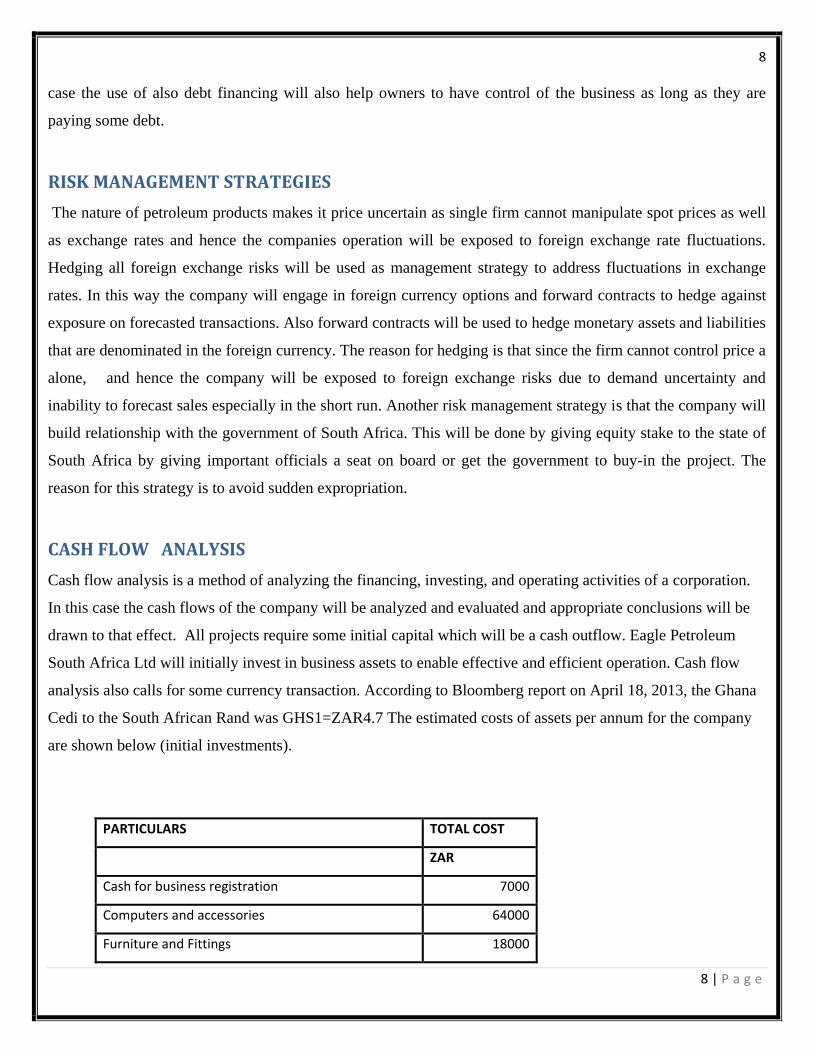
CASH FLOW ANALYSIS
Cash flow analysis is a method of analyzing the financing, investing, and operating activities of a corporation.
In this case the cash flows of the company will be analyzed and evaluated and appropriate conclusions will be
drawn to that effect. All projects require some initial capital which will be a cash outflow. Eagle Petroleum
South Africa Ltd will initially invest in business assets to enable effective and efficient operation. Cash flow
analysis also calls for some currency transaction. According to Bloomberg report on April 18, 2013, the Ghana
Cedi to the South African Rand was GHS1=ZAR4.7 The estimated costs of assets per annum for the company
are shown below (initial investments).
PARTICULARS TOTAL COST
ZAR
Cash for business registration 7000
Computers and accessories 64000
Furniture and Fittings 18000
9
9 | P a g e
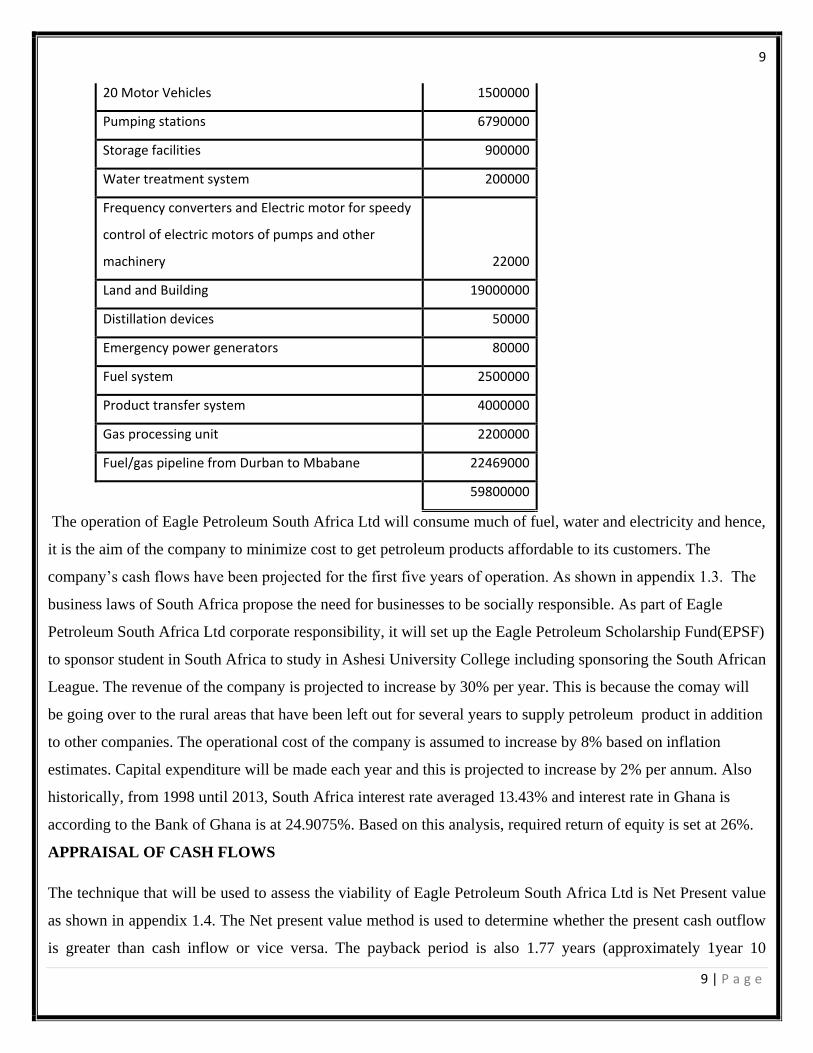
The operation of Eagle Petroleum South Africa Ltd will consume much of fuel, water and electricity and hence,
it is the aim of the company to minimize cost to get petroleum products affordable to its customers. The
company’s cash flows have been projected for the first five years of operation. As shown in appendix 1.3. The
business laws of South Africa propose the need for businesses to be socially responsible. As part of Eagle
Petroleum South Africa Ltd corporate responsibility, it will set up the Eagle Petroleum Scholarship Fund(EPSF)
to sponsor student in South Africa to study in Ashesi University College including sponsoring the South African
League. The revenue of the company is projected to increase by 30% per year. This is because the comay will
be going over to the rural areas that have been left out for several years to supply petroleum product in addition
to other companies. The operational cost of the company is assumed to increase by 8% based on inflation
estimates. Capital expenditure will be made each year and this is projected to increase by 2% per annum. Also
historically, from 1998 until 2013, South Africa interest rate averaged 13.43% and interest rate in Ghana is
according to the Bank of Ghana is at 24.9075%. Based on this analysis, required return of equity is set at 26%.
APPRAISAL OF CASH FLOWS
The technique that will be used to assess the viability of Eagle Petroleum South Africa Ltd is Net Present value
as shown in appendix 1.4. The Net present value method is used to determine whether the present cash outflow
is greater than cash inflow or vice versa. The payback period is also 1.77 years (approximately 1year 10
20 Motor Vehicles 1500000
Pumping stations 6790000
Storage facilities 900000
Water treatment system 200000
Frequency converters and Electric motor for speedy
control of electric motors of pumps and other
machinery 22000
Land and Building 19000000
Distillation devices 50000
Emergency power generators 80000
Fuel system 2500000
Product transfer system 4000000
Gas processing unit 2200000
Fuel/gas pipeline from Durban to Mbabane 22469000
59800000
10
10 | P a g e
months). Net present value from the calculation is 167317693.9.This implies that the present cash inflow is
greater than its present cash outflow and based on this, Eagle Petroleum South Africa Ltd project is a feasible
one.
CONCLUSION
Eagle Petroleum South Africa Ltd is a company whose major interest is not centred on maximizing shareholder
value alone but also focusing on the economic well-being of the society. Based on the calculations of Net
Present value which shows a positive figure and looking at the payback period, Eagle Petroleum South Africa
Ltd has proven indeed a feasible project that needs to be implemented. The company will as well provide
employment to individuals in South Africa. This will go a long way to increase the national output of South
Africa. It is in this light that it seems more economically and financially prudent to embark on implementing the
project.
.
.
11
11 | P a g e
References
Blomstermo, Sallis (2006). Choice of foreign market entry mode in service firms. International Marketing
Review, 23 (2), 211-229
Dayananda, D, Irons, R, Herbohn, J. and Rowland, P. 2002. Financial appraisal of investment projects. Capital
Budgeting. New York: Pitt
Eberhard, Van(1995). Poverty and Power: Energy and the South African state. London, Pluto Press and UCT
Press
Eskon. (2005). The International Market Entry Choices of Start-Up Companies in High Technology Industries
Joumal of International Marketing, 8(2), 33-62
Gelb , Black(2010) .Foreign direct investment in South Africa, in S Estrin & K Meyer(eds), Investment
Strategies in Emerging Markets, Edward Elgar, Cheltenham, UK,2004
“Ghana and South Africa Sign Six Agreements” http://www.presidency.gov.gh/press-centre/general-
news/ghana-and-south-africa-sign-six-agreements
International Monetary Fund (IMF), International Financial Statistics, www.imf.org. Accessed 22nd April, 2013.
Modigliani, F.; Miller, M. (2003: 261). "The Cost of Capital, Corporation Finance and the Theory of
Investment". American Economic American Economic Review 48 (3): 261–297.
Pan, Tse. (1999). “The impact of order and mode of market entry on profitability and market share.” Journal of
International Business Studies 30(1): 81-104.
South African Reserve Bank, Exchange Control Manual, www.resbank.co.za, August 2010
World Bank &IFC (2013). Doing Business: Smarter Regulations for Small and Medium Size Enterprise
12
12 | P a g e
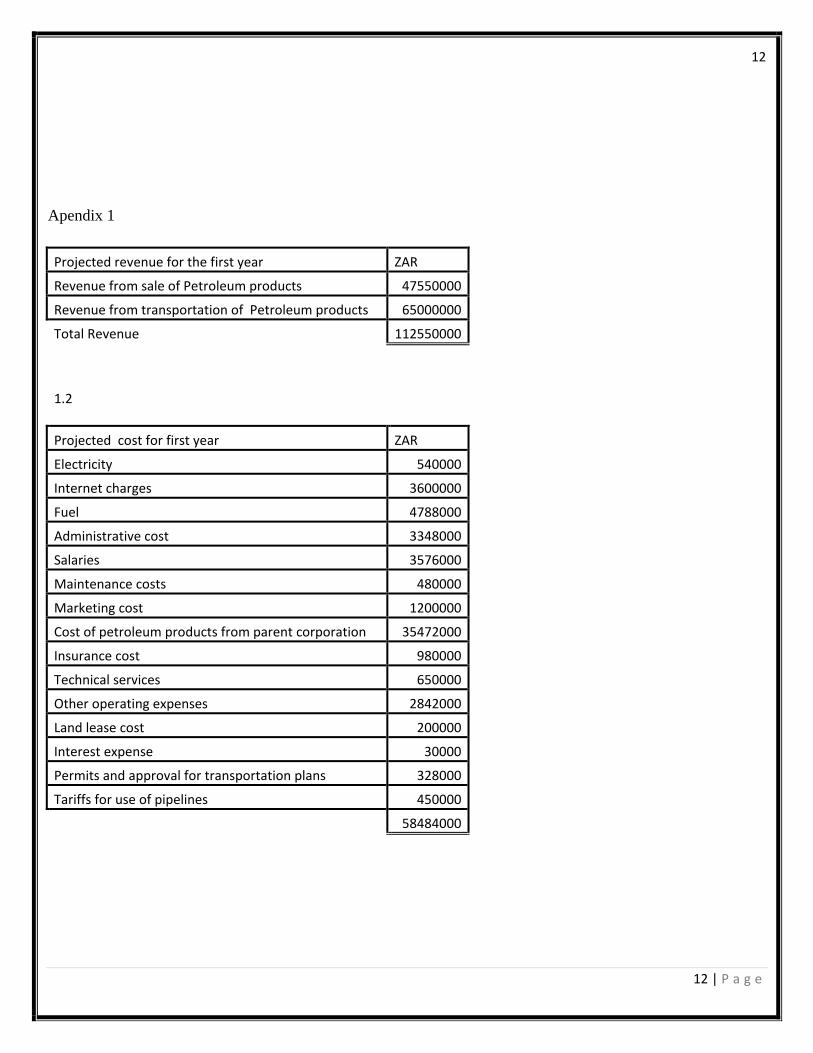
Apendix 1
Projected revenue for the first year ZAR
Revenue from sale of Petroleum products 47550000
Revenue from transportation of Petroleum products 65000000
Total Revenue 112550000
1.2
Projected cost for first year ZAR
Electricity 540000
Internet charges 3600000
Fuel 4788000
Administrative cost 3348000
Salaries 3576000
Maintenance costs 480000
Marketing cost 1200000
Cost of petroleum products from parent corporation 35472000
Insurance cost 980000
Technical services 650000
Other operating expenses 2842000
Land lease cost 200000
Interest expense 30000
Permits and approval for transportation plans 328000
Tariffs for use of pipelines 450000
58484000
13
13 | P a g e
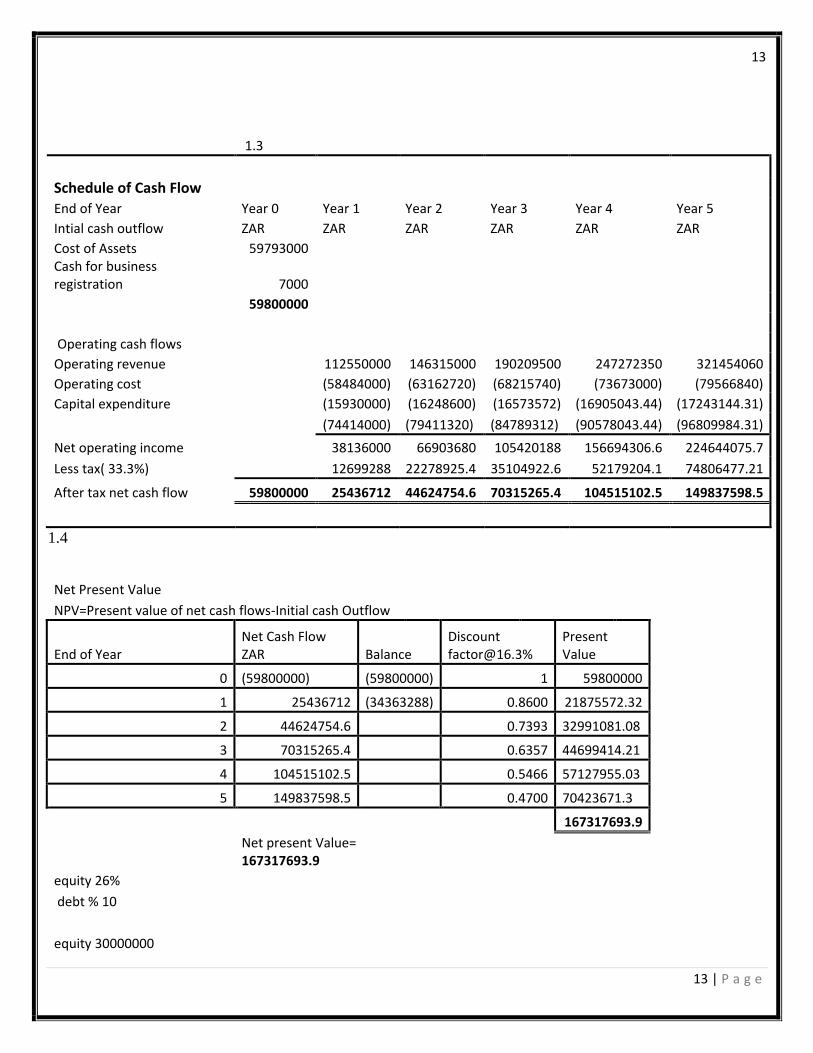
1.3
Schedule of Cash Flow
End of Year Year 0 Year 1 Year 2 Year 3 Year 4 Year 5
Intial cash outflow ZAR ZAR ZAR ZAR ZAR ZAR
Cost of Assets 59793000
Cash for business registration 7000
59800000
Operating cash flows
Operating revenue
112550000 146315000 190209500 247272350 321454060
Operating cost
(58484000) (63162720) (68215740) (73673000) (79566840)
Capital expenditure
(15930000) (16248600) (16573572) (16905043.44) (17243144.31)
(74414000) (79411320) (84789312) (90578043.44) (96809984.31)
Net operating income
38136000 66903680 105420188 156694306.6 224644075.7
Less tax( 33.3%) 12699288 22278925.4 35104922.6 52179204.1 74806477.21
After tax net cash flow 59800000 25436712 44624754.6 70315265.4 104515102.5 149837598.5
1.4
Net Present Value NPV=Present value of net cash flows-Initial cash Outflow
End of Year Net Cash Flow ZAR Balance
Discount [email protected]%
Present Value
0 (59800000) (59800000) 1 59800000
1 25436712 (34363288) 0.8600 21875572.32
2 44624754.6 0.7393 32991081.08
3 70315265.4 0.6357 44699414.21
4 104515102.5 0.5466 57127955.03
5 149837598.5 0.4700 70423671.3
167317693.9
Net present Value= 167317693.9
equity 26%
debt % 10
equity 30000000
14
14 | P a g e
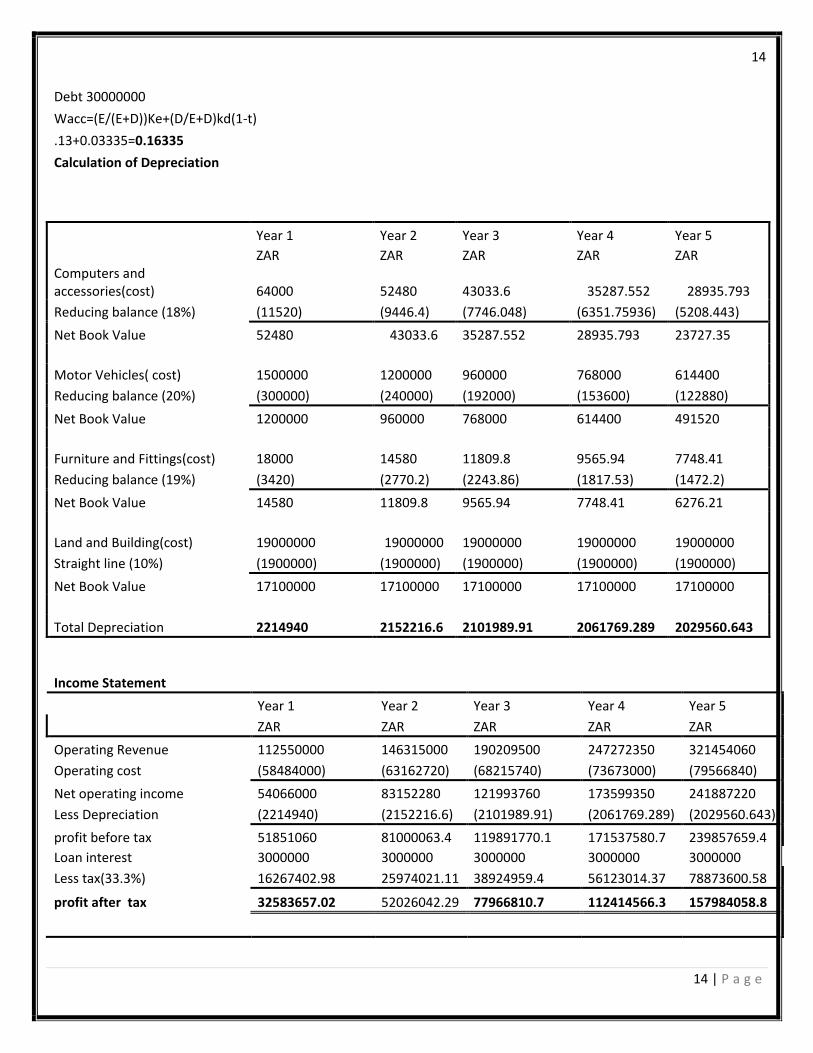
Debt 30000000
Wacc=(E/(E+D))Ke+(D/E+D)kd(1-t)
.13+0.03335=0.16335
Calculation of Depreciation
Year 1 Year 2 Year 3 Year 4 Year 5
ZAR ZAR ZAR ZAR ZAR Computers and accessories(cost) 64000 52480 43033.6 35287.552 28935.793
Reducing balance (18%) (11520) (9446.4) (7746.048) (6351.75936) (5208.443)
Net Book Value 52480 43033.6 35287.552 28935.793 23727.35
Motor Vehicles( cost) 1500000 1200000 960000 768000 614400
Reducing balance (20%) (300000) (240000) (192000) (153600) (122880)
Net Book Value 1200000 960000 768000 614400 491520
Furniture and Fittings(cost) 18000 14580 11809.8 9565.94 7748.41
Reducing balance (19%) (3420) (2770.2) (2243.86) (1817.53) (1472.2)
Net Book Value 14580 11809.8 9565.94 7748.41 6276.21
Land and Building(cost) 19000000 19000000 19000000 19000000 19000000
Straight line (10%) (1900000) (1900000) (1900000) (1900000) (1900000)
Net Book Value 17100000 17100000 17100000 17100000 17100000
Total Depreciation 2214940 2152216.6 2101989.91 2061769.289 2029560.643
Income Statement
Year 1 Year 2 Year 3 Year 4 Year 5
ZAR ZAR ZAR ZAR ZAR
Operating Revenue 112550000 146315000 190209500 247272350 321454060
Operating cost (58484000) (63162720) (68215740) (73673000) (79566840)
Net operating income 54066000 83152280 121993760 173599350 241887220
Less Depreciation (2214940) (2152216.6) (2101989.91) (2061769.289) (2029560.643)
profit before tax 51851060 81000063.4 119891770.1 171537580.7 239857659.4
Loan interest 3000000 3000000 3000000 3000000 3000000
Less tax(33.3%) 16267402.98 25974021.11 38924959.4 56123014.37 78873600.58
profit after tax 32583657.02 52026042.29 77966810.7 112414566.3 157984058.8
15
15 | P a g e
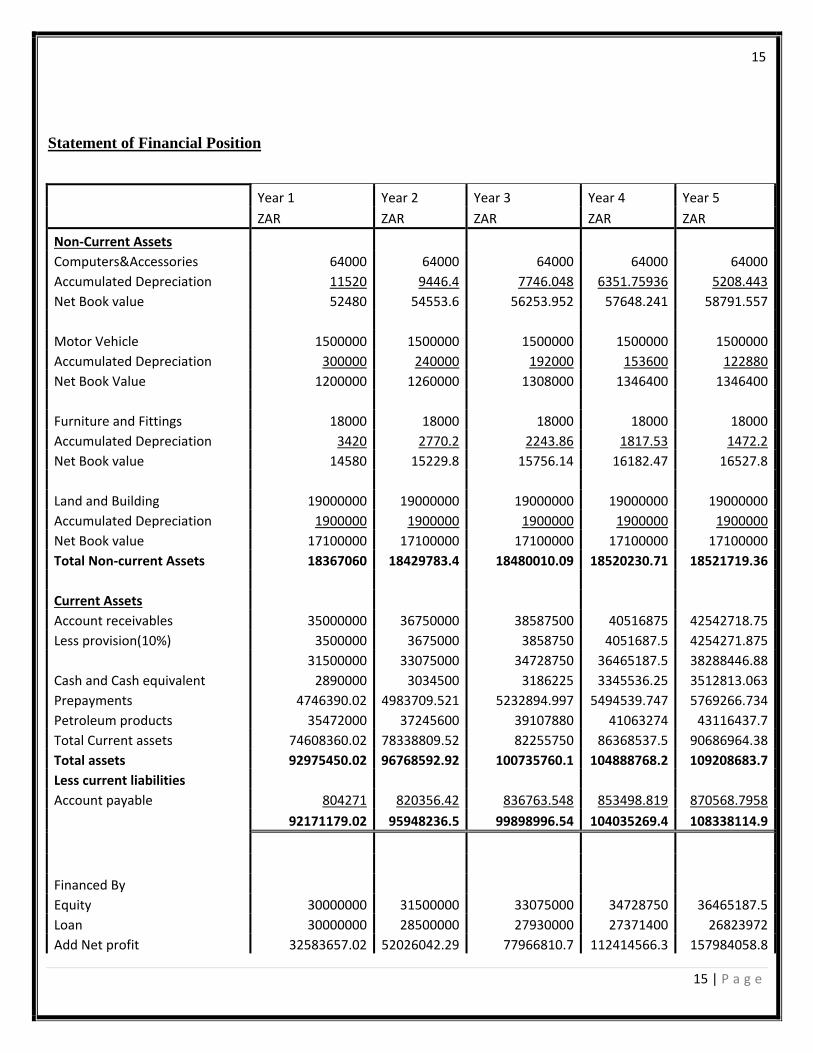
Statement of Financial Position
Year 1 Year 2 Year 3 Year 4 Year 5
ZAR ZAR ZAR ZAR ZAR
Non-Current Assets
Computers&Accessories 64000 64000 64000 64000 64000
Accumulated Depreciation 11520 9446.4 7746.048 6351.75936 5208.443
Net Book value 52480 54553.6 56253.952 57648.241 58791.557
Motor Vehicle 1500000 1500000 1500000 1500000 1500000
Accumulated Depreciation 300000 240000 192000 153600 122880
Net Book Value 1200000 1260000 1308000 1346400 1346400
Furniture and Fittings 18000 18000 18000 18000 18000
Accumulated Depreciation 3420 2770.2 2243.86 1817.53 1472.2
Net Book value 14580 15229.8 15756.14 16182.47 16527.8
Land and Building 19000000 19000000 19000000 19000000 19000000
Accumulated Depreciation 1900000 1900000 1900000 1900000 1900000
Net Book value 17100000 17100000 17100000 17100000 17100000
Total Non-current Assets 18367060 18429783.4 18480010.09 18520230.71 18521719.36
Current Assets
Account receivables 35000000 36750000 38587500 40516875 42542718.75
Less provision(10%) 3500000 3675000 3858750 4051687.5 4254271.875
31500000 33075000 34728750 36465187.5 38288446.88
Cash and Cash equivalent 2890000 3034500 3186225 3345536.25 3512813.063
Prepayments 4746390.02 4983709.521 5232894.997 5494539.747 5769266.734
Petroleum products 35472000 37245600 39107880 41063274 43116437.7
Total Current assets 74608360.02 78338809.52 82255750 86368537.5 90686964.38
Total assets 92975450.02 96768592.92 100735760.1 104888768.2 109208683.7
Less current liabilities
Account payable 804271 820356.42 836763.548 853498.819 870568.7958
92171179.02 95948236.5 99898996.54 104035269.4 108338114.9
Financed By
Equity 30000000 31500000 33075000 34728750 36465187.5
Loan 30000000 28500000 27930000 27371400 26823972
Add Net profit 32583657.02 52026042.29 77966810.7 112414566.3 157984058.8
16
16 | P a g e
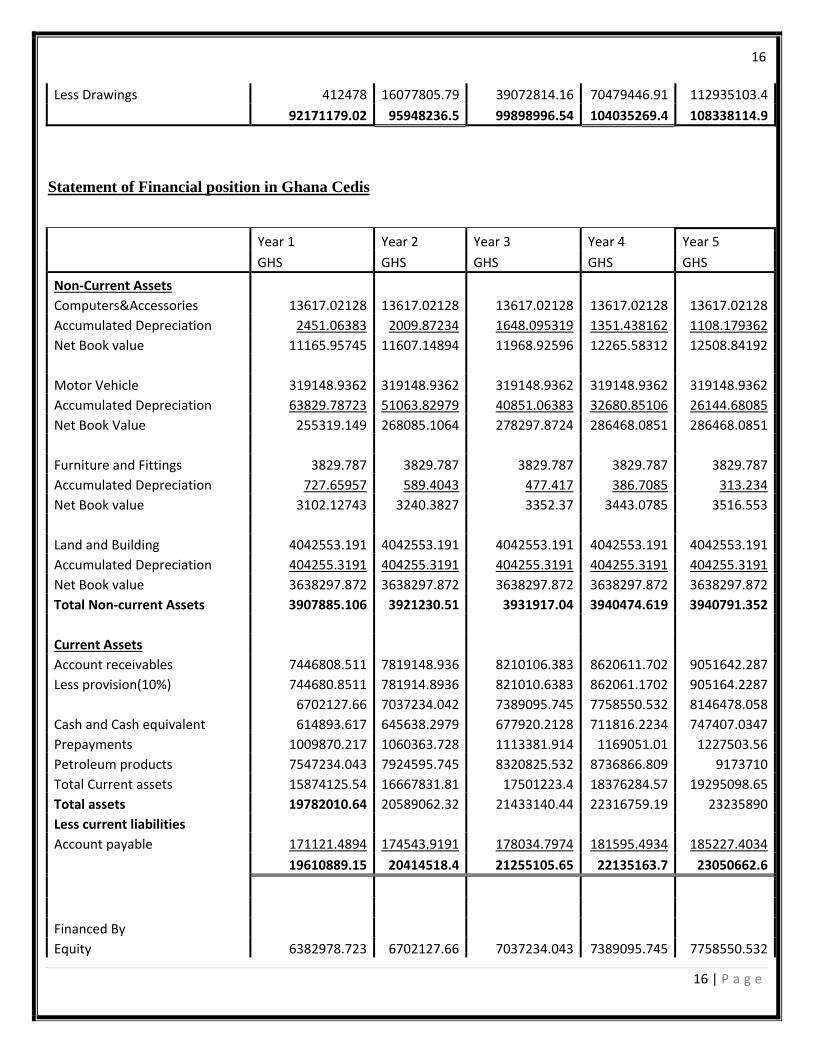
Less Drawings 412478 16077805.79 39072814.16 70479446.91 112935103.4
92171179.02 95948236.5 99898996.54 104035269.4 108338114.9
Statement of Financial position in Ghana Cedis
Year 1 Year 2 Year 3 Year 4 Year 5
GHS GHS GHS GHS GHS
Non-Current Assets
Computers&Accessories 13617.02128 13617.02128 13617.02128 13617.02128 13617.02128
Accumulated Depreciation 2451.06383 2009.87234 1648.095319 1351.438162 1108.179362
Net Book value 11165.95745 11607.14894 11968.92596 12265.58312 12508.84192
Motor Vehicle 319148.9362 319148.9362 319148.9362 319148.9362 319148.9362
Accumulated Depreciation 63829.78723 51063.82979 40851.06383 32680.85106 26144.68085
Net Book Value 255319.149 268085.1064 278297.8724 286468.0851 286468.0851
Furniture and Fittings 3829.787 3829.787 3829.787 3829.787 3829.787
Accumulated Depreciation 727.65957 589.4043 477.417 386.7085 313.234
Net Book value 3102.12743 3240.3827 3352.37 3443.0785 3516.553
Land and Building 4042553.191 4042553.191 4042553.191 4042553.191 4042553.191
Accumulated Depreciation 404255.3191 404255.3191 404255.3191 404255.3191 404255.3191
Net Book value 3638297.872 3638297.872 3638297.872 3638297.872 3638297.872
Total Non-current Assets 3907885.106 3921230.51 3931917.04 3940474.619 3940791.352
Current Assets
Account receivables 7446808.511 7819148.936 8210106.383 8620611.702 9051642.287
Less provision(10%) 744680.8511 781914.8936 821010.6383 862061.1702 905164.2287
6702127.66 7037234.042 7389095.745 7758550.532 8146478.058
Cash and Cash equivalent 614893.617 645638.2979 677920.2128 711816.2234 747407.0347
Prepayments 1009870.217 1060363.728 1113381.914 1169051.01 1227503.56
Petroleum products 7547234.043 7924595.745 8320825.532 8736866.809 9173710
Total Current assets 15874125.54 16667831.81 17501223.4 18376284.57 19295098.65
Total assets 19782010.64 20589062.32 21433140.44 22316759.19 23235890
Less current liabilities
Account payable 171121.4894 174543.9191 178034.7974 181595.4934 185227.4034
19610889.15 20414518.4 21255105.65 22135163.7 23050662.6
Financed By
Equity 6382978.723 6702127.66 7037234.043 7389095.745 7758550.532
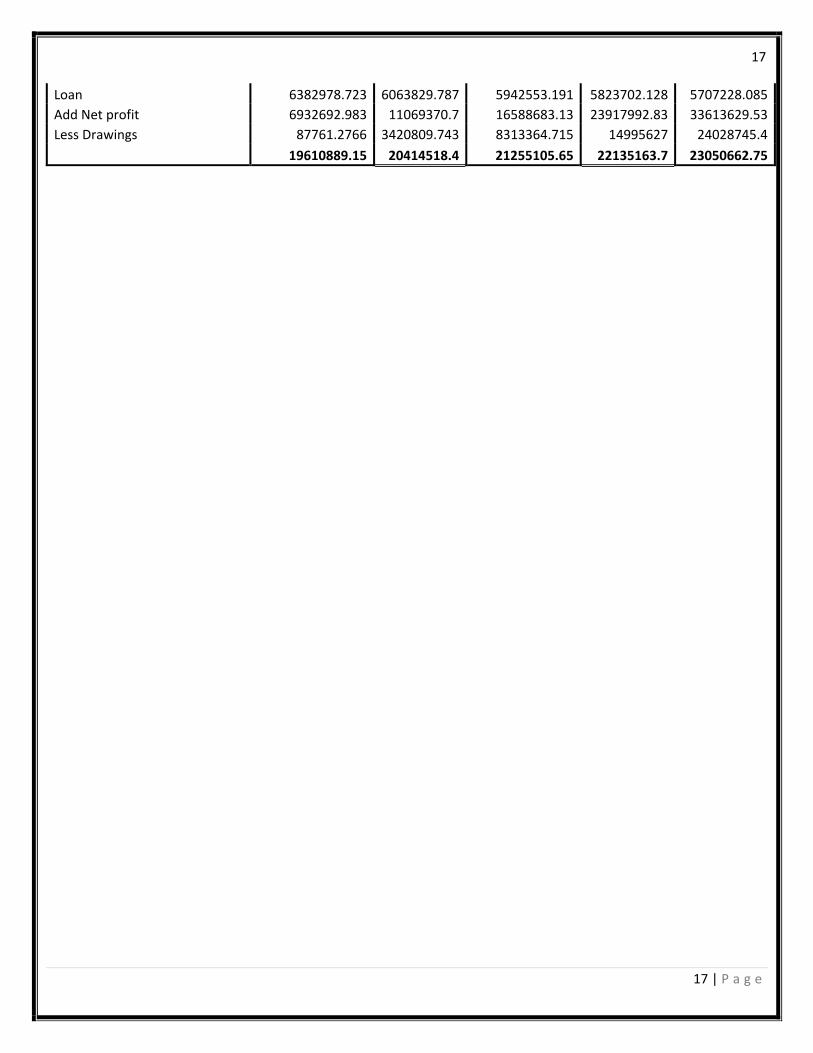
17
17 | P a g e
Loan 6382978.723 6063829.787 5942553.191 5823702.128 5707228.085
Add Net profit 6932692.983 11069370.7 16588683.13 23917992.83 33613629.53
Less Drawings 87761.2766 3420809.743 8313364.715 14995627 24028745.4
19610889.15 20414518.4 21255105.65 22135163.7 23050662.75