foreign direct investment and relative wages - citeseerx
TRANSCRIPT
Journal of International Economics 42 (1997) 371–393
Foreign direct investment and relative wages: Evidencefrom Mexico’s maquiladoras
,a b *Robert C. Feenstra , Gordon H. HansonaDepartment of Economics, University of California, Davis, CA 95616, USA
bDepartment of Economics, University of Texas, Austin, TX 78712, USA
Abstract
In this paper, we examine the increase in relative wages for skilled workers in Mexicoduring the 1980s. Rising wage inequality in Mexico is linked to foreign capital inflows. Westudy the impact of foreign direct investment (FDI) on the skilled labor share of wages inMexico over 1975–1988. We measure FDI using regional data on foreign assembly plants.Growth in FDI is positively correlated with the relative demand for skilled labor. In regionswhere FDI has concentrated, growth in FDI can account for over 50 percent of the increasein the skilled labor wage share that occurred in the late 1980s. 1997 Elsevier Science B.V.
Keywords: Foreign direct investment; Outsourcing; Wage inequality; Multinational en-terprises
JEL classification: F14; F21; F23; J31
1. Introduction
During the 1980s, the United States experienced a dramatic increase in wageinequality, as the wages of more-skilled workers increased relative to those ofless-skilled workers (Bound and Johnson, 1992; Katz and Murphy, 1992; Juhn,Murphy, and Pierce (Juhn et al., 1992)). While there is general agreement that therelative-wage changes are due to an increase in the relative demand for skilledlabor, economists are sharply divided over the source of the demand shift. Two
*Corresponding author. Tel.: 512-475-8522; fax: 512-471-3510; e-mail: [email protected]
0022-1996/97/$17.00 1997 Elsevier Science B.V. All rights reservedPII S0022-1996( 96 )01475-4
372 R.C. Feenstra, G.H. Hanson / Journal of International Economics 42 (1997) 371 –393
explanations have dominated the debate. One is that the advent of computers andrelated technologies have caused firms to switch towards production techniquesthat are biased in favor of skilled workers (Davis and Haltiwanger, 1991;Lawrence and Slaughter, 1993; Berman, Bound, and Griliches (Berman et al.,1994)); the other is that an increase in import competition from low-wagecountries has shifted resources towards industries that use skilled labor relativelyintensively (Leamer, 1993, 1994; Borjas and Ramey, 1995; Wood, 1994).
The literature has so far only considered the experiences of the United Statesand a few other advanced economies. This is surprising, given that both skill-biased technical change and increased foreign competition have global implica-tions. In particular, little attention has been devoted to wage movements in thelow-wage trading partners of the United States. There is evidence that thesecountries have experienced a similar rise in wage inequality. Feliciano (1993)finds that in Mexico a rise in the returns to education has contributed to anincrease in the relative wage of skilled workers; over the period 1986–1990, thewages of manufacturing workers in the 90th wage percentile increased by 16percent relative to those in the 10th wage percentile. Robbins (1994) finds asimilar pattern in Chile, where over the period 1980–1990 the wages of universitygraduates increased by 56.4 percent relative to those of high school graduates. Weshall also report an increase in wage inequality for Mexico.
We argue that the rise in wage inequality across dissimilar countries isconsistent with a third explanation: that capital flows from North to South, and acorresponding rise in outsourcing by Northern multinationals, have contributed toa worldwide increase in the relative demand for skilled labor. In a recent paper(Feenstra and Hanson, 1996), we develop a model which shows that capital flowsfrom North to South, or more generally, any increase in the Southern capital stockrelative to that in the North, can increase the relative wage of skilled labor in bothregions. In our model, the output of each industry is produced using many inputs,each of which differ in their requirements of skilled and unskilled labor. If factorprices are not equalized between countries, then under plausible conditions theNorth specializes in inputs that are relatively intensive in skilled labor and theSouth specializes in inputs that are relatively intensive in unskilled labor. A flowof capital from North to South, which we identify as outsourcing by Northernfirms, shifts an increasing portion of input production to the South. The activitiesoutsourced to the South are, from the North’s perspective, ones that use relativelylarge amounts of unskilled labor, but, from the South’s perspective, are ones forwhich the reverse is true. The result is an increase in the relative demand forskilled labor in both regions, which, in turn, causes the relative wage of skilledlabor to rise in both regions.
While the capital accumulation–outsourcing hypothesis has captured muchattention in the popular press, it has been largely dismissed in the academicliterature. Berman, Bound, and Griliches (Berman et al., 1994) claim that U.S.materials imports, which they use to measure foreign outsourcing, are too small to
R.C. Feenstra, G.H. Hanson / Journal of International Economics 42 (1997) 371 –393 373
have impacted U.S. wages. Lawrence (1994) argues that the fact that U.S.multinationals have increased the relative employment of non-production workersabroad provides further support for the hypothesis that this shift is due to biasedtechnological change. In our previous work, we take issue with the narrowdefinition of outsourcing that these authors use, but we also feel that an equallyimportant point has been ignored: from the perspective of the South foreign directinvestment (FDI) represents a huge inflow of resources. In Mexico, FDI equaled13.7 percent of total fixed investment in 1987 and 9.6 percent in 1989; and inChina, FDI totaled 3.7 percent of gross domestic investment in 1988 and 7.9percent in 1991. Foreign activities of this magnitude are sufficient to have had amajor impact on recipient-country labor markets.
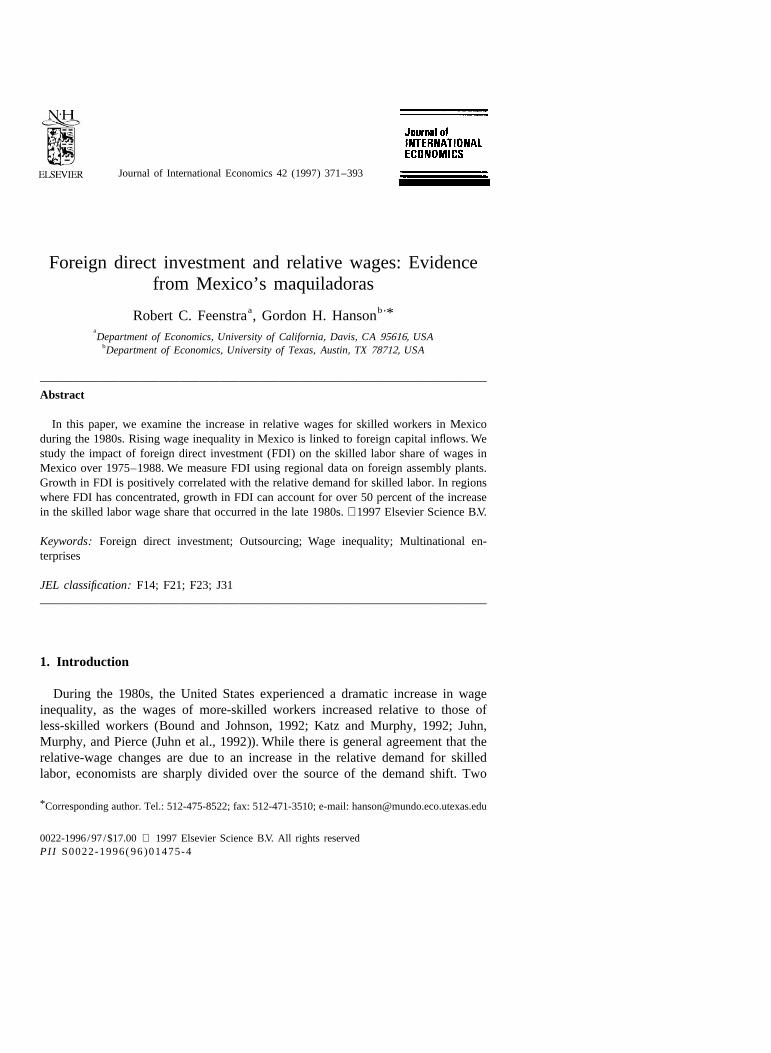
In this paper, we apply our model of trade and investment to study the effect ofFDI on the relative demand for skilled labor in Mexico. Fig. 1 shows the relativewages and employment of skilled and unskilled workers in Mexico for the period
11965–1988. Since 1985, the wages of skilled workers have increased dramaticallyrelative to those of unskilled workers. Mexico’s recent policy reforms and itsproximity to the United States make the country a particularly interesting case. Inthe early 1980s, the government relaxed restrictions on foreign investment. Theresult was a sudden infusion of foreign capital. A large share of FDI inmanufacturing has gone into the creation of in-bond foreign assembly plants,
Fig. 1. Relative wages and employment in Mexican manufacturing.
1We use non-production workers to identify skilled labor and production workers to identify unskilledlabor. While there are problems with this classification (Leamer, 1994), there is evidence that inpractice it successfully tracks employment and wages by skill category (Berman, Bound, and Griliches(Berman et al., 1994); Sachs and Shatz, 1994).
374 R.C. Feenstra, G.H. Hanson / Journal of International Economics 42 (1997) 371 –393
known as maquiladoras, which are concentrated in the Mexico–U.S. border region.The FDI boom, then, has resulted in a region-specific shock to labor demand.Maquiladoras import most of their intermediate inputs from abroad and export
2virtually all of their output. Their primary source for inputs and primarydestination market for outputs is the United States. The suddenness of the policychange and the subsequent regional concentration of FDI create a naturalexperiment of sorts, in which we can sharply identify the effects of foreigninvestment on relative labor demand. In contrast, if FDI were spread evenly acrossregions within a country, its effects on labor demand would be indistinguishablefrom those of other macro shocks.
We shall study the impact of FDI using state-level data on two-digit industriesfrom the Mexico Industrial Census for the period 1975 to 1988. We measure thestate-level growth in FDI using data on the regional activities of maquiladoras.Given that maquiladoras are primarily the result of outsourcing by U.S. multina-tionals, their activities are an appropriate measure of foreign investment for thehypothesis that we test. To preview the results, we find that growth in FDI ispositively correlated with the relative demand for skilled labor. In the regionswhere FDI was most concentrated, growth in FDI can account for over 50 percentof the increase in the share of skilled labor in total wages that occurred during thelate 1980s. This is consistent with the hypothesis that outsourcing by multination-als has been a significant factor in the increase in the relative demand for skilledlabor in Mexico.
2. Theory
2.1. Foreign investment and relative wages
To motivate the empirical approach we take in the following section, we brieflyoutline the model in Feenstra and Hanson (1996). Consider a world economy withtwo countries, North and South, where each country i has given endowments ofcapital (K ), skilled labor (H ), and unskilled labor (L ). For country i, let r be thei i i i
return to capital, q be the wage to skilled labor, and w be the wage to unskilledi i
labor. We assume initially that there is no international factor mobility and that3relative factor endowments are such that r . r and q /w . q /w .S N S S N N
There is a single final good, Y, which is assembled from a continuum ofintermediate inputs, indexed by z [ [0, 1]. Inputs vary in terms of the relativeamounts of skilled and unskilled labor used in production. Each unit of z requiresa (z) units of skilled labor and a (z) units of unskilled labor, where the inputs areH L
2Until 1988, maquiladoras were required by law to export all output.3The factor-price assumptions are consistent with U.S. and Mexican wage data (Feenstra and Hanson,1996).
R.C. Feenstra, G.H. Hanson / Journal of International Economics 42 (1997) 371 –393 375
arranged such that a (z) /a (z) is increasing in z. Each input is produced accordingH L
to the production function,
uL(z) H(z) 12u]] ]]x(z) 5 min , [K(z)] (1)F H JGa (z) a (z)L H
where L(z), H(z) and K(z) are the amounts of unskilled labor, skilled labor, andcapital, respectively, used in the production of input z. The final good Y is thencostlessly assembled according to the Cobb–Douglas function,
1
ln Y 5E a(z) ln x(z) dz (2)0
where e a(z) dz51.To determine the pattern of trade in inputs between the North and South, we
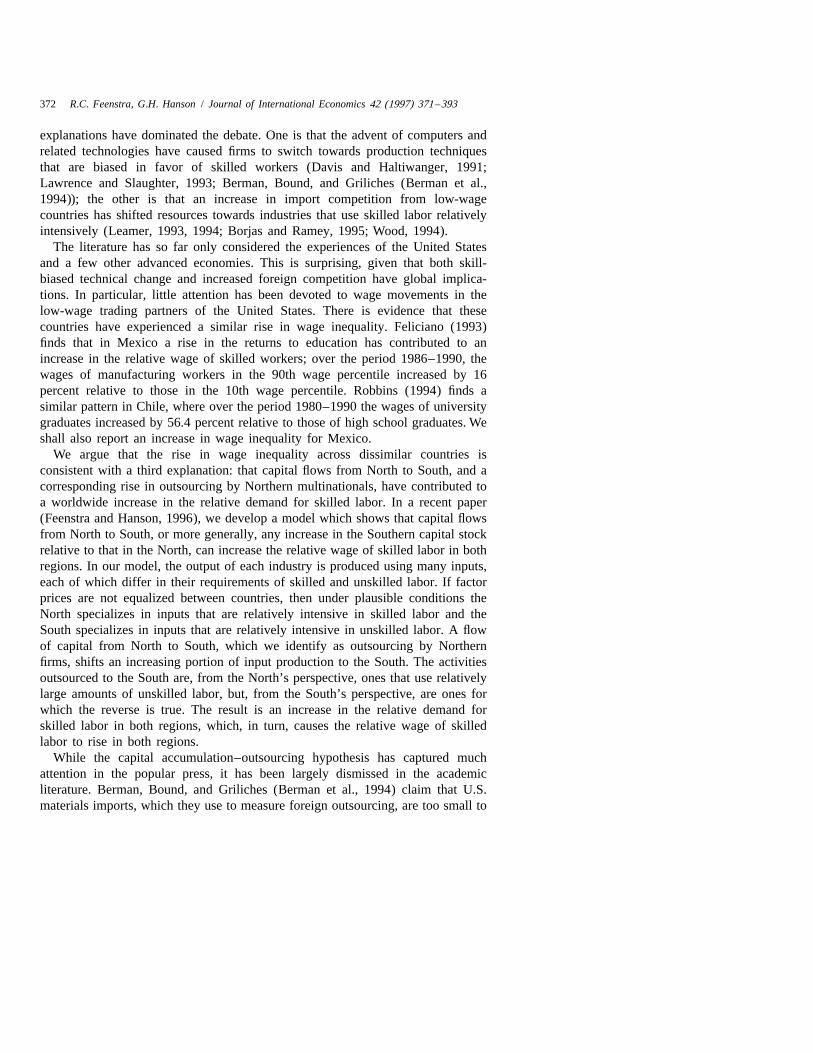
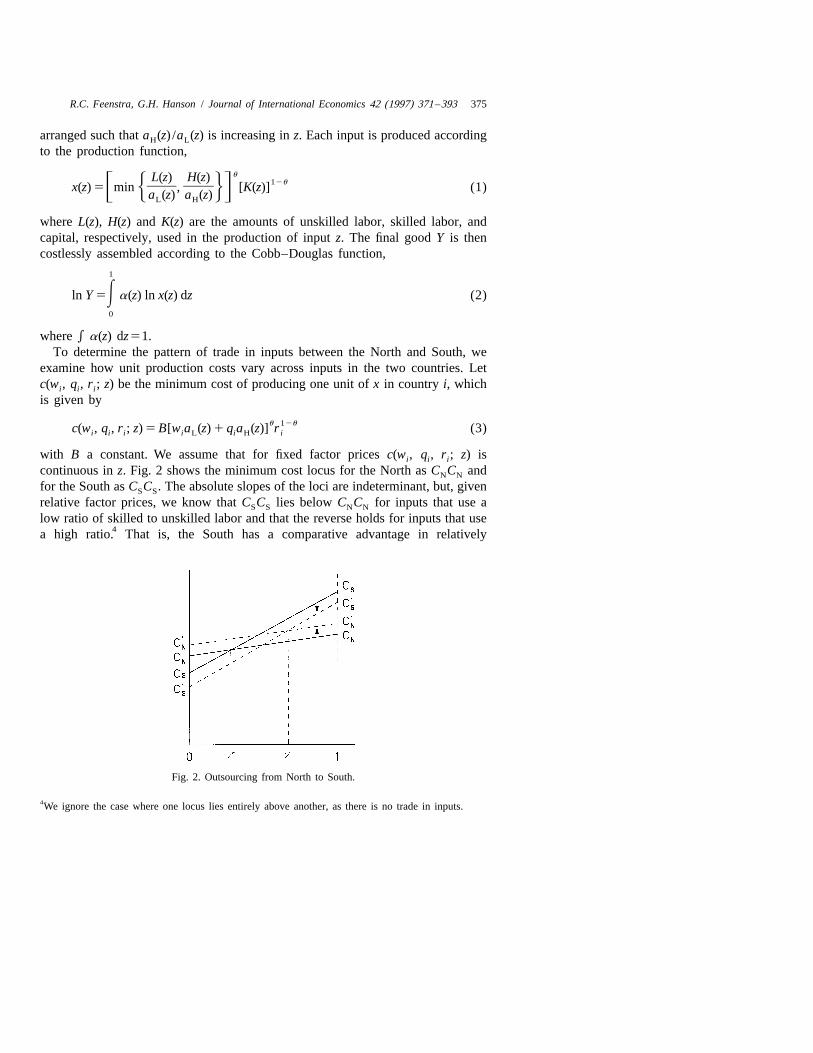
examine how unit production costs vary across inputs in the two countries. Letc(w , q , r ; z) be the minimum cost of producing one unit of x in country i, whichi i i
is given by
u 12uc(w , q , r ; z) 5 B[w a (z) 1 q a (z)] r (3)i i i i L i H i
with B a constant. We assume that for fixed factor prices c(w , q , r ; z) isi i i
continuous in z. Fig. 2 shows the minimum cost locus for the North as C C andN N
for the South as C C . The absolute slopes of the loci are indeterminant, but, givenS S
relative factor prices, we know that C C lies below C C for inputs that use aS S N N
low ratio of skilled to unskilled labor and that the reverse holds for inputs that use4a high ratio. That is, the South has a comparative advantage in relatively
Fig. 2. Outsourcing from North to South.
4We ignore the case where one locus lies entirely above another, as there is no trade in inputs.
376 R.C. Feenstra, G.H. Hanson / Journal of International Economics 42 (1997) 371 –393
non-skill-intensive inputs. Let z* be the cutoff intermediate input, at which theminimum cost loci are equated; it is implicitly defined by
c(w , q , r ; z*) 5 c(w , q , r ; z*) (4)S S S N N N
The critical value z* defines the trading equilibrium: the South produces inputsthat are relatively intensive in the use of unskilled labor, z[[0, z* ), and the Northproduces inputs that are relatively intensive in the use of skilled labor, z[(z*, 1].
For the outcome in Fig. 2 to be an equilibrium, factor markets in both countriesmust clear. We permit labor to be mobile between skill categories, such as mayresult from education or training opportunities that allow unskilled workers tobecome skilled workers. This implies that the supply of each type of labor isresponsive to the relative wage; we assume, in particular, that ≠L (q /w , V ) /≠(q /i i i i i
w )#0 and ≠H (q /w , V ) /≠(q /w )$0, where V is a vector of exogenousi i i i i i i i
variables that condition labor supply. By Shephard’s lemma, the demand for eachfactor is given by differentiating (3) with respect to its price. Labor marketclearing requires that in the South
z*12urS
]]]]]L (q /w , V ) 5E Bu a (z)x (z) dz (5)F GS S S S L Sw a (z) 1 q a (z)S L S H0
and
z*12urS
]]]]]H (q /w , V ) 5E Bu a (z)x (z) dz (6)F GS S S S H Sw a (z) 1 q a (z)S L S H0
Full employment of capital in the South can be defined from the productionfunction in (1), which implies that capital will receive share (12u ) of nationalincome,
r K 5 [w L 1 q H ](1 2u ) /u (7)S S S S S S
Conditions (4)–(7), along with the analogous full-employment conditions in theNorth and world expenditure E equated to the sum of world factor payments,define the world trading equilibrium. Thus, factor prices and the critical value z*are determined as functions of the exogenous variables, K and V (i5N, S). Wei i
make the determination of z* explicit by
z* 5 F(K , K , V , V ) (8)S N S N
We discuss some of the properties of the function F() below.To identify the effects of capital mobility on relative wages and employment, it
is useful to define the relative demand for skilled and unskilled labor. Combining
R.C. Feenstra, G.H. Hanson / Journal of International Economics 42 (1997) 371 –393 377
(5)–(7), we define an expression for D (q /w ), the relative demand for skilledS S S5labor in the South,
z*
a (z)a(z)EH]]]]]E dzF Gw a (z) 1 q a (z)S L s H
0]]]]]]]]D (q /w , z*) ; (9)S S S z*
a (z)a(z)EL]]]]]E dzF Gw a (z) 1 q a (z)S L s H
0
An analogous condition, D (q /w ), defines relative labor demand in the North.N N N
Feenstra and Hanson (1996) show that the relative demand for skilled labor inboth the North and the South is increasing in the critical value, z*. The intuitionfor the result is straightforward. An increase in z* implies a shift in inputproduction from North to South. In the South, the range of input productionexpands towards inputs that use a relatively high ratio of skilled to unskilled labor.This causes an increase in average skill intensity, which, in turn, causes anincrease in the relative demand for skilled labor. The activities that leave theNorth, on the other hand, use a low ratio of skilled to unskilled labor relative tothose that remain, which implies that the North also experiences an increase in theaverage skill intensity of production and an increase in the relative demand forskilled labor. It can also be shown that in both countries the relative demand forskilled labor is decreasing in q /w .i i
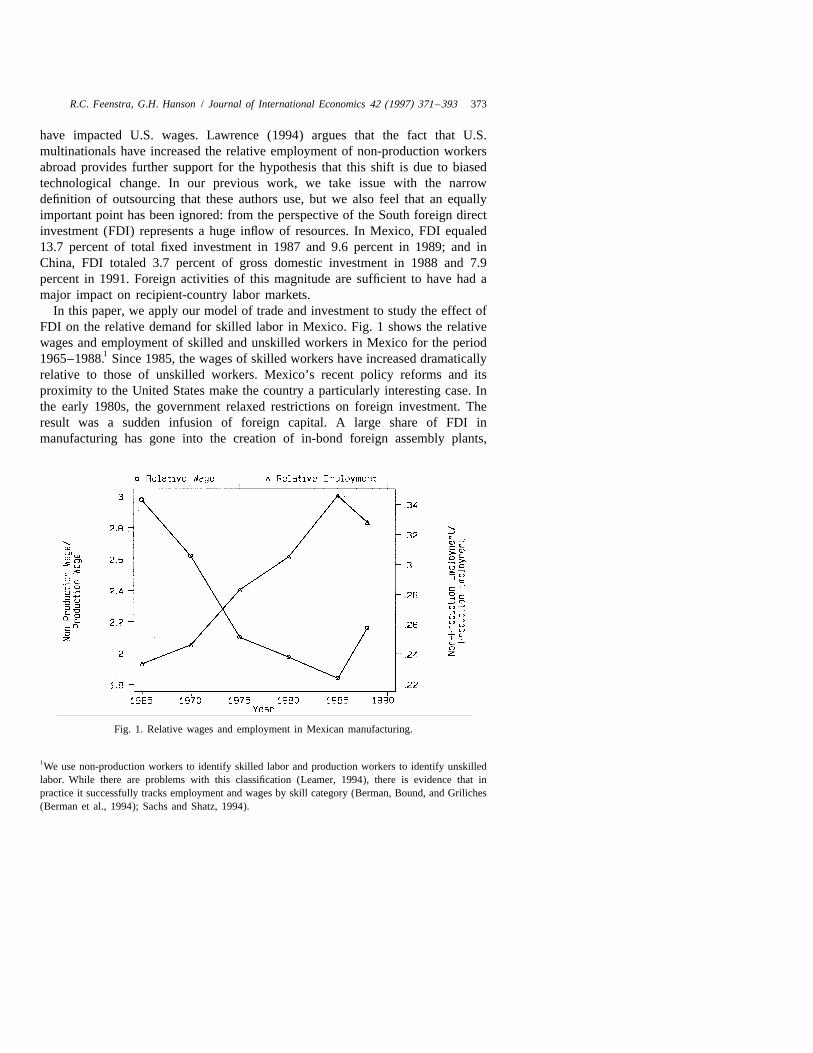
Consider a movement of capital from North to South, which we interpret as anincrease in outsourcing by Northern firms to the South. From (7), the immediateeffect is to reduce r and raise r . At constant wages, C C shifts down and C CS N S S N N
shifts up, as shown in Fig. 2, causing z* to increase. The movement of capital, ofcourse, also changes wages in both countries, which affects the slopes of theminimum cost loci. Such feedback effects do not change the qualitative resultsshown in Fig. 2: in general equilibrium, a capital flow from North to South raisesz*. This implies that in Eq. (8) the function F(K , K , V , V ), which defines z*, isS N S n
increasing in the ratio, K /K . The fact that z* increases implies that relativeS N
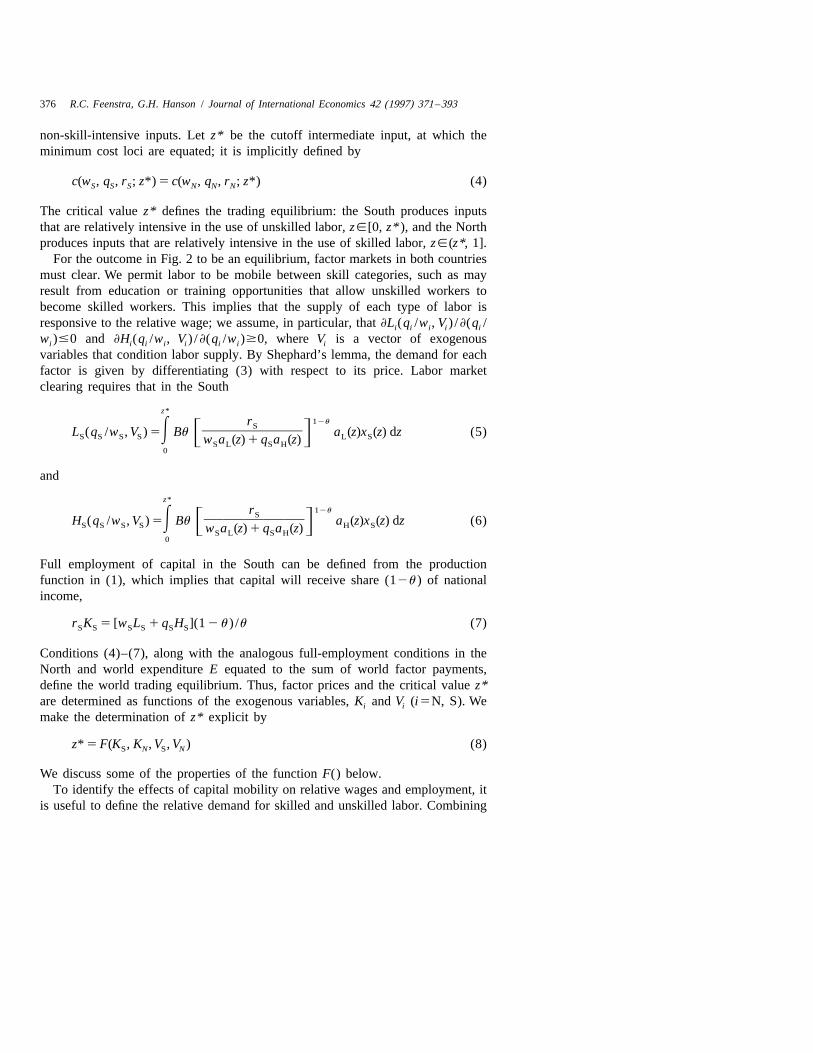
capital accumulation in the South causes an increase in the relative demand for6skilled labor in both countries. We show this in Fig. 3. The effect of capital
accumulation on the relative wages of skilled workers is unambiguously positive;the effect on the relative employment of skilled labor is also positive, as long asthe relative labor supply schedule is not vertical. Though wage inequality rises inboth countries, it can be shown that it is still possible for workers in both countries
5We also make use of the demand for inputs produced in the South, given by x (z)5a(z)E /c (z), z[[0,s s
z*).6In Feenstra and Hanson (1996), we also show that these results apply to neutral technological progressin the South relative to the North.
378 R.C. Feenstra, G.H. Hanson / Journal of International Economics 42 (1997) 371 –393
Fig. 3. Outsourcing and relative labor demand.
to be better off, since the increase in Southern supply lowers the prices of itsinputs. It can also be shown that capital accumulation in the South causes theprice-index of Northern inputs to increase relative to that of the Southern inputs.
2.2. An empirical model
To test the effects of foreign direct investment on skilled wages and employ-ment, we examine the case of Mexico, which has received large capital inflowsfrom the United States and, to a lesser extent, other Northern countries. As adependent variable, we use the skilled-labor share of total wages to measurerelative labor demand, since it incorporates the effects of both relative wages and
7relative employment. From Eqs. (8,9), and the equilibrium depicted in Fig. 3, theskilled-labor share of total wages in Mexico, WSH , can be expressed as a functiont
of U.S. and Mexican capital stocks and exogenous factors that affect U.S. andMexican labor supply:
US USWSH 5 G(K , V ; K , V ) (10)t t t t t
where K is the Mexican capital stock, V is a vector of variables that conditiont t
Mexican labor supply, and US indexes U.S. values. To implement Eq. (10)empirically, we need to specify the exogenous factors, V and V , and thet US t
observations over which (10) will be estimated.Using national-level data to estimate (10) would provide us with too few
observations. Instead, we disaggregate Mexican manufacturing by region andindustry. We estimate the skilled labor share of total wages at the state and industry
7In Fig. 3, for instance, if relative labor supply curve is vertical, then an increase in z* will leaverelative employment unaffected but will raise the skilled labor share of total wages.
R.C. Feenstra, G.H. Hanson / Journal of International Economics 42 (1997) 371 –393 379
level as a function of the capital stock and labor-supply conditions at the statelevel. In this specification, we allow the skilled-labor wage share to vary acrossindustries, as will be the case if industries use different technologies, and we treatthe supply of capital as fixed at the region level. Treating the regional supply ofcapital as exogenous is more plausible than treating the region–industry supply ofcapital as exogenous.
The regional analysis goes somewhat beyond our theoretical model. In Fig. 2,for example, there would be separate cost loci for each region of the South.Nominal wages would not be equalized in such a setting, as long as there existedregionally non-traded goods, such as housing, whose supply depends on regionallyfixed factors of production. We extend the theoretical model to a regional settingby assuming that the functional form of G() in (10) is the same across regions andindustries, after making the standard correction for fixed industry and regioneffects. We ignore, however, cross-sectional variation in U.S. (Northern) variables.One rationale for doing so is that, to the extent that such factors only vary overtime, we can control for their presence by including fixed time effects in the
8estimation.We assume that Eq. (10), expressed in first differences, can be written as
H LDWSH 5 f 1 f D ln(K ) 1 f D ln(WA ) 1 f D ln(WA ) 1 e (11)ijt 1 2 it 3 it 4 it ijt
where i indexes the state, j indexes the industry, t indexes the year, K is the totalit
manufacturing capital stock in state i, and e is an i.i.d. random error term. Theijt
sources of the disturbance in Eq. (11) include unobserved shocks to technology ornon-labor factor prices that affect the relative demand for skilled labor. Firstdifferencing eliminates from (11) time-invariant factors that cause the skilled-laborwage share to vary across states and industries. We include two regressors thatcondition relative labor supply in state i, the alternative wage for skilled workers in
Hstate i, WA (where H indexes skilled labor), and the alternative wage for unskilleditLworkers in state i, WA (where L indexes unskilled labor). The alternative wageit
variables control for the non-manufacturing labor-market opportunities of skilledand unskilled labor in state i. There are, of course, other variables that in principleaffect labor supply, but data limitations prevent us from considering such factors.
2.3. Estimation issues
The main obstacle to the estimation of (13) is that we do not have a directmeasure of the total capital stock. Instead, we express K , the total capital stock ini t
Dstate i, as the sum of the domestic capital stock, K , and the foreign capital stock,i tFK . In log first differences,i t
8If the U.S. factors that influence Mexican wages vary across time and industries, our specification inincomplete.
380 R.C. Feenstra, G.H. Hanson / Journal of International Economics 42 (1997) 371 –393
FK itD]D ln(K ) 5 D ln(K ) 1 D ln 1 1S Dit it DK it
D FWe have a direct measure of K , but not of K . Given this, we shall proxy fori t i tF DK /K by using the ratio of foreign manufacturing establishments to domestici t i t
F Dmanufacturing establishments in state i, E /E . The estimating equation becomes,i t i t
FE itD H]DWSH 5 b 1 b D ln(K ) 1 b D ln 1 1 1 b D ln(WA )S Dijt 1 2 it 3 D 4 itE it
L1 b D ln(WA ) 1h (12)5 it ijt
F D F DTo the extent that the variable D ln(11E /E ) measures D ln (11K /K ) withi t i t i t i t
error, the regressor will be negatively correlated with the error term, h . In theij t
presence of measurement error, OLS estimates of b will be biased toward zero.3
To correct for measurement error, we take an instrumental variables (IV) approachto estimating Eq. (12). Since the domestic capital stock itself may be measured
D F Dwith error, we instrument for both D ln(K ) and D ln(11E /E ).i t i t i t
It is worth noting that under certain conditions, measurement error in (12) willnot cause severe problems. If capital per establishment in foreign manufacturingplants relative to that in domestic manufacturing plants is constant across time andstates, we can define this ratio as a :
F FK /Eit it]]a ; D DK /Eit it
F DMaking use of this ratio, the relationship between the true variable, ln(11K /K ),i t i t
and its proxied value is
F F F FK K E Eit it it it] ] ] ]ln 1 1 ¯ ¯ a ¯ a ln 1 1 (13)S D S DD D D DK K E Eit it it it
F DThe first approximation in Eq. (13) relies on K /K being small in each state.i t i t
There is no data to directly confirm this, but data on employment suggests thatF DK /K is not too large; the ratio of state employment in foreign manufacturingi t i t
plants to state employment in domestic manufacturing plants ranges from 0 to0.36. The second approximation in Eq. (13) simply relies on the constancy of a
F Dover time and across states. The third approximation in (13) relies on E /Ei t i t
being small, which is confirmed in our data; the ratio ranges from 0 to 0.07. If theF Dapproximations in (13) hold reasonably well, then the proxy for ln(11K /K )i t i t
will differ from the true value by a multiplicative constant. In this case, the onlyeffects of measurement error are that the OLS estimates of b and its standard3
error will be a fraction 1/a of their true value. Even if the approximations in Eq.
R.C. Feenstra, G.H. Hanson / Journal of International Economics 42 (1997) 371 –393 381
(13) do not hold that well, our use of instrumental variables should in principlecorrect for measurement error caused by using a proxy.
3. Relative wages and employment in mexico
We study relative labor demand in a panel of nine two-digit (ISIC) industries inMexico’s 32 states over the period 1975 to 1988. Wage and employment data areavailable at five-year intervals from the Mexico Industrial Census. This providesthree sets of observations on the change in the skilled labor share of total wages,1975–1980, 1980–1985, and 1985–1988.
3.1. Variable definition
The unit of observation at which we study relative labor demand is thestate-industry. We measure the employment of skilled (unskilled) workers as theaverage annual employment of non-production (production) workers, and the wagepaid to skilled (unskilled) labor as the average annual wage of non-production(production) workers. The skilled labor wage share is then measured as non-production wages as a share of total wages.
HWe measure the alternative wage for skilled labor-appearing as WA in (12)—asthe average annual state wage in professional services and the alternative wage for
Lunskilled labor-appearing as WA in (12)—as the average annual state wage infood services. Both variables are deflated by the national CPI. We measure the
Dstate domestic capital stock-appearing as K in (12)—as the real value of fixedassets in domestic state manufacturing establishments. Finally, we measure the
F Dratio of foreign to domestic manufacturing establishments—appearing as E /E in(12)—as the ratio of the number of maquiladoras in a state to the number ofdomestic state manufacturing establishments. Maquiladoras account for a subset offoreign firms in any given state. Given that our model relates foreign capitalinflows in the South to outsourcing by Northern multinationals, it is appropriate torestrict our definition of foreign firms to those that explicitly engage in outsourc-ing.
To estimate (14) using IV, we need to specify instrumental variables for thedomestic and foreign capital stocks. A valid instrument is one that is correlatedwith the state capital stock and uncorrelated with unobserved shocks to thestate-industry skilled labor share of total wages. Good instruments can be difficultto find, which is true in our case. The instruments we use, in addition to theexogenous explanatory variables, are total state manufacturing income, total statevalue added by domestic manufacturing plants, total state value added bymaquiladoras, and a measure of unit transport costs for state manufacturing plants.All variables, except transport costs, are expressed in log first differences. Wediscuss each of the instruments in turn.
382 R.C. Feenstra, G.H. Hanson / Journal of International Economics 42 (1997) 371 –393
Total state manufacturing income is a measure of the size of the local market.Domestic and foreign producers are, all else equal, likely to locate theirmanufacturing operations in regions with large consumer markets, in which casethe capital stock will be positively correlated with market size. State value added iscorrelated with the state capital stock, given that capital is an input in production.If it is the case, however, that skill intensity varies with the level of output, thenvalue added should be included as an explanatory variable in the regression. Whilethis is not a prediction of our theoretical model, it is consistent with other modelsof labor demand. We estimate specifications using total state manufacturing valueadded either solely as an instrument or as an additional explanatory variable. Unittransport costs to the United States are likely to be important in the maquiladoralocation decision, since maquiladoras obtain most of their non-labor inputs fromparent firms in the United States and export their output to the United States. Wemeasure transport costs to the United States as log distance from the state capitalto the nearest Mexico–U.S. border crossing. Given Mexico City is the country’slargest internal market, we use log distance from the state capital to Mexico Cityas an additional instrument.
3.2. Trade and investment policy
During the 1980s, Mexico dramatically reformed its trade policy and itsregulations on foreign investment. The policy changes were followed by largeinflows of foreign direct investment. This sequence of events provides an idealexperiment in which to study the impact of capital inflows on the skilled laborwage share. To provide context for the empirical analysis, we briefly describe thechanges in Mexican trade and investment policy.
Prior to 1982, the Mexican government maintained tight restrictions on foreignownership and high barriers to trade, as part of a conscious policy to promote thecreation of a domestically-owned manufacturing base (Whiting, 1992). Thegovernment regulated foreign ownership by subjecting foreign investment toofficial approval and maintaining a 49 percent ownership cap on foreign holdingsin individual firms, and it restricted foreign trade through import tariffs, import-license requirements, and controls on exports.
In 1983, the Mexican government moved to relax the foreign ownership cap,expedite the approval of foreign investment projects, and eliminate manyregulations governing maquiladoras (Wilson, 1992). These reforms were inducedin part by a severe balance of payments crisis. Since the inception of the programin the 1960s, maquiladoras have been exempt from foreign ownership limitationsand free from paying value-added taxes on domestic inputs and import duties onimported inputs, under the provision that they export all of their output. A plantposts a bond with the government equal to the value of the import duty, which isreturned to it once the plant exports the output made from the inputs (hence theterm ‘‘in-bond’’). Initially, the bureaucratic steps necessary to obtain these benefits
R.C. Feenstra, G.H. Hanson / Journal of International Economics 42 (1997) 371 –393 383
were burdensome. The 1983 reform substantially simplified the process ofobtaining legal recognition as a maquiladora. One motivation for the maquiladoraregime is to take advantage of Item 807 of the Tariff Schedule of the UnitedStates, which exempts U.S. firms that import goods assembled from U.S.-madecomponents from paying import duties on the value of U.S. content in the good. In1988, 98.5% of intermediate inputs used by maquiladoras were imported fromabroad.
In 1985, the government began to liberalize trade and announced plans to jointhe General Agreement on Trade and Tariffs (GATT). Prior to reform, the nationalweighted-average tariff was 23.5 percent, import-license requirements covered92.2 percent of national production, and there were export controls on 85 percentof non-oil exports. By 1987, the government had reduced import-license coverageto 25.4 percent of production, cut the average tariff to 11.8 percent, and abolishedexport controls.
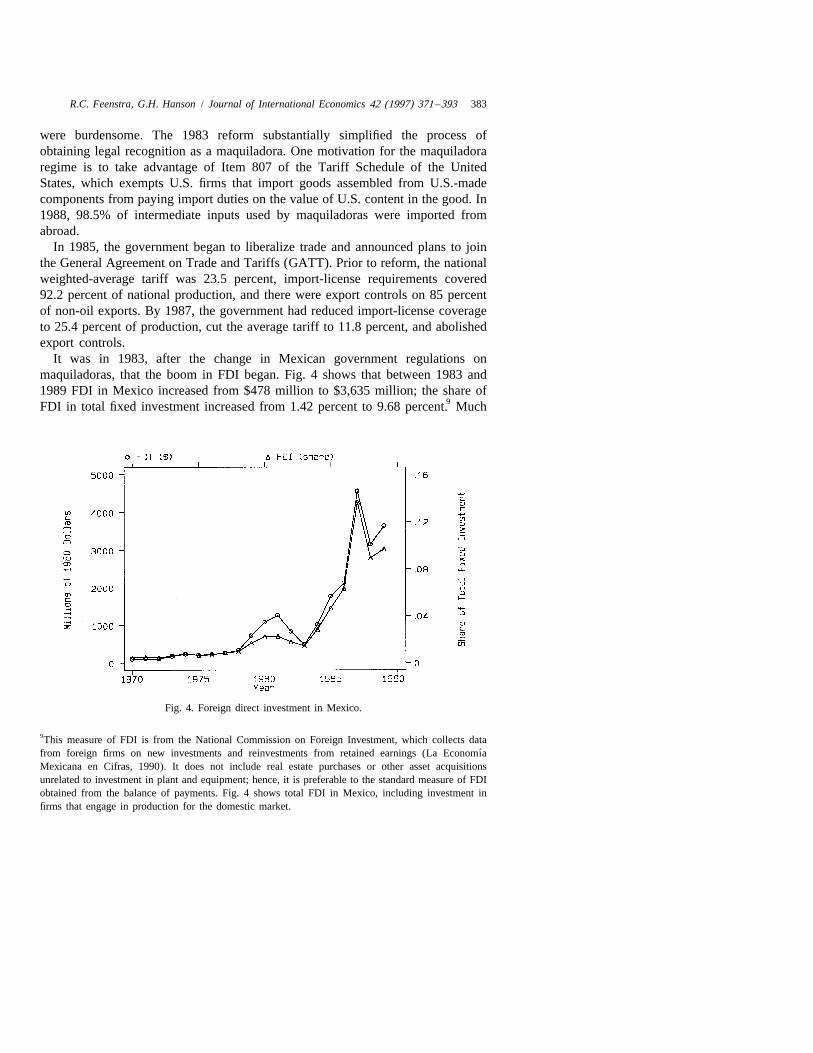
It was in 1983, after the change in Mexican government regulations onmaquiladoras, that the boom in FDI began. Fig. 4 shows that between 1983 and1989 FDI in Mexico increased from $478 million to $3,635 million; the share of
9FDI in total fixed investment increased from 1.42 percent to 9.68 percent. Much
Fig. 4. Foreign direct investment in Mexico.
9This measure of FDI is from the National Commission on Foreign Investment, which collects data´from foreign firms on new investments and reinvestments from retained earnings (La Economıa
Mexicana en Cifras, 1990). It does not include real estate purchases or other asset acquisitionsunrelated to investment in plant and equipment; hence, it is preferable to the standard measure of FDIobtained from the balance of payments. Fig. 4 shows total FDI in Mexico, including investment infirms that engage in production for the domestic market.
384 R.C. Feenstra, G.H. Hanson / Journal of International Economics 42 (1997) 371 –393
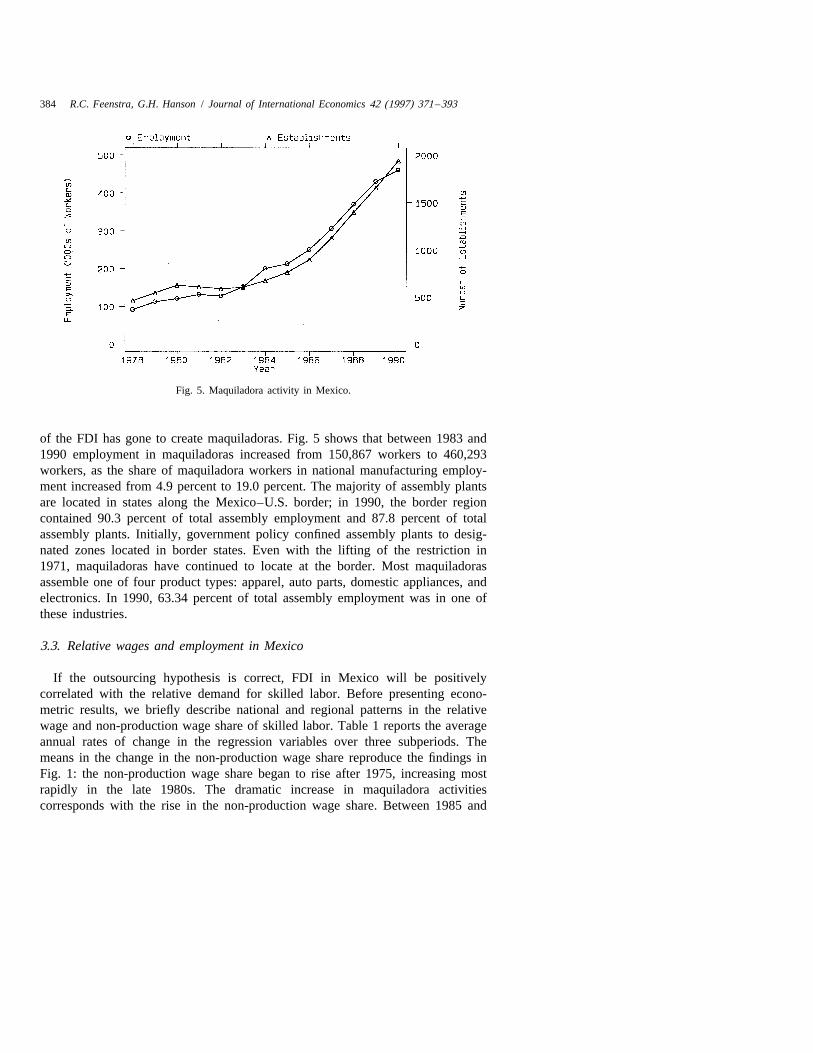
Fig. 5. Maquiladora activity in Mexico.
of the FDI has gone to create maquiladoras. Fig. 5 shows that between 1983 and1990 employment in maquiladoras increased from 150,867 workers to 460,293workers, as the share of maquiladora workers in national manufacturing employ-ment increased from 4.9 percent to 19.0 percent. The majority of assembly plantsare located in states along the Mexico–U.S. border; in 1990, the border regioncontained 90.3 percent of total assembly employment and 87.8 percent of totalassembly plants. Initially, government policy confined assembly plants to desig-nated zones located in border states. Even with the lifting of the restriction in1971, maquiladoras have continued to locate at the border. Most maquiladorasassemble one of four product types: apparel, auto parts, domestic appliances, andelectronics. In 1990, 63.34 percent of total assembly employment was in one ofthese industries.
3.3. Relative wages and employment in Mexico
If the outsourcing hypothesis is correct, FDI in Mexico will be positivelycorrelated with the relative demand for skilled labor. Before presenting econo-metric results, we briefly describe national and regional patterns in the relativewage and non-production wage share of skilled labor. Table 1 reports the averageannual rates of change in the regression variables over three subperiods. Themeans in the change in the non-production wage share reproduce the findings inFig. 1: the non-production wage share began to rise after 1975, increasing mostrapidly in the late 1980s. The dramatic increase in maquiladora activitiescorresponds with the rise in the non-production wage share. Between 1985 and
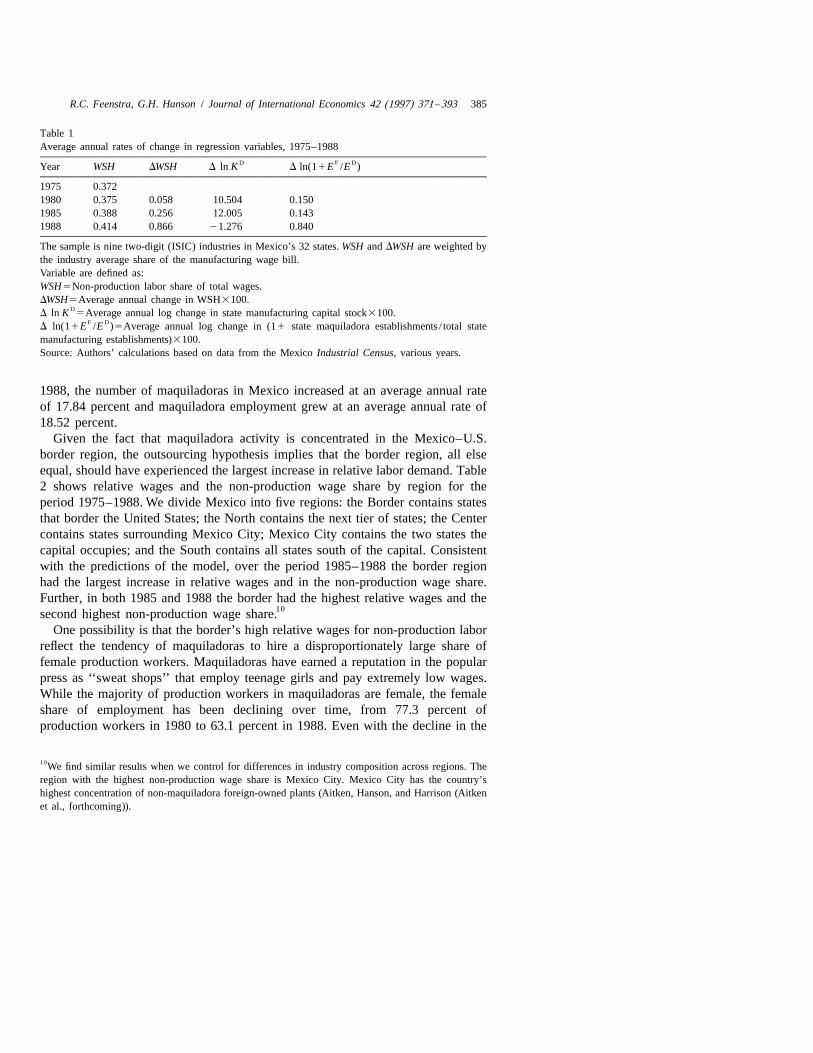
R.C. Feenstra, G.H. Hanson / Journal of International Economics 42 (1997) 371 –393 385
Table 1Average annual rates of change in regression variables, 1975–1988
D F DYear WSH DWSH D ln K D ln(11E /E )
1975 0.3721980 0.375 0.058 10.504 0.1501985 0.388 0.256 12.005 0.1431988 0.414 0.866 21.276 0.840
The sample is nine two-digit (ISIC) industries in Mexico’s 32 states. WSH and DWSH are weighted bythe industry average share of the manufacturing wage bill.Variable are defined as:WSH5Non-production labor share of total wages.DWSH5Average annual change in WSH3100.
DD ln K 5Average annual log change in state manufacturing capital stock3100.
F DD ln(11E /E )5Average annual log change in (11 state maquiladora establishments / total statemanufacturing establishments)3100.Source: Authors’ calculations based on data from the Mexico Industrial Census, various years.
1988, the number of maquiladoras in Mexico increased at an average annual rateof 17.84 percent and maquiladora employment grew at an average annual rate of18.52 percent.
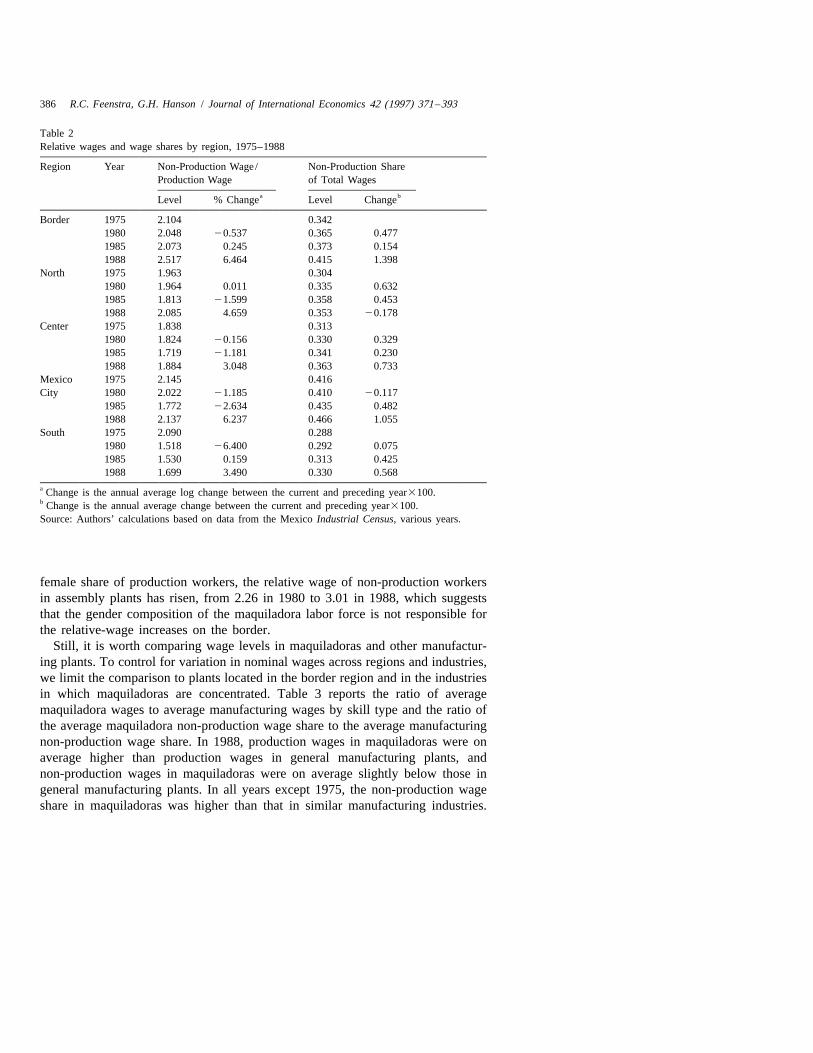
Given the fact that maquiladora activity is concentrated in the Mexico–U.S.border region, the outsourcing hypothesis implies that the border region, all elseequal, should have experienced the largest increase in relative labor demand. Table2 shows relative wages and the non-production wage share by region for theperiod 1975–1988. We divide Mexico into five regions: the Border contains statesthat border the United States; the North contains the next tier of states; the Centercontains states surrounding Mexico City; Mexico City contains the two states thecapital occupies; and the South contains all states south of the capital. Consistentwith the predictions of the model, over the period 1985–1988 the border regionhad the largest increase in relative wages and in the non-production wage share.Further, in both 1985 and 1988 the border had the highest relative wages and the
10second highest non-production wage share.One possibility is that the border’s high relative wages for non-production labor
reflect the tendency of maquiladoras to hire a disproportionately large share offemale production workers. Maquiladoras have earned a reputation in the popularpress as ‘‘sweat shops’’ that employ teenage girls and pay extremely low wages.While the majority of production workers in maquiladoras are female, the femaleshare of employment has been declining over time, from 77.3 percent ofproduction workers in 1980 to 63.1 percent in 1988. Even with the decline in the
10We find similar results when we control for differences in industry composition across regions. Theregion with the highest non-production wage share is Mexico City. Mexico City has the country’shighest concentration of non-maquiladora foreign-owned plants (Aitken, Hanson, and Harrison (Aitkenet al., forthcoming)).
386 R.C. Feenstra, G.H. Hanson / Journal of International Economics 42 (1997) 371 –393
Table 2Relative wages and wage shares by region, 1975–1988
Region Year Non-Production Wage/ Non-Production ShareProduction Wage of Total Wages
a bLevel % Change Level Change
Border 1975 2.104 0.3421980 2.048 20.537 0.365 0.4771985 2.073 0.245 0.373 0.1541988 2.517 6.464 0.415 1.398
North 1975 1.963 0.3041980 1.964 0.011 0.335 0.6321985 1.813 21.599 0.358 0.4531988 2.085 4.659 0.353 20.178
Center 1975 1.838 0.3131980 1.824 20.156 0.330 0.3291985 1.719 21.181 0.341 0.2301988 1.884 3.048 0.363 0.733
Mexico 1975 2.145 0.416City 1980 2.022 21.185 0.410 20.117
1985 1.772 22.634 0.435 0.4821988 2.137 6.237 0.466 1.055
South 1975 2.090 0.2881980 1.518 26.400 0.292 0.0751985 1.530 0.159 0.313 0.4251988 1.699 3.490 0.330 0.568
a Change is the annual average log change between the current and preceding year3100.b Change is the annual average change between the current and preceding year3100.Source: Authors’ calculations based on data from the Mexico Industrial Census, various years.
female share of production workers, the relative wage of non-production workersin assembly plants has risen, from 2.26 in 1980 to 3.01 in 1988, which suggeststhat the gender composition of the maquiladora labor force is not responsible forthe relative-wage increases on the border.
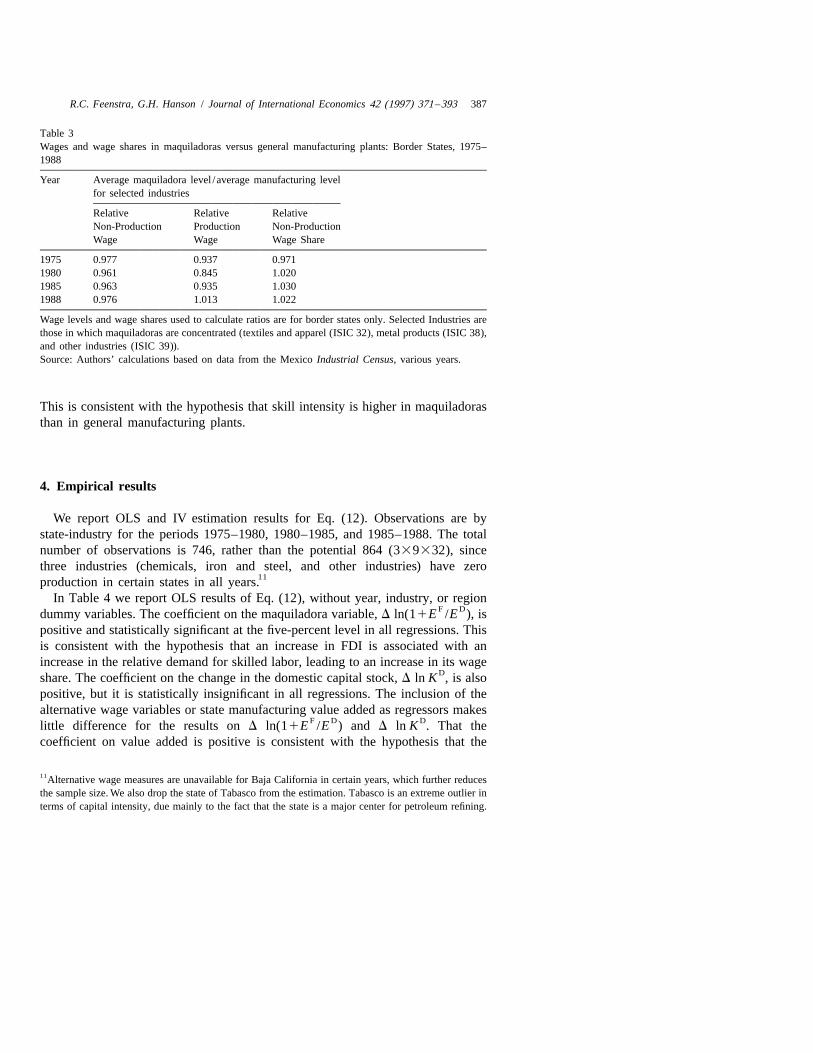
Still, it is worth comparing wage levels in maquiladoras and other manufactur-ing plants. To control for variation in nominal wages across regions and industries,we limit the comparison to plants located in the border region and in the industriesin which maquiladoras are concentrated. Table 3 reports the ratio of averagemaquiladora wages to average manufacturing wages by skill type and the ratio ofthe average maquiladora non-production wage share to the average manufacturingnon-production wage share. In 1988, production wages in maquiladoras were onaverage higher than production wages in general manufacturing plants, andnon-production wages in maquiladoras were on average slightly below those ingeneral manufacturing plants. In all years except 1975, the non-production wageshare in maquiladoras was higher than that in similar manufacturing industries.
R.C. Feenstra, G.H. Hanson / Journal of International Economics 42 (1997) 371 –393 387
Table 3Wages and wage shares in maquiladoras versus general manufacturing plants: Border States, 1975–1988
Year Average maquiladora level /average manufacturing levelfor selected industries
Relative Relative RelativeNon-Production Production Non-ProductionWage Wage Wage Share
1975 0.977 0.937 0.9711980 0.961 0.845 1.0201985 0.963 0.935 1.0301988 0.976 1.013 1.022
Wage levels and wage shares used to calculate ratios are for border states only. Selected Industries arethose in which maquiladoras are concentrated (textiles and apparel (ISIC 32), metal products (ISIC 38),and other industries (ISIC 39)).Source: Authors’ calculations based on data from the Mexico Industrial Census, various years.
This is consistent with the hypothesis that skill intensity is higher in maquiladorasthan in general manufacturing plants.
4. Empirical results
We report OLS and IV estimation results for Eq. (12). Observations are bystate-industry for the periods 1975–1980, 1980–1985, and 1985–1988. The totalnumber of observations is 746, rather than the potential 864 (339332), sincethree industries (chemicals, iron and steel, and other industries) have zero
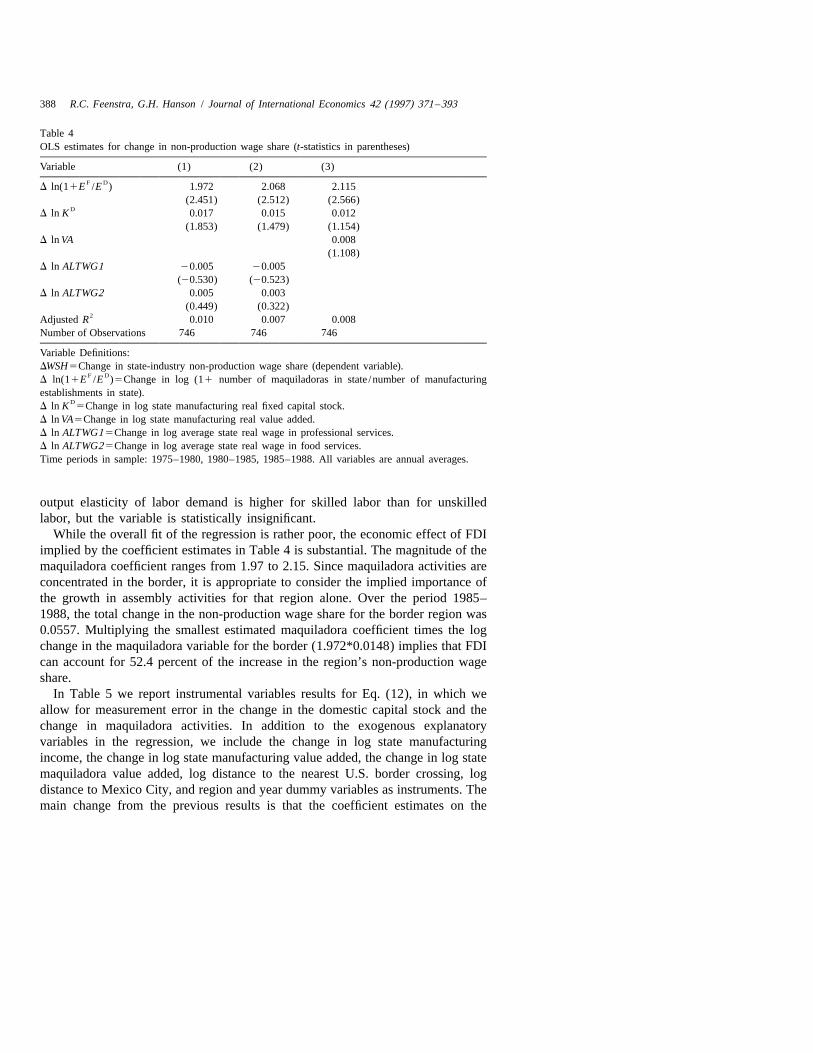
11production in certain states in all years.In Table 4 we report OLS results of Eq. (12), without year, industry, or region
F Ddummy variables. The coefficient on the maquiladora variable, D ln(11E /E ), ispositive and statistically significant at the five-percent level in all regressions. Thisis consistent with the hypothesis that an increase in FDI is associated with anincrease in the relative demand for skilled labor, leading to an increase in its wage
Dshare. The coefficient on the change in the domestic capital stock, D ln K , is alsopositive, but it is statistically insignificant in all regressions. The inclusion of thealternative wage variables or state manufacturing value added as regressors makes
F D Dlittle difference for the results on D ln(11E /E ) and D ln K . That thecoefficient on value added is positive is consistent with the hypothesis that the
11Alternative wage measures are unavailable for Baja California in certain years, which further reducesthe sample size. We also drop the state of Tabasco from the estimation. Tabasco is an extreme outlier interms of capital intensity, due mainly to the fact that the state is a major center for petroleum refining.
388 R.C. Feenstra, G.H. Hanson / Journal of International Economics 42 (1997) 371 –393
Table 4OLS estimates for change in non-production wage share (t-statistics in parentheses)
Variable (1) (2) (3)F D
D ln(11E /E ) 1.972 2.068 2.115(2.451) (2.512) (2.566)
DD ln K 0.017 0.015 0.012
(1.853) (1.479) (1.154)D ln VA 0.008
(1.108)D ln ALTWG1 20.005 20.005
(20.530) (20.523)D ln ALTWG2 0.005 0.003
(0.449) (0.322)2Adjusted R 0.010 0.007 0.008
Number of Observations 746 746 746
Variable Definitions:DWSH5Change in state-industry non-production wage share (dependent variable).
F DD ln(11E /E )5Change in log (11 number of maquiladoras in state /number of manufacturingestablishments in state).
DD ln K 5Change in log state manufacturing real fixed capital stock.D ln VA5Change in log state manufacturing real value added.D ln ALTWG1 5Change in log average state real wage in professional services.D ln ALTWG2 5Change in log average state real wage in food services.Time periods in sample: 1975–1980, 1980–1985, 1985–1988. All variables are annual averages.
output elasticity of labor demand is higher for skilled labor than for unskilledlabor, but the variable is statistically insignificant.
While the overall fit of the regression is rather poor, the economic effect of FDIimplied by the coefficient estimates in Table 4 is substantial. The magnitude of themaquiladora coefficient ranges from 1.97 to 2.15. Since maquiladora activities areconcentrated in the border, it is appropriate to consider the implied importance ofthe growth in assembly activities for that region alone. Over the period 1985–1988, the total change in the non-production wage share for the border region was0.0557. Multiplying the smallest estimated maquiladora coefficient times the logchange in the maquiladora variable for the border (1.972*0.0148) implies that FDIcan account for 52.4 percent of the increase in the region’s non-production wageshare.
In Table 5 we report instrumental variables results for Eq. (12), in which weallow for measurement error in the change in the domestic capital stock and thechange in maquiladora activities. In addition to the exogenous explanatoryvariables in the regression, we include the change in log state manufacturingincome, the change in log state manufacturing value added, the change in log statemaquiladora value added, log distance to the nearest U.S. border crossing, logdistance to Mexico City, and region and year dummy variables as instruments. Themain change from the previous results is that the coefficient estimates on the
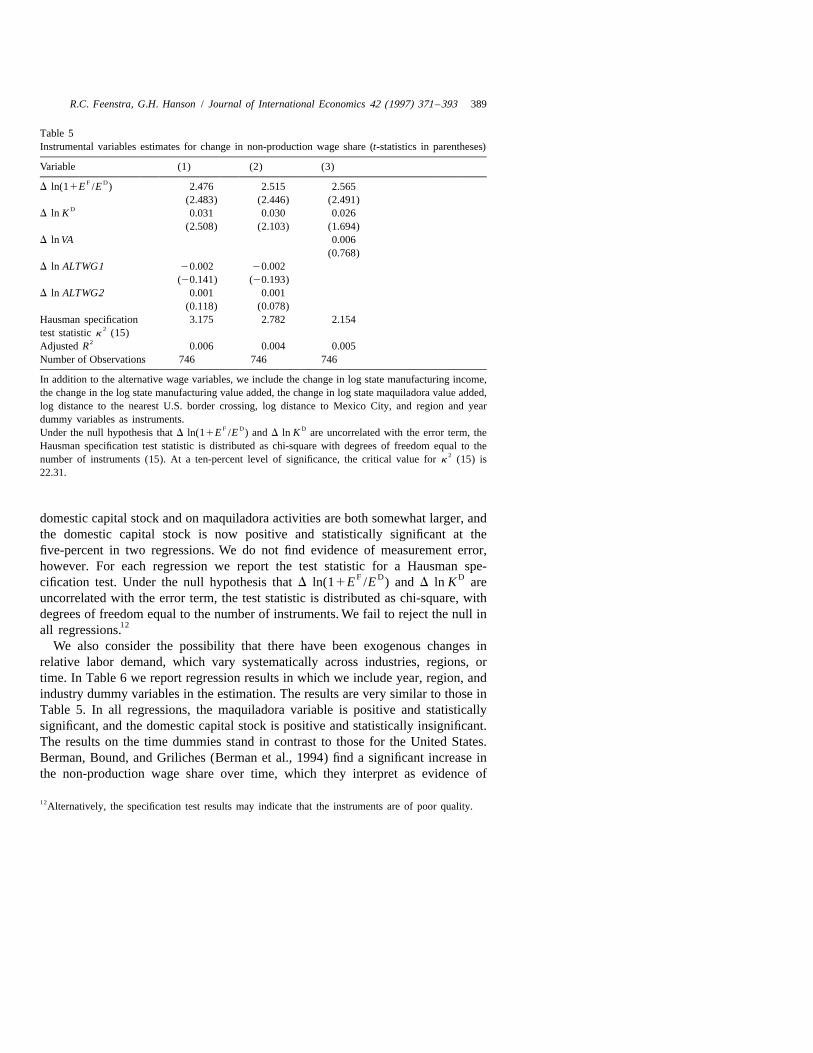
R.C. Feenstra, G.H. Hanson / Journal of International Economics 42 (1997) 371 –393 389
Table 5Instrumental variables estimates for change in non-production wage share (t-statistics in parentheses)
Variable (1) (2) (3)F D
D ln(11E /E ) 2.476 2.515 2.565(2.483) (2.446) (2.491)
DD ln K 0.031 0.030 0.026
(2.508) (2.103) (1.694)D ln VA 0.006
(0.768)D ln ALTWG1 20.002 20.002
(20.141) (20.193)D ln ALTWG2 0.001 0.001
(0.118) (0.078)Hausman specification 3.175 2.782 2.154
2test statistic k (15)2Adjusted R 0.006 0.004 0.005
Number of Observations 746 746 746
In addition to the alternative wage variables, we include the change in log state manufacturing income,the change in the log state manufacturing value added, the change in log state maquiladora value added,log distance to the nearest U.S. border crossing, log distance to Mexico City, and region and yeardummy variables as instruments.
F D DUnder the null hypothesis that D ln(11E /E ) and D ln K are uncorrelated with the error term, theHausman specification test statistic is distributed as chi-square with degrees of freedom equal to the
2number of instruments (15). At a ten-percent level of significance, the critical value for k (15) is22.31.
domestic capital stock and on maquiladora activities are both somewhat larger, andthe domestic capital stock is now positive and statistically significant at thefive-percent in two regressions. We do not find evidence of measurement error,however. For each regression we report the test statistic for a Hausman spe-
F D Dcification test. Under the null hypothesis that D ln(11E /E ) and D ln K areuncorrelated with the error term, the test statistic is distributed as chi-square, withdegrees of freedom equal to the number of instruments. We fail to reject the null in
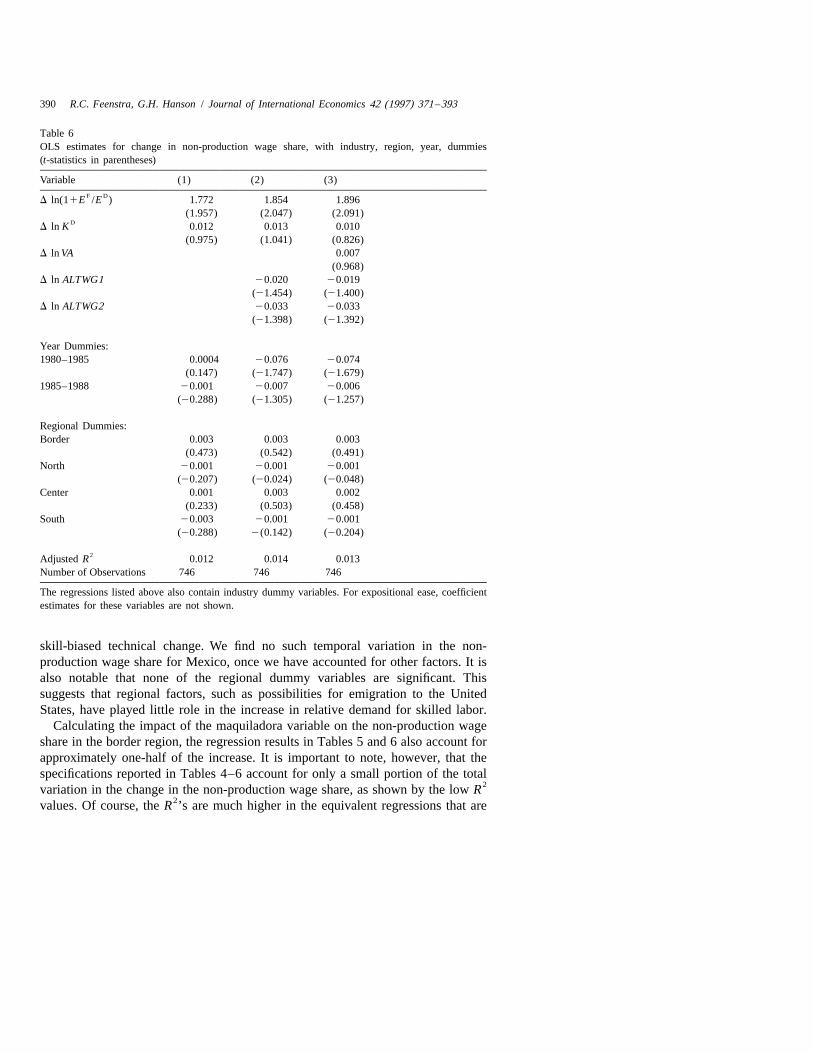
12all regressions.We also consider the possibility that there have been exogenous changes in
relative labor demand, which vary systematically across industries, regions, ortime. In Table 6 we report regression results in which we include year, region, andindustry dummy variables in the estimation. The results are very similar to those inTable 5. In all regressions, the maquiladora variable is positive and statisticallysignificant, and the domestic capital stock is positive and statistically insignificant.The results on the time dummies stand in contrast to those for the United States.Berman, Bound, and Griliches (Berman et al., 1994) find a significant increase inthe non-production wage share over time, which they interpret as evidence of
12Alternatively, the specification test results may indicate that the instruments are of poor quality.
390 R.C. Feenstra, G.H. Hanson / Journal of International Economics 42 (1997) 371 –393
Table 6OLS estimates for change in non-production wage share, with industry, region, year, dummies(t-statistics in parentheses)
Variable (1) (2) (3)F D
D ln(11E /E ) 1.772 1.854 1.896(1.957) (2.047) (2.091)
DD ln K 0.012 0.013 0.010
(0.975) (1.041) (0.826)D ln VA 0.007
(0.968)D ln ALTWG1 20.020 20.019
(21.454) (21.400)D ln ALTWG2 20.033 20.033
(21.398) (21.392)
Year Dummies:1980–1985 0.0004 20.076 20.074
(0.147) (21.747) (21.679)1985–1988 20.001 20.007 20.006
(20.288) (21.305) (21.257)
Regional Dummies:Border 0.003 0.003 0.003
(0.473) (0.542) (0.491)North 20.001 20.001 20.001
(20.207) (20.024) (20.048)Center 0.001 0.003 0.002
(0.233) (0.503) (0.458)South 20.003 20.001 20.001
(20.288) 2(0.142) (20.204)
2Adjusted R 0.012 0.014 0.013Number of Observations 746 746 746
The regressions listed above also contain industry dummy variables. For expositional ease, coefficientestimates for these variables are not shown.
skill-biased technical change. We find no such temporal variation in the non-production wage share for Mexico, once we have accounted for other factors. It isalso notable that none of the regional dummy variables are significant. Thissuggests that regional factors, such as possibilities for emigration to the UnitedStates, have played little role in the increase in relative demand for skilled labor.
Calculating the impact of the maquiladora variable on the non-production wageshare in the border region, the regression results in Tables 5 and 6 also account forapproximately one-half of the increase. It is important to note, however, that thespecifications reported in Tables 4–6 account for only a small portion of the total
2variation in the change in the non-production wage share, as shown by the low R2values. Of course, the R ’s are much higher in the equivalent regressions that are
R.C. Feenstra, G.H. Hanson / Journal of International Economics 42 (1997) 371 –393 391
run in levels, rather than first differences, with a full set of state-industry fixedeffects included. We have also experimented with running the regressions in levels,including a limited set of controls on states and industries. The coefficientestimates in these regressions are very similar to those reported above. Without
2choosing which measure of the R is most relevant, it is clear that there are factorsthat determine the non-production wage additional to those we have included.
Perhaps the most compelling additional explanation is that changes in Mexico’slabor-market institutions have caused a shift away from unskilled labor. During the1980s, the government aggressively pursued price and wage agreements withbusiness and labor groups and deindexed the minimum wage as means to controlinflation. The real value of the minimum wage fell steadily over the decade, andMexico’s major unions, which had enjoyed considerable political influence in the1960s and 1970s, appeared much less able to dictate industry wage agreements.While the decline of union power could account for an overall decrease in theproduction labor share of total wages, there is little reason to believe it couldaccount for the regional variation in relative-wage changes that we observe inTable 2. Mexico’s unions are national organizations that negotiate labor contractsfor entire industries. Such agreements generally do not allow for regional variationin contractual terms. Changing labor-market institutions, while not providing acomplete explanation for the observed increase in the skilled labor share of totalwages, are an important additional factor in Mexico’s recent wage changes.
5. Conclusion
The results we present in this paper suggest that, contrary to the prevailing viewin the literature, foreign direct investment has important consequences for therelative wages and employment of skilled and unskilled workers. We find that inMexico over the period 1975–1988, FDI is positively correlated with the relativedemand for skilled labor and that it can account for a large portion of the increasein the skilled labor share of total wages. A large fraction of new foreignmanufacturing activities in Mexico are the result of outsourcing by U.S. multina-tionals. The implications of FDI for labor demand in the United States have beendownplayed, due mainly to the belief that outsourcing accounts for a small shareof U.S. materials purchases. Our findings cast doubt on this view. FDI into Mexicohas been of a sufficient magnitude to have had large effects on the country’s labormarket. It is worthwhile, then, to reconsider the scale of outsourcing by U.S.multinationals and to further assess it effects on recipient countries.
In addition, the manner in which FDI has affected relative labor demand inMexico suggests that the tendency in the literature to disassociate trade withwithin-industry labor demand shifts is unwarranted. The increase in the skilledlabor share of total wages in Mexico, as in the United States, has been largely theresult of within-industry changes in wage shares, rather than between-industry
392 R.C. Feenstra, G.H. Hanson / Journal of International Economics 42 (1997) 371 –393
shifts in employment. Berman, Bound, and Griliches (Berman et al., 1994) arguethat such within-industry shifts are inconsistent with foreign outsourcing as anexplanation for the increase in the relative demand for skilled labor, duepresumably to Stolper–Samuelson-type arguments about how trade affects sectoralemployment. Our findings provide evidence to the contrary. Within-industry labordemand shifts are perfectly consistent with increased outsourcing in particular, andwith increased trade in general.
Acknowledgments
We thank Dan Trefler and seminar participants at Boston College, DartmouthCollege, Harvard University, MIT, the University of Texas, and the University ofToronto for helpful comments. Hanson acknowledges financial support from theCenter for the Study of Western Hemispheric Trade at the University of Texas.Martin Rico and Raymond Robertson provided excellent research assistance.
References
Aitken, B., G.H. Hanson and A.E. Harrison, forthcoming, Spillovers, foreign investment, and exportbehavior, Journal of International Economics.
Berman, E., J. Bound and Z. Griliches, 1994, Changes in the demand for skilled labor within U.S.manufacturing: evidence from the annual survey of manufacturers, Quarterly Journal of Economics109, 367–398.
Bound, J. and G. Johnson, 1992, Changes in the structure of wages in the 1980s: an evaluation ofalternative explanations, American Economic Review 82, 371–92.
Borjas, G.J. and V.A. Ramey, 1995, Foreign competition, market power, and wage inequality: theoryand evidence, Quarterly Journal of Economics 110, 1075–1111.
Davis, S.J. and J. Haltiwanger, 1991, Wage dispersion between and within U.S. manufacturing plants,1963–86, Brookings Papers on Economic Activity: Microeconomics 1991, 115–200.
´La Economıa Mexicana en Cifras, 1990 (Nacional Financiera, Mexico City).Feenstra, R.C. and G.H. Hanson, 1996, Foreign investment, outsourcing and relative wages, in: R.C.
Feenstra, G.M. Grossman and D.A. Irwin, eds., Political economy of trade policy: essays in honor ofJagdish Bhagwati (MIT Press, Cambridge) 89–127.
Feliciano, Z., 1993, Workers and trade liberalization: the impact of trade reforms in Mexico on wagesand employment, mimeo, Harvard University.
Juhn, C., K.M. Murphy and B. Pierce, 1992, Wage inequality and the rise in returns to skill, Journal ofPolitical Economy 101, 410–442.
Katz, L. and K.M. Murphy, 1992, Changes in relative wages, 1963–1987: supply and demand factors,Quarterly Journal of Economics 107, 35–78.
Lawrence, R.Z., 1994, Trade, multinationals, and labor, NBER Working Paper Number 4836.Lawrence, R.Z. and M.J. Slaughter, 1993, Trade and U.S. wages: great sucking sound or small hiccup?,
Brookings Papers on Economic Activity 2, 161–227.Leamer, E., 1993, Wage effects of a U.S.–Mexico free trade agreement, in: P.M. Garber, ed., The
Mexico–U.S. free trade agreement (MIT Press, Cambridge) 57–128.Leamer, E., 1994, Trade, wages, and revolving door ideas, NBER Working Paper Number 4716.

R.C. Feenstra, G.H. Hanson / Journal of International Economics 42 (1997) 371 –393 393
Robbins, D., 1994, Relative wage structure in Chile: the effects of liberalization, mimeo, HarvardInstitute for International Development.
Sachs, J.D. and H.J. Shatz, 1994, Trade and jobs in U.S. manufacturing, Brookings Papers onEconomic Activity 1, 1–84.
Whiting, V., 1992, The political economy of foreign investment in Mexico: nationalism, liberalism, andconstraints on choice (Johns Hopkins University Press, Baltimore).
Wilson, P.A., 1992, Exports and local development: Mexico’s new maquiladoras (University of TexasPress, Austin).
Wood, A., 1994, North-south trade, employment, and inequality (Clarendon Press, Oxford).