employment and wages of female japanese workers
TRANSCRIPT
Employment and Wages of Female JapaneseWorkers: Past, Present, and Future
YOSHI-FUMI NAKATA and RYOJI TAKEHIRO*
Introduction
The last 50 years have been a period of dramatic change for Japanesewomen in every aspect of their lives. We present their brief history sinceWorld War II in Table 1. As the table shows, their progress was conspicuousin political activities, work, and education. But the table also tells us that theprogress was not a continuous, steady improvement. For example, ineducation, their experiencewas amovement between progress and regression.The regression in women’s education includes the inclusion, as late as 1989, ofhousekeeping as a compulsory subject for female high school students.Similarly, the experience of women in the workplace has been a mixture of
positive and negative. It took 20 years for employment of women outside thehome to become common, even though the post-war Japanese Constitution,in 1946, guaranteed women’s equal rights in the workplace. During the 1960sand 1970s, it was mostly married women who drove women’s progress in theworkplace. In 1982, a milestone was reached when as many as one-half ofmarried women were in the labor market. Young educated women madefurther progress in the 1980s, and finally surpassed their male counterparts interms of the new graduate employment rate in 1991. The darker side of thisprogress is that the experience of women in the workplace has often not beena progression toward full equality. For example, despite the rising tide offemale workers coming into their offices in late the 1970s, most male
*The authors’ affiliations are: Yoshi-Fumi Nakata, Doshisha Management School, Doshisha Uni-
versity; Ryoji Takehiro, Faculty of Economics, Doshisha University. We gratefully acknowledge the
generous financial support of Doshisha University (1997–1998 Research Promotion Grant), the Zengin
Foundation for Studies on Economics and Finance (1998 Grant), and the Ministry of Education, Japan
(Grant-in-Aid for Scientific Research-B). We also wish to express special thanks to our two research
assistants, Dai Miyamoto of the Graduate School of Economics and Akiko Ono of the Graduate School
of Policy and Management, Doshisha University.
Industrial Relations, Vol. 41, No. 4 (October 2002). � 2002 Regents of the University of CaliforniaPublished by Blackwell Publishing, Inc. 350 Main Street, Malden, MA 02148, USA, and 108 Cowley
Road, Oxford, OX4 1JF, UK.
521
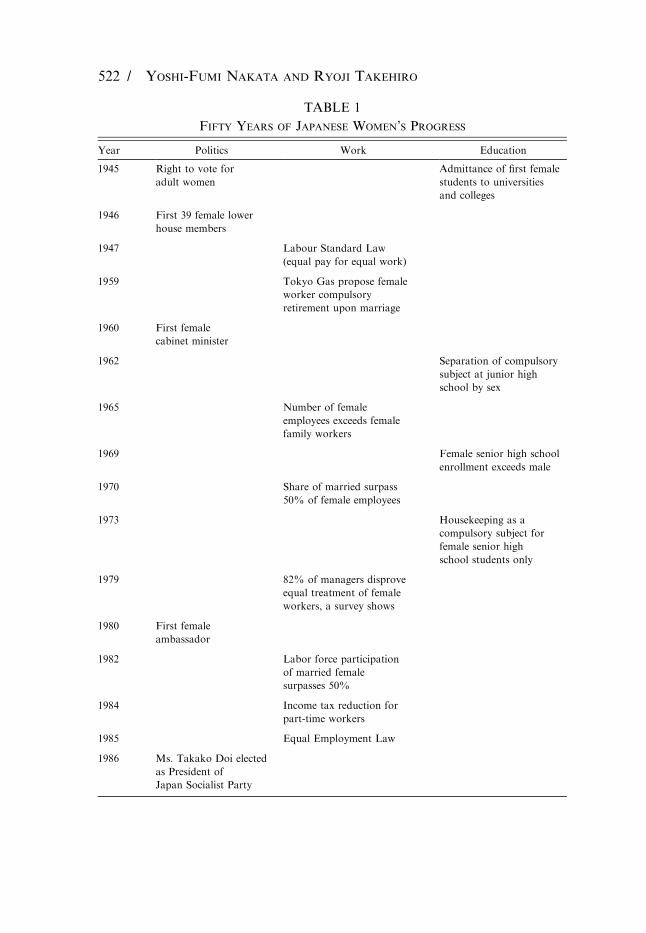
TABLE 1
Fifty Years of Japanese Women’s Progress
Year Politics Work Education
1945 Right to vote for
adult women
Admittance of first female
students to universities
and colleges
1946 First 39 female lower
house members
1947 Labour Standard Law
(equal pay for equal work)
1959 Tokyo Gas propose female
worker compulsory
retirement upon marriage
1960 First female
cabinet minister
1962 Separation of compulsory
subject at junior high
school by sex
1965 Number of female
employees exceeds female
family workers
1969 Female senior high school
enrollment exceeds male
1970 Share of married surpass
50% of female employees
1973 Housekeeping as a
compulsory subject for
female senior high
school students only
1979 82% of managers disprove
equal treatment of female
workers, a survey shows
1980 First female
ambassador
1982 Labor force participation
of married female
surpasses 50%
1984 Income tax reduction for
part-time workers
1985 Equal Employment Law
1986 Ms. Takako Doi elected
as President of
Japan Socialist Party
522 / Yoshi-Fumi Nakata and Ryoji Takehiro
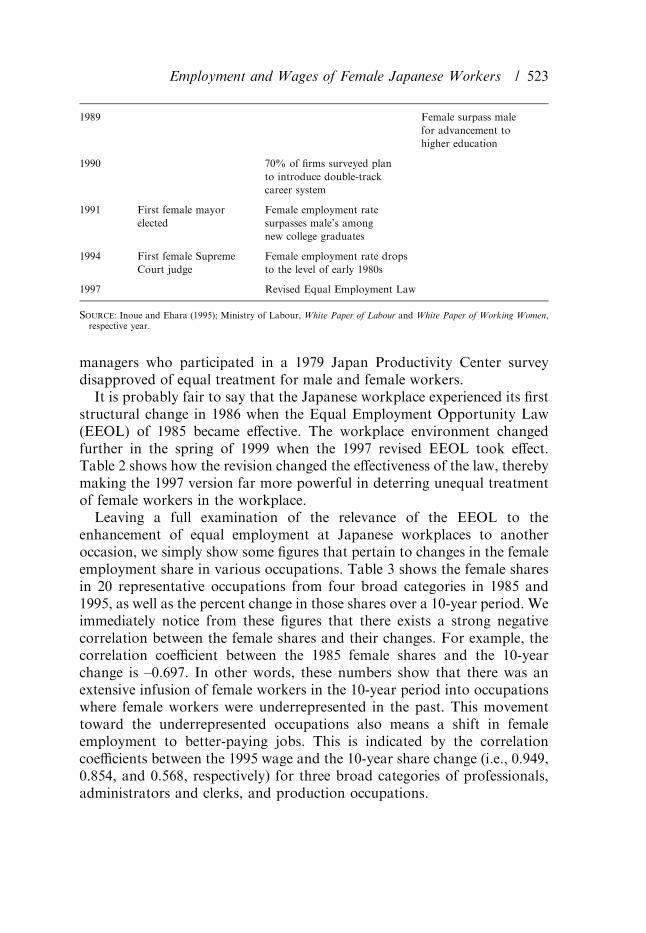
managers who participated in a 1979 Japan Productivity Center surveydisapproved of equal treatment for male and female workers.It is probably fair to say that the Japanese workplace experienced its first
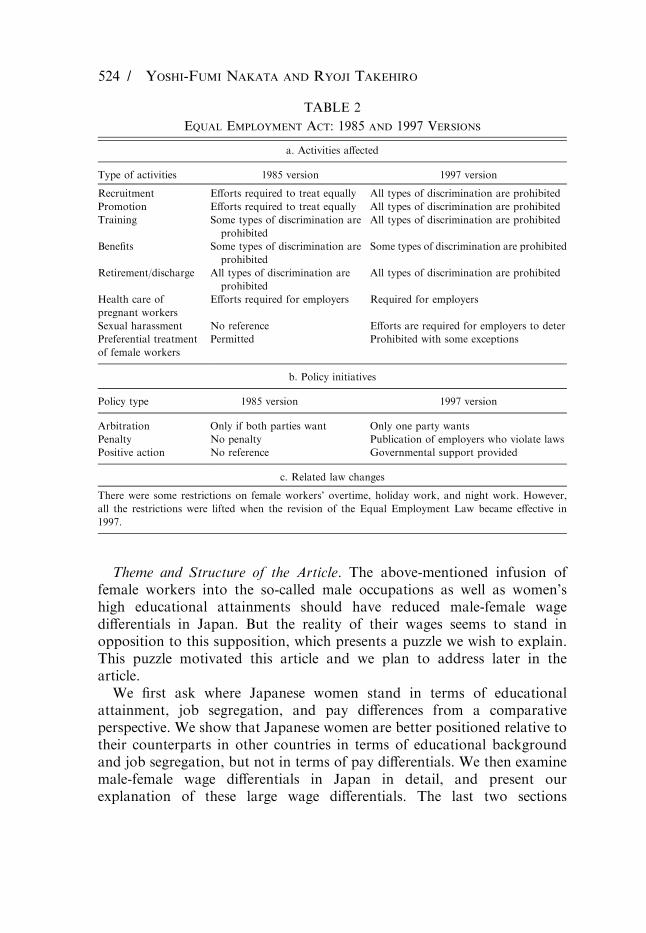
structural change in 1986 when the Equal Employment Opportunity Law(EEOL) of 1985 became effective. The workplace environment changedfurther in the spring of 1999 when the 1997 revised EEOL took effect.Table 2 shows how the revision changed the effectiveness of the law, therebymaking the 1997 version far more powerful in deterring unequal treatmentof female workers in the workplace.Leaving a full examination of the relevance of the EEOL to the
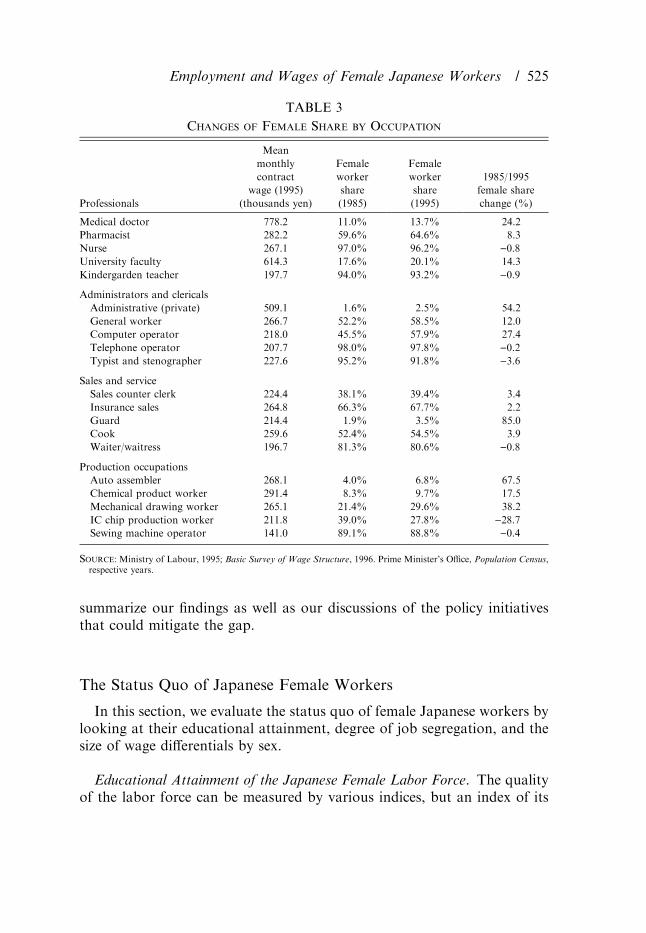
enhancement of equal employment at Japanese workplaces to anotheroccasion, we simply show some figures that pertain to changes in the femaleemployment share in various occupations. Table 3 shows the female sharesin 20 representative occupations from four broad categories in 1985 and1995, as well as the percent change in those shares over a 10-year period. Weimmediately notice from these figures that there exists a strong negativecorrelation between the female shares and their changes. For example, thecorrelation coefficient between the 1985 female shares and the 10-yearchange is –0.697. In other words, these numbers show that there was anextensive infusion of female workers in the 10-year period into occupationswhere female workers were underrepresented in the past. This movementtoward the underrepresented occupations also means a shift in femaleemployment to better-paying jobs. This is indicated by the correlationcoefficients between the 1995 wage and the 10-year share change (i.e., 0.949,0.854, and 0.568, respectively) for three broad categories of professionals,administrators and clerks, and production occupations.
1989 Female surpass male
for advancement to
higher education
1990 70% of firms surveyed plan
to introduce double-track
career system
1991 First female mayor
elected
Female employment rate
surpasses male’s among
new college graduates
1994 First female Supreme
Court judge
Female employment rate drops
to the level of early 1980s
1997 Revised Equal Employment Law
Source: Inoue and Ehara (1995); Ministry of Labour, White Paper of Labour and White Paper of Working Women,respective year.
Employment and Wages of Female Japanese Workers / 523
Theme and Structure of the Article. The above-mentioned infusion offemale workers into the so-called male occupations as well as women’shigh educational attainments should have reduced male-female wagedifferentials in Japan. But the reality of their wages seems to stand inopposition to this supposition, which presents a puzzle we wish to explain.This puzzle motivated this article and we plan to address later in thearticle.We first ask where Japanese women stand in terms of educational
attainment, job segregation, and pay differences from a comparativeperspective. We show that Japanese women are better positioned relative totheir counterparts in other countries in terms of educational backgroundand job segregation, but not in terms of pay differentials. We then examinemale-female wage differentials in Japan in detail, and present ourexplanation of these large wage differentials. The last two sections
TABLE 2
Equal Employment Act: 1985 and 1997 Versions
a. Activities affected
Type of activities 1985 version 1997 version
Recruitment Efforts required to treat equally All types of discrimination are prohibited
Promotion Efforts required to treat equally All types of discrimination are prohibited
Training Some types of discrimination are
prohibited
All types of discrimination are prohibited
Benefits Some types of discrimination are
prohibited
Some types of discrimination are prohibited
Retirement/discharge All types of discrimination are
prohibited
All types of discrimination are prohibited
Health care of
pregnant workers
Efforts required for employers Required for employers
Sexual harassment No reference Efforts are required for employers to deter
Preferential treatment
of female workers
Permitted Prohibited with some exceptions
b. Policy initiatives
Policy type 1985 version 1997 version
Arbitration Only if both parties want Only one party wants
Penalty No penalty Publication of employers who violate laws
Positive action No reference Governmental support provided
c. Related law changes
There were some restrictions on female workers’ overtime, holiday work, and night work. However,
all the restrictions were lifted when the revision of the Equal Employment Law became effective in
1997.
524 / Yoshi-Fumi Nakata and Ryoji Takehiro
summarize our findings as well as our discussions of the policy initiativesthat could mitigate the gap.
The Status Quo of Japanese Female Workers
In this section, we evaluate the status quo of female Japanese workers bylooking at their educational attainment, degree of job segregation, and thesize of wage differentials by sex.
Educational Attainment of the Japanese Female Labor Force. The qualityof the labor force can be measured by various indices, but an index of its
TABLE 3
Changes of Female Share by Occupation
Professionals
Mean
monthly
contract
wage (1995)
(thousands yen)
Female
worker
share
(1985)
Female
worker
share
(1995)
1985/1995
female share
change (%)
Medical doctor 778.2 11.0% 13.7% 24.2
Pharmacist 282.2 59.6% 64.6% 8.3
Nurse 267.1 97.0% 96.2% )0.8University faculty 614.3 17.6% 20.1% 14.3
Kindergarden teacher 197.7 94.0% 93.2% )0.9
Administrators and clericals
Administrative (private) 509.1 1.6% 2.5% 54.2
General worker 266.7 52.2% 58.5% 12.0
Computer operator 218.0 45.5% 57.9% 27.4
Telephone operator 207.7 98.0% 97.8% )0.2Typist and stenographer 227.6 95.2% 91.8% )3.6
Sales and service
Sales counter clerk 224.4 38.1% 39.4% 3.4
Insurance sales 264.8 66.3% 67.7% 2.2
Guard 214.4 1.9% 3.5% 85.0
Cook 259.6 52.4% 54.5% 3.9
Waiter/waitress 196.7 81.3% 80.6% )0.8
Production occupations
Auto assembler 268.1 4.0% 6.8% 67.5
Chemical product worker 291.4 8.3% 9.7% 17.5
Mechanical drawing worker 265.1 21.4% 29.6% 38.2
IC chip production worker 211.8 39.0% 27.8% )28.7Sewing machine operator 141.0 89.1% 88.8% )0.4
Source: Ministry of Labour, 1995; Basic Survey of Wage Structure, 1996. Prime Minister’s Office, Population Census,respective years.
Employment and Wages of Female Japanese Workers / 525
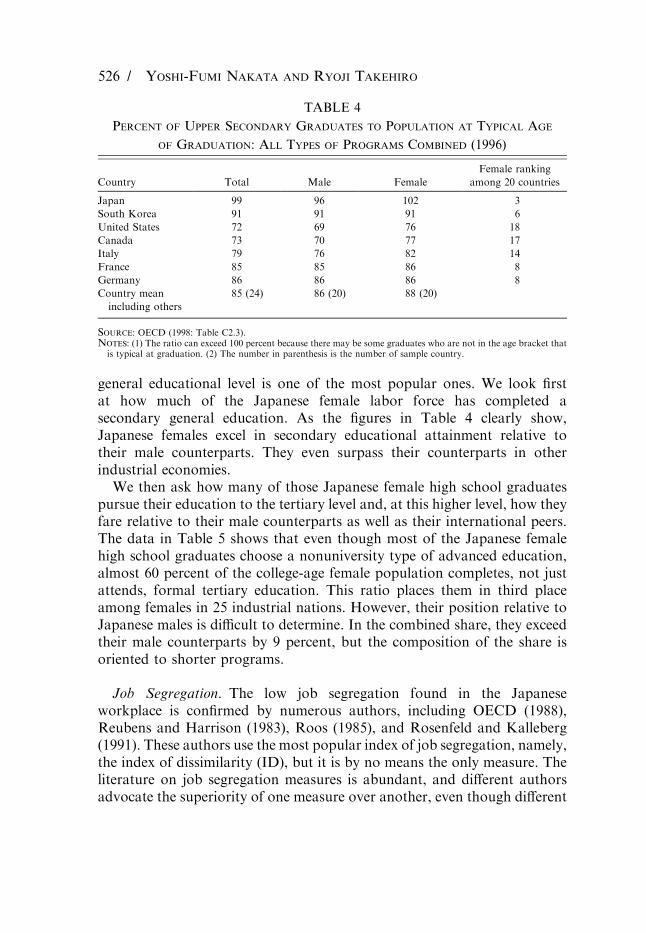
general educational level is one of the most popular ones. We look firstat how much of the Japanese female labor force has completed asecondary general education. As the figures in Table 4 clearly show,Japanese females excel in secondary educational attainment relative totheir male counterparts. They even surpass their counterparts in otherindustrial economies.We then ask how many of those Japanese female high school graduates
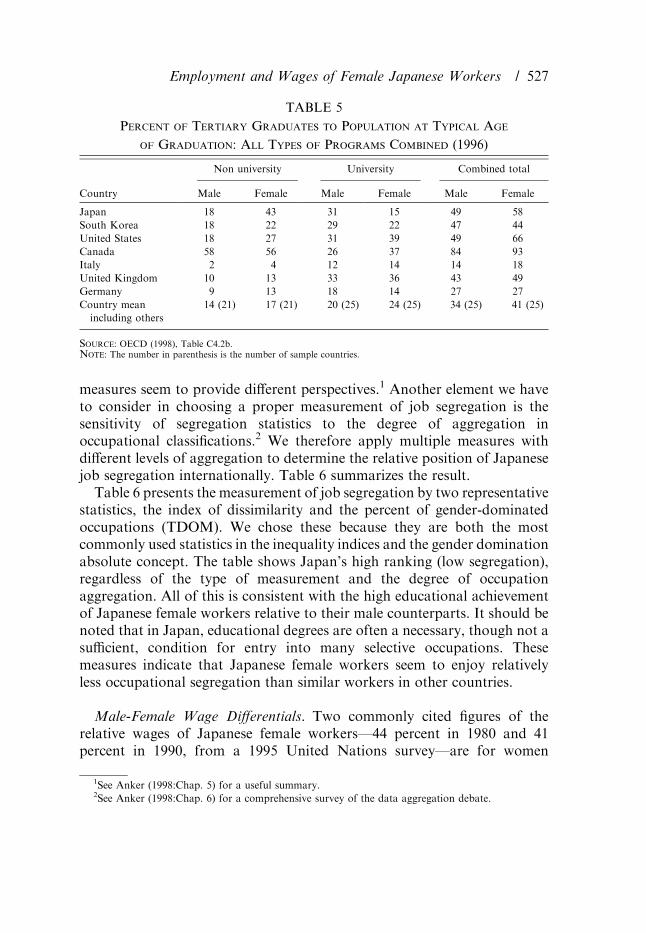
pursue their education to the tertiary level and, at this higher level, how theyfare relative to their male counterparts as well as their international peers.The data in Table 5 shows that even though most of the Japanese femalehigh school graduates choose a nonuniversity type of advanced education,almost 60 percent of the college-age female population completes, not justattends, formal tertiary education. This ratio places them in third placeamong females in 25 industrial nations. However, their position relative toJapanese males is difficult to determine. In the combined share, they exceedtheir male counterparts by 9 percent, but the composition of the share isoriented to shorter programs.
Job Segregation. The low job segregation found in the Japaneseworkplace is confirmed by numerous authors, including OECD (1988),Reubens and Harrison (1983), Roos (1985), and Rosenfeld and Kalleberg(1991). These authors use the most popular index of job segregation, namely,the index of dissimilarity (ID), but it is by no means the only measure. Theliterature on job segregation measures is abundant, and different authorsadvocate the superiority of one measure over another, even though different
TABLE 4
Percent of Upper Secondary Graduates to Population at Typical Age
of Graduation: All Types of Programs Combined (1996)
Country Total Male Female
Female ranking
among 20 countries
Japan 99 96 102 3
South Korea 91 91 91 6
United States 72 69 76 18
Canada 73 70 77 17
Italy 79 76 82 14
France 85 85 86 8
Germany 86 86 86 8
Country mean
including others
85 (24) 86 (20) 88 (20)
Source: OECD (1998: Table C2.3).Notes: (1) The ratio can exceed 100 percent because there may be some graduates who are not in the age bracket thatis typical at graduation. (2) The number in parenthesis is the number of sample country.
526 / Yoshi-Fumi Nakata and Ryoji Takehiro
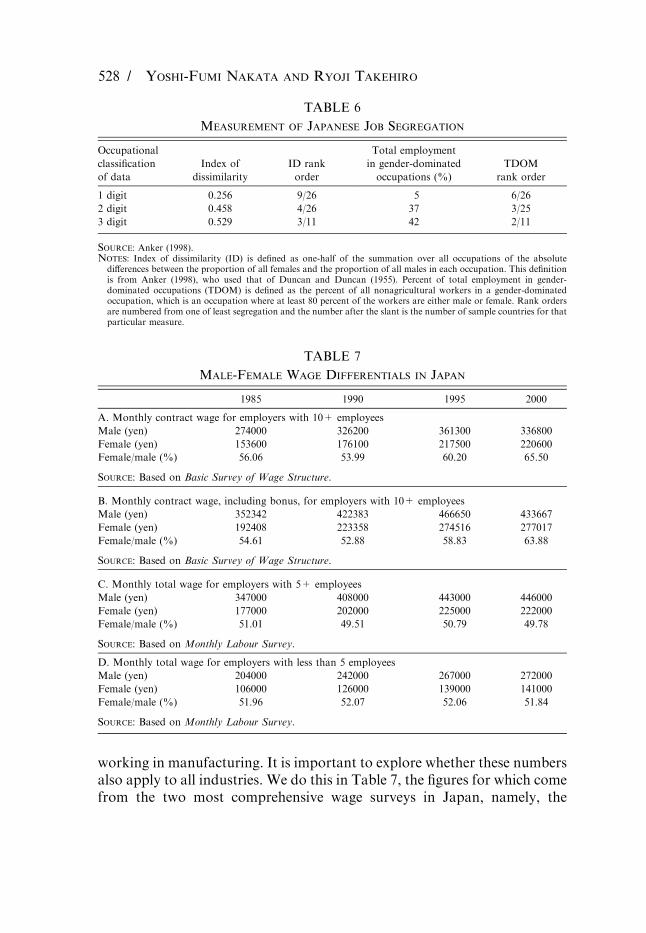
measures seem to provide different perspectives.1 Another element we haveto consider in choosing a proper measurement of job segregation is thesensitivity of segregation statistics to the degree of aggregation inoccupational classifications.2 We therefore apply multiple measures withdifferent levels of aggregation to determine the relative position of Japanesejob segregation internationally. Table 6 summarizes the result.Table 6 presents the measurement of job segregation by two representative
statistics, the index of dissimilarity and the percent of gender-dominatedoccupations (TDOM). We chose these because they are both the mostcommonly used statistics in the inequality indices and the gender dominationabsolute concept. The table shows Japan’s high ranking (low segregation),regardless of the type of measurement and the degree of occupationaggregation. All of this is consistent with the high educational achievementof Japanese female workers relative to their male counterparts. It should benoted that in Japan, educational degrees are often a necessary, though not asufficient, condition for entry into many selective occupations. Thesemeasures indicate that Japanese female workers seem to enjoy relativelyless occupational segregation than similar workers in other countries.
Male-Female Wage Differentials. Two commonly cited figures of therelative wages of Japanese female workers—44 percent in 1980 and 41percent in 1990, from a 1995 United Nations survey—are for women
TABLE 5
Percent of Tertiary Graduates to Population at Typical Age
of Graduation: All Types of Programs Combined (1996)
Non university University Combined total
Country Male Female Male Female Male Female
Japan 18 43 31 15 49 58
South Korea 18 22 29 22 47 44
United States 18 27 31 39 49 66
Canada 58 56 26 37 84 93
Italy 2 4 12 14 14 18
United Kingdom 10 13 33 36 43 49
Germany 9 13 18 14 27 27
Country mean
including others
14 (21) 17 (21) 20 (25) 24 (25) 34 (25) 41 (25)
Source: OECD (1998), Table C4.2b.Note: The number in parenthesis is the number of sample countries.
1See Anker (1998:Chap. 5) for a useful summary.2See Anker (1998:Chap. 6) for a comprehensive survey of the data aggregation debate.
Employment and Wages of Female Japanese Workers / 527
working in manufacturing. It is important to explore whether these numbersalso apply to all industries. We do this in Table 7, the figures for which comefrom the two most comprehensive wage surveys in Japan, namely, the
TABLE 6
Measurement of Japanese Job Segregation
Occupational
classification
of data
Index of
dissimilarity
ID rank
order
Total employment
in gender-dominated
occupations (%)
TDOM
rank order
1 digit 0.256 9/26 5 6/26
2 digit 0.458 4/26 37 3/25
3 digit 0.529 3/11 42 2/11
Source: Anker (1998).Notes: Index of dissimilarity (ID) is defined as one-half of the summation over all occupations of the absolutedifferences between the proportion of all females and the proportion of all males in each occupation. This definitionis from Anker (1998), who used that of Duncan and Duncan (1955). Percent of total employment in gender-dominated occupations (TDOM) is defined as the percent of all nonagricultural workers in a gender-dominatedoccupation, which is an occupation where at least 80 percent of the workers are either male or female. Rank ordersare numbered from one of least segregation and the number after the slant is the number of sample countries for thatparticular measure.
TABLE 7
Male-Female Wage Differentials in Japan
1985 1990 1995 2000
A. Monthly contract wage for employers with 10+ employees
Male (yen) 274000 326200 361300 336800
Female (yen) 153600 176100 217500 220600
Female/male (%) 56.06 53.99 60.20 65.50
Source: Based on Basic Survey of Wage Structure.
B. Monthly contract wage, including bonus, for employers with 10+ employees
Male (yen) 352342 422383 466650 433667
Female (yen) 192408 223358 274516 277017
Female/male (%) 54.61 52.88 58.83 63.88
Source: Based on Basic Survey of Wage Structure.
C. Monthly total wage for employers with 5+ employees
Male (yen) 347000 408000 443000 446000
Female (yen) 177000 202000 225000 222000
Female/male (%) 51.01 49.51 50.79 49.78
Source: Based on Monthly Labour Survey.
D. Monthly total wage for employers with less than 5 employees
Male (yen) 204000 242000 267000 272000
Female (yen) 106000 126000 139000 141000
Female/male (%) 51.96 52.07 52.06 51.84
Source: Based on Monthly Labour Survey.
528 / Yoshi-Fumi Nakata and Ryoji Takehiro
Ministry of Labour’s annual Basic Survey of Wage Structure and theMonthly Labour Survey.Table 7 shows, first, that the wage gap shown in the UN figures is
substantially larger than those obtained from two of the most representativewage surveys. Second, the female-male gap widens as the coverage of paycomponents increases. The figures in Section A of Table 7 are for monthlycontract wages only. When we add the monthly equivalent of an annualbonus to the figures in Section A, the gap is widened, as seen in Section B.The gap is widened more in Section C when overtime pay and otherpayments for nonregular hours of work are included, although the coverageof firm size is somewhat different for Section C. Third, the wage gap at smallfirms is not much smaller than that at larger firms. Comparing figures inSections C and D from the same survey, we see that the wage gap isconsistently smaller for small firms, although the differences are rather small.Fourth, Japanese wage differentials by gender are large by any measure andshow no sign of monotonic improvement in the 1980s and 1990s.Given this information, how can we evaluate the 1995 UN report’s claim
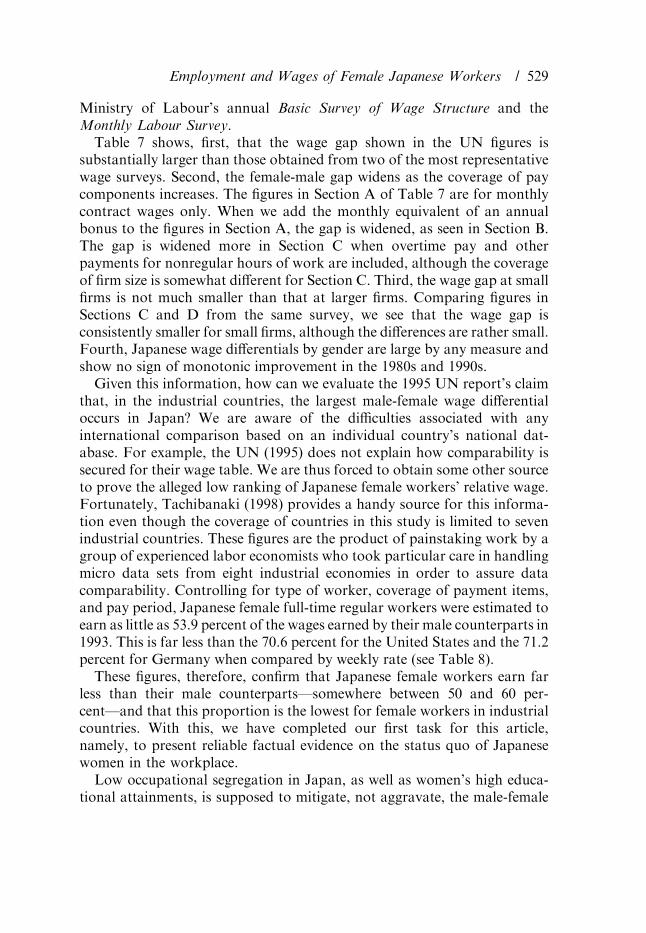
that, in the industrial countries, the largest male-female wage differentialoccurs in Japan? We are aware of the difficulties associated with anyinternational comparison based on an individual country’s national dat-abase. For example, the UN (1995) does not explain how comparability issecured for their wage table. We are thus forced to obtain some other sourceto prove the alleged low ranking of Japanese female workers’ relative wage.Fortunately, Tachibanaki (1998) provides a handy source for this informa-tion even though the coverage of countries in this study is limited to sevenindustrial countries. These figures are the product of painstaking work by agroup of experienced labor economists who took particular care in handlingmicro data sets from eight industrial economies in order to assure datacomparability. Controlling for type of worker, coverage of payment items,and pay period, Japanese female full-time regular workers were estimated toearn as little as 53.9 percent of the wages earned by their male counterparts in1993. This is far less than the 70.6 percent for the United States and the 71.2percent for Germany when compared by weekly rate (see Table 8).These figures, therefore, confirm that Japanese female workers earn far
less than their male counterparts—somewhere between 50 and 60 per-cent—and that this proportion is the lowest for female workers in industrialcountries. With this, we have completed our first task for this article,namely, to present reliable factual evidence on the status quo of Japanesewomen in the workplace.Low occupational segregation in Japan, as well as women’s high educa-
tional attainments, is supposed to mitigate, not aggravate, the male-female
Employment and Wages of Female Japanese Workers / 529
wage differential in Japan. But the reality of their wages stands inopposition to this supposition, which presents the puzzle we wish to explainin the following section.
Reconsideration of Educational Attainment and Job Segregation
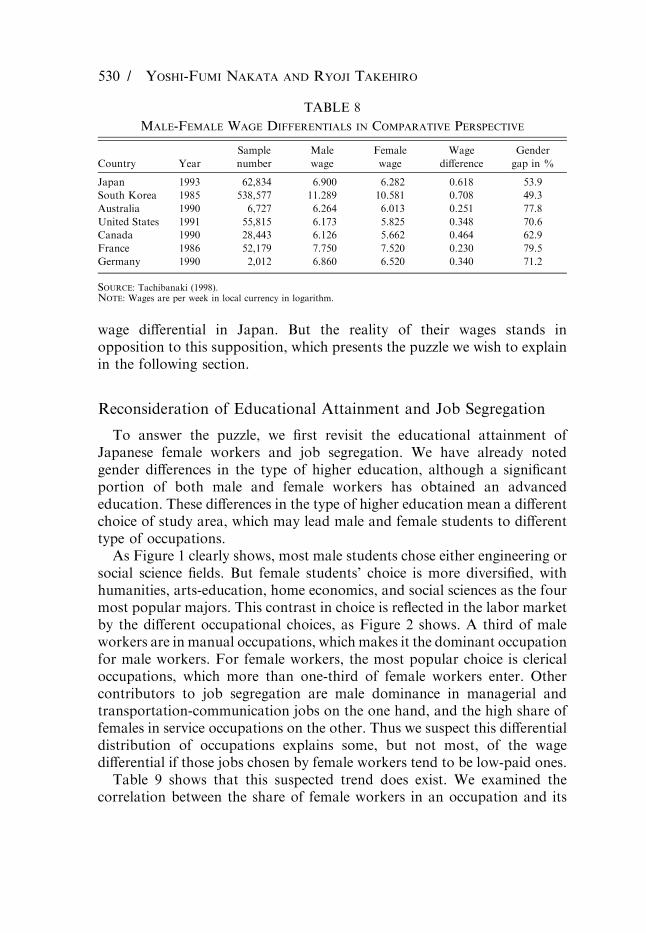
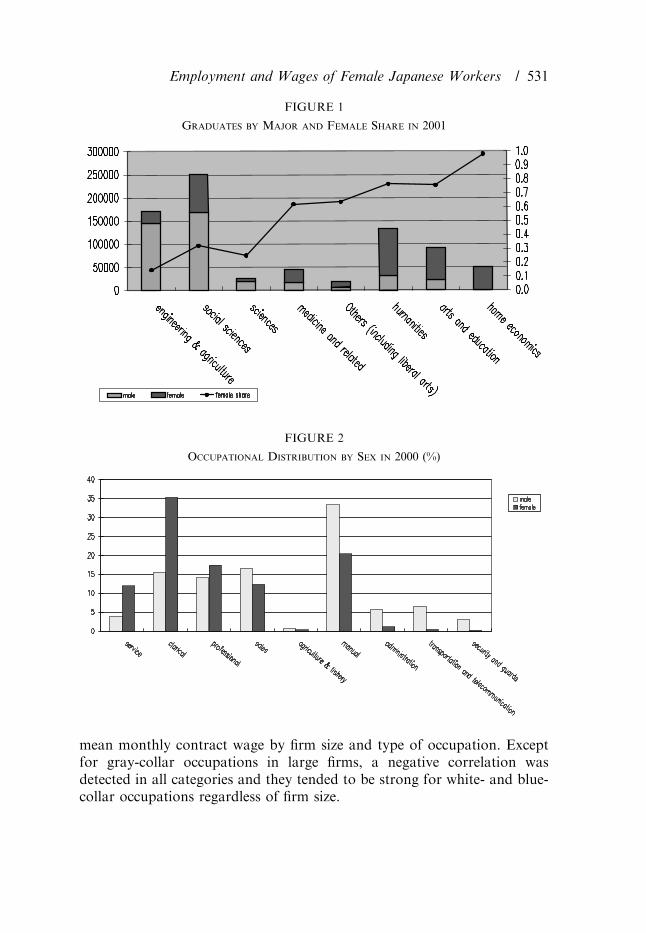
To answer the puzzle, we first revisit the educational attainment ofJapanese female workers and job segregation. We have already notedgender differences in the type of higher education, although a significantportion of both male and female workers has obtained an advancededucation. These differences in the type of higher education mean a differentchoice of study area, which may lead male and female students to differenttype of occupations.As Figure 1 clearly shows, most male students chose either engineering or
social science fields. But female students’ choice is more diversified, withhumanities, arts-education, home economics, and social sciences as the fourmost popular majors. This contrast in choice is reflected in the labor marketby the different occupational choices, as Figure 2 shows. A third of maleworkers are in manual occupations, which makes it the dominant occupationfor male workers. For female workers, the most popular choice is clericaloccupations, which more than one-third of female workers enter. Othercontributors to job segregation are male dominance in managerial andtransportation-communication jobs on the one hand, and the high share offemales in service occupations on the other. Thus we suspect this differentialdistribution of occupations explains some, but not most, of the wagedifferential if those jobs chosen by female workers tend to be low-paid ones.Table 9 shows that this suspected trend does exist. We examined the
correlation between the share of female workers in an occupation and its
TABLE 8
Male-Female Wage Differentials in Comparative Perspective
Country Year
Sample
number
Male
wage
Female
wage
Wage
difference
Gender
gap in %
Japan 1993 62,834 6.900 6.282 0.618 53.9
South Korea 1985 538,577 11.289 10.581 0.708 49.3
Australia 1990 6,727 6.264 6.013 0.251 77.8
United States 1991 55,815 6.173 5.825 0.348 70.6
Canada 1990 28,443 6.126 5.662 0.464 62.9
France 1986 52,179 7.750 7.520 0.230 79.5
Germany 1990 2,012 6.860 6.520 0.340 71.2
Source: Tachibanaki (1998).Note: Wages are per week in local currency in logarithm.
530 / Yoshi-Fumi Nakata and Ryoji Takehiro
mean monthly contract wage by firm size and type of occupation. Exceptfor gray-collar occupations in large firms, a negative correlation wasdetected in all categories and they tended to be strong for white- and blue-collar occupations regardless of firm size.
FIGURE 1
Graduates by Major and Female Share in 2001
FIGURE 2
Occupational Distribution by Sex in 2000 (%)
Employment and Wages of Female Japanese Workers / 531

Given this correlation, we evaluate the impact of this tendency of femaleworkers to work in lower-paid occupations in Table 10. The table shows theexpected female wage ratio to male workers if they take up the sameoccupations as males do. The wage differentials are reduced substantially inall firm-size categories for all three occupation categories. The improvementis larger for those categories that show a strong negative correlationbetween female share and occupational wage, as suspected.
Three Hypotheses of Large Wage Differentials in Japan
The question that emerges in the previous section is why female workersearn so much less than their male counterparts even after we control for
TABLE 9
Female Share and Wage Level of Occupation
Firm size Occupation group Samples Correlation coefficient
Large white-collar 23 )0.54gray-collar 14 0.25
blue-collar 54 )0.25
Medium white-collar 24 )0.51gray-collar 15 )0.20blue-collar 67 )0.57
Small white-collar 24 )0.46gray-collar 15 )0.10blue-collar 68 )0.66
Source: Ministry of Labour, Wage Census, Vol. 3, 2000.Note: Wage level is the mean monthly wage for male and female workers together.
TABLE 10
Female/Male Wage Ratio After Occupational Distribution Adjusted
Firm size Occupation group Simple mean of ratio Adjusted ratio
Large 0.63 white 0.77 0.85
gray 0.76 0.73
blue 0.67 0.73
Medium 0.67 white 0.64 0.85
gray 0.79 0.79
blue 0.65 0.80
Small 0.67 white 0.64 0.81
gray 0.70 0.70
blue 0.59 0.73
Source: Ministry of Labour, Wage Census, Vol. 3, 2000.
532 / Yoshi-Fumi Nakata and Ryoji Takehiro
differences in occupational distribution by sex in Japan. To answer thisquestion we will examine the following three hypotheses. They are whatmay be called the intermittent labor market experience hypothesis, thesegregated career path hypothesis, and the Nenko living wage hypothesis.We will explain them one by one below.
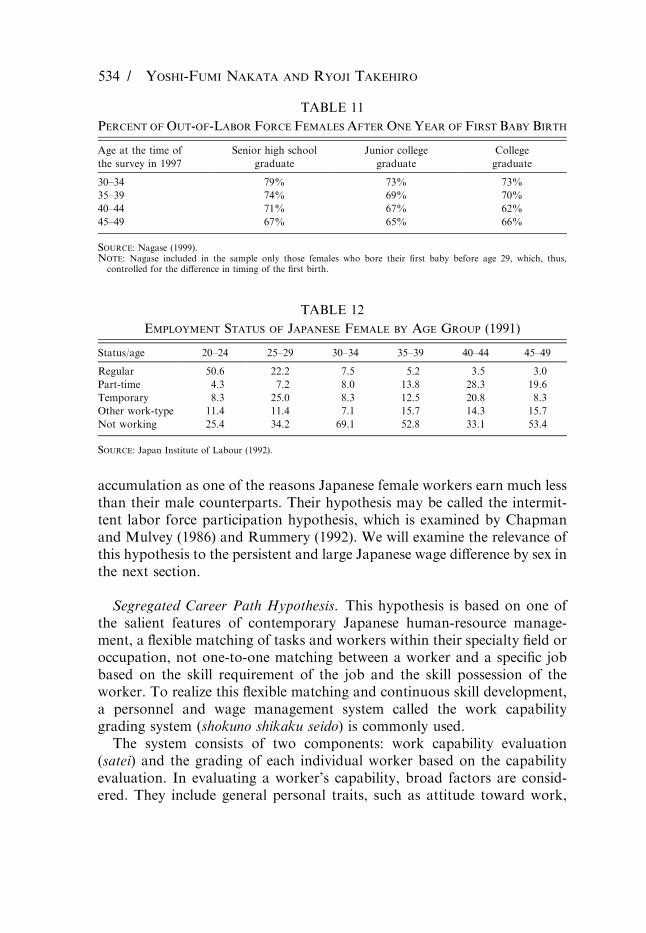
Intermittent Labor Market Experience Hypothesis. This hypothesis hasits base in the peculiar characteristics of female labor supply in Japan.Female workers have a very high probability of labor market intermissiondue to marriage, as well as childbearing, which creates a M-shaped laborforce participation curve. For example, in 1987 the percent share of jobseparation due to marriage among female workers between 25 and 34 yearsof age was 25.8 percent, while the figure in 1997 was slightly larger, 26.1percent.3 Given the larger share of unmarried women in their late 20s andearly 30s in 1997 compared to 1987, the actual rising trend should bestronger than these numbers indicate. Consistent with this observation,Nagase (1999) found that the recent cohort has a higher probability of beingout of the labor force after the birth of their first baby, as is indicated inTable 11.Another distinctive feature of Japanese female labor market participation
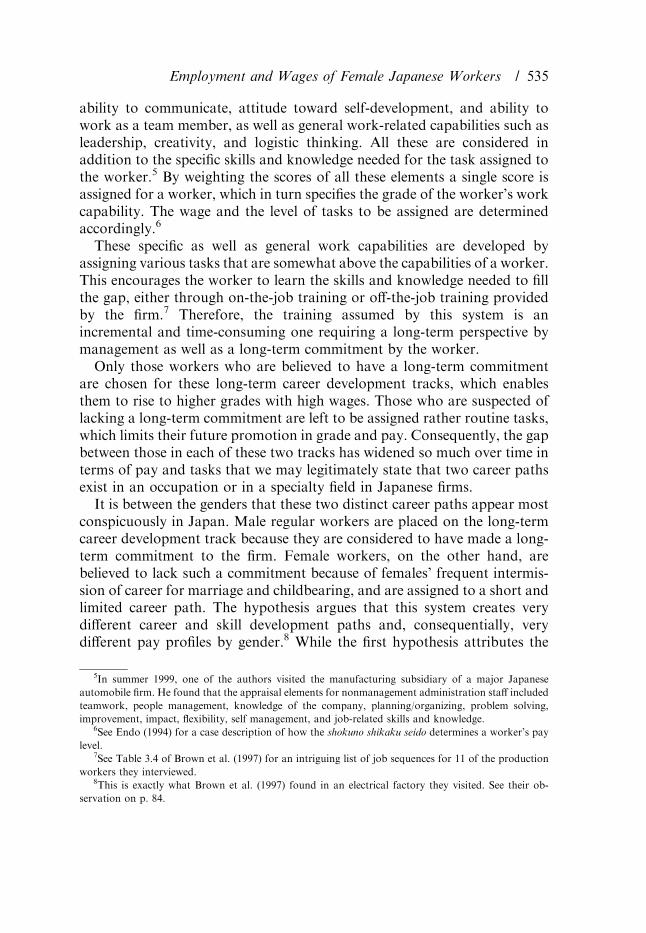
is the dramatic drop of regular employment status for women as young astheir late 20s, and a continuous decline of that status, as Table 12 depicts.To offset this drop in the late 20s, there is a surge in temporary
employment status, along with a substantial increase in those outside thelabor force. Then, in their early 30s, except for a rather stable share of part-timers, all other categories decline considerably, reflecting a discontinuousjump of nonworking women in that age group. It is only in their late 30sthat Japanese women return to work, with various employment statusesexcept that of regular worker. All these numbers confirm the alreadydiscussed high labor market detachment of female workers upon marriageand childbearing. The increase in casual work status among middle-agedfemale workers, along with the monotonic decline of regular statusworkers, enhances the Japanese female workers’ instability of employmentmentioned above.As a result of these two characteristics the mean job tenure difference
between male and female regular workers in Japan is one of the largest inthe industrial economies.4 Both Koike (1988) and Wakisaka (1998), as wellas others, have noted this tenure difference and its consequential weak skill
3Ministry of Labour, Basic Survey of Employment Structure, respective years.4See OECD (1993: Table 4.1).
Employment and Wages of Female Japanese Workers / 533
accumulation as one of the reasons Japanese female workers earn much lessthan their male counterparts. Their hypothesis may be called the intermit-tent labor force participation hypothesis, which is examined by Chapmanand Mulvey (1986) and Rummery (1992). We will examine the relevance ofthis hypothesis to the persistent and large Japanese wage difference by sex inthe next section.
Segregated Career Path Hypothesis. This hypothesis is based on one ofthe salient features of contemporary Japanese human-resource manage-ment, a flexible matching of tasks and workers within their specialty field oroccupation, not one-to-one matching between a worker and a specific jobbased on the skill requirement of the job and the skill possession of theworker. To realize this flexible matching and continuous skill development,a personnel and wage management system called the work capabilitygrading system (shokuno shikaku seido) is commonly used.The system consists of two components: work capability evaluation
(satei) and the grading of each individual worker based on the capabilityevaluation. In evaluating a worker’s capability, broad factors are consid-ered. They include general personal traits, such as attitude toward work,
TABLE 11
Percent of Out-of-Labor Force Females After One Year of First Baby Birth
Age at the time of
the survey in 1997
Senior high school
graduate
Junior college
graduate
College
graduate
30–34 79% 73% 73%
35–39 74% 69% 70%
40–44 71% 67% 62%
45–49 67% 65% 66%
Source: Nagase (1999).Note: Nagase included in the sample only those females who bore their first baby before age 29, which, thus,controlled for the difference in timing of the first birth.
TABLE 12
Employment Status of Japanese Female by Age Group (1991)
Status/age 20–24 25–29 30–34 35–39 40–44 45–49
Regular 50.6 22.2 7.5 5.2 3.5 3.0
Part-time 4.3 7.2 8.0 13.8 28.3 19.6
Temporary 8.3 25.0 8.3 12.5 20.8 8.3
Other work-type 11.4 11.4 7.1 15.7 14.3 15.7
Not working 25.4 34.2 69.1 52.8 33.1 53.4
Source: Japan Institute of Labour (1992).
534 / Yoshi-Fumi Nakata and Ryoji Takehiro
ability to communicate, attitude toward self-development, and ability towork as a team member, as well as general work-related capabilities such asleadership, creativity, and logistic thinking. All these are considered inaddition to the specific skills and knowledge needed for the task assigned tothe worker.5 By weighting the scores of all these elements a single score isassigned for a worker, which in turn specifies the grade of the worker’s workcapability. The wage and the level of tasks to be assigned are determinedaccordingly.6
These specific as well as general work capabilities are developed byassigning various tasks that are somewhat above the capabilities of a worker.This encourages the worker to learn the skills and knowledge needed to fillthe gap, either through on-the-job training or off-the-job training providedby the firm.7 Therefore, the training assumed by this system is anincremental and time-consuming one requiring a long-term perspective bymanagement as well as a long-term commitment by the worker.Only those workers who are believed to have a long-term commitment
are chosen for these long-term career development tracks, which enablesthem to rise to higher grades with high wages. Those who are suspected oflacking a long-term commitment are left to be assigned rather routine tasks,which limits their future promotion in grade and pay. Consequently, the gapbetween those in each of these two tracks has widened so much over time interms of pay and tasks that we may legitimately state that two career pathsexist in an occupation or in a specialty field in Japanese firms.It is between the genders that these two distinct career paths appear most
conspicuously in Japan. Male regular workers are placed on the long-termcareer development track because they are considered to have made a long-term commitment to the firm. Female workers, on the other hand, arebelieved to lack such a commitment because of females’ frequent intermis-sion of career for marriage and childbearing, and are assigned to a short andlimited career path. The hypothesis argues that this system creates verydifferent career and skill development paths and, consequentially, verydifferent pay profiles by gender.8 While the first hypothesis attributes the
5In summer 1999, one of the authors visited the manufacturing subsidiary of a major Japanese
automobile firm. He found that the appraisal elements for nonmanagement administration staff included
teamwork, people management, knowledge of the company, planning/organizing, problem solving,
improvement, impact, flexibility, self management, and job-related skills and knowledge.6See Endo (1994) for a case description of how the shokuno shikaku seido determines a worker’s pay
level.7See Table 3.4 of Brown et al. (1997) for an intriguing list of job sequences for 11 of the production
workers they interviewed.8This is exactly what Brown et al. (1997) found in an electrical factory they visited. See their ob-
servation on p. 84.
Employment and Wages of Female Japanese Workers / 535
lower pay for female workers to their short tenure, the segregated career pathhypothesis believes that it is the difference of accumulated skill between maleand female workers with the same tenure within the same occupation.One explicit means of managing these dichotomous career paths is what
is called ‘‘double-track personnel management,’’9 which provides two careerpaths for job applicants, with one leading to a high-commitment, high-return career and the other leading to a low-commitment, low-return career.Employers then allow the applicants to choose either of these paths. Bygiving the applicants the right to choose, employers can avoid violating therequirements of the Equal Employment Act that was introduced in 1986.The resulting segregated career management by gender may be justified bythe economics of statistical discrimination against female workers who havedemonstrated their generally weak attachment and commitment to a job.
Nenko Living Wage Hypothesis. We call the third explanation the Nenkoliving wage hypothesis. The Nenko wage refers to both the pay principleand the wage paid based on this principle. The Nenko wage principle meansthat long service and hard work by an employee should be rewarded, andthat the pay should be determined according to this principle, withparticular attention given to the needs of employees.10 One implicitassumption behind this principle is its application only to male regularworkers who start their service at a young age, but not to female employeeseven if they are in regular status jobs.The definition of the Nenko wage presented here is a classical one and it is
rather difficult to find a firm that pays exclusively based on this principletoday. A contemporary interpretation of the Nenko wage is the wage that isbased on the mixture of Nenko and other principles. The Nenko wageprinciple can be realized in the work capability wage system. Under thissystem, it is a worker’s work capability grade that determines the wage. Weknow that capability evaluation (satei) includes elements prone to subjectivejudgment, as Endo (1994) demonstrated. It is very possible that manage-ment systematically gives lower appraisal scores to female workers at theirannual evaluation and sets the pay as well as the pay increase lower relativeto otherwise comparable male workers. If this kind of manipulation forfemale workers and a reverse manipulation for male workers wereundertaken, it could result in a Nenko living wage for male workers anda rather flat wage profile for female workers. The Nenko living wage
9This wording is borrowed from Wakisaka (1998).10The standard definition of the Nenko wage can be found in several places, including the popular
handbook of Japanese industrial relations by Shirai (1983).
536 / Yoshi-Fumi Nakata and Ryoji Takehiro
hypothesis includes this route to wage discrimination as well as the personalfactors route.But why do employers stick to the Nenko living wage principle and pay
only male workers more? Is there any rationale for this wage paymentsystem? One explanation purports that the Nenko living wage principleenhances overall work morale and, thus, improves labor productivity. Inother words, it simply pays. It is perceived to be a fair and a proper thing todo. This explanation is based on the belief that Japan is a country whereroles in a family are still clearly divided along gender lines (i.e., a husband isthe primary wage earner and a wife is at home in charge of domestic affairs).A corollary to this thesis is that a man should be paid enough to support afamily, while a woman’s pay can be minimized since she is not working for aliving and is at most supplementing her family budget. This is exactly whatBrown et al. (1997), after a three-year investigation of numerous Japanesefirms and offices, see as the Japanese socioeconomic system.11
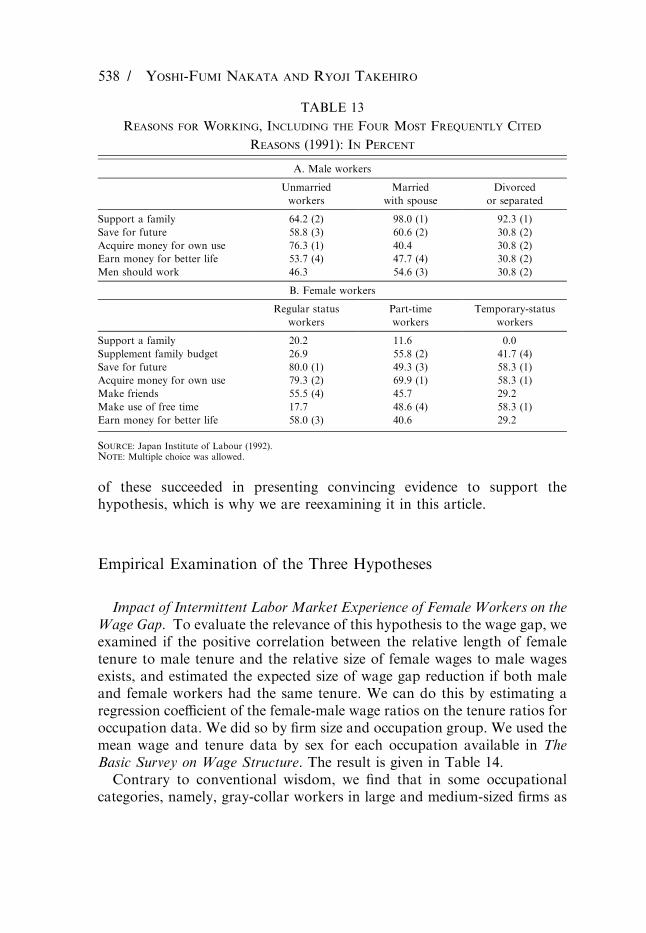
This picture of the Japanese family and the meaning of work looksomewhat out of date, but factual evidence is abundant to show therelevance of this picture to contemporary Japan. The same Japan Instituteof Labour survey used for Table 12 included a question concerning this.Table 13 reproduces its main findings.There is a choice of ‘‘to support a family’’ in the questionnaire, along with
11 other choices, but it was one of the least frequently cited reasons forfemale workers. The percentages for that choice are 20.2 percent, 11.6percent, and 0.0 percent for regular, part-time, and temporary workers,respectively. For male workers, and particularly for those who are marriedor have been married, it is the paramount reason to work and was chosen by98 percent and 92.3 percent of the respondents, respectively.Reflecting this widely accepted perception of a differentialmeaning ofwork
by sex, labor unions, particularly those whose membership is predominantlymale members, set up a wage principle based on the male worker’s life-cycleneeds. For example, the confederation of Japan Automobile Workers unionspublish their wage policy regularly, a principle clearly stated in the following:
Using the life-cycle needs applicable to auto industry workers as the base, wepursue the wage level, which properly rewards our hard work and consequentlyplaces us at the top of all industries. (JAW (1988), translation by the authors)
There have been several attempts to examine this line of explanation,including Sano (1984), Nakata (1997), and Nakata (1998). However, none
11Although they use the term ‘‘living wage,’’ it appears that they mean exactly the same as the wage
paid by the Nenko wage principle. See Brown et al. (1998:37).
Employment and Wages of Female Japanese Workers / 537
of these succeeded in presenting convincing evidence to support thehypothesis, which is why we are reexamining it in this article.
Empirical Examination of the Three Hypotheses
Impact of Intermittent Labor Market Experience of Female Workers on theWage Gap. To evaluate the relevance of this hypothesis to the wage gap, weexamined if the positive correlation between the relative length of femaletenure to male tenure and the relative size of female wages to male wagesexists, and estimated the expected size of wage gap reduction if both maleand female workers had the same tenure. We can do this by estimating aregression coefficient of the female-male wage ratios on the tenure ratios foroccupation data. We did so by firm size and occupation group. We used themean wage and tenure data by sex for each occupation available in TheBasic Survey on Wage Structure. The result is given in Table 14.Contrary to conventional wisdom, we find that in some occupational
categories, namely, gray-collar workers in large and medium-sized firms as
TABLE 13
Reasons for Working, Including the Four Most Frequently Cited
Reasons (1991): In Percent
A. Male workers
Unmarried
workers
Married
with spouse
Divorced
or separated
Support a family 64.2 (2) 98.0 (1) 92.3 (1)
Save for future 58.8 (3) 60.6 (2) 30.8 (2)
Acquire money for own use 76.3 (1) 40.4 30.8 (2)
Earn money for better life 53.7 (4) 47.7 (4) 30.8 (2)
Men should work 46.3 54.6 (3) 30.8 (2)
B. Female workers
Regular status
workers
Part-time
workers
Temporary-status
workers
Support a family 20.2 11.6 0.0
Supplement family budget 26.9 55.8 (2) 41.7 (4)
Save for future 80.0 (1) 49.3 (3) 58.3 (1)
Acquire money for own use 79.3 (2) 69.9 (1) 58.3 (1)
Make friends 55.5 (4) 45.7 29.2
Make use of free time 17.7 48.6 (4) 58.3 (1)
Earn money for better life 58.0 (3) 40.6 29.2
Source: Japan Institute of Labour (1992).Note: Multiple choice was allowed.
538 / Yoshi-Fumi Nakata and Ryoji Takehiro

well as white-collar workers in small firms, female workers actually havelonger tenure than male workers. This fact itself undermines the relevanceof this hypothesis, as it contradicts the basic assumption that femaleworkers have shorter tenure than male counterparts. The regression resultsalso show that for most firm-size and occupational groups, the outcomescontradict the hypothesis. First, among nine firm-size and occupationalgroups in the table only in four cases does the explanatory variable, i.e., thefemale-male tenure ratio, have a statistically significant positive impact onthe female-male wage ratio. For the other five groups, the relative size offemale tenure does not show any relation with the relative wage. Second,even among those four statistically significant cases, the impact of therelative tenure is very limited as the changes of the wage ratio are estimatedto be small.The results in Table 14 thus press us to look further for other
explanations of the sizable wage gap even after controlling for occupationand tenure differences by sex.
Impact of Segmented Career Paths on the Wage Gap. This hypothesispredicts that even among those who choose the same occupation, the actualcontents of work may be different between male and female workers. Maleworkers may be given more training opportunities and acquire more skillsthan female counterparts through double-track personnel management.Accordingly, wages may diverge among male and female workers of thesame occupation as they gain tenure and/or experience. We examine thepredictions for three occupations in Figure 3. The occupations are system
TABLE 14
Female/Male Wage and Tenure Ratios
Firm size Occupation Samples
Female/male
tenure ratio
Female/male
wage ratio
Wage ratio
after adjusted
tenure difference
Change of
wage ratio
Large white 24 0.78 0.78 0.86 0.08
gray 15 1.09 0.73 0.73 0.00
blue 68 0.89 0.68 0.69 0.01
Medium white 24 0.89 0.83 0.85 0.02
gray 15 1.19 0.83 0.84 0.01
blue 67 0.80 0.74 0.75 0.01
Small white 23 1.21 0.87 0.85 )0.02gray 14 0.90 0.74 0.76 0.01
blue 54 0.73 0.74 0.78 0.04
Source: Ministry of Labour, Basic Survey of Wage Structure, Vol.3, 2000.
Employment and Wages of Female Japanese Workers / 539
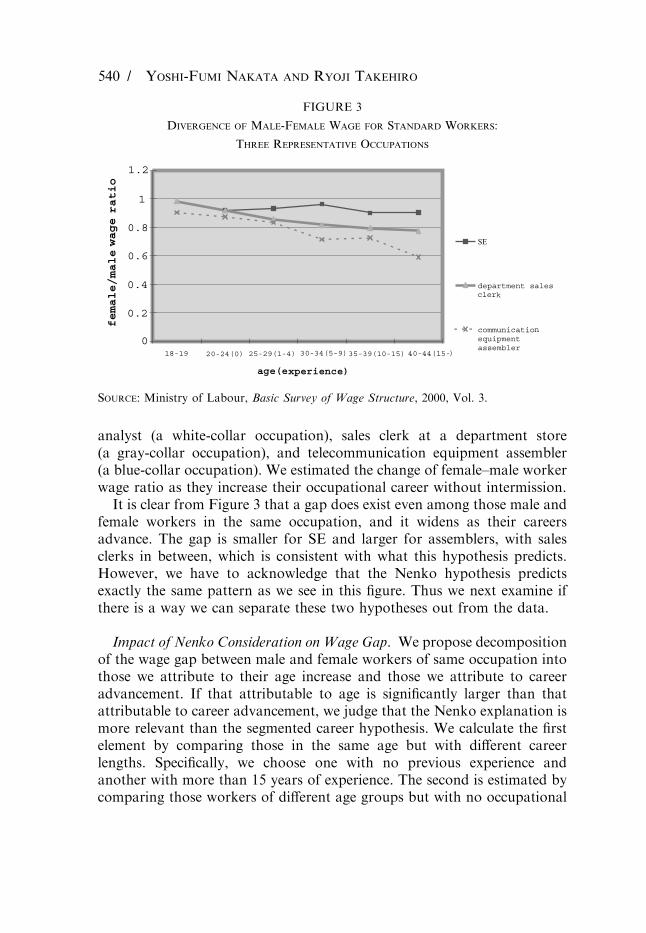
analyst (a white-collar occupation), sales clerk at a department store(a gray-collar occupation), and telecommunication equipment assembler(a blue-collar occupation). We estimated the change of female–male workerwage ratio as they increase their occupational career without intermission.It is clear from Figure 3 that a gap does exist even among those male and
female workers in the same occupation, and it widens as their careersadvance. The gap is smaller for SE and larger for assemblers, with salesclerks in between, which is consistent with what this hypothesis predicts.However, we have to acknowledge that the Nenko hypothesis predictsexactly the same pattern as we see in this figure. Thus we next examine ifthere is a way we can separate these two hypotheses out from the data.
Impact of Nenko Consideration on Wage Gap. We propose decompositionof the wage gap between male and female workers of same occupation intothose we attribute to their age increase and those we attribute to careeradvancement. If that attributable to age is significantly larger than thatattributable to career advancement, we judge that the Nenko explanation ismore relevant than the segmented career hypothesis. We calculate the firstelement by comparing those in the same age but with different careerlengths. Specifically, we choose one with no previous experience andanother with more than 15 years of experience. The second is estimated bycomparing those workers of different age groups but with no occupational
0
0.2
0.4
0.6
0.8
1
1.2
18-19 20-24(0) 25-29(1-4) 30-34(5-9)35-39(10-15) 40-44(15-)
age(experience)
female/malewageratio
SE
department sales clerk
communicationequipmentassembler
FIGURE 3
Divergence of Male-Female Wage for Standard Workers:
Three Representative Occupations
Source: Ministry of Labour, Basic Survey of Wage Structure, 2000, Vol. 3.
540 / Yoshi-Fumi Nakata and Ryoji Takehiro
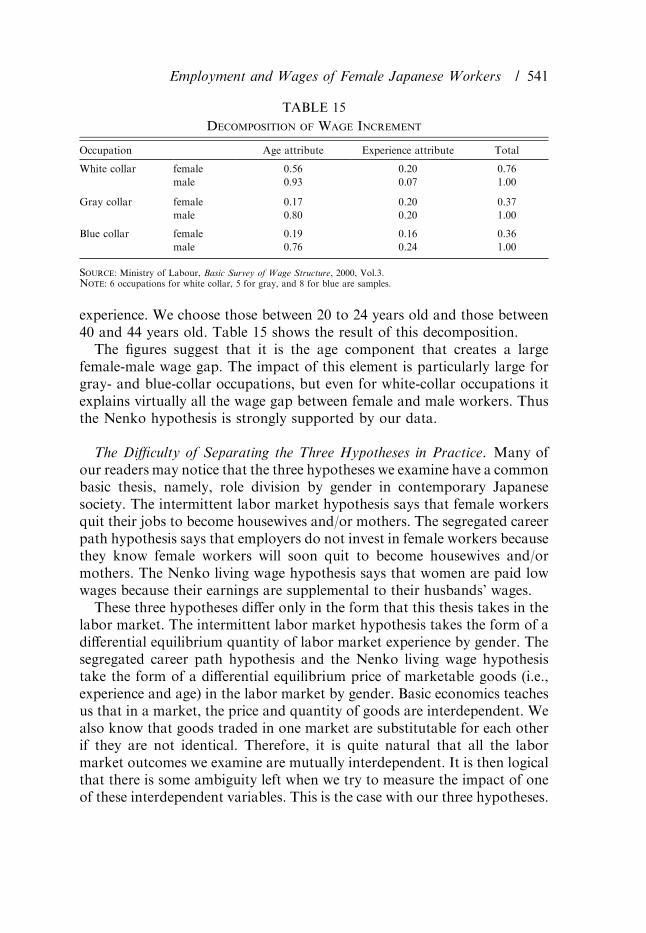
experience. We choose those between 20 to 24 years old and those between40 and 44 years old. Table 15 shows the result of this decomposition.The figures suggest that it is the age component that creates a large
female-male wage gap. The impact of this element is particularly large forgray- and blue-collar occupations, but even for white-collar occupations itexplains virtually all the wage gap between female and male workers. Thusthe Nenko hypothesis is strongly supported by our data.
The Difficulty of Separating the Three Hypotheses in Practice. Many ofour readers may notice that the three hypotheses we examine have a commonbasic thesis, namely, role division by gender in contemporary Japanesesociety. The intermittent labor market hypothesis says that female workersquit their jobs to become housewives and/or mothers. The segregated careerpath hypothesis says that employers do not invest in female workers becausethey know female workers will soon quit to become housewives and/ormothers. The Nenko living wage hypothesis says that women are paid lowwages because their earnings are supplemental to their husbands’ wages.These three hypotheses differ only in the form that this thesis takes in the
labor market. The intermittent labor market hypothesis takes the form of adifferential equilibrium quantity of labor market experience by gender. Thesegregated career path hypothesis and the Nenko living wage hypothesistake the form of a differential equilibrium price of marketable goods (i.e.,experience and age) in the labor market by gender. Basic economics teachesus that in a market, the price and quantity of goods are interdependent. Wealso know that goods traded in one market are substitutable for each otherif they are not identical. Therefore, it is quite natural that all the labormarket outcomes we examine are mutually interdependent. It is then logicalthat there is some ambiguity left when we try to measure the impact of oneof these interdependent variables. This is the case with our three hypotheses.
TABLE 15
Decomposition of Wage Increment
Occupation Age attribute Experience attribute Total
White collar female 0.56 0.20 0.76
male 0.93 0.07 1.00
Gray collar female 0.17 0.20 0.37
male 0.80 0.20 1.00
Blue collar female 0.19 0.16 0.36
male 0.76 0.24 1.00
Source: Ministry of Labour, Basic Survey of Wage Structure, 2000, Vol.3.Note: 6 occupations for white collar, 5 for gray, and 8 for blue are samples.
Employment and Wages of Female Japanese Workers / 541
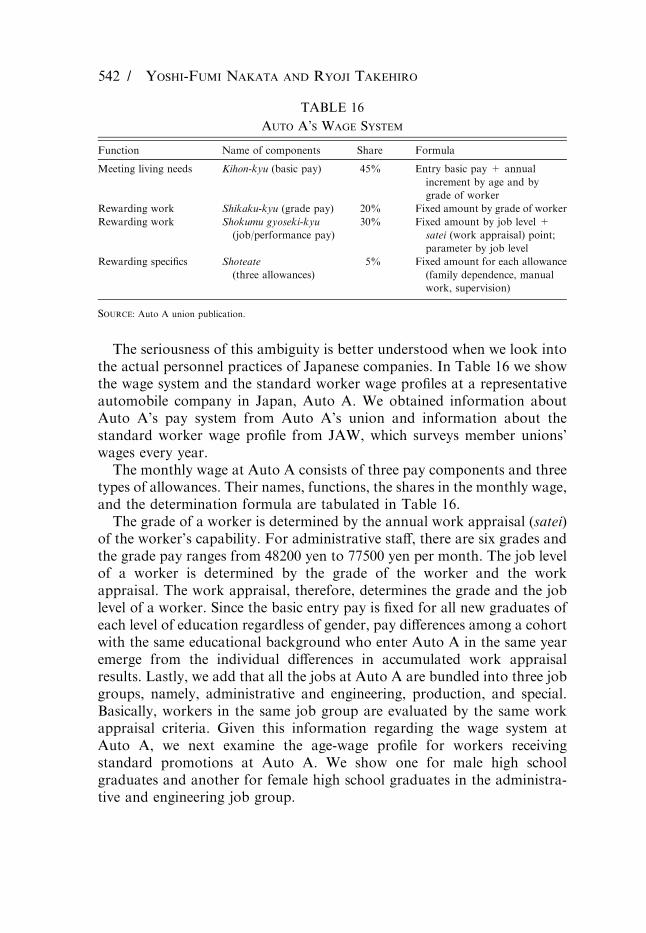
The seriousness of this ambiguity is better understood when we look intothe actual personnel practices of Japanese companies. In Table 16 we showthe wage system and the standard worker wage profiles at a representativeautomobile company in Japan, Auto A. We obtained information aboutAuto A’s pay system from Auto A’s union and information about thestandard worker wage profile from JAW, which surveys member unions’wages every year.The monthly wage at Auto A consists of three pay components and three
types of allowances. Their names, functions, the shares in the monthly wage,and the determination formula are tabulated in Table 16.The grade of a worker is determined by the annual work appraisal (satei)
of the worker’s capability. For administrative staff, there are six grades andthe grade pay ranges from 48200 yen to 77500 yen per month. The job levelof a worker is determined by the grade of the worker and the workappraisal. The work appraisal, therefore, determines the grade and the joblevel of a worker. Since the basic entry pay is fixed for all new graduates ofeach level of education regardless of gender, pay differences among a cohortwith the same educational background who enter Auto A in the same yearemerge from the individual differences in accumulated work appraisalresults. Lastly, we add that all the jobs at Auto A are bundled into three jobgroups, namely, administrative and engineering, production, and special.Basically, workers in the same job group are evaluated by the same workappraisal criteria. Given this information regarding the wage system atAuto A, we next examine the age-wage profile for workers receivingstandard promotions at Auto A. We show one for male high schoolgraduates and another for female high school graduates in the administra-tive and engineering job group.
TABLE 16
Auto A’s Wage System
Function Name of components Share Formula
Meeting living needs Kihon-kyu (basic pay) 45% Entry basic pay + annual
increment by age and by
grade of worker
Rewarding work Shikaku-kyu (grade pay) 20% Fixed amount by grade of worker
Rewarding work Shokumu gyoseki-kyu
(job/performance pay)
30% Fixed amount by job level +
satei (work appraisal) point;
parameter by job level
Rewarding specifics Shoteate
(three allowances)
5% Fixed amount for each allowance
(family dependence, manual
work, supervision)
Source: Auto A union publication.
542 / Yoshi-Fumi Nakata and Ryoji Takehiro
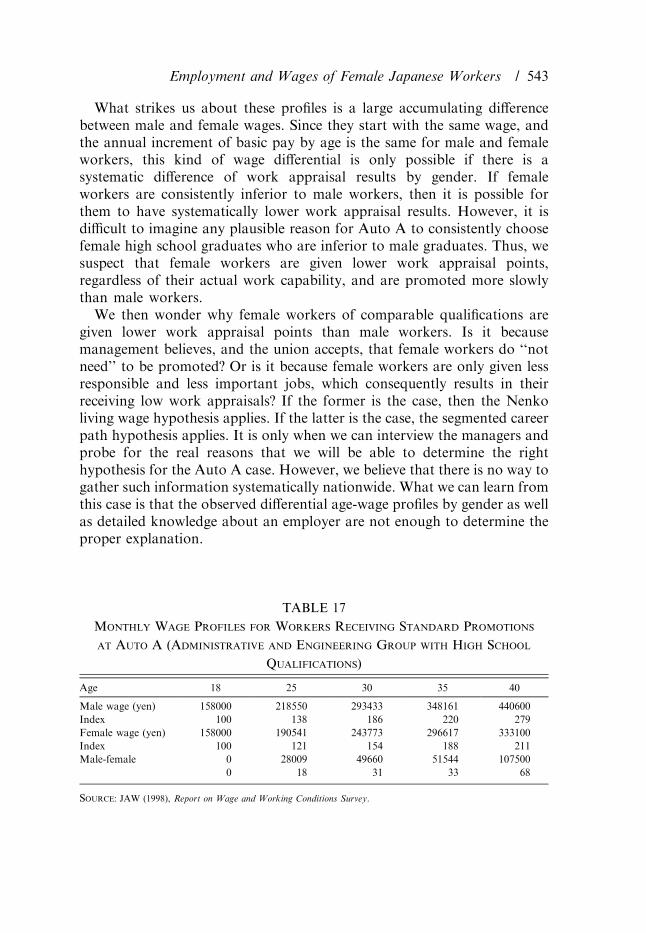
What strikes us about these profiles is a large accumulating differencebetween male and female wages. Since they start with the same wage, andthe annual increment of basic pay by age is the same for male and femaleworkers, this kind of wage differential is only possible if there is asystematic difference of work appraisal results by gender. If femaleworkers are consistently inferior to male workers, then it is possible forthem to have systematically lower work appraisal results. However, it isdifficult to imagine any plausible reason for Auto A to consistently choosefemale high school graduates who are inferior to male graduates. Thus, wesuspect that female workers are given lower work appraisal points,regardless of their actual work capability, and are promoted more slowlythan male workers.We then wonder why female workers of comparable qualifications are
given lower work appraisal points than male workers. Is it becausemanagement believes, and the union accepts, that female workers do ‘‘notneed’’ to be promoted? Or is it because female workers are only given lessresponsible and less important jobs, which consequently results in theirreceiving low work appraisals? If the former is the case, then the Nenkoliving wage hypothesis applies. If the latter is the case, the segmented careerpath hypothesis applies. It is only when we can interview the managers andprobe for the real reasons that we will be able to determine the righthypothesis for the Auto A case. However, we believe that there is no way togather such information systematically nationwide. What we can learn fromthis case is that the observed differential age-wage profiles by gender as wellas detailed knowledge about an employer are not enough to determine theproper explanation.
TABLE 17
Monthly Wage Profiles for Workers Receiving Standard Promotions
at Auto A (Administrative and Engineering Group with High School
Qualifications)
Age 18 25 30 35 40
Male wage (yen) 158000 218550 293433 348161 440600
Index 100 138 186 220 279
Female wage (yen) 158000 190541 243773 296617 333100
Index 100 121 154 188 211
Male-female 0 28009 49660 51544 107500
0 18 31 33 68
Source: JAW (1998), Report on Wage and Working Conditions Survey.
Employment and Wages of Female Japanese Workers / 543
Concluding Remarks
What Have We Learned from Our Expedition? Japanese women havemade substantial progress toward equal treatment in the workplace. Theyhave achieved one of the highest education levels and one of the leastsegregated occupational composition levels in the world, yet internationallycomparable national data place their wages relative to those of men at thebottom of world industrial economies. We thus pursued explanations forthese differentials between male and female workers engaging the sameoccupations at similar employers by examining three hypotheses based onthe peculiarities of the Japanese labor market.We first suspected that the frequent job separations of Japanese women
upon marriage and childbirth were the primary reason for reducing theirlabor market value. However, in each occupation, female workers werefound to be as stable as males by the measures of company tenure and thelength of occupational experience. Thus, the differentials of these measuresonly marginally explain the wage differentials.Calling to mind the common employment practice at large Japanese firms
called double-track personnel management, we then examined the possibil-ity of female workers being segregated into a nonpromotion track withineach occupation. However, we found that controlling for these factors doesnot much improve the wage gap.Finally, we considered the Nenko living wage hypothesis that empha-
sizes the socially accepted family role division by gender (i.e., the maleworker is the primary wage earner for a family and the female worker is asupplemental wage earner with little need of wage promotion). The datashowed a clear widening of the gap as workers age, even after controllingfor all the conventional variables. The impact of the profile difference bygender was substantial across occupations, and left as much as one-third ofthe male wage as the differential that may be explained by thisconsideration.We would like to offer two qualifications. One is that our data represent a
sizable but still specific segment of the entire Japanese labor market andthus care is necessary before generalizing the findings. The other is thenecessity to interpret our macro findings about the personnel managementpractices commonly found in Japanese companies by finding out how thesecompanies manage to pay less to female workers having the samequalifications as male workers, and how they make this acceptable to bothindividual workers and the unions.
544 / Yoshi-Fumi Nakata and Ryoji Takehiro
What Can We Say About the Future Prospects of Japanese WorkingWomen? In the course of writing this article, we encountered severalstartling facts. Sharing these with our readers may lead us to some usefulideas on the future prospects of Japanese working women.One of our concerns is with the way the Ministry of Labour’s official
occupational wage data are published. Our wage data source, The BasicSurvey of Wage Structure, has been conducted every year for the last 50years, although there have been some important changes. Throughout thesurvey’s history up to 1995, the Ministry published the occupational wagesurvey results for two separate lists of occupations, one for male workersand the other for female workers. Only small segments of these occupationsappeared in both lists, such as the 19 occupations we analyzed, leaving mostto appear only either in the male list or the female list. Given the report’spopularity as a wage reference for management and unions, this fact issuspected of affecting perceptions about men’s occupations and women’soccupations. Knowing that the Equal Employment Opportunity Law wasenacted as a result of the Ministry’s initiative in 1986, the ministry’spublication of lists of men’s and women’s occupations appears self-contradictory, to say the least.Our second concern is also about the publication of occupational wages,
but this time by labor unions. As we saw in the Auto A example, the Auto Aunion responded to Japan Auto Workers’ Union’s questionnaire onstandard workers’ wages by supplying separate numbers by gender. It isan eye-opening fact that there are such large wage differentials between menand women in the same job category who have the same educationalqualifications at one of Japan’s leading automobile companies, as we notedin Table 17. It is still more startling to learn that both the Auto A union aswell as JAW accept this as normal by calling these wages ‘‘standard wages.’’The automobile industry is not alone in publishing separate ‘‘standardwages’’ by gender in union wage surveys. The second largest private unionafter JAW, namely Denki-Rengo (Japanese Electrical Electronic andInformation Union), does this as well, as do many minor industrial unions.These two episodes raise questions about the effectiveness of labor policies
as well as unions’ initiatives concerning equal treatment of male and femaleworkers in Japan. We all know that a law without enforcement provisionsdoes not work. This was the situation in Japan with the 1986 EEOL untilApril 1, 1999. As noted in Table 2, the first version of this law had no meansof enforcement; it even had a clause allowing employers to post female-onlyjob ads, a clear contradiction of the principle of equal treatment. Only in1999 did a revised equal employment law that prohibits female-only postingsbecome effective. Therefore, we may have to wait several more years before
Employment and Wages of Female Japanese Workers / 545
we can discuss, in any meaningful way, the effectiveness of policy initiativeson this issue. The prospects are equally grim for workers’ initiatives,particularly for those proposed by labor unions.Japanese women have come a long way in the last 50 years, but their
journey has just begun.
References
Anker, Richard. 1998. Gender and Jobs: Sex Segregation of Occupations in the World. Geneva: Inter-
national Labour Organization.
Blau, Francine D., and Lawrence M. Kahn. 1995. ‘‘The Gender Earnings Gap: Some International
Evidence.’’ In Differences and Changes in Wage Structure, edited by Richard Freeman and
Lawrence F. Katz, pp. 105–43. Chicago, IL: University of Chicago Press.
Brown, Clair, Yoshifumi Nakata, Micheal Reich, and Lloyd Ulman. 1997. Work and Pay in the United
States and Japan. Oxford: Oxford University Press.
Chapman, B., and C. Mulvey. 1986. ‘‘An Analysis of the Origins of Sex Difference in Australian
Wages.’’ Journal of Industrial Relations 18:504–20.
Duncan, Otis Dudley, and Beverly Duncan. 1955. ‘‘A Methodological Analysis of Segregation Indexes.’’
American Sociological Review 20:210–17.
Endo, Koshi. 1994. ‘‘Satei (Personal Assessment) and Interworker Competition in Japanese Firms.’’
Industrial Relations 33:70–82.
Gunderson, Morley. 1994. Comparable Worth and Gender Discrimination: An International Perspective.
Japan Institute of Labour. 1992. Survey Research Report, No. 21, Tokyo: Japan Institute of Labour.
Jaw. 1988. Internal documents prepared for 1988 Spring Wage Offensive.
Jaw. 1998. Report on Wage and Working Conditions Survey. Tokyo: JAW.
Inoue, Teruko, and Yumiko Enara. 1995. Ministry of Labour,White Paper of Labour andWhite Paper
of Working Women.
Koike, Kazuo. 1988. Understanding Industrial Relations in Modern Japan. London: Macmillan.
Ministry of Labour, Japan. Various years. White Paper of Labour. Tokyo: Japan Institute of Labour.
Ministry of Labour, Japan. Various years. Monthly Labour Survey, Tokyo: Ministry of Labour.
Ministry of Labour, Japan. Various years. Basic Survey of Employment Structure, Tokyo: Ministry of
Labour.
———. Various years. Basic Survey of Wage Structure. Tokyo: Rodo Horei Kyokai.
Mitani, Naoki. 1995. ‘‘Jyosei Koyo to Danjyo Koyokikai Kinto Ho’’ [‘‘Female Employment and
Equal Employment Opportunity Act’’]. In Nihon no Koyo System to Rodoshijyo [Japanese
Employment System and Labour Market], edited by T. Inoki and Y. Higuchi, Tokyo: Nihonkeizai
Shinposya.
Nagase, Nobuko. 1999. ‘‘Factors for the Low Japanese Birth Rate’’ [‘‘Syoushika no Yoin’’]. Jinko
Mondai Kenkyu, forthcoming.
Nakata Yoshifumi. 1997. ‘‘Factor Analysis of Japanese Sex Wage Differentials’’ [‘‘Nihon ni okeru danjyo
chingin kakusa no yoinbunseki’’]. In Changes of Employment Practices and Female Labor
[Koyokanko no henka to jyosei rodo], edited by Hiroyuki Chuma and Terukazu Suruga. Tokyo:
University of Tokyo Press.
———.1998. ‘‘Canada:CanadianWageDifferentialswithSpecialAttention to itsOccupationalAge-Wage
Profile.’’ In Wage Differentials: An International Comparison, edited by Toshiaki Tachibanaki,
pp. 145–72. London: Macmillan.
OECD. 1988. OECD Employment Outlook 1988. Paris: OECD.
———. 1993. OECD Employment Outlook 1993. Paris: OECD.
———. 1998. Education at a Glance: OECD Indicators 1998. Paris: OECD.
Prime Ministers Office, Japan. Various years. Population Census, Tokyo: Ninon Tokei KyoKai.
546 / Yoshi-Fumi Nakata and Ryoji Takehiro
Reubens, Beatrice, and John A. C. Harrison. 1983. ‘‘Occupational Dissimilarity by Age and Sex.’’ In
Youth at Work: An International Survey, edited by B. Reubens, pp. 39–85. Towa, NJ: Rowman
and Allanhead.
Roos, Patricia A. 1985. Gender and Work: A Comparative Analysis of Industrial Societies. Stoneybrook,
NY: SUNY Press.
Rosenfeld, Rachel A., and Arne L. Kalleberg. 1991. ‘‘Gender Inequality in the Labour Market: A Cross-
National Perspective.’’ Acta Sociologica 34:207–25.
Rummery, Sarah. 1992. ‘‘The Contribution of Intermittent Labour Force Participation to the Gender
Wage Differentials.’’ Economic Record 68:351–64.
Sano, Yoko. 1984. ‘‘Koyokikai Kinto eno Rodokeizai Bunseki’’ [‘‘Labor Economic Analysis of Equal
Employment Opportunity’’]. Monthly Journal of the Japan Institute of Labour 26:2–12.
Shimada, Haruo. 1983. ‘‘Survey of the English-Language Literature.’’ In Contemporary Industrial
Relations in Japan, edited by Taishiro Shirui, MAdison, WI. University of Wisconsin Press.
Shirai, Taishiro. 1983. Contemporary Industrial Relations in Japan. Madison, WI: University of
Wisconsin Press.
Tachibanaki, Toshiaki. 1998. Wage Differentials: An International Comparison. London: Macmillan.
United Nations. 1995. The World’s Women 1995: Trends and Statistics. Social Statistics and Indicators,
Series K, No. 12. New York: United Nations.
Wakisaka, Akira. 1998. ‘‘Women at Work.’’ In Japanese Labour and Management in Transition, edited
by Mari Sako and Hiroki Sato. London: Routledge.
Employment and Wages of Female Japanese Workers / 547