migration, labor supply, wages and agriculture - citeseerx
TRANSCRIPT
Developing Country Studies www.iiste.org
ISSN 2224-607X (Paper) ISSN 2225-0565 (Online)
Vol.4, No.16, 2014
91
Migration, Labor Supply, Wages and Agriculture:
A Case Study in Rural Odisha
Mahendra P.Agasty (Corresponding Author)
Asst.Professor of Economics
Silicon Institute of Technology,Bhubaneswar, Odisha, India,Pin-751024
E-mail- [email protected]
Dr. Rabi N. Patra
Deputy Director (Studies),
Gopabandhu Academy of Administration, Bhubaneswar, Odisha, India,Pin-751023
Email- [email protected]
Abstract
Migration of unskilled labour out of agriculture is a basic characteristic of the process of industrialization,
urbanization, modernization and economic development both historically and contemporarily. This paper
outlines the recent developments in agricultural labour markets in rural odisha and investigates the issues of
agricultural out migration and their implications for agriculture both from theoretical and empirical perspectives.
The results indicate that migration does matter. It impacts on labour supply, real wage rate, productivity, output
and cropping pattern in agriculture. The overall results contradict the prognosis of the surplus labour model and
are consistent with the propositions of the market theory of wages as also with the findings of some of the earlier
studies concerning other countries/areas.
Keywords: Migration, Agriculture, Minimum Wages Act, Odisha, MNREGA
JEL Classification: J 61, R 23, Q12, Q15
Section I
Introduction
1.1 Backdrop
Since the mid-1980s the national and sub-national economies in India have been experiencing remarkable
economic growth and unprecedented structural transformation in the composition of domestic product, labour
markets and occupational patterns indicating a shift from a traditional agrarian economy towards one dominated
by the non-agricultural sector, especially by the services sector . The structural changes in the labour markets and
employment is reflected in a number of ways. These include massive movements of labour from the rural to the
urban areas and from the farm to the non-farm activities within the rural areas and growing participation of
women in paid work. Increasing urbanization with rapid growth of both formal and informal economic activities
in the urban centres; considerable diversification in the production pattern favoring petty trade, construction
works, small transport operations and the other services in the country side; and the operation of the Mahatma
Gandhi National Rural Employment Guarantee Scheme (MNREGS) have facilitated the observed change in the
occupational structure. Implementation of various government programmes for the below poverty lines (BPL)
rural households has been an important factor contributing to the change in work patterns and additionally to the
reduced participation of people in the labour markets (people prefer leisure to work). Consequently, workers are
getting increasingly disinterested in agriculture and are migrating to the urban centres for more lucrative
livelihood means. And the rural economy has exhibited exemplary dynamism leading to a significant decline in
the share of agriculture in both output and employment over the years.
Since labour is a vital input in agriculture, this situation reflects an inequlibrium between demand for and supply
of labor and the resultant labour shortage in the farm sector is pushing the wage rate persistently and perceptibly
upwards. Agricultural wages are increasing not only due to a demand-supply mismatch in the labour market but
also because of rising non-farm wages , so much so that the wages paid by the farmers are much higher than that
mandated by the minimum wage laws. Paradoxically enough, higher farm wages have failed to check the exodus
of labour from the agriculture sector to the non agriculture one and the impact on labour supply in agriculture
proved negative too. In the process, agriculture is suffering a dual loss shrinking labour supply and rising wages
and costs.
1.2 Review of Literature
Migration and rural development programme induced changes in sectoral labour flows and wage rates and the
fact that they have implications for productivity; production and cropping pattern in agriculture have been the
subject of much concern and fierce debate among researchers, planners and policy makers concerning labour,
Developing Country Studies www.iiste.org
ISSN 2224-607X (Paper) ISSN 2225-0565 (Online)
Vol.4, No.16, 2014
92
wages and agricultural policies. But surprisingly these issues have remained a less researched area as yet. A brief
review of available literature on the subject is presented here
In a recent work concerning Albania, Miluka et al. (2010) point to rural households using migration as a strategy
to move out of agriculture with remaining family members working significantly fewer hours in farm production
activities, both in total and on a per capita basis. In an earlier study using 2002 and 2003 Living Standard
Measurement Studies data on Albania, Mc Carthy et al. (2006) found evidence of a net increase in agricultural
income despite significant reduction in the allocation of labour to crop production. But according to a study by
Brennan et al. (2012) the impact of rural-urban migration on farm output appears to be very minimal with slight
increase in meat production and slight decrease in feed output in the Vietnamese agriculture.
Brauw (2010) examined the effect of seasonal migration on agricultural production on the basis of the Vietnam
Living Standards Survey data 1992-3 and 1997-8. He found that migrant households reduced their labour
involvement in agriculture more than the non-migrant ones and chosen to change the crop mix from a relatively
more labour intensive rice crop to comparatively more land-intensive non-rice crops. The study by Rozelle et al.
(1999) with respect to north east China is worth mentioning. They observed that migration lowers maize yields
due to reduced labour supply but migrant remittances more than compensate the lost labour effect and so yields
are higher for households with migrants than those without. However, some of the earlier studies (Lipton, 1980;
Palmer, 1985) show that migrant remittances presumably facilitate substitution of labour for leisure, reduce
labour efforts and lead to lower farm productivity. Similarly, studies by Funkhouser (1992), and Radrigue and
Tiongson (2001) also found lower labour participation on the farms on account of remittances. The results of
studies by Itzigsohn (1995), Germenji and Swinnen (2004), and Azam and Gulbert (2005) reveal that remittances
contribute to farm inefficiencies.
Ohajianya’s (2005) study in Imo sate of Nigeria suggests that labour migration out of agriculture and the
consequential labour shortage on the farms have negatively impacted on agricultural production. Parganiha et al.
(2009), from their study in Chattisgarh, observed that seasonal migration is the cause of labour shortage in
agriculture and since agriculture in the state is less mechanized and based primarily on manpower, agricultural
activities and production are adversely affected. The studies by Prabakar et al. (2011) in Cuddalore district of
Tamilnadu indicate acute shortage of labor for agricultural works affecting the productivity levels of all crops.
The works of Ofuoku and Chukwuji (2012) relating to Nigeria Delta reveals that migration leads to labour
shortage, incomplete harvesting, loss of farm revenue and hence impacts negatively on plantation agriculture.
An analysis of the above review reveals that existing works on the subject are time and area specific studies.
They do not shed any light on the impact of falling labour supply following migration and implementation of
rural development programmes on wages, costs, productivity, output and crop mix in agriculture. This paper is a
modest attempt to fill the research gap by examining the aforestated issues in agriculture at a micro level in the
state of Odisha, India.
1.3 Objectives of the study
The broad objectives of the study are as follows:
1. To discuss the issues in the labour market and determination of wages in agriculture
2. To analyse the causes of labour scarcity and wage increase in agriculture
3. To assess the effect of labour constraints and wage increase on cost structure, productivity and output in
agriculture
4. To examine the changes in cropping pattern due to labour shortage and wage rise in agriculture
1.4 Data base and Methodology
The study is based on both primary and secondary data. For collection of primary data a four stage random
sampling procedure has been followed in the study. Out of the 30 districts in the state one district was selected in
the first stage. In the second stage three blocks were selected from the district. From each block two villages
were selected in the third stage. In the final stage households were selected from the sample villages. Following
this process of elimination and selection, 100 households having sent 139 migrants,50 households with returned
migrants and 150 non-migrant households have been considered for in-depth investigation. Data have been
collected from the selected households through a well-designed pre-tested schedule canvassed in person among
them. The data relate to three years- 2002, 2007 and 2012. Since households do not keep any record of activities
and transactions, utmost care has been taken to elicit correct information from them and to minimize data
inaccuracies. Cross questioning and peer group discussion procedures have been adopted for the purpose.
Secondary data have been collected from the published sources and the same have been duly acknowledged in
Developing Country Studies www.iiste.org
ISSN 2224-607X (Paper) ISSN 2225-0565 (Online)
Vol.4, No.16, 2014
93
the paper. Simple statistical tools have been used to analyse data and draw conclusions therefrom
1.5 Structure of the study
The remainder of this paper is organized in four sections.The issues in agricultural labour market and
determination of farm wages have been discussed in the following section with insights from economic theory
and public policy. The results of our empirical survey have been presented in section 3.In section 4 we conclude
the paper with a summary of findings and some policy implications.
SECTION-II
The Agricultural Labour Market and Farm wages: Theories, Myths and Reality
Labour is an important factor input in agriculture. It accounts for more than 40 per cent of the total cost of
production of field crops. The determination of farm wages and the supply of labour to agriculture are, therefore,
central to any investigation concerning crop production and agricultural growth. The wage rate in agriculture is a
complex issue because it is conditioned by multiple forces such as the social, economic, cultural and institutional
arrangements obtaining in the farm sector and in the rural areas at large, by the wage rate in the non-farm sector
and in the urban areas, and by government policy. It also impacts on consumption, living standards and
efficiency of workers and well-being of the agricultural labour households as also on cost of production and
profitability of agriculture. The supply of labour to agriculture is an equally complex issue. It is determined by
mobility of labour, opportunities available in the non-farm sector and urban areas, the relative non-agricultural
wage rate and above all the workers’ attitude towards agriculture. In such view of things the broader
development paradigm stresses on agricultural labour and wages as both ends and means.
2.1 Wage Theories and Agriculture
Elementary microeconomic theory postulates a good number of principles of wage determination. Four such
theories which have conventionally been considered relevant to agriculture are analyzed here. The first of them
is the subsistence theory which conceived of the wage rates as the natural price of labour, the price necessary to
enable the laborers to subsist and to perpetuate their race without increase or diminution (Ricardo, 1815 in Sraffa,
1970).The second is the marginal productivity theory which envisages a wage rate equal to the marginal product
of labour Clark, 1899: Hicks, 1932; Marshall). The third one goes by the name of nutrionally based efficiency
wage hypothesis which links wages to efficiency and productivity of labour through
consumption.(Liebenstein,1957; Majumdar, 1959; Mirrlees, 1975, Rodgers, 1975; Stiglitz,1976).Finally, we
have the modern and market theory which views wages as the price of labour determined by the demand for and
supply of labour and hence by the relative bargaining power of the employers and the workers.
In primary producing low income traditional economies agriculture has long been identified with a small-scale
family-based economic activity. The small holder family farms use no hired labour or very little of them and the
use of paid labour is limited mostly to medium and large farms. With low industrialization and urbanization and
a small tertiary sector, the scope of non-farm employment is extremely limited. The rural workforce exhibit very
low mobility (geographical and occupational) and hence are engaged largely in the agricultural
sector.Unsuprisingly ,agriculture in these countries is dubbed as the subsistence sector and characterized by
unchanging technology, surplus labour and overcrowding with close-to-zero marginal product of labour (MPL),
a zero or negligible opportunity cost of labour outside agriculture and abysmally low and stable equilibrium
agricultural wage may also be explained by the existence of interlinked factor markets in agriculture and is
consistent with the practice of tied labour under which workers are attached to the agriculturists with a kind of
long term contract.
Traditional agriculture, surplus rural labour and a subsistence wage rate were the key building blocks of the dual
economy growth model (Lewis, 1954; Ranis-Fei, 1964).In the Lewis model, for example, economic
development takes place with expansion of the urban industrial sector fuelled by utilizing surplus labour drawn
from the subsistence sector at the given wage rate. When industrial expansion reaches a point at which surplus
rural labour is fully exhausted, then only wages in the subsistence sector can rise .Low rural and farm wages are
also the cornerstone of prominent migration theories ( Todaro, Harris Todaro ). Higher non-farm urban wages
relative to the subsistence low rural wages are the chief motivating force behind migration of agricultural
workers to the urban areas in the Todarian models. One implication of these models is that massive rural
migration can cause a labour shortage in the rural areas and can push up the rural wage rate above the prevailing
level.
2.2 The Minimum Wage Laws
Historically low wages were considered as the sine qua non of traditional stagnant agriculture. The worst
Developing Country Studies www.iiste.org
ISSN 2224-607X (Paper) ISSN 2225-0565 (Online)
Vol.4, No.16, 2014
94
situation was to be seen in countries like India where most of the rural population was dependent on agriculture,
dependency load in farm households was very high and in the absence of non-farm employment opportunities,
the agricultural labour market was flooded by countless number of unorganized landless labourers.
Contemporarily low agricultural wages are viewed as exploitation of labour and a human rights issue inducing
and rather compelling the governments in many countries to initiate and implement effective wage protection
policies.
With a view to addressing the plight of labour and protecting the interest of farm labour households, the
government of India entered into an era of regulation of agricultural wages by enacting the minimum wages act,
1948 with provision for fixation and periodic revision by a process and by invoking authority. The floor wage
was intended to provide for subsistence as well as preservation of efficiency with some measures of education,
medical requirements and amenities. It consists of a basic wage plus a cost of living index linked premium on it
and mandates employers not to pay a wage less than the prescribed minimum. Obviously, the meaningfulness of
the minimum wage law is contingent upon fixing it at a level above the market wage. The minimum wage for
unskilled labour in agriculture is now in vogue in all states of the country but they do differ across states and are
revised periodically through legislative action.
2.3 Myths and Reality
In this backdrop an examination of the state of labour supply and of wages in agriculture is worth sketching. The
marginal productivity principle is a curiosom in agricultural labour market, partly because it is difficult to
compute MPL and largely because MPL in developing countries’ agriculture is highly seasonal (Lucas,1987).
Further if one member of a family moves out of agriculture ,the remaining members may work additional hours
and in that case the output forgone and output added cannot be appropriately measured. Finally, withdrawal of
labour from agriculture being selective, a reasonably accurate measurement of forgone output may be a
herculean task. The subsistence and efficiency wages theories are equally vague. How much wage is needed to
meet subsistence requirement and how much of it can keep a worker efficient are the questions which are
difficult to resolve. Hence the conventional wage theories are unrealistic. The minimum wage law despite its
good intentions has been reduced to a useless fifth wheel too.
The operational impracticability and redundance of these theories and minimum wage laws is furthered by the
following. The economy has moved to a higher growth path and the employment opportunities have significantly
increased and diversified. The rural workers now have a wider choice of occupations and they exhibit
unprecedented geographical and occupational mobility. Migration to urban centres for livelihoods, a negative
attitude towards agricultural work and availability of MNREGA and other non-farm jobs have become
prominent now a days. Above all, the beneficiary oriented programmes for the BPL households have a negative
impact on labour force participation rate in the rural areas. All these have a decisive impact on the rural
households’ labour allocation decisions between on-farm and off-farm activities and on their desire to work per
se. As a consequence, the relative importance of agriculture in employment for the rural workers has declined
remarkably causing considerable reduction in labour supply to agriculture.
Significant changes have occurred in the demand for labour in agriculture. Farming, which was family-labour
based, traditional technology driven and a way of life kind of activity, underwent dramatic changes with the
advent and spread of Green Revolution technology. The new farm technology is not only capital intensive
involving small scale mechanization of most farm activities like cultivation,transplantation, weeding,
interculture, crop cuttings & carrying, thrashing, harvesting, processing and distribution but also land
augmenting and labour using. After all a machine has to be driven by a man. These developments along with
increasing cropping intensity and growing importance of timely farming operations have led to enormous rise in
the demand for agricultural labour. The emotional attachment of the people to their farm land and their strong
desire to cultivate own land despite odds rather than leasing them out and /or leaving them idle for fear of
damage to land quality have been the additional factors at work on the demand side.
In the face of an increasing demand for labour and a falling supply, agriculture is suffering from acute labour
scarcity and the notions of surplus rural labour , zero MPL and negligible opportunity cost of labour have
become misnomers. The agricultural labour market has started showing symptoms of monopoly. The farm wage
rate is practically determined by market forces of demand and supply and relative bargaining strength of the
transactors. The situation has taken a U turn with agricultural wages far exceeding the minimum prescribed by
law thus rendering the minimum wage law obsolete. In Marxian terminology, the expropriators are expropriated.
It is not only that farm wages have increased. The differences between wages for performing specific tasks and
those for multiple duties have become more pronounced too. Wages are also impacted by human capital
Developing Country Studies www.iiste.org
ISSN 2224-607X (Paper) ISSN 2225-0565 (Online)
Vol.4, No.16, 2014
95
differences and local labour market conditions. A single state-wide wage for farm workers even with similar
human capital does not exist. A new development in respect of farm wages has been the payment of piece wages
to workers.
2.4 Wage Determination in Agriculture
The determination of agricultural wages in developing countries like India is an intriguing issue of long standing
debate in academic and policy making circles. Since real wages of agricultural labour remained palpably low at
an unchanged level for a very long period of time, it was initially believed that they are determined by
subsistence, efficiency wage and marginal productivity (SEM) theories and by institutional forces. But of late , a
large body of literature based on scholarly empirical studies has emerged which indicate that agricultural real
wages have exhibited long term upward trends and are determined by the forces of demand for and supply of
farm labour indicating a resurgence of the neoclassical apparatus in explaining wage determination in
agriculture(Bardhan,1973,1977;Sukhatme,1978;Bardhan,1979,1979a;Rosenzweig,1978,1980;Vaidyanathan,198
0:Ahmed,1981;Lal,1984;Binswanger and Rosenzweig,1984; Lucas,1997).The focus of the debate is on the shape
of the labour supply and demand schedules.
The following figure illustrates different views on the determination of wages in the agriculture labour markets
in the developing countries.
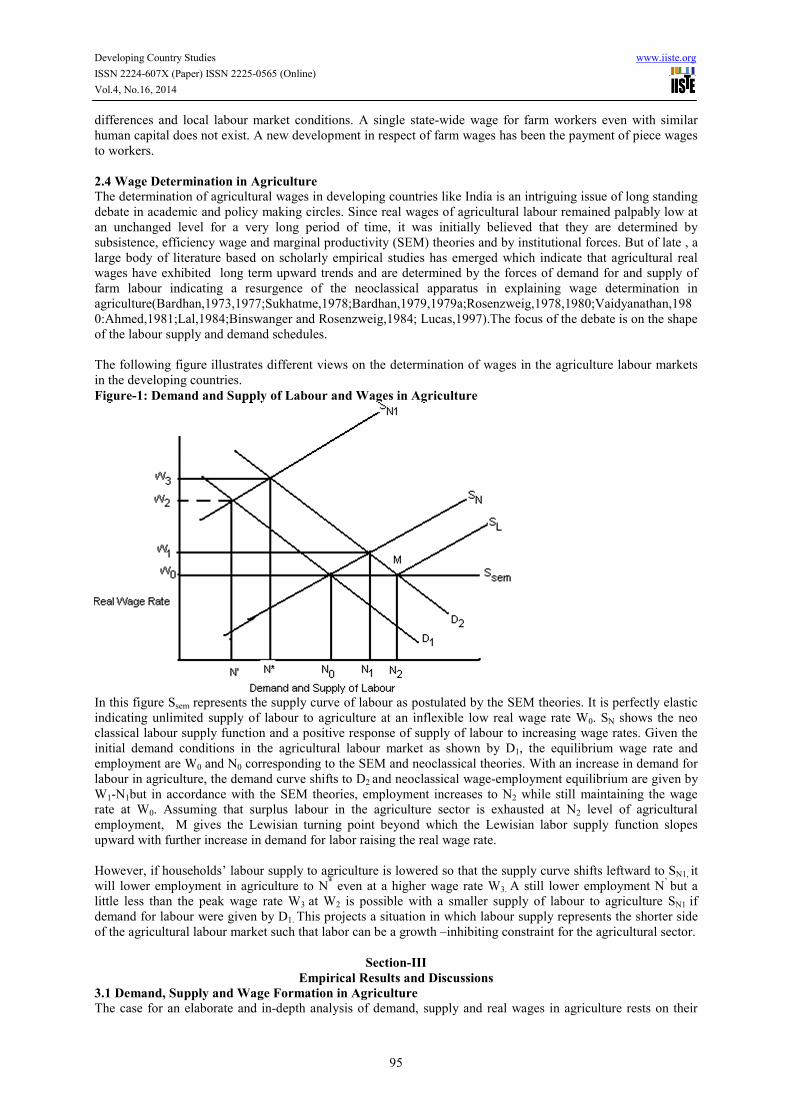
Figure-1: Demand and Supply of Labour and Wages in Agriculture
In this figure Ssem represents the supply curve of labour as postulated by the SEM theories. It is perfectly elastic
indicating unlimited supply of labour to agriculture at an inflexible low real wage rate W0. SN shows the neo
classical labour supply function and a positive response of supply of labour to increasing wage rates. Given the
initial demand conditions in the agricultural labour market as shown by D1, the equilibrium wage rate and
employment are W0 and N0 corresponding to the SEM and neoclassical theories. With an increase in demand for
labour in agriculture, the demand curve shifts to D2 and neoclassical wage-employment equilibrium are given by
W1-N1but in accordance with the SEM theories, employment increases to N2 while still maintaining the wage
rate at W0. Assuming that surplus labour in the agriculture sector is exhausted at N2 level of agricultural
employment, M gives the Lewisian turning point beyond which the Lewisian labor supply function slopes
upward with further increase in demand for labor raising the real wage rate.
However, if households’ labour supply to agriculture is lowered so that the supply curve shifts leftward to SN1, it
will lower employment in agriculture to N* even at a higher wage rate W3. A still lower employment N
’ but a
little less than the peak wage rate W3 at W2 is possible with a smaller supply of labour to agriculture SN1 if
demand for labour were given by D1. This projects a situation in which labour supply represents the shorter side
of the agricultural labour market such that labor can be a growth –inhibiting constraint for the agricultural sector.
Section-III
Empirical Results and Discussions
3.1 Demand, Supply and Wage Formation in Agriculture
The case for an elaborate and in-depth analysis of demand, supply and real wages in agriculture rests on their
Developing Country Studies www.iiste.org
ISSN 2224-607X (Paper) ISSN 2225-0565 (Online)
Vol.4, No.16, 2014
96
importance for examining the determinants of labour requirement, its availability and their relative role in wage
formation in the farm sector. It is also crucial for verification (confirmation/modification/rejection) of the recent
apprehension regarding acute labour shortage especially in peak period farm activities which demand more
labor .We intend to focus on these dimensions here with the help of primary data.
3.1.1 Demand for Farm Labour
The demand for farm labour comes from two categories of farm households. The first includes households with
large amounts of cultivated land who carry on agricultural operations with hired laborers and they use very little
family labour.The second comprises those with small amounts of land who operate largely with family labour.
They use very little paid labour and some of them also use exchange workers. Some households in both these
groups have migrants working outside and some are without them.
Labour demand in agriculture is observed to have been influenced by five sets of factors. The first is the pattern
of distribution of agricultural land. A highly unequal distribution means a large demand for paid labour while a
less skewed distribution calls for a smaller demand. The second is prevalence of tenancy. A high incidence of
tenancy will have less number of households using hired labour and the demand for paid workers will be low.
The most important factor is use of advanced farm technology which is labour-using. .Multiple cropping; intense
interculture and the consideration of economy in time which characterize new technology have led to large
increase in the demand for hired workers. Wage rate is another factor on the demand side. A higher agricultural
wage rate is likely to promote substitution of machinery and may induce landowners to lease out their land or
leave them fallow which means a smaller demand for labour. Finally, migration out of agriculture, by reducing
the number of workers who would otherwise have worked on their own farms, also leads to an increase in the
demand for wage workers.
In analyzing demand for labour in agriculture, we have made two simple assumptions. The first is the
assumption of a close agricultural labour market. This means that hiring workers across adjacent villages is rare
and can be ignored. Secondly, our primary data relate to month-wise per acre requirements of labour for
production of kharif paddy. We assume a given art of agriculture for all households over the period to estimate
the total labour requirement for three years i.e; 2002, 2007 and 2012.
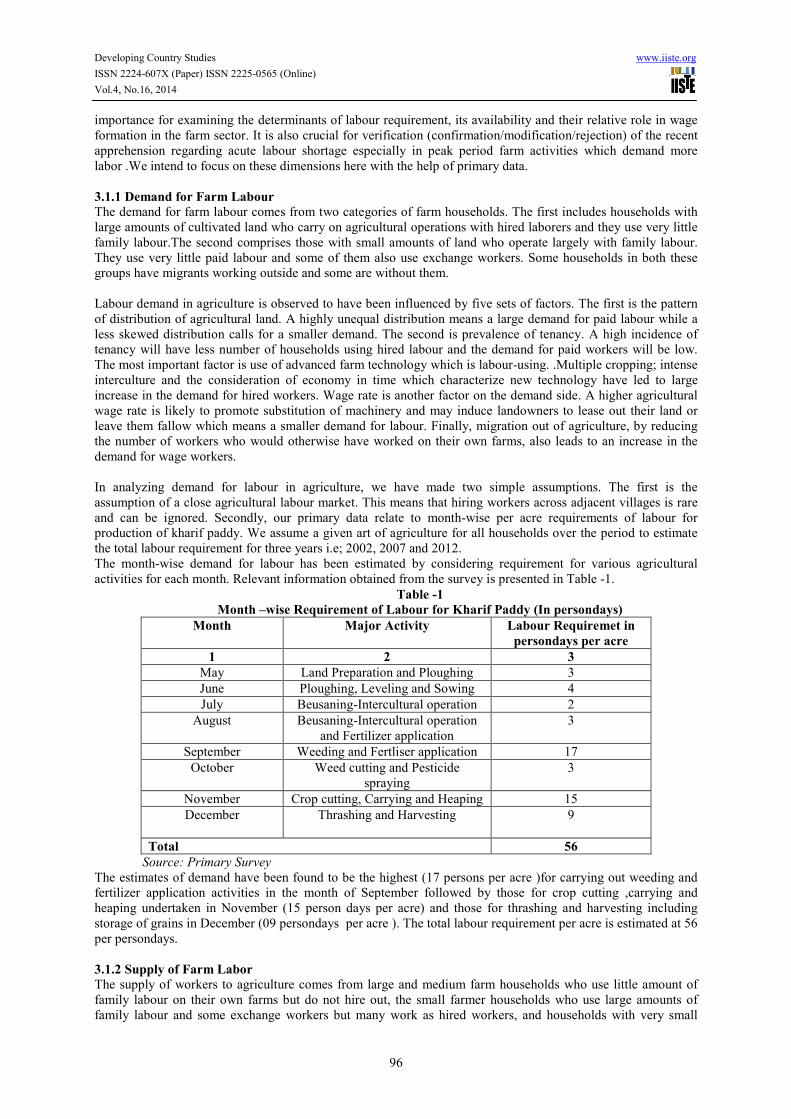
The month-wise demand for labour has been estimated by considering requirement for various agricultural
activities for each month. Relevant information obtained from the survey is presented in Table -1.
Table -1
Month –wise Requirement of Labour for Kharif Paddy (In persondays)
Month Major Activity Labour Requiremet in
persondays per acre
1 2 3
May Land Preparation and Ploughing 3
June Ploughing, Leveling and Sowing 4
July Beusaning-Intercultural operation 2
August Beusaning-Intercultural operation
and Fertilizer application
3
September Weeding and Fertliser application 17
October Weed cutting and Pesticide
spraying
3
November Crop cutting, Carrying and Heaping 15
December Thrashing and Harvesting 9
Total 56
Source: Primary Survey
The estimates of demand have been found to be the highest (17 persons per acre )for carrying out weeding and
fertilizer application activities in the month of September followed by those for crop cutting ,carrying and
heaping undertaken in November (15 person days per acre) and those for thrashing and harvesting including
storage of grains in December (09 persondays per acre ). The total labour requirement per acre is estimated at 56
per persondays.
3.1.2 Supply of Farm Labor
The supply of workers to agriculture comes from large and medium farm households who use little amount of
family labour on their own farms but do not hire out, the small farmer households who use large amounts of
family labour and some exchange workers but many work as hired workers, and households with very small
Developing Country Studies www.iiste.org
ISSN 2224-607X (Paper) ISSN 2225-0565 (Online)
Vol.4, No.16, 2014
97
amount of land or no land who are primarily dependent on wage income. Between migrant and non-migrant
households in the latter two groups, the supply of hired worker is more from the non-migrant categories. A
highly skewed distribution of agricultural land, a low incidence of tenancy and a large proportion of agricultural
workers in the total working population make a large supply of farm workers possible. A less unequal land
distribution, a high incidence of tenancy, a small proportion of agricultural workers, a more diversifies
employment structure and migration of workers to urban areas even in the face of rising rural wage rate tend to
lower the supply of labour to agriculture.
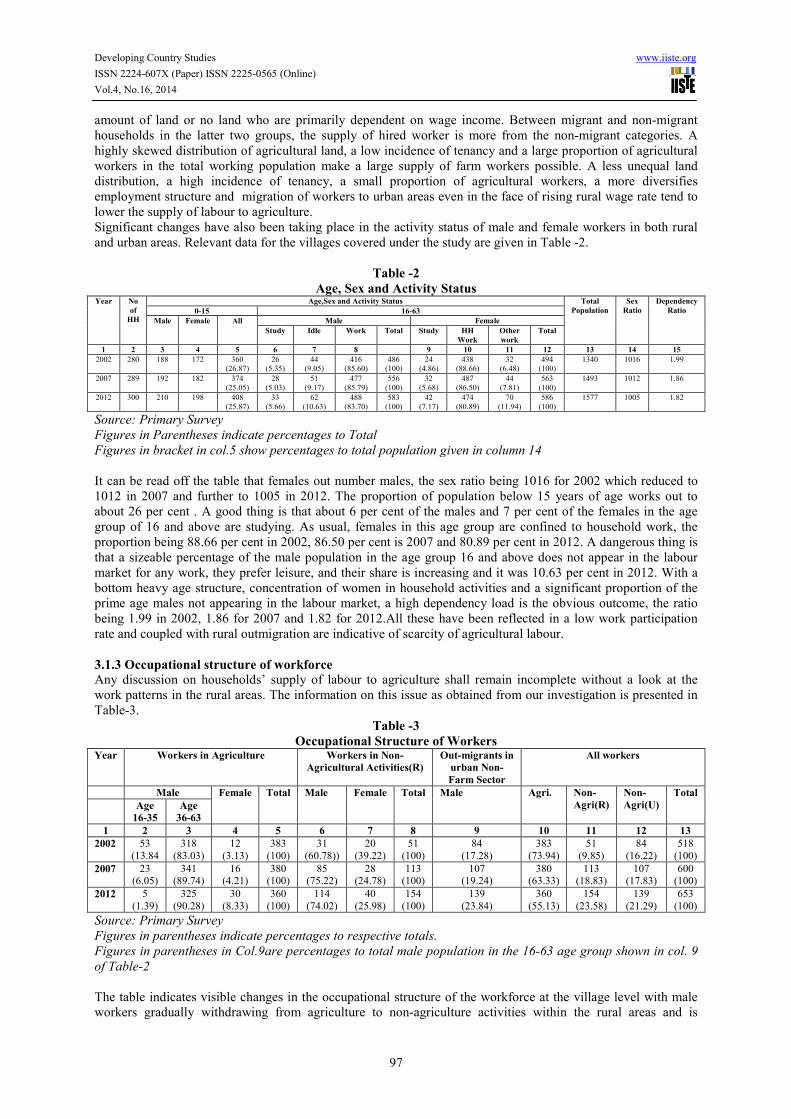
Significant changes have also been taking place in the activity status of male and female workers in both rural
and urban areas. Relevant data for the villages covered under the study are given in Table -2.
Table -2
Age, Sex and Activity Status Year No
of
HH
Age,Sex and Activity Status Total
Population
Sex
Ratio
Dependency
Ratio 0-15 16-63
Male Female All Male Female
Study Idle Work Total Study HH
Work
Other
work
Total
1 2 3 4 5 6 7 8 9 10 11 12 13 14 15
2002 280 188 172 360
(26.87)
26
(5.35)
44
(9.05)
416
(85.60)
486
(100)
24
(4.86)
438
(88.66)
32
(6.48)
494
(100)
1340 1016 1.99
2007 289 192 182 374
(25.05)
28
(5.03)
51
(9.17)
477
(85.79)
556
(100)
32
(5.68)
487
(86.50)
44
(7.81)
563
(100)
1493 1012 1.86
2012 300 210 198 408
(25.87)
33
(5.66)
62
(10.63)
488
(83.70)
583
(100)
42
(7.17)
474
(80.89)
70
(11.94)
586
(100)
1577 1005 1.82
Source: Primary Survey
Figures in Parentheses indicate percentages to Total
Figures in bracket in col.5 show percentages to total population given in column 14
It can be read off the table that females out number males, the sex ratio being 1016 for 2002 which reduced to
1012 in 2007 and further to 1005 in 2012. The proportion of population below 15 years of age works out to
about 26 per cent . A good thing is that about 6 per cent of the males and 7 per cent of the females in the age
group of 16 and above are studying. As usual, females in this age group are confined to household work, the
proportion being 88.66 per cent in 2002, 86.50 per cent is 2007 and 80.89 per cent in 2012. A dangerous thing is
that a sizeable percentage of the male population in the age group 16 and above does not appear in the labour
market for any work, they prefer leisure, and their share is increasing and it was 10.63 per cent in 2012. With a
bottom heavy age structure, concentration of women in household activities and a significant proportion of the
prime age males not appearing in the labour market, a high dependency load is the obvious outcome, the ratio
being 1.99 in 2002, 1.86 for 2007 and 1.82 for 2012.All these have been reflected in a low work participation
rate and coupled with rural outmigration are indicative of scarcity of agricultural labour.
3.1.3 Occupational structure of workforce
Any discussion on households’ supply of labour to agriculture shall remain incomplete without a look at the
work patterns in the rural areas. The information on this issue as obtained from our investigation is presented in
Table-3.
Table -3
Occupational Structure of Workers Year Workers in Agriculture Workers in Non-
Agricultural Activities(R)
Out-migrants in
urban Non-
Farm Sector
All workers
Male Female Total Male Female Total Male Agri. Non-
Agri(R)
Non-
Agri(U)
Total
Age
16-35
Age
36-63
1 2 3 4 5 6 7 8 9 10 11 12 13
2002 53
(13.84
318
(83.03)
12
(3.13)
383
(100)
31
(60.78))
20
(39.22)
51
(100)
84
(17.28)
383
(73.94)
51
(9.85)
84
(16.22)
518
(100)
2007 23 (6.05)
341 (89.74)
16 (4.21)
380 (100)
85 (75.22)
28 (24.78)
113 (100)
107 (19.24)
380 (63.33)
113 (18.83)
107 (17.83)
600 (100)
2012 5
(1.39)
325
(90.28)
30
(8.33)
360
(100)
114
(74.02)
40
(25.98)
154
(100)
139
(23.84)
360
(55.13)
154
(23.58)
139
(21.29)
653
(100)
Source: Primary Survey
Figures in parentheses indicate percentages to respective totals.
Figures in parentheses in Col.9are percentages to total male population in the 16-63 age group shown in col. 9
of Table-2
The table indicates visible changes in the occupational structure of the workforce at the village level with male
workers gradually withdrawing from agriculture to non-agriculture activities within the rural areas and is
Developing Country Studies www.iiste.org
ISSN 2224-607X (Paper) ISSN 2225-0565 (Online)
Vol.4, No.16, 2014
98
migrating to urban non-farm jobs. The absolute number of male workers in agriculture has declined from 371 in
2002 to 364 in 2007 and 330 in 2012. The number of prime age male workers (16-35 age group) is declining
faster. While the share of male workers in total agricultural workers has fallen from 96.87 per cent in 2002 to
95.79 per cent in 2007 and to 91.67 per cent in 2012,that in the prime age group has come down from 13.84 per
cent to 6.05 per cent and again to 1.39 per cent in these years respectively. This means that both the number and
share of female agricultural workers has increased over the years from 12 (3.13 per cent) to 16 (4.21 per cent)
and 30 (8.33 per cent) in the successive years, under reference. Agriculturists also prefer female workers because
male workers are not available and females work at lower wages. This situation reflects a kind of senilitisation of
male workforce and feminization in agriculture. Some diversification of work patterns has also taken place
within the rural areas with workers taking up MNREGA and other construction works, petty trade activities,
teaching and health worker jobs etc, and male out migration to urban areas. This is because the workers consider
manual farm work as non-prestigious and degrading but nonfarm work as less demanding and more prestigious.
The share of male migrants from the study villages working in urban areas in total workers in the 16-63 age
groups has increased from 17.28 per cent in 2002 to 19.24 per cent in 2007 and 55.13 per cent in 2012.
Considering all workers as a whole, the share of agriculture has declined drastically from 73.94 per cent in 2002
to 63.33 per cent in 2007 and 23.84 per cent in 2012. As can be seen from the table that rural and urban non-
agricultural activities in total employment has increased markedly during the period covered in the study. These
results fit well with the overall structural change in employment at the macro level favoring more knowledge
based and physically less cumbersome activities.
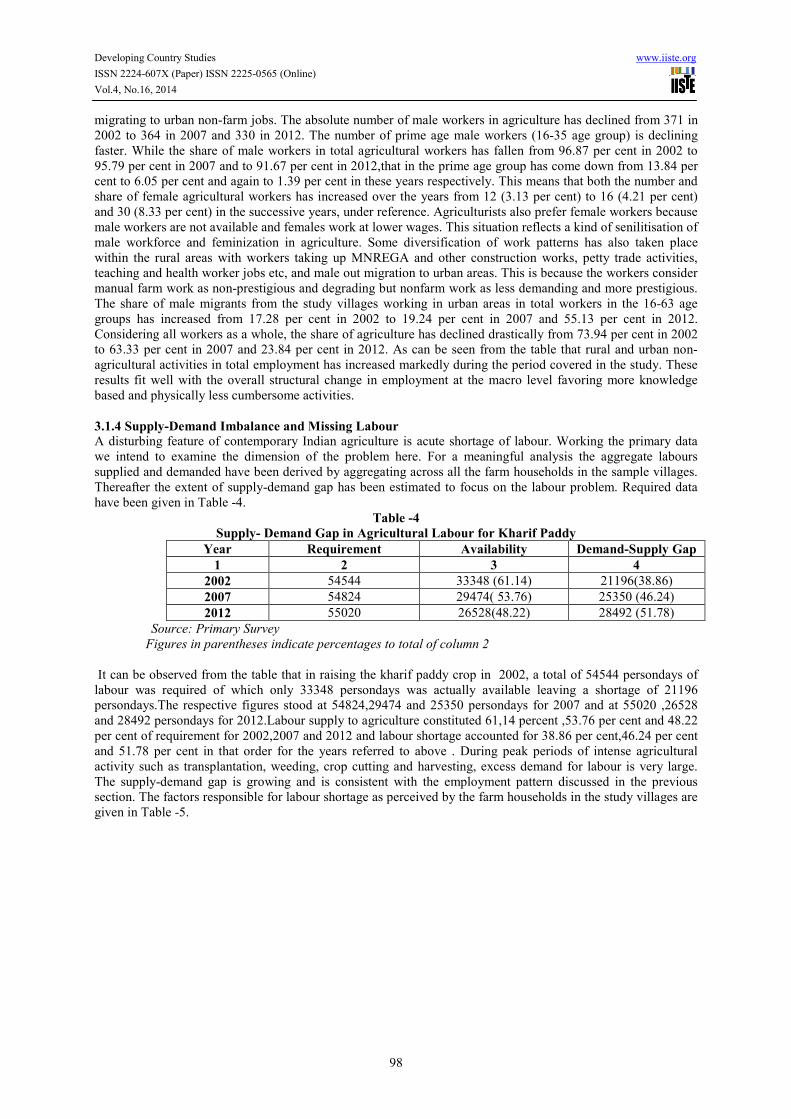
3.1.4 Supply-Demand Imbalance and Missing Labour
A disturbing feature of contemporary Indian agriculture is acute shortage of labour. Working the primary data
we intend to examine the dimension of the problem here. For a meaningful analysis the aggregate labours
supplied and demanded have been derived by aggregating across all the farm households in the sample villages.
Thereafter the extent of supply-demand gap has been estimated to focus on the labour problem. Required data
have been given in Table -4.
Table -4
Supply- Demand Gap in Agricultural Labour for Kharif Paddy
Year Requirement Availability Demand-Supply Gap
1 2 3 4
2002 54544 33348 (61.14) 21196(38.86)
2007 54824 29474( 53.76) 25350 (46.24)
2012 55020 26528(48.22) 28492 (51.78)
Source: Primary Survey
Figures in parentheses indicate percentages to total of column 2
It can be observed from the table that in raising the kharif paddy crop in 2002, a total of 54544 persondays of
labour was required of which only 33348 persondays was actually available leaving a shortage of 21196
persondays.The respective figures stood at 54824,29474 and 25350 persondays for 2007 and at 55020 ,26528
and 28492 persondays for 2012.Labour supply to agriculture constituted 61,14 percent ,53.76 per cent and 48.22
per cent of requirement for 2002,2007 and 2012 and labour shortage accounted for 38.86 per cent,46.24 per cent
and 51.78 per cent in that order for the years referred to above . During peak periods of intense agricultural
activity such as transplantation, weeding, crop cutting and harvesting, excess demand for labour is very large.
The supply-demand gap is growing and is consistent with the employment pattern discussed in the previous
section. The factors responsible for labour shortage as perceived by the farm households in the study villages are
given in Table -5.
Developing Country Studies www.iiste.org
ISSN 2224-607X (Paper) ISSN 2225-0565 (Online)
Vol.4, No.16, 2014
99
Table- 5
Causes of Labor Shortage
Causes Migrant HH Non-Migrant
HH
Return-Migrants
HH
All HH
1 2 3 4 5
Migration of labour 55(55.00) 81(54.00) 27(54) 163(54.33)
Food Security Programmes
for BPL
Families
25(25.00) 39(26.00) 12(24) 76(25.33)
Preference for non-farm
work
15(15.00) 21(14.00) 8 (16) 44(14.66)
Negative attitude towards
Agriculture
05(5.00) 09 (6.00) 03(6) 17(5.66)
Total 100(100.00) 150(100.00) 50(100) 300(100)
Source: Primary Survey
Figures in Parentheses indicate Percentage to Total
Migration out of agriculture has been reported to be the most important reason for labour shortage in agriculture
and more than 54 per cent of the households covered under the study have cited migration out of agriculture as
their first response cause .It is followed by food security programmes for the BPL families such as provision of
25-35 kgs of rice at Rs 2/kg recently lowered to Rs1/kg in odisha. This has been reported by 25 per cent of farm
households. Preferences for non-farm work in the rural areas and a negative attitude towards agriculture have
been reported by the respondents (15 per cent and 6 per cent respectively) as the other causes. A more or less
uniform pattern of response has been observed in all the three categories of farm households surveyed by us. In
the course of focus group discussion (FGDs) held in the villages two things came out .The first is that people are
not interested in agriculture and are withdrawing from agricultural work gradually. While the well-to-do consider
working on the farm as a low esteem job, the people dependent upon wage income view agricultural work more
demanding and less wage yielding compared to non-farm work in the rural and urban areas. Many of the workers
have migrated out not because wage work is not available in the rural areas but more because they do not intend
to do physical work in agriculture. The problem of workers opting out of agriculture causing labour scarcity in
this sector can be paraphrased as “missing labour” in agriculture. Secondly, the farm households also came out
in the open against the governments’ heavily subsidized rice programmes which induce people to stay away
from the labour market and enjoy free riding and leisure in the face of acute labour shortage in agriculture. This
is taking a toll on agriculture.
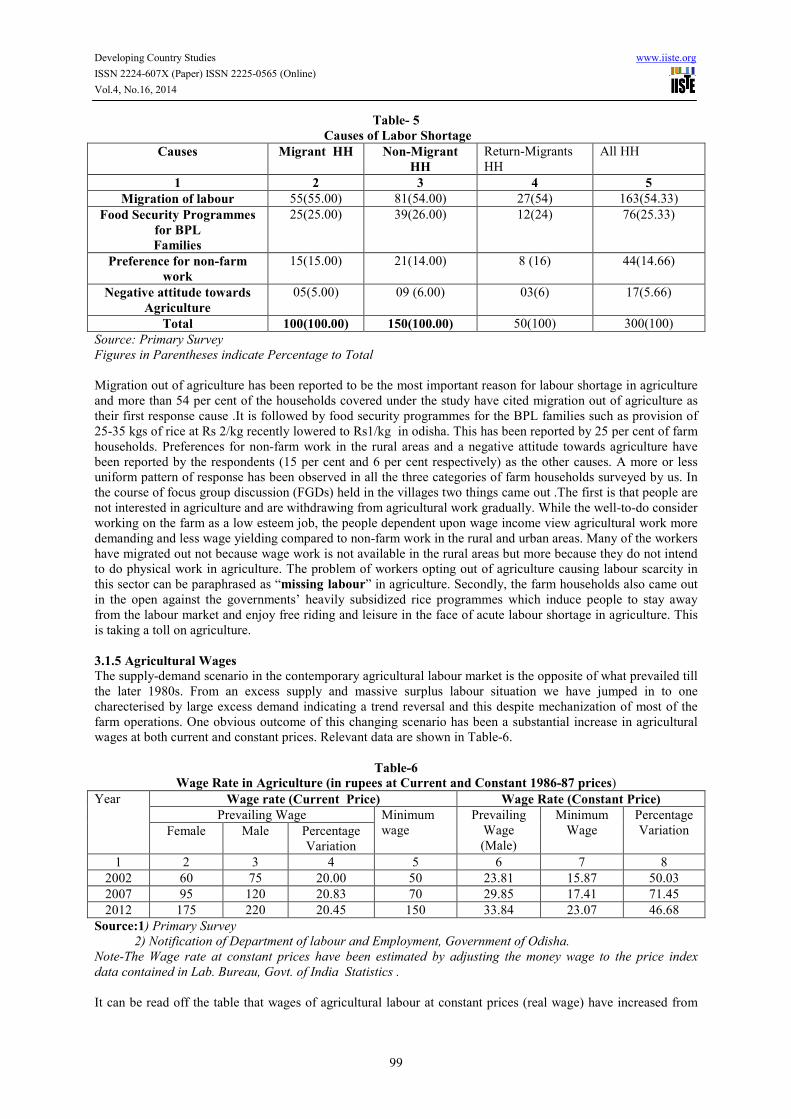
3.1.5 Agricultural Wages
The supply-demand scenario in the contemporary agricultural labour market is the opposite of what prevailed till
the later 1980s. From an excess supply and massive surplus labour situation we have jumped in to one
charecterised by large excess demand indicating a trend reversal and this despite mechanization of most of the
farm operations. One obvious outcome of this changing scenario has been a substantial increase in agricultural
wages at both current and constant prices. Relevant data are shown in Table-6.
Table-6
Wage Rate in Agriculture (in rupees at Current and Constant 1986-87 prices)
Year Wage rate (Current Price) Wage Rate (Constant Price)
Prevailing Wage Minimum
wage
Prevailing
Wage
(Male)
Minimum
Wage
Percentage
Variation Female Male Percentage
Variation
1 2 3 4 5 6 7 8
2002 60 75 20.00 50 23.81 15.87 50.03
2007 95 120 20.83 70 29.85 17.41 71.45
2012 175 220 20.45 150 33.84 23.07 46.68
Source:1) Primary Survey
2) Notification of Department of labour and Employment, Government of Odisha.
Note-The Wage rate at constant prices have been estimated by adjusting the money wage to the price index
data contained in Lab. Bureau, Govt. of India Statistics .
It can be read off the table that wages of agricultural labour at constant prices (real wage) have increased from
Developing Country Studies www.iiste.org
ISSN 2224-607X (Paper) ISSN 2225-0565 (Online)
Vol.4, No.16, 2014
100
Rs 23.81 in 2002 to 29.85 in 2007 and Rs 33.84 in 2012. The increase is much higher at current prices-the
figures being Rs 75,Rs 120 and Rs 220 for the years in that order. The upward trend in agricultural wages
implies that the farm sector has reached the Lewesian turning point. Again, the market wage rates were
substantially higher than the minimum wage rate prescribed for unskilled labour in agriculture. While prevailing
wages were 50.03 per cent, greater than minimum wages in 2002, they stood at 71.45 per cent and 46.68 per cent
above the latter in 2007 and 2012 respectively. This bears a direct relationship with overall economic growth,
increase in farm productivity, and structural transformation in the economy. And more importantly, it invalidates
the hypothesis that labour is immiserising.
Our survey reveals gender differences in agricultural wages. The market wages of women agricultural workers
continue to remain much below that of male farm workers even though the minimum wage laws mandate gender
neutral wages. Women are paid around 20 per cent less than men in wages. It is thus clear that minimum wage
provisions are not contributing to wage equalization across gender.
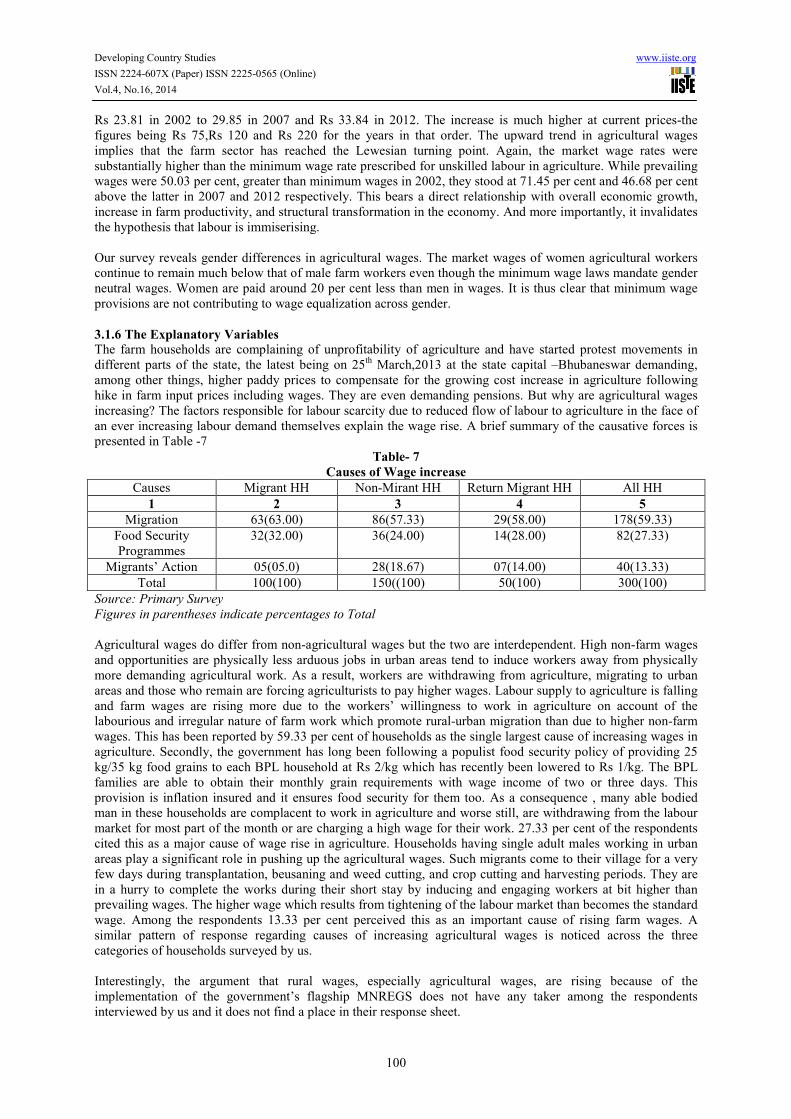
3.1.6 The Explanatory Variables The farm households are complaining of unprofitability of agriculture and have started protest movements in
different parts of the state, the latest being on 25th
March,2013 at the state capital –Bhubaneswar demanding,
among other things, higher paddy prices to compensate for the growing cost increase in agriculture following
hike in farm input prices including wages. They are even demanding pensions. But why are agricultural wages
increasing? The factors responsible for labour scarcity due to reduced flow of labour to agriculture in the face of
an ever increasing labour demand themselves explain the wage rise. A brief summary of the causative forces is
presented in Table -7
Table- 7
Causes of Wage increase
Causes Migrant HH Non-Mirant HH Return Migrant HH All HH
1 2 3 4 5
Migration 63(63.00) 86(57.33) 29(58.00) 178(59.33)
Food Security
Programmes
32(32.00) 36(24.00) 14(28.00) 82(27.33)
Migrants’ Action 05(05.0) 28(18.67) 07(14.00) 40(13.33)
Total 100(100) 150((100) 50(100) 300(100)
Source: Primary Survey
Figures in parentheses indicate percentages to Total
Agricultural wages do differ from non-agricultural wages but the two are interdependent. High non-farm wages
and opportunities are physically less arduous jobs in urban areas tend to induce workers away from physically
more demanding agricultural work. As a result, workers are withdrawing from agriculture, migrating to urban
areas and those who remain are forcing agriculturists to pay higher wages. Labour supply to agriculture is falling
and farm wages are rising more due to the workers’ willingness to work in agriculture on account of the
labourious and irregular nature of farm work which promote rural-urban migration than due to higher non-farm
wages. This has been reported by 59.33 per cent of households as the single largest cause of increasing wages in
agriculture. Secondly, the government has long been following a populist food security policy of providing 25
kg/35 kg food grains to each BPL household at Rs 2/kg which has recently been lowered to Rs 1/kg. The BPL
families are able to obtain their monthly grain requirements with wage income of two or three days. This
provision is inflation insured and it ensures food security for them too. As a consequence , many able bodied
man in these households are complacent to work in agriculture and worse still, are withdrawing from the labour
market for most part of the month or are charging a high wage for their work. 27.33 per cent of the respondents
cited this as a major cause of wage rise in agriculture. Households having single adult males working in urban
areas play a significant role in pushing up the agricultural wages. Such migrants come to their village for a very
few days during transplantation, beusaning and weed cutting, and crop cutting and harvesting periods. They are
in a hurry to complete the works during their short stay by inducing and engaging workers at bit higher than
prevailing wages. The higher wage which results from tightening of the labour market than becomes the standard
wage. Among the respondents 13.33 per cent perceived this as an important cause of rising farm wages. A
similar pattern of response regarding causes of increasing agricultural wages is noticed across the three
categories of households surveyed by us.
Interestingly, the argument that rural wages, especially agricultural wages, are rising because of the
implementation of the government’s flagship MNREGS does not have any taker among the respondents
interviewed by us and it does not find a place in their response sheet.
Developing Country Studies www.iiste.org
ISSN 2224-607X (Paper) ISSN 2225-0565 (Online)
Vol.4, No.16, 2014
101
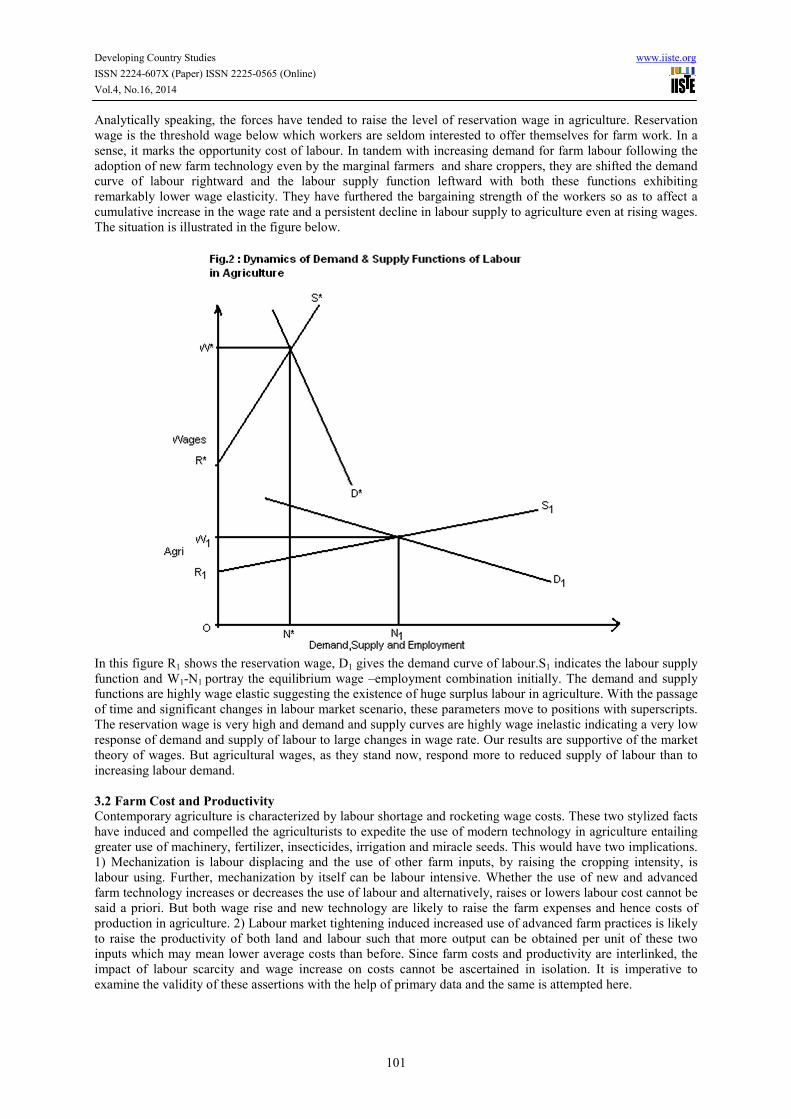
Analytically speaking, the forces have tended to raise the level of reservation wage in agriculture. Reservation
wage is the threshold wage below which workers are seldom interested to offer themselves for farm work. In a
sense, it marks the opportunity cost of labour. In tandem with increasing demand for farm labour following the
adoption of new farm technology even by the marginal farmers and share croppers, they are shifted the demand
curve of labour rightward and the labour supply function leftward with both these functions exhibiting
remarkably lower wage elasticity. They have furthered the bargaining strength of the workers so as to affect a
cumulative increase in the wage rate and a persistent decline in labour supply to agriculture even at rising wages.
The situation is illustrated in the figure below.
In this figure R1 shows the reservation wage, D1 gives the demand curve of labour.S1 indicates the labour supply
function and W1-N1 portray the equilibrium wage –employment combination initially. The demand and supply
functions are highly wage elastic suggesting the existence of huge surplus labour in agriculture. With the passage
of time and significant changes in labour market scenario, these parameters move to positions with superscripts.
The reservation wage is very high and demand and supply curves are highly wage inelastic indicating a very low
response of demand and supply of labour to large changes in wage rate. Our results are supportive of the market
theory of wages. But agricultural wages, as they stand now, respond more to reduced supply of labour than to
increasing labour demand.
3.2 Farm Cost and Productivity
Contemporary agriculture is characterized by labour shortage and rocketing wage costs. These two stylized facts
have induced and compelled the agriculturists to expedite the use of modern technology in agriculture entailing
greater use of machinery, fertilizer, insecticides, irrigation and miracle seeds. This would have two implications.
1) Mechanization is labour displacing and the use of other farm inputs, by raising the cropping intensity, is
labour using. Further, mechanization by itself can be labour intensive. Whether the use of new and advanced
farm technology increases or decreases the use of labour and alternatively, raises or lowers labour cost cannot be
said a priori. But both wage rise and new technology are likely to raise the farm expenses and hence costs of
production in agriculture. 2) Labour market tightening induced increased use of advanced farm practices is likely
to raise the productivity of both land and labour such that more output can be obtained per unit of these two
inputs which may mean lower average costs than before. Since farm costs and productivity are interlinked, the
impact of labour scarcity and wage increase on costs cannot be ascertained in isolation. It is imperative to
examine the validity of these assertions with the help of primary data and the same is attempted here.
Developing Country Studies www.iiste.org
ISSN 2224-607X (Paper) ISSN 2225-0565 (Online)
Vol.4, No.16, 2014
102
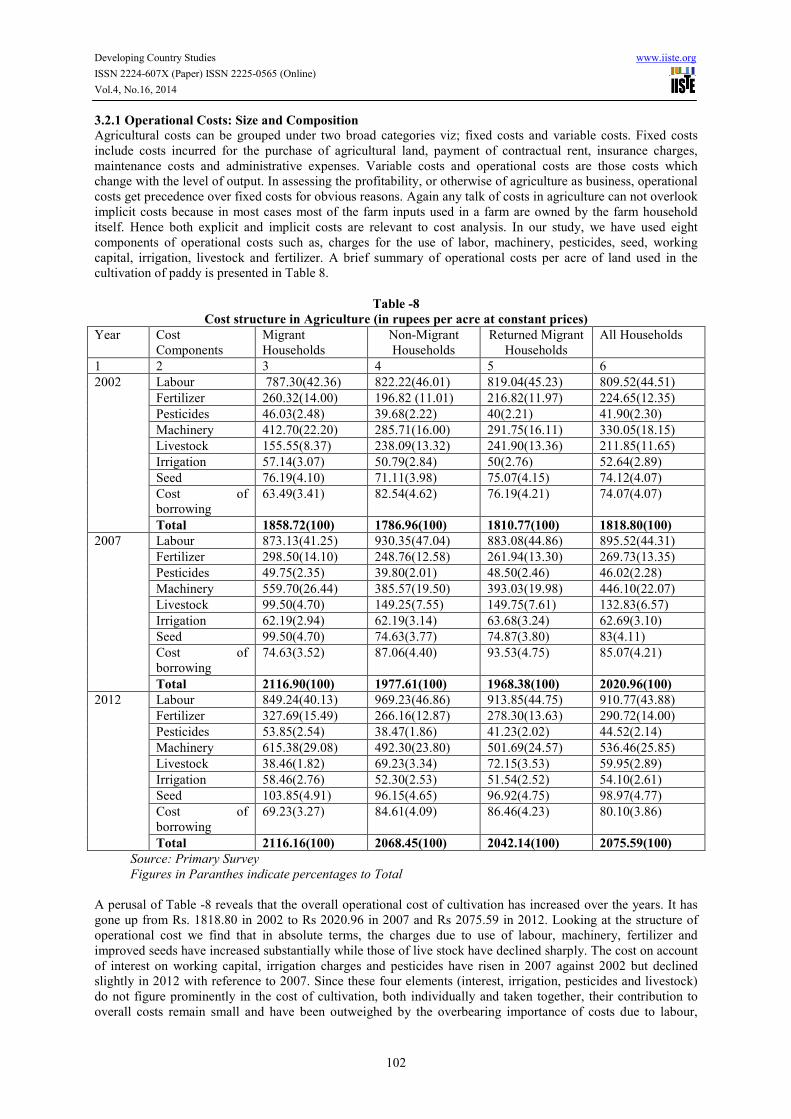
3.2.1 Operational Costs: Size and Composition
Agricultural costs can be grouped under two broad categories viz; fixed costs and variable costs. Fixed costs
include costs incurred for the purchase of agricultural land, payment of contractual rent, insurance charges,
maintenance costs and administrative expenses. Variable costs and operational costs are those costs which
change with the level of output. In assessing the profitability, or otherwise of agriculture as business, operational
costs get precedence over fixed costs for obvious reasons. Again any talk of costs in agriculture can not overlook
implicit costs because in most cases most of the farm inputs used in a farm are owned by the farm household
itself. Hence both explicit and implicit costs are relevant to cost analysis. In our study, we have used eight
components of operational costs such as, charges for the use of labor, machinery, pesticides, seed, working
capital, irrigation, livestock and fertilizer. A brief summary of operational costs per acre of land used in the
cultivation of paddy is presented in Table 8.
Table -8
Cost structure in Agriculture (in rupees per acre at constant prices)
Year Cost
Components
Migrant
Households
Non-Migrant
Households
Returned Migrant
Households
All Households
1 2 3 4 5 6
2002 Labour 787.30(42.36) 822.22(46.01) 819.04(45.23) 809.52(44.51)
Fertilizer 260.32(14.00) 196.82 (11.01) 216.82(11.97) 224.65(12.35)
Pesticides 46.03(2.48) 39.68(2.22) 40(2.21) 41.90(2.30)
Machinery 412.70(22.20) 285.71(16.00) 291.75(16.11) 330.05(18.15)
Livestock 155.55(8.37) 238.09(13.32) 241.90(13.36) 211.85(11.65)
Irrigation 57.14(3.07) 50.79(2.84) 50(2.76) 52.64(2.89)
Seed 76.19(4.10) 71.11(3.98) 75.07(4.15) 74.12(4.07)
Cost of
borrowing
63.49(3.41) 82.54(4.62) 76.19(4.21) 74.07(4.07)
Total 1858.72(100) 1786.96(100) 1810.77(100) 1818.80(100)
2007 Labour 873.13(41.25) 930.35(47.04) 883.08(44.86) 895.52(44.31)
Fertilizer 298.50(14.10) 248.76(12.58) 261.94(13.30) 269.73(13.35)
Pesticides 49.75(2.35) 39.80(2.01) 48.50(2.46) 46.02(2.28)
Machinery 559.70(26.44) 385.57(19.50) 393.03(19.98) 446.10(22.07)
Livestock 99.50(4.70) 149.25(7.55) 149.75(7.61) 132.83(6.57)
Irrigation 62.19(2.94) 62.19(3.14) 63.68(3.24) 62.69(3.10)
Seed 99.50(4.70) 74.63(3.77) 74.87(3.80) 83(4.11)
Cost of
borrowing
74.63(3.52) 87.06(4.40) 93.53(4.75) 85.07(4.21)
Total 2116.90(100) 1977.61(100) 1968.38(100) 2020.96(100)
2012 Labour 849.24(40.13) 969.23(46.86) 913.85(44.75) 910.77(43.88)
Fertilizer 327.69(15.49) 266.16(12.87) 278.30(13.63) 290.72(14.00)
Pesticides 53.85(2.54) 38.47(1.86) 41.23(2.02) 44.52(2.14)
Machinery 615.38(29.08) 492.30(23.80) 501.69(24.57) 536.46(25.85)
Livestock 38.46(1.82) 69.23(3.34) 72.15(3.53) 59.95(2.89)
Irrigation 58.46(2.76) 52.30(2.53) 51.54(2.52) 54.10(2.61)
Seed 103.85(4.91) 96.15(4.65) 96.92(4.75) 98.97(4.77)
Cost of
borrowing
69.23(3.27) 84.61(4.09) 86.46(4.23) 80.10(3.86)
Total 2116.16(100) 2068.45(100) 2042.14(100) 2075.59(100)
Source: Primary Survey
Figures in Paranthes indicate percentages to Total
A perusal of Table -8 reveals that the overall operational cost of cultivation has increased over the years. It has
gone up from Rs. 1818.80 in 2002 to Rs 2020.96 in 2007 and Rs 2075.59 in 2012. Looking at the structure of
operational cost we find that in absolute terms, the charges due to use of labour, machinery, fertilizer and
improved seeds have increased substantially while those of live stock have declined sharply. The cost on account
of interest on working capital, irrigation charges and pesticides have risen in 2007 against 2002 but declined
slightly in 2012 with reference to 2007. Since these four elements (interest, irrigation, pesticides and livestock)
do not figure prominently in the cost of cultivation, both individually and taken together, their contribution to
overall costs remain small and have been outweighed by the overbearing importance of costs due to labour,
Developing Country Studies www.iiste.org
ISSN 2224-607X (Paper) ISSN 2225-0565 (Online)
Vol.4, No.16, 2014
103
machinery, fertilizer and seeds which continue to be large and rising leading to a continuous increase in costs per
acre of land.
A glimpse of the breakup of operational costs as depicted in Table-8 also reflects shifts in the relative importance
of different components in the overall cost of production of paddy. On comparing the elements it has been
revealed that the share of cost of human labour has declined marginally from44.51` percent in 2002 to 44.31
percent in 2007 and to 43.88 percent in 2012 while that of machinery has gone up remarkably from 18.15
percent in 2002 to 22.07 percent 2007 and to 25.85 percent in 2012. The percentage shares of fertilizer and seeds
have registered some increase but that of draught labour has declined drastically from 11.65 per cent in 2002 to
6.57 per cent in 2007 and to 2.89 per cent in 2012. The relative shares of interest, irrigation and pesticides have
remained roughly stable at around 4 per cent, 3 per cent and 2 per cent respectively over the years considered in
the study.
It is evident from the table that labour cost continues to be the single largest component of total operational cost
of cultivation accounting for about 44 per cent of the total. The wage cost in absolute terms has been increasing
despite a fall in use of labour and increasing mechanization, thanks to the ever increasing wage rate. This
suggests that agriculture still continues to be a highly labor-intensive activity and that the scope for
mechanization is not unlimited. Second to human labour is the cost due to use of machines and tools which
continues to shoot up over the years. This is followed by fertilizer cost, interest charges, livestock charges,
irrigation costs and expenditure on pesticides in that order. This shift in the relative contribution of individual
components of cost of cultivation is suggestive of the fact that agriculture is commercialising and modernizing.
A similar picture of costs of production and shifts in the comparative importance of the elements is discernible
across the three categories of households covered in the study. However, the decline in the share of labour cost
and the increase in charges on account of machinery and fertilizer use are little higher for the migrant households
than for the returned migrant and non-migrant households. Between the latter two household categories, the
respective shifts are bit greater for the returned migrant households.
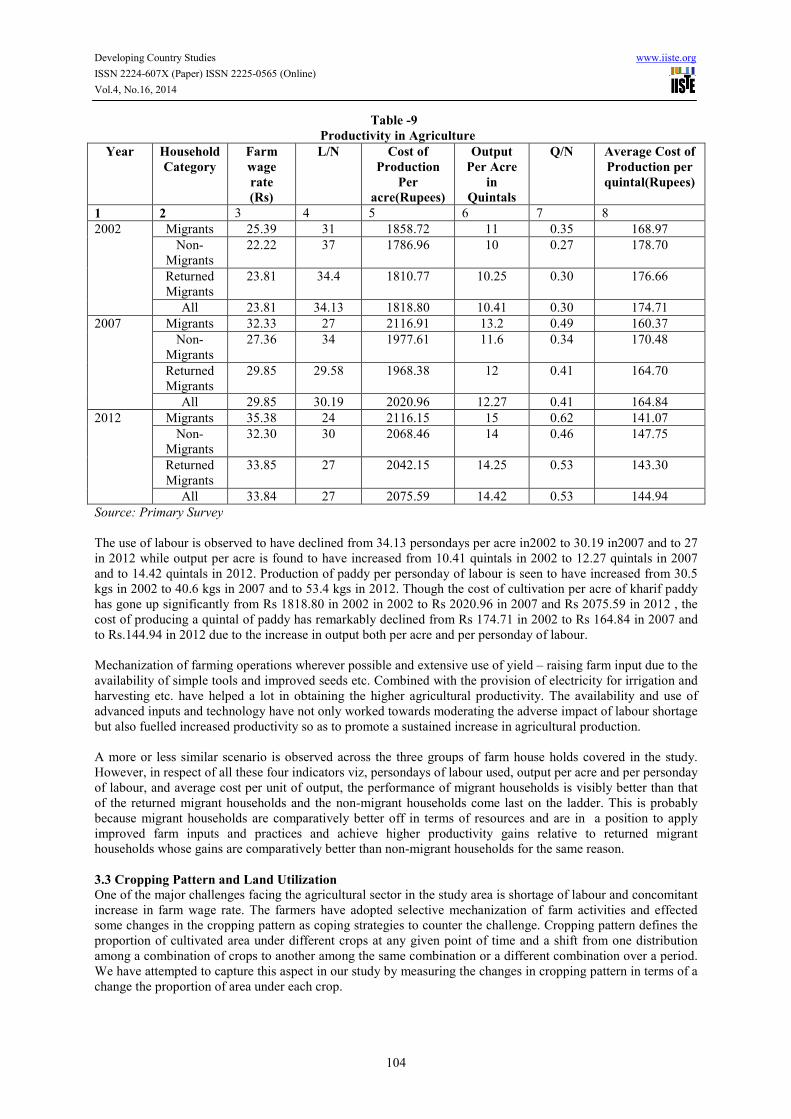
3.2.2 Productivity in Agriculture
We define agricultural productivity in terms of output of kharif paddy per cropped acre and per personday of
labour assuming that land, labour and machinery have a more or less stable relationship in agriculture. Our
assumption is based on the observed low degree of substitutability among these three factors. Since costs and
output per unit of cultivated land are uniquely related, the average cost of paddy can also shed some light on the
issue of viability and profitability in agriculture. Information relating to these dimensions in agriculture are
presented in Table -9.A consistent decline in persondays of labour used per cropped acre and a persistent
increase is the output of paddy both per acre and per personday of labour are clearly visible in Table-9.
Developing Country Studies www.iiste.org
ISSN 2224-607X (Paper) ISSN 2225-0565 (Online)
Vol.4, No.16, 2014
104
Table -9
Productivity in Agriculture
Year Household
Category
Farm
wage
rate
(Rs)
L/N
Cost of
Production
Per
acre(Rupees)
Output
Per Acre
in
Quintals
Q/N Average Cost of
Production per
quintal(Rupees)
1 2 3 4 5 6 7 8
2002 Migrants 25.39 31 1858.72 11 0.35 168.97
Non-
Migrants
22.22 37 1786.96 10 0.27 178.70
Returned
Migrants
23.81 34.4 1810.77 10.25 0.30 176.66
All 23.81 34.13 1818.80 10.41 0.30 174.71
2007 Migrants 32.33 27 2116.91 13.2 0.49 160.37
Non-
Migrants
27.36 34 1977.61 11.6 0.34 170.48
Returned
Migrants
29.85 29.58 1968.38 12 0.41 164.70
All 29.85 30.19 2020.96 12.27 0.41 164.84
2012 Migrants 35.38 24 2116.15 15 0.62 141.07
Non-
Migrants
32.30 30 2068.46 14 0.46 147.75
Returned
Migrants
33.85 27 2042.15 14.25 0.53 143.30
All 33.84 27 2075.59 14.42 0.53 144.94
Source: Primary Survey
The use of labour is observed to have declined from 34.13 persondays per acre in2002 to 30.19 in2007 and to 27
in 2012 while output per acre is found to have increased from 10.41 quintals in 2002 to 12.27 quintals in 2007
and to 14.42 quintals in 2012. Production of paddy per personday of labour is seen to have increased from 30.5
kgs in 2002 to 40.6 kgs in 2007 and to 53.4 kgs in 2012. Though the cost of cultivation per acre of kharif paddy
has gone up significantly from Rs 1818.80 in 2002 in 2002 to Rs 2020.96 in 2007 and Rs 2075.59 in 2012 , the
cost of producing a quintal of paddy has remarkably declined from Rs 174.71 in 2002 to Rs 164.84 in 2007 and
to Rs.144.94 in 2012 due to the increase in output both per acre and per personday of labour.
Mechanization of farming operations wherever possible and extensive use of yield – raising farm input due to the
availability of simple tools and improved seeds etc. Combined with the provision of electricity for irrigation and
harvesting etc. have helped a lot in obtaining the higher agricultural productivity. The availability and use of
advanced inputs and technology have not only worked towards moderating the adverse impact of labour shortage
but also fuelled increased productivity so as to promote a sustained increase in agricultural production.
A more or less similar scenario is observed across the three groups of farm house holds covered in the study.
However, in respect of all these four indicators viz, persondays of labour used, output per acre and per personday
of labour, and average cost per unit of output, the performance of migrant households is visibly better than that
of the returned migrant households and the non-migrant households come last on the ladder. This is probably
because migrant households are comparatively better off in terms of resources and are in a position to apply
improved farm inputs and practices and achieve higher productivity gains relative to returned migrant
households whose gains are comparatively better than non-migrant households for the same reason.
3.3 Cropping Pattern and Land Utilization
One of the major challenges facing the agricultural sector in the study area is shortage of labour and concomitant
increase in farm wage rate. The farmers have adopted selective mechanization of farm activities and effected
some changes in the cropping pattern as coping strategies to counter the challenge. Cropping pattern defines the
proportion of cultivated area under different crops at any given point of time and a shift from one distribution
among a combination of crops to another among the same combination or a different combination over a period.
We have attempted to capture this aspect in our study by measuring the changes in cropping pattern in terms of a
change the proportion of area under each crop.
Developing Country Studies www.iiste.org
ISSN 2224-607X (Paper) ISSN 2225-0565 (Online)
Vol.4, No.16, 2014
105
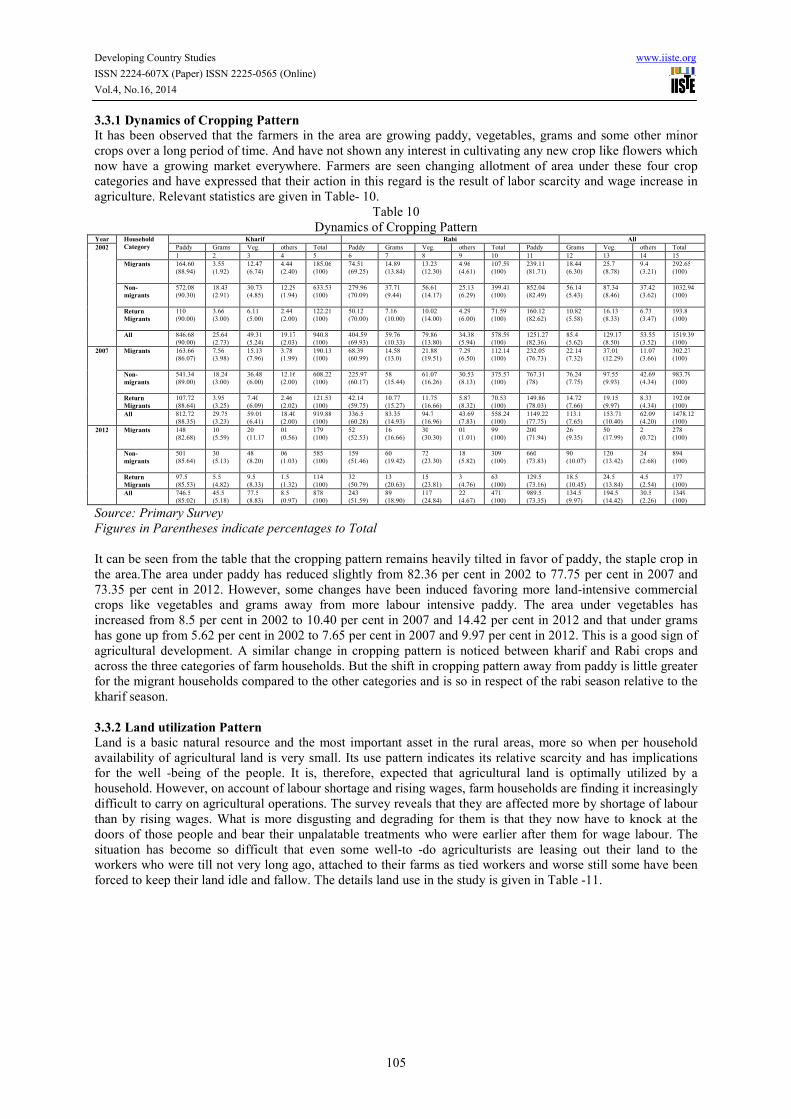
3.3.1 Dynamics of Cropping Pattern It has been observed that the farmers in the area are growing paddy, vegetables, grams and some other minor
crops over a long period of time. And have not shown any interest in cultivating any new crop like flowers which
now have a growing market everywhere. Farmers are seen changing allotment of area under these four crop
categories and have expressed that their action in this regard is the result of labor scarcity and wage increase in
agriculture. Relevant statistics are given in Table- 10.
Table 10
Dynamics of Cropping Pattern Year Household
Category
Kharif Rabi All
2002 Paddy Grams Veg. others Total Paddy Grams Veg. others Total Paddy Grams Veg. others Total
1 2 3 4 5 6 7 8 9 10 11 12 13 14 15
Migrants 164.60
(88.94)
3.55
(1.92)
12.47
(6.74)
4.44
(2.40)
185.06
(100)
74.51
(69.25)
14.89
(13.84)
13.23
(12.30)
4.96
(4.61)
107.59
(100)
239.11
(81.71)
18.44
(6.30)
25.7
(8.78)
9.4
(3.21)
292.65
(100)
Non-
migrants
572.08
(90.30)
18.43
(2.91)
30.73
(4.85)
12.29
(1.94)
633.53
(100)
279.96
(70.09)
37.71
(9.44)
56.61
(14.17)
25.13
(6.29)
399.41
(100)
852.04
(82.49)
56.14
(5.43)
87.34
(8.46)
37.42
(3.62)
1032.94
(100)
Return
Migrants
110
(90.00)
3.66
(3.00)
6.11
(5.00)
2.44
(2.00)
122.21
(100)
50.12
(70.00)
7.16
(10.00)
10.02
(14.00)
4.29
(6.00)
71.59
(100)
160.12
(82.62)
10.82
(5.58)
16.13
(8.33)
6.73
(3.47)
193.8
(100)
All 846.68
(90.00)
25.64
(2.73)
49.31
(5.24)
19.17
(2.03)
940.8
(100)
404.59
(69.93)
59.76
(10.33)
79.86
(13.80)
34.38
(5.94)
578.59
(100)
1251.27
(82.36)
85.4
(5.62)
129.17
(8.50)
53.55
(3.52)
1519.39
(100)
2007 Migrants 163.66
(86.07)
7.56
(3.98)
15.13
(7.96)
3.78
(1.99)
190.13
(100)
68.39
(60.99)
14.58
(13.0)
21.88
(19.51)
7.29
(6.50)
112.14
(100)
232.05
(76.73)
22.14
(7.32)
37.01
(12.29)
11.07
(3.66)
302.27
(100)
Non-
migrants
541.34
(89.00)
18.24
(3.00)
36.48
(6.00)
12.16
(2.00)
608.22
(100)
225.97
(60.17)
58
(15.44)
61.07
(16.26)
30.53
(8.13)
375.57
(100)
767.31
(78)
76.24
(7.75)
97.55
(9.93)
42.69
(4.34)
983.79
(100)
Return
Migrants
107.72
(88.64)
3.95
(3.25)
7.40
(6.09)
2.46
(2.02)
121.53
(100)
42.14
(59.75)
10.77
(15.27)
11.75
(16.66)
5.87
(8.32)
70.53
(100)
149.86
(78.03)
14.72
(7.66)
19.15
(9.97)
8.33
(4.34)
192.06
(100)
All 812.72
(88.35)
29.75
(3.23)
59.01
(6.41)
18.40
(2.00)
919.88
(100)
336.5
(60.28)
83.35
(14.93)
94.7
(16.96)
43.69
(7.83)
558.24
(100)
1149.22
(77.75)
113.1
(7.65)
153.71
(10.40)
62.09
(4.20)
1478.12
(100)
2012 Migrants 148
(82.68)
10
(5.59)
20
(11.17
01
(0.56)
179
(100)
52
(52.53)
16
(16.66)
30
(30.30)
01
(1.01)
99
(100)
200
(71.94)
26
(9.35)
50
(17.99)
2
(0.72)
278
(100)
Non-
migrants
501
(85.64)
30
(5.13)
48
(8.20)
06
(1.03)
585
(100)
159
(51.46)
60
(19.42)
72
(23.30)
18
(5.82)
309
(100)
660
(73.83)
90
(10.07)
120
(13.42)
24
(2.68)
894
(100)
Return
Migrants
97.5
(85.53)
5.5
(4.82)
9.5
(8.33)
1.5
(1.32)
114
(100)
32
(50.79)
13
(20.63)
15
(23.81)
3
(4.76)
63
(100)
129.5
(73.16)
18.5
(10.45)
24.5
(13.84)
4.5
(2.54)
177
(100)
All 746.5
(85.02)
45.5
(5.18)
77.5
(8.83)
8.5
(0.97)
878
(100)
243
(51.59)
89
(18.90)
117
(24.84)
22
(4.67)
471
(100)
989.5
(73.35)
134.5
(9.97)
194.5
(14.42)
30.5
(2.26)
1349
(100)
Source: Primary Survey
Figures in Parentheses indicate percentages to Total
It can be seen from the table that the cropping pattern remains heavily tilted in favor of paddy, the staple crop in
the area.The area under paddy has reduced slightly from 82.36 per cent in 2002 to 77.75 per cent in 2007 and
73.35 per cent in 2012. However, some changes have been induced favoring more land-intensive commercial
crops like vegetables and grams away from more labour intensive paddy. The area under vegetables has
increased from 8.5 per cent in 2002 to 10.40 per cent in 2007 and 14.42 per cent in 2012 and that under grams
has gone up from 5.62 per cent in 2002 to 7.65 per cent in 2007 and 9.97 per cent in 2012. This is a good sign of
agricultural development. A similar change in cropping pattern is noticed between kharif and Rabi crops and
across the three categories of farm households. But the shift in cropping pattern away from paddy is little greater
for the migrant households compared to the other categories and is so in respect of the rabi season relative to the
kharif season.
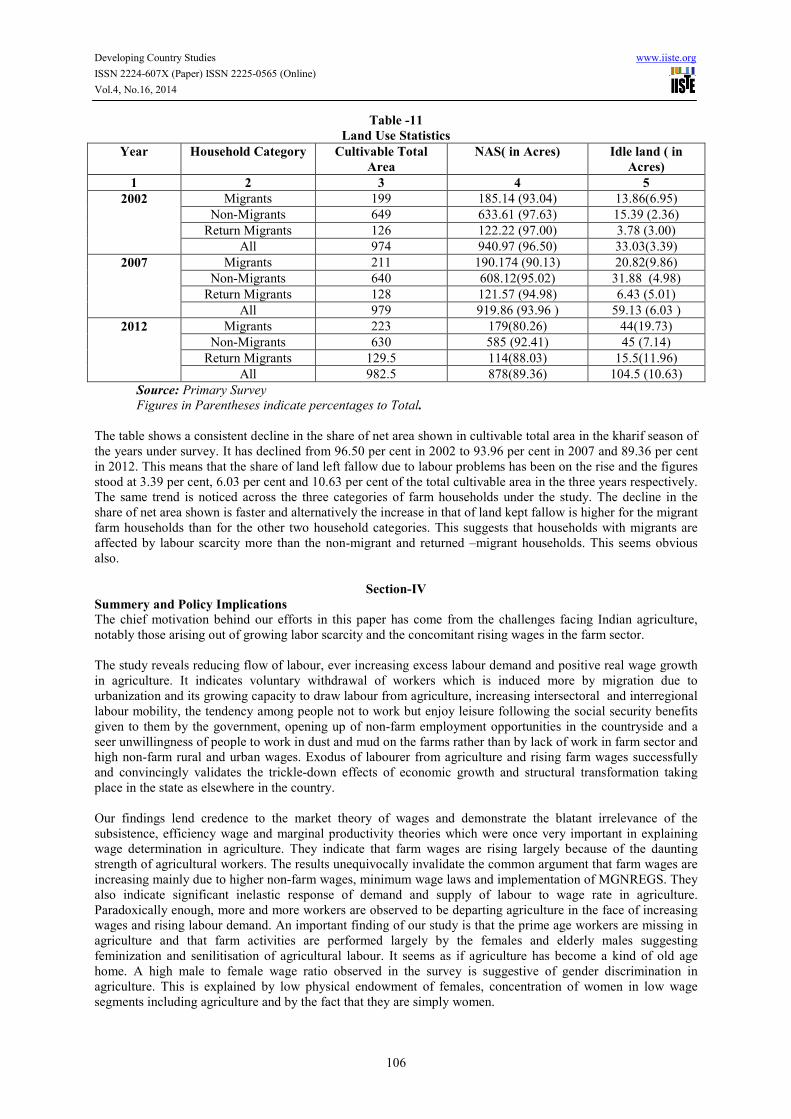
3.3.2 Land utilization Pattern
Land is a basic natural resource and the most important asset in the rural areas, more so when per household
availability of agricultural land is very small. Its use pattern indicates its relative scarcity and has implications
for the well -being of the people. It is, therefore, expected that agricultural land is optimally utilized by a
household. However, on account of labour shortage and rising wages, farm households are finding it increasingly
difficult to carry on agricultural operations. The survey reveals that they are affected more by shortage of labour
than by rising wages. What is more disgusting and degrading for them is that they now have to knock at the
doors of those people and bear their unpalatable treatments who were earlier after them for wage labour. The
situation has become so difficult that even some well-to -do agriculturists are leasing out their land to the
workers who were till not very long ago, attached to their farms as tied workers and worse still some have been
forced to keep their land idle and fallow. The details land use in the study is given in Table -11.
Developing Country Studies www.iiste.org
ISSN 2224-607X (Paper) ISSN 2225-0565 (Online)
Vol.4, No.16, 2014
106
Table -11
Land Use Statistics
Year Household Category Cultivable Total
Area
NAS( in Acres) Idle land ( in
Acres)
1 2 3 4 5
2002 Migrants 199 185.14 (93.04) 13.86(6.95)
Non-Migrants 649 633.61 (97.63) 15.39 (2.36)
Return Migrants 126 122.22 (97.00) 3.78 (3.00)
All 974 940.97 (96.50) 33.03(3.39)
2007 Migrants 211 190.174 (90.13) 20.82(9.86)
Non-Migrants 640 608.12(95.02) 31.88 (4.98)
Return Migrants 128 121.57 (94.98) 6.43 (5.01)
All 979 919.86 (93.96 ) 59.13 (6.03 )
2012 Migrants 223 179(80.26) 44(19.73)
Non-Migrants 630 585 (92.41) 45 (7.14)
Return Migrants 129.5 114(88.03) 15.5(11.96)
All 982.5 878(89.36) 104.5 (10.63)
Source: Primary Survey
Figures in Parentheses indicate percentages to Total.
The table shows a consistent decline in the share of net area shown in cultivable total area in the kharif season of
the years under survey. It has declined from 96.50 per cent in 2002 to 93.96 per cent in 2007 and 89.36 per cent
in 2012. This means that the share of land left fallow due to labour problems has been on the rise and the figures
stood at 3.39 per cent, 6.03 per cent and 10.63 per cent of the total cultivable area in the three years respectively.
The same trend is noticed across the three categories of farm households under the study. The decline in the
share of net area shown is faster and alternatively the increase in that of land kept fallow is higher for the migrant
farm households than for the other two household categories. This suggests that households with migrants are
affected by labour scarcity more than the non-migrant and returned –migrant households. This seems obvious
also.
Section-IV
Summery and Policy Implications
The chief motivation behind our efforts in this paper has come from the challenges facing Indian agriculture,
notably those arising out of growing labor scarcity and the concomitant rising wages in the farm sector.
The study reveals reducing flow of labour, ever increasing excess labour demand and positive real wage growth
in agriculture. It indicates voluntary withdrawal of workers which is induced more by migration due to
urbanization and its growing capacity to draw labour from agriculture, increasing intersectoral and interregional
labour mobility, the tendency among people not to work but enjoy leisure following the social security benefits
given to them by the government, opening up of non-farm employment opportunities in the countryside and a
seer unwillingness of people to work in dust and mud on the farms rather than by lack of work in farm sector and
high non-farm rural and urban wages. Exodus of labourer from agriculture and rising farm wages successfully
and convincingly validates the trickle-down effects of economic growth and structural transformation taking
place in the state as elsewhere in the country.
Our findings lend credence to the market theory of wages and demonstrate the blatant irrelevance of the
subsistence, efficiency wage and marginal productivity theories which were once very important in explaining
wage determination in agriculture. They indicate that farm wages are rising largely because of the daunting
strength of agricultural workers. The results unequivocally invalidate the common argument that farm wages are
increasing mainly due to higher non-farm wages, minimum wage laws and implementation of MGNREGS. They
also indicate significant inelastic response of demand and supply of labour to wage rate in agriculture.
Paradoxically enough, more and more workers are observed to be departing agriculture in the face of increasing
wages and rising labour demand. An important finding of our study is that the prime age workers are missing in
agriculture and that farm activities are performed largely by the females and elderly males suggesting
feminization and senilitisation of agricultural labour. It seems as if agriculture has become a kind of old age
home. A high male to female wage ratio observed in the survey is suggestive of gender discrimination in
agriculture. This is explained by low physical endowment of females, concentration of women in low wage
segments including agriculture and by the fact that they are simply women.
Developing Country Studies www.iiste.org
ISSN 2224-607X (Paper) ISSN 2225-0565 (Online)
Vol.4, No.16, 2014
107
The study shows a declining trend of labour use and a rising trend of wage cost and total cost of cultivation per
unit of cultivated land. Rising wage rates explain this conflicting situation. Cost of human labour continues to be
the single largest component accounting for about 44 per cent of total operational cost of cultivation. The share
of machinery component is increasing and it now constitutes about 26 per cent of operational costs. This means
that farmers are mechanizing with the help of migrant remittances and funds raised from other sources to
compensate the lost labour and that agriculture still remains a predominantly labour-intensive activity due to
limited scope for mechanisation of farm operations.
A noteworthy finding of the survey is that labour scarcity and rising wages have not affected agricultural
productivity. On the contrary, output per acre and per personday of labour have increased and the average cost
per unit of output has lowered in agriculture due mainly to adoption of improved farming practices including the
use of quality seeds-fertilizer-insecticides combine, timely operations and a wider use of small machines and
mechanized implements in the operations wherever practicable.
Notwithstanding the acute shortage of labour and rising wages, the cropping pattern remains heavily tilted
towards paddy, the staple crop in Odisha. However, economic motivation and labour and wage problems have,
of late, induced some changes in the cropping pattern favoring relatively more land-intensive and high value
crops like grams and vegetables away from more labour-intensive paddy. But fact remains that pursuing
agriculture as an occupation has become an increasingly difficult proposition for the farmers on account of the
labour problems so much so that some famers, despite their strong attachment towards land and cultivation, are
forced to lease out and/or leave some land fallow. This is a dangerous sign indeed.
Contemporary agriculture exhibits two stylized empirical facts. First, it involves grueling and gruesome manual
work and working on the farms is considered derogatory for which workers are withdrawing from agriculture.
Second, it has become a high cost-low yielding occupation for which even people with reasonable amounts of
cultivable land are not interested to do agriculture. On the basis of our findings we submit the following policy
suggestions to counter the challenge.
Expeditious diversification within the agricultural sector favoring more land-intensive, less labour- using and
high income yielding activities such as cultivation of pisciculture, vegetables, groundnut, floriculture and pulses
will boost farm income, increase profitability and absorb the labour supply shocks.
Promotion of location and small farm size specific technological innovations will strengthen working skills,
increase labour efficiency, lower costs, increase farm profitability, reduce labour requirement in cultivation and
cope with labour scarcity. Gearing up of Krishi Vigyan Kendras and agricultural extension systems at the micro
level and developing female labour friendly farm machinery will yield extra dividends. Training sessions for
farmers for improving their decision making ability and level of knowledge with encouragement to adopt
sustainable labour-saving cultivation practices by using machines instead of manual labor wherever possible will
be rewarding.
A community approach to agriculture can be an effective coping mechanism. Under this system voluntary
groups of farmers can be formed for pooling up of labor to work on each other’s farms in terms of a kind of
labour exchange system. The group can also buy costly machinery and implements in terms of a custom hiring
system and promote mechanization.
The need of an integrated production-processing-storage – marketing system of agriculture is well recognized in
economics of agricultural practices. It will not only minimize post-harvest losses and help value addition but also
provide gainfull employment for most part of the year. Development of micro agricultural enterprises can be
specially useful in retaining workers in agriculture through provision of farm- based and home based off-farm
jobs.
Redesigning MGNREGS works so as not to coincide with the peak period in cereal centric agriculture can
moderate labour scarcity, a remunerative price policy can make agriculture economically lucrative and
promotion of rural infrastructure can provide the much needed linkage for accelerating the pace of agricultural
development in the rural areas.
The implementation of social security schemes, the provision of 25 kilograms rice at one rupee rate to the BPL
households in particular, has catapulted the agricultural sector. This raises a question mark over the economic
justification of the programme and obviously there is reason for concern. While the concernedness of the
Developing Country Studies www.iiste.org
ISSN 2224-607X (Paper) ISSN 2225-0565 (Online)
Vol.4, No.16, 2014
108
government in ensuring food security is well received with applause, a similar anxiousness is missing in dealing
with the problem of negative inducement to work emanating from loose implementation of the scheme. Let
subsidized/ free rice be given to the deserving but not at the cost of promoting the no-work syndrome. It is high
time for the government to evolve some kind of mechanism to arrest this malpractice by integrating social
security benefits with positive work.
Although the present study examined the working of the agricultural labour market and its implications for
agricultural development, and provides useful insights into the linkages obtaining in the rural economy and the
rural-urban and farm-nonfarm continuum, it does not mark the last work on the issues at hand. It studied a kind
of bivariate relationship and of association between labour scarcity and wage rate on the one hand and
agricultural development on the other on the basis of a survey of 300 households in a coastal district of Odisha,
the results of which do not claim universality. Further research aimed at better understanding the causal
pathways and the causal effects of wage and labour problems in agriculture will be fruitful. Incorporating land
tenure, agro ecological and crop-specific micro climate issues into the study will yield rich dividends.
References
Agasty.M.P and Patra.R.N. (2013). Migration, Wages and Agriculture: Empirical Evidence and Policy
Implications. IOSR Journal of Humanities And Social Science (IOSR-JHSS), Vol 14(5),pp. 09-20,
doi10.9790/1959-1450920.
Azam, Jean-Paul and Flore Gubert. (2006), Migrant Remittances and Economic Development in Africa: A
Review of Evidence, Journal of African Economies,Vol. 15(2), pp.426-462.
--------------- (2005), Those in the Kayes: The Impact of Remittance on the Recipients in Africa, Revue
Economique, Vol.56(6), pp. 1331-1358.
Bardhan,P. (1973), Factors Affecting Wage Rates for Agricultural Labour, Economic and Political Weekly,
Vol.8, pp. A56-A63.
------------------- (1977), Rural Employment, Wages and Labour Markets in India: A Survey of Research; Part I,II,
and III, Economic and Political Weekly, Vol. 12,pp. A34-A48,1062-1074,1108-1118.
-------------------- (1979), Wages and Unemployment in a Poor Agrarian Economy: A Theoretical and Empirical
Analysis, Journal of Political Economy, Vol. 87, pp.479-500.
Brennan, D., Elizabeth Petersen, Nguyen Ngoc Que and David Vanzetti. (2012), Rural-Urban Migration and
Vietnamese Agriculture, 56th
AARES Annual Conference, Fremantle, Western Australia, 7-10th
February 2012.
Binswanger, Hans P. and M.R. Rosenzweig. (1986), Behavioral and Material Determinants of Production
Relations in Agriculture, The Journal of Development Studies, Vol.32, pp. 503-539.
Binswanger, H.P. and M.R. Rosenzweig, eds. (1984), Contractual arrangements, employment and wages in
rural labor markets in Asia ,Yale University Press, New Haven.
Clark, J.B. (1899),The Distribution of Wealth: A Theory of Wages, Interest and Profits,1927 edition, New York:
Macmillan.
de Brauw, A. (2010), Seasonal Migration in Vietnam, ESA Working Paper No. 07-04.
Funkhouser,E. (1992), Migration from Nicaragua: Some Recent Evidence, World Development, Vol.20(8).pp.
1209-1218.
Germenji, E. and Swinnen, J. (2004), Impact of Remittances on Household-based Farms in Rural Albania, Paper
Presented at the International Conference on New Perspectives on Albanian Migration and Development,
Albania.
Hicks, J.R. (1932a), The Theory of Wages, London: Macmillan.
-------------- (1932b) Marginal Productivity and the Principle of Variation, Economica Vol.12, pp. 79-88.
---------------(1932c), A Rejoinder, Marginal productivity and the Lausanne School, a reply to Henry Schultz,
Economica, Vol.12, pp. 297-300.
Itzigsohn, Jose. (1995), Migrant Remittances, Labor Markets, and Household Strategies: A Comparative
Analysis of Low-Income Household Strategies in the Caribbean Basin, Social Forces, Vol.74(2), pp. 633-55.
Leibenstein,H.(1957), The Theory of Underemployment in Backward Economies, Journal of Political Economy,
Vol.65( 2), pp. 91-103.
Lewis,W.A. (1954), Economic Development with Unlimited Supply of Labour, The Manchester
School,Vol.22(2),pp. 139-191.
Lipton, Michael. (1980), Migration from the Rural Areas of Poor Countries: The Impact on Rural Productivity
and Income Distribution, World Development, Vol. 8(1), pp. 1–24.
Lucas,R.E.B. (1987), Emigration to South Africa’s Mines, The American Economic Review, Vol. 77(3), pp.313-
30.
Majumdar,D. (1959), Marginal Productivity Theory of Wages and Disguised Unemployment, Review of
Economic Studies, Vol. 26.pp.190-197.
Developing Country Studies www.iiste.org
ISSN 2224-607X (Paper) ISSN 2225-0565 (Online)
Vol.4, No.16, 2014
109
Mc Carthy, N.Carletto,G.Davis and I. Maltsglou. (2006), Assessing the Impact of Massive Out-Migration on
Agriculture,ESA Working Paper, No.06-14, FAO, Rome..
Miluka J., Gero Carletto, Benjamin Davis, and Alberto Zezza. (2010), The Vanishing Farms? The Impact of
International Migration on Albanian Family Farming, Journal of Development Studies, Vol. 46(1), pp.140-161.
Mirrlees, J.A.(1975), A Pure theory of Underdeveloped Economies in Reynolds, L.G. (ed), Agriculture in
Development Theory , Yale University Press.
Ofuoku and Chukwuji. (2012) , The Impact of Rural-Urban Migration on Plantation Agriculture in Nigeria Delta
Region, Nigeria, Journal of Rural Social Sciences, Vol. 27(1), pp.137-51.
Palmer, I. (1985), The Impact of Male Out-Migration on Women in Farming, West Hartford, CT: Kumarian
Press.
Parganiha, O. P., M.L.Sharma, P.M.Praye, and V.K Soni. (2009), Migration effect of Agricultural Labourers on
Agricultural Activities. Indian Research Journal of Extension Education, Vol. 9 ( 3), pp. 95-98.
Prabakar, C., K. Sita Devi and S. Selvam. (2011), Labour Scarcity-Its immensity and Impact on Agriculture,
Agricultural Economics Research Review,Vol.24 (conference number), pp. 373-380.
Ranis, G., and J.C. Fei. (1964), Development of the Labor Surplus Economy: Theory and Policy, Homewood, Ill,
R.D. Irwin.
Rodgers, G.B.(1975), Nutritionally Based Wage Determination in Low Income Labour Market, Oxford
Economic Papers.
Rodriguez, E., and E.R. Tiongson . (2001), Temporary migration overseas and household labor supply: evidence
from urban Philippines, International Migration Review, Vol.35 (3), pp. 709-725.
Rozelle, S., J.Taylor, and A. de Brauw, A. (1999), Migration, Remittances and Agricultural Productivity in
China. American Economic Review, 89(2), pp. 287–291.
Sraffa, P. (1960), Production of Commodities by Means of Commodities: Prelude to a Critique of Economic
Theory, Cambridge University Press, Cambridge.
Stiglitz, J. E.(1976), The Efficiency Wage Hypothesis, Surplus Labour and Distribution of Income in LDCs,
Oxford Economic Papers.Vol.28(2),pp. 185-207.
Sukhatme, P. (1978), Assessment of Adequacy of diets at different income levels, Economic and Political
Weekly, Special Number, pp.1373-1384.
Vaidyanathan, A. (1980), Unemployment and Wages in an Agrarian Economy, Working Paper No.120, Centre
for Development Studies, Trivandrum.
The IISTE is a pioneer in the Open-Access hosting service and academic event
management. The aim of the firm is Accelerating Global Knowledge Sharing.
More information about the firm can be found on the homepage:
http://www.iiste.org
CALL FOR JOURNAL PAPERS
There are more than 30 peer-reviewed academic journals hosted under the hosting
platform.
Prospective authors of journals can find the submission instruction on the
following page: http://www.iiste.org/journals/ All the journals articles are available
online to the readers all over the world without financial, legal, or technical barriers
other than those inseparable from gaining access to the internet itself. Paper version
of the journals is also available upon request of readers and authors.
MORE RESOURCES
Book publication information: http://www.iiste.org/book/
IISTE Knowledge Sharing Partners
EBSCO, Index Copernicus, Ulrich's Periodicals Directory, JournalTOCS, PKP Open
Archives Harvester, Bielefeld Academic Search Engine, Elektronische
Zeitschriftenbibliothek EZB, Open J-Gate, OCLC WorldCat, Universe Digtial
Library , NewJour, Google Scholar