flexural behaviour of the north algerian margin and tectonic implications
TRANSCRIPT
Geophysical Journal InternationalGeophys. J. Int. (2015) 201, 1426–1436 doi: 10.1093/gji/ggv098
GJI Geodynamics and tectonics
Flexural behaviour of the north Algerian margin and tectonicimplications
Lamine Hamai,1,2 Carole Petit,1 Abdeslem Abtout,2 Abdelkarim Yelles-Chaouche2
and Jacques Deverchere3
1Geoazur, CNRS-UNS-IRD, 250 rue Albert Einstein, F-06560 Valbonne-Sophia Antipolis, France. E-mail: [email protected] de Recherches en Astronomie Astrophysique et Geophysique, Route de l’Observatoire, BP 63, Algiers, Algeria3Domaines Oceaniques, Institut Europeen de la Mer, CNRS-UBO, Technopole Brest-Iroise, Place Nicolas Copernic, F-29280 Plouzane, France
Accepted 2015 February 24. Received 2015 February 23; in original form 2014 October 15
S U M M A R YThe Algerian margin formed through back-arc opening of the Algerian basin (MediterraneanSea) resulting from the roll-back of the Tethyan slab. Recent geophysical data acquired alongthe Algerian margin showed evidence of active or recent compressive deformation in thebasin due to the ongoing Africa–Eurasia convergence. Published data from four wide-angleseismic profiles have allowed imaging the deep structure of the Algerian margin and its adjacentbasins. In this study, we converted these velocity models into density models, then into isostaticanomalies. This allowed us to image an isostatic disequilibrium (relative to a local isostasymodel) reaching a maximum amplitude at the margin toe. Converting isostatic anomalies intoMoho depth variations shows that the Moho extracted from wide-angle seismic data is deeperthan the one predicted by a local isostasy model in the oceanic domain, and shallower thanit in the continental domain. These anomalies can be interpreted by opposite flexures of twoplates separated by a plate boundary located close to the margin toe. We use a finite elementmodel to simulate the lithospheric flexure. The amplitude of the equivalent vertical Mohodeflection is larger in the central part of the study area (6–7 km) than on the easternmost andwesternmost profiles (3 km). The effective elastic thickness used to best match the computeddeflection is always extremely low (always less than 10 km) and probably reflects the relativelylow strength of the lithosphere close to the plate boundary. Comparison with other wide-angleseismic profiles across an active and a passive margin show that the North Algerian margindisplays isostatic anomalies close to that of an active margin. Finally, plate flexure is highestat the southern tip of the ocean-continent transition, possibly indicating that a former passivemargin detachment is reactivated as a crustal scale reverse fault pre-dating a future subduction.
Key words: Gravity anomalies and Earth structure; Continental margins: convergent;Dynamics of lithosphere and mantle; Lithospheric flexure; Crustal structure.
1 I N T RO D U C T I O N
Whereas oceanic subduction is one of the most important processesof plate tectonics, understanding how and where it begins is stilla matter of debate, mostly because examples of incipient oceanicsubduction worldwide are scarce (e.g. Gerya 2011, and referencestherein). The transition from passive to active margin can resultfrom various phenomena, including buoyancy contrasts, thermalinstability of the oceanic lithosphere, differential surface loadingdue to erosion and deposition, body forces or other parameters (e.g.Gurnis 1992; Faccenna et al. 1999; Regenauer-Lieb et al. 2001;Niu et al. 2003; Zhu et al. 2009). Commonly, subduction initi-ation mechanisms are assumed to fall into two categories (Stern
2004, and references therein): induced or spontaneous, dependingon whether they are driven by the far-field tectonic plate motions orby local gravitational instabilities. In all cases, most numerical mod-els of subduction initiation require a pre-existing weakness zone inwhich deformation is located (Gerya 2011, and references therein).However, the actual structures of this weak zone, its origin, and itsrelationship with the early stages of compressional deformation arestill unclear. Deciphering the structure of a recently inverted pas-sive or transform margin can thus help understanding how inducedsubduction initiates and localizes.
The Algerian basin is a young oceanic basin (∼20 Ma or less,Schettino & Turco 2006, 2011; van Hinsbergen et al. 2014) un-dergoing compressive boundary conditions due to Africa–Eurasia
1426 C© The Authors 2015. Published by Oxford University Press on behalf of The Royal Astronomical Society.
by guest on April 5, 2015
http://gji.oxfordjournals.org/D
ownloaded from
Flexural behaviour of the north Algerian margin 1427
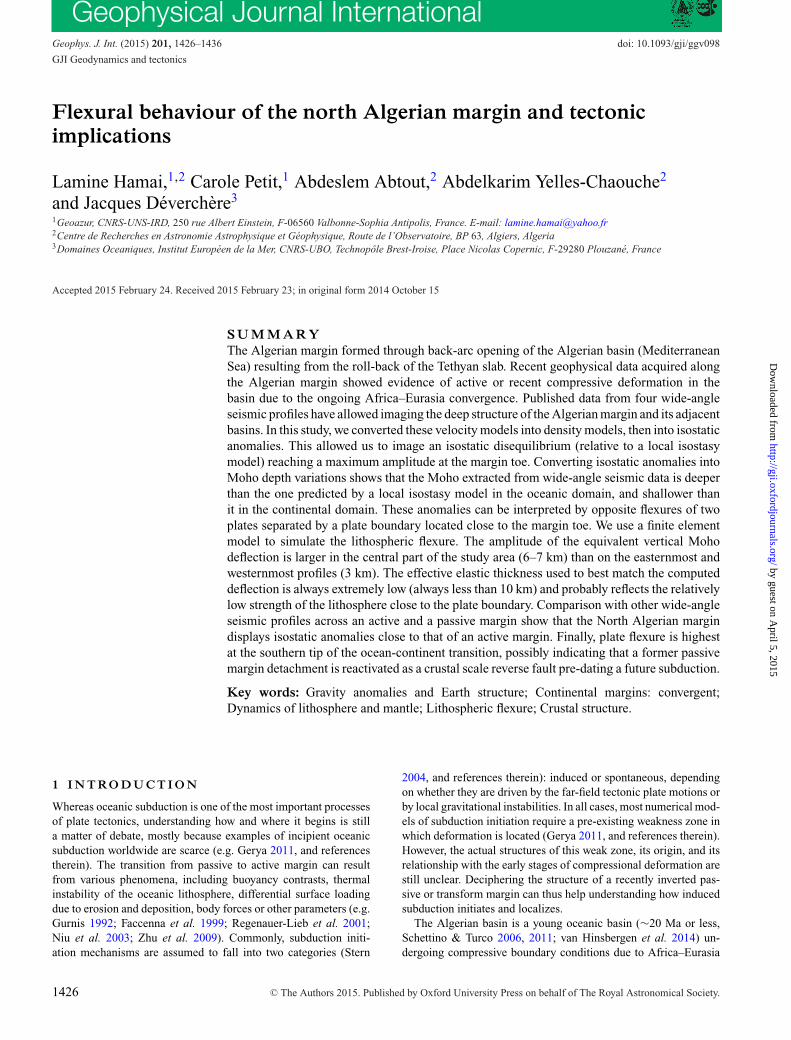
Figure 1. Topography, bathymetry by ETOPO1 1-min global relief (www.ngdc.noaa.gov) and seismicity of the Algerian margin (epicentres and focalmechanisms). Solid lines indicate the location of the SPIRAL wide-angle profiles. Inset shows a more regional tectonic sketch of the Mediterranean Region(modified after Barrier et al. 2004).
convergence at a rate of less than ∼1 cm yr−1 (Dewey et al. 1989;Serpelloni et al. 2007; Carminati et al. 2012). These kinematicboundary conditions favor subduction inception along the NorthAfrican margin (Cloetingh et al. 1982, 1989). Northern Algeria,located at the Africa–Eurasia Plate boundary south of the Algerianbasin, currently undergoes a slow compressional deformation on itscontinental margin (Auzende et al. 1972; Frizon de Lamotte et al.2011), as evidenced by active seismicity recorded both on land andat sea (Domzig et al. 2006; Yelles-Chaouche et al. 2006; Kherroubiet al. 2009; Kherroubi 2011). This recent compression (of whichthe onset is dated between 10 and 2 Ma) between Eurasia and Africahas been proposed earlier (e.g. Le Pichon 1968; Talwani et al. 1969;Caputo et al. 1970; McKenzie et al. 1970), however from Gibraltarto Sicily, the precise geometry of the plate boundary is still poorlydefined, because the deformation is still diffuse and not yet local-ized on a well-defined plate interface. The North African marginin Algeria may therefore represent a transitional stage between ac-tive and passive margin settings (Lonergan & White 1997; Gueguenet al. 1998; Rosenbaum et al. 2002a; Faccenna et al. 2004; Mauffretet al. 2004; Jolivet et al. 2006, 2009; Yelles et al. 2009; Carminatiet al. 2012). If this was the case, then the lithosphere should displayan isostatic signal close to that of mature subduction zones, thatis, a progressive downward bending of the oceanic plate towardsthe continental margin that is not due to a ‘normal’ plate deflectionunder its own load.
In this study, we use recently published 2-D velocity models com-puted from wide-angle seismic data of the SPIRAL 2009 survey onthe North Algerian margin (Aidi et al. 2013; Lepretre et al. 2013;Mihoubi et al. 2014; Bouyahiaoui et al. 2015). The velocity struc-ture is converted into a density structure and an isostatic analysisis performed by comparing measured (from merged data sets) andcomputed gravity anomalies. Isostatic anomalies are modelled us-ing a broken elastic plate model. From these results, we aim (1) totest whether a flexural effect is indeed detectable along the Algerianmargin, (2) if so, to evidence the along-strike changes of flexureand of mechanical properties of the oceanic lithosphere and (3)to discuss their origin by comparison with other types of marginsworldwide.
2 S U M M A RY O F G E O DY NA M I C A LH I S T O RY
The Western Mediterranean Sea belongs to the Alpine orogenicsystem and is located near the boundary of Africa and Eurasiaplates. The western Mediterranean basin depicts a unique, complexstructure, with its steep mountain ranges and large continental islandblocks which separate several sub-basins (Fig. 1).
During the Liassic, the opening of the central Atlantic causeda sinistral strike-slip motion between Africa and Iberia, creatinga transform zone passing through the Gibraltar strait (Roca et al.2004). Approximately at the same time, the dislocation of Pangealed to the opening of the Alpine Tethys (Irving 1977, 2004; Muttoniet al. 1996; Frizon de Lamotte et al. 1991, 2011). The northernTethyan passive margin is born at the southern edge of the AlKa-PeCa (Alboran Kabylia Peloritan and Calabria, Bouillin 1986) con-tinental block system, itself attached to the Sardinia and Balearicproto-islands. In the Late Cretaceous (84 Ma, e.g. Gelabert et al.2002), the motion of the African plate changed due to the openingof the South Atlantic, causing the onset of convergence between Eu-rope and Africa (Olivet et al. 1982; Dewey et al. 1989; Ricou 1996;Rosenbaum et al. 2002a; Cavazza et al. 2004; Schettino & Turco2011). This new stress regime initiated the closure of the TethysOcean, which was accommodated in the Maghreb by northwardsubduction and opening of the Algerian backarc basin between sta-ble Eurasia and AlKaPeCa microcontinents. This stage ended withthe collision between the continental AlKaPeCa blocks and Africa(Lonergan & White 1997; Gueguen et al. 1998; Roca et al. 1999;Verges & Sabat 1999; Frizon de Lamotte et al. 2000; Faccennaet al. 2001; Roca 2001; Rosenbaum et al. 2002a; Mauffret et al.2004). These continental blocks, initially belonging to the Euro-pean margin (Bouillin 1986), broke up into several sub-blocks thatmigrated southward and formed the internal zones of the Alpinesouth-Mediterranean belt after their collision with North Africa.A two-stage kinematic model of opening of the Algerian basin hasbeen proposed, with a first N–S opening due to the southward migra-tion of the AlKaPeCa blocks at 35 Myr, followed by an EW openingwith the formation of oceanic crust along NS trending accretionary
by guest on April 5, 2015
http://gji.oxfordjournals.org/D
ownloaded from
1428 L. Hamai et al.
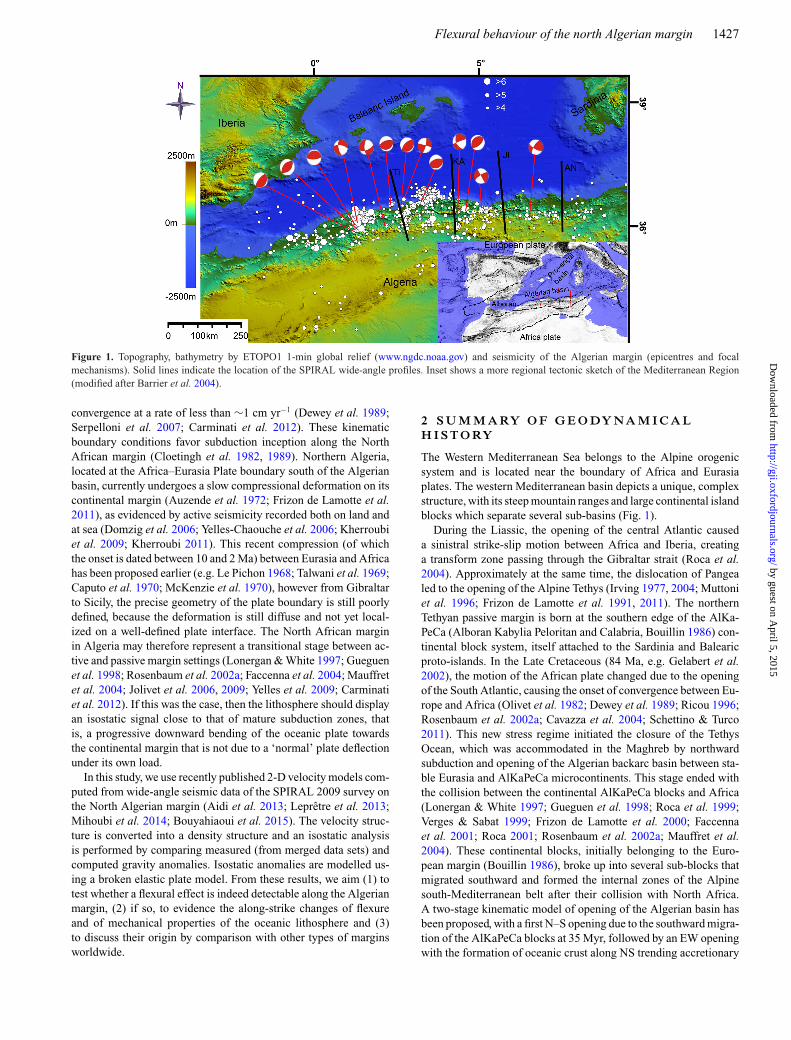
Figure 2. Free air anomaly map of northern Algeria. Solid lines mark the SPIRAL wide-angle seismic profiles (TI = Tipaza, KA = Greater Kabylia,JI = Jijel, AN = Annaba).
centres between 16 and 8 Myr (Mauffret et al. 2004; Mauffret 2007;van Hinsbergen et al. 2014). According to this hypothesis, the latestage of opening of the basin is associated with the westward migra-tion of the Gibraltar Arc and eastward migration of the Calabrianarc, and occurred after the collision of the Kabylian massifs withNorth Africa. Magmatism attributed to slab detachment occurredfirst in the Langhien (∼15 Ma) at the central Algerian coast and thenspread to the west and east, supporting the hypothesis of oppositemigration of the Calabrian and Gibraltar slab tears (Carminati et al.1998; Maury et al. 2000; Savelli 2002; Spakman & Wortel 2004).Nowadays, the still ongoing Africa–Europe convergence is recordedin Algeria, both in the coastal basins on land (e.g. the Chelif andMitidja basins) and in the offshore, with characteristic fold-thruststructures (Boudiaf 1996; Deverchere et al. 2005; Domzig et al.2006; Yelles-Chaouche et al. 2006; Kherroubi et al. 2009; Yelleset al. 2009).
3 AVA I L A B L E DATA S E T S
In order to quantitatively assess the mechanical properties at theplate boundary, several terrestrial and marine gravity data sets fromthe ‘Bureau Gravimetrique International (BGI, International Gravi-metric Bureau 2012), http://bgi.obs-mip.fr’ database were used.This database consists of irregularly spaced points issue from someof survey, attached to different gravity bases (Bouyahiaoui et al.2011). Its accuracy is estimated at 1 mGal and the measurementsare attached to the 1930 Potsdam network (Idres & Aifa 1995).
In order to use the BGI data, it was essential to bring all data sur-vey to the same level of reference (for the data to be homogeneous).For this purpose, we used the new gravity measurements acquiredin the framework of missions CRAAG at places where BGI dataexisted (Abtout et al. 2014). Comparison of old data to new mea-surements allowed us to compute a systematic offset due to different
attachments. This difference was added to the old values to bringthem to the same reference ellipsoid as the absolute measurements.
In a second step, outliers were eliminated by a systematic searchof peaks outside the mean distribution, centred on a square of100 km × 100 km. These treatments provided a self-consistentfree-air anomaly map attached to the absolute gravity referencebases.
The resulting free air anomaly map shows several positive anoma-lies on the northern of continental margin, and negative anomaliesrepresenting the sedimentary basins (Fig. 2). The latter are namely,the backarc Mitidja basins near Algiers, the Tizi Ouzou basin andthe small basins of Guelma and Seybouse in the East near Annaba.Positive anomalies on the continental domain are limited to the northby negative anomalies representing the limit of the margin. Somepositive anomalies however extend offshore, in the Kheir Eddinebank in Algiers, and the Edough massif near Annaba.
Free air anomaly profiles were then drawn along four wide-angleseismic profiles of the SPIRAL survey (Tipaza, Greater Kabylia,Jijel and Annaba profiles from west to east, Fig. 2), in order toprovide a first-order check on the velocity model determined byforward inversion of wide-angle data (Aidi et al. 2013; Lepretreet al. 2013; Mihoubi et al. 2014; Bouyahiaoui et al. 2015).
4 M E T H O D S
For each of the four profiles, the final velocity model computedfrom wide-angle seismic forward modelling was converted into aregular 5 km × 1 km velocity V grid using a linear interpolationmethod. We convert it into a density ρ profile using two differentvelocity–density conversion rules in order to test the sensitivity ofour models to the velocity–density conversion factor.
We first use three different velocity–density conversions for thesediments, upper crust and deep crust and mantle, using Hamilton
by guest on April 5, 2015
http://gji.oxfordjournals.org/D
ownloaded from
Flexural behaviour of the north Algerian margin 1429
(1978), Carlson & Herrick (1990) and Birch (1961) laws, such as,respectively:
ρ = 1 + 1.18(V − 1.5)0.22
ρ = 3.61 − 6.0
V
B = dV
dρ. (1)
For the Birch law, we choose a B factor of 2.8 and an integrationconstant of –1.45 in order to retrieve commonly accepted densityvalues of 1030 and 3300 kg m−3 for the water and uppermost mantle,respectively. The second conversion model uses the Birch law for allcrust and mantle rocks. The velocity–density conversion is differentfor the salt layer, for which the density is of 2200 kg m−3 for seismicvelocities ranging between 3.9 and 4.1 km s−1. The density modelsare then used to calculate a theoretical gravimetric anomaly that canbe compared to the measured one.
We then test if the profiles are in local isostatic equilibrium in anAiry sense. If this was the case, then the weight of each vertical col-umn should be the same all along the profile. For each longitudinalprofile node, the weight P(x) of the column of crust and mantle arecomputed such as:
P(x) =Z∑
z=0
gρ(x, z)h, (2)
Where h is the height of the grid element (constant), g the gravi-tational acceleration and Z is the compensation depth (taken as thedeepest point of the profile). Relative weight anomalies �P(x) arecomputed along the profile by subtracting an average to the com-puted column weights. These anomalies can be interpreted as devia-tions from the local isostatic equilibrium in the Airy sense. Positivedeflection means that the lithosphere is heavier than predicted byan Airy-type model, which can be interpreted for instance as anupward flexure resulting in a Moho uplift and mantle emplacementat crustal levels.
We convert these ‘weight anomalies’ in an equivalent deflectionof the Moho �hmoho with:
�hmoho = −�P(ρm − ρc), (3)
where ρm and ρc are the upper mantle and crust densities, respec-tively. �hmoho is therefore the amount of deflection that should besubstracted from the observed Moho to bring it to an isostaticallycompensated (‘unflexed’) position. We then model this calculateddeflection using a thin elastic plate model and a trial and error ap-proach. In this model, the plate bends under the effect of verticalloads and/or moments, which cause the observed plate deflection.Here, all vertical loads due to density changes within the crust arealready taken into account by the isostatic analysis, and we seekmodelling an ‘additional’ Moho deflection due to external platebending forces. The flexure w of a thin elastic plate in 1-D under anapplied load q depends on its rigidity D such as:
Dd4w
dx4+ (ρm − ρc)gw = q(x), (4)
where D is the lithosphere rigidity connected to the effective elasticthickness Te:
D = E .T e3
12.(1 − ν2)(5)
With E and v the Young’s modulus and the Poisson coefficient,respectively. In a mechanically couple lithosphere, Te is simply the
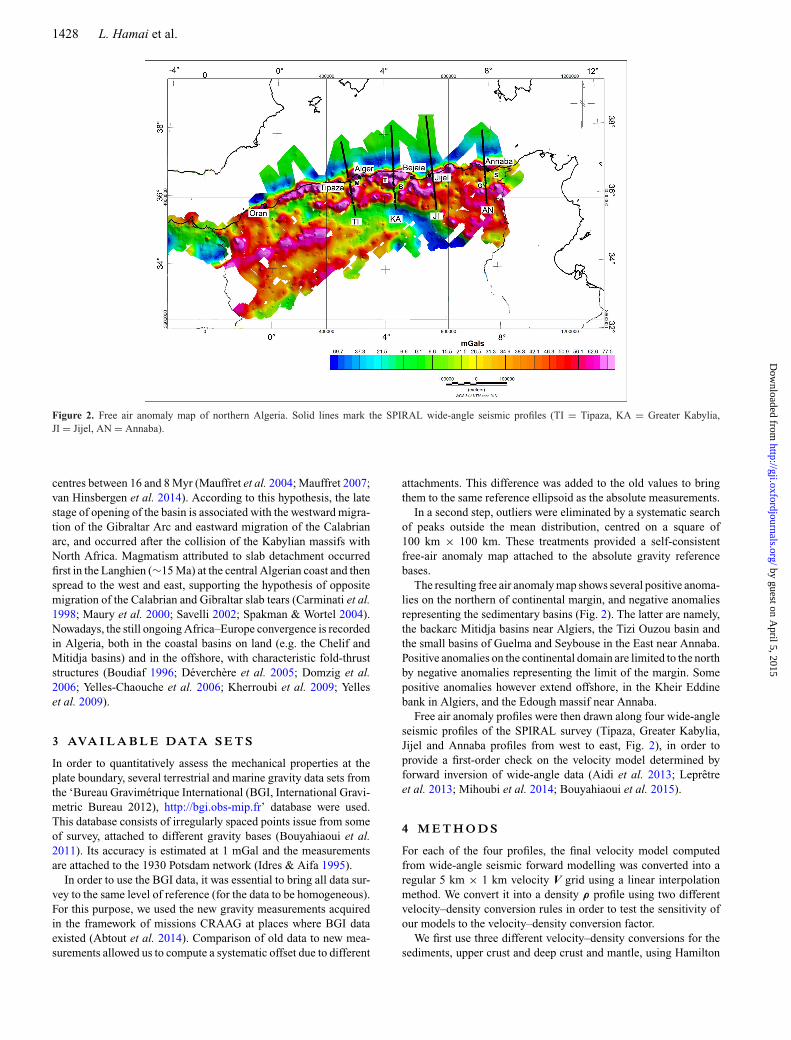
Figure 3. Setup of the flexural models. Te is the effective elastic thicknessin km. The deflection (w) is set to zero at the extremities of the plates, andimposed at the plate junction.
sum of the elastic thicknesses of the crust and mantle. If they aremechanically decoupled, Te writes (Burov & Diament 1995):
T e = (h3
mant + h3crust
)1/3, (6)
where hcrust and hmant are the crust and mantle elastic thicknesses,respectively.
A finite element formulation is used to model the lithosphericflexure at the plate boundary (Kwon & Bang 2000). The profiles arediscretized into two distinct plates for the continental and oceanicparts, which allow us to apply opposite flexures on both domains.The two plates can be separated by a transition zone of variablewidth where no flexure is computed. This transition zone is a freeslip boundary, that is, each plate can move independently fromthe other one. We have focused our study on the oceanic part becausethe continental domain is less well constrained due to the lackof seismic shots on land. The deflection and the plate curvatureoppositely to their point of junction (x = 0) are set to zero, and theamount of deflection computed from the equivalent Moho deflectionis applied at both ends of each plate (x = end), such as (Fig. 3):
w(0) = 0
d2w
dx2 (0)= 0
w(end) = �hmoho(end). (7)
The misfit (in km) between the computed flexure and the modelledone is calculated given by the rms value:
rms =√√√√ 1
N
N∑i=0
(wobsi − wcalc
i )2, (8)
where N is the number of points, wobs is the observed flexure andwcalc is the flexure calculated using the finite element method. In allour models, the effective elastic thickness is assumed constant. Themain reason is that the seismic profiles are short compared to thecharacteristic wavelength of flexural response. As a consequence,we are able to determine only the effective elastic thickness of thelithosphere close to the plate boundaries, which is probably muchlower than the overall plate rigidity (because of local plate weaken-ing due to tectonic deformation and bending stresses). Introducinga plate variable rigidity on such short profiles would rather help usfitting a noise than a true signal in the plate flexure.
5 M O D E L L I N G R E S U LT S
We present in this section the results of gravity, isostasy and flex-ure modelling of each profile from west to east (Figs 4–7, and
by guest on April 5, 2015
http://gji.oxfordjournals.org/D
ownloaded from
1430 L. Hamai et al.
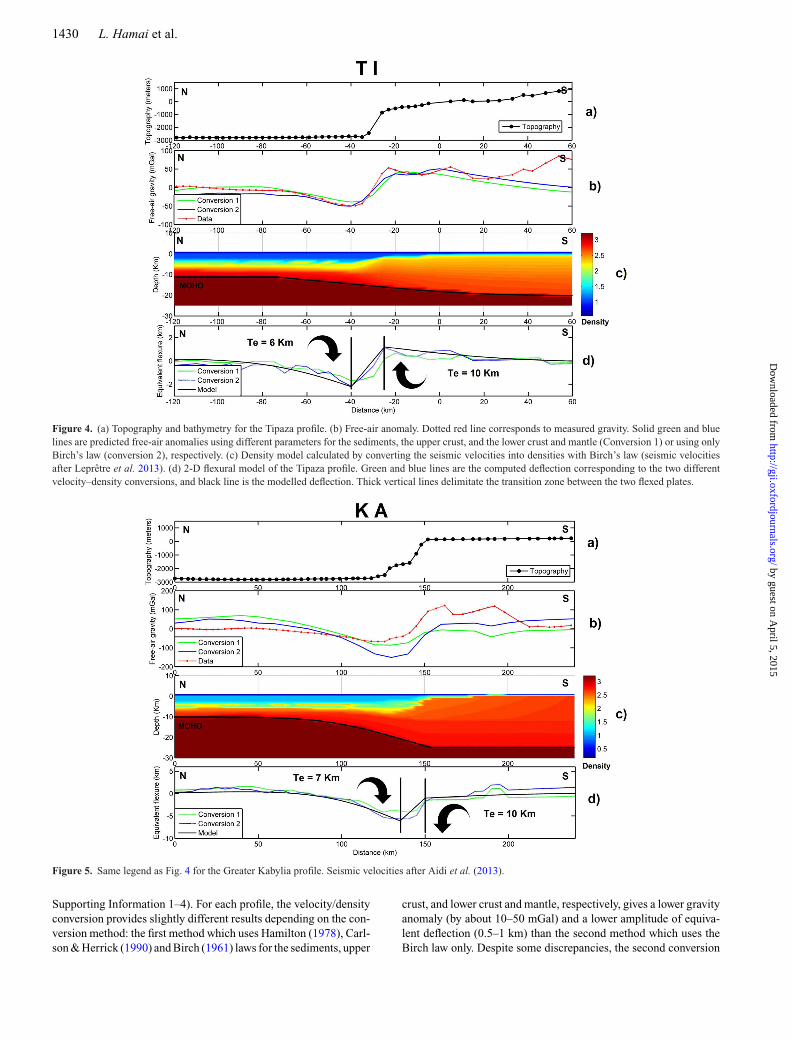
Figure 4. (a) Topography and bathymetry for the Tipaza profile. (b) Free-air anomaly. Dotted red line corresponds to measured gravity. Solid green and bluelines are predicted free-air anomalies using different parameters for the sediments, the upper crust, and the lower crust and mantle (Conversion 1) or using onlyBirch’s law (conversion 2), respectively. (c) Density model calculated by converting the seismic velocities into densities with Birch’s law (seismic velocitiesafter Lepretre et al. 2013). (d) 2-D flexural model of the Tipaza profile. Green and blue lines are the computed deflection corresponding to the two differentvelocity–density conversions, and black line is the modelled deflection. Thick vertical lines delimitate the transition zone between the two flexed plates.
Figure 5. Same legend as Fig. 4 for the Greater Kabylia profile. Seismic velocities after Aidi et al. (2013).
Supporting Information 1–4). For each profile, the velocity/densityconversion provides slightly different results depending on the con-version method: the first method which uses Hamilton (1978), Carl-son & Herrick (1990) and Birch (1961) laws for the sediments, upper
crust, and lower crust and mantle, respectively, gives a lower gravityanomaly (by about 10–50 mGal) and a lower amplitude of equiva-lent deflection (0.5–1 km) than the second method which uses theBirch law only. Despite some discrepancies, the second conversion
by guest on April 5, 2015
http://gji.oxfordjournals.org/D
ownloaded from
Flexural behaviour of the north Algerian margin 1431
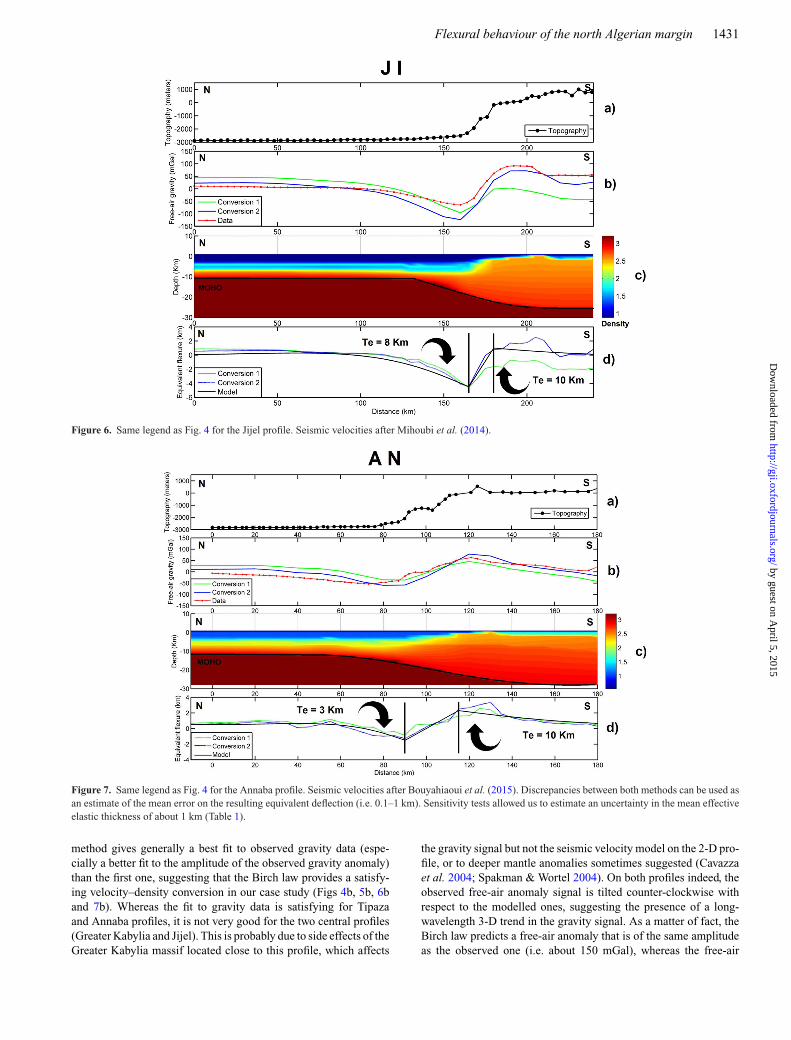
Figure 6. Same legend as Fig. 4 for the Jijel profile. Seismic velocities after Mihoubi et al. (2014).
Figure 7. Same legend as Fig. 4 for the Annaba profile. Seismic velocities after Bouyahiaoui et al. (2015). Discrepancies between both methods can be used asan estimate of the mean error on the resulting equivalent deflection (i.e. 0.1–1 km). Sensitivity tests allowed us to estimate an uncertainty in the mean effectiveelastic thickness of about 1 km (Table 1).
method gives generally a best fit to observed gravity data (espe-cially a better fit to the amplitude of the observed gravity anomaly)than the first one, suggesting that the Birch law provides a satisfy-ing velocity–density conversion in our case study (Figs 4b, 5b, 6band 7b). Whereas the fit to gravity data is satisfying for Tipazaand Annaba profiles, it is not very good for the two central profiles(Greater Kabylia and Jijel). This is probably due to side effects of theGreater Kabylia massif located close to this profile, which affects
the gravity signal but not the seismic velocity model on the 2-D pro-file, or to deeper mantle anomalies sometimes suggested (Cavazzaet al. 2004; Spakman & Wortel 2004). On both profiles indeed, theobserved free-air anomaly signal is tilted counter-clockwise withrespect to the modelled ones, suggesting the presence of a long-wavelength 3-D trend in the gravity signal. As a matter of fact, theBirch law predicts a free-air anomaly that is of the same amplitudeas the observed one (i.e. about 150 mGal), whereas the free-air
by guest on April 5, 2015
http://gji.oxfordjournals.org/D
ownloaded from
1432 L. Hamai et al.
Table 1. Flexural parameters for the 4 modelled profiles, with the amplitude of the imposed deflectionat the oceanic plate boundary and the best-fitting effective elastic thickness determined from rmsanalysis.
Profile Tipaza Greater Kabylia Jijel Annaba
Amplitude of downward oceanic flexure (km) 2 ± 1 6.1 ± 0.5 4.5 ± 0.5 2 ± 1Best-fitting Te (km) 6 ± 1 7 ± 1 6 ± 1 3 ± 1Rms conversion 1 (km) 0.33 0.80 0.45 0.72Rms conversion 2 (km) 0.23 0.48 0.31 0.36
anomaly predicted by the first conversion method is of much loweramplitude (less than 100 mGal). For this reason, we chose to keepthe second conversion method (Birch’s law only) for all profiles.
5.1 Tipaza profile
The computed deflection shows a clear undercompensation (massexcess) on the continental part and overcompensation (mass deficit)beneath the oceanic domain (Fig. 4c). Moreover, departure fromlocal equilibrium increases exponentially when approaching theocean–continent transition, both on the continental and oceanicparts. For the flexural model, the parameters of the continental plateare set to an elastic thickness of 10 km, because of the lack ofconstraints on the crustal structure, and a deflection of –1.2 km isimposed at the plate end. For the oceanic plate, the deflection is setat 2.2 km at the plate end and we calculated the rms for severalelastic layers of different thicknesses between 3 and 7 km (Table 1).The elastic thickness which gives the best fit between observed andmodelled data is 6 ± 1 km. The width of the transition zone (i.e.between the continental and oceanic plates) in this profile is 20 km(between km-40 and km-20).
5.2 Greater Kabylia profile
Like for the Tipaza profile, the deflection model (Fig. 5c) showsovercompensation on the oceanic crust; however, the isostatic signalis much less clear on the continental part. We set the parametersof the continental plate to an elastic thickness of 10 km and adeflection at 1.2 km is imposed at the point located at 150 km fromthe beginning of the profile, but this remains unconstrained. Forthe oceanic plate, we set the deflection at 6 km and we calculatedthe rms for several elastic layers of different thicknesses between4 and 10 km (Table 1). The elastic thickness which gives the bestfit between observed and modelled data is 7 ± 1 km. The width ofthe transition zone in this profile is 20 km (between km-130 andkm-150).
5.3 Jijel profile
The computed deflection also shows a clear overcompensation(downward flexure) on the oceanic part, increasing towards the footof the margin, like for the two former profiles (Fig. 6c). The conti-nental part does not display any clear isostatic anomaly but, like forthe previous profiles, the velocity model is poorly constrained. Weset the parameters of the continental plate to an elastic thickness of10 km and a deflection of –1 km (km 160), whereas for the oceanicplate, we set the deflection at 4.5 km and tested different Te valuesbetween 4 and 10 km (Table 1). The elastic thickness which givesthe best fit between observed and modelled data is 8 ± 1 km. Thewidth of the transition zone in this profile is 15 km (between 165and 180 km).
5.4 Annaba profile
The computed deflection along this profile shows a slight over-compensation (downward flexure) on the oceanic part, increasingtowards the foot of the margin, and an undercompensation on thecontinental domain (Fig. 7c). We set the parameters of the conti-nental plate to an elastic thickness of 10 km and a deflection of–2.8 km, whereas for the oceanic plate, we set the deflection at2 km and tested different Te values between 2 and 7 km (Table 1).The elastic thickness which gives the best fit between observed andmodelled data is 3 km. The width of the transition zone in thisprofile is 25 km (between km-90 and km-115).
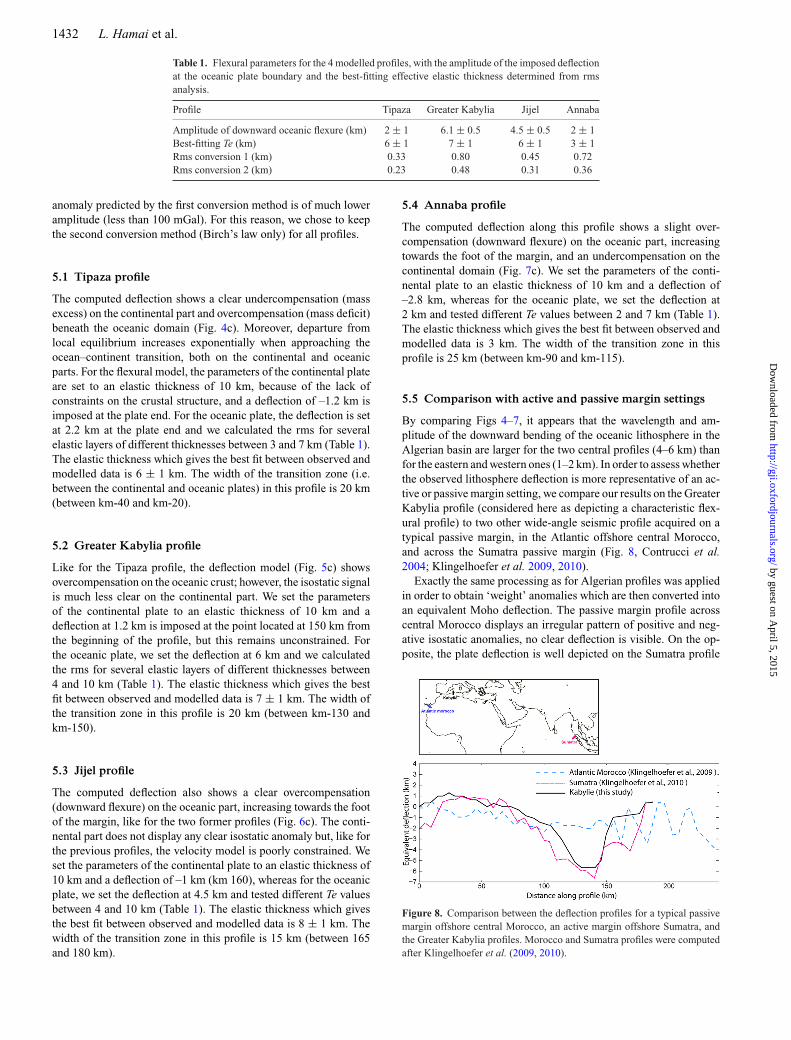
5.5 Comparison with active and passive margin settings
By comparing Figs 4–7, it appears that the wavelength and am-plitude of the downward bending of the oceanic lithosphere in theAlgerian basin are larger for the two central profiles (4–6 km) thanfor the eastern and western ones (1–2 km). In order to assess whetherthe observed lithosphere deflection is more representative of an ac-tive or passive margin setting, we compare our results on the GreaterKabylia profile (considered here as depicting a characteristic flex-ural profile) to two other wide-angle seismic profile acquired on atypical passive margin, in the Atlantic offshore central Morocco,and across the Sumatra passive margin (Fig. 8, Contrucci et al.2004; Klingelhoefer et al. 2009, 2010).
Exactly the same processing as for Algerian profiles was appliedin order to obtain ‘weight’ anomalies which are then converted intoan equivalent Moho deflection. The passive margin profile acrosscentral Morocco displays an irregular pattern of positive and neg-ative isostatic anomalies, no clear deflection is visible. On the op-posite, the plate deflection is well depicted on the Sumatra profile
Figure 8. Comparison between the deflection profiles for a typical passivemargin offshore central Morocco, an active margin offshore Sumatra, andthe Greater Kabylia profiles. Morocco and Sumatra profiles were computedafter Klingelhoefer et al. (2009, 2010).
by guest on April 5, 2015
http://gji.oxfordjournals.org/D
ownloaded from
Flexural behaviour of the north Algerian margin 1433
where it reaches more than 6 km at the trench. This comparisonshows that the Greater Kabylia profile in Algeria, where plate de-flection is the largest, has an isostatic signature very similar to thatof a typical subduction margin, although no oceanic slab is presentlyaccommodating the Africa–Europe convergence off Algeria.
6 D I S C U S S I O N
By converting isostatic anomalies into Moho depth variations acrossfour segments of the present-day Algerian margin, we show that theMoho extracted from wide-angle seismic data is deeper than theone predicted by a local isostasy model in the oceanic domain, andshallower than it in the continental domain. These anomalies canbe interpreted at first order by opposite flexures of two convergingplates characterized by effective elastic thicknesses (Te) rangingbetween 3 and 7 km for the oceanic lithosphere. We find no system-atic trend in Te variations is observed along the margin, although itis worth noting that for the westernmost profile, Te is twice lowerthan for the other ones (3 km instead of 6–7 km). These Te valuesare unexpectedly low for an oceanic lithosphere (Watts & Burov2003), even only 20 Myr old. However, our profiles are rather short(∼200 km), so we can only reproduce the short wavelength com-ponent of the plate flexure, close to the plate boundary. Therefore,these low Te values are most likely underestimated. Furthermore,these low values may also reflect a local weakening of the oceaniccrust, either by flexural stresses or by tectonic or thermal processes:indeed, the collision of the Inner Zones (AlKaPeCa blocks) withthe African margin at ca. 19 Ma has been followed by a lateral slabdetachment of opposite directions (see Part 1), a process which hasinduced a migrating volcanic activity near the margin (Maury et al.2000) and has likely weakened the overlying lithosphere.
The amplitude of downward flexure is slightly different fromone profile to another, depending on their position along the coast.These changes could be (at least partly) related to the difference ingeometry of the margin segments and their regional geodynamic andkinematic evolution that is likely polyphased and strikingly differentfrom east to west (e.g. Medaouri et al. 2014; van Hinsbergen et al.2014).
The different models display a transition zone betweencontinental-upward and oceanic-downward flexed plates. This zoneis approximately 20 km wide and is shifted to the south (of ca.20 km) with respect to the location of the ocean–continent transi-tion as depicted by velocity models (Fig. 9).
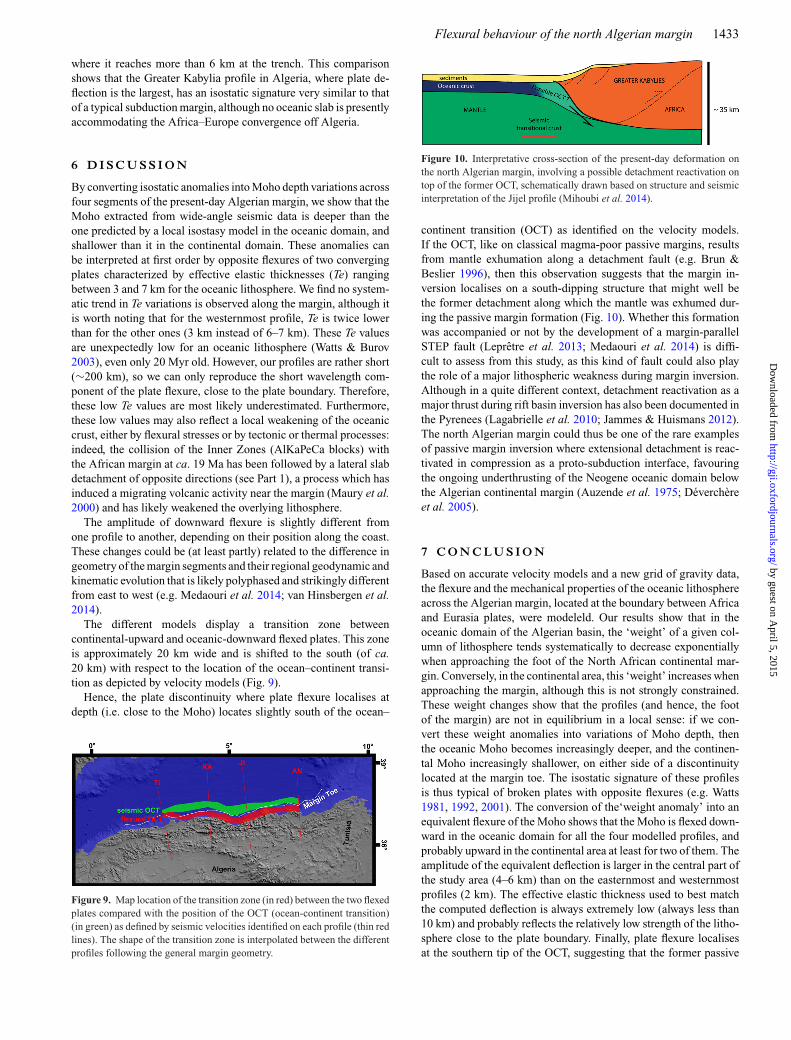
Hence, the plate discontinuity where plate flexure localises atdepth (i.e. close to the Moho) locates slightly south of the ocean–
Figure 9. Map location of the transition zone (in red) between the two flexedplates compared with the position of the OCT (ocean-continent transition)(in green) as defined by seismic velocities identified on each profile (thin redlines). The shape of the transition zone is interpolated between the differentprofiles following the general margin geometry.
Figure 10. Interpretative cross-section of the present-day deformation onthe north Algerian margin, involving a possible detachment reactivation ontop of the former OCT, schematically drawn based on structure and seismicinterpretation of the Jijel profile (Mihoubi et al. 2014).
continent transition (OCT) as identified on the velocity models.If the OCT, like on classical magma-poor passive margins, resultsfrom mantle exhumation along a detachment fault (e.g. Brun &Beslier 1996), then this observation suggests that the margin in-version localises on a south-dipping structure that might well bethe former detachment along which the mantle was exhumed dur-ing the passive margin formation (Fig. 10). Whether this formationwas accompanied or not by the development of a margin-parallelSTEP fault (Lepretre et al. 2013; Medaouri et al. 2014) is diffi-cult to assess from this study, as this kind of fault could also playthe role of a major lithospheric weakness during margin inversion.Although in a quite different context, detachment reactivation as amajor thrust during rift basin inversion has also been documented inthe Pyrenees (Lagabrielle et al. 2010; Jammes & Huismans 2012).The north Algerian margin could thus be one of the rare examplesof passive margin inversion where extensional detachment is reac-tivated in compression as a proto-subduction interface, favouringthe ongoing underthrusting of the Neogene oceanic domain belowthe Algerian continental margin (Auzende et al. 1975; Deverchereet al. 2005).
7 C O N C LU S I O N
Based on accurate velocity models and a new grid of gravity data,the flexure and the mechanical properties of the oceanic lithosphereacross the Algerian margin, located at the boundary between Africaand Eurasia plates, were modeleld. Our results show that in theoceanic domain of the Algerian basin, the ‘weight’ of a given col-umn of lithosphere tends systematically to decrease exponentiallywhen approaching the foot of the North African continental mar-gin. Conversely, in the continental area, this ‘weight’ increases whenapproaching the margin, although this is not strongly constrained.These weight changes show that the profiles (and hence, the footof the margin) are not in equilibrium in a local sense: if we con-vert these weight anomalies into variations of Moho depth, thenthe oceanic Moho becomes increasingly deeper, and the continen-tal Moho increasingly shallower, on either side of a discontinuitylocated at the margin toe. The isostatic signature of these profilesis thus typical of broken plates with opposite flexures (e.g. Watts1981, 1992, 2001). The conversion of the‘weight anomaly’ into anequivalent flexure of the Moho shows that the Moho is flexed down-ward in the oceanic domain for all the four modelled profiles, andprobably upward in the continental area at least for two of them. Theamplitude of the equivalent deflection is larger in the central part ofthe study area (4–6 km) than on the easternmost and westernmostprofiles (2 km). The effective elastic thickness used to best matchthe computed deflection is always extremely low (always less than10 km) and probably reflects the relatively low strength of the litho-sphere close to the plate boundary. Finally, plate flexure localisesat the southern tip of the OCT, suggesting that the former passive
by guest on April 5, 2015
http://gji.oxfordjournals.org/D
ownloaded from
1434 L. Hamai et al.
margin detachment is reactivated as a crustal-scale reverse faultpre-dating a future subduction of the Neogene oceanic lithosphere.
A C K N OW L E D G E M E N T S
We thank the teams of the SPIRAL Project, on land and at sea, fortheir huge work that allowed us to collect the seismic data set used inthis study. We benefited from the input by Frauke Klingelhoefer forthe use of seismic data and comparison with other margins. EditorStephane Labrosse, Laurent Jolivet and an anonymous reviewer arethanked for their constructive and positive reviews.
R E F E R E N C E S
Abtout, A., Boukerbout, H., Bouyahiaoui, B. & Gibert, D., 2014.Gravimetric evidences of active faults and underground structureof the Cheliff seismogenic basin (Algeria), J. Afr. Earth Sci.,doi:10.1016/j.jafrearsci.2014.02.011.
Aidi, C. et al., 2013. Deep structures of the Algerian continental margin in theGreat kabylies- Insights from wide-angle seismic modeling, AGU2013.T21A-2522. Continental Rifts and Rifted Margins, Posters. CONTROLID: 1794050.
Auzende, J.M., Olivet, J.L. & Bonnin, J., 1972. Une structure compressiveau nord de l’Algerie, Deep Sea Res., 19, 149–155.
Auzende, J.M., Bonnin, J. & Olivet, J.L. 1975. La marge nord-africaineconsideree comme marge active, Bull. Soc. Geol. Fr., 17, 486–495.
Barrier, E., Chamot-Rooke, N. & Giordano, G., 2004. Geodynamic maps ofthe Mediterranean: tectonics and kinematics (1:3.000.000 scale), Com-mission for the Geological Map of the World (CGMW).
Birch, F., 1961. The velocity of compressional waves in rocks to 10 kilobars,part 2, J. geophys. Res., 66, 2199–2224.
Boudiaf, A., 1996. Etude sismotectonique de la region d’Alger et de laKabylie (Algerie): Utilisation des modeles numeriques de terrain (MNT)et de la teledetection pour la reconnaissance des structures tectoniquesactives: contribution a l’evaluation de l’alea sismique, PhD thesis, Uni-versite Montpellier II, 274 pp.
Bouillin, J.P., 1986. Le bassin Maghrebin : une ancienne limite entre l’Europeet l’Afrique a l’ouest des Alpes, Bull. Soc. Geol. Fr., 8, 547–558.
Bouyahiaoui, B., Djeddi, M., Abtout, A., Boukerbout, H. & Akacem, N.,2011. Etude de la croute archeenne du mole In Ouzzal (Hoggar Occi-dentale) par la methode gravimetrique: identification des sources par latransformee en ondelettes continues, Bull. Serv. Geog. Nat., 22, 259–274.
Bouyahiaoui, B. et al., 2015. Crustal structure of the eastern Algerian marginand adjacent deep basin (western Mediterranean) and implications forkinematic reconstructions, Geophys. J. Int., in press.
Brun, J.-P. & Beslier, M.-O., 1996. Mantle exhumation at passive margins,Earth planet. Sci. Lett., 142, 161–173.
Burov, E.B. & Diament, M., 1995. The effective elastic thickness (Te) of con-tinental lithosphere: what does it really mean? J. geophys. Res., 100(B3),3905–3928.
Carlson, R.L. & Herrick, C.N., 1990. Densities and porosities in the oceaniccrust and their variations with depth and age, J. geophys. Res., 95, 9153–9170.
Carminati, E., Wortel, M.J.R., Spakman, W. & Sabadini, R., 1998. Therole of slab detachment processes in the opening of the western–centralMediterranean basins: some geological and geophysical evidence, Earthplanet. Sci. Lett., 160, 651–665.
Carminati, E., Lustrino, M. & Dogliono, C., 2012. Geodynamic evolutionof the central and western Mediterranean: tectonics vs. igneous petrologyconstraints, Tectonophysics, doi:10.1016/j.tecto.2012.01.026.
Caputo, M., Panza, G.F. & Postpischl, D., 1970. Deep structure of theMediterranean basin, J. geophys. Res., 75, 4919–4923.
Cavazza, W., Roure, F., Spakman, W., Stampfli, G.M., Ziegler, P.A. & Grp,T.P.W., 2004. The transmed Atlas: geological-geophysical fabric of theMediterranean region—final report of the project, Episodes, 27, 244–254.
Cloetingh, S.A.P.L., Wortel, M.J.R. & Vlaar, N.J., 1982. Evolution of passivecontinental margins and initiation of subduction zones, Nature, 297, 139–142.
Cloetingh, S., Wortel, R. & Vlaar, N.J., 1989. On the initiation of subductionzones, Pure appl. Geophys., 129, 7–25.
Contrucci, I., Klingelhofer, F., Perrot, J., Bartolome, R., Gutscher, M.A.,Sahabi, M., Malod, J.A. & Rehault, J.P., 2004. The crustal structure of theNW-Moroccan continental margin from wide-angle and reflection seismicdata, Geophys. J. Int., 159, 117–128.
Deverchere, J. et al., 2005. Active thrust faulting offshore Boumerdes, Al-geria, and its relations to the 2003 Mw 6.9 earthquake, Geophys. Res.Lett., 32, doi:10.1029/2004GL021646.
Dewey, J.F., Helman, M.L., Turco, E., Hutron, D.H.W. & Knott, S.D., 1989.Kinematics of Western Mediterranean, in Alpine Tectonics, Vol. 45, pp.265–283, ed. Coward, M.P., Detrich, D. & Park, R.G., Geol. Soc. London,Spec. Publ.
Domzig, A. et al., 2006. Searching for the Africa-Eurasia Miocene boundaryonshore Western Algeria (Maradja’03 cruise), C. R. Geosci., 338, 80–91.
Faccenna, C., Giardini, D., Davy, P. & Argentieri, A., 1999. Initiation of sub-duction at Atlantic-type margins: insights from laboratory experiments,J. geophys. Res., 104, 2749–2766.
Faccenna, C., Becker, T.W., Lucente, F.P., Jolivet, L. & Rossetti, F., 2001.History of subduction and back-arc extension in the Central Mediter-ranean, Geophys. J. Int., 145, 809–820.
Faccenna, C., Piromallo, C., Crespo-Blanc, A., Jolivet, L. & Rossetti, F.,2004. Lateral slab deformation and the origin of the western Mediter-ranean arcs, Tectonics, 23, TC1012, doi:10.1029/2002TC001488.
Frizon de Lamotte, D., Andrieux, J. & Guezou, J.C., 1991. Cinematiquedes chevauchements neogenes dans l’Arc betico-rifain: discussion sur lesmodeles geodynamiques, Bull. Soc. Geol. Fr., 162, 611–626.
Frizon de Lamotte, D., Saint Bezar, B.A., Bracene, R. & Mercier, E., 2000.The two main steps of the Atlas building and geodynamics of the westernMediterranean, Tectonics, 19, 740–761.
Frizon de Lamotte, D., Raulin, C., Mouchot, N., Wrobel-Daveau, J.C.,Blanpied, C. & Ringenbach, J.C., 2011. The southernmost margin ofthe Tethys realm during the Mesozoic and Cenozoic: initial geom-etry and timing of the inversion processes, Tectonics, 30, TC3002,doi:10.1029/2010TC002691.
Gelabert, B., Sabat, F. & Rodriguez-Perea, A., 2002. A new proposal for thelate Cenozoic geodynamic evolution of the western Mediterranean, TerraNova, 14, 93–100.
Gerya, T., 2011. Future directions in subduction modeling, J. Geodyn., 52,344–378.
Gueguen, E., Doglioni, C. & Fernandez, M., 1998. On the post-25 Mageodynamic evolution of the western Mediterranean, Tectonophysics, 298,259–269.
Gurnis, M., 1992. Rapid continental subsidence following the initiation andevolution of subduction, Science, 255, 1556–1558.
Hamilton, E.L., 1978. Sound velocity-density relations in sea-floor sedi-ments and rocks, J. acoust. Soc. Am., 63, 366–377.
Idres, M. & Aifa, T., 1995. Some parameters to improve a gravity networkaccuracy: application to the new reference base stations network of theNorth of Algeria, Bull. Serv. Geol. Algerie, 6, 79–94.
International Gravimetric Bureau, 2012. IAG Geodesist’s Handbook, 2012,J. Geod., 86(10), Springer, doi:10.1007/s00190-012-0584-1.
Irving, E., 1977. Drift of the major continental blocks since the Devonian,Nature, 270, 304–309.
Irving, E., 2004. The case for Pangea B, and Intra-Pangean Megashear, inTimescales of the Paleomagnetic Field, Geophysical Monograph Series145, pp. 13–27, American Geophysical Union.
Jammes, S. & Huismans, R., 2012. Structural styles of mountain building:controls of lithospheric rheologic stratification and extensional inheri-tance, J. geophys. Res., 117, doi:10.1029/2012JB009376.
Jolivet, L., Augier, R., Robin, C., Suc, J.P. & Rouchy, J.M., 2006.Lithospheric-scale geodynamic context of the Messinian salinity crisis,Sediment. Geol., 188–189, 9–33.
Jolivet, L., Faccenna, C. & Piromallo, C., 2009. From mantle to crust:stretching the Mediterranean, Earth planet. Sci. Lett., 285, 198–209.
by guest on April 5, 2015
http://gji.oxfordjournals.org/D
ownloaded from
Flexural behaviour of the north Algerian margin 1435
Kherroubi, A., 2011. Etude de la sismicite de l’offshore algerien, PhD thesis,Univ. Tlemcen, Algeria, 158 pp.
Kherroubi, A. et al., 2009. Recent and active deformation pattern off theeasternmost Algerian margin, Western Mediterranean Sea: new evidencefor contractional tectonic reactivation, Mar. Geol., 261(1), 17–32.
Klingelhoefer, F. et al., 2009. Crustal structure of the SW-Moroccan marginfrom wide-angle and reflection seismic data (the DAKHLA experiment)Part A: Wide-angle seismic models, Tectonophysics, 468, 63–82.
Klingelhoefer, F. et al., 2010. Limits of the seismogenic zone in theepicentral region of the 26 December 2004 great Sumatra-Andamanearthquake: results from seismic refraction and wide-angle reflec-tion surveys and thermal modeling, J. geophys. Res., 115, B01304,doi:10.1029/2009JB006569.
Kwon, Y.W. & Bang, H., 2000. The Finite Element Method Using Matlab,CRC Press, 624 pp.
Lagabrielle, Y., Labaume, P. & De Saint-Blanquat, M., 2010. Mantle ex-humation, crustal denudation and gravity tectonics during Cretaceousrifting in the Pyrenees: new messages from the lherzolite bodies, Tecton-ics, 29, TC4012, doi:10.1029/2009tC002588.
Le Pichon, X., 1968. Sea-floor spreading and continental drift, J. geophys.Res., 73, 3661–3697.
Lepretre, A., Klingelhoefer, F., Graindorge, D., Schnurle, P., Beslier, M.O.,Yelles, K., Deverchere, J. & Bracene, R., 2013. Multiphased tectonicevolution of the Central Algerian margin from combined wide-angle andreflection seismic data off Tipaza, Algeria, J. geophys. Res., 118, 3899–3916.
Lonergan, L. & White, N., 1997. Origin of the Betic-Rif mountain belt,Tectonics, 16, 504–522.
Mauffret, A., 2007. The Northwestrn (Maghreb) Boundary of the Nubia(Africa) Plate, Tectonophysics, 429, 21–44.
Mauffret, A., Frizon de Lamotte, D., Lallemant, S., Gorini, C. & Maillard,A., 2004. E-W opening of the Algerian basin (Western Mediterranean),Terra Nova, 16, 257–264.
Maury, R.C. et al., 2000. Post-collision neogene magmatism of the Mediter-ranean Maghreb margin: a consequence of slab breakoff, C.R. Acad. Sci.Paris, 331, 159–173.
McKenzie, D., Molnar, P. & Davies, D., 1970. Plate tectonics of the Red Seaand East Africa, Nature, 226, 243–248.
Medaouri, M., Deverchere, J., Graindorge, D., Bracene, R., Badji, R.,Ouabadi, A., Yelles-Chaouche, K. & Bendiab, F., 2014. The transitionfrom Alboran to Algerian basins (Western Mediterranean Sea): chronos-tratigraphy, deep crustal structure and tectonic evolution at the rear of anarrow slab rollback, J. Geodyn., 77, 186–205.
Mihoubi, A. et al., 2014. Seismic imaging of the eastern Algerian margin offJijel: integrating wide-angle seismic modeling and multichannel seismicpre-stack depth migration, Geophys. J. Int., 198, 1486–1503.
Muttoni, G., Kent, D.V. & Channell, J.E.T., 1996. The evolution of Pangea:palaeomagnetic constraints from the Southern Alps, Italy, Earth planet.Sci. Lett., 146, 107–120.
Niu, Y., O’Hara, M.J.O. & Pearce, J.A., 2003. Initiation of subduction zonesas a consequence of lateral compositional buoyancy contrast within thelithosphere: a petrological perspective, J. Petrol., 44, 851–866.
Olivet, J.L., Bonnin, J., Beuzart, P. & Auzende, J.M., 1982. Cinematiquedes plaques et paleogeographie: une revue, Bull. Soc. Geol. Fr., 7,875–892.
Regenauer-Lieb, K., Yuen, D. & Branlund, J., 2001. The initiation of sub-duction: criticality by addition of water? Science, 294, 578–580.
Ricou, L.E., 1996. The plate tectonic history of the past Tethys Ocean, inThe Oceans Basins and Margin. The Tethys Ocean, Vol. 8, pp. 3–70, edsNairn, A.E.M., Ricou, L.-E., Vrielynck, B. & Dercourt, J., Plenum Press.
Roca, E., Sans, M., Cabrera, L. & Marzo, M., 1999. Oligocene to MiddleMiocene evolution of the central Catalan margin (northwestern Mediter-ranean), Tectonophysics, 315, 209–233.
Roca, E., 2001. The Northwest-Mediterranean basin (Valencia trough, Gulfof Lions and Liguro-Provencal basins): structure and geodynamic evo-lution, in Peri-Tethyan rift/Wrench Basins and Passive Margins, Vol.186, pp. 671–706, eds Ziegler, P.A., Cavazza, W., Robertson, A.F.H. &Crasquin-Soleau, S., Mem. Mus. Nat. Hist. Nat.
Roca, E. et al., 2004. Transmed Transect II, in The TRANSMED Atlas: TheMediterranean Region from Crust to Mantle, eds Cavazza, W., Roure, F.,Spakman, W., Stampfli, G.M. & Ziegler, P.A., Springer-Verlag.
Rosenbaum, G., Lister, G.S. & Duboz, C., 2002. Reconstruction of thetectonic evolution of the western Mediterranean since the Oligocene,in Reconstruction of the evolution of the Alpine-Himalayan Oro-gen, edited by G. Rosenbaum, and G.S. Lister, J. Virtual Explor., 8,107–126.
Savelli, C., 2002. Time–space distribution of magmatic activity in the west-ern Mediterranean and peripheral orogens during the past 30 Ma (a stim-ulus to geodynamic considerations), J. Geodyn., 34, 99–126.
Schettino, A. & Turco, E., 2006. Plate kinematics of the Western Mediter-ranean region during the Oligocene and Early Miocene, Geophys. J. Int.,166(3), 1398–1423.
Schettino, A. & Turco, E., 2011. Tectonic history of the western tethys sincethe late Triassic, Geol. Soc. Am. Bull., 123, 89–105.
Serpelloni, E., Vannucci, G., Pondrelli, S., Argnani, A., Casula, G., Anzidei,M., Baldi, P. & Gasperini, P., 2007. Kinematics of the Western Africa-Eurasia plate boundary from focal mechanisms and GPS data, Geophys.J. Int., 169, 1180–1200.
Spakman, W. & Wortel, M.J.R., 2004. A tomographic view on WesternMediterranean Geodynamics, in The TRANSMED Atlas: The Mediter-ranean Region from Crust to Mantle, pp. 31–52, eds Cavazza, W., Roure,F., Spakman, W., Stampfli, G.M. & Ziegler, P., Springer-Verlag.
Stern, R.J., 2004. Subduction initiation: spontaneous and induced, Earthplanet. Sci. Lett., 226, 275–292.
Talwani, M., Fitman, W.C. & Heirtzler, J.R., 1969. Magnetic anomalies inthe North Atlantic (abs 406), Trans. Am. Geophys. Un., 50, 189.
van Hinsbergen, D.J.J., Vissers, R.L.M. & Spakman, W., 2014. Origin andconsequences of western Mediterranean subduction, rollback, and slabsegmentation, Tectonics, 33, 393–419.
Verges, J. & Sabat, F., 1999. Constraints on the Western Mediterraneankinematics evolution along a 1000-km transect from Iberia to Africa, inThe Mediterranean Basin: Tertiary Extensions within the Alpine Orogen,Vol. 156, pp. 63–80, eds Durand, B., Jolivet, L., Horvath, F. & Seranne,M., Geol. Soc. Spec. Publ.
Watts, A.B., 1981. The U.S. Atlantic continental margin: subsidence history,crustal structure and thermal evolution, American Assoc. Petrol. Geol.Education Course #19, 75 pp.
Watts, A.B., 1992. The effective elastic thickness of the lithosphere and theevolution of foreland basins, Basin Res., 4, 169–178.
Watts, A.B., 2001. Isostasy and Flexure of the Lithosphere, 458 pp., Cam-bridge Univ. Press.
Watts, A.B. & Burov, E.B., 2003. Lithospheric strength and its relationshipto the elastic and seismogenic thickness, Earth planet. Sci. Lett., 213,113–131.
Yelles, A. et al., 2009. Plio-Quaternary reactivation of the Neogene marginoff NW Algiers, Algeria: the Khayr al Din bank, Tectonophysics, 475,98–116.
Yelles-Chaouche, A.K., Boudiaf, A., Djellit, H. & Bracene, R., 2006. Latectonique active de la region nord-algerienne, C.R. Geosci., 338, 126–139.
Zhu, G., Gerya, T.V., Yuen, D.A., Honda, S., Yoshida, T. & Connolly,J.A.D., 2009. 3-D dynamics of hydrous thermalchemical plumes inoceanic subduction zones, Geochem. Geophys. Geosyst., 10, Q11006,doi:10.1029/2009GC002625.
S U P P O RT I N G I N F O R M AT I O N
Additional Supporting Information may be found in the online ver-sion of this paper:
Figure 1. Topography, bathymetry by ETOPO1 1-min global re-lief (www.ngdc.noaa.gov) and seismicity of the Algerian margin(epicentres and focal mechanisms). Solid lines indicate the locationof the SPIRAL wide-angle profiles. Inset shows a more regional
by guest on April 5, 2015
http://gji.oxfordjournals.org/D
ownloaded from
1436 L. Hamai et al.
tectonic sketch of the Mediterranean Region (modified after Bar-rier et al. 2004).Figure 2. Free air anomaly map of northern Algeria. Solid linesmark the SPIRAL wide-angle seismic profiles (TI = Tipaza, KA =Greater Kabylia, JI = Jijel, AN = Annaba).Figure 3. Setup of the flexural models. Te is the effective elasticthickness in km. The deflection (w) is set to zero at the extremitiesof the plates, and imposed at the plate junction.Figure 4. (a) Topography and bathymetry for the Tipaza profile. (b)Free-air anomaly. Dotted red line corresponds to measured gravity.Solid green and blue lines are predicted free-air anomalies using dif-ferent parameters for the sediments, the upper crust, and the lowercrust and mantle (Conversion 1) or using only Birch’s law (con-version 2), respectively. (c) Density model calculated by converting
the seismic velocities into densities with Birch’s law (seismic ve-locities after Lepretre et al. 2013). (d) 2-D flexural model of theTipaza profile. Green and blue lines are the computed deflectioncorresponding to the two different velocity–density conversions,and black line is the modelled deflection. Thick vertical lines de-limitate the transition zone between the two flexed plates. (http://gji.oxfordjournals.org/lookup/suppl/doi:10.1093/gji/ggv098/-/DC1)
Please note: Oxford University Press is not responsible forthe content or functionality of any supporting materials sup-plied by the authors. Any queries (other than missing mate-rial) should be directed to the corresponding author for thepaper.
by guest on April 5, 2015
http://gji.oxfordjournals.org/D
ownloaded from