quality evaluation of algerian honeys: eucalyptus, jujube
TRANSCRIPT

Dissertation submitted to Escola Superior Agrária de Bragançca to obtain the
Degree of Master in Biotechnological engineering under the scope of the double
diploma with Université Moulay Taher in Algeria
Seloua Kaid
Supervised by
Miguel José Rodrigues Vilas Boas
Soraia Isabel Domingues Marcos Falcão
Kaddour Ziani
Bragança 2021
Quality evaluation of Algerian honeys:
Eucalyptus, Jujube, Euphorbia and multiflora

I
Acknowledgment
First of all, I want to thank Professor Miguel Vilas Boas, for having dragged me to this great
school, this great institution (IPB), for all the knowledge he transmitted to me, for his patience,
dedication, permanent availability, support, advice, for friendship and good mood. Thank you
very much, for the topic you proposed to develop, which made me interested in the world of
bees.
Also want to thank my co-supervisor Dr. Soraia Falcão, for her wise advice and suggestions,
for her patience and for the support provided at all times of this work.
I am grateful to my co-supervisor, Dr Kaddour Ziani, for all his commitment, professionalism,
understanding, patience and support shown throughout this work.
I would also like to thank Professor Paulo Russo-Almeida from LabApisUTAD
, for its
collaboration in the melissopalynological analysis
I also thank my dear colleague Andreia Tomás for the availability shown in the laboratory and
for the transmission of knowledge, for companionship, help, guidance, patience, advice,
courage, good disposition, friendship and understanding demonstrated throughout the work.
Thank you very much!
I would like to thank the professors of the Master in biotechnological engineering, from the
Escola Superior Agraária de Bragança, my thanks for the knowledge that was transmitted to
me over this year and for the push they gave me to make this step a reality.
To the entire CIMO laboratory team that were always available to assist in whatever was
necessary, for having integrated me and for the knowledge they transmitted to me.
I also think the biochemistry department at the Faculty of Science of the University of Dr
moulay Taher University Saida Algeria.

II
DEDICATION
This thesis is dedicated to:
The sake of Allah, my Creator and my Master
My great teacher and messenger, Mohammed (May Allah bless and grant him), who
taught us the purpose of life.
My homeland Algeria, the warmest womb that I miss it a lot, and I am just waiting
impatiently to breathe its fresh air again after a year and six months absence
My great parents, who never stop giving of themselves in countless ways, I miss you
so much and forgive me for the long absence
My beloved brothers and sisters
My friends who encourage and support me
All the people in my life who touch my heart, I dedicate this research.

III
Abstract
This study was intended to evaluate the quality parameters of ten honey samples, from
various regions in semi-arid region of Algeria. Different parameters such as the
melissopalynological and the physicochemical properties of the honeys (moisture, color,
electrical conductivity, 5-hydroxymethylfurfural, pH, acidity, proline, and diastase activity)
were determined, as well as the evaluation of sugars, minerals and phenolic compounds.
Nutritional composition, antioxidant activity (reducing power and DPPH free radical
scavenging activity), anti-inflammatory and cytotoxicity were also evaluated. Finally,
antibiotics residues such as sulphonamides and tetracyclines antibiotics residues were
screened.
The melissopalynological results identified ten types of pollen, with Cytisus striatus
pollen being identified as the most abundant, present in all samples with percentages between
26.0 % and 83.8 %. EC1, MF1 and MF2 (Sidi Belabes region) were classified as monofloral
of Cytisus striatus honey. Additionally, although samples J1 to J3 were not considered as
Jujube monofloral, they showed a high percentage of Ziziphus pollen. The remaining samples
(EC2, EF1, EF2, and EF3) were classified as multifloral.
Regarding the physicochemical parameters, no significant differences were found in
the color of the samples which ranged between amber, light amber and extra light amber.
Moisture content was found to be between 13.6% (EF1) and 18.3% (EC1), while pH values
ranged between 4.2 and 5.1. Electrical conductivity values varied between 270 and 410
μS.cm-1
, while 5- hydroxymethylfurfural content showed values between 0 and 36.5 mg.kg
-1
and diastase values between 8.8 DN and 13.3 DN. Concerning the proline content, the
samples showed proline levels between 2.2–4.7 mg/kg, indicating a good maturity of the
honeys and absence of adulteration. All the honeys meet the standard required by the
European legislation with exception of the diastase index. The sugar profile, analyzed by high
pressure liquid chromatography with refractive index detection (HPLC-RI), showed that all
samples have higher fructose content than glucose, being the total more than 88.70 %,
allowing the classification of all the samples as nectar honeys.
Within the minerals, potassium was quantitatively the most important mineral (72.93%
of total minerals quantified), having an average content 730.59mg/kg, followed by sodium,
calcium and magnesium, with 17.05%, 4.43% and 4.22%, respectively, while cadmium and
lead had the lowest concentration, 0.003 % and 0.04% respectively.

IV
The total phenolic content of the analyzed honey samples ranged between 0.7 mg
GAE/g, for samples EF and J and 1.4 mg GAE/g, for samples EC, with an average of 0.9 mg
GAE/g. The total flavonoid content varied from 0.03 to 0.09 mg QE/g with the highest levels
observed in J honey samples. The values obtained for DPPH ranged from 0.02 to 0.04 mg/mL,
without significant differences between the samples.
The analysis of the phenolic profile was performed by UPLC/DAD/ESI-MSn, where
nineteen phenolic compounds were identified, including six phenolic acids, nine flavonoids,
two isoprenoids (abscisic acid isomers), one phenolic diterpenoid (carnosol) and one
spermidine (N1, N
5, N
10-tri-p-coumaroyespermidine). The major quantity of phenolic
compounds was found in sample EC1 with 202 mg/100 g, while sample EF3 showed the
lowest amount with 59.85 mg/100 g.
Concerning the anti-tumoral evaluation, all the studied extracts presented good activity,
with MF1 showing the highest cytotoxicity, followed by EF1. Also, all the extracts under
study showed anti-inflammatory capacity, with IC50 values between 8 and 400 µg/mL.
Regarding the antibiotics residues, its presence was found in three of the samples
(MF1 EF1 EF3) showed positive results for sulphonamides residues.
Keywords: honey, melissopalynological analysis, physicochemical parameters, antioxidant
activity, anti-inflammatory activity, cytotoxicity, antibiotic residues
V
Resumo
Este estudo teve por objetivo avaliar os parâmetros de qualidade de dez amostras de mel, de
várias regiões da região semiárida da Argélia. Neste âmbito foram determinadas as
características melissopalinológicas e os parâmetros físico-químicos dos méis (humidade, cor,
condutividade elétrica, 5-hidroximetilfurfural, pH, acidez, prolina e diástase), bem como
efetuada a avaliação do perfil de açúcares, minerais e compostos fenólicos. A presença de
resíduos de antibióticos como sulfonamidas e tetraciclinas foi também verificada.
Paralelamente foi estudada a composição nutricional dos méis e a sua bioatividade através da
atividade antioxidante (DPPH e poder redutor), anti-inflamatória e citotoxicidade.
Os resultados melissopalinológicos identificaram dez tipos de pólen, sendo o pólen de
Cytisus striatus o mais frequente, estando presente em todas as amostras com percentagens
entre 26,0% e 83,8%. As amostras EC1, MF1 e MF2 (região de Sidi Belabes) foram
classificados como méis monoflorais de Cytisus striatus. Já as amostras J1, J2 e J3, não
tenham sido consideradas monoflorais de Jujube, apresentaram uma alta percentagem de
pólen de Ziziphus. As restantes amostras (EC2, EF1, EF2 e EF3) foram classificadas como
méis multiflorais.
Em relação aos parâmetros físico-químicos, não foram encontradas diferenças significativas
na cor das amostras que variaram entre âmbar, âmbar claro e âmbar extra claro. Os resultados
do teor de humidade encontrados ficaram entre 13,6% (EF1) e 18,3% (EC1), enquanto os
valores do pH variaram entre 4,2 e 5,1. Os valores da condutividade elétrica variaram entre
270 e 410 μS.cm-1
, enquanto o conteúdo de 5-hidroximetilfurfural apresentou valores entre 0
e 36,5 mg.kg-1
e a diástase variou entre 8,8 DN e 13,3 DN. Quanto ao conteúdo de prolina, as
amostras apresentaram níveis de prolina entre 2,2–4,7 mg/kg, indicando boa maturidade dos
méis e ausência de adulteração. Todos os méis presentaram valores dentro do requerido pela
legislação europeia, com exceção do índice de diástase. O perfil de açúcares, analisado por
cromatografia líquida de alta pressão com deteção de índice de refração (HPLC-RI),
confirmou um maior teor de frutose do que glucose, sendo o total superior a 88,7%,
permitindo a classificação de todas as amostras como méis de néctar.
O potássio foi o mineral encontrado em maior quantidade (72,93% dos minerais totais
quantificados), tendo um teor médio de 730,59mg/kg, seguido do sódio, cálcio e magnésio
com17,05%, 4,43% e 4,22% respetivamente), enquanto o cádmio e o chumbo apresentaram a
concentração mais baixa, 0,003% e 0,04%, respetivamente.

VI
O conteúdo fenólico total das amostras variou entre 0,7 mg GAE/g, para as amostras EF e J
e 1,4 mg GAE/g, para as amostras CE, apresentando uma média de 0,9 mg GAE/g. O teor de
flavonóides totais variou entre 0,03 e 0,09 mg QE/g, sendo as amostras J as que apresentaram
um valor mais elevado. Os valores obtidos para o DPPH variaram entre 0,02 e 0,04 mg/mL,
sem diferenças significativas entre as amostras.
A análise do perfil dos compostos fenólicos foi realizada por UPLC/DAD/ESI-MSn, onde
foram identificados dezanove compostos fenólicos, incluindo seis ácidos fenólicos, nove
flavonóides, dois isoprenóides (isómeros do ácido abscísico), um diterpenóide fenólico
(carnosol) e uma espermidina (N1, N
5, N
10-tri-p-coumaroyespermidina). A amostra EC1
apresentou a maior quantidade de compostos fenólicos com 202 mg/100g, enquanto a amostra
EF3 apresentou a menor quantidade com 59,85 mg/100 g.
Quanto à avaliação anti-tumoral, todos os extratos estudados apresentaram atividade, sendo
o MF1 o que apresentou maior citotoxicidade, seguido do EF1. Além disso, os extratos
apresentaram capacidade anti-inflamatória, com valores de IC50 entre 8 e 400 µg/mL.
Em relação aos resíduos de antibióticos verificou-se a presença de três das amostras (MF1,
EF1, EF3) com resultados positivos para resíduos de sulfonamidas.
Palavras-chave: mel, análise melissopalinológica, parâmetros físico-químicos, atividade
antioxidante, atividade anti-inflamatória, citotoxicidade, resíduos de antibióticos

VII
Index
Acknowledgment .................................................................................. I
Abstract .............................................................................................. III
Resumo ................................................................................................. V
Figures Index ....................................................................................... X
Tables index ....................................................................................... XI
Abbreviations List ........................................................................... XII
Chapter I- Introduction ...................................................................... 1
Introduction .......................................................................................... 2
1.1. Objectives ........................................................................................................................ 2
1.2. Honey bees and bee products .......................................................................................... 4
1.2.1. Apis mellifera ........................................................................................................... 4
1.2.2. Bee Products ............................................................................................................. 5
1.3. Honey categories concerning origin ................................................................................ 6
1.3.1. Nectar honey ............................................................................................................ 6
1.3.2. Honeydew honey ...................................................................................................... 6
1.4. Honey chemical composition .......................................................................................... 7
1.4.1. Sugars ....................................................................................................................... 8
1.4.2. Water content ........................................................................................................... 8
1.4.3. Proteins and amino acids .......................................................................................... 8
1.4.4. Enzymes ................................................................................................................... 9
1.4.5. 5-Hydroxylmethylfurfural (5-HMF) ........................................................................ 9
1.4.6. Organic acids .......................................................................................................... 10
1.4.7. Vitamins ................................................................................................................. 10
1.4.8. Mineral content ...................................................................................................... 10
1.4.9. Volatile compounds ................................................................................................ 11
1.4.10. Phenolic compounds ............................................................................................ 11
1.5. Other physicochemical parameters ............................................................................... 12
1.5.1. Color ....................................................................................................................... 12
1.5.2. Electrical conductivity ............................................................................................ 12
1.5.3. pH and acidity ........................................................................................................ 12

VIII
1.6. Antibiotic residues in honey .......................................................................................... 13
1.7. Biological properties of honey ...................................................................................... 13
1.8. Beekeeping in Algeria ................................................................................................... 14
1.9. Algerian honey .............................................................................................................. 15
1.9.1. Eucalyptus honey ................................................................................................... 15
1.9.2. Euphorbia honey .................................................................................................... 16
1.9.3. Jujube honey ........................................................................................................... 17
Chapter II- Materials and methods ................................................. 18
2.Material and methods .................................................................... 19
2.1. Honey samples .............................................................................................................. 19
2.2. Honey analysis .............................................................................................................. 20
2.2.1. Pollen analysis ........................................................................................................ 20
2.2.2. Physicochemical analysis ....................................................................................... 21
2.2.3. Ash content ............................................................................................................. 29
2.2.3.2. Protein content ..................................................................................................... 29
2.3. Spectrophotometric analysis of the phenolic compounds ............................................. 30
2.3.1. Total phenolic content ................................................................................................ 30
2.3.2Total flavonoid content ................................................................................................ 30
2.4. Phenolic compounds ..................................................................................................... 30
2.4.1. Extraction ............................................................................................................... 30
2.4.2. Phenolic profile by UPLC / DAD / ESI-MSn ......................................................... 31
2.5. Antioxidant activity ....................................................................................................... 33
2.5.1. DPPH˙ assay ........................................................................................................... 33
2.5.2. Reducing power activity ......................................................................................... 34
2.6. Cytotoxic potential ........................................................................................................ 34
2.7. Anti-inflammatory activity ............................................................................................ 35
2.8. Detection of antibiotics residues ................................................................................... 35
2.8.1.Tetracycline residues ............................................................................................... 36
2.8.2. Sulphonamide residues ........................................................................................... 37
Chapter III- Results and discussion ................................................. 38
3. Results and discussion ................................................................... 39
3.1. Melissopalynological analysis ....................................................................................... 39

IX
3.2. Physicochemical parameters ......................................................................................... 40
3.2.1. Color ....................................................................................................................... 40
3.2.2. Moisture content ..................................................................................................... 41
3.2.3. Electrical conductivity ............................................................................................ 42
3.2.4. pH, free, lactonic and total acidity ......................................................................... 43
3.2.5. Proline .................................................................................................................... 44
3.2.6. 5-HMF .................................................................................................................... 45
3.2.7. Diastase activity ..................................................................................................... 46
3.3. Sugar analysis ............................................................................................................ 46
3.4. Minerals ......................................................................................................................... 48
3.5. Nutritional parameters ................................................................................................... 50
3.6. Total phenolics and total flavonoids contents ............................................................... 51
3.7. Phenolic compounds by UPLC / DAD / ESI-MSn ........................................................ 52
3.8. Antioxidant activity ....................................................................................................... 57
3.8.1. DPPH ...................................................................................................................... 57
3.8.2. Reducing power ...................................................................................................... 57
3.9. Cytotoxic potential ........................................................................................................ 58
3.10. Anti-inflammatory activity .......................................................................................... 59
3.11. Screening of antibiotics residues ................................................................................. 60
Chapter IV- Conclusion and Future Perspectives ......................... 62
Conclusion .......................................................................................... 63
Future perspectives ............................................................................ 65
Chapter V- References ...................................................................... 66
References ........................................................................................... 67
Chapter VI- Appendix ....................................................................... 83
Appendix ............................................................................................. 84

X
Figures Index
Figure 1. (A) Worker European honeybee, Apis mellifera Linnaeus. (B) A Queen. (C) Drone
(male) European honeybee, Apis mellifera. Photograph by Alexander wild
https://www.alexanderwild.com/Insects/Stories/Honey-Bees/i-3DtbsJ. .................................... 4
Figure 2. 5-HMF formation resulting from a sugar decomposition reaction (Bogdanov, 2014)
.................................................................................................................................................. 10
Figure 3. (A) The Langstroth hive and (B) the Langstroth hive different parts (John, 2014).
.................................................................................................................................................. 14
Figure 4. Number of honeybee colonies in Algeria from 2002 to 2010. (B) Honey production
in Algeria from 2002 to 2010. Source: Ministry of Agriculture and Rural Development:
MADR (2009-2010) (Adjlane, Doumandji and Haddad N. al., 2012). .................................... 14
Figure 5. Images showing (A): Apis mellifera intermissa bee and a (B): Apis mellifera
Sahariensis bee (Tlemcani, 2013). ........................................................................................... 15
Figure 6. (A) Eucalyptus plant (Orantes, Gonell, Torres et al., 2018). (B) Euphorbia plant. (C)
Jujube plant (Photograph by Andrii Salomatin,
https://www.shutterstock.com/fr/g/Andrii%2BSalomatin retrieved on 24-05-2 ..................... 17
Figure 7. Geographic origin of the honey samples. ................................................................ 19
Figure 8. Conductivity meter. .................................................................................................. 21
Figure 9. Potenciometer titrator. .............................................................................................. 22
Figure 10. Phenolic compounds extraction stages; acidified water (pH 2) (A), deionized water
(B), and methanol (C). .............................................................................................................. 31
Figure 11. UPLC / DAD / ESI-MSn
equipment ...................................................................... 33
Figure 12. Charm LSC 7600 ................................................................................................... 36

XI
Tables index Table 1. Honey composition after (Bogdanov, 2009) values in g/100g. ................................... 7
Table 2. Physicochemical properties of Jujube, Euphorbia, Eucalyptus honeys of arid and
semi-arid zones in north Africa ................................................................................................ 16
Table 3. Geographic origin and other information from honey samples. ................................ 20
Table 4. Calibration curve for sugars ...................................................................................... 24
Table 5. The calibration standards used in the spectrophotometer for the determination of
potassium and sodium. ............................................................................................................. 25
Table 6. The calibration standards used in the spectrophotometer for the determination of
calcium and magnesium. .......................................................................................................... 26
Table 7. The calibration standards used in the spectrophotometer for the determination of iron.
.................................................................................................................................................. 27
Table 8. The calibration standards used in the spectrophotometer for determination of lead . 28
Table 9. The calibration standards used in the spectrophotometer for the determination of
manganese, copper, and cadmium. ........................................................................................... 28
Table 10. DPPH assay steps. ................................................................................................... 33
Table 11. Pollen characteristics of the analyzed honey samples. ............................................ 40
Table 12. Physicochemical parameters: color, moisture content and conductivity. ................ 41
Table 13. pH and acidity of the honey samples analyzed........................................................ 44
Table 14. Physicochemical parameters of honey: 5- HMF, diastase and proline. .................. 46
Table 15. Sugar profile, obtained by HPLC-RI, of the studied honey samples (values
expressed in g/100g of honey). ................................................................................................ 48
Table 16. Minerals contents, obtained by using flame atomic absorption spectrophotometer
(values expressed in mg/100 kg of honey). .............................................................................. 49
Table 17. Nutritional values of honey: Ash, energy, proteins and carbohydrates. .................. 50
Table 18. Total phenolic and total flavonoid contents and antioxidant activity of honey
samples. .................................................................................................................................... 52
Table 19. Phenolic compounds and abscisic acid identified by UPLC/DAD/ESi-MSn in the
honey samples under study. ..................................................................................................... 53
Table 20. Quantification of phenolic compounds, expressed in mg/100 g honey. .................. 56
Table 22. Cytotoxicity potential and anti-inflammatory activity (GI50 values, µg/mL).......... 59
Table 23. Residues screening using CHARM II. .................................................................... 60

XII
Abbreviations List
[M-H]- - Ion product
5-HMF - 5-Hydroxymethylfurfural
Abs – Absorbance
AFB- American foulbrood
DN- Diastase index
GAE- Gallic acid equivalents
EU- European Union
HPLC– High pressure liquid chromatography
IHC– International Honey Commission
IR - Refractive index
LC- Liquid chromatography
LC-MS- Liquid chromatography coupled to mass spectrometry
MS- Mass spectrometry
m/z- mass to charge ratio
QE- quercetin equivalents
rpm- Rotation per minute
SPE- Solid phase extraction
TR - Retention time
UPLC/DAD/ESI-MSn- Ultra-pressure liquid chromatography with photodiode detection
coupled to tandem mass spectrometry with electrospray ionization.

1

Chapter I- Introduction
1
Chapter I- Introduction

Chapter I- Introduction
2
Introduction
Algeria has a rich variety of melliferous plants, which is distributed in different
bioclimatic zones. It has a potentially large beekeeping production area, but honey production
remains low. This weakness is due to the lack of expertise of intensive production techniques
on the part of beekeepers, but also due to climate change and absent of transhumance.
In Algeria, the agricultural sector set up during the year 2000 an operational strategy
for agricultural development (national agricultural development plan PNDA) extended from
2002 to the rural domain in favor of new attributions entrusted by the government to the
ministry of agriculture and rural development. In this context, attention was given to
beekeeping production and in particular to the establishment of modern hives and the
production of honey (Adjlane, Doumandji and Haddad, 2012).
Honey is the world's primary sweetener and nature's original sweetener prepared by
honeybees. Honey has been used as a food and medicine for at least 6000 years. The demand
for high quality honey is attracting great attention because of its health benefits (Alvarez-
Suarez et al., 2010) derived from its diversity and has been shown to have biological
properties, such as antimicrobial, antiviral, antiparasitic, anti-inflammatory, antioxidant,
antimutagenic and antitumor effects (Bogdanov, Jurendic, Sieber, & Gallmann, 2008).
Diseases prevention through consumption of honey is probably due to the presence of more
than 181 substances, such as amino acids, enzymes, proteins, vitamins, minerals, ash, organic
acids and phenolic compounds (Ouchemoukh et al., 2007; Ferreira et al., 2009). Its
composition varies with the floral source used by the bees, the harvest period and the geo-
climatic conditions of the regions concerned (Mbogning et al., 2011). In Algeria, several
studies on honey characterization have been carried out; we can cite the studies of: (Chefrour,
2007), (Ouchemoukh et al, 2007), (Makhloufi et al 2010), (Zerrouk et al 2011), (Zerrouk et al,
2014), (Nair, 2014), (Draiaia et al, 2015) and (Haouam et al, 2016).
1.1. Objectives
Algerian beekeepers who have constantly attempted to rescue and guarantee the
common characteristics of honey hope to discover different markets from local ones. For that,
an extensive study of the Algerian honey is needed, having in mind the establishment of
quality and authenticity guidelines and regulations. The aim of the present study is to evaluate
the quality of Algerian honey and verify its compliance with the established standards of
Codex. For that, ten samples with different botanical and geographical origin were analyzed

Chapter I- Introduction
3
regarding the following physicochemical parameters: melissopalynological analysis, color,
moisture, acidity, pH, ash content, electrical conductivity, diastase index, proline, 5-
hydroxymethylfurfural (HMF), nutritional composition and mineral content. Phenolic
compounds were evaluated through spectrophotometric methods and liquid chromatography
coupled with mass spectroscopy (LC-MS). Antioxidant activity (reducing power, DPPH free
radical scavenging activity), cytotoxicity and anti-inflammatory activities were also evaluated.
Finally, the presence of antibiotics, recurrent residues in honey, such as tetracyclines and
sulphonamides were screened to attest its safety.

Chapter I- Introduction
4
1.2. Honey bees and bee products
1.2.1. Apis mellifera
Apis mellifera naturally occurs in Europe, the Middle East, and Africa. This
species has been subdivided into at least 20 recognized subspecies (Mortensen, Schmehl
and Ellis, 2013). Like all Hymenopterans, honeybees have haplo-diploid sex
determination. Unfertilized eggs develop into drones (males), and fertilized eggs develop
into females. Female larvae, which taken care with a standard food regimen of pollen,
nectar, and brood nourishment become grown-up worker bees. Female larvae fed with a
rich food regimen of royal jelly, pollen, and nectar become queen (Mortensen, Schmehl
and Ellis, 2013). Worker honeybees are non-reproductive females. They are the smallest
in physical size of the three ranks and their body is designed specifically for pollen and
nectar collection (Fig.1.A). Queen honeybee (Fig.1.B) is the only reproductive female in
the colony. Her head and thorax are similar in size compared to that of the worker, while
the abdomen is more extended and plumper. Drones are the male cast of honeybees.
Drone's head and thorax are bigger than those of the females, (Fig.1.C) (Mortensen,
Schmehl and Ellis, 2013).
Figure 1. (A) Worker European honeybee, Apis mellifera Linnaeus. (B) A Queen. (C) Drone
(male) European honeybee, Apis mellifera. Photograph by Alexander wild
https://www.alexanderwild.com/Insects/Stories/Honey-Bees/i-3DtbsJ.
A
B
C

Chapter I- Introduction
5
1.2.2. Bee Products
1.2.2.1. Beeswax
Beeswax is an extremely inert common material that is secreted by worker bees
from the wax glands (Avshalom and Yaacov, 1996). Bees use beeswax to grow their
larvae and construct honeycomb cells where pollen and honey are stored. When secreted
by bees, beeswax is white, but in the honey combs rapidly obscures due to the contact
with the bees and also the pollen and honey (Avshalom and Yaacov, 1996).
1.2.2.2. Propolis
The word propolis comes from the Greek «pro» = in front, «polis» = city, and
means a substance with a protecting role for the bee colony (Bogdanov, 2014). Bees
gathered resinous exudates from leaf buds, shoots and petioles of leaves from different
plants with their mandibles, which once introduced into the hive, are mixed with wax and
salivary secretions, in order to produce propolis, which is used as a building and defense
material within the hive. Propolis has a very complex composition which is dependent on
the plant origin (Bankova and De Castro, 2000). The main chemical classes and most
bioactive compounds found in propolis are the phenolic compounds, which are
responsible for most of the bioactivities (Bankova and De Castro, 2000).
1.2.2.3. Royal jelly
Royal jelly is a bee product secreted by the hypopharyngeal and mandibular glands
of the nurse working bees (Zahran et al., 2016), between the 6th
and 12th
day of their life
cycle. This bee product is a white-yellow colloid with a pH between 3.6–4.2, with a
variable composition which depends on the metabolic and physiologic condition of the
worker bees, bee specie and on the seasonal and local conditions (Scorselli and Donadio,
2005).
1.2.2.4. Bee pollen and bee bread
Pollen grains are microscopic structures, male gametes located in the anthers of
stamens, indispensable for the fertilization of the female sexual organ of the flower (Krell,
1996). Pollen is extremely important for the hive, it is the main source of food for the
larvae providing them with important nutrients for their development such as proteins, and
carbohydrates, lipids, vitamins and minerals (Luz et al.,2010).

Chapter I- Introduction
6
1.2.2.5. Bee venom
Bee venom (BV) is an odorless and transparent liquid produced by female worker
bees containing a hydrolytic mixture of proteins with acid pH (4.5 to 5.5) that bees often
use as a defense tool against predators. One drop of BV consists of 88% of water and only
0.1 µg of dry venom (Bellik, 2015)
1.2.2.6. Honey
The Codex Alimentarius defined honey as a natural sweet substance, produced by
honeybees from the nectar of plants, secretions of their living parts, or excretions of plant-
sucking insects on the living parts of plants, which the bees collect, transform by
combining with specific substances of their own, deposit, dehydrate, store and leave in
honeycombs to ripen and mature (Codex Alimentarius, 2001). The definition of honey
under European Union (EU) legislation is very similar, with the difference that it
stipulates the bee species as being Apis mellifera (Directive 2001/110/EC).
1.3. Honey categories concerning origin
1.3.1. Nectar honey
This type of honey is produced by bees after they harvest the nectar of the flowers.
Nectar is a sugar-rich liquid produced by plants in glands called nectaries, and mainly
exist to encourage pollination by insects and other animals. About 95% of the dry
substance are sugars, the rest are amino acids (0.05 %), minerals (0.02-0.45 %) and
restricted amounts of organic acids, nutrients, and vitamins (Bogdanov, 2014). According
to their botanical origin, nectar honeys can be classified as monofloral honeys, if they are
produced from a single family or plant species, or as multifloral honeys when there is no
floral species that stands out. This assessment is often carried out through an analysis of
pollen grains that are present in honey, considering that when collecting nectar in the
flower, bees transport pollen grains that they will inadvertently introduce into honey
(Bear, 2009).
1.3.2. Honeydew honey
Honeydew honey is formed from secretions of living parts of plants or from the
excretions of sucking insects (Hemiptera, mostly aphids) (Terrab et al., 2003). These
insects break the plant cell and ingest the sap. The excess is excreted as droplets of
honeydew, which are gathered by the bees (Bogdanov, 2014). Honeydew is a solution

Chapter I- Introduction
7
with varying sugar concentration (5-60 %), containing mainly sucrose, besides higher
sugars (oligosaccharides). There are also smaller amounts of amino acids, proteins,
minerals, acids and vitamins. Besides, honeydew contains cells of algae and fungi
(Bogdanov, 2014).
1.4. Honey chemical composition
Honey is composed mainly by sugars, glucose and fructose, and in a less amount
water and other components like minerals, vitamins, proteins and amino acids, Table 1.
Table 1. Honey composition after (Bogdanov, 2009) values in g/100g.
Nectar honey g/100g Honeydew honey g/100g
Average Min-Max Average Min-Max
Water content 17.2 15-20 16.3 15-20
Fructose 38.2 30-45 31.8 28-40
Glucose 31.3 24-40 26.1 19-32
Sucrose 0.7 0.1 0.5 0.1-4.7
Other disaccharides 5.0 4.8 4.0 16
Melezitose <0.1 - 4.0 0.3-22.0
Erlose 0.8 - 1.0 0.16
Other
oligosaccharides
3.6 0.56 13.1 0.1-0.6
Total sugars 79.7 0.5-1 80.5 -
Minerals 0.2 0.1-0.5 0.9 0.6-2
Amino acids and
proteins
0.3 0.2-0.4 0.6 0.4-0.7
Organic acids 0.5 0.2-0.8 1.1 0.8-1.5
pH 3.9 3.5-4.5 5.2 4.5-6.5

Chapter I- Introduction
8
1.4.1. Sugars
Sugars are the main constituents of honey, comprising about 95 % of honey dry
weight (Bogdanov, 2014). The monosaccharides glucose and fructose are the main sugars
found in honey, which are the building blocks of the more complex sugars and are the
resulting products of the disaccharide sucrose hydrolysis (White, 1980). The main
oligosaccharides in nectar honeys are disaccharides: sucrose, maltose, turanose, erlose.
Honeydew honey also contains the trisaccharides melezitose and raffinose. Trace amounts
of tetra and pentasaccharides have also been isolated, including isomaltotetraose and
isomaltopentaose (Bogdanov, 2014).
1.4.2. Water content
Water is the second largest constituent of honey, and its content is also related to
the maturity of this product. The moisture content can be influenced by floral and
geographical origin, climatic factors, season of the year, processing and storage
conditions, as well as the degree of maturity achieved in the hive (Gallina et al., 2010). It
has significant impact on the physical properties of honey, such as, viscosity and
crystallization, but also taste, color, flavor, solubility, conservation and specific gravity
and also in the shelf life of the product. According to the Codex Alimentarius Committee
on Sugars, the moisture content in honey should not exceed 20 g /100 g (Codex
Alimentarius, 2001). If the moisture content is higher, the honey is more likely to ferment
due to the presence of yeasts and osmophilic microorganisms. Since honey is hygroscopic,
the moisture in honey can also increase during the processing operations of the product, as
well as the inadequate storage conditions (White, 1980).
1.4.3. Proteins and amino acids
Proteins and amino acids in honey are originated from both bees (salivary glands),
and plants (nectar, honeydew and mainly pollen). About 20 different non-enzymatic
proteins have been identified in honey (De-Melo et al., 2018). The quantity of proteins can
vary from 0.1 to 0.7%, Table 1. Overheated or long-time stored honeys show a reduction
or absence of protein content (De-Melo et al., 2018). Around 26 amino acids have been
detected in honey, such as proline, glutamic acid, alanine, phenylalanine, tyrosine, leucine,
among others (Cotte and Giroud, 2004). The most abundant amino acid found in honey is
proline, ranging from 50 to 85% of the total. The proline content in honeys should be

Chapter I- Introduction
9
higher than 200 mg/kg (Bogdanov, 2002). When the values of this amino acid are
significantly lower than 180 mg/kg, the minimum value that has been agreed for genuine
honey, it indicates sugar adulteration. Proline can be seen as quality criteria for honey
ripeness (Von-der, Dustmann, 1991).
1.4.4. Enzymes
The degrees of enzymes present in honey are sometimes used as an indicator for
honey quality, freshness and overheating. Enzymes in honey are originates from the honey
bees or from the plant visited by the bees. Diastase (α- and β-amylase) digests starch to
maltose and is relatively stable to heat and storage and invertase (glucosidase) catalyzes
mainly the conversion of sucrose to glucose and fructose, but also many other sugar
conversions (Raude, 1994). Also, glucose oxidase and catalase regulate the production of
H2O2, one of the honey antibacterial factors (Bogdanov, 2014). The enzyme content also
depends on temperature, honey botanical origin, nectar abundance flow, state and strength
of the colony, seasonal activity of the bee, bee specie, diet, age and physiological stage of
the bee (De-Melo et al., 2018).
Diastase activity is a physicochemical parameter usually investigated as marker of
honey freshness (Fechner et al., 2016; Flores et al., 2015). It can be expressed in Schade,
Göthe or diastase units and honey generally should present a diastase activity of at least 8
Schade units, which is the minimum value accepted by regulatory organizations (Codex
Alimentarius Commission, 2001). Similar to 5-HMF, the diastase activity can be used as an
indicator of aging and increase temperature because it may be reduced during storage or when
the product is subjected to heating above 60 oC (Fechner et al., 2016; Flores et al., 2015).
1.4.5. 5-Hydroxylmethylfurfural (5-HMF)
5-HMF is a product of the decomposition of monosaccharides such as fructose,
Fig. 2. The reaction occurs slowly and naturally during the storage of honey, and much
more quickly when honey is heated. The 5-HMF amount present in honey is the reference
used as a guide to the amount of heating that has taken place; the higher the 5-HMF value,
the lower the quality of the honey (Bear, 2009). However, 5-HMF alone cannot be used to
determine the severity of the heat treatment, because other factors can influence the levels
of 5-HMF, such as the sugar profile, presence of organic acids, pH, moisture content,
water activity and floral source. Therefore, the 5-HMF content gives only an indication of
overheating or inadequate storage conditions (Bogdanov, 2014). As indicated by the

Chapter I- Introduction
10
Codex Alimentarius and EU standards, the 5-HMF maximum is 40 mg/kg for the mixture
or processed honey, and a maximum of 80 mg/kg for honeys with a tropical origin.
(Bogdanov, 2014).
Figure 2. 5-HMF formation resulting from a sugar decomposition reaction (Bogdanov, 2014)
1.4.6. Organic acids
Honey contains organic acids, in equilibrium with the corresponding lactone,
representing less than 0.5% of total solids. They are important for honey taste, aroma,
color, acidity and honey preservation, making it difficult for microorganisms to grow
(Bogdanov, 2014). Organic acids in honey have different sources, while some acids can
come directly from nectar or honeydew, the majority, are produced from sugars by the
action of enzymes secreted by bees during ripeness and storage (De-Melo et al., 2018).
Gluconic acid is the main honey organic acid, representing the 70–90% of the total
(Bogdanov, 2014). It comes from glucose by the action of glucose oxidase. In addition to
gluconic acid, more than 30 different non-aromatic organic acids were found in honey.
Legally, organic acids should not exceed 50 meq/kg. For honey intended for industry, the
tolerated limit is of 80 milliequivalents (Lequet, 2010).
1.4.7. Vitamins
Honey has small amounts of vitamins, which come mainly from the pollen grains
in suspension (Matzke and Bogdanov, 2003). Vitamins found in honey include thiamine
(B1), riboflavin (B2), nicotinic acid (B3), pantothenic acid (B5), pyridoxine (B6), biotin
(B8), folic acid (B9) and also vitamin C. Those vitamins present in honey are preserved
due to the low pH of honey. The commercial filtration of honey may cause a reduction in
vitamin content due to the almost complete removal of pollen. Also, the loss of vitamins
in honey can happen due to the oxidation of ascorbic acid by the hydrogen peroxide
produced by glucose oxidase (Ciulu et al., 2011).
1.4.8. Mineral content
Mineral composition in honey is generally low, ranging between 0.02 and 0.3% in
nectar honeys, while in honeydew honeys can reach 1% of the total (Felsner et al., 2004).

Chapter I- Introduction
11
Its content can vary with the soil and climatic conditions, as well as the chemical
composition of the nectars originated from the different botanical sources. Also, the
harvesting and the beekeeping techniques can have influence in the honey mineral
(Felsner et al., 2004) content. The main minerals found in honeys are potassium, sodium,
calcium and magnesium and in lesser amounts iron, copper and, manganese. In minor
quantities, as trace elements, are found boron, phosphorus, sulfur, silicon and nickel,
among others (Doner, 2003). Generally, dark honeys contain more minerals than the light
ones, being higher in honeydew honeys (Bear, 2009). The mineral content is correlated
with the ash percentage and the electrical conductivity (Da Silva et al., 2016).
1.4.9. Volatile compounds
Researchers began the study of honey aromatic substance in the mid of 1960.
Honey volatiles are the substances responsible for the honey fragrance. Most of them are
derived from plants, but also some are included by the honey bees. Until now around 600
compounds have been identified in the volatile fraction of honey, and some are used as
markers of monofloral honeys, such as 3,9-epoxy-1-p-mentadieno, t-8-p-menthan-oxide-
1,2-diol and cis- rose, which have been proposed as markers of lemon honey; diketones,
sulfur compounds and alkanes are characteristic of eucalyptus honey, while hexane and
heptanal are the main compounds in the aroma of lavender honeys (Castro-Vázquez et al.,
2007). Other volatiles from different chemical families are present in honey at very low
concentrations, such as monoterpenes, C13-norisoprenoid, sesquiterpenes, benzene
derivatives and, to a lower content, superior alcohols, esters, fatty acids, ketones, terpenes
and aldehydes (Pontes et al., 2007).
1.4.10. Phenolic compounds
Phenolic compounds are plant-derived secondary metabolites. These compounds
have been used as chemotaxonomic markers in plant systematics. They have been
recommended as potential markers for the determination of botanical origin of honey and
for the differentiation between monofloral and multifloral honeys. In honey, as well as
from pollen or propolis they are mainly derived from plants (Ferreres, Ortiz and Silva,
1992), being present in a range of 5–1300 mg/kg (Gheldof and Engeseth, 2002).
According to the phenolic structural features, polyphenols are divided into two main
groups, phenolic acids and flavonoids (Tomás- Barberan et al., 2001). Flavonoids
aglycones are the mainly polyphenols found in honey. The loss of the sugar moiety of the

Chapter I- Introduction
12
glycosides present in nectar is due to the hydrolysis by bee saliva enzymes (Tomás-
Barberán et al., 2001). Dark honeys usually contain a higher quantity of phenolic
compounds than the light ones. Dark honeys have been reported to contain more phenolic
acid derivatives but less flavonoids than light ones (Tomás-Barberan et al., 2001).
1.5. Other physicochemical parameters
1.5.1. Color
Honey color can vary from practically colorless to brown dark, sometimes with
green or reddish reflexes. These variations in the color of honey can related to its flavor:
honey with lighter color have a gentle flavor while the darker honeys have a stronger
flavor (Marchini, Sodré and Moreti, 2004). The color of honey depends on its floral
origin, climate factors during nectar flow, soil conditions and the temperature at which the
honey matures in the hive. Also, pollen, sugars, carotenoids, xanthophylls, anthocyanins,
minerals, amino acids and phenolic compounds, mainly flavonoids (Bogdanov et al.,
2004). Furthermore, honeydew honey is darker than bloom honey primarily because of
mineral and phenolic substance and other components (Can et al., 2015).
1.5.2. Electrical conductivity
Electrical conductivity is a property related to the ability of a material to lead an
electric flow. Honey contains minerals and acids, serving as electrolytes, which can
conduct the electrical current, thus, the higher their content, the higher the resulting
conductivity. It is an indicator often used in the quality control of honey that can be used
to distinguish floral honeys from honeydew honeys. At present it is the most useful quality
parameter for the discrimination between floral honeys and honeydew honeys. As this
parameter is directly related to the ash content, it was included in the Codex Alimentarius
Standards, replacing the determination of the ash in honey. The standards recommend a
maximum value of 0.8 mS cm-1
(Codex Alimentarius, 2001; Bogdanov, 2014).
1.5.3. pH and acidity
The pH of honey ranges between 3.5 and 5.5 depending on its floral and
geographical source, the pH of nectar, soil or plant association, and the amount of
different acids and minerals (Crane, 1985). While pH analysis is useful as an auxiliary
variable to estimate the quality of the product and as a parameter for evaluating total
acidity, it is not directly related to free acidity due to the actions of the buffer acids and

Chapter I- Introduction
13
minerals present in honey (Pereira et al., 2009). The acidity of honey can be assessed as
free, lactonic, and total (free + lactonic) acidity (Navarrete et al., 2005). Free acidity is a
parameter related to the deterioration of honey, being its limit established as 50 meq kg-1
(Codex Alimentarius, 2001; EU Commission, 2002). Higher values may be indicative of
fermentation of sugars into organic acids (Almeida et al., 2013).
1.6. Antibiotic residues in honey
According to Regulation (EC) No 470/2009, no veterinary medicinal product is
permitted in beekeeping products. In fact, no antibiotic has ever had an MRL (Maximum
residue limits) in honey (Cara et al., 2012). However, some countries, like Switzerland,
UK, and Belgium, have established action limits for antibiotics in honey, which generally
lies between 0.01 to 0.05 mg/kg for each antibiotic group (Al-Waili et al., 2012). Some
antibiotics have the potential to produce toxic reactions in consumers directly while some
other can produce allergic or hypersensitivity reactions (Velicer et al., 2004). Antibiotic
residues consumed along with food and honey can produce resistance in bacterial
populations. Antibiotic resistance is a global public health problem and continues to
be a challenging issue (Al-Waili et al., 2012). Two main approaches are used to
determine the content of antibiotic residues in honey: screening tests and multi-stage
analytical methodologies. The simple tests provide qualitative information, enabling
determination of a single target analyte. With multi-stage methods, a fairly broad spectrum
of analytes can be determined in one analytical run. (Barganska, Slebioda and Namiesnik,
2011).
1.7. Biological properties of honey
Honey has been found to contain significant antioxidant compounds including
glucose oxidase, catalase, ascorbic acid, flavonoids, phenolic acids, carotenoid
derivatives, organic acids, amino acids and proteins (Beretta et al., 2005). Research
showed a correlation between color and antioxidant capacity, with the darker honeys
providing the highest levels of antioxidants (Jaganathan and Mandal, 2009).
Phenolic content in honey is responsible for anti-inflammatory effect (Al-Waili,
Boni, 2003). These phenolic and flavonoids compounds cause the suppression of the pro-
inflammatory activities of cyclooxygenase-2 (COX-2) and/or inducible nitric oxide
synthase (iNOS) (Viuda, Ruiz, Fernandez, 2008). Furthermore, ingestion of diluted
natural honey has produced reductions on concentrations of prostaglandins such as PGE2

Chapter I- Introduction
14
(prostaglandin E2), PGF2α (prostaglandin F2a) and thromboxane B2 in plasma of normal
individuals (Reyes, Segovia and Shibayama, 2007).
1.8. Beekeeping in Algeria
Beekeeping in Algeria is practiced mainly in the north of the country, where the
floral diversity is ensured almost all the year. The honeybees need to be adapted to the
desert climate and to be resistant to unfavorable environmental conditions such as high
temperatures and strong prevailing winds. Hives which are best suited or adapted to the
desert conditions must be used. Traditional hives made from rocks and muds are known
from ancient times in Algerian deserts. Nowadays, Langstroth hive type is used in Algeria,
Fig.3, with modifications due to the hot weather (Moustafa, 2001).
A B
Figure 3. (A) The Langstroth hive and (B) the Langstroth hive different parts (John, 2014).
In 2010, the Algerian Beekeeping Organization, counted around 1.2 million
colonies Fig.4.A, and 20,000 beekeepers. The development of honey production shows a
clear increase from 2002 to 2010, Fig.4.B (Adjlane et al., 2012).
Figure 4. Number of honeybee colonies in Algeria from 2002 to 2010. (B) Honey production
in Algeria from 2002 to 2010. Source: Ministry of Agriculture and Rural Development:
MADR (2009-2010) (Adjlane, Doumandji and Haddad N. al., 2012).
0
5
10
15
2002 2004 2006 2008 2010
colo
nie
s num
ber
x 1
00
00
0
years
0
1
2
3
4
5
2002 2004 2006 2008 2010
ho
ney
pro
duct
ion (
on
mil
lio
n o
f kg)
years

Chapter I- Introduction
15
A B
In Algeria, there are two main bee subspecies. The Tellian bee (Apis mellifera
intermissa), Fig.5-(A), is native of the region located between the atlas and the
Mediterranean which is known by the name of Tell. It is characterized by its black
abdomen and its agressivity. The main advantages of this bee are its longevity, remarkable
ability to harvest pollen and a high production of honey which can reach up to 100 kg per
colony provided that modern beekeeping methods are applied (Fresnay, 1981).
The Saharan (desert) bee (Apis mellifera sahariensis), Fig.-5(B), better known as
the Sahara bee, or locally the yellow bee. It is recognized for its many advantageous
features such as the high breeding, the precocity, the extraordinary aptitude for nectar and
pollen harvesting and good adaptability under difficult climatic conditions (Kessi, 2013).
Figure 5. Images showing (A): Apis mellifera intermissa bee and a (B): Apis mellifera
Sahariensis bee (Tlemcani, 2013).
1.9. Algerian honey
In this research, representative Algerian honeys such as, Euphorbia (Euphorbia
bupleuroides), jujube (Ziziphus lotus), Eucalyptus (Eucalyptus globulus) and multifloral
honeys will be focused.
1.9.1. Eucalyptus honey
The eucalyptus tree is a large, fast-growing evergreen that is native
from Australia and Tasmania. The tree can grow to 125-160 meters. Eucalyptus belongs to
the Myrtaceae family and more than 300 species of eucalyptus are described as
Eucalyptus globulus, Fig 6.A, which is the most common and well-known (Catherin,
2020). Many of which produce enough nectar for honey bees to yield appreciable amounts
of honey (Catherin, 2020; Persano, Baldi and Piazza, 2004). The main physicochemical
parameters are shown in, Table2. It is a honey with a clear amber color, a wet wood, very
intense and persistent aroma, a sweet with a slight acid note and a medium tendency for
crystallization with fine crystals (Orantes et al., 2018).

Chapter I- Introduction
16
1.9.2. Euphorbia honey
Euphorbia is one of the largest flowering plant in the spurge family
(Euphorbiaceae). With over 2,000 species, euphorbias can range from tiny annual plants
to large and long-lived trees and look completely different. In the deserts of Africa and
Madagascar, euphorbia adapted its physical characteristics becoming similar to cacti of
America, although they are not cacti (Cherif et al., 2011). Recent inventory of native
plants in Algeria identify over 51 species of Euphorbiaceae, where E. bupleuroides,
Fig.6.B, is the main species used by bees to produce honey (Le Houèrou, 1995; Quezel
and Médail, 2003).
Table 2. Physicochemical properties of Jujube, Euphorbia, Eucalyptus honeys of arid and
semi-arid zones in north Africa (Cherif et al., 2016; Cherif et al., 2016); (Makhloufi et al.,
2010)
The main physicochemical parameters are shown in Table 2. It is a honey with
golden yellow to dark amber color, with a sweet, pinch in the throat with a typical light bit
back flavor and with a spicy almost peppered aroma and pungent flavor (Cherif et al.,
2011).
Botanical
origin
pH Electrical
conductivity
s/cm
Water
content
%
Diastase
Schade
unit
Sucrose
%
5- HMF
mg/kg
References
Ziziphus 4.4 673 16.65 15.63 0.61 8.71 (Cherif et al.,
2016)
Euphorbia 4.2 411 17.06 12.67 0.97 12.08 (Cherif et
al., 2011)
Eucalyptus 4.2 769 16.5 9.64 25.63 (Makhloufi
et
al., 2010)

Chapter I- Introduction
17
A B C
Figure 6. (A) Eucalyptus plant (Orantes, Gonell, Torres et al., 2018). (B) Euphorbia plant. (C)
Jujube plant (Photograph by Andrii Salomatin,
https://www.shutterstock.com/fr/g/Andrii%2BSalomatin retrieved on 24-05-2
1.9.3. Jujube honey
Ziziphus lotus L. belongs to the family Rhamnaceae, which consist of about 135
species. The trees are medium-sized, growing 7-10 meters high, with shiny green leaves
about 5 cm long. The edible fruits are a globose dark yellow drupe with 1–1.5 cm
diameter, Fig.6.C. The wild jujube Ziziphus lotus is a species found in many habitats of
arid and semiarid regions of the Mediterranean area, throughout Libya to Morocco and
Algeria (Benammar et al., 2010).
Jujube honey is a highly demanded product in Algeria and worldwide, being
considered one of the most expensive honeys. Despite the commercial interest, this honey
type has been scarcely described (Cherif et al., 2016). The main physicochemical
parameters of jujube honey are shown in Table2. Its color is varied from light-amber to
amber.
Chapter II- Materials and methods
18
Chapter II- Materials and methods

Chapter II- Materials and methods
19
2.Material and methods
2.1. Honey samples This work was carried out with ten Algerian monofloral and multifloral honey samples,
obtained from local beekeepers and harvested in 2019, Fig.7. The honey samples were
stored in the original containers at room temperature.
Figure 7. Geographic origin of the honey samples.
In Table 3, there is information regarding the honey samples used throughout this
work, namely their geographical origin, year of production and other relevant information on
the label. Also the probable floral origin, given by the label, is shown in the Table 3.

Chapter II- Materials and methods
20
Table 3. Geographic origin and other information from honey samples.
Samples Floral origin on the
label
Geographic origin Collection
year
EC1 Eucalyptus Sidi Belabes 2019
EC2 Eucalyptus Sidi Belabes 2019
MF1 Multifloral Sidi Belabes 2019
MF2 Multifloral Sidi Belabes 2019
J1 Jujube Ein Safra 2019
J2 Jujube Ein Safra 2019
J3 Jujube Ein Safra 2019
EF1 Euphorbia El bayed 2019
EF2 Euphorbia El bayed 2019
EF3 Euphorbia El bayed 2019
2.2. Honey analysis
The honey characterization was carried out through the identification of their floral
origin by pollen analysis and by the evaluation of the physicochemical
parameters, defined by the International Honey Commission (IHC) (International Honey
Commission. 2009). Also, the composition of proteins, phenolic compounds and
antioxidant activity was evaluated. All parameters were evaluated in triplicate.
2.2.1. Pollen analysis
For pollen analysis, 10 g of honey, for each sample, were dissolved in 20 mL of
distilled water and centrifuged at 3500 rpm for 10 min. After discarding the supernatant
liquid, 2 mL of glacial acetic acid were added and vortexed. The tube was centrifuged in
the same conditions and the supernatant discarded. Then, 2 mL of the acetolysis solution

Chapter II- Materials and methods
21
(acetic anhydride: sulphuric acid, 9:1) were added and the solution vortexed. The tube was
placed in a boiling water bath for 3 min. After cooling and centrifuged, the supernatant
was discarded and 4 mL of 50% glycerol solution was added followed by another step of
centrifugation and removal of the supernatant. A volume of liquefied glycerol-gelatin was
added and immediately vortexed. Then, 17 µL of the mixture were pipetted and spread on
a slide at 40 oC. The slides were allowed to rest, at room temperature, in an invert
position. After sealing the coverslips with nail varnish, the slides were observed under an
optical microscope, at 1000X magnification, 500-1000 pollen grains per sample and
complete lines were counted and identified at random in the coverslip area (Von Der et al,
2004). This work was done in collaboration with LabApisUTAD
.
2.2.2. Physicochemical analysis
2.2.2.1. Color
The color intensity of honey samples was measured according to the Pfund scale.
Briefly, homogeneous honey samples were transferred into a cuvette with a 10 mm light
path until the cuvette was approximately full. Then, the cuvette was inserted into a C221
colorimeter (Hanna Instruments, Woonsocket, RI, USA). color grades were expressed in
millimeter (mm) Pfund grades, compared to an analytical-grade glycerol standard.
2.2.2.2. Moisture content
Moisture content was determined using a hand refractometer (Digit-5890, Ref:
8100.5890), expressing the results in percentages.
2.2.2.3. Electrical conductivity
A honey solution was prepared by diluting 20 g of anhydrous honey in 25mL of
deionized water, and the respective electrical conductivity was measured with the help of a
calibrated Consort C868 conductivity meter (Hanna Instruments, Woonsocket, RI, USA),
Fig. 8. The results are expressed in mS.cm-1
.
Figure 8. Conductivity meter.

Chapter II- Materials and methods
22
2.2.2.4 pH, free and lactonic acidity
Free acidity, pH, lactone acidity and total acidity measurements were performed
according to IHC (the International Honey Commission (Bogdanov, 2002). Briefly, 5 g of
honey were dissolved in 25 mL of deionized water, which were pipetted into a beaker where
the pH electrode was immersed and the initial pH value was read. This solution was titrated
with 0.119 M sodium hydroxide, NaOH. The volume spent to reach the equivalence point
(pH=7) was recorded, and the obtained value allowed the determination of the free acidity.
Immediately, an additional volume of 0.119 M NaOH to complete 10 mL was added, and
without delay, back-titrated with 0.022 M sulfuric acid, H2SO4, to pH 7, and so obtaining the
lactonic acidity. Total acidity results were obtained by adding free and lactone acidities. The
results are expressed in meq.kg-1
of honey. The titrations were done using a HI902
potentiometer titrator (Hanna instruments, pH 211 microprocessor pH meters), Fig. 9.
Figure 9. Potenciometer titrator.
2.2.2.5. Proline
The proline content in honey samples was measured weighting 0.5 g of honey into a
volumetric flask and dissolved in about 10 mL deionize distilled water. Then, 0.5 mL of
diluted honey solution was placed in a test tube, 0.5 mL of deionized water (blank test) into
a second tube, and 0.5 mL of proline standard (0.032 M) solution into a third tube. After, 0.5
mL of deionized water, 1 mL of formic acid (98%) and 1 mL of ninhydrin solution (3%)
were added to each tube. The tubes were capped carefully and shaken vigorously. After,
they were placed in ultrasound for 15 min followed into a water bath at 100°C for 15 min
and then transferred to a water bath at 70°C for 10 min. Finally, 5 mL of 2-propanol (50%)
was added and the tubes were capped immediately. After the tubes were allowed to cool
down for 45 min, the absorbance was measured at 510 nm using a UV/Vis
spectrophotometer (Specord 200 spectrophotometer, Analytikjena, Jena, Germany). Proline
content of honey, in mg/kg, was calculated according to following equation:

Chapter II- Materials and methods
23
Equation 1. Proline= ((Abs sample)/(Abs standard)) × ((Weight standard)/(Weight sample)) ×80
2.2.2.6 5-Hydroxymethylfurfural (5-HMF)
For the 5-HMF quantification, 5 g of honey were weighted and dissolved in 25 mL
of deionized water and transferred quantitatively into a 50 mL volumetric flask. Then, 0.5
mL Carrez solution I and Carrez solution II were added, completing the final volume of 50
mL with deionized water. The solution was filtered through Waltman paper, rejecting the
first 10 mL of filtrate. The filtrate was pipetted into each of two test tubes. To one of the
tubes, 5 mL of distilled water (sample solution) was added and to the other 5 mL of sodium
bisulphite solution, NaHSO3, 0.2% (reference solution). The absorbance was measured at
284 nm and 336 nm in a spectrophotometer (Specord 200 spectrophotometer, Analytikjena,
Jena, Germany), and the 5-HMF value was expressed in mg/kg and determined according to
the following equation:
Equation 2. HMF= (Abs284-Abs336) ×149.7× (5/ (sample weight))
2.2.2.7. Diastase activity
For the measurement of the diastase index the Phadebas method (Bogdanov, 2002)
was used. For that, 0.1g of honey was weighed, quantitatively transferred to a 10 mL
volumetric flask and completed the volume with 0.1M acetate buffer (pH=5.2). After
preparing the solution, 5 mL were added to a test tube (sample) and placed in a water bath of
40 °C, together with a second tube (reference solution) containing instead 5 mL of 0.1 M
acetate buffer solution (pH 5.2). Then, the Phadebas tablets were added to the two tubes,
which, after mixing, were kept at 40ºC for 15 minutes, After this time, The absorbance was
measured at 620 nm using a spectrophotometer (Specord 200 spectrophotometer,
Analytikjena, Jena, Germany). The result was presented as diastase index (DN), in Schade
units, corresponding to a unit of diastase and the enzymatic activity of 1 g of honey capable
of hydrolyzing 0.01 g of starch at 40ºC in one hour. The formulas used to calculate the DN
value were as follows:
Equation 4. DN= 28.2*Abs620 + 2.64, if DN > 8
Equation 3. DN= 35.2*Abs620 – 0.46 if DN<8

Chapter II- Materials and methods
24
2.2.3. Sugar analysis
For sugars analysis, about 2.5 g of honey was mixed with 20 mL of deionized water
and 12.5 mL of methanol and 1 mL of xylose (internal standard, 30mg/mL) and the resulting
solution was diluted to a final volume of 50 mL with deionized water. Afterwards, the
sample was passed through a 0.2 μm filter and analyzed by high performance liquid
chromatography coupled to a refractive index detector (HPLC-RI). HPLC-RI was performed
on an integrated Knauer system with pump (Smartline 1000), a degasser (Smartline 5000), a
UV detector (Knauer Smartline 2300) and an autosampler (Jasco, AS-2057). Data
acquisition and remote control of the HPLC system was done by Clarity Chrom software
(Knauer, Berlin, Germany). The chromatographic separation was achieved using a
Eurospher 100-5 NH2 (4.6 × 250 mm, 5 mm, Knauer) column at 30 ˚C. The mobile phase
was composed by acetonitrile/water, 80:20 (v/v) at a flow rate of 1.3 mL/min. The
identification of sugars was obtained by comparison of retention time between samples and
standards. Quantification was achieved using calibration curves of Table 4.
Table 4. Calibration curve for sugars.
Sugars Calibration curve R2
Fructose y = 82.665x + 75.806 0.9900
Glucose y = 60.65x + 154.24 0.9903
Sucrose y = 66.558x + 58.629 0.9907
Trehalose y = 86.976x + 0.7149 0.9900
Turanose y = 129.76x - 10.213 0.9983
Maltulose y = 71.156x + 1.4642 0.9976
Maltose y = 65.454x - 2.224 0.9996
Melezitose y = 58.269x + 18.123 0.9903
Raffinose y =53.431x + 12.721 0.9941
Melibiose y = 32.126x +6.8297 0.9903
Kojibiose y= 95.399x + 1.8282 0.9981
Erlose y = 60.749x + 9.616 0.9913
Isomaltose y = 57.638x - 1.958 0.9968

Chapter II- Materials and methods
25
2.2.4. Minerals
For the test of the minerals content, the following elements were assessed: magnesium
(Mg), calcium (Ca), sodium (Na), and potassium (K), via the spectrophotometer of flame
atomic absorption: Pye Unicam PU9100X. The detection of manganese (Mn), copper (Cu)
cadmium (Cd) and lead (Pb) was done using atomic absorption spectrophotometry thought
graphite chamber via a Perkin Elmer PinAAcle 900 spectrophotometer.
2.2.4.1. Sample Digestion
A sample of 1g was weighted into a PTFE digestion tube then 10 mL of concentrated
nitric acid (HNO3) was added. The sample was digested in a microwave via the following
temperature gradient sequencer: a power of 1200 W during 15 minutes until 200ºC. The
continuous of these conditions were sustained for another 15 minutes. After that, it was
cooled and quantitatively transferred into a volumetric flask of 50 mL.
2.2.4.2. Sample Analysis
The quantification of the different minerals required a previous preparation for
specific solutions and standards according to the following procedures:
2.2.4.2.1. Potassium and Sodium
For the quantification of the sodium and potassium elements, a cesium chloride
buffer (10 g/L) and the preparation of different standard solutions were done according to
the following requirement: solution 1: 10 mL of the potassium standard (1000 ppm) and 5
mL of sodium standard (1000 ppm) were pipetted into a flask of 20 mL and the volume
completed with deionized water. Then the dilution of this stock solution was done further,
according to (Table 5), for presenting the calibration standards as follows.
Table 5. The calibration standards used in the spectrophotometer for the determination of
potassium and sodium.
Standard V(sample)/mL Vf/mL
P1/4 0.25
50
P1/2 0.25
P1 1.00
P2 2.00
P3 3.00
P4 4.00
P5 5.00

Chapter II- Materials and methods
26
The calibration standards were done in the spectrophotometer resulted from the ten-
fold dilution of these standards (5.0 mL solution of each standard and 5 mL CsCl buffer in a
final volume of 50 mL). For the analysis of potassium, a digested supplement solution of 5
mL, buffer solution of 1 mL and 4 mL of deionized water were added. For the analysis of
sodium, 10 mL of the digested supplement solution, 1 mL of the buffer solution were added.
The recording of the result was taken according to the conditions suggested for the tools.
2.2.4.2.2. Calcium and Magnesium
For the detection and quantification of calcium and magnesium, a solution (10 g/L)
of lanthanum was prepared by diluting 13.15 g of La(NO3)2 in 1L of deionized water. Also,
a Ca standard solution (1000 ppm, solution 2) and an Mg standard solution (1000 ppm,
solution 3) was set in 10 ml of deionized water. Also, from stock solutions 2 and 3 a series
of standard solutions were set according to the following (Table 6).
Table 6. The calibration standards used in the spectrophotometer for the determination of
calcium and magnesium.
Standard V (sol 2)/mL V (sol 3)/mL Vf/mL
P1/4 0.25 0.25 50
P1/2 0.25 0.25
P1 1.00 1.00
P2 2.00 2.00
P3 3.00 3.00
P4 4.00 4.00
P5 5.00 5.00
The standards applied in the spectrophotometer calibration to determine the content
of Ca are done from the ten-fold dilution of these standards (5.0 mL solution of each
standard and 5 mL of solution La to a final volume of 50 mL). The standards applied in the
spectrophotometer calibration to determine the content of Mg were done from the thirty-
three-fold dilution of these standards (1.50mL solution of each standard and 5 mL of
solution La to a final volume of 50mL). To detect the content of potassium in the
supplement, a digested supplement solution of 5 mL, buffer solution of 1 mL and 4 mL of
deionized water were added. For the quantification, a digested solution of 10 mL and
lanthanum solution of 1 ml was added. To determine the Ca and Mg the recommended
condition according to the equipment was followed.

Chapter II- Materials and methods
27
2.2.4.2.3. Iron
Matrix modifier: diluted 1.7mL of magnesium nitrate solution, Mg(NO3)2, 10 g/L to
10 mL of solution with deionized water.
Standard 1: diluted 0.50 mL of 1000 ppm standard solution to 50mL with deionized
water.
Standard 2: diluted 0.50 mL of standard solution to 50 mL with deionized water.
The standards used to construct the calibration curve resulted from the automatic
dilution of standard 2 according to the table. For sample analysis, 20 µL of the sample was
pipetted from a 5 µL matrix modifier. The instrumental conditions recommended for iron
analysis were used.
Table 7. The calibration standards used in the spectrophotometer for the determination of iron.
Standard V(P2) /µL V(Matrix)/µL V (H2O) /µL
P1/4 5 5 15
P1/2 10 5 10
P3/4 15 5 5
P1 20 5 0
2.2.4.2.4. Lead
Matrix modifier: 0.10 mL of magnesium nitrate solution, Mg(NO3)2, and 1.0 mL of
10% monobasic ammonium phosphate solution were diluted to 10mL of solution with
deionized water.
Standard 1: 0.50 mL of 1000 ppm standard solution was diluted to 50 mL with
deionized water.
Standard 2: 0.70 mL of standard 1 solution was diluted to 50 mL with deionized
water.
The standards used to construct the calibration curve resulted from the automatic
dilution of standard 2, according to Table 8.
For the sample analysis, 20µL of the sample was pipetted with a 5 µL of matrix
modifier. The instrumental conditions for the analysis of lead were used.

Chapter II- Materials and methods
28
Table 8. The calibration standards used in the spectrophotometer for the determination of lead
Standard V(P2) /µL V(Matrix )/µ
L
V (H2O) /µL
P1/4 5 5 15
P1/2 10 5 10
P3/4 15 5 5
P1 20 5 0
2.2.4.2.5. Manganese, Copper, and Cadmium
To determine the content of manganese, a modified matrix was applied by the
dilution of 1.7 mL of a magnesium nitrate solution, Mg(NO3)2, 10 g/L to final volume of 10
mL with deionized water. Two standards for manganese were done, one diluting 0.50 mL of
standard solution (1000 ppm) to a final volume of 50 mL of deionized water and another by
the dilution of 0.20 mL of the previous solution to a final volume of 50 mL of deionized
water (standard 2). For copper, a modified matrix resulted from the dilution of 1.0 mL of
palladium solution, Pd, 10 g/L, and 0.1mL of magnesium nitrate solution, Mg(NO3)2, to a
final volume of 10 mL of solution in deionized water. After that, the preparation of two
copper standards was done by the dilution of 0.50 mL of the 1000 ppm standard solution (Vf
= 50 mL deionized water, standard 1) and the dilution of 0.50mL of the previous solution to
a final volume of 50mL (standard 2). To determine the cadmium content, preparation of
modified matrix was done by the dilution of 0.10 mL of magnesium nitrate solution,
Mg(NO3)2, and 1.0 mL of 10% monobasic ammonium phosphate solution, NH4H2PO4, in 10
mL of deionized water. The preparation of two standard solutions was then done, the first by
the dilution of 0.25 mL of standard solution (1000 ppm) to 50 mL with deionized water
(standard 1) and the second, by dilution of 0.10 mL of the above solution to 50 mL with
deionized water (standard 2). The standards applied for the construction of the calibration
curve resulted from diluting standard 2, according to (Table 9). To analyze all the samples,
20 μL of sample and 5 μL of the modified matrix were pipetted with the application of the
recommended instrumental conditions for each one of the analyses.
Table 9. The calibration standards used in the spectrophotometer for the determination of
manganese, copper, and cadmium.
Standard V(P2)/mL V(matrix)/mL V (H2O)/µL
P1/4 5 5 15
P1/2 10 5 10
P1 15 5 5
P2 20 5 0

Chapter II- Materials and methods
29
2.2.3. Nutritional parameters
2.2.3. Ash content
The ash content was determined, in triplicate, indirectly through its calculation, according
to the defined in the literature (Sancho el al, 1992) using the following formula:
Equation 6. % Ash= (conductivity/1000)-0.14/1.74
2.2.3.2. Protein content
For the determination of the protein content,1 g of honey sample was weighed into a
250 mL test tube, 2 catalyst tablets (9% CuSO4) and 15 mL concentrated sulphuric acid
(98%) were added. The blank was prepared with all chemicals and without sample; 5mL of
distilled water was used instead of sample. Samples were digested for 70 minutes at 400 °C.
Before distillation and titration, the test tubes were let to cool down to 50-60 °C, then 25 mL
of distilled water was added to the mixture. The samples were distilled according to the
following parameters; HCl (0.2M) as titrant solution, NaOH (32 %): 50 mL, H3BO3 (4 %
with indicators): 30 mL. For the conversion of nitrogen content into total protein, a factor of
6.25 was used, expressing the results in g/100 g of honey.
2.2.3.3. Total Carbohydrates:
The carbohydrate content of the honey samples was obtained by differential
calculation considering the following expression defined in the literature (Nogueira et al,
2012):
Equation 7. % Total carbohydrates = (100% -Moisture)- (% ash+%protein+%lipids)
2.2.3.4. Energy
The energy value expressed in kcal was calculated in 100g of honey, using the
following equation (Estevinho et al, 2012):
Equation 8. Energy value (kcal/100g) =4× (%protein+%carbohydrates) +9× (%lipid)

Chapter II- Materials and methods
30
2.3. Spectrophotometric analysis of the phenolic compounds
2.3.1. Total phenolic content
For the total phenolic content, 1 g of honey sample was diluted with 10 mL methanol.
Then, an aliquot of 0.5 mL of the solution was mixed with 0.5 mL of the Folin–Ciocalteu
reagent and 1 mL of a 20% sodium carbonate solution. Deionized water was added to a final
volume of 5 mL. Following the incubation of 1 hour, the absorbance of the reaction mixture
was measured at 760 nm using a spectrophotometer (Analytik Jena, Jena, Germany). Gallic
acid was used (0.005–0.15 mg/mL) as the standard solution and the values expresses as
milligram of gallic acid equivalent per g of sample (mg GAE/g).
2.3.2Total flavonoid content
Total flavonoid content was determined using the aluminum chloride (AlCl3)
colorimetric method (Alothman, Bhat and Karim, 2009). The Al3+
cations form stable
complexes with free hydroxyl groups of flavonoids this causes the extension of the
conjugated system a shift of the absorption maxima to a longer wavelength region, allowing
quantification in a spectrophotometer at 415 nm (Buriol et al, 2009). The honey solutions
were prepared at the concentration of 0.1 g/mL. One milliliter of the stock solution was
diluted with 10 mL of methanol and then mixed with 0.5 mL of a 5% aluminum chloride
solution (2% aluminum chloride in 5% acetic acid/methanol) and the volume adjusted to 5
mL with 5% acetic acid/methanol. Following incubation for 30 min, in the dark at room
temperature, the absorbance was measured at 415 nm using a spectrophotometer (Analytik
Jena, Jena, Germany). Quercetin was used to calculate the standard curve (0.0016-0.5
mg/mL) and the results were expressed as mg of quercetin equivalents per g of sample (mg
QE/g).
2.4. Phenolic compounds
2.4.1. Extraction
Extraction of polyphenols from honey is generally accomplished using either liquid–
liquid extraction (LLE) or solid-phase extraction (SPE). In both methods, the first step is to
separate the sugars, which make up the great majority of the honey mass. In our case SPE
followed by LLE were used. For that, 25 g honeys were mixed with 125 mL of acidified
water (pH 2 with HCl) until completely fluid and filtered through cotton to remove solid
particles. The extraction was conducted in a glass column (25 cm x 2 cm) fitted with an

Chapter II- Materials and methods
31
opening valve and a fritted glass support. The column was packed with 25 g of
Amberlite®XAD
®-2 in methanol, Figure 10. The phenolic compounds remained in the
column, while sugars and other polar compounds eluted with the water. After passing the
honey solution, the column was washed with the acidified water and then with deionized
water. Then, the phenolic fraction was eluted with methanol and the solution evaporated
under reduced pressure at 40 oC. The residue was re-dissolved in 5 mL of water and
extracted with diethyl ether (5 mL x 3). The resulting extracts were combined, concentrated
under reduced pressure and re-dissolved in methanol for further LC-MS analysis.
Figure 10. Phenolic compounds extraction stages; acidified water (pH 2) (A), deionized water
(B), and methanol (C).
2.4.2. Phenolic profile by UPLC / DAD / ESI-MSn
The phenolic compounds characterization was made through UPLC / DAD / ESI-
MSn performed on a Dionex UPLC 3000 equipment (Thermo Scientific, USA) (Figure 11)
equipped with a photodiode detector and coupled to a mass detector. The chromatographic
system consisted of a quaternary pump, an automatic sampler maintained at 5ºC, a degasser,
a photodiode array detector and an automatic thermostatic column compartment. The
2 cm
1-Column packing: 25g resin
2- Conditioning: 50 mL A
3- Sample loading: 25g of honey solubilized
in 125 mL of A
4-washing: 50 mL of A then 150 mL of B
5- Elution:150 mL of C
Purification

Chapter II- Materials and methods
32
chromatographic separation was performed on a U-VDSpher PUR C18-E 100 mm x 2.0 mm
i.d. column, with particle size of 1.8 μm (VDS Optilab, Germany), maintained at 30ºC. The
mobile phase was composed of (A) 0.1% (v / v) formic acid in water and (B) 0.1% (v / v)
formic acid in acetonitrile, previously degassed and filtered using a nylon membrane with
0.22 μm porosity. A linear gradient with a flow rate of 0.3 mL/min was used: 0.0-1.0 min 20%
B ; 1.0-11.1 min 20-95% (B); 95% (B) for 2 min; 13.1-13.3 min 95-20% (B); and 20% (B)
for 5 min. The injection volume was 3 μl. Spectral data for all peaks were detected in the
range 190-600 nm. Each sample was filtered through a 0.2 µm nylon membrane (Whatman).
Mass analysis was performed on a LTQ XL mass spectrometer (Thermo Scientific, CA,
USA), in negative mode, equipped with an ESI electro spray ionization source: spray
voltage, 5 kV; capillary voltage, -20V; capillary tube voltage, -65V; capillary temperature,
325 ° C; gas flow and auxiliary gas (N2), 50 and 10 (arbitrary units), respectively. Mass
spectra were acquired in the mass range 100-1000 m/z. Mass spectra were acquired by full
range acquisition covering 100–1000 m/z. For the fragmentation study, a data dependent
scan was performed by deploying collision-induced dissociation (CID). The normalized
collision energy of CID cell was set at 35 (arbitrary units). Data acquisition was performed
using the Xcalibur® software (Thermo Scientific, CA, USA). Quantification was performed
with standard substance calibration curves for p-hydroxybenzoic acid (y = 4x10⁶x-134082;
R2 = 0.9988), caffeic acid (y = 3x10
6x-12895; R
2 = 0.9998), p-coumaric acid (y = 4x10
6x-
13435; R2 = 0,9999), quercetin (y = 893859 x-11231; R
2 = 0.9999), chrysin (y = 5x10
6 x-
32533; R2 = 0.9990), naringenin (y = 5x10
6 + 14548, R
2 = 0.9996) and abscisic acid (y =
2x10⁷x-4x10
6; R
2 = 0.9988). When standards were not available, the compounds were
expressed by equivalents of the structurally more similar phenolic compound. The
elucidation of the structure of phenolic compounds was carried out by comparing their
chromatographic behavior, UV spectra and mass profile with that obtained for commercial
standards and also with the information obtained in the literature when these were not
available.

Chapter II- Materials and methods
33
Figure 11. UPLC / DAD / ESI-MSn
equipment
2.5. Antioxidant activity
2.5.1. DPPH˙ assay
The antiradical activity of the honey samples was estimated using the 2, 2-diphenyl-
1-picrylhydrazyl hydrate radical (DPPH˙). For that, 1g of honey was dissolved in 10 mL of
methanol 20 %. Using a microplate, sample solution, methanol and DPPH were added as
described in the Table10. The absorbance was read at 515 nm using an ELX800 Microplate
Reader (Bio-Tek Instruments, Inc.). Different sample concentrations were used in order to
obtain antiradical curves for calculating the EC50 values, according to the following equation:
%Inhibition = [(Abs DPPH−Abs sample)/Abs DPPH.] × 100
For comparison a standard solution of gallic acid was used with an average value of
EC50 of 1.22 mg/mL.
Table 10. DPPH assay steps.
Well Volume (L)
A 10 L Sample solution +140 L methanol+150 L DPPH
*3
B 20 L Sample solution+130 L methanol+150 L DPPH
*3
C 40 L Sample solution +110 L methanol+150 L DPPH
*3
D 60 L Sample solution + 90 L methanol+150ul DPPH *3
E 80 L Sample solution +70 L methanol+150 L DPPH
*3
F 100 L Sample solution +50 L methanol+150 L DPPH
*3
G Blanc (150 L methanol+150 L DPPH) *3

Chapter II- Materials and methods
34
2.5.2. Reducing power activity
The reducing power of honey samples was measured by the ferricyanide prussian
blue assay. Through this assay the capacity to convert Fe3+
into Fe2+
is determined,
measuring the absorbance at 700 nm (Ferreira et al., 2009). A volume of 0.125 mL of honey
sample (0.1g/mL) was mixed with 1.125 mL of phosphate buffer (0.2 mol/L, pH 6.6) and
1.250 mL of 1% potassium ferricyanide. The mixture was incubated in a water bath at 50 ºC
for 20 min at 100 rpm. Then, 1.250 mL of 10% trichloroacetic acid was added to the mixture
and centrifuged at 3000 rpm (Centurion K2R series) for 10 min. The supernatant (1.250 mL)
was mixed with deionized water (1.250 mL) and FeCl3 (0.250 mL, 0.1%), and the
absorbance was measured at 700 nm. Gallic acid was used as standard (0.001-0.01 mg/mL),
and results were expressed as milligram of gallic acid equivalent per 100 g dry of sample
(mg GAE/100 g).
2.6. Cytotoxic potential
The following human tumor cell lines were used: AGS (gastric adenocarcinoma),
CaCo (colorectal adenocarcinoma), MCF-7 (breast adenocarcinoma), and NCI-H460 (lung
carcinoma). A non-tumor cell line, Vero (African green monkey kidney), was also tested.
All of them were maintained in RPMI-1640 medium supplemented with 10% fetal bovine
serum, glutamine (2 mM), penicillin (100 U/mL) and streptomycin (100 mg/mL), with the
exception of Vero, that wasmaintained in DMEM medium supplemented with fetal bovine
serum (10%), glutamine and antibiotics. The culture flasks were incubated in an incubator at
37ºC and with 5% CO2, under a humid atmosphere. The cells were used only when they had
70 to 80% confluence. A known mass of each of the extracts (8 mg) was dissolved in H2O (1
mL), in order to obtain the stock solutions with a concentration of 8 mg/mL. From which
successive dilutions were made, obtaining the concentrations to be tested (0.125 - 8 mg/mL).
Each of the extract concentrations (10 μL) were incubated with the cell suspension (190 μL)
of the cell lines tested in 96-well microplates for 72 hours. The microplates were incubated
at 37ºC and with 5% CO2, in a humid atmosphere, after checking the adherence of the cells.
All cell lines are tested at a concentration of 10,000 cells/well, except for Vero in which a
density of 19,000 cells/well was used. After the incubation period, the cells were corrected:
TCA (10% w/v; 100 μL) was previously cooled and plates were incubated for 1 hour at 4ºC,
washed with water and, after drying, a SRB solution (0.057%, m/v; 100 μL) was added, left
to stand at room temperature for 30 minutes. To remove non-adhered SRB, plates were
washed three times with a solution of acetic acid (1% v/v) and placed to dry. Finally, an

Chapter II- Materials and methods
35
adhered SRB was solubilized with Tris (10 mM, 200 μL) and the absorbance at a
wavelength of 540 nm was read in the Biotek ELX800 microplate reader. The results are
expressed in terms of the concentration of extract with the ability to inhibit cell growth by
50% - GI50. As a positive control ellipticin was used.
2.7. Anti-inflammatory activity
The extracts were dissolved in H2O in order to obtain a final concentration of 8
mg/mL. From which successive dilutions were carried out, obtaining the concentrations to
be tested (0.125 - 8 mg/mL). The RAW 264.7 mouse macrophage cell line, obtained from
DMSMZ - Leibniz - Institut DSMZ - Deutsche Sammlung von Mikroorganismen und
Zellkulturen GmbH, was grown in DMEM medium, supplemented with heat-inactivated
(SFB) fetal serum (10%), glutamine and antibiotics, and kept in an incubator at 37ºC, with
5% CO2 and under a humid atmosphere. Cells were detached with a cell scraper. An aliquot
of the cell suspension of macrophages (300 μL) with a cell density of 5 x 10⁵ cells/mL and
with a proportion of dead cells below 5% according to the Trypan blue exclusion test, was
placed in each well. The microplate was incubated for 24 hours in the incubator with the
conditions previously indicated in order to allow an adequate adherence and multiplication
of the cells. After that period, the cells were treated with different concentrations of extract
(15 μL, 0.125 - 8 mg/mL) and incubated for one hour, with the range of concentrations
tested being 6.25 - 400 μg/mL. Stimulation was performed with the addition of 30 μL of the
liposaccharide solution - LPS (1 mL/mL) and incubated for an additional 24 hours.
Dexamethasone (50 mM) was used as a positive control and samples in the absence of LPS
were used as a negative control. Quantification of nitric oxide was performed using a Griess
reagent system kit (nitrophenamide, ethylenediamine and nitrite solutions) and through the
nitrite calibration curve (100 mM sodium nitrite at 1.6 mM) prepared in a 96-well plate. The
nitric oxide produced was determined by reading absorbances at 540 nm (ELX800 Biotek
microplate reader, Bio-Tek Instruments, Inc., Winooski, VT, USA) and by comparison with
the standard calibration line. The results were calculated through the graphical
representation of the percentage of inhibition of nitric oxide production versus the sample
concentration and expressed in relation to the concentration of each of the extracts that
causes the 50% inhibition of nitric oxide production - IC50.
2.8. Detection of antibiotics residues

Chapter II- Materials and methods
36
The Charm II test uses an antibody (as a binder) with specific receptor sites that bind all
of the target antibiotics. The binder is added to a sample extract followed by addition of an
exact amount of H3 or C
14 labeled antibiotics (as a tracer). Firstly, the unknown antibiotics in
the sample combines with the receptor sites and then the radio labeled antibiotics occupy the
remaining sites. After this reaction is complete, a scintillation fluid is added and the
concentration of either H3 or C
14 associated with the binder is measured in counts per minute
(CPM) using the Charm II system (Charm LSC 7600, Charm Science Inc., USA), Figure 12.
Samples with high counts are considered negative (tracer antibiotics are largely bound to the
binder) and samples with low counts are considered positive (tracer antibiotics are largely
free in solution). Thus, the greater the counts, the lower the original antibiotic concentration
in the samples (Kwon et al, 2011).
Figure 12. Charm LSC 7600
The detection of tetracycline and sulphonamide followed the operator’ s manuals
attached to the device.
2.8.1.Tetracycline residues
The charm II tetracycline test for honey is a rapid immunoreceptor assay for the
detection of tetracyclines in honey at 10 to 20 ng/g or parts per billion (ppb). For that, 5 g of
sample were weighted into a centrifuge tube and mixed vigorously with 20 mL of distilled
water. In an empty test tube the green tablet was added with 300 μL of water and mixed 10
seconds to break the tablet. Then, 0.5 mL of the sample or control solution was added and
mixed immediately. After incubation (45 C° for 5 min), the orange tablet was added, and the
solution was mixed immediately. After a second incubation (45 C° for 5 min), the black
tablet was added and the solution was mixed immediately and centrifuged for 5 min at 5000
rpm. Meanwhile, new test tube was labeled and the white tablet with 300 μL of water is
added. The supernatant from the first tube were poured into the new labeled test tube and

Chapter II- Materials and methods
37
mixed immediately. After incubation (45 C° for 5 min), the solutions were centrifuged for 5
min at 5000 rpm. Finally, the supernatant was removed and additional 300 μL of water was
added to the tube and mixed thoroughly to break up the pellet. After, 3 mL of scintillation
fluid was added into the tube, which was shaken until the mixture has with a uniform cloudy
appearance. CPM (count per minute) were read on [3H] channel by using (Charm LSC 7600,
Charm Science Inc., USA).
2.8.2. Sulphonamide residues
The sensitivity of Charm II sulfa drug test for honey is set to detect sulphonamide at
10 ng/g or ppb. 5 g of sample were weighted and mixed vigorously with 20 mL of distilled
water. An extraction procedure is required to free sulfa drugs bounded to the sugars in honey
and to eliminate interference from sulfa drug analogs, filtrating the solution followed by SPE
extraction in C18 cartridge. After extraction, a white tablet was added to an empty test tube
than mixed well with 300 μL of water, and followed by the addition of 5 mL of extracted
solution. A pink tablet was then added to the tube and mixed immediately. After incubation
(85C° for 3 min) the solution was centrifuged for 3 min at 3400 rpm. Supernatants were
poured off, fat rings were removed, and test tubes were wiped with swabs to avoid
disturbing the pellet. Finally, 300 μL of water were added into the tube and mixed
thoroughly to break up the pellet. 3 mL of scintillation fluid was added into each tube and
shaken until the mixture has a uniform cloudy appearance. CPM (count per minute) were
read on [3H] channel by using (Charm LSC 7600, Charm Science Inc., USA).

Chapter III- Results and discussion
38
Chapter III- Results and discussion

Chapter III- Results and discussion
39
3. Results and discussion
3.1. Melissopalynological analysis
Pollen analysis of honey, or mellissopalynology, is of great importance for quality
control. Honey always includes numerous pollen grains (mainly from the plant species
foraged by honey bees) and honeydew elements (like wax tubes, algae and fungal spores)
that altogether provide a good fingerprint of the environment where the honey comes from.
Pollen analysis can therefore be useful to determine and control the geographical and
botanical origin of honeys even if sensory and physicochemical analyses are also needed for
a correct diagnosis of botanical origin. Moreover, pollen analysis provides some important
information about honey extraction and filtration, fermentation (Russmann, 1998),
adulteration types (Kerkvliet et al., 1995) and hygienic aspects such as contamination with
mineral dust, soot, or starch grains (Louveaux et al., 1978).
Multifloral honeys have in their composition percentages of pollen from various
floral species, while monofloral honeys are characterized by honeys obtained mainly from a
single plant species (≥ 45% of the same pollen type), although this value may vary according
to the plant's ability to produce pollen. (Estevinho et al, 2012).
Honey samples EC1 and EC2 from Sidi Belabes region had Cytisus striatus type as
the dominant pollen and accompanying pollen respectively, in fact EC1 and EC2 which were
labeled as eucalyptus and showed low percentages of eucalyptus pollen, Table 11. Cytisus
striatus was also the dominant pollen type of MF1 and MF2, which represented a minimum
of 83.3% to a maximum of 83.8% of the total pollen content, Table 11. Honey samples EF,
from El Bayadh region, had Cytisus striatus type as the dominant pollen for the three
samples, with an average of 79.8%, instead of Euphorbia pollen which were indicated in the
commercial label. Regarding to this pollen type, it can be either the Cytisus striatus type or
another within the same genus, like C. arboreus, C. triflorus, C. purgains, C. pinifolius, C.
fontanesii, C. monspessulanus, C. arboreus, which were previously reported as present in
the areas of the apiaries (Quezel and Santra, 1962). Honey samples J1, J2 and J3 from Ain
Safra region, contained pollen grains from Ziziphus sp. in percentages ranging between 38.4%
and 40.5%. Thus, the pollen of this species is nearly dominant, suggesting that this plant is
the main source of pollen in these honeys, Table 11. Cytisus striatus pollen type was present
in a total of 10 samples and it considered dominant in 7 of them.

Chapter III- Results and discussion
40
Table 11. Pollen characteristics of the analyzed honey samples.
Sample Floral origin on
the label D A I
EC1 Eucalyptus sp. Cytisus striatus
type (47.3%)
Brassica napus type
(18.4%)
Eucalyptus sp.
(5.5%);
Sesamoides sp.
(5.9%); Rhamnus
alaternus (13.9%)
EC2 Eucalyptus sp. -
Cytisus striatus type
(39.3%); Brassica
napus type (12.6%);
Rhamnus alaternus
(26.8%);
Eucalyptus sp.
(5.1%);
Sesamoides sp.
(9.1%)
MF1 Multifloral Cytisus striatus
type (83.3%) -
Calina racemosa
(5.0%)
MF2 Multifloral Cytisus striatus
type (83.8%) -
Calina racemosa
(5.0%)
EF1 Euphorbia sp. Cytisus striatus
type (82.3%) -
Centaurea sp.
(4.5%); Brassica
napus type (6.3%)
EF2 Euphorbia sp. Cytisus striatus
type (76.9%) -
Centaurea sp.
(5.6%); Brassica
napus type (7.9%)
EF3 Euphorbia sp. Cytisus striatus
type (80.2%) -
Centaurea sp.
(6.4%); Brassica
napus type (5.8%)
J1 Ziziphus sp. -
Ziziphus sp.
(39.5%); Eucalyptus
sp. (16.2%); Cytisus
striatus type
(25.8%)
Echium sp. (4.9%)
J2 Ziziphus sp. -
Ziziphus sp.
(40.5%); Cytisus
striatus type
(28.6%)
Eucalyptus sp.
(12.6%); Echium
sp. (3.9%)
J3 Ziziphus sp. -
Ziziphus sp.
(38.4%); Cytisus
striatus type
(26.0%)
Eucalyptus sp.
(15.1%); Echium
sp. (3.4%)
D: Dominant pollen (≥ 45%); A: Accompanying pollen (15% - 45%); I: Important pollen (3% - 15%).
3.2. Physicochemical parameters
3.2.1. Color
The color of honey is closely linked to its botanical origin and is an important
parameter for evaluating honey quality. Honey color is generally related to its sensory
properties such as flavor and odor and can give information on its floral source, mineral
content, and storage conditions. The colorimetric analysis of the honey was performed using
the Pfund scale by the direct reading in the colorimeter. The color ranged from (extra light

Chapter III- Results and discussion
41
amber until amber), Table 12, EC1 honey presented the darker color and EF1 and EF3
showed the clearest color. Honey samples EC1 and EC2 showed amber color, with values of
89mm and 88 mm Pfund, respectively, while MF1 and MF2 presented a light amber color,
79 and 77 mm Pfund, respectively. All these results are in accordance with the last study on
multifloral honey samples of Morocco (Chakir et al., 2016), and were similar to those
obtained by (Homrani et al., 2020) on Algerian honeys. J1, J2 and J3 honey samples
showed extra light amber color in which values ranged between 51 and 55 mm Pfund. The
results obtained were very near to those obtained on Citrus and Retama honeys from
Algerian semi-arid region (Homrani et al., 2020). The three EF samples (EF1, EF2, EF3, and
EF4) gave the same color, extra light amber, which were in accordance with those obtained
previously (Homrani et al., 2020).
Table 12. Physicochemical parameters: color, moisture content and conductivity.
Samples Color (mm Pfund) Moisture
content
(%)
Conductivity
(µS.cm- 1
)
EC1 89 ± 0 (Amber)
18 ± 0 410 ± 0.02
EC2 88 ± 0 (Amber)
18 ± 0 410 ± 0.02
MF1 79 ± 0 (Light Amber)
15 ± 0 270 ± 0.01
MF2 77 ± 0 (Light Amber)
15 ±0 300 ± 0.06
J1 55 ± 0 (Extra Light Amber)
15 ± 0 370 ± 0.01
J2 55 ± 0 (Extra Light Amber)
15 ± 0 370 ± 0.01
J3 55 ± 0 (Extra Light Amber)
15 ± 0 370 ± 0.01
EF1 51 ± 0 (Extra Light Amber)
14 ± 0 360 ± 0.01
EF2 52 ± 0 (Extra Light Amber)
14 ± 0 360 ± 0.01
EF3 51 ± 0 (Extra Light Amber) 14 ± 0 360 ± 0.00
3.2.2. Moisture content
Moisture is a parameter related to the maturity degree of honey and temperature. In
the present study, the moisture values varied between 14% (EF1) and 18% (EC1), which

Chapter III- Results and discussion
42
were within the limit of 20% stablished by the European Community regulations (The
Council of the European Union, 2002), Table 12. EC honey samples have the highest water
content around 18 , which were in accordance with the values found in Hedysarum
coronarium and Eucalyptus honeys from Bejaia region (Ouchemoukh et al., 2006) and
higher than those obtained in Morocco (Chakir et al., 2016). The moisture content of MF
samples were in the order of 15, which were similar to results previously report in
Capparis and multifloral honeys from Bejaia region (Ouchemoukh et al., 2006). However,
when comparing the results with Morocco multifloral honey samples (Chakir et al., 2016),
the latest presented higher water content (17.8) comparing to our samples. In another
hand, the water content of Ziziphus samples, around 15%, are directly in line with the results
previously reported by Algerian Ziziphus honeys (Latifa et al, 2013). The water content of
EF samples was 14%, consistent with what has been previously found in Algerian
Euphorbia honey (Latifa et al, 2013) harvested in the semi-arid region of Algeria.
3.2.3. Electrical conductivity
Electrical conductivity (EC) is closely related to the concentration of mineral and
organic acids and shows great variability according to the floral origin. The sample with
electrical conductivity values higher than 800 μS.cm−1
are considered honeydew honeys.
While those that express values below 800 μS.cm−1
are considered nectar honey or mixtures
of different nectars (Bogdanov, 2011). All analyzed honeys presented values less than 800
μS.cm−1
, ranging between 270 and 410 μs.cm−1
, being considered nectar honeys. EC
samples showed the higher values among our honey samples 410 μS.cm−1
, Table 12. Those
values were within the values found in Algerian honeys (between 410 and 630 μS.cm−1
)
(Djamila B, Paul S, 2010) and less than those found in Moroccan honeys (768.78 μS.cm−1
)
reported by (Chakir et al., 2016). MF honey samples showed values between 270 (MF1) and
300 (MF2) μScm−1
. Hadia et al., (2017) found similar results (100 and 370.5 μS.cm−1
) in
multifloral honey harvested in the east of Algeria. The EC average value for Z honey was
370 μS.cm−1
.The values are lower than those given for Z. lotus of Morocco (673.42 μs.cm−1
)
previously reported (Chakir et al., 2016) and near to those given for Z. lotus of Algeria
(478.25 μS.cm−1
) reported by (Latifa, 2013).
The EC average of EF honeys was 360 μs.cm−1
. Our results are similar to the
findings previously reported by (Latifa, 2013) and lower than those obtained by (Chakir et
al., 2016) on Moroccan Euphorbia samples.

Chapter III- Results and discussion
43
3.2.4. pH, free, lactonic and total acidity
Ibrahim Khalil et al., (2012), indicated that honey is naturally acidic regardless of its
geographical origin, which may be due to the presence of organic acids that contribute to its
flavor and stability against microbial spoilage. Nectar honeys usually have low pH values
(3.3 to 4.6). Honeydew honeys have, due to their higher buffering salt content, higher
average pH values (Bogdanov, 1995).
The results obtained in this study show that all the analyzed honeys are acidic and
within the standard limit (Codex Food, 2001), ranging from 4.2 to 5.1, Table 13. EF samples
are the most acidic with (pH=4.37), followed by MF samples (pH=4.44), the lower acidity
was detected in the honey samples from Ziziphus (4.93 in average), while EC honeys
showed values between 4.4 and 4.9. The pH of samples from Algerian semi-arid regions
(Media, Djelfa, El aghouat) was 3.61 to 4.16 and 3.49 to 4.44 (Zerrouk et al. 2011 and
Zerrouk and Bahloul. 2020), respectively.
The pH values of nectar honeys vary between 3.5 and 4.5 and honeydew honeys have
higher average pH values between 4.5 and 5.5 (Gonnet, 1986). We could say that the honeys
studied are of the nectar type.
The acidity of honey is mainly due to gluconic acid (Vaillani and Mary, 1988), which
results from the oxidation of glucose by the enzyme glucosidase from the bee (Russo, 1997).
Rogulja et al., (2009) suggested that honeys with lighter color are characterized by a low
content in organic acids, while darker honeys generally appear richer in acidity. Free acidity
gives information about the origin of honey and influencing its stability (Pataca et al., 2007).
The values obtained for free acidity in our study were between 11and 18.3 meqkg-1
and
between 5.8 and 43.9 meqkg-1
at the two equivalence points (pH=7 and pH=8.3),
respectively. All the honeys analyzed are within the required standard of the Codex
Alimentarius (1998), which is 50 meqkg-1
, indicating an absence of unwanted fermentation
in our samples. The results are also in accordance with previous work carried out on
Algerian honeys. Zerrouk et al. (2011) found values ranging between 14.91 and 40.33
meqkg-1
, while Makhloufi (2010) report values between 17.97– 49.1 meqkg-1
.
Lactonic acidity is considered as an acidity reserve when honey becomes alkaline
(Gonnet, 1982). The values obtained in our lactonic acidity study are between 5.7 and 36.1
meqkg-1
. Total acidity is the sum of free and lactonic acidity, it is a quality criterion, and our
results showed values between 20.1 and 64.7meqkg-1
, and these results indicate that all the
honeys analyzed comply with the standard required by the codex. Our results are higher than

Chapter III- Results and discussion
44
those given by Hadia (2020) ranged between 17.12 to 34.29 meqkg-1
on north of Algeria and
are similar to those given on Morocco honeys from semi-arid regions reported by (Chakir et
al 2016) ranged between 11.94–58.03 meqkg-1
Table 13. pH and acidity of the honey samples analyzed.
Sample pH
Free acidity
pH=7
(meqkg-1
)
Free acidity
pH=8,3
(meqkg-1
)
Lactonic
(meqkg-1
)
Total
(meqkg-1
)
EC1 4.4 18.3 ± 0.3 12.2 ± 1.1 17.5 ± 0.6 24.7
EC2 4.9 18.1 ± 0,1 13.0 ± 2.0 15.5 ± 0.7 22.9
MF1 4.2 18.3 ± 0.0 12.7 ± 1.5 17.2 ± 0.5 24.3
MF2 4.6 18.3 ± 0.1 21.9 ± 0.5 31.5 ± 0.4 46.1
J1 4.9 11.5 ± 1.1 22.6 ± 1.6 28.5 ± 0.2 43.2
J2 5.1 12.1 ± 0.8 17.6 ± 0.4 22.8 ± 0.6 35.6
J3 4.8 11.0 ± 0.8 21.7 ± 0.4 35.8 ± 0.5 50.6
EF1 4.4 17.2 ± 0.1 43.9 ± 0.4 27.1 ± 0.1 58.3
EF2 4.3 17.3 ± 0.0 41.6 ± 1.8 36.1 ± 0.3 64.7
EF3 4.4 17.2 ± 0.1 5.8 ± 0.1 5.7 ± 0.1 20.1
3.2.5. Proline
Proline is an important amino acid that originates mostly from the salivary secretions
of Apis mellifera during the conversion of nectar into honey (Bergner and al, 1972). Proline
content is an indication of honey ripeness and, in some cases, sugar adulteration. Some
authors have reported that high concentrations of proline are also typical for honeydew
honeys. Indirectly, proline levels also reflect botanical origin (Cotte and al, 2004). Previous
studies found that the proline content of honey was associated with its floral and
geographical origin (Kečkeš et al, 2013). The proline concentration should be above 0.180
mg/g, lesser values could mean that the honey is possibly corrupted by sugar addition
(Bogdanov. 2002).

Chapter III- Results and discussion
45
The studied honey samples have good proline levels (2.2 – 4.7 mg/g), higher than the
minimum limit proposed by Bogdanov et al. (2002), indicating the maturity of the honeys
and absence of adulteration. The proline content in EC ranged between two values 3.4 (EC1)
and 3.6 (EC2) mg/g, two times higher than those found in Algerian honeys given by
(Ouchemoukh and al 2006). As well, the proline average of MF samples was around 3.3
mg/g, ranging between 3.2 (MF1) and 3.4 (MF2) mg/g. These values are two times higher
than those found in Algerian honey given by Ouchemoukh 2006 and similar to those given
by (Latifa, 2013). In the J samples, proline value was around 3.6 mg/g, ranging between 2.7
(J1) and 4.2 (J3) mg/g. Concerning EF, the proline average is around 3.6 mg/kg ranged
between 2.22 (EF1) and 4.7 (EF2) mg/g.
3.2.6. 5-HMF
The presence of 5-HMF in honey result from the slow degradation of fructose which,
in an acidic environment, breaks down and loses three water molecules. This process is
accelerated by heating. The high acidity and water content promote this transformation
(Hadia and Ali, 2017).
HMF is an indicator of the freshness and overheating of honey. According to White
(1978), the level of HMF is a quality criterion of several varieties of food (Nozal et al., 2001)
such as honey, which can provide all the necessary information regarding the heat exposure
of any honey. There are differences between floral and honeydew honeys, between honeys
of various botanical origins and also it depends on the variations in pH and acidity (Hadia
and Ali, 2017). Freshly harvested honey contains virtually no HMF. On the other hand, in
the case of hot storage, this value increases (Bogdanov, 1988; Mendes et al., 1998). The
European legislation (European Honey Directive, 2001) established the limit of 40 mg.kg-1
,
with the exception for honeys from tropical countries or regions where the maximum value
may reach 80 mg.kg-1
.
The results in this study, Table 14, are between 0 and 36.5 mg.kg-1
, being within the
standard required by the European legislation. The HMF average of EC honeys is around 35
mg.kg-1
and are similar to those given by (Djamila B and Paul S, 2010) and beyond those
found in Morocco honeys (between 3.25 and 43.87 mg.kg-1
) by (Chakir et al., 2016). The
HMF average of MF honeys is around 26 mg.kg-1
, while for J samples its around 2 mg.kg-1
.
Those latter are also within those found by (Latifa 2013) in Ziziphus Algerian honey
(between 0 and 6 mg.kg-1
). The HMF average of EF honeys is around 20 mg.kg-1
range
between three values 19.2 (EF1), 18.7(EF2), 21.0 (EF3) mg.kg-1
. Our results were similar to

Chapter III- Results and discussion
46
those reported by (Chakir et al., 2016) in Moroccan honey harvested in semi-arid region
(between 12.08 and 20.32 mg.kg-1
).
Table 14. Physicochemical parameters of honey: 5- HMF, diastase and proline.
3.2.7. Diastase activity
Diastase content depends on the floral and geographical origins of the honey.
Diastase enzymes are sensitive to heat and consequently is able to indicate overheating of
the product and the degree of preservation (Ligia et al, 2020).
The results of our honeys were between 8.8 DN and 13.8 DN, they were in
accordance with the minimum of 8 DN established by the European Community Regulation
(The Council of the European Union, 2002). EF samples have the higher values; however J
samples have the lower diastase index. The diastase results are lower than those given in
Moroccan honeys (14.45 DN in average) reported by (Chakir et al, 2016), as well as
Tunisian honeys (17.6 DN in average) reported by (Jilani et al, 2008)
3.3. Sugar analysis
Honey is a supersaturated sugar solution in which major compounds are
monosaccharides (fructose and glucose), which represent about 75% of the sugars found in
Sample
HMF (mgkg-1
)
Diastase (DN)
Proline
(mgg-1
)
EC1 34.2 ± 3.1 9.3 ± 0.1 3.6 ± 0.1
EC2 36.5 ± 2.3 10.1 ± 0.5 3.4 ± 0.0
MF1 25.8 ± 1.8 9.4 ± 0.0 3.2 ± 0.1
MF2 27.7 ± 1.1 9.4 ± 0.4 3.4 ± 0.0
J1 5.9 ± 0.7 9.7 ± 1.0 2.7 ± 0.1
J2 0.0 ± 2.4 8.8 ± 1.1 3.7 ± 0.1
J3 0.0 ± 2.0 12.8 ± 0.4 4.5 ± 0.3
EF1 19.2 ± 1.4 13.8 ± 0.4 2.2 ± 0.2
EF2 18.7 ± 1.7 12.4 ± 0.4 4.7 ± 0.5
EF3 21.0 ± 1.6 12.2 ± 0.4 3.9 ± 0.0

Chapter III- Results and discussion
47
honey. The percentage of glucose and fructose for nectar honeys should not be less than
60%, and for honeydew honeys it should be a minimum of 45% (Decree-Law nº 214/2003).
The sugar profile also gives information on the origin of honey, with honeydew honeys
having higher levels of trisaccharides (melezitose or erlose).
All samples under study revealed higher fructose content than glucose, Table 15,
with these two monosaccharides representing more than 88%, which allows to classify them,
in accordance with international legislation, as nectar honeys. The analyzed samples do not
have sucrose which is indicative of no unadulterated honeys. The sugar profile of the
different samples showed a similar composition, with values ranging between 37.8 - 43.4
g/100 g and 29.9 – 36.5 g/100 g for fructose and glucose, respectively. The EF samples,
showed the highest values of glucose and fructose, 43.26 g/100g of fructose and 36.16 g/100
g of glucose, while MF samples showed the lowest values of fructose and glucose, 37.9
g/100 g and 29.9 g/100 g, respectively. The values are in accordance with the Algerian
honey levels of fructose which were found to vary between 33.40 and 48.60 g/100 g and
glucose levels to vary between 26.67 and 38.42 g/100 g (Ouchemoukh et al, 2010).
The sugars in honey are responsible for its viscosity, hygroscopicity and
crystallization. The distribution between the different sugars will provide valuable
information that will allow predicting the rate of crystallization and the stability of the
structure of honey (Pourtallier et al, 1970). Crystallization is occurring naturally in honey
depending on its composition in sugars and moisture and that appears related to the type of
honey. The ratios of F/G (fructose/glucose) and G/H (glucose/moisture) provide information
on predicting the time that a honey sample takes to crystallize. The ratio of fructose to
glucose depends largely on the source of nectar. Many researchers report that the fructose
and glucose ratio have an average value of 1.2 for honey, stating that values greater than 1.3
imply a slow crystallization, above 1.5 indicates that honey does not crystallize and less than
1.1 indicates that crystallization is rapid. This process occurs because glucose is a sugar
more insoluble in water than fructose. The speed at which glucose crystallization occurs also
depends on the G/H ratio. According to the literature (Escuredo et al 2014), the
crystallization of a honey is slow or null when the G/H ratio is less than 1.7 and fast when
the ratio is greater than 2 (Escuredo et al,2014). In Table 15, the samples analyzed at the F/G
ratio have values between 1.2 and 1.3 which can be said that all samples have a slow
tendency to crystallize, and the values of G/H oscillate between 1.7 and 2.6 indicating that
the samples have an average propensity to crystallize.
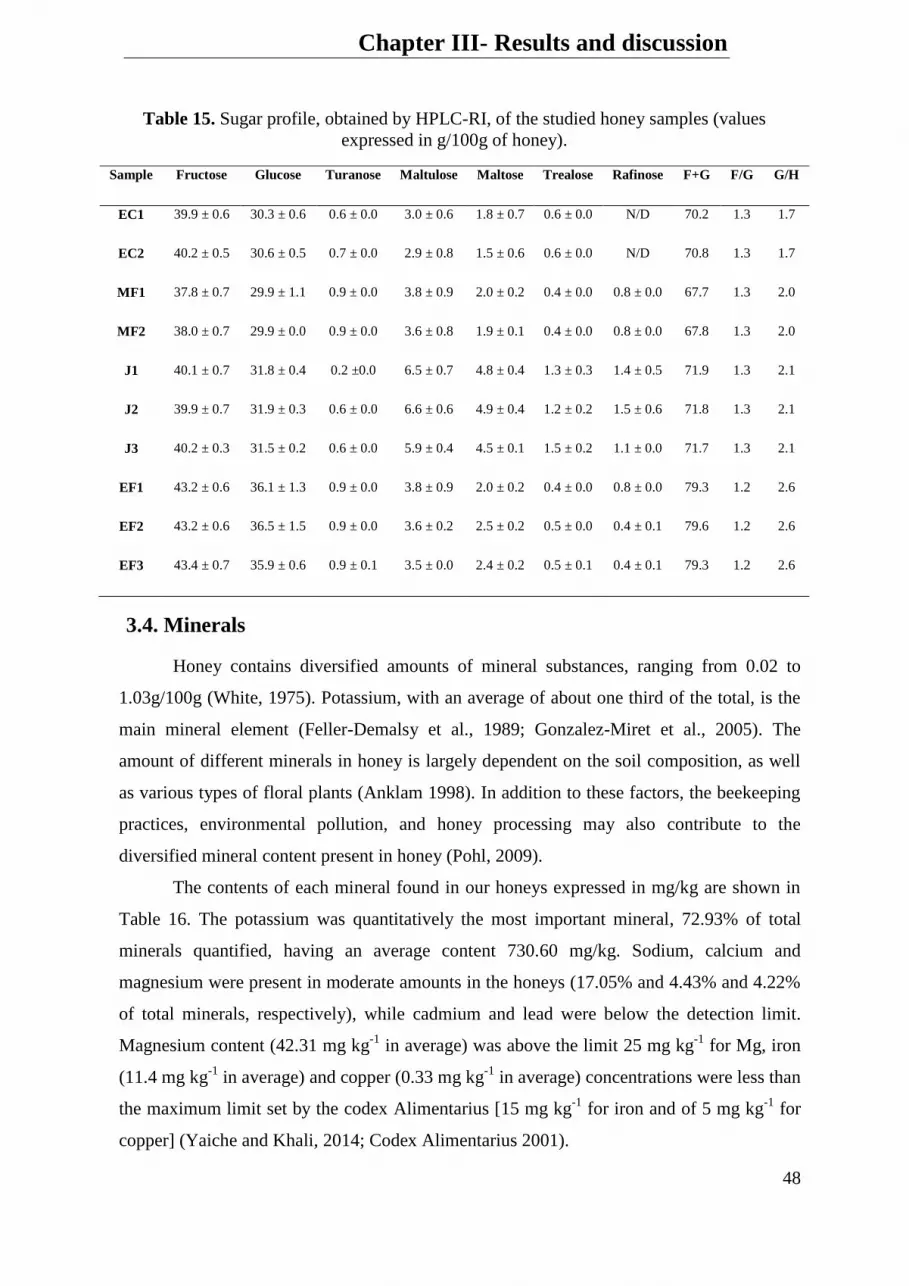
Chapter III- Results and discussion
48
Table 15. Sugar profile, obtained by HPLC-RI, of the studied honey samples (values
expressed in g/100g of honey).
Sample Fructose Glucose Turanose Maltulose Maltose Trealose Rafinose F+G F/G G/H
EC1 39.9 ± 0.6 30.3 ± 0.6 0.6 ± 0.0 3.0 ± 0.6 1.8 ± 0.7 0.6 ± 0.0 N/D 70.2 1.3 1.7
EC2 40.2 ± 0.5 30.6 ± 0.5 0.7 ± 0.0 2.9 ± 0.8 1.5 ± 0.6 0.6 ± 0.0 N/D 70.8 1.3 1.7
MF1 37.8 ± 0.7 29.9 ± 1.1 0.9 ± 0.0 3.8 ± 0.9 2.0 ± 0.2 0.4 ± 0.0 0.8 ± 0.0 67.7 1.3 2.0
MF2 38.0 ± 0.7 29.9 ± 0.0 0.9 ± 0.0 3.6 ± 0.8 1.9 ± 0.1 0.4 ± 0.0 0.8 ± 0.0 67.8 1.3 2.0
J1 40.1 ± 0.7 31.8 ± 0.4 0.2 ±0.0 6.5 ± 0.7 4.8 ± 0.4 1.3 ± 0.3 1.4 ± 0.5 71.9 1.3 2.1
J2 39.9 ± 0.7 31.9 ± 0.3 0.6 ± 0.0 6.6 ± 0.6 4.9 ± 0.4 1.2 ± 0.2 1.5 ± 0.6 71.8 1.3 2.1
J3 40.2 ± 0.3 31.5 ± 0.2 0.6 ± 0.0 5.9 ± 0.4 4.5 ± 0.1 1.5 ± 0.2 1.1 ± 0.0 71.7 1.3 2.1
EF1 43.2 ± 0.6 36.1 ± 1.3 0.9 ± 0.0 3.8 ± 0.9 2.0 ± 0.2 0.4 ± 0.0 0.8 ± 0.0 79.3 1.2 2.6
EF2 43.2 ± 0.6 36.5 ± 1.5 0.9 ± 0.0 3.6 ± 0.2 2.5 ± 0.2 0.5 ± 0.0 0.4 ± 0.1 79.6 1.2 2.6
EF3 43.4 ± 0.7 35.9 ± 0.6 0.9 ± 0.1 3.5 ± 0.0 2.4 ± 0.2 0.5 ± 0.1 0.4 ± 0.1 79.3 1.2 2.6
3.4. Minerals
Honey contains diversified amounts of mineral substances, ranging from 0.02 to
1.03g/100g (White, 1975). Potassium, with an average of about one third of the total, is the
main mineral element (Feller-Demalsy et al., 1989; Gonzalez-Miret et al., 2005). The
amount of different minerals in honey is largely dependent on the soil composition, as well
as various types of floral plants (Anklam 1998). In addition to these factors, the beekeeping
practices, environmental pollution, and honey processing may also contribute to the
diversified mineral content present in honey (Pohl, 2009).
The contents of each mineral found in our honeys expressed in mg/kg are shown in
Table 16. The potassium was quantitatively the most important mineral, 72.93% of total
minerals quantified, having an average content 730.60 mg/kg. Sodium, calcium and
magnesium were present in moderate amounts in the honeys (17.05% and 4.43% and 4.22%
of total minerals, respectively), while cadmium and lead were below the detection limit.
Magnesium content (42.31 mg kg-1
in average) was above the limit 25 mg kg-1
for Mg, iron
(11.4 mg kg-1
in average) and copper (0.33 mg kg-1
in average) concentrations were less than
the maximum limit set by the codex Alimentarius [15 mg kg-1
for iron and of 5 mg kg-1
for
copper] (Yaiche and Khali, 2014; Codex Alimentarius 2001).

Chapter III- Results and discussion
49
Lead and cadmium are released into the environment through its use in various
industrial processes, and enters the food chain from uptake by plants from contaminated soil
or water. Moreover, Cd and Pb are considered bioindicators for honey contamination (Licata
et al. 2004). The regulations establish a maximum level of 300 μg kg-1
, recommended by
FAO/WHO/1984 (Al-Eed et al. 2002) while for Cd the European legislation and the Codex
Alimentarius, 2001 fixed a maximum of 0.05 mg kg-1
, nevertheless our results did not reveal
its presence. Z samples showed the highest values of potassium, sodium and calcium
however Euphorbia labeled samples showed the highest values of magnesium, while EC
samples presented the highest values of manganese and MF samples showed the highest
values of iron, lead and cadmium.
Table 16. Minerals contents, obtained by using flame atomic absorption spectrophotometer
(values expressed in mg/100 kg of honey).
Samples Potassium
(mg/kg)
Sodium
(mg/kg)
Calcium
(mg/kg)
Magnesium
(mg/kg)
Manganese
(mg/kg)
Copper
(mg/kg)
Cadmium
(mg/kg)
Iron.
(mg/kg)
Lead
(mg/kg)
J1 979.9±12.
6 285.6±40.2 40.4±4.0 31.8±2.6 0,4±0,0 0.3±0.0 <0.03 8.7±0.1 <0.4
J2 863.7±6.8 243.0±60.3 40.2±5.0 31.9±2.9 0.4±0.0 0.4±0.0 <0.03 8.6±0.4 <0.4
J3 737.2±7.7 84.3±2.2 43.5±9.0 29.9±5.5 0.4±0.0 0.4±0.0 <0.03 8.8±0.5 <0.4
EF1 462.5±27.
1 142.7±5.6 46.6±1.5 50.8±2.5 0.9±0.0 0.3±0.0 <0.03 13.0±1.1 <0.4
EF2 684.4±7.4 229.0±1.0 48.0±2.4 54.2±7.2 0.9±0,0 0.3±0.0 <0.03 12.6±2.2 <0.4
EF3 518.2±2.5 169.3±0.7 32.6±1.4 49.9±5.0 0.9±0,0 0.3±0.0 <0.03 12.8±1.7 <0.4
EC1 937.7±1.4 157.6±2.8 51.1±6.8 47.6±1.2 1.9±0,7 0.3±0.1 <0.03 10.7±0.4 <0.4
EC2 884.2±4.7 177.6±2.8 41.4±6.8 49.3±1.2 0.5±0.1 0.4±0.1 <0.03 11.3±0.4 <0.4
MF1 744.2±3.4 123.8±1,0 85.3±3.1 40.5±2.3 1.8±0,6 0.3±0.0 <0.03 14.9±1.6 <0.4
MF2 494.1±3.5 93.8±1.0 14.7±3.9 37.2±2.3 0.5±0,0 0.3±0.0 <0.03 12.6±1.6 <0.4

Chapter III- Results and discussion
50
3.5. Nutritional parameters
Honey is considered of high nutritional value. Its ash content is related to color and
flavor, and it is often observed that honeys with higher ash content are also those that have a
darker color and a stronger flavor (Escuredo et al, 2013). In addition, the ash content also
contributes to the electrical conductivity of honey, with a positive correlation between these
two parameters. The Codex Alimentarius (Codex Alimentarius Commission, 1981) does not
provide values for this parameter. Some studies have shown an average value of 0.17% (w/w)
in honey (Chakir et al, 2011). The results obtained in this study for the ash content, varied
between 0.07 and 0.16%, being within the recommended values for nectar honey, Table 17.
According to Anklam (1998), the proteins in honey are related to plant nectar, bees
enzymes and pollen. The quantity of proteins can vary from 0.1 to 0.7 g/100 g Anklam
(1998). Overheated or long-time stored honeys show a reduction or absence of protein
content (De-Melo et al., 2018).
Table 17. Nutritional values of honey: Ash, energy, proteins and carbohydrates.
Sample
Ash (g/100 g) Protein (g/100 g) Energy (kcal) Carbohydrates
(mg/100g)
EC1 0.16±0.01 0.7 ± 0.00 327±0.0 81.0±0.0
EC2 0.16±0.01 0.6 ± 0.0 326±0.0 80.9±0.0
MF1 0.07±0.01 0.5 ± 0.1 340±0.0 84.5±0.1
MF2 0.11±0.04 0.5 ± 0.2 340±0.0 84.5±0.2
J1 0.13 ± 0.0 0.7 ± 0.0 340±0.0 84.3±0.0
J2 0.13 ± 0.0 0.7 ± 0.0 339±0.0 84.2±0.0
J3 0.13± 0.0 0.7 ± 0.0 341±0.0 84.5±0.0
EF1 0.13 ± 0.0 0.6 ± 0.0 345±0.0 85.7±0.0
EF2 0.13 ± 0.0 0.6 ± 0.1 344±0.0 85.5±0.1
EF3 0.13 ± 0.0 0.6 ± 0.0 344±0.0 85.3±0.0

Chapter III- Results and discussion
51
The results obtained in this study vary between 0.5 and 0.7g/100g, Table 17. This
variation can be associated to the type of flora and the diets of the bees (El Sohaimy et al.,
2015). Sample J1 is the richest in protein, with a rate of 0.7 g/100g. This is the sample that
comes mainly from Ziziphus, moderately rich in pollen. Sample MF1 is the poorest in
proteins with a content equal to 0.5g/100g. The range of protein observe in our results are
similar to the results obtained by Ouchemoukh and his collaborators in (2007) who found
values between 0.37 and 0.94 g/100g in the Bejaia (City in the north of Algeria) honeys.
Also, the protein content of most Tunisian honeys was between 0.13 and 0.16 mg / 100g of
honey (Boussaid et al., 2014).
As with the mineral and protein content, there is also no legislation that regulates the
limits for the energy value and carbohydrate content present in the different honeys. The
honey samples studied showed similar values of carbohydrates, ranging from 80.9 to 85.7
g/100g, and of energy value, with values between 326 and 345 kcal, Table17.
3.6. Total phenolics and total flavonoids contents
Polyphenols are a class of important secondary metabolites with multiple phenolic
hydroxyl groups in which the main sources are plant secretions, and includes flavonoids,
phenolic acids, stilbenes, and tannins (hydrolysable and condensed), which are mainly
synthesized by the phenylpropanoid metabolic pathway (Kumar and Goel, 2019). They
possess various pharmacological activities, such as anti-cardiovascular, anti-oxidation, anti-
inflammatory, and anti-tumor effects (Olas B. (2020). Among the structures identified in
honey: phenolic acids (benzoic and cinnamic acids), flavonoids (flavones and flavanones)
are the major compounds detected in variable proportions (Al Mamary et al., 2002 cited in
Yahia Mahammed, 2015). A correlation between the antioxidant activity and total phenolic
content is frequently established in literature [Al, M.L et al, 2009- Aljadi et al, 2004]. The
high levels of flavonoids, phenolic acids, ensure a high level of antioxidants in honey which
is the hallmark of its effect as a natural medical product (Madhavi and Kailash, 2014).
According to Anklam (1998), a careful evaluation of polyphenol content could
probably give an indication of the botanical, geographic and climatic origin of honey and the
conditions of plant sources in the region likewise it allows to differentiate between
honeydew, and nectar honey. Darker honeys are richest in phenolic compounds when
comparing with lighter color honeys (Campus et al., 1983).

Chapter III- Results and discussion
52
Table 18. Total phenolic and total flavonoid contents and antioxidant activity of honey
samples.
Sample
Total phenolic
content (mg/GAE.g-1
)
Total flavonoid content
(mg/QE.g-1
)
EC1 1.4 ± 0.0 0.07 ± 0.00
EC2 1.2 ± 0.0 0.05 ± 0.00
MF1 0.8 ± 0.2 0.08 ± 0.01
MF2 0.9 ± 0.2 0.07 ± 0.04
J1 0.7 ± 0.0 0.05 ± 0.00
J2 0.7 ± 0.0 0.03 ± 0.00
J3 0.8 ± 0.1 0.04 ± 0.02
EF1 1.1 ± 0.1 0.06 ± 0.02
EF2 0.7 ± 0.0 0.06 ± 0.00
EF3 0.7 ± 0.0 0.09 ± 0.01
The total phenolic content values obtained in our work vary from 0.7 mg GAE/g
honey (EC1) to 1.4 mg GAE/g honey (EF and J), with an average of 0.9 mg GAE/g honey,
Table 18. Our results are higher than those obtained by Khalil et al., (2012), who reported
values between 0.459 ± 0.0015 mg GAE/g honey for Algerian samples. Douka et al., (2014),
reported values between 1.66 to 4.27 mg GAE /g honey in some honeys from western
Algeria.
The total flavonoid content of honey samples (mg of QE/100 g) varied from 0.03 to
0.09 mg QE/g, Table 18, with the highest levels observed in J honeys. The mean values for
total flavonoids were 0.06 mg QE/g, which were similar to those obtained previously (Khalil
et al, 2012).
3.7. Phenolic compounds by UPLC / DAD / ESI-MSn
Nowadays, new analytical technologies, such as the analysis of the profile of
phenolic compounds, are used to characterize and evaluate the authenticity of honeys
associated with particular botanical origins. The profile of phenolic compounds was

Chapter III- Results and discussion
53
evaluated by UPLC/DAD/ESI-MSn, after the extraction of these compounds from the honey
samples. The methodology allowed the elucidation of the phenolic compounds by
comparing their chromatographic profile, UV spectrum and mass spectrometry information,
with reference compounds. When standards were not available, structural information was
confirmed with the combination of UV data and MS fragmentations described in the
literature. ESI-MSn in the negative mode was used due to the great sensitivity that this mode
presents in the detection of the different classes of phenolic compounds (Falcão et al, 2013).
Table 19 shows the various compounds identified in each sample, with the respective
retention time, maximum absorbance bands and mass spectrometry information.
Table 19. Phenolic compounds and abscisic acid identified by UPLC/DAD/ESi-MSn in the
honey samples under study.
aConfirmed with standard;
bConfirmed with MS
n fragmentation; Confirmed with references:
cOuchemouck et al.,
2016; dBertoncelj et al., 2011;
eFalcão et al., 2019;
fFalcão et al., 2013;
In this study it was possible to identify nineteen phenolic compounds, which
included nine flavonoids, six phenolic acids, two isoprenoids, one spermidine and one
Nº Compound TR (min) λmax (min) [M-H]- [M-H]
2
1 Benzoic acid derivativeb,c
1.25 284 121, [M+46]-
:167
2 p- Hidroxybenzoic acida,b
1.87 256 137 93
3 Caffeic acida,b
2.07 292, 322 179 135
4 p-coumaric acida,b
2.82 310 163, [M+46]-
:209
5 Salicylic acida,b
6.11 301 137 93
6 Syringetinb
6.38 276 345 161(100), 285(91), 309(21),
327(24)
7 trans, trans- Abscisic
acida,b,d
6.88 265 263 154(100), 153 (69), 220 (36)
8 p- hydroxybenzoic
derivitaveb
7.05 219, 203 199 155(100), 137(20)
9 cis, trans- Abcisic acida,b,d
7.46 265 263 154(100), 153(69), , 220(36)
10 Isorhamnetin rhamnosideb
7.57 254, 354 461 315
11 Pinobanksin-5-methyl-
etherb,f
7.67 287 285 267 (100), 239 (29), 252 (13)
12 Quercetina,b
7.76 256, 370 301 179(100), 151(69)
13 N1, N
5, N
10-tri-p-
coumaroyespermidineb,e
8.31 292, 308 582 462(100), 436(10), 342(7)
14 Pinobanksinb,f
8.33 292 271 253(100), 225(20), 151(10)
15 Kaempferola,b
8.45 269, 345 285 229(100), 151(93), 257(80)
16 Carnosolb
8.92 329 241 (100), 185 (65), 311 (58)
17 Chrysina,b
10 269 253 253(100), 209(49), 225(17)
18 Pinocembrina,b
10.13 290 255 213 (100), 151 (34) 253(100),
271(20)
19 Galangina,b
10.22 265, 300sh, 358 269 269 (100), 241 (61), 227 (20), 151
(20)

Chapter III- Results and discussion
54
phenolic diterpene. Among the identified phenolic acids, three are derived from benzoic acid
(benzoic acid derivative, p-hydroxybenzoic acid, salicylic acid and p-hydroxybenzoic acid
derivative) and two are derivatives of cinnamic acid (caffeic acid, p-coumaric acid. Of the
nine flavonoids identified, five belong to the class of flavonols (syringetin, isorhamnetin
rhamoside, quercetin and kaempferol), two to the flavone class (chrysin, galangin), one
flavanone (pinocembrine) and two dihydroflavonols (pinobanksin-5-methyl- ether and
pinobanksin). In addition two isoprenoids, which included two isomers of abscisic acid,
have also been identified (cis, trans- and trans, trans-), as well as carnosol, which is a
phenolic diterpene, and spermidine: N1,N
5,N
10-tri-p-coumaroyespermidine. Among the
compounds identified (Table 20), it can be seen that p-coumaric acid were presented only in
EC samples while kaempferol, pinocembrin and galangin were presented only in J samples.
The trans, trans isomer of abscisic acid was presented in both EC and J samples but it was
presented in high concentration in J honeys than EC honeys. The compounds specific for
one type of sample can be considered as marker compounds for that honey. In Table 20, it
can be seen that the samples that presented the greatest amount of phenolic compounds are
sample EC1 with 202 mg/100 g and with the lowest amount is sample EF3 with 60 mg/100
g. It can be seen that in relation to phenolic acids, the EC1 is the one with the highest
amount of compounds derived from benzoic acid (92 mg/100g) and the EC2 sample stands
out for the acids derivatives of cinnamic acid (58.6mg/100g). These phenolic compounds
were already reported in Algerian honeys (Ouchemoukh et al, 2017). Moreover, it has been
found by Can et al. (2015) that benzoic, caffeic and p-coumaric acids were present in
differing amounts in all unifloral Turkish honeys.
The flavonoids found in honey come from pollen, propolis and nectar, with propolis
being the richest source of flavonoids. Pinobanksin and its derivatives, pinocembrine,
chrysin and galangin are compounds described as propolis derivatives (Falcão et al, 2013;
Tomás et al, 2001). Pinobanksin is present in all samples in exception of EC1 and EC2 and
pinocembrine is present in small amount only in samples J1, J2 and J3, with values ranging
between 0.1-13.5mg/100 g and 003-0.2 mg 100g, respectively, Table 20.
Some authors (Tomás et al, 2001) report that the amount of flavonoids is higher in
honeys harvested during dry seasons with high temperatures and that the darker honeys
contain more derivatives of phenolic acids, while lighter honeys contain more flavonoids
(De-Melo et al, 2017). Abscisic acid (two isomers) is an important phytohormone regulating
plant growth, and has an essential role in multiple physiological processes of plants.

Chapter III- Results and discussion
55
Abscisic acid controls downstream responses to abiotic and biotic environmental changes
(Chen et al, 2020). Its content varied between 8.3 and 20.1 mg/100 g for isomer 1 (trans,
trans- abscisic acid) and 6.2 and 25.7 mg/100 g for isomer 2 (cis, trans- abcisic acid), Table
20. Ouchemoukh and his collaborators, 2017 identified the two isomers in Algerian honeys.

Chapter III- Results and discussion
56
Table 20. Quantification of phenolic compounds, expressed in mg/100 g honey.
Compound
EC1 EC2 MF1 MF2 J1 J2 J3 EF1 EF2 EF3
Benzoic acid
derivative 26.3±0.2 19.7±0.1
24.2±1.
3 33.4±0.4 5.9±0.2 4.9±0.0 7.8±0.0 9.7±0.1 14.7±0.2
7.2±0.0
p- Hidroxybenzoic
acid 30.6±1.1 28.0±0.8 8.4±0.3 9.2±1.0 8.6±0.0 10.6±0.7 18.7±0.1 10.6±0.2 17.0±0.4 7.5±0.1
Caffeic acid 5.3±0.6 5.0±0.4 8.9±1.4 10.6±0.5 1.1±0.0 1.0±0.3 1.2±0.3 1.7±0.5 0.01±0.0
0 0.05±0.01
p-Coumaric acid 42.8±0.1 52.5±0.3 - - - - - - - -
salicylic acid 1.9±0.1 2.1±0.2 1.1±0.1 4.0±0.7 2.3±0.1 3.3±0.0 5.0±0.1 1.6±0.2 1.0±0.1 0.1±0.0
Syringetin 14.6±0.1 16.5±1.7 17.3±2.
2 24.9±1.4 9.9±0.2 12.0±1.6 7.1±0.1 35.9±0.1 54.2±0.8 19.6±0.0
trans, trans-
abscisic acid 9.8±0.0 8.3±0.2 - - 20.1±0.6
14.7±0.7
16.3±0.6 - - -
p- hydroxybenzoic
derivitave 35.1±0.4 23.9±0.0
10.8±0.
2 12.2±0.1 3.5±0.1 3.6±0.0 4.0±0.6 2.1±0.0 4.8±0.7 1.4±0.0
cis, trans- Abcisic
acid 9.5±0.0 8.3±0.0 6.2±0.8 9.3±0.4 22.0±0.0 19.3±0.0 25.7±0.1 16.2±0.0 20.3±0.2 8.7±0.0
Isorhamnetin
Rhamnoside 16.1±0.4 10.5±0.9 - - - - - - - -
Pinobanksin-5-
methyl- ether 0.4±0.0 0.2±0.0 0.4±0.0 0.4±0.2 0.4±0.1 0.1±0.0 0.1±0.0 0.4±0.1 0.8±0.1 0.3±0.0
Quercetin 5.2±0.3 1.9±0.0 2.7±0.5 3.9±0.0 9.7±0.2 3.4±0.5 4.5±0.2 9.5±0.2 16.7±1.5 6.7±0.5
N1,N
5,N
10-tri-p-
coumaroyspermidin
e
2.9±0.0 1.1±0.0 0.5±0.1 1.2±0.4 1.1±0.0 2.0±0.2 1.2±0.1 1.1±0.0 2.2±0.2 1.1±0.1
Pinobanksin - - 2.8±0.2 3.9±0.2 0.1±0.0 13.5±0.1 12.8±1.0 11.5±0.0 13.3±0.1 6.0±0.0
Kaempferol - - - - 7.9±0.0 16.5±2.3 3.4±0.1 - - -
Carnosol 1.0±0.0 0.5±0.0 - - 0.7±0.1 0.9±0.1 1.1±0.1 - - -
Chrysin 0.7±0.0 0.9±0.1 0.5±0.0 0.9±0.1 3.4±0.2 2.9±0.2 3.2±0.1 2.4±0.1 3.6±0.1 1.2±0.0
Pinocembrin - - - - 0.03±0.00 0.2±0.0 0.2±0.0 - - -
Galangin - - - - 2.0±0.2 2.6±0.1 3.4±0.3 - - -

Chapter IV- Conclusion and perspectives
57
3.8. Antioxidant activity
3.8.1. DPPH
The scavenging activity of honey samples had been measured by DPPH assay. The
unpaired electron of DPPH forms a pair with hydrogen donated by free radical scavenging
antioxidant from honey and thus converting the purple colored odd electron DPPH to its reduced
form in yellow. The lower the EC50 value the higher the scavenging capacity of honey, because it
requires lesser amount of radical scavenger from the honey to reduce DPPH (Chua et al, 2013).
The values obtained for DPPH in the analyzed samples are represented in Table 21 and ranged
from 0.02 to 0.04 mg/mL, with higher antioxidant activity associated with EC and J honeys and a
lower antioxidant activity associated with EF honeys. The values are correlated with the
concentration of phenolic acids and flavonoids in the samples. Our results are lower than those
obtained in a Moroccan study where the results of DPPH showed EC50 values ranged between
0.245 ± 0.009 mg/mL and 0.832 ± 0.069 mg/mL, meaning that, our honeys have a higher
antioxidant activity than Moroccan samples (El Ghouizi et al, 2021).
Table 21. The antioxidant activity; reducing power and DPPH assay
Sample
Reducing power
(mg/GAE.g-1
)
DPPH
(EC50 mg/mL)
EC1 0.03 ± 0.00 0.02 ± 0.00
EC2 0.04 ± 0.00 0.02 ± 0.00
MF1 0.04 ± 0.00 0.04 ± 0.00
MF2 0.04 ± 0.00 0.03 ± 0.00
J1 0.04 ± 0.00 0.03 ± 0.00
J2 0.04 ± 0.00 0.02 ± 0.00
J3 0.04 ± 0.00 0.02 ± 0.00
EF1 0.04 ± 0.00 0.03 ± 0.00
EF2 0.04 ± 0.00 0.04 ± 0.00
EF3 0.04 ± 0.00 0.03 ± 0.00
3.8.2. Reducing power
Fe (III) reduction is often used as an indicator of electron-donating activity. The presence
of reducing agents in the honey reduced the ferric ions. This reduction is quantified by an
absorbance measurement at 700 nm against a blank, with an increase in absorbance associated
with high reducing power (Mouhoubi, 2016). Table 21 shows the values of the samples evaluated

Chapter IV- Conclusion and perspectives
58
by the reducing power, expressed in equivalents of gallic acid (mg GAE.g-1
). Results of the
reducing power showed that there was no significant difference between our samples observing a
variation between 0.03 and 0.04 mg GAE.g-1
. As described in the literature (Hatami et al, 2014;
Lamuela and Rosa, 2018), it is possible to observe that samples with lower levels of total
phenolic compounds were those that registered lower values of reducing power. Also, the
presence of other non-phenolic compounds such as enzymes (glucose oxidase and catalase) and
non-enzyme materials (vitamins and amino acids) may influence this activity (Aljadi and
Kumaruddin, 2004).
3.9. Cytotoxic potential
The last decade has witnessed an astronomical increase in the amount of research
investigating the role of honey in the treatment of various diseases, including cancer. These
health benefits of honey in treating diverse diseases can be attributed to its various
pharmacologically active constituents, especially flavonoids and phenolic constituents, which
included anti-inflammatory, antioxidant, antiproliferative, antitumor, antimetastatic and
anticancer Candiracci et al, 2012; Samarghandian et al, 2011).
The cytotoxicity of the Algerian honeys was evaluated in four human tumor cell lines
(AGS-gastric adenocarcinoma, CaCo colorectal adenocarcinoma, MCF-7 breast adenocarcinoma,
NCI H460- lung carcinoma) and a non-tumor cell line, Vero (African green monkey kidney). All
the studied extracts inhibited the growth of the mentioned tumor cell lines. MF1 gave the highest
cytotoxicity, followed by EF1, Table 22, presenting the lowest GI50 values against the tested tumor
cell lines. The AGS cell line was the most sensible to the studied samples in the average, the MF1
extract was the most active (GI50 8.1μg/mL; an excellent GI50 value in comparison with Portuguese
Propolis extracts for example (Ricardo et al 2014). This activity could be related to the chemical
composition of those samples. From the analysis of Table 20, it can be observed that samples EF1
and MF1 have significant concentrations of total phenolic and total flavonoids compounds. The
EF3 sample showed the highest GI50 values for all the tested tumor cell lines with an average (375
μg/mL). This fact could be explained by its poor phenolic composition. These results can be
explained also by the level of hydrogen peroxide of these samples. Hydrogen peroxide was
reported to be responsible for the proliferative effect of honey in cancer cells (A. Henriques et al,
2006).
Despite the high cytotoxicity displayed by most of the honey samples against tumor cell
lines studied, the samples also showed toxicity for non-tumor (normal) cell line, however they
reporting higher GI50 values when compared to tumor cell lines.

Chapter IV- Conclusion and perspectives
59
Ricardo and his collaborators in 2014 found that total flavonoids were positively
correlated (R2 values higher than 0.5) with the cytotoxicity. However, the cytotoxicity was not
correlated (R2 values lower than 0.5) with flavonols, dihydroflavonols, and flavonoid esters.
The present data highlight the high cytotoxicity of Algerian honeys against tumor cell
lines, being in agreement with Siti Noritrah et al. 2019, who reported a marked activity of
Malaysian honey against human lung adenocarcinoma epithelial cell line (A549). As well, our
results were similar to those obtained by Hamada et al, 2019 on Moroccan and Palestinian
honeys rom different regions.
Table 21. Cytotoxicity potential (GI50 values, µg/mL). and anti-inflammatory activity (CI50 values,
µg/mL).
3.10. Anti-inflammatory activity
Inflammation usually occurs when infectious microorganisms such as bacteria, viruses
or fungi invade the body, reside in particular tissues and/or circulate in the blood (Artis and
Spits, 2015; Isailovic et al,2015). Inflammation may also happen in response to processes such
as tissue injury, cell death, cancer, ischemia and degeneration (Artis and Spits, 2015, Lucas et
al, 2006). Mostly, both the innate immune response as well as the adaptive immune response
are involved in the formation of inflammation.
The anti-inflammatory activity of our honey samples was assessed using the mouse
macrophage (RAW 264.7) cell line. All honey extracts under study showed anti-inflammatory
capacity, with IC50 values between 8 and 400 µg/mL. The highest activity was observed for
sample J2, followed by the samples J1 and EC1, with an IC50 value of 9 µg/mL. In opposite the
MF1 sample showed the highest IC50 values for the tested cell line more than 400 μg/mL Table
21. This fact could be explained by its poor phenolic composition. This is the first time, to the
Cell
lines
GI50
EC1 EC2 MF1 MF2 EF1 EF2 EF3 EF4 J1 J2 J3
CaCo 13.7±0.2 176±16 151±7 8.1±0.2 194±17 >400 >400 22.1±0.3 62±1 228±11 71±7
AGS 60±5 9±1 193±8 48±2 194±17 >400 >400 22.1±0.3 62±1 228±11 72±7
MCF-7 383±23 371±3 65±2 281±18 249±25 >400 >400 271±2 >400 >400 >400
NCl-
H460 328±5 283±4 168±10 359±5 163±10 221±23 300±31 212±10 >400 >400 >400
VERO 254±7 245±8 >400 302±21 >400 >400 >400 237±7 >400 >400 >400
RAW 9.5±0.2 43±1 >400 12.7±0.1 57±3 82±4 150±4 9±1 9±1 8±1 8.5±0.3

Chapter IV- Conclusion and perspectives
60
best of our knowledge, that the effects of Algerian honey extracts on anti-inflammatory
activity have been evaluated in vitro.
3.11. Screening of antibiotics residues
Tetracyclines are commonly applied in the treatment of many bacterial infections of the
digestive system, the respiratory system and the skin. Also they are used as a growth stimulant in
animals, in some countries its commonly use as additive in animal feed. The large-scale
application of tetracyclines carries the risk of their residues appearing in food. For other side,
sulphonamides has been used for treatment of American foulbrood (Paenibacillus larvae subsp,
larvae) a deadly disease to honeybees. In 1940, sodium sulfathiazole was registered in the USA
for the control of AFB (Moreno et al, 2009. In some countries outside Europe the use of
tetracyclines, sulphonamides and other antibiotics is still legalized for the treatment of American
foul brood (Reybroeck, 2002). Oxytetracycline is currently the only antibiotic registered for use
by Canadian beekeepers to treat American foulbrood (AFB), a highly contagious bacterial
disease of larvae, difficult to eradicate, caused by the rod-shaped bacteria Paenibacillus larvae).
In Europe this is an illegal practice because ubiquitous administration of antibiotics may cause
bacteria to become resistant to many drugs and spread antibiotic-resistant strains of bacteria
(Żaneta et al, 2011). Antibiotic resistance has become a major concern due to overuse of
antibiotics, leading to difficult to treat infections in humans and animals, with increased
morbidity and mortality (Lekshmi et al, 2017). Because of that, the presence of residues of
antibiotics in European honey is not permitted.
Table 22. Residues screening using CHARM II.
Sample Sulfonamide (10 ppb) Tetracycline (15 ppb)
EC1 2205 Negative 2635 Negative
EC2 2183 Negative 2575 Negative
MF1 1525 Positive 2530 Negative
MF2 1751 Negative 2560 Negative
J1 2408 Negative 1980 Negative
J2 2552 Negative 1815 Negative
J3 2877 Negative 1839 Negative
EF1 1050 Positive 1663 Negative
EF2 2267 Negative 2523 Negative
EF3 1475 Positive 1677 Negative

Chapter IV- Conclusion and perspectives
61
The charm II test is a screening test used for different food matrix such as meat and milk.
This has been adapted for honey testing (Bogdanov, 2003), allowing the detection of many
antibiotics (penicillin, tetracycline, macrolides, sulfonamides, and aminoglycosides) by an
immunocompetition reaction between the molecule to be sought and a molecule marked with
C14 or H3 (Audigie et al, 1995). The results of the residues screening for sulfonamides and
tetracyclines in our samples are summarized in Table 22. Out of this monitoring and screening
data it could be concluded that the frequency of antibiotics residues agents in Algerian honeys
from local beekeepers is very low, but still a concern if international trade is to be considered. In
case of tetracycline residues all the results were negative; on the other hand, three of our samples
(MF1, EF1, EF3) showed positive results for Sulfonamide residues.

Chapter IV- Conclusion and perspectives
62
Chapter IV- Conclusion and
Future Perspectives

Chapter IV- Conclusion and perspectives
63
Conclusion
The results of the melissopalynological analysis show that the honey samples analyzed
contain a great diversity of pollen grains, with no elements of honeydew being identified,
which allows us to conclude that these are nectar honeys. Ten types of pollen were identified,
Cytisus striatus pollen were the most abundant, being present in all samples with percentages
between 26.0 % and 83.8 %, with samples EC1 (region of Sidi Belabes), MF1 and MF2
(region of Sidi Belabes) classified as monofloral Cytisus striatus honey. Although samples J1,
J2 and J3 were not consider monofloral, they showed high percentages of Ziziphus pollen
(greater than 39.5 %). The remaining samples were classified as multifloral. The results of the
melissopalynological analysis seem to indicate that no samples of honey really correspond to
the beekeeper classification. Thus, although food security is not at stake, the need to create
additional mechanisms to ensure the authenticity of this type of food product becomes
imperative.
There was a significant difference in color remarked between all studied samples of
honey ranged between amber, light amber and extra light amber. Changes in color might be
attributed to the beekeeper’s interventions and different ways of handling the combs such as
using of old honeycombs, contact with metals and exposure to either high temperatures or light.
The higher Pfund and color intensity values might indicate higher phenolic compounds and
flavonoids. The moisture content of the honey samples was within the limits established by the
legal requirements, that is, less than 20%, which allows us to conclude that the honey will have
been extracted with the appropriate degree of maturation. Regarding electrical conductivity,
the honey samples analyzed showed values between 270 and 410 μS.cm-1
. In general, all
samples showed conductivity values below 800 μS.cm-1
, which means that confirms the
samples as nectar origin. The values established by Codex Alimentarius clearly confirm our
results. The pH values were between 4.2 and 5.1 which again point out for the nectar origin.
The values of free acidity were between 5.8 and 45.0 meq.kg-1
, being below the 50.0 meq.kg-1
stipulated in the Codex Alimentarius, indicating the absence of undesirable fermentation
processes for the quality of honey. The evaluation of the 5-HMF content and the diastase index
provides important information about the quality of the honey, namely about the occurrence of
heat treatments or inadequate storage conditions. The results were in accordance with the
European legislation, ranging between 0 and 36.5 mg.kg-1
. Regarding diastase, the results
ranged between 8.8 and 13.3 DN, being within the quality legal requirements. Honey samples
presented high proline levels (2.2–4.7 mg/kg), indicating a good maturity of the honeys and
absence of adulteration. For the proteins, the values varied between 0.5 and 0.7 mg/100 g. This

Chapter IV- Conclusion and perspectives
64
variation can be attributed to the type of flora and the diets of the bees.
All samples showed higher fructose than glucose content, with these two
monosaccharides representing more than 89%, allowing the classification of the honeys as nectar
honeys. The presence of sucrose was not detected, indicating unadulterated honeys.
Concerning the mineral content, the potassium was found to be the most important
mineral (73% of total minerals quantified), followed by sodium, calcium and magnesium, with
17%, 4.4% and 4.2% of total minerals, respectively. Cadmium and lead where below the limit of
detection.
The determination of the total phenolic compounds content by the Folin-Ciocalteau
method showed values between 0.7 mg GAE/g honey (EF and J) and 1.4 mg GAE/g honey (EC).
The total flavonoid content of honey samples varied from 0.03 to 0.09 mg QE/g honey, with the
highest levels observed in jujube honeys. The scavenging activity of the honeys was evaluated by
DPPH assay, with results ranging 0.02 to 0.04 mg/mL, with higher antioxidant activity associated
with EC and J honeys and a lower antioxidant activity associated with EF honeys. Regarding the
reducing power activity, results showed that there was no significant difference between our
samples observing a variation between 0.03 and 0.04 mgGAE.g-1
.
The analysis of the phenolic compounds profile was performed by UPLC/DAD/ESI-MSn,
where was possible to identified nineteen phenolic compounds (six phenolic acids and nine
flavonoids), two isoprenoid compounds (abscisic acid isomers), one phenolic diterpene (carnosol)
and one spermidine (N1, N
5, N
10-tri-p-coumaroyespermidine). The honey samples analyzed
showed a similar phenolic composition, in which the different compounds are present in almost
all samples, with some differences in their concentrations. Among the compounds identified, it
can be seen that p-coumaric acid, syringetin as well benzoic acid are those that were detected in
most samples in higher concentrations, followed by the two isomers of abscisic acid (cis, trans-
and trans, trans- isomers). Sample EC1 presented the highest quantity of phenolic compounds,
with 202 mg/100 g, while EF3 showed the lowest amount with 59.85 mg/100 g.
The anti-inflammatory activity of the samples was assessed using the mouse macrophage
(RAW 264.7) cell line. All honey extracts under study showed anti-inflammatory capacity, with
GI50 values between 8 and 400 µg/mL. The highest activity was observed for sample J2, followed
by the samples J1 and EC1, with an GI50 value of 9 µg/mL. The cytotoxicity of the Algerian
honeys was evaluated in four human tumor cell lines (AGS-gastric adenocarcinoma, CaCo-
colorectal adenocarcinoma, MCF-7 breast adenocarcinoma, NCI H460- lung carcinoma) and a
non-tumor cell line, Vero (African green monkey kidney). All the studied extracts inhibited the
growth of the mentioned tumor cell lines. MF1 gave the highest cytotoxicity, followed by EF1.

Chapter IV- Conclusion and perspectives
65
The use of antibiotics in beekeeping is an illegal practice in Europe because ubiquitous
administration of antibiotics may cause bacteria to become resistant to many drugs. The
frequency of antibiotics residues in Algerian honeys from local beekeepers is very low. For
tetracycline residues, results were negatives while, three of the samples (MF1, EF1, EF3) showed
positive results of sulfonamide.
Future perspectives
This study concerned the characterization and evaluation of samples from semi-arid
regions in Algeria, and the verification of its compliance with the established legal standards. In
the continuation of this work some recommendations for future research are given below:
It would be important to confirm these results by analyzing more samples of these honeys,
specially Cytisus striatus, considering that this is the first time that this type of mono
flower honey from Algeria has been studied;
A statistical analysis must be applied to obtain the correlation between different
parameters and the influence of each parameter to another;
Identify potential floral markers of the honeys of Cytisus striatus, namely through the
evaluation of the profile in volatile compounds;
A comparison between Algerian honeys and Portuguese honeys with same floral source
should be studied.

Chapter IV- Conclusion and perspectives
66
Chapter V- References

Chapter IV- Conclusion and perspectives
67
References
Adjlane N., Doumandji SE., Haddad N. (2012). Situation de l'apiculture en Algérie : facteurs
menaçant la survie des colonies d'abeilles locales Apis mellifera intermissa. CahAgric, 21, 235-
41.
Al-Eed MA, Assubaie FN, El-Garawany MM, El-Hamshary H, El-Tayeb ZM. (2002).
Determination of heavy metal levels in common spices. Egypt J Appl Sci. 17:87–98.
Aline Meda, Charles Euloge Lamien, Marco Romito, Jeanne Millogo, Odile Germaine Nacoulm.
(2005). Determination of the total phenolic, flavonoid and proline contents in Burkina Fasan
honey, as well as their radical scavenging activity, Food Chemistry, Volume 91: Issue 3, 571-577
Aljadi A., Kamaruddin M. (2004). Evaluation of the phenolic contents and antioxidant capacities
of two Malaysian floral honeys. Food Chem, 85,513–518.
Almeida L.B., Stramm K.M., Horita A., Barth O.M., de Freitas A.S., Estevinho L.M. (2013).
Comparative study of the physicochemical and palynological characteristics of honey from
Melipona subnitida and Apis mellifera. International Journal of Food Science & Technology, 48,
1698–1706.
Al, Ml.; Daniel, D.; Moise, A.; Bobis, O.; Laslo, L.(2009). Bogdanov, S. Physicochemical and
bioactive properties of different floral origin honeys from Romania. Food Chem. 2009, 112, 863–
867.
Alothman M, Bhat R, Karim AA. (2009). Antioxidant capacity and phenolic content of selected
tropical fruits from Malaysia, extracted with different solvents. Food Chemistry.
2009;115: 785–788.
Alvarez-Suarez, Tulipani, S. Romandini, E.Bertoli, M. Battinon. (2010). Contribution of honey
in nutrition and human health a review. Mediterranean Journal of Nutrition and metabolism. 3(1),
15-23.
Al-Waili N., Boni N.(2003). Natural honey lowers plasma prostaglandin concentrations in
normal individuals. J Med Food, 6, 29.33

Chapter IV- Conclusion and perspectives
68
Al- Waili N., Salom K., Al- Ghamdi A., Javed M. (2012). Antibiotics, pesticide, and Microbial
contaminants of honey : humain health hazards. Scientific world journal, 93, 08-49
Amri A, (2006). Evaluation physico-chimique et determination de l’origine botanique de
quelques variétés de miel produites à l’Est. Mémoire de Magistere. Université Badji Mokhtar,
Annaba, Algérie. 108 p.
Anklam E, A. (1998). Review of the analytical methods to determine the geographical and
botanical origin of honey, Food chemistry, 63, 549-562
Artis, D., & Spits, H. (2015). The biology of innate lymphoid cells. Nature, 517(7534), 293-301.
Audigie C. L., Dupont G., Zonszain F., (1995). Competition test measured by radioactivity
(flickering properties of contaminated milk).
Avshalom M., Yaacov L. (1996). Bee products properties, applications and apitherapy. Plenum
press. New York.269 pages. ISBN (978-1-40757-9373-4).
Bankova V., De Castro S. Marcucci MC. (2000). Propolis: recent advances in chemistry and
plant origin. Apidologie, 31, 3-15.
Barberan T., MARTOS I., FERRERES F., RADOVIC B., ANKLAM E. (2001). HPLC
flavonoid profiles as markers for the botanical origin of European unifloral honeys. Journal of
the Science of Food and Agriculture, 81, 485-496.
Barganska Z, Slebioda M and Namiesnik J. (2011). Determination of antibiotic residues in
honey. Trends in Analytical Chemistry, 30(7), 1035-1041.
Baum K. A, Rubink W.L, Coulson R. N, Vaughn M and Bryant J. R, 2004. Pollen Selection by
Feral Honey Bee (Hymenoptera: Apideae) Colonies in a Coastal Prairie Landscape. Environ
Entomology. 33(3), 727-739.
Bear N. (2009), Bee and their role in forest livelihoods: a guide to the services provided by bees
and sustainable harvesting processing and marketing of their products. Food and agriculture
organization of the United Nations. Michigan university. pages number 204. ISBN:
92510627659789251062760.
Bellik Y. (2015). Bee Venom: Its potential use in alternative medicine. Anti-Infect. Agents. 2015;
13, 3–16.

Chapter IV- Conclusion and perspectives
69
Benammar C., Hichami A., Yessoufou A., Simonin A.M., Belarbi, M., Allali, H., & Khan, N.A.
(2010). Zizyphus lotus (Desf.) modulates antioxidant activity and human T-cell proliferation.
BMC Complementary and Alternative Medicine, 24, 10–54.
Benaziza-Bouchema D, Schweitzer P, (2010). Caractérisation des principaux miels des régions
du Nord de l’Algérie. Cah Agric; 19: 432-438.
Beretta G., Granata P., Ferrero M., Orioli M., Facino R.M.2005. Standardization of antioxidant
properties of honey by a combination of spectrophotometric/fluorimetric assays and chemometric.
Anal Chim Acta, 533,185-91
Bergner, K.G.; Hahn, H. Zum phenylalaningehalt von honigen. Z. Ernahrungswiss. (1972), 11,
47–54.
Bertoncelj, J., Polak, T., Kropf, U., Korosˇec, M., Golob, T. (2011). LC-DAD-ESI/MS analysis
of flavonoids and abscisic acid with chemometric approach for the classification of Slovenian
honey. Food Chemistry. 127, 296–302
Bogdanov, S. (1988). Bienenvolk und Schadstoffbelastung. Schweiz. Bienenztg.111: 571-575
Bogdanov, S., Martin, P., & Lüllmann, C. 1997. Harmonised methods of the European Honey
Commission. Apidologie (pp. 1–59). France: Elsevier
Bogdanov. S. (2002). Harmonized Methods of the International Honey Commission. 1-62
Bogdanov, S., 2003. Current status of analytical methods for the detection of residues in bee
products. Apiacta, 38(3), pp.190-197.
Bogdanov S., Ruoff K., Persano L. (2004) .Physico-chemical methods for the characterization of
unifloral honeys. A review Apidologie, 35 (Special issue), 4-17.
Bogdanov S, T. Jurendic, R. Sieber, P. Gallmann Honey for nutrition and health: a review
Journal of the American College of Nutrition, 27 (6) (2008), pp. 667-689.
Bogdanov S., 2009. Physical properties of honey. In: Book of Honey, Chapter 4. Bee Product
Science. <www.bee-hexagon.net>.
Bogdanov S, (2011). The Honey Book, Bee Product Science.
Fromhttp://www.beehexagon.net.last accessed 10/04/2019.
Bogdanov S. (2014): the honey book “chapter 05”.www.bee-hexagon.net.

Chapter IV- Conclusion and perspectives
70
Boussaid A., Chouaibi M., Rezig L., Hellal R., Donsı F., Ferrari G and Hamdi S, (2014).
Physicochemical and bioactive properties of six honey samples from various floral origins from
Tunisia. Arabian Journal of Chemistry. 10p.
Buba, F., Gidado, A., Shugaba, A, (2013). Analysis of biochemical composition of honey
samples from North-East Nigeria. Biochem Anal. Biochem. 2 (3), 139.
Buriol L, Finger D, Schmidt EM, dos Santos JMT, da Rosa MR, Quináia SP, Torres YN, Santa
HSD, Pessoa C, de Moraes MO, Costa-Lotufo LV, Ferreira PMP, Sawaya ACHF, Eberlin
MN.(2009). Chemical composition and biological activity of oil propolis extract: An alternative
to ethanolic extract. Quimica Nova. 2009;32:296.
Can Z., Yildiz O., Sahin H., Akyuz T.E., Silici, S., & Kolayli, S. (2015). An investigation of
Turkish honeys: Their physico-chemical properties, Antioxidant capacities and phenolic profiles.
Food Chemistry, 180, 133-141.
Candiracci, M., Piatti, E., Dominguez-Barragan, M., GarciaAntras, D., Morgado, B., Ruano, D.,
Gutiérrez, J.F., Parrado, J. & Castano, A. (2012), Anti-inflammatory activity of a honey
flavonoid extract on lipopolysaccharide-activated N13 microglial cells. Journal of Agricultural
and Food Chemistry 60(50): 12304-12311.
Cara C.M., Dumitrel G.A., Glevitzky M., Perju D. (2012). Stability of tetracycline residues in
honey. J. Serb. Chem. Soc. 77:879-886.
Castro-Vázquez L., Díaz-Maroto M.C., & Pérez-Coello M.S. (2007). Aroma composition and
new chemical markers of Spanish citrus honeys. Food Chemistry, 103, 601–606.
Catherine D. (2020). Eucalyptus Honey Uses, Nutrition and Benefits [on line].ln: Diet
Hive, .disponible on: https://diethive.com/eucalyptus-honey/
Chakir.A, Romane A,Marcazzan, Ferrazzi. (2016). physicochemical properties of some honeys
produced from different plants in Morocco. Arabian Journal of Chemistry, 9: 946-954.
Chaves N, J.C. Escudero, C. Gutierrez-Merino Seasonal variations of exudate of Cistus ladanifer
Journal of Chemical Ecology, 19 (11) (1993), pp. 2577-2591.
Chefrour A, Draiaia R, Tahar A, Ait KY, Bennadja S and Battesti MJ, (2009). Physicochemical
characteristics and pollen spectrum of some north-eastern Algerian honeys, Afr. J. Food Agric.
Nutr. Dev, 9, 1276-1293.
Chen, K. et al. (2020) Abscisic acid dynamics, signaling, and functions in plants. J. Integr. Plant
Biol. 62, 25–54.

Chapter IV- Conclusion and perspectives
71
Cherif A., Abderrahmane R., Nicoletta B., Donatella B., Paola F., (2011). Major and Trace
Elements in Different Types of Moroccan Honeys. Australian Journal of Basic and Applied
Sciences, 5,223-231, ISSN 1991-8178
Cherif A., Abdurrahman R., Gian L., Paola F. (2016), physicochemical properties of some
honeys produced from different plants in Morocco. Arabian Journal of Chemistry, 9, 946-954
Chua, L. S., Rahaman, N. L., Adnan, N. A., & Eddie Tan, T. T. (2013). Antioxidant Activity of
Three Honey Samples in relation with Their Biochemical Components. Journal of analytical
methods in chemistry, 2013, 313798. https://doi.org/10.1155/2013/313798
Ciulu M., Solinas, S., Floris, I., Panzanellia, A., Pilo, M. I., Piu, P. C., et al. (2011). RP-
HPLC determination of water-soluble vitamins in honey. Talanta, 83, 924–929.
Codex Alimentarius Commission. (1981). Revised Codex Standard for Honey; Codex STAN,
12-1981, Rev. 1 1987, Rev. 2. 2001
Codex Alimentarius Committee on Sugars (2001). Codex standard 12, revised Codex Standard
for Honey. Standards and Standard Methods, 11, 1–7
Cotte J., Casabianca H., Giroud B., Albert M., Lheritier J., Grenier-loustalot M. F., (2004).
Characterization of honey amino acid profiles using high- pressure liquid chromatography to
control authenticity. Analytical and Bioanalytical Chemistry, 378, 1342-1350.
Crane E. (1985) O livro do Mel [Honey book, in Portuguese]. São Paulo: Livraria Nobel; 1985.
226p
Da Silva P.M., Gauche C., Gonzaga L.V., Costa A.C.O., Fett R. (2016) Honey: Chemical
composition, stability and authenticity. Food Chemistry, 196:309–323.
De-Melo A., De Almeida M, Sancho M., Pascual A. (2018). Composition and properties of
Apis mellifera honey: A review, Journal of Apicultural Research, 57(1), 35-37.
Decreto-Lei nº 214/2003 de 18 de Setembro, Diário da República nº 216 –Iª Série A,Ministério
da Agricultura Desenvolvimento Rural e Pescas. (Lisboa).
Díez, M.J.; Andres, C.; Terrab, A. (2004) Physicochemical parameters and pollen analysis of
Moroccan honeydew honeys. Int. J. Food Sci. Technol, 39: 167–176.

Chapter IV- Conclusion and perspectives
72
Directive 2001/110/EC of December 2001 relating honey. Off J Eur Comm L 10 :47-52.
Doner L. (2003). Honey. In B. Caballero, P.M. Finglas, & L.C. Trugo (Eds.), Encyclopedia of
food sciences and nutrition (2nd ed., pp. 3125–3130). London: Academic Press.
Draiaiaa R., Chefrour A., Dainese N., Borin A., Manzinello C., GALLINA A. and Franco
Mutinelli F., (2015). Physicochemical parameters and antibiotics residuals in Algerian honey.
African Journal of Biotechnologie, 14(14), 1242-1251.
Edreva A. (2005), the importance of non-photosynthetic pigments and cinnamic acid derivatives
in photoprotection Agriculture, Ecosystems and Environment, 106, pp. 135-146
El Ghouizi Asmae, El Meyiy Nawal, Meryem Bakour, Badiaa Lyoussi. (2021). Moroccan
Monoloral bee pollen: Botanical origin, physicochemical characterization, and Antioxidant
Activities, Journal of food quality, vol.2021, Article 8877266, 10 pages..
El Sohaimy S. A., S.H.D. Masry S. H. D. and M.G. Shehata M. G. (2015). Physicochemical
characteristics of honey from different origins. Annals of Agricultural Science, 60(2), 279-287.
Estevinho, L. M., Rodrigues, S., Pereira, A. P., Feás, X. (2012). Portuguese bee pollen:
palynological study, nutritional and microbiological evaluation. International Journal of Food
Science and Technology, 47, 429-435.
European Commission. (2002). Honey and microbiological hazards. Report European
Commission of Health & Consumer Protection Directorate-General, 1-40.
European Honey Directive. (2001). Official Journal of the European Communities. Website:
(http://www.ihc-platform.net/publications.html).
Escuredo, O., Dobre, I., González, M. F., Seijo, M. C. (2014). Contribution of botanical origin
and sugar composition of honeys on the crystallization phenomenon. Food Chemistry. 149, 84–
90
Falcão, Soraia I, Nuno Vale, Paula Gomes, Maria RM Domingues, Cristina Freire, Susana M
Cardoso, and Miguel Vilas‐Boas. 2013. 'Phenolic profiling of Portuguese propolis by LC–MS
spectrometry: Uncommon propolis rich in flavonoid glycosides', Phytochemical Analysis, 24:
309-18.

Chapter IV- Conclusion and perspectives
73
Falcão, Soraia I, Ricardo C Calhelha, Soumaya Touzani, Badiaâ Lyoussi, Isabel CFR Ferreira,
and Miguel Vilas-Boas. 2019. 'In Vitro Interactions of Moroccan Propolis Phytochemical’s on
Human Tumor Cell Lines and Anti-Inflammatory Properties', Biomolecules, 9: 315.
FELLER-DEMALSY, M J; VINCENT, B; BEAULIEU, F. (1989). Mineral content and
geographical origin of Canadian honeys. Apidologie 20 (1): 77–91.
Felsner M., Cano C., Matos J, Almeida M., Bruns R.. (2004). Optimization of thermogravimetric
analysis of ash content in honey. Journal of the Brazilian Chemical Society, 15, 797–802.
Ferreres F., Ortiz A., Silva C., García-Viguera C., Tomás-Barberán F.A., Tomás-Lorente F.
(1992). Flavonoids of “La Alcarria” honey: A study of their botanical origin. Zeitschrift fu¨r
Lebensmittel-Untersuchung und -Forschung, 194, 139–143.
Ferreira I.C.F.R., Aires E., Barreira J.C.M., Estevinho L.M. (2009). Antioxidant activity of
Portuguese honey samples: Different contributions of the entire honey and phenolic extract. Food
Chemistry, 114, 1438-1443.
Frankel S, G E Robinson & M R Berenbaum. (1998). Antioxidant capacity and correlated
characteristics of 14 unifloral honeys, Journal of Apicultural Research, 37:1, 27-
31, DOI: 10.1080/00218839.1998.11100951
Fresnay j. (1981). Biométrie de l’abeille. 2eme ed.echouffour, orne office d’inf.doc.apic. 56p
Gallina A., Stocco N., Mutinelli F. (2010). Karl Fischer Titration to determine moisture in honey:
A new simplified approach. Food Control, 21(6), 942–944.
Gheldof N., & Engeseth N.J. (2002). Antioxidant capacity of honeys from various floral sources
based on the determi-nation of oxygen radical absorbance capacity and inhibition of in vitro
lipoprotein oxidation in human serum samples. Journal of Agricultural and Food Chemistry, 50,
3050–3055.
Gonzalez-miret M. L., Terrab A., Hernanz D., Fernandez-recamales M. A., Heredia F. J, (2005)
Multivariate correlation between color and mineral composition of honeys and by their botanical
origin. Journal of Agricultural and Food Chemistry 53 (7)

Chapter IV- Conclusion and perspectives
74
Haderbache L., Bousdira M., Mohammedi A. (2013). Ziziphus lotus and Euphorbia
bupleuroides Algerian honeys. World Applied Sciences Journal, 24(11), 1536–1543.
Hadia Laouar, Ali Taha., (2017). Physicochemical analysis of some honeys from humid regions
in North East Algeria. Journal of Chemical and Pharmaceutical Sciences 10 ;50-54.
Halima H., Bissati-bouafia S., (2018) Etude melissopalynologique, physco-chimique et
antibactérienne de quelques échantillons de miels du sud Algérien (Doctoral dissertation).
Université Kasdi Merbah-Ouergla, Faculté des Sciences de la Nature et de la Vie Département
des Sciences Agronomiques.
Hatami T, Emami SA, Miraghaee SS, Mojarrab M. (2014), Total Phenolic Contents and
Antioxidant Activities of Different Extracts and Fractions from the Aerial Parts of Artemisia
biennis Willd. Iran J Pharm Res. 2014; 13 (2):551-559
Henriques, A., Jackson, S., Cooper, R. and Burton, N. (2006). Free radical production and
quenching in honeys with wound healing potential. Journal of Antimicrobial
Chemotherapy, 58(4), pp.773-777.
Haouam L., Tahar A., Dailly H., Lahrichi A., Chaqroune A., Abdennour C. (2016).
Physicochemical properties and major elements contents of Algerian honeys from semi-arid
regions. Emirates Journal of Food and Agriculture. 28(2), 107-115.
Isailovic, N., Daigo, K., Mantovani, A., Selmi, C. (2015). Interleukin-17 and innate immunity in
infections and chronic inflammation. Journal of autoimmunity, 60, 1-11.
Jaganathan S., Mandal M. (2009). Antiproliferative Effects of Honey and of Its Polyphenols: A
Review. J Biomed Biotechnol, 83, 06-16
Jean-Prost P. (1987). Apiculture. Ed. Tec. Et Doc, 6ème édition, 310-346.
John Tomas. (2014). Hive components (on line). Ln: PCBA (pierce country beekeepers
association). Disponible on: (https://www.pcbeekeepers.org/)
Jorge, J. M., Pérez-García, F., Wendisch, V. F. (2017). A new metabolic route for the
fermentative production of 5-aminovalerate from glucose and alternative carbon
sources. Bioresource technology, 245, 1701-1709.

Chapter IV- Conclusion and perspectives
75
Kassim M, Achoui M, Mustafa MR, Mohd MA, Yusuf KM. (2010) Ellagic acid, phenolic acids
and flavonoids in Malaysian honey extracts demonstrate in vitro anti-inflammatory activity.
Nutr Res 30:650–659.
Khalil, I., Moniruzzaman, M., Boukraâ, L., Benhanifia, M., Islam, A., Islam, N., Sulaiman, S. A.,
& Gan, S. H. (2012). Physicochemical and antioxidant properties of Algerian honey. Molecules
(Basel, Switzerland), 17(9), 11199–11215. https://doi.org/10.3390/molecules170911199
Kečkeš J, Trifković J, Andrić F, Jovetić M, Tešić Z, Milojković-Opsenica. (2013). Amino acids
profile of Serbian unifloral honeys. D J Sci Food Agric. Oct; 93(13):3368-3376.
Kenjeric D., Mandic, M. L., Primorac, L., Bubalo, D., Perl, A. (2007) Flavonoid profile of
Robinia honeys produced in Croatia Food Chemistry. De-Melo, A. A. M., Almeida-Muradian , L.
B., Sancho, M. T., Pascual-Maté, A. (2017).Composition and properties of Apis mellifera honey:
A review; Journal of apicultural research.
Kessi O. (2013) .Biométrie essai de caractérisation de l’abaille Apis mellifica sahariensis [on
line] .ln : ITEL (institut technique des elevages). disponible
on :(http://www.itelv.dz/index.php/elevages/45-elevages-apicoles.html).
Kwon, G. Owens, Y.S. Ok, D.B. Lee, W.-T. Jeon, J.G. Kim, K.-R. Kim. (2011) Applicability of
the Charm II system for monitoring antibiotic residues in manure-based composts, Waste
Management, Volume 31, Issue 1, Pages 39-44

Appendix
76
Krell R. (1996). Value-added products from beekeeping. Rome: FAO. FAO Agricultural
Services Bulletin, 124, 87-113.
Kumar, N., & Goel, N. (2019). Phenolic acids: Natural versatile molecules with promising
therapeutic applications. Biotechnology reports (Amsterdam, Netherlands), 24, e00370.
https://doi.org/10.1016/j.btre.2019.e00370
Lamuela-Raventós, Rosa M. (2018), "Folin–Ciocalteu method for the measurement of total
phenolic content and antioxidant capacity." Measurement of Antioxidant Activity & Capacity
Recent Trends and Applications (2018): 107-117.
Le Houérou H.N. (1995) - Considérations biogéographiques sur les steppes arides du nord de
l’Afrique. Sécheresse, 6(2),167 - 182 .
Lekshmi M, Ammini P, Kumar S, Varela MF. (2017).The food production environment and the
development of antimicrobial resistance in human pathogens of animal origin. Microorganisms.
2017; 5:11–25.
Licata P, Trombetta D, Cristani M, Martino D, Naccari F. (2004). Organochlorine compounds
and heavy metals in the soft tissue of the mussel Mytilus galloprovincialis collected from Lake
Faro (Sicily, Italy). Environ Int. 30(6):805–810.
Ligia Bicudo de Almeida-Muradian, Ortrud Monika Barth, Vincent Dietemann,
Michael Eyer, Alex da Silva de Freitas, Anne-Claire Martel, Gian Luigi Marcazzan, Carla Marina
Marchese, Carla Mucignat-Caretta, Ana Pascual-Maté, Wim Reybroeck, M. Teresa Sancho &
José Augusto Gasparotto Sattler. (2020). Standard methods for Apis mellifera honey research,
Journal of Apicultural Research, 59:3, 1-62,
Lopes M., Falcão S.I.; Dimou M., Thrasyvoulou, A., Vilas-Boas M. (2018). Impact of traditional
and modern beekeeping technologies on the quality of honey of Guinea-Bissau, Journal of
Apicultural Research, 57(3), 406-417.
Lquet L. (2010), Du nectar a un miel de qualite : controles analytiques du miel et conseils
pratiques a l’intention de l’apiculteur amateur, thése docteur vétérinaire, Claude Bernard –
university .lyoni , 194 pages.

Appendix
77
Lucas, R. M., & Ponsonby, A. L. (2006). Considering the potential benefits as well as adverse
effects of sun exposure: can all the potential benefits be provided by oral vitamin
supplementation?. Progress in biophysics and molecular biology, 92(1), 140-149. Molan, P. C.
(1999). The role of honey in the management of wounds. Journal of wound care, 8(8), 415-418.
Luz C., Junior G., Fonseca R. L. S., Sousa P.R. (2010). Comparative pollen preferences by
Africanized honeybees Apis mellifera L. of two colonies in Paraná de Minas, Minas Gerais,
Brazil. Anais da Academia Brasileira de Ciencias, 82, 293- 304.
Makhloufi C., Kerkvliet J., Giancarlo R., Choukri A., Riad S. (2010). Characterization of
Algerian honeys by palynological and physico-chemical methods. Apidologie. 41.509–521
Manila Candiracci M, Piatti E, Dominguez-Barragán M, García-Antrás D, Morgado B, Ruano D,
Gutiérrez JF, Parrado J, Castaño A. (2012), Anti-inflammatory activity of a honey flavonoid
extract on lipopolysaccharide-activated N13 microglial cells. J Agric Food Chem. Dec
19;60(50):12304-11. doi: 10.1021/jf302468h. Epub 2012 Dec 5. PMID: 23176387.
Marchini LC, Sodré GS, Moreti ACCC. (2014). Mel brasileiro: composição e Normas [Brazilian
honey: composition and rules, in Portuguese]. Ribeirão Preto: ASP, 111p.
Matzke A., Bogdanov S. (2003). La propolis – un antibiotique naturel. Edition VDB
6235Winikon; 72 pages.
Mbogning, E., Tchoumboue1, J., Damesse F., Sanou Sobze, M. et Canini A. (2011).
Caractéristiques physico-chimiques des miels de la zone Soudano-guinéenne de l’Ouest et de
l’Adamaoua Cameroun, Tropicultura, 29, 3, 168-175.
Mendes E., BrojoProença E., Ferreira IMPLVO and Ferreira MA. (1998). Quality evaluation of
Portuguese honey, Carbohydrate Polymers, 37: 219-223
Moreno-Bondi, M.D. Marazuela, S. Herranz, E. Rodriguez, Anal. Bioanal. Chem. 395. (2009)
921. [9] T.S. Thompson, D.K. Noot, Anal. Chim. Acta 551 (2005) 168. [10] J. Kisała, M.
Dzugan, Zeszyty Naukowe 11 (2009) 115.

Appendix
78
Mortensen A., Schmehl D and Ellis J. (2013). European honey bees-Apis mellifera Linnaeus and
subspecies (Insecta: Hymenoptera: Apidae). [On line]. In: featured creatures- university of
Florida. Disponible on < http://www.ufl.edu/>.
Mouhoubi-Tafinine, S. Ouchemoukh, A. Tamendjari Antioxidant activity of some Algerian
honey and propolis Indust Crop Prod, 88 (2016), pp. 85-90.
Moustafa H. (2001). Beekeeping in Africa :I: North, East and west African
countries.apimondia.37th intapic.congr.,28 oct-1 nov 2001,Durban ,south Africa. ISBN : 0- 620-
27768-8.
Navarrete M., Casado S., Minelli M., Segura A., Bonetti A., Dinelli G., Fernandez, A. (2005).
Direct determination of aliphatic acids in honey by coelectroosmotic capillary zone
electrophoresis. Journal of Apicultural Research, 44(2), 65–70.
Nair S., Meddah B. and Aoues A. (2013). Pollen spectrum of honey produced in Algeria, African
Journal of Agricultural Research, 8(21), 2540-2544.
Nogueira, C., Iglesias, A., Feás, X., Estevinho, L. M. (2012). Commercial Bee Pollen with
Different Geographical Origins: A Comprehensive Approach. International Journal of Molecular
Sciences, 13, 11173-11187.
Nozal M. J., Bernal J. L., Toribio L., Jiménez J. J. and Martin M. T. (2001). High performance
liquid chromatographic determination of methyl anthranilate, hydroxy methyl furfural and related
compounds in honey, Journal of Chromatography A, 917: 95-103.
Ouchemoukh S, Louaileche H, Scheitzer P. (2006). Physicochemical characteristics and pollen
spectrum of some Algerian honey, 18: 52-58.
Ouchemoukh S, Nadia Amessis-Ouchemoukh, María Gómez-Romero, Farid Aboud, Alonzo
Giuseppe, Alberto Fernández-Gutiérrez, Antonio Segura-Carretero. (2016). Characterisation of
phenolic compounds in Algerian honeys by RP-HPLC coupled to electrospray time-of-flight
mass spectrometry, LWT - Food Science and Technology, Volume 85, Part B, 2017, Pages 460-
469, ISSN 0023-6438,

Appendix
79
Orontes J., Gonell F, Torres, C., Gomez-Paluelo A. (2018). "Guia de mieles monoflorales
lbericas"
Olas B. (2020). Honey and Its Phenolic Compounds as an Effective Natural Medicine for
Cardiovascular Diseases in Humans?. Nutrients, 12(2), 283.
Pereira A., Dias T., Andrade J., and Ramalhosa E., Estevinho L.M. (2009). Mead production:
selection and characterization assays of Saccharomyces cerevisiae strains. Food and Chemical
Toxicology, 47, 2057–2063.
Persano L; Pino R. (2004). Main European unifloral honeys : descriptive sheets. Apidologie
(Celle), 35, 38-81.
Pohl P. (2009). Determination of metal content in honey by atomic absorption and emission
spectrometries. TRAC 28: 117-28
Pontes M., Marques J. C., & Câmara J. S. (2007). Screening of volatile composition from
Portuguese multifloral honeys using headspace solid-phase microextraction-gas chromatography–
quadrupole mass spectrometry. Talanta, 74, 91–103.
Pourtallier, J., Taliercio, Y. (1970). Les caractéristiques physicochimiques des miels en fonction
de leur origine florale. 1. Application à un Project pour les grandes variétés de miels. Bull. Aic.
Doc. Sci. Techn. Inf. 13: 58-68.
Quezel P, and Santra S. (1962). Nouvelle flore de l'Algérie et des régions désertiques
méridionales. 6 ème Edition. Paris
Quezel P. Médail L. (2003). Ecologie et Biogéographie des forêts du bassin méditerranéen.
France. Sergent, CETAAM. Paris. Elsevier.
Raude R. (1994) Analyse der Saccharide Spaltenden Enzyme des Bienenhonigs. Dr. Dissertation;
Celle, Deutschland Niedersächsisches Landesinstitut für Bienenkunde.
Rebiai A, Lanez T. (2014). Comparative study of honey collected from different flora of Algeria.
J Fund Appl.Sci, 6: 48-55

Appendix
80
Reyes K., Segovia J., Shibayama M., Vergara P, Moreno M.G. (2007). Curcumin protects against
acute liver damage in the rat by inhibiting NFkappaB, pro-inflammatory cytokines production
and oxidative stress. Biochim Biophys Acta 1770, 989-996.
Reybroeck, W. (2002). Residues of antibiotics and sulphonamides in honey on the Belgian
market. group, 200, p.50.
Salter R. (2003). CHARM II System Comprehensive Residue Analysis System for Honey,
Apiacta, 38, 198-206.
S. Samarghandian, J.T. Afshari, S. Davoodi. (2011), Honey induces apoptosis in renal cell
carcinoma Pharmacognosy Magazine, 7, pp. 46-52.
Sancho, M.T., Muniategui, S., Huidobro, J. F., Simal, J. (1992). Evaluating soluble and insoluble
ash, alkalinity of soluble and insoluble ash and total alkalinity of ash in honey using electrical
conductivity measurements at 20 ºC. Apidologie, 23, 291-297.
Schweitzer P. (2004). Mauvaise herbe et apiculture, Laboratoire d’analyse et d’écologie apicole,
Rev. L’abeille de France, 7,9 -11.
Scorselli R; Donadio E. (2005).Regular article towards royal jelly
proteome ,proteomics ,5,769-776.
I. Sergiel, P. Pohl, M. (2014). Biesaga Characterisation of honeys according to their content of
phenolic compounds using high performance liquid chromatography/tandem mass spectrometry.
Food Chemistry, 145, pp. 404-408.
Siti Norfitrah Mohd Salim, Logaraj Ramakreshnan, Chng Saun Fong, Ridhwan Abdul Wahab,
Mohammad Syaiful Bahari Abdull Rasad.(2019). In-vitro cytotoxicity of Trigona itama honey
against human lung adenocarcinoma epithelial cell line (A549), European Journal of Integrative
Medicine,Volume 30.
Solayman, A. Islam, S. Paul, Y. Ali, M.I. Khalil, N. Alam, S.H. (2016). Gan Physicochemical
properties, minerals, trace elements, and heavy metals in honey of different origins: A
comprehensive review comprehensive Reviews in Food Science and Food Safety, 15, pp. 219-
233.

Appendix
81
Subrahmanyam, M. (1998). A prospective randomized clinical and histological study of
superficial burn wound healing with honey and silver sulfadiazine. Burns, 24(2), 157-161.
Subrahmanyam M. .(2001), Archan Hemmady, S.G. Pawar Antibacterial activity of honey on
bacteria isolated from wounds Annals of Burns and Fire Disasters, 16 (1).
Tomás-Barberán, F. A., Martos, I., Ferreres, F., Radovic, B. S., Anklam, E. (2001). HPLC
flavonoid profiles as markers for the botanical origin of European unifloral honeys. Journal of the
Science of Food and Agriculture. 81, 485–496.
Terrab A, González A.G, Díez M.J, Heredia F.J. (2003). Mineral content and electrical
conductivity of the honeys produced in north–west Morocco and their contribution to the
characterization of unifloral honeys. J Sci Food Agric, 83 ,637–643.
Tlemcani I. (2013).Caractérisation morphologique des trois populations d’abeilles marocaines
/ composition phénolique du miel. Mémoire de fin d’étude, Faculté des Sciences et Techniques
Fès.Marroc.
Velicer C., Heckbert S., Lampe J., Potter J, Robertson C., Taplin S. (2004). Antibiotic use in
relation to the risk of breast cancer. The Journal of the American Medical Association; 291 (7),
827–835.
Viuda M., Ruiz,Y., Fernández J., Pérez J. (2008) Functional properties of honey, propolis, and
royal jelly. J Food Sci, 73, 117–124.
Von-der-O W., Dustmann J. (1991). Prolin ALS Kriterium der Reife des
Von Der Ohea, W., Oddob, L. P., Pianab, M. L., Morlotc, M., Martind, P. (2004). Harmonized
methods of melissopalynology. Apidologie, 35 S18–S25
White JW. (1978). Honey, Advances in Food Res, 24: 287–374.
White J, And Landis W. (1980), Honey composition and properties. Beekeeping in the United
States Agriculture Handbook, 335, 82 – 91.
B. Winkel-Shirley, (2002) Biosynthesis of flavonoids and effects of stress Current Opinion in
Plant Biology, 5 (2002), pp. 218-223.
Yaiche Achour H, Khali M. (2014). Composition physicochimique des miels Algériens.
Determination des elements traces et des elements potentiellement toxiques. Afr Sci. 10(2):
127–136.

Appendix
82
Zahran A., Elsayh K., Saad K., Eloseily E., Osman N.S., Alblihed M.A., Badr G., Mahmoud
M.H. (2016). Effects of royal jelly supplementation on regulatory T cells in children with SLE.
Food and Nutrition Research, 605(1), 1-10.
Żaneta Bargańska, Jacek Namieśnik, Marek Ślebioda. (2011). Determination of antibiotic
residues in honey, TrAC Trends in Analytical Chemistry, Volume 30, Issue 7, Pages 1035-1041,
ISSN 0165-9936,
Zerrouk S., Fallico B.G.,Arena E.N., Gabriele F. Ballistreri G.F. and Larbi A. Boughediri L.A.
(2011). Quality evaluation of some honey from the central region of Algeria, Jordan Journal of
Biological Sciences, 4(4), 243 – 248.
Zerrouk S., Seijo.M. C., Boughediri L., Escuredo O. and Rodriguez-Flores M. S. (2014).
Palynological characterization of Algérian honeys according to their geographical and botanical
origin. Grana, 53(2), 147-158.
Zucchi P., Marcazzan G. L., Dal pozzo M., Sabatini A. G., Desalvo F., Floris I., (2006). Il
contenuto di etanolo nel miele per la valutazione di processi fermentativi. APOidea 3 (1): 18- 26.

Appendix
83
Chapter VI- Appendix

Appendix
84
Appendix
Attached are two abstracts that resulted from two panel communications:
Seloua Kaid, Soraia I. Falcão, Andreia Tomás, Ziani Kaddour,
Miguel Vilas-Boas. Physico-
chemical evaluation of Algerian honeys: Eucalyptus, Jujube, and Spurge, multifloral. NPA
(Natural Products Application: Health, Cosmetic and food), Online Edition 4-5 Feb 2021.
Seloua Kaid, Soraia I. Falcão, Andreia Tomás, Ziani Kaddour,Miguel Vilas-Boas.
Characterization of Algerian honeys by phenolic compounds LC-DAD-ESI/MSn analysis:
Eucalyptus, Jujube, Spurge and multifloral.7 PYCHEM (Portuguese Young Chemists Meetings),
20-22 May 2021 Bragança

Appendix
85
PHYSICO-CHEMICAL EVALUATION OF ALGERIAN HONEYS: EUCALYPTUS, JUJUBE,
SPURGE AND MULTIFLORAL
Seloua Kaid,1,2
Soraia I. Falcão,1, Andreia Tomás,
1 Ziani Kaddour,
2 Miguel Vilas-Boas
1*
1 Centro de Investigação de Montanha (CIMO), Instituto Politécnico de Bragança, Campus de
Santa Apolónia, 5300-253 Bragança, Portugal; 2 Laboratory of Biotoxicology, Pharmacognosy
and Biological Valorization of Plants, Department of Biology, Taher Moulay University of Saida,
Saida, 20000, Algeria. *[email protected]
Arid and semi-arid zones represent nearly two-thirds of Algerian area. The immensity of these
territories and the absence of systematic studies of the bee flora, make honeys from these regions
poorly studied and poorly understood. The aim of the present study was to evaluate the quality of
semi-arid Algerian honeys and verify its compliance with the established honey standards. For
that, ten samples with different botanical and geographical origin, Eucalyptus (EC), Jujube (J),
Euphorbia (EF) and multifloral (MF), were analyzed regarding the following physicochemical
parameters: moisture, color, pH, free acidity, electrical conductivity, hydroxymethylfurfural
(HMF), diastase index and proline. Concerning the moisture content, the samples presented
values below the 20 % allowed by European Community regulations, ranging from 13.6% (EF)
and 18.3% (EC). Eucalyptus honeys showed a darker color when comparing to the other samples
All honey samples presented conductivity values lower than 0.8 ms.cm−1
, ranging between 0.27
(MF) and 0.41 (EC) ms.cm−1
which are in accordance with the standard results for nectar honeys.
The honeys pH values varied between 4.2 (MF) and 5.1 (J) with an average value equal to 4.6.
For free acidity, tested at pH 8.3, the values where between 12.2 meq.kg-1
(EC) and 43.9 meq.kg-1
(EF). The HMF levels observed for the samples had a minimum of 0.53 (J) and a maximum of
36.5 (EC) mg.kg-1
, while diastase values ranged between 8.8 DN and 14.3 DN, being in
accordance with the required by the European legislation (<40 mg.kg-1
and not less than 8 DN).
For proline, the values ranged between 2.2 and 4.7 mg/g indicating the maturity of the honeys
and absence of adulteration. Generally, the samples were found to meet the requirements of the
international honey standards and were within those found in previous studies about
physicochemical properties of Algerian and Moroccan honeys [1].
References
[1] C. Makhloufi, J.D., Kerkvliet, G.R., D’albore, A. Choukri, R. Samar, Apidologie, 41 (2010)
509.
Acknowledgments
The authors are grateful to the Foundation for Science and Technology (FCT, Portugal) for
financial support by national funds FCT/MCTES to CIMO (UIDB/00690/2020). National
funding by FCT- Foundation for Science and Technology, through the institutional scientific
employment program-contract with Soraia I. Falcão.

Appendix
86

Appendix
87
Characterization of Algerian honeys by phenolic compounds LC-DAD-ESI/MSn
analysis: Eucalyptus, Jujube, and Spurge and multifloral
Seloua Kaid,1 Soraia I. Falcão,
1 Andreia Tomás, Ziani Kaddour,
2 Miguel Vilas-Boas
1*
1 Centro de Investigação de Montanha (CIMO), Instituto Politécnico de Bragança, Campus de
Santa Apolónia, 5300-253 Bragança, Portugal; 2 Laboratory of Biotoxicology, Pharmacognosy
and Biological Valorization of Plants, Department of Biology, Taher Moulay University of Saida,
20000 Saida, Algeria. *[email protected]
Honey is a complex hive product produced by Apis mellifera bees, composed mainly by
carbohydrates and containing small amounts of other constituents such as minerals, proteins,
vitamins, organic acids, phenolic compounds, enzymes, and other phytochemicals [1]. The
quality of a honey is correlated with its chemical composition and botanical origin. The phenolic
profiles of honeys are determined by their phyto-geographical origin(s), and by the climatic
conditions of the collection site [2]. Thus, identification and quantification of the phenolic
compounds present in honey is of great interest for its origin assessment.
The aim of this research is to determine the phenolic composition of selected honeys collected
from the semi-arid region of Algeria. For that, eleven honey samples, including three from
eucalyptus, four from spurge, three from jujube and two from multifloral botanical origin. The
phenolic compounds were extracted and analyzed trough liquid chromatography coupled to diode
array detection and electrospray ionization mass spectrometry (LC-DAD-ESI/MS) operating in
negative ion mode. The analysis of the UV spectra together with the molecular ion identification
[M-H]- and MS
n fragmentation allowed the identification of twenty-two phenolic compounds,
among which the most abundant were the abscisic acid isomers (m/z 263), p-hydroxibenzoic acid
(m/z 137), p-coumaric acid (m/z 163), quercetin (m/z 301) and pinobanksin (m/z 271. The
phenolics identified varied quantitatively depending on the botanical origin, with Eucalyptus
honey showing the highest content of phenolic compounds.
References
[1] J. Bertoncelj, T. Polak, U. Kropf, M. Korošec, T. Golob, Food Chemistry, 127 (2011) 296.
[2] S. Ouchemoukh, N. Amessis-Ouchemoukh, M. Gómez-Romero, F. Aboud, A. Giuseppe, A.
Fernández-Gutiérrez, A. Segura-Carretero, LWT-Food Science and Technology, 85 (2017) 460.
Acknowledgments
The authors are grateful to the Foundation for Science and Technology (FCT, Portugal) for
financial support by national funds FCT/MCTES to CIMO (UIDB/00690/2020). National
funding by FCT-Foundation for Science and Technology, through the institutional scientific
employment program-contract with Soraia I. Falcão.

Chapter V- References
88