fiscal policy and macroeconomic performance in the euro area - lessons for the future
TRANSCRIPT
Working Paper
7/2006
Eckhard Hein and Achim Truger,
Macroeconomic Policy Institute (IMK) in the Hans Boeckler Foundation
Fiscal Policy and Macroeconomic Performance in the Euro area
– Lessons for the Future
Hans-Böckler-Straße 39 D-40476 Düsseldorf Germany Phone: +49-211-7778-331 [email protected] http://www.imk-boeckler.de
Fiscal Policy and Macroeconomic Performance in the Euro area
– Lessons for the Future#
Eckhard Hein and Achim Truger*
Macroeconomic Policy Institute (IMK) in the Hans Boeckler Foundation, Duesseldorf, Germany
Abstract Since the start of the European Monetary Union fiscal policy in the Euro area has been dominated by the Stability and Growth Pact (SGP). Quite obviously the SGP has been unsuccessful in fulfilling its goals, fiscal sustainability and supporting economic growth. More and more countries have exceeded the 3 percent of GDP limit for the budget deficit, while at the same time macroeconomic performance has been unsatisfactory. We analyse fiscal policy and its macroeconomic impact for the Euro area as a whole and for selected countries and compare it with US fiscal policy, with a special emphasis on the period 2001-2005. Whereas US fiscal policy has been strongly counter-cyclical, thus stabilising the economy, in the Euro area fiscal policy has been much more restrictive and has had pro-cyclical and therefore destabilising effects for many countries. However, one cannot put all the blame on fiscal policy. The ECB’s restrictive monetary policy and divergent and destabilising wage developments across the Euro area are at least as important as fiscal policy in the explanation of the Euro area’s weak economic performance. As a possible solution for the future, we suggest to replace the SGP by expenditure paths as coordination tool, and we discuss an important modification of the concept. Such expenditure paths could co-ordinate fiscal policies across the Euro area in a counter-cyclical way and at the same time ensure fiscal sustainability. Unfortunately, as long as monetary and wage policies remain un-coordinated and destabilising, any improvements in fiscal policy will not be very effective in enhancing economic performance. JEL-Code: E 62, E 63, E 65, E 61. Key words: Fiscal policy, consolidation strategies, macroeconomic policy mix, Euro area Corresponding author Dr. Achim Truger IMK in der Hans Boeckler Stiftung Hans Boeckler Str. 39 40476 Duesseldorf Germany e-mail: [email protected]
# Revised version of a paper prepared for the ‘Franklin Conference on the Future of Europe’, March 2-4, Franklin College, Lugano, Switzerland, to be published in Bibow, J., Terzi, A. (eds.): Euroland and the World Economy: Global Player or Global Drag?, Basingstoke (Palgrave/Macmillan) 2007. We are grateful to the editors for helpful comments on an earlier version. * The authors would like to thank Katja Rietzler for updating some of the data used in Sections 2 and 3.

1
1. Introduction
Since the start of the European Monetary Union (EMU) fiscal policy in the Euro area has
been dominated by the Stability and Growth Pact (SGP). However, the SGP has been
unsuccessful in fulfilling both of its goals, fiscal sustainability and supporting economic
growth: In recent years, more and more countries have exceeded the 3 percent of GDP limit
for the budget deficit. At the same time, macroeconomic performance has been unsatisfactory,
with the Euro area economy only slowly recovering from the post-2000 stagnation. The
prolonged stagnation as well as the ongoing fiscal problems have revived the macroeconomic
debate on a reform of the SGP. A reform was finally introduced after a legal conflict between
the European Commission and the European Council about the Council’s right to simply
ignore the Commission’s recommendation to further pursue the excessive deficit procedures
against France and Germany. However, the reform did not fundamentally change the SGP.
Therefore, the economic and political debates on SGP reforms continue. In the current paper
we would like to contribute to this debate. After a rather detailed account of fiscal policy
developments and their impact on the Euro area economy, we present a modified expenditure
path concept as an alternative to the current SGP.
The paper is an extension of our earlier work, in which we tried to explain the long-run
growth and employment differentials between the Euro area and the USA by a
macroeconomic policy view, stressing the more restrictive stance of monetary, fiscal and
wage policies under the ‘Maastricht Regime’.1 We proceed as follows: Section 2 compares
the macroeconomic performance in the Euro area and its individual member countries with
the performance of the US economy. Section 3 provides a more detailed description of fiscal
policies and consolidation efforts in the Euro area since 1991. In Section 4 we analyse the
macroeconomic impact of fiscal policy and in Section 5 we will put this in a broader
perspective discussing also monetary and wage policies. In Section 6 we comment on the
recent modifications of the SGP and present our reform proposal based on expenditure paths.
Section 7 points to a potential drawback by asking whether fiscal policy can really improve
1 See Hein/Truger (2005a, 2005b) and Hein/Niechoj (2006) on the Maastricht regime, Hein/Truger (2005c, 2005d) on the special situation of the German economy and Hein/Truger (2006a), Hein/Schulten/Truger (2006) on the risks of deflation in Germany and Europe associated with this constellation. Also Fritsche et al. (2005), Palley (1998) and Solow (2000) have argued that a favourable coordination between monetary and fiscal policies rather than deregulated labour markets can be held responsible for the superior development of the US-economy during the 1990s compared to Germany or the EU.
2
growth and employment under the current regime of monetary and wage policies in Europe.
Section 8 concludes.
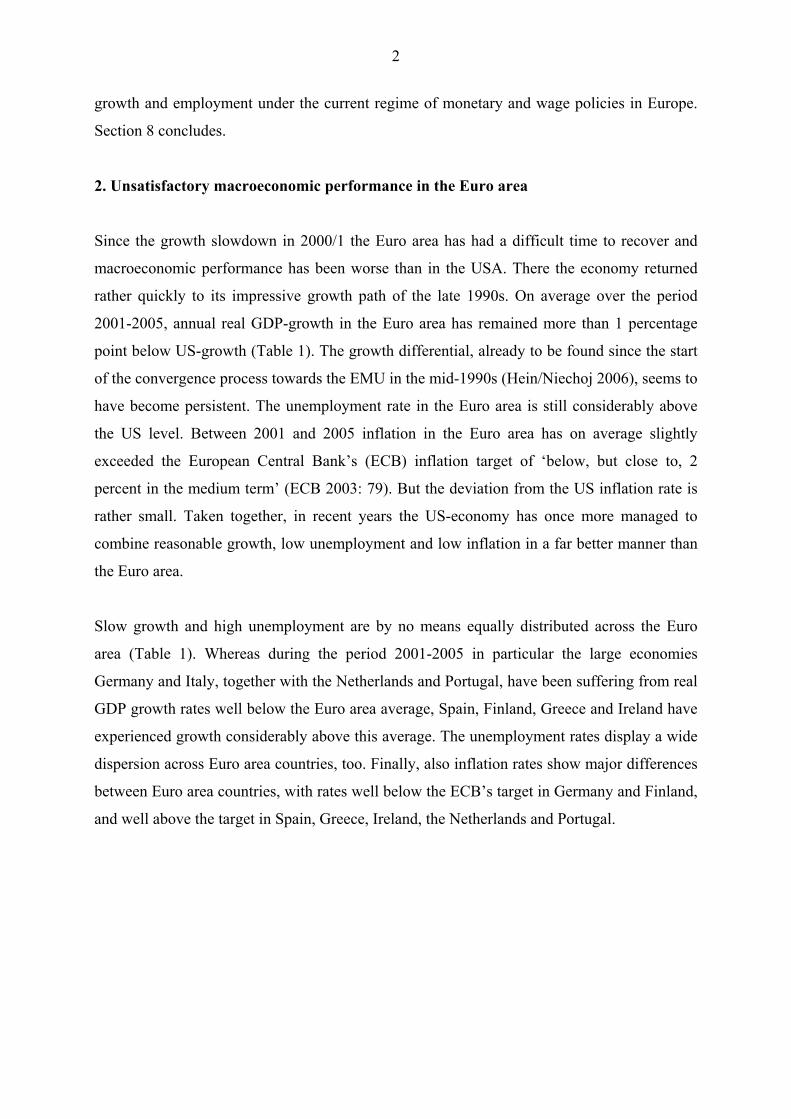
2. Unsatisfactory macroeconomic performance in the Euro area
Since the growth slowdown in 2000/1 the Euro area has had a difficult time to recover and
macroeconomic performance has been worse than in the USA. There the economy returned
rather quickly to its impressive growth path of the late 1990s. On average over the period
2001-2005, annual real GDP-growth in the Euro area has remained more than 1 percentage
point below US-growth (Table 1). The growth differential, already to be found since the start
of the convergence process towards the EMU in the mid-1990s (Hein/Niechoj 2006), seems to
have become persistent. The unemployment rate in the Euro area is still considerably above
the US level. Between 2001 and 2005 inflation in the Euro area has on average slightly
exceeded the European Central Bank’s (ECB) inflation target of ‘below, but close to, 2
percent in the medium term’ (ECB 2003: 79). But the deviation from the US inflation rate is
rather small. Taken together, in recent years the US-economy has once more managed to
combine reasonable growth, low unemployment and low inflation in a far better manner than
the Euro area.
Slow growth and high unemployment are by no means equally distributed across the Euro
area (Table 1). Whereas during the period 2001-2005 in particular the large economies
Germany and Italy, together with the Netherlands and Portugal, have been suffering from real
GDP growth rates well below the Euro area average, Spain, Finland, Greece and Ireland have
experienced growth considerably above this average. The unemployment rates display a wide
dispersion across Euro area countries, too. Finally, also inflation rates show major differences
between Euro area countries, with rates well below the ECB’s target in Germany and Finland,
and well above the target in Spain, Greece, Ireland, the Netherlands and Portugal.
3
USA1 Euro area2
Real GDP, annual growth rate, percent 2.6 1.4
Growth contribution of domestic demand including stocks, percentage points
3.1 1.3
Growth contribution of private consumption, percentage points
2.2 0.8
Growth contribution of public consumption, percentage points
0.4 0.4
Growth contribution of gross fixed capital formation, percentage points
0.5 0.2
Growth contribution of balance of goods and services,percentage points
-0.5 0.1
Employment, annual growth, percent 0.7 0.9
Unemployment rate, percent
5.4 8.5
Inflation rate (HCPI), percent 2.6 2.2
Table 1: Real GDP growth, growth contributions of demand aggregates, unemployment rate and inflation rate in the Euro area countries, average values for 2001-2005*
Ger-many France Italy Spain Austria Belgium Finland Greece Ireland Nether-
lands Portugal
0.7 1.6 0.6 3.1 1.5 1.5 2.3 4.4 4.6 0.9 0.6
-0.2 2.0 1.0 4.2 0.7 1.4 2.3 4.5 3.0 0.5 0.5
0.2 1.1 0.3 2.0 0.6 0.6 1.6 2.7 1.9 0.2 0.9
0.0 0.5 0.4 0.8 0.1 0.5 0.4 0.3 0.5 0.5 0.4
-0.4 0.3 0.3 1.4 0.0 0.4 0.4 1.4 1.4 -0.1 -0.7
0.9 -0.4 -0.4 -1.1 0.8 0.1 0.0 -0.1 1.6 0.4 0.1
-0.2 0.5 1.2 2.9 0.2 0.5 0.9 1.3 2.9 0.0 0.4
8.7 9.2 8.4 10.5 4.4 7.8 8.9 10.2 4.4 3.6 5.9
1.41.6 2.0 2.4
1 USA: national CPI, 2 Euro area: HCPI.Source: Eurostat; authors’ calculations; U.S. inflation rate: Reuters Eco Win.
3.23.5 3.4 2.83.2 1.9 2.0
3. Maastricht, the SGP, and fiscal consolidation in the Euro area-countries since 1991 Since the early 1990s fiscal policy in the Euro area has been dominated by the Treaty of
Maastricht and since the start of the Euro in 1999 by the Amsterdam SGP (European
Commission 2002). As conditions of entry to the monetary union, the Maastricht Treaty set a
maximum deficit ratio (proportion of current budget deficit in relation to GDP) of 3 percent
and a maximum debt ratio (proportion of public debt in relation to GDP) of 60 percent. In
1997, the SGP made this regulation even tougher by prescribing for the medium term, i.e. a
time span which stretches across economic cycles, balanced budgets or budget surpluses in
order to reduce the level of debt.2 Achieving these conditions was intended, on the one hand,
to enable the automatic stabilisers to work during economic downturns without violating the 3
percent deficit criterion. On the other hand, it should ensure the long run sustainability of
public finances. Especially, it was intended to create leeway for possible future funding
objectives which may arise from demographic developments such as social security provision
for the elderly.
4
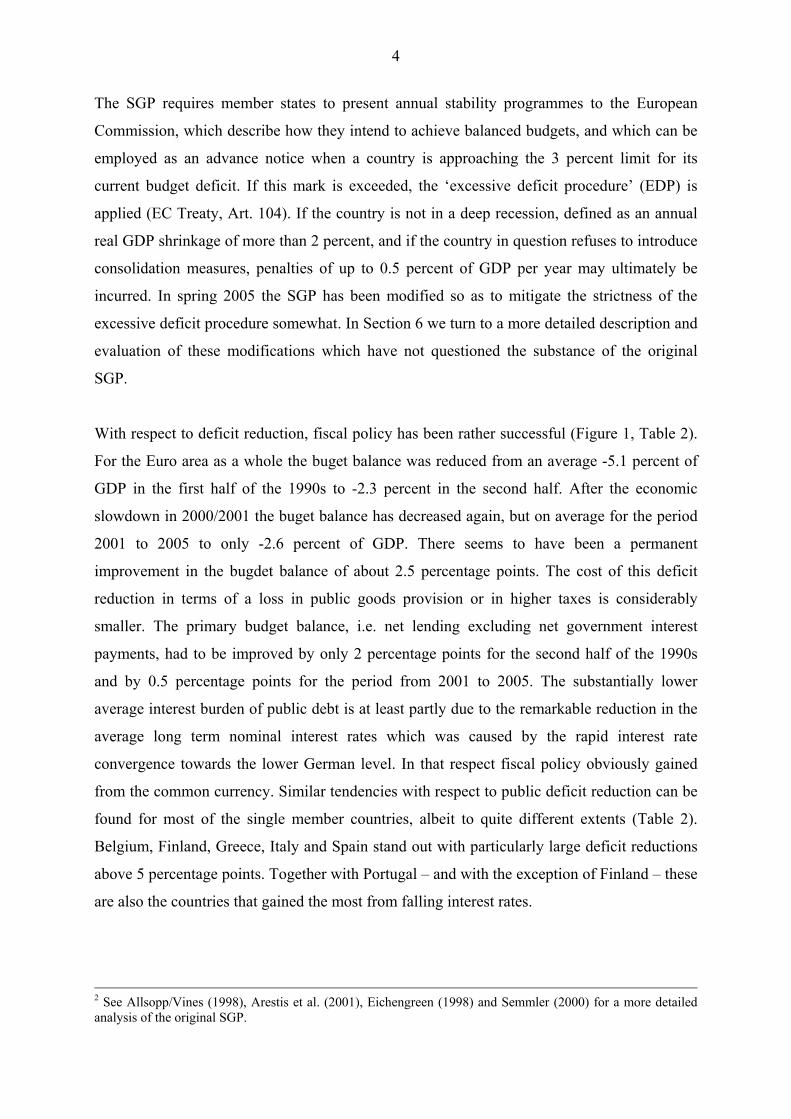
The SGP requires member states to present annual stability programmes to the European
Commission, which describe how they intend to achieve balanced budgets, and which can be
employed as an advance notice when a country is approaching the 3 percent limit for its
current budget deficit. If this mark is exceeded, the ‘excessive deficit procedure’ (EDP) is
applied (EC Treaty, Art. 104). If the country is not in a deep recession, defined as an annual
real GDP shrinkage of more than 2 percent, and if the country in question refuses to introduce
consolidation measures, penalties of up to 0.5 percent of GDP per year may ultimately be
incurred. In spring 2005 the SGP has been modified so as to mitigate the strictness of the
excessive deficit procedure somewhat. In Section 6 we turn to a more detailed description and
evaluation of these modifications which have not questioned the substance of the original
SGP.
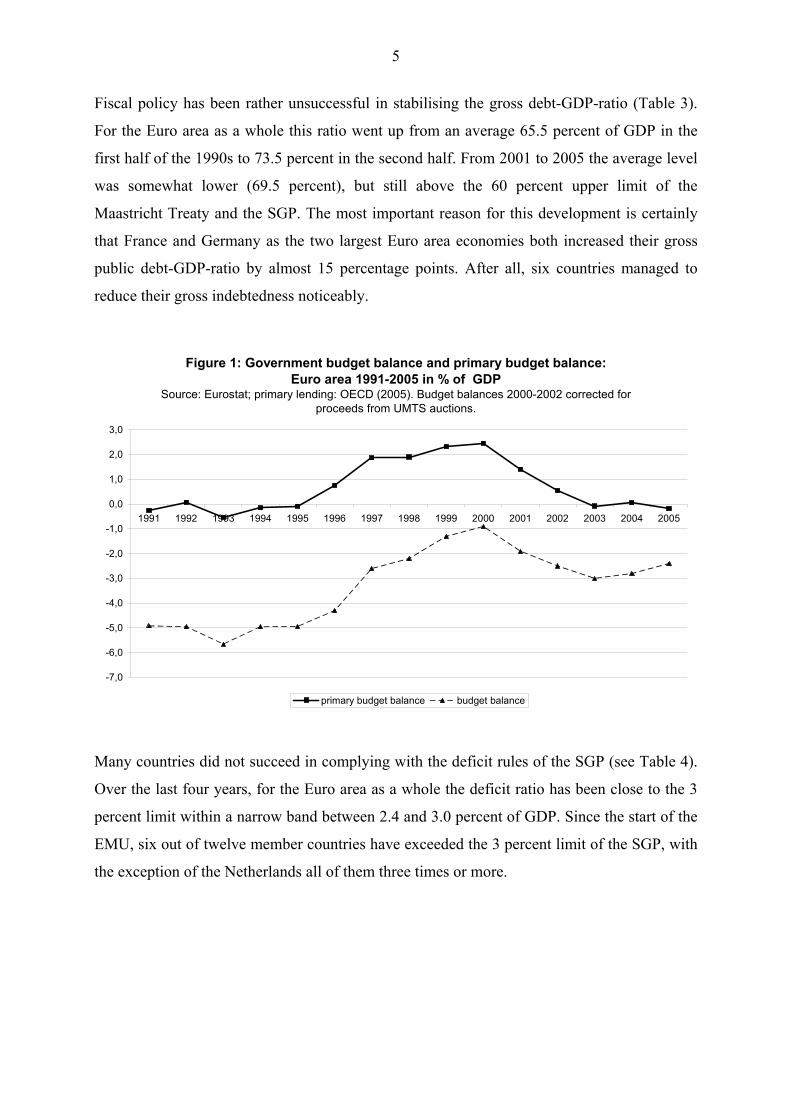
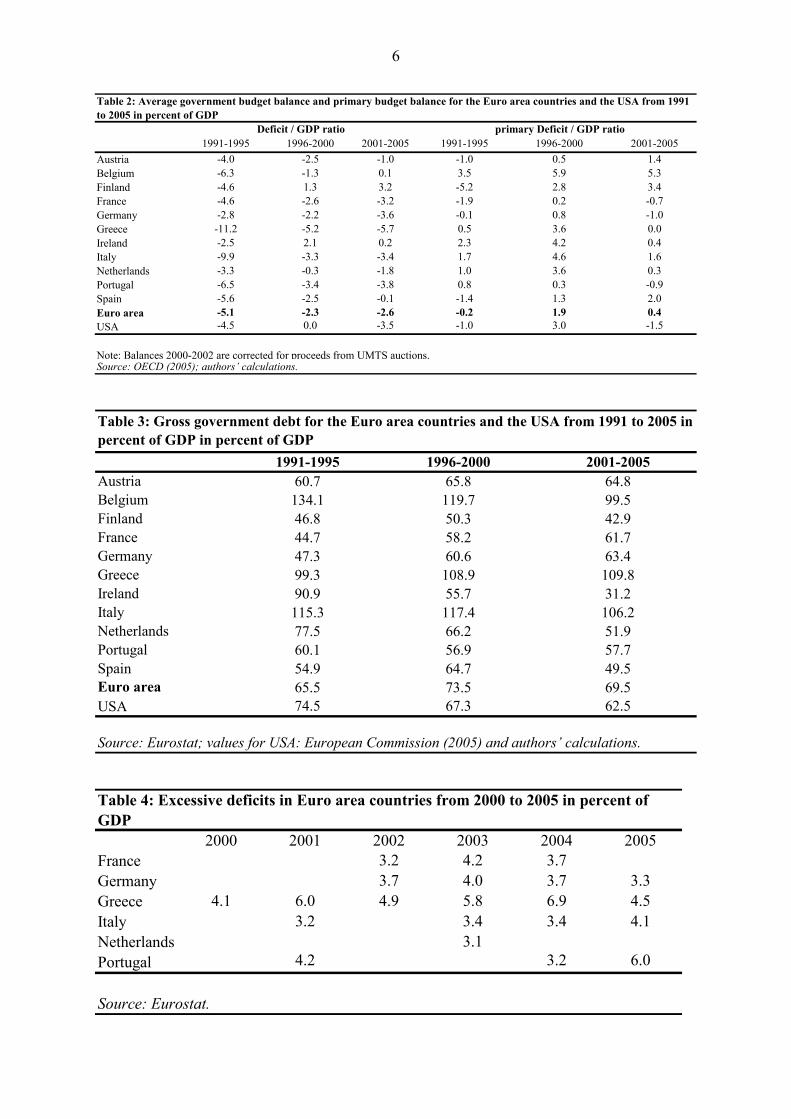
With respect to deficit reduction, fiscal policy has been rather successful (Figure 1, Table 2).
For the Euro area as a whole the buget balance was reduced from an average -5.1 percent of
GDP in the first half of the 1990s to -2.3 percent in the second half. After the economic
slowdown in 2000/2001 the buget balance has decreased again, but on average for the period
2001 to 2005 to only -2.6 percent of GDP. There seems to have been a permanent
improvement in the bugdet balance of about 2.5 percentage points. The cost of this deficit
reduction in terms of a loss in public goods provision or in higher taxes is considerably
smaller. The primary budget balance, i.e. net lending excluding net government interest
payments, had to be improved by only 2 percentage points for the second half of the 1990s
and by 0.5 percentage points for the period from 2001 to 2005. The substantially lower
average interest burden of public debt is at least partly due to the remarkable reduction in the
average long term nominal interest rates which was caused by the rapid interest rate
convergence towards the lower German level. In that respect fiscal policy obviously gained
from the common currency. Similar tendencies with respect to public deficit reduction can be
found for most of the single member countries, albeit to quite different extents (Table 2).
Belgium, Finland, Greece, Italy and Spain stand out with particularly large deficit reductions
above 5 percentage points. Together with Portugal – and with the exception of Finland – these
are also the countries that gained the most from falling interest rates.
2 See Allsopp/Vines (1998), Arestis et al. (2001), Eichengreen (1998) and Semmler (2000) for a more detailed analysis of the original SGP.
5
Fiscal policy has been rather unsuccessful in stabilising the gross debt-GDP-ratio (Table 3).
For the Euro area as a whole this ratio went up from an average 65.5 percent of GDP in the
first half of the 1990s to 73.5 percent in the second half. From 2001 to 2005 the average level
was somewhat lower (69.5 percent), but still above the 60 percent upper limit of the
Maastricht Treaty and the SGP. The most important reason for this development is certainly
that France and Germany as the two largest Euro area economies both increased their gross
public debt-GDP-ratio by almost 15 percentage points. After all, six countries managed to
reduce their gross indebtedness noticeably.
Figure 1: Government budget balance and primary budget balance: Euro area 1991-2005 in % of GDP
Source: Eurostat; primary lending: OECD (2005). Budget balances 2000-2002 corrected for proceeds from UMTS auctions.
-7,0
-6,0
-5,0
-4,0
-3,0
-2,0
-1,0
0,0
1,0
2,0
3,0
1991 1992 1993 1994 1995 1996 1997 1998 1999 2000 2001 2002 2003 2004 2005
primary budget balance budget balance
Many countries did not succeed in complying with the deficit rules of the SGP (see Table 4).
Over the last four years, for the Euro area as a whole the deficit ratio has been close to the 3
percent limit within a narrow band between 2.4 and 3.0 percent of GDP. Since the start of the
EMU, six out of twelve member countries have exceeded the 3 percent limit of the SGP, with
the exception of the Netherlands all of them three times or more.
6
1991-1995 1996-2000 2001-2005 1991-1995 1996-2000 2001-2005Austria -4.0 -2.5 -1.0 -1.0 0.5 1.4Belgium -6.3 -1.3 0.1 3.5 5.9 5.3Finland -4.6 1.3 3.2 -5.2 2.8 3.4France -4.6 -2.6 -3.2 -1.9 0.2 -0.7Germany -2.8 -2.2 -3.6 -0.1 0.8 -1.0Greece -11.2 -5.2 -5.7 0.5 3.6 0.0Ireland -2.5 2.1 0.2 2.3 4.2 0.4Italy -9.9 -3.3 -3.4 1.7 4.6 1.6Netherlands -3.3 -0.3 -1.8 1.0 3.6 0.3Portugal -6.5 -3.4 -3.8 0.8 0.3 -0.9Spain -5.6 -2.5 -0.1 -1.4 1.3 2.0Euro area -5.1 -2.3 -2.6 -0.2 1.9 0.4USA -4.5 0.0 -3.5 -1.0 3.0 -1.5
Note: Balances 2000-2002 are corrected for proceeds from UMTS auctions.Source: OECD (2005); authors’ calculations.
Table 2: Average government budget balance and primary budget balance for the Euro area countries and the USA from 1991 to 2005 in percent of GDP
Deficit / GDP ratio primary Deficit / GDP ratio
1991-1995 1996-2000 2001-2005Austria 60.7 65.8 64.8Belgium 134.1 119.7 99.5Finland 46.8 50.3 42.9France 44.7 58.2 61.7Germany 47.3 60.6 63.4Greece 99.3 108.9 109.8Ireland 90.9 55.7 31.2Italy 115.3 117.4 106.2Netherlands 77.5 66.2 51.9Portugal 60.1 56.9 57.7Spain 54.9 64.7 49.5Euro area 65.5 73.5 69.5USA 74.5 67.3 62.5
Table 3: Gross government debt for the Euro area countries and the USA from 1991 to 2005 in percent of GDP in percent of GDP
Source: Eurostat; values for USA: European Commission (2005) and authors’ calculations.
2000 2001 2002 2003 2004 2005France 3.2 4.2 3.7Germany 3.7 4.0 3.7 3.3Greece 4.1 6.0 4.9 5.8 6.9 4.5Italy 3.2 3.4 3.4 4.1Netherlands 3.1Portugal 4.2 3.2 6.0
Table 4: Excessive deficits in Euro area countries from 2000 to 2005 in percent of GDP
Source: Eurostat.
7
4. The macroeconomic impact of fiscal policy In order to take account of the macroeconomic impact of fiscal policy it is not sufficient to
look at the development of actual deficits, as in the previous section. Actual deficits may
simply reflect the underlying economic situation and not active fiscal policy. Therefore, we
assess the extent to which fiscal policy exerts a stabilising or destabilising influence on the
business cycle by comparing changes in the output gap and the cyclically adjusted budget
balance-potential GDP ratio (CBR), using the relevant values from the OECD Economic
Outlook (OECD 2005).3 The output gap serves as an indicator of the current state of
economic activity. If it is positive, capacity is outstripped, if it is negative, capacity is not
fully utilised. Consequently, a positive change in the output gap indicates a cyclical upturn,
whereas a negative change points to a cyclical downturn. If there is a positive (negative)
change in the CBR, then structural deficits fall (rise) or structural surpluses rise (fall), and
fiscal policy provides a restrictive (expansive) stimulus to demand. If the CBR remains
constant in the face of a changing output gap, fiscal policy is neither expansive nor restrictive
and the automatic stabilisers are simply left to take effect.
Such cyclically adjusted measures can be criticised for a number of theoretical and empirical
reasons and should therefore be interpreted with great care. Theoretically, they are very close
to the idea embedded in the standard NAIRU models: There is a long-run equilibrium,
determined by structural characteristics of the labour market, which is independent of the
short-run fluctuations generated by demand shocks or macroeconomic policy. We do not
share this view (Hein 2004, 2006a, 2006b). Empirically, these measures are very sensitive to
the exact method used and to the choice of observation period. The separation of a cyclical
from a potential or trend component can be biased because the potential component may be
endogenous. After some years of high (low) growth caused by ‘short-term’ demand side
measures or shocks, the potential or trend growth will go up (down) thereby underestimating
the cyclical component compared to a situation without such demand side measures or
shocks. Therefore, the cyclically adjusted budget deficits (surpluses) for low (high) growth
countries may be considerably overestimated. Despite these serious problems we consider the
measures as useful. First, the OECD numbers we have used have proven to be less susceptible
to the endogeneity bias than, for example, the values published by the European Commission
3 For a detailed exposition of the methods used by the OECD see Giorno et al. (1995).
8
(2005). Second, if certain empirical findings about the stabilising or destabilising effects of
fiscal policy can be derived within such a mainstream framework, then this rather strengthens
the point from a heterodox perspective.4
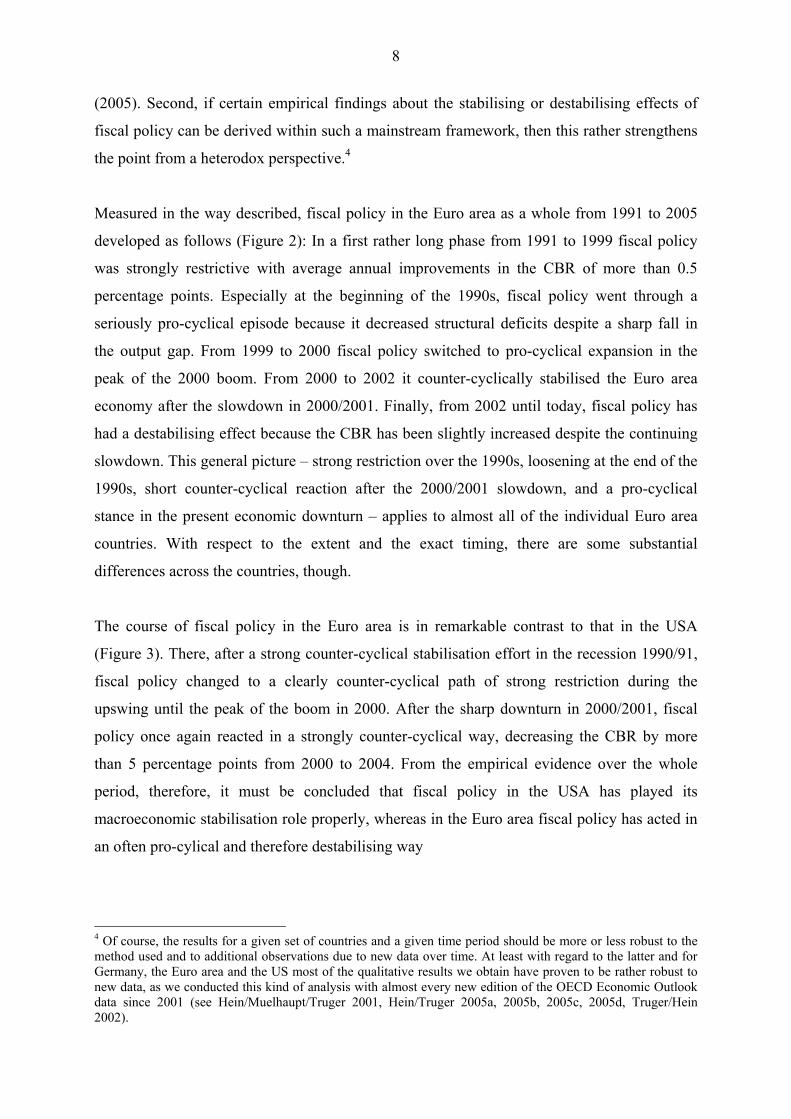
Measured in the way described, fiscal policy in the Euro area as a whole from 1991 to 2005
developed as follows (Figure 2): In a first rather long phase from 1991 to 1999 fiscal policy
was strongly restrictive with average annual improvements in the CBR of more than 0.5
percentage points. Especially at the beginning of the 1990s, fiscal policy went through a
seriously pro-cyclical episode because it decreased structural deficits despite a sharp fall in
the output gap. From 1999 to 2000 fiscal policy switched to pro-cyclical expansion in the
peak of the 2000 boom. From 2000 to 2002 it counter-cyclically stabilised the Euro area
economy after the slowdown in 2000/2001. Finally, from 2002 until today, fiscal policy has
had a destabilising effect because the CBR has been slightly increased despite the continuing
slowdown. This general picture – strong restriction over the 1990s, loosening at the end of the
1990s, short counter-cyclical reaction after the 2000/2001 slowdown, and a pro-cyclical
stance in the present economic downturn – applies to almost all of the individual Euro area
countries. With respect to the extent and the exact timing, there are some substantial
differences across the countries, though.
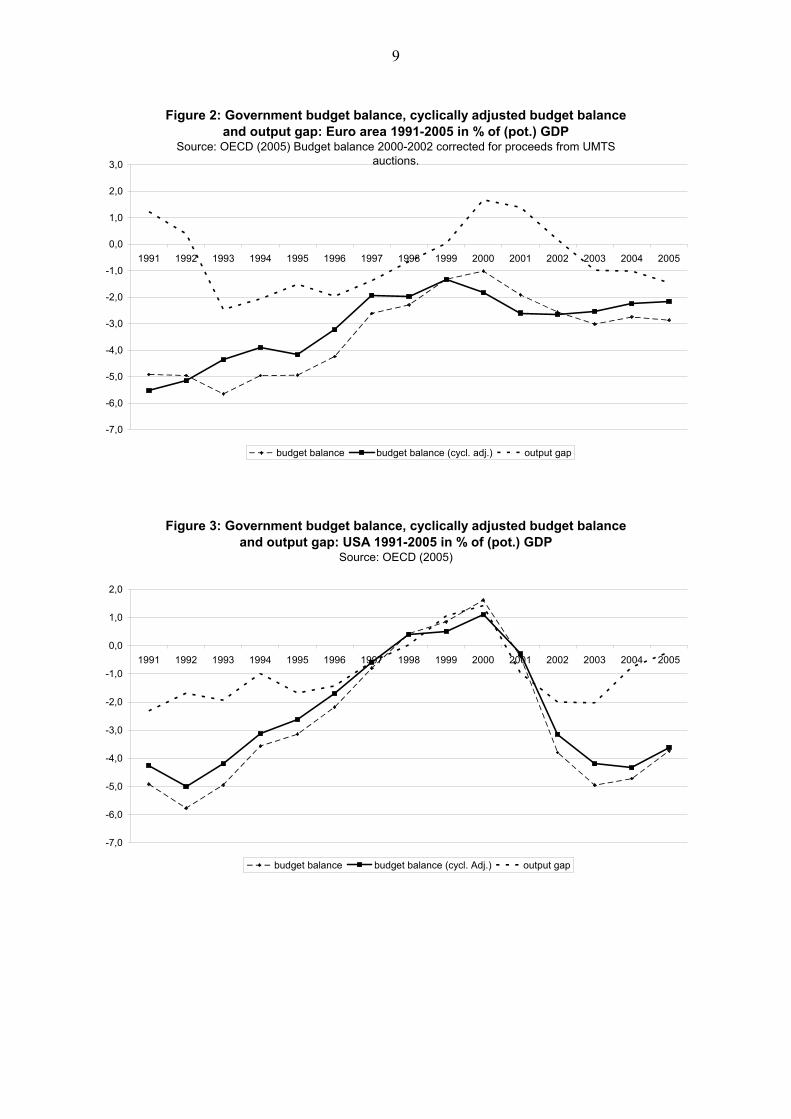
The course of fiscal policy in the Euro area is in remarkable contrast to that in the USA
(Figure 3). There, after a strong counter-cyclical stabilisation effort in the recession 1990/91,
fiscal policy changed to a clearly counter-cyclical path of strong restriction during the
upswing until the peak of the boom in 2000. After the sharp downturn in 2000/2001, fiscal
policy once again reacted in a strongly counter-cyclical way, decreasing the CBR by more
than 5 percentage points from 2000 to 2004. From the empirical evidence over the whole
period, therefore, it must be concluded that fiscal policy in the USA has played its
macroeconomic stabilisation role properly, whereas in the Euro area fiscal policy has acted in
an often pro-cylical and therefore destabilising way
4 Of course, the results for a given set of countries and a given time period should be more or less robust to the method used and to additional observations due to new data over time. At least with regard to the latter and for Germany, the Euro area and the US most of the qualitative results we obtain have proven to be rather robust to new data, as we conducted this kind of analysis with almost every new edition of the OECD Economic Outlook data since 2001 (see Hein/Muelhaupt/Truger 2001, Hein/Truger 2005a, 2005b, 2005c, 2005d, Truger/Hein 2002).
9
Figure 2: Government budget balance, cyclically adjusted budget balance and output gap: Euro area 1991-2005 in % of (pot.) GDP
Source: OECD (2005) Budget balance 2000-2002 corrected for proceeds from UMTS auctions.
-7,0
-6,0
-5,0
-4,0
-3,0
-2,0
-1,0
0,0
1,0
2,0
3,0
1991 1992 1993 1994 1995 1996 1997 1998 1999 2000 2001 2002 2003 2004 2005
budget balance budget balance (cycl. adj.) output gap
Figure 3: Government budget balance, cyclically adjusted budget balance and output gap: USA 1991-2005 in % of (pot.) GDP
Source: OECD (2005)
-7,0
-6,0
-5,0
-4,0
-3,0
-2,0
-1,0
0,0
1,0
2,0
1991 1992 1993 1994 1995 1996 1997 1998 1999 2000 2001 2002 2003 2004 2005
budget balance budget balance (cycl. Adj.) output gap
10
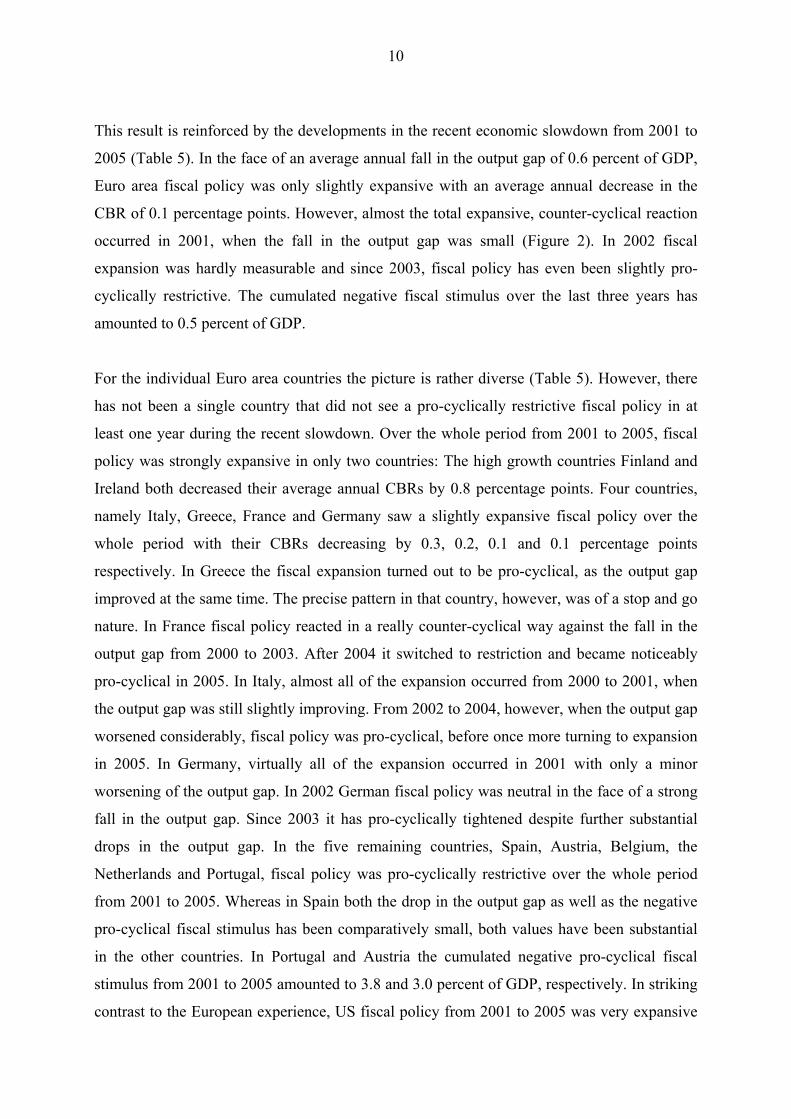
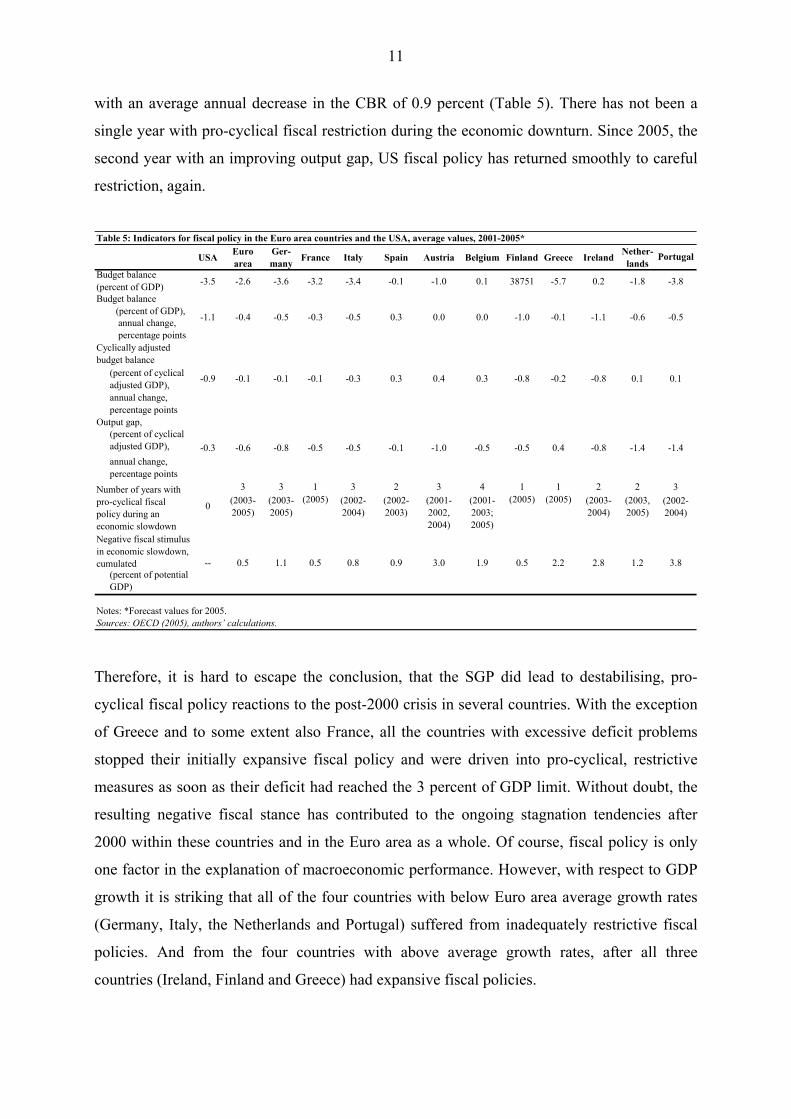
This result is reinforced by the developments in the recent economic slowdown from 2001 to
2005 (Table 5). In the face of an average annual fall in the output gap of 0.6 percent of GDP,
Euro area fiscal policy was only slightly expansive with an average annual decrease in the
CBR of 0.1 percentage points. However, almost the total expansive, counter-cyclical reaction
occurred in 2001, when the fall in the output gap was small (Figure 2). In 2002 fiscal
expansion was hardly measurable and since 2003, fiscal policy has even been slightly pro-
cyclically restrictive. The cumulated negative fiscal stimulus over the last three years has
amounted to 0.5 percent of GDP.
For the individual Euro area countries the picture is rather diverse (Table 5). However, there
has not been a single country that did not see a pro-cyclically restrictive fiscal policy in at
least one year during the recent slowdown. Over the whole period from 2001 to 2005, fiscal
policy was strongly expansive in only two countries: The high growth countries Finland and
Ireland both decreased their average annual CBRs by 0.8 percentage points. Four countries,
namely Italy, Greece, France and Germany saw a slightly expansive fiscal policy over the
whole period with their CBRs decreasing by 0.3, 0.2, 0.1 and 0.1 percentage points
respectively. In Greece the fiscal expansion turned out to be pro-cyclical, as the output gap
improved at the same time. The precise pattern in that country, however, was of a stop and go
nature. In France fiscal policy reacted in a really counter-cyclical way against the fall in the
output gap from 2000 to 2003. After 2004 it switched to restriction and became noticeably
pro-cyclical in 2005. In Italy, almost all of the expansion occurred from 2000 to 2001, when
the output gap was still slightly improving. From 2002 to 2004, however, when the output gap
worsened considerably, fiscal policy was pro-cyclical, before once more turning to expansion
in 2005. In Germany, virtually all of the expansion occurred in 2001 with only a minor
worsening of the output gap. In 2002 German fiscal policy was neutral in the face of a strong
fall in the output gap. Since 2003 it has pro-cyclically tightened despite further substantial
drops in the output gap. In the five remaining countries, Spain, Austria, Belgium, the
Netherlands and Portugal, fiscal policy was pro-cyclically restrictive over the whole period
from 2001 to 2005. Whereas in Spain both the drop in the output gap as well as the negative
pro-cyclical fiscal stimulus has been comparatively small, both values have been substantial
in the other countries. In Portugal and Austria the cumulated negative pro-cyclical fiscal
stimulus from 2001 to 2005 amounted to 3.8 and 3.0 percent of GDP, respectively. In striking
contrast to the European experience, US fiscal policy from 2001 to 2005 was very expansive
11
with an average annual decrease in the CBR of 0.9 percent (Table 5). There has not been a
single year with pro-cyclical fiscal restriction during the economic downturn. Since 2005, the
second year with an improving output gap, US fiscal policy has returned smoothly to careful
restriction, again.
USA Euro area
Ger-many France Italy Spain Austria Belgium Finland Greece Ireland Nether-
landsBudget balance(percent of GDP)Budget balance (percent of GDP), annual change, percentage pointsCyclically adjusted budget balance
(percent of cyclical adjusted GDP),annual change, percentage points
Output gap,(percent of cyclical adjusted GDP),annual change, percentage points
3 3 1 3 2 3 4 1 1 2 2(2003-2005)
(2003-2005)
(2005) (2002-2004)
(2002-2003)
(2001-2002,
(2001-2003;
(2005) (2005) (2003-2004)
(2003, 2005)
2004) 2005)Negative fiscal stimulus in economic slowdown, cumulated
(percent of potential GDP)
Table 5: Indicators for fiscal policy in the Euro area countries and the USA, average values, 2001-2005*
(2002-2004)
3Number of years withpro-cyclical fiscal policy during an economic slowdown
0
0.4 -0.8-0.5
3.8
Notes: *Forecast values for 2005.Sources: OECD (2005), authors’ calculations.
0.5 2.2 2.8 1.20.8 0.9 3.0 1.9-- 0.5 1.1 0.5
-1.4 -1.4
0.1-0.2 -0.8 0.1
-0.3 -0.6 -0.8 -0.5 -0.5 -0.1 -1.0
-0.8-0.3 0.3 0.4 0.3
-0.5
-0.5
-0.9 -0.1 -0.1 -0.1
-1.0 -0.1 -1.1 -0.6-0.5 0.3 0.0 0.0-1.1 -0.4 -0.5 -0.3
-5.7 0.2 -1.8 -3.8
Portugal
-3.5 -2.6 -3.6 -3.2 -3.4 -0.1 -1.0 0.1 38751
Therefore, it is hard to escape the conclusion, that the SGP did lead to destabilising, pro-
cyclical fiscal policy reactions to the post-2000 crisis in several countries. With the exception
of Greece and to some extent also France, all the countries with excessive deficit problems
stopped their initially expansive fiscal policy and were driven into pro-cyclical, restrictive
measures as soon as their deficit had reached the 3 percent of GDP limit. Without doubt, the
resulting negative fiscal stance has contributed to the ongoing stagnation tendencies after
2000 within these countries and in the Euro area as a whole. Of course, fiscal policy is only
one factor in the explanation of macroeconomic performance. However, with respect to GDP
growth it is striking that all of the four countries with below Euro area average growth rates
(Germany, Italy, the Netherlands and Portugal) suffered from inadequately restrictive fiscal
policies. And from the four countries with above average growth rates, after all three
countries (Ireland, Finland and Greece) had expansive fiscal policies.
12
It is sometimes argued that the countries with excessive deficits might have avoided their
problems and the ensuing pro-cyclical fiscal policy if they had pursued a tighter fiscal policy
during ‘good times’. At the first sight this argument has some appeal as most of the countries
in question had at least one short episode of pro-cyclical expansion at the end of the 1990s or
in 2000. However, stronger fiscal restriction could have meant some damage. As a rough
estimate suggests, in order to avoid excessive deficits and pro-cyclically restrictive policies in
the period from 2001 to 2005, the countries concerned would have had to decrease their
budget deficits by an additional 2 to 4 percent of GDP within only 2 or 3 years. Moreover, the
restriction would have hit the economies in a situation in which they were just recovering
from the early and mid-1990s stagnation with a prolonged period of tight and often pro-
cyclical fiscal policies. Without doubt, the ‘good times’ would have been turned into ‘bad
times’ by such a policy. As the ultimate retreat proponents of tighter fiscal policy might
question that restrictive fiscal policy causes any demand side problems, at all, due to ‘non-
Keynesian effects’ of fiscal consolidation (see e.g. Alesina Perotti 1996). However, it has
convincingly been argued that such a position cannot be defended in any sensible way (see
e.g. Arestis/Sawyer 2003).
5. The macroeconomic impact of monetary policy and wage developments Macroeconomic performance cannot be explained solely by fiscal policy but has also to take
into account monetary and wage policies. Monetary policy can be assessed by the
development of the short-term real interest rate. It is now widely accepted that modern central
banks use the short-term nominal interest rate as an economic policy instrument. If central
banks target inflation they have to set nominal interest rates with an eye to the ensuing real
rate, as proposed in the famous Taylor-rule, for example (Taylor 1993). In order to take into
account the underlying economic situation, we consult the differences between both the short-
and long-term real interest rate and real GDP-growth. We expect a negative influence of real
interest rates on economic growth working through different transmission channels (money,
credit, asset prices, exchange rates) (Bernanke/Gertler 1995, Cecchetti 1995).
13
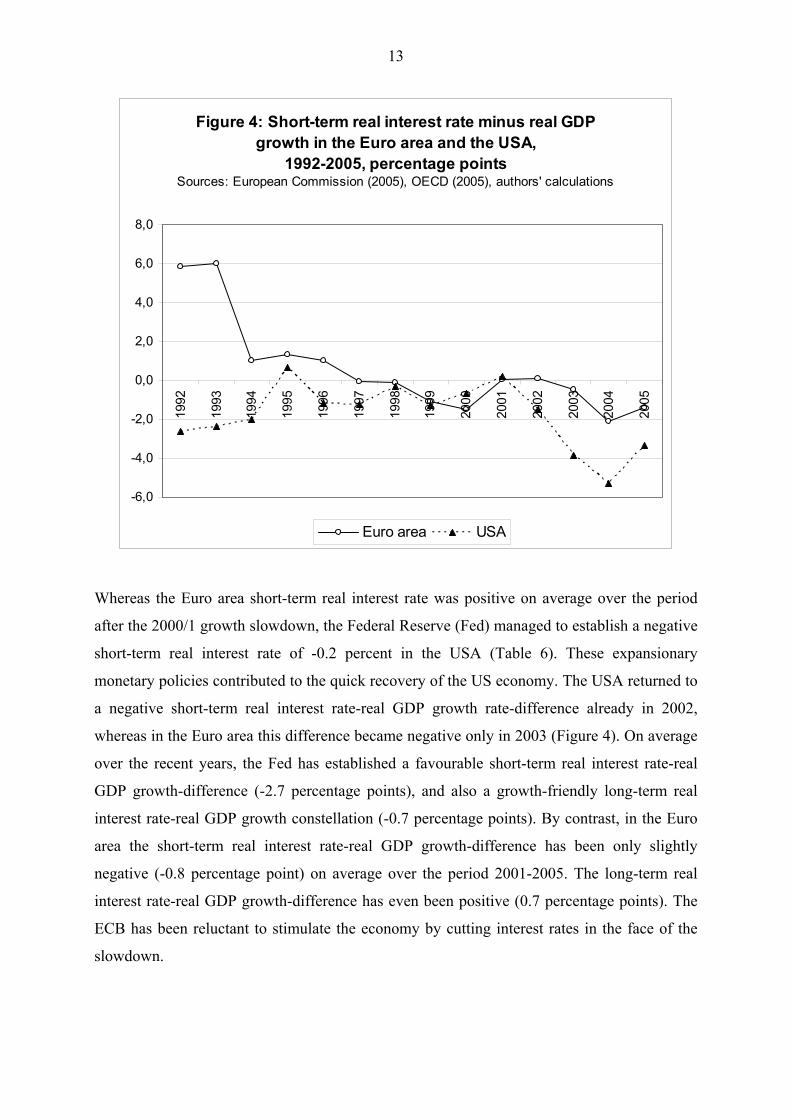
Figure 4: Short-term real interest rate minus real GDP growth in the Euro area and the USA,
1992-2005, percentage points Sources: European Commission (2005), OECD (2005), authors' calculations
-6,0
-4,0
-2,0
0,0
2,0
4,0
6,0
8,0
1992
1993
1994
1995
1996
1997
1998
1999
2000
2001
2002
2003
2004
2005
Euro area USA
Whereas the Euro area short-term real interest rate was positive on average over the period
after the 2000/1 growth slowdown, the Federal Reserve (Fed) managed to establish a negative
short-term real interest rate of -0.2 percent in the USA (Table 6). These expansionary
monetary policies contributed to the quick recovery of the US economy. The USA returned to
a negative short-term real interest rate-real GDP growth rate-difference already in 2002,
whereas in the Euro area this difference became negative only in 2003 (Figure 4). On average
over the recent years, the Fed has established a favourable short-term real interest rate-real
GDP growth-difference (-2.7 percentage points), and also a growth-friendly long-term real
interest rate-real GDP growth constellation (-0.7 percentage points). By contrast, in the Euro
area the short-term real interest rate-real GDP growth-difference has been only slightly
negative (-0.8 percentage point) on average over the period 2001-2005. The long-term real
interest rate-real GDP growth-difference has even been positive (0.7 percentage points). The
ECB has been reluctant to stimulate the economy by cutting interest rates in the face of the
slowdown.
14
USAEuro area Germany France Italy Spain Austria Belgium Finland Greece Ireland
Nether-lands Portugal
Monetary PolicyShort-term real interest rate,
percentLong-term real interest rate,
percentShort-term real interest rate minus real GDP growth,
percentage pointsLong-term real interest rate minus real GDP growth,
percentage pointsWage PolicyNominal compensation per employee, annual growth,
percentNominal unit labour costs,annual growth,
percentLabour income share#,
percentChange in labour income share to previous year,
percentage points -0.6
Notes: *Forecast values for 2005, #compensation per employee divided by GDP at current market prices per person employed.Sources: European Commission (2005), OECD (2005), authors’ calculations.
0.5 -0.2 -0.2 0.00.2 -0.5 -0.6 -0.2-0.4 -0.2 -0.5 0.0
58.0 47.8 59.2 63.0
2.1
62.6 58.0 58.1 57.4 55.6 57.1 62.5 61.7 55.6
1.8 3.3 3.3 2.73.2 2.9 0.8 1.81.7 1.7 0.3 1.7
6.5 5.7 3.9 2.3
0.6
4.0 2.5 1.7 2.7 3.1 3.3 2.0 2.8 3.2
0.7 -3.3 -4.3 0.71.3 -2.0 1.0 0.8-0.7 0.7 1.9 0.7
-4.9 -5.7 -0.8 -1.0
1.2
-2.7 -0.8 0.5 -0.8 -0.4 -3.5 -0.5 -0.7 -0.8
2.9 1.0 0.9 1.42.0 1.1 2.5 2.31.9 2.1 2.6 2.3
-0.7 -0.6 0.0 -0.4
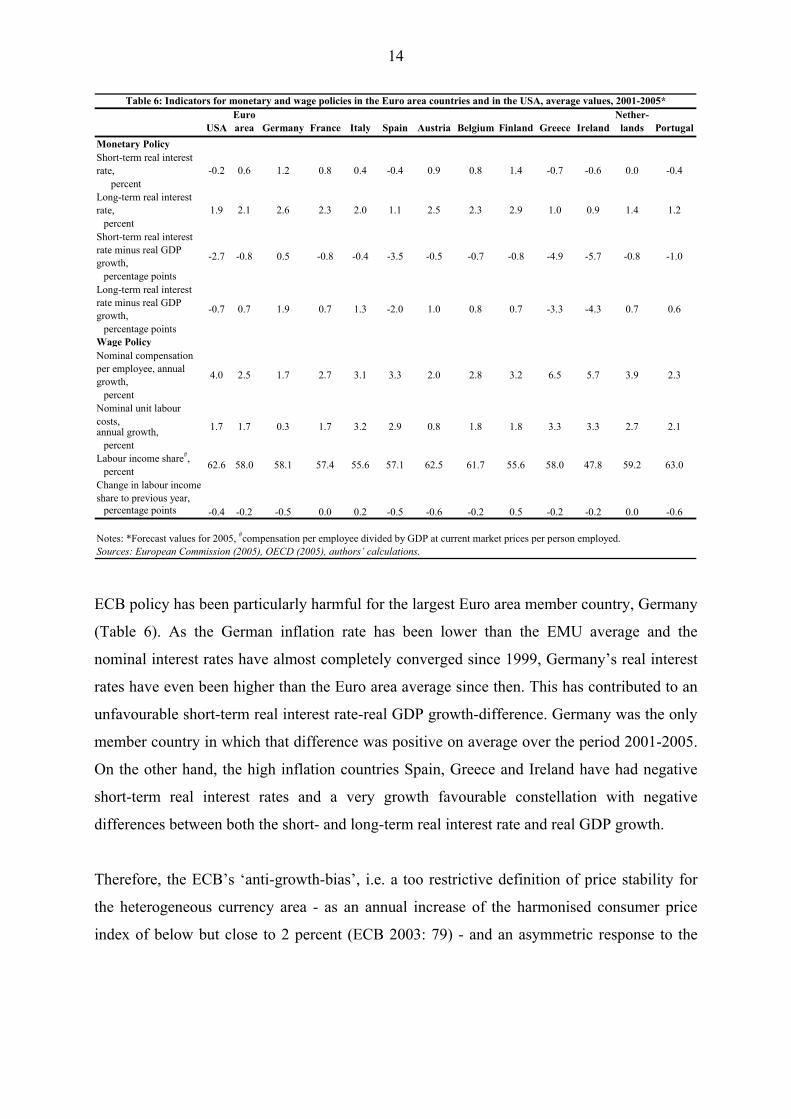
Table 6: Indicators for monetary and wage policies in the Euro area countries and in the USA, average values, 2001-2005*
-0.2 0.6 1.2 0.8 0.4 -0.4 0.9 0.8 1.4
ECB policy has been particularly harmful for the largest Euro area member country, Germany
(Table 6). As the German inflation rate has been lower than the EMU average and the
nominal interest rates have almost completely converged since 1999, Germany’s real interest
rates have even been higher than the Euro area average since then. This has contributed to an
unfavourable short-term real interest rate-real GDP growth-difference. Germany was the only
member country in which that difference was positive on average over the period 2001-2005.
On the other hand, the high inflation countries Spain, Greece and Ireland have had negative
short-term real interest rates and a very growth favourable constellation with negative
differences between both the short- and long-term real interest rate and real GDP growth.
Therefore, the ECB’s ‘anti-growth-bias’, i.e. a too restrictive definition of price stability for
the heterogeneous currency area - as an annual increase of the harmonised consumer price
index of below but close to 2 percent (ECB 2003: 79) - and an asymmetric response to the
15
expected deviation of actual from target inflation,5 has contributed to the weak growth and
employment performance of the Euro area as a whole and to the economic problems of the
largest Euro area member, Germany, in particular. However, it has to be conceded that the
ECB cannot react directly towards the inflation differences between Euro area member
countries. This is where wage policies become relevant.
Wage policies can be assessed by nominal wage growth (compensation per employee), unit
labour cost growth and the labour income share. Nominal wage setting affects unit labour cost
growth and inflation. If nominal wages increase at a faster pace than productivity plus the
price level do, unit labour cost growth and inflation will speed up.6 This will cause real
interest rates to fall. If nominal wages increase at a rate below the sum of productivity growth
and inflation, unit labour cost growth will slow down and cause disinflation. Finally, deflation
may be the consequence. Deflation causes increasing real interest rates and rising real debts
with potentially negative effects on investment and growth.7 Once deflationary processes have
started, monetary policies lowering nominal interest rates will be ineffective.
Wage policies, however, may not only affect prices, but may also change distribution if firms
do not completely pass unit labour cost variations to prices or if prices of other inputs do not
change in step with unit labour costs. Under these conditions nominal wage moderation
causes the labour income share to fall (Hein/Schulten/Truger 2006). Theoretically, the effects
of income shares on GDP growth are ambiguous (Bhaduri/Marglin 1990). With the
propensity to save out of wages falling short of the savings propensity out of profits, a falling
labour income share means a cut-back in consumption demand and capacity utilisation with
directly contractive effects on investment and GDP growth. A fall in labour income shares
that is associated with nominal wage restraint would, on the other hand, improve international
competitiveness and, therefore, stimulate export demand, investment and growth. With a
slowdown in inflation, the central bank may also cut interest rates and stimulate investment
and growth. Finally, a falling labour income share is associated with rising unit profits which
may also improve investment and growth.
5 The ECB has tended to tighten whenever inflation increased above the target without relaxing when inflation expectations came down. For a general critique of the ECB’s ‘anti-growth bias’ see Bibow (2002, 2005a, 2005b) Hein (2002) and Hein/Truger (2006b). 6 See Arestis/Sawyer (2005) and Hein (2006a) for recent post-Keynesian models of distribution conflict and inflation. 7 See Hein (2006a, 2006b) for the integration of real debt effects into Kaleckian models of distribution and growth with conflict inflation.
16
Since the stimulating effects of wage moderation and declining labour income shares for
investment and growth are rather indirect and uncertain, in particular in large and rather
closed economies as the Euro area and the USA, the direct and contractive effects will
presumably dominate here. And since nominal wage increases, which will shift distribution in
favour of labour income, will also trigger inflation and concomitant restrictive central bank
interventions, nominal wage growth according to the sum of long-run productivity growth and
the central bank’s inflation target and hence roughly stable labour income shares should be
generally favourable for growth and employment in large and rather closed currency areas.
On average over the period 2001-2005, nominal wage growth in the Euro area has been
lagging behind the USA (Table 6). But taking into account productivity growth, nominal
wage increases in both currency areas have been stability oriented: nominal unit labour costs
have grown by 1.7 percent and have hence not caused any inflationary pressures. Moderate
wage increases were accompanied by a decline in the labour income share, both in the Euro
area and in the USA. Whereas in the USA this decline compensated for the increase in the
previous years generating a stationary trend since the early 1990s, in the Euro area the recent
decline has continued the decreasing trend since the early 1990s. Although labour income
shares in the two economies had similar levels in the early 1990s, the Euro area value is by
now 4 percentage points below the US-value contributing to domestic demand problems in
Europe.
Below the surface of Euro area aggregate values there is a wide dispersion of wages and
nominal unit labour cost growth rates (Table 6). In Italy, Spain, Greece, Ireland and the
Netherlands nominal unit labour costs have grown at rates around 3 percent on average
between 2001 and 2005 which interfered with the ECB’s overly ambitious inflation target.
Nominal unit labour costs in Germany, however, and to a lesser extent in Austria, have grown
at especially low rates causing deflationary risks, which have been accompanied by a rapid
decline in labour income shares contributing to domestic demand problems. Especially wage
developments in Germany have been completely inappropriate for the largest economy in a
currency union:8 Overly moderate wage policies have improved price competitiveness and
profitability of German firms and have made German export surpluses almost quadruple
between 2001 and 2005. Since around 44 percent of German exports go to the Euro area,
17
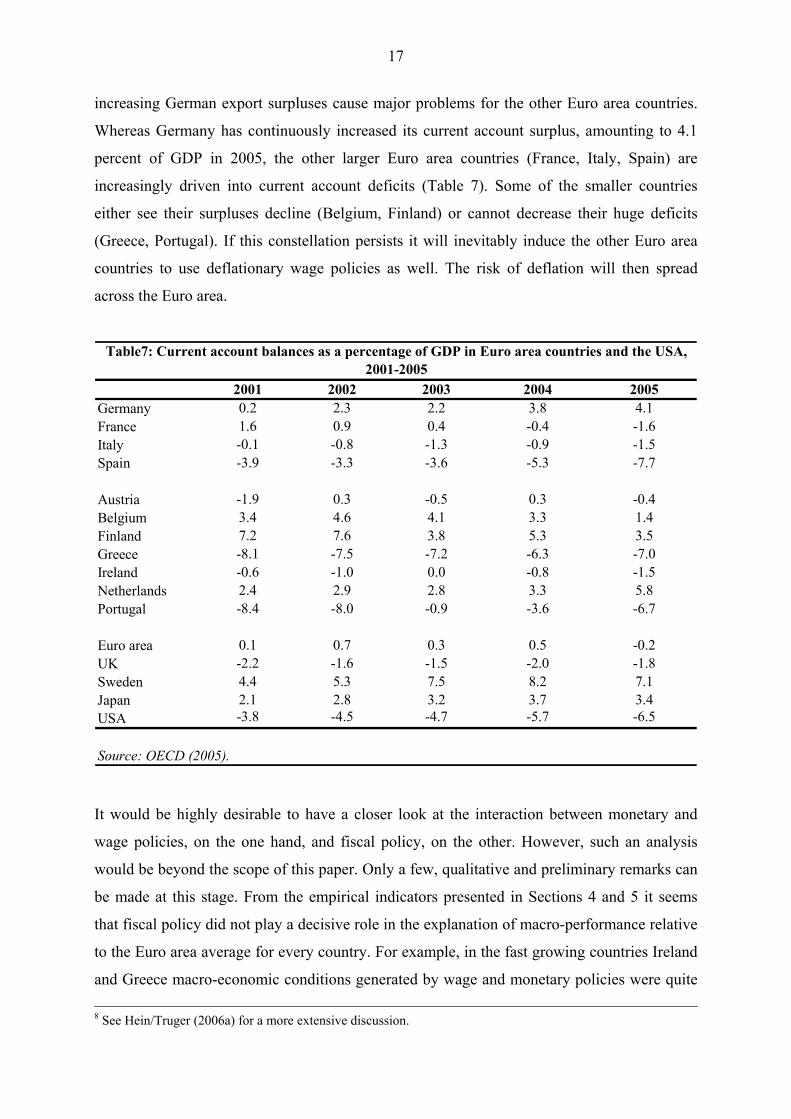
increasing German export surpluses cause major problems for the other Euro area countries.
Whereas Germany has continuously increased its current account surplus, amounting to 4.1
percent of GDP in 2005, the other larger Euro area countries (France, Italy, Spain) are
increasingly driven into current account deficits (Table 7). Some of the smaller countries
either see their surpluses decline (Belgium, Finland) or cannot decrease their huge deficits
(Greece, Portugal). If this constellation persists it will inevitably induce the other Euro area
countries to use deflationary wage policies as well. The risk of deflation will then spread
across the Euro area.
2001 2002 2003 2004 2005Germany 0.2 2.3 2.2 3.8 4.1France 1.6 0.9 0.4 -0.4 -1.6Italy -0.1 -0.8 -1.3 -0.9 -1.5Spain -3.9 -3.3 -3.6 -5.3 -7.7
Austria -1.9 0.3 -0.5 0.3 -0.4Belgium 3.4 4.6 4.1 3.3 1.4Finland 7.2 7.6 3.8 5.3 3.5Greece -8.1 -7.5 -7.2 -6.3 -7.0Ireland -0.6 -1.0 0.0 -0.8 -1.5Netherlands 2.4 2.9 2.8 3.3 5.8Portugal -8.4 -8.0 -0.9 -3.6 -6.7
Euro area 0.1 0.7 0.3 0.5 -0.2UK -2.2 -1.6 -1.5 -2.0 -1.8Sweden 4.4 5.3 7.5 8.2 7.1Japan 2.1 2.8 3.2 3.7 3.4USA -3.8 -4.5 -4.7 -5.7 -6.5
Table7: Current account balances as a percentage of GDP in Euro area countries and the USA, 2001-2005
Source: OECD (2005).
It would be highly desirable to have a closer look at the interaction between monetary and
wage policies, on the one hand, and fiscal policy, on the other. However, such an analysis
would be beyond the scope of this paper. Only a few, qualitative and preliminary remarks can
be made at this stage. From the empirical indicators presented in Sections 4 and 5 it seems
that fiscal policy did not play a decisive role in the explanation of macro-performance relative
to the Euro area average for every country. For example, in the fast growing countries Ireland
and Greece macro-economic conditions generated by wage and monetary policies were quite 8 See Hein/Truger (2006a) for a more extensive discussion.
18
favourable for above average growth rates. Likewise, in the slowly growing countries
Germany, and to a lesser extent also Italy, the conditions generated by monetary and wage
policies in themselves seem to have been adverse to growth. In the four countries just
mentioned, therefore fiscal policy seems to have played the role of an additional factor
amplifying the tendencies generated by the other policy areas. In Spain, the slightly restrictive
effect of fiscal policy was too weak to compensate for the favourable growth conditions
generated by monetary and wage policies. However, it seems that in the Netherlands and
Portugal, where monetary and wage policies reactions were rather close to the Euro area
average, fiscal policy turned the balance towards the below average growth performance. The
same seems to hold for Finland’s above average growth.
6. Improving fiscal policy within the EMU: Towards an expenditure path concept
6.1 The 2005 reform
In the light of these results, a reform of the SGP was inevitable. The recent reform in spring
2005 means some important changes (European Council 2005). Alongside substantial
modifications with respect to the medium term objectives, which permit some deviation from
the ‘close to balance or in surplus rule’ depending on national circumstances, the application
of the EDP has been reformed and softened to some extent: The Council has specified the
‘relevant factors’ to determine whether a country exceeding the 3 percent limit ‘really’ has an
excessive deficit. The previous exception of a severe economic downturn has been softened
and it is now included an accumulated loss of output due to protracted very slow growth. The
following types of spending may justify a temporary and small transgression of the deficit
limit: spending on the Lisbon agenda, especially R&D and innovation policies, public
investment, financial contributions to international solidarity and European unification as well
as pension reforms. Debt sustainability is to be given greater relevance, too. Also the
deadlines before identifying excessive deficits, taking action following a policy
recommendation, and for the deficit to actually be corrected have all been extended.
The reform has addressed one of the most obvious failings of the original SGP: Countries
with difficulties in meeting the 3 percent ceiling or the close to balance medium-term target
now have a range of possible factors that they can call upon to justify their inability to meet
the targets. Some of the factors – debt sustainability or spending on the Lisbon agenda
certainly make more sense from a macroeconomic point of view than others (pension reform).
19
Nevertheless, the reform has increased fiscal leeway for some countries to a certain extent.
For example, Germany and France can avoid the immediate threat of penalties. However, the
practical usefulness of the reform is limited. This has been demonstrated by the recent
recommendations by the Commission and the decisions by the Council concerning the EDPs
against Germany, Italy and Portugal.9 In these cases both the Commission and the Council
have taken a rather narrow view and do not even seem to concede the full leeway given by the
reformed SGP. Despite the fact that the economic recovery is only weak and uncertain, a
rather ambitious and risky consolidation path has been called for.
Therefore, a more fundamental reform of the SGP is required. In what follows, we present an
alternative coordination and consolidation concept based on expenditure paths that allows for
coordinated fiscal policies across the Euro area in a counter-cyclical way, while at the same
time ensuring fiscal sustainability. We first present the original concept and then some
modifications.10
6.2 Expenditure paths for non-cyclical government spending
We take as given that fiscal policy remains essentially a matter of national responsibility. The
goal for national fiscal policy is having automatic stabilisers work – always under the
constraint that for the individual countries a given medium term debt-GDP-ratio is not
exceeded. Without such a limit, there may arise the ultimate danger of an ever accelerating
government debt limiting the room of manoeuvre for public investment and other desirable
government expenditure. Increasing public interest payments may also have serious regressive
distributional effects with a negative impact on aggregate demand.
To this end, the individual countries should establish expenditure paths for non-cyclical
spending, which would be financed in the long term by tax revenue.11 Cyclical spending
should then be allowed to float freely around this target without being constrained by budget
deficit limits. In this concept, governments can and should refrain from discretionary tax
9 For an up to date overview of the EDPs see the relevant internet pages of the European Commission under http://ec.europa.eu/economy_finance/about/activities/sgp/procedures_en.htm. 10 Buti et al. (2003) give an overview of a series of reform approaches which for reasons of space cannot be discussed here. For an overview of the more recent debate on the SGP see Coeuré/Pisani-Ferry (2005) and Calmfors (2005). 11 For the original proposal for the Euro area see Hein/Truger (2005d ). On similar proposals for Germany see Bartsch et al. (2002), Eicker-Wolf/Truger (2003) and Horn/Truger (2005). These proposals are based on the work of Horn/Scheremet (1999) who refer to the successful process of budget consolidation in the US during the 1990s.
20
cuts/increases other than for purposes of changing the level of government spending. In a
downturn, increases in expenditure and falls in revenue cause budget deficits which are
financed by borrowing, thus increasing the level of debt. In an upturn, on the other hand,
budget surpluses arise, which are used for consolidation purposes. If non-cyclical spending
grows at a higher rate than long-term nominal GDP, the result is rising super-cyclical budget
deficits. If it grows at a slower rate, structural deficits are reduced. Alignment of the
expenditure path with a growth rate below the long- term nominal GDP path can therefore
contribute to a revenue-side budget consolidation, if a structural deficit requiring
consolidation existed at the outset. Therefore, countries exceeding their public debt target
value should choose an expenditure growth rate slightly below nominal GDP trend growth,
whereas others could let expenditure grow at the same rate as nominal trend GDP.12 Of
course, such values for the expenditure paths should be a matter for co-ordination between
member countries. In addition, with a modernised stability pact there should be checks to
ensure that individual countries comply with the prescribed expenditure paths for non-cyclical
public spending. Moreover, the appropriateness of these expenditure paths themselves should
also be subject to regular review, since the reference variable, i.e. the nominal potential GDP
path, is liable to change as a result of public and private investment activity.
In our view, the expenditure path concept has several advantages.13 First, with respect to
consolidation, the ultimate target value is the debt-GDP-ratio, which is much more directly
relevant for fiscal sustainability than budget deficits. Second, the chosen variable, non-
cyclical government spending, is in fact under the government’s control, whereas the budget
deficit is an endogenous variable of the whole macroeconomic process. Third, the expenditure
path allows for automatic stabilisers to take effect. The adoption of pro-cyclical fiscal policies
12 Taking nominal GDP trend growth as a reference for non-cyclical spending may be problematic if there are large variations in the inflation rate. The trend may then be subject to frequent changes that do not reflect changes in the underlying real growth trend. Additionally, there might be an incentive for governments to inflate, in order to get more fiscal leeway. We are grateful to Joerg Bibow and Andrea Terzi for pointing out this latter possibility to us. Therefore, one might also use the real GDP trend plus the ECB’s target rate as a reference for the expenditure path. In order to simplify the exposition we refrain from doing so in the text. Nevertheless, we have included the real GDP trend plus the inflation target in Table 8. 13 It has been argued that expenditure paths imply a very specific concept of the desirable public spending ratio and that they therefore restrict national governments’ room for manoeuvre (Buti et al. 2003a: 104). However, it should be pointed out that in the context of the concept presented here, first, the paths established are country-specific. Second, the path approach does actually allow for changes in the public spending-GDP-ratio. In this case, however, an increase in this ratio would have to be financed by additional taxation. A reduction in the public spending-GDP-ratio would be possible by lowering the expenditure path and taxation. Although this could have the effect of increasing the average restrictiveness of fiscal policy, the adjustment would nevertheless be smoothed out and the automatic stabilisers would be able to continue operating in a somewhat weakened fashion around the lower path.
21
is prevented. Fourth, there is real coordination of fiscal policies within the Euro area,
preventing free rider behaviour. Pressure from the European level might also help to enforce
counter-cyclical fiscal policy on the level of the individual countries. Fifth, under the current
macroeconomic regime dominated by monetary policy, macro-economically sensible and
hence ‘credible’ rules for fiscal policy might also induce the ECB to cooperate.
6.3 An adjusted expenditure path concept with a bit more discretion
How would the Euro area and its member countries have fared in the period 2001 to 2005
under the described expenditure path regime? As the concept relies completely on automatic
stabilisers, one can use the results of the analysis of cyclical deficits from Table 5 as well as
Figures 2 as a first approximation. If fiscal policy had been completely neutral, that would
have meant a zero percentage point change in the cyclically adjusted budget deficits.
Obviously, fiscal policy in Belgium, Spain, Austria, the Netherlands and Portugal could have
been more expansive and hence less destabilising. As seen before, the latter three countries
have been hurt particularly by the restrictive stance of their fiscal policies, and the latter two
are also among the countries that were or still are subject to the excessive deficit procedure.
On average all the other countries would have seen more restrictive fiscal policies under the
expenditure path. For Greece this would have been desirable, because its fiscal policy was
pro-cyclically expansive. For Italy, the same may be true, as the fiscal expansion occurred in
2001 when the output gap was still improving, so that fiscal policy would have been slightly
less restrictive during the slowdown from 2002 to 2005. Ireland and Finland would have been
forced to refrain from their more or less successful discretionary counter-cyclical fiscal
policies, which would certainly have reduced their above average growth substantially. From
these countries’ point of view, this would have been regrettable, but from the point of view of
decreasing economic divergence within the Euro area, it would have been welcomed – under
the condition, of course, that the average level of growth attained by the macroeconomic
policy mix in the Euro area is appropriate. The more problematic cases seem to be France and
Germany. In both countries the substantial discretionary counter-cyclical fiscal expansions in
the first years after the slowdown, would not have been possible under the conditions of an
expenditure path. On the other hand, these countries would not have been forced into
restriction in later years. At first sight the expenditure path would have been an improvement
for many countries, but not for all, particularly not for France and Germany, two of the
countries most in trouble with their excessive deficits.

22
USA Euro area Germany France Italy Spain Austria Belgium Finland Greece Ireland Nether-
lands Portugal
Gross domestic product, value, market prices
4.9 3.5 1.7 3.3 3.5 7.4 3.1 3.6 3.2 8.1 9.0 3.4 3.6
GDP trend* 5.2 4.0 2.2 3.8 4.5 7.4 3.5 3.8 5.6 8.5 13.3 5.6 6.4real GDP trend* plus target inflation rate
5.3 4.4 3.7 4.6 3.7 5.9 4.4 4.3 4.7 5.8 10.4 4.8 5.0
Government final consumption expenditure
7.0 4.2 1.2 4.3 4.9 8.4 2.5 5.0 5.6 6.6 12.1 5.6 5.4
Government fixed capital formation 5.0 3.5 -4.2 4.3 8.2 9.5 -2.9 2.5 6.1 3.1 11.2 4.0 -1.6
Subsidies 6.1 1.7 -4.0 7.9 1.9 5.1 3.5 2.6 -0.1 1.4 4.7 1.8 10.4Gross government interest payments -1.2 -1.4 -0.3 0.6 -1.7 -3.5 -1.0 -4.2 -6.7 -1.2 -2.1 -4.3 2.0
Social security benefits paid by government 7.3 4.0 2.5 3.8 4.4 7.0 4.0 4.7 4.2 9.4 14.8 3.7 8.7
Government total disbursements 6.3 3.7 1.4 4.1 4.0 7.1 2.2 3.6 4.4 6.1 11.5 5.3 5.4
Total receipts 2.9 2.9 0.2 3.4 2.9 7.9 2.2 3.5 2.3 6.2 8.3 3.8 4.3Government Investment (percent GDP)
2.7 2.5 1.5 3.2 2.5 3.5 1.1 1.7 2.9 3.7 3.9 3.3 3.3
Table 8: Nominal growth rates of GDP, trend GDP, selected categories of government expenditures and total revenue for the Euro area countries and the USA, average 2001-2005 in percent
Notes: *GDP trend: 6 year moving average of annual growth rates.Source: EU-Commission (2005).
However, this rather mixed evaluation changes considerably, if one takes a look not only at
the development of structural deficits but also at the average growth rates of public
expenditures and revenues (Table 8). If we take the growth rate of final government
consumption as a proxy for non-cyclical expenditure, according to the expenditure path, final
government consumption should grow in line with the nominal GDP trend (moving average
of the growth rates of the past six years). The same applies for government investment and
also subsidies. Government social benefits and interest payments may vary with cyclical
fluctuations; the former can be expected to grow at a higher rate than nominal GDP trend
during economic slowdowns and rising unemployment. In the absence of discretionary tax
increases/tax cuts, public revenue should grow in line with actual nominal GDP.
For the Euro area as a whole and for most of the countries, especially for Germany, public
revenues grew at a rate significantly lower than actual nominal GDP. This is a strong
indication, that there have been substantial discretionary tax cuts in many countries (for
Germany: Truger/Jacoby 2004, Truger 2004). At the same time, for some of these countries,
especially again for Germany, non-cyclical government expenditure, and in fact also total
expenditure grew at a significantly lower rate than nominal trend GDP. Also quite strikingly,
for some countries the growth rate of social benefits has been lower than could be expected
from the extent of the economic slump. Therefore, in some countries a more expansive fiscal
policy would have been achieved through a shift in the expenditure-/revenue mix. Most

23
importantly, less tax cuts in favour of higher expenditure growth would have been more in
accordance with the expenditure path concept and could have had a positive macroeconomic
effect, because expenditure multipliers are substantially higher than tax multipliers. In
addition, a shift between different revenue categories might also have been conducive to
growth.
Nevertheless, under the conditions of an expenditure path the gain in terms of fiscal expansion
relative to the status quo would certainly not have been very strong and it is doubtful, whether
it would have been strong enough for a sustained economic recovery in the Euro area
countries which were hit the hardest by the post-2000 slowdown. Even in the absence of
reliable quantitative econometric results considerable doubts can be obtained by qualitative
considerations. Taking the US economy as a benchmark, letting automatic stabilisers work
would hardly have been sufficient for the Euro area to recover in a comparable way. As
already demonstrated (Figure 3), US fiscal policy reacted in an aggressively discretionary
counter-cyclical way against the slowdown, decreasing the CBR by more than 5 percentage
points from 2000 to 2004.
Two objections may be raised. First, automatic stabilisers in the USA are usually estimated to
be considerably lower than in most European welfare states, so that relying on automatic
stabilisers might nevertheless be sufficient in Europe. Second, it is well known that the US
government reacted to a large part with aggressive tax cuts to the post-2000 slowdown, which
may be rather ineffective due to low multipliers. However, both objections cannot change the
basic conclusion. First, with respect to automatic stabilisers, the overall fiscal policy reaction
in the USA was much more aggressive than anything that could have been achieved by
automatic stabilisers in any Euro area country: The actual deficit in the USA was increased by
6.6 percent of GDP from 2000 to 2003 in the face of a worsening of the output gap of 3.4
percent of GDP, i.e. an increase of almost two percentage points per percentage point of
decrease in the output gap. However, the usual estimates for automatic stabilisers in many
European countries are somewhat higher than 0.5 percent (see e.g. van den Noord 2000).
Additionally, one must take into account that many of the labour market reform strategies
advocated by the European commission would actually lead to a considerable weakening of
automatic stabilisers in Europe (Mabbett/Schelkle 2005). Second, with respect to tax cuts,
although the Bush tax cuts played a very substantial role in the fiscal expansion in the USA
the expenditure side was also much more expansive than its Euro area counterpart, with a
24
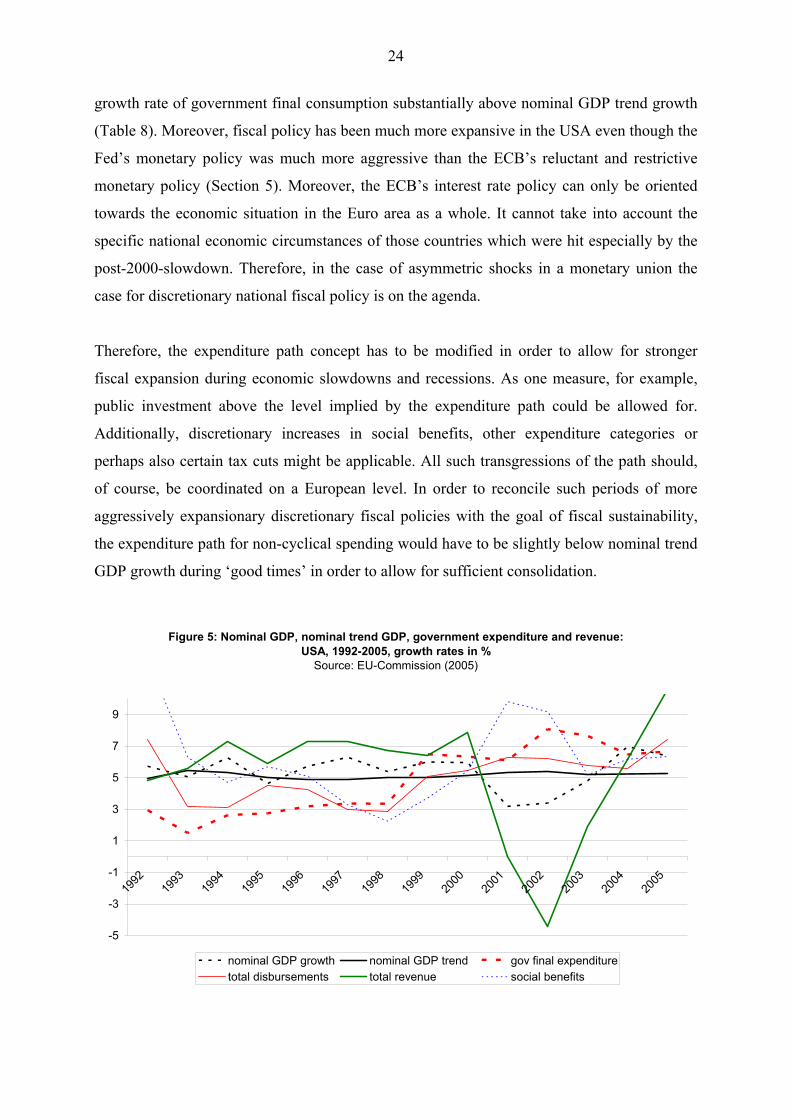
growth rate of government final consumption substantially above nominal GDP trend growth
(Table 8). Moreover, fiscal policy has been much more expansive in the USA even though the
Fed’s monetary policy was much more aggressive than the ECB’s reluctant and restrictive
monetary policy (Section 5). Moreover, the ECB’s interest rate policy can only be oriented
towards the economic situation in the Euro area as a whole. It cannot take into account the
specific national economic circumstances of those countries which were hit especially by the
post-2000-slowdown. Therefore, in the case of asymmetric shocks in a monetary union the
case for discretionary national fiscal policy is on the agenda.
Therefore, the expenditure path concept has to be modified in order to allow for stronger
fiscal expansion during economic slowdowns and recessions. As one measure, for example,
public investment above the level implied by the expenditure path could be allowed for.
Additionally, discretionary increases in social benefits, other expenditure categories or
perhaps also certain tax cuts might be applicable. All such transgressions of the path should,
of course, be coordinated on a European level. In order to reconcile such periods of more
aggressively expansionary discretionary fiscal policies with the goal of fiscal sustainability,
the expenditure path for non-cyclical spending would have to be slightly below nominal trend
GDP growth during ‘good times’ in order to allow for sufficient consolidation.
Figure 5: Nominal GDP, nominal trend GDP, government expenditure and revenue: USA, 1992-2005, growth rates in %
Source: EU-Commission (2005)
-5
-3
-1
1
3
5
7
9
1992
1993
1994
1995
1996
1997
1998
1999
2000
2001
2002
2003
2004
2005
nominal GDP growth nominal GDP trend gov final expendituretotal disbursements total revenue social benefits
25
Actually, this seems to have been exactly the strategy US fiscal policy has chosen (Figure 5).
In the USA, non-cyclical government expenditure grew at a rate of about 3 percent from 1992
until 1998, whereas the nominal GDP trend grew between 5 and 6 percent. During the
persistent upswing with decreasing unemployment, the growth rate of social benefits declined.
At the same time, tax revenues grew more than proportionately, as is to be expected in the
absence of major tax cuts. The result was fiscal consolidation: By 1998 the government
budget was in balance. After consolidation had been achieved, non-cyclical expenditure grew
in line with nominal GDP trend until the slowdown in 2000/2001. Since then non-cyclical
expenditure growth has been significantly accelerated. In addition, social benefits have been
raised in a discretionary way and huge tax cuts have been implemented, thus exerting an
enormous fiscal stimulus to the economy. Since 2004, well after the recovery had been
achieved, tax revenues have been accelerating strongly again. At the same time the expansion
of government expenditure has been decreased to a certain amount. It remains to be seen,
whether fiscal policy in the USA will repeat its successful consolidation strategy of the 1990s.
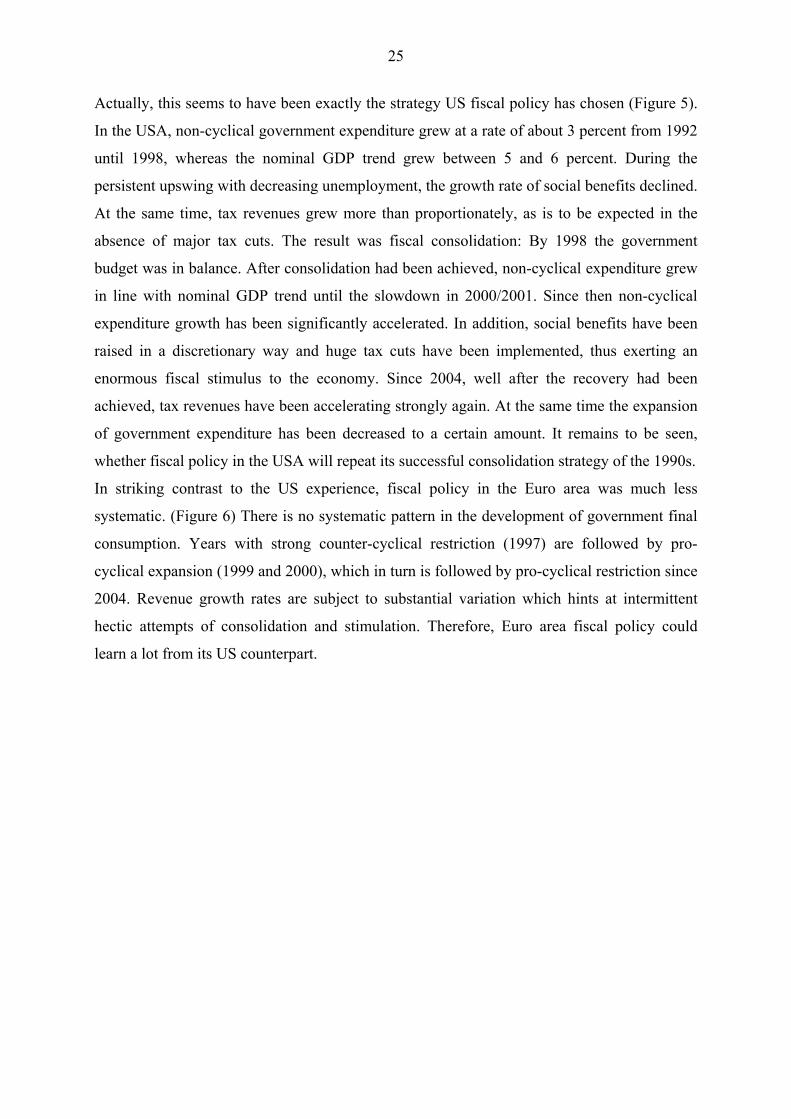
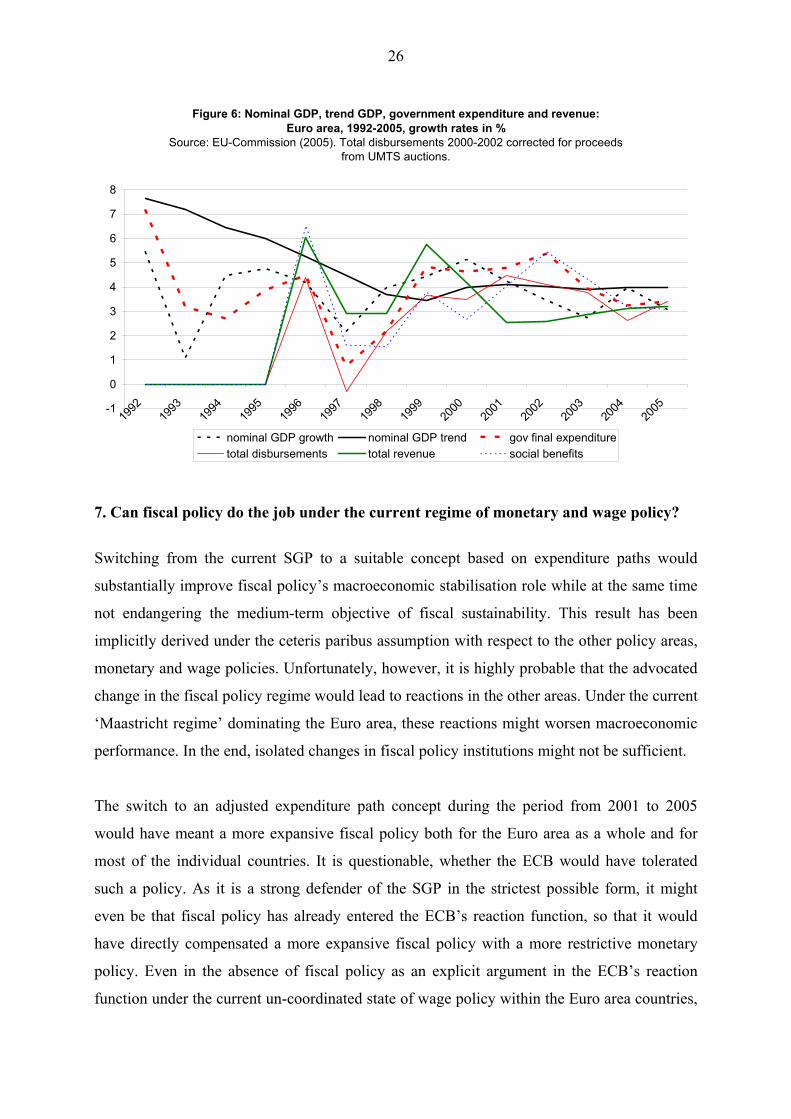
In striking contrast to the US experience, fiscal policy in the Euro area was much less
systematic. (Figure 6) There is no systematic pattern in the development of government final
consumption. Years with strong counter-cyclical restriction (1997) are followed by pro-
cyclical expansion (1999 and 2000), which in turn is followed by pro-cyclical restriction since
2004. Revenue growth rates are subject to substantial variation which hints at intermittent
hectic attempts of consolidation and stimulation. Therefore, Euro area fiscal policy could
learn a lot from its US counterpart.
26
Figure 6: Nominal GDP, trend GDP, government expenditure and revenue: Euro area, 1992-2005, growth rates in %
Source: EU-Commission (2005). Total disbursements 2000-2002 corrected for proceeds from UMTS auctions.
-1
0
1
2
3
4
5
6
7
8
1992
1993
1994
1995
1996
1997
1998
1999
2000
2001
2002
2003
2004
2005
nominal GDP growth nominal GDP trend gov final expendituretotal disbursements total revenue social benefits
7. Can fiscal policy do the job under the current regime of monetary and wage policy?
Switching from the current SGP to a suitable concept based on expenditure paths would
substantially improve fiscal policy’s macroeconomic stabilisation role while at the same time
not endangering the medium-term objective of fiscal sustainability. This result has been
implicitly derived under the ceteris paribus assumption with respect to the other policy areas,
monetary and wage policies. Unfortunately, however, it is highly probable that the advocated
change in the fiscal policy regime would lead to reactions in the other areas. Under the current
‘Maastricht regime’ dominating the Euro area, these reactions might worsen macroeconomic
performance. In the end, isolated changes in fiscal policy institutions might not be sufficient.
The switch to an adjusted expenditure path concept during the period from 2001 to 2005
would have meant a more expansive fiscal policy both for the Euro area as a whole and for
most of the individual countries. It is questionable, whether the ECB would have tolerated
such a policy. As it is a strong defender of the SGP in the strictest possible form, it might
even be that fiscal policy has already entered the ECB’s reaction function, so that it would
have directly compensated a more expansive fiscal policy with a more restrictive monetary
policy. Even in the absence of fiscal policy as an explicit argument in the ECB’s reaction
function under the current un-coordinated state of wage policy within the Euro area countries,
27
a stronger fiscal expansion would have certainly led to an increase in wage growth. Given the
ECB’s too ambitiously low inflation target, the ensuing inflationary tendencies or just the
improvement in the output gap, would certainly have induced the ECB to raise interest rates,
thereby worsening macroeconomic conditions all over the Euro area.14 As a side effect,
government debt and interest payments would have further risen, limiting fiscal leeway in the
future. Therefore, a thorough change in the framework of fiscal policies in the Euro area
might require a similarly thorough change in the framework of monetary and wage policies to
be effective in enhancing economic performance.
8. Conclusion
Since the start of the European Monetary Union fiscal policy in the Euro area has been
dominated by the SGP. Quite obviously the SGP has been unsuccessful in fulfilling its goals,
fiscal sustainability and supporting economic growth. More and more countries have
exceeded the 3 percent of GDP limit for the budget deficit and the public debt-GDP ratios
have been growing, while at the same time macroeconomic performance has been
unsatisfactory. It has been shown that, whereas US fiscal policy has acted in a strongly
counter-cyclical way, stabilising the economy, in the Euro area fiscal policy has been much
more restrictive and has had pro-cyclical and therefore destabilising effects for many
countries. It has also been shown, that one cannot put all the blame on fiscal policy: The
ECB’s restrictive monetary policy and divergent wage developments across the Euro area are
at least as important as fiscal policy in the explanation of the Euro area’s weak economic
performance. As a possible solution for the future we have suggested to replace the SGP by
expenditure paths for non-cyclical spending as coordination tool, and we have discussed an
important modification of the concept. Expenditure paths could co-ordinate fiscal policies
within the Euro area in a counter-cyclical way and at the same time ensure fiscal
sustainability. As the comparison with US fiscal policy suggested, the expenditure path
should be set at a rate below nominal trend GDP with variations above trend allowed during
economic downturns. Replacing the SGP with such an expenditure path concept would
substantially contribute to a better macroeconomic performance within the Euro area.
Unfortunately, as long as monetary and wage policies remain un-coordinated and
destabilising any isolated improvements in fiscal policy might not be very effective in 14 For a recent empirical estimation of the ECB’s reaction function see Hein/Truger (2006b). Empirically there is no indication that the budget deficit has entered the ECB’s reaction function, however both the output gap, and
28
enhancing economic performance. Therefore, the key to improving the Euro area economy is
to establish a regime of coordinated macroeconomic policy including fiscal as well as
monetary and wage policies.
References Alesina, A., Perotti, R. (1996): Fiscal Adjustments in OECD Countries: Composition and
Macroeconomic Effects, NBER Working Paper 5730, August 1996.
Allsopp, C., Vines, D. (1998): The assessment: macroeconomic policy after EMU, Oxford Review of Economic Policy, 14 (3): 1-23.
Arestis, P. et al. (2001): An alternative stability pact for the European Union, Cambridge Journal of Economics, 25, 113-130.
Arestis, P., Sawyer, M. (2003): Reinventing fiscal policy, in: Journal of Post Keynesian Economics, 26: 3-25.
Arestis, P., Sawyer, M. (2005): Aggregate demand, conflict and capacity in the inflationary process, Cambridge Journal of Economics, 29: 959-974.
Bartsch, K. et al. (2002): WSI Konjunkturbericht 2002: Makroökonomische Verantwortung wahrnehmen!, WSI Mitteilungen, 55 (12), 691-705.
Bernanke, B., Gertler, M. (1995): Inside the black box: the credit channel of monetary policy transmission. Journal of Economic Perspectives, 9: 27-48.
Bhaduri, A., Marglin, S. (1990): Unemployment and the real wage: the economic basis for contesting political ideologies, Cambridge Journal of Economics, 14: 375-393.
Bibow, J. (2002): The monetary policies of the European Central Bank and euro’s (mal)performance: a stability-oriented assessment, International Review of Applied Economics, 16: 31-50.
Bibow, J. (2005a): Europe’s quest for monetary stability: central banking gone astray, The Levy Economics Institute of Bard College, Working Paper No. 428.
Bibow, J. (2005b): Bad for Euroland, worse for Germany - the ECB’s record, The Levy Economics Institute of Bard College, Working Paper No. 429.
Blanchard, O. (2003): Macroeconomics, 3rd ed., London et al. (Prentice Hall).
Blanchard, O., Giavazzi, F. (2003): Improving the SGP through a Proper Accounting of Public Investment, Centre for Economic Policy Research, London.
Buti, M. et al. (2003): Revisiting the Stability and Growth Pact: grand design or internal adjustment?, European Commission, Directorate-Generale for Economic and Financial Affairs, Economic Papers, Number 180.
Buti, M. et al. (2003a): Revisiting EMU´s Stability and Growth Pact: A pragmatic way forward, Oxford Review of Economic Policy, 19 (1), 100-111.
Calmfors, L. (2005): What remains of the Stability and Pact and what next?, Swedisch Institute for European Policies, Report No. 8, Stockholm.
Cecchetti, S.G. (1995): Distinguishing theories of the monetary transmission mechanism, Federal Reserve Bank of St. Louis Review, 77 (3): 83-97.
unit labour cost growth turn out to be highly significant.
29
Coeuré, B., Pisani-Ferry, J. (2005): Fiscal Policy in EMU: Towards a Sustainability and Growth Pact, Oxford Review of Economic Policy, 21 (4), 598- 617.
ECB (2003): The outcome of the ECB’s evaluation of its monetary policy strategy, Monthly Bulletin, June: 79-92.
ECB (2006): Monthly Bulletin, January.
European Council (2005): Improving the implementation of the Stability and Growth Pact, Series: UEM 97, ECOFIN 104, Brussels, 21 March 2005.
Eichengreen, B. (1998): European monetary unification: A tour d’horizon, Oxford Review of Economic Policy, 14 (3), 24-40.
Eicker-Wolff, K., Truger, A. (2003): Alternativen zum Sparen in der Krise – für eine nachfrageschonende Konsolidierungspolitik, WSI Mitteilungen, 56 (6), 344-352.
European Commission (2002): Co-ordination of economic policies in the EU: A presentation of key features of the main procedures, Directorate General Economic and Financial Affairs, Euro Papers, Number 45, Brussels.
European Commission (2005): Annual macro-economic database (AMECO), December 2005, http://europa.eu.int/comm/economy_finance/indicators/annual_macro_economic_database/ameco_en.htm.
Fritsche et al. (2005): Macroeconomic regime and economic development: the case of the USA, in: Hein, E. et al. (eds.), Macroeconomic Policy Coordination in Europe and the Role of the Trade Unions, Brussels (ETUI).
Giorno, C, Richardson, P., Rosevaere, D, van den Noord, P. (1995): Estimating Potential Output, Output Gaps and Structural Budget Balances, OECD Economics Department Working Papers No. 152, Paris.
Hein, E. (2002): Monetary policy and wage bargaining in the EMU: restrictive ECB policies, high unemployment, nominal wage restraint and inflation above the target, Banca Nazionale del Lavoro Quarterly Review, 55: 299-337.
Hein, E. (2004): Die NAIRU – eine post-keynesianische Interpretation, Intervention. Zeitschrift für Ökonomie, 1: 43-66.
Hein, E. (2006a): Wage bargaining and monetary policy in a Kaleckian monetary distribution and growth model: trying to make sense of the NAIRU, Intervention. Journal of Economics, forthcoming.
Hein, E. (2006b): On the (in-)stability and the endogeneity of the ‘normal’ rate of capacity utilisation in a post-Keynesian/Kaleckian ‘monetary’ distribution and growth model, Indian Development Review, 4: 129-150.
Hein, E., Muelhaupt, B., Truger, A. (2001): WSI-Standortbericht 2001: Eine makroökonomische Perspektive, WSI Mitteilungen, 54: 351-358.
Hein, E., Niechoj, T. (2006): Guidelines for sustained growth in the EU? The concept and the consequences of the Broad Economic Policy Guidelines, in: McCombie, J., Rodriguez, C. (eds.), Institutions, Public Policy and Governance, Basingstoke (Palgrave/Macmillan), forthcoming.
Hein, E., Schulten, T., Truger, A. (2006): Deflation risks in Germany and the EMU: the role of wages and wage bargaining, in: Hein, E., Heise, A., Truger, A. (eds.), Wages, Employment, Distribution and Growth. International Perspectives, Basingstoke (Palgrave/Macmillan).
Hein, E., Truger, A. (2005a): What ever happened to Germany? Is the decline of the former European key currency country caused by structural sclerosis or by macroeconomic mismanagement?, International Review of Applied Economics, 19: 3-28.
30
Hein, E., Truger, A. (2005b): A different view of Germany’s stagnation, Challenge. The Magazine of Economic Affairs, 48 (6): 64-94.
Hein, E., Truger, A. (2005c): European Monetary Union: nominal convergence, real divergence and slow growth?, Structural Change and Economic Dynamics, 16: 7-33.
Hein, E., Truger, A. (2005d): Macroeconomic coordination as an economic policy concept - opportunities and obstacles in the EMU, in: Hein, E., et al. (eds.), Macroeconomic Policy Coordination in Europe and the Role of the Trade Unions, Brussels (ETUI).
Hein, E., Truger, A. (2006a): Germany‘s post-2000 stagnation in the European context – a lesson in macroeconomic mismanagement, IMK Working Paper, 3/2006, Duesseldorf: Macroeconomic Policy Institute (IMK) in the Hans-Boeckler-Foundation.
Hein, E., Truger, A. (2006b): Monetary policy, macroeconomic policy mix and economic performance in the Euro area, IMK Working Paper, 6/2006, Duesseldorf: Macroeconomic Policy Institute (IMK) in the Hans-Boeckler-Foundation.
Horn, G.A., Scheremet, W. (1999): Erfolgreiche Konsolidierung des amerikanischen Staatshaushalts – ein Beispiel für Europa?, DIW- Wochenbericht 12/1999, 227-233.
Horn, G.A., Truger, A. (2005): Strategien zur Konsolidierung der öffentlichen Haushalte, WSI Mitteilungen, 58, 425-432.
Mabbett, D., Schelkle, W. (2005): Bringing Macroeconomics back into the political economy of reform: the Lisbon Agenda and the ‘fiscal philosophy’ of EMU, mimeo.
OECD (2005): Economic Outlook, No. 78, December 2005, http://www.oecd.org/document/61/0,2340,en_2649_201185_2483901_1_1_1_1,00.html.
Palley, T. (1998): Restoring prosperity: why the U.S. model is not the answer for the United States or Europe, Journal of Post Keynesian Economics, 20, 337-52.
Semmler, W. (2000): The European Monetary Union: Success of failure? Political Economy. Review of Political Economy and Social Sciences, 7, 5-24.
Solow, R. M. (2000): Unemployment in the United States and in Europe: a contrast and the reasons, Ifo-Studien, 46: 1-12.
Taylor, J.B. (1993): Discretion versus policy rules in practice, in: Carnegie Rochester Conference Series on Public Policy, 39: 195-214.
Truger, A. (2004): Rot-grüne Steuerreformen, Finanzpolitik und makroökonomische Performance – was ist schief gelaufen?, in: Hein, E., Heise, A., Truger, A. (eds.): Finanzpolitik in der Kontro-verse, Marburg (Metropolis).
Truger, A., Jacoby, W. (2004): Tax Reforms and ‘Modell Deutschland’ – Lessons from four Years of Red-Green Tax Policy, in: Sperling, J. (ed.): Germany at 55: Berlin is not Bonn, Manchester (Manchester University Press).
Truger, A., Hein, E. (2002): Schlusslicht Deutschland: Makroökonomische Ursachen, Wirtschaftsdienst, 82, 402-410.
van den Noord, P. (2000): The size and role of economic stabilisers in the 1990s and beyond, OECD Economics Department Working Papers No. 230, Paris.
Publisher: Hans-Böckler-Stiftung, Hans-Böckler-Str. 39, 40476 Düsseldorf, Germany Phone: +49-211-7778-331, [email protected], http://www.imk-boeckler.de IMK Working Paper is an online publication series available at: http://www.boeckler.de/cps/rde/xchg/hbs/hs.xls/31939.html ISSN: 1861-2199 The views expressed in this paper do not necessarily reflect those of the IMK or the Hans-Böckler-Foundation. All rights reserved. Reproduction for educational and non-commercial purposes is permitted provided that the source is acknowledged.