disaster risk from a macroeconomic perspective: a metric for fiscal vulnerability evaluation
TRANSCRIPT
Disaster risk from a macroeconomic perspective: a metric for fiscal vulnerability evaluation
Omar D. Cardona, Mario G. Ordaz, Mabel C. Marulanda, Martha L. Carreño and Alex H. Barbat1
The Disaster Deficit Index (DDI) measures macroeconomic and financial risk in a country according to possible catastrophic scenario events. Extreme disasters can generate financial deficit due to sudden and elevated need of resources to restore affected inventories. The DDI captures the relationship between the economic loss that a country could experience when a catastrophic event occurs and the availability of funds to address the situation. The proposed model utilises the procedures of the insurance industry in establishing probable losses, based on critical impacts during a given period of exposure; for economic resilience, the model allows one to calculate the country’s financial ability to cope with a critical impact. There are limitations and costs associ-ated with access to resources that one must consider as feasible values according to the country’s macroeconomic and financial conditions. This paper presents the DDI model and the results of its application to 19 countries of the Americas and aims to guide governmental decision-making in disaster risk reduction.
Keywords: contingent liabilities, Disaster Deficit Index, economic resilience, fiscal sustainability, probable losses, seismic vulnerability
IntroductionDisaster risk is not only associated with the occurrence of intense physical processes, but also with the conditions of vulnerability that favour or facilitate disasters when these processes transpire. Disaster risk management requires the measuring of risk by taking into account not only the expected physical damage, the number of victims and equivalent economic loss, but also social, organisational and institutional factors (Carreño, Cardona and Barbat, 2007a, 2007b). Difficulty in achieving effective disaster risk management has been, in part, due to a lack of a comprehensive conceptual framework of disaster risk to facilitate a multidisciplinary evaluation and intervention. Most existing indices and evaluation techniques do not adequately express risk and are not based on a holistic approach that invites the intervention of vulnerability. It is necessary to make risk manifest itself in various ways, according to different decisionmakers in diverse organisations and institutions. If risk is not presented and explained in a way that attracts the attention of stakeholders, it will not be possible to make progress in reducing the impacts. The various planning agencies dealing with the economy, environment, housing, infrastructure, agriculture or health, to mention but a few relevant areas, must be made aware of the risks
doi:10.1111/j.03613666.2010.01183.x
Disasters, 2010, 34(4): 1064−1083. © 2010 The Author(s). Journal compilation © Overseas Development Institute, 2010Published by Blackwell Publishing, 9600 Garsington Road, Oxford, OX4 2DQ, UK and 350 Main Street, Malden, MA 02148, USA
Disaster risk from a macroeconomic perspective 1065
that each sector faces. From another perspective, different levels of government should be considered, taking into account that risk is different at the local level (a community or a city) as compared to the national level. Risk is more detailed on a microsocial or microterritorial scale. When results are aggregated at larger scales, the resolution is lower. Therefore, the information required, the risk intervention actions, the decisionmaking, the social actors and the stakeholders become different at each level. In this regard, appropriate evaluation tools are necessary to make it easy to understand risk problems and to guide the decisionmaking process. It is fundamentally important to understand how vulnerability is generated and how it increases. In addition, performance benchmarks are needed to facilitate access by decisionmakers to relevant information as well as the identification and proposal of effective policies and actions. Models to estimate the impact of disasters on economic growth have been developed, such as the model used in the Hot Spots project of the World Bank (2004) and the one by the United Nations Development Programme (UNDP, 2004) to estimate the Disaster Risk Index (DRI), which measures the relative vulnerability of countries to three key natural hazards—earthquakes, tropical cyclones and floods—identifies development factors that contribute to risk, and shows in quantitative terms, just how the effects of disasters can be reduced or exacerbated by policy choices. However, serious theoretical controversies still exist about whether disasters have a significant impact on economic development. According to the results obtained by AlbalaBertrand (1993, 2002), disasters usually affect less productive capital and unskilled labour; therefore, while leading to profound social consequences, they have little bearing on the macro economy of a country. Similar models have been formulated by the International Institute for Applied Systems Analysis (IIASA) (Mechler et al., 2006) and by Freeman et al. (2002a, 2002b). Benson (2003) and the Economic Commission for Latin American and the Caribbean (ECLAC, 2003), among others, argue that, in the long run, such impacts may be important for certain economies. The Institute of Environmental Studies (IDEA) (2005) of the National University of Colombia, in Manizales, presents an analytical approach to growth and disasters. It concludes that, ‘in the stationary state’, disasters may reduce the level of savings in society and thus the amount of capital and income per person, that is, recurrent and random disasters affect per capita income and growth rates in the long term.
System of indicatorsThe system of indicators was developed by IDEA for the InterAmerican Development Bank, within the framework of its Program of Indicators for Disaster Risk and Risk Management in the Americas. Programme reports, technical details and the application results for the countries in the Americas can be consulted at http://idea.unalmzl.edu.co (Cardona, 2010; Carreño, Cardona and Barbat, 2005; IDEA, 2005).
Omar D. Cardona et al.1066
The system of risk indicators was proposed to enable the depiction of disaster risk at the national level, permitting the identification of key issues by economic and social category. It also makes possible the creation of national risk management performance benchmarks in order to establish performance targets for improving management effectiveness. Four components or composite indicators were designed to represent the main elements of vulnerability and to show each country’s progress in managing risk. The Disaster Deficit Index (DDI) measures country risk from a macroeconomic and financial standpoint when it faces possible catastrophic events. The Local Disaster Index (LDI) attempts to identify the social and environmental risk that derives from more recurrent lower level events, which are often chronic at the local and subnational level. The Prevalent Vulnerability Index (PVI) characterises prevailing vulnerability conditions reflected in exposure in disasterprone areas, socioeconomic fragility and a lack of social resilience in general. Lastly, the Risk Management Index (RMI) reflects the organisational, development and institutional action taken to reduce vulnerability and losses, to prepare for crisis and to recover efficiently. The system covers different aspects of the risk problematic and takes into account aspects such as: potential damage and loss due to the probability of extreme events; recurrent disasters or losses; socioenvironmental conditions that facilitate disasters; capacity for macroeconomic recovery; behaviour of key services; institutional capacity; and the effectiveness of basic risk management instruments, including risk identification, prevention and mitigation measures, financial mechanisms and risk transference, emergency response levels, and preparedness and recovery capacity. The system was designed to permit measurement and monitoring over time and the identification of insecure conditions and their causes, as well as to facilitate grouping and comparison of countries using criteria related to hazard levels and the socioeconomic conditions that affect vulnerability levels. The main objective of this paper is to present the DDI model and the potential macroeconomic and financial impacts on a country in the event of a catastrophe. Likewise, the results of an evaluation of 14 countries of the Americas with regard to the dimensions of fiscal exposure and potential deficit in the countries are presented. Finally, the paper identifies and proposes possible effective governmental policies and actions through risk transfer mechanisms, using insurance and reinsurance, contingency credit or other instruments offered on the capital market.
Disaster Deficit IndexThe DDI measures country risk from a macroeconomic and financial perspective according to possible catastrophic events. It captures the relationship between the economic loss that a particular country could bear when a catastrophic event takes place and the implications in terms of available external and internal resources to cope with the situation. To calculate the index, one must estimate the critical impacts
Disaster risk from a macroeconomic perspective 1067
during a given period of exposure, as well as a country’s financial ability to deal with the situation. Construction of the DDI necessitates undertaking a forecast based on historical and scientific evidence, as well as measuring the value of infrastructure and other assets and services that are likely to be affected. The DDI represents the relationship between the demand for contingent resources to cover the losses, L
RP,
caused by the Maximum Considered Event (MCE),2 and the public sector’s economic resilience, R
EP, that is, the availability of internal and external funds to restore affected
inventories.3 Thus, the DDI is calculated as follows:
(1)
where
(2)
LR
P represents the maximum direct economic impact in probabilistic terms on public and private stocks that are a government’s responsibility (liability). The value of public sector capital inventory losses is a fraction, φ, of the loss of all affected goods, L
R, which is associated with an MCE of intensity I
R, and whose annual exceedance
rate (or return period, TR)4 is defined in the same way for all countries (that is,
return periods of 50, 100 and 500 years, whose probability during any 10year exposure period is 18 per cent, 10 per cent and 2 per cent, respectively). This total loss, L
R, can be estimated as follows:
(3)
E is the economic value of all property exposed; V( ) is the vulnerability function, which relates the intensity of the event to the fraction of the value that is lost if an event of such intensity takes place; I
R is the intensity associated with the selected
return period; CS is a coefficient that considers local site effects; and K is a factor that
corrects for uncertainty in the vulnerability function. Economic resilience, R
EP (the denominator of the index), is defined as:
(4)
FiP represents the internal and external resources that were potentially available
to a government, as the promoter of recovery and as owner of affected goods, when the evaluation was undertaken. Limitations and costs are associated with access to these resources and these must be taken into account as feasible values according to the macroeconomic and financial conditions of the country. In this evaluation, the following aspects have been considered: the approximate insurance and reinsurance payments
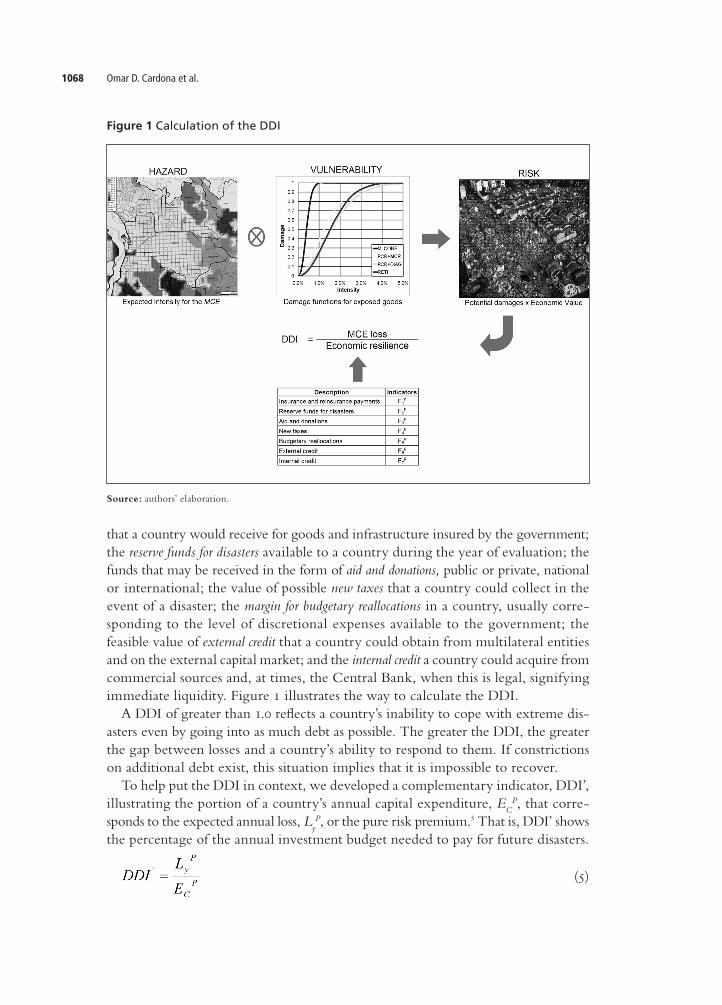
Omar D. Cardona et al.1068
that a country would receive for goods and infrastructure insured by the government; the reserve funds for disasters available to a country during the year of evaluation; the funds that may be received in the form of aid and donations, public or private, national or international; the value of possible new taxes that a country could collect in the event of a disaster; the margin for budgetary reallocations in a country, usually corresponding to the level of discretional expenses available to the government; the feasible value of external credit that a country could obtain from multilateral entities and on the external capital market; and the internal credit a country could acquire from commercial sources and, at times, the Central Bank, when this is legal, signifying immediate liquidity. Figure 1 illustrates the way to calculate the DDI. A DDI of greater than 1.0 reflects a country’s inability to cope with extreme disasters even by going into as much debt as possible. The greater the DDI, the greater the gap between losses and a country’s ability to respond to them. If constrictions on additional debt exist, this situation implies that it is impossible to recover. To help put the DDI in context, we developed a complementary indicator, DDI’, illustrating the portion of a country’s annual capital expenditure, E
CP, that corre
sponds to the expected annual loss, LyP, or the pure risk premium.5 That is, DDI’ shows
the percentage of the annual investment budget needed to pay for future disasters.
(5)
Figure 1 Calculation of the DDI
Source: authors’ elaboration.
Disaster risk from a macroeconomic perspective 1069
The pure premium value is equivalent to the approximate annual average investment that a country would need to cover losses associated with major future disasters. The DDI’ can also be estimated by considering the amount of sustainable resources due to intertemporal surplus, S
iP. Henceforth, the percentage of the potential sav
ings, at present value, that the technical premium would represent is:
(6)
The sustainable amount of resources due to intertemporal surplus, SiP, is the
saving, calculated over a 10year period, that the government can access to cope best with disasters (IDEA, 2005). What one needs to know is whether the government, from a traditional standpoint, complies with its intertemporal budgetary restriction. That is to say, if expenditure and income flows guarantee—in presentvalue terms—that current and future primary surpluses permit the cancelling of the current stock of debt. In other words, financial discipline requires that government action be limited and that financial capacity to deal with disasters complies with the intertemporal restriction of public finances. In the event that annual losses exceed the amount of resources available in the surplus, it is predicted that, over time, there will be a deficit due to disasters, which inevitably increase overall debt levels. That is, the country does not have sufficient resources to face future disasters. In the event that restrictions on additional indebtedness exist, this signifies that recovery is impossible. In general, a negative intertemporal surplus means that a premium payment would increase the existent deficit. In summary, three different DDIs are proposed. Each one provides an interesting and useful figure, for a ministry of finance and economics, related to the potential financial sustainability problem of a country with regard to potential disasters. Yet, together, they paint a compressed picture of the fiscal vulnerability of a country due to disasters. Below we consider the theoretical framework of risk and the variables involved in equation 3 from a specific hazard and vulnerability perspective.
Estimating probable lossesComputation of losses in future natural hazard events (index numerator) is always a complex problem. Due to the uncertainties of this process, one must regard losses as random variables, which can only be known in a probabilistic sense, that is, through their probability distributions. Consequently, such an approach has been adopted in this model (Ordaz and SantaCruz, 2003). Given existing knowledge, it is clearly theoretically impossible to predict the occurrence and magnitude of all future natural hazard events. In view of the uncertain nature of the processes involved, a secondbest choice is to estimate the probability distribution of occurrence of all future impacts. In general, however, this estimation is also an immense task.
Omar D. Cardona et al.1070
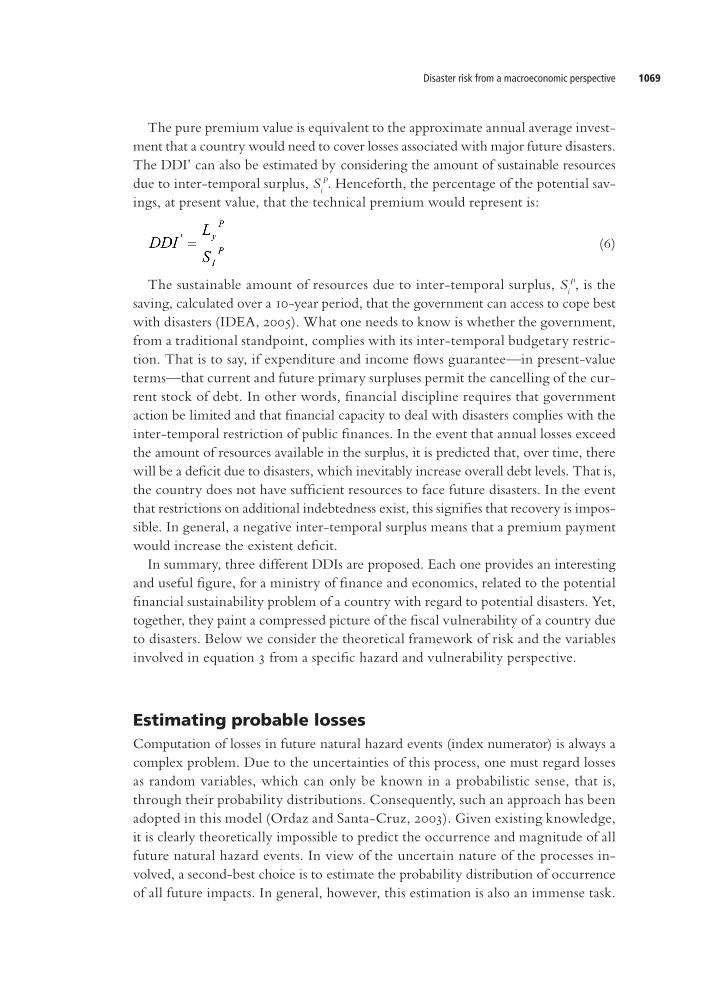
A convenient way of describing the required probability distributions (those for occurrence times and scale of physical impact) is to use the exceedance rate curve of the physical losses (loss exceedence curve (LEC)).6 This curve indicates the frequency of the events that would generate losses equal to or greater than a given loss; the inverse of the exceedance rate is the return period. The probable maximum loss (PML)7 curve is equivalent to the LEC. Figure 2 provides an example of this risk metric.8
Hazard
In this context, intensity is defined as a local measure of the disturbance produced by a natural event to those physical characteristics of the environment relevant to the case being study. For all types of hazards, it is almost impossible to describe the intensity using a single parameter. For instance, when dealing with earthquake hazards, the peak ground acceleration offers some general information on the size of the ground motion, but it does not give indications about frequency content. This is crucial for an accurate estimation of structural response. Hence, a single parameter description of intensity will always be incomplete. However, a multivariable description of intensity is far too complex with regard to our goals (actually, very few, if any, risk assessments undertaken in the past have considered multivariable descriptions of intensity). We propose to use a single measure of intensity for each type of hazard
Figure 2 Example of a PML curve and the results for several return periods
Source: authors’ elaboration.
Disaster risk from a macroeconomic perspective 1071
that correlates well with damage and for which hazard measures are relatively easy to obtain. One should note that, since we are mainly interested in disasters that have an economic impact at the national level, we have restricted ourselves to those hazards that produce large, immediate economic losses, such as earthquakes or hurricanes. While other hazards, such as landslides, are extremely important at the local level, and historically have claimed many victims, their economic impact has been limited. Slow onset disasters, such as a drought, are also very important, but their economic effects are deferred over time. As these do not have immediate effects, they are beyond the scope of the proposed estimation model. In many cases, hazard assessments are obtained from regional studies, or by assuming average environmental conditions. For example, seismic hazard maps are usually produced by assuming average, firm soil conditions, that is, no significant amplification of seismic intensity due to soft soil. Furthermore, wind velocity maps are generally produced assuming average exposure conditions, that is, velocities are not obtained for sites on hills, but for reference sites. For each type of hazard, though, particular environmental characteristics may exist in the cities under study that cause intensities to be greater or less than those in the neighbourhood. In other words, environmental characteristics may exist that differ from those corresponding to the standard characteristics used in hazard evaluation. These characteristics are known as local site conditions, and they give rise to local site effects. Within the framework of the present project, the local site effects in all cities and for all types of hazards are impossible to take into account in any kind of accurate manner. An initial rough approach would be simply to ignore the site effects—this means considering that CS=1 in equation 3. However, there are cases in which the local site effects cannot be disregarded. Since by definition these site effects are local, it would be impossible for us to accord general rules as to the adequate values of C
S for all cities and
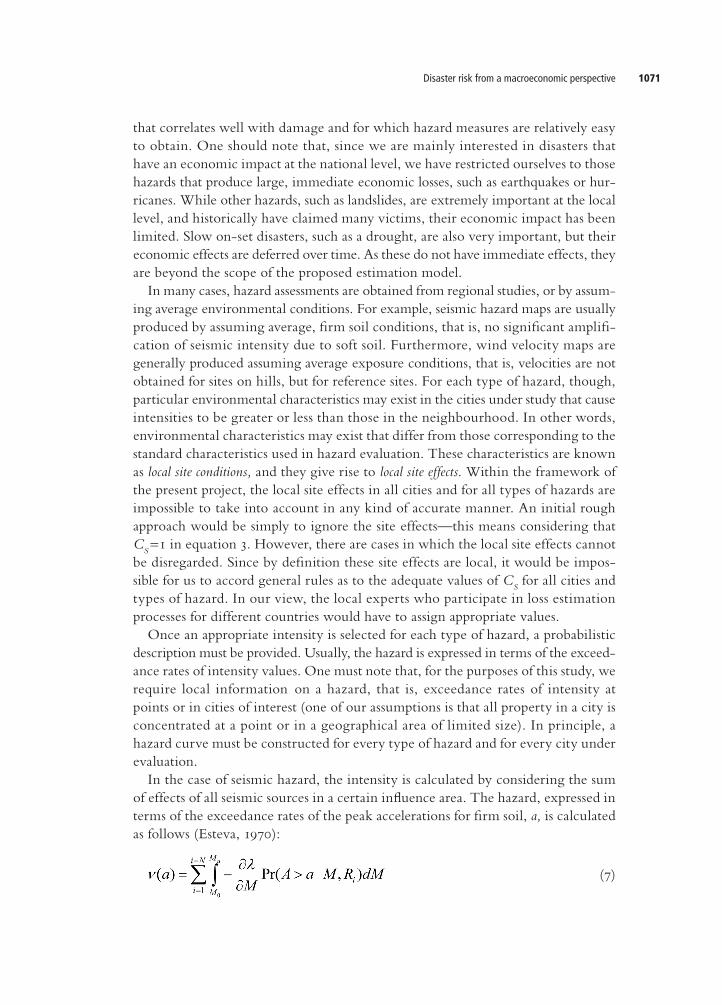
types of hazard. In our view, the local experts who participate in loss estimation processes for different countries would have to assign appropriate values. Once an appropriate intensity is selected for each type of hazard, a probabilistic description must be provided. Usually, the hazard is expressed in terms of the exceedance rates of intensity values. One must note that, for the purposes of this study, we require local information on a hazard, that is, exceedance rates of intensity at points or in cities of interest (one of our assumptions is that all property in a city is concentrated at a point or in a geographical area of limited size). In principle, a hazard curve must be constructed for every type of hazard and for every city under evaluation. In the case of seismic hazard, the intensity is calculated by considering the sum of effects of all seismic sources in a certain influence area. The hazard, expressed in terms of the exceedance rates of the peak accelerations for firm soil, a, is calculated as follows (Esteva, 1970):
(7)
Omar D. Cardona et al.1072
The sum includes all of the seismic sources, N, and Pr(A>a|M,Ri) is the probability of the intensity exceeding a certain value, given the earthquake’s magnitude, M, and the distance between the i th source and the site, R
i. The λ(M) function rep
resents the activity rates of the seismic sources. The integral is calculated from M0 to M
u,, indicating that the contribution of all the magnitudes is taken into account
for each seismic source. It is important to note that equation 7 would be exact if the seismic sources were points, but in reality they are volumes; therefore, the hypocentres are located not only in the centres of the sources but also, with equal probability, in any point inside the corresponding volume. Supposing that the intensity variable has a lognormal distribution given the magnitude and distance, the probability Pr(A>a|M, R
i) is calculated in the following way:
(8)
Ф(.) is the standard normal distribution, MED(A|M, Ri) is the median value of the intensity variable (from the corresponding attenuation law), and σ
Lna is the standard
deviation of the natural logarithm of a. Equations 7 and 8 include both the attenuation law and its uncertainty. The seismic hazard is expressed in terms of the exceedance rates of given values of seismic intensity. The seismic intensity, a, refers to the pseudoacceleration response spectra ordinates for a five per cent of critical damping for a given structural period, T. Once the attenuation laws are calculated for different structural periods, it is possible to determine uniform hazard spectra for a specific site, based on the calculated intensity value (acceleration) for a fixed return period.
Vulnerability
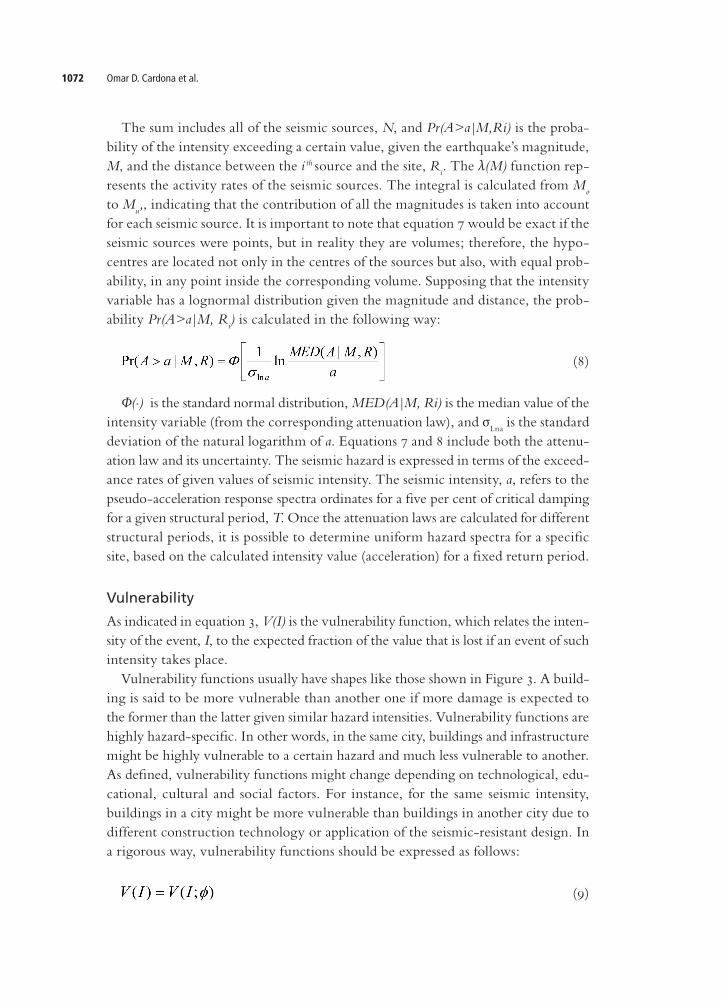
As indicated in equation 3, V(I) is the vulnerability function, which relates the intensity of the event, I, to the expected fraction of the value that is lost if an event of such intensity takes place. Vulnerability functions usually have shapes like those shown in Figure 3. A building is said to be more vulnerable than another one if more damage is expected to the former than the latter given similar hazard intensities. Vulnerability functions are highly hazardspecific. In other words, in the same city, buildings and infrastructure might be highly vulnerable to a certain hazard and much less vulnerable to another. As defined, vulnerability functions might change depending on technological, educational, cultural and social factors. For instance, for the same seismic intensity, buildings in a city might be more vulnerable than buildings in another city due to different construction technology or application of the seismicresistant design. In a rigorous way, vulnerability functions should be expressed as follows:
(9)
Disaster risk from a macroeconomic perspective 1073
Figure 3 Representation of vulnerability functions
Source: authors’ elaboration.
ϕ is a set of parameters that will be denoted as vulnerability factors. In fact, it is through these factors that one can appreciate the effects of prevention and assess their economic impact. Considering, for instance, that the vulnerability curves correspond to earthquake hazard, it is conceivable that the application of seismicresistant design in a city (a change in one of the vulnerability factors) could move the vulnerability function from the ‘more vulnerable’ to the ‘less vulnerable’ case of Figure 2. Usually, investments in the development, implementation and enforcement of seismic regulations would be much lower than the amount saved by reducing vulnerability. Hence, improving design practices would be a sound decision even from an economic standpoint. Cardona et al. (2008) present a discussion of the probabilistic cost–benefit ratio. From the above, one may deduce that we always see V (I;ϕf) as related to expected damage, that is, to the expected value (in a probabilistic sense) of the damage. Due to the uncertainties involved, it is impossible to predict damage resulting from an event with a given intensity. Thus, we try to predict its expected damage with V (I;ϕ), keeping in mind that there are uncertainties that one cannot neglect. There are, of course, rigorous, probabilistic ways to account for this uncertainty. One way of solving this problem is to find a factor, which we call K (see equation 3), that relates the loss estimator that would be obtained by accounting for the uncertainty with the loss estimators obtained by disregarding this uncertainty. Factor K depends on three key variables: the uncertainty in the vulnerability relation; the shape of the intensity exceedance rate curve; and the return period. We found that, under reasonable
Omar D. Cardona et al.1074
hypotheses, a factor of K=1.2~1.3 is reasonable for our goals.9 Vulnerability functions can be expressed analytically using:
(10)
α and γ are parameters that define the shape of the function. Table 1 presents some values of α and γ for some building constructions (Ordaz and SantaCruz, 2003). So far, our analysis has been restricted to estimate losses in cities or regions of limited geographical size. Key to the definition of ‘limited geographical size’ is our hypothesis that everything within the city is affected simultaneously by the event being studied. In reality, damage during disasters varies, sometimes widely, even within a city, so our hypothesis hardly, if ever, holds, but this assumption has to be made for the sake of simplicity. However, for extensive regions, comprising several cities, perhaps hundreds of kilometres apart, it would be extremely risky to assume that everything is affected simultaneously. Therefore, we have to derive ways to combine the computed loss estimators for each city in order to obtain a reasonable combined estimator for the whole country. We call these rules aggregation rules. IDEA (2005) presents details of the mathematical relations between the exceedance rates and other interesting and useful measures of risk; it also sets out rigorous probabilistic ways to account for the vulnerability uncertainty and the rules of aggregation of losses. Economic losses in cities due to natural events were evaluated using a simplified method to estimate the inventory of exposed assets based on proxy values validated by institutions and local consultants in each country. Basically, a set of parameters was estimated using: the cost per square metre of different construction classes; the number of constructed square metres in each main city in relation to the number of inhabitants; the distribution of built areas (public or private buildings); and the inventory of assets that, in case of a disaster, would represent a responsibility of the government. A set of local validations and random samples was produced to confirm the accuracy of these proxies. This approximated method allows government officials and local consultants to use the model with relatively little effort and without need of very detailed cadastral data.
Potentially available resourcesEconomic resilience (the denominator of the DDI) represents internal and external resources available to or accessible by the government when the evaluation was done.
Table 1 Parameters for some vulnerability functions
Construction class α γ
Non-reinforced masonry 5.0 0.25
Confined masonry 5.5 0.50
Reinforced concrete frames 3.0 0.40
Disaster risk from a macroeconomic perspective 1075
However, limitations and costs are associated with access to these resources, which one must take into account. Seven constraints are explicitly taken into consideration in this study:
F1p corresponds approximately to the insurance and reinsurance payments that a country
would receive for goods and infrastructure insured by the government. Insurance is an incipient business in developing countries and an insurance culture does not really exist yet. The vast majority of insurance payments made after largescale events have been to the private sector, particularly to large industries. In various countries, it is mandatory to insure public assets, but this legal requirement is not complied with thoroughly, especially in decentralised territorial entities and local governments. A simple way of estimating the value of insured physical wealth is to calculate insurance expenses as a proportion of gross domestic product (GDP). For example, according to an accepted proxy supported by Freeman et al. (2002b), if it is equivalent to two per cent of GDP, then insurance companies will cover two per cent of losses.
F2p corresponds to the reserve funds for disasters that a country has available during the
evaluation year. Some countries have established calamity or disaster funds (annual budget funds or multiyear budget funds). In various countries, principal and sectoral funds may be found in different institutions and ministries, such as public works and infrastructure, health and civil defence. In addition, decentralised funds exist at different territorial levels. This value must be estimated as the sum of the national available reserves plus the reserves existing in the potentially affected areas.
F3p represents the funds that may be received as aid and donations, public or private,
national or international. Usually external aid is given for emergency response and few resources are made available for rehabilitation and reconstruction (Cummins and Mahul, 2009). After a major event, help is generally received in the form of food, clothing, tents, and equipment, but little in the way of cash. Detailed information often is not available regarding aid received from governments, nongovernmental organisations (NGOs) and humanitarian aid agencies. To estimate this, one must conduct an approximate and realistic analysis of such aid as a percentage of losses during previous events. There are difficulties in producing this kind of estimate because it depends on the size of the donations and on the geopolitical concerns of the donors (Freeman et al., 2002b).
F4p corresponds to the possible value of new taxes that countries could collect in the
event of disasters. Taxes have been imposed and applied to financial and banking operations in the past (ranging between 2‰ and 3‰). Such taxation, though, may lead to contention and the transfer of savings abroad. In general, severe doubt exists as to the suitability of imposing such taxes due to their unpopularity. This value should take into account political feasibility. In some cases, it may be viable to introduce a transitory tax as was done in some countries to finance reconstruction.
F5p estimates the margin for budgetary reallocations in each country. In countries where
limitations and constitutional controls on budgets exist, this value usually corresponds
Omar D. Cardona et al.1076
to the margin of discretional expenses available to the government. In some countries, it depends on the political decision of competent authorities. However, restrictions exist that impede larger reallocations due to the inevitable obligations of public spending on such variables as salaries, social expenses and debt servicing. Equally, there may be accumulated obligations related to previous budgets. Reallocation of nonexecuted loans from multilateral organisations may be considered here. If it is impossible to obtain a precise estimate of the margin for budgetary reallocation, a rough approximation is 60 per cent of the investment in capital goods, as a percentage of GDP.
F6p corresponds to the feasible value of external credit that a country could obtain from
multilateral entities and on the external capital market. Generally, loan conditions with respect to multilateral financial institutions are more favourable but they are restricted with regard to the level of sustainability of external debt and the relationship between debt servicing and exports. Interest rates, in general, depend on per capita income. Access to credit on the international capital market depends on internal and external financial risk calculations, determining risk premiums and commercial rates for debt titles. No matter what, access to credit signifies an increase in debt servicing obligations and a reduction in a country’s capacity to absorb new debt. Therefore, the maximum value of external credit should be estimated via an analysis of the obligations and limitations facing the government.
F7p represents the internal credit a country may obtain from commercial and, on occa
sion, the Central Bank, when this is legal, signifying immediate liquidity. In addition, after a major disaster, it is possible at times to obtain resources from international reserves, although this type of operation is generally complicated and may signify a risk to the balance of payments. Credit with commercial banks also entails limitations and costs and depends on the workings of local credit markets. In general, these will be scarce. In weak markets, a large amount of credit may affect internal consumption, local investment and interest rates. Additional available credit should be estimated by taking into account capacity to pay the loan and the capacity of national capital markets.
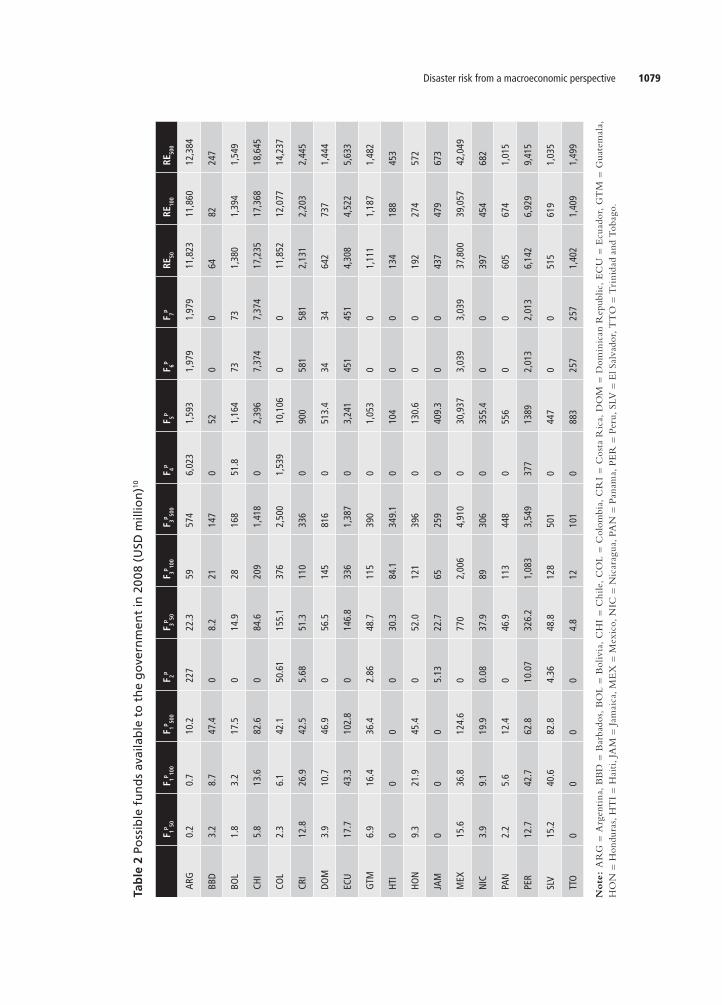
Potentially available resources were calculated by making some assumptions that were discussed with economic authorities in the same way in all countries. Furthermore, IDEA (2005) presents a method for estimating taxes on financial transactions and a model for calculating the external financial situation of a country and access to internal credit, taking into account the associated uncertainties. It is important to note that the assessment of potentially available resources is proposed while considering restrictions or feasible values and without considering possible associated costs of access to some of these funds and opportunity costs that could be important. To obtain more accurate values, some countries calculated the DDI using detailed catastrophe models and macroeconomic techniques and by taking into account not only the national level but also subnational units and different development sectors.
Disaster risk from a macroeconomic perspective 1077
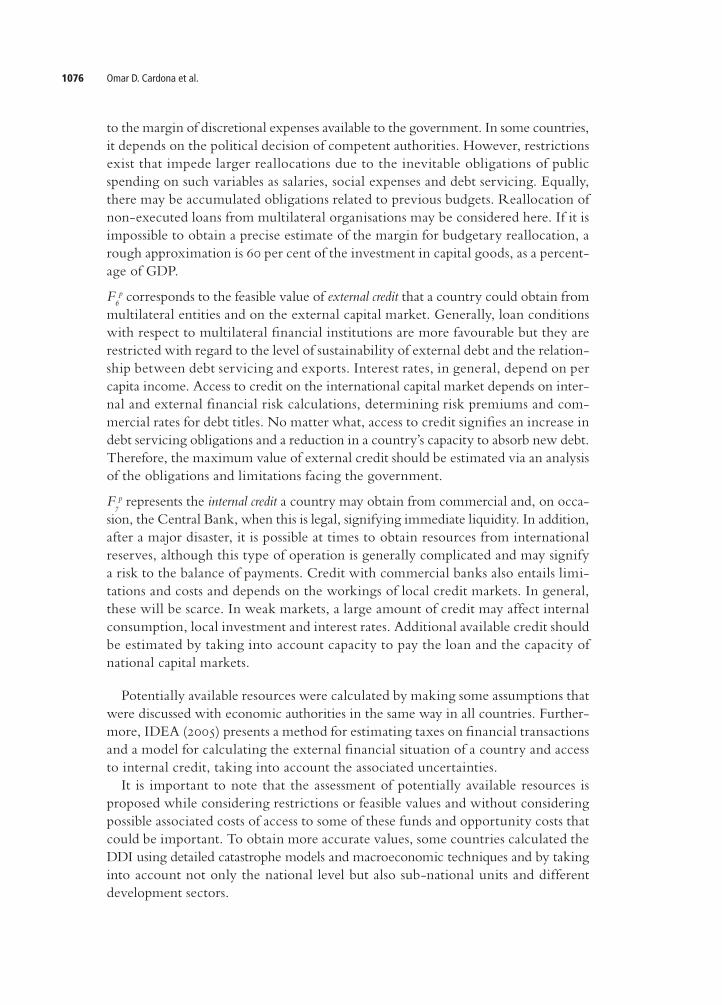
Results of application of the DDI in the AmericasDifferent DDI were calculated for 19 countries of Latin America and the Caribbean in the period 19802008, in ranges of five years (Cardona, 2010). Information was gathered in coordination with the institutions of countries that were willing to participate in the programme and that are member states of the InterAmerican Development Bank (IDB). In general, according to results obtained for the past two decades, most countries show a significant lack of capacity to deal with potential losses in the case of extreme events, even if they are associated with 50 and 100year return periods. Even though the situation was more critical for most countries in the 1980s and the early 1990s (the DDI climbed to more than 6.0), the current situation is still worrying given the increase in potential losses and the low economic resilience demonstrated by the majority of the countries. In 2008, the most critical situations were in Honduras, Haiti, Barbados and Dominican Republic, with a DDI of more than 5.0. Belize and Nicaragua were close behind with a DDI of more than 4.0. The left side of Figure 4 shows the DDI in 2008 calculated for an MCE with a 500year return period (two per cent probability of occurrence in 10 years). The right side of Figure 4 shows the maximum loss, L, to the government during the same period. Government responsibility was restricted to the sum of losses associated with public sector buildings and housing for the lowest income population.
Figure 4 DDI and PML in 500 years
Source: authors’ elaboration.

Omar D. Cardona et al.1078
Seventeen of the 19 evaluated countries have a DDI of more than 1.0. Honduras, Haiti, Barbados and Dominican Republic with a DDI of 6.96, 6.29, 5.75 and 5.68, respectively, are in the most critical situation. Argentina and Mexico have a DDI of lower than 1.0. This means that, although Mexico could face a gross loss of USD 17,544 million compared to USD 3,984 million for Honduras, it could access resources that would allow it to cover these losses. Honduras’s low economic capacity to cope with extreme events explains this situation. The left side of Figure 5 shows the DDI’
CE for 2008, while the right side shows
the annual expected loss, Ly. Honduras has the highest DDI’ relative to capital expenditure—the annual cost of future disasters represents nearly 30 per cent of capital investment. Peru comes second with 16.2 per cent. Eleven countries have values below five per cent of the investment budget (capital expenditure of fixed assets). The DDI is a risk proxy. Based on evaluations for the year 2008, Colombia, Mexico and Peru are prone to future extreme disaster risk. These countries are likely to suffer significant losses in the case of low probability, high consequence events. Ecuador and Chile also face relatively high loss; the Dominican Republic, Honduras and Guatemala are in the midrange of countries. Belize, Haiti and Barbados have a relatively poor ability to obtain reconstruction assistance, while Mexico may suffer high losses but its economic resilience is high. Argentina, Colombia and Bolivia have minor relative risk profiles for extreme events, but this does not mean that risk
Figure 5 DDI’CE and Annual Probable Loss (Ly)
Source: authors’ elaboration.
Disaster risk from a macroeconomic perspective 1079
Tab
le 2
Po
ssib
le f
un
ds
avai
lab
le t
o t
he
go
vern
men
t in
200
8 (U
SD m
illio
n)10
F 1p 50F 1p 10
0F 1p 50
0F 2p
F 3p 50F 3p 10
0F 3p 50
0F 4p
F 5pF 6p
F 7pRE
50RE
100
RE50
0
ARG
0.2
0.7
10.2
227
22.3
5957
46,
023
1,59
3
1,
979
1,97
911
,823
11,8
6012
,384
BBD
3.2
8.7
47.4
08.
221
147
052
00
6482
247
BOL
1.8
3.2
17.5
014
.928
168
51.8
1,16
4 73
731,
380
1,39
41,
549
CHI
5.8
13.6
82.6
084
.620
91,
418
02,
396
7,37
47,
374
17,2
3517
,368
18,6
45
COL
2.3
6.1
42.1
50.6
115
5.1
376
2,50
01,
539
10,1
06
00
11,8
5212
,077
14,2
37
CRI
12.8
26.9
42.5
5.68
51.3
110
336
090
0 58
158
12,
131
2,20
32,
445
DOM
3.9
10.7
46.9
056
.514
581
60
513.
434
3464
273
71,
444
ECU
17.7
43.3
102.
80
146.
833
61,
387
03,
241
451
451
4,30
84,
522
5,63
3
GTM
6.9
16.4
36.4
2.86
48.7
115
390
01,
053
00
1,11
11,
187
1,48
2
HTI
00
00
30.3
84.1
349.
10
104
00
134
188
453
HON
9.3
21.9
45.4
052
.012
139
60
130.
60
019
227
457
2
JAM
00
05.
1322
.765
259
040
9.3
00
437
479
673
MEX
15.6
36.8
124.
60
770
2,00
64,
910
030
,937
3,03
93,
039
37,8
0039
,057
42,0
49
NIC
3.9
9.1
19.9
0.08
37.9
8930
60
355.
40
039
745
468
2
PAN
2.2
5.6
12.4
046
.911
344
80
556
00
605
674
1,01
5
PER
12.7
42.7
62.8
10.0
732
6.2
1,08
33,
549
377
1389
2,01
32,
013
6,14
26,
929
9,41
5
SLV
15.2
40.6
82.8
4.36
48.8
128
501
044
7 0
051
561
91,
035
TTO
00
00
4.8
1210
10
883
257
257
1,40
21,
409
1,49
9
Note
: A
RG
= A
rgen
tina
, B
BD
= B
arba
dos,
BO
L =
Bol
ivia
, C
HI
= C
hile
, C
OL
= C
olom
bia,
CR
I =
Cos
ta R
ica,
DO
M =
Dom
inic
an R
epub
lic,
EC
U =
Ecu
ador
, G
TM
= G
uate
mal
a,
HO
N =
Hon
dura
s, H
TI
= H
aiti
, JA
M =
Jam
aica
, ME
X =
Mex
ico,
NIC
= N
icar
agua
, PA
N =
Pan
ama,
PE
R =
Per
u, S
LV =
El S
alva
dor,
TT
O =
Tri
nid
ad a
nd T
obag
o.
Omar D. Cardona et al.1080
is low. Largescale losses are expected in Colombia but its capacity to deal with losses is relatively good. In general, looking at the different results of the research, obtained from 1980–2008 in fiveyear periods, the risk associated with extreme events has increased over time in all of the countries (Cardona, 2010). The main reason for this is the growing inventory and rising vulnerability of nonengineered dwellings because of a lack of control and the generation of slums and scattered districts in the main cities. These indicators provide a simple way of measuring a country’s fiscal exposure and potential deficit (or contingency liabilities) in case of an extreme disaster. They allow national decisionmakers to gauge the budgetary implications of such an event and highlight the importance of including this type of information in financial and budgetary processes. These results underline the need to identify and propose effective policies and actions, such as using insurance and reinsurance (transfer mechanisms) to protect government resources or establishing reserves based on adequate loss estimation criteria. Other such actions include contracting contingency credits and, in particular, investing in structural (retrofitting) and nonstructural prevention and mitigation to reduce potential damage and losses as well as the potential economic impact of disasters. Table 2 presents as disaggregation of economic resilience (IDEA, 2005; Cardona, 2010). Application of this model indicates that the countries of Latin America and the Caribbean face significant risks that have yet to be fully recognised or taken into account by individuals, decisionmakers and society as a whole. These indicators represent a first step towards measuring risk so that it can be accorded the priority it deserves in the development process. Once risk has been identified and measured, activities can be implemented to reduce it and control it.
ConclusionThe approach proposed here is fundamentally a probabilistic risk model similar to those used for loss transfer and retention purposes. Consequently, it is substantially different to that used by the United Nations Development Programme (UNDP, 2004) to estimate the Disaster Risk Index (DRI) and the one used in the Hot Spots project of the World Bank (2004). It is also significantly different to approaches applied in the majority of models proposed to estimate the impact of disasters on economic growth. Application of these indicators and an evaluation of the inventories of public assets reveal that Colombia and Mexico have implemented efficient insurance strategies and other mechanisms of risk transfer and retention, such as CAT bonds and contingency credits. In addition, given that the losses of lowincome householders in Colombia are the responsibility of the government, coverage of poor people has been promoted in Manizales through the design of a collective private home insurance scheme based on crosssubsidies. Furthermore, taking into account fiscal vulnerability and sustainability, ministries of finance in Colombia and Mexico have made
Disaster risk from a macroeconomic perspective 1081
extreme disasters a contingent liability in their general financial balance sheets. Moreover, substantial programmes for structural retrofitting of hospitals, schools and other infrastructure have been promoted in the main cities of these countries.
AcknowledgmentThis work occurred thanks to the financial support of the InterAmerican Develop ment Bank within the framework of the Program of Indicators for Disaster Risk and Risk Management for the Americas (Operations ATN/JF7907RG and RGT1579/ATN/MD11238RG). Financial assistance was also received from the Spanish Ministry of Education and Science and the project benefited from FEDER funds; projects: CGL200504541C0302 and Project PSE 112005 (PSS380000200514) HABITAT 2030, CONSOLIDER and SEDUREC, REF. CSD200600060.
CorrespondenceOmar D. Cardona, Universidad Nacional de Colombia, Sede Manizales, IDEA, Cra. 27 No.6460, Manizales, Colombia. Email: [email protected]
Mario G. Ordaz, Instituto de Ingeniería, Universidad Nacional Autónoma de México (UNAM), Mexico DF. Email: [email protected]
Mabel C. Marulanda, Universidad Politécnica de Cataluña, Campus Norte, C/Gran Capitán s/n Mod. C1, 08034, Barcelona, Spain. Email: [email protected]
Martha L. Carreño, Universidad Politécnica de Cataluña, Campus Norte, C/Gran Capitán s/n Mod. C1, 08034, Barcelona, Spain. Email: [email protected]
Alex H. Barbat, Universidad Politécnica de Cataluña, Campus Norte, C/Gran Capitán s/n Mod. C1, 08034, Barcelona, Spain. Email: [email protected]
Endnotes1 Omar D. Cardona is Professor at the Universidad Nacional de Colombia; Mario G. Ordaz is
Professor at the Instituto de Ingeniería, Universidad Nacional Autónoma de México (UNAM), Mexico; Mabel C. Marulanda is Research Assistant at the Universidad Politécnica de Cataluña, Spain; Martha L. Carreño is Postdoctoral Researcher at the Universidad Politécnica de Cataluña; Spain; and Alex H. Barbat is Professor at the Universidad Politécnica de Cataluña, Spain.
2 This model follows the example set by the insurance industry in establishing a reference point (the Probable Maximum Loss, PML) for calculating potential losses (ASTM International, 1999; Ordaz and SantaCruz, 2003).
3 Freeman et al. (2002b) have proposed a similar approach to estimate the resource gap. They state that being able to access sufficient funds for reconstruction quickly after a disaster is critical for a country’s ability to recover with minimal longterm consequences.
4 Return period, Tr, is the inverse of the loss exceedance rate, representing the mean interval of
time in which a given loss occurrence is expected.
Omar D. Cardona et al.1082
5 Pure risk premium is equal to the average annual loss divided by the replacement value of the asset, usually expressed as a rate per mille (‰) of monetary value. Average annual loss is the expected loss per year. Computationally, it is the sum of products of event expected losses and event annual occurrence probabilities for all stochastic events considered in the loss model. In probabilistic terms, it is the mathematical expectation of the annual loss.
6 The Loss Exceedance Curve represents the annual frequency with which a loss of any specified monetary amount will be exceeded. This is the most important catastrophe risk metric for risk managers, since it estimates the amount of funds required to meet risk management objectives. The LEC can be calculated for the largest event in one year or for all (cumulative) events in one year. For risk management purposes, the latter estimate is preferred, since it includes the possibility of one or more severe events resulting from earthquakes.
7 Probable maximum loss represents the loss amount for a given annual exceedance frequency, or its inverse, the return period. The election of a return period depends on a stakeholder’s risk tolerance; for example, in the insurance industry, the return periods used to define the PML vary between 200year loss and 1,500year loss.
8 A large body of work exists on earthquake loss assessments. See, for example, the ATC13 (Applied Technology Council, 1985) and the HAZUS (NIBS, 1999), which are considered outstanding methods. See also Coburn and Spence (1992) and EERI (1997). Cardona et al. (2008) provide details of modular risk modelling.
9 Note that if a constant factor K=1.2 is used for all countries, cities and types of hazard then it becomes irrelevant for comparison purposes. However, we prefer to deal with K explicitly for two reasons. The first is of symbolic nature: it helps us to keep in mind that our assessment process is uncertain and that we must account for uncertainty in a formal way. The second reason is that, as defined, our loss estimators have a clear meaning: they are economic losses, measured in monetary units. Thus, their scale is relevant.
10 Values equal to zero mean that it is impossible to access resources due to economic restrictions.
ReferencesAlbalaBertrand, J.M. (1993) ‘Natural disaster situations and growth: a macroeconomic model for
sudden disasters impacts’. World Development. 21(9). pp. 1417–1434.AlbalaBertrand, J.M (2002) ‘Urban disasters and globalization’. In A. Kreimer, M. Arnold and A.
Carlin (eds.) The Future of Disaster Risk: Building Safer Cities. Disaster Risk Management Series No. 3. World Bank, Washington, DC. pp. 75–82. http://www.unisdr.org/eng/library/Literature/ 7759.pdf (accessed on 7 May 2010)
ASTM International (1999) Standard Guide for the Estimation of Building Damageability in Earthquakes. E 202699. ASTM International, West Conshohocken, PA.
ATC (Applied Technology Council) (1985) Earthquake Damage Evaluation Data for California. ATC13 (FEMA). ATC, Redwood City, CA.
Benson, C. (2003) The Economy-wide Impact of Natural Disasters in Developing Countries. University of London, London.
Cardona, O.D. (2010) Indicators of Disaster Risk and Risk Management: Program for Latin America and the Caribbean. Summary Report (online). InterAmerican Development Bank (IDB)/Institute of Environmental Studies (IDEA) and ERNAL, Manizales. http://www.manizales.unal.edu.co/ProyectosEspeciales/bid2/documentos/SummaryIndicatorsIDBIDEAERN_Hti.pdf (accessed on 13 June 2010).
Cardona, O.D., M.G. Ordaz, L.E. Yamin, M.C. Marulanda and A.H. Barbat (2008) ‘Earthquake loss assessment for integrated disaster risk management’. Journal of Earthquake Engineering. 12(S2). pp. 48–59.
Disaster risk from a macroeconomic perspective 1083
Carreño, M.L, O.D. Cardona and A.H. Barbat (2005) Sistema de indicadores para la evaluación de riesgos. CIMNE monograph IS52. International Center for Numerical Methods in Engineering, Barcelona.
Carreño, M.L, O.D. Cardona and A.H. Barbat (2007a) ‘A disaster risk management performance index’. Journal of Natural Hazards. 41(1). pp. 1–20.
Carreño, M.L, O.D. Cardona and A.H. Barbat (2007b) ‘Urban seismic risk evaluation: a holistic approach’. Journal of Natural Hazards. 40(1). pp. 137–172.
Coburn, A. and R. Spence (1992) Earthquake Protection. John Wiley & Sons, Chichester.Cummins, J.D. and O. Mahul (2009) Catastrophe Risk Financing in Developing Countries: Principles for
Public Intervention. World Bank, Washington, DC.ECLAC (Economic Commission for Latin American and the Caribbean) (2003) Manual para la estimación
de los efectos socio-económicos y ambientales de los desastres. ECLAC and the World Bank, Washington, DC. EERI (Earthquake Engineering Research Institute) (1997) ‘Theme issue: loss estimation’. Earthquake
Spectra. 13(4).Esteva, L. (1970) Regionalización sísmica de México para fines de ingeniería. Serie Azul 246. Engineering
Institute, Universidad Nacional Autónoma de México (UNAM), Mexico.Freeman, P.K., L.A. Martin, R. Mechler and K. Warner (2002a) Catastrophes and Development: Integrating
Natural Catastrophes into Development Planning. Disaster Risk Management Working Paper Series. No. 4. World Bank, Washington, DC.
Freeman, P.K. et al. (2002b) Disaster Risk Management: National Systems for the Comprehensive Manage-ment of Disaster Financial Strategies for Natural Disaster Reconstruction. InterAmerican Development Bank, Washington, DC.
IDEA (Institute of Environmental Studies) (2005) System of Indicators for Disaster Risk Management: Program for Latin American and the Caribbean. Main technical report (online). IDB/IDEA Program of Indicators for Disaster Risk Management, National University of Colombia, Manizales.
http://www.manizales.unal.edu.co/ProyectosEspeciales/bid2/documentos/SummaryreportIDB Updated2007v1.pdf (accessed on 19 May 2010).
Mechler, R., S. Hochrainer, J. LinneroothBayer and G. Pflug (2006) ‘Public sector financial vulnerability to disasters: the IIASA CATSIM model’. In J. Birkmann (ed.) Measuring Vulnerability to Hazards of Natural Origin: Towards Disaster Resilient Societies. United Nations University Press, Tokyo. pp. 380–398.
NIBS (National Institute of Building Sciences) (1999) Earthquake Loss Estimation Methodology HAZUS, Technical Manual, Vol. 1. Prepared by the National Institute of Building Sciences for the Federal Emergency Management Agency, Washington, DC.
Ordaz, M. and S. SantaCruz (2003) Computation of Physical Damage to Property due to Natural Hazard Events. IDB/IDEA Program of Indicators for Risk Management, National University of Colombia, Manizales. http://www.manizales.unal.edu.co/ProyectosEspeciales/bid2/documentos/MarioOrdaz_ SSantaCruzEMBarcelonaNov2003[1].pdf (accessed on 19 May 2010).
UNDP (United Nations Development Programme) (2004) ‘International patterns of risk’. Reducing Disaster Risk: A Challenge for Development. UNDP, Geneva. pp. 29–55. http://www.undp.org/cpr/ whats_new/rdr_english.pdf (accessed on 7 May 2010).
World Bank (2004) Natural Disaster Hotspots: A Global Risk Analysis—Synthesis Report. Center for Hazards and Risk Research, University of Columbia, Palisades, NY. http://sedac.ciesin.columbia.edu/hazards/hotspots/synthesisreport.pdf (accessed on 19 May 2010).