first large-scale dna barcoding assessment of reptiles in the biodiversity hotspot of madagascar,...
TRANSCRIPT
First Large-Scale DNA Barcoding Assessment of Reptilesin the Biodiversity Hotspot of Madagascar, Based onNewly Designed COI PrimersZoltan T. Nagy1*, Gontran Sonet1, Frank Glaw2, Miguel Vences3
1 Joint Experimental Molecular Unit, Royal Belgian Institute of Natural Sciences, Brussels, Belgium, 2 Zoologische Staatssammlung Munchen, Munchen, Germany,
3 Zoological Institute, Technical University of Braunschweig, Braunschweig, Germany
Abstract
Background: DNA barcoding of non-avian reptiles based on the cytochrome oxidase subunit I (COI) gene is still in a veryearly stage, mainly due to technical problems. Using a newly developed set of reptile-specific primers for COI we present thefirst comprehensive study targeting the entire reptile fauna of the fourth-largest island in the world, the biodiversity hotspotof Madagascar.
Methodology/Principal Findings: Representatives of the majority of Madagascan non-avian reptile species (includingSquamata and Testudines) were sampled and successfully DNA barcoded. The new primer pair achieved a constantly highsuccess rate (72.7–100%) for most squamates. More than 250 species of reptiles (out of the 393 described ones;representing around 64% of the known diversity of species) were barcoded. The average interspecific genetic distancewithin families ranged from a low of 13.4% in the Boidae to a high of 29.8% in the Gekkonidae. Using the average geneticdivergence between sister species as a threshold, 41–48 new candidate (undescribed) species were identified. Simulationswere used to evaluate the performance of DNA barcoding as a function of completeness of taxon sampling and fragmentlength. Compared with available multi-gene phylogenies, DNA barcoding correctly assigned most samples to species, genusand family with high confidence and the analysis of fewer taxa resulted in an increased number of well supported lineages.Shorter marker-lengths generally decreased the number of well supported nodes, but even mini-barcodes of 100 bpcorrectly assigned many samples to genus and family.
Conclusions/Significance: The new protocols might help to promote DNA barcoding of reptiles and the established libraryof reference DNA barcodes will facilitate the molecular identification of Madagascan reptiles. Our results might be useful toeasily recognize undescribed diversity (i.e. novel taxa), to resolve taxonomic problems, and to monitor the international pettrade without specialized expert knowledge.
Citation: Nagy ZT, Sonet G, Glaw F, Vences M (2012) First Large-Scale DNA Barcoding Assessment of Reptiles in the Biodiversity Hotspot of Madagascar, Based onNewly Designed COI Primers. PLoS ONE 7(3): e34506. doi:10.1371/journal.pone.0034506
Editor: Jerome Chave, Centre National de la Recherche Scientifique, France
Received October 11, 2011; Accepted March 2, 2012; Published March 30, 2012
Copyright: � 2012 Nagy et al. This is an open-access article distributed under the terms of the Creative Commons Attribution License, which permitsunrestricted use, distribution, and reproduction in any medium, provided the original author and source are credited.
Funding: The study was funded by the Belgian Science Policy Office (Belspo). The funders had no role in study design, data collection and analysis, decision topublish, or preparation of the manuscript.
Competing Interests: The authors have declared that no competing interests exist.
* E-mail: [email protected]
Introduction
The elementary question how many species of eukaryotic
organisms live on Earth has in the past decades led to remarkable
controversies [1–5]. Current estimates of global species numbers
differ enormously, ranging from 2 to 100 million, while ca. 1.7–1.9
million species have thus far been formally described. However,
there is a broad agreement that the highest proportion of Earth’s
biodiversity—expressed in species numbers—is yet to be discov-
ered and described. Even in several of the most prominent animal
groups such as vertebrates and butterflies, a remarkable propor-
tion of undescribed diversity is being discovered (e.g. Lepidoptera:
[6]; fish: [7]; amphibians: [8–10]). Given that just 16,000–20,000
species are being described per year [11,12] and traditional
taxonomy involves high costs (estimated between $39,000–
$122,000/species including salaries etc. [13]), strategies are
required to speed up both the process of species discovery and
species delimitation and description. A solution for the second of
these challenges, the Linnean shortfall [14], is not in sight. Besides
more posts for professional taxonomists [15], fundamentally new
ideas and approaches will be required, especially in hyperdiverse
groups such as small insects or nematodes. On the contrary, the
initial identification of new species has been much facilitated and
accelerated by DNA-based methods, and the term DNA
barcoding has been proposed [16–19]. Similar to a long standing
practice in microbiology [20], a short DNA sequence of a standard
marker is used for species identification—in animals typically the
mitochondrial gene for cytochrome oxidase subunit I (COI). This
molecular survey method has been applied in a number of
vertebrate taxa (e.g. birds: [21,22]; fish: [23]) and invertebrates
(e.g. spiders: [24], Lepidoptera: [25–27], marine invertebrates:
[28], and Heteroptera: [29]). DNA barcoding has the potential to
increase the rate of discovery enormously [30] and to discover
unexpected genetic diversity such as in butterflies [31–32] or in
PLoS ONE | www.plosone.org 1 March 2012 | Volume 7 | Issue 3 | e34506
amphipods [33,34]. From practical point of view, DNA barcoding
requires a comprehensive reference database [35]. Such reference
data sets are being assembled by the barcoding campaigns
initiated by the Consortium for the Barcode of Life (CBOL). For
vertebrates, campaigns focusing on fish, birds and mammals have
been started: the ‘Fish Barcode of Life Initiative’ (FISH-BOL,
www.fishbol.org; [36]), the ‘Shark Barcode of Life’ project (www.
sharkbol.org), the ‘All Birds Barcoding Initiative’ (ABBI, www.
barcodingbirds.org) and the ‘Mammal Barcode of Life’ (www.
mammaliabol.org) project. A new barcoding campaign called
ColdCode dedicated to amphibians and non-avian reptiles has
been announced in September 2011, and new COI primers for
amphibians have been published [37]. Although molecular data
are regularly used to discover and delimit new species of reptiles,
no large-scale DNA barcoding effort has so far targeted an entire
species-rich reptile fauna of a large region.
To facilitate reading, we will in the following use the traditional
term ‘reptiles’ for species included in the vertebrate orders
Squamata, Testudines, Crocodylia, and Rhynchocephalia, i.e.
Sauropsida excluding birds. We continue using the term ‘reptiles’
for practical reasons only and without any phylogenetic relevance.
Due to technical problems in the amplification and evaluation
of COI sequences in amphibians and reptiles linked to a high
variability of sequences including priming sites, authors of previous
attempts [38] have preferred the use of a fragment of the
mitochondrial 16 S rRNA gene for DNA barcoding (sensu lato)
despite its non-coding characteristics and resulting alignment
problems. Although recent publications claim that the difficulties
of COI amplification in amphibians can be overcome [39], various
teams have experienced problems. Therefore, COI as marker for
molecular identification and for phylogenetic and phylogeographic
studies has been rarely used by herpetologists. Consequently, there
is a serious lack of DNA barcodes for amphibians and reptiles, and
according to the Barcode of Life Data Systems [18] DNA barcodes
of most taxa of reptiles (even on higher taxonomic levels)
inhabiting Madagascar are virtually absent. This highlights the
need for development and testing of primers and amplification
strategies for these organisms [40].
Here we start filling this gap and provide a DNA barcoding
assessment of the reptile fauna of Madagascar, the fourth-largest
island in the world that has been flagged as one of the most
important hotspots for biodiversity conservation [41] and as a
model region to study species diversification [42]. Madagascar’s
biota is most fascinating due to the unique level of endemism
associated with high alpha diversity [43]. Approximately 92% of
the non-marine species of Madagascan reptiles (i.e. excluding sea
turtles and sea snakes) are endemic to the island, and many of
them are furthermore microendemic to very small ranges [42]. By
2007, around 370 nominal species of reptiles were known from
Madagascar [44]. Thanks to intensive and integrative taxonomic
work in the last approximately 20 years, this number is
continuously growing. Since 2007 alone, 22 new species have
been described, bringing the total number of nominal species of
reptiles from Madagascar up to 393 at present. Genetic,
phylogenetic and phylogeographic information on several taxo-
nomic groups is accumulating as well [43,45]. At the same time,
increased and insufficiently controlled human activities affecting
the habitats seriously threaten the long-term sustainment of this
fauna and make a comprehensive assessment of the diversity a
high priority.
In this study we aim to characterize the majority of Madagascan
reptiles by DNA barcoding based on a newly developed set of
reptile-specific primers for COI. We compare the performance of
this method to assess the species diversity of a large biodiversity
hotspot, exemplified by the Madagascan ‘‘microcontinent’’ with its
clades of reptiles of different temporal diversification background,
and test the performance of the method depending on barcode
length and completeness of taxon sampling.
Materials and Methods
Ethics statementNo experiments were conducted using living animals. Further-
more, none of the samples were specifically collected for this
project. We exclusively used museum samples which were already
available and were deposited in a tissue bank.
All field researches and collecting of specimens were approved
by the Madagascan Ministere de l’Environnement, des Eaux et des
Forets (Direction des Eaux et Forets, DEF) under the following
permits: 156-MEF/SG/DGEF/DADF/SCB dated 12 December
2002; 238-MINENVEF/SG/DGEF/DPB/SCBLF dated 14 No-
vember 2003; 238-MINENV.EF/SG/DGEF/DPB/SCBLF/
RECH dated 22 December 2004; 272-MINENV.EF/SG/
DGEF/DPB/SCBLF/RECH dated 8 November 2005; 298-
MINENV.EF/SG/DGEF/DPB/SCBLF/RECH dated 22 De-
cember 2006; 036/08 MEEFT/SG/DGEF/DSAP/SSE dated 30
January 2008; 26/09/MEEFT/SG/DGEF/DSAP/SLRSE dated
3 February 2009; 48/09/MEEFT/SG/DGEF/DSAP/SSE dated
9 March 2009; 188/09/MEEFT/SG/DGEF/DSAP/SSE dated
16 September 2009; 195/09/MEEFT/SG/DGEF/DSAP/SSE
dated 28 September 2009. Export of specimens was approved by
the DEF under permits: 063C-EA02/MG03, dated 26 February
2003; 094C-EA03/MG04, dated 1 March 2004; 103C-EA03/
MG05, dated 15 March 2005; E 1400/06, dated 1 June 2006;
055N-EA03/MG10, dated 25 March 2010. Import of species
protected by CITES into Germany was approved by the German
authorities (Bundesamt fur Naturschutz). Voucher specimens were
euthanized using proved methods (e.g. anaesthesia with ketamine,
followed by ketamine overdosis) that do not require approval by an
ethics committee.
SamplingWe sampled 468 specimens of Madagascan reptiles mostly
deposited in publically accessible natural history collections (for list
of samples, see Table S1). About 420 of these samples were
determined to belonged to 251 nominal species. Another ca. 50
samples could not be reliably assigned to any nominal species
based on morphology and had high sequence divergences to the
other samples included (candidate species as defined below).
Samples belong to nine squamate families, Chamaeleonidae,
Iguanidae (Opluridae), Gerrhosauridae, Scincidae, Gekkonidae,
Boidae, Lamprophiidae, Psammophiidae (the latter two snake
families were formerly included in Colubridae sensu lato),
Typhlopidae (sensu lato, i.e. also including the recently described
Xenotyphlopidae), and to the tortoise and turtle families
Testudinidae and Pelomedusidae. Due to practical problems such
as restricted distribution and rareness of species, identification
problems, or inclusion of species in CITES, only a limited amount
of samples were available for the majority of species (on average,
1.7 samples per species, ranging from 1 to 5). Therefore, our
sampling strategy was to include only single samples for most
species but to select these as carefully as possible, making sure their
identification is correct and they are backed by a traceable
voucher specimen. For this purpose we chose, whenever possible,
samples from type material (holo- or paratypes) or collected at or
near the type locality. All collecting localities are listed in Table S1.
Altogether about 85 species were represented by at least one
specimen from the type locality or its surroundings, and altogether
DNA Barcoding of Madagascan Reptiles
PLoS ONE | www.plosone.org 2 March 2012 | Volume 7 | Issue 3 | e34506
23 species were represented by sequences from type specimens
(marked in Table S1).
Lab methodsSpecimens and samples were collected from numerous localities
in Madagascar in the years 2000–2009. Tissue samples removed
from freshly collected specimens were stored in 95–99% ethanol.
Total genomic DNA was extracted with commercial kits, we used
the NucleoSpin Tissue Kit (Macherey-Nagel, Germany) and the
Qiagen DNeasy 96 Blood & Tissue Kit (Qiagen, Germany).
We newly designed a degenerative primer pair based on
squamate mitochondrial genome sequences available in GenBank.
This primer pair amplifies the standard barcoding region
(maximal length: 664 bp) of the cytochrome oxidase I gene [46]:
RepCOI-F: 59-TNT TMT CAA CNA ACC ACA AAG A-39 and
RepCOI-R: 59-ACT TCT GGR TGK CCA AAR AAT CA-39.
The PCR protocol followed the profile of 94uC for 3 min; 40
cycles of 94uC for 40 s, 48.5uC for 30 s and 72uC for 60 s; 72uCfor 7 min, and subsequent storage at 4uC. PCR products were
visualized on ca. 1.2% agarose gel, and purified using the
NucleoFast 96 PCR Plate (Macherey-Nagel, Germany). PCR
products were sequenced bidirectionally using the same primers.
The sequencing was mainly carried out on an ABI 3130xl
automated capillary sequencer using BigDye v1.1 chemistry and
following the manufacturer’s instructions (Life Technologies,
USA). Some samples were resolved on automated sequencers by
a commercial service provider for DNA sequencing.
EvaluationSequences were assembled, aligned and checked for their
quality using the SeqScape v2.5 software (Life Technologies,
USA). Sequences of doubtful mitochondrial origin (e.g. sequences
showing suspiciously high divergence to any other COI sequence
or where internal stop codons were detected), were removed from
the final data set. We only used sequences with a length
encompassing at least 90% of the standard animal barcoding
region (i.e. at least 600 bp) as a high-quality read and based our
calculation on success rates on this yardstick. The alignment was
submitted to a test of substitution saturation [47,48] as
implemented in DAMBE v5.2.34 [49]. In addition, transitions
and transversions were plotted against Kimura 2-parameter (K2p)
divergences to visualize possible saturation at higher divergence
level. Neighbor-joining (NJ) trees based on K2p distances were
calculated using MEGA5 [50]. We also used Bayesian inference
and calculated a Bayesian consensus tree and posterior probabil-
ities supporting nodes using MrBayes v3.1.2 [51]. For the latter
analysis, the best-fit nucleotide substitution model was selected by
jModeltest [52] using AIC(c) and BIC. In the Bayesian analysis,
two parallel runs with four chains each were run for 10 million
generations. The first 60% of the trees were discarded, the
convergence of the chains was monitored by Tracer v1.5 [53]. A
maximum likelihood (ML) tree was calculated and a ML bootstrap
test with 100 replicates was performed using the DIVEIN web
server [54] that is based on PhyML v3.0 [55].
To assess the number of deep genealogical lineages in our
dataset that represent potentially undescribed species, we first
determined a threshold value of genetic divergences that typically
are found among closely related species. For this we used a
reference subset of our data with sequences of unambiguously
identified specimens. This reference set included 251 well-
delimited nominal species represented by single specimens and
belonging to eight squamate families. Psammophiid snakes, turtles
and tortoises were excluded from these analyses due to the low
number of specimens and species included. Average interspecific
genetic divergence (both K2p and p distance) was calculated in
each squamate family involved. In addition, average values of
genetic distance were calculated among all well-supported sister
species (supported by .70% bootstrap and selected based on the
initial NJ analysis) in each of those eight families. These average
divergences were then used as family-specific thresholds for
candidate species (as defined according to Vieites et al. [8]) in
the complete data set. We counted as candidate species those
unidentified lineages differentiated by a genetic divergence above
the family-specific threshold from their closest relative.
We assessed by simulations the effect of a less comprehensive
taxon sampling (only a certain proportion of species included) and
of a reduced genetic sampling (shorter DNA fragment used) on the
results. In the first test series (taxon subsampling), four times 100
random subsets of our data set were created, including 75, 50, 25,
and 10% of the species included in the original data set. In the
second test series, we aimed to evaluate the performance of the
‘‘mini-barcode’’ approach [56]. Fragments stretching over the first
100, 200, 300, and 450 bp of the barcoding region were selected,
respectively. For each subsets produced in both test series (i.e. 400
subsets in the subsampling with variable number of taxa, 4 in the
subsampling with different fragment size), NJ trees based on K2p
distances were calculated, and bootstrap analyses with 1000
replicates were carried out. The topology and bootstrap values of
these trees were then compared with the most complete NJ tree
obtained with the original data set. We checked in all trees
whether genera and families were clustered as groups and
recorded the support values of those groups. Groups with single
specimens were obviously excluded from the analysis.
One goal of DNA barcoding is to match an unidentified
sample to a certain species by comparison with existing sequences
of well-identified species. When a species-level identification is
ambiguous because of an incomplete set of references, it often is
desirable to obtain at least a reliable attribution of the non-
identified sample to a higher taxon, for example a genus. In
incomplete databases, identification tends to decrease with
increasing taxon coverage [57] but obviously with a complete
set of reference sequences of all species, identification success will
be very high. We tested the success of COI sequences to correctly
cluster with a sequence to a higher clade by selecting a number of
genera reliably known to be monophyletic from previous
phylogenetic studies. (Liopholidophis, Lygodactylus, Phelsuma, Trachy-
lepis, Uroplatus and Zonosaurus). We scored whether these genera
became non-monophyletic in COI trees at lower taxon sampling
or with shorter sequences, and whether this topology received
high support values. Non-monophyly in this case implies a wrong
genus-level assignment of at least some of the sequences and in a
tree-based approach is thus an indicator to the reliability by
which sequences of unknown identity without a clear match in a
reference database can be attributed to genus-level. Tests were
performed on the complete data set, on the ‘mini-barcode’ data
set (all sequences, 100 bp) and on 100 subsets including 10% of
the species (full sequence length). The automation of the
subsampling and the analysis of NJ trees was implemented in
an R script (Sonet & Nagy unpublished).
Results
DNA barcodes for Madagascan reptilesUsing the new primer pair, we produced COI sequences for the
majority (ca. 64%) of the Madagascan species of reptiles. Beyond
well recognizable and ‘‘established’’ species, we also included
several confirmed or unconfirmed candidate species [8] and
indicate these as ‘sp.’ or ‘aff.’.
DNA Barcoding of Madagascan Reptiles
PLoS ONE | www.plosone.org 3 March 2012 | Volume 7 | Issue 3 | e34506
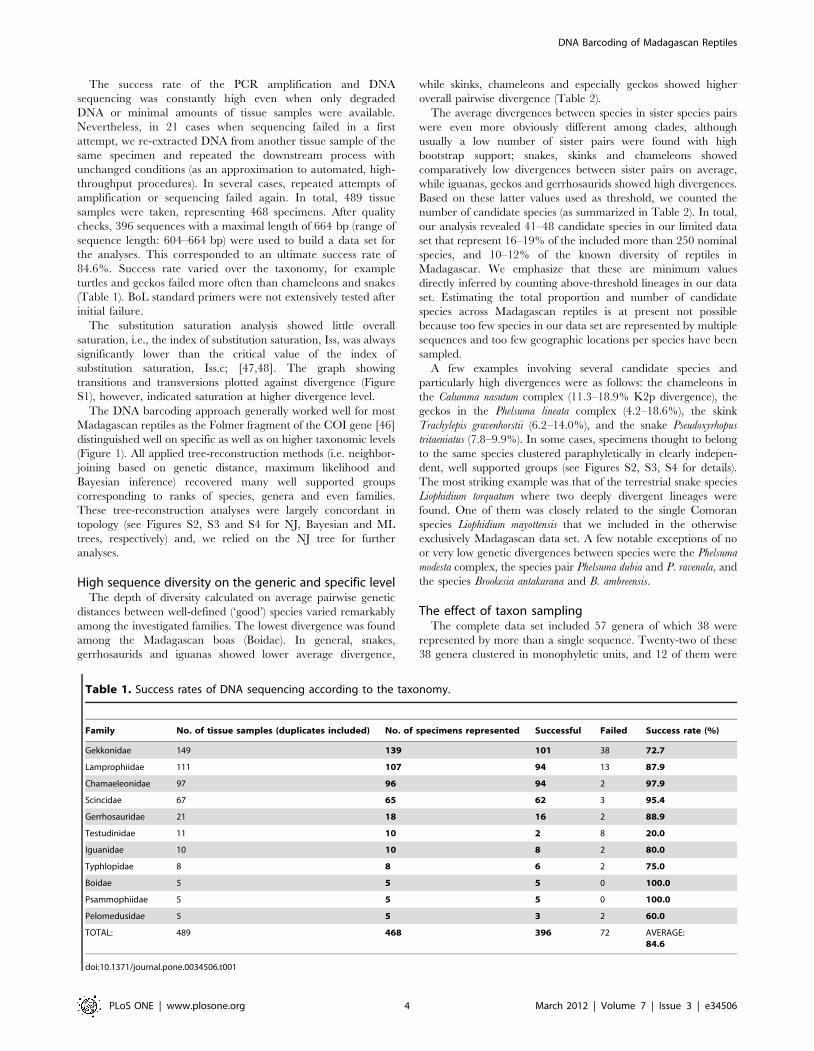
The success rate of the PCR amplification and DNA
sequencing was constantly high even when only degraded
DNA or minimal amounts of tissue samples were available.
Nevertheless, in 21 cases when sequencing failed in a first
attempt, we re-extracted DNA from another tissue sample of the
same specimen and repeated the downstream process with
unchanged conditions (as an approximation to automated, high-
throughput procedures). In several cases, repeated attempts of
amplification or sequencing failed again. In total, 489 tissue
samples were taken, representing 468 specimens. After quality
checks, 396 sequences with a maximal length of 664 bp (range of
sequence length: 604–664 bp) were used to build a data set for
the analyses. This corresponded to an ultimate success rate of
84.6%. Success rate varied over the taxonomy, for example
turtles and geckos failed more often than chameleons and snakes
(Table 1). BoL standard primers were not extensively tested after
initial failure.
The substitution saturation analysis showed little overall
saturation, i.e., the index of substitution saturation, Iss, was always
significantly lower than the critical value of the index of
substitution saturation, Iss.c; [47,48]. The graph showing
transitions and transversions plotted against divergence (Figure
S1), however, indicated saturation at higher divergence level.
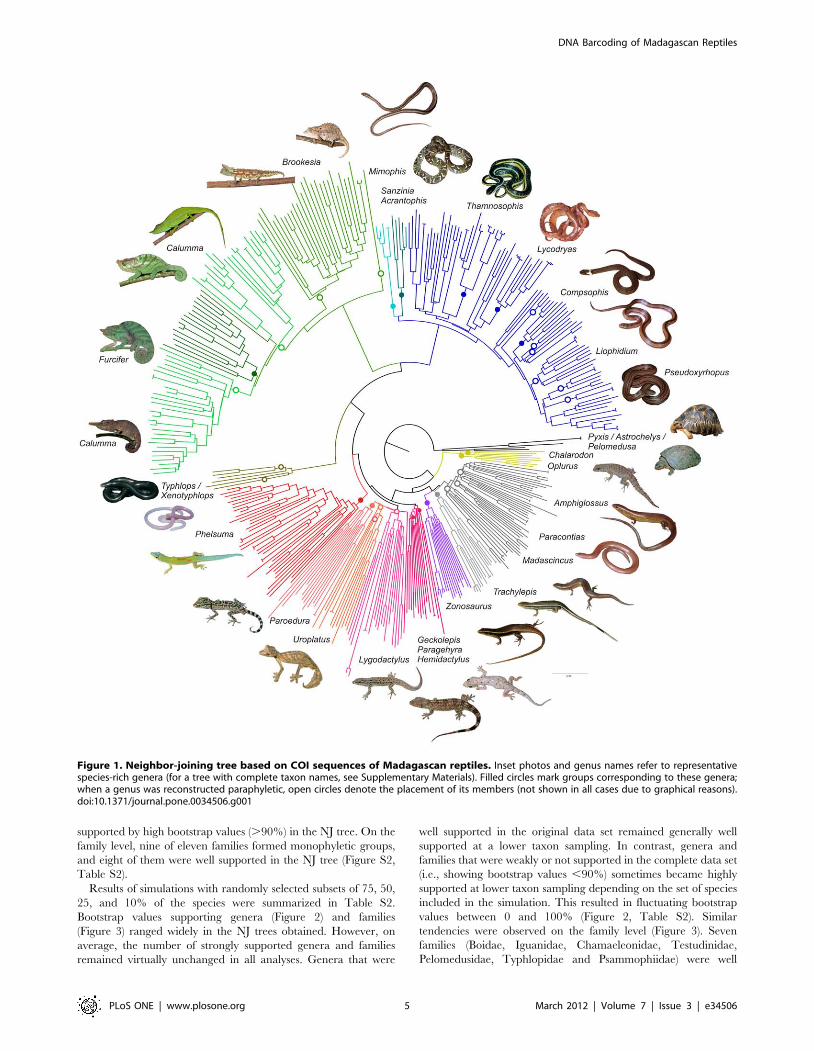
The DNA barcoding approach generally worked well for most
Madagascan reptiles as the Folmer fragment of the COI gene [46]
distinguished well on specific as well as on higher taxonomic levels
(Figure 1). All applied tree-reconstruction methods (i.e. neighbor-
joining based on genetic distance, maximum likelihood and
Bayesian inference) recovered many well supported groups
corresponding to ranks of species, genera and even families.
These tree-reconstruction analyses were largely concordant in
topology (see Figures S2, S3 and S4 for NJ, Bayesian and ML
trees, respectively) and, we relied on the NJ tree for further
analyses.
High sequence diversity on the generic and specific levelThe depth of diversity calculated on average pairwise genetic
distances between well-defined (‘good’) species varied remarkably
among the investigated families. The lowest divergence was found
among the Madagascan boas (Boidae). In general, snakes,
gerrhosaurids and iguanas showed lower average divergence,
while skinks, chameleons and especially geckos showed higher
overall pairwise divergence (Table 2).
The average divergences between species in sister species pairs
were even more obviously different among clades, although
usually a low number of sister pairs were found with high
bootstrap support; snakes, skinks and chameleons showed
comparatively low divergences between sister pairs on average,
while iguanas, geckos and gerrhosaurids showed high divergences.
Based on these latter values used as threshold, we counted the
number of candidate species (as summarized in Table 2). In total,
our analysis revealed 41–48 candidate species in our limited data
set that represent 16–19% of the included more than 250 nominal
species, and 10–12% of the known diversity of reptiles in
Madagascar. We emphasize that these are minimum values
directly inferred by counting above-threshold lineages in our data
set. Estimating the total proportion and number of candidate
species across Madagascan reptiles is at present not possible
because too few species in our data set are represented by multiple
sequences and too few geographic locations per species have been
sampled.
A few examples involving several candidate species and
particularly high divergences were as follows: the chameleons in
the Calumma nasutum complex (11.3–18.9% K2p divergence), the
geckos in the Phelsuma lineata complex (4.2–18.6%), the skink
Trachylepis gravenhorstii (6.2–14.0%), and the snake Pseudoxyrhopus
tritaeniatus (7.8–9.9%). In some cases, specimens thought to belong
to the same species clustered paraphyletically in clearly indepen-
dent, well supported groups (see Figures S2, S3, S4 for details).
The most striking example was that of the terrestrial snake species
Liophidium torquatum where two deeply divergent lineages were
found. One of them was closely related to the single Comoran
species Liophidium mayottensis that we included in the otherwise
exclusively Madagascan data set. A few notable exceptions of no
or very low genetic divergences between species were the Phelsuma
modesta complex, the species pair Phelsuma dubia and P. ravenala, and
the species Brookesia antakarana and B. ambreensis.
The effect of taxon samplingThe complete data set included 57 genera of which 38 were
represented by more than a single sequence. Twenty-two of these
38 genera clustered in monophyletic units, and 12 of them were
Table 1. Success rates of DNA sequencing according to the taxonomy.
Family No. of tissue samples (duplicates included) No. of specimens represented Successful Failed Success rate (%)
Gekkonidae 149 139 101 38 72.7
Lamprophiidae 111 107 94 13 87.9
Chamaeleonidae 97 96 94 2 97.9
Scincidae 67 65 62 3 95.4
Gerrhosauridae 21 18 16 2 88.9
Testudinidae 11 10 2 8 20.0
Iguanidae 10 10 8 2 80.0
Typhlopidae 8 8 6 2 75.0
Boidae 5 5 5 0 100.0
Psammophiidae 5 5 5 0 100.0
Pelomedusidae 5 5 3 2 60.0
TOTAL: 489 468 396 72 AVERAGE:84.6
doi:10.1371/journal.pone.0034506.t001
DNA Barcoding of Madagascan Reptiles
PLoS ONE | www.plosone.org 4 March 2012 | Volume 7 | Issue 3 | e34506
supported by high bootstrap values (.90%) in the NJ tree. On the
family level, nine of eleven families formed monophyletic groups,
and eight of them were well supported in the NJ tree (Figure S2,
Table S2).
Results of simulations with randomly selected subsets of 75, 50,
25, and 10% of the species were summarized in Table S2.
Bootstrap values supporting genera (Figure 2) and families
(Figure 3) ranged widely in the NJ trees obtained. However, on
average, the number of strongly supported genera and families
remained virtually unchanged in all analyses. Genera that were
well supported in the original data set remained generally well
supported at a lower taxon sampling. In contrast, genera and
families that were weakly or not supported in the complete data set
(i.e., showing bootstrap values ,90%) sometimes became highly
supported at lower taxon sampling depending on the set of species
included in the simulation. This resulted in fluctuating bootstrap
values between 0 and 100% (Figure 2, Table S2). Similar
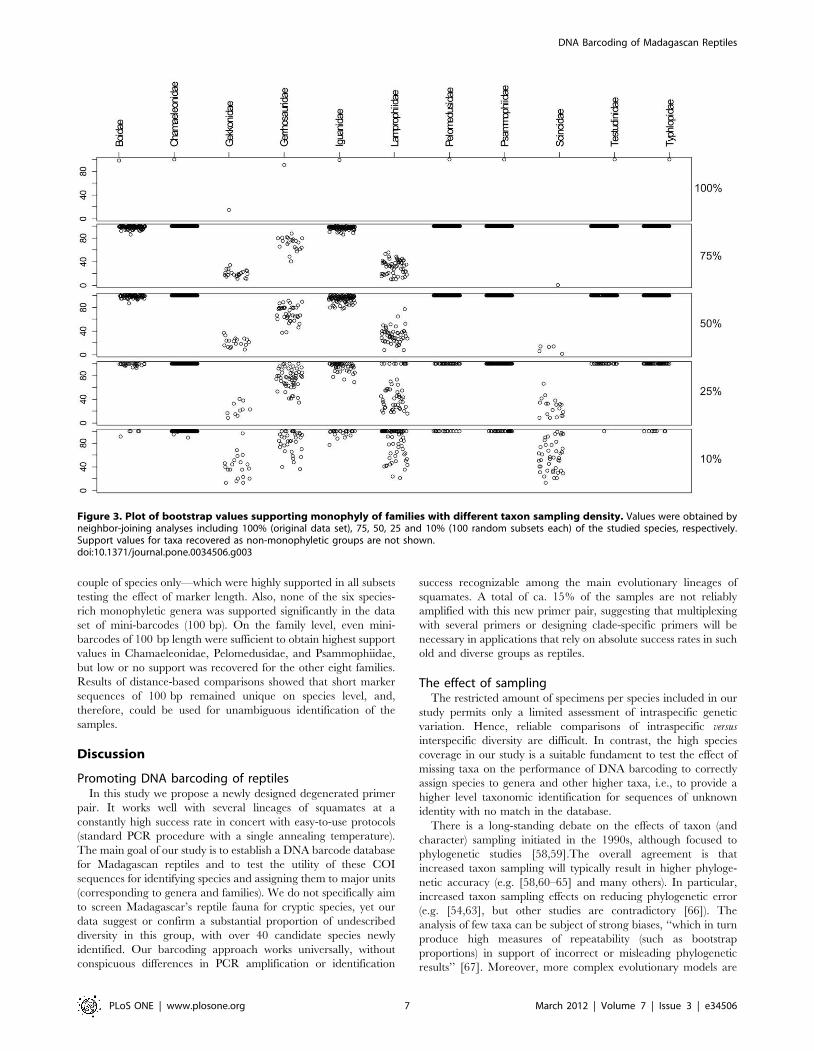
tendencies were observed on the family level (Figure 3). Seven
families (Boidae, Iguanidae, Chamaeleonidae, Testudinidae,
Pelomedusidae, Typhlopidae and Psammophiidae) were well
Figure 1. Neighbor-joining tree based on COI sequences of Madagascan reptiles. Inset photos and genus names refer to representativespecies-rich genera (for a tree with complete taxon names, see Supplementary Materials). Filled circles mark groups corresponding to these genera;when a genus was reconstructed paraphyletic, open circles denote the placement of its members (not shown in all cases due to graphical reasons).doi:10.1371/journal.pone.0034506.g001
DNA Barcoding of Madagascan Reptiles
PLoS ONE | www.plosone.org 5 March 2012 | Volume 7 | Issue 3 | e34506
supported irrespective of the depth of taxon sampling, while the
other families investigated (i.e. Lamprophiidae, Scincidae, Gekko-
nidae and Gerrhosauridae) received increasing support with
decreasing taxon sampling.
For the six species-rich genera known to be monophyletic, in
80% of the randomizations the monophyly was confirmed with
high support values.
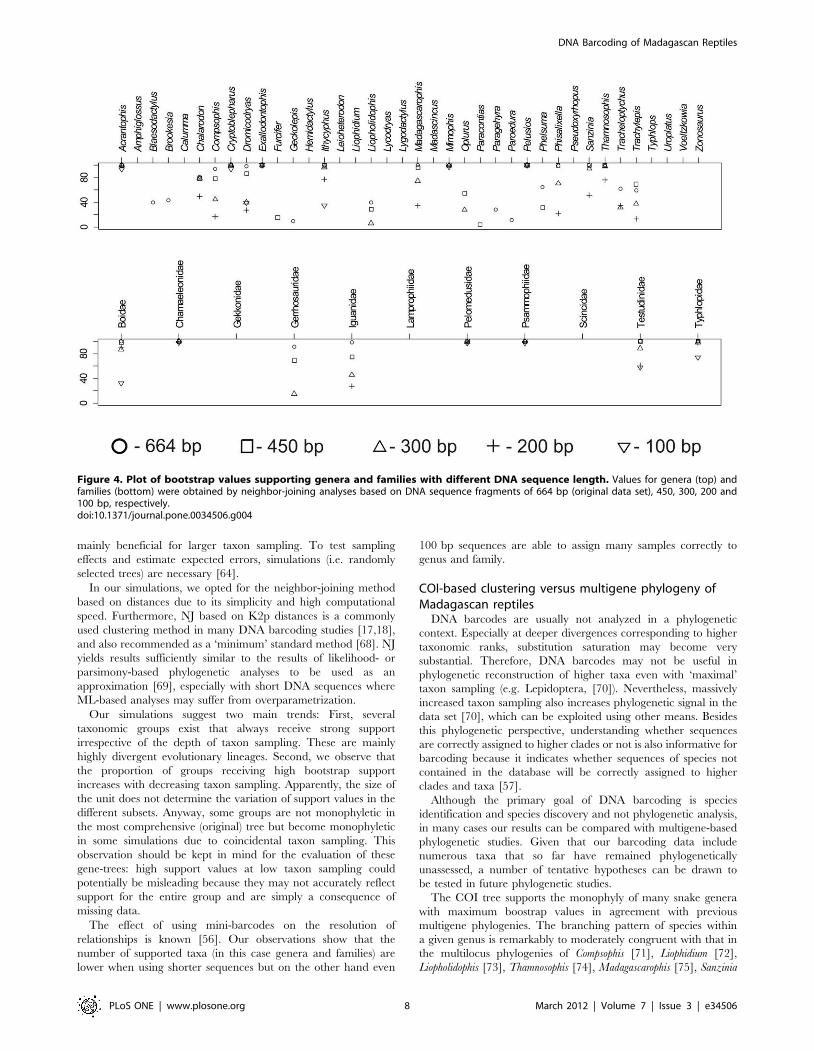
The effect of marker length – barcodes versus mini-barcodes
Neighbor-joining analyses based on shorter sequences (450,
300, 200, and 100 bp, respectively) showed that the number of
well supported groups (with bootstrap values over 90%) decreased
with shorter marker length (Figure 4), both on family- and genus-
level. A few genera were found—mostly including a single or a
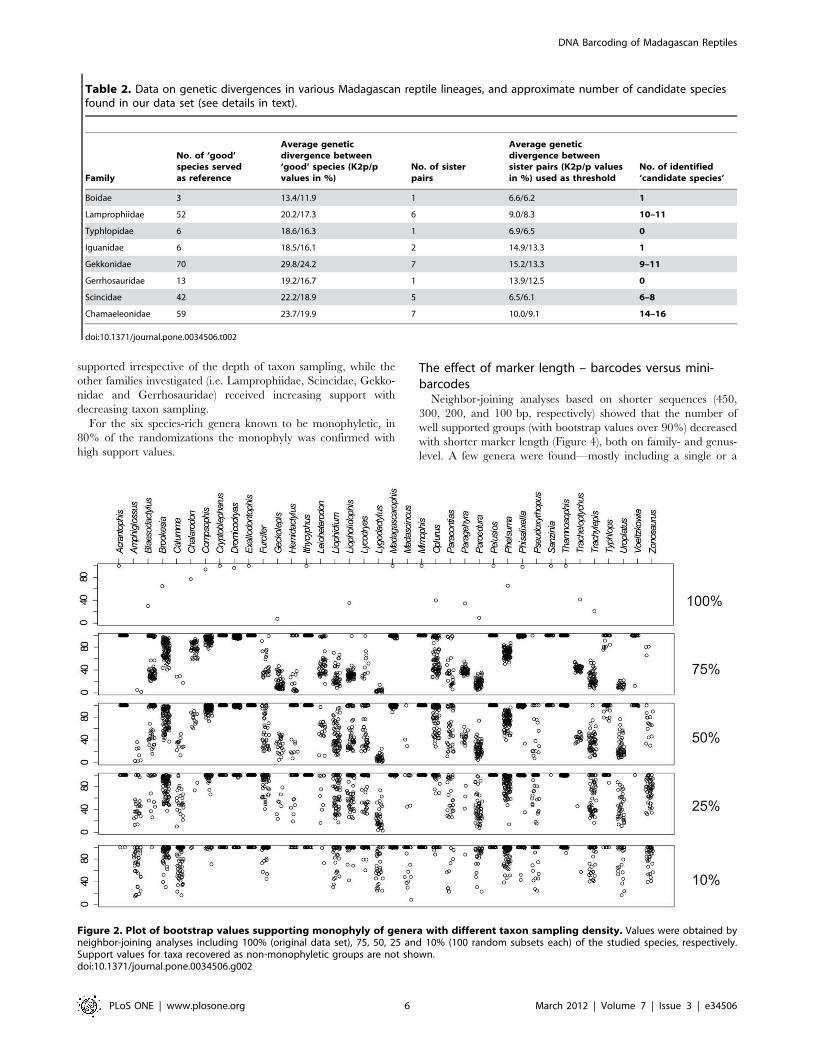
Table 2. Data on genetic divergences in various Madagascan reptile lineages, and approximate number of candidate speciesfound in our data set (see details in text).
Family
No. of ‘good’species servedas reference
Average geneticdivergence between‘good’ species (K2p/pvalues in %)
No. of sisterpairs
Average geneticdivergence betweensister pairs (K2p/p valuesin %) used as threshold
No. of identified‘candidate species’
Boidae 3 13.4/11.9 1 6.6/6.2 1
Lamprophiidae 52 20.2/17.3 6 9.0/8.3 10–11
Typhlopidae 6 18.6/16.3 1 6.9/6.5 0
Iguanidae 6 18.5/16.1 2 14.9/13.3 1
Gekkonidae 70 29.8/24.2 7 15.2/13.3 9–11
Gerrhosauridae 13 19.2/16.7 1 13.9/12.5 0
Scincidae 42 22.2/18.9 5 6.5/6.1 6–8
Chamaeleonidae 59 23.7/19.9 7 10.0/9.1 14–16
doi:10.1371/journal.pone.0034506.t002
Figure 2. Plot of bootstrap values supporting monophyly of genera with different taxon sampling density. Values were obtained byneighbor-joining analyses including 100% (original data set), 75, 50, 25 and 10% (100 random subsets each) of the studied species, respectively.Support values for taxa recovered as non-monophyletic groups are not shown.doi:10.1371/journal.pone.0034506.g002
DNA Barcoding of Madagascan Reptiles
PLoS ONE | www.plosone.org 6 March 2012 | Volume 7 | Issue 3 | e34506
couple of species only—which were highly supported in all subsets
testing the effect of marker length. Also, none of the six species-
rich monophyletic genera was supported significantly in the data
set of mini-barcodes (100 bp). On the family level, even mini-
barcodes of 100 bp length were sufficient to obtain highest support
values in Chamaeleonidae, Pelomedusidae, and Psammophiidae,
but low or no support was recovered for the other eight families.
Results of distance-based comparisons showed that short marker
sequences of 100 bp remained unique on species level, and,
therefore, could be used for unambiguous identification of the
samples.
Discussion
Promoting DNA barcoding of reptilesIn this study we propose a newly designed degenerated primer
pair. It works well with several lineages of squamates at a
constantly high success rate in concert with easy-to-use protocols
(standard PCR procedure with a single annealing temperature).
The main goal of our study is to establish a DNA barcode database
for Madagascan reptiles and to test the utility of these COI
sequences for identifying species and assigning them to major units
(corresponding to genera and families). We do not specifically aim
to screen Madagascar’s reptile fauna for cryptic species, yet our
data suggest or confirm a substantial proportion of undescribed
diversity in this group, with over 40 candidate species newly
identified. Our barcoding approach works universally, without
conspicuous differences in PCR amplification or identification
success recognizable among the main evolutionary lineages of
squamates. A total of ca. 15% of the samples are not reliably
amplified with this new primer pair, suggesting that multiplexing
with several primers or designing clade-specific primers will be
necessary in applications that rely on absolute success rates in such
old and diverse groups as reptiles.
The effect of samplingThe restricted amount of specimens per species included in our
study permits only a limited assessment of intraspecific genetic
variation. Hence, reliable comparisons of intraspecific versus
interspecific diversity are difficult. In contrast, the high species
coverage in our study is a suitable fundament to test the effect of
missing taxa on the performance of DNA barcoding to correctly
assign species to genera and other higher taxa, i.e., to provide a
higher level taxonomic identification for sequences of unknown
identity with no match in the database.
There is a long-standing debate on the effects of taxon (and
character) sampling initiated in the 1990s, although focused to
phylogenetic studies [58,59].The overall agreement is that
increased taxon sampling will typically result in higher phyloge-
netic accuracy (e.g. [58,60–65] and many others). In particular,
increased taxon sampling effects on reducing phylogenetic error
(e.g. [54,63], but other studies are contradictory [66]). The
analysis of few taxa can be subject of strong biases, ‘‘which in turn
produce high measures of repeatability (such as bootstrap
proportions) in support of incorrect or misleading phylogenetic
results’’ [67]. Moreover, more complex evolutionary models are
Figure 3. Plot of bootstrap values supporting monophyly of families with different taxon sampling density. Values were obtained byneighbor-joining analyses including 100% (original data set), 75, 50, 25 and 10% (100 random subsets each) of the studied species, respectively.Support values for taxa recovered as non-monophyletic groups are not shown.doi:10.1371/journal.pone.0034506.g003
DNA Barcoding of Madagascan Reptiles
PLoS ONE | www.plosone.org 7 March 2012 | Volume 7 | Issue 3 | e34506
mainly beneficial for larger taxon sampling. To test sampling
effects and estimate expected errors, simulations (i.e. randomly
selected trees) are necessary [64].
In our simulations, we opted for the neighbor-joining method
based on distances due to its simplicity and high computational
speed. Furthermore, NJ based on K2p distances is a commonly
used clustering method in many DNA barcoding studies [17,18],
and also recommended as a ‘minimum’ standard method [68]. NJ
yields results sufficiently similar to the results of likelihood- or
parsimony-based phylogenetic analyses to be used as an
approximation [69], especially with short DNA sequences where
ML-based analyses may suffer from overparametrization.
Our simulations suggest two main trends: First, several
taxonomic groups exist that always receive strong support
irrespective of the depth of taxon sampling. These are mainly
highly divergent evolutionary lineages. Second, we observe that
the proportion of groups receiving high bootstrap support
increases with decreasing taxon sampling. Apparently, the size of
the unit does not determine the variation of support values in the
different subsets. Anyway, some groups are not monophyletic in
the most comprehensive (original) tree but become monophyletic
in some simulations due to coincidental taxon sampling. This
observation should be kept in mind for the evaluation of these
gene-trees: high support values at low taxon sampling could
potentially be misleading because they may not accurately reflect
support for the entire group and are simply a consequence of
missing data.
The effect of using mini-barcodes on the resolution of
relationships is known [56]. Our observations show that the
number of supported taxa (in this case genera and families) are
lower when using shorter sequences but on the other hand even
100 bp sequences are able to assign many samples correctly to
genus and family.
COI-based clustering versus multigene phylogeny ofMadagascan reptiles
DNA barcodes are usually not analyzed in a phylogenetic
context. Especially at deeper divergences corresponding to higher
taxonomic ranks, substitution saturation may become very
substantial. Therefore, DNA barcodes may not be useful in
phylogenetic reconstruction of higher taxa even with ‘maximal’
taxon sampling (e.g. Lepidoptera, [70]). Nevertheless, massively
increased taxon sampling also increases phylogenetic signal in the
data set [70], which can be exploited using other means. Besides
this phylogenetic perspective, understanding whether sequences
are correctly assigned to higher clades or not is also informative for
barcoding because it indicates whether sequences of species not
contained in the database will be correctly assigned to higher
clades and taxa [57].
Although the primary goal of DNA barcoding is species
identification and species discovery and not phylogenetic analysis,
in many cases our results can be compared with multigene-based
phylogenetic studies. Given that our barcoding data include
numerous taxa that so far have remained phylogenetically
unassessed, a number of tentative hypotheses can be drawn to
be tested in future phylogenetic studies.
The COI tree supports the monophyly of many snake genera
with maximum boostrap values in agreement with previous
multigene phylogenies. The branching pattern of species within
a given genus is remarkably to moderately congruent with that in
the multilocus phylogenies of Compsophis [71], Liophidium [72],
Liopholidophis [73], Thamnosophis [74], Madagascarophis [75], Sanzinia
Figure 4. Plot of bootstrap values supporting genera and families with different DNA sequence length. Values for genera (top) andfamilies (bottom) were obtained by neighbor-joining analyses based on DNA sequence fragments of 664 bp (original data set), 450, 300, 200 and100 bp, respectively.doi:10.1371/journal.pone.0034506.g004
DNA Barcoding of Madagascan Reptiles
PLoS ONE | www.plosone.org 8 March 2012 | Volume 7 | Issue 3 | e34506
and Acrantophis [76], although a less complete sampling in several
of the multigene trees does not allow exact comparisons. The
polyphyly of the former snake genus Stenophis, only recently
resolved by recognizing three monophyletic genera (Lycodryas,
Parastenophis and Phisalixella; [77]) is also recovered, as is the
polyphyly of the snake genus Liopholidophis sensu lato, splitted in the
two monophyletic genera Liopholidophis and Thamnosophis [73]. The
genus Pseudoxyrhopus appears to be polyphyletic as well. The main
group includes Heteroliodon fohy (suggesting that this species is
perhaps just a miniaturized member of Pseudoxyrhopus, [78]), while
at least two other species (P. heterurus and P. cf. imerinae) form two
independent lineages. Unfortunately, no comprehensive multi-
locus phylogeny is available for this complex.
Regarding chameleons, the polyphyly of the genus Calumma is in
agreement with a previous study [79]. The genus Furcifer is
recovered as monophyletic except for F. balteatus which is one of
the most basal Furcifer species [79]. The dwarf chameleons of the
genus Brookesia appear as monophyletic without B. nasus which
together with B. lolontany forms the most basal Brookesia clade [80].
Among gerrhosaurids, Tracheloptychus is found to be nested within
Zonosaurus, in agreement with a paraphyletic genus Zonosaurus [81].
The most taxonomically convoluted assemblage is that of the
fossorial scincid lizards [82,83]. Our COI-based tree shows the
genera Voeltzkowia, Pygomeles and Androngo nested within Amphiglos-
sus, a result consistent with the published phylogeny [82], implying
that taxonomic changes are required. In the gecko genus Paroedura,
several sister group relationships [84] are correctly recovered by
COI sequences. Intrageneric relationships are also largely
correctly inferred among the day-geckos of the genus Phelsuma
[85]. For the leaf-tailed geckos (genus Uroplatus), we have a lower
species coverage, and therefore a comparison with a phylogenetic
study [86] is less informative. Our results on Madagascan iguanas
– genera Oplurus and Chalarodon – confirm earlier findings [87].
Summarizing we conclude that our single-gene tree is
remarkably informative in recovering shallow-level phylogenetic
relationships (i.e. correct attribution to existing families, genera,
and species groups in most cases). It also has the potential to point
to possibly non-monophyletic species (e. g. Phelsuma madagascariensis
sensu lato, P. lineata sensu lato) and genera (Amphiglossus, Brookesia,
Calumma, Zonosaurus), which are so far not resolved by morpho-
logical data sets. However, in cases when results seem to be in
conflict with current taxonomy, we suggest a taxonomic re-
assessment to confirm or redefine species boundaries. This should
be made by in-depth investigations using additional molecular
markers and morphological traits.
Utility of DNA barcodes of Madagascan reptilesSimilar to Madagascan frogs [8], taxonomy of squamates is
limping far behind the collection of specimens of candidate species
by intensive field surveys. This study now allows for a further
acceleration of the identification of candidate species, by
comparing newly obtained sequences with our database of reliably
vouchered and often topotypical sequences. DNA barcoding may
thereby play an eminent role and provide an effective and cost-
efficient tool to help understanding the diversity of reptiles of
Madagascar, although the Linnean shortfall remains. In fact, a
preliminary and often molecular-only definition of a candidate
species still requires a time-consuming species delimitation analysis
and subsequently a formal scientific description. For future surveys
of biotic diversity in Madagascar and elsewhere, we strongly
recommend the collection of tissue samples for molecular analysis
of all collected specimens. Furthermore, we suggest to use DNA
barcoding for a large-scale screening of genetic diversity especially
in groups such as the Madagascan reptiles and amphibians where
large reference sequence databases now exist ([8,88] this study).
Two major reasons might have positively influenced our
barcoding analyses. First, our comprehensive sampling includes
more than 250 nominal species. Second, the long duration of
faunal survey work in Madagascar is likely responsible for
removing many taxonomic artefacts. Such artefacts can lead to
strong and hardly reconcilable inconsistencies between barcoding
data and non-molecular data and thereby strongly reduce the
utility and resolution of DNA barcoding.
The use of DNA barcodes has significant applications for
conservation. Numerous species of reptiles from Madagascar are
highly priced in the pet trade and exported from Madagascar in
large numbers [89,90]. Many of these species are listed in the
appendices of the Convention on the International Trade of
Endangered Species (CITES) and, thus, their commerce needs to be
internationally monitored. At present, in Madagascar this applies to
all chameleons, all tortoises and most turtles, all geckos of the genera
Uroplatus and Phelsuma, Madagascan boas, and the Nile crocodile, a
total of 140 species. Other species are subjected to export quotas
from Madagascar or to recommendations to all CITES parties to
suspend imports or to import bans in some countries (such as most
species of chameleons in the European Union). Between 1985 and
2001, a total of 193,768 chameleons were legally exported from
Madagascar and many instances of illegal trade have been recorded
[89]. A reliable identification of all life stages of Madagascan reptiles
is therefore a high priority in order to set up a sustainable trade
system. Identification is not trivial given the difficulties in diagnosing
juvenile and female chameleons. For example, the high level of
morphological similarity among juveniles often confounds the
identification of species, and even genera of chameleons. Also, many
species of Phelsuma and Uroplatus are very difficult to tell
morphologically apart even as adults. Recent advances in obtaining
reliable DNA sequences from oral or cloacal swabbing [91–93]
allows almost non-invasive sampling of reptiles thereby accounting
for animal welfare. The COI database provides barcodes for about
110 of the 140 Madagascan reptiles included in CITES, and
thereby provides a solid basis for future controls of the trade via
molecular identification methods.
Supporting Information
Figure S1 Graph showing transitions and transversionsplotted against K2p divergence.
(PPT)
Figure S2 Neighbor-joining tree based on COI sequenc-es of Madagascan reptiles including specimen data.
(PDF)
Figure S3 Bayesian tree based on COI sequences ofMadagascan reptiles.
(PDF)
Figure S4 Maximum likelihood tree based on COIsequences of Madagascan reptiles.
(PDF)
Table S1 Data of specimens and samples used in thestudy.
(XLS)
Table S2 Comparison of support values (bootstrapvalues, NJ analyses) for taxonomically relevant groupsin the original data set and in simulations withsubsampling.
(DOC)
DNA Barcoding of Madagascan Reptiles
PLoS ONE | www.plosone.org 9 March 2012 | Volume 7 | Issue 3 | e34506
Acknowledgments
We are indebted to a large number of friends, colleagues and students who
have contributed to the sampling and accompanied us during field work
over the years and of which we can only name some: Franco Andreone,
Parfait Bora, Euan Edwards, Michael Franzen, Sebastian Gehring, Jorn
Kohler, Maciej Pabijan, Jim and Carol Patton, Marta Puente, Louis du
Preez, Liliane Raharivololoniaina, Emile Rajeriarison, Theo Rajoafiarison,
Roger-Daniel Randrianiaina, Jasmin Randrianirina, Ignacio de la Riva,
Axel Strauß, Meike Teschke, David R. Vieites, and Katharina C.
Wollenberg. We are grateful to the staff of Madagascar National Parks,
in particular to the local administration of Ranomafana and Analamazao-
tra-Mantadia National Parks, for continued support. MICET/ICTE
provided important logistical support. We are grateful to the Malagasy
authorities for research and export permits. This study was carried out
under collaboration accords between the Technische Universitat
Braunschweig and the Departement de Biologie Animale of the Universite
d’Antananarivo. This project ‘BarMar’ (Barcoding of Madagascan
reptiles) was carried out by the Joint Experimental Molecular Unit.
Author Contributions
Conceived and designed the experiments: ZTN MV. Performed the
experiments: ZTN GS. Analyzed the data: ZTN GS FG MV. Contributed
reagents/materials/analysis tools: ZTN GS FG MV. Wrote the paper:
ZTN GS FG MV.
References
1. Stork NE (1988) Insect diversity: facts, fiction and speculation. Biol J Linn Soc35: 321–337.
2. May RM (1990) How many species? Phil Trans R Soc B 330: 293–304.
3. Briggs JC (1994) Species diversity: Land and sea compared. Syst Biol 43:
130–135.
4. Mora C, Tittensor DP, Adl S, Simpson AGB, Worm B (2011) How many species
are there on earth and in the ocean? PLoS Biol 9: e1001127.
5. Costello MJ, Wilson S, Houlding B (in press) Predicting total global speciesrichness using rates of species description and estimates of taxonomic effort. Syst
Biol.
6. Strutzenberger P, Brehm G, Fiedler K (2011) DNA barcoding-based species
delimitation increases species count of Eois (Geometridae) moths in a well-studied tropical mountain forest by up to 50%. Insect Science 18: 349–362.
7. Lara A, Ponce de Leon JL, Rodriguez R, Casane D, Cote G, et al. (2010) DNA
barcoding of Cuban freshwater fishes: evidence for cryptic species andtaxonomic conflicts. Mol Ecol Res 10: 421–430.
8. Vieites DR, Wollenberg KC, Andreone F, Kohler J, Glaw F, et al. (2009) Vast
underestimation of Madagascar’s biodiversity evidenced by an integrative
amphibian inventory. Proc Natl Acad Sci U S A 106: 8267–8272.
9. Crawford AJ, Lips KR, Bermingham E (2010) Epidemic disease decimatesamphibian abundance, species diversity, and evolutionary history in the
highlands of central Panama. Proc Natl Acad Sci U S A 107: 13777–13782.
10. Giam X, Scheffers BR, Sodhi NS, Wilcove DS, Ceballos G, et al. (2012)
Reservoirs of richness: least disturbed tropical forests are centres of undescribedspecies diversity. Proc R Soc B 279: 67–76.
11. Chapman AD (2009) Numbers of living species in Australia and the world.
Report for the Australian Biological Resources Study, Australian BiologicalResources Study, Canberra.
12. ION (2011) Index of Organism Names. Available: http://www.organismnames.
com/metrics.htm?page = graphs. Accessed 2011 Aug 25.
13. Carbayo F, Marques AC (2011) The costs of describing the entire animal
kingdom. Trends Ecol Evol 26: 154–155.
14. Brown JH, Lomolino MV (1998) Biogeography. Sunderland, Massachusetts:Sinauer Associates. 691 p.
15. Hoagland KE (1996) The taxonomic impediment and the Convention of
Biodiversity. Assoc Syst Collect Newsl 24: 61–62, 66–67.
16. Hebert PDN, Cywinska A, Ball SL, deWaard JR (2003) Biological identifications
through DNA barcodes. Proc R Soc B 270: 313–321.
17. Hajibabaei M, Singer GAC, Hebert PDN, Hickey DA (2007) DNA barcoding:how it complements taxonomy, molecular phylogenetics and population
genetics. Trends Genet 23: 167–172.
18. Ratnasingham S, Hebert PDN (2007) BOLD: The Barcode of Life Data System
(www.barcodinglife.org). Mol Ecol Notes 7: 355–364.
19. Goldstein PZ, DeSalle R (2010) Integrating DNA barcode data and taxonomicpractice: Determination, discovery, and description. Bioessays 33: 135–147.
20. Stackebrandt E, Goebel BM (1994) Taxonomic note: a place for DNA-DNA
reassociation and 16 S rRNA sequence analysis in the present species definitionin bacteriology. Int J Syst Bacteriol 44: 846–849.
21. Hebert PDN, Stoeckle MY, Zemlak TS, Francis CM (2004) Identification ofbirds through DNA barcodes. PLoS Biol 2: 1657–1663.
22. Kerr KCR, Stoeckle MY, Dove CJ, Weigt LA, Francis CM, et al. (2007)
Comprehensive DNA barcode coverage of North American birds. Mol EcolNotes 7: 535–543.
23. Ward RD, Zemlak TS, Innes BH, Last PR, Hebert PDN (2005) DNA barcoding
Australia’s fish species. Phil Trans R Soc B 360: 1847–1857.
24. Barrett RDH, Hebert PDN (2005) Identifying spiders through DNA barcodes.
Can J Zool 83: 481–491.
25. Hajibabaei M, Janzen DH, Burns JM, Hallwachs W, Hebert PDN (2006) DNAbarcodes distinguish species of tropical Lepidoptera. Proc Natl Acad Sci U S A
103: 968–971.
26. Elias M, Hill RI, Willmott KR, Dasmahapatra KK, Brower AVZ, et al. (2007)
Limited performance of DNA barcoding in a diverse community of tropicalbutterflies. Proc R Soc B 274: 2881–2889.
27. Hausmann A, Haszprunar G, Hebert PDN (2011) DNA Barcoding the
geometrid fauna of Bavaria (Lepidoptera): Successes, surprises, and questions.PLoS ONE 6: e17134.
28. Grant RA, Linse K (2009) Barcoding antarctic biodiversity; current status andthe CAML initiative, a case study of marine invertebrates. Polar Biol 32:
1629–1637.
29. Park DS, Foottit R, Maw E, Hebert PDN (2011) Barcoding bugs: DNA-based
identification of the true bugs (Insecta: Hemiptera: Heteroptera). PLoS ONE 6:e18749.
30. Smith MA, Fisher BL, Hebert PDN (2005) DNA barcoding for effective
biodiversity assessment of a hyperdiverse arthropod group: the ants ofMadagascar. Phil Trans R Soc B 360: 1825–1834.
31. Hebert PDN, Penton EH, Burns JM, Janzen DH, Hallwachs W (2004) Tenspecies in one: DNA barcoding reveals cryptic species in the neotropical skipper
butterfly Astraptes fulgerator. Proc Natl Acad Sci U S A 101: 14812–14817.
32. Brower AVZ (2006) Problems with DNA barcodes for species delimitation: ‘ten
species’ of Astraptes fulgerator reassessed (Lepidoptera: Hesperiidae). Syst Biodiv 4:127–132.
33. Witt JDS, Threloff DL, Hebert PDN (2006) DNA barcoding reveals
extraordinary cryptic diversity in an amphipod genus: implications for desertspring conservation. Mol Ecol 15: 3073–3082.
34. Havermans C, Nagy ZT, Sonet G, De Broyer C, Martin P (2011) DNAbarcoding reveals new insights into the diversity of Antarctic species of Orchomene
sensu lato (Crustacea: Amphipoda: Lysianassoidea). Deep Sea Res II 58: 230–241.
35. Ekrem T, Willassen E, Stur E (2007) A comprehensive DNA sequence library isessential for identification with DNA barcodes. Mol Phylogenet Evol 43:
530–542.
36. Ward RD, Hanner R, Hebert PDN (2009) The campaign to DNA barcode all
fishes, FISH-BOL. J Fish Biol 74: 329–356.
37. Che J, Chen HM, Yang JX, Jin JQ, Jiang K, et al. (2012) Universal COI primersfor DNA barcoding amphibians. Mol Ecol Resourin press.
38. Vences M, Thomas M, van der Meijden A, Chiari Y, Vieites DR (2005)Comparative performance of the 16 S rRNA gene in DNA barcoding of
amphibians. Frontiers Zool 2: 5.
39. Smith MA, Poyarkov NA, Jr., Hebert PDN (2008) CO1 DNA barcodingamphibians: take the chance, meet the challenge. Mol Ecol Res 8: 235–246.
40. Vences M, Nagy ZT, Sonet G, Verheyen E (in press) DNA barcoding ofamphibians and reptiles. In: Kress WJ, Erickson DL, eds. DNA barcodes:
Methods and protocols. Berlin: Humana Press, Springer Science+PublishingMedia.
41. Myers N, Mittermeier RA, Mittermeier CG, da Fonseca GAB, Kent J (2000)Biodiversity hotspots for conservation priorities. Nature 403: 853–858.
42. Vences M, Wollenberg KC, Vieites DR, Lees DC (2009) Madagascar as a model
region of species diversification. Trends Ecol Evol 24: 456–465.
43. Yoder AD, Nowak MD (2006) Has vicariance or dispersal been the predominant
biogeographic force in Madagascar? Only time will tell. Ann Rev Ecol Evol Syst37: 405–431.
44. Glaw F, Vences M (2007) A field guide to the amphibians and reptiles of
Madagascar. 3rd edition. Cologne: Vences and Glaw Publishers. 495 p.
45. Vences M (2004) Origin of Madagascar’s extant fauna: a perspective from
amphibians, reptiles and other non-flying vertebrates. Ital J Zool Suppl 2:217–228.
46. Folmer O, Black M, Hoeh W, Lutz R, Vrijenhoek R (1994) DNA primers for
amplification of mitochondrial cytochrome c oxidase subunit I from diversemetazoan invertebrates. Mol Mar Biol Biotech 3: 294–299.
47. Xia X, Xie Z, Salemi M, Chen L, Wang Y (2003) An index of substitutionsaturation and its application. Mol Phylogenet Evol 26: 1–7.
48. Xia X, Lemey P (2009) Assessing substitution saturation with DAMBE. In:
Lemey P, Salemi M, Vandamme AM, eds. The Phylogenetichandbook: A practical approach to DNA and protein phylogeny, 2nd edition
Cambridge University Press. pp 615–630.
49. Xia X, Xie Z (2001) DAMBE: Data analysis in molecular biology and evolution.
J Hered 92: 371–373.
50. Tamura K, Peterson D, Peterson N, Stecher G, Nei M, et al. (2011) MEGA5:
Molecular Evolutionary Genetics Analysis using maximum likelihood, evolu-tionary distance, and maximum parsimony methods. Mol Biol Evol 28:
2731–2739.
51. Ronquist F, Huelsenbeck JP (2003) MrBayes 3: Bayesian phylogenetic inferenceunder mixed models. Bioinformatics 19: 1572–1574.
DNA Barcoding of Madagascan Reptiles
PLoS ONE | www.plosone.org 10 March 2012 | Volume 7 | Issue 3 | e34506
52. Posada D (2008) jModelTest: Phylogenetic model averaging. Mol Biol Evol 25:
1253–1256.53. Rambaut A, Drummond AJ (2009) Tracer v1.5. Available: http://beast.bio.ed.
ac.uk/Tracer. Accessed 2012 Jan 26.
54. Deng W, Maust BS, Nickle DC, Learn GH, Liu Y, et al. (2010) DIVEIN: a webserver to analyze phylogenies, sequence divergence, diversity, and informative
sites. BioTechniques 48: 405–408.55. Guindon S, Dufayard JF, Lefort V, Anisimova M, Hordijk W, et al. (2010) New
algorithms and methods to estimate maximum-likelihood phylogenies: assessing
the performance of PhyML 3.0. Syst Biol 59: 307–321.56. Meusnier I, Singer GAC, Landry JF, Hickey DA, Hebert PDN, et al. (2008) A
universal DNA mini-barcode for biodiversity analysis. BMC Genomics 9: 214.57. Virgilio M, Backeljau T, Nevado B, De Meyer M (2010) Comparative
performances of DNA barcoding across insect orders. BMC Bioinformatics11: e206.
58. Hillis DM (1996) Inferring complex phylogenies. Nature 383: 130–131.
59. Kim J (1996) General inconsistency conditions for maximum parsimony: Effectsof branch lengths and increasing numbers of taxa. Syst Biol 45: 363–374.
60. Graybeal A (1998) Is it better to add taxa or characters to a difficult phylogeneticproblem? Syst Biol 47: 9–17.
61. Hillis DM (1998) Taxonomic sampling, phylogenetic accuracy, and investigator
bias. Syst Biol 47: 3–8.62. Rannala B, Huelsenbeck JP, Yang Z, Nielsen R (1998) Taxon sampling and the
accuracy of large phylogenies. Syst Biol 47: 702–710.63. Pollock DD, Zwickl DJ, McGuire JA, Hillis DM (2002) Increased taxon
sampling is advantageous for phylogenetic inference. Syst Biol 51: 664–671.64. Zwickl DJ, Hillis DM (2002) Increased taxon sampling greatly reduces
phylogenetic error. Syst Biol 51: 588–598.
65. Hillis DM, Pollock DD, McGuire JA, Zwickl DJ (2003) Is sparse taxon samplinga problem for phylogenetic inference? Syst Biol 52: 124–126.
66. Rosenberg MS, Kumar S (2001) Incomplete taxon sampling is not a problem forphylogenetic inference. Proc Natl Acad Sci U S A 98: 10751–10756.
67. Heath TA, 1 Zwickl DJ, Kim J, Hillis DM (2008) Taxon sampling affects
inferences of macroevolutionary processes from phylogenetic trees. Syst Biol 57:160–166.
68. St John K, Warnow T, Moret B, Vawter L (2003) Performance study ofphylogenetic methods: (unweighted) quartet methods and neighbor-joining.
J Algorithms 48: 173–193.69. Roch S (2010) Toward extracting all phylogenetic information from matrices of
evolutionary distances. Science 327: 1376–1379.
70. Wilson JJ (2011) Assessing the value of DNA barcodes for molecularphylogenetics: Effect of increased taxon sampling in Lepidoptera. PLoS ONE
6: e24769.71. Glaw F, Nagy ZT, Vences M (2007) Phylogenetic relationships and classification
of the Malagasy pseudoxyrhophiine snake genera Geodipsas and Compsophis based
on morphological and molecular data. Zootaxa 1517: 53–62.72. Vieites DR, Ratsoavina FM, Randrianiaina RD, Nagy ZT, Glaw F, et al. (2010)
A rhapsody of colours from Madagascar: discovery of a remarkable new snake ofthe genus Liophidium and its phylogenetic relationships. Salamandra 46: 1–10.
73. Glaw F, Nagy ZT, Franzen M, Vences M (2007) Molecular phylogeny andsystematics of the pseudoxyrhophiine snake genus Liopholidophis (Reptilia,
Colubridae): evolution of its exceptional sexual dimorphism and descriptions
of new taxa. Zool Scripta 36: 291–300.74. Glaw F, Nagy ZT, Kohler J, Franzen M, Vences M (2009) Phylogenetic
relationships of a new species of pseudoxyrhophiine snake (Reptilia: Lampro-phiidae: Thamnosophis) suggest a biogeographical link between western and
northern Madagascar. Org Divers Evol 9: 13–22.
75. Nagy ZT, Glaw F, Andreone F, Wink M, Vences M (2007) Species boundaries
in Malagasy snakes of the genus Madagascarophis (Serpentes: Colubridae sensu
lato) assessed by nuclear and mitochondrial markers. Org Divers Evol 7:
241–251.
76. Orozco-terWengel P, Nagy ZT, Vieites DR, Vences M, Louis E, Jr. (2008)
Phylogeography and phylogenetic relationships of Malagasy tree and ground
boas. Biol J Linn Soc 95: 640–652.
77. Nagy ZT, Glaw F, Vences M (2010) Systematics of the snake genera Stenophis
and Lycodryas from Madagascar and the Comoros. Zool Scripta 39: 426–435.
78. Nagy ZT, Joger U, Wink M, Glaw F, Vences M (2003) Multiple colonization of
Madagascar and Socotra by colubrid snakes: evidence from nuclear and
mitochondrial gene phylogenies. Proc R Soc B 270: 2613–2621.
79. Townsend TM, Tolley KA, Glaw F, Bohme W, Vences M (2011) Eastward from
Africa: palaeocurrent-mediated chameleon dispersal to the Seychelles islands.
Biol Letters 7: 225–228.
80. Townsend TM, Vieites DR, Glaw F, Vences M (2009) Testing species-level
diversification hypotheses in Madagascar: the case of microendemic Brookesia leaf
chameleons. Syst Biol 58: 641–656.
81. Raselimanana AP, Noonan B, Karanth KP, Gauthier J, Yoder AD (2009)
Phylogeny and evolution of Malagasy plated lizards. Mol Phylogenet Evol 50:
336–344.
82. Crottini A, Dordel J, Kohler J, Glaw F, Schmitz A, et al. (2009) A multilocus
phylogeny of Malagasy scincid lizards elucidates the relationships of the fossorial
genera Androngo and Cryptoscincus. Mol Phylogenet Evol 53: 345–350.
83. Kohler J, Vences M, Erbacher M, Glaw F (2010) Systematics of limbless scincid
lizards from northern Madagascar: morphology, phylogenetic relationships and
implications for classification (Squamata: Scincidae). Org Divers Evol 10:
147–159.
84. Jackman TR, Bauer AM, Greenbaum E, Glaw F, Vences M (2008) Molecular
phylogenetic relationships among species of the Malagasy-Comoran gecko genus
Paroedura (Squamata: Gekkonidae). Mol Phylogenet Evol 46: 74–81.
85. Rocha S, Vences M, Glaw F, Posada D, Harris DJ (2009) Multigene phylogeny
of Malagasy day geckos of the genus Phelsuma. Mol Phylogenet Evol 52:
530–537.
86. Greenbaum E, Bauer AM, Jackman TR, Vences M, Glaw F (2007) A phylogeny
of the enigmatic Madagascan geckos of the genus Uroplatus (Squamata:
Gekkonidae). Zootaxa 1493: 41–51.
87. Munchenberg T, Wollenberg KC, Glaw F, Vences M (2008) Molecular
phylogeny and geographic variation of Malagasy iguanas (Oplurus and
Chalarodon). Amphibia-Reptilia 29: 319–327.
88. Wollenberg KC, Vieites DR, Glaw F, Vences M (2011) Speciation in little: the
role of range and body size in the diversification of Malagasy mantellid frogs.
BMC Evol Biol 11: 217.
89. Carpenter AI, Robson O, Rowcliffe JM, Watkinson AR (2005) The impacts of
international and national governance changes on a traded resource: a case
study of Madagascar and its chameleon trade. Biol Cons 123: 279–287.
90. Todd M (2011) Trade in Malagasy reptiles and amphibians in Thailand.
TRAFFIC Southeast Asia, Petaling Jaya, Selangor, Malaysia. 30 p.
91. Miller HC (2006) Cloacal and buccal swabs are a reliable source of DNA for
microsatellite genotyping of reptiles. Cons Genet 7: 1001–1003.
92. Beebee TJC (2008) Buccal swabbing as a source of DNA from squamate reptiles.
Cons Genet 9: 1087–1088.
93. Schulte U, Gebhard F, Heinz L, Veith M, Hochkirch A (2011) Buccal swabs as a
reliable non-invasive tissue sampling method for DNA analysis in the lacertid
lizard Podarcis muralis. North-West J Zool 7: 325–328.
DNA Barcoding of Madagascan Reptiles
PLoS ONE | www.plosone.org 11 March 2012 | Volume 7 | Issue 3 | e34506