final 2018/19 annual report - waterberg district municipality
TRANSCRIPT
1
WATERBERG DISTRICT MUNICIPALITY
FINAL 2018/19 ANNUAL REPORT
2
Table of Contents
CHAPTER 1 –EXECUTIVE MAYOR FOREWORD AND EXECUTIVE SUMMARY ................................................................................. 4
1.1 COMPONENT A – EXECUTIVE MAYOR‘S FOREWORD ...................................................................................................... 4
1.2 COMPONENT B- EXECUTIVE SUMMARY – MUNICIPAL MANAGER’S OVERVIEW ............................................................ 5
1.1. MUNICIPAL FUNCTION, POPULATION AND ENVIRONMENT OVERVIEW ......................................................................... 6
2. CHAPTER 2 ....................................................................................................................................................................... 11
2.1 COMPONENT A-POLITICAL AND ADMINISTRATIVE GOVERNANCE ............................................................................... 11
2.2 COMPONENT B-INTER-GOVERNMENTAL RELATIONS (IGR) .......................................................................................... 18
2.3 COMPONENT C-PUBLIC ACCOUNTABILITY AND PARTICIPATION .................................................................................. 18
2.4 COMPONENT D- CORPORATIVE GOVERNANCE OVERVIEW .......................................................................................... 19
3. CHAPTER 3-BASIC SERVICES DELIVERY (PERFORMANCE REPORT) .................................................................................... 21
3.1 COMPONENT A-BASIC SERVICE .................................................................................................................................... 21
3.2 COMPONENT B-TRANSPORT (INCLUDING VEHICLES LICENCING & PUBLIC BUS OPERATIONS ...................................... 21
3.3 COMPONENT C-PLANNING AND DEVELOPMENT ......................................................................................................... 22
3.4 COMPONENT D- MUNICIPAL SERVICES ........................................................................................................................ 25
3.5 COMPONENT E- ENVIRONMENTAL PROTECTION (MANAGEMENT) .............................................................................. 27
3.6 COMPONENT F- HEALTH INSPECTION, FOOD AND ABATTOIR LICENSING AND INSPECTION......................................... 29
3.7 COMPONENT G-SECURITY AND SAFETY ....................................................................................................................... 31
3.8 COMPONENT H- SPORTS AND RECREATION ................................................................................................................. 33
3.9 COMPONENT I- CORPORATE POLICY, OFFICES AND OTHER OFFICES ............................................................................ 35
3.10 COMPONENT J- MISCELLANEOUS ................................................................................................................................ 46
3.11 COMPONENT K-ORGANISATIONAL PERFORMANCE SCORE-CARD ................................................................................ 49
4. EXTERNAL SERVICE PROVIDERS ........................................................................................................................................ 53
5. OTHER EXTERNAL SERVICE PROVIDERS (TOP TEN) ........................................................................................................... 54
6. CHAPTER 4 ....................................................................................................................................................................... 56
6.1 COMPONENT A –INTRODUCTION TO THE MUNICIPAL PERSONNEL ................................................................... 56
6.2 COMPONENT B-MANAGING THE MUNICIPAL WORKFORCE ................................................................................. 56
6.3 COMPONENT C-CAPACITATING THE MUNICIPAL WORKFORCE .......................................................................... 59
6.4 COMPONENT D-MANAGING THE WORKFORCE EXPENDITURE ........................................................................... 60
7. CHAPTER 5- STATEMENT OF FINANCIAL PERFORMANCE .................................................................................................. 61
8. CHAPTER 6-AUDITOR GENERAL OPINION OF FINANCIAL STATEMENTS ............................................................................ 69
GLOSSARY .............................................................................................................................................................................. 110
APPENDICES ........................................................................................................................................................................... 112
APPENDICES ........................................................................................................................................................................... 113
APPENDIX B – COMMITTEES & COMMITTEE PURPOSES ......................................................................................................... 118
APPENDIX C– THIRD TIER ADMINISTRATIVE STRUCTURE ........................................................................................................ 118
APPENDIX D– FUNCTIONS OF MUNICIPALITY/ENTITY............................................................................................................. 118
3
APPENDIX E–WARD REPORTING ............................................................................................................................................. 120
APPENDIX F1- WARD INFORMATION ...................................................................................................................................... 120
APPENDIX F2- BASIC SERVICE PROVISION ............................................................................................................................... 120
APPENDIX F3- TOP FOUR SERVICE DELIVERY PRIORITY IN A WARD ........................................................................................ 120
APPENDIX G- RECOMMENDATIONS OF THE MUNICIPAL AUDIT COMMITTEE 2018/19 ........................................................... 121
APPENDIX H – LONG TERM CONTRACTS AND PUBLIC PRIVATE PARTNERSHIP ........................................................................ 122
APPENDIX J- DISCLOSURE OF FINANCIAL INTEREST ................................................................................................................ 124
APPENDIX K- REVENUE COLLECTION PERFORMANCE BY VOTE AND BY SOURCE .................................................................... 127
APPENDIX K (II) – REVENUE COLLECTION PERFORMANCE BY SOURCE .................................................................................... 127
APPENDIX L – CONDITIONAL GRANTS RECEIVED: EXCLUDING MIG......................................................................................... 127
APPENDIX M- CAPITAL EXPENDITURE – NEW & UPGRADE/ RENEWAL PROGRAMMES .......................................................... 127
APPENDIX M – CAPITAL EXPENDITURE – NEW ASSETS PROGRAMME .................................................................................... 127
APPENDIX N –CAPITAL PROGRAMME BY PROJECT 2018/19 ................................................................................................... 127
APPENDIX O - CAPITAL PROJECT BY WARD 2018/19 ............................................................................................................... 127
APPENDIX P – SERVICES CONNECTION BACKLOGS AT SCHOOLS AND CLINICS ........................................................................ 128
APPENDIX Q – SERVICE BACKLOGS EXPERIENCED BY THE COMMUNITY WHERE ANOTHER SPHERE OF GOVERNMENT IS
RESPONSIBLE FOR SERVICE PROVISION .................................................................................................................................. 128
APPENDIX R –DECLARATION OF LOAN AND GRANTS MADE BY THE MUNICIPALITY ............................................................... 129
APPENDIX S – DECLARATION OF RETURN NOT MADE IN DUE TIME UNDER MFMA S71 ......................................................... 129
APPENDIX T PRESIDENTIAL OUTCOME FOR LOCAL GOVERNMENT ......................................................................................... 129
APPENDIX U - AUDITED ANNUAL FINANCIAL STATEMENTS 2018/2019 .................................................................................. 129
4
CHAPTER 1 –EXECUTIVE MAYOR FOREWORD AND EXECUTIVE SUMMARY
1.1 COMPONENT A – EXECUTIVE MAYOR‘S FOREWORD
(a) Vision
“To be the energy hub and eco-tourism destination in Southern Africa”.
(b) Mission
“ To invest in a constituency of talented human capital who are motivated and innovative to build a sustainable economy in the field of energy, minerals and
eco-tourism for the benefit of all our communities “
It gives pleasure to present the Annual Report of the Waterberg District Municipality for the 208/19 Financial Year. The
period under review has presented opportunities outweigh by our challenges. The fact that the Waterberg District
Municipality is a category C1 municipality remain to out pose financial sustainability threads to the district.
Major planned service delivery projects continue to be compromised due to the municipality`s severe budgetary
constraints. As the new financial year is about to unfold, our effectiveness and relevance will be put to test by way of
transforming our plans as enshrined in the Integrated Development Plan (IDP) to correspond directly with the resources
at our disposal and respond directly to quantifiable deliverables that will have an impact to our communities.
This can easily be achieved if we are all effective in discharging our responsibilities and strengthening oversight roles to
ensure good governance and financial management.
Waterberg District Municipality is determined to reinforce its Performance Management System in order to regain the
attainment of the Clean Audit in the 2019/2020 financial year. The district has consistently received Qualified Audit
Opinions in the past two consecutive financial years. Through the introduction of new management, hard work and
dedication, the opinion was able to migrate from Qualified to Unqualified for the Financial Year 2018/19.
We however remain committed to our resolve to migrate further from Unqualified to the Clean Audit in the next audit
period. We are convinced that with the active role played by our Management, Council and Oversight Committees, our
target will be easily achieved.
Immense gratitude should be given to the entire leadership of the Waterberg District Municipality for the unity,
cooperation and commitment demonstrated throughout the financial year. The determination displayed by Management
and the work force in general is truly appreciated.
Our special sincere appreciation is extended to our communities for their continued support and understanding.
The year ahead is full of many opportunities to explore as we strive to ensure that quality services that will bring dignity
are delivered to our communities.
Together will take our district to greater heights.
_____________________
S.M Mataboge Executive Mayor
5
1.2 Component B- Executive summary – Municipal Manager’s Overview
Waterberg District Municipality was one of the fewest municipalities in the Limpopo Province to achieve the Unqualified
audit Outcome after the poor Qualification received in the prior year which achievement is remarkable in itself. Its
Integrated Development Plan (IDP) has for the past four years in the 2016 -2021 Term of council being highly credible
and its Service Delivery Budget and Implementation Plan has matured over the years.
Management and leadership have succeeded to produce credible strategic documents over the years. The most critical
challenge is successful implementation of its strategic document namely the IDP. The two Departments namely
Corporate Support and Shared Services and the Office of the Executive Mayor were outstanding in 2018/19 in
implementing their projects in the year under review.
The Oversight committees of the institution were functional namely : Municipal Public Accounts Committee( MPAC), and
the functioning of the Audit Committee have assisted the municipality to strengthen its oversight role- which role is able
to achieve the Unqualified Audit outcome. The establishment of the Financial Misconduct Board (FMB) has also
assisted the municipality do deal with the Unauthorised, irregular, fruitless and Wasteful (UIFW) expenditure which the
municipality was uncaring over the years.
Having regard to the developmental nature of the local government, the municipality has continued to put premium
value on public participation. The views of the stakeholders are and will always be important. Public Participation was
just more than listening and it was effecting changes to IDP when a call was made. It is always important to frequently
keep the community abreast of the performance of the municipality against its targets.
___________________ M.Z Namate
Acting Municipal Manager
6
1.1. Municipal Function, Population and Environment Overview
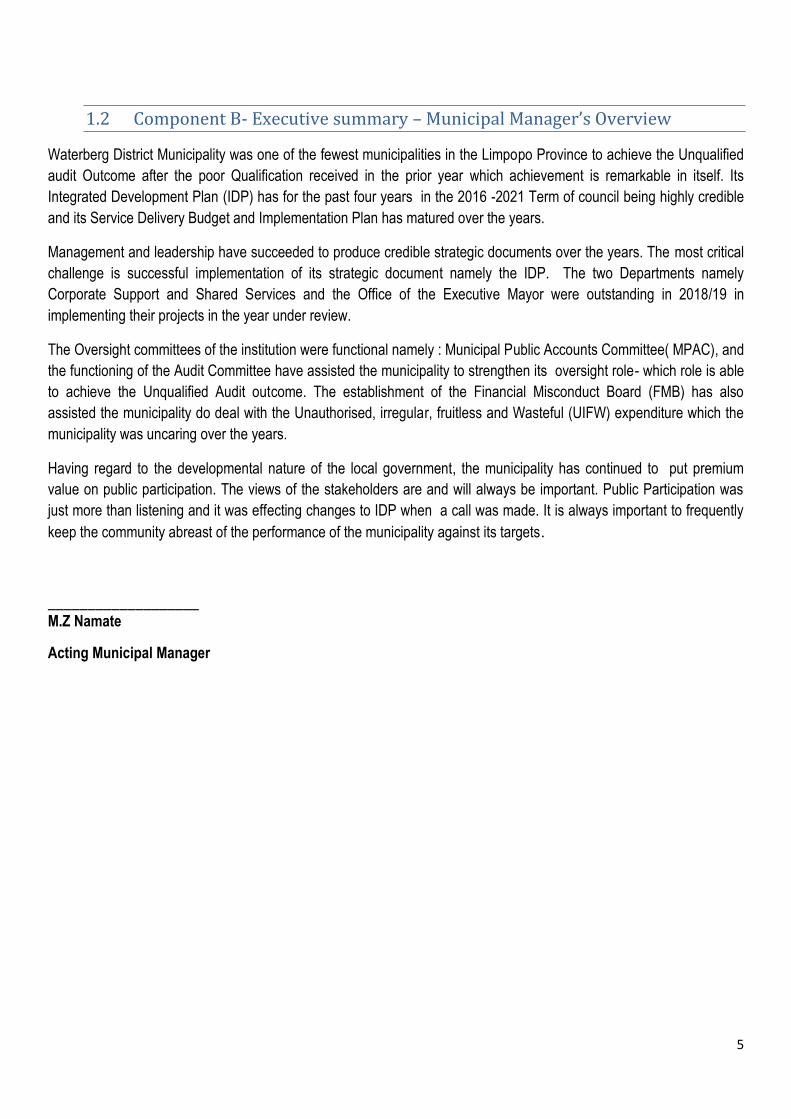
The Waterberg District Municipality is a Category C1 municipality located in the western part of the Limpopo
Province. The district municipality shares its borders with the Capricorn District Municipality in the north and the
Sekhukhune District Municipality in the east. The Southwestern boundary abuts the North West Province, while
the Gauteng Province lies on the Southeastern side.
The District shares its five border control points with Botswana, namely Groblersbrug, Stockpoort, Derdepoort,
Zanzibar and Platjan. Five local municipalities - Bela-Bela, Lephalale, Modimolle-Mookgophong, Mogalakwena
and Thabazimbi, make up the Waterberg District Municipality, which has a ground surface area of about 45
110km ². (District SDF)
Location of Waterberg within the Limpopo province geographical map
7
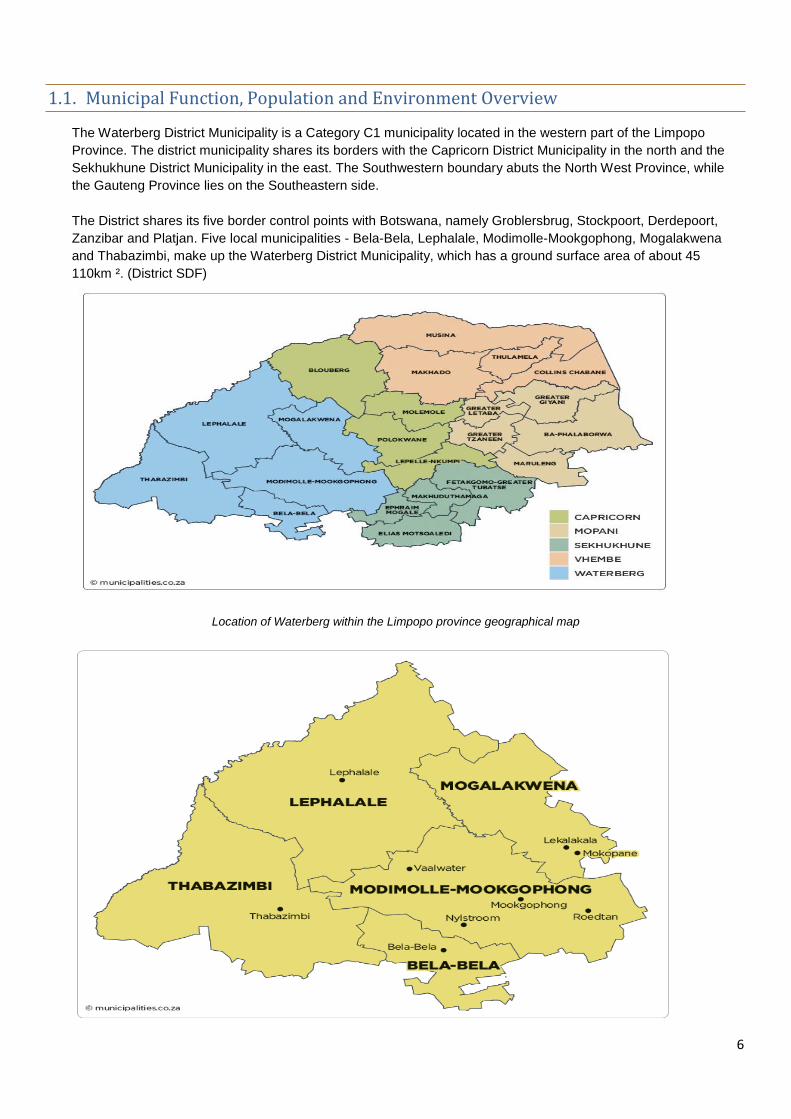
Geographical Map of the District
The District is made-up of five local municipalities - Bela-Bela, Lephalale, Modimolle-Mookgophong, Mogalakwena
and Thabazimbi as reflected in map above.
Below is the table which situate Waterberg District Municipality (WDM) within Limpopo Province as it relates to the
Province in terms of coverage per square metre and population.
Table 1: DISTRICT IN COMPARISON WITH LIMPOPO PROVINCE
Municipality Total area in km² % of total Population % of total
Waterberg 45 110 39 745757 13
Limpopo Provence 126 323 100 5 404 868 100
1.3.1 Demographics
According to the Census 2011, the population growth rate was 1, 2% over a 10 year period, and according 2016
community survey the population rate increased to 9.8%
Male Female Total 2011 Male Female Total 2016
Thabazimbi 42 773 29 072 71 845 57259 38973 96232
Lephalale 56 704 48 259 104 964 76528 60098 136626
Mookgophong 15 748 14 760 30 509 54393 53305 107698
Modimolle 30 614 29 760 60 373
Bela-Bela 28 799 27 603 56 401 38961 37335 76296
Mogalakwena 137 512 158 285 295 796 154352 174553 328905
Waterberg 312 150 307 739 619 889 381493 364264 745757
Figure1. Demographics: Census 2011 and community survey 2016
The district area is both a hot and semi-arid in nature. The rain falls mainly in January and December. There are a
number of places of which its biodiversity is a source of tourism attraction. There are Municipalities which had
been proclaimed by the Department of Environmental Affairs to be contributing to pollution within the as a result of
mining activities which had raised some environmental concerns. The District Municipality has a mandate to deal
with air quality issues. Such municipalities are as follows:
-Mogalakwena, Thabazimbi and Lephalale
1.3.2. Service Delivery Overview.
The service delivery of the municipality is mainly confined to the disaster management and firefighting services.
Unlike the other district municipalities in the Province, Waterberg District Municipality it is not a water services
authority. The 6 local municipalities are responsible for providing basic services.
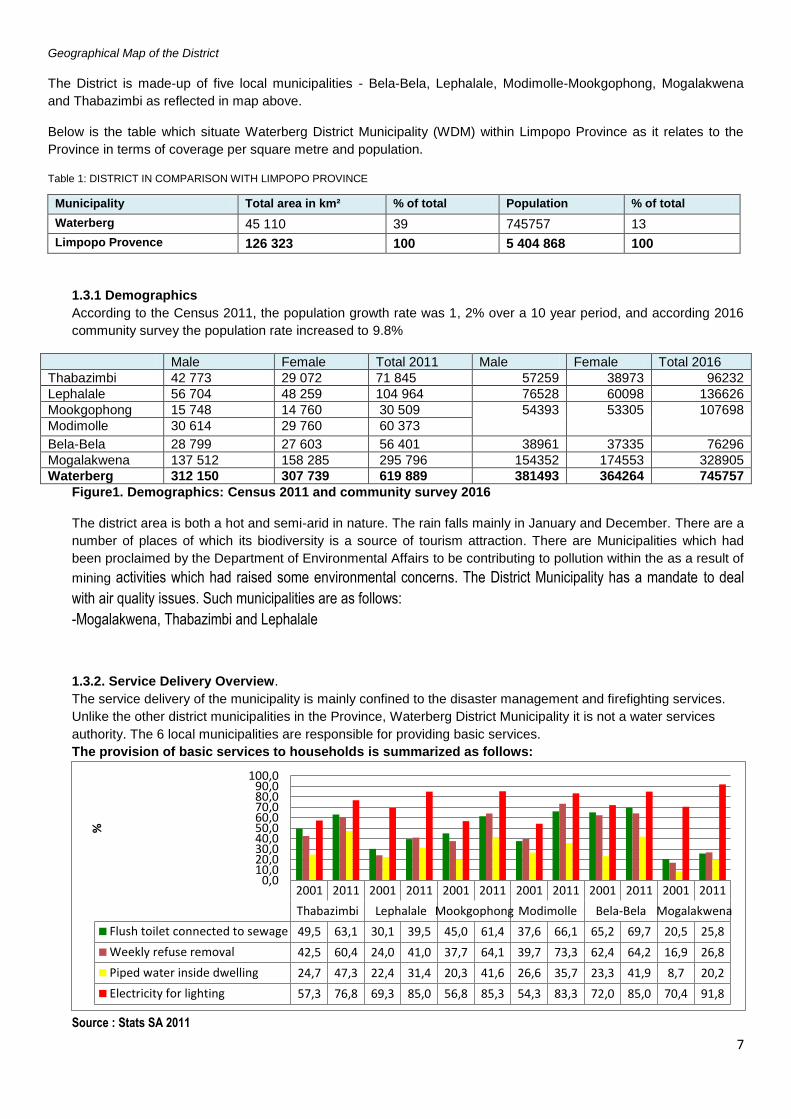
The provision of basic services to households is summarized as follows:
Source : Stats SA 2011
2001 2011 2001 2011 2001 2011 2001 2011 2001 2011 2001 2011
Thabazimbi Lephalale Mookgophong Modimolle Bela-Bela Mogalakwena
Flush toilet connected to sewage 49,5 63,1 30,1 39,5 45,0 61,4 37,6 66,1 65,2 69,7 20,5 25,8
Weekly refuse removal 42,5 60,4 24,0 41,0 37,7 64,1 39,7 73,3 62,4 64,2 16,9 26,8
Piped water inside dwelling 24,7 47,3 22,4 31,4 20,3 41,6 26,6 35,7 23,3 41,9 8,7 20,2
Electricity for lighting 57,3 76,8 69,3 85,0 56,8 85,3 54,3 83,3 72,0 85,0 70,4 91,8
0,010,020,030,040,050,060,070,080,090,0
100,0
%
8
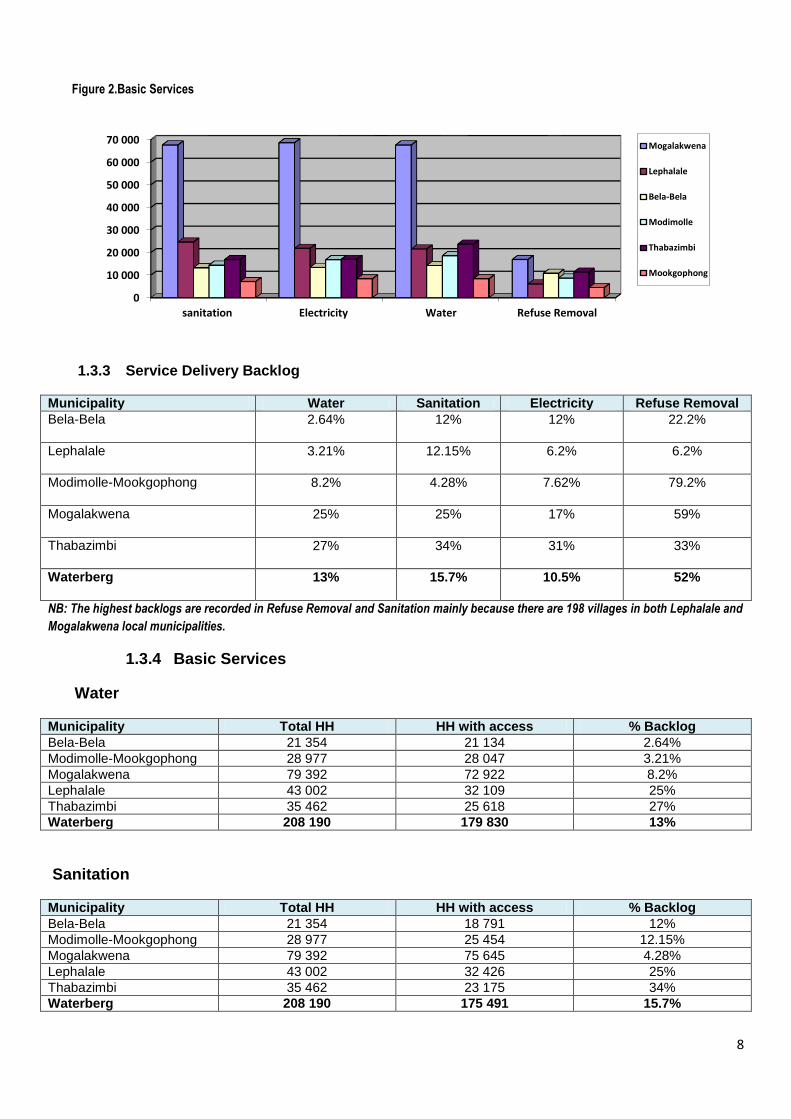
Figure 2.Basic Services
1.3.3 Service Delivery Backlog
Municipality Water Sanitation Electricity Refuse Removal
Bela-Bela 2.64% 12% 12% 22.2%
Lephalale 3.21% 12.15% 6.2% 6.2%
Modimolle-Mookgophong 8.2% 4.28% 7.62% 79.2%
Mogalakwena 25% 25% 17% 59%
Thabazimbi 27% 34% 31% 33%
Waterberg 13% 15.7% 10.5% 52%
NB: The highest backlogs are recorded in Refuse Removal and Sanitation mainly because there are 198 villages in both Lephalale and
Mogalakwena local municipalities.
1.3.4 Basic Services
Water
Municipality Total HH HH with access % Backlog
Bela-Bela 21 354 21 134 2.64%
Modimolle-Mookgophong 28 977 28 047 3.21%
Mogalakwena 79 392 72 922 8.2%
Lephalale 43 002 32 109 25%
Thabazimbi 35 462 25 618 27%
Waterberg 208 190 179 830 13%
Sanitation
Municipality Total HH HH with access % Backlog
Bela-Bela 21 354 18 791 12%
Modimolle-Mookgophong 28 977 25 454 12.15%
Mogalakwena 79 392 75 645 4.28%
Lephalale 43 002 32 426 25%
Thabazimbi 35 462 23 175 34%
Waterberg 208 190 175 491 15.7%
0
10 000
20 000
30 000
40 000
50 000
60 000
70 000
sanitation Electricity Water Refuse Removal
Mogalakwena
Lephalale
Bela-Bela
Modimolle
Thabazimbi
Mookgophong
9
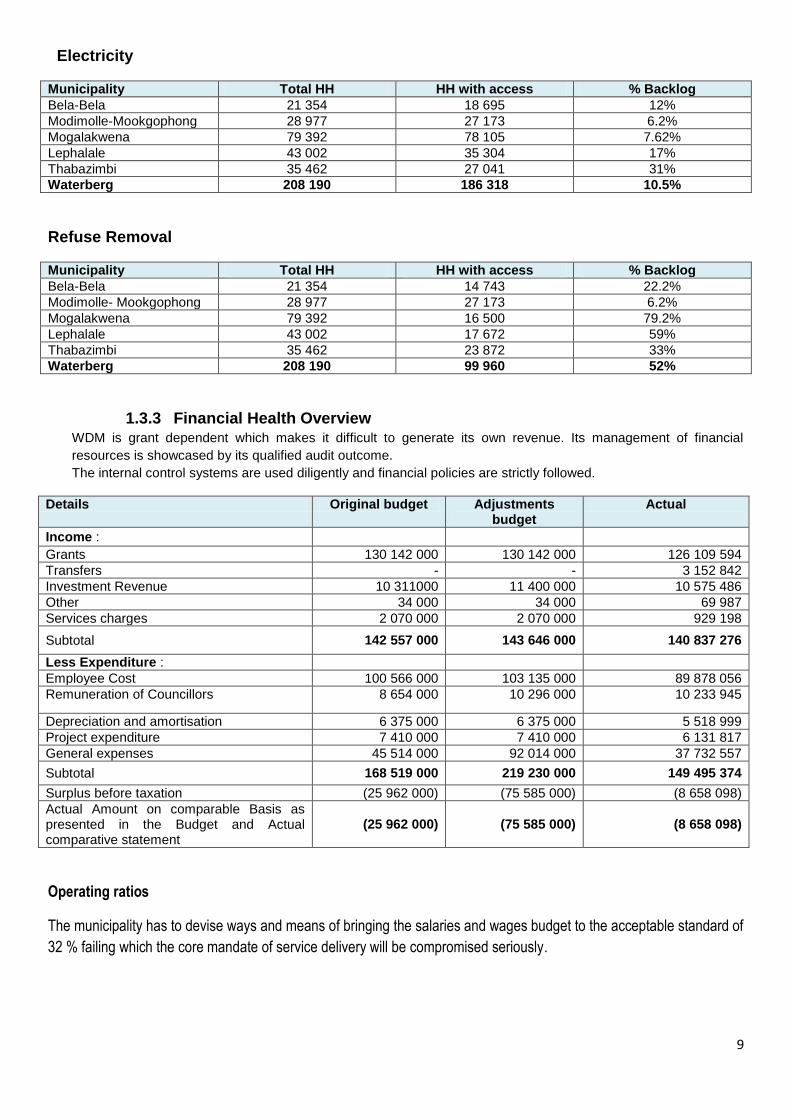
Electricity
Municipality Total HH HH with access % Backlog
Bela-Bela 21 354 18 695 12%
Modimolle-Mookgophong 28 977 27 173 6.2%
Mogalakwena 79 392 78 105 7.62%
Lephalale 43 002 35 304 17%
Thabazimbi 35 462 27 041 31%
Waterberg 208 190 186 318 10.5%
Refuse Removal
Municipality Total HH HH with access % Backlog
Bela-Bela 21 354 14 743 22.2%
Modimolle- Mookgophong 28 977 27 173 6.2%
Mogalakwena 79 392 16 500 79.2%
Lephalale 43 002 17 672 59%
Thabazimbi 35 462 23 872 33%
Waterberg 208 190 99 960 52%
1.3.3 Financial Health Overview WDM is grant dependent which makes it difficult to generate its own revenue. Its management of financial
resources is showcased by its qualified audit outcome.
The internal control systems are used diligently and financial policies are strictly followed.
Details Original budget Adjustments budget
Actual
Income :
Grants 130 142 000 130 142 000 126 109 594
Transfers - - 3 152 842
Investment Revenue 10 311000 11 400 000 10 575 486
Other 34 000 34 000 69 987
Services charges 2 070 000 2 070 000 929 198
Subtotal 142 557 000 143 646 000 140 837 276
Less Expenditure :
Employee Cost 100 566 000 103 135 000 89 878 056
Remuneration of Councillors 8 654 000 10 296 000 10 233 945
Depreciation and amortisation 6 375 000 6 375 000 5 518 999
Project expenditure 7 410 000 7 410 000 6 131 817
General expenses 45 514 000 92 014 000 37 732 557
Subtotal 168 519 000 219 230 000 149 495 374
Surplus before taxation (25 962 000) (75 585 000) (8 658 098)
Actual Amount on comparable Basis as presented in the Budget and Actual comparative statement
(25 962 000) (75 585 000) (8 658 098)
Operating ratios
The municipality has to devise ways and means of bringing the salaries and wages budget to the acceptable standard of
32 % failing which the core mandate of service delivery will be compromised seriously.
10
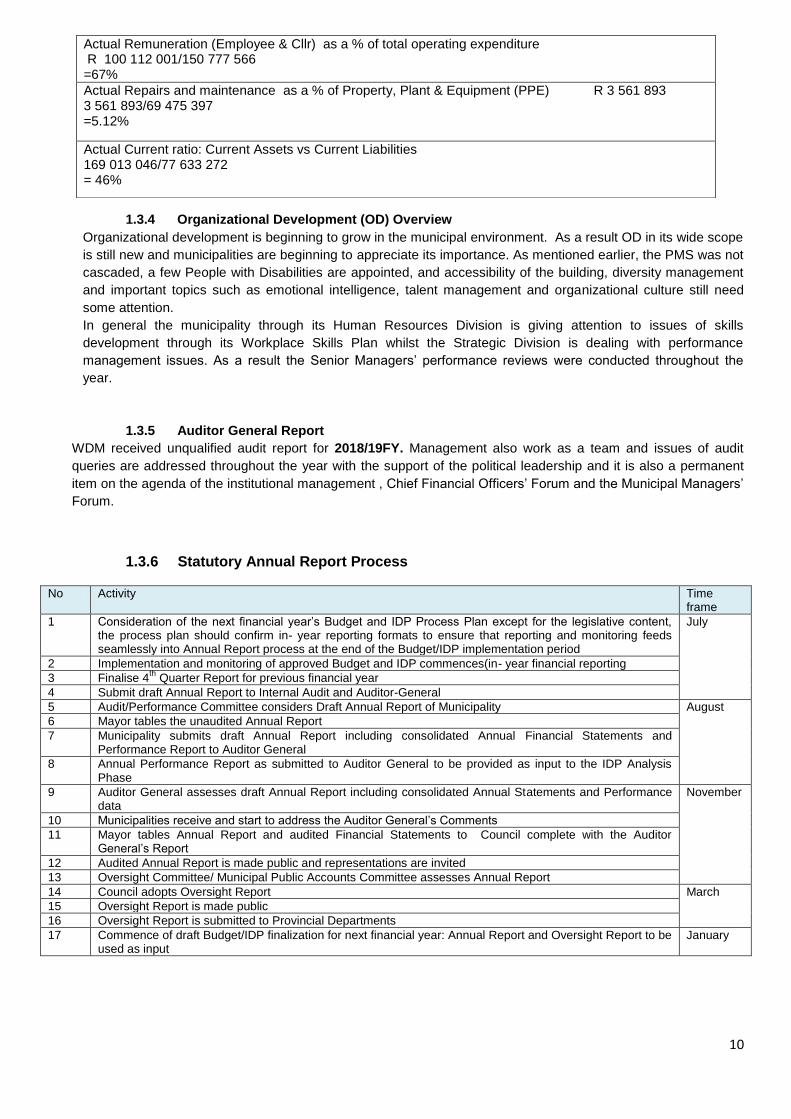
1.3.4 Organizational Development (OD) Overview
Organizational development is beginning to grow in the municipal environment. As a result OD in its wide scope
is still new and municipalities are beginning to appreciate its importance. As mentioned earlier, the PMS was not
cascaded, a few People with Disabilities are appointed, and accessibility of the building, diversity management
and important topics such as emotional intelligence, talent management and organizational culture still need
some attention.
In general the municipality through its Human Resources Division is giving attention to issues of skills
development through its Workplace Skills Plan whilst the Strategic Division is dealing with performance
management issues. As a result the Senior Managers’ performance reviews were conducted throughout the
year.
1.3.5 Auditor General Report
WDM received unqualified audit report for 2018/19FY. Management also work as a team and issues of audit
queries are addressed throughout the year with the support of the political leadership and it is also a permanent
item on the agenda of the institutional management , Chief Financial Officers’ Forum and the Municipal Managers’
Forum.
1.3.6 Statutory Annual Report Process
No Activity Time frame
1 Consideration of the next financial year’s Budget and IDP Process Plan except for the legislative content, the process plan should confirm in- year reporting formats to ensure that reporting and monitoring feeds seamlessly into Annual Report process at the end of the Budget/IDP implementation period
July
2 Implementation and monitoring of approved Budget and IDP commences(in- year financial reporting
3 Finalise 4th
Quarter Report for previous financial year
4 Submit draft Annual Report to Internal Audit and Auditor-General
5 Audit/Performance Committee considers Draft Annual Report of Municipality August
6 Mayor tables the unaudited Annual Report
7 Municipality submits draft Annual Report including consolidated Annual Financial Statements and Performance Report to Auditor General
8 Annual Performance Report as submitted to Auditor General to be provided as input to the IDP Analysis Phase
9 Auditor General assesses draft Annual Report including consolidated Annual Statements and Performance data
November
10 Municipalities receive and start to address the Auditor General’s Comments
11 Mayor tables Annual Report and audited Financial Statements to Council complete with the Auditor General’s Report
12 Audited Annual Report is made public and representations are invited
13 Oversight Committee/ Municipal Public Accounts Committee assesses Annual Report
14 Council adopts Oversight Report March
15 Oversight Report is made public
16 Oversight Report is submitted to Provincial Departments
17 Commence of draft Budget/IDP finalization for next financial year: Annual Report and Oversight Report to be used as input
January
Actual Remuneration (Employee & Cllr) as a % of total operating expenditure R 100 112 001/150 777 566 =67%
Actual Repairs and maintenance as a % of Property, Plant & Equipment (PPE) R 3 561 893 3 561 893/69 475 397 =5.12%
Actual Current ratio: Current Assets vs Current Liabilities 169 013 046/77 633 272 = 46%
11
2. Chapter 2
INTRODUCTION TO GOVERNANCE
Waterberg District Municipality is a category C municipality and has an Executive Mayoral System. The Council
comprises of 35 councillors of which composed of directly and indirectly representatives and 2 traditional leaders. The
majority of the councillors are from the ANC with DA and EFF and FF+ as opposition parties.
Throughout the year, the Municipal Manager as the head administration played his role in terms of section 55 of the
Municipal Systems Act. Amongst many of his roles, the Municipal Manager was able to advise the political structures
and political office bearers of the municipality and also carried out the decisions of the political structures and the
political office bearers of the municipality. It is the responsibility of the Municipal Manager to advise council to take
decisions which are in line with legislation and policies of the municipality.
The IDP review was used as main public participation tool which implemented /used to allow the communities to
participate in the affairs of the municipality. The IDP Representative Fora were convened by the Office of the
Municipal Manager, chaired by the Executive Mayor. The Ordinary Council meetings and the Portfolio were organized
throughout the year and were chaired by the Mayoral Committee Members and eventually reported to the Mayoral
Committee and the Council.
During the year under review, the Municipal Manager had also convened the Municipal Managers Forum which is
attended by the local municipality municipal managers from the 5 local municipalities, the WDM section 57 managers
and the senior managers of the 12 sector departments within the District. As a technical committee they prepare
technical reports which are presented in the District Intergovernmental Relations Forum. This forum (District IGR
Forum) also served as preparation for the Provincial IGR Forum whereby the Executive Mayors presented their
District wide reports. EXCO Lekgotla decisions are discussed and implemented based on the reports. Discussions
and resolutions presented at Exco Lekgotla are also presented at Min-Mec Meetings.
The implementation of the Performance Management System also serves as tool which is used to hold the Senior
Managers accountable for their performances. The Municipal Manager himself assessed his Senior Managers and
was assessed by the Executive Mayor. The IDP Representative Forum was used to report the performance of the
council to the community. Over and above all these, the Executive Mayor had also convened izimbizos to report back
to the community on all matters of service delivery. To improve on the effectiveness of the process, after every imbizo,
the Office of Executive Mayor drafted a follow up programme on all the issues that were raised.
2.1 Component A-Political and Administrative Governance
2.1.1 POLITICAL GOVERNANCE
Section 52 (a) of the Municipal Finance Management Act provides that the Mayor must provide general political
guidance over the fiscal and financial affairs of the Municipality. The Mayoral Committee is also established in
terms of Section 79 of the Municipal Structures Act. Section 80 committees namely Budget and Treasury Office,
Transformation and Administration, Infrastructure Development, Planning and Economic Development, Special
Projects and Community Committees are chaired by the Mayoral Committee members.
Municipal Public Accounts Committee comprising of 10 members was established to play an oversight role and
work closely with the Performance Audit Committee and the Audit Committee.
2.1.2 COUNCIL
Council is the legislative arm of the Municipality and highest decision making body over issues such as approval
of the Budget and the IDP. These are functions that cannot be delegated to any Committees of the Council.

12
13
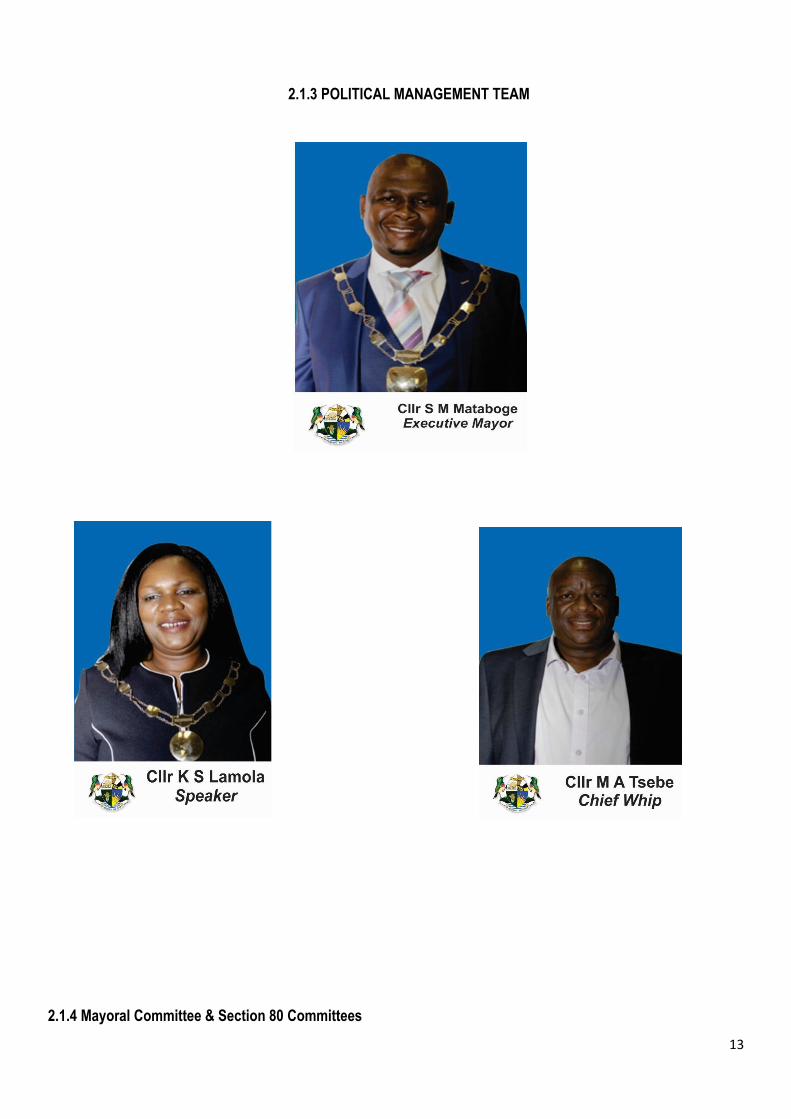
2.1.3 POLITICAL MANAGEMENT TEAM
2.1.4 Mayoral Committee & Section 80 Committees
14
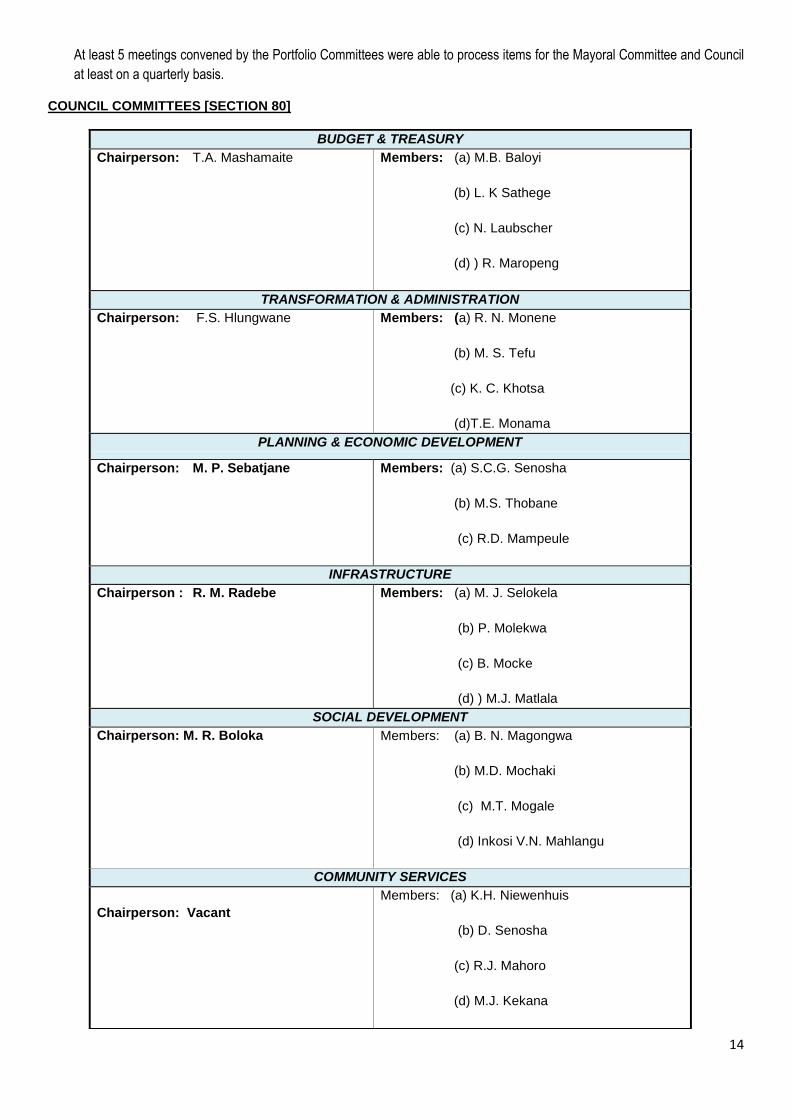
At least 5 meetings convened by the Portfolio Committees were able to process items for the Mayoral Committee and Council
at least on a quarterly basis.
COUNCIL COMMITTEES [SECTION 80]
BUDGET & TREASURY
Chairperson: T.A. Mashamaite Members: (a) M.B. Baloyi
(b) L. K Sathege
(c) N. Laubscher
(d) ) R. Maropeng
TRANSFORMATION & ADMINISTRATION
Chairperson: F.S. Hlungwane
Members: (a) R. N. Monene
(b) M. S. Tefu
(c) K. C. Khotsa
(d)T.E. Monama
PLANNING & ECONOMIC DEVELOPMENT
Chairperson: M. P. Sebatjane Members: (a) S.C.G. Senosha
(b) M.S. Thobane
(c) R.D. Mampeule
INFRASTRUCTURE
Chairperson : R. M. Radebe Members: (a) M. J. Selokela
(b) P. Molekwa
(c) B. Mocke
(d) ) M.J. Matlala
SOCIAL DEVELOPMENT
Chairperson: M. R. Boloka Members: (a) B. N. Magongwa
(b) M.D. Mochaki
(c) M.T. Mogale
(d) Inkosi V.N. Mahlangu
COMMUNITY SERVICES
Chairperson: Vacant
Members: (a) K.H. Niewenhuis
(b) D. Senosha
(c) R.J. Mahoro
(d) M.J. Kekana
15
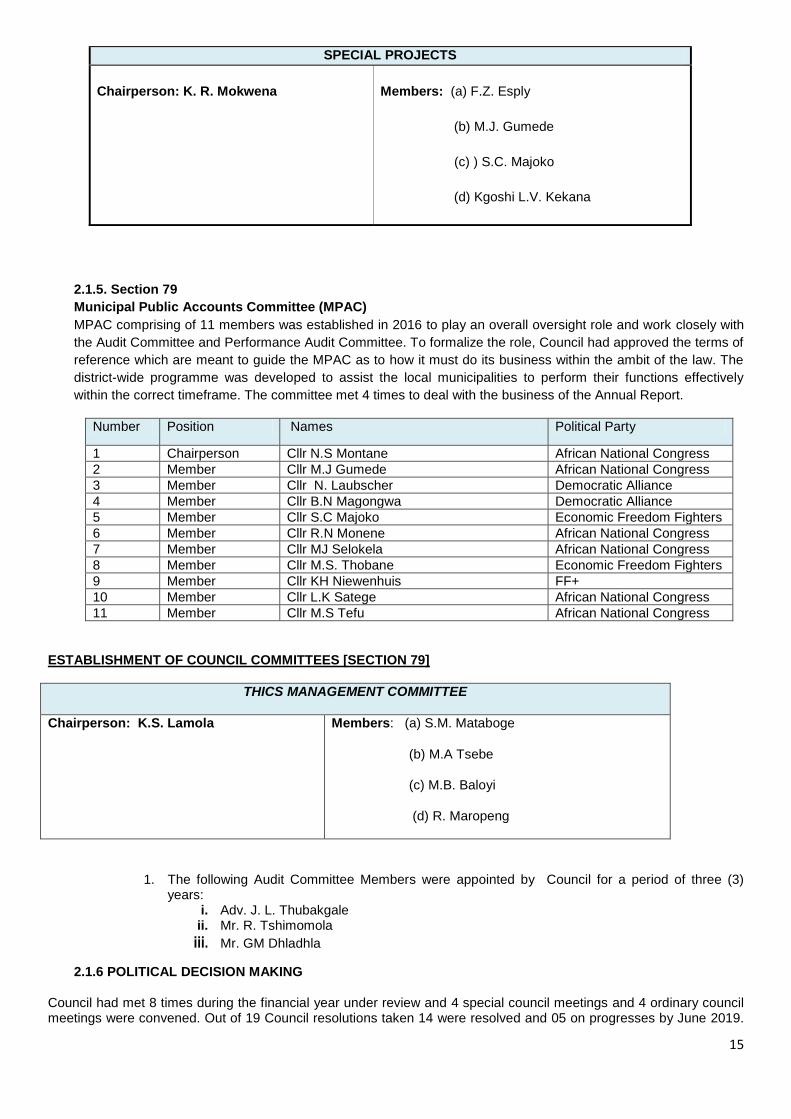
SPECIAL PROJECTS
Chairperson: K. R. Mokwena
Members: (a) F.Z. Esply
(b) M.J. Gumede
(c) ) S.C. Majoko
(d) Kgoshi L.V. Kekana
2.1.5. Section 79
Municipal Public Accounts Committee (MPAC)
MPAC comprising of 11 members was established in 2016 to play an overall oversight role and work closely with
the Audit Committee and Performance Audit Committee. To formalize the role, Council had approved the terms of
reference which are meant to guide the MPAC as to how it must do its business within the ambit of the law. The
district-wide programme was developed to assist the local municipalities to perform their functions effectively
within the correct timeframe. The committee met 4 times to deal with the business of the Annual Report.
Number Position Names Political Party
1 Chairperson Cllr N.S Montane African National Congress
2 Member Cllr M.J Gumede African National Congress
3 Member Cllr N. Laubscher Democratic Alliance
4 Member Cllr B.N Magongwa Democratic Alliance
5 Member Cllr S.C Majoko Economic Freedom Fighters
6 Member Cllr R.N Monene African National Congress
7 Member Cllr MJ Selokela African National Congress
8 Member Cllr M.S. Thobane Economic Freedom Fighters
9 Member Cllr KH Niewenhuis FF+
10 Member Cllr L.K Satege African National Congress
11 Member Cllr M.S Tefu African National Congress
ESTABLISHMENT OF COUNCIL COMMITTEES [SECTION 79]
THICS MANAGEMENT COMMITTEE
Chairperson: K.S. Lamola Members: (a) S.M. Mataboge
(b) M.A Tsebe
(c) M.B. Baloyi
(d) R. Maropeng
1. The following Audit Committee Members were appointed by Council for a period of three (3) years:
i. Adv. J. L. Thubakgale ii. Mr. R. Tshimomola
iii. Mr. GM Dhladhla
2.1.6 POLITICAL DECISION MAKING
Council had met 8 times during the financial year under review and 4 special council meetings and 4 ordinary council meetings were convened. Out of 19 Council resolutions taken 14 were resolved and 05 on progresses by June 2019.
16
It is normal procedure for Portfolio Committee meetings to be convened before Council and some special Council of the decisions was on the tabling of the IDP/Budget/SDBIP and the Adjustments budget.
2.2 ADMINISTRATIVE GOVERNANCE
In terms of section 54A of the Municipal Systems Amendment Act, the Municipal Manager is appointed as the
Accounting Officer. Apart from being head of administration, he is also important link with the political office bearer.
M.M Maluleka Municipal Manager
The Office of Municipal Manager comprises of 2 divisions namely: Strategic Planning & Support and Internal Audit.
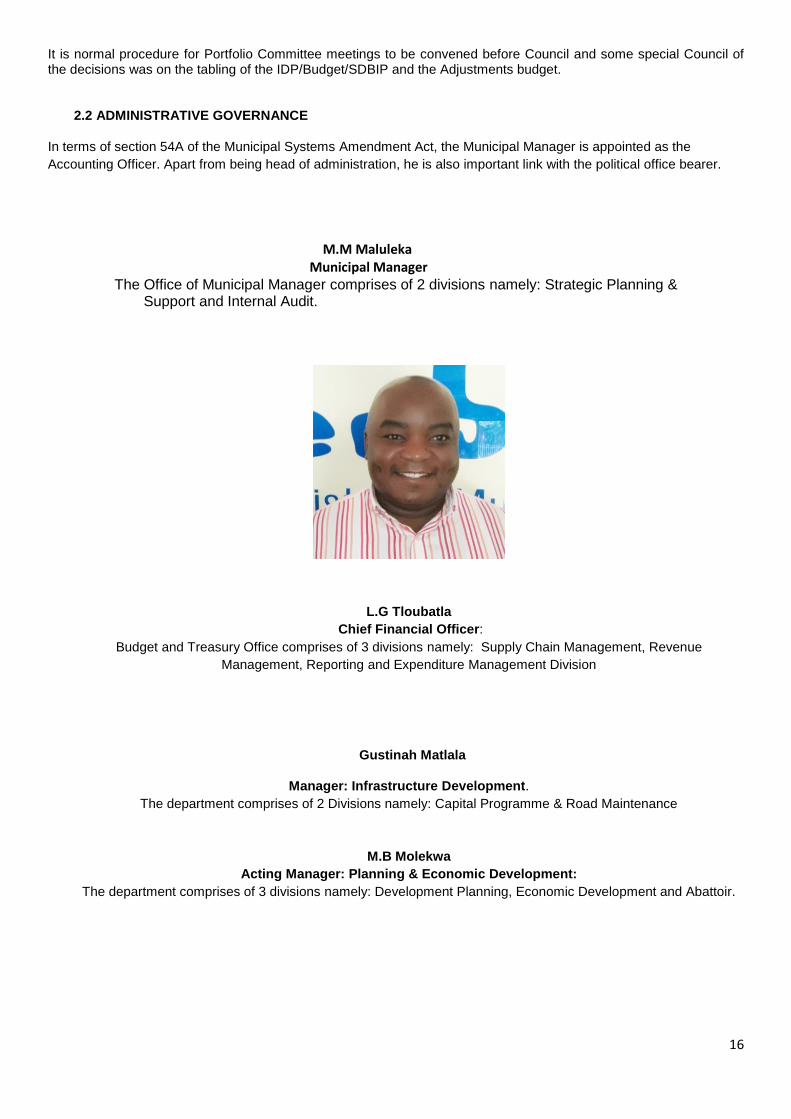
L.G Tloubatla
Chief Financial Officer:
Budget and Treasury Office comprises of 3 divisions namely: Supply Chain Management, Revenue
Management, Reporting and Expenditure Management Division
Gustinah Matlala
Manager: Infrastructure Development.
The department comprises of 2 Divisions namely: Capital Programme & Road Maintenance
M.B Molekwa
Acting Manager: Planning & Economic Development:
The department comprises of 3 divisions namely: Development Planning, Economic Development and Abattoir.
17
.
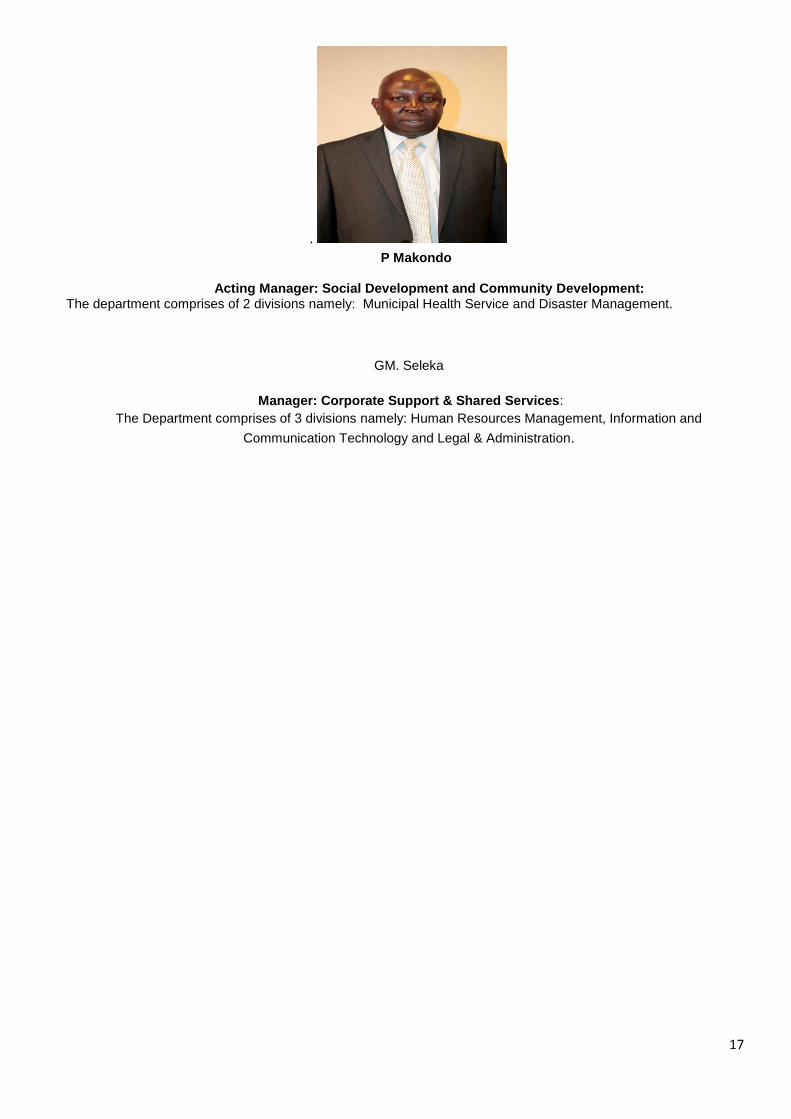
P Makondo
Acting Manager: Social Development and Community Development: The department comprises of 2 divisions namely: Municipal Health Service and Disaster Management.
GM. Seleka
Manager: Corporate Support & Shared Services:
The Department comprises of 3 divisions namely: Human Resources Management, Information and
Communication Technology and Legal & Administration.
18
2.2 Component B-inter-Governmental Relations (IGR)
2.2.1 DISTRICT INTERGOVERMENTAL RELATIONS FORUM
Waterberg District Municipality is the coordinator of the Intergovernmental Relations in the District. An IGR
framework was adopted in 2007 - which framework was used to give effect to the objects of the Intergovernmental
Relations Framework Act. The Technical Committee of Senior Managers ,Sector Departments and Municipal
Managers meet at least once a quarter and prepare reports which must be submitted to the Premier – Mayors
Forum. Attendance by sector departments is a serious challenge and therefore hampers progress in terms of
planning and service delivery.
2.2.2 PROVINCIAL INTERGOVERNMENTAL RELATIONS FORUM
The Province has initiated the Premier Mayors Forum which meets at least twice in a year. All 24 Mayors and the
Municipal Managers and the Senior Managers meet and discuss issues of Governance. The Forum is attended
by the District Mayors and the Municipal Managers. The Executive Mayor presents the technical report of the
District before going to the Forum at the Province this forum.
2.2.3 NATIONAL INTERGOVERNMENTAL STRUCTURE
South Africa is a unitary state that is characterized by 3 spheres of government as enshrined in the Constitution of
the Republic. All spheres are expected to cooperate with one another in the spirit of cooperative governance.
These structures are helpful in that information and programmes are shared and alignment becomes the outcome
of such efforts. All important decisions of the national intergovernmental forum should find expression in the lower
IGR structures.
In general the Senior Managers at the District level need to appreciate the importance of IGR by attending
themselves and avoid sending junior officials to IGR activities, which undermines the main thrust of such
gatherings. The sector departments are expected to present reports to the Forum- which will show some of the
IDP projects they are implementing, with regard to progress made.
2.3 Component C-Public Accountability and Participation
In terms of section 15 of the Municipal Structures Act requires a municipality must organize its administration to
facilitate and promote a culture of accountability among its staff. Democratic governance entails reporting to the
community and other stakeholders as to how the deployed resources have been used to deliver services.
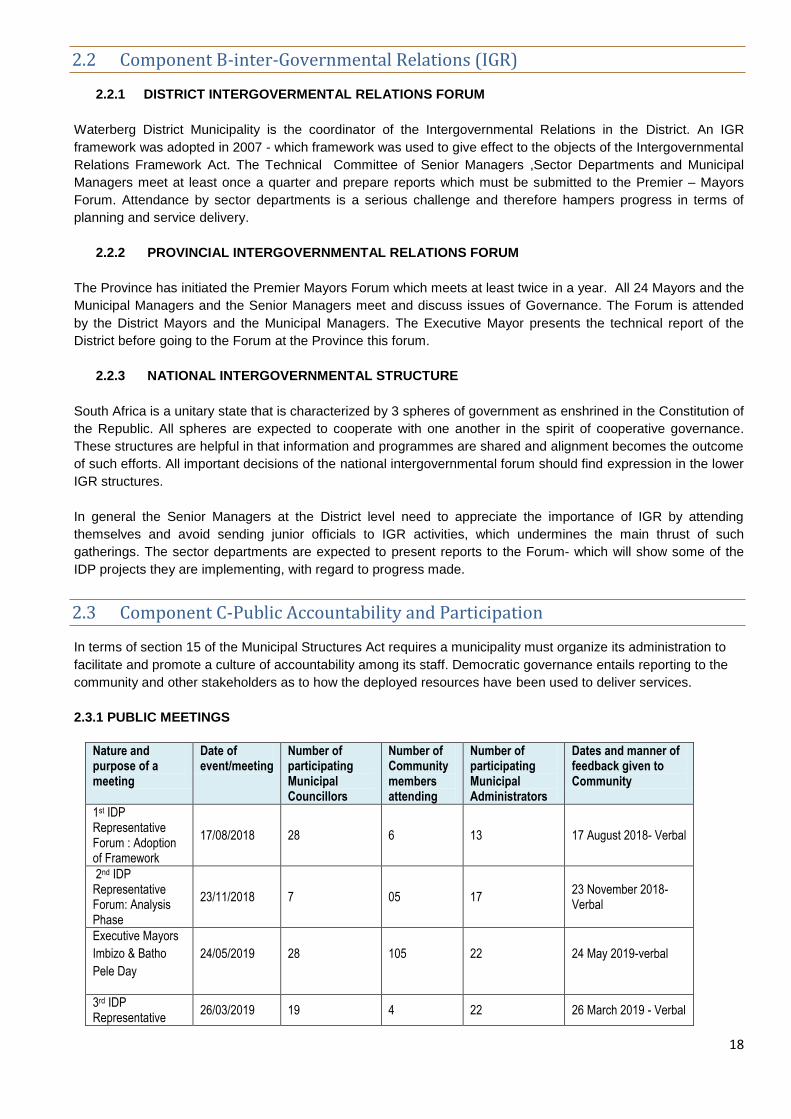
2.3.1 PUBLIC MEETINGS
Nature and purpose of a meeting
Date of event/meeting
Number of participating Municipal Councillors
Number of Community members attending
Number of participating Municipal Administrators
Dates and manner of feedback given to Community
1st IDP Representative Forum : Adoption of Framework
17/08/2018 28 6 13 17 August 2018- Verbal
2nd IDP Representative Forum: Analysis Phase
23/11/2018 7 05 17 23 November 2018- Verbal
Executive Mayors
Imbizo & Batho
Pele Day
24/05/2019 28 105 22 24 May 2019-verbal
3rd IDP Representative
26/03/2019 19 4 22 26 March 2019 - Verbal
19
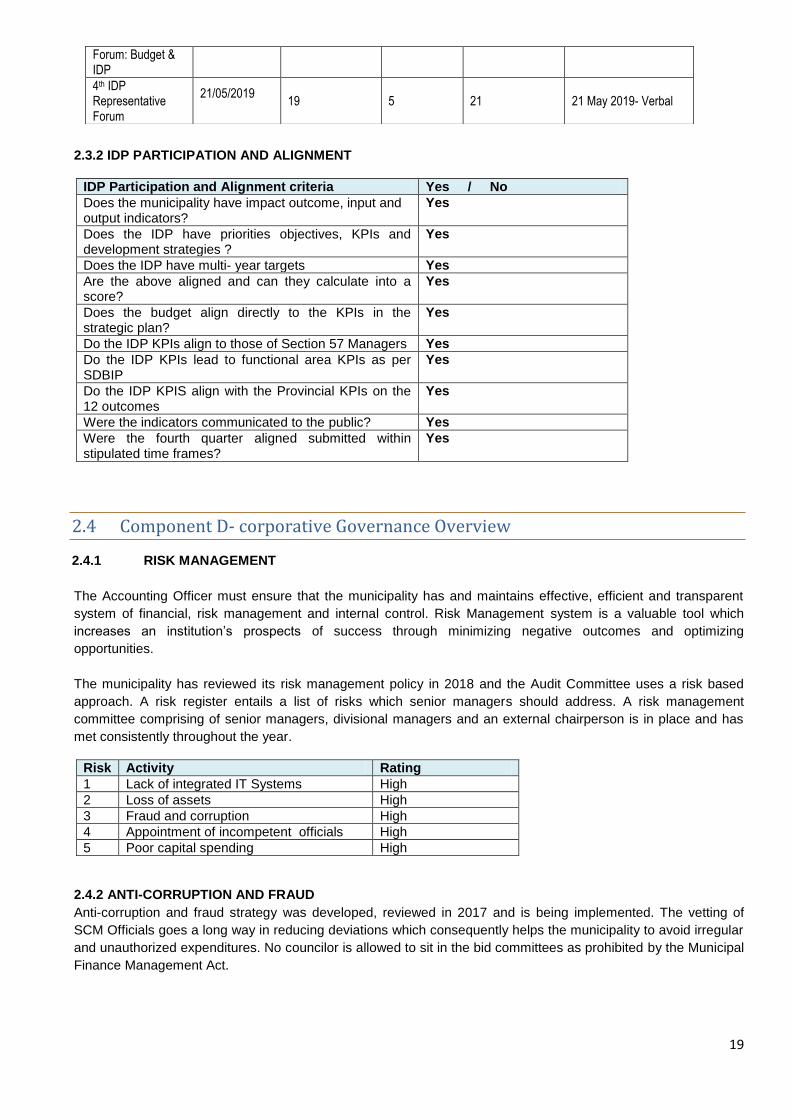
2.3.2 IDP PARTICIPATION AND ALIGNMENT
IDP Participation and Alignment criteria Yes / No
Does the municipality have impact outcome, input and output indicators?
Yes
Does the IDP have priorities objectives, KPIs and development strategies ?
Yes
Does the IDP have multi- year targets Yes
Are the above aligned and can they calculate into a score?
Yes
Does the budget align directly to the KPIs in the strategic plan?
Yes
Do the IDP KPIs align to those of Section 57 Managers Yes
Do the IDP KPIs lead to functional area KPIs as per SDBIP
Yes
Do the IDP KPIS align with the Provincial KPIs on the 12 outcomes
Yes
Were the indicators communicated to the public? Yes
Were the fourth quarter aligned submitted within stipulated time frames?
Yes
2.4 Component D- corporative Governance Overview
2.4.1 RISK MANAGEMENT
The Accounting Officer must ensure that the municipality has and maintains effective, efficient and transparent
system of financial, risk management and internal control. Risk Management system is a valuable tool which
increases an institution’s prospects of success through minimizing negative outcomes and optimizing
opportunities.
The municipality has reviewed its risk management policy in 2018 and the Audit Committee uses a risk based
approach. A risk register entails a list of risks which senior managers should address. A risk management
committee comprising of senior managers, divisional managers and an external chairperson is in place and has
met consistently throughout the year.
Risk Activity Rating
1 Lack of integrated IT Systems High
2 Loss of assets High
3 Fraud and corruption High
4 Appointment of incompetent officials High
5 Poor capital spending High
2.4.2 ANTI-CORRUPTION AND FRAUD
Anti-corruption and fraud strategy was developed, reviewed in 2017 and is being implemented. The vetting of
SCM Officials goes a long way in reducing deviations which consequently helps the municipality to avoid irregular
and unauthorized expenditures. No councilor is allowed to sit in the bid committees as prohibited by the Municipal
Finance Management Act.
Forum: Budget & IDP
4th IDP Representative Forum
21/05/2019
19 5 21 21 May 2019- Verbal
20
2.4.3 SUPPLY CHAIN MANAGEMENT
The Supply Chain Management Policy has been reviewed and is therefore in line with the MFMA Regulations.
The Budget and Treasury Office is ensuring that the abovementioned be implemented without fear or favor. The 3
bid system is in place and the officials who sit in the committees have a fairly good understanding of the SCM
processes and regulations. To reduce the possibility of fraud, SCM officials or members who sit in the tender
committees have been vetted. The effective use of declaration of interest forms and regular reporting to Council
on SCM Deviations is a necessary deterrent.
There are workshops conducted to ensure that officials involved on the Supply Chain matters are abreast with the
new trends, developments and legislative environment guiding the Supply Chain Management Systems.
2.4.4 BY-LAWS
The procedure to develop a by-law is explicit in the Orders of Council document. The Corporate Services is best
placed to lead a public participation process on the development of the by-laws. For the year under review no new
by- law neither was develop nor was an old by-law reviewed. The delay of promulgation rests with COGHSTA and
makes it difficult to enforce certain decisions- which decisions will lack legal force. Municipal Systems empowers
municipal councils to pass and implement by-laws in order to improve their service of the communities within their
areas of jurisdiction.
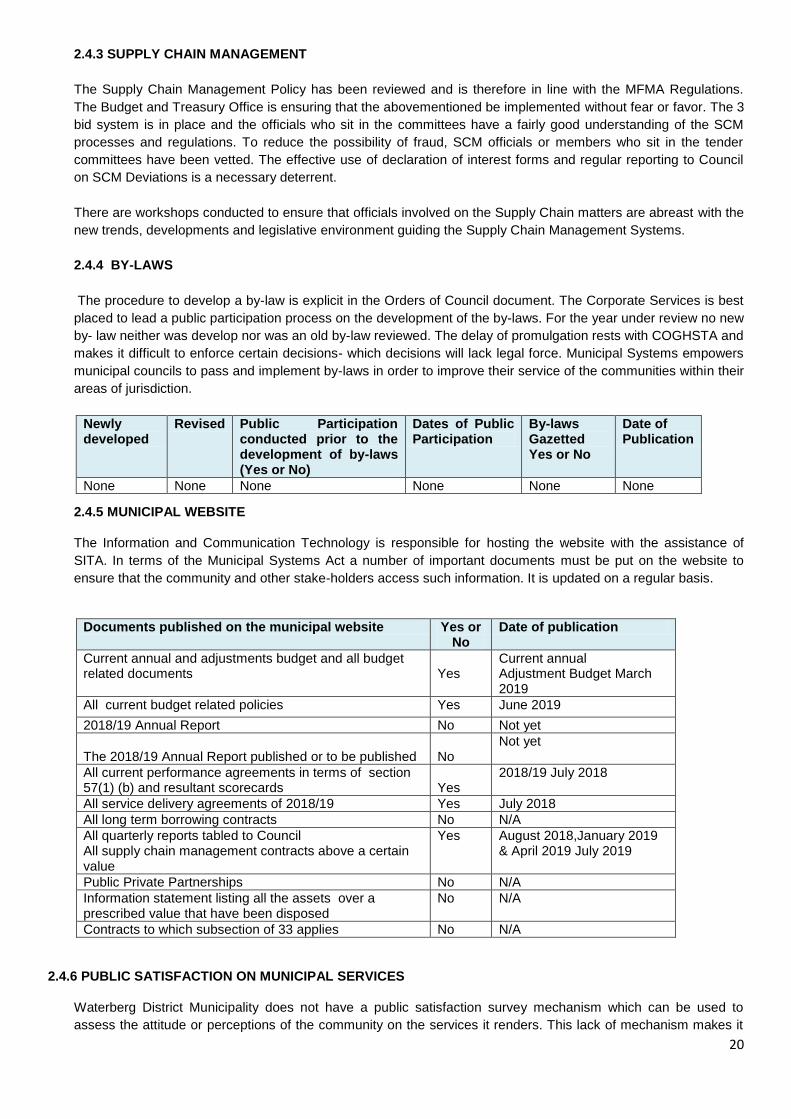
2.4.5 MUNICIPAL WEBSITE
The Information and Communication Technology is responsible for hosting the website with the assistance of
SITA. In terms of the Municipal Systems Act a number of important documents must be put on the website to
ensure that the community and other stake-holders access such information. It is updated on a regular basis.
Documents published on the municipal website Yes or No
Date of publication
Current annual and adjustments budget and all budget related documents
Yes
Current annual Adjustment Budget March 2019
All current budget related policies Yes June 2019
2018/19 Annual Report No Not yet
The 2018/19 Annual Report published or to be published
No
Not yet
All current performance agreements in terms of section 57(1) (b) and resultant scorecards
Yes
2018/19 July 2018
All service delivery agreements of 2018/19 Yes July 2018
All long term borrowing contracts No N/A
All quarterly reports tabled to Council All supply chain management contracts above a certain value
Yes August 2018,January 2019 & April 2019 July 2019
Public Private Partnerships No N/A
Information statement listing all the assets over a prescribed value that have been disposed
No N/A
Contracts to which subsection of 33 applies No N/A
2.4.6 PUBLIC SATISFACTION ON MUNICIPAL SERVICES
Waterberg District Municipality does not have a public satisfaction survey mechanism which can be used to
assess the attitude or perceptions of the community on the services it renders. This lack of mechanism makes it
Newly developed
Revised Public Participation conducted prior to the development of by-laws (Yes or No)
Dates of Public Participation
By-laws Gazetted Yes or No
Date of Publication
None None None None None None
21
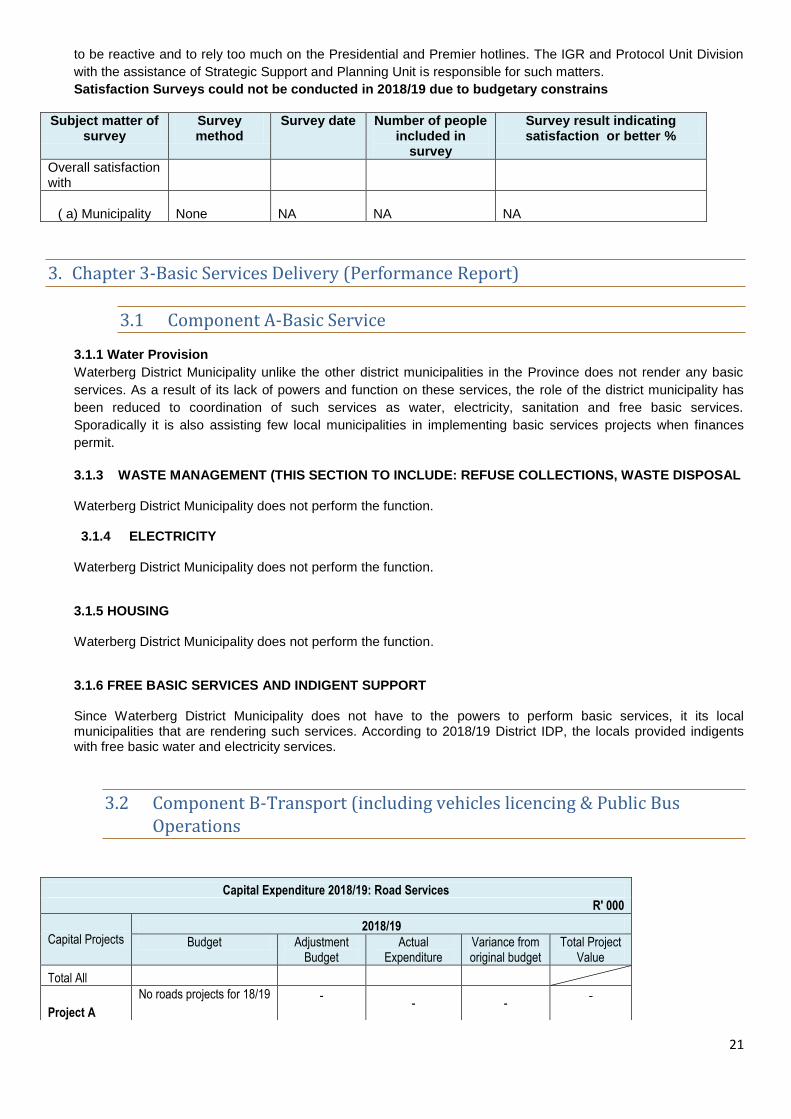
to be reactive and to rely too much on the Presidential and Premier hotlines. The IGR and Protocol Unit Division
with the assistance of Strategic Support and Planning Unit is responsible for such matters.
Satisfaction Surveys could not be conducted in 2018/19 due to budgetary constrains
Subject matter of survey
Survey method
Survey date Number of people included in
survey
Survey result indicating satisfaction or better %
Overall satisfaction with
( a) Municipality
None
NA
NA
NA
3. Chapter 3-Basic Services Delivery (Performance Report)
3.1 Component A-Basic Service
3.1.1 Water Provision
Waterberg District Municipality unlike the other district municipalities in the Province does not render any basic
services. As a result of its lack of powers and function on these services, the role of the district municipality has
been reduced to coordination of such services as water, electricity, sanitation and free basic services.
Sporadically it is also assisting few local municipalities in implementing basic services projects when finances
permit.
3.1.3 WASTE MANAGEMENT (THIS SECTION TO INCLUDE: REFUSE COLLECTIONS, WASTE DISPOSAL Waterberg District Municipality does not perform the function.
3.1.4 ELECTRICITY
Waterberg District Municipality does not perform the function.
3.1.5 HOUSING Waterberg District Municipality does not perform the function.
3.1.6 FREE BASIC SERVICES AND INDIGENT SUPPORT Since Waterberg District Municipality does not have to the powers to perform basic services, it its local municipalities that are rendering such services. According to 2018/19 District IDP, the locals provided indigents with free basic water and electricity services.
3.2 Component B-Transport (including vehicles licencing & Public Bus Operations
Capital Expenditure 2018/19: Road Services R' 000
Capital Projects 2018/19
Budget Adjustment Budget
Actual Expenditure
Variance from original budget
Total Project Value
Total All
Project A
No roads projects for 18/19 - - -
-
22
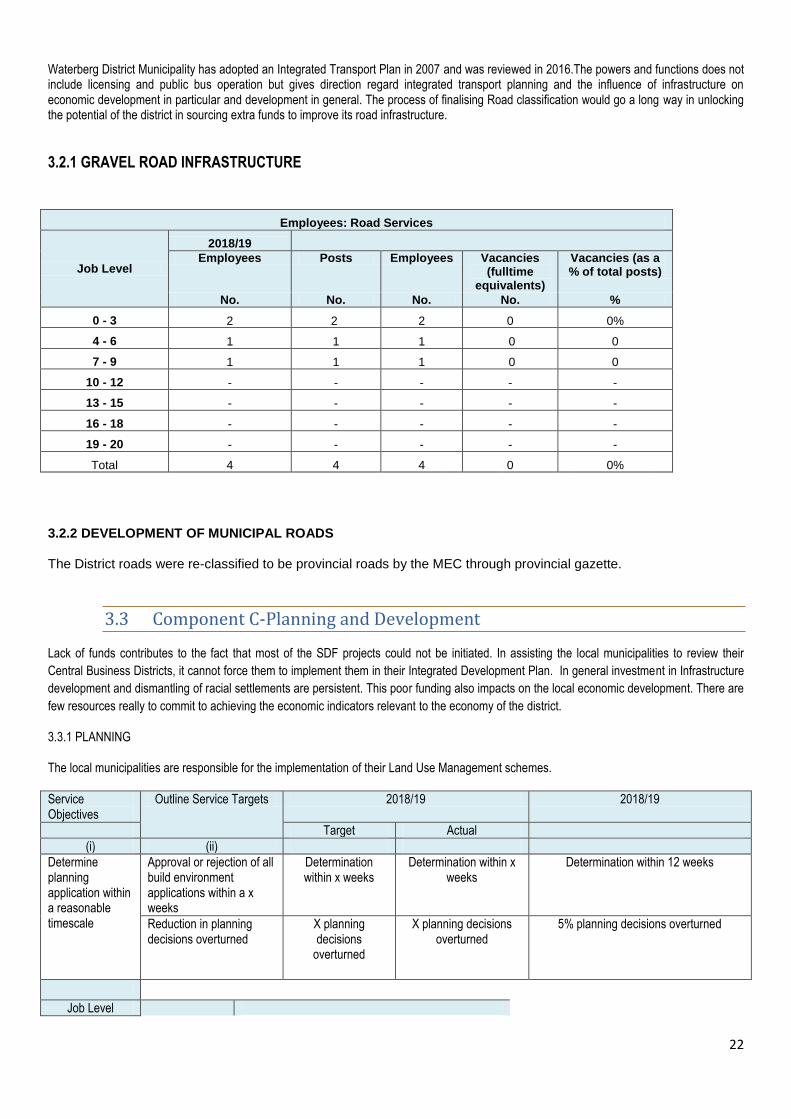
Waterberg District Municipality has adopted an Integrated Transport Plan in 2007 and was reviewed in 2016.The powers and functions does not include licensing and public bus operation but gives direction regard integrated transport planning and the influence of infrastructure on economic development in particular and development in general. The process of finalising Road classification would go a long way in unlocking the potential of the district in sourcing extra funds to improve its road infrastructure.
3.2.1 GRAVEL ROAD INFRASTRUCTURE
3.2.2 DEVELOPMENT OF MUNICIPAL ROADS The District roads were re-classified to be provincial roads by the MEC through provincial gazette.
3.3 Component C-Planning and Development
Lack of funds contributes to the fact that most of the SDF projects could not be initiated. In assisting the local municipalities to review their
Central Business Districts, it cannot force them to implement them in their Integrated Development Plan. In general investment in Infrastructure
development and dismantling of racial settlements are persistent. This poor funding also impacts on the local economic development. There are
few resources really to commit to achieving the economic indicators relevant to the economy of the district.
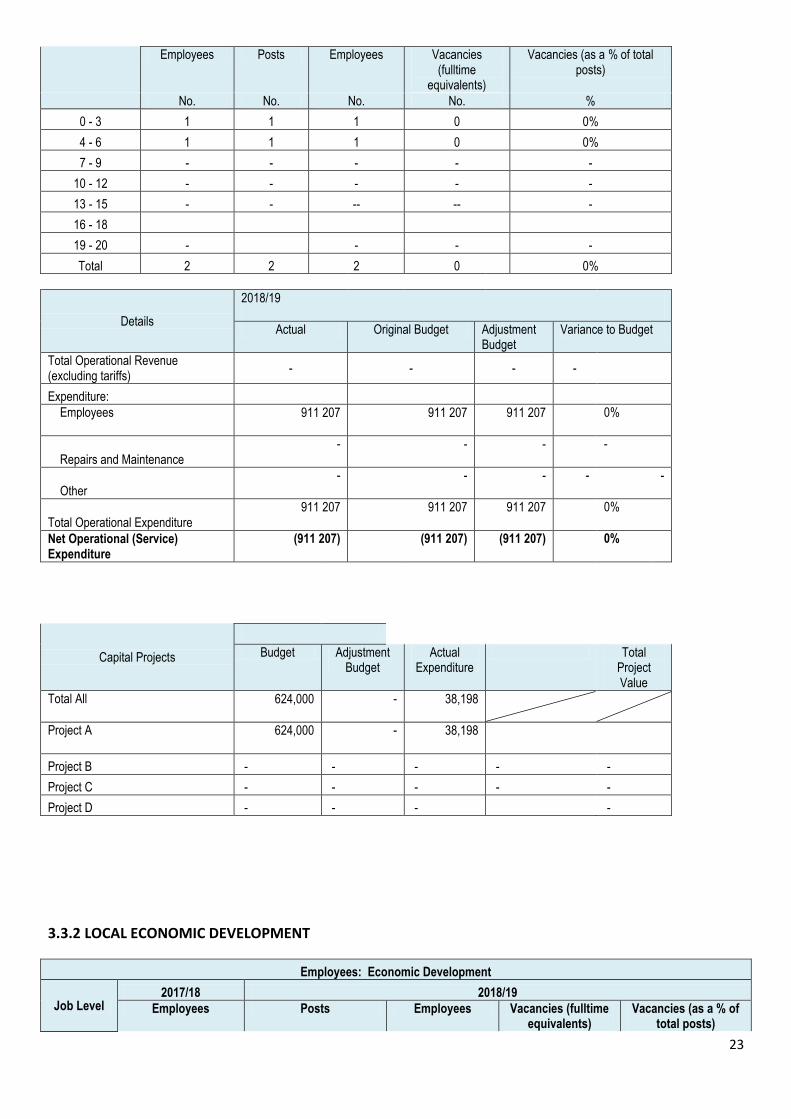
3.3.1 PLANNING
The local municipalities are responsible for the implementation of their Land Use Management schemes.
Service Objectives
Outline Service Targets 2018/19 2018/19
Target Actual
(i) (ii)
Determine planning application within a reasonable timescale
Approval or rejection of all build environment applications within a x weeks
Determination within x weeks
Determination within x weeks
Determination within 12 weeks
Reduction in planning decisions overturned
X planning decisions
overturned
X planning decisions overturned
5% planning decisions overturned
Job Level
Employees: Road Services
Job Level
2018/19 Employees Posts Employees Vacancies (fulltime
equivalents)
Vacancies (as a % of total posts)
No. No. No. No. %
0 - 3 2 2 2 0 0%
4 - 6 1 1 1 0 0
7 - 9 1 1 1 0 0
10 - 12 - - - - -
13 - 15 - - - - -
16 - 18 - - - - -
19 - 20 - - - - -
Total 4 4 4 0 0%
23
Employees Posts Employees Vacancies (fulltime
equivalents)
Vacancies (as a % of total posts)
No. No. No. No. %
0 - 3 1 1 1 0 0%
4 - 6 1 1 1 0 0%
7 - 9 - - - - -
10 - 12 - - - - -
13 - 15 - - -- -- -
16 - 18 19 - 20 -
- - -
Total 2 2 2 0 0%
Details
2018/19
Actual Original Budget Adjustment Budget
Variance to Budget
Total Operational Revenue (excluding tariffs)
- - - -
Expenditure:
Employees 911 207 911 207 911 207 0%
Repairs and Maintenance
- - -
-
Other
- - - - -
Total Operational Expenditure 911 207 911 207 911 207 0%
Net Operational (Service) Expenditure
(911 207) (911 207) (911 207) 0%
Capital Projects
Budget Adjustment Budget
Actual Expenditure
Total Project Value
Total All 624,000 - 38,198
Project A 624,000 - 38,198
Project B - - - - -
Project C - - - - -
Project D - - - -
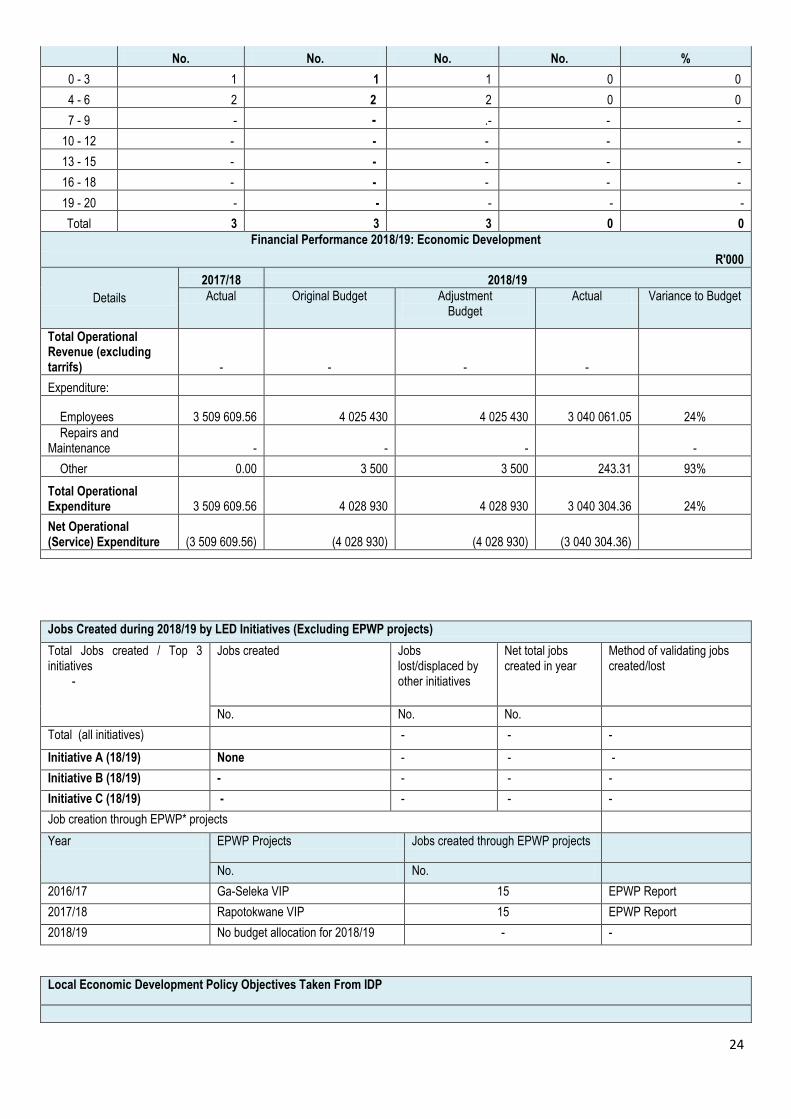
3.3.2 LOCAL ECONOMIC DEVELOPMENT
Employees: Economic Development
Job Level 2017/18 2018/19
Employees Posts Employees Vacancies (fulltime equivalents)
Vacancies (as a % of total posts)
24
No. No. No. No. %
0 - 3 1 1 1 0 0
4 - 6 2 2 2 0 0
7 - 9 - - .- - -
10 - 12 - - - - -
13 - 15 - - - - -
16 - 18 - - - - -
19 - 20 - - - - -
Total 3 3 3 0 0
Financial Performance 2018/19: Economic Development
R'000
Details
2017/18 2018/19
Actual Original Budget Adjustment Budget
Actual Variance to Budget
Total Operational Revenue (excluding tarrifs) - - - -
Expenditure:
Employees 3 509 609.56 4 025 430 4 025 430 3 040 061.05 24%
Repairs and Maintenance - - - -
Other 0.00 3 500 3 500 243.31 93%
Total Operational Expenditure 3 509 609.56 4 028 930 4 028 930 3 040 304.36 24%
Net Operational (Service) Expenditure (3 509 609.56) (4 028 930) (4 028 930) (3 040 304.36)
Jobs Created during 2018/19 by LED Initiatives (Excluding EPWP projects)
Total Jobs created / Top 3 initiatives
-
Jobs created Jobs lost/displaced by other initiatives
Net total jobs created in year
Method of validating jobs created/lost
No. No. No.
Total (all initiatives) - - -
Initiative A (18/19) None - - -
Initiative B (18/19) - - - -
Initiative C (18/19) - - - -
Job creation through EPWP* projects
Year EPWP Projects Jobs created through EPWP projects
No. No.
2016/17 Ga-Seleka VIP 15 EPWP Report
2017/18 Rapotokwane VIP 15 EPWP Report
2018/19 No budget allocation for 2018/19 - -
Local Economic Development Policy Objectives Taken From IDP
25
Service Objectives Outline Service Targets
2016/17 2017/18 2018/19
Target Actual Target Actual Target Actual
Service Indicators
(i) (ii)
Service Objectives; To ensure optimal utilisation of and adherence to space economy
Job creation
Number of jobs created to LED Initiatives
15 33 0 0 0 0
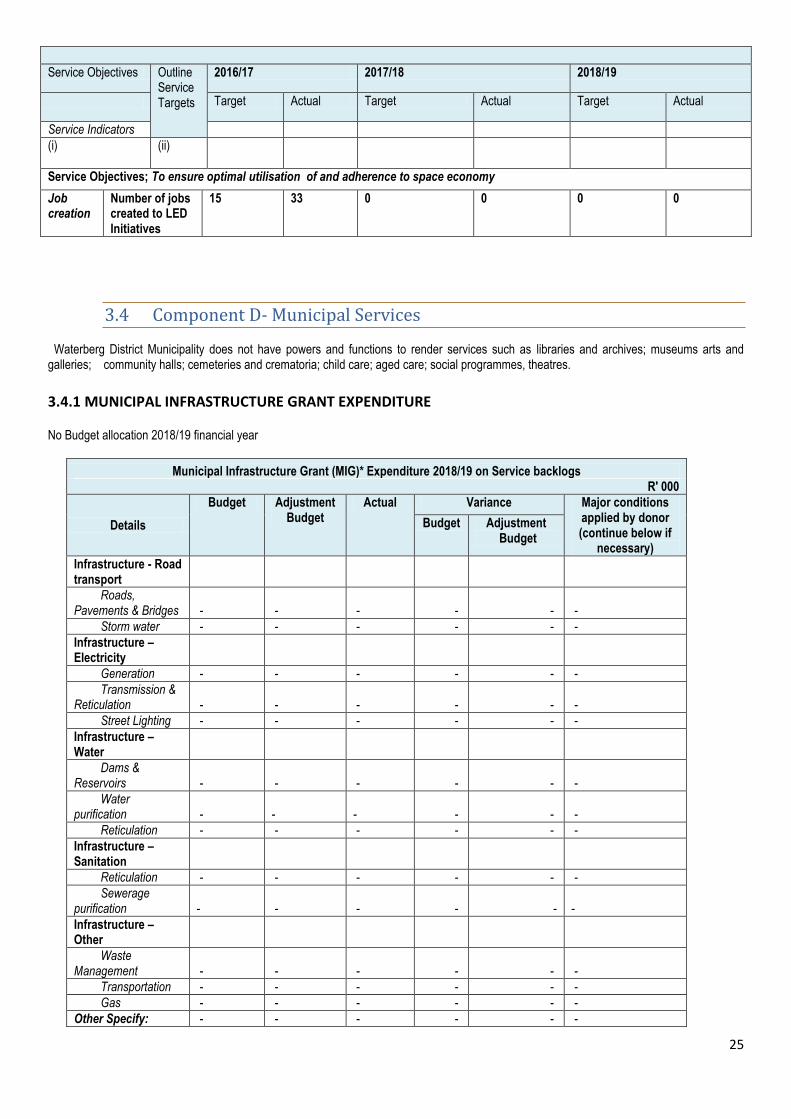
3.4 Component D- Municipal Services
Waterberg District Municipality does not have powers and functions to render services such as libraries and archives; museums arts and galleries; community halls; cemeteries and crematoria; child care; aged care; social programmes, theatres.
3.4.1 MUNICIPAL INFRASTRUCTURE GRANT EXPENDITURE
No Budget allocation 2018/19 financial year
Municipal Infrastructure Grant (MIG)* Expenditure 2018/19 on Service backlogs R' 000
Details
Budget Adjustment Budget
Actual Variance Major conditions applied by donor (continue below if
necessary)
Budget Adjustment Budget
Infrastructure - Road transport
Roads, Pavements & Bridges - - - - - -
Storm water - - - - - -
Infrastructure – Electricity
Generation - - - - - -
Transmission & Reticulation - - - - - -
Street Lighting - - - - - -
Infrastructure – Water
Dams & Reservoirs - - - - - -
Water purification - - - - - -
Reticulation - - - - - -
Infrastructure – Sanitation
Reticulation - - - - - -
Sewerage purification - - - - - -
Infrastructure – Other
Waste Management - - - - - -
Transportation - - - - - -
Gas - - - - - -
Other Specify: - - - - - -
26
- - - - - -
Total - - - - -
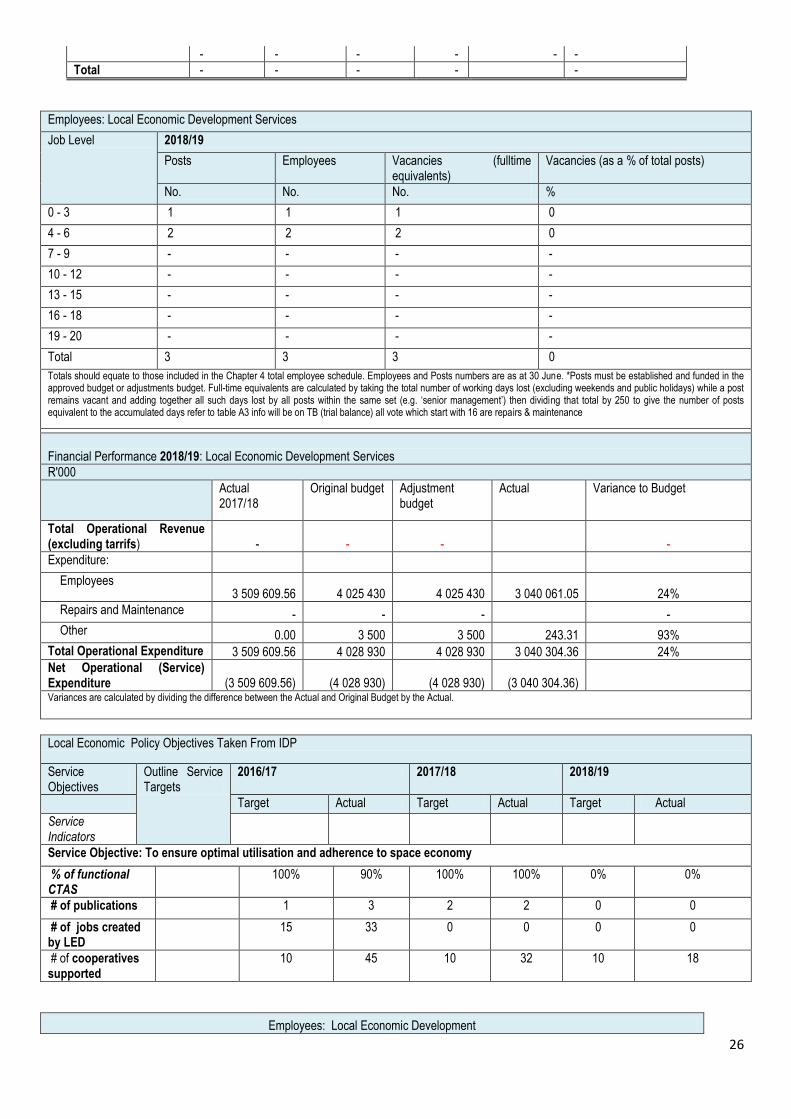
Employees: Local Economic Development Services
Job Level 2018/19
Posts Employees Vacancies (fulltime equivalents)
Vacancies (as a % of total posts)
No. No. No. %
0 - 3 1 1 1 0
4 - 6 2 2 2 0
7 - 9 - - - -
10 - 12 - - - -
13 - 15 - - - -
16 - 18 - - - -
19 - 20 - - - -
Total 3 3 3 0
Totals should equate to those included in the Chapter 4 total employee schedule. Employees and Posts numbers are as at 30 June. *Posts must be established and funded in the approved budget or adjustments budget. Full-time equivalents are calculated by taking the total number of working days lost (excluding weekends and public holidays) while a post remains vacant and adding together all such days lost by all posts within the same set (e.g. ‘senior management’) then dividing that total by 250 to give the number of posts equivalent to the accumulated days refer to table A3 info will be on TB (trial balance) all vote which start with 16 are repairs & maintenance
Financial Performance 2018/19: Local Economic Development Services
R'000
Actual 2017/18
Original budget Adjustment budget
Actual Variance to Budget
Total Operational Revenue (excluding tarrifs) - - - -
Expenditure:
Employees 3 509 609.56 4 025 430 4 025 430 3 040 061.05 24%
Repairs and Maintenance - - - -
Other 0.00 3 500 3 500 243.31 93%
Total Operational Expenditure 3 509 609.56 4 028 930 4 028 930 3 040 304.36 24%
Net Operational (Service) Expenditure (3 509 609.56) (4 028 930) (4 028 930) (3 040 304.36) Variances are calculated by dividing the difference between the Actual and Original Budget by the Actual.
Local Economic Policy Objectives Taken From IDP
Service Objectives
Outline Service Targets
2016/17 2017/18 2018/19
Target Actual Target Actual Target Actual
Service Indicators
Service Objective: To ensure optimal utilisation and adherence to space economy
% of functional CTAS
100% 90% 100% 100% 0% 0%
# of publications 1 3 2 2 0 0
# of jobs created by LED
15 33 0 0 0 0
# of cooperatives supported
10 45 10 32 10 18
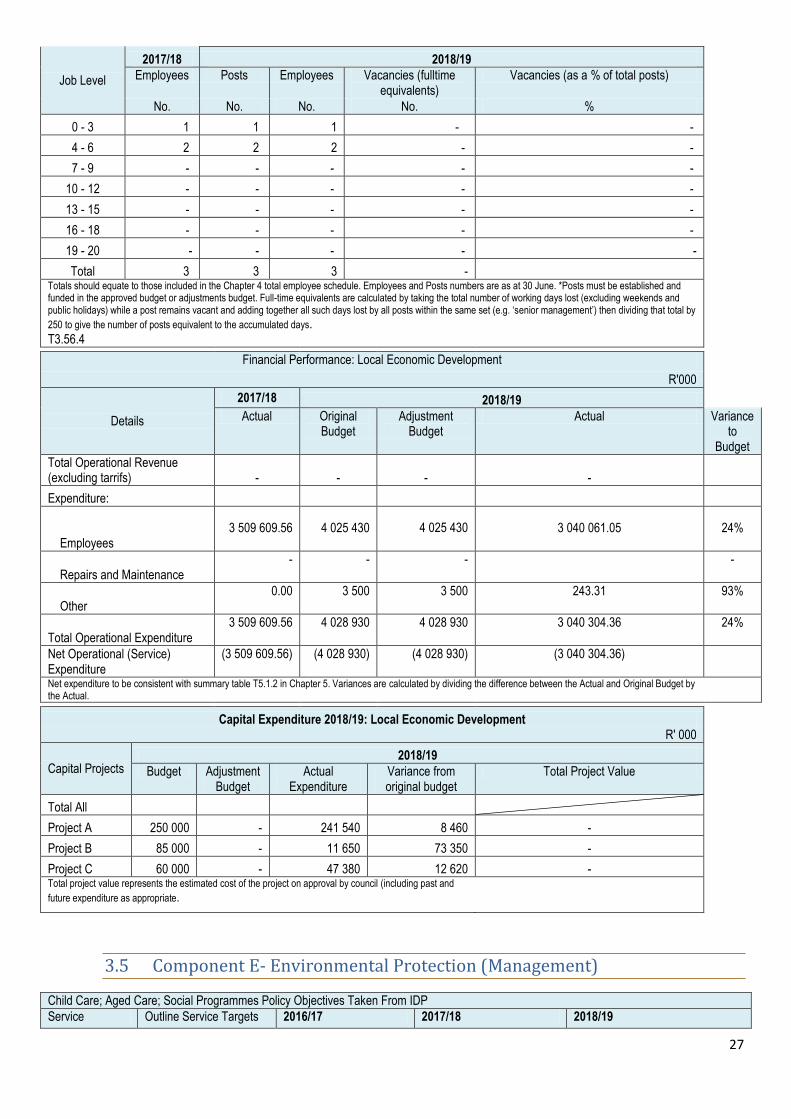
Employees: Local Economic Development
27
Job Level
2017/18 2018/19
Employees Posts Employees Vacancies (fulltime equivalents)
Vacancies (as a % of total posts)
No. No. No. No. %
0 - 3 1 1 1 - -
4 - 6 2 2 2 - -
7 - 9 - - - - -
10 - 12 - - - - -
13 - 15 - - - - -
16 - 18 - - - - -
19 - 20 - - - - -
Total 3 3 3 - Totals should equate to those included in the Chapter 4 total employee schedule. Employees and Posts numbers are as at 30 June. *Posts must be established and funded in the approved budget or adjustments budget. Full-time equivalents are calculated by taking the total number of working days lost (excluding weekends and public holidays) while a post remains vacant and adding together all such days lost by all posts within the same set (e.g. ‘senior management’) then dividing that total by
250 to give the number of posts equivalent to the accumulated days. T3.56.4
Financial Performance: Local Economic Development
R'000
Details
2017/18 2018/19
Actual Original Budget
Adjustment Budget
Actual Variance to
Budget
Total Operational Revenue (excluding tarrifs) - - - -
Expenditure:
Employees 3 509 609.56 4 025 430 4 025 430 3 040 061.05 24%
Repairs and Maintenance - - - -
Other 0.00 3 500 3 500 243.31 93%
Total Operational Expenditure 3 509 609.56 4 028 930 4 028 930 3 040 304.36 24%
Net Operational (Service) Expenditure
(3 509 609.56) (4 028 930) (4 028 930) (3 040 304.36)
Net expenditure to be consistent with summary table T5.1.2 in Chapter 5. Variances are calculated by dividing the difference between the Actual and Original Budget by the Actual.
Capital Expenditure 2018/19: Local Economic Development R' 000
Capital Projects 2018/19
Budget Adjustment Budget
Actual Expenditure
Variance from original budget
Total Project Value
Total All
Project A 250 000 - 241 540 8 460 -
Project B 85 000 - 11 650 73 350 -
Project C 60 000 - 47 380 12 620 - Total project value represents the estimated cost of the project on approval by council (including past and
future expenditure as appropriate.
3.5 Component E- Environmental Protection (Management)
Child Care; Aged Care; Social Programmes Policy Objectives Taken From IDP
Service Outline Service Targets 2016/17 2017/18 2018/19
28
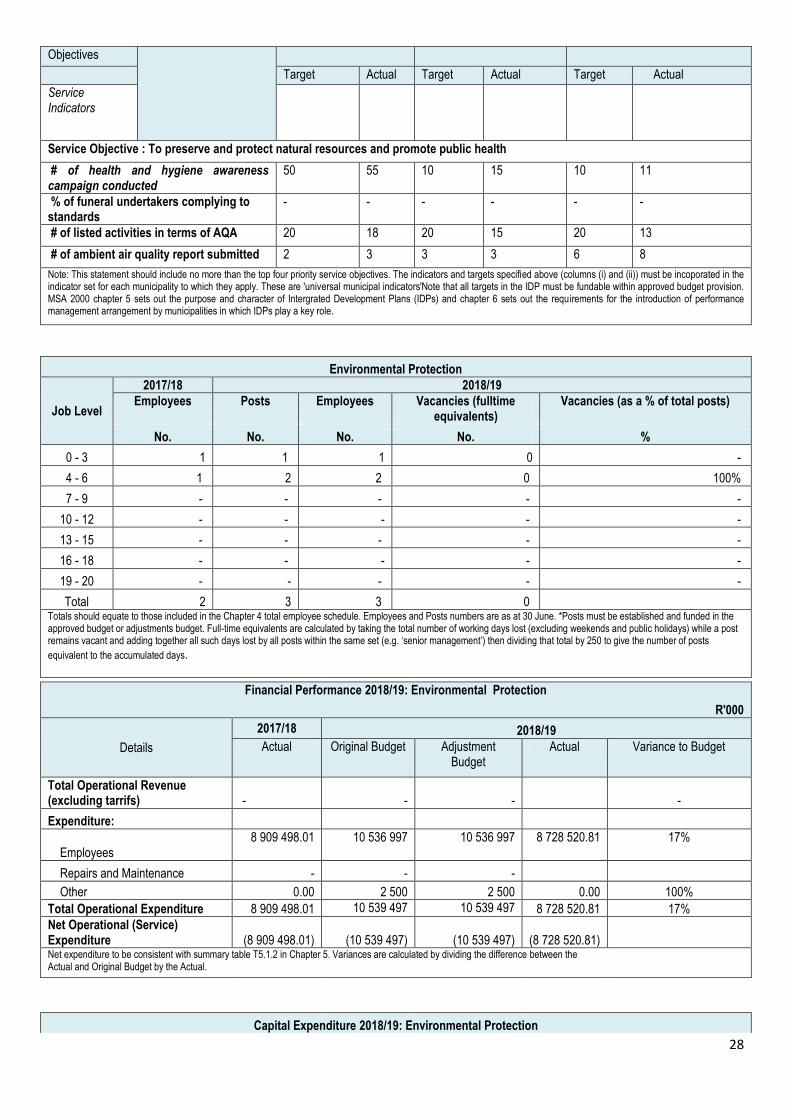
Objectives
Target Actual Target Actual Target Actual
Service Indicators
Service Objective : To preserve and protect natural resources and promote public health
# of health and hygiene awareness campaign conducted
50 55 10 15 10 11
% of funeral undertakers complying to standards
- - - - - -
# of listed activities in terms of AQA 20 18 20 15 20 13
# of ambient air quality report submitted 2 3 3 3 6 8
Note: This statement should include no more than the top four priority service objectives. The indicators and targets specified above (columns (i) and (ii)) must be incoporated in the indicator set for each municipality to which they apply. These are 'universal municipal indicators'Note that all targets in the IDP must be fundable within approved budget provision. MSA 2000 chapter 5 sets out the purpose and character of Intergrated Development Plans (IDPs) and chapter 6 sets out the requirements for the introduction of performance management arrangement by municipalities in which IDPs play a key role.
Environmental Protection
Job Level
2017/18 2018/19
Employees Posts Employees Vacancies (fulltime equivalents)
Vacancies (as a % of total posts)
No. No. No. No. %
0 - 3 1 1 1 0 -
4 - 6 1 2 2 0 100%
7 - 9 - - - - -
10 - 12 - - - - -
13 - 15 - - - - -
16 - 18 - - - - -
19 - 20 - - - - -
Total 2 3 3 0 Totals should equate to those included in the Chapter 4 total employee schedule. Employees and Posts numbers are as at 30 June. *Posts must be established and funded in the approved budget or adjustments budget. Full-time equivalents are calculated by taking the total number of working days lost (excluding weekends and public holidays) while a post remains vacant and adding together all such days lost by all posts within the same set (e.g. ‘senior management’) then dividing that total by 250 to give the number of posts
equivalent to the accumulated days.
Financial Performance 2018/19: Environmental Protection
R'000
Details
2017/18 2018/19
Actual Original Budget Adjustment Budget
Actual Variance to Budget
Total Operational Revenue (excluding tarrifs) - - - -
Expenditure:
Employees 8 909 498.01 10 536 997 10 536 997 8 728 520.81 17%
Repairs and Maintenance - - -
Other 0.00 2 500 2 500 0.00 100%
Total Operational Expenditure 8 909 498.01 10 539 497 10 539 497 8 728 520.81 17%
Net Operational (Service) Expenditure (8 909 498.01) (10 539 497) (10 539 497) (8 728 520.81) Net expenditure to be consistent with summary table T5.1.2 in Chapter 5. Variances are calculated by dividing the difference between the Actual and Original Budget by the Actual.
Capital Expenditure 2018/19: Environmental Protection
29
R' 000
Capital Projects
2018/19
Budget Adjustment Budget
Actual Expenditure
Variance from original budget
Total Project Value
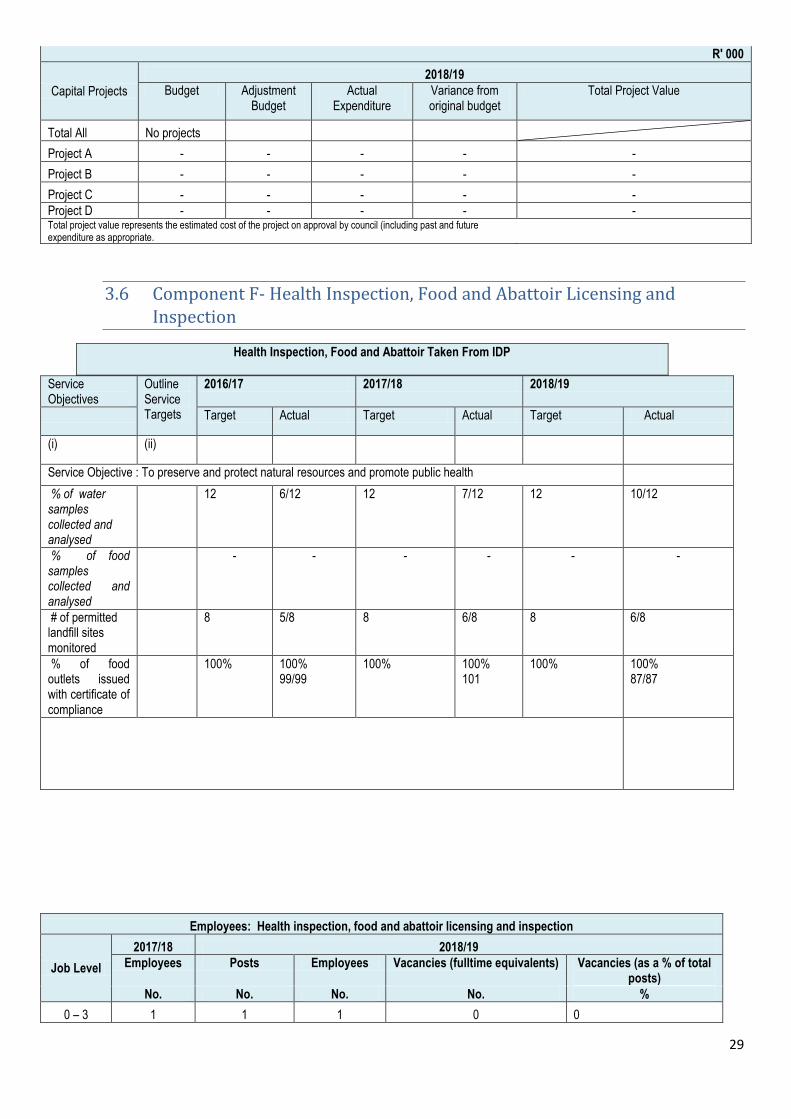
Total All No projects
Project A - - - - -
Project B - - - - -
Project C - - - - -
Project D - - - - - Total project value represents the estimated cost of the project on approval by council (including past and future expenditure as appropriate.
3.6 Component F- Health Inspection, Food and Abattoir Licensing and Inspection
Health Inspection, Food and Abattoir Taken From IDP
Service Objectives
Outline Service Targets
2016/17 2017/18 2018/19
Target Actual Target Actual Target Actual
(i) (ii)
Service Objective : To preserve and protect natural resources and promote public health
% of water samples collected and analysed
12 6/12 12 7/12 12 10/12
% of food samples collected and analysed
- - - - - -
# of permitted landfill sites monitored
8 5/8 8 6/8 8 6/8
% of food outlets issued with certificate of compliance
100% 100% 99/99
100% 100% 101
100% 100% 87/87
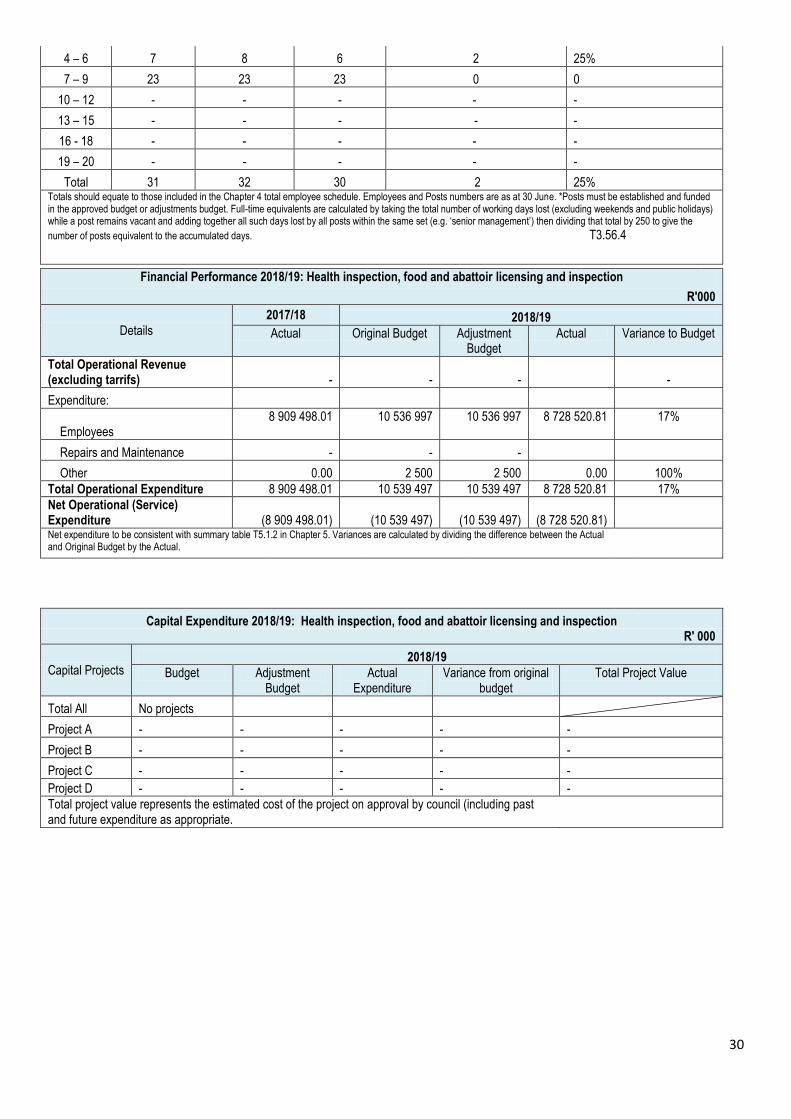
Employees: Health inspection, food and abattoir licensing and inspection
Job Level
2017/18 2018/19
Employees Posts Employees Vacancies (fulltime equivalents) Vacancies (as a % of total posts)
No. No. No. No. %
0 – 3 1 1 1 0 0
30
4 – 6 7 8 6 2 25%
7 – 9 23 23 23 0 0
10 – 12 - - - - -
13 – 15 - - - - -
16 - 18 - - - - -
19 – 20 - - - - -
Total 31 32 30 2 25% Totals should equate to those included in the Chapter 4 total employee schedule. Employees and Posts numbers are as at 30 June. *Posts must be established and funded in the approved budget or adjustments budget. Full-time equivalents are calculated by taking the total number of working days lost (excluding weekends and public holidays) while a post remains vacant and adding together all such days lost by all posts within the same set (e.g. ‘senior management’) then dividing that total by 250 to give the
number of posts equivalent to the accumulated days. T3.56.4
Financial Performance 2018/19: Health inspection, food and abattoir licensing and inspection
R'000
Details
2017/18 2018/19
Actual Original Budget Adjustment Budget
Actual Variance to Budget
Total Operational Revenue (excluding tarrifs) - - - -
Expenditure:
Employees 8 909 498.01 10 536 997 10 536 997 8 728 520.81 17%
Repairs and Maintenance - - -
Other 0.00 2 500 2 500 0.00 100%
Total Operational Expenditure 8 909 498.01 10 539 497 10 539 497 8 728 520.81 17%
Net Operational (Service) Expenditure (8 909 498.01) (10 539 497) (10 539 497) (8 728 520.81) Net expenditure to be consistent with summary table T5.1.2 in Chapter 5. Variances are calculated by dividing the difference between the Actual and Original Budget by the Actual.
Capital Expenditure 2018/19: Health inspection, food and abattoir licensing and inspection R' 000
Capital Projects 2018/19
Budget Adjustment Budget
Actual Expenditure
Variance from original budget
Total Project Value
Total All No projects
Project A - - - - -
Project B - - - - -
Project C - - - - -
Project D - - - - -
Total project value represents the estimated cost of the project on approval by council (including past and future expenditure as appropriate.
31
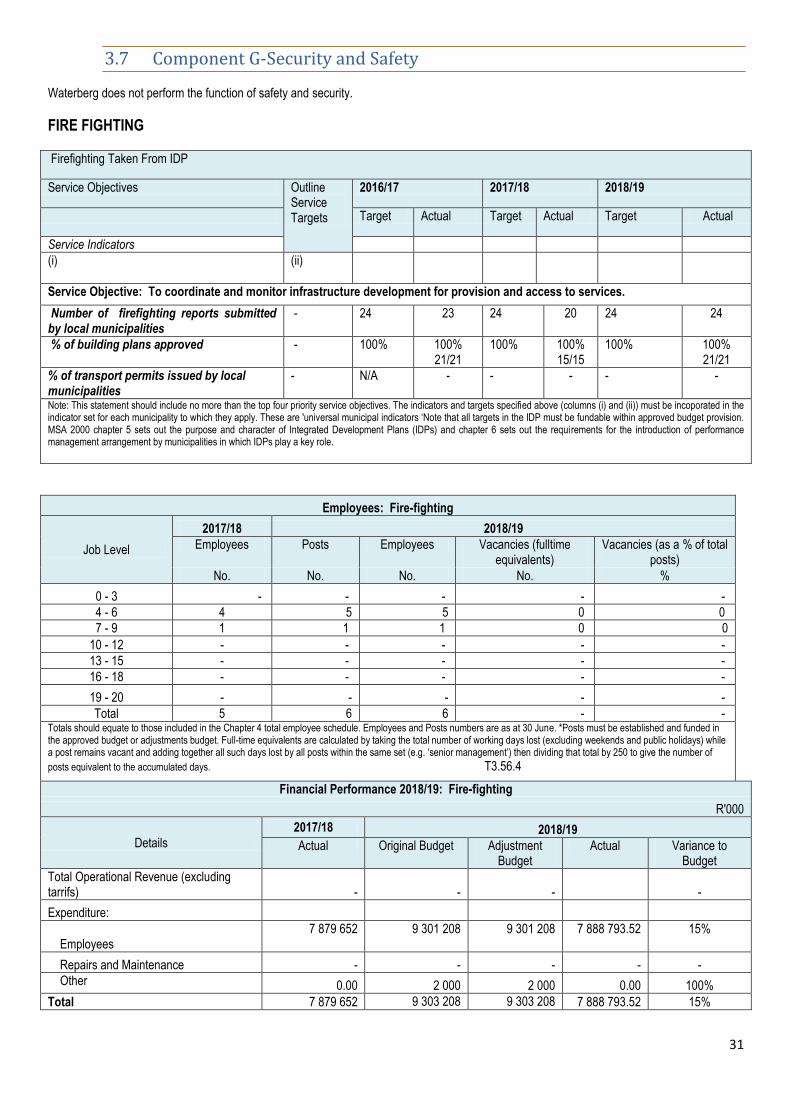
3.7 Component G-Security and Safety
Waterberg does not perform the function of safety and security.
FIRE FIGHTING
Firefighting Taken From IDP
Service Objectives Outline Service Targets
2016/17 2017/18 2018/19
Target Actual Target Actual Target Actual
Service Indicators
(i) (ii)
Service Objective: To coordinate and monitor infrastructure development for provision and access to services.
Number of firefighting reports submitted by local municipalities
- 24 23 24 20 24 24
% of building plans approved - 100% 100% 21/21
100% 100% 15/15
100% 100% 21/21
% of transport permits issued by local municipalities
- N/A - - - - -
Note: This statement should include no more than the top four priority service objectives. The indicators and targets specified above (columns (i) and (ii)) must be incoporated in the indicator set for each municipality to which they apply. These are 'universal municipal indicators ‘Note that all targets in the IDP must be fundable within approved budget provision. MSA 2000 chapter 5 sets out the purpose and character of Integrated Development Plans (IDPs) and chapter 6 sets out the requirements for the introduction of performance management arrangement by municipalities in which IDPs play a key role.
Employees: Fire-fighting
Job Level
2017/18 2018/19
Employees Posts Employees Vacancies (fulltime equivalents)
Vacancies (as a % of total posts)
No. No. No. No. %
0 - 3 - - - - -
4 - 6 4 5 5 0 0
7 - 9 1 1 1 0 0
10 - 12 - - - - -
13 - 15 - - - - -
16 - 18 - - - - -
19 - 20 - - - - -
Total 5 6 6 - - Totals should equate to those included in the Chapter 4 total employee schedule. Employees and Posts numbers are as at 30 June. *Posts must be established and funded in the approved budget or adjustments budget. Full-time equivalents are calculated by taking the total number of working days lost (excluding weekends and public holidays) while a post remains vacant and adding together all such days lost by all posts within the same set (e.g. ‘senior management’) then dividing that total by 250 to give the number of
posts equivalent to the accumulated days. T3.56.4
Financial Performance 2018/19: Fire-fighting
R'000
Details
2017/18 2018/19
Actual Original Budget Adjustment Budget
Actual Variance to Budget
Total Operational Revenue (excluding tarrifs) - - - -
Expenditure:
Employees 7 879 652 9 301 208 9 301 208 7 888 793.52 15%
Repairs and Maintenance - - - - -
Other 0.00 2 000 2 000 0.00 100%
Total 7 879 652 9 303 208 9 303 208 7 888 793.52 15%
32
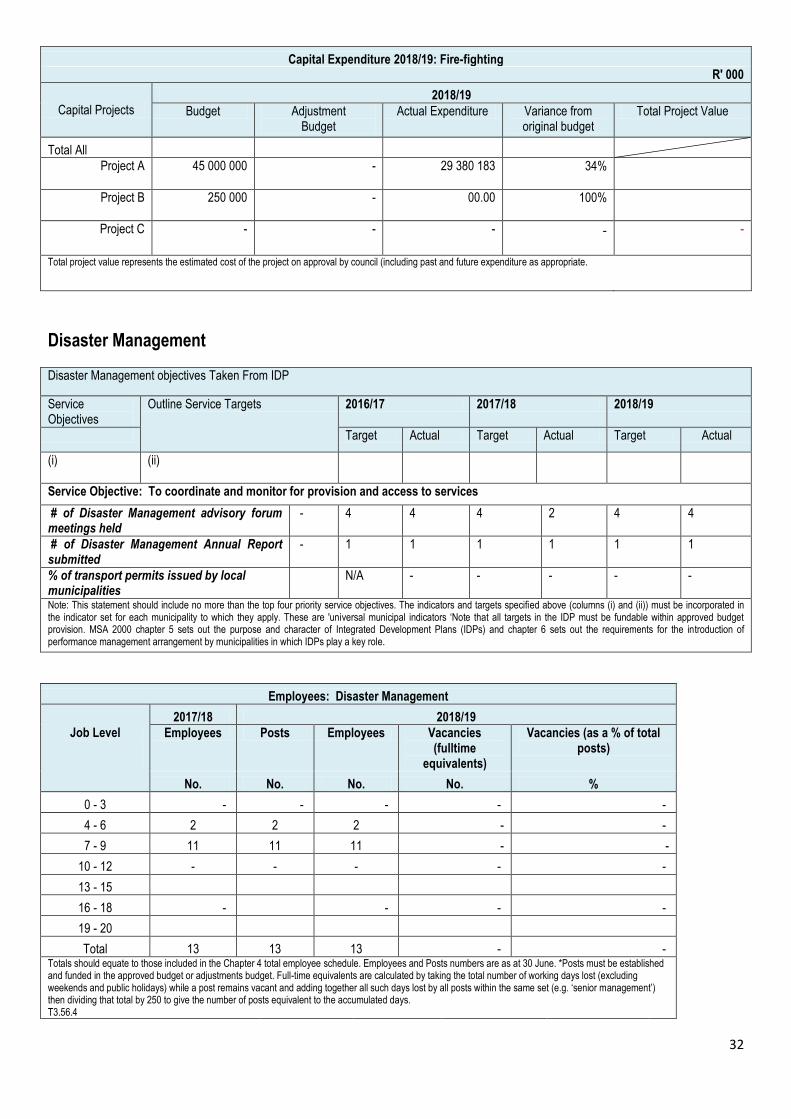
Capital Expenditure 2018/19: Fire-fighting R' 000
Capital Projects 2018/19
Budget Adjustment Budget
Actual Expenditure Variance from original budget
Total Project Value
Total All
Project A 45 000 000 - 29 380 183 34%
Project B 250 000 - 00.00 100%
Project C - - - - -
Total project value represents the estimated cost of the project on approval by council (including past and future expenditure as appropriate.
Disaster Management
Disaster Management objectives Taken From IDP
Service Objectives
Outline Service Targets 2016/17 2017/18 2018/19
Target Actual Target Actual Target Actual
(i) (ii)
Service Objective: To coordinate and monitor for provision and access to services
# of Disaster Management advisory forum meetings held
- 4 4 4 2 4 4
# of Disaster Management Annual Report submitted
- 1 1 1 1 1 1
% of transport permits issued by local municipalities
N/A - - - - -
Note: This statement should include no more than the top four priority service objectives. The indicators and targets specified above (columns (i) and (ii)) must be incorporated in the indicator set for each municipality to which they apply. These are 'universal municipal indicators ‘Note that all targets in the IDP must be fundable within approved budget provision. MSA 2000 chapter 5 sets out the purpose and character of Integrated Development Plans (IDPs) and chapter 6 sets out the requirements for the introduction of performance management arrangement by municipalities in which IDPs play a key role.
Employees: Disaster Management
Job Level
2017/18 2018/19
Employees Posts Employees Vacancies (fulltime
equivalents)
Vacancies (as a % of total posts)
No. No. No. No. %
0 - 3 - - - - -
4 - 6 2 2 2 - -
7 - 9 11 11 11 - -
10 - 12 - - - - -
13 - 15
16 - 18 -
- - -
19 - 20
Total 13 13 13 - - Totals should equate to those included in the Chapter 4 total employee schedule. Employees and Posts numbers are as at 30 June. *Posts must be established and funded in the approved budget or adjustments budget. Full-time equivalents are calculated by taking the total number of working days lost (excluding weekends and public holidays) while a post remains vacant and adding together all such days lost by all posts within the same set (e.g. ‘senior management’) then dividing that total by 250 to give the number of posts equivalent to the accumulated days. T3.56.4
33
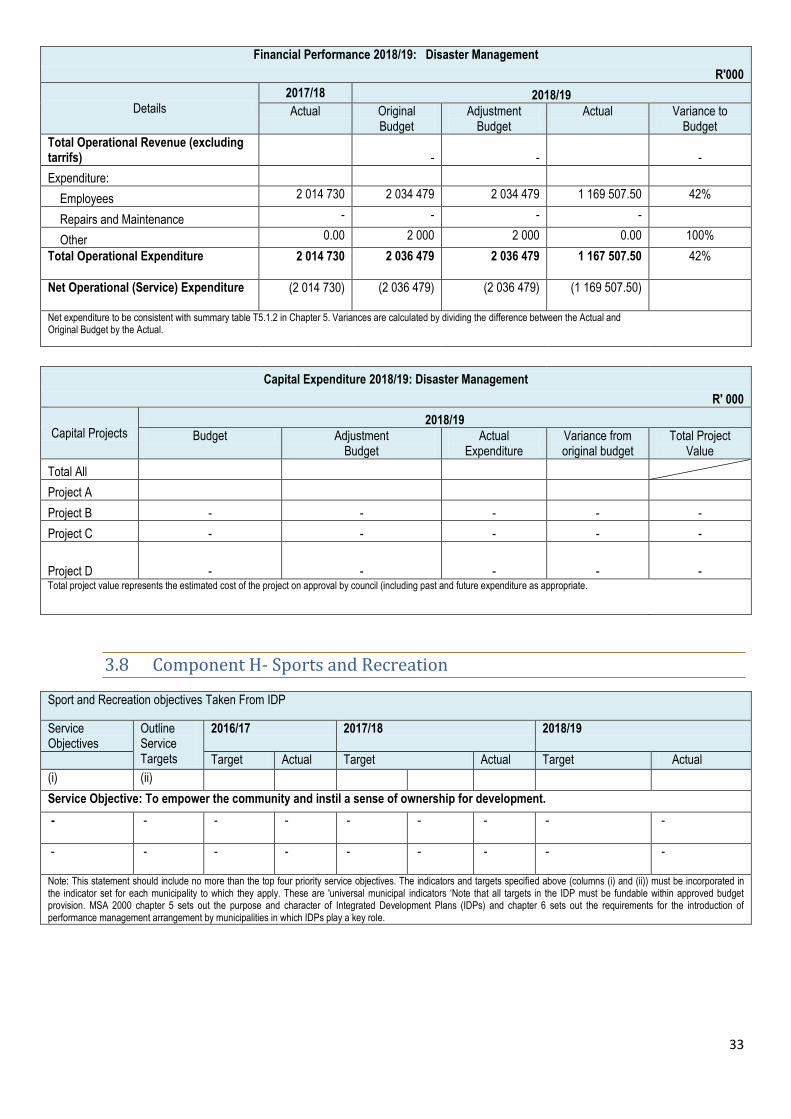
Financial Performance 2018/19: Disaster Management
R'000
Details 2017/18 2018/19
Actual Original Budget
Adjustment Budget
Actual Variance to Budget
Total Operational Revenue (excluding tarrifs) - - -
Expenditure:
Employees 2 014 730 2 034 479 2 034 479 1 169 507.50 42%
Repairs and Maintenance - - - -
Other 0.00 2 000 2 000 0.00 100%
Total Operational Expenditure 2 014 730 2 036 479 2 036 479 1 167 507.50 42%
Net Operational (Service) Expenditure (2 014 730) (2 036 479) (2 036 479) (1 169 507.50)
Net expenditure to be consistent with summary table T5.1.2 in Chapter 5. Variances are calculated by dividing the difference between the Actual and Original Budget by the Actual.
Capital Expenditure 2018/19: Disaster Management
R' 000
Capital Projects 2018/19
Budget Adjustment Budget
Actual Expenditure
Variance from original budget
Total Project Value
Total All
Project A
Project B - - - - -
Project C - - - - -
Project D - - - - - Total project value represents the estimated cost of the project on approval by council (including past and future expenditure as appropriate.
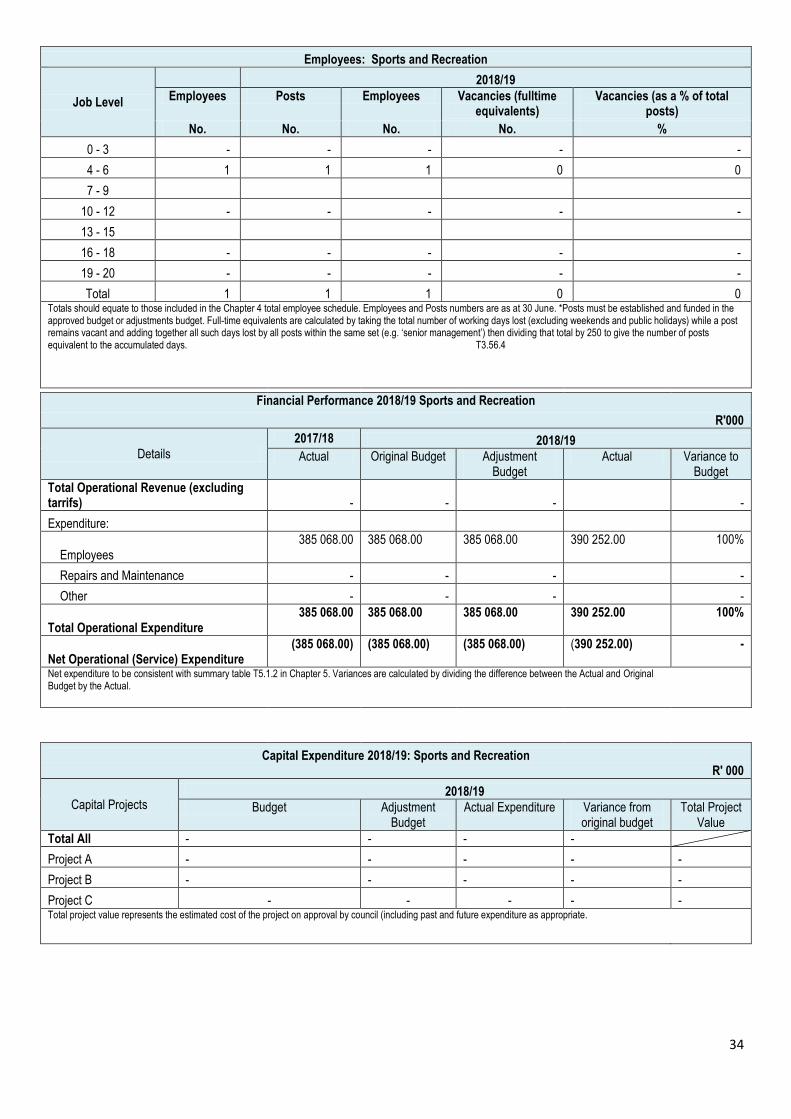
3.8 Component H- Sports and Recreation
Sport and Recreation objectives Taken From IDP
Service Objectives
Outline Service Targets
2016/17 2017/18 2018/19
Target Actual Target Actual Target Actual
(i) (ii)
Service Objective: To empower the community and instil a sense of ownership for development.
- - - - - - - - -
- - - - - - - - -
Note: This statement should include no more than the top four priority service objectives. The indicators and targets specified above (columns (i) and (ii)) must be incorporated in the indicator set for each municipality to which they apply. These are 'universal municipal indicators ‘Note that all targets in the IDP must be fundable within approved budget provision. MSA 2000 chapter 5 sets out the purpose and character of Integrated Development Plans (IDPs) and chapter 6 sets out the requirements for the introduction of performance management arrangement by municipalities in which IDPs play a key role.
34
Employees: Sports and Recreation
Job Level
2018/19
Employees Posts Employees Vacancies (fulltime equivalents)
Vacancies (as a % of total posts)
No. No. No. No. %
0 - 3 - - - - -
4 - 6 1 1 1 0 0
7 - 9
10 - 12 - - - - -
13 - 15
16 - 18 - - - - -
19 - 20 - - - - -
Total 1 1 1 0 0 Totals should equate to those included in the Chapter 4 total employee schedule. Employees and Posts numbers are as at 30 June. *Posts must be established and funded in the approved budget or adjustments budget. Full-time equivalents are calculated by taking the total number of working days lost (excluding weekends and public holidays) while a post remains vacant and adding together all such days lost by all posts within the same set (e.g. ‘senior management’) then dividing that total by 250 to give the number of posts equivalent to the accumulated days. T3.56.4
Financial Performance 2018/19 Sports and Recreation
R'000
Details
2017/18 2018/19
Actual Original Budget Adjustment Budget
Actual Variance to Budget
Total Operational Revenue (excluding tarrifs) - - - -
Expenditure:
Employees 385 068.00 385 068.00 385 068.00 390 252.00 100%
Repairs and Maintenance - - - -
Other - - - -
Total Operational Expenditure 385 068.00 385 068.00 385 068.00 390 252.00 100%
Net Operational (Service) Expenditure (385 068.00) (385 068.00) (385 068.00) (390 252.00) -
Net expenditure to be consistent with summary table T5.1.2 in Chapter 5. Variances are calculated by dividing the difference between the Actual and Original Budget by the Actual.
Capital Expenditure 2018/19: Sports and Recreation R' 000
Capital Projects 2018/19
Budget Adjustment Budget
Actual Expenditure Variance from original budget
Total Project Value
Total All - - - -
Project A - - - - -
Project B - - - - -
Project C - - - - - Total project value represents the estimated cost of the project on approval by council (including past and future expenditure as appropriate.
35
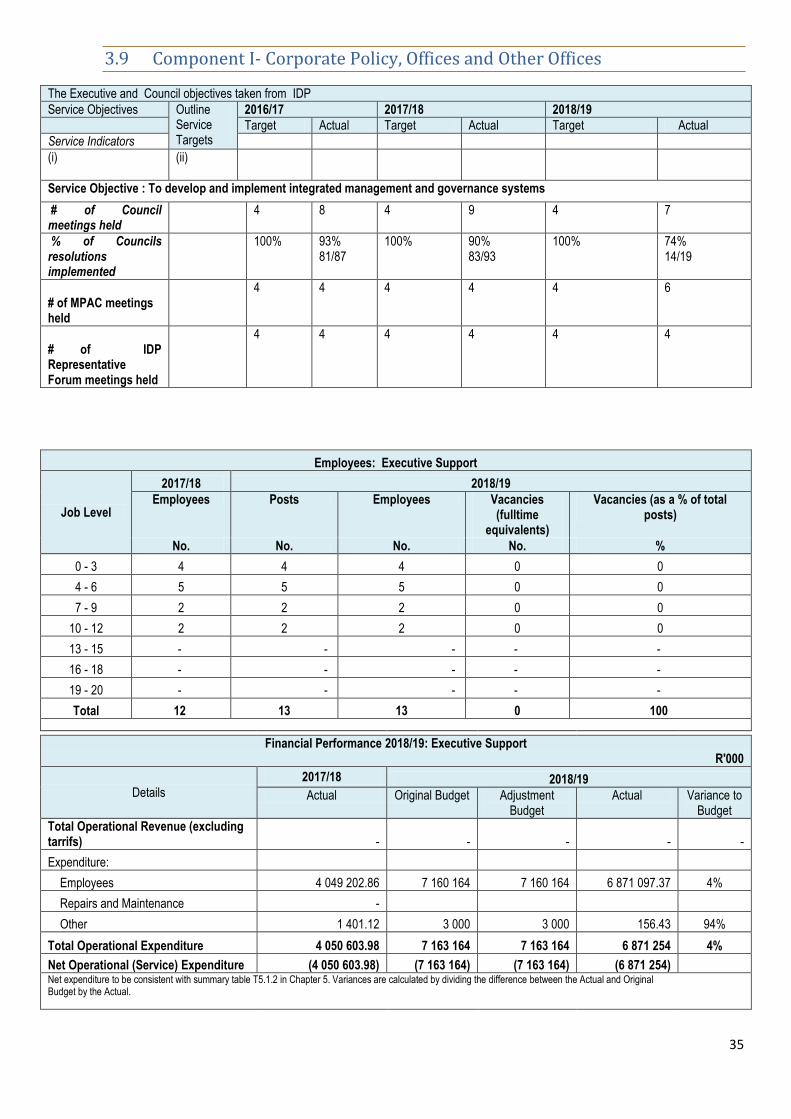
3.9 Component I- Corporate Policy, Offices and Other Offices
The Executive and Council objectives taken from IDP
Service Objectives Outline Service Targets
2016/17 2017/18 2018/19
Target Actual Target Actual Target Actual
Service Indicators
(i) (ii)
Service Objective : To develop and implement integrated management and governance systems
# of Council meetings held
4 8 4 9 4 7
% of Councils resolutions implemented
100% 93% 81/87
100% 90% 83/93
100% 74% 14/19
# of MPAC meetings held
4 4 4 4 4 6
# of IDP Representative Forum meetings held
4 4 4 4 4 4
Employees: Executive Support
Job Level
2017/18 2018/19
Employees Posts Employees Vacancies (fulltime
equivalents)
Vacancies (as a % of total posts)
No. No. No. No. %
0 - 3 4 4 4 0 0
4 - 6 5 5 5 0 0
7 - 9 2 2 2 0 0
10 - 12 2 2 2 0 0
13 - 15 - - - - -
16 - 18 - - - - -
19 - 20 - - - - -
Total 12 13 13 0 100
Financial Performance 2018/19: Executive Support R'000
Details
2017/18 2018/19
Actual Original Budget Adjustment Budget
Actual Variance to Budget
Total Operational Revenue (excluding tarrifs) - - - - -
Expenditure:
Employees 4 049 202.86 7 160 164 7 160 164 6 871 097.37 4%
Repairs and Maintenance -
Other 1 401.12 3 000 3 000 156.43 94%
Total Operational Expenditure 4 050 603.98 7 163 164 7 163 164 6 871 254 4%
Net Operational (Service) Expenditure (4 050 603.98) (7 163 164) (7 163 164) (6 871 254) Net expenditure to be consistent with summary table T5.1.2 in Chapter 5. Variances are calculated by dividing the difference between the Actual and Original Budget by the Actual.
36
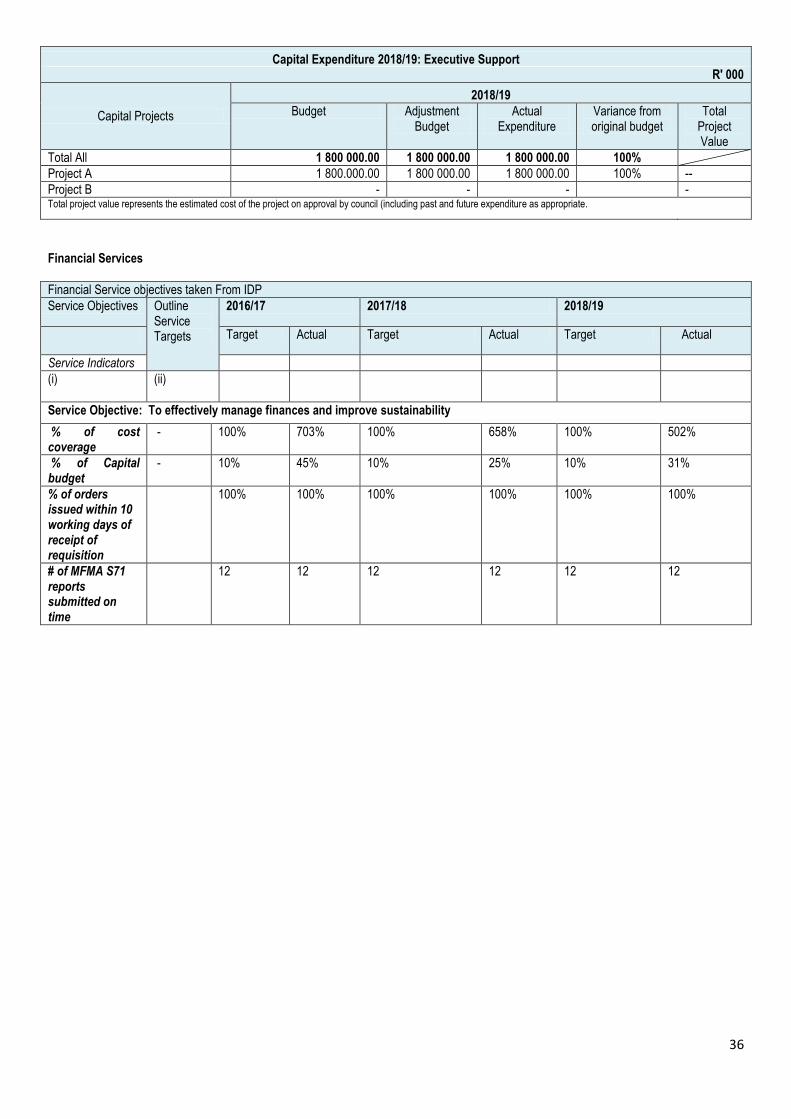
Capital Expenditure 2018/19: Executive Support R' 000
Capital Projects
2018/19
Budget Adjustment Budget
Actual Expenditure
Variance from original budget
Total Project Value
Total All 1 800 000.00 1 800 000.00 1 800 000.00 100%
Project A 1 800.000.00 1 800 000.00 1 800 000.00 100% --
Project B - - - - Total project value represents the estimated cost of the project on approval by council (including past and future expenditure as appropriate.
Financial Services
Financial Service objectives taken From IDP
Service Objectives Outline Service Targets
2016/17 2017/18 2018/19
Target Actual Target Actual Target Actual
Service Indicators
(i) (ii)
Service Objective: To effectively manage finances and improve sustainability
% of cost coverage
- 100% 703% 100% 658% 100% 502%
% of Capital budget
- 10% 45% 10% 25% 10% 31%
% of orders issued within 10 working days of receipt of requisition
100% 100% 100% 100% 100% 100%
# of MFMA S71 reports submitted on time
12 12 12 12 12 12
37
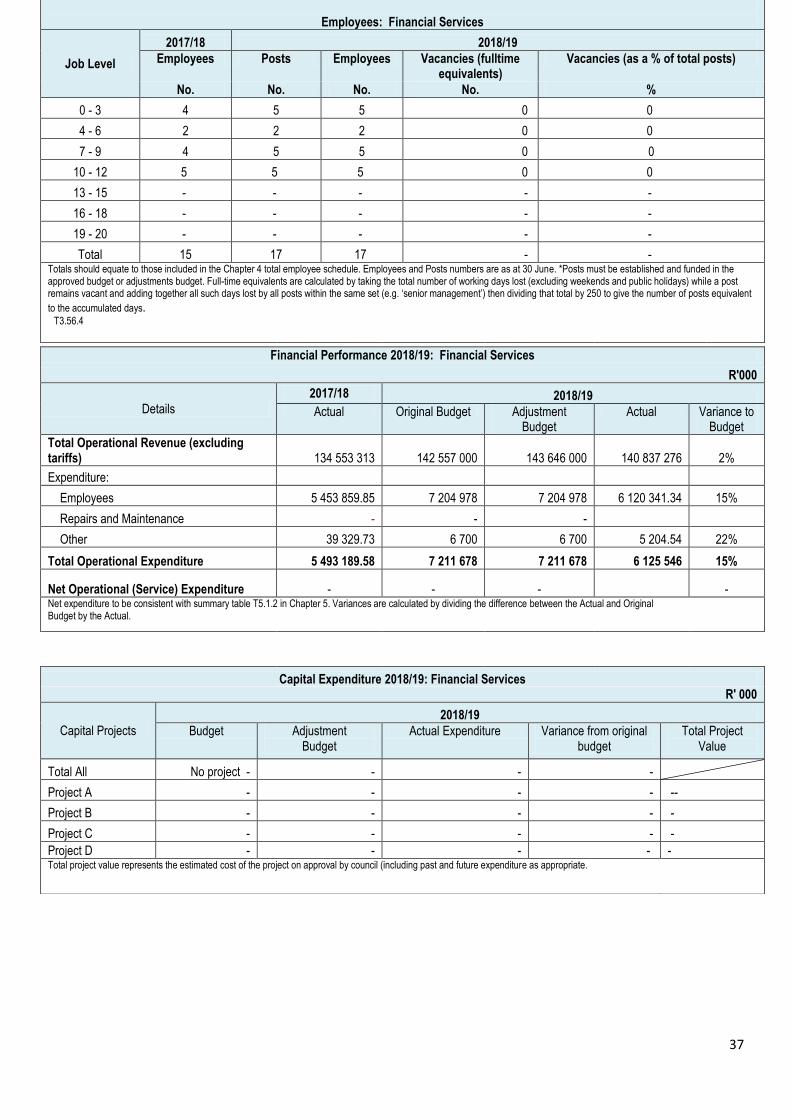
Employees: Financial Services
Job Level
2017/18 2018/19
Employees Posts Employees Vacancies (fulltime equivalents)
Vacancies (as a % of total posts)
No. No. No. No. %
0 - 3 4 5 5 0 0
4 - 6 2 2 2 0 0
7 - 9 4 5 5 0 0
10 - 12 5 5 5 0 0
13 - 15 - - - - -
16 - 18 - - - - -
19 - 20 - - - - -
Total 15 17 17 - - Totals should equate to those included in the Chapter 4 total employee schedule. Employees and Posts numbers are as at 30 June. *Posts must be established and funded in the approved budget or adjustments budget. Full-time equivalents are calculated by taking the total number of working days lost (excluding weekends and public holidays) while a post remains vacant and adding together all such days lost by all posts within the same set (e.g. ‘senior management’) then dividing that total by 250 to give the number of posts equivalent
to the accumulated days. T3.56.4
Financial Performance 2018/19: Financial Services
R'000
Details
2017/18 2018/19
Actual Original Budget Adjustment Budget
Actual Variance to Budget
Total Operational Revenue (excluding tariffs) 134 553 313 142 557 000 143 646 000 140 837 276 2%
Expenditure:
Employees 5 453 859.85 7 204 978 7 204 978 6 120 341.34 15%
Repairs and Maintenance - - -
Other 39 329.73 6 700 6 700 5 204.54 22%
Total Operational Expenditure 5 493 189.58 7 211 678 7 211 678 6 125 546 15%
Net Operational (Service) Expenditure - - - - Net expenditure to be consistent with summary table T5.1.2 in Chapter 5. Variances are calculated by dividing the difference between the Actual and Original Budget by the Actual.
Capital Expenditure 2018/19: Financial Services R' 000
Capital Projects
2018/19
Budget Adjustment Budget
Actual Expenditure Variance from original budget
Total Project Value
Total All No project - - - -
Project A - - - - --
Project B - - - - -
Project C - - - - -
Project D - - - - - Total project value represents the estimated cost of the project on approval by council (including past and future expenditure as appropriate.
38
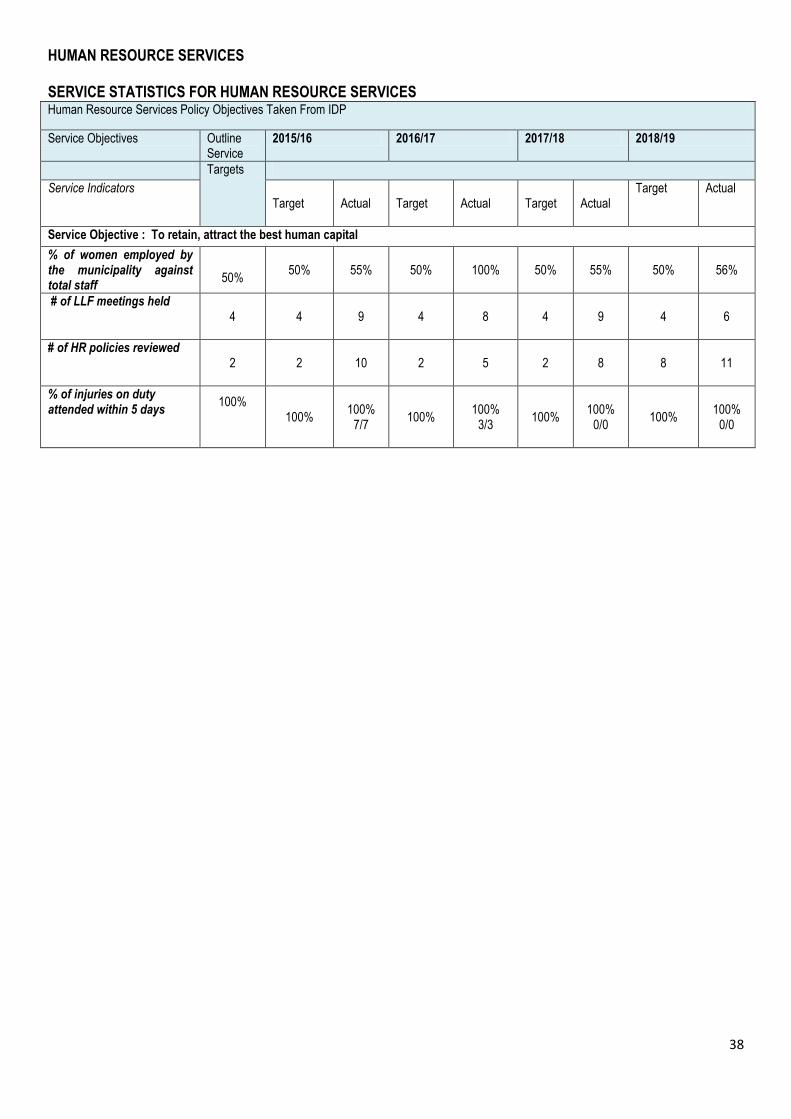
HUMAN RESOURCE SERVICES SERVICE STATISTICS FOR HUMAN RESOURCE SERVICES Human Resource Services Policy Objectives Taken From IDP
Service Objectives Outline Service
2015/16 2016/17 2017/18 2018/19
Targets
Service Indicators Target
Actual
Target
Actual
Target
Actual
Target Actual
Service Objective : To retain, attract the best human capital
% of women employed by the municipality against total staff
50%
50% 55% 50% 100% 50% 55% 50% 56%
# of LLF meetings held 4
4 9 4 8 4 9 4 6
# of HR policies reviewed 2
2 10 2 5 2 8 8 11
% of injuries on duty attended within 5 days
100%
100% 100%
7/7 100%
100% 3/3
100% 100%
0/0 100%
100% 0/0
39
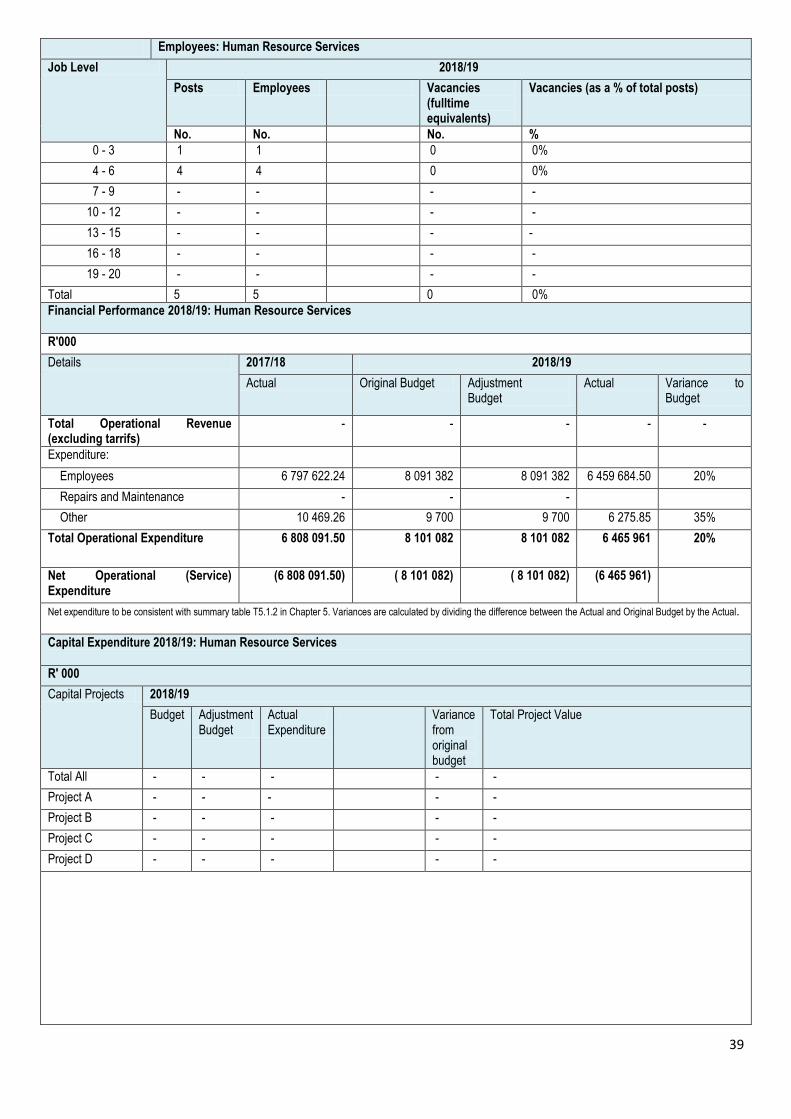
Employees: Human Resource Services
Job Level 2018/19
Posts Employees Vacancies (fulltime equivalents)
Vacancies (as a % of total posts)
No. No. No. %
0 - 3 1 1 0 0%
4 - 6 4 4 0 0%
7 - 9 - - - -
10 - 12 - - - -
13 - 15 - - - -
16 - 18 - - - -
19 - 20 - - - -
Total 5 5 0 0%
Financial Performance 2018/19: Human Resource Services
R'000
Details 2017/18 2018/19
Actual Original Budget Adjustment Budget
Actual Variance to Budget
Total Operational Revenue (excluding tarrifs)
- - - - -
Expenditure:
Employees 6 797 622.24 8 091 382 8 091 382 6 459 684.50 20%
Repairs and Maintenance - - -
Other 10 469.26 9 700 9 700 6 275.85 35%
Total Operational Expenditure 6 808 091.50 8 101 082 8 101 082 6 465 961 20%
Net Operational (Service) Expenditure
(6 808 091.50) ( 8 101 082) ( 8 101 082) (6 465 961)
Net expenditure to be consistent with summary table T5.1.2 in Chapter 5. Variances are calculated by dividing the difference between the Actual and Original Budget by the Actual.
Capital Expenditure 2018/19: Human Resource Services
R' 000
Capital Projects 2018/19
Budget Adjustment Budget
Actual Expenditure
Variance from original budget
Total Project Value
Total All - - - - -
Project A - - - - -
Project B - - - - -
Project C - - - - -
Project D - - - - -
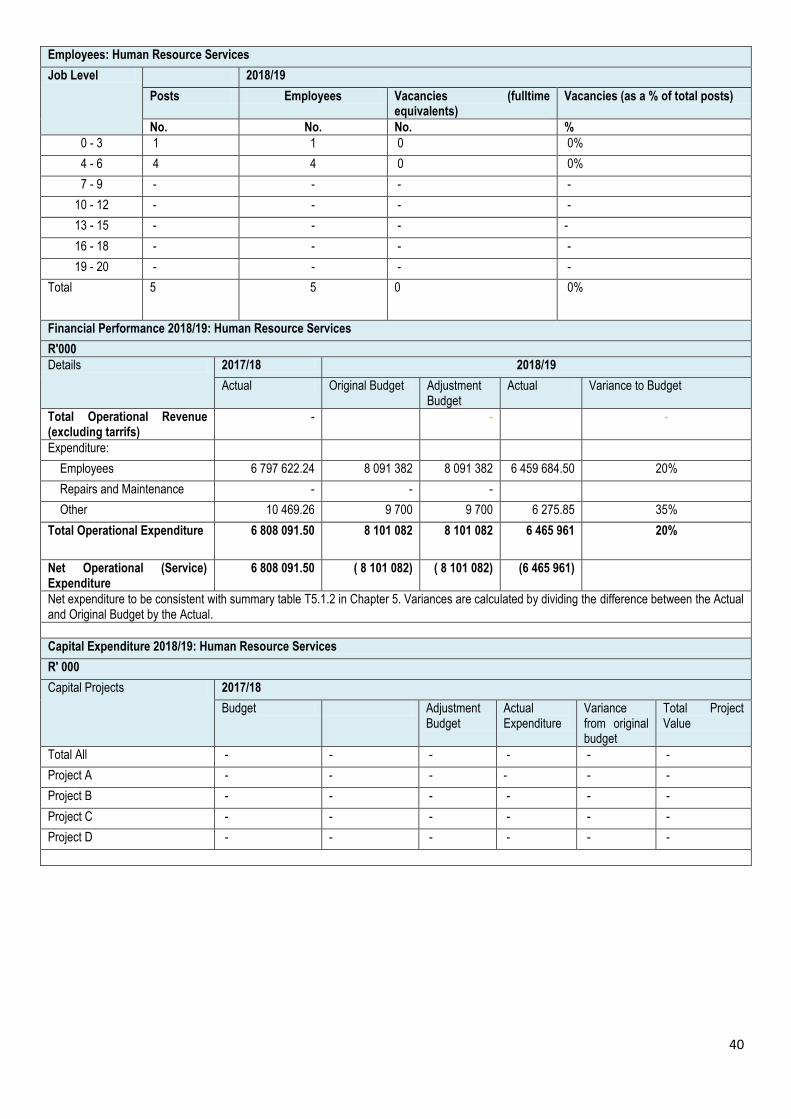
40
Employees: Human Resource Services
Job Level 2018/19
Posts Employees Vacancies (fulltime equivalents)
Vacancies (as a % of total posts)
No. No. No. %
0 - 3 1 1 0 0%
4 - 6 4 4 0 0%
7 - 9 - - - -
10 - 12 - - - -
13 - 15 - - - -
16 - 18 - - - -
19 - 20 - - - -
Total 5 5 0 0%
Financial Performance 2018/19: Human Resource Services
R'000
Details 2017/18 2018/19
Actual Original Budget Adjustment Budget
Actual Variance to Budget
Total Operational Revenue (excluding tarrifs)
- - -
Expenditure:
Employees 6 797 622.24 8 091 382 8 091 382 6 459 684.50 20%
Repairs and Maintenance - - -
Other 10 469.26 9 700 9 700 6 275.85 35%
Total Operational Expenditure 6 808 091.50 8 101 082 8 101 082 6 465 961 20%
Net Operational (Service) Expenditure
6 808 091.50 ( 8 101 082) ( 8 101 082) (6 465 961)
Net expenditure to be consistent with summary table T5.1.2 in Chapter 5. Variances are calculated by dividing the difference between the Actual and Original Budget by the Actual.
Capital Expenditure 2018/19: Human Resource Services
R' 000
Capital Projects 2017/18
Budget Adjustment Budget
Actual Expenditure
Variance from original budget
Total Project Value
Total All - - - - - -
Project A - - - - - -
Project B - - - - - -
Project C - - - - - -
Project D - - - - - -
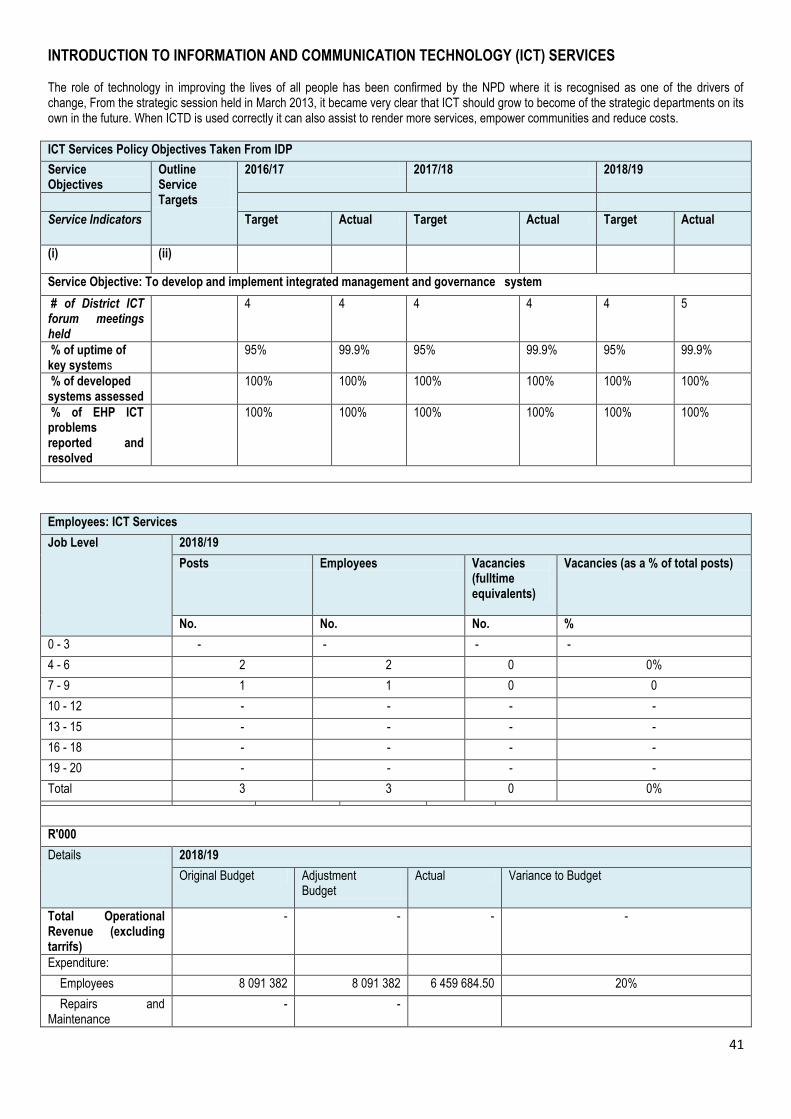
41
INTRODUCTION TO INFORMATION AND COMMUNICATION TECHNOLOGY (ICT) SERVICES The role of technology in improving the lives of all people has been confirmed by the NPD where it is recognised as one of the drivers of change, From the strategic session held in March 2013, it became very clear that ICT should grow to become of the strategic departments on its own in the future. When ICTD is used correctly it can also assist to render more services, empower communities and reduce costs.
ICT Services Policy Objectives Taken From IDP
Service Objectives
Outline Service Targets
2016/17 2017/18 2018/19
Service Indicators Target Actual Target Actual Target Actual
(i) (ii)
Service Objective: To develop and implement integrated management and governance system
# of District ICT forum meetings held
4 4 4 4 4 5
% of uptime of key systems
95% 99.9% 95% 99.9% 95% 99.9%
% of developed systems assessed
100% 100% 100% 100% 100% 100%
% of EHP ICT problems reported and resolved
100% 100% 100% 100% 100% 100%
Employees: ICT Services
Job Level 2018/19
Posts Employees Vacancies (fulltime equivalents)
Vacancies (as a % of total posts)
No. No. No. %
0 - 3 - - - -
4 - 6 2 2 0 0%
7 - 9 1 1 0 0
10 - 12 - - - -
13 - 15 - - - -
16 - 18 - - - -
19 - 20 - - - -
Total 3 3 0 0%
R'000
Details 2018/19
Original Budget Adjustment Budget
Actual Variance to Budget
Total Operational Revenue (excluding tarrifs)
- - - -
Expenditure:
Employees 8 091 382 8 091 382 6 459 684.50 20%
Repairs and Maintenance
- -
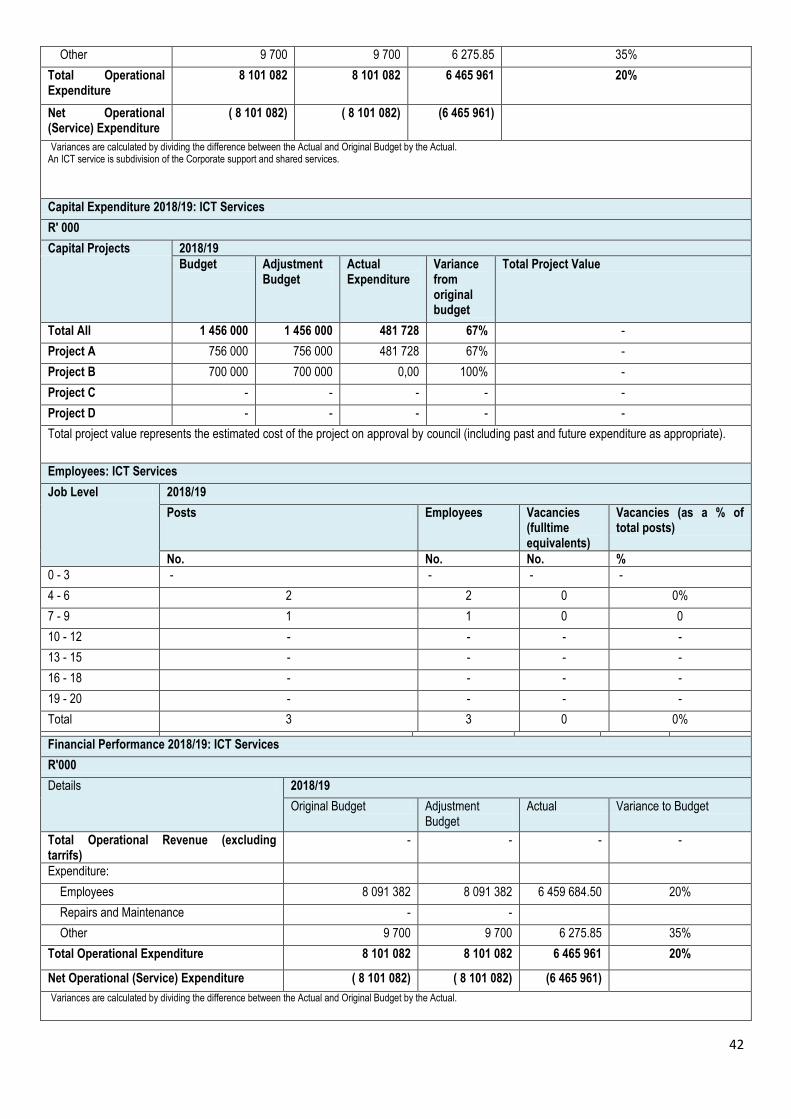
42
Other 9 700 9 700 6 275.85 35%
Total Operational Expenditure
8 101 082 8 101 082 6 465 961 20%
Net Operational (Service) Expenditure
( 8 101 082) ( 8 101 082) (6 465 961)
Variances are calculated by dividing the difference between the Actual and Original Budget by the Actual. An ICT service is subdivision of the Corporate support and shared services.
Capital Expenditure 2018/19: ICT Services
R' 000
Capital Projects 2018/19
Budget Adjustment Budget
Actual Expenditure
Variance from original budget
Total Project Value
Total All 1 456 000 1 456 000 481 728 67% -
Project A 756 000 756 000 481 728 67% -
Project B 700 000 700 000 0,00 100% -
Project C - - - - -
Project D - - - - -
Total project value represents the estimated cost of the project on approval by council (including past and future expenditure as appropriate).
Employees: ICT Services
Job Level 2018/19
Posts Employees Vacancies (fulltime equivalents)
Vacancies (as a % of total posts)
No. No. No. %
0 - 3 - - - -
4 - 6 2 2 0 0%
7 - 9 1 1 0 0
10 - 12 - - - -
13 - 15 - - - -
16 - 18 - - - -
19 - 20 - - - -
Total 3 3 0 0%
Financial Performance 2018/19: ICT Services
R'000
Details 2018/19
Original Budget Adjustment Budget
Actual Variance to Budget
Total Operational Revenue (excluding tarrifs)
- - - -
Expenditure:
Employees 8 091 382 8 091 382 6 459 684.50 20%
Repairs and Maintenance - -
Other 9 700 9 700 6 275.85 35%
Total Operational Expenditure 8 101 082 8 101 082 6 465 961 20%
Net Operational (Service) Expenditure ( 8 101 082) ( 8 101 082) (6 465 961)
Variances are calculated by dividing the difference between the Actual and Original Budget by the Actual.
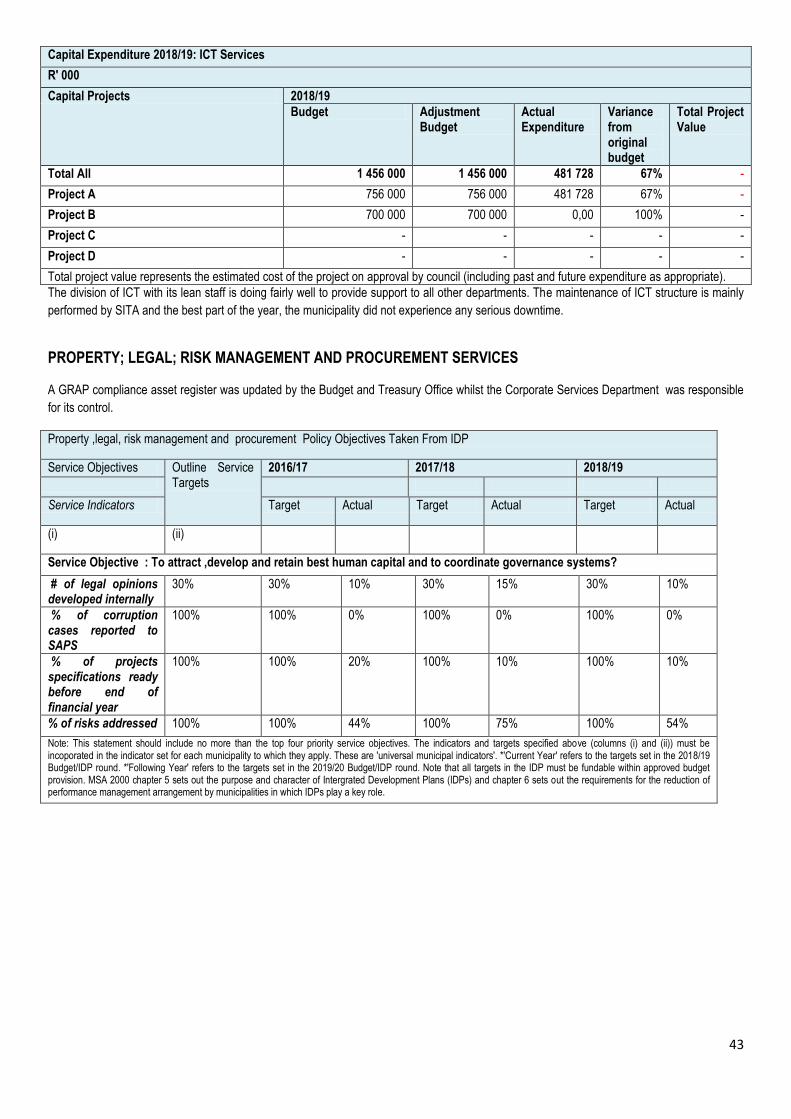
43
Capital Expenditure 2018/19: ICT Services
R' 000
Capital Projects 2018/19
Budget Adjustment Budget
Actual Expenditure
Variance from original budget
Total Project Value
Total All 1 456 000 1 456 000 481 728 67% -
Project A 756 000 756 000 481 728 67% -
Project B 700 000 700 000 0,00 100% -
Project C - - - - -
Project D - - - - -
Total project value represents the estimated cost of the project on approval by council (including past and future expenditure as appropriate).
The division of ICT with its lean staff is doing fairly well to provide support to all other departments. The maintenance of ICT structure is mainly
performed by SITA and the best part of the year, the municipality did not experience any serious downtime.
PROPERTY; LEGAL; RISK MANAGEMENT AND PROCUREMENT SERVICES A GRAP compliance asset register was updated by the Budget and Treasury Office whilst the Corporate Services Department was responsible
for its control.
Property ,legal, risk management and procurement Policy Objectives Taken From IDP
Service Objectives Outline Service Targets
2016/17 2017/18 2018/19
Service Indicators Target Actual Target Actual Target Actual
(i) (ii)
Service Objective : To attract ,develop and retain best human capital and to coordinate governance systems?
# of legal opinions developed internally
30% 30% 10% 30% 15% 30% 10%
% of corruption cases reported to SAPS
100% 100% 0% 100% 0% 100% 0%
% of projects specifications ready before end of financial year
100% 100% 20% 100% 10% 100% 10%
% of risks addressed 100% 100% 44% 100% 75% 100% 54%
Note: This statement should include no more than the top four priority service objectives. The indicators and targets specified above (columns (i) and (ii)) must be incoporated in the indicator set for each municipality to which they apply. These are 'universal municipal indicators'. *'Current Year' refers to the targets set in the 2018/19 Budget/IDP round. *'Following Year' refers to the targets set in the 2019/20 Budget/IDP round. Note that all targets in the IDP must be fundable within approved budget provision. MSA 2000 chapter 5 sets out the purpose and character of Intergrated Development Plans (IDPs) and chapter 6 sets out the requirements for the reduction of performance management arrangement by municipalities in which IDPs play a key role.
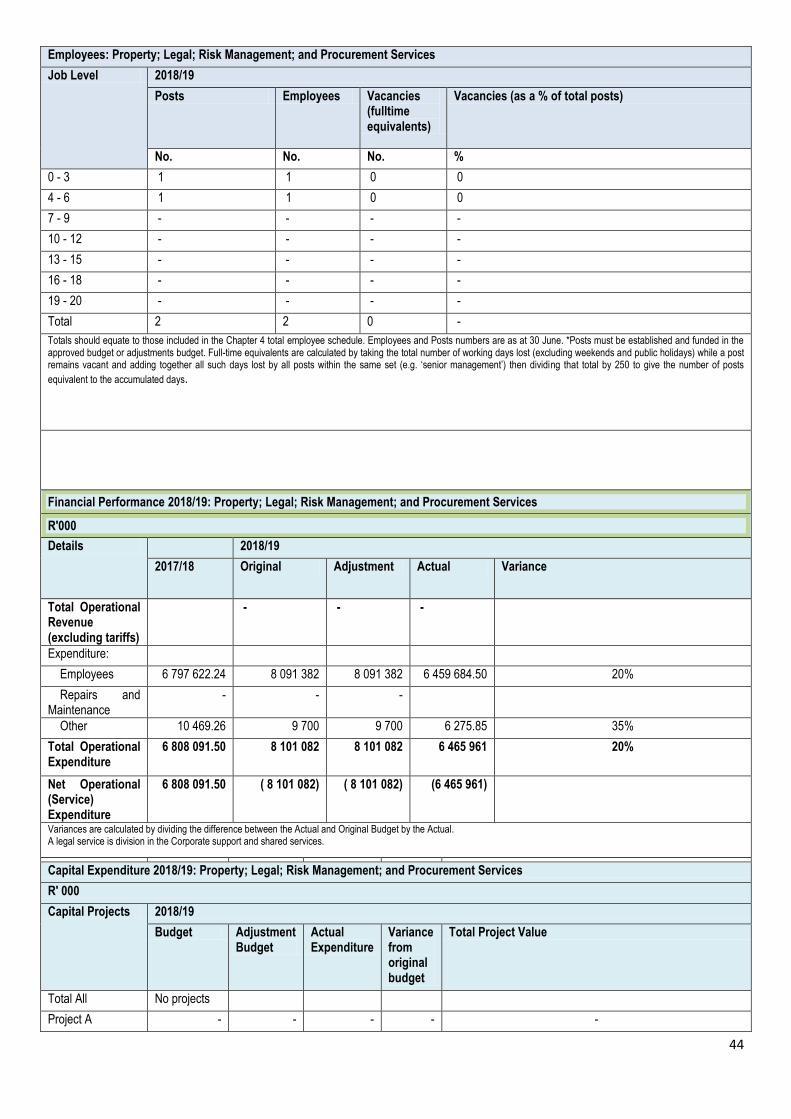
44
Employees: Property; Legal; Risk Management; and Procurement Services
Job Level 2018/19
Posts Employees Vacancies (fulltime equivalents)
Vacancies (as a % of total posts)
No. No. No. %
0 - 3 1 1 0 0
4 - 6 1 1 0 0
7 - 9 - - - -
10 - 12 - - - -
13 - 15 - - - -
16 - 18 - - - -
19 - 20 - - - -
Total 2 2 0 -
Totals should equate to those included in the Chapter 4 total employee schedule. Employees and Posts numbers are as at 30 June. *Posts must be established and funded in the approved budget or adjustments budget. Full-time equivalents are calculated by taking the total number of working days lost (excluding weekends and public holidays) while a post remains vacant and adding together all such days lost by all posts within the same set (e.g. ‘senior management’) then dividing that total by 250 to give the number of posts
equivalent to the accumulated days.
Financial Performance 2018/19: Property; Legal; Risk Management; and Procurement Services
R'000
Details 2018/19
2017/18 Original Adjustment Actual Variance
Total Operational Revenue (excluding tariffs)
- - -
Expenditure:
Employees 6 797 622.24 8 091 382 8 091 382 6 459 684.50 20%
Repairs and Maintenance
- - -
Other 10 469.26 9 700 9 700 6 275.85 35%
Total Operational Expenditure
6 808 091.50 8 101 082 8 101 082 6 465 961 20%
Net Operational (Service) Expenditure
6 808 091.50 ( 8 101 082) ( 8 101 082) (6 465 961)
Variances are calculated by dividing the difference between the Actual and Original Budget by the Actual. A legal service is division in the Corporate support and shared services.
Capital Expenditure 2018/19: Property; Legal; Risk Management; and Procurement Services
R' 000
Capital Projects 2018/19
Budget Adjustment Budget
Actual Expenditure
Variance from original budget
Total Project Value
Total All No projects
Project A - - - - -
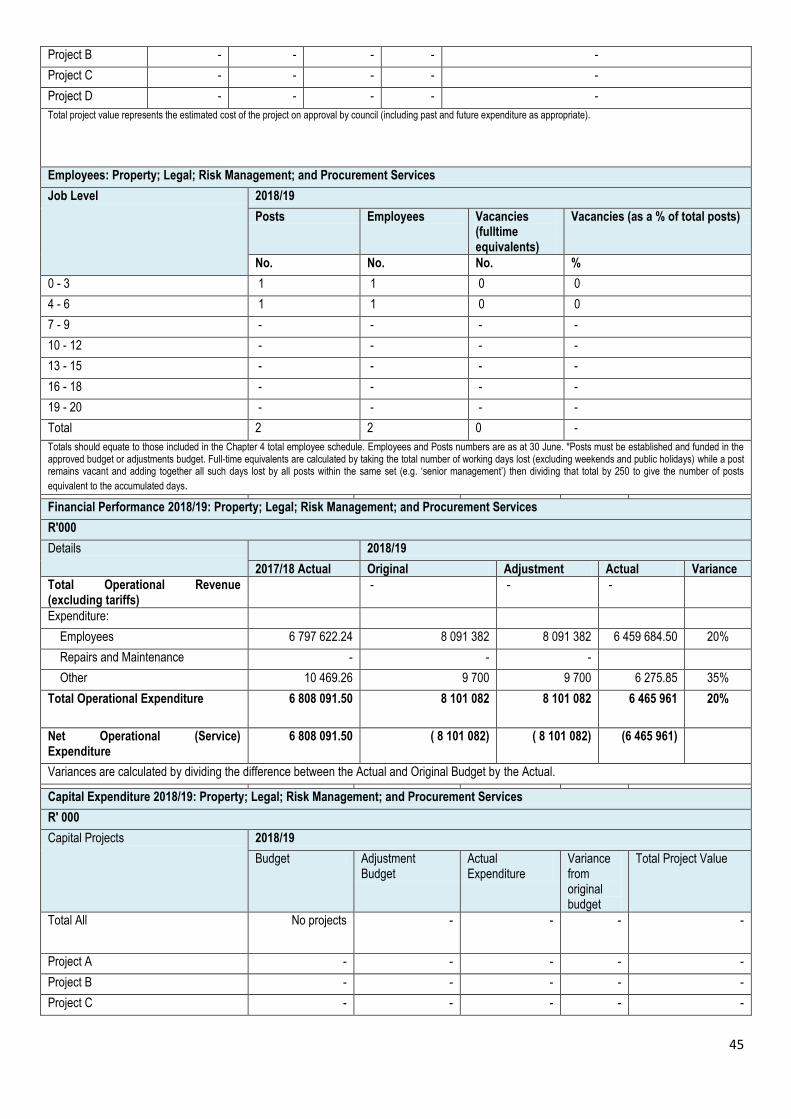
45
Project B - - - - -
Project C - - - - -
Project D - - - - -
Total project value represents the estimated cost of the project on approval by council (including past and future expenditure as appropriate).
Employees: Property; Legal; Risk Management; and Procurement Services
Job Level 2018/19
Posts Employees Vacancies (fulltime equivalents)
Vacancies (as a % of total posts)
No. No. No. %
0 - 3 1 1 0 0
4 - 6 1 1 0 0
7 - 9 - - - -
10 - 12 - - - -
13 - 15 - - - -
16 - 18 - - - -
19 - 20 - - - -
Total 2 2 0 -
Totals should equate to those included in the Chapter 4 total employee schedule. Employees and Posts numbers are as at 30 June. *Posts must be established and funded in the approved budget or adjustments budget. Full-time equivalents are calculated by taking the total number of working days lost (excluding weekends and public holidays) while a post remains vacant and adding together all such days lost by all posts within the same set (e.g. ‘senior management’) then dividing that total by 250 to give the number of posts
equivalent to the accumulated days.
Financial Performance 2018/19: Property; Legal; Risk Management; and Procurement Services
R'000
Details 2018/19
2017/18 Actual Original Adjustment Actual Variance
Total Operational Revenue (excluding tariffs)
- - -
Expenditure:
Employees 6 797 622.24 8 091 382 8 091 382 6 459 684.50 20%
Repairs and Maintenance - - -
Other 10 469.26 9 700 9 700 6 275.85 35%
Total Operational Expenditure 6 808 091.50 8 101 082 8 101 082 6 465 961 20%
Net Operational (Service) Expenditure
6 808 091.50 ( 8 101 082) ( 8 101 082) (6 465 961)
Variances are calculated by dividing the difference between the Actual and Original Budget by the Actual.
Capital Expenditure 2018/19: Property; Legal; Risk Management; and Procurement Services
R' 000
Capital Projects 2018/19
Budget Adjustment Budget
Actual Expenditure
Variance from original budget
Total Project Value
Total All No projects - - - -
Project A - - - - -
Project B - - - - -
Project C - - - - -
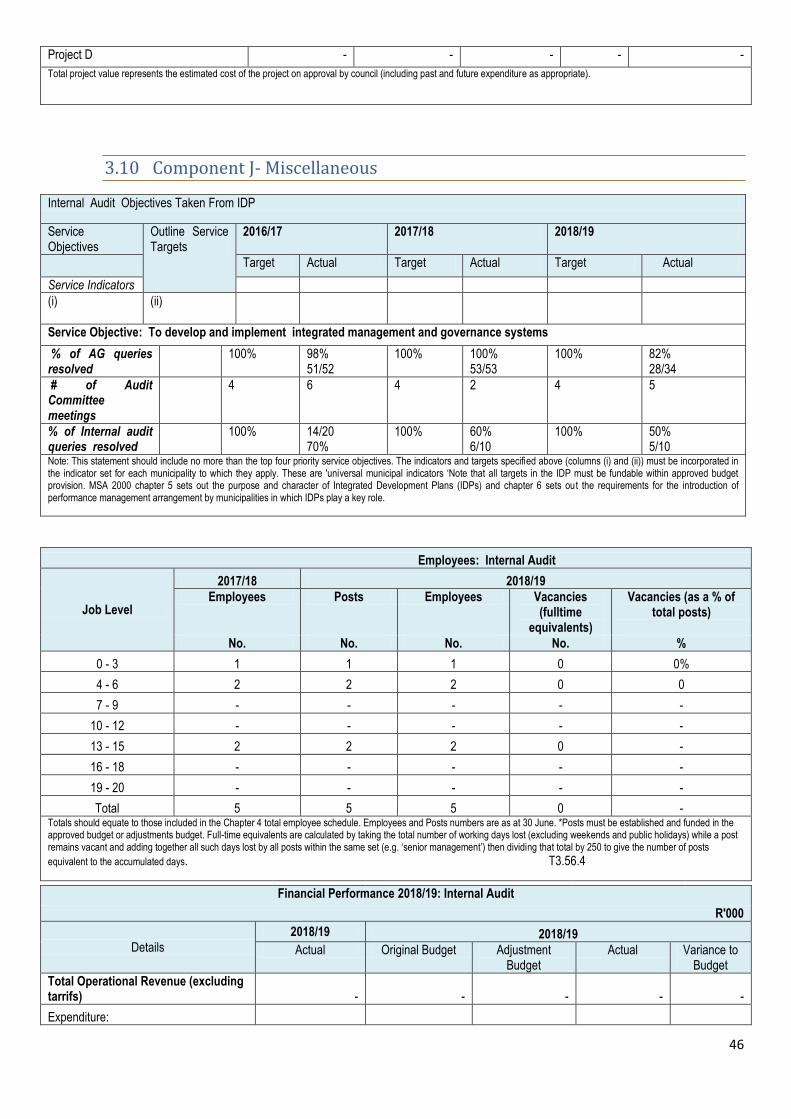
46
Project D - - - - -
Total project value represents the estimated cost of the project on approval by council (including past and future expenditure as appropriate).
3.10 Component J- Miscellaneous
Internal Audit Objectives Taken From IDP
Service Objectives
Outline Service Targets
2016/17 2017/18 2018/19
Target Actual Target Actual Target Actual
Service Indicators
(i) (ii)
Service Objective: To develop and implement integrated management and governance systems
% of AG queries resolved
100% 98% 51/52
100% 100% 53/53
100% 82% 28/34
# of Audit Committee meetings
4 6 4 2 4 5
% of Internal audit queries resolved
100% 14/20 70%
100% 60% 6/10
100% 50% 5/10
Note: This statement should include no more than the top four priority service objectives. The indicators and targets specified above (columns (i) and (ii)) must be incorporated in the indicator set for each municipality to which they apply. These are 'universal municipal indicators ‘Note that all targets in the IDP must be fundable within approved budget provision. MSA 2000 chapter 5 sets out the purpose and character of Integrated Development Plans (IDPs) and chapter 6 sets out the requirements for the introduction of performance management arrangement by municipalities in which IDPs play a key role.
Employees: Internal Audit
Job Level
2017/18 2018/19
Employees Posts Employees Vacancies (fulltime
equivalents)
Vacancies (as a % of total posts)
No. No. No. No. %
0 - 3 1 1 1 0 0%
4 - 6 2 2 2 0 0
7 - 9 - - - - -
10 - 12 - - - - -
13 - 15 2 2 2 0 -
16 - 18 - - - - -
19 - 20 - - - - -
Total 5 5 5 0 - Totals should equate to those included in the Chapter 4 total employee schedule. Employees and Posts numbers are as at 30 June. *Posts must be established and funded in the approved budget or adjustments budget. Full-time equivalents are calculated by taking the total number of working days lost (excluding weekends and public holidays) while a post remains vacant and adding together all such days lost by all posts within the same set (e.g. ‘senior management’) then dividing that total by 250 to give the number of posts
equivalent to the accumulated days. T3.56.4
Financial Performance 2018/19: Internal Audit
R'000
Details
2018/19 2018/19
Actual Original Budget Adjustment Budget
Actual Variance to Budget
Total Operational Revenue (excluding tarrifs) - - - - -
Expenditure:
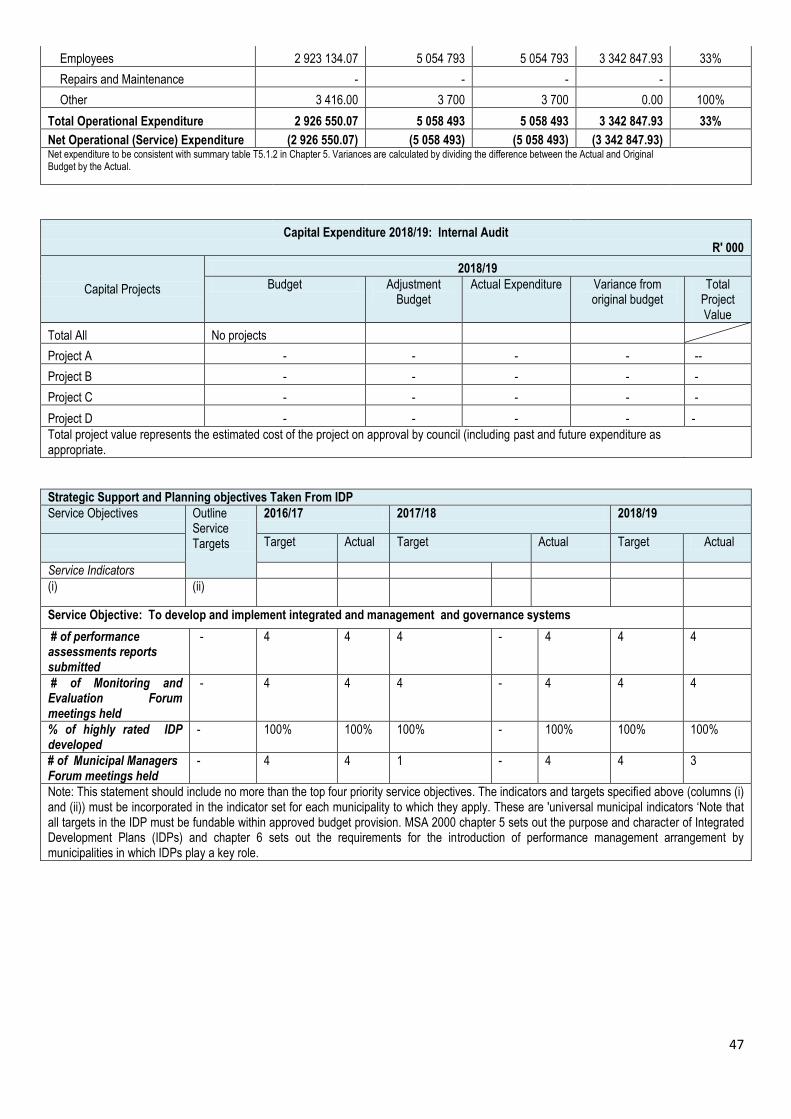
47
Employees 2 923 134.07 5 054 793 5 054 793 3 342 847.93 33%
Repairs and Maintenance - - - -
Other 3 416.00 3 700 3 700 0.00 100%
Total Operational Expenditure 2 926 550.07 5 058 493 5 058 493 3 342 847.93 33%
Net Operational (Service) Expenditure (2 926 550.07) (5 058 493) (5 058 493) (3 342 847.93) Net expenditure to be consistent with summary table T5.1.2 in Chapter 5. Variances are calculated by dividing the difference between the Actual and Original Budget by the Actual.
Capital Expenditure 2018/19: Internal Audit R' 000
Capital Projects
2018/19
Budget Adjustment Budget
Actual Expenditure Variance from original budget
Total Project Value
Total All No projects
Project A - - - - --
Project B - - - - -
Project C - - - - -
Project D - - - - -
Total project value represents the estimated cost of the project on approval by council (including past and future expenditure as appropriate.
Strategic Support and Planning objectives Taken From IDP
Service Objectives Outline Service Targets
2016/17 2017/18 2018/19
Target Actual Target Actual Target Actual
Service Indicators
(i) (ii)
Service Objective: To develop and implement integrated and management and governance systems
# of performance assessments reports submitted
- 4 4 4 - 4 4 4
# of Monitoring and Evaluation Forum meetings held
- 4 4 4 - 4 4 4
% of highly rated IDP developed
- 100% 100% 100% - 100% 100% 100%
# of Municipal Managers Forum meetings held
- 4 4 1 - 4 4 3
Note: This statement should include no more than the top four priority service objectives. The indicators and targets specified above (columns (i) and (ii)) must be incorporated in the indicator set for each municipality to which they apply. These are 'universal municipal indicators ‘Note that all targets in the IDP must be fundable within approved budget provision. MSA 2000 chapter 5 sets out the purpose and character of Integrated Development Plans (IDPs) and chapter 6 sets out the requirements for the introduction of performance management arrangement by municipalities in which IDPs play a key role.
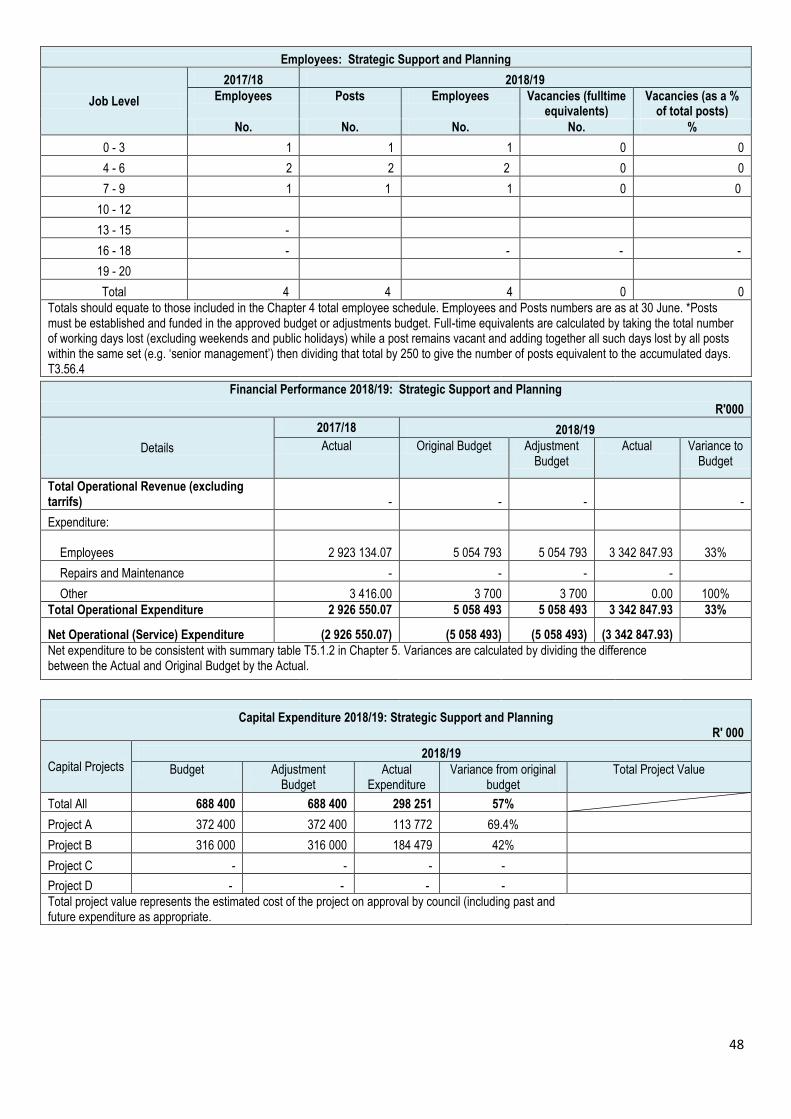
48
Employees: Strategic Support and Planning
Job Level
2017/18 2018/19
Employees Posts Employees Vacancies (fulltime equivalents)
Vacancies (as a % of total posts)
No. No. No. No. %
0 - 3 1 1 1 0 0
4 - 6 2 2 2 0 0
7 - 9 1 1 1 0 0
10 - 12
13 - 15 -
16 - 18 - - - -
19 - 20
Total 4 4 4 0 0
Totals should equate to those included in the Chapter 4 total employee schedule. Employees and Posts numbers are as at 30 June. *Posts must be established and funded in the approved budget or adjustments budget. Full-time equivalents are calculated by taking the total number of working days lost (excluding weekends and public holidays) while a post remains vacant and adding together all such days lost by all posts within the same set (e.g. ‘senior management’) then dividing that total by 250 to give the number of posts equivalent to the accumulated days. T3.56.4
Financial Performance 2018/19: Strategic Support and Planning
R'000
Details
2017/18 2018/19
Actual Original Budget Adjustment Budget
Actual Variance to Budget
Total Operational Revenue (excluding tarrifs) - - - -
Expenditure:
Employees 2 923 134.07 5 054 793 5 054 793 3 342 847.93 33%
Repairs and Maintenance - - - -
Other 3 416.00 3 700 3 700 0.00 100%
Total Operational Expenditure 2 926 550.07 5 058 493 5 058 493 3 342 847.93 33%
Net Operational (Service) Expenditure (2 926 550.07) (5 058 493) (5 058 493) (3 342 847.93)
Net expenditure to be consistent with summary table T5.1.2 in Chapter 5. Variances are calculated by dividing the difference between the Actual and Original Budget by the Actual.
Capital Expenditure 2018/19: Strategic Support and Planning R' 000
Capital Projects 2018/19
Budget Adjustment Budget
Actual Expenditure
Variance from original budget
Total Project Value
Total All 688 400 688 400 298 251 57%
Project A 372 400 372 400 113 772 69.4%
Project B 316 000 316 000 184 479 42%
Project C - - - -
Project D - - - -
Total project value represents the estimated cost of the project on approval by council (including past and future expenditure as appropriate.
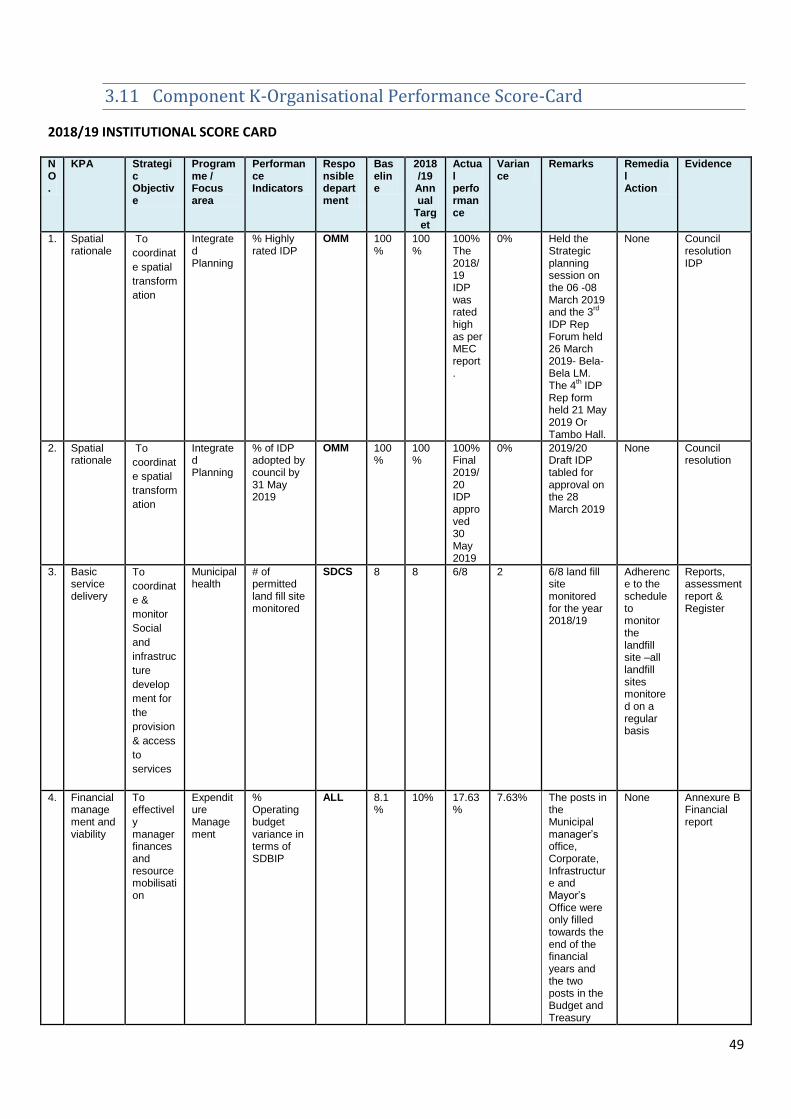
49
3.11 Component K-Organisational Performance Score-Card
2018/19 INSTITUTIONAL SCORE CARD
NO.
KPA Strategic Objective
Programme / Focus area
Performance Indicators
Responsible department
Baseline
2018/19 Annual
Target
Actual performance
Variance
Remarks Remedial Action
Evidence
1. Spatial rationale
To
coordinat
e spatial
transform
ation
Integrated Planning
% Highly rated IDP
OMM 100%
100%
100% The 2018/19 IDP was rated high as per MEC report.
0% Held the Strategic planning session on the 06 -08 March 2019 and the 3
rd
IDP Rep Forum held 26 March 2019- Bela-Bela LM. The 4
th IDP
Rep form held 21 May 2019 Or Tambo Hall.
None Council resolution IDP
2. Spatial rationale
To
coordinat
e spatial
transform
ation
Integrated Planning
% of IDP adopted by council by 31 May 2019
OMM 100%
100%
100% Final 2019/20 IDP approved 30 May 2019
0% 2019/20 Draft IDP tabled for approval on the 28 March 2019
None Council resolution
3. Basic service delivery
To
coordinat
e &
monitor
Social
and
infrastruc
ture
develop
ment for
the
provision
& access
to
services
Municipal health
# of permitted land fill site monitored
SDCS 8 8 6/8 2 6/8 land fill site monitored for the year 2018/19
Adherence to the schedule to monitor the landfill site –all landfill sites monitored on a regular basis
Reports, assessment report & Register
4. Financial management and viability
To effectively manager finances and resource mobilisation
Expenditure Management
% Operating budget variance in terms of SDBIP
ALL 8.1%
10% 17.63%
7.63% The posts in the Municipal manager’s office, Corporate, Infrastructure and Mayor’s Office were only filled towards the end of the financial years and the two posts in the Budget and Treasury
None Annexure B Financial report
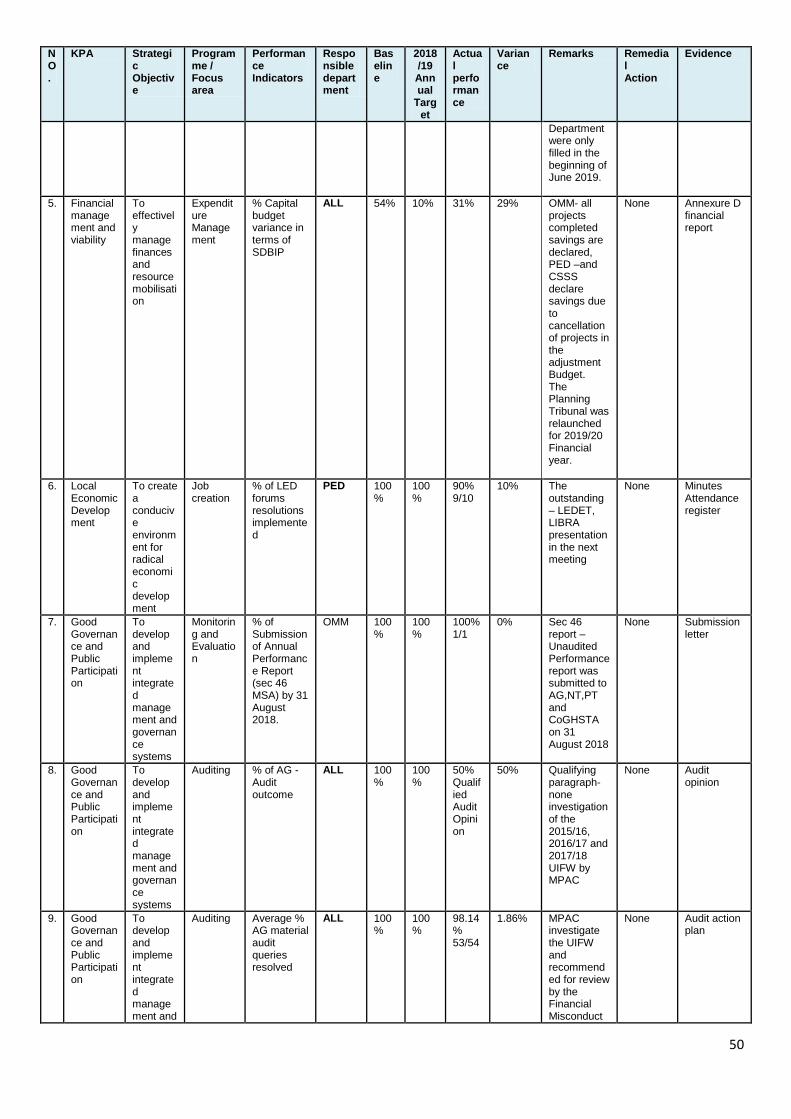
50
NO.
KPA Strategic Objective
Programme / Focus area
Performance Indicators
Responsible department
Baseline
2018/19 Annual
Target
Actual performance
Variance
Remarks Remedial Action
Evidence
Department were only filled in the beginning of June 2019.
5. Financial management and viability
To effectively manage finances and resource mobilisation
Expenditure Management
% Capital budget variance in terms of SDBIP
ALL 54% 10% 31% 29% OMM- all projects completed savings are declared, PED –and CSSS declare savings due to cancellation of projects in the adjustment Budget. The Planning Tribunal was relaunched for 2019/20 Financial year.
None Annexure D financial report
6. Local Economic Development
To create a conducive environment for radical economic development
Job creation
% of LED forums resolutions implemented
PED 100%
100%
90% 9/10
10% The outstanding – LEDET, LIBRA presentation in the next meeting
None Minutes Attendance register
7. Good Governance and Public Participation
To develop and implement integrated management and governance systems
Monitoring and Evaluation
% of Submission of Annual Performance Report (sec 46 MSA) by 31 August 2018.
OMM 100%
100%
100% 1/1
0% Sec 46 report –Unaudited Performance report was submitted to AG,NT,PT and CoGHSTA on 31 August 2018
None Submission letter
8. Good Governance and Public Participation
To develop and implement integrated management and governance systems
Auditing % of AG -Audit outcome
ALL 100%
100%
50% Qualified Audit Opinion
50% Qualifying paragraph- none investigation of the 2015/16, 2016/17 and 2017/18 UIFW by MPAC
None Audit opinion
9. Good Governance and Public Participation
To develop and implement integrated management and
Auditing Average % AG material audit queries resolved
ALL 100%
100%
98.14% 53/54
1.86% MPAC investigate the UIFW and recommended for review by the Financial Misconduct
None Audit action plan
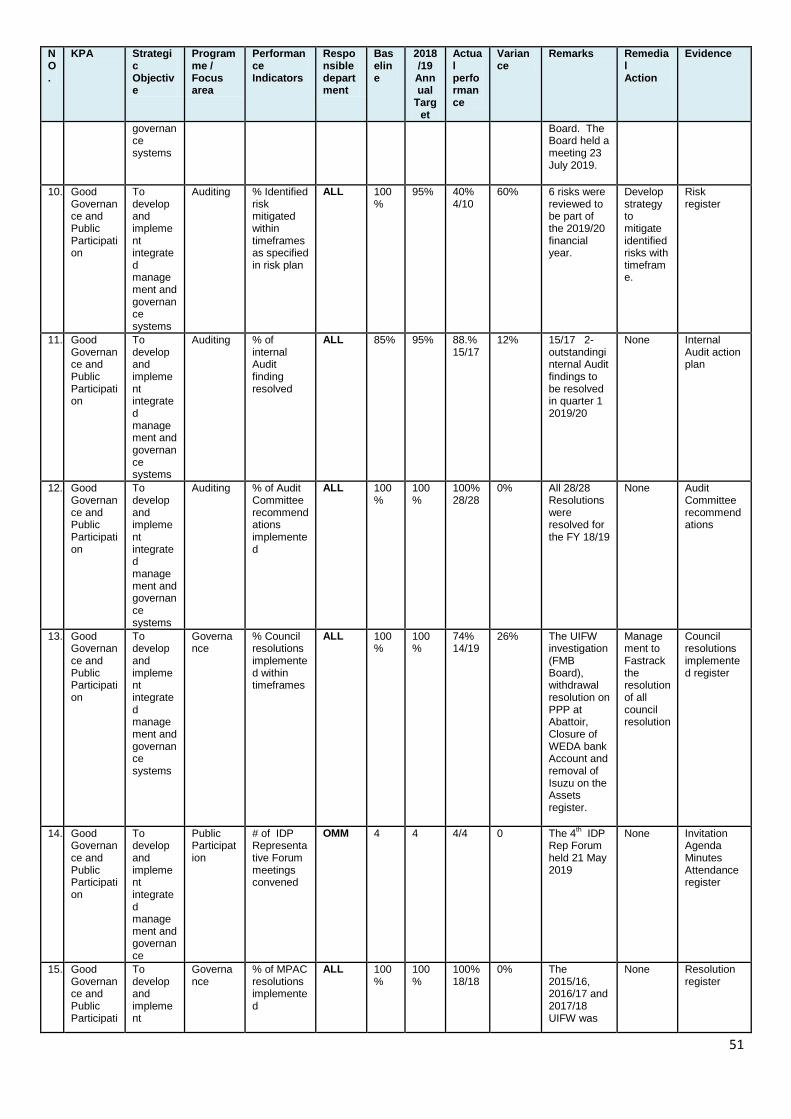
51
NO.
KPA Strategic Objective
Programme / Focus area
Performance Indicators
Responsible department
Baseline
2018/19 Annual
Target
Actual performance
Variance
Remarks Remedial Action
Evidence
governance systems
Board. The Board held a meeting 23 July 2019.
10. Good Governance and Public Participation
To develop and implement integrated management and governance systems
Auditing % Identified risk mitigated within timeframes as specified in risk plan
ALL 100%
95% 40% 4/10
60% 6 risks were reviewed to be part of the 2019/20 financial year.
Develop strategy to mitigate identified risks with timeframe.
Risk register
11. Good Governance and Public Participation
To develop and implement integrated management and governance systems
Auditing % of internal Audit finding resolved
ALL 85% 95% 88.% 15/17
12%
15/17 2-outstandinginternal Audit findings to be resolved in quarter 1 2019/20
None Internal Audit action plan
12. Good Governance and Public Participation
To develop and implement integrated management and governance systems
Auditing % of Audit Committee recommendations implemented
ALL 100%
100%
100% 28/28
0% All 28/28 Resolutions were resolved for the FY 18/19
None Audit Committee recommendations
13. Good Governance and Public Participation
To develop and implement integrated management and governance systems
Governance
% Council resolutions implemented within timeframes
ALL 100%
100%
74% 14/19
26% The UIFW investigation (FMB Board), withdrawal resolution on PPP at Abattoir, Closure of WEDA bank Account and removal of Isuzu on the Assets register.
Management to Fastrack the resolution of all council resolution
Council resolutions implemented register
14. Good Governance and Public Participation
To develop and implement integrated management and governance
Public Participation
# of IDP Representative Forum meetings convened
OMM 4 4 4/4 0 The 4th IDP
Rep Forum held 21 May 2019
None Invitation Agenda Minutes Attendance register
15. Good Governance and Public Participati
To develop and implement
Governance
% of MPAC resolutions implemented
ALL 100%
100%
100% 18/18
0% The 2015/16, 2016/17 and 2017/18 UIFW was
None Resolution register
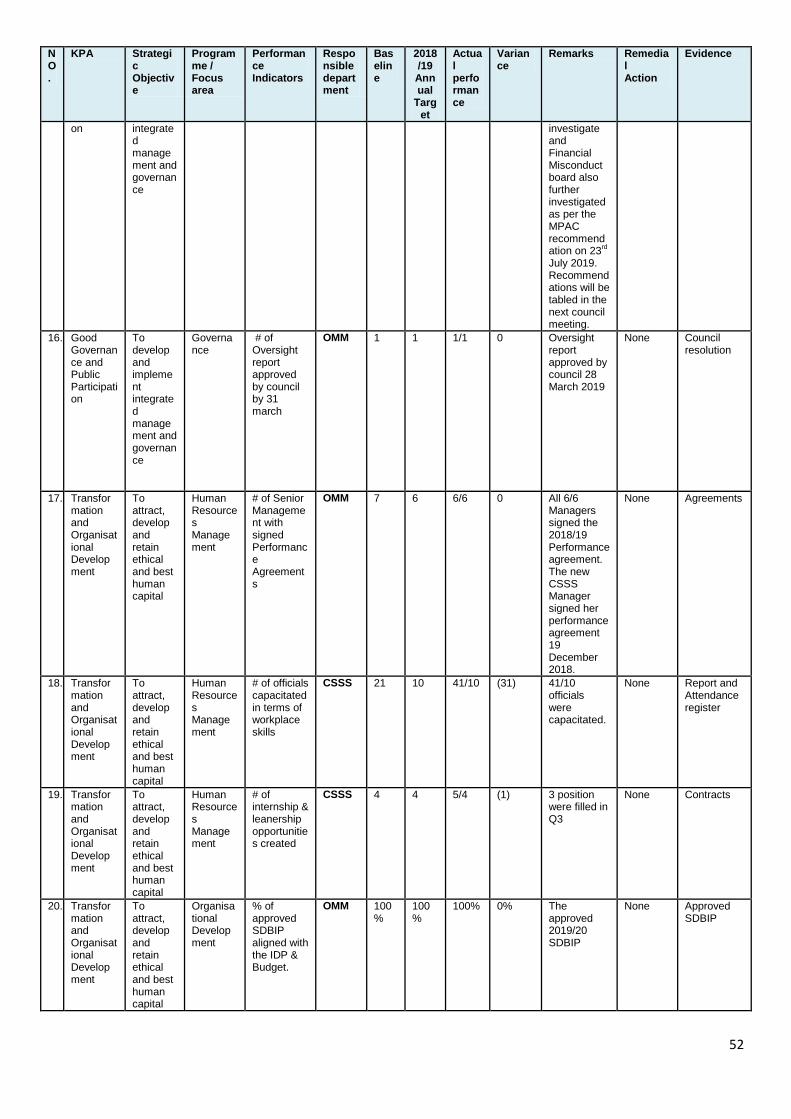
52
NO.
KPA Strategic Objective
Programme / Focus area
Performance Indicators
Responsible department
Baseline
2018/19 Annual
Target
Actual performance
Variance
Remarks Remedial Action
Evidence
on integrated management and governance
investigate and Financial Misconduct board also further investigated as per the MPAC recommendation on 23
rd
July 2019. Recommendations will be tabled in the next council meeting.
16. Good Governance and Public Participation
To develop and implement integrated management and governance
Governance
# of Oversight report approved by council by 31 march
OMM 1 1 1/1 0 Oversight report approved by council 28 March 2019
None Council resolution
17. Transformation and Organisational Development
To attract, develop and retain ethical and best human capital
Human Resources Management
# of Senior Management with signed Performance Agreements
OMM 7 6 6/6 0 All 6/6 Managers signed the 2018/19 Performance agreement. The new CSSS Manager signed her performance agreement 19 December 2018.
None Agreements
18. Transformation and Organisational Development
To attract, develop and retain ethical and best human capital
Human Resources Management
# of officials capacitated in terms of workplace skills
CSSS 21 10 41/10 (31) 41/10 officials were capacitated.
None Report and Attendance register
19. Transformation and Organisational Development
To attract, develop and retain ethical and best human capital
Human Resources Management
# of internship & leanership opportunities created
CSSS 4 4 5/4 (1) 3 position were filled in Q3
None Contracts
20. Transformation and Organisational Development
To attract, develop and retain ethical and best human capital
Organisational Development
% of approved SDBIP aligned with the IDP & Budget.
OMM 100%
100%
100% 0% The approved 2019/20 SDBIP
None Approved SDBIP
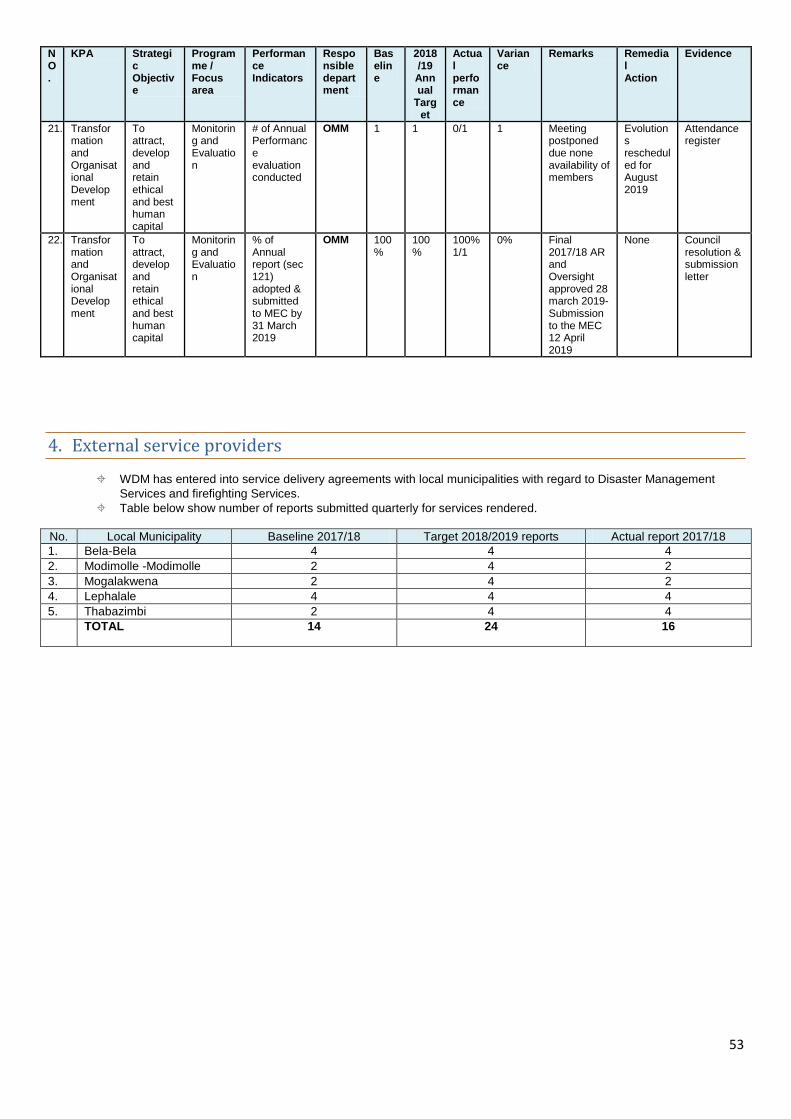
53
NO.
KPA Strategic Objective
Programme / Focus area
Performance Indicators
Responsible department
Baseline
2018/19 Annual
Target
Actual performance
Variance
Remarks Remedial Action
Evidence
21. Transformation and Organisational Development
To attract, develop and retain ethical and best human capital
Monitoring and Evaluation
# of Annual Performance evaluation conducted
OMM 1 1 0/1 1 Meeting postponed due none availability of members
Evolutions rescheduled for August 2019
Attendance register
22. Transformation and Organisational Development
To attract, develop and retain ethical and best human capital
Monitoring and Evaluation
% of Annual report (sec 121) adopted & submitted to MEC by 31 March 2019
OMM 100%
100%
100% 1/1
0% Final 2017/18 AR and Oversight approved 28 march 2019- Submission to the MEC 12 April 2019
None Council resolution & submission letter
4. External service providers
WDM has entered into service delivery agreements with local municipalities with regard to Disaster Management
Services and firefighting Services.
Table below show number of reports submitted quarterly for services rendered.
No. Local Municipality Baseline 2017/18 Target 2018/2019 reports Actual report 2017/18
1. Bela-Bela 4 4 4
2. Modimolle -Modimolle 2 4 2
3. Mogalakwena 2 4 2
4. Lephalale 4 4 4
5. Thabazimbi 2 4 4
TOTAL 14 24 16
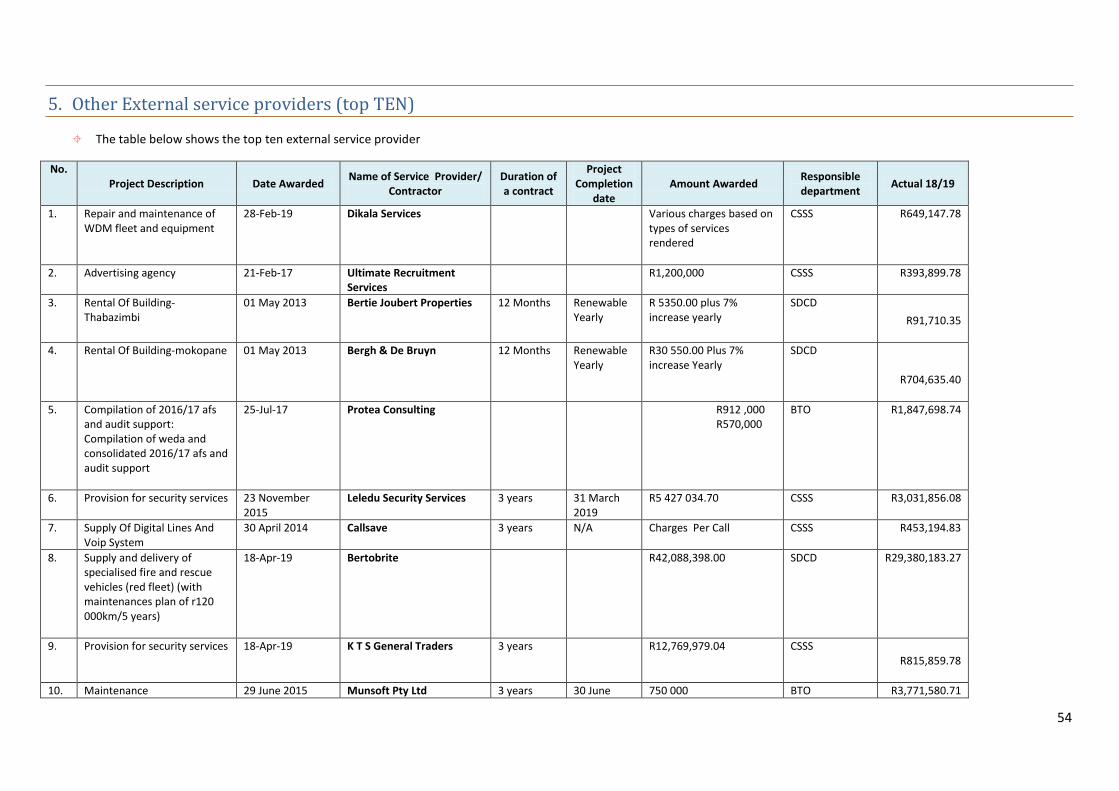
54
5. Other External service providers (top TEN)
The table below shows the top ten external service provider
No. Project Description Date Awarded
Name of Service Provider/ Contractor
Duration of a contract
Project Completion
date Amount Awarded
Responsible department
Actual 18/19
1. Repair and maintenance of WDM fleet and equipment
28-Feb-19
Dikala Services Various charges based on types of services rendered
CSSS R649,147.78
2. Advertising agency 21-Feb-17
Ultimate Recruitment Services
R1,200,000 CSSS R393,899.78
3. Rental Of Building-Thabazimbi
01 May 2013 Bertie Joubert Properties 12 Months Renewable Yearly
R 5350.00 plus 7% increase yearly
SDCD R91,710.35
4. Rental Of Building-mokopane 01 May 2013 Bergh & De Bruyn 12 Months Renewable Yearly
R30 550.00 Plus 7% increase Yearly
SDCD
R704,635.40
5. Compilation of 2016/17 afs and audit support: Compilation of weda and consolidated 2016/17 afs and audit support
25-Jul-17
Protea Consulting R912 ,000 R570,000
BTO R1,847,698.74
6. Provision for security services 23 November 2015
Leledu Security Services 3 years 31 March 2019
R5 427 034.70 CSSS R3,031,856.08
7. Supply Of Digital Lines And Voip System
30 April 2014 Callsave 3 years N/A Charges Per Call
CSSS R453,194.83
8. Supply and delivery of specialised fire and rescue vehicles (red fleet) (with maintenances plan of r120 000km/5 years)
18-Apr-19
Bertobrite R42,088,398.00
SDCD R29,380,183.27
9. Provision for security services 18-Apr-19
K T S General Traders 3 years R12,769,979.04
CSSS R815,859.78
10. Maintenance 29 June 2015 Munsoft Pty Ltd 3 years 30 June 750 000 BTO R3,771,580.71
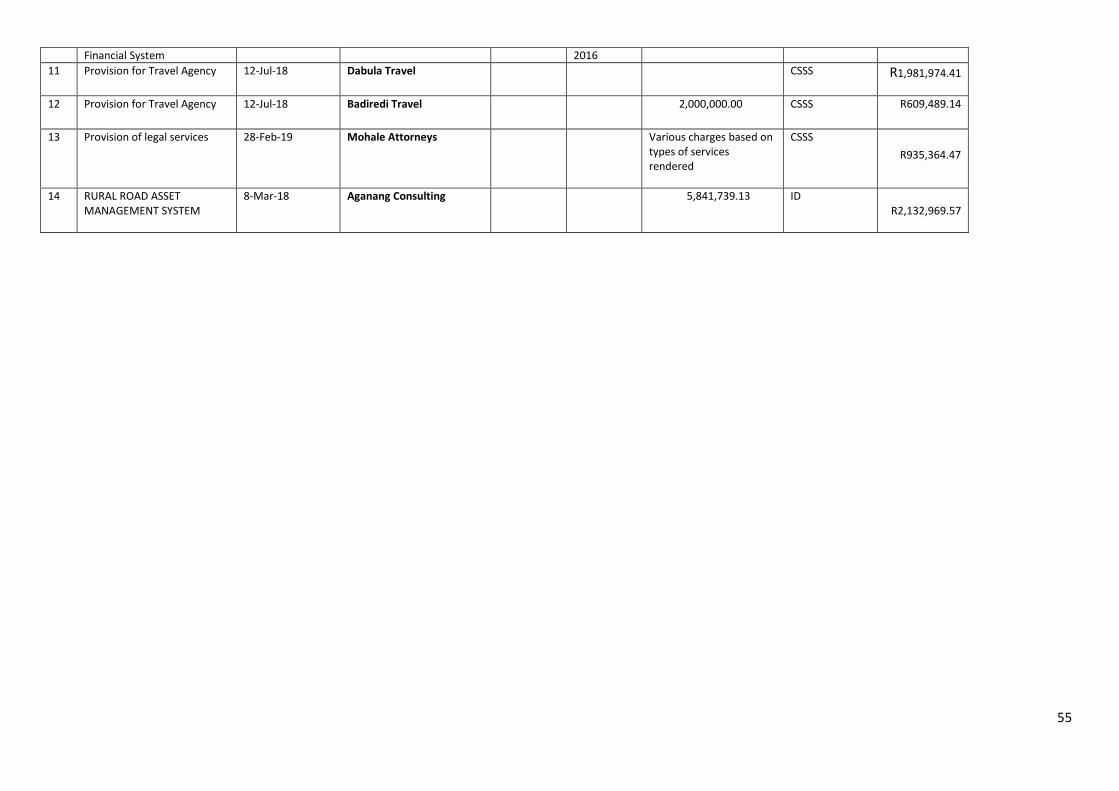
55
Financial System 2016
11 Provision for Travel Agency 12-Jul-18
Dabula Travel CSSS R1,981,974.41
12 Provision for Travel Agency 12-Jul-18
Badiredi Travel 2,000,000.00
CSSS R609,489.14
13 Provision of legal services
28-Feb-19
Mohale Attorneys Various charges based on types of services rendered
CSSS R935,364.47
14 RURAL ROAD ASSET MANAGEMENT SYSTEM
8-Mar-18
Aganang Consulting 5,841,739.13
ID R2,132,969.57
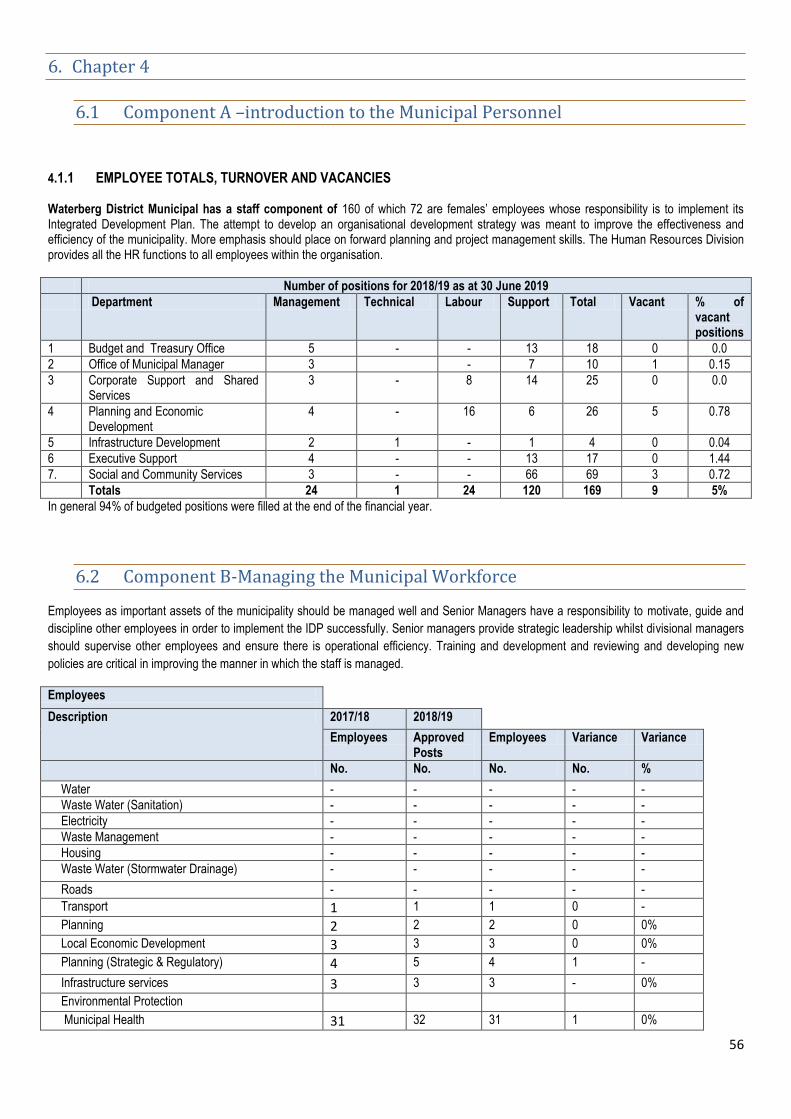
56
6. Chapter 4
6.1 Component A –introduction to the Municipal Personnel
4.1.1 EMPLOYEE TOTALS, TURNOVER AND VACANCIES Waterberg District Municipal has a staff component of 160 of which 72 are females’ employees whose responsibility is to implement its Integrated Development Plan. The attempt to develop an organisational development strategy was meant to improve the effectiveness and efficiency of the municipality. More emphasis should place on forward planning and project management skills. The Human Resources Division provides all the HR functions to all employees within the organisation.
Number of positions for 2018/19 as at 30 June 2019
Department Management Technical Labour Support Total Vacant % of vacant positions
1 Budget and Treasury Office 5 - - 13 18 0 0.0
2 Office of Municipal Manager 3 - 7 10 1 0.15
3 Corporate Support and Shared Services
3 - 8 14 25 0 0.0
4 Planning and Economic Development
4 - 16 6 26 5 0.78
5 Infrastructure Development 2 1 - 1 4 0 0.04
6 Executive Support 4 - - 13 17 0 1.44
7. Social and Community Services 3 - - 66 69 3 0.72
Totals 24 1 24 120 169 9 5%
In general 94% of budgeted positions were filled at the end of the financial year.
6.2 Component B-Managing the Municipal Workforce
Employees as important assets of the municipality should be managed well and Senior Managers have a responsibility to motivate, guide and
discipline other employees in order to implement the IDP successfully. Senior managers provide strategic leadership whilst divisional managers
should supervise other employees and ensure there is operational efficiency. Training and development and reviewing and developing new
policies are critical in improving the manner in which the staff is managed.
Employees
Description 2017/18 2018/19
Employees Approved Posts
Employees Variance Variance
No. No. No. No. %
Water - - - - -
Waste Water (Sanitation) - - - - -
Electricity - - - - -
Waste Management - - - - -
Housing - - - - -
Waste Water (Stormwater Drainage) - - - - -
Roads - - - - -
Transport 1 1 1 0 -
Planning 2 2 2 0 0%
Local Economic Development 3 3 3 0 0%
Planning (Strategic & Regulatory) 4 5 4 1 -
Infrastructure services 3 3 3 - 0%
Environmental Protection
Municipal Health 31 32 31 1 0%
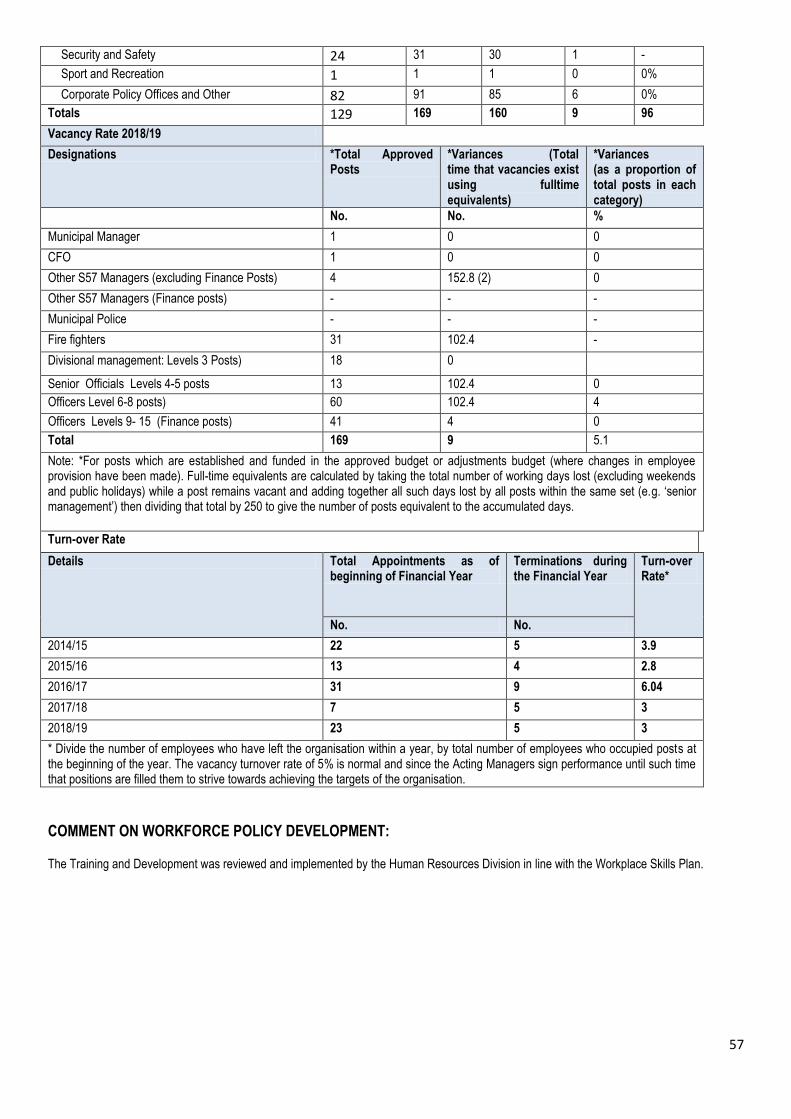
57
Security and Safety 24 31 30 1 -
Sport and Recreation 1 1 1 0 0%
Corporate Policy Offices and Other 82 91 85 6 0%
Totals 129 169 160 9 96
Vacancy Rate 2018/19
Designations *Total Approved Posts
*Variances (Total time that vacancies exist using fulltime equivalents)
*Variances (as a proportion of total posts in each category)
No. No. %
Municipal Manager 1 0 0
CFO 1 0 0
Other S57 Managers (excluding Finance Posts) 4 152.8 (2) 0
Other S57 Managers (Finance posts) - - -
Municipal Police - - -
Fire fighters 31 102.4 -
Divisional management: Levels 3 Posts) 18 0
Senior Officials Levels 4-5 posts 13 102.4 0
Officers Level 6-8 posts) 60 102.4 4
Officers Levels 9- 15 (Finance posts) 41 4 0
Total 169 9 5.1
Note: *For posts which are established and funded in the approved budget or adjustments budget (where changes in employee provision have been made). Full-time equivalents are calculated by taking the total number of working days lost (excluding weekends and public holidays) while a post remains vacant and adding together all such days lost by all posts within the same set (e.g. ‘senior management’) then dividing that total by 250 to give the number of posts equivalent to the accumulated days.
Turn-over Rate
Details Total Appointments as of beginning of Financial Year
Terminations during the Financial Year
Turn-over Rate*
No. No.
2014/15 22 5 3.9
2015/16 13 4 2.8
2016/17 31 9 6.04
2017/18 7 5 3
2018/19 23 5 3
* Divide the number of employees who have left the organisation within a year, by total number of employees who occupied posts at the beginning of the year. The vacancy turnover rate of 5% is normal and since the Acting Managers sign performance until such time that positions are filled them to strive towards achieving the targets of the organisation.
COMMENT ON WORKFORCE POLICY DEVELOPMENT:
The Training and Development was reviewed and implemented by the Human Resources Division in line with the Workplace Skills Plan.
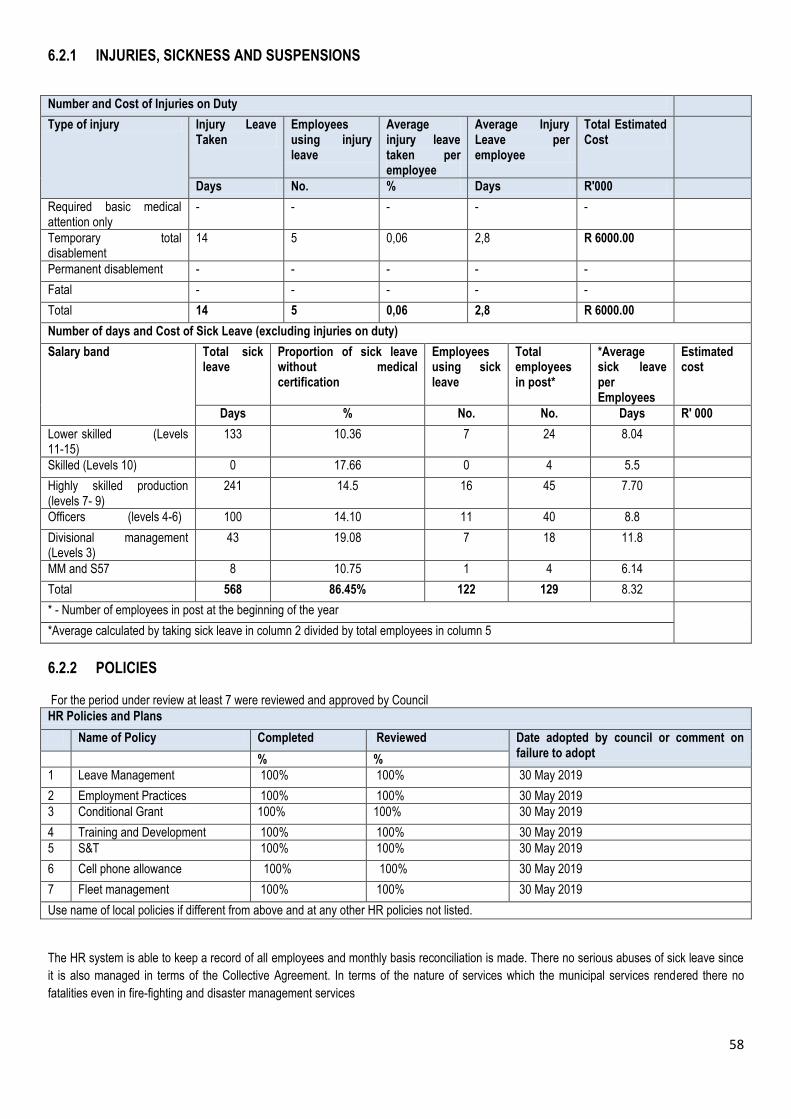
58
6.2.1 INJURIES, SICKNESS AND SUSPENSIONS
Number and Cost of Injuries on Duty
Type of injury Injury Leave Taken
Employees using injury leave
Average injury leave taken per employee
Average Injury Leave per employee
Total Estimated Cost
Days No. % Days R'000
Required basic medical attention only
- - - - -
Temporary total disablement
14 5 0,06 2,8 R 6000.00
Permanent disablement - - - - -
Fatal - - - - -
Total 14 5 0,06 2,8 R 6000.00
Number of days and Cost of Sick Leave (excluding injuries on duty)
Salary band Total sick leave
Proportion of sick leave without medical certification
Employees using sick leave
Total employees in post*
*Average sick leave per Employees
Estimated cost
Days % No. No. Days R' 000
Lower skilled (Levels 11-15)
133 10.36 7 24 8.04
Skilled (Levels 10) 0 17.66 0 4 5.5
Highly skilled production (levels 7- 9)
241 14.5 16 45
7.70
Officers (levels 4-6) 100 14.10 11 40 8.8
Divisional management (Levels 3)
43 19.08 7 18 11.8
MM and S57 8 10.75 1 4 6.14
Total 568 86.45% 122 129 8.32
* - Number of employees in post at the beginning of the year
*Average calculated by taking sick leave in column 2 divided by total employees in column 5
6.2.2 POLICIES For the period under review at least 7 were reviewed and approved by Council
HR Policies and Plans
Name of Policy Completed Reviewed Date adopted by council or comment on failure to adopt
% %
1 Leave Management 100% 100% 30 May 2019
2 Employment Practices 100% 100% 30 May 2019
3 Conditional Grant 100% 100% 30 May 2019
4 Training and Development 100% 100% 30 May 2019
5 S&T 100% 100% 30 May 2019
6 Cell phone allowance 100% 100% 30 May 2019
7 Fleet management 100% 100% 30 May 2019
Use name of local policies if different from above and at any other HR policies not listed.
The HR system is able to keep a record of all employees and monthly basis reconciliation is made. There no serious abuses of sick leave since
it is also managed in terms of the Collective Agreement. In terms of the nature of services which the municipal services rendered there no
fatalities even in fire-fighting and disaster management services
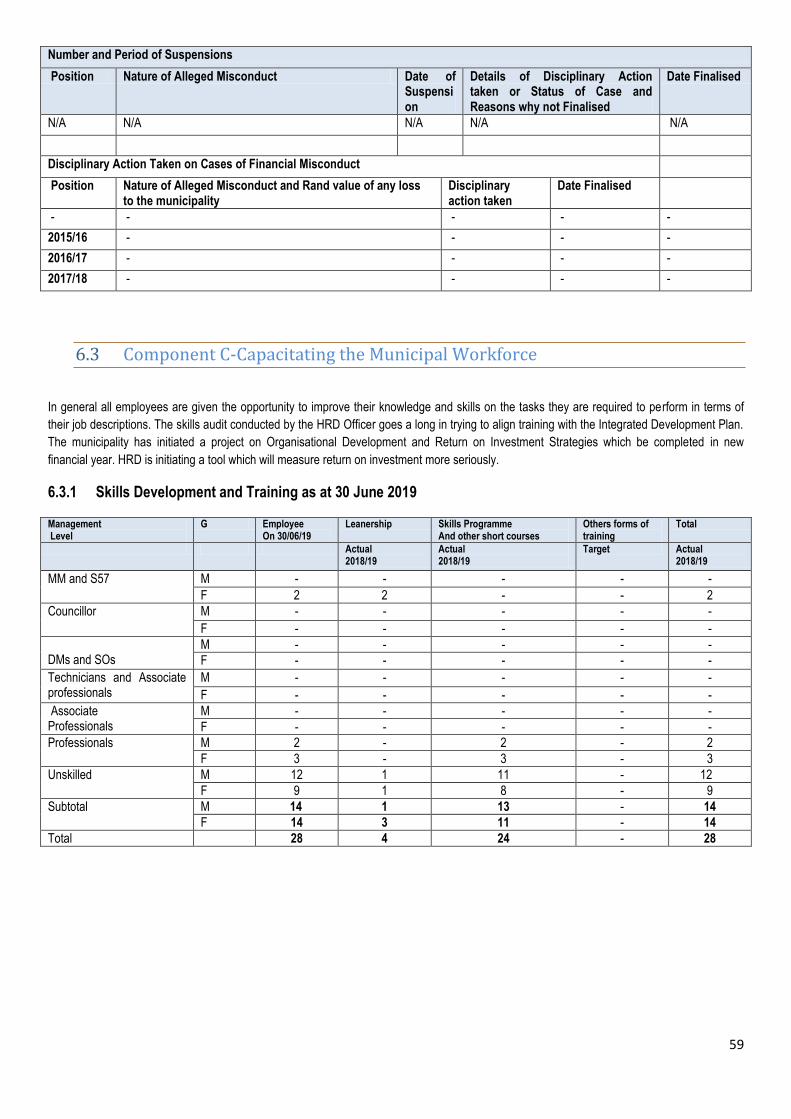
59
Number and Period of Suspensions
Position Nature of Alleged Misconduct Date of Suspension
Details of Disciplinary Action taken or Status of Case and Reasons why not Finalised
Date Finalised
N/A N/A N/A N/A N/A
Disciplinary Action Taken on Cases of Financial Misconduct
Position Nature of Alleged Misconduct and Rand value of any loss to the municipality
Disciplinary action taken
Date Finalised
- - - - -
2015/16 - - - -
2016/17 - - - -
2017/18 - - - -
6.3 Component C-Capacitating the Municipal Workforce
In general all employees are given the opportunity to improve their knowledge and skills on the tasks they are required to perform in terms of
their job descriptions. The skills audit conducted by the HRD Officer goes a long in trying to align training with the Integrated Development Plan.
The municipality has initiated a project on Organisational Development and Return on Investment Strategies which be completed in new
financial year. HRD is initiating a tool which will measure return on investment more seriously.
6.3.1 Skills Development and Training as at 30 June 2019
Management Level
G Employee On 30/06/19
Leanership Skills Programme And other short courses
Others forms of training
Total
Actual 2018/19
Actual 2018/19
Target Actual 2018/19
MM and S57
M - - - - -
F 2 2 - - 2
Councillor
M - - - - -
F - - - - -
DMs and SOs
M - - - - -
F - - - - -
Technicians and Associate professionals
M - - - - -
F - - - - -
Associate Professionals
M - - - - -
F - - - - -
Professionals M 2 - 2 - 2
F 3 - 3 - 3
Unskilled M 12 1 11 - 12
F 9 1 8 - 9
Subtotal M 14 1 13 - 14
F 14 3 11 - 14
Total 28 4 24 - 28
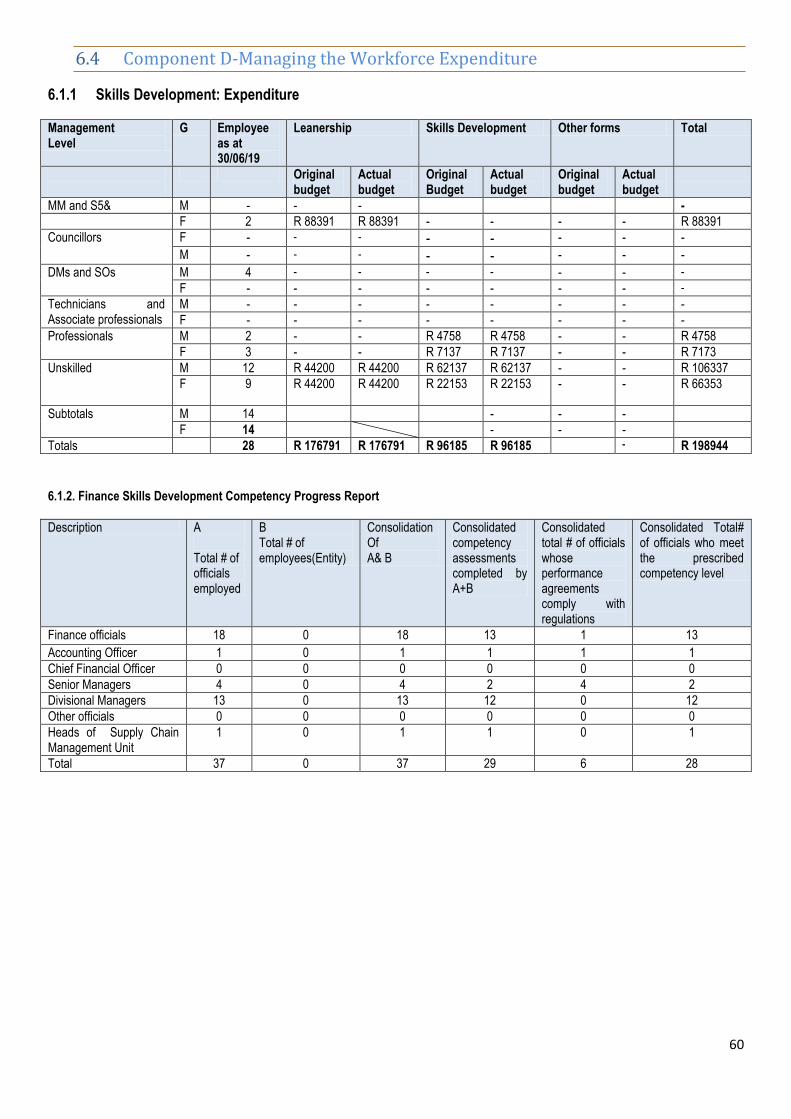
60
6.4 Component D-Managing the Workforce Expenditure
6.1.1 Skills Development: Expenditure
Management Level
G Employee as at 30/06/19
Leanership Skills Development Other forms Total
Original budget
Actual budget
Original Budget
Actual budget
Original budget
Actual budget
MM and S5& M - - - -
F 2 R 88391 R 88391 - - - - R 88391
Councillors F - - - - - - - -
M - - - - - - - -
DMs and SOs M 4 - - - - - - -
F - - - - - - - -
Technicians and Associate professionals
M - - - - - - - -
F - - - - - - - -
Professionals M 2 - - R 4758 R 4758 - - R 4758
F 3 - - R 7137 R 7137 - - R 7173
Unskilled M 12 R 44200 R 44200 R 62137 R 62137 - - R 106337
F 9 R 44200 R 44200 R 22153 R 22153 - - R 66353
Subtotals M 14 - - -
F 14 - - -
Totals 28 R 176791 R 176791 R 96185 R 96185 - R 198944
6.1.2. Finance Skills Development Competency Progress Report
Description A Total # of officials employed
B Total # of employees(Entity)
Consolidation Of A& B
Consolidated competency assessments completed by A+B
Consolidated total # of officials whose performance agreements comply with regulations
Consolidated Total# of officials who meet the prescribed competency level
Finance officials 18 0 18 13 1 13
Accounting Officer 1 0 1 1 1 1
Chief Financial Officer 0 0 0 0 0 0
Senior Managers 4 0 4 2 4 2
Divisional Managers 13 0 13 12 0 12
Other officials 0 0 0 0 0 0
Heads of Supply Chain Management Unit
1 0 1 1 0 1
Total 37 0 37 29 6 28
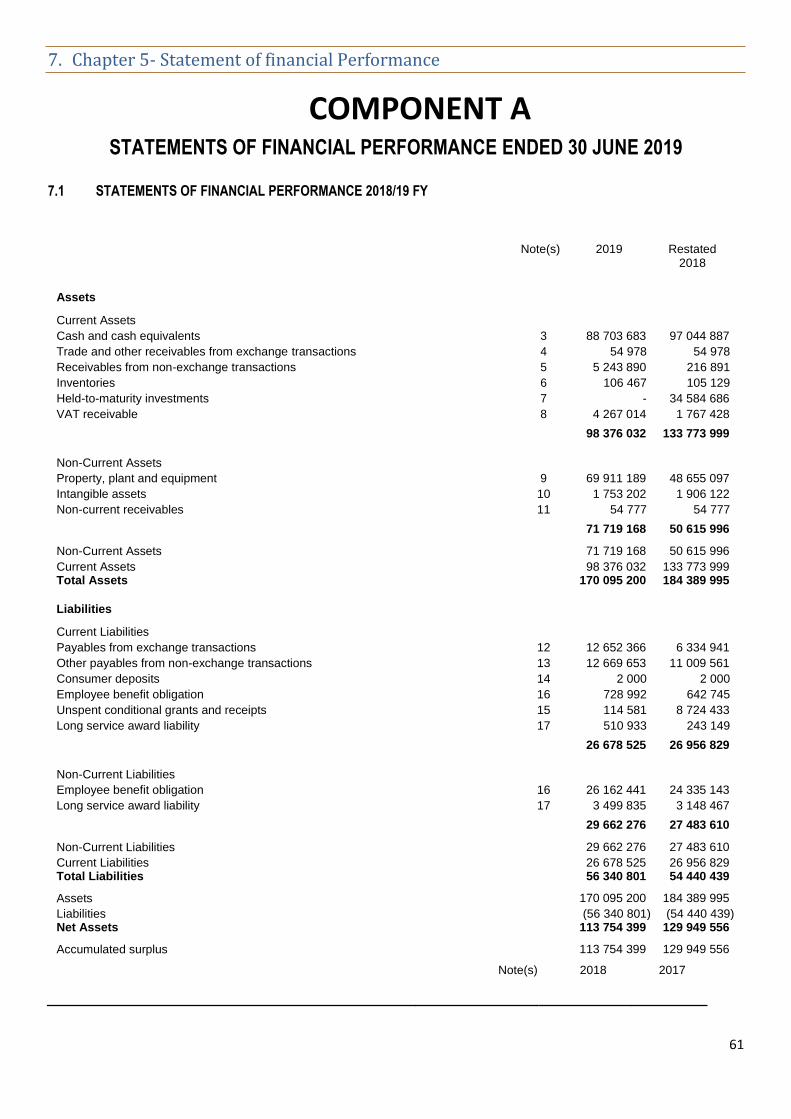
61
7. Chapter 5- Statement of financial Performance
COMPONENT A STATEMENTS OF FINANCIAL PERFORMANCE ENDED 30 JUNE 2019
7.1 STATEMENTS OF FINANCIAL PERFORMANCE 2018/19 FY
Note(s) 2019 Restated 2018
Assets
Current Assets Cash and cash equivalents 3 88 703 683 97 044 887
Trade and other receivables from exchange transactions 4 54 978 54 978
Receivables from non-exchange transactions 5 5 243 890 216 891
Inventories 6 106 467 105 129
Held-to-maturity investments 7 - 34 584 686
VAT receivable 8 4 267 014 1 767 428
98 376 032 133 773 999
Non-Current Assets
Property, plant and equipment 9 69 911 189 48 655 097
Intangible assets 10 1 753 202 1 906 122
Non-current receivables 11 54 777 54 777
71 719 168 50 615 996
Non-Current Assets 71 719 168 50 615 996
Current Assets 98 376 032 133 773 999 Total Assets 170 095 200 184 389 995
Liabilities
Current Liabilities Payables from exchange transactions 12 12 652 366 6 334 941
Other payables from non-exchange transactions 13 12 669 653 11 009 561
Consumer deposits 14 2 000 2 000
Employee benefit obligation 16 728 992 642 745
Unspent conditional grants and receipts 15 114 581 8 724 433
Long service award liability 17 510 933 243 149
26 678 525 26 956 829
Non-Current Liabilities
Employee benefit obligation 16 26 162 441 24 335 143
Long service award liability 17 3 499 835 3 148 467
29 662 276 27 483 610
Non-Current Liabilities 29 662 276 27 483 610
Current Liabilities 26 678 525 26 956 829 Total Liabilities 56 340 801 54 440 439
Assets 170 095 200 184 389 995
Liabilities (56 340 801) (54 440 439) Net Assets 113 754 399 129 949 556
Accumulated surplus 113 754 399 129 949 556
Note(s) 2018 2017
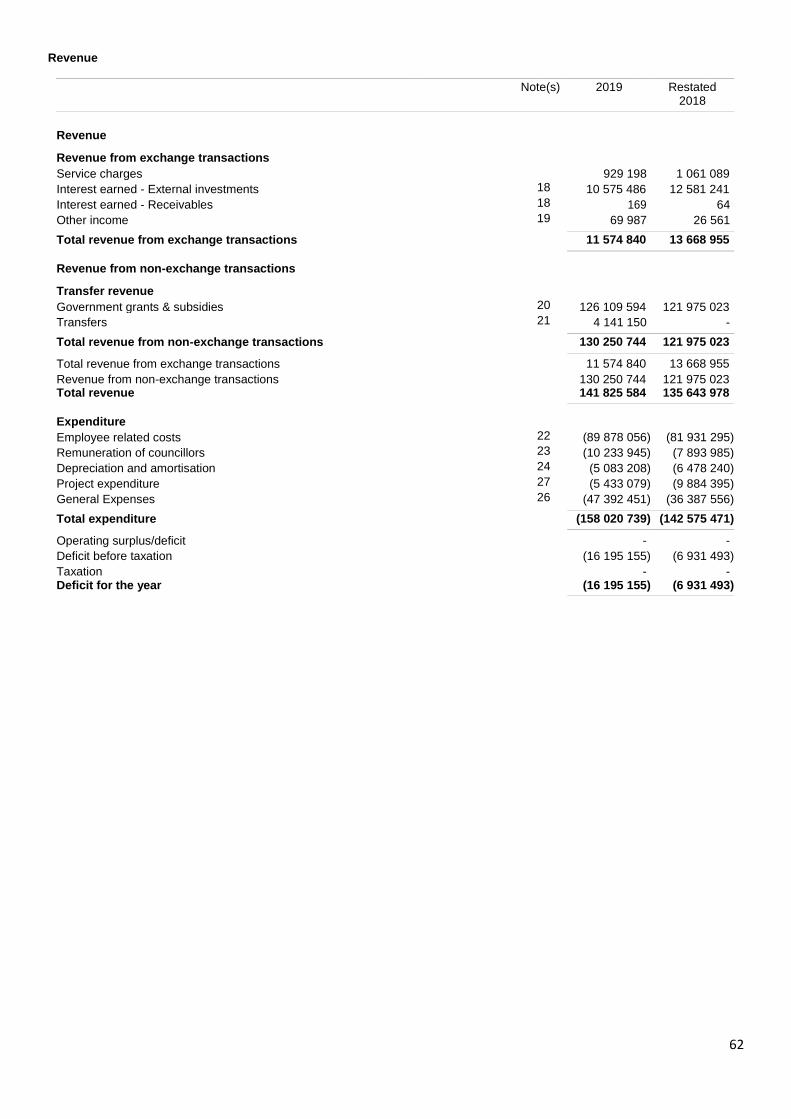
62
Revenue
Note(s) 2019 Restated 2018
Revenue
Revenue from exchange transactions Service charges 929 198 1 061 089
Interest earned - External investments 18 10 575 486 12 581 241
Interest earned - Receivables 18 169 64
Other income 19 69 987 26 561
Total revenue from exchange transactions 11 574 840 13 668 955
Revenue from non-exchange transactions
Transfer revenue
Government grants & subsidies
20
126 109 594
121 975 023
Transfers 21 4 141 150 -
Total revenue from non-exchange transactions 130 250 744 121 975 023
Total revenue from exchange transactions 11 574 840 13 668 955
Revenue from non-exchange transactions 130 250 744 121 975 023 Total revenue 141 825 584 135 643 978
Expenditure
Employee related costs
22
(89 878 056)
(81 931 295)
Remuneration of councillors 23 (10 233 945) (7 893 985)
Depreciation and amortisation 24 (5 083 208) (6 478 240)
Project expenditure 27 (5 433 079) (9 884 395)
General Expenses 26 (47 392 451) (36 387 556)
Total expenditure (158 020 739) (142 575 471)
Operating surplus/deficit - -
Deficit before taxation (16 195 155) (6 931 493)
Taxation Deficit for the year
- (16 195 155)
- (6 931 493)
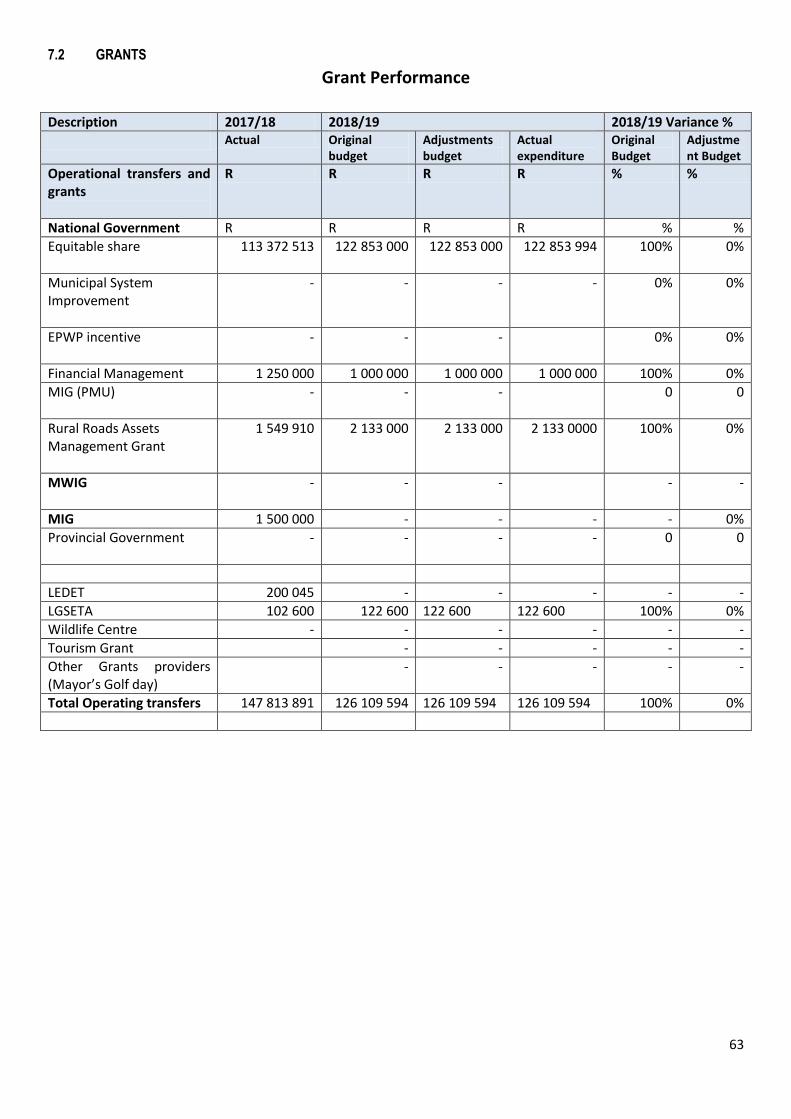
63
7.2 GRANTS
Grant Performance
Description 2017/18 2018/19 2018/19 Variance %
Actual Original budget
Adjustments budget
Actual expenditure
Original Budget
Adjustment Budget
Operational transfers and grants
R R R R % %
National Government R R R R % %
Equitable share
113 372 513 122 853 000 122 853 000 122 853 994 100% 0%
Municipal System Improvement
- - - - 0% 0%
EPWP incentive
- - - 0% 0%
Financial Management 1 250 000 1 000 000 1 000 000 1 000 000 100% 0%
MIG (PMU)
- - - 0 0
Rural Roads Assets Management Grant
1 549 910 2 133 000 2 133 000 2 133 0000 100% 0%
MWIG
- - - - -
MIG 1 500 000 - - - - 0%
Provincial Government
- - - - 0 0
LEDET 200 045 - - - - -
LGSETA 102 600 122 600 122 600 122 600 100% 0%
Wildlife Centre - - - - - -
Tourism Grant - - - - -
Other Grants providers (Mayor’s Golf day)
- - - - -
Total Operating transfers 147 813 891 126 109 594 126 109 594 126 109 594 100% 0%
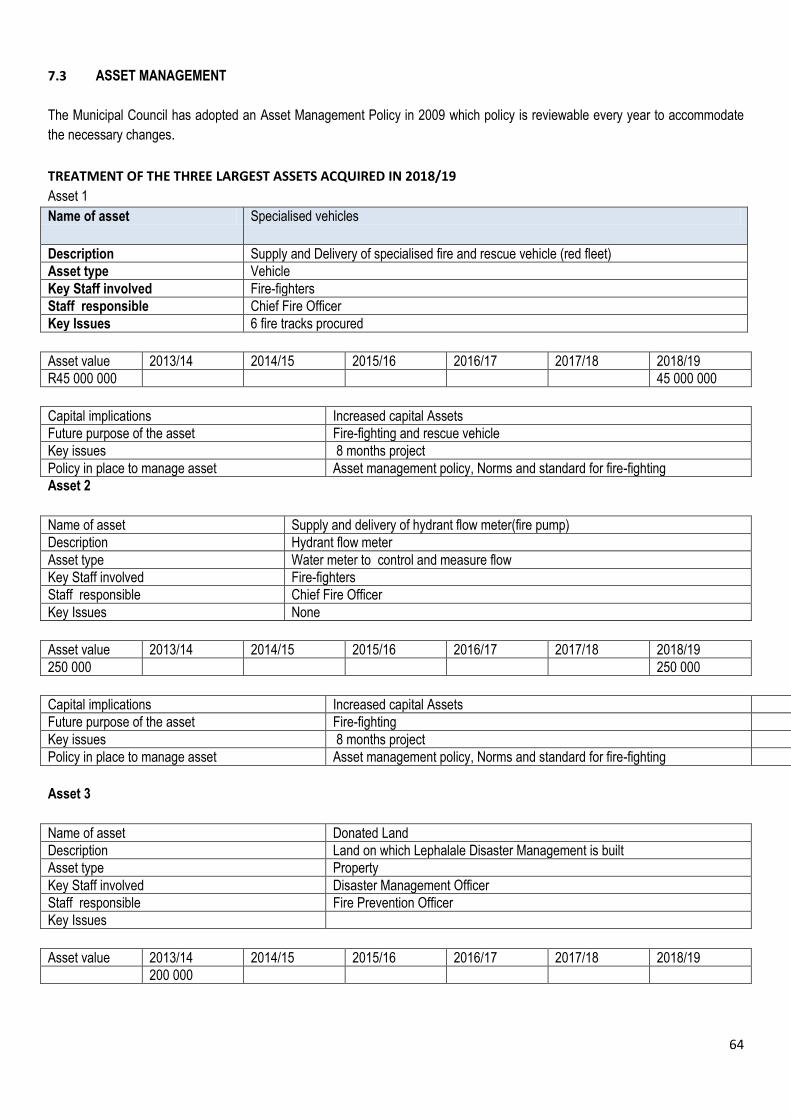
64
7.3 ASSET MANAGEMENT
The Municipal Council has adopted an Asset Management Policy in 2009 which policy is reviewable every year to accommodate
the necessary changes.
TREATMENT OF THE THREE LARGEST ASSETS ACQUIRED IN 2018/19
Asset 1
Name of asset Specialised vehicles
Description Supply and Delivery of specialised fire and rescue vehicle (red fleet)
Asset type Vehicle
Key Staff involved Fire-fighters
Staff responsible Chief Fire Officer
Key Issues 6 fire tracks procured
Asset value 2013/14 2014/15 2015/16 2016/17 2017/18 2018/19
R45 000 000 45 000 000
Capital implications Increased capital Assets
Future purpose of the asset Fire-fighting and rescue vehicle
Key issues 8 months project
Policy in place to manage asset Asset management policy, Norms and standard for fire-fighting
Asset 2
Name of asset Supply and delivery of hydrant flow meter(fire pump)
Description Hydrant flow meter
Asset type Water meter to control and measure flow
Key Staff involved Fire-fighters
Staff responsible Chief Fire Officer
Key Issues None
Asset value 2013/14 2014/15 2015/16 2016/17 2017/18 2018/19
250 000 250 000
Capital implications Increased capital Assets
Future purpose of the asset Fire-fighting
Key issues 8 months project
Policy in place to manage asset Asset management policy, Norms and standard for fire-fighting
Asset 3
Name of asset Donated Land
Description Land on which Lephalale Disaster Management is built
Asset type Property
Key Staff involved Disaster Management Officer
Staff responsible Fire Prevention Officer
Key Issues
Asset value 2013/14 2014/15 2015/16 2016/17 2017/18 2018/19
200 000
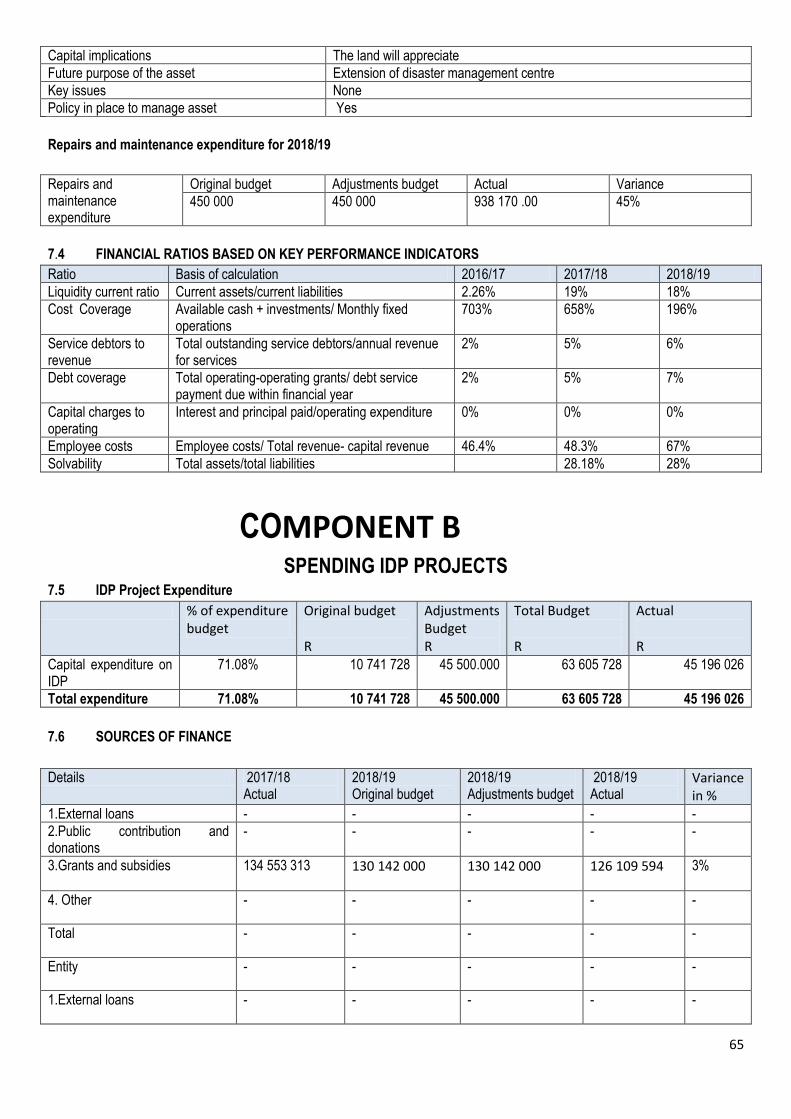
65
Capital implications The land will appreciate
Future purpose of the asset Extension of disaster management centre
Key issues None
Policy in place to manage asset Yes
Repairs and maintenance expenditure for 2018/19
Repairs and maintenance expenditure
Original budget Adjustments budget Actual Variance
450 000 450 000 938 170 .00 45%
7.4 FINANCIAL RATIOS BASED ON KEY PERFORMANCE INDICATORS
Ratio Basis of calculation 2016/17 2017/18 2018/19
Liquidity current ratio Current assets/current liabilities 2.26% 19% 18%
Cost Coverage Available cash + investments/ Monthly fixed operations
703% 658% 196%
Service debtors to revenue
Total outstanding service debtors/annual revenue for services
2% 5% 6%
Debt coverage Total operating-operating grants/ debt service payment due within financial year
2% 5% 7%
Capital charges to operating
Interest and principal paid/operating expenditure 0% 0% 0%
Employee costs Employee costs/ Total revenue- capital revenue 46.4% 48.3% 67%
Solvability Total assets/total liabilities 28.18% 28%
COMPONENT B SPENDING IDP PROJECTS
7.5 IDP Project Expenditure
% of expenditure budget
Original budget R
Adjustments Budget R
Total Budget R
Actual R
Capital expenditure on IDP
71.08% 10 741 728 45 500.000 63 605 728 45 196 026
Total expenditure 71.08% 10 741 728 45 500.000 63 605 728 45 196 026
7.6 SOURCES OF FINANCE
Details 2017/18 Actual
2018/19 Original budget
2018/19 Adjustments budget
2018/19 Actual
Variance in %
1.External loans - - - - -
2.Public contribution and donations
- - - - -
3.Grants and subsidies 134 553 313 130 142 000 130 142 000 126 109 594 3%
4. Other - - - - -
Total - - - - -
Entity - - - - -
1.External loans - - - - -
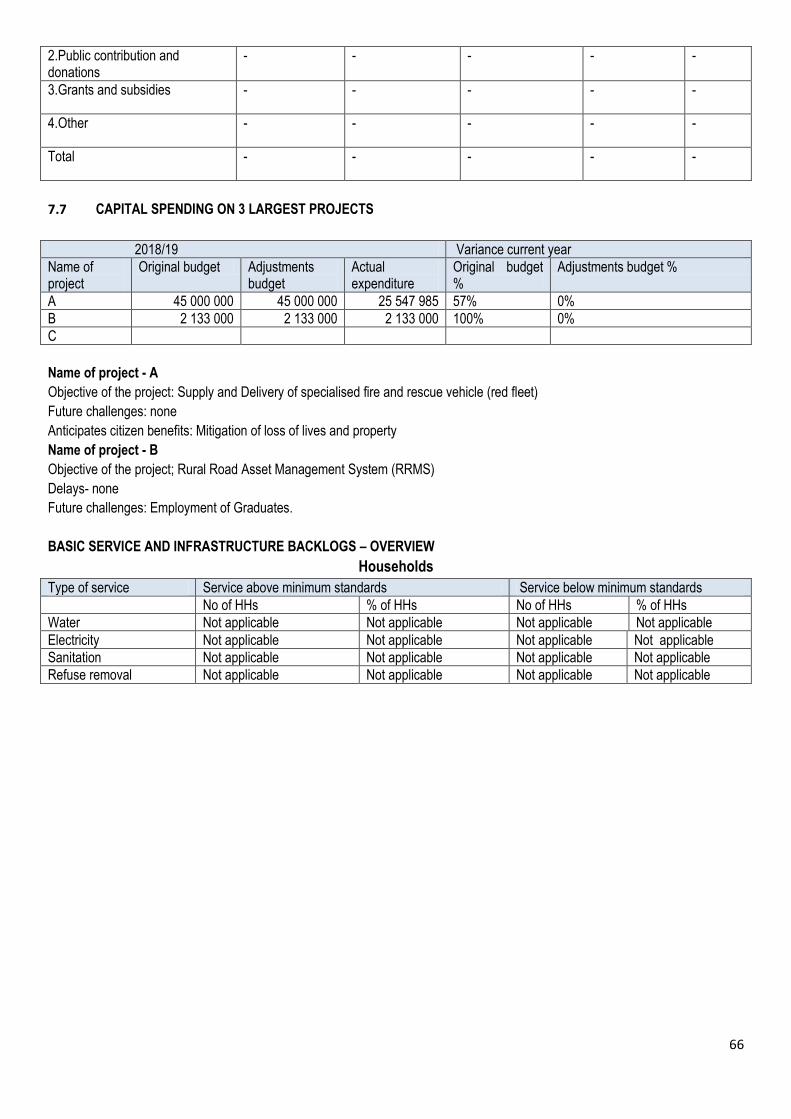
66
2.Public contribution and donations
- - - - -
3.Grants and subsidies - - - - -
4.Other - - - - -
Total - - - - -
7.7 CAPITAL SPENDING ON 3 LARGEST PROJECTS
2018/19 Variance current year
Name of project
Original budget Adjustments budget
Actual expenditure
Original budget %
Adjustments budget %
A 45 000 000 45 000 000 25 547 985 57% 0%
B 2 133 000 2 133 000 2 133 000 100% 0%
C
Name of project - A
Objective of the project: Supply and Delivery of specialised fire and rescue vehicle (red fleet)
Future challenges: none
Anticipates citizen benefits: Mitigation of loss of lives and property
Name of project - B
Objective of the project; Rural Road Asset Management System (RRMS)
Delays- none
Future challenges: Employment of Graduates.
BASIC SERVICE AND INFRASTRUCTURE BACKLOGS – OVERVIEW
Households
Type of service Service above minimum standards Service below minimum standards
No of HHs % of HHs No of HHs % of HHs
Water Not applicable Not applicable Not applicable Not applicable
Electricity Not applicable Not applicable Not applicable Not applicable
Sanitation Not applicable Not applicable Not applicable Not applicable
Refuse removal Not applicable Not applicable Not applicable Not applicable
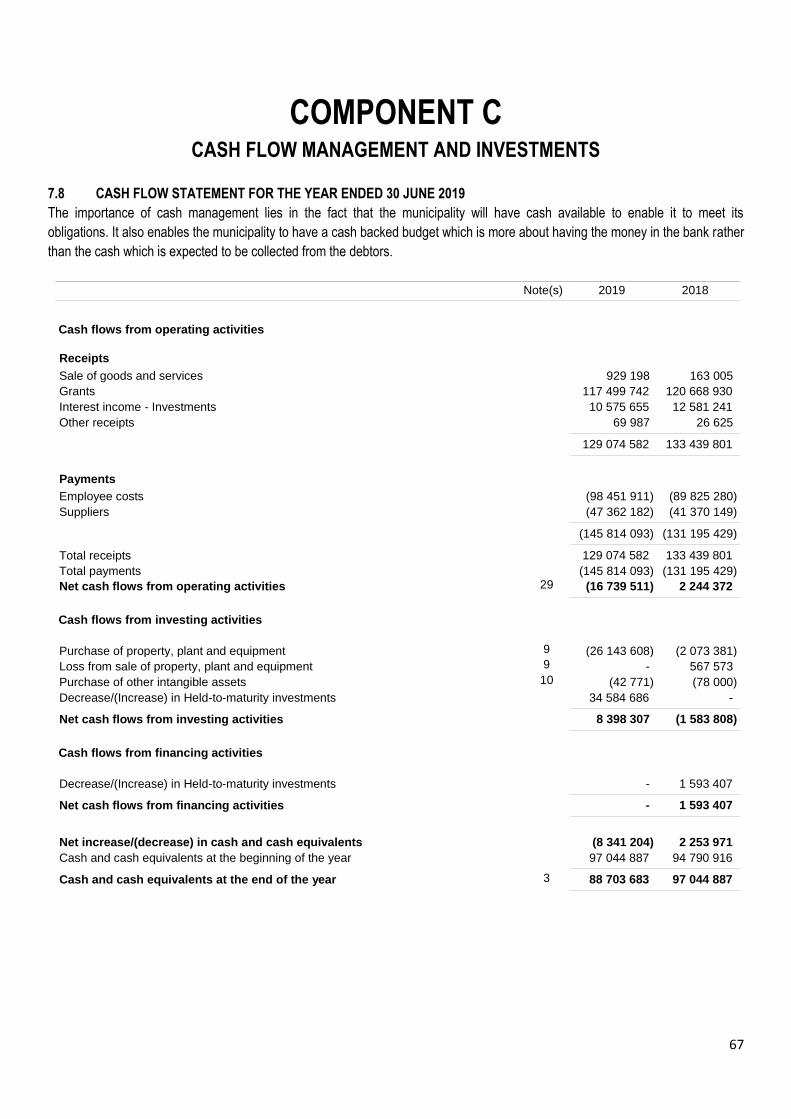
67
COMPONENT C CASH FLOW MANAGEMENT AND INVESTMENTS
7.8 CASH FLOW STATEMENT FOR THE YEAR ENDED 30 JUNE 2019
The importance of cash management lies in the fact that the municipality will have cash available to enable it to meet its
obligations. It also enables the municipality to have a cash backed budget which is more about having the money in the bank rather
than the cash which is expected to be collected from the debtors.
Note(s) 2019 2018
Cash flows from operating activities
Receipts
Sale of goods and services 929 198 163 005
Grants 117 499 742 120 668 930
Interest income - Investments 10 575 655 12 581 241
Other receipts 69 987 26 625
129 074 582 133 439 801
Payments
Employee costs (98 451 911) (89 825 280)
Suppliers (47 362 182) (41 370 149)
(145 814 093) (131 195 429)
Total receipts 129 074 582 133 439 801
Total payments (145 814 093) (131 195 429)
Net cash flows from operating activities 29 (16 739 511) 2 244 372
Cash flows from investing activities
Purchase of property, plant and equipment 9 (26 143 608) (2 073 381)
Loss from sale of property, plant and equipment 9 - 567 573
Purchase of other intangible assets 10 (42 771) (78 000)
Decrease/(Increase) in Held-to-maturity investments 34 584 686 -
Net cash flows from investing activities 8 398 307 (1 583 808)
Cash flows from financing activities
Decrease/(Increase) in Held-to-maturity investments - 1 593 407
Net cash flows from financing activities - 1 593 407
Net increase/(decrease) in cash and cash equivalents
(8 341 204)
2 253 971
Cash and cash equivalents at the beginning of the year 97 044 887 94 790 916
Cash and cash equivalents at the end of the year 3 88 703 683 97 044 887
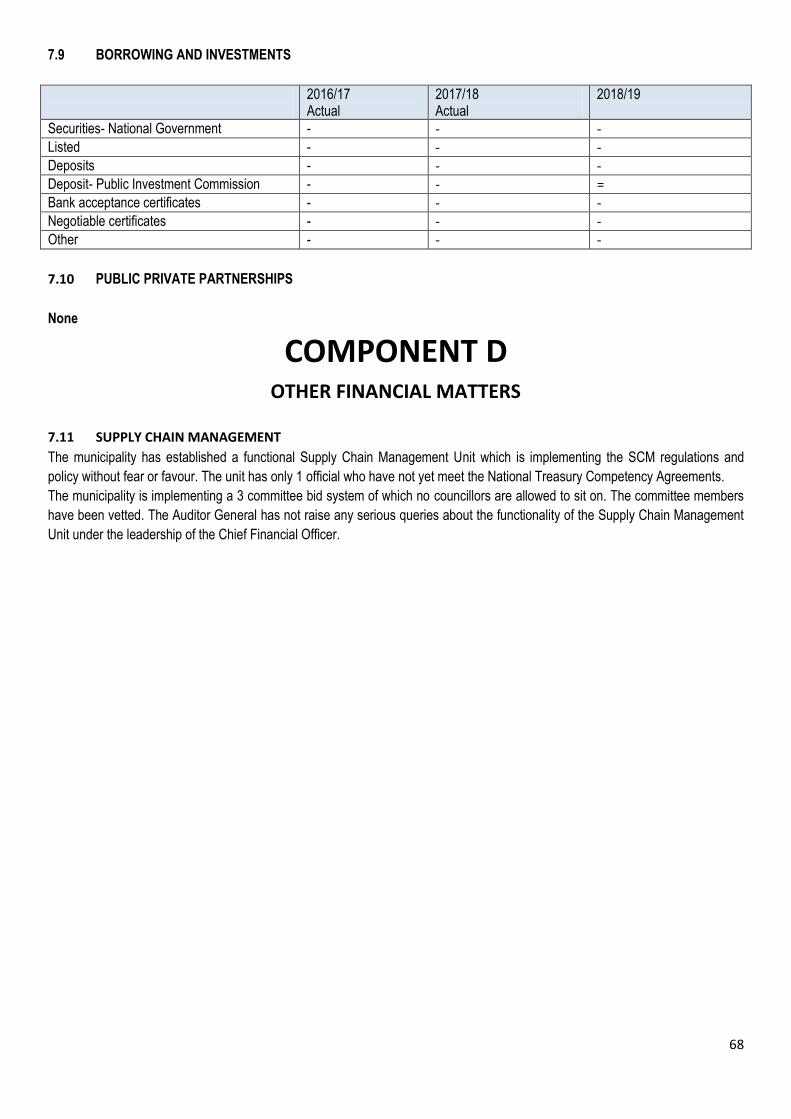
68
7.9 BORROWING AND INVESTMENTS
2016/17 Actual
2017/18 Actual
2018/19
Securities- National Government - - - Listed - - -
Deposits - - - Deposit- Public Investment Commission - - = Bank acceptance certificates - - - Negotiable certificates - - - Other - - -
7.10 PUBLIC PRIVATE PARTNERSHIPS
None
COMPONENT D OTHER FINANCIAL MATTERS
7.11 SUPPLY CHAIN MANAGEMENT
The municipality has established a functional Supply Chain Management Unit which is implementing the SCM regulations and
policy without fear or favour. The unit has only 1 official who have not yet meet the National Treasury Competency Agreements.
The municipality is implementing a 3 committee bid system of which no councillors are allowed to sit on. The committee members
have been vetted. The Auditor General has not raise any serious queries about the functionality of the Supply Chain Management
Unit under the leadership of the Chief Financial Officer.
69
8. Chapter 6-AUDITOR GENERAL OPINION OF FINANCIAL STATEMENTS
COMPONENT A AUDITOR-GENERAL OPINION 2017/18
70
71
72
73
74
75
76
77
COMPONENT B AUDITOR-GENERAL OPINION 2018/19
Report of the auditor-general to Limpopo provincial legislature and the
council of Waterberg District Municipality
Report on the audit of the financial statements
Opinion
1. I have audited the financial statements of the Waterberg District Municiplaity set out on pages … to … ,
which comprise the statement of financial position as at 30 June 2019, the statement of financial
performance, statement of changes in net assets, cash flow statement and statement of comparison of
budget and actual amounts for the year then ended, as well as the notes to the financial statements,
including a summary of significant accounting policies.
2. In my opinion, the financial statements present fairly, in all material respects, the financial position of
the Waterberg District Municipality as at 30 June 2019, and its financial performance and cash flows for
the year then ended in accordance with South African standard of Generally Recognised Accounting
Practice (SA Standard of GRAP) and the requirements of the Municipal Finance Management Act of
South Africa (Act No. 56 of 2003) (MFMA) and Division Of Revenue Act of South Africa, 2017 ( Act
No.3 of 2017) (DORA).
Basis of unqualified opinion
3. I conducted my audit in accordance with the International Standards on Auditing (ISAs). My
responsibilities under those standards are further described in the auditor-general’s responsibilities for
the audit of the financial statements section of this auditor’s report.
4. I am independent of the municipality in accordance with sections 290 and 291 of the International
Ethics Standards Board for Accountants’ Code of ethics for professional accountants and, parts 1 and 3
of the International Ethics Standards Board for Accountants’ International Code of Ethics for
Professional Accountants (including International Independence Standards) (IESBA codes) as well as
the ethical requirements that are relevant to my audit in South Africa. I have fulfilled my other ethical
responsibilities in accordance with these requirements and the IESBA codes.
5. I believe that the audit evidence I have obtained is sufficient and appropriate to provide a basis for my
opinion.
Emphasis of matter
6. I draw attention to the matter below. My opinion is not modified in respect of this matter.
Material deficit for the year
7. As disclosed in the Statement of Financial Performance, a material deficit of R18 472 594 was incurred
for the 2018-19 financial year which was a combined result of insufficient revenue from exchange
transactions being collected during the period and that the municipality budgeted for an overall deficit
during the annual budgeting process.
Other matters
78
8. I draw attention to the matters below. My opinion is not modified in respect of these matters.
Unaudited disclosure note
9. In terms of section 125(2)(e) of the MFMA, the municipality is required to disclose particulars of non-
compliance with the MFMA in note 34 to the financial statements. This disclosure requirement did not
form part of the audit of the financial statements and, accordingly, I do not express an opinion on it.
Unaudited disclosure note
10. In The supplementary information set out on pages XX to XX does not form part of the financial
statements and is presented as additional information. I have not audited these schedules and,
accordingly, I do not express an opinion on them.
Responsibilities of the accounting officer for the financial statements
11. The accounting officer is responsible for the preparation and fair presentation of the financial
statements in accordance with South African Standards of Generally Recognised Accounting Practice
(GRAP), Municipal Finance Management Act of South Africa, 2003 (Act No. 56 of 2003) (MFMA) and
the Division of Revenue Act of South Africa, 2017 (Act No. 3 of 2017) (DORA) , and for such internal
control as the accounting officer determines is necessary to enable the preparation of financial
statements that are free from material misstatement, whether due to fraud or error.
12. In preparing the financial statements, the accounting officer is responsible for assessing the
municipality’s ability to continue as a going concern, disclosing, as applicable, matters relating to going
concern and using the going concern basis of accounting unless the appropriate governance structure
either intends to liquidate the municipality or to cease operations, or has no realistic alternative but to
do so.
Auditor-general’s responsibilities for the audit of the financial statements
13. My objectives are to obtain reasonable assurance about whether the financial statements as a whole
are free from material misstatement, whether due to fraud or error, and to issue an auditor’s report that
includes my opinion. Reasonable assurance is a high level of assurance, but is not a guarantee that an
audit conducted in accordance with the ISAs will always detect a material misstatement when it exists.
Misstatements can arise from fraud or error and are considered material if, individually or in aggregate,
they could reasonably be expected to influence the economic decisions of users taken on the basis of
these financial statements.
14. A further description of my responsibilities for the audit of the financial statements is included in the
annexure to this auditor’s report.
Report on the audit of the annual performance report
Introduction and scope
15. In accordance with the Public Audit Act of South Africa, 2004 (Act No. 25 of 2004) (PAA) and the
general notice issued in terms thereof, I have a responsibility to report material findings on the reported
performance information against predetermined objectives for selected development priorities
presented in the annual performance report. I performed procedures to identify findings but not to
gather evidence to express assurance.
16. My procedures address the reported performance information, which must be based on the approved
performance planning documents of the municipality. I have not evaluated the completeness and
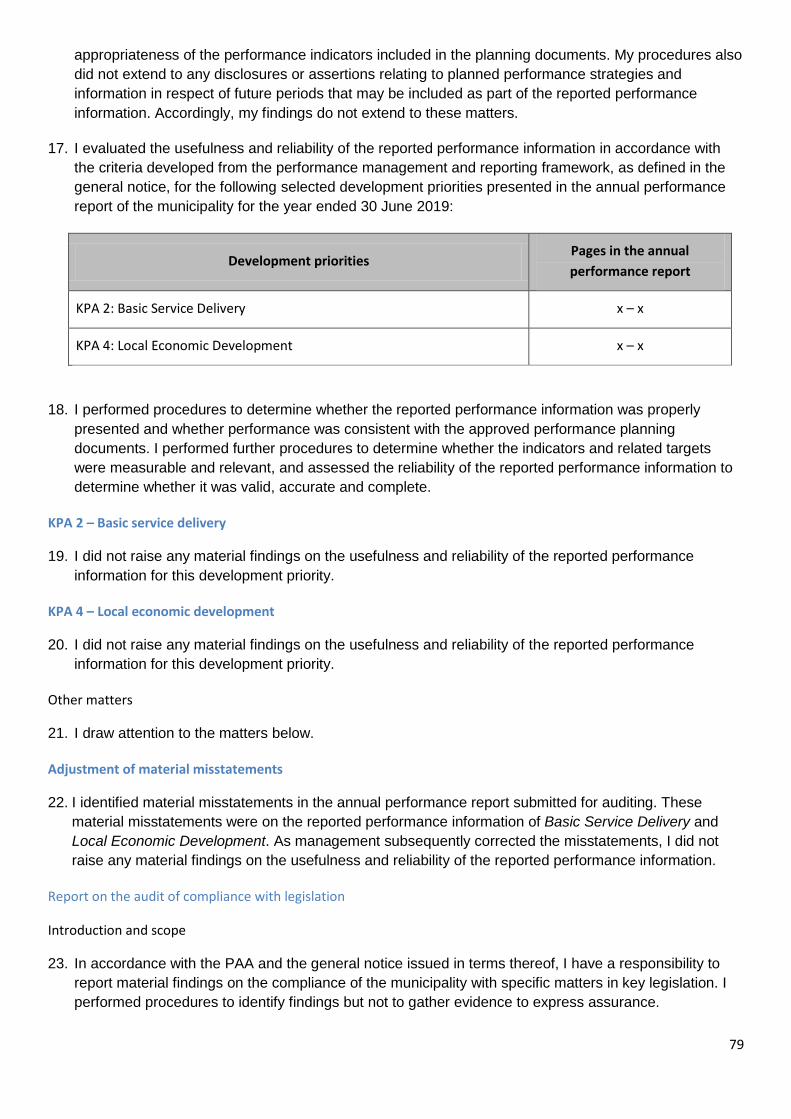
79
appropriateness of the performance indicators included in the planning documents. My procedures also
did not extend to any disclosures or assertions relating to planned performance strategies and
information in respect of future periods that may be included as part of the reported performance
information. Accordingly, my findings do not extend to these matters.
17. I evaluated the usefulness and reliability of the reported performance information in accordance with
the criteria developed from the performance management and reporting framework, as defined in the
general notice, for the following selected development priorities presented in the annual performance
report of the municipality for the year ended 30 June 2019:
Development priorities Pages in the annual
performance report
KPA 2: Basic Service Delivery x – x
KPA 4: Local Economic Development x – x
18. I performed procedures to determine whether the reported performance information was properly
presented and whether performance was consistent with the approved performance planning
documents. I performed further procedures to determine whether the indicators and related targets
were measurable and relevant, and assessed the reliability of the reported performance information to
determine whether it was valid, accurate and complete.
KPA 2 – Basic service delivery
19. I did not raise any material findings on the usefulness and reliability of the reported performance
information for this development priority.
KPA 4 – Local economic development
20. I did not raise any material findings on the usefulness and reliability of the reported performance
information for this development priority.
Other matters
21. I draw attention to the matters below.
Adjustment of material misstatements
22. I identified material misstatements in the annual performance report submitted for auditing. These
material misstatements were on the reported performance information of Basic Service Delivery and
Local Economic Development. As management subsequently corrected the misstatements, I did not
raise any material findings on the usefulness and reliability of the reported performance information.
Report on the audit of compliance with legislation
Introduction and scope
23. In accordance with the PAA and the general notice issued in terms thereof, I have a responsibility to
report material findings on the compliance of the municipality with specific matters in key legislation. I
performed procedures to identify findings but not to gather evidence to express assurance.
80
24. The material findings on compliance with specific matters in key legislations are as follows:
Financial statements, performance and annual reports
25. The financial statements submitted for auditing were not prepared in all material respects in accordance
with the requirements of section 122(1) of the MFMA.
26. Material misstatements of non-current assets, current assets, current liabilities, expenditure and
disclosure items identified by the auditors in the submitted financial statement were subsequently
corrected, resulting in the financial statements receiving an unqualified audit opinion.
Expenditure management
27. Money owed by the municipality was not always paid within 30 days, as required by section 65(2)(e) of
the MFMA.
28. Reasonable steps were not taken to prevent irregular expenditure amounting to R12 284 371 as
disclosed in note 32 to the annual financial statements, as required by section 62(1)(d) of the MFMA.
The majority of the irregular expenditure was caused by non-compliance with the requirements of
Supply Chain Management Regulation 32 of the MFMA in sourcing goods and services.
Strategic planning and performance management
29. Annual performance objectives and indicators were not established for Waterberg Economic
Development Agency as required by section 93B(a) of the Municipal Systems Act (MSA).
30. The performance of Waterberg Economic Development Agency was not monitored and reviewed as
part of the annual budget process, as required by section 93B(b) of the MSA.
Other information
31. The accounting officer is responsible for the other information. The other information comprises the
information included in the annual report, the audit committee’s report. The other information does not
include the financial statements, the auditor’s report and those selected development priorities
presented in the annual performance report that have been specifically reported in this auditor’s report.
32. My opinion on the financial statements and findings on the reported performance information and
compliance with legislation do not cover the other information and I do not express an audit opinion or
any form of assurance conclusion thereon.
33. In connection with my audit, my responsibility is to read the other information and, in doing so, consider
whether the other information is materially inconsistent with the financial statements and the selected
development priorities presented in the annual performance report, or my knowledge obtained in the
audit, or otherwise appears to be materially misstated.
34. I did not receive the other information prior to the date of this auditor’s report. When I do receive and
read this information, if I conclude that there is a material misstatement therein, I am required to
communicate the matter to those charged with governance and request that the other information be
corrected. If the other information is not corrected, I may have to retract this auditor’s report and re-
issue an amended report as appropriate. However, if it is corrected this will not be necessary.
81
Internal control deficiencies
35. I considered internal control relevant to my audit of the financial statements, reported performance
information and compliance with applicable legislation; however, my objective was not to express any
form of assurance on it. The matters reported below are limited to the significant internal control
deficiencies that resulted in the findings on compliance with legislation included in this report.
36. The annual financial statements and the annual performance report provided for audit were not free
from material misstatement as numerous findings were detected through the audit process.
37. Non-compliance with legislation could have been prevented had compliance been properly reviewed
and monitored.
Pretoria
30 November 2019
82
COMPONENT B Audit committee Report 2018/19
WATERBERG DISTRICT MUNICIPALITY’S AUDIT COMMITTEE (AC) ANNUAL REPORT TO COUNCIL
FOR PERIOD ENDED 30 JUNE 2019
1. INTRODUCTION
The Audit Committee of Waterberg District Municipality was established by Municipal Council in
accordance with section 166 (1) of the Municipal Finance Management Act (MFMA). The Audit Committee
operates as an independent advisory body to the Council, Political Office bearers, Accounting Officer,
Management and staff, thereby assisting Council in its oversight role. The role, functions, and authority of
the Audit Committee are prescribed in terms of section 166 (2) of the Act, National Treasury’s Risk
Management Framework and Circular 65 issued by National Treasury.
2. AUDIT COMMITTEE FIDUCIARY DUTIES
In terms of Section 166 of the Municipal Finance Management Act (No. 56 of 2003), the Audit Committee
must:
(a) advise the Municipal Council, the political office-bearers, the Accounting Officer and the
management staff of the municipality on matters relating to:-
(i) Internal financial controls and internal audit;
(ii) Risk management;
(iii) Accounting policies;
(iv) The adequacy, reliability and accuracy of financial reporting and information;
(v) Performance management;
(vi) Effective governance;
(vii) Compliance with the MFMA, the DORA and any other applicable legislation;
(viii) Performance evaluation; and
(ix) Any other issues referred to it by the municipality
(b) review the annual financial statements to provide the council of the municipality with an authoritative
and credible view of the financial position of the municipality, its effectiveness and its overall level of
compliance with the MFMA, the DORA and any other applicable legislation;
(c) respond to the Council on any issues raised by the Auditor-General in the audit report;
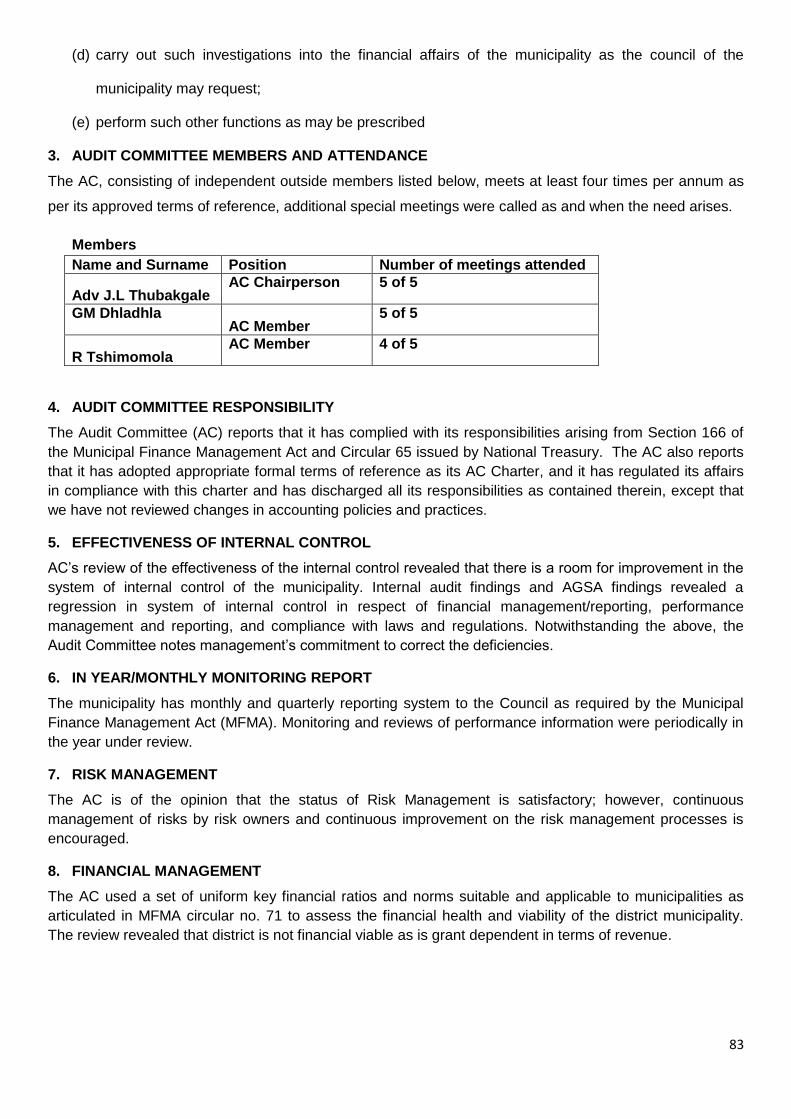
83
(d) carry out such investigations into the financial affairs of the municipality as the council of the
municipality may request;
(e) perform such other functions as may be prescribed
3. AUDIT COMMITTEE MEMBERS AND ATTENDANCE
The AC, consisting of independent outside members listed below, meets at least four times per annum as
per its approved terms of reference, additional special meetings were called as and when the need arises.
Members
Name and Surname Position Number of meetings attended
Adv J.L Thubakgale AC Chairperson 5 of 5
GM Dhladhla AC Member
5 of 5
R Tshimomola AC Member 4 of 5
4. AUDIT COMMITTEE RESPONSIBILITY
The Audit Committee (AC) reports that it has complied with its responsibilities arising from Section 166 of
the Municipal Finance Management Act and Circular 65 issued by National Treasury. The AC also reports
that it has adopted appropriate formal terms of reference as its AC Charter, and it has regulated its affairs
in compliance with this charter and has discharged all its responsibilities as contained therein, except that
we have not reviewed changes in accounting policies and practices.
5. EFFECTIVENESS OF INTERNAL CONTROL
AC’s review of the effectiveness of the internal control revealed that there is a room for improvement in the
system of internal control of the municipality. Internal audit findings and AGSA findings revealed a
regression in system of internal control in respect of financial management/reporting, performance
management and reporting, and compliance with laws and regulations. Notwithstanding the above, the
Audit Committee notes management’s commitment to correct the deficiencies.
6. IN YEAR/MONTHLY MONITORING REPORT
The municipality has monthly and quarterly reporting system to the Council as required by the Municipal
Finance Management Act (MFMA). Monitoring and reviews of performance information were periodically in
the year under review.
7. RISK MANAGEMENT
The AC is of the opinion that the status of Risk Management is satisfactory; however, continuous
management of risks by risk owners and continuous improvement on the risk management processes is
encouraged.
8. FINANCIAL MANAGEMENT
The AC used a set of uniform key financial ratios and norms suitable and applicable to municipalities as
articulated in MFMA circular no. 71 to assess the financial health and viability of the district municipality.
The review revealed that district is not financial viable as is grant dependent in terms of revenue.
84
9. COMPLIANCE WITH LAWS AND REGULATIONS
A number of non-compliance with the enabling laws and regulations were revealed during the year. Thus,
there is a room for improvement in so far as establishing an effective system for monitoring compliance with
laws and regulations and the results of management’s investigation and follow-up (including disciplinary
action) of any instances of non-compliance. Thus, the AC recommended implementation of compliance
management system and framework in order to addresses the issues of non-compliance.
10. INTERNAL AUDIT
The Internal Audit reported to the Municipal Manager administratively and functionally independently
reported to the Audit Committee in the execution of their duties during the 2018/19 Financial Year. There
were no restrictions imposed to the Internal Audit in the execution of their duties.
The AC is satisfied with the effectiveness of Internal Audit. The above conclusion is based on:
Reviewal with management and approval the internal audit charter, strategic and operational
plans, internal audit activities, staffing (including competence and qualifications), and
organisational structure of the Internal Audit Unit;
Implementation of the approved the annual internal audit plan and all major changes to the
plan.
There were no unjustified restrictions or limitations on work of the internal audit caused by the
unit.
Review the internal audit budget, resource plan, activities, and organizational structure of the
internal audit function;
Compliance with the IIA’s international standards for the professional practice by Internal
Auditing unit
11. EXTERNAL AUDIT
11.1 The AC did review the Auditor-General ’s proposed audit scope and approach, including
coordination of audit effort with internal audit in respect of 2018/19 financial year; and on a regular basis,
met separately with the Auditor-General to discuss any matters that the committee or auditors believe
should be discussed privately.
11.2 The AC evaluated management responses to the reports or findings of the Auditor-General (Action
plan to address prior year findings) on quarterly basis and gave inputs and advice on how best to
addressed the findings raised by the AGSA.
11.3 At the time of submission of the annual financial statements and performance report to AGSA for
audit, all the AGSA findings were resolved as at 31 August 2019.
a. AC interacted with Final Audit and Management Letter issued by AGSA and concurs with AGSA’s
observations. WDM has received an unqualified audit opinion with findings.
85
12. PERFORMANCE MANAGEMENT
The AC reviewed effectiveness and functionality of the performance management system and it appears to
be functional. However, there is a room for improvement in so far as achievement of planned targets is
concerned, usefulness and reliability of performance information as well as management’s adequate review
and monitoring of performance management information/reports.
13. FINANCIAL REPORTING
The AC reviewed the quality, accuracy, uselessness, reliability and appropriateness of monthly, quarterly
and annual financial reporting and observed that there is a room for improvement in so far as compliance
with section 122 of the MFMA and management’s review and monitoring of financial reports.
14. IT GOVERNANCE
The AC did review current IT governance and arrangement and noted there is a room for improvement in
so far as fully implementation of ICT Governance Framework.
15. IMPLEMENTATIONS OF AUDIT COMMITTEE RESOLUTIONS
As at the end of the year, all Audit Committee resolutions were implemented satisfactorily.
16. IMPLEMENTATION OF COUNCIL RESOLUTIONS
As at the end of the year a large number of Council resolutions were implemented and however, the AC
recommends development and implementation of Council resolutions management systems and possible
automation of the management of council resolutions.
17. LEADERSHIP
Municipality Council did provide somewhat effective leadership based on a culture of honest and good
governance. However there is a room for improvement in so far as management’s oversight on the financial
statements, performance reporting and compliance with laws and regulations governing the district
municipality.
18. CONCLUSION
The AC wishes to acknowledge the commitment from Council, management and staff of the municipality.
We would also like to thank the Executive Mayor for his support, Councilors, senior management for their
efforts and internal audit for their contribution.
Adv J.L Thubakgale
Waterberg District Municipality
Chairperson of the Audit Committee
10 December 2019
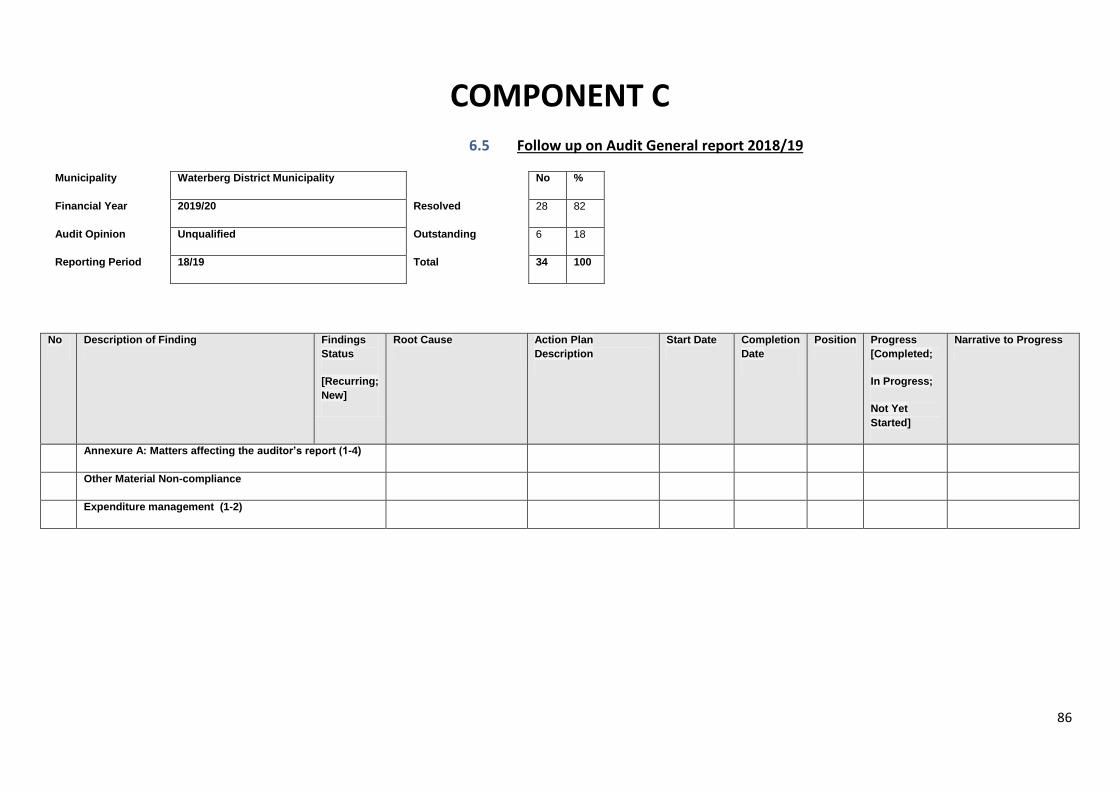
86
COMPONENT C
6.5 Follow up on Audit General report 2018/19
Municipality Waterberg District Municipality No %
Financial Year 2019/20 Resolved 28 82
Audit Opinion Unqualified Outstanding 6 18
Reporting Period 18/19 Total 34 100
No Description of Finding Findings
Status
[Recurring;
New]
Root Cause Action Plan
Description
Start Date Completion
Date
Position Progress
[Completed;
In Progress;
Not Yet
Started]
Narrative to Progress
Annexure A: Matters affecting the auditor’s report (1-4)
Other Material Non-compliance
Expenditure management (1-2)
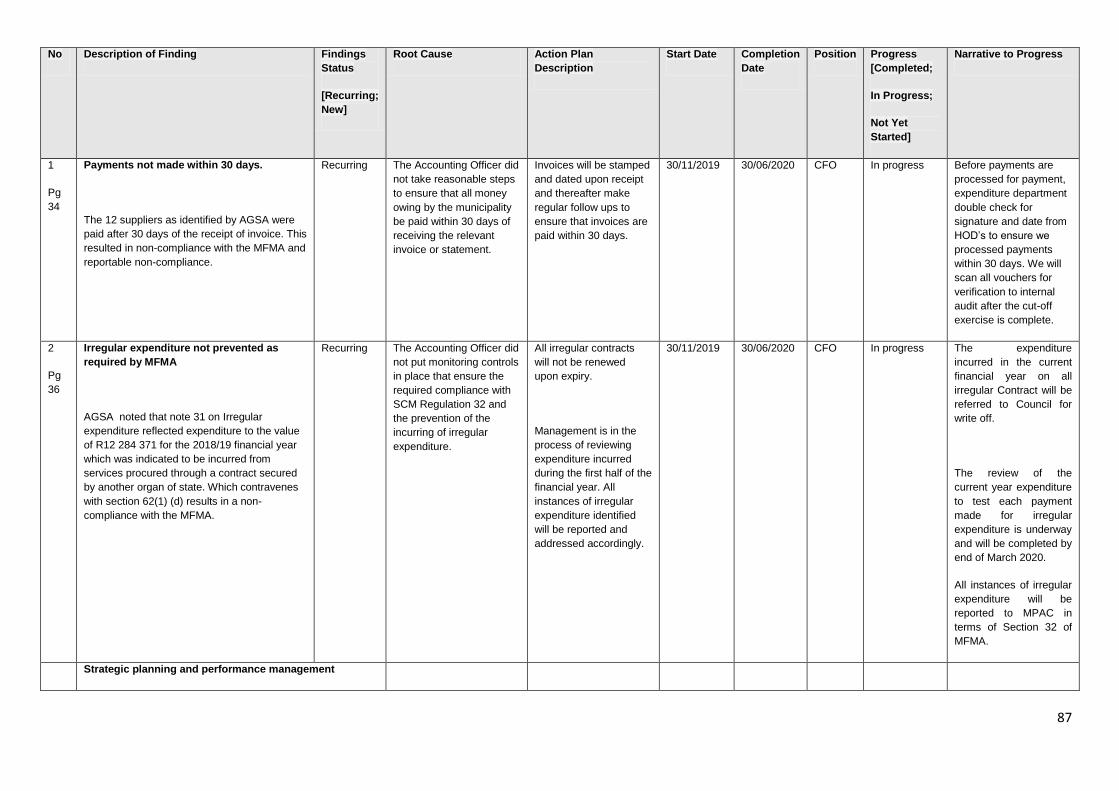
87
No Description of Finding Findings
Status
[Recurring;
New]
Root Cause Action Plan
Description
Start Date Completion
Date
Position Progress
[Completed;
In Progress;
Not Yet
Started]
Narrative to Progress
1
Pg
34
Payments not made within 30 days.
The 12 suppliers as identified by AGSA were
paid after 30 days of the receipt of invoice. This
resulted in non-compliance with the MFMA and
reportable non-compliance.
Recurring The Accounting Officer did
not take reasonable steps
to ensure that all money
owing by the municipality
be paid within 30 days of
receiving the relevant
invoice or statement.
Invoices will be stamped
and dated upon receipt
and thereafter make
regular follow ups to
ensure that invoices are
paid within 30 days.
30/11/2019 30/06/2020 CFO In progress Before payments are
processed for payment,
expenditure department
double check for
signature and date from
HOD’s to ensure we
processed payments
within 30 days. We will
scan all vouchers for
verification to internal
audit after the cut-off
exercise is complete.
2
Pg
36
Irregular expenditure not prevented as
required by MFMA
AGSA noted that note 31 on Irregular
expenditure reflected expenditure to the value
of R12 284 371 for the 2018/19 financial year
which was indicated to be incurred from
services procured through a contract secured
by another organ of state. Which contravenes
with section 62(1) (d) results in a non-
compliance with the MFMA.
Recurring The Accounting Officer did
not put monitoring controls
in place that ensure the
required compliance with
SCM Regulation 32 and
the prevention of the
incurring of irregular
expenditure.
All irregular contracts
will not be renewed
upon expiry.
Management is in the
process of reviewing
expenditure incurred
during the first half of the
financial year. All
instances of irregular
expenditure identified
will be reported and
addressed accordingly.
30/11/2019 30/06/2020 CFO In progress The expenditure
incurred in the current
financial year on all
irregular Contract will be
referred to Council for
write off.
The review of the
current year expenditure
to test each payment
made for irregular
expenditure is underway
and will be completed by
end of March 2020.
All instances of irregular
expenditure will be
reported to MPAC in
terms of Section 32 of
MFMA.
Strategic planning and performance management
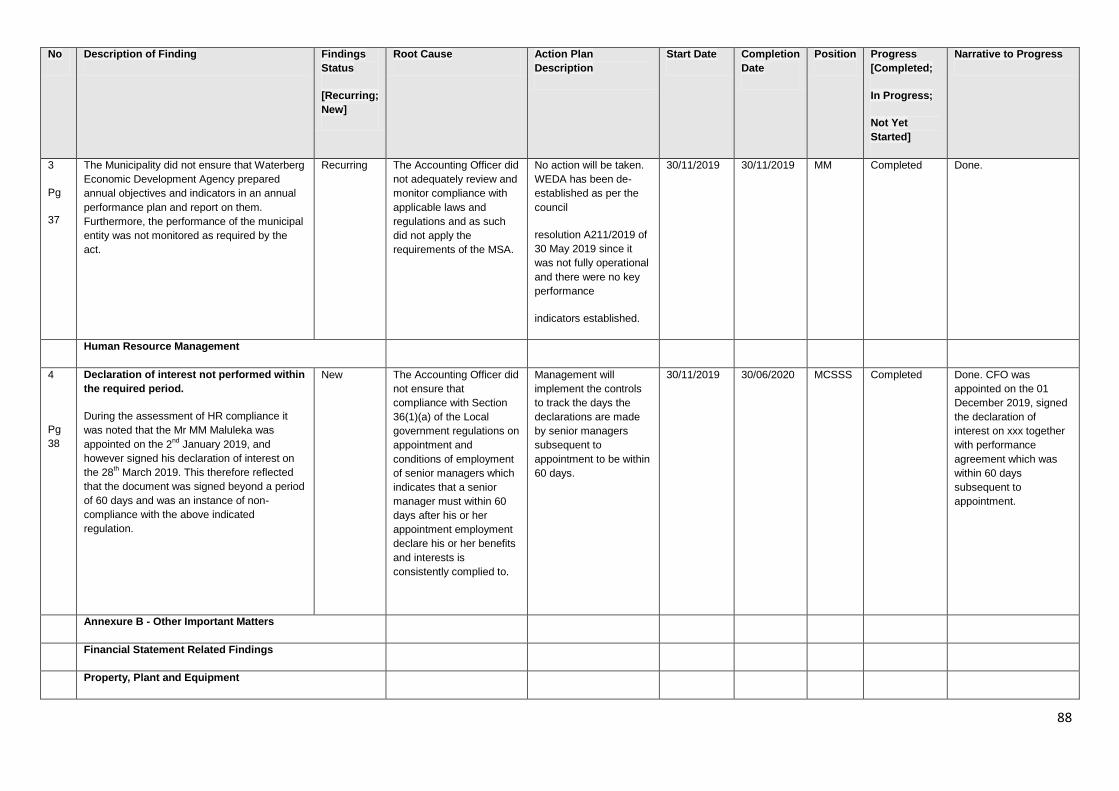
88
No Description of Finding Findings
Status
[Recurring;
New]
Root Cause Action Plan
Description
Start Date Completion
Date
Position Progress
[Completed;
In Progress;
Not Yet
Started]
Narrative to Progress
3
Pg
37
The Municipality did not ensure that Waterberg
Economic Development Agency prepared
annual objectives and indicators in an annual
performance plan and report on them.
Furthermore, the performance of the municipal
entity was not monitored as required by the
act.
Recurring The Accounting Officer did
not adequately review and
monitor compliance with
applicable laws and
regulations and as such
did not apply the
requirements of the MSA.
No action will be taken.
WEDA has been de-
established as per the
council
resolution A211/2019 of
30 May 2019 since it
was not fully operational
and there were no key
performance
indicators established.
30/11/2019 30/11/2019 MM Completed Done.
Human Resource Management
4
Pg
38
Declaration of interest not performed within
the required period.
During the assessment of HR compliance it
was noted that the Mr MM Maluleka was
appointed on the 2nd
January 2019, and
however signed his declaration of interest on
the 28th March 2019. This therefore reflected
that the document was signed beyond a period
of 60 days and was an instance of non-
compliance with the above indicated
regulation.
New
The Accounting Officer did
not ensure that
compliance with Section
36(1)(a) of the Local
government regulations on
appointment and
conditions of employment
of senior managers which
indicates that a senior
manager must within 60
days after his or her
appointment employment
declare his or her benefits
and interests is
consistently complied to.
Management will
implement the controls
to track the days the
declarations are made
by senior managers
subsequent to
appointment to be within
60 days.
30/11/2019 30/06/2020 MCSSS Completed Done. CFO was
appointed on the 01
December 2019, signed
the declaration of
interest on xxx together
with performance
agreement which was
within 60 days
subsequent to
appointment.
Annexure B - Other Important Matters
Financial Statement Related Findings
Property, Plant and Equipment
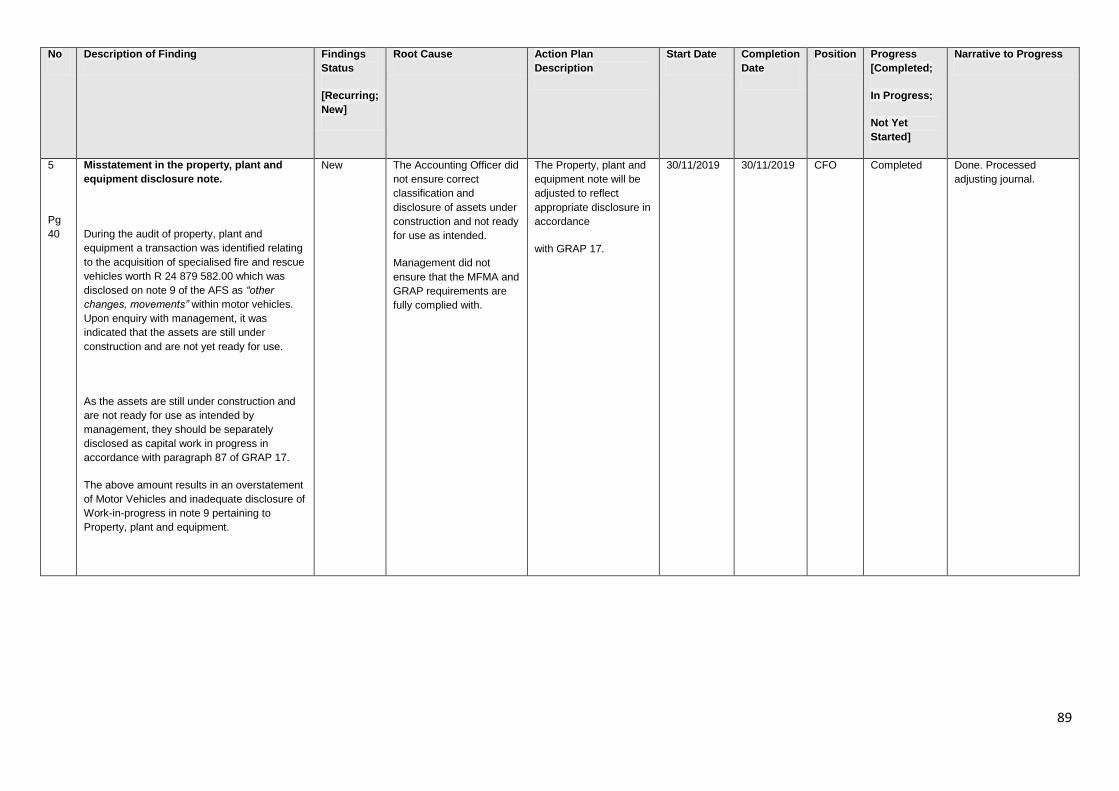
89
No Description of Finding Findings
Status
[Recurring;
New]
Root Cause Action Plan
Description
Start Date Completion
Date
Position Progress
[Completed;
In Progress;
Not Yet
Started]
Narrative to Progress
5
Pg
40
Misstatement in the property, plant and
equipment disclosure note.
During the audit of property, plant and
equipment a transaction was identified relating
to the acquisition of specialised fire and rescue
vehicles worth R 24 879 582.00 which was
disclosed on note 9 of the AFS as “other
changes, movements” within motor vehicles.
Upon enquiry with management, it was
indicated that the assets are still under
construction and are not yet ready for use.
As the assets are still under construction and
are not ready for use as intended by
management, they should be separately
disclosed as capital work in progress in
accordance with paragraph 87 of GRAP 17.
The above amount results in an overstatement
of Motor Vehicles and inadequate disclosure of
Work-in-progress in note 9 pertaining to
Property, plant and equipment.
New The Accounting Officer did
not ensure correct
classification and
disclosure of assets under
construction and not ready
for use as intended.
Management did not
ensure that the MFMA and
GRAP requirements are
fully complied with.
The Property, plant and
equipment note will be
adjusted to reflect
appropriate disclosure in
accordance
with GRAP 17.
30/11/2019 30/11/2019 CFO Completed Done. Processed
adjusting journal.
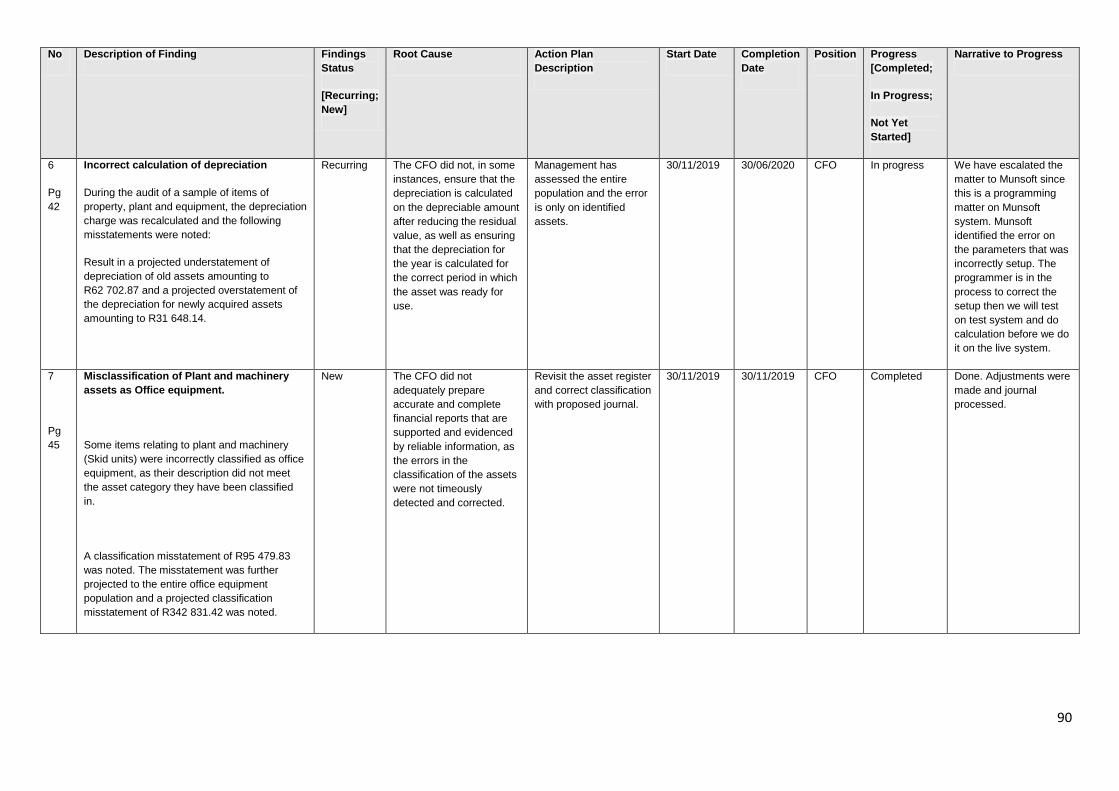
90
No Description of Finding Findings
Status
[Recurring;
New]
Root Cause Action Plan
Description
Start Date Completion
Date
Position Progress
[Completed;
In Progress;
Not Yet
Started]
Narrative to Progress
6
Pg
42
Incorrect calculation of depreciation
During the audit of a sample of items of
property, plant and equipment, the depreciation
charge was recalculated and the following
misstatements were noted:
Result in a projected understatement of
depreciation of old assets amounting to
R62 702.87 and a projected overstatement of
the depreciation for newly acquired assets
amounting to R31 648.14.
Recurring The CFO did not, in some
instances, ensure that the
depreciation is calculated
on the depreciable amount
after reducing the residual
value, as well as ensuring
that the depreciation for
the year is calculated for
the correct period in which
the asset was ready for
use.
Management has
assessed the entire
population and the error
is only on identified
assets.
30/11/2019 30/06/2020 CFO In progress We have escalated the
matter to Munsoft since
this is a programming
matter on Munsoft
system. Munsoft
identified the error on
the parameters that was
incorrectly setup. The
programmer is in the
process to correct the
setup then we will test
on test system and do
calculation before we do
it on the live system.
7
Pg
45
Misclassification of Plant and machinery
assets as Office equipment.
Some items relating to plant and machinery
(Skid units) were incorrectly classified as office
equipment, as their description did not meet
the asset category they have been classified
in.
A classification misstatement of R95 479.83
was noted. The misstatement was further
projected to the entire office equipment
population and a projected classification
misstatement of R342 831.42 was noted.
New The CFO did not
adequately prepare
accurate and complete
financial reports that are
supported and evidenced
by reliable information, as
the errors in the
classification of the assets
were not timeously
detected and corrected.
Revisit the asset register
and correct classification
with proposed journal.
30/11/2019 30/11/2019 CFO Completed Done. Adjustments were
made and journal
processed.
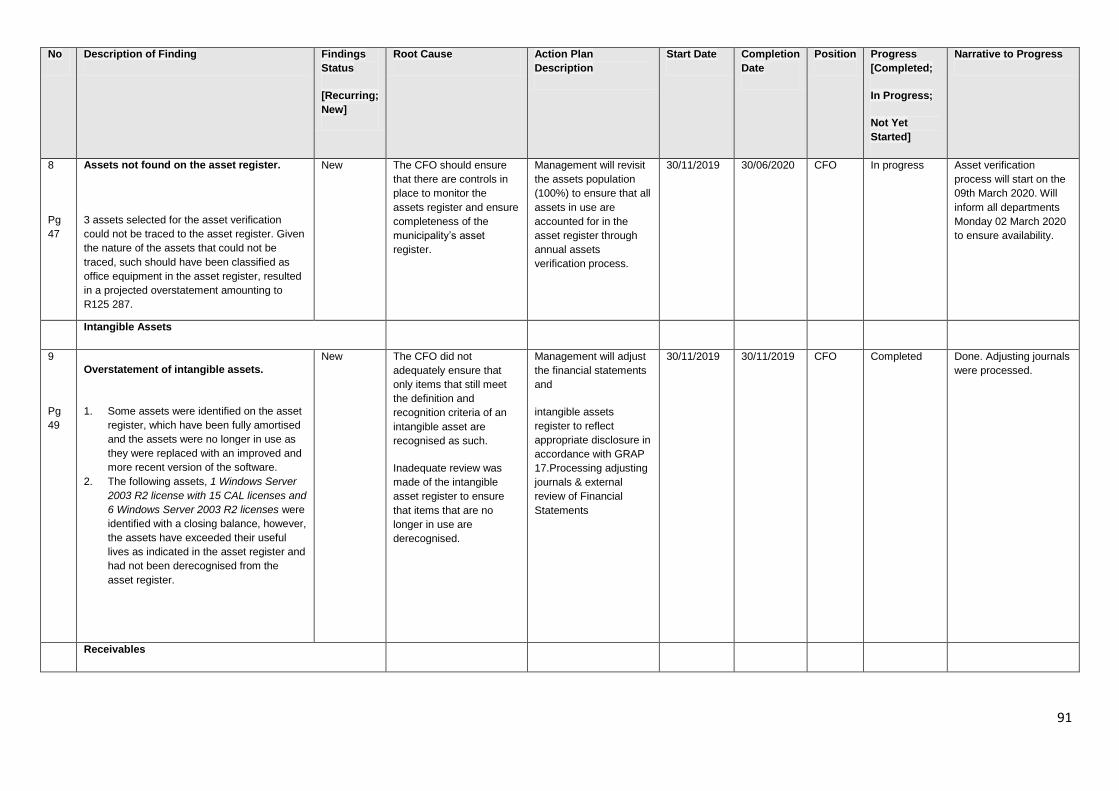
91
No Description of Finding Findings
Status
[Recurring;
New]
Root Cause Action Plan
Description
Start Date Completion
Date
Position Progress
[Completed;
In Progress;
Not Yet
Started]
Narrative to Progress
8
Pg
47
Assets not found on the asset register.
3 assets selected for the asset verification
could not be traced to the asset register. Given
the nature of the assets that could not be
traced, such should have been classified as
office equipment in the asset register, resulted
in a projected overstatement amounting to
R125 287.
New The CFO should ensure
that there are controls in
place to monitor the
assets register and ensure
completeness of the
municipality’s asset
register.
Management will revisit
the assets population
(100%) to ensure that all
assets in use are
accounted for in the
asset register through
annual assets
verification process.
30/11/2019 30/06/2020 CFO In progress Asset verification
process will start on the
09th March 2020. Will
inform all departments
Monday 02 March 2020
to ensure availability.
Intangible Assets
9
Pg
49
Overstatement of intangible assets.
1. Some assets were identified on the asset
register, which have been fully amortised
and the assets were no longer in use as
they were replaced with an improved and
more recent version of the software.
2. The following assets, 1 Windows Server
2003 R2 license with 15 CAL licenses and
6 Windows Server 2003 R2 licenses were
identified with a closing balance, however,
the assets have exceeded their useful
lives as indicated in the asset register and
had not been derecognised from the
asset register.
New The CFO did not
adequately ensure that
only items that still meet
the definition and
recognition criteria of an
intangible asset are
recognised as such.
Inadequate review was
made of the intangible
asset register to ensure
that items that are no
longer in use are
derecognised.
Management will adjust
the financial statements
and
intangible assets
register to reflect
appropriate disclosure in
accordance with GRAP
17.Processing adjusting
journals & external
review of Financial
Statements
30/11/2019 30/11/2019 CFO Completed Done. Adjusting journals
were processed.
Receivables
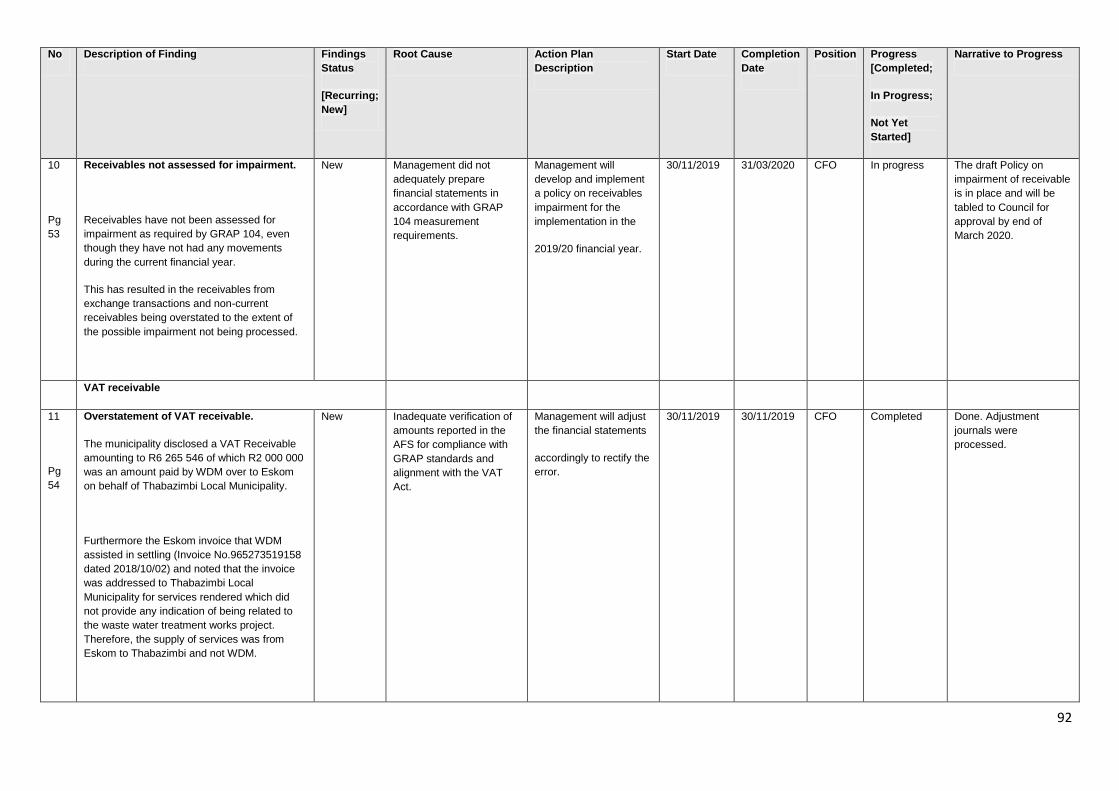
92
No Description of Finding Findings
Status
[Recurring;
New]
Root Cause Action Plan
Description
Start Date Completion
Date
Position Progress
[Completed;
In Progress;
Not Yet
Started]
Narrative to Progress
10
Pg
53
Receivables not assessed for impairment.
Receivables have not been assessed for
impairment as required by GRAP 104, even
though they have not had any movements
during the current financial year.
This has resulted in the receivables from
exchange transactions and non-current
receivables being overstated to the extent of
the possible impairment not being processed.
New Management did not
adequately prepare
financial statements in
accordance with GRAP
104 measurement
requirements.
Management will
develop and implement
a policy on receivables
impairment for the
implementation in the
2019/20 financial year.
30/11/2019 31/03/2020 CFO In progress The draft Policy on
impairment of receivable
is in place and will be
tabled to Council for
approval by end of
March 2020.
VAT receivable
11
Pg
54
Overstatement of VAT receivable.
The municipality disclosed a VAT Receivable
amounting to R6 265 546 of which R2 000 000
was an amount paid by WDM over to Eskom
on behalf of Thabazimbi Local Municipality.
Furthermore the Eskom invoice that WDM
assisted in settling (Invoice No.965273519158
dated 2018/10/02) and noted that the invoice
was addressed to Thabazimbi Local
Municipality for services rendered which did
not provide any indication of being related to
the waste water treatment works project.
Therefore, the supply of services was from
Eskom to Thabazimbi and not WDM.
New Inadequate verification of
amounts reported in the
AFS for compliance with
GRAP standards and
alignment with the VAT
Act.
Management will adjust
the financial statements
accordingly to rectify the
error.
30/11/2019 30/11/2019 CFO Completed Done. Adjustment
journals were
processed.
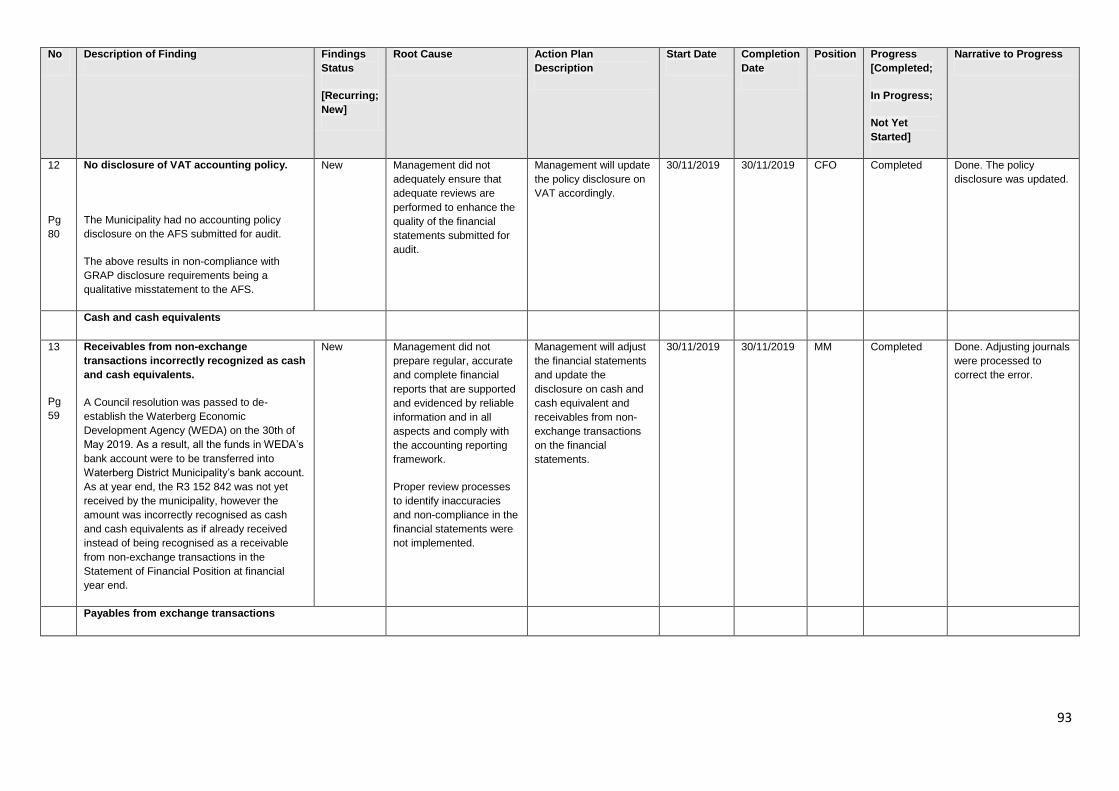
93
No Description of Finding Findings
Status
[Recurring;
New]
Root Cause Action Plan
Description
Start Date Completion
Date
Position Progress
[Completed;
In Progress;
Not Yet
Started]
Narrative to Progress
12
Pg
80
No disclosure of VAT accounting policy.
The Municipality had no accounting policy
disclosure on the AFS submitted for audit.
The above results in non-compliance with
GRAP disclosure requirements being a
qualitative misstatement to the AFS.
New Management did not
adequately ensure that
adequate reviews are
performed to enhance the
quality of the financial
statements submitted for
audit.
Management will update
the policy disclosure on
VAT accordingly.
30/11/2019 30/11/2019 CFO Completed Done. The policy
disclosure was updated.
Cash and cash equivalents
13
Pg
59
Receivables from non-exchange
transactions incorrectly recognized as cash
and cash equivalents.
A Council resolution was passed to de-
establish the Waterberg Economic
Development Agency (WEDA) on the 30th of
May 2019. As a result, all the funds in WEDA’s
bank account were to be transferred into
Waterberg District Municipality’s bank account.
As at year end, the R3 152 842 was not yet
received by the municipality, however the
amount was incorrectly recognised as cash
and cash equivalents as if already received
instead of being recognised as a receivable
from non-exchange transactions in the
Statement of Financial Position at financial
year end.
New Management did not
prepare regular, accurate
and complete financial
reports that are supported
and evidenced by reliable
information and in all
aspects and comply with
the accounting reporting
framework.
Proper review processes
to identify inaccuracies
and non-compliance in the
financial statements were
not implemented.
Management will adjust
the financial statements
and update the
disclosure on cash and
cash equivalent and
receivables from non-
exchange transactions
on the financial
statements.
30/11/2019 30/11/2019 MM Completed Done. Adjusting journals
were processed to
correct the error.
Payables from exchange transactions
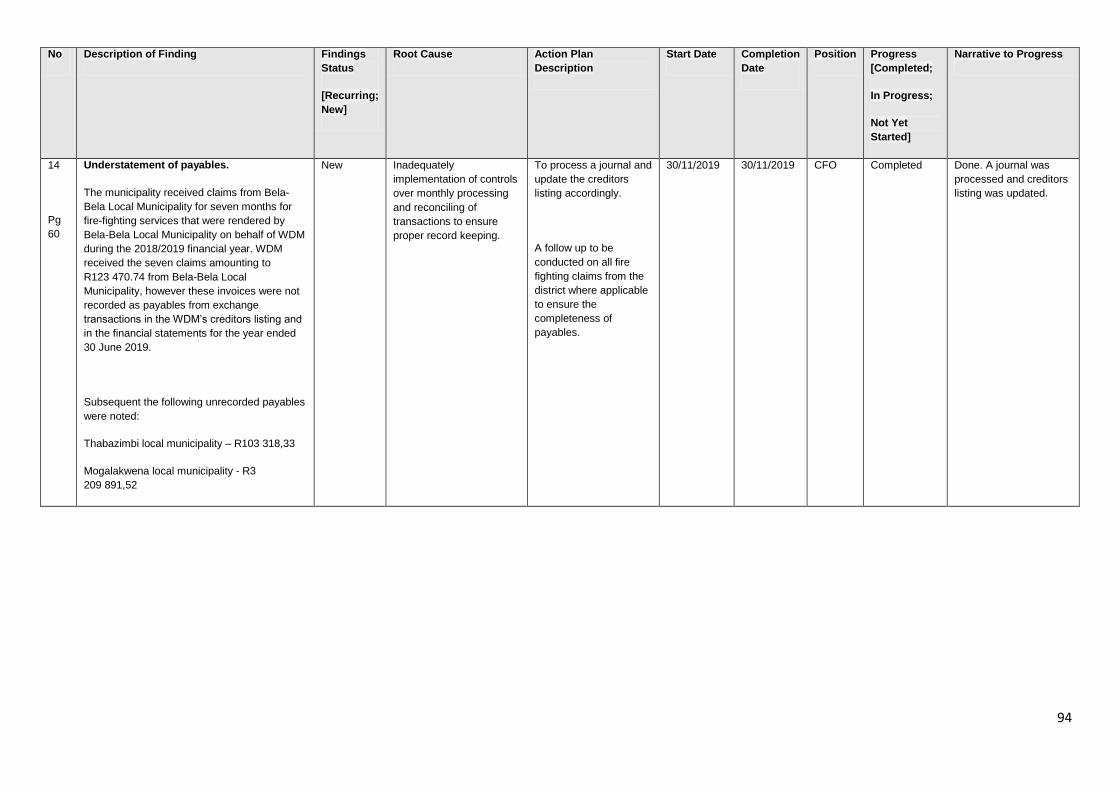
94
No Description of Finding Findings
Status
[Recurring;
New]
Root Cause Action Plan
Description
Start Date Completion
Date
Position Progress
[Completed;
In Progress;
Not Yet
Started]
Narrative to Progress
14
Pg
60
Understatement of payables.
The municipality received claims from Bela-
Bela Local Municipality for seven months for
fire-fighting services that were rendered by
Bela-Bela Local Municipality on behalf of WDM
during the 2018/2019 financial year. WDM
received the seven claims amounting to
R123 470.74 from Bela-Bela Local
Municipality, however these invoices were not
recorded as payables from exchange
transactions in the WDM’s creditors listing and
in the financial statements for the year ended
30 June 2019.
Subsequent the following unrecorded payables
were noted:
Thabazimbi local municipality – R103 318,33
Mogalakwena local municipality - R3
209 891,52
New Inadequately
implementation of controls
over monthly processing
and reconciling of
transactions to ensure
proper record keeping.
To process a journal and
update the creditors
listing accordingly.
A follow up to be
conducted on all fire
fighting claims from the
district where applicable
to ensure the
completeness of
payables.
30/11/2019 30/11/2019 CFO Completed Done. A journal was
processed and creditors
listing was updated.
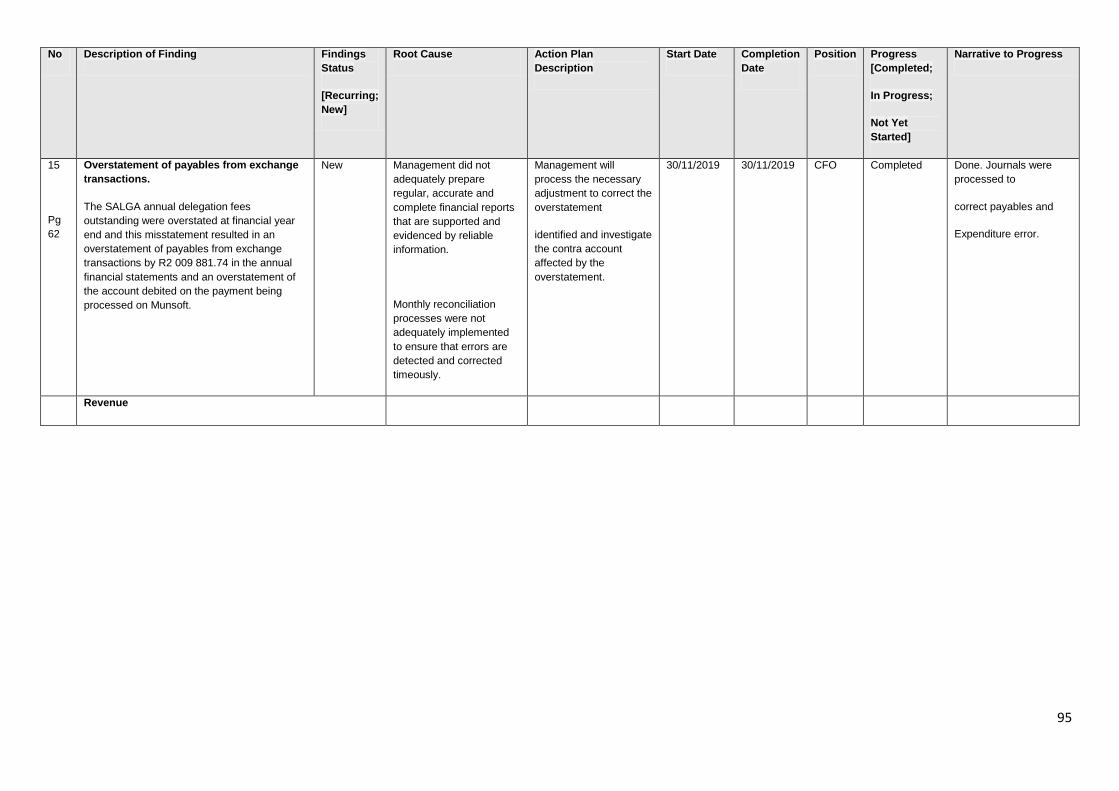
95
No Description of Finding Findings
Status
[Recurring;
New]
Root Cause Action Plan
Description
Start Date Completion
Date
Position Progress
[Completed;
In Progress;
Not Yet
Started]
Narrative to Progress
15
Pg
62
Overstatement of payables from exchange
transactions.
The SALGA annual delegation fees
outstanding were overstated at financial year
end and this misstatement resulted in an
overstatement of payables from exchange
transactions by R2 009 881.74 in the annual
financial statements and an overstatement of
the account debited on the payment being
processed on Munsoft.
New Management did not
adequately prepare
regular, accurate and
complete financial reports
that are supported and
evidenced by reliable
information.
Monthly reconciliation
processes were not
adequately implemented
to ensure that errors are
detected and corrected
timeously.
Management will
process the necessary
adjustment to correct the
overstatement
identified and investigate
the contra account
affected by the
overstatement.
30/11/2019 30/11/2019 CFO Completed Done. Journals were
processed to
correct payables and
Expenditure error.
Revenue
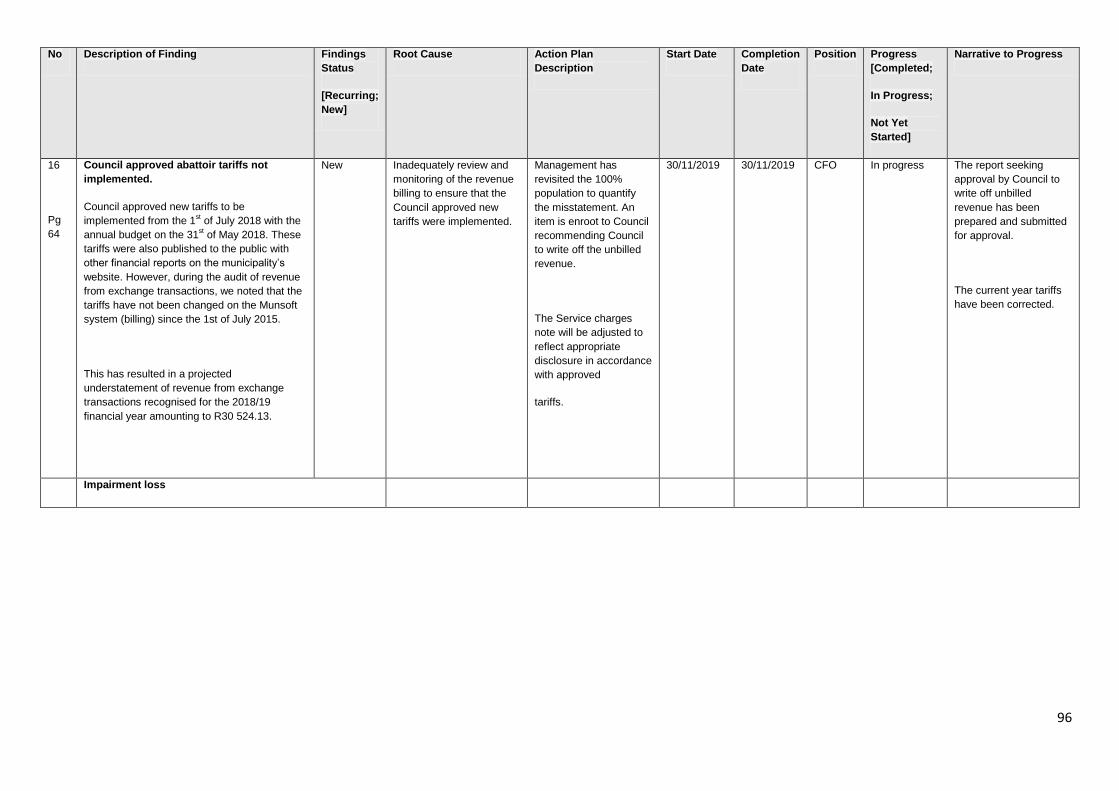
96
No Description of Finding Findings
Status
[Recurring;
New]
Root Cause Action Plan
Description
Start Date Completion
Date
Position Progress
[Completed;
In Progress;
Not Yet
Started]
Narrative to Progress
16
Pg
64
Council approved abattoir tariffs not
implemented.
Council approved new tariffs to be
implemented from the 1st of July 2018 with the
annual budget on the 31st of May 2018. These
tariffs were also published to the public with
other financial reports on the municipality’s
website. However, during the audit of revenue
from exchange transactions, we noted that the
tariffs have not been changed on the Munsoft
system (billing) since the 1st of July 2015.
This has resulted in a projected
understatement of revenue from exchange
transactions recognised for the 2018/19
financial year amounting to R30 524.13.
New Inadequately review and
monitoring of the revenue
billing to ensure that the
Council approved new
tariffs were implemented.
Management has
revisited the 100%
population to quantify
the misstatement. An
item is enroot to Council
recommending Council
to write off the unbilled
revenue.
The Service charges
note will be adjusted to
reflect appropriate
disclosure in accordance
with approved
tariffs.
30/11/2019 30/11/2019 CFO In progress The report seeking
approval by Council to
write off unbilled
revenue has been
prepared and submitted
for approval.
The current year tariffs
have been corrected.
Impairment loss
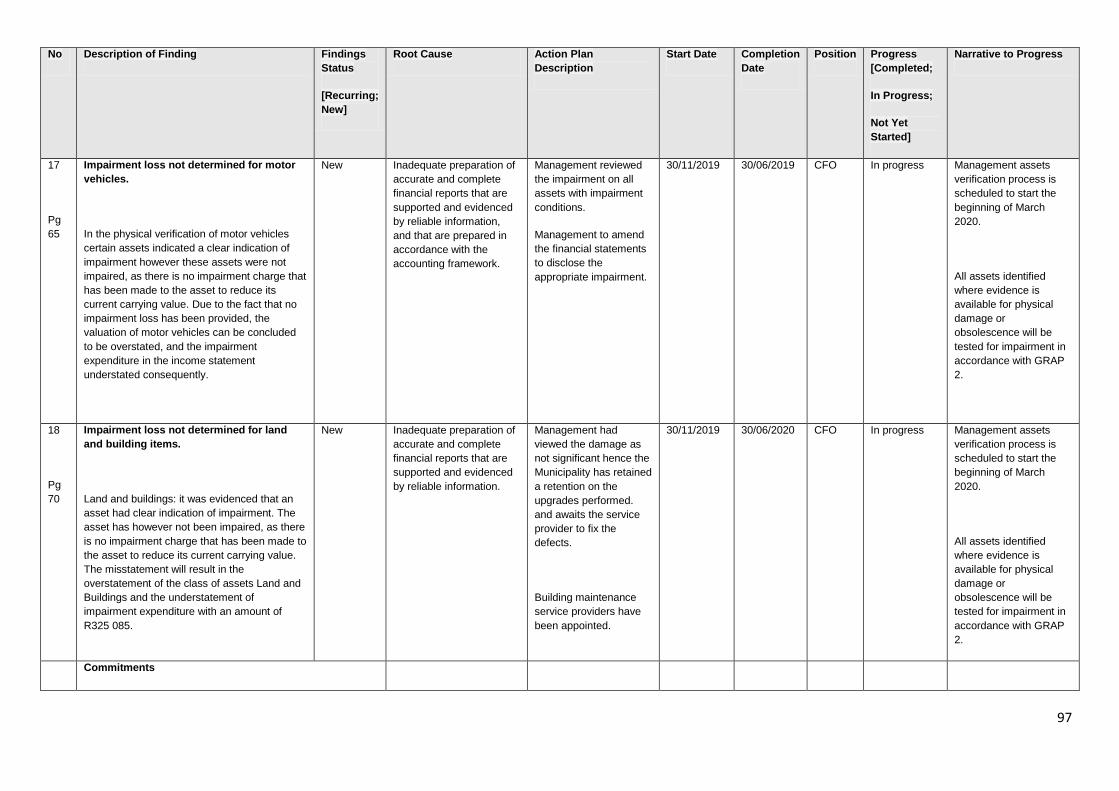
97
No Description of Finding Findings
Status
[Recurring;
New]
Root Cause Action Plan
Description
Start Date Completion
Date
Position Progress
[Completed;
In Progress;
Not Yet
Started]
Narrative to Progress
17
Pg
65
Impairment loss not determined for motor
vehicles.
In the physical verification of motor vehicles
certain assets indicated a clear indication of
impairment however these assets were not
impaired, as there is no impairment charge that
has been made to the asset to reduce its
current carrying value. Due to the fact that no
impairment loss has been provided, the
valuation of motor vehicles can be concluded
to be overstated, and the impairment
expenditure in the income statement
understated consequently.
New
Inadequate preparation of
accurate and complete
financial reports that are
supported and evidenced
by reliable information,
and that are prepared in
accordance with the
accounting framework.
Management reviewed
the impairment on all
assets with impairment
conditions.
Management to amend
the financial statements
to disclose the
appropriate impairment.
30/11/2019 30/06/2019 CFO In progress Management assets
verification process is
scheduled to start the
beginning of March
2020.
All assets identified
where evidence is
available for physical
damage or
obsolescence will be
tested for impairment in
accordance with GRAP
2.
18
Pg
70
Impairment loss not determined for land
and building items.
Land and buildings: it was evidenced that an
asset had clear indication of impairment. The
asset has however not been impaired, as there
is no impairment charge that has been made to
the asset to reduce its current carrying value.
The misstatement will result in the
overstatement of the class of assets Land and
Buildings and the understatement of
impairment expenditure with an amount of
R325 085.
New Inadequate preparation of
accurate and complete
financial reports that are
supported and evidenced
by reliable information.
Management had
viewed the damage as
not significant hence the
Municipality has retained
a retention on the
upgrades performed.
and awaits the service
provider to fix the
defects.
Building maintenance
service providers have
been appointed.
30/11/2019 30/06/2020 CFO In progress Management assets
verification process is
scheduled to start the
beginning of March
2020.
All assets identified
where evidence is
available for physical
damage or
obsolescence will be
tested for impairment in
accordance with GRAP
2.
Commitments
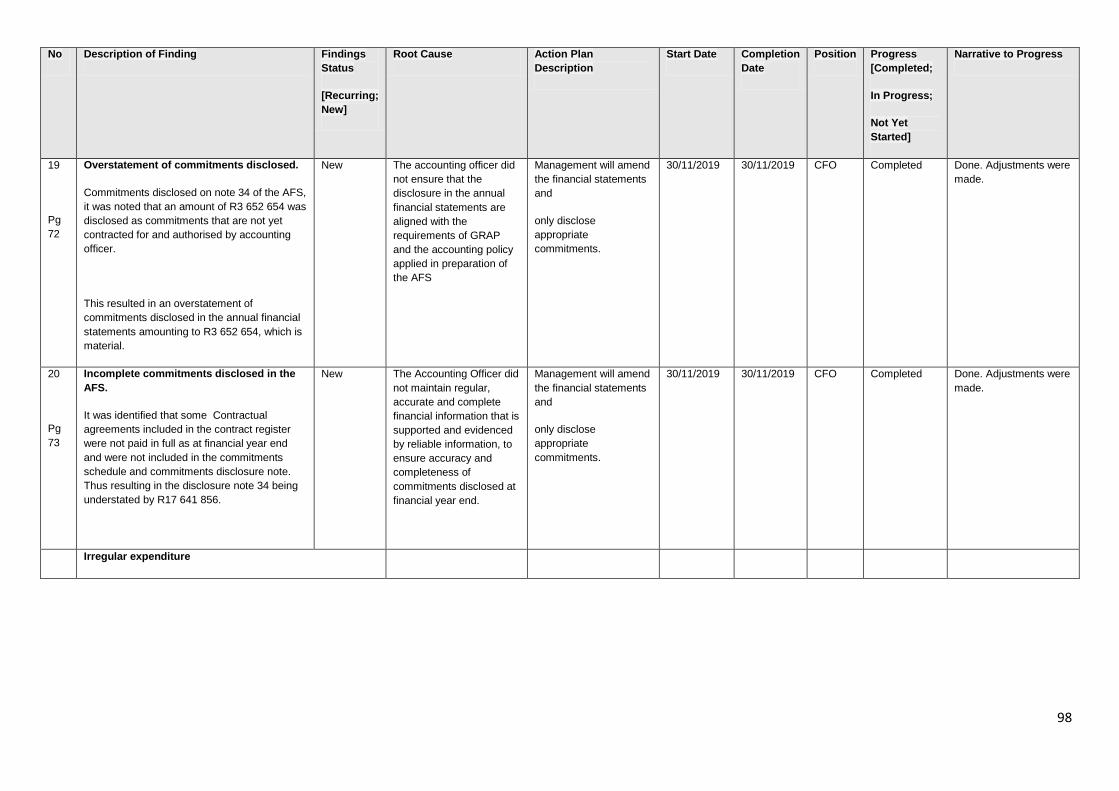
98
No Description of Finding Findings
Status
[Recurring;
New]
Root Cause Action Plan
Description
Start Date Completion
Date
Position Progress
[Completed;
In Progress;
Not Yet
Started]
Narrative to Progress
19
Pg
72
Overstatement of commitments disclosed.
Commitments disclosed on note 34 of the AFS,
it was noted that an amount of R3 652 654 was
disclosed as commitments that are not yet
contracted for and authorised by accounting
officer.
This resulted in an overstatement of
commitments disclosed in the annual financial
statements amounting to R3 652 654, which is
material.
New The accounting officer did
not ensure that the
disclosure in the annual
financial statements are
aligned with the
requirements of GRAP
and the accounting policy
applied in preparation of
the AFS
Management will amend
the financial statements
and
only disclose
appropriate
commitments.
30/11/2019 30/11/2019 CFO Completed Done. Adjustments were
made.
20
Pg
73
Incomplete commitments disclosed in the
AFS.
It was identified that some Contractual
agreements included in the contract register
were not paid in full as at financial year end
and were not included in the commitments
schedule and commitments disclosure note.
Thus resulting in the disclosure note 34 being
understated by R17 641 856.
New The Accounting Officer did
not maintain regular,
accurate and complete
financial information that is
supported and evidenced
by reliable information, to
ensure accuracy and
completeness of
commitments disclosed at
financial year end.
Management will amend
the financial statements
and
only disclose
appropriate
commitments.
30/11/2019 30/11/2019 CFO Completed Done. Adjustments were
made.
Irregular expenditure
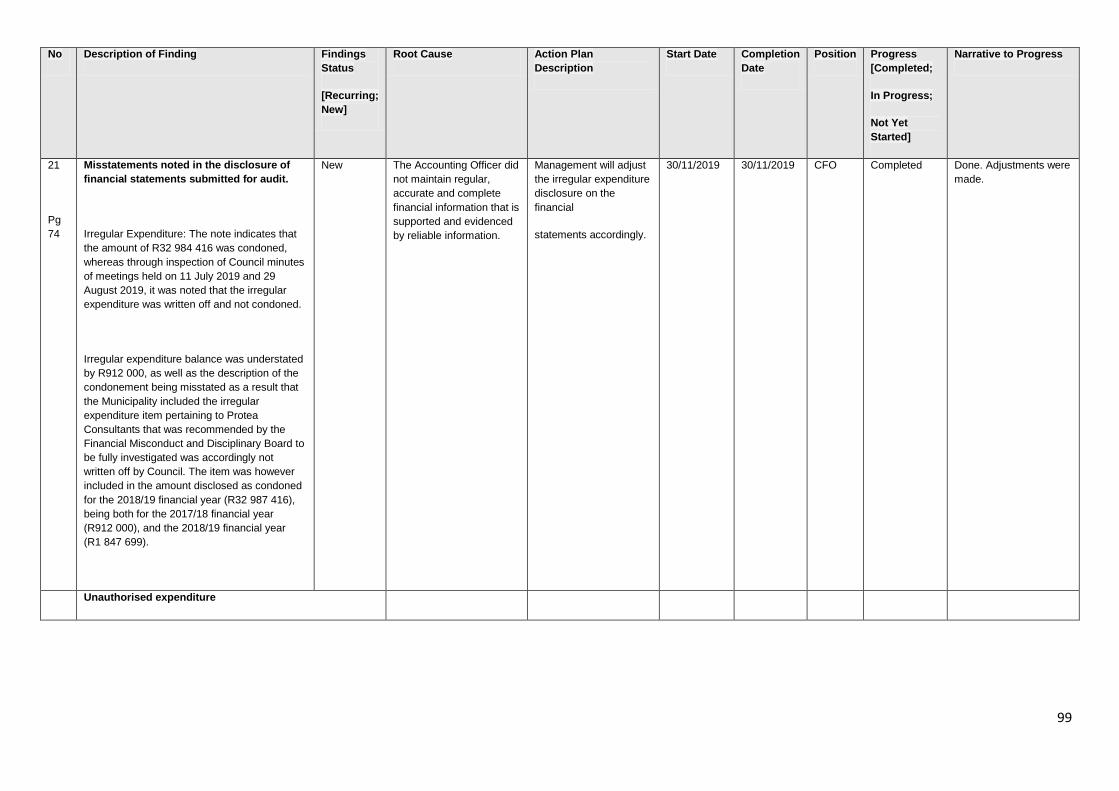
99
No Description of Finding Findings
Status
[Recurring;
New]
Root Cause Action Plan
Description
Start Date Completion
Date
Position Progress
[Completed;
In Progress;
Not Yet
Started]
Narrative to Progress
21
Pg
74
Misstatements noted in the disclosure of
financial statements submitted for audit.
Irregular Expenditure: The note indicates that
the amount of R32 984 416 was condoned,
whereas through inspection of Council minutes
of meetings held on 11 July 2019 and 29
August 2019, it was noted that the irregular
expenditure was written off and not condoned.
Irregular expenditure balance was understated
by R912 000, as well as the description of the
condonement being misstated as a result that
the Municipality included the irregular
expenditure item pertaining to Protea
Consultants that was recommended by the
Financial Misconduct and Disciplinary Board to
be fully investigated was accordingly not
written off by Council. The item was however
included in the amount disclosed as condoned
for the 2018/19 financial year (R32 987 416),
being both for the 2017/18 financial year
(R912 000), and the 2018/19 financial year
(R1 847 699).
New The Accounting Officer did
not maintain regular,
accurate and complete
financial information that is
supported and evidenced
by reliable information.
Management will adjust
the irregular expenditure
disclosure on the
financial
statements accordingly.
30/11/2019 30/11/2019 CFO Completed Done. Adjustments were
made.
Unauthorised expenditure
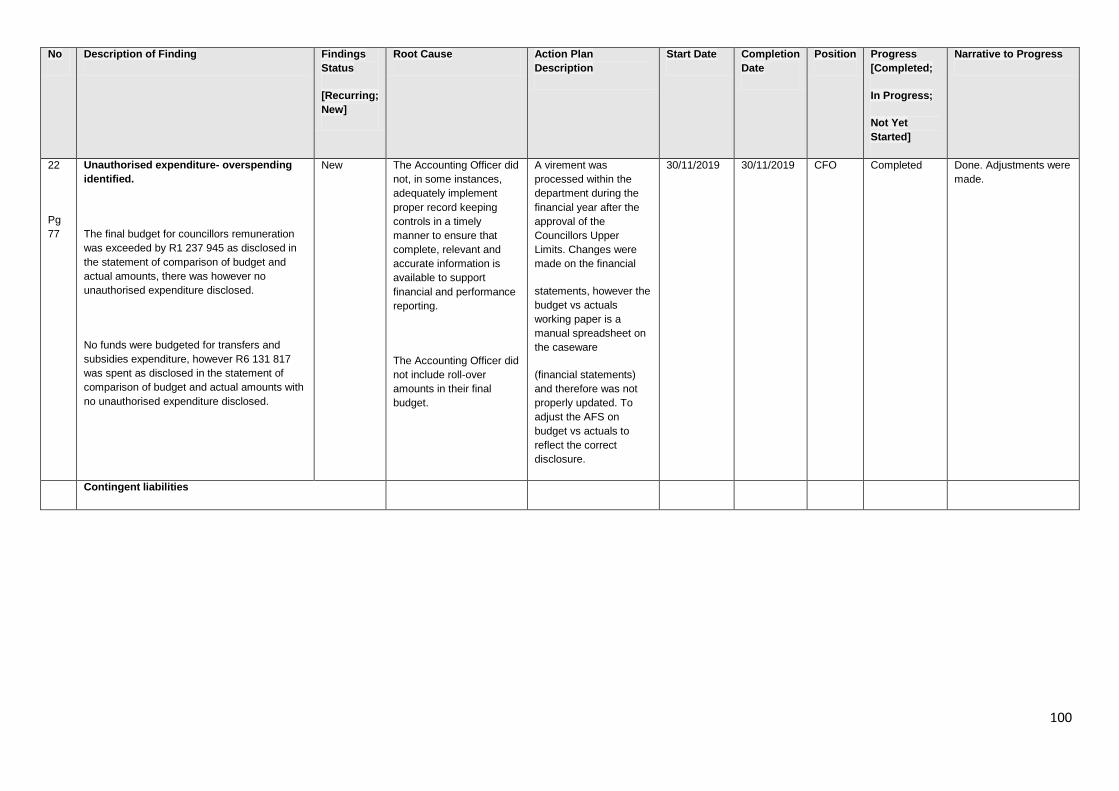
100
No Description of Finding Findings
Status
[Recurring;
New]
Root Cause Action Plan
Description
Start Date Completion
Date
Position Progress
[Completed;
In Progress;
Not Yet
Started]
Narrative to Progress
22
Pg
77
Unauthorised expenditure- overspending
identified.
The final budget for councillors remuneration
was exceeded by R1 237 945 as disclosed in
the statement of comparison of budget and
actual amounts, there was however no
unauthorised expenditure disclosed.
No funds were budgeted for transfers and
subsidies expenditure, however R6 131 817
was spent as disclosed in the statement of
comparison of budget and actual amounts with
no unauthorised expenditure disclosed.
New The Accounting Officer did
not, in some instances,
adequately implement
proper record keeping
controls in a timely
manner to ensure that
complete, relevant and
accurate information is
available to support
financial and performance
reporting.
The Accounting Officer did
not include roll-over
amounts in their final
budget.
A virement was
processed within the
department during the
financial year after the
approval of the
Councillors Upper
Limits. Changes were
made on the financial
statements, however the
budget vs actuals
working paper is a
manual spreadsheet on
the caseware
(financial statements)
and therefore was not
properly updated. To
adjust the AFS on
budget vs actuals to
reflect the correct
disclosure.
30/11/2019 30/11/2019 CFO Completed Done. Adjustments were
made.
Contingent liabilities
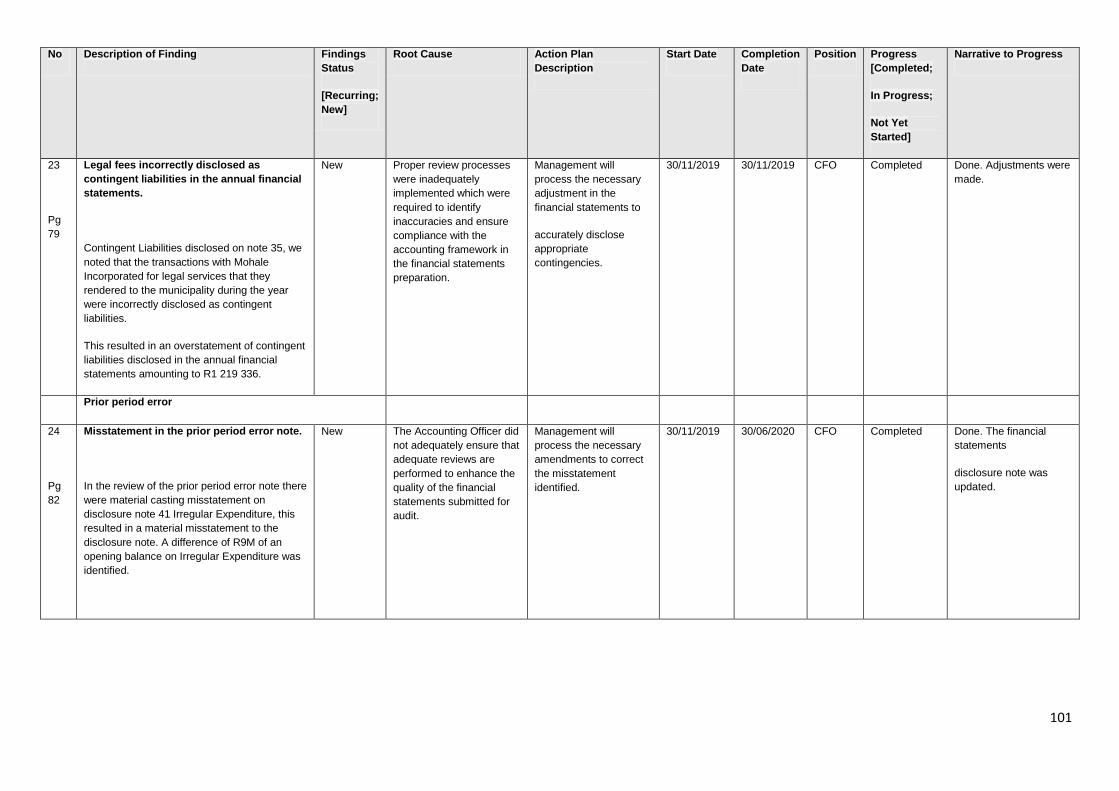
101
No Description of Finding Findings
Status
[Recurring;
New]
Root Cause Action Plan
Description
Start Date Completion
Date
Position Progress
[Completed;
In Progress;
Not Yet
Started]
Narrative to Progress
23
Pg
79
Legal fees incorrectly disclosed as
contingent liabilities in the annual financial
statements.
Contingent Liabilities disclosed on note 35, we
noted that the transactions with Mohale
Incorporated for legal services that they
rendered to the municipality during the year
were incorrectly disclosed as contingent
liabilities.
This resulted in an overstatement of contingent
liabilities disclosed in the annual financial
statements amounting to R1 219 336.
New Proper review processes
were inadequately
implemented which were
required to identify
inaccuracies and ensure
compliance with the
accounting framework in
the financial statements
preparation.
Management will
process the necessary
adjustment in the
financial statements to
accurately disclose
appropriate
contingencies.
30/11/2019 30/11/2019 CFO Completed Done. Adjustments were
made.
Prior period error
24
Pg
82
Misstatement in the prior period error note.
In the review of the prior period error note there
were material casting misstatement on
disclosure note 41 Irregular Expenditure, this
resulted in a material misstatement to the
disclosure note. A difference of R9M of an
opening balance on Irregular Expenditure was
identified.
New The Accounting Officer did
not adequately ensure that
adequate reviews are
performed to enhance the
quality of the financial
statements submitted for
audit.
Management will
process the necessary
amendments to correct
the misstatement
identified.
30/11/2019 30/06/2020 CFO Completed Done. The financial
statements
disclosure note was
updated.
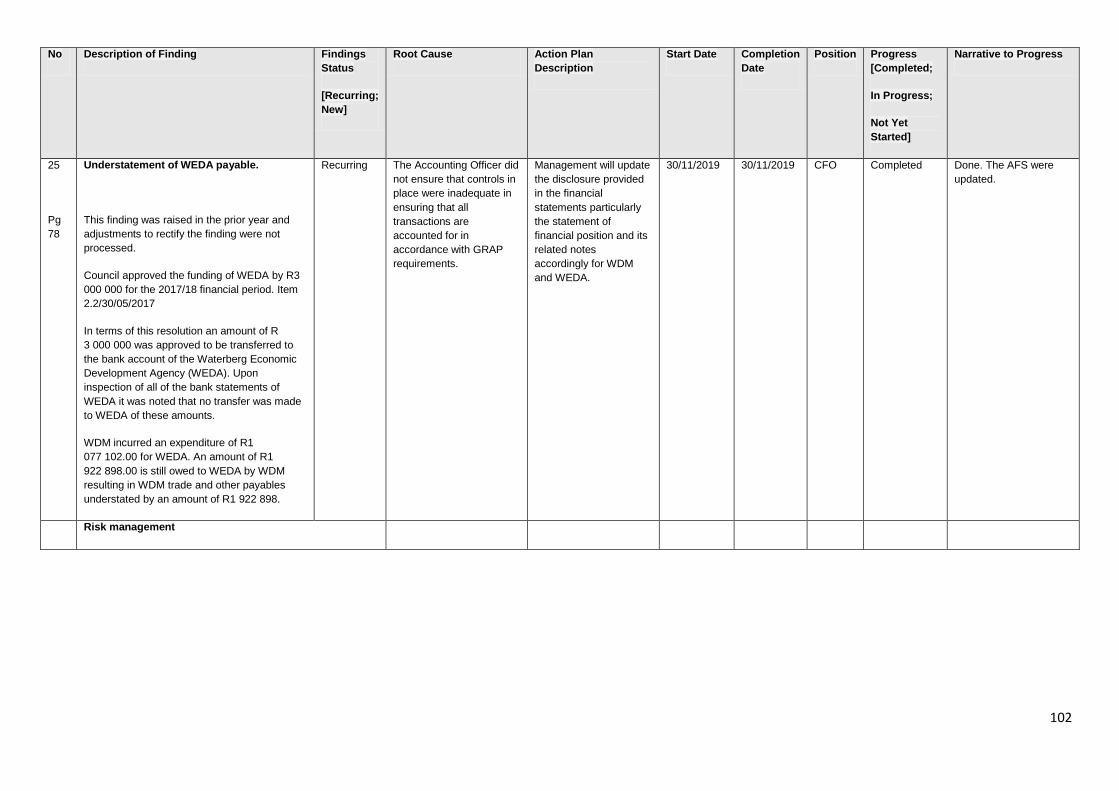
102
No Description of Finding Findings
Status
[Recurring;
New]
Root Cause Action Plan
Description
Start Date Completion
Date
Position Progress
[Completed;
In Progress;
Not Yet
Started]
Narrative to Progress
25
Pg
78
Understatement of WEDA payable.
This finding was raised in the prior year and
adjustments to rectify the finding were not
processed.
Council approved the funding of WEDA by R3
000 000 for the 2017/18 financial period. Item
2.2/30/05/2017
In terms of this resolution an amount of R
3 000 000 was approved to be transferred to
the bank account of the Waterberg Economic
Development Agency (WEDA). Upon
inspection of all of the bank statements of
WEDA it was noted that no transfer was made
to WEDA of these amounts.
WDM incurred an expenditure of R1
077 102.00 for WEDA. An amount of R1
922 898.00 is still owed to WEDA by WDM
resulting in WDM trade and other payables
understated by an amount of R1 922 898.
Recurring The Accounting Officer did
not ensure that controls in
place were inadequate in
ensuring that all
transactions are
accounted for in
accordance with GRAP
requirements.
Management will update
the disclosure provided
in the financial
statements particularly
the statement of
financial position and its
related notes
accordingly for WDM
and WEDA.
30/11/2019 30/11/2019 CFO Completed Done. The AFS were
updated.
Risk management
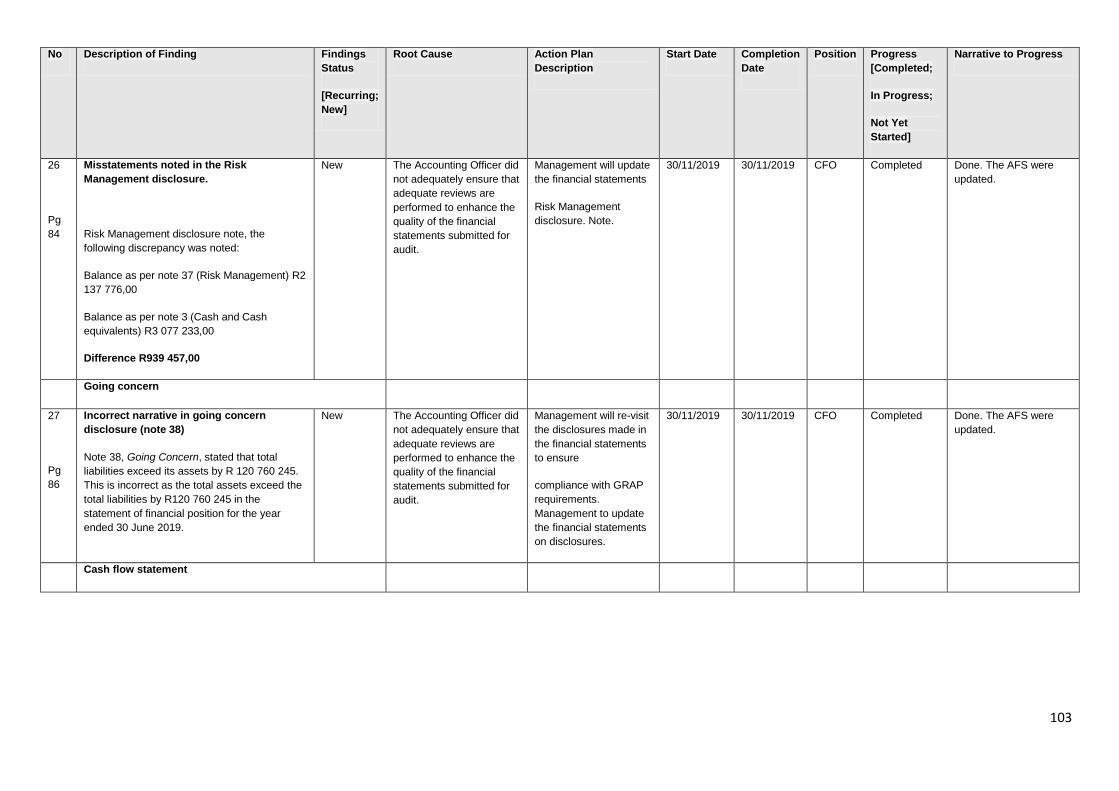
103
No Description of Finding Findings
Status
[Recurring;
New]
Root Cause Action Plan
Description
Start Date Completion
Date
Position Progress
[Completed;
In Progress;
Not Yet
Started]
Narrative to Progress
26
Pg
84
Misstatements noted in the Risk
Management disclosure.
Risk Management disclosure note, the
following discrepancy was noted:
Balance as per note 37 (Risk Management) R2
137 776,00
Balance as per note 3 (Cash and Cash
equivalents) R3 077 233,00
Difference R939 457,00
New The Accounting Officer did
not adequately ensure that
adequate reviews are
performed to enhance the
quality of the financial
statements submitted for
audit.
Management will update
the financial statements
Risk Management
disclosure. Note.
30/11/2019 30/11/2019 CFO Completed Done. The AFS were
updated.
Going concern
27
Pg
86
Incorrect narrative in going concern
disclosure (note 38)
Note 38, Going Concern, stated that total
liabilities exceed its assets by R 120 760 245.
This is incorrect as the total assets exceed the
total liabilities by R120 760 245 in the
statement of financial position for the year
ended 30 June 2019.
New The Accounting Officer did
not adequately ensure that
adequate reviews are
performed to enhance the
quality of the financial
statements submitted for
audit.
Management will re-visit
the disclosures made in
the financial statements
to ensure
compliance with GRAP
requirements.
Management to update
the financial statements
on disclosures.
30/11/2019 30/11/2019 CFO Completed Done. The AFS were
updated.
Cash flow statement
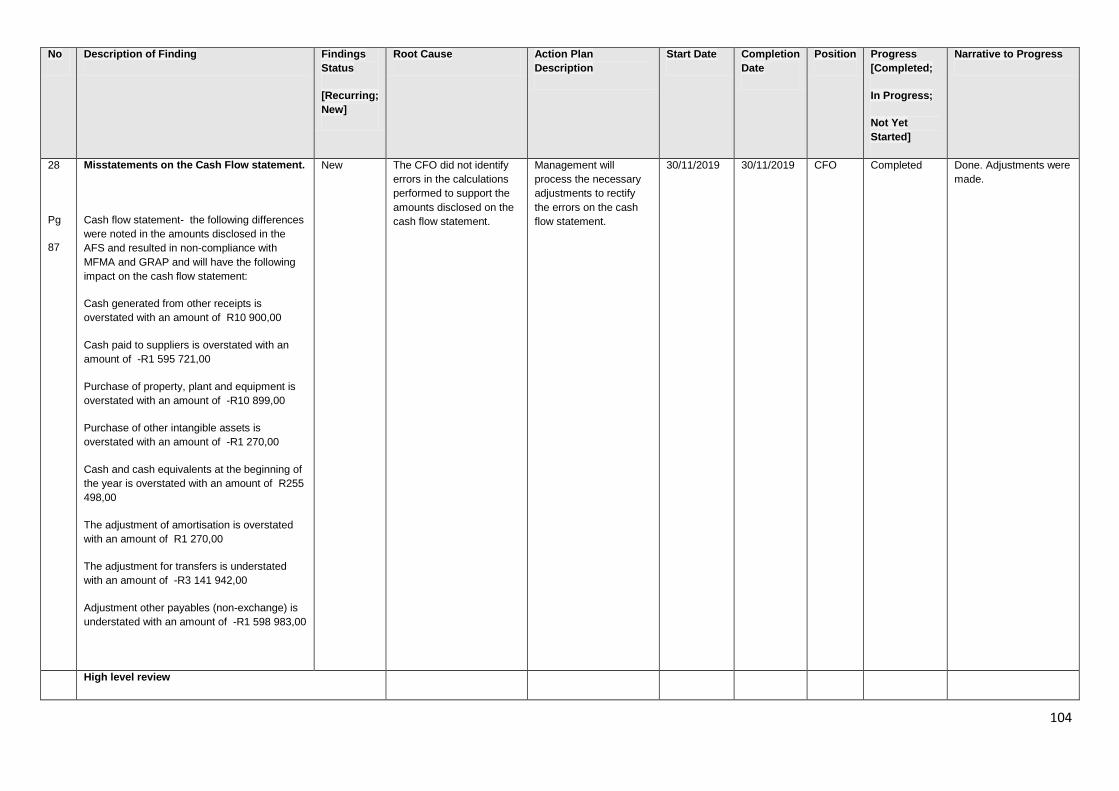
104
No Description of Finding Findings
Status
[Recurring;
New]
Root Cause Action Plan
Description
Start Date Completion
Date
Position Progress
[Completed;
In Progress;
Not Yet
Started]
Narrative to Progress
28
Pg
87
Misstatements on the Cash Flow statement.
Cash flow statement- the following differences
were noted in the amounts disclosed in the
AFS and resulted in non-compliance with
MFMA and GRAP and will have the following
impact on the cash flow statement:
Cash generated from other receipts is
overstated with an amount of R10 900,00
Cash paid to suppliers is overstated with an
amount of -R1 595 721,00
Purchase of property, plant and equipment is
overstated with an amount of -R10 899,00
Purchase of other intangible assets is
overstated with an amount of -R1 270,00
Cash and cash equivalents at the beginning of
the year is overstated with an amount of R255
498,00
The adjustment of amortisation is overstated
with an amount of R1 270,00
The adjustment for transfers is understated
with an amount of -R3 141 942,00
Adjustment other payables (non-exchange) is
understated with an amount of -R1 598 983,00
New The CFO did not identify
errors in the calculations
performed to support the
amounts disclosed on the
cash flow statement.
Management will
process the necessary
adjustments to rectify
the errors on the cash
flow statement.
30/11/2019 30/11/2019 CFO Completed Done. Adjustments were
made.
High level review
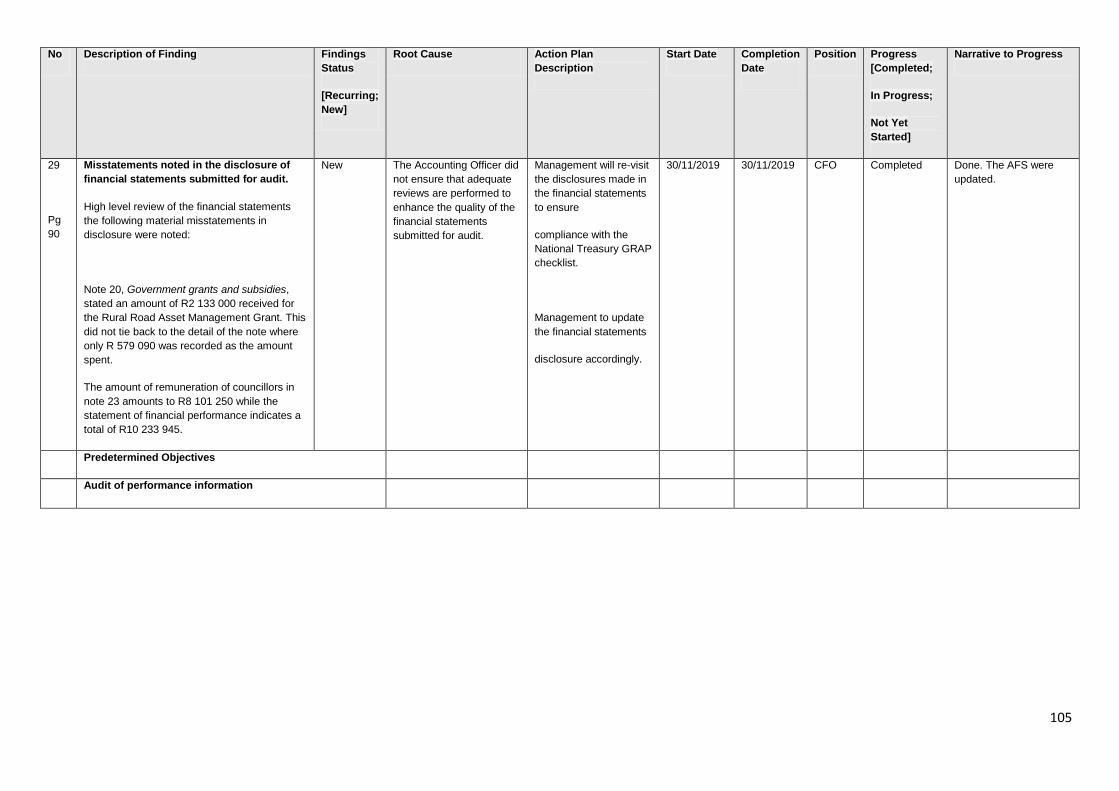
105
No Description of Finding Findings
Status
[Recurring;
New]
Root Cause Action Plan
Description
Start Date Completion
Date
Position Progress
[Completed;
In Progress;
Not Yet
Started]
Narrative to Progress
29
Pg
90
Misstatements noted in the disclosure of
financial statements submitted for audit.
High level review of the financial statements
the following material misstatements in
disclosure were noted:
Note 20, Government grants and subsidies,
stated an amount of R2 133 000 received for
the Rural Road Asset Management Grant. This
did not tie back to the detail of the note where
only R 579 090 was recorded as the amount
spent.
The amount of remuneration of councillors in
note 23 amounts to R8 101 250 while the
statement of financial performance indicates a
total of R10 233 945.
New The Accounting Officer did
not ensure that adequate
reviews are performed to
enhance the quality of the
financial statements
submitted for audit.
Management will re-visit
the disclosures made in
the financial statements
to ensure
compliance with the
National Treasury GRAP
checklist.
Management to update
the financial statements
disclosure accordingly.
30/11/2019 30/11/2019 CFO Completed Done. The AFS were
updated.
Predetermined Objectives
Audit of performance information
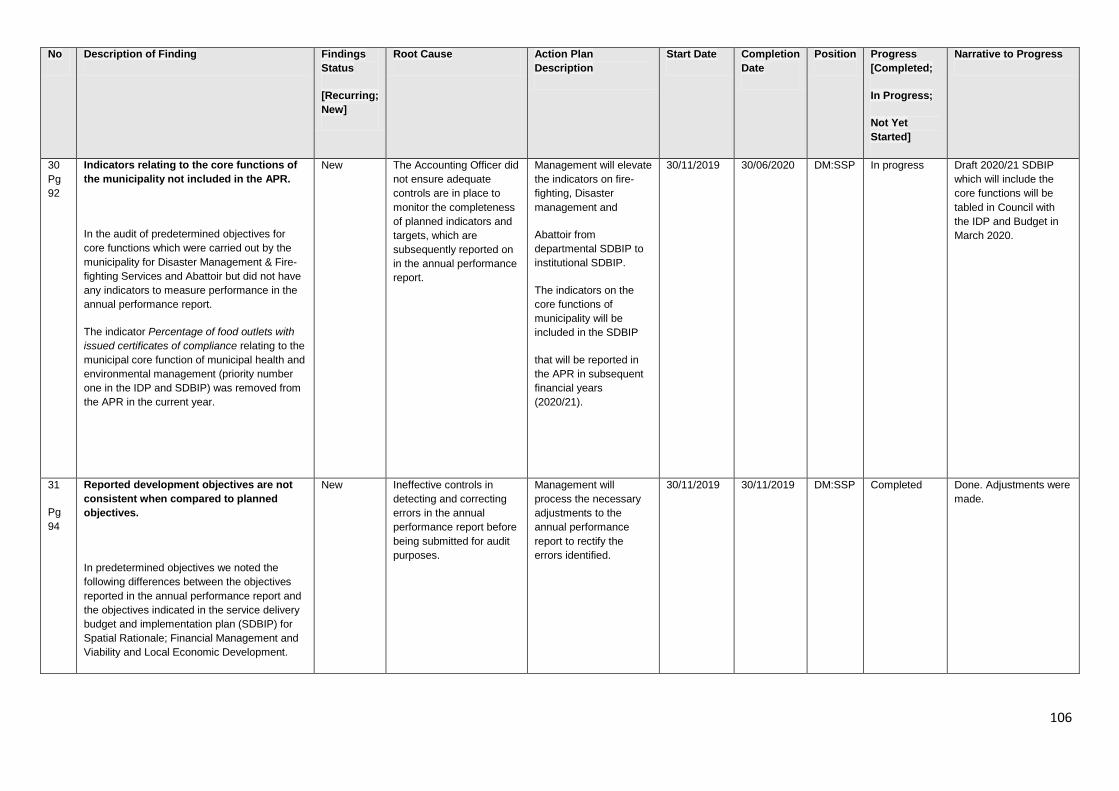
106
No Description of Finding Findings
Status
[Recurring;
New]
Root Cause Action Plan
Description
Start Date Completion
Date
Position Progress
[Completed;
In Progress;
Not Yet
Started]
Narrative to Progress
30
Pg
92
Indicators relating to the core functions of
the municipality not included in the APR.
In the audit of predetermined objectives for
core functions which were carried out by the
municipality for Disaster Management & Fire-
fighting Services and Abattoir but did not have
any indicators to measure performance in the
annual performance report.
The indicator Percentage of food outlets with
issued certificates of compliance relating to the
municipal core function of municipal health and
environmental management (priority number
one in the IDP and SDBIP) was removed from
the APR in the current year.
New The Accounting Officer did
not ensure adequate
controls are in place to
monitor the completeness
of planned indicators and
targets, which are
subsequently reported on
in the annual performance
report.
Management will elevate
the indicators on fire-
fighting, Disaster
management and
Abattoir from
departmental SDBIP to
institutional SDBIP.
The indicators on the
core functions of
municipality will be
included in the SDBIP
that will be reported in
the APR in subsequent
financial years
(2020/21).
30/11/2019 30/06/2020 DM:SSP In progress Draft 2020/21 SDBIP
which will include the
core functions will be
tabled in Council with
the IDP and Budget in
March 2020.
31
Pg
94
Reported development objectives are not
consistent when compared to planned
objectives.
In predetermined objectives we noted the
following differences between the objectives
reported in the annual performance report and
the objectives indicated in the service delivery
budget and implementation plan (SDBIP) for
Spatial Rationale; Financial Management and
Viability and Local Economic Development.
New Ineffective controls in
detecting and correcting
errors in the annual
performance report before
being submitted for audit
purposes.
Management will
process the necessary
adjustments to the
annual performance
report to rectify the
errors identified.
30/11/2019 30/11/2019 DM:SSP Completed Done. Adjustments were
made.
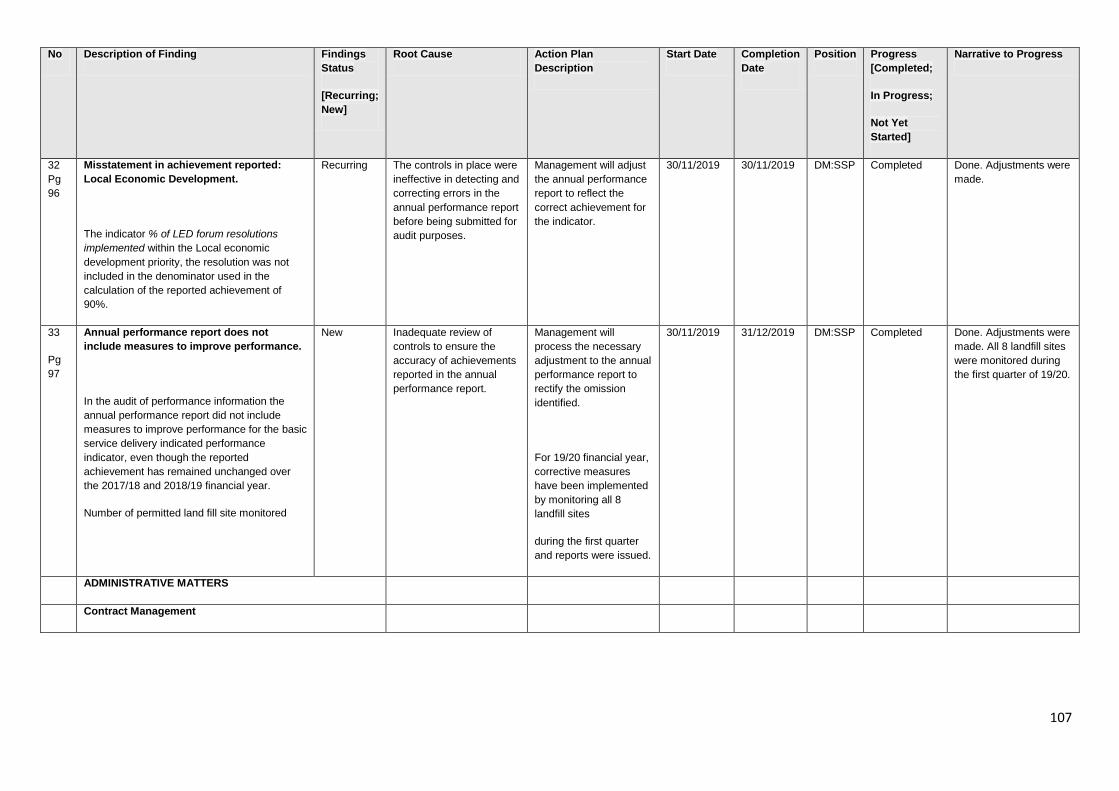
107
No Description of Finding Findings
Status
[Recurring;
New]
Root Cause Action Plan
Description
Start Date Completion
Date
Position Progress
[Completed;
In Progress;
Not Yet
Started]
Narrative to Progress
32
Pg
96
Misstatement in achievement reported:
Local Economic Development.
The indicator % of LED forum resolutions
implemented within the Local economic
development priority, the resolution was not
included in the denominator used in the
calculation of the reported achievement of
90%.
Recurring The controls in place were
ineffective in detecting and
correcting errors in the
annual performance report
before being submitted for
audit purposes.
Management will adjust
the annual performance
report to reflect the
correct achievement for
the indicator.
30/11/2019 30/11/2019 DM:SSP Completed Done. Adjustments were
made.
33
Pg
97
Annual performance report does not
include measures to improve performance.
In the audit of performance information the
annual performance report did not include
measures to improve performance for the basic
service delivery indicated performance
indicator, even though the reported
achievement has remained unchanged over
the 2017/18 and 2018/19 financial year.
Number of permitted land fill site monitored
New Inadequate review of
controls to ensure the
accuracy of achievements
reported in the annual
performance report.
Management will
process the necessary
adjustment to the annual
performance report to
rectify the omission
identified.
For 19/20 financial year,
corrective measures
have been implemented
by monitoring all 8
landfill sites
during the first quarter
and reports were issued.
30/11/2019 31/12/2019 DM:SSP Completed Done. Adjustments were
made. All 8 landfill sites
were monitored during
the first quarter of 19/20.
ADMINISTRATIVE MATTERS
Contract Management
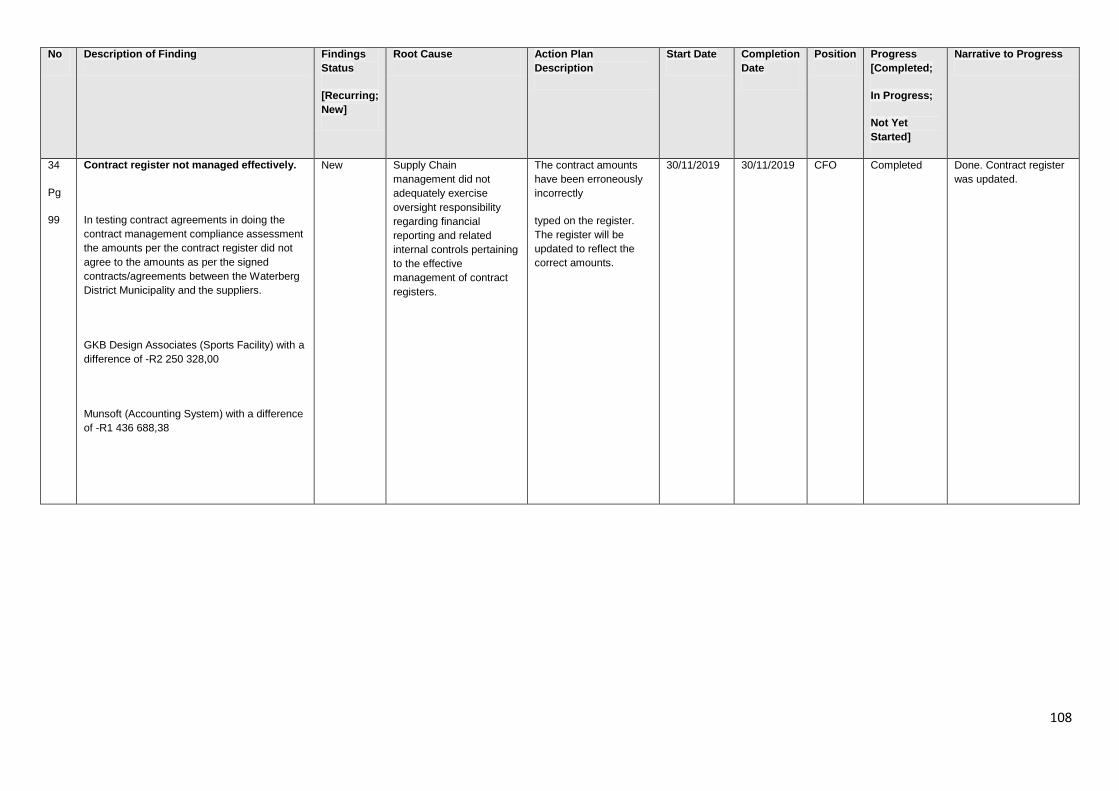
108
No Description of Finding Findings
Status
[Recurring;
New]
Root Cause Action Plan
Description
Start Date Completion
Date
Position Progress
[Completed;
In Progress;
Not Yet
Started]
Narrative to Progress
34
Pg
99
Contract register not managed effectively.
In testing contract agreements in doing the
contract management compliance assessment
the amounts per the contract register did not
agree to the amounts as per the signed
contracts/agreements between the Waterberg
District Municipality and the suppliers.
GKB Design Associates (Sports Facility) with a
difference of -R2 250 328,00
Munsoft (Accounting System) with a difference
of -R1 436 688,38
New Supply Chain
management did not
adequately exercise
oversight responsibility
regarding financial
reporting and related
internal controls pertaining
to the effective
management of contract
registers.
The contract amounts
have been erroneously
incorrectly
typed on the register.
The register will be
updated to reflect the
correct amounts.
30/11/2019 30/11/2019 CFO Completed Done. Contract register
was updated.
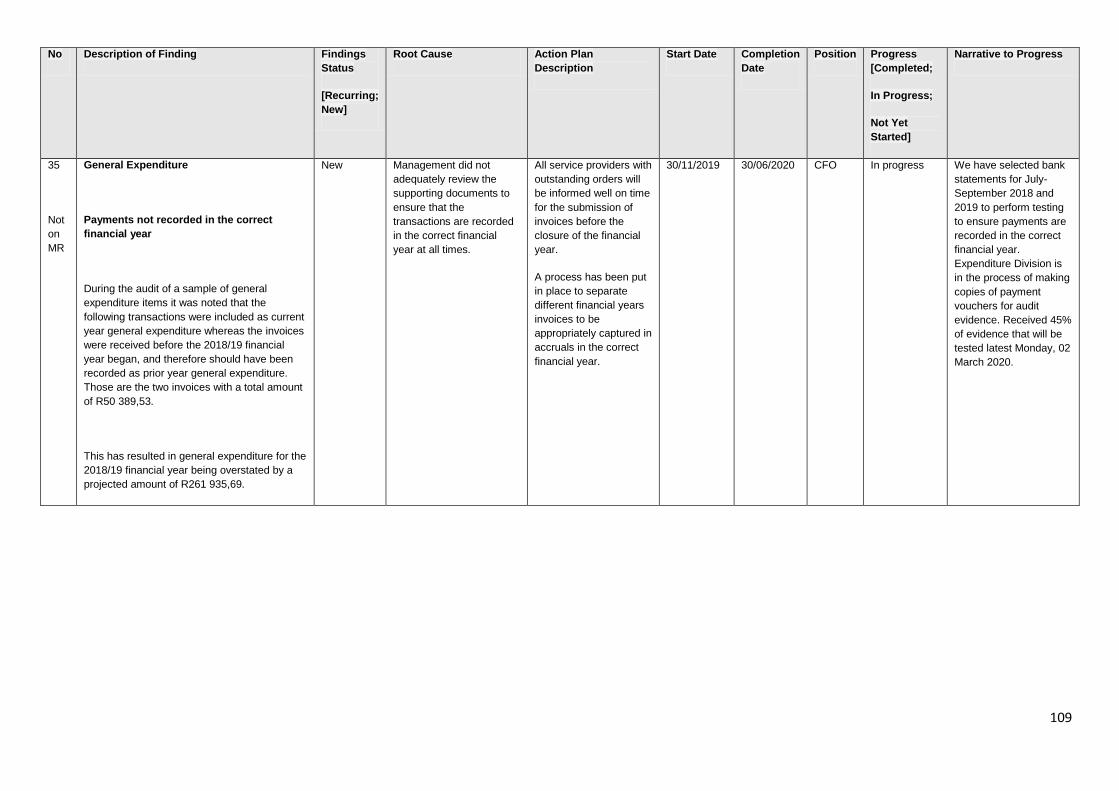
109
No Description of Finding Findings
Status
[Recurring;
New]
Root Cause Action Plan
Description
Start Date Completion
Date
Position Progress
[Completed;
In Progress;
Not Yet
Started]
Narrative to Progress
35
Not
on
MR
General Expenditure
Payments not recorded in the correct
financial year
During the audit of a sample of general
expenditure items it was noted that the
following transactions were included as current
year general expenditure whereas the invoices
were received before the 2018/19 financial
year began, and therefore should have been
recorded as prior year general expenditure.
Those are the two invoices with a total amount
of R50 389,53.
This has resulted in general expenditure for the
2018/19 financial year being overstated by a
projected amount of R261 935,69.
New Management did not
adequately review the
supporting documents to
ensure that the
transactions are recorded
in the correct financial
year at all times.
All service providers with
outstanding orders will
be informed well on time
for the submission of
invoices before the
closure of the financial
year.
A process has been put
in place to separate
different financial years
invoices to be
appropriately captured in
accruals in the correct
financial year.
30/11/2019 30/06/2020 CFO In progress We have selected bank
statements for July-
September 2018 and
2019 to perform testing
to ensure payments are
recorded in the correct
financial year.
Expenditure Division is
in the process of making
copies of payment
vouchers for audit
evidence. Received 45%
of evidence that will be
tested latest Monday, 02
March 2020.
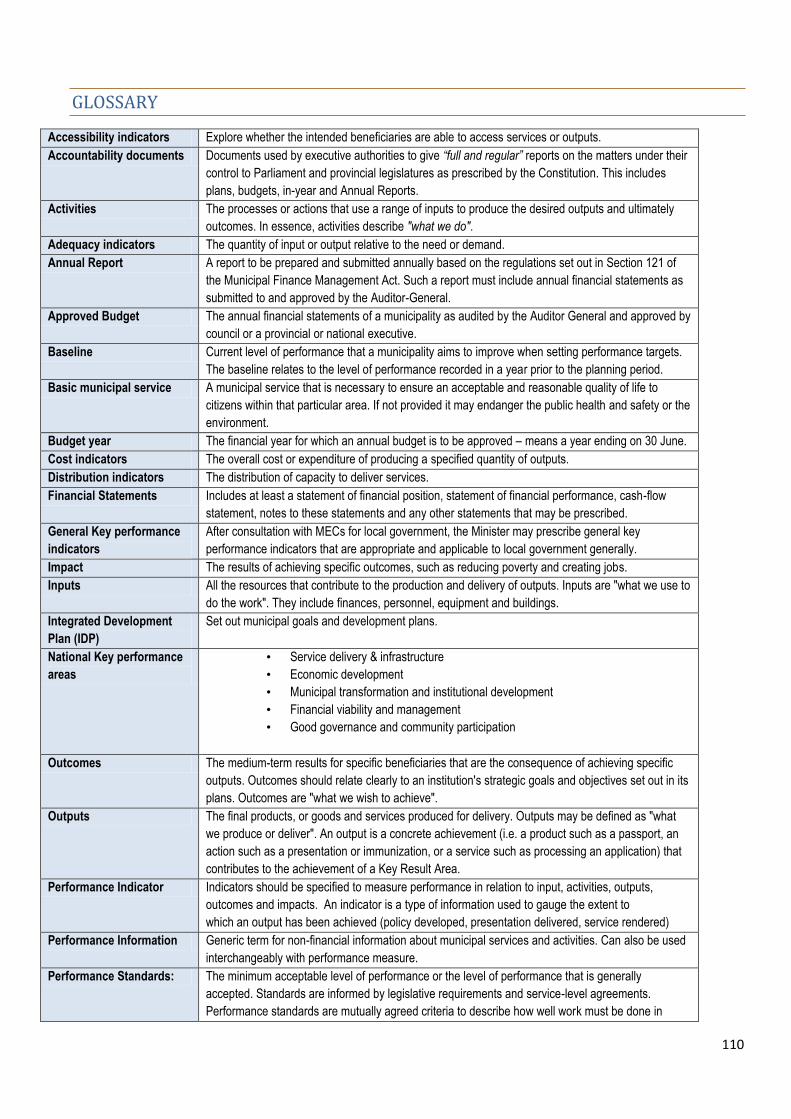
110
GLOSSARY
Accessibility indicators Explore whether the intended beneficiaries are able to access services or outputs.
Accountability documents Documents used by executive authorities to give “full and regular” reports on the matters under their
control to Parliament and provincial legislatures as prescribed by the Constitution. This includes
plans, budgets, in-year and Annual Reports.
Activities The processes or actions that use a range of inputs to produce the desired outputs and ultimately
outcomes. In essence, activities describe "what we do".
Adequacy indicators The quantity of input or output relative to the need or demand.
Annual Report A report to be prepared and submitted annually based on the regulations set out in Section 121 of
the Municipal Finance Management Act. Such a report must include annual financial statements as
submitted to and approved by the Auditor-General.
Approved Budget The annual financial statements of a municipality as audited by the Auditor General and approved by
council or a provincial or national executive.
Baseline Current level of performance that a municipality aims to improve when setting performance targets.
The baseline relates to the level of performance recorded in a year prior to the planning period.
Basic municipal service A municipal service that is necessary to ensure an acceptable and reasonable quality of life to
citizens within that particular area. If not provided it may endanger the public health and safety or the
environment.
Budget year The financial year for which an annual budget is to be approved – means a year ending on 30 June.
Cost indicators The overall cost or expenditure of producing a specified quantity of outputs.
Distribution indicators The distribution of capacity to deliver services.
Financial Statements Includes at least a statement of financial position, statement of financial performance, cash-flow
statement, notes to these statements and any other statements that may be prescribed.
General Key performance
indicators
After consultation with MECs for local government, the Minister may prescribe general key
performance indicators that are appropriate and applicable to local government generally.
Impact The results of achieving specific outcomes, such as reducing poverty and creating jobs.
Inputs All the resources that contribute to the production and delivery of outputs. Inputs are "what we use to
do the work". They include finances, personnel, equipment and buildings.
Integrated Development
Plan (IDP)
Set out municipal goals and development plans.
National Key performance
areas
• Service delivery & infrastructure
• Economic development
• Municipal transformation and institutional development
• Financial viability and management
• Good governance and community participation
Outcomes The medium-term results for specific beneficiaries that are the consequence of achieving specific
outputs. Outcomes should relate clearly to an institution's strategic goals and objectives set out in its
plans. Outcomes are "what we wish to achieve".
Outputs The final products, or goods and services produced for delivery. Outputs may be defined as "what
we produce or deliver". An output is a concrete achievement (i.e. a product such as a passport, an
action such as a presentation or immunization, or a service such as processing an application) that
contributes to the achievement of a Key Result Area.
Performance Indicator Indicators should be specified to measure performance in relation to input, activities, outputs,
outcomes and impacts. An indicator is a type of information used to gauge the extent to
which an output has been achieved (policy developed, presentation delivered, service rendered)
Performance Information Generic term for non-financial information about municipal services and activities. Can also be used
interchangeably with performance measure.
Performance Standards: The minimum acceptable level of performance or the level of performance that is generally
accepted. Standards are informed by legislative requirements and service-level agreements.
Performance standards are mutually agreed criteria to describe how well work must be done in
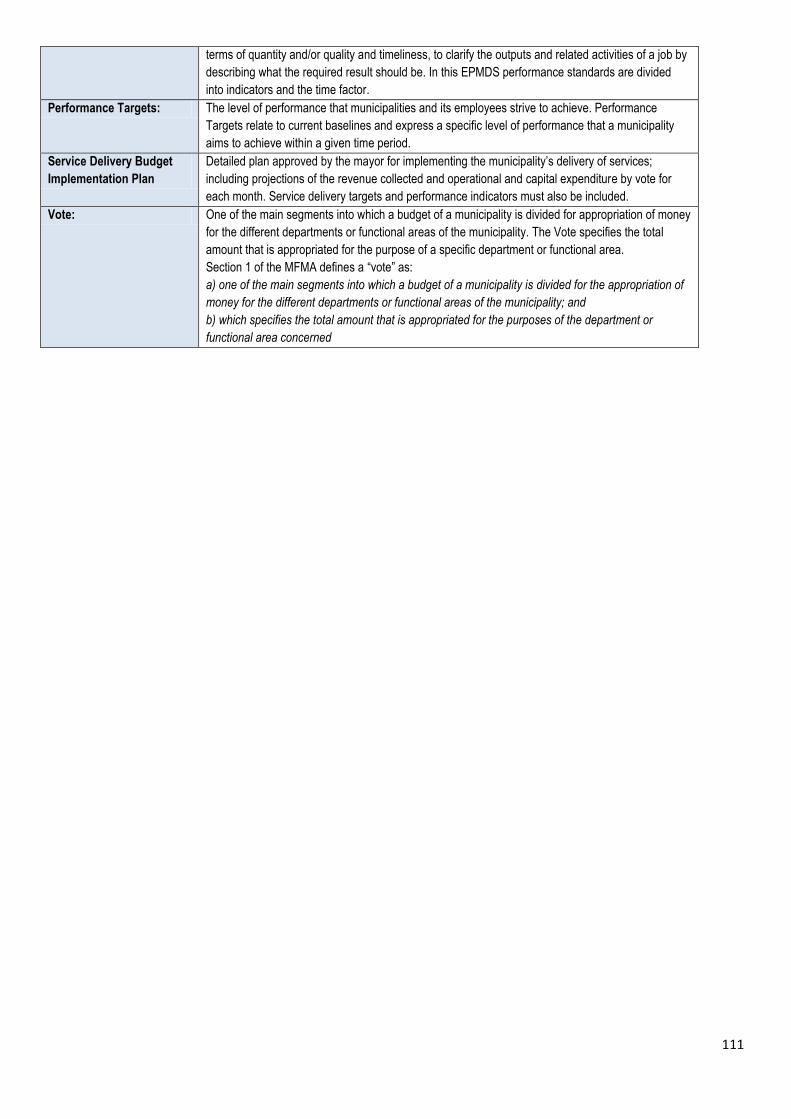
111
terms of quantity and/or quality and timeliness, to clarify the outputs and related activities of a job by
describing what the required result should be. In this EPMDS performance standards are divided
into indicators and the time factor.
Performance Targets: The level of performance that municipalities and its employees strive to achieve. Performance
Targets relate to current baselines and express a specific level of performance that a municipality
aims to achieve within a given time period.
Service Delivery Budget
Implementation Plan
Detailed plan approved by the mayor for implementing the municipality’s delivery of services;
including projections of the revenue collected and operational and capital expenditure by vote for
each month. Service delivery targets and performance indicators must also be included.
Vote: One of the main segments into which a budget of a municipality is divided for appropriation of money
for the different departments or functional areas of the municipality. The Vote specifies the total
amount that is appropriated for the purpose of a specific department or functional area.
Section 1 of the MFMA defines a “vote” as:
a) one of the main segments into which a budget of a municipality is divided for the appropriation of
money for the different departments or functional areas of the municipality; and
b) which specifies the total amount that is appropriated for the purposes of the department or
functional area concerned
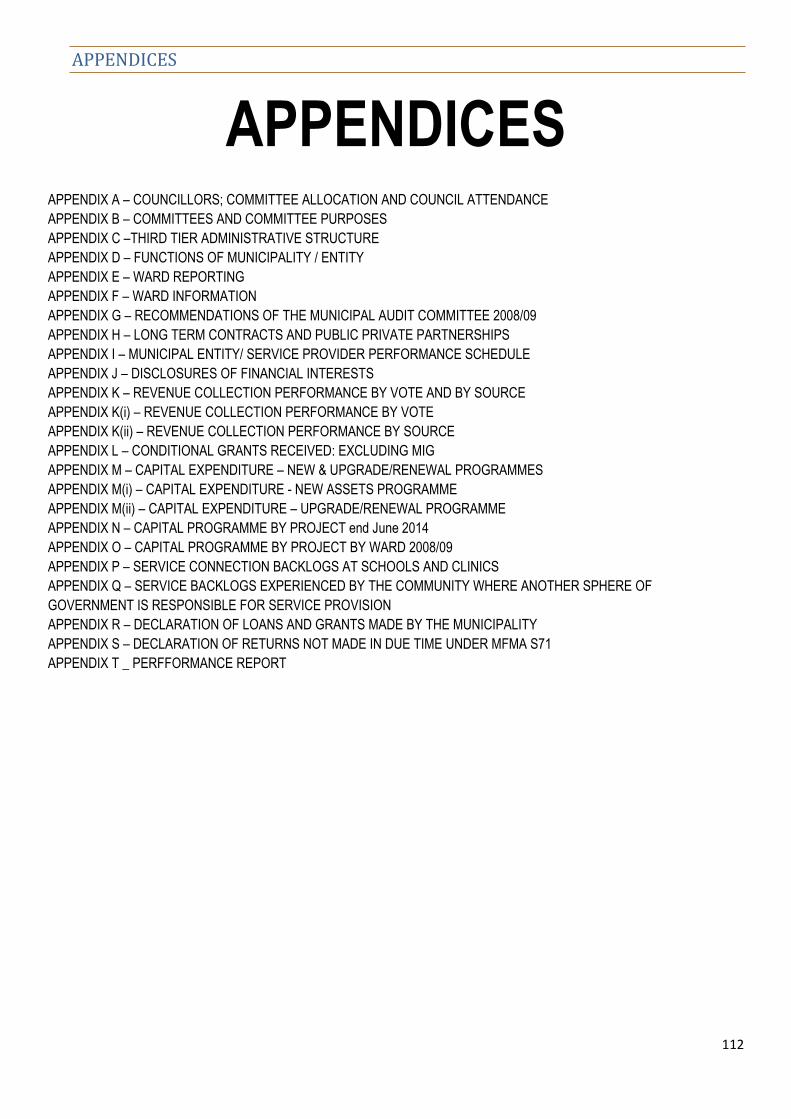
112
APPENDICES
APPENDICES
APPENDIX A – COUNCILLORS; COMMITTEE ALLOCATION AND COUNCIL ATTENDANCE
APPENDIX B – COMMITTEES AND COMMITTEE PURPOSES
APPENDIX C –THIRD TIER ADMINISTRATIVE STRUCTURE
APPENDIX D – FUNCTIONS OF MUNICIPALITY / ENTITY
APPENDIX E – WARD REPORTING
APPENDIX F – WARD INFORMATION
APPENDIX G – RECOMMENDATIONS OF THE MUNICIPAL AUDIT COMMITTEE 2008/09
APPENDIX H – LONG TERM CONTRACTS AND PUBLIC PRIVATE PARTNERSHIPS
APPENDIX I – MUNICIPAL ENTITY/ SERVICE PROVIDER PERFORMANCE SCHEDULE
APPENDIX J – DISCLOSURES OF FINANCIAL INTERESTS
APPENDIX K – REVENUE COLLECTION PERFORMANCE BY VOTE AND BY SOURCE
APPENDIX K(i) – REVENUE COLLECTION PERFORMANCE BY VOTE
APPENDIX K(ii) – REVENUE COLLECTION PERFORMANCE BY SOURCE
APPENDIX L – CONDITIONAL GRANTS RECEIVED: EXCLUDING MIG
APPENDIX M – CAPITAL EXPENDITURE – NEW & UPGRADE/RENEWAL PROGRAMMES
APPENDIX M(i) – CAPITAL EXPENDITURE - NEW ASSETS PROGRAMME
APPENDIX M(ii) – CAPITAL EXPENDITURE – UPGRADE/RENEWAL PROGRAMME
APPENDIX N – CAPITAL PROGRAMME BY PROJECT end June 2014
APPENDIX O – CAPITAL PROGRAMME BY PROJECT BY WARD 2008/09
APPENDIX P – SERVICE CONNECTION BACKLOGS AT SCHOOLS AND CLINICS
APPENDIX Q – SERVICE BACKLOGS EXPERIENCED BY THE COMMUNITY WHERE ANOTHER SPHERE OF
GOVERNMENT IS RESPONSIBLE FOR SERVICE PROVISION
APPENDIX R – DECLARATION OF LOANS AND GRANTS MADE BY THE MUNICIPALITY
APPENDIX S – DECLARATION OF RETURNS NOT MADE IN DUE TIME UNDER MFMA S71
APPENDIX T _ PERFFORMANCE REPORT
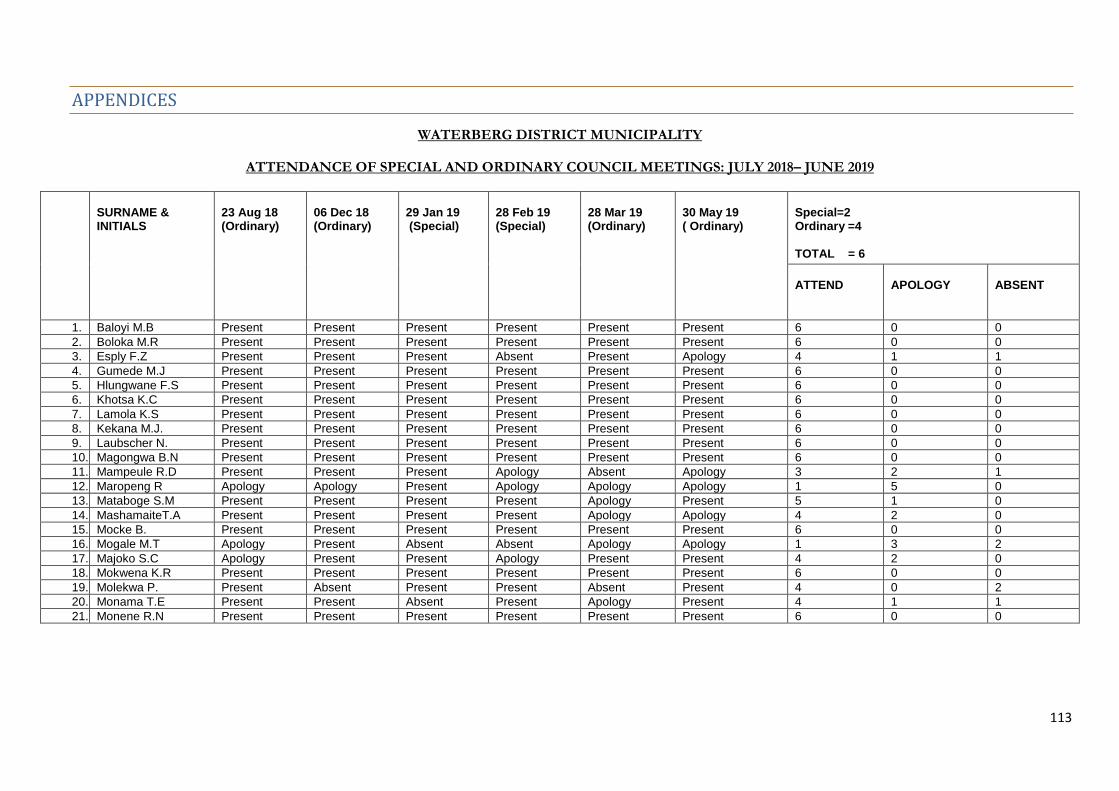
113
APPENDICES
WATERBERG DISTRICT MUNICIPALITY
ATTENDANCE OF SPECIAL AND ORDINARY COUNCIL MEETINGS: JULY 2018– JUNE 2019
SURNAME & INITIALS
23 Aug 18 (Ordinary)
06 Dec 18 (Ordinary)
29 Jan 19 (Special)
28 Feb 19 (Special)
28 Mar 19 (Ordinary)
30 May 19 ( Ordinary)
Special=2 Ordinary =4 TOTAL = 6
ATTEND
APOLOGY
ABSENT
1. Baloyi M.B Present Present Present Present Present Present 6 0 0
2. Boloka M.R Present Present Present Present Present Present 6 0 0
3. Esply F.Z Present Present Present Absent Present Apology 4 1 1
4. Gumede M.J Present Present Present Present Present Present 6 0 0
5. Hlungwane F.S Present Present Present Present Present Present 6 0 0
6. Khotsa K.C Present Present Present Present Present Present 6 0 0
7. Lamola K.S Present Present Present Present Present Present 6 0 0
8. Kekana M.J. Present Present Present Present Present Present 6 0 0
9. Laubscher N. Present Present Present Present Present Present 6 0 0
10. Magongwa B.N Present Present Present Present Present Present 6 0 0
11. Mampeule R.D Present Present Present Apology Absent Apology 3 2 1
12. Maropeng R Apology Apology Present Apology Apology Apology 1 5 0
13. Mataboge S.M Present Present Present Present Apology Present 5 1 0
14. MashamaiteT.A Present Present Present Present Apology Apology 4 2 0
15. Mocke B. Present Present Present Present Present Present 6 0 0
16. Mogale M.T Apology Present Absent Absent Apology Apology 1 3 2
17. Majoko S.C Apology Present Present Apology Present Present 4 2 0
18. Mokwena K.R Present Present Present Present Present Present 6 0 0
19. Molekwa P. Present Absent Present Present Absent Present 4 0 2
20. Monama T.E Present Present Absent Present Apology Present 4 1 1
21. Monene R.N Present Present Present Present Present Present 6 0 0
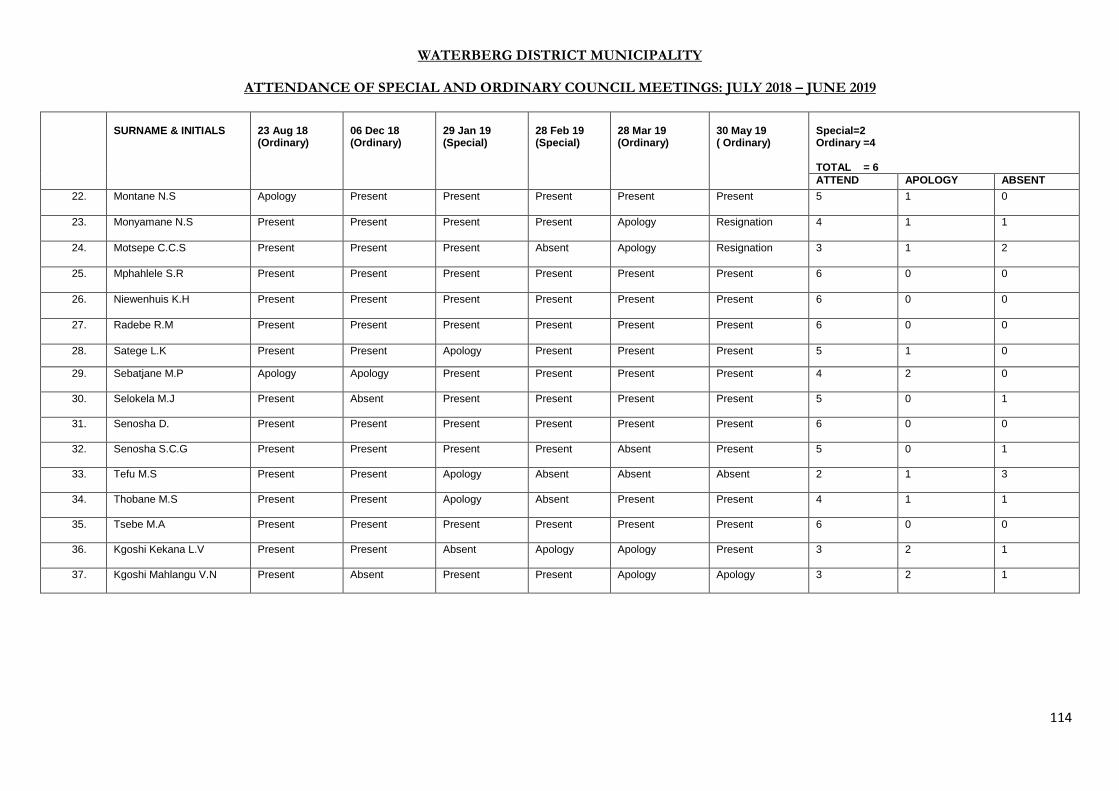
114
WATERBERG DISTRICT MUNICIPALITY
ATTENDANCE OF SPECIAL AND ORDINARY COUNCIL MEETINGS: JULY 2018 – JUNE 2019
SURNAME & INITIALS
23 Aug 18 (Ordinary)
06 Dec 18 (Ordinary)
29 Jan 19 (Special)
28 Feb 19 (Special)
28 Mar 19 (Ordinary)
30 May 19 ( Ordinary)
Special=2 Ordinary =4 TOTAL = 6
ATTEND APOLOGY ABSENT
22. Montane N.S Apology Present Present Present Present Present 5 1 0
23. Monyamane N.S Present Present Present Present Apology Resignation 4 1 1
24. Motsepe C.C.S Present Present Present Absent Apology Resignation 3 1 2
25. Mphahlele S.R Present Present Present Present Present Present 6 0 0
26. Niewenhuis K.H Present Present Present Present Present Present 6 0 0
27. Radebe R.M Present Present Present Present Present Present 6 0 0
28. Satege L.K Present Present Apology Present Present Present 5 1 0
29. Sebatjane M.P Apology Apology Present Present Present Present
4 2 0
30. Selokela M.J Present Absent Present Present Present Present
5 0 1
31. Senosha D. Present Present Present Present Present Present
6 0 0
32. Senosha S.C.G Present Present Present Present Absent Present
5 0 1
33. Tefu M.S Present Present Apology Absent Absent Absent
2 1 3
34. Thobane M.S Present Present Apology Absent Present Present
4 1 1
35. Tsebe M.A Present Present Present Present Present Present
6 0 0
36. Kgoshi Kekana L.V Present Present Absent Apology Apology Present
3 2 1
37. Kgoshi Mahlangu V.N Present Absent Present Present Apology Apology
3 2 1
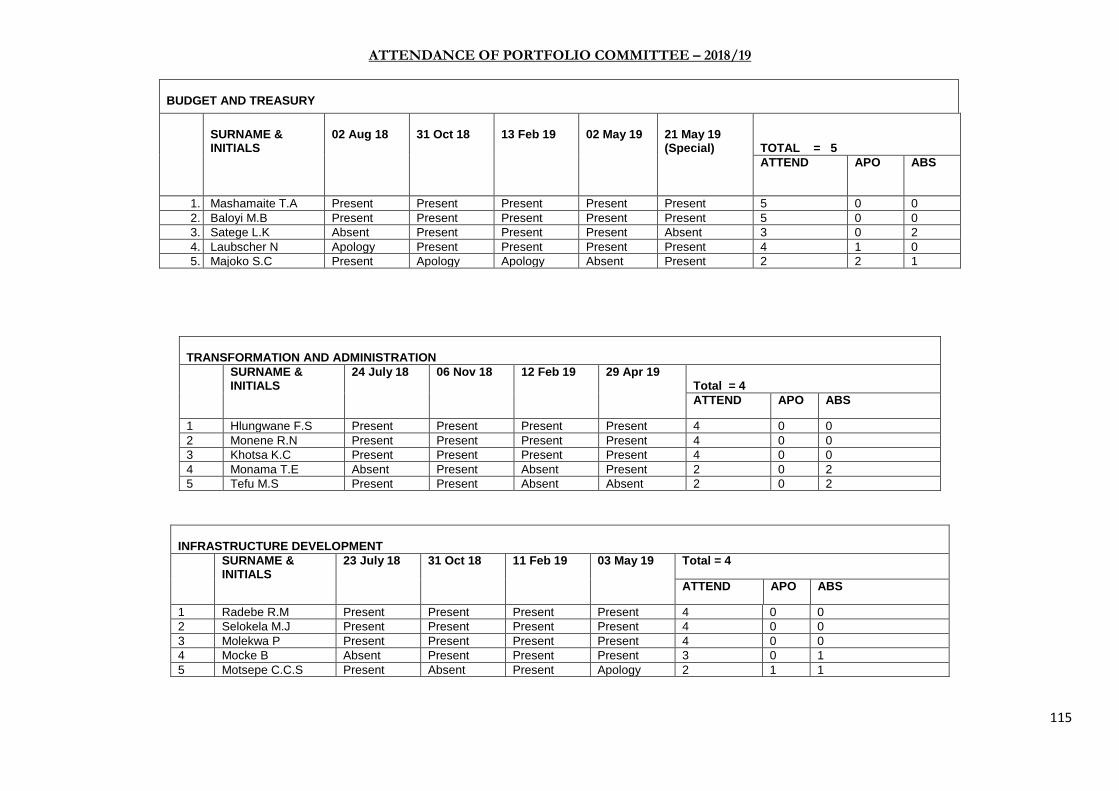
115
ATTENDANCE OF PORTFOLIO COMMITTEE – 2018/19
BUDGET AND TREASURY
SURNAME & INITIALS
02 Aug 18
31 Oct 18
13 Feb 19
02 May 19
21 May 19 (Special)
TOTAL = 5
ATTEND APO ABS
1. Mashamaite T.A Present Present Present Present Present 5 0 0
2. Baloyi M.B Present Present Present Present Present 5 0 0
3. Satege L.K Absent Present Present Present Absent 3 0 2
4. Laubscher N Apology Present Present Present Present 4 1 0
5. Majoko S.C Present Apology Apology Absent Present 2 2 1
TRANSFORMATION AND ADMINISTRATION
SURNAME & INITIALS
24 July 18 06 Nov 18 12 Feb 19 29 Apr 19 Total = 4
ATTEND APO ABS
1 Hlungwane F.S Present Present Present Present 4 0 0
2 Monene R.N Present Present Present Present 4 0 0
3 Khotsa K.C Present Present Present Present 4 0 0
4 Monama T.E Absent Present Absent Present 2 0 2
5 Tefu M.S Present Present Absent Absent 2 0 2
INFRASTRUCTURE DEVELOPMENT
SURNAME & INITIALS
23 July 18 31 Oct 18 11 Feb 19 03 May 19 Total = 4
ATTEND APO ABS
1 Radebe R.M Present Present Present Present 4 0 0
2 Selokela M.J Present Present Present Present 4 0 0
3 Molekwa P Present Present Present Present 4 0 0
4 Mocke B Absent Present Present Present 3 0 1
5 Motsepe C.C.S Present Absent Present Apology 2 1 1
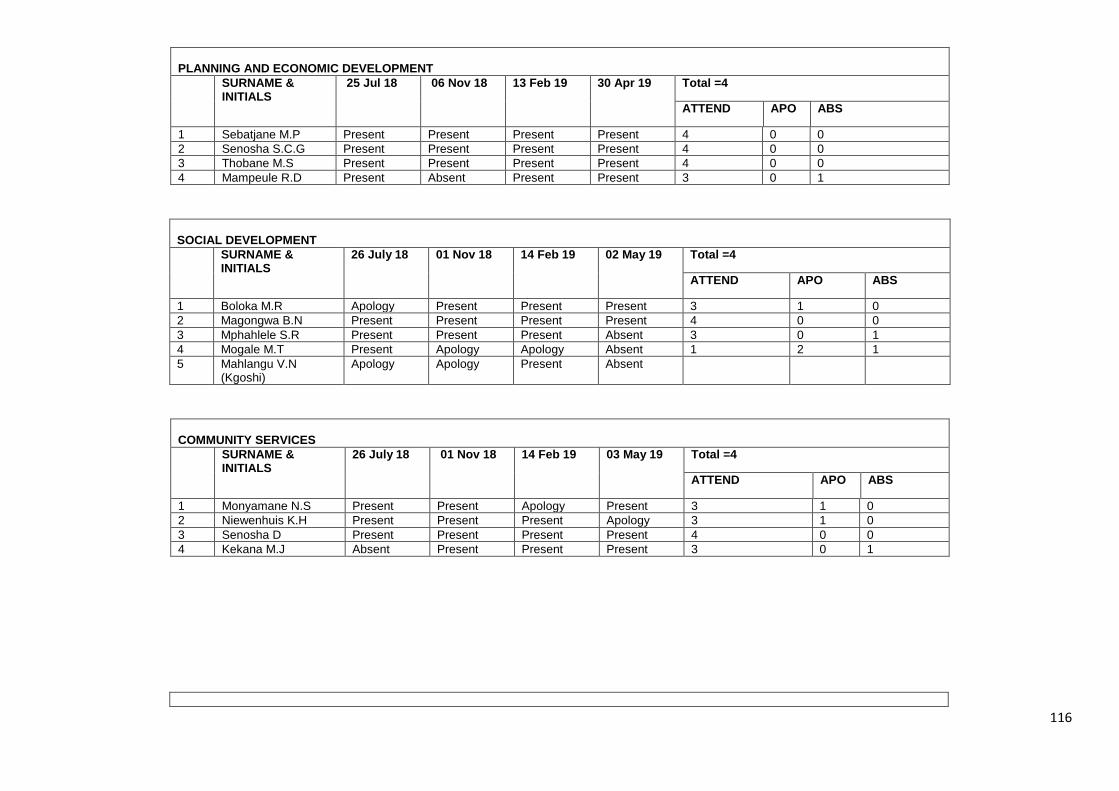
116
PLANNING AND ECONOMIC DEVELOPMENT
SURNAME & INITIALS
25 Jul 18 06 Nov 18 13 Feb 19 30 Apr 19 Total =4
ATTEND APO ABS
1 Sebatjane M.P Present Present Present Present 4 0 0
2 Senosha S.C.G Present Present Present Present 4 0 0
3 Thobane M.S Present Present Present Present 4 0 0
4 Mampeule R.D Present Absent Present Present 3 0 1
SOCIAL DEVELOPMENT
SURNAME & INITIALS
26 July 18 01 Nov 18 14 Feb 19 02 May 19 Total =4
ATTEND APO ABS
1 Boloka M.R Apology Present Present Present 3 1 0
2 Magongwa B.N Present Present Present Present 4 0 0
3 Mphahlele S.R Present Present Present Absent 3 0 1
4 Mogale M.T Present Apology Apology Absent 1 2 1
5 Mahlangu V.N (Kgoshi)
Apology Apology Present Absent
COMMUNITY SERVICES
SURNAME & INITIALS
26 July 18 01 Nov 18 14 Feb 19 03 May 19 Total =4
ATTEND APO ABS
1 Monyamane N.S Present Present Apology Present 3 1 0
2 Niewenhuis K.H Present Present Present Apology 3 1 0
3 Senosha D Present Present Present Present 4 0 0
4 Kekana M.J Absent Present Present Present 3 0 1
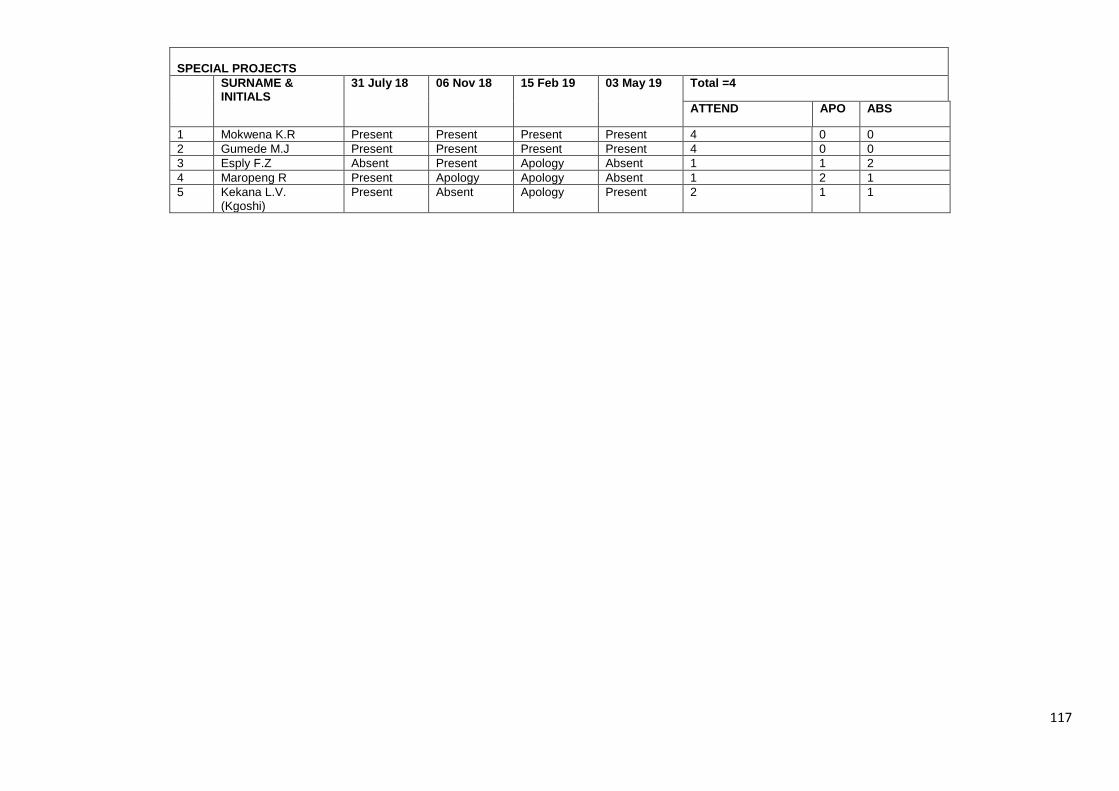
117
SPECIAL PROJECTS
SURNAME & INITIALS
31 July 18 06 Nov 18 15 Feb 19 03 May 19 Total =4
ATTEND APO ABS
1 Mokwena K.R Present Present Present Present 4 0 0
2 Gumede M.J Present Present Present Present 4 0 0
3 Esply F.Z Absent Present Apology Absent 1 1 2
4 Maropeng R Present Apology Apology Absent 1 2 1
5 Kekana L.V. (Kgoshi)
Present Absent Apology Present 2 1 1
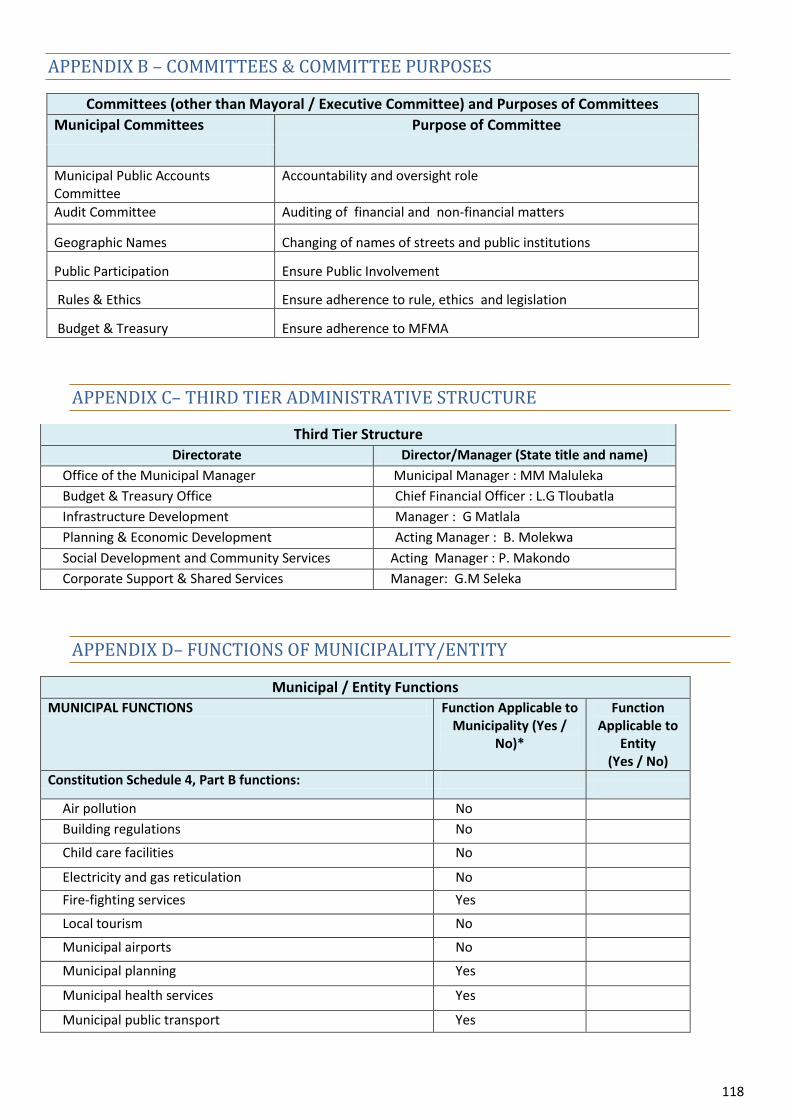
118
APPENDIX B – COMMITTEES & COMMITTEE PURPOSES
Committees (other than Mayoral / Executive Committee) and Purposes of Committees
Municipal Committees Purpose of Committee
Municipal Public Accounts Committee
Accountability and oversight role
Audit Committee Auditing of financial and non-financial matters
Geographic Names Changing of names of streets and public institutions
Public Participation Ensure Public Involvement
Rules & Ethics Ensure adherence to rule, ethics and legislation
Budget & Treasury Ensure adherence to MFMA
APPENDIX C– THIRD TIER ADMINISTRATIVE STRUCTURE
Third Tier Structure
Directorate Director/Manager (State title and name)
Office of the Municipal Manager Municipal Manager : MM Maluleka
Budget & Treasury Office Chief Financial Officer : L.G Tloubatla
Infrastructure Development Manager : G Matlala
Planning & Economic Development Acting Manager : B. Molekwa
Social Development and Community Services Acting Manager : P. Makondo
Corporate Support & Shared Services Manager: G.M Seleka
APPENDIX D– FUNCTIONS OF MUNICIPALITY/ENTITY
Municipal / Entity Functions
MUNICIPAL FUNCTIONS Function Applicable to Municipality (Yes /
No)*
Function Applicable to
Entity (Yes / No)
Constitution Schedule 4, Part B functions:
Air pollution No
Building regulations No
Child care facilities No
Electricity and gas reticulation No
Fire-fighting services Yes
Local tourism No
Municipal airports No
Municipal planning Yes
Municipal health services Yes
Municipal public transport Yes
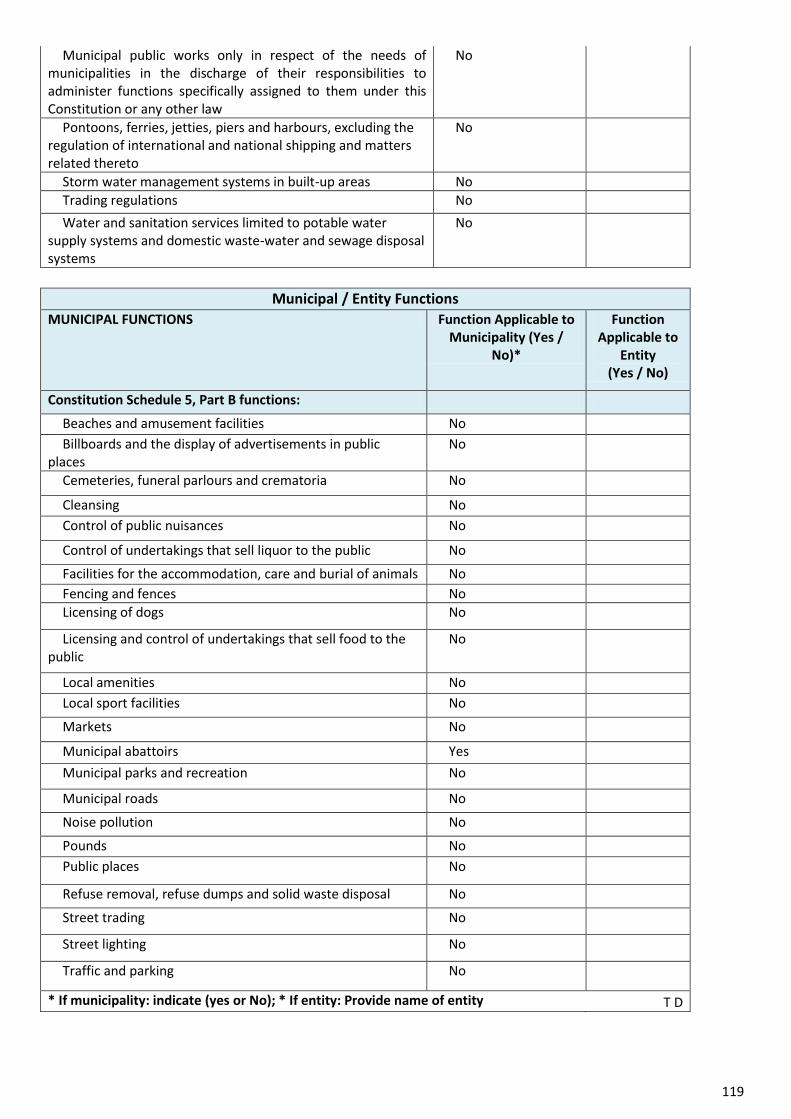
119
Municipal public works only in respect of the needs of municipalities in the discharge of their responsibilities to administer functions specifically assigned to them under this Constitution or any other law
No
Pontoons, ferries, jetties, piers and harbours, excluding the regulation of international and national shipping and matters related thereto
No
Storm water management systems in built-up areas No
Trading regulations No
Water and sanitation services limited to potable water supply systems and domestic waste-water and sewage disposal systems
No
Municipal / Entity Functions
MUNICIPAL FUNCTIONS Function Applicable to Municipality (Yes /
No)*
Function Applicable to
Entity (Yes / No)
Constitution Schedule 5, Part B functions:
Beaches and amusement facilities No
Billboards and the display of advertisements in public places
No
Cemeteries, funeral parlours and crematoria No
Cleansing No
Control of public nuisances No
Control of undertakings that sell liquor to the public No
Facilities for the accommodation, care and burial of animals No
Fencing and fences No
Licensing of dogs No
Licensing and control of undertakings that sell food to the public
No
Local amenities No
Local sport facilities No
Markets No
Municipal abattoirs Yes
Municipal parks and recreation No
Municipal roads No
Noise pollution No
Pounds No
Public places No
Refuse removal, refuse dumps and solid waste disposal No
Street trading No
Street lighting No
Traffic and parking No
* If municipality: indicate (yes or No); * If entity: Provide name of entity T D
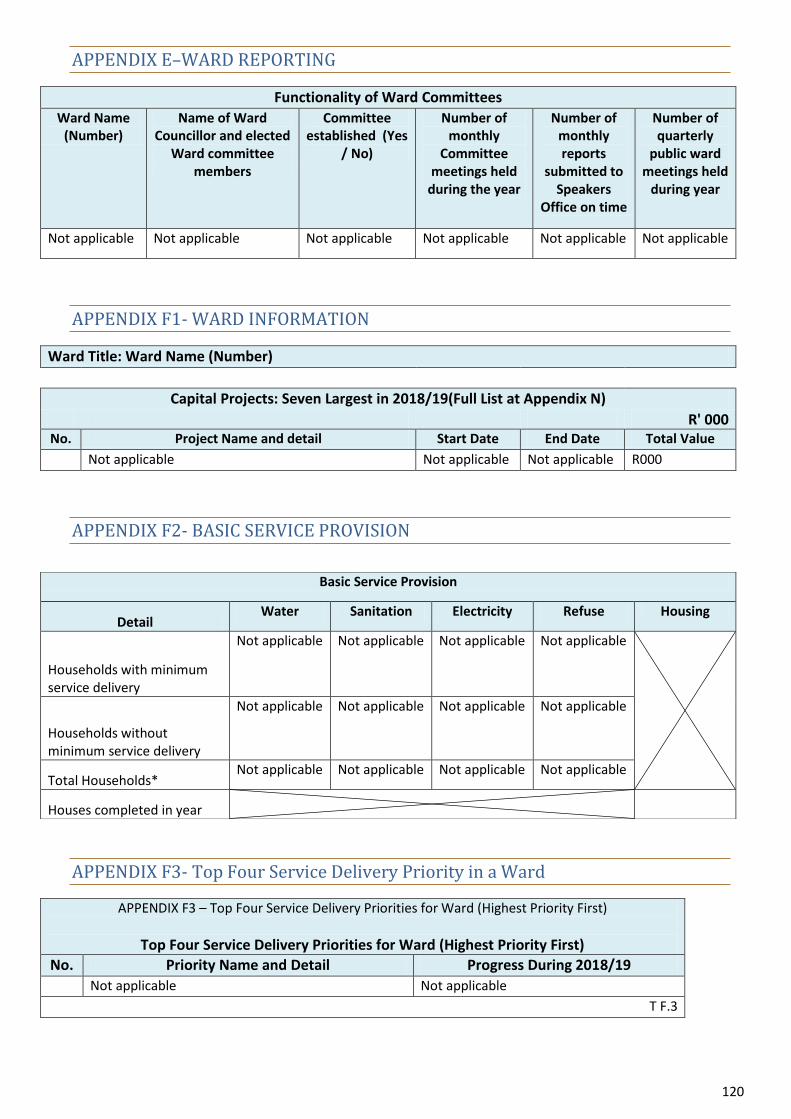
120
APPENDIX E–WARD REPORTING
Functionality of Ward Committees
Ward Name (Number)
Name of Ward Councillor and elected
Ward committee members
Committee established (Yes
/ No)
Number of monthly
Committee meetings held
during the year
Number of monthly reports
submitted to Speakers
Office on time
Number of quarterly
public ward meetings held
during year
Not applicable Not applicable Not applicable Not applicable Not applicable Not applicable
APPENDIX F1- WARD INFORMATION
Ward Title: Ward Name (Number)
Capital Projects: Seven Largest in 2018/19(Full List at Appendix N)
R' 000 No. Project Name and detail Start Date End Date Total Value
Not applicable Not applicable Not applicable R000
APPENDIX F2- BASIC SERVICE PROVISION
APPENDIX F3- Top Four Service Delivery Priority in a Ward
APPENDIX F3 – Top Four Service Delivery Priorities for Ward (Highest Priority First)
Top Four Service Delivery Priorities for Ward (Highest Priority First)
No. Priority Name and Detail Progress During 2018/19
Not applicable Not applicable
T F.3
Basic Service Provision
Detail Water Sanitation Electricity Refuse Housing
Households with minimum service delivery
Not applicable Not applicable Not applicable Not applicable
Households without minimum service delivery
Not applicable Not applicable Not applicable Not applicable
Total Households* Not applicable Not applicable Not applicable Not applicable
Houses completed in year
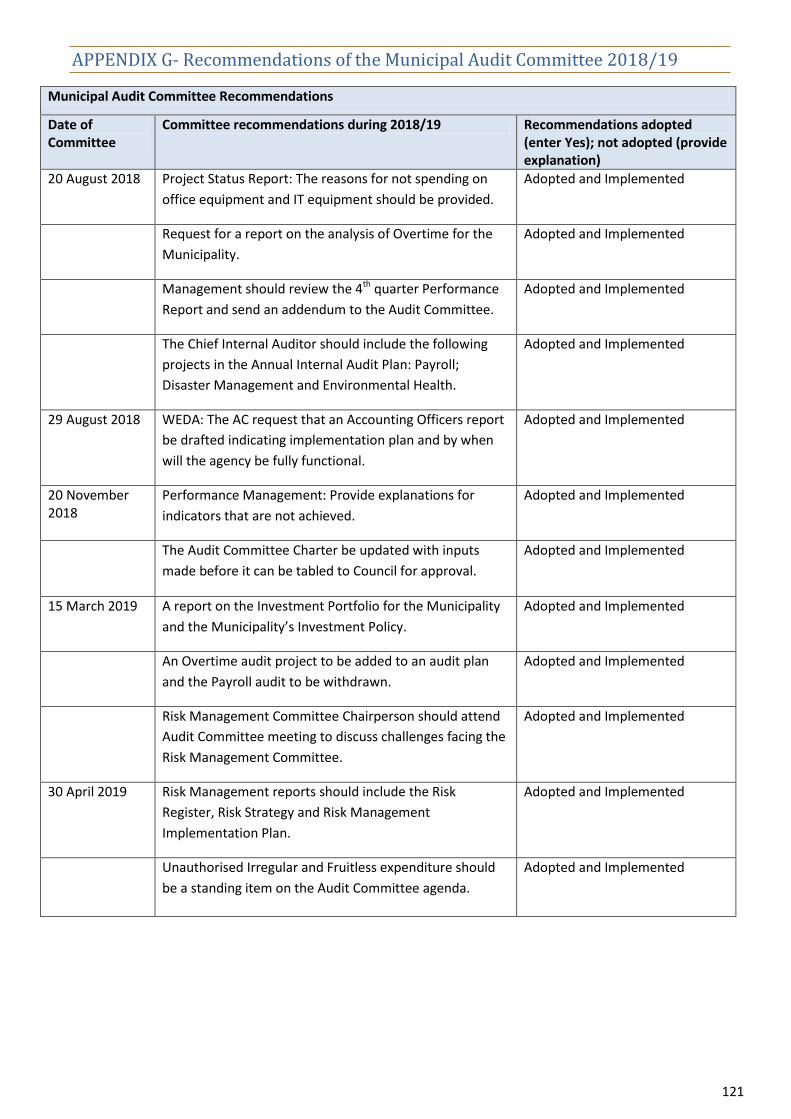
121
APPENDIX G- Recommendations of the Municipal Audit Committee 2018/19
Municipal Audit Committee Recommendations
Date of Committee
Committee recommendations during 2018/19 Recommendations adopted (enter Yes); not adopted (provide explanation)
20 August 2018 Project Status Report: The reasons for not spending on
office equipment and IT equipment should be provided.
Adopted and Implemented
Request for a report on the analysis of Overtime for the
Municipality.
Adopted and Implemented
Management should review the 4th quarter Performance
Report and send an addendum to the Audit Committee.
Adopted and Implemented
The Chief Internal Auditor should include the following
projects in the Annual Internal Audit Plan: Payroll;
Disaster Management and Environmental Health.
Adopted and Implemented
29 August 2018 WEDA: The AC request that an Accounting Officers report
be drafted indicating implementation plan and by when
will the agency be fully functional.
Adopted and Implemented
20 November 2018
Performance Management: Provide explanations for
indicators that are not achieved.
Adopted and Implemented
The Audit Committee Charter be updated with inputs
made before it can be tabled to Council for approval.
Adopted and Implemented
15 March 2019 A report on the Investment Portfolio for the Municipality
and the Municipality’s Investment Policy.
Adopted and Implemented
An Overtime audit project to be added to an audit plan
and the Payroll audit to be withdrawn.
Adopted and Implemented
Risk Management Committee Chairperson should attend
Audit Committee meeting to discuss challenges facing the
Risk Management Committee.
Adopted and Implemented
30 April 2019 Risk Management reports should include the Risk
Register, Risk Strategy and Risk Management
Implementation Plan.
Adopted and Implemented
Unauthorised Irregular and Fruitless expenditure should
be a standing item on the Audit Committee agenda.
Adopted and Implemented
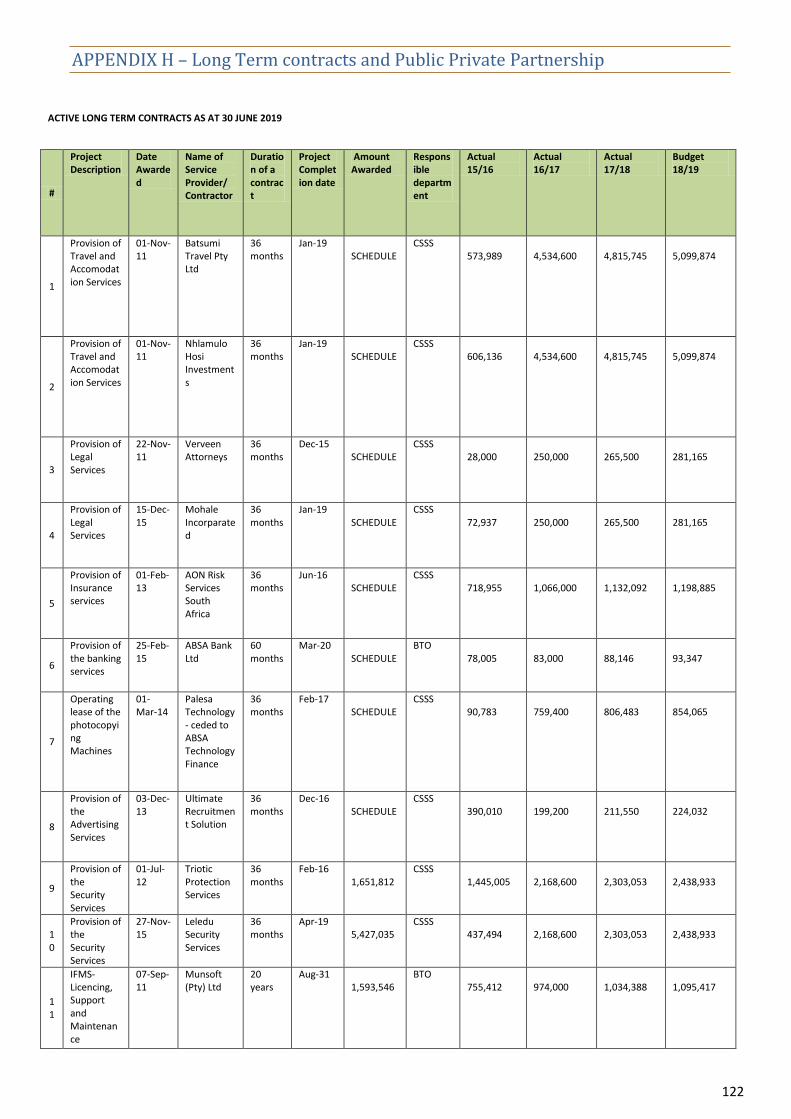
122
APPENDIX H – Long Term contracts and Public Private Partnership
ACTIVE LONG TERM CONTRACTS AS AT 30 JUNE 2019
#
Project Description
Date Awarded
Name of Service Provider/ Contractor
Duration of a contract
Project Completion date
Amount Awarded
Responsible department
Actual 15/16
Actual 16/17
Actual 17/18
Budget 18/19
1
Provision of Travel and Accomodation Services
01-Nov-11
Batsumi Travel Pty Ltd
36 months
Jan-19 SCHEDULE
CSSS 573,989
4,534,600
4,815,745
5,099,874
2
Provision of Travel and Accomodation Services
01-Nov-11
Nhlamulo Hosi Investments
36 months
Jan-19 SCHEDULE
CSSS 606,136
4,534,600
4,815,745
5,099,874
3
Provision of Legal Services
22-Nov-11
Verveen Attorneys
36 months
Dec-15 SCHEDULE
CSSS 28,000
250,000
265,500
281,165
4
Provision of Legal Services
15-Dec-15
Mohale Incorparated
36 months
Jan-19 SCHEDULE
CSSS 72,937
250,000
265,500
281,165
5
Provision of Insurance services
01-Feb-13
AON Risk Services South Africa
36 months
Jun-16 SCHEDULE
CSSS 718,955
1,066,000
1,132,092
1,198,885
6
Provision of the banking services
25-Feb-15
ABSA Bank Ltd
60 months
Mar-20 SCHEDULE
BTO 78,005
83,000
88,146
93,347
7
Operating lease of the photocopying Machines
01-Mar-14
Palesa Technology - ceded to ABSA Technology Finance
36 months
Feb-17 SCHEDULE
CSSS 90,783
759,400
806,483
854,065
8
Provision of the Advertising Services
03-Dec-13
Ultimate Recruitment Solution
36 months
Dec-16 SCHEDULE
CSSS 390,010
199,200
211,550
224,032
9
Provision of the Security Services
01-Jul-12
Triotic Protection Services
36 months
Feb-16 1,651,812
CSSS 1,445,005
2,168,600
2,303,053
2,438,933
10
Provision of the Security Services
27-Nov-15
Leledu Security Services
36 months
Apr-19 5,427,035
CSSS 437,494
2,168,600
2,303,053
2,438,933
11
IFMS- Licencing, Support and Maintenance
07-Sep-11
Munsoft (Pty) Ltd
20 years
Aug-31 1,593,546
BTO 755,412
974,000
1,034,388
1,095,417
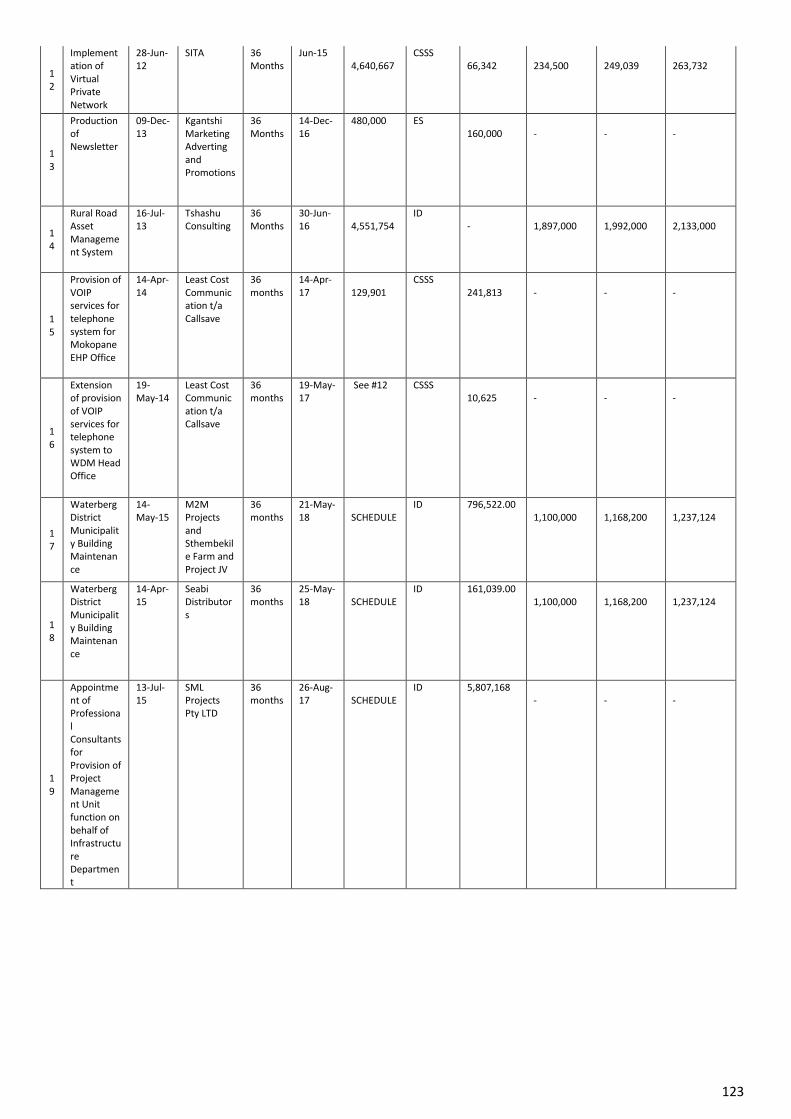
123
12
Implementation of Virtual Private Network
28-Jun-12
SITA 36 Months
Jun-15 4,640,667
CSSS 66,342
234,500
249,039
263,732
13
Production of Newsletter
09-Dec-13
Kgantshi Marketing Adverting and Promotions
36 Months
14-Dec-16
480,000 ES 160,000
-
-
-
14
Rural Road Asset Management System
16-Jul-13
Tshashu Consulting
36 Months
30-Jun-16
4,551,754
ID -
1,897,000
1,992,000
2,133,000
15
Provision of VOIP services for telephone system for Mokopane EHP Office
14-Apr-14
Least Cost Communication t/a Callsave
36 months
14-Apr-17
129,901
CSSS 241,813
-
-
-
16
Extension of provision of VOIP services for telephone system to WDM Head Office
19-May-14
Least Cost Communication t/a Callsave
36 months
19-May-17
See #12 CSSS 10,625
-
-
-
17
Waterberg District Municipality Building Maintenance
14-May-15
M2M Projects and Sthembekile Farm and Project JV
36 months
21-May-18
SCHEDULE
ID 796,522.00 1,100,000
1,168,200
1,237,124
18
Waterberg District Municipality Building Maintenance
14-Apr-15
Seabi Distributors
36 months
25-May-18
SCHEDULE
ID 161,039.00 1,100,000
1,168,200
1,237,124
19
Appointment of Professional Consultants for Provision of Project Management Unit function on behalf of Infrastructure Department
13-Jul-15
SML Projects Pty LTD
36 months
26-Aug-17
SCHEDULE
ID 5,807,168 -
-
-
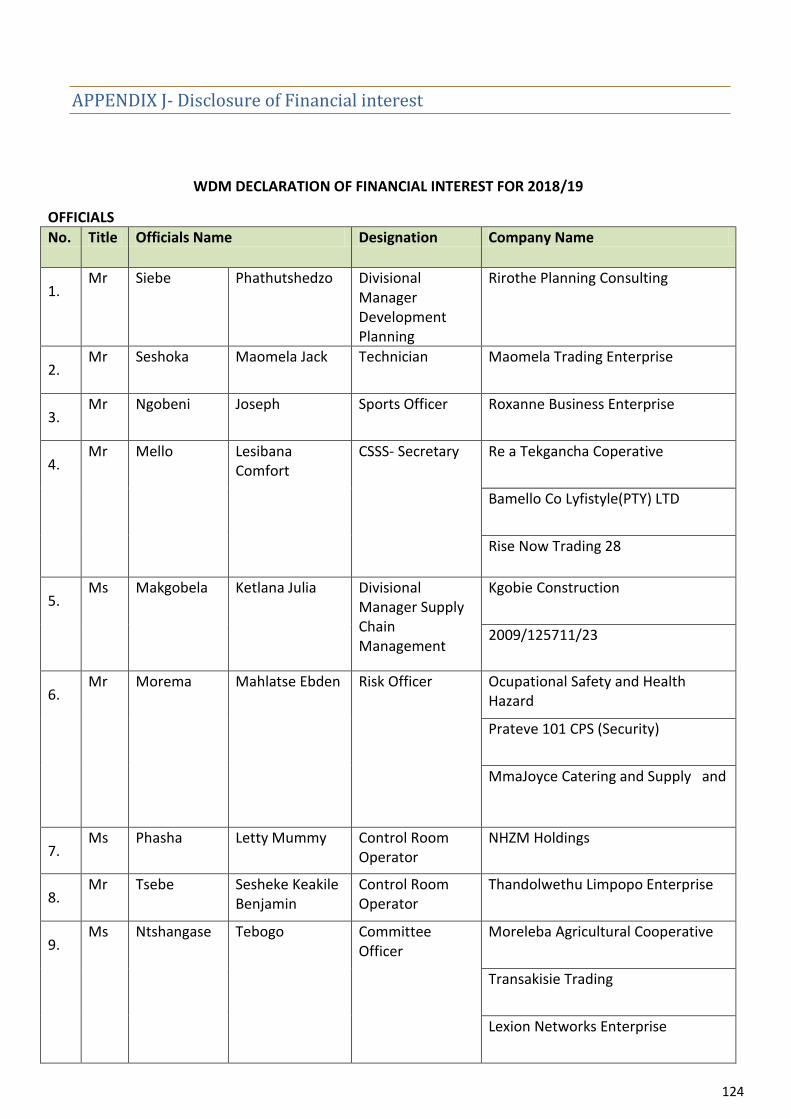
124
APPENDIX J- Disclosure of Financial interest
WDM DECLARATION OF FINANCIAL INTEREST FOR 2018/19
OFFICIALS
No. Title Officials Name Designation Company Name
1. Mr Siebe Phathutshedzo Divisional
Manager Development Planning
Rirothe Planning Consulting
2. Mr Seshoka Maomela Jack Technician Maomela Trading Enterprise
3. Mr Ngobeni Joseph Sports Officer Roxanne Business Enterprise
4. Mr Mello Lesibana
Comfort CSSS- Secretary Re a Tekgancha Coperative
Bamello Co Lyfistyle(PTY) LTD
Rise Now Trading 28
5. Ms Makgobela Ketlana Julia Divisional
Manager Supply Chain Management
Kgobie Construction
2009/125711/23
6. Mr Morema Mahlatse Ebden Risk Officer Ocupational Safety and Health
Hazard
Prateve 101 CPS (Security)
MmaJoyce Catering and Supply and
7. Ms Phasha Letty Mummy Control Room
Operator NHZM Holdings
8. Mr Tsebe Sesheke Keakile
Benjamin Control Room Operator
Thandolwethu Limpopo Enterprise
9. Ms Ntshangase Tebogo Committee
Officer Moreleba Agricultural Cooperative
Transakisie Trading
Lexion Networks Enterprise
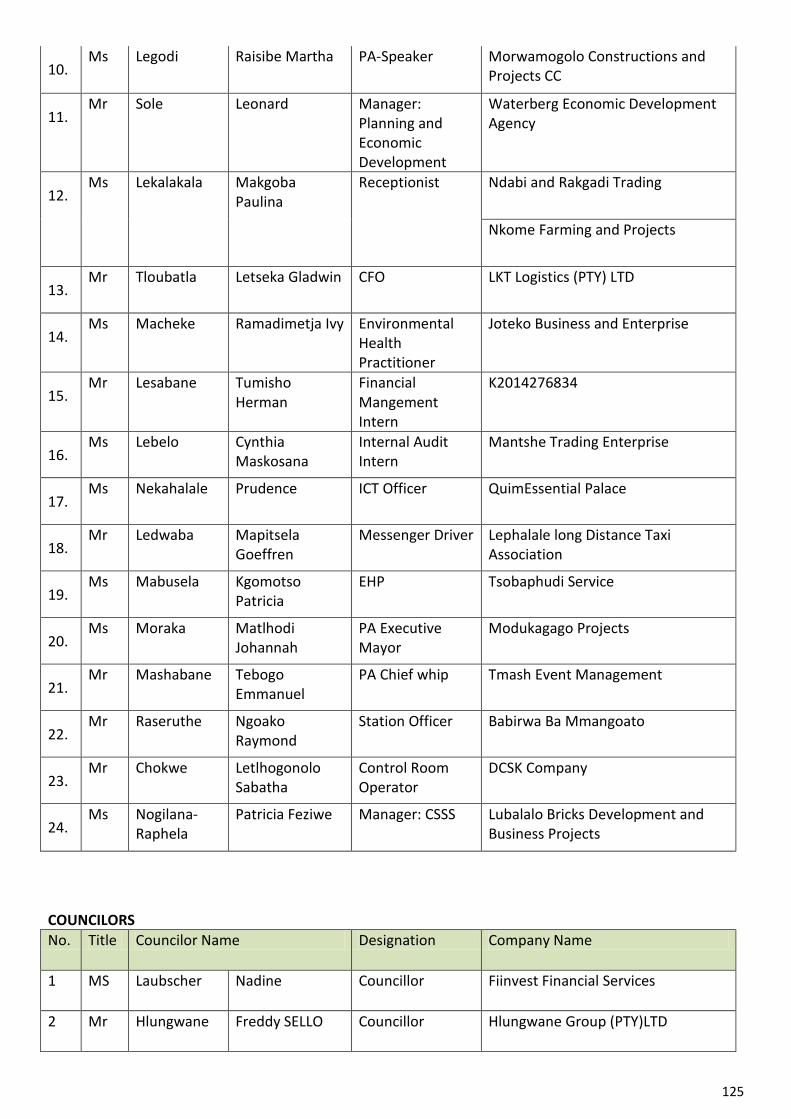
125
10. Ms Legodi Raisibe Martha PA-Speaker Morwamogolo Constructions and
Projects CC
11. Mr Sole Leonard Manager:
Planning and Economic Development
Waterberg Economic Development Agency
12. Ms Lekalakala Makgoba
Paulina Receptionist Ndabi and Rakgadi Trading
Nkome Farming and Projects
13. Mr Tloubatla Letseka Gladwin CFO LKT Logistics (PTY) LTD
14. Ms Macheke Ramadimetja Ivy Environmental
Health Practitioner
Joteko Business and Enterprise
15. Mr Lesabane Tumisho
Herman Financial Mangement Intern
K2014276834
16. Ms Lebelo Cynthia
Maskosana Internal Audit Intern
Mantshe Trading Enterprise
17. Ms Nekahalale Prudence ICT Officer QuimEssential Palace
18. Mr Ledwaba Mapitsela
Goeffren Messenger Driver Lephalale long Distance Taxi
Association
19. Ms Mabusela Kgomotso
Patricia EHP Tsobaphudi Service
20. Ms Moraka Matlhodi
Johannah PA Executive Mayor
Modukagago Projects
21. Mr Mashabane Tebogo
Emmanuel PA Chief whip Tmash Event Management
22. Mr Raseruthe Ngoako
Raymond Station Officer Babirwa Ba Mmangoato
23. Mr Chokwe Letlhogonolo
Sabatha Control Room Operator
DCSK Company
24. Ms Nogilana-
Raphela Patricia Feziwe Manager: CSSS Lubalalo Bricks Development and
Business Projects
COUNCILORS
No. Title Councilor Name Designation Company Name
1 MS Laubscher Nadine Councillor Fiinvest Financial Services
2 Mr Hlungwane Freddy SELLO Councillor Hlungwane Group (PTY)LTD
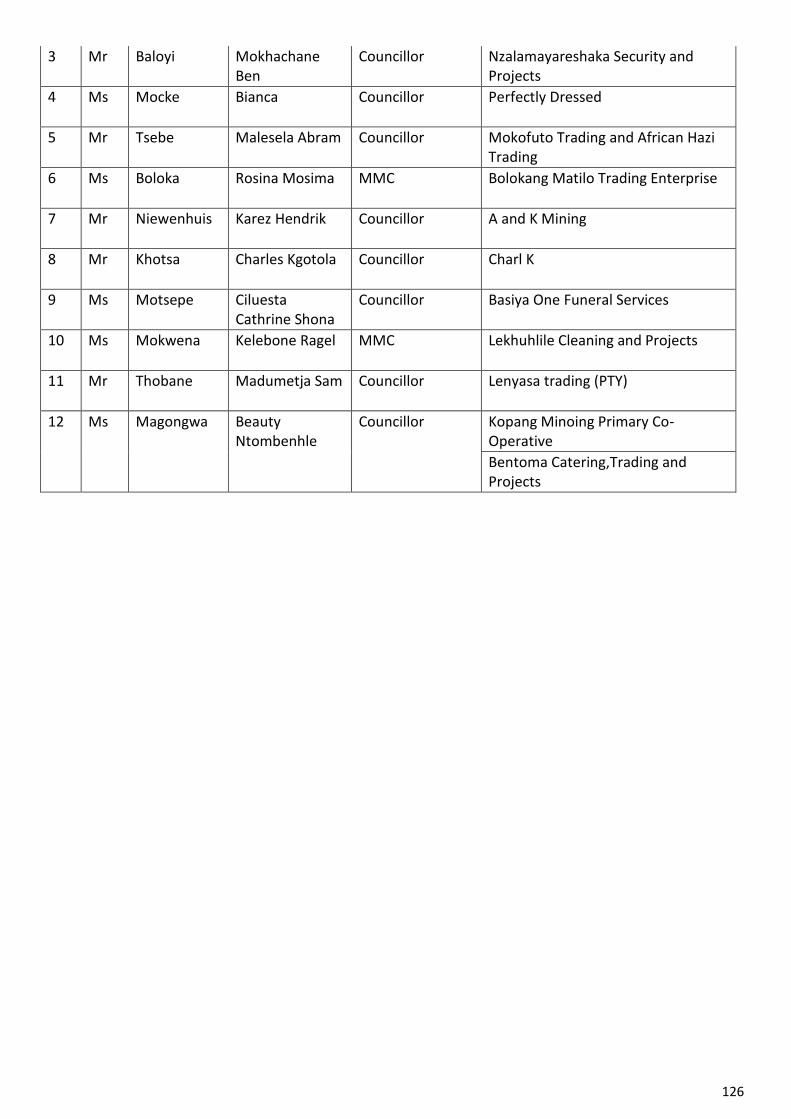
126
3 Mr Baloyi Mokhachane Ben
Councillor Nzalamayareshaka Security and Projects
4 Ms Mocke Bianca Councillor Perfectly Dressed
5 Mr Tsebe Malesela Abram Councillor Mokofuto Trading and African Hazi Trading
6 Ms Boloka Rosina Mosima MMC Bolokang Matilo Trading Enterprise
7 Mr Niewenhuis Karez Hendrik Councillor A and K Mining
8 Mr Khotsa Charles Kgotola Councillor Charl K
9 Ms Motsepe Ciluesta Cathrine Shona
Councillor Basiya One Funeral Services
10 Ms Mokwena Kelebone Ragel MMC Lekhuhlile Cleaning and Projects
11 Mr Thobane Madumetja Sam Councillor Lenyasa trading (PTY)
12 Ms Magongwa Beauty Ntombenhle
Councillor Kopang Minoing Primary Co-Operative
Bentoma Catering,Trading and Projects
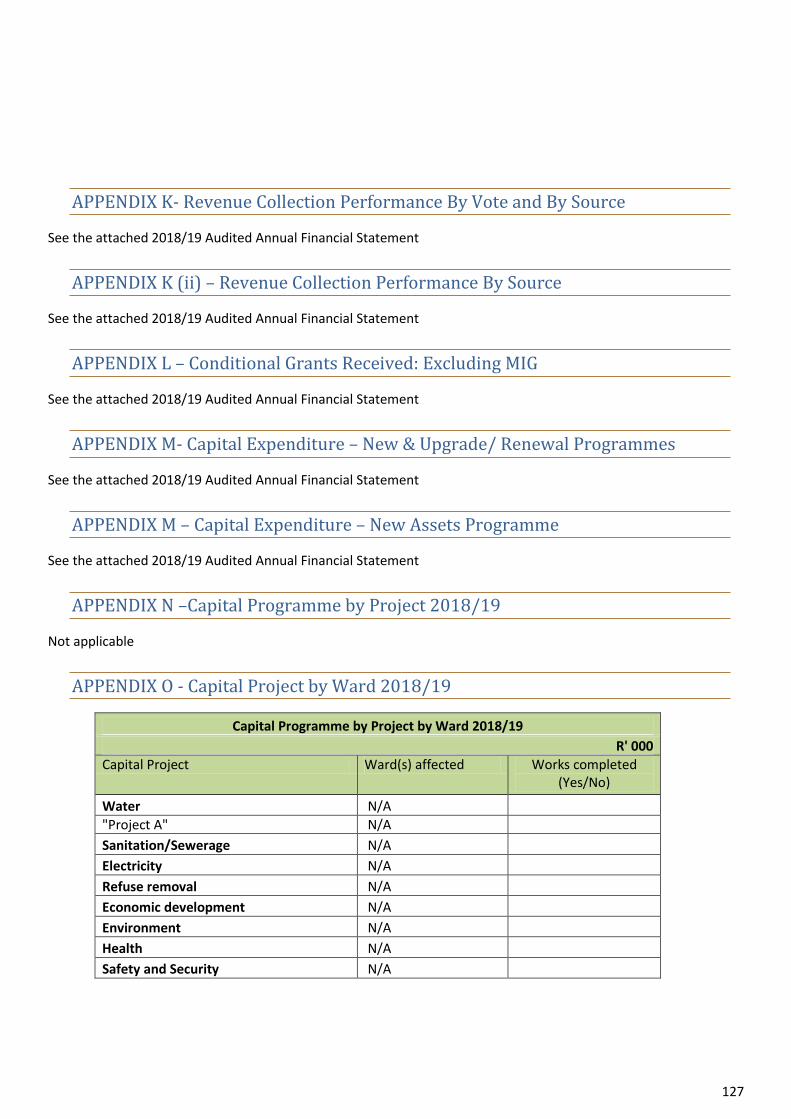
127
APPENDIX K- Revenue Collection Performance By Vote and By Source
See the attached 2018/19 Audited Annual Financial Statement
APPENDIX K (ii) – Revenue Collection Performance By Source
See the attached 2018/19 Audited Annual Financial Statement
APPENDIX L – Conditional Grants Received: Excluding MIG
See the attached 2018/19 Audited Annual Financial Statement
APPENDIX M- Capital Expenditure – New & Upgrade/ Renewal Programmes
See the attached 2018/19 Audited Annual Financial Statement
APPENDIX M – Capital Expenditure – New Assets Programme
See the attached 2018/19 Audited Annual Financial Statement
APPENDIX N –Capital Programme by Project 2018/19
Not applicable
APPENDIX O - Capital Project by Ward 2018/19
Capital Programme by Project by Ward 2018/19
R' 000
Capital Project Ward(s) affected Works completed (Yes/No)
Water N/A
"Project A" N/A
Sanitation/Sewerage N/A
Electricity N/A
Refuse removal N/A
Economic development N/A
Environment N/A
Health N/A
Safety and Security N/A
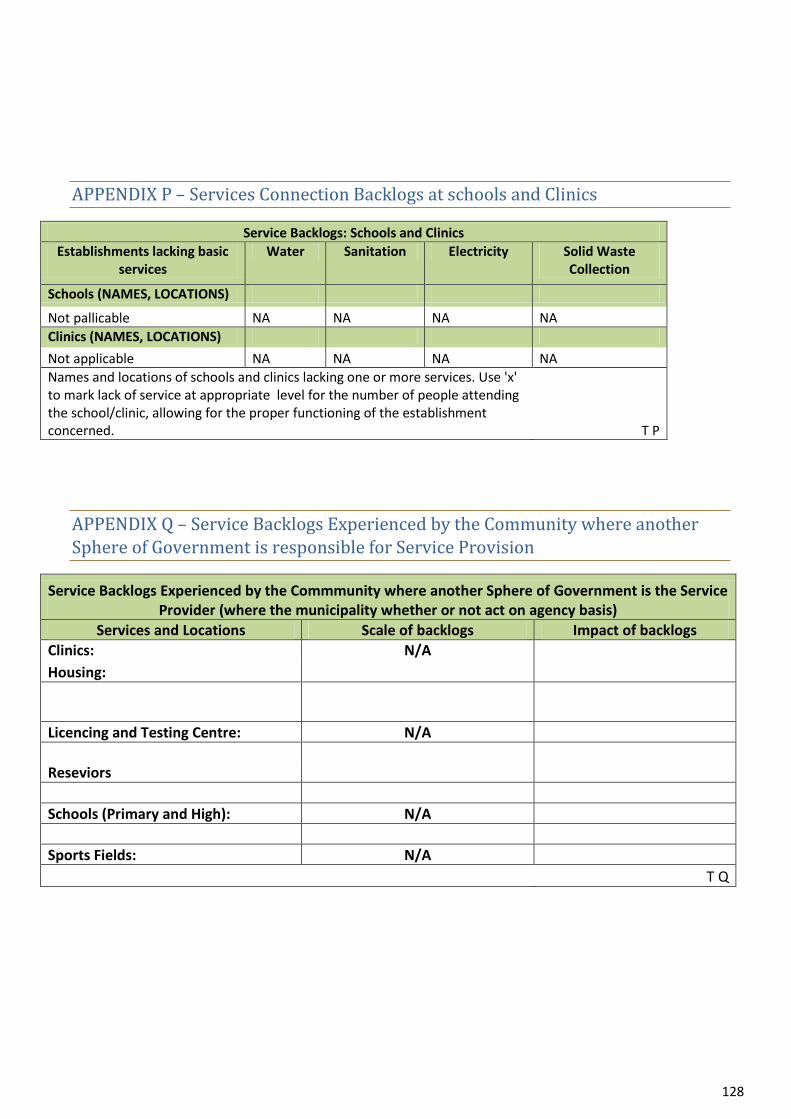
128
APPENDIX P – Services Connection Backlogs at schools and Clinics
Service Backlogs: Schools and Clinics
Establishments lacking basic services
Water Sanitation Electricity Solid Waste Collection
Schools (NAMES, LOCATIONS)
Not pallicable NA NA NA NA
Clinics (NAMES, LOCATIONS)
Not applicable NA NA NA NA
Names and locations of schools and clinics lacking one or more services. Use 'x' to mark lack of service at appropriate level for the number of people attending the school/clinic, allowing for the proper functioning of the establishment concerned. T P
APPENDIX Q – Service Backlogs Experienced by the Community where another Sphere of Government is responsible for Service Provision
Service Backlogs Experienced by the Commmunity where another Sphere of Government is the Service Provider (where the municipality whether or not act on agency basis)
Services and Locations Scale of backlogs Impact of backlogs
Clinics: N/A
Housing:
Licencing and Testing Centre: N/A
Reseviors
Schools (Primary and High): N/A
Sports Fields: N/A
T Q
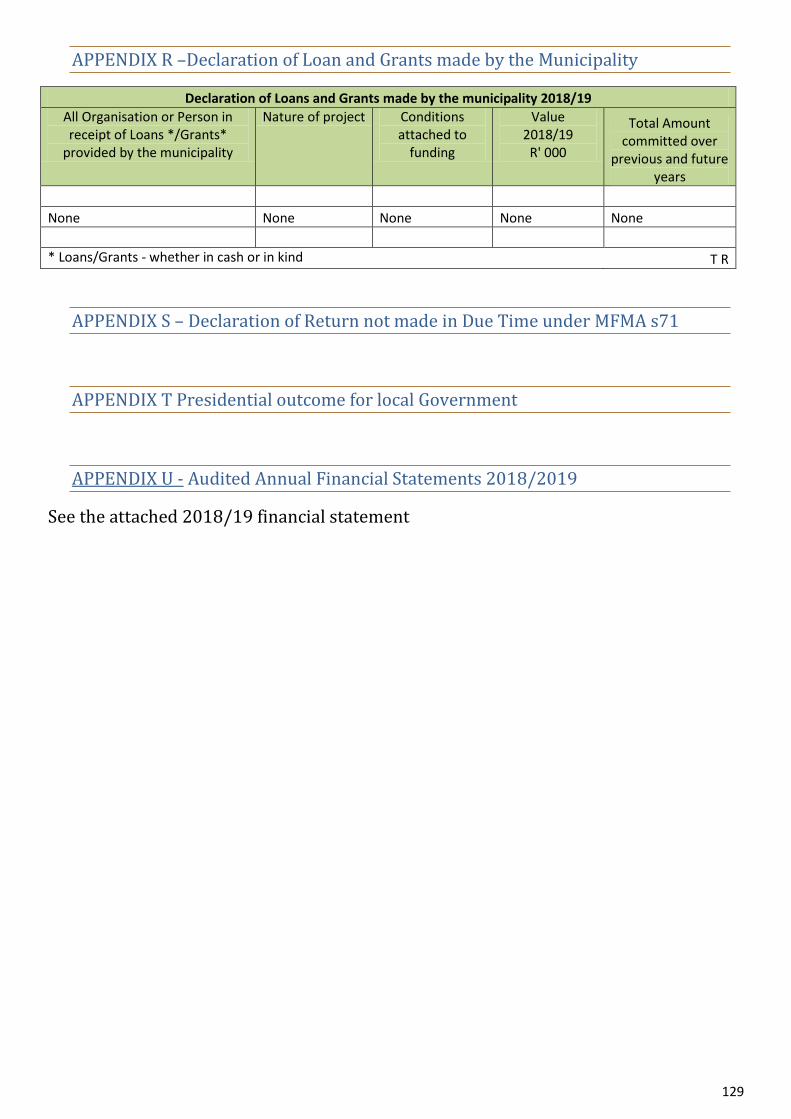
129
APPENDIX R –Declaration of Loan and Grants made by the Municipality
Declaration of Loans and Grants made by the municipality 2018/19
All Organisation or Person in receipt of Loans */Grants*
provided by the municipality
Nature of project Conditions attached to
funding
Value 2018/19
R' 000
Total Amount committed over
previous and future years
None None None None None
* Loans/Grants - whether in cash or in kind T R
APPENDIX S – Declaration of Return not made in Due Time under MFMA s71
APPENDIX T Presidential outcome for local Government
APPENDIX U - Audited Annual Financial Statements 2018/2019
See the attached 2018/19 financial statement