swartland municipality - fewlb nexus
TRANSCRIPT
Swartland Municipality
INTEGRATED DEVELOPMENT PLAN FOR 2012-2017 C O U N C I L ’ S S U S T A I N A B L E L O N G T E R M S T R A T E G Y
As revised on 30 May 2013
Swartland Municipality
INTEGRATED DEVELOPMENT PLAN FOR 2012-2017 C O U N C I L ’ S S U S T A I N A B L E L O N G T E R M S T R A T E G Y
As revised on 30 May 2013
I N T E G R A T E D D E V E L O P M E N T P L A N F O R 2 0 1 2 - 2 0 1 7 Compiled in terms of the Local Government: Municipal Systems Act, 2000 (Act 32 of 2000)
Adopted by the Municipal Council on 31 May 2012
The Integrated Development Plan is the Municipality’s principal five year strategic plan that deals with the most critical development needs of the municipal area (external focus) as well as the most critical governance needs of the organisation (internal focus).
The Integrated Development Plan – is adopted by the council within one year after a municipal election and remains in force for the council’s elected term (a period of five years); is drafted and reviewed annually in consultation with the local community as well as interested organs of state and other role players; guides and informs all planning and development, and all decisions with regard to planning, management and development; forms the framework and basis for the municipality’s medium term expenditure framework, annual budgets and performance management system; and seeks to promote integration by balancing the economic, ecological and social pillars of sustainability without compromising the institutional capacity required
in the implementation, and by coordinating actions across sectors and spheres of government.
T H E I N T E G R A T E D D E V E L O P M E N T P L A N O N C D Included with this document is a CD that contains an electronic version of the IDP. The electronic version is in a format that can be viewed by any internet browser such as Internet Explorer, Google Chrome or Firefox. The CD should run automatically and open a menu. If not, look for the file named Contents.htm in the root folder of the CD. Double click on this file and the menu will open.
All documents referred to in the IDP and available in electronic format are included on the CD. The references to these documents in the electronic version of the IDP are hyperlinked to the actual documents, which mean that the documents can also be viewed by simply clicking on the hyperlink.
The idea behind the interactive CD is to provide readers with an all-inclusive library of IDP-related documents because we believe that the IDP is more than just this one document.
We want to encourage you to look at the referenced documents on the CD – it will provide you with the bigger picture and help you to understand the full context of the IDP.
C O N T E N T S FOREWORD BY THE EXECUTIVE MAYOR FOREWORD BY THE MUNICIPAL MANAGER CHAPTER 1: INTRODUCTION AND BACKGROUND 1
1.1 Swartland municipal area at a glance 1 1.2 Context 2 1.3 Integrated Development Planning 6 1.4 Legal status of the IDP 6 1.5 The third generation IDP 6 1.6 Annual review of the IDP 7 1.7 Relationship between the IDP, budget, performance management and risk management 7 1.8 Performance management for councillors 8 1.9 The IDP and area plans 8
CHAPTER 2: THE PLANNING PROCESS 9 2.1 Roles and responsibilities 9 2.2 Five year cycle of the IDP 10 2.3 First year process followed 11 2.4 Annual process followed in 2012/2013 13
CHAPTER 3: THE ORGANISATION 14 3.1 Section 53 role clarification 14 3.2 The council and council committees 15 3.3 The administration 18
CHAPTER 4: INTERGOVERNMENTAL POLICY ALIGNMENT 19 4.1 Millennium Development Goals 19 4.2 National policy directives 20
(a) The 12 Outcomes adopted by by the Cabinet Lekgotla in January 2010 20 (b) National Development Plan (NDP) - November 2011 21 (c) National Spatial Development Perspective (NSDP) - 2006 25
4.3 Provincial policy directives 25 4.4 District Municipality IDP 28 4.5 Alignment between national, provincial and local government strategic plans 29
CHAPTER 5: SECTORAL PLANS IN TERMS OF SECTION 26 OF THE MUNICIPAL SYSTEMS ACT 30 5.1 2012 SPATIAL DEVELOPMENT FRAMEWORK - SYNOPSIS 30
(a) Vision 30 (b) Objectives 30 (c) New development areas and developments 30 (d) Cross cutting issues 33 Figure 4 36 Strategy Maps 1 to 13 37
5.2 FINANCIAL PLAN (financial sustainability plan) 47 (a) Executive summary 47 (b) Data analysis 47 (c) Legislative requirements 47 (d) Financial strategies 48 (e) Medium Term Revenue and Expenditure Framework 2012/2013 (MTREF) 48 (f) Revenue raising strategies 50 (g) Summary 62
5.3 DISASTER MANAGEMENT PLAN 64 (a) Introduction 64 (b) Legislation 64 (c) The Corporate Disaster Management Plan 64 (d) Disaster Management Framework (June 2006) 65 (e) Linkage with the integrated development plan of the Swartland Municipality 65 (f) Standard operating procedures 65 (g) Disaster management centre 65 (h) When is it a disaster? 65 (i) Disaster management in the Swartland 65 (j) Risk assessment 66 (k) New risks 68 (l) Shared responsibility for disaster management 68 (m) Nodal point for disaster management 68 (n) Funding 68
CHAPTER 6: CURRENT REALITY, OPPORTUNITIES AND CHALLENGES 70 6.1 Current reality 70
(a) Services backlogs 70 (b) Human settlements pipeline 73 (c) Prioritisation of services by ward committees 74 (d) Five year capital budget 76 (e) Major restraining factors 76
6.2 Opportunities 77 (a) The widening of the N7 77 (b) New road link between the R45 (Malmesbury/Paarl) and the R45 (Malmesbury/Hopefield) 77 (c) Extension of PPC 77 (d) Swartland regional shopping mall 78 (e) Possible new airport 78 (f) Proximity to the Cape Metropole 79 (g) Industrial development zone - Saldanha Bay 79 (h) Indoor community sport centre Wesbank 80 (i) Development of new sport fields in Riebeek West 80 (j) Urban renewal project in Malmesbury 80 (k) National Department of Environmental Affairs - EPWP project 81 (l) Conservation and tourism initiative - Dassen Island 81
6.3 Challenges 82 (a) Economic decline and poverty 82 (b) Local economic development (LED) 84 (c) Climate change 88 (d) Migration patterns 89
CHAPTER 7: THE STRATEGY 91 7.1 Vision, mission and slogan 91 7.2 Leadership philosophy and values 91 7.3 The Municipality’s five year strategy 92 7.4 Financial implications of the strategy 115 7.5 Implementation of the strategy 116
CHAPTER 8: INVOLVEMENT OF PROVINCIAL SECTOR DEPARTMENTS 117 8.1 Agriculture 117 8.2 Community Safety 117 8.3 Cultural Affairs and Sport 117 8.4 Economic Development and Tourism 118 8.5 Education 118 8.6 Environmental Affairs and Development Planning 118 8.7 Health 119 8.8 Human Settlements 119 8.9 Social Development 119 8.11 Transport and Public Works 120
ANNEXURE 1: SWARTLAND PROFILE 121 1.1 Demographics 121 1.2 Social development and well-being 123 1.3 Access to housing 126 1.4 Access to municipal services 127 1.5 Economy 131
ANNEXURE 2: EXTERNAL ANALYSIS 137 2.1 2011 Client service survey 137 2.2 Area plans 140
ANNEXURE 3: SUMMARY OF RELEVANT SECTOR PLANS AND POLICY 141
Forewords by Executive Mayor and Municipal Manager
F O R E W O R D B Y T H E E X E C U T I V E M A Y O R Many of our citizens exist in a self-perpetuating poverty trap. Very young and poor single mothers struggle to provide nutrition and basic healthcare for their children, often unaware of the basic services available to them. The inadequate availability of skills makes it hard to attract jobs to economically depressed areas, which, in turn, deprives people of employment and leaves them dependant on the state. Low incomes, poor living conditions and inadequate education levels increases the vulnerability of the poor to diseases such as HIV / Aids and tuberculosis.
After 16 yrs of democracy inequalities are growing, our life-supporting ecosystems continue to deteriorate at an alarming rate, unemployment remains high and poverty remains widespread and persists alongside affluence.
Local government is judged by its ability to deliver services, promote socio-economic development and govern effectively. As Mayor I am aware of the numerous responsibilities bestowed on the Council to bring about fundamental changes to our region that will have a positive effect on the livelihoods of all our people. Local Government is both the most intimate sphere of government and the one that impacts most on the everyday lives of citizens.
With the approval of this third generation Integrated Development Plan (IDP), Swartland Municipality is embarking on a challenging journey. This journey towards excellent local government basically consists of five steps, each representing a level of achievement, from the lowest level of ‘survival’ to a level of ‘actualisation’. I believe, however, that we cannot progress to a next more fulfilling level before the needs of the existing level have been met. The five levels are: 1. Providing excellent, democratic, transparent, and open government with zero tolerance for corruption at any level. 2. Getting the basics right. Provide for the most fundamental needs of our citizens by getting the basic service delivery right. 3. Putting heart into our communities to make them vibrant and safe. Provide excellent community facilities efficiently and effectively in order to provide places
and services through which citizens can take their opportunities. 4. Helping our citizens to be successful by enabling opportunities and driving local economic growth. 5. Creating a better future for all by taking a firmly sustainable approach to our environment.
From the Municipality’s side we will commit to: A professional service to every town, settlement and rural area; create a platform for local economic development that can result in job creation; create opportunities so that ordinary citizens can take responsibility and break free from the cycle of poverty; good financial planning and control, free of any form of corruption; the spending of municipal funds in a responsible and transparent manner; and be a productive workforce with a high work ethic and a high standard of customer care.
I wish to invite all of you – councillors, officials, citizens, business, government and non-government organisations - to become part of this journey. Join hands with us - LET’S MAKE IT HAPPEN!
Tijmen van Essen
Forewords by Executive Mayor and Municipal Manager
F O R E W O R D B Y T H E M U N I C I P A L M A N A G E R Challenges in local government have fundamentally changed the way we go about doing our business. The demands set to municipalities by national and provincial government and in the vast number of applicable Acts and Regulations are high, but the expectations of our community are even higher.
According to the 2009 State of Local Government Report most municipalities in South Africa struggle with a number of service delivery and governance problems that include: • Huge service delivery and backlog challenges • Poor communication and accountability relationships with communities • Corruption and fraud • Poor financial management • Weak civil society formations • Insufficient municipal capacity due to lack of scarce skills
Although Swartland Municipality is still functioning on a high standard in most respects, we are also faced with serious challenges. We realised that a good strategy is necessary to counter any downward trend regarding the functioning of the Municipality and to move the organisation to even greater achievements.
In consultation with a wide spectrum of public stakeholders the Municipality identified the most critical issues and risks that need to be addressed should the organisation wish to survive the challenges and continue to function effectively, efficiently and economical. This process led to the formulation of seven strategic outcomes (what we wish to achieve): • A financially sustainable municipality with well maintained assets • Satisfied, involved and well informed clients • An effective, efficient, motivated and appropriately skilled work force • Access to affordable and reliable municipal infrastructure • Sustainable development of the municipal area (with special emphasis on previously neglected areas) • A lean, integrated, stable and corruption free organisation • Increased community safety through traffic policing, by-law enforcement and disaster management
These strategic outcomes form the core of the Municipality’s strategy in Chapter 7 of this document. Here the strategic outcomes are unpacked into outputs, actions, processes, key performance indicators and targets. This is what the Municipality will focus on over the five year term of this Integrated Development Plan. The strategy in Chapter 7 will become a standard item on the agenda of Top Management in order to continuously monitor the success of processes, actions and outputs in the achievement of the seven strategic outcomes.
I wish to thank every person who contributed to the compilation of this document and especially the strategy in Chapter 7. We now need every role player, whether a councillor, member of the public or an official, to support the Municipality in its difficult journey over the next five years.
Joggie Scholtz

Chapter 1: Introduction and background
1
C H A P T E R 1 : I N T R O D U C T I O N A N D B A C K G R O U N D
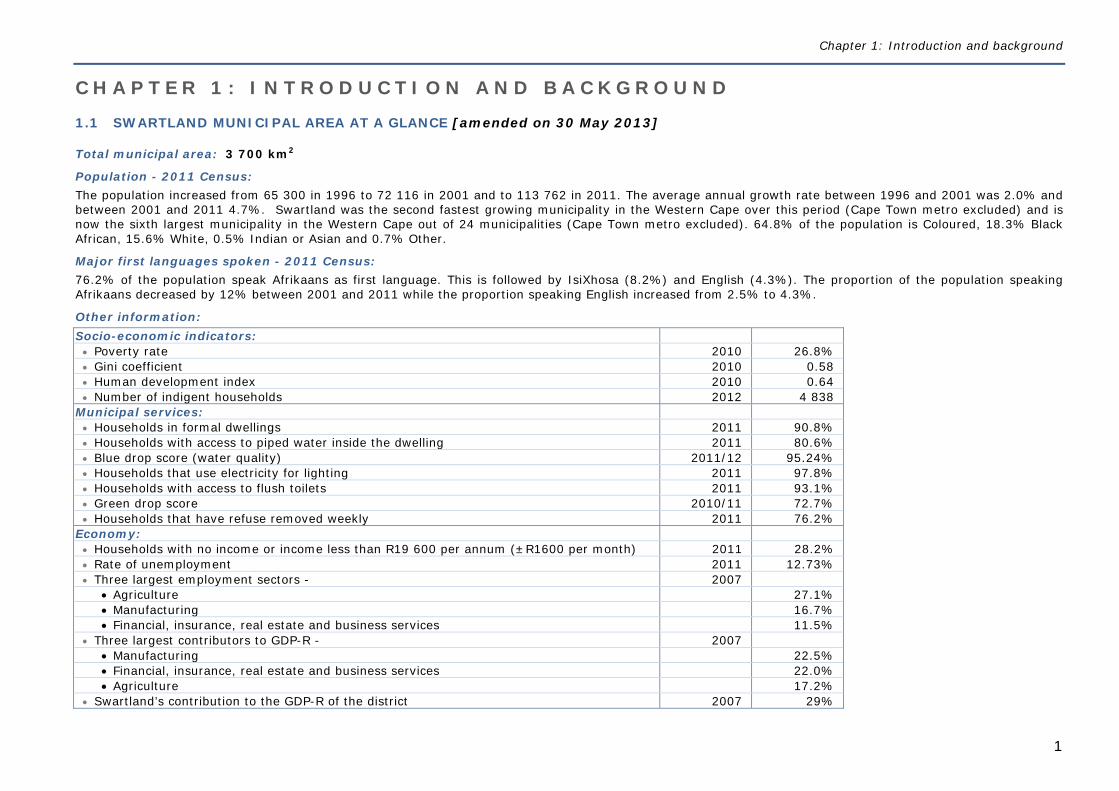
1.1 SWARTLAND MUNICIPAL AREA AT A GLANCE [amended on 30 May 2013]
Total municipal area: 3 700 km2
Population - 2011 Census: The population increased from 65 300 in 1996 to 72 116 in 2001 and to 113 762 in 2011. The average annual growth rate between 1996 and 2001 was 2.0% and between 2001 and 2011 4.7%. Swartland was the second fastest growing municipality in the Western Cape over this period (Cape Town metro excluded) and is now the sixth largest municipality in the Western Cape out of 24 municipalities (Cape Town metro excluded). 64.8% of the population is Coloured, 18.3% Black African, 15.6% White, 0.5% Indian or Asian and 0.7% Other.
Major first languages spoken - 2011 Census: 76.2% of the population speak Afrikaans as first language. This is followed by IsiXhosa (8.2%) and English (4.3%). The proportion of the population speaking Afrikaans decreased by 12% between 2001 and 2011 while the proportion speaking English increased from 2.5% to 4.3%.
Other information: Socio-economic indicators: Poverty rate 2010 26.8% Gini coefficient 2010 0.58 Human development index 2010 0.64 Number of indigent households 2012 4 838
Municipal services: Households in formal dwellings 2011 90.8% Households with access to piped water inside the dwelling 2011 80.6% Blue drop score (water quality) 2011/12 95.24% Households that use electricity for lighting 2011 97.8% Households with access to flush toilets 2011 93.1% Green drop score 2010/11 72.7% Households that have refuse removed weekly 2011 76.2%
Economy: Households with no income or income less than R19 600 per annum (±R1600 per month) 2011 28.2% Rate of unemployment 2011 12.73% Three largest employment sectors - 2007
Agriculture 27.1% Manufacturing 16.7% Financial, insurance, real estate and business services 11.5%
Three largest contributors to GDP-R - 2007 Manufacturing 22.5% Financial, insurance, real estate and business services 22.0% Agriculture 17.2%
Swartland’s contribution to the GDP-R of the district 2007 29%
Integrated Development Plan for 2012-2017
2
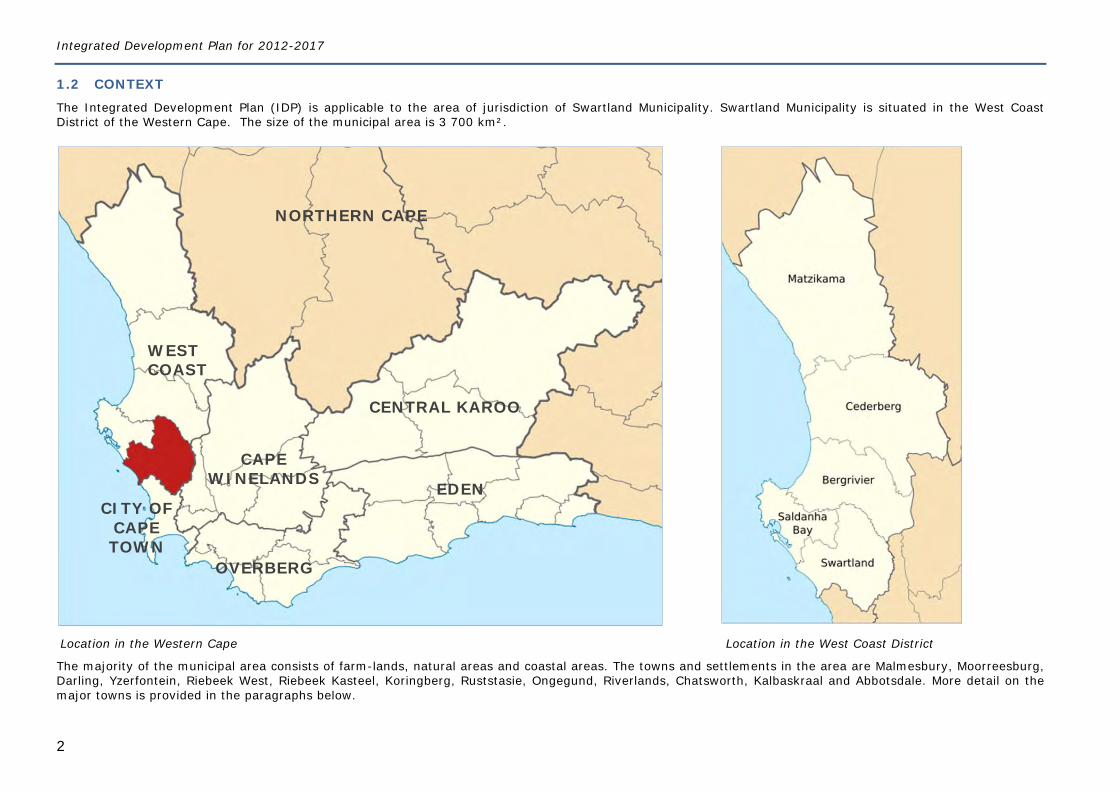
1.2 CONTEXT The Integrated Development Plan (IDP) is applicable to the area of jurisdiction of Swartland Municipality. Swartland Municipality is situated in the West Coast District of the Western Cape. The size of the municipal area is 3 700 km².
Location in the Western Cape Location in the West Coast District
The majority of the municipal area consists of farm-lands, natural areas and coastal areas. The towns and settlements in the area are Malmesbury, Moorreesburg, Darling, Yzerfontein, Riebeek West, Riebeek Kasteel, Koringberg, Ruststasie, Ongegund, Riverlands, Chatsworth, Kalbaskraal and Abbotsdale. More detail on the major towns is provided in the paragraphs below.
NORTHERN CAPE
CENTRAL KAROO
EDEN
CAPE WINELANDS
OVERBERG
WEST COAST
CITY OF CAPE TOWN
Chapter 1: Introduction and background
3
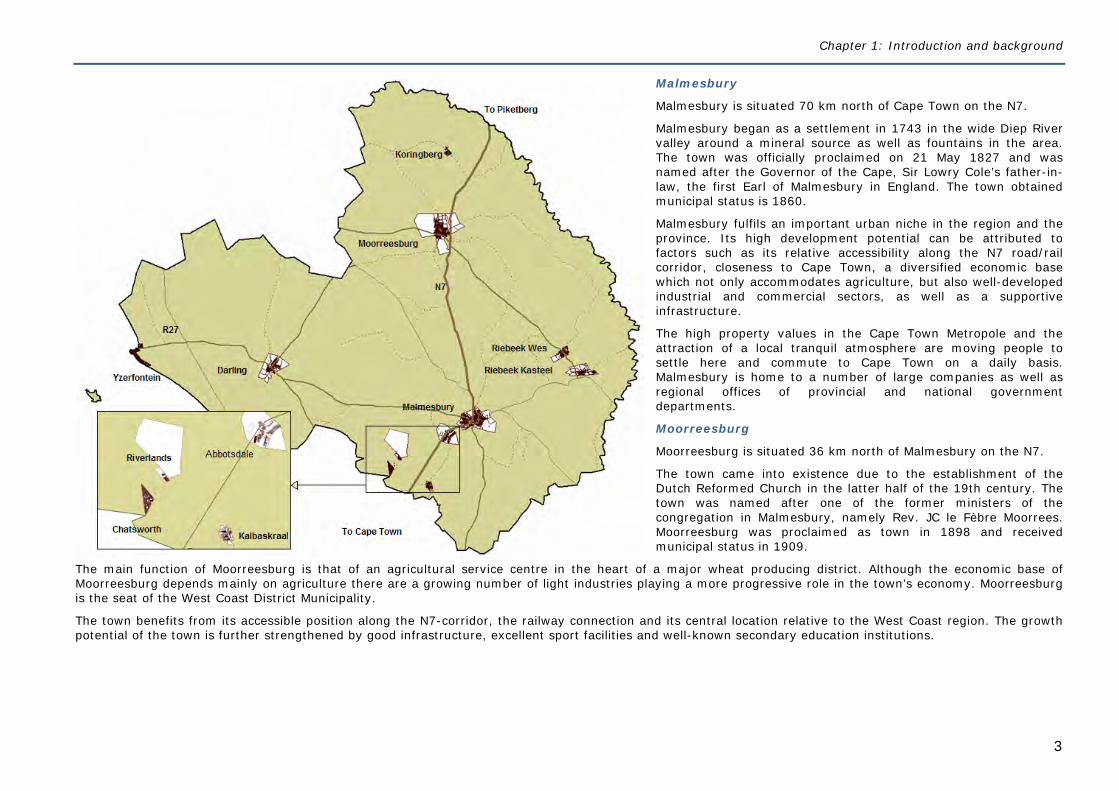
Malmesbury
Malmesbury is situated 70 km north of Cape Town on the N7.
Malmesbury began as a settlement in 1743 in the wide Diep River valley around a mineral source as well as fountains in the area. The town was officially proclaimed on 21 May 1827 and was named after the Governor of the Cape, Sir Lowry Cole’s father-in-law, the first Earl of Malmesbury in England. The town obtained municipal status is 1860.
Malmesbury fulfils an important urban niche in the region and the province. Its high development potential can be attributed to factors such as its relative accessibility along the N7 road/rail corridor, closeness to Cape Town, a diversified economic base which not only accommodates agriculture, but also well-developed industrial and commercial sectors, as well as a supportive infrastructure.
The high property values in the Cape Town Metropole and the attraction of a local tranquil atmosphere are moving people to settle here and commute to Cape Town on a daily basis. Malmesbury is home to a number of large companies as well as regional offices of provincial and national government departments.
Moorreesburg
Moorreesburg is situated 36 km north of Malmesbury on the N7.
The town came into existence due to the establishment of the Dutch Reformed Church in the latter half of the 19th century. The town was named after one of the former ministers of the congregation in Malmesbury, namely Rev. JC le Fèbre Moorrees. Moorreesburg was proclaimed as town in 1898 and received municipal status in 1909.
The main function of Moorreesburg is that of an agricultural service centre in the heart of a major wheat producing district. Although the economic base of Moorreesburg depends mainly on agriculture there are a growing number of light industries playing a more progressive role in the town’s economy. Moorreesburg is the seat of the West Coast District Municipality.
The town benefits from its accessible position along the N7-corridor, the railway connection and its central location relative to the West Coast region. The growth potential of the town is further strengthened by good infrastructure, excellent sport facilities and well-known secondary education institutions.
Integrated Development Plan for 2012-2017
4
Darling
Darling is situated 78 km north of Cape Town and 37 km west of Malmesbury.
By the beginning of the 18th century about 29 farmers lived in an area called Groenkloof and on one of these farms, Langfontein. It is on this farm that Darling was established in 1853. The town was named after Charles Henry Darling who came to the Cape in 1851 as Lieutenant Governor. The first erven (between 300 and 400) were auctioned on 5 October 1853. The first Dutch Reformed Church was built in 1857, the school in 1896 and the town hall in 1899.
The economy of Darling is related to agriculture and is sometimes described as the milk and vegetable barn of Cape Town. A number of light industries provide some job opportunities, but tourism is becoming more and more a stronghold in the local urban economy. The particular place identity (‘branding’) of Darling is linked with its annual veld-flower and orchid show, art galleries, Evita’s Perron and private nature reserves.
Yzerfontein
Yzerfontein is situated 88 km north of Cape Town on the R27 and 63 km west of Malmesbury.
In 1739 an area known as Groenekloof (the area from Koeberg in the south to Saldanha in the north) was subdivided into 46 farms of which Yzerfontein was one. The original Yzerfontein town was established in 1935 when a portion of the farm Yzerfontein was subdivided into approximately 330 erven. Between the 1970’s en 1990’s a further 1523 erven were proclaimed. Yzerfontein fast developed into the sought-after coastal town that it is today. Although many of the permanent residents are retired, there are a substantial number of residents working in Cape Town and other centres who travel daily.
The economy is based on the development of local tourism, holiday/weekend house developments, as well as a retirement function. With the exception of a few restaurants, cafes and a number of guest houses, the business sector is weakly developed. Purchasing power goes mostly to Darling, Vredenburg and the Metropole. The town has limited harbour facilities which are mainly used for water recreation.
Riebeek West and Riebeek Kasteel
Riebeek Kasteel is situated 88 km north-east of Cape Town and 24 km east of Malmesbury. Riebeek West is 6 km north of Riebeek Kasteel.
Willem Adriaan van der Stel who became governor in 1699 opened up a new area for free burghers (which included the Riebeek Valley). He called this area Land of the Waveren. Some of the first farmers were Huguenots. This led to the early establishment of vineyards along with wheat and other fruit crops. The original settlers were joined by others in the 1730's and 40's and the area under the mountain became a sparsely populated farming community. Over the years Riebeek Kasteel became inhabited by wagon makers and other artisans while retired farmers settled in Riebeek West.
The towns have a rural village character and a beautiful environment, and this contributes to their popularity as retirement and tourist destinations (especially as weekend and holiday homes). The PPC cement works is situated close to Riebeek-Wes and generated to some extent a mining and related commercial setting.
Chapter 1: Introduction and background
5
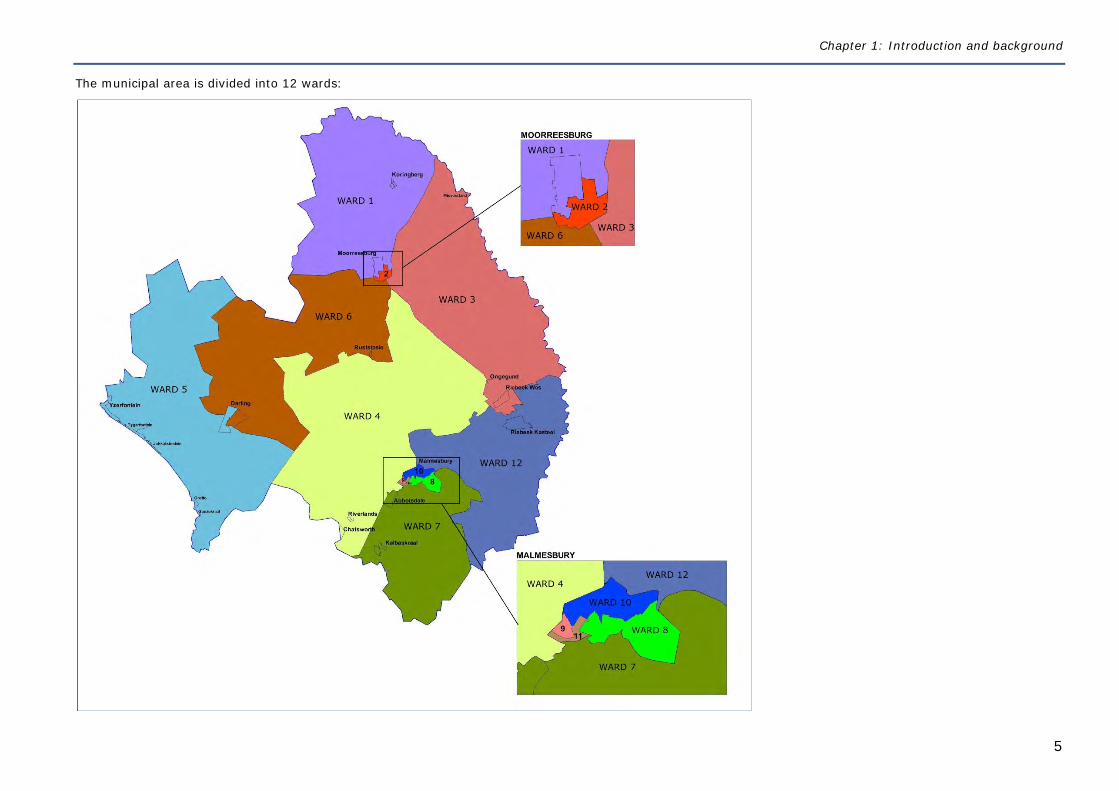
The municipal area is divided into 12 wards:
Integrated Development Plan for 2012-2017
6
1.3 INTEGRATED DEVELOPMENT PLANNING Integrated development planning is the key tool for local government to cope with its role and function in terms of the SA Constitution and other applicable legislation. In contrast to the role municipal strategic planning has played in the past, integrated development planning is now seen as a function of municipal management, as part of an integrated system of planning and delivery. The IDP process is meant to arrive at decisions on issues such as municipal budget priorities, land management, social and economic development and institutional transformation in a consultative, systematic and strategic manner.
The integrated development planning process has to provide a forum for identifying, discussing and resolving the real issues in a municipality (which may be over-arching issues for the whole municipality, as well as issues of specific communities or stakeholder groups) to a level of detail which is required for realistic costing and which helps manage the implementation process without much delay.
The Integrated Development Plan (IDP) is the Municipality’s principal strategic plan that deals with the most critical development needs of the municipal area (external focus) as well as the most critical governance needs of the organisation (internal focus).
The IDP – is adopted by the council within one year after a municipal election and remains in force for the council’s elected term (a period of five years); is drafted and reviewed annually in consultation with the local community as well as interested organs of state and other role players; guides and informs all planning and development, and all decisions with regard to planning, management and development; forms the framework and basis for the municipality’s medium term expenditure framework, annual budgets and performance management system; and seeks to promote integration by balancing the economic, ecological and social pillars of sustainability without compromising the institutional capacity required in
the implementation, and by coordinating actions across sectors and spheres of government.
1.4 LEGAL STATUS OF THE IDP In terms of Section 35(1) of the Municipal Systems Act No 32 of 2000 an IDP adopted by the council of a municipality- (a) is the principal strategic planning instrument which guides and informs all planning and development, and all decisions with regard to planning, management
and development, in the municipality; (b) binds the municipality in the exercise of its executive authority, except to the extent of any inconsistency between a municipality’s integrated development
plan and national or provincial legislation, in which case such legislation prevails; and (c) binds all other persons to the extent that those parts of the integrated development plan that impose duties or affect the rights of those persons have been
passed as a by-law.
1.5 THE THIRD GENERATION IDP The first generation IDP’s dealt with the period 2002-2007 and the second generation IDP’s with the period 2007-2012. Municipalities entered the third five year IDP cycle with the municipal elections in May 2011. The new council that was constituted after the elections immediately started preparing a new five year IDP. This third generation IDP will be effective from 1 July 2012 up to 30 June 2017.
Municipalities are encouraged and supported by both national and provincial government to develop realistic and credible IDP’s that not only comply with relevant legislation but also - are owned by local leadership, municipal management and community as the single strategic plan to direct resources within the municipality; are driven by the management team and systems within the municipality with implementation regularly monitored during the year through the performance
management system; contain a long term development strategy that can guide investment across the municipal area;
Chapter 1: Introduction and background
7
provide an investment plan for national, provincial and local government and non-governmental stakeholders to enhance and enable joint planning and resource alignment to improve service delivery to all stakeholders; and
include local area plans to localise the strategy and implementation of the IDP.
1.6 ANNUAL REVIEW OF THE IDP The IDP has to be reviewed annually. The review process serves as an institutional learning process where stakeholders can meet to discuss the successes and frustrations of the past year. It is not designed to interfere with the long-term strategic orientation of the municipality to accommodate new whims and additional demands. It remains a strategic process of ensuring the institution remains in touch with their intentions and the environment within which it functions.
Although the implementation of the IDP is monitored through the performance management system, an annual process is required to check the relevance of the strategic plan within a dynamic environment.
The IDP has to be reviewed annually in order to - ensure its relevance as the Municipality’s strategic plan; inform other components of the Municipal business process including institutional and financial planning and budgeting; and inform the cyclical inter-governmental planning and budgeting cycle.
The purpose of a review is to - reflect and report on progress made with respect to the five year strategy (and key outcomes) in the IDP; make adjustments to the strategy in the 5 year IDP necessary because of changing internal and external circumstances that impact on the appropriateness of
the IDP; determine annual targets and activities for the next financial year in line with the five year strategy; and inform the Municipality’s financial and institutional planning and most importantly, the drafting of the annual budget.
1.7 RELATIONSHIP BETWEEN THE IDP, BUDGET, PERFORMANCE MANAGEMENT AND RISK MANAGEMENT In terms of the Performance Management Guide for Municipalities, DPLG, 2001 “the IDP process and performance management process should appear to be seamlessly integrated. The IDP fulfils the planning stage of performance management. Performance management fulfils the implementation management, monitoring and evaluation of the IDP process”.
Integrated Development Planning was introduced as the strategic management tool to realise the developmental role of local government. Performance management, on the other hand, is a management tool introduced to facilitate the implementation of the IDP, and as such forms an integral part of the IDP.
The budget attaches money to the IDP objectives and this is monitored through the service delivery and budget implementation plan (SDBIP). The budget makes the implementation of the IDP possible and the IDP provides the strategic direction for the budget.
Risk Management is one of Management’s core responsibilities according to section 62 of the Municipal Finance Management Act (MFMA) and is an integral part of the internal processes of a municipality. It is a systematic process to identify, evaluate and address risks on a continuous basis before such risks can impact negatively on the service delivery capacity of the Swartland Municipality. When properly executed risk management provides reasonable assurance that the institution will be successful in achieving its goals and objectives.
In Swartland Municipality risk management is now also fully integrated with the IDP and the risks are linked to the strategic outcomes.
Integrated Development Plan for 2012-2017
8
1.8 PERFORMANCE MANAGEMENT FOR COUNCILLORS Although not a statutory requirement and not linked to the strategic objectives in the IDP, the performance of councillors is being measured from January 2010. All councillors participate in this performance management exercise on a voluntary basis with no bonuses involved. It does not venture on the party political domain and only measures councillors’ performance in their capacity as legitimately elected members of the Swartland Municipal Council.
In the search for performance indicators the following acts and documents were used: ACTS: Municipal Systems Act No 32 of 2000 Municipal Structures Act No 117 of 1998 Municipal Finance Management Act No 56 of 2003
DOCUMENTS: Improving Government Performance: Our Approach, Presidency, 2009 Policy Framework for the Government-wide Monitoring & Evaluation System, Presidency, 2007 Performance Management Guide for Municipalities, Department of Provincial and Local Government, 2001 Handbook for Municipal Councillors, SALGA, 2006
Performance management for councillors was approved at a council meeting held on 26 November 2009 and was implemented from 1 January 2010.
1.9 THE IDP AND AREA PLANS Area plans which are compiled for the different towns and settlements in the Swartland area include: an understanding of social diversity in the community, the assets, vulnerabilities and preferences of these different social groups; an analysis of the services available to these groups, as well as the strengths, weaknesses, opportunities and threats facing the community a consensus on priorities for the relevant ward(s); plans to address these priorities, based on what the ward will do, the support needed from the municipality, and support from other organisations; identification of projects for the IDP; and an action plan for the ward committee to take forward their plan and help communities to reach consensus and to have direction.
Area plans help to ensure that the IDP is more targeted and relevant to addressing the priorities of all groups, including the most vulnerable. Area plans provide ward committees with a systematic planning and implementation process to perform their roles and responsibilities. Area plans will also be used by ward committees for monitoring and evaluation which gives the committees an ongoing role through the year.
The area plans that form attachments to this IDP should be regarded as part and parcel of this plan. It is therefore important to note that the area plans contain information used in defining the Municipality’s long term strategy, but that is not duplicated in the IDP. In future area plans will form the basis for dialogue between the Municipality and ward committees regarding the identification of priorities and budget requests.
Chapter 2: The planning process
9
C H A P T E R 2 : T H E P L A N N I N G P R O C E S S
2.1 ROLES AND RESPONSIBILITIES
(a) Municipal Council
The Council is the ultimate decision-making authority. Decisions to approve or amend the municipality's integrated development plan (IDP) may not be delegated and have to be taken by the full Council.
(b) Executive Mayor
In terms of the Municipal Systems Act and the Municipal Finance Management Act the Executive Mayor must- manage the drafting of the IDP; assign responsibilities in this regard to the municipal manager; submit the draft plan to the municipal council for adoption; and co-ordinate the annual revision of the IDP and determine how the IDP is to be taken into account or revised for the purposes of the budget.
(c) Swartland Municipal Advisory Forum
The Swartland Municipal Advisory Forum (SMAF) functions as the IDP Representative Forum and comprises of two members from each ward committee (24 members) as well as any other role players or stakeholders the Executive Mayor wishes to co-opt onto the Forum for one or more meetings or for a specific purpose. The SMAF advises the Executive Mayor on matters relating to the IDP. It does not have any decision making powers.
Although ward committees provide for representation of communities on a geographical basis, there are also a number of sector interests not covered by ward committees that play a major role within the municipal area, such as education, business and agriculture. Liaison with and involvement of such sector groups is therefore also crucial in order to get a full picture of the current reality in our area. Liaison with sector groups is done mainly through the SMAF and workshops.
(d) Ward Committees
The role of the Ward Committees with respect to the IDP is to - assist the ward councillor (who is the chairperson) in identifying challenges and needs of residents; provide a mechanism for discussion and negotiation between different stakeholders in the ward; interact with other forums and organisations on matters affecting the ward; draw up a ward plan that offers suggestions on how to improve service delivery in the particular ward; disseminate information in the ward; and monitor the implementation process concerning its area.
(e) Municipal Manager
The municipal manager, together with the Strategic Manager and Directors, forms the steering committee that is responsible for the design and execution of all arrangements regarding the compilation of the IDP.
He also is, subject to the policy directions of the municipal council, responsible and accountable for-
Integrated Development Plan for 2012-2017
10
the implementation of the IDP and the monitoring of progress with implementation of the plan; and the formation and development of an administration equipped to carry out the task of implementing the IDP.
(f) Heads of Departments and Officials
Their role is to - provide relevant technical, sector and financial information for analysis for determining priority issues; contribute technical expertise in the consideration and finalisation of strategies and identification of projects; and provide departmental operational and capital budgetary information.
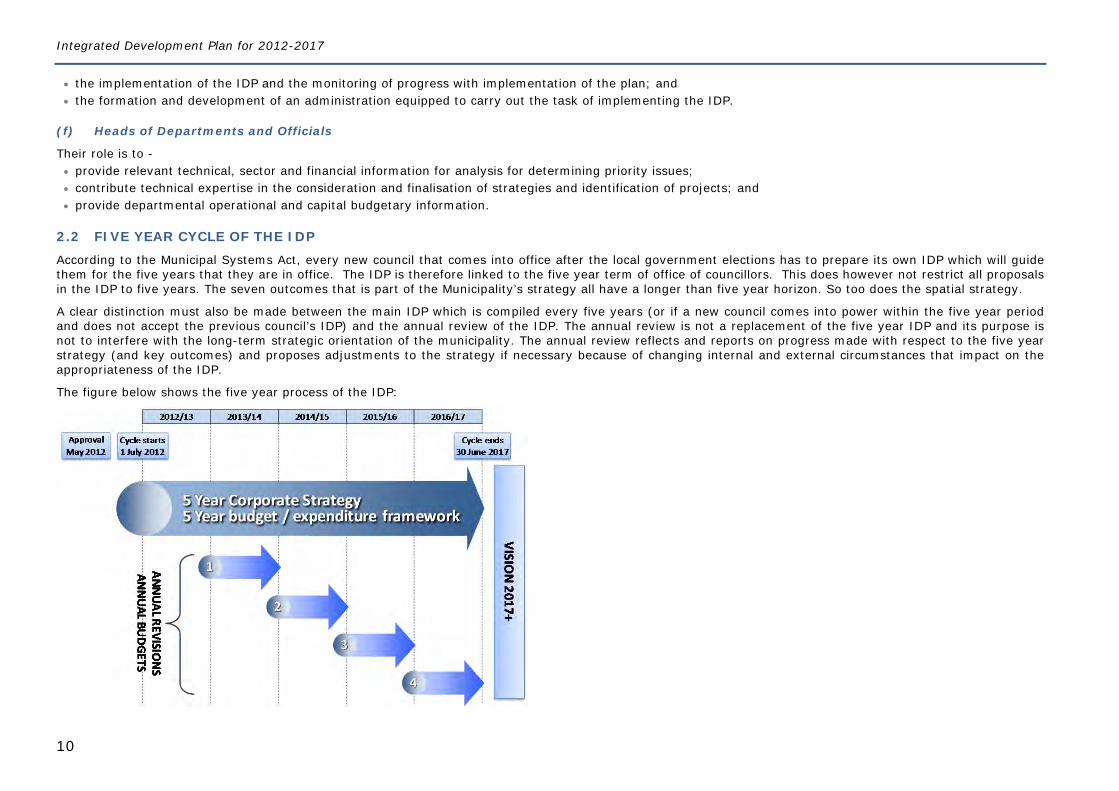
2.2 FIVE YEAR CYCLE OF THE IDP According to the Municipal Systems Act, every new council that comes into office after the local government elections has to prepare its own IDP which will guide them for the five years that they are in office. The IDP is therefore linked to the five year term of office of councillors. This does however not restrict all proposals in the IDP to five years. The seven outcomes that is part of the Municipality’s strategy all have a longer than five year horizon. So too does the spatial strategy.
A clear distinction must also be made between the main IDP which is compiled every five years (or if a new council comes into power within the five year period and does not accept the previous council’s IDP) and the annual review of the IDP. The annual review is not a replacement of the five year IDP and its purpose is not to interfere with the long-term strategic orientation of the municipality. The annual review reflects and reports on progress made with respect to the five year strategy (and key outcomes) and proposes adjustments to the strategy if necessary because of changing internal and external circumstances that impact on the appropriateness of the IDP.
The figure below shows the five year process of the IDP:
Chapter 2: The planning process
11
2.3 FIRST YEAR PROCESS FOLLOWED
August 2011 (preparation and process)
The Process Plan and time schedule that guided the planning and drafting of this IDP was approved by Council on 25 August. An IDP Indaba was held by the Provincial Government of the Western Cape with municipalities in the West Coast District. The purpose of the Indaba was
mainly to provide Provincial guidance and dialogue on provincial policies and programmes and to create a platform for alignment between the three spheres of government.
The election of ward committee members commenced.
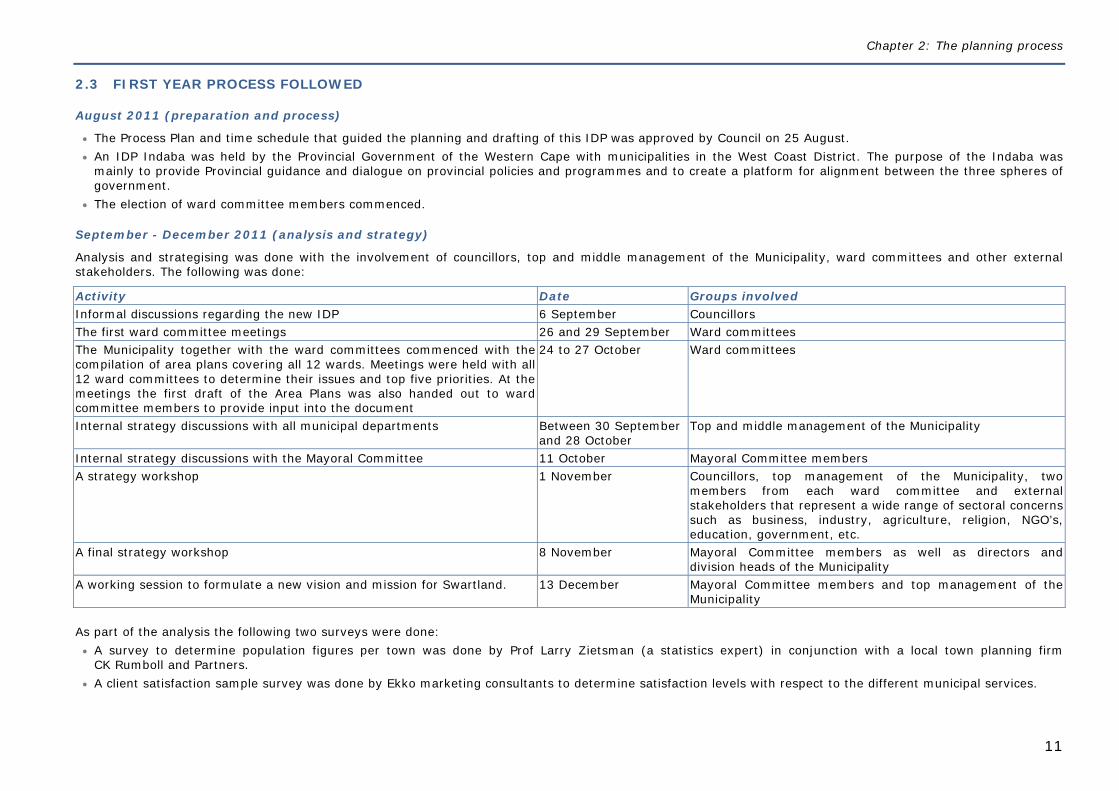
September - December 2011 (analysis and strategy)
Analysis and strategising was done with the involvement of councillors, top and middle management of the Municipality, ward committees and other external stakeholders. The following was done:
Activity Date Groups involved Informal discussions regarding the new IDP 6 September Councillors The first ward committee meetings 26 and 29 September Ward committees The Municipality together with the ward committees commenced with the compilation of area plans covering all 12 wards. Meetings were held with all 12 ward committees to determine their issues and top five priorities. At the meetings the first draft of the Area Plans was also handed out to ward committee members to provide input into the document
24 to 27 October Ward committees
Internal strategy discussions with all municipal departments Between 30 September and 28 October
Top and middle management of the Municipality
Internal strategy discussions with the Mayoral Committee 11 October Mayoral Committee members A strategy workshop 1 November Councillors, top management of the Municipality, two
members from each ward committee and external stakeholders that represent a wide range of sectoral concerns such as business, industry, agriculture, religion, NGO’s, education, government, etc.
A final strategy workshop 8 November Mayoral Committee members as well as directors and division heads of the Municipality
A working session to formulate a new vision and mission for Swartland. 13 December Mayoral Committee members and top management of the Municipality
As part of the analysis the following two surveys were done: A survey to determine population figures per town was done by Prof Larry Zietsman (a statistics expert) in conjunction with a local town planning firm
CK Rumboll and Partners. A client satisfaction sample survey was done by Ekko marketing consultants to determine satisfaction levels with respect to the different municipal services.
Integrated Development Plan for 2012-2017
12
January - March 2012 (completing the draft documents)
The five year capital expenditure framework was finalised.
A second IDP Indaba was held on 16 February to focus on improving strategic alignment between municipalities and the province.
The IDP document and Area Plans were completed.
A second series of workshops were held with ward committees (this time extended to include people from the sectors which ward committee members represent) between 27 February and 5 March to finalise the area plans.
An IDP / budget integration meeting was held on 1 March with top management.
On 6 March a workshop was held with the NGO sector in Swartland to engage with them on the IDP strategy.
The IDP document and Area Plans were submitted to the Mayoral Committee on 20 March and to the Council on 29 March for consideration.
A workshop on local economic development was held on 21 March. The program for the day focused on job creation in Swartland and guest speakers included min Alan Winde (MEC Economic Development and Tourism), mr John Peters (IEDS Director) and ms Rene Whiteman (DBSA). The afternoon session took the form of an Indaba with contributions by the Municipal Manager (mr Joggie Scholtz) and the Director Development Services (mr Johan Steenkamp). Inputs from the workshop and indaba are included in the Strategy in Chapter 7 of this document.
April 2012 (community inputs and document refinement)
The draft IDP document and Area Plans were made public on 3 and 4 April and the community was invited to submit representations.
A public meeting involving all councillors, top management of the Municipality, external stakeholders and the public was held on 19 April to give feedback and to obtain inputs on the draft IDP and annual budget.
May - June 2012 (final approval)
The IDP document and Area Plans were submitted to the Mayoral Committee on 16 May and to the Council on 31 May for final approval.
A copy of the approved IDP was submitted to the MEC for local government as well as Provincial Treasury on 5 June.
Notice was given to the public of the adoption of the IDP on 13 and 14 June.
A summary of the IDP was also advertised on 13 and 14 June.
Chapter 2: The planning process
13
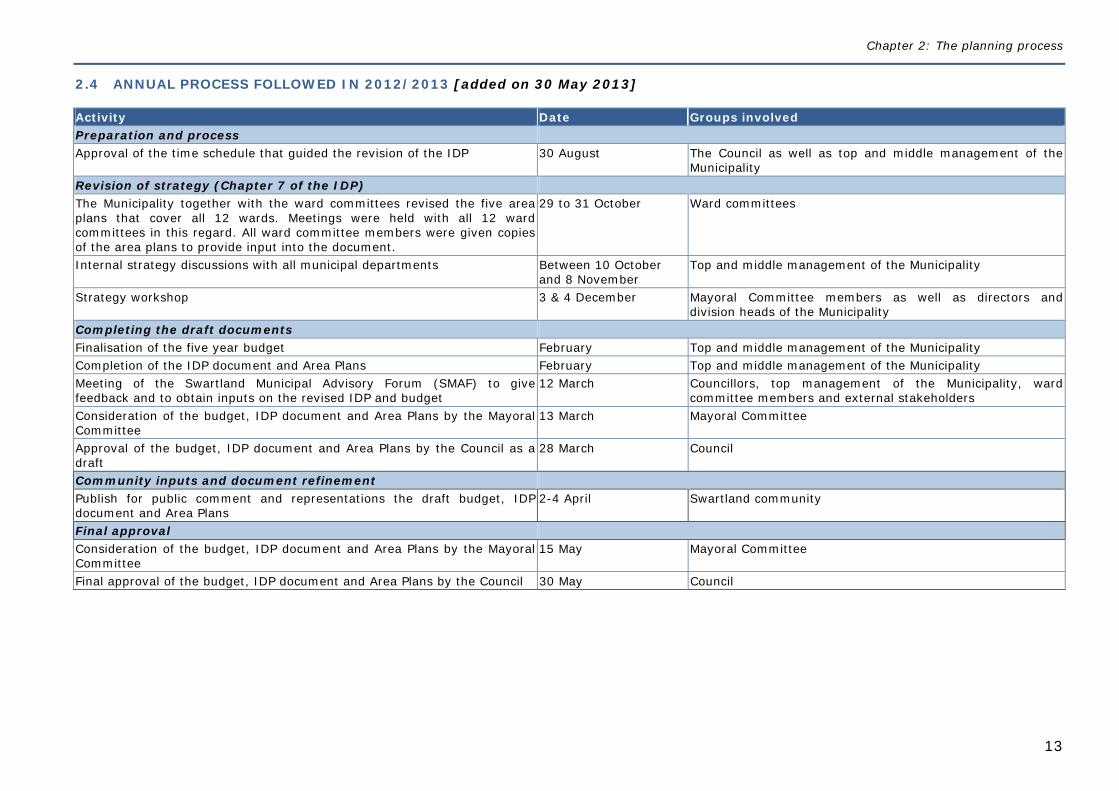
2.4 ANNUAL PROCESS FOLLOWED IN 2012/2013 [added on 30 May 2013]
Activity Date Groups involved Preparation and process Approval of the time schedule that guided the revision of the IDP 30 August The Council as well as top and middle management of the
Municipality Revision of strategy (Chapter 7 of the IDP) The Municipality together with the ward committees revised the five area plans that cover all 12 wards. Meetings were held with all 12 ward committees in this regard. All ward committee members were given copies of the area plans to provide input into the document.
29 to 31 October Ward committees
Internal strategy discussions with all municipal departments Between 10 October and 8 November
Top and middle management of the Municipality
Strategy workshop 3 & 4 December Mayoral Committee members as well as directors and division heads of the Municipality
Completing the draft documents Finalisation of the five year budget February Top and middle management of the Municipality Completion of the IDP document and Area Plans February Top and middle management of the Municipality Meeting of the Swartland Municipal Advisory Forum (SMAF) to give feedback and to obtain inputs on the revised IDP and budget
12 March Councillors, top management of the Municipality, ward committee members and external stakeholders
Consideration of the budget, IDP document and Area Plans by the Mayoral Committee
13 March Mayoral Committee
Approval of the budget, IDP document and Area Plans by the Council as a draft
28 March Council
Community inputs and document refinement Publish for public comment and representations the draft budget, IDP document and Area Plans
2-4 April Swartland community
Final approval Consideration of the budget, IDP document and Area Plans by the Mayoral Committee
15 May Mayoral Committee
Final approval of the budget, IDP document and Area Plans by the Council 30 May Council
Integrated Development Plan for 2012-2017
14
C H A P T E R 3 : T H E O R G A N I S A T I O N
3.1 SECTION 53 ROLE CLARIFICATION Section 53 of the Municipal Systems Act (Act 32 of 2000) stipulates inter alia that the respective roles and areas of responsibility of each political structure and political office bearer of the Municipality and of the municipal manager must be defined. The section below is based on the Section 53 role clarification that was approved at the council meeting of May 2011.
(a) Municipal Council
Governs by making and administrating laws, raising taxes and taking decisions that affect people’s rights; is a tax authority that may raise property taxes and service levies; is the primary decision maker and takes all the decisions of the Municipality except those that are delegated to political structures, political office bearers,
individual councillors or officials; can delegate responsibilities and duties for the purposes of fast and effective decision making; must strive towards the constitutional objects of local government; must consult the community with respect to local government matters; and is the only decision maker on non-delegated matters such as the approval of the IDP and budget.
(b) Executive Mayor
Is the executive and political leader of the Municipality and is in this capacity supported by the mayoral committee; is the social and ceremonial head of the Municipality; must identify the needs of the Municipality and must evaluate progress against key performance indicators; is the defender of the public’s right to be heard; has many responsibilities with respect to the annual budget, the budget process, budget control and various other financial matters; and performs the duties and exercise the responsibilities that were delegated to him by the council.
(c) Mayoral Committee
Its members are elected by the Executive Mayor from the ranks of councillors, with the exception of the Deputy Executive Mayor who is elected by the council and is an ex officio member of the mayoral committee;
Its functional responsibility area is linked to that of the Executive Mayor to the extend that he must operate together with the members of the mayoral committee;
Its primary task is to assist the Executive Mayor in the execution of his powers - it is in fact an “extension of the office of Executive Mayor”; and The committee has no powers of its own – decision making remains that of the Executive Mayor.
Chapter 3: The Organisation
15
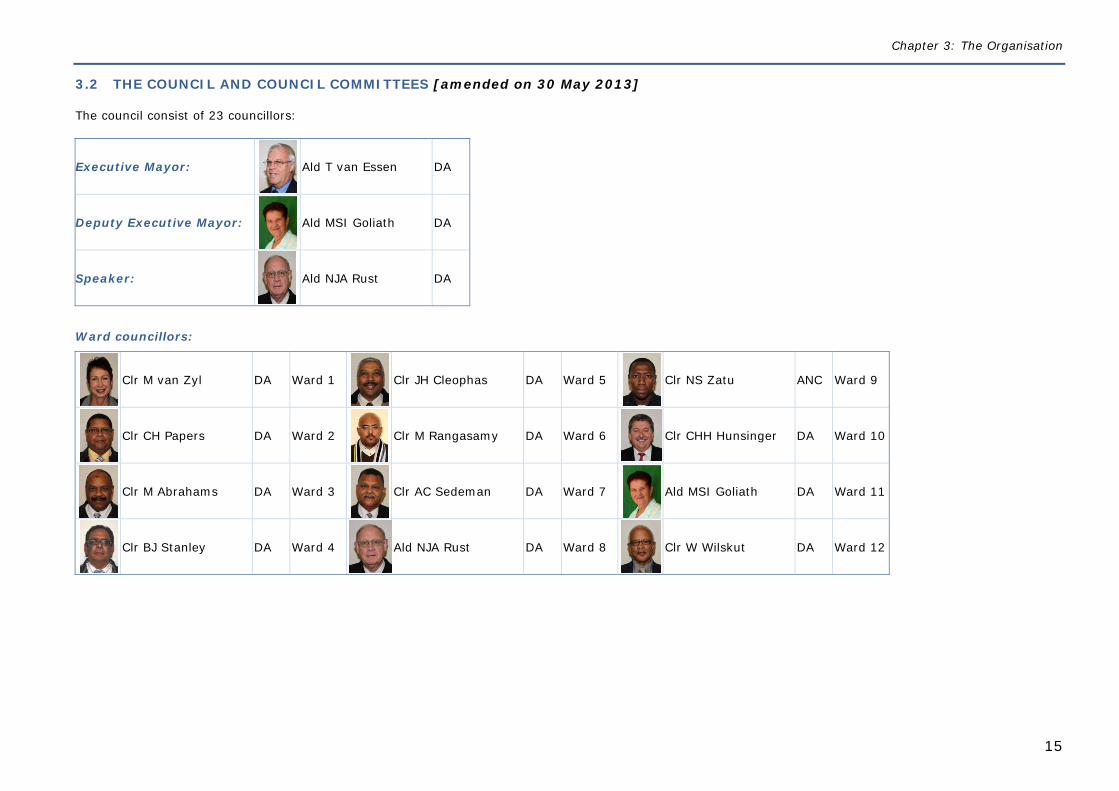
3.2 THE COUNCIL AND COUNCIL COMMITTEES [amended on 30 May 2013]
The council consist of 23 councillors:
Executive Mayor:
Ald T van Essen DA
Deputy Executive Mayor:
Ald MSI Goliath DA
Speaker:
Ald NJA Rust DA
Ward councillors:
Clr M van Zyl DA Ward 1
Clr JH Cleophas DA Ward 5
Clr NS Zatu ANC Ward 9
Clr CH Papers DA Ward 2
Clr M Rangasamy DA Ward 6
Clr CHH Hunsinger DA Ward 10
Clr M Abrahams DA Ward 3
Clr AC Sedeman DA Ward 7
Ald MSI Goliath DA Ward 11
Clr BJ Stanley DA Ward 4 Ald NJA Rust DA Ward 8
Clr W Wilskut DA Ward 12
Integrated Development Plan for 2012-2017
16
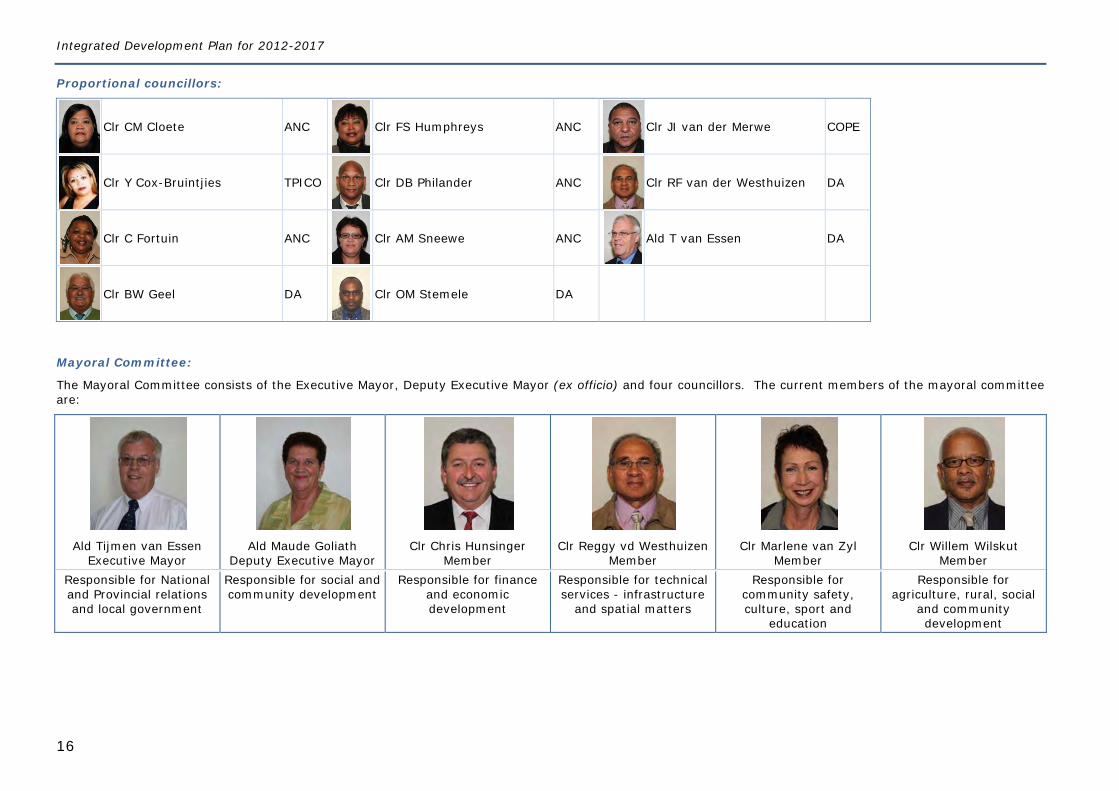
Proportional councillors:
Clr CM Cloete ANC
Clr FS Humphreys ANC Clr JI van der Merwe COPE
Clr Y Cox-Bruintjies TPICO
Clr DB Philander ANC Clr RF van der Westhuizen DA
Clr C Fortuin ANC
Clr AM Sneewe ANC
Ald T van Essen DA
Clr BW Geel DA
Clr OM Stemele DA
Mayoral Committee:
The Mayoral Committee consists of the Executive Mayor, Deputy Executive Mayor (ex officio) and four councillors. The current members of the mayoral committee are:
Ald Tijmen van Essen
Executive Mayor
Ald Maude Goliath
Deputy Executive Mayor
Clr Chris Hunsinger
Member
Clr Reggy vd Westhuizen
Member
Clr Marlene van Zyl
Member
Clr Willem Wilskut
Member Responsible for National and Provincial relations and local government
Responsible for social and community development
Responsible for finance and economic development
Responsible for technical services - infrastructure
and spatial matters
Responsible for community safety, culture, sport and
education
Responsible for agriculture, rural, social
and community development
Chapter 3: The Organisation
17
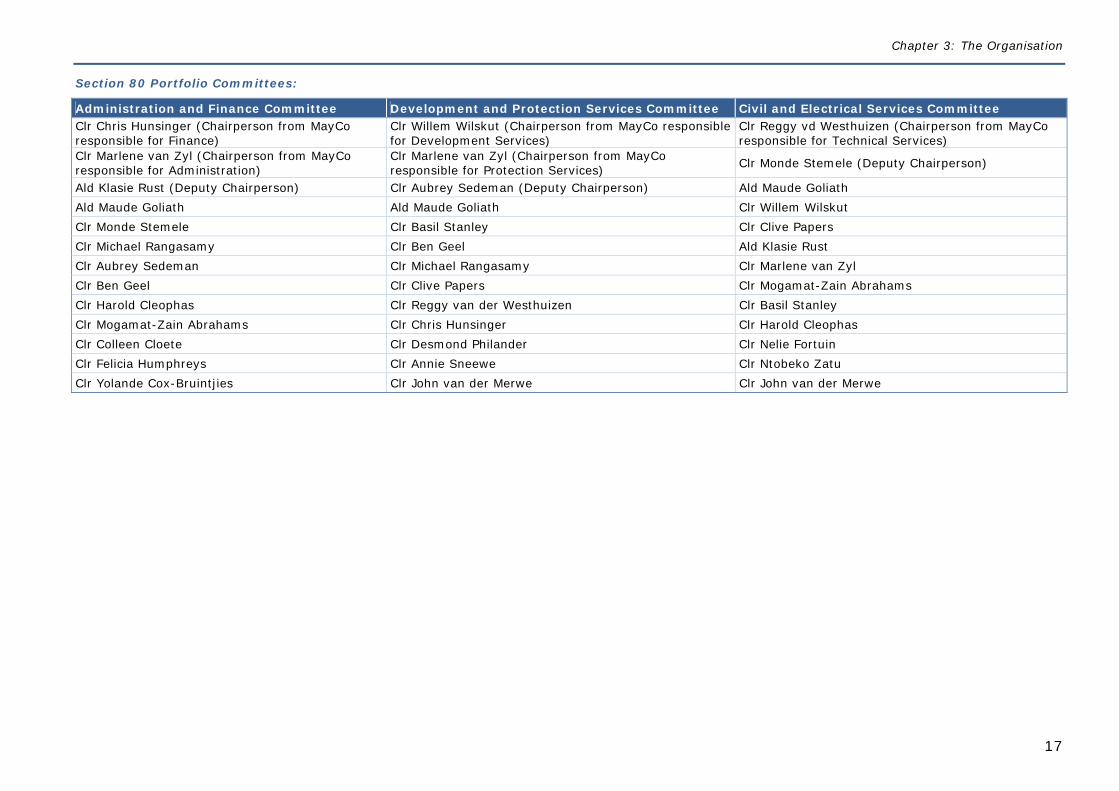
Section 80 Portfolio Committees:
Administration and Finance Committee Development and Protection Services Committee Civil and Electrical Services Committee Clr Chris Hunsinger (Chairperson from MayCo responsible for Finance)
Clr Willem Wilskut (Chairperson from MayCo responsible for Development Services)
Clr Reggy vd Westhuizen (Chairperson from MayCo responsible for Technical Services)
Clr Marlene van Zyl (Chairperson from MayCo responsible for Administration)
Clr Marlene van Zyl (Chairperson from MayCo responsible for Protection Services) Clr Monde Stemele (Deputy Chairperson)
Ald Klasie Rust (Deputy Chairperson) Clr Aubrey Sedeman (Deputy Chairperson) Ald Maude Goliath Ald Maude Goliath Ald Maude Goliath Clr Willem Wilskut Clr Monde Stemele Clr Basil Stanley Clr Clive Papers Clr Michael Rangasamy Clr Ben Geel Ald Klasie Rust Clr Aubrey Sedeman Clr Michael Rangasamy Clr Marlene van Zyl Clr Ben Geel Clr Clive Papers Clr Mogamat-Zain Abrahams Clr Harold Cleophas Clr Reggy van der Westhuizen Clr Basil Stanley Clr Mogamat-Zain Abrahams Clr Chris Hunsinger Clr Harold Cleophas Clr Colleen Cloete Clr Desmond Philander Clr Nelie Fortuin Clr Felicia Humphreys Clr Annie Sneewe Clr Ntobeko Zatu Clr Yolande Cox-Bruintjies Clr John van der Merwe Clr John van der Merwe
Integrated Development Plan for 2012-2017
18
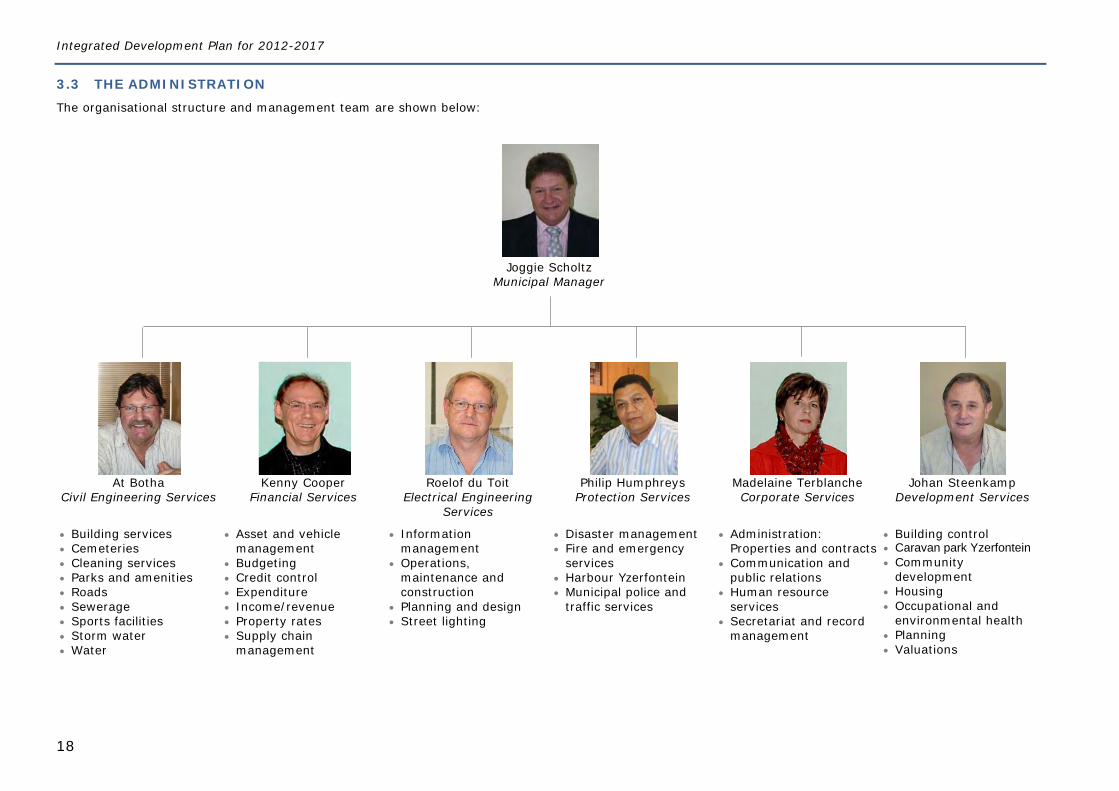
3.3 THE ADMINISTRATION The organisational structure and management team are shown below:
At Botha
Civil Engineering Services
Kenny Cooper
Financial Services
Roelof du Toit
Electrical Engineering Services
Philip Humphreys
Protection Services
Madelaine Terblanche Corporate Services
Johan Steenkamp
Development Services
Building services Cemeteries Cleaning services Parks and amenities Roads Sewerage Sports facilities Storm water Water
Asset and vehicle management
Budgeting Credit control Expenditure Income/revenue Property rates Supply chain
management
Information management
Operations, maintenance and construction
Planning and design Street lighting
Disaster management Fire and emergency
services Harbour Yzerfontein Municipal police and
traffic services
Administration: Properties and contracts
Communication and public relations
Human resource services
Secretariat and record management
Building control Caravan park Yzerfontein Community
development Housing Occupational and
environmental health Planning Valuations
Joggie Scholtz
Municipal Manager
Chapter 4: Intergovernmental policy alignment
19
C H A P T E R 4 : I N T E R G O V E R N M E N T A L P O L I C Y A L I G N M E N T
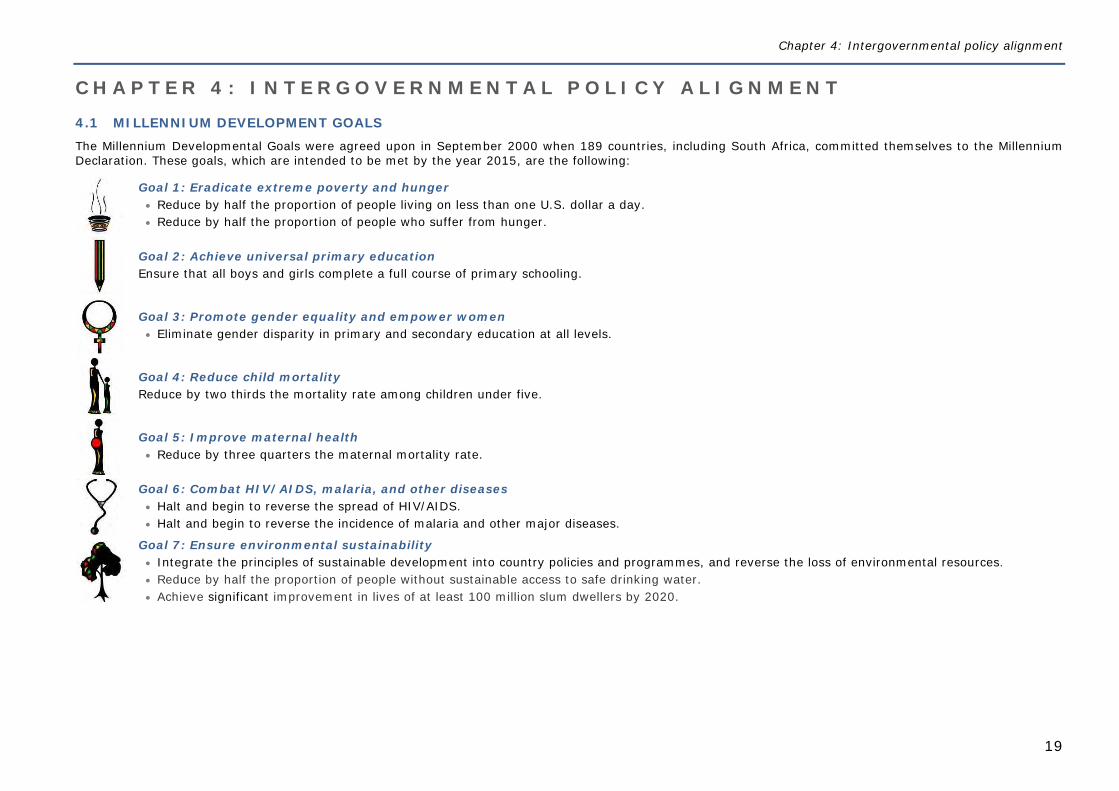
4.1 MILLENNIUM DEVELOPMENT GOALS The Millennium Developmental Goals were agreed upon in September 2000 when 189 countries, including South Africa, committed themselves to the Millennium Declaration. These goals, which are intended to be met by the year 2015, are the following:
Goal 1: Eradicate extreme poverty and hunger Reduce by half the proportion of people living on less than one U.S. dollar a day. Reduce by half the proportion of people who suffer from hunger.
Goal 2: Achieve universal primary education Ensure that all boys and girls complete a full course of primary schooling.
Goal 3: Promote gender equality and empower women Eliminate gender disparity in primary and secondary education at all levels.
Goal 4: Reduce child mortality Reduce by two thirds the mortality rate among children under five.
Goal 5: Improve maternal health Reduce by three quarters the maternal mortality rate.
Goal 6: Combat HIV/AIDS, malaria, and other diseases Halt and begin to reverse the spread of HIV/AIDS. Halt and begin to reverse the incidence of malaria and other major diseases.
Goal 7: Ensure environmental sustainability Integrate the principles of sustainable development into country policies and programmes, and reverse the loss of environmental resources. Reduce by half the proportion of people without sustainable access to safe drinking water. Achieve significant improvement in lives of at least 100 million slum dwellers by 2020.
Integrated Development Plan for 2012-2017
20
Goal 8: Develop a global partnership for development Develop an open trading and financial system that is rule-based, predictable and non-discriminatory. Address the least developed countries’ special needs that include tariff- and quota-free access for exports, enhanced debt relief, cancellation of debt
and more generous development assistance. Address the special needs of landlocked and small island developing countries. Deal comprehensively with developing countries’ debt problems through national and international measures to make debt sustainable in the long
term. In cooperation with the developing countries, develop decent and productive work for the youth. In cooperation with pharmaceutical companies, provide access to affordable essential drugs in developing countries.
4.2 NATIONAL POLICY DIRECTIVES (a) The 12 Outcomes adopted by the Cabinet Lekgotla in January 2010
1. Improved quality of basic education. 2. A long and healthy life for all South Africans. 3. All people in South Africa are and feel safe. 4. Decent employment through inclusive economic growth. 5. A skilled and capable workforce to support an inclusive growth path. 6. An efficient, competitive and responsive economic infrastructure network. 7. Vibrant, equitable and sustainable rural communities with food security for all. 8. Sustainable human settlements and improved quality of household life. 9. A responsive, accountable, effective and efficient local government system. 10. Environmental assets and natural resources that are well protected and continually enhanced. 11. Create a better South Africa and contribute to a better and safer Africa and World. 12. An efficient, effective and development oriented public service and an empowered, fair and inclusive citizenship.
At the end of April 2010, the President signed performance agreements with all 34 Cabinet Ministers. In these performance agreements, Ministers were tasked to establish an Implementation Forum for each of the twelve outcomes. In each implementation forum Ministers and all other parties responsible for delivering on an outcome, had to develop a Delivery Agreement.
The Delivery Agreement refines and provides more detail to the outputs, targets, indicators and key activities for each outcome, and identifies required inputs and clarify roles and responsibilities. It spells out who has to do what, by when and with what resources.
In respect of Outcome 9, a Delivery Agreement was signed between the MEC’s for Local Government of the respective Provinces and the Executive Mayors of all municipalities.
Chapter 4: Intergovernmental policy alignment
21
(b) National Development Plan (NDP) - November 2011 [amended on 30 May 2013]
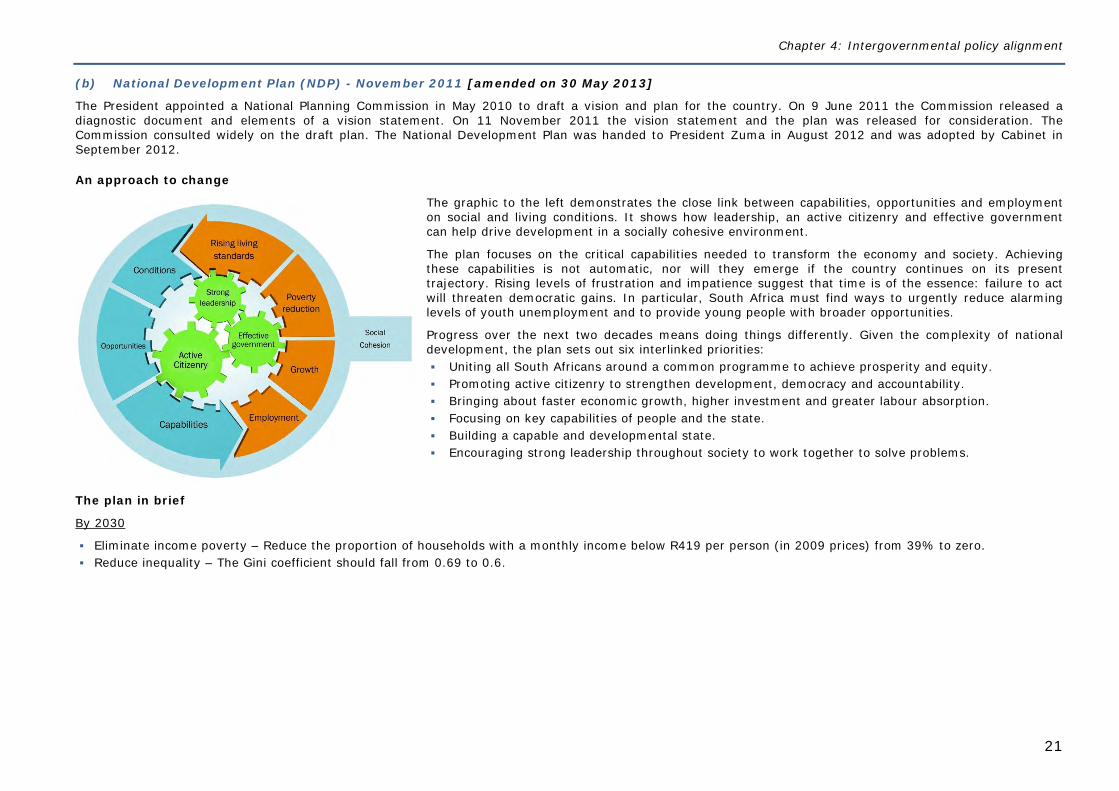
The President appointed a National Planning Commission in May 2010 to draft a vision and plan for the country. On 9 June 2011 the Commission released a diagnostic document and elements of a vision statement. On 11 November 2011 the vision statement and the plan was released for consideration. The Commission consulted widely on the draft plan. The National Development Plan was handed to President Zuma in August 2012 and was adopted by Cabinet in September 2012.
An approach to change
The graphic to the left demonstrates the close link between capabilities, opportunities and employment on social and living conditions. It shows how leadership, an active citizenry and effective government can help drive development in a socially cohesive environment.
The plan focuses on the critical capabilities needed to transform the economy and society. Achieving these capabilities is not automatic, nor will they emerge if the country continues on its present trajectory. Rising levels of frustration and impatience suggest that time is of the essence: failure to act will threaten democratic gains. In particular, South Africa must find ways to urgently reduce alarming levels of youth unemployment and to provide young people with broader opportunities.
Progress over the next two decades means doing things differently. Given the complexity of national development, the plan sets out six interlinked priorities: Uniting all South Africans around a common programme to achieve prosperity and equity. Promoting active citizenry to strengthen development, democracy and accountability. Bringing about faster economic growth, higher investment and greater labour absorption. Focusing on key capabilities of people and the state. Building a capable and developmental state. Encouraging strong leadership throughout society to work together to solve problems.
The plan in brief
By 2030
Eliminate income poverty – Reduce the proportion of households with a monthly income below R419 per person (in 2009 prices) from 39% to zero. Reduce inequality – The Gini coefficient should fall from 0.69 to 0.6.
Integrated Development Plan for 2012-2017
22
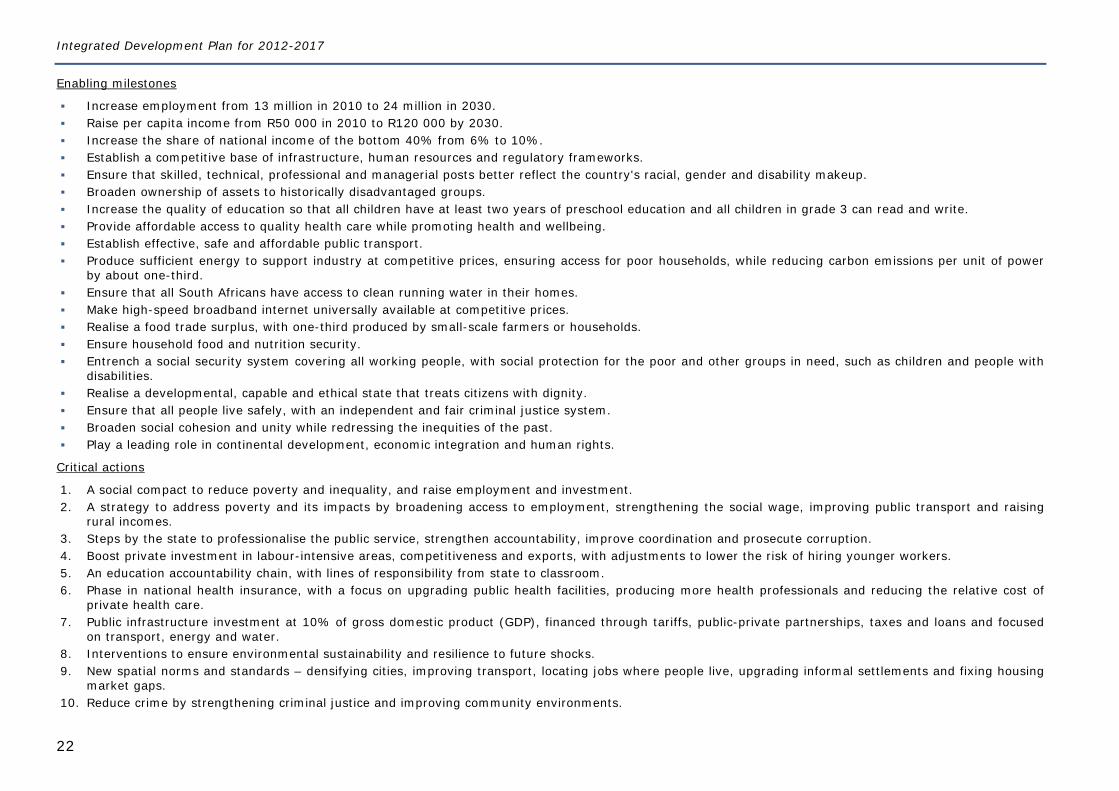
Enabling milestones
Increase employment from 13 million in 2010 to 24 million in 2030. Raise per capita income from R50 000 in 2010 to R120 000 by 2030. Increase the share of national income of the bottom 40% from 6% to 10%. Establish a competitive base of infrastructure, human resources and regulatory frameworks. Ensure that skilled, technical, professional and managerial posts better reflect the country's racial, gender and disability makeup. Broaden ownership of assets to historically disadvantaged groups. Increase the quality of education so that all children have at least two years of preschool education and all children in grade 3 can read and write. Provide affordable access to quality health care while promoting health and wellbeing. Establish effective, safe and affordable public transport. Produce sufficient energy to support industry at competitive prices, ensuring access for poor households, while reducing carbon emissions per unit of power
by about one-third. Ensure that all South Africans have access to clean running water in their homes. Make high-speed broadband internet universally available at competitive prices. Realise a food trade surplus, with one-third produced by small-scale farmers or households. Ensure household food and nutrition security. Entrench a social security system covering all working people, with social protection for the poor and other groups in need, such as children and people with
disabilities. Realise a developmental, capable and ethical state that treats citizens with dignity. Ensure that all people live safely, with an independent and fair criminal justice system. Broaden social cohesion and unity while redressing the inequities of the past. Play a leading role in continental development, economic integration and human rights.
Critical actions
1. A social compact to reduce poverty and inequality, and raise employment and investment. 2. A strategy to address poverty and its impacts by broadening access to employment, strengthening the social wage, improving public transport and raising
rural incomes. 3. Steps by the state to professionalise the public service, strengthen accountability, improve coordination and prosecute corruption. 4. Boost private investment in labour-intensive areas, competitiveness and exports, with adjustments to lower the risk of hiring younger workers. 5. An education accountability chain, with lines of responsibility from state to classroom. 6. Phase in national health insurance, with a focus on upgrading public health facilities, producing more health professionals and reducing the relative cost of
private health care. 7. Public infrastructure investment at 10% of gross domestic product (GDP), financed through tariffs, public-private partnerships, taxes and loans and focused
on transport, energy and water. 8. Interventions to ensure environmental sustainability and resilience to future shocks. 9. New spatial norms and standards – densifying cities, improving transport, locating jobs where people live, upgrading informal settlements and fixing housing
market gaps. 10. Reduce crime by strengthening criminal justice and improving community environments.
Chapter 4: Intergovernmental policy alignment
23
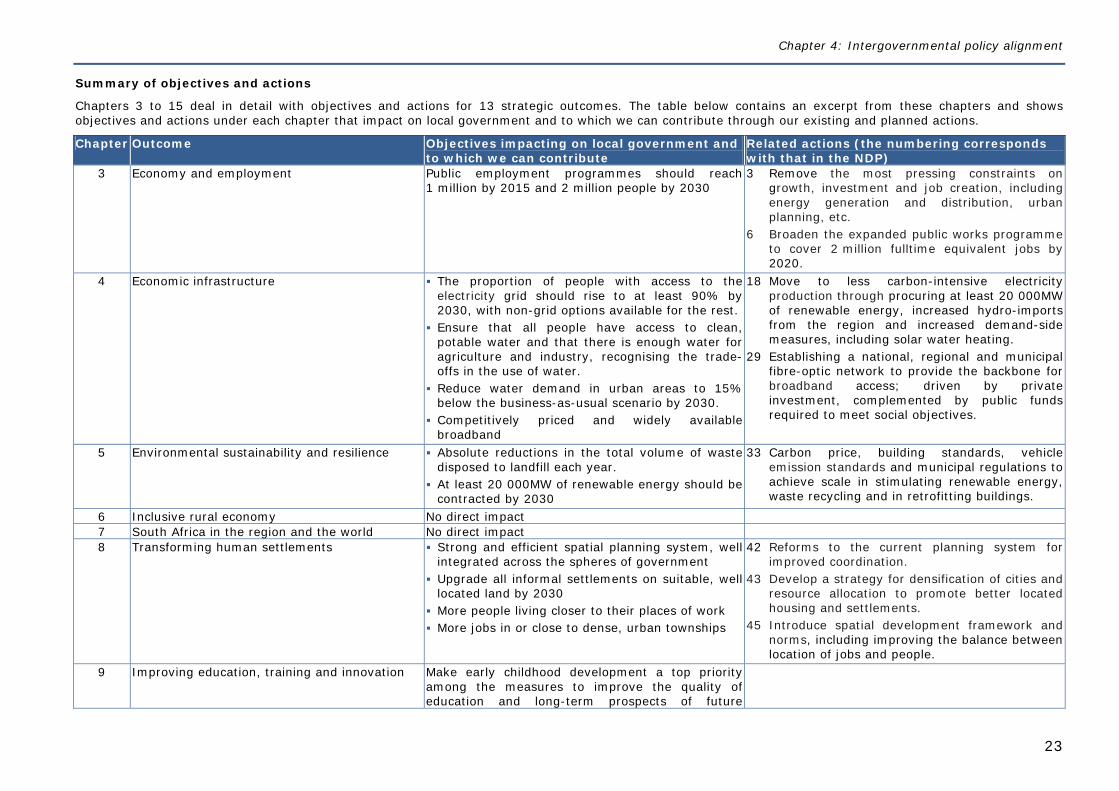
Summary of objectives and actions
Chapters 3 to 15 deal in detail with objectives and actions for 13 strategic outcomes. The table below contains an excerpt from these chapters and shows objectives and actions under each chapter that impact on local government and to which we can contribute through our existing and planned actions.
Chapter Outcome Objectives impacting on local government and to which we can contribute
Related actions (the numbering corresponds with that in the NDP)
3 Economy and employment Public employment programmes should reach 1 million by 2015 and 2 million people by 2030
3 Remove the most pressing constraints on growth, investment and job creation, including energy generation and distribution, urban planning, etc.
6 Broaden the expanded public works programme to cover 2 million fulltime equivalent jobs by 2020.
4 Economic infrastructure The proportion of people with access to the electricity grid should rise to at least 90% by 2030, with non-grid options available for the rest.
Ensure that all people have access to clean, potable water and that there is enough water for agriculture and industry, recognising the trade-offs in the use of water.
Reduce water demand in urban areas to 15% below the business-as-usual scenario by 2030.
Competitively priced and widely available broadband
18 Move to less carbon-intensive electricity production through procuring at least 20 000MW of renewable energy, increased hydro-imports from the region and increased demand-side measures, including solar water heating.
29 Establishing a national, regional and municipal fibre-optic network to provide the backbone for broadband access; driven by private investment, complemented by public funds required to meet social objectives.
5 Environmental sustainability and resilience Absolute reductions in the total volume of waste disposed to landfill each year.
At least 20 000MW of renewable energy should be contracted by 2030
33 Carbon price, building standards, vehicle emission standards and municipal regulations to achieve scale in stimulating renewable energy, waste recycling and in retrofitting buildings.
6 Inclusive rural economy No direct impact 7 South Africa in the region and the world No direct impact 8 Transforming human settlements Strong and efficient spatial planning system, well
integrated across the spheres of government Upgrade all informal settlements on suitable, well
located land by 2030 More people living closer to their places of work More jobs in or close to dense, urban townships
42 Reforms to the current planning system for improved coordination.
43 Develop a strategy for densification of cities and resource allocation to promote better located housing and settlements.
45 Introduce spatial development framework and norms, including improving the balance between location of jobs and people.
9 Improving education, training and innovation Make early childhood development a top priority among the measures to improve the quality of education and long-term prospects of future
Integrated Development Plan for 2012-2017
24
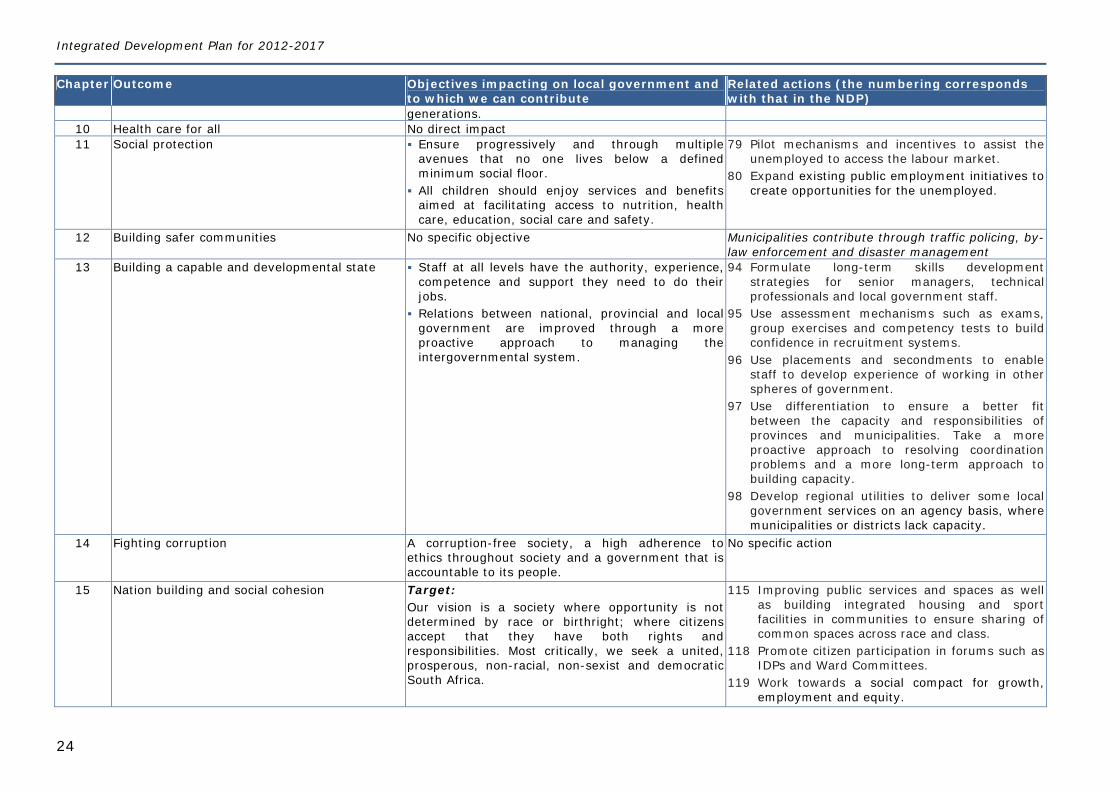
Chapter Outcome Objectives impacting on local government and to which we can contribute
Related actions (the numbering corresponds with that in the NDP)
generations. 10 Health care for all No direct impact 11 Social protection Ensure progressively and through multiple
avenues that no one lives below a defined minimum social floor.
All children should enjoy services and benefits aimed at facilitating access to nutrition, health care, education, social care and safety.
79 Pilot mechanisms and incentives to assist the unemployed to access the labour market.
80 Expand existing public employment initiatives to create opportunities for the unemployed.
12 Building safer communities No specific objective Municipalities contribute through traffic policing, by-law enforcement and disaster management
13 Building a capable and developmental state Staff at all levels have the authority, experience, competence and support they need to do their jobs.
Relations between national, provincial and local government are improved through a more proactive approach to managing the intergovernmental system.
94 Formulate long-term skills development strategies for senior managers, technical professionals and local government staff.
95 Use assessment mechanisms such as exams, group exercises and competency tests to build confidence in recruitment systems.
96 Use placements and secondments to enable staff to develop experience of working in other spheres of government.
97 Use differentiation to ensure a better fit between the capacity and responsibilities of provinces and municipalities. Take a more proactive approach to resolving coordination problems and a more long-term approach to building capacity.
98 Develop regional utilities to deliver some local government services on an agency basis, where municipalities or districts lack capacity.
14 Fighting corruption A corruption-free society, a high adherence to ethics throughout society and a government that is accountable to its people.
No specific action
15 Nation building and social cohesion Target: Our vision is a society where opportunity is not determined by race or birthright; where citizens accept that they have both rights and responsibilities. Most critically, we seek a united, prosperous, non-racial, non-sexist and democratic South Africa.
115 Improving public services and spaces as well as building integrated housing and sport facilities in communities to ensure sharing of common spaces across race and class.
118 Promote citizen participation in forums such as IDPs and Ward Committees.
119 Work towards a social compact for growth, employment and equity.
Chapter 4: Intergovernmental policy alignment
25
(c) National Spatial Development Perspective (NSDP) - 2006
The NSDP provides a framework for deliberating the future development of the national space economy and recommends mechanisms to bring about optimum alignment between infrastructure investment and development programmes within localities. It is not a national development plan; nor does it predetermine what should happen where, when and how. Instead, it utilises principles and the notions of need and potential as a common backdrop against which investment and spending decisions should be considered and made.
The NSDP puts forward the following national spatial vision:
“South Africa will become a nation in which investment in infrastructure and development programmes support government’s growth and development objectives: By focusing economic growth and employment creation in areas where this is most effective and sustainable; Supporting restructuring where feasible to ensure greater competitiveness; Fostering development on the basis of local potential; and Ensuring that development institutions are able to provide basic needs throughout the country.”
The NSDP puts forward five normative principles: Rapid economic growth that is sustained and inclusive is a prerequisite for the achievement of other policy objectives, among which poverty alleviation is key. Government has a constitutional obligation to provide basic services to all citizens wherever they reside. Beyond the above-mentioned constitutional obligation, government spending on fixed investment should be focused on localities with economic growth and/or
economic potential in order to gear up private-sector investment, stimulate sustainable economic activities and create long-term employment opportunities. Efforts to address past and current social inequalities should focus on people, not places. In localities where there are both high levels of poverty and
demonstrated economic potential, this could include fixed capital investment beyond basic services to exploit the potential of those localities. In localities with demonstrated low economic potential, government should, beyond the provision of basic services, concentrate primarily on human development by providing education and training, social transfers such as grants and poverty-relief programmes. People should also be enabled to gravitate - if they choose to - to localities that are more likely to provide sustainable employment and economic opportunities.
In order to overcome the spatial distortions of apartheid, future settlement and economic development opportunities should be channelled into activity corridors and nodes that are adjacent to or that link the main growth centres. Infrastructure investment should primarily support localities that will become major growth nodes.
4.3 PROVINCIAL POLICY DIRECTIVES Western Cape’s Draft Strategic Plan - 2011.
In 2011 the Provincial Government of the Western Cape (PGWC) published the Draft Strategic Plan with the title “Delivering the open opportunity society for all”. The Draft Strategic plan puts forward the following 12 strategic objectives:
1 Creating opportunities for growth and jobs by focussing on - the development of a provincial vision and brand the development of a corruption-free, efficient public sector a regulatory environment that is efficient an infrastructure and asset development strategy
2 Improving education outcomes by focussing on - literacy and numeracy outcomes
Integrated Development Plan for 2012-2017
26
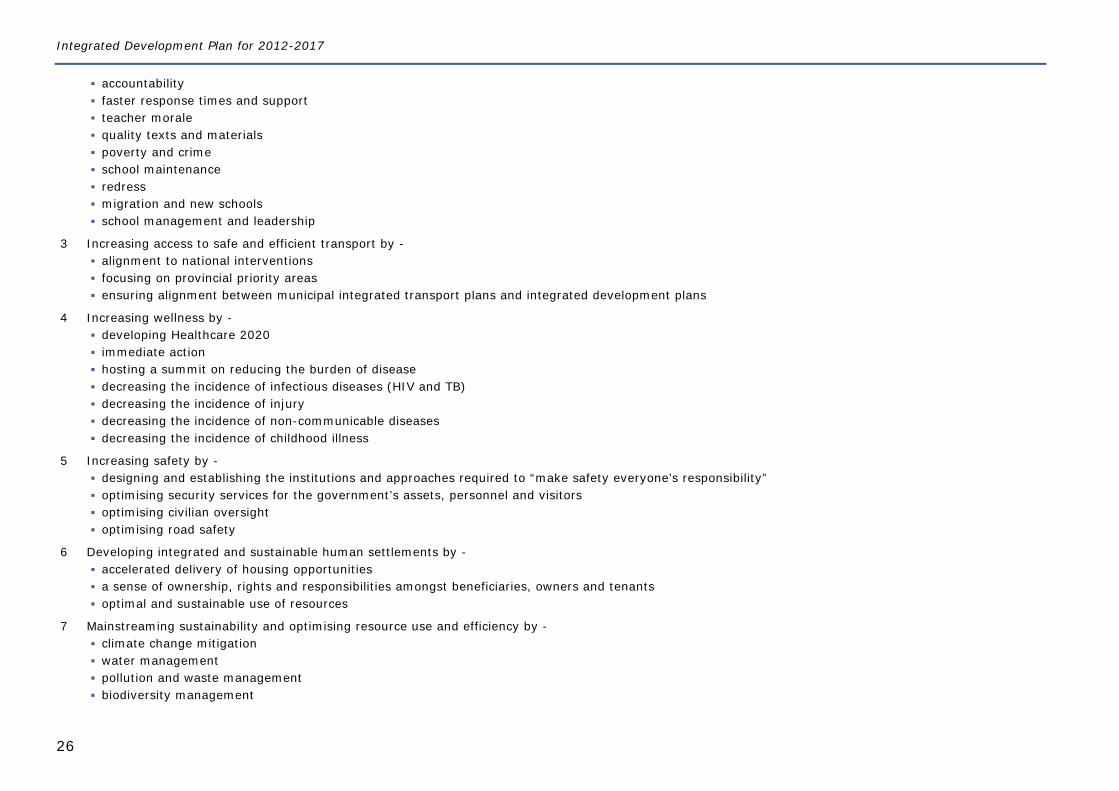
accountability faster response times and support teacher morale quality texts and materials poverty and crime school maintenance redress migration and new schools school management and leadership
3 Increasing access to safe and efficient transport by - alignment to national interventions focusing on provincial priority areas ensuring alignment between municipal integrated transport plans and integrated development plans
4 Increasing wellness by - developing Healthcare 2020 immediate action hosting a summit on reducing the burden of disease decreasing the incidence of infectious diseases (HIV and TB) decreasing the incidence of injury decreasing the incidence of non-communicable diseases decreasing the incidence of childhood illness
5 Increasing safety by - designing and establishing the institutions and approaches required to “make safety everyone’s responsibility” optimising security services for the government’s assets, personnel and visitors optimising civilian oversight optimising road safety
6 Developing integrated and sustainable human settlements by - accelerated delivery of housing opportunities a sense of ownership, rights and responsibilities amongst beneficiaries, owners and tenants optimal and sustainable use of resources
7 Mainstreaming sustainability and optimising resource use and efficiency by - climate change mitigation water management pollution and waste management biodiversity management
Chapter 4: Intergovernmental policy alignment
27
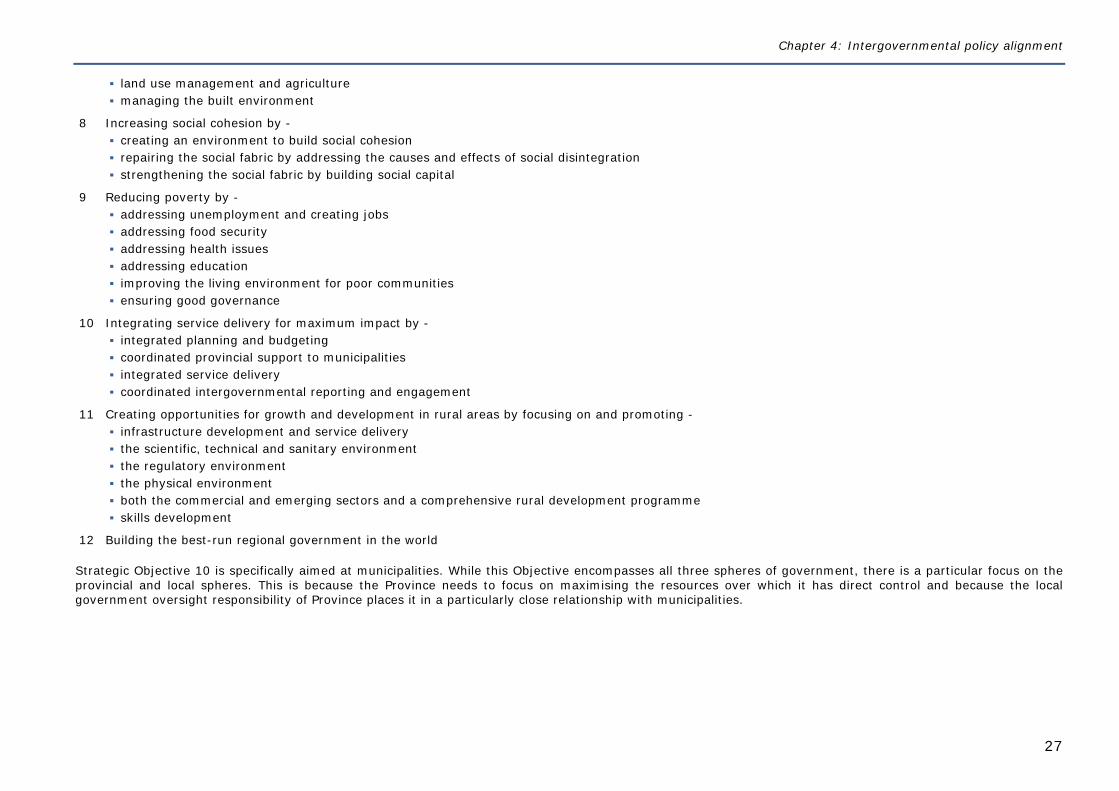
land use management and agriculture managing the built environment
8 Increasing social cohesion by - creating an environment to build social cohesion repairing the social fabric by addressing the causes and effects of social disintegration strengthening the social fabric by building social capital
9 Reducing poverty by - addressing unemployment and creating jobs addressing food security addressing health issues addressing education improving the living environment for poor communities ensuring good governance
10 Integrating service delivery for maximum impact by - integrated planning and budgeting coordinated provincial support to municipalities integrated service delivery coordinated intergovernmental reporting and engagement
11 Creating opportunities for growth and development in rural areas by focusing on and promoting - infrastructure development and service delivery the scientific, technical and sanitary environment the regulatory environment the physical environment both the commercial and emerging sectors and a comprehensive rural development programme skills development
12 Building the best-run regional government in the world
Strategic Objective 10 is specifically aimed at municipalities. While this Objective encompasses all three spheres of government, there is a particular focus on the provincial and local spheres. This is because the Province needs to focus on maximising the resources over which it has direct control and because the local government oversight responsibility of Province places it in a particularly close relationship with municipalities.
Integrated Development Plan for 2012-2017
28
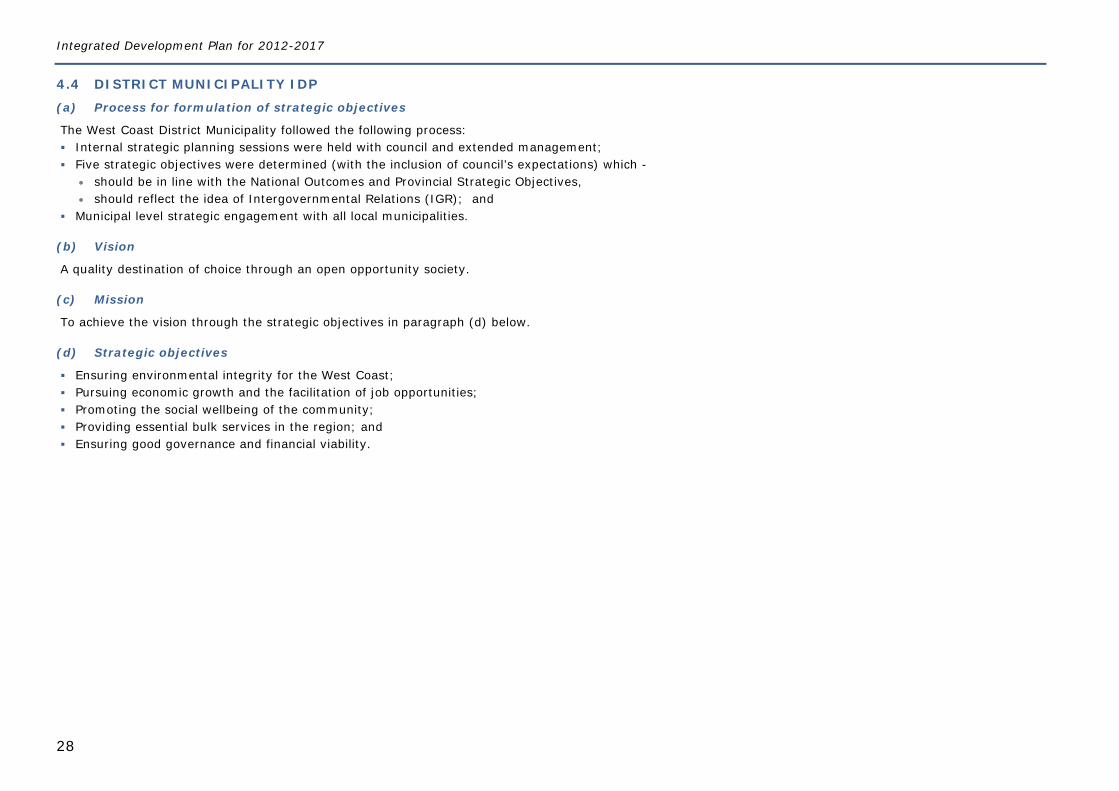
4.4 DISTRICT MUNICIPALITY IDP (a) Process for formulation of strategic objectives
The West Coast District Municipality followed the following process: Internal strategic planning sessions were held with council and extended management; Five strategic objectives were determined (with the inclusion of council’s expectations) which -
should be in line with the National Outcomes and Provincial Strategic Objectives, should reflect the idea of Intergovernmental Relations (IGR); and
Municipal level strategic engagement with all local municipalities.
(b) Vision
A quality destination of choice through an open opportunity society.
(c) Mission
To achieve the vision through the strategic objectives in paragraph (d) below.
(d) Strategic objectives
Ensuring environmental integrity for the West Coast; Pursuing economic growth and the facilitation of job opportunities; Promoting the social wellbeing of the community; Providing essential bulk services in the region; and Ensuring good governance and financial viability.
Chapter 4: Intergovernmental policy alignment
29
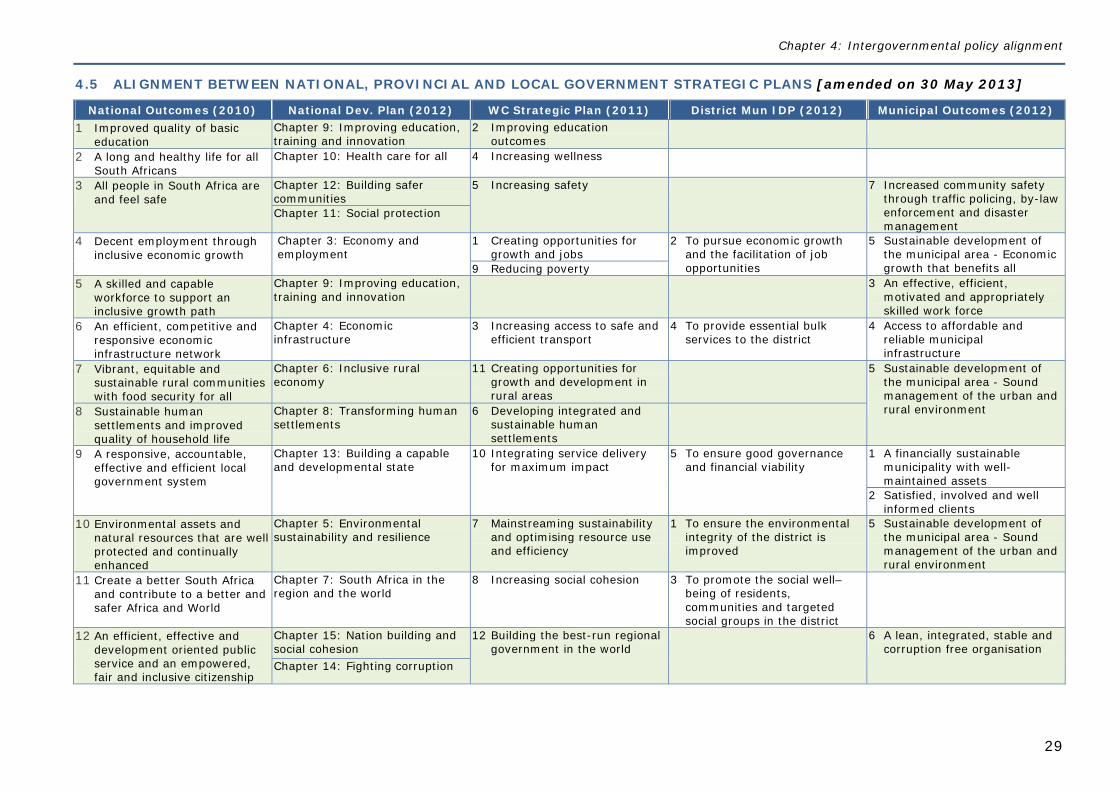
4.5 ALIGNMENT BETWEEN NATIONAL, PROVINCIAL AND LOCAL GOVERNMENT STRATEGIC PLANS [amended on 30 May 2013]
National Outcomes (2010) National Dev. Plan (2012) WC Strategic Plan (2011) District Mun IDP (2012) Municipal Outcomes (2012) 1 Improved quality of basic
education Chapter 9: Improving education, training and innovation
2 Improving education outcomes
2 A long and healthy life for all South Africans
Chapter 10: Health care for all 4 Increasing wellness
3 All people in South Africa are and feel safe
Chapter 12: Building safer communities
5 Increasing safety 7 Increased community safety through traffic policing, by-law enforcement and disaster management
Chapter 11: Social protection
4 Decent employment through inclusive economic growth
Chapter 3: Economy and employment
1 Creating opportunities for growth and jobs
2 To pursue economic growth and the facilitation of job opportunities
5 Sustainable development of the municipal area - Economic growth that benefits all 9 Reducing poverty
5 A skilled and capable workforce to support an inclusive growth path
Chapter 9: Improving education, training and innovation
3 An effective, efficient, motivated and appropriately skilled work force
6 An efficient, competitive and responsive economic infrastructure network
Chapter 4: Economic infrastructure
3 Increasing access to safe and efficient transport
4 To provide essential bulk services to the district
4 Access to affordable and reliable municipal infrastructure
7 Vibrant, equitable and sustainable rural communities with food security for all
Chapter 6: Inclusive rural economy
11 Creating opportunities for growth and development in rural areas
5 Sustainable development of the municipal area - Sound management of the urban and rural environment 8 Sustainable human
settlements and improved quality of household life
Chapter 8: Transforming human settlements
6 Developing integrated and sustainable human settlements
9 A responsive, accountable, effective and efficient local government system
Chapter 13: Building a capable and developmental state
10 Integrating service delivery for maximum impact
5 To ensure good governance and financial viability
1 A financially sustainable municipality with well-maintained assets
2 Satisfied, involved and well informed clients
10 Environmental assets and natural resources that are well protected and continually enhanced
Chapter 5: Environmental sustainability and resilience
7 Mainstreaming sustainability and optimising resource use and efficiency
1 To ensure the environmental integrity of the district is improved
5 Sustainable development of the municipal area - Sound management of the urban and rural environment
11 Create a better South Africa and contribute to a better and safer Africa and World
Chapter 7: South Africa in the region and the world
8 Increasing social cohesion 3 To promote the social well–being of residents, communities and targeted social groups in the district
12 An efficient, effective and development oriented public service and an empowered, fair and inclusive citizenship
Chapter 15: Nation building and social cohesion
12 Building the best-run regional government in the world
6 A lean, integrated, stable and corruption free organisation
Chapter 14: Fighting corruption
Integrated Development Plan for 2012-2017
30
C H A P T E R 5 : S E C T O R A L P L A N S I N T E R M S O F S E C T I O N 2 6 O F T H E M U N I C I P A L S Y S T E M S A C T
5.1 2012 SPATIAL DEVELOPMENT FRAMEWORK - SYNOPSIS
(a) Vision
Balance development and conservation in an economically prosperous Swartland for all.
(b) Objectives
Bio-physical: To determine conservation and development borders, overlay zones for natural areas (valleys and mountains), agriculture, water catchment and sources, and heritage areas.
Socio-economic: To stimulate the economy by creating meaningful employment opportunities by focussing on regional exports and the creation of tourist, rural, and commercial corridors (i.e. rural development and climate change corridors) thus reducing poverty. Encouraging social upliftment through housing provision and ownership.
Built: To provide sufficient bulk infrastructure to service the expanding housing and industrial demand. To be supportive of the rural areas by encouraging transport networks, education and access to information through the electronic media. Protect the integrity of the smaller towns. Support the movement to seek alternative energy generation methods.
(c) New development areas and developments
The SDF provides the following directives for the various precincts:
Urban precinct
The urban precinct comprises of mixed use, residential, business and industrial areas supported by social and bulk infrastructure. The following are proposed: Provide and maintain social infrastructure particularly in Wesbank, Ilinge Lethu, Darling, between Esterhof and Riebeek Kasteel, between Hooikraal, Rosenhof
and Moorreesburg, Chatsworth and Riverlands. Provide sufficient bulk infrastructure and services according to development potential of towns:
o Electricity: Malmesbury o Water: Yzerfontein, Darling, Koringberg, Riebeek Valley and Malmesbury o Sewerage: Yzerfontein, Darling, Koringberg, Riebeek Valley, Malmesbury, Riverlands and Kalbaskraal
Expand residential precincts and provide sufficient integrated housing options according to development potential of towns. Protect and strengthen the cultural and heritage landscape. Promote open space networks including conservation of waterways, Diep River, Platklip, No Go, Darling River, within urban areas with accompanying walkways
and cycle paths.
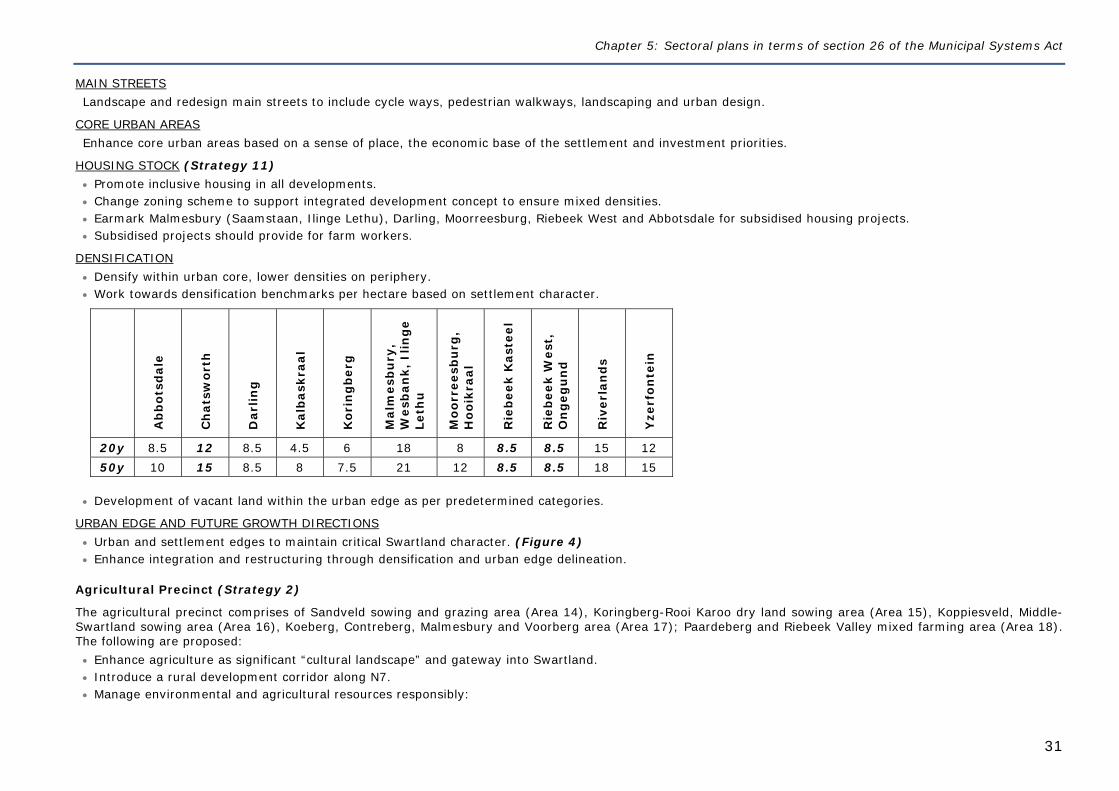
Chapter 5: Sectoral plans in terms of section 26 of the Municipal Systems Act
31
MAIN STREETS Landscape and redesign main streets to include cycle ways, pedestrian walkways, landscaping and urban design.
CORE URBAN AREAS Enhance core urban areas based on a sense of place, the economic base of the settlement and investment priorities.
HOUSING STOCK (Strategy 11) Promote inclusive housing in all developments. Change zoning scheme to support integrated development concept to ensure mixed densities. Earmark Malmesbury (Saamstaan, Ilinge Lethu), Darling, Moorreesburg, Riebeek West and Abbotsdale for subsidised housing projects. Subsidised projects should provide for farm workers.
DENSIFICATION Densify within urban core, lower densities on periphery. Work towards densification benchmarks per hectare based on settlement character.
Ab
bot
sdal
e
Ch
atsw
orth
Dar
ling
Kal
bas
kraa
l
Ko
rin
gb
erg
Mal
mes
bu
ry,
Wes
ban
k, I
ling
e Le
thu
Mo
orr
eesb
urg
, H
ooik
raal
Rie
bee
k K
aste
el
Rie
bee
k W
est,
O
ng
egu
nd
Riv
erla
nd
s
Yze
rfon
tein
20y 8.5 12 8.5 4.5 6 18 8 8.5 8.5 15 12 50y 10 15 8.5 8 7.5 21 12 8.5 8.5 18 15
Development of vacant land within the urban edge as per predetermined categories.
URBAN EDGE AND FUTURE GROWTH DIRECTIONS Urban and settlement edges to maintain critical Swartland character. (Figure 4) Enhance integration and restructuring through densification and urban edge delineation.
Agricultural Precinct (Strategy 2)
The agricultural precinct comprises of Sandveld sowing and grazing area (Area 14), Koringberg-Rooi Karoo dry land sowing area (Area 15), Koppiesveld, Middle-Swartland sowing area (Area 16), Koeberg, Contreberg, Malmesbury and Voorberg area (Area 17); Paardeberg and Riebeek Valley mixed farming area (Area 18). The following are proposed: Enhance agriculture as significant “cultural landscape” and gateway into Swartland. Introduce a rural development corridor along N7. Manage environmental and agricultural resources responsibly:
Integrated Development Plan for 2012-2017
32
o Protect conservation worthy vegetation and natural habitats o Conserve water resources and catchment areas o Reduce surface and groundwater pollution o Manage Steep Slopes and Elevated Areas
Enhance food security on different cadastral scales. Identify and develop viable land reform (Strategy 12) Provide and support sustainable rural infrastructure and services (Strategy 13)
Natural/Conservation Precinct (Strategy 6)
The natural/conservation precinct comprises the Aprilskloof, Kasteelberg, and Riverlands Nature reserve and several private nature reserves along the West Coast. The following are proposed: Protect and strengthen the natural and built environment. Regulate rural development according to bio regional planning initiatives. Permit diversification of land use to provide for promotion of tourism (e.g. eco- and adventure tourism including information centres, overnight accommodation,
restaurants, environmental education centres, parking areas, ablution facilities, etc.) Protect and strengthen the visual landscape
CONSERVANCIES Foster voluntary co-operative environmental management through the establishment of conservancies (e.g. Aprilskloof and Riebeek River Conservancy) to protect fynbos remnants, ecological corridors (e.g. Groen, Diep and Berg River) and linkages.
DEVELOPMENT LINE Establish, on a case-by-case (i.e. property-by-property) basis, a development line1 to determine the boundary between the agricultural use area and the natural area (i.e. steep mountain-side) within the agricultural and natural precincts.
HERITAGE AREAS (Strategy 7) Protect the built environment. Buildings of historic value as per heritage study to become core informants of architectural and landscape guidelines. Conduct a heritage study for rural areas as was conducted for the urban built environment.
ECOLOGICAL CORRIDORS (Strategy 6) Establish ecological corridors and linkages with sufficient fire breaks, along and between conservation worthy elements, such as: Along rivers and water courses (Groen, Diep and Berg River) implement no development ecological setbacks:
o 1:50 and 1:100 year flood-lines o A 10-32 meter buffer zone from the bank of the river, depending on ecological status of river
Remnants and core flora linkages (Kasteelberg, River lands, Pela, Yzerfontein, Paardeberg Nature Reserve).
1 In accordance with criteria as per “Guideline for the Management of Development on Mountains, Hills and Ridges of the Western Cape, 2002 (Western Cape Department of Environment and Cultural Affairs and Sport)
Chapter 5: Sectoral plans in terms of section 26 of the Municipal Systems Act
33
Mountains and hills (Koringberg, Kasteelberg, Porseleinberg and Paardeberg; Darling Hills and Dassenberg). Along the West Coast from southern municipal boundary to northern municipal boundary. Along all road reserves through promotion of indigenous planting or protection of existing indigenous vegetation or tree-lines (e.g. Eucalyptus Trees). In urban areas within urban edge, conserve open spaces and corridors (Malmesbury, Moorreesburg, Darling, and Kalbaskraal) ensure sufficient buffer space to
protect water and wetland systems and remove alien vegetation.
Coastal Precinct (Strategy 6)
The coastal precinct comprises the total coastline, including Dassen Island, crossing the R27 to the Darling Hills. The following is proposed: Permit diversification from agricultural use to provide for promotion of tourism (e.g. eco- and adventure tourism including information centres, overnight
accommodation, restaurants, environmental education centres, parking areas, ablution facilities, etc.) and conservation of the coastline.
(d) Cross cutting issues
Bulk Infrastructure and Services (Strategy 13)
Execute municipal core function forming the backbone of the Swartland economy: Provide bulk infrastructure and services according to industrial growth potential of towns and according to Human Settlement Plan and Residential expansion
proposed as per urban edge determination.
Movement networks and Public Transport (Strategy 5)
Transport networks and modes determine accessiblity. Transport should be accessible to all as it is an important factor in the economic viability of the region, bringing people to their place of work,education and amenities needed to support the community.
GATEWAY AREAS Swartland have five gateways into the municipal area which should be treated as follows: R27 south and north– keep natural veldt character N7 north – keep agricultural character N7 south – introduce agricultural development corridor character Hermon/R45 – introduce agricultural development node character
URBAN AREA Use main and connector routes to integrate previously segregated areas through economic opportunities that are more accessible. Provide supportive pedestrian walkways and crossovers to support economic activities and to strengthen integration.
RURAL AREA Roadside developments to adhere to development guidelines i.e. set-back lines, uniform signage and roadway reserves (indigenous vegetation corridors).
Local Economic Development (Strategy 1)
Facilitate economic development in urban areas and: Create secondary nodes within the previously segregated areas of Koringberg, Wesbank, Ilingulethu, Moorreesburg and Darling.
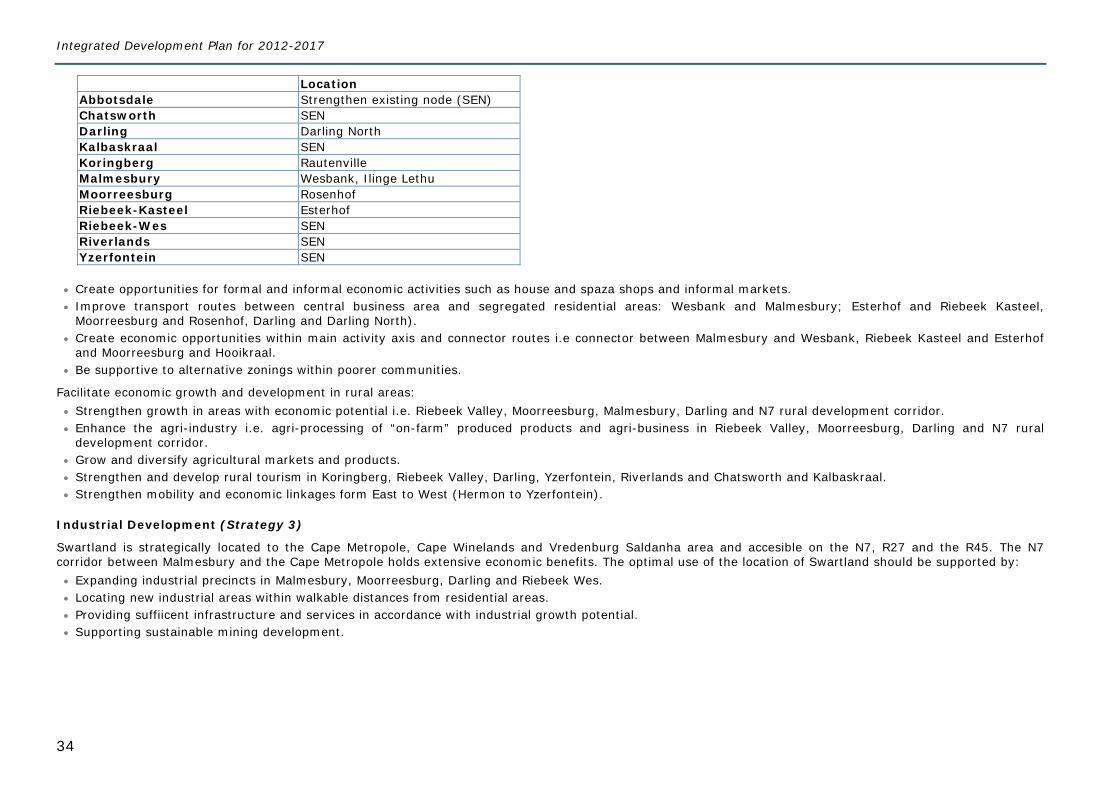
Integrated Development Plan for 2012-2017
34
Location Abbotsdale Strengthen existing node (SEN) Chatsworth SEN Darling Darling North Kalbaskraal SEN Koringberg Rautenville Malmesbury Wesbank, Ilinge Lethu Moorreesburg Rosenhof Riebeek-Kasteel Esterhof Riebeek-Wes SEN Riverlands SEN Yzerfontein SEN
Create opportunities for formal and informal economic activities such as house and spaza shops and informal markets. Improve transport routes between central business area and segregated residential areas: Wesbank and Malmesbury; Esterhof and Riebeek Kasteel,
Moorreesburg and Rosenhof, Darling and Darling North). Create economic opportunities within main activity axis and connector routes i.e connector between Malmesbury and Wesbank, Riebeek Kasteel and Esterhof
and Moorreesburg and Hooikraal. Be supportive to alternative zonings within poorer communities.
Facilitate economic growth and development in rural areas: Strengthen growth in areas with economic potential i.e. Riebeek Valley, Moorreesburg, Malmesbury, Darling and N7 rural development corridor. Enhance the agri-industry i.e. agri-processing of “on-farm” produced products and agri-business in Riebeek Valley, Moorreesburg, Darling and N7 rural
development corridor. Grow and diversify agricultural markets and products. Strengthen and develop rural tourism in Koringberg, Riebeek Valley, Darling, Yzerfontein, Riverlands and Chatsworth and Kalbaskraal. Strengthen mobility and economic linkages form East to West (Hermon to Yzerfontein).
Industrial Development (Strategy 3)
Swartland is strategically located to the Cape Metropole, Cape Winelands and Vredenburg Saldanha area and accesible on the N7, R27 and the R45. The N7 corridor between Malmesbury and the Cape Metropole holds extensive economic benefits. The optimal use of the location of Swartland should be supported by: Expanding industrial precincts in Malmesbury, Moorreesburg, Darling and Riebeek Wes. Locating new industrial areas within walkable distances from residential areas. Providing suffiicent infrastructure and services in accordance with industrial growth potential. Supporting sustainable mining development.
Chapter 5: Sectoral plans in terms of section 26 of the Municipal Systems Act
35
Tourism Development (Strategy 4)
Incorporate the following tourism strategies in the spatial proposals: Expand existing sources in Swartland i.e. Riebeek Valley, Darling, Koringberg, Riverlands, Chatsworth and Kalbaskraal; Opportunities to be accessible to majority of Swartlanders; Create and promote opportunities (i.e. guest farms, recreation accommodation, resorts) in rural Swartland (wine route, wheat route, Swartland Meander, West
Coast Nature Reserve route, Mission station route, Flower route, Agricultural landscape route); Identify specific tourism opportunities in each town and maximize the use of such opportunities through effective marketing; Maintain and upgrade existing tourism roads and services between settlements (i.e. Darling and Malmesbury). Define focus areas for eco-tourism purposes (e.g. information, accommodation, etc.).
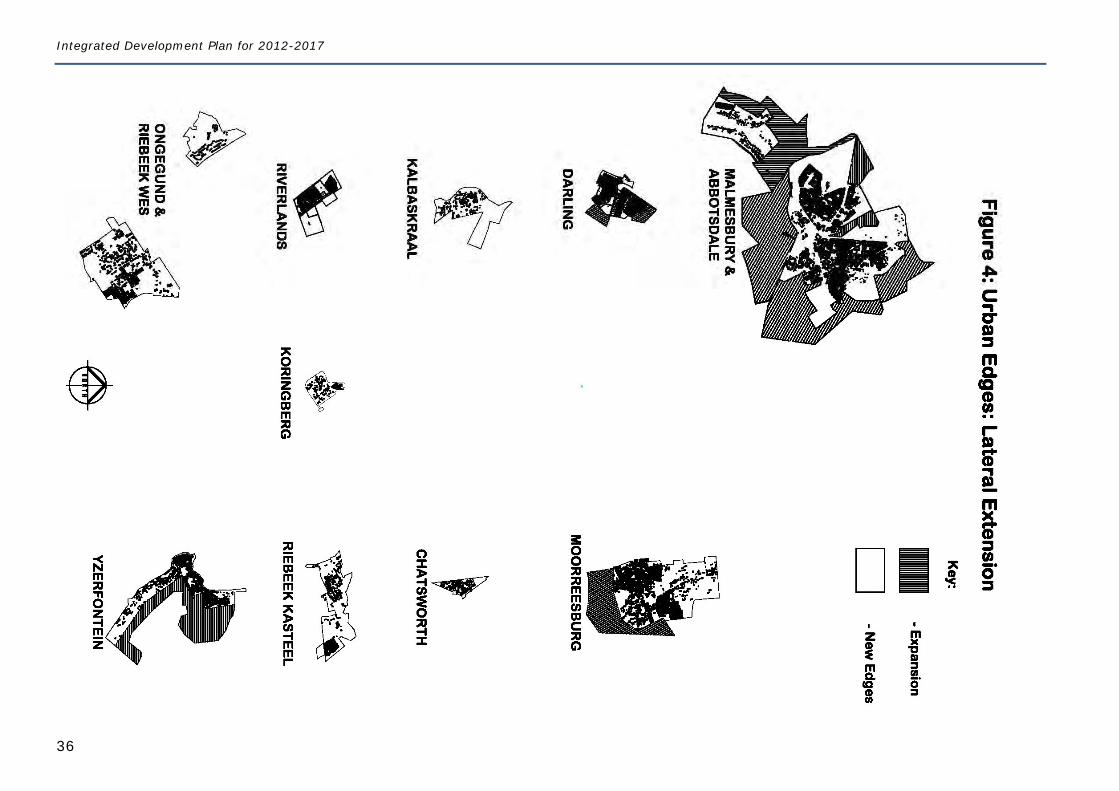
Integrated Development Plan for 2012-2017
36
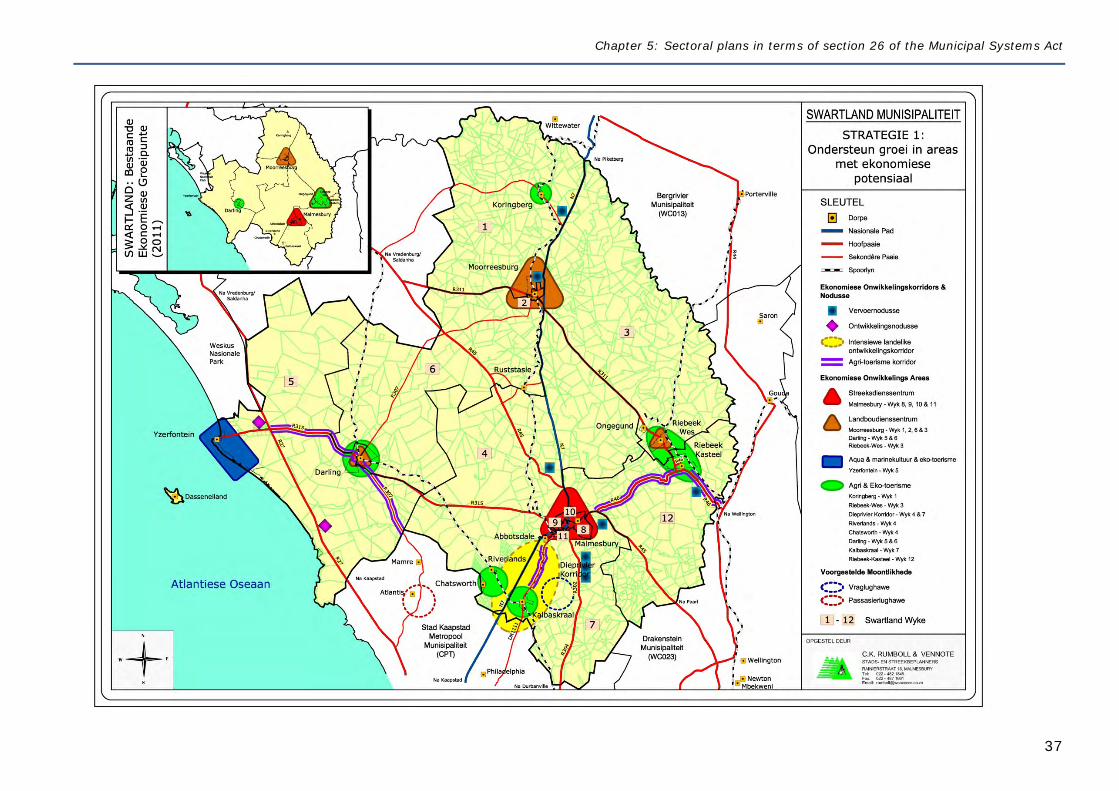
Chapter 5: Sectoral plans in terms of section 26 of the Municipal Systems Act
37
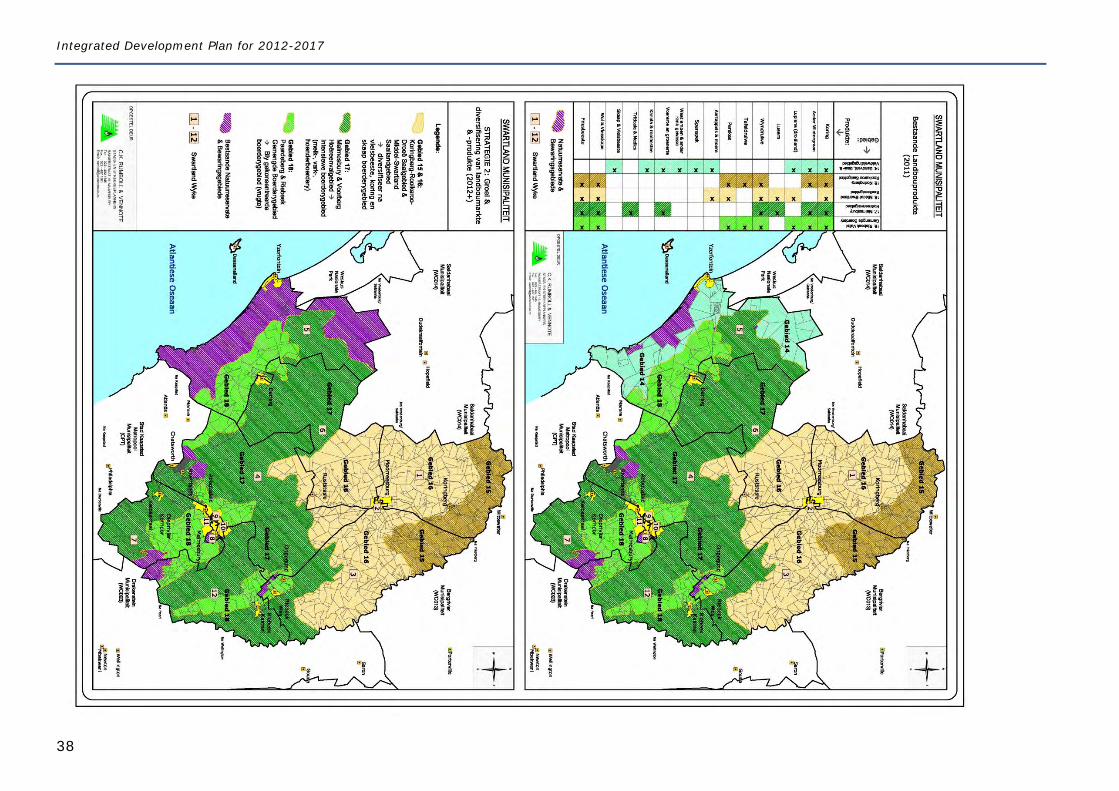
Integrated Development Plan for 2012-2017
38
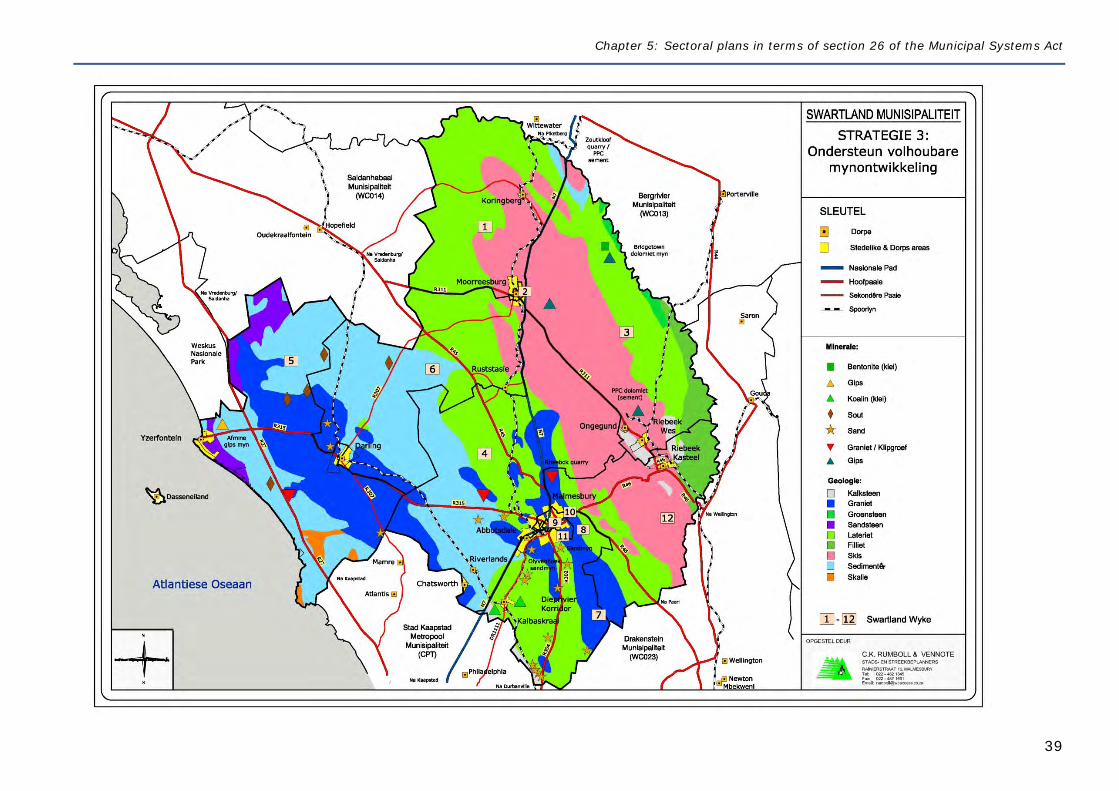
Chapter 5: Sectoral plans in terms of section 26 of the Municipal Systems Act
39
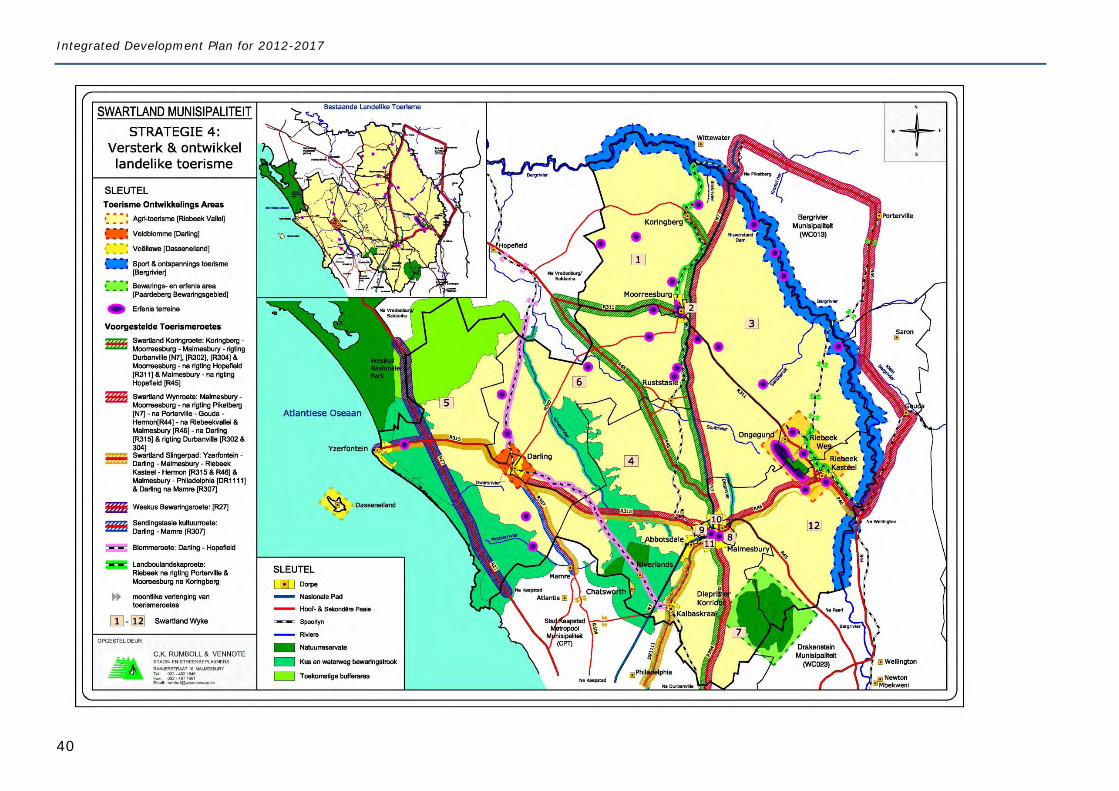
Integrated Development Plan for 2012-2017
40
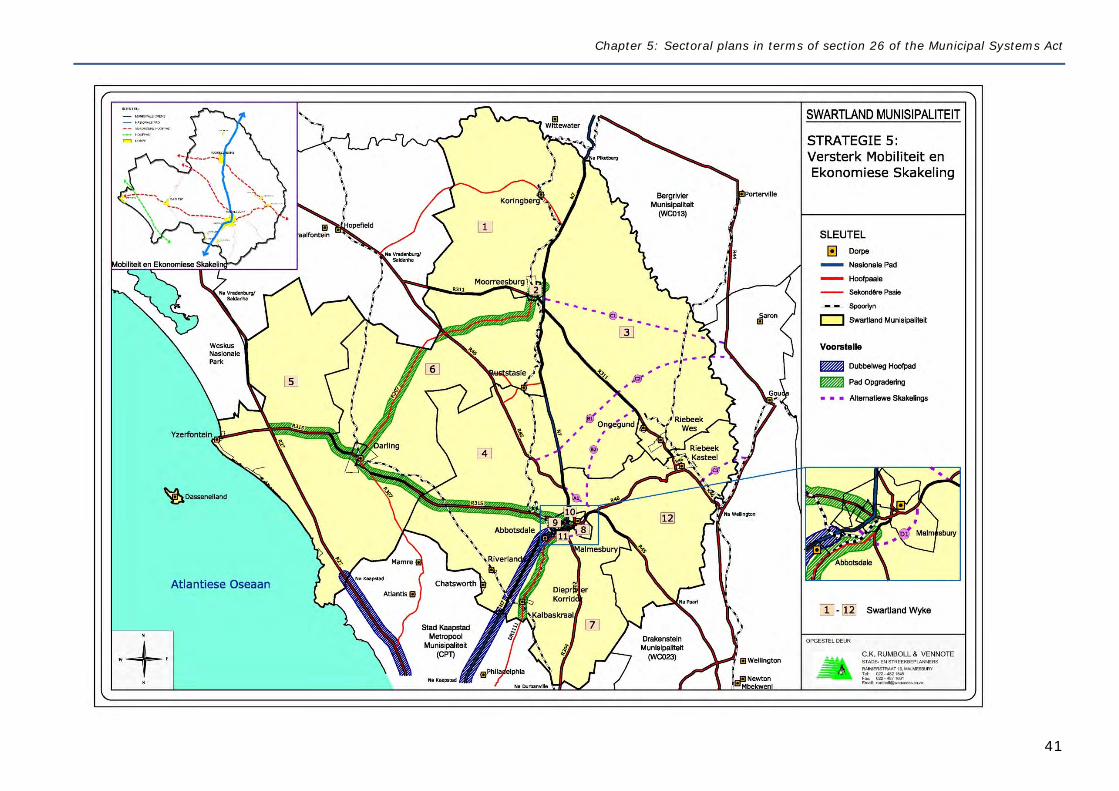
Chapter 5: Sectoral plans in terms of section 26 of the Municipal Systems Act
41
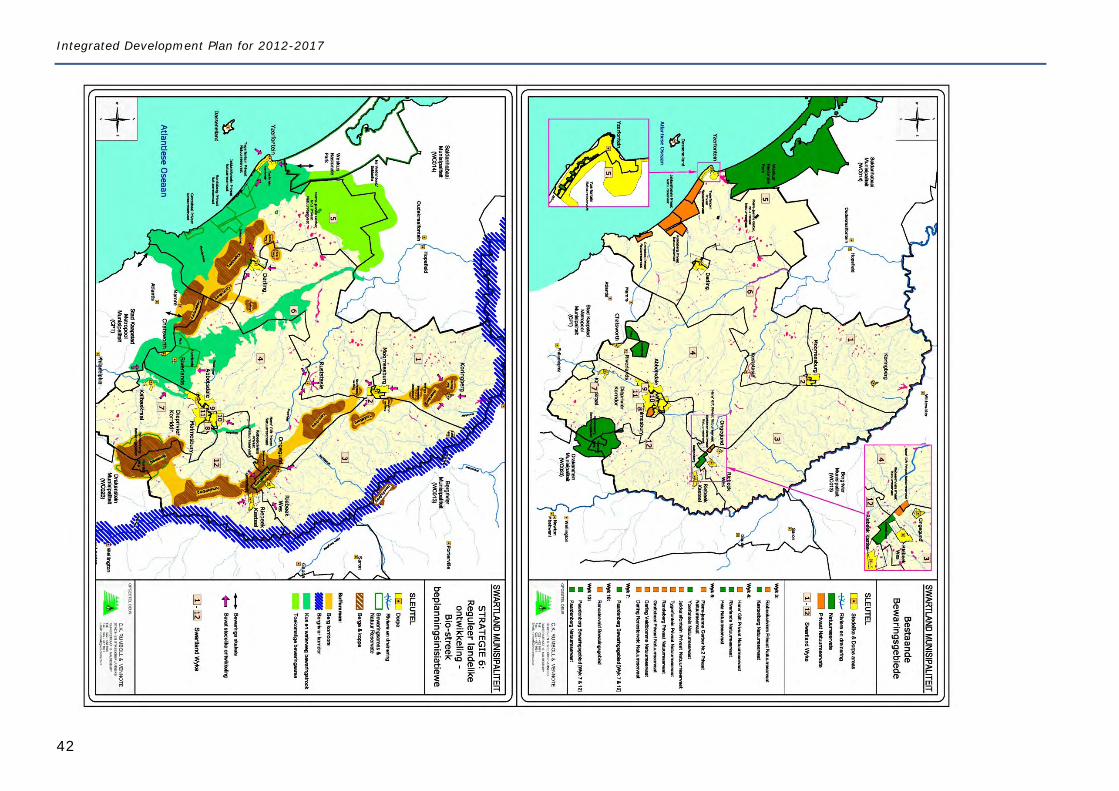
Integrated Development Plan for 2012-2017
42
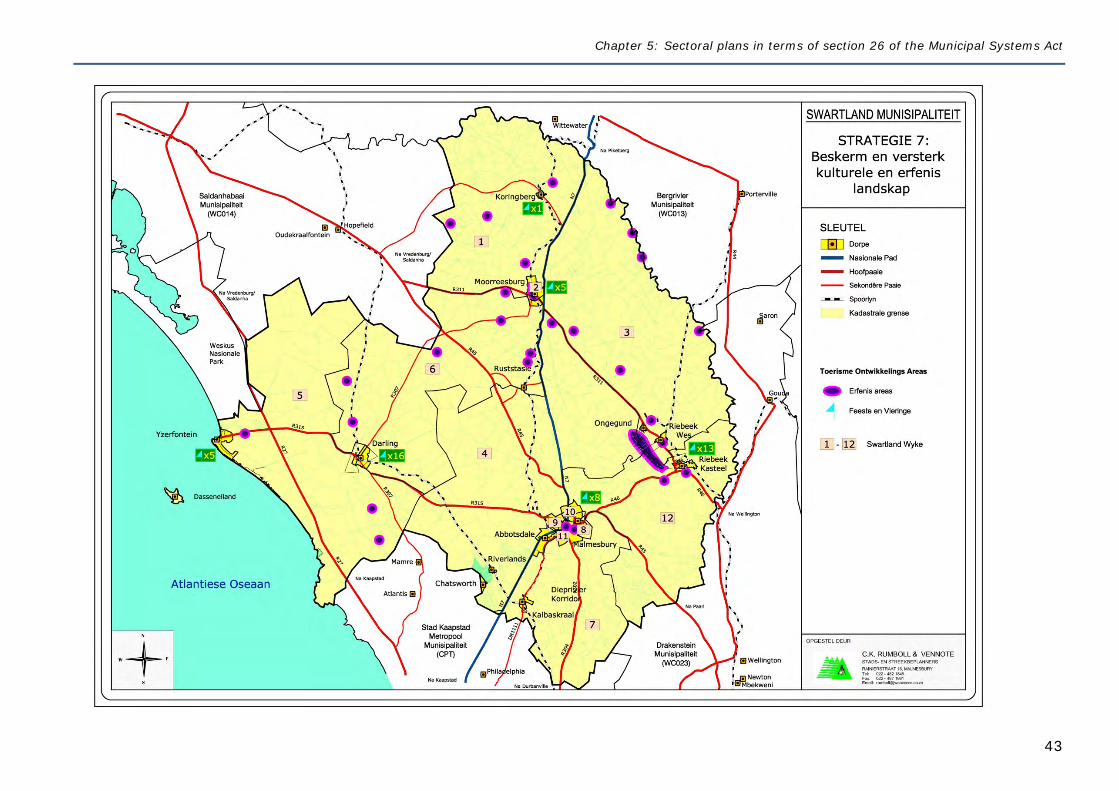
Chapter 5: Sectoral plans in terms of section 26 of the Municipal Systems Act
43
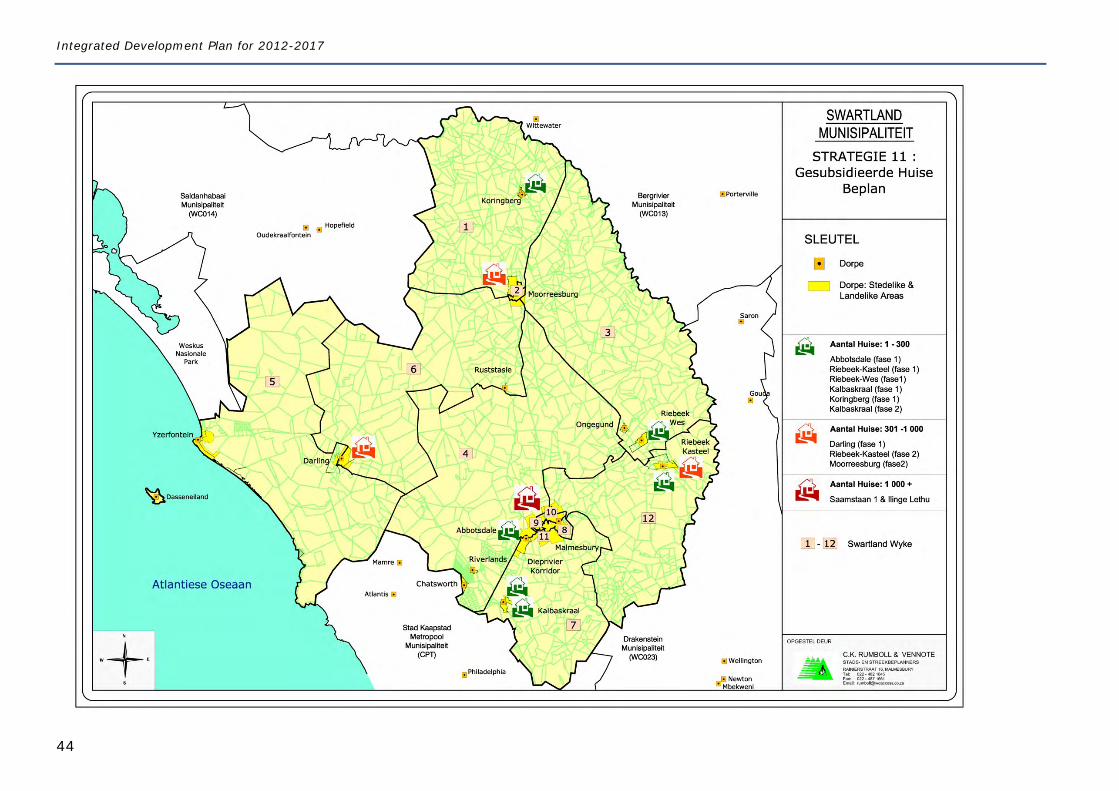
Integrated Development Plan for 2012-2017
44
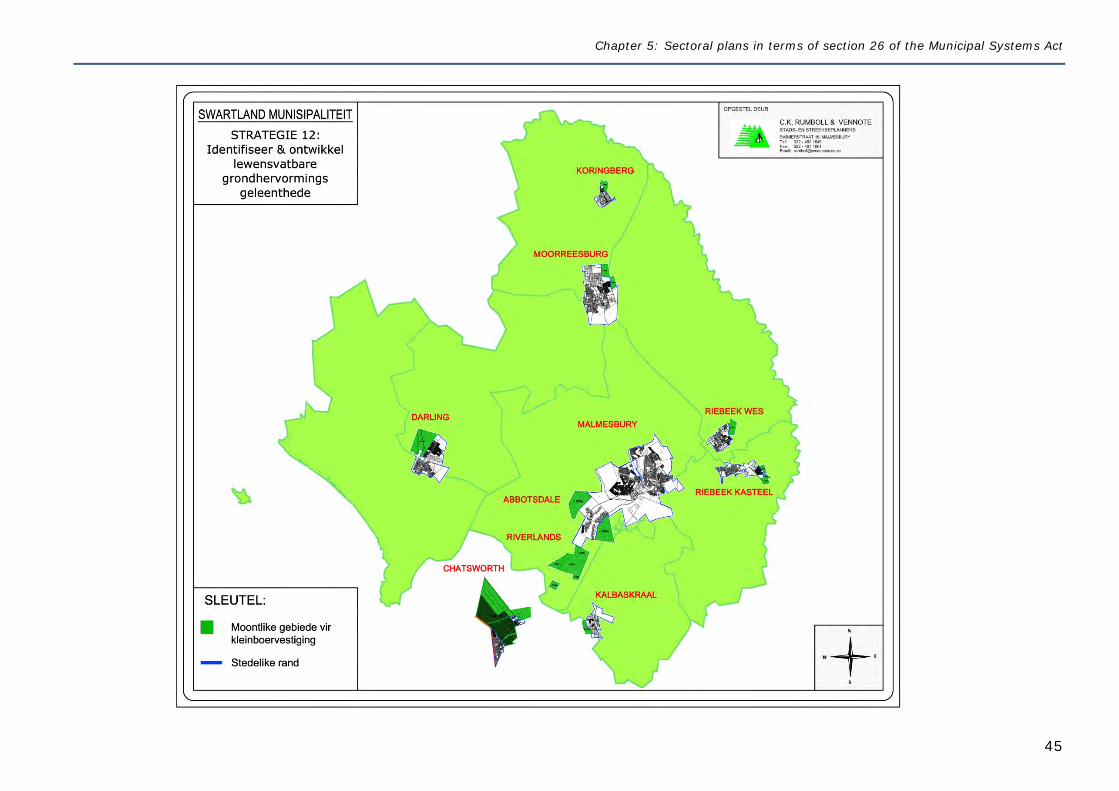
Chapter 5: Sectoral plans in terms of section 26 of the Municipal Systems Act
45
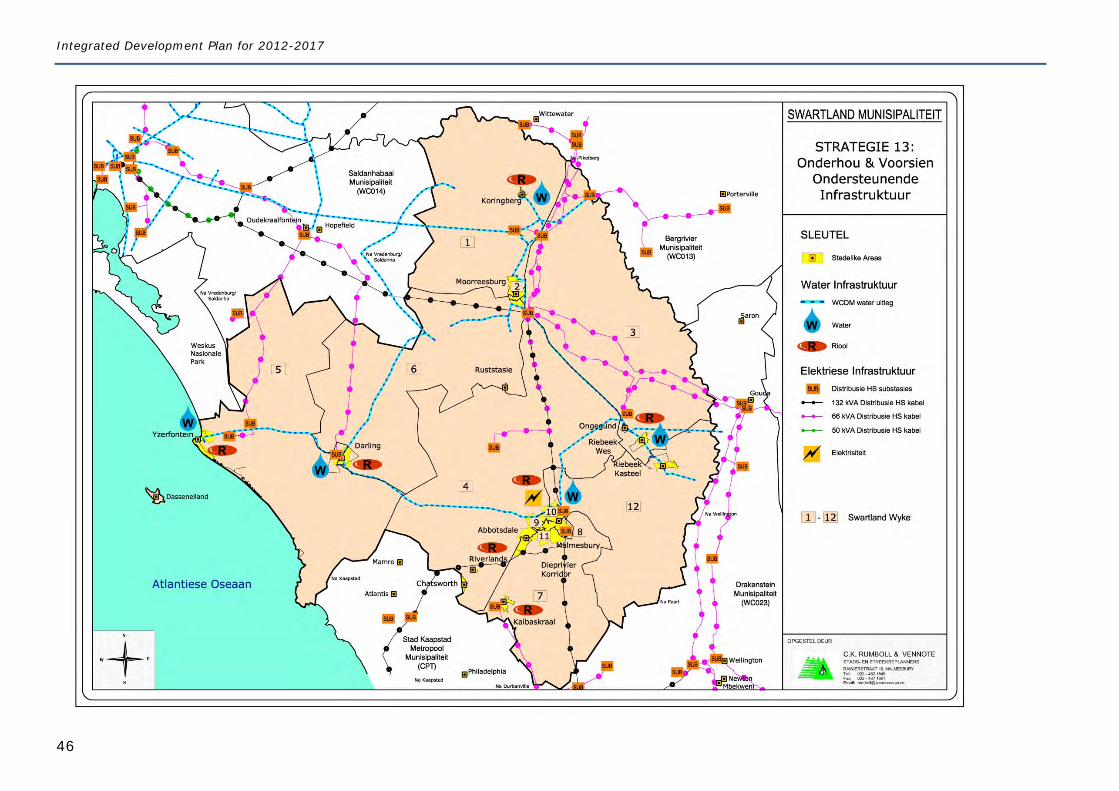
Integrated Development Plan for 2012-2017
46
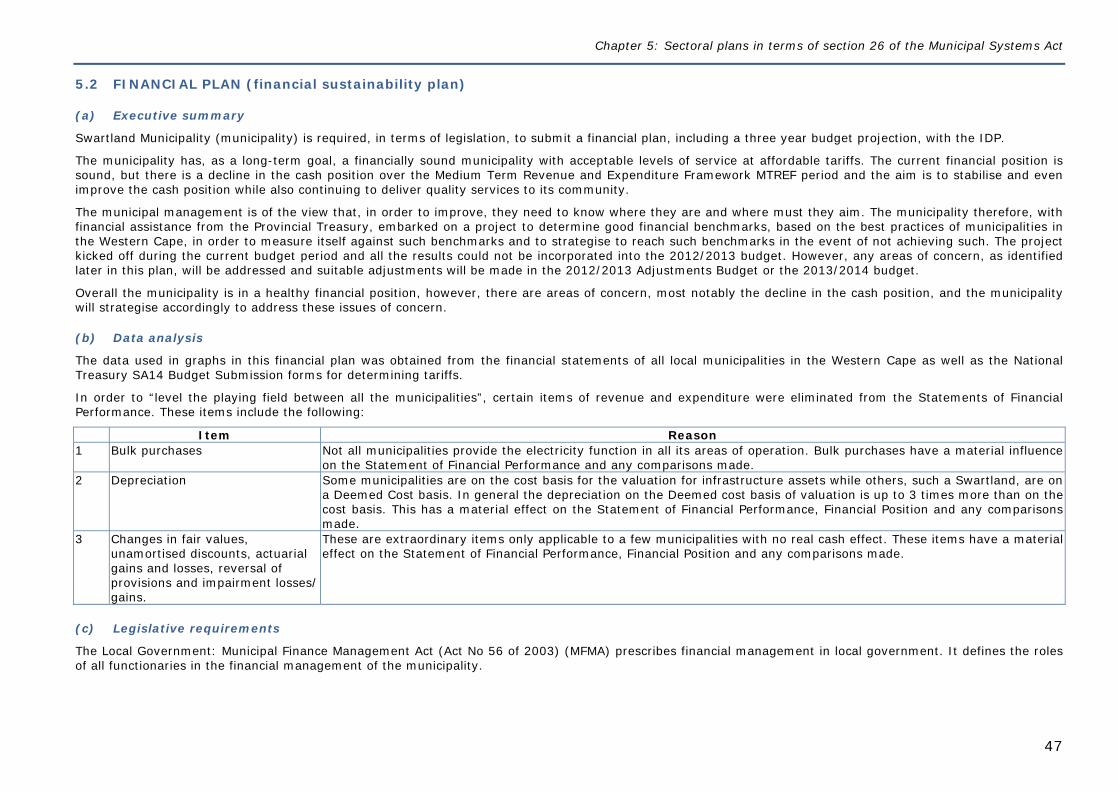
Chapter 5: Sectoral plans in terms of section 26 of the Municipal Systems Act
47
5.2 FINANCIAL PLAN (financial sustainability plan)
(a) Executive summary
Swartland Municipality (municipality) is required, in terms of legislation, to submit a financial plan, including a three year budget projection, with the IDP.
The municipality has, as a long-term goal, a financially sound municipality with acceptable levels of service at affordable tariffs. The current financial position is sound, but there is a decline in the cash position over the Medium Term Revenue and Expenditure Framework MTREF period and the aim is to stabilise and even improve the cash position while also continuing to deliver quality services to its community.
The municipal management is of the view that, in order to improve, they need to know where they are and where must they aim. The municipality therefore, with financial assistance from the Provincial Treasury, embarked on a project to determine good financial benchmarks, based on the best practices of municipalities in the Western Cape, in order to measure itself against such benchmarks and to strategise to reach such benchmarks in the event of not achieving such. The project kicked off during the current budget period and all the results could not be incorporated into the 2012/2013 budget. However, any areas of concern, as identified later in this plan, will be addressed and suitable adjustments will be made in the 2012/2013 Adjustments Budget or the 2013/2014 budget.
Overall the municipality is in a healthy financial position, however, there are areas of concern, most notably the decline in the cash position, and the municipality will strategise accordingly to address these issues of concern.
(b) Data analysis
The data used in graphs in this financial plan was obtained from the financial statements of all local municipalities in the Western Cape as well as the National Treasury SA14 Budget Submission forms for determining tariffs.
In order to “level the playing field between all the municipalities”, certain items of revenue and expenditure were eliminated from the Statements of Financial Performance. These items include the following:
Item Reason 1 Bulk purchases Not all municipalities provide the electricity function in all its areas of operation. Bulk purchases have a material influence
on the Statement of Financial Performance and any comparisons made. 2 Depreciation Some municipalities are on the cost basis for the valuation for infrastructure assets while others, such a Swartland, are on
a Deemed Cost basis. In general the depreciation on the Deemed cost basis of valuation is up to 3 times more than on the cost basis. This has a material effect on the Statement of Financial Performance, Financial Position and any comparisons made.
3 Changes in fair values, unamortised discounts, actuarial gains and losses, reversal of provisions and impairment losses/ gains.
These are extraordinary items only applicable to a few municipalities with no real cash effect. These items have a material effect on the Statement of Financial Performance, Financial Position and any comparisons made.
(c) Legislative requirements
The Local Government: Municipal Finance Management Act (Act No 56 of 2003) (MFMA) prescribes financial management in local government. It defines the roles of all functionaries in the financial management of the municipality.
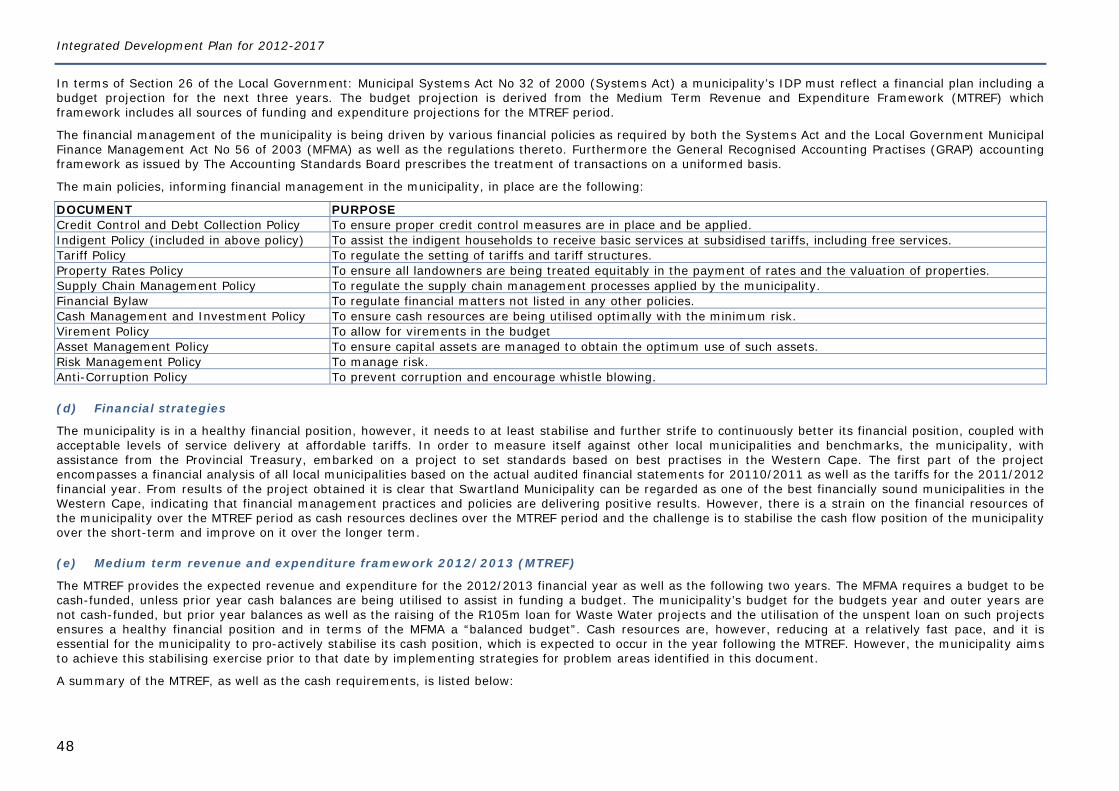
Integrated Development Plan for 2012-2017
48
In terms of Section 26 of the Local Government: Municipal Systems Act No 32 of 2000 (Systems Act) a municipality’s IDP must reflect a financial plan including a budget projection for the next three years. The budget projection is derived from the Medium Term Revenue and Expenditure Framework (MTREF) which framework includes all sources of funding and expenditure projections for the MTREF period.
The financial management of the municipality is being driven by various financial policies as required by both the Systems Act and the Local Government Municipal Finance Management Act No 56 of 2003 (MFMA) as well as the regulations thereto. Furthermore the General Recognised Accounting Practises (GRAP) accounting framework as issued by The Accounting Standards Board prescribes the treatment of transactions on a uniformed basis.
The main policies, informing financial management in the municipality, in place are the following:
DOCUMENT PURPOSE Credit Control and Debt Collection Policy To ensure proper credit control measures are in place and be applied. Indigent Policy (included in above policy) To assist the indigent households to receive basic services at subsidised tariffs, including free services. Tariff Policy To regulate the setting of tariffs and tariff structures. Property Rates Policy To ensure all landowners are being treated equitably in the payment of rates and the valuation of properties. Supply Chain Management Policy To regulate the supply chain management processes applied by the municipality. Financial Bylaw To regulate financial matters not listed in any other policies. Cash Management and Investment Policy To ensure cash resources are being utilised optimally with the minimum risk. Virement Policy To allow for virements in the budget Asset Management Policy To ensure capital assets are managed to obtain the optimum use of such assets. Risk Management Policy To manage risk. Anti-Corruption Policy To prevent corruption and encourage whistle blowing.
(d) Financial strategies
The municipality is in a healthy financial position, however, it needs to at least stabilise and further strife to continuously better its financial position, coupled with acceptable levels of service delivery at affordable tariffs. In order to measure itself against other local municipalities and benchmarks, the municipality, with assistance from the Provincial Treasury, embarked on a project to set standards based on best practises in the Western Cape. The first part of the project encompasses a financial analysis of all local municipalities based on the actual audited financial statements for 20110/2011 as well as the tariffs for the 2011/2012 financial year. From results of the project obtained it is clear that Swartland Municipality can be regarded as one of the best financially sound municipalities in the Western Cape, indicating that financial management practices and policies are delivering positive results. However, there is a strain on the financial resources of the municipality over the MTREF period as cash resources declines over the MTREF period and the challenge is to stabilise the cash flow position of the municipality over the short-term and improve on it over the longer term.
(e) Medium term revenue and expenditure framework 2012/2013 (MTREF)
The MTREF provides the expected revenue and expenditure for the 2012/2013 financial year as well as the following two years. The MFMA requires a budget to be cash-funded, unless prior year cash balances are being utilised to assist in funding a budget. The municipality’s budget for the budgets year and outer years are not cash-funded, but prior year balances as well as the raising of the R105m loan for Waste Water projects and the utilisation of the unspent loan on such projects ensures a healthy financial position and in terms of the MFMA a “balanced budget”. Cash resources are, however, reducing at a relatively fast pace, and it is essential for the municipality to pro-actively stabilise its cash position, which is expected to occur in the year following the MTREF. However, the municipality aims to achieve this stabilising exercise prior to that date by implementing strategies for problem areas identified in this document.
A summary of the MTREF, as well as the cash requirements, is listed below:
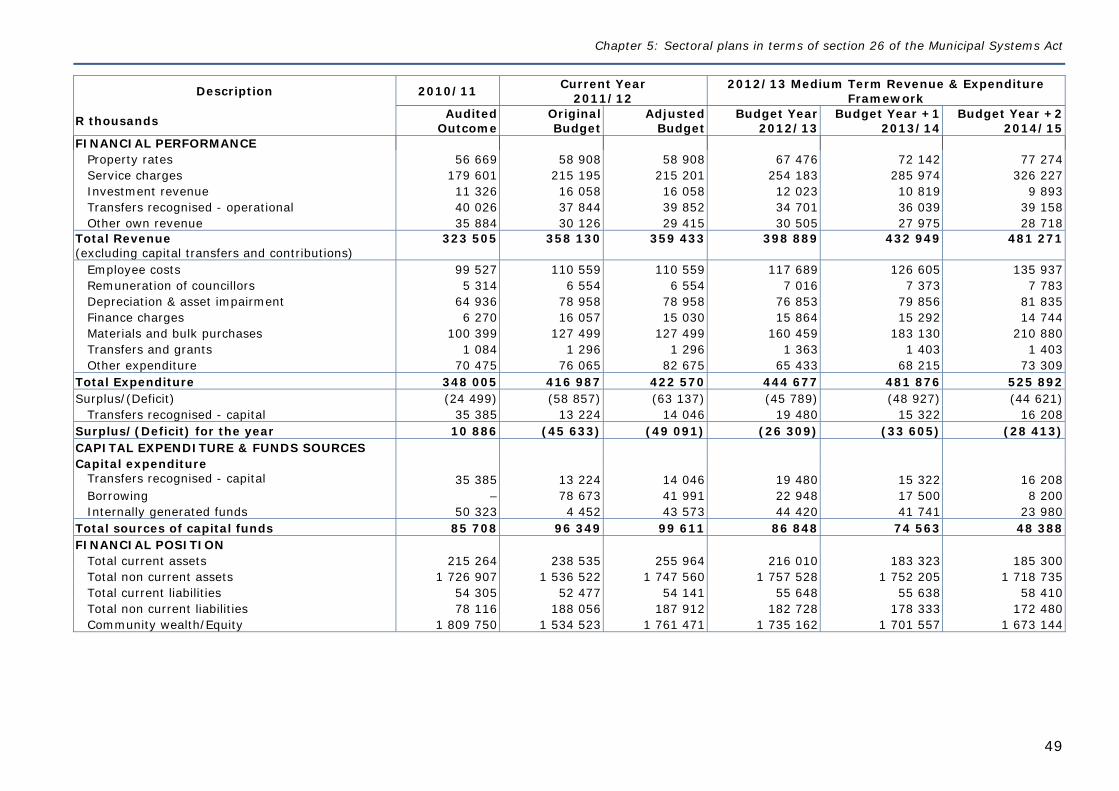
Chapter 5: Sectoral plans in terms of section 26 of the Municipal Systems Act
49
Description 2010/11 Current Year 2011/12
2012/13 Medium Term Revenue & Expenditure Framework
R thousands Audited Outcome
Original Budget
Adjusted Budget
Budget Year 2012/13
Budget Year +1 2013/14
Budget Year +2 2014/15
FINANCIAL PERFORMANCE Property rates 56 669 58 908 58 908 67 476 72 142 77 274 Service charges 179 601 215 195 215 201 254 183 285 974 326 227 Investment revenue 11 326 16 058 16 058 12 023 10 819 9 893 Transfers recognised - operational 40 026 37 844 39 852 34 701 36 039 39 158 Other own revenue 35 884 30 126 29 415 30 505 27 975 28 718
Total Revenue (excluding capital transfers and contributions)
323 505 358 130 359 433 398 889 432 949 481 271
Employee costs 99 527 110 559 110 559 117 689 126 605 135 937 Remuneration of councillors 5 314 6 554 6 554 7 016 7 373 7 783 Depreciation & asset impairment 64 936 78 958 78 958 76 853 79 856 81 835 Finance charges 6 270 16 057 15 030 15 864 15 292 14 744 Materials and bulk purchases 100 399 127 499 127 499 160 459 183 130 210 880 Transfers and grants 1 084 1 296 1 296 1 363 1 403 1 403 Other expenditure 70 475 76 065 82 675 65 433 68 215 73 309
Total Expenditure 348 005 416 987 422 570 444 677 481 876 525 892 Surplus/(Deficit) (24 499) (58 857) (63 137) (45 789) (48 927) (44 621)
Transfers recognised - capital 35 385 13 224 14 046 19 480 15 322 16 208 Surplus/(Deficit) for the year 10 886 (45 633) (49 091) (26 309) (33 605) (28 413) CAPITAL EXPENDITURE & FUNDS SOURCES Capital expenditure
Transfers recognised - capital 35 385 13 224 14 046 19 480 15 322 16 208 Borrowing – 78 673 41 991 22 948 17 500 8 200 Internally generated funds 50 323 4 452 43 573 44 420 41 741 23 980
Total sources of capital funds 85 708 96 349 99 611 86 848 74 563 48 388 FINANCIAL POSITION
Total current assets 215 264 238 535 255 964 216 010 183 323 185 300 Total non current assets 1 726 907 1 536 522 1 747 560 1 757 528 1 752 205 1 718 735 Total current liabilities 54 305 52 477 54 141 55 648 55 638 58 410 Total non current liabilities 78 116 188 056 187 912 182 728 178 333 172 480 Community wealth/Equity 1 809 750 1 534 523 1 761 471 1 735 162 1 701 557 1 673 144
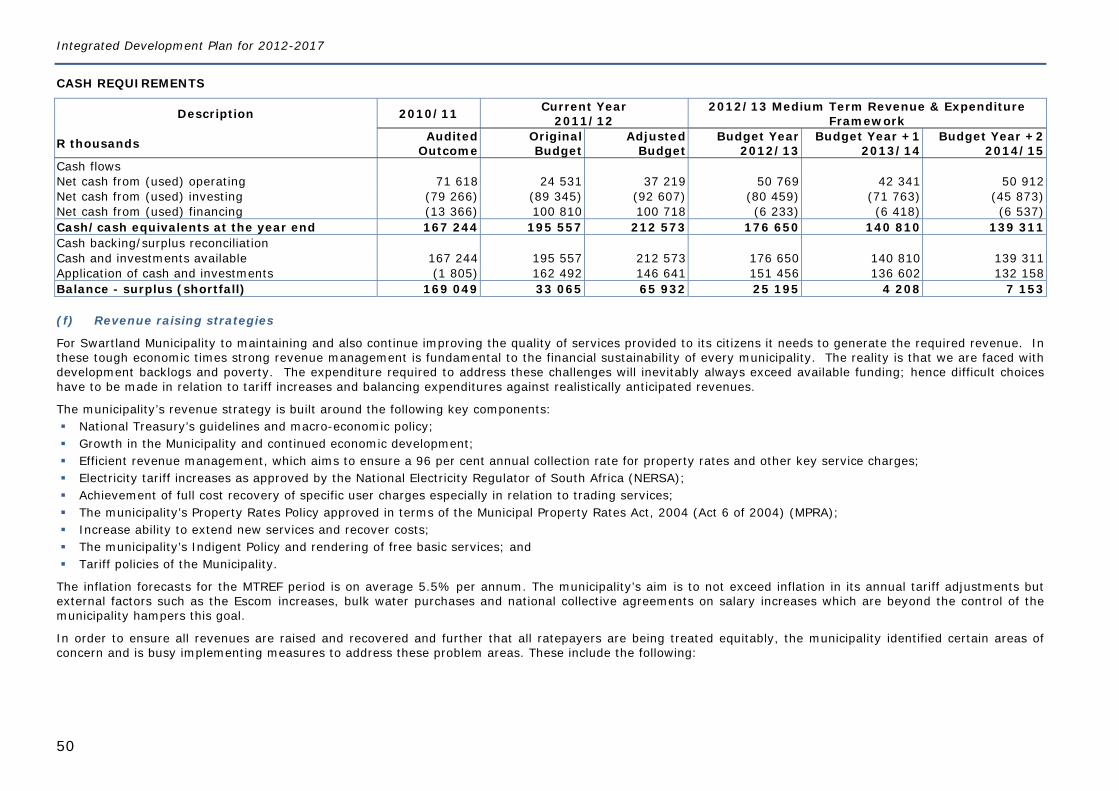
Integrated Development Plan for 2012-2017
50
CASH REQUIREMENTS
Description 2010/11 Current Year 2011/12
2012/13 Medium Term Revenue & Expenditure Framework
R thousands Audited Outcome
Original Budget
Adjusted Budget
Budget Year 2012/13
Budget Year +1 2013/14
Budget Year +2 2014/15
Cash flows Net cash from (used) operating 71 618 24 531 37 219 50 769 42 341 50 912 Net cash from (used) investing (79 266) (89 345) (92 607) (80 459) (71 763) (45 873) Net cash from (used) financing (13 366) 100 810 100 718 (6 233) (6 418) (6 537) Cash/cash equivalents at the year end 167 244 195 557 212 573 176 650 140 810 139 311 Cash backing/surplus reconciliation Cash and investments available 167 244 195 557 212 573 176 650 140 810 139 311 Application of cash and investments (1 805) 162 492 146 641 151 456 136 602 132 158 Balance - surplus (shortfall) 169 049 33 065 65 932 25 195 4 208 7 153
(f) Revenue raising strategies
For Swartland Municipality to maintaining and also continue improving the quality of services provided to its citizens it needs to generate the required revenue. In these tough economic times strong revenue management is fundamental to the financial sustainability of every municipality. The reality is that we are faced with development backlogs and poverty. The expenditure required to address these challenges will inevitably always exceed available funding; hence difficult choices have to be made in relation to tariff increases and balancing expenditures against realistically anticipated revenues.
The municipality’s revenue strategy is built around the following key components: National Treasury’s guidelines and macro-economic policy; Growth in the Municipality and continued economic development; Efficient revenue management, which aims to ensure a 96 per cent annual collection rate for property rates and other key service charges; Electricity tariff increases as approved by the National Electricity Regulator of South Africa (NERSA); Achievement of full cost recovery of specific user charges especially in relation to trading services; The municipality’s Property Rates Policy approved in terms of the Municipal Property Rates Act, 2004 (Act 6 of 2004) (MPRA); Increase ability to extend new services and recover costs; The municipality’s Indigent Policy and rendering of free basic services; and Tariff policies of the Municipality.
The inflation forecasts for the MTREF period is on average 5.5% per annum. The municipality’s aim is to not exceed inflation in its annual tariff adjustments but external factors such as the Escom increases, bulk water purchases and national collective agreements on salary increases which are beyond the control of the municipality hampers this goal.
In order to ensure all revenues are raised and recovered and further that all ratepayers are being treated equitably, the municipality identified certain areas of concern and is busy implementing measures to address these problem areas. These include the following:
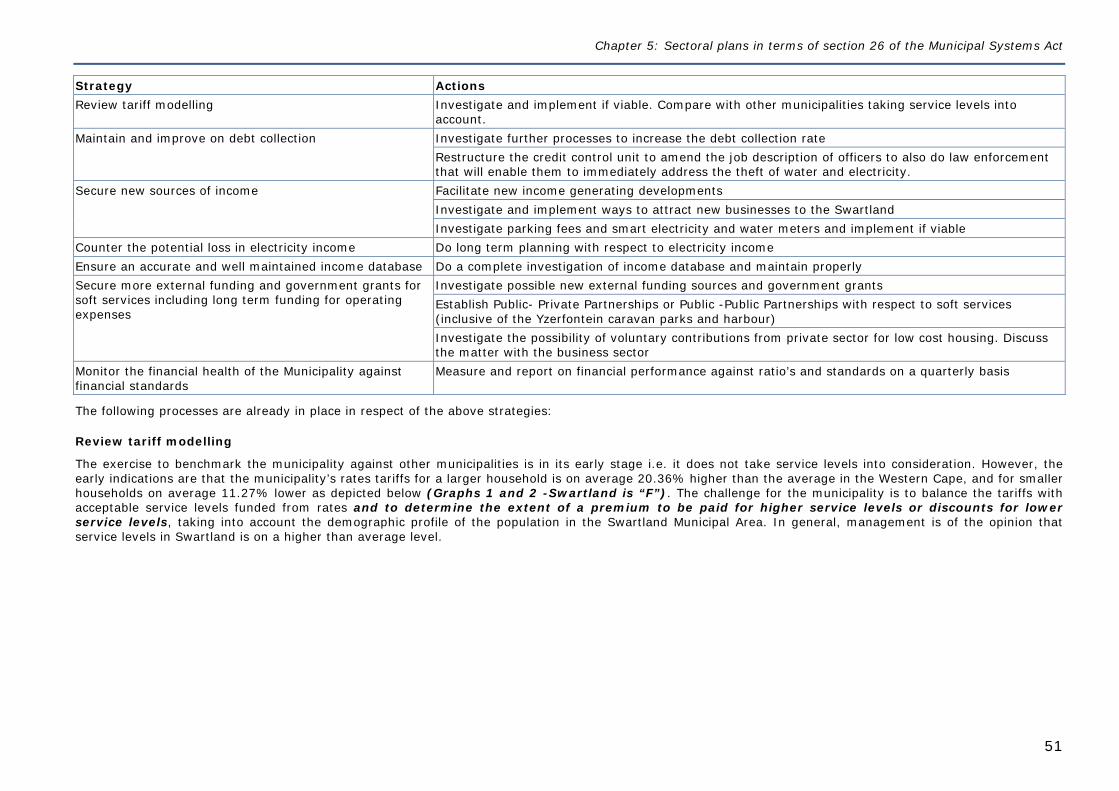
Chapter 5: Sectoral plans in terms of section 26 of the Municipal Systems Act
51
Strategy Actions Review tariff modelling Investigate and implement if viable. Compare with other municipalities taking service levels into
account. Maintain and improve on debt collection Investigate further processes to increase the debt collection rate Restructure the credit control unit to amend the job description of officers to also do law enforcement
that will enable them to immediately address the theft of water and electricity. Secure new sources of income Facilitate new income generating developments Investigate and implement ways to attract new businesses to the Swartland Investigate parking fees and smart electricity and water meters and implement if viable Counter the potential loss in electricity income Do long term planning with respect to electricity income Ensure an accurate and well maintained income database Do a complete investigation of income database and maintain properly Secure more external funding and government grants for soft services including long term funding for operating expenses
Investigate possible new external funding sources and government grants Establish Public- Private Partnerships or Public -Public Partnerships with respect to soft services (inclusive of the Yzerfontein caravan parks and harbour)
Investigate the possibility of voluntary contributions from private sector for low cost housing. Discuss the matter with the business sector
Monitor the financial health of the Municipality against financial standards
Measure and report on financial performance against ratio’s and standards on a quarterly basis
The following processes are already in place in respect of the above strategies:
Review tariff modelling
The exercise to benchmark the municipality against other municipalities is in its early stage i.e. it does not take service levels into consideration. However, the early indications are that the municipality’s rates tariffs for a larger household is on average 20.36% higher than the average in the Western Cape, and for smaller households on average 11.27% lower as depicted below (Graphs 1 and 2 -Swartland is “F”). The challenge for the municipality is to balance the tariffs with acceptable service levels funded from rates and to determine the extent of a premium to be paid for higher service levels or discounts for lower service levels, taking into account the demographic profile of the population in the Swartland Municipal Area. In general, management is of the opinion that service levels in Swartland is on a higher than average level.
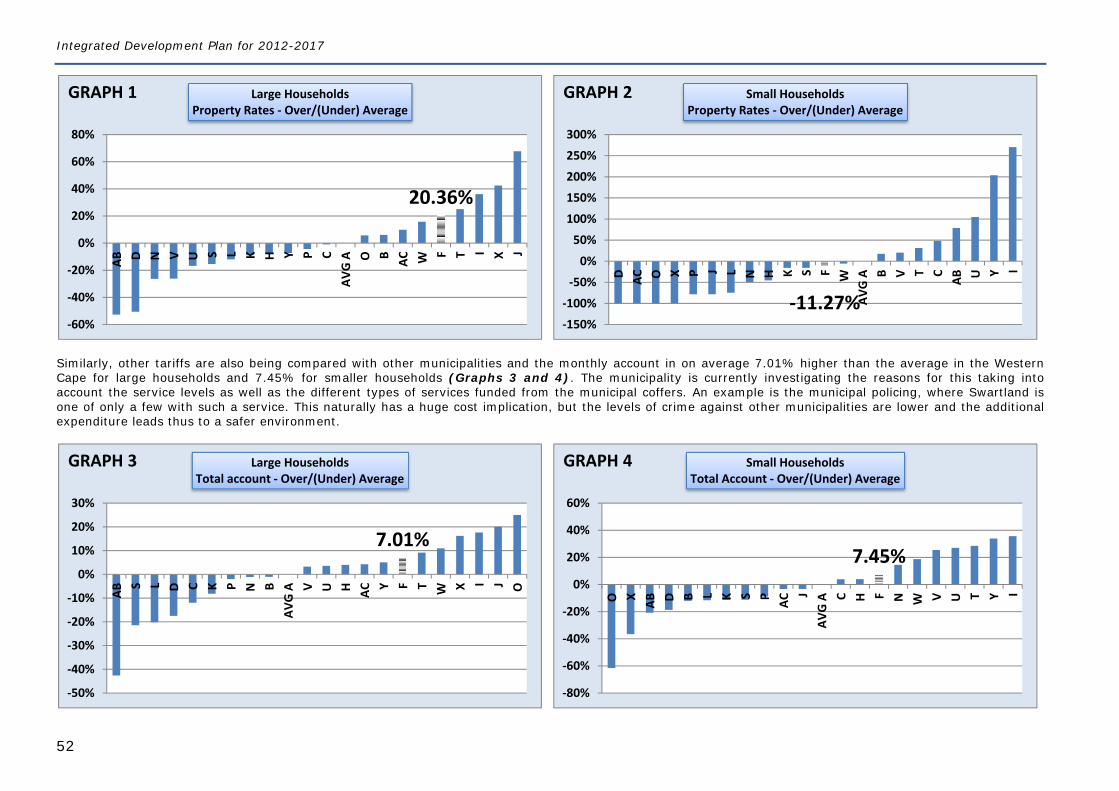
Integrated Development Plan for 2012-2017
52
Similarly, other tariffs are also being compared with other municipalities and the monthly account in on average 7.01% higher than the average in the Western Cape for large households and 7.45% for smaller households (Graphs 3 and 4). The municipality is currently investigating the reasons for this taking into account the service levels as well as the different types of services funded from the municipal coffers. An example is the municipal policing, where Swartland is one of only a few with such a service. This naturally has a huge cost implication, but the levels of crime against other municipalities are lower and the additional expenditure leads thus to a safer environment.
20.36%
‐60%
‐40%
‐20%
0%
20%
40%
60%
80%AB D N V U S L K H Y P C
AVG A O B AC W F T I X J
Large HouseholdsProperty Rates ‐ Over/(Under) Average
GRAPH 1
‐11.27%‐150%
‐100%
‐50%
0%
50%
100%
150%
200%
250%
300%
D AC O X P J L N H K S F WAV
G A B V T CAB U Y I
Small HouseholdsProperty Rates ‐ Over/(Under) Average
GRAPH 2
7.01%
‐50%
‐40%
‐30%
‐20%
‐10%
0%
10%
20%
30%
ABS L D C K P N B
AVG A V U H AC Y F T W X I J O
Large HouseholdsTotal account ‐ Over/(Under) Average
GRAPH 3
7.45%
‐80%
‐60%
‐40%
‐20%
0%
20%
40%
60%
O X AB D B L K S P ACJ
AVG A C H F N W V U T Y I
Small HouseholdsTotal Account ‐ Over/(Under) Average
GRAPH 4
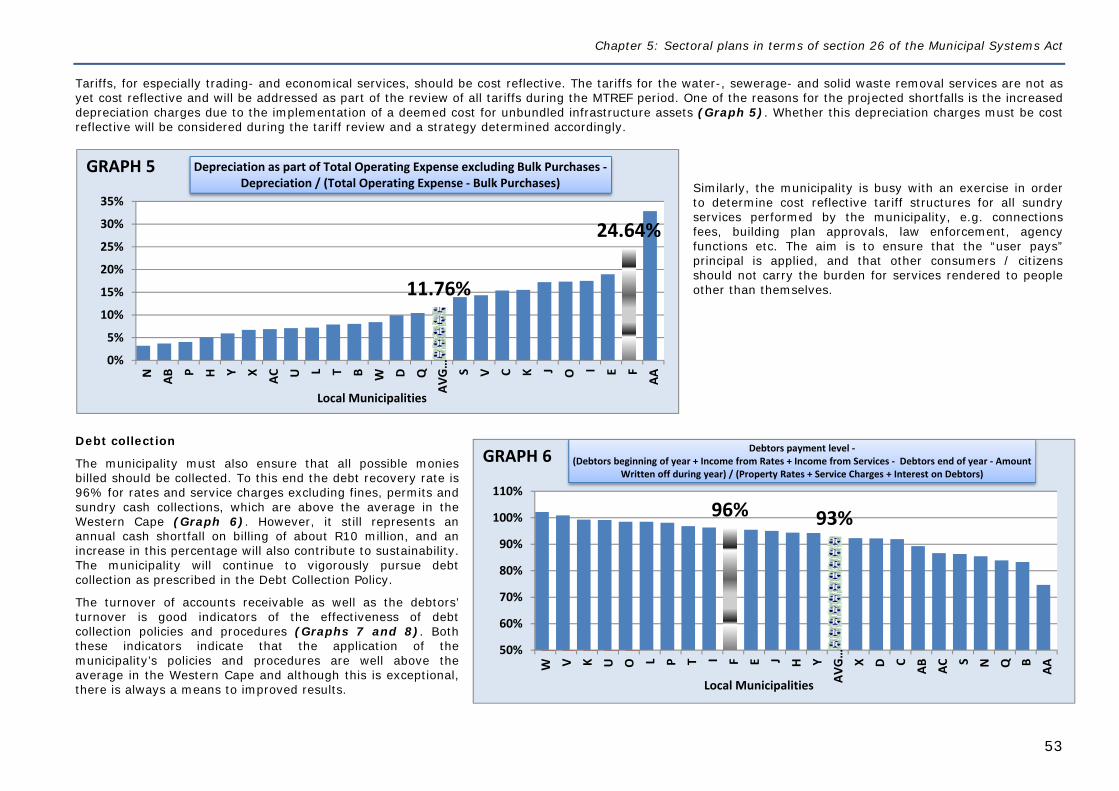
Chapter 5: Sectoral plans in terms of section 26 of the Municipal Systems Act
53
96% 93%
50%
60%
70%
80%
90%
100%
110%
W V K U O L P T I F E J H Y
AVG… X D C
AB AC
S N Q B
AA
Local Municipalities
Debtors payment level ‐(Debtors beginning of year + Income from Rates + Income from Services ‐ Debtors end of year ‐ Amount
Written off during year) / (Property Rates + Service Charges + Interest on Debtors)GRAPH 6
11.76%
24.64%
0%
5%
10%
15%
20%
25%
30%
35%
N AB
P H Y X AC U L T B W D Q
AVG… S V C K J O I E F
AA
Local Municipalities
Depreciation as part of Total Operating Expense excluding Bulk Purchases ‐Depreciation / (Total Operating Expense ‐ Bulk Purchases)
GRAPH 5
Tariffs, for especially trading- and economical services, should be cost reflective. The tariffs for the water-, sewerage- and solid waste removal services are not as yet cost reflective and will be addressed as part of the review of all tariffs during the MTREF period. One of the reasons for the projected shortfalls is the increased depreciation charges due to the implementation of a deemed cost for unbundled infrastructure assets (Graph 5). Whether this depreciation charges must be cost reflective will be considered during the tariff review and a strategy determined accordingly.
Similarly, the municipality is busy with an exercise in order to determine cost reflective tariff structures for all sundry services performed by the municipality, e.g. connections fees, building plan approvals, law enforcement, agency functions etc. The aim is to ensure that the “user pays” principal is applied, and that other consumers / citizens should not carry the burden for services rendered to people other than themselves.
Debt collection
The municipality must also ensure that all possible monies billed should be collected. To this end the debt recovery rate is 96% for rates and service charges excluding fines, permits and sundry cash collections, which are above the average in the Western Cape (Graph 6). However, it still represents an annual cash shortfall on billing of about R10 million, and an increase in this percentage will also contribute to sustainability. The municipality will continue to vigorously pursue debt collection as prescribed in the Debt Collection Policy.
The turnover of accounts receivable as well as the debtors’ turnover is good indicators of the effectiveness of debt collection policies and procedures (Graphs 7 and 8). Both these indicators indicate that the application of the municipality’s policies and procedures are well above the average in the Western Cape and although this is exceptional, there is always a means to improved results.
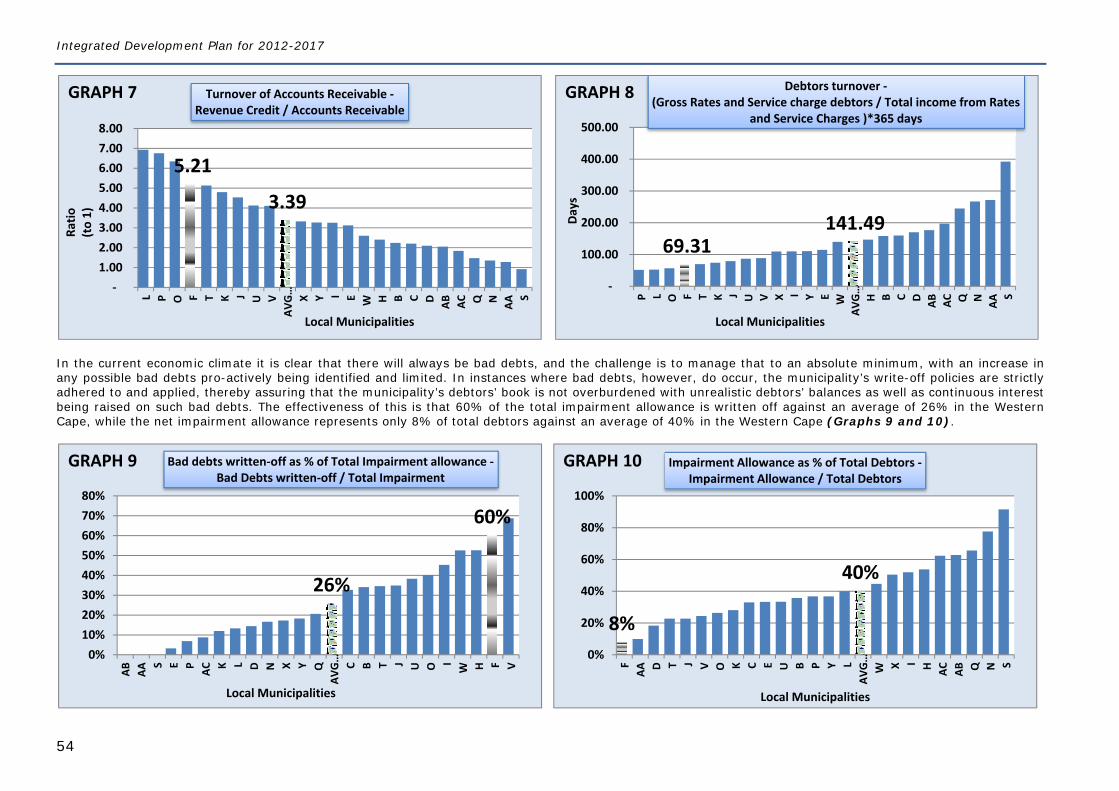
Integrated Development Plan for 2012-2017
54
In the current economic climate it is clear that there will always be bad debts, and the challenge is to manage that to an absolute minimum, with an increase in any possible bad debts pro-actively being identified and limited. In instances where bad debts, however, do occur, the municipality’s write-off policies are strictly adhered to and applied, thereby assuring that the municipality’s debtors’ book is not overburdened with unrealistic debtors’ balances as well as continuous interest being raised on such bad debts. The effectiveness of this is that 60% of the total impairment allowance is written off against an average of 26% in the Western Cape, while the net impairment allowance represents only 8% of total debtors against an average of 40% in the Western Cape (Graphs 9 and 10).
5.21
3.39
‐ 1.00 2.00 3.00 4.00 5.00 6.00 7.00 8.00
L P O F T K J U VAV
G… X Y I E W H B C D AB AC Q N AAS
Ratio
(to 1)
Local Municipalities
Turnover of Accounts Receivable ‐Revenue Credit / Accounts Receivable
GRAPH 7
69.31 141.49
‐
100.00
200.00
300.00
400.00
500.00
P L O F T K J U V X I Y E WAV
G…
H B C D AB AC Q N AAS
Days
Local Municipalities
Debtors turnover ‐(Gross Rates and Service charge debtors / Total income from Rates
and Service Charges )*365 days
GRAPH 8
26%
60%
0%10%20%30%40%50%60%70%80%
AB AAS E P AC K L D N X Y Q
AVG… C B T J U O I
W H F V
Local Municipalities
Bad debts written‐off as % of Total Impairment allowance ‐Bad Debts written‐off / Total Impairment
GRAPH 9
8%
40%
0%
20%
40%
60%
80%
100%
FAA D T J V O K C E U B P Y L
AVG…
W X I H AC AB Q N S
Local Municipalities
Impairment Allowance as % of Total Debtors ‐Impairment Allowance / Total Debtors
GRAPH 10
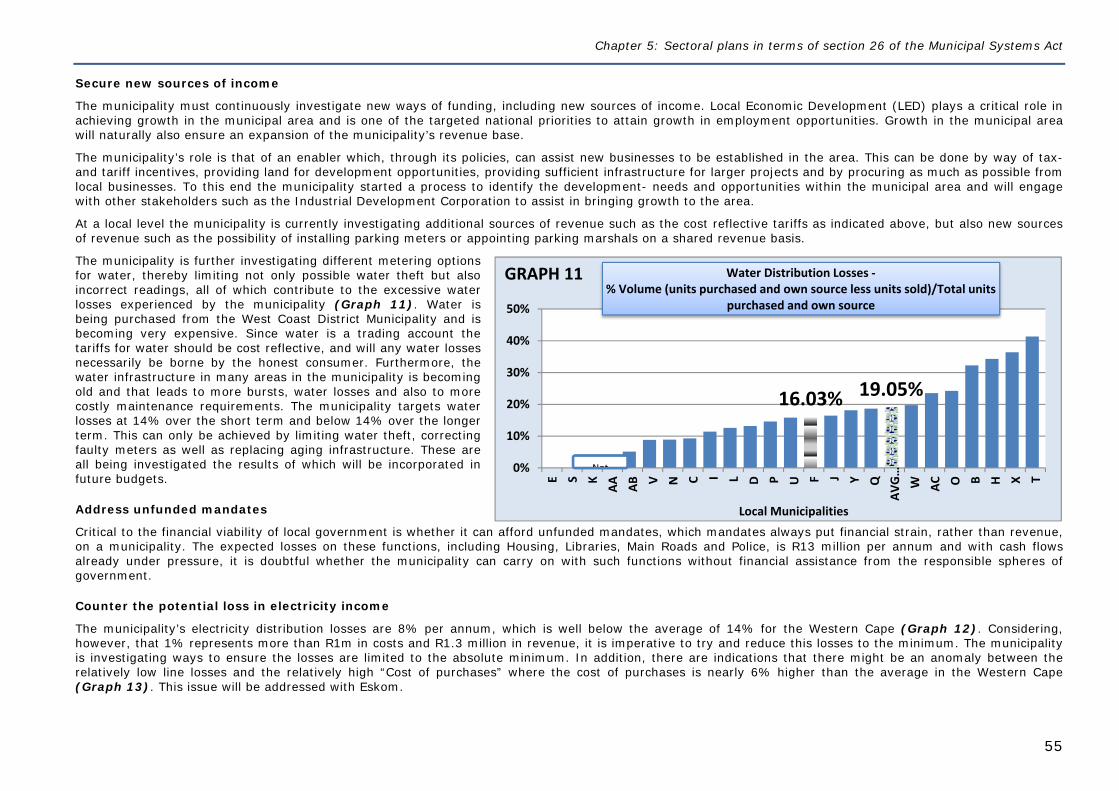
Chapter 5: Sectoral plans in terms of section 26 of the Municipal Systems Act
55
16.03% 19.05%
0%
10%
20%
30%
40%
50%
E S KAA AB V N C I L D P U F J Y Q
AVG…
W AC O B H X T
Local Municipalities
Water Distribution Losses ‐% Volume (units purchased and own source less units sold)/Total units
purchased and own source
Not
GRAPH 11
Secure new sources of income
The municipality must continuously investigate new ways of funding, including new sources of income. Local Economic Development (LED) plays a critical role in achieving growth in the municipal area and is one of the targeted national priorities to attain growth in employment opportunities. Growth in the municipal area will naturally also ensure an expansion of the municipality’s revenue base.
The municipality’s role is that of an enabler which, through its policies, can assist new businesses to be established in the area. This can be done by way of tax- and tariff incentives, providing land for development opportunities, providing sufficient infrastructure for larger projects and by procuring as much as possible from local businesses. To this end the municipality started a process to identify the development- needs and opportunities within the municipal area and will engage with other stakeholders such as the Industrial Development Corporation to assist in bringing growth to the area.
At a local level the municipality is currently investigating additional sources of revenue such as the cost reflective tariffs as indicated above, but also new sources of revenue such as the possibility of installing parking meters or appointing parking marshals on a shared revenue basis.
The municipality is further investigating different metering options for water, thereby limiting not only possible water theft but also incorrect readings, all of which contribute to the excessive water losses experienced by the municipality (Graph 11). Water is being purchased from the West Coast District Municipality and is becoming very expensive. Since water is a trading account the tariffs for water should be cost reflective, and will any water losses necessarily be borne by the honest consumer. Furthermore, the water infrastructure in many areas in the municipality is becoming old and that leads to more bursts, water losses and also to more costly maintenance requirements. The municipality targets water losses at 14% over the short term and below 14% over the longer term. This can only be achieved by limiting water theft, correcting faulty meters as well as replacing aging infrastructure. These are all being investigated the results of which will be incorporated in future budgets.
Address unfunded mandates
Critical to the financial viability of local government is whether it can afford unfunded mandates, which mandates always put financial strain, rather than revenue, on a municipality. The expected losses on these functions, including Housing, Libraries, Main Roads and Police, is R13 million per annum and with cash flows already under pressure, it is doubtful whether the municipality can carry on with such functions without financial assistance from the responsible spheres of government.
Counter the potential loss in electricity income
The municipality’s electricity distribution losses are 8% per annum, which is well below the average of 14% for the Western Cape (Graph 12). Considering, however, that 1% represents more than R1m in costs and R1.3 million in revenue, it is imperative to try and reduce this losses to the minimum. The municipality is investigating ways to ensure the losses are limited to the absolute minimum. In addition, there are indications that there might be an anomaly between the relatively low line losses and the relatively high “Cost of purchases” where the cost of purchases is nearly 6% higher than the average in the Western Cape (Graph 13). This issue will be addressed with Eskom.
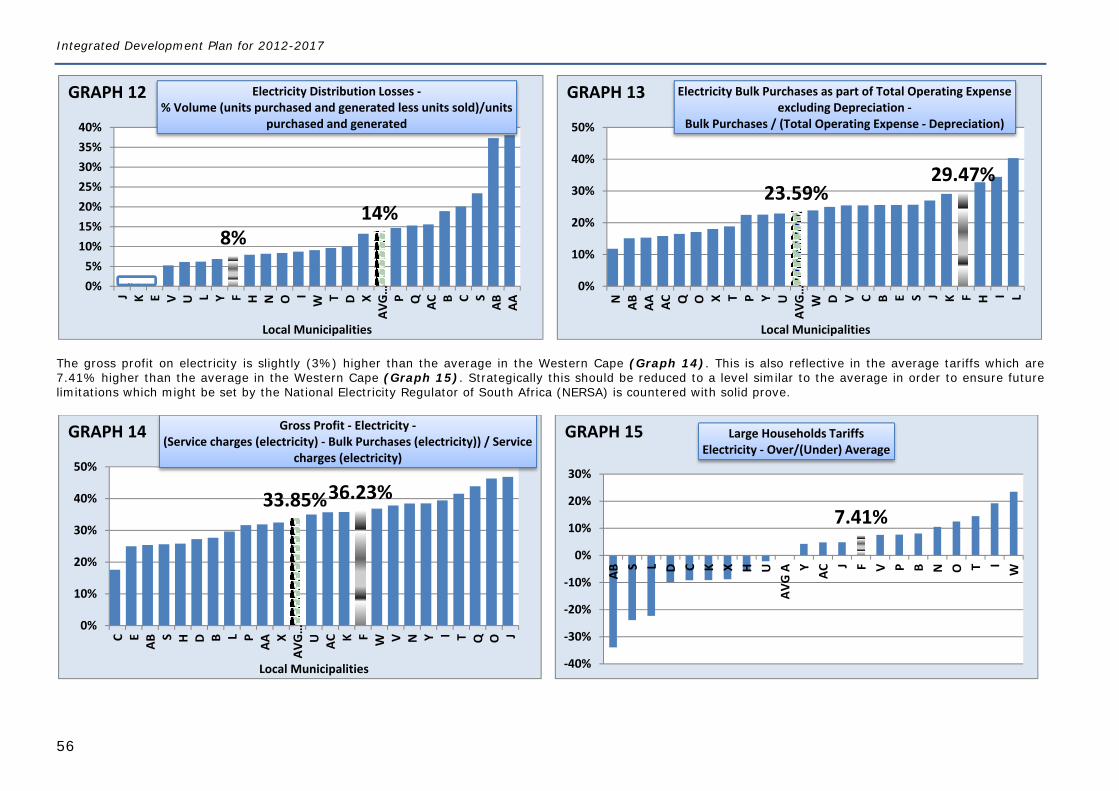
Integrated Development Plan for 2012-2017
56
The gross profit on electricity is slightly (3%) higher than the average in the Western Cape (Graph 14). This is also reflective in the average tariffs which are 7.41% higher than the average in the Western Cape (Graph 15). Strategically this should be reduced to a level similar to the average in order to ensure future limitations which might be set by the National Electricity Regulator of South Africa (NERSA) is countered with solid prove.
8%14%
0%5%10%15%20%25%30%35%40%
J K E V U L Y F H N O IW T D X
AVG… P Q AC B C S
AB AA
Local Municipalities
Electricity Distribution Losses ‐% Volume (units purchased and generated less units sold)/units
purchased and generated
N t
GRAPH 12
23.59%29.47%
0%
10%
20%
30%
40%
50%
N AB AA AC Q O X T P Y UAV
G…
W D V C B E S J K F H I L
Local Municipalities
Electricity Bulk Purchases as part of Total Operating Expense excluding Depreciation ‐
Bulk Purchases / (Total Operating Expense ‐ Depreciation)
GRAPH 13
33.85%36.23%
0%
10%
20%
30%
40%
50%
C EABS H D B L P
AAX
AVG…
U AC K F W V N Y I T Q O J
Local Municipalities
Gross Profit ‐ Electricity ‐(Service charges (electricity) ‐ Bulk Purchases (electricity)) / Service
charges (electricity)
GRAPH 14
7.41%
‐40%
‐30%
‐20%
‐10%
0%
10%
20%
30%
ABS L D C K X H U
AVG A Y ACJ F V P B N O T I
W
Large Households TariffsElectricity ‐ Over/(Under) Average
GRAPH 15
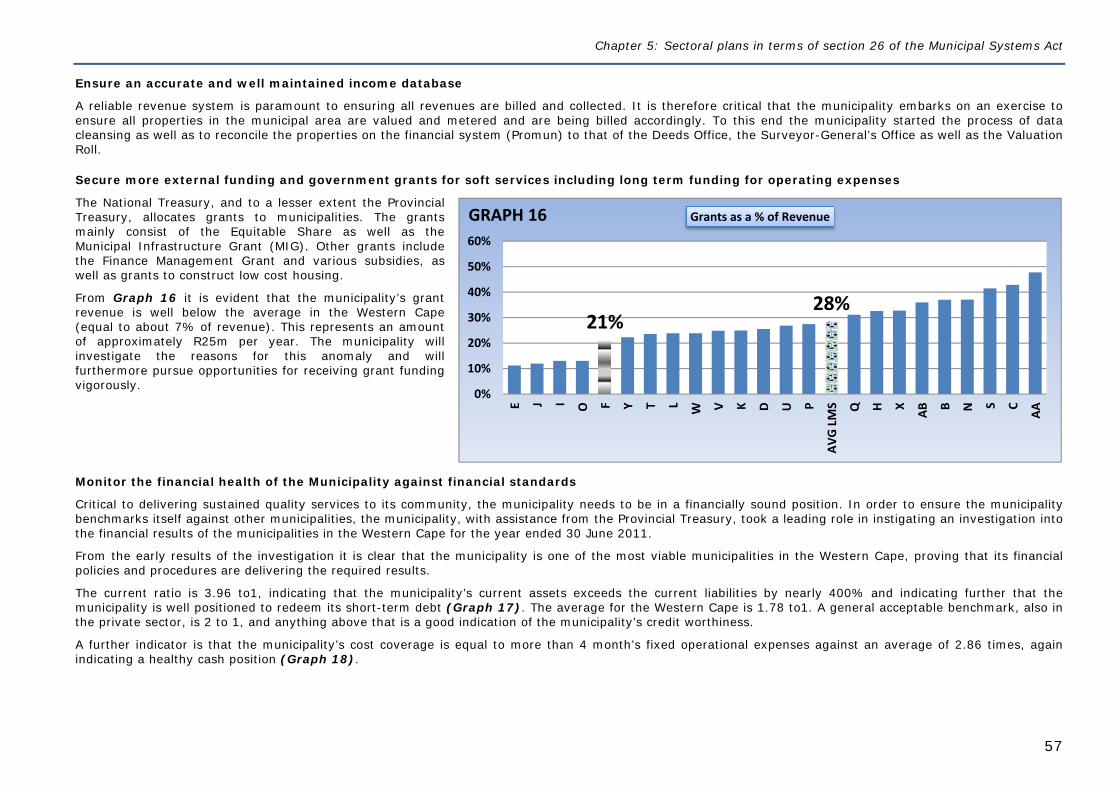
Chapter 5: Sectoral plans in terms of section 26 of the Municipal Systems Act
57
21%28%
0%
10%
20%
30%
40%
50%
60%
E J I O F Y T L W V K D U P
AVG LMS Q H X AB B N S C
AA
Grants as a % of RevenueGRAPH 16
Ensure an accurate and well maintained income database
A reliable revenue system is paramount to ensuring all revenues are billed and collected. It is therefore critical that the municipality embarks on an exercise to ensure all properties in the municipal area are valued and metered and are being billed accordingly. To this end the municipality started the process of data cleansing as well as to reconcile the properties on the financial system (Promun) to that of the Deeds Office, the Surveyor-General’s Office as well as the Valuation Roll.
Secure more external funding and government grants for soft services including long term funding for operating expenses
The National Treasury, and to a lesser extent the Provincial Treasury, allocates grants to municipalities. The grants mainly consist of the Equitable Share as well as the Municipal Infrastructure Grant (MIG). Other grants include the Finance Management Grant and various subsidies, as well as grants to construct low cost housing.
From Graph 16 it is evident that the municipality’s grant revenue is well below the average in the Western Cape (equal to about 7% of revenue). This represents an amount of approximately R25m per year. The municipality will investigate the reasons for this anomaly and will furthermore pursue opportunities for receiving grant funding vigorously.
Monitor the financial health of the Municipality against financial standards
Critical to delivering sustained quality services to its community, the municipality needs to be in a financially sound position. In order to ensure the municipality benchmarks itself against other municipalities, the municipality, with assistance from the Provincial Treasury, took a leading role in instigating an investigation into the financial results of the municipalities in the Western Cape for the year ended 30 June 2011.
From the early results of the investigation it is clear that the municipality is one of the most viable municipalities in the Western Cape, proving that its financial policies and procedures are delivering the required results.
The current ratio is 3.96 to1, indicating that the municipality’s current assets exceeds the current liabilities by nearly 400% and indicating further that the municipality is well positioned to redeem its short-term debt (Graph 17). The average for the Western Cape is 1.78 to1. A general acceptable benchmark, also in the private sector, is 2 to 1, and anything above that is a good indication of the municipality’s credit worthiness.
A further indicator is that the municipality’s cost coverage is equal to more than 4 month’s fixed operational expenses against an average of 2.86 times, again indicating a healthy cash position (Graph 18).
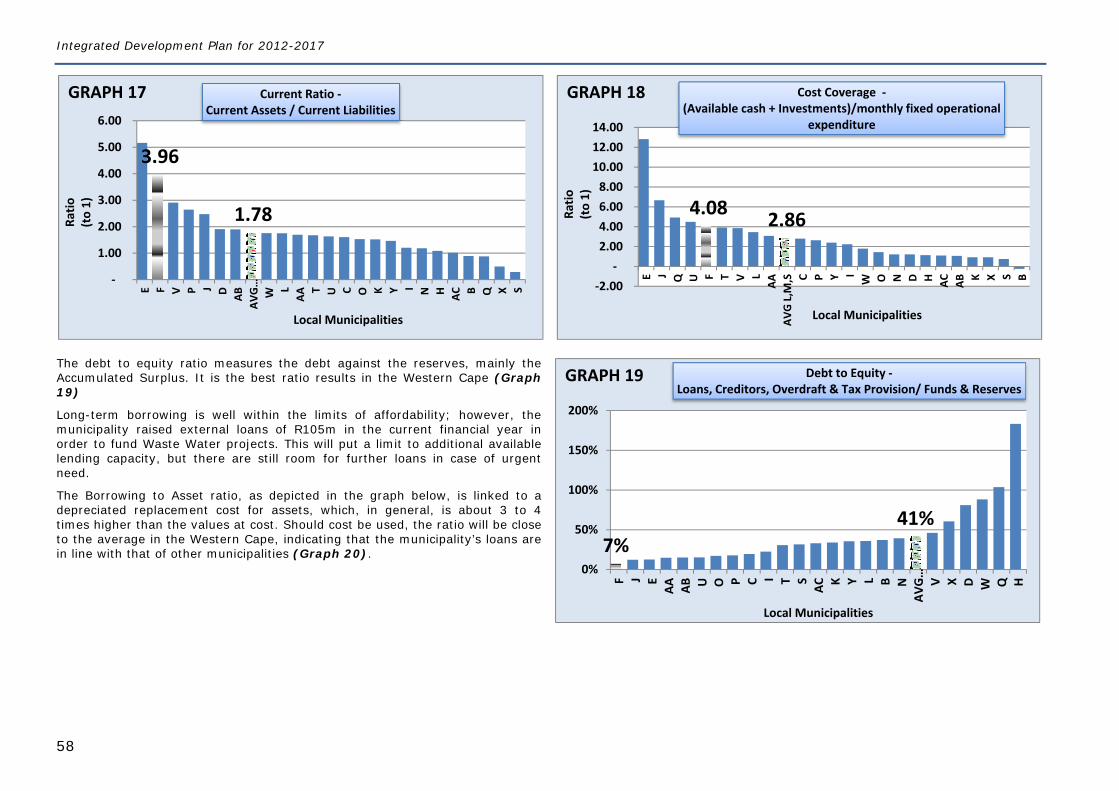
Integrated Development Plan for 2012-2017
58
7%41%
0%
50%
100%
150%
200%
F J EAA AB U O P C I T SAC K Y L B N
AVG… V X D W Q H
Local Municipalities
Debt to Equity ‐Loans, Creditors, Overdraft & Tax Provision/ Funds & Reserves
GRAPH 19
The debt to equity ratio measures the debt against the reserves, mainly the Accumulated Surplus. It is the best ratio results in the Western Cape (Graph 19)
Long-term borrowing is well within the limits of affordability; however, the municipality raised external loans of R105m in the current financial year in order to fund Waste Water projects. This will put a limit to additional available lending capacity, but there are still room for further loans in case of urgent need.
The Borrowing to Asset ratio, as depicted in the graph below, is linked to a depreciated replacement cost for assets, which, in general, is about 3 to 4 times higher than the values at cost. Should cost be used, the ratio will be close to the average in the Western Cape, indicating that the municipality’s loans are in line with that of other municipalities (Graph 20).
3.96
1.78
‐
1.00
2.00
3.00
4.00
5.00
6.00
E F V P J D ABAV
G…
W LAAT U C O K Y I N H AC B Q X S
Ratio
(to 1)
Local Municipalities
Current Ratio ‐Current Assets / Current Liabilities
GRAPH 17
4.08 2.86
‐2.00 ‐
2.00 4.00 6.00 8.00
10.00 12.00 14.00
E J Q U F T V LAA
AVG L,M
,S C P Y IW O N D H AC AB K X S B
Ratio
(to 1)
Local Municipalities
Cost Coverage ‐(Available cash + Investments)/monthly fixed operational
expenditure
GRAPH 18
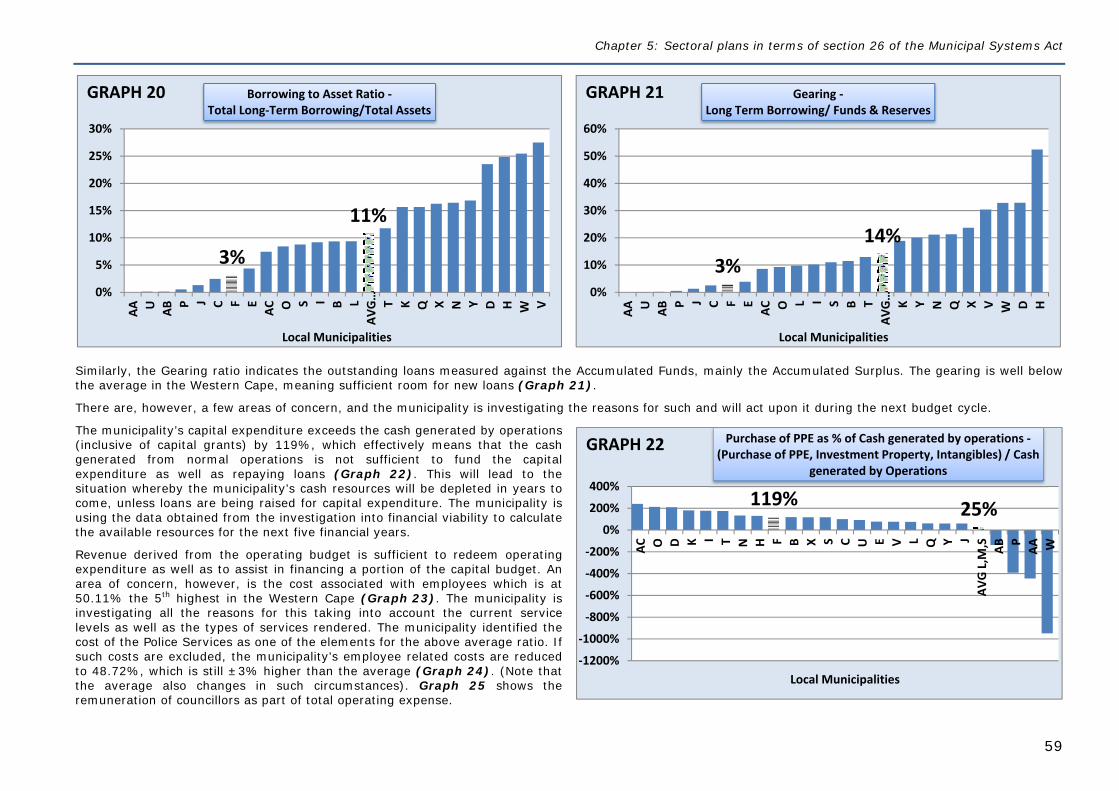
Chapter 5: Sectoral plans in terms of section 26 of the Municipal Systems Act
59
119% 25%
‐1200%
‐1000%
‐800%
‐600%
‐400%
‐200%
0%
200%
400%
AC O D K I T N H F B X S C U E V L Q Y JAV
G L,M
,S ABP
AA W
Local Municipalities
Purchase of PPE as % of Cash generated by operations ‐(Purchase of PPE, Investment Property, Intangibles) / Cash
generated by Operations
GRAPH 22
Similarly, the Gearing ratio indicates the outstanding loans measured against the Accumulated Funds, mainly the Accumulated Surplus. The gearing is well below the average in the Western Cape, meaning sufficient room for new loans (Graph 21).
There are, however, a few areas of concern, and the municipality is investigating the reasons for such and will act upon it during the next budget cycle.
The municipality’s capital expenditure exceeds the cash generated by operations (inclusive of capital grants) by 119%, which effectively means that the cash generated from normal operations is not sufficient to fund the capital expenditure as well as repaying loans (Graph 22). This will lead to the situation whereby the municipality’s cash resources will be depleted in years to come, unless loans are being raised for capital expenditure. The municipality is using the data obtained from the investigation into financial viability to calculate the available resources for the next five financial years.
Revenue derived from the operating budget is sufficient to redeem operating expenditure as well as to assist in financing a portion of the capital budget. An area of concern, however, is the cost associated with employees which is at 50.11% the 5th highest in the Western Cape (Graph 23). The municipality is investigating all the reasons for this taking into account the current service levels as well as the types of services rendered. The municipality identified the cost of the Police Services as one of the elements for the above average ratio. If such costs are excluded, the municipality’s employee related costs are reduced to 48.72%, which is still ±3% higher than the average (Graph 24). (Note that the average also changes in such circumstances). Graph 25 shows the remuneration of councillors as part of total operating expense.
3%
11%
0%
5%
10%
15%
20%
25%
30%AA U ABP J C F E
AC O S I B LAV
G… T K Q X N Y D H W V
Local Municipalities
Borrowing to Asset Ratio ‐Total Long‐Term Borrowing/Total Assets
GRAPH 20
3%14%
0%
10%
20%
30%
40%
50%
60%
AA U ABP J C F E
AC O L I S B TAV
G… K Y N Q X V W D H
Local Municipalities
Gearing ‐Long Term Borrowing/ Funds & Reserves
GRAPH 21
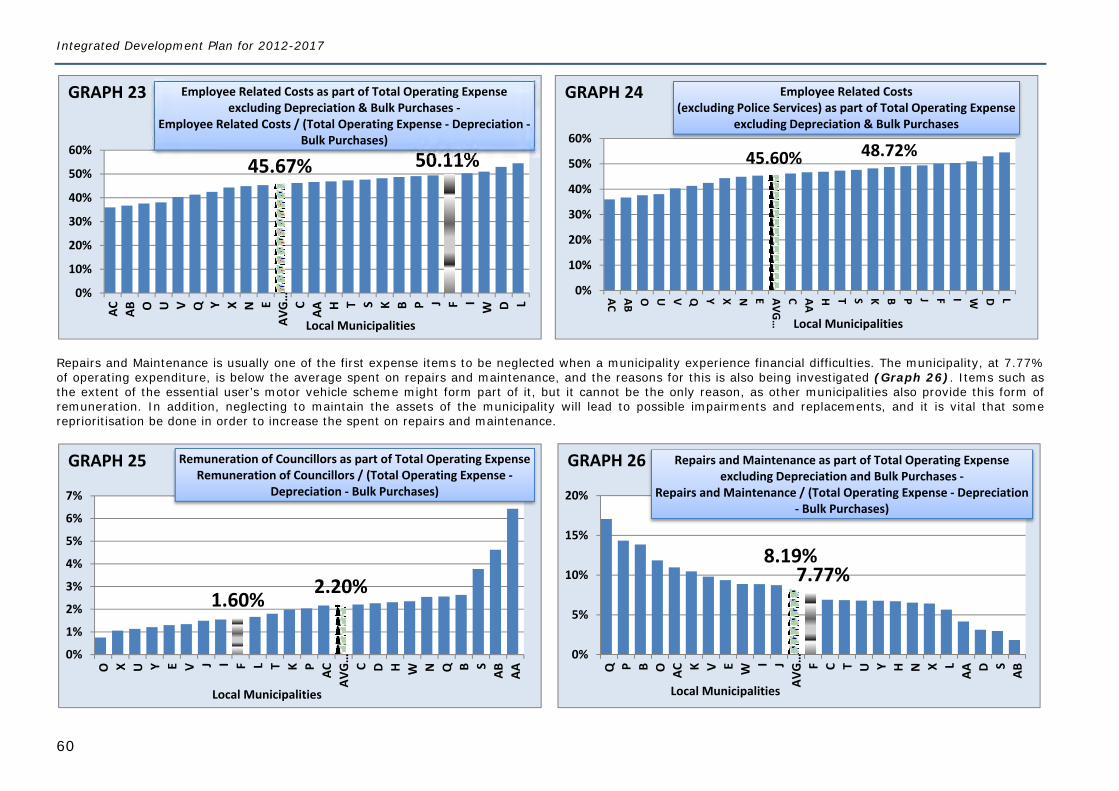
Integrated Development Plan for 2012-2017
60
Repairs and Maintenance is usually one of the first expense items to be neglected when a municipality experience financial difficulties. The municipality, at 7.77% of operating expenditure, is below the average spent on repairs and maintenance, and the reasons for this is also being investigated (Graph 26). Items such as the extent of the essential user’s motor vehicle scheme might form part of it, but it cannot be the only reason, as other municipalities also provide this form of remuneration. In addition, neglecting to maintain the assets of the municipality will lead to possible impairments and replacements, and it is vital that some reprioritisation be done in order to increase the spent on repairs and maintenance.
45.67% 50.11%
0%
10%
20%
30%
40%
50%
60%
AC AB O U V Q Y X N EAV
G… C
AA H T S K B P J F IW D L
Local Municipalities
Employee Related Costs as part of Total Operating Expense excluding Depreciation & Bulk Purchases ‐
Employee Related Costs / (Total Operating Expense ‐ Depreciation ‐Bulk Purchases)
GRAPH 23
45.60% 48.72%
0%
10%
20%
30%
40%
50%
60%
AC AB O U V Q Y X N E AVG…
C AA H T S K B P J F I W D L
Local Municipalities
Employee Related Costs (excluding Police Services) as part of Total Operating Expense
excluding Depreciation & Bulk Purchases
GRAPH 24
1.60%2.20%
0%
1%
2%
3%
4%
5%
6%
7%
O X U Y E V J I F L T K P ACAV
G… C D H W N Q B S
AB AA
Local Municipalities
Remuneration of Councillors as part of Total Operating ExpenseRemuneration of Councillors / (Total Operating Expense ‐
Depreciation ‐ Bulk Purchases)
GRAPH 25
8.19%7.77%
0%
5%
10%
15%
20%
Q P B O AC K V E WI J
AVG… F C T U Y H N X L
AA D SAB
Local Municipalities
Repairs and Maintenance as part of Total Operating Expense excluding Depreciation and Bulk Purchases ‐
Repairs and Maintenance / (Total Operating Expense ‐ Depreciation ‐ Bulk Purchases)
GRAPH 26
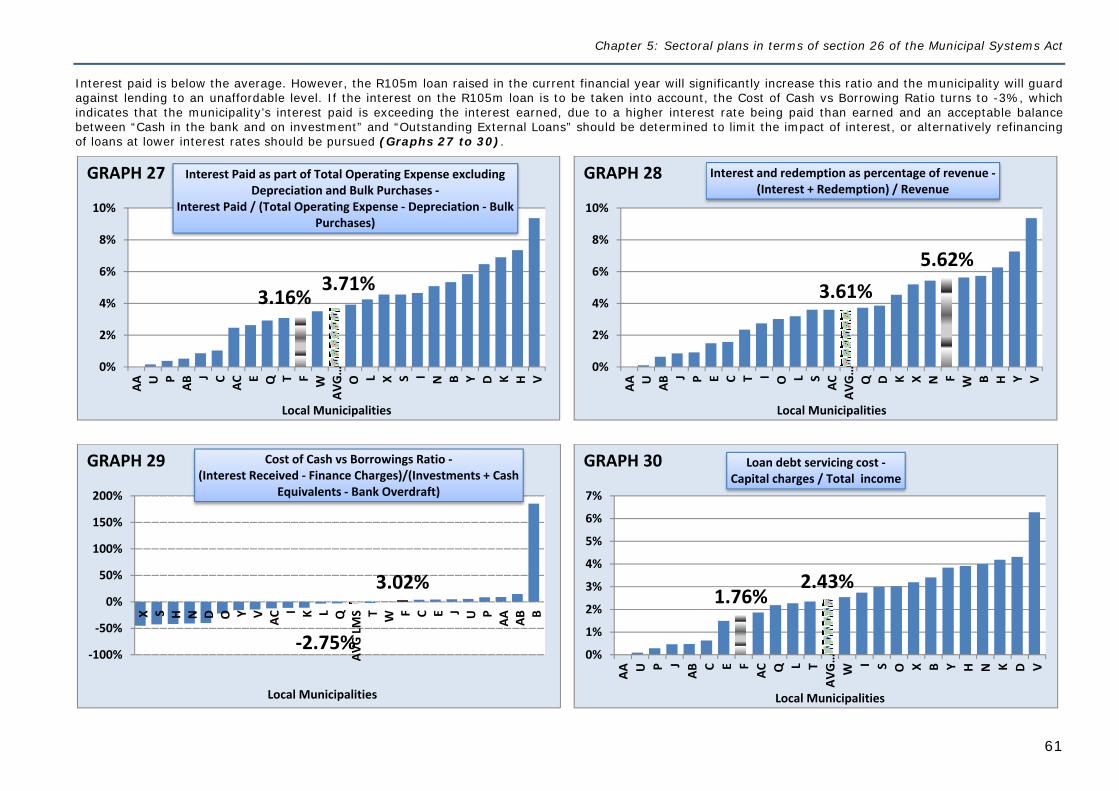
Chapter 5: Sectoral plans in terms of section 26 of the Municipal Systems Act
61
Interest paid is below the average. However, the R105m loan raised in the current financial year will significantly increase this ratio and the municipality will guard against lending to an unaffordable level. If the interest on the R105m loan is to be taken into account, the Cost of Cash vs Borrowing Ratio turns to -3%, which indicates that the municipality’s interest paid is exceeding the interest earned, due to a higher interest rate being paid than earned and an acceptable balance between “Cash in the bank and on investment” and “Outstanding External Loans” should be determined to limit the impact of interest, or alternatively refinancing of loans at lower interest rates should be pursued (Graphs 27 to 30).
3.16%3.71%
0%
2%
4%
6%
8%
10%
AA U PABJ C ACE Q T F W
AVG…
O L X S I N B Y D K H V
Local Municipalities
Interest Paid as part of Total Operating Expense excluding Depreciation and Bulk Purchases ‐
Interest Paid / (Total Operating Expense ‐ Depreciation ‐ Bulk Purchases)
GRAPH 27
3.61%5.62%
0%
2%
4%
6%
8%
10%
AA U ABJ P E C T I O L S
ACAV
G…
Q D K X N F W B H Y V
Local Municipalities
Interest and redemption as percentage of revenue ‐(Interest + Redemption) / Revenue
GRAPH 28
‐2.75%
3.02%
‐100%
‐50%
0%
50%
100%
150%
200%
X S H N D O Y V ACI K L Q
AVG LMS T W F C E J U P
AA AB B
Local Municipalities
Cost of Cash vs Borrowings Ratio ‐(Interest Received ‐ Finance Charges)/(Investments + Cash
Equivalents ‐ Bank Overdraft)
GRAPH 29
1.76%2.43%
0%
1%
2%
3%
4%
5%
6%
7%
AA U P JABC E F
AC Q L TAV
G…
WI S O X B Y H N K D V
Local Municipalities
Loan debt servicing cost ‐Capital charges / Total income
GRAPH 30
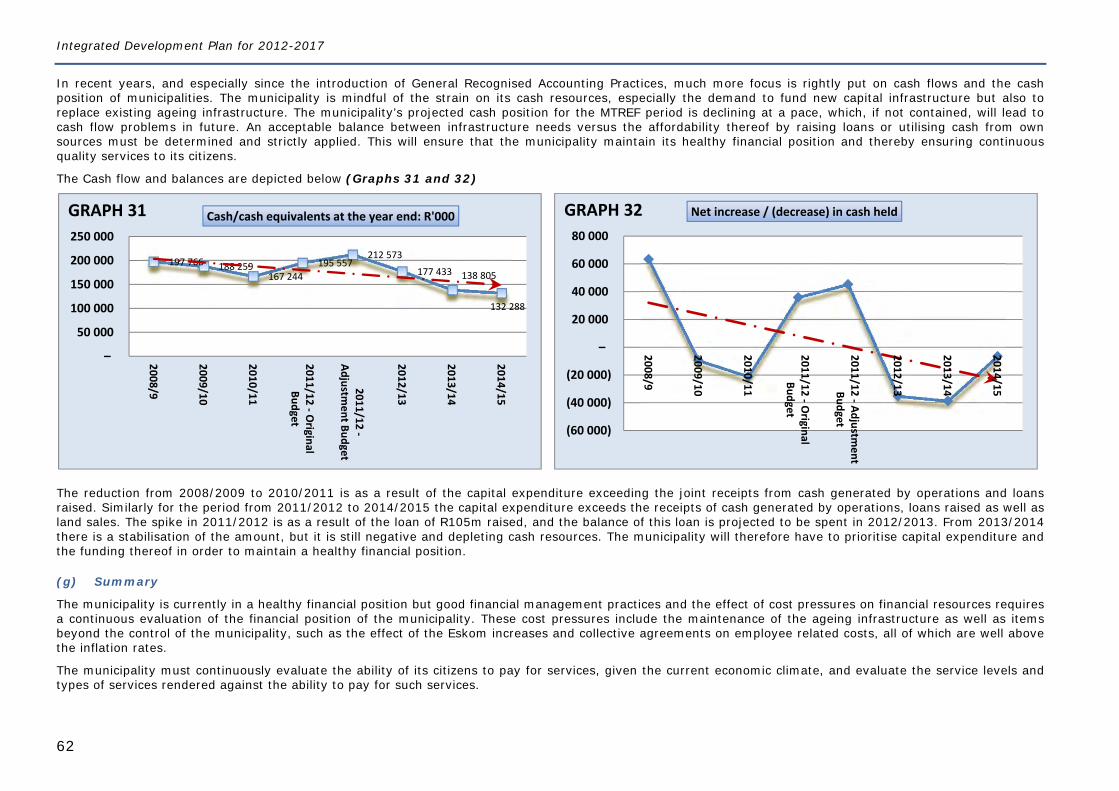
Integrated Development Plan for 2012-2017
62
In recent years, and especially since the introduction of General Recognised Accounting Practices, much more focus is rightly put on cash flows and the cash position of municipalities. The municipality is mindful of the strain on its cash resources, especially the demand to fund new capital infrastructure but also to replace existing ageing infrastructure. The municipality’s projected cash position for the MTREF period is declining at a pace, which, if not contained, will lead to cash flow problems in future. An acceptable balance between infrastructure needs versus the affordability thereof by raising loans or utilising cash from own sources must be determined and strictly applied. This will ensure that the municipality maintain its healthy financial position and thereby ensuring continuous quality services to its citizens.
The Cash flow and balances are depicted below (Graphs 31 and 32)
The reduction from 2008/2009 to 2010/2011 is as a result of the capital expenditure exceeding the joint receipts from cash generated by operations and loans raised. Similarly for the period from 2011/2012 to 2014/2015 the capital expenditure exceeds the receipts of cash generated by operations, loans raised as well as land sales. The spike in 2011/2012 is as a result of the loan of R105m raised, and the balance of this loan is projected to be spent in 2012/2013. From 2013/2014 there is a stabilisation of the amount, but it is still negative and depleting cash resources. The municipality will therefore have to prioritise capital expenditure and the funding thereof in order to maintain a healthy financial position.
(g) Summary
The municipality is currently in a healthy financial position but good financial management practices and the effect of cost pressures on financial resources requires a continuous evaluation of the financial position of the municipality. These cost pressures include the maintenance of the ageing infrastructure as well as items beyond the control of the municipality, such as the effect of the Eskom increases and collective agreements on employee related costs, all of which are well above the inflation rates.
The municipality must continuously evaluate the ability of its citizens to pay for services, given the current economic climate, and evaluate the service levels and types of services rendered against the ability to pay for such services.
197 766 188 259 167 244
195 557 212 573
177 433 138 805
132 288
–
50 000
100 000
150 000
200 000
250 000
2008/9
2009/10
2010/11
2011/12 ‐ Original
Budget
2011/12 ‐Adjustm
ent Budget
2012/13
2013/14
2014/15
Cash/cash equivalents at the year end: R'000GRAPH 31
(60 000)
(40 000)
(20 000)
–
20 000
40 000
60 000
80 000
2008/9
2009/10
2010/11
2011/12 ‐ Original
Budget
2011/12 ‐ Adjustment
Budget
2012/13
2013/14
2014/15
Net increase / (decrease) in cash heldGRAPH 32
Chapter 5: Sectoral plans in terms of section 26 of the Municipal Systems Act
63
The effect of the R105m loan raised for Waste Water projects does not reflect in the analysis in this report, and must be taken into account before further capital expansion is considered.
The municipality will use the information gathered from its financial viability exercise and implement strategies accordingly.
Bibliography
Tariff information – National Treasury SA14 Budget Return Forms
Other financial information – Annual Financial Statements of all municipalities
Swartland Municipality 2012/2013 Draft MTREF
Integrated Development Plan for 2012-2017
64
5.3 DISASTER MANAGEMENT PLAN
(a) Introduction
Disaster Management has its origin in civil defence which started during the Second World War when communities organised themselves to protect their properties and lives. Since then it evolved into more formal civil defence structures, but always with the emphasis on response. For example, during the 1969 earthquake in Tulbagh and the 1981 flood in Laingsburg, the Defence Force was primarily responsible for the response to the disasters.
After the 1994 flood in the Cape Flats, legislation was revised in order to put the emphasis on prevention rather than response. As a result the Disaster Management Act was promulgated in 2002.
(b) Legislation
Three main pieces of legislation regulate Disaster Management in South Africa: The Disaster Management Act (2002) The National Framework on Disaster Management (2005) The Disaster Management Regulations (2005) Disaster Management Volunteer Regulations (2010)
From this legislation subsequent policies were drawn up for the West Coast which include the Swartland Municipal area:
1. The Disaster Management Risk Assessment (April 2006)
2. The West Coast Disaster Management Framework (June 2006). The framework consists of four key performance indicators: Institutional capacity Risk assessment Risk reduction Response and recovery
and three enablers: Information and communication Training, Education and Awareness Funding
(c) The corporate disaster management plan
The “Corporate Disaster Management Plan” is the single disaster management plan for a municipal area called for in Section 53 of the Disaster Management Act: “Each municipality must, within the applicable municipal disaster management framework… prepare a disaster management plan for its area according to the circumstances prevailing in the area…” This plan refers to the Municipality (the business) and not the Municipality (the community). In this plan each line function within the municipality will be given specific tasks during a disaster e.g. Finance: to assist with emergency procurement; Human Resources: to employ temporary staff to assist with tasks. The Corporate Disaster Management plan is closely linked to job descriptions of each staff member.
Chapter 5: Sectoral plans in terms of section 26 of the Municipal Systems Act
65
(d) Disaster management framework (June 2006)
Since the Risk Assessment indicated what was threatening the West Coast and inter alia the Swartland, a framework was developed to strategically address the risks based on the National and Provincial Frameworks. This framework will be updated during the 2012/13 budget year as part of a joint venture between the Provincial Disaster Management Centre and the West Coast Disaster Management Centre as a pilot project for the Western Cape. The complete document is available on the website. The Swartland Municipality has to prepare and execute its disaster management plan within the disaster management framework of the West Coast District Municipality.
(e) Linkage with the integrated development plan of the Swartland Municipality
Both the Municipal Systems Act and the Disaster Management Act require the inclusion of a Disaster Management Plan into the IDP of the Municipality. It would however not be practical to include the complete Disaster Management Plan with all its annexures. The complete plan can therefore be considered as an annexure to the IDP, while a brief summary of the document will be included in the IDP.
It is our aim to include disaster risk management in the planning and execution stages of all IDP projects. This will ensure the integration of disaster management into the IDP and will ensure that all plans and projects are focused on contributing to disaster risk reduction and disaster preparedness - thus reducing the impact of disasters on lives, property, community activities, the economy and the environment in the Swartland Municipality.
Swartland has its own Disaster Management plan linked to that of the West Coast District Plan. This plan has to be updated during the 2012 /2013 budget year. From the Disaster Management Plan line functions can draw up their own plans and standard operating procedures (SOP's).
(f) Standard operating procedures
From the Disaster Management plan and the subsequent risk specific plan, each line function that is involved draws up its own procedures to address the various component of the plan. This is done by using a list of instructions that is called standard operating procedures.
(g) Disaster management centre
The West Coast Disaster Management Centre was opened in September 2008. The building is located in Moorreesburg. It provides a 24 hour call taking and dispatch facility. An organisational facility is also available that is not only used as a Joint Operation Centre (JOC) during disasters, but also as a venue for planning sessions outside disaster periods. A tactical facility is available as well as offices for various emergency services. The aim is to make it a one stop centre for all incident reporting. This centre is a big advantage to the Swartland Municipality as it is too costly for Swartland to have its own disaster management centre.
(h) When is it a disaster?
Disaster means a progressive or sudden, widespread or localised, natural or human-caused occurrence which causes of threatens to cause death, injury or disease, damage to property, infrastructure of the environment, or disruption of the life of a community and is of a magnitude that exceeds the ability of those affected by the disaster to cope with its effects using only their own resources. (Disaster Management Act)
In practice this means that when a municipality has reached the end of its own capacity or capability it may declare a local disaster. When a district then gets involved and more than one municipality is involved, a district disaster may be declared. If more than one district has reached its capacity, a provincial disaster may be declared.
(i) Disaster management in the Swartland
The Municipal Disaster Management Plan of Swartland Municipality ( June 2007) consists of the components as indicated in the figure below.
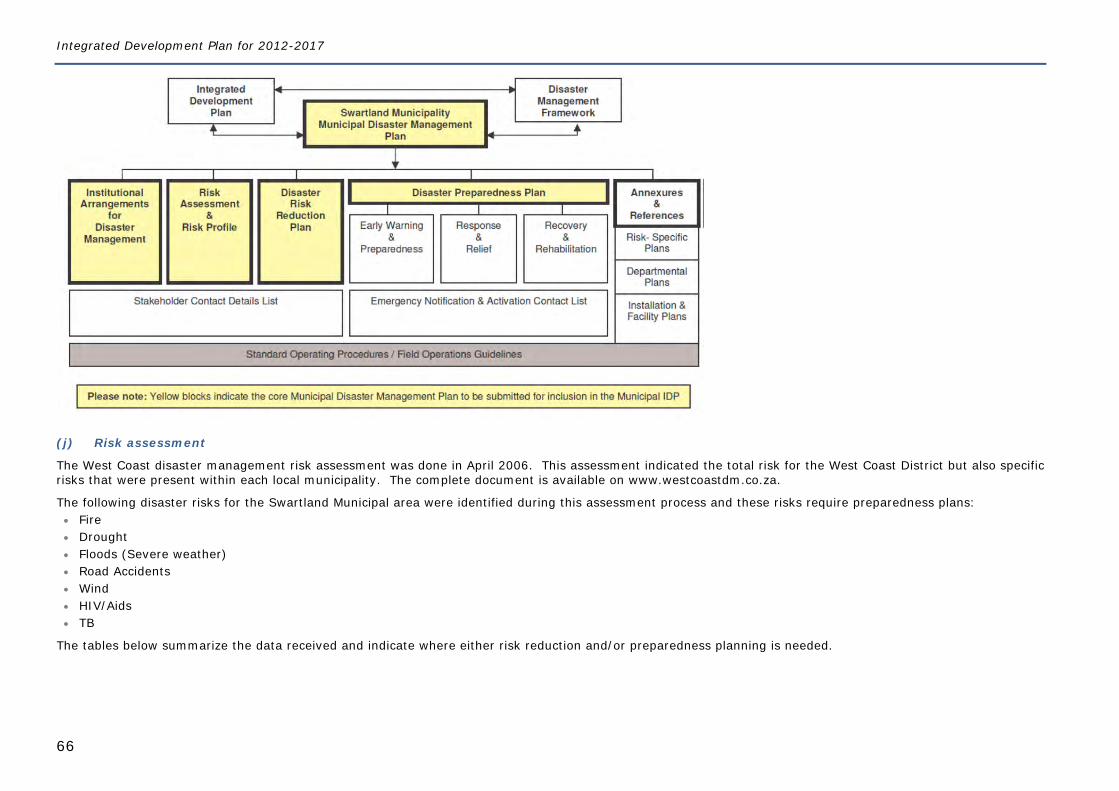
Integrated Development Plan for 2012-2017
66
(j) Risk assessment
The West Coast disaster management risk assessment was done in April 2006. This assessment indicated the total risk for the West Coast District but also specific risks that were present within each local municipality. The complete document is available on www.westcoastdm.co.za.
The following disaster risks for the Swartland Municipal area were identified during this assessment process and these risks require preparedness plans: Fire Drought Floods (Severe weather) Road Accidents Wind HIV/Aids TB
The tables below summarize the data received and indicate where either risk reduction and/or preparedness planning is needed.
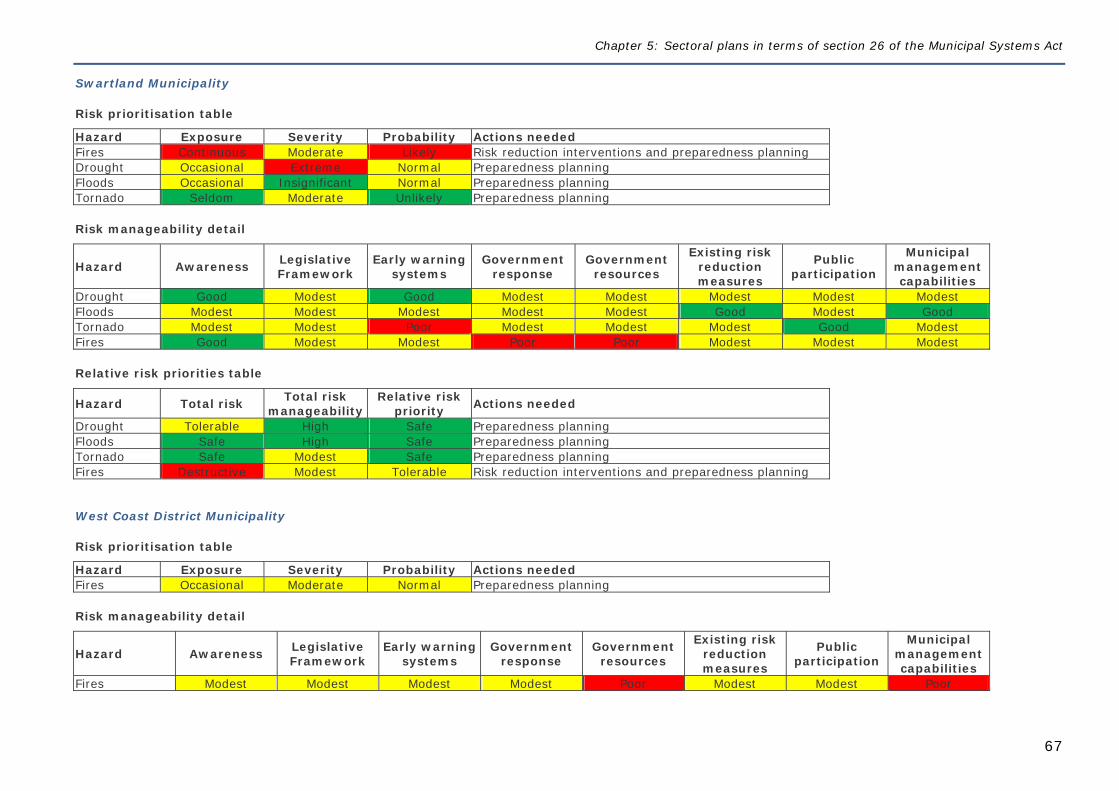
Chapter 5: Sectoral plans in terms of section 26 of the Municipal Systems Act
67
Swartland Municipality
Risk prioritisation table
Hazard Exposure Severity Probability Actions needed Fires Continuous Moderate Likely Risk reduction interventions and preparedness planning Drought Occasional Extreme Normal Preparedness planning Floods Occasional Insignificant Normal Preparedness planning Tornado Seldom Moderate Unlikely Preparedness planning
Risk manageability detail
Hazard Awareness Legislative Framework
Early warning systems
Government response
Government resources
Existing risk reduction measures
Public participation
Municipal management capabilities
Drought Good Modest Good Modest Modest Modest Modest Modest Floods Modest Modest Modest Modest Modest Good Modest Good Tornado Modest Modest Poor Modest Modest Modest Good Modest Fires Good Modest Modest Poor Poor Modest Modest Modest
Relative risk priorities table
Hazard Total risk Total risk manageability
Relative risk priority Actions needed
Drought Tolerable High Safe Preparedness planning Floods Safe High Safe Preparedness planning Tornado Safe Modest Safe Preparedness planning Fires Destructive Modest Tolerable Risk reduction interventions and preparedness planning
West Coast District Municipality
Risk prioritisation table
Hazard Exposure Severity Probability Actions needed Fires Occasional Moderate Normal Preparedness planning
Risk manageability detail
Hazard Awareness Legislative Framework
Early warning systems
Government response
Government resources
Existing risk reduction measures
Public participation
Municipal management capabilities
Fires Modest Modest Modest Modest Poor Modest Modest Poor
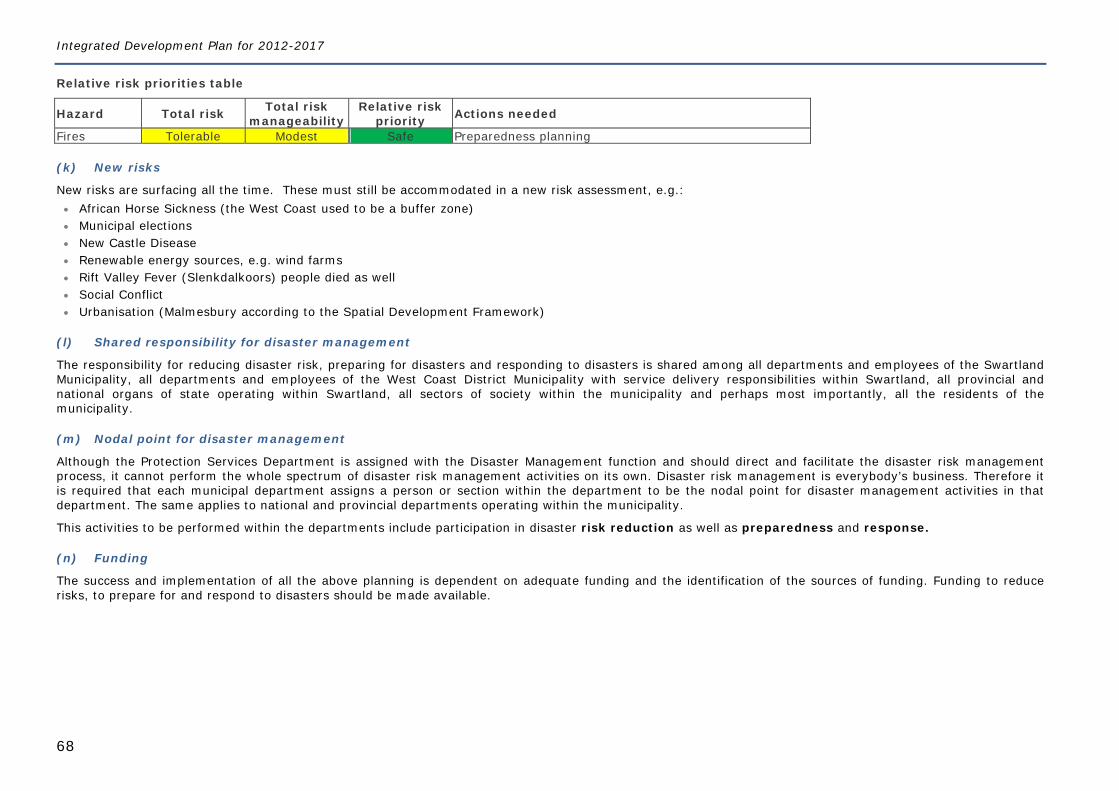
Integrated Development Plan for 2012-2017
68
Relative risk priorities table
Hazard Total risk Total risk manageability
Relative risk priority Actions needed
Fires Tolerable Modest Safe Preparedness planning
(k) New risks
New risks are surfacing all the time. These must still be accommodated in a new risk assessment, e.g.: African Horse Sickness (the West Coast used to be a buffer zone) Municipal elections New Castle Disease Renewable energy sources, e.g. wind farms Rift Valley Fever (Slenkdalkoors) people died as well Social Conflict Urbanisation (Malmesbury according to the Spatial Development Framework)
(l) Shared responsibility for disaster management
The responsibility for reducing disaster risk, preparing for disasters and responding to disasters is shared among all departments and employees of the Swartland Municipality, all departments and employees of the West Coast District Municipality with service delivery responsibilities within Swartland, all provincial and national organs of state operating within Swartland, all sectors of society within the municipality and perhaps most importantly, all the residents of the municipality.
(m) Nodal point for disaster management
Although the Protection Services Department is assigned with the Disaster Management function and should direct and facilitate the disaster risk management process, it cannot perform the whole spectrum of disaster risk management activities on its own. Disaster risk management is everybody’s business. Therefore it is required that each municipal department assigns a person or section within the department to be the nodal point for disaster management activities in that department. The same applies to national and provincial departments operating within the municipality.
This activities to be performed within the departments include participation in disaster risk reduction as well as preparedness and response.
(n) Funding
The success and implementation of all the above planning is dependent on adequate funding and the identification of the sources of funding. Funding to reduce risks, to prepare for and respond to disasters should be made available.
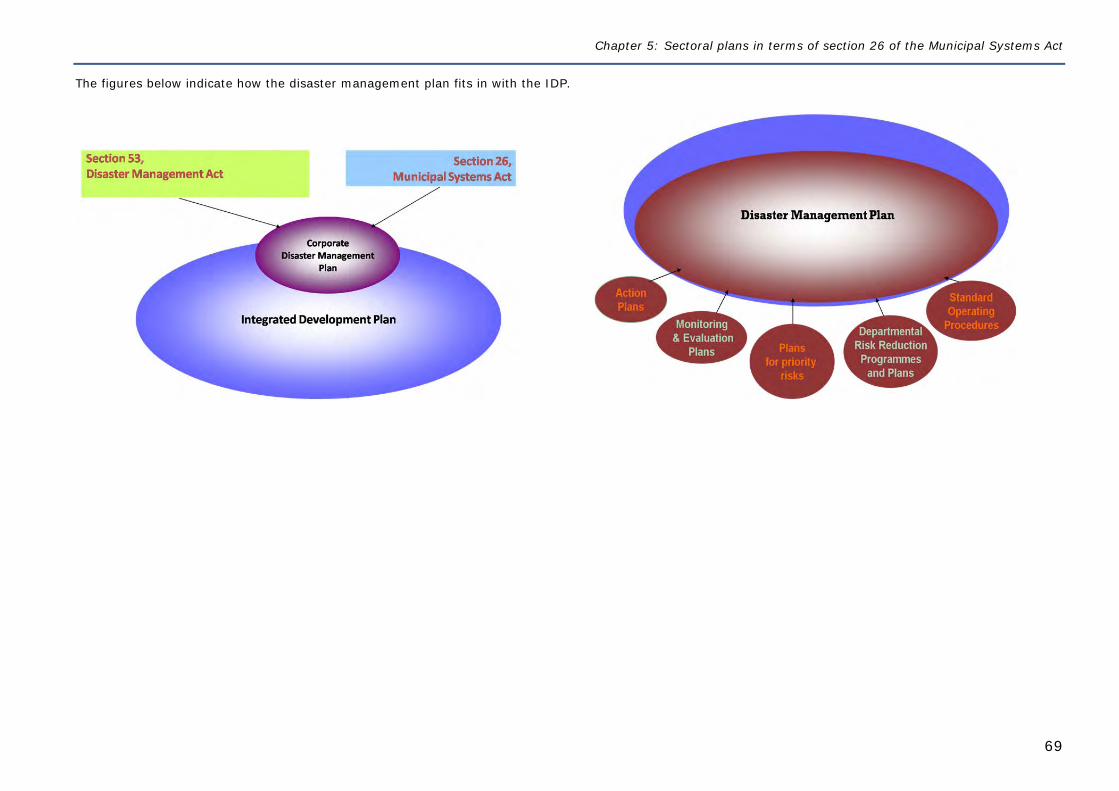
Chapter 5: Sectoral plans in terms of section 26 of the Municipal Systems Act
69
The figures below indicate how the disaster management plan fits in with the IDP.
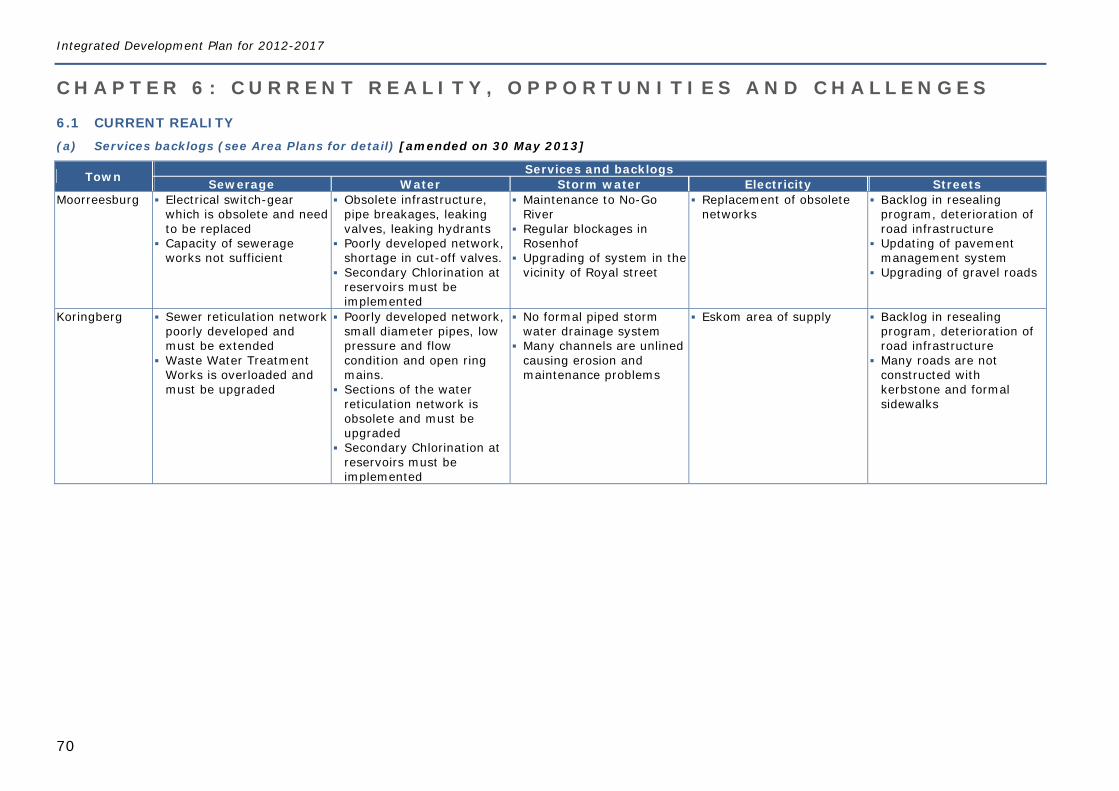
Integrated Development Plan for 2012-2017
70
C H A P T E R 6 : C U R R E N T R E A L I T Y , O P P O R T U N I T I E S A N D C H A L L E N G E S
6.1 CURRENT REALITY (a) Services backlogs (see Area Plans for detail) [amended on 30 May 2013]
Town Services and backlogs Sewerage Water Storm water Electricity Streets
Moorreesburg Electrical switch-gear which is obsolete and need to be replaced
Capacity of sewerage works not sufficient
Obsolete infrastructure, pipe breakages, leaking valves, leaking hydrants
Poorly developed network, shortage in cut-off valves.
Secondary Chlorination at reservoirs must be implemented
Maintenance to No-Go River
Regular blockages in Rosenhof
Upgrading of system in the vicinity of Royal street
Replacement of obsolete networks
Backlog in resealing program, deterioration of road infrastructure
Updating of pavement management system
Upgrading of gravel roads
Koringberg Sewer reticulation network poorly developed and must be extended
Waste Water Treatment Works is overloaded and must be upgraded
Poorly developed network, small diameter pipes, low pressure and flow condition and open ring mains.
Sections of the water reticulation network is obsolete and must be upgraded
Secondary Chlorination at reservoirs must be implemented
No formal piped storm water drainage system
Many channels are unlined causing erosion and maintenance problems
Eskom area of supply Backlog in resealing program, deterioration of road infrastructure
Many roads are not constructed with kerbstone and formal sidewalks
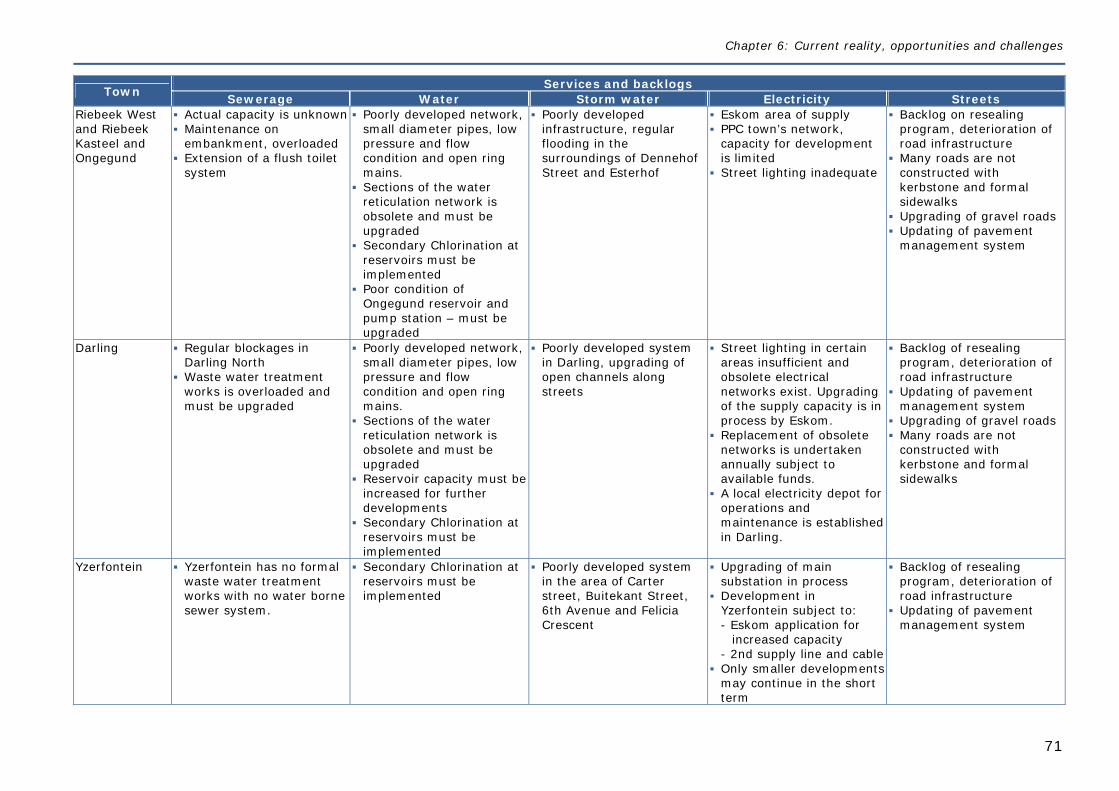
Chapter 6: Current reality, opportunities and challenges
71
Town Services and backlogs Sewerage Water Storm water Electricity Streets
Riebeek West and Riebeek Kasteel and Ongegund
Actual capacity is unknown Maintenance on
embankment, overloaded Extension of a flush toilet
system
Poorly developed network, small diameter pipes, low pressure and flow condition and open ring mains.
Sections of the water reticulation network is obsolete and must be upgraded
Secondary Chlorination at reservoirs must be implemented
Poor condition of Ongegund reservoir and pump station – must be upgraded
Poorly developed infrastructure, regular flooding in the surroundings of Dennehof Street and Esterhof
Eskom area of supply PPC town’s network,
capacity for development is limited
Street lighting inadequate
Backlog on resealing program, deterioration of road infrastructure
Many roads are not constructed with kerbstone and formal sidewalks
Upgrading of gravel roads Updating of pavement
management system
Darling Regular blockages in Darling North
Waste water treatment works is overloaded and must be upgraded
Poorly developed network, small diameter pipes, low pressure and flow condition and open ring mains.
Sections of the water reticulation network is obsolete and must be upgraded
Reservoir capacity must be increased for further developments
Secondary Chlorination at reservoirs must be implemented
Poorly developed system in Darling, upgrading of open channels along streets
Street lighting in certain areas insufficient and obsolete electrical networks exist. Upgrading of the supply capacity is in process by Eskom.
Replacement of obsolete networks is undertaken annually subject to available funds.
A local electricity depot for operations and maintenance is established in Darling.
Backlog of resealing program, deterioration of road infrastructure
Updating of pavement management system
Upgrading of gravel roads Many roads are not
constructed with kerbstone and formal sidewalks
Yzerfontein Yzerfontein has no formal waste water treatment works with no water borne sewer system.
Secondary Chlorination at reservoirs must be implemented
Poorly developed system in the area of Carter street, Buitekant Street, 6th Avenue and Felicia Crescent
Upgrading of main substation in process
Development in Yzerfontein subject to: - Eskom application for
increased capacity - 2nd supply line and cable
Only smaller developments may continue in the short term
Backlog of resealing program, deterioration of road infrastructure
Updating of pavement management system
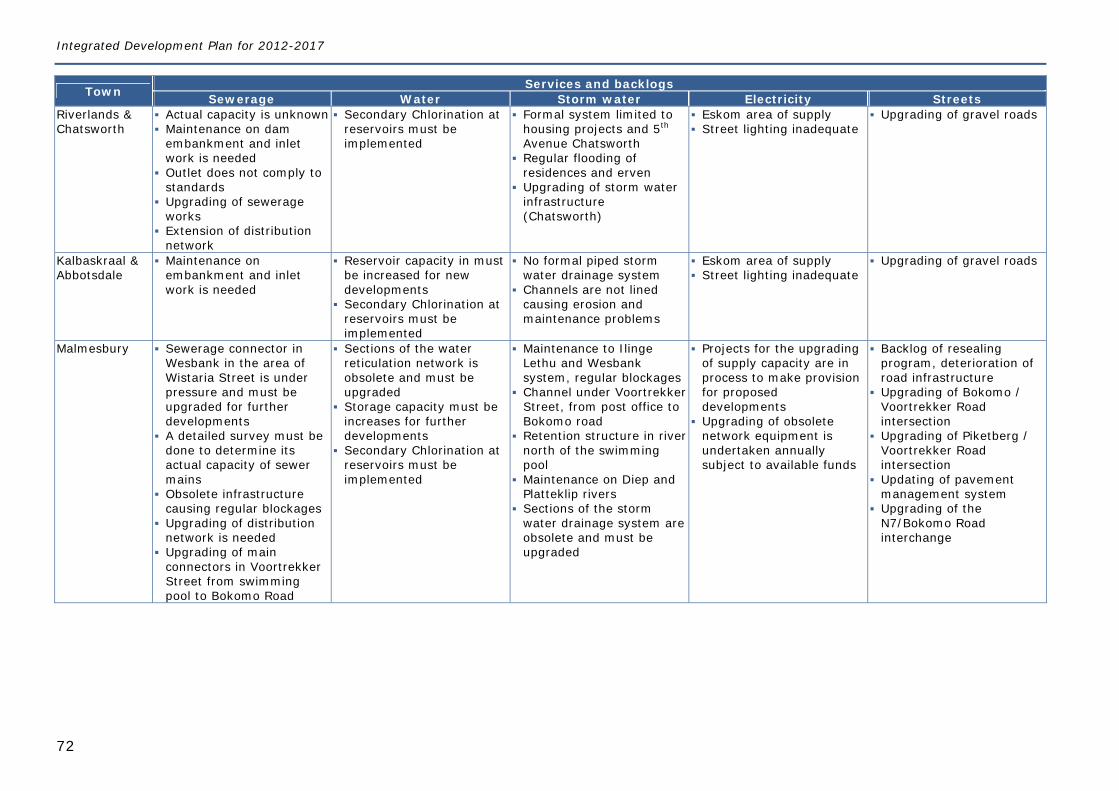
Integrated Development Plan for 2012-2017
72
Town Services and backlogs Sewerage Water Storm water Electricity Streets
Riverlands & Chatsworth
Actual capacity is unknown Maintenance on dam
embankment and inlet work is needed
Outlet does not comply to standards
Upgrading of sewerage works
Extension of distribution network
Secondary Chlorination at reservoirs must be implemented
Formal system limited to housing projects and 5th Avenue Chatsworth
Regular flooding of residences and erven
Upgrading of storm water infrastructure (Chatsworth)
Eskom area of supply Street lighting inadequate
Upgrading of gravel roads
Kalbaskraal & Abbotsdale
Maintenance on embankment and inlet work is needed
Reservoir capacity in must be increased for new developments
Secondary Chlorination at reservoirs must be implemented
No formal piped storm water drainage system
Channels are not lined causing erosion and maintenance problems
Eskom area of supply Street lighting inadequate
Upgrading of gravel roads
Malmesbury Sewerage connector in Wesbank in the area of Wistaria Street is under pressure and must be upgraded for further developments
A detailed survey must be done to determine its actual capacity of sewer mains
Obsolete infrastructure causing regular blockages
Upgrading of distribution network is needed
Upgrading of main connectors in Voortrekker Street from swimming pool to Bokomo Road
Sections of the water reticulation network is obsolete and must be upgraded
Storage capacity must be increases for further developments
Secondary Chlorination at reservoirs must be implemented
Maintenance to Ilinge Lethu and Wesbank system, regular blockages
Channel under Voortrekker Street, from post office to Bokomo road
Retention structure in river north of the swimming pool
Maintenance on Diep and Platteklip rivers
Sections of the storm water drainage system are obsolete and must be upgraded
Projects for the upgrading of supply capacity are in process to make provision for proposed developments
Upgrading of obsolete network equipment is undertaken annually subject to available funds
Backlog of resealing program, deterioration of road infrastructure
Upgrading of Bokomo / Voortrekker Road intersection
Upgrading of Piketberg / Voortrekker Road intersection
Updating of pavement management system
Upgrading of the N7/Bokomo Road interchange
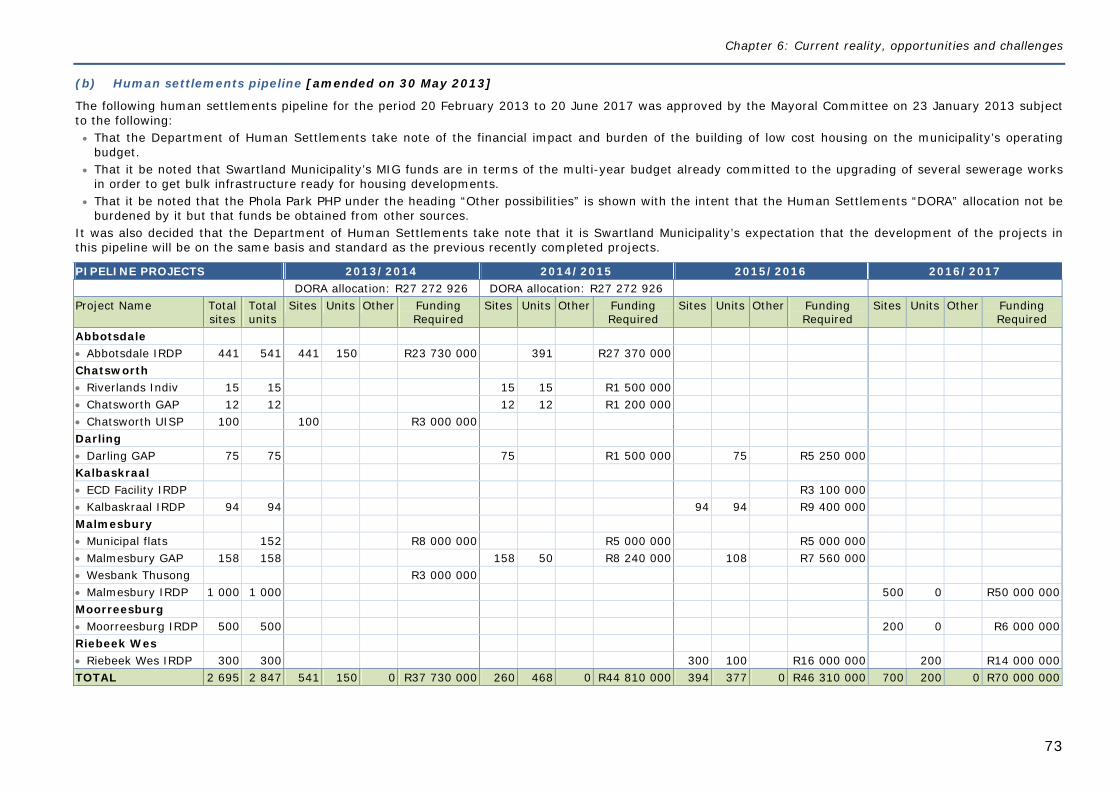
Chapter 6: Current reality, opportunities and challenges
73
(b) Human settlements pipeline [amended on 30 May 2013]
The following human settlements pipeline for the period 20 February 2013 to 20 June 2017 was approved by the Mayoral Committee on 23 January 2013 subject to the following: That the Department of Human Settlements take note of the financial impact and burden of the building of low cost housing on the municipality’s operating
budget. That it be noted that Swartland Municipality’s MIG funds are in terms of the multi-year budget already committed to the upgrading of several sewerage works
in order to get bulk infrastructure ready for housing developments. That it be noted that the Phola Park PHP under the heading “Other possibilities” is shown with the intent that the Human Settlements “DORA” allocation not be
burdened by it but that funds be obtained from other sources. It was also decided that the Department of Human Settlements take note that it is Swartland Municipality’s expectation that the development of the projects in this pipeline will be on the same basis and standard as the previous recently completed projects.
PIPELINE PROJECTS 2013/2014 2014/2015 2015/2016 2016/2017 DORA allocation: R27 272 926 DORA allocation: R27 272 926 Project Name Total
sites Total units
Sites Units Other Funding Required
Sites Units Other Funding Required
Sites Units Other Funding Required
Sites Units Other Funding Required
Abbotsdale Abbotsdale IRDP 441 541 441 150 R23 730 000 391 R27 370 000 Chatsworth Riverlands Indiv 15 15 15 15 R1 500 000 Chatsworth GAP 12 12 12 12 R1 200 000 Chatsworth UISP 100 100 R3 000 000 Darling Darling GAP 75 75 75 R1 500 000 75 R5 250 000 Kalbaskraal ECD Facility IRDP R3 100 000 Kalbaskraal IRDP 94 94 94 94 R9 400 000 Malmesbury Municipal flats 152 R8 000 000 R5 000 000 R5 000 000 Malmesbury GAP 158 158 158 50 R8 240 000 108 R7 560 000 Wesbank Thusong R3 000 000 Malmesbury IRDP 1 000 1 000 500 0 R50 000 000 Moorreesburg Moorreesburg IRDP 500 500 200 0 R6 000 000 Riebeek Wes Riebeek Wes IRDP 300 300 300 100 R16 000 000 200 R14 000 000 TOTAL 2 695 2 847 541 150 0 R37 730 000 260 468 0 R44 810 000 394 377 0 R46 310 000 700 200 0 R70 000 000
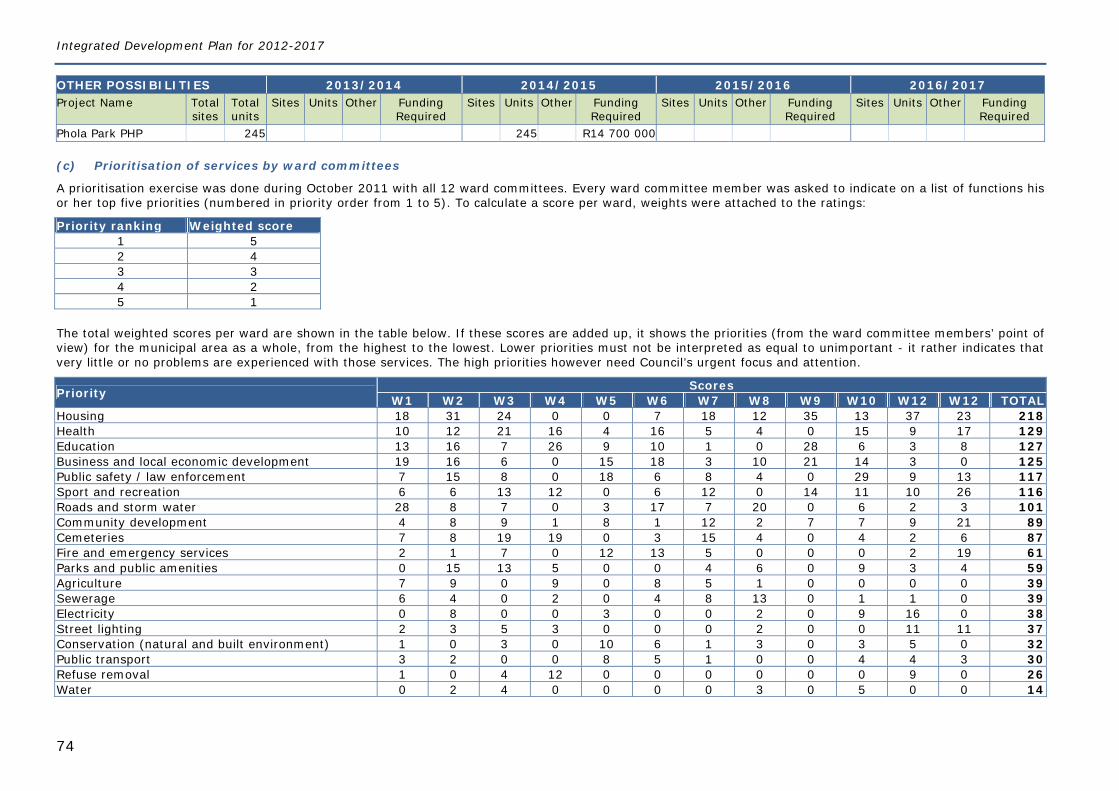
Integrated Development Plan for 2012-2017
74
OTHER POSSIBILITIES 2013/2014 2014/2015 2015/2016 2016/2017 Project Name Total
sites Total units
Sites Units Other Funding Required
Sites Units Other Funding Required
Sites Units Other Funding Required
Sites Units Other Funding Required
Phola Park PHP 245 245 R14 700 000
(c) Prioritisation of services by ward committees
A prioritisation exercise was done during October 2011 with all 12 ward committees. Every ward committee member was asked to indicate on a list of functions his or her top five priorities (numbered in priority order from 1 to 5). To calculate a score per ward, weights were attached to the ratings:
Priority ranking Weighted score 1 5 2 4 3 3 4 2 5 1
The total weighted scores per ward are shown in the table below. If these scores are added up, it shows the priorities (from the ward committee members’ point of view) for the municipal area as a whole, from the highest to the lowest. Lower priorities must not be interpreted as equal to unimportant - it rather indicates that very little or no problems are experienced with those services. The high priorities however need Council’s urgent focus and attention.
Priority Scores W1 W2 W3 W4 W5 W6 W7 W8 W9 W10 W12 W12 TOTAL
Housing 18 31 24 0 0 7 18 12 35 13 37 23 218 Health 10 12 21 16 4 16 5 4 0 15 9 17 129 Education 13 16 7 26 9 10 1 0 28 6 3 8 127 Business and local economic development 19 16 6 0 15 18 3 10 21 14 3 0 125 Public safety / law enforcement 7 15 8 0 18 6 8 4 0 29 9 13 117 Sport and recreation 6 6 13 12 0 6 12 0 14 11 10 26 116 Roads and storm water 28 8 7 0 3 17 7 20 0 6 2 3 101 Community development 4 8 9 1 8 1 12 2 7 7 9 21 89 Cemeteries 7 8 19 19 0 3 15 4 0 4 2 6 87 Fire and emergency services 2 1 7 0 12 13 5 0 0 0 2 19 61 Parks and public amenities 0 15 13 5 0 0 4 6 0 9 3 4 59 Agriculture 7 9 0 9 0 8 5 1 0 0 0 0 39 Sewerage 6 4 0 2 0 4 8 13 0 1 1 0 39 Electricity 0 8 0 0 3 0 0 2 0 9 16 0 38 Street lighting 2 3 5 3 0 0 0 2 0 0 11 11 37 Conservation (natural and built environment) 1 0 3 0 10 6 1 3 0 3 5 0 32 Public transport 3 2 0 0 8 5 1 0 0 4 4 3 30 Refuse removal 1 0 4 12 0 0 0 0 0 0 9 0 26 Water 0 2 4 0 0 0 0 3 0 5 0 0 14
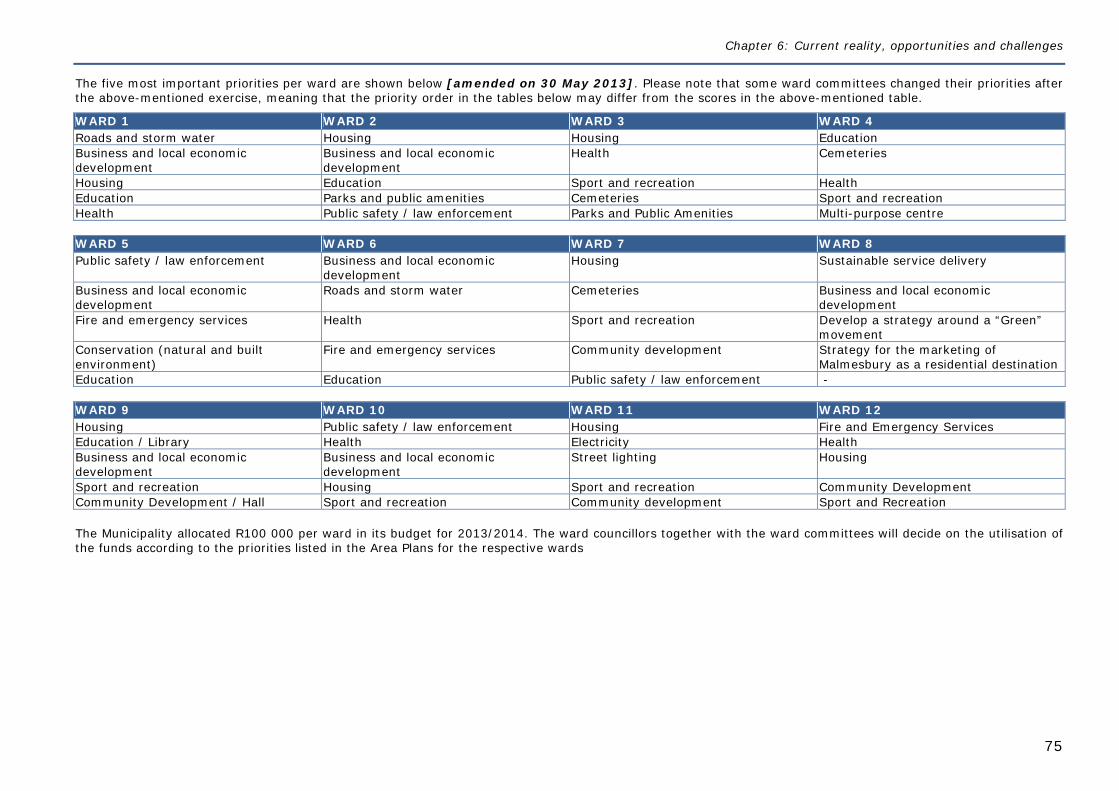
Chapter 6: Current reality, opportunities and challenges
75
The five most important priorities per ward are shown below [amended on 30 May 2013]. Please note that some ward committees changed their priorities after the above-mentioned exercise, meaning that the priority order in the tables below may differ from the scores in the above-mentioned table.
WARD 1 WARD 2 WARD 3 WARD 4 Roads and storm water Housing Housing Education Business and local economic development
Business and local economic development
Health Cemeteries
Housing Education Sport and recreation Health Education Parks and public amenities Cemeteries Sport and recreation Health Public safety / law enforcement Parks and Public Amenities Multi-purpose centre WARD 5 WARD 6 WARD 7 WARD 8 Public safety / law enforcement Business and local economic
development Housing Sustainable service delivery
Business and local economic development
Roads and storm water Cemeteries Business and local economic development
Fire and emergency services Health Sport and recreation Develop a strategy around a “Green” movement
Conservation (natural and built environment)
Fire and emergency services Community development Strategy for the marketing of Malmesbury as a residential destination
Education Education Public safety / law enforcement - WARD 9 WARD 10 WARD 11 WARD 12 Housing Public safety / law enforcement Housing Fire and Emergency Services Education / Library Health Electricity Health Business and local economic development
Business and local economic development
Street lighting Housing
Sport and recreation Housing Sport and recreation Community Development Community Development / Hall Sport and recreation Community development Sport and Recreation
The Municipality allocated R100 000 per ward in its budget for 2013/2014. The ward councillors together with the ward committees will decide on the utilisation of the funds according to the priorities listed in the Area Plans for the respective wards
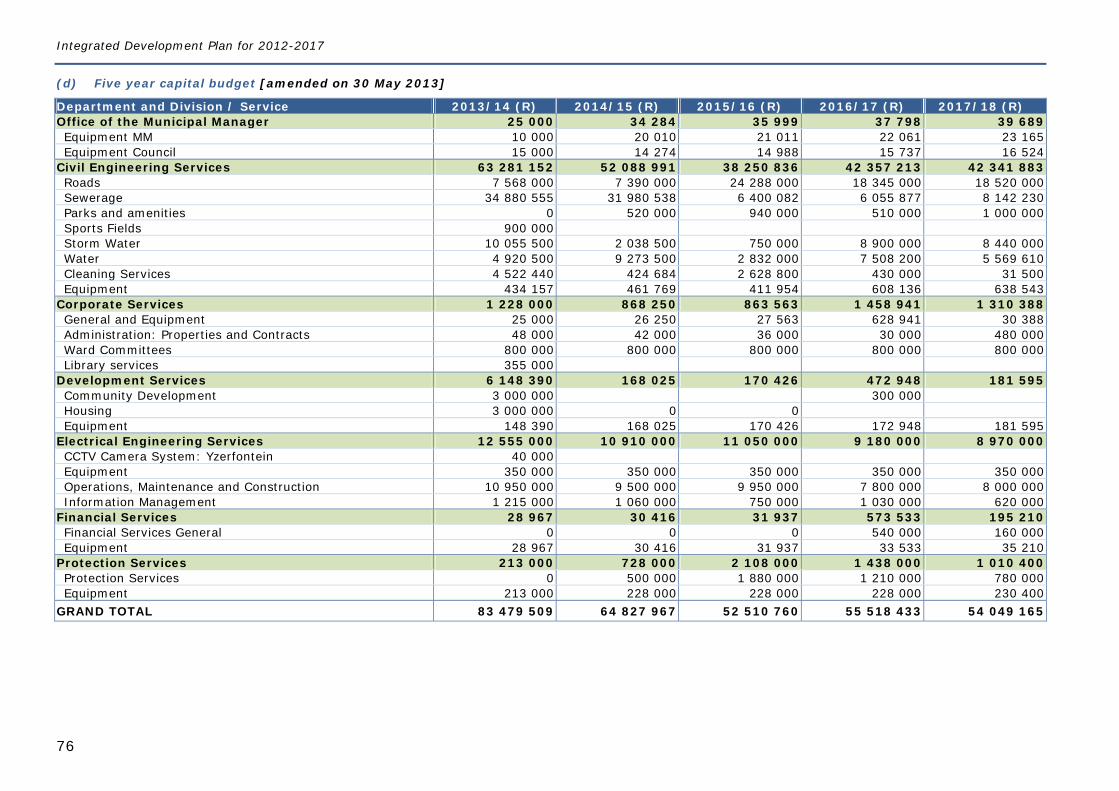
Integrated Development Plan for 2012-2017
76
(d) Five year capital budget [amended on 30 May 2013]
Department and Division / Service 2013/14 (R) 2014/15 (R) 2015/16 (R) 2016/17 (R) 2017/18 (R) Office of the Municipal Manager 25 000 34 284 35 999 37 798 39 689 Equipment MM 10 000 20 010 21 011 22 061 23 165 Equipment Council 15 000 14 274 14 988 15 737 16 524
Civil Engineering Services 63 281 152 52 088 991 38 250 836 42 357 213 42 341 883 Roads 7 568 000 7 390 000 24 288 000 18 345 000 18 520 000 Sewerage 34 880 555 31 980 538 6 400 082 6 055 877 8 142 230 Parks and amenities 0 520 000 940 000 510 000 1 000 000 Sports Fields 900 000 Storm Water 10 055 500 2 038 500 750 000 8 900 000 8 440 000 Water 4 920 500 9 273 500 2 832 000 7 508 200 5 569 610 Cleaning Services 4 522 440 424 684 2 628 800 430 000 31 500 Equipment 434 157 461 769 411 954 608 136 638 543
Corporate Services 1 228 000 868 250 863 563 1 458 941 1 310 388 General and Equipment 25 000 26 250 27 563 628 941 30 388 Administration: Properties and Contracts 48 000 42 000 36 000 30 000 480 000 Ward Committees 800 000 800 000 800 000 800 000 800 000 Library services 355 000
Development Services 6 148 390 168 025 170 426 472 948 181 595 Community Development 3 000 000 300 000 Housing 3 000 000 0 0 Equipment 148 390 168 025 170 426 172 948 181 595
Electrical Engineering Services 12 555 000 10 910 000 11 050 000 9 180 000 8 970 000 CCTV Camera System: Yzerfontein 40 000 Equipment 350 000 350 000 350 000 350 000 350 000 Operations, Maintenance and Construction 10 950 000 9 500 000 9 950 000 7 800 000 8 000 000 Information Management 1 215 000 1 060 000 750 000 1 030 000 620 000
Financial Services 28 967 30 416 31 937 573 533 195 210 Financial Services General 0 0 0 540 000 160 000 Equipment 28 967 30 416 31 937 33 533 35 210
Protection Services 213 000 728 000 2 108 000 1 438 000 1 010 400 Protection Services 0 500 000 1 880 000 1 210 000 780 000 Equipment 213 000 228 000 228 000 228 000 230 400
GRAND TOTAL 83 479 509 64 827 967 52 510 760 55 518 433 54 049 165
Chapter 6: Current reality, opportunities and challenges
77
(e) Major restraining factors
The following external factors have a massive impact on the finances of the Municipality and limit sustainable service delivery: Eskom’s excessive annual tariff increases of between 20% and 30% over the past four years; higher that inflation rate increases in the price of bulk water purchased by the Municipality from the West Coast District Municipality; high salary increases as determined by collective agreements on national level; the retention and attraction of skilled staff; a lack of capacity with respect to sewerage, electricity and bulk water supply; services backlogs in Ward 4 and 7; upgrading and renewal of existing infrastructure; the possible implementation of a one government service which will further paralyse service delivery; and unfunded or underfunded mandates such as libraries, museums, motor licenses, road worthy testing, learners and drivers licenses, veld fires and low cost
housing.
6.2 OPPORTUNITIES (a) The widening of the N7
This project by SANRAL to double the N7 from the Melkbosstrand Road intersection in the south up to Malmesbury will be done in three phases: The first phase (7 km) is from the Melkbosstrand Road intersection up to the southern Atlantis intersection. An environmental impact study for this phase
(which includes public participation) has been completed and approved. It is envisaged that the contract for Phase 1 will be awarded in March 2012 and that construction will start as early as April 2012.
The second phase (18 km) is from the southern Atlantis intersection up to the farm Leliefontein. Consulting engineers have already been appointed for the design of this phase. It is envisaged that construction will commence in the first half of 2014.
The third phase (11 km) is from the farm Leliefontein up to Malmesbury. The process of appointing consulting engineers for this phase has already started. It is envisaged that Phase 3 will commence in 2015.
Phases 2 and 3 are however subject to securing the necessary funds, purchasing of land within the road reserve and the approval of environmental impact studies.
The intersections to Melkbosstrand, Atlantis and Hopefield will also be made safer. This project that will take an estimated six years to complete will undoubtedly open up new economic opportunities for Malmesbury and the Swartland.
(b) New road link between the R45 (Malmesbury/Paarl) and the R45 (Malmesbury/Hopefield)
In line with the national and regional planning directives for the development of the Saldanha area, the R45 has been identified by Provincial Government Western Cape (PGWC) as a possible freight route linking the Saldanha area to the N1.
The existing R45 from Vredenburg via Hopefield links to the N7 north of Malmesbury. Traffic then has to passes through Malmesbury before heading eastwardly out towards Paarl. To establish a workable link from Saldanha to the N1, a bypass has been identified passing on the northern side of Malmesbury to link the R45 from west of the N7 to the intersection between the R46 and the R45 on the eastern side of the town – a new section of road of approximate 6 to 8 km.
The PGWC has already appointed BKS (Pty) Ltd for the planning, design and implementation of a Malmesbury bypass. The investigation and planning phase takes on average approximately two years.
Integrated Development Plan for 2012-2017
78
(c) Extension of PPC
PPC is planning to upgrade its cement manufacturing plant north of Riebeek West. The plant requires an extensive upgrade and the replacement of equipment to ensure compliance under the new environmental legislation and energy efficiency standards. The upgrading will also increase the plant’s production ability from 570 kilotons of clinker per annum to 800 kilotons (an increase of 40%). The 800 kilotons of clinker production capacity would enable the manufacturing of up to 930 kilotons of cement depending on the extenders used in the manufacturing process.
Due to recent changes in environmental legislation, PPC are required to upgrade or replace equipment at the Riebeek plant to be compliant when the new air quality regulations (and the associated minimum emission standards) come into effect. PPC is required to comply with the Section 21 emission limits set by the National Environmental Management: Air Quality Act (No. 39 of 2004). No changes to the existing cement manufacturing plant footprint would be required for the upgrade and no additional staff would be required to operate the upgraded plant as PPC has stated that it intends to upskill existing staff as required.
The intended upgrading will extend the operational lifespan of the plant by an additional 30 years, i.e. to approximately 2045.
The proposed construction phase will be undertaken by a series of contractors and their subcontractors over a period of approximately 27 months. The capital expenditure estimated for the construction phase will amount to R1.3 billion. Approximately R232 million of this total amount will be spent on salaries of construction workers.
The higher production will result in more heavy goods vehicles (HGVs) using the region’s roads. However, due to PPC’s commitment that all additional HGVs above the 2007 levels will travel along the R311 north instead of through the Valley towns, the upgrade will not increase the perceived nuisance of PPC related HGVs on the towns of Riebeek Kasteel and Riebeek West and no noise level increases are expected in these towns.
The economy of the Western Cape, the Swartland region, and the Riebeek Valley will be positively impacted by the injection of capital into the regional and local economies. The proposed upgrade is likely to precipitate local economic perturbations relating to the expenditure on local goods, services and labour, the effect on property values, and the influence on municipal finance.
(d) Swartland regional shopping mall
Swartland Municipality decided in 2007 already that the most appropriate site for a regional shopping centre is at the northern side of Malmesbury close to intersection of Voortrekker Road and the N7. In 2011 an application to develop such a shopping centre was turned down by the Department of Environmental Affairs and Development Planning in terms of the National Environmental Act No 107 of 1998. The application was for a shopping centre with a gross leasable floor area of ±37 000 m² (preferred layout).
From the reasons provided with the decision to turn down the application, it can be concluded that the Department was not against the development of a regional shopping centre in Malmesbury per se but against the specific application on the specific site.
The establishment of a regional shopping mall in Malmesbury is still a priority for Council and is regarded as critical to the long term development of the town being the commercial centre of the Swartland. The Council also firmly believes that the above-mentioned site is still the most appropriate location for such a development. If a fully fledged regional centre can be development, it will have the following benefits: The flow of income out of the area as a result of the commercial pull of Cape Town can be reduced. Business can be attracted from outside the area, especially from the north. Specialist services which were previously only provided by Cape Town can now be accessed in the area. The residential attractiveness of the town can be further improved, which can increase the inflow of medium to high income households.
Chapter 6: Current reality, opportunities and challenges
79
(e) Possible new airport
A new international airport is envisaged for the Cape Metropole. The proposed location is approximately 26 km to the north of Durbanville, 8 km to the south of Malmesbury and 16 km to the east of Atlantis. This location is in the Swartland Municipal Area in the vicinity of Kalbaskraal.
The project is still in a planning phase. The initial plans for the airport are to attend to the large need for freight transport. Although work on this project has been ongoing for nearly six years now and has faced many challenges, it is now on the verge of being finalised (which includes funding arrangements).
This development will have a significant effect on the municipal area. Industrial development in Malmesbury and Atlantis will expand and thus provide new job opportunities. It will further increase the desirability of Swartland towns as residential alternative to Cape Town.
It may be interesting to note that 90% of all fresh produce, including fresh fish from the West Coast and surrounding areas is currently transported by road to OR Tambo Airport and flown out the country at great expense. The loss in taxes to the Western Cape Government is enormous every year. The envisaged closure of Langebaanweg as a training facility opens up development possibilities to the private sector. The potential of Langebaanweg as an alternative location for an international standard airport should be investigated. This can also result in Somerveld airfield (used as an alternative for Langebaanweg) being used to its full potential by the private sector.
(f) Proximity to the Cape Metropole
The strategic location of the Swartland in relation to the Cape Metropole and the existing infrastructure links created by the N7 and the railway line, opens up opportunities form economic growth.
Swartland Municipality borders on the municipal area of Cape Town. Towns such as Malmesbury (65 km north of Cape Town) and Darling (70 km north of Cape Town) provide an attractive alternative as business, industrial and residential area. The Swartland offers a relaxed rural lifestyle not far from the attractions of Cape Town. It offers competitive and highly accessible industrial land close to markets and suppliers.
There are two main roads cutting through the municipal area: The N7 that links Namibia and Africa in the north to Cape Town in the south and the R27 that links Cape Town with Saldanha and Vredenburg.
Secondary roads of regional importance are the R45 that links Vredenburg with Malmesbury and Paarl, the R315 that links Yzerfontein with Darling and Malmesbury and the R46 that links Hermon and the Riebeek Valley with Malmesbury.
The railway routes on which cargo and passengers are transported, run from Cape Town or Bellville and enters Swartland at Kalbaskraal where the line splits. One railway line runs north through Moorreesburg and Koringberg and ends in Bitterfontein. A second railway line runs in a westerly direction from Kalbaskraal via Darling to Vredenburg while a third line runs from Paarl to Porterville.
The Cape Town and Saldanha Bay harbours and the Cape Town International Airport provide excellent infrastructure for local business.
Good residential growth during the past decade in towns such as Malmesbury, Riebeek Kasteel, Riebeek West, Darling and Yzerfontein shows that Swartland is seen as an alternative residential area to the Cape Metropole (especially Malmesbury with its direct N7 link to Cape Town).
The development of the N7 corridor between Malmesbury and the Cape Metropole is supported by the following: The main growth direction of the Cape Metropole is to the north; the possible development of a new freight airport in die Swartland area; and growth in agri-processing in the area to the south of Malmesbury in the corridor between Malmesbury and Kalbaskraal.
Integrated Development Plan for 2012-2017
80
(g) Industrial development zone - Saldanha Bay
The establishment of a niche industrial hub in Saldanha Bay that offers real incentives to investors will contribute significantly to growth in the Western Cape and country. It will also boost the Province’s manufacturing position and enable it to become a preferred destination for the oil and gas industry.
The feasibility study for this project found that, after 25 years, an IDZ in Saldanha Bay would generate between R11.2 billion and R31.6 billion for the Province’s economy each year. It would also create between 12 000 and 29 000 sustainable jobs. The study also found that there was sufficient non-environmentally sensitive land upon which the development could take place.
The Western Cape Provincial Government’s contribution to operationalise the Saldanha Bay IDZ over the medium term is as follows: R5 million in the coming year, R5.28 million in year two and R5.57 million in year three.
When promulgated, the SEZ legislation currently before national parliament will bolster the IDZ by allowing for additional incentive support. It also reiterates the strong commitment of National Government to advancing the economy and creating jobs through infrastructure-led projects such as the Saldanha Bay IDZ. The Provincial Government has set themselves very tight deadlines and will be requesting national cabinet sign off by the end of the year.
The Provincial Government will also improve the road network that will support the Saldanha IDZ and Port expansion. We have set aside R23.31 million over the medium term for planning and to complete the feasibility study required for this project.
(h) Indoor community sport centre Wesbank
Hope Through Action (HTA), a UK based welfare organisation, has invested in a community sport centre in Mbekweni (Paarl / Wellington) in 2010. Due to the growing success of the facility in Mbekweni, HTA has decided to invest in 3 more such facilities in the Western Cape to develop their plans for the future: Franschhoek (Stellenbosch Municipal Area) Malmesbury (Swartland Municipal Area) Dysseldorp (Oudtshoorn Municipal Area)
There is no doubt that young people living in South African townships face a range of challenges in their daily lives and need help to break the cycle of poverty and underachievement. There are many other communities in the Western Cape that HTA believe would benefit from their unique approach of combining a modern sports centre with tightly integrated development programmes.
A process of selecting the relevant communities using a formal assessment process was undertaken during 2011 to ensure that their funds are targeted at areas where maximum benefit can be achieved.
HTA remains actively involved in the management of the centre after its development, e.g. for Mbekweni Community Sports Centre they’ve continued their fundraising so that they can provide more outdoor facilities to complement the indoor centre and to enable HTA to offer different sports and work with more young people.
The intension is also to expand their programmes to include practical life skills, and extend the services available from the centre. To support their ambitions they will train more volunteer coaches to deliver their development programmes, so that they can reach more young people and build on the Mbekweni achievements so far.
(i) Development of new sport fields in Riebeek West
In August 2010 an application was submitted to the National Lottery Distribution Trust Fund (NLDTF) for the upgrade of various sport facilities within Swartland. The NLDTF informed the Municipality in October 2011 that a grant of R955 000 has been allocated towards Riebeek West Sport Grounds.
Chapter 6: Current reality, opportunities and challenges
81
The new draft Spatial Development Framework contains a development plan for Riebeek West that earmarks the sport grounds for which the grant was allocated for light industrial area. The plan also proposes a new multisport facility on erven 326 and 327 directly southeast of Lang Street.
The Municipal Manager thus gave instructions in March 2012 that the NLDTF grant be allocated to the newly planned multisport facility. In the mean time the Municipality also secured a grants of approximately R15 million for the development of this facility.
(j) Urban renewal project in Malmesbury
The future of the River Road in Malmesbury will be handled in accordance with the Transport Study to determine whether or not the road is necessary. If the road is not necessary it opens up opportunities to develop the area that would have been taken up by the road. The area concerned has great potential for urban renewal.
(k) National Department of Environmental Affairs - EPWP project
R11.5 million has been allocated by the Department for an EPWP project that covers the area from the West Coast National Park boundary up to Chapmans Peak. The aim of the project is the clean-up of beaches, maintenance of the dunes and removal of alien vegetation along the coast line. Swartland Municipality currently expects in the region of 10% of the amount for work along the coast line within our municipal area.
The Municipality provided the Department with the following requests for possible inclusion in the project: Rehabilitation of the sand dunes in the surroundings of the Yzerfontein Caravan Park; Pearl Bay: Make wooden walkways of the old Jeep tracks and create a walk route; remove alien plants on the dunes; cleaning of beach from Grotto Bay to the boundary of the West Coast National Park north of Yzerfontein; fencing in of beach area near Yzerfontein Caravan Park; construction of public refuse drop-off points along the walk route; maintenance of the existing walk routes and walk ways; repair and placement of information signs; cleaning of river; and help to get an information centre going.
Twenty people from Darling’s list of unemployed have been employed at R75 per day for the two year period. The project will be executed during the 2011/12 and 2012/13 financial years.
(l) Conservation and tourism initiative - Dassen Island
The following information was obtained from the Cape West Coast Biosphere’s comment on the Management Plan for the Dassen Island Nature Reserve dated 13 February 2012: The Protected Area Expansion strategy for Dassen Island Nature Reserve is to establish a Marine Protected Area of a 20 km diameter around the island. It
should be considered consolidating the proposed MPA with the Sixteen Mile Beach MPA and creating a single MPA from South Head at the entrance to Saldanha Bay (in the north) to Bok Point (in the south).
There is a need to investigate a tourism initiative for Dassen Island, which has a high tourism potential due to the ecological & cultural-historic heritage and its strategic location with regard to other offshore islands such Robben Island. Dassen Island is an extremely sensitive environment, however if strictly controlled and monitored, tourism activities could take place that would not have a significant negative impact. Marine-based tourism (permitted through a system that
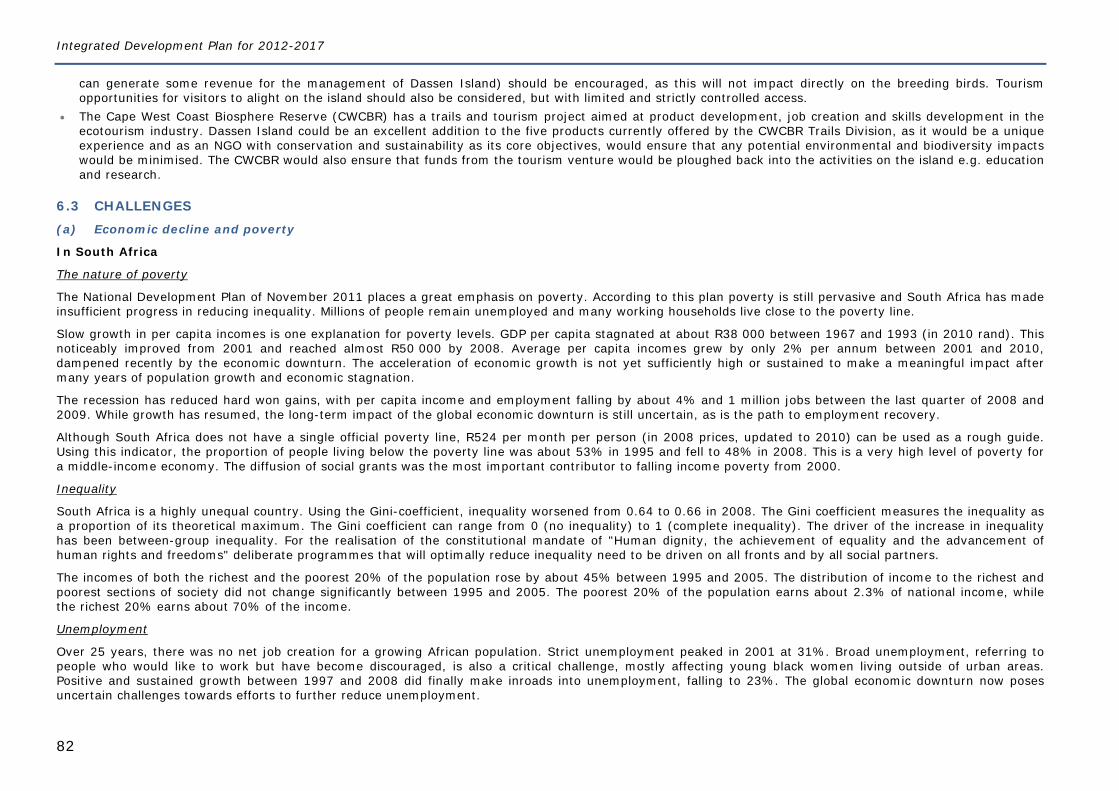
Integrated Development Plan for 2012-2017
82
can generate some revenue for the management of Dassen Island) should be encouraged, as this will not impact directly on the breeding birds. Tourism opportunities for visitors to alight on the island should also be considered, but with limited and strictly controlled access.
The Cape West Coast Biosphere Reserve (CWCBR) has a trails and tourism project aimed at product development, job creation and skills development in the ecotourism industry. Dassen Island could be an excellent addition to the five products currently offered by the CWCBR Trails Division, as it would be a unique experience and as an NGO with conservation and sustainability as its core objectives, would ensure that any potential environmental and biodiversity impacts would be minimised. The CWCBR would also ensure that funds from the tourism venture would be ploughed back into the activities on the island e.g. education and research.
6.3 CHALLENGES (a) Economic decline and poverty
In South Africa
The nature of poverty
The National Development Plan of November 2011 places a great emphasis on poverty. According to this plan poverty is still pervasive and South Africa has made insufficient progress in reducing inequality. Millions of people remain unemployed and many working households live close to the poverty line.
Slow growth in per capita incomes is one explanation for poverty levels. GDP per capita stagnated at about R38 000 between 1967 and 1993 (in 2010 rand). This noticeably improved from 2001 and reached almost R50 000 by 2008. Average per capita incomes grew by only 2% per annum between 2001 and 2010, dampened recently by the economic downturn. The acceleration of economic growth is not yet sufficiently high or sustained to make a meaningful impact after many years of population growth and economic stagnation.
The recession has reduced hard won gains, with per capita income and employment falling by about 4% and 1 million jobs between the last quarter of 2008 and 2009. While growth has resumed, the long-term impact of the global economic downturn is still uncertain, as is the path to employment recovery.
Although South Africa does not have a single official poverty line, R524 per month per person (in 2008 prices, updated to 2010) can be used as a rough guide. Using this indicator, the proportion of people living below the poverty line was about 53% in 1995 and fell to 48% in 2008. This is a very high level of poverty for a middle-income economy. The diffusion of social grants was the most important contributor to falling income poverty from 2000.
Inequality
South Africa is a highly unequal country. Using the Gini-coefficient, inequality worsened from 0.64 to 0.66 in 2008. The Gini coefficient measures the inequality as a proportion of its theoretical maximum. The Gini coefficient can range from 0 (no inequality) to 1 (complete inequality). The driver of the increase in inequality has been between-group inequality. For the realisation of the constitutional mandate of "Human dignity, the achievement of equality and the advancement of human rights and freedoms" deliberate programmes that will optimally reduce inequality need to be driven on all fronts and by all social partners.
The incomes of both the richest and the poorest 20% of the population rose by about 45% between 1995 and 2005. The distribution of income to the richest and poorest sections of society did not change significantly between 1995 and 2005. The poorest 20% of the population earns about 2.3% of national income, while the richest 20% earns about 70% of the income.
Unemployment
Over 25 years, there was no net job creation for a growing African population. Strict unemployment peaked in 2001 at 31%. Broad unemployment, referring to people who would like to work but have become discouraged, is also a critical challenge, mostly affecting young black women living outside of urban areas. Positive and sustained growth between 1997 and 2008 did finally make inroads into unemployment, falling to 23%. The global economic downturn now poses uncertain challenges towards efforts to further reduce unemployment.
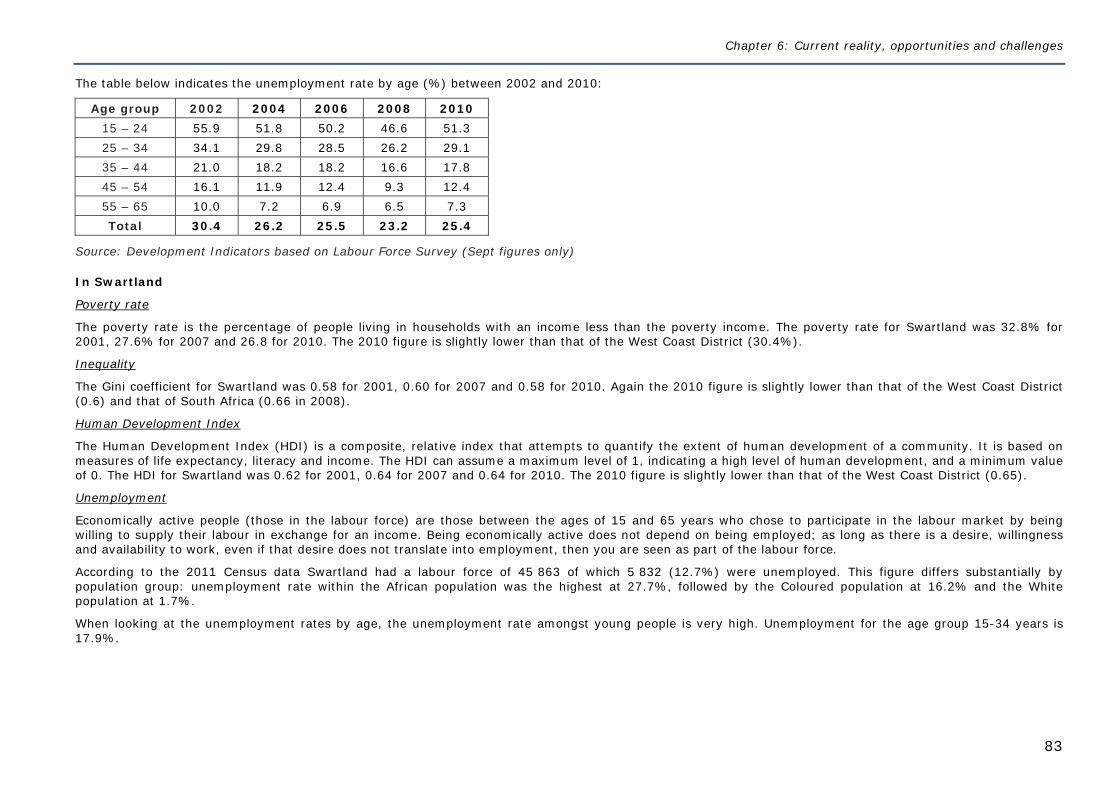
Chapter 6: Current reality, opportunities and challenges
83
The table below indicates the unemployment rate by age (%) between 2002 and 2010:
Age group 2002 2004 2006 2008 2010 15 – 24 55.9 51.8 50.2 46.6 51.3 25 – 34 34.1 29.8 28.5 26.2 29.1 35 – 44 21.0 18.2 18.2 16.6 17.8 45 – 54 16.1 11.9 12.4 9.3 12.4 55 – 65 10.0 7.2 6.9 6.5 7.3 Total 30.4 26.2 25.5 23.2 25.4
Source: Development Indicators based on Labour Force Survey (Sept figures only)
In Swartland
Poverty rate
The poverty rate is the percentage of people living in households with an income less than the poverty income. The poverty rate for Swartland was 32.8% for 2001, 27.6% for 2007 and 26.8 for 2010. The 2010 figure is slightly lower than that of the West Coast District (30.4%).
Inequality
The Gini coefficient for Swartland was 0.58 for 2001, 0.60 for 2007 and 0.58 for 2010. Again the 2010 figure is slightly lower than that of the West Coast District (0.6) and that of South Africa (0.66 in 2008).
Human Development Index
The Human Development Index (HDI) is a composite, relative index that attempts to quantify the extent of human development of a community. It is based on measures of life expectancy, literacy and income. The HDI can assume a maximum level of 1, indicating a high level of human development, and a minimum value of 0. The HDI for Swartland was 0.62 for 2001, 0.64 for 2007 and 0.64 for 2010. The 2010 figure is slightly lower than that of the West Coast District (0.65).
Unemployment
Economically active people (those in the labour force) are those between the ages of 15 and 65 years who chose to participate in the labour market by being willing to supply their labour in exchange for an income. Being economically active does not depend on being employed; as long as there is a desire, willingness and availability to work, even if that desire does not translate into employment, then you are seen as part of the labour force.
According to the 2011 Census data Swartland had a labour force of 45 863 of which 5 832 (12.7%) were unemployed. This figure differs substantially by population group: unemployment rate within the African population was the highest at 27.7%, followed by the Coloured population at 16.2% and the White population at 1.7%.
When looking at the unemployment rates by age, the unemployment rate amongst young people is very high. Unemployment for the age group 15-34 years is 17.9%.
Integrated Development Plan for 2012-2017
84
(b) Local economic development (LED)
What is LED?
The World Bank’s current defines LED as follows: “Local Economic Development (LED) offers local government, the private sector, the not-for-profit sectors and the local community the opportunity to work together to improve the local economy. It aims to enhance competitiveness and thus encourage sustainable growth that is inclusive.”
Another definition is “an ongoing process by which key stakeholders and institutions from all spheres of society, the public and private sector as well as civil society, work jointly to create a unique advantage for the locality and its firms, tackle market failures, remove bureaucratic obstacles for local businesses and strengthen the competitiveness of local firms.”
The White Paper on Local Government (1998) introduces the concept of “developmental local government” which is defined as “Local government committed to working with citizens and groups within the community to find sustainable ways to meet their social, economic and material needs, and improve the quality of their lives.” However the same document makes it clear that “Local Government is not directly responsible for creating jobs. Rather, it is responsible for taking active steps to ensure that the overall economic and social conditions of the locality are conducive to the creation of employment opportunities”. Thus, local economic development is about creating a platform and environment to engage stakeholders in implementing strategies and programmes.
While the Constitution (1996) places a great responsibility on municipalities to facilitate LED, the schedule in the Constitution that lists the functions of municipalities does not include LED. This has contributed to an interpretation that sees LED as an un-funded mandate for municipalities. National Government’s LED Framework (2006) therefore emphasised that municipalities are not responsible for creating jobs but should rather invest in providing the overall economic and social conditions conducive to creating employment opportunities. LED is therefore about creating a platform and environment to engage stakeholders in implementing strategies and programmes.
Stages of LED
In the early stages of LED, activities focussed strongly on the marketing of locations to external investors, often linked with incentive systems such as tax breaks and/or reduced costs of public services (such as water and electricity) and infrastructure development. In a second phase, attention shifted to endogenous economic potentials, striving to support the competitiveness of existing firms, promoting entrepreneurship and business start-ups. This was often done via entrepreneurship development and training programmes, business support and business linkage mechanisms, providing access to finance, skills development, rural development and sectoral development approaches.
Since the late 1990s, a more holistic approach to LED has become prevalent.
LED Framework (2006)
This Framework emphasised that local government is not responsible for creating jobs but should rather invest in providing the overall economic and social conditions conducive to creating employment opportunities. Local economic development is therefore about creating a platform and environment to engage stakeholders in implementing strategies and programmes. The Framework emphasizes that municipalities have a key role in creating an environment conducive for investment through the provision of infrastructure and quality services, rather than by developing programmes and attempting to create jobs directly.
Swartland LED seminar - 21 March 2012
The drive to sensitise the local business community of Swartland and to align stakeholders to the principles of sustainability took place on 21 March 2012 when a day seminar was held in the Malmesbury Town Hall. More than 300 people attended this very successful local economic development day as part of Human Rights Day, focussing on jobs and local initiatives to activate growth. A convincing mandate to “take the next step” was received with lists of signatures in support of the Swartland Economic Development Support Charter. The seminar showed that a lot of goodwill and willingness exists amongst the broad business community of Swartland to join forces and find new methods of doing things. Apart from creating an atmosphere where people feel at ease to create new enterprises, Swartland

Chapter 6: Current reality, opportunities and challenges
85
Municipality understands the necessity of retention and expansion of current businesses in the Swartland region. As local government we are keen to respond and contribute.
West Coast Economic Development Partnership
The West Coast District Municipality in partnership with GIZ, the technical cooperation arm of the German government, has been consulting with a range of economic stakeholders across the district with a view to identifying, packaging and promoting strategic catalytic projects which have district wide economic impact as exploring the potential for developing collaboration amongst role-players. In the course of consultative meetings with the local municipalities and a range of stakeholders it has become apparent that there is a need to establish a partnership body involving the private sector, the non-profit sector and government to promote the regional economy.
Stakeholders have also noted that a very solid basis for the creation of such a partnership exists. Factors cited include: The high degree of structured collaboration between the district municipality and the local municipalities in the region; The positive relationships between local government and the private sector in the region; The strong regional tourism organisation and network through the regional tourism organisation (RTO); The well-organised business and agricultural sector at provincial and town level.
Structure It is proposed that the partnership would be governed by two structures: A Steering Committee broadly representative of major economic interests in the region meeting on a quarterly basis. A Management Committee to manage the work required to establish the partnership meeting on a monthly basis.
The partnership should potentially be positioned as the West Coast arm of the provincial EDP but this will need to be consulted with both the provincial EDP as well as local stakeholders.
Programme elements The West Coast partnership programme would comprise some of the following activities: Economy mapping: The West Coast economic development partnership will work with the EDP to map both the economic stakeholders in the region as well as
all major projects, events and initiatives in the region with a potentially catalytic impact on the economy. Economic visioning: The West Coast partnership will initiate a series of stakeholder dialogues through its partners in order to stimulate the development of
innovative and visionary thinking about the regional economy. Network Building Programme: The West Coast partnership will promote strong economic networks and collaborations through local town-based working
groups, sector working groups, stakeholder dialogues, business breakfast forums and newsletters. Project and Enterprise support. The partnership will provide support to enterprises and projects by linking private and public innovators and entrepreneurs with
knowledge, funding and opportunity through feasibility studies, market exploration, investment events and the creation of on-line investment platform for small to medium social and economic projects.
Regional Economic Development Learning Partnership. The West Coast partnership with support from GIZ will establish a learning partnership with other regional processes in areas with similar challenges to the West Coast.
Western Cape Economic Development Partnership
Swartland, one of only 4 Municipalities from the Western Cape, was acknowledged as one of the forming members amongst the 40 key organisations of the Western Cape Economic Development Partnership (EDP) that was launched in Cape Town on 26th April, 2012 at the Cape Town Film Studios. Representing Swartland Municipality was Mayor Tijmen van Essen and Councillor Chris Hunsinger amongst business associations from Western Cape, industry bodies, sector
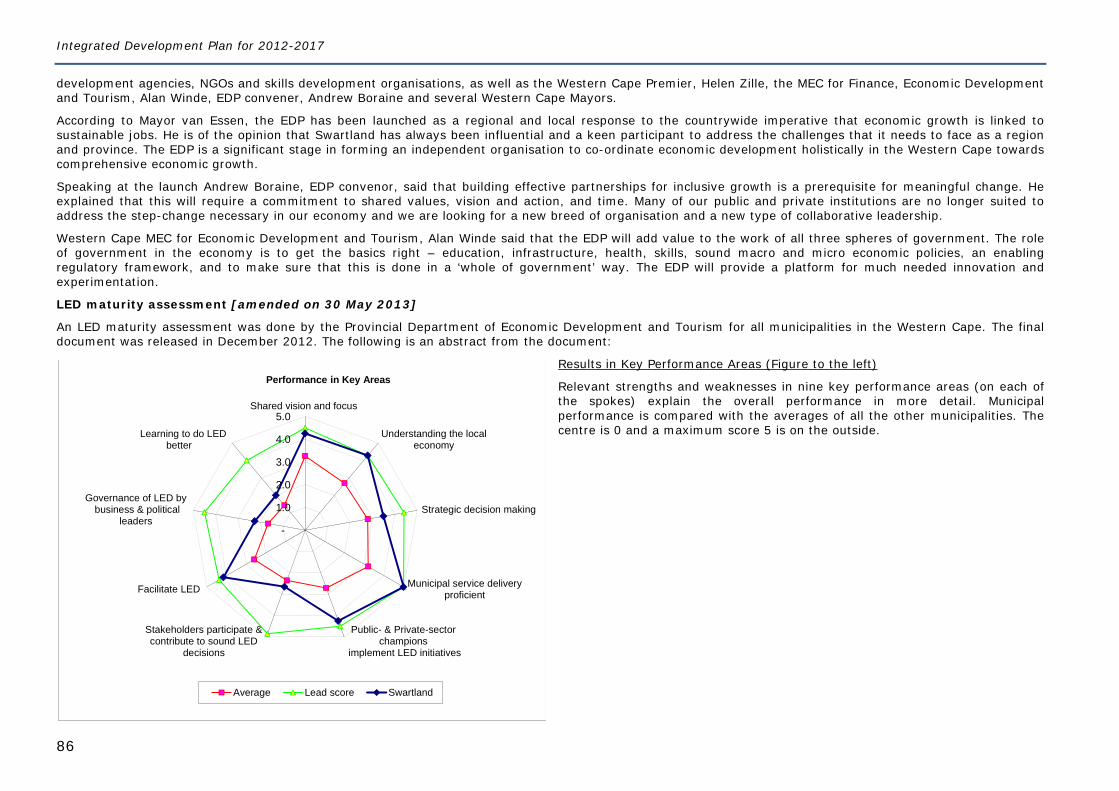
Integrated Development Plan for 2012-2017
86
development agencies, NGOs and skills development organisations, as well as the Western Cape Premier, Helen Zille, the MEC for Finance, Economic Development and Tourism, Alan Winde, EDP convener, Andrew Boraine and several Western Cape Mayors.
According to Mayor van Essen, the EDP has been launched as a regional and local response to the countrywide imperative that economic growth is linked to sustainable jobs. He is of the opinion that Swartland has always been influential and a keen participant to address the challenges that it needs to face as a region and province. The EDP is a significant stage in forming an independent organisation to co-ordinate economic development holistically in the Western Cape towards comprehensive economic growth.
Speaking at the launch Andrew Boraine, EDP convenor, said that building effective partnerships for inclusive growth is a prerequisite for meaningful change. He explained that this will require a commitment to shared values, vision and action, and time. Many of our public and private institutions are no longer suited to address the step-change necessary in our economy and we are looking for a new breed of organisation and a new type of collaborative leadership.
Western Cape MEC for Economic Development and Tourism, Alan Winde said that the EDP will add value to the work of all three spheres of government. The role of government in the economy is to get the basics right – education, infrastructure, health, skills, sound macro and micro economic policies, an enabling regulatory framework, and to make sure that this is done in a ‘whole of government’ way. The EDP will provide a platform for much needed innovation and experimentation.
LED maturity assessment [amended on 30 May 2013]
An LED maturity assessment was done by the Provincial Department of Economic Development and Tourism for all municipalities in the Western Cape. The final document was released in December 2012. The following is an abstract from the document:
Results in Key Performance Areas (Figure to the left)
Relevant strengths and weaknesses in nine key performance areas (on each of the spokes) explain the overall performance in more detail. Municipal performance is compared with the averages of all the other municipalities. The centre is 0 and a maximum score 5 is on the outside.
-
1.0
2.0
3.0
4.0
5.0Shared vision and focus
Understanding the localeconomy
Strategic decision making
Municipal service deliveryproficient
Public- & Private-sectorchampions
implement LED initiatives
Stakeholders participate &contribute to sound LED
decisions
Facilitate LED
Governance of LED by business & political
leaders
Learning to do LEDbetter
Performance in Key Areas
Average Lead score Swartland
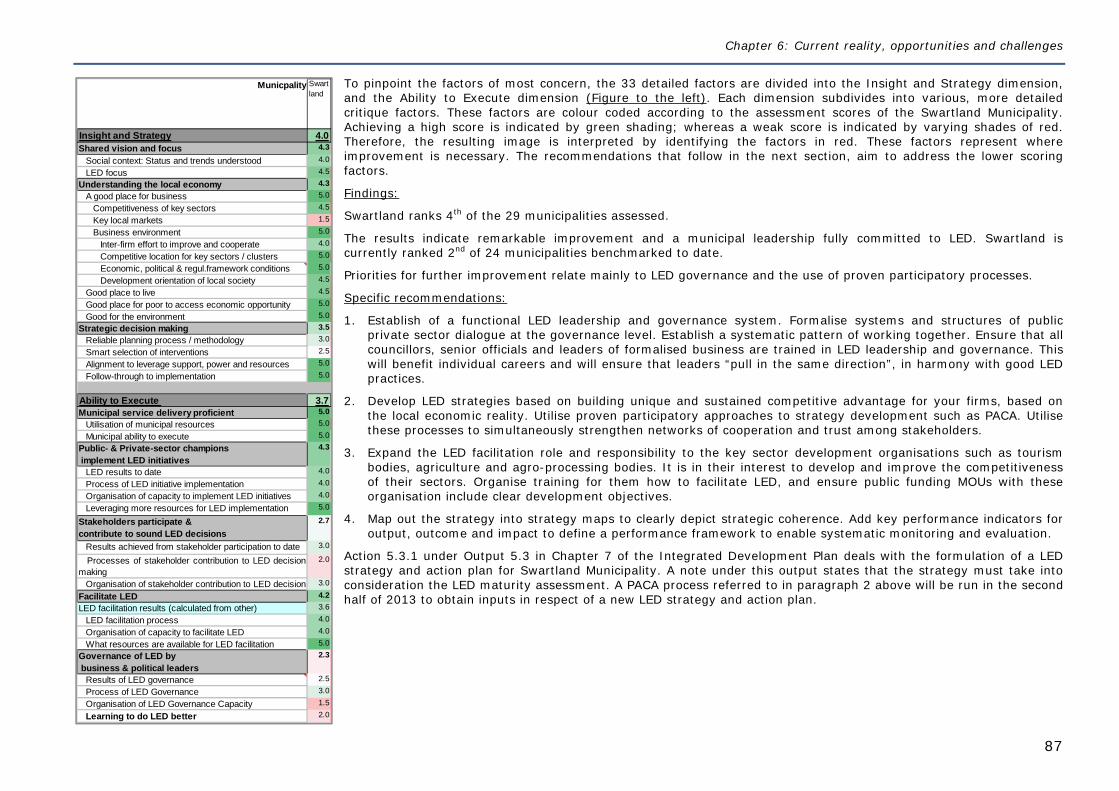
Chapter 6: Current reality, opportunities and challenges
87
Swartland
Insight and Strategy 4.0Shared vision and focus 4.3
Social context: Status and trends understood 4.0
LED focus 4.5
Understanding the local economy 4.3 A good place for business 5.0
Competitiveness of key sectors 4.5
Key local markets 1.5
Business environment 5.0
Inter-firm effort to improve and cooperate 4.0
Competitive location for key sectors / clusters 5.0
Economic, political & regul.framework conditions 5.0
Development orientation of local society 4.5
Good place to live 4.5
Good place for poor to access economic opportunity 5.0
Good for the environment 5.0
Strategic decision making 3.5 Reliable planning process / methodology 3.0
Smart selection of interventions 2.5
Alignment to leverage support, power and resources 5.0
Follow-through to implementation 5.0
Ability to Execute 3.7Municipal service delivery proficient 5.0 Utilisation of municipal resources 5.0
Municipal ability to execute 5.0
Public- & Private-sector champions implement LED initiatives
4.3
LED results to date 4.0
Process of LED initiative implementation 4.0
Organisation of capacity to implement LED initiatives 4.0
Leveraging more resources for LED implementation 5.0
Stakeholders participate & contribute to sound LED decisions
2.7
Results achieved from stakeholder participation to date 3.0
Processes of stakeholder contribution to LED decisionmaking
2.0
Organisation of stakeholder contribution to LED decision 3.0
Facilitate LED 4.2LED facilitation results (calculated from other) 3.6
LED facilitation process 4.0
Organisation of capacity to facilitate LED 4.0
What resources are available for LED facilitation 5.0
Governance of LED by business & political leaders
2.3
Results of LED governance 2.5
Process of LED Governance 3.0
Organisation of LED Governance Capacity 1.5
Learning to do LED better 2.0
Municpality To pinpoint the factors of most concern, the 33 detailed factors are divided into the Insight and Strategy dimension, and the Ability to Execute dimension (Figure to the left). Each dimension subdivides into various, more detailed critique factors. These factors are colour coded according to the assessment scores of the Swartland Municipality. Achieving a high score is indicated by green shading; whereas a weak score is indicated by varying shades of red. Therefore, the resulting image is interpreted by identifying the factors in red. These factors represent where improvement is necessary. The recommendations that follow in the next section, aim to address the lower scoring factors.
Findings:
Swartland ranks 4th of the 29 municipalities assessed.
The results indicate remarkable improvement and a municipal leadership fully committed to LED. Swartland is currently ranked 2nd of 24 municipalities benchmarked to date.
Priorities for further improvement relate mainly to LED governance and the use of proven participatory processes.
Specific recommendations:
1. Establish of a functional LED leadership and governance system. Formalise systems and structures of public private sector dialogue at the governance level. Establish a systematic pattern of working together. Ensure that all councillors, senior officials and leaders of formalised business are trained in LED leadership and governance. This will benefit individual careers and will ensure that leaders “pull in the same direction”, in harmony with good LED practices.
2. Develop LED strategies based on building unique and sustained competitive advantage for your firms, based on the local economic reality. Utilise proven participatory approaches to strategy development such as PACA. Utilise these processes to simultaneously strengthen networks of cooperation and trust among stakeholders.
3. Expand the LED facilitation role and responsibility to the key sector development organisations such as tourism bodies, agriculture and agro-processing bodies. It is in their interest to develop and improve the competitiveness of their sectors. Organise training for them how to facilitate LED, and ensure public funding MOUs with these organisation include clear development objectives.
4. Map out the strategy into strategy maps to clearly depict strategic coherence. Add key performance indicators for output, outcome and impact to define a performance framework to enable systematic monitoring and evaluation.
Action 5.3.1 under Output 5.3 in Chapter 7 of the Integrated Development Plan deals with the formulation of a LED strategy and action plan for Swartland Municipality. A note under this output states that the strategy must take into consideration the LED maturity assessment. A PACA process referred to in paragraph 2 above will be run in the second half of 2013 to obtain inputs in respect of a new LED strategy and action plan.
Integrated Development Plan for 2012-2017
88
What Swartland Municipality is already committed to
Swartland Municipality is committed to maximise its contribution to LED and job creation by - fully participating in the expanded public works programme (EPWP) using labour intensive methods wherever possible putting an obligation on service providers to use labour intensive approaches supporting labour intensive LED projects supporting the interns programme (this has already led to a number of permanent appointments) creating an enabling environment for investments and other activities that will lead to job creation timely delivery in spending on our capital programme effective revenue management sufficient provision for repairs and maintenance having more supply chain open days with a focus on small, medium and micro enterprises (SMME’s) monitoring red tape issues through the Municipality’s performance management system a bigger focus on the informal economy, the social economy and a decent work facilitating the use of the Jobs Fund interacting with the Provincial Government regarding new scheme regulations that will reduce red tape evaluating the appropriateness of our current approach to LED versus the establishment of a more focussed LED unit (affordability / financing?) fully supporting the Western Cape as well as the West Coast Economic Development Partnership (EDP) shifting paradigms with respect to -
- economy and tourism boundaries - optimum IT efficiency (telecoms) - green economy / renewable energy
looking at possible benefits from the Atlantis corridor.
(c) Climate change
The information under this heading was obtained from the document “A climate change strategy and action plan for the Western Cape” issued by the Provincial Government in December 2008.
Climate change is one of the biggest challenges facing the international community. Although media coverage and talk is generally about the future impacts of climate change, our climate is in fact already changing and a further level of climate change is inevitable.
The Western Cape is one of the areas within South Africa that can expect the highest degree of climate change and will be most adversely affected, with the predicted warming and drying conditions being most apparent in the western part of the region.
If we continue along a business as usual path using energy in the way that we currently do, we are set to increase our energy consumption in the Western Cape Province from approximately 250 million gigajoule (GJ) in 2004 to 375 million GJ by 2020. Our industrial and transport sectors are currently the highest contributors towards this energy consumption. The Western Cape, as is the rest of South Africa, is heavily dependent on fossil fuels for its energy needs which means that we release a disproportionate amount of greenhouse gases for the energy that we use. This will serve as our contribution to climate change and may come back to haunt us in the form of droughts, floods and sea level rise that will cause significant socio-economic challenges.
Chapter 6: Current reality, opportunities and challenges
89
The leading international assessment on the costs of climate change, the Stern Review, estimates that damages from unmitigated climate change could range between 5% and 20% of GDP annually by 2100.
The Western Cape is particularly vulnerable to the effects of climate change because of our coastal location and the influence of rising sea temperatures on our weather patterns. Since 2001, more than a dozen floods have ravaged our landscape and resources, as have several droughts. We were particularly hard hit in 2007 and 2008, when floods damaged key infrastructure, roads and crops in the province, costing our fiscus in excess of R1 billion each year.
Although the scale and exact manifestation of the change is less certain, the application of a range of climate models to the province makes it possible to identify a number of stress factors with likely results: An increase in the annual average temperature of at least 1°C by 2050 (the Intergovernmental Panel on Climate Change (IPCC) Fourth Assessment Report
released in February this year shows an expected increase of between 3 and 5°C by 2100). A possible increase in the frequency and intensity of extreme events. An increase in conditions conducive to wildfires (higher temperatures and increased wind velocity) Reduced rainfall in the western parts of the Western Cape. Decreased water resources. Reduced soil moisture from an increase in temperature coupled with a decrease in average precipitation. Temperature impacts on crop activities - crop burn, drought, pests and microbes resulting in yield reductions, and loss of rural livelihoods.
The above statements should not be regarded as forecasts but rather as indications of possible directions and scale of change. The most useful approach is to use these projections as an experimental basis for assessing additional risk - that is, the potential exposure to hazards to life, biodiversity or economic interests that climatic changes on this scale could pose.
Vulnerable systems identified as priorities are: Natural systems - water, biodiversity, and coastal and marine systems and resources Economic sectors - agriculture, tourism and fisheries Economic resources and infrastructure - energy, transport, health and air quality The built environment, livelihoods and disasters - social systems and extreme events (floods, fires).
Climate change can influence and react with a range of macro-variables. In the Western Cape it can be a driver of internal migration - should rural livelihoods decline - and production patterns. Climate change could interact with demographic and behavioural trends with implications for future health care and community service needs. Increased demands on the province’s already-threatened energy security and water supply systems will have economic and social consequences. In addition, the province is likely to be influenced by international climate impacts and responses and the related effect on commodity prices, demand and volumes, requisite changes to production processes and socio-economic factors, including pressure for disaster relief and migration.
Various renewable energy initiatives are currently being investigated or planned for the West Coast area. The Council strongly supports renewable energy initiatives and in Chapter 7 of this document (Action 5.2.2 Protect environmental quality) it is proposed that a climate change strategy for Swartland be formulated before June 2013.
(d) Migration patterns
Migration constitutes a major challenge for the Swartland as it reflects in-migration of relatively unskilled persons and the out-migration of generally more highly skilled elements of the population better able to compete on merit in the larger labour market and thus also a serious loss for Swartland. No detailed statistics are available on the in- or out-migration of people to and from the Swartland, but the following observations can be made:
Integrated Development Plan for 2012-2017
90
Migration to the Swartland is a function of the availability of infrastructure, services and job opportunities, but these elements enjoy different priority in the decision making of different population groups.
Towns such as Malmesbury in the Swartland offering comparatively high levels of infrastructure provision and perceived generally better employment prospects are likely in relative terms and given a sustained economic growth rate to attract increasing numbers of low income migrants in search of employment and better living conditions.
The tendency under the White and Coloured population in the age group 20 to 30 years is to leave Swartland in search of employment elsewhere whereas the African population considers the Swartland as a better option to find employment than their places of origin.
A notable trend appears to be the permanent in-migration of both professionals and retired people into the coastal and inland small towns. The relative imbalance in the growth of the higher income and the lower income components of the local population will increase the exposure of Swartland to
external funding through the intergovernmental transfer mechanism. The Equitable Shares grant is fast becoming inadequate in relation to the actual costs of providing services. This imbalance can result in upward pressure on local poverty levels with an increasing proportion of local households having to rely on some form of state subsidy or social grant as their means of survival.
Actions taken by Swartland to stimulate local economic growth and providing infrastructure and services in themselves create expectations of employment and of a relatively improved quality of life and thus potentially increase in-migration.
Although in- and out-migration cannot be stopped, it must still be managed with great care by the Municipality.
Chapter 7: The Strategy
91
C H A P T E R 7 : T H E S T R A T E G Y 7.1 VISION, MISSION AND SLOGAN
New vision and mission statements as well as a slogan for Swartland Municipality were formulated in 2011. It was circulated to all staff members my means of the Municipality’s internal newsletter and they were invited to comment or to give inputs. The final vision, mission and motto are as follows:
(a) Vision (an idealized view of where or what an organisation would like to be in the future - “where we are going”)
Swartland Municipality is a frontline organisation which promotes sustainable development and delivers services effectively and efficiently to all its people by building partnerships with all stakeholders.
The key words and phrases in the vision must be interpreted as follows: Municipality: A municipality consists of the political structures, the administration and the community (Systems Act Section 2). Frontline: Dictionary definition: At the forefront of something, leading, foremost, influential, most important (in Afrikaans: toonaangewende) Sustainable development: Development that "meets the needs of the present without compromising the ability of future generations to meet their own
needs”. It rests on three “pillars” i.e. economic development, social development and environmental protection. Effectively: A measure of how inputs and outputs relate to the achievement of an institution's strategic objectives and goals. Efficiently: Maximum level of output for a given set of inputs, or the minimum required inputs to produce a given level of output. Partnerships: The purpose of partnerships is the joint creation of prosperity and the fair distribution thereof. Stakeholders: Any person, organisation, company or government body that has some form of interest in the Swartland municipal area.
(b) Mission (an organisation’s present business scope and purpose - “who we are, what we do and why we are here”)
At Swartland Municipality it is our mission to promote social and economic stability and growth through the sustainable delivery of services in terms of our legal powers and functions to all our interested parties.
(c) Slogan (a brief statement used to express a principle, goal, or ideal)
Dedicated to service excellence!
7.2 LEADERSHIP PHILOSOPHY AND VALUES
(a) Leadership philosophy
Through participation, understanding and purposefulness we create an environment in which staff flourish and deliver an outstanding and sustainable service.
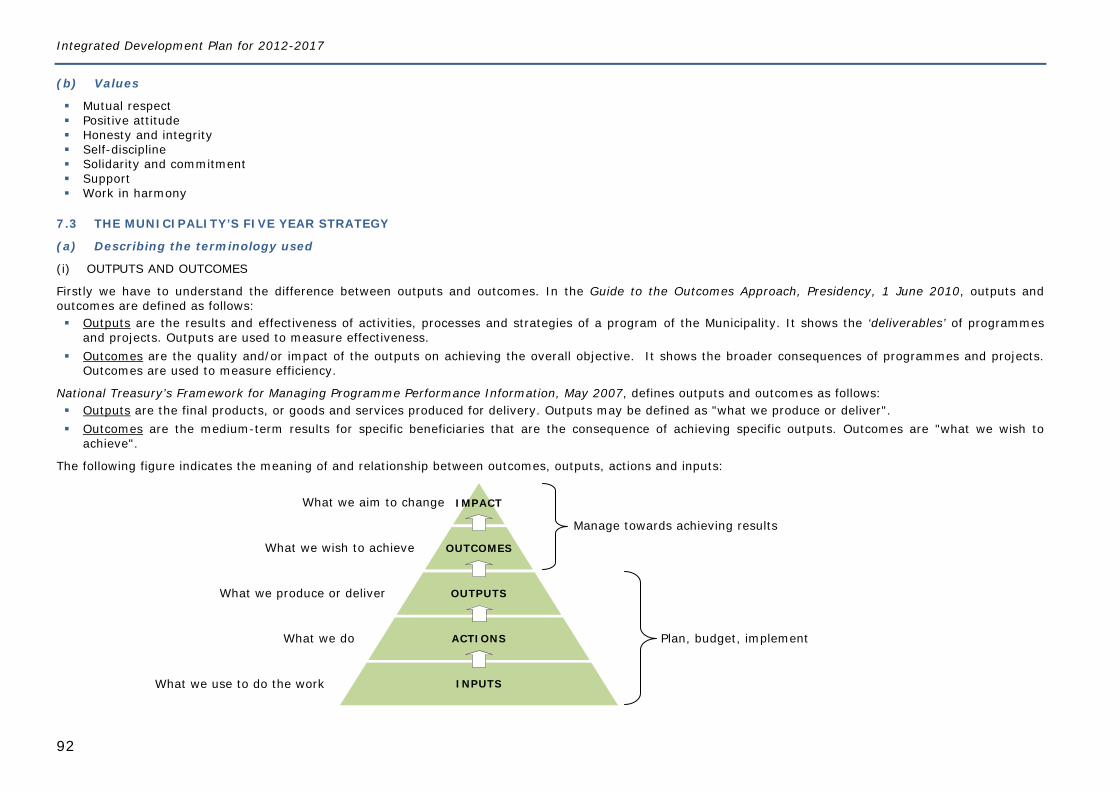
Integrated Development Plan for 2012-2017
92
IMPACT
OUTCOMES
OUTPUTS
ACTIONS
INPUTS
(b) Values
Mutual respect Positive attitude Honesty and integrity Self-discipline Solidarity and commitment Support Work in harmony
7.3 THE MUNICIPALITY’S FIVE YEAR STRATEGY
(a) Describing the terminology used
(i) OUTPUTS AND OUTCOMES
Firstly we have to understand the difference between outputs and outcomes. In the Guide to the Outcomes Approach, Presidency, 1 June 2010, outputs and outcomes are defined as follows: Outputs are the results and effectiveness of activities, processes and strategies of a program of the Municipality. It shows the ‘deliverables’ of programmes
and projects. Outputs are used to measure effectiveness. Outcomes are the quality and/or impact of the outputs on achieving the overall objective. It shows the broader consequences of programmes and projects.
Outcomes are used to measure efficiency.
National Treasury’s Framework for Managing Programme Performance Information, May 2007, defines outputs and outcomes as follows: Outputs are the final products, or goods and services produced for delivery. Outputs may be defined as "what we produce or deliver". Outcomes are the medium-term results for specific beneficiaries that are the consequence of achieving specific outputs. Outcomes are "what we wish to
achieve".
The following figure indicates the meaning of and relationship between outcomes, outputs, actions and inputs:
Manage towards achieving results
Plan, budget, implement
What we aim to change
What we wish to achieve
What we produce or deliver
What we do
What we use to do the work
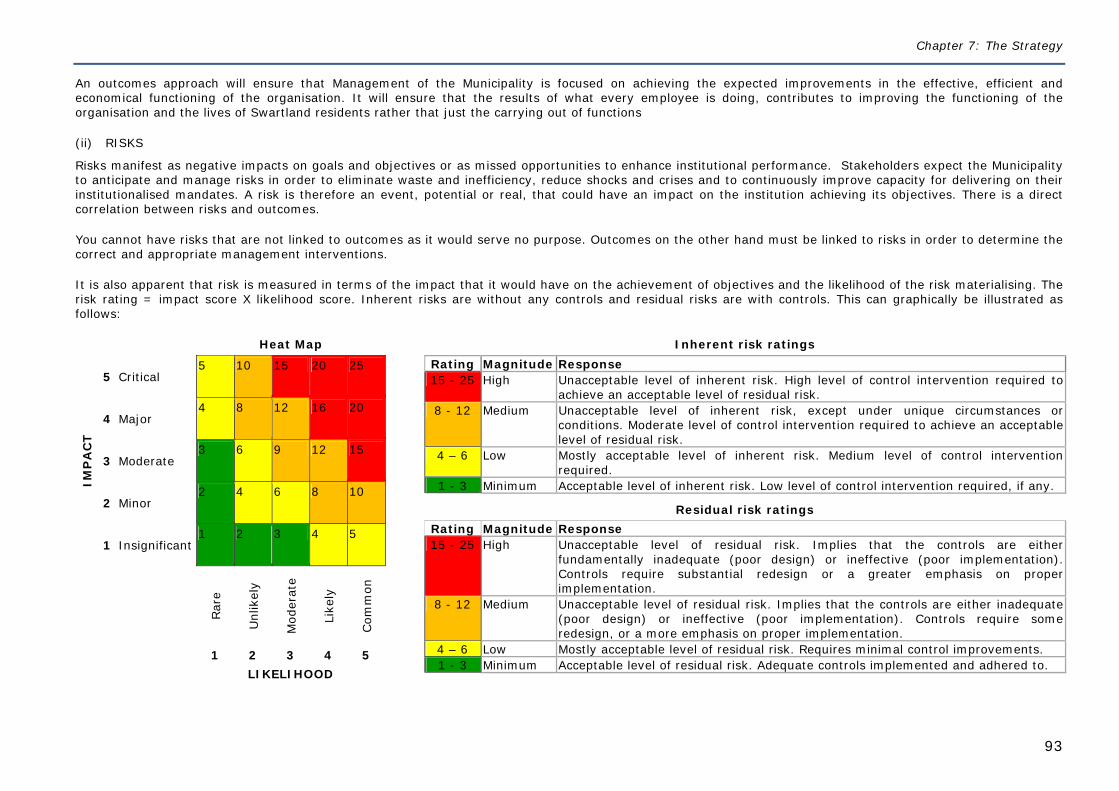
Chapter 7: The Strategy
93
An outcomes approach will ensure that Management of the Municipality is focused on achieving the expected improvements in the effective, efficient and economical functioning of the organisation. It will ensure that the results of what every employee is doing, contributes to improving the functioning of the organisation and the lives of Swartland residents rather that just the carrying out of functions
(ii) RISKS
Risks manifest as negative impacts on goals and objectives or as missed opportunities to enhance institutional performance. Stakeholders expect the Municipality to anticipate and manage risks in order to eliminate waste and inefficiency, reduce shocks and crises and to continuously improve capacity for delivering on their institutionalised mandates. A risk is therefore an event, potential or real, that could have an impact on the institution achieving its objectives. There is a direct correlation between risks and outcomes.
You cannot have risks that are not linked to outcomes as it would serve no purpose. Outcomes on the other hand must be linked to risks in order to determine the correct and appropriate management interventions.
It is also apparent that risk is measured in terms of the impact that it would have on the achievement of objectives and the likelihood of the risk materialising. The risk rating = impact score X likelihood score. Inherent risks are without any controls and residual risks are with controls. This can graphically be illustrated as follows:
Heat Map
IMP
AC
T
5 Critical 5 10 15 20 25
4 Major 4 8 12 16 20
3 Moderate 3 6 9 12 15
2 Minor 2 4 6 8 10
1 Insignificant 1 2 3 4 5
Rar
e
Unl
ikel
y
Mod
erat
e
Like
ly
Com
mon
1 2 3 4 5 LIKELIHOOD
Inherent risk ratings Rating Magnitude Response 15 - 25 High Unacceptable level of inherent risk. High level of control intervention required to
achieve an acceptable level of residual risk. 8 - 12 Medium Unacceptable level of inherent risk, except under unique circumstances or
conditions. Moderate level of control intervention required to achieve an acceptable level of residual risk.
4 – 6 Low Mostly acceptable level of inherent risk. Medium level of control intervention required.
1 - 3 Minimum Acceptable level of inherent risk. Low level of control intervention required, if any.
Residual risk ratings Rating Magnitude Response 15 - 25 High Unacceptable level of residual risk. Implies that the controls are either
fundamentally inadequate (poor design) or ineffective (poor implementation). Controls require substantial redesign or a greater emphasis on proper implementation.
8 - 12 Medium Unacceptable level of residual risk. Implies that the controls are either inadequate (poor design) or ineffective (poor implementation). Controls require some redesign, or a more emphasis on proper implementation.
4 – 6 Low Mostly acceptable level of residual risk. Requires minimal control improvements. 1 - 3 Minimum Acceptable level of residual risk. Adequate controls implemented and adhered to.
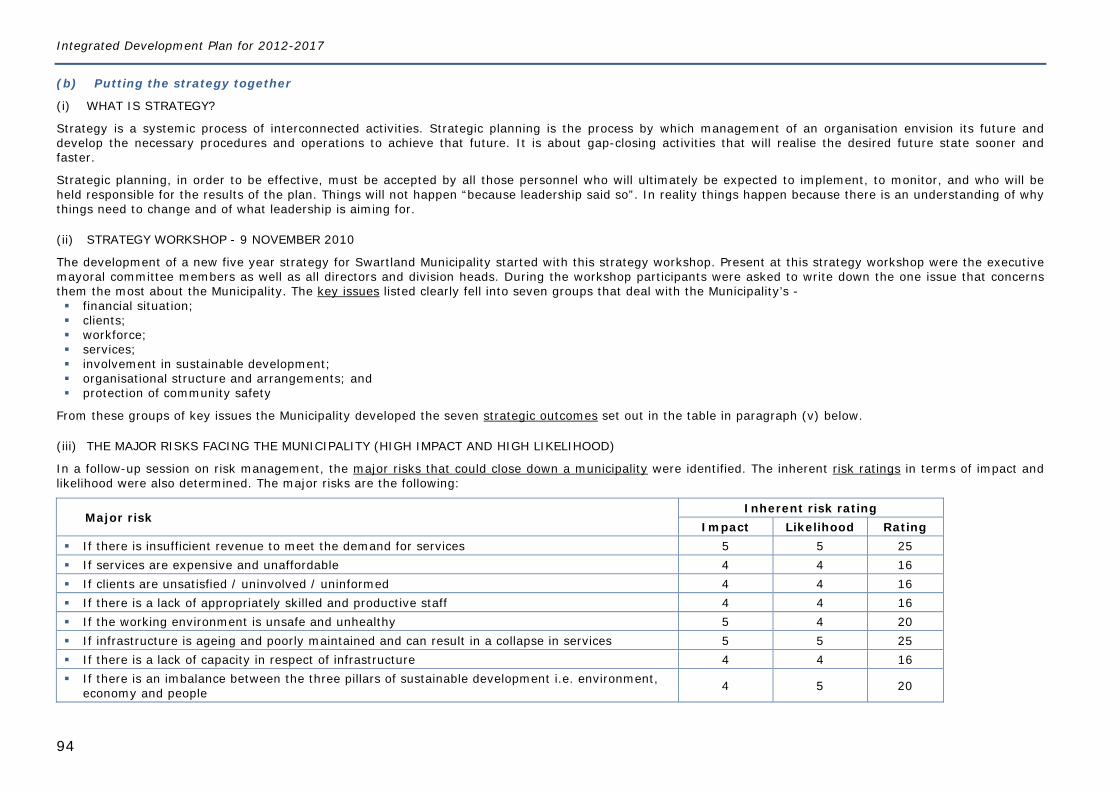
Integrated Development Plan for 2012-2017
94
(b) Putting the strategy together
(i) WHAT IS STRATEGY?
Strategy is a systemic process of interconnected activities. Strategic planning is the process by which management of an organisation envision its future and develop the necessary procedures and operations to achieve that future. It is about gap-closing activities that will realise the desired future state sooner and faster.
Strategic planning, in order to be effective, must be accepted by all those personnel who will ultimately be expected to implement, to monitor, and who will be held responsible for the results of the plan. Things will not happen “because leadership said so”. In reality things happen because there is an understanding of why things need to change and of what leadership is aiming for.
(ii) STRATEGY WORKSHOP - 9 NOVEMBER 2010
The development of a new five year strategy for Swartland Municipality started with this strategy workshop. Present at this strategy workshop were the executive mayoral committee members as well as all directors and division heads. During the workshop participants were asked to write down the one issue that concerns them the most about the Municipality. The key issues listed clearly fell into seven groups that deal with the Municipality’s - financial situation; clients; workforce; services; involvement in sustainable development; organisational structure and arrangements; and protection of community safety
From these groups of key issues the Municipality developed the seven strategic outcomes set out in the table in paragraph (v) below.
(iii) THE MAJOR RISKS FACING THE MUNICIPALITY (HIGH IMPACT AND HIGH LIKELIHOOD)
In a follow-up session on risk management, the major risks that could close down a municipality were identified. The inherent risk ratings in terms of impact and likelihood were also determined. The major risks are the following:
Major risk Inherent risk rating
Impact Likelihood Rating If there is insufficient revenue to meet the demand for services 5 5 25 If services are expensive and unaffordable 4 4 16 If clients are unsatisfied / uninvolved / uninformed 4 4 16 If there is a lack of appropriately skilled and productive staff 4 4 16 If the working environment is unsafe and unhealthy 5 4 20 If infrastructure is ageing and poorly maintained and can result in a collapse in services 5 5 25 If there is a lack of capacity in respect of infrastructure 4 4 16 If there is an imbalance between the three pillars of sustainable development i.e. environment,
economy and people 4 5 20
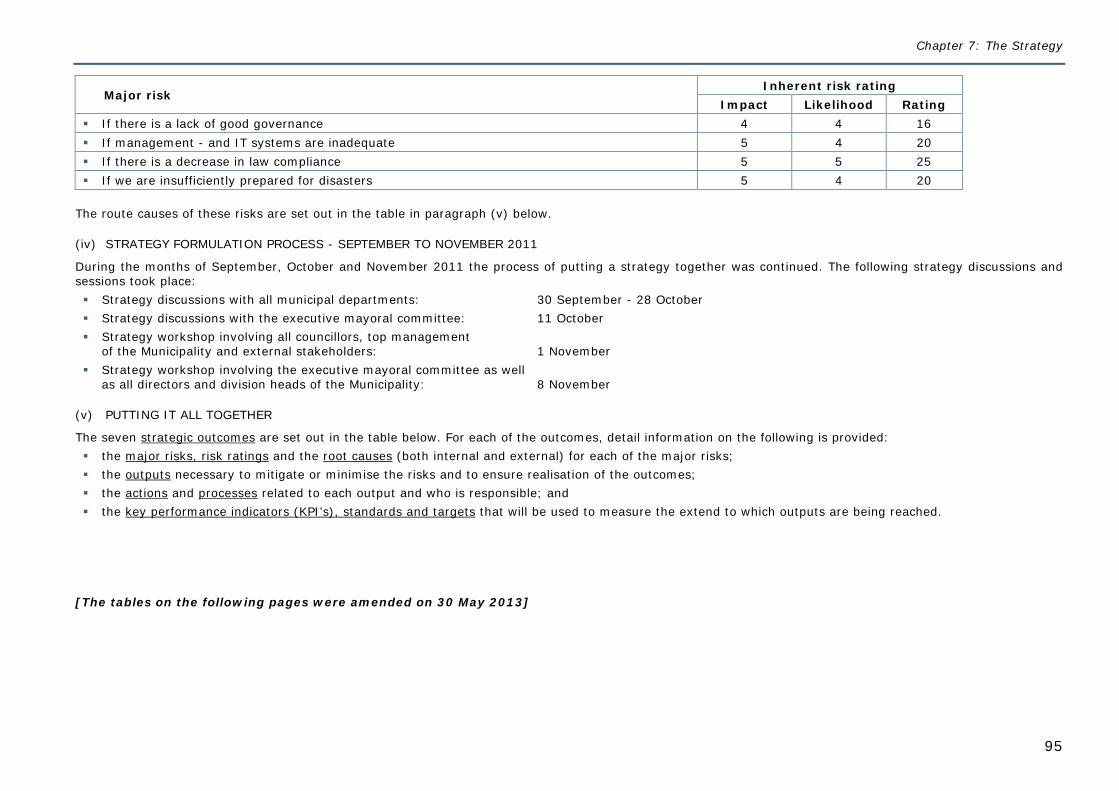
Chapter 7: The Strategy
95
Major risk Inherent risk rating
Impact Likelihood Rating If there is a lack of good governance 4 4 16 If management - and IT systems are inadequate 5 4 20 If there is a decrease in law compliance 5 5 25 If we are insufficiently prepared for disasters 5 4 20
The route causes of these risks are set out in the table in paragraph (v) below.
(iv) STRATEGY FORMULATION PROCESS - SEPTEMBER TO NOVEMBER 2011
During the months of September, October and November 2011 the process of putting a strategy together was continued. The following strategy discussions and sessions took place: Strategy discussions with all municipal departments: 30 September - 28 October Strategy discussions with the executive mayoral committee: 11 October Strategy workshop involving all councillors, top management
of the Municipality and external stakeholders: 1 November
Strategy workshop involving the executive mayoral committee as well as all directors and division heads of the Municipality:
8 November
(v) PUTTING IT ALL TOGETHER
The seven strategic outcomes are set out in the table below. For each of the outcomes, detail information on the following is provided: the major risks, risk ratings and the root causes (both internal and external) for each of the major risks; the outputs necessary to mitigate or minimise the risks and to ensure realisation of the outcomes; the actions and processes related to each output and who is responsible; and the key performance indicators (KPI’s), standards and targets that will be used to measure the extend to which outputs are being reached.
[The tables on the following pages were amended on 30 May 2013]
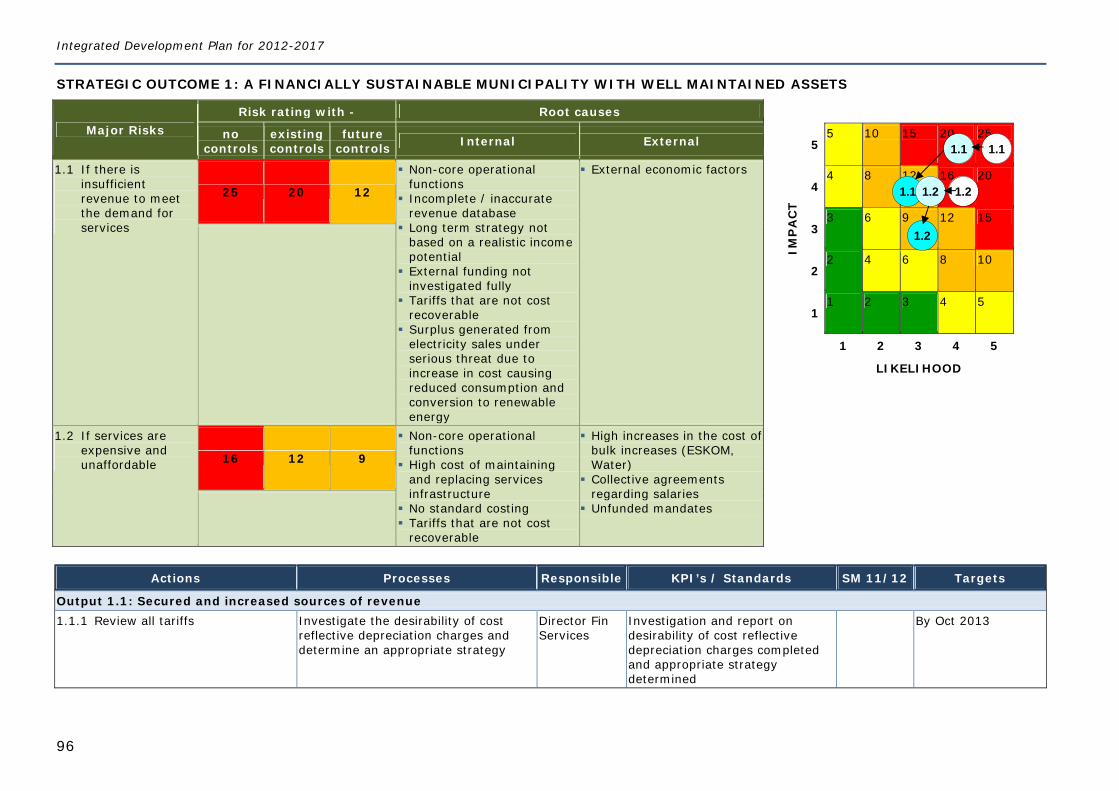
Integrated Development Plan for 2012-2017
96
STRATEGIC OUTCOME 1: A FINANCIALLY SUSTAINABLE MUNICIPALITY WITH WELL MAINTAINED ASSETS
Major Risks Risk rating with - Root causes
IMP
AC
T
5 5 10 15 20 25
4 4 8 12 16 20
3 3 6 9 12 15
2 2 4 6 8 10
1 1 2 3 4 5
1 2 3 4 5
LIKELIHOOD
no controls
existing controls
future controls Internal External
1.1 If there is insufficient revenue to meet the demand for services
25 20 12
Non-core operational functions
Incomplete / inaccurate revenue database
Long term strategy not based on a realistic income potential
External funding not investigated fully
Tariffs that are not cost recoverable
Surplus generated from electricity sales under serious threat due to increase in cost causing reduced consumption and conversion to renewable energy
External economic factors
1.2 If services are expensive and unaffordable 16 12 9
Non-core operational functions
High cost of maintaining and replacing services infrastructure
No standard costing Tariffs that are not cost
recoverable
High increases in the cost of bulk increases (ESKOM, Water)
Collective agreements regarding salaries
Unfunded mandates
Actions Processes Responsible KPI’s / Standards SM 11/12 Targets
Output 1.1: Secured and increased sources of revenue 1.1.1 Review all tariffs Investigate the desirability of cost
reflective depreciation charges and determine an appropriate strategy
Director Fin Services
Investigation and report on desirability of cost reflective depreciation charges completed and appropriate strategy determined
By Oct 2013
1.2
1.1 1.1
1.1 1.2
1.2
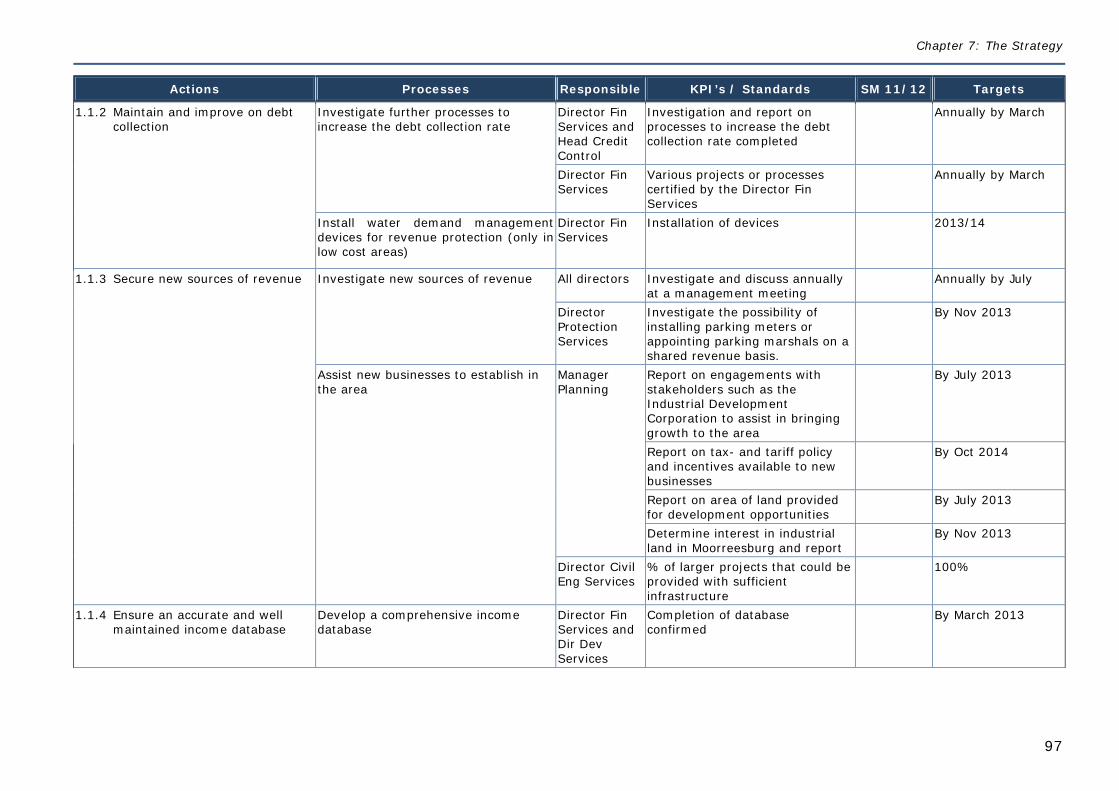
Chapter 7: The Strategy
97
Actions Processes Responsible KPI’s / Standards SM 11/12 Targets
1.1.2 Maintain and improve on debt collection
Investigate further processes to increase the debt collection rate
Director Fin Services and Head Credit Control
Investigation and report on processes to increase the debt collection rate completed
Annually by March
Director Fin Services
Various projects or processes certified by the Director Fin Services
Annually by March
Install water demand management devices for revenue protection (only in low cost areas)
Director Fin Services
Installation of devices 2013/14
1.1.3 Secure new sources of revenue Investigate new sources of revenue All directors Investigate and discuss annually at a management meeting
Annually by July
Director Protection Services
Investigate the possibility of installing parking meters or appointing parking marshals on a shared revenue basis.
By Nov 2013
Assist new businesses to establish in the area
Manager Planning
Report on engagements with stakeholders such as the Industrial Development Corporation to assist in bringing growth to the area
By July 2013
Report on tax- and tariff policy and incentives available to new businesses
By Oct 2014
Report on area of land provided for development opportunities
By July 2013
Determine interest in industrial land in Moorreesburg and report
By Nov 2013
Director Civil Eng Services
% of larger projects that could be provided with sufficient infrastructure
100%
1.1.4 Ensure an accurate and well maintained income database
Develop a comprehensive income database
Director Fin Services and Dir Dev Services
Completion of database confirmed
By March 2013
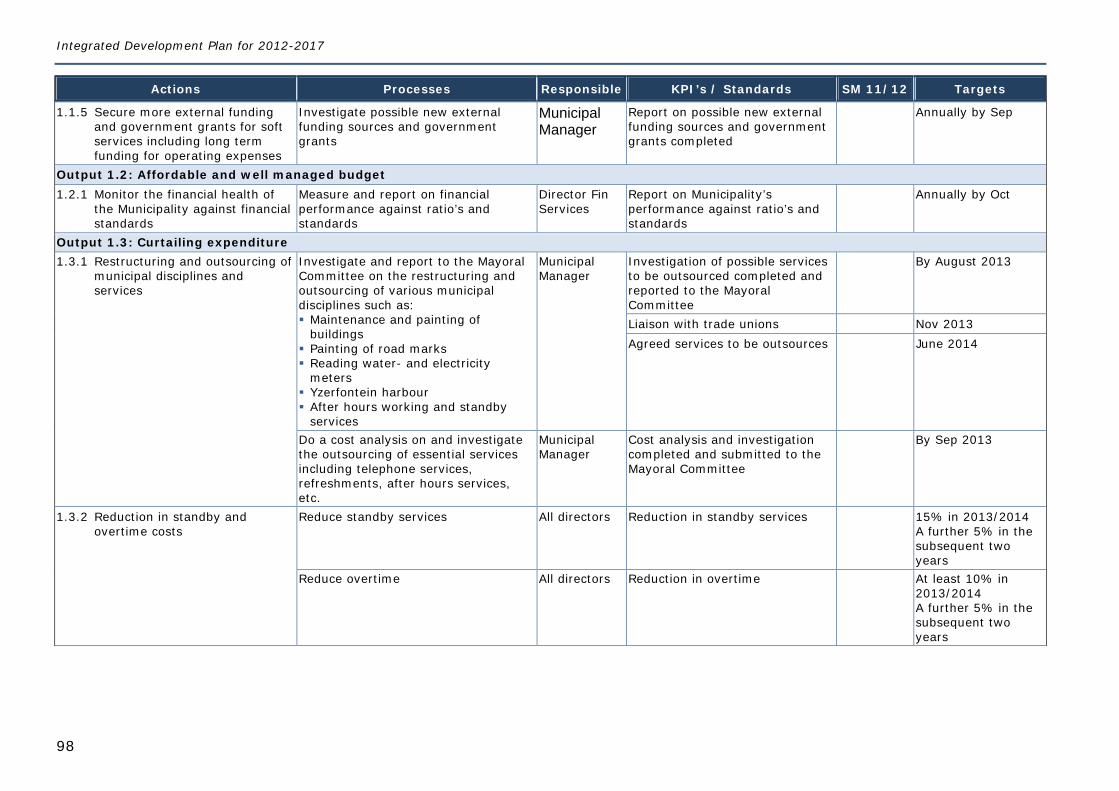
Integrated Development Plan for 2012-2017
98
Actions Processes Responsible KPI’s / Standards SM 11/12 Targets
1.1.5 Secure more external funding and government grants for soft services including long term funding for operating expenses
Investigate possible new external funding sources and government grants
Municipal Manager
Report on possible new external funding sources and government grants completed
Annually by Sep
Output 1.2: Affordable and well managed budget 1.2.1 Monitor the financial health of
the Municipality against financial standards
Measure and report on financial performance against ratio’s and standards
Director Fin Services
Report on Municipality’s performance against ratio’s and standards
Annually by Oct
Output 1.3: Curtailing expenditure 1.3.1 Restructuring and outsourcing of
municipal disciplines and services
Investigate and report to the Mayoral Committee on the restructuring and outsourcing of various municipal disciplines such as: Maintenance and painting of
buildings Painting of road marks Reading water- and electricity
meters Yzerfontein harbour After hours working and standby
services
Municipal Manager
Investigation of possible services to be outsourced completed and reported to the Mayoral Committee
By August 2013
Liaison with trade unions Nov 2013 Agreed services to be outsources June 2014
Do a cost analysis on and investigate the outsourcing of essential services including telephone services, refreshments, after hours services, etc.
Municipal Manager
Cost analysis and investigation completed and submitted to the Mayoral Committee
By Sep 2013
1.3.2 Reduction in standby and overtime costs
Reduce standby services All directors Reduction in standby services 15% in 2013/2014 A further 5% in the subsequent two years
Reduce overtime All directors Reduction in overtime At least 10% in 2013/2014 A further 5% in the subsequent two years
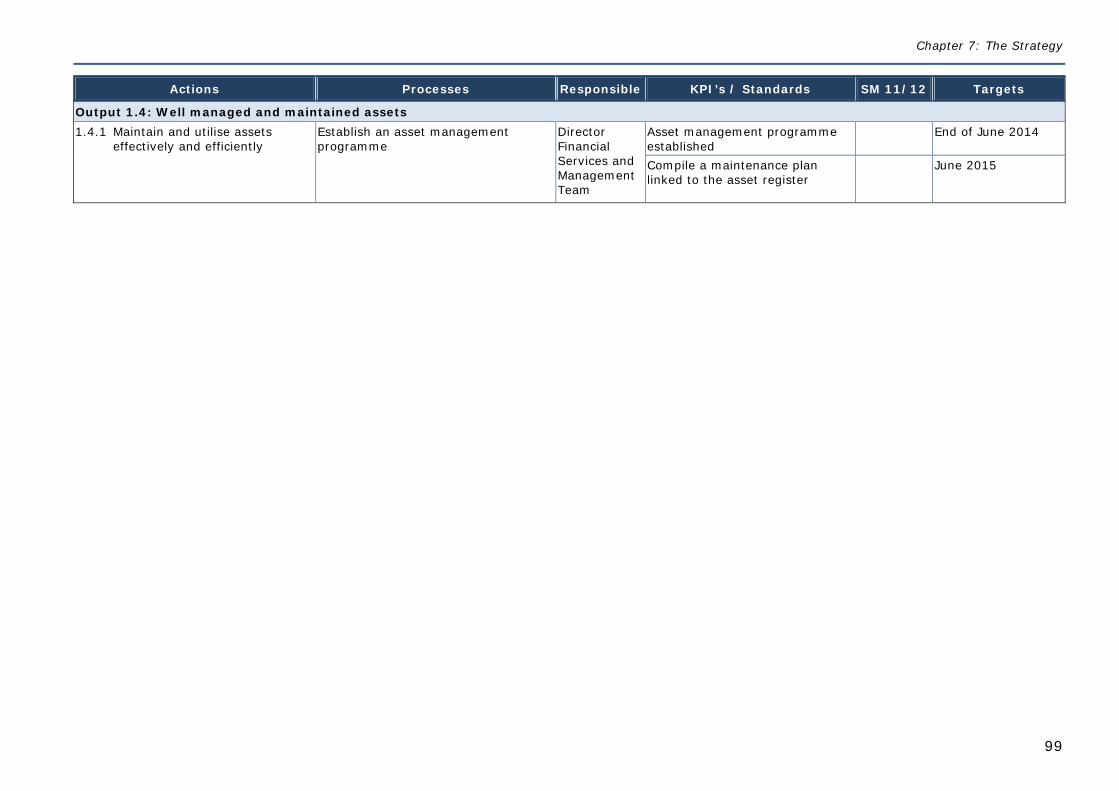
Chapter 7: The Strategy
99
Actions Processes Responsible KPI’s / Standards SM 11/12 Targets
Output 1.4: Well managed and maintained assets 1.4.1 Maintain and utilise assets
effectively and efficiently Establish an asset management programme
Director Financial Services and Management Team
Asset management programme established
End of June 2014
Compile a maintenance plan linked to the asset register
June 2015
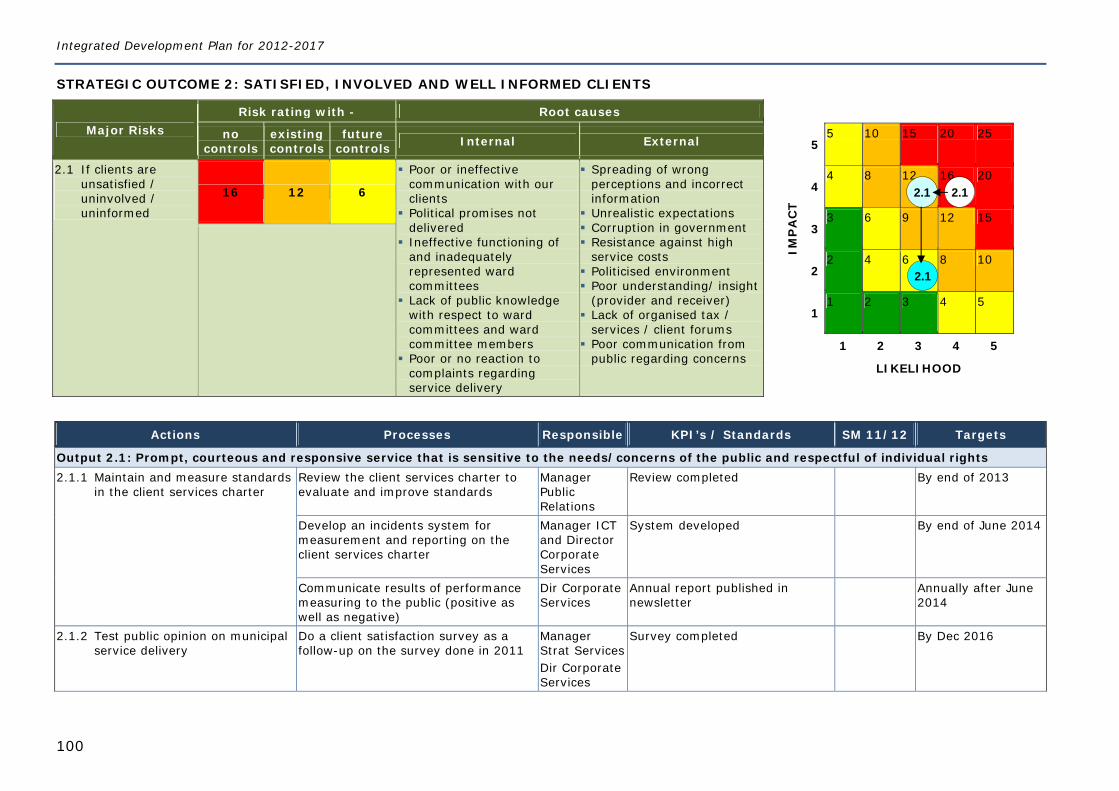
Integrated Development Plan for 2012-2017
100
STRATEGIC OUTCOME 2: SATISFIED, INVOLVED AND WELL INFORMED CLIENTS
Major Risks Risk rating with - Root causes
IMP
AC
T
5 5 10 15 20 25
4 4 8 12 16 20
3 3 6 9 12 15
2 2 4 6 8 10
1 1 2 3 4 5
1 2 3 4 5
LIKELIHOOD
no controls
existing controls
future controls Internal External
2.1 If clients are unsatisfied / uninvolved / uninformed
16 12 6
Poor or ineffective communication with our clients
Political promises not delivered
Ineffective functioning of and inadequately represented ward committees
Lack of public knowledge with respect to ward committees and ward committee members
Poor or no reaction to complaints regarding service delivery
Spreading of wrong perceptions and incorrect information
Unrealistic expectations Corruption in government Resistance against high
service costs Politicised environment Poor understanding/ insight
(provider and receiver) Lack of organised tax /
services / client forums Poor communication from
public regarding concerns
Actions Processes Responsible KPI’s / Standards SM 11/12 Targets
Output 2.1: Prompt, courteous and responsive service that is sensitive to the needs/concerns of the public and respectful of individual rights 2.1.1 Maintain and measure standards
in the client services charter Review the client services charter to evaluate and improve standards
Manager Public Relations
Review completed By end of 2013
Develop an incidents system for measurement and reporting on the client services charter
Manager ICT and Director Corporate Services
System developed By end of June 2014
Communicate results of performance measuring to the public (positive as well as negative)
Dir Corporate Services
Annual report published in newsletter
Annually after June 2014
2.1.2 Test public opinion on municipal service delivery
Do a client satisfaction survey as a follow-up on the survey done in 2011
Manager Strat Services Dir Corporate Services
Survey completed By Dec 2016
2.12.1
2.1
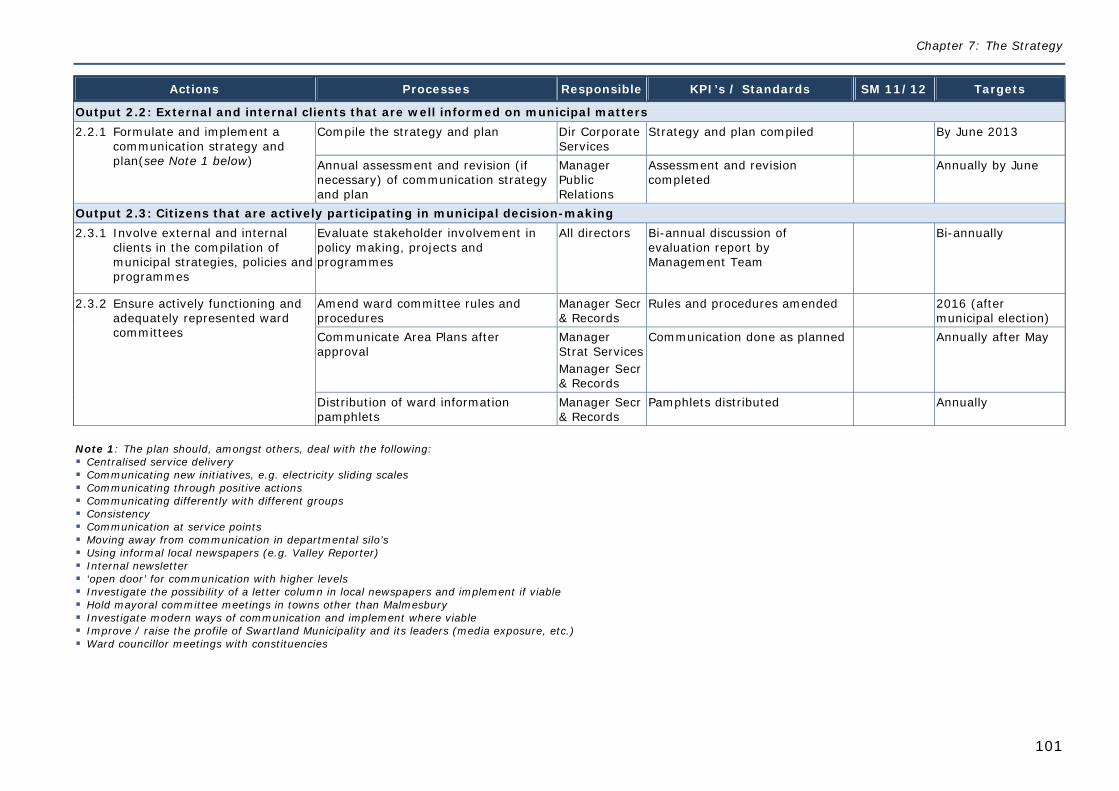
Chapter 7: The Strategy
101
Actions Processes Responsible KPI’s / Standards SM 11/12 Targets
Output 2.2: External and internal clients that are well informed on municipal matters 2.2.1 Formulate and implement a
communication strategy and plan(see Note 1 below)
Compile the strategy and plan Dir Corporate Services
Strategy and plan compiled By June 2013
Annual assessment and revision (if necessary) of communication strategy and plan
Manager Public Relations
Assessment and revision completed
Annually by June
Output 2.3: Citizens that are actively participating in municipal decision-making 2.3.1 Involve external and internal
clients in the compilation of municipal strategies, policies and programmes
Evaluate stakeholder involvement in policy making, projects and programmes
All directors Bi-annual discussion of evaluation report by Management Team
Bi-annually
2.3.2 Ensure actively functioning and adequately represented ward committees
Amend ward committee rules and procedures
Manager Secr & Records
Rules and procedures amended 2016 (after municipal election)
Communicate Area Plans after approval
Manager Strat Services Manager Secr & Records
Communication done as planned Annually after May
Distribution of ward information pamphlets
Manager Secr & Records
Pamphlets distributed Annually
Note 1: The plan should, amongst others, deal with the following: Centralised service delivery Communicating new initiatives, e.g. electricity sliding scales Communicating through positive actions Communicating differently with different groups Consistency Communication at service points Moving away from communication in departmental silo’s Using informal local newspapers (e.g. Valley Reporter) Internal newsletter ‘open door’ for communication with higher levels Investigate the possibility of a letter column in local newspapers and implement if viable Hold mayoral committee meetings in towns other than Malmesbury Investigate modern ways of communication and implement where viable Improve / raise the profile of Swartland Municipality and its leaders (media exposure, etc.) Ward councillor meetings with constituencies
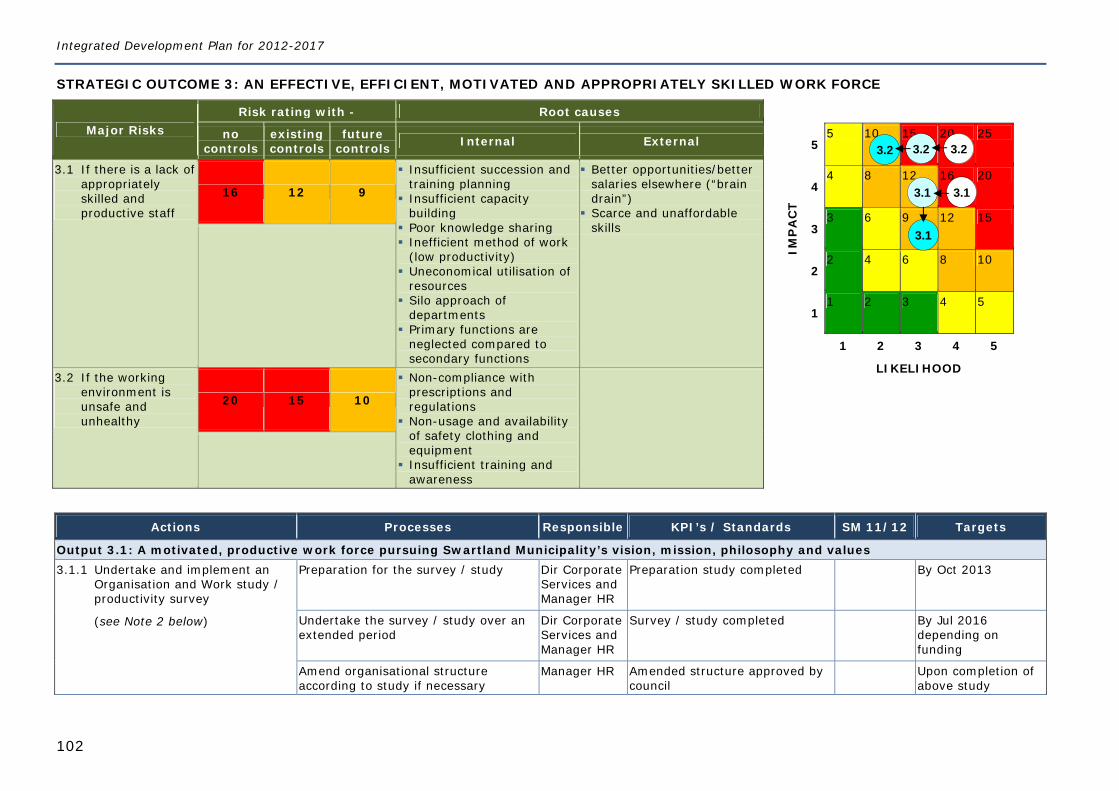
Integrated Development Plan for 2012-2017
102
STRATEGIC OUTCOME 3: AN EFFECTIVE, EFFICIENT, MOTIVATED AND APPROPRIATELY SKILLED WORK FORCE
Major Risks Risk rating with - Root causes
IMP
AC
T
5 5 10 15 20 25
4 4 8 12 16 20
3 3 6 9 12 15
2 2 4 6 8 10
1 1 2 3 4 5
1 2 3 4 5
LIKELIHOOD
no controls
existing controls
future controls Internal External
3.1 If there is a lack of appropriately skilled and productive staff
16 12 9
Insufficient succession and training planning
Insufficient capacity building
Poor knowledge sharing Inefficient method of work
(low productivity) Uneconomical utilisation of
resources Silo approach of
departments Primary functions are
neglected compared to secondary functions
Better opportunities/better salaries elsewhere (“brain drain”)
Scarce and unaffordable skills
3.2 If the working environment is unsafe and unhealthy
20 15 10
Non-compliance with prescriptions and regulations
Non-usage and availability of safety clothing and equipment
Insufficient training and awareness
Actions Processes Responsible KPI’s / Standards SM 11/12 Targets
Output 3.1: A motivated, productive work force pursuing Swartland Municipality’s vision, mission, philosophy and values 3.1.1 Undertake and implement an
Organisation and Work study / productivity survey
(see Note 2 below)
Preparation for the survey / study Dir Corporate Services and Manager HR
Preparation study completed By Oct 2013
Undertake the survey / study over an extended period
Dir Corporate Services and Manager HR
Survey / study completed By Jul 2016 depending on funding
Amend organisational structure according to study if necessary
Manager HR Amended structure approved by council
Upon completion of above study
3.1
3.23.2
3.1
3.1
3.2
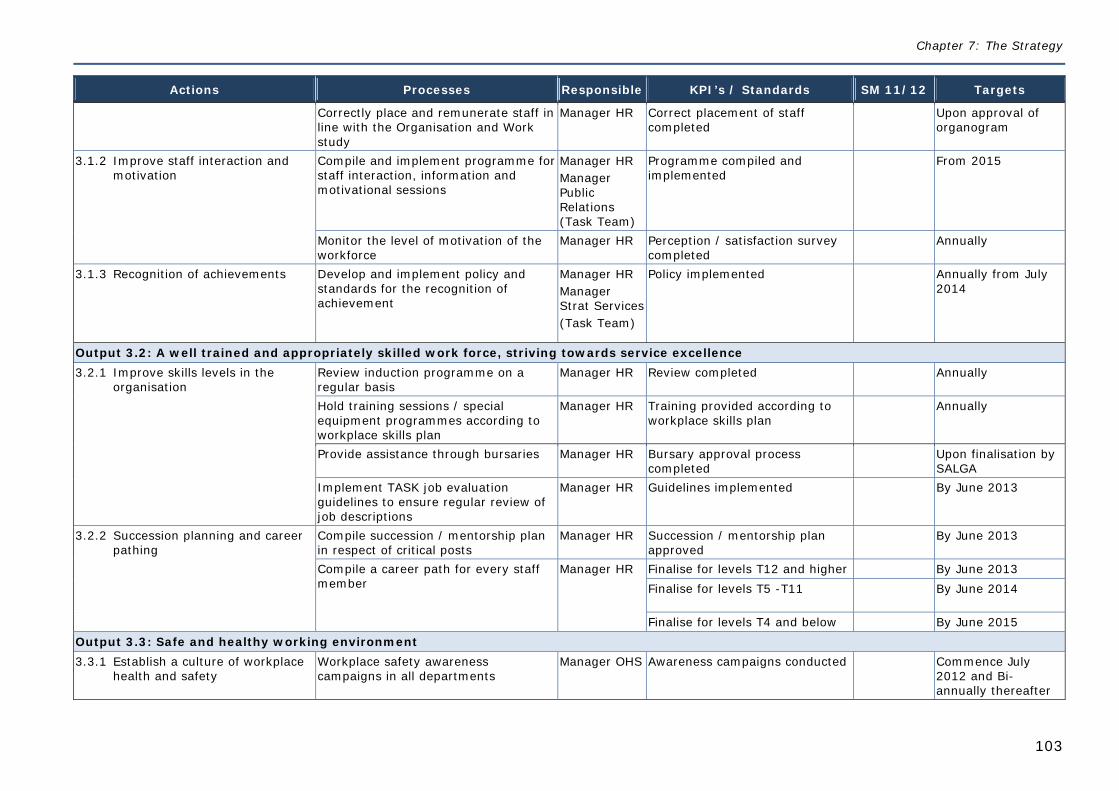
Chapter 7: The Strategy
103
Actions Processes Responsible KPI’s / Standards SM 11/12 Targets
Correctly place and remunerate staff in line with the Organisation and Work study
Manager HR Correct placement of staff completed
Upon approval of organogram
3.1.2 Improve staff interaction and motivation
Compile and implement programme for staff interaction, information and motivational sessions
Manager HR Manager Public Relations (Task Team)
Programme compiled and implemented
From 2015
Monitor the level of motivation of the workforce
Manager HR Perception / satisfaction survey completed
Annually
3.1.3 Recognition of achievements Develop and implement policy and standards for the recognition of achievement
Manager HR Manager Strat Services (Task Team)
Policy implemented Annually from July 2014
Output 3.2: A well trained and appropriately skilled work force, striving towards service excellence 3.2.1 Improve skills levels in the
organisation Review induction programme on a regular basis
Manager HR Review completed Annually
Hold training sessions / special equipment programmes according to workplace skills plan
Manager HR Training provided according to workplace skills plan
Annually
Provide assistance through bursaries Manager HR Bursary approval process completed
Upon finalisation by SALGA
Implement TASK job evaluation guidelines to ensure regular review of job descriptions
Manager HR Guidelines implemented By June 2013
3.2.2 Succession planning and career pathing
Compile succession / mentorship plan in respect of critical posts
Manager HR Succession / mentorship plan approved
By June 2013
Compile a career path for every staff member
Manager HR Finalise for levels T12 and higher By June 2013 Finalise for levels T5 -T11 By June 2014
Finalise for levels T4 and below By June 2015 Output 3.3: Safe and healthy working environment 3.3.1 Establish a culture of workplace
health and safety Workplace safety awareness campaigns in all departments
Manager OHS Awareness campaigns conducted Commence July 2012 and Bi-annually thereafter
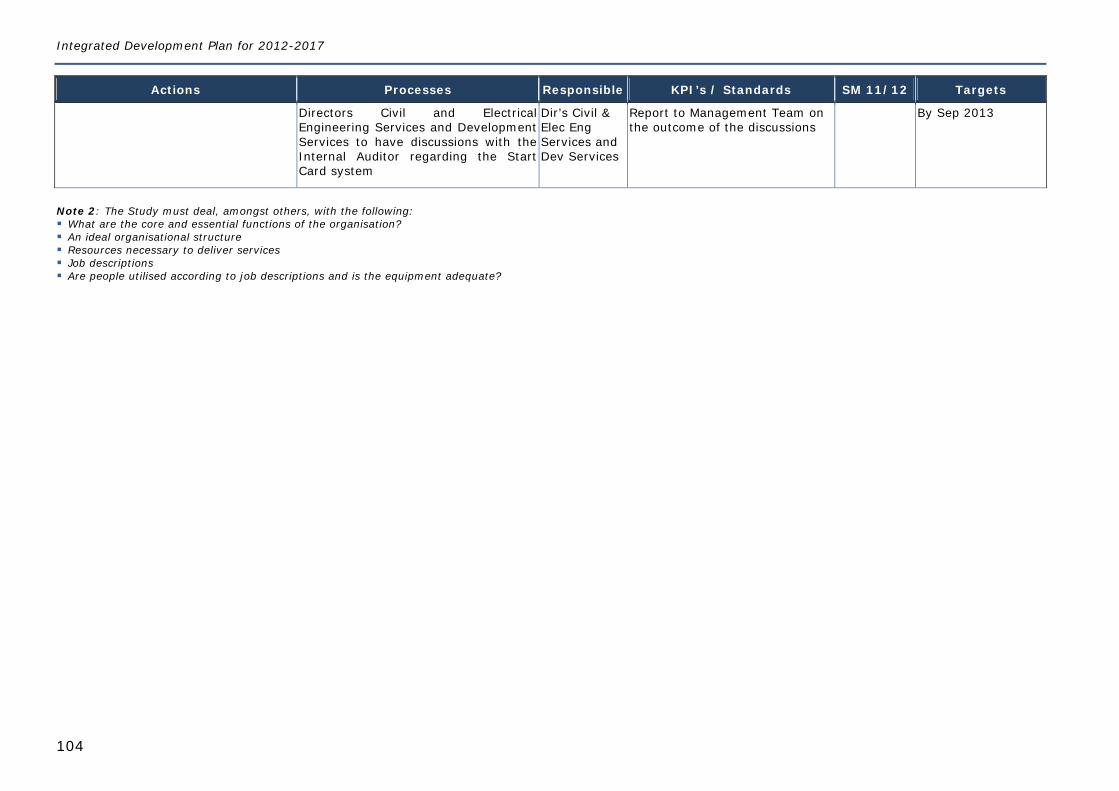
Integrated Development Plan for 2012-2017
104
Actions Processes Responsible KPI’s / Standards SM 11/12 Targets
Directors Civil and Electrical Engineering Services and Development Services to have discussions with the Internal Auditor regarding the Start Card system
Dir’s Civil & Elec Eng Services and Dev Services
Report to Management Team on the outcome of the discussions
By Sep 2013
Note 2: The Study must deal, amongst others, with the following: What are the core and essential functions of the organisation? An ideal organisational structure Resources necessary to deliver services Job descriptions Are people utilised according to job descriptions and is the equipment adequate?
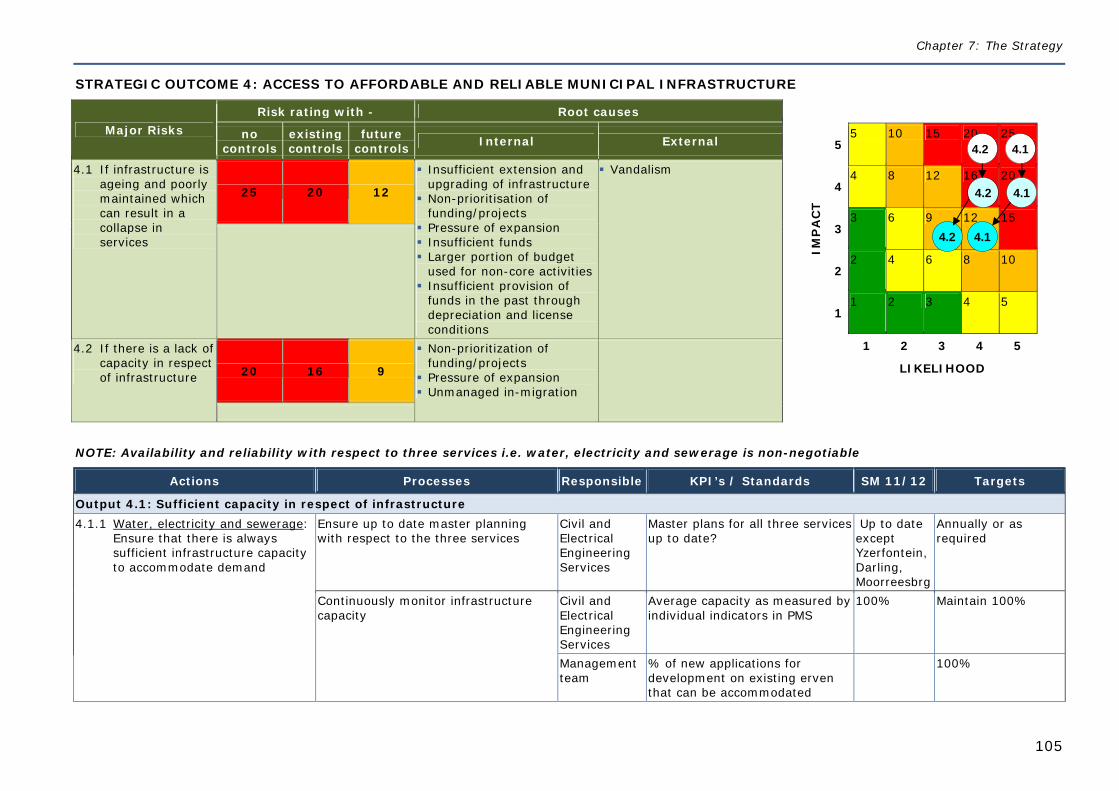
Chapter 7: The Strategy
105
STRATEGIC OUTCOME 4: ACCESS TO AFFORDABLE AND RELIABLE MUNICIPAL INFRASTRUCTURE
Major Risks Risk rating with - Root causes
IMP
AC
T
5 5 10 15 20 25
4 4 8 12 16 20
3 3 6 9 12 15
2 2 4 6 8 10
1 1 2 3 4 5
1 2 3 4 5
LIKELIHOOD
no controls
existing controls
future controls Internal External
4.1 If infrastructure is ageing and poorly maintained which can result in a collapse in services
25 20 12
Insufficient extension and upgrading of infrastructure
Non-prioritisation of funding/projects
Pressure of expansion Insufficient funds Larger portion of budget
used for non-core activities Insufficient provision of
funds in the past through depreciation and license conditions
Vandalism
4.2 If there is a lack of capacity in respect of infrastructure 20 16 9
Non-prioritization of funding/projects
Pressure of expansion Unmanaged in-migration
NOTE: Availability and reliability with respect to three services i.e. water, electricity and sewerage is non-negotiable
Actions Processes Responsible KPI’s / Standards SM 11/12 Targets
Output 4.1: Sufficient capacity in respect of infrastructure 4.1.1 Water, electricity and sewerage:
Ensure that there is always sufficient infrastructure capacity to accommodate demand
Ensure up to date master planning with respect to the three services
Civil and Electrical Engineering Services
Master plans for all three services up to date?
Up to date except Yzerfontein, Darling, Moorreesbrg
Annually or as required
Continuously monitor infrastructure capacity
Civil and Electrical Engineering Services
Average capacity as measured by individual indicators in PMS
100% Maintain 100%
Management team
% of new applications for development on existing erven that can be accommodated
100%
4.2 4.1
4.2 4.1
4.1 4.2
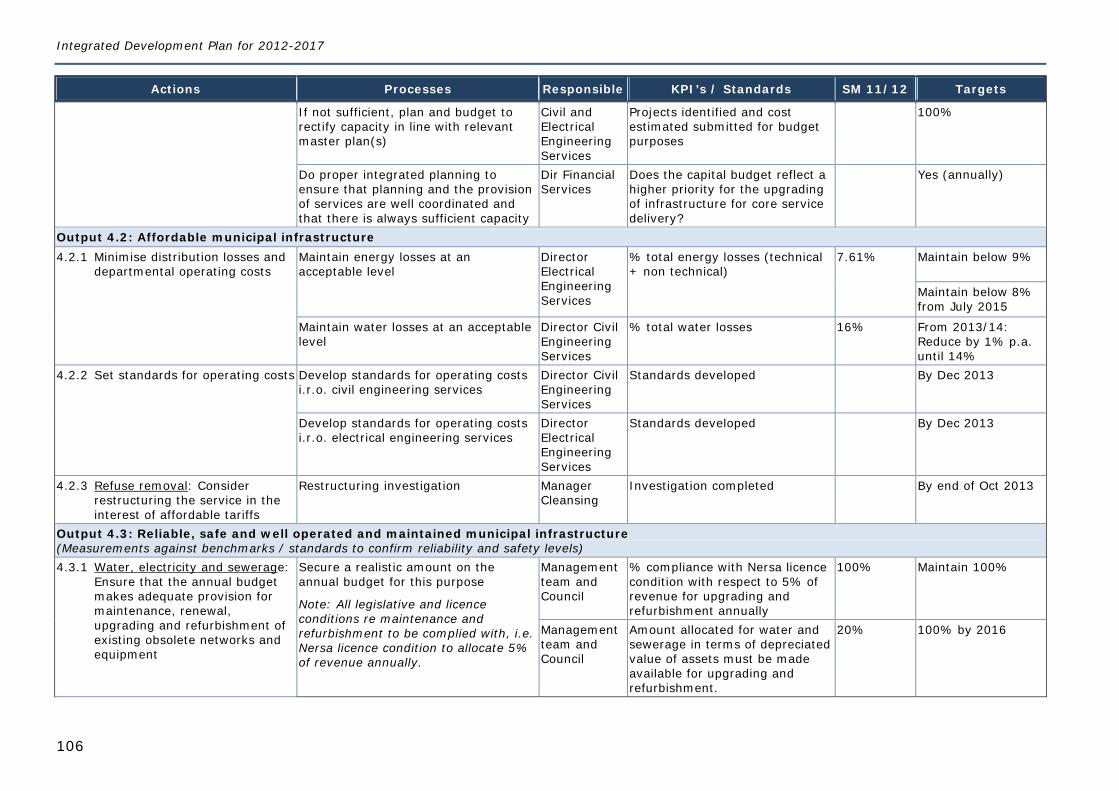
Integrated Development Plan for 2012-2017
106
Actions Processes Responsible KPI’s / Standards SM 11/12 Targets
If not sufficient, plan and budget to rectify capacity in line with relevant master plan(s)
Civil and Electrical Engineering Services
Projects identified and cost estimated submitted for budget purposes
100%
Do proper integrated planning to ensure that planning and the provision of services are well coordinated and that there is always sufficient capacity
Dir Financial Services
Does the capital budget reflect a higher priority for the upgrading of infrastructure for core service delivery?
Yes (annually)
Output 4.2: Affordable municipal infrastructure 4.2.1 Minimise distribution losses and
departmental operating costs Maintain energy losses at an acceptable level
Director Electrical Engineering Services
% total energy losses (technical + non technical)
7.61% Maintain below 9%
Maintain below 8% from July 2015
Maintain water losses at an acceptable level
Director Civil Engineering Services
% total water losses 16% From 2013/14: Reduce by 1% p.a. until 14%
4.2.2 Set standards for operating costs Develop standards for operating costs i.r.o. civil engineering services
Director Civil Engineering Services
Standards developed By Dec 2013
Develop standards for operating costs i.r.o. electrical engineering services
Director Electrical Engineering Services
Standards developed By Dec 2013
4.2.3 Refuse removal: Consider restructuring the service in the interest of affordable tariffs
Restructuring investigation Manager Cleansing
Investigation completed By end of Oct 2013
Output 4.3: Reliable, safe and well operated and maintained municipal infrastructure (Measurements against benchmarks / standards to confirm reliability and safety levels) 4.3.1 Water, electricity and sewerage:
Ensure that the annual budget makes adequate provision for maintenance, renewal, upgrading and refurbishment of existing obsolete networks and equipment
Secure a realistic amount on the annual budget for this purpose
Note: All legislative and licence conditions re maintenance and refurbishment to be complied with, i.e. Nersa licence condition to allocate 5% of revenue annually.
Management team and Council
% compliance with Nersa licence condition with respect to 5% of revenue for upgrading and refurbishment annually
100% Maintain 100%
Management team and Council
Amount allocated for water and sewerage in terms of depreciated value of assets must be made available for upgrading and refurbishment.
20% 100% by 2016
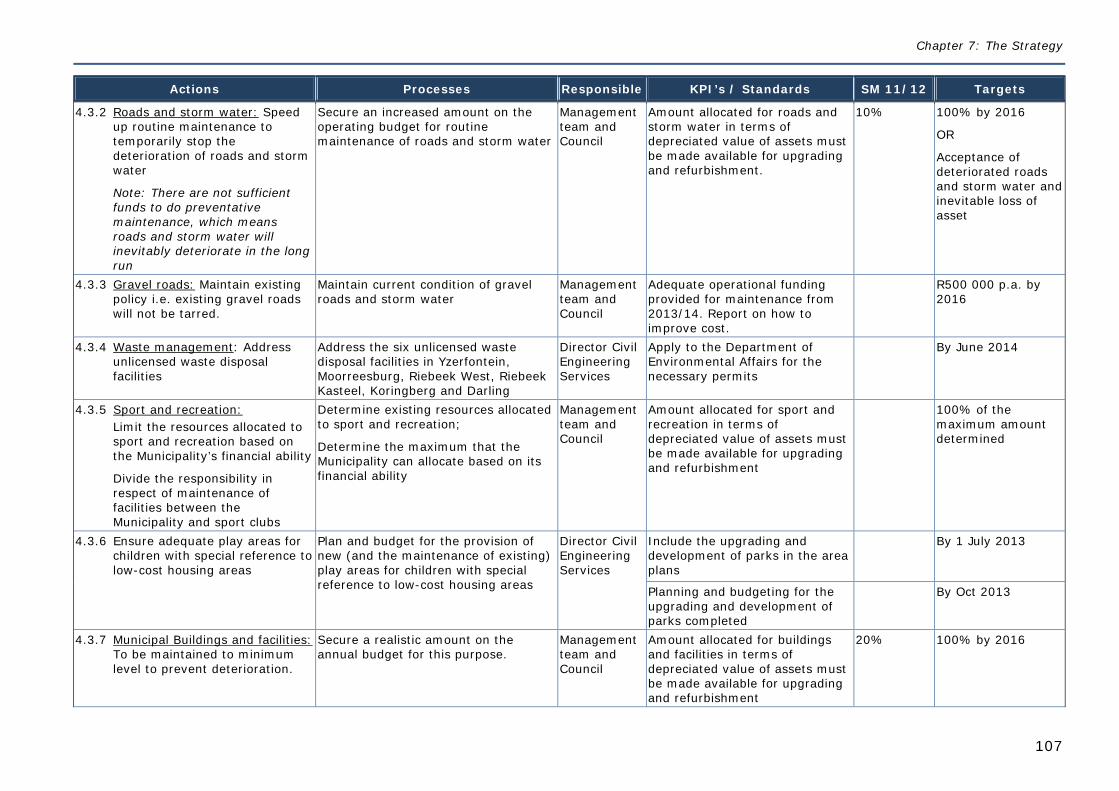
Chapter 7: The Strategy
107
Actions Processes Responsible KPI’s / Standards SM 11/12 Targets
4.3.2 Roads and storm water: Speed up routine maintenance to temporarily stop the deterioration of roads and storm water
Note: There are not sufficient funds to do preventative maintenance, which means roads and storm water will inevitably deteriorate in the long run
Secure an increased amount on the operating budget for routine maintenance of roads and storm water
Management team and Council
Amount allocated for roads and storm water in terms of depreciated value of assets must be made available for upgrading and refurbishment.
10% 100% by 2016
OR
Acceptance of deteriorated roads and storm water and inevitable loss of asset
4.3.3 Gravel roads: Maintain existing policy i.e. existing gravel roads will not be tarred.
Maintain current condition of gravel roads and storm water
Management team and Council
Adequate operational funding provided for maintenance from 2013/14. Report on how to improve cost.
R500 000 p.a. by 2016
4.3.4 Waste management: Address unlicensed waste disposal facilities
Address the six unlicensed waste disposal facilities in Yzerfontein, Moorreesburg, Riebeek West, Riebeek Kasteel, Koringberg and Darling
Director Civil Engineering Services
Apply to the Department of Environmental Affairs for the necessary permits
By June 2014
4.3.5 Sport and recreation: Limit the resources allocated to sport and recreation based on the Municipality’s financial ability
Divide the responsibility in respect of maintenance of facilities between the Municipality and sport clubs
Determine existing resources allocated to sport and recreation;
Determine the maximum that the Municipality can allocate based on its financial ability
Management team and Council
Amount allocated for sport and recreation in terms of depreciated value of assets must be made available for upgrading and refurbishment
100% of the maximum amount determined
4.3.6 Ensure adequate play areas for children with special reference to low-cost housing areas
Plan and budget for the provision of new (and the maintenance of existing) play areas for children with special reference to low-cost housing areas
Director Civil Engineering Services
Include the upgrading and development of parks in the area plans
By 1 July 2013
Planning and budgeting for the upgrading and development of parks completed
By Oct 2013
4.3.7 Municipal Buildings and facilities: To be maintained to minimum level to prevent deterioration.
Secure a realistic amount on the annual budget for this purpose.
Management team and Council
Amount allocated for buildings and facilities in terms of depreciated value of assets must be made available for upgrading and refurbishment
20% 100% by 2016
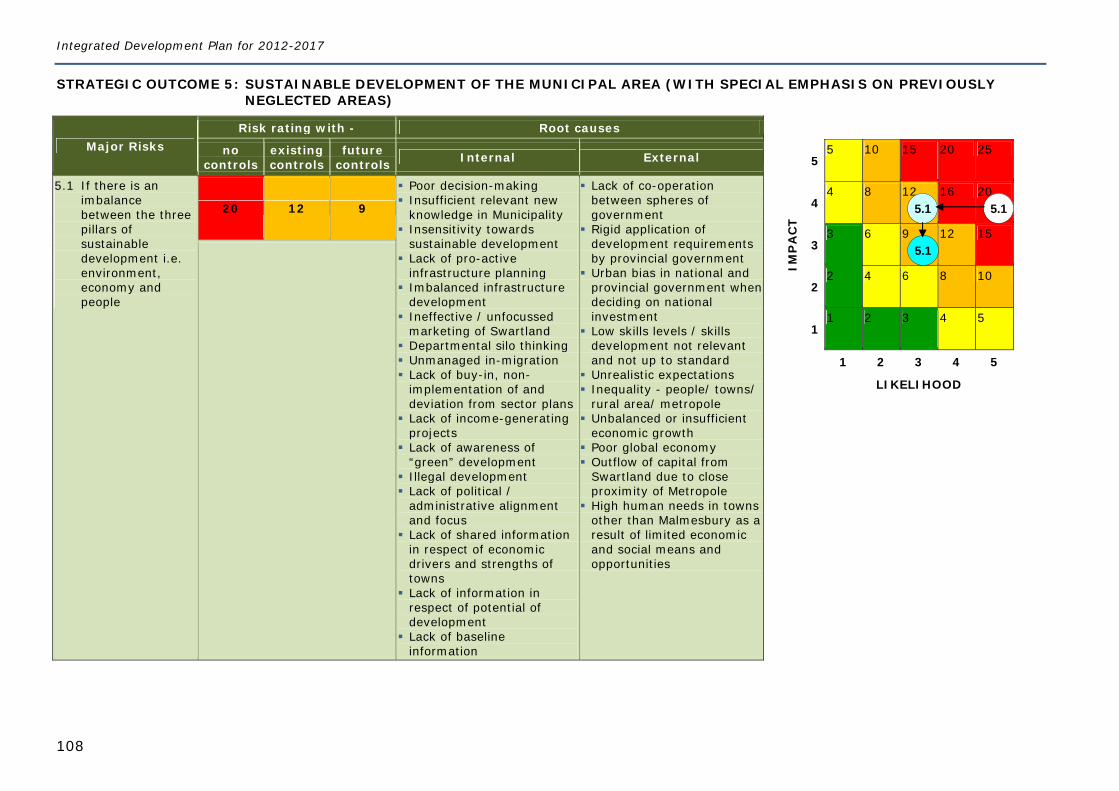
Integrated Development Plan for 2012-2017
108
STRATEGIC OUTCOME 5: SUSTAINABLE DEVELOPMENT OF THE MUNICIPAL AREA (WITH SPECIAL EMPHASIS ON PREVIOUSLY NEGLECTED AREAS)
Major Risks Risk rating with - Root causes
IMP
AC
T
5 5 10 15 20 25
4 4 8 12 16 20
3 3 6 9 12 15
2 2 4 6 8 10
1 1 2 3 4 5
1 2 3 4 5
LIKELIHOOD
no controls
existing controls
future controls Internal External
5.1 If there is an imbalance between the three pillars of sustainable development i.e. environment, economy and people
20 12 9
Poor decision-making Insufficient relevant new
knowledge in Municipality Insensitivity towards
sustainable development Lack of pro-active
infrastructure planning Imbalanced infrastructure
development Ineffective / unfocussed
marketing of Swartland Departmental silo thinking Unmanaged in-migration Lack of buy-in, non-
implementation of and deviation from sector plans
Lack of income-generating projects
Lack of awareness of “green” development
Illegal development Lack of political /
administrative alignment and focus
Lack of shared information in respect of economic drivers and strengths of towns
Lack of information in respect of potential of development
Lack of baseline information
Lack of co-operation between spheres of government
Rigid application of development requirements by provincial government
Urban bias in national and provincial government when deciding on national investment
Low skills levels / skills development not relevant and not up to standard
Unrealistic expectations Inequality - people/ towns/
rural area/ metropole Unbalanced or insufficient
economic growth Poor global economy Outflow of capital from
Swartland due to close proximity of Metropole
High human needs in towns other than Malmesbury as a result of limited economic and social means and opportunities
5.1 5.1
5.1
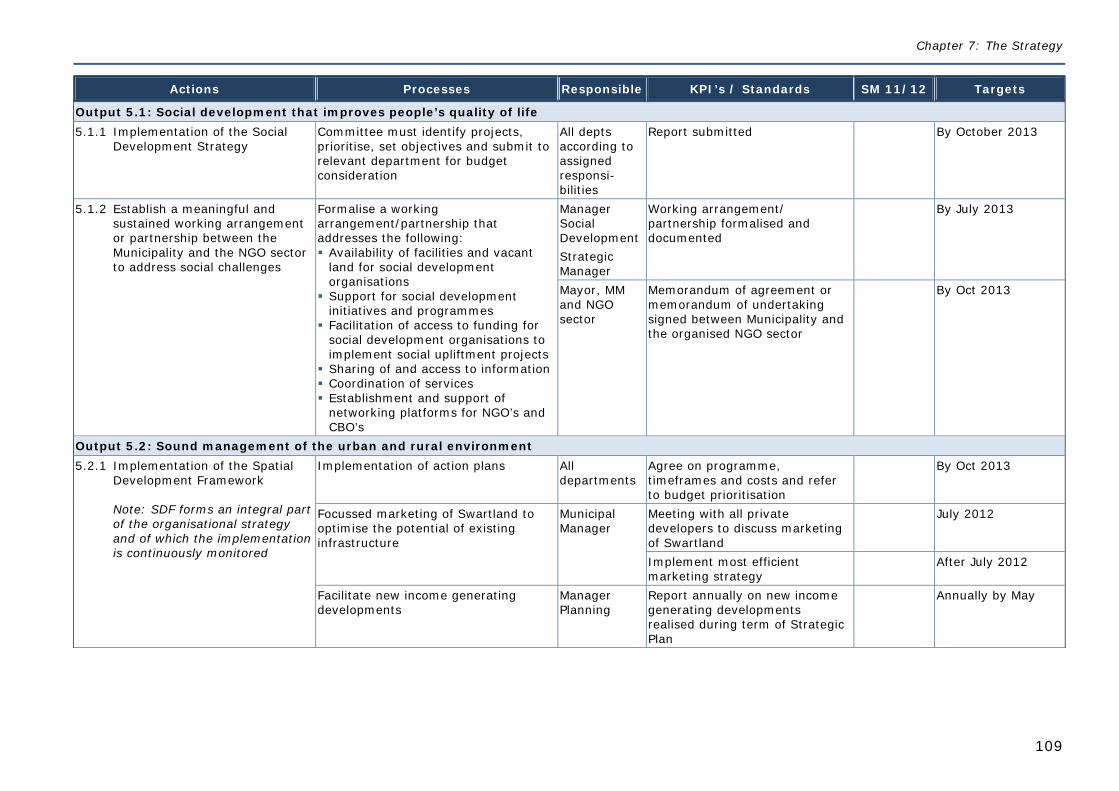
Chapter 7: The Strategy
109
Actions Processes Responsible KPI’s / Standards SM 11/12 Targets
Output 5.1: Social development that improves people’s quality of life 5.1.1 Implementation of the Social
Development Strategy Committee must identify projects, prioritise, set objectives and submit to relevant department for budget consideration
All depts according to assigned responsi-bilities
Report submitted By October 2013
5.1.2 Establish a meaningful and sustained working arrangement or partnership between the Municipality and the NGO sector to address social challenges
Formalise a working arrangement/partnership that addresses the following: Availability of facilities and vacant
land for social development organisations
Support for social development initiatives and programmes
Facilitation of access to funding for social development organisations to implement social upliftment projects
Sharing of and access to information Coordination of services Establishment and support of
networking platforms for NGO’s and CBO’s
Manager Social Development Strategic Manager
Working arrangement/ partnership formalised and documented
By July 2013
Mayor, MM and NGO sector
Memorandum of agreement or memorandum of undertaking signed between Municipality and the organised NGO sector
By Oct 2013
Output 5.2: Sound management of the urban and rural environment 5.2.1 Implementation of the Spatial
Development Framework Note: SDF forms an integral part
of the organisational strategy and of which the implementation is continuously monitored
Implementation of action plans All departments
Agree on programme, timeframes and costs and refer to budget prioritisation
By Oct 2013
Focussed marketing of Swartland to optimise the potential of existing infrastructure
Municipal Manager
Meeting with all private developers to discuss marketing of Swartland
July 2012
Implement most efficient marketing strategy
After July 2012
Facilitate new income generating developments
Manager Planning
Report annually on new income generating developments realised during term of Strategic Plan
Annually by May
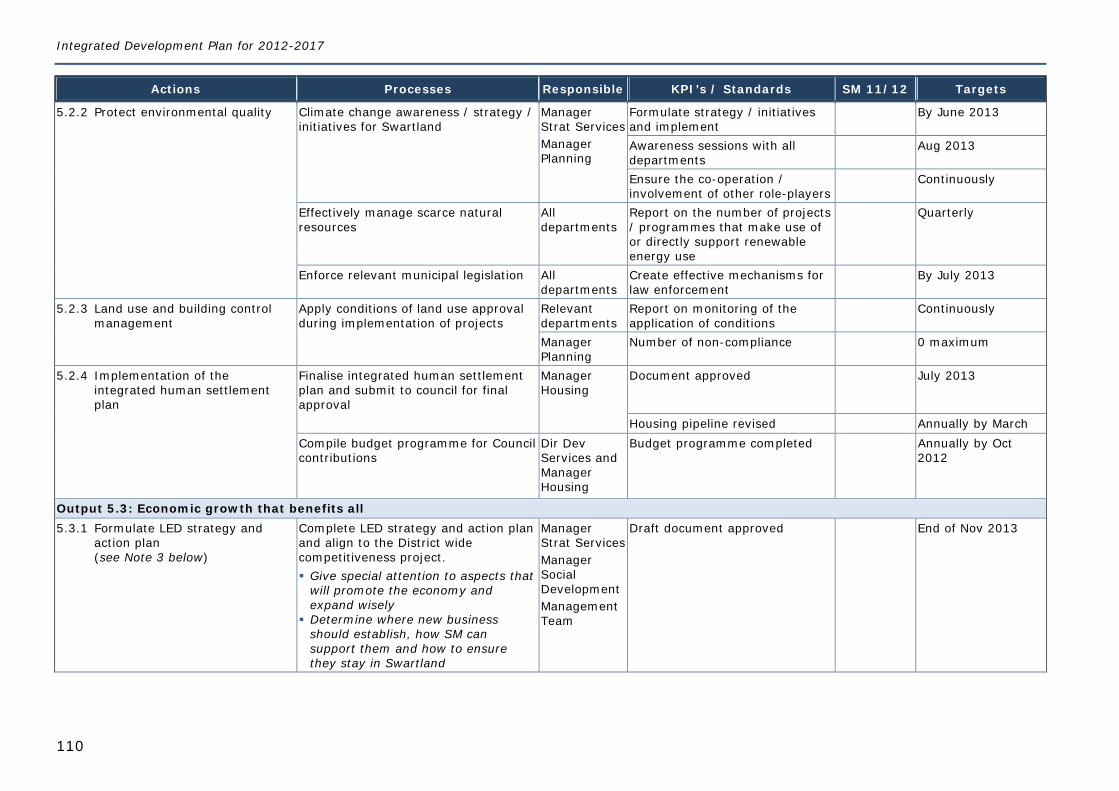
Integrated Development Plan for 2012-2017
110
Actions Processes Responsible KPI’s / Standards SM 11/12 Targets
5.2.2 Protect environmental quality Climate change awareness / strategy / initiatives for Swartland
Manager Strat Services Manager Planning
Formulate strategy / initiatives and implement
By June 2013
Awareness sessions with all departments
Aug 2013
Ensure the co-operation / involvement of other role-players
Continuously
Effectively manage scarce natural resources
All departments
Report on the number of projects / programmes that make use of or directly support renewable energy use
Quarterly
Enforce relevant municipal legislation All departments
Create effective mechanisms for law enforcement
By July 2013
5.2.3 Land use and building control management
Apply conditions of land use approval during implementation of projects
Relevant departments
Report on monitoring of the application of conditions
Continuously
Manager Planning
Number of non-compliance 0 maximum
5.2.4 Implementation of the integrated human settlement plan
Finalise integrated human settlement plan and submit to council for final approval
Manager Housing
Document approved July 2013
Housing pipeline revised Annually by March Compile budget programme for Council
contributions Dir Dev Services and Manager Housing
Budget programme completed Annually by Oct 2012
Output 5.3: Economic growth that benefits all 5.3.1 Formulate LED strategy and
action plan (see Note 3 below)
Complete LED strategy and action plan and align to the District wide competitiveness project. Give special attention to aspects that
will promote the economy and expand wisely
Determine where new business should establish, how SM can support them and how to ensure they stay in Swartland
Manager Strat Services Manager Social Development Management Team
Draft document approved End of Nov 2013
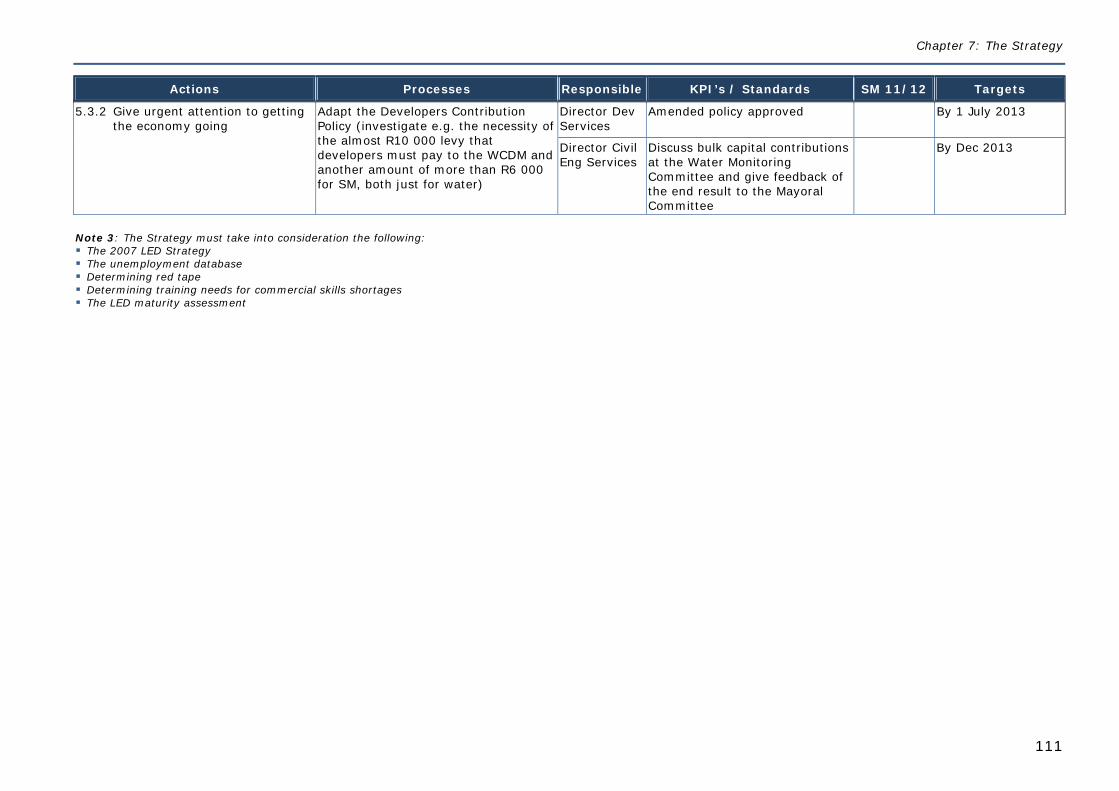
Chapter 7: The Strategy
111
Actions Processes Responsible KPI’s / Standards SM 11/12 Targets
5.3.2 Give urgent attention to getting the economy going
Adapt the Developers Contribution Policy (investigate e.g. the necessity of the almost R10 000 levy that developers must pay to the WCDM and another amount of more than R6 000 for SM, both just for water)
Director Dev Services
Amended policy approved By 1 July 2013
Director Civil Eng Services
Discuss bulk capital contributions at the Water Monitoring Committee and give feedback of the end result to the Mayoral Committee
By Dec 2013
Note 3: The Strategy must take into consideration the following: The 2007 LED Strategy The unemployment database Determining red tape Determining training needs for commercial skills shortages The LED maturity assessment
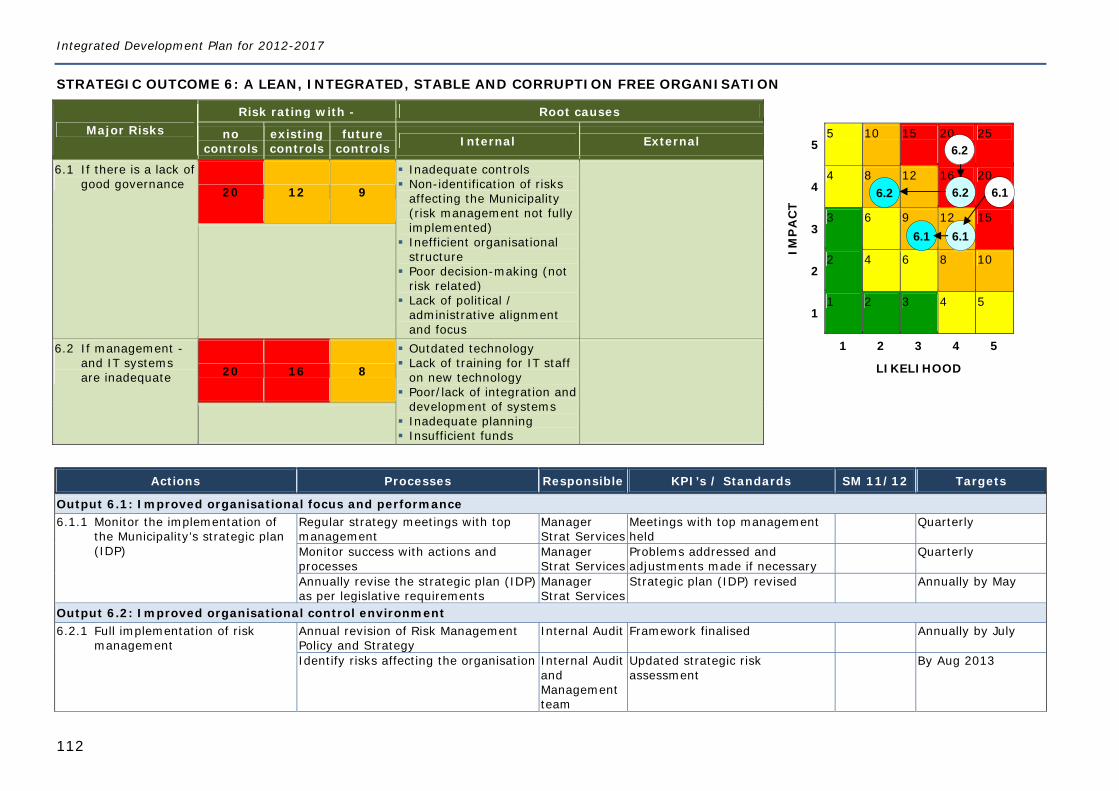
Integrated Development Plan for 2012-2017
112
STRATEGIC OUTCOME 6: A LEAN, INTEGRATED, STABLE AND CORRUPTION FREE ORGANISATION
Major Risks Risk rating with - Root causes
IMP
AC
T
5 5 10 15 20 25
4 4 8 12 16 20
3 3 6 9 12 15
2 2 4 6 8 10
1 1 2 3 4 5
1 2 3 4 5
LIKELIHOOD
no controls
existing controls
future controls Internal External
6.1 If there is a lack of good governance
20 12 9
Inadequate controls Non-identification of risks
affecting the Municipality (risk management not fully implemented)
Inefficient organisational structure
Poor decision-making (not risk related)
Lack of political / administrative alignment and focus
6.2 If management - and IT systems are inadequate 20 16 8
Outdated technology Lack of training for IT staff
on new technology Poor/lack of integration and
development of systems Inadequate planning Insufficient funds
Actions Processes Responsible KPI’s / Standards SM 11/12 Targets
Output 6.1: Improved organisational focus and performance 6.1.1 Monitor the implementation of
the Municipality’s strategic plan (IDP)
Regular strategy meetings with top management
Manager Strat Services
Meetings with top management held
Quarterly
Monitor success with actions and processes
Manager Strat Services
Problems addressed and adjustments made if necessary
Quarterly
Annually revise the strategic plan (IDP) as per legislative requirements
Manager Strat Services
Strategic plan (IDP) revised Annually by May
Output 6.2: Improved organisational control environment 6.2.1 Full implementation of risk
management Annual revision of Risk Management Policy and Strategy
Internal Audit Framework finalised Annually by July
Identify risks affecting the organisation Internal Audit and Management team
Updated strategic risk assessment
By Aug 2013
6.1
6.2
6.26.2
6.16.1
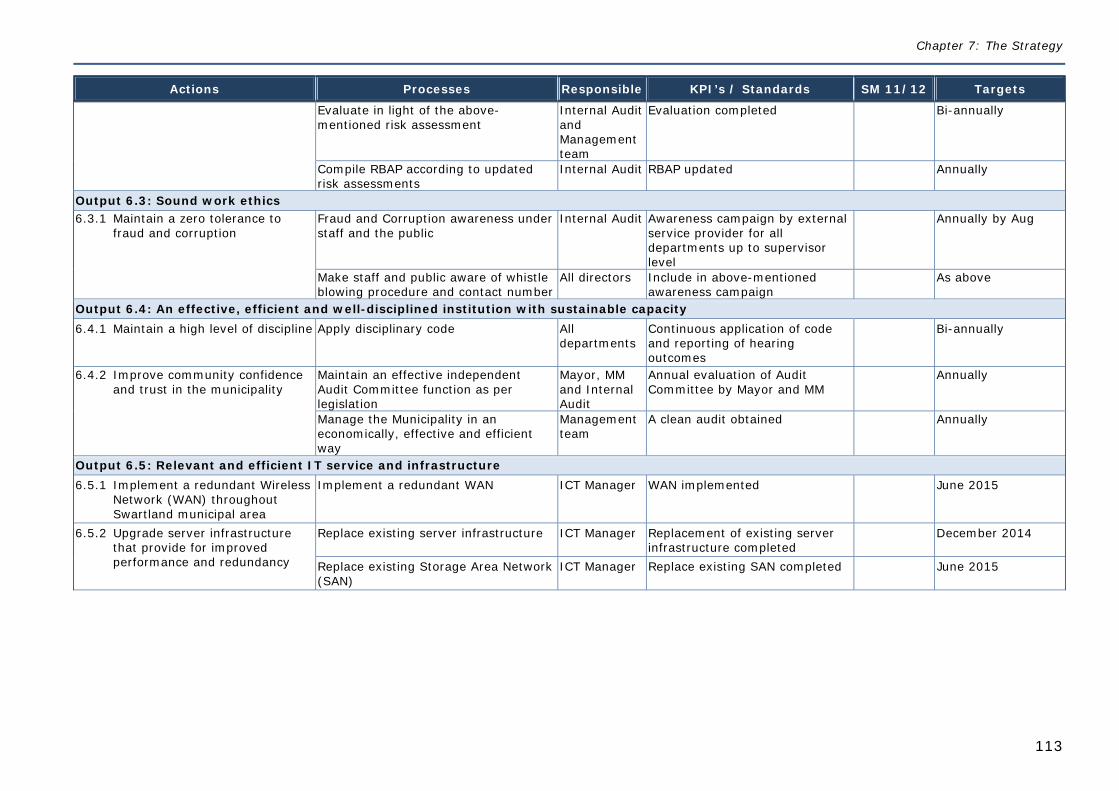
Chapter 7: The Strategy
113
Actions Processes Responsible KPI’s / Standards SM 11/12 Targets
Evaluate in light of the above-mentioned risk assessment
Internal Audit and Management team
Evaluation completed Bi-annually
Compile RBAP according to updated risk assessments
Internal Audit RBAP updated Annually
Output 6.3: Sound work ethics 6.3.1 Maintain a zero tolerance to
fraud and corruption Fraud and Corruption awareness under staff and the public
Internal Audit Awareness campaign by external service provider for all departments up to supervisor level
Annually by Aug
Make staff and public aware of whistle blowing procedure and contact number
All directors Include in above-mentioned awareness campaign
As above
Output 6.4: An effective, efficient and well-disciplined institution with sustainable capacity 6.4.1 Maintain a high level of discipline Apply disciplinary code All
departments Continuous application of code and reporting of hearing outcomes
Bi-annually
6.4.2 Improve community confidence and trust in the municipality
Maintain an effective independent Audit Committee function as per legislation
Mayor, MM and Internal Audit
Annual evaluation of Audit Committee by Mayor and MM
Annually
Manage the Municipality in an economically, effective and efficient way
Management team
A clean audit obtained Annually
Output 6.5: Relevant and efficient IT service and infrastructure 6.5.1 Implement a redundant Wireless
Network (WAN) throughout Swartland municipal area
Implement a redundant WAN ICT Manager WAN implemented June 2015
6.5.2 Upgrade server infrastructure that provide for improved performance and redundancy
Replace existing server infrastructure ICT Manager Replacement of existing server infrastructure completed
December 2014
Replace existing Storage Area Network (SAN)
ICT Manager Replace existing SAN completed June 2015
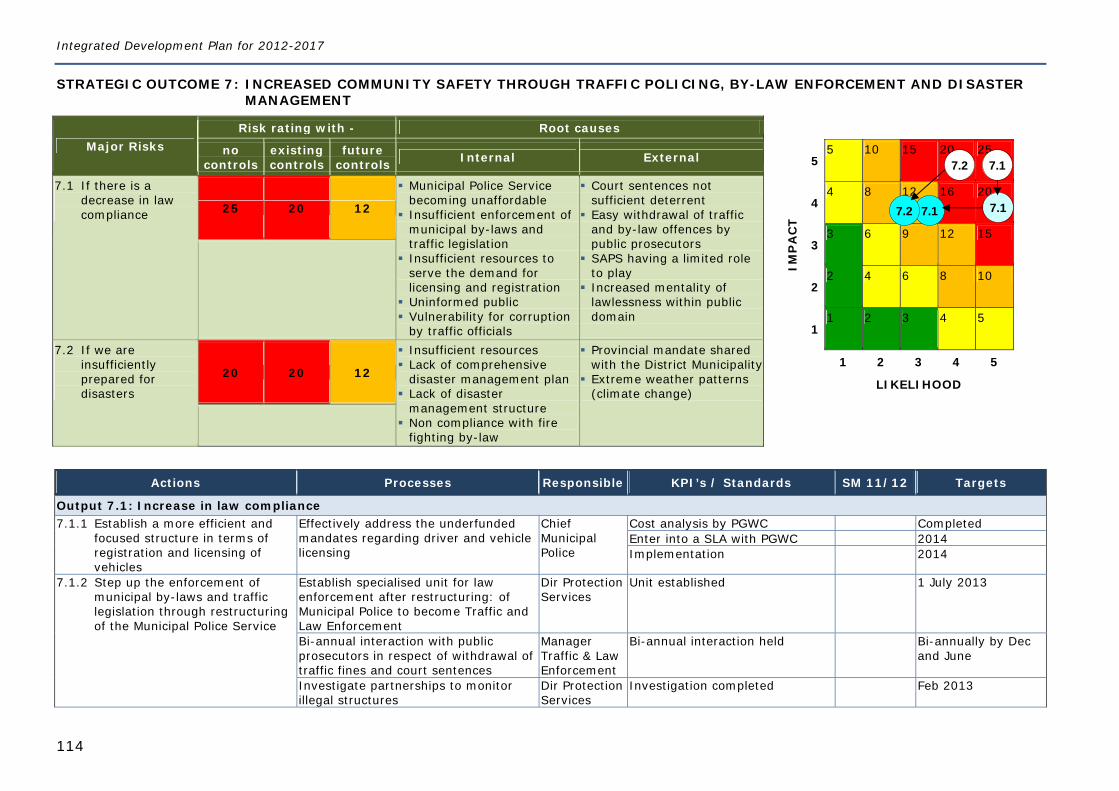
Integrated Development Plan for 2012-2017
114
STRATEGIC OUTCOME 7: INCREASED COMMUNITY SAFETY THROUGH TRAFFIC POLICING, BY-LAW ENFORCEMENT AND DISASTER MANAGEMENT
Major Risks Risk rating with - Root causes
IMP
AC
T
5 5 10 15 20 25
4 4 8 12 16 20
3 3 6 9 12 15
2 2 4 6 8 10
1 1 2 3 4 5
1 2 3 4 5
LIKELIHOOD
no controls
existing controls
future controls Internal External
7.1 If there is a decrease in law compliance 25 20 12
Municipal Police Service becoming unaffordable
Insufficient enforcement of municipal by-laws and traffic legislation
Insufficient resources to serve the demand for licensing and registration
Uninformed public Vulnerability for corruption
by traffic officials
Court sentences not sufficient deterrent
Easy withdrawal of traffic and by-law offences by public prosecutors
SAPS having a limited role to play
Increased mentality of lawlessness within public domain
7.2 If we are insufficiently prepared for disasters
20 20 12
Insufficient resources Lack of comprehensive
disaster management plan Lack of disaster
management structure Non compliance with fire
fighting by-law
Provincial mandate shared with the District Municipality
Extreme weather patterns (climate change)
Actions Processes Responsible KPI’s / Standards SM 11/12 Targets
Output 7.1: Increase in law compliance 7.1.1 Establish a more efficient and
focused structure in terms of registration and licensing of vehicles
Effectively address the underfunded mandates regarding driver and vehicle licensing
Chief Municipal Police
Cost analysis by PGWC Completed Enter into a SLA with PGWC 2014 Implementation 2014
7.1.2 Step up the enforcement of municipal by-laws and traffic legislation through restructuring of the Municipal Police Service
Establish specialised unit for law enforcement after restructuring: of Municipal Police to become Traffic and Law Enforcement
Dir Protection Services
Unit established 1 July 2013
Bi-annual interaction with public prosecutors in respect of withdrawal of traffic fines and court sentences
Manager Traffic & Law Enforcement
Bi-annual interaction held Bi-annually by Dec and June
Investigate partnerships to monitor illegal structures
Dir Protection Services
Investigation completed Feb 2013
7.1 7.2
7.17.2 7.1
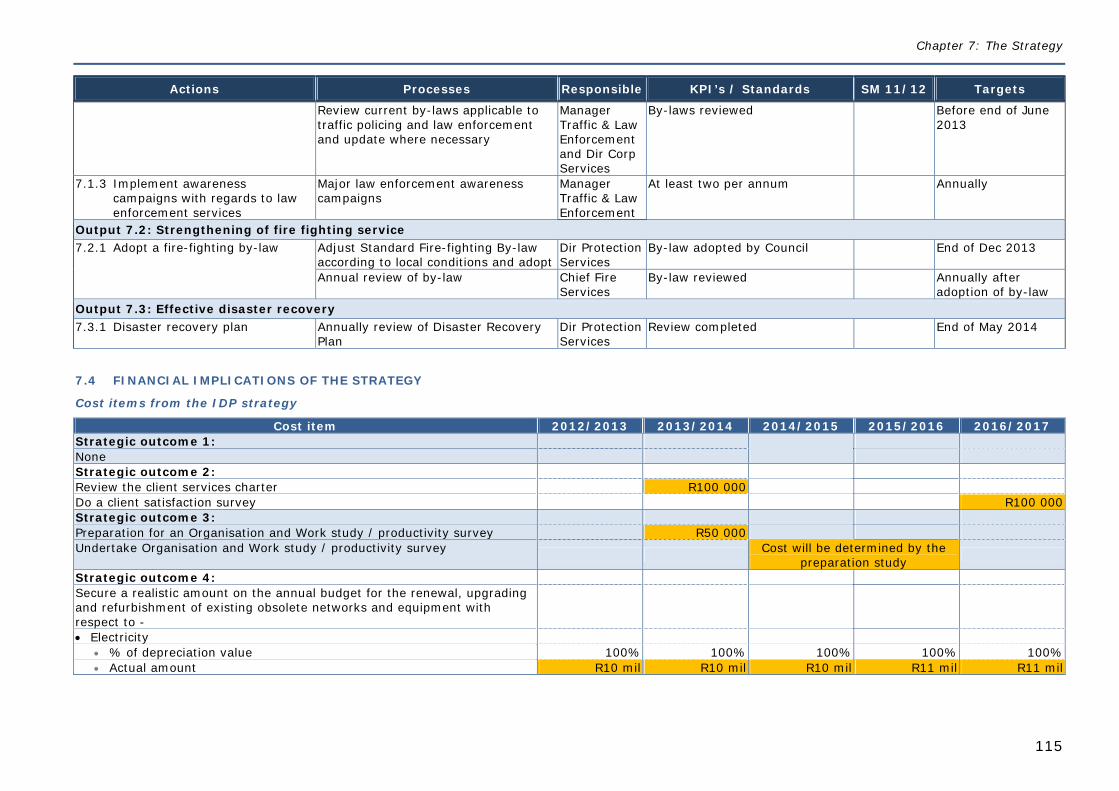
Chapter 7: The Strategy
115
Actions Processes Responsible KPI’s / Standards SM 11/12 Targets
Review current by-laws applicable to traffic policing and law enforcement and update where necessary
Manager Traffic & Law Enforcement and Dir Corp Services
By-laws reviewed Before end of June 2013
7.1.3 Implement awareness campaigns with regards to law enforcement services
Major law enforcement awareness campaigns
Manager Traffic & Law Enforcement
At least two per annum Annually
Output 7.2: Strengthening of fire fighting service 7.2.1 Adopt a fire-fighting by-law Adjust Standard Fire-fighting By-law
according to local conditions and adopt Dir Protection Services
By-law adopted by Council End of Dec 2013
Annual review of by-law Chief Fire Services
By-law reviewed Annually after adoption of by-law
Output 7.3: Effective disaster recovery 7.3.1 Disaster recovery plan Annually review of Disaster Recovery
Plan Dir Protection Services
Review completed End of May 2014
7.4 FINANCIAL IMPLICATIONS OF THE STRATEGY
Cost items from the IDP strategy
Cost item 2012/2013 2013/2014 2014/2015 2015/2016 2016/2017 Strategic outcome 1: None Strategic outcome 2: Review the client services charter R100 000 Do a client satisfaction survey R100 000 Strategic outcome 3: Preparation for an Organisation and Work study / productivity survey R50 000 Undertake Organisation and Work study / productivity survey Cost will be determined by the
preparation study
Strategic outcome 4: Secure a realistic amount on the annual budget for the renewal, upgrading and refurbishment of existing obsolete networks and equipment with respect to -
Electricity % of depreciation value 100% 100% 100% 100% 100% Actual amount R10 mil R10 mil R10 mil R11 mil R11 mil
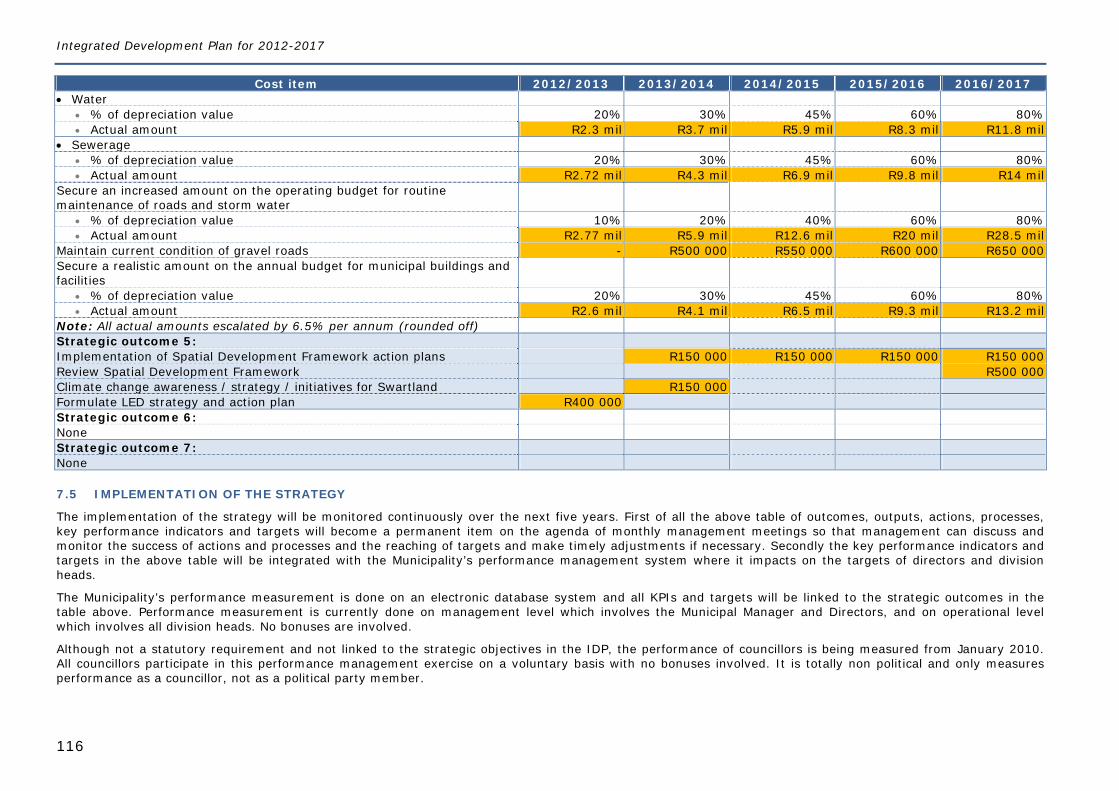
Integrated Development Plan for 2012-2017
116
Cost item 2012/2013 2013/2014 2014/2015 2015/2016 2016/2017 Water
% of depreciation value 20% 30% 45% 60% 80% Actual amount R2.3 mil R3.7 mil R5.9 mil R8.3 mil R11.8 mil
Sewerage % of depreciation value 20% 30% 45% 60% 80% Actual amount R2.72 mil R4.3 mil R6.9 mil R9.8 mil R14 mil
Secure an increased amount on the operating budget for routine maintenance of roads and storm water
% of depreciation value 10% 20% 40% 60% 80% Actual amount R2.77 mil R5.9 mil R12.6 mil R20 mil R28.5 mil
Maintain current condition of gravel roads - R500 000 R550 000 R600 000 R650 000 Secure a realistic amount on the annual budget for municipal buildings and facilities
% of depreciation value 20% 30% 45% 60% 80% Actual amount R2.6 mil R4.1 mil R6.5 mil R9.3 mil R13.2 mil
Note: All actual amounts escalated by 6.5% per annum (rounded off) Strategic outcome 5: Implementation of Spatial Development Framework action plans R150 000 R150 000 R150 000 R150 000 Review Spatial Development Framework R500 000 Climate change awareness / strategy / initiatives for Swartland R150 000 Formulate LED strategy and action plan R400 000 Strategic outcome 6: None Strategic outcome 7: None
7.5 IMPLEMENTATION OF THE STRATEGY
The implementation of the strategy will be monitored continuously over the next five years. First of all the above table of outcomes, outputs, actions, processes, key performance indicators and targets will become a permanent item on the agenda of monthly management meetings so that management can discuss and monitor the success of actions and processes and the reaching of targets and make timely adjustments if necessary. Secondly the key performance indicators and targets in the above table will be integrated with the Municipality’s performance management system where it impacts on the targets of directors and division heads.
The Municipality’s performance measurement is done on an electronic database system and all KPIs and targets will be linked to the strategic outcomes in the table above. Performance measurement is currently done on management level which involves the Municipal Manager and Directors, and on operational level which involves all division heads. No bonuses are involved.
Although not a statutory requirement and not linked to the strategic objectives in the IDP, the performance of councillors is being measured from January 2010. All councillors participate in this performance management exercise on a voluntary basis with no bonuses involved. It is totally non political and only measures performance as a councillor, not as a political party member.
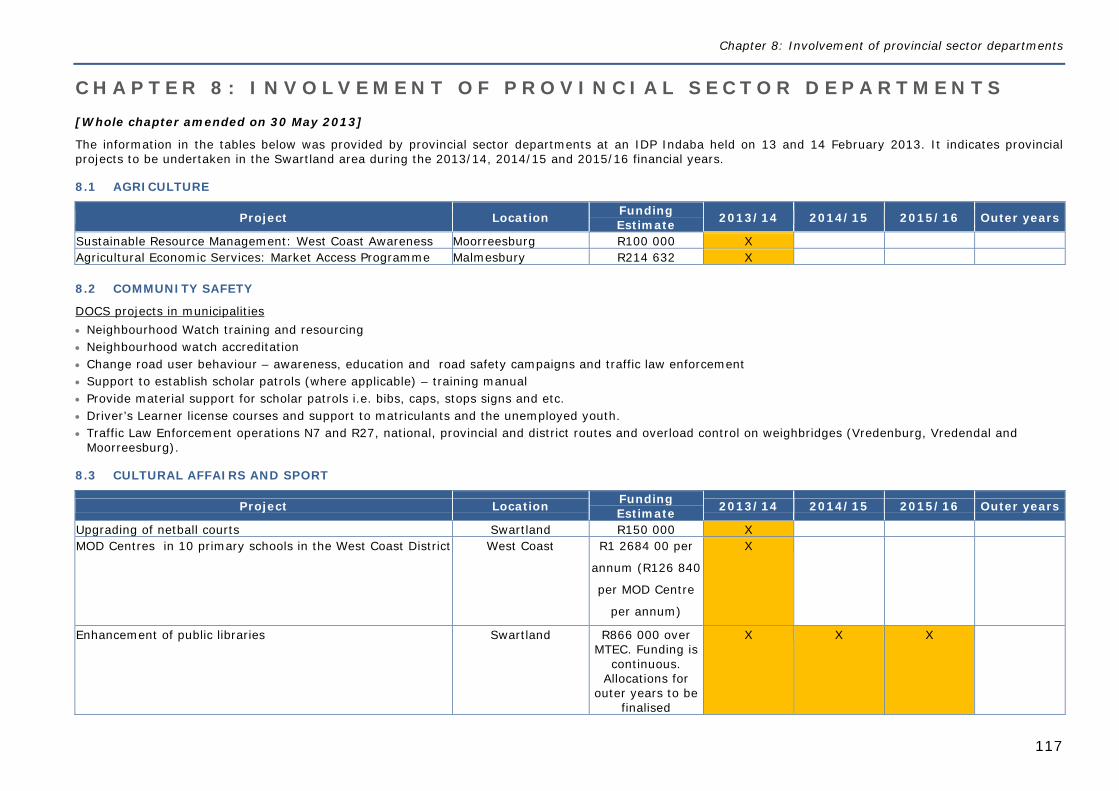
Chapter 8: Involvement of provincial sector departments
117
C H A P T E R 8 : I N V O L V E M E N T O F P R O V I N C I A L S E C T O R D E P A R T M E N T S [Whole chapter amended on 30 May 2013]
The information in the tables below was provided by provincial sector departments at an IDP Indaba held on 13 and 14 February 2013. It indicates provincial projects to be undertaken in the Swartland area during the 2013/14, 2014/15 and 2015/16 financial years.
8.1 AGRICULTURE
Project Location Funding Estimate 2013/14 2014/15 2015/16 Outer years
Sustainable Resource Management: West Coast Awareness Moorreesburg R100 000 X Agricultural Economic Services: Market Access Programme Malmesbury R214 632 X
8.2 COMMUNITY SAFETY
DOCS projects in municipalities Neighbourhood Watch training and resourcing Neighbourhood watch accreditation Change road user behaviour – awareness, education and road safety campaigns and traffic law enforcement Support to establish scholar patrols (where applicable) – training manual Provide material support for scholar patrols i.e. bibs, caps, stops signs and etc. Driver’s Learner license courses and support to matriculants and the unemployed youth. Traffic Law Enforcement operations N7 and R27, national, provincial and district routes and overload control on weighbridges (Vredenburg, Vredendal and
Moorreesburg).
8.3 CULTURAL AFFAIRS AND SPORT
Project Location Funding Estimate 2013/14 2014/15 2015/16 Outer years
Upgrading of netball courts Swartland R150 000 X MOD Centres in 10 primary schools in the West Coast District West Coast R1 2684 00 per
annum (R126 840
per MOD Centre
per annum)
X
Enhancement of public libraries Swartland R866 000 over MTEC. Funding is
continuous. Allocations for
outer years to be finalised
X X X
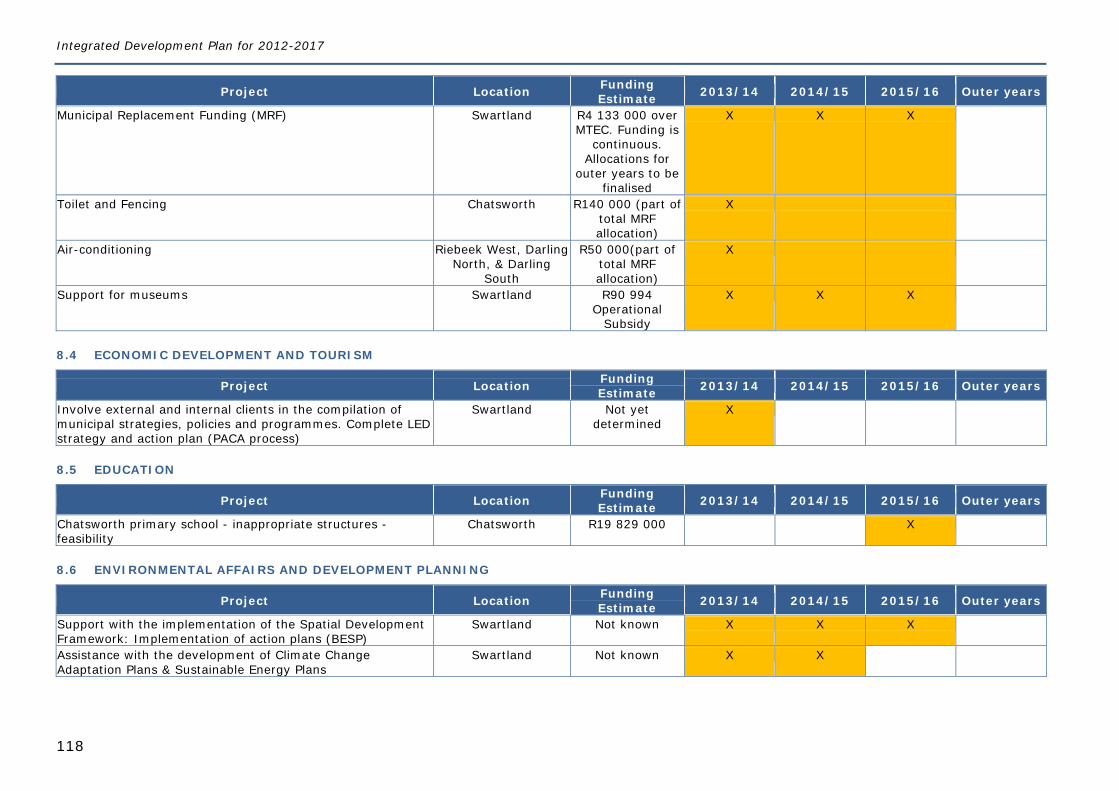
Integrated Development Plan for 2012-2017
118
Project Location Funding Estimate 2013/14 2014/15 2015/16 Outer years
Municipal Replacement Funding (MRF) Swartland R4 133 000 over MTEC. Funding is
continuous. Allocations for
outer years to be finalised
X X X
Toilet and Fencing Chatsworth R140 000 (part of total MRF allocation)
X
Air-conditioning Riebeek West, Darling North, & Darling
South
R50 000(part of total MRF allocation)
X
Support for museums Swartland R90 994 Operational
Subsidy
X X X
8.4 ECONOMIC DEVELOPMENT AND TOURISM
Project Location Funding Estimate 2013/14 2014/15 2015/16 Outer years
Involve external and internal clients in the compilation of municipal strategies, policies and programmes. Complete LED strategy and action plan (PACA process)
Swartland Not yet determined
X
8.5 EDUCATION
Project Location Funding Estimate 2013/14 2014/15 2015/16 Outer years
Chatsworth primary school - inappropriate structures - feasibility
Chatsworth R19 829 000 X
8.6 ENVIRONMENTAL AFFAIRS AND DEVELOPMENT PLANNING
Project Location Funding Estimate 2013/14 2014/15 2015/16 Outer years
Support with the implementation of the Spatial Development Framework: Implementation of action plans (BESP)
Swartland Not known X X X
Assistance with the development of Climate Change Adaptation Plans & Sustainable Energy Plans
Swartland Not known X X
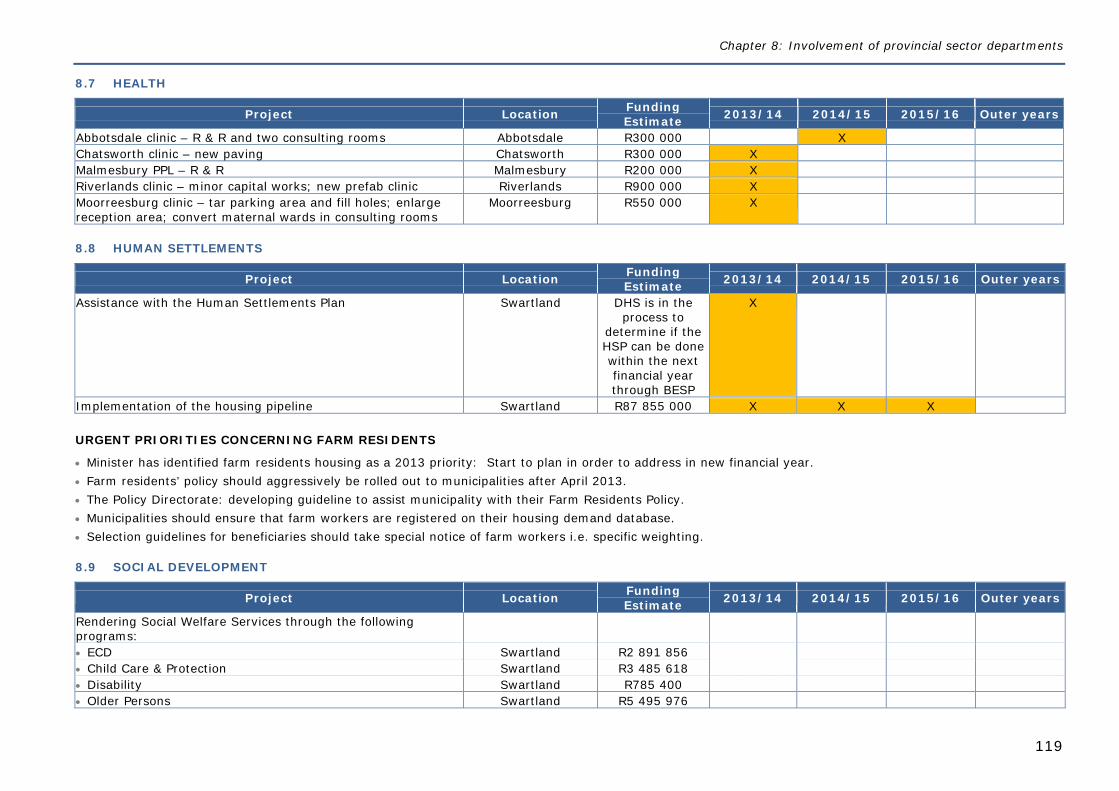
Chapter 8: Involvement of provincial sector departments
119
8.7 HEALTH
Project Location Funding Estimate 2013/14 2014/15 2015/16 Outer years
Abbotsdale clinic – R & R and two consulting rooms Abbotsdale R300 000 X Chatsworth clinic – new paving Chatsworth R300 000 X Malmesbury PPL – R & R Malmesbury R200 000 X Riverlands clinic – minor capital works; new prefab clinic Riverlands R900 000 X Moorreesburg clinic – tar parking area and fill holes; enlarge reception area; convert maternal wards in consulting rooms
Moorreesburg R550 000 X
8.8 HUMAN SETTLEMENTS
Project Location Funding Estimate 2013/14 2014/15 2015/16 Outer years
Assistance with the Human Settlements Plan Swartland DHS is in the process to
determine if the HSP can be done within the next financial year through BESP
X
Implementation of the housing pipeline Swartland R87 855 000 X X X URGENT PRIORITIES CONCERNING FARM RESIDENTS
Minister has identified farm residents housing as a 2013 priority: Start to plan in order to address in new financial year. Farm residents’ policy should aggressively be rolled out to municipalities after April 2013. The Policy Directorate: developing guideline to assist municipality with their Farm Residents Policy. Municipalities should ensure that farm workers are registered on their housing demand database. Selection guidelines for beneficiaries should take special notice of farm workers i.e. specific weighting.
8.9 SOCIAL DEVELOPMENT
Project Location Funding Estimate 2013/14 2014/15 2015/16 Outer years
Rendering Social Welfare Services through the following programs:
ECD Swartland R2 891 856 Child Care & Protection Swartland R3 485 618 Disability Swartland R785 400 Older Persons Swartland R5 495 976
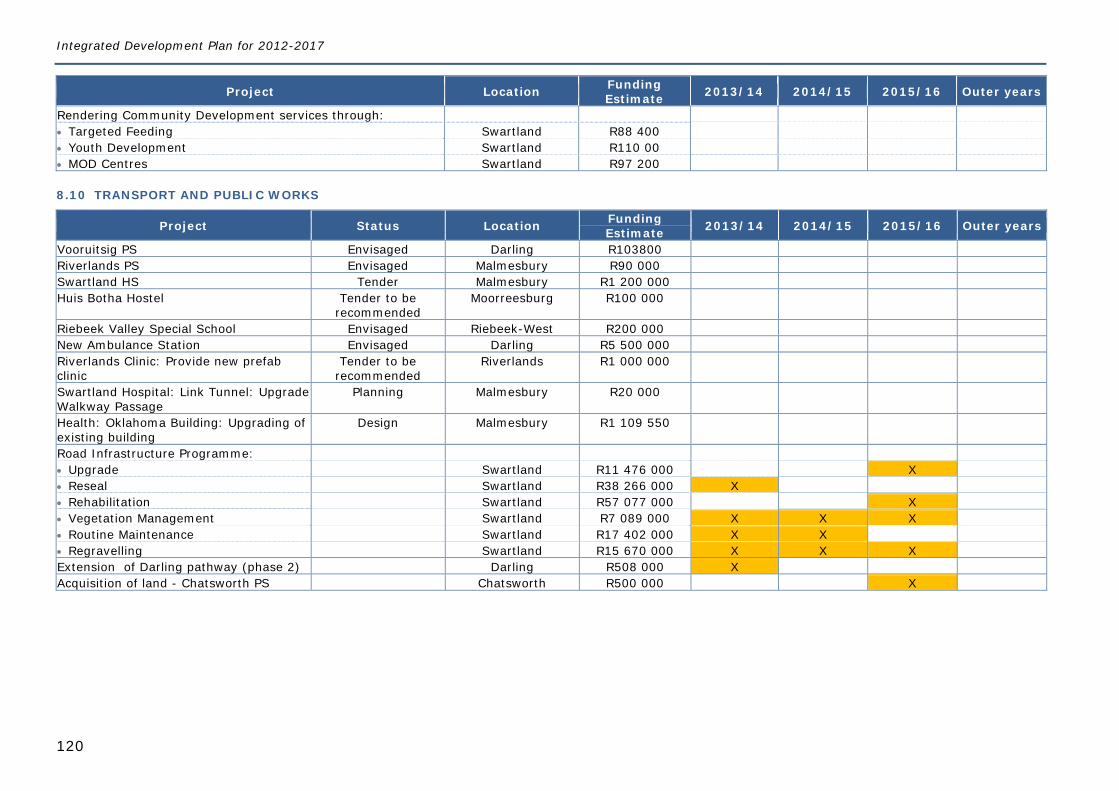
Integrated Development Plan for 2012-2017
120
Project Location Funding Estimate 2013/14 2014/15 2015/16 Outer years
Rendering Community Development services through: Targeted Feeding Swartland R88 400 Youth Development Swartland R110 00 MOD Centres Swartland R97 200
8.10 TRANSPORT AND PUBLIC WORKS
Project Status Location Funding Estimate 2013/14 2014/15 2015/16 Outer years
Vooruitsig PS Envisaged Darling R103800 Riverlands PS Envisaged Malmesbury R90 000 Swartland HS Tender Malmesbury R1 200 000 Huis Botha Hostel Tender to be
recommended Moorreesburg R100 000
Riebeek Valley Special School Envisaged Riebeek-West R200 000 New Ambulance Station Envisaged Darling R5 500 000 Riverlands Clinic: Provide new prefab clinic
Tender to be recommended
Riverlands R1 000 000
Swartland Hospital: Link Tunnel: Upgrade Walkway Passage
Planning Malmesbury R20 000
Health: Oklahoma Building: Upgrading of existing building
Design Malmesbury R1 109 550
Road Infrastructure Programme: Upgrade Swartland R11 476 000 X Reseal Swartland R38 266 000 X Rehabilitation Swartland R57 077 000 X Vegetation Management Swartland R7 089 000 X X X Routine Maintenance Swartland R17 402 000 X X Regravelling Swartland R15 670 000 X X X Extension of Darling pathway (phase 2) Darling R508 000 X Acquisition of land - Chatsworth PS Chatsworth R500 000 X
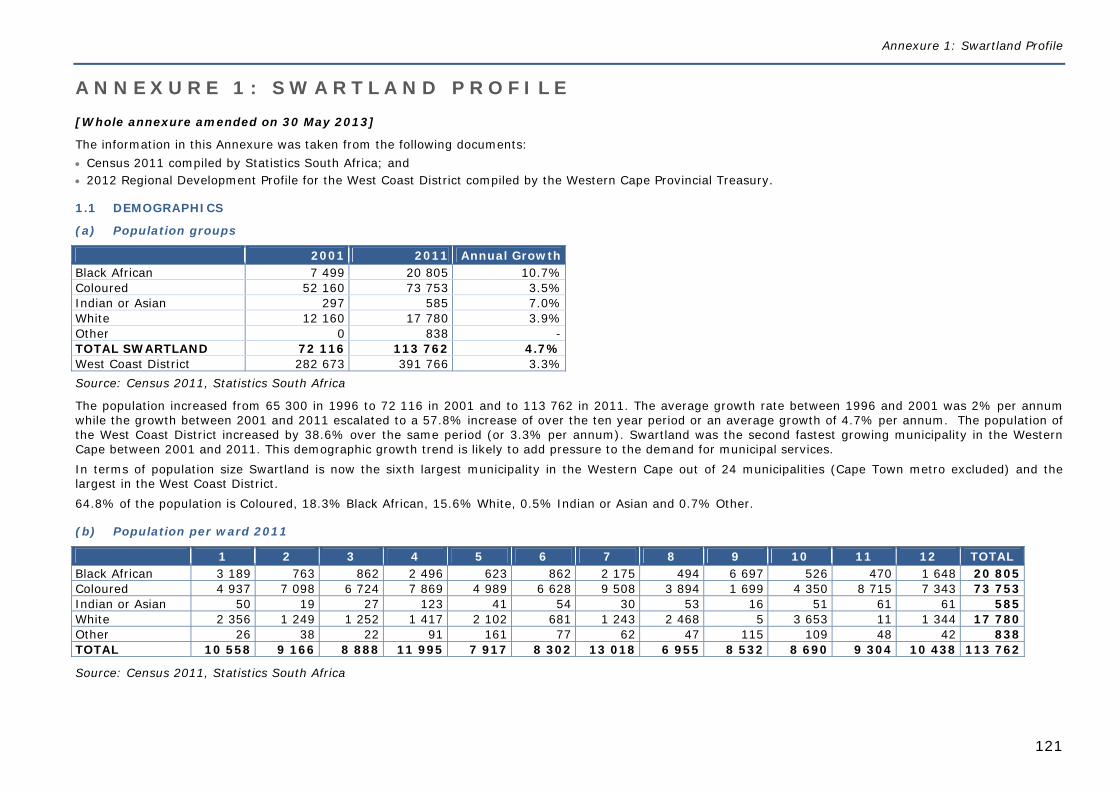
Annexure 1: Swartland Profile
121
A N N E X U R E 1 : S W A R T L A N D P R O F I L E [Whole annexure amended on 30 May 2013]
The information in this Annexure was taken from the following documents: Census 2011 compiled by Statistics South Africa; and 2012 Regional Development Profile for the West Coast District compiled by the Western Cape Provincial Treasury.
1.1 DEMOGRAPHICS
(a) Population groups
2001 2011 Annual Growth Black African 7 499 20 805 10.7% Coloured 52 160 73 753 3.5% Indian or Asian 297 585 7.0% White 12 160 17 780 3.9% Other 0 838 - TOTAL SWARTLAND 72 116 113 762 4.7% West Coast District 282 673 391 766 3.3% Source: Census 2011, Statistics South Africa
The population increased from 65 300 in 1996 to 72 116 in 2001 and to 113 762 in 2011. The average growth rate between 1996 and 2001 was 2% per annum while the growth between 2001 and 2011 escalated to a 57.8% increase of over the ten year period or an average growth of 4.7% per annum. The population of the West Coast District increased by 38.6% over the same period (or 3.3% per annum). Swartland was the second fastest growing municipality in the Western Cape between 2001 and 2011. This demographic growth trend is likely to add pressure to the demand for municipal services. In terms of population size Swartland is now the sixth largest municipality in the Western Cape out of 24 municipalities (Cape Town metro excluded) and the largest in the West Coast District. 64.8% of the population is Coloured, 18.3% Black African, 15.6% White, 0.5% Indian or Asian and 0.7% Other.
(b) Population per ward 2011
1 2 3 4 5 6 7 8 9 10 11 12 TOTAL Black African 3 189 763 862 2 496 623 862 2 175 494 6 697 526 470 1 648 20 805 Coloured 4 937 7 098 6 724 7 869 4 989 6 628 9 508 3 894 1 699 4 350 8 715 7 343 73 753 Indian or Asian 50 19 27 123 41 54 30 53 16 51 61 61 585 White 2 356 1 249 1 252 1 417 2 102 681 1 243 2 468 5 3 653 11 1 344 17 780 Other 26 38 22 91 161 77 62 47 115 109 48 42 838 TOTAL 10 558 9 166 8 888 11 995 7 917 8 302 13 018 6 955 8 532 8 690 9 304 10 438 113 762
Source: Census 2011, Statistics South Africa
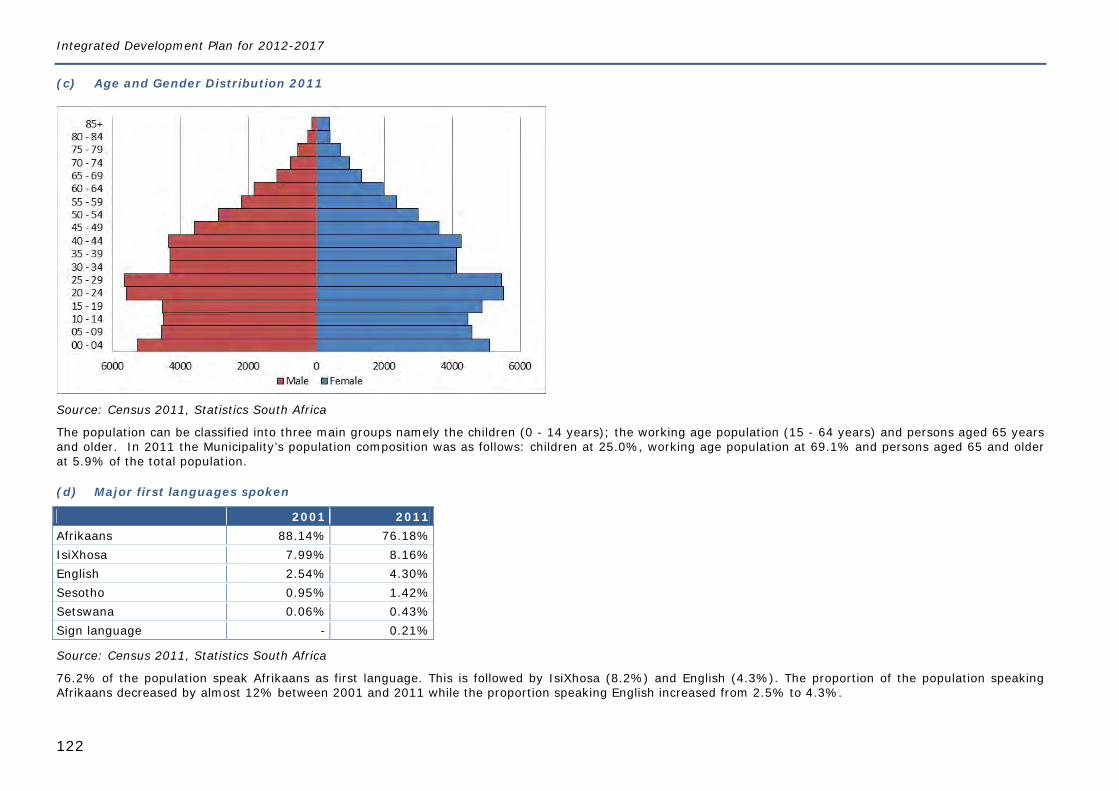
Integrated Development Plan for 2012-2017
122
(c) Age and Gender Distribution 2011
Source: Census 2011, Statistics South Africa
The population can be classified into three main groups namely the children (0 - 14 years); the working age population (15 - 64 years) and persons aged 65 years and older. In 2011 the Municipality’s population composition was as follows: children at 25.0%, working age population at 69.1% and persons aged 65 and older at 5.9% of the total population.
(d) Major first languages spoken
2001 2011 Afrikaans 88.14% 76.18% IsiXhosa 7.99% 8.16% English 2.54% 4.30% Sesotho 0.95% 1.42% Setswana 0.06% 0.43% Sign language - 0.21%
Source: Census 2011, Statistics South Africa
76.2% of the population speak Afrikaans as first language. This is followed by IsiXhosa (8.2%) and English (4.3%). The proportion of the population speaking Afrikaans decreased by almost 12% between 2001 and 2011 while the proportion speaking English increased from 2.5% to 4.3%.
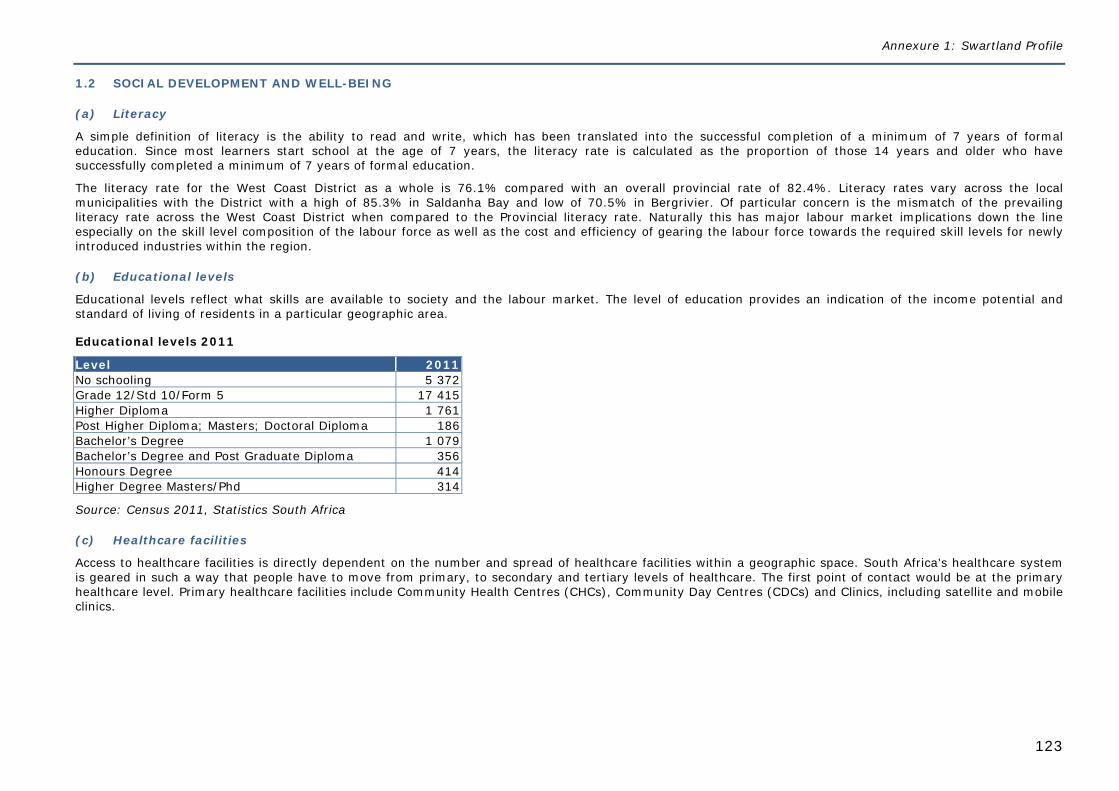
Annexure 1: Swartland Profile
123
1.2 SOCIAL DEVELOPMENT AND WELL-BEING
(a) Literacy
A simple definition of literacy is the ability to read and write, which has been translated into the successful completion of a minimum of 7 years of formal education. Since most learners start school at the age of 7 years, the literacy rate is calculated as the proportion of those 14 years and older who have successfully completed a minimum of 7 years of formal education.
The literacy rate for the West Coast District as a whole is 76.1% compared with an overall provincial rate of 82.4%. Literacy rates vary across the local municipalities with the District with a high of 85.3% in Saldanha Bay and low of 70.5% in Bergrivier. Of particular concern is the mismatch of the prevailing literacy rate across the West Coast District when compared to the Provincial literacy rate. Naturally this has major labour market implications down the line especially on the skill level composition of the labour force as well as the cost and efficiency of gearing the labour force towards the required skill levels for newly introduced industries within the region.
(b) Educational levels
Educational levels reflect what skills are available to society and the labour market. The level of education provides an indication of the income potential and standard of living of residents in a particular geographic area.
Educational levels 2011
Level 2011 No schooling 5 372 Grade 12/Std 10/Form 5 17 415 Higher Diploma 1 761 Post Higher Diploma; Masters; Doctoral Diploma 186 Bachelor’s Degree 1 079 Bachelor’s Degree and Post Graduate Diploma 356 Honours Degree 414 Higher Degree Masters/Phd 314
Source: Census 2011, Statistics South Africa
(c) Healthcare facilities
Access to healthcare facilities is directly dependent on the number and spread of healthcare facilities within a geographic space. South Africa’s healthcare system is geared in such a way that people have to move from primary, to secondary and tertiary levels of healthcare. The first point of contact would be at the primary healthcare level. Primary healthcare facilities include Community Health Centres (CHCs), Community Day Centres (CDCs) and Clinics, including satellite and mobile clinics.
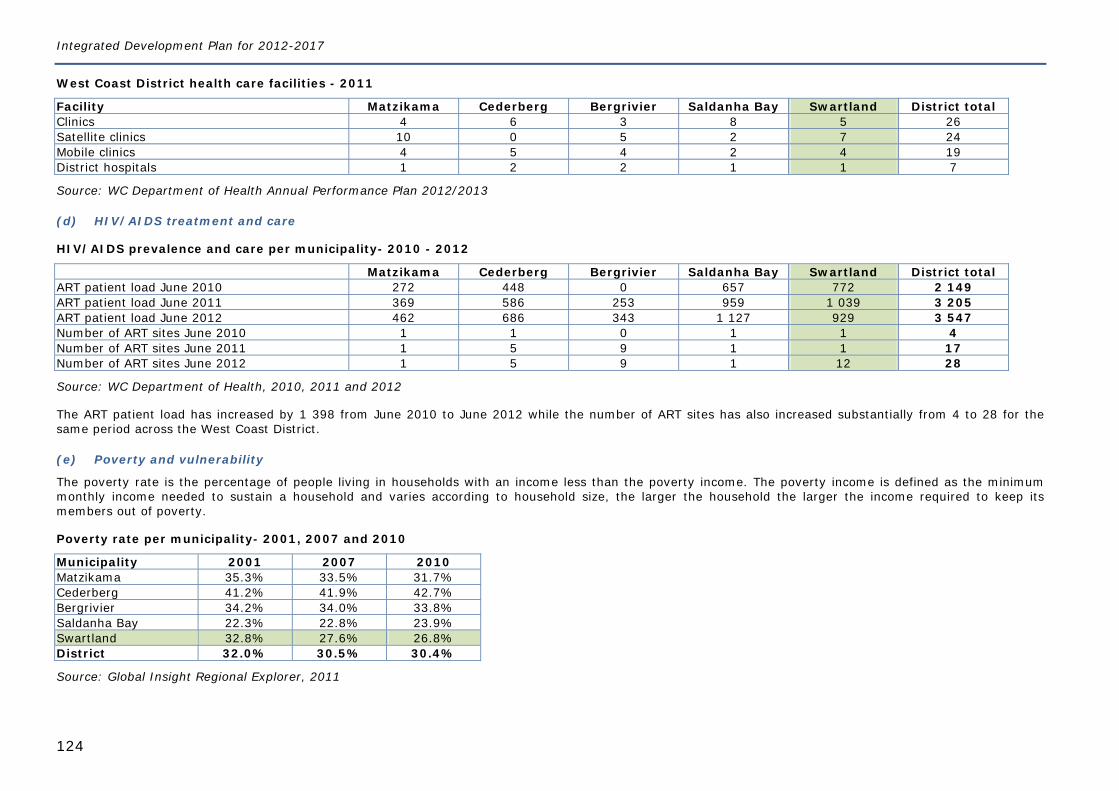
Integrated Development Plan for 2012-2017
124
West Coast District health care facilities - 2011
Facility Matzikama Cederberg Bergrivier Saldanha Bay Swartland District total Clinics 4 6 3 8 5 26 Satellite clinics 10 0 5 2 7 24 Mobile clinics 4 5 4 2 4 19 District hospitals 1 2 2 1 1 7
Source: WC Department of Health Annual Performance Plan 2012/2013
(d) HIV/AIDS treatment and care
HIV/AIDS prevalence and care per municipality- 2010 - 2012
Matzikama Cederberg Bergrivier Saldanha Bay Swartland District total ART patient load June 2010 272 448 0 657 772 2 149 ART patient load June 2011 369 586 253 959 1 039 3 205 ART patient load June 2012 462 686 343 1 127 929 3 547 Number of ART sites June 2010 1 1 0 1 1 4 Number of ART sites June 2011 1 5 9 1 1 17 Number of ART sites June 2012 1 5 9 1 12 28
Source: WC Department of Health, 2010, 2011 and 2012
The ART patient load has increased by 1 398 from June 2010 to June 2012 while the number of ART sites has also increased substantially from 4 to 28 for the same period across the West Coast District.
(e) Poverty and vulnerability
The poverty rate is the percentage of people living in households with an income less than the poverty income. The poverty income is defined as the minimum monthly income needed to sustain a household and varies according to household size, the larger the household the larger the income required to keep its members out of poverty.
Poverty rate per municipality- 2001, 2007 and 2010
Municipality 2001 2007 2010 Matzikama 35.3% 33.5% 31.7% Cederberg 41.2% 41.9% 42.7% Bergrivier 34.2% 34.0% 33.8% Saldanha Bay 22.3% 22.8% 23.9% Swartland 32.8% 27.6% 26.8% District 32.0% 30.5% 30.4%
Source: Global Insight Regional Explorer, 2011

Annexure 1: Swartland Profile
125
The poverty rate is a cause for concern in general. For the year 2010, Bergrivier (33.8%); Matzikama (31.7%) and Cederberg (42.7%) recorded alarming levels of poverty. Saldanha Bay has consistently recorded low poverty rates relative to its neighbouring municipalities but there was a slight increase from 22.3% in 2001 to 23.9% in 2010. Swartland’s poverty rate has declined substantially from 32.8% in 2001 to 26.8% in 2010.
(f) Gini coefficient
The Gini coefficient is a summary statistic of income inequality, which varies from 0 (in the case of perfect equality where all households earn equal income) to 1 (in the case where one household earns all the income and other households earn nothing). In practice the coefficient is likely to vary from approximately 0.25 to 0.70. The national figure is 0.7.
Gini Coefficient per municipality- 2001, 2007 and 2010
Municipality 2001 2007 2010 Matzikama 0.60 0.61 0.60 Cederberg 0.62 0.64 0.64 Bergrivier 0.56 0.58 0.57 Saldanha Bay 0.57 0.59 0.58 Swartland 0.58 0.60 0.58 District 0.59 0.61 0.60
Source: Global Insight Regional Explorer, 2011
In general income inequality is common across the West Coast District. Again, comparisons can be made to the poverty levels across the region as well the disparity in education levels suggesting strong linkages to a productive labour force divided by regional boundaries with associated economic opportunities/benefits.
(g) Human Development Index
The Human Development Index (HDI) is a composite, relative index that attempts to quantify the extent of human development of a community. It is based on measures of life expectancy, literacy and income. It is thus seen as a measure of people’s ability to live a long and healthy life, to communicate, to participate in the life of the community and to have sufficient resources to obtain a decent living. The HDI can assume a maximum level of 1, indicating a high level of human development, and a minimum value of 0.
Human Development Index per municipality - 2001, 2007 and 2010
Municipality 2001 2007 2010 Matzikama 0.62 0.64 0.64 Cederberg 0.59 0.60 0.60 Bergrivier 0.61 0.63 0.63 Saldanha Bay 0.67 0.69 0.69 Swartland 0.62 0.64 0.64 District 0.63 0.64 0.65
Source: Global Insight Regional Explorer, 2011
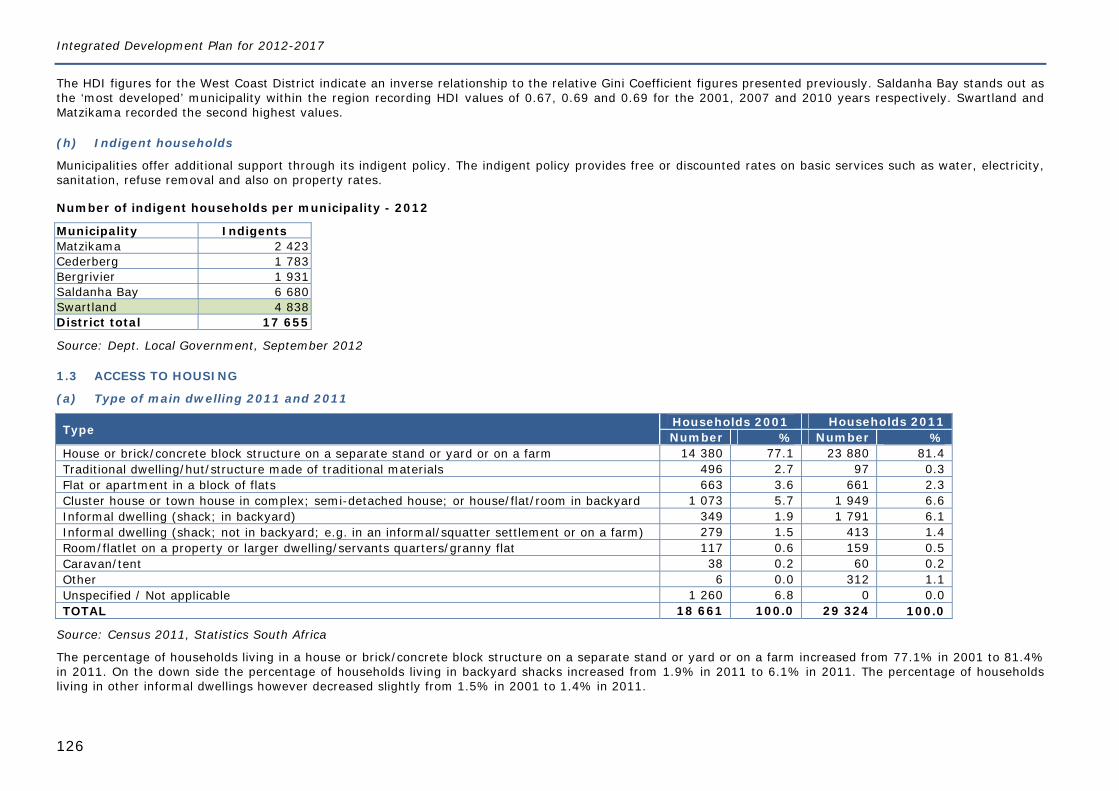
Integrated Development Plan for 2012-2017
126
The HDI figures for the West Coast District indicate an inverse relationship to the relative Gini Coefficient figures presented previously. Saldanha Bay stands out as the ‘most developed’ municipality within the region recording HDI values of 0.67, 0.69 and 0.69 for the 2001, 2007 and 2010 years respectively. Swartland and Matzikama recorded the second highest values.
(h) Indigent households
Municipalities offer additional support through its indigent policy. The indigent policy provides free or discounted rates on basic services such as water, electricity, sanitation, refuse removal and also on property rates.
Number of indigent households per municipality - 2012
Municipality Indigents Matzikama 2 423 Cederberg 1 783 Bergrivier 1 931 Saldanha Bay 6 680 Swartland 4 838 District total 17 655
Source: Dept. Local Government, September 2012
1.3 ACCESS TO HOUSING
(a) Type of main dwelling 2011 and 2011
Type Households 2001 Households 2011 Number % Number %
House or brick/concrete block structure on a separate stand or yard or on a farm 14 380 77.1 23 880 81.4 Traditional dwelling/hut/structure made of traditional materials 496 2.7 97 0.3 Flat or apartment in a block of flats 663 3.6 661 2.3 Cluster house or town house in complex; semi-detached house; or house/flat/room in backyard 1 073 5.7 1 949 6.6 Informal dwelling (shack; in backyard) 349 1.9 1 791 6.1 Informal dwelling (shack; not in backyard; e.g. in an informal/squatter settlement or on a farm) 279 1.5 413 1.4 Room/flatlet on a property or larger dwelling/servants quarters/granny flat 117 0.6 159 0.5 Caravan/tent 38 0.2 60 0.2 Other 6 0.0 312 1.1 Unspecified / Not applicable 1 260 6.8 0 0.0 TOTAL 18 661 100.0 29 324 100.0
Source: Census 2011, Statistics South Africa
The percentage of households living in a house or brick/concrete block structure on a separate stand or yard or on a farm increased from 77.1% in 2001 to 81.4% in 2011. On the down side the percentage of households living in backyard shacks increased from 1.9% in 2011 to 6.1% in 2011. The percentage of households living in other informal dwellings however decreased slightly from 1.5% in 2001 to 1.4% in 2011.
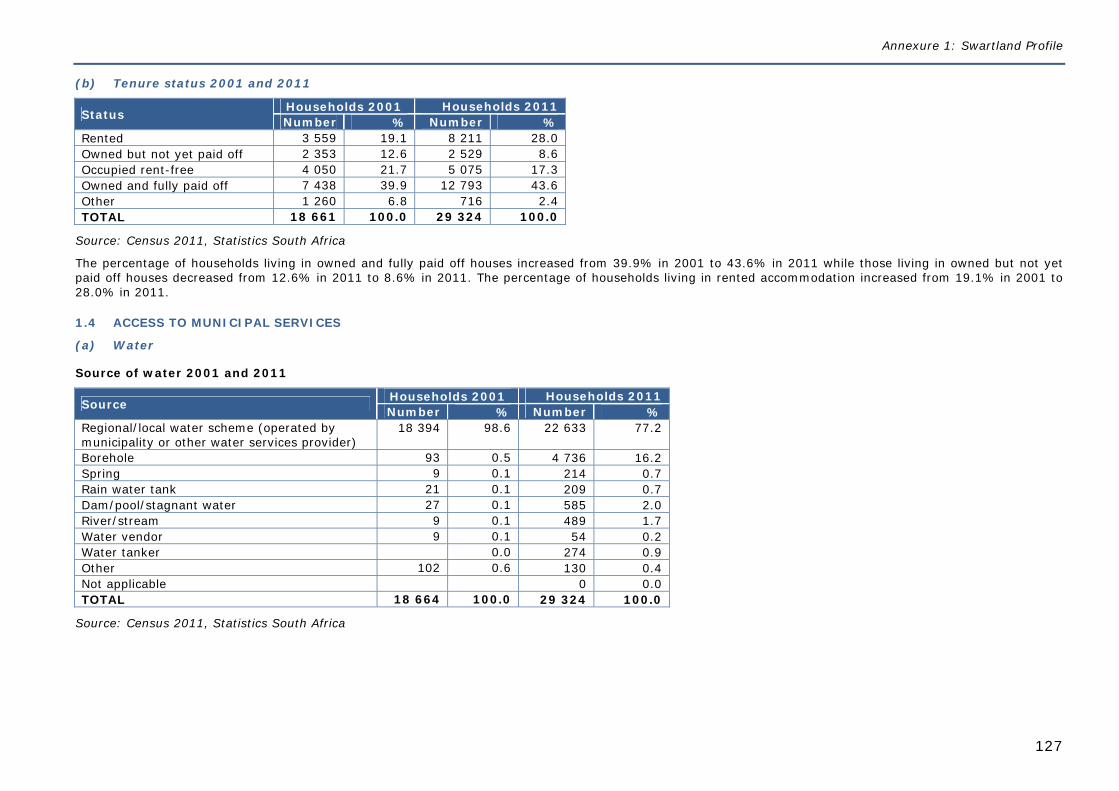
Annexure 1: Swartland Profile
127
(b) Tenure status 2001 and 2011
Status Households 2001 Households 2011 Number % Number %
Rented 3 559 19.1 8 211 28.0 Owned but not yet paid off 2 353 12.6 2 529 8.6 Occupied rent-free 4 050 21.7 5 075 17.3 Owned and fully paid off 7 438 39.9 12 793 43.6 Other 1 260 6.8 716 2.4 TOTAL 18 661 100.0 29 324 100.0
Source: Census 2011, Statistics South Africa
The percentage of households living in owned and fully paid off houses increased from 39.9% in 2001 to 43.6% in 2011 while those living in owned but not yet paid off houses decreased from 12.6% in 2011 to 8.6% in 2011. The percentage of households living in rented accommodation increased from 19.1% in 2001 to 28.0% in 2011.
1.4 ACCESS TO MUNICIPAL SERVICES
(a) Water
Source of water 2001 and 2011
Source Households 2001 Households 2011 Number % Number %
Regional/local water scheme (operated by municipality or other water services provider)
18 394 98.6 22 633 77.2
Borehole 93 0.5 4 736 16.2 Spring 9 0.1 214 0.7 Rain water tank 21 0.1 209 0.7 Dam/pool/stagnant water 27 0.1 585 2.0 River/stream 9 0.1 489 1.7 Water vendor 9 0.1 54 0.2 Water tanker 0.0 274 0.9 Other 102 0.6 130 0.4 Not applicable 0 0.0 TOTAL 18 664 100.0 29 324 100.0
Source: Census 2011, Statistics South Africa
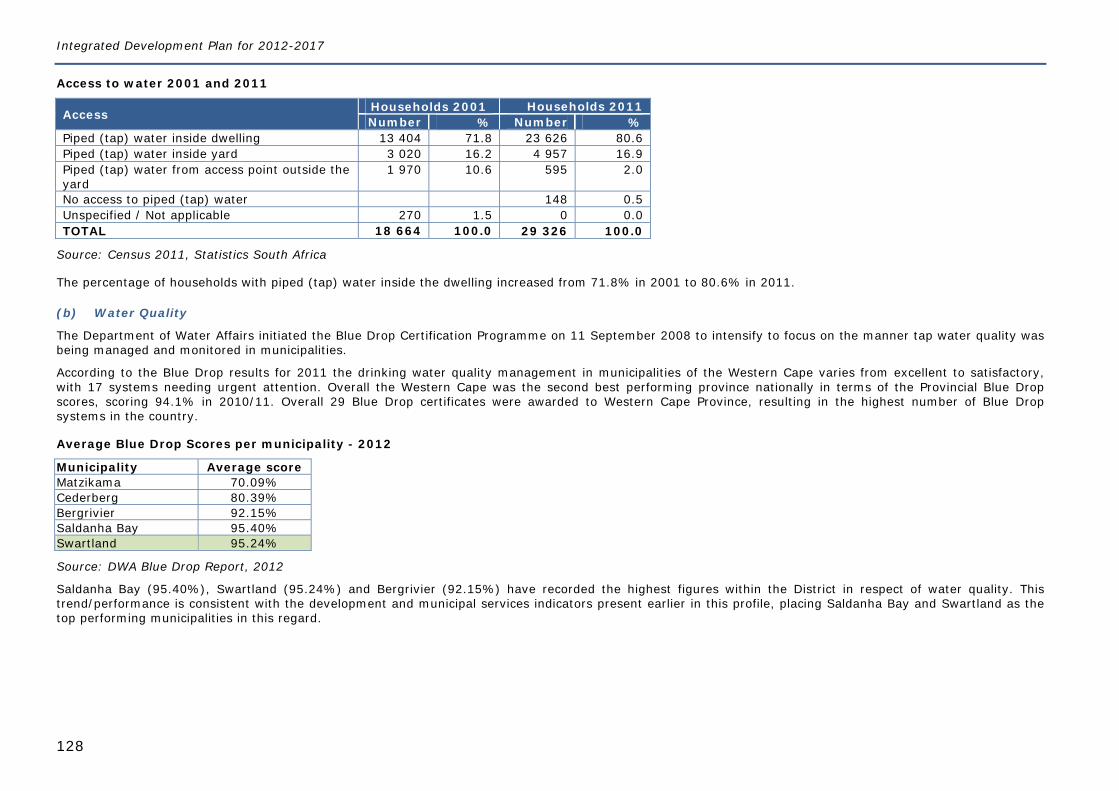
Integrated Development Plan for 2012-2017
128
Access to water 2001 and 2011
Access Households 2001 Households 2011 Number % Number %
Piped (tap) water inside dwelling 13 404 71.8 23 626 80.6 Piped (tap) water inside yard 3 020 16.2 4 957 16.9 Piped (tap) water from access point outside the yard
1 970 10.6 595 2.0
No access to piped (tap) water 148 0.5 Unspecified / Not applicable 270 1.5 0 0.0 TOTAL 18 664 100.0 29 326 100.0
Source: Census 2011, Statistics South Africa
The percentage of households with piped (tap) water inside the dwelling increased from 71.8% in 2001 to 80.6% in 2011.
(b) Water Quality
The Department of Water Affairs initiated the Blue Drop Certification Programme on 11 September 2008 to intensify to focus on the manner tap water quality was being managed and monitored in municipalities.
According to the Blue Drop results for 2011 the drinking water quality management in municipalities of the Western Cape varies from excellent to satisfactory, with 17 systems needing urgent attention. Overall the Western Cape was the second best performing province nationally in terms of the Provincial Blue Drop scores, scoring 94.1% in 2010/11. Overall 29 Blue Drop certificates were awarded to Western Cape Province, resulting in the highest number of Blue Drop systems in the country.
Average Blue Drop Scores per municipality - 2012
Municipality Average score Matzikama 70.09% Cederberg 80.39% Bergrivier 92.15% Saldanha Bay 95.40% Swartland 95.24%
Source: DWA Blue Drop Report, 2012
Saldanha Bay (95.40%), Swartland (95.24%) and Bergrivier (92.15%) have recorded the highest figures within the District in respect of water quality. This trend/performance is consistent with the development and municipal services indicators present earlier in this profile, placing Saldanha Bay and Swartland as the top performing municipalities in this regard.
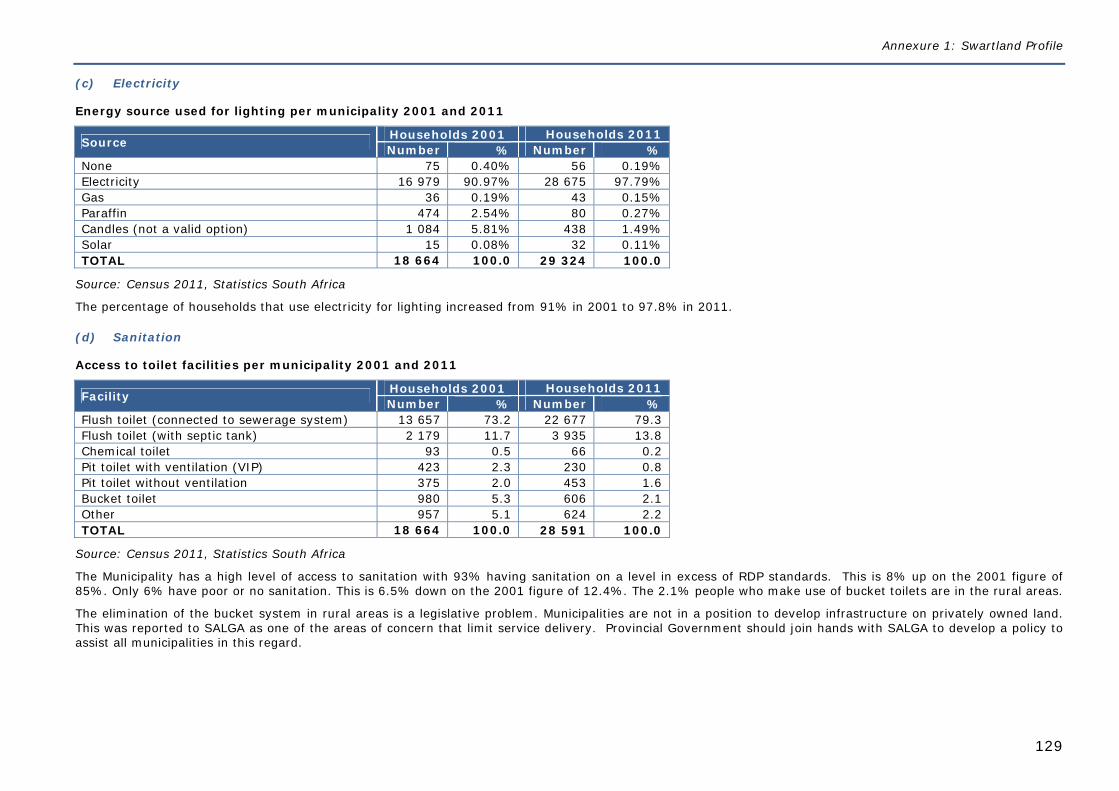
Annexure 1: Swartland Profile
129
(c) Electricity
Energy source used for lighting per municipality 2001 and 2011
Source Households 2001 Households 2011 Number % Number %
None 75 0.40% 56 0.19% Electricity 16 979 90.97% 28 675 97.79% Gas 36 0.19% 43 0.15% Paraffin 474 2.54% 80 0.27% Candles (not a valid option) 1 084 5.81% 438 1.49% Solar 15 0.08% 32 0.11% TOTAL 18 664 100.0 29 324 100.0
Source: Census 2011, Statistics South Africa
The percentage of households that use electricity for lighting increased from 91% in 2001 to 97.8% in 2011.
(d) Sanitation
Access to toilet facilities per municipality 2001 and 2011
Facility Households 2001 Households 2011 Number % Number %
Flush toilet (connected to sewerage system) 13 657 73.2 22 677 79.3 Flush toilet (with septic tank) 2 179 11.7 3 935 13.8 Chemical toilet 93 0.5 66 0.2 Pit toilet with ventilation (VIP) 423 2.3 230 0.8 Pit toilet without ventilation 375 2.0 453 1.6 Bucket toilet 980 5.3 606 2.1 Other 957 5.1 624 2.2 TOTAL 18 664 100.0 28 591 100.0
Source: Census 2011, Statistics South Africa
The Municipality has a high level of access to sanitation with 93% having sanitation on a level in excess of RDP standards. This is 8% up on the 2001 figure of 85%. Only 6% have poor or no sanitation. This is 6.5% down on the 2001 figure of 12.4%. The 2.1% people who make use of bucket toilets are in the rural areas.
The elimination of the bucket system in rural areas is a legislative problem. Municipalities are not in a position to develop infrastructure on privately owned land. This was reported to SALGA as one of the areas of concern that limit service delivery. Provincial Government should join hands with SALGA to develop a policy to assist all municipalities in this regard.
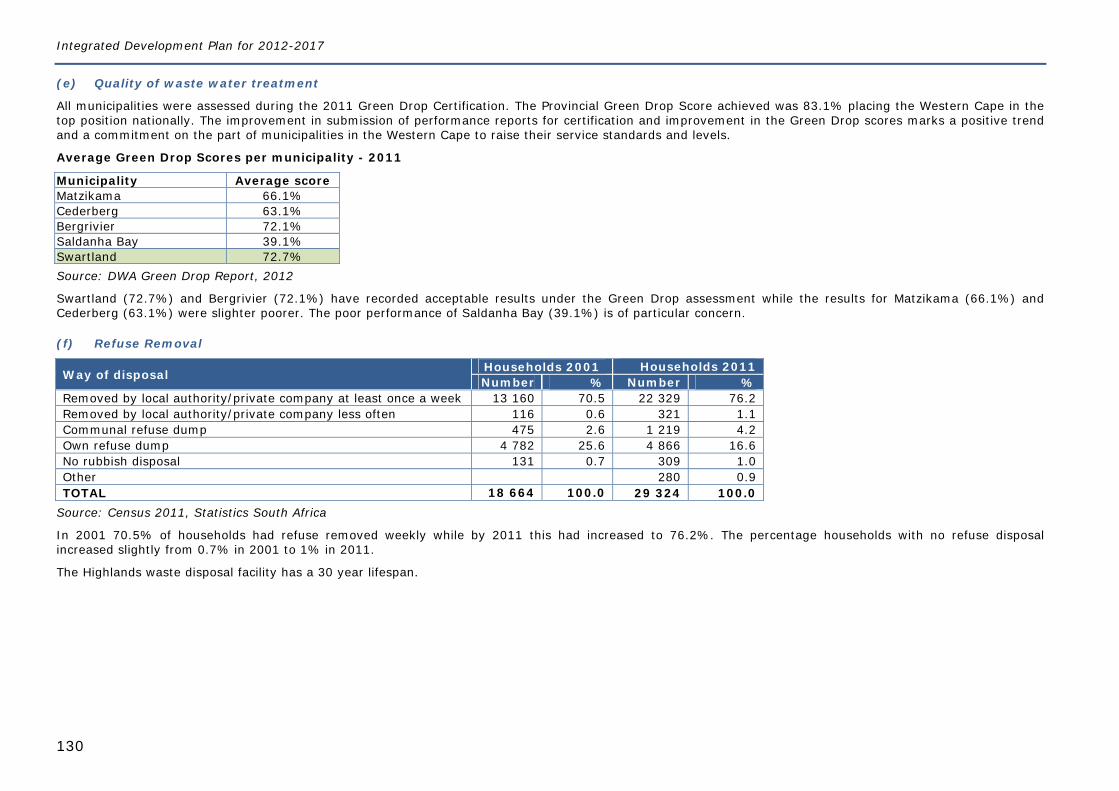
Integrated Development Plan for 2012-2017
130
(e) Quality of waste water treatment
All municipalities were assessed during the 2011 Green Drop Certification. The Provincial Green Drop Score achieved was 83.1% placing the Western Cape in the top position nationally. The improvement in submission of performance reports for certification and improvement in the Green Drop scores marks a positive trend and a commitment on the part of municipalities in the Western Cape to raise their service standards and levels.
Average Green Drop Scores per municipality - 2011
Municipality Average score Matzikama 66.1% Cederberg 63.1% Bergrivier 72.1% Saldanha Bay 39.1% Swartland 72.7% Source: DWA Green Drop Report, 2012
Swartland (72.7%) and Bergrivier (72.1%) have recorded acceptable results under the Green Drop assessment while the results for Matzikama (66.1%) and Cederberg (63.1%) were slighter poorer. The poor performance of Saldanha Bay (39.1%) is of particular concern.
(f) Refuse Removal
Way of disposal Households 2001 Households 2011 Number % Number %
Removed by local authority/private company at least once a week 13 160 70.5 22 329 76.2 Removed by local authority/private company less often 116 0.6 321 1.1 Communal refuse dump 475 2.6 1 219 4.2 Own refuse dump 4 782 25.6 4 866 16.6 No rubbish disposal 131 0.7 309 1.0 Other 280 0.9 TOTAL 18 664 100.0 29 324 100.0
Source: Census 2011, Statistics South Africa
In 2001 70.5% of households had refuse removed weekly while by 2011 this had increased to 76.2%. The percentage households with no refuse disposal increased slightly from 0.7% in 2001 to 1% in 2011.
The Highlands waste disposal facility has a 30 year lifespan.
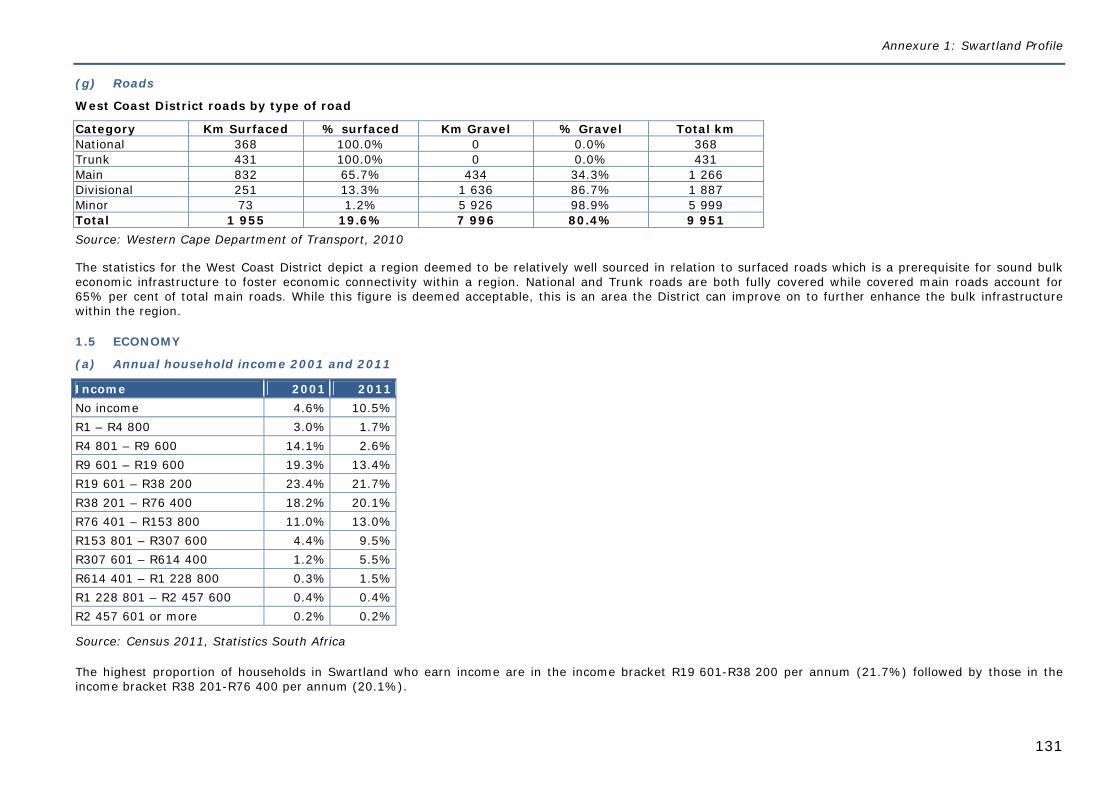
Annexure 1: Swartland Profile
131
(g) Roads
West Coast District roads by type of road
Category Km Surfaced % surfaced Km Gravel % Gravel Total km National 368 100.0% 0 0.0% 368 Trunk 431 100.0% 0 0.0% 431 Main 832 65.7% 434 34.3% 1 266 Divisional 251 13.3% 1 636 86.7% 1 887 Minor 73 1.2% 5 926 98.9% 5 999 Total 1 955 19.6% 7 996 80.4% 9 951 Source: Western Cape Department of Transport, 2010
The statistics for the West Coast District depict a region deemed to be relatively well sourced in relation to surfaced roads which is a prerequisite for sound bulk economic infrastructure to foster economic connectivity within a region. National and Trunk roads are both fully covered while covered main roads account for 65% per cent of total main roads. While this figure is deemed acceptable, this is an area the District can improve on to further enhance the bulk infrastructure within the region.
1.5 ECONOMY
(a) Annual household income 2001 and 2011
Income 2001 2011 No income 4.6% 10.5% R1 – R4 800 3.0% 1.7% R4 801 – R9 600 14.1% 2.6% R9 601 – R19 600 19.3% 13.4% R19 601 – R38 200 23.4% 21.7% R38 201 – R76 400 18.2% 20.1% R76 401 – R153 800 11.0% 13.0% R153 801 – R307 600 4.4% 9.5% R307 601 – R614 400 1.2% 5.5% R614 401 – R1 228 800 0.3% 1.5% R1 228 801 – R2 457 600 0.4% 0.4% R2 457 601 or more 0.2% 0.2%
Source: Census 2011, Statistics South Africa
The highest proportion of households in Swartland who earn income are in the income bracket R19 601-R38 200 per annum (21.7%) followed by those in the income bracket R38 201-R76 400 per annum (20.1%).
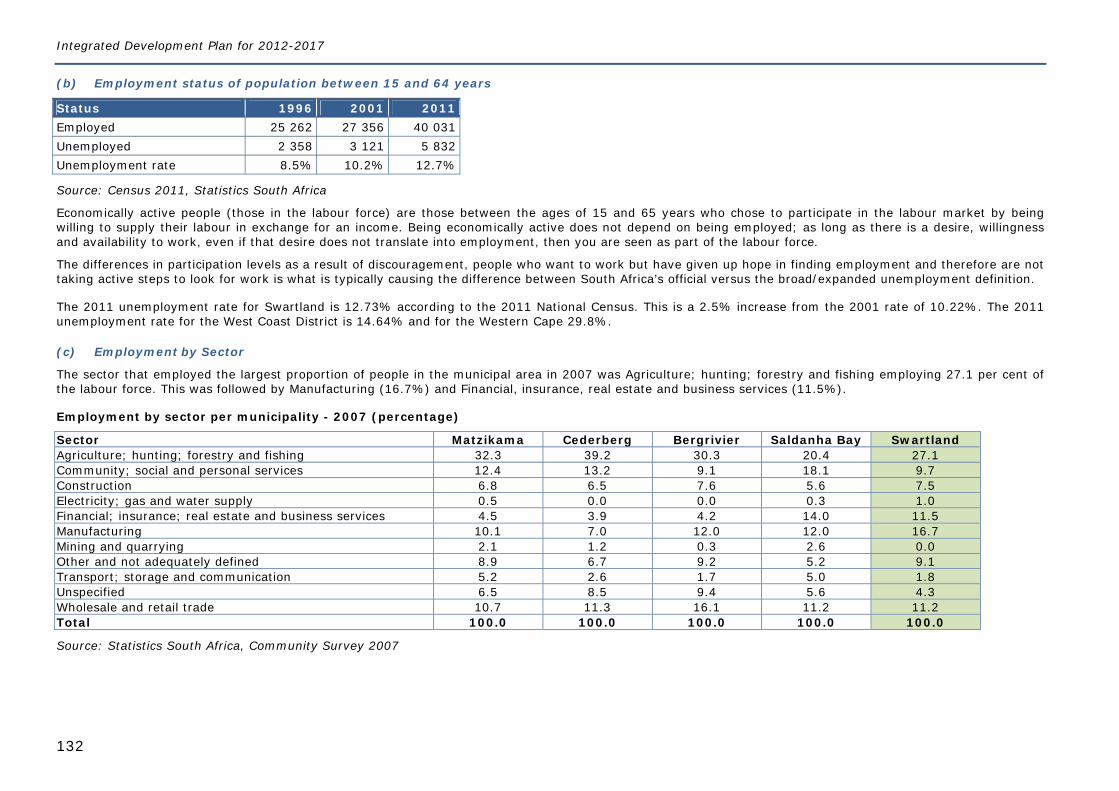
Integrated Development Plan for 2012-2017
132
(b) Employment status of population between 15 and 64 years
Status 1996 2001 2011 Employed 25 262 27 356 40 031 Unemployed 2 358 3 121 5 832 Unemployment rate 8.5% 10.2% 12.7%
Source: Census 2011, Statistics South Africa
Economically active people (those in the labour force) are those between the ages of 15 and 65 years who chose to participate in the labour market by being willing to supply their labour in exchange for an income. Being economically active does not depend on being employed; as long as there is a desire, willingness and availability to work, even if that desire does not translate into employment, then you are seen as part of the labour force.
The differences in participation levels as a result of discouragement, people who want to work but have given up hope in finding employment and therefore are not taking active steps to look for work is what is typically causing the difference between South Africa’s official versus the broad/expanded unemployment definition.
The 2011 unemployment rate for Swartland is 12.73% according to the 2011 National Census. This is a 2.5% increase from the 2001 rate of 10.22%. The 2011 unemployment rate for the West Coast District is 14.64% and for the Western Cape 29.8%.
(c) Employment by Sector
The sector that employed the largest proportion of people in the municipal area in 2007 was Agriculture; hunting; forestry and fishing employing 27.1 per cent of the labour force. This was followed by Manufacturing (16.7%) and Financial, insurance, real estate and business services (11.5%).
Employment by sector per municipality - 2007 (percentage)
Sector Matzikama Cederberg Bergrivier Saldanha Bay Swartland Agriculture; hunting; forestry and fishing 32.3 39.2 30.3 20.4 27.1 Community; social and personal services 12.4 13.2 9.1 18.1 9.7 Construction 6.8 6.5 7.6 5.6 7.5 Electricity; gas and water supply 0.5 0.0 0.0 0.3 1.0 Financial; insurance; real estate and business services 4.5 3.9 4.2 14.0 11.5 Manufacturing 10.1 7.0 12.0 12.0 16.7 Mining and quarrying 2.1 1.2 0.3 2.6 0.0 Other and not adequately defined 8.9 6.7 9.2 5.2 9.1 Transport; storage and communication 5.2 2.6 1.7 5.0 1.8 Unspecified 6.5 8.5 9.4 5.6 4.3 Wholesale and retail trade 10.7 11.3 16.1 11.2 11.2 Total 100.0 100.0 100.0 100.0 100.0
Source: Statistics South Africa, Community Survey 2007
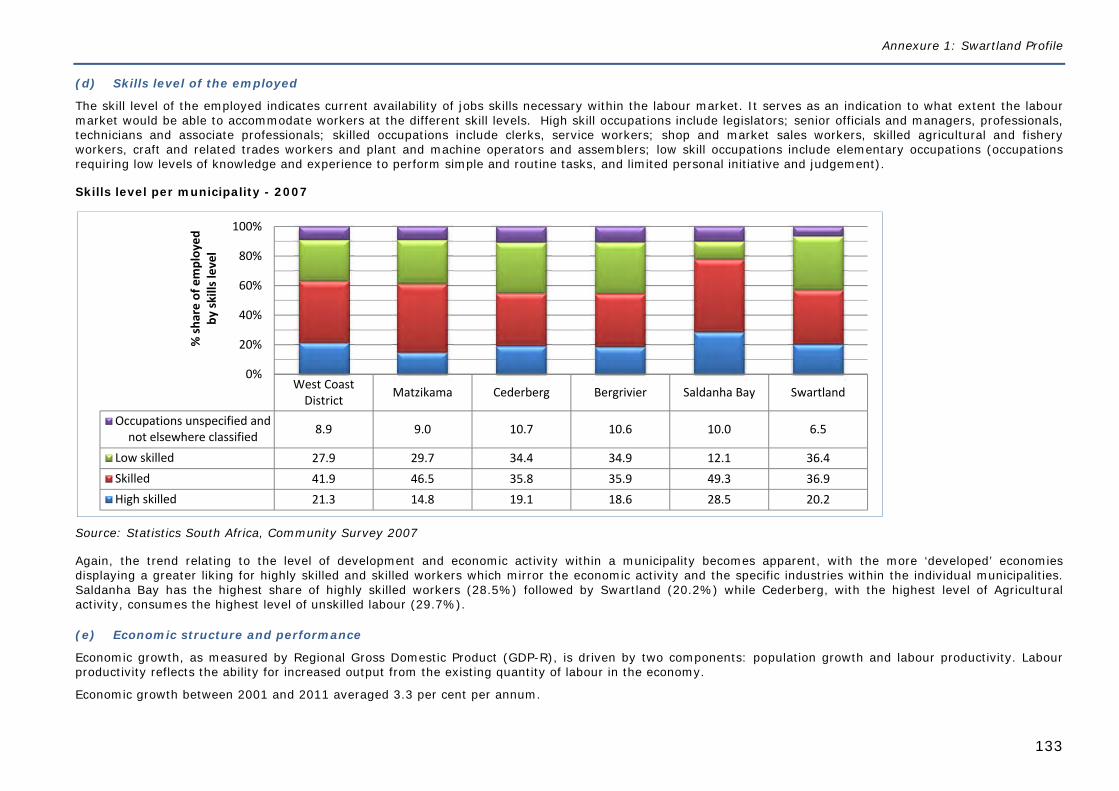
Annexure 1: Swartland Profile
133
(d) Skills level of the employed
The skill level of the employed indicates current availability of jobs skills necessary within the labour market. It serves as an indication to what extent the labour market would be able to accommodate workers at the different skill levels. High skill occupations include legislators; senior officials and managers, professionals, technicians and associate professionals; skilled occupations include clerks, service workers; shop and market sales workers, skilled agricultural and fishery workers, craft and related trades workers and plant and machine operators and assemblers; low skill occupations include elementary occupations (occupations requiring low levels of knowledge and experience to perform simple and routine tasks, and limited personal initiative and judgement).
Skills level per municipality - 2007
Source: Statistics South Africa, Community Survey 2007
Again, the trend relating to the level of development and economic activity within a municipality becomes apparent, with the more ‘developed’ economies displaying a greater liking for highly skilled and skilled workers which mirror the economic activity and the specific industries within the individual municipalities. Saldanha Bay has the highest share of highly skilled workers (28.5%) followed by Swartland (20.2%) while Cederberg, with the highest level of Agricultural activity, consumes the highest level of unskilled labour (29.7%).
(e) Economic structure and performance
Economic growth, as measured by Regional Gross Domestic Product (GDP-R), is driven by two components: population growth and labour productivity. Labour productivity reflects the ability for increased output from the existing quantity of labour in the economy.
Economic growth between 2001 and 2011 averaged 3.3 per cent per annum.
West CoastDistrict Matzikama Cederberg Bergrivier Saldanha Bay Swartland
Occupations unspecified andnot elsewhere classified 8.9 9.0 10.7 10.6 10.0 6.5
Low skilled 27.9 29.7 34.4 34.9 12.1 36.4Skilled 41.9 46.5 35.8 35.9 49.3 36.9High skilled 21.3 14.8 19.1 18.6 28.5 20.2
0%
20%
40%
60%
80%
100%
% sh
are of employed
by sk
ills level
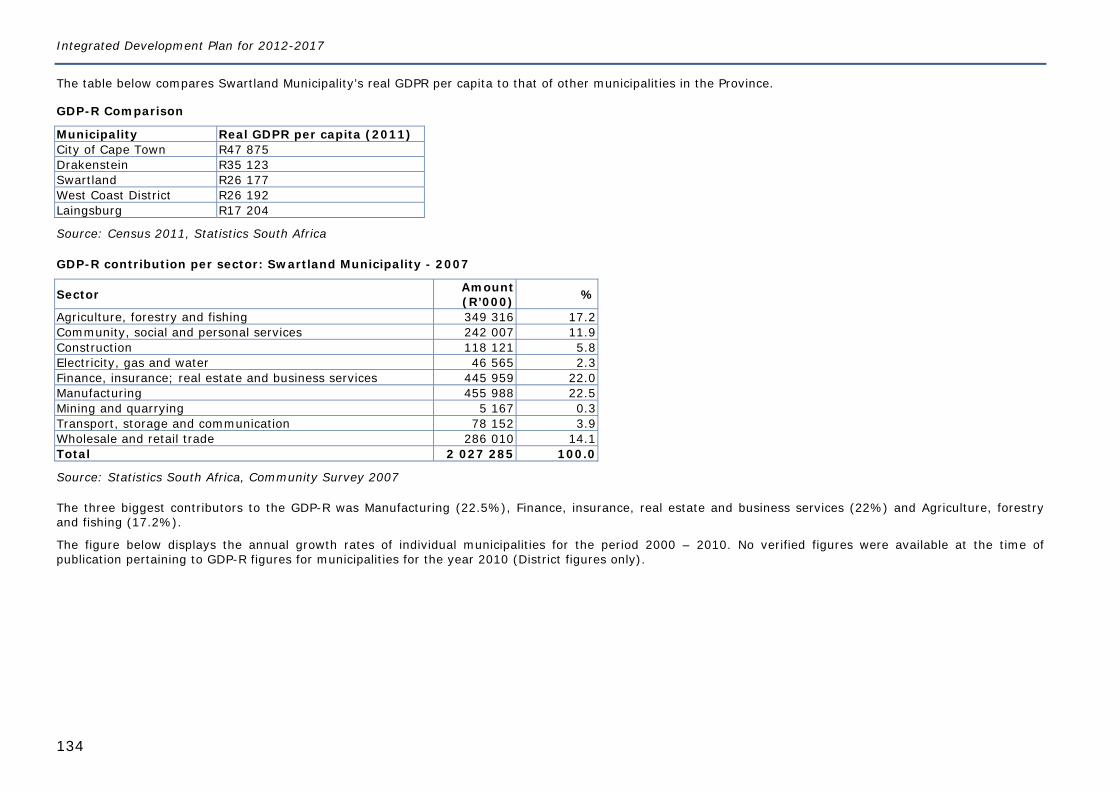
Integrated Development Plan for 2012-2017
134
The table below compares Swartland Municipality’s real GDPR per capita to that of other municipalities in the Province.
GDP-R Comparison
Municipality Real GDPR per capita (2011) City of Cape Town R47 875 Drakenstein R35 123 Swartland R26 177 West Coast District R26 192 Laingsburg R17 204
Source: Census 2011, Statistics South Africa
GDP-R contribution per sector: Swartland Municipality - 2007
Sector Amount (R’000) %
Agriculture, forestry and fishing 349 316 17.2 Community, social and personal services 242 007 11.9 Construction 118 121 5.8 Electricity, gas and water 46 565 2.3 Finance, insurance; real estate and business services 445 959 22.0 Manufacturing 455 988 22.5 Mining and quarrying 5 167 0.3 Transport, storage and communication 78 152 3.9 Wholesale and retail trade 286 010 14.1 Total 2 027 285 100.0
Source: Statistics South Africa, Community Survey 2007
The three biggest contributors to the GDP-R was Manufacturing (22.5%), Finance, insurance, real estate and business services (22%) and Agriculture, forestry and fishing (17.2%).
The figure below displays the annual growth rates of individual municipalities for the period 2000 – 2010. No verified figures were available at the time of publication pertaining to GDP-R figures for municipalities for the year 2010 (District figures only).
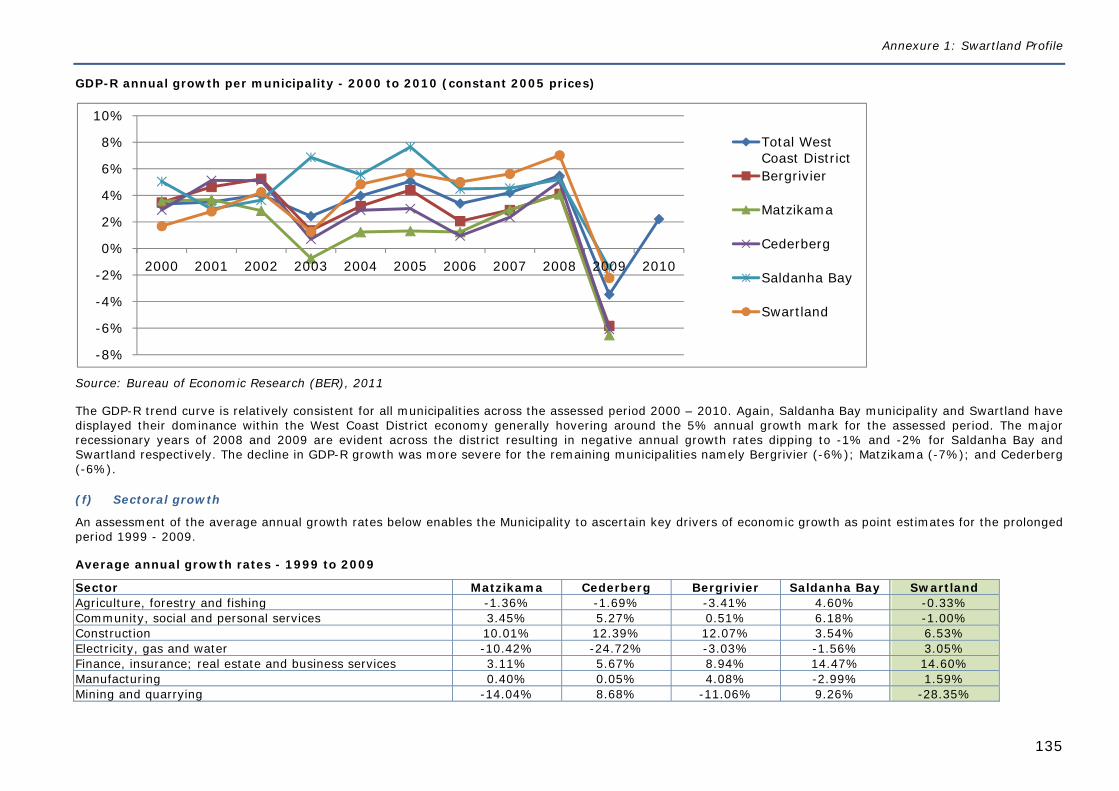
Annexure 1: Swartland Profile
135
GDP-R annual growth per municipality - 2000 to 2010 (constant 2005 prices)
Source: Bureau of Economic Research (BER), 2011
The GDP-R trend curve is relatively consistent for all municipalities across the assessed period 2000 – 2010. Again, Saldanha Bay municipality and Swartland have displayed their dominance within the West Coast District economy generally hovering around the 5% annual growth mark for the assessed period. The major recessionary years of 2008 and 2009 are evident across the district resulting in negative annual growth rates dipping to -1% and -2% for Saldanha Bay and Swartland respectively. The decline in GDP-R growth was more severe for the remaining municipalities namely Bergrivier (-6%); Matzikama (-7%); and Cederberg (-6%).
(f) Sectoral growth
An assessment of the average annual growth rates below enables the Municipality to ascertain key drivers of economic growth as point estimates for the prolonged period 1999 - 2009.
Average annual growth rates - 1999 to 2009
Sector Matzikama Cederberg Bergrivier Saldanha Bay Swartland Agriculture, forestry and fishing -1.36% -1.69% -3.41% 4.60% -0.33% Community, social and personal services 3.45% 5.27% 0.51% 6.18% -1.00% Construction 10.01% 12.39% 12.07% 3.54% 6.53% Electricity, gas and water -10.42% -24.72% -3.03% -1.56% 3.05% Finance, insurance; real estate and business services 3.11% 5.67% 8.94% 14.47% 14.60% Manufacturing 0.40% 0.05% 4.08% -2.99% 1.59% Mining and quarrying -14.04% 8.68% -11.06% 9.26% -28.35%
-8%
-6%
-4%
-2%
0%
2%
4%
6%
8%
10%
2000 2001 2002 2003 2004 2005 2006 2007 2008 2009 2010
Total WestCoast DistrictBergrivier
Matzikama
Cederberg
Saldanha Bay
Swartland
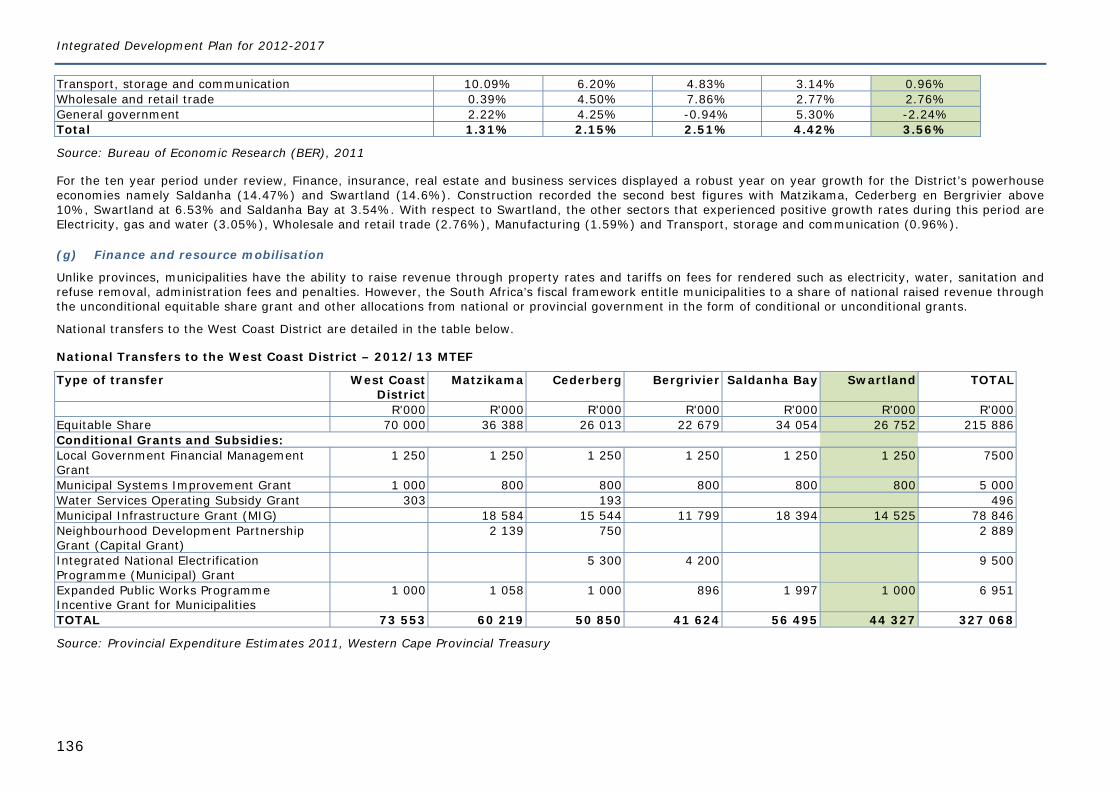
Integrated Development Plan for 2012-2017
136
Transport, storage and communication 10.09% 6.20% 4.83% 3.14% 0.96% Wholesale and retail trade 0.39% 4.50% 7.86% 2.77% 2.76% General government 2.22% 4.25% -0.94% 5.30% -2.24% Total 1.31% 2.15% 2.51% 4.42% 3.56%
Source: Bureau of Economic Research (BER), 2011
For the ten year period under review, Finance, insurance, real estate and business services displayed a robust year on year growth for the District’s powerhouse economies namely Saldanha (14.47%) and Swartland (14.6%). Construction recorded the second best figures with Matzikama, Cederberg en Bergrivier above 10%, Swartland at 6.53% and Saldanha Bay at 3.54%. With respect to Swartland, the other sectors that experienced positive growth rates during this period are Electricity, gas and water (3.05%), Wholesale and retail trade (2.76%), Manufacturing (1.59%) and Transport, storage and communication (0.96%).
(g) Finance and resource mobilisation
Unlike provinces, municipalities have the ability to raise revenue through property rates and tariffs on fees for rendered such as electricity, water, sanitation and refuse removal, administration fees and penalties. However, the South Africa’s fiscal framework entitle municipalities to a share of national raised revenue through the unconditional equitable share grant and other allocations from national or provincial government in the form of conditional or unconditional grants.
National transfers to the West Coast District are detailed in the table below.
National Transfers to the West Coast District – 2012/13 MTEF
Type of transfer West Coast District
Matzikama Cederberg Bergrivier Saldanha Bay Swartland TOTAL
R'000 R'000 R'000 R'000 R'000 R'000 R'000 Equitable Share 70 000 36 388 26 013 22 679 34 054 26 752 215 886 Conditional Grants and Subsidies: Local Government Financial Management Grant
1 250 1 250 1 250 1 250 1 250 1 250 7500
Municipal Systems Improvement Grant 1 000 800 800 800 800 800 5 000 Water Services Operating Subsidy Grant 303 193 496 Municipal Infrastructure Grant (MIG) 18 584 15 544 11 799 18 394 14 525 78 846 Neighbourhood Development Partnership Grant (Capital Grant)
2 139 750 2 889
Integrated National Electrification Programme (Municipal) Grant
5 300 4 200 9 500
Expanded Public Works Programme Incentive Grant for Municipalities
1 000 1 058 1 000 896 1 997 1 000 6 951
TOTAL 73 553 60 219 50 850 41 624 56 495 44 327 327 068
Source: Provincial Expenditure Estimates 2011, Western Cape Provincial Treasury
Annexure 2: External Analysis
137
A N N E X U R E 2 : E X T E R N A L A N A L Y S I S The external analysis was done through the following surveys and studies:
The 2011 Draft Spatial Development Framework (spatial and environmental analysis). The Spatial Development Framework is discussed in Chapter 5. The Regional Development Profile Study for the West Coast District that was done by the Western Cape Provincial Treasury in 2011 (social and economic analysis). The
Regional Development Profile Study is discussed in Annexure 1. The Client Service Survey that was done by Ekko Marketing Consultants in 2011 for all the towns and settlements in the municipal area. The Area Plans that were complied by the 12 ward committees between October 2011 and February 2012. The Area Plans deal with services backlogs per area,
the 5 most critical priorities per ward, action plans to address the priorities, and the Municipality’s 5 year capital budget broken down per area.
2.1 2011 CLIENT SERVICE SURVEY
(a) Research objectives, methodology and sample structure
Since service delivery is of major importance to Swartland Municipality, the need was expressed to do a survey amongst rate payers in order to determine how well it fares in maintaining the standards as set out in the Client Service Charter.
The target audience for the survey was identified as rate payers in each of the different towns within Swartland Municipality’s area of responsibility. Towns include Malmesbury (and surrounding settlements), Moorreesburg (including Koringberg), Darling, Riebeek Wes and Riebeek Kasteel as well as Yzerfontein (including Grotto Bay).
Telephonic interviews were conducted with 348 rate payers. The sample was stratified per town, taking into account the population sizes of the different towns. This means that the results are representative of the area that the municipality serves.
A structured questionnaire was used according to which rate payers had to evaluate the different services of the municipality.
Respondents were asked to evaluate the different service aspects on the following five point scale:
Excellent = 5 Good = 4 Average = 3 Poor = 2 Very poor = 1
Evaluations were only provided by those who had knowledge of a particular service aspect, or to whom the service is delivered (e.g. many respondents could not provide an evaluation of the service rendered with respect to building plans since they have not had any dealings with it).
Respondents also had the opportunity to motivate their scores in the event of a poor/very poor score. Although the main reasons for low scores are highlighted in the report, detail motivations are provided per town/area in Appendixes.
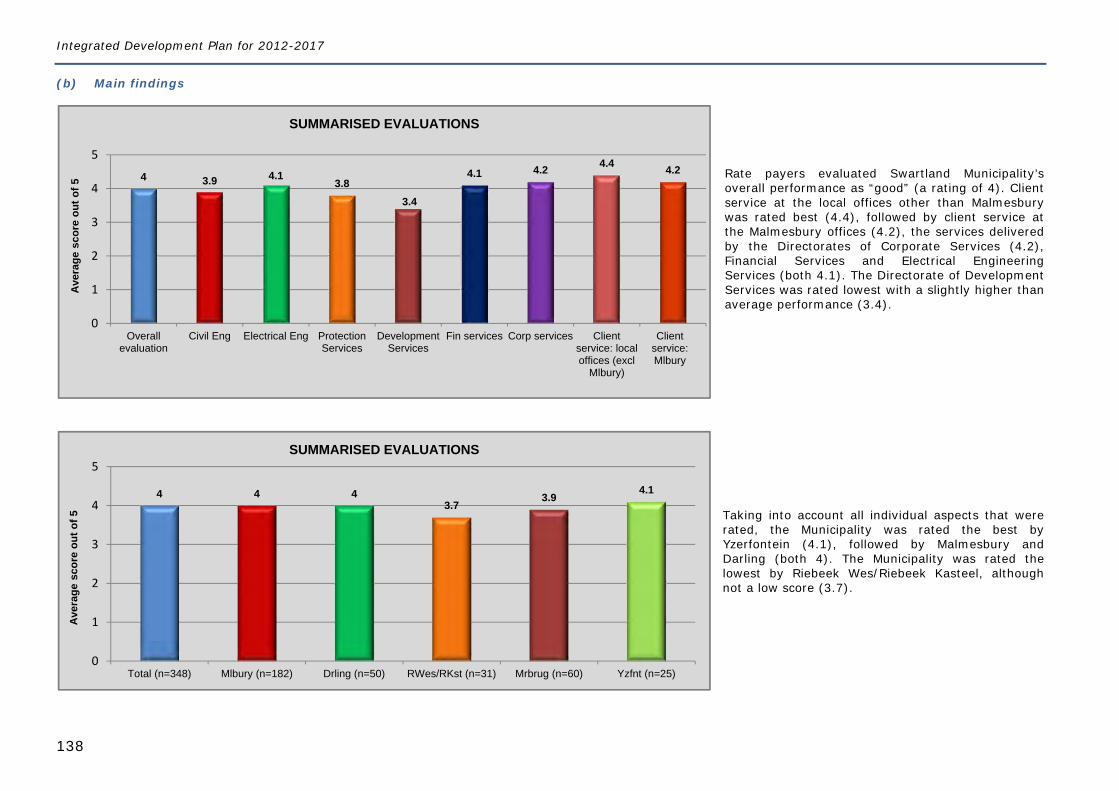
Integrated Development Plan for 2012-2017
138
4 3.9 4.13.8
3.4
4.1 4.2 4.4 4.2
0
1
2
3
4
5
Overallevaluation
Civil Eng Electrical Eng ProtectionServices
DevelopmentServices
Fin services Corp services Clientservice: localoffices (excl
Mlbury)
Clientservice:Mlbury
Ave
rage
sco
re o
ut o
f 5
SUMMARISED EVALUATIONS
4 4 43.7
3.94.1
0
1
2
3
4
5
Total (n=348) Mlbury (n=182) Drling (n=50) RWes/RKst (n=31) Mrbrug (n=60) Yzfnt (n=25)
Ave
rage
sco
re o
ut o
f 5
SUMMARISED EVALUATIONS
(b) Main findings
Rate payers evaluated Swartland Municipality’s overall performance as “good” (a rating of 4). Client service at the local offices other than Malmesbury was rated best (4.4), followed by client service at the Malmesbury offices (4.2), the services delivered by the Directorates of Corporate Services (4.2), Financial Services and Electrical Engineering Services (both 4.1). The Directorate of Development Services was rated lowest with a slightly higher than average performance (3.4).
Taking into account all individual aspects that were rated, the Municipality was rated the best by Yzerfontein (4.1), followed by Malmesbury and Darling (both 4). The Municipality was rated the lowest by Riebeek Wes/Riebeek Kasteel, although not a low score (3.7).
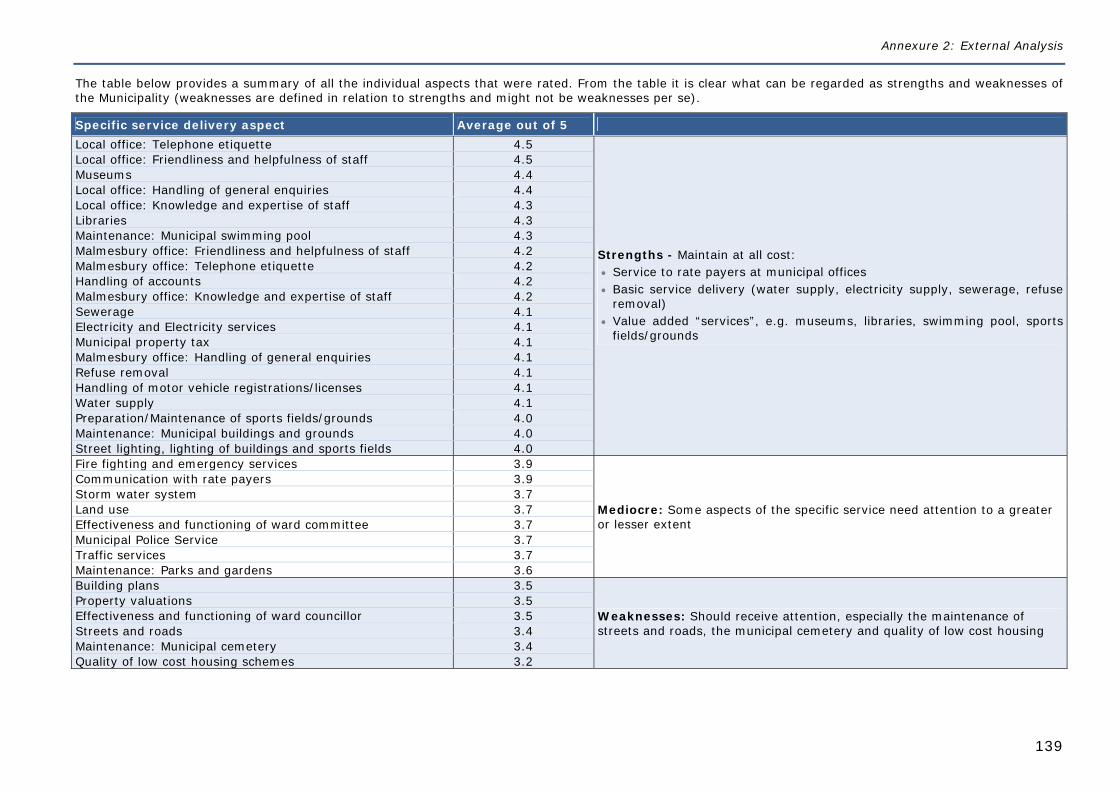
Annexure 2: External Analysis
139
The table below provides a summary of all the individual aspects that were rated. From the table it is clear what can be regarded as strengths and weaknesses of the Municipality (weaknesses are defined in relation to strengths and might not be weaknesses per se).
Specific service delivery aspect Average out of 5 Local office: Telephone etiquette 4.5
Strengths - Maintain at all cost: Service to rate payers at municipal offices Basic service delivery (water supply, electricity supply, sewerage, refuse
removal) Value added “services”, e.g. museums, libraries, swimming pool, sports
fields/grounds
Local office: Friendliness and helpfulness of staff 4.5 Museums 4.4 Local office: Handling of general enquiries 4.4 Local office: Knowledge and expertise of staff 4.3 Libraries 4.3 Maintenance: Municipal swimming pool 4.3 Malmesbury office: Friendliness and helpfulness of staff 4.2 Malmesbury office: Telephone etiquette 4.2 Handling of accounts 4.2 Malmesbury office: Knowledge and expertise of staff 4.2 Sewerage 4.1 Electricity and Electricity services 4.1 Municipal property tax 4.1 Malmesbury office: Handling of general enquiries 4.1 Refuse removal 4.1 Handling of motor vehicle registrations/licenses 4.1 Water supply 4.1 Preparation/Maintenance of sports fields/grounds 4.0 Maintenance: Municipal buildings and grounds 4.0 Street lighting, lighting of buildings and sports fields 4.0 Fire fighting and emergency services 3.9
Mediocre: Some aspects of the specific service need attention to a greater or lesser extent
Communication with rate payers 3.9 Storm water system 3.7 Land use 3.7 Effectiveness and functioning of ward committee 3.7 Municipal Police Service 3.7 Traffic services 3.7 Maintenance: Parks and gardens 3.6 Building plans 3.5
Weaknesses: Should receive attention, especially the maintenance of streets and roads, the municipal cemetery and quality of low cost housing
Property valuations 3.5 Effectiveness and functioning of ward councillor 3.5 Streets and roads 3.4 Maintenance: Municipal cemetery 3.4 Quality of low cost housing schemes 3.2
Integrated Development Plan for 2012-2017
140
(c) Other findings
Awareness of ward councillors and ward committees is low. Only 33% were aware who their ward councillor is and only 14% were aware who serves on their ward committees.
Respondents who were aware of the ward councillor and ward committee were asked to rate the effectiveness and functioning of these. Both the ward councillor and ward committee received a score between average and good (3.5 and 3.7 respectively). Approximately a quarter of those aware of their ward councillor however indicated that they cannot evaluate him/her since they do not know what they should do or that they do not see him/her at all.
95% of respondents regard regular communication from the Municipality as important and the written media is preferred when the Municipality communicates with respondents. It therefore does not come as a surprise that 83% of the respondents regard the municipal newsletter as the source providing the best information regarding the Municipality. When they want to find out more about the Municipality’s services, the municipal office or municipal officials will be consulted (82% of the respondents).
Overall, only 12% of respondents indicated that they are aware of the Client Service Charter and that they own a copy of it. A further 16% are aware of the charter but do not own their own copy. A very high 71% of respondents are not aware of the Client Service Charter.
2.2 AREA PLANS
The Municipality together with the ward committees commenced with the compilation of area plans covering all 12 wards. From 24 to 27 October meetings were held with all 12 ward committees to determine their issues and top five priorities. At the meetings the first draft of the area plans was also handed out to ward committee members to provide input into the document.
The area plans were finalised at a second series of meetings with ward committees (this time extended to include people from the sectors which ward committee members represent) between 27 February and 5 March.
Area-based planning is an initiative that complements the IDP process by focusing and zooming in on communities. Communities in this sense are represented by settlements and wards. Because wards are often delineated in a way that divides areas that in reality represent coherent communities or settlements, Swartland decided to take an approach that in the first place focuses on sensible geographical areas. It however also deals with wards so that ward planning is not neglected. To achieve this, a number of wards are combined for each area plan to echo the area-based approach in a pragmatic way.
The following five planning areas were identified:
Planning areas Wards Towns and settlements North 1 and 2 Moorreesburg and Koringberg East 3 and 12 Riebeek West and Riebeek Kasteel West 5 and 6 Darling and Yzerfontein South 4 and 7 Abbotsdale, Chatsworth, Riverlands and Kalbaskraal Central 8, 9, 10 and 11 (and small portions of wards 4, 7 and 12) Malmesbury
The importance of the role of the wards and ward committees is built into the process as the second Section of each Area Plan presents the ward committee members and the planning they have been involved with. It also contains the community inputs and the results of the public meetings pertaining to those wards.
Each area plan includes amongst others 2011 population figures and related demographic data, services capacity and backlogs, the most important priorities of the different wards, proposals from the Spatial Development Framework for that area, and the municipal capital budget for the next five years.
A summary of the ward priorities is provided in Chapter 6.
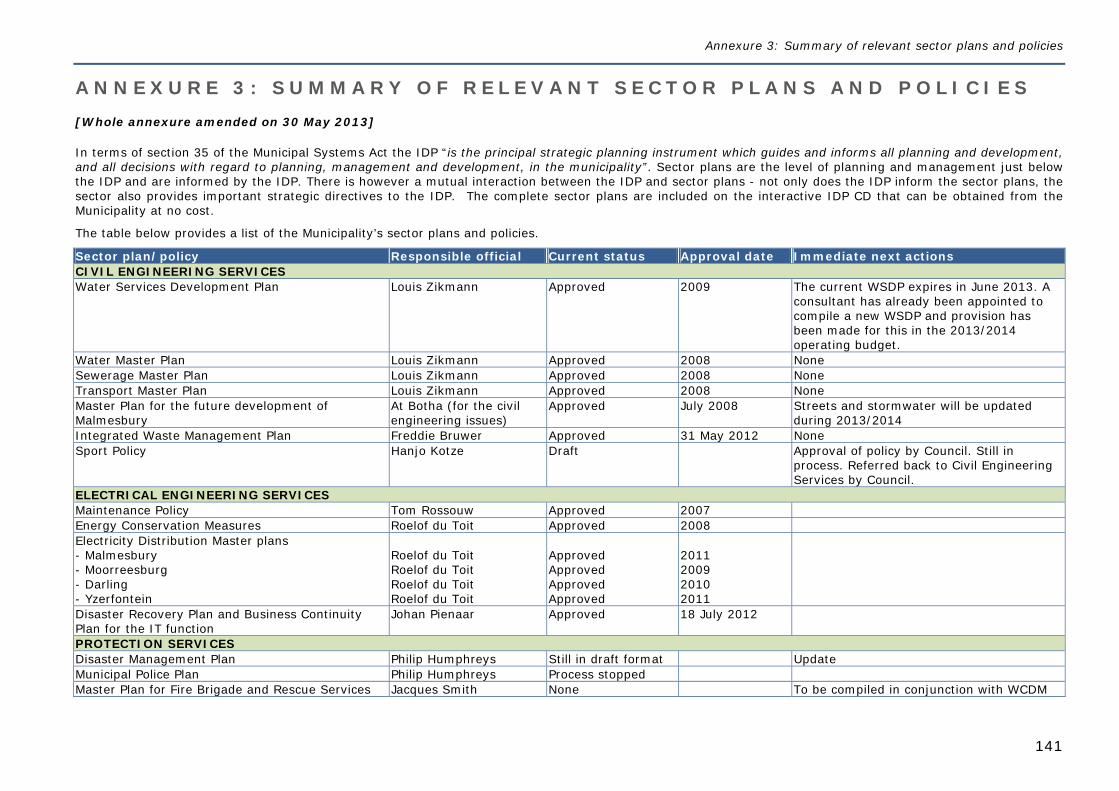
Annexure 3: Summary of relevant sector plans and policies
141
A N N E X U R E 3 : S U M M A R Y O F R E L E V A N T S E C T O R P L A N S A N D P O L I C I E S [Whole annexure amended on 30 May 2013]
In terms of section 35 of the Municipal Systems Act the IDP “is the principal strategic planning instrument which guides and informs all planning and development, and all decisions with regard to planning, management and development, in the municipality”. Sector plans are the level of planning and management just below the IDP and are informed by the IDP. There is however a mutual interaction between the IDP and sector plans - not only does the IDP inform the sector plans, the sector also provides important strategic directives to the IDP. The complete sector plans are included on the interactive IDP CD that can be obtained from the Municipality at no cost.
The table below provides a list of the Municipality’s sector plans and policies.
Sector plan/policy Responsible official Current status Approval date Immediate next actions CIVIL ENGINEERING SERVICES Water Services Development Plan Louis Zikmann Approved 2009 The current WSDP expires in June 2013. A
consultant has already been appointed to compile a new WSDP and provision has been made for this in the 2013/2014 operating budget.
Water Master Plan Louis Zikmann Approved 2008 None Sewerage Master Plan Louis Zikmann Approved 2008 None Transport Master Plan Louis Zikmann Approved 2008 None Master Plan for the future development of Malmesbury
At Botha (for the civil engineering issues)
Approved July 2008 Streets and stormwater will be updated during 2013/2014
Integrated Waste Management Plan Freddie Bruwer Approved 31 May 2012 None Sport Policy Hanjo Kotze Draft Approval of policy by Council. Still in
process. Referred back to Civil Engineering Services by Council.
ELECTRICAL ENGINEERING SERVICES Maintenance Policy Tom Rossouw Approved 2007 Energy Conservation Measures Roelof du Toit Approved 2008 Electricity Distribution Master plans - Malmesbury - Moorreesburg - Darling - Yzerfontein
Roelof du Toit Roelof du Toit Roelof du Toit Roelof du Toit
Approved Approved Approved Approved
2011 2009 2010 2011
Disaster Recovery Plan and Business Continuity Plan for the IT function
Johan Pienaar Approved 18 July 2012
PROTECTION SERVICES Disaster Management Plan Philip Humphreys Still in draft format Update Municipal Police Plan Philip Humphreys Process stopped Master Plan for Fire Brigade and Rescue Services Jacques Smith None To be compiled in conjunction with WCDM
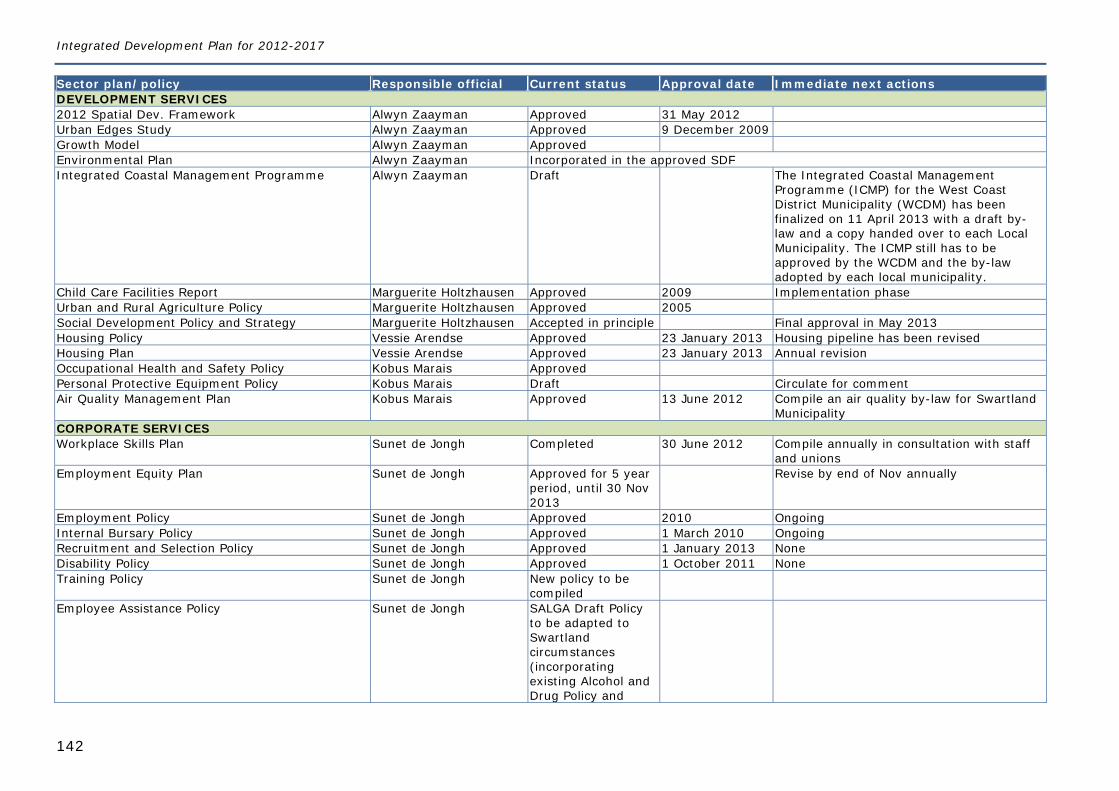
Integrated Development Plan for 2012-2017
142
Sector plan/policy Responsible official Current status Approval date Immediate next actions DEVELOPMENT SERVICES 2012 Spatial Dev. Framework Alwyn Zaayman Approved 31 May 2012 Urban Edges Study Alwyn Zaayman Approved 9 December 2009 Growth Model Alwyn Zaayman Approved Environmental Plan Alwyn Zaayman Incorporated in the approved SDF Integrated Coastal Management Programme Alwyn Zaayman Draft The Integrated Coastal Management
Programme (ICMP) for the West Coast District Municipality (WCDM) has been finalized on 11 April 2013 with a draft by-law and a copy handed over to each Local Municipality. The ICMP still has to be approved by the WCDM and the by-law adopted by each local municipality.
Child Care Facilities Report Marguerite Holtzhausen Approved 2009 Implementation phase Urban and Rural Agriculture Policy Marguerite Holtzhausen Approved 2005 Social Development Policy and Strategy Marguerite Holtzhausen Accepted in principle Final approval in May 2013 Housing Policy Vessie Arendse Approved 23 January 2013 Housing pipeline has been revised Housing Plan Vessie Arendse Approved 23 January 2013 Annual revision Occupational Health and Safety Policy Kobus Marais Approved Personal Protective Equipment Policy Kobus Marais Draft Circulate for comment Air Quality Management Plan Kobus Marais Approved 13 June 2012 Compile an air quality by-law for Swartland
Municipality CORPORATE SERVICES Workplace Skills Plan Sunet de Jongh Completed 30 June 2012 Compile annually in consultation with staff
and unions Employment Equity Plan Sunet de Jongh Approved for 5 year
period, until 30 Nov 2013
Revise by end of Nov annually
Employment Policy Sunet de Jongh Approved 2010 Ongoing Internal Bursary Policy Sunet de Jongh Approved 1 March 2010 Ongoing Recruitment and Selection Policy Sunet de Jongh Approved 1 January 2013 None Disability Policy Sunet de Jongh Approved 1 October 2011 None Training Policy Sunet de Jongh New policy to be
compiled
Employee Assistance Policy Sunet de Jongh SALGA Draft Policy to be adapted to Swartland circumstances (incorporating existing Alcohol and Drug Policy and
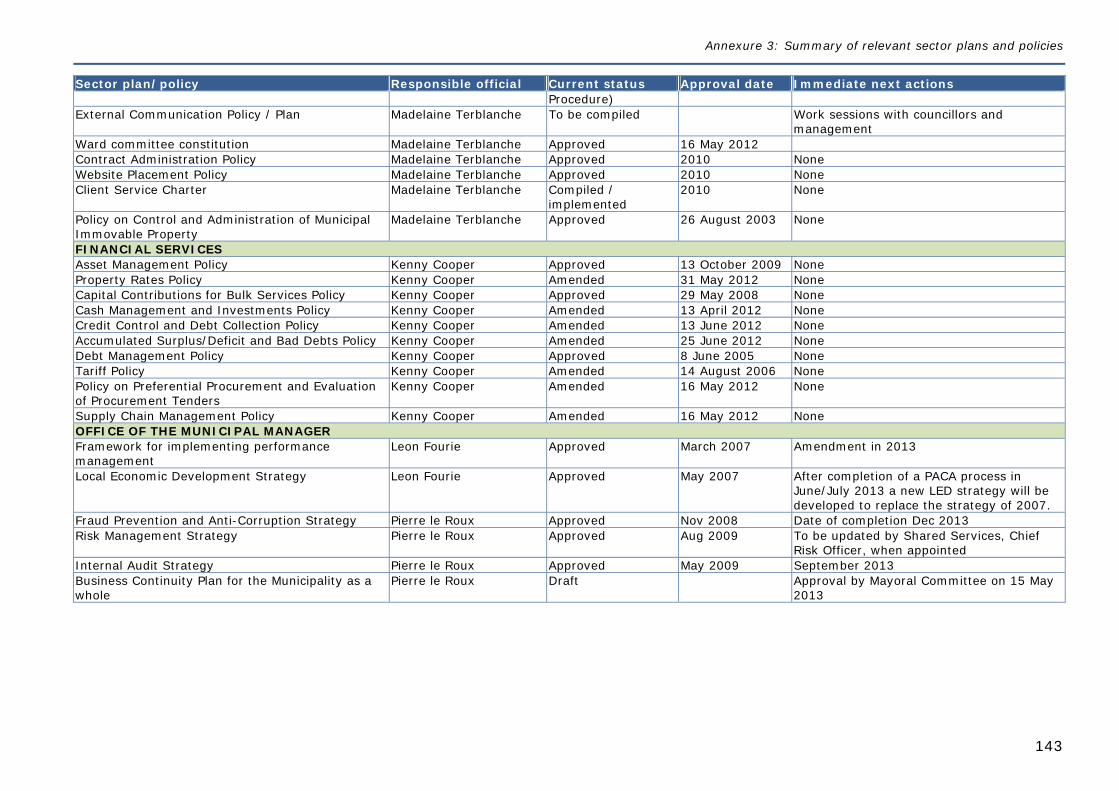
Annexure 3: Summary of relevant sector plans and policies
143
Sector plan/policy Responsible official Current status Approval date Immediate next actions Procedure)
External Communication Policy / Plan Madelaine Terblanche To be compiled Work sessions with councillors and management
Ward committee constitution Madelaine Terblanche Approved 16 May 2012 Contract Administration Policy Madelaine Terblanche Approved 2010 None Website Placement Policy Madelaine Terblanche Approved 2010 None Client Service Charter Madelaine Terblanche Compiled /
implemented 2010 None
Policy on Control and Administration of Municipal Immovable Property
Madelaine Terblanche Approved 26 August 2003 None
FINANCIAL SERVICES Asset Management Policy Kenny Cooper Approved 13 October 2009 None Property Rates Policy Kenny Cooper Amended 31 May 2012 None Capital Contributions for Bulk Services Policy Kenny Cooper Approved 29 May 2008 None Cash Management and Investments Policy Kenny Cooper Amended 13 April 2012 None Credit Control and Debt Collection Policy Kenny Cooper Amended 13 June 2012 None Accumulated Surplus/Deficit and Bad Debts Policy Kenny Cooper Amended 25 June 2012 None Debt Management Policy Kenny Cooper Approved 8 June 2005 None Tariff Policy Kenny Cooper Amended 14 August 2006 None Policy on Preferential Procurement and Evaluation of Procurement Tenders
Kenny Cooper Amended 16 May 2012 None
Supply Chain Management Policy Kenny Cooper Amended 16 May 2012 None OFFICE OF THE MUNICIPAL MANAGER Framework for implementing performance management
Leon Fourie Approved March 2007 Amendment in 2013
Local Economic Development Strategy Leon Fourie Approved May 2007 After completion of a PACA process in June/July 2013 a new LED strategy will be developed to replace the strategy of 2007.
Fraud Prevention and Anti-Corruption Strategy Pierre le Roux Approved Nov 2008 Date of completion Dec 2013 Risk Management Strategy Pierre le Roux Approved Aug 2009 To be updated by Shared Services, Chief
Risk Officer, when appointed Internal Audit Strategy Pierre le Roux Approved May 2009 September 2013 Business Continuity Plan for the Municipality as a whole
Pierre le Roux Draft Approval by Mayoral Committee on 15 May 2013