annual report - molemole municipality
TRANSCRIPT
2018/19
Private Bag X 44 Private Bag X 44
Mogwadi Morebeng
0715 0715
Physical Address: Main Office Morebeng Office
303 Church Street 25 Cnr. Roets & Viviers Street
Mogwadi Mogwadi 0715
0715
Contact no: 015 501 2300/ 015 501 0243/4 015 501 2371
Website address: www.molemole.gov.za
@mlmmunicipality
Molemole Local Municipality
Vision: A developmental people driven organization that serves its people
Mission: To provide essential and sustainable services in an efficient and effective manner

2
CONTENTS
CONTENTS ............................................................................................................................................................ 2
EXECUTIVE SUMMARY .............................................................................................................................................. 8
COMPONENT A: MAYOR’S FOREWORD .......................................................................................... 8
1.1. MUNICIPAL FUNCTIONS, POPULATION AND ENVIRONMENTAL
OVERVIEW ................................................................................................................................ 14
1.2. SERVICE DELIVERY OVERVIEW ............................................................................... 22
1.3. FINANCIAL HEALTH OVERVIEW .............................................................................. 23
1.4. ORGANISATIONAL DEVELOPMENT OVERVIEW ............................................................ 28
1.6 AUDITOR GENERAL REPORT ..................................................................................... 29
1.7 STATUTORY ANNUAL REPORT PROCESS .............................................................. 30
CHAPTER 2 – GOVERNANCE ......................................................................................................................... 32
COMPONENT A: POLITICAL AND ADMINISTRATIVE GOVERNANCE ............................................. 32
2.1 POLITICAL GOVERNANCE ........................................................................................... 32
2.2 ADMINISTRATIVE GOVERNANCE ............................................................................ 35
COMPONENT B: INTERGOVERNMENTAL RELATIONS ....................................................................... 38
2.3 INTERGOVERNMENTAL RELATIONS ....................................................................... 38
COMPONENT C: PUBLIC ACCOUNTABILITY AND PARTICIPATION ................................................. 38
2.4 PUBLIC MEETINGS ........................................................................................................ 39
2.5 IDP PARTICIPATION AND ALIGNMENT ................................................................ 41
COMPONENT D: CORPORATE GOVERNANCE ..................................................................................... 42
2.6 RISK MANAGEMENT ...................................................................................................... 42
2.7 ANTI-CORRUPTION AND FRAUD ............................................................................. 45
2.8 SUPPLY CHAIN MANAGEMENT ................................................................................. 46
2.9 BY-LAWS ........................................................................................................................... 48
2.10 WEBSITES ......................................................................................................................... 48
2.11 PUBLIC SATISFACTION ON MUNICIPAL SERVICES................................. 50
CHAPTER 3 – SERVICE DELIVERY PERFORMANCE ............................................................................... 52
(PERFORMANCE REPORT PART I) ............................................................................................................... 52
3
1. FINANCIAL PERFORMANCE OF THE MUNICIPALITY FOR THE FINANCIAL YEAR 2018/19 ................................ 53
1.1 Total Revenue and Expenditure by Source ........................................................................................... 53
1.2 Graphical Illustration: Revenue and Expenditure for 2017/18 and 2018/19 .............................. 55
1.3 Operating Budget and Expenditure for the 2018/19 financial year ................................................... 56
1.4 Capital Budget and Expenditure for the 2018/19 financial year .................................................. 57
1.5 Graphical Illustration: Annual budget vs actual Expenditure per financial year ........................ 58
1.6 COMPREHENSIVE ANALYSIS OF SERVICE DEBTORS............................................................................. 58
1.7 Graphical Illustration: Total Debt 2017/18 and 2018/19 ...................................................................... 59
2. 170NON-FINANCIAL/SERVICE DELIVERY PERFORMANCE ................................................................................ 60
5.1 Summary of non-Financial Performance per Municipal Departments during 2017/18 FY ................ 60
5.2 Summary of non-Financial Performance per Municipal Departments during 2018/19 FY
61
5.3 Graphical illustration: Percentage of targets achieved ................................................................. 62
3. SUMMARY OF NON- PERFORMANCE OF SET TARGETS AND MEASURES TO IMPROVE PERFORMANCE ......... 63
1.5 Departmental performance against planned targets as per the 2018/19 SDBIP ......................................... 65
3.1 Local Economic Development and Planning ......................................................................................... 66
7.2 Technical Services ................................................................................................................................. 73
7.3 Community Services ............................................................................................................................. 80
7.4 Corporate Services ............................................................................................................................... 85
7.5 Municipal Manager’s Office ................................................................................................................. 94
7.6 Budget and Treasury Department ..................................................................................................... 107
4. KEY CHALLENGES DURING THE YEAR UNDER REVIEW - 2018/19 .................................................................. 118
COMPONENT A: BASIC SERVICES ........................................................................................................ 119
3.1. WATER PROVISION .................................................................................................... 119
3.2 WASTE WATER (SANITATION) PROVISION ..................................................... 120
3.3 ELECTRICITY ................................................................................................................. 122
3.4 WASTE MANAGEMENT ................................................................................................ 125
4
3.5 HOUSING ......................................................................................................................... 128
3.6 FREE BASIC SERVICES AND INDIGENT SUPPORT .......................................... 129
COMPONENT B: ROAD TRANSPORT ..................................................................................................... 132
3.7 ROADS .............................................................................................................................. 132
3.8 TRANSPORT (INCLUDING VEHICLE LICENSING & PUBLIC BUS
OPERATION) .......................................................................................................................... 136
3.9 WASTE WATER (STORMWATER DRAINAGE) ............................................................... 139
COMPONENT C: PLANNING AND DEVELOPMENT .......................................................................... 142
3.10 PLANNING .............................................................................................................. 142
3.11 LOCAL ECONOMIC DEVELOPMENT (INCLUDING TOURISM AND
MARKET PLACES) ................................................................................................................. 145
COMPONENT D: COMMUNITY & SOCIAL SERVICES ......................................................................... 149
3.12 LIBRARIES; ARCHIEVES; MUSEUMS; GALLERIES; COMMUNITY
FACILITIES; OTHER (THEATRES, ZOOS, ETC) .......................................................... 149
3.13 CEMETORIES AND CREMATORIUMS ............................................................ 151
3.14 CHILD CARE; AGED CARE; SOCIAL PROGRAMMES................................. 151
COMPONENT E: ENVIRONMENTAL PROTECTION ............................................................................. 153
3.15 POLLUTION CONTROL ....................................................................................... 153
COMPONENT F: HEALTH ......................................................................................................................... 153
3.17 CLINICS ................................................................................................................... 153
3.18 AMBULANCE SERVICES ..................................................................................... 154
3.19 HEALTH INSPECTION; FOOD AND ABBATOIR LICENSING AND
INSPECTION; ETC ................................................................................................................ 154
COMPONENT G: SECURITY AND SAFETY .......................................................................................... 154
3.20 POLICE ..................................................................................................................... 154
3.21 FIRE .......................................................................................................................... 154
3.22 OTHER (DISASTER MANAGEMENT, ANIMAL LICENCING AND
CONTROL, CONTROL OF PUBLIC NUISANCES AND OTHER) .......................... 154
COMPONENT H: SPORT AND RECREATION........................................................................................ 155
5
3.23 SPORT AND RECREATION ......................................................................................... 155
COMPONENT I: CORPORATE POLICY OFFICES AND OTHER SERVICES ................................... 156
3.24 EXECUTIVE AND COUNCIL ............................................................................... 156
3.25 FINANCIAL SERVICES ....................................................................................... 158
3.26 HUMAN RESOURCE SERVICES ................................................................................ 161
3.27 INFORMATION AND COMMUNICATION TECHNOLOGY (ICT) SERVICES
167
3.28 PROPERTY; LEGAL; RISK MANAGEMENT AND PROCUREMENT
SERVICES ................................................................................................................................ 169
COMPONENT J: MISCELLANEOUS ......................................................................................................... 170
COMPONENT K: ORGANISATIONAL PERFOMANCE SCORECARD ............................................... 170
CHAPTER 4 – ORGANISATIONAL DEVELOPMENT PERFORMANCE ................................................. 171
(PERFORMANCE REPORT PART II) ............................................................................................................ 171
COMPONENT A: INTRODUCTION TO THE MUNICIPAL PERSONNEL ........................................... 171
4.1 EMPLOYEE TOTALS, TURNOVER AND VACANCIES .......................................... 172
COMPONENT B: MANAGING THE MUNICIPAL WORKFORCE ......................................................... 174
4.2 HR Policies ...................................................................................................................... 174
4.3 Injury on duty ............................................................................................................... 175
PERFORMANCE REWARDS ................................................................................................ 177
COMPONENT C: CAPACITATING THE MUNICIPAL WORKFORCE ................................................. 177
4.5 SKILLS DEVELOPMENT AND TRAINING .............................................................. 177
COMPONENT D: MANAGING THE WORKFORCE EXPENDITURE................................................... 180
4.6 EMPLOYEE EXPENDITURE ........................................................................................ 180
CHAPTER 5 – FINANCIAL PERFORMANCE .............................................................................................. 182
COMPONENT A: STATEMENTS OF FINANCIAL PERFORMANCE ................................................... 183
5.1 Introduction to financial statements ................................................................... 183
5.2 GRANTS PERFORMANCE ............................................................................................ 191
5.3 ASSET MANAGEMENT ................................................................................................. 192
5.4 FINANCIAL RATIOS BASED ON KEY PERFORMANCE INDICATORS......................... 195
6
COMPONENT B: SPENDING AGAINST CAPITAL BUDGET................................................................ 204
5.4 SOURCES OF FINANCE ............................................................................................... 205
COMPONENT C: CASH FLOW MANAGEMENT AND INVESTMENTS .............................................. 209
5.9 CASH FLOW ...................................................................................................................... 209
5.10 Municipal investments ...................................................................................... 211
COMPONENT D: OTHER FINANCIAL MATTERS .................................................................................. 213
5.12 GRAP COMPLIANCE ............................................................................................ 213
COMPONENT A: AUDITOR-GENERAL OPINION OF FINANCIAL STATEMENTS 2017-18 .......... 214
6.1 AUDITOR GENERAL REPORTS Year -1 (Previous year) ................................................ 214
A SUMMARY OF AUDIT FINDINGS FOR THE 2017/18 FINANCIAL YEAR IS
TABLED BELOW ..................................................................................................................... 215
COMPONENT B: AUDITOR-GENERAL OPINION YEAR (2018/19) ................................................... 217
6.2 AUDITOR GENERAL REPORT YEAR 2018/19 ..................................................... 217
GLOSSARY ........................................................................................................................................................ 220
APPENDICES .................................................................................................................................................... 223
APPENDIX A – COUNCILLORS; COMMITTEE ALLOCATION AND COUNCIL ATTENDANCE .... 224
APPENDIX B – COMMITTEES AND COMMITTEE PURPOSES.......................................................... 226
APPENDIX C –THIRD TIER ADMINISTRATIVE STRUCTURE ............................................................ 228
APPENDIX D – FUNCTIONS OF MUNICIPALITY / ENTITY ................................................................. 229
APPENDIX E – WARD REPORTING ......................................................................................................... 231
APPENDIX F – WARD INFORMATION ..................................................................................................... 238
APPENDIX G – RECOMMENDATIONS OF THE MUNICIPAL AUDIT COMMITTEE YEAR 2018/19
.......................................................................................................................................................................... 241
APPENDIX H – LONG TERM CONTRACTS AND PUBLIC PRIVATE PARTNERSHIPS ................. 264
APPENDIX I – MUNICIPAL ENTITY/ SERVICE PROVIDER PERFORMANCE SCHEDULE .......... 265
APPENDIX J – DISCLOSURES OF FINANCIAL INTERESTS: SENIOR MANAGERS ..................... 271
APPENDIX K: REVENUE COLLECTION PERFORMANCE BY VOTE AND BY SOURCE ............. 272
7
APPENDIX K (i): REVENUE COLLECTION PERFORMANCE BY VOTE ........................................... 272
APPENDIX K (ii): REVENUE COLLECTION PERFORMANCE BY SOURCE .................................... 274
APPENDIX L: CONDITIONAL GRANTS RECEIVED: EXCLUDING MIG ........................................... 275
APPENDIX M: CAPITAL EXPENDITURE – NEW & UPGRADE/RENEWAL PROGRAMMES ....... 276
APPENDIX M (i): CAPITAL EXPENDITURE - NEW ASSETS PROGRAMME.................................... 276
APPENDIX M (ii): CAPITAL EXPENDITURE – UPGRADE/RENEWAL PROGRAMME ................... 279
APPENDIX N – CAPITAL PROGRAMME BY PROJECT YEAR 2018/19 ............................................ 282
APPENDIX O – CAPITAL PROGRAMME BY PROJECT BY WARD YEAR 2017/18 ........................ 283
APPENDIX P – SERVICE CONNECTION BACKLOGS AT SCHOOLS AND CLINICS..................... 284
APPENDIX Q – SERVICE BACKLOGS EXPERIENCED BY THE COMMUNITY WHERE ANOTHER
SPHERE OF GOVERNMENT IS RESPONSIBLE FOR SERVICE PROVISION ................................ 285
APPENDIX R – DECLARATION OF LOANS AND GRANTS MADE BY THE MUNICIPALITY ........ 286
APPENDIX S – NATIONAL AND PROVINCIAL OUTCOMES FOR LOCAL GOVERNMENT .......... 287
VOLUME II: ANNUAL FINANCIAL STATEMENTS ................................................................................ 288
Report of the auditor-general to the Limpopo Provincial Legislation and council on Molemole Local Municipality
.............................................................................................................................................................................. 384
Report on the 2018/19 financial statements ....................................................................... 384
EXECUTIVE SUMMARY
COMPONENT A: MAYOR’S FOREWORD
1. Introduction
Molemole municipality is endowed with agricultural, tourism and mining potential which need a
concerted effort to exploit in order to realize our potential of local economic development for the
citizens of this municipality. It is therefore our intention to ensure our service delivery programme
is aligned with Limpopo Development plan as well other national policies to ensure a truly
integrated development agenda. We continue to participate in the provincial and national forums
with a view to come with practical ways to advance the developmental agenda of government.
Sector departments are invited to the planning sessions of the municipality for them to appreciate
the challenges we face a rural based municipality.
The present Council is in its fourth year of the five year term. This Annual report seeks to provide a comprehensive performance report of the municipality in the 2018/19 financial year. Like any local
government authority Molemole municipality is seized with the responsibility to discharge its mandate of providing basic services to the residents of the municipality. The 2018/19 Annual report is based on the approved IDP, Budget as well as performance management system for the 2018/19 financial year. At the start of the 2018/19 financial year I have outlined several service delivery programmes that this Council committed to implement in the financial year. It is therefore logical that we provide the outcome of that implementation programme as part of our commitment to be a transparent, open and accountable administration.
2. Public participation Our public participation drive continues to be a pillar of our intention to involve the people from the planning, implementation as well as review process of our service delivery agenda. During the 2018/19 the municipality held quarterly outreach programmes to give a report card on our quarterly targets. Molemole municipality is a water services provider while Capricorn District
municipality is an authority. We are also pleased with our District municipality for organizing outreach programmes with a view to listen to the concerns of the people on delivery of water and sanitation services in our area. Furthermore, we appreciate the community of Molemole for their participation during the preparation of the 2019/20 IDP and Budget. It is only through your involvement that we can indeed
realize the dream of a developmental local government that serves its people. After a long and hard reflection, and also considering the limited financial resources at our disposal, the Council of Molemole came up with a credible IDP over the next three financial years (2019/20 – 2021/22) that sought to touch the lives of our people across all the wards. Let me also appreciate the community
of Molemole for having gone all out an express their hard earned democratic right during the May 2019 National and Provincial Elections. We further encouraged anyone above the age of sixteen (16) to go and register as voters as we prepare for the coming 2021 Local government elections.
3. Capacity building of Councillors
We continue to capacitate our Councillors as well as Ward committees to ensure they oversee the activities of administration. Councillors and Ward Councillors play a key intermediary role between the municipality and the residents, hence in the 2018/19 financial year three training programmes and two training programmes were coordinated for Councillors and Ward Committees, respectively.
9
Our council committee continued to hold meetings in line with predetermined schedules. Our governance committees, MPAC an Ethics committees are fully functional and are able to consider quarterly reports and monitor service delivery projects to ensure our people get good value for money invested in such projects.
4. Financial Viability And Sustainability
The main challenge of unsatisfactory revenue collection is still plaguing our municipality. We however am pleased to report that we have steamed ahead with the full implementation of Credit and debt collection policies to ensure we are able to recover the costs of providing services. It is only through successful recovery of what is due to the municipality that we are able to sustainably continue to discharge our constitutional mandate of providing basic services to our constituency.
I would like to thank the municipal administration, led by the Municipal Manager for their gallant efforts of ensuring adherence to internal control systems. This is evident in the reduction of Auditor-General queries from thirty eight (38) in the previous financial year to the current twenty five (25).
5. Key service delivery programmes in the year under review
The long outstanding project of Eisleben to Ramokgopa gravel to tar road is finally completed. We made this commitment the previous state of the municipal address. The 400 meter Mohodi to Maponto gravel to tar road project has also been completed. The Matipane to Madikana gravel to tar road project has been at the beginning of third quarter. The projects for upgrading of internal streets for Capricorn Park and Nthabiseng were also completed successfully. All the above projects were completed way ahead of schedule. It is for this reason that COGTA has allocated an additional
R 12 million in recognition this achievement. The money has been reallocated to Capricorn Park and Nthabiseng to implement further scope. Our engagements with Sanral to prioritize our D roads are
continuing. Mohodi Sports Complex is one of the projects that has been dragging on for a long time. This Council has committed to finalize implementation of this project in the 2019/20 financial year. Installation of 2500 grandstands have been budgeted for a total amount of R 3 million.
Our cost recovery in electricity sales is still a worrying factor. It is for this reason that a service provider has been appointed towards the end of the 2018/19 financial year for replacement of old meters with smart meters. The intention is ensure the municipality reduces the electricity loses to within the 10% band as required by MFMA. Most importantly, however, is to ensure we are able to recover the cost of buying electricity and channel the money into other key service delivery
projects. We further call on our community in Mogwadi and Morebeng to cooperate with the municipality in this regard and further to that discourage illegal connections within our midst. We are grateful for the continued electrification programme run by Eskom in our villages. In the previous financial year Eskom made a commitment to electrify our villages. Sekakene village in
Ward 08, Ga-Phasha in Ward 03 have benefitted from these programme. We are further grateful that the programme will continue well into the 2019/20 financial year, benefitting the community of
Kanana (21 households), Rheinland/Westphalia (108 households) and Ga-Phago, Sekuruwe, Kolopo, Flora and Ga-phaudi in Wards 15 & 16, benefitting 120 households. It is sad to report that Moletji cluster office is behind schedule due to land dispute and capacity challenges of the service provider. We are however still committed to get the office completed, hence the initial contractor was terminated and the project has been reprioritized in the 2019/20 financial year.
To be recognised by our colleagues and peers at a provincial and national government level for our successes is very important as it provides a benchmark for success. We are grateful for the
10
recognition by the Premier of Limpopo for consistent unqualified audit opinions in four consecutive financial years.
Although the Municipality faces many challenges, we are very optimistic that together we shall
successfully manage to better the lives of our people.
11
COMPONENT B: MUNICIPAL MANAGER’S OVERVIEW Outlined below is a summary of how the municipality has performed on its mandate, powers and function during the year under review. 2.1 Institutional Transformation and Organisational Development
A complete assessment and staff review of our Organogram was done resulting after the successful
work study exercise done with COGHSTA. This will provide the necessary skills and staff
complement to fulfil the mandate of the Municipality. The outcome of the work study has helped
the municipality to identify areas that need to be beefed up with personnel to ensure efficiency of
our operations. We have also reconfigured some positions by moving office of the IDP to the
Municipal Manager’s office. This will ensure IDP Manager will work together with PMS Manager,
overseen by the Municipal Manager. The District Job evaluation committee is at an advanced stage
of job evaluation to ensure the municipality is on par with its peers in terms of grading of personnel
posts.
We have experienced relative stability in the Senior Management positions, with only one vacant
position around November 2018 after expiry of the contract of the Senior Manager: Local Economic
Development. This position will be filled in the 1st quarter of the 2019/20 financial year.
Employee capacity building is still central to this administration. The municipality has coordinated
seven (07) employee training programmes in the year under review. Just over R 400,000 has been
spent on employee bursary scheme in support employee career development. We continue to
facilitate Internship and learnership programmes, with six programmes facilitated during the
2018/19 financial year. The programmes related to financial management, public administration
and Management, communication, Risk management, local economic development, town and urban
development. We have also partnered with Services Seta to facilitate a 12 month cleaning and
Hygiene internship programme, which benefited about 115 learners. These learners receive a
stipend of R 2,000 per month for transport and other logistics.
In the previous financial year we have committed to cascade performance management systems to
all levels of employees. It is pleasing to report that much work has been done to realize this goal.
Performance plans for Managers have been finalized and will be activated in the first quarter of the
2019/20 financial year. It is our firm commitment to finalize cascading to all employees at the end
of the 2nd quarter.
12
2.2 Basic Services and Infrastructure Delivery
The municipality has been doing very well with implementation of MIG projects. As at June 2019
the municipality spent 97% of MIG funding. This has helped us to get additional funding of R 12
million which has been used to speed up implementation of our two remaining MIG projects,
Nthabiseng and Capricorn Internal Streets in Ward one. We have committed in the 2019/20
financial year to conduct feasibility study for further projects. The report of this study will serve as
a critical base for registering further service delivery projects in the coming financial years.
As part of our compliance to environmental management prescripts we have finalized the
integrated waste management plan in the year under review. Additional skip loader bins have been
procured to extend refuse collection in rural villages. This will be complemented by the purchase of
a skip loader truck in the 2019/20 financial year.
2.3 Local Economic Development
The Municipality has successfully hosted the 2019 Career and Skills Expo on Friday, 12th of April
2019 at Mohodi Community Hall. The Expo benefited 1115 grade 12 learners of which 618 were
females and 497 were males. We have also hosted a successful investor conference in the fourth
quarter of the 2018/19. This is our annual event where business, government and civil society
converge under one roof to generate creative ideas of boosting economic growth through
entrepreneurship. With unemployment figures at alarming levels, this type of conference is a
necessity if we are to reverse those figures, especially among the youth sections of our population.
It is an accepted fact that small businesses have a high labour absorption rate than their large
counterparts. Just over 22% of procurement spent in the 2018/19 financial year went to local
suppliers; representing about R 17.8 million in monetary terms.
2.4 Financial Viability and Sustainable Management
The municipality is still heavily grant dependent with 69% of income derived from grant funding. Our enforcement of credit control and debt collection policy is starting to bear some fruits. As at the end of the 2018/19 financial year we had already collected 79% of billed revenue. This improvement will ensure the sustainability of the municipality. We thank the residents of Mogwadi and Morebeng as well as our sector departments for honouring their accounts as and when whey
become due.
An increase in our revenue is also critical as it helps the municipality to fulfil one of the important mandate, provision of free basic services to the indigents. In the year under review total beneficiaries for free basic services (water, refuse removal and electricity) stood at 5079 with a monthly provision of R 2500 per household. The total income on investment for the year under review was R 1.8 million compared to R 1.5 million in the 2017/18 financial year. This represents an increase of 20% from the previous
financial year. With the current ratio of 3.1 (way above the Treasury norm of 1.5 – 2.11) the municipality had R 3.1 for every R 1 of the current liability. This liquidity level was well on course to
13
meet the municipal short-term operational requirements like staff benefits and other payables from exchange transactions. We shall continue to make prudent investment decisions by investing in credible investment portfolios to boost the municipal cash income. 2.5 Good Governance and Administration
Following an unqualified audit opinion in the 2017/18 financial year the municipal administration has been working purposefully to address all the thirty eight findings, made of five (5) matters affecting audit report and the balance under Administrative matters. We are proud to report that as at the start of the 2018/19 audit the municipality managed to resolve 95% of issues raised by the Auditor-General for the 2017/18 financial year. It must be reported that the 2018/19 audit was the most exhausting one. Although our intention was to improve on the previous audit opinion we are
still pleased to report that we maintained the unqualified audit opinion for the 2018/19 financial
year. The total number of findings have reduced from thirty eight (38) to only twenty five (25). This is a great improvement considering that the municipality did not have any irregular expenditure for the year under review. It should also be emphasized that the municipality has incurred an unauthorized expenditure of R 8,835,388 which related to depreciation, bulk electricity purchases, Loss on disposal of assets and Actuarial losses.
The municipality’s performance with regard to performance reports is quite satisfactory as all statutory reports are submitted to stakeholders well on time. These include quarterly performance and financial reports, Back to Basics, mid-year performance report, reviewed SDBIP as well as adjustment reports. The 2017/18 Annual report was also submitted well on time after an oversight report by MPAC. Risk assessment and the development and implementation of measures to mitigate the top 5 risks.
The following top 5 risks have been identified during the Strategic risk assessment:
a. Inadequate Performance Management Systems b. Noncompliance to Supply Chain Management prescripts c. Electricity distribution losses d. Misalignment of process to ICT Governance Framework
e. Landfill sites not adequately managed
14
1.1. MUNICIPAL FUNCTIONS, POPULATION AND ENVIRONMENTAL
OVERVIEW
a) INTRODUCTION TO BACKGROUND DATA
Molemole Local Municipality (MLM) is located in the Capricorn District Municipality (CDM) in the
Limpopo Province. The neighboring Local Municipalities under the district are Blouberg, Lepelle-
Nkumpi and Polokwane. Molemole Local Municipality head office is located in Mogwadi, which is 65
kilometers from the North of Polokwane along the R521. The municipality is bordered by:
Polokwane Local Municipality to the South;
Blouberg Local Municipality to the North West;
Greater Letaba Local Municipality towards the South East; and
Makhado Local Municipality in the Northern direction
Following the 2016 local government elections and revision of demarcations by the Municipal
Demarcation Board (MDB) the total number of wards increased from 14 to 16. The subsequent
increase in villages led to an increase of ward committees to 160.
b) DEMOGRAPHIC ANALYSIS.1
According to Statssa census report of 2011 the total population for the municipality stood at
108,321, with an average growth rate of -0.1%. The total population has however increased to 125
327 after the incorporation of about sixteen villages from the former Aganang municipality
following its disestablishment prior 2016 local government elections. According to the Municipal
Capacity Assessment of the Municipal Demarcation Board (2018) the total population of Molemole
municipality stands at 126 489, representing an increase of 0.93% or by 1162 more people.
The majority of the population is comprised of Black Africans at 98,4% with the remaining 1.6%
made up of whites, Coloured, Indians and other (Statssa,2011). According to Municipal Capacity
Assessment report (2018) the municipality has recorded a slight increase in the population of Black
Africans to 98.6%. Molemole Local Municipality has a population density of 31.9 persons per square
kilometer, which is lower than the district, provincial and national averages of 75.1, 43.2 and 40.9
persons per square kilometers respectively which infers that the municipality is sparsely populated
relative to the district, province and South Africa. The Municipality covers an area of 3347km². The
total number of households has increased from 30,043 in 2011 to 34,642 in 2018. Furthermore
1 The demographic analysis compared data from Statssa 2011, Statssa Community Survey and Municipal Capacity
assessment (2018) from MDB. The MDB report (2018) was generated after an assessment of all municipalities to provide
services and provides the latest population trends since 2016 Community Survey by Statssa.
15
54% of the households are headed by women. This would require even more resources to provide
service delivery infrastructure especially since most of the roads are mainly gravel and require
continuous maintenance by the municipality.
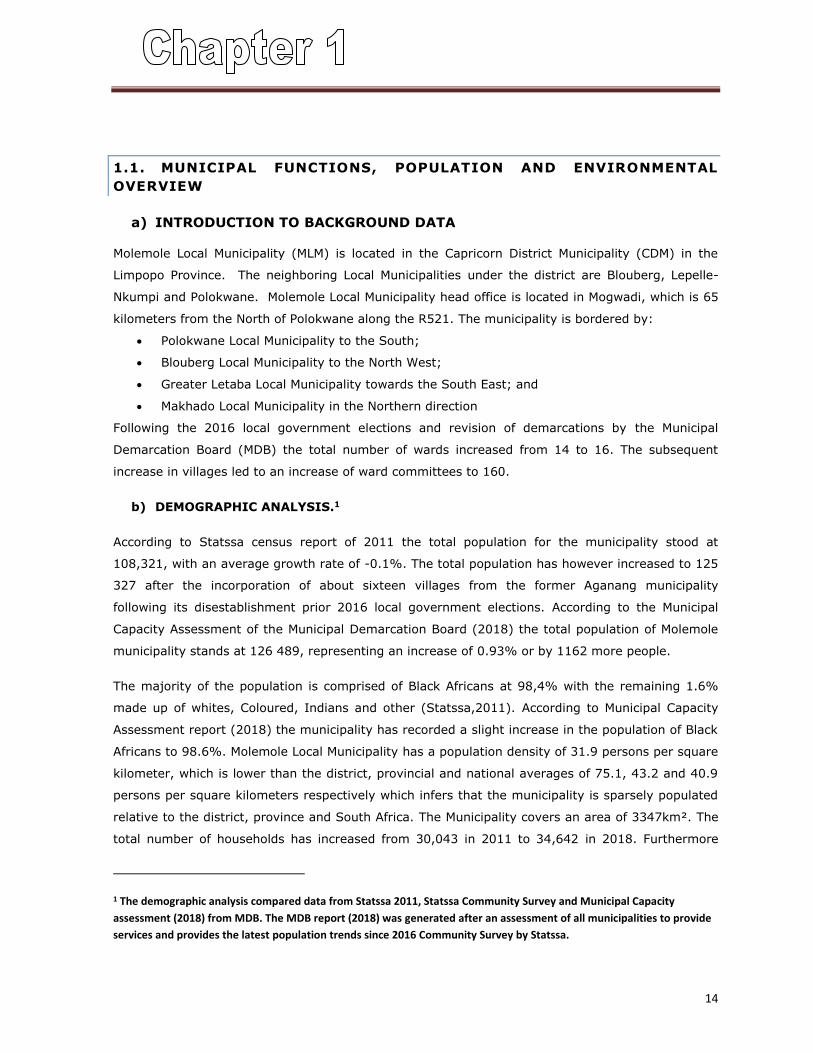
c. POPULATION TRENDS
Demographic trends are key driving forces in any economic development strategy and hence must
be considered in any planning process. The demographic profile influences the type and level of
demand of goods and services and the pressure on provision of government services to the public.
According to Figure 1.1 below, it is clear that Molemole Municipality has the lowest (8.6%) of
population in the CDM District as compared to other four Local Municipalities and only 2% of the
population.
Figure 1.1: Population Composition in the CDM
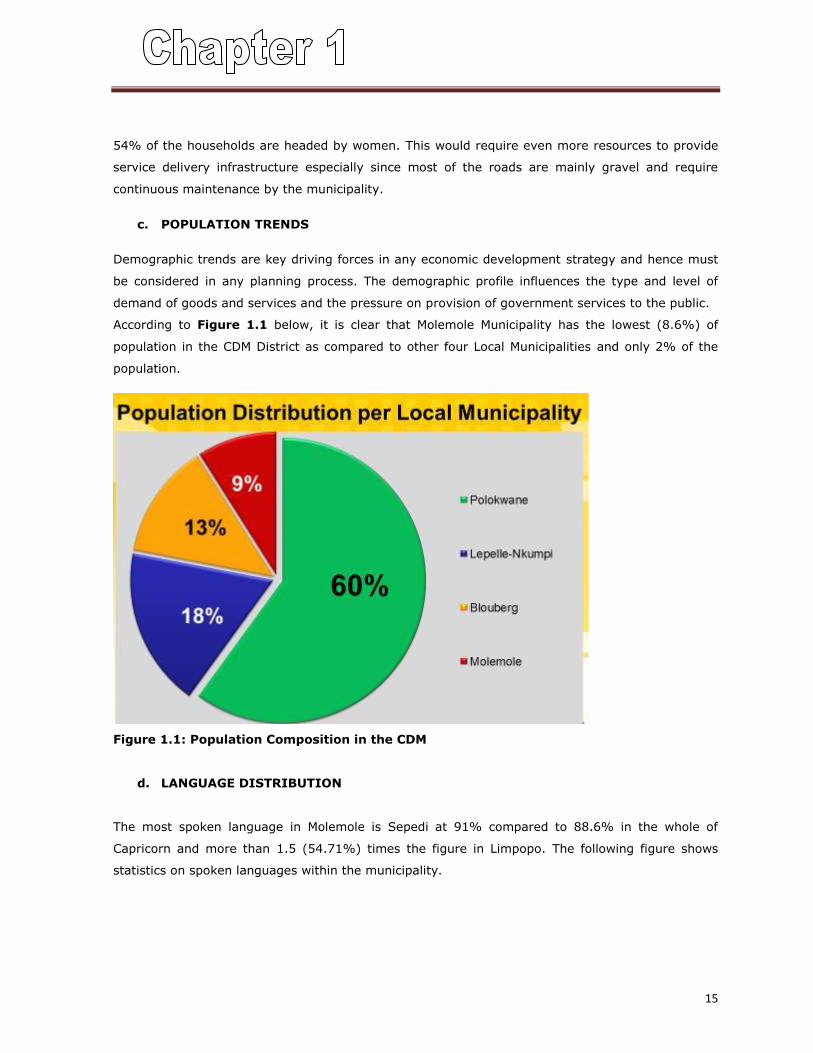
d. LANGUAGE DISTRIBUTION
The most spoken language in Molemole is Sepedi at 91% compared to 88.6% in the whole of
Capricorn and more than 1.5 (54.71%) times the figure in Limpopo. The following figure shows
statistics on spoken languages within the municipality.
16
Figure 1.2: Population by most spoken language community survey: 2016 survey
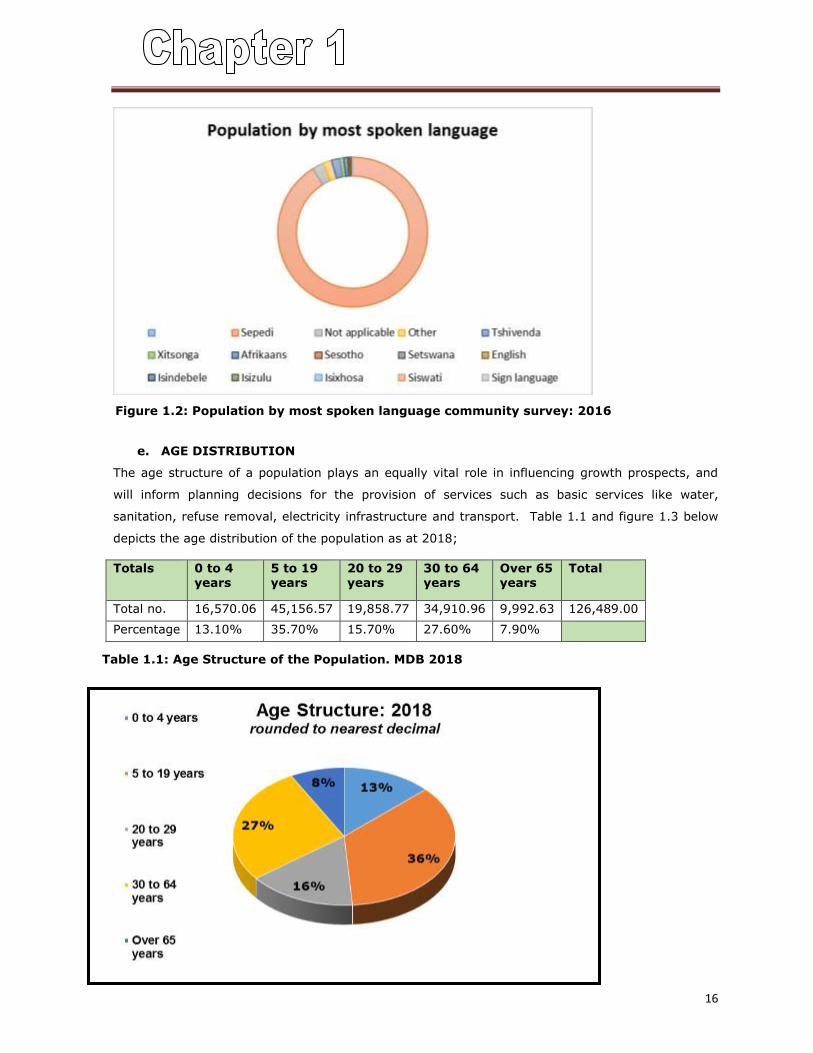
Table 1.1: Age Structure of the Population. MDB 2018
Figure 1.3: Age Structure of the Population. MDB 2018
e. AGE DISTRIBUTION
The age structure of a population plays an equally vital role in influencing growth prospects, and
will inform planning decisions for the provision of services such as basic services like water,
sanitation, refuse removal, electricity infrastructure and transport. Table 1.1 and figure 1.3 below
depicts the age distribution of the population as at 2018;
Totals 0 to 4 years
5 to 19 years
20 to 29 years
30 to 64 years
Over 65 years
Total
Total no. 16,570.06 45,156.57 19,858.77 34,910.96 9,992.63 126,489.00
Percentage 13.10% 35.70% 15.70% 27.60% 7.90%
17
Figure 1.3: Age Structure of the Population. MDB 2018
Figure 1.3 depicts age distribution of Molemole population. It is evident from the figure that 51.4%
of the population is of a school going age whilst 27.6% are of general working age. Almost 10 000
(7.9%) of the population are of over the age of 65. The intensity of poverty for the municipality has
increased by 0.9 percentage points between 2011 and 2016 from 41.7% (21.4% poverty head
count) to 42.6% (21.2% poverty head count). Unemployment and incidents of inequality are some
of the causes of poverty. This place a burden on the municipality to divert a chunk of its budget on
provision of free basic services.
The composition of the population above can be attributed to the following factors:
Young adults and young couples are migrating to urban areas.
Most wealthy people are also migrating to urban areas to access good basic services as
compared to services at local municipalities.
The decline in population size have negative impact on the investment opportunities and thus
affects the economic potential of the municipality.
Youth between the ages of 18 – 35 are also migrating to urban areas in order to access tertiary
education and explore employment opportunities.
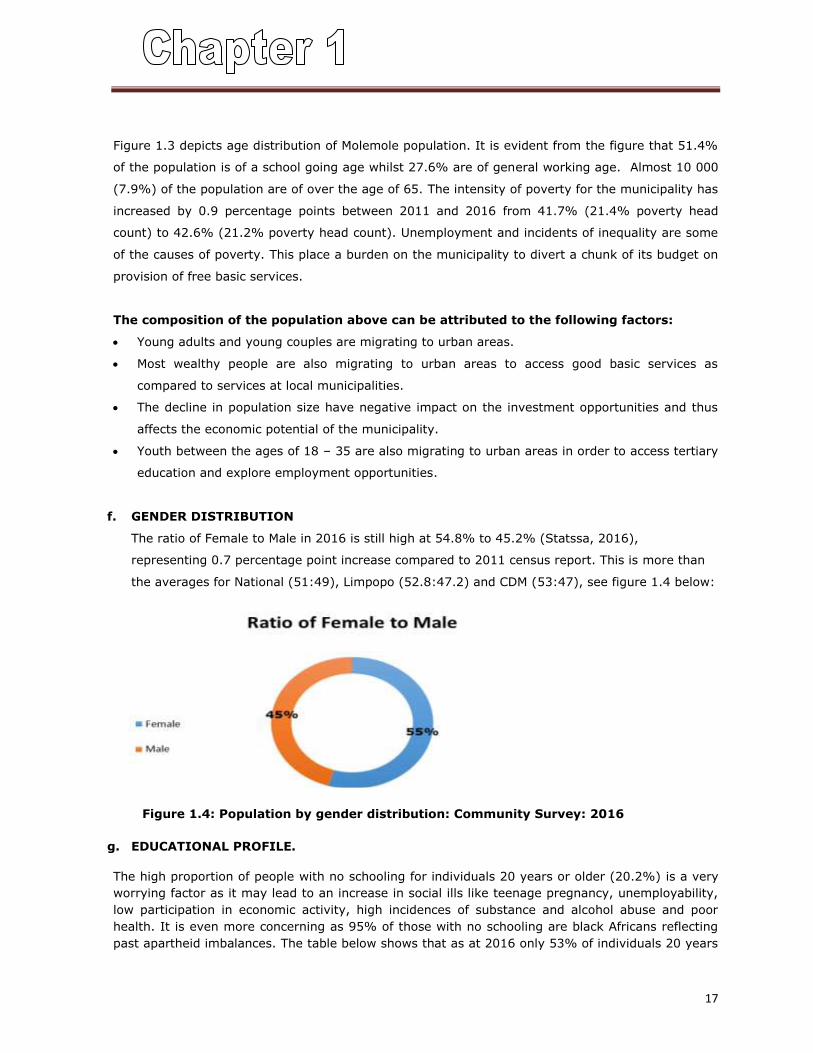
f. GENDER DISTRIBUTION
The ratio of Female to Male in 2016 is still high at 54.8% to 45.2% (Statssa, 2016),
representing 0.7 percentage point increase compared to 2011 census report. This is more than
the averages for National (51:49), Limpopo (52.8:47.2) and CDM (53:47), see figure 1.4 below:
g. EDUCATIONAL PROFILE.
The high proportion of people with no schooling for individuals 20 years or older (20.2%) is a very
worrying factor as it may lead to an increase in social ills like teenage pregnancy, unemployability,
low participation in economic activity, high incidences of substance and alcohol abuse and poor
health. It is even more concerning as 95% of those with no schooling are black Africans reflecting
past apartheid imbalances. The table below shows that as at 2016 only 53% of individuals 20 years
Figure 1.4: Population by gender distribution: Community Survey: 2016
18
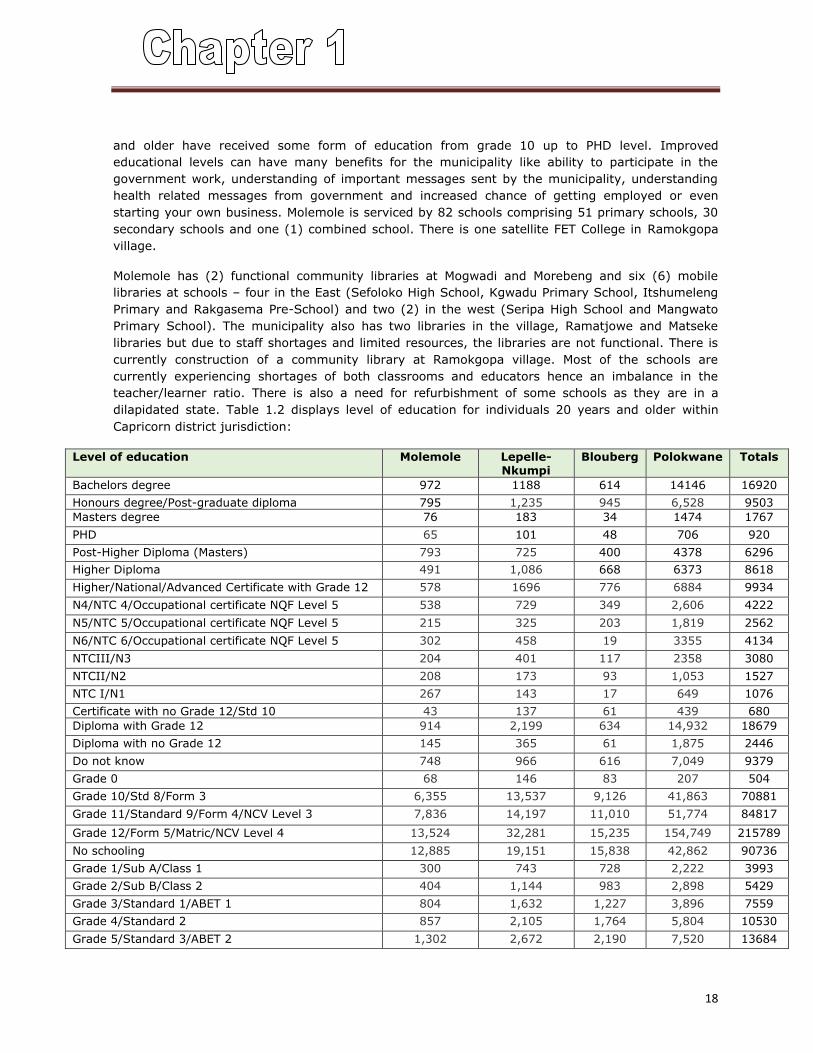
and older have received some form of education from grade 10 up to PHD level. Improved
educational levels can have many benefits for the municipality like ability to participate in the
government work, understanding of important messages sent by the municipality, understanding
health related messages from government and increased chance of getting employed or even
starting your own business. Molemole is serviced by 82 schools comprising 51 primary schools, 30
secondary schools and one (1) combined school. There is one satellite FET College in Ramokgopa
village.
Molemole has (2) functional community libraries at Mogwadi and Morebeng and six (6) mobile
libraries at schools – four in the East (Sefoloko High School, Kgwadu Primary School, Itshumeleng
Primary and Rakgasema Pre-School) and two (2) in the west (Seripa High School and Mangwato
Primary School). The municipality also has two libraries in the village, Ramatjowe and Matseke
libraries but due to staff shortages and limited resources, the libraries are not functional. There is
currently construction of a community library at Ramokgopa village. Most of the schools are
currently experiencing shortages of both classrooms and educators hence an imbalance in the
teacher/learner ratio. There is also a need for refurbishment of some schools as they are in a
dilapidated state. Table 1.2 displays level of education for individuals 20 years and older within
Capricorn district jurisdiction:
Level of education Molemole Lepelle-Nkumpi
Blouberg Polokwane Totals
Bachelors degree 972 1188 614 14146 16920
Honours degree/Post-graduate diploma 795 1,235 945 6,528 9503
Masters degree 76 183 34 1474 1767
PHD 65 101 48 706 920
Post-Higher Diploma (Masters) 793 725 400 4378 6296
Higher Diploma 491 1,086 668 6373 8618
Higher/National/Advanced Certificate with Grade 12 578 1696 776 6884 9934
N4/NTC 4/Occupational certificate NQF Level 5 538 729 349 2,606 4222
N5/NTC 5/Occupational certificate NQF Level 5 215 325 203 1,819 2562
N6/NTC 6/Occupational certificate NQF Level 5 302 458 19 3355 4134
NTCIII/N3 204 401 117 2358 3080
NTCII/N2 208 173 93 1,053 1527
NTC I/N1 267 143 17 649 1076
Certificate with no Grade 12/Std 10 43 137 61 439 680
Diploma with Grade 12 914 2,199 634 14,932 18679
Diploma with no Grade 12 145 365 61 1,875 2446
Do not know 748 966 616 7,049 9379
Grade 0 68 146 83 207 504
Grade 10/Std 8/Form 3 6,355 13,537 9,126 41,863 70881
Grade 11/Standard 9/Form 4/NCV Level 3 7,836 14,197 11,010 51,774 84817
Grade 12/Form 5/Matric/NCV Level 4 13,524 32,281 15,235 154,749 215789
No schooling 12,885 19,151 15,838 42,862 90736
Grade 1/Sub A/Class 1 300 743 728 2,222 3993
Grade 2/Sub B/Class 2 404 1,144 983 2,898 5429
Grade 3/Standard 1/ABET 1 804 1,632 1,227 3,896 7559
Grade 4/Standard 2 857 2,105 1,764 5,804 10530
Grade 5/Standard 3/ABET 2 1,302 2,672 2,190 7,520 13684
19
Table 1.2: Level of Education in Molemole municipality for Individuals 20 years and older.
Source: Statssa 2016 Community Survey
Level of education Molemole Lepelle-Nkumpi
Blouberg Polokwane Totals
Grade 6/Standard 4 1,691 2,725 2,508 8,133 15057
Grade 7/Standard 5/ABET 3 2,953 7,375 4,548 12,764 27640
Grade 8/Standard 6/Form 1 2,953 7,375 4,548 22,042 36918
Grade 9/Standard 7/Form 2/ABET 4/Occupational certificate NQF Level 1
4,202 7,635 6,074 23,873 41784
Other 916 688 345 6,282 8231
Unspecified 71 38 236 113 458
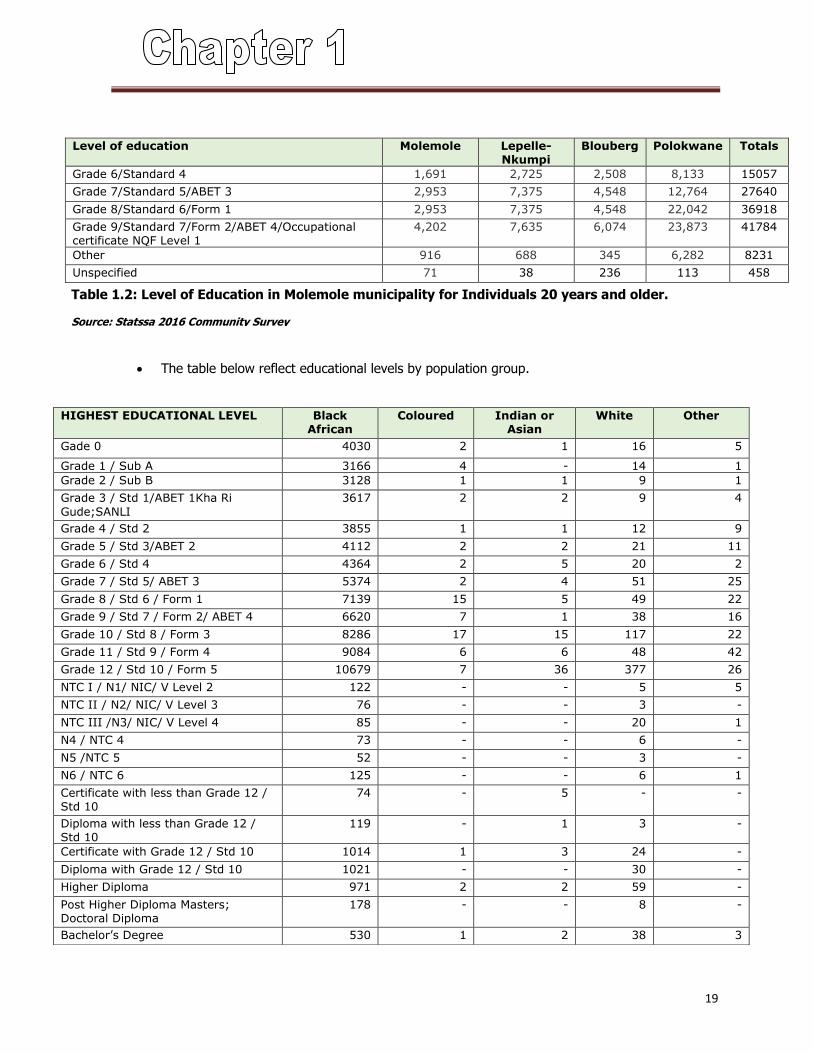
The table below reflect educational levels by population group.
HIGHEST EDUCATIONAL LEVEL Black African
Coloured Indian or Asian
White Other
Gade 0 4030 2 1 16 5
Grade 1 / Sub A 3166 4 - 14 1
Grade 2 / Sub B 3128 1 1 9 1
Grade 3 / Std 1/ABET 1Kha Ri
Gude;SANLI
3617 2 2 9 4
Grade 4 / Std 2 3855 1 1 12 9
Grade 5 / Std 3/ABET 2 4112 2 2 21 11
Grade 6 / Std 4 4364 2 5 20 2
Grade 7 / Std 5/ ABET 3 5374 2 4 51 25
Grade 8 / Std 6 / Form 1 7139 15 5 49 22
Grade 9 / Std 7 / Form 2/ ABET 4 6620 7 1 38 16
Grade 10 / Std 8 / Form 3 8286 17 15 117 22
Grade 11 / Std 9 / Form 4 9084 6 6 48 42
Grade 12 / Std 10 / Form 5 10679 7 36 377 26
NTC I / N1/ NIC/ V Level 2 122 - - 5 5
NTC II / N2/ NIC/ V Level 3 76 - - 3 -
NTC III /N3/ NIC/ V Level 4 85 - - 20 1
N4 / NTC 4 73 - - 6 -
N5 /NTC 5 52 - - 3 -
N6 / NTC 6 125 - - 6 1
Certificate with less than Grade 12 / Std 10
74 - 5 - -
Diploma with less than Grade 12 / Std 10
119 - 1 3 -
Certificate with Grade 12 / Std 10 1014 1 3 24 -
Diploma with Grade 12 / Std 10 1021 - - 30 -
Higher Diploma 971 2 2 59 -
Post Higher Diploma Masters; Doctoral Diploma
178 - - 8 -
Bachelor’s Degree 530 1 2 38 3
20
Table 1.3: Level of Education by population group: Statssa 2016 Community Survey
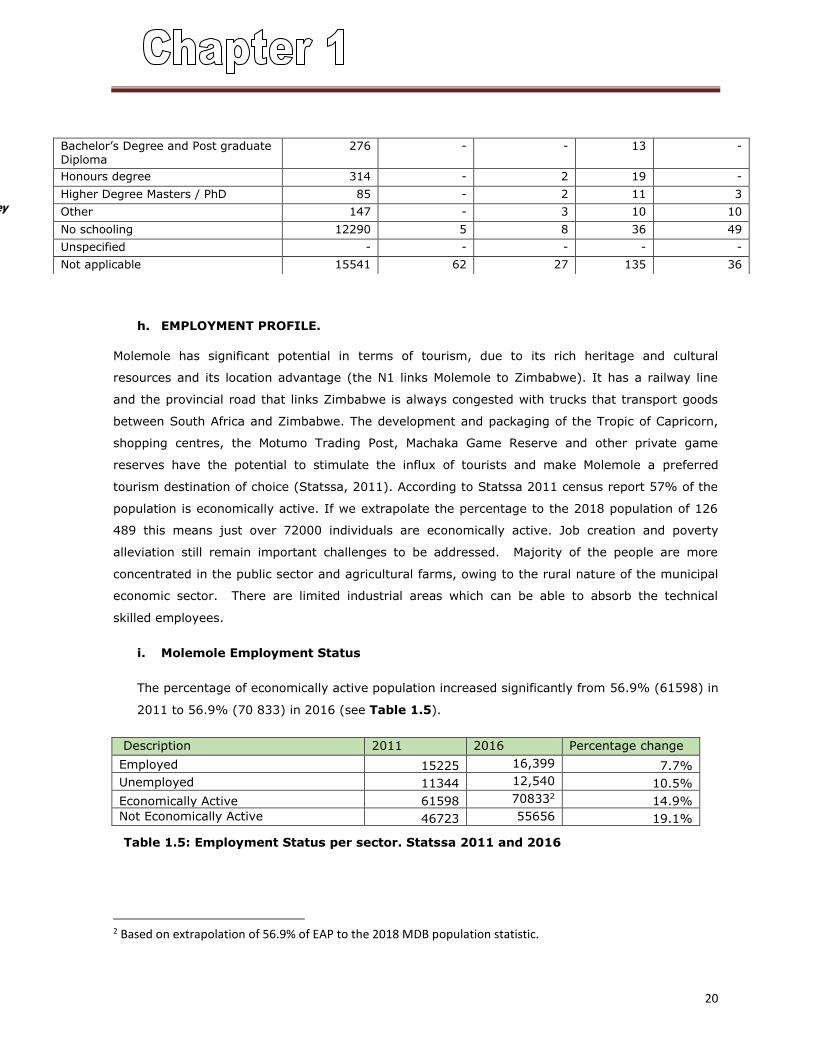
Table 1.5: Employment Status per sector. Statssa 2011 and 2016
h. EMPLOYMENT PROFILE.
Molemole has significant potential in terms of tourism, due to its rich heritage and cultural
resources and its location advantage (the N1 links Molemole to Zimbabwe). It has a railway line
and the provincial road that links Zimbabwe is always congested with trucks that transport goods
between South Africa and Zimbabwe. The development and packaging of the Tropic of Capricorn,
shopping centres, the Motumo Trading Post, Machaka Game Reserve and other private game
reserves have the potential to stimulate the influx of tourists and make Molemole a preferred
tourism destination of choice (Statssa, 2011). According to Statssa 2011 census report 57% of the
population is economically active. If we extrapolate the percentage to the 2018 population of 126
489 this means just over 72000 individuals are economically active. Job creation and poverty
alleviation still remain important challenges to be addressed. Majority of the people are more
concentrated in the public sector and agricultural farms, owing to the rural nature of the municipal
economic sector. There are limited industrial areas which can be able to absorb the technical
skilled employees.
i. Molemole Employment Status
The percentage of economically active population increased significantly from 56.9% (61598) in
2011 to 56.9% (70 833) in 2016 (see Table 1.5).
Description 2011 2016 Percentage change
Employed 15225 16,399 7.7%
Unemployed 11344 12,540 10.5%
Economically Active 61598 708332 14.9%
Not Economically Active 46723 55656 19.1%
2 Based on extrapolation of 56.9% of EAP to the 2018 MDB population statistic.
Bachelor’s Degree and Post graduate Diploma
276 - - 13 -
Honours degree 314 - 2 19 -
Higher Degree Masters / PhD 85 - 2 11 3
Other 147 - 3 10 10
No schooling 12290 5 8 36 49
Unspecified - - - - -
Not applicable 15541 62 27 135 36
21
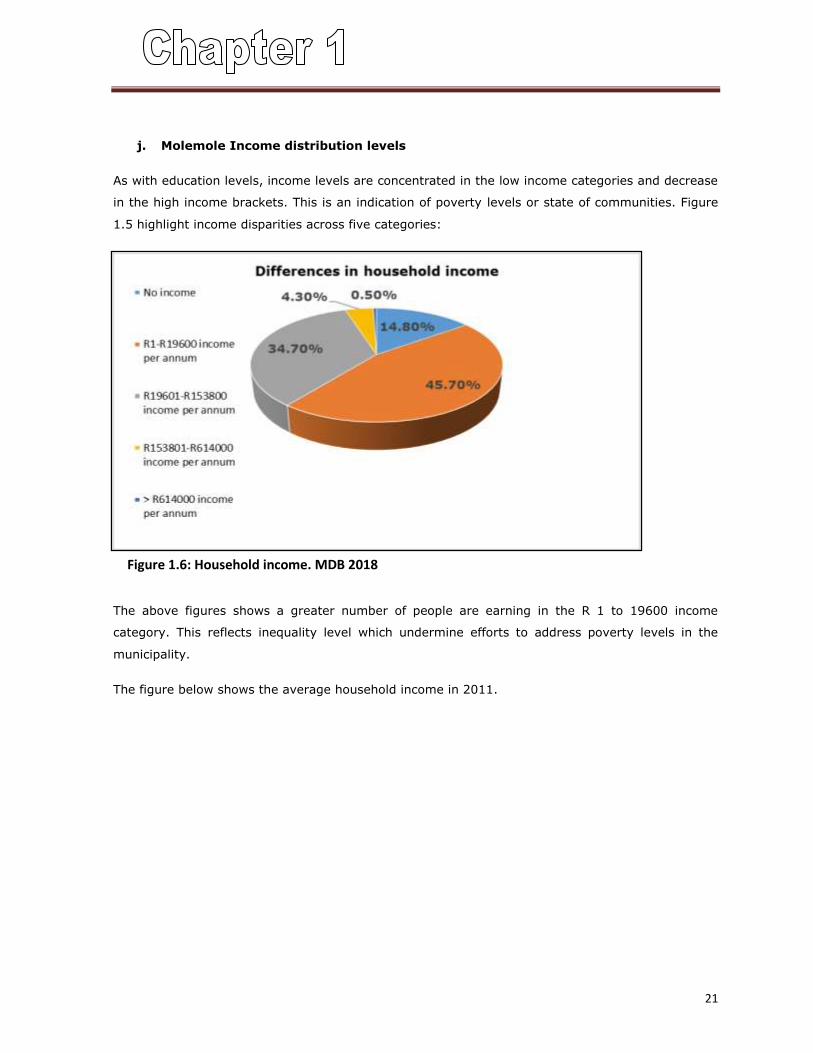
Figure 1.6: Household income. MDB 2018
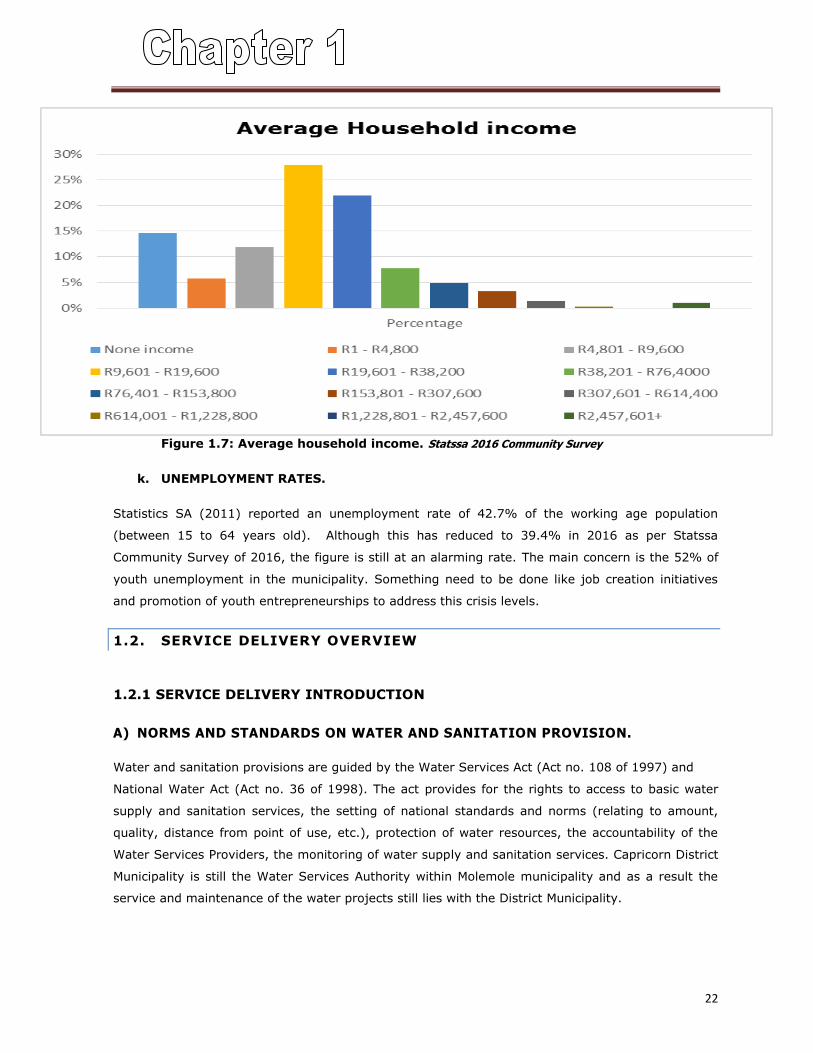
j. Molemole Income distribution levels
As with education levels, income levels are concentrated in the low income categories and decrease
in the high income brackets. This is an indication of poverty levels or state of communities. Figure
1.5 highlight income disparities across five categories:
The above figures shows a greater number of people are earning in the R 1 to 19600 income
category. This reflects inequality level which undermine efforts to address poverty levels in the
municipality.
The figure below shows the average household income in 2011.
22
Figure 1.6 Average Income household. Statssa 2011
Figure 1.7: Average household income. Statssa 2016 Community Survey
k. UNEMPLOYMENT RATES.
Statistics SA (2011) reported an unemployment rate of 42.7% of the working age population
(between 15 to 64 years old). Although this has reduced to 39.4% in 2016 as per Statssa
Community Survey of 2016, the figure is still at an alarming rate. The main concern is the 52% of
youth unemployment in the municipality. Something need to be done like job creation initiatives
and promotion of youth entrepreneurships to address this crisis levels.
1.2. SERVICE DELIVERY OVERVIEW
1.2.1 SERVICE DELIVERY INTRODUCTION
A) NORMS AND STANDARDS ON WATER AND SANITATION PROVISION.
Water and sanitation provisions are guided by the Water Services Act (Act no. 108 of 1997) and
National Water Act (Act no. 36 of 1998). The act provides for the rights to access to basic water
supply and sanitation services, the setting of national standards and norms (relating to amount,
quality, distance from point of use, etc.), protection of water resources, the accountability of the
Water Services Providers, the monitoring of water supply and sanitation services. Capricorn District
Municipality is still the Water Services Authority within Molemole municipality and as a result the
service and maintenance of the water projects still lies with the District Municipality.
23
Source: Statssa: 2016 Community Survey
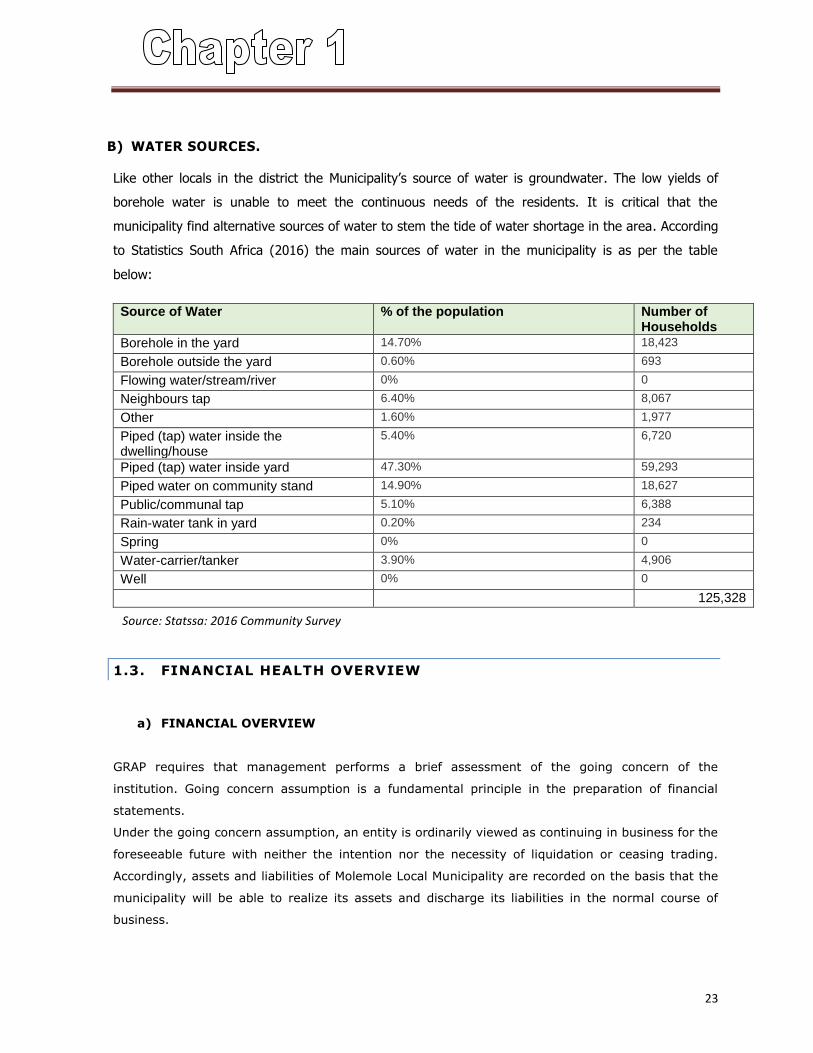
B) WATER SOURCES.
Like other locals in the district the Municipality’s source of water is groundwater. The low yields of
borehole water is unable to meet the continuous needs of the residents. It is critical that the
municipality find alternative sources of water to stem the tide of water shortage in the area. According
to Statistics South Africa (2016) the main sources of water in the municipality is as per the table
below:
Source of Water % of the population Number of Households
Borehole in the yard 14.70% 18,423
Borehole outside the yard 0.60% 693
Flowing water/stream/river 0% 0
Neighbours tap 6.40% 8,067
Other 1.60% 1,977
Piped (tap) water inside the dwelling/house
5.40% 6,720
Piped (tap) water inside yard 47.30% 59,293
Piped water on community stand 14.90% 18,627
Public/communal tap 5.10% 6,388
Rain-water tank in yard 0.20% 234
Spring 0% 0
Water-carrier/tanker 3.90% 4,906
Well 0% 0
125,328
1.3. FINANCIAL HEALTH OVERVIEW
a) FINANCIAL OVERVIEW
GRAP requires that management performs a brief assessment of the going concern of the
institution. Going concern assumption is a fundamental principle in the preparation of financial
statements.
Under the going concern assumption, an entity is ordinarily viewed as continuing in business for the
foreseeable future with neither the intention nor the necessity of liquidation or ceasing trading.
Accordingly, assets and liabilities of Molemole Local Municipality are recorded on the basis that the
municipality will be able to realize its assets and discharge its liabilities in the normal course of
business.
24
Management of Molemole Local Municipality confirms that no uncertainties were noted in making its
assessment. The Municipality is currently facing no cash flow challenges, only general resistance
mainly resulting from unpaid services by the surrounding communities, however these is a reason
why a formal service(s) Debt Recovery Strategy was approved by Council and is currently
implemented. Together with a process of improving service delivery.
b) THE CURRENT RATIO
The current ratio is a liquidity ratio that measures the municipality’s ability to pay its short-term
debt. To gauge this ability, the current ratio considers the current total assets of the municipality
(both liquid and illiquid) relative to current total liabilities.
• Norm
The legislated norm ranges is 1.5 to 2:1
The Current ratio: 2018/19 2017/18
Current assets : R 99 981 606 R 113 287 027
Current liability : R 33 103 849 R 33 995 231
Ratio 3.0:1 3.3:1
• Interpretation of Results
The ratio 3:0 for the current year is above the norm which means that the municipality will be able
to pay its short term obligations with the available current assets. When comparing the current
year ratio to the prior year of 3.3:1 it could be said it is stable, thus no indication of uncertainties
on the liquidity of the municipality.
The Going concern assessment took into account all available information for the foreseeable
future. Other factors considered include the ones below;
i. FINANCIAL
The Municipality’s net assets amount of R 295 523 701is positive; the Net working Capital of the
Municipality is significantly in a healthy balance. The Municipality has been operating in a positive
cash flow for the past financial year and it is envisaged that the trend will continue in the following
financial year. All creditors were paid as per the goods and services offered within the stipulated 30
day periods. The Municipality does not have significant long term borrowings and do not have any
loans with any 3rd party. There are no new financial commitments with any party and priority is
25
given to the already roll over project. All the projects listed on the commitments register were
provided for on the approved municipal budget.
ii. CONTINGENT LIABILITIES
The pending contingent liabilities as at end of June 2019 amounted to R 4,526,269.00 which
constitute 0.02% of the Municipality’s net assets. This will not threaten the going concern of the
municipality even if it may be required to be paid. All pending legal or regulatory proceedings
against the municipality will be resolved and amount due paid if required by law.
iii. MITIGATING PLANS
The municipality’s debtors’ book amounting to R 97,182,988,59 (including 30% commission
receivable from water debtors and interest). This is a huge amount considering that the
municipality is heavily reliant on grant funding to discharge its service delivery responsibilities. To
this effect the municipality has commenced a rigorous debt collection campaign to liquidate this
asset and the collection rate has improved since then. Most of the debtor’s amount from
municipality emanated through the assets/debtors received from the former disestablished
Aganang local municipality after some villages were incorporated into Molemole municipality.
iv. CASH FLOW ANALYSIS
There are no borrowings approaching maturity without realistic prospects of renewal or repayment;
or excessive reliance on short-term borrowings to finance long-term assets. The municipal cash
flow indicated a positive balance which has been maintained for the previous three consecutive
financial years. The municipal cash flow at the current year stood at R 19,373,721compared to the
prior year cash balance of R 41, 774,239 which is a decrease of 53.6% or R 22.6 million. a healthy
cash flow has helped the municipality to honour its short-term obligations hence the high current
ratio. Lastly, it is pleasing to report that the municipality did not have overdraft facility or any other
short/long term loan liability during the year under review.
v. OTHER
The Municipality complied fully with statutory requirements. There is no pending legal or regulatory
proceedings against the municipality that may, if successful, result in claims that the municipality is
unlikely to be able to honour. There is no threat of any changes in law or regulation or government
policy expected to adversely affect the municipality.
26
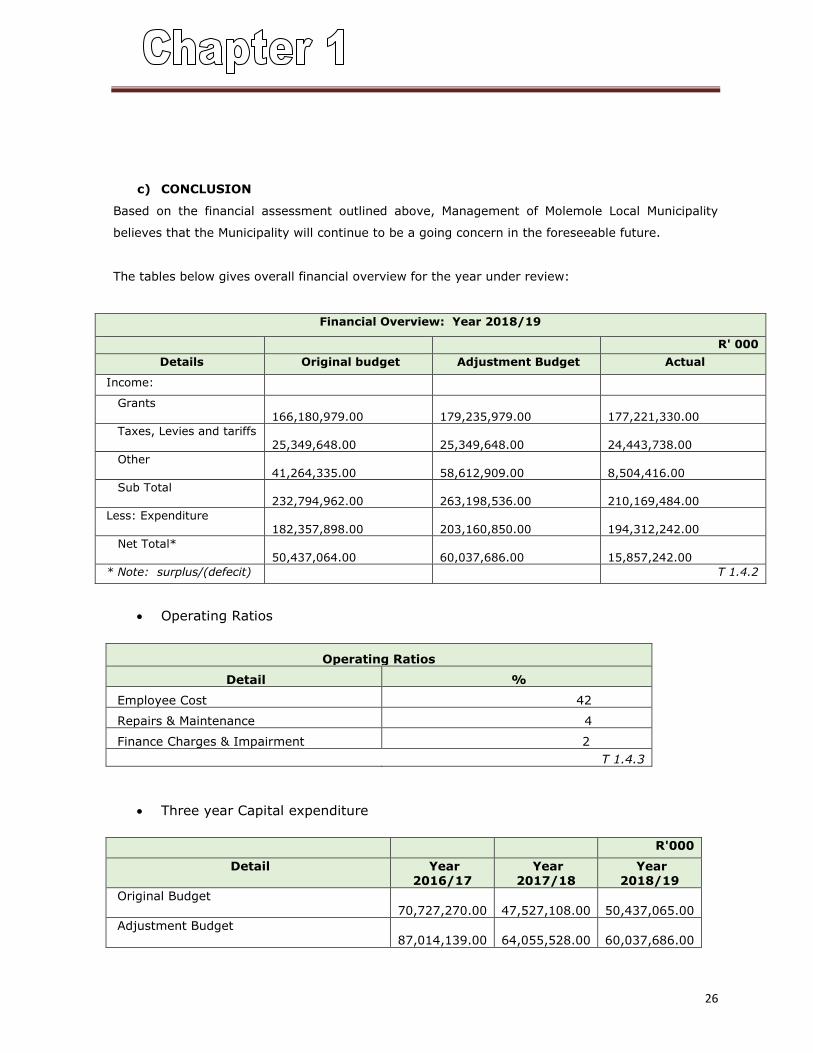
c) CONCLUSION
Based on the financial assessment outlined above, Management of Molemole Local Municipality
believes that the Municipality will continue to be a going concern in the foreseeable future.
The tables below gives overall financial overview for the year under review:
Financial Overview: Year 2018/19
R' 000
Details Original budget Adjustment Budget Actual
Income:
Grants 166,180,979.00
179,235,979.00
177,221,330.00
Taxes, Levies and tariffs 25,349,648.00
25,349,648.00
24,443,738.00
Other 41,264,335.00
58,612,909.00
8,504,416.00
Sub Total 232,794,962.00
263,198,536.00
210,169,484.00
Less: Expenditure 182,357,898.00
203,160,850.00
194,312,242.00
Net Total* 50,437,064.00
60,037,686.00
15,857,242.00
* Note: surplus/(defecit) T 1.4.2
Operating Ratios
Operating Ratios
Detail %
Employee Cost 42
Repairs & Maintenance 4
Finance Charges & Impairment 2
T 1.4.3
Three year Capital expenditure
R'000
Detail Year 2016/17
Year 2017/18
Year 2018/19
Original Budget 70,727,270.00
47,527,108.00
50,437,065.00
Adjustment Budget 87,014,139.00
64,055,528.00
60,037,686.00
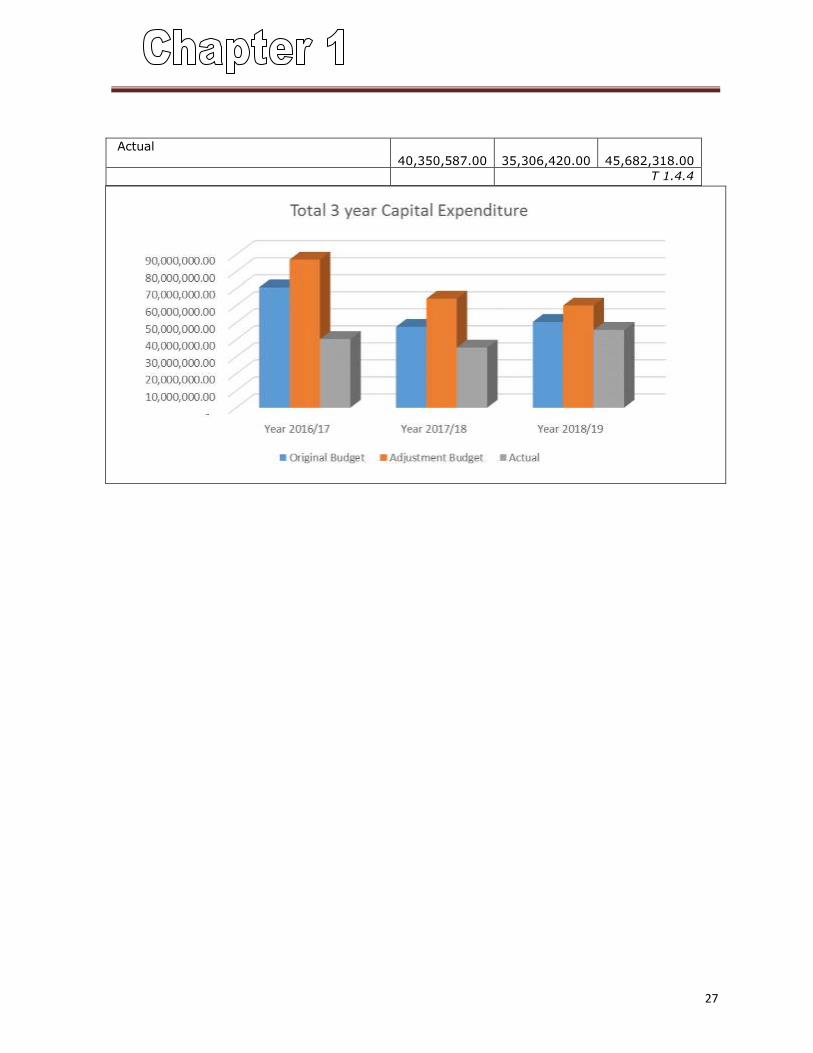
27
Actual 40,350,587.00
35,306,420.00
45,682,318.00
T 1.4.4
1.4. ORGANISATIONAL DEVELOPMENT OVERVIEW
a) ORGANISATIONAL DEVELOPMENT PERFORMANCE
The municipality developed a Workplace Skills plan (WSP) to guide provision of training to
employees and Councillors. A total of seven training programmes were coordinated for employees
and three programmes for Councillors. An annual training report is submitted to LGSETA as part of
compliance to legislative framework. Training programmes covered included Municipal Finance
Management Programme, Payroll Management, and Project Management. Furthermore, training on
Municipal Governance has been arranged for Admin Staff in the coming financial year. We hope the
skills acquired through the training will prepare the employees for promotional opportunities and
help enhance the municipal retention and succession strategies.
The following Human Resource Committee have been put in place to assist with HR Governance
issues:
Training Committee
Employment Equity Committee
Local Labour Forum
Employment Equity committee
Workplace Forum (Local Labour Forum)
Health & Safety Committee
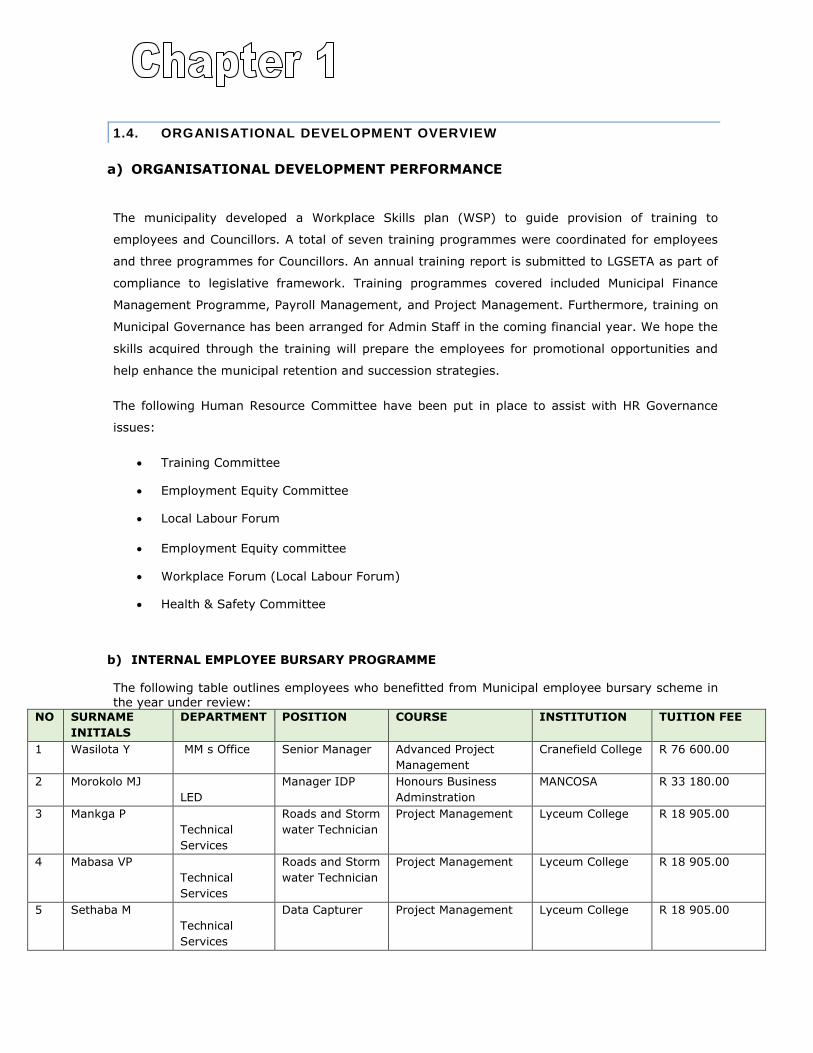
b) INTERNAL EMPLOYEE BURSARY PROGRAMME
The following table outlines employees who benefitted from Municipal employee bursary scheme in the year under review:
NO SURNAME
INITIALS
DEPARTMENT POSITION COURSE INSTITUTION TUITION FEE
1 Wasilota Y MM s Office Senior Manager Advanced Project
Management
Cranefield College R 76 600.00
2 Morokolo MJ
LED
Manager IDP Honours Business
Adminstration
MANCOSA R 33 180.00
3 Mankga P
Technical
Services
Roads and Storm
water Technician
Project Management Lyceum College R 18 905.00
4 Mabasa VP
Technical
Services
Roads and Storm
water Technician
Project Management Lyceum College R 18 905.00
5 Sethaba M
Technical
Services
Data Capturer Project Management Lyceum College R 18 905.00
29
c) INTERNSHIPS AND LEARNERSHIP
A total of six (6) internship programmes were coordinated during the 2018/19 financial year. These
included internships for Financial Management, Administration and Auxiliary services, Town and
Regional planning, Communication Services, and Integrated Development as well Internal Auditing.
The municipality has also created opportunities for experiential training for students who need
practical experience to qualify for their qualifications. During the year under review the municipality
has given opportunities for learners in the areas of Cleaning and Hygiene services, Human
Resources Services, Financial Accounting, Local Economic Development as well as Human Resource
Management.
1.6 AUDITOR GENERAL REPORT
16.1 AUDITOR GENERAL REPORT: YEAR 18/19
Although the municipal council and its administration has put all their efforts in pursuit of the clean
audit opinion it is however pleasing that the municipality has once again obtained an unqualified
audit opinion with material findings, which is for the fifth consecutive time. We remain committed
to be one of the municipalities in the province to achieve the unqualified audit opinion with no
material findings. The total number of audit findings for this year has also reduced from thirty eight
(38) in the 2017/18 to twenty five (25). The municipality did not incur any irregular expenditure in
the year under review.
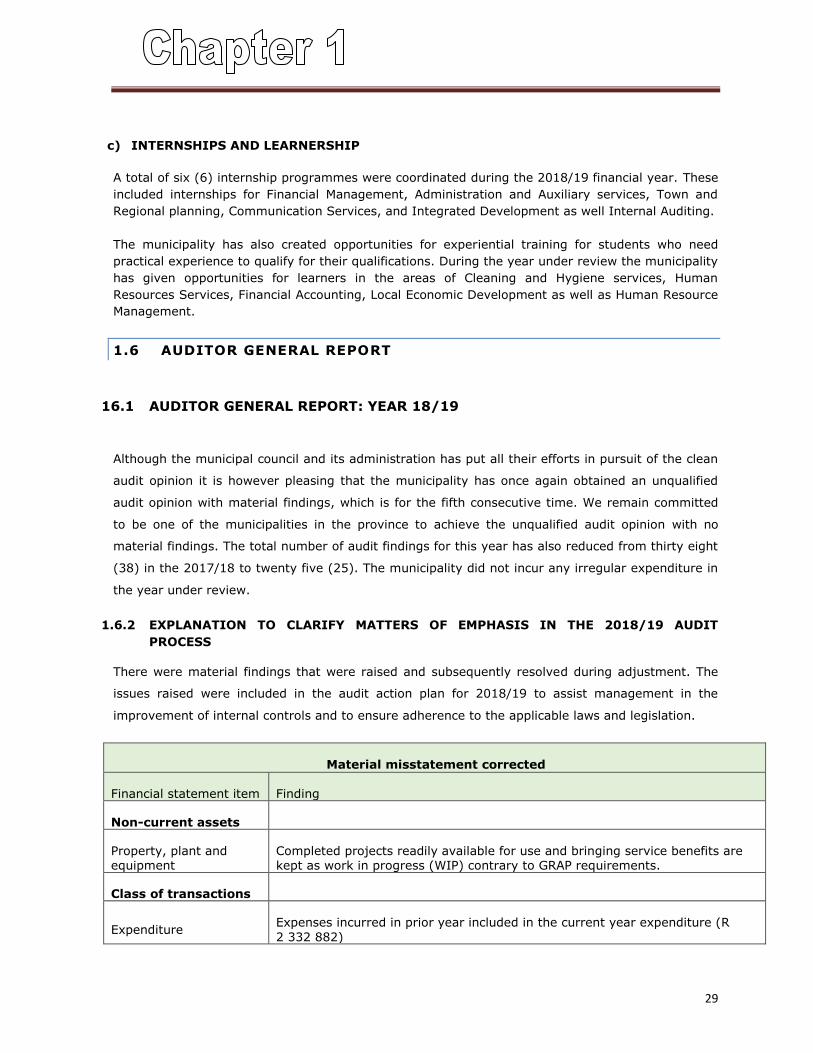
1.6.2 EXPLANATION TO CLARIFY MATTERS OF EMPHASIS IN THE 2018/19 AUDIT
PROCESS
There were material findings that were raised and subsequently resolved during adjustment. The
issues raised were included in the audit action plan for 2018/19 to assist management in the
improvement of internal controls and to ensure adherence to the applicable laws and legislation.
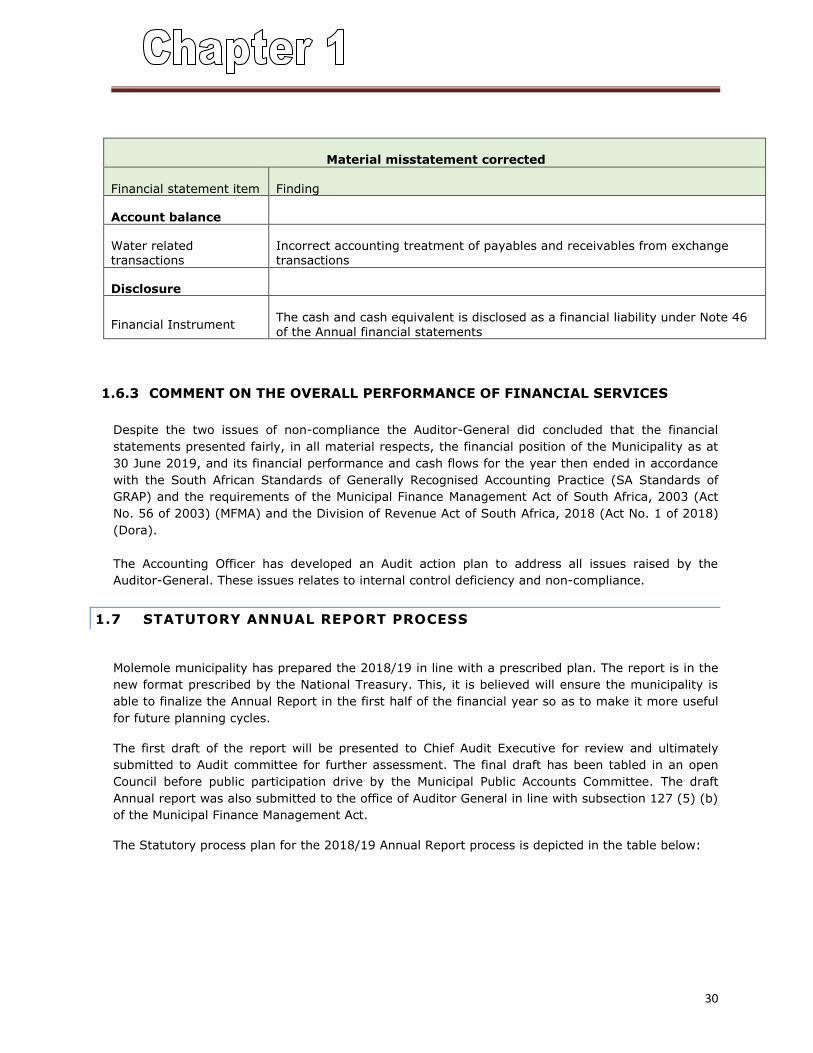
Material misstatement corrected
Financial statement item Finding
Non-current assets
Property, plant and equipment
Completed projects readily available for use and bringing service benefits are kept as work in progress (WIP) contrary to GRAP requirements.
Class of transactions
Expenditure Expenses incurred in prior year included in the current year expenditure (R
2 332 882)
30
Material misstatement corrected
Financial statement item Finding
Account balance
Water related transactions
Incorrect accounting treatment of payables and receivables from exchange transactions
Disclosure
Financial Instrument The cash and cash equivalent is disclosed as a financial liability under Note 46
of the Annual financial statements
1.6.3 COMMENT ON THE OVERALL PERFORMANCE OF FINANCIAL SERVICES
Despite the two issues of non-compliance the Auditor-General did concluded that the financial
statements presented fairly, in all material respects, the financial position of the Municipality as at
30 June 2019, and its financial performance and cash flows for the year then ended in accordance
with the South African Standards of Generally Recognised Accounting Practice (SA Standards of
GRAP) and the requirements of the Municipal Finance Management Act of South Africa, 2003 (Act
No. 56 of 2003) (MFMA) and the Division of Revenue Act of South Africa, 2018 (Act No. 1 of 2018)
(Dora).
The Accounting Officer has developed an Audit action plan to address all issues raised by the
Auditor-General. These issues relates to internal control deficiency and non-compliance.
1.7 STATUTORY ANNUAL REPORT PROCESS
Molemole municipality has prepared the 2018/19 in line with a prescribed plan. The report is in the
new format prescribed by the National Treasury. This, it is believed will ensure the municipality is
able to finalize the Annual Report in the first half of the financial year so as to make it more useful
for future planning cycles.
The first draft of the report will be presented to Chief Audit Executive for review and ultimately
submitted to Audit committee for further assessment. The final draft has been tabled in an open
Council before public participation drive by the Municipal Public Accounts Committee. The draft
Annual report was also submitted to the office of Auditor General in line with subsection 127 (5) (b)
of the Municipal Finance Management Act.
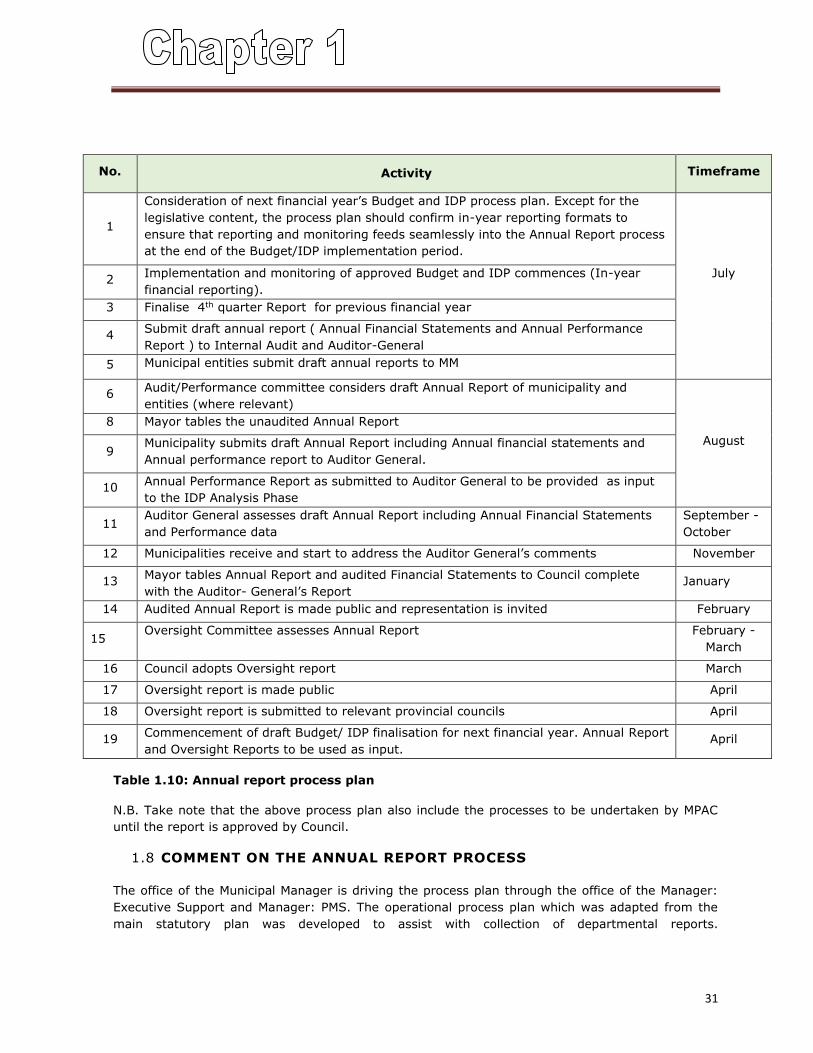
The Statutory process plan for the 2018/19 Annual Report process is depicted in the table below:
31
No. Activity Timeframe
1
Consideration of next financial year’s Budget and IDP process plan. Except for the
legislative content, the process plan should confirm in-year reporting formats to
ensure that reporting and monitoring feeds seamlessly into the Annual Report process
at the end of the Budget/IDP implementation period.
July
2
Implementation and monitoring of approved Budget and IDP commences (In-year
financial reporting).
3 Finalise 4th quarter Report for previous financial year
4 Submit draft annual report ( Annual Financial Statements and Annual Performance
Report ) to Internal Audit and Auditor-General
5 Municipal entities submit draft annual reports to MM
6 Audit/Performance committee considers draft Annual Report of municipality and
entities (where relevant)
August
8 Mayor tables the unaudited Annual Report
9 Municipality submits draft Annual Report including Annual financial statements and
Annual performance report to Auditor General.
10 Annual Performance Report as submitted to Auditor General to be provided as input
to the IDP Analysis Phase
11 Auditor General assesses draft Annual Report including Annual Financial Statements
and Performance data
September -
October
12 Municipalities receive and start to address the Auditor General’s comments November
13 Mayor tables Annual Report and audited Financial Statements to Council complete
with the Auditor- General’s Report January
14 Audited Annual Report is made public and representation is invited February
15 Oversight Committee assesses Annual Report February -
March
16 Council adopts Oversight report March
17 Oversight report is made public April
18 Oversight report is submitted to relevant provincial councils April
19 Commencement of draft Budget/ IDP finalisation for next financial year. Annual Report
and Oversight Reports to be used as input. April
Table 1.10: Annual report process plan
N.B. Take note that the above process plan also include the processes to be undertaken by MPAC
until the report is approved by Council.
1.8 COMMENT ON THE ANNUAL REPORT PROCESS
The office of the Municipal Manager is driving the process plan through the office of the Manager:
Executive Support and Manager: PMS. The operational process plan which was adapted from the
main statutory plan was developed to assist with collection of departmental reports.
CHAPTER 2 – GOVERNANCE
COMPONENT A: POLITICAL AND ADMINISTRATIVE GOVERNANCE
a) INTRODUCTION TO POLITICAL AND ADMINISTRATIVE GOVERNANCE
The municipality has the following governance structures to oversee administrative functions: Audit
Committee, Risk Management Committee, Senior Management and Extended Management
Committee. All the governance committees are functional and are able to hold meetings as
scheduled. Subcommittees have also been established in various areas to assist high order
committees to advance internal control systems. During the year under review the municipality had
subcommittees for the following areas: Health and Safety, Local Labour forum, Information and
Communication systems, employment equity and Batho pele
The municipal council has established its political governance structures to play oversight role to
Management activities. These structures are discussed in the following section.
2.1 POLITICAL GOVERNANCE
a) INTRODUCTION TO POLITICAL GOVERNANCE
The Municipal Council, its committees, i.e. Portfolio committees, Section 79,Executive Committee as
well Municipal Public Accounts Committee (MPAC) are functional and were able to hold their
meetings in line with council approved corporate calendar. Council has also constituted Ethics
Committee and the Chairperson duly appointed. The Speaker of Council has established a multi-
party women caucus comprising of women Councillors from all the parties that constitute the
municipal Council.
The portfolio committees were able to hold their monthly meetings to consider issues within their
spheres of operation, e.g. Corporate Services, Technical services, Finance, Local Economic and
Development as well as Community related issues. All the resolutions from the Portfolio committees
were submitted for consideration by the Executive committee with a view to recommend for Council
for approval.
The Municipal Public Accounts committee has played a critical oversight over Administrative
activities. This involved project visits and monitoring, investigating matters referred to it by
Council. The committee was able to consider quarterly performance reports to ensure the
community gets good value for the public funds entrusted to Council.
The Ward committees from sixteen wards are fully functional. All ward committees are able to
submit their monthly reports to guide the municipality on service delivery needs at ward level. It
can be reported that the municipality process 48 reports on a quarterly basis from ward
committees.
33
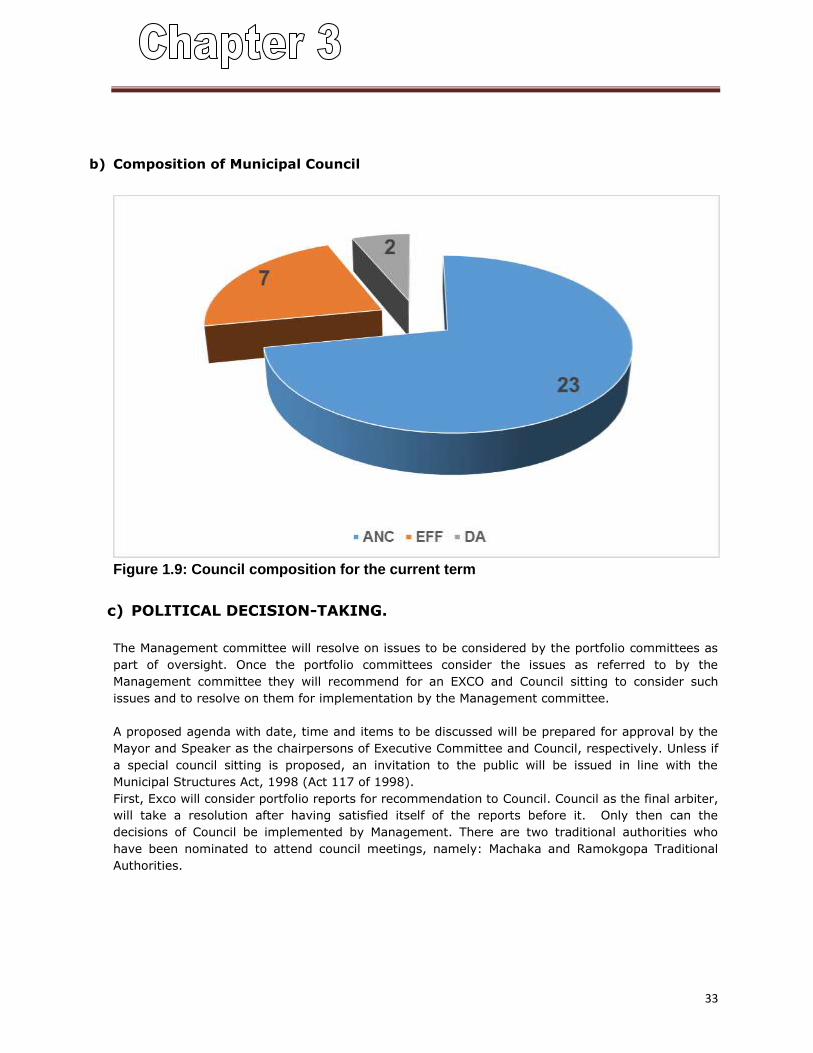
b) Composition of Municipal Council
Figure 1.9: Council composition for the current term
c) POLITICAL DECISION-TAKING.
The Management committee will resolve on issues to be considered by the portfolio committees as
part of oversight. Once the portfolio committees consider the issues as referred to by the
Management committee they will recommend for an EXCO and Council sitting to consider such
issues and to resolve on them for implementation by the Management committee.
A proposed agenda with date, time and items to be discussed will be prepared for approval by the
Mayor and Speaker as the chairpersons of Executive Committee and Council, respectively. Unless if
a special council sitting is proposed, an invitation to the public will be issued in line with the
Municipal Structures Act, 1998 (Act 117 of 1998).
First, Exco will consider portfolio reports for recommendation to Council. Council as the final arbiter,
will take a resolution after having satisfied itself of the reports before it. Only then can the
decisions of Council be implemented by Management. There are two traditional authorities who
have been nominated to attend council meetings, namely: Machaka and Ramokgopa Traditional
Authorities.
34
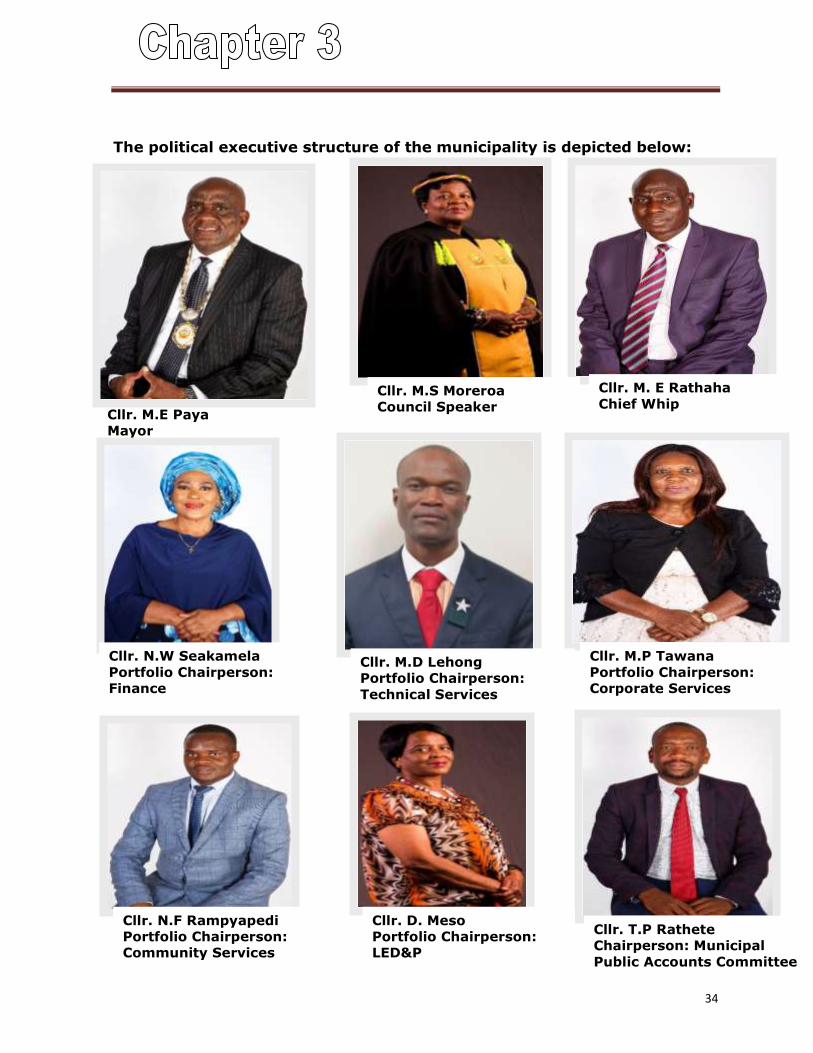
Cllr. M.E Paya
Mayor
dfjdfdj
The political executive structure of the municipality is depicted below:
Cllr. M.S Moreroa
Council Speaker
dfjdfdj
Cllr. M. E Rathaha
Chief Whip
dfjdfdj
Cllr. N.W Seakamela
Portfolio Chairperson:
Finance
dfjdfdj
Cllr. M.D Lehong
Portfolio Chairperson:
Technical Services
dfjdfdj
Cllr. M.P Tawana
Portfolio Chairperson:
Corporate Services
dfjdfdj
Cllr. N.F Rampyapedi
Portfolio Chairperson:
Community Services
dfjdfdj
Cllr. D. Meso
Portfolio Chairperson:
LED&P
dfjdfdj
Cllr. T.P Rathete
Chairperson: Municipal
Public Accounts Committee
dfjdfdj
35
2.2 ADMINISTRATIVE GOVERNANCE
a) INTRODUCTION TO ADMINISTRATIVE GOVERNANCE
Other administrative subcommittees that assist Management in executing its functions are: Batho
Pele committee, OHSA committee, Local Labour forum, Bid committees (Specification, Evaluation
and Adjudication), Employment Equity committee and Training committee. These subcommittees
have all convened their scheduled meetings successfully. With cascading of PMS to all employees in
the 2019/20 financial year, the municipality will establish the PMS committee.
It is through the functionality of these committees that the municipality was able to resolve a total
of 36 out of 38 audit findings raised in the 2017/18 financial audit report. Furthermore, an average
of 92% of internal audit findings were resolved.
It should however be reported that the Risk Committee chairperson has resigned from the
committee and the municipality is currently in the final stages of finding a suitable replacement.
The municipality appreciate the support given by Capricorn District municipality to ensure our Risk
committee is able to perform its function. The strategic and operational risk registers for 2019/20
have been compiled together with mitigation strategies. The progress is being monitored and
reported to both Risk Management and Audit committees on a quarterly basis.
b) HOW THE MUNICIPAL MANAGER AND SENIOR MANAGERS WORK TOGETHER
COOPERATIVELY IN THEIR THEMATIC AND SERVICE GROUP ROLES TO MAKE
THE GREATEST IMPACT ON SERVICE DELIVERY
The municipality had a relatively stable top leadership during the 2018/19 financial year despite the
contract for Senior Manager: LED&P having expired in November 2018. A Manager for Town and
Regional planning has been appointed by Council to act as the Senior Manager whilst the
recruitment process was underway. It is expected that the process will be finalized by the 2nd
quarter of the 2019/20 financial year.
All Senior Managers account to the Municipal Manager as head of administration. This is done
through Management committee, comprising of Executive Management as well as Extended
Management committee meeting. Management committee meetings are held in line with the
approved corporate calendar. Decisions of management are referred to relevant portfolio
committees for consideration and recommendation to Council for approval.
36
The Senior Managers are responsible for communicating with their respective departments through
middle Managers and ensure that matters discussed at Senior Management level are cascaded
down for effective execution of the targets set-out for each department per the IDP with respective
middle managers. Decisions approved by Council are binding and become obligatory for
management to implement them. Departmental Managers hold general staff meetings to cascade
management decisions to all levels of employees and for implementation.
c) TOP ADMINISTRATIVE STRUCTURE
DESIGNATION INITIALS AND SURNAME Key Performance Areas
Municipal Manager Mr. M.L Mosena Oversee overall administration of the municipality, Interact
with Mayor and Council committees, Implement Council
resolutions and other Governance committees, Performance
Management and Monitoring, Legal services, Enforce
Internal Control systems, Risk Management,
Implementation of IGR initiatives and Oversee functions of
all municipal departments.
Chief Financial
Officer
Ms. K. Zulu Budget and Reporting, Revenue Management, Expenditure
Management and Supply chain management
Senior Manager:
Corporate Services
Mr. K.E Makgatho Administration and Auxiliary services, Human Resources
management and labour relations, Information and
Communication Technology and Council Support services.
Senior Manager:
Technical Services
Mr. Y. Wasilota Implementation of Service delivery projects/programmes,
Electrical and Maintenance services, Oversee management
of Municipal Infrastructure Grant (MIG), Provision and
maintenance of water and sanitation services
Senior Manager:
Community Services
Ms. M.F Mabuela Maintenance of social and public amenities, Implementation
of EPWP programmes, Environmental management, Traffic
and Law enforcement.
Senior Manager:
LED&P
Vacant Local economic development, Town and Regional planning
services

37
Mr. M.L Mosena
Municipal Manager
dfjdfdj
Ms. K.W Zulu
Chief Financial Officer
dfjdfdj
Mr. Y. Wasilota
Technical Services
dfjdfdj
Mr. K.E Makgatho
Corporate Services
dfjdfdj
Ms. M.F Mabuela
Community Services
dfjdfdj
Senior Management Team
N.B. The contract for Senior Manager: LED & P expired in November 2018. Recruitment process is
underway to find a replacement.
38
COMPONENT B: INTERGOVERNMENTAL RELATIONS
INTRODUCTION TO CO-OPERATIVE GOVERNANCE AND
INTERGOVERNMENTALRELATIONS
2.3 INTERGOVERNMENTAL RELATIONS
a) NATIONAL, PROVINCIAL AND DISTRICT INTERGOVERNMENTAL STRUCTURES
The municipality has been well represented in all the National Intergovernmental structures
through the office of the Mayor, Speaker, Chief Whip as well as the Municipal Manager. These
structures include, among others: National SALGA, Cooperative Government and Traditional Affairs,
Presidential summits, other structures initiated by the various departments.
The municipality is also fully represented in all Provincial and District structures to report on issues
relating to provincial service delivery. It is our firm belief that these structures are critical in that
we are able to share best practices which can be duplicated in our local municipality. These include
Premier and Executive Mayor’s IGRs, Salga working groups which are attended by relevant
departments and Portfolio Councillor. These forums are convened on a monthly and quarterly basis.
Other forums where the municipality is represented include: Provincial and District IDP Managers’
forums, Disaster and Environmental forums, Provincial Thusong Service center forums, Batho Pele
forums, Provincial and District Service Complaints forums, Back to Basics forums, Provincial and
District Special Programmes forums (HIV/AIDS, Disability, Youth, Older persons and Women &
Children).
b) RELATIONSHIPS WITH MUNICIPAL ENTITIES
The Municipality does not have any entity.
COMPONENT C: PUBLIC ACCOUNTABILITY AND PARTICIPATION
a) OVERVIEW OF PUBLIC ACCOUNTABILITY AND PARTICIPATION
The continued success of a municipality is determined to a large extent, on the accountability of all
key role players and stakeholders in the local governance process. The municipality public
accountability is premised on the vision and mission that puts people at the forefront in all the
developmental agenda. The IDP process plan is a tool used to involve the communities to
undertake all the stages of the development of the IDP. Four (4) public consultative meetings were
held in all the four clusters, covering all the sixteen (16) wards of the municipality. The Municipal
Public Accounts committee has held public participation on the 2017/18 Annual report to give the
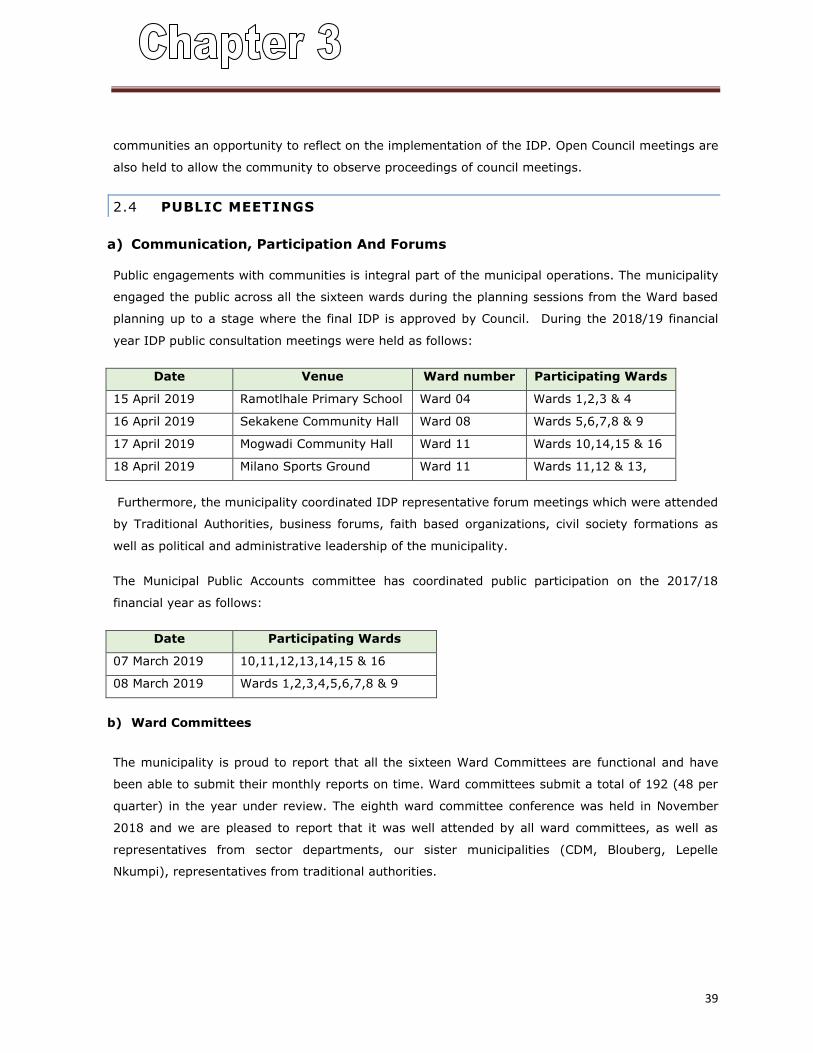
39
communities an opportunity to reflect on the implementation of the IDP. Open Council meetings are
also held to allow the community to observe proceedings of council meetings.
2.4 PUBLIC MEETINGS
a) Communication, Participation And Forums
Public engagements with communities is integral part of the municipal operations. The municipality
engaged the public across all the sixteen wards during the planning sessions from the Ward based
planning up to a stage where the final IDP is approved by Council. During the 2018/19 financial
year IDP public consultation meetings were held as follows:
Date Venue Ward number Participating Wards
15 April 2019 Ramotlhale Primary School Ward 04 Wards 1,2,3 & 4
16 April 2019 Sekakene Community Hall Ward 08 Wards 5,6,7,8 & 9
17 April 2019 Mogwadi Community Hall Ward 11 Wards 10,14,15 & 16
18 April 2019 Milano Sports Ground Ward 11 Wards 11,12 & 13,
Furthermore, the municipality coordinated IDP representative forum meetings which were attended
by Traditional Authorities, business forums, faith based organizations, civil society formations as
well as political and administrative leadership of the municipality.
The Municipal Public Accounts committee has coordinated public participation on the 2017/18
financial year as follows:
Date Participating Wards
07 March 2019 10,11,12,13,14,15 & 16
08 March 2019 Wards 1,2,3,4,5,6,7,8 & 9
b) Ward Committees
The municipality is proud to report that all the sixteen Ward Committees are functional and have
been able to submit their monthly reports on time. Ward committees submit a total of 192 (48 per
quarter) in the year under review. The eighth ward committee conference was held in November
2018 and we are pleased to report that it was well attended by all ward committees, as well as
representatives from sector departments, our sister municipalities (CDM, Blouberg, Lepelle
Nkumpi), representatives from traditional authorities.
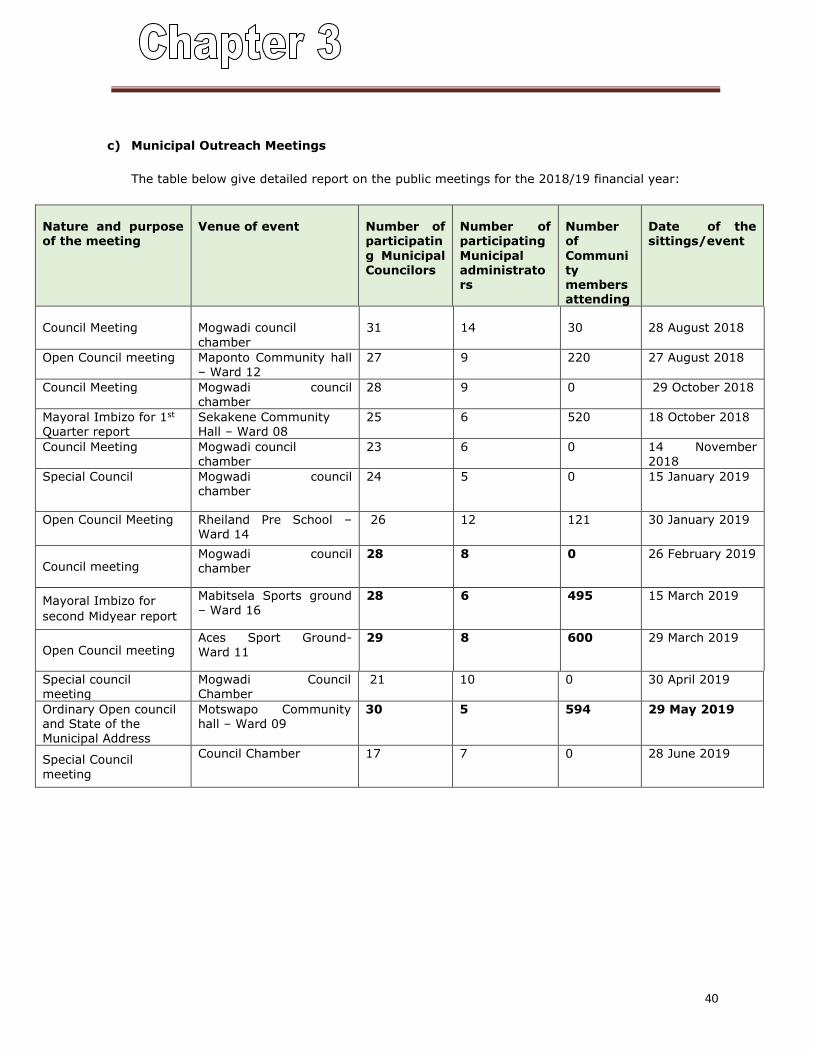
40
c) Municipal Outreach Meetings
The table below give detailed report on the public meetings for the 2018/19 financial year:
Nature and purpose of the meeting
Venue of event Number of participatin
g Municipal Councilors
Number of participating
Municipal administrators
Number of
Community members attending
Date of the sittings/event
Council Meeting Mogwadi council
chamber
31 14 30 28 August 2018
Open Council meeting Maponto Community hall – Ward 12
27 9 220 27 August 2018
Council Meeting Mogwadi council chamber
28 9 0 29 October 2018
Mayoral Imbizo for 1st Quarter report
Sekakene Community Hall – Ward 08
25 6 520 18 October 2018
Council Meeting Mogwadi council chamber
23 6 0 14 November 2018
Special Council Mogwadi council chamber
24 5 0 15 January 2019
Open Council Meeting Rheiland Pre School – Ward 14
26 12 121 30 January 2019
Council meeting Mogwadi council
chamber
28 8 0 26 February 2019
Mayoral Imbizo for
second Midyear report
Mabitsela Sports ground – Ward 16
28 6 495 15 March 2019
Open Council meeting Aces Sport Ground- Ward 11
29 8 600 29 March 2019
Special council meeting
Mogwadi Council Chamber
21 10 0 30 April 2019
Ordinary Open council and State of the Municipal Address
Motswapo Community hall – Ward 09
30 5 594 29 May 2019
Special Council
meeting
Council Chamber 17 7 0 28 June 2019
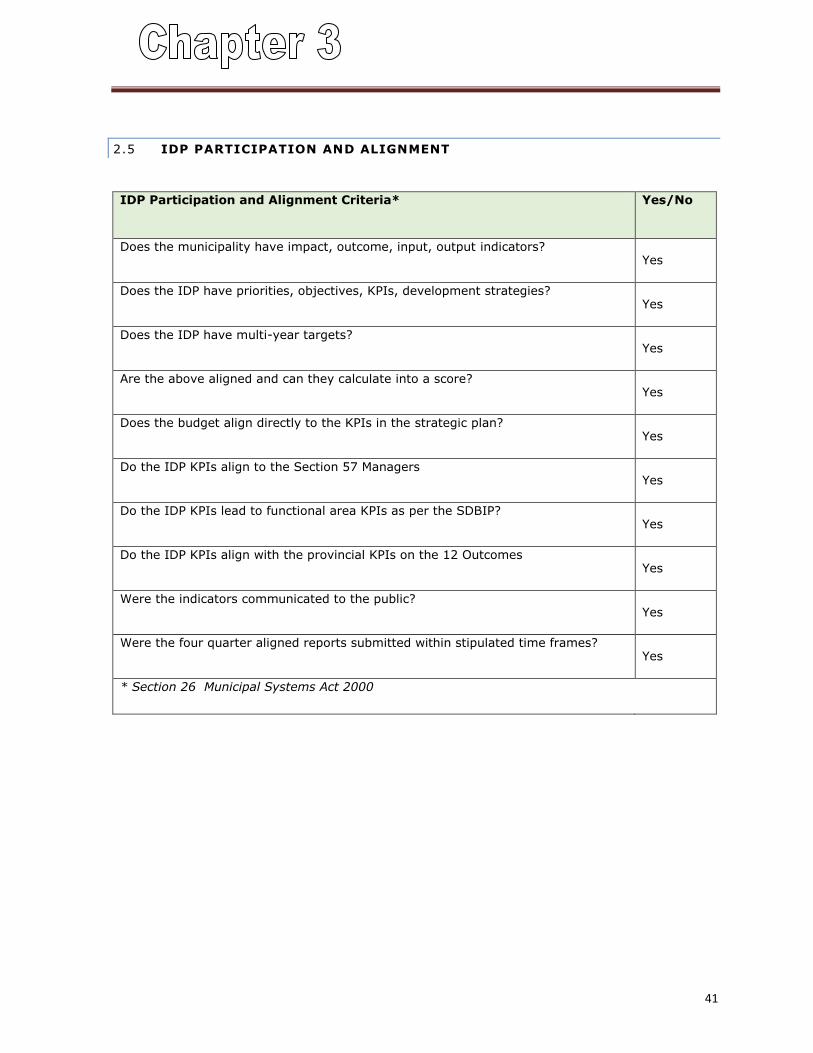
41
2.5 IDP PARTICIPATION AND ALIGNMENT
IDP Participation and Alignment Criteria* Yes/No
Does the municipality have impact, outcome, input, output indicators? Yes
Does the IDP have priorities, objectives, KPIs, development strategies? Yes
Does the IDP have multi-year targets? Yes
Are the above aligned and can they calculate into a score? Yes
Does the budget align directly to the KPIs in the strategic plan? Yes
Do the IDP KPIs align to the Section 57 Managers Yes
Do the IDP KPIs lead to functional area KPIs as per the SDBIP? Yes
Do the IDP KPIs align with the provincial KPIs on the 12 Outcomes Yes
Were the indicators communicated to the public? Yes
Were the four quarter aligned reports submitted within stipulated time frames? Yes
* Section 26 Municipal Systems Act 2000
42
COMPONENT D: CORPORATE GOVERNANCE
a) OVERVIEW OF CORPORATE GOVERNANCE
Molemole municipality consists of seven service points for the residents in both Mogwadi and
Morebeng. Mogwadi is home for the municipal head office as well as one Driver’s License and
Testing Center (DLCTC), Technical Office and Library services. In Morebeng there is a satellite
office, a DLTC as well as the Library. The municipality has entered a service level agreement with
departments of Sports, Arts and Culture and Transport for the running of DLTC and Library
Services. The construction of Moletji Office Cluster to cater for Wards 10,15 & 16 was delayed due
to land claim dispute and the incapacity of the contractor. The project was terminated at the end of
2018/19 financial year and the municipality has prioritized its implementation in the by the end of
the 2019/20 second quarter.
We engaged with COGHSTA to assist the municipality with review of the organizational structure
with a view to come up with an efficient organogram that can ensure effective administration. The
outcome of this review has assisted the municipal leadership to craft a responsive structure for the
2019/20 financial year. The reviewed structure enjoyed full support of the Labour organization and
Council before approval by the municipal manager. It is believed the reviewed structure will also
stabilize the workforce and reduce turnover rates.
It was reported that the municipality has migrated to the online leave management system as a
way to manage employee leave. The main objective of this migration was to reduce the huge leave
provision experienced in the previous financial years. The municipality introduced forced leaves in
the fourth quarter to address this challenge and we are grateful to report that the initiative has led
to a reduction of leave provision. These mechanisms will be applied in the coming financial years
until we make a significant dent on the leave provision figure of above R 5 million.
2.6 RISK MANAGEMENT
Section 62(i) (c) of the Municipal Finance Management Act, 2003 (Act 53 of 2003) requires a
municipality to have and maintain an effective, efficient and transparent system of risk
management. According to Public Sector Risk Management framework the Risk Management
Committee is an oversight committee responsible to the Accounting Officer for the monitoring of
risk management (i.e. to assist in designing, implementing and coordinating the institution’s risk
management initiatives). The municipality has experienced a setback after the resignation of the
Risk Committee chairperson during the course of the financial year under review. To plug the gap
left by the resignation the municipality requested CDM to second an official from within its Risk
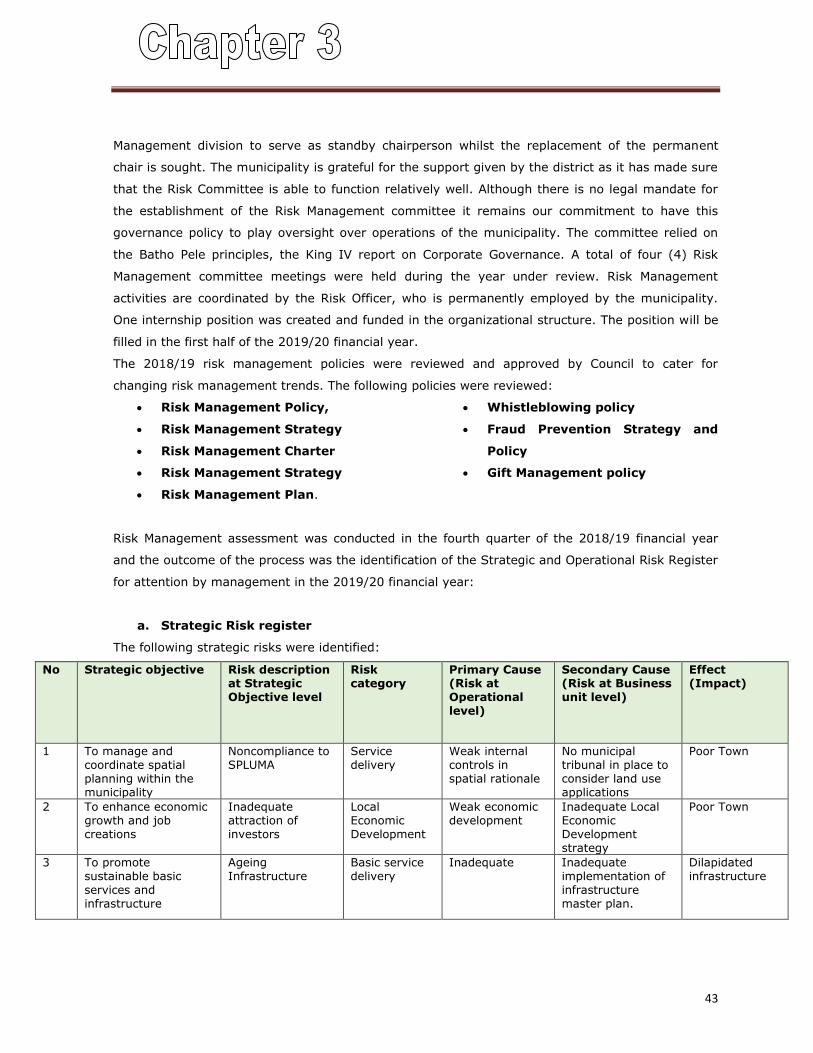
43
Management division to serve as standby chairperson whilst the replacement of the permanent
chair is sought. The municipality is grateful for the support given by the district as it has made sure
that the Risk Committee is able to function relatively well. Although there is no legal mandate for
the establishment of the Risk Management committee it remains our commitment to have this
governance policy to play oversight over operations of the municipality. The committee relied on
the Batho Pele principles, the King IV report on Corporate Governance. A total of four (4) Risk
Management committee meetings were held during the year under review. Risk Management
activities are coordinated by the Risk Officer, who is permanently employed by the municipality.
One internship position was created and funded in the organizational structure. The position will be
filled in the first half of the 2019/20 financial year.
The 2018/19 risk management policies were reviewed and approved by Council to cater for
changing risk management trends. The following policies were reviewed:
Risk Management Policy,
Risk Management Strategy
Risk Management Charter
Risk Management Strategy
Risk Management Plan.
Whistleblowing policy
Fraud Prevention Strategy and
Policy
Gift Management policy
Risk Management assessment was conducted in the fourth quarter of the 2018/19 financial year
and the outcome of the process was the identification of the Strategic and Operational Risk Register
for attention by management in the 2019/20 financial year:
a. Strategic Risk register
The following strategic risks were identified:
No Strategic objective Risk description at Strategic Objective level
Risk category
Primary Cause (Risk at Operational level)
Secondary Cause (Risk at Business unit level)
Effect (Impact)
1 To manage and coordinate spatial planning within the municipality
Noncompliance to SPLUMA
Service delivery
Weak internal controls in spatial rationale
No municipal tribunal in place to consider land use applications
Poor Town
2 To enhance economic growth and job creations
Inadequate attraction of investors
Local Economic Development
Weak economic development
Inadequate Local Economic Development strategy
Poor Town
3 To promote sustainable basic services and infrastructure
Ageing Infrastructure
Basic service delivery
Inadequate Inadequate implementation of infrastructure master plan.
Dilapidated infrastructure
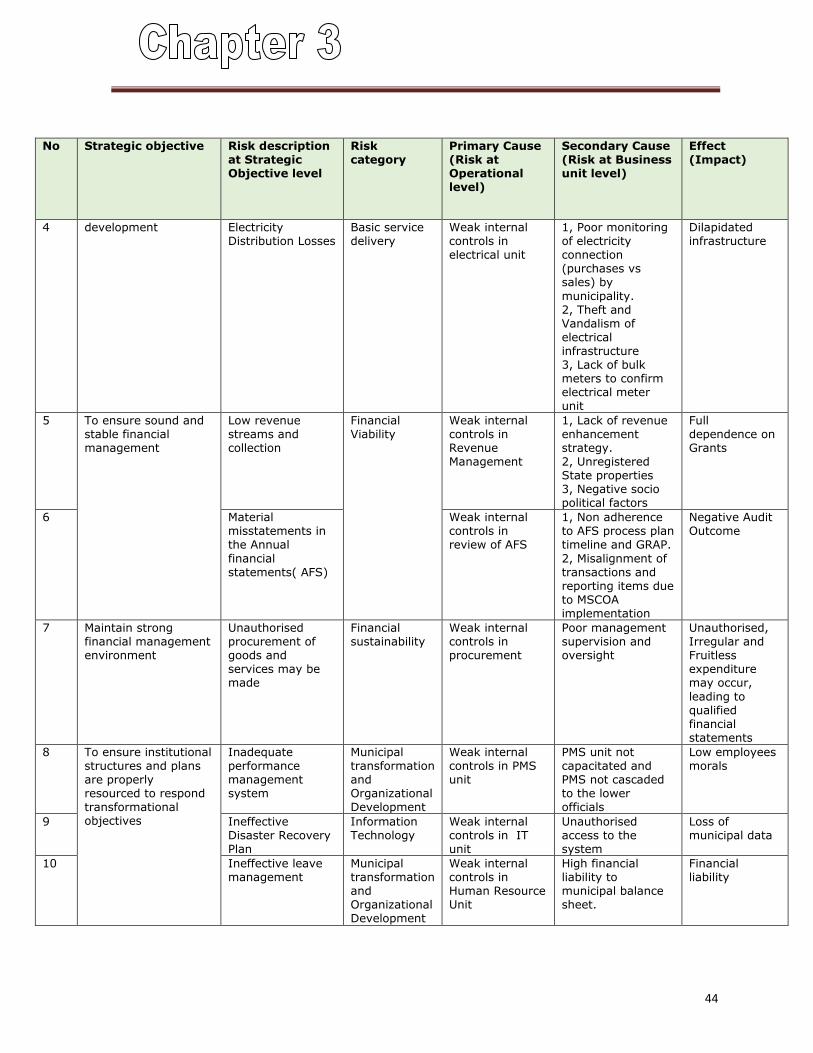
44
No Strategic objective Risk description at Strategic Objective level
Risk category
Primary Cause (Risk at Operational level)
Secondary Cause (Risk at Business unit level)
Effect (Impact)
4 development Electricity Distribution Losses
Basic service delivery
Weak internal controls in electrical unit
1, Poor monitoring of electricity connection (purchases vs sales) by
municipality. 2, Theft and Vandalism of electrical infrastructure 3, Lack of bulk meters to confirm electrical meter unit
Dilapidated infrastructure
5 To ensure sound and stable financial management
Low revenue streams and collection
Financial Viability
Weak internal controls in Revenue Management
1, Lack of revenue enhancement strategy. 2, Unregistered State properties 3, Negative socio political factors
Full dependence on Grants
6 Material misstatements in the Annual
financial statements( AFS)
Weak internal controls in review of AFS
1, Non adherence to AFS process plan timeline and GRAP.
2, Misalignment of transactions and reporting items due to MSCOA implementation
Negative Audit Outcome
7 Maintain strong financial management environment
Unauthorised procurement of goods and services may be made
Financial sustainability
Weak internal controls in procurement
Poor management supervision and oversight
Unauthorised, Irregular and Fruitless expenditure may occur,
leading to qualified financial statements
8 To ensure institutional structures and plans are properly resourced to respond transformational objectives
Inadequate performance management system
Municipal transformation and Organizational Development
Weak internal controls in PMS unit
PMS unit not capacitated and PMS not cascaded to the lower officials
Low employees morals
9 Ineffective Disaster Recovery Plan
Information Technology
Weak internal controls in IT unit
Unauthorised access to the system
Loss of municipal data
10 Ineffective leave management
Municipal transformation and Organizational Development
Weak internal controls in Human Resource Unit
High financial liability to municipal balance sheet.
Financial liability
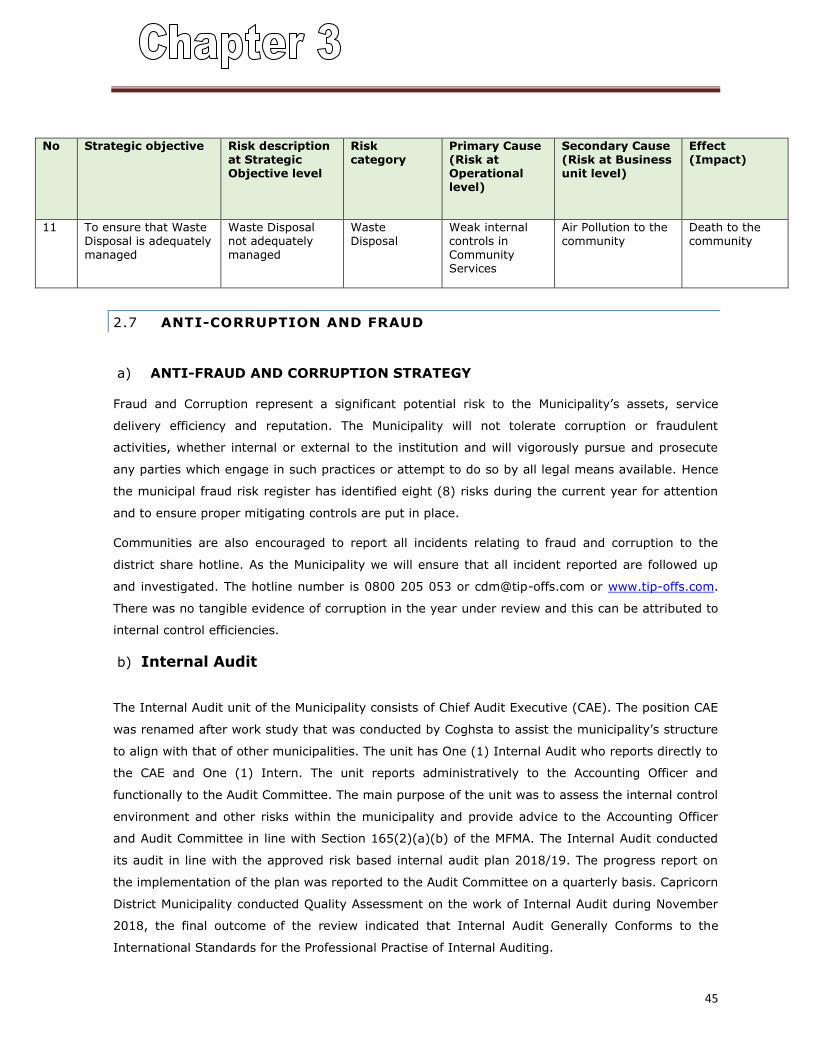
45
No Strategic objective Risk description at Strategic Objective level
Risk category
Primary Cause (Risk at Operational level)
Secondary Cause (Risk at Business unit level)
Effect (Impact)
11 To ensure that Waste Disposal is adequately managed
Waste Disposal not adequately managed
Waste Disposal
Weak internal controls in Community Services
Air Pollution to the community
Death to the community
2.7 ANTI-CORRUPTION AND FRAUD
a) ANTI-FRAUD AND CORRUPTION STRATEGY
Fraud and Corruption represent a significant potential risk to the Municipality’s assets, service
delivery efficiency and reputation. The Municipality will not tolerate corruption or fraudulent
activities, whether internal or external to the institution and will vigorously pursue and prosecute
any parties which engage in such practices or attempt to do so by all legal means available. Hence
the municipal fraud risk register has identified eight (8) risks during the current year for attention
and to ensure proper mitigating controls are put in place.
Communities are also encouraged to report all incidents relating to fraud and corruption to the
district share hotline. As the Municipality we will ensure that all incident reported are followed up
and investigated. The hotline number is 0800 205 053 or [email protected] or www.tip-offs.com.
There was no tangible evidence of corruption in the year under review and this can be attributed to
internal control efficiencies.
b) Internal Audit
The Internal Audit unit of the Municipality consists of Chief Audit Executive (CAE). The position CAE
was renamed after work study that was conducted by Coghsta to assist the municipality’s structure
to align with that of other municipalities. The unit has One (1) Internal Audit who reports directly to
the CAE and One (1) Intern. The unit reports administratively to the Accounting Officer and
functionally to the Audit Committee. The main purpose of the unit was to assess the internal control
environment and other risks within the municipality and provide advice to the Accounting Officer
and Audit Committee in line with Section 165(2)(a)(b) of the MFMA. The Internal Audit conducted
its audit in line with the approved risk based internal audit plan 2018/19. The progress report on
the implementation of the plan was reported to the Audit Committee on a quarterly basis. Capricorn
District Municipality conducted Quality Assessment on the work of Internal Audit during November
2018, the final outcome of the review indicated that Internal Audit Generally Conforms to the
International Standards for the Professional Practise of Internal Auditing.
46
2.8 SUPPLY CHAIN MANAGEMENT
a) OVERVIEW SUPPLY CHAIN MANAGEMENT (SCM)
Section 217(1) of the Constitution of South Africa requires that every organ of the state and all
public institutions and related structures shall contract for goods and services in accordance with a
system which is Fair, Equitable, Transparent, Competitive and Cost effective
The above principles are ushered and are made alive through a range of legislation and supply
chain management is governed and enforced in compliance with the constitutional principles
through the procurement policy framework Act (Act 5 of 2005) as amended and the appropriate
SCM regulations. The municipality applies SCM principles to procure goods and services for the
municipality.
b) SCM POLICY
The council of the Municipality approved the supply chain management policy on the 29st May 2019.
The policy is in line with requirements of section 112 of the MFMA as well as principles outlined in
Municipal Supply Chain Regulations (2005). The SCM practices are also guided by the various
Circulars issued by Treasury from time to time. The provisions of these circulars are filtered in the
SCM policy during Annual policy reviews. The policy review is also guided by shortcomings
identified during Audit process, both internally and externally.
c) SCM UNIT
The SCM unit falls under the Budget and Treasury Department and consists of the SCM Manager
who reports directly to the Chief Financial Officer. There is also the Asset Officer, Procurement
Officer, Procurement Clerk and 2x Inventory Clerks. The CFO is the Accounting Officer for the
department. The position for Accountant Assets became vacant after the previous incumbent was
appointed as the SCM Manager following the resignation of the SCM Manager to pursue a career as
CFO at Blouberg Municipality. Recruitment process is fully underway to find a suitable replacement
as the municipality view asset management as a critical function in the unit.
d) BID COMMITTEES
All members of bid committees are delegated in writing by the municipal manager to serve on
these respective committees. These delegations are accepted in writing. Molemole municipality has
put in place mechanism to ensure that the committees that preside over procurement are
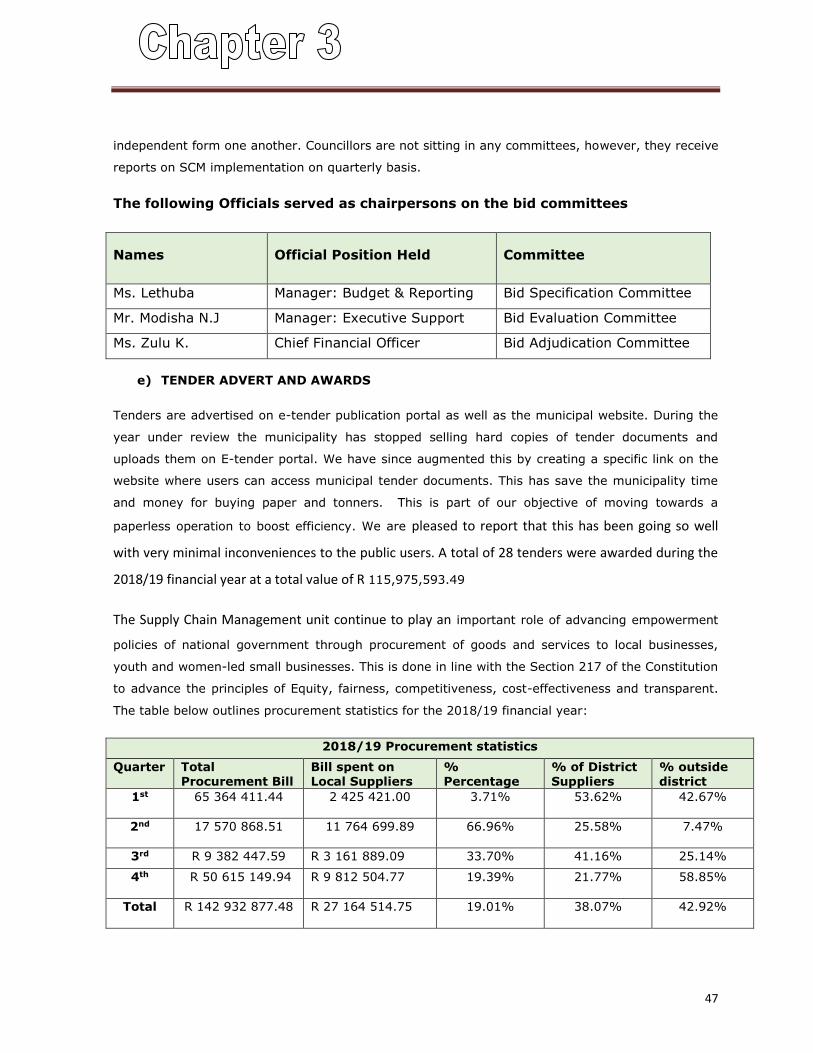
47
independent form one another. Councillors are not sitting in any committees, however, they receive
reports on SCM implementation on quarterly basis.
The following Officials served as chairpersons on the bid committees
Names Official Position Held Committee
Ms. Lethuba Manager: Budget & Reporting Bid Specification Committee
Mr. Modisha N.J Manager: Executive Support Bid Evaluation Committee
Ms. Zulu K. Chief Financial Officer Bid Adjudication Committee
e) TENDER ADVERT AND AWARDS
Tenders are advertised on e-tender publication portal as well as the municipal website. During the
year under review the municipality has stopped selling hard copies of tender documents and
uploads them on E-tender portal. We have since augmented this by creating a specific link on the
website where users can access municipal tender documents. This has save the municipality time
and money for buying paper and tonners. This is part of our objective of moving towards a
paperless operation to boost efficiency. We are pleased to report that this has been going so well
with very minimal inconveniences to the public users. A total of 28 tenders were awarded during the
2018/19 financial year at a total value of R 115,975,593.49
The Supply Chain Management unit continue to play an important role of advancing empowerment
policies of national government through procurement of goods and services to local businesses,
youth and women-led small businesses. This is done in line with the Section 217 of the Constitution
to advance the principles of Equity, fairness, competitiveness, cost-effectiveness and transparent.
The table below outlines procurement statistics for the 2018/19 financial year:
2018/19 Procurement statistics
Quarter Total Procurement Bill
Bill spent on Local Suppliers
% Percentage
% of District Suppliers
% outside district
1st 65 364 411.44
2 425 421.00 3.71% 53.62% 42.67%
2nd 17 570 868.51 11 764 699.89
66.96% 25.58% 7.47%
3rd R 9 382 447.59 R 3 161 889.09 33.70% 41.16% 25.14%
4th R 50 615 149.94
R 9 812 504.77
19.39% 21.77% 58.85%
Total R 142 932 877.48
R 27 164 514.75
19.01%
38.07% 42.92%
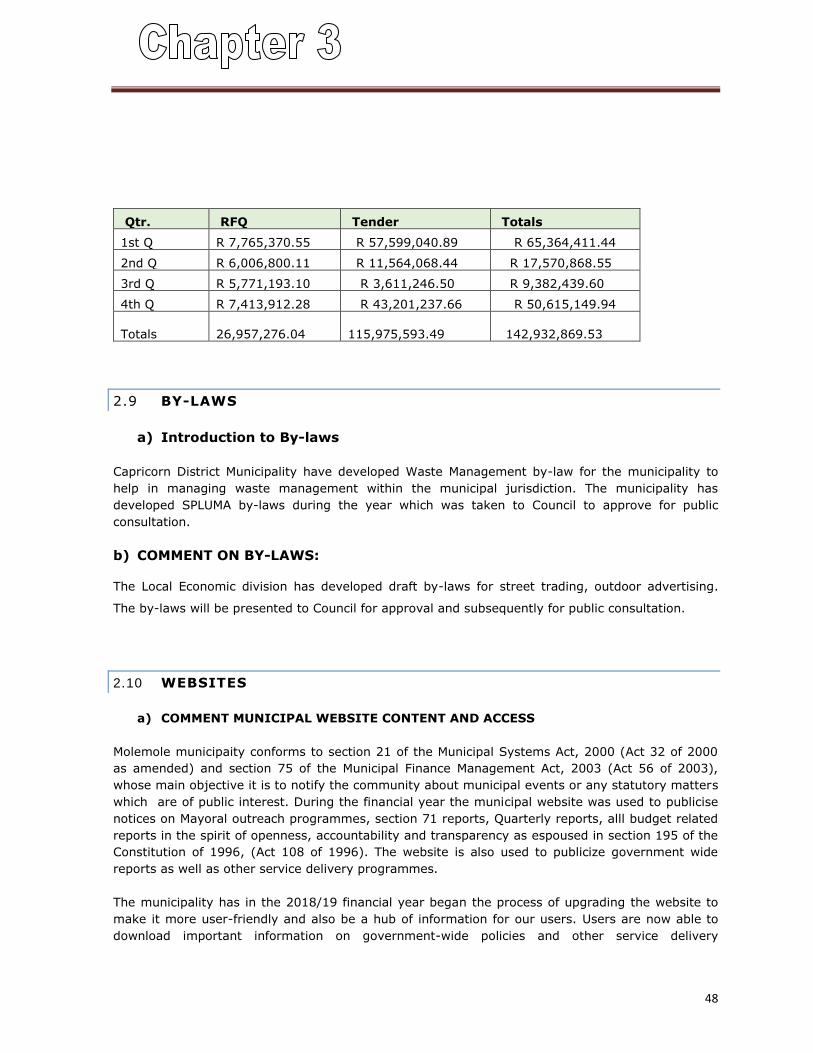
48
Qtr. RFQ Tender Totals
1st Q R 7,765,370.55 R 57,599,040.89 R 65,364,411.44
2nd Q R 6,006,800.11 R 11,564,068.44 R 17,570,868.55
3rd Q R 5,771,193.10 R 3,611,246.50 R 9,382,439.60
4th Q R 7,413,912.28 R 43,201,237.66 R 50,615,149.94
Totals
26,957,276.04
115,975,593.49 142,932,869.53
2.9 BY-LAWS
a) Introduction to By-laws
Capricorn District Municipality have developed Waste Management by-law for the municipality to
help in managing waste management within the municipal jurisdiction. The municipality has
developed SPLUMA by-laws during the year which was taken to Council to approve for public
consultation.
b) COMMENT ON BY-LAWS:
The Local Economic division has developed draft by-laws for street trading, outdoor advertising.
The by-laws will be presented to Council for approval and subsequently for public consultation.
2.10 WEBSITES
a) COMMENT MUNICIPAL WEBSITE CONTENT AND ACCESS
Molemole municipaity conforms to section 21 of the Municipal Systems Act, 2000 (Act 32 of 2000
as amended) and section 75 of the Municipal Finance Management Act, 2003 (Act 56 of 2003),
whose main objective it is to notify the community about municipal events or any statutory matters
which are of public interest. During the financial year the municipal website was used to publicise
notices on Mayoral outreach programmes, section 71 reports, Quarterly reports, alll budget related
reports in the spirit of openness, accountability and transparency as espoused in section 195 of the
Constitution of 1996, (Act 108 of 1996). The website is also used to publicize government wide
reports as well as other service delivery programmes.
The municipality has in the 2018/19 financial year began the process of upgrading the website to
make it more user-friendly and also be a hub of information for our users. Users are now able to
download important information on government-wide policies and other service delivery
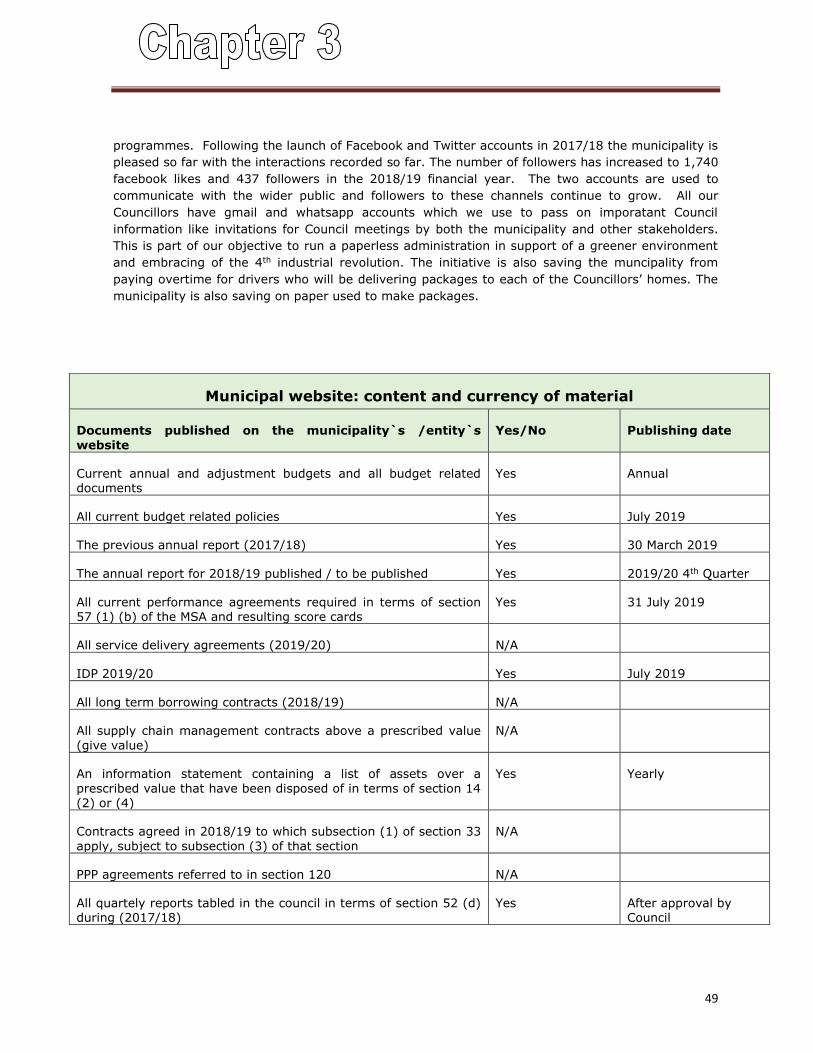
49
programmes. Following the launch of Facebook and Twitter accounts in 2017/18 the municipality is
pleased so far with the interactions recorded so far. The number of followers has increased to 1,740
facebook likes and 437 followers in the 2018/19 financial year. The two accounts are used to
communicate with the wider public and followers to these channels continue to grow. All our
Councillors have gmail and whatsapp accounts which we use to pass on imporatant Council
information like invitations for Council meetings by both the municipality and other stakeholders.
This is part of our objective to run a paperless administration in support of a greener environment
and embracing of the 4th industrial revolution. The initiative is also saving the muncipality from
paying overtime for drivers who will be delivering packages to each of the Councillors’ homes. The
municipality is also saving on paper used to make packages.
Municipal website: content and currency of material
Documents published on the municipality`s /entity`s
website
Yes/No Publishing date
Current annual and adjustment budgets and all budget related documents
Yes Annual
All current budget related policies Yes July 2019
The previous annual report (2017/18) Yes 30 March 2019
The annual report for 2018/19 published / to be published Yes 2019/20 4th Quarter
All current performance agreements required in terms of section 57 (1) (b) of the MSA and resulting score cards
Yes 31 July 2019
All service delivery agreements (2019/20) N/A
IDP 2019/20 Yes July 2019
All long term borrowing contracts (2018/19) N/A
All supply chain management contracts above a prescribed value
(give value)
N/A
An information statement containing a list of assets over a
prescribed value that have been disposed of in terms of section 14
(2) or (4)
Yes Yearly
Contracts agreed in 2018/19 to which subsection (1) of section 33
apply, subject to subsection (3) of that section
N/A
PPP agreements referred to in section 120 N/A
All quartely reports tabled in the council in terms of section 52 (d) during (2017/18)
Yes After approval by Council
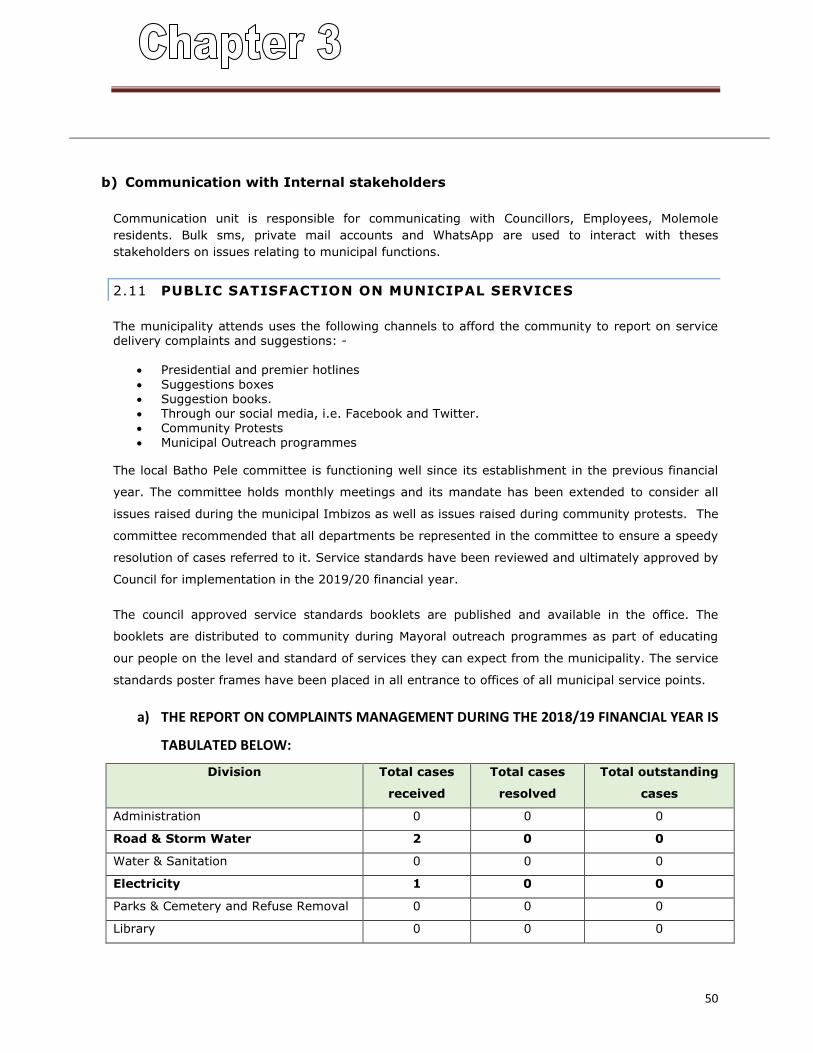
50
b) Communication with Internal stakeholders
Communication unit is responsible for communicating with Councillors, Employees, Molemole
residents. Bulk sms, private mail accounts and WhatsApp are used to interact with theses
stakeholders on issues relating to municipal functions.
2.11 PUBLIC SATISFACTION ON MUNICIPAL SERVICES
The municipality attends uses the following channels to afford the community to report on service
delivery complaints and suggestions: -
Presidential and premier hotlines
Suggestions boxes Suggestion books. Through our social media, i.e. Facebook and Twitter. Community Protests Municipal Outreach programmes
The local Batho Pele committee is functioning well since its establishment in the previous financial
year. The committee holds monthly meetings and its mandate has been extended to consider all
issues raised during the municipal Imbizos as well as issues raised during community protests. The
committee recommended that all departments be represented in the committee to ensure a speedy
resolution of cases referred to it. Service standards have been reviewed and ultimately approved by
Council for implementation in the 2019/20 financial year.
The council approved service standards booklets are published and available in the office. The
booklets are distributed to community during Mayoral outreach programmes as part of educating
our people on the level and standard of services they can expect from the municipality. The service
standards poster frames have been placed in all entrance to offices of all municipal service points.
a) THE REPORT ON COMPLAINTS MANAGEMENT DURING THE 2018/19 FINANCIAL YEAR IS
TABULATED BELOW:
Division Total cases
received
Total cases
resolved
Total outstanding
cases
Administration 0 0 0
Road & Storm Water 2 0 0
Water & Sanitation 0 0 0
Electricity 1 0 0
Parks & Cemetery and Refuse Removal 0 0 0
Library 0 0 0
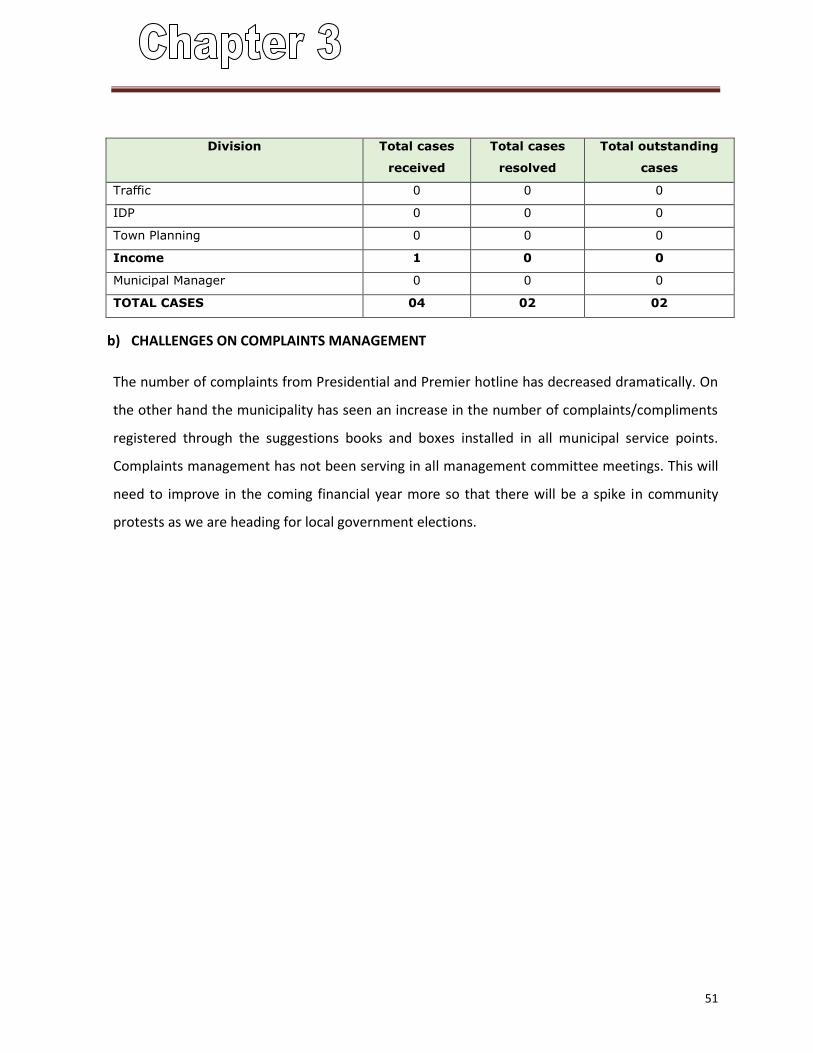
51
Division Total cases
received
Total cases
resolved
Total outstanding
cases
Traffic 0 0 0
IDP 0 0 0
Town Planning 0 0 0
Income 1 0 0
Municipal Manager 0 0 0
TOTAL CASES 04 02 02
b) CHALLENGES ON COMPLAINTS MANAGEMENT
The number of complaints from Presidential and Premier hotline has decreased dramatically. On
the other hand the municipality has seen an increase in the number of complaints/compliments
registered through the suggestions books and boxes installed in all municipal service points.
Complaints management has not been serving in all management committee meetings. This will
need to improve in the coming financial year more so that there will be a spike in community
protests as we are heading for local government elections.

52
CHAPTER 3 – SERVICE DELIVERY PERFORMANCE
(PERFORMANCE REPORT PART I)
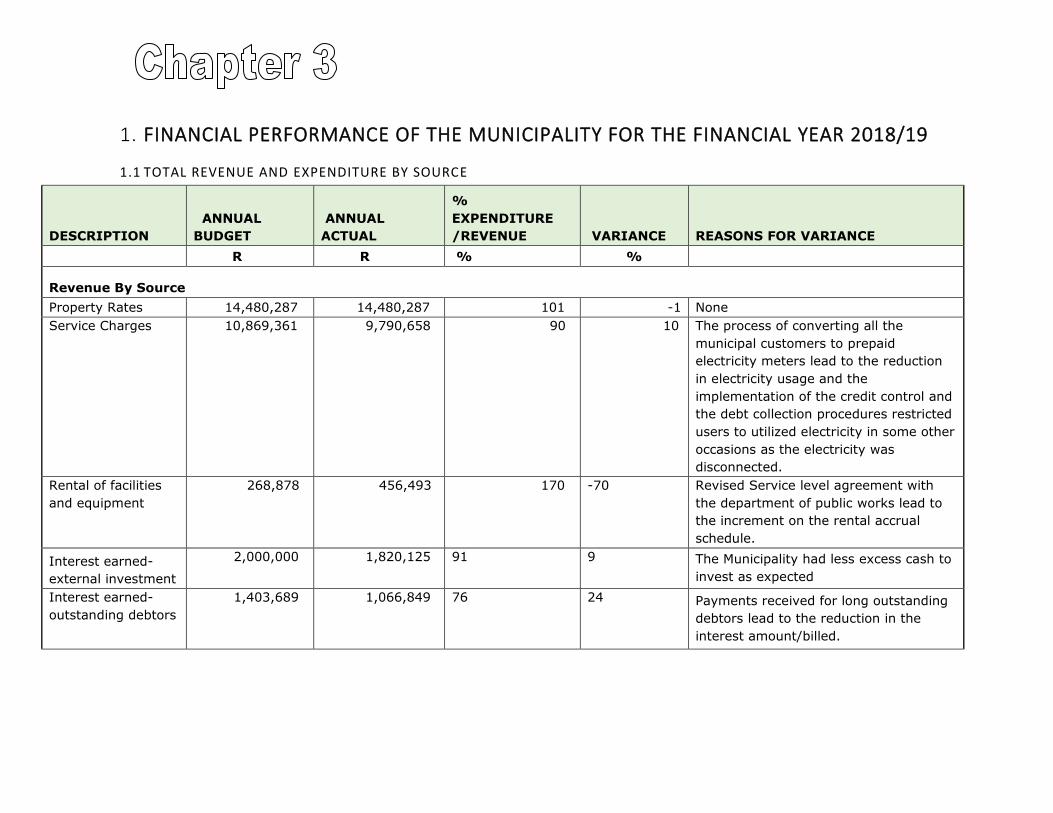
1. FINANCIAL PERFORMANCE OF THE MUNICIPALITY FOR THE FINANCIAL YEAR 2018/19
1.1 TOTAL REVENUE AND EXPENDITURE BY SOURCE
DESCRIPTION
ANNUAL
BUDGET
ANNUAL
ACTUAL
%
EXPENDITURE
/REVENUE VARIANCE REASONS FOR VARIANCE
R R % %
Revenue By Source
Property Rates 14,480,287 14,480,287 101 -1 None
Service Charges 10,869,361 9,790,658 90 10 The process of converting all the
municipal customers to prepaid
electricity meters lead to the reduction
in electricity usage and the
implementation of the credit control and
the debt collection procedures restricted
users to utilized electricity in some other
occasions as the electricity was
disconnected.
Rental of facilities
and equipment
268,878 456,493 170 -70 Revised Service level agreement with
the department of public works lead to
the increment on the rental accrual
schedule.
Interest earned-
external investment
2,000,000 1,820,125 91 9 The Municipality had less excess cash to
invest as expected
Interest earned-
outstanding debtors
1,403,689 1,066,849 76 24 Payments received for long outstanding
debtors lead to the reduction in the
interest amount/billed.
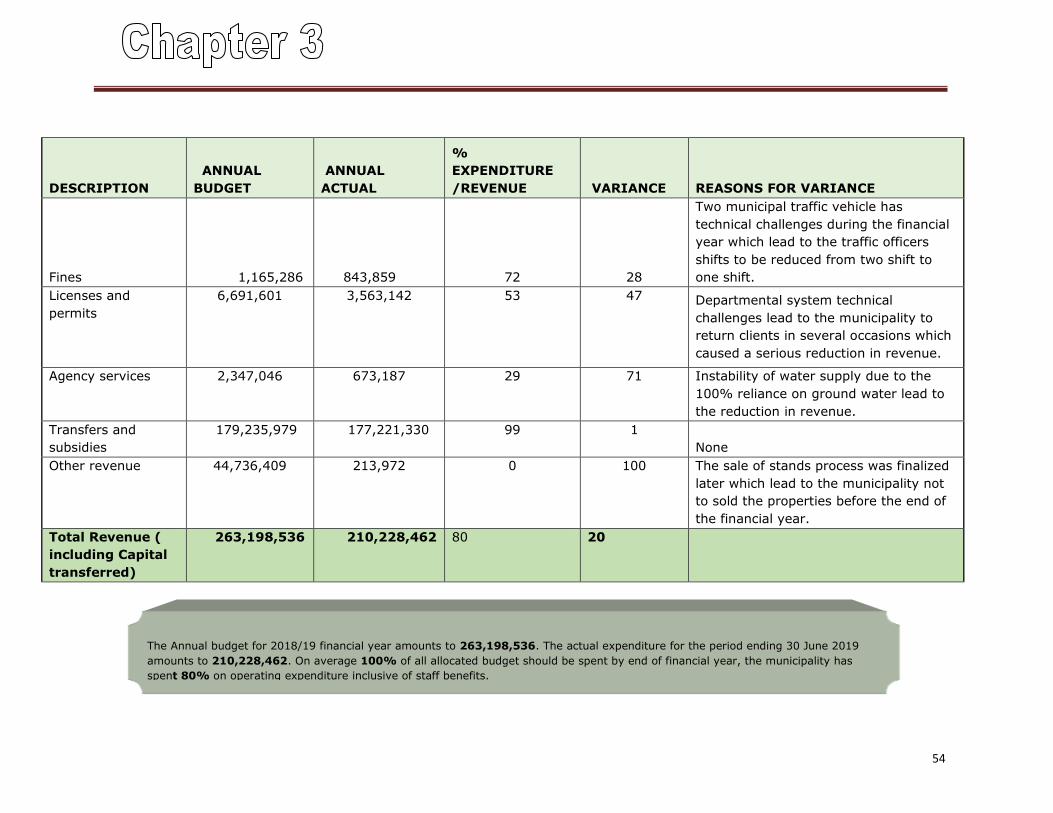
54
The Annual budget for 2018/19 financial year amounts to 263,198,536. The actual expenditure for the period ending 30 June 2019
amounts to 210,228,462. On average 100% of all allocated budget should be spent by end of financial year, the municipality has
spent 80% on operating expenditure inclusive of staff benefits.
DESCRIPTION
ANNUAL
BUDGET
ANNUAL
ACTUAL
%
EXPENDITURE
/REVENUE VARIANCE REASONS FOR VARIANCE
Fines 1,165,286 843,859 72 28
Two municipal traffic vehicle has
technical challenges during the financial
year which lead to the traffic officers
shifts to be reduced from two shift to
one shift.
Licenses and
permits
6,691,601 3,563,142 53 47 Departmental system technical
challenges lead to the municipality to
return clients in several occasions which
caused a serious reduction in revenue.
Agency services 2,347,046 673,187 29 71 Instability of water supply due to the
100% reliance on ground water lead to
the reduction in revenue.
Transfers and
subsidies
179,235,979 177,221,330 99 1
None
Other revenue 44,736,409 213,972 0 100 The sale of stands process was finalized
later which lead to the municipality not
to sold the properties before the end of
the financial year.
Total Revenue (
including Capital
transferred)
263,198,536 210,228,462 80 20
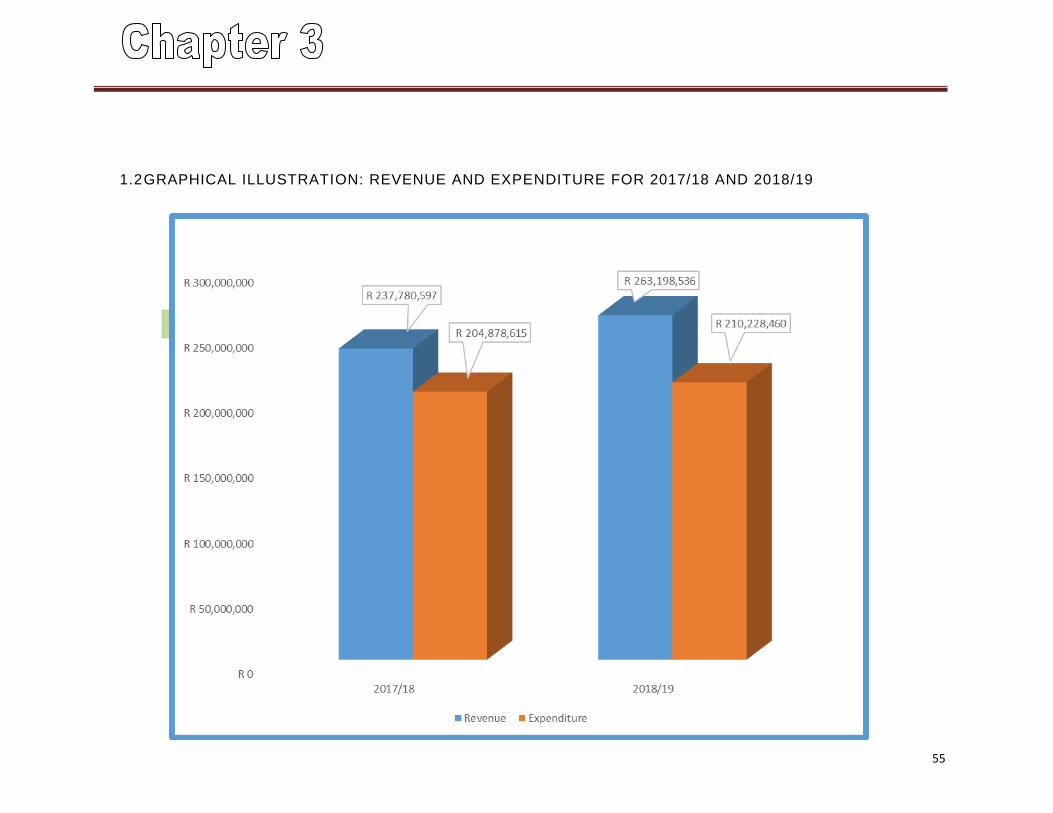
55
1.2 GRAPHICAL ILLUSTRATION: REVENUE AND EXPENDITURE FOR 2017/18 AND 2018/19
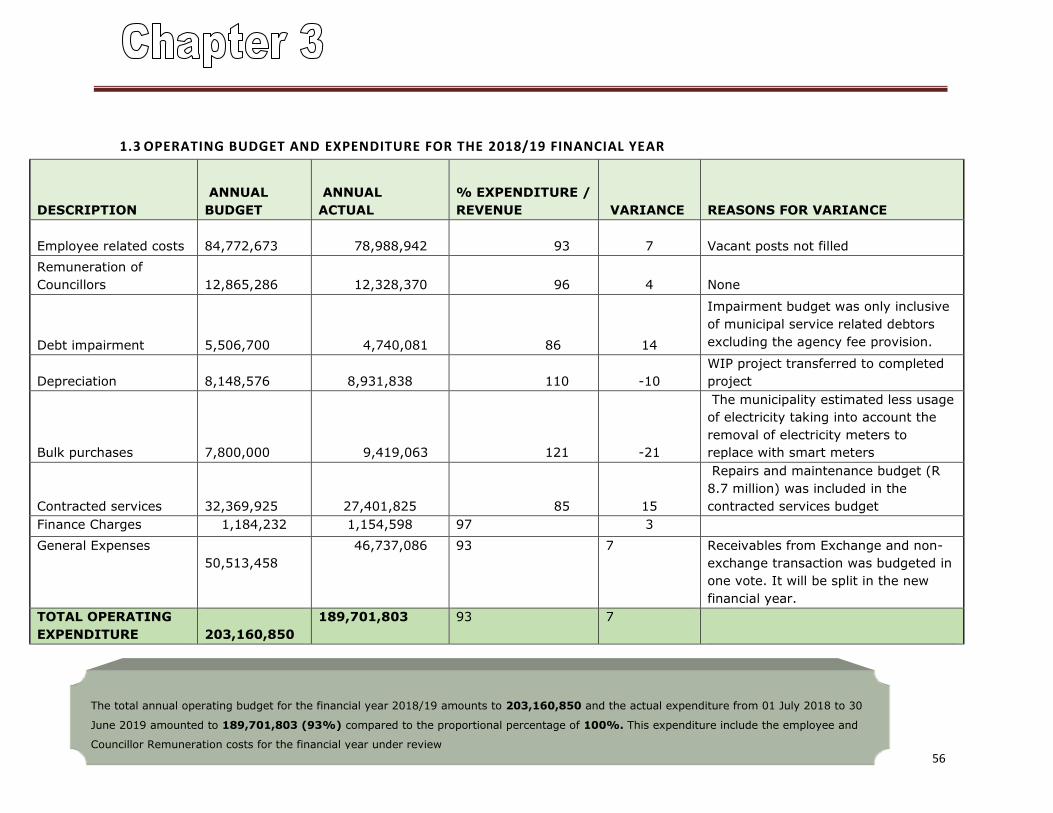
56
The total annual operating budget for the financial year 2018/19 amounts to 203,160,850 and the actual expenditure from 01 July 2018 to 30
June 2019 amounted to 189,701,803 (93%) compared to the proportional percentage of 100%. This expenditure include the employee and
Councillor Remuneration costs for the financial year under review
1.3 OPERATING BUDGET AND EXPENDITURE FOR THE 2018/19 FINANCIAL YEAR
DESCRIPTION
ANNUAL
BUDGET
ANNUAL
ACTUAL
% EXPENDITURE /
REVENUE VARIANCE REASONS FOR VARIANCE
Employee related costs
84,772,673 78,988,942 93 7 Vacant posts not filled
Remuneration of
Councillors
12,865,286 12,328,370 96 4 None
Debt impairment
5,506,700 4,740,081 86 14
Impairment budget was only inclusive
of municipal service related debtors
excluding the agency fee provision.
Depreciation
8,148,576 8,931,838 110 -10
WIP project transferred to completed
project
Bulk purchases
7,800,000 9,419,063 121 -21
The municipality estimated less usage
of electricity taking into account the
removal of electricity meters to
replace with smart meters
Contracted services
32,369,925 27,401,825 85 15
Repairs and maintenance budget (R
8.7 million) was included in the
contracted services budget
Finance Charges 1,184,232 1,154,598 97 3
General Expenses
50,513,458
46,737,086 93 7 Receivables from Exchange and non-
exchange transaction was budgeted in
one vote. It will be split in the new
financial year.
TOTAL OPERATING
EXPENDITURE
203,160,850
189,701,803 93 7
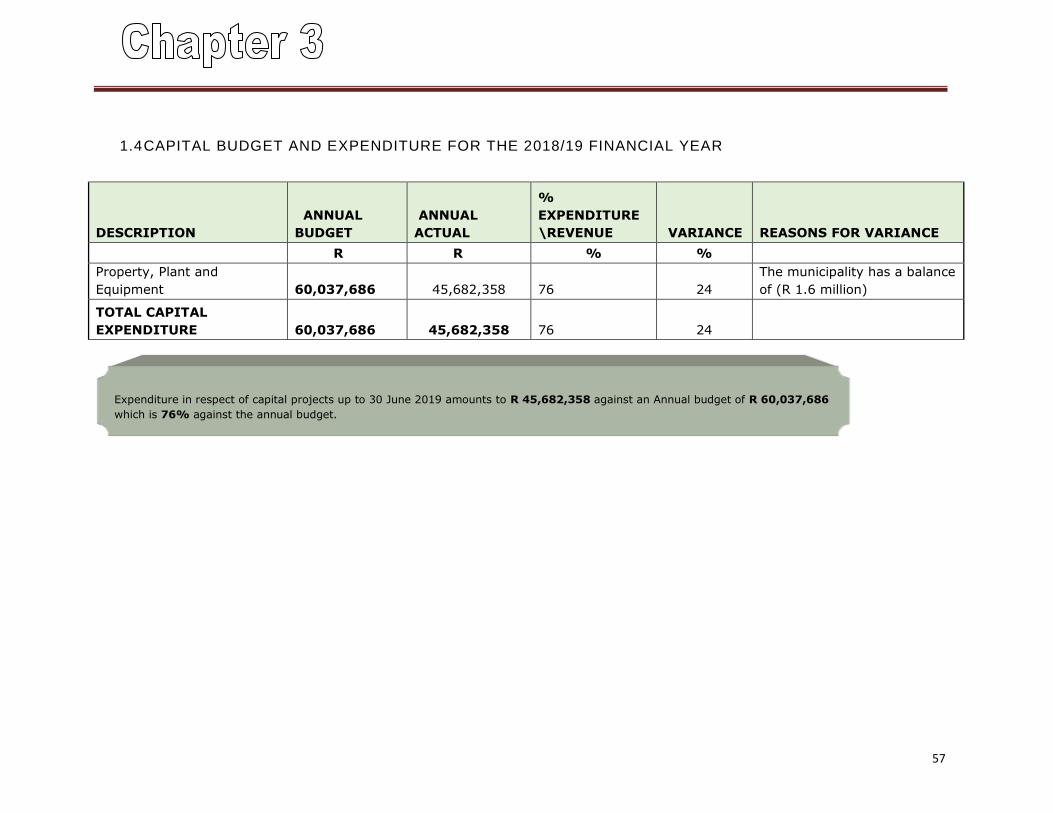
57
Expenditure in respect of capital projects up to 30 June 2019 amounts to R 45,682,358 against an Annual budget of R 60,037,686
which is 76% against the annual budget.
1.4 CAPITAL BUDGET AND EXPENDITURE FOR THE 2018/19 FINANCIAL YEAR
DESCRIPTION
ANNUAL
BUDGET
ANNUAL
ACTUAL
%
EXPENDITURE
\REVENUE VARIANCE REASONS FOR VARIANCE
R R % %
Property, Plant and
Equipment
60,037,686 45,682,358
76 24
The municipality has a balance
of (R 1.6 million)
TOTAL CAPITAL
EXPENDITURE
60,037,686 45,682,358
76 24
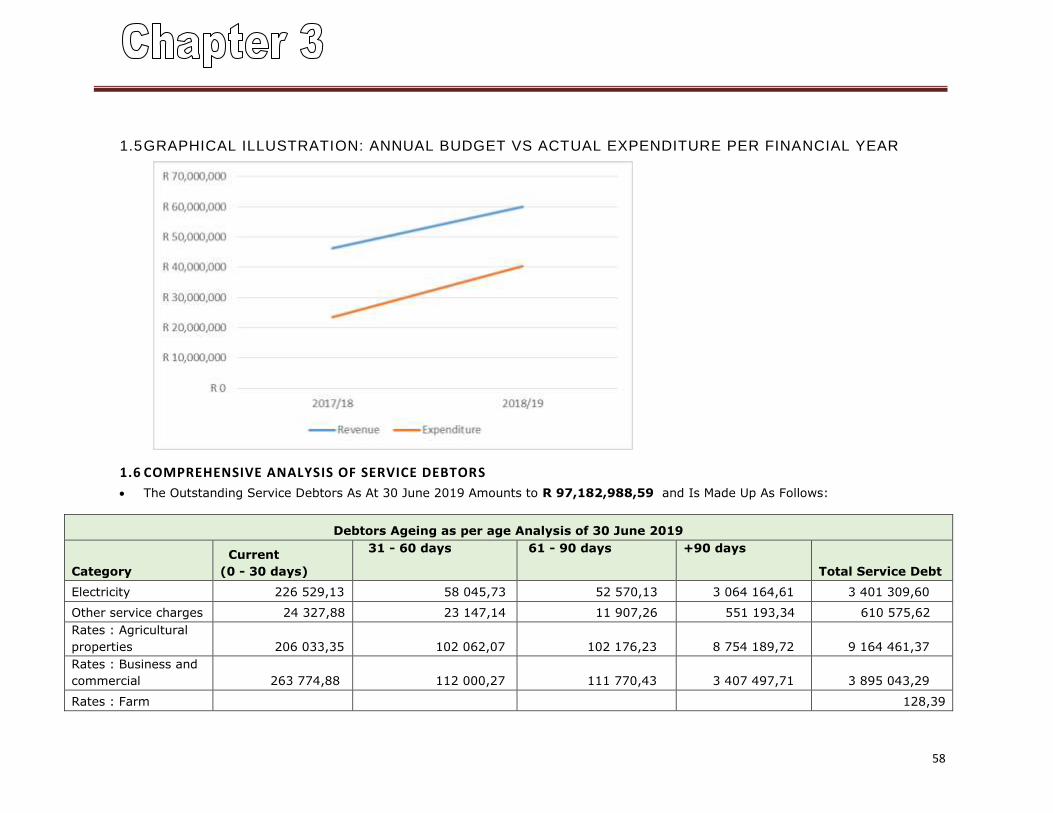
58
1.5 GRAPHICAL ILLUSTRATION: ANNUAL BUDGET VS ACTUAL EXPENDITURE PER FINANCIAL YEAR
1.6 COMPREHENSIVE ANALYSIS OF SERVICE DEBTORS
The Outstanding Service Debtors As At 30 June 2019 Amounts to R 97,182,988,59 and Is Made Up As Follows:
Debtors Ageing as per age Analysis of 30 June 2019
Category
Current
(0 - 30 days)
31 - 60 days 61 - 90 days +90 days
Total Service Debt
Electricity 226 529,13 58 045,73 52 570,13 3 064 164,61 3 401 309,60
Other service charges 24 327,88 23 147,14 11 907,26 551 193,34 610 575,62
Rates : Agricultural
properties 206 033,35 102 062,07 102 176,23 8 754 189,72 9 164 461,37
Rates : Business and
commercial 263 774,88 112 000,27 111 770,43 3 407 497,71 3 895 043,29
Rates : Farm 128,39
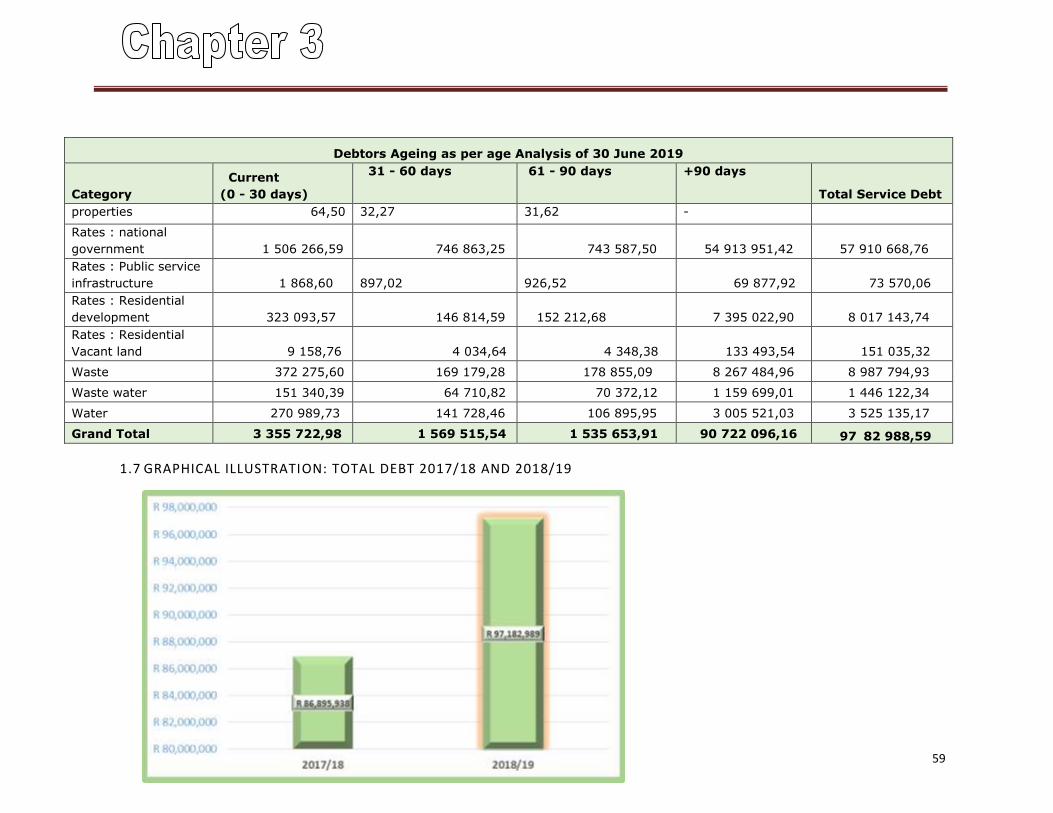
59
Debtors Ageing as per age Analysis of 30 June 2019
Category
Current
(0 - 30 days)
31 - 60 days 61 - 90 days +90 days
Total Service Debt
properties 64,50 32,27 31,62 -
Rates : national
government 1 506 266,59 746 863,25 743 587,50 54 913 951,42 57 910 668,76
Rates : Public service
infrastructure 1 868,60
897,02
926,52 69 877,92 73 570,06
Rates : Residential
development 323 093,57 146 814,59 152 212,68 7 395 022,90 8 017 143,74
Rates : Residential
Vacant land 9 158,76 4 034,64 4 348,38 133 493,54 151 035,32
Waste 372 275,60 169 179,28 178 855,09 8 267 484,96 8 987 794,93
Waste water 151 340,39 64 710,82 70 372,12 1 159 699,01 1 446 122,34
Water 270 989,73 141 728,46 106 895,95 3 005 521,03 3 525 135,17
Grand Total 3 355 722,98 1 569 515,54 1 535 653,91 90 722 096,16 97 82 988,59
1.7 GRAPHICAL ILLUSTRATION: TOTAL DEBT 2017/18 AND 2018/19
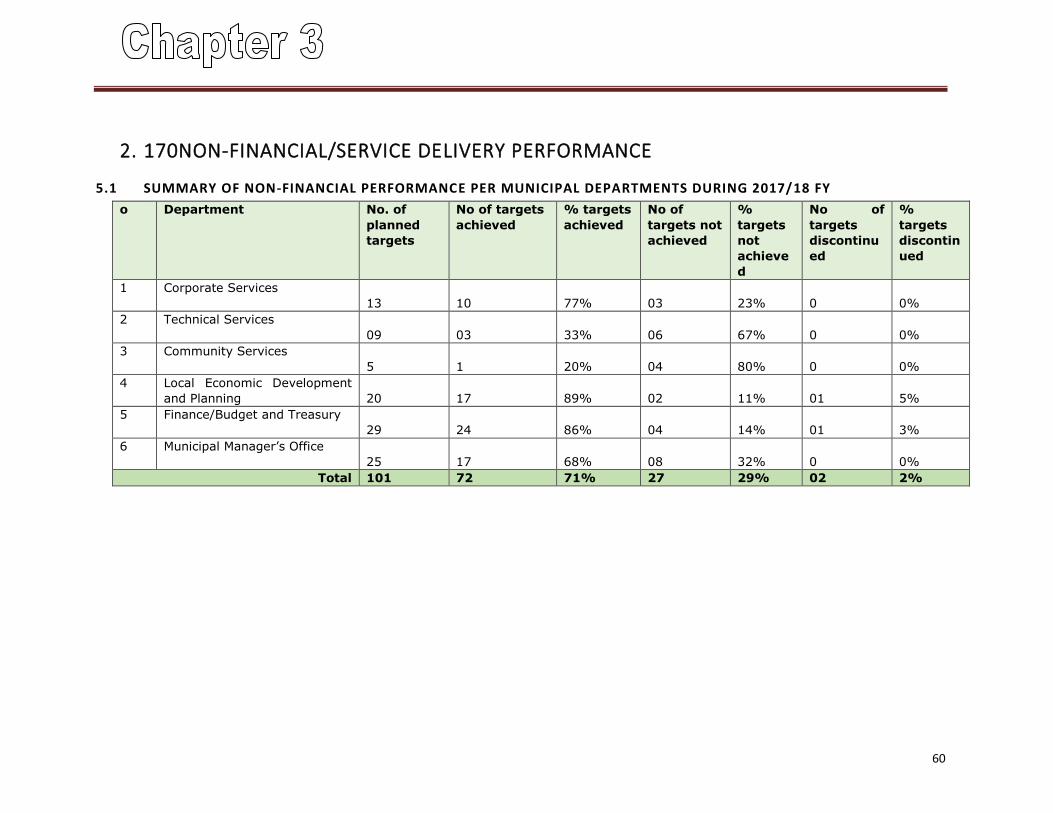
60
2. 170NON-FINANCIAL/SERVICE DELIVERY PERFORMANCE
5.1 SUMMARY OF NON-FINANCIAL PERFORMANCE PER MUNICIPAL DEPARTMENTS DURING 2017/18 FY
o Department No. of
planned
targets
No of targets
achieved
% targets
achieved
No of
targets not
achieved
%
targets
not
achieve
d
No of
targets
discontinu
ed
%
targets
discontin
ued
1 Corporate Services
13
10
77%
03
23%
0
0%
2 Technical Services
09
03
33%
06
67%
0
0%
3 Community Services
5
1
20%
04
80%
0
0%
4 Local Economic Development
and Planning
20
17
89%
02
11%
01
5%
5 Finance/Budget and Treasury
29
24
86%
04
14%
01
3%
6 Municipal Manager’s Office
25
17
68%
08
32%
0
0%
Total 101 72 71% 27 29% 02 2%
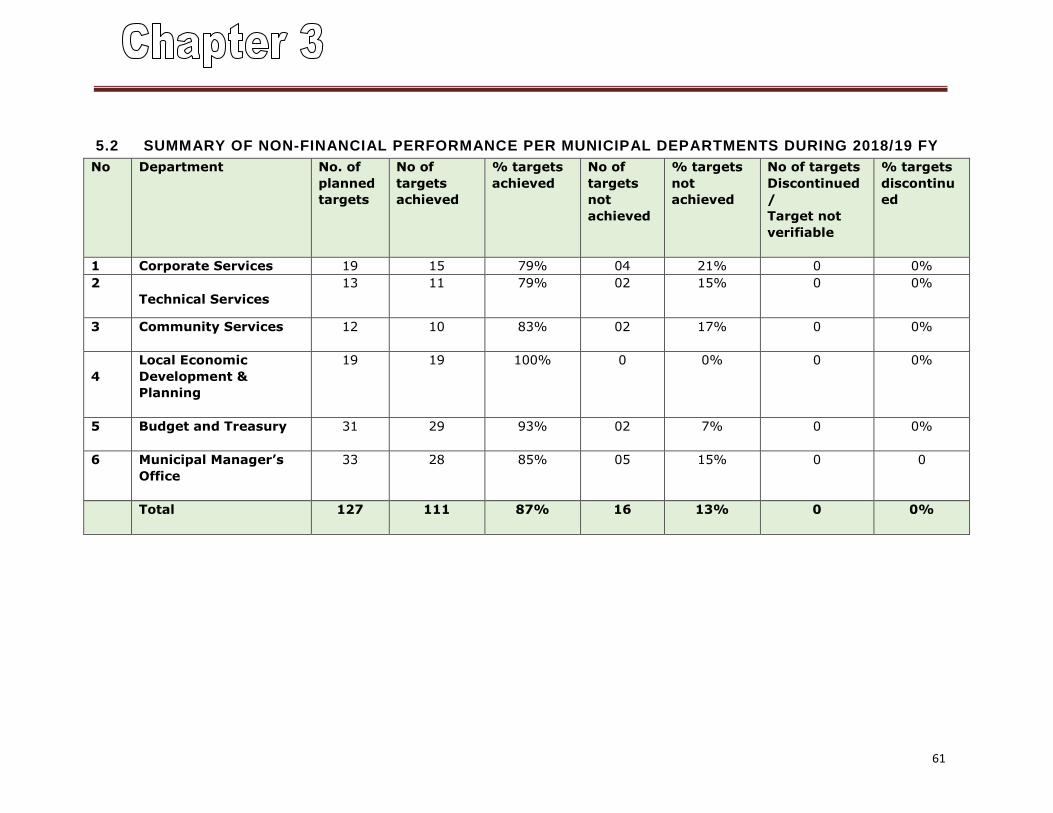
61
5.2 SUMMARY OF NON-FINANCIAL PERFORMANCE PER MUNICIPAL DEPARTMENTS DURING 2018/19 FY
No Department No. of
planned
targets
No of
targets
achieved
% targets
achieved
No of
targets
not
achieved
% targets
not
achieved
No of targets
Discontinued
/
Target not
verifiable
% targets
discontinu
ed
1 Corporate Services 19 15 79% 04 21% 0 0%
2
Technical Services
13 11 79% 02 15% 0 0%
3 Community Services
12 10 83% 02 17% 0 0%
4
Local Economic
Development &
Planning
19 19 100% 0 0% 0 0%
5 Budget and Treasury
31 29 93% 02 7% 0 0%
6 Municipal Manager’s
Office
33 28 85% 05 15% 0 0
Total
127 111 87% 16 13% 0 0%
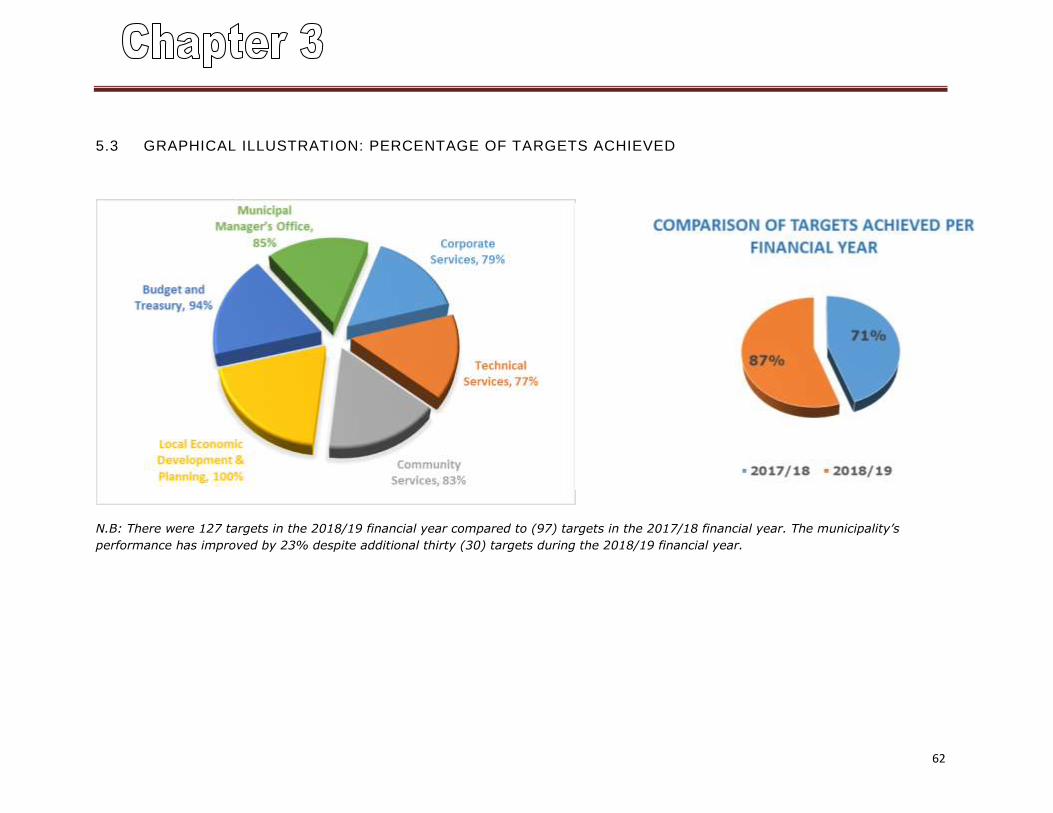
62
5.3 GRAPHICAL ILLUSTRATION: PERCENTAGE OF TARGETS ACHIEVED
N.B: There were 127 targets in the 2018/19 financial year compared to (97) targets in the 2017/18 financial year. The municipality’s
performance has improved by 23% despite additional thirty (30) targets during the 2018/19 financial year.
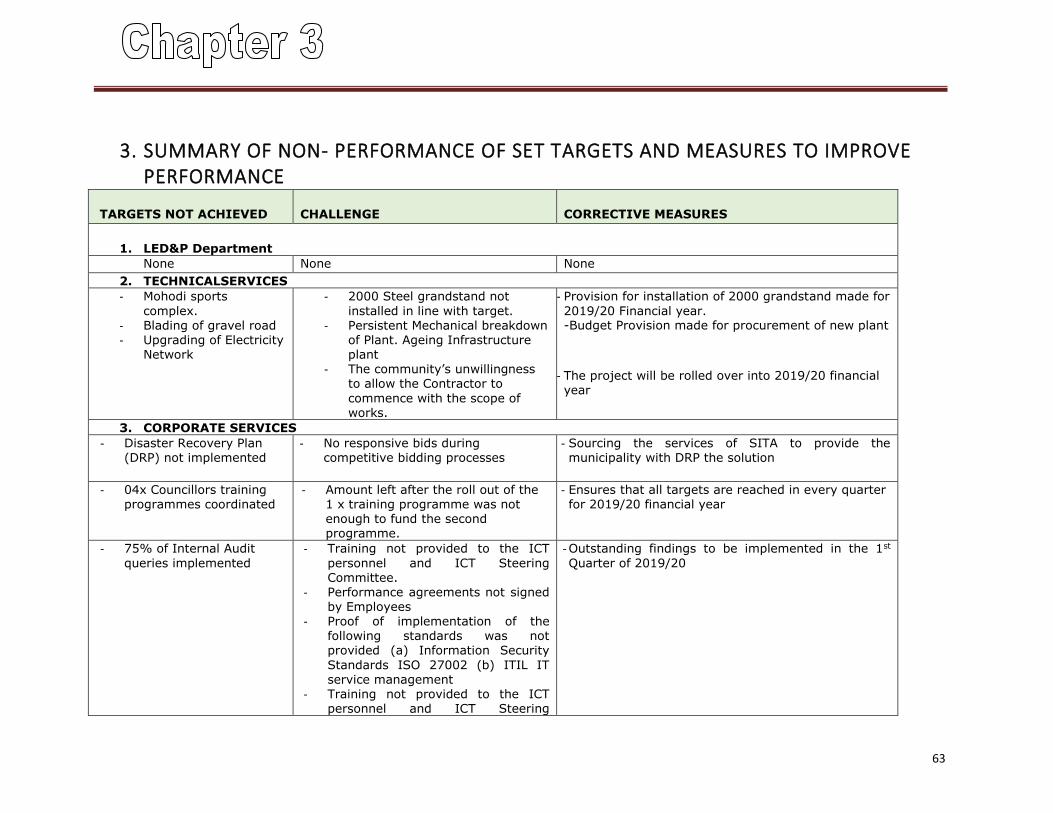
63
3. SUMMARY OF NON- PERFORMANCE OF SET TARGETS AND MEASURES TO IMPROVE PERFORMANCE
TARGETS NOT ACHIEVED
CHALLENGE
CORRECTIVE MEASURES
1. LED&P Department
None None None
2. TECHNICALSERVICES
- Mohodi sports
complex. - Blading of gravel road - Upgrading of Electricity
Network
- 2000 Steel grandstand not
installed in line with target. - Persistent Mechanical breakdown
of Plant. Ageing Infrastructure plant
- The community’s unwillingness to allow the Contractor to
commence with the scope of works.
- Provision for installation of 2000 grandstand made for
2019/20 Financial year. -Budget Provision made for procurement of new plant
- The project will be rolled over into 2019/20 financial year
3. CORPORATE SERVICES
- Disaster Recovery Plan (DRP) not implemented
- No responsive bids during competitive bidding processes
- Sourcing the services of SITA to provide the municipality with DRP the solution
- 04x Councillors training programmes coordinated
- Amount left after the roll out of the 1 x training programme was not enough to fund the second programme.
- Ensures that all targets are reached in every quarter for 2019/20 financial year
- 75% of Internal Audit
queries implemented
- Training not provided to the ICT
personnel and ICT Steering Committee.
- Performance agreements not signed by Employees
- Proof of implementation of the following standards was not provided (a) Information Security
Standards ISO 27002 (b) ITIL IT service management
- Training not provided to the ICT personnel and ICT Steering
- Outstanding findings to be implemented in the 1st
Quarter of 2019/20
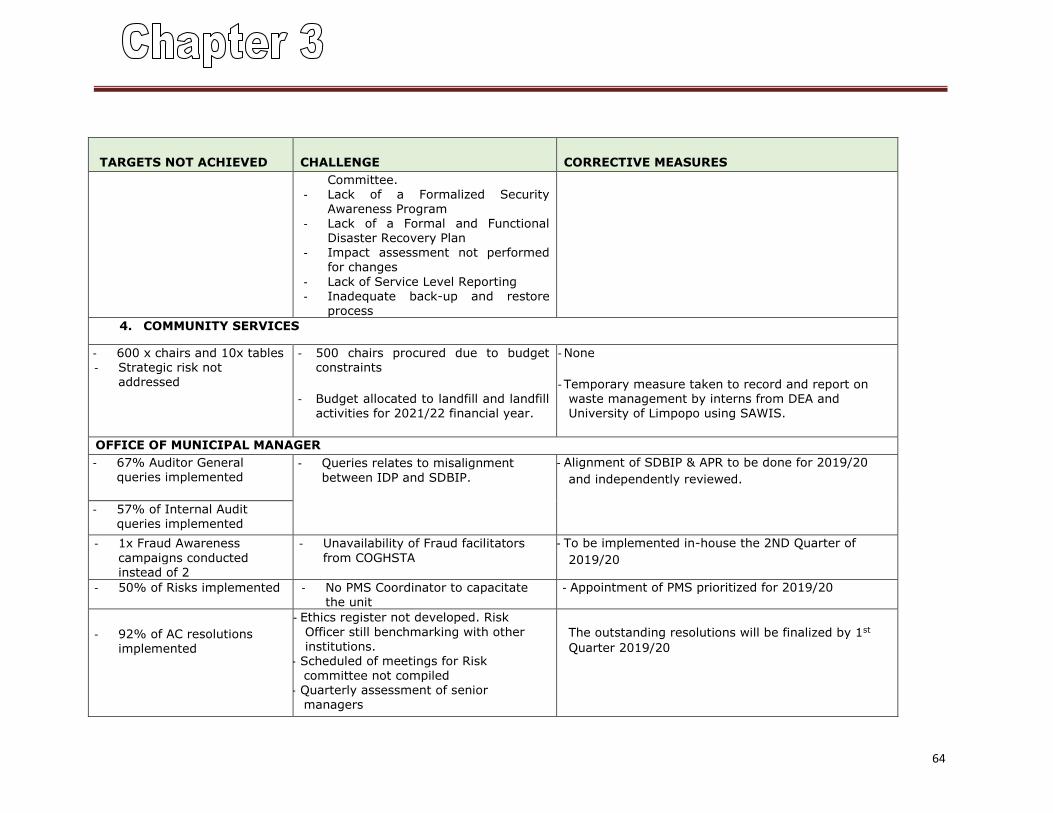
64
TARGETS NOT ACHIEVED
CHALLENGE
CORRECTIVE MEASURES
Committee. - Lack of a Formalized Security
Awareness Program - Lack of a Formal and Functional
Disaster Recovery Plan - Impact assessment not performed
for changes
- Lack of Service Level Reporting - Inadequate back-up and restore
process
4. COMMUNITY SERVICES
- 600 x chairs and 10x tables - Strategic risk not
addressed
- 500 chairs procured due to budget constraints
- Budget allocated to landfill and landfill activities for 2021/22 financial year.
- None
- Temporary measure taken to record and report on waste management by interns from DEA and University of Limpopo using SAWIS.
OFFICE OF MUNICIPAL MANAGER
- 67% Auditor General queries implemented
- Queries relates to misalignment
between IDP and SDBIP.
- Alignment of SDBIP & APR to be done for 2019/20
and independently reviewed.
- 57% of Internal Audit queries implemented
- 1x Fraud Awareness
campaigns conducted instead of 2
- Unavailability of Fraud facilitators
from COGHSTA
- To be implemented in-house the 2ND Quarter of
2019/20
- 50% of Risks implemented - No PMS Coordinator to capacitate the unit
- Appointment of PMS prioritized for 2019/20
- 92% of AC resolutions implemented
- Ethics register not developed. Risk
Officer still benchmarking with other institutions.
- Scheduled of meetings for Risk committee not compiled
- Quarterly assessment of senior managers
The outstanding resolutions will be finalized by 1st
Quarter 2019/20
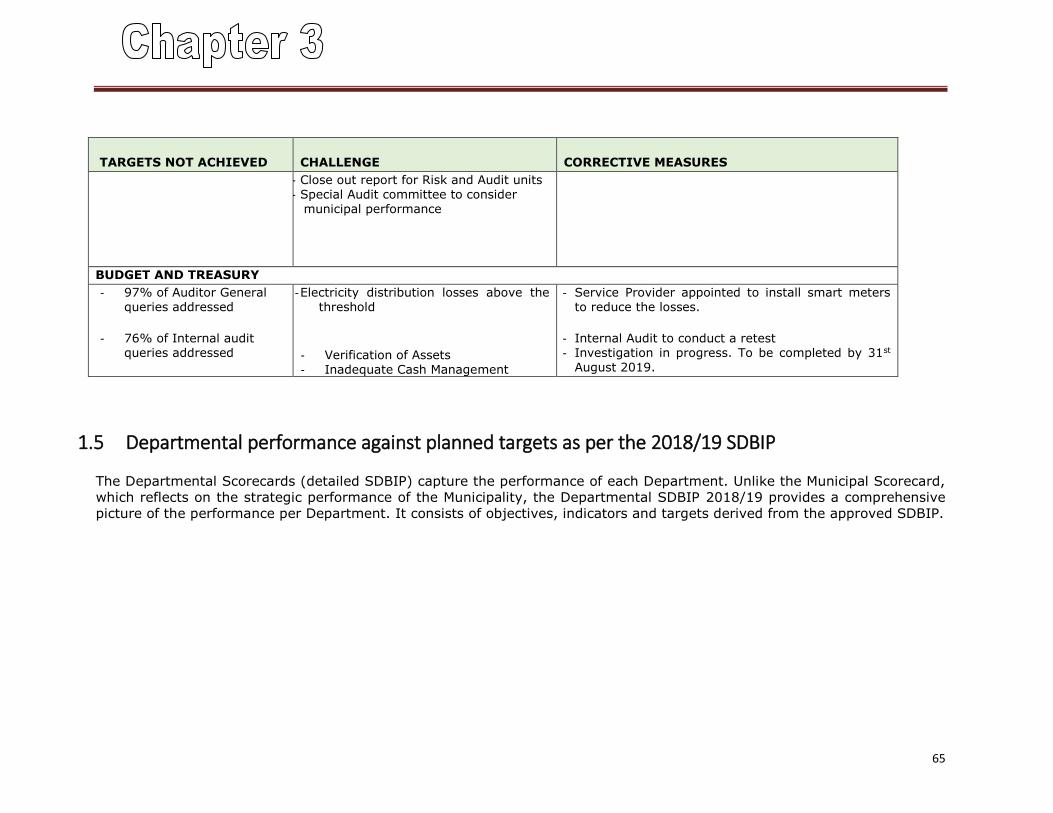
65
TARGETS NOT ACHIEVED
CHALLENGE
CORRECTIVE MEASURES
- Close out report for Risk and Audit units - Special Audit committee to consider
municipal performance
BUDGET AND TREASURY
- 97% of Auditor General queries addressed
- 76% of Internal audit queries addressed
- Electricity distribution losses above the threshold
- Verification of Assets - Inadequate Cash Management
- Service Provider appointed to install smart meters to reduce the losses.
- Internal Audit to conduct a retest - Investigation in progress. To be completed by 31st
August 2019.
1.5 Departmental performance against planned targets as per the 2018/19 SDBIP
The Departmental Scorecards (detailed SDBIP) capture the performance of each Department. Unlike the Municipal Scorecard,
which reflects on the strategic performance of the Municipality, the Departmental SDBIP 2018/19 provides a comprehensive
picture of the performance per Department. It consists of objectives, indicators and targets derived from the approved SDBIP.
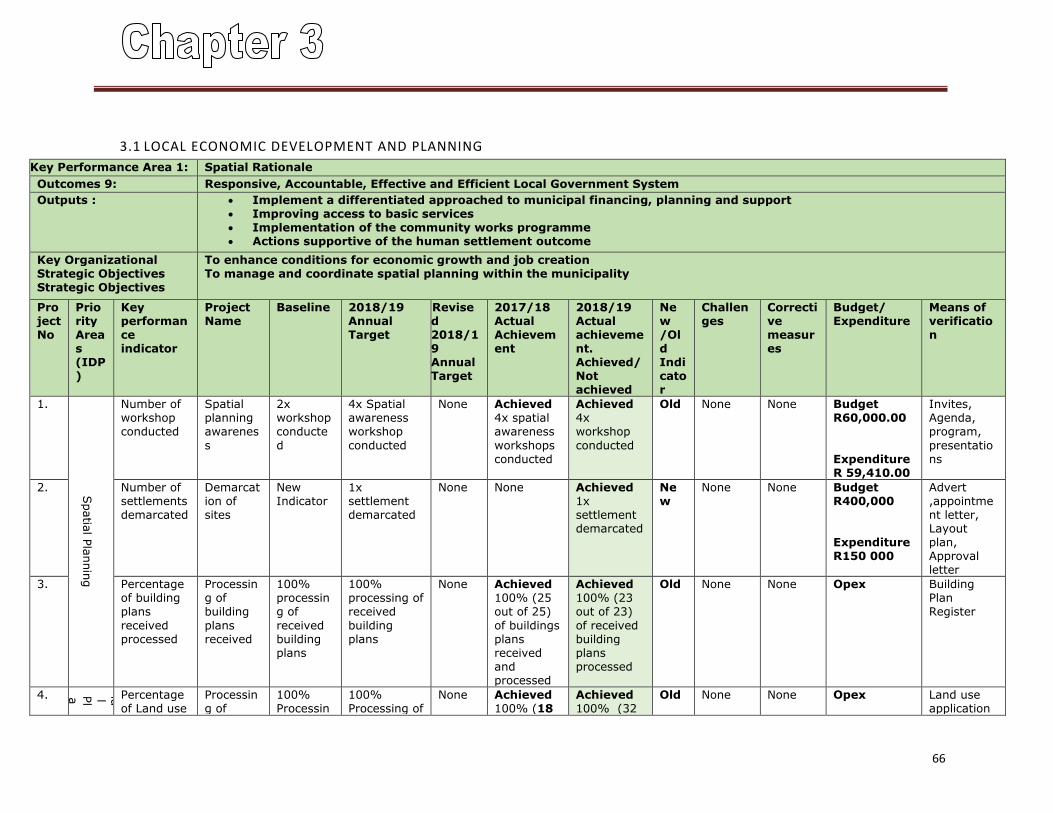
66
3.1 LOCAL ECONOMIC DEVELOPMENT AND PLANNING
Key Performance Area 1: Spatial Rationale
Outcomes 9: Responsive, Accountable, Effective and Efficient Local Government System
Outputs : Implement a differentiated approached to municipal financing, planning and support Improving access to basic services Implementation of the community works programme Actions supportive of the human settlement outcome
Key Organizational Strategic Objectives Strategic Objectives
To enhance conditions for economic growth and job creation To manage and coordinate spatial planning within the municipality
Project No
Priority Areas (IDP)
Key performance indicator
Project Name
Baseline 2018/19 Annual Target
Revised 2018/19 Annual Target
2017/18 Actual Achievement
2018/19 Actual achievement. Achieved/ Not achieved
New /Old Indicator
Challenges
Corrective measures
Budget/ Expenditure
Means of verification
1.
Spatia
l Pla
nnin
g
Number of workshop conducted
Spatial planning awarenes
s
2x workshop conducte
d
4x Spatial awareness workshop
conducted
None Achieved 4x spatial awareness
workshops conducted
Achieved 4x workshop
conducted
Old None None Budget R60,000.00
Expenditure R 59,410.00
Invites, Agenda, program,
presentations
2. Number of settlements demarcated
Demarcation of sites
New Indicator
1x settlement demarcated
None None Achieved 1x settlement demarcated
New
None None Budget R400,000 Expenditure R150 000
Advert ,appointment letter, Layout plan, Approval letter
3. Percentage of building plans
received processed
Processing of building
plans received
100% processing of
received building plans
100% processing of received
building plans
None Achieved 100% (25 out of 25)
of buildings plans received and processed
Achieved 100% (23 out of 23)
of received building plans processed
Old None None Opex Building Plan Register
4.
Spat
ial
Planni
ng
Percentage of Land use
Processing of
100% Processin
100% Processing of
None Achieved 100% (18
Achieved 100% (32
Old None None Opex Land use application
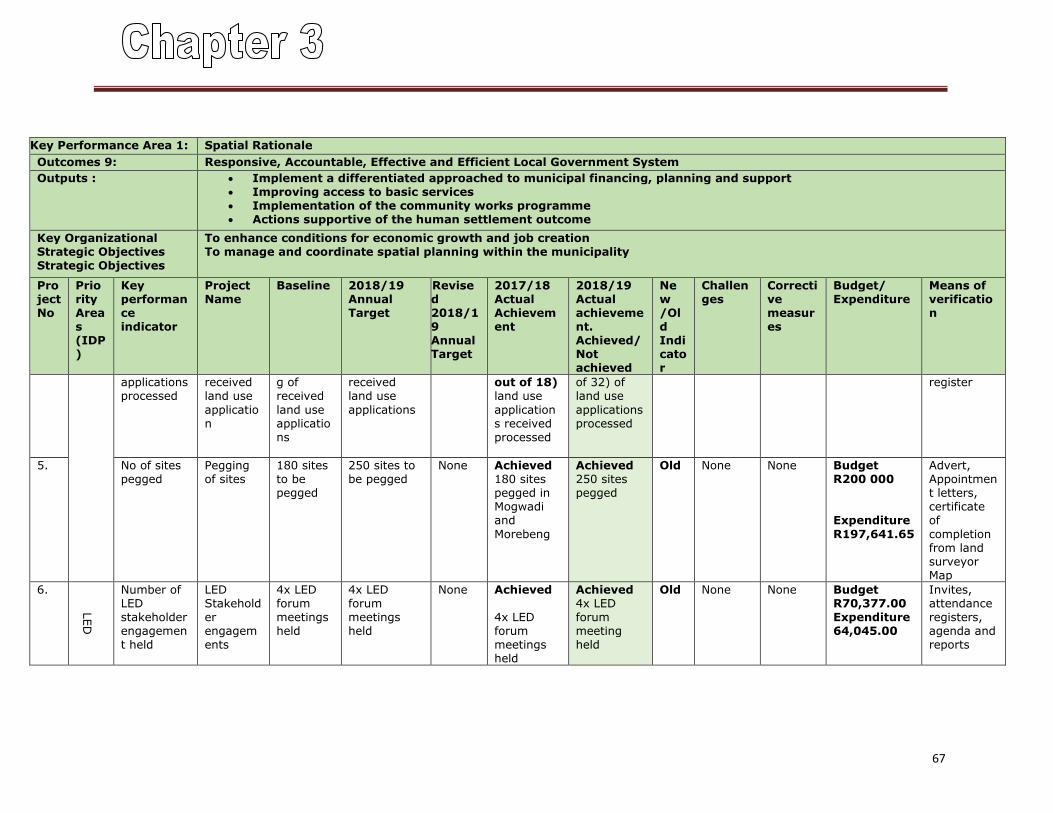
67
Key Performance Area 1: Spatial Rationale
Outcomes 9: Responsive, Accountable, Effective and Efficient Local Government System
Outputs : Implement a differentiated approached to municipal financing, planning and support Improving access to basic services Implementation of the community works programme Actions supportive of the human settlement outcome
Key Organizational Strategic Objectives Strategic Objectives
To enhance conditions for economic growth and job creation To manage and coordinate spatial planning within the municipality
Project No
Priority Areas (IDP)
Key performance indicator
Project Name
Baseline 2018/19 Annual Target
Revised 2018/19 Annual Target
2017/18 Actual Achievement
2018/19 Actual achievement. Achieved/ Not achieved
New /Old Indicator
Challenges
Corrective measures
Budget/ Expenditure
Means of verification
applications processed
received land use
application
g of received
land use applications
received land use
applications
out of 18) land use
applications received processed
of 32) of land use
applications processed
register
5. No of sites pegged
Pegging of sites
180 sites to be pegged
250 sites to be pegged
None Achieved 180 sites pegged in Mogwadi and
Morebeng
Achieved 250 sites pegged
Old None None Budget R200 000 Expenditure
R197,641.65
Advert, Appointment letters, certificate of
completion from land surveyor Map
6.
LED
Number of LED stakeholder engagement held
LED Stakeholder engagements
4x LED forum meetings held
4x LED forum meetings held
None Achieved 4x LED forum meetings held
Achieved 4x LED forum meeting held
Old None None Budget R70,377.00 Expenditure 64,045.00
Invites, attendance registers, agenda and reports
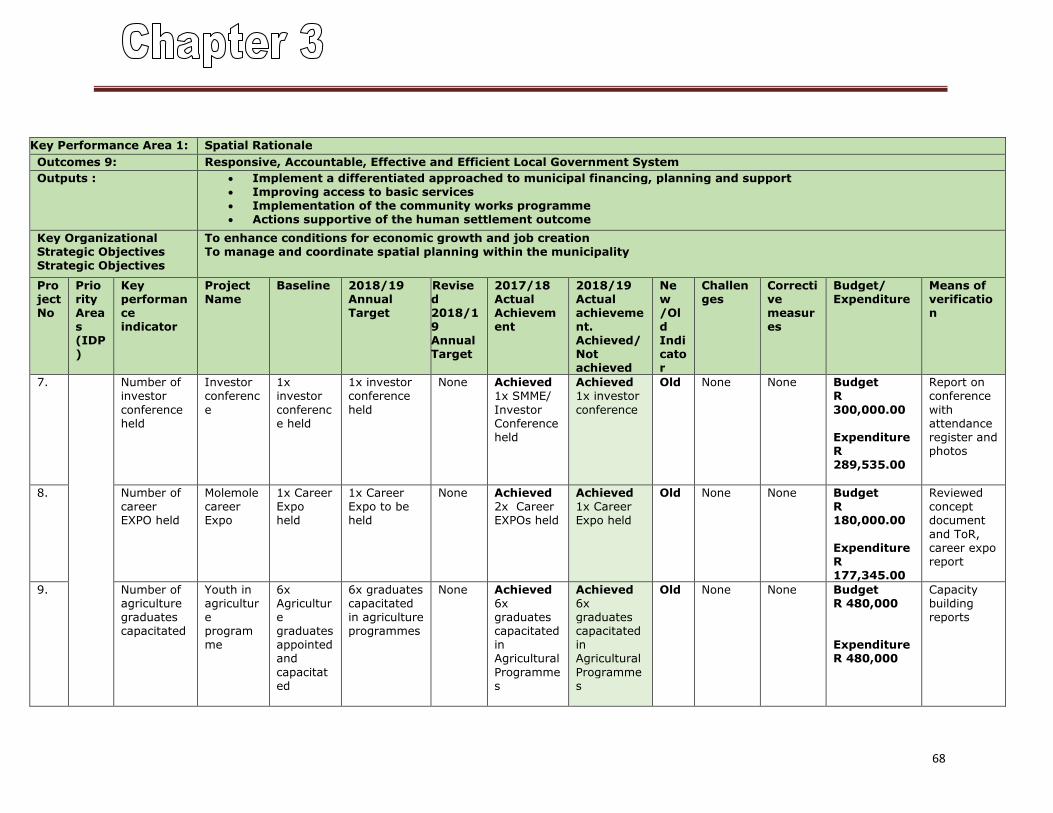
68
Key Performance Area 1: Spatial Rationale
Outcomes 9: Responsive, Accountable, Effective and Efficient Local Government System
Outputs : Implement a differentiated approached to municipal financing, planning and support Improving access to basic services Implementation of the community works programme Actions supportive of the human settlement outcome
Key Organizational Strategic Objectives Strategic Objectives
To enhance conditions for economic growth and job creation To manage and coordinate spatial planning within the municipality
Project No
Priority Areas (IDP)
Key performance indicator
Project Name
Baseline 2018/19 Annual Target
Revised 2018/19 Annual Target
2017/18 Actual Achievement
2018/19 Actual achievement. Achieved/ Not achieved
New /Old Indicator
Challenges
Corrective measures
Budget/ Expenditure
Means of verification
7. Number of investor
conference held
Investor conferenc
e
1x investor
conference held
1x investor conference
held
None Achieved 1x SMME/
Investor Conference held
Achieved 1x investor
conference
Old None None Budget R
300,000.00 Expenditure R 289,535.00
Report on conference
with attendance register and photos
8. Number of career EXPO held
Molemole career Expo
1x Career Expo held
1x Career Expo to be held
None Achieved 2x Career EXPOs held
Achieved 1x Career Expo held
Old None None Budget R 180,000.00
Expenditure R 177,345.00
Reviewed concept document
and ToR, career expo report
9. Number of agriculture graduates capacitated
Youth in agriculture programme
6x Agriculture graduates appointed and
capacitated
6x graduates capacitated in agriculture programmes
None Achieved 6x graduates capacitated in Agricultural
Programmes
Achieved 6x graduates capacitated in Agricultural
Programmes
Old None None Budget R 480,000 Expenditure R 480,000
Capacity building reports
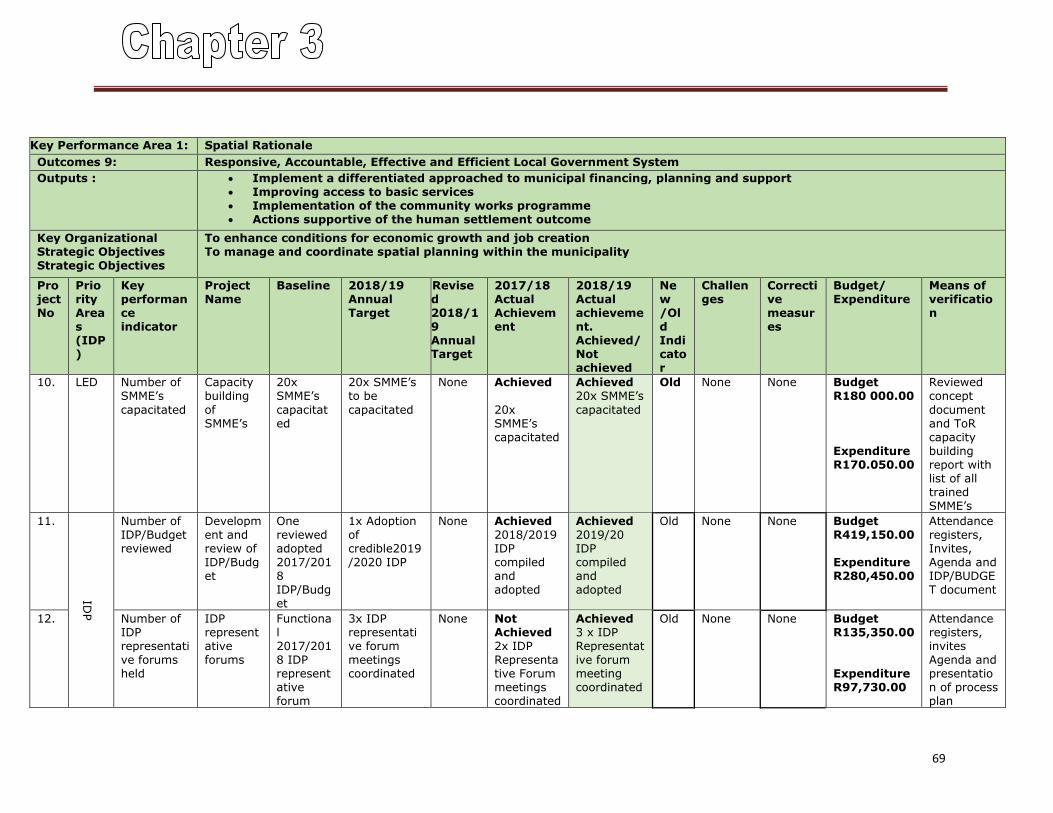
69
Key Performance Area 1: Spatial Rationale
Outcomes 9: Responsive, Accountable, Effective and Efficient Local Government System
Outputs : Implement a differentiated approached to municipal financing, planning and support Improving access to basic services Implementation of the community works programme Actions supportive of the human settlement outcome
Key Organizational Strategic Objectives Strategic Objectives
To enhance conditions for economic growth and job creation To manage and coordinate spatial planning within the municipality
Project No
Priority Areas (IDP)
Key performance indicator
Project Name
Baseline 2018/19 Annual Target
Revised 2018/19 Annual Target
2017/18 Actual Achievement
2018/19 Actual achievement. Achieved/ Not achieved
New /Old Indicator
Challenges
Corrective measures
Budget/ Expenditure
Means of verification
10. LED Number of SMME’s
capacitated
Capacity building
of SMME’s
20x SMME’s
capacitated
20x SMME’s to be
capacitated
None Achieved
20x SMME’s capacitated
Achieved 20x SMME’s
capacitated
Old None None Budget R180 000.00
Expenditure R170.050.00
Reviewed concept
document and ToR capacity building report with list of all trained SMME’s
11.
IDP
Number of IDP/Budget reviewed
Development and review of IDP/Budget
One reviewed adopted 2017/2018 IDP/Budget
1x Adoption of credible2019/2020 IDP
None Achieved 2018/2019 IDP compiled and adopted
Achieved 2019/20 IDP compiled and adopted
Old None None Budget R419,150.00 Expenditure R280,450.00
Attendance registers, Invites, Agenda and IDP/BUDGET document
12. Number of IDP representative forums held
IDP representative forums
Functional 2017/2018 IDP representative forum
3x IDP representative forum meetings coordinated
None Not Achieved 2x IDP Representative Forum meetings coordinated
Achieved 3 x IDP Representative forum meeting coordinated
Old None None Budget R135,350.00 Expenditure R97,730.00
Attendance registers, invites Agenda and presentation of process plan
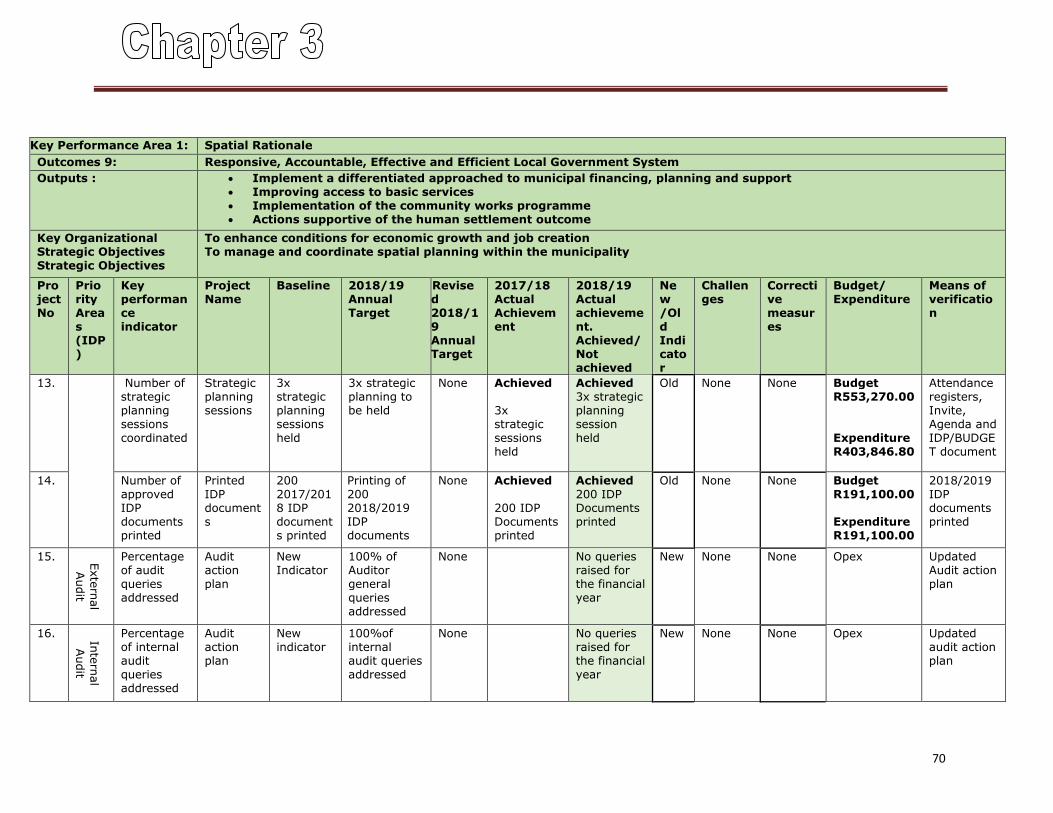
70
Key Performance Area 1: Spatial Rationale
Outcomes 9: Responsive, Accountable, Effective and Efficient Local Government System
Outputs : Implement a differentiated approached to municipal financing, planning and support Improving access to basic services Implementation of the community works programme Actions supportive of the human settlement outcome
Key Organizational Strategic Objectives Strategic Objectives
To enhance conditions for economic growth and job creation To manage and coordinate spatial planning within the municipality
Project No
Priority Areas (IDP)
Key performance indicator
Project Name
Baseline 2018/19 Annual Target
Revised 2018/19 Annual Target
2017/18 Actual Achievement
2018/19 Actual achievement. Achieved/ Not achieved
New /Old Indicator
Challenges
Corrective measures
Budget/ Expenditure
Means of verification
13.
Number of strategic planning sessions coordinated
Strategic planning sessions
3x strategic planning sessions held
3x strategic planning to be held
None Achieved 3x strategic sessions held
Achieved 3x strategic planning session held
Old None None Budget R553,270.00 Expenditure R403,846.80
Attendance registers, Invite, Agenda and IDP/BUDGET document
14. Number of approved IDP documents printed
Printed IDP documents
200 2017/2018 IDP documents printed
Printing of 200 2018/2019 IDP documents
None Achieved 200 IDP Documents printed
Achieved 200 IDP Documents printed
Old None None Budget R191,100.00 Expenditure R191,100.00
2018/2019 IDP documents printed
15. Exte
rnal
Audit
Percentage of audit queries addressed
Audit action plan
New Indicator
100% of Auditor general queries addressed
None No queries raised for the financial year
New None None Opex Updated Audit action plan
16. Inte
rnal
Audit
Percentage of internal audit queries addressed
Audit action plan
New indicator
100%of internal audit queries addressed
None No queries raised for the financial year
New None None Opex Updated audit action plan
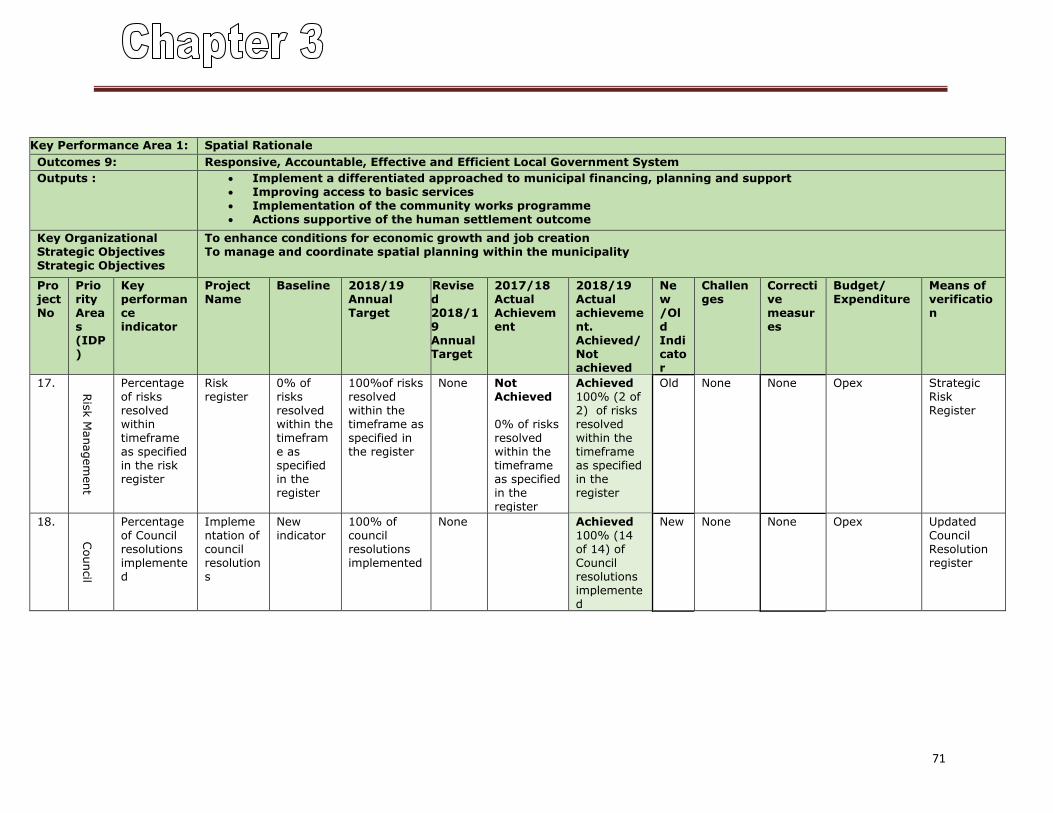
71
Key Performance Area 1: Spatial Rationale
Outcomes 9: Responsive, Accountable, Effective and Efficient Local Government System
Outputs : Implement a differentiated approached to municipal financing, planning and support Improving access to basic services Implementation of the community works programme Actions supportive of the human settlement outcome
Key Organizational Strategic Objectives Strategic Objectives
To enhance conditions for economic growth and job creation To manage and coordinate spatial planning within the municipality
Project No
Priority Areas (IDP)
Key performance indicator
Project Name
Baseline 2018/19 Annual Target
Revised 2018/19 Annual Target
2017/18 Actual Achievement
2018/19 Actual achievement. Achieved/ Not achieved
New /Old Indicator
Challenges
Corrective measures
Budget/ Expenditure
Means of verification
17.
Ris
k M
anagem
ent
Percentage of risks resolved within timeframe as specified in the risk register
Risk register
0% of risks resolved within the timeframe as specified in the register
100%of risks resolved within the timeframe as specified in the register
None Not Achieved 0% of risks resolved within the timeframe as specified in the register
Achieved 100% (2 of 2) of risks resolved within the timeframe as specified in the register
Old None None Opex Strategic Risk Register
18.
Council
Percentage of Council resolutions implemented
Implementation of council resolutions
New indicator
100% of council resolutions implemented
None Achieved 100% (14 of 14) of Council resolutions implemented
New None None Opex Updated Council Resolution register
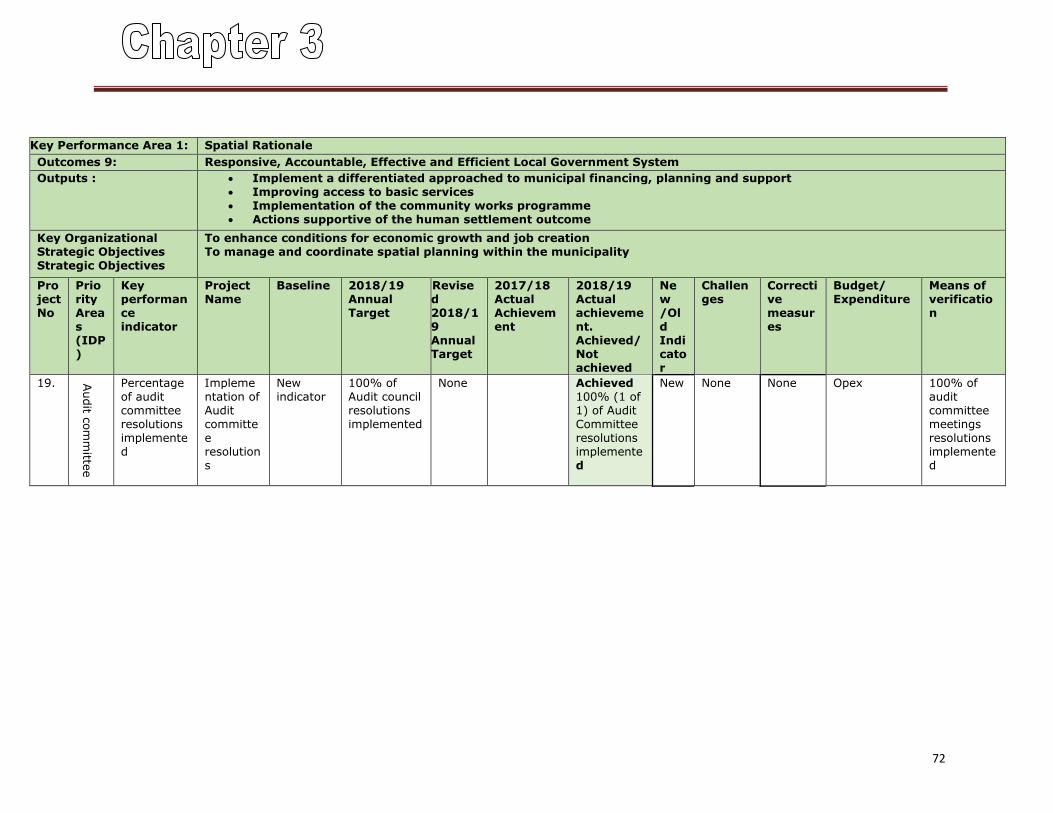
72
Key Performance Area 1: Spatial Rationale
Outcomes 9: Responsive, Accountable, Effective and Efficient Local Government System
Outputs : Implement a differentiated approached to municipal financing, planning and support Improving access to basic services Implementation of the community works programme Actions supportive of the human settlement outcome
Key Organizational Strategic Objectives Strategic Objectives
To enhance conditions for economic growth and job creation To manage and coordinate spatial planning within the municipality
Project No
Priority Areas (IDP)
Key performance indicator
Project Name
Baseline 2018/19 Annual Target
Revised 2018/19 Annual Target
2017/18 Actual Achievement
2018/19 Actual achievement. Achieved/ Not achieved
New /Old Indicator
Challenges
Corrective measures
Budget/ Expenditure
Means of verification
19. Audit c
om
mitte
e
Percentage of audit committee resolutions implemented
Implementation of Audit committee resolutions
New indicator
100% of Audit council resolutions implemented
None Achieved 100% (1 of 1) of Audit Committee resolutions implemented
New None None Opex 100% of audit committee meetings resolutions implemented
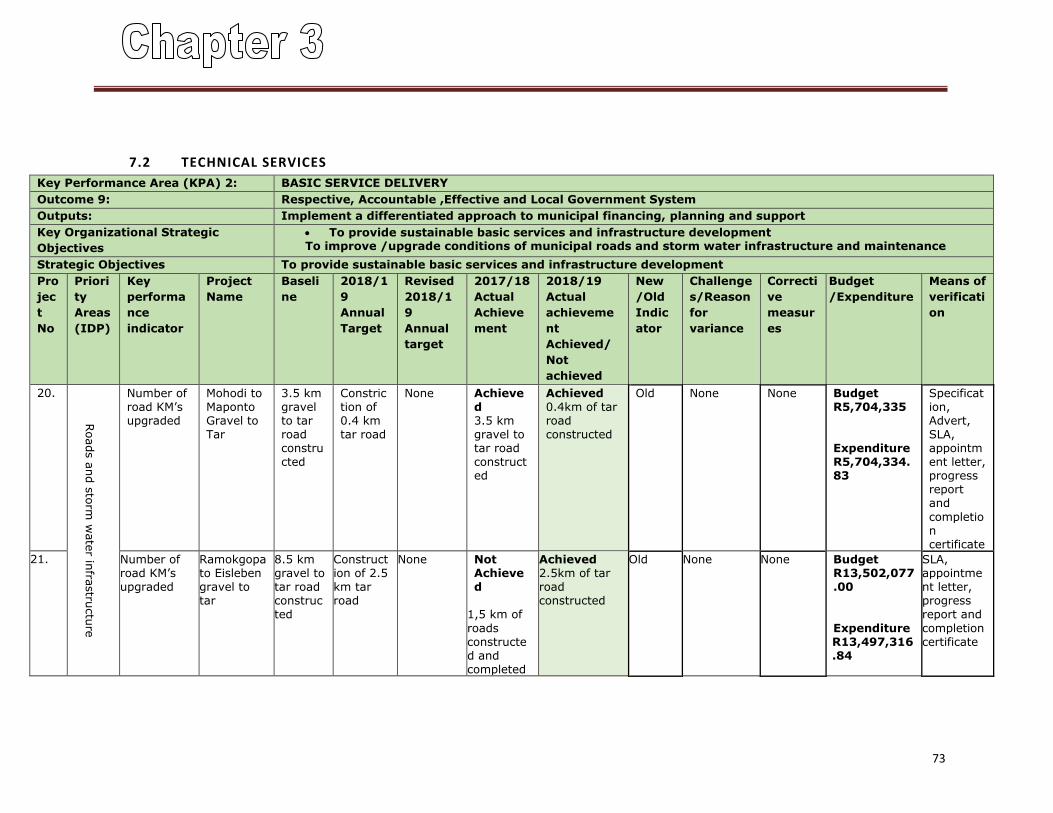
73
7.2 TECHNICAL SERVICES
Key Performance Area (KPA) 2: BASIC SERVICE DELIVERY
Outcome 9: Respective, Accountable ,Effective and Local Government System
Outputs: Implement a differentiated approach to municipal financing, planning and support
Key Organizational Strategic
Objectives
To provide sustainable basic services and infrastructure development To improve /upgrade conditions of municipal roads and storm water infrastructure and maintenance
Strategic Objectives To provide sustainable basic services and infrastructure development
Pro
jec
t
No
Priori
ty
Areas
(IDP)
Key
performa
nce
indicator
Project
Name
Baseli
ne
2018/1
9
Annual
Target
Revised
2018/1
9
Annual
target
2017/18
Actual
Achieve
ment
2018/19
Actual
achieveme
nt
Achieved/
Not
achieved
New
/Old
Indic
ator
Challenge
s/Reason
for
variance
Correcti
ve
measur
es
Budget
/Expenditure
Means of
verificati
on
20.
Roads a
nd s
torm
wate
r infra
stru
ctu
re
Number of road KM’s upgraded
Mohodi to Maponto Gravel to Tar
3.5 km gravel to tar road constructed
Constriction of 0.4 km tar road
None Achieved 3.5 km gravel to tar road constructed
Achieved 0.4km of tar road constructed
Old None None Budget R5,704,335 Expenditure R5,704,334.83
Specification, Advert, SLA, appointment letter, progress report and
completion certificate
21. Number of road KM’s upgraded
Ramokgopa to Eisleben gravel to tar
8.5 km gravel to tar road constructed
Construction of 2.5 km tar road
None Not Achieved
1,5 km of
roads constructed and completed
Achieved 2.5km of tar road constructed
Old None None Budget R13,502,077.00
Expenditure R13,497,316.84
SLA, appointment letter, progress report and
completion certificate
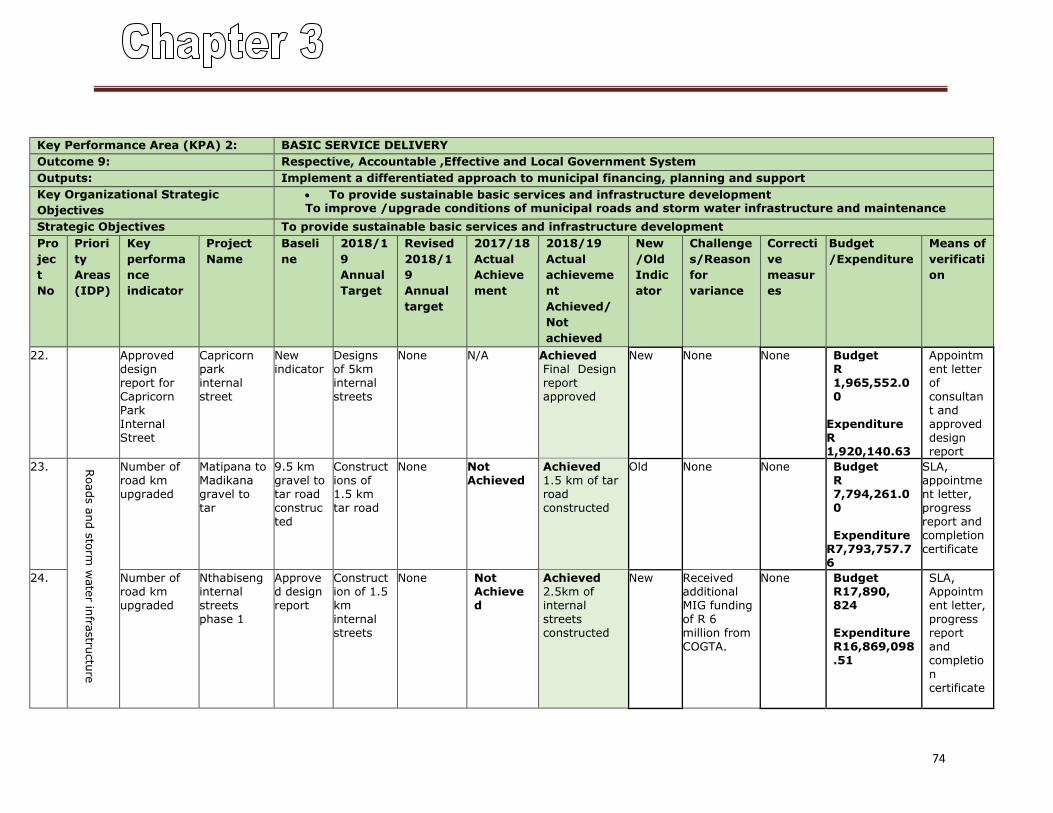
74
Key Performance Area (KPA) 2: BASIC SERVICE DELIVERY
Outcome 9: Respective, Accountable ,Effective and Local Government System
Outputs: Implement a differentiated approach to municipal financing, planning and support
Key Organizational Strategic
Objectives
To provide sustainable basic services and infrastructure development To improve /upgrade conditions of municipal roads and storm water infrastructure and maintenance
Strategic Objectives To provide sustainable basic services and infrastructure development
Pro
jec
t
No
Priori
ty
Areas
(IDP)
Key
performa
nce
indicator
Project
Name
Baseli
ne
2018/1
9
Annual
Target
Revised
2018/1
9
Annual
target
2017/18
Actual
Achieve
ment
2018/19
Actual
achieveme
nt
Achieved/
Not
achieved
New
/Old
Indic
ator
Challenge
s/Reason
for
variance
Correcti
ve
measur
es
Budget
/Expenditure
Means of
verificati
on
22. Approved design report for Capricorn Park Internal Street
Capricorn park internal street
New indicator
Designs of 5km internal streets
None N/A Achieved Final Design report approved
New None None Budget R 1,965,552.00
Expenditure R 1,920,140.63
Appointment letter of consultant and approved design report
23. Roads a
nd s
torm
wate
r infra
stru
ctu
re
Number of road km upgraded
Matipana to Madikana gravel to tar
9.5 km gravel to tar road constructed
Constructions of 1.5 km tar road
None Not Achieved
Achieved 1.5 km of tar road constructed
Old None None Budget R 7,794,261.00 Expenditure
R7,793,757.76
SLA, appointment letter, progress report and completion certificate
24. Number of road km upgraded
Nthabiseng internal streets phase 1
Approved design report
Construction of 1.5 km internal streets
None Not Achieved
Achieved 2.5km of internal streets constructed
New Received additional MIG funding of R 6 million from COGTA.
None Budget R17,890, 824 Expenditure R16,869,098.51
SLA, Appointment letter, progress report and completio
n certificate
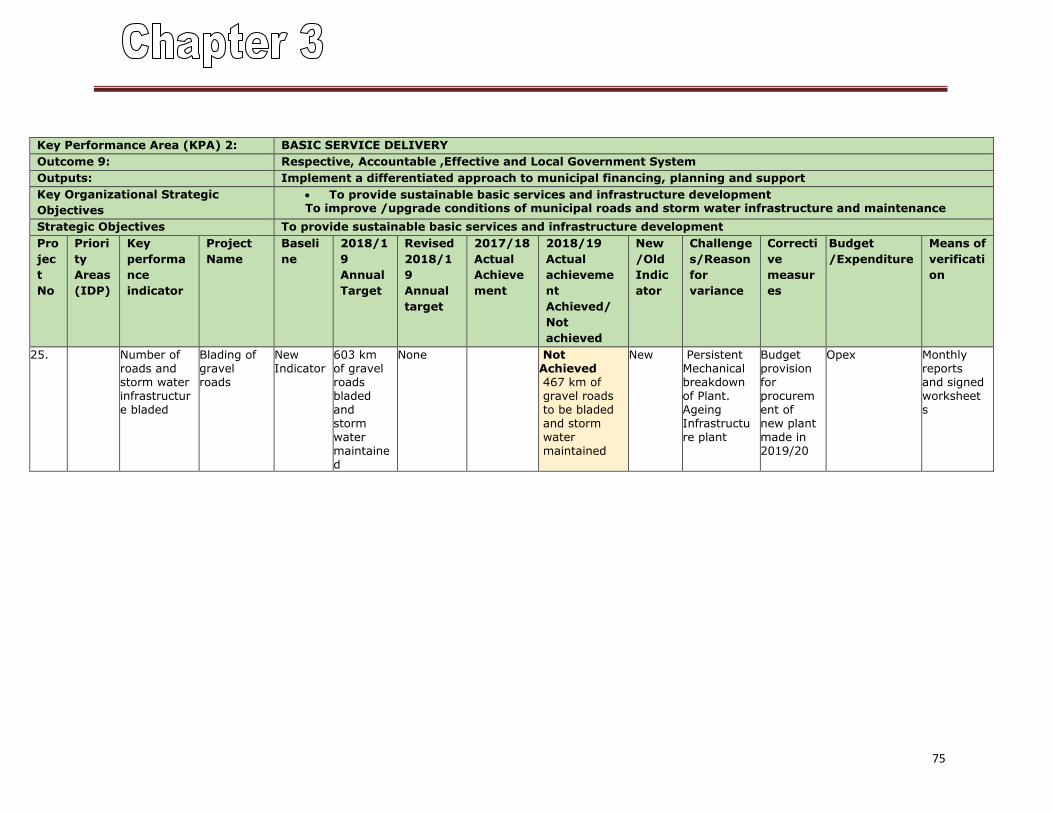
75
Key Performance Area (KPA) 2: BASIC SERVICE DELIVERY
Outcome 9: Respective, Accountable ,Effective and Local Government System
Outputs: Implement a differentiated approach to municipal financing, planning and support
Key Organizational Strategic
Objectives
To provide sustainable basic services and infrastructure development To improve /upgrade conditions of municipal roads and storm water infrastructure and maintenance
Strategic Objectives To provide sustainable basic services and infrastructure development
Pro
jec
t
No
Priori
ty
Areas
(IDP)
Key
performa
nce
indicator
Project
Name
Baseli
ne
2018/1
9
Annual
Target
Revised
2018/1
9
Annual
target
2017/18
Actual
Achieve
ment
2018/19
Actual
achieveme
nt
Achieved/
Not
achieved
New
/Old
Indic
ator
Challenge
s/Reason
for
variance
Correcti
ve
measur
es
Budget
/Expenditure
Means of
verificati
on
25. Number of roads and storm water infrastructure bladed
Blading of gravel roads
New Indicator
603 km of gravel roads bladed and storm water maintained
None Not Achieved 467 km of gravel roads to be bladed and storm water maintained
New Persistent Mechanical breakdown of Plant. Ageing Infrastructure plant
Budget provision for procurement of new plant made in 2019/20
Opex Monthly reports and signed worksheets
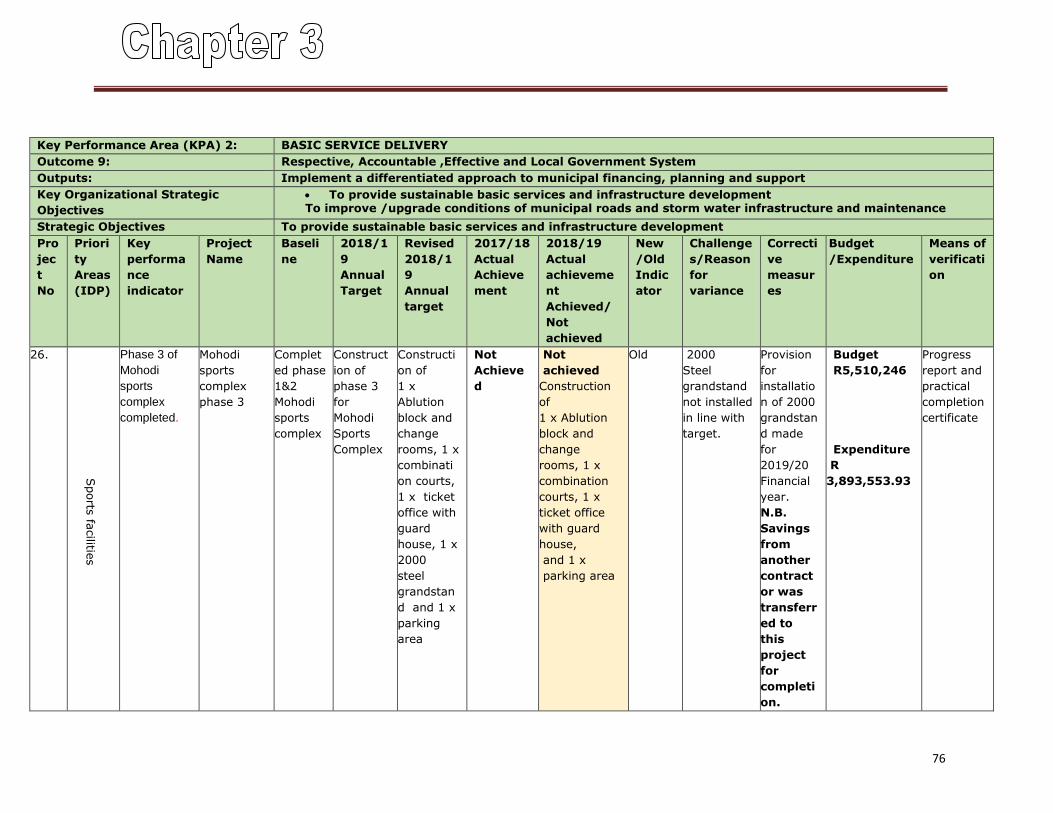
76
Key Performance Area (KPA) 2: BASIC SERVICE DELIVERY
Outcome 9: Respective, Accountable ,Effective and Local Government System
Outputs: Implement a differentiated approach to municipal financing, planning and support
Key Organizational Strategic
Objectives
To provide sustainable basic services and infrastructure development To improve /upgrade conditions of municipal roads and storm water infrastructure and maintenance
Strategic Objectives To provide sustainable basic services and infrastructure development
Pro
jec
t
No
Priori
ty
Areas
(IDP)
Key
performa
nce
indicator
Project
Name
Baseli
ne
2018/1
9
Annual
Target
Revised
2018/1
9
Annual
target
2017/18
Actual
Achieve
ment
2018/19
Actual
achieveme
nt
Achieved/
Not
achieved
New
/Old
Indic
ator
Challenge
s/Reason
for
variance
Correcti
ve
measur
es
Budget
/Expenditure
Means of
verificati
on
26.
Sports
facilitie
s
Phase 3 of
Mohodi
sports
complex
completed.
Mohodi
sports
complex
phase 3
Complet
ed phase
1&2
Mohodi
sports
complex
Construct
ion of
phase 3
for
Mohodi
Sports
Complex
Constructi
on of
1 x
Ablution
block and
change
rooms, 1 x
combinati
on courts,
1 x ticket
office with
guard
house, 1 x
2000
steel
grandstan
d and 1 x
parking
area
Not
Achieve
d
Not
achieved
Construction
of
1 x Ablution
block and
change
rooms, 1 x
combination
courts, 1 x
ticket office
with guard
house,
and 1 x
parking area
Old 2000
Steel
grandstand
not installed
in line with
target.
Provision
for
installatio
n of 2000
grandstan
d made
for
2019/20
Financial
year.
N.B.
Savings
from
another
contract
or was
transferr
ed to
this
project
for
completi
on.
Budget
R5,510,246
Expenditure
R
3,893,553.93
Progress
report and
practical
completion
certificate
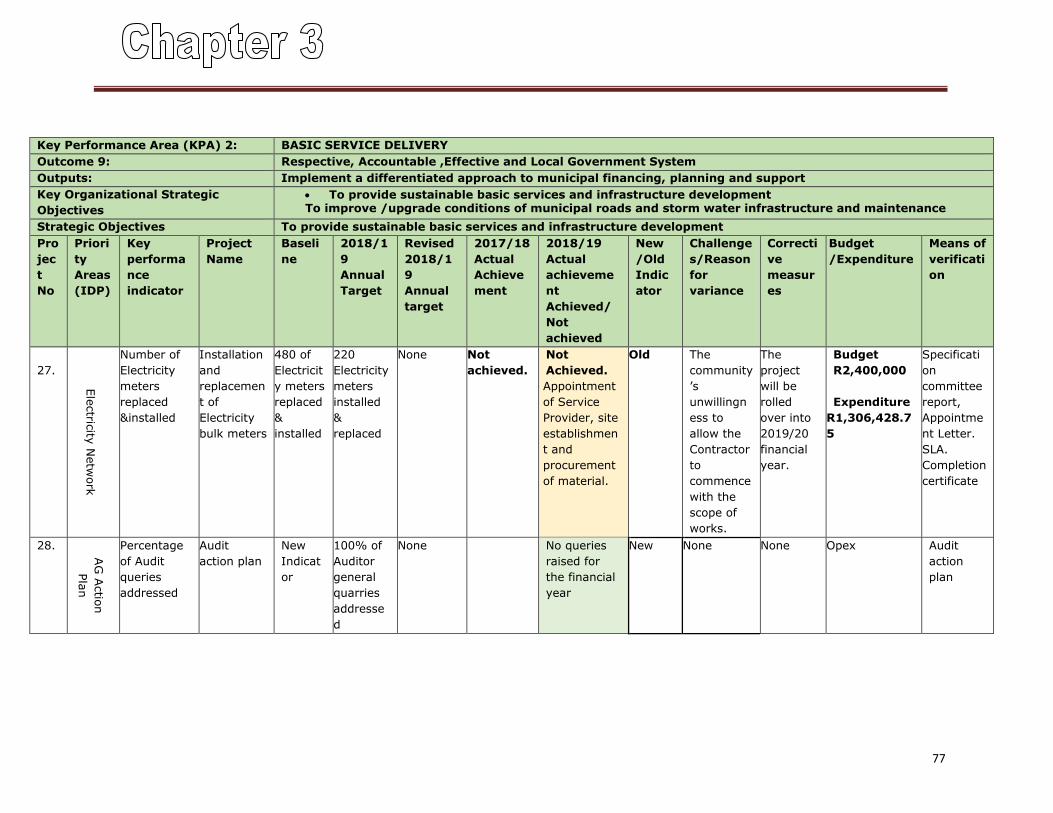
77
Key Performance Area (KPA) 2: BASIC SERVICE DELIVERY
Outcome 9: Respective, Accountable ,Effective and Local Government System
Outputs: Implement a differentiated approach to municipal financing, planning and support
Key Organizational Strategic
Objectives
To provide sustainable basic services and infrastructure development To improve /upgrade conditions of municipal roads and storm water infrastructure and maintenance
Strategic Objectives To provide sustainable basic services and infrastructure development
Pro
jec
t
No
Priori
ty
Areas
(IDP)
Key
performa
nce
indicator
Project
Name
Baseli
ne
2018/1
9
Annual
Target
Revised
2018/1
9
Annual
target
2017/18
Actual
Achieve
ment
2018/19
Actual
achieveme
nt
Achieved/
Not
achieved
New
/Old
Indic
ator
Challenge
s/Reason
for
variance
Correcti
ve
measur
es
Budget
/Expenditure
Means of
verificati
on
27.
Ele
ctric
ity N
etw
ork
Number of
Electricity
meters
replaced
&installed
Installation
and
replacemen
t of
Electricity
bulk meters
480 of
Electricit
y meters
replaced
&
installed
220
Electricity
meters
installed
&
replaced
None Not
achieved.
Not
Achieved.
Appointment
of Service
Provider, site
establishmen
t and
procurement
of material.
Old The
community
’s
unwillingn
ess to
allow the
Contractor
to
commence
with the
scope of
works.
The
project
will be
rolled
over into
2019/20
financial
year.
Budget
R2,400,000
Expenditure
R1,306,428.7
5
Specificati
on
committee
report,
Appointme
nt Letter.
SLA.
Completion
certificate
28.
AG
Actio
n
Pla
n
Percentage
of Audit
queries
addressed
Audit
action plan
New
Indicat
or
100% of
Auditor
general
quarries
addresse
d
None No queries
raised for
the financial
year
New None None Opex Audit
action
plan
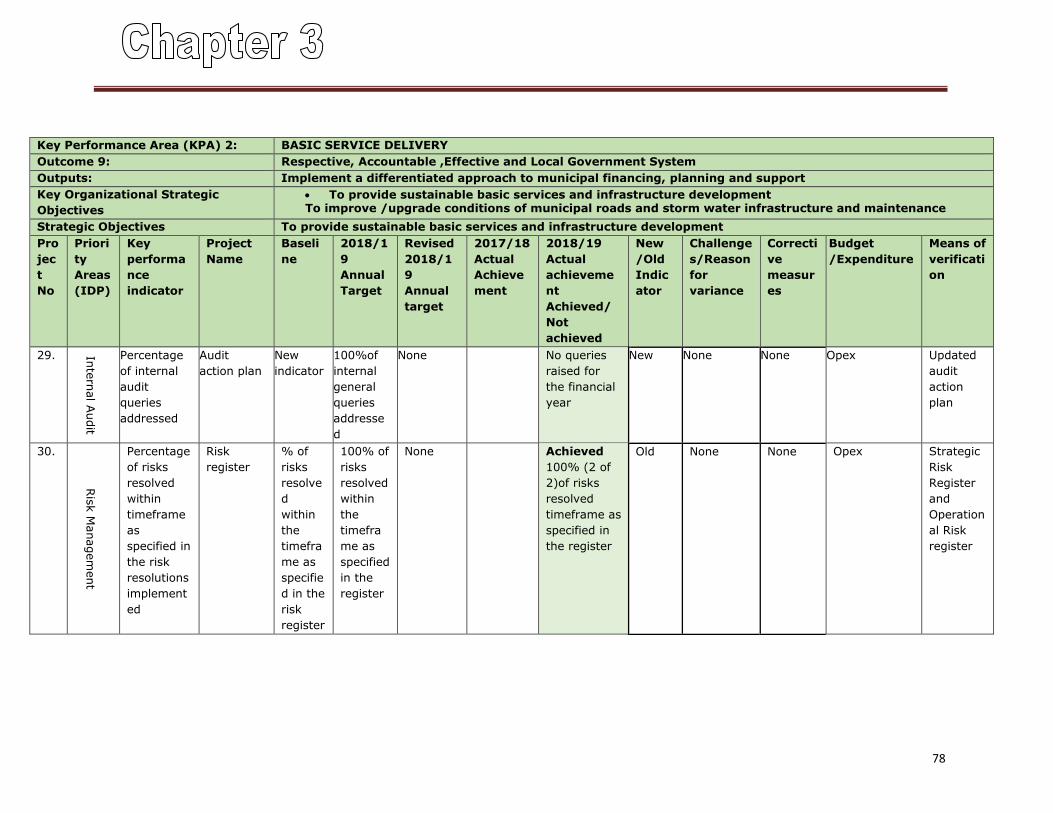
78
Key Performance Area (KPA) 2: BASIC SERVICE DELIVERY
Outcome 9: Respective, Accountable ,Effective and Local Government System
Outputs: Implement a differentiated approach to municipal financing, planning and support
Key Organizational Strategic
Objectives
To provide sustainable basic services and infrastructure development To improve /upgrade conditions of municipal roads and storm water infrastructure and maintenance
Strategic Objectives To provide sustainable basic services and infrastructure development
Pro
jec
t
No
Priori
ty
Areas
(IDP)
Key
performa
nce
indicator
Project
Name
Baseli
ne
2018/1
9
Annual
Target
Revised
2018/1
9
Annual
target
2017/18
Actual
Achieve
ment
2018/19
Actual
achieveme
nt
Achieved/
Not
achieved
New
/Old
Indic
ator
Challenge
s/Reason
for
variance
Correcti
ve
measur
es
Budget
/Expenditure
Means of
verificati
on
29. Inte
rnal A
udit
Percentage
of internal
audit
queries
addressed
Audit
action plan
New
indicator
100%of
internal
general
queries
addresse
d
None No queries
raised for
the financial
year
New None None Opex Updated
audit
action
plan
30.
Ris
k M
anagem
ent
Percentage
of risks
resolved
within
timeframe
as
specified in
the risk
resolutions
implement
ed
Risk
register
% of
risks
resolve
d
within
the
timefra
me as
specifie
d in the
risk
register
100% of
risks
resolved
within
the
timefra
me as
specified
in the
register
None Achieved
100% (2 of
2)of risks
resolved
timeframe as
specified in
the register
Old None None Opex Strategic
Risk
Register
and
Operation
al Risk
register
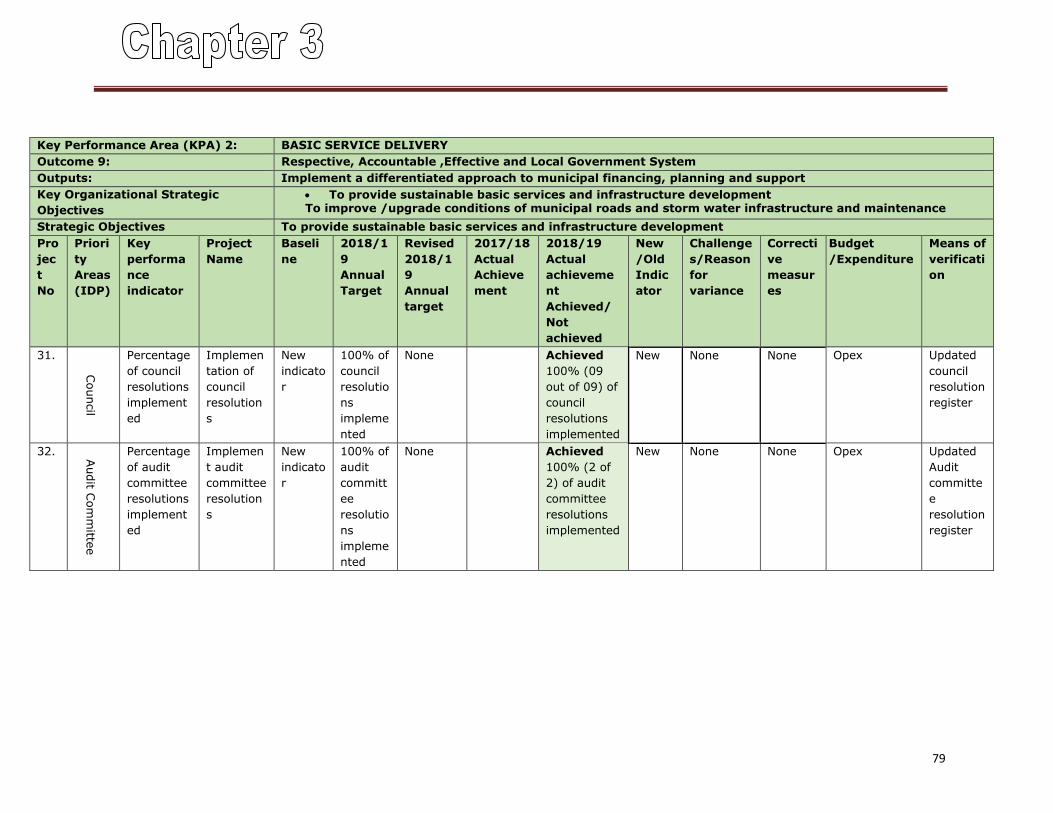
79
Key Performance Area (KPA) 2: BASIC SERVICE DELIVERY
Outcome 9: Respective, Accountable ,Effective and Local Government System
Outputs: Implement a differentiated approach to municipal financing, planning and support
Key Organizational Strategic
Objectives
To provide sustainable basic services and infrastructure development To improve /upgrade conditions of municipal roads and storm water infrastructure and maintenance
Strategic Objectives To provide sustainable basic services and infrastructure development
Pro
jec
t
No
Priori
ty
Areas
(IDP)
Key
performa
nce
indicator
Project
Name
Baseli
ne
2018/1
9
Annual
Target
Revised
2018/1
9
Annual
target
2017/18
Actual
Achieve
ment
2018/19
Actual
achieveme
nt
Achieved/
Not
achieved
New
/Old
Indic
ator
Challenge
s/Reason
for
variance
Correcti
ve
measur
es
Budget
/Expenditure
Means of
verificati
on
31.
Council
Percentage
of council
resolutions
implement
ed
Implemen
tation of
council
resolution
s
New
indicato
r
100% of
council
resolutio
ns
impleme
nted
None Achieved
100% (09
out of 09) of
council
resolutions
implemented
New None None Opex Updated
council
resolution
register
32. Audit C
om
mitte
e
Percentage
of audit
committee
resolutions
implement
ed
Implemen
t audit
committee
resolution
s
New
indicato
r
100% of
audit
committ
ee
resolutio
ns
impleme
nted
None Achieved
100% (2 of
2) of audit
committee
resolutions
implemented
New None None Opex Updated
Audit
committe
e
resolution
register
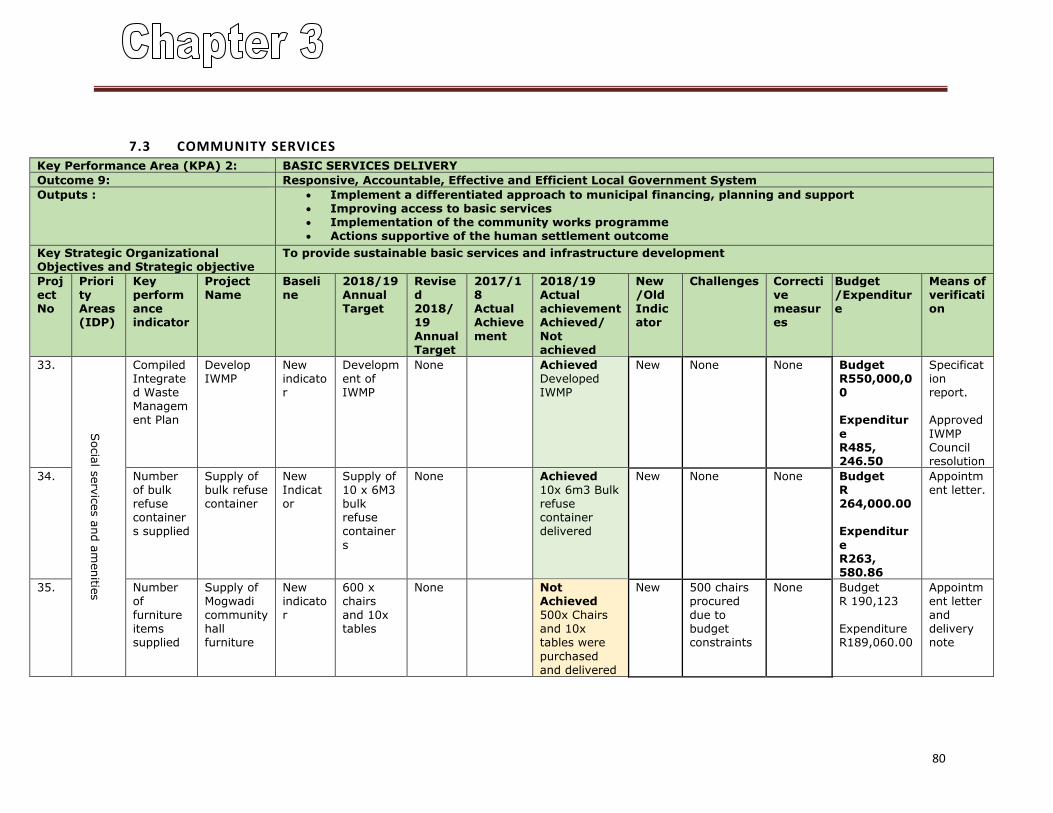
80
7.3 COMMUNITY SERVICES
Key Performance Area (KPA) 2: BASIC SERVICES DELIVERY
Outcome 9: Responsive, Accountable, Effective and Efficient Local Government System
Outputs : Implement a differentiated approach to municipal financing, planning and support Improving access to basic services Implementation of the community works programme Actions supportive of the human settlement outcome
Key Strategic Organizational Objectives and Strategic objective
To provide sustainable basic services and infrastructure development
Project No
Priority Areas(IDP)
Key performance indicator
Project Name
Baseline
2018/19 Annual Target
Revised 2018/19
Annual Target
2017/18 Actual Achieve
ment
2018/19 Actual achievement Achieved/
Not achieved
New /Old Indicator
Challenges Corrective measures
Budget /Expenditure
Means of verification
33.
Socia
l serv
ices a
nd a
menitie
s
Compiled Integrated Waste Management Plan
Develop IWMP
New indicator
Development of IWMP
None Achieved Developed IWMP
New None None Budget R550,000,00 Expenditur
e R485, 246.50
Specification report. Approved
IWMP Council resolution
34. Number of bulk refuse containers supplied
Supply of bulk refuse container
New Indicator
Supply of 10 x 6M3 bulk refuse container
s
None Achieved 10x 6m3 Bulk refuse container delivered
New None None Budget R 264,000.00 Expenditur
e R263, 580.86
Appointment letter.
35. Number of furniture items supplied
Supply of Mogwadi community hall furniture
New indicator
600 x chairs and 10x tables
None Not Achieved 500x Chairs and 10x tables were
purchased and delivered
New 500 chairs procured due to budget constraints
None Budget R 190,123 Expenditure R189,060.00
Appointment letter and delivery note
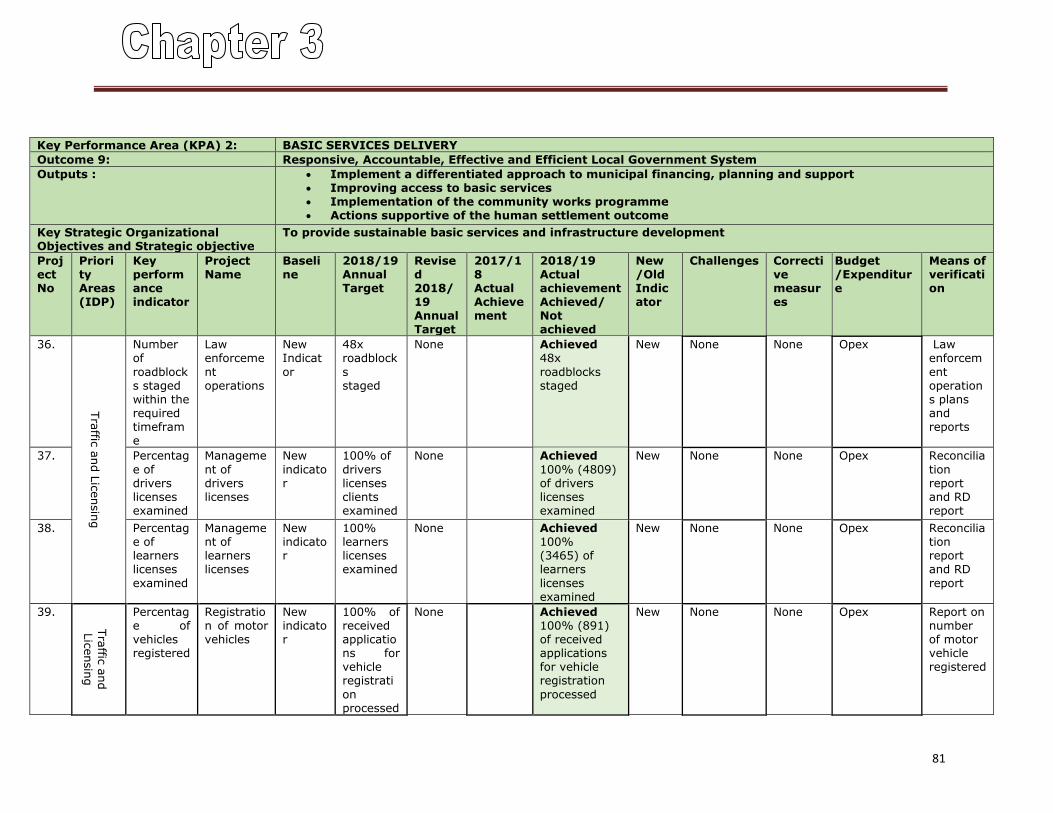
81
Key Performance Area (KPA) 2: BASIC SERVICES DELIVERY
Outcome 9: Responsive, Accountable, Effective and Efficient Local Government System
Outputs : Implement a differentiated approach to municipal financing, planning and support Improving access to basic services Implementation of the community works programme Actions supportive of the human settlement outcome
Key Strategic Organizational Objectives and Strategic objective
To provide sustainable basic services and infrastructure development
Project No
Priority Areas(IDP)
Key performance indicator
Project Name
Baseline
2018/19 Annual Target
Revised 2018/19 Annual Target
2017/18 Actual Achievement
2018/19 Actual achievement Achieved/ Not achieved
New /Old Indicator
Challenges Corrective measures
Budget /Expenditure
Means of verification
36.
Tra
ffic a
nd L
icensin
g
Number of
roadblocks staged within the required timeframe
Law enforceme
nt operations
New Indicat
or
48x roadblock
s staged
None Achieved 48x
roadblocks staged
New None None Opex Law enforcem
ent operations plans and reports
37. Percentag
e of drivers licenses examined
Manageme
nt of drivers licenses
New
indicator
100% of
drivers licenses clients examined
None Achieved
100% (4809) of drivers licenses examined
New None None Opex Reconcilia
tion report and RD report
38. Percentage of learners licenses
examined
Management of learners licenses
New indicator
100% learners licenses examined
None Achieved 100% (3465) of learners
licenses examined
New None None Opex Reconciliation report and RD
report
39.
Tra
ffic a
nd
Lic
ensin
g
Percentage of vehicles registered
Registration of motor vehicles
New indicator
100% of received applications for vehicle registrati
on processed
None Achieved 100% (891) of received applications for vehicle registration
processed
New None None Opex Report on number of motor vehicle registered
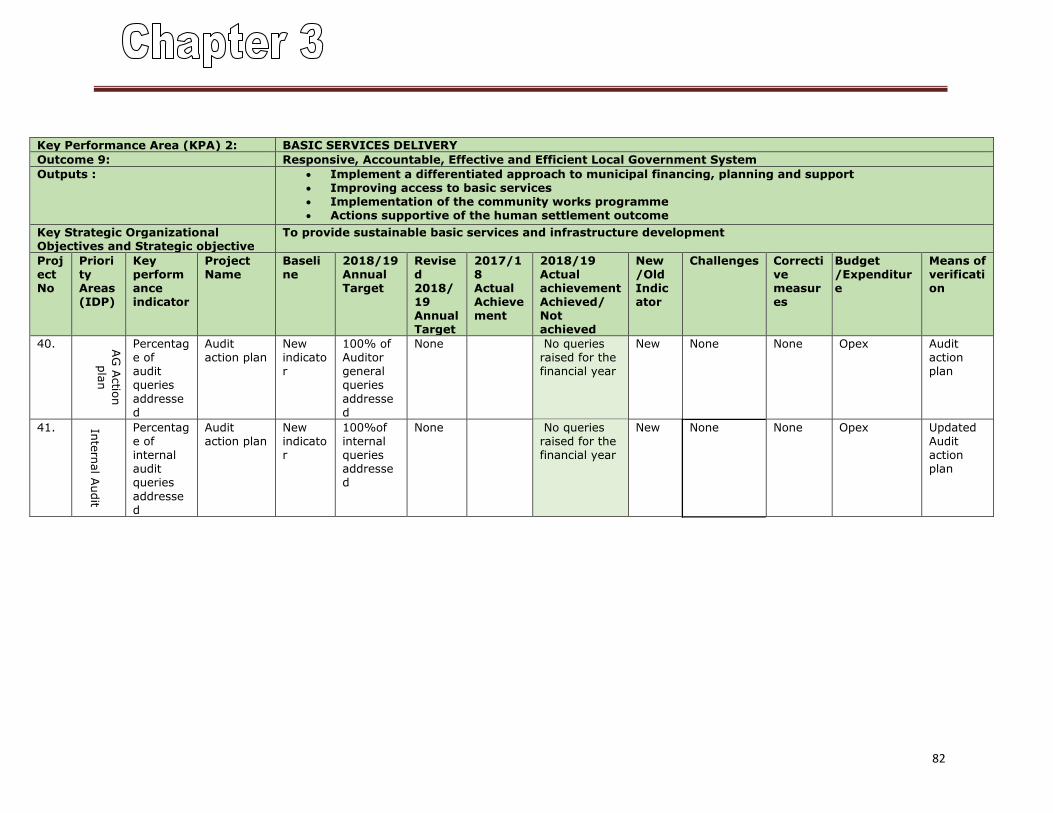
82
Key Performance Area (KPA) 2: BASIC SERVICES DELIVERY
Outcome 9: Responsive, Accountable, Effective and Efficient Local Government System
Outputs : Implement a differentiated approach to municipal financing, planning and support Improving access to basic services Implementation of the community works programme Actions supportive of the human settlement outcome
Key Strategic Organizational Objectives and Strategic objective
To provide sustainable basic services and infrastructure development
Project No
Priority Areas(IDP)
Key performance indicator
Project Name
Baseline
2018/19 Annual Target
Revised 2018/19 Annual Target
2017/18 Actual Achievement
2018/19 Actual achievement Achieved/ Not achieved
New /Old Indicator
Challenges Corrective measures
Budget /Expenditure
Means of verification
40.
AG
Actio
n
pla
n
Percentage of audit queries
addressed
Audit action plan
New indicator
100% of Auditor general queries
addressed
None No queries raised for the financial year
New None None Opex Audit action plan
41. Inte
rnal A
udit
Percentage of internal audit queries
addressed
Audit action plan
New indicator
100%of internal queries addressed
None No queries raised for the financial year
New None None Opex Updated Audit action plan
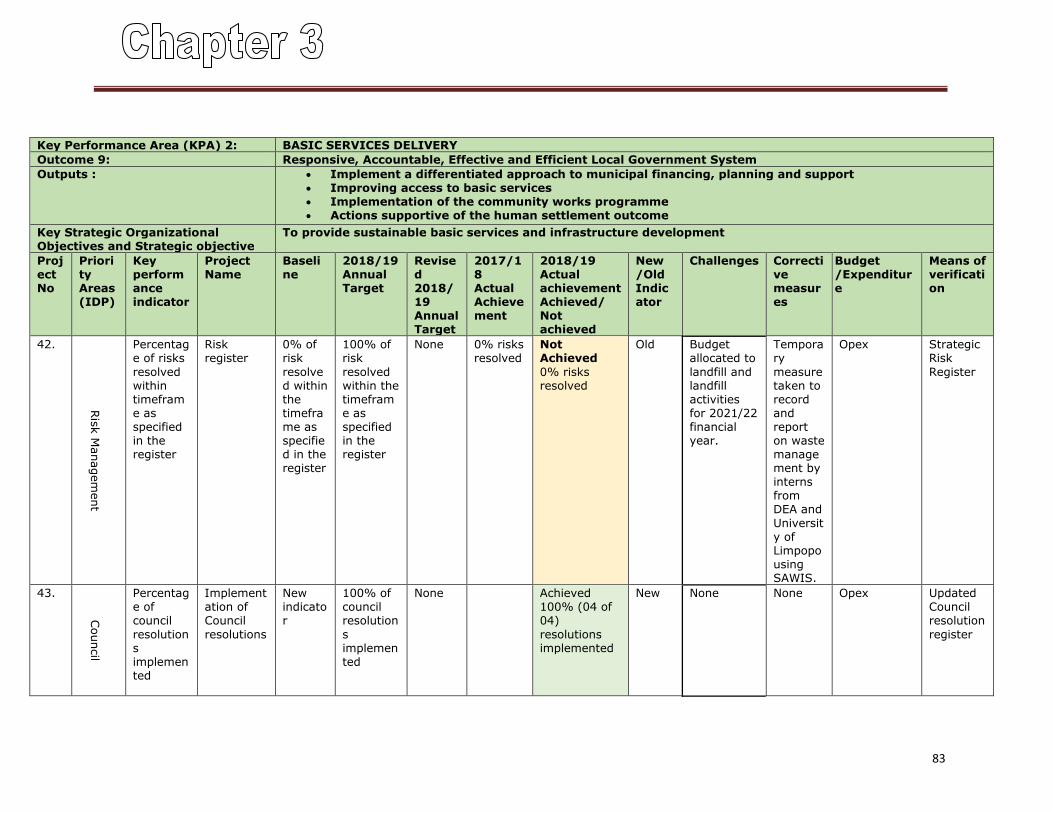
83
Key Performance Area (KPA) 2: BASIC SERVICES DELIVERY
Outcome 9: Responsive, Accountable, Effective and Efficient Local Government System
Outputs : Implement a differentiated approach to municipal financing, planning and support Improving access to basic services Implementation of the community works programme Actions supportive of the human settlement outcome
Key Strategic Organizational Objectives and Strategic objective
To provide sustainable basic services and infrastructure development
Project No
Priority Areas(IDP)
Key performance indicator
Project Name
Baseline
2018/19 Annual Target
Revised 2018/19 Annual Target
2017/18 Actual Achievement
2018/19 Actual achievement Achieved/ Not achieved
New /Old Indicator
Challenges Corrective measures
Budget /Expenditure
Means of verification
42.
Ris
k M
anagem
ent
Percentage of risks
resolved within timeframe as specified in the register
Risk register
0% of risk
resolved within the timeframe as specified in the register
100% of risk
resolved within the timeframe as specified in the register
None 0% risks resolved
Not Achieved
0% risks resolved
Old Budget allocated to
landfill and landfill activities for 2021/22 financial year.
Temporary
measure taken to record and report on waste management by interns from DEA and
University of Limpopo using SAWIS.
Opex Strategic Risk
Register
43.
Council
Percentage of council
resolutions implemented
Implementation of Council
resolutions
New indicator
100% of council resolution
s implemented
None Achieved 100% (04 of 04)
resolutions implemented
New None None Opex Updated Council resolution
register
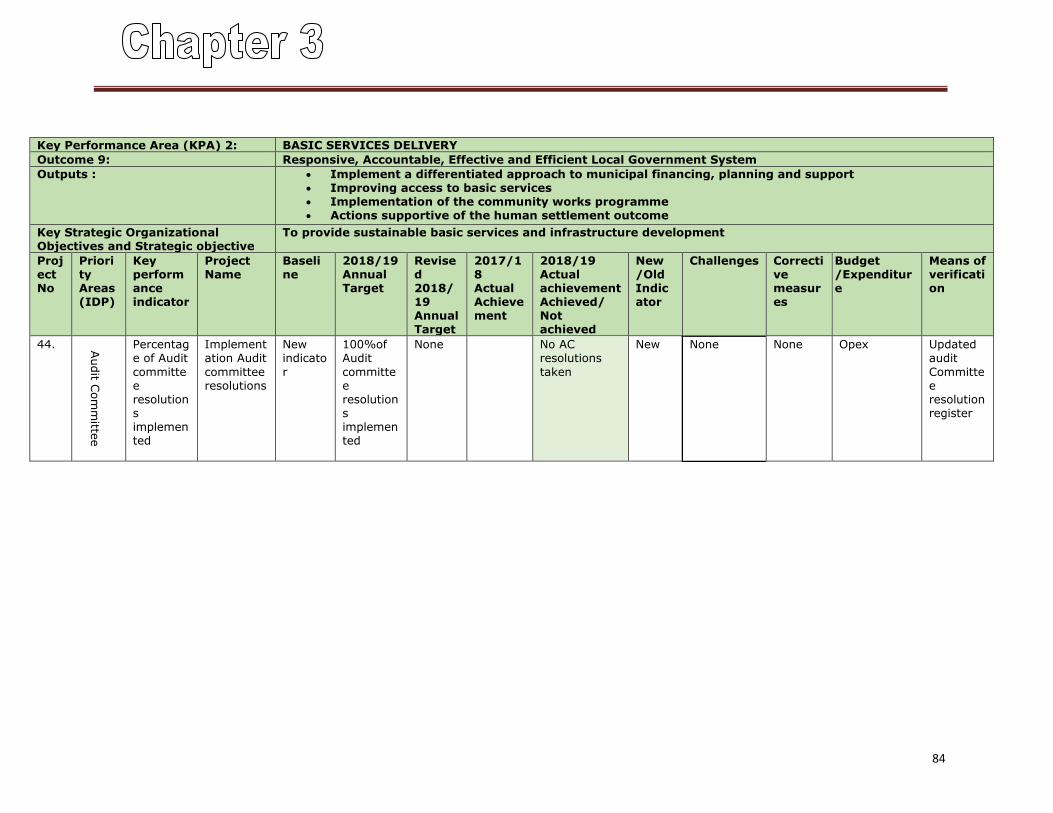
84
Key Performance Area (KPA) 2: BASIC SERVICES DELIVERY
Outcome 9: Responsive, Accountable, Effective and Efficient Local Government System
Outputs : Implement a differentiated approach to municipal financing, planning and support Improving access to basic services Implementation of the community works programme Actions supportive of the human settlement outcome
Key Strategic Organizational Objectives and Strategic objective
To provide sustainable basic services and infrastructure development
Project No
Priority Areas(IDP)
Key performance indicator
Project Name
Baseline
2018/19 Annual Target
Revised 2018/19 Annual Target
2017/18 Actual Achievement
2018/19 Actual achievement Achieved/ Not achieved
New /Old Indicator
Challenges Corrective measures
Budget /Expenditure
Means of verification
44. Audit C
om
mitte
e
Percentage of Audit
committee resolutions implemented
Implementation Audit
committee resolutions
New indicato
r
100%of Audit
committee resolutions implemented
None No AC resolutions
taken
New None None Opex Updated audit
Committee resolution register
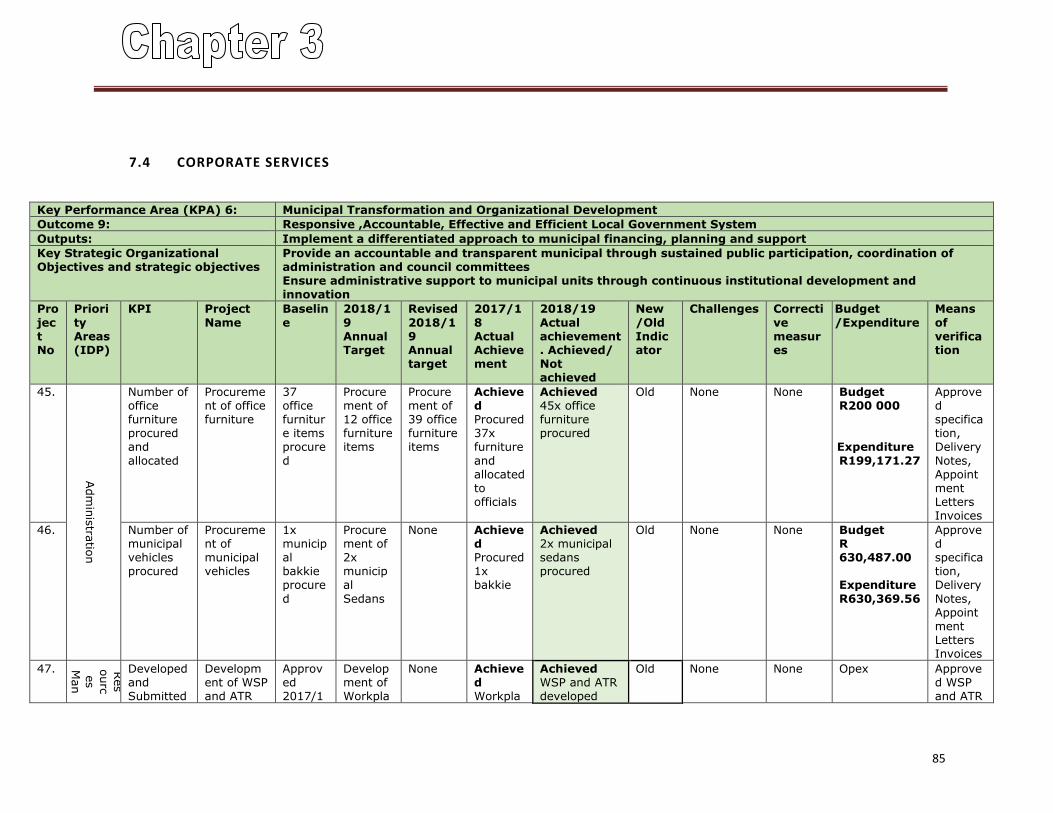
85
7.4 CORPORATE SERVICES
Key Performance Area (KPA) 6: Municipal Transformation and Organizational Development
Outcome 9: Responsive ,Accountable, Effective and Efficient Local Government System
Outputs: Implement a differentiated approach to municipal financing, planning and support
Key Strategic Organizational Objectives and strategic objectives
Provide an accountable and transparent municipal through sustained public participation, coordination of administration and council committees Ensure administrative support to municipal units through continuous institutional development and innovation
Pro
ject No
Priori
ty Areas (IDP)
KPI Project
Name
Baselin
e
2018/1
9 Annual Target
Revised
2018/19 Annual target
2017/1
8 Actual Achievement
2018/19
Actual achievement. Achieved/ Not achieved
New
/Old Indicator
Challenges Correcti
ve measures
Budget
/Expenditure
Means
of verification
45.
Adm
inis
tratio
n
Number of office furniture procured and
allocated
Procurement of office furniture
37 office furniture items procure
d
Procurement of 12 office furniture items
Procurement of 39 office furniture items
Achieved Procured 37x furniture
and allocated to officials
Achieved 45x office furniture procured
Old None None Budget R200 000
Expenditure
R199,171.27
Approved specification, Delivery
Notes, Appointment Letters Invoices
46. Number of municipal vehicles procured
Procurement of municipal vehicles
1x municipal bakkie procure
d
Procurement of 2x municipal
Sedans
None Achieved Procured 1x bakkie
Achieved 2x municipal sedans procured
Old None None Budget R 630,487.00 Expenditure
R630,369.56
Approved specification, Delivery
Notes, Appointment Letters Invoices
47. Hu
man
Res
ourc
es
Man
age
men
t
Developed and Submitted
Development of WSP and ATR
Approved 2017/1
Development of Workpla
None Achieved Workpla
Achieved WSP and ATR developed
Old None None Opex Approved WSP and ATR
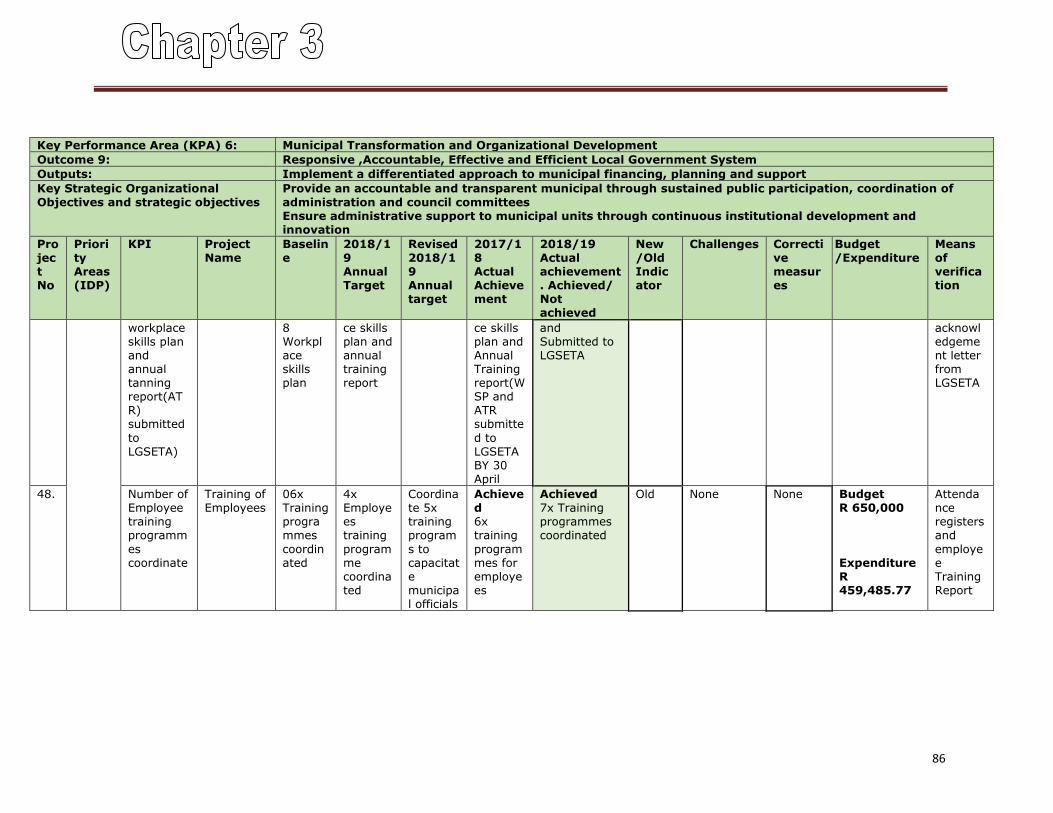
86
Key Performance Area (KPA) 6: Municipal Transformation and Organizational Development
Outcome 9: Responsive ,Accountable, Effective and Efficient Local Government System
Outputs: Implement a differentiated approach to municipal financing, planning and support
Key Strategic Organizational
Objectives and strategic objectives
Provide an accountable and transparent municipal through sustained public participation, coordination of
administration and council committees Ensure administrative support to municipal units through continuous institutional development and innovation
Project No
Priority Areas (IDP)
KPI Project Name
Baseline
2018/19 Annual Target
Revised 2018/19 Annual target
2017/18 Actual Achievement
2018/19 Actual achievement. Achieved/ Not achieved
New /Old Indicator
Challenges Corrective measures
Budget /Expenditure
Means of verification
workplace skills plan and annual tanning report(ATR) submitted
to LGSETA)
8 Workplace skills plan
ce skills plan and annual training report
ce skills plan and Annual Training report(WSP and ATR submitte
d to LGSETA BY 30 April
and Submitted to LGSETA
acknowledgement letter from LGSETA
48. Number of Employee training programm
es coordinate
Training of Employees
06x Training programmes
coordinated
4x Employees training
programme coordinated
Coordinate 5x training program
s to capacitate municipal officials
Achieved 6x training
programmes for employees
Achieved 7x Training programmes coordinated
Old None None Budget R 650,000
Expenditure R 459,485.77
Attendance registers and
employee Training Report
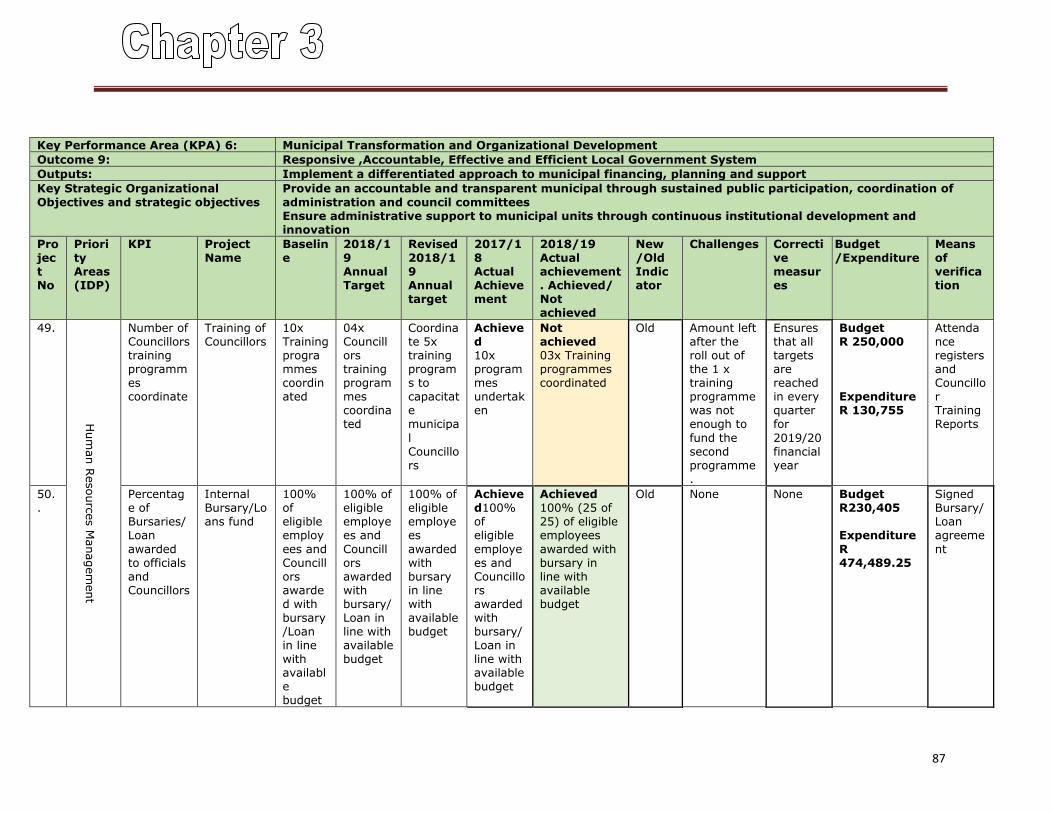
87
Key Performance Area (KPA) 6: Municipal Transformation and Organizational Development
Outcome 9: Responsive ,Accountable, Effective and Efficient Local Government System
Outputs: Implement a differentiated approach to municipal financing, planning and support
Key Strategic Organizational
Objectives and strategic objectives
Provide an accountable and transparent municipal through sustained public participation, coordination of
administration and council committees Ensure administrative support to municipal units through continuous institutional development and innovation
Project No
Priority Areas (IDP)
KPI Project Name
Baseline
2018/19 Annual Target
Revised 2018/19 Annual target
2017/18 Actual Achievement
2018/19 Actual achievement. Achieved/ Not achieved
New /Old Indicator
Challenges Corrective measures
Budget /Expenditure
Means of verification
49.
Hum
an R
esourc
es M
anagem
ent
Number of Councillors training programmes coordinate
Training of Councillors
10x Training programmes coordinated
04x Councillors training programmes coordinated
Coordinate 5x training programs to capacitate municipa
l Councillors
Achieved 10x programmes undertaken
Not achieved 03x Training programmes coordinated
Old Amount left after the roll out of the 1 x training programme was not enough to
fund the second programme.
Ensures that all targets are reached in every quarter for
2019/20 financial year
Budget R 250,000 Expenditure R 130,755
Attendance registers and Councillor Training Reports
50..
Percentage of Bursaries/Loan
awarded to officials and Councillors
Internal Bursary/Loans fund
100% of eligible employ
ees and Councillors awarded with bursary/Loan in line with available budget
100% of eligible employees and
Councillors awarded with bursary/Loan in line with available budget
100% of eligible employees
awarded with bursary in line with available budget
Achieved100% of eligible
employees and Councillors awarded with bursary/Loan in line with available budget
Achieved 100% (25 of 25) of eligible employees
awarded with bursary in line with available budget
Old None None Budget R230,405 Expenditure
R 474,489.25
Signed Bursary/Loan agreeme
nt
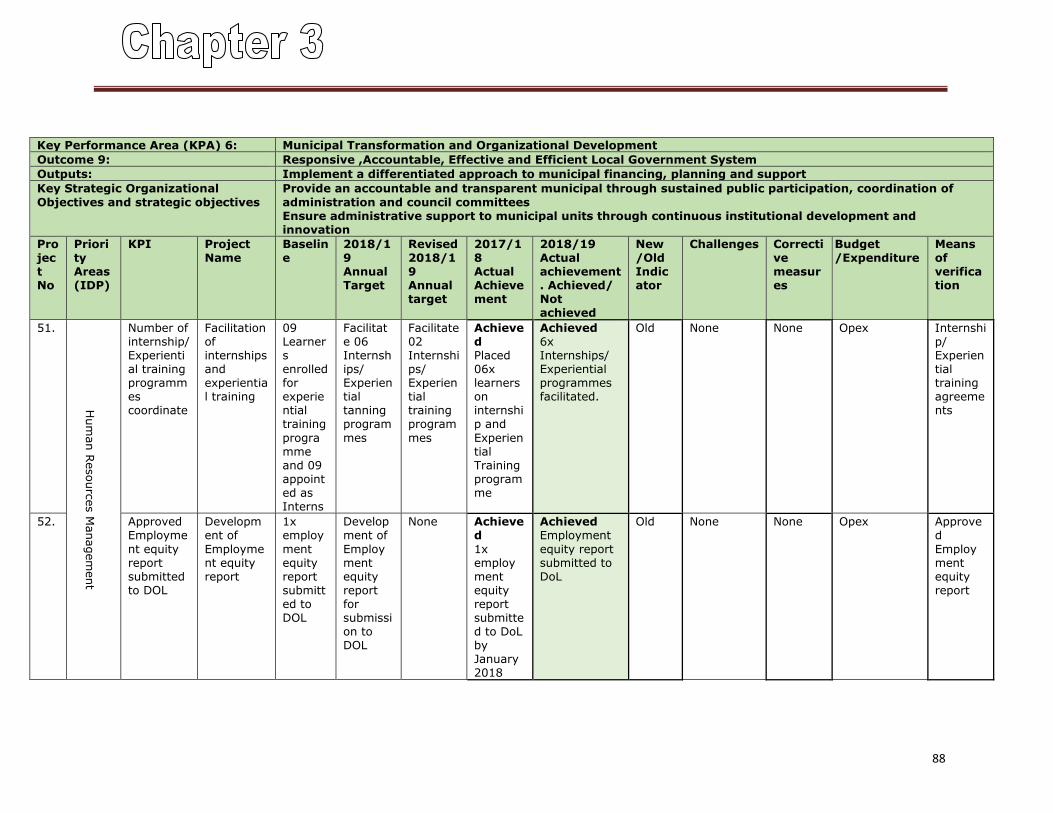
88
Key Performance Area (KPA) 6: Municipal Transformation and Organizational Development
Outcome 9: Responsive ,Accountable, Effective and Efficient Local Government System
Outputs: Implement a differentiated approach to municipal financing, planning and support
Key Strategic Organizational
Objectives and strategic objectives
Provide an accountable and transparent municipal through sustained public participation, coordination of
administration and council committees Ensure administrative support to municipal units through continuous institutional development and innovation
Project No
Priority Areas (IDP)
KPI Project Name
Baseline
2018/19 Annual Target
Revised 2018/19 Annual target
2017/18 Actual Achievement
2018/19 Actual achievement. Achieved/ Not achieved
New /Old Indicator
Challenges Corrective measures
Budget /Expenditure
Means of verification
51.
Hum
an R
esourc
es M
anagem
ent
Number of internship/ Experiential training programmes coordinate
Facilitation of internships and experiential training
09 Learners enrolled for experiential training
programme and 09 appointed as Interns
Facilitate 06 Internships/ Experiential tanning program
mes
Facilitate 02 Internships/ Experiential training program
mes
Achieved Placed 06x learners on internship and
Experiential Training programme
Achieved 6x Internships/ Experiential programmes facilitated.
Old None None Opex Internship/ Experiential training agreements
52. Approved Employme
nt equity report submitted to DOL
Development of
Employment equity report
1x employ
ment equity report submitted to DOL
Development of
Employment equity report for submission to DOL
None Achieved
1x employment equity report submitted to DoL by January 2018
Achieved Employment
equity report submitted to DoL
Old None None Opex Approved
Employment equity report
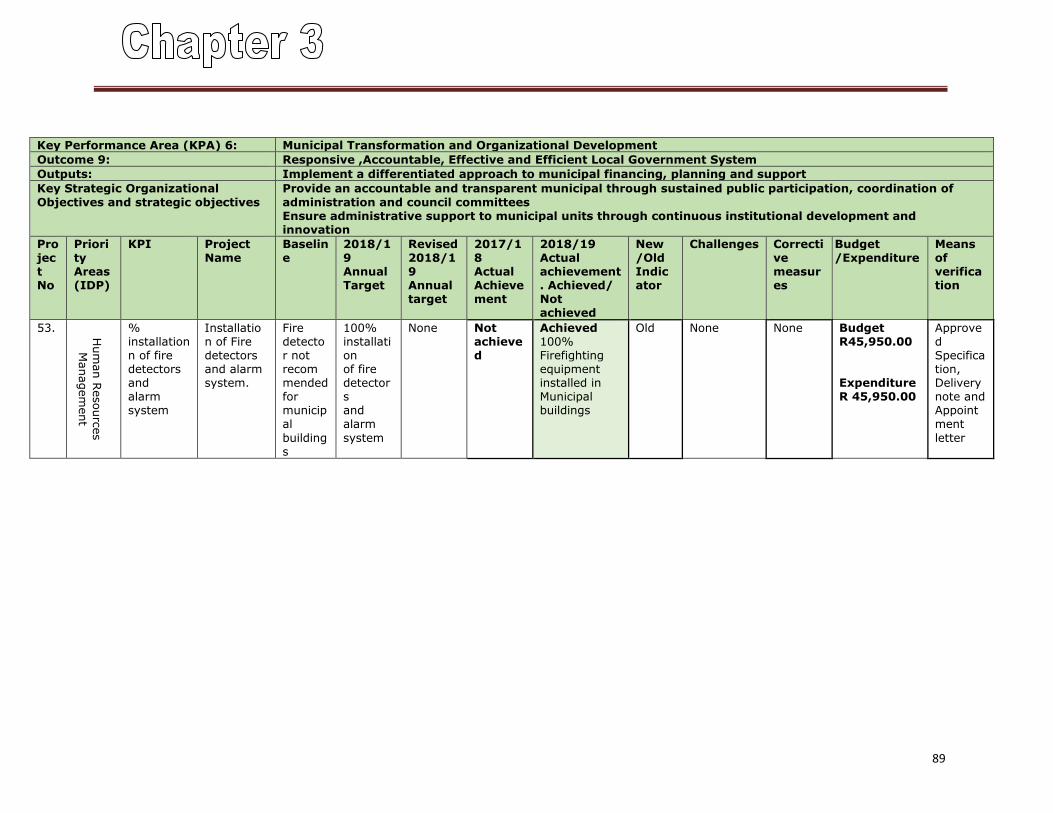
89
Key Performance Area (KPA) 6: Municipal Transformation and Organizational Development
Outcome 9: Responsive ,Accountable, Effective and Efficient Local Government System
Outputs: Implement a differentiated approach to municipal financing, planning and support
Key Strategic Organizational
Objectives and strategic objectives
Provide an accountable and transparent municipal through sustained public participation, coordination of
administration and council committees Ensure administrative support to municipal units through continuous institutional development and innovation
Project No
Priority Areas (IDP)
KPI Project Name
Baseline
2018/19 Annual Target
Revised 2018/19 Annual target
2017/18 Actual Achievement
2018/19 Actual achievement. Achieved/ Not achieved
New /Old Indicator
Challenges Corrective measures
Budget /Expenditure
Means of verification
53.
Hum
an R
esourc
es
Managem
ent
% installation n of fire detectors and alarm system
Installation of Fire detectors and alarm system.
Fire detector not recommended for municipal
buildings
100% installation of fire detectors and alarm
system
None Not achieved
Achieved 100% Firefighting equipment installed in Municipal buildings
Old None None Budget R45,950.00 Expenditure R 45,950.00
Approved Specification, Delivery note and Appointment
letter
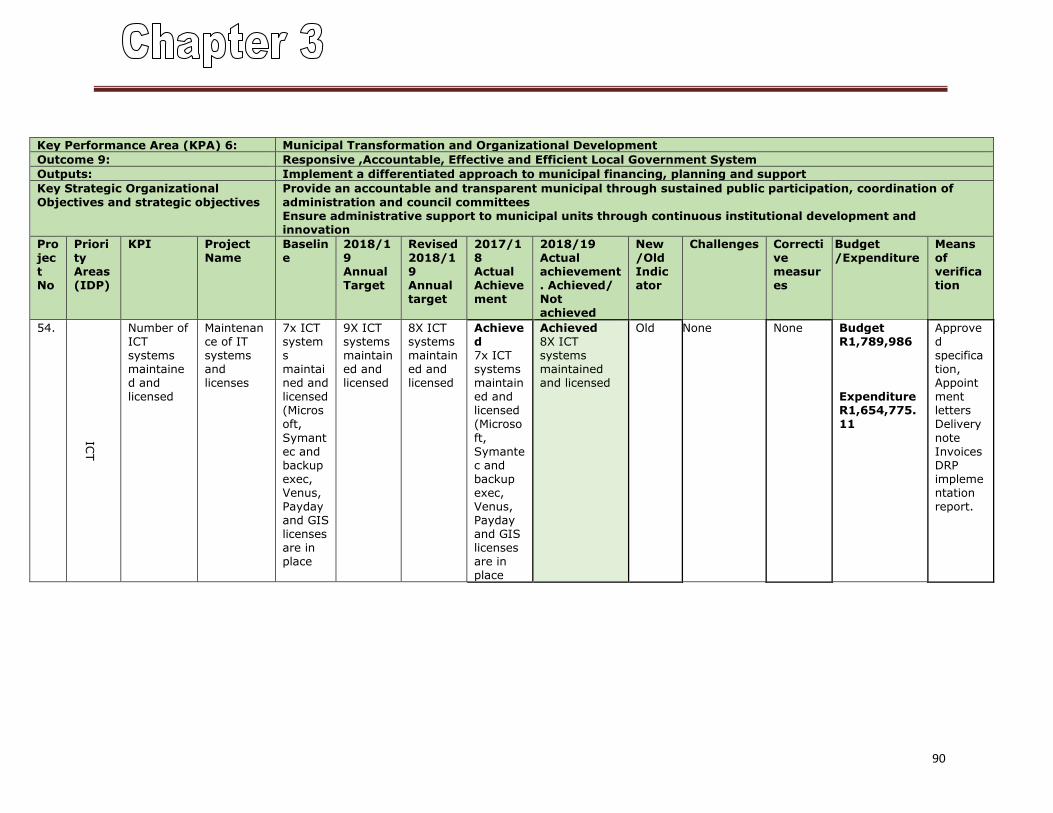
90
Key Performance Area (KPA) 6: Municipal Transformation and Organizational Development
Outcome 9: Responsive ,Accountable, Effective and Efficient Local Government System
Outputs: Implement a differentiated approach to municipal financing, planning and support
Key Strategic Organizational
Objectives and strategic objectives
Provide an accountable and transparent municipal through sustained public participation, coordination of
administration and council committees Ensure administrative support to municipal units through continuous institutional development and innovation
Project No
Priority Areas (IDP)
KPI Project Name
Baseline
2018/19 Annual Target
Revised 2018/19 Annual target
2017/18 Actual Achievement
2018/19 Actual achievement. Achieved/ Not achieved
New /Old Indicator
Challenges Corrective measures
Budget /Expenditure
Means of verification
54.
ICT
Number of ICT systems maintained and licensed
Maintenance of IT systems and licenses
7x ICT systems maintained and licensed (Microsoft,
Symantec and backup exec, Venus, Payday and GIS licenses are in place
9X ICT systems maintained and licensed
8X ICT systems maintained and licensed
Achieved 7x ICT systems maintained and licensed (Microso
ft, Symantec and backup exec, Venus, Payday and GIS licenses are in place
Achieved 8X ICT systems maintained and licensed
Old None None Budget R1,789,986 Expenditure R1,654,775.11
Approved specification, Appointment letters Delivery
note Invoices DRP implementation report.
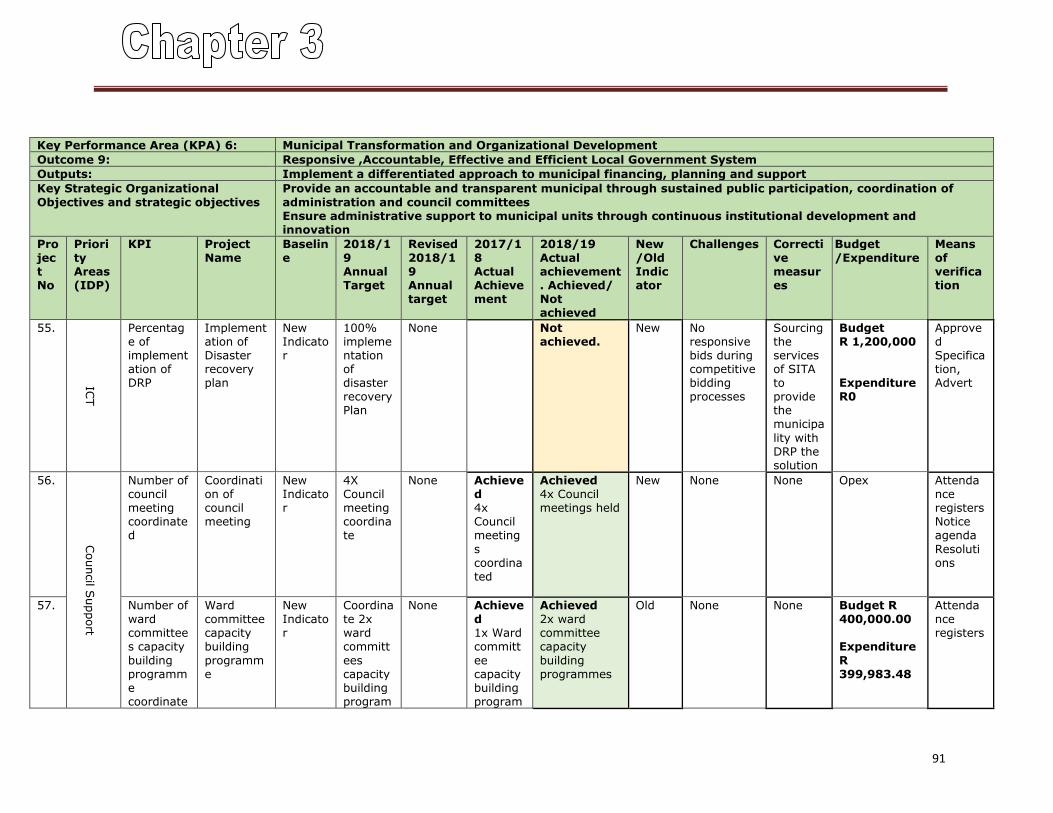
91
Key Performance Area (KPA) 6: Municipal Transformation and Organizational Development
Outcome 9: Responsive ,Accountable, Effective and Efficient Local Government System
Outputs: Implement a differentiated approach to municipal financing, planning and support
Key Strategic Organizational
Objectives and strategic objectives
Provide an accountable and transparent municipal through sustained public participation, coordination of
administration and council committees Ensure administrative support to municipal units through continuous institutional development and innovation
Project No
Priority Areas (IDP)
KPI Project Name
Baseline
2018/19 Annual Target
Revised 2018/19 Annual target
2017/18 Actual Achievement
2018/19 Actual achievement. Achieved/ Not achieved
New /Old Indicator
Challenges Corrective measures
Budget /Expenditure
Means of verification
55.
ICT
Percentage of implementation of DRP
Implementation of Disaster recovery plan
New Indicator
100% implementation of disaster recovery Plan
None Not achieved.
New No responsive bids during competitive bidding processes
Sourcing the services of SITA to provide the municipa
lity with DRP the solution
Budget R 1,200,000 Expenditure R0
Approved Specification, Advert
56.
Council S
upport
Number of council meeting coordinated
Coordination of council meeting
New Indicator
4X Council meeting coordinate
None Achieved 4x Council meeting
s coordinated
Achieved 4x Council meetings held
New None None Opex
Attendance registers Notice agenda
Resolutions
57. Number of ward committees capacity
building programme coordinate
Ward committee capacity building
programme
New Indicator
Coordinate 2x ward committ
ees capacity building program
None Achieved 1x Ward committ
ee capacity building program
Achieved 2x ward committee capacity
building programmes
Old None None Budget R 400,000.00 Expenditure
R 399,983.48
Attendance registers
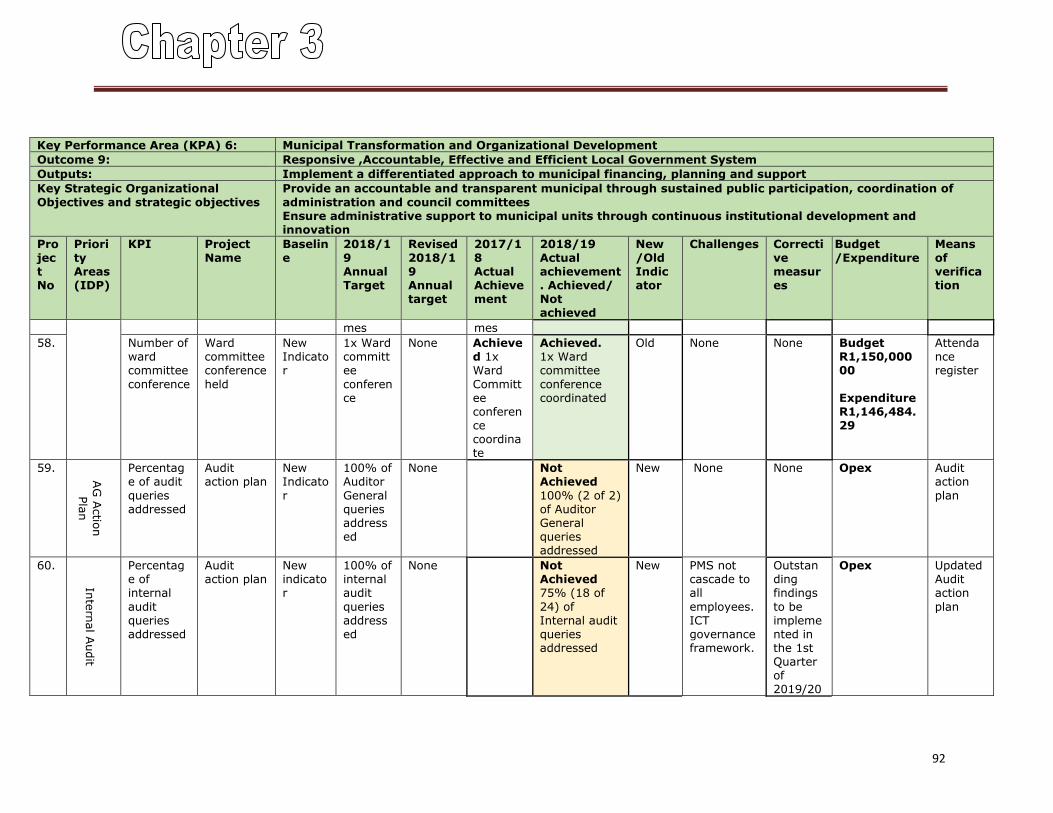
92
Key Performance Area (KPA) 6: Municipal Transformation and Organizational Development
Outcome 9: Responsive ,Accountable, Effective and Efficient Local Government System
Outputs: Implement a differentiated approach to municipal financing, planning and support
Key Strategic Organizational
Objectives and strategic objectives
Provide an accountable and transparent municipal through sustained public participation, coordination of
administration and council committees Ensure administrative support to municipal units through continuous institutional development and innovation
Project No
Priority Areas (IDP)
KPI Project Name
Baseline
2018/19 Annual Target
Revised 2018/19 Annual target
2017/18 Actual Achievement
2018/19 Actual achievement. Achieved/ Not achieved
New /Old Indicator
Challenges Corrective measures
Budget /Expenditure
Means of verification
mes mes
58. Number of ward committee
conference
Ward committee conference
held
New Indicator
1x Ward committee
conference
None Achieved 1x Ward
Committee conference coordinate
Achieved. 1x Ward committee
conference coordinated
Old None None Budget R1,150,000 00
Expenditure R1,146,484.29
Attendance register
59.
AG
Actio
n
Pla
n
Percentage of audit
queries addressed
Audit action plan
New Indicato
r
100% of Auditor
General queries addressed
None Not Achieved
100% (2 of 2) of Auditor General queries addressed
New None None Opex Audit action
plan
60.
Inte
rnal A
udit
Percentage of internal
audit queries addressed
Audit action plan
New indicator
100% of internal audit
queries addressed
None Not Achieved 75% (18 of
24) of Internal audit queries addressed
New PMS not cascade to all
employees. ICT governance framework.
Outstanding findings
to be implemented in the 1st Quarter of 2019/20
Opex Updated Audit action
plan
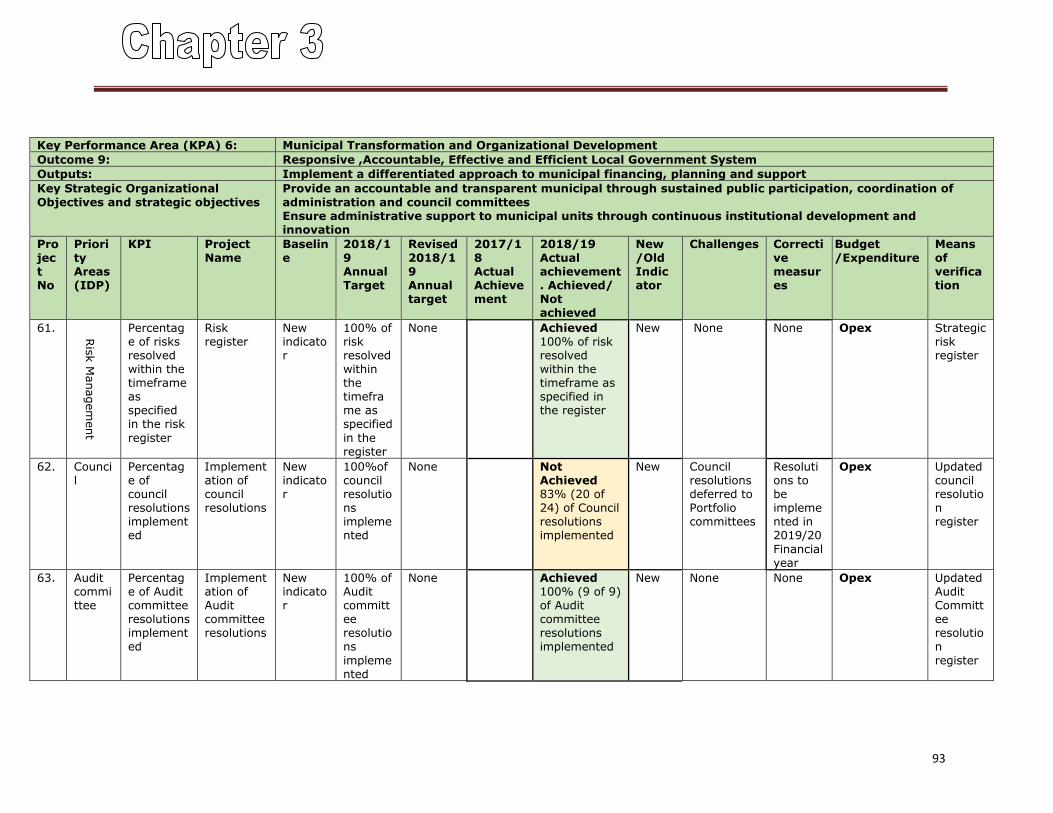
93
Key Performance Area (KPA) 6: Municipal Transformation and Organizational Development
Outcome 9: Responsive ,Accountable, Effective and Efficient Local Government System
Outputs: Implement a differentiated approach to municipal financing, planning and support
Key Strategic Organizational
Objectives and strategic objectives
Provide an accountable and transparent municipal through sustained public participation, coordination of
administration and council committees Ensure administrative support to municipal units through continuous institutional development and innovation
Project No
Priority Areas (IDP)
KPI Project Name
Baseline
2018/19 Annual Target
Revised 2018/19 Annual target
2017/18 Actual Achievement
2018/19 Actual achievement. Achieved/ Not achieved
New /Old Indicator
Challenges Corrective measures
Budget /Expenditure
Means of verification
61.
Ris
k M
anagem
ent
Percentage of risks resolved within the timeframe as specified in the risk
register
Risk register
New indicator
100% of risk resolved within the timeframe as specified
in the register
None Achieved 100% of risk resolved within the timeframe as specified in the register
New None None Opex Strategic risk register
62. Council
Percentage of council resolutions implemented
Implementation of council resolutions
New indicator
100%of council resolutions implemented
None Not Achieved 83% (20 of 24) of Council resolutions implemented
New Council resolutions deferred to Portfolio committees
Resolutions to be implemented in 2019/20
Financial year
Opex Updated council resolution register
63. Audit committee
Percentage of Audit committee resolutions implemented
Implementation of Audit committee resolutions
New indicator
100% of Audit committee resolutions
implemented
None Achieved 100% (9 of 9) of Audit committee resolutions implemented
New None None Opex Updated Audit Committee resolution
register
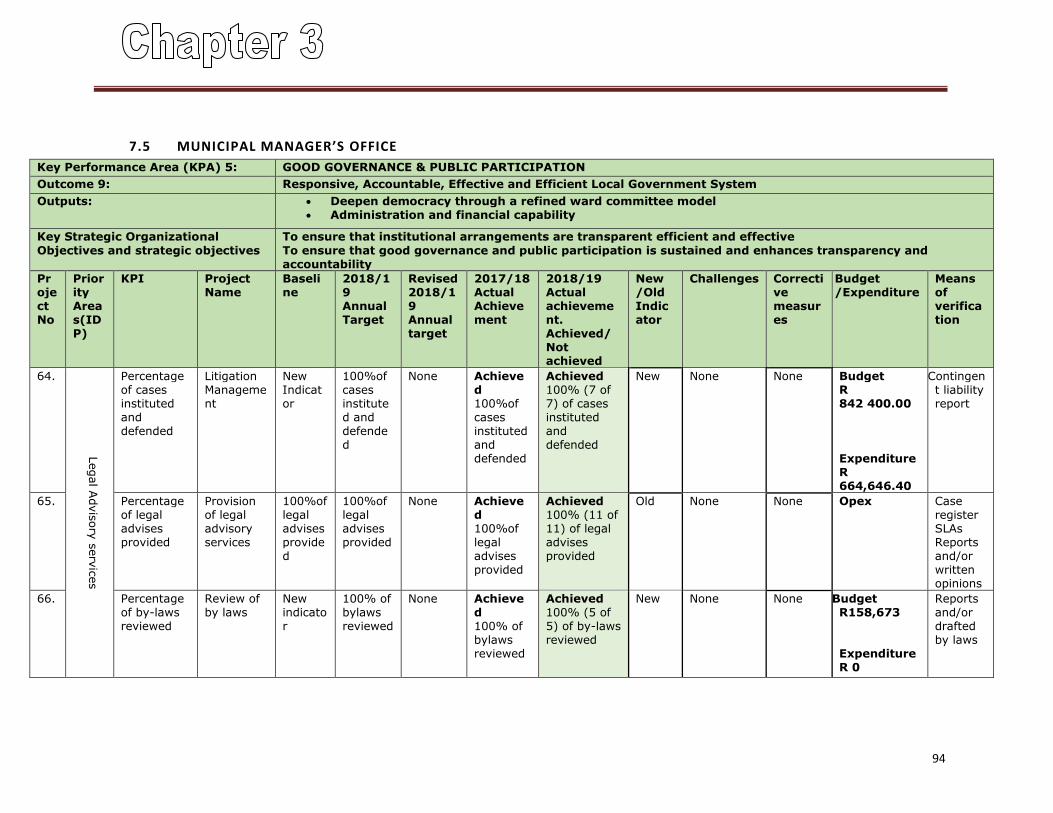
94
7.5 MUNICIPAL MANAGER’S OFFICE
Key Performance Area (KPA) 5: GOOD GOVERNANCE & PUBLIC PARTICIPATION
Outcome 9: Responsive, Accountable, Effective and Efficient Local Government System
Outputs: Deepen democracy through a refined ward committee model Administration and financial capability
Key Strategic Organizational
Objectives and strategic objectives
To ensure that institutional arrangements are transparent efficient and effective
To ensure that good governance and public participation is sustained and enhances transparency and accountability
Project No
Priority Areas(IDP)
KPI
Project Name
Baseline
2018/19 Annual Target
Revised2018/19 Annual target
2017/18 Actual Achievement
2018/19 Actual achievement. Achieved/ Not achieved
New /Old Indicator
Challenges Corrective measures
Budget /Expenditure
Means of verification
64.
Legal A
dvis
ory
serv
ices
Percentage of cases instituted and defended
Litigation Management
New Indicator
100%of cases instituted and defended
None Achieved 100%of cases instituted and defended
Achieved 100% (7 of 7) of cases instituted and defended
New None None Budget R 842 400.00 Expenditure R 664,646.40
Contingent liability report
65. Percentage of legal advises provided
Provision of legal advisory services
100%of legal advises provided
100%of legal advises provided
None Achieved 100%of legal advises provided
Achieved 100% (11 of 11) of legal advises provided
Old None None Opex Case register SLAs Reports and/or written opinions
66. Percentage of by-laws reviewed
Review of by laws
New indicator
100% of bylaws reviewed
None Achieved 100% of bylaws reviewed
Achieved 100% (5 of 5) of by-laws reviewed
New None None Budget R158,673 Expenditure R 0
Reports and/or drafted by laws
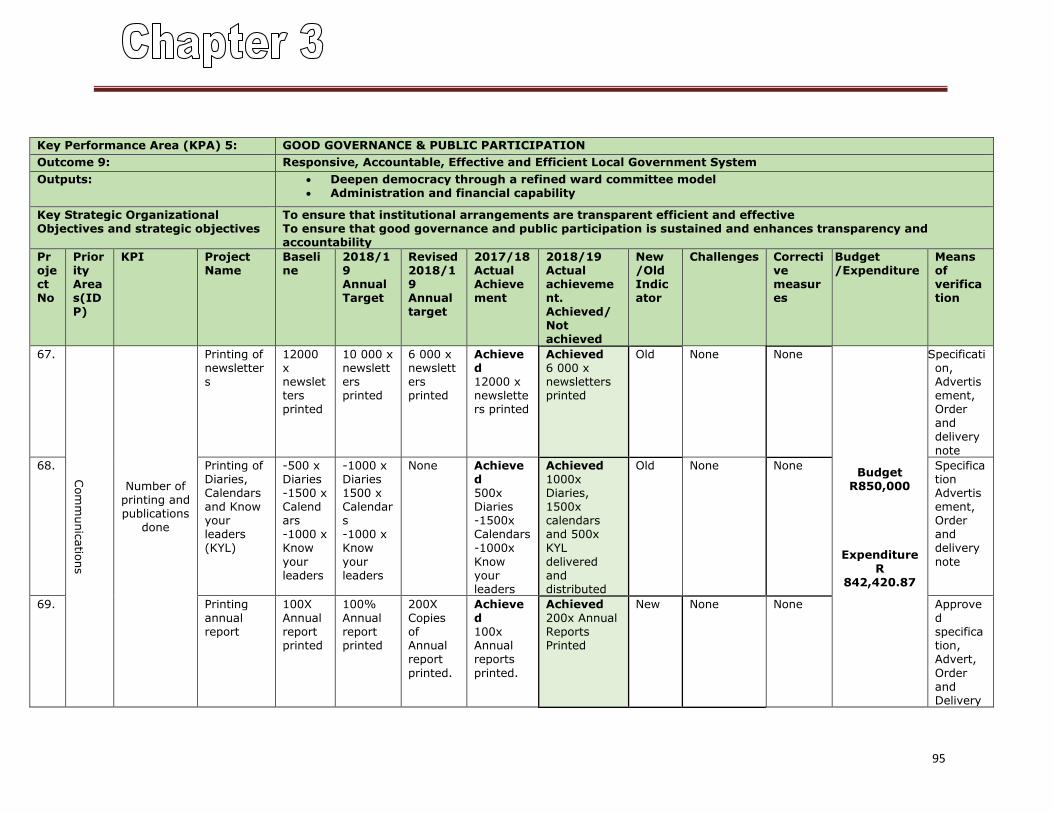
95
Key Performance Area (KPA) 5: GOOD GOVERNANCE & PUBLIC PARTICIPATION
Outcome 9: Responsive, Accountable, Effective and Efficient Local Government System
Outputs: Deepen democracy through a refined ward committee model Administration and financial capability
Key Strategic Organizational Objectives and strategic objectives
To ensure that institutional arrangements are transparent efficient and effective To ensure that good governance and public participation is sustained and enhances transparency and accountability
Project No
Priority Areas(IDP)
KPI
Project Name
Baseline
2018/19 Annual Target
Revised2018/19 Annual target
2017/18 Actual Achievement
2018/19 Actual achievement. Achieved/ Not achieved
New /Old Indicator
Challenges Corrective measures
Budget /Expenditure
Means of verification
67.
Com
munic
atio
ns
Number of printing and publications
done
Printing of newsletters
12000 x newsletters printed
10 000 x newsletters printed
6 000 x newsletters printed
Achieved 12000 x newsletters printed
Achieved 6 000 x newsletters printed
Old None None
Budget R850,000
Expenditure
R 842,420.87
Specification, Advertisement, Order and delivery
note
68.
Printing of Diaries, Calendars and Know your leaders (KYL)
-500 x Diaries -1500 x Calendars -1000 x Know
your leaders
-1000 x Diaries 1500 x Calendars -1000 x Know
your leaders
None Achieved 500x Diaries -1500x Calendars -1000x
Know your leaders
Achieved 1000x Diaries, 1500x calendars and 500x KYL
delivered and distributed
Old None None Specification Advertisement, Order and delivery
note
69. Printing annual report
100X Annual report printed
100% Annual report printed
200X Copies of Annual report
printed.
Achieved 100x Annual reports
printed.
Achieved 200x Annual Reports Printed
New None None Approved specification, Advert,
Order and Delivery
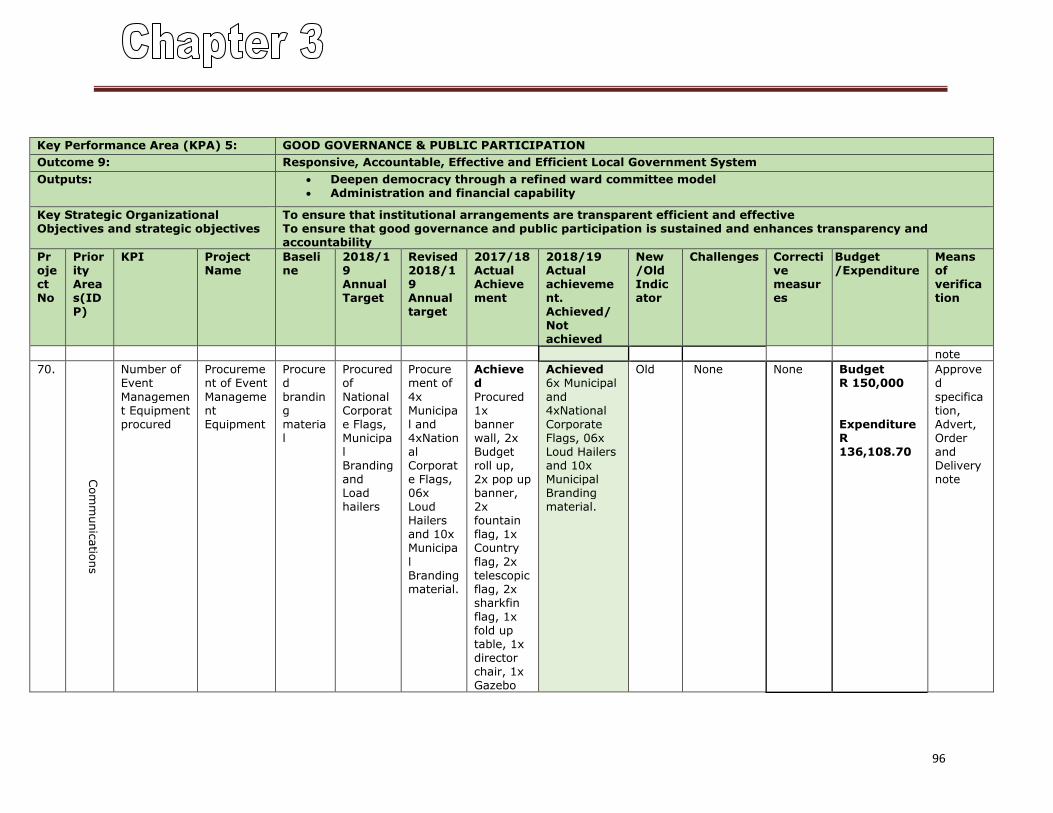
96
Key Performance Area (KPA) 5: GOOD GOVERNANCE & PUBLIC PARTICIPATION
Outcome 9: Responsive, Accountable, Effective and Efficient Local Government System
Outputs: Deepen democracy through a refined ward committee model Administration and financial capability
Key Strategic Organizational Objectives and strategic objectives
To ensure that institutional arrangements are transparent efficient and effective To ensure that good governance and public participation is sustained and enhances transparency and accountability
Project No
Priority Areas(IDP)
KPI
Project Name
Baseline
2018/19 Annual Target
Revised2018/19 Annual target
2017/18 Actual Achievement
2018/19 Actual achievement. Achieved/ Not achieved
New /Old Indicator
Challenges Corrective measures
Budget /Expenditure
Means of verification
note
70.
Com
munic
atio
ns
Number of Event
Management Equipment procured
Procurement of Event
Management Equipment
Procured
branding material
Procured of
National Corporate Flags, Municipal Branding and Load hailers
Procurement of
4x Municipal and 4xNational Corporate Flags, 06x Loud Hailers and 10x Municipa
l Branding material.
Achieved
Procured 1x banner wall, 2x Budget roll up, 2x pop up banner, 2x fountain flag, 1x Country
flag, 2x telescopic flag, 2x sharkfin flag, 1x fold up table, 1x director chair, 1x Gazebo
Achieved 6x Municipal
and 4xNational Corporate Flags, 06x Loud Hailers and 10x Municipal Branding material.
Old None None Budget R 150,000
Expenditure R 136,108.70
Approved
specification, Advert, Order and Delivery note
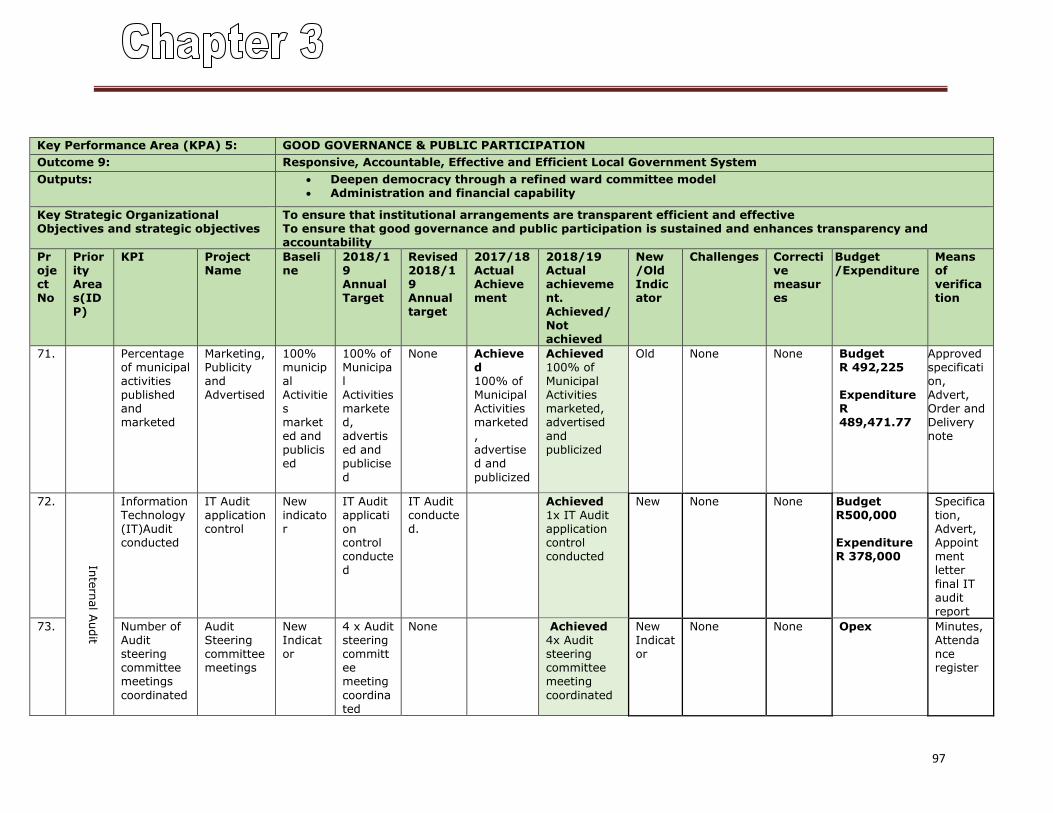
97
Key Performance Area (KPA) 5: GOOD GOVERNANCE & PUBLIC PARTICIPATION
Outcome 9: Responsive, Accountable, Effective and Efficient Local Government System
Outputs: Deepen democracy through a refined ward committee model Administration and financial capability
Key Strategic Organizational Objectives and strategic objectives
To ensure that institutional arrangements are transparent efficient and effective To ensure that good governance and public participation is sustained and enhances transparency and accountability
Project No
Priority Areas(IDP)
KPI
Project Name
Baseline
2018/19 Annual Target
Revised2018/19 Annual target
2017/18 Actual Achievement
2018/19 Actual achievement. Achieved/ Not achieved
New /Old Indicator
Challenges Corrective measures
Budget /Expenditure
Means of verification
71. Percentage of municipal activities published and marketed
Marketing, Publicity and Advertised
100% municipal Activities marketed and publicised
100% of Municipal Activities marketed, advertised and publicise
d
None Achieved 100% of Municipal Activities marketed, advertised and
publicized
Achieved 100% of Municipal Activities marketed, advertised and publicized
Old None None Budget R 492,225 Expenditure R 489,471.77
Approved specification, Advert, Order and Delivery note
72.
Inte
rnal A
udit
Information Technology(IT)Audit conducted
IT Audit application control
New indicator
IT Audit application control conducted
IT Audit conducted.
Achieved 1x IT Audit application control conducted
New None None Budget R500,000 Expenditure R 378,000
Specification, Advert, Appointment letter
final IT audit report
73. Number of Audit steering committee meetings
coordinated
Audit Steering committee meetings
New Indicator
4 x Audit steering committee meeting
coordinated
None Achieved 4x Audit steering committee meeting
coordinated
New Indicator
None None Opex Minutes, Attendance register
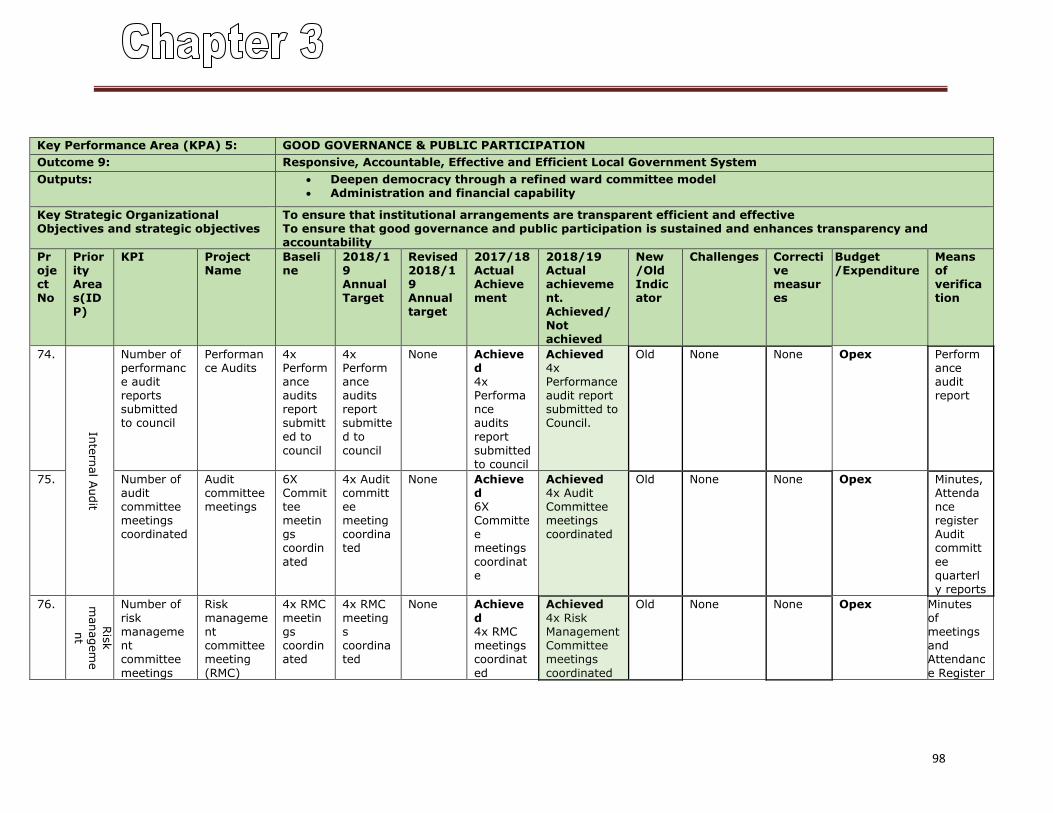
98
Key Performance Area (KPA) 5: GOOD GOVERNANCE & PUBLIC PARTICIPATION
Outcome 9: Responsive, Accountable, Effective and Efficient Local Government System
Outputs: Deepen democracy through a refined ward committee model Administration and financial capability
Key Strategic Organizational Objectives and strategic objectives
To ensure that institutional arrangements are transparent efficient and effective To ensure that good governance and public participation is sustained and enhances transparency and accountability
Project No
Priority Areas(IDP)
KPI
Project Name
Baseline
2018/19 Annual Target
Revised2018/19 Annual target
2017/18 Actual Achievement
2018/19 Actual achievement. Achieved/ Not achieved
New /Old Indicator
Challenges Corrective measures
Budget /Expenditure
Means of verification
74.
Inte
rnal A
udit
Number of performance audit reports submitted to council
Performance Audits
4x Performance audits report submitted to
council
4x Performance audits report submitted to
council
None Achieved 4x Performance audits report
submitted to council
Achieved 4x Performance audit report submitted to Council.
Old None None Opex Performance audit report
75. Number of audit committee meetings coordinated
Audit committee meetings
6X Committee meetings coordin
ated
4x Audit committee meeting coordinated
None Achieved 6X Committee meetings
coordinate
Achieved 4x Audit Committee meetings coordinated
Old None None Opex Minutes, Attendance register Audit committ
ee quarterly reports
76.
Ris
k
managem
e
nt
Number of risk management committee
meetings
Risk management committee meeting
(RMC)
4x RMC meetings coordinated
4x RMC meetings coordinated
None Achieved 4x RMC meetings coordinat
ed
Achieved 4x Risk Management Committee meetings
coordinated
Old None None Opex Minutes of meetings and Attendanc
e Register
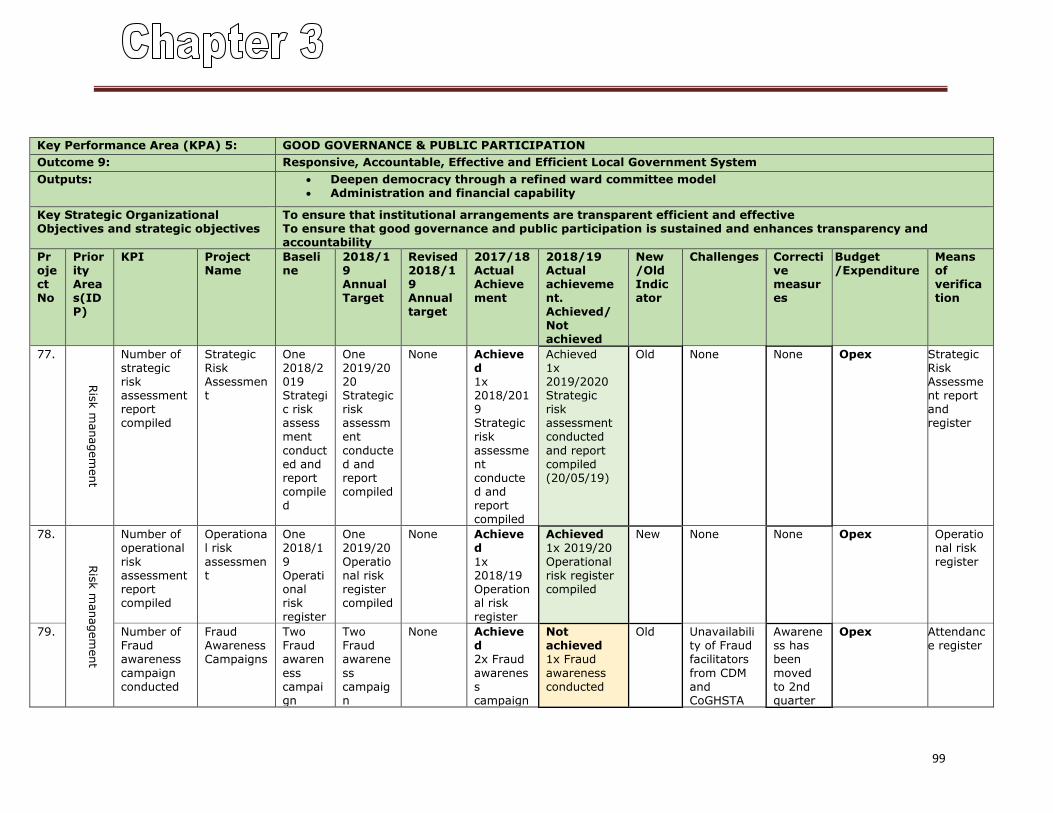
99
Key Performance Area (KPA) 5: GOOD GOVERNANCE & PUBLIC PARTICIPATION
Outcome 9: Responsive, Accountable, Effective and Efficient Local Government System
Outputs: Deepen democracy through a refined ward committee model Administration and financial capability
Key Strategic Organizational Objectives and strategic objectives
To ensure that institutional arrangements are transparent efficient and effective To ensure that good governance and public participation is sustained and enhances transparency and accountability
Project No
Priority Areas(IDP)
KPI
Project Name
Baseline
2018/19 Annual Target
Revised2018/19 Annual target
2017/18 Actual Achievement
2018/19 Actual achievement. Achieved/ Not achieved
New /Old Indicator
Challenges Corrective measures
Budget /Expenditure
Means of verification
77.
Ris
k m
anagem
ent
Number of strategic risk assessment report compiled
Strategic Risk Assessment
One 2018/2019 Strategic risk assessment
conducted and report compiled
One 2019/2020 Strategic risk assessment
conducted and report compiled
None Achieved 1x 2018/2019 Strategic risk
assessment conducted and report compiled
Achieved 1x 2019/2020 Strategic risk assessment conducted
and report compiled (20/05/19)
Old None None Opex Strategic Risk Assessment report and register
78.
Ris
k m
anagem
ent
Number of operational
risk assessment report compiled
Operational risk
assessment
One 2018/1
9 Operational risk register
One 2019/20
Operational risk register compiled
None Achieved
1x 2018/19 Operational risk register
Achieved 1x 2019/20
Operational risk register compiled
New None None Opex Operational risk
register
79. Number of Fraud awareness
campaign conducted
Fraud Awareness Campaigns
Two Fraud awaren
ess campaign
Two Fraud awarene
ss campaign
None Achieved 2x Fraud
awareness campaign
Not achieved 1x Fraud
awareness conducted
Old Unavailability of Fraud facilitators
from CDM and CoGHSTA
Awareness has been
moved to 2nd quarter
Opex Attendance register
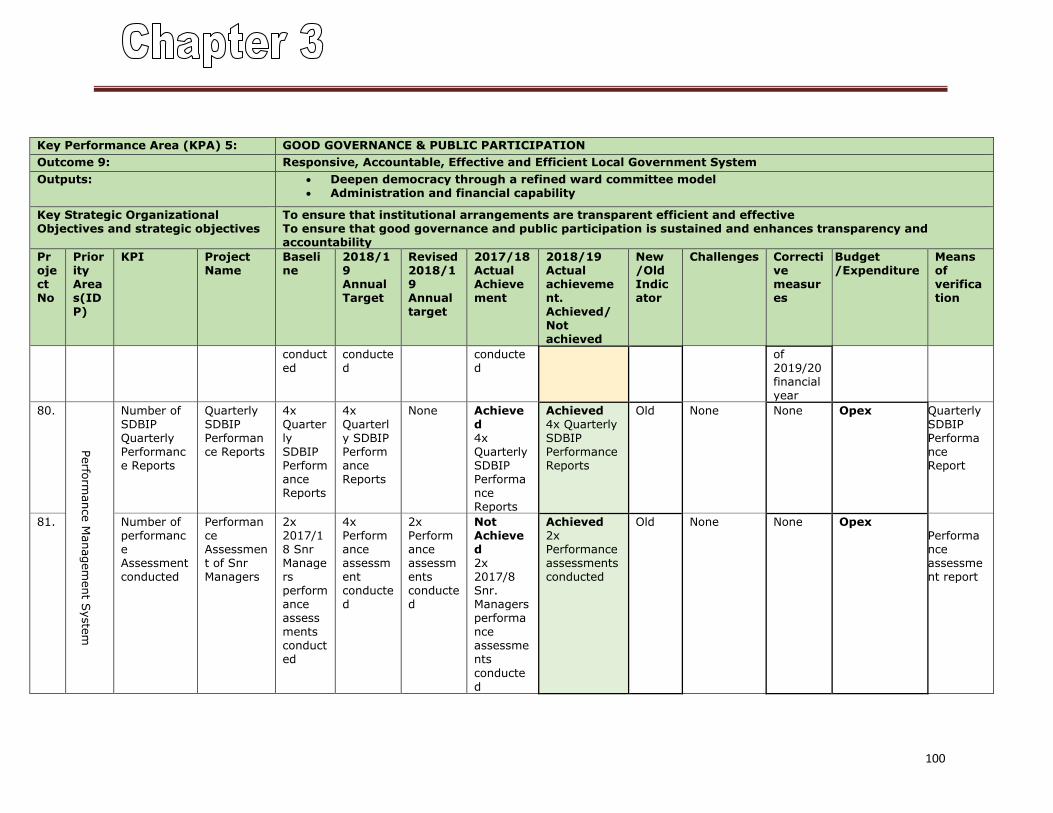
100
Key Performance Area (KPA) 5: GOOD GOVERNANCE & PUBLIC PARTICIPATION
Outcome 9: Responsive, Accountable, Effective and Efficient Local Government System
Outputs: Deepen democracy through a refined ward committee model Administration and financial capability
Key Strategic Organizational Objectives and strategic objectives
To ensure that institutional arrangements are transparent efficient and effective To ensure that good governance and public participation is sustained and enhances transparency and accountability
Project No
Priority Areas(IDP)
KPI
Project Name
Baseline
2018/19 Annual Target
Revised2018/19 Annual target
2017/18 Actual Achievement
2018/19 Actual achievement. Achieved/ Not achieved
New /Old Indicator
Challenges Corrective measures
Budget /Expenditure
Means of verification
conducted
conducted
conducted
of 2019/20 financial year
80.
Perfo
rmance M
anagem
ent S
yste
m
Number of SDBIP Quarterly Performance Reports
Quarterly SDBIP Performance Reports
4x Quarterly SDBIP Performance Reports
4x Quarterly SDBIP Performance Reports
None Achieved 4x Quarterly SDBIP Performance Reports
Achieved 4x Quarterly SDBIP Performance Reports
Old None None Opex Quarterly SDBIP Performance Report
81. Number of performance Assessment conducted
Performance Assessment of Snr Managers
2x 2017/18 Snr Managers performance assessments conducted
4x Performance assessment conducted
2x Performance assessments conducted
Not Achieved 2x 2017/8 Snr. Managers performance assessments
conducted
Achieved 2x Performance assessments conducted
Old None None Opex Performance assessment report
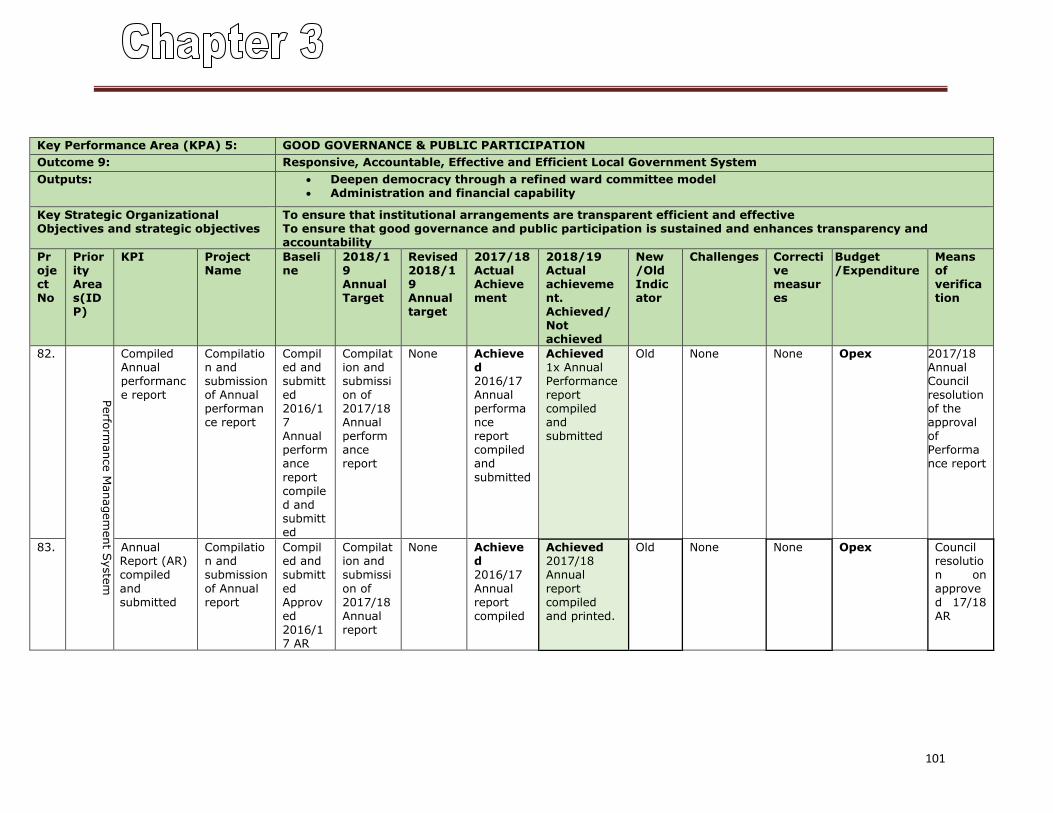
101
Key Performance Area (KPA) 5: GOOD GOVERNANCE & PUBLIC PARTICIPATION
Outcome 9: Responsive, Accountable, Effective and Efficient Local Government System
Outputs: Deepen democracy through a refined ward committee model Administration and financial capability
Key Strategic Organizational Objectives and strategic objectives
To ensure that institutional arrangements are transparent efficient and effective To ensure that good governance and public participation is sustained and enhances transparency and accountability
Project No
Priority Areas(IDP)
KPI
Project Name
Baseline
2018/19 Annual Target
Revised2018/19 Annual target
2017/18 Actual Achievement
2018/19 Actual achievement. Achieved/ Not achieved
New /Old Indicator
Challenges Corrective measures
Budget /Expenditure
Means of verification
82.
Perfo
rmance M
anagem
ent S
yste
m
Compiled Annual performance report
Compilation and submission of Annual performance report
Compiled and submitted 2016/17 Annual performance
report compiled and submitted
Compilation and submission of 2017/18 Annual performance report
None Achieved 2016/17 Annual performance report compiled and
submitted
Achieved 1x Annual Performance report compiled and submitted
Old None None Opex 2017/18 Annual Council resolution of the approval of Performance report
83. Annual Report (AR) compiled
and submitted
Compilation and submission
of Annual report
Compiled and submitt
ed Approved 2016/17 AR
Compilation and submissi
on of 2017/18 Annual report
None Achieved 2016/17
Annual report compiled
Achieved 2017/18 Annual
report compiled and printed.
Old None None Opex Council resolution on
approved 17/18 AR
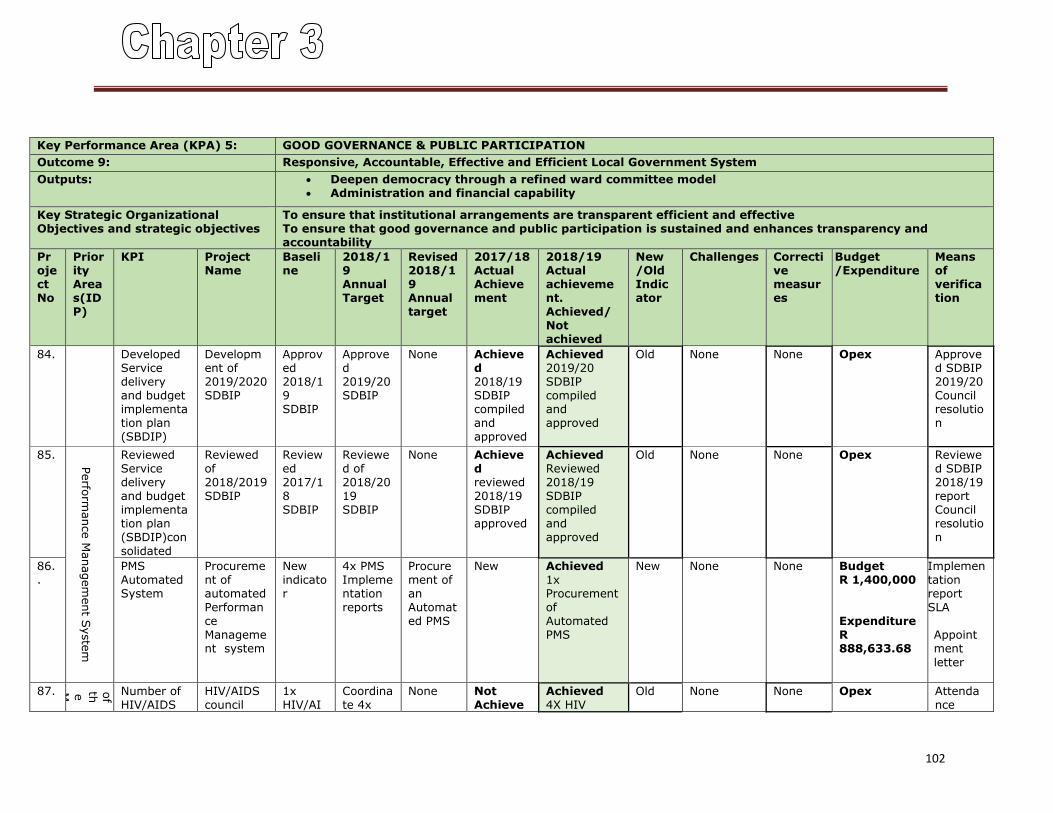
102
Key Performance Area (KPA) 5: GOOD GOVERNANCE & PUBLIC PARTICIPATION
Outcome 9: Responsive, Accountable, Effective and Efficient Local Government System
Outputs: Deepen democracy through a refined ward committee model Administration and financial capability
Key Strategic Organizational Objectives and strategic objectives
To ensure that institutional arrangements are transparent efficient and effective To ensure that good governance and public participation is sustained and enhances transparency and accountability
Project No
Priority Areas(IDP)
KPI
Project Name
Baseline
2018/19 Annual Target
Revised2018/19 Annual target
2017/18 Actual Achievement
2018/19 Actual achievement. Achieved/ Not achieved
New /Old Indicator
Challenges Corrective measures
Budget /Expenditure
Means of verification
84. Developed Service delivery and budget implementation plan (SBDIP)
Development of 2019/2020 SDBIP
Approved 2018/19 SDBIP
Approved 2019/20 SDBIP
None Achieved 2018/19 SDBIP compiled and approved
Achieved 2019/20 SDBIP compiled and approved
Old None None Opex Approved SDBIP 2019/20 Council resolution
85.
Perfo
rmance M
anagem
ent S
yste
m
Reviewed Service delivery and budget implementation plan (SBDIP)con
solidated
Reviewed of 2018/2019 SDBIP
Reviewed 2017/18 SDBIP
Reviewed of 2018/2019 SDBIP
None Achieved reviewed 2018/19 SDBIP approved
Achieved Reviewed 2018/19 SDBIP compiled and approved
Old None None Opex Reviewed SDBIP 2018/19 report Council resolution
86..
PMS Automated System
Procurement of automated Performance Management system
New indicator
4x PMS Implementation reports
Procurement of an Automated PMS
New Achieved 1x Procurement of Automated PMS
New None None Budget R 1,400,000 Expenditure R 888,633.68
Implementation report SLA Appointment
letter
87. Office
of
the
Mayor
Number of HIV/AIDS
HIV/AIDS council
1x HIV/AI
Coordinate 4x
None Not Achieve
Achieved 4X HIV
Old None None Opex Attendance
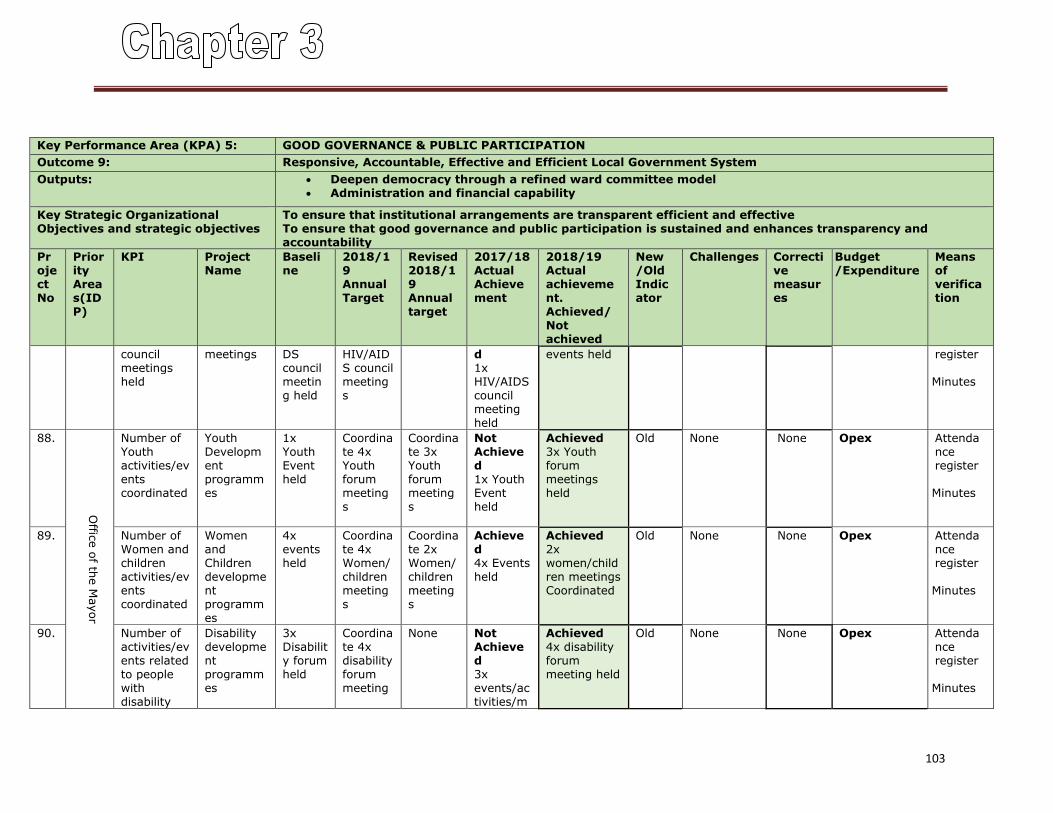
103
Key Performance Area (KPA) 5: GOOD GOVERNANCE & PUBLIC PARTICIPATION
Outcome 9: Responsive, Accountable, Effective and Efficient Local Government System
Outputs: Deepen democracy through a refined ward committee model Administration and financial capability
Key Strategic Organizational Objectives and strategic objectives
To ensure that institutional arrangements are transparent efficient and effective To ensure that good governance and public participation is sustained and enhances transparency and accountability
Project No
Priority Areas(IDP)
KPI
Project Name
Baseline
2018/19 Annual Target
Revised2018/19 Annual target
2017/18 Actual Achievement
2018/19 Actual achievement. Achieved/ Not achieved
New /Old Indicator
Challenges Corrective measures
Budget /Expenditure
Means of verification
council meetings held
meetings DS council meeting held
HIV/AIDS council meetings
d 1x HIV/AIDS council meeting held
events held register
Minutes
88.
Offic
e o
f the M
ayor
Number of Youth activities/events coordinated
Youth Development programmes
1x Youth Event held
Coordinate 4x Youth forum meetings
Coordinate 3x Youth forum meetings
Not Achieved 1x Youth Event held
Achieved 3x Youth forum meetings held
Old None None Opex Attendance register
Minutes
89. Number of Women and children activities/events coordinated
Women and Children development programmes
4x events held
Coordinate 4x Women/children meetings
Coordinate 2x Women/children meetings
Achieved 4x Events held
Achieved 2x women/children meetings Coordinated
Old None None Opex Attendance register
Minutes
90. Number of activities/events related to people with disability
Disability development programmes
3x Disability forum held
Coordinate 4x disability forum meeting
None Not Achieved 3x events/activities/m
Achieved 4x disability forum meeting held
Old None None Opex Attendance register
Minutes
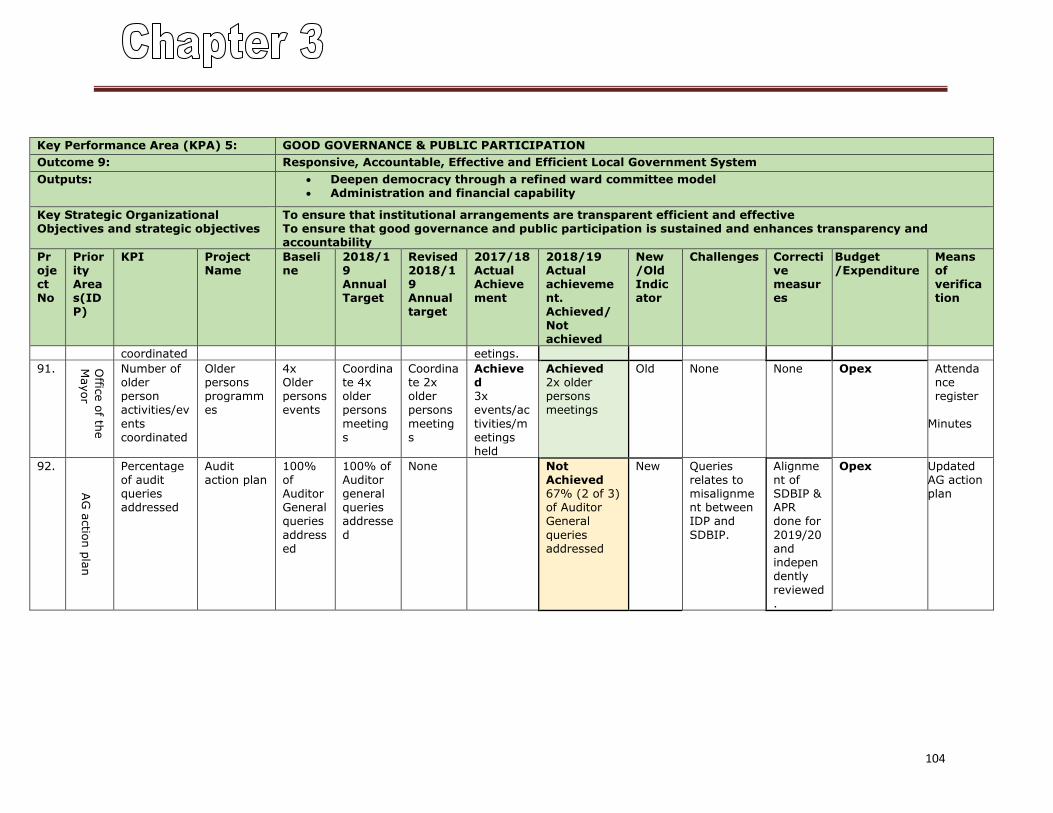
104
Key Performance Area (KPA) 5: GOOD GOVERNANCE & PUBLIC PARTICIPATION
Outcome 9: Responsive, Accountable, Effective and Efficient Local Government System
Outputs: Deepen democracy through a refined ward committee model Administration and financial capability
Key Strategic Organizational Objectives and strategic objectives
To ensure that institutional arrangements are transparent efficient and effective To ensure that good governance and public participation is sustained and enhances transparency and accountability
Project No
Priority Areas(IDP)
KPI
Project Name
Baseline
2018/19 Annual Target
Revised2018/19 Annual target
2017/18 Actual Achievement
2018/19 Actual achievement. Achieved/ Not achieved
New /Old Indicator
Challenges Corrective measures
Budget /Expenditure
Means of verification
coordinated eetings.
91. Offic
e o
f the
Mayor
Number of older person activities/ev
ents coordinated
Older persons programmes
4x Older persons events
Coordinate 4x older persons
meetings
Coordinate 2x older persons
meetings
Achieved 3x events/ac
tivities/meetings held
Achieved 2x older persons meetings
Old None None Opex Attendance register
Minutes
92.
AG
actio
n p
lan
Percentage of audit queries addressed
Audit action plan
100% of Auditor General queries
addressed
100% of Auditor general queries addresse
d
None Not Achieved 67% (2 of 3) of Auditor General
queries addressed
New Queries relates to misalignment between IDP and
SDBIP.
Alignment of SDBIP & APR done for
2019/20 and independently reviewed.
Opex Updated AG action plan
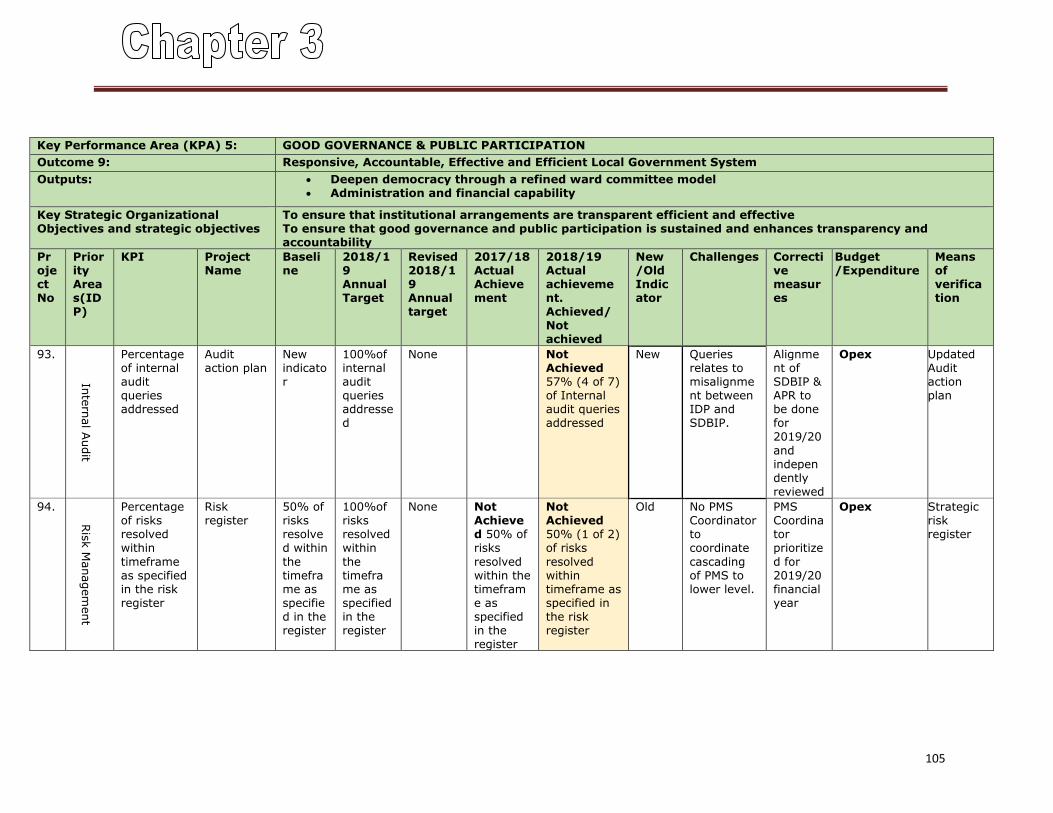
105
Key Performance Area (KPA) 5: GOOD GOVERNANCE & PUBLIC PARTICIPATION
Outcome 9: Responsive, Accountable, Effective and Efficient Local Government System
Outputs: Deepen democracy through a refined ward committee model Administration and financial capability
Key Strategic Organizational Objectives and strategic objectives
To ensure that institutional arrangements are transparent efficient and effective To ensure that good governance and public participation is sustained and enhances transparency and accountability
Project No
Priority Areas(IDP)
KPI
Project Name
Baseline
2018/19 Annual Target
Revised2018/19 Annual target
2017/18 Actual Achievement
2018/19 Actual achievement. Achieved/ Not achieved
New /Old Indicator
Challenges Corrective measures
Budget /Expenditure
Means of verification
93.
Inte
rnal A
udit
Percentage of internal audit queries addressed
Audit action plan
New indicator
100%of internal audit queries addressed
None Not Achieved 57% (4 of 7) of Internal audit queries addressed
New Queries relates to misalignment between IDP and SDBIP.
Alignment of SDBIP & APR to be done for 2019/20
and independently reviewed
Opex Updated Audit action plan
94.
Ris
k M
anagem
ent
Percentage of risks resolved within
timeframe as specified in the risk register
Risk register
50% of risks resolved within
the timeframe as specified in the register
100%of risks resolved within
the timeframe as specified in the register
None Not Achieved 50% of risks
resolved within the timeframe as specified in the register
Not Achieved 50% (1 of 2) of risks
resolved within timeframe as specified in the risk register
Old No PMS Coordinator to coordinate
cascading of PMS to lower level.
PMS Coordinator prioritize
d for 2019/20 financial year
Opex Strategic risk register
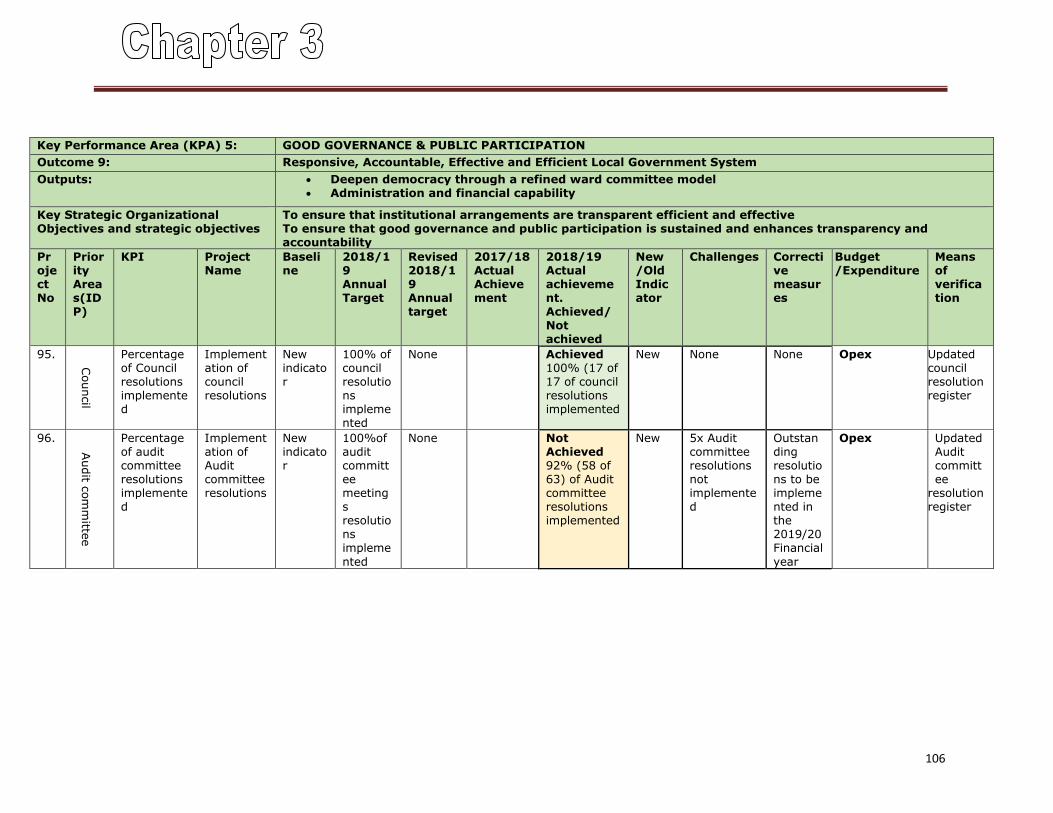
106
Key Performance Area (KPA) 5: GOOD GOVERNANCE & PUBLIC PARTICIPATION
Outcome 9: Responsive, Accountable, Effective and Efficient Local Government System
Outputs: Deepen democracy through a refined ward committee model Administration and financial capability
Key Strategic Organizational Objectives and strategic objectives
To ensure that institutional arrangements are transparent efficient and effective To ensure that good governance and public participation is sustained and enhances transparency and accountability
Project No
Priority Areas(IDP)
KPI
Project Name
Baseline
2018/19 Annual Target
Revised2018/19 Annual target
2017/18 Actual Achievement
2018/19 Actual achievement. Achieved/ Not achieved
New /Old Indicator
Challenges Corrective measures
Budget /Expenditure
Means of verification
95.
Council
Percentage of Council resolutions implemented
Implementation of council resolutions
New indicator
100% of council resolutions implemented
None Achieved 100% (17 of 17 of council resolutions implemented
New None None Opex Updated council resolution register
96.
Audit c
om
mitte
e
Percentage of audit committee resolutions implemented
Implementation of Audit committee resolutions
New indicator
100%of audit committee meetings resolutions impleme
nted
None Not Achieved 92% (58 of 63) of Audit committee resolutions implemented
New 5x Audit committee resolutions not implemented
Outstanding resolutions to be implemented in the 2019/20 Financial
year
Opex Updated Audit committee
resolution register
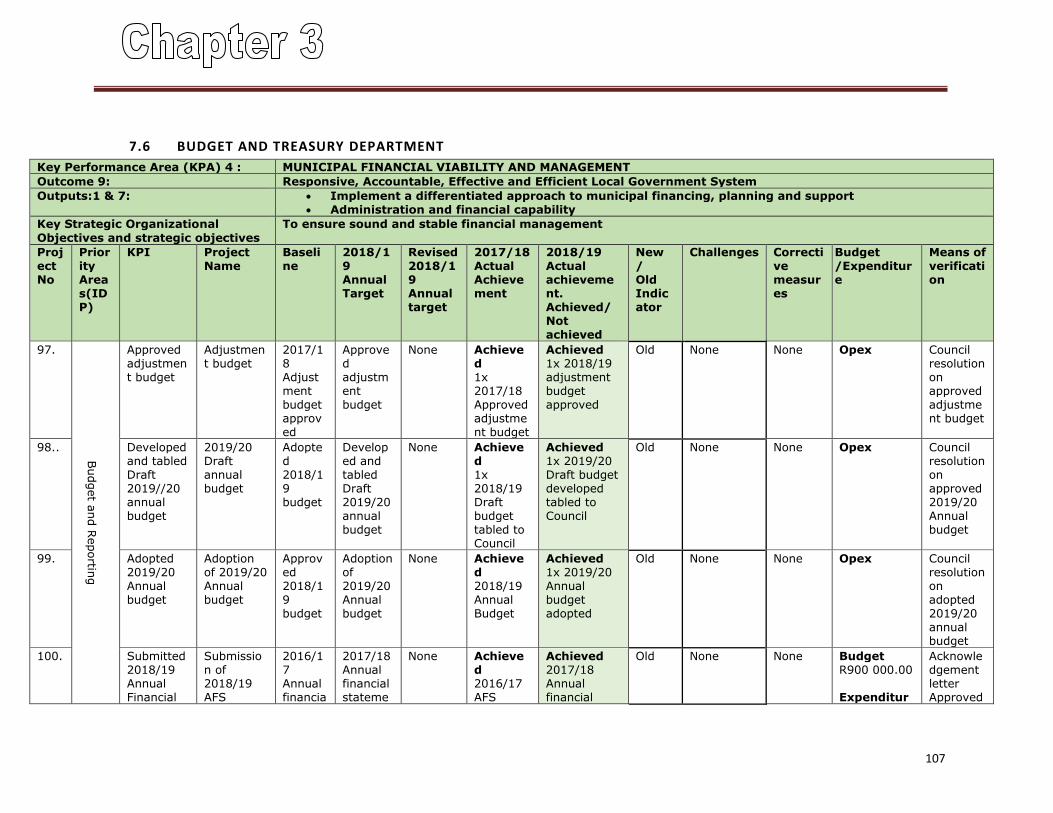
107
7.6 BUDGET AND TREASURY DEPARTMENT
Key Performance Area (KPA) 4 : MUNICIPAL FINANCIAL VIABILITY AND MANAGEMENT
Outcome 9: Responsive, Accountable, Effective and Efficient Local Government System
Outputs:1 & 7: Implement a differentiated approach to municipal financing, planning and support Administration and financial capability
Key Strategic Organizational
Objectives and strategic objectives
To ensure sound and stable financial management
Project No
Priority Areas(IDP)
KPI
Project Name
Baseline
2018/19 Annual Target
Revised 2018/19 Annual target
2017/18 Actual Achievement
2018/19 Actual achievement. Achieved/ Not achieved
New / Old Indicator
Challenges Corrective measures
Budget /Expenditure
Means of verification
97.
Budget a
nd R
eportin
g
Approved adjustment budget
Adjustment budget
2017/18 Adjustment budget approved
Approved adjustment budget
None Achieved 1x 2017/18 Approved adjustment budget
Achieved 1x 2018/19 adjustment budget approved
Old None None Opex Council resolution on approved adjustment budget
98.. Developed and tabled Draft 2019//20 annual budget
2019/20 Draft annual budget
Adopted 2018/19 budget
Developed and tabled Draft 2019/20 annual budget
None Achieved 1x 2018/19 Draft budget tabled to Council
Achieved 1x 2019/20 Draft budget developed tabled to Council
Old None None Opex Council resolution on approved 2019/20 Annual budget
99. Adopted 2019/20 Annual budget
Adoption of 2019/20 Annual budget
Approved 2018/19 budget
Adoption of 2019/20 Annual budget
None Achieved 2018/19 Annual Budget
Achieved 1x 2019/20 Annual budget adopted
Old None None Opex Council resolution on adopted 2019/20 annual budget
100. Submitted 2018/19 Annual Financial
Submission of 2018/19 AFS
2016/17 Annual financia
2017/18 Annual financial stateme
None Achieved 2016/17 AFS
Achieved 2017/18 Annual financial
Old None None Budget R900 000.00 Expenditur
Acknowledgement letter Approved
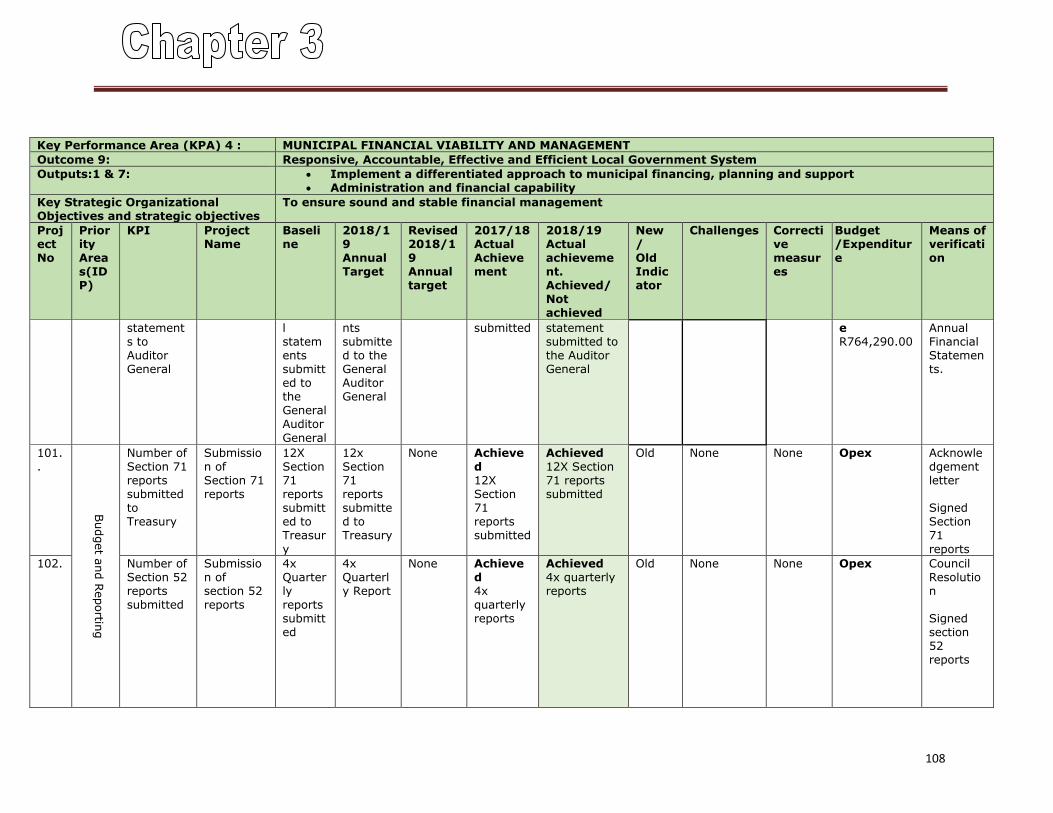
108
Key Performance Area (KPA) 4 : MUNICIPAL FINANCIAL VIABILITY AND MANAGEMENT
Outcome 9: Responsive, Accountable, Effective and Efficient Local Government System
Outputs:1 & 7: Implement a differentiated approach to municipal financing, planning and support Administration and financial capability
Key Strategic Organizational Objectives and strategic objectives
To ensure sound and stable financial management
Project No
Priority Areas(IDP)
KPI
Project Name
Baseline
2018/19 Annual Target
Revised 2018/19 Annual target
2017/18 Actual Achievement
2018/19 Actual achievement. Achieved/ Not achieved
New / Old Indicator
Challenges Corrective measures
Budget /Expenditure
Means of verification
statements to Auditor General
l statements submitted to the General Auditor
General
nts submitted to the General Auditor General
submitted statement submitted to the Auditor General
e R764,290.00
Annual Financial Statements.
101..
Budget a
nd R
eportin
g
Number of Section 71 reports submitted to Treasury
Submission of Section 71 reports
12X Section 71 reports submitted to Treasur
y
12x Section 71 reports submitted to Treasury
None Achieved 12X Section 71 reports submitted
Achieved 12X Section 71 reports submitted
Old None None Opex Acknowledgement letter Signed Section 71
reports
102. Number of Section 52 reports submitted
Submission of section 52 reports
4x Quarterly reports submitted
4x Quarterly Report
None Achieved 4x quarterly reports
Achieved 4x quarterly reports
Old None None Opex Council Resolution Signed section 52 reports
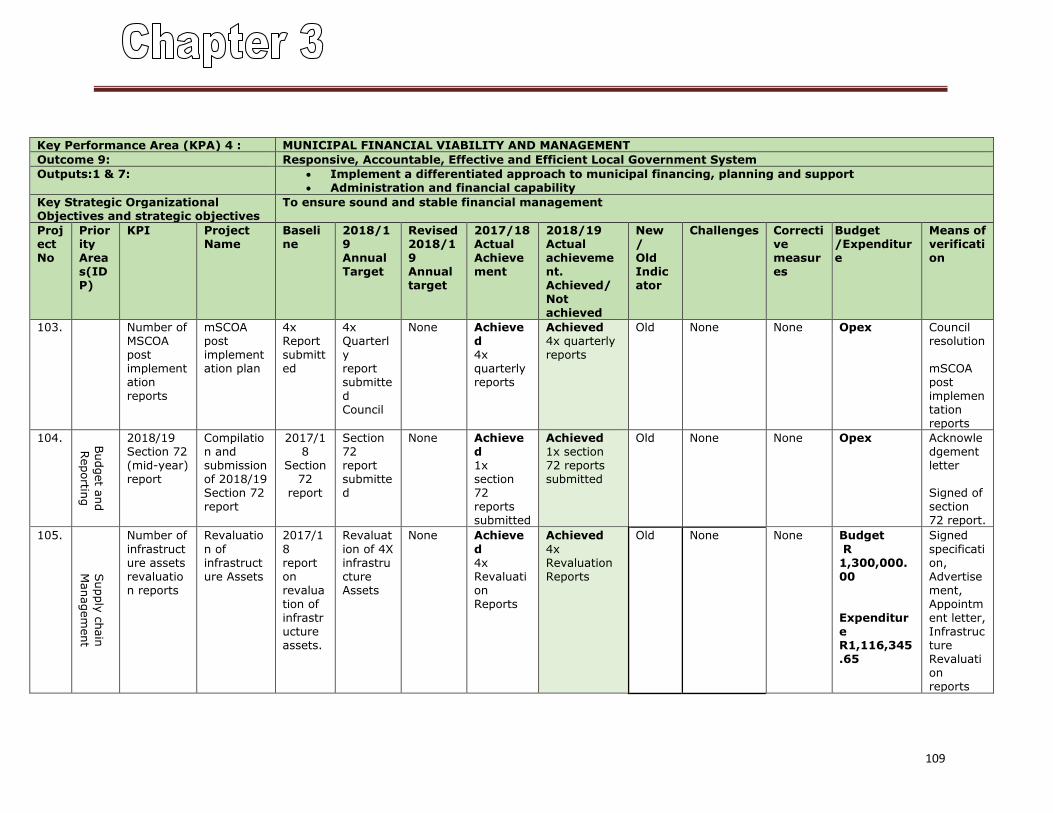
109
Key Performance Area (KPA) 4 : MUNICIPAL FINANCIAL VIABILITY AND MANAGEMENT
Outcome 9: Responsive, Accountable, Effective and Efficient Local Government System
Outputs:1 & 7: Implement a differentiated approach to municipal financing, planning and support Administration and financial capability
Key Strategic Organizational Objectives and strategic objectives
To ensure sound and stable financial management
Project No
Priority Areas(IDP)
KPI
Project Name
Baseline
2018/19 Annual Target
Revised 2018/19 Annual target
2017/18 Actual Achievement
2018/19 Actual achievement. Achieved/ Not achieved
New / Old Indicator
Challenges Corrective measures
Budget /Expenditure
Means of verification
103. Number of MSCOA post implementation reports
mSCOA post implementation plan
4x Report submitted
4x Quarterly report submitted Council
None Achieved 4x quarterly reports
Achieved 4x quarterly reports
Old None None Opex Council resolution mSCOA post implementation reports
104. Budget a
nd
Reportin
g
2018/19 Section 72 (mid-year) report
Compilation and submission of 2018/19 Section 72 report
2017/18
Section 72
report
Section 72 report submitted
None Achieved 1x section 72 reports submitted
Achieved 1x section 72 reports submitted
Old None None Opex Acknowledgement letter Signed of section 72 report.
105.
Supply
chain
Managem
ent
Number of
infrastructure assets revaluation reports
Revaluatio
n of infrastructure Assets
2017/1
8 report on revaluation of infrastructure assets.
Revaluat
ion of 4X infrastructure Assets
None Achieve
d 4x Revaluation Reports
Achieved
4x Revaluation Reports
Old None None Budget
R 1,300,000.00 Expenditure R1,116,345.65
Signed
specification, Advertisement, Appointment letter, Infrastructure Revaluation reports
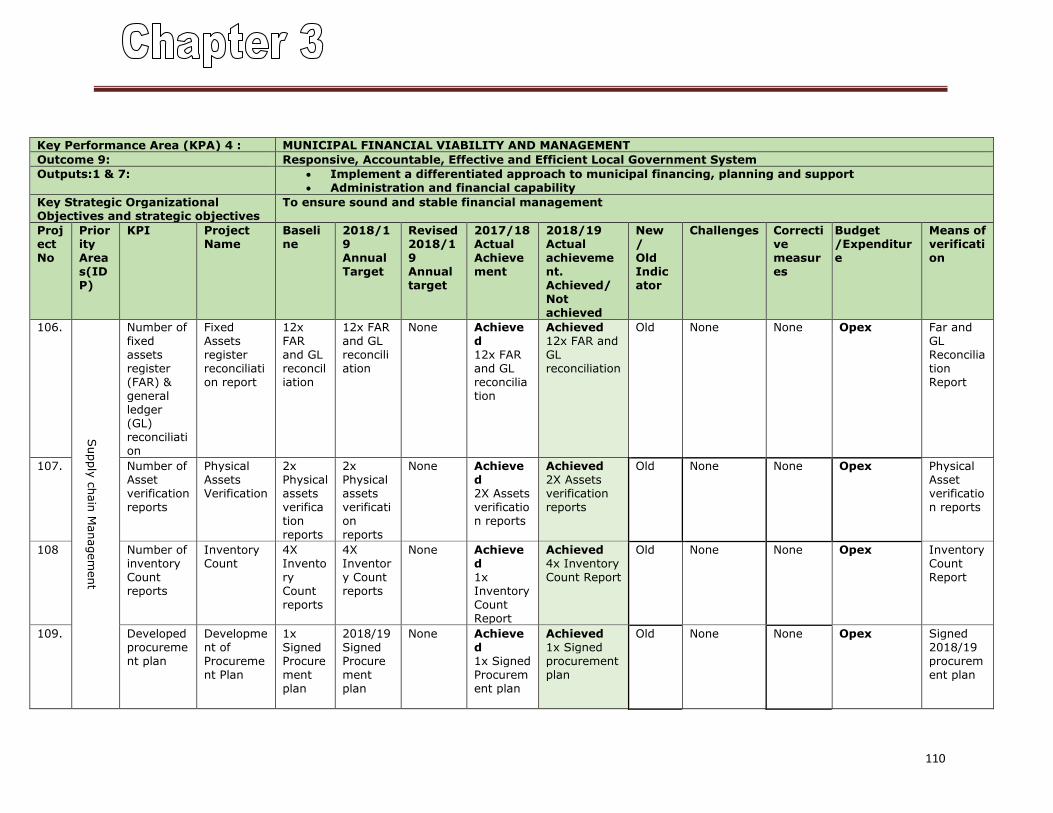
110
Key Performance Area (KPA) 4 : MUNICIPAL FINANCIAL VIABILITY AND MANAGEMENT
Outcome 9: Responsive, Accountable, Effective and Efficient Local Government System
Outputs:1 & 7: Implement a differentiated approach to municipal financing, planning and support Administration and financial capability
Key Strategic Organizational Objectives and strategic objectives
To ensure sound and stable financial management
Project No
Priority Areas(IDP)
KPI
Project Name
Baseline
2018/19 Annual Target
Revised 2018/19 Annual target
2017/18 Actual Achievement
2018/19 Actual achievement. Achieved/ Not achieved
New / Old Indicator
Challenges Corrective measures
Budget /Expenditure
Means of verification
106.
Supply
chain
Managem
ent
Number of fixed assets register (FAR) & general ledger (GL) reconciliation
Fixed Assets register reconciliation report
12x FAR and GL reconciliation
12x FAR and GL reconciliation
None Achieved 12x FAR and GL reconciliation
Achieved 12x FAR and GL reconciliation
Old None None Opex Far and GL Reconciliation Report
107. Number of Asset verification reports
Physical Assets Verification
2x Physical assets verification reports
2x Physical assets verification reports
None Achieved 2X Assets verification reports
Achieved 2X Assets verification reports
Old None None Opex Physical Asset verification reports
108 Number of inventory Count reports
Inventory Count
4X Inventory Count reports
4X Inventory Count reports
None Achieved 1x Inventory Count Report
Achieved 4x Inventory Count Report
Old None None Opex Inventory Count Report
109. Developed procurement plan
Development of Procurement Plan
1x Signed Procurement plan
2018/19 Signed Procurement plan
None Achieved 1x Signed Procurement plan
Achieved 1x Signed procurement plan
Old None None Opex Signed 2018/19 procurement plan
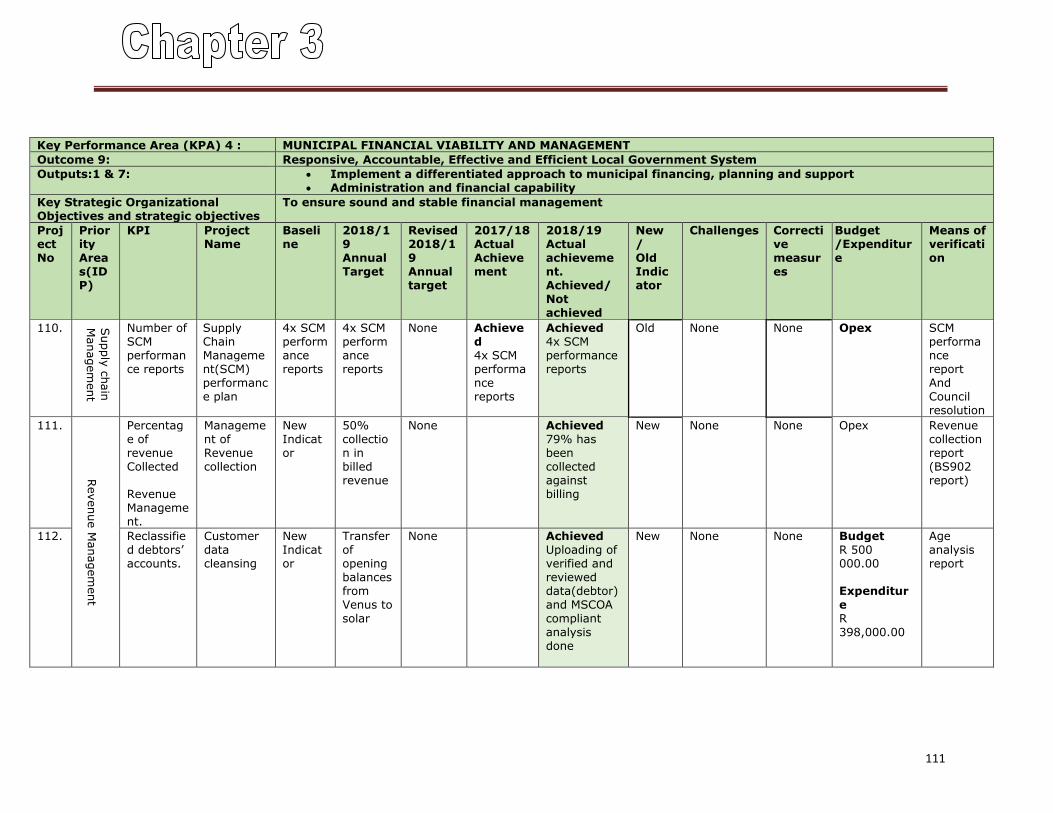
111
Key Performance Area (KPA) 4 : MUNICIPAL FINANCIAL VIABILITY AND MANAGEMENT
Outcome 9: Responsive, Accountable, Effective and Efficient Local Government System
Outputs:1 & 7: Implement a differentiated approach to municipal financing, planning and support Administration and financial capability
Key Strategic Organizational Objectives and strategic objectives
To ensure sound and stable financial management
Project No
Priority Areas(IDP)
KPI
Project Name
Baseline
2018/19 Annual Target
Revised 2018/19 Annual target
2017/18 Actual Achievement
2018/19 Actual achievement. Achieved/ Not achieved
New / Old Indicator
Challenges Corrective measures
Budget /Expenditure
Means of verification
110. Supply
chain
Managem
ent
Number of SCM performance reports
Supply Chain Management(SCM) performance plan
4x SCM performance reports
4x SCM performance reports
None Achieved 4x SCM performance reports
Achieved 4x SCM performance reports
Old None None Opex SCM performance report And Council resolution
111.
Revenue M
anagem
ent
Percentage of revenue Collected Revenue Management.
Management of Revenue collection
New Indicator
50% collection in billed revenue
None Achieved 79% has been collected against billing
New None None Opex Revenue collection report (BS902 report)
112. Reclassified debtors’ accounts.
Customer data cleansing
New Indicator
Transfer of opening balances from Venus to solar
None Achieved Uploading of verified and reviewed data(debtor) and MSCOA compliant analysis done
New None None Budget R 500 000.00 Expenditure R 398,000.00
Age analysis report
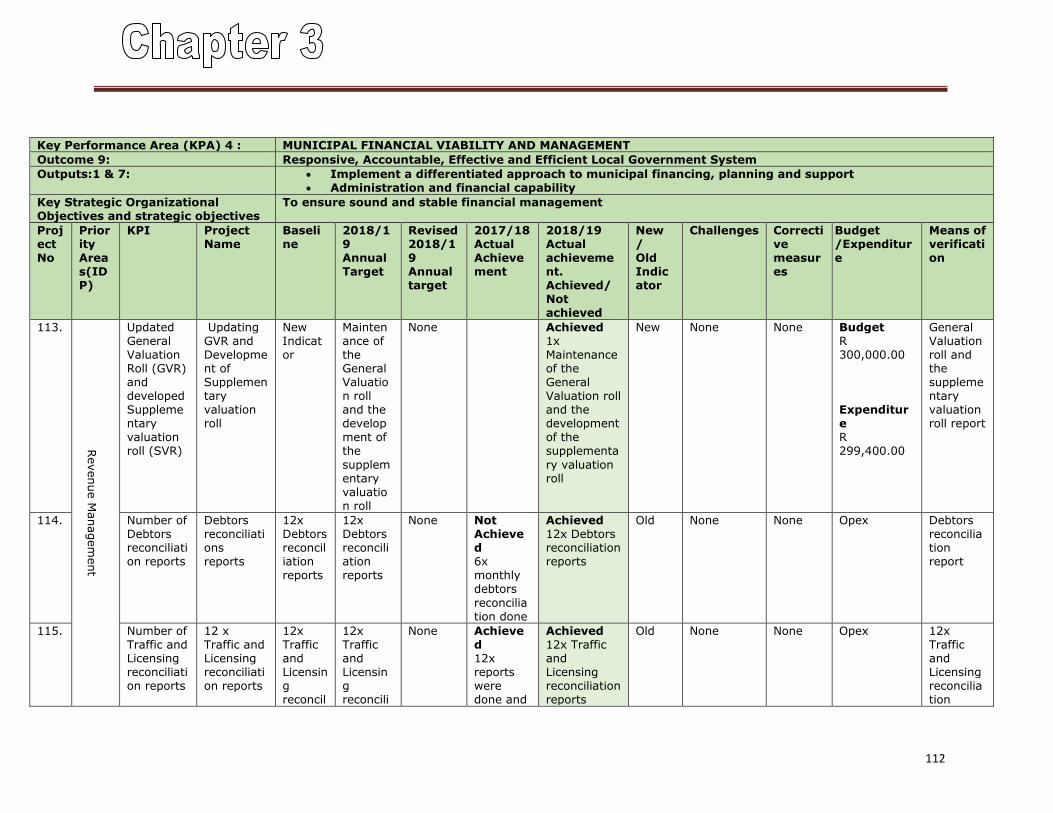
112
Key Performance Area (KPA) 4 : MUNICIPAL FINANCIAL VIABILITY AND MANAGEMENT
Outcome 9: Responsive, Accountable, Effective and Efficient Local Government System
Outputs:1 & 7: Implement a differentiated approach to municipal financing, planning and support Administration and financial capability
Key Strategic Organizational Objectives and strategic objectives
To ensure sound and stable financial management
Project No
Priority Areas(IDP)
KPI
Project Name
Baseline
2018/19 Annual Target
Revised 2018/19 Annual target
2017/18 Actual Achievement
2018/19 Actual achievement. Achieved/ Not achieved
New / Old Indicator
Challenges Corrective measures
Budget /Expenditure
Means of verification
113.
Revenue M
anagem
ent
Updated General Valuation Roll (GVR) and developed Supplementary valuation roll (SVR)
Updating GVR and Development of Supplementary valuation roll
New Indicator
Maintenance of the General Valuation roll and the development of the
supplementary valuation roll
None
Achieved 1x Maintenance of the General Valuation roll and the development of the supplementa
ry valuation roll
New None None Budget R 300,000.00 Expenditure R 299,400.00
General Valuation roll and the supplementary valuation roll report
114. Number of Debtors reconciliation reports
Debtors reconciliations reports
12x Debtors reconciliation reports
12x Debtors reconciliation reports
None Not Achieved 6x monthly debtors
reconciliation done
Achieved 12x Debtors reconciliation reports
Old None None Opex Debtors reconciliation report
115. Number of Traffic and Licensing reconciliation reports
12 x Traffic and Licensing reconciliation reports
12x Traffic and Licensing reconcil
12x Traffic and Licensing reconcili
None Achieved 12x reports were done and
Achieved 12x Traffic and Licensing reconciliation reports
Old None None Opex 12x Traffic and Licensing reconciliation
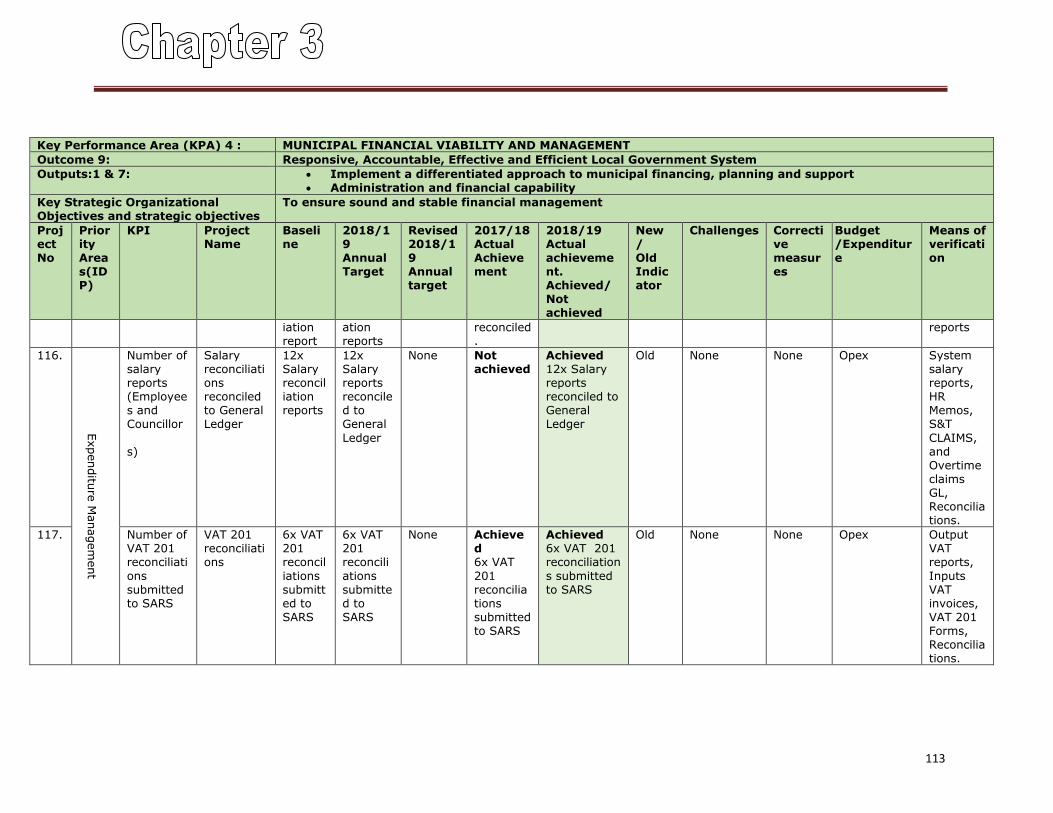
113
Key Performance Area (KPA) 4 : MUNICIPAL FINANCIAL VIABILITY AND MANAGEMENT
Outcome 9: Responsive, Accountable, Effective and Efficient Local Government System
Outputs:1 & 7: Implement a differentiated approach to municipal financing, planning and support Administration and financial capability
Key Strategic Organizational Objectives and strategic objectives
To ensure sound and stable financial management
Project No
Priority Areas(IDP)
KPI
Project Name
Baseline
2018/19 Annual Target
Revised 2018/19 Annual target
2017/18 Actual Achievement
2018/19 Actual achievement. Achieved/ Not achieved
New / Old Indicator
Challenges Corrective measures
Budget /Expenditure
Means of verification
iation report
ation reports
reconciled.
reports
116.
Expenditu
re M
anagem
ent
Number of salary reports (Employees and Councillor
s)
Salary reconciliations reconciled to General Ledger
12x Salary reconciliation reports
12x Salary reports reconciled to General
Ledger
None Not achieved
Achieved 12x Salary reports reconciled to General Ledger
Old None None Opex System salary reports, HR Memos, S&T
CLAIMS, and Overtime claims GL, Reconciliations.
117. Number of VAT 201 reconciliati
ons submitted to SARS
VAT 201 reconciliations
6x VAT 201 reconcil
iations submitted to SARS
6x VAT 201 reconcili
ations submitted to SARS
None Achieved 6x VAT
201 reconciliations submitted to SARS
Achieved 6x VAT 201 reconciliation
s submitted to SARS
Old None None Opex Output VAT reports,
Inputs VAT invoices, VAT 201 Forms, Reconciliations.
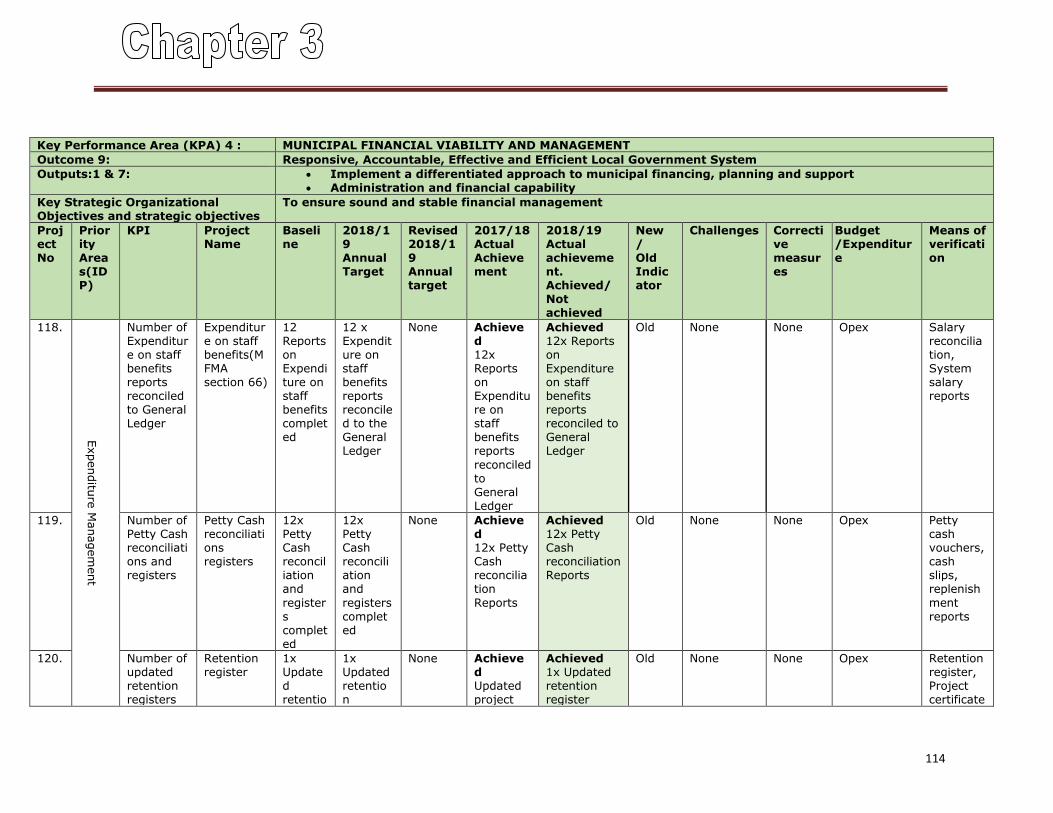
114
Key Performance Area (KPA) 4 : MUNICIPAL FINANCIAL VIABILITY AND MANAGEMENT
Outcome 9: Responsive, Accountable, Effective and Efficient Local Government System
Outputs:1 & 7: Implement a differentiated approach to municipal financing, planning and support Administration and financial capability
Key Strategic Organizational Objectives and strategic objectives
To ensure sound and stable financial management
Project No
Priority Areas(IDP)
KPI
Project Name
Baseline
2018/19 Annual Target
Revised 2018/19 Annual target
2017/18 Actual Achievement
2018/19 Actual achievement. Achieved/ Not achieved
New / Old Indicator
Challenges Corrective measures
Budget /Expenditure
Means of verification
118.
Expenditu
re M
anagem
ent
Number of Expenditure on staff benefits reports reconciled to General Ledger
Expenditure on staff benefits(MFMA section 66)
12 Reports on Expenditure on staff benefits completed
12 x Expenditure on staff benefits reports reconciled to the General Ledger
None Achieved 12x Reports on Expenditure on staff benefits reports
reconciled to General Ledger
Achieved 12x Reports on Expenditure on staff benefits reports reconciled to General Ledger
Old None None Opex Salary reconciliation, System salary reports
119. Number of Petty Cash reconciliations and registers
Petty Cash reconciliations registers
12x Petty Cash reconciliation and
registers completed
12x Petty Cash reconciliation and
registers completed
None Achieved 12x Petty Cash reconciliation
Reports
Achieved 12x Petty Cash reconciliation Reports
Old None None Opex Petty cash vouchers, cash slips, replenish
ment reports
120. Number of updated retention registers
Retention register
1x Updated retentio
1x Updated retention
None Achieved Updated project
Achieved 1x Updated retention register
Old None None Opex Retention register, Project certificate
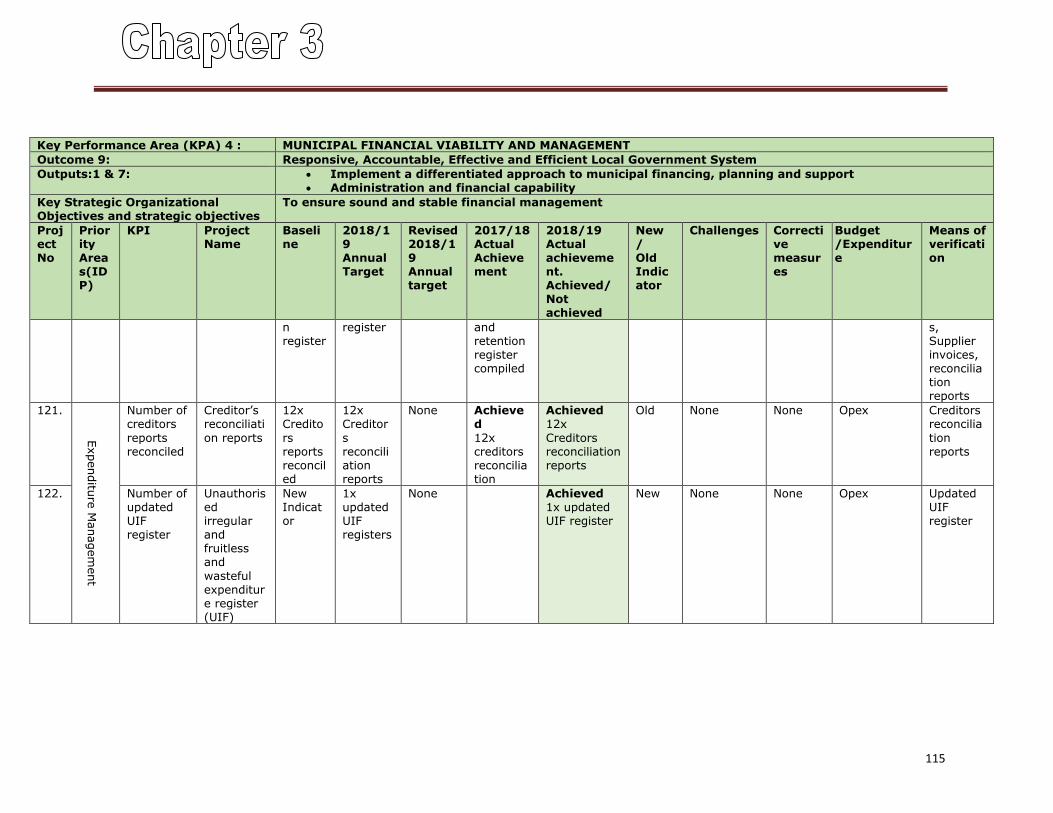
115
Key Performance Area (KPA) 4 : MUNICIPAL FINANCIAL VIABILITY AND MANAGEMENT
Outcome 9: Responsive, Accountable, Effective and Efficient Local Government System
Outputs:1 & 7: Implement a differentiated approach to municipal financing, planning and support Administration and financial capability
Key Strategic Organizational Objectives and strategic objectives
To ensure sound and stable financial management
Project No
Priority Areas(IDP)
KPI
Project Name
Baseline
2018/19 Annual Target
Revised 2018/19 Annual target
2017/18 Actual Achievement
2018/19 Actual achievement. Achieved/ Not achieved
New / Old Indicator
Challenges Corrective measures
Budget /Expenditure
Means of verification
n register
register and retention register compiled
s, Supplier invoices, reconciliation reports
121.
Expenditu
re M
anagem
ent
Number of creditors
reports reconciled
Creditor’s reconciliati
on reports
12x Credito
rs reports reconciled
12x Creditor
s reconciliation reports
None Achieved
12x creditors reconciliation
Achieved 12x
Creditors reconciliation reports
Old None None Opex Creditors reconcilia
tion reports
122. Number of updated UIF register
Unauthorised irregular and fruitless and
wasteful expenditure register (UIF)
New Indicator
1x updated UIF registers
None Achieved 1x updated UIF register
New None None Opex Updated UIF register
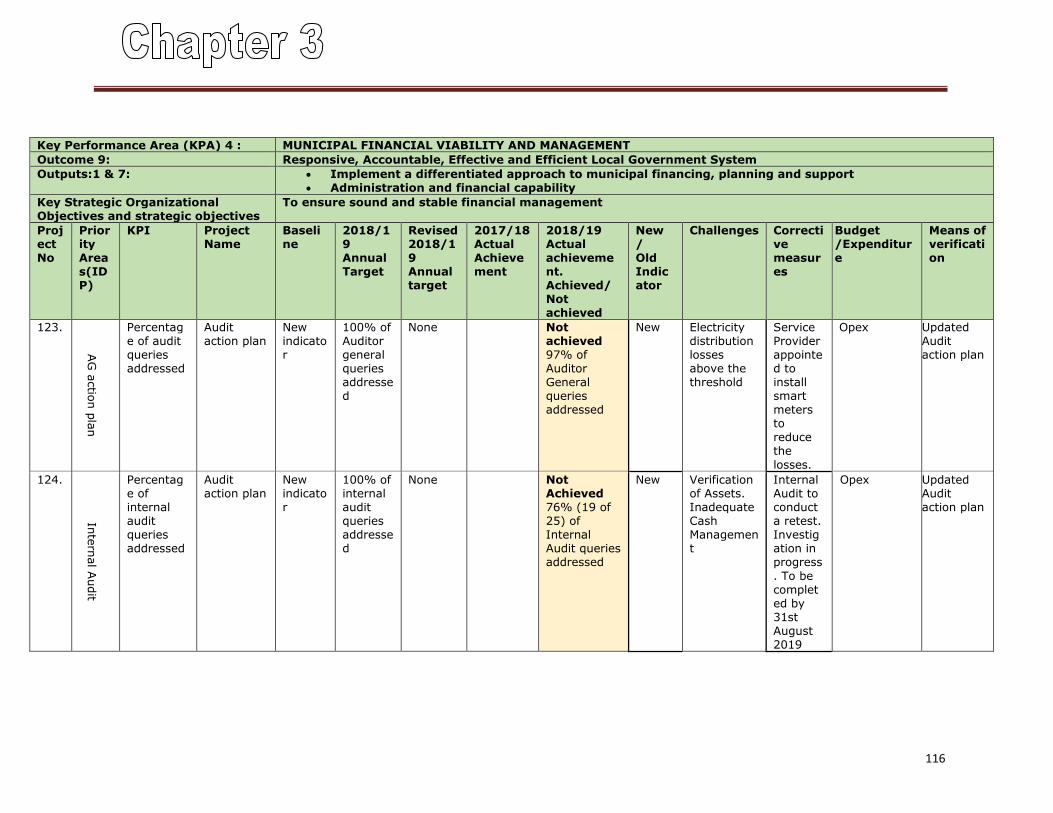
116
Key Performance Area (KPA) 4 : MUNICIPAL FINANCIAL VIABILITY AND MANAGEMENT
Outcome 9: Responsive, Accountable, Effective and Efficient Local Government System
Outputs:1 & 7: Implement a differentiated approach to municipal financing, planning and support Administration and financial capability
Key Strategic Organizational Objectives and strategic objectives
To ensure sound and stable financial management
Project No
Priority Areas(IDP)
KPI
Project Name
Baseline
2018/19 Annual Target
Revised 2018/19 Annual target
2017/18 Actual Achievement
2018/19 Actual achievement. Achieved/ Not achieved
New / Old Indicator
Challenges Corrective measures
Budget /Expenditure
Means of verification
123.
AG
actio
n p
lan
Percentage of audit queries addressed
Audit action plan
New indicator
100% of Auditor general queries addressed
None Not achieved 97% of Auditor General queries addressed
New Electricity distribution losses above the threshold
Service Provider appointed to install smart meters to reduce the
losses.
Opex Updated Audit action plan
124.
Inte
rnal A
udit
Percentage of internal audit queries addressed
Audit action plan
New indicator
100% of internal audit queries addressed
None Not Achieved 76% (19 of 25) of Internal Audit queries addressed
New Verification of Assets. Inadequate Cash Management
Internal Audit to conduct a retest. Investigation in progress
. To be completed by 31st August 2019
Opex Updated Audit action plan
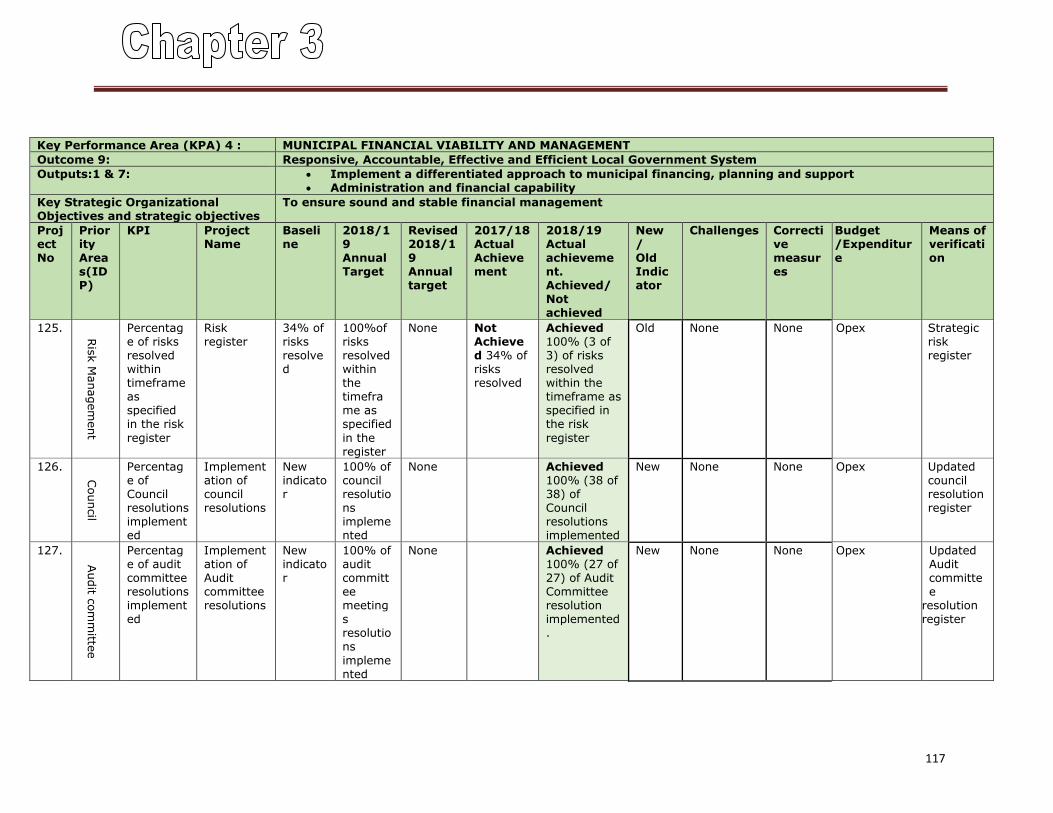
117
Key Performance Area (KPA) 4 : MUNICIPAL FINANCIAL VIABILITY AND MANAGEMENT
Outcome 9: Responsive, Accountable, Effective and Efficient Local Government System
Outputs:1 & 7: Implement a differentiated approach to municipal financing, planning and support Administration and financial capability
Key Strategic Organizational Objectives and strategic objectives
To ensure sound and stable financial management
Project No
Priority Areas(IDP)
KPI
Project Name
Baseline
2018/19 Annual Target
Revised 2018/19 Annual target
2017/18 Actual Achievement
2018/19 Actual achievement. Achieved/ Not achieved
New / Old Indicator
Challenges Corrective measures
Budget /Expenditure
Means of verification
125.
Ris
k M
anagem
ent
Percentage of risks resolved within timeframe as specified in the risk
register
Risk register
34% of risks resolved
100%of risks resolved within the timeframe as specified
in the register
None Not Achieved 34% of risks resolved
Achieved 100% (3 of 3) of risks resolved within the timeframe as specified in the risk
register
Old None None Opex Strategic risk register
126.
Council
Percentage of Council resolutions implemented
Implementation of council resolutions
New indicator
100% of council resolutions implemented
None Achieved 100% (38 of 38) of Council resolutions implemented
New None None Opex Updated council resolution register
127.
Audit c
om
mitte
e
Percentage of audit committee resolutions implemented
Implementation of Audit committee resolutions
New indicator
100% of audit committee meetings resolutions
implemented
None Achieved 100% (27 of 27) of Audit Committee resolution implemented.
New None None Opex Updated Audit committee
resolution register
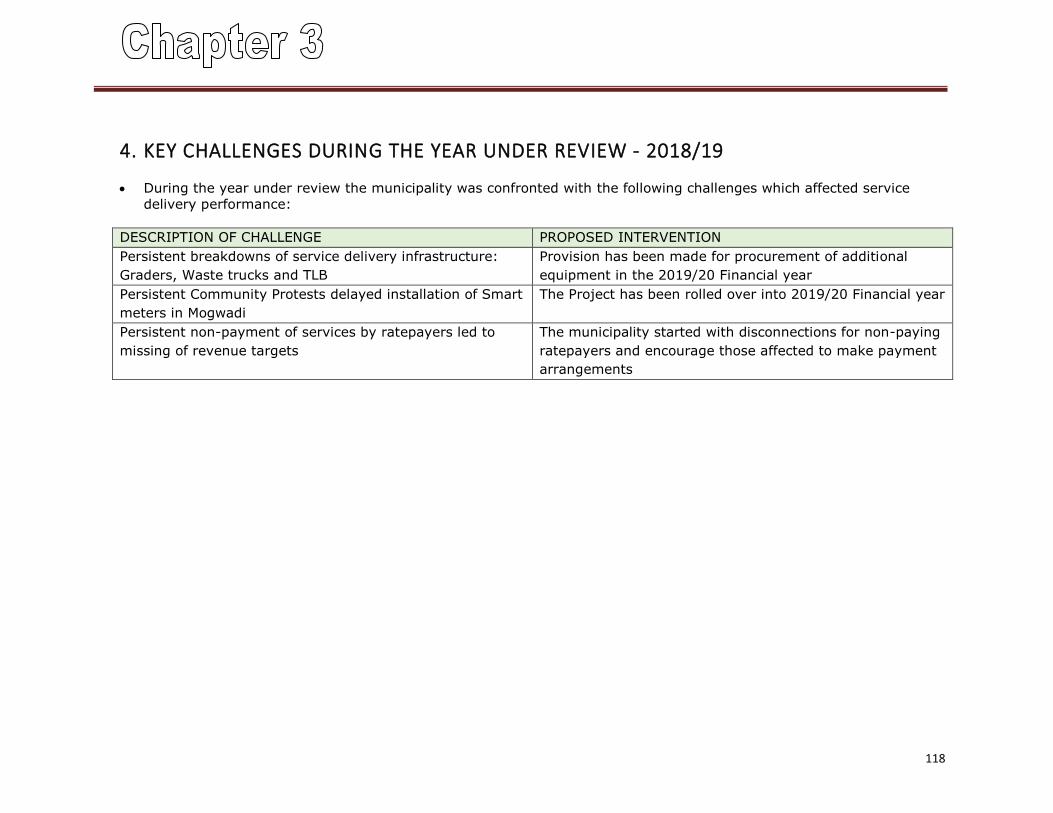
118
4. KEY CHALLENGES DURING THE YEAR UNDER REVIEW - 2018/19
During the year under review the municipality was confronted with the following challenges which affected service
delivery performance:
DESCRIPTION OF CHALLENGE PROPOSED INTERVENTION
Persistent breakdowns of service delivery infrastructure:
Graders, Waste trucks and TLB
Provision has been made for procurement of additional
equipment in the 2019/20 Financial year
Persistent Community Protests delayed installation of Smart
meters in Mogwadi
The Project has been rolled over into 2019/20 Financial year
Persistent non-payment of services by ratepayers led to
missing of revenue targets
The municipality started with disconnections for non-paying
ratepayers and encourage those affected to make payment
arrangements
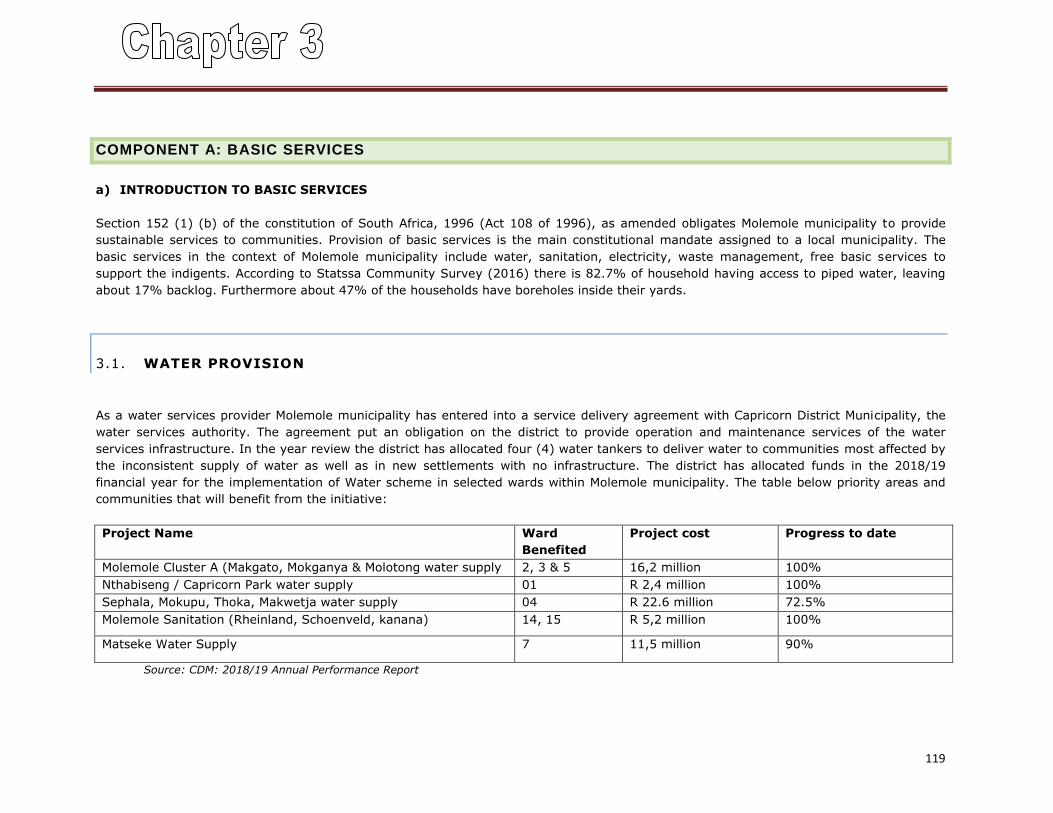
119
COMPONENT A: BASIC SERVICES
a) INTRODUCTION TO BASIC SERVICES
Section 152 (1) (b) of the constitution of South Africa, 1996 (Act 108 of 1996), as amended obligates Molemole municipality to provide
sustainable services to communities. Provision of basic services is the main constitutional mandate assigned to a local municipality. The
basic services in the context of Molemole municipality include water, sanitation, electricity, waste management, free basic services to
support the indigents. According to Statssa Community Survey (2016) there is 82.7% of household having access to piped water, leaving
about 17% backlog. Furthermore about 47% of the households have boreholes inside their yards.
3.1. WATER PROVISION
As a water services provider Molemole municipality has entered into a service delivery agreement with Capricorn District Municipality, the
water services authority. The agreement put an obligation on the district to provide operation and maintenance services of the water
services infrastructure. In the year review the district has allocated four (4) water tankers to deliver water to communities most affected by
the inconsistent supply of water as well as in new settlements with no infrastructure. The district has allocated funds in the 2018/19
financial year for the implementation of Water scheme in selected wards within Molemole municipality. The table below priority areas and
communities that will benefit from the initiative:
Project Name Ward
Benefited
Project cost Progress to date
Molemole Cluster A (Makgato, Mokganya & Molotong water supply 2, 3 & 5 16,2 million 100%
Nthabiseng / Capricorn Park water supply 01 R 2,4 million 100%
Sephala, Mokupu, Thoka, Makwetja water supply 04 R 22.6 million 72.5%
Molemole Sanitation (Rheinland, Schoenveld, kanana) 14, 15 R 5,2 million 100%
Matseke Water Supply 7 11,5 million 90%
Source: CDM: 2018/19 Annual Performance Report
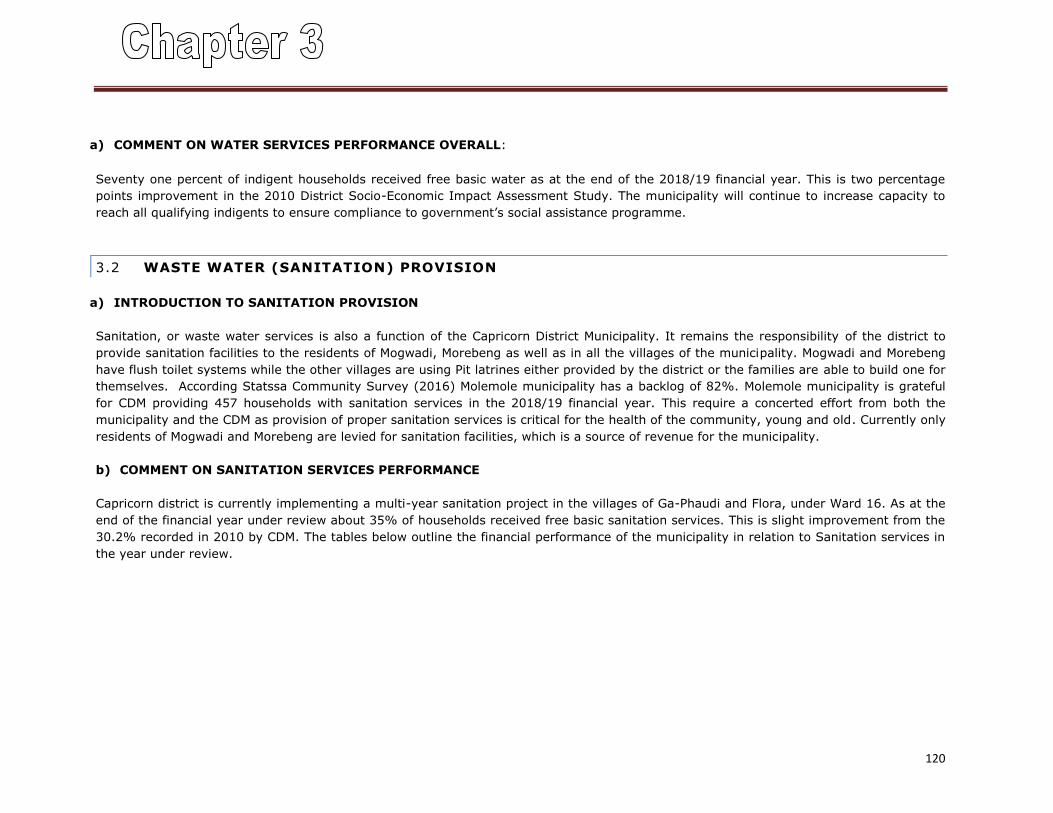
120
a) COMMENT ON WATER SERVICES PERFORMANCE OVERALL:
Seventy one percent of indigent households received free basic water as at the end of the 2018/19 financial year. This is two percentage
points improvement in the 2010 District Socio-Economic Impact Assessment Study. The municipality will continue to increase capacity to
reach all qualifying indigents to ensure compliance to government’s social assistance programme.
3.2 WASTE WATER (SANITATION) PROVISION
a) INTRODUCTION TO SANITATION PROVISION
Sanitation, or waste water services is also a function of the Capricorn District Municipality. It remains the responsibility of the district to
provide sanitation facilities to the residents of Mogwadi, Morebeng as well as in all the villages of the municipality. Mogwadi and Morebeng
have flush toilet systems while the other villages are using Pit latrines either provided by the district or the families are able to build one for
themselves. According Statssa Community Survey (2016) Molemole municipality has a backlog of 82%. Molemole municipality is grateful
for CDM providing 457 households with sanitation services in the 2018/19 financial year. This require a concerted effort from both the
municipality and the CDM as provision of proper sanitation services is critical for the health of the community, young and old. Currently only
residents of Mogwadi and Morebeng are levied for sanitation facilities, which is a source of revenue for the municipality.
b) COMMENT ON SANITATION SERVICES PERFORMANCE
Capricorn district is currently implementing a multi-year sanitation project in the villages of Ga-Phaudi and Flora, under Ward 16. As at the
end of the financial year under review about 35% of households received free basic sanitation services. This is slight improvement from the
30.2% recorded in 2010 by CDM. The tables below outline the financial performance of the municipality in relation to Sanitation services in
the year under review.
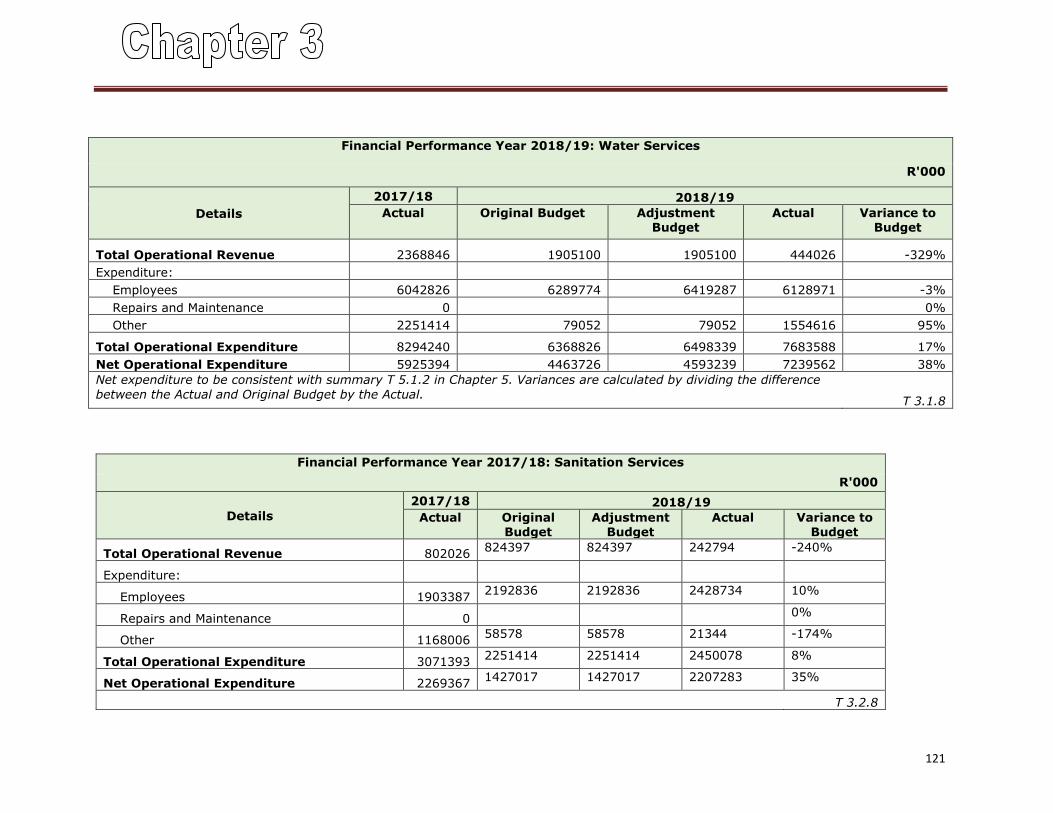
121
Financial Performance Year 2018/19: Water Services
R'000
Details
2017/18 2018/19
Actual Original Budget Adjustment Budget
Actual Variance to Budget
Total Operational Revenue 2368846 1905100 1905100 444026 -329%
Expenditure:
Employees 6042826 6289774 6419287 6128971 -3%
Repairs and Maintenance 0 0%
Other 2251414 79052 79052 1554616 95%
Total Operational Expenditure 8294240 6368826 6498339 7683588 17%
Net Operational Expenditure 5925394 4463726 4593239 7239562 38%
Net expenditure to be consistent with summary T 5.1.2 in Chapter 5. Variances are calculated by dividing the difference
between the Actual and Original Budget by the Actual. T 3.1.8
Financial Performance Year 2017/18: Sanitation Services
R'000
Details
2017/18 2018/19
Actual Original Budget
Adjustment Budget
Actual Variance to Budget
Total Operational Revenue 802026 824397 824397 242794 -240%
Expenditure:
Employees 1903387 2192836 2192836 2428734 10%
Repairs and Maintenance 0 0%
Other 1168006 58578 58578 21344 -174%
Total Operational Expenditure 3071393 2251414 2251414 2450078 8%
Net Operational Expenditure 2269367 1427017 1427017 2207283 35%
T 3.2.8
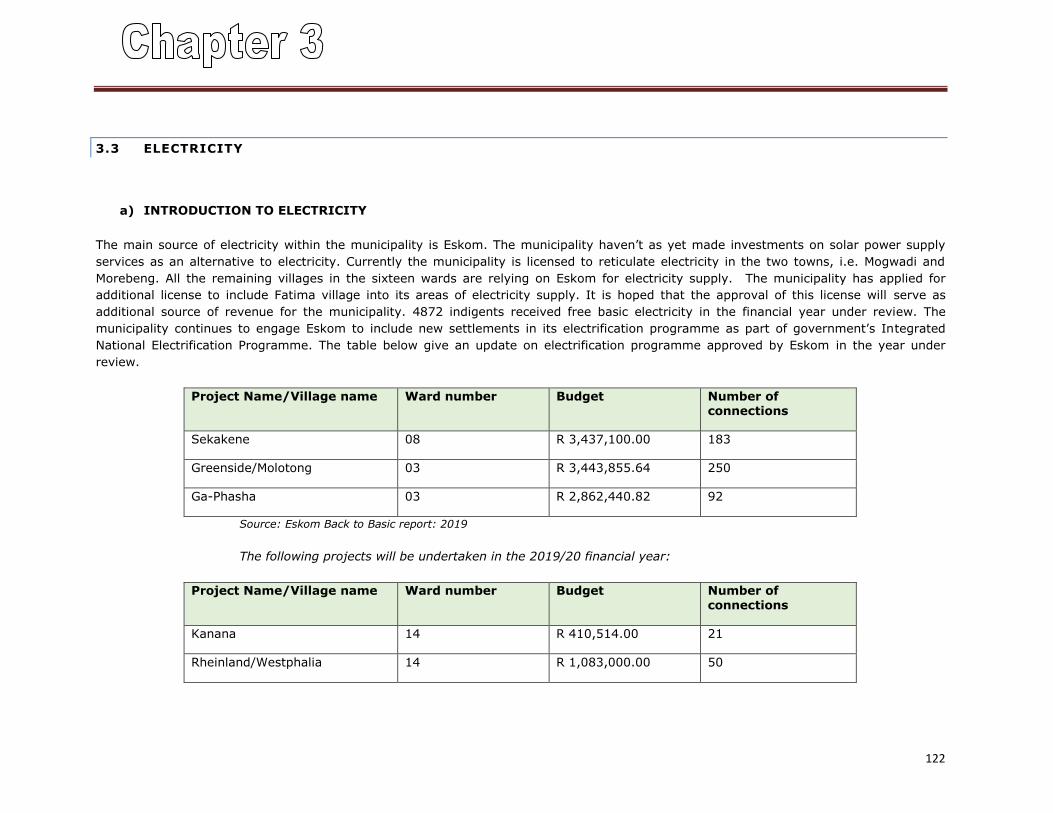
122
3.3 ELECTRICITY
a) INTRODUCTION TO ELECTRICITY
The main source of electricity within the municipality is Eskom. The municipality haven’t as yet made investments on solar power supply
services as an alternative to electricity. Currently the municipality is licensed to reticulate electricity in the two towns, i.e. Mogwadi and
Morebeng. All the remaining villages in the sixteen wards are relying on Eskom for electricity supply. The municipality has applied for
additional license to include Fatima village into its areas of electricity supply. It is hoped that the approval of this license will serve as
additional source of revenue for the municipality. 4872 indigents received free basic electricity in the financial year under review. The
municipality continues to engage Eskom to include new settlements in its electrification programme as part of government’s Integrated
National Electrification Programme. The table below give an update on electrification programme approved by Eskom in the year under
review.
Project Name/Village name Ward number Budget Number of connections
Sekakene 08 R 3,437,100.00 183
Greenside/Molotong 03 R 3,443,855.64 250
Ga-Phasha 03 R 2,862,440.82 92
Source: Eskom Back to Basic report: 2019
The following projects will be undertaken in the 2019/20 financial year:
Project Name/Village name Ward number Budget Number of connections
Kanana 14 R 410,514.00 21
Rheinland/Westphalia 14 R 1,083,000.00 50
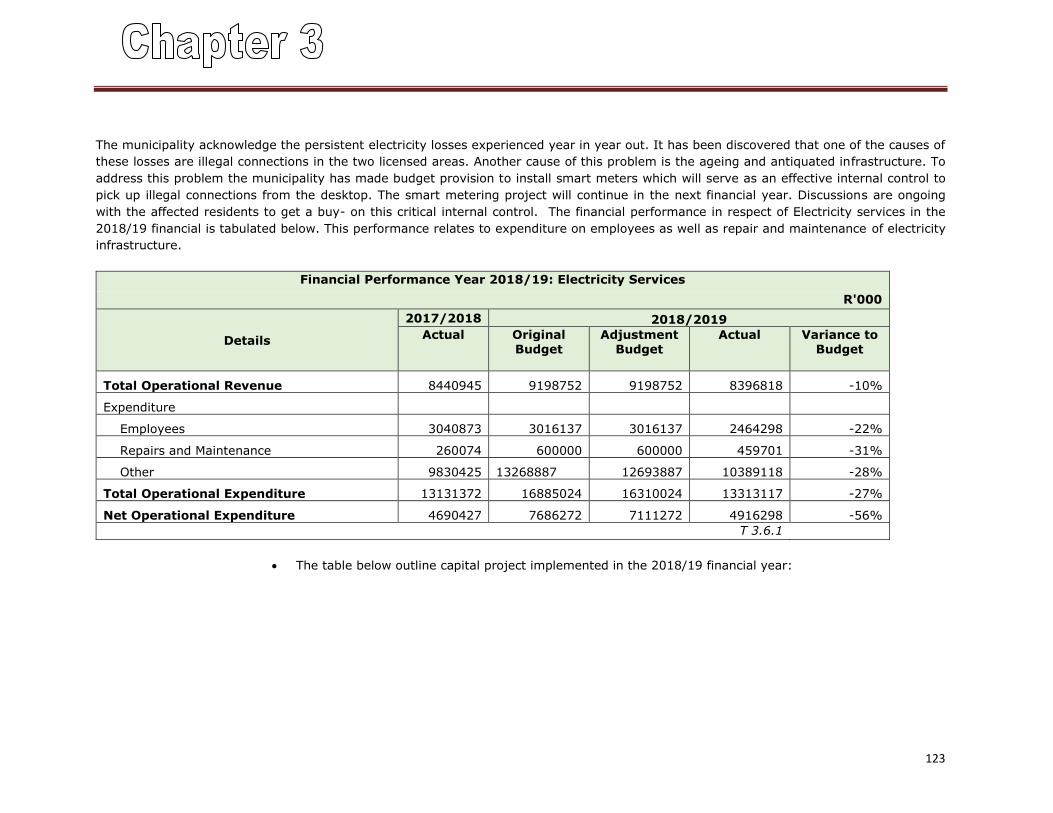
123
The municipality acknowledge the persistent electricity losses experienced year in year out. It has been discovered that one of the causes of
these losses are illegal connections in the two licensed areas. Another cause of this problem is the ageing and antiquated infrastructure. To
address this problem the municipality has made budget provision to install smart meters which will serve as an effective internal control to
pick up illegal connections from the desktop. The smart metering project will continue in the next financial year. Discussions are ongoing
with the affected residents to get a buy- on this critical internal control. The financial performance in respect of Electricity services in the
2018/19 financial is tabulated below. This performance relates to expenditure on employees as well as repair and maintenance of electricity
infrastructure.
Financial Performance Year 2018/19: Electricity Services
R'000
Details
2017/2018 2018/2019
Actual Original Budget
Adjustment Budget
Actual Variance to Budget
Total Operational Revenue 8440945 9198752 9198752 8396818 -10%
Expenditure
Employees 3040873 3016137 3016137 2464298 -22%
Repairs and Maintenance 260074 600000 600000 459701 -31%
Other 9830425 13268887 12693887 10389118 -28%
Total Operational Expenditure 13131372 16885024 16310024 13313117 -27%
Net Operational Expenditure 4690427 7686272 7111272 4916298 -56%
T 3.6.1
The table below outline capital project implemented in the 2018/19 financial year:
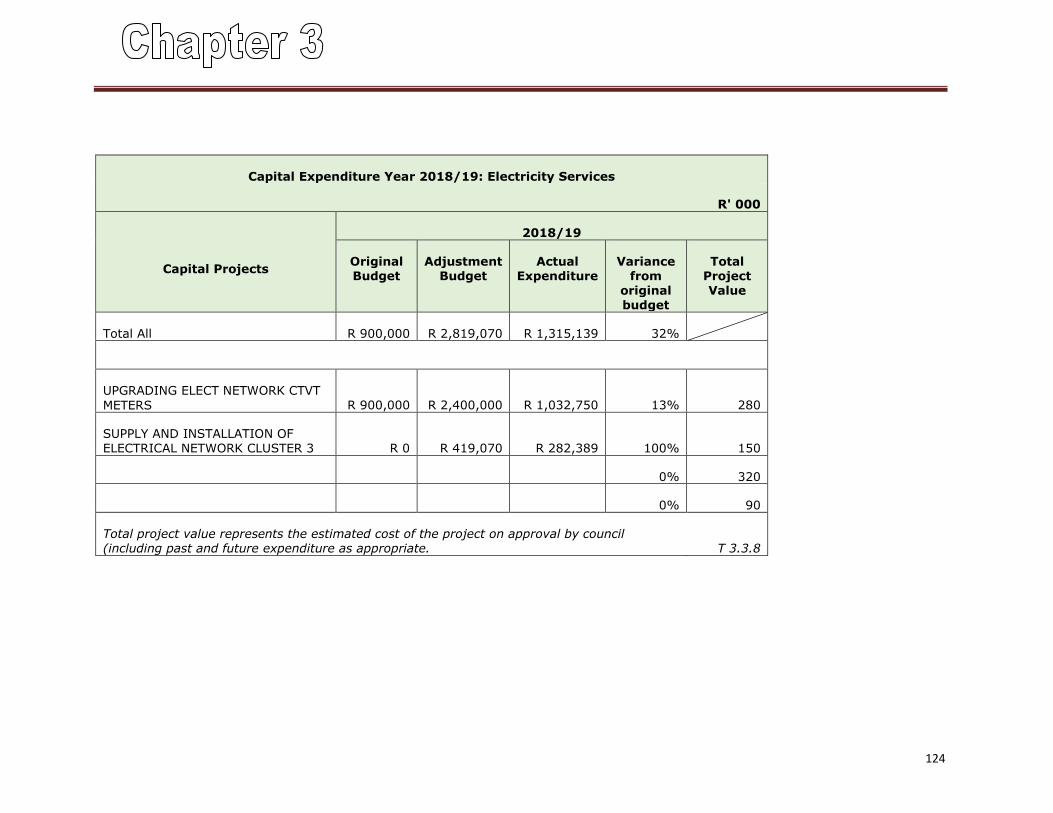
124
Capital Expenditure Year 2018/19: Electricity Services
R' 000
Capital Projects
2018/19
Original Budget
Adjustment Budget
Actual Expenditure
Variance from
original budget
Total Project Value
Total All R 900,000 R 2,819,070 R 1,315,139 32%
UPGRADING ELECT NETWORK CTVT
METERS R 900,000 R 2,400,000 R 1,032,750 13% 280
SUPPLY AND INSTALLATION OF ELECTRICAL NETWORK CLUSTER 3 R 0 R 419,070 R 282,389 100% 150
0% 320
0% 90
Total project value represents the estimated cost of the project on approval by council (including past and future expenditure as appropriate. T 3.3.8
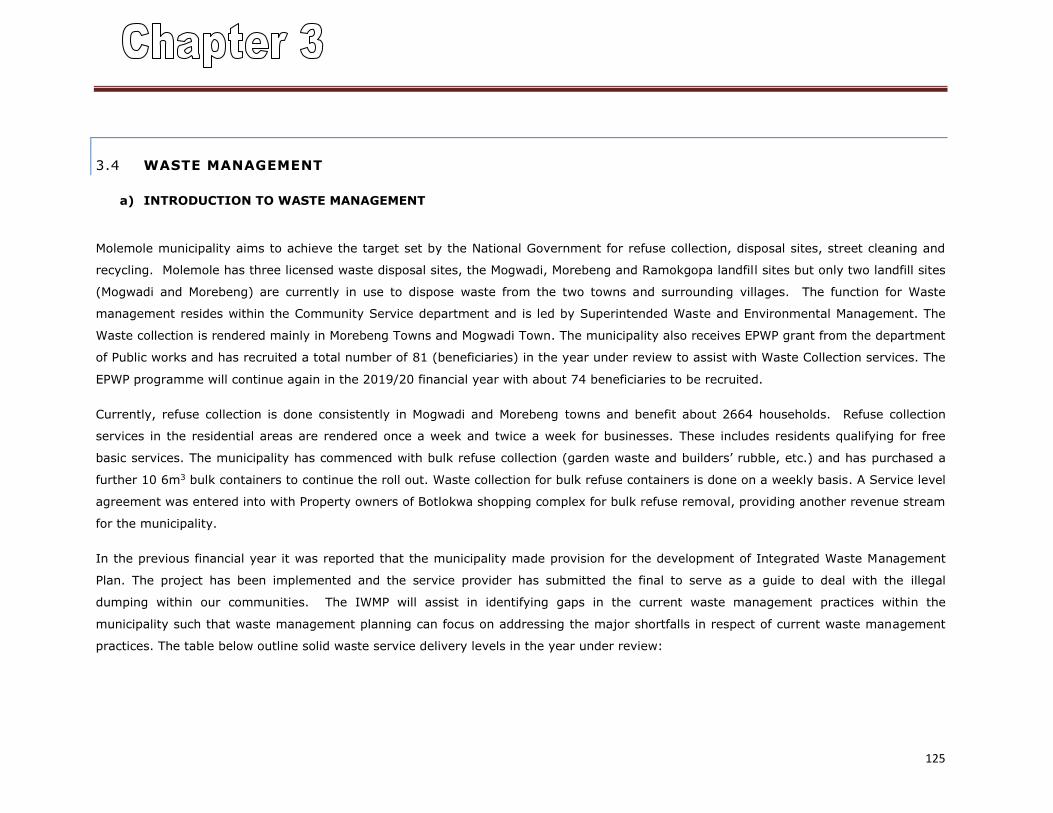
125
3.4 WASTE MANAGEMENT
a) INTRODUCTION TO WASTE MANAGEMENT
Molemole municipality aims to achieve the target set by the National Government for refuse collection, disposal sites, street cleaning and
recycling. Molemole has three licensed waste disposal sites, the Mogwadi, Morebeng and Ramokgopa landfill sites but only two landfill sites
(Mogwadi and Morebeng) are currently in use to dispose waste from the two towns and surrounding villages. The function for Waste
management resides within the Community Service department and is led by Superintended Waste and Environmental Management. The
Waste collection is rendered mainly in Morebeng Towns and Mogwadi Town. The municipality also receives EPWP grant from the department
of Public works and has recruited a total number of 81 (beneficiaries) in the year under review to assist with Waste Collection services. The
EPWP programme will continue again in the 2019/20 financial year with about 74 beneficiaries to be recruited.
Currently, refuse collection is done consistently in Mogwadi and Morebeng towns and benefit about 2664 households. Refuse collection
services in the residential areas are rendered once a week and twice a week for businesses. These includes residents qualifying for free
basic services. The municipality has commenced with bulk refuse collection (garden waste and builders’ rubble, etc.) and has purchased a
further 10 6m3 bulk containers to continue the roll out. Waste collection for bulk refuse containers is done on a weekly basis. A Service level
agreement was entered into with Property owners of Botlokwa shopping complex for bulk refuse removal, providing another revenue stream
for the municipality.
In the previous financial year it was reported that the municipality made provision for the development of Integrated Waste Management
Plan. The project has been implemented and the service provider has submitted the final to serve as a guide to deal with the illegal
dumping within our communities. The IWMP will assist in identifying gaps in the current waste management practices within the
municipality such that waste management planning can focus on addressing the major shortfalls in respect of current waste management
practices. The table below outline solid waste service delivery levels in the year under review:
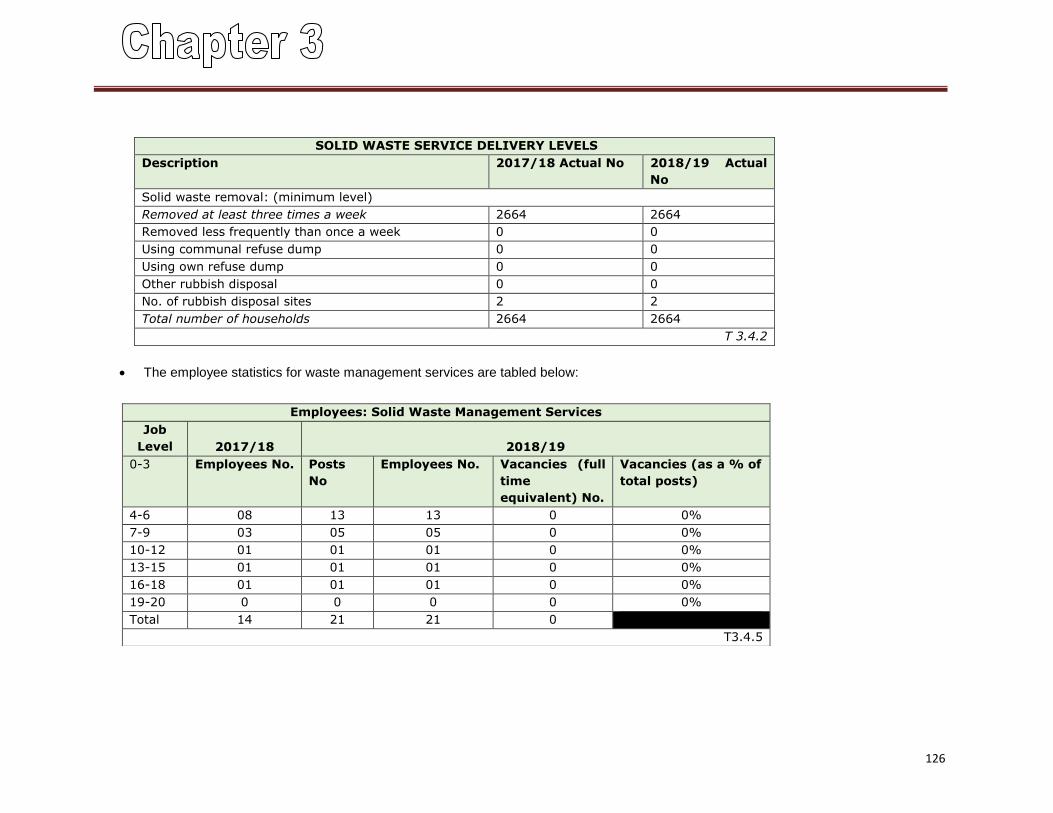
126
SOLID WASTE SERVICE DELIVERY LEVELS
Description 2017/18 Actual No 2018/19 Actual
No
Solid waste removal: (minimum level)
Removed at least three times a week 2664 2664
Removed less frequently than once a week 0 0
Using communal refuse dump 0 0
Using own refuse dump 0 0
Other rubbish disposal 0 0
No. of rubbish disposal sites 2 2
Total number of households 2664 2664
T 3.4.2
The employee statistics for waste management services are tabled below:
Employees: Solid Waste Management Services
Job
Level 2017/18 2018/19
0-3 Employees No. Posts
No
Employees No. Vacancies (full
time
equivalent) No.
Vacancies (as a % of
total posts)
4-6 08 13 13 0 0%
7-9 03 05 05 0 0%
10-12 01 01 01 0 0%
13-15 01 01 01 0 0%
16-18 01 01 01 0 0%
19-20 0 0 0 0 0%
Total 14 21 21 0
T3.4.5
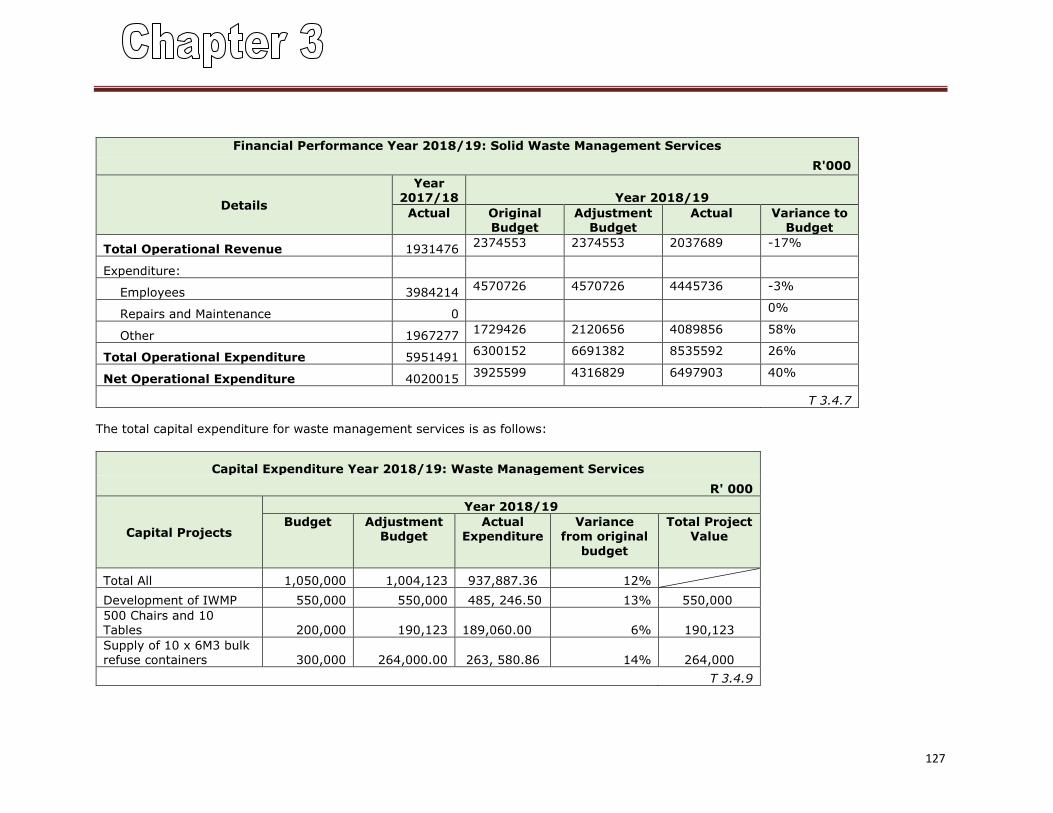
127
Financial Performance Year 2018/19: Solid Waste Management Services
R'000
Details
Year 2017/18 Year 2018/19
Actual Original Budget
Adjustment Budget
Actual Variance to Budget
Total Operational Revenue 1931476 2374553 2374553 2037689 -17%
Expenditure:
Employees 3984214 4570726 4570726 4445736 -3%
Repairs and Maintenance 0 0%
Other 1967277 1729426 2120656 4089856 58%
Total Operational Expenditure 5951491 6300152 6691382 8535592 26%
Net Operational Expenditure 4020015 3925599 4316829 6497903 40%
T 3.4.7
The total capital expenditure for waste management services is as follows:
Capital Expenditure Year 2018/19: Waste Management Services
R' 000
Capital Projects
Year 2018/19
Budget Adjustment Budget
Actual Expenditure
Variance from original
budget
Total Project Value
Total All 1,050,000 1,004,123 937,887.36 12%
Development of IWMP 550,000 550,000 485, 246.50 13% 550,000
500 Chairs and 10 Tables 200,000 190,123 189,060.00 6% 190,123
Supply of 10 x 6M3 bulk refuse containers 300,000 264,000.00 263, 580.86 14% 264,000
T 3.4.9
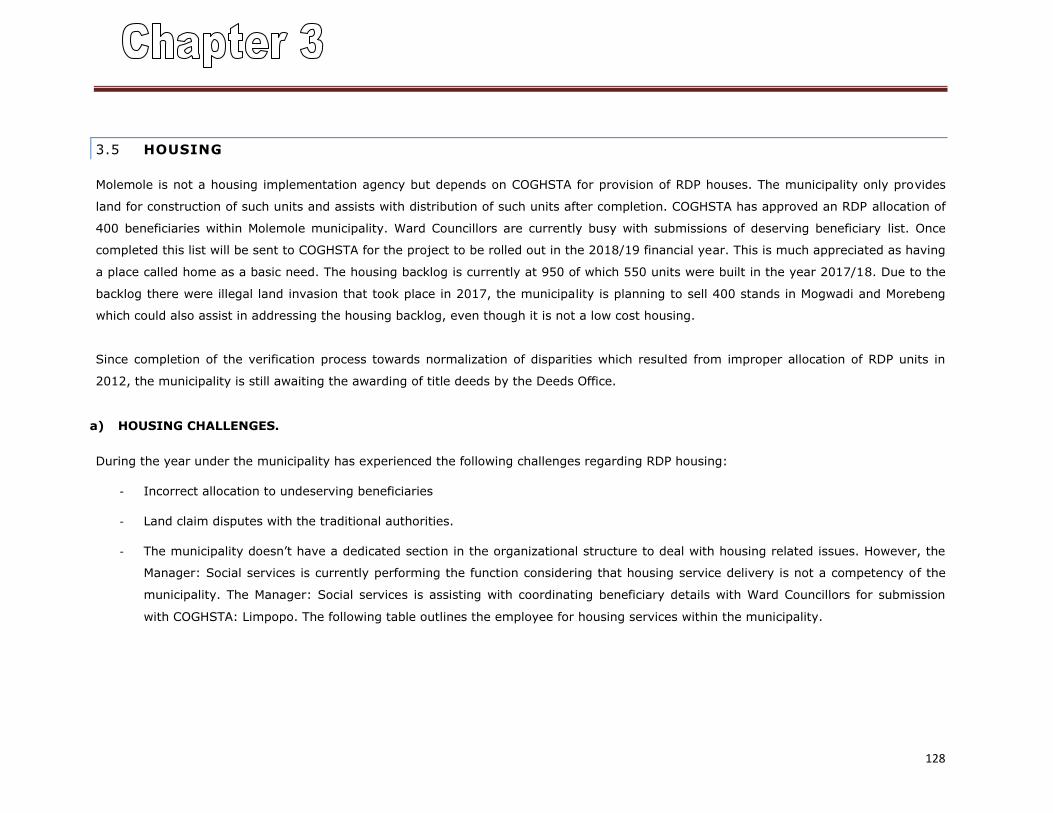
128
3.5 HOUSING
Molemole is not a housing implementation agency but depends on COGHSTA for provision of RDP houses. The municipality only provides
land for construction of such units and assists with distribution of such units after completion. COGHSTA has approved an RDP allocation of
400 beneficiaries within Molemole municipality. Ward Councillors are currently busy with submissions of deserving beneficiary list. Once
completed this list will be sent to COGHSTA for the project to be rolled out in the 2018/19 financial year. This is much appreciated as having
a place called home as a basic need. The housing backlog is currently at 950 of which 550 units were built in the year 2017/18. Due to the
backlog there were illegal land invasion that took place in 2017, the municipality is planning to sell 400 stands in Mogwadi and Morebeng
which could also assist in addressing the housing backlog, even though it is not a low cost housing.
Since completion of the verification process towards normalization of disparities which resulted from improper allocation of RDP units in
2012, the municipality is still awaiting the awarding of title deeds by the Deeds Office.
a) HOUSING CHALLENGES.
During the year under the municipality has experienced the following challenges regarding RDP housing:
- Incorrect allocation to undeserving beneficiaries
- Land claim disputes with the traditional authorities.
- The municipality doesn’t have a dedicated section in the organizational structure to deal with housing related issues. However, the
Manager: Social services is currently performing the function considering that housing service delivery is not a competency of the
municipality. The Manager: Social services is assisting with coordinating beneficiary details with Ward Councillors for submission
with COGHSTA: Limpopo. The following table outlines the employee for housing services within the municipality.
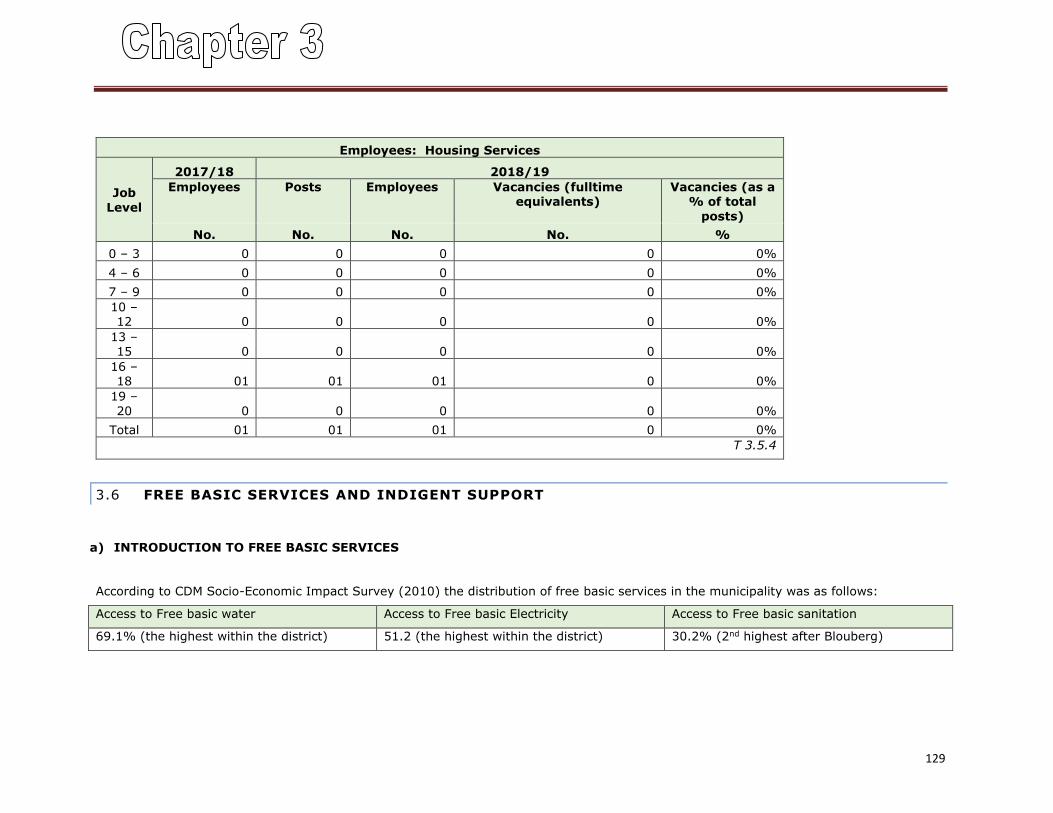
129
Employees: Housing Services
Job
Level
2017/18 2018/19
Employees Posts Employees Vacancies (fulltime equivalents)
Vacancies (as a % of total
posts)
No. No. No. No. %
0 – 3 0 0 0 0 0%
4 – 6 0 0 0 0 0%
7 – 9 0 0 0 0 0%
10 – 12 0 0 0 0 0%
13 – 15 0 0 0 0 0%
16 – 18 01 01 01 0 0%
19 –
20 0 0 0 0 0%
Total 01 01 01 0 0%
T 3.5.4
3.6 FREE BASIC SERVICES AND INDIGENT SUPPORT
a) INTRODUCTION TO FREE BASIC SERVICES
According to CDM Socio-Economic Impact Survey (2010) the distribution of free basic services in the municipality was as follows:
Access to Free basic water Access to Free basic Electricity Access to Free basic sanitation
69.1% (the highest within the district) 51.2 (the highest within the district) 30.2% (2nd highest after Blouberg)
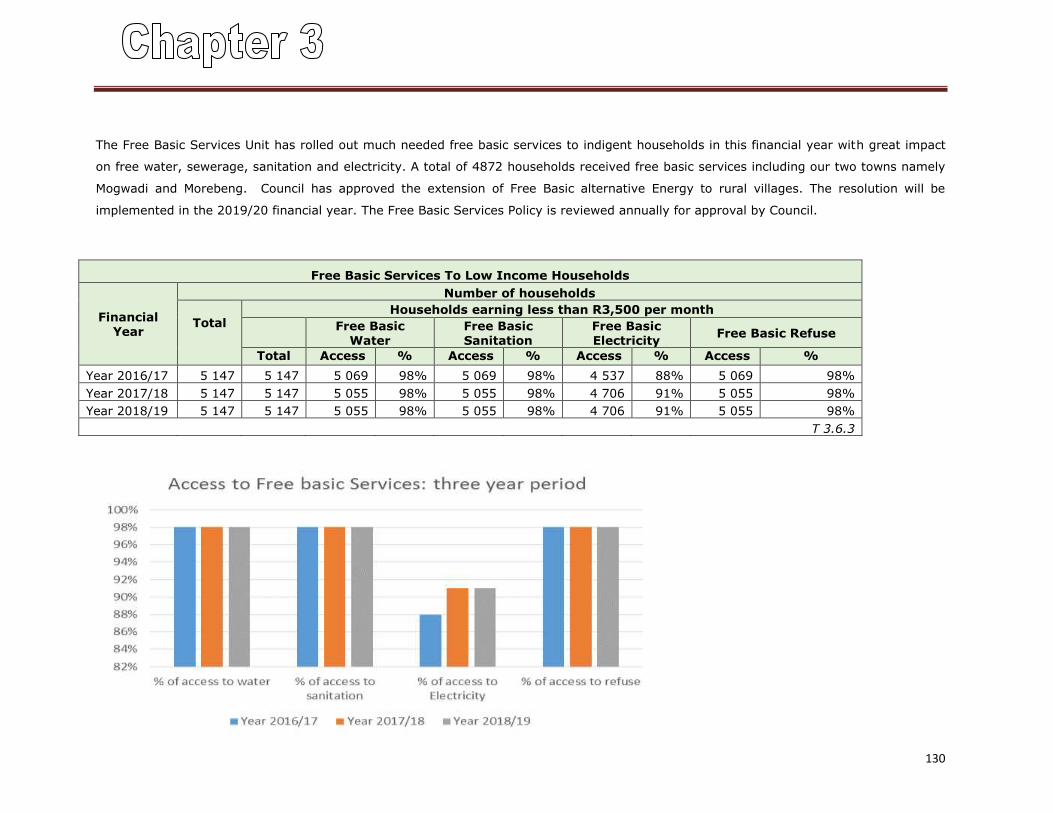
130
The Free Basic Services Unit has rolled out much needed free basic services to indigent households in this financial year with great impact
on free water, sewerage, sanitation and electricity. A total of 4872 households received free basic services including our two towns namely
Mogwadi and Morebeng. Council has approved the extension of Free Basic alternative Energy to rural villages. The resolution will be
implemented in the 2019/20 financial year. The Free Basic Services Policy is reviewed annually for approval by Council.
Free Basic Services To Low Income Households
Financial Year
Number of households
Total
Households earning less than R3,500 per month
Free Basic
Water Free Basic Sanitation
Free Basic Electricity
Free Basic Refuse
Total Access % Access % Access % Access %
Year 2016/17 5 147 5 147 5 069 98% 5 069 98% 4 537 88% 5 069 98%
Year 2017/18 5 147 5 147 5 055 98% 5 055 98% 4 706 91% 5 055 98%
Year 2018/19 5 147 5 147 5 055 98% 5 055 98% 4 706 91% 5 055 98%
T 3.6.3
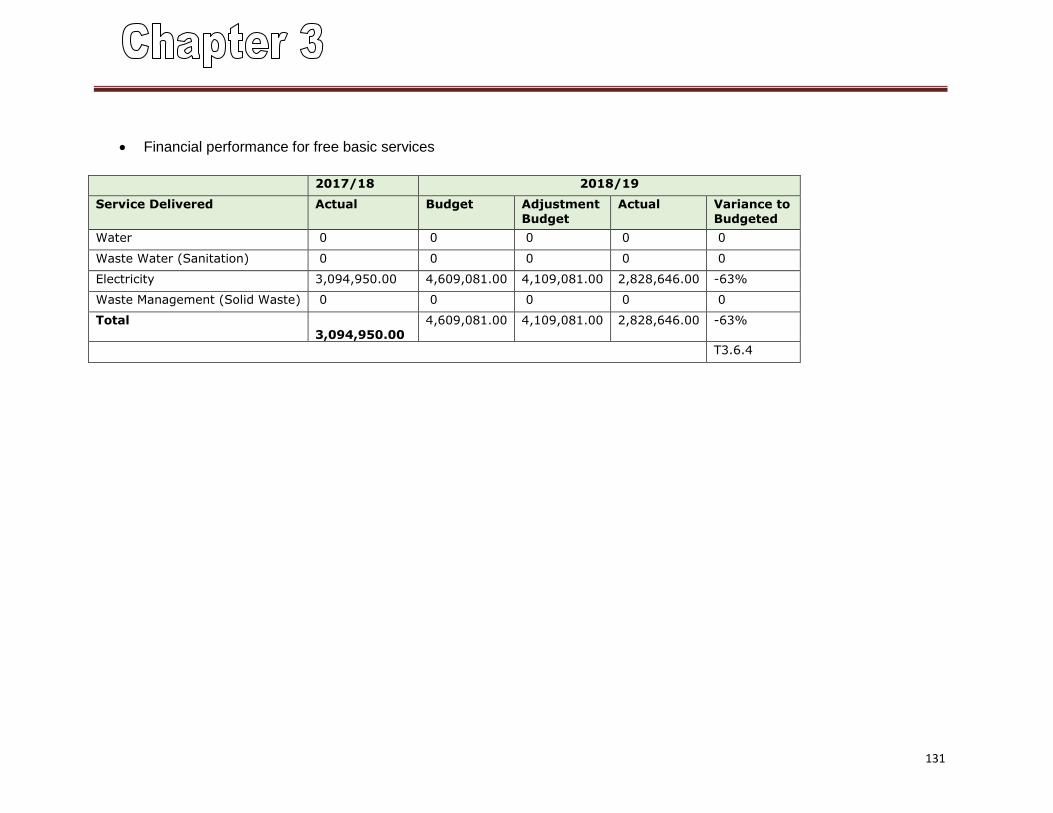
131
Financial performance for free basic services
2017/18 2018/19
Service Delivered Actual Budget Adjustment
Budget
Actual Variance to
Budgeted
Water 0 0 0 0 0
Waste Water (Sanitation) 0 0 0 0 0
Electricity 3,094,950.00 4,609,081.00 4,109,081.00 2,828,646.00 -63%
Waste Management (Solid Waste) 0 0 0 0 0
Total 3,094,950.00
4,609,081.00 4,109,081.00 2,828,646.00 -63%
T3.6.4
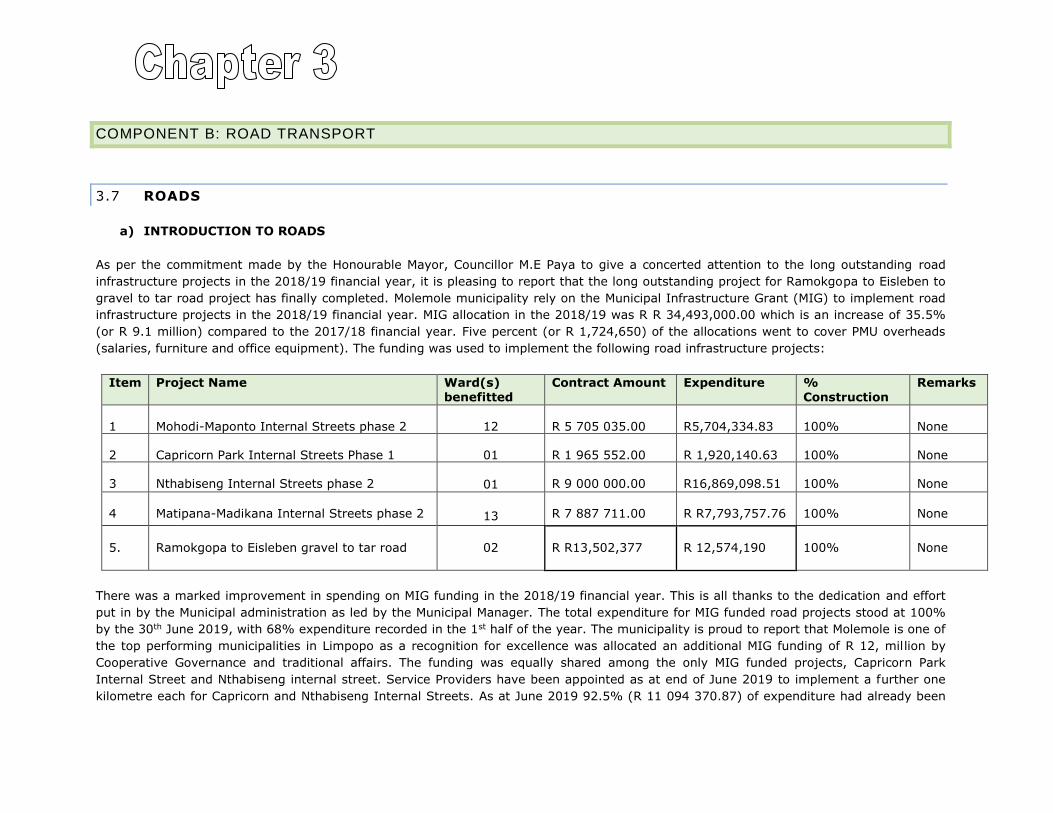
COMPONENT B: ROAD TRANSPORT
3.7 ROADS
a) INTRODUCTION TO ROADS
As per the commitment made by the Honourable Mayor, Councillor M.E Paya to give a concerted attention to the long outstanding road
infrastructure projects in the 2018/19 financial year, it is pleasing to report that the long outstanding project for Ramokgopa to Eisleben to
gravel to tar road project has finally completed. Molemole municipality rely on the Municipal Infrastructure Grant (MIG) to implement road
infrastructure projects in the 2018/19 financial year. MIG allocation in the 2018/19 was R R 34,493,000.00 which is an increase of 35.5%
(or R 9.1 million) compared to the 2017/18 financial year. Five percent (or R 1,724,650) of the allocations went to cover PMU overheads
(salaries, furniture and office equipment). The funding was used to implement the following road infrastructure projects:
Item Project Name Ward(s) benefitted
Contract Amount Expenditure % Construction
Remarks
1 Mohodi-Maponto Internal Streets phase 2 12 R 5 705 035.00 R5,704,334.83 100% None
2 Capricorn Park Internal Streets Phase 1 01 R 1 965 552.00 R 1,920,140.63 100% None
3 Nthabiseng Internal Streets phase 2 01 R 9 000 000.00 R16,869,098.51 100% None
4 Matipana-Madikana Internal Streets phase 2 13 R 7 887 711.00 R R7,793,757.76 100% None
5. Ramokgopa to Eisleben gravel to tar road 02 R R13,502,377 R 12,574,190 100% None
There was a marked improvement in spending on MIG funding in the 2018/19 financial year. This is all thanks to the dedication and effort
put in by the Municipal administration as led by the Municipal Manager. The total expenditure for MIG funded road projects stood at 100%
by the 30th June 2019, with 68% expenditure recorded in the 1st half of the year. The municipality is proud to report that Molemole is one of
the top performing municipalities in Limpopo as a recognition for excellence was allocated an additional MIG funding of R 12, million by
Cooperative Governance and traditional affairs. The funding was equally shared among the only MIG funded projects, Capricorn Park
Internal Street and Nthabiseng internal street. Service Providers have been appointed as at end of June 2019 to implement a further one
kilometre each for Capricorn and Nthabiseng Internal Streets. As at June 2019 92.5% (R 11 094 370.87) of expenditure had already been
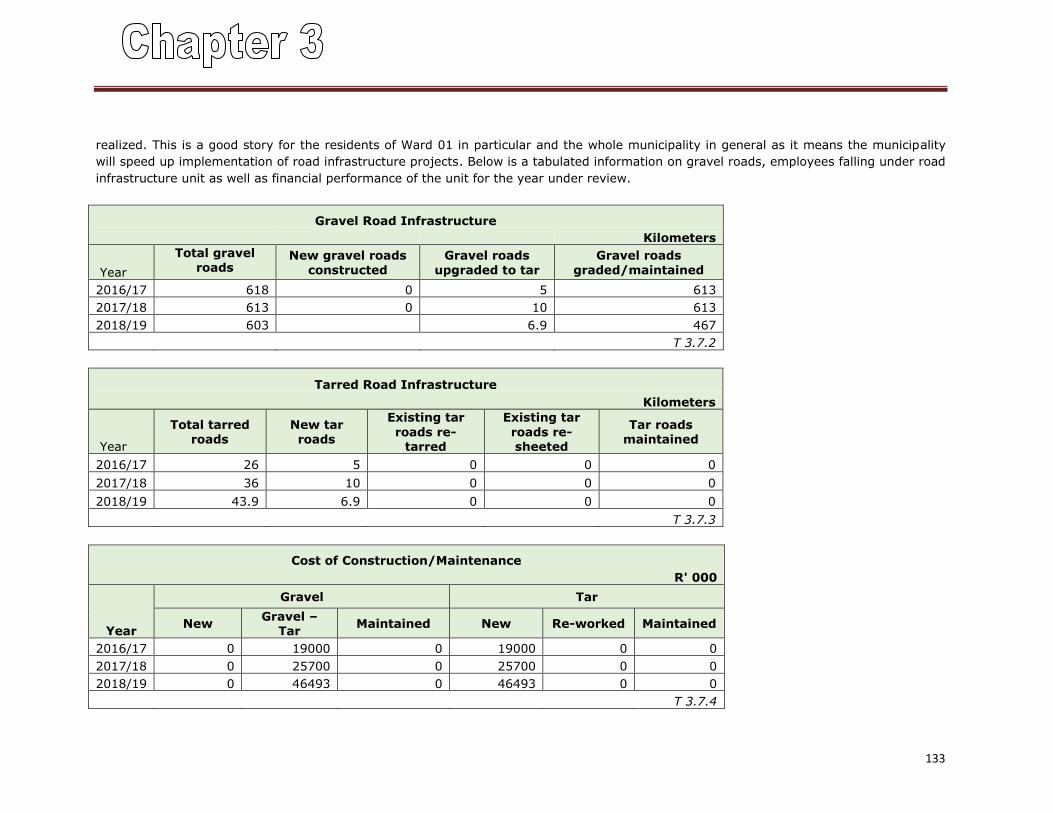
133
realized. This is a good story for the residents of Ward 01 in particular and the whole municipality in general as it means the municipality
will speed up implementation of road infrastructure projects. Below is a tabulated information on gravel roads, employees falling under road
infrastructure unit as well as financial performance of the unit for the year under review.
Gravel Road Infrastructure
Kilometers
Year
Total gravel
roads New gravel roads
constructed
Gravel roads
upgraded to tar
Gravel roads
graded/maintained
2016/17 618 0 5 613
2017/18 613 0 10 613
2018/19 603 6.9 467
T 3.7.2
Tarred Road Infrastructure
Kilometers
Year
Total tarred
roads
New tar
roads
Existing tar
roads re-tarred
Existing tar
roads re-sheeted
Tar roads
maintained
2016/17 26 5 0 0 0
2017/18 36 10 0 0 0
2018/19 43.9 6.9 0 0 0
T 3.7.3
Cost of Construction/Maintenance
R' 000
Year
Gravel Tar
New Gravel –
Tar Maintained New Re-worked Maintained
2016/17 0 19000 0 19000 0 0
2017/18 0 25700 0 25700 0 0
2018/19 0 46493 0 46493 0 0
T 3.7.4
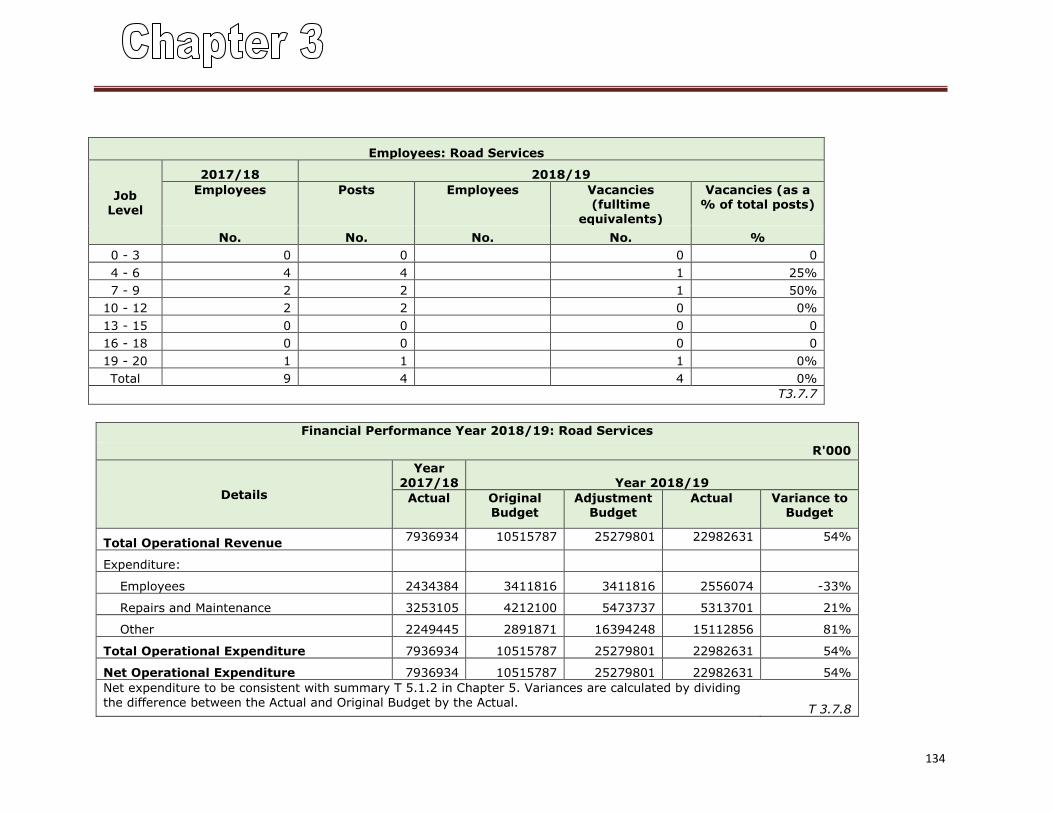
134
Employees: Road Services
Job Level
2017/18 2018/19
Employees Posts Employees Vacancies (fulltime
equivalents)
Vacancies (as a % of total posts)
No. No. No. No. %
0 - 3 0 0 0 0
4 - 6 4 4 1 25%
7 - 9 2 2 1 50%
10 - 12 2 2 0 0%
13 - 15 0 0 0 0
16 - 18 0 0 0 0
19 - 20 1 1 1 0%
Total 9 4 4 0%
T3.7.7
Financial Performance Year 2018/19: Road Services
R'000
Details
Year
2017/18 Year 2018/19
Actual Original Budget
Adjustment Budget
Actual Variance to Budget
Total Operational Revenue 7936934 10515787 25279801 22982631 54%
Expenditure:
Employees 2434384 3411816 3411816 2556074 -33%
Repairs and Maintenance 3253105 4212100 5473737 5313701 21%
Other 2249445 2891871 16394248 15112856 81%
Total Operational Expenditure 7936934 10515787 25279801 22982631 54%
Net Operational Expenditure 7936934 10515787 25279801 22982631 54%
Net expenditure to be consistent with summary T 5.1.2 in Chapter 5. Variances are calculated by dividing
the difference between the Actual and Original Budget by the Actual. T 3.7.8
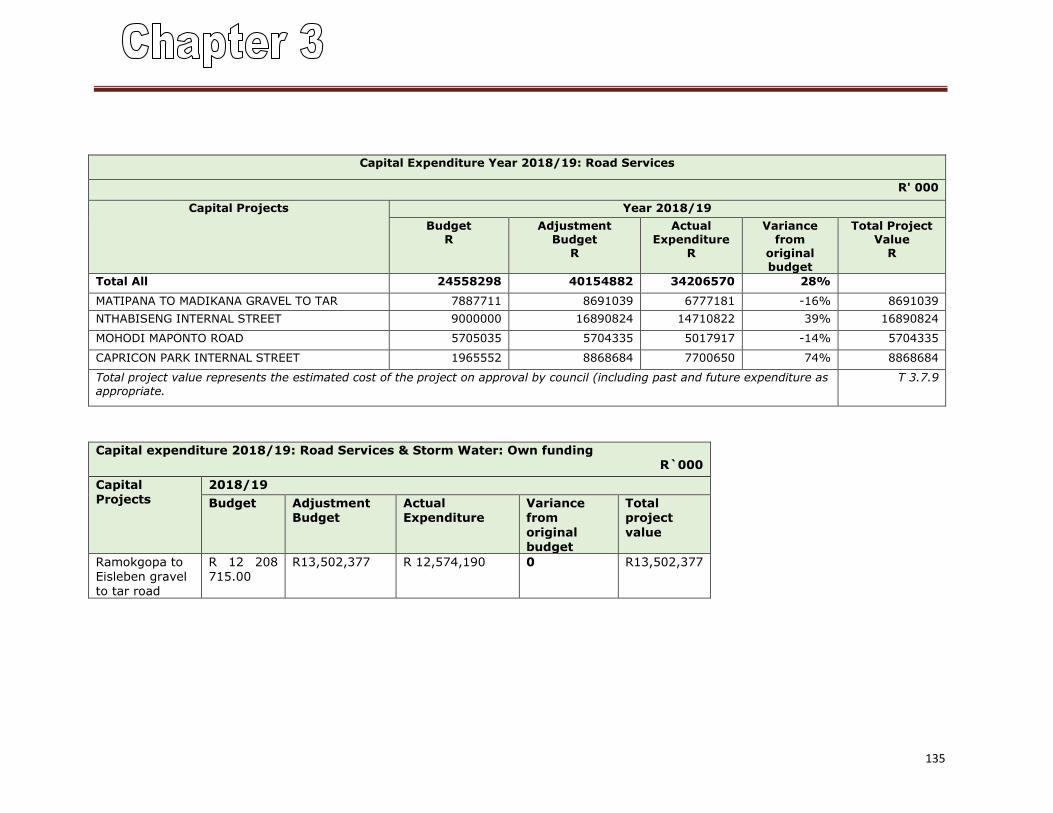
135
Capital Expenditure Year 2018/19: Road Services
R' 000
Capital Projects Year 2018/19
Budget R
Adjustment Budget
R
Actual Expenditure
R
Variance from
original budget
Total Project Value
R
Total All 24558298 40154882 34206570 28%
MATIPANA TO MADIKANA GRAVEL TO TAR 7887711 8691039 6777181 -16% 8691039
NTHABISENG INTERNAL STREET 9000000 16890824 14710822 39% 16890824
MOHODI MAPONTO ROAD 5705035 5704335 5017917 -14% 5704335
CAPRICON PARK INTERNAL STREET 1965552 8868684 7700650 74% 8868684
Total project value represents the estimated cost of the project on approval by council (including past and future expenditure as appropriate.
T 3.7.9
Capital expenditure 2018/19: Road Services & Storm Water: Own funding R`000
Capital Projects
2018/19
Budget Adjustment Budget
Actual Expenditure
Variance from
original budget
Total project
value
Ramokgopa to Eisleben gravel to tar road
R 12 208 715.00
R13,502,377
R 12,574,190
0 R13,502,377
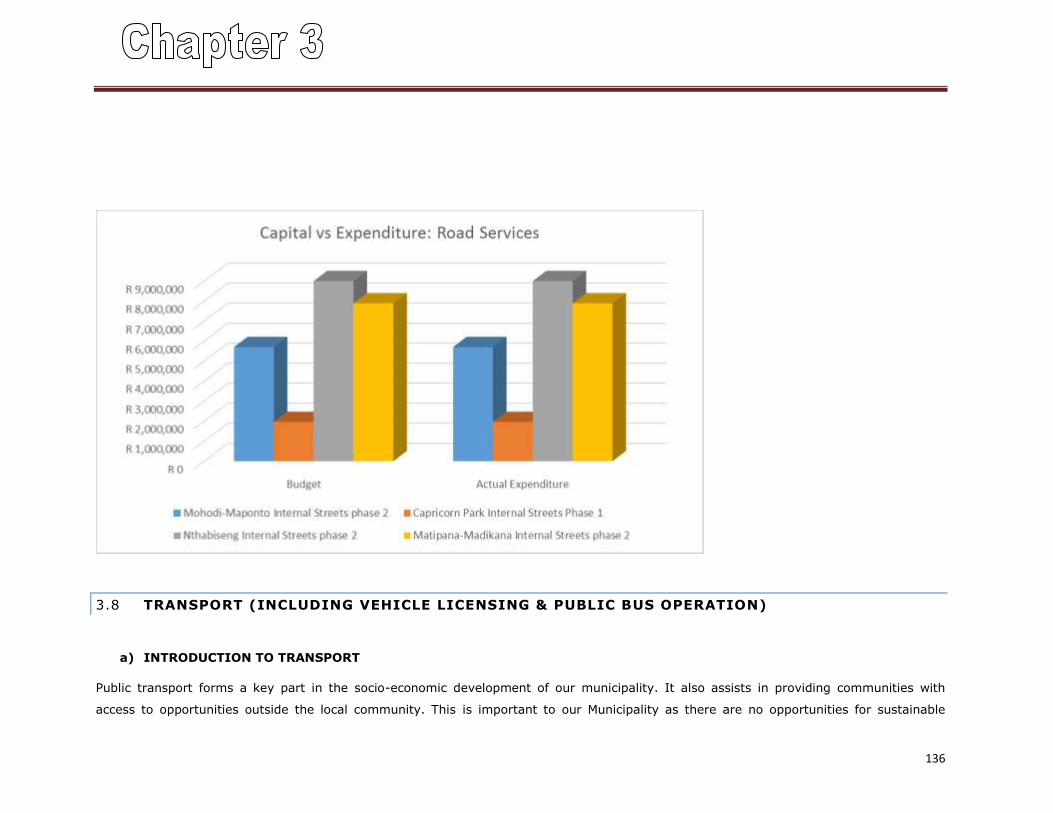
136
3.8 TRANSPORT (INCLUDING VEHICLE LICENSING & PUBLIC BUS OPERATION)
a) INTRODUCTION TO TRANSPORT
Public transport forms a key part in the socio-economic development of our municipality. It also assists in providing communities with
access to opportunities outside the local community. This is important to our Municipality as there are no opportunities for sustainable
137
employment in most villages. The communities are mostly dependent on public transport to reach health care facilities, schools and other
social facilities.
The Limpopo’s road network within the District consist of National, Provincial and District roads. The national roads are managed by
SANRAL, Provincial and District road network is managed by Road Agency Limpopo and the Provincial Department of Public Works, Roads
and Infrastructure. The municipality has Law Enforcement Officers and through concerted law enforcement and educational campaigns, we
strive for the reduction of fatal crashes on our municipal roads especially along the N1 from Polokwane to Musina. Operating from the
limited budget it is difficult for the municipality to plan for a 24 hours’ law enforcement deployment on critical routes and hotspots on the
road, however the traffic division managed to conduct 48 road blocks in 2018/19 financial year for the safety of our people, driver and
vehicle fitness, minimizing traffic violations. The municipality is operating two Driver’s License and Testing Centres operating in Mogwadi
and Morebeng. For the year under review the two centres have processed a total of 2643 driver’s licenses and 1879 learner’s licenses. A
further 258 of received applications for vehicle registrations were processed.
The railway line that runs between Musina and Johannesburg passes in our municipality with Morebeng as one of the stations. There is no
landing strip in the municipal area. Apart from the road network, there is a railway line servicing the Molemole LM. This line links
Polokwane to Makhado and other towns in the north and south via Molemole LM in a north-south direction. Currently this line only provides
a freight service and long distance passenger service. There is a need to unearth economic activities emanating from this railway line.
Being a municipality that its economy is mainly on agriculture, the railway could serve as a link to transport fruit and vegetables to the
market.
The municipality now have eleven existing and functional scholar patrol points attended to within the municipality. Due to a skeletal traffic
staff other scholar patrols are conducted by the Molemole Community Safety Forum (CSF). The patrol points are:
Dendron primary school
Deelkraal primary school
Boduma primary school
Lephalale primary school
Kgothloana primary school
Nhlodimele primary school
138
Nanedi primary school
Phala primary school
Lehaiwa secondary school
Kgwadu primary school
Makgato cross
b) CDM Integrated Transport Plan
The CDM Integrated Transport Plan (2007, ITP) prioritized the following projects for tarring over a short to medium term period:
Surfacing of Road D2037 linking Mogwadi to Bandelierkop; (not yet surfaced)
Surfacing of Road D15 (P54/1) linking between CDM and Vhembe DM around Morebeng; (not yet surfaced)
Surfacing of Road D3459 which is gravel road between Ga-Kgare and Road D1200;(surfaced) and
Surfacing of Road D879 which is road between Boschbokhoek and Provincial Road D1356.
N.B. The roads mentioned above have not yet been surfaced except Road D3459, gravel road between Ga-Kgare and Rroad D1200.
c) POSSIBLE CAUSES OF ACCIDENTS.
Pedestrians;
Fatigue; Un-safe Overtaking; Reckless driving; Over speeding; Use of cell phone while driving;
Drunken driving and Road conditions (permanent pot holes)
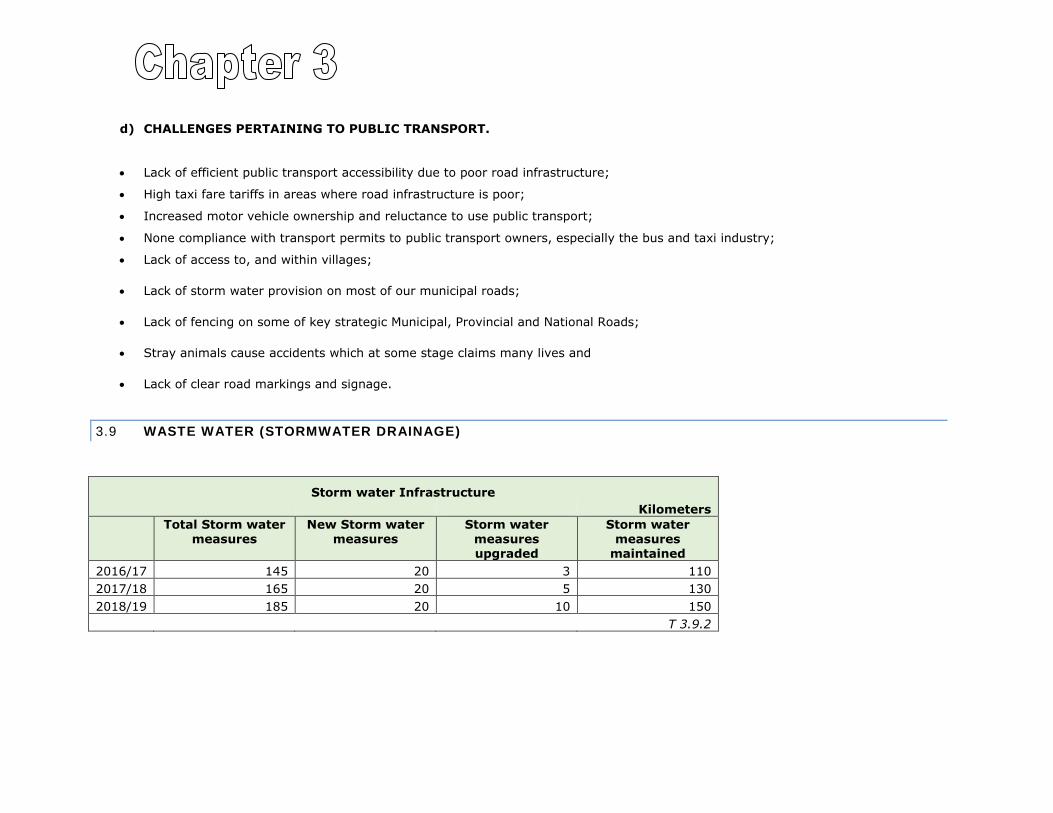
d) CHALLENGES PERTAINING TO PUBLIC TRANSPORT.
Lack of efficient public transport accessibility due to poor road infrastructure;
High taxi fare tariffs in areas where road infrastructure is poor;
Increased motor vehicle ownership and reluctance to use public transport;
None compliance with transport permits to public transport owners, especially the bus and taxi industry;
Lack of access to, and within villages;
Lack of storm water provision on most of our municipal roads;
Lack of fencing on some of key strategic Municipal, Provincial and National Roads;
Stray animals cause accidents which at some stage claims many lives and
Lack of clear road markings and signage.
3.9 WASTE WATER (STORMWATER DRAINAGE)
Storm water Infrastructure
Kilometers
Total Storm water measures
New Storm water measures
Storm water measures upgraded
Storm water measures
maintained
2016/17 145 20 3 110
2017/18 165 20 5 130
2018/19 185 20 10 150
T 3.9.2
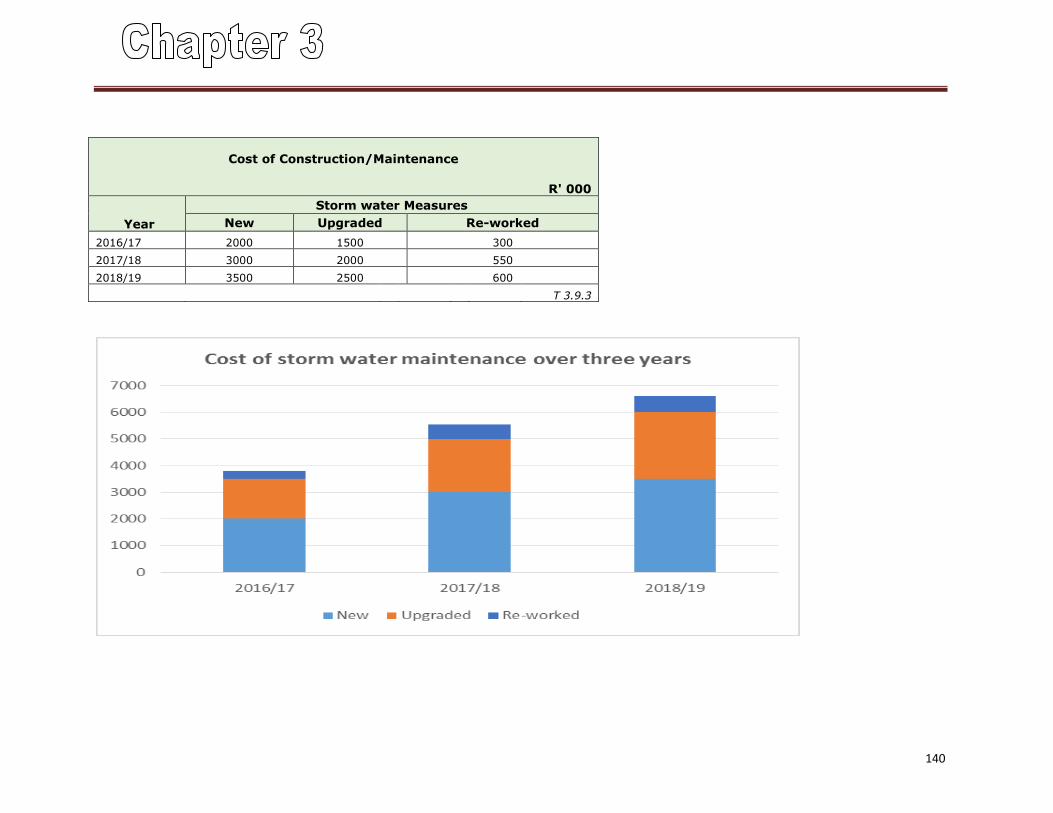
140
Cost of Construction/Maintenance
R' 000
Year
Storm water Measures
New Upgraded Re-worked
2016/17 2000 1500 300
2017/18 3000 2000 550
2018/19 3500 2500 600
T 3.9.3
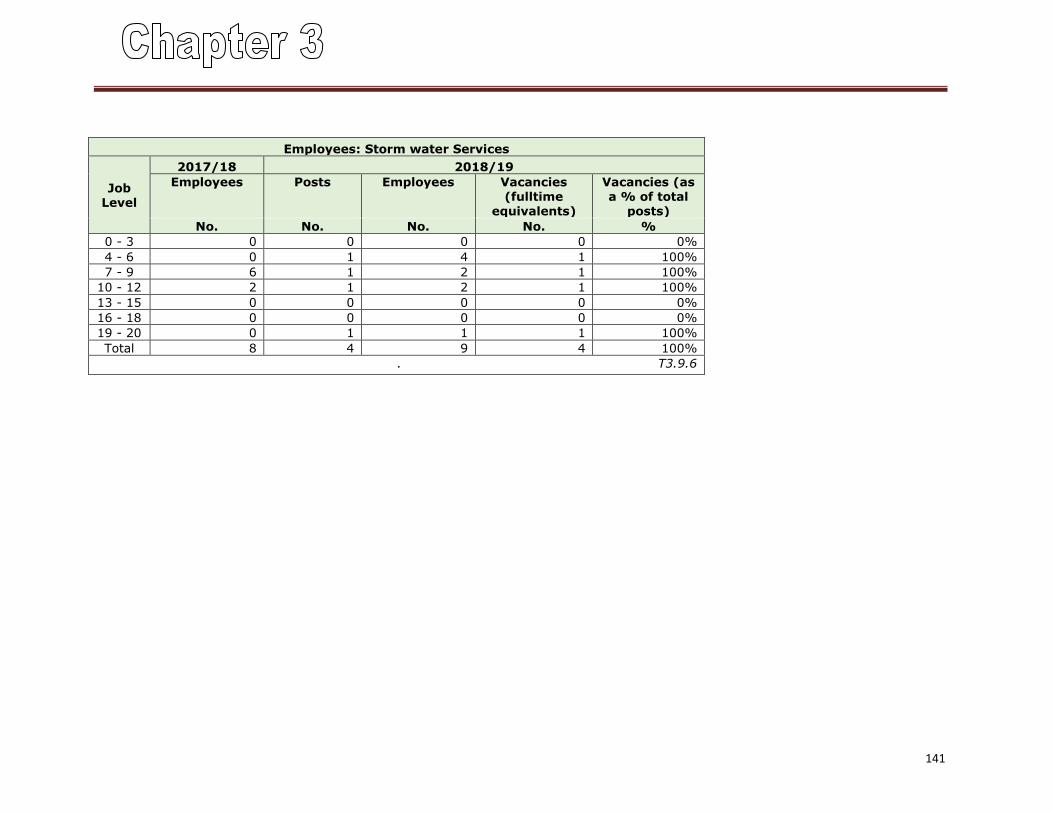
141
Employees: Storm water Services
Job Level
2017/18 2018/19
Employees Posts Employees Vacancies (fulltime
equivalents)
Vacancies (as a % of total
posts)
No. No. No. No. %
0 - 3 0 0 0 0 0%
4 - 6 0 1 4 1 100%
7 - 9 6 1 2 1 100%
10 - 12 2 1 2 1 100%
13 - 15 0 0 0 0 0%
16 - 18 0 0 0 0 0%
19 - 20 0 1 1 1 100%
Total 8 4 9 4 100%
. T3.9.6
142
COMPONENT C: PLANNING AND DEVELOPMENT
3.10 PLANNING
a) INTRODUCTION TO PLANNING
The municipality’s planning strategy is to promote orderly development by implementing Integrated Development Planning and Spatial
Rationale Principles. Molemole is characterized by first and second order settlement patterns. An analysis of the regional and local context
of Molemole Local Municipality has revealed a Municipality as mentioned earlier that is characterized by a fragmented spatial structure
comprising of small, low density, spatially segregated settlements with limited economic and social opportunities which have created
unviable and unsustainable settlements.
The potential for mining activities, vegetable and livestock farming provide opportunities for backward and forward linkages which will open
up job opportunities and more economic opportunities in other sectors such as agro-processing, beneficiation projects, etc. This scenario is
likely to help the municipality to have balance of economic growth in primary, secondary and tertiary sector. The LED strategy provides an
indication of LED programmes, projects, stakeholders and the institutional requirements to implement the LED strategy.
The dominant economic sectors (mining, tourism and subsistence farming) characterizing Molemole local municipality should be protected
and exploited via appropriate spatial allocation. Similarly, there is a need for the diversification of the economy by focusing on all economic
sectors (e.g. tourism), and not just the primary sector (e.g. mining). Such an approach would render Molemole local municipality less
vulnerable to external pressures.
Molemole Local Municipality (MLM) is located in the Capricorn District Municipality (CDM) in the Limpopo Province. The neighboring local
municipalities forming the CDM are Blouberg, Aganang, Lepelle-Nkumpi and Polokwane. The Municipality has two towns known as Mogwadi
(formerly known as Dendron) which is the administrative and economic capital of the Municipality and Morebeng. The two towns were
classified as District Growth Points by Capricorn District Municipality. The municipality is institutionalizing initiatives to expand the two
towns spatially and economically. These includes fast tracking funds to install bulk infrastructure in the newly demarcated sites in Morebeng
and Mogwadi
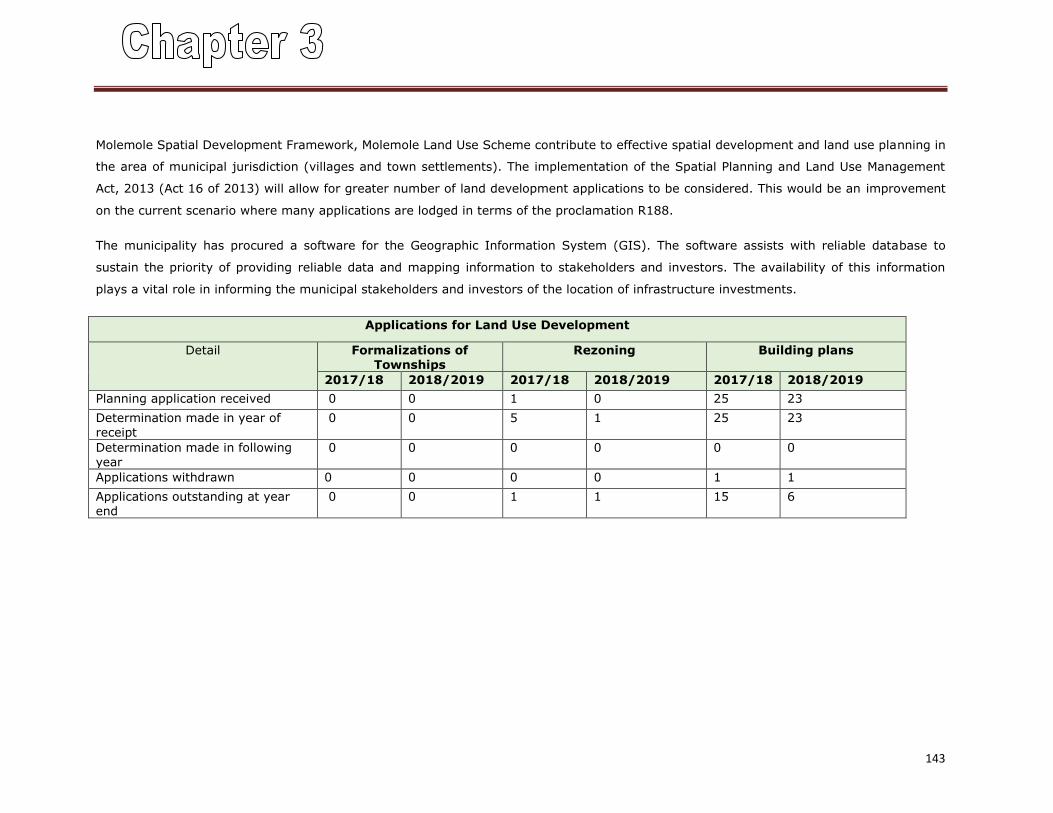
143
Molemole Spatial Development Framework, Molemole Land Use Scheme contribute to effective spatial development and land use planning in
the area of municipal jurisdiction (villages and town settlements). The implementation of the Spatial Planning and Land Use Management
Act, 2013 (Act 16 of 2013) will allow for greater number of land development applications to be considered. This would be an improvement
on the current scenario where many applications are lodged in terms of the proclamation R188.
The municipality has procured a software for the Geographic Information System (GIS). The software assists with reliable database to
sustain the priority of providing reliable data and mapping information to stakeholders and investors. The availability of this information
plays a vital role in informing the municipal stakeholders and investors of the location of infrastructure investments.
Applications for Land Use Development
Detail Formalizations of Townships
Rezoning Building plans
2017/18 2018/2019 2017/18 2018/2019 2017/18 2018/2019
Planning application received 0 0 1 0 25 23
Determination made in year of
receipt
0 0 5 1 25 23
Determination made in following year
0 0 0 0 0 0
Applications withdrawn 0 0 0 0 1 1
Applications outstanding at year end
0 0 1 1 15 6
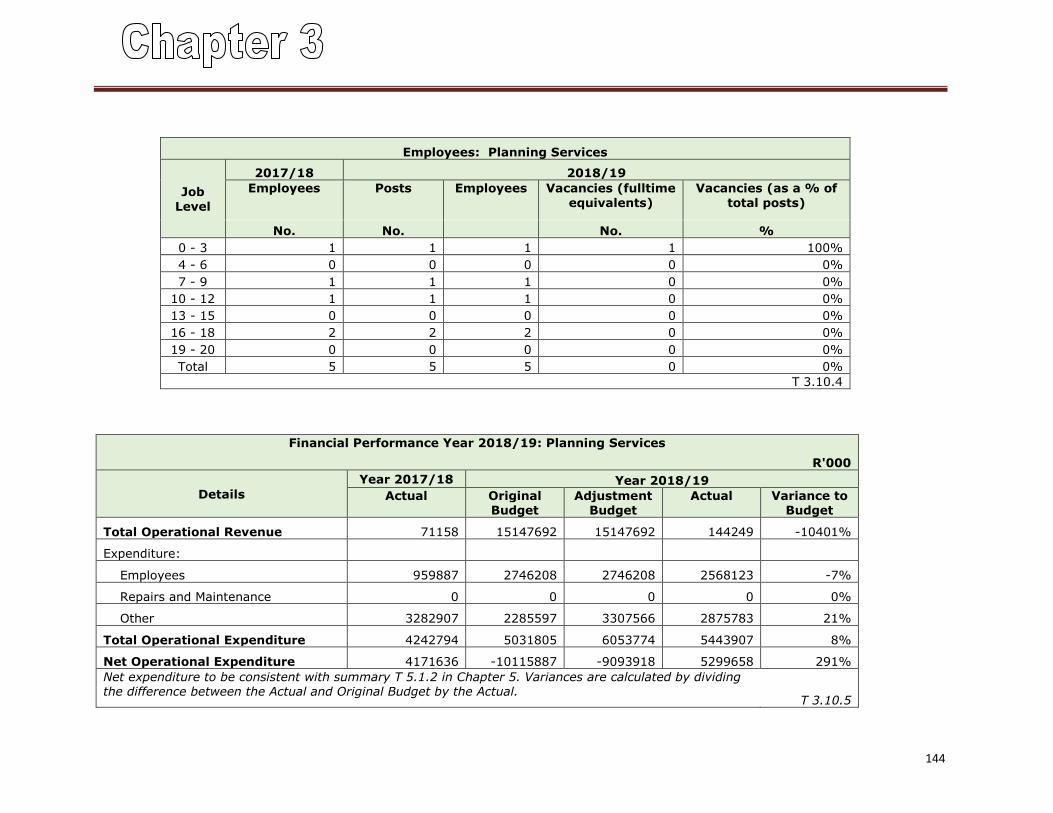
144
Employees: Planning Services
Job
Level
2017/18 2018/19
Employees Posts Employees Vacancies (fulltime
equivalents)
Vacancies (as a % of
total posts)
No. No. No. %
0 - 3 1 1 1 1 100%
4 - 6 0 0 0 0 0%
7 - 9 1 1 1 0 0%
10 - 12 1 1 1 0 0%
13 - 15 0 0 0 0 0%
16 - 18 2 2 2 0 0%
19 - 20 0 0 0 0 0%
Total 5 5 5 0 0%
T 3.10.4
Financial Performance Year 2018/19: Planning Services
R'000
Details
Year 2017/18 Year 2018/19
Actual Original Budget
Adjustment Budget
Actual Variance to Budget
Total Operational Revenue 71158 15147692 15147692 144249 -10401%
Expenditure:
Employees 959887 2746208 2746208 2568123 -7%
Repairs and Maintenance 0 0 0 0 0%
Other 3282907 2285597 3307566 2875783 21%
Total Operational Expenditure 4242794 5031805 6053774 5443907 8%
Net Operational Expenditure 4171636 -10115887 -9093918 5299658 291%
Net expenditure to be consistent with summary T 5.1.2 in Chapter 5. Variances are calculated by dividing the difference between the Actual and Original Budget by the Actual.
T 3.10.5
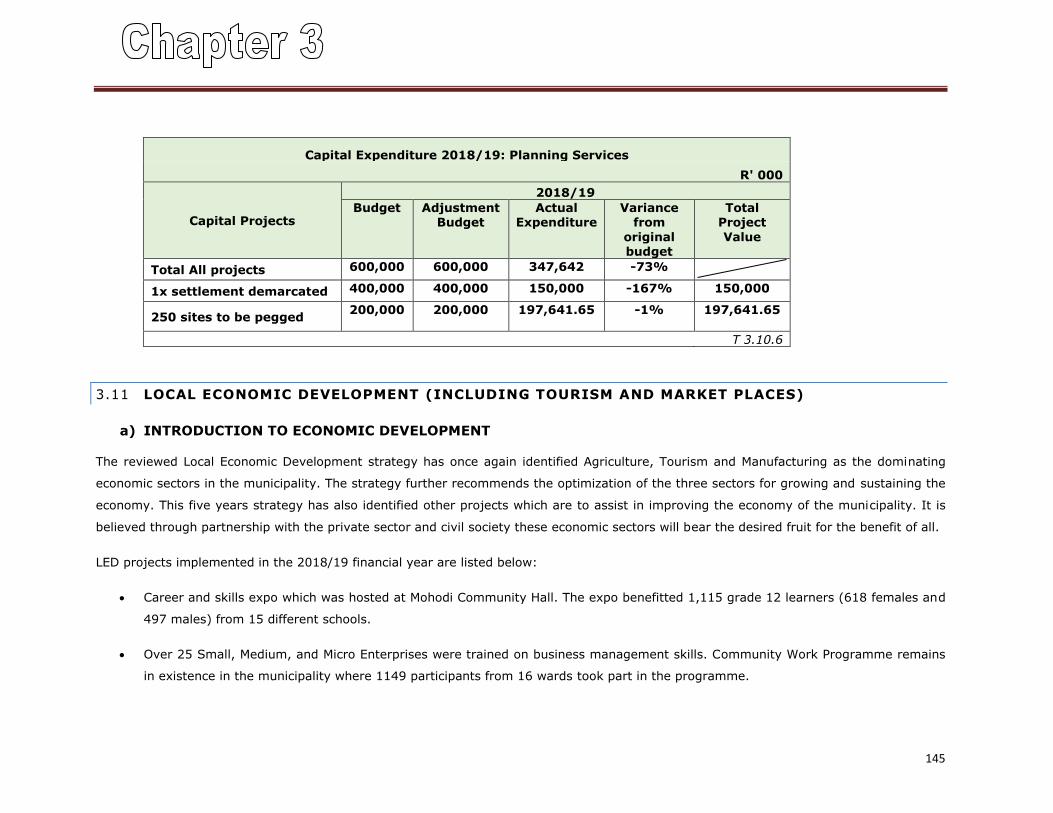
145
Capital Expenditure 2018/19: Planning Services
R' 000
Capital Projects
2018/19
Budget Adjustment Budget
Actual Expenditure
Variance from
original budget
Total Project
Value
Total All projects 600,000 600,000 347,642 -73%
1x settlement demarcated 400,000 400,000 150,000 -167% 150,000
250 sites to be pegged 200,000 200,000 197,641.65 -1% 197,641.65
T 3.10.6
3.11 LOCAL ECONOMIC DEVELOPMENT (INCLUDING TOURISM AND MARKET PLACES)
a) INTRODUCTION TO ECONOMIC DEVELOPMENT
The reviewed Local Economic Development strategy has once again identified Agriculture, Tourism and Manufacturing as the dominating
economic sectors in the municipality. The strategy further recommends the optimization of the three sectors for growing and sustaining the
economy. This five years strategy has also identified other projects which are to assist in improving the economy of the municipality. It is
believed through partnership with the private sector and civil society these economic sectors will bear the desired fruit for the benefit of all.
LED projects implemented in the 2018/19 financial year are listed below:
Career and skills expo which was hosted at Mohodi Community Hall. The expo benefitted 1,115 grade 12 learners (618 females and
497 males) from 15 different schools.
Over 25 Small, Medium, and Micro Enterprises were trained on business management skills. Community Work Programme remains
in existence in the municipality where 1149 participants from 16 wards took part in the programme.
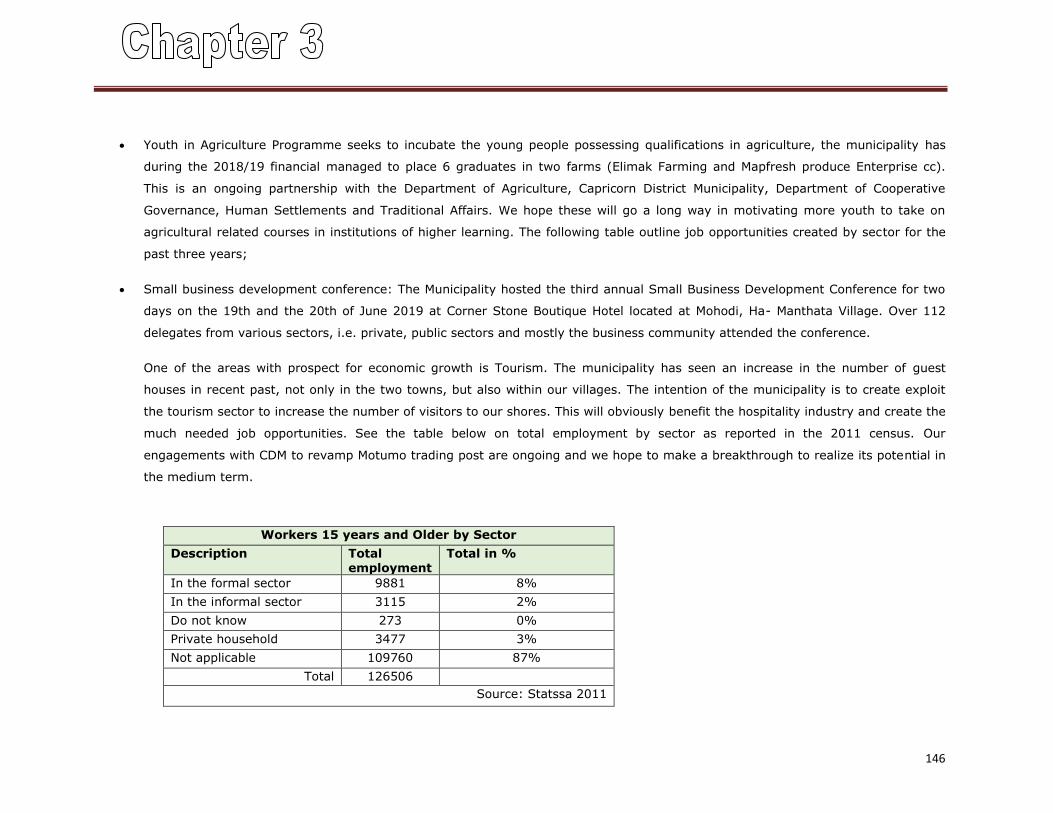
146
Youth in Agriculture Programme seeks to incubate the young people possessing qualifications in agriculture, the municipality has
during the 2018/19 financial managed to place 6 graduates in two farms (Elimak Farming and Mapfresh produce Enterprise cc).
This is an ongoing partnership with the Department of Agriculture, Capricorn District Municipality, Department of Cooperative
Governance, Human Settlements and Traditional Affairs. We hope these will go a long way in motivating more youth to take on
agricultural related courses in institutions of higher learning. The following table outline job opportunities created by sector for the
past three years;
Small business development conference: The Municipality hosted the third annual Small Business Development Conference for two
days on the 19th and the 20th of June 2019 at Corner Stone Boutique Hotel located at Mohodi, Ha- Manthata Village. Over 112
delegates from various sectors, i.e. private, public sectors and mostly the business community attended the conference.
One of the areas with prospect for economic growth is Tourism. The municipality has seen an increase in the number of guest
houses in recent past, not only in the two towns, but also within our villages. The intention of the municipality is to create exploit
the tourism sector to increase the number of visitors to our shores. This will obviously benefit the hospitality industry and create the
much needed job opportunities. See the table below on total employment by sector as reported in the 2011 census. Our
engagements with CDM to revamp Motumo trading post are ongoing and we hope to make a breakthrough to realize its potential in
the medium term.
Workers 15 years and Older by Sector
Description Total employment
Total in %
In the formal sector 9881 8%
In the informal sector 3115 2%
Do not know 273 0%
Private household 3477 3%
Not applicable 109760 87%
Total 126506
Source: Statssa 2011
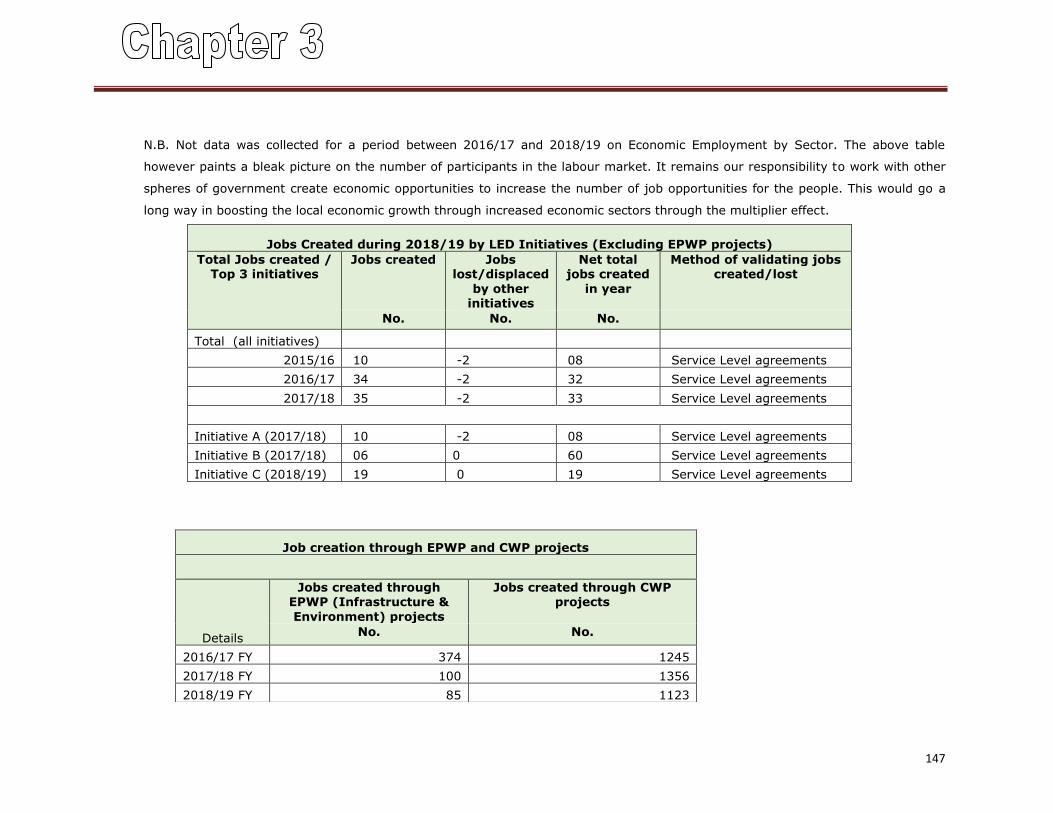
147
N.B. Not data was collected for a period between 2016/17 and 2018/19 on Economic Employment by Sector. The above table
however paints a bleak picture on the number of participants in the labour market. It remains our responsibility to work with other
spheres of government create economic opportunities to increase the number of job opportunities for the people. This would go a
long way in boosting the local economic growth through increased economic sectors through the multiplier effect.
Jobs Created during 2018/19 by LED Initiatives (Excluding EPWP projects)
Total Jobs created / Top 3 initiatives
Jobs created Jobs lost/displaced
by other initiatives
Net total jobs created
in year
Method of validating jobs created/lost
No. No. No.
Total (all initiatives)
2015/16 10 -2 08 Service Level agreements
2016/17 34 -2 32 Service Level agreements
2017/18 35 -2 33 Service Level agreements
Initiative A (2017/18) 10 -2 08 Service Level agreements
Initiative B (2017/18) 06 0 60 Service Level agreements
Initiative C (2018/19) 19 0 19 Service Level agreements
Job creation through EPWP and CWP projects
Details
Jobs created through EPWP (Infrastructure &
Environment) projects
Jobs created through CWP projects
No. No.
2016/17 FY 374 1245
2017/18 FY 100 1356
2018/19 FY 85 1123
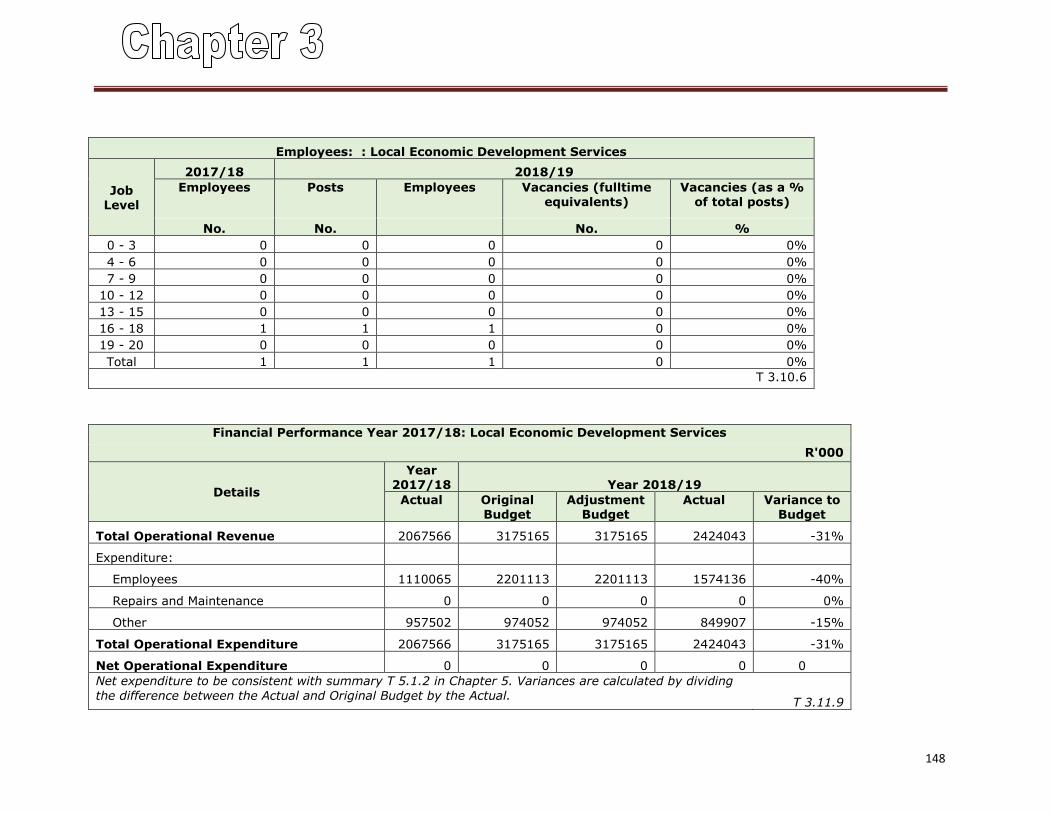
148
Employees: : Local Economic Development Services
Job Level
2017/18 2018/19
Employees Posts Employees Vacancies (fulltime equivalents)
Vacancies (as a % of total posts)
No. No. No. %
0 - 3 0 0 0 0 0%
4 - 6 0 0 0 0 0%
7 - 9 0 0 0 0 0%
10 - 12 0 0 0 0 0%
13 - 15 0 0 0 0 0%
16 - 18 1 1 1 0 0%
19 - 20 0 0 0 0 0%
Total 1 1 1 0 0%
T 3.10.6
Financial Performance Year 2017/18: Local Economic Development Services
R'000
Details
Year 2017/18 Year 2018/19
Actual Original Budget
Adjustment Budget
Actual Variance to Budget
Total Operational Revenue 2067566 3175165 3175165 2424043 -31%
Expenditure:
Employees 1110065 2201113 2201113 1574136 -40%
Repairs and Maintenance 0 0 0 0 0%
Other 957502 974052 974052 849907 -15%
Total Operational Expenditure 2067566 3175165 3175165 2424043 -31%
Net Operational Expenditure 0 0 0 0 0
Net expenditure to be consistent with summary T 5.1.2 in Chapter 5. Variances are calculated by dividing
the difference between the Actual and Original Budget by the Actual. T 3.11.9
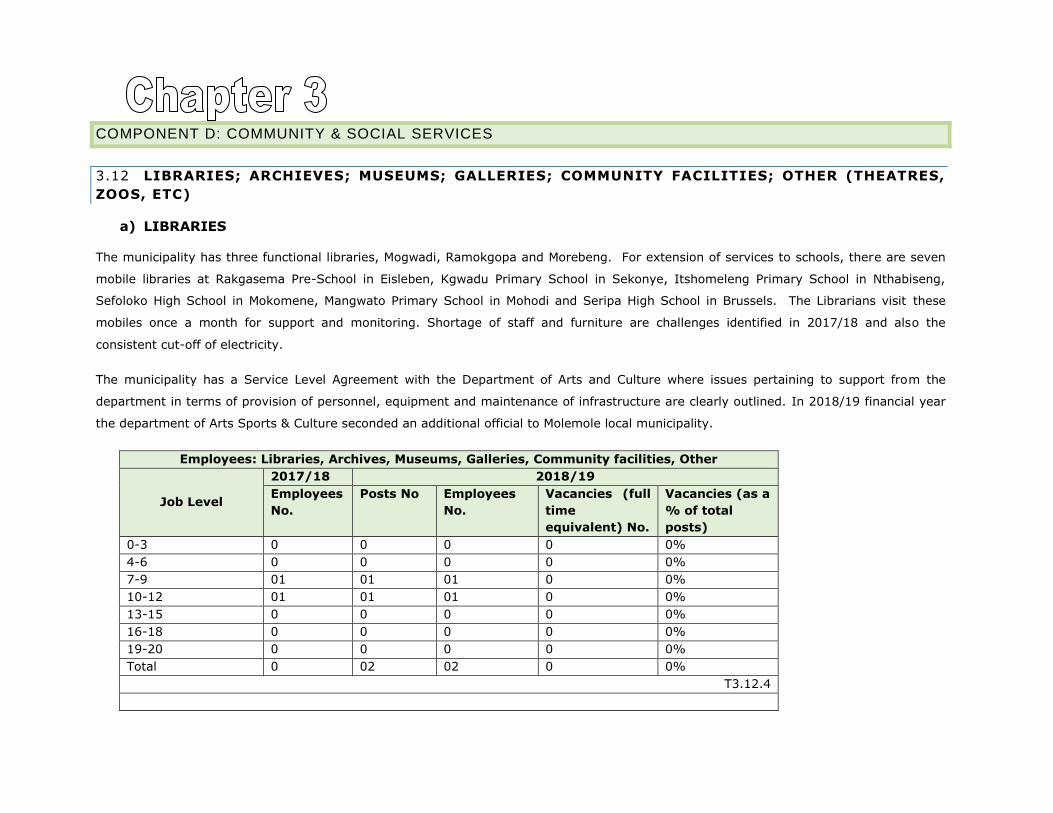
COMPONENT D: COMMUNITY & SOCIAL SERVICES
3.12 LIBRARIES; ARCHIEVES; MUSEUMS; GALLERIES; COMMUNITY FACILITIES; OTHER (THEATRES,
ZOOS, ETC)
a) LIBRARIES
The municipality has three functional libraries, Mogwadi, Ramokgopa and Morebeng. For extension of services to schools, there are seven
mobile libraries at Rakgasema Pre-School in Eisleben, Kgwadu Primary School in Sekonye, Itshomeleng Primary School in Nthabiseng,
Sefoloko High School in Mokomene, Mangwato Primary School in Mohodi and Seripa High School in Brussels. The Librarians visit these
mobiles once a month for support and monitoring. Shortage of staff and furniture are challenges identified in 2017/18 and also the
consistent cut-off of electricity.
The municipality has a Service Level Agreement with the Department of Arts and Culture where issues pertaining to support from the
department in terms of provision of personnel, equipment and maintenance of infrastructure are clearly outlined. In 2018/19 financial year
the department of Arts Sports & Culture seconded an additional official to Molemole local municipality.
Employees: Libraries, Archives, Museums, Galleries, Community facilities, Other
Job Level
2017/18 2018/19
Employees
No.
Posts No Employees
No.
Vacancies (full
time
equivalent) No.
Vacancies (as a
% of total
posts)
0-3 0 0 0 0 0%
4-6 0 0 0 0 0%
7-9 01 01 01 0 0%
10-12 01 01 01 0 0%
13-15 0 0 0 0 0%
16-18 0 0 0 0 0%
19-20 0 0 0 0 0%
Total 0 02 02 0 0%
T3.12.4
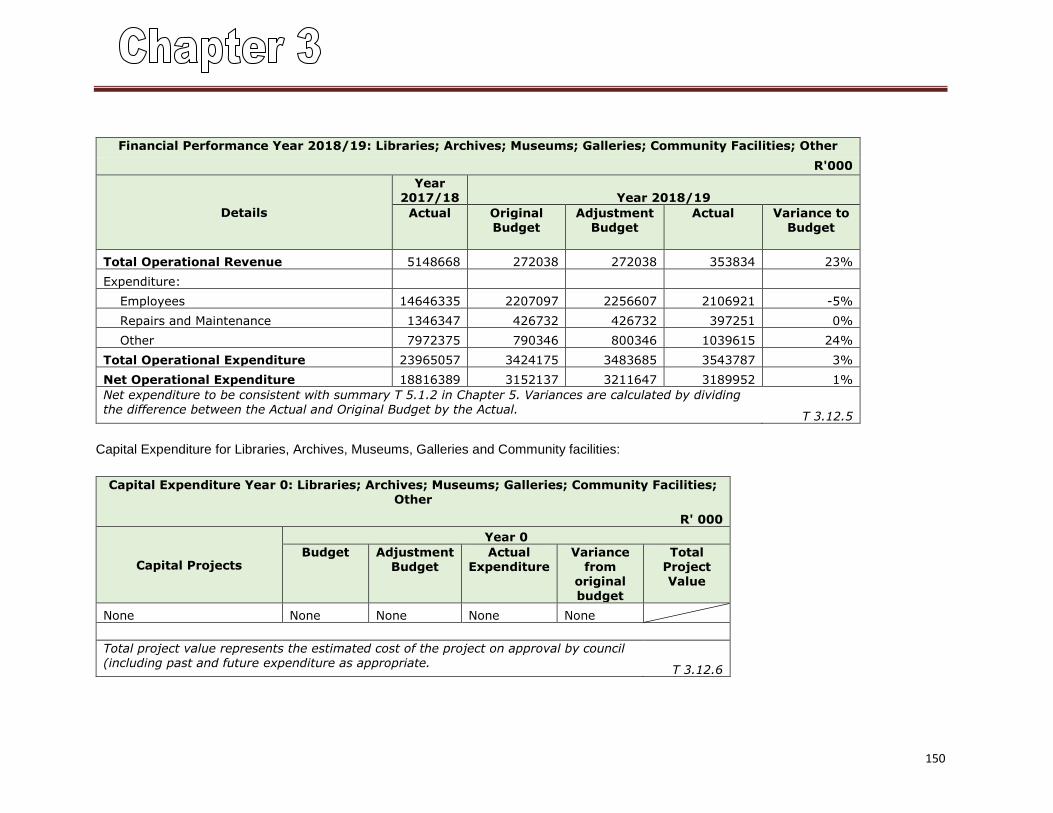
150
Financial Performance Year 2018/19: Libraries; Archives; Museums; Galleries; Community Facilities; Other
R'000
Details
Year 2017/18 Year 2018/19
Actual Original Budget
Adjustment Budget
Actual Variance to Budget
Total Operational Revenue 5148668 272038 272038 353834 23%
Expenditure:
Employees 14646335 2207097 2256607 2106921 -5%
Repairs and Maintenance 1346347 426732 426732 397251 0%
Other 7972375 790346 800346 1039615 24%
Total Operational Expenditure 23965057 3424175 3483685 3543787 3%
Net Operational Expenditure 18816389 3152137 3211647 3189952 1%
Net expenditure to be consistent with summary T 5.1.2 in Chapter 5. Variances are calculated by dividing the difference between the Actual and Original Budget by the Actual.
T 3.12.5
Capital Expenditure for Libraries, Archives, Museums, Galleries and Community facilities:
Capital Expenditure Year 0: Libraries; Archives; Museums; Galleries; Community Facilities; Other
R' 000
Capital Projects
Year 0
Budget Adjustment Budget
Actual Expenditure
Variance from
original budget
Total Project Value
None None None None None
Total project value represents the estimated cost of the project on approval by council (including past and future expenditure as appropriate.
T 3.12.6
151
3.13 CEMETORIES AND CREMATORIUMS
a) CEMETERIES
The municipality still has two cemeteries in our towns of Mogwadi and Morebeng. Both cemeteries are fenced but still lack ablution blocks.
The cemeteries are maintained on a continuous basis by the staff from Community services department. The municipality is responsible for
digging graves as and when there is need by appointing a service provider. Rural communities are supported by grading of roads leading to
cemeteries and cutting of grass by Community Works Programme (CWP) beneficiaries. Currently the municipality does not have any
crematoriums.
b) SERVICE STATISTICS FOR CEMETORIES
The department is considering insourcing the function as it has proved to not be cost-effective to appoint a service provider every time
there is a funeral. Budget allocation has been approved in the 2019/20 financial year for the procurement of a Tractor Loader Backhoe
(TLB) to enable the insourcing.
3.14 CHILD CARE; AGED CARE; SOCIAL PROGRAMMES
a) INTRODUCTION TO CHILD AND AGED CARE; SOCIAL PROGRAMMES
The special programmes office is responsible for the coordination of activities relating to: HIV/AIDS, People living with Disabilities, Older
Persons, Youth as well as Women and Children. The municipal council has approved an additional two more positions in the Special
Programmes unit as a way of appreciating the challenges of only one official to coordinate all the activities under this unit. The two positions
are expected to be filled in the first quarter of the 2019/20 financial year. This will go a long way ensuring an effective coordination of all
the activities.
The following forums have been established to assist with coordination of special programmes functions:
- Local Aids Council: The council hold meetings on a quarterly basis and is chaired by the Mayor. The Technical Aids Committee is
chaired by the Municipal Manager and prepares reports for the Local Aids Council. The Council is constituted by civil society, sector
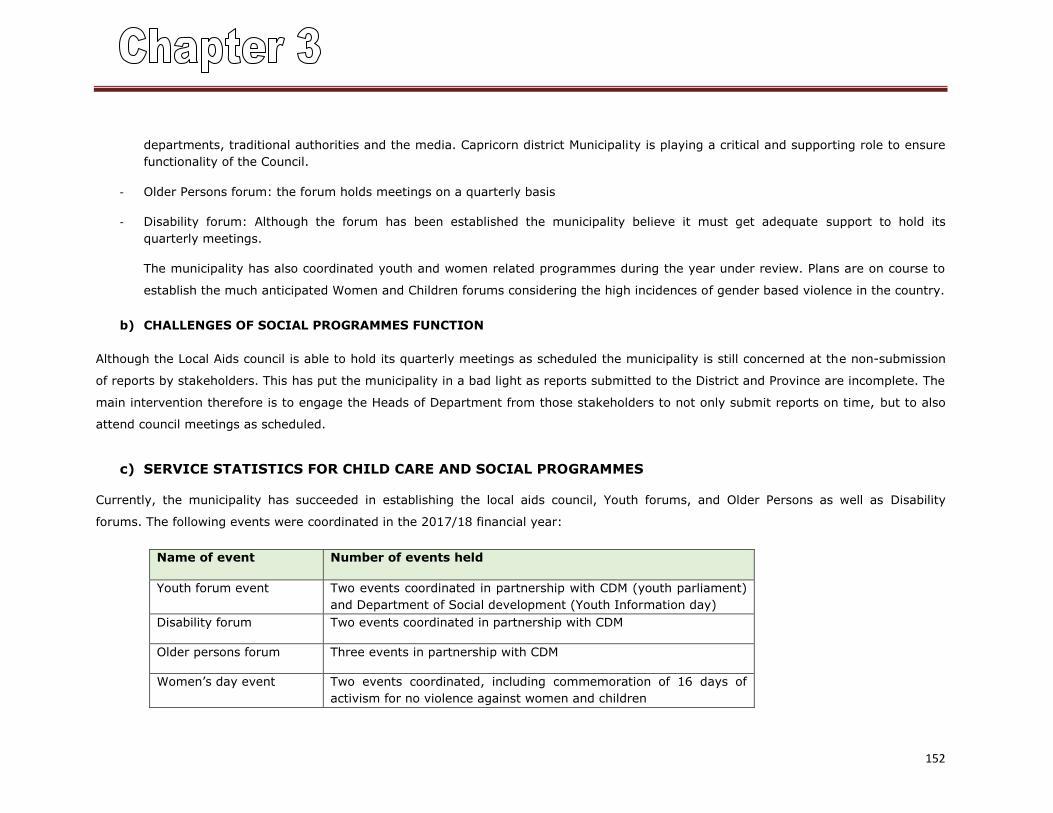
152
departments, traditional authorities and the media. Capricorn district Municipality is playing a critical and supporting role to ensure
functionality of the Council.
- Older Persons forum: the forum holds meetings on a quarterly basis
- Disability forum: Although the forum has been established the municipality believe it must get adequate support to hold its
quarterly meetings.
The municipality has also coordinated youth and women related programmes during the year under review. Plans are on course to
establish the much anticipated Women and Children forums considering the high incidences of gender based violence in the country.
b) CHALLENGES OF SOCIAL PROGRAMMES FUNCTION
Although the Local Aids council is able to hold its quarterly meetings as scheduled the municipality is still concerned at the non-submission
of reports by stakeholders. This has put the municipality in a bad light as reports submitted to the District and Province are incomplete. The
main intervention therefore is to engage the Heads of Department from those stakeholders to not only submit reports on time, but to also
attend council meetings as scheduled.
c) SERVICE STATISTICS FOR CHILD CARE AND SOCIAL PROGRAMMES
Currently, the municipality has succeeded in establishing the local aids council, Youth forums, and Older Persons as well as Disability
forums. The following events were coordinated in the 2017/18 financial year:
Name of event Number of events held
Youth forum event
Two events coordinated in partnership with CDM (youth parliament)
and Department of Social development (Youth Information day)
Disability forum
Two events coordinated in partnership with CDM
Older persons forum
Three events in partnership with CDM
Women’s day event Two events coordinated, including commemoration of 16 days of
activism for no violence against women and children
153
COMPONENT E: ENVIRONMENTAL PROTECTION
3.15 POLLUTION CONTROL
a) INTRODUCTION TO POLLUTION CONTROL
The district is the competent authority on air quality. The municipality provides a facilitation and coordination role on initiatives conducted
within the municipal jurisdiction. The District has just finalized the air quality management plan (AQMP) in February 2018 which focus on
the following aspects:
Health impacts of key atmospheric pollutants
Meteorological review
Ambient air quality control and management
Source identification and emission quantification
Air quality management
Emission reduction strategies and implementation
Capacity Building and training. The municipality will provide a supporting role during the implementation of the above within our area. The AQMP plan will guide the
current state of air quality in an area, how it is changing over time and what can be done to ensure clean air is achieved and
maintained.
COMPONENT F: HEALTH
3.17 CLINICS
The function is a key competency for the Department of Health. The municipality only plays a coordinating role by referring any community
requests to the department of health. All requests raised during Mayoral Imbizos are accordingly forwarded and follow ups are made to give
feedback to the community.
154
3.18 AMBULANCE SERVICES
The function is a key competency for the Department of Social development. The municipality only plays a coordinating role
3.19 HEALTH INSPECTION; FOOD AND ABBATOIR LICENSING AND INSPECTION; ETC
The function is a key competency for the Capricorn District Municipality. The municipality only plays a coordinating role
COMPONENT G: SECURITY AND SAFETY
The Community Safety Forum (CSF) in Molemole local municipality was established during 2010/11 financial year by the MEC of the
department of Safety, Security and Liaison, the structure is still existing, and members were inaugurated on the 8th May 2017 and will serve
for a period of five (5) years. The main aim of the CSF is to empower the community of Molemole on issues related to safety and security at
their local areas. Molemole municipality has nine (9) CSF members, who at first were working voluntarily without being paid. Currently the
municipality managed to accommodate them in the Extended Public Works Programme (EPWP) budget.
3.20 POLICE
The function is a key competency for the South African Police Services (SAPS)
3.21 FIRE
The function is a key competency for the Capricorn District Municipality.
3.22 OTHER (DISASTER MANAGEMENT, ANIMAL LICENCING AND CONTROL, CONTROL OF PUBLIC
NUISANCES AND OTHER)
The functions are a key competency for the South African Police Services (SAPS) and Capricorn District Municipality.
155
COMPONENT H: SPORT AND RECREATION
3.23 SPORT AND RECREATION
a) INTRODUCTION TO SPORTS AND RECREATION
Sports and Recreation are key competencies of the Department of Sports, Arts and Culture. The municipality coordinates programmes from
the department and Capricorn District Municipality. Due to budget constraints, there are limitations for coordination and community
support at times.
After failure by the municipality to pursue the service provider to complete the renovation of Ramokgopa stadium the Council of Molemole
approved budget for finalization of the work in the 2019/20 financial year. Mohodi sports complex project could not be finalized in the
2018/19 financial year as envisaged. Council has however allocated the budget for the installation of grand stands in the 2019/20 financial
year. It expected that the stadium will be handed over by the end of 2nd quarter of the 2019/20 financial year.
The municipality is still continuing to assist with grading of soccer fields in the villages to create a platform for the youth to engage in sports
and recreational activities. The municipality has participated in all district and provincial games and gave support to local participants
through transportation.
156
COMPONENT I: CORPORATE POLICY OFFICES AND OTHER SERVICES
3.24 EXECUTIVE AND COUNCIL
a) INTRODUCTION TO CORPORATE POLICY OFFICES
The functions in this category are distributed amongst different Directorates within the Municipality. Corporate policy issues are handled on
a departmental basis depending on the responsibility for the specific function. The Directorate Financial Services is responsible for the
financial affairs or the Municipality. The Directorate Corporate Services is responsible for the Human Resources as well as Information
Technology functions of the Municipality. The latter Directorate is also responsible for rendering general administrative services to the
Municipality overall as well as administrative and support services to ensure the effective functioning of Council and its Committees. Specific
support services are rendered to the Office of the Mayor, Executive Committee and the Office of the Speaker and Chief Whip.
b) THE EXECUTIVE AND COUNCIL
The municipal council consists of thirty two (32) Councillors composed of three political parties, the ANC, the EFF and the Democratic
Alliance. Molemole municipality has constituted an Executive Committee led by the Mayor, Councillor Paya. Corporate Services department
is responsible to provide general administrative support to the office of the Speaker and Chief Whip whilst office of the MM is responsible to
provide administrative support to office of the Mayor.
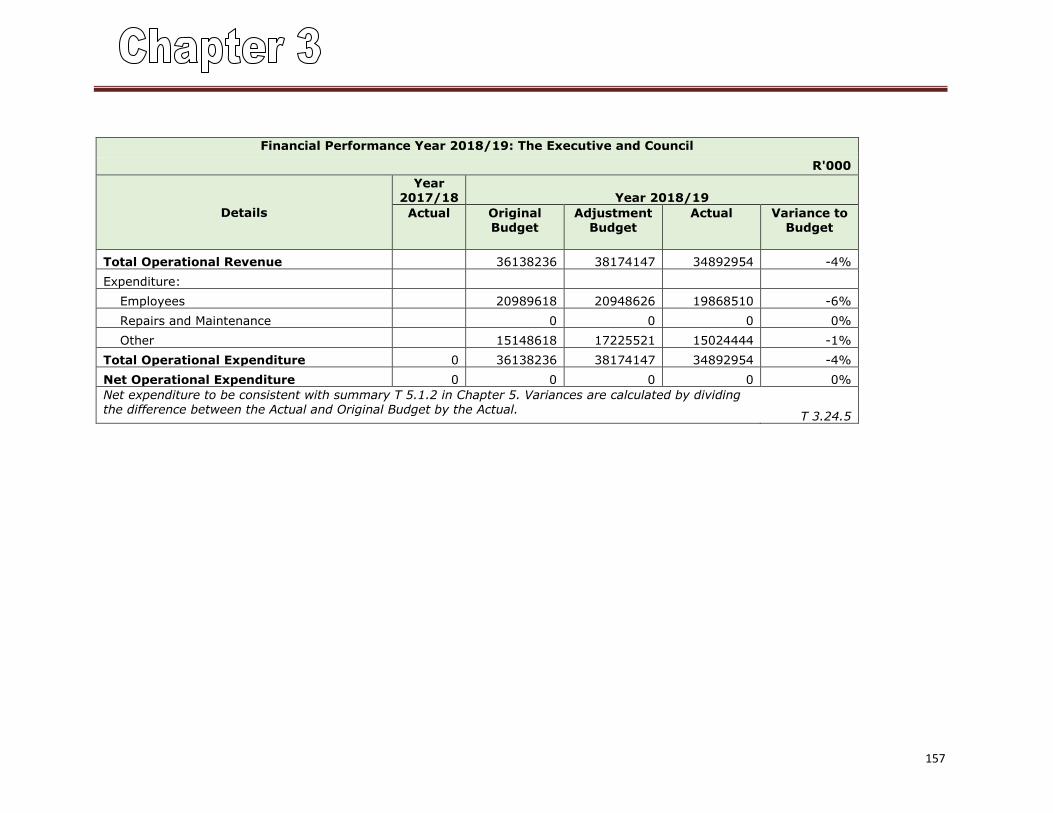
157
Financial Performance Year 2018/19: The Executive and Council
R'000
Details
Year 2017/18 Year 2018/19
Actual Original Budget
Adjustment Budget
Actual Variance to Budget
Total Operational Revenue 36138236 38174147 34892954 -4%
Expenditure:
Employees 20989618 20948626 19868510 -6%
Repairs and Maintenance 0 0 0 0%
Other 15148618 17225521 15024444 -1%
Total Operational Expenditure 0 36138236 38174147 34892954 -4%
Net Operational Expenditure 0 0 0 0 0%
Net expenditure to be consistent with summary T 5.1.2 in Chapter 5. Variances are calculated by dividing the difference between the Actual and Original Budget by the Actual.
T 3.24.5
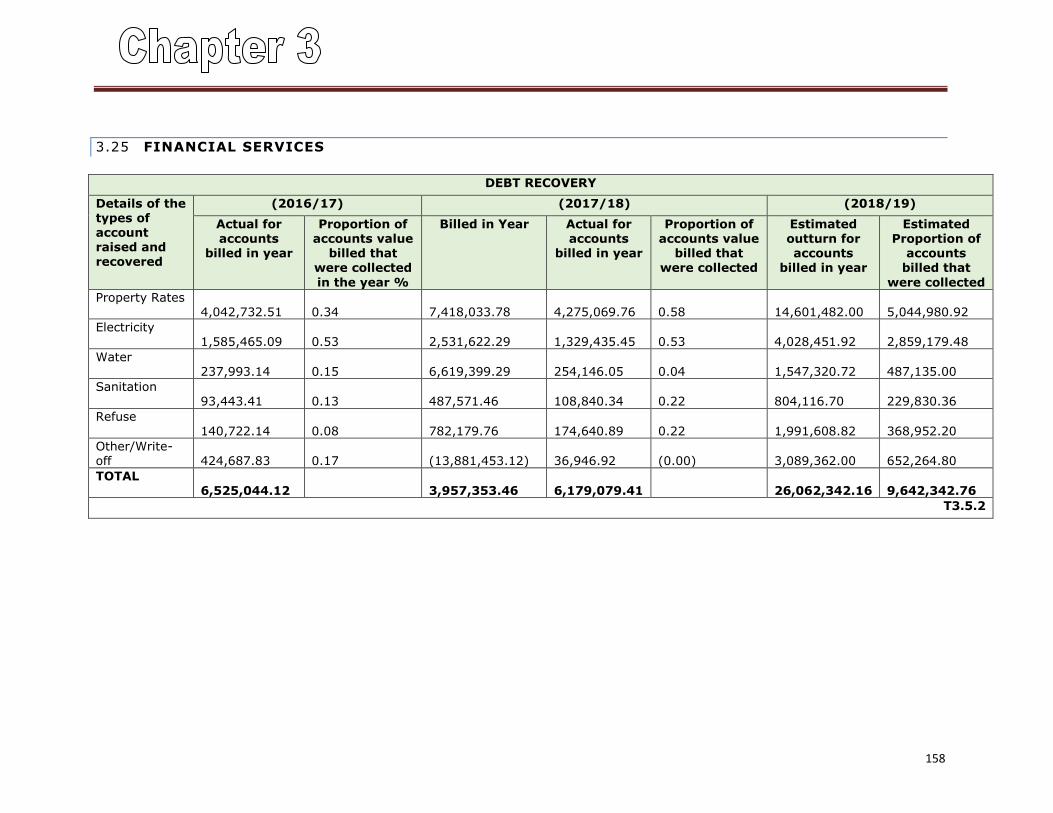
158
3.25 FINANCIAL SERVICES
DEBT RECOVERY
Details of the types of account raised and
recovered
(2016/17) (2017/18) (2018/19)
Actual for accounts
billed in year
Proportion of accounts value
billed that
were collected
in the year %
Billed in Year Actual for accounts
billed in year
Proportion of accounts value
billed that
were collected
Estimated outturn for accounts
billed in year
Estimated Proportion of
accounts
billed that
were collected
Property Rates 4,042,732.51
0.34
7,418,033.78
4,275,069.76
0.58
14,601,482.00
5,044,980.92
Electricity 1,585,465.09
0.53
2,531,622.29
1,329,435.45
0.53
4,028,451.92
2,859,179.48
Water 237,993.14
0.15
6,619,399.29
254,146.05
0.04
1,547,320.72
487,135.00
Sanitation 93,443.41
0.13
487,571.46
108,840.34
0.22
804,116.70
229,830.36
Refuse
140,722.14
0.08
782,179.76
174,640.89
0.22
1,991,608.82
368,952.20
Other/Write-off
424,687.83
0.17
(13,881,453.12)
36,946.92
(0.00)
3,089,362.00
652,264.80
TOTAL 6,525,044.12
3,957,353.46
6,179,079.41
26,062,342.16
9,642,342.76
T3.5.2
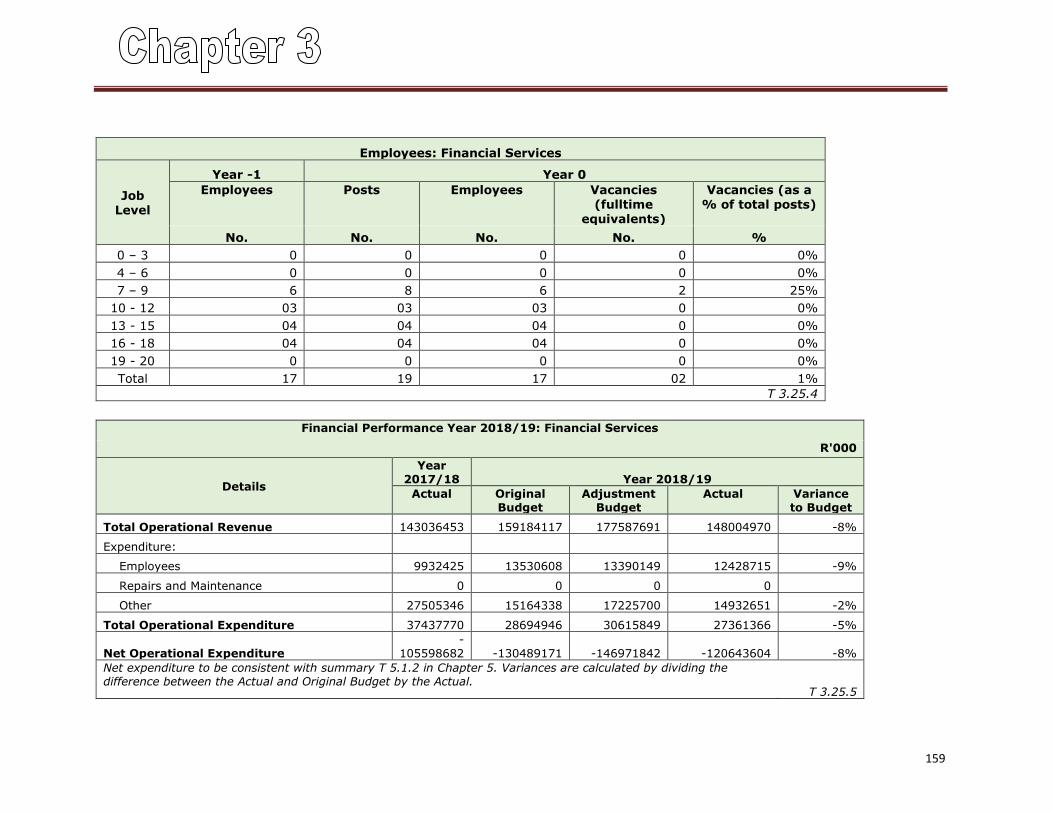
159
Employees: Financial Services
Job Level
Year -1 Year 0
Employees Posts Employees Vacancies (fulltime
equivalents)
Vacancies (as a % of total posts)
No. No. No. No. %
0 – 3 0 0 0 0 0%
4 – 6 0 0 0 0 0%
7 – 9 6 8 6 2 25%
10 - 12 03 03 03 0 0%
13 - 15 04 04 04 0 0%
16 - 18 04 04 04 0 0%
19 - 20 0 0 0 0 0%
Total 17 19 17 02 1%
T 3.25.4
Financial Performance Year 2018/19: Financial Services
R'000
Details
Year 2017/18 Year 2018/19
Actual Original Budget
Adjustment Budget
Actual Variance to Budget
Total Operational Revenue 143036453 159184117 177587691 148004970 -8%
Expenditure:
Employees 9932425 13530608 13390149 12428715 -9%
Repairs and Maintenance 0 0 0 0
Other 27505346 15164338 17225700 14932651 -2%
Total Operational Expenditure 37437770 28694946 30615849 27361366 -5%
Net Operational Expenditure
-
105598682 -130489171 -146971842 -120643604 -8%
Net expenditure to be consistent with summary T 5.1.2 in Chapter 5. Variances are calculated by dividing the difference between the Actual and Original Budget by the Actual.
T 3.25.5
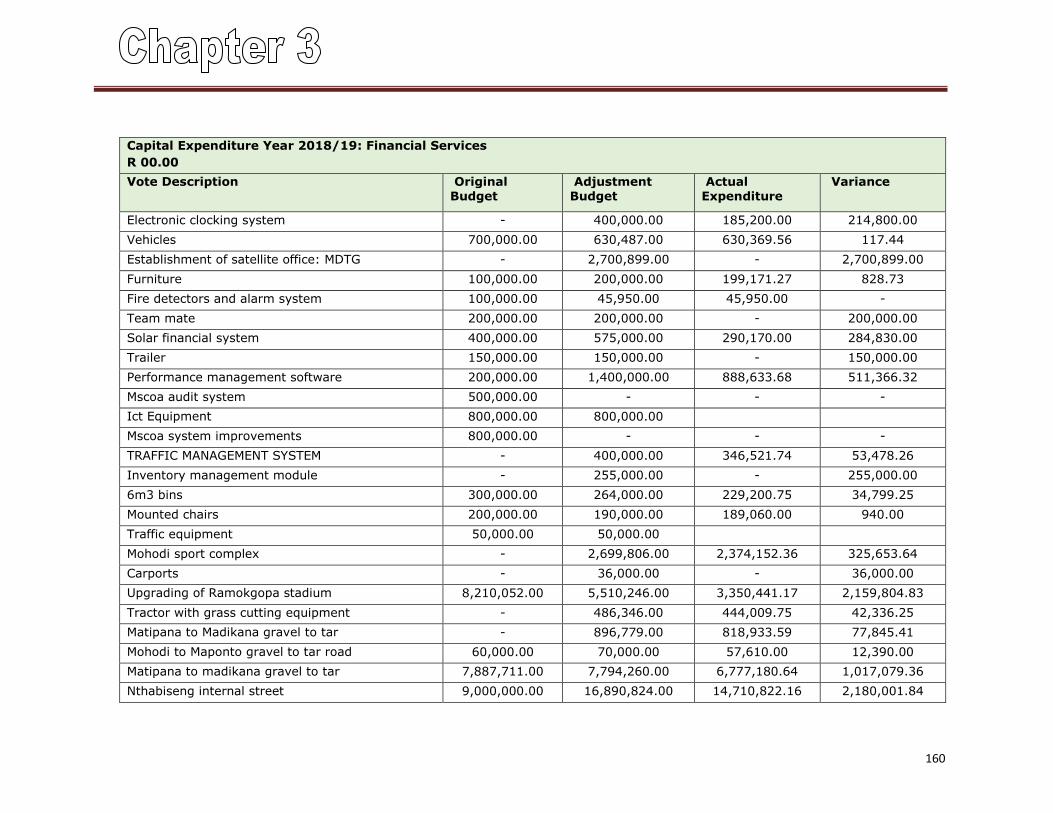
160
Capital Expenditure Year 2018/19: Financial Services
R 00.00
Vote Description Original Budget
Adjustment Budget
Actual Expenditure
Variance
Electronic clocking system - 400,000.00 185,200.00 214,800.00
Vehicles 700,000.00 630,487.00 630,369.56 117.44
Establishment of satellite office: MDTG - 2,700,899.00 - 2,700,899.00
Furniture 100,000.00 200,000.00 199,171.27 828.73
Fire detectors and alarm system 100,000.00 45,950.00 45,950.00 -
Team mate 200,000.00 200,000.00 - 200,000.00
Solar financial system 400,000.00 575,000.00 290,170.00 284,830.00
Trailer 150,000.00 150,000.00 - 150,000.00
Performance management software 200,000.00 1,400,000.00 888,633.68 511,366.32
Mscoa audit system 500,000.00 - - -
Ict Equipment 800,000.00 800,000.00
Mscoa system improvements 800,000.00 - - -
TRAFFIC MANAGEMENT SYSTEM - 400,000.00 346,521.74 53,478.26
Inventory management module - 255,000.00 - 255,000.00
6m3 bins 300,000.00 264,000.00 229,200.75 34,799.25
Mounted chairs 200,000.00 190,000.00 189,060.00 940.00
Traffic equipment 50,000.00 50,000.00
Mohodi sport complex - 2,699,806.00 2,374,152.36 325,653.64
Carports - 36,000.00 - 36,000.00
Upgrading of Ramokgopa stadium 8,210,052.00 5,510,246.00 3,350,441.17 2,159,804.83
Tractor with grass cutting equipment - 486,346.00 444,009.75 42,336.25
Matipana to Madikana gravel to tar - 896,779.00 818,933.59 77,845.41
Mohodi to Maponto gravel to tar road 60,000.00 70,000.00 57,610.00 12,390.00
Matipana to madikana gravel to tar 7,887,711.00 7,794,260.00 6,777,180.64 1,017,079.36
Nthabiseng internal street 9,000,000.00 16,890,824.00 14,710,822.16 2,180,001.84
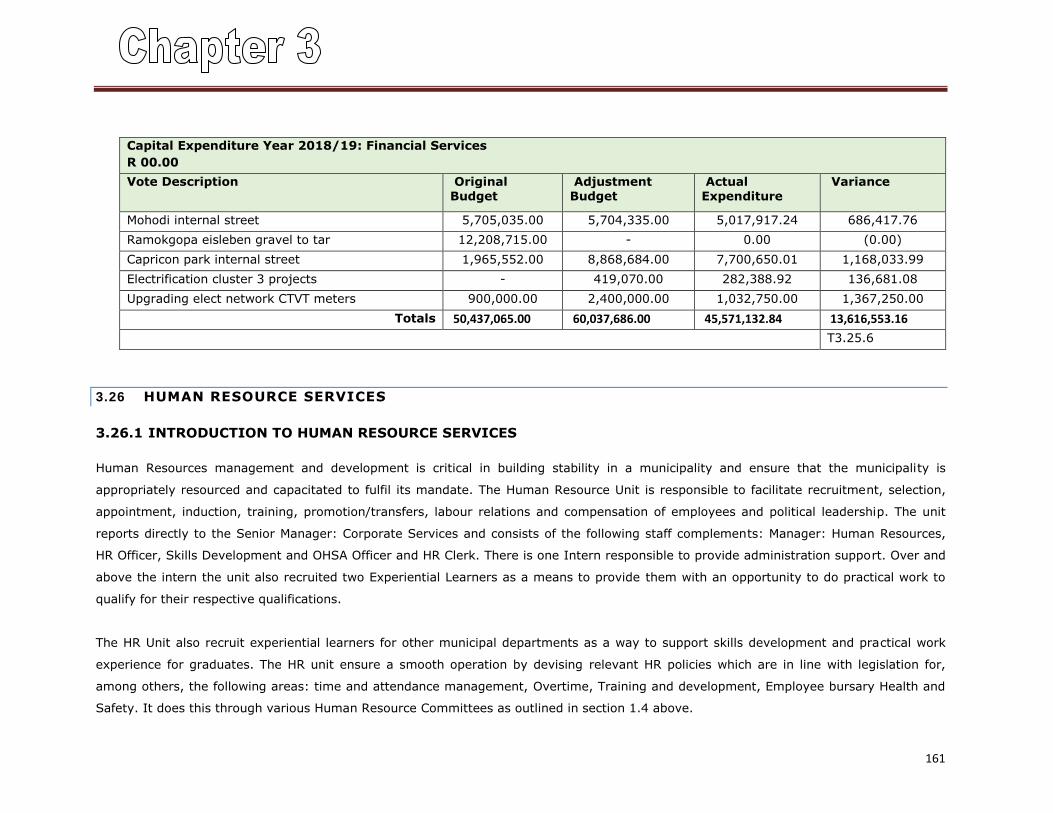
161
Capital Expenditure Year 2018/19: Financial Services
R 00.00
Vote Description Original Budget
Adjustment Budget
Actual Expenditure
Variance
Mohodi internal street 5,705,035.00 5,704,335.00 5,017,917.24 686,417.76
Ramokgopa eisleben gravel to tar 12,208,715.00 - 0.00 (0.00)
Capricon park internal street 1,965,552.00 8,868,684.00 7,700,650.01 1,168,033.99
Electrification cluster 3 projects - 419,070.00 282,388.92 136,681.08
Upgrading elect network CTVT meters 900,000.00 2,400,000.00 1,032,750.00 1,367,250.00
Totals 50,437,065.00 60,037,686.00 45,571,132.84 13,616,553.16
T3.25.6
3.26 HUMAN RESOURCE SERVICES
3.26.1 INTRODUCTION TO HUMAN RESOURCE SERVICES
Human Resources management and development is critical in building stability in a municipality and ensure that the municipality is
appropriately resourced and capacitated to fulfil its mandate. The Human Resource Unit is responsible to facilitate recruitment, selection,
appointment, induction, training, promotion/transfers, labour relations and compensation of employees and political leadership. The unit
reports directly to the Senior Manager: Corporate Services and consists of the following staff complements: Manager: Human Resources,
HR Officer, Skills Development and OHSA Officer and HR Clerk. There is one Intern responsible to provide administration support. Over and
above the intern the unit also recruited two Experiential Learners as a means to provide them with an opportunity to do practical work to
qualify for their respective qualifications.
The HR Unit also recruit experiential learners for other municipal departments as a way to support skills development and practical work
experience for graduates. The HR unit ensure a smooth operation by devising relevant HR policies which are in line with legislation for,
among others, the following areas: time and attendance management, Overtime, Training and development, Employee bursary Health and
Safety. It does this through various Human Resource Committees as outlined in section 1.4 above.
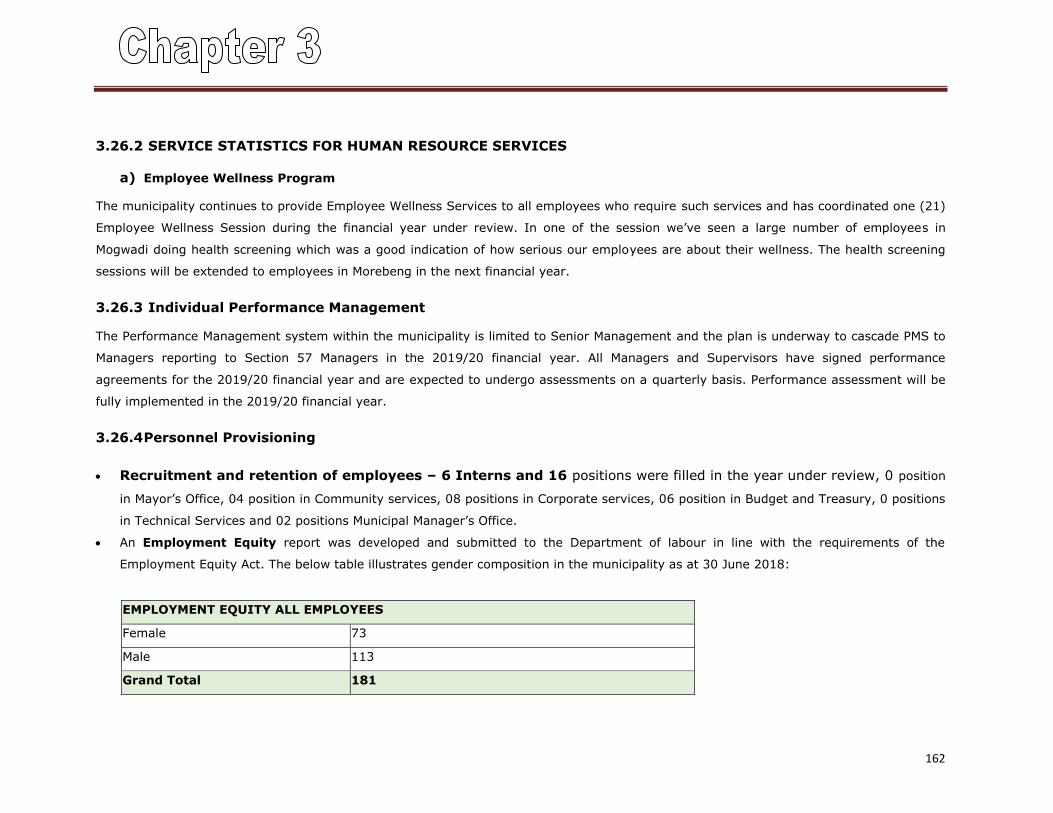
162
3.26.2 SERVICE STATISTICS FOR HUMAN RESOURCE SERVICES
a) Employee Wellness Program
The municipality continues to provide Employee Wellness Services to all employees who require such services and has coordinated one (21)
Employee Wellness Session during the financial year under review. In one of the session we’ve seen a large number of employees in
Mogwadi doing health screening which was a good indication of how serious our employees are about their wellness. The health screening
sessions will be extended to employees in Morebeng in the next financial year.
3.26.3 Individual Performance Management
The Performance Management system within the municipality is limited to Senior Management and the plan is underway to cascade PMS to
Managers reporting to Section 57 Managers in the 2019/20 financial year. All Managers and Supervisors have signed performance
agreements for the 2019/20 financial year and are expected to undergo assessments on a quarterly basis. Performance assessment will be
fully implemented in the 2019/20 financial year.
3.26.4 Personnel Provisioning
Recruitment and retention of employees – 6 Interns and 16 positions were filled in the year under review, 0 position
in Mayor’s Office, 04 position in Community services, 08 positions in Corporate services, 06 position in Budget and Treasury, 0 positions
in Technical Services and 02 positions Municipal Manager’s Office.
An Employment Equity report was developed and submitted to the Department of labour in line with the requirements of the
Employment Equity Act. The below table illustrates gender composition in the municipality as at 30 June 2018:
EMPLOYMENT EQUITY ALL EMPLOYEES
Female 73
Male 113
Grand Total 181
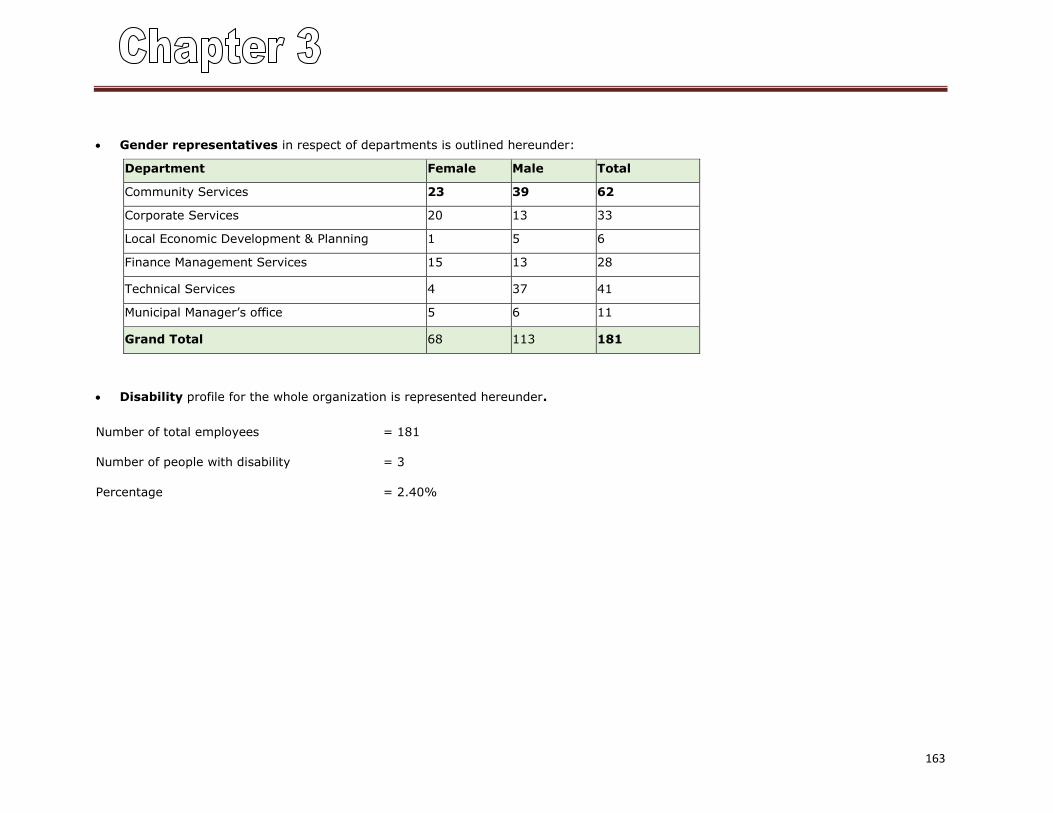
163
Gender representatives in respect of departments is outlined hereunder:
Department Female Male Total
Community Services 23 39 62
Corporate Services 20 13 33
Local Economic Development & Planning 1 5 6
Finance Management Services 15 13 28
Technical Services 4 37 41
Municipal Manager’s office 5 6 11
Grand Total 68 113 181
Disability profile for the whole organization is represented hereunder.
Number of total employees = 181
Number of people with disability = 3
Percentage = 2.40%
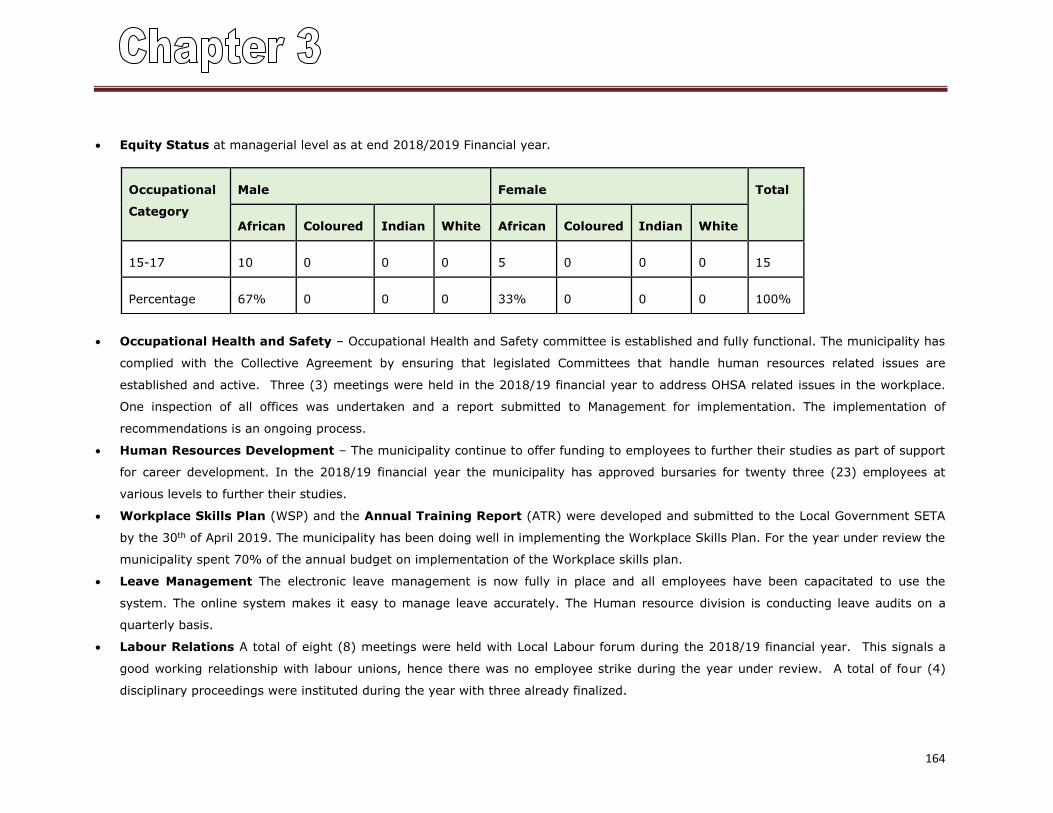
164
Equity Status at managerial level as at end 2018/2019 Financial year.
Occupational Health and Safety – Occupational Health and Safety committee is established and fully functional. The municipality has
complied with the Collective Agreement by ensuring that legislated Committees that handle human resources related issues are
established and active. Three (3) meetings were held in the 2018/19 financial year to address OHSA related issues in the workplace.
One inspection of all offices was undertaken and a report submitted to Management for implementation. The implementation of
recommendations is an ongoing process.
Human Resources Development – The municipality continue to offer funding to employees to further their studies as part of support
for career development. In the 2018/19 financial year the municipality has approved bursaries for twenty three (23) employees at
various levels to further their studies.
Workplace Skills Plan (WSP) and the Annual Training Report (ATR) were developed and submitted to the Local Government SETA
by the 30th of April 2019. The municipality has been doing well in implementing the Workplace Skills Plan. For the year under review the
municipality spent 70% of the annual budget on implementation of the Workplace skills plan.
Leave Management The electronic leave management is now fully in place and all employees have been capacitated to use the
system. The online system makes it easy to manage leave accurately. The Human resource division is conducting leave audits on a
quarterly basis.
Labour Relations A total of eight (8) meetings were held with Local Labour forum during the 2018/19 financial year. This signals a
good working relationship with labour unions, hence there was no employee strike during the year under review. A total of four (4)
disciplinary proceedings were instituted during the year with three already finalized.
Occupational
Category
Male Female Total
African Coloured Indian White African Coloured Indian White
15-17 10 0 0 0 5 0 0 0 15
Percentage 67% 0 0 0 33% 0 0 0 100%
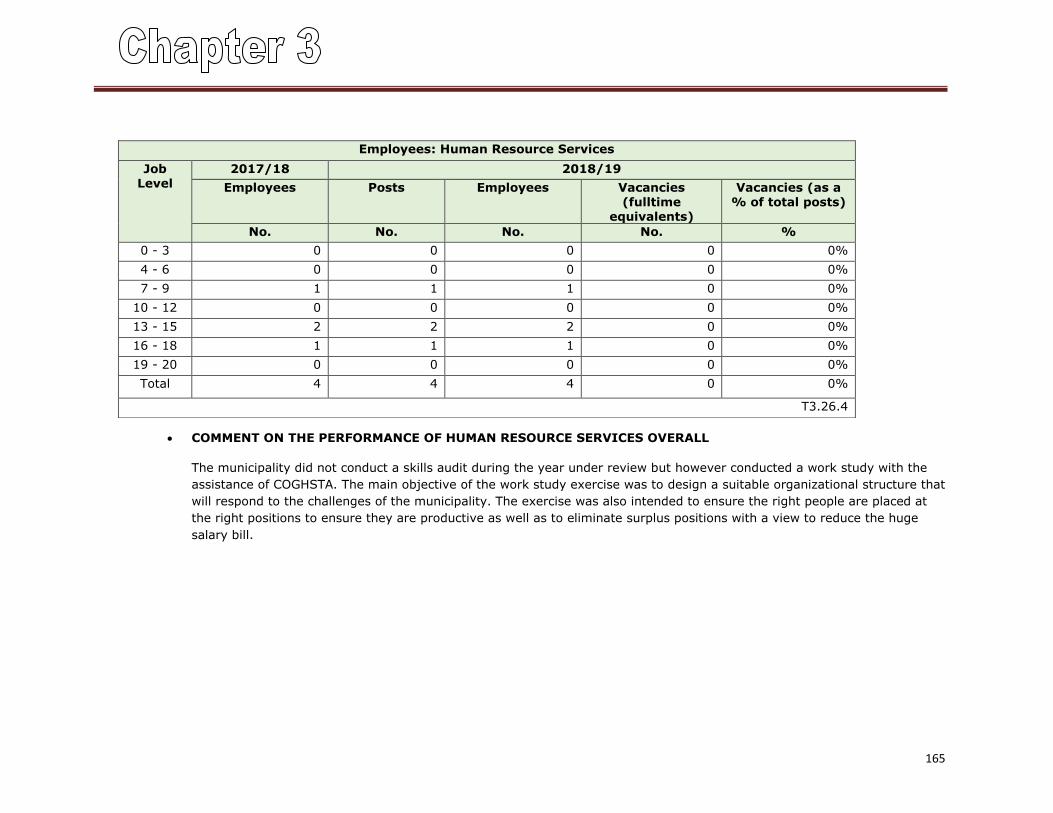
165
COMMENT ON THE PERFORMANCE OF HUMAN RESOURCE SERVICES OVERALL
The municipality did not conduct a skills audit during the year under review but however conducted a work study with the
assistance of COGHSTA. The main objective of the work study exercise was to design a suitable organizational structure that
will respond to the challenges of the municipality. The exercise was also intended to ensure the right people are placed at
the right positions to ensure they are productive as well as to eliminate surplus positions with a view to reduce the huge
salary bill.
Employees: Human Resource Services
Job Level
2017/18 2018/19
Employees Posts Employees Vacancies (fulltime
equivalents)
Vacancies (as a % of total posts)
No. No. No. No. %
0 - 3 0 0 0 0 0%
4 - 6 0 0 0 0 0%
7 - 9 1 1 1 0 0%
10 - 12 0 0 0 0 0%
13 - 15 2 2 2 0 0%
16 - 18 1 1 1 0 0%
19 - 20 0 0 0 0 0%
Total 4 4 4 0 0%
T3.26.4
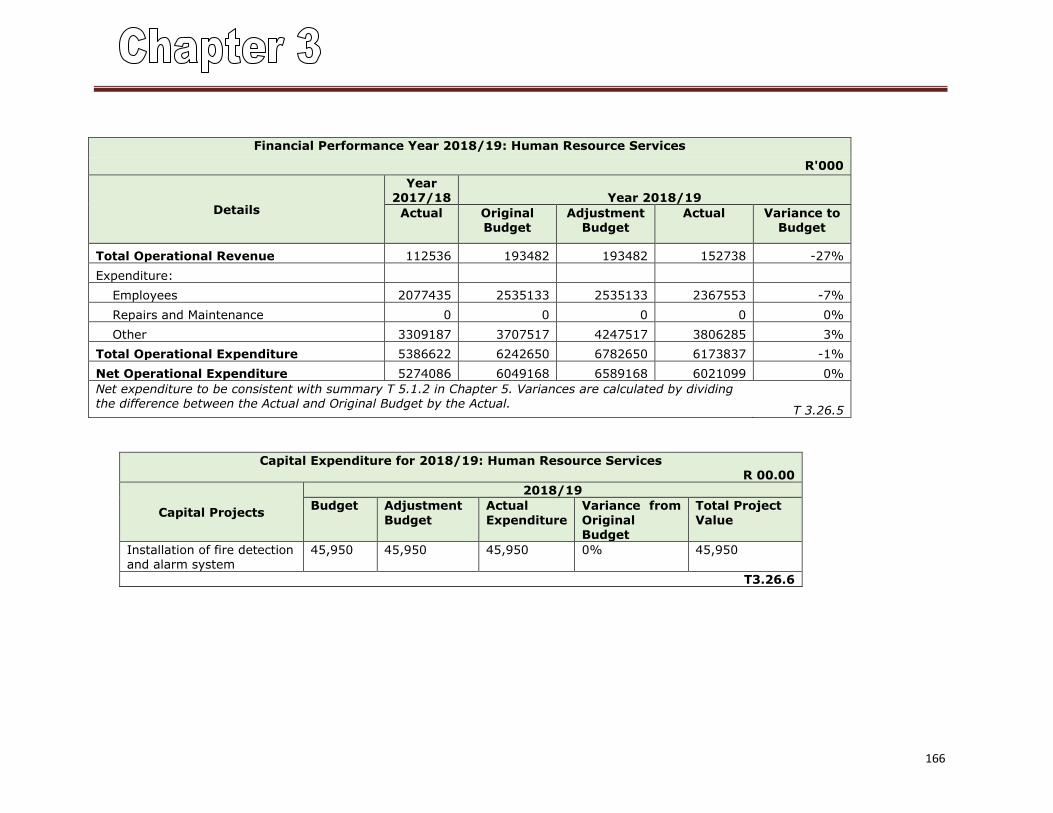
166
Financial Performance Year 2018/19: Human Resource Services
R'000
Details
Year 2017/18 Year 2018/19
Actual Original Budget
Adjustment Budget
Actual Variance to Budget
Total Operational Revenue 112536 193482 193482 152738 -27%
Expenditure:
Employees 2077435 2535133 2535133 2367553 -7%
Repairs and Maintenance 0 0 0 0 0%
Other 3309187 3707517 4247517 3806285 3%
Total Operational Expenditure 5386622 6242650 6782650 6173837 -1%
Net Operational Expenditure 5274086 6049168 6589168 6021099 0%
Net expenditure to be consistent with summary T 5.1.2 in Chapter 5. Variances are calculated by dividing the difference between the Actual and Original Budget by the Actual.
T 3.26.5
Capital Expenditure for 2018/19: Human Resource Services R 00.00
Capital Projects
2018/19
Budget Adjustment
Budget
Actual
Expenditure
Variance from
Original Budget
Total Project
Value
Installation of fire detection and alarm system
45,950 45,950
45,950 0%
45,950
T3.26.6
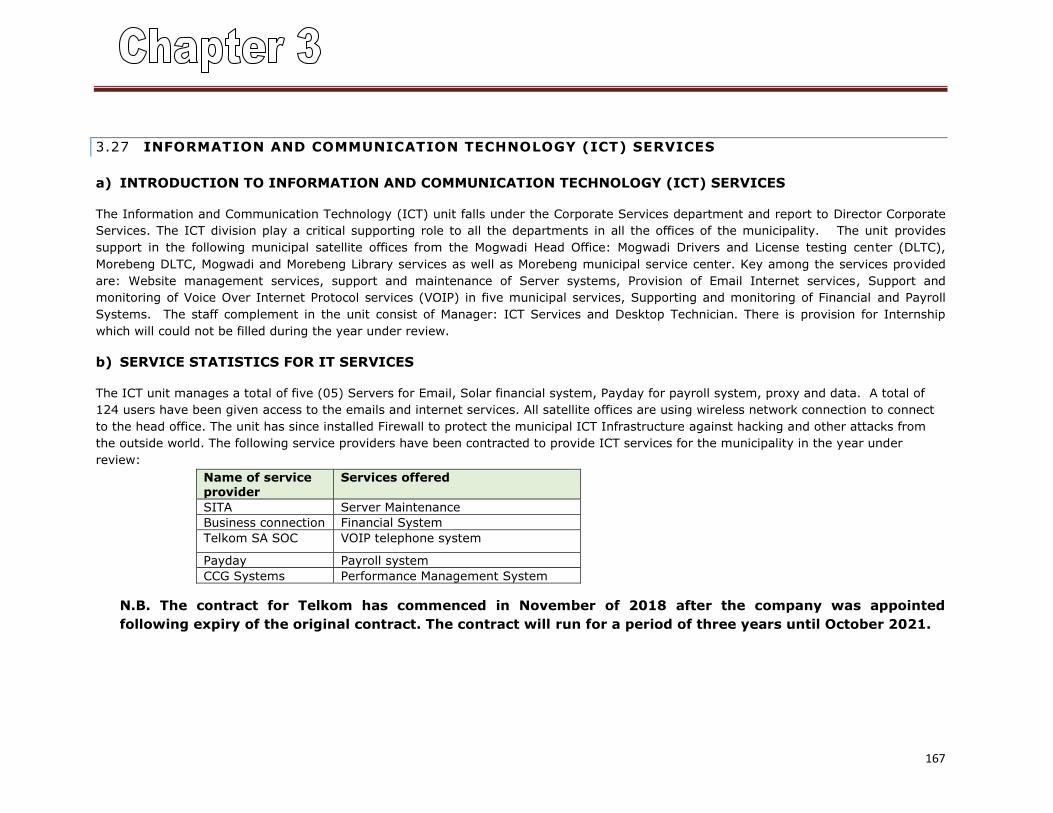
167
3.27 INFORMATION AND COMMUNICATION TECHNOLOGY (ICT) SERVICES
a) INTRODUCTION TO INFORMATION AND COMMUNICATION TECHNOLOGY (ICT) SERVICES
The Information and Communication Technology (ICT) unit falls under the Corporate Services department and report to Director Corporate
Services. The ICT division play a critical supporting role to all the departments in all the offices of the municipality. The unit provides
support in the following municipal satellite offices from the Mogwadi Head Office: Mogwadi Drivers and License testing center (DLTC),
Morebeng DLTC, Mogwadi and Morebeng Library services as well as Morebeng municipal service center. Key among the services provided
are: Website management services, support and maintenance of Server systems, Provision of Email Internet services, Support and
monitoring of Voice Over Internet Protocol services (VOIP) in five municipal services, Supporting and monitoring of Financial and Payroll
Systems. The staff complement in the unit consist of Manager: ICT Services and Desktop Technician. There is provision for Internship
which will could not be filled during the year under review.
b) SERVICE STATISTICS FOR IT SERVICES
The ICT unit manages a total of five (05) Servers for Email, Solar financial system, Payday for payroll system, proxy and data. A total of
124 users have been given access to the emails and internet services. All satellite offices are using wireless network connection to connect
to the head office. The unit has since installed Firewall to protect the municipal ICT Infrastructure against hacking and other attacks from
the outside world. The following service providers have been contracted to provide ICT services for the municipality in the year under
review:
Name of service provider
Services offered
SITA Server Maintenance
Business connection Financial System
Telkom SA SOC VOIP telephone system
Payday Payroll system
CCG Systems Performance Management System
N.B. The contract for Telkom has commenced in November of 2018 after the company was appointed
following expiry of the original contract. The contract will run for a period of three years until October 2021.
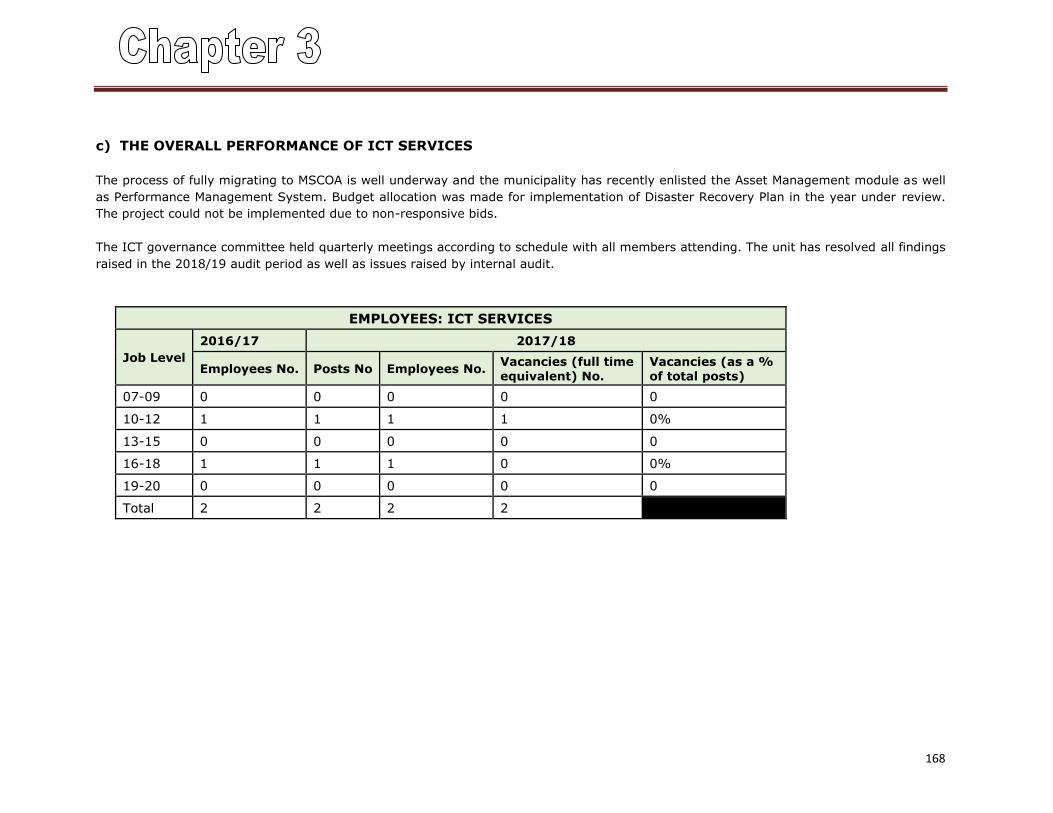
168
c) THE OVERALL PERFORMANCE OF ICT SERVICES
The process of fully migrating to MSCOA is well underway and the municipality has recently enlisted the Asset Management module as well
as Performance Management System. Budget allocation was made for implementation of Disaster Recovery Plan in the year under review.
The project could not be implemented due to non-responsive bids.
The ICT governance committee held quarterly meetings according to schedule with all members attending. The unit has resolved all findings
raised in the 2018/19 audit period as well as issues raised by internal audit.
EMPLOYEES: ICT SERVICES
Job Level
2016/17 2017/18
Employees No. Posts No Employees No. Vacancies (full time equivalent) No.
Vacancies (as a % of total posts)
07-09 0 0 0 0 0
10-12 1 1 1 1 0%
13-15 0 0 0 0 0
16-18 1 1 1 0 0%
19-20 0 0 0 0 0
Total 2 2 2 2
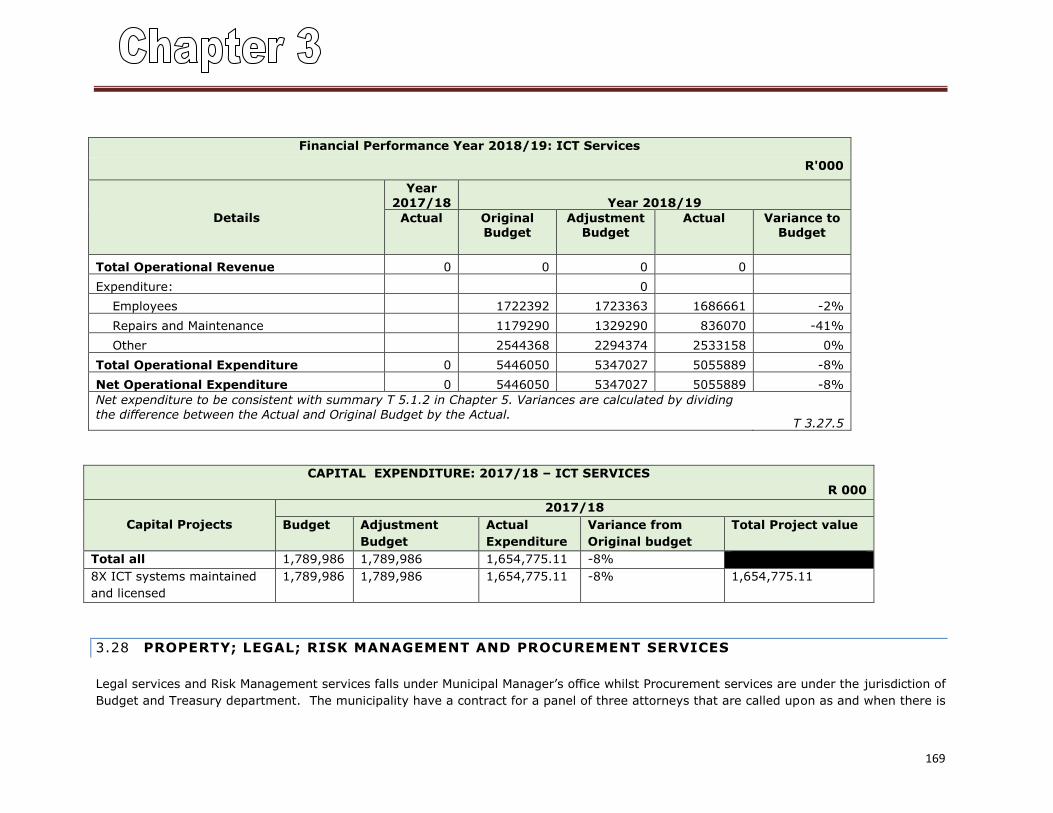
169
Financial Performance Year 2018/19: ICT Services
R'000
Details
Year
2017/18 Year 2018/19
Actual Original Budget
Adjustment Budget
Actual Variance to Budget
Total Operational Revenue 0 0 0 0 Expenditure: 0
Employees 1722392 1723363 1686661 -2%
Repairs and Maintenance 1179290 1329290 836070 -41%
Other 2544368 2294374 2533158 0%
Total Operational Expenditure 0 5446050 5347027 5055889 -8%
Net Operational Expenditure 0 5446050 5347027 5055889 -8%
Net expenditure to be consistent with summary T 5.1.2 in Chapter 5. Variances are calculated by dividing
the difference between the Actual and Original Budget by the Actual. T 3.27.5
CAPITAL EXPENDITURE: 2017/18 – ICT SERVICES
R 000
Capital Projects
2017/18
Budget Adjustment
Budget
Actual
Expenditure
Variance from
Original budget
Total Project value
Total all 1,789,986 1,789,986 1,654,775.11 -8%
8X ICT systems maintained
and licensed
1,789,986 1,789,986 1,654,775.11 -8% 1,654,775.11
3.28 PROPERTY; LEGAL; RISK MANAGEMENT AND PROCUREMENT SERVICES
Legal services and Risk Management services falls under Municipal Manager’s office whilst Procurement services are under the jurisdiction of
Budget and Treasury department. The municipality have a contract for a panel of three attorneys that are called upon as and when there is
170
a need to institute or defend the municipalities in litigations matters. The Legal division will be embarking on procurement process for new
panel as the current contract is set to expire in the first quarter of 2018/19 financial year. Currently the Legal unit is manned by one
Manager and there is consideration to beef up the unit for a smooth running of the function. The total pending cases as at June 2018 were
twenty four (24) in number. This is constituted by eight (8) active cases, eight (8) dormant cases and eight (08) have been settled.
Risk Management services is led by a Risk Officer who reports directly to the Municipal Manager. The unit plays a critical role of security
management, insurance administration as well as providing risk management services in all municipal outreach events, serving as Safety
Officer. There were no capital projects undertaken in both the Legal and Risk Management services more so considering that the functions
are more administrative and internal in their orientation.
COMPONENT J: MISCELLANEOUS
None.
COMPONENT K: ORGANISATIONAL PERFOMANCE SCORECARD
See sections 3.2 and 3.3 above for a comprehensive report on performance of each department for the 2017/18 financial
year.
CHAPTER 4 – ORGANISATIONAL DEVELOPMENT PERFORMANCE
(PERFORMANCE REPORT PART II)
COMPONENT A: INTRODUCTION TO THE MUNICIPAL PERSONNEL
The Skills Development Act and Municipal Systems Act require employers to supply employees with the necessary training in order to
develop its human resource capacity. With the requirements of the Skills Development Act and Municipal Systems Act as motive the Human
Resource unit, under Corporate Services will ensure policies and procedures are effective and efficient to ensure a productive workforce at
all times. We strive to ensure a smooth succession planning by creating an organizational structure that ensure there is always someone to
perform the task in the event of illness, resignation and absenteeism for whatever reason of the another employee.
Training is implemented in line with the Workplace skills Plan and closely monitored by the duly constituted Municipal Training committee.
The municipality continues to appropriate the budget for a continuous human capital investment through training and development as well
as support through employee wellness programmes. We believe this is the only way for continued functionality and sustainability of the
municipality
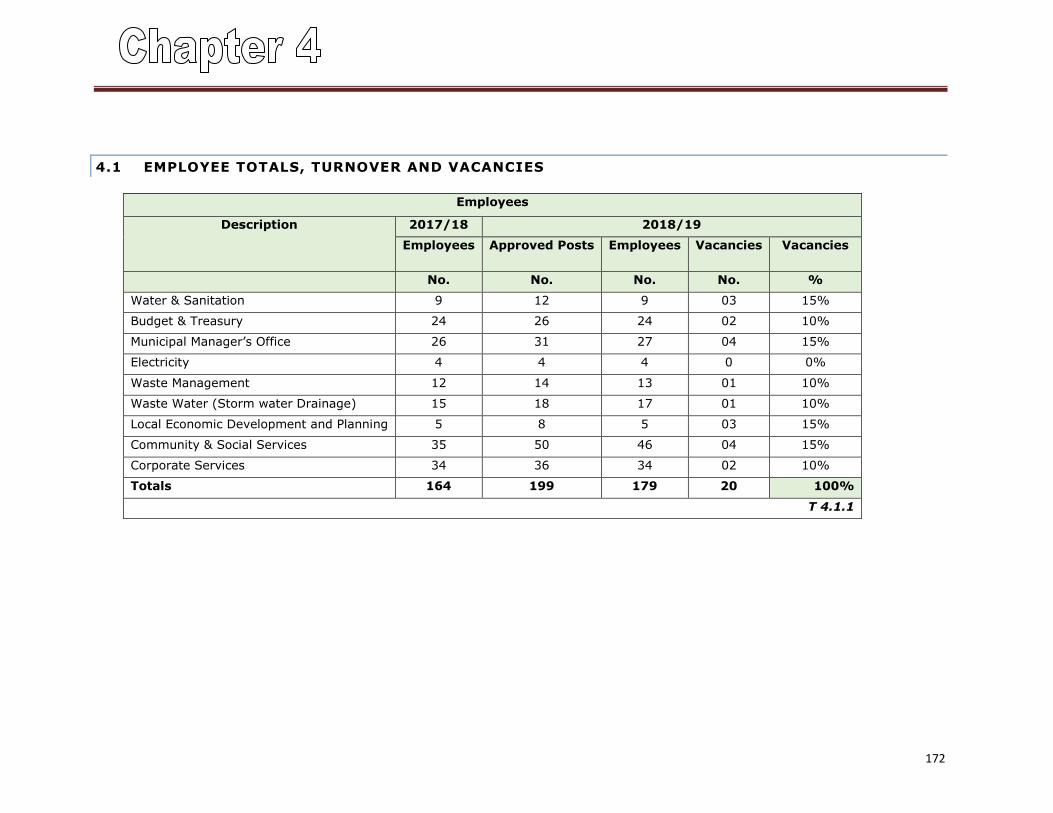
172
4.1 EMPLOYEE TOTALS, TURNOVER AND VACANCIES
Employees
Description 2017/18 2018/19
Employees Approved Posts Employees Vacancies Vacancies
No. No. No. No. %
Water & Sanitation 9 12 9 03 15%
Budget & Treasury 24 26 24 02 10%
Municipal Manager’s Office 26 31 27 04 15%
Electricity 4 4 4 0 0%
Waste Management 12 14 13 01 10%
Waste Water (Storm water Drainage) 15 18 17 01 10%
Local Economic Development and Planning 5 8 5 03 15%
Community & Social Services 35 50 46 04 15%
Corporate Services 34 36 34 02 10%
Totals 164 199 179 20 100%
T 4.1.1
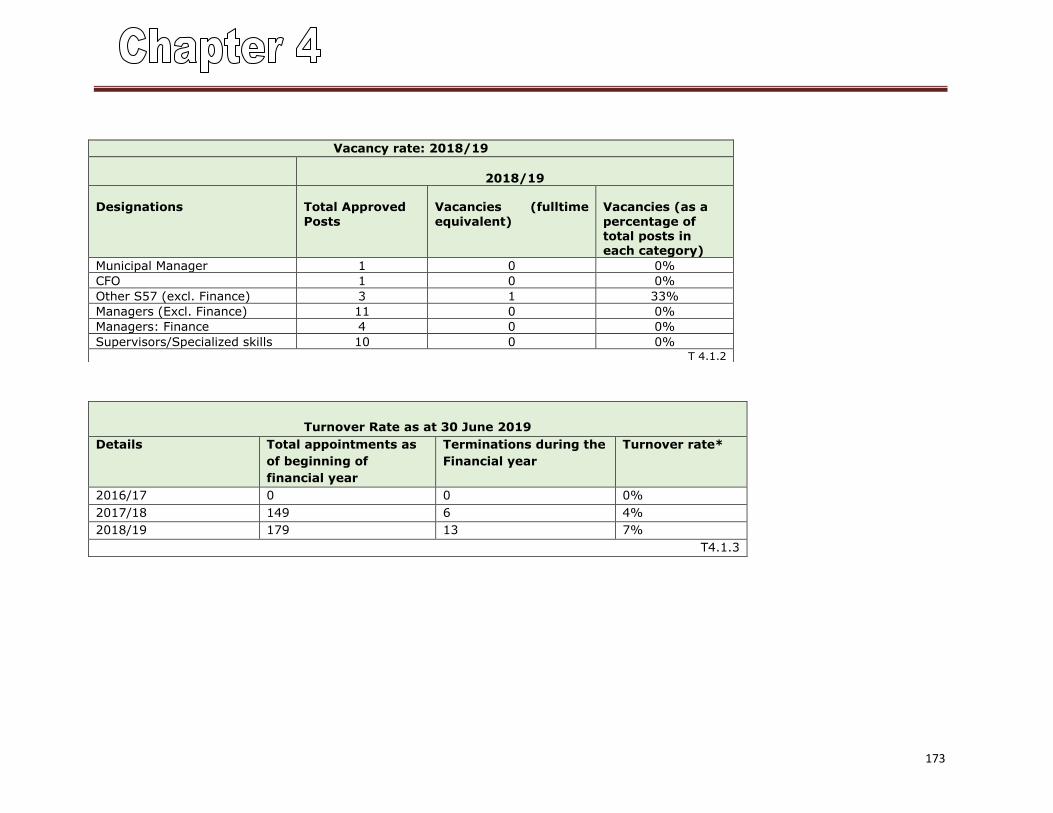
173
Turnover Rate as at 30 June 2019
Details Total appointments as
of beginning of
financial year
Terminations during the
Financial year
Turnover rate*
2016/17 0 0 0%
2017/18 149 6 4%
2018/19 179 13 7%
T4.1.3
Vacancy rate: 2018/19
2018/19
Designations Total Approved
Posts
Vacancies (fulltime
equivalent)
Vacancies (as a
percentage of total posts in each category)
Municipal Manager 1 0 0%
CFO 1 0 0%
Other S57 (excl. Finance) 3 1 33%
Managers (Excl. Finance) 11 0 0%
Managers: Finance 4 0 0%
Supervisors/Specialized skills 10 0 0% T 4.1.2
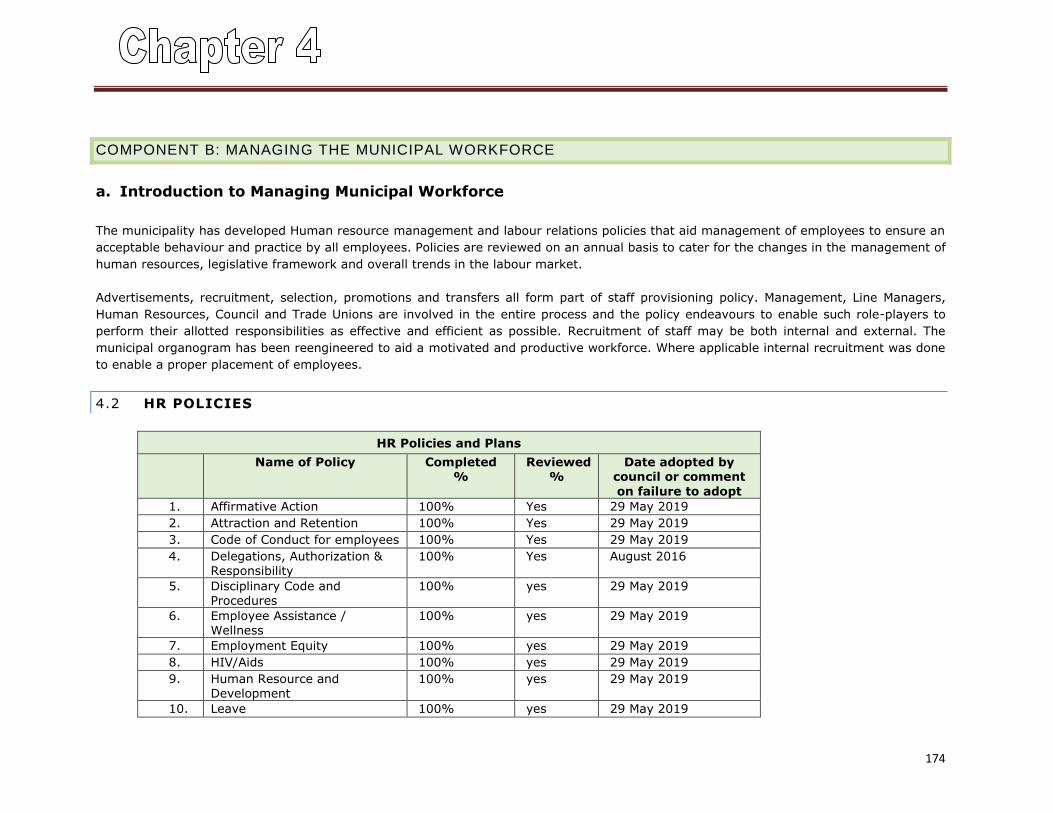
174
COMPONENT B: MANAGING THE MUNICIPAL WORKFORCE
a. Introduction to Managing Municipal Workforce
The municipality has developed Human resource management and labour relations policies that aid management of employees to ensure an
acceptable behaviour and practice by all employees. Policies are reviewed on an annual basis to cater for the changes in the management of
human resources, legislative framework and overall trends in the labour market.
Advertisements, recruitment, selection, promotions and transfers all form part of staff provisioning policy. Management, Line Managers,
Human Resources, Council and Trade Unions are involved in the entire process and the policy endeavours to enable such role-players to
perform their allotted responsibilities as effective and efficient as possible. Recruitment of staff may be both internal and external. The
municipal organogram has been reengineered to aid a motivated and productive workforce. Where applicable internal recruitment was done
to enable a proper placement of employees.
4.2 HR POLICIES
HR Policies and Plans
Name of Policy
Completed %
Reviewed %
Date adopted by council or comment
on failure to adopt
1. Affirmative Action 100% Yes 29 May 2019
2. Attraction and Retention 100% Yes 29 May 2019
3. Code of Conduct for employees 100% Yes 29 May 2019
4. Delegations, Authorization & Responsibility
100% Yes August 2016
5. Disciplinary Code and Procedures
100% yes 29 May 2019
6. Employee Assistance / Wellness
100% yes 29 May 2019
7. Employment Equity 100% yes 29 May 2019
8. HIV/Aids 100% yes 29 May 2019
9. Human Resource and Development
100% yes 29 May 2019
10. Leave 100% yes 29 May 2019
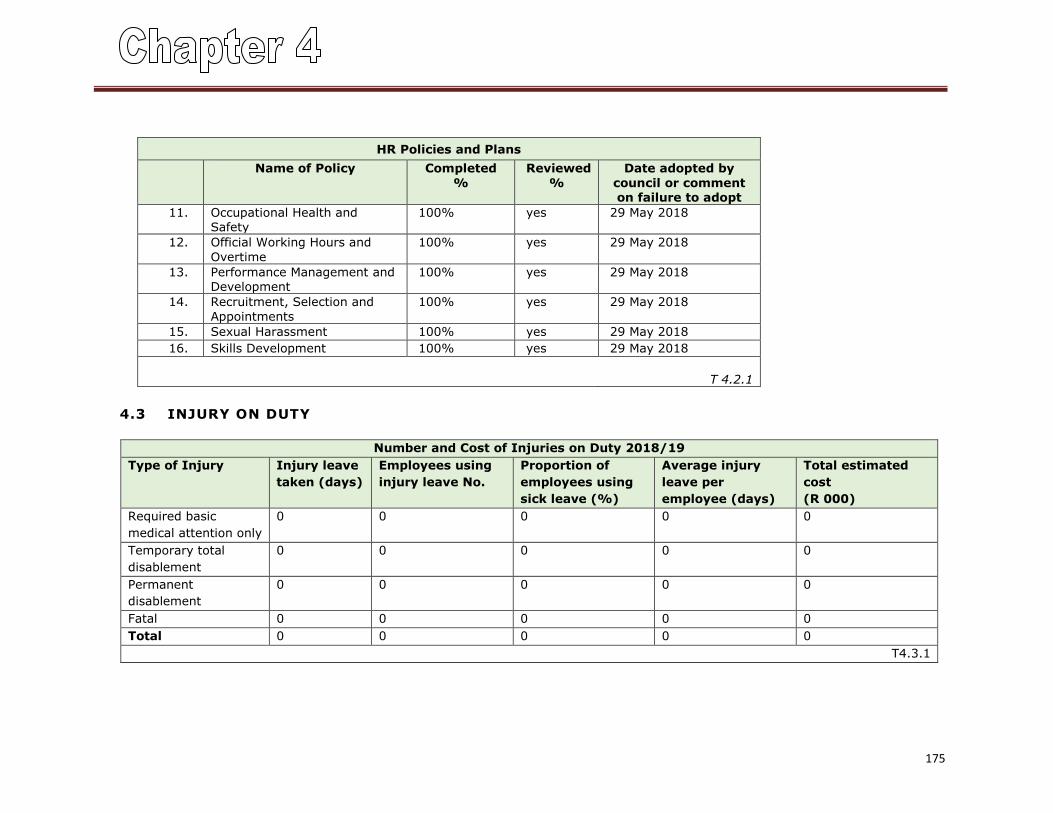
175
HR Policies and Plans
Name of Policy
Completed
%
Reviewed
%
Date adopted by
council or comment on failure to adopt
11. Occupational Health and Safety
100% yes 29 May 2018
12. Official Working Hours and
Overtime
100% yes 29 May 2018
13. Performance Management and Development
100% yes 29 May 2018
14. Recruitment, Selection and
Appointments
100% yes 29 May 2018
15. Sexual Harassment 100% yes 29 May 2018
16. Skills Development 100% yes 29 May 2018
T 4.2.1
4.3 INJURY ON DUTY
Number and Cost of Injuries on Duty 2018/19
Type of Injury Injury leave
taken (days)
Employees using
injury leave No.
Proportion of
employees using
sick leave (%)
Average injury
leave per
employee (days)
Total estimated
cost
(R 000)
Required basic
medical attention only
0 0 0 0 0
Temporary total
disablement
0 0 0 0 0
Permanent
disablement
0 0 0 0 0
Fatal 0 0 0 0 0
Total 0 0 0 0 0
T4.3.1
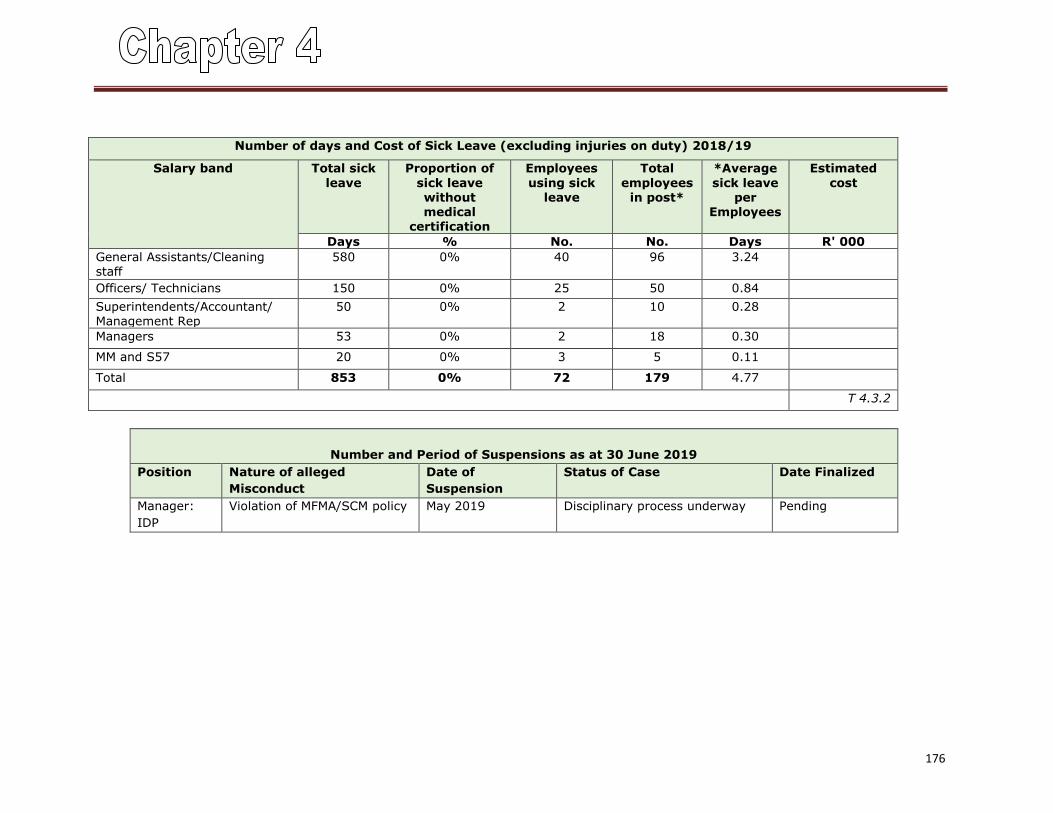
176
Number of days and Cost of Sick Leave (excluding injuries on duty) 2018/19
Salary band Total sick
leave
Proportion of
sick leave without medical
certification
Employees
using sick leave
Total
employees in post*
*Average
sick leave per
Employees
Estimated
cost
Days % No. No. Days R' 000
General Assistants/Cleaning staff
580 0% 40 96 3.24
Officers/ Technicians 150 0% 25 50 0.84
Superintendents/Accountant/ Management Rep
50 0% 2 10 0.28
Managers 53 0% 2 18 0.30
MM and S57 20 0% 3 5 0.11
Total 853 0% 72 179 4.77
T 4.3.2
Number and Period of Suspensions as at 30 June 2019
Position Nature of alleged
Misconduct
Date of
Suspension
Status of Case Date Finalized
Manager:
IDP
Violation of MFMA/SCM policy May 2019 Disciplinary process underway Pending
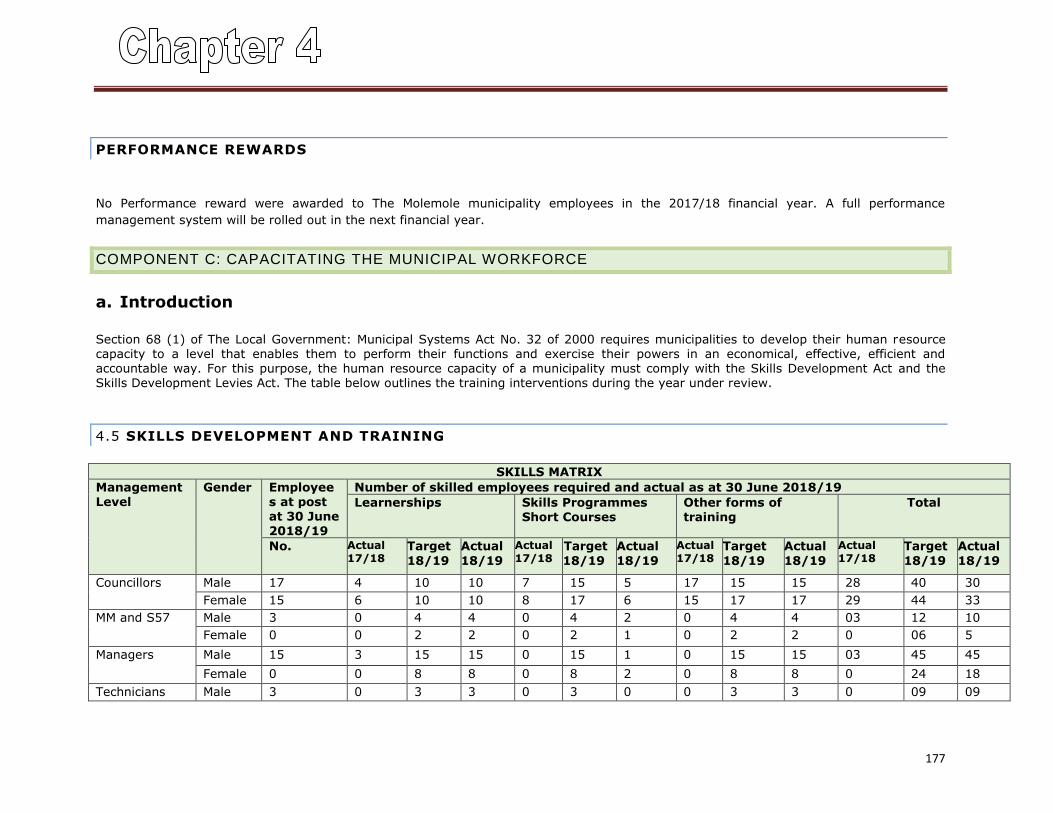
177
PERFORMANCE REWARDS
No Performance reward were awarded to The Molemole municipality employees in the 2017/18 financial year. A full performance
management system will be rolled out in the next financial year.
COMPONENT C: CAPACITATING THE MUNICIPAL WORKFORCE
a. Introduction
Section 68 (1) of The Local Government: Municipal Systems Act No. 32 of 2000 requires municipalities to develop their human resource capacity to a level that enables them to perform their functions and exercise their powers in an economical, effective, efficient and accountable way. For this purpose, the human resource capacity of a municipality must comply with the Skills Development Act and the Skills Development Levies Act. The table below outlines the training interventions during the year under review.
4.5 SKILLS DEVELOPMENT AND TRAINING
SKILLS MATRIX
Management Level
Gender Employees at post at 30 June 2018/19
Number of skilled employees required and actual as at 30 June 2018/19
Learnerships Skills Programmes Short Courses
Other forms of training
Total
No. Actual
17/18 Target
18/19
Actual
18/19
Actual
17/18 Target
18/19
Actual
18/19
Actual
17/18 Target
18/19
Actual
18/19
Actual
17/18 Target
18/19
Actual
18/19
Councillors Male 17 4 10 10 7 15 5 17 15 15 28 40 30
Female 15 6 10 10 8 17 6 15 17 17 29 44 33
MM and S57 Male 3 0 4 4 0 4 2 0 4 4 03 12 10
Female 0 0 2 2 0 2 1 0 2 2 0 06 5
Managers Male 15 3 15 15 0 15 1 0 15 15 03 45 45
Female 0 0 8 8 0 8 2 0 8 8 0 24 18
Technicians Male 3 0 3 3 0 3 0 0 3 3 0 09 09
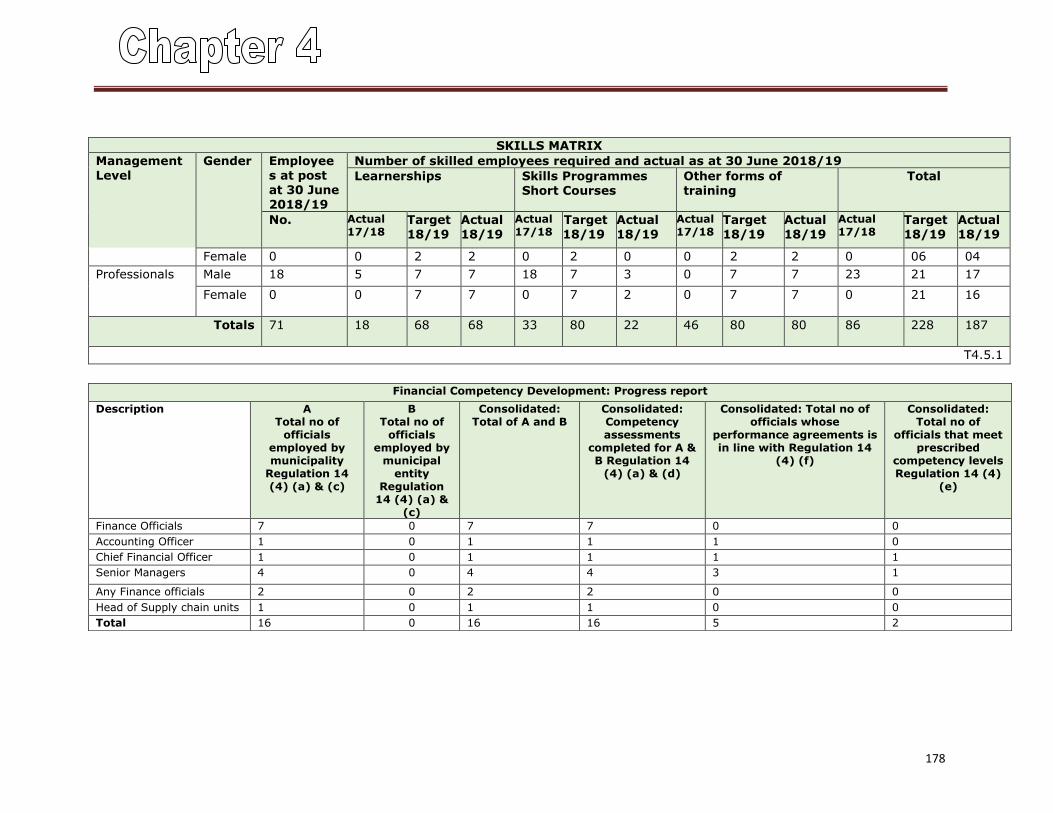
178
SKILLS MATRIX
Management Level
Gender Employees at post at 30 June 2018/19
Number of skilled employees required and actual as at 30 June 2018/19
Learnerships Skills Programmes Short Courses
Other forms of training
Total
No. Actual 17/18
Target 18/19
Actual 18/19
Actual 17/18
Target 18/19
Actual 18/19
Actual 17/18
Target 18/19
Actual 18/19
Actual 17/18
Target 18/19
Actual 18/19
Female 0 0 2 2 0 2 0 0 2 2 0 06 04
Professionals Male 18 5 7 7 18 7 3 0 7 7 23 21 17
Female 0 0 7 7 0 7 2 0 7 7 0 21 16
Totals
71 18 68 68 33 80 22 46 80 80 86 228 187
T4.5.1
Financial Competency Development: Progress report
Description A Total no of
officials employed by municipality
Regulation 14 (4) (a) & (c)
B Total no of
officials employed by
municipal entity
Regulation 14 (4) (a) &
(c)
Consolidated: Total of A and B
Consolidated: Competency assessments
completed for A & B Regulation 14
(4) (a) & (d)
Consolidated: Total no of officials whose
performance agreements is in line with Regulation 14
(4) (f)
Consolidated: Total no of
officials that meet prescribed
competency levels Regulation 14 (4)
(e)
Finance Officials 7 0 7 7 0 0
Accounting Officer 1 0 1 1 1 0
Chief Financial Officer 1 0 1 1 1 1
Senior Managers 4 0 4 4 3 1
Any Finance officials 2 0 2 2 0 0
Head of Supply chain units 1 0 1 1 0 0
Total 16 0 16 16 5 2
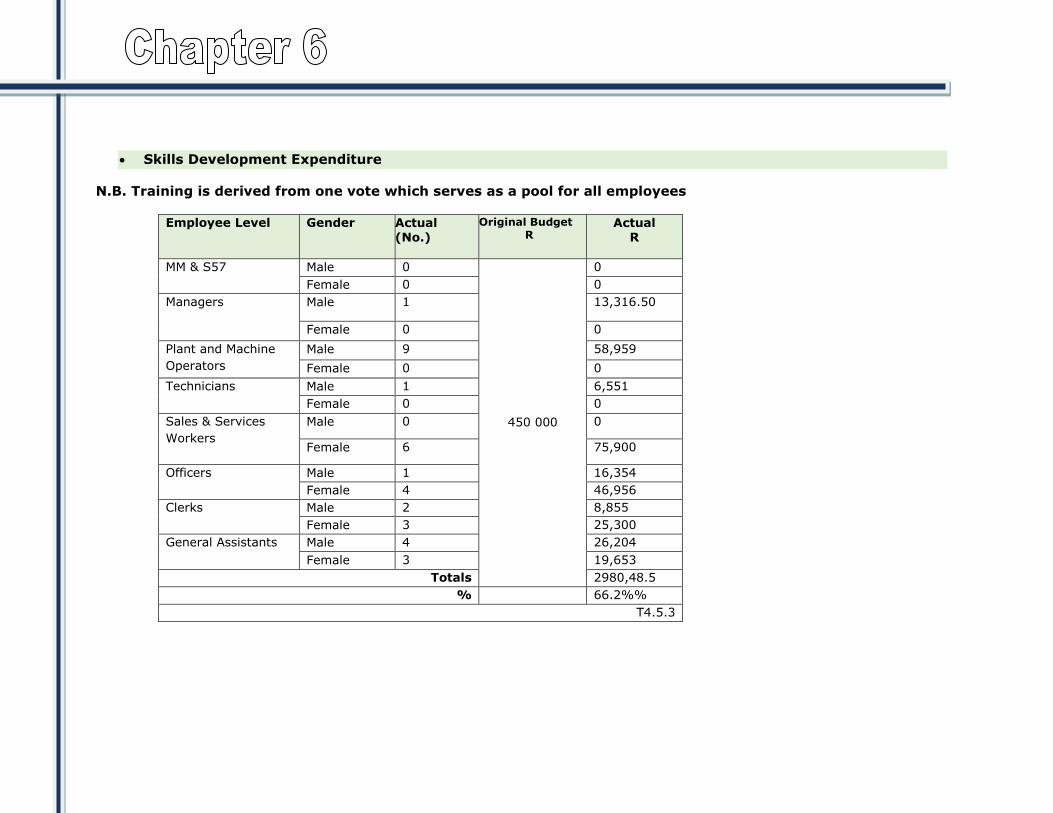
Skills Development Expenditure
N.B. Training is derived from one vote which serves as a pool for all employees
Employee Level Gender Actual (No.)
Original Budget R
Actual R
MM & S57 Male 0
450 000
0
Female 0 0
Managers Male 1 13,316.50
Female 0 0
Plant and Machine
Operators
Male 9 58,959
Female 0 0
Technicians Male 1 6,551
Female 0 0
Sales & Services
Workers
Male 0 0
Female 6 75,900
Officers Male 1 16,354
Female 4 46,956
Clerks Male 2 8,855
Female 3 25,300
General Assistants Male 4 26,204
Female 3 19,653
Totals 2980,48.5
% 66.2%%
T4.5.3
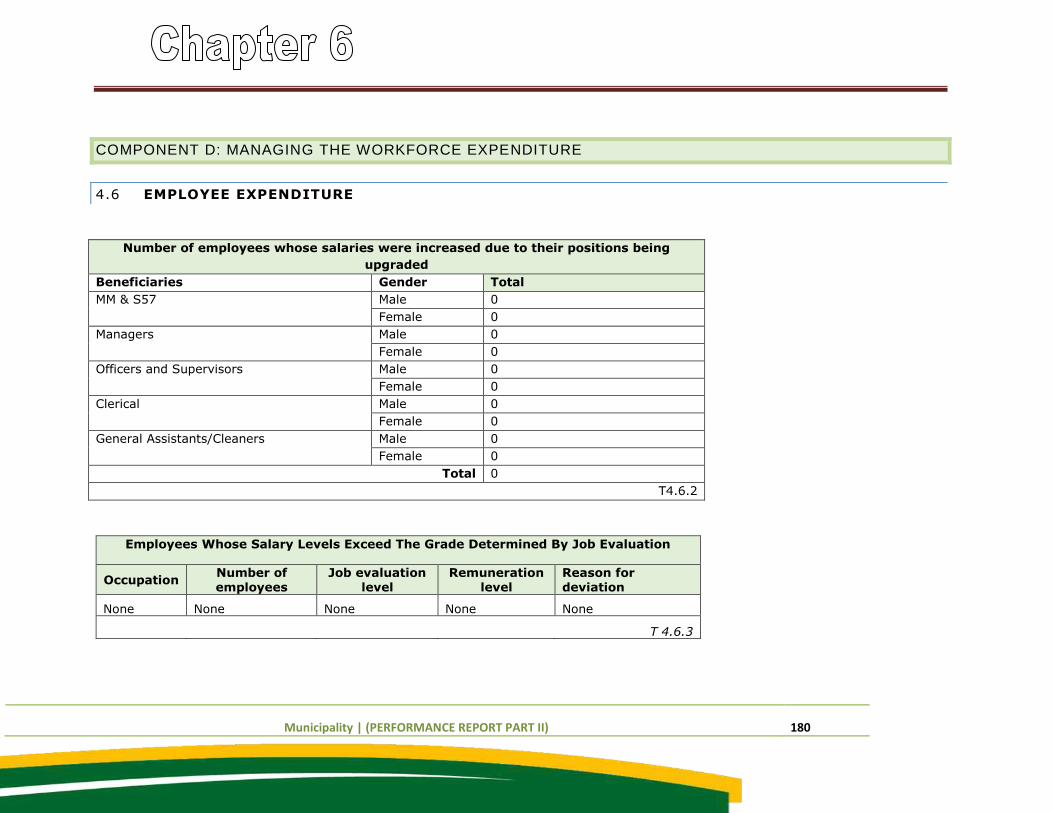
Municipality | (PERFORMANCE REPORT PART II) 180
COMPONENT D: MANAGING THE WORKFORCE EXPENDITURE
4.6 EMPLOYEE EXPENDITURE
Number of employees whose salaries were increased due to their positions being
upgraded
Beneficiaries Gender Total
MM & S57 Male 0
Female 0
Managers Male 0
Female 0
Officers and Supervisors Male 0
Female 0
Clerical Male 0
Female 0
General Assistants/Cleaners Male 0
Female 0
Total 0
T4.6.2
Employees Whose Salary Levels Exceed The Grade Determined By Job Evaluation
Occupation Number of employees
Job evaluation level
Remuneration level
Reason for deviation
None None None None None
T 4.6.3
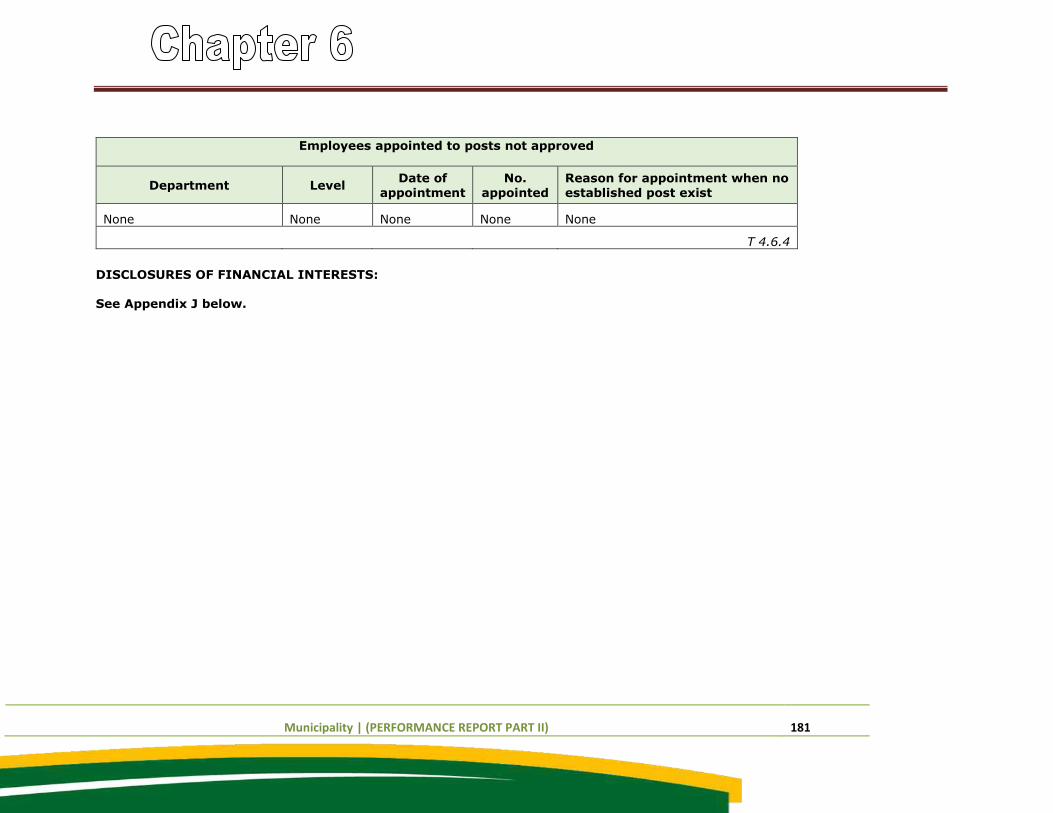
Municipality | (PERFORMANCE REPORT PART II) 181
Employees appointed to posts not approved
Department Level Date of
appointment
No.
appointed
Reason for appointment when no
established post exist
None None None None None
T 4.6.4
DISCLOSURES OF FINANCIAL INTERESTS: See Appendix J below.
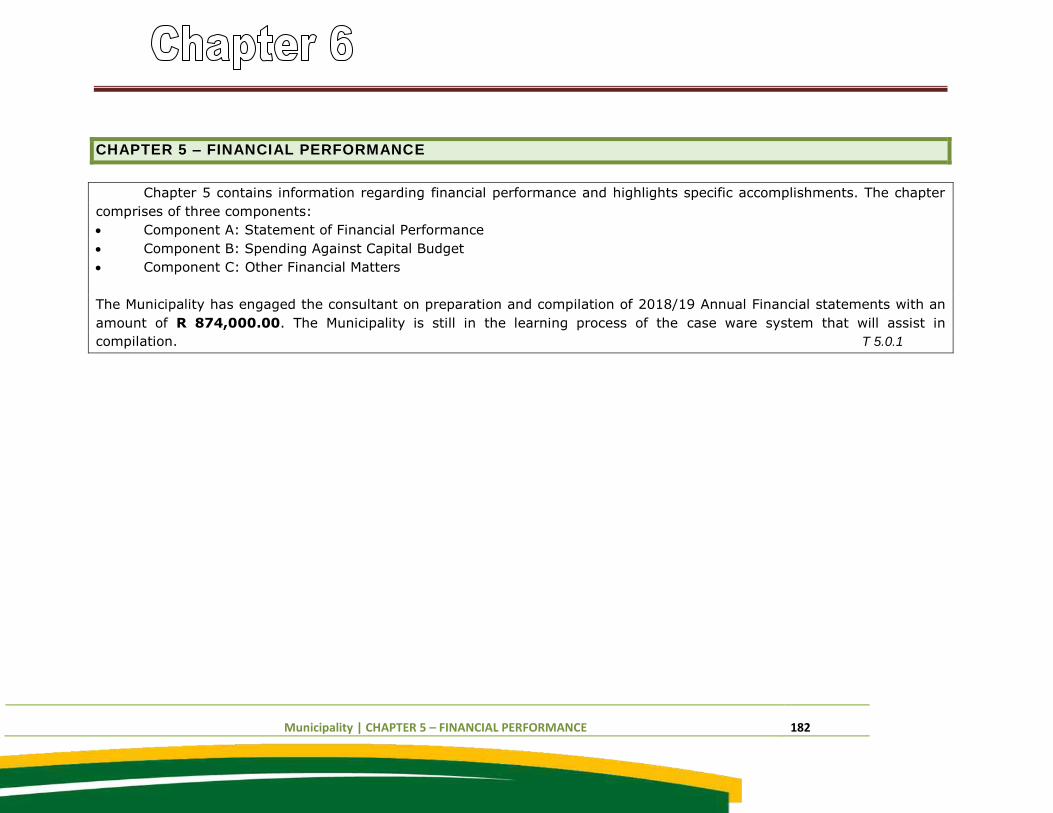
Municipality | CHAPTER 5 – FINANCIAL PERFORMANCE 182
CHAPTER 5 – FINANCIAL PERFORMANCE
Chapter 5 contains information regarding financial performance and highlights specific accomplishments. The chapter
comprises of three components:
Component A: Statement of Financial Performance
Component B: Spending Against Capital Budget
Component C: Other Financial Matters
The Municipality has engaged the consultant on preparation and compilation of 2018/19 Annual Financial statements with an
amount of R 874,000.00. The Municipality is still in the learning process of the case ware system that will assist in
compilation. T 5.0.1
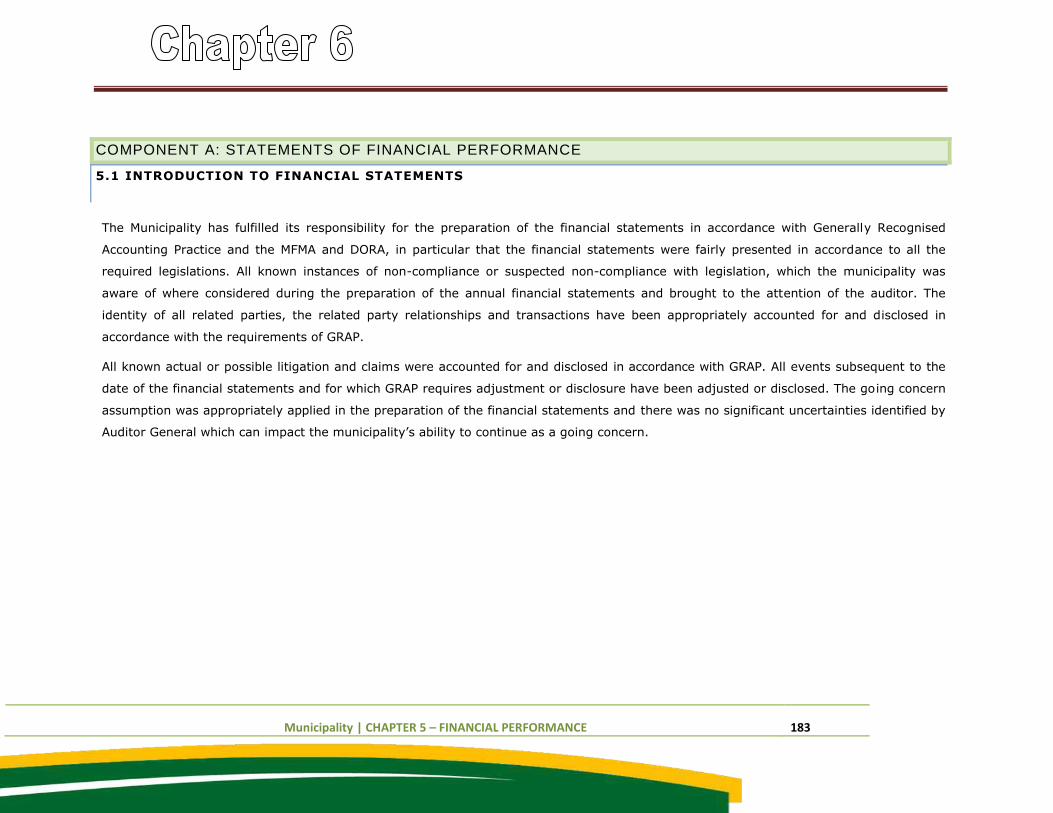
Municipality | CHAPTER 5 – FINANCIAL PERFORMANCE 183
COMPONENT A: STATEMENTS OF FINANCIAL PERFORMANCE
5.1 INTRODUCTION TO FINANCIAL STATEMENTS
The Municipality has fulfilled its responsibility for the preparation of the financial statements in accordance with Generally Recognised
Accounting Practice and the MFMA and DORA, in particular that the financial statements were fairly presented in accordance to all the
required legislations. All known instances of non-compliance or suspected non-compliance with legislation, which the municipality was
aware of where considered during the preparation of the annual financial statements and brought to the attention of the auditor. The
identity of all related parties, the related party relationships and transactions have been appropriately accounted for and disclosed in
accordance with the requirements of GRAP.
All known actual or possible litigation and claims were accounted for and disclosed in accordance with GRAP. All events subsequent to the
date of the financial statements and for which GRAP requires adjustment or disclosure have been adjusted or disclosed. The going concern
assumption was appropriately applied in the preparation of the financial statements and there was no significant uncertainties identified by
Auditor General which can impact the municipality’s ability to continue as a going concern.
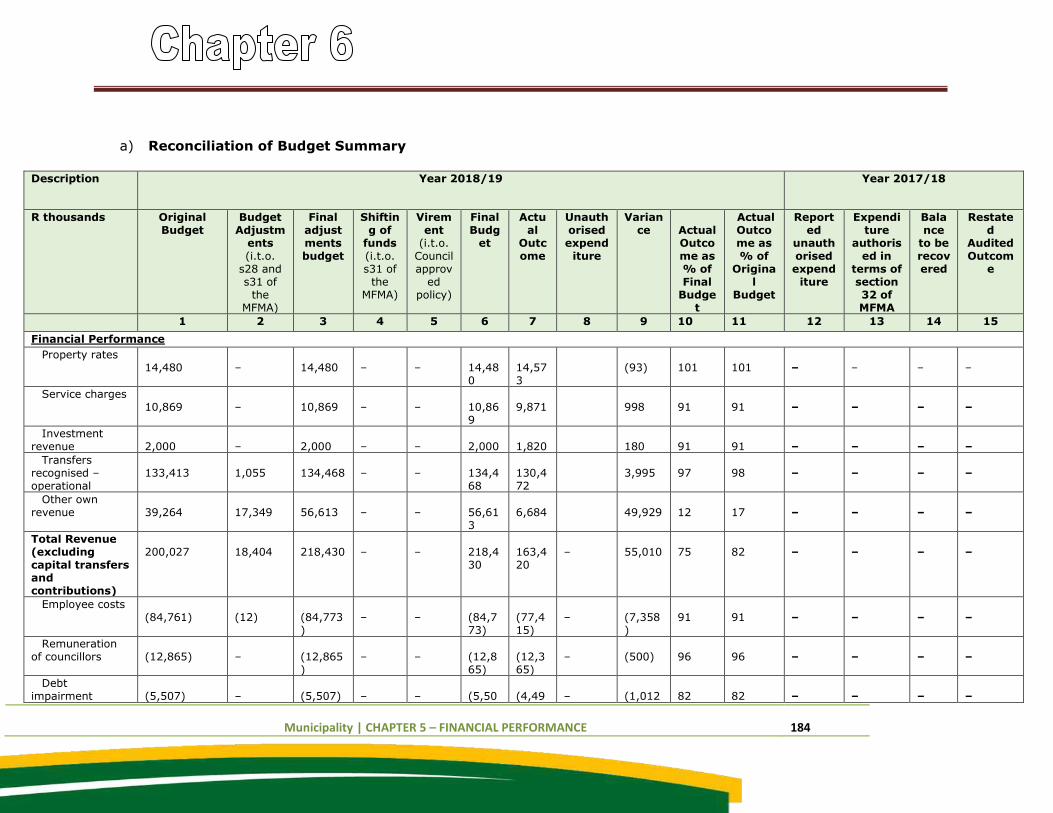
Municipality | CHAPTER 5 – FINANCIAL PERFORMANCE 184
a) Reconciliation of Budget Summary
Description Year 2018/19 Year 2017/18
R thousands Original Budget
Budget Adjustm
ents (i.t.o.
s28 and s31 of
the MFMA)
Final adjustments budget
Shifting of
funds (i.t.o. s31 of
the MFMA)
Virement
(i.t.o. Council approv
ed policy)
Final Budg
et
Actual
Outcome
Unauthorised expend
iture
Variance
Actual Outcome as % of Final
Budget
Actual Outcome as % of
Original
Budget
Reported
unauthorised expend
iture
Expenditure
authorised in
terms of section 32 of MFMA
Balance
to be recovered
Restated
Audited Outcom
e
1 2 3 4 5 6 7 8 9 10 11 12 13 14 15
Financial Performance
Property rates 14,480
–
14,480
–
–
14,480
14,573
(93)
101
101
–
–
–
–
Service charges 10,869
–
10,869
–
–
10,869
9,871
998
91
91
–
–
–
–
Investment revenue
2,000
–
2,000
–
–
2,000
1,820
180
91
91
–
–
–
–
Transfers recognised – operational
133,413
1,055
134,468
–
–
134,468
130,472
3,995
97
98
–
–
–
–
Other own revenue
39,264
17,349
56,613
–
–
56,613
6,684
49,929
12
17
–
–
–
–
Total Revenue (excluding capital transfers and contributions)
200,027
18,404
218,430
–
–
218,430
163,420
–
55,010
75
82
–
–
–
–
Employee costs (84,761)
(12)
(84,773)
–
–
(84,773)
(77,415)
–
(7,358)
91
91
–
–
–
–
Remuneration of councillors
(12,865)
–
(12,865)
–
–
(12,865)
(12,365)
–
(500)
96
96
–
–
–
–
Debt impairment
(5,507)
–
(5,507)
–
–
(5,50
(4,49
–
(1,012
82
82
–
–
–
–
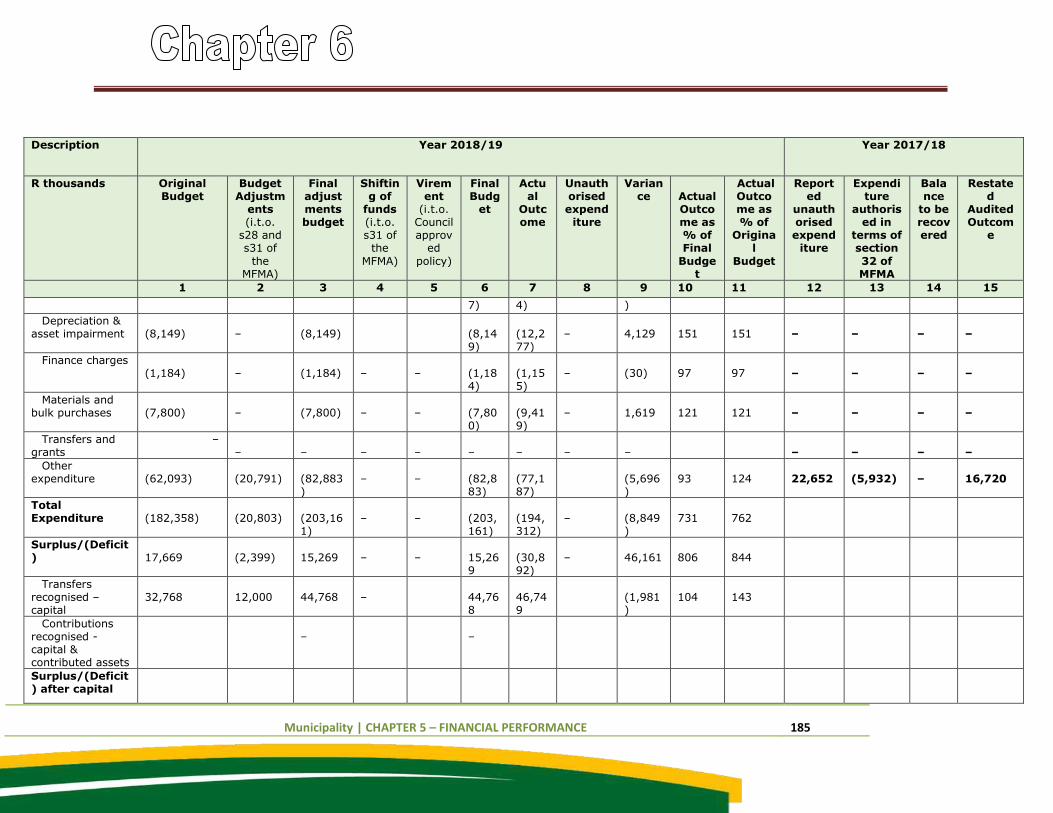
Municipality | CHAPTER 5 – FINANCIAL PERFORMANCE 185
Description Year 2018/19 Year 2017/18
R thousands Original Budget
Budget Adjustm
ents (i.t.o.
s28 and s31 of
the MFMA)
Final adjustments budget
Shifting of
funds (i.t.o. s31 of
the
MFMA)
Virement
(i.t.o. Council approv
ed
policy)
Final Budg
et
Actual
Outcome
Unauthorised expend
iture
Variance
Actual Outcome as % of Final
Budget
Actual Outcome as % of
Original
Budget
Reported
unauthorised expend
iture
Expenditure
authorised in
terms of section
32 of MFMA
Balance
to be recovered
Restated
Audited Outcom
e
1 2 3 4 5 6 7 8 9 10 11 12 13 14 15
7) 4) )
Depreciation & asset impairment
(8,149)
–
(8,149)
(8,149)
(12,277)
–
4,129
151
151
–
–
–
–
Finance charges (1,184)
–
(1,184)
–
–
(1,184)
(1,155)
–
(30)
97
97
–
–
–
–
Materials and bulk purchases
(7,800)
–
(7,800)
–
–
(7,800)
(9,419)
–
1,619
121
121
–
–
–
–
Transfers and grants
– –
–
–
–
–
–
–
–
–
–
–
–
Other expenditure
(62,093)
(20,791)
(82,883)
–
–
(82,883)
(77,187)
(5,696)
93
124
22,652
(5,932)
–
16,720
Total Expenditure
(182,358)
(20,803)
(203,161)
–
–
(203,161)
(194,312)
–
(8,849)
731
762
Surplus/(Deficit)
17,669
(2,399)
15,269
–
–
15,269
(30,892)
–
46,161
806
844
Transfers recognised – capital
32,768
12,000
44,768
–
44,768
46,749
(1,981)
104
143
Contributions recognised - capital & contributed assets
–
–
Surplus/(Deficit) after capital
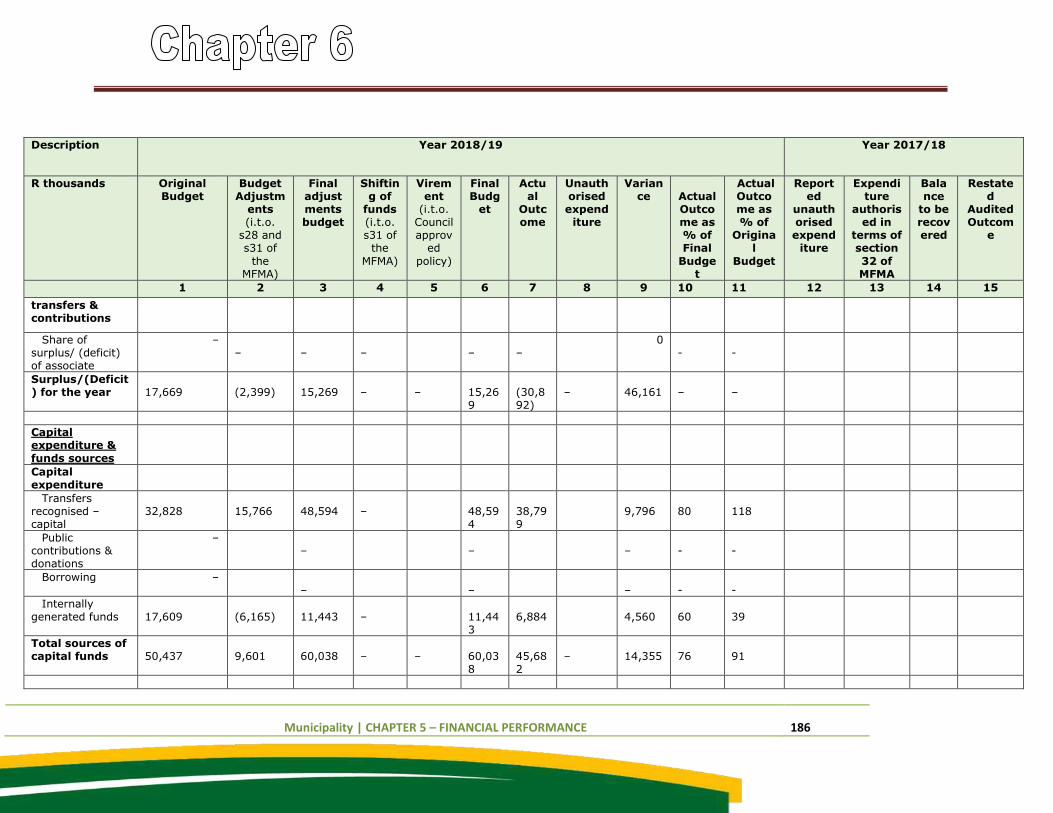
Municipality | CHAPTER 5 – FINANCIAL PERFORMANCE 186
Description Year 2018/19 Year 2017/18
R thousands Original Budget
Budget Adjustm
ents (i.t.o.
s28 and s31 of
the MFMA)
Final adjustments budget
Shifting of
funds (i.t.o. s31 of
the
MFMA)
Virement
(i.t.o. Council approv
ed
policy)
Final Budg
et
Actual
Outcome
Unauthorised expend
iture
Variance
Actual Outcome as % of Final
Budget
Actual Outcome as % of
Original
Budget
Reported
unauthorised expend
iture
Expenditure
authorised in
terms of section
32 of MFMA
Balance
to be recovered
Restated
Audited Outcom
e
1 2 3 4 5 6 7 8 9 10 11 12 13 14 15
transfers & contributions
Share of surplus/ (deficit) of associate
– –
–
–
–
–
0 -
-
Surplus/(Deficit) for the year
17,669
(2,399)
15,269
–
–
15,269
(30,892)
–
46,161
–
–
Capital expenditure &
funds sources
Capital expenditure
Transfers recognised – capital
32,828
15,766
48,594
–
48,594
38,799
9,796
80
118
Public contributions & donations
– –
–
–
-
-
Borrowing – –
–
–
-
-
Internally generated funds
17,609
(6,165)
11,443
–
11,443
6,884
4,560
60
39
Total sources of capital funds
50,437
9,601
60,038
–
–
60,038
45,682
–
14,355
76
91
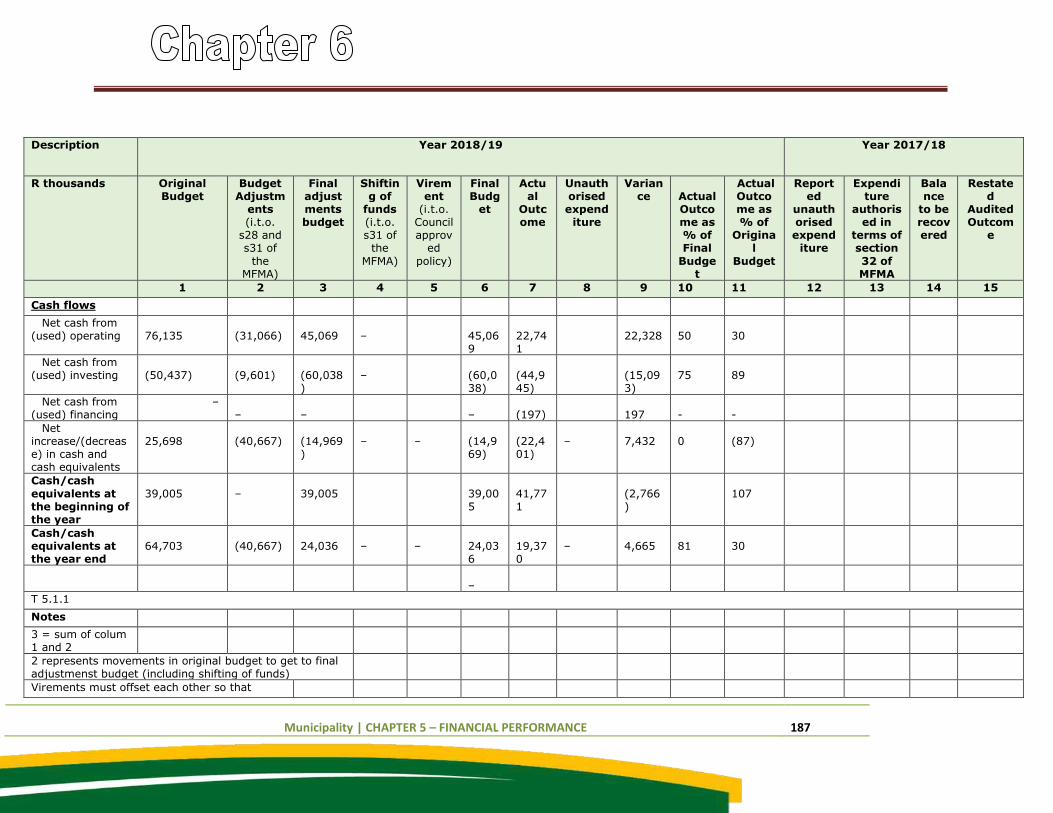
Municipality | CHAPTER 5 – FINANCIAL PERFORMANCE 187
Description Year 2018/19 Year 2017/18
R thousands Original Budget
Budget Adjustm
ents (i.t.o.
s28 and s31 of
the MFMA)
Final adjustments budget
Shifting of
funds (i.t.o. s31 of
the
MFMA)
Virement
(i.t.o. Council approv
ed
policy)
Final Budg
et
Actual
Outcome
Unauthorised expend
iture
Variance
Actual Outcome as % of Final
Budget
Actual Outcome as % of
Original
Budget
Reported
unauthorised expend
iture
Expenditure
authorised in
terms of section
32 of MFMA
Balance
to be recovered
Restated
Audited Outcom
e
1 2 3 4 5 6 7 8 9 10 11 12 13 14 15
Cash flows
Net cash from (used) operating
76,135
(31,066)
45,069
–
45,069
22,741
22,328
50
30
Net cash from (used) investing
(50,437)
(9,601)
(60,038)
–
(60,038)
(44,945)
(15,093)
75
89
Net cash from (used) financing
– –
–
–
(197)
197
-
-
Net increase/(decrease) in cash and cash equivalents
25,698
(40,667)
(14,969)
–
–
(14,969)
(22,401)
–
7,432
0
(87)
Cash/cash
equivalents at the beginning of the year
39,005
–
39,005
39,005
41,771
(2,766)
107
Cash/cash equivalents at the year end
64,703
(40,667)
24,036
–
–
24,036
19,370
–
4,665
81
30
–
T 5.1.1
Notes
3 = sum of colum 1 and 2
2 represents movements in original budget to get to final adjustmenst budget (including shifting of funds)
Virements must offset each other so that
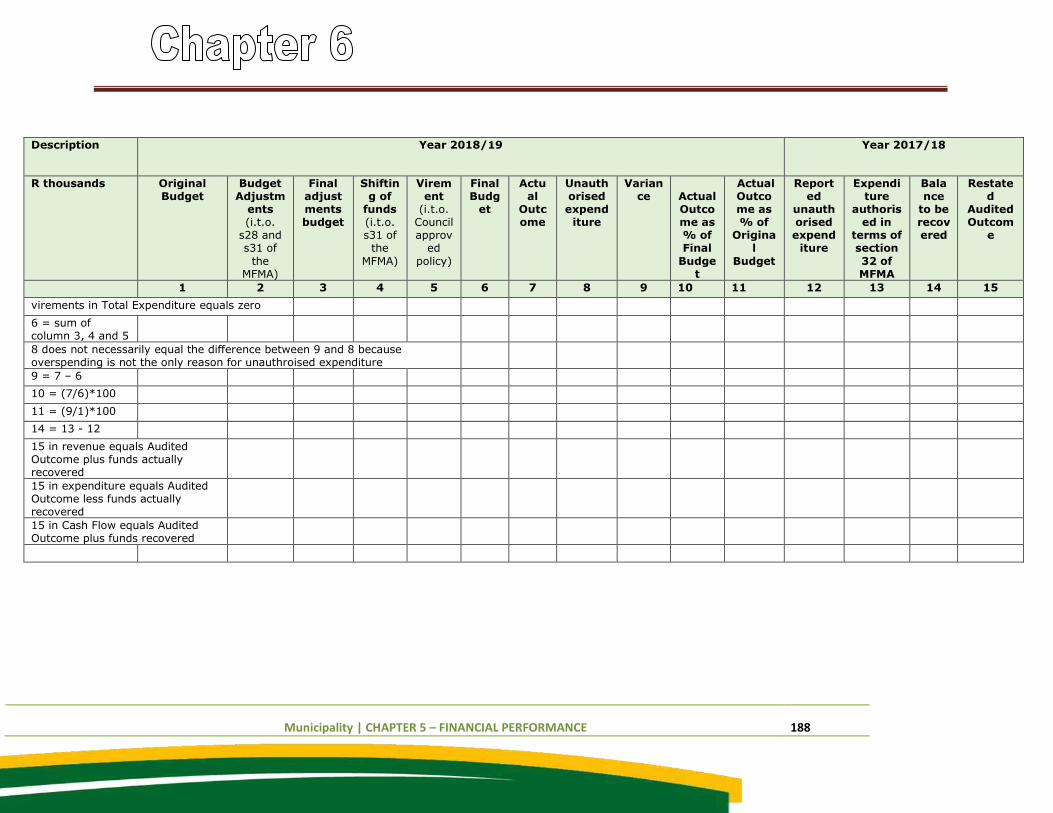
Municipality | CHAPTER 5 – FINANCIAL PERFORMANCE 188
Description Year 2018/19 Year 2017/18
R thousands Original Budget
Budget Adjustm
ents (i.t.o.
s28 and s31 of
the MFMA)
Final adjustments budget
Shifting of
funds (i.t.o. s31 of
the
MFMA)
Virement
(i.t.o. Council approv
ed
policy)
Final Budg
et
Actual
Outcome
Unauthorised expend
iture
Variance
Actual Outcome as % of Final
Budget
Actual Outcome as % of
Original
Budget
Reported
unauthorised expend
iture
Expenditure
authorised in
terms of section
32 of MFMA
Balance
to be recovered
Restated
Audited Outcom
e
1 2 3 4 5 6 7 8 9 10 11 12 13 14 15
virements in Total Expenditure equals zero
6 = sum of column 3, 4 and 5
8 does not necessarily equal the difference between 9 and 8 because overspending is not the only reason for unauthroised expenditure
9 = 7 – 6
10 = (7/6)*100
11 = (9/1)*100
14 = 13 - 12
15 in revenue equals Audited Outcome plus funds actually recovered
15 in expenditure equals Audited Outcome less funds actually recovered
15 in Cash Flow equals Audited Outcome plus funds recovered
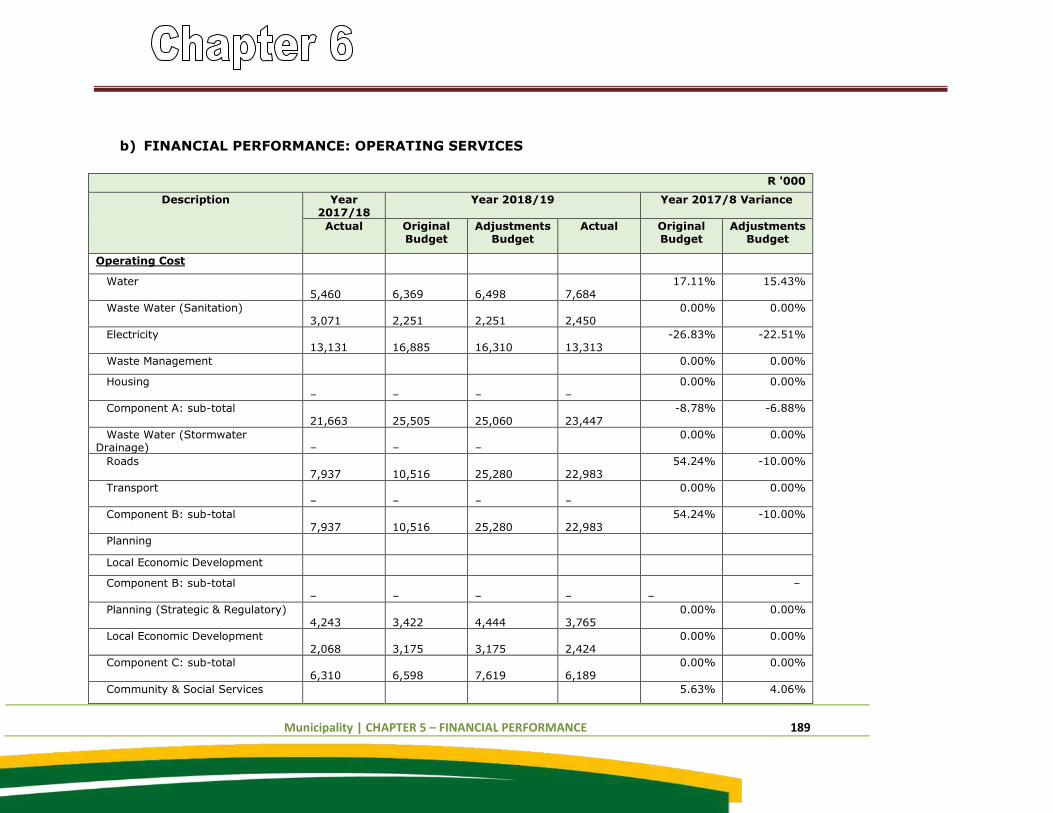
Municipality | CHAPTER 5 – FINANCIAL PERFORMANCE 189
b) FINANCIAL PERFORMANCE: OPERATING SERVICES
R '000
Description Year 2017/18
Year 2018/19 Year 2017/8 Variance
Actual Original Budget
Adjustments Budget
Actual Original Budget
Adjustments Budget
Operating Cost
Water 5,460
6,369
6,498
7,684
17.11% 15.43%
Waste Water (Sanitation) 3,071
2,251
2,251
2,450
0.00% 0.00%
Electricity 13,131
16,885
16,310
13,313
-26.83% -22.51%
Waste Management 0.00% 0.00%
Housing –
–
–
–
0.00% 0.00%
Component A: sub-total 21,663
25,505
25,060
23,447
-8.78% -6.88%
Waste Water (Stormwater Drainage)
–
–
–
0.00% 0.00%
Roads 7,937
10,516
25,280
22,983
54.24% -10.00%
Transport –
–
–
–
0.00% 0.00%
Component B: sub-total 7,937
10,516
25,280
22,983
54.24% -10.00%
Planning
Local Economic Development
Component B: sub-total –
–
–
–
–
–
Planning (Strategic & Regulatory) 4,243
3,422
4,444
3,765
0.00% 0.00%
Local Economic Development 2,068
3,175
3,175
2,424
0.00% 0.00%
Component C: sub-total 6,310
6,598
7,619
6,189
0.00% 0.00%
Community & Social Services 5.63% 4.06%
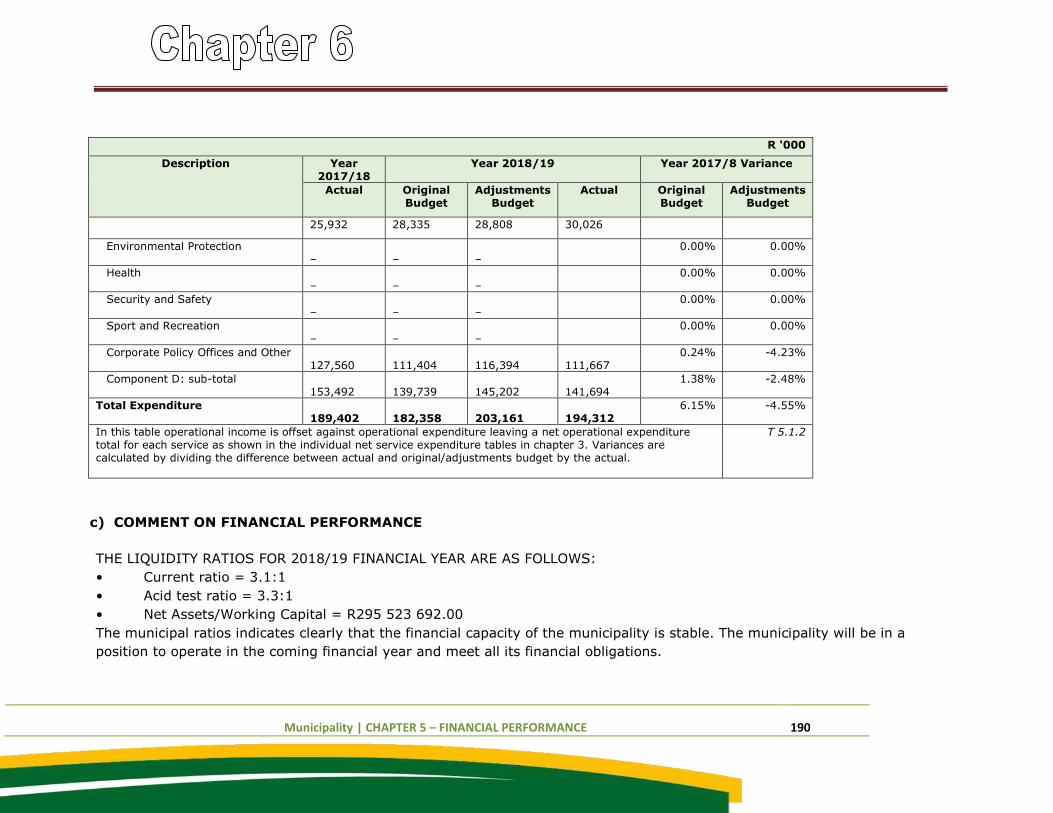
Municipality | CHAPTER 5 – FINANCIAL PERFORMANCE 190
R '000
Description Year 2017/18
Year 2018/19 Year 2017/8 Variance
Actual Original Budget
Adjustments Budget
Actual Original Budget
Adjustments Budget
25,932 28,335 28,808 30,026
Environmental Protection –
–
–
0.00% 0.00%
Health –
–
–
0.00% 0.00%
Security and Safety –
–
–
0.00% 0.00%
Sport and Recreation –
–
–
0.00% 0.00%
Corporate Policy Offices and Other 127,560
111,404
116,394
111,667
0.24% -4.23%
Component D: sub-total 153,492
139,739
145,202
141,694
1.38% -2.48%
Total Expenditure 189,402
182,358
203,161
194,312
6.15% -4.55%
In this table operational income is offset against operational expenditure leaving a net operational expenditure total for each service as shown in the individual net service expenditure tables in chapter 3. Variances are calculated by dividing the difference between actual and original/adjustments budget by the actual.
T 5.1.2
c) COMMENT ON FINANCIAL PERFORMANCE
THE LIQUIDITY RATIOS FOR 2018/19 FINANCIAL YEAR ARE AS FOLLOWS:
• Current ratio = 3.1:1
• Acid test ratio = 3.3:1
• Net Assets/Working Capital = R295 523 692.00
The municipal ratios indicates clearly that the financial capacity of the municipality is stable. The municipality will be in a
position to operate in the coming financial year and meet all its financial obligations.
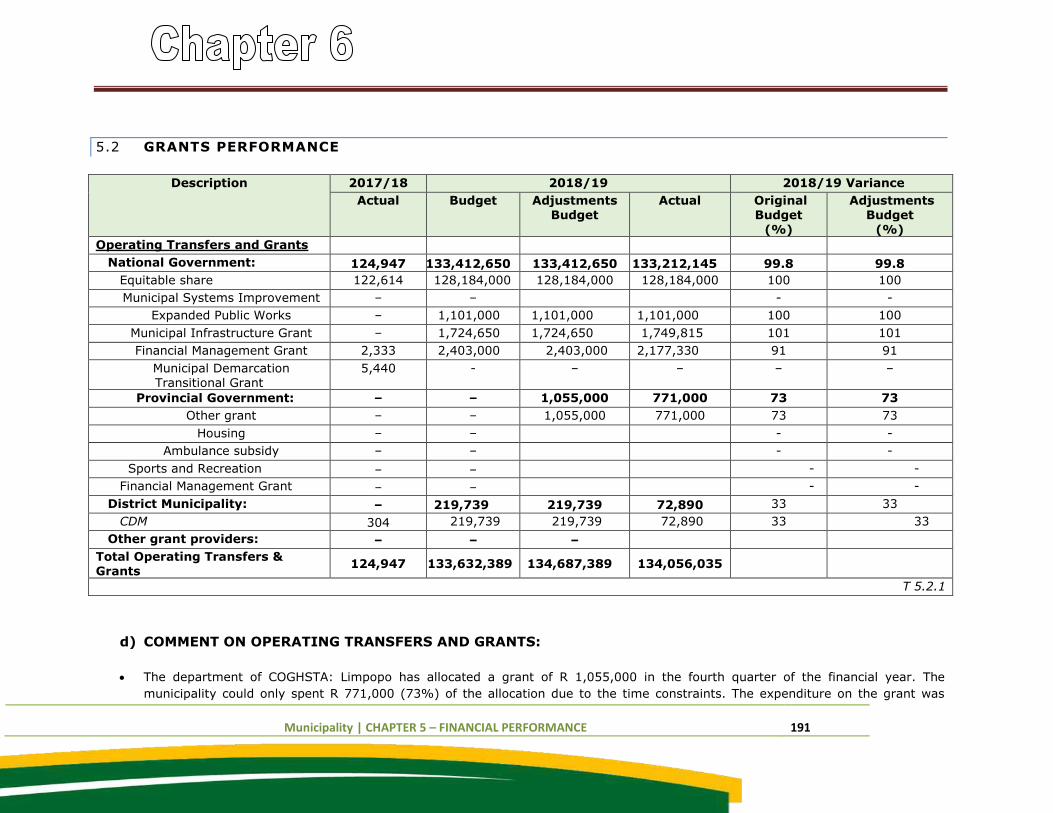
Municipality | CHAPTER 5 – FINANCIAL PERFORMANCE 191
5.2 GRANTS PERFORMANCE
Description 2017/18 2018/19 2018/19 Variance
Actual Budget Adjustments Budget
Actual Original Budget
(%)
Adjustments Budget
(%)
Operating Transfers and Grants
National Government: 124,947 133,412,650 133,412,650 133,212,145 99.8 99.8
Equitable share 122,614 128,184,000 128,184,000 128,184,000 100 100
Municipal Systems Improvement – – - -
Expanded Public Works – 1,101,000 1,101,000 1,101,000 100 100
Municipal Infrastructure Grant – 1,724,650 1,724,650 1,749,815 101 101
Financial Management Grant 2,333 2,403,000 2,403,000 2,177,330 91 91
Municipal Demarcation Transitional Grant
5,440 - – – – –
Provincial Government: – – 1,055,000 771,000 73 73
Other grant – – 1,055,000 771,000 73 73
Housing – – - -
Ambulance subsidy – – - -
Sports and Recreation – – - -
Financial Management Grant – – - -
District Municipality: – 219,739 219,739 72,890 33 33
CDM 304 219,739 219,739 72,890 33 33
Other grant providers: – – –
Total Operating Transfers & Grants
124,947 133,632,389 134,687,389 134,056,035
T 5.2.1
d) COMMENT ON OPERATING TRANSFERS AND GRANTS:
The department of COGHSTA: Limpopo has allocated a grant of R 1,055,000 in the fourth quarter of the financial year. The
municipality could only spent R 771,000 (73%) of the allocation due to the time constraints. The expenditure on the grant was
Municipality | CHAPTER 5 – FINANCIAL PERFORMANCE 192
spent on network points for Electronic Clocking system, Traffic Management system to manage traffic fines as well as Inventory
system.
e) GRANTS RECEIVED FROM SOURCES OTHER THAN DIVISION OF REVENUE ACT (DORA)
The municipality did not receive any grants other than the one from DORA.
5.3 ASSET MANAGEMENT
a) INTRODUCTION TO ASSET MANAGEMENT
The Asset management function falls under Chief Financial Officer in the Budget and Treasury department. The staff complement of the unit
consists of SCM Manager, Accountant Assets and two inventory Clerks. The Accountant: Assets position became vacant in the latter part of
the financial year. The recruitment process was undertaken to find a suitable replacement as we acknowledge the complexity of this
function. The management of assets is guided by the approved Assets Management policy as well as National Treasury circulars which are
issued from time to time.
Two assets verifications were conducted during the year under review to update the assets register of the municipality. Obsolette assets
were identified during the verification process which were submitted to council to approve disposal. These assets were disposed in the 3rd
quarter of the financial year following Council approval.
The Fixed Asset register was reconciled over the twelve months of the financial year as required by the regulatory framework. As reported
earlier in this report the municipality has conducted a revaluation of infrastructure assets which is done after every 4 years. The revaluation
included municipal roads, Fleet land and buildings with a view have an updated and correct asset values in the municipal asset register.
The municipality has migrated to an electronic Municipal Asset module as part of ensuring compliance to Municipal Chart of Accounts
(MSCOA). The migration will help the municipality to accurately and properly account on the assets.
The following reports have been updated on the asset module:
a. Revaluation of land and buildings
b. Residual amounts
c. Review of useful lives
d. Unbundling of Assets
e. Council Auction
f. Assets purchased in the current year.
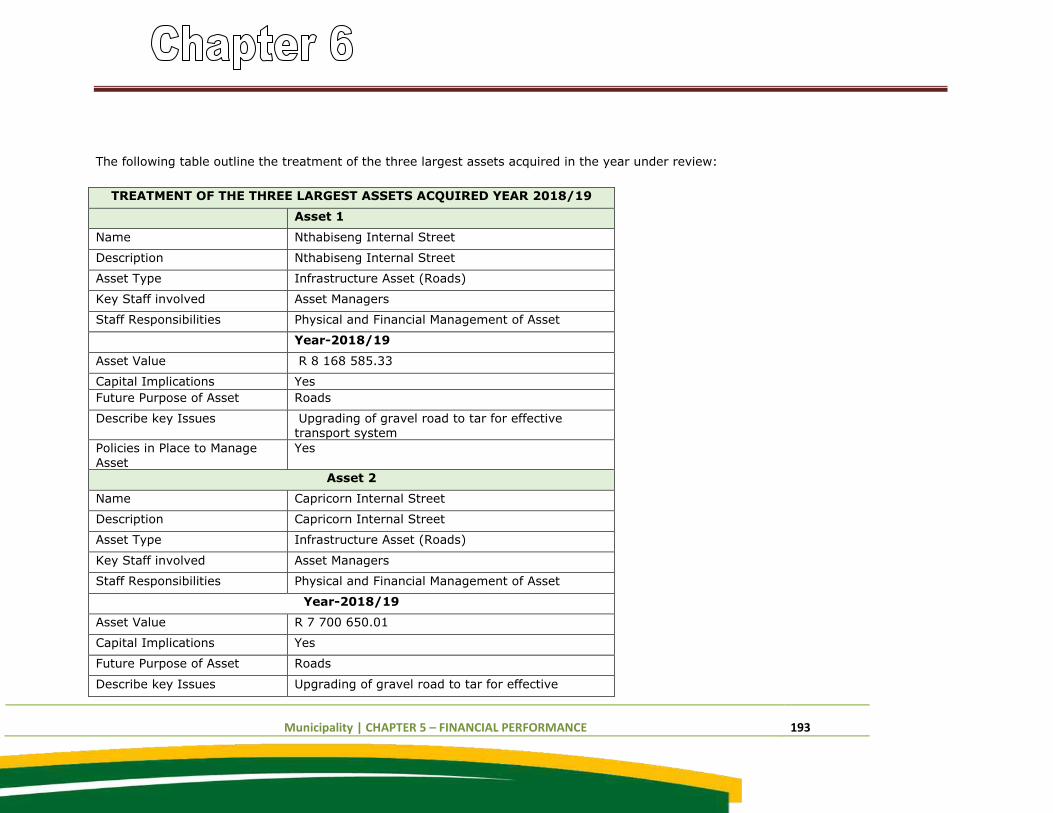
Municipality | CHAPTER 5 – FINANCIAL PERFORMANCE 193
The following table outline the treatment of the three largest assets acquired in the year under review:
TREATMENT OF THE THREE LARGEST ASSETS ACQUIRED YEAR 2018/19
Asset 1
Name Nthabiseng Internal Street
Description Nthabiseng Internal Street
Asset Type Infrastructure Asset (Roads)
Key Staff involved Asset Managers
Staff Responsibilities Physical and Financial Management of Asset
Year-2018/19
Asset Value R 8 168 585.33
Capital Implications Yes
Future Purpose of Asset Roads
Describe key Issues Upgrading of gravel road to tar for effective
transport system
Policies in Place to Manage
Asset
Yes
Asset 2
Name Capricorn Internal Street
Description Capricorn Internal Street
Asset Type Infrastructure Asset (Roads)
Key Staff involved Asset Managers
Staff Responsibilities Physical and Financial Management of Asset
Year-2018/19
Asset Value R 7 700 650.01
Capital Implications Yes
Future Purpose of Asset Roads
Describe key Issues Upgrading of gravel road to tar for effective
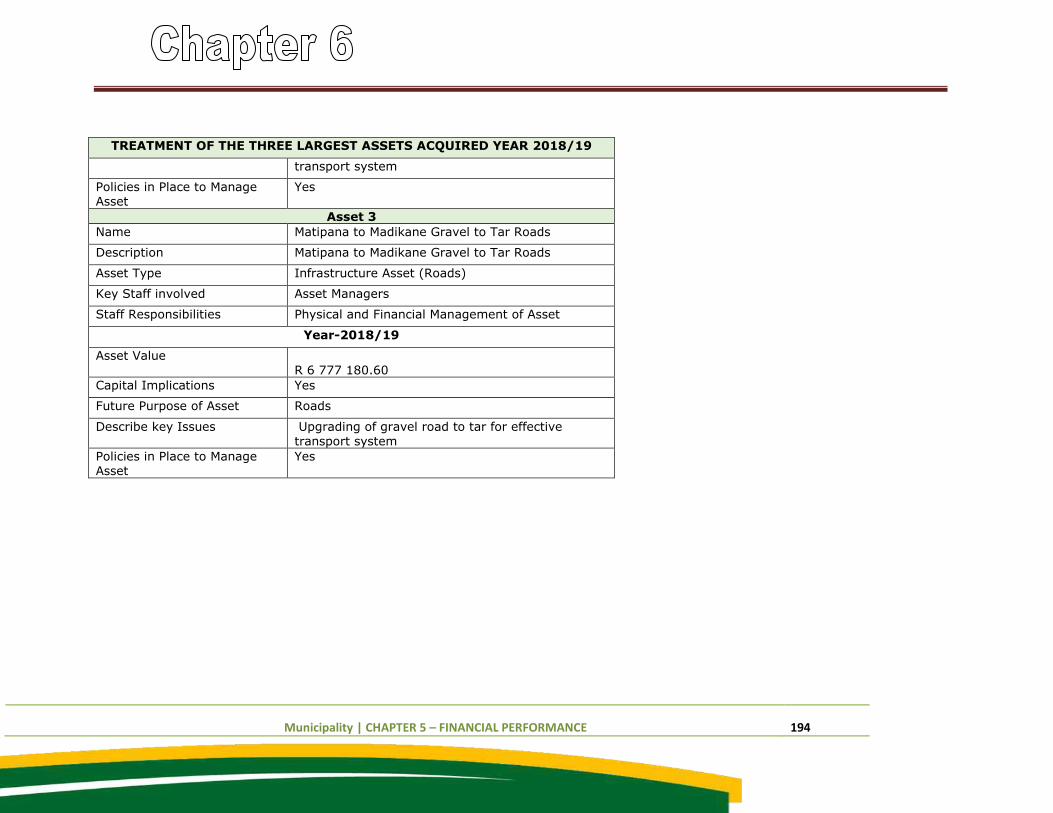
Municipality | CHAPTER 5 – FINANCIAL PERFORMANCE 194
TREATMENT OF THE THREE LARGEST ASSETS ACQUIRED YEAR 2018/19
transport system
Policies in Place to Manage Asset
Yes
Asset 3
Name Matipana to Madikane Gravel to Tar Roads
Description Matipana to Madikane Gravel to Tar Roads
Asset Type Infrastructure Asset (Roads)
Key Staff involved Asset Managers
Staff Responsibilities Physical and Financial Management of Asset
Year-2018/19
Asset Value R 6 777 180.60
Capital Implications Yes
Future Purpose of Asset Roads
Describe key Issues Upgrading of gravel road to tar for effective
transport system
Policies in Place to Manage Asset
Yes
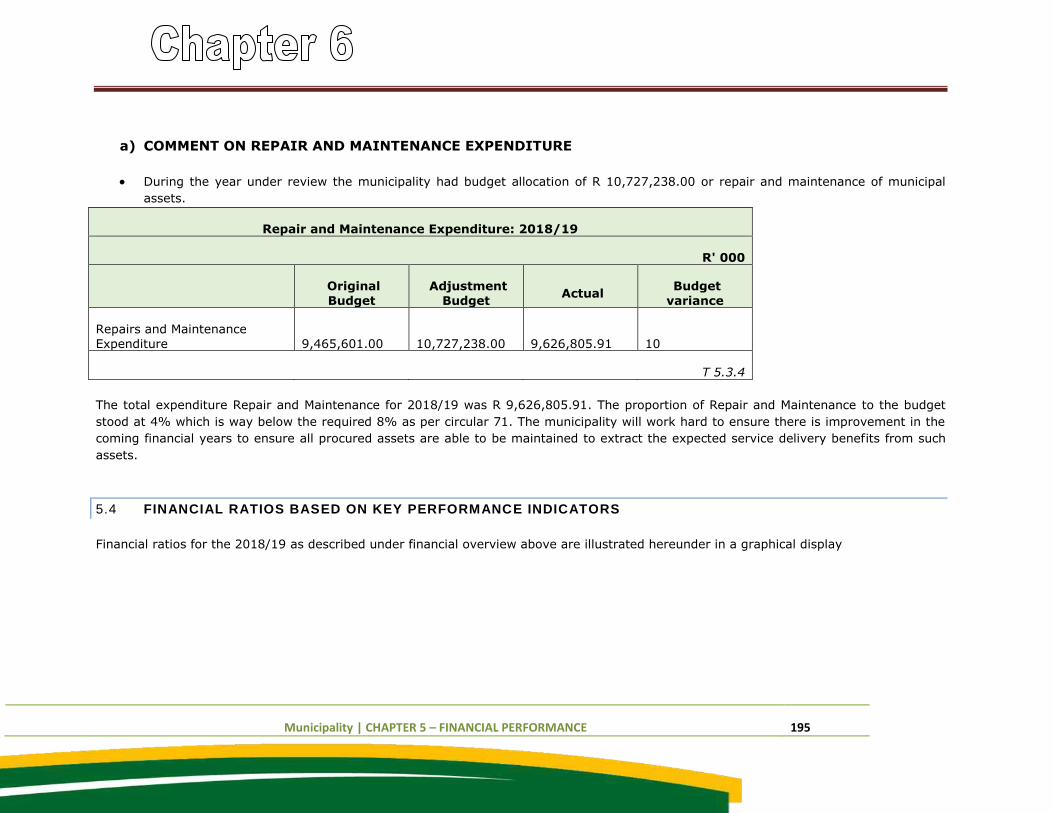
Municipality | CHAPTER 5 – FINANCIAL PERFORMANCE 195
a) COMMENT ON REPAIR AND MAINTENANCE EXPENDITURE
During the year under review the municipality had budget allocation of R 10,727,238.00 or repair and maintenance of municipal
assets.
Repair and Maintenance Expenditure: 2018/19
R' 000
Original
Budget
Adjustment
Budget Actual
Budget
variance
Repairs and Maintenance
Expenditure
9,465,601.00
10,727,238.00
9,626,805.91
10
T 5.3.4
The total expenditure Repair and Maintenance for 2018/19 was R 9,626,805.91. The proportion of Repair and Maintenance to the budget
stood at 4% which is way below the required 8% as per circular 71. The municipality will work hard to ensure there is improvement in the
coming financial years to ensure all procured assets are able to be maintained to extract the expected service delivery benefits from such
assets.
5.4 FINANCIAL RATIOS BASED ON KEY PERFORMANCE INDICATORS
Financial ratios for the 2018/19 as described under financial overview above are illustrated hereunder in a graphical display
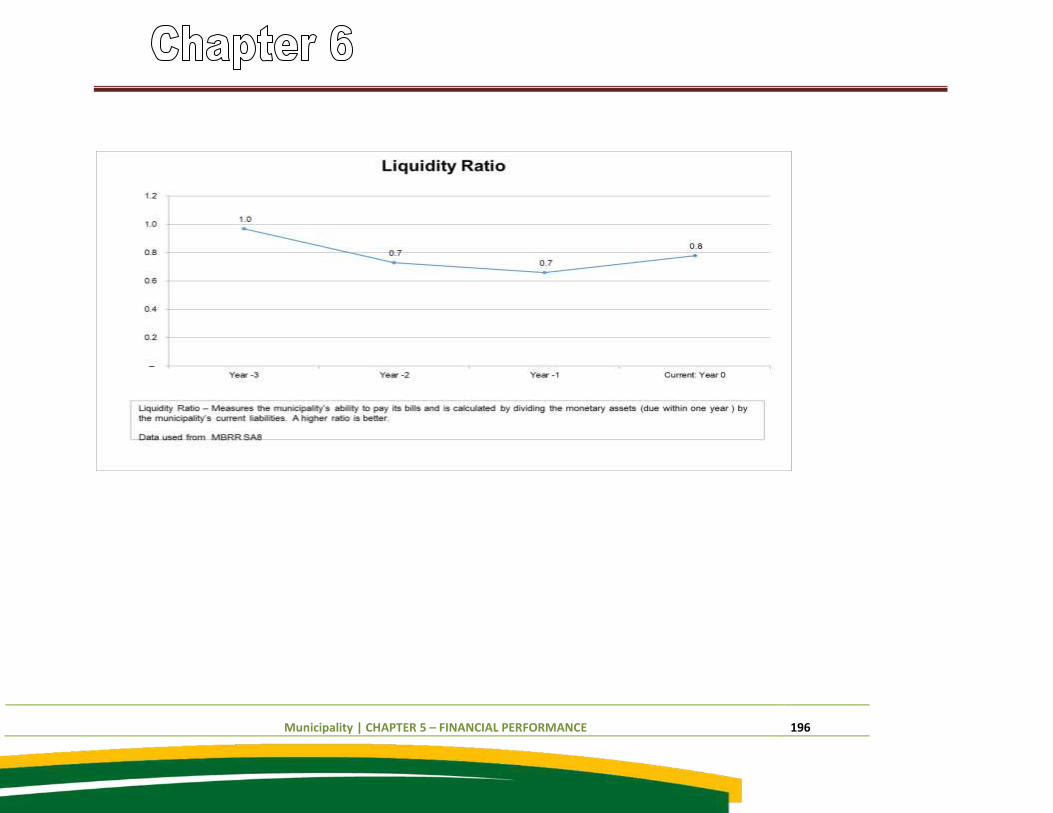
Municipality | CHAPTER 5 – FINANCIAL PERFORMANCE 196
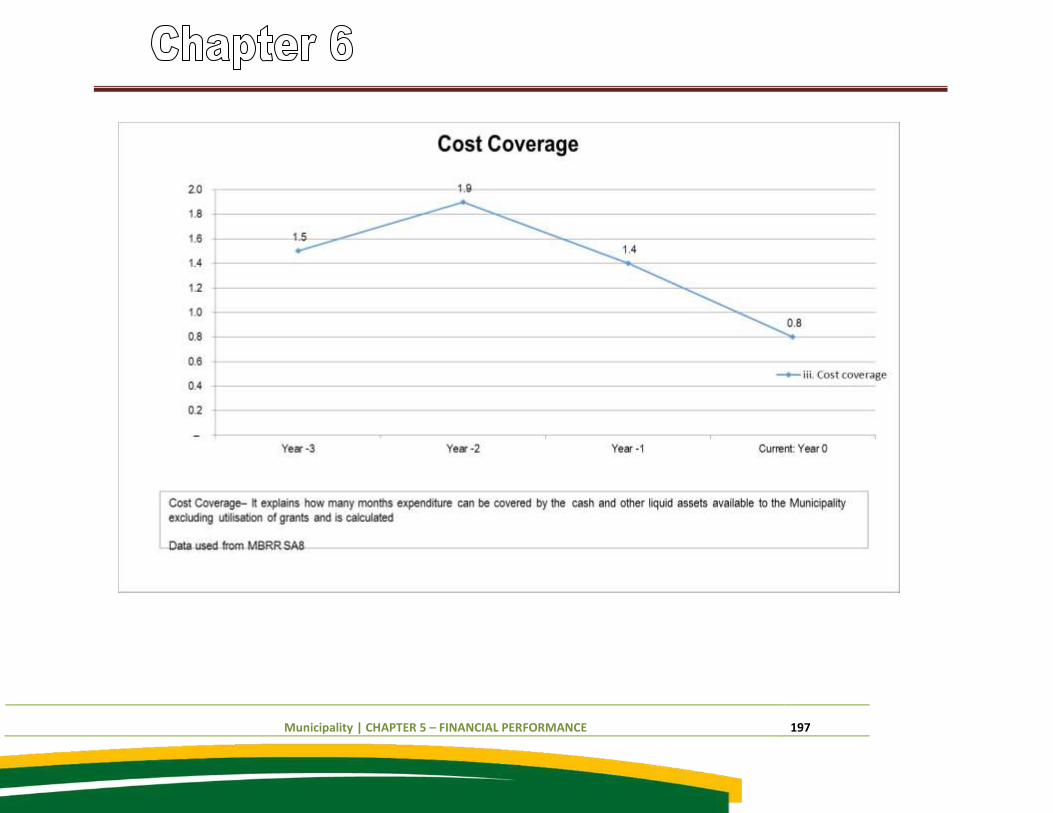
Municipality | CHAPTER 5 – FINANCIAL PERFORMANCE 197
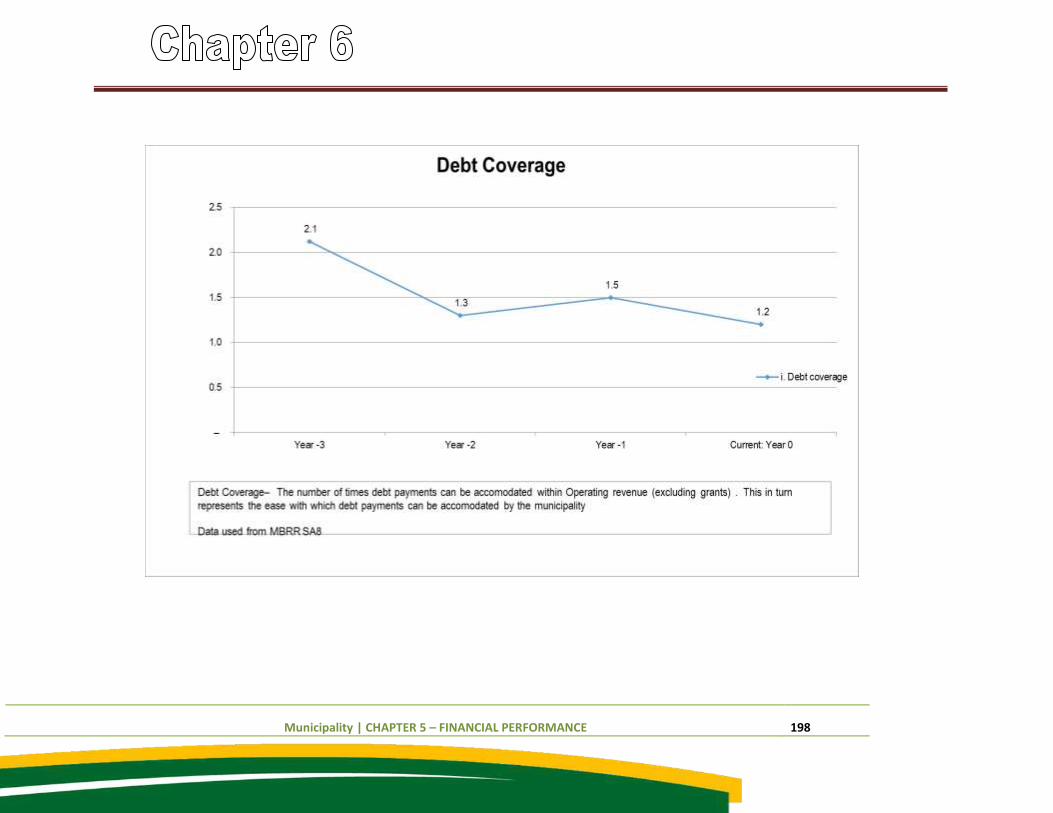
Municipality | CHAPTER 5 – FINANCIAL PERFORMANCE 198

Municipality | CHAPTER 5 – FINANCIAL PERFORMANCE 199
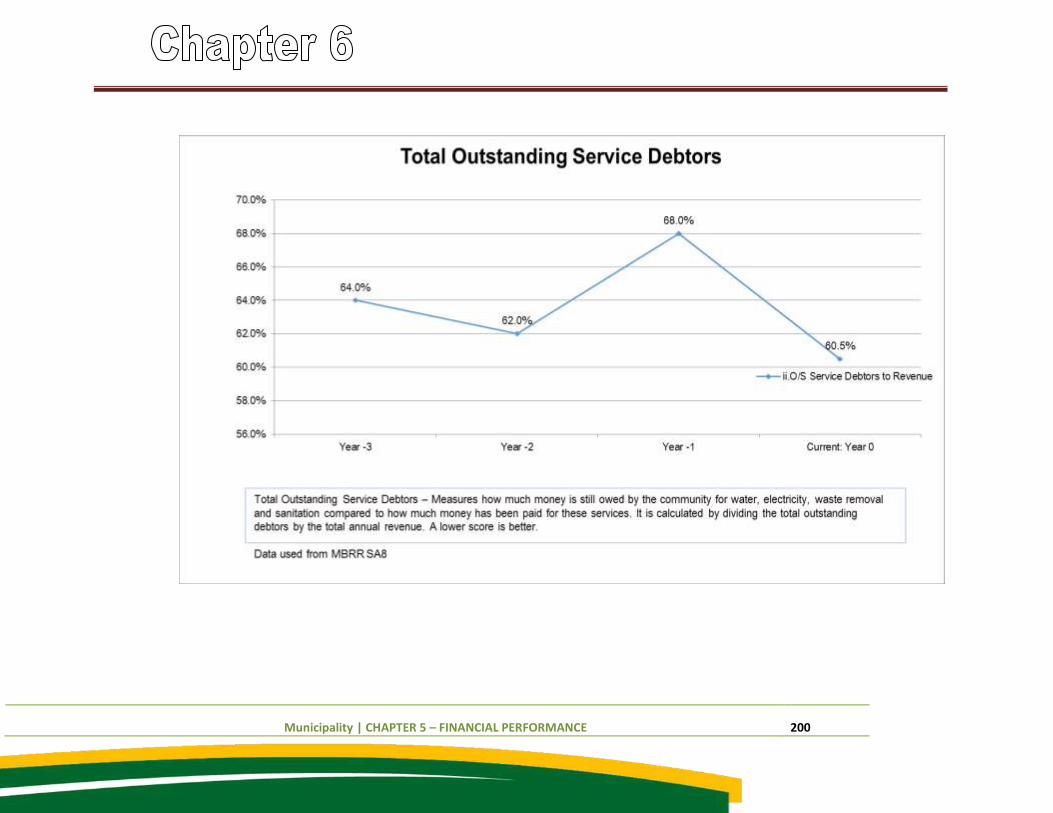
Municipality | CHAPTER 5 – FINANCIAL PERFORMANCE 200
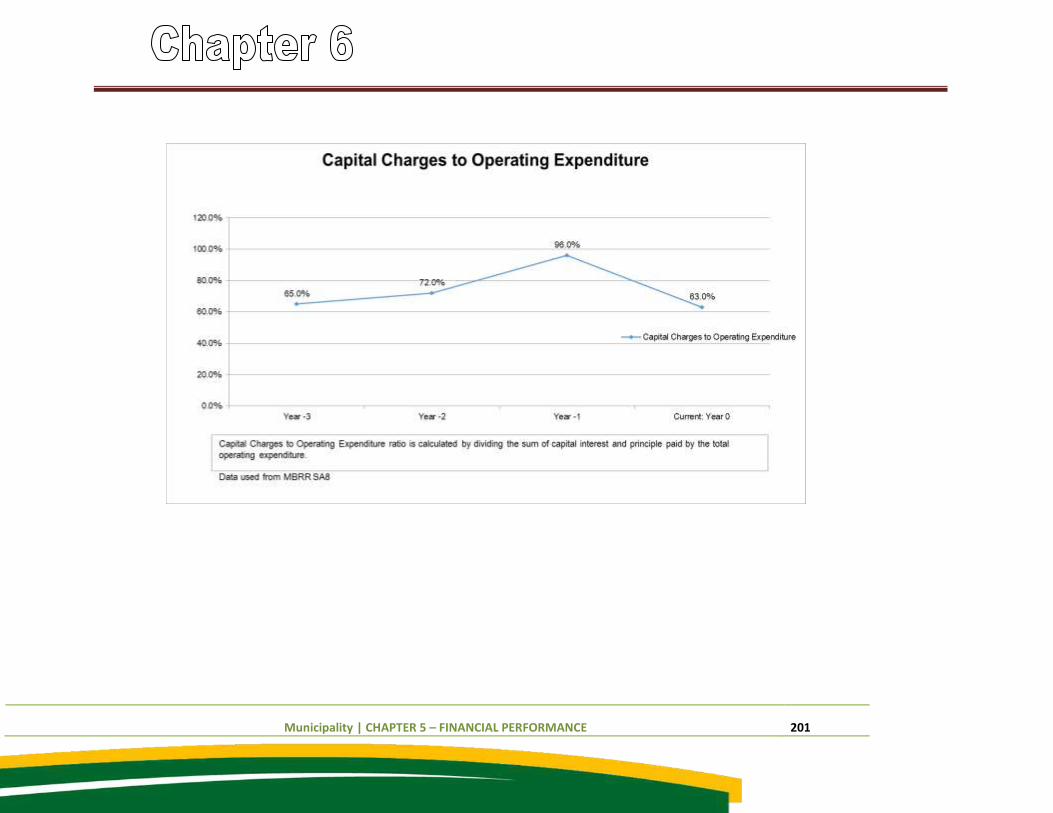
Municipality | CHAPTER 5 – FINANCIAL PERFORMANCE 201
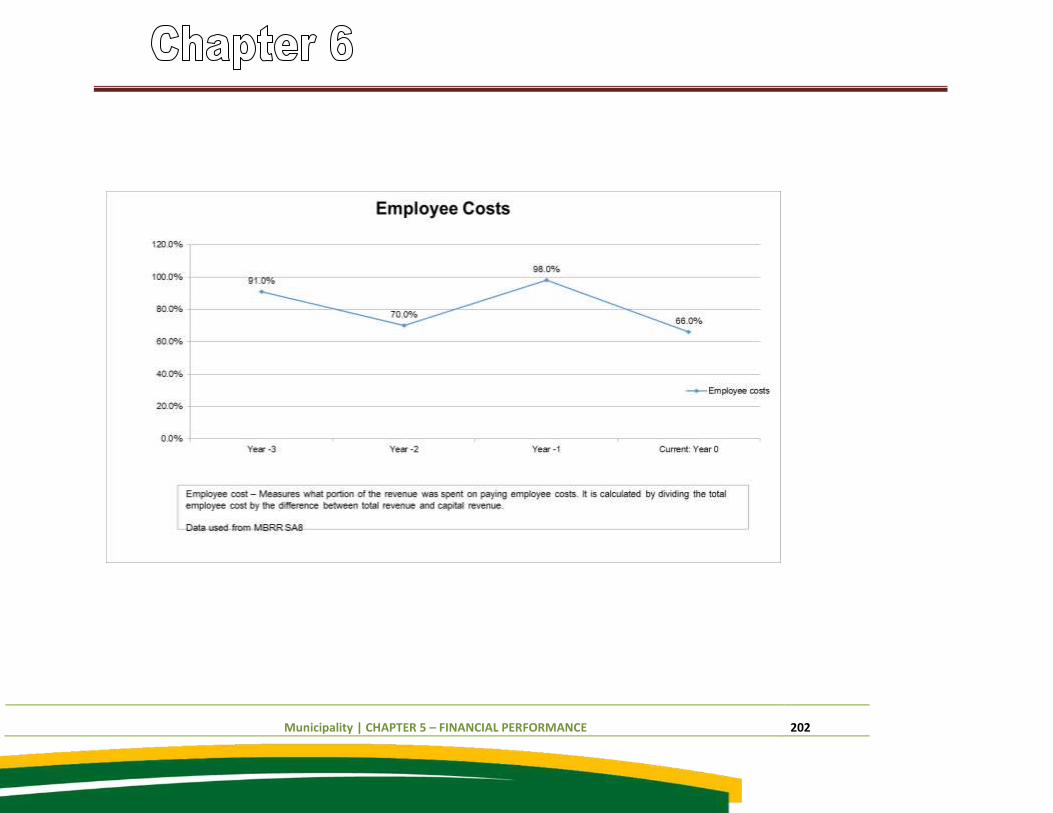
Municipality | CHAPTER 5 – FINANCIAL PERFORMANCE 202
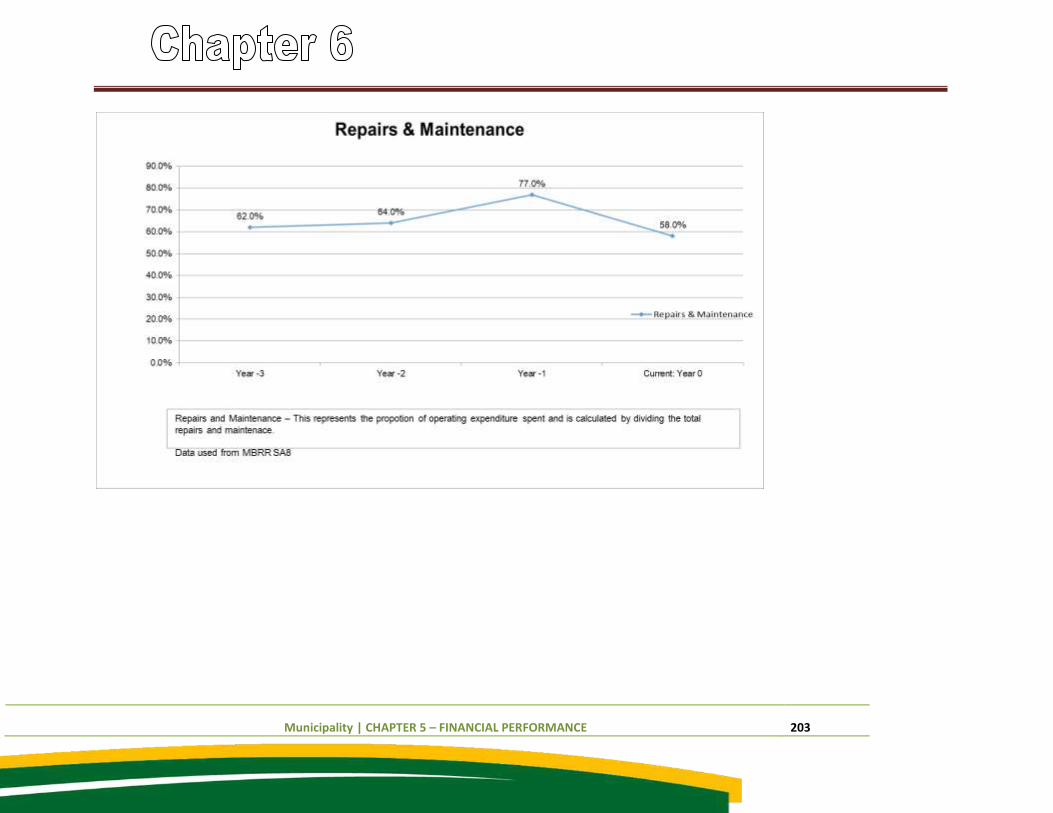
Municipality | CHAPTER 5 – FINANCIAL PERFORMANCE 203
Municipality | CHAPTER 5 – FINANCIAL PERFORMANCE 204
COMMENT ON FINANCIAL RATIOS:
The ratio 3:0 is above the norm which means that the municipality will be able to pay its short term obligations with the
available current assets. When comparing the current year ratio to the prior year it is stable, thus no indication of
uncertainties on the liquidity of the municipality.
The Municipality’s net assets amount of R 295 523 701
COMPONENT B: SPENDING AGAINST CAPITAL BUDGET
a) INTRODUCTION TO SPENDING AGAINST CAPITAL BUDGET
Capital expenditure relates mainly to construction projects that will have lasting value over many years. Molemole municipality fund Capital
projects via grants and funds generated from own user fees. Component B deals with capital spending indicating where the funding comes
from and whether Municipalities are able to spend the available funding as planned. In this component it is important to indicate the
different sources of funding as well as how these funds are spend. Highlight the 5 largest projects (see T5.7.1) and indicate what portion of
the capital budget they use. In the introduction briefly refer to these key aspects of capital expenditure (usually relating to new works and
renewal projects) and to Appendices M (relating to the new works and renewal programmes), N (relating to the full programme of full
capital projects, and O (relating to the alignment of projects to wards).
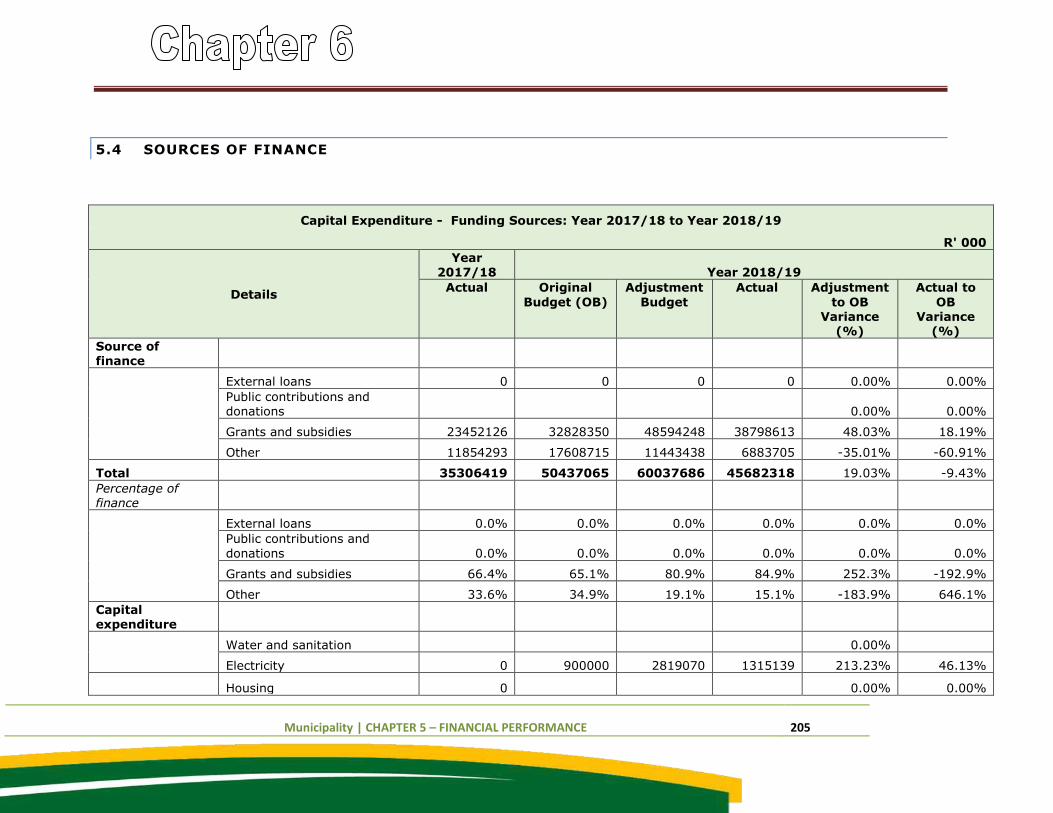
Municipality | CHAPTER 5 – FINANCIAL PERFORMANCE 205
5.4 SOURCES OF FINANCE
Capital Expenditure - Funding Sources: Year 2017/18 to Year 2018/19
R' 000
Details
Year 2017/18 Year 2018/19
Actual Original
Budget (OB)
Adjustment
Budget
Actual Adjustment
to OB Variance
(%)
Actual to
OB Variance
(%)
Source of finance
External loans 0 0 0 0 0.00% 0.00%
Public contributions and donations 0.00% 0.00%
Grants and subsidies 23452126 32828350 48594248 38798613 48.03% 18.19%
Other 11854293 17608715 11443438 6883705 -35.01% -60.91%
Total 35306419 50437065 60037686 45682318 19.03% -9.43%
Percentage of finance
External loans 0.0% 0.0% 0.0% 0.0% 0.0% 0.0%
Public contributions and
donations 0.0% 0.0% 0.0% 0.0% 0.0% 0.0%
Grants and subsidies 66.4% 65.1% 80.9% 84.9% 252.3% -192.9%
Other 33.6% 34.9% 19.1% 15.1% -183.9% 646.1%
Capital expenditure
Water and sanitation 0.00%
Electricity 0 900000 2819070 1315139 213.23% 46.13%
Housing 0 0.00% 0.00%
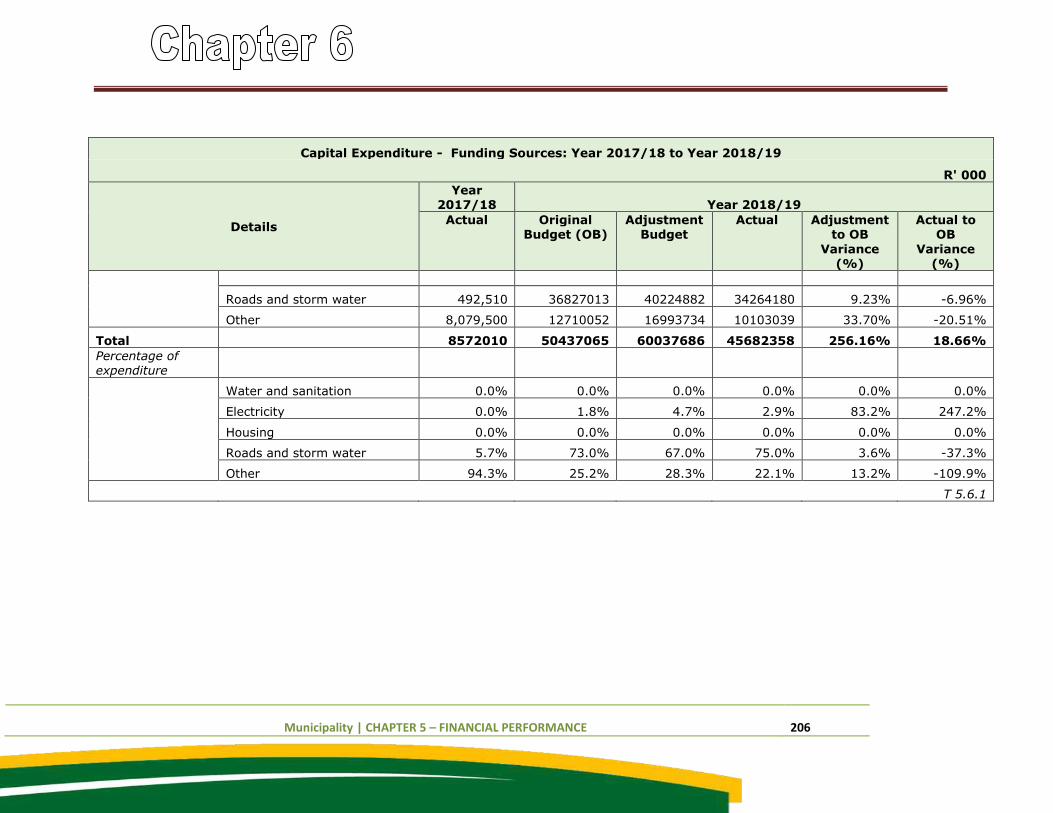
Municipality | CHAPTER 5 – FINANCIAL PERFORMANCE 206
Capital Expenditure - Funding Sources: Year 2017/18 to Year 2018/19
R' 000
Details
Year 2017/18 Year 2018/19
Actual Original Budget (OB)
Adjustment Budget
Actual Adjustment to OB
Variance
(%)
Actual to OB
Variance
(%)
Roads and storm water 492,510 36827013 40224882 34264180 9.23% -6.96%
Other 8,079,500 12710052 16993734 10103039 33.70% -20.51%
Total 8572010 50437065 60037686 45682358 256.16% 18.66%
Percentage of expenditure
Water and sanitation 0.0% 0.0% 0.0% 0.0% 0.0% 0.0%
Electricity 0.0% 1.8% 4.7% 2.9% 83.2% 247.2%
Housing 0.0% 0.0% 0.0% 0.0% 0.0% 0.0%
Roads and storm water 5.7% 73.0% 67.0% 75.0% 3.6% -37.3%
Other 94.3% 25.2% 28.3% 22.1% 13.2% -109.9%
T 5.6.1
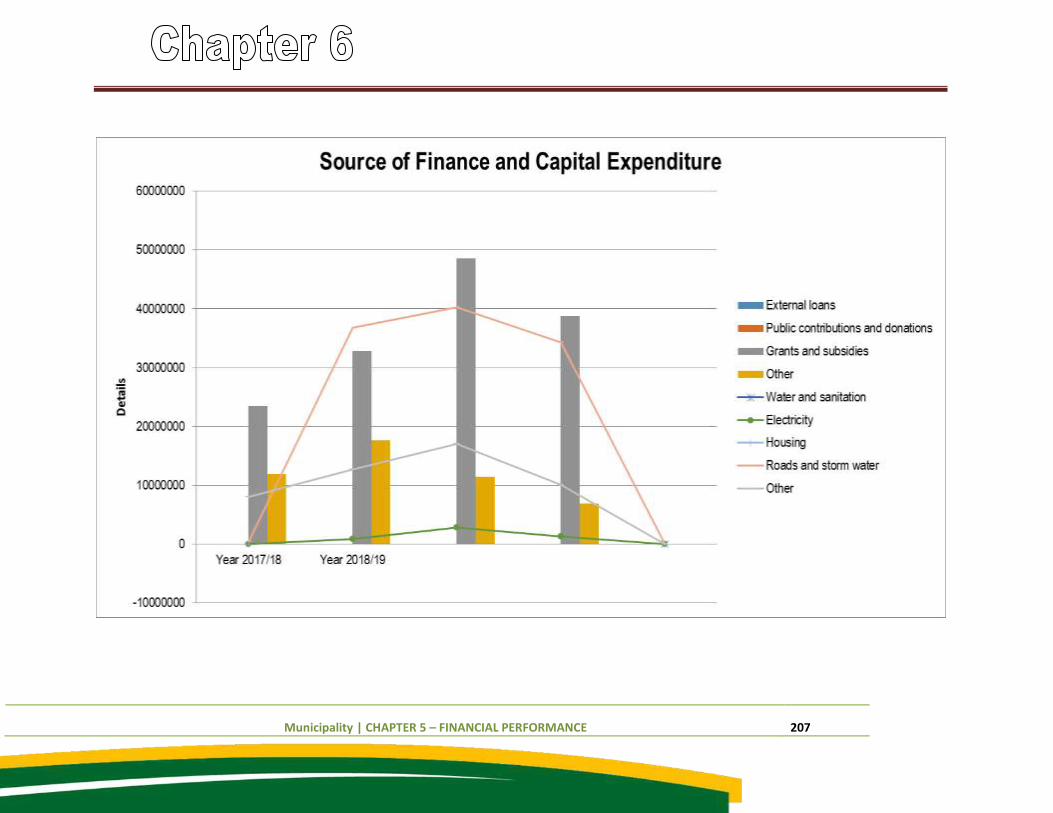
Municipality | CHAPTER 5 – FINANCIAL PERFORMANCE 207
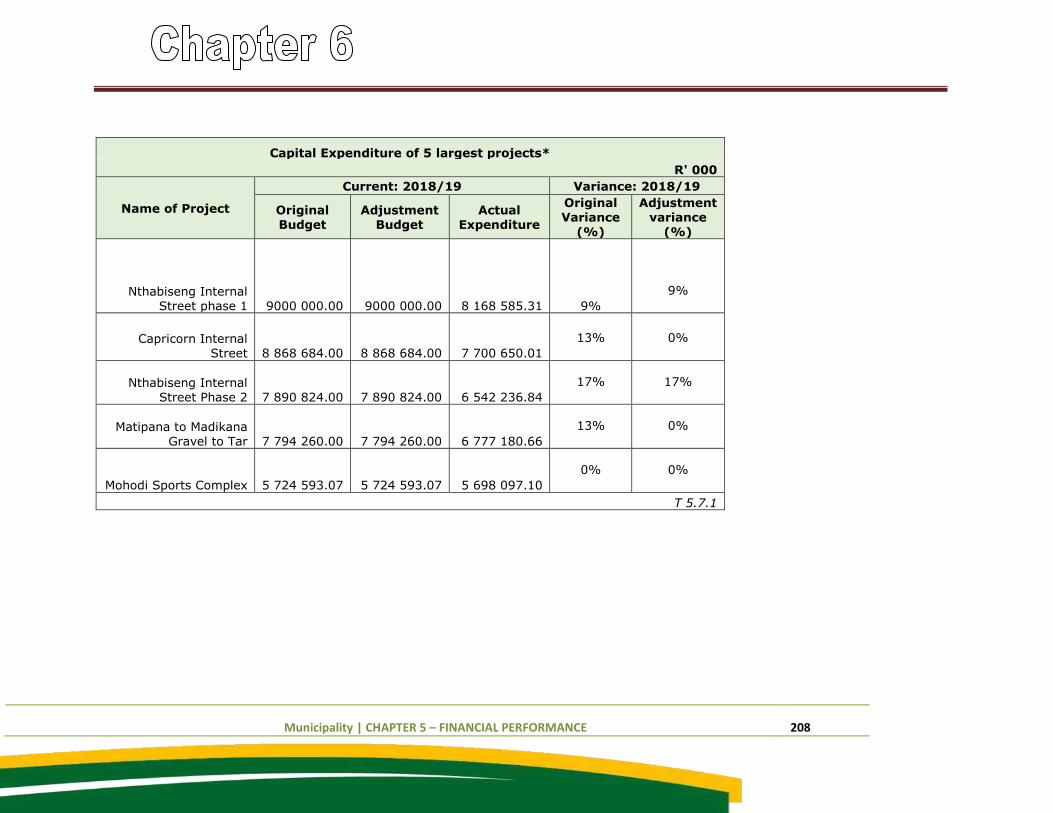
Municipality | CHAPTER 5 – FINANCIAL PERFORMANCE 208
Capital Expenditure of 5 largest projects*
R' 000
Name of Project
Current: 2018/19 Variance: 2018/19
Original Budget
Adjustment Budget
Actual Expenditure
Original Variance
(%)
Adjustment variance
(%)
Nthabiseng Internal Street phase 1 9000 000.00 9000 000.00 8 168 585.31 9%
9%
Capricorn Internal Street 8 868 684.00 8 868 684.00 7 700 650.01
13% 0%
Nthabiseng Internal Street Phase 2 7 890 824.00 7 890 824.00 6 542 236.84
17% 17%
Matipana to Madikana
Gravel to Tar 7 794 260.00 7 794 260.00 6 777 180.66
13% 0%
Mohodi Sports Complex 5 724 593.07 5 724 593.07 5 698 097.10
0% 0%
T 5.7.1
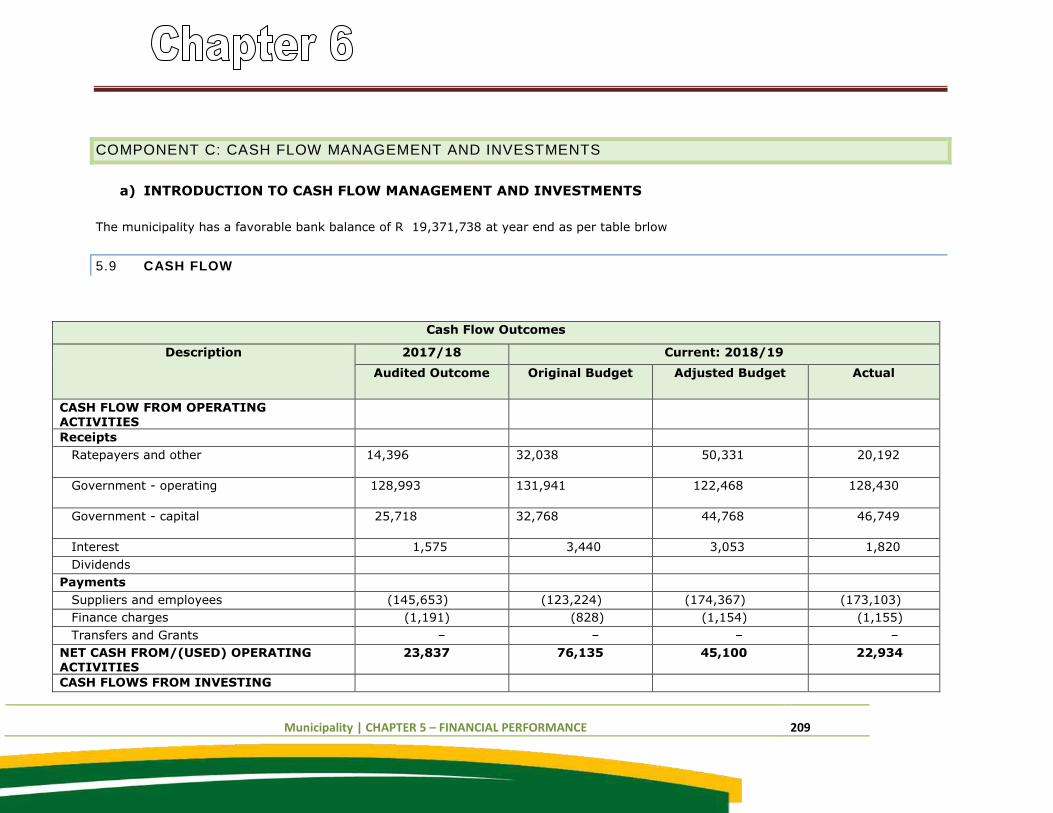
Municipality | CHAPTER 5 – FINANCIAL PERFORMANCE 209
COMPONENT C: CASH FLOW MANAGEMENT AND INVESTMENTS
a) INTRODUCTION TO CASH FLOW MANAGEMENT AND INVESTMENTS
The municipality has a favorable bank balance of R 19,371,738 at year end as per table brlow
5.9 CASH FLOW
Cash Flow Outcomes
Description 2017/18 Current: 2018/19
Audited Outcome Original Budget Adjusted Budget Actual
CASH FLOW FROM OPERATING ACTIVITIES
Receipts
Ratepayers and other 14,396 32,038 50,331 20,192
Government - operating 128,993 131,941 122,468 128,430
Government - capital 25,718 32,768 44,768 46,749
Interest 1,575 3,440 3,053 1,820
Dividends
Payments
Suppliers and employees (145,653) (123,224) (174,367) (173,103)
Finance charges (1,191) (828) (1,154) (1,155)
Transfers and Grants – – – –
NET CASH FROM/(USED) OPERATING ACTIVITIES
23,837 76,135 45,100 22,934
CASH FLOWS FROM INVESTING
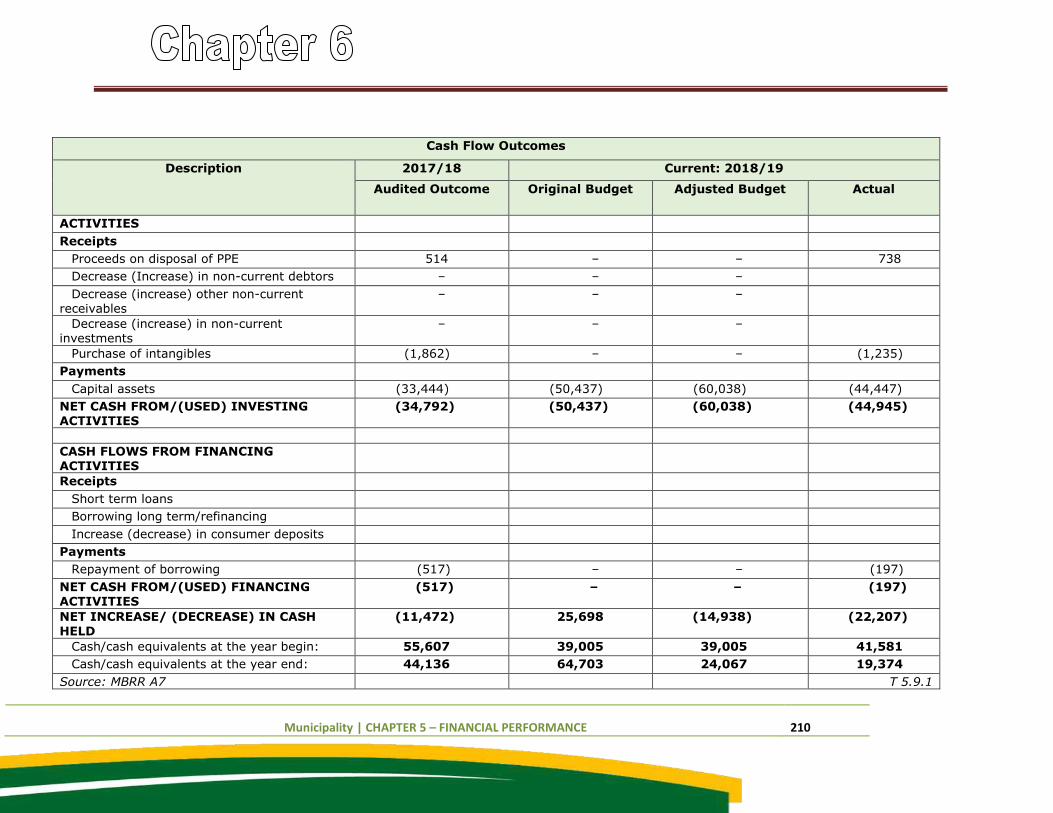
Municipality | CHAPTER 5 – FINANCIAL PERFORMANCE 210
Cash Flow Outcomes
Description 2017/18 Current: 2018/19
Audited Outcome Original Budget Adjusted Budget Actual
ACTIVITIES
Receipts
Proceeds on disposal of PPE 514 – – 738
Decrease (Increase) in non-current debtors – – –
Decrease (increase) other non-current receivables
– – –
Decrease (increase) in non-current investments
– – –
Purchase of intangibles (1,862) – – (1,235)
Payments
Capital assets (33,444) (50,437) (60,038) (44,447)
NET CASH FROM/(USED) INVESTING ACTIVITIES
(34,792) (50,437) (60,038) (44,945)
CASH FLOWS FROM FINANCING ACTIVITIES
Receipts
Short term loans
Borrowing long term/refinancing
Increase (decrease) in consumer deposits
Payments
Repayment of borrowing (517) – – (197)
NET CASH FROM/(USED) FINANCING ACTIVITIES
(517) – – (197)
NET INCREASE/ (DECREASE) IN CASH HELD
(11,472) 25,698 (14,938) (22,207)
Cash/cash equivalents at the year begin: 55,607 39,005 39,005 41,581
Cash/cash equivalents at the year end: 44,136 64,703 24,067 19,374
Source: MBRR A7 T 5.9.1
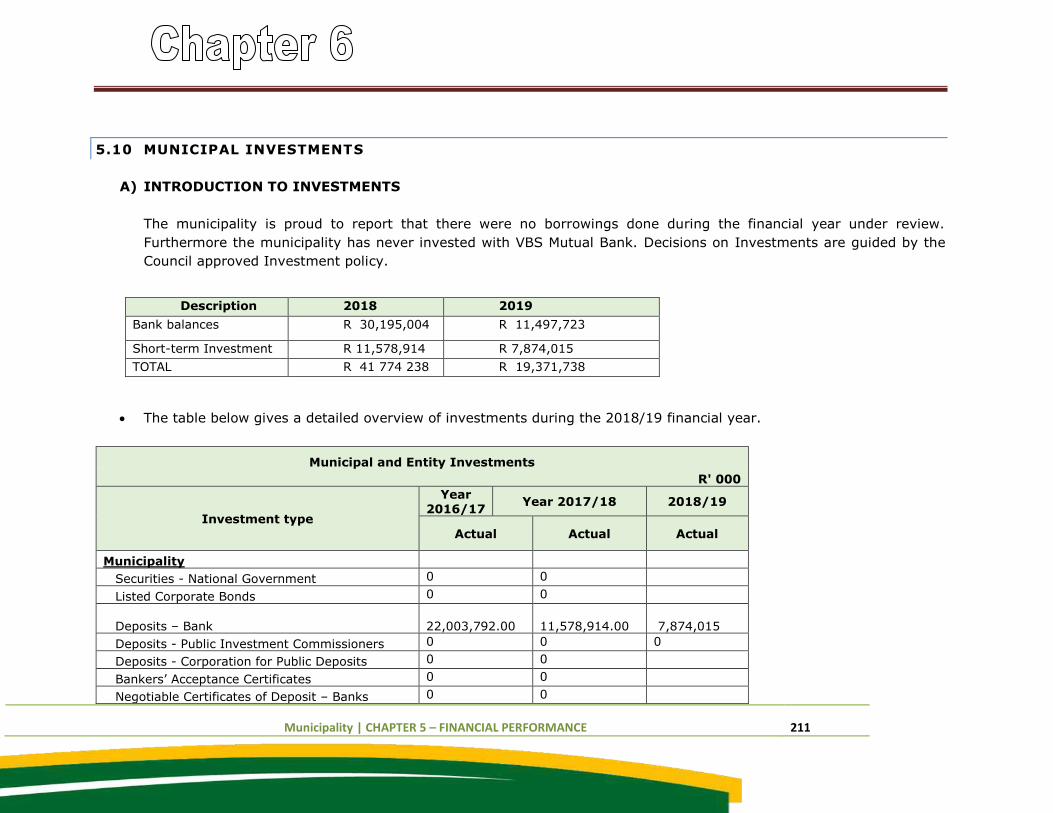
Municipality | CHAPTER 5 – FINANCIAL PERFORMANCE 211
5.10 MUNICIPAL INVESTMENTS
A) INTRODUCTION TO INVESTMENTS
The municipality is proud to report that there were no borrowings done during the financial year under review.
Furthermore the municipality has never invested with VBS Mutual Bank. Decisions on Investments are guided by the
Council approved Investment policy.
The table below gives a detailed overview of investments during the 2018/19 financial year.
Municipal and Entity Investments
R' 000
Investment type
Year 2016/17
Year 2017/18 2018/19
Actual Actual Actual
Municipality
Securities - National Government 0 0
Listed Corporate Bonds 0 0
Deposits – Bank 22,003,792.00
11,578,914.00 7,874,015
Deposits - Public Investment Commissioners 0 0 0
Deposits - Corporation for Public Deposits 0 0
Bankers’ Acceptance Certificates 0 0
Negotiable Certificates of Deposit – Banks 0 0
Description 2018 2019
Bank balances R 30,195,004 R 11,497,723
Short-term Investment R 11,578,914 R 7,874,015
TOTAL R 41 774 238 R 19,371,738
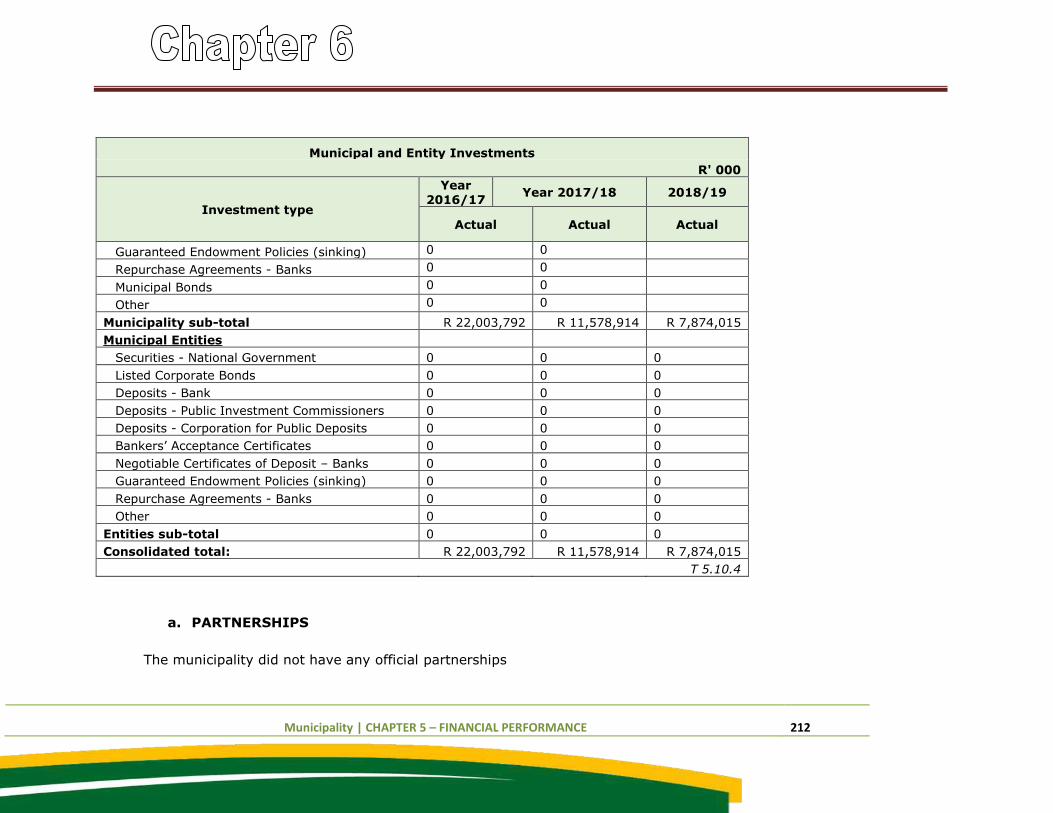
Municipality | CHAPTER 5 – FINANCIAL PERFORMANCE 212
Municipal and Entity Investments
R' 000
Investment type
Year 2016/17
Year 2017/18 2018/19
Actual Actual Actual
Guaranteed Endowment Policies (sinking) 0 0
Repurchase Agreements - Banks 0 0
Municipal Bonds 0 0
Other 0 0
Municipality sub-total R 22,003,792 R 11,578,914 R 7,874,015
Municipal Entities
Securities - National Government 0 0 0
Listed Corporate Bonds 0 0 0
Deposits - Bank 0 0 0
Deposits - Public Investment Commissioners 0 0 0
Deposits - Corporation for Public Deposits 0 0 0
Bankers’ Acceptance Certificates 0 0 0
Negotiable Certificates of Deposit – Banks 0 0 0
Guaranteed Endowment Policies (sinking) 0 0 0
Repurchase Agreements - Banks 0 0 0
Other 0 0 0
Entities sub-total 0 0 0
Consolidated total: R 22,003,792 R 11,578,914 R 7,874,015
T 5.10.4
a. PARTNERSHIPS
The municipality did not have any official partnerships
Municipality | CHAPTER 5 – FINANCIAL PERFORMANCE 213
COMPONENT D: OTHER FINANCIAL MATTERS
5.12 GRAP COMPLIANCE
GRAP is an acronym for Generally Recognized Accounting Practice and it provides the rules for which municipalities are required to
maintain their financial accounts. Successful GRAP compliance will ensure that municipal accounts are comparable and more informative for
the municipality. It will also ensure that the municipality is more accountable to its citizens and other stakeholders. Information on GRAP
compliance is needed to enable the National Treasury to assess the pace of progress and to consider the implications if not adhered to.
Molemole Municipality followed the directives issued by the Accounting Standards Board in compiling the 2018/19 Annual Financial
Statements. Molemole municipality’s Asset management policy and Asset register are in compliance with GRAP
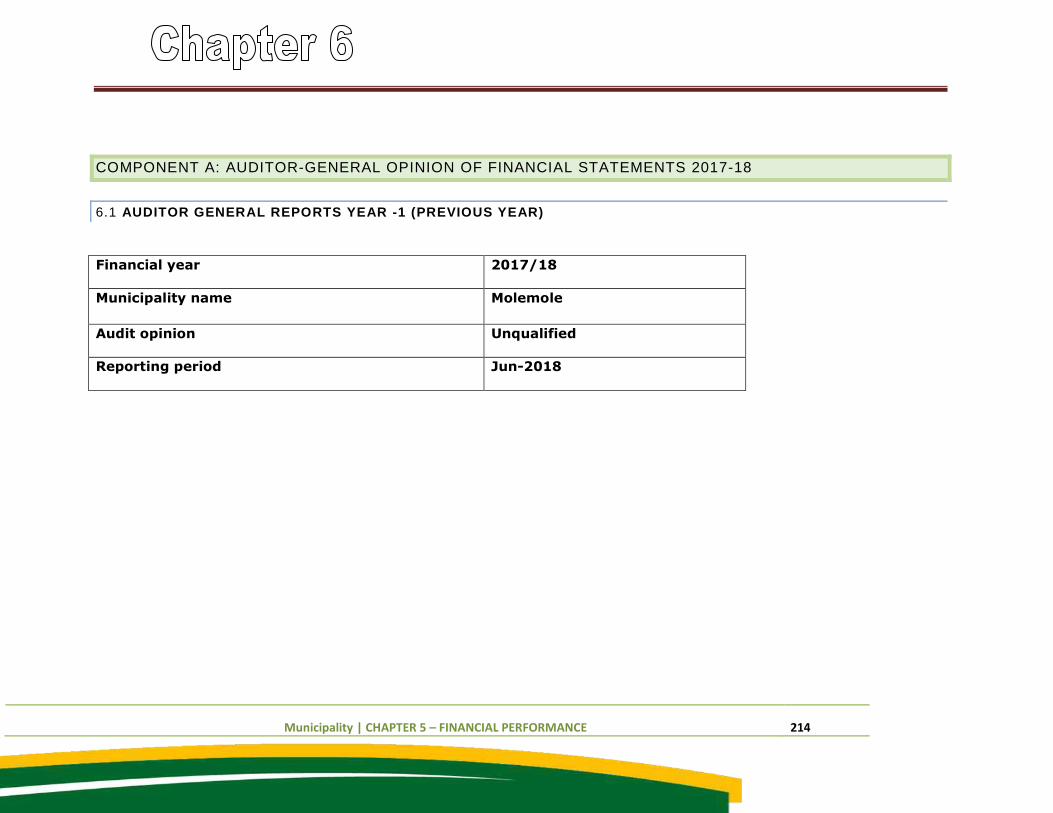
Municipality | CHAPTER 5 – FINANCIAL PERFORMANCE 214
COMPONENT A: AUDITOR-GENERAL OPINION OF FINANCIAL STATEMENTS 2017-18
6.1 AUDITOR GENERAL REPORTS YEAR -1 (PREVIOUS YEAR)
Financial year 2017/18
Municipality name Molemole
Audit opinion Unqualified
Reporting period Jun-2018
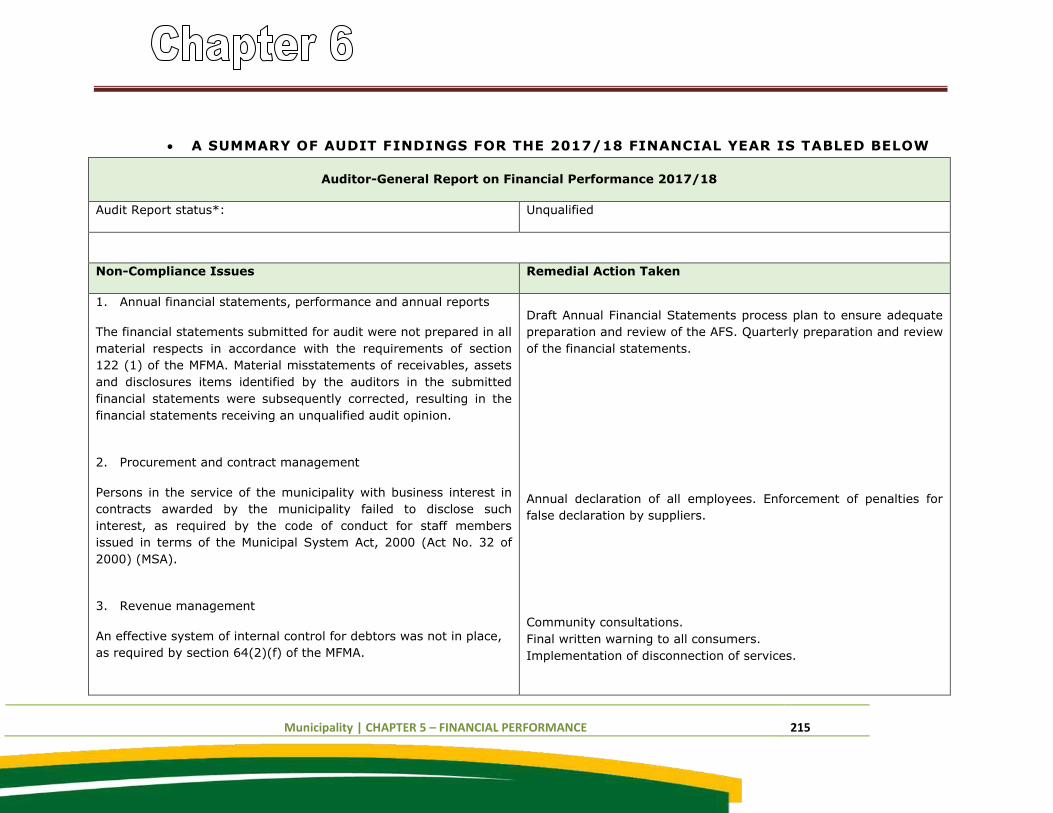
Municipality | CHAPTER 5 – FINANCIAL PERFORMANCE 215
A SUMMARY OF AUDIT FINDINGS FOR THE 2017/18 FINANCIAL YEAR IS TABLED BELOW
Auditor-General Report on Financial Performance 2017/18
Audit Report status*: Unqualified
Non-Compliance Issues Remedial Action Taken
1. Annual financial statements, performance and annual reports
The financial statements submitted for audit were not prepared in all
material respects in accordance with the requirements of section
122 (1) of the MFMA. Material misstatements of receivables, assets
and disclosures items identified by the auditors in the submitted
financial statements were subsequently corrected, resulting in the
financial statements receiving an unqualified audit opinion.
2. Procurement and contract management
Persons in the service of the municipality with business interest in
contracts awarded by the municipality failed to disclose such
interest, as required by the code of conduct for staff members
issued in terms of the Municipal System Act, 2000 (Act No. 32 of
2000) (MSA).
3. Revenue management
An effective system of internal control for debtors was not in place,
as required by section 64(2)(f) of the MFMA.
Draft Annual Financial Statements process plan to ensure adequate
preparation and review of the AFS. Quarterly preparation and review
of the financial statements.
Annual declaration of all employees. Enforcement of penalties for
false declaration by suppliers.
Community consultations.
Final written warning to all consumers.
Implementation of disconnection of services.
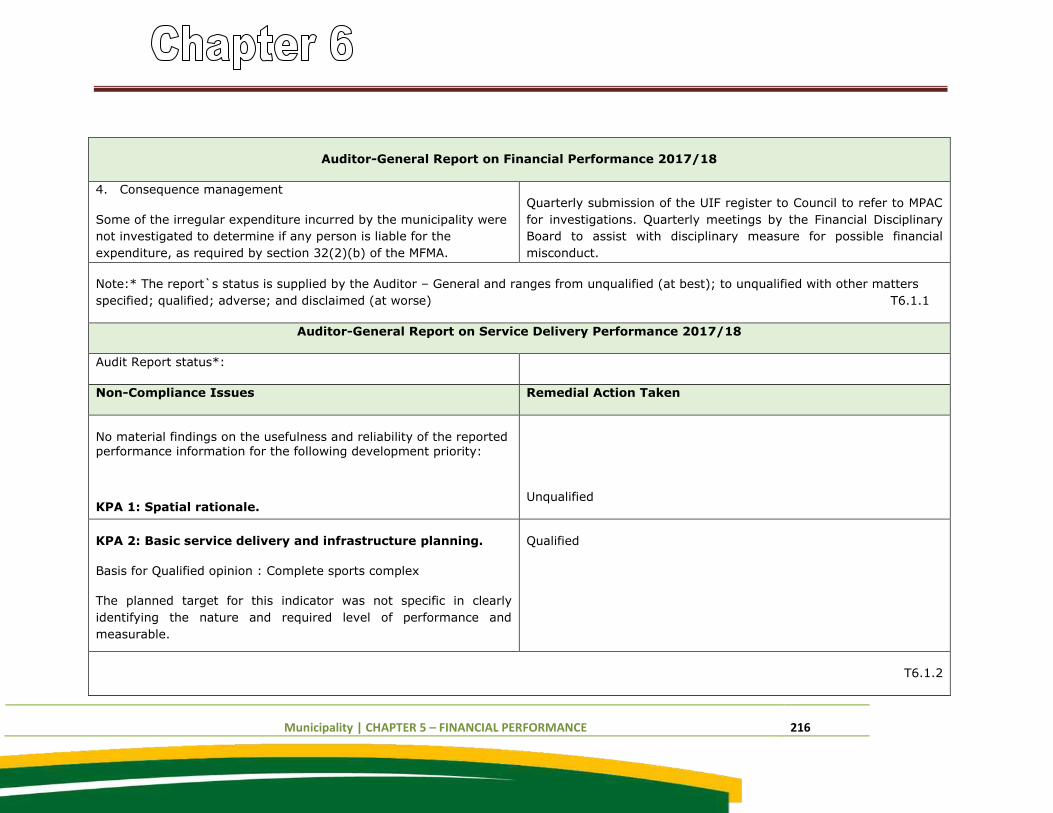
Municipality | CHAPTER 5 – FINANCIAL PERFORMANCE 216
Auditor-General Report on Financial Performance 2017/18
4. Consequence management
Some of the irregular expenditure incurred by the municipality were
not investigated to determine if any person is liable for the
expenditure, as required by section 32(2)(b) of the MFMA.
Quarterly submission of the UIF register to Council to refer to MPAC
for investigations. Quarterly meetings by the Financial Disciplinary
Board to assist with disciplinary measure for possible financial
misconduct.
Note:* The report`s status is supplied by the Auditor – General and ranges from unqualified (at best); to unqualified with other matters
specified; qualified; adverse; and disclaimed (at worse) T6.1.1
Auditor-General Report on Service Delivery Performance 2017/18
Audit Report status*:
Non-Compliance Issues Remedial Action Taken
No material findings on the usefulness and reliability of the reported performance information for the following development priority:
KPA 1: Spatial rationale.
Unqualified
KPA 2: Basic service delivery and infrastructure planning.
Basis for Qualified opinion : Complete sports complex
The planned target for this indicator was not specific in clearly
identifying the nature and required level of performance and
measurable.
Qualified
T6.1.2
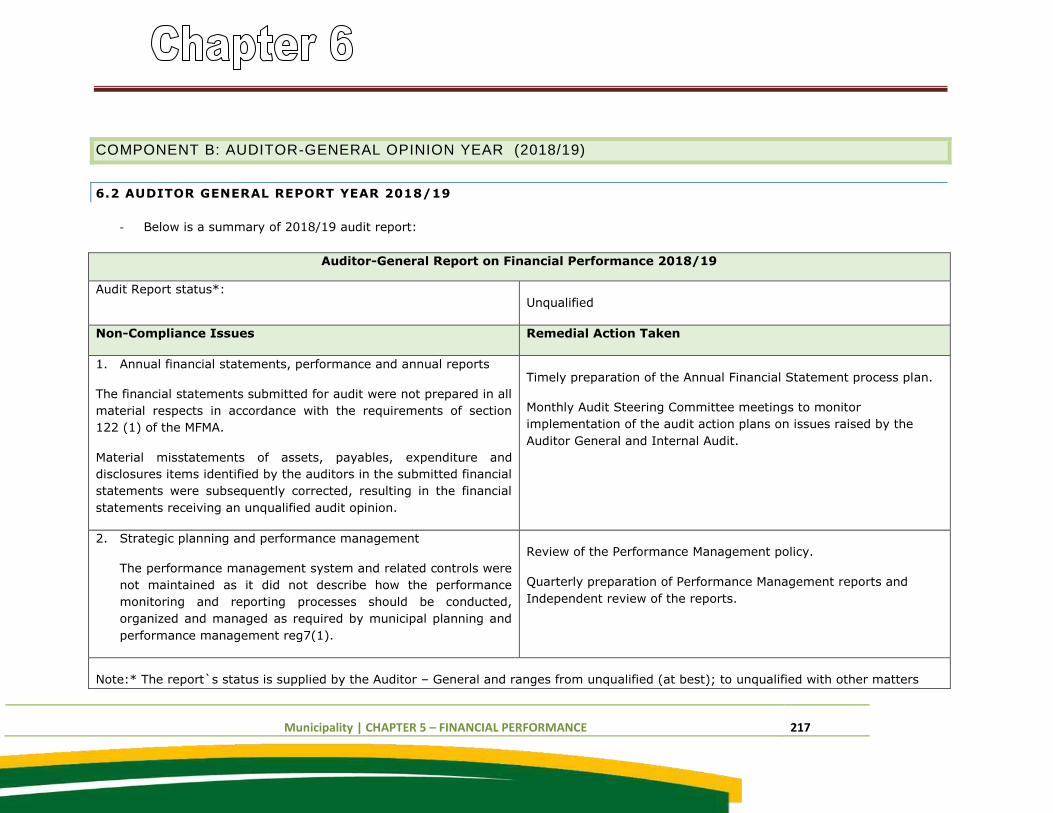
Municipality | CHAPTER 5 – FINANCIAL PERFORMANCE 217
COMPONENT B: AUDITOR-GENERAL OPINION YEAR (2018/19)
6.2 AUDITOR GENERAL REPORT YEAR 2018/19
- Below is a summary of 2018/19 audit report:
Auditor-General Report on Financial Performance 2018/19
Audit Report status*: Unqualified
Non-Compliance Issues Remedial Action Taken
1. Annual financial statements, performance and annual reports
The financial statements submitted for audit were not prepared in all
material respects in accordance with the requirements of section
122 (1) of the MFMA.
Material misstatements of assets, payables, expenditure and
disclosures items identified by the auditors in the submitted financial
statements were subsequently corrected, resulting in the financial
statements receiving an unqualified audit opinion.
Timely preparation of the Annual Financial Statement process plan.
Monthly Audit Steering Committee meetings to monitor
implementation of the audit action plans on issues raised by the
Auditor General and Internal Audit.
2. Strategic planning and performance management
The performance management system and related controls were
not maintained as it did not describe how the performance
monitoring and reporting processes should be conducted,
organized and managed as required by municipal planning and
performance management reg7(1).
Review of the Performance Management policy.
Quarterly preparation of Performance Management reports and
Independent review of the reports.
Note:* The report`s status is supplied by the Auditor – General and ranges from unqualified (at best); to unqualified with other matters
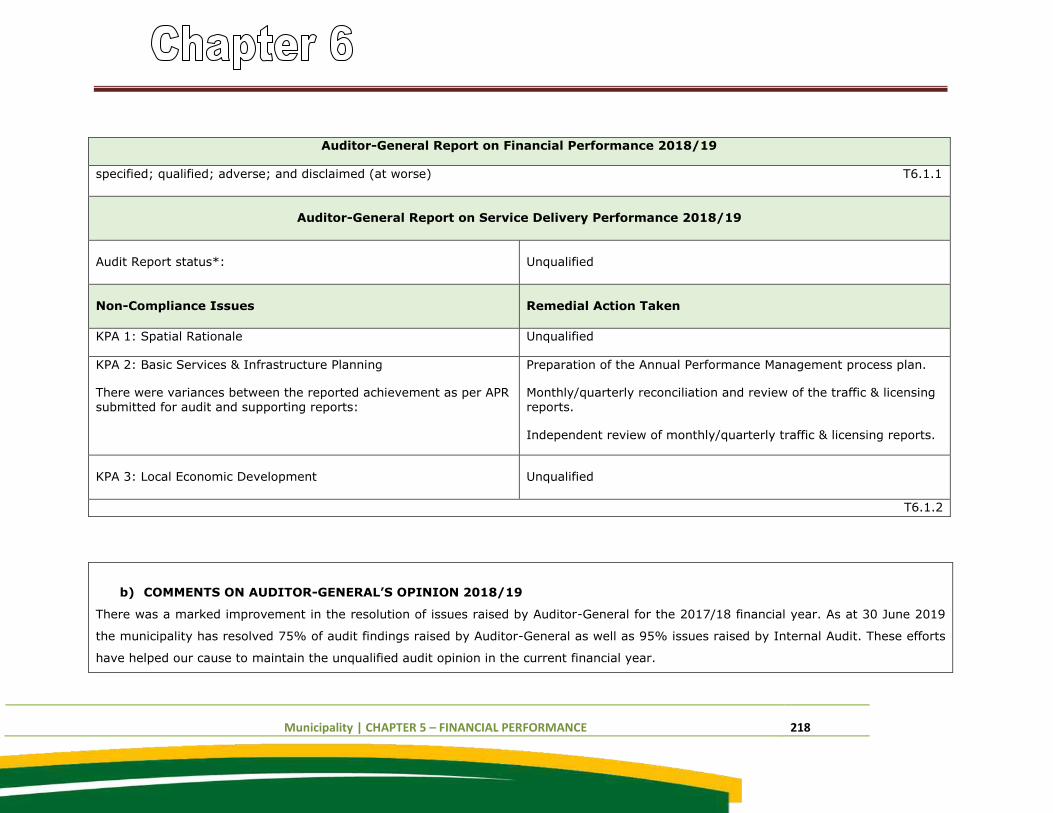
Municipality | CHAPTER 5 – FINANCIAL PERFORMANCE 218
Auditor-General Report on Financial Performance 2018/19
specified; qualified; adverse; and disclaimed (at worse) T6.1.1
Auditor-General Report on Service Delivery Performance 2018/19
Audit Report status*: Unqualified
Non-Compliance Issues Remedial Action Taken
KPA 1: Spatial Rationale Unqualified
KPA 2: Basic Services & Infrastructure Planning
There were variances between the reported achievement as per APR submitted for audit and supporting reports:
Preparation of the Annual Performance Management process plan.
Monthly/quarterly reconciliation and review of the traffic & licensing reports.
Independent review of monthly/quarterly traffic & licensing reports.
KPA 3: Local Economic Development Unqualified
T6.1.2
b) COMMENTS ON AUDITOR-GENERAL’S OPINION 2018/19
There was a marked improvement in the resolution of issues raised by Auditor-General for the 2017/18 financial year. As at 30 June 2019
the municipality has resolved 75% of audit findings raised by Auditor-General as well as 95% issues raised by Internal Audit. These efforts
have helped our cause to maintain the unqualified audit opinion in the current financial year.
Municipality | CHAPTER 5 – FINANCIAL PERFORMANCE 219
c) COMMENTS ON MFMA SECTION 71 RESPONSIBILITIES:
All section 71 reports for the 2018/19 financial year were submitted to both National and Provincial Treasury, COGHSTA and the Mayor in
the format prescribed by National Treasury. The signed copies are also published in the municipal website in line with section 75 of the
Municipal Finance Management Act, 2003 (Act 53 of 2003)
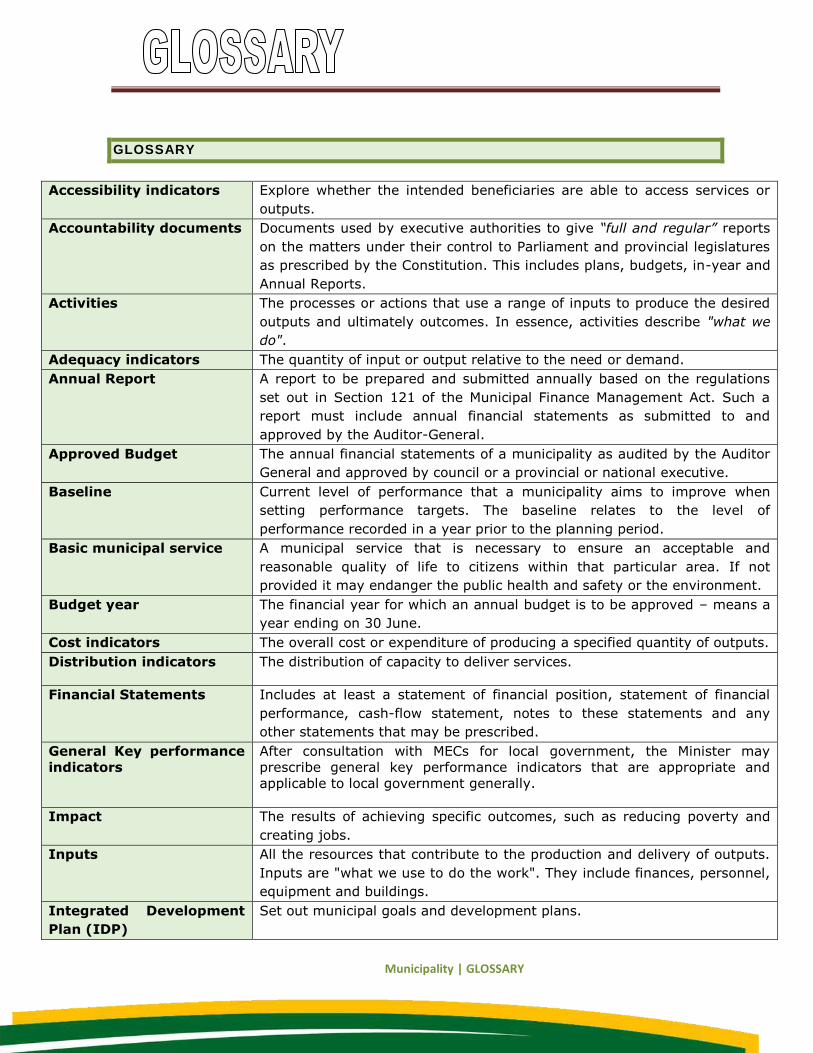
Municipality | GLOSSARY
GLOSSARY
Accessibility indicators Explore whether the intended beneficiaries are able to access services or
outputs.
Accountability documents Documents used by executive authorities to give “full and regular” reports
on the matters under their control to Parliament and provincial legislatures
as prescribed by the Constitution. This includes plans, budgets, in-year and
Annual Reports.
Activities The processes or actions that use a range of inputs to produce the desired
outputs and ultimately outcomes. In essence, activities describe "what we
do".
Adequacy indicators The quantity of input or output relative to the need or demand.
Annual Report A report to be prepared and submitted annually based on the regulations
set out in Section 121 of the Municipal Finance Management Act. Such a
report must include annual financial statements as submitted to and
approved by the Auditor-General.
Approved Budget The annual financial statements of a municipality as audited by the Auditor
General and approved by council or a provincial or national executive.
Baseline Current level of performance that a municipality aims to improve when
setting performance targets. The baseline relates to the level of
performance recorded in a year prior to the planning period.
Basic municipal service A municipal service that is necessary to ensure an acceptable and
reasonable quality of life to citizens within that particular area. If not
provided it may endanger the public health and safety or the environment.
Budget year The financial year for which an annual budget is to be approved – means a
year ending on 30 June.
Cost indicators The overall cost or expenditure of producing a specified quantity of outputs.
Distribution indicators The distribution of capacity to deliver services.
Financial Statements Includes at least a statement of financial position, statement of financial
performance, cash-flow statement, notes to these statements and any
other statements that may be prescribed.
General Key performance
indicators
After consultation with MECs for local government, the Minister may
prescribe general key performance indicators that are appropriate and
applicable to local government generally.
Impact The results of achieving specific outcomes, such as reducing poverty and
creating jobs.
Inputs All the resources that contribute to the production and delivery of outputs.
Inputs are "what we use to do the work". They include finances, personnel,
equipment and buildings.
Integrated Development
Plan (IDP)
Set out municipal goals and development plans.
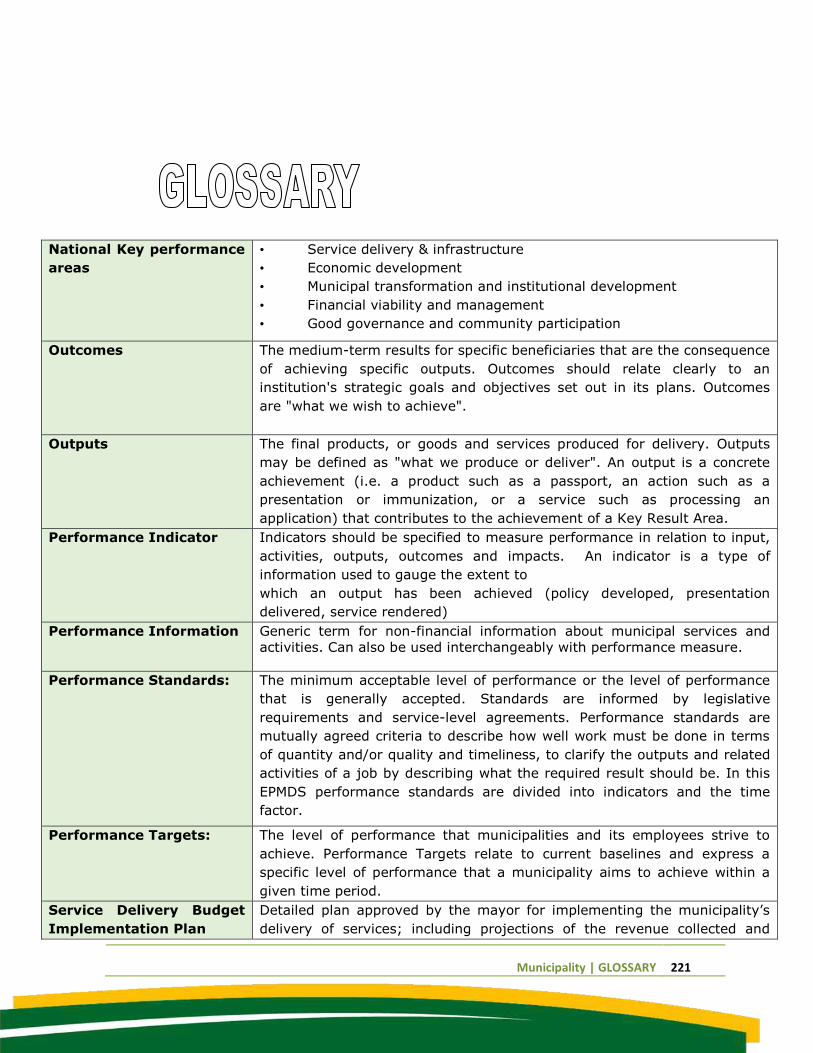
Municipality | GLOSSARY 221
National Key performance
areas
• Service delivery & infrastructure
• Economic development
• Municipal transformation and institutional development
• Financial viability and management
• Good governance and community participation
Outcomes The medium-term results for specific beneficiaries that are the consequence
of achieving specific outputs. Outcomes should relate clearly to an
institution's strategic goals and objectives set out in its plans. Outcomes
are "what we wish to achieve".
Outputs The final products, or goods and services produced for delivery. Outputs
may be defined as "what we produce or deliver". An output is a concrete
achievement (i.e. a product such as a passport, an action such as a
presentation or immunization, or a service such as processing an
application) that contributes to the achievement of a Key Result Area.
Performance Indicator Indicators should be specified to measure performance in relation to input,
activities, outputs, outcomes and impacts. An indicator is a type of
information used to gauge the extent to
which an output has been achieved (policy developed, presentation
delivered, service rendered)
Performance Information Generic term for non-financial information about municipal services and
activities. Can also be used interchangeably with performance measure.
Performance Standards: The minimum acceptable level of performance or the level of performance
that is generally accepted. Standards are informed by legislative
requirements and service-level agreements. Performance standards are
mutually agreed criteria to describe how well work must be done in terms
of quantity and/or quality and timeliness, to clarify the outputs and related
activities of a job by describing what the required result should be. In this
EPMDS performance standards are divided into indicators and the time
factor.
Performance Targets: The level of performance that municipalities and its employees strive to
achieve. Performance Targets relate to current baselines and express a
specific level of performance that a municipality aims to achieve within a
given time period.
Service Delivery Budget
Implementation Plan
Detailed plan approved by the mayor for implementing the municipality’s
delivery of services; including projections of the revenue collected and
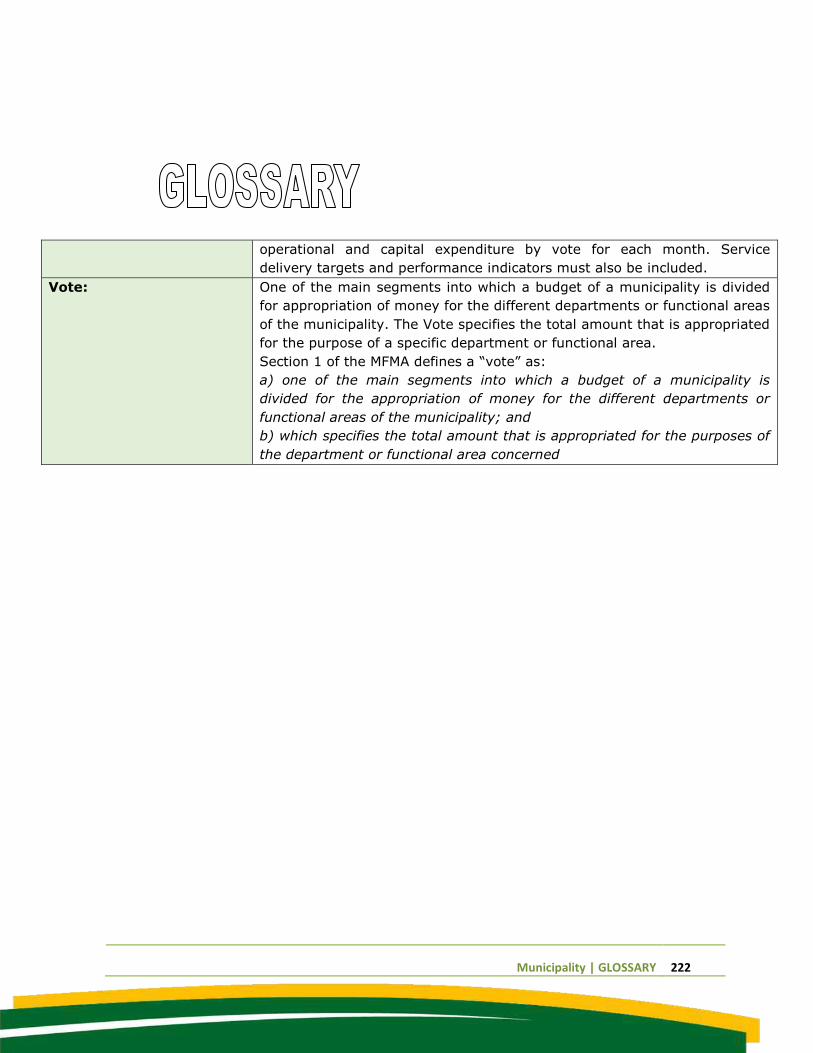
Municipality | GLOSSARY 222
operational and capital expenditure by vote for each month. Service
delivery targets and performance indicators must also be included.
Vote: One of the main segments into which a budget of a municipality is divided
for appropriation of money for the different departments or functional areas
of the municipality. The Vote specifies the total amount that is appropriated
for the purpose of a specific department or functional area.
Section 1 of the MFMA defines a “vote” as:
a) one of the main segments into which a budget of a municipality is
divided for the appropriation of money for the different departments or
functional areas of the municipality; and
b) which specifies the total amount that is appropriated for the purposes of
the department or functional area concerned

Municipality | APPENDICES
APPENDICES
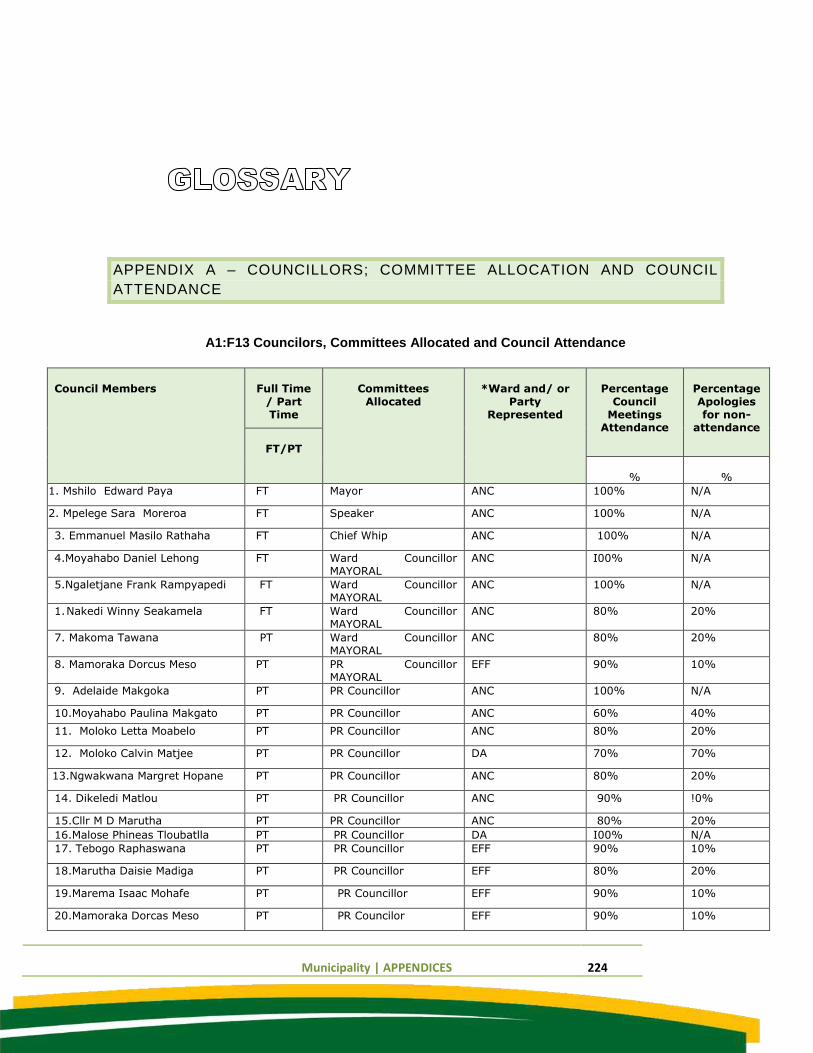
Municipality | APPENDICES 224
APPENDIX A – COUNCILLORS; COMMITTEE ALLOCATION AND COUNCIL
ATTENDANCE
A1:F13 Councilors, Committees Allocated and Council Attendance
Council Members Full Time
/ Part Time
Committees
Allocated
*Ward and/ or
Party Represented
Percentage
Council Meetings
Attendance
Percentage
Apologies for non-
attendance
FT/PT
% %
1. Mshilo Edward Paya FT Mayor ANC 100% N/A
2. Mpelege Sara Moreroa FT Speaker ANC 100% N/A
3. Emmanuel Masilo Rathaha FT Chief Whip ANC 100% N/A
4.Moyahabo Daniel Lehong FT Ward Councillor MAYORAL
ANC I00% N/A
5.Ngaletjane Frank Rampyapedi FT Ward Councillor MAYORAL
ANC 100% N/A
1. Nakedi Winny Seakamela FT Ward Councillor MAYORAL
ANC 80% 20%
7. Makoma Tawana PT Ward Councillor MAYORAL
ANC 80% 20%
8. Mamoraka Dorcus Meso PT PR Councillor MAYORAL
EFF 90% 10%
9. Adelaide Makgoka PT PR Councillor ANC 100% N/A
10.Moyahabo Paulina Makgato PT PR Councillor ANC 60% 40%
11. Moloko Letta Moabelo PT PR Councillor ANC 80% 20%
12. Moloko Calvin Matjee PT PR Councillor DA 70% 70%
13.Ngwakwana Margret Hopane PT PR Councillor ANC 80% 20%
14. Dikeledi Matlou PT PR Councillor ANC 90% !0%
15.Cllr M D Marutha PT PR Councillor ANC 80% 20%
16.Malose Phineas Tloubatlla PT PR Councillor DA I00% N/A
17. Tebogo Raphaswana PT PR Councillor EFF 90% 10%
18.Marutha Daisie Madiga PT PR Councillor EFF 80% 20%
19.Marema Isaac Mohafe PT PR Councillor EFF 90% 10%
20.Mamoraka Dorcas Meso PT PR Councilor EFF 90% 10%
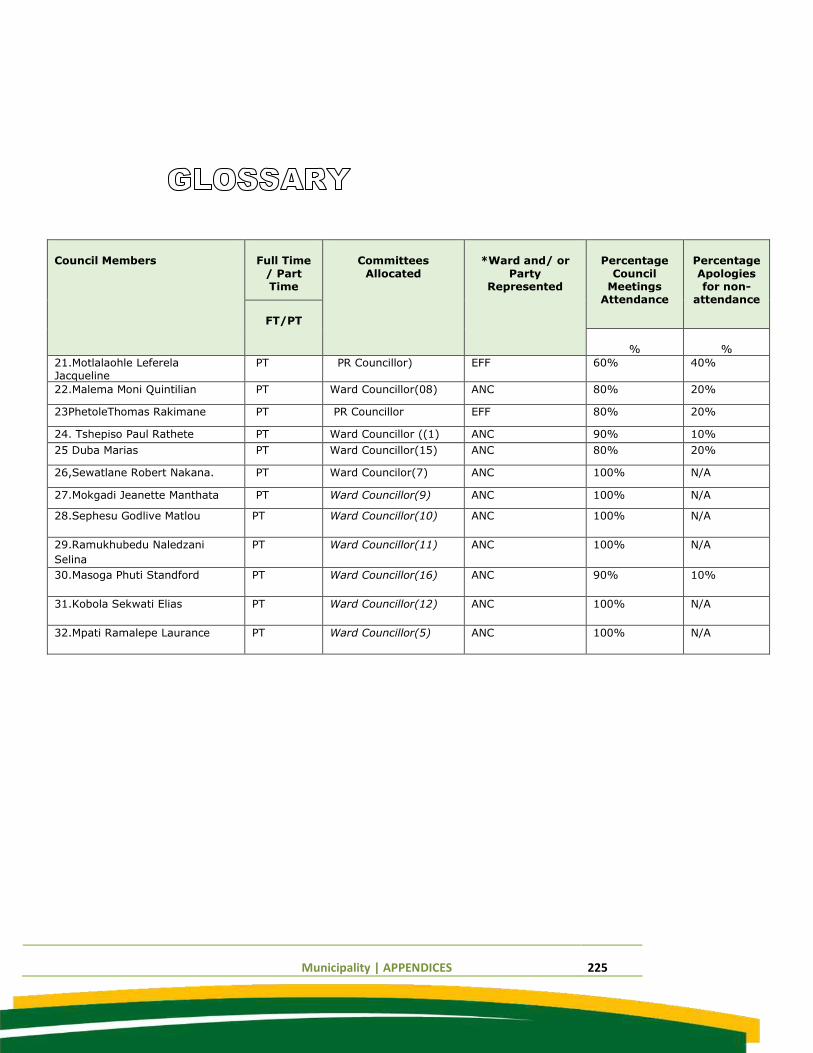
Municipality | APPENDICES 225
Council Members Full Time
/ Part Time
Committees
Allocated
*Ward and/ or
Party Represented
Percentage
Council Meetings
Attendance
Percentage
Apologies for non-
attendance
FT/PT
% %
21.Motlalaohle Leferela Jacqueline
PT PR Councillor) EFF 60% 40%
22.Malema Moni Quintilian PT Ward Councillor(08) ANC 80% 20%
23PhetoleThomas Rakimane PT PR Councillor EFF 80% 20%
24. Tshepiso Paul Rathete PT Ward Councillor ((1) ANC 90% 10%
25 Duba Marias PT Ward Councillor(15) ANC 80% 20%
26,Sewatlane Robert Nakana. PT Ward Councilor(7) ANC 100% N/A
27.Mokgadi Jeanette Manthata PT Ward Councillor(9) ANC 100% N/A
28.Sephesu Godlive Matlou PT Ward Councillor(10) ANC 100% N/A
29.Ramukhubedu Naledzani
Selina
PT Ward Councillor(11) ANC 100% N/A
30.Masoga Phuti Standford PT Ward Councillor(16) ANC 90% 10%
31.Kobola Sekwati Elias PT Ward Councillor(12) ANC 100% N/A
32.Mpati Ramalepe Laurance PT Ward Councillor(5) ANC 100% N/A
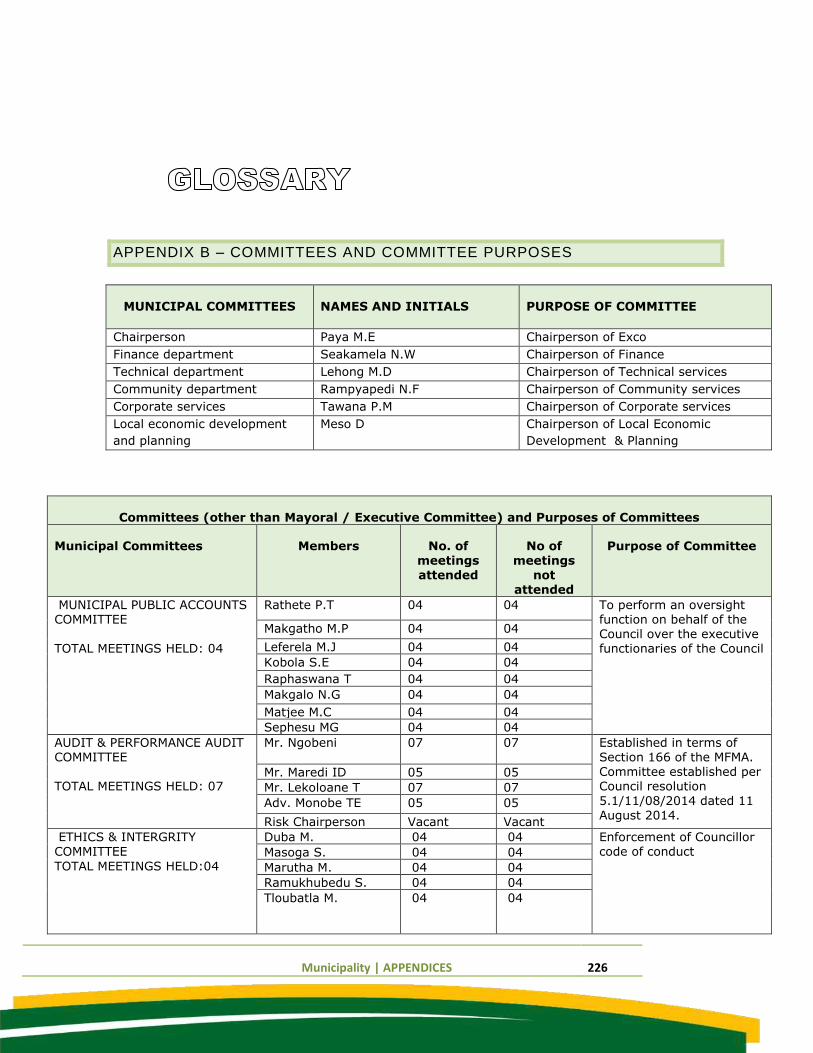
Municipality | APPENDICES 226
APPENDIX B – COMMITTEES AND COMMITTEE PURPOSES
MUNICIPAL COMMITTEES NAMES AND INITIALS PURPOSE OF COMMITTEE
Chairperson Paya M.E Chairperson of Exco
Finance department Seakamela N.W Chairperson of Finance
Technical department Lehong M.D Chairperson of Technical services
Community department Rampyapedi N.F Chairperson of Community services
Corporate services Tawana P.M Chairperson of Corporate services
Local economic development
and planning
Meso D Chairperson of Local Economic
Development & Planning
Committees (other than Mayoral / Executive Committee) and Purposes of Committees
Municipal Committees Members No. of meetings
attended
No of meetings
not attended
Purpose of Committee
MUNICIPAL PUBLIC ACCOUNTS COMMITTEE TOTAL MEETINGS HELD: 04
Rathete P.T 04 04 To perform an oversight function on behalf of the Council over the executive functionaries of the Council
Makgatho M.P 04 04
Leferela M.J 04 04
Kobola S.E 04 04
Raphaswana T 04 04
Makgalo N.G 04 04
Matjee M.C 04 04
Sephesu MG 04 04
AUDIT & PERFORMANCE AUDIT COMMITTEE TOTAL MEETINGS HELD: 07
Mr. Ngobeni 07 07
Established in terms of Section 166 of the MFMA. Committee established per Council resolution
5.1/11/08/2014 dated 11 August 2014.
Mr. Maredi ID 05 05
Mr. Lekoloane T 07 07
Adv. Monobe TE 05 05
Risk Chairperson Vacant Vacant
ETHICS & INTERGRITY COMMITTEE
TOTAL MEETINGS HELD:04
Duba M. 04 04 Enforcement of Councillor code of conduct Masoga S. 04 04
Marutha M. 04 04
Ramukhubedu S. 04 04
Tloubatla M. 04 04
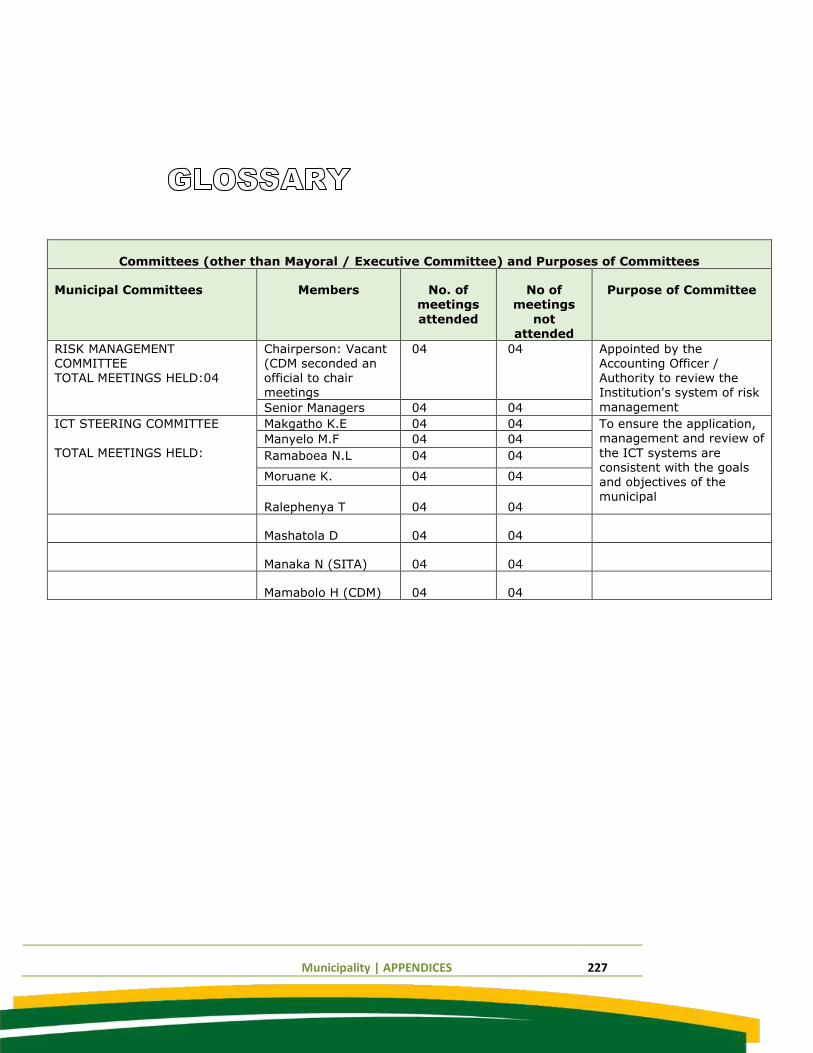
Municipality | APPENDICES 227
Committees (other than Mayoral / Executive Committee) and Purposes of Committees
Municipal Committees Members No. of meetings
attended
No of meetings
not
attended
Purpose of Committee
RISK MANAGEMENT COMMITTEE TOTAL MEETINGS HELD:04
Chairperson: Vacant (CDM seconded an official to chair meetings
04 04 Appointed by the Accounting Officer / Authority to review the Institution's system of risk
management Senior Managers 04 04
ICT STEERING COMMITTEE
TOTAL MEETINGS HELD:
Makgatho K.E 04 04 To ensure the application, management and review of
the ICT systems are consistent with the goals and objectives of the municipal
Manyelo M.F 04 04
Ramaboea N.L 04 04
Moruane K. 04 04
Ralephenya T 04 04
Mashatola D 04 04
Manaka N (SITA) 04 04
Mamabolo H (CDM) 04 04
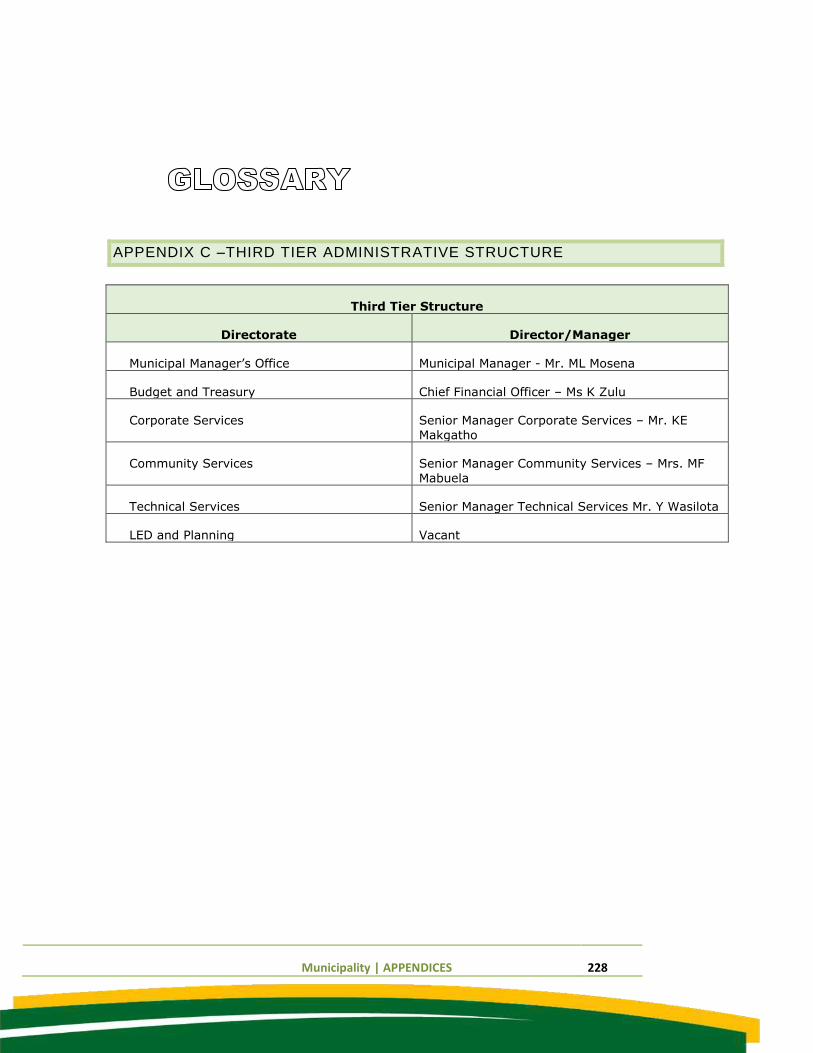
Municipality | APPENDICES 228
APPENDIX C –THIRD TIER ADMINISTRATIVE STRUCTURE
Third Tier Structure
Directorate Director/Manager
Municipal Manager’s Office Municipal Manager - Mr. ML Mosena
Budget and Treasury Chief Financial Officer – Ms K Zulu
Corporate Services Senior Manager Corporate Services – Mr. KE
Makgatho
Community Services Senior Manager Community Services – Mrs. MF
Mabuela
Technical Services Senior Manager Technical Services Mr. Y Wasilota
LED and Planning Vacant
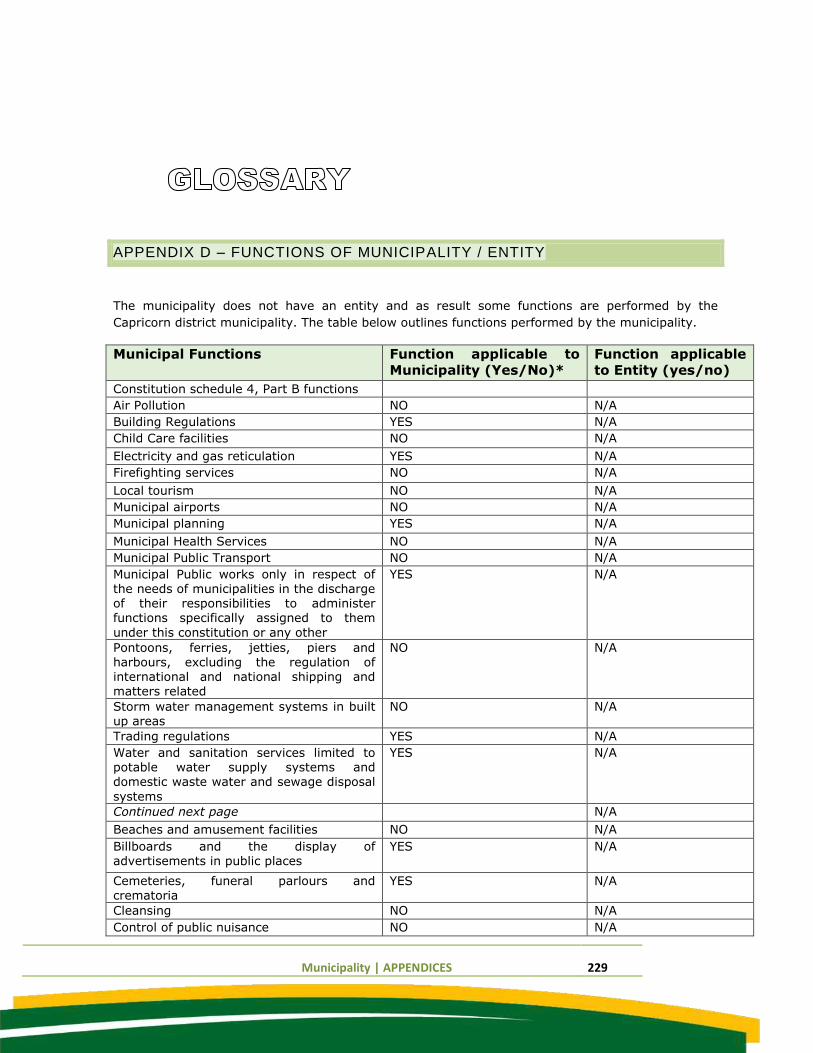
Municipality | APPENDICES 229
APPENDIX D – FUNCTIONS OF MUNICIPALITY / ENTITY
The municipality does not have an entity and as result some functions are performed by the
Capricorn district municipality. The table below outlines functions performed by the municipality.
Municipal Functions Function applicable to
Municipality (Yes/No)*
Function applicable
to Entity (yes/no)
Constitution schedule 4, Part B functions
Air Pollution NO N/A
Building Regulations YES N/A
Child Care facilities NO N/A
Electricity and gas reticulation YES N/A
Firefighting services NO N/A
Local tourism NO N/A
Municipal airports NO N/A
Municipal planning YES N/A
Municipal Health Services NO N/A
Municipal Public Transport NO N/A
Municipal Public works only in respect of the needs of municipalities in the discharge of their responsibilities to administer functions specifically assigned to them
under this constitution or any other
YES N/A
Pontoons, ferries, jetties, piers and harbours, excluding the regulation of international and national shipping and matters related
NO N/A
Storm water management systems in built up areas
NO N/A
Trading regulations YES N/A
Water and sanitation services limited to potable water supply systems and domestic waste water and sewage disposal
systems
YES N/A
Continued next page N/A
Beaches and amusement facilities NO N/A
Billboards and the display of advertisements in public places
YES N/A
Cemeteries, funeral parlours and crematoria
YES N/A
Cleansing NO N/A
Control of public nuisance NO N/A
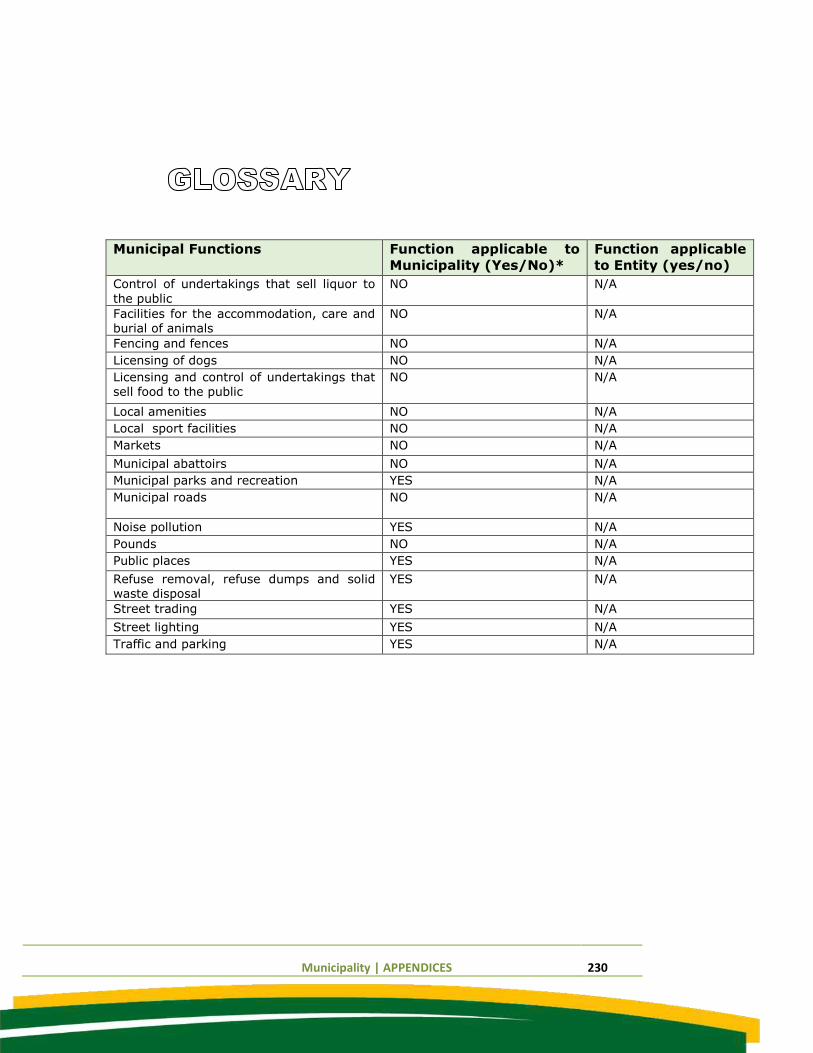
Municipality | APPENDICES 230
Municipal Functions Function applicable to
Municipality (Yes/No)*
Function applicable
to Entity (yes/no)
Control of undertakings that sell liquor to
the public
NO N/A
Facilities for the accommodation, care and burial of animals
NO N/A
Fencing and fences NO N/A
Licensing of dogs NO N/A
Licensing and control of undertakings that sell food to the public
NO N/A
Local amenities NO N/A
Local sport facilities NO N/A
Markets NO N/A
Municipal abattoirs NO N/A
Municipal parks and recreation YES N/A
Municipal roads
NO N/A
Noise pollution YES N/A
Pounds NO N/A
Public places YES N/A
Refuse removal, refuse dumps and solid waste disposal
YES N/A
Street trading YES N/A
Street lighting YES N/A
Traffic and parking YES N/A
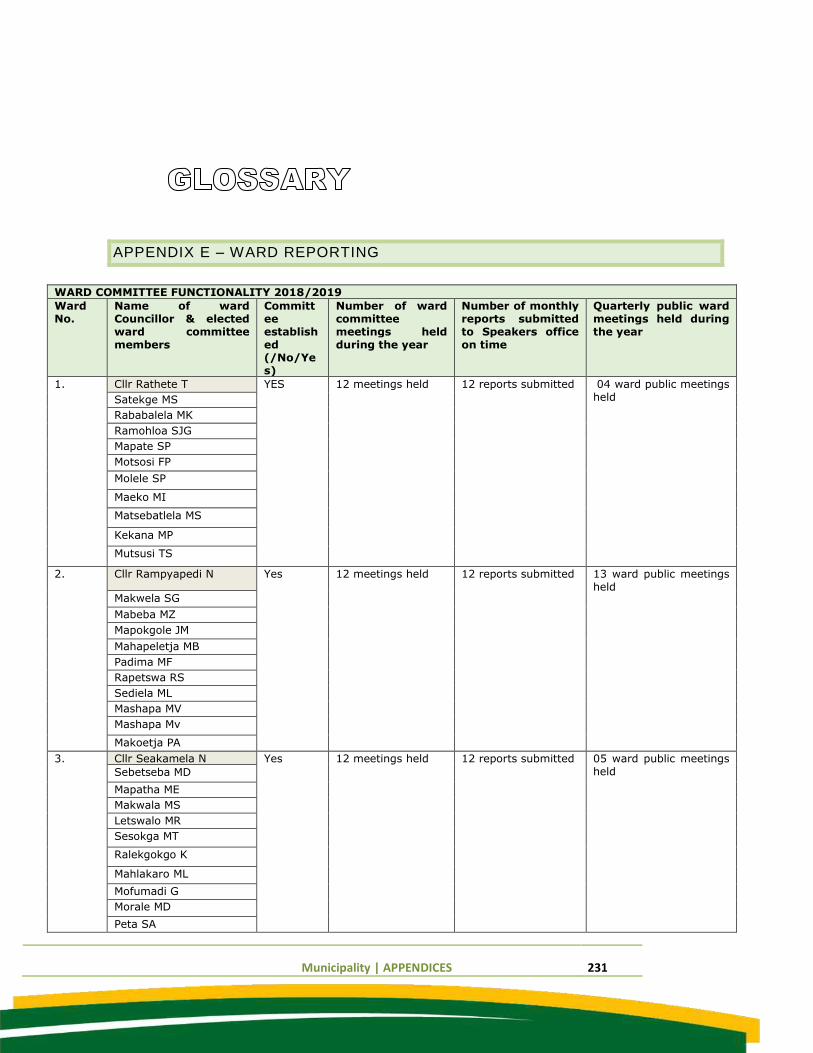
Municipality | APPENDICES 231
APPENDIX E – WARD REPORTING
WARD COMMITTEE FUNCTIONALITY 2018/2019
Ward No.
Name of ward Councillor & elected ward committee members
Committee established (/No/Yes)
Number of ward committee meetings held during the year
Number of monthly reports submitted to Speakers office on time
Quarterly public ward meetings held during the year
1. Cllr Rathete T YES 12 meetings held 12 reports submitted 04 ward public meetings held
Satekge MS
Rababalela MK
Ramohloa SJG
Mapate SP
Motsosi FP
Molele SP
Maeko MI
Matsebatlela MS
Kekana MP
Mutsusi TS
2. Cllr Rampyapedi N Yes 12 meetings held 12 reports submitted 13 ward public meetings held
Makwela SG
Mabeba MZ
Mapokgole JM
Mahapeletja MB
Padima MF
Rapetswa RS
Sediela ML
Mashapa MV
Mashapa Mv
Makoetja PA
3. Cllr Seakamela N Yes
12 meetings held
12 reports submitted 05 ward public meetings held
Sebetseba MD
Mapatha ME
Makwala MS
Letswalo MR
Sesokga MT
Ralekgokgo K
Mahlakaro ML
Mofumadi G
Morale MD
Peta SA
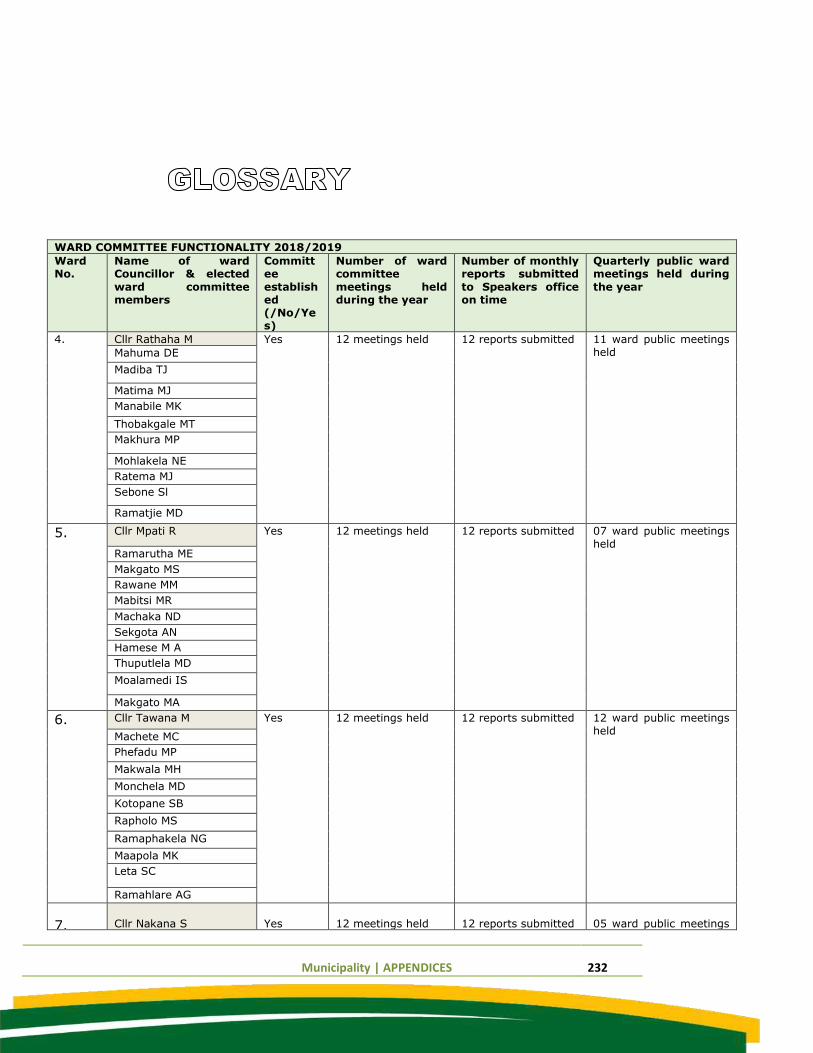
Municipality | APPENDICES 232
WARD COMMITTEE FUNCTIONALITY 2018/2019
Ward No.
Name of ward Councillor & elected
ward committee members
Committee
established (/No/Yes)
Number of ward committee
meetings held during the year
Number of monthly reports submitted
to Speakers office on time
Quarterly public ward meetings held during
the year
4. Cllr Rathaha M Yes
12 meetings held 12 reports submitted 11 ward public meetings held
Mahuma DE
Madiba TJ
Matima MJ
Manabile MK
Thobakgale MT
Makhura MP
Mohlakela NE
Ratema MJ
Sebone Sl
Ramatjie MD
5. Cllr Mpati R Yes
12 meetings held 12 reports submitted 07 ward public meetings held Ramarutha ME
Makgato MS
Rawane MM
Mabitsi MR
Machaka ND
Sekgota AN
Hamese M A
Thuputlela MD
Moalamedi IS
Makgato MA
6. Cllr Tawana M Yes
12 meetings held
12 reports submitted 12 ward public meetings held
Machete MC
Phefadu MP
Makwala MH
Monchela MD
Kotopane SB
Rapholo MS
Ramaphakela NG
Maapola MK
Leta SC
Ramahlare AG
7. Cllr Nakana S Yes 12 meetings held 12 reports submitted 05 ward public meetings
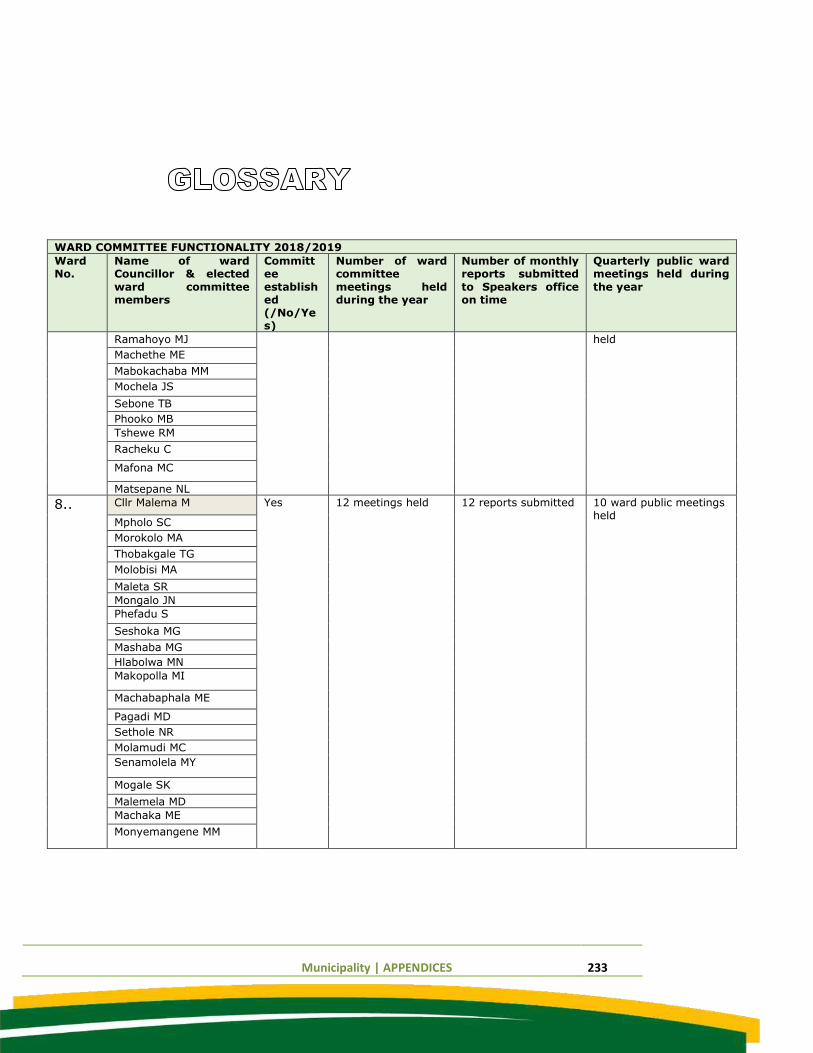
Municipality | APPENDICES 233
WARD COMMITTEE FUNCTIONALITY 2018/2019
Ward No.
Name of ward Councillor & elected
ward committee members
Committee
established (/No/Yes)
Number of ward committee
meetings held during the year
Number of monthly reports submitted
to Speakers office on time
Quarterly public ward meetings held during
the year
Ramahoyo MJ held
Machethe ME
Mabokachaba MM
Mochela JS
Sebone TB
Phooko MB
Tshewe RM
Racheku C
Mafona MC
Matsepane NL
8.. Cllr Malema M Yes
12 meetings held 12 reports submitted 10 ward public meetings held
Mpholo SC
Morokolo MA
Thobakgale TG
Molobisi MA
Maleta SR
Mongalo JN
Phefadu S
Seshoka MG
Mashaba MG
Hlabolwa MN
Makopolla MI
Machabaphala ME
Pagadi MD
Sethole NR
Molamudi MC
Senamolela MY
Mogale SK
Malemela MD
Machaka ME
Monyemangene MM
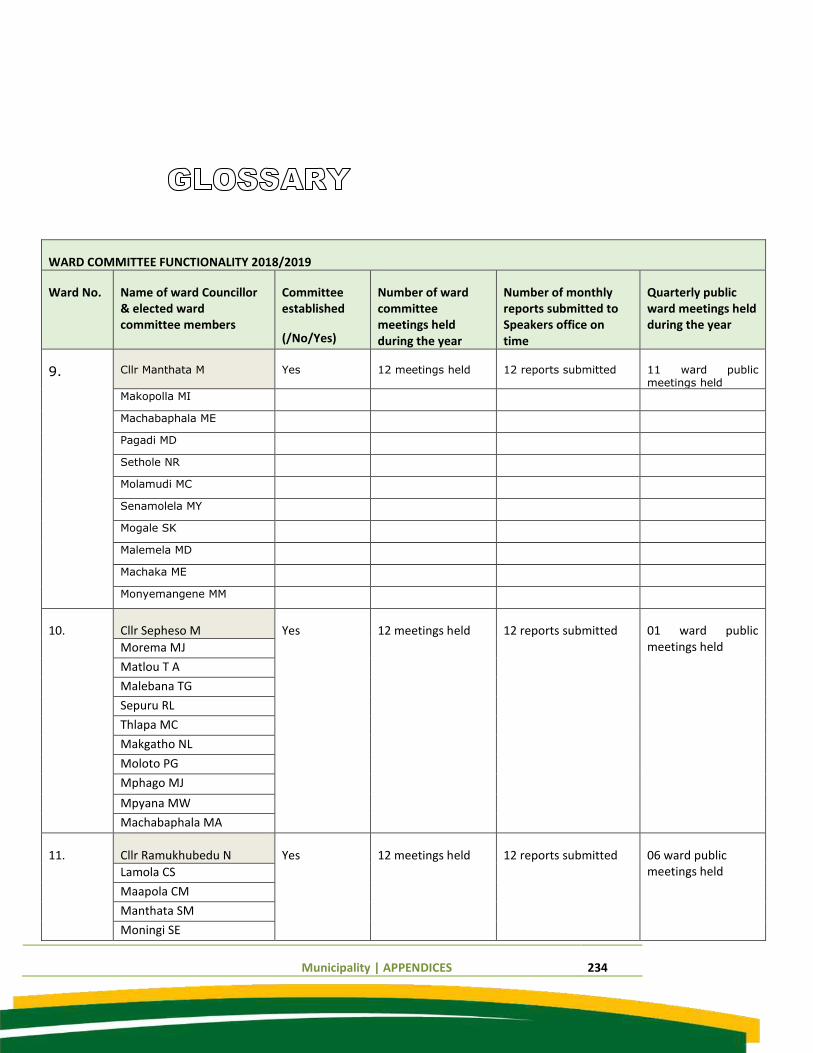
Municipality | APPENDICES 234
WARD COMMITTEE FUNCTIONALITY 2018/2019
Ward No. Name of ward Councillor & elected ward committee members
Committee established
(/No/Yes)
Number of ward committee meetings held during the year
Number of monthly reports submitted to Speakers office on time
Quarterly public ward meetings held during the year
9. Cllr Manthata M Yes 12 meetings held 12 reports submitted 11 ward public meetings held
Makopolla MI
Machabaphala ME
Pagadi MD
Sethole NR
Molamudi MC
Senamolela MY
Mogale SK
Malemela MD
Machaka ME
Monyemangene MM
10. Cllr Sepheso M Yes
12 meetings held 12 reports submitted 01 ward public meetings held
Morema MJ
Matlou T A
Malebana TG
Sepuru RL
Thlapa MC
Makgatho NL
Moloto PG
Mphago MJ
Mpyana MW
Machabaphala MA
11. Cllr Ramukhubedu N Yes
12 meetings held 12 reports submitted 06 ward public meetings held
Lamola CS
Maapola CM
Manthata SM
Moningi SE
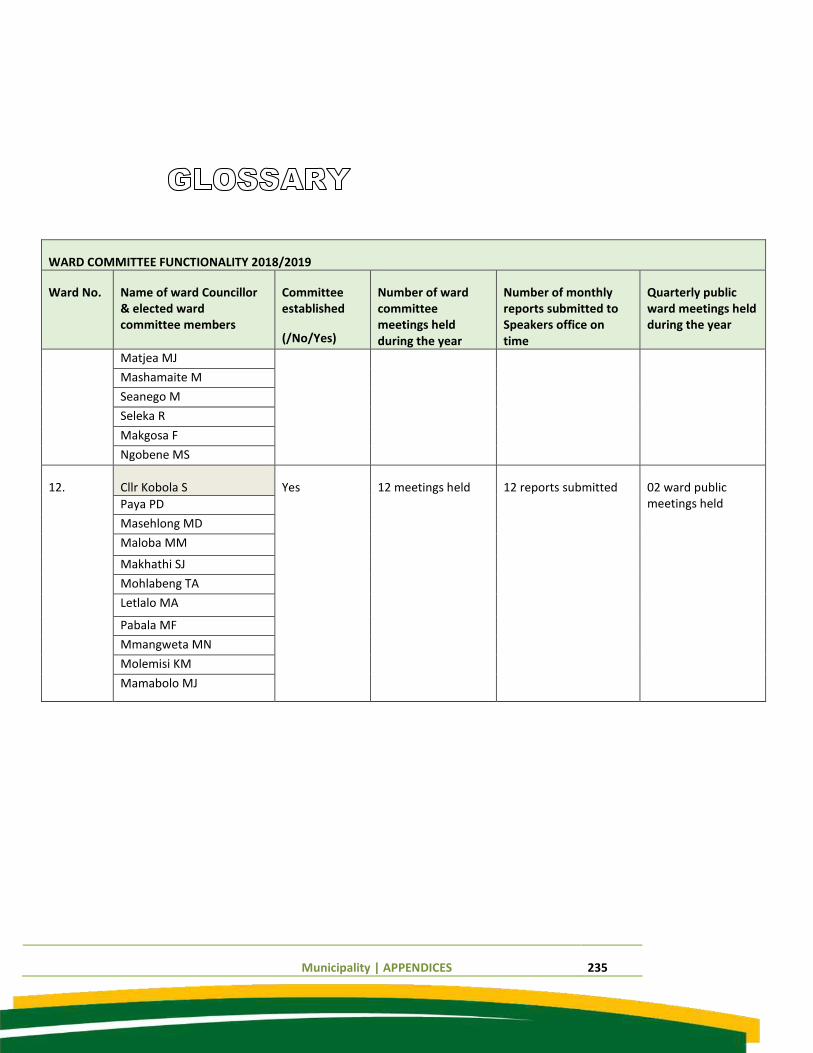
Municipality | APPENDICES 235
WARD COMMITTEE FUNCTIONALITY 2018/2019
Ward No. Name of ward Councillor & elected ward committee members
Committee established
(/No/Yes)
Number of ward committee meetings held during the year
Number of monthly reports submitted to Speakers office on time
Quarterly public ward meetings held during the year
Matjea MJ
Mashamaite M
Seanego M
Seleka R
Makgosa F
Ngobene MS
12. Cllr Kobola S Yes
12 meetings held
12 reports submitted 02 ward public meetings held
Paya PD
Masehlong MD
Maloba MM
Makhathi SJ
Mohlabeng TA
Letlalo MA
Pabala MF
Mmangweta MN
Molemisi KM
Mamabolo MJ
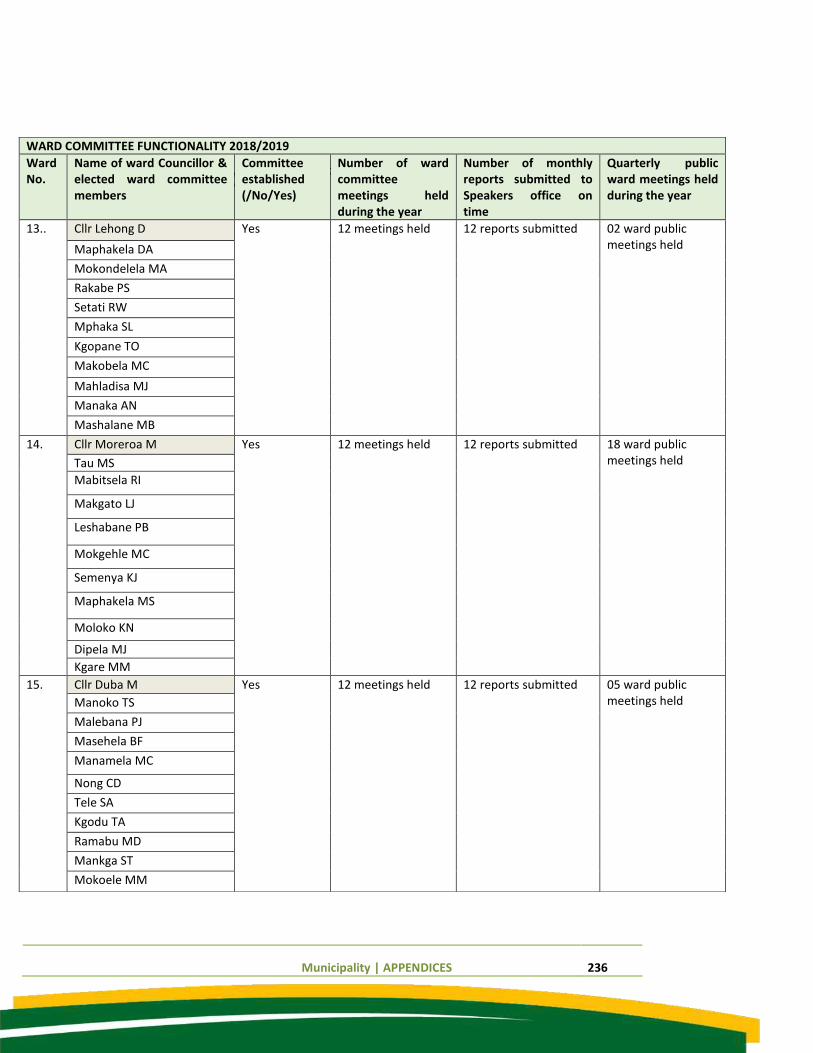
Municipality | APPENDICES 236
WARD COMMITTEE FUNCTIONALITY 2018/2019
Ward No.
Name of ward Councillor & elected ward committee members
Committee established (/No/Yes)
Number of ward committee meetings held during the year
Number of monthly reports submitted to Speakers office on time
Quarterly public ward meetings held during the year
13.. Cllr Lehong D Yes
12 meetings held 12 reports submitted 02 ward public meetings held
Maphakela DA
Mokondelela MA
Rakabe PS
Setati RW
Mphaka SL
Kgopane TO
Makobela MC
Mahladisa MJ
Manaka AN
Mashalane MB
14. Cllr Moreroa M Yes
12 meetings held 12 reports submitted 18 ward public meetings held
Tau MS
Mabitsela RI
Makgato LJ
Leshabane PB
Mokgehle MC
Semenya KJ
Maphakela MS
Moloko KN
Dipela MJ
Kgare MM
15. Cllr Duba M Yes
12 meetings held 12 reports submitted 05 ward public meetings held
Manoko TS
Malebana PJ
Masehela BF
Manamela MC
Nong CD
Tele SA
Kgodu TA
Ramabu MD
Mankga ST
Mokoele MM
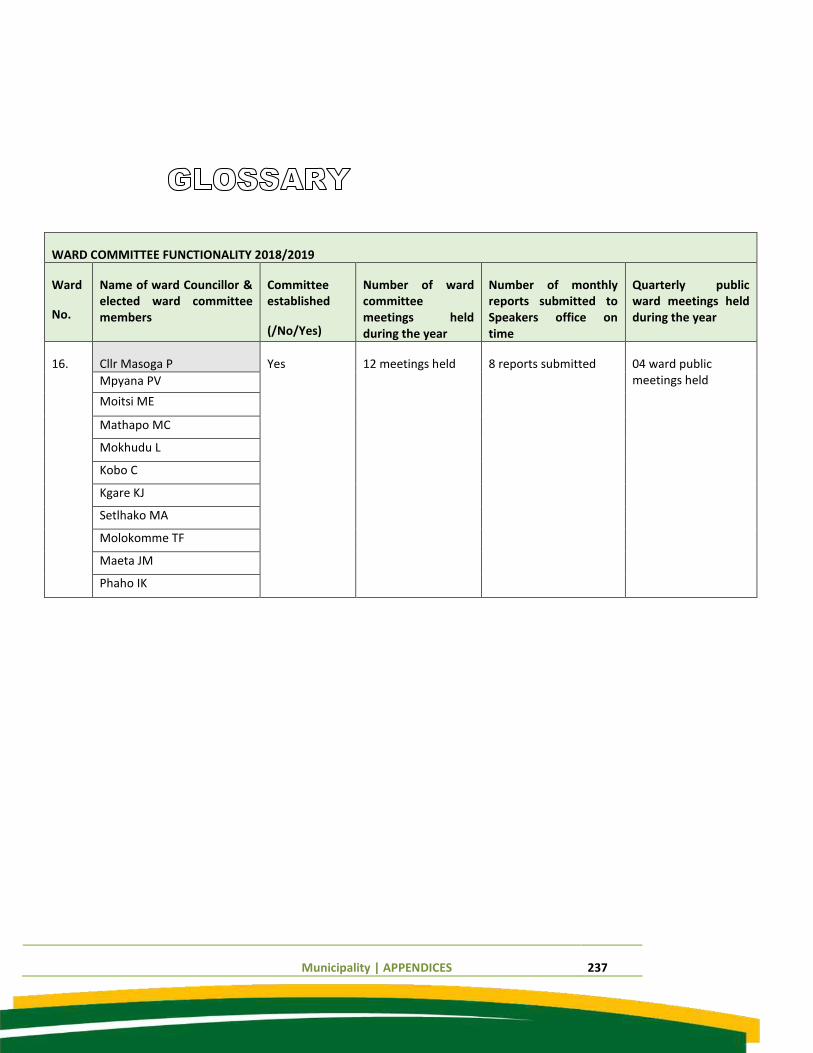
Municipality | APPENDICES 237
WARD COMMITTEE FUNCTIONALITY 2018/2019
Ward
No.
Name of ward Councillor & elected ward committee members
Committee established
(/No/Yes)
Number of ward committee meetings held during the year
Number of monthly reports submitted to Speakers office on time
Quarterly public ward meetings held during the year
16. Cllr Masoga P Yes
12 meetings held 8 reports submitted 04 ward public meetings held
Mpyana PV
Moitsi ME
Mathapo MC
Mokhudu L
Kobo C
Kgare KJ
Setlhako MA
Molokomme TF
Maeta JM
Phaho IK
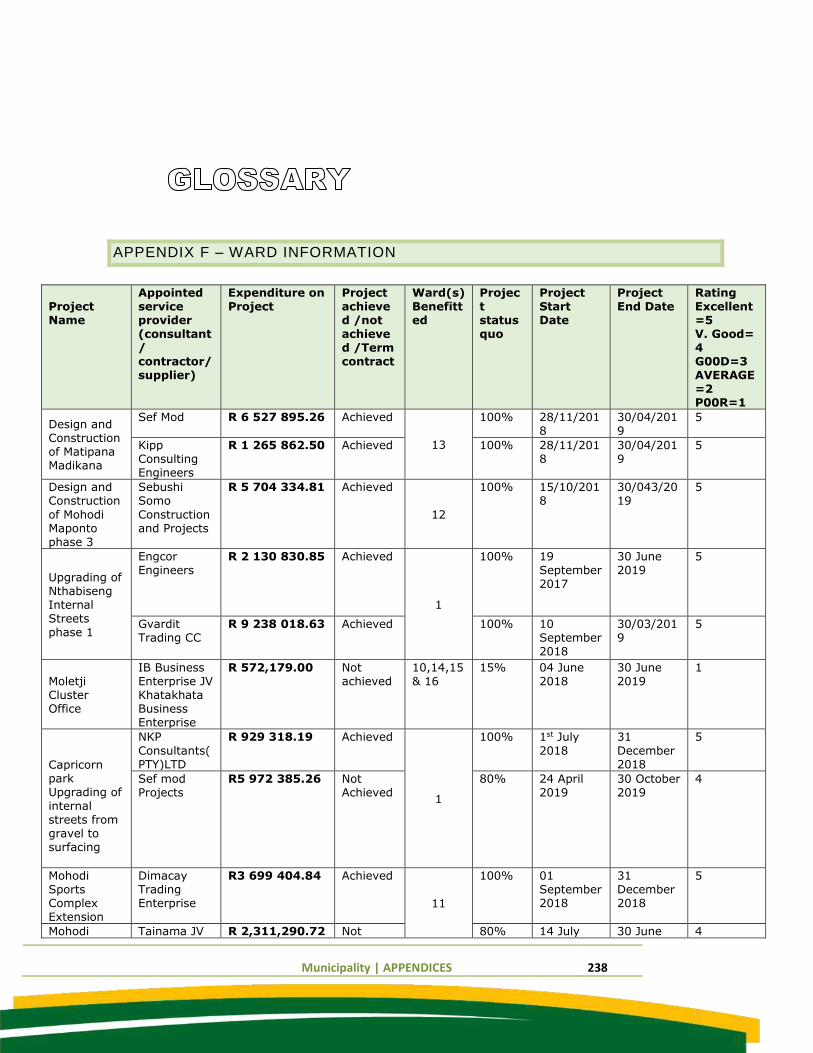
Municipality | APPENDICES 238
APPENDIX F – WARD INFORMATION
Project Name
Appointed service provider (consultant/ contractor/ supplier)
Expenditure on Project
Project achieved /not achieved /Term contract
Ward(s) Benefitted
Project status quo
Project Start Date
Project End Date
Rating Excellent=5 V. Good= 4 G00D=3 AVERAGE=2 P00R=1
Design and Construction of Matipana Madikana
Sef Mod R 6 527 895.26 Achieved
13
100% 28/11/2018
30/04/2019
5
Kipp Consulting Engineers
R 1 265 862.50 Achieved 100% 28/11/2018
30/04/2019
5
Design and Construction
of Mohodi Maponto phase 3
Sebushi Somo
Construction and Projects
R 5 704 334.81 Achieved
12
100% 15/10/2018
30/043/2019
5
Upgrading of Nthabiseng Internal Streets phase 1
Engcor Engineers
R 2 130 830.85 Achieved
1
100% 19 September 2017
30 June 2019
5
Gvardit Trading CC
R 9 238 018.63 Achieved 100% 10 September 2018
30/03/2019
5
Moletji Cluster Office
IB Business Enterprise JV Khatakhata Business Enterprise
R 572,179.00 Not achieved
10,14,15 & 16
15% 04 June 2018
30 June 2019
1
Capricorn park Upgrading of internal streets from gravel to surfacing
NKP
Consultants(PTY)LTD
R 929 318.19 Achieved
1
100% 1st July
2018
31
December 2018
5
Sef mod Projects
R5 972 385.26 Not Achieved
80% 24 April 2019
30 October 2019
4
Mohodi Sports Complex Extension
Dimacay Trading Enterprise
R3 699 404.84 Achieved
11
100% 01 September 2018
31 December 2018
5
Mohodi Tainama JV R 2,311,290.72 Not 80% 14 July 30 June 4
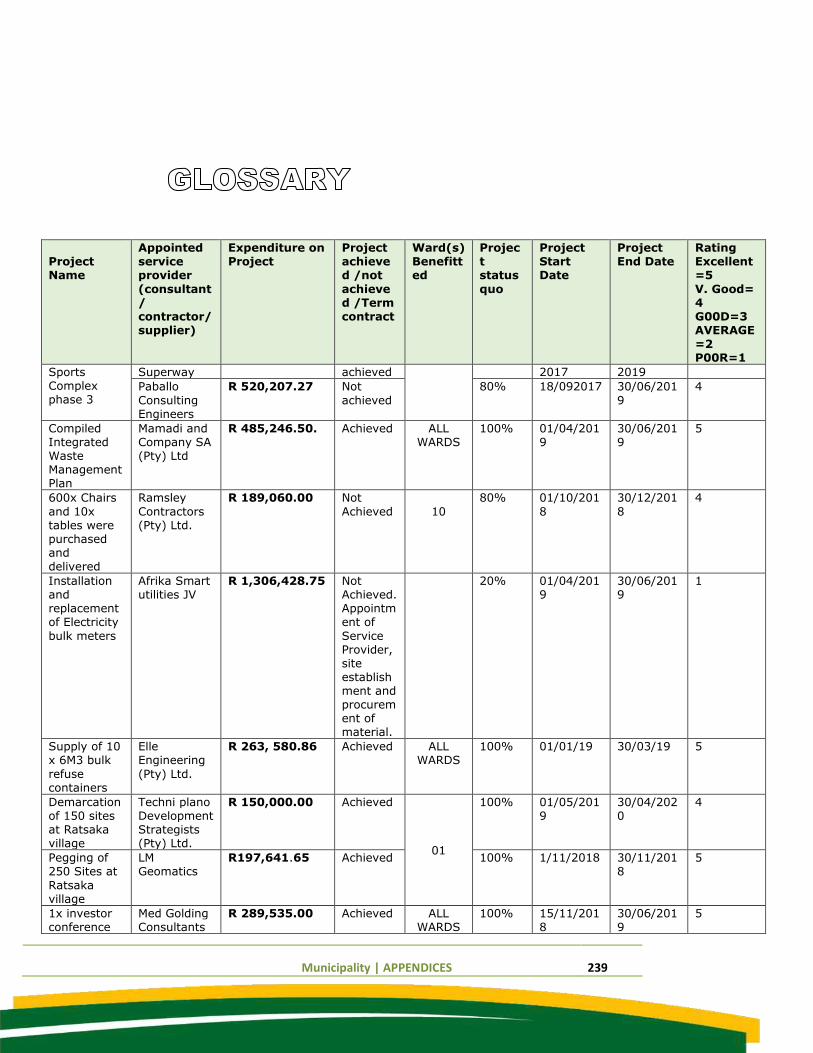
Municipality | APPENDICES 239
Project Name
Appointed service provider
(consultant/ contractor/ supplier)
Expenditure on Project
Project achieved /not
achieved /Term contract
Ward(s) Benefitted
Project status
quo
Project Start Date
Project End Date
Rating Excellent=5
V. Good= 4 G00D=3 AVERAGE=2 P00R=1
Sports Complex phase 3
Superway achieved 2017 2019
Paballo
Consulting Engineers
R 520,207.27 Not
achieved
80% 18/092017 30/06/201
9
4
Compiled Integrated Waste Management Plan
Mamadi and Company SA (Pty) Ltd
R 485,246.50. Achieved ALL WARDS
100% 01/04/2019
30/06/2019
5
600x Chairs
and 10x tables were purchased and delivered
Ramsley
Contractors (Pty) Ltd.
R 189,060.00 Not
Achieved
10
80% 01/10/201
8
30/12/201
8
4
Installation and replacement of Electricity
bulk meters
Afrika Smart utilities JV
R 1,306,428.75 Not Achieved. Appointment of
Service Provider, site establishment and procurement of material.
20% 01/04/2019
30/06/2019
1
Supply of 10 x 6M3 bulk
refuse containers
Elle Engineering
(Pty) Ltd.
R 263, 580.86 Achieved ALL WARDS
100% 01/01/19 30/03/19 5
Demarcation of 150 sites at Ratsaka village
Techni plano Development Strategists (Pty) Ltd.
R 150,000.00 Achieved
01
100% 01/05/2019
30/04/2020
4
Pegging of 250 Sites at
Ratsaka village
LM Geomatics
R197,641.65 Achieved 100% 1/11/2018 30/11/2018
5
1x investor conference
Med Golding Consultants
R 289,535.00 Achieved ALL WARDS
100% 15/11/2018
30/06/2019
5
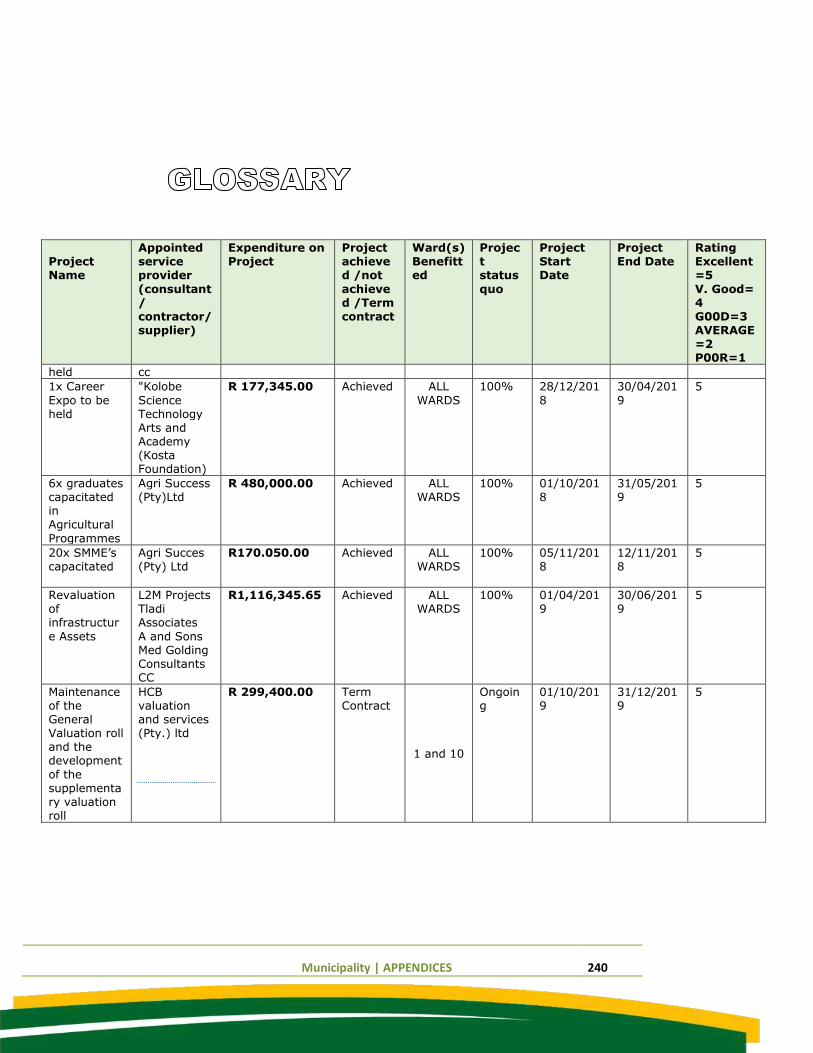
Municipality | APPENDICES 240
Project Name
Appointed service provider
(consultant/ contractor/ supplier)
Expenditure on Project
Project achieved /not
achieved /Term contract
Ward(s) Benefitted
Project status
quo
Project Start Date
Project End Date
Rating Excellent=5
V. Good= 4 G00D=3 AVERAGE=2 P00R=1
held cc
1x Career
Expo to be held
"Kolobe
Science Technology Arts and Academy (Kosta Foundation)
R 177,345.00 Achieved ALL
WARDS
100% 28/12/201
8
30/04/201
9
5
6x graduates capacitated in Agricultural
Programmes
Agri Success (Pty)Ltd
R 480,000.00 Achieved ALL WARDS
100% 01/10/2018
31/05/2019
5
20x SMME’s capacitated
Agri Succes (Pty) Ltd
R170.050.00 Achieved ALL WARDS
100% 05/11/2018
12/11/2018
5
Revaluation of infrastructur
e Assets
L2M Projects Tladi Associates
A and Sons Med Golding Consultants CC
R1,116,345.65 Achieved ALL WARDS
100% 01/04/2019
30/06/2019
5
Maintenance of the General Valuation roll and the development
of the supplementary valuation roll
HCB valuation and services (Pty.) ltd
R 299,400.00 Term Contract
1 and 10
Ongoing
01/10/2019
31/12/2019
5
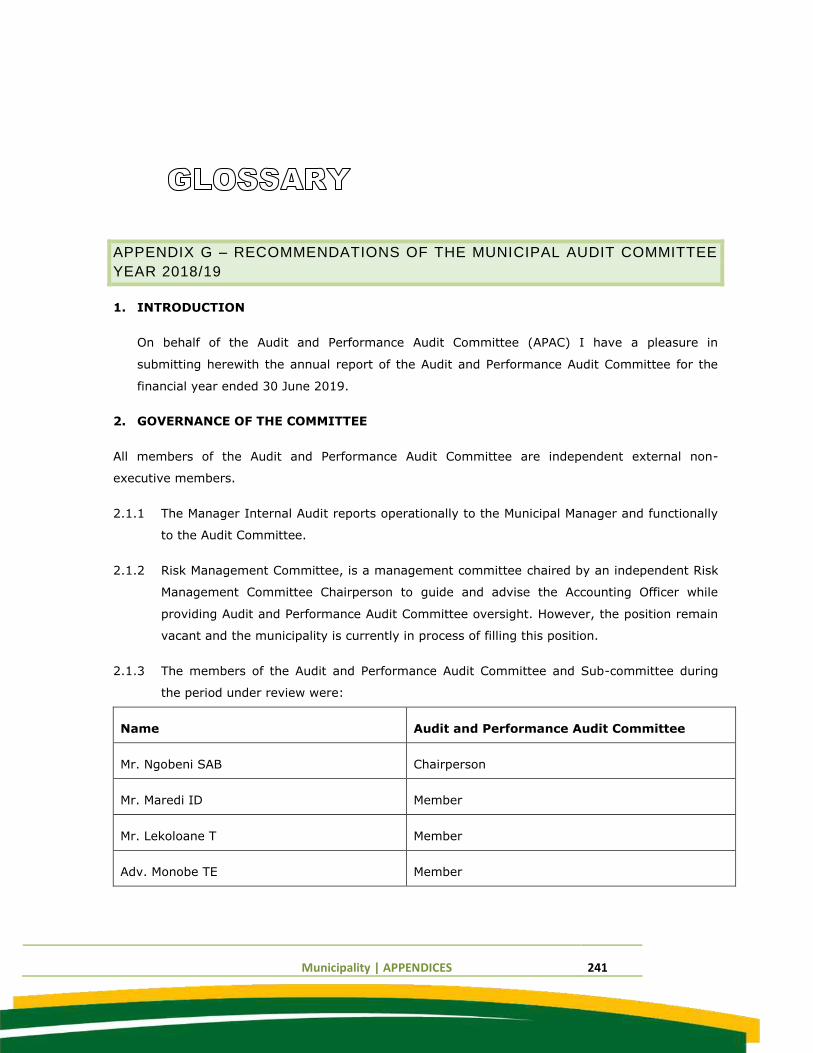
Municipality | APPENDICES 241
APPENDIX G – RECOMMENDATIONS OF THE MUNICIPAL AUDIT COMMITTEE
YEAR 2018/19
1. INTRODUCTION
On behalf of the Audit and Performance Audit Committee (APAC) I have a pleasure in
submitting herewith the annual report of the Audit and Performance Audit Committee for the
financial year ended 30 June 2019.
2. GOVERNANCE OF THE COMMITTEE
All members of the Audit and Performance Audit Committee are independent external non-
executive members.
2.1.1 The Manager Internal Audit reports operationally to the Municipal Manager and functionally
to the Audit Committee.
2.1.2 Risk Management Committee, is a management committee chaired by an independent Risk
Management Committee Chairperson to guide and advise the Accounting Officer while
providing Audit and Performance Audit Committee oversight. However, the position remain
vacant and the municipality is currently in process of filling this position.
2.1.3 The members of the Audit and Performance Audit Committee and Sub-committee during
the period under review were:
Name Audit and Performance Audit Committee
Mr. Ngobeni SAB Chairperson
Mr. Maredi ID Member
Mr. Lekoloane T Member
Adv. Monobe TE Member
Municipality | APPENDICES 242
Name Risk Management Committee
Vacant
3. AUDIT COMMITTEE RESPONSIBILITIES
The Audit Committee consists of four (4) members and this is line with Circular 65 of the MFMA.
The committee is expected to meet at least four times in a year. The committee held seven (7)
meetings during 2018/19 financial year. In carrying out its mandate which is conferred by its
terms of reference and section 166 of the MFMA, the committee confirms that taking into
consideration the reports by both internal and external auditors, it has reviewed and assessed
the following:
a) The effectiveness of internal control systems;
b) The effectiveness of internal audit;
c) The effectiveness of the risk management processes.
d) The risk areas of the entity’s operations to be covered in the scope of internal and
external audits;
e) The adequacy, reliability and accuracy of financial information provided to management
and other users of such information;
f) Any accounting and auditing concerns identified as a result of internal and external
audits;
g) The municipality’s compliance with legal and regulatory provisions;
h) The activities of the internal audit function, including its annual work programme,
coordination with external auditors,
i) The reports of significant investigations and the responses of management to specific
recommendations;
j) Where relevant, the independence and objectivity of the external auditors.
Municipality | APPENDICES 243
4. Year-End Process
4.1 Evaluation of Financial Statements
APC reviewed the annual financial statements prepared by the municipality at the audit committee
meeting held in August 2019, and recommended them for audit.
4.2 Evaluation of Annul Report
At the same audit committee meeting, APC evaluated draft annual report (including performance
report) and recommended the report for audit after further refinement by management.
5. INTERNAL CONTROL
5.1 Internal Audit evaluated effectiveness of municipal system of internal controls following
AG (SA) Methodology and using the tool provided by AG (SA).
5.2 Internal Audit reported system weaknesses and recommended corrective actions for
management to address the deficiencies. Management implemented part of the internal audit
recommendations to enhance the system of internal controls to the acceptable level.
5.3 Based on the information and explanations given by management, Internal audit function and
discussions with independent External Auditors on the result of the audits, the audit committee
is of the opinion that the internal accounting controls were adequately designed but not fully
implemented to ensure completeness, accuracy and reliability of financial records for preparing
the annual financial statements, and to ensure that the accountability for assets and liabilities is
maintained.
6. INTERNAL AUDIT
6.1 The Internal Audit team managed to execute and complete substantial all original approved risk
based audit projects within the allocated budget hours and time-frames. It is against this
backdrop that the following conclusion must be understood that the internal audit unit under
the leadership of the Manager Internal Audit in material respect was found to be effective and
adds value to the whole value chain.
Municipality | APPENDICES 244
6.2 The committee is extremely satisfied that the internal audit has during the period under review
effectively focused its available resources towards identified critical risk areas in accordance
with the approved Risk Based Annual Audit plan for 2018/2019. The committee also approved
the Risk Based Annual Audit plan for the 2018/2019 reporting period and was given the
assurance that every effort will be made by the Accounting Officer to have all the resources
available to properly execute the plan.
6.3 All Internal Audit activities were completed in accordance with the approved Internal Audit
Charter and no compromise of the independence or objectivity of the function was observed
throughout for the year under review.
7. In-Year Management and Monthly/Quarterly Report
The municipality has reported monthly and quarterly to Treasury as is required by the MFMA. The
Audit Committee reviewed the quality, accuracy, uselessness, reliability and appropriateness of
quarterly and annual financial and performance reporting and concluded that the municipality
should continue with culture/good practice of reporting timeously.
8. PERFORMANCE MANAGEMENT
8.1 The Audit and Performance Audit Committee noted that Management has developed a
performance management policy, which was approved by Council.
8.2 Internal Audit unit has in line with the MFMA/MSA regulations audited on a quarterly basis
performance information. All system weaknesses reported were brought to the attention of the
Accounting Officer.
9. Risk Management
The APC is of the opinion that municipality’s risk management maturity level is somewhat
satisfactorily. The municipality should fast-track appointment of independent Risk Management
Committee Chairperson, and conduct regular risk assessments and robust monitoring.
Municipality | APPENDICES 245
10. Compliance with laws and regulations
The municipality recorded a notable improvement in so far as compliance with the enabling laws
and regulations and APC commend management for such improvement. As result, the APC
recommended strengthening of the current compliance management system with an objective of
addressing the issues of non-compliance with laws and regulations.
11. Auditor General’s Report
The APC evaluated management responses to the report or findings of the Auditor-General (Action
plan to address prior year findings) on quarterly basis and gave inputs and advice on how best to
address the findings raised by the AGSA.
12. Interaction With The Municipal Public Accounts Committee (MPAC)
The Chairperson of the Audit Committee and MPAC Chairperson had meetings to discuss the
Annual Report with a view of finalization of the Oversight report. Meetings are schedule as per
requests due to aligned activities from both committees with a view of providing and
strengthening of oversight mandate.
13. Conclusion
The APC wishes to acknowledge the commitment from Council, management and staff of the
municipality. The stability in terms of the political and administrative leadership of the
municipality has contributed to these improvements report above. We would also like to thank
the Mayor for his support, Councilors, senior management for their efforts and internal audit for
their contribution.
…………………………… SAB Ngobeni
Chairperson Audit and Performance Committee
Municipality | APPENDICES 246
AUDIT COMMITTEE SCHEDULE OF RESOLUTIONS 2018/19
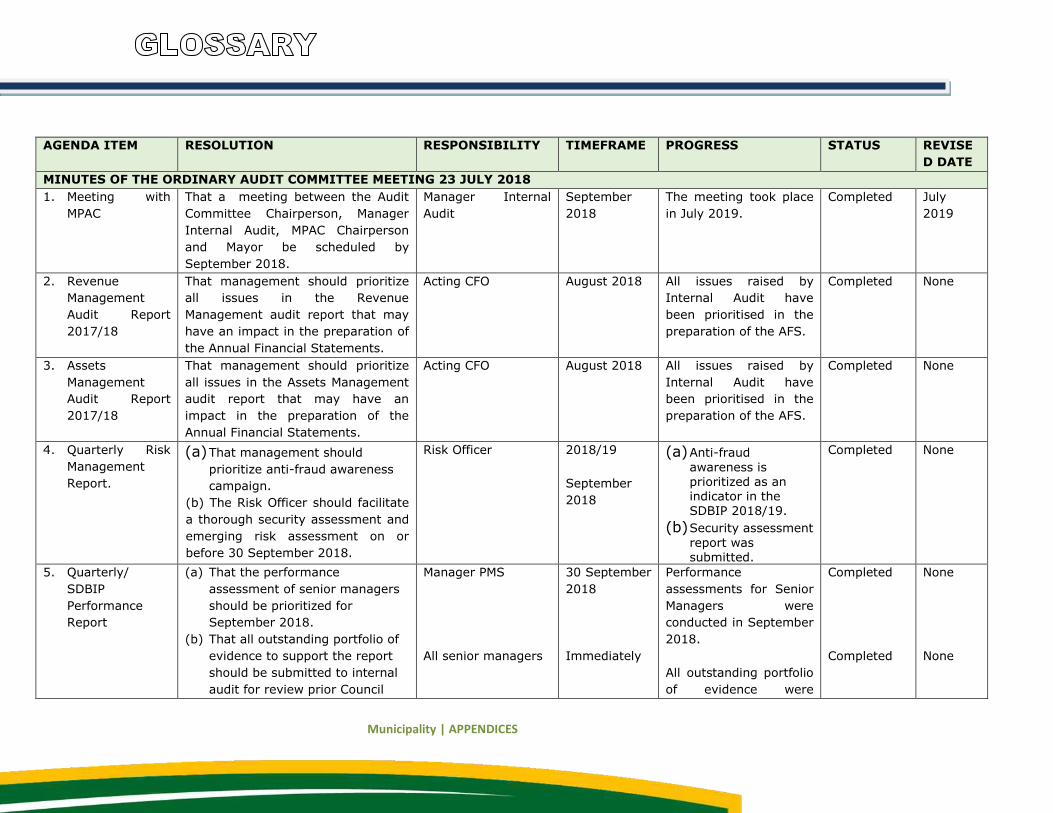
Municipality | APPENDICES
AGENDA ITEM RESOLUTION RESPONSIBILITY TIMEFRAME PROGRESS STATUS REVISE
D DATE
MINUTES OF THE ORDINARY AUDIT COMMITTEE MEETING 23 JULY 2018
1. Meeting with
MPAC
That a meeting between the Audit
Committee Chairperson, Manager
Internal Audit, MPAC Chairperson
and Mayor be scheduled by
September 2018.
Manager Internal
Audit
September
2018
The meeting took place
in July 2019.
Completed July
2019
2. Revenue
Management
Audit Report
2017/18
That management should prioritize
all issues in the Revenue
Management audit report that may
have an impact in the preparation of
the Annual Financial Statements.
Acting CFO August 2018 All issues raised by
Internal Audit have
been prioritised in the
preparation of the AFS.
Completed None
3. Assets
Management
Audit Report
2017/18
That management should prioritize
all issues in the Assets Management
audit report that may have an
impact in the preparation of the
Annual Financial Statements.
Acting CFO August 2018 All issues raised by
Internal Audit have
been prioritised in the
preparation of the AFS.
Completed None
4. Quarterly Risk
Management
Report.
(a) That management should
prioritize anti-fraud awareness
campaign.
(b) The Risk Officer should facilitate
a thorough security assessment and
emerging risk assessment on or
before 30 September 2018.
Risk Officer 2018/19
September
2018
(a) Anti-fraud
awareness is prioritized as an indicator in the SDBIP 2018/19.
(b) Security assessment
report was submitted.
Completed None
5. Quarterly/
SDBIP
Performance
Report
(a) That the performance
assessment of senior managers
should be prioritized for
September 2018.
(b) That all outstanding portfolio of
evidence to support the report
should be submitted to internal
audit for review prior Council
Manager PMS
All senior managers
30 September
2018
Immediately
Performance
assessments for Senior
Managers were
conducted in September
2018.
All outstanding portfolio
of evidence were
Completed
Completed
None
None
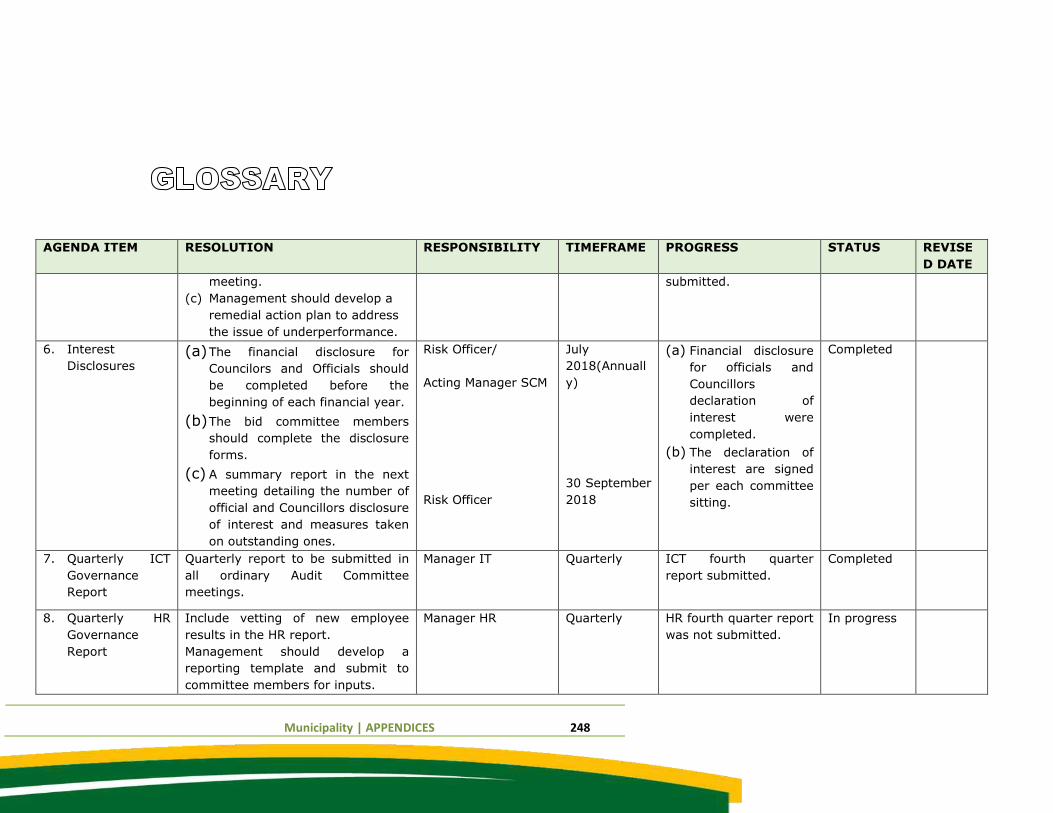
Municipality | APPENDICES 248
AGENDA ITEM RESOLUTION RESPONSIBILITY TIMEFRAME PROGRESS STATUS REVISE
D DATE
meeting.
(c) Management should develop a
remedial action plan to address
the issue of underperformance.
submitted.
6. Interest
Disclosures (a) The financial disclosure for
Councilors and Officials should
be completed before the
beginning of each financial year.
(b) The bid committee members
should complete the disclosure
forms.
(c) A summary report in the next
meeting detailing the number of
official and Councillors disclosure
of interest and measures taken
on outstanding ones.
Risk Officer/
Acting Manager SCM
Risk Officer
July
2018(Annuall
y)
30 September
2018
(a) Financial disclosure
for officials and
Councillors
declaration of
interest were
completed.
(b) The declaration of
interest are signed
per each committee
sitting.
Completed
7. Quarterly ICT
Governance
Report
Quarterly report to be submitted in
all ordinary Audit Committee
meetings.
Manager IT Quarterly ICT fourth quarter
report submitted.
Completed
8. Quarterly HR
Governance
Report
Include vetting of new employee
results in the HR report.
Management should develop a
reporting template and submit to
committee members for inputs.
Manager HR Quarterly HR fourth quarter report
was not submitted.
In progress
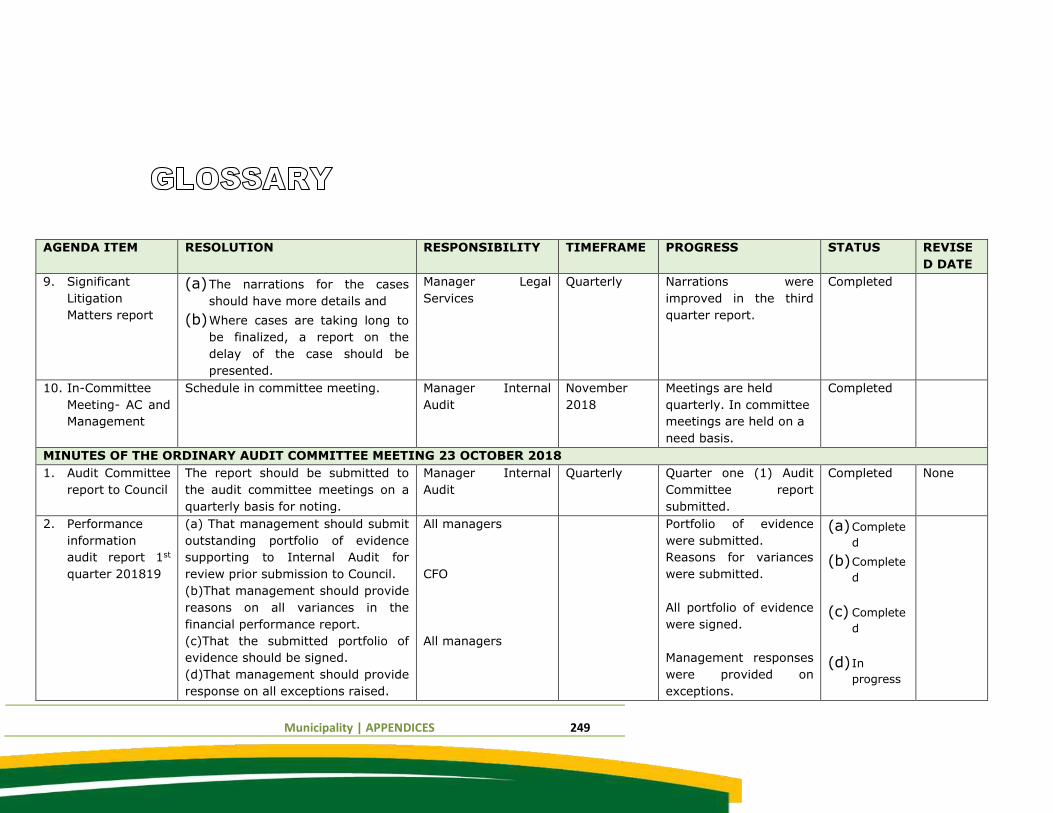
Municipality | APPENDICES 249
AGENDA ITEM RESOLUTION RESPONSIBILITY TIMEFRAME PROGRESS STATUS REVISE
D DATE
9. Significant
Litigation
Matters report
(a) The narrations for the cases
should have more details and
(b) Where cases are taking long to
be finalized, a report on the
delay of the case should be
presented.
Manager Legal
Services
Quarterly Narrations were
improved in the third
quarter report.
Completed
10. In-Committee
Meeting- AC and
Management
Schedule in committee meeting. Manager Internal
Audit
November
2018
Meetings are held
quarterly. In committee
meetings are held on a
need basis.
Completed
MINUTES OF THE ORDINARY AUDIT COMMITTEE MEETING 23 OCTOBER 2018
1. Audit Committee
report to Council
The report should be submitted to
the audit committee meetings on a
quarterly basis for noting.
Manager Internal
Audit
Quarterly Quarter one (1) Audit
Committee report
submitted.
Completed None
2. Performance
information
audit report 1st
quarter 201819
(a) That management should submit
outstanding portfolio of evidence
supporting to Internal Audit for
review prior submission to Council.
(b)That management should provide
reasons on all variances in the
financial performance report.
(c)That the submitted portfolio of
evidence should be signed.
(d)That management should provide
response on all exceptions raised.
All managers
CFO
All managers
Portfolio of evidence
were submitted.
Reasons for variances
were submitted.
All portfolio of evidence
were signed.
Management responses
were provided on
exceptions.
(a) Complete
d
(b) Complete
d
(c) Complete
d
(d) In
progress
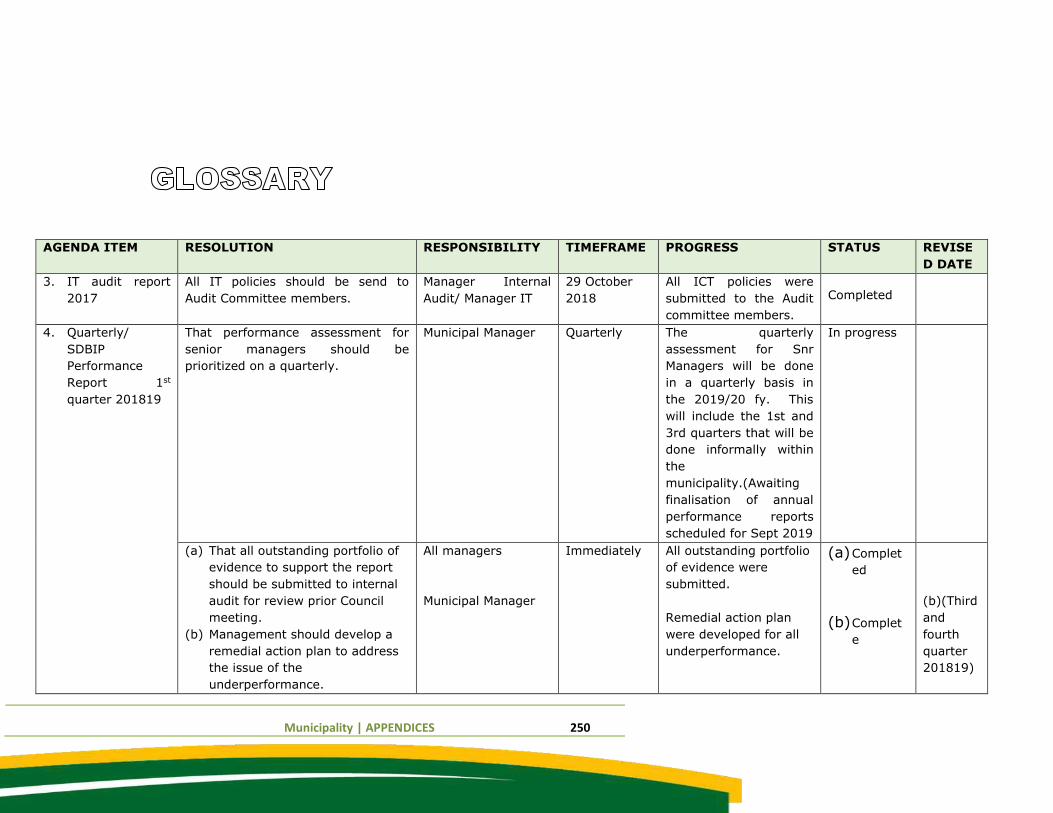
Municipality | APPENDICES 250
AGENDA ITEM RESOLUTION RESPONSIBILITY TIMEFRAME PROGRESS STATUS REVISE
D DATE
3. IT audit report
2017
All IT policies should be send to
Audit Committee members.
Manager Internal
Audit/ Manager IT
29 October
2018
All ICT policies were
submitted to the Audit
committee members.
Completed
4. Quarterly/
SDBIP
Performance
Report 1st
quarter 201819
That performance assessment for
senior managers should be
prioritized on a quarterly.
Municipal Manager Quarterly The quarterly
assessment for Snr
Managers will be done
in a quarterly basis in
the 2019/20 fy. This
will include the 1st and
3rd quarters that will be
done informally within
the
municipality.(Awaiting
finalisation of annual
performance reports
scheduled for Sept 2019
In progress
(a) That all outstanding portfolio of
evidence to support the report
should be submitted to internal
audit for review prior Council
meeting.
(b) Management should develop a
remedial action plan to address
the issue of the
underperformance.
All managers
Municipal Manager
Immediately
All outstanding portfolio
of evidence were
submitted.
Remedial action plan
were developed for all
underperformance.
(a) Complet
ed
(b) Complet
e
(b)(Third
and
fourth
quarter
201819)
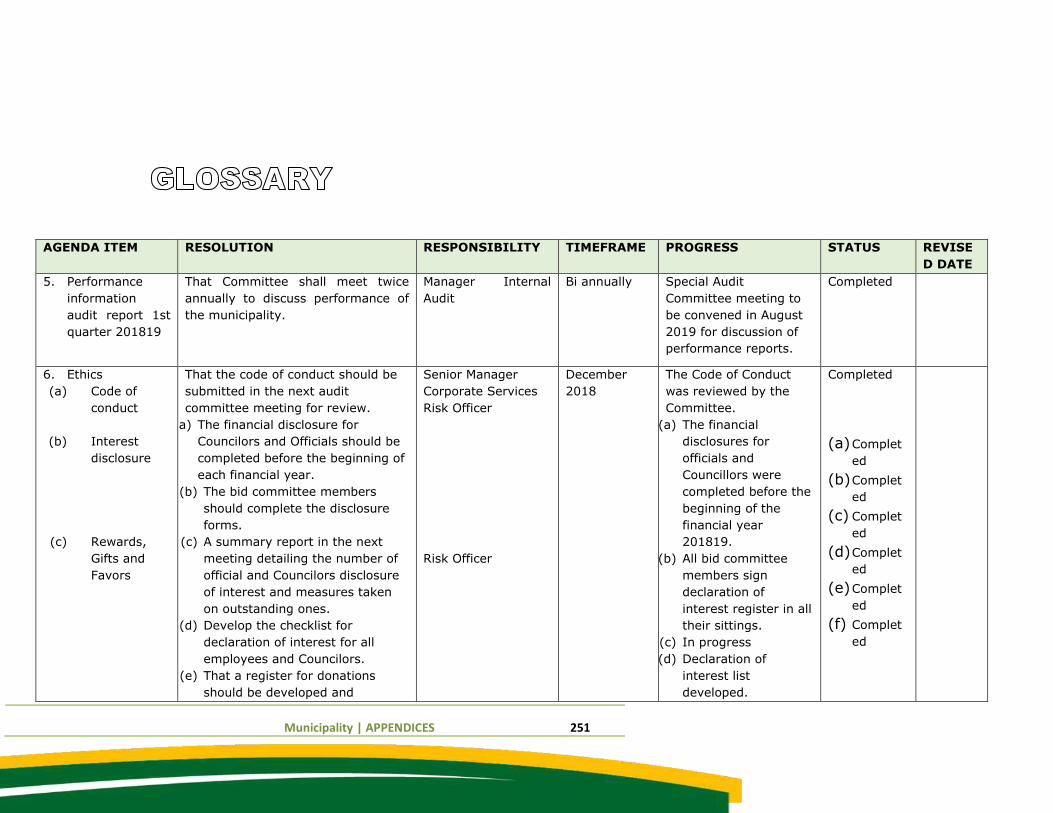
Municipality | APPENDICES 251
AGENDA ITEM RESOLUTION RESPONSIBILITY TIMEFRAME PROGRESS STATUS REVISE
D DATE
5. Performance
information
audit report 1st
quarter 201819
That Committee shall meet twice
annually to discuss performance of
the municipality.
Manager Internal
Audit
Bi annually Special Audit
Committee meeting to
be convened in August
2019 for discussion of
performance reports.
Completed
6. Ethics
(a) Code of
conduct
(b) Interest
disclosure
(c) Rewards,
Gifts and
Favors
That the code of conduct should be
submitted in the next audit
committee meeting for review.
(a) The financial disclosure for
Councilors and Officials should be
completed before the beginning of
each financial year.
(b) The bid committee members
should complete the disclosure
forms.
(c) A summary report in the next
meeting detailing the number of
official and Councilors disclosure
of interest and measures taken
on outstanding ones.
(d) Develop the checklist for
declaration of interest for all
employees and Councilors.
(e) That a register for donations
should be developed and
Senior Manager
Corporate Services
Risk Officer
Risk Officer
December
2018
The Code of Conduct
was reviewed by the
Committee.
(a) The financial
disclosures for
officials and
Councillors were
completed before the
beginning of the
financial year
201819.
(b) All bid committee
members sign
declaration of
interest register in all
their sittings.
(c) In progress
(d) Declaration of
interest list
developed.
Completed
(a) Complet
ed
(b) Complet
ed
(c) Complet
ed
(d) Complet
ed
(e) Complet
ed
(f) Complet
ed
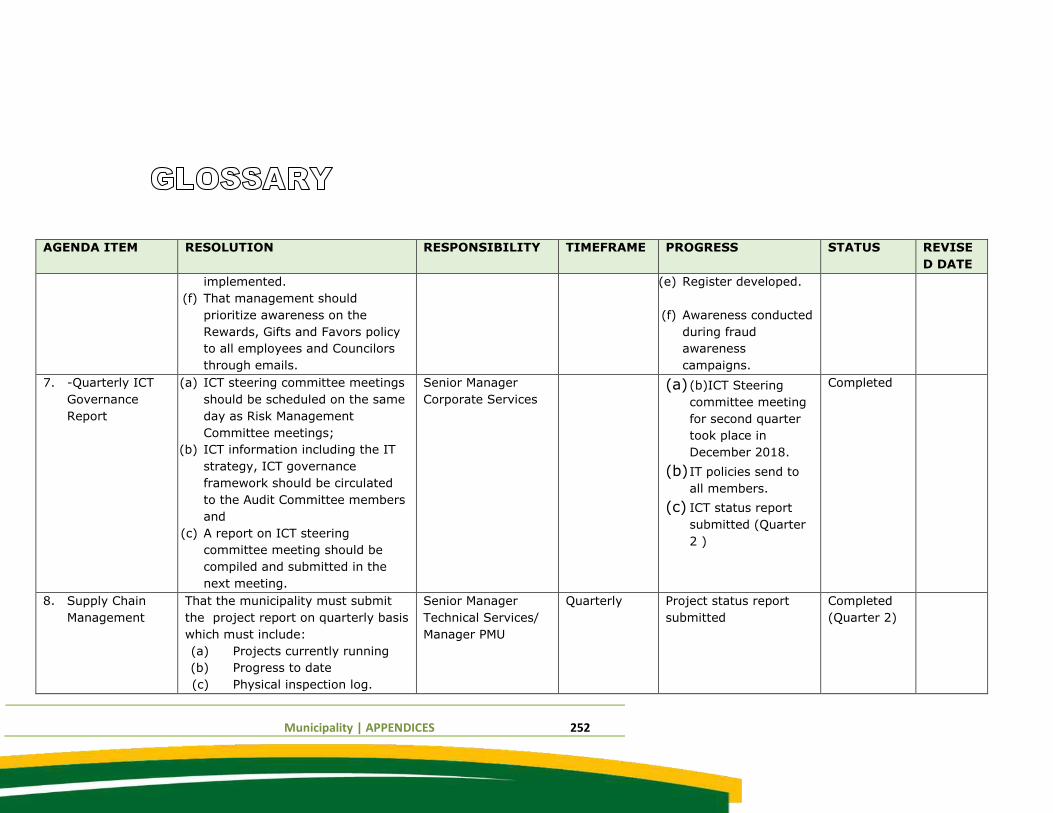
Municipality | APPENDICES 252
AGENDA ITEM RESOLUTION RESPONSIBILITY TIMEFRAME PROGRESS STATUS REVISE
D DATE
implemented.
(f) That management should
prioritize awareness on the
Rewards, Gifts and Favors policy
to all employees and Councilors
through emails.
(e) Register developed.
(f) Awareness conducted
during fraud
awareness
campaigns.
7. -Quarterly ICT
Governance
Report
(a) ICT steering committee meetings
should be scheduled on the same
day as Risk Management
Committee meetings;
(b) ICT information including the IT
strategy, ICT governance
framework should be circulated
to the Audit Committee members
and
(c) A report on ICT steering
committee meeting should be
compiled and submitted in the
next meeting.
Senior Manager
Corporate Services
(a) (b)ICT Steering
committee meeting
for second quarter
took place in
December 2018.
(b) IT policies send to
all members.
(c) ICT status report
submitted (Quarter
2 )
Completed
8. Supply Chain
Management
That the municipality must submit
the project report on quarterly basis
which must include:
(a) Projects currently running
(b) Progress to date
(c) Physical inspection log.
Senior Manager
Technical Services/
Manager PMU
Quarterly Project status report
submitted
Completed
(Quarter 2)
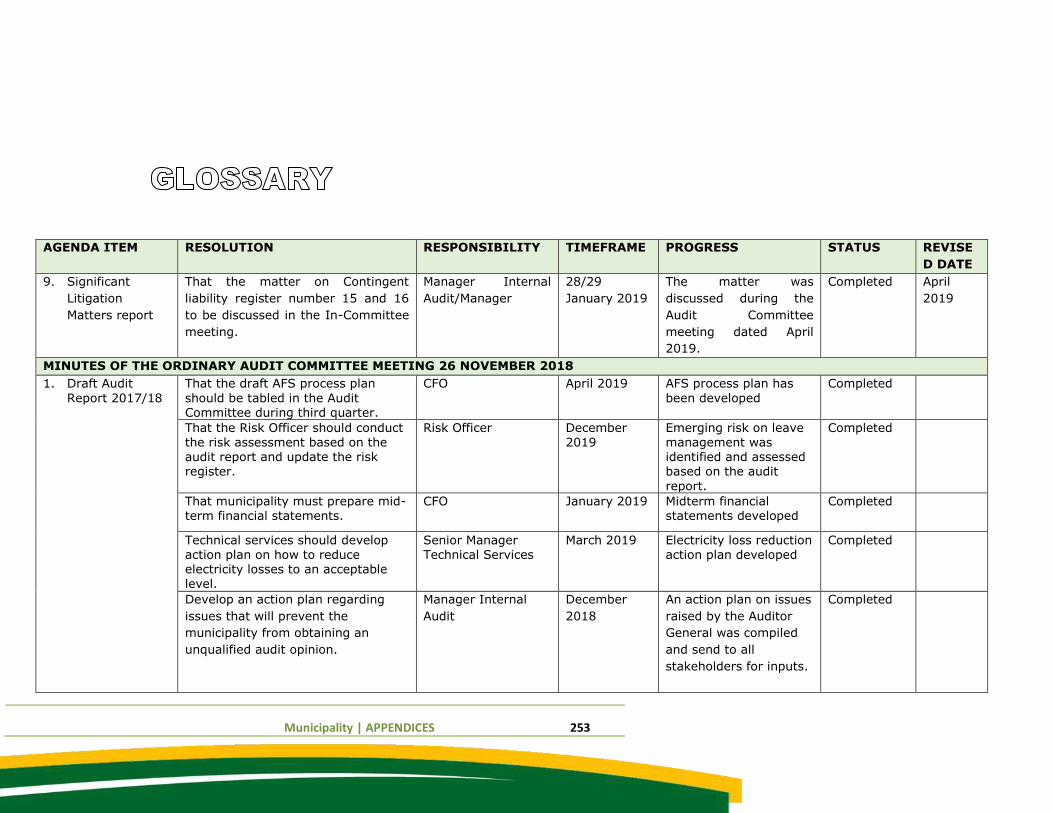
Municipality | APPENDICES 253
AGENDA ITEM RESOLUTION RESPONSIBILITY TIMEFRAME PROGRESS STATUS REVISE
D DATE
9. Significant
Litigation
Matters report
That the matter on Contingent
liability register number 15 and 16
to be discussed in the In-Committee
meeting.
Manager Internal
Audit/Manager
28/29
January 2019
The matter was
discussed during the
Audit Committee
meeting dated April
2019.
Completed April
2019
MINUTES OF THE ORDINARY AUDIT COMMITTEE MEETING 26 NOVEMBER 2018
1. Draft Audit
Report 2017/18
That the draft AFS process plan
should be tabled in the Audit Committee during third quarter.
CFO April 2019 AFS process plan has
been developed
Completed
That the Risk Officer should conduct
the risk assessment based on the audit report and update the risk register.
Risk Officer December
2019
Emerging risk on leave
management was identified and assessed based on the audit
report.
Completed
That municipality must prepare mid-term financial statements.
CFO January 2019 Midterm financial statements developed
Completed
Technical services should develop action plan on how to reduce electricity losses to an acceptable level.
Senior Manager Technical Services
March 2019 Electricity loss reduction action plan developed
Completed
Develop an action plan regarding
issues that will prevent the
municipality from obtaining an
unqualified audit opinion.
Manager Internal
Audit
December
2018
An action plan on issues
raised by the Auditor
General was compiled
and send to all
stakeholders for inputs.
Completed
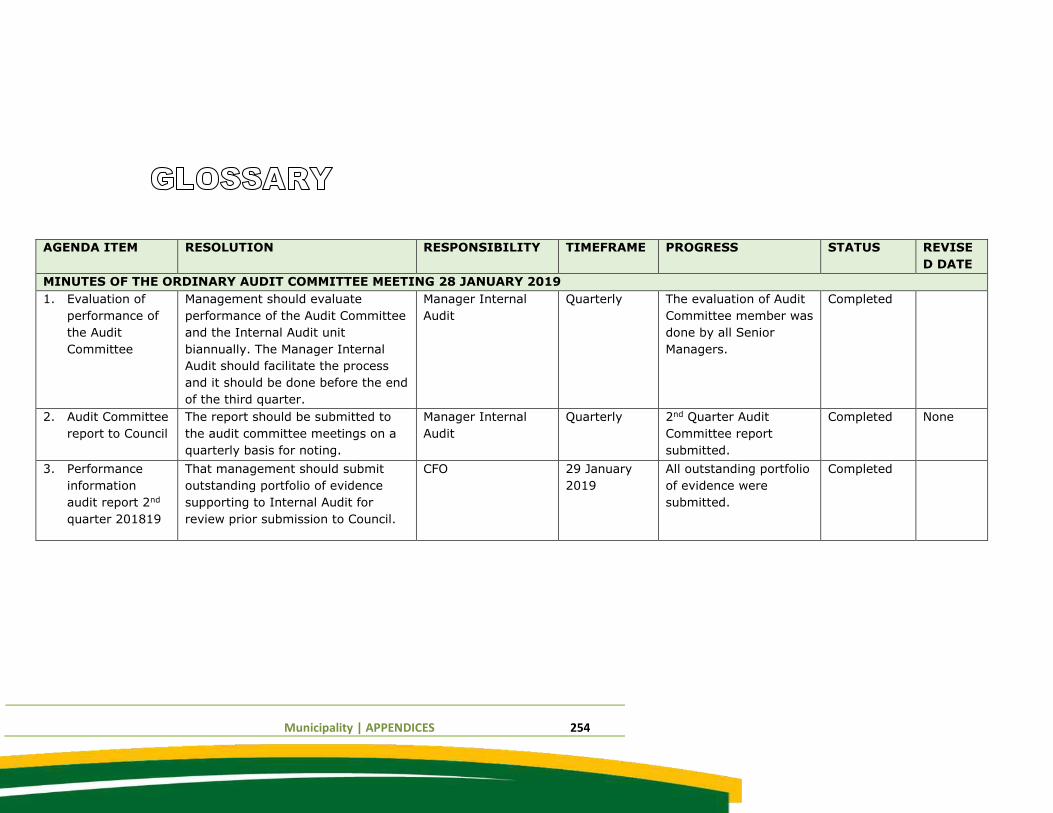
Municipality | APPENDICES 254
AGENDA ITEM RESOLUTION RESPONSIBILITY TIMEFRAME PROGRESS STATUS REVISE
D DATE
MINUTES OF THE ORDINARY AUDIT COMMITTEE MEETING 28 JANUARY 2019
1. Evaluation of
performance of
the Audit
Committee
Management should evaluate
performance of the Audit Committee
and the Internal Audit unit
biannually. The Manager Internal
Audit should facilitate the process
and it should be done before the end
of the third quarter.
Manager Internal
Audit
Quarterly The evaluation of Audit
Committee member was
done by all Senior
Managers.
Completed
2. Audit Committee
report to Council
The report should be submitted to
the audit committee meetings on a
quarterly basis for noting.
Manager Internal
Audit
Quarterly
2nd Quarter Audit
Committee report
submitted.
Completed
None
3. Performance
information
audit report 2nd
quarter 201819
That management should submit
outstanding portfolio of evidence
supporting to Internal Audit for
review prior submission to Council.
CFO 29 January
2019
All outstanding portfolio
of evidence were
submitted.
Completed
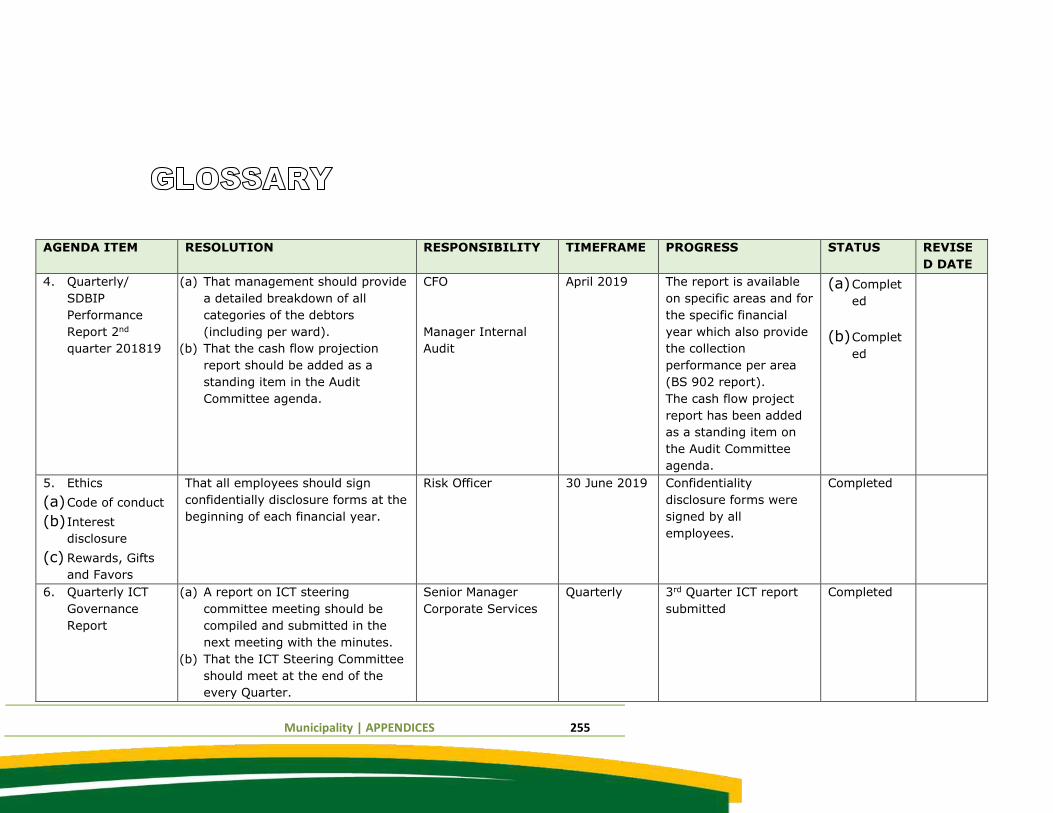
Municipality | APPENDICES 255
AGENDA ITEM RESOLUTION RESPONSIBILITY TIMEFRAME PROGRESS STATUS REVISE
D DATE
4. Quarterly/
SDBIP
Performance
Report 2nd
quarter 201819
(a) That management should provide
a detailed breakdown of all
categories of the debtors
(including per ward).
(b) That the cash flow projection
report should be added as a
standing item in the Audit
Committee agenda.
CFO
Manager Internal
Audit
April 2019
The report is available
on specific areas and for
the specific financial
year which also provide
the collection
performance per area
(BS 902 report).
The cash flow project
report has been added
as a standing item on
the Audit Committee
agenda.
(a) Complet
ed
(b) Complet
ed
5. Ethics
(a) Code of conduct
(b) Interest
disclosure
(c) Rewards, Gifts
and Favors
That all employees should sign
confidentially disclosure forms at the
beginning of each financial year.
Risk Officer 30 June 2019 Confidentiality
disclosure forms were
signed by all
employees.
Completed
6. Quarterly ICT
Governance
Report
(a) A report on ICT steering
committee meeting should be
compiled and submitted in the
next meeting with the minutes.
(b) That the ICT Steering Committee
should meet at the end of the
every Quarter.
Senior Manager
Corporate Services
Quarterly 3rd Quarter ICT report
submitted
Completed
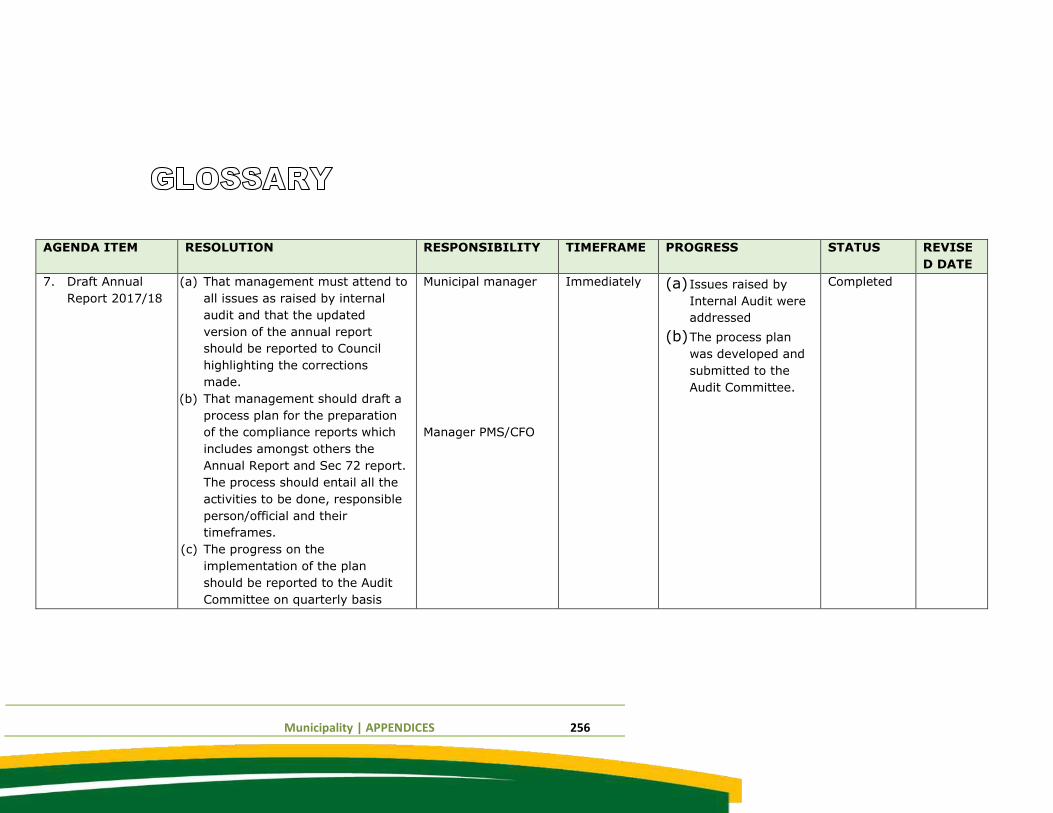
Municipality | APPENDICES 256
AGENDA ITEM RESOLUTION RESPONSIBILITY TIMEFRAME PROGRESS STATUS REVISE
D DATE
7. Draft Annual
Report 2017/18
(a) That management must attend to
all issues as raised by internal
audit and that the updated
version of the annual report
should be reported to Council
highlighting the corrections
made.
(b) That management should draft a
process plan for the preparation
of the compliance reports which
includes amongst others the
Annual Report and Sec 72 report.
The process should entail all the
activities to be done, responsible
person/official and their
timeframes.
(c) The progress on the
implementation of the plan
should be reported to the Audit
Committee on quarterly basis
Municipal manager
Manager PMS/CFO
Immediately (a) Issues raised by
Internal Audit were
addressed
(b) The process plan
was developed and
submitted to the
Audit Committee.
Completed
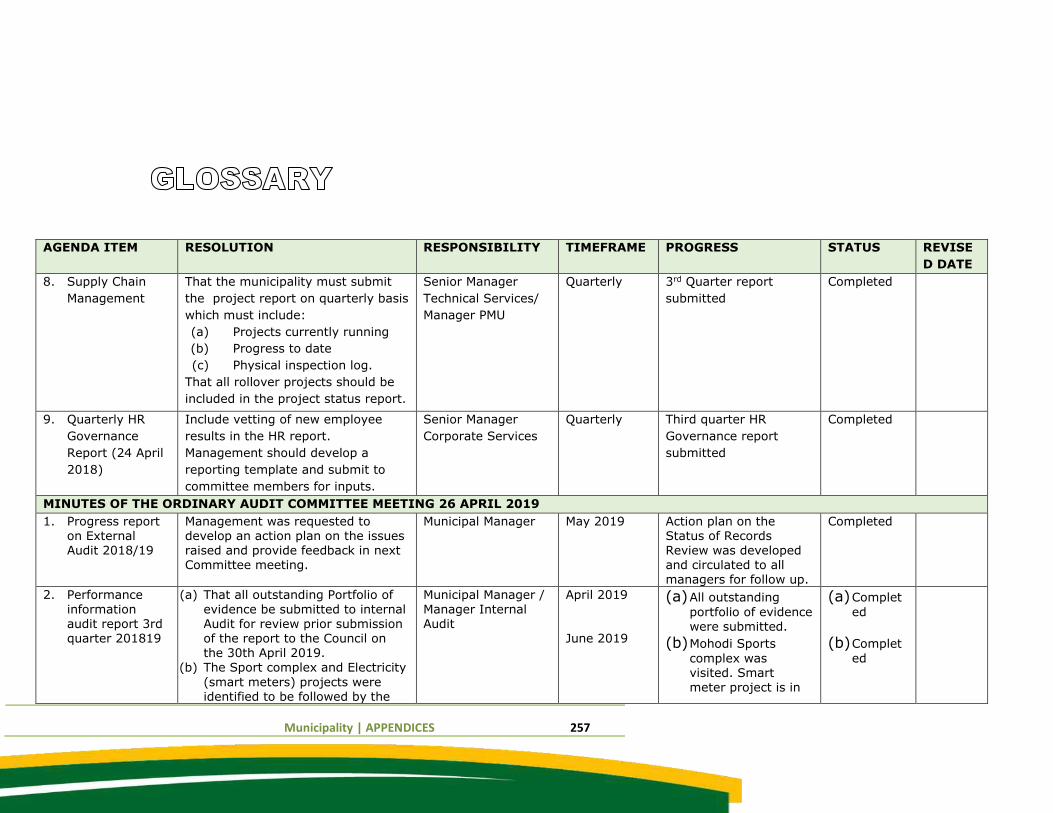
Municipality | APPENDICES 257
AGENDA ITEM RESOLUTION RESPONSIBILITY TIMEFRAME PROGRESS STATUS REVISE
D DATE
8. Supply Chain
Management
That the municipality must submit
the project report on quarterly basis
which must include:
(a) Projects currently running
(b) Progress to date
(c) Physical inspection log.
That all rollover projects should be
included in the project status report.
Senior Manager
Technical Services/
Manager PMU
Quarterly 3rd Quarter report
submitted
Completed
9. Quarterly HR
Governance
Report (24 April
2018)
Include vetting of new employee
results in the HR report.
Management should develop a
reporting template and submit to
committee members for inputs.
Senior Manager
Corporate Services
Quarterly Third quarter HR
Governance report
submitted
Completed
MINUTES OF THE ORDINARY AUDIT COMMITTEE MEETING 26 APRIL 2019
1. Progress report on External Audit 2018/19
Management was requested to develop an action plan on the issues raised and provide feedback in next Committee meeting.
Municipal Manager May 2019 Action plan on the Status of Records Review was developed and circulated to all managers for follow up.
Completed
2. Performance
information audit report 3rd quarter 201819
(a) That all outstanding Portfolio of
evidence be submitted to internal Audit for review prior submission of the report to the Council on the 30th April 2019.
(b) The Sport complex and Electricity
(smart meters) projects were identified to be followed by the
Municipal Manager /
Manager Internal Audit
April 2019
June 2019
(a) All outstanding
portfolio of evidence were submitted.
(b) Mohodi Sports
complex was visited. Smart meter project is in
(a) Complet
ed
(b) Complet
ed
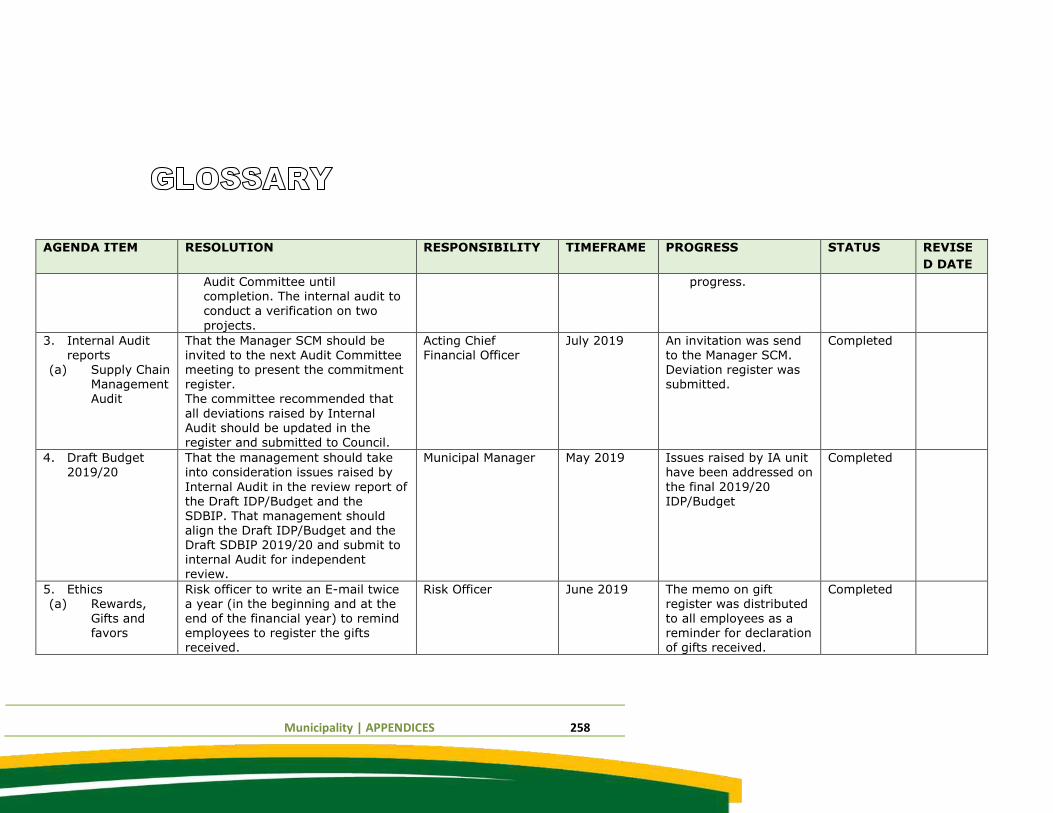
Municipality | APPENDICES 258
AGENDA ITEM RESOLUTION RESPONSIBILITY TIMEFRAME PROGRESS STATUS REVISE
D DATE
Audit Committee until completion. The internal audit to conduct a verification on two
projects.
progress.
3. Internal Audit reports
(a) Supply Chain Management Audit
That the Manager SCM should be invited to the next Audit Committee meeting to present the commitment register. The committee recommended that
all deviations raised by Internal Audit should be updated in the
register and submitted to Council.
Acting Chief Financial Officer
July 2019 An invitation was send to the Manager SCM. Deviation register was submitted.
Completed
4. Draft Budget 2019/20
That the management should take into consideration issues raised by
Internal Audit in the review report of the Draft IDP/Budget and the SDBIP. That management should align the Draft IDP/Budget and the Draft SDBIP 2019/20 and submit to internal Audit for independent review.
Municipal Manager May 2019 Issues raised by IA unit have been addressed on
the final 2019/20 IDP/Budget
Completed
5. Ethics (a) Rewards,
Gifts and favors
Risk officer to write an E-mail twice a year (in the beginning and at the
end of the financial year) to remind employees to register the gifts received.
Risk Officer June 2019 The memo on gift register was distributed
to all employees as a reminder for declaration of gifts received.
Completed
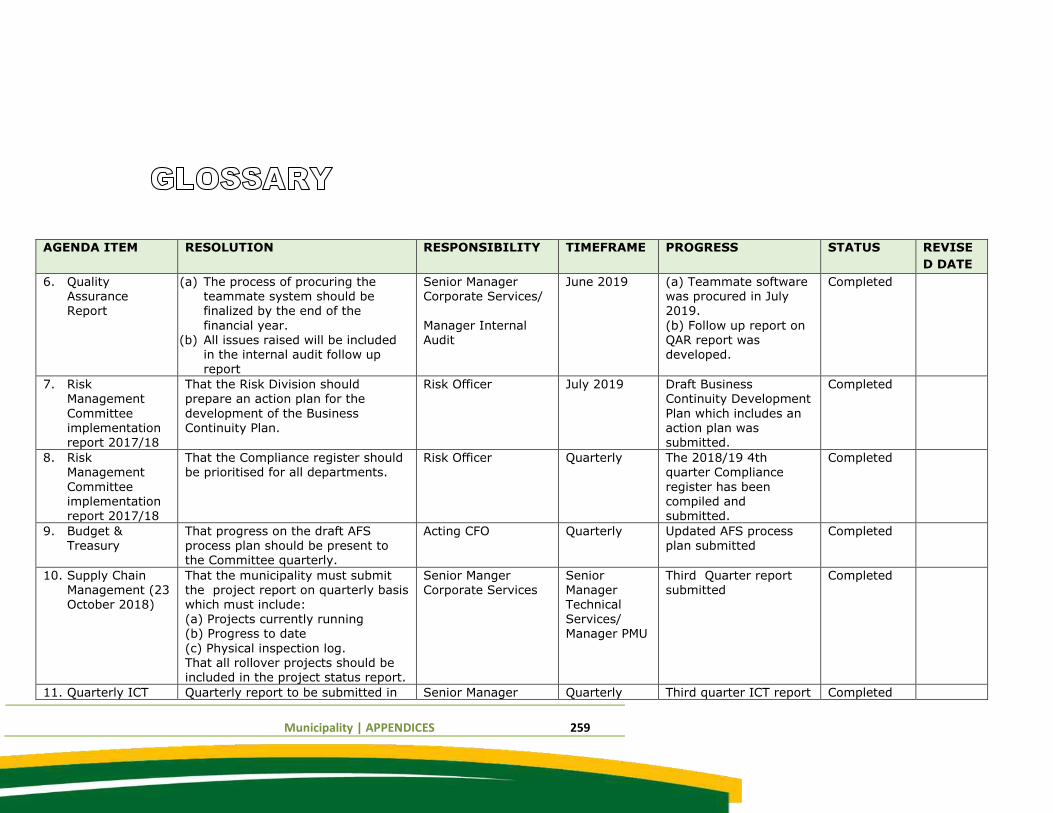
Municipality | APPENDICES 259
AGENDA ITEM RESOLUTION RESPONSIBILITY TIMEFRAME PROGRESS STATUS REVISE
D DATE
6. Quality Assurance Report
(a) The process of procuring the teammate system should be finalized by the end of the
financial year. (b) All issues raised will be included
in the internal audit follow up report
Senior Manager Corporate Services/
Manager Internal Audit
June 2019 (a) Teammate software was procured in July 2019.
(b) Follow up report on QAR report was developed.
Completed
7. Risk Management
Committee implementation
report 2017/18
That the Risk Division should prepare an action plan for the
development of the Business Continuity Plan.
Risk Officer July 2019 Draft Business Continuity Development
Plan which includes an action plan was
submitted.
Completed
8. Risk Management
Committee implementation report 2017/18
That the Compliance register should be prioritised for all departments.
Risk Officer Quarterly The 2018/19 4th quarter Compliance
register has been compiled and submitted.
Completed
9. Budget & Treasury
That progress on the draft AFS process plan should be present to the Committee quarterly.
Acting CFO Quarterly Updated AFS process plan submitted
Completed
10. Supply Chain Management (23 October 2018)
That the municipality must submit the project report on quarterly basis which must include:
(a) Projects currently running (b) Progress to date
(c) Physical inspection log. That all rollover projects should be included in the project status report.
Senior Manger Corporate Services
Senior Manager Technical
Services/ Manager PMU
Third Quarter report submitted
Completed
11. Quarterly ICT Quarterly report to be submitted in Senior Manager Quarterly Third quarter ICT report Completed
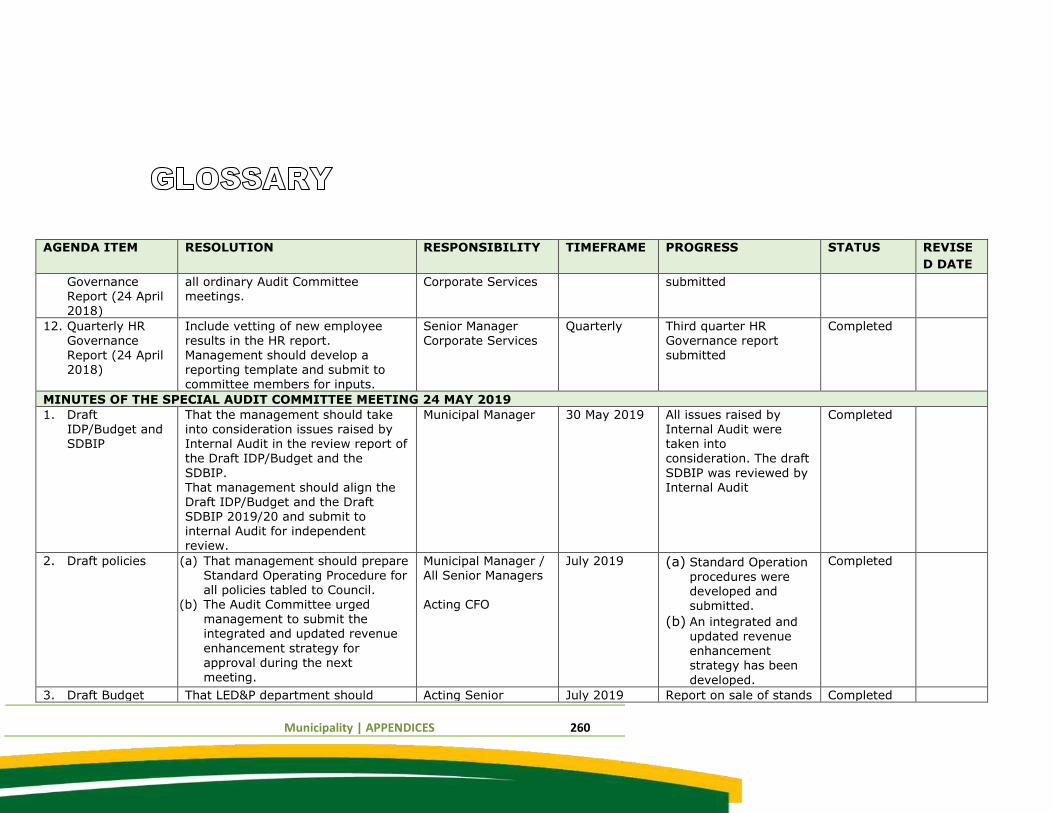
Municipality | APPENDICES 260
AGENDA ITEM RESOLUTION RESPONSIBILITY TIMEFRAME PROGRESS STATUS REVISE
D DATE
Governance Report (24 April 2018)
all ordinary Audit Committee meetings.
Corporate Services submitted
12. Quarterly HR Governance Report (24 April 2018)
Include vetting of new employee results in the HR report. Management should develop a reporting template and submit to committee members for inputs.
Senior Manager Corporate Services
Quarterly Third quarter HR Governance report submitted
Completed
MINUTES OF THE SPECIAL AUDIT COMMITTEE MEETING 24 MAY 2019
1. Draft IDP/Budget and
SDBIP
That the management should take into consideration issues raised by
Internal Audit in the review report of the Draft IDP/Budget and the
SDBIP. That management should align the Draft IDP/Budget and the Draft SDBIP 2019/20 and submit to internal Audit for independent review.
Municipal Manager 30 May 2019 All issues raised by Internal Audit were
taken into consideration. The draft
SDBIP was reviewed by Internal Audit
Completed
2. Draft policies (a) That management should prepare Standard Operating Procedure for all policies tabled to Council.
(b) The Audit Committee urged
management to submit the integrated and updated revenue
enhancement strategy for approval during the next meeting.
Municipal Manager / All Senior Managers Acting CFO
July 2019 (a) Standard Operation procedures were developed and submitted.
(b) An integrated and updated revenue enhancement strategy has been
developed.
Completed
3. Draft Budget That LED&P department should Acting Senior July 2019 Report on sale of stands Completed
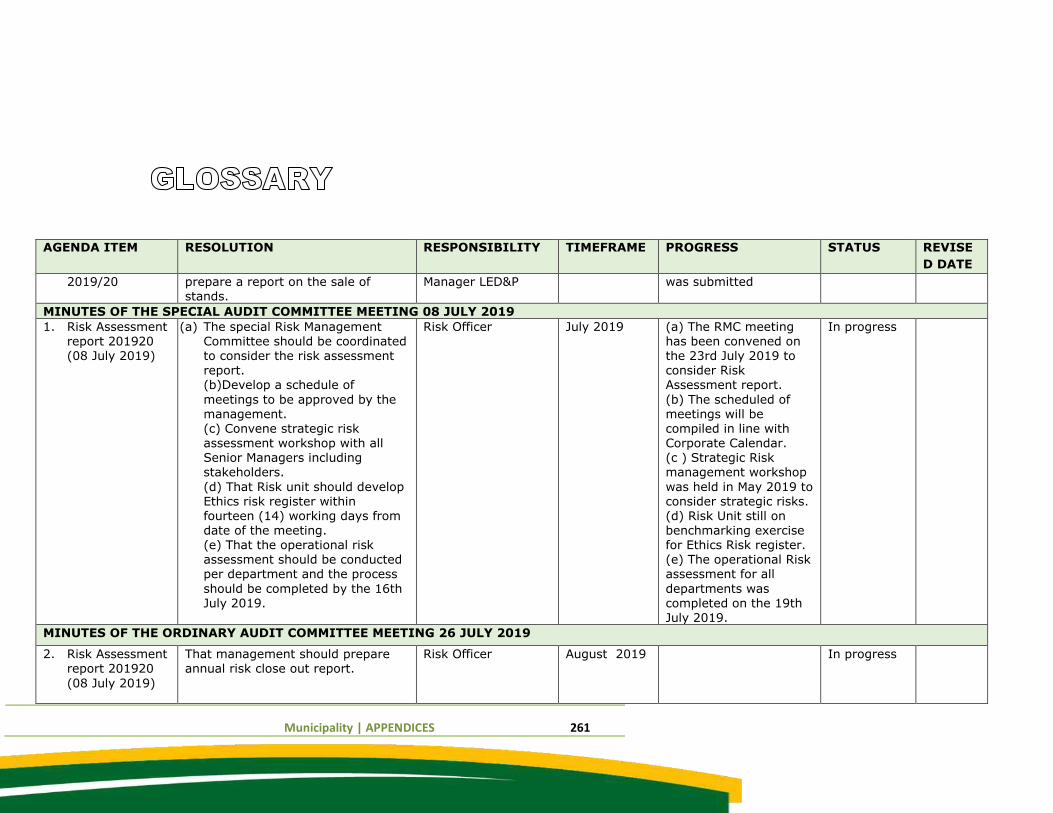
Municipality | APPENDICES 261
AGENDA ITEM RESOLUTION RESPONSIBILITY TIMEFRAME PROGRESS STATUS REVISE
D DATE
2019/20 prepare a report on the sale of stands.
Manager LED&P was submitted
MINUTES OF THE SPECIAL AUDIT COMMITTEE MEETING 08 JULY 2019
1. Risk Assessment report 201920 (08 July 2019)
(a) The special Risk Management Committee should be coordinated to consider the risk assessment report. (b)Develop a schedule of
meetings to be approved by the management. (c) Convene strategic risk
assessment workshop with all Senior Managers including stakeholders.
(d) That Risk unit should develop Ethics risk register within fourteen (14) working days from date of the meeting. (e) That the operational risk assessment should be conducted per department and the process
should be completed by the 16th July 2019.
Risk Officer July 2019 (a) The RMC meeting has been convened on the 23rd July 2019 to consider Risk Assessment report.
(b) The scheduled of meetings will be compiled in line with
Corporate Calendar. (c ) Strategic Risk management workshop
was held in May 2019 to consider strategic risks. (d) Risk Unit still on benchmarking exercise for Ethics Risk register. (e) The operational Risk assessment for all
departments was completed on the 19th
July 2019.
In progress
MINUTES OF THE ORDINARY AUDIT COMMITTEE MEETING 26 JULY 2019
2. Risk Assessment report 201920
(08 July 2019)
That management should prepare annual risk close out report.
Risk Officer August 2019 In progress
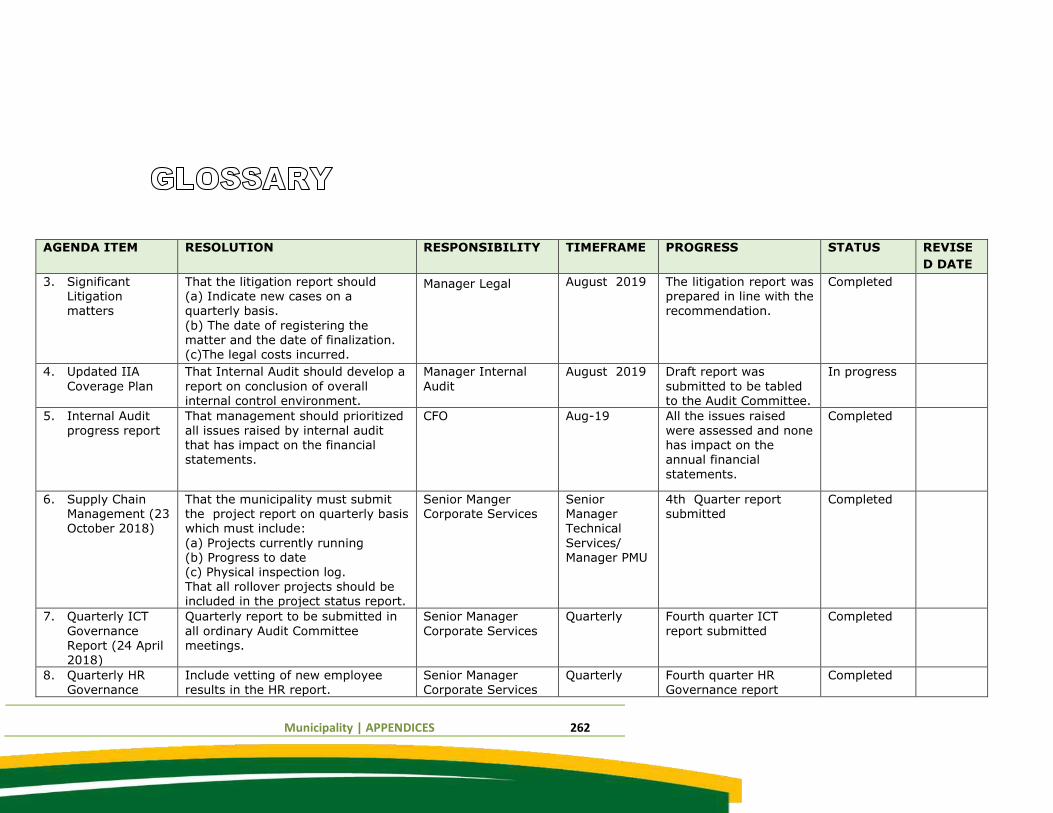
Municipality | APPENDICES 262
AGENDA ITEM RESOLUTION RESPONSIBILITY TIMEFRAME PROGRESS STATUS REVISE
D DATE
3. Significant Litigation matters
That the litigation report should (a) Indicate new cases on a quarterly basis.
(b) The date of registering the matter and the date of finalization. (c)The legal costs incurred.
Manager Legal
August 2019 The litigation report was prepared in line with the recommendation.
Completed
4. Updated IIA
Coverage Plan
That Internal Audit should develop a
report on conclusion of overall internal control environment.
Manager Internal
Audit
August 2019 Draft report was
submitted to be tabled to the Audit Committee.
In progress
5. Internal Audit
progress report
That management should prioritized
all issues raised by internal audit that has impact on the financial statements.
CFO Aug-19 All the issues raised
were assessed and none has impact on the annual financial
statements.
Completed
6. Supply Chain Management (23 October 2018)
That the municipality must submit the project report on quarterly basis which must include:
(a) Projects currently running (b) Progress to date (c) Physical inspection log. That all rollover projects should be included in the project status report.
Senior Manger Corporate Services
Senior Manager Technical
Services/ Manager PMU
4th Quarter report submitted
Completed
7. Quarterly ICT
Governance Report (24 April 2018)
Quarterly report to be submitted in
all ordinary Audit Committee meetings.
Senior Manager
Corporate Services
Quarterly Fourth quarter ICT
report submitted
Completed
8. Quarterly HR Governance
Include vetting of new employee results in the HR report.
Senior Manager Corporate Services
Quarterly Fourth quarter HR Governance report
Completed
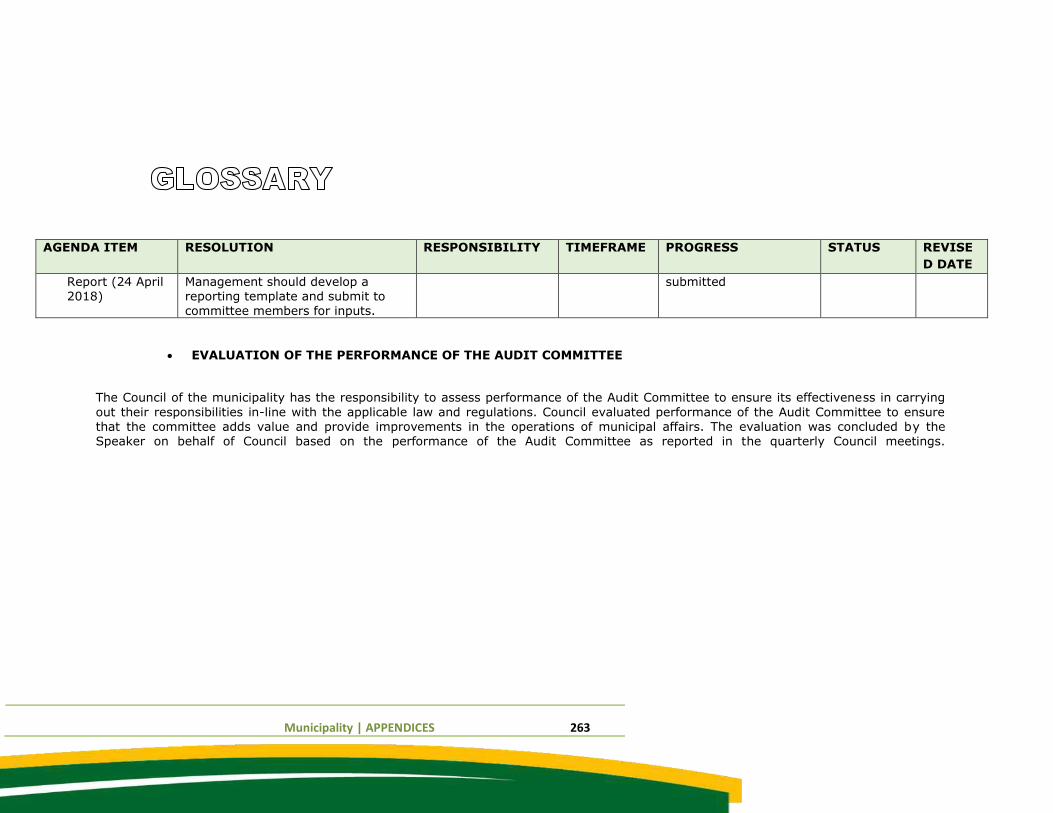
Municipality | APPENDICES 263
AGENDA ITEM RESOLUTION RESPONSIBILITY TIMEFRAME PROGRESS STATUS REVISE
D DATE
Report (24 April 2018)
Management should develop a reporting template and submit to committee members for inputs.
submitted
EVALUATION OF THE PERFORMANCE OF THE AUDIT COMMITTEE
The Council of the municipality has the responsibility to assess performance of the Audit Committee to ensure its effectiveness in carrying
out their responsibilities in-line with the applicable law and regulations. Council evaluated performance of the Audit Committee to ensure that the committee adds value and provide improvements in the operations of municipal affairs. The evaluation was concluded by the
Speaker on behalf of Council based on the performance of the Audit Committee as reported in the quarterly Council meetings.
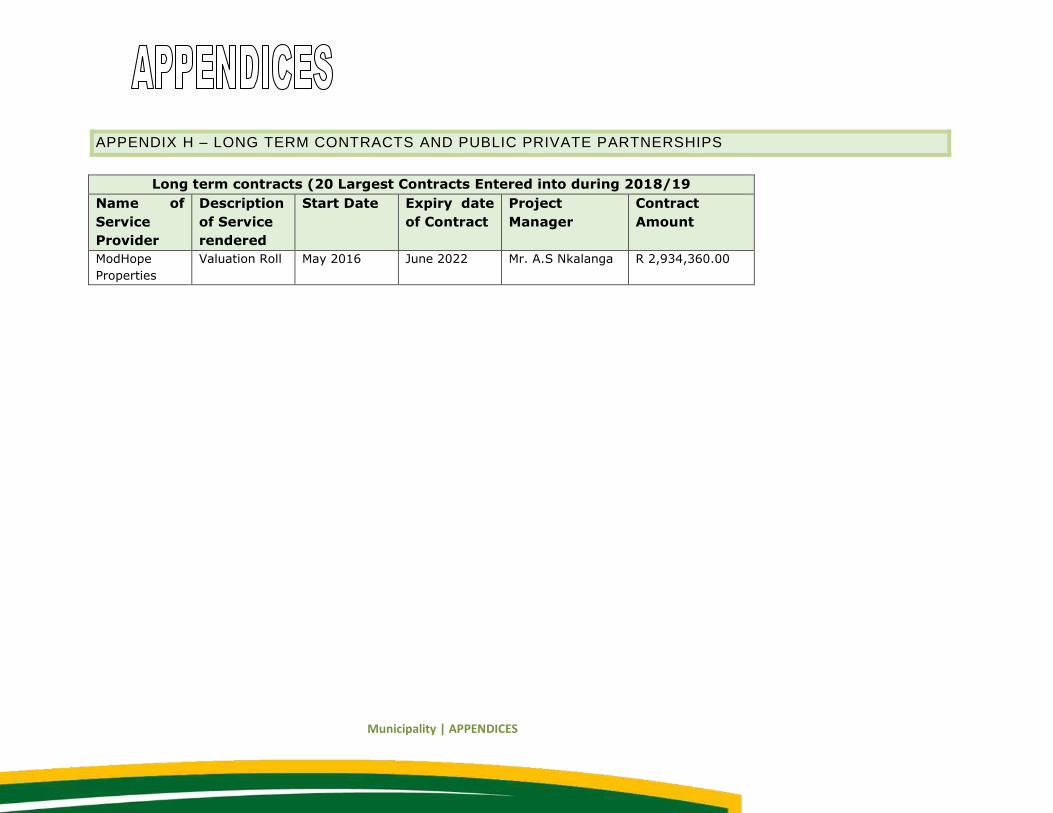
Municipality | APPENDICES
APPENDIX H – LONG TERM CONTRACTS AND PUBLIC PRIVATE PARTNERSHIPS
Long term contracts (20 Largest Contracts Entered into during 2018/19
Name of
Service
Provider
Description
of Service
rendered
Start Date Expiry date
of Contract
Project
Manager
Contract
Amount
ModHope
Properties
Valuation Roll May 2016 June 2022 Mr. A.S Nkalanga R 2,934,360.00
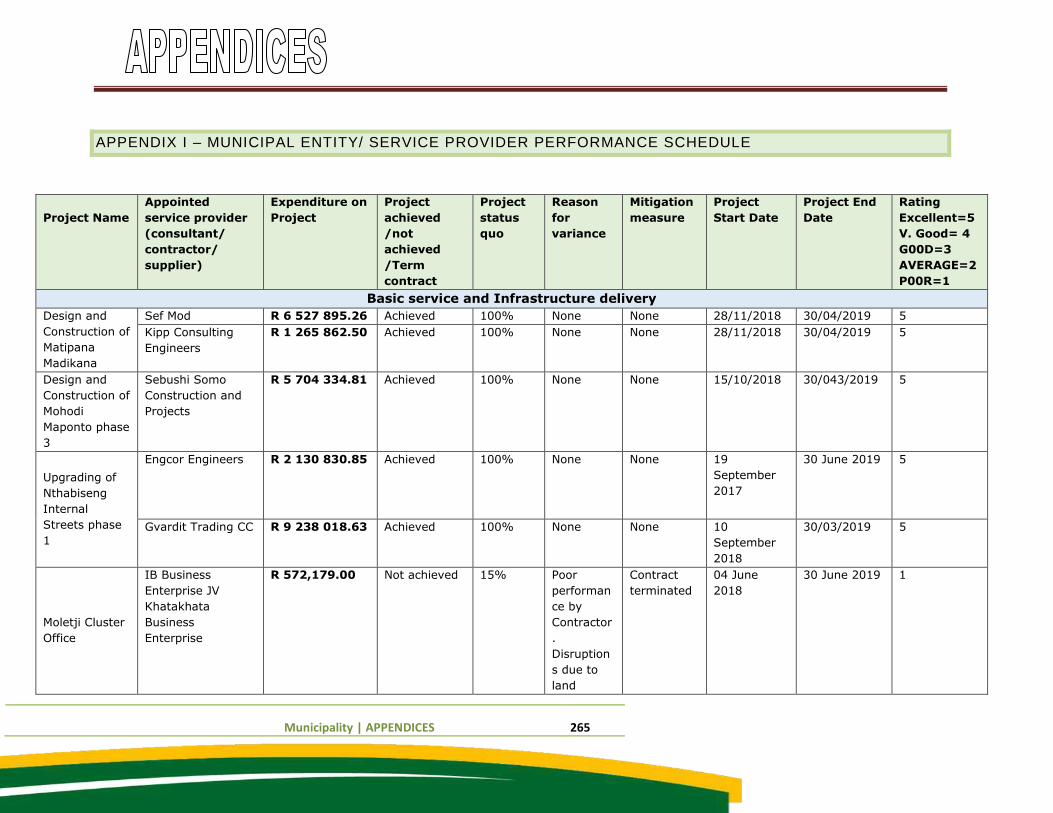
Municipality | APPENDICES 265
APPENDIX I – MUNICIPAL ENTITY/ SERVICE PROVIDER PERFORMANCE SCHEDULE
Project Name
Appointed
service provider
(consultant/
contractor/
supplier)
Expenditure on
Project
Project
achieved
/not
achieved
/Term
contract
Project
status
quo
Reason
for
variance
Mitigation
measure
Project
Start Date
Project End
Date
Rating
Excellent=5
V. Good= 4
G00D=3
AVERAGE=2
P00R=1
Basic service and Infrastructure delivery
Design and
Construction of
Matipana
Madikana
Sef Mod R 6 527 895.26 Achieved 100% None None 28/11/2018 30/04/2019 5
Kipp Consulting
Engineers
R 1 265 862.50 Achieved 100% None None 28/11/2018 30/04/2019 5
Design and
Construction of
Mohodi
Maponto phase
3
Sebushi Somo
Construction and
Projects
R 5 704 334.81 Achieved 100% None None 15/10/2018 30/043/2019 5
Upgrading of
Nthabiseng
Internal
Streets phase
1
Engcor Engineers R 2 130 830.85 Achieved 100% None None 19
September
2017
30 June 2019 5
Gvardit Trading CC R 9 238 018.63 Achieved 100% None None 10
September
2018
30/03/2019 5
Moletji Cluster
Office
IB Business
Enterprise JV
Khatakhata
Business
Enterprise
R 572,179.00 Not achieved 15% Poor
performan
ce by
Contractor
.
Disruption
s due to
land
Contract
terminated
04 June
2018
30 June 2019 1
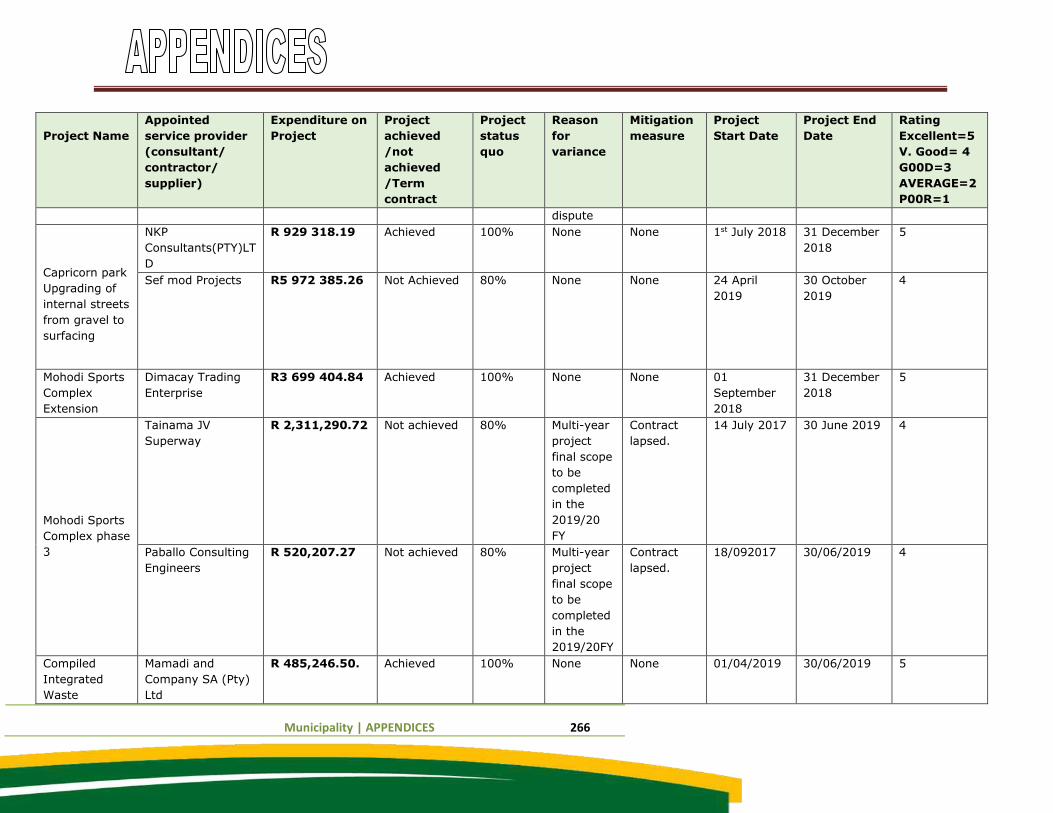
Municipality | APPENDICES 266
Project Name
Appointed
service provider
(consultant/
contractor/
supplier)
Expenditure on
Project
Project
achieved
/not
achieved
/Term
contract
Project
status
quo
Reason
for
variance
Mitigation
measure
Project
Start Date
Project End
Date
Rating
Excellent=5
V. Good= 4
G00D=3
AVERAGE=2
P00R=1
dispute
Capricorn park
Upgrading of
internal streets
from gravel to
surfacing
NKP
Consultants(PTY)LT
D
R 929 318.19 Achieved 100% None None 1st July 2018 31 December
2018
5
Sef mod Projects R5 972 385.26 Not Achieved 80% None None 24 April
2019
30 October
2019
4
Mohodi Sports
Complex
Extension
Dimacay Trading
Enterprise
R3 699 404.84 Achieved 100% None None 01
September
2018
31 December
2018
5
Mohodi Sports
Complex phase
3
Tainama JV
Superway
R 2,311,290.72 Not achieved 80% Multi-year
project
final scope
to be
completed
in the
2019/20
FY
Contract
lapsed.
14 July 2017 30 June 2019 4
Paballo Consulting
Engineers
R 520,207.27 Not achieved 80% Multi-year
project
final scope
to be
completed
in the
2019/20FY
Contract
lapsed.
18/092017 30/06/2019 4
Compiled
Integrated
Waste
Mamadi and
Company SA (Pty)
Ltd
R 485,246.50. Achieved 100% None None 01/04/2019 30/06/2019 5
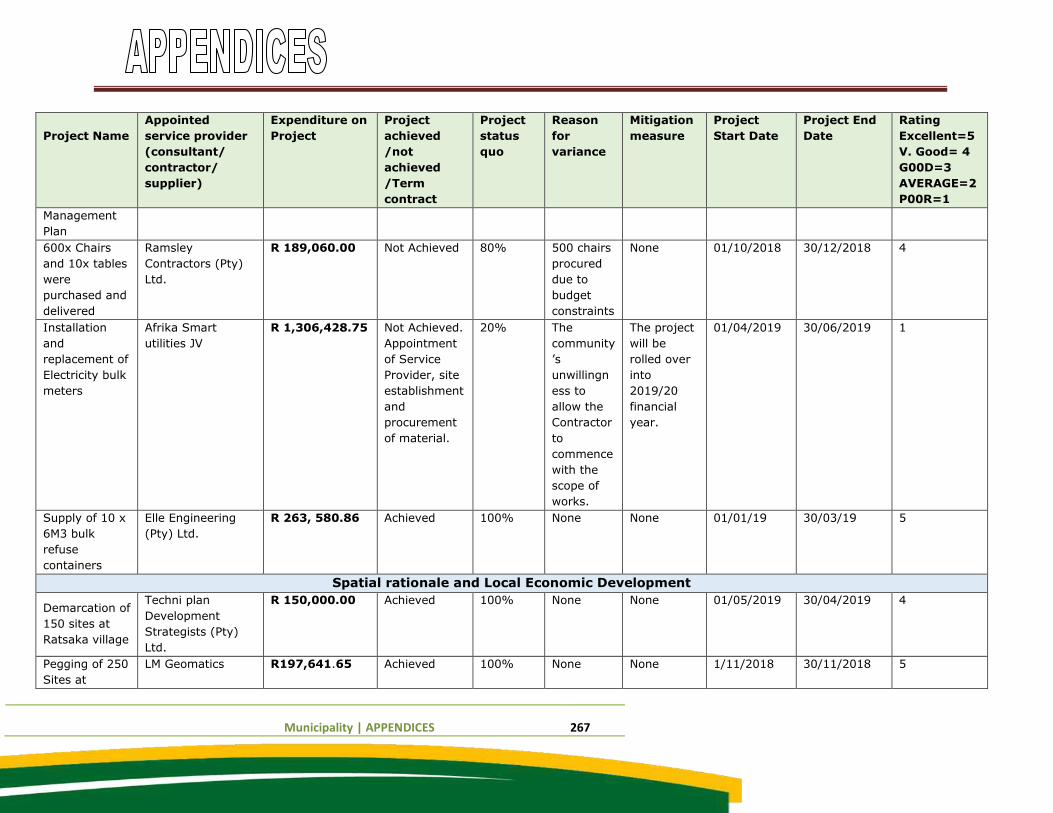
Municipality | APPENDICES 267
Project Name
Appointed
service provider
(consultant/
contractor/
supplier)
Expenditure on
Project
Project
achieved
/not
achieved
/Term
contract
Project
status
quo
Reason
for
variance
Mitigation
measure
Project
Start Date
Project End
Date
Rating
Excellent=5
V. Good= 4
G00D=3
AVERAGE=2
P00R=1
Management
Plan
600x Chairs
and 10x tables
were
purchased and
delivered
Ramsley
Contractors (Pty)
Ltd.
R 189,060.00 Not Achieved 80% 500 chairs
procured
due to
budget
constraints
None 01/10/2018 30/12/2018 4
Installation
and
replacement of
Electricity bulk
meters
Afrika Smart
utilities JV
R 1,306,428.75 Not Achieved.
Appointment
of Service
Provider, site
establishment
and
procurement
of material.
20% The
community
’s
unwillingn
ess to
allow the
Contractor
to
commence
with the
scope of
works.
The project
will be
rolled over
into
2019/20
financial
year.
01/04/2019 30/06/2019 1
Supply of 10 x
6M3 bulk
refuse
containers
Elle Engineering
(Pty) Ltd.
R 263, 580.86 Achieved 100% None None 01/01/19 30/03/19 5
Spatial rationale and Local Economic Development
Demarcation of
150 sites at
Ratsaka village
Techni plan
Development
Strategists (Pty)
Ltd.
R 150,000.00 Achieved 100% None None 01/05/2019 30/04/2019 4
Pegging of 250
Sites at
LM Geomatics R197,641.65 Achieved 100% None None 1/11/2018 30/11/2018 5
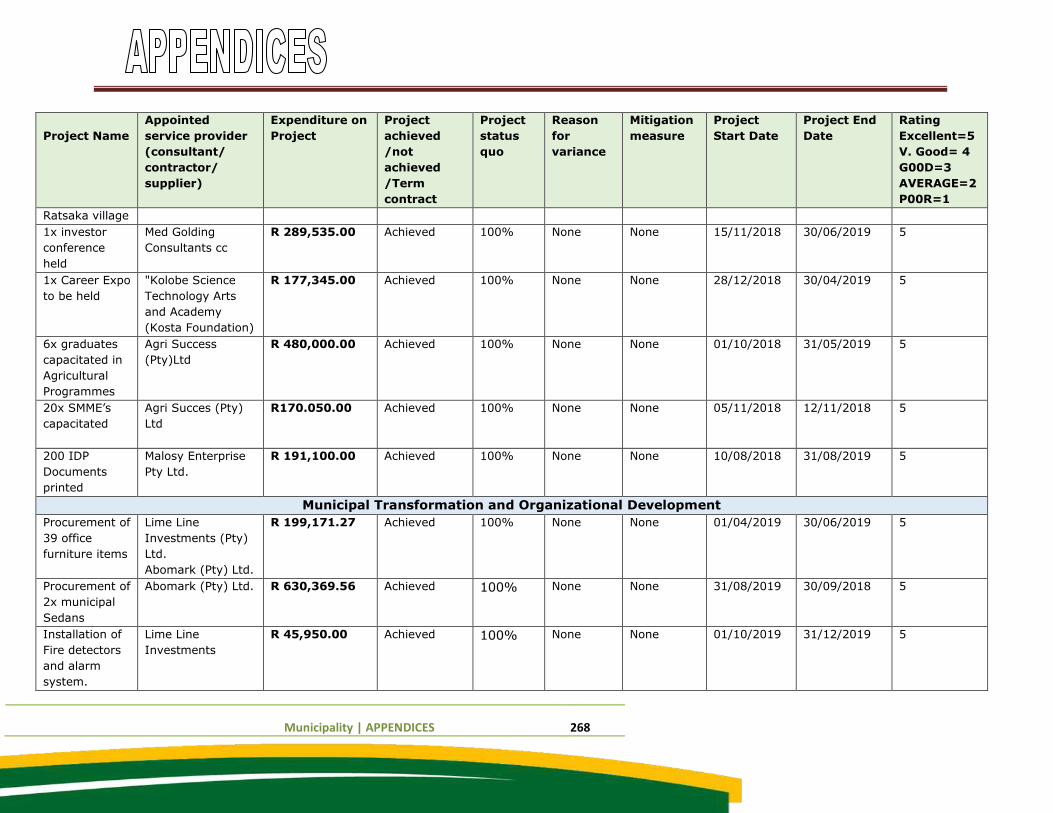
Municipality | APPENDICES 268
Project Name
Appointed
service provider
(consultant/
contractor/
supplier)
Expenditure on
Project
Project
achieved
/not
achieved
/Term
contract
Project
status
quo
Reason
for
variance
Mitigation
measure
Project
Start Date
Project End
Date
Rating
Excellent=5
V. Good= 4
G00D=3
AVERAGE=2
P00R=1
Ratsaka village
1x investor
conference
held
Med Golding
Consultants cc
R 289,535.00 Achieved 100% None None 15/11/2018 30/06/2019 5
1x Career Expo
to be held
"Kolobe Science
Technology Arts
and Academy
(Kosta Foundation)
R 177,345.00 Achieved 100% None None 28/12/2018 30/04/2019 5
6x graduates
capacitated in
Agricultural
Programmes
Agri Success
(Pty)Ltd
R 480,000.00 Achieved 100% None None 01/10/2018 31/05/2019 5
20x SMME’s
capacitated
Agri Succes (Pty)
Ltd
R170.050.00 Achieved 100% None None 05/11/2018 12/11/2018 5
200 IDP
Documents
printed
Malosy Enterprise
Pty Ltd.
R 191,100.00 Achieved 100% None None 10/08/2018 31/08/2019 5
Municipal Transformation and Organizational Development
Procurement of
39 office
furniture items
Lime Line
Investments (Pty)
Ltd.
Abomark (Pty) Ltd.
R 199,171.27 Achieved 100% None None 01/04/2019 30/06/2019 5
Procurement of
2x municipal
Sedans
Abomark (Pty) Ltd. R 630,369.56 Achieved 100% None None 31/08/2019 30/09/2018 5
Installation of
Fire detectors
and alarm
system.
Lime Line
Investments
R 45,950.00 Achieved 100% None None 01/10/2019 31/12/2019 5
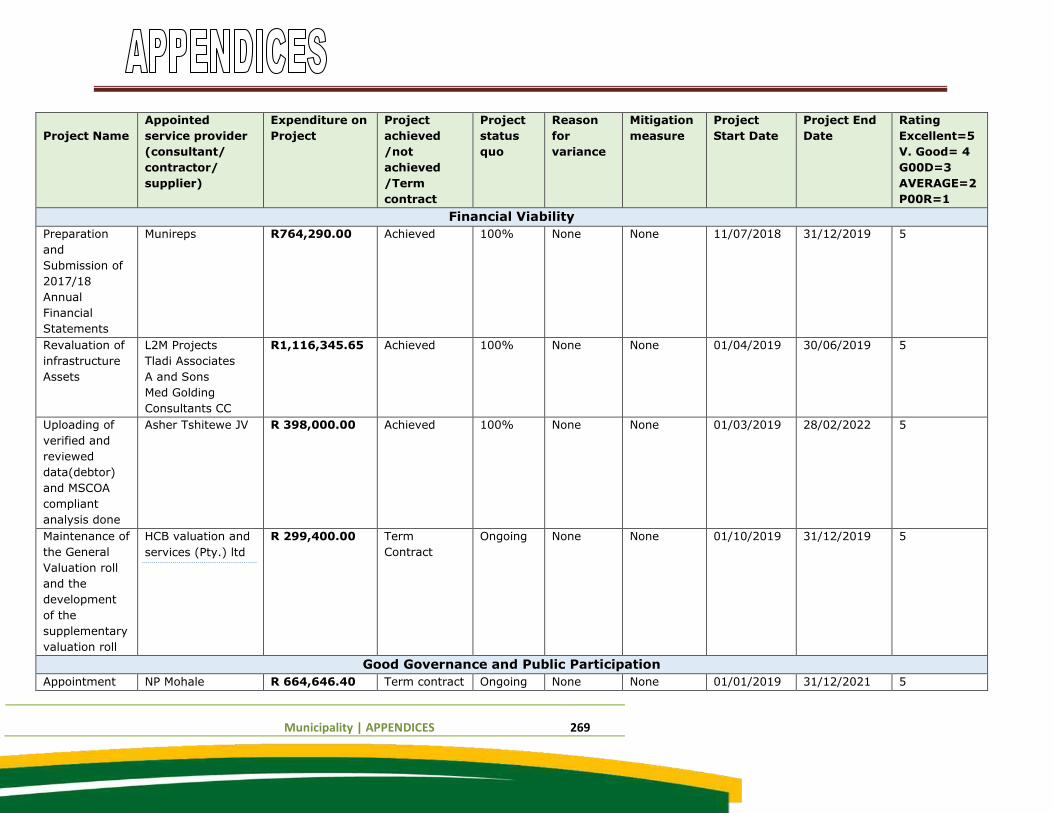
Municipality | APPENDICES 269
Project Name
Appointed
service provider
(consultant/
contractor/
supplier)
Expenditure on
Project
Project
achieved
/not
achieved
/Term
contract
Project
status
quo
Reason
for
variance
Mitigation
measure
Project
Start Date
Project End
Date
Rating
Excellent=5
V. Good= 4
G00D=3
AVERAGE=2
P00R=1
Financial Viability
Preparation
and
Submission of
2017/18
Annual
Financial
Statements
Munireps R764,290.00 Achieved 100% None None 11/07/2018 31/12/2019 5
Revaluation of
infrastructure
Assets
L2M Projects
Tladi Associates
A and Sons
Med Golding
Consultants CC
R1,116,345.65 Achieved 100% None None 01/04/2019 30/06/2019 5
Uploading of
verified and
reviewed
data(debtor)
and MSCOA
compliant
analysis done
Asher Tshitewe JV R 398,000.00 Achieved 100% None None 01/03/2019 28/02/2022 5
Maintenance of
the General
Valuation roll
and the
development
of the
supplementary
valuation roll
HCB valuation and
services (Pty.) ltd
R 299,400.00 Term
Contract
Ongoing None None 01/10/2019 31/12/2019 5
Good Governance and Public Participation
Appointment NP Mohale R 664,646.40 Term contract Ongoing None None 01/01/2019 31/12/2021 5
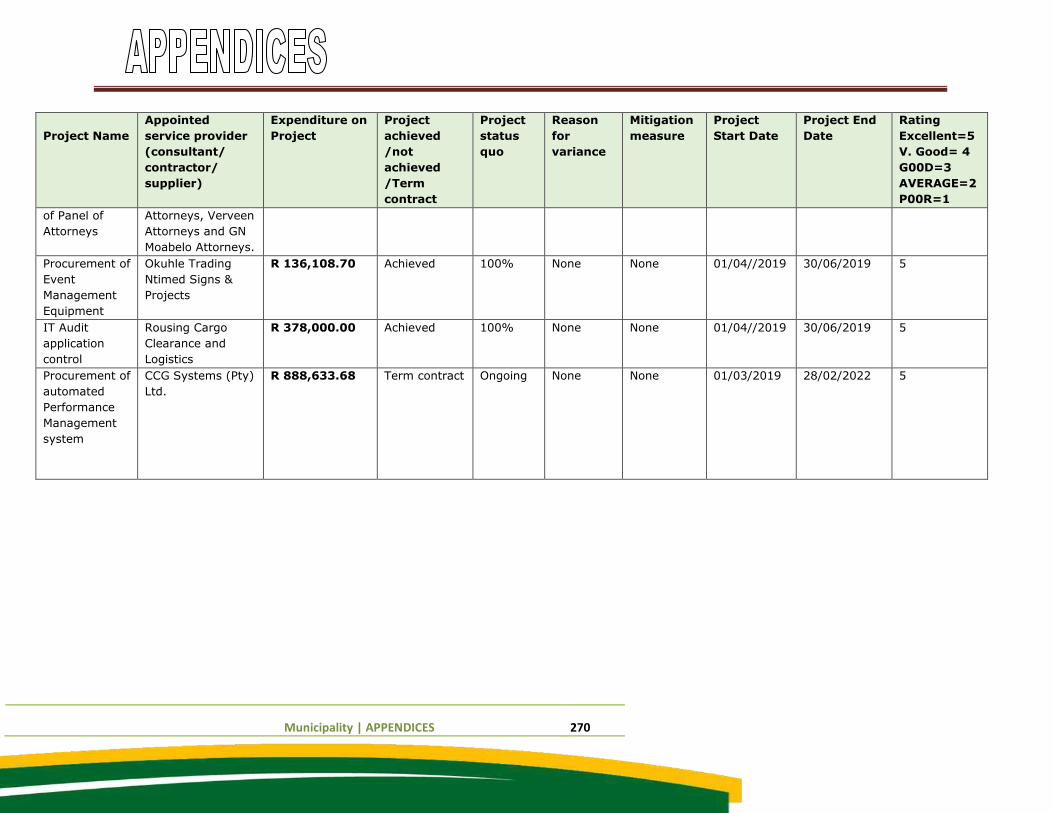
Municipality | APPENDICES 270
Project Name
Appointed
service provider
(consultant/
contractor/
supplier)
Expenditure on
Project
Project
achieved
/not
achieved
/Term
contract
Project
status
quo
Reason
for
variance
Mitigation
measure
Project
Start Date
Project End
Date
Rating
Excellent=5
V. Good= 4
G00D=3
AVERAGE=2
P00R=1
of Panel of
Attorneys
Attorneys, Verveen
Attorneys and GN
Moabelo Attorneys.
Procurement of
Event
Management
Equipment
Okuhle Trading
Ntimed Signs &
Projects
R 136,108.70 Achieved 100% None None 01/04//2019 30/06/2019 5
IT Audit
application
control
Rousing Cargo
Clearance and
Logistics
R 378,000.00 Achieved 100% None None 01/04//2019 30/06/2019 5
Procurement of
automated
Performance
Management
system
CCG Systems (Pty)
Ltd.
R 888,633.68 Term contract Ongoing None None 01/03/2019 28/02/2022 5
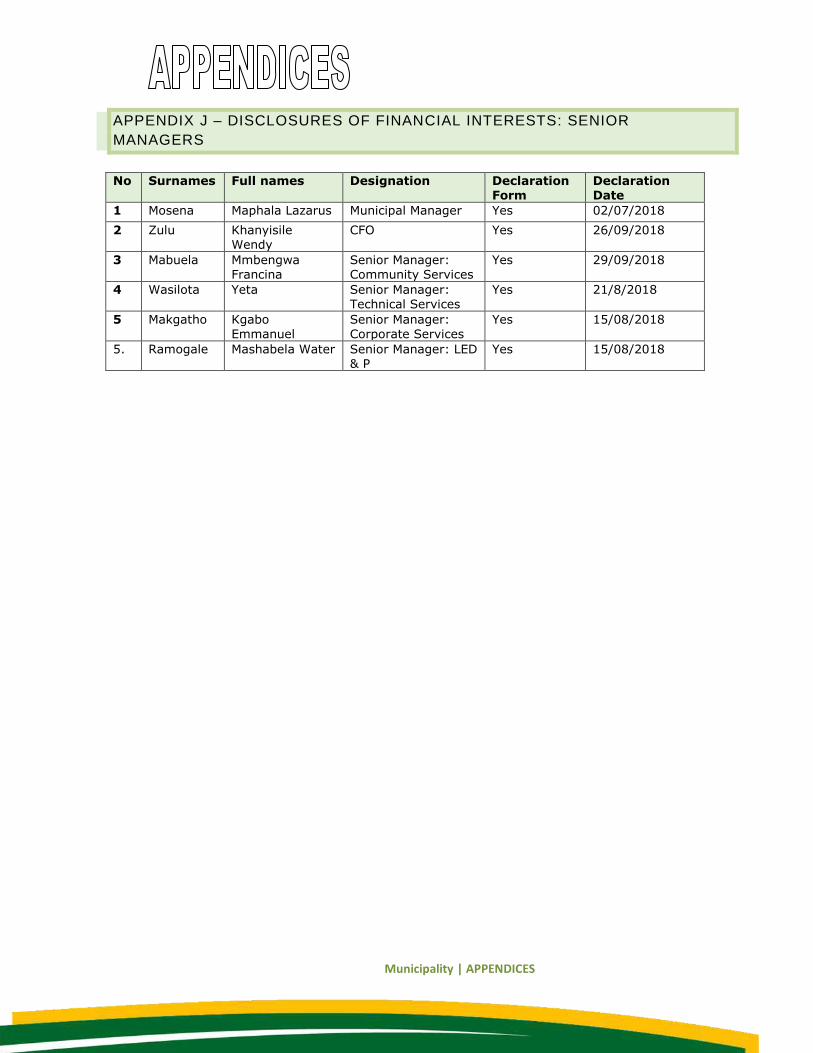
Municipality | APPENDICES
APPENDIX J – DISCLOSURES OF FINANCIAL INTERESTS: SENIOR
MANAGERS
No Surnames Full names Designation Declaration Form
Declaration Date
1 Mosena Maphala Lazarus Municipal Manager Yes 02/07/2018
2 Zulu Khanyisile Wendy
CFO Yes 26/09/2018
3 Mabuela Mmbengwa Francina
Senior Manager: Community Services
Yes 29/09/2018
4 Wasilota Yeta Senior Manager: Technical Services
Yes 21/8/2018
5 Makgatho Kgabo
Emmanuel
Senior Manager:
Corporate Services
Yes 15/08/2018
5. Ramogale Mashabela Water Senior Manager: LED & P
Yes 15/08/2018
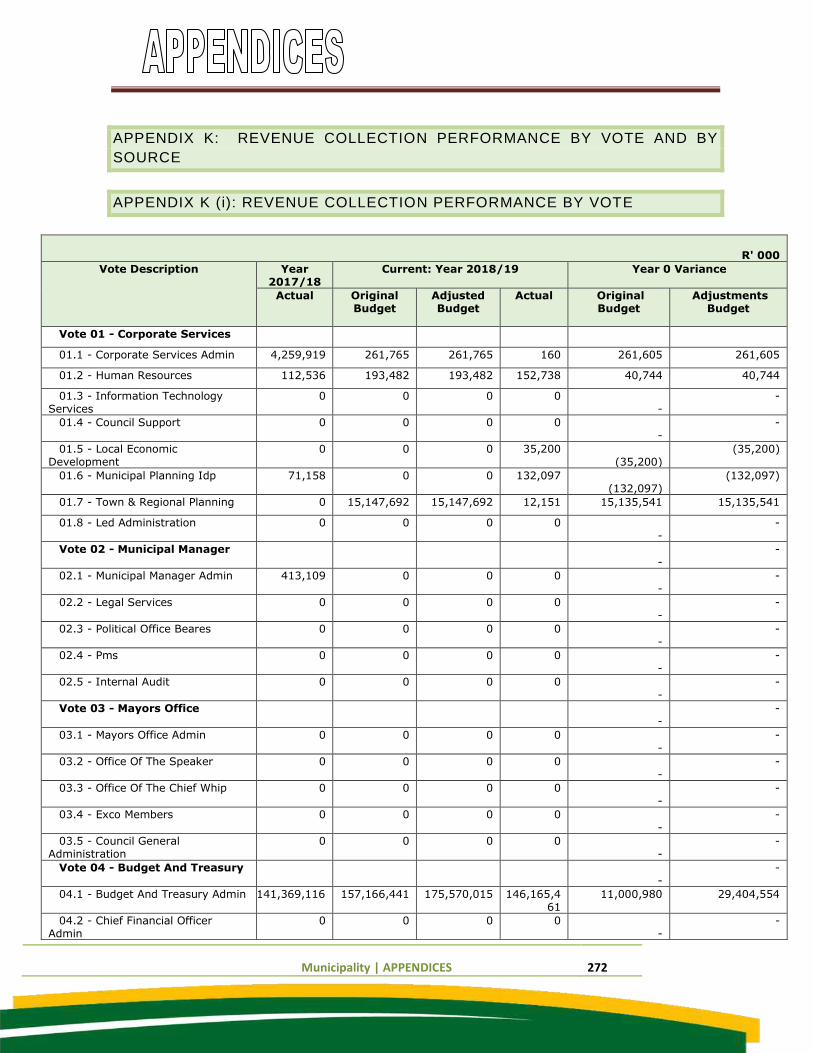
Municipality | APPENDICES 272
APPENDIX K: REVENUE COLLECTION PERFORMANCE BY VOTE AND BY
SOURCE
APPENDIX K (i): REVENUE COLLECTION PERFORMANCE BY VOTE
R' 000
Vote Description Year 2017/18
Current: Year 2018/19 Year 0 Variance
Actual Original Budget
Adjusted Budget
Actual Original Budget
Adjustments Budget
Vote 01 - Corporate Services
01.1 - Corporate Services Admin 4,259,919 261,765 261,765 160 261,605 261,605
01.2 - Human Resources 112,536 193,482 193,482 152,738 40,744 40,744
01.3 - Information Technology Services
0 0 0 0 -
-
01.4 - Council Support 0 0 0 0 -
-
01.5 - Local Economic Development
0 0 0 35,200 (35,200)
(35,200)
01.6 - Municipal Planning Idp 71,158 0 0 132,097 (132,097)
(132,097)
01.7 - Town & Regional Planning 0 15,147,692 15,147,692 12,151 15,135,541 15,135,541
01.8 - Led Administration 0 0 0 0 -
-
Vote 02 - Municipal Manager -
-
02.1 - Municipal Manager Admin 413,109 0 0 0 -
-
02.2 - Legal Services 0 0 0 0 -
-
02.3 - Political Office Beares 0 0 0 0 -
-
02.4 - Pms 0 0 0 0 -
-
02.5 - Internal Audit 0 0 0 0 -
-
Vote 03 - Mayors Office -
-
03.1 - Mayors Office Admin 0 0 0 0 -
-
03.2 - Office Of The Speaker 0 0 0 0 -
-
03.3 - Office Of The Chief Whip 0 0 0 0 -
-
03.4 - Exco Members 0 0 0 0 -
-
03.5 - Council General Administration
0 0 0 0 -
-
Vote 04 - Budget And Treasury -
-
04.1 - Budget And Treasury Admin 141,369,116 157,166,441 175,570,015 146,165,461
11,000,980 29,404,554
04.2 - Chief Financial Officer Admin
0 0 0 0 -
-
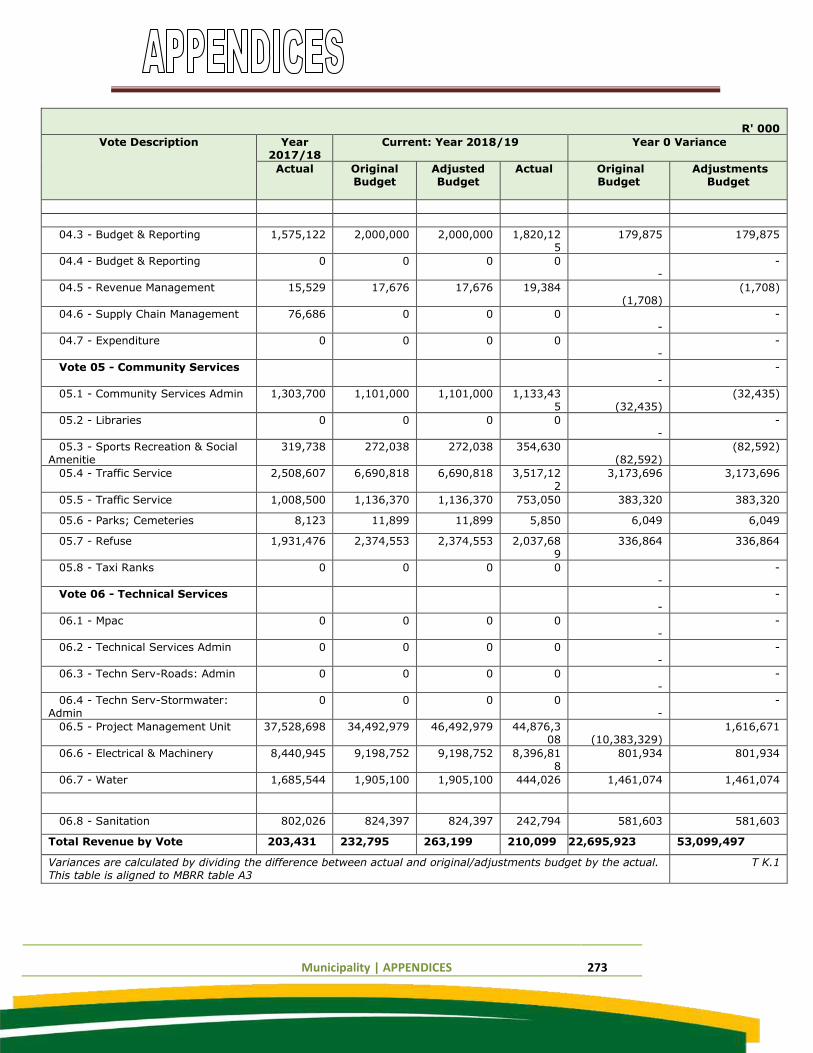
Municipality | APPENDICES 273
R' 000
Vote Description Year 2017/18
Current: Year 2018/19 Year 0 Variance
Actual Original Budget
Adjusted Budget
Actual Original Budget
Adjustments Budget
04.3 - Budget & Reporting 1,575,122 2,000,000 2,000,000 1,820,125
179,875 179,875
04.4 - Budget & Reporting 0 0 0 0 -
-
04.5 - Revenue Management 15,529 17,676 17,676 19,384 (1,708)
(1,708)
04.6 - Supply Chain Management 76,686 0 0 0 -
-
04.7 - Expenditure 0 0 0 0 -
-
Vote 05 - Community Services -
-
05.1 - Community Services Admin 1,303,700 1,101,000 1,101,000 1,133,435
(32,435)
(32,435)
05.2 - Libraries 0 0 0 0 -
-
05.3 - Sports Recreation & Social Amenitie
319,738 272,038 272,038 354,630 (82,592)
(82,592)
05.4 - Traffic Service 2,508,607 6,690,818 6,690,818 3,517,122
3,173,696 3,173,696
05.5 - Traffic Service 1,008,500 1,136,370 1,136,370 753,050 383,320 383,320
05.6 - Parks; Cemeteries 8,123 11,899 11,899 5,850 6,049 6,049
05.7 - Refuse 1,931,476 2,374,553 2,374,553 2,037,689
336,864 336,864
05.8 - Taxi Ranks 0 0 0 0 -
-
Vote 06 - Technical Services -
-
06.1 - Mpac 0 0 0 0 -
-
06.2 - Technical Services Admin 0 0 0 0 -
-
06.3 - Techn Serv-Roads: Admin 0 0 0 0 -
-
06.4 - Techn Serv-Stormwater: Admin
0 0 0 0 -
-
06.5 - Project Management Unit 37,528,698 34,492,979 46,492,979 44,876,308
(10,383,329)
1,616,671
06.6 - Electrical & Machinery 8,440,945 9,198,752 9,198,752 8,396,818
801,934 801,934
06.7 - Water 1,685,544 1,905,100 1,905,100 444,026 1,461,074 1,461,074
06.8 - Sanitation 802,026 824,397 824,397 242,794 581,603 581,603
Total Revenue by Vote 203,431 232,795 263,199 210,099 22,695,923 53,099,497
Variances are calculated by dividing the difference between actual and original/adjustments budget by the actual. This table is aligned to MBRR table A3
T K.1
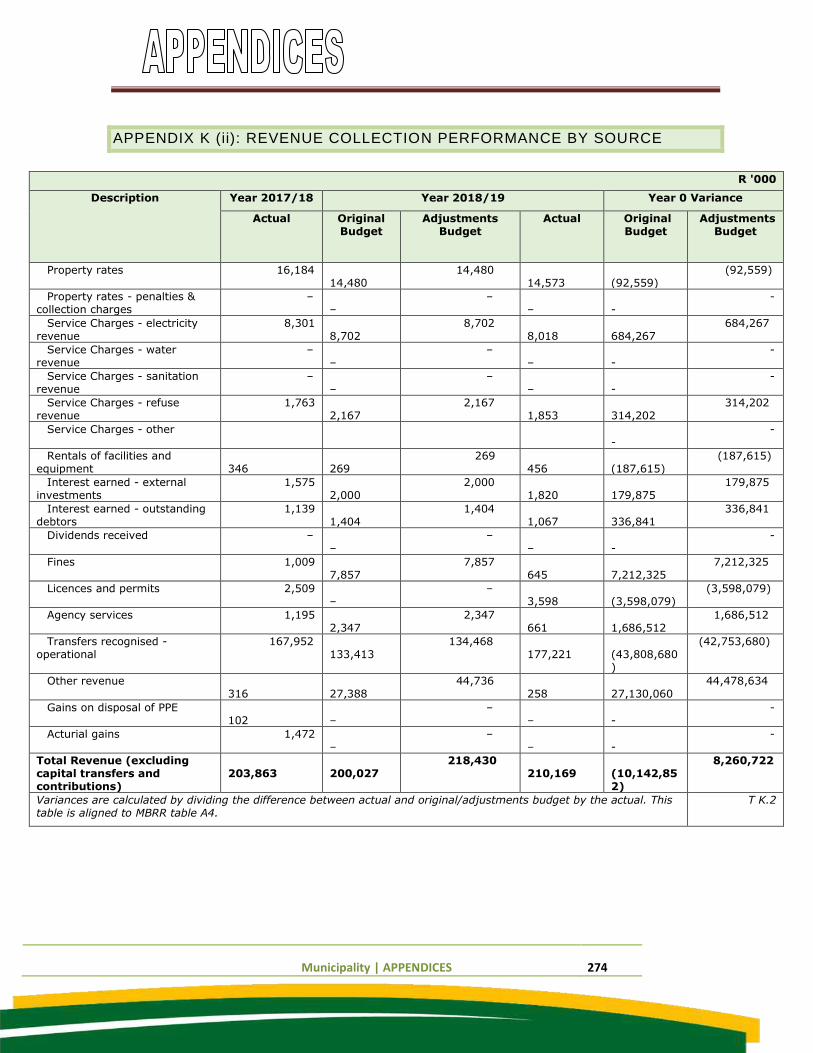
Municipality | APPENDICES 274
APPENDIX K (ii): REVENUE COLLECTION PERFORMANCE BY SOURCE
R '000
Description Year 2017/18 Year 2018/19 Year 0 Variance
Actual Original Budget
Adjustments Budget
Actual Original Budget
Adjustments Budget
Property rates 16,184 14,480
14,480 14,573
(92,559)
(92,559)
Property rates - penalties & collection charges
– –
– –
-
-
Service Charges - electricity revenue
8,301 8,702
8,702 8,018
684,267
684,267
Service Charges - water revenue
– –
– –
-
-
Service Charges - sanitation revenue
– –
– –
-
-
Service Charges - refuse revenue
1,763 2,167
2,167 1,853
314,202
314,202
Service Charges - other -
-
Rentals of facilities and equipment
346
269
269 456
(187,615)
(187,615)
Interest earned - external investments
1,575 2,000
2,000 1,820
179,875
179,875
Interest earned - outstanding debtors
1,139 1,404
1,404 1,067
336,841
336,841
Dividends received – –
– –
-
-
Fines 1,009 7,857
7,857 645
7,212,325
7,212,325
Licences and permits 2,509 –
– 3,598
(3,598,079)
(3,598,079)
Agency services 1,195 2,347
2,347 661
1,686,512
1,686,512
Transfers recognised - operational
167,952 133,413
134,468 177,221
(43,808,680)
(42,753,680)
Other revenue 316
27,388
44,736 258
27,130,060
44,478,634
Gains on disposal of PPE 102
–
– –
-
-
Acturial gains 1,472 –
– –
-
-
Total Revenue (excluding capital transfers and contributions)
203,863
200,027
218,430 210,169
(10,142,852)
8,260,722
Variances are calculated by dividing the difference between actual and original/adjustments budget by the actual. This table is aligned to MBRR table A4.
T K.2
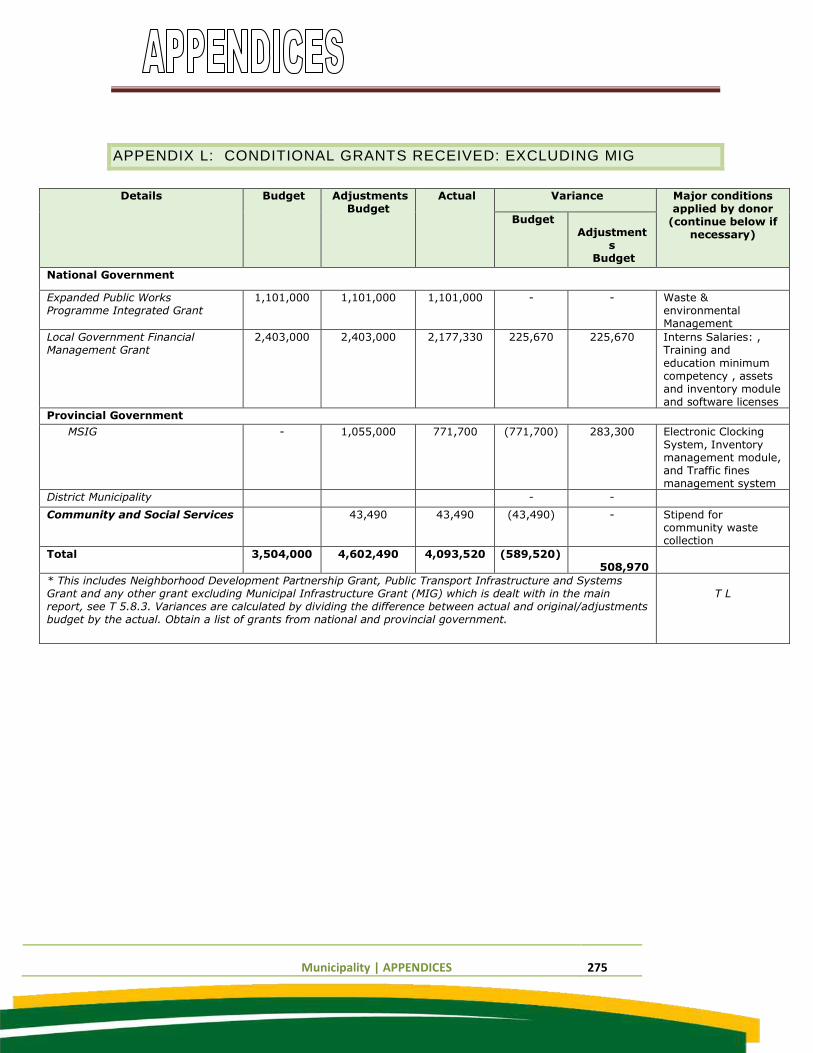
Municipality | APPENDICES 275
APPENDIX L: CONDITIONAL GRANTS RECEIVED: EXCLUDING MIG
Details Budget Adjustments Budget
Actual Variance Major conditions applied by donor
(continue below if necessary)
Budget Adjustment
s Budget
National Government
Expanded Public Works Programme Integrated Grant
1,101,000 1,101,000 1,101,000 - - Waste & environmental Management
Local Government Financial Management Grant
2,403,000 2,403,000 2,177,330 225,670 225,670 Interns Salaries: , Training and
education minimum competency , assets and inventory module and software licenses
Provincial Government
MSIG - 1,055,000 771,700 (771,700) 283,300 Electronic Clocking System, Inventory management module, and Traffic fines management system
District Municipality - -
Community and Social Services 43,490 43,490 (43,490) - Stipend for community waste collection
Total 3,504,000 4,602,490 4,093,520 (589,520) 508,970
* This includes Neighborhood Development Partnership Grant, Public Transport Infrastructure and Systems Grant and any other grant excluding Municipal Infrastructure Grant (MIG) which is dealt with in the main report, see T 5.8.3. Variances are calculated by dividing the difference between actual and original/adjustments budget by the actual. Obtain a list of grants from national and provincial government.
T L
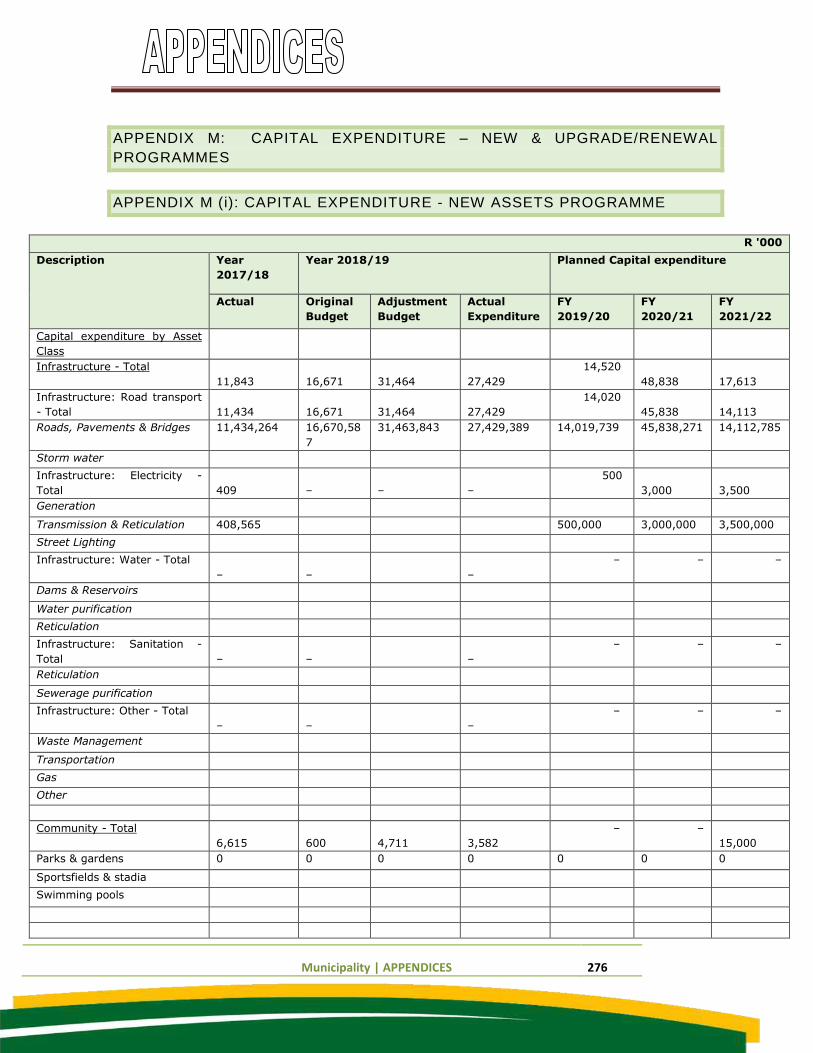
Municipality | APPENDICES 276
APPENDIX M: CAPITAL EXPENDITURE – NEW & UPGRADE/RENEWAL
PROGRAMMES
APPENDIX M (i): CAPITAL EXPENDITURE - NEW ASSETS PROGRAMME
R '000
Description Year
2017/18
Year 2018/19 Planned Capital expenditure
Actual Original
Budget
Adjustment
Budget
Actual
Expenditure
FY
2019/20
FY
2020/21
FY
2021/22
Capital expenditure by Asset
Class
Infrastructure - Total
11,843
16,671
31,464
27,429
14,520
48,838
17,613
Infrastructure: Road transport
- Total
11,434
16,671
31,464
27,429
14,020
45,838
14,113
Roads, Pavements & Bridges 11,434,264 16,670,58
7
31,463,843 27,429,389 14,019,739 45,838,271 14,112,785
Storm water
Infrastructure: Electricity -
Total
409
–
–
–
500
3,000
3,500
Generation
Transmission & Reticulation 408,565 500,000 3,000,000 3,500,000
Street Lighting
Infrastructure: Water - Total
–
–
–
– – –
Dams & Reservoirs
Water purification
Reticulation
Infrastructure: Sanitation -
Total
–
–
–
– – –
Reticulation
Sewerage purification
Infrastructure: Other - Total
–
–
–
– – –
Waste Management
Transportation
Gas
Other
Community - Total
6,615
600
4,711
3,582
– –
15,000
Parks & gardens 0 0 0 0 0 0 0
Sportsfields & stadia
Swimming pools
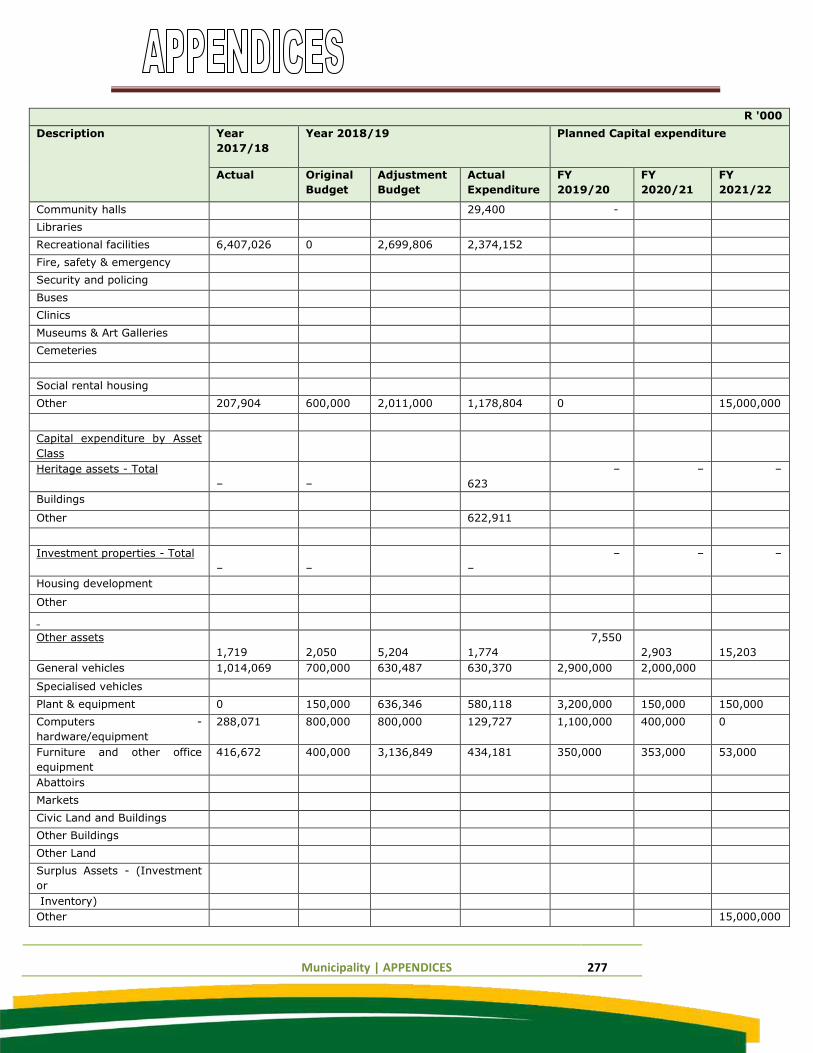
Municipality | APPENDICES 277
R '000
Description Year
2017/18
Year 2018/19 Planned Capital expenditure
Actual Original
Budget
Adjustment
Budget
Actual
Expenditure
FY
2019/20
FY
2020/21
FY
2021/22
Community halls 29,400 -
Libraries
Recreational facilities 6,407,026 0 2,699,806 2,374,152
Fire, safety & emergency
Security and policing
Buses
Clinics
Museums & Art Galleries
Cemeteries
Social rental housing
Other 207,904 600,000 2,011,000 1,178,804 0 15,000,000
Capital expenditure by Asset
Class
Heritage assets - Total
–
–
623
– – –
Buildings
Other 622,911
Investment properties - Total
–
–
–
– – –
Housing development
Other
Other assets
1,719
2,050
5,204
1,774
7,550
2,903
15,203
General vehicles 1,014,069 700,000 630,487 630,370 2,900,000 2,000,000
Specialised vehicles
Plant & equipment 0 150,000 636,346 580,118 3,200,000 150,000 150,000
Computers -
hardware/equipment
288,071 800,000 800,000 129,727 1,100,000 400,000 0
Furniture and other office
equipment
416,672 400,000 3,136,849 434,181 350,000 353,000 53,000
Abattoirs
Markets
Civic Land and Buildings
Other Buildings
Other Land
Surplus Assets - (Investment
or
Inventory)
Other 15,000,000
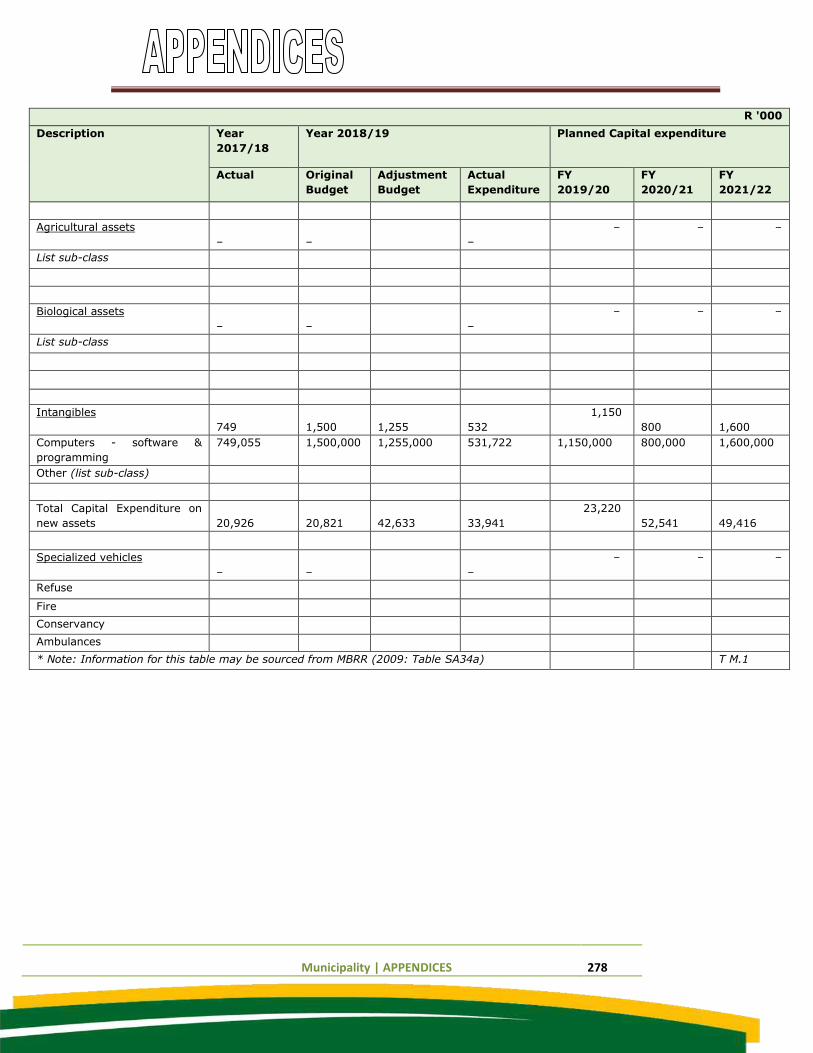
Municipality | APPENDICES 278
R '000
Description Year
2017/18
Year 2018/19 Planned Capital expenditure
Actual Original
Budget
Adjustment
Budget
Actual
Expenditure
FY
2019/20
FY
2020/21
FY
2021/22
Agricultural assets
–
–
–
– – –
List sub-class
Biological assets
–
–
–
– – –
List sub-class
Intangibles
749
1,500
1,255
532
1,150
800
1,600
Computers - software &
programming
749,055 1,500,000 1,255,000 531,722 1,150,000 800,000 1,600,000
Other (list sub-class)
Total Capital Expenditure on
new assets
20,926
20,821
42,633
33,941
23,220
52,541
49,416
Specialized vehicles
–
–
–
– – –
Refuse
Fire
Conservancy
Ambulances
* Note: Information for this table may be sourced from MBRR (2009: Table SA34a) T M.1
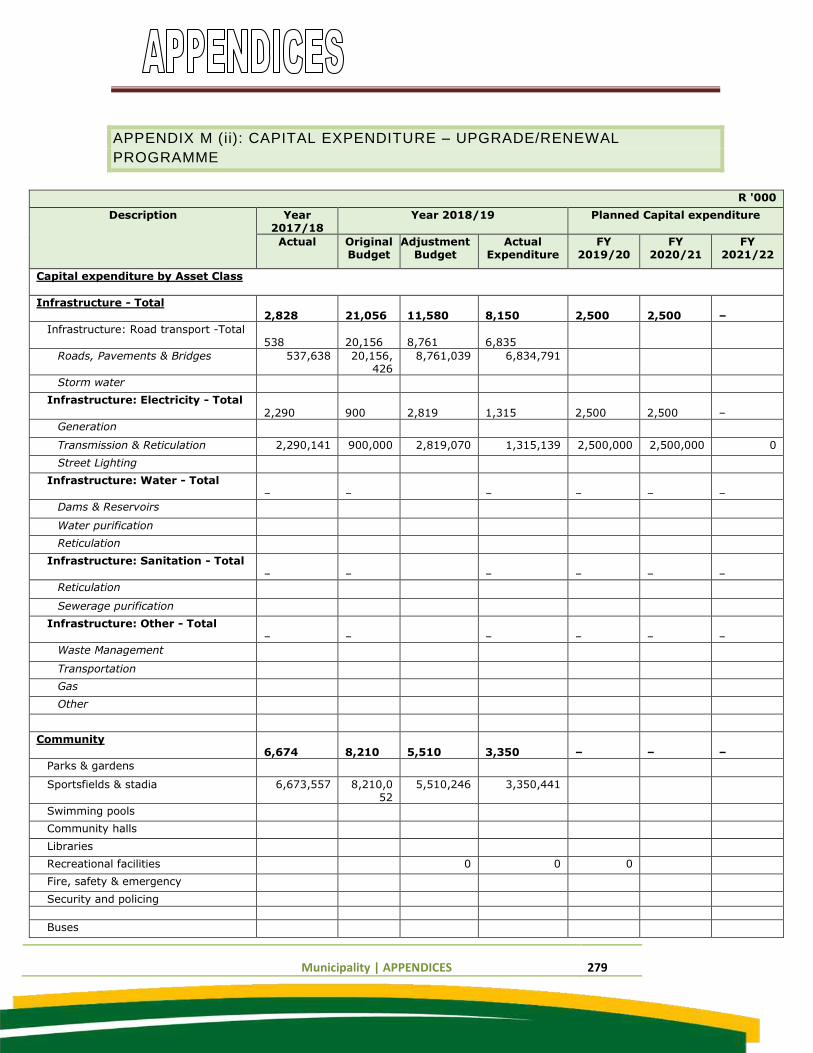
Municipality | APPENDICES 279
APPENDIX M (ii): CAPITAL EXPENDITURE – UPGRADE/RENEWAL
PROGRAMME
R '000
Description Year 2017/18
Year 2018/19 Planned Capital expenditure
Actual Original Budget
Adjustment Budget
Actual Expenditure
FY 2019/20
FY 2020/21
FY 2021/22
Capital expenditure by Asset Class
Infrastructure - Total 2,828
21,056
11,580
8,150
2,500
2,500
–
Infrastructure: Road transport -Total 538
20,156
8,761
6,835
Roads, Pavements & Bridges 537,638 20,156,426
8,761,039 6,834,791
Storm water
Infrastructure: Electricity - Total 2,290
900
2,819
1,315
2,500
2,500
–
Generation
Transmission & Reticulation 2,290,141 900,000 2,819,070 1,315,139 2,500,000 2,500,000 0
Street Lighting
Infrastructure: Water - Total –
–
–
–
–
–
Dams & Reservoirs
Water purification
Reticulation
Infrastructure: Sanitation - Total –
–
–
–
–
–
Reticulation
Sewerage purification
Infrastructure: Other - Total –
–
–
–
–
–
Waste Management
Transportation
Gas
Other
Community 6,674
8,210
5,510
3,350
–
–
–
Parks & gardens
Sportsfields & stadia 6,673,557 8,210,052
5,510,246 3,350,441
Swimming pools
Community halls
Libraries
Recreational facilities 0 0 0
Fire, safety & emergency
Security and policing
Buses
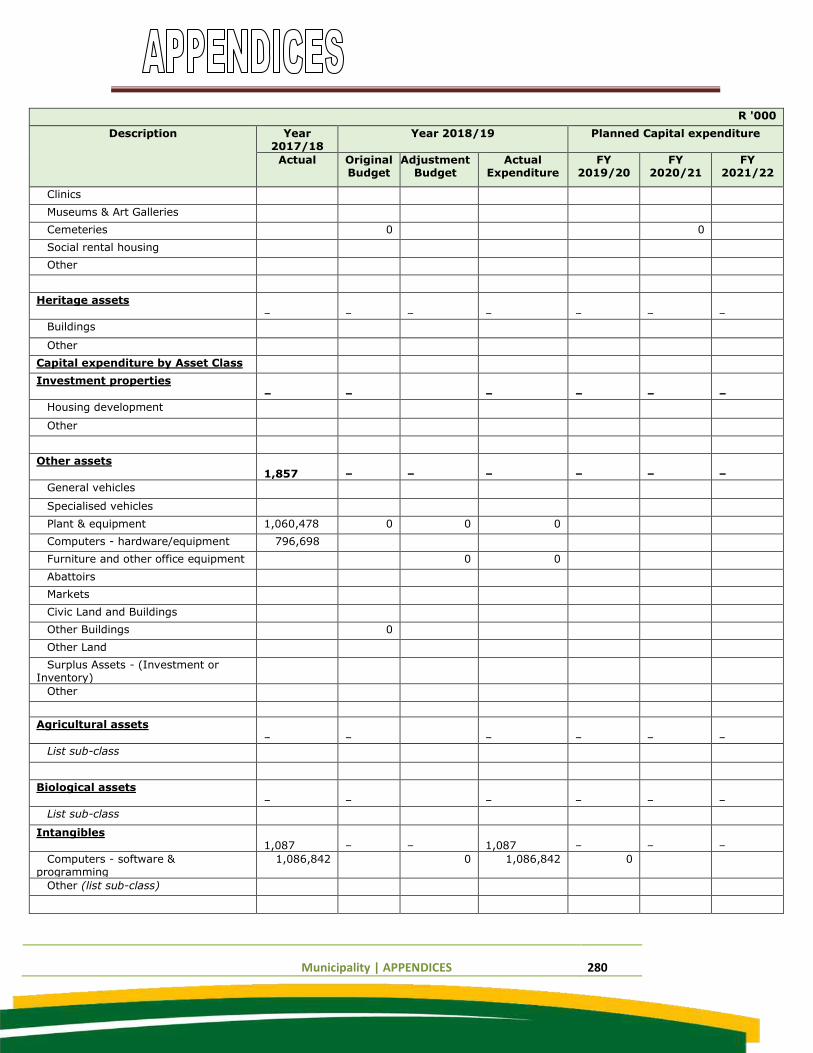
Municipality | APPENDICES 280
R '000
Description Year 2017/18
Year 2018/19 Planned Capital expenditure
Actual Original Budget
Adjustment Budget
Actual Expenditure
FY 2019/20
FY 2020/21
FY 2021/22
Clinics
Museums & Art Galleries
Cemeteries 0 0
Social rental housing
Other
Heritage assets –
–
–
–
–
–
–
Buildings
Other
Capital expenditure by Asset Class
Investment properties –
–
–
–
–
–
Housing development
Other
Other assets 1,857
–
–
–
–
–
–
General vehicles
Specialised vehicles
Plant & equipment 1,060,478 0 0 0
Computers - hardware/equipment 796,698
Furniture and other office equipment 0 0
Abattoirs
Markets
Civic Land and Buildings
Other Buildings 0
Other Land
Surplus Assets - (Investment or Inventory)
Other
Agricultural assets –
–
–
–
–
–
List sub-class
Biological assets –
–
–
–
–
–
List sub-class
Intangibles 1,087
–
–
1,087
–
–
–
Computers - software & programming
1,086,842 0 1,086,842 0
Other (list sub-class)
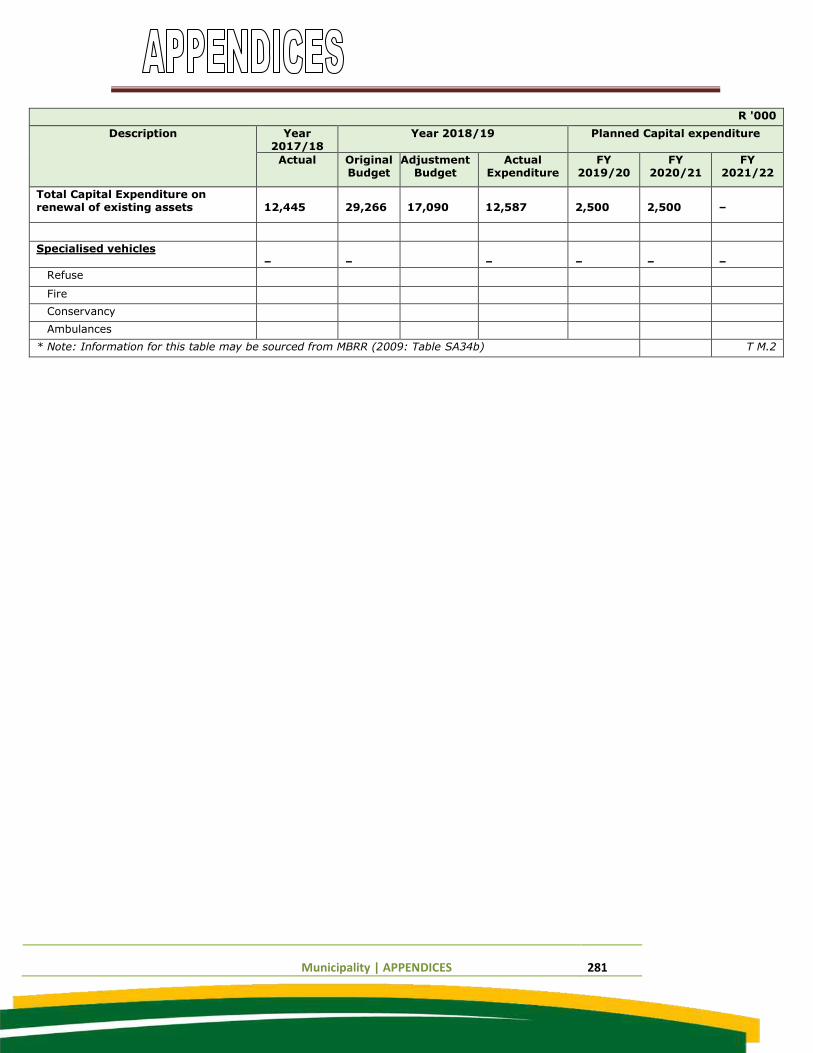
Municipality | APPENDICES 281
R '000
Description Year 2017/18
Year 2018/19 Planned Capital expenditure
Actual Original Budget
Adjustment Budget
Actual Expenditure
FY 2019/20
FY 2020/21
FY 2021/22
Total Capital Expenditure on renewal of existing assets
12,445
29,266
17,090
12,587
2,500
2,500
–
Specialised vehicles –
–
–
–
–
–
Refuse
Fire
Conservancy
Ambulances
* Note: Information for this table may be sourced from MBRR (2009: Table SA34b) T M.2
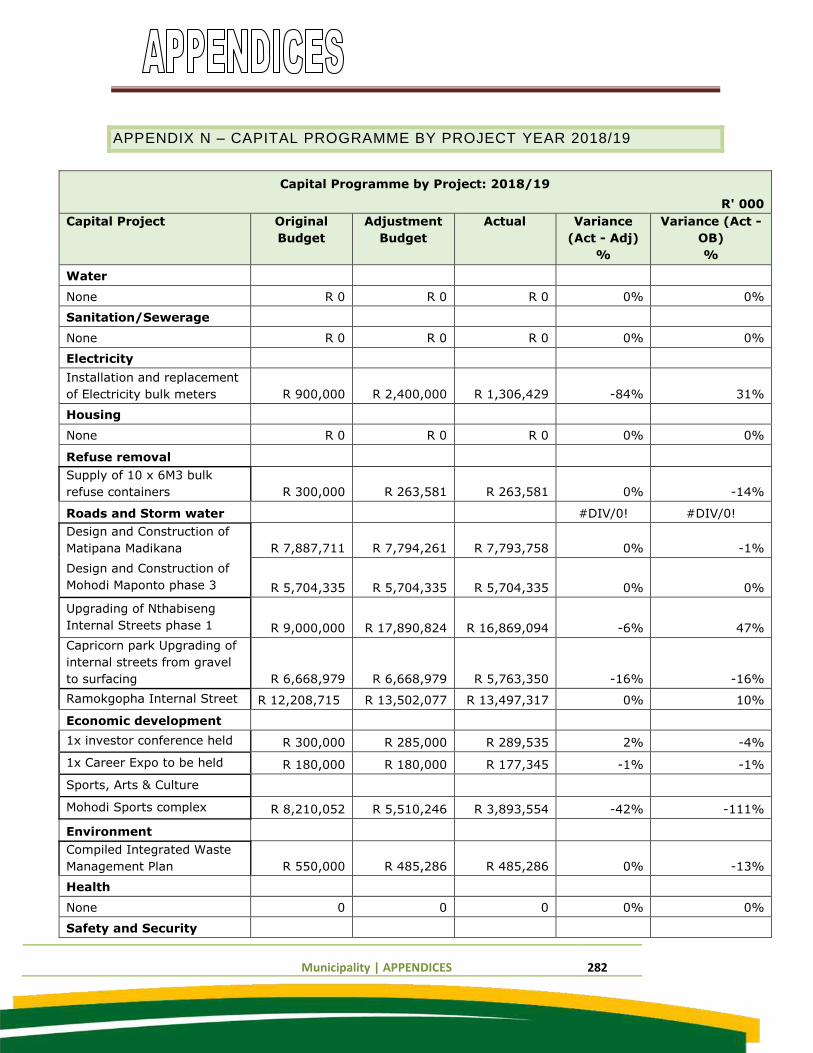
Municipality | APPENDICES 282
APPENDIX N – CAPITAL PROGRAMME BY PROJECT YEAR 2018/19
Capital Programme by Project: 2018/19
R' 000
Capital Project Original
Budget
Adjustment
Budget
Actual Variance
(Act - Adj)
%
Variance (Act -
OB)
%
Water
None R 0 R 0 R 0 0% 0%
Sanitation/Sewerage
None R 0 R 0 R 0 0% 0%
Electricity
Installation and replacement
of Electricity bulk meters R 900,000 R 2,400,000 R 1,306,429 -84% 31%
Housing
None R 0 R 0 R 0 0% 0%
Refuse removal
Supply of 10 x 6M3 bulk
refuse containers R 300,000 R 263,581 R 263,581 0% -14%
Roads and Storm water #DIV/0! #DIV/0!
Design and Construction of
Matipana Madikana R 7,887,711 R 7,794,261 R 7,793,758 0% -1%
Design and Construction of
Mohodi Maponto phase 3 R 5,704,335 R 5,704,335 R 5,704,335 0% 0%
Upgrading of Nthabiseng
Internal Streets phase 1 R 9,000,000 R 17,890,824 R 16,869,094 -6% 47%
Capricorn park Upgrading of
internal streets from gravel
to surfacing R 6,668,979 R 6,668,979 R 5,763,350 -16% -16%
Ramokgopha Internal Street R 12,208,715 R 13,502,077 R 13,497,317 0% 10%
Economic development
1x investor conference held R 300,000 R 285,000 R 289,535 2% -4%
1x Career Expo to be held R 180,000 R 180,000 R 177,345 -1% -1%
Sports, Arts & Culture
Mohodi Sports complex R 8,210,052 R 5,510,246 R 3,893,554 -42% -111%
Environment
Compiled Integrated Waste
Management Plan R 550,000 R 485,286 R 485,286 0% -13%
Health
None 0 0 0 0% 0%
Safety and Security
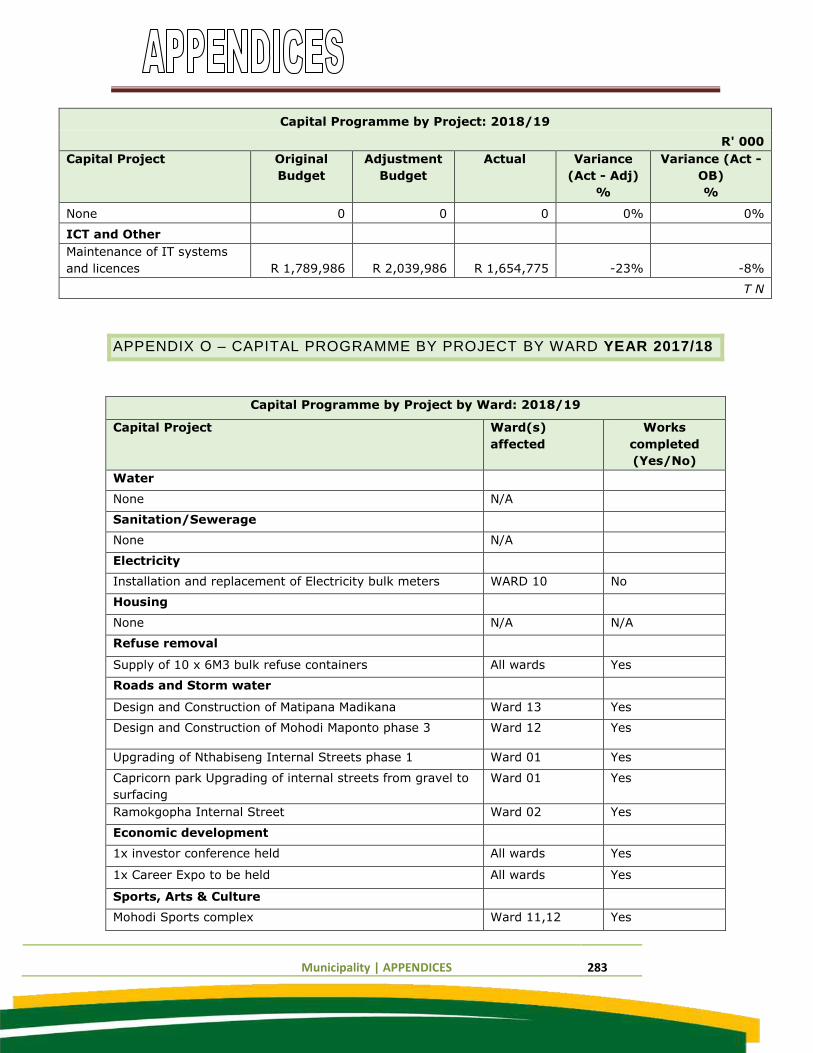
Municipality | APPENDICES 283
Capital Programme by Project: 2018/19
R' 000
Capital Project Original
Budget
Adjustment
Budget
Actual Variance
(Act - Adj)
%
Variance (Act -
OB)
%
None 0 0 0 0% 0%
ICT and Other
Maintenance of IT systems
and licences R 1,789,986 R 2,039,986 R 1,654,775 -23% -8%
T N
APPENDIX O – CAPITAL PROGRAMME BY PROJECT BY WARD YEAR 2017/18
Capital Programme by Project by Ward: 2018/19
Capital Project Ward(s)
affected
Works
completed
(Yes/No)
Water
None N/A
Sanitation/Sewerage
None N/A
Electricity
Installation and replacement of Electricity bulk meters WARD 10 No
Housing
None N/A N/A
Refuse removal
Supply of 10 x 6M3 bulk refuse containers All wards Yes
Roads and Storm water
Design and Construction of Matipana Madikana Ward 13 Yes
Design and Construction of Mohodi Maponto phase 3 Ward 12 Yes
Upgrading of Nthabiseng Internal Streets phase 1 Ward 01 Yes
Capricorn park Upgrading of internal streets from gravel to
surfacing
Ward 01 Yes
Ramokgopha Internal Street Ward 02 Yes
Economic development
1x investor conference held All wards Yes
1x Career Expo to be held All wards Yes
Sports, Arts & Culture
Mohodi Sports complex Ward 11,12 Yes
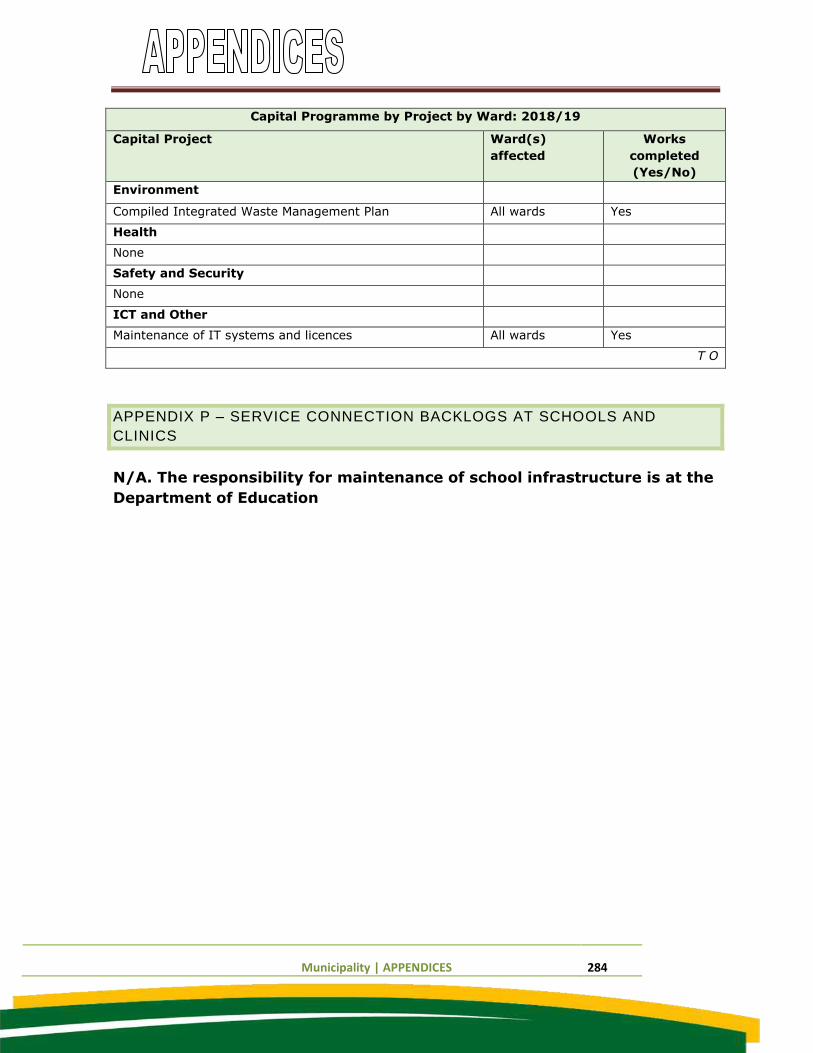
Municipality | APPENDICES 284
Capital Programme by Project by Ward: 2018/19
Capital Project Ward(s)
affected
Works
completed
(Yes/No)
Environment
Compiled Integrated Waste Management Plan All wards Yes
Health
None
Safety and Security
None
ICT and Other
Maintenance of IT systems and licences All wards Yes
T O
APPENDIX P – SERVICE CONNECTION BACKLOGS AT SCHOOLS AND
CLINICS
N/A. The responsibility for maintenance of school infrastructure is at the
Department of Education
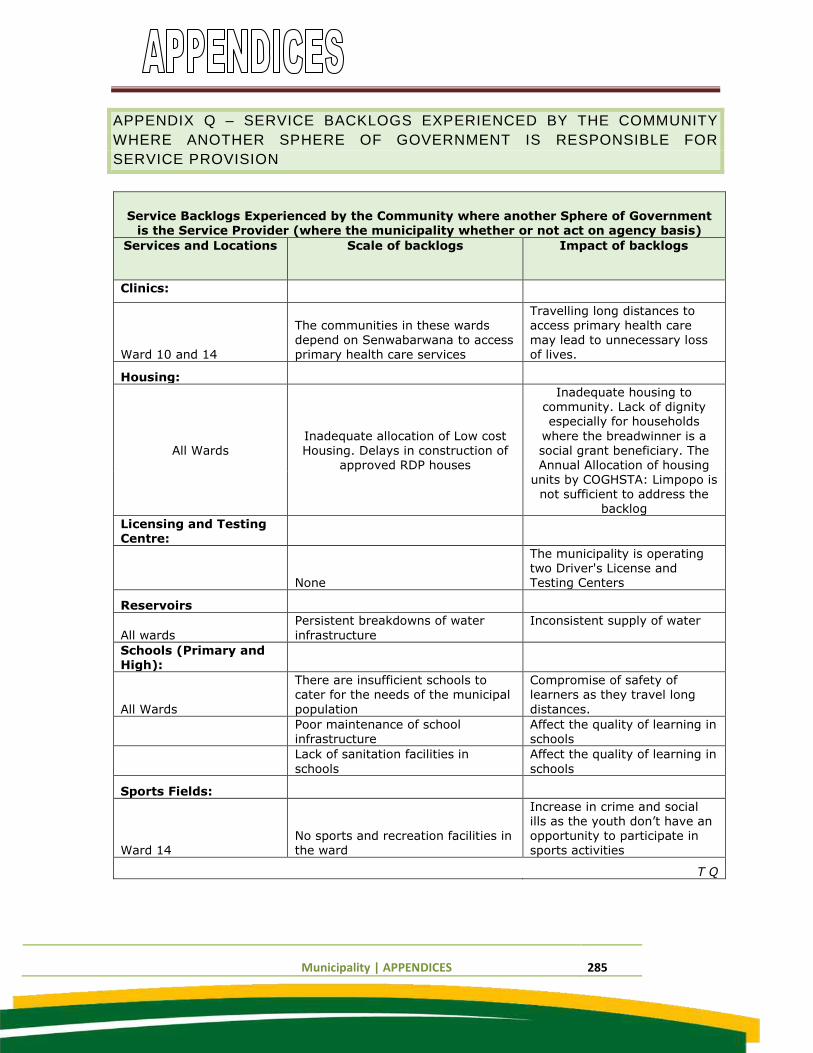
Municipality | APPENDICES 285
APPENDIX Q – SERVICE BACKLOGS EXPERIENCED BY THE COMMUNITY
WHERE ANOTHER SPHERE OF GOVERNMENT IS RESPONSIBLE FOR
SERVICE PROVISION
Service Backlogs Experienced by the Community where another Sphere of Government is the Service Provider (where the municipality whether or not act on agency basis)
Services and Locations Scale of backlogs Impact of backlogs
Clinics:
Ward 10 and 14
The communities in these wards
depend on Senwabarwana to access primary health care services
Travelling long distances to access primary health care
may lead to unnecessary loss of lives.
Housing:
All Wards Inadequate allocation of Low cost Housing. Delays in construction of
approved RDP houses
Inadequate housing to community. Lack of dignity especially for households
where the breadwinner is a social grant beneficiary. The Annual Allocation of housing
units by COGHSTA: Limpopo is not sufficient to address the
backlog
Licensing and Testing Centre:
None
The municipality is operating
two Driver's License and Testing Centers
Reservoirs
All wards
Persistent breakdowns of water
infrastructure
Inconsistent supply of water
Schools (Primary and High):
All Wards
There are insufficient schools to cater for the needs of the municipal
population
Compromise of safety of learners as they travel long
distances.
Poor maintenance of school infrastructure
Affect the quality of learning in schools
Lack of sanitation facilities in
schools
Affect the quality of learning in
schools
Sports Fields:
Ward 14 No sports and recreation facilities in the ward
Increase in crime and social ills as the youth don’t have an opportunity to participate in sports activities
T Q
Municipality | APPENDICES 286
APPENDIX R – DECLARATION OF LOANS AND GRANTS MADE BY THE
MUNICIPALITY
The municipality didn’t have any overdraft facility during the year under review. The
Municipality did not take any loans during the year under review. The municipality is
operating with a positive balance hence it was able to honour all its obligations due to a
3:1 current ratio. There were no grants issued by the municipality.
Municipality | APPENDICES 287
APPENDIX S – NATIONAL AND PROVINCIAL OUTCOMES FOR LOCAL
GOVERNMENT
N/A
Municipality | APPENDICES 288
VOLUME II: ANNUAL FINANCIAL STATEMENTS
Municipality | APPENDICES 289
Molemole Local Municipality
(Registration number LIM353)
Financial statements
for the year ended 30 June 2019
Municipality | APPENDICES 290
Molemole Local Municipality
(Registration number LIM353)
Financial Statements for the year ended 30 June 2019
General Information
Legal form of entity Local Government
Nature of business and principal activities Performing the functions as set out in the Constitution (Act no 108 of 1996) .
Providing municipal services and maintaining the best interests of the local
community mainly in the Mogwadi area.
Mayor Cllr M E Paya
Councillors Cllr E M Rathaha
Cllr M S Moreroa
Cllr N W Seakamela
Cllr M P Tawana
Cllr M D Lehong
Cllr N F Rampyapedi
Cllr M A Kobo
Cllr P T Rathete
Cllr R L Mpati
Cllr S R Nakana
Cllr M Q Malema
Cllr M J Manthata
Cllr G M Sepheso
Municipality | APPENDICES 291
Cllr N S Ramukhubedu
Cllr S E Kobola
Cllr M Duba
Cllr P S Masoga
Cllr M P Makgato
Cllr M L Moabelo
Cllr N M Hopane
Cllr D Matlou
Cllr N G Makgalo
Cllr M A Makgoka
Cllr T Raphaswana
Cllr M D Marutha
Cllr M I Mohafe
Cllr M D Meso
Cllr P T Rakimane
Cllr M J Leferela
Cllr M C Matjee
Cllr M P Tloubatla
Business address 303 Church Street
Mogwadi
0715
Municipality | APPENDICES 292
Grading of local authority Level 3 Local Municipality
Chief Finance Officer (CFO) Miss Khanyisile Zulu
Accounting Officer Mr. ML Mosena
Postal address Private Bag X44
Mogwadi
0715
1
Municipality | APPENDICES 293
Molemole Local Municipality
(Registration number LIM353)
Financial Statements for the year ended 30 June 2019
General Information
Bankers Nedbank
Auditors Office of the Auditor General (Limpopo)
Website Address www.molemole.gov.za
Email Address [email protected]
Audit Committee chairperson Mr SA Ngobeni
Audit Committee members Ms TE Monobe
Mr ID Maredi
Mr TA Lekoloane
2
Municipality | APPENDICES 294
Molemole Local Municipality
(Registration number LIM353)
Financial Statements for the year ended 30 June 2019
Index
The reports and statements set out below comprise the financial statements presented to the Municipal Council and the
provincial legislature:
Page
Accounting Officer's Responsibilities and Approval 4
Accounting Officer's Report 5
Statement of Financial Position 6
Statement of Financial Performance 7
Statement of Changes in Net Assets 8
Cash Flow Statement 9
Statement of Comparison of Budget and Accrual Amounts 10 - 13
Appropriation Statement 14 - 16
Accounting Policies 17 - 35
Notes to the Financial Statements 36 - 71
The following supplementary information does not form part of the financial statements and is unaudited:
Schedule 1 - Contingent Liabilities 72 - 71
Schedule 2 - Contingent Assets 72 - 71
Appendix G(2): Budgeted Financial Performance (revenue and expenditure by municipal vote)
Municipality | APPENDICES 295
COIDA Compensation for Occupational Injuries and Diseases Act
CRR Capital Replacement Reserve
DBSA Development Bank of South Africa
GRAP Generally Recognised Accounting Practice
IAS International Accounting Standards
CIGFARO Charted Institute of Goverment Finance and Risk officers
IPSAS International Public Sector Accounting Standards
ME's Municipal Entities
MEC Member of the Executive Council
MFMA Municipal Finance Management Act
MIG Municipal Infrastructure Grant (Previously CMIP)
VAT Value Added Tax
3
Municipality | APPENDICES 296
Molemole Local Municipality
(Registration number LIM353)
Financial Statements for the year ended 30 June 2019
Accounting Officer's Responsibilities and Approval
The accounting officer is required by the Municipal Finance Management Act (Act 56 of 2003), to maintain adequate
accounting records and is responsible for the content and integrity of the financial statements and related financial information
included in this report. It is the responsibility of the accounting officer to ensure that the financial statements fairly present the
state of affairs of the municipality as at the end of the financial year and the results of its operations and cash flows for the
period then ended.
The financial statements have been prepared in accordance with Standards of Generally Recognised Accounting Practice
(GRAP) including any interpretations, guidelines and directives issued by the Accounting Standards Board.
The financial statements are based upon appropriate accounting policies consistently applied and supported by reasonable
and prudent judgements and estimates.
The accounting officer acknowledges that he is ultimately responsible for the system of internal financial control established by the municipality and place considerable importance on maintaining a strong control environment. To enable the accounting
officer to meet these responsibilities, the accounting officer sets standards for internal control aimed at reducing the risk of error or deficit in a cost effective manner. The standards include the proper delegation of responsibilities within a clearly defined framework, effective accounting procedures and adequate segregation of duties to ensure an acceptable level of risk. These
controls are monitored throughout the municipality and all employees are required to maintain the highest ethical standards in ensuring the municipality’s business is conducted in a manner that in all reasonable circumstances is above reproach. The focus of risk management in the municipality is on identifying, assessing, managing and monitoring all known forms of risk
across the municipality. While operating risk cannot be fully eliminated, the municipality endeavours to minimize it by ensuring that appropriate infrastructure, controls, systems and ethical behaviour are applied and managed within predetermined procedures and constraints.
The accounting officer is of the opinion, based on the information and explanations given by management that the system of
internal control provides reasonable assurance that the financial records may be relied on for the preparation of the financial
statements. However, any system of internal financial control can provide only reasonable, and not absolute, assurance
against material misstatement or deficit.
The accounting officer has reviewed the municipality’s cash flow forecast for the year to 30 June 2020 and, in the light of this
review and the current financial position, he is satisfied that the municipality has or has access to adequate resources to
continue in operational existence for the foreseeable future.
The financial statements set out on pages 5 to 71, which have been prepared on the going concern basis, were approved by
the accounting officer on 31 August 2019 and were signed on its behalf by:
4
Municipality | APPENDICES 297
Molemole Local Municipality
(Registration number LIM353)
Financial Statements for the year ended 30 June 2019
Accounting Officer's Report
The accounting officer submits his report for the year ended 30 June 2019.
1. Going concern
The financial statements have been prepared on the basis of accounting policies applicable to a going concern. This basis
presumes that funds will be available to finance future operations and that the realisation of assets and settlement of liabilities,
contingent obligations and commitments will occur in the ordinary course of business.
2. Accounting policies
The financial statements prepared in accordance with the South African Statements of Generally Accepted Accounting Practice
(GAAP), including any interpretations of such Statements issued by the Accounting Practices Board, and in accordance with the
prescribed Standards of Generally Recognised Accounting Practices (GRAP) issued by the Accounting Standards Board as the
prescribed framework by National Treasury.
5
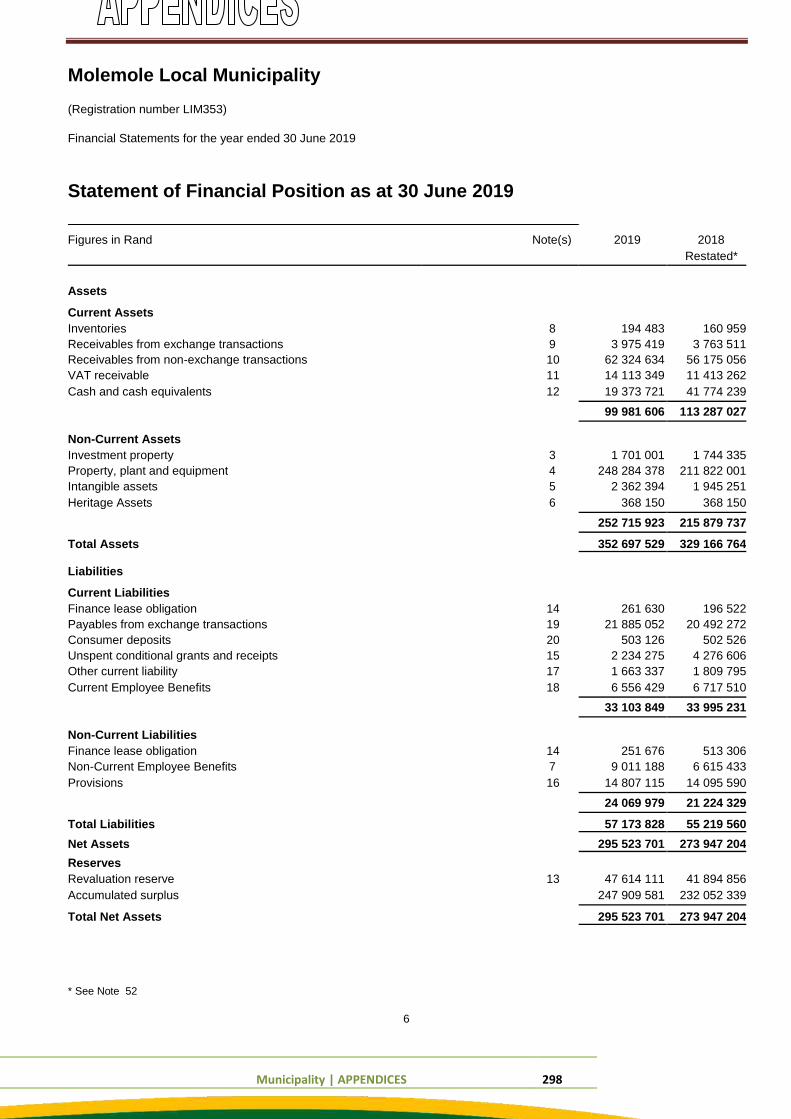
Municipality | APPENDICES 298
Molemole Local Municipality
(Registration number LIM353)
Financial Statements for the year ended 30 June 2019
Statement of Financial Position as at 30 June 2019
Figures in Rand Note(s) 2019 2018
Restated*
Assets
Current Assets
Inventories 8 194 483 160 959
Receivables from exchange transactions 9 3 975 419 3 763 511
Receivables from non-exchange transactions 10 62 324 634 56 175 056
VAT receivable 11 14 113 349 11 413 262
Cash and cash equivalents 12 19 373 721 41 774 239
99 981 606 113 287 027
Non-Current Assets
Investment property 3 1 701 001 1 744 335
Property, plant and equipment 4 248 284 378 211 822 001
Intangible assets 5 2 362 394 1 945 251
Heritage Assets 6 368 150 368 150
252 715 923 215 879 737
Total Assets
352 697 529 329 166 764
Liabilities
Current Liabilities
Finance lease obligation 14 261 630 196 522
Payables from exchange transactions 19 21 885 052 20 492 272
Consumer deposits 20 503 126 502 526
Unspent conditional grants and receipts 15 2 234 275 4 276 606
Other current liability 17 1 663 337 1 809 795
Current Employee Benefits 18 6 556 429 6 717 510
33 103 849 33 995 231
Non-Current Liabilities
Finance lease obligation 14 251 676 513 306
Non-Current Employee Benefits 7 9 011 188 6 615 433
Provisions 16 14 807 115 14 095 590
24 069 979 21 224 329
Total Liabilities
57 173 828 55 219 560
Net Assets 295 523 701 273 947 204
Reserves
Revaluation reserve 13 47 614 111 41 894 856
Accumulated surplus 247 909 581 232 052 339
Total Net Assets
295 523 701 273 947 204
* See Note 52
6
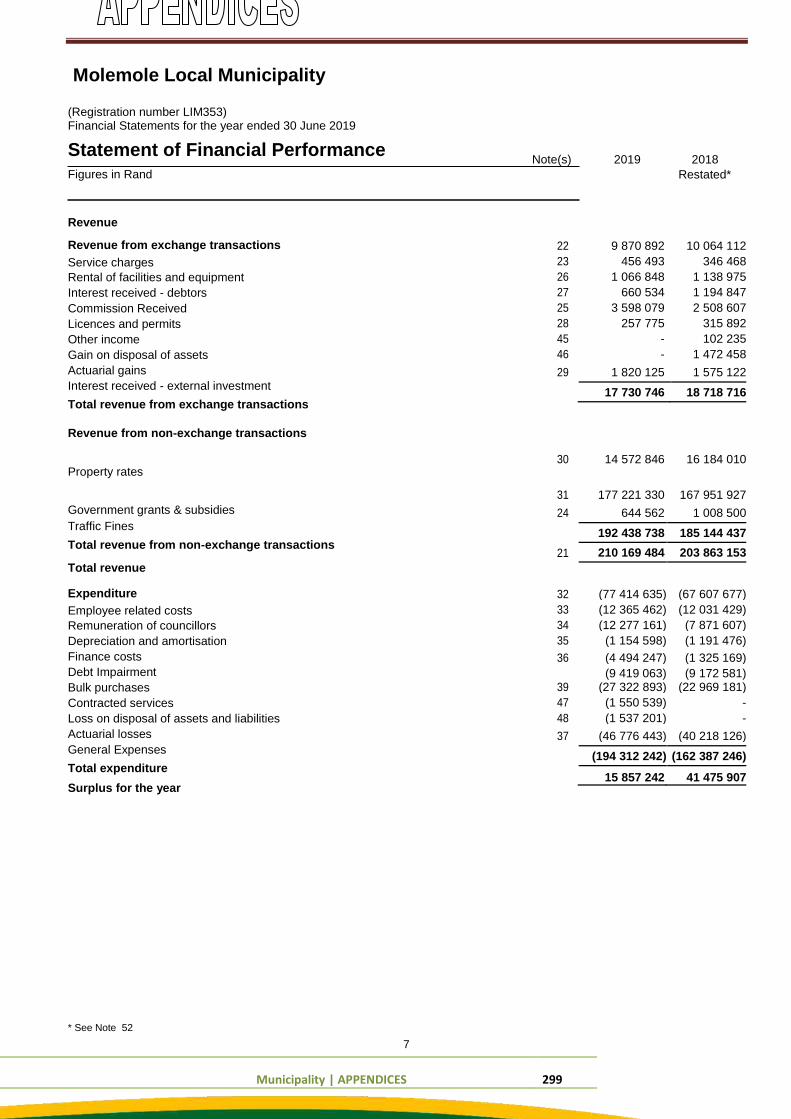
Municipality | APPENDICES 299
Molemole Local Municipality
(Registration number LIM353) Financial Statements for the year ended 30 June 2019
Statement of Financial Performance Figures in Rand
Revenue Revenue from exchange transactions Service charges Rental of facilities and equipment Interest received - debtors Commission Received Licences and permits Other income Gain on disposal of assets Actuarial gains Interest received - external investment Total revenue from exchange transactions Revenue from non-exchange transactions
Property rates
Government grants & subsidies Traffic Fines Total revenue from non-exchange transactions
Total revenue Expenditure Employee related costs Remuneration of councillors Depreciation and amortisation Finance costs Debt Impairment Bulk purchases Contracted services Loss on disposal of assets and liabilities Actuarial losses General Expenses Total expenditure Surplus for the year
Note(s) 2019 2018 Restated*
22 9 870 892 10 064 112
23 456 493 346 468
26 1 066 848 1 138 975
27 660 534 1 194 847
25 3 598 079 2 508 607
28 257 775 315 892
45 - 102 235
46 - 1 472 458
29 1 820 125 1 575 122
17 730 746 18 718 716
30 14 572 846 16 184 010
31 177 221 330 167 951 927
24 644 562 1 008 500
192 438 738 185 144 437
21
210 169 484 203 863 153
32
(77 414 635) (67 607 677)
33 (12 365 462) (12 031 429)
34 (12 277 161) (7 871 607)
35 (1 154 598) (1 191 476)
36 (4 494 247) (1 325 169)
39 (9 419 063) (9 172 581)
(27 322 893) (22 969 181)
47 (1 550 539) -
48 (1 537 201) -
37 (46 776 443) (40 218 126)
(194 312 242) (162 387 246)
15 857 242 41 475 907
* See Note 52
7
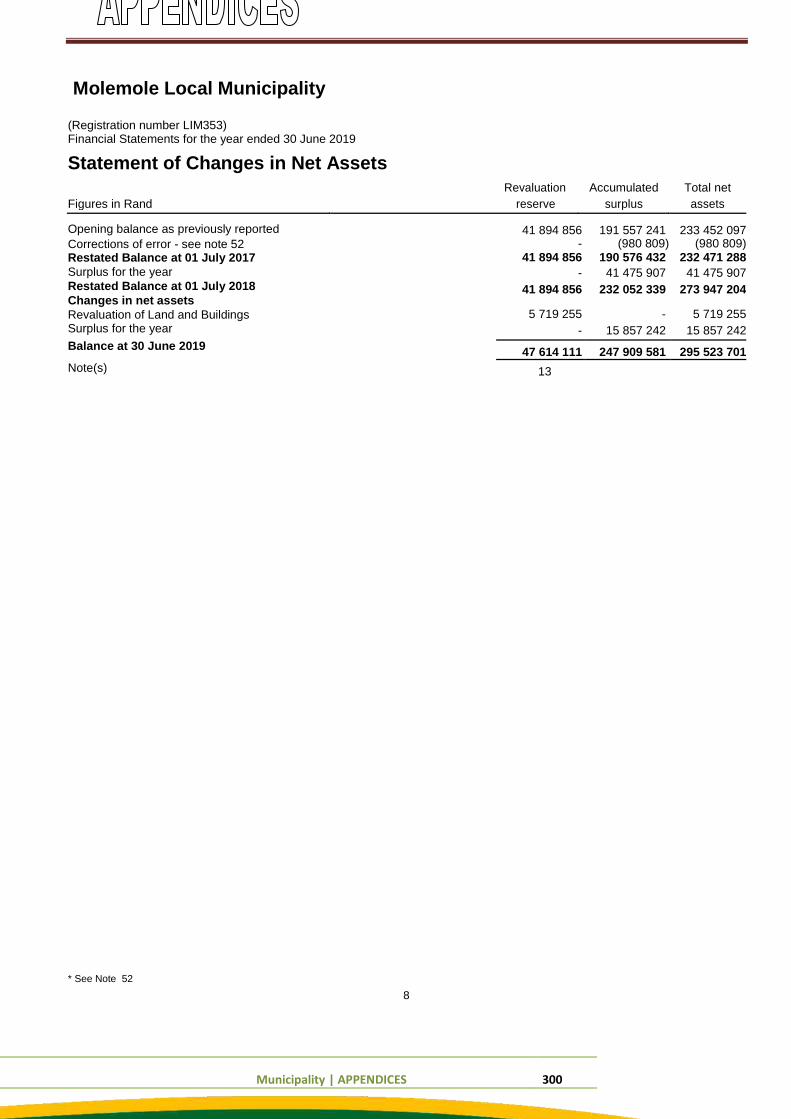
Municipality | APPENDICES 300
Molemole Local Municipality
(Registration number LIM353) Financial Statements for the year ended 30 June 2019
Statement of Changes in Net Assets Revaluation Accumulated Total net
Figures in Rand reserve surplus assets
Opening balance as previously reported Corrections of error - see note 52 Restated Balance at 01 July 2017 Surplus for the year Restated Balance at 01 July 2018 Changes in net assets Revaluation of Land and Buildings Surplus for the year Balance at 30 June 2019 Note(s)
41 894 856 191 557 241 233 452 097 - (980 809) (980 809)
41 894 856 190 576 432 232 471 288
- 41 475 907 41 475 907
41 894 856 232 052 339 273 947 204
5 719 255 - 5 719 255
- 15 857 242 15 857 242
47 614 111 247 909 581 295 523 701
13
* See Note 52
8
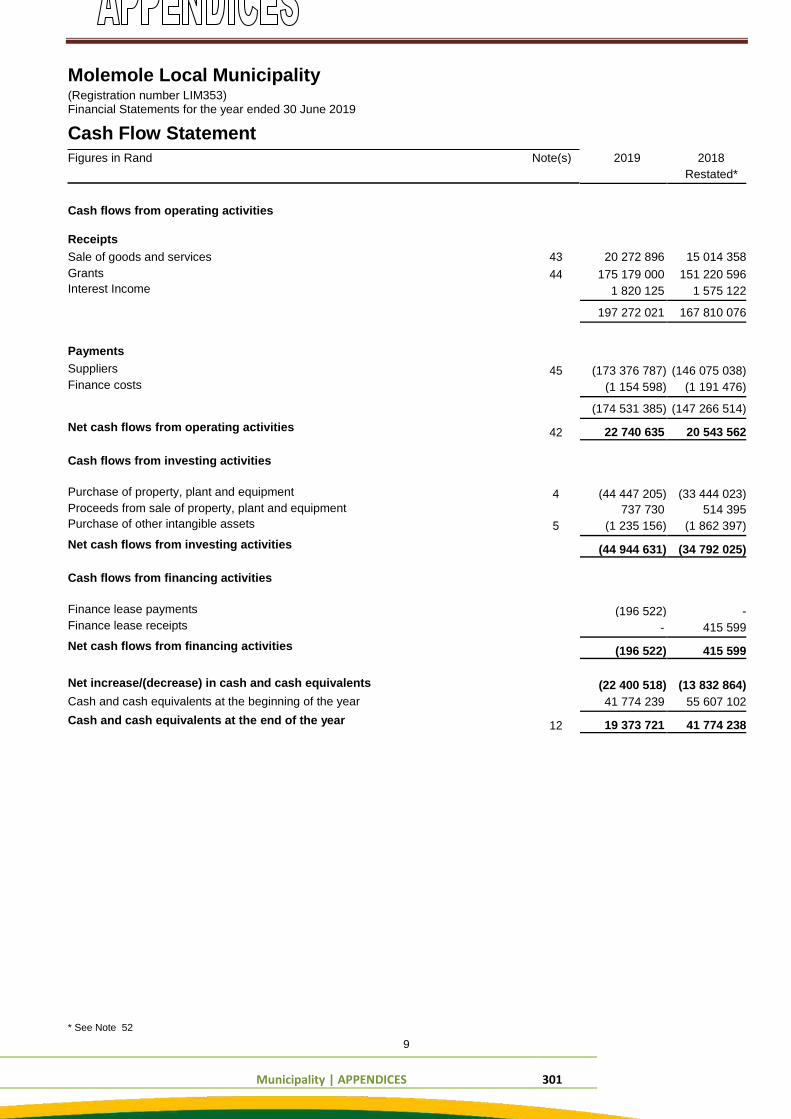
Municipality | APPENDICES 301
Molemole Local Municipality (Registration number LIM353) Financial Statements for the year ended 30 June 2019
Cash Flow Statement Figures in Rand
Cash flows from operating activities Receipts Sale of goods and services Grants Interest Income
Payments Suppliers Finance costs Net cash flows from operating activities
Cash flows from investing activities
Purchase of property, plant and equipment Proceeds from sale of property, plant and equipment Purchase of other intangible assets Net cash flows from investing activities
Cash flows from financing activities
Finance lease payments Finance lease receipts Net cash flows from financing activities
Net increase/(decrease) in cash and cash equivalents
Cash and cash equivalents at the beginning of the year Cash and cash equivalents at the end of the year
Note(s) 2019 2018
Restated*
43
20 272 896 15 014 358
44 175 179 000 151 220 596
1 820 125 1 575 122
197 272 021 167 810 076
45
(173 376 787) (146 075 038)
(1 154 598) (1 191 476)
(174 531 385) (147 266 514)
42
22 740 635 20 543 562
4 (44 447 205) (33 444 023)
5
737 730 514 395
(1 235 156) (1 862 397)
(44 944 631) (34 792 025)
(196 522) -
- 415 599
(196 522) 415 599
(22 400 518) (13 832 864)
41 774 239 55 607 102
12
19 373 721 41 774 238
* See Note 52
9
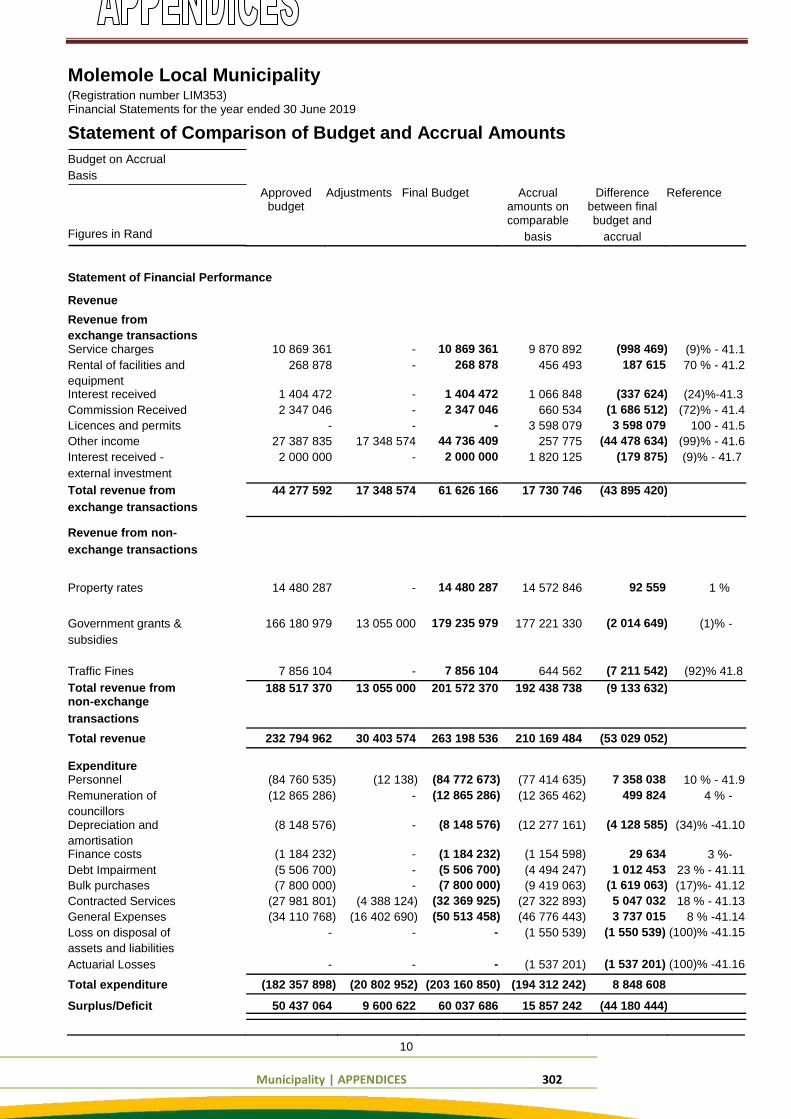
Municipality | APPENDICES 302
Molemole Local Municipality (Registration number LIM353) Financial Statements for the year ended 30 June 2019
Statement of Comparison of Budget and Accrual Amounts Budget on Accrual
Basis Figures in Rand
Approved Adjustments Final Budget Accrual Difference Reference budget amounts on between final
comparable budget and
basis accrual
Statement of Financial Performance
Revenue
Revenue from
exchange transactions 10 869 361
(998 469) (9)% - 41.1
Service charges 10 869 361 - 9 870 892
Rental of facilities and 268 878 - 268 878 456 493 187 615 70 % - 41.2
equipment 1 404 472
(337 624) (24)%-41.3
Interest received 1 404 472 - 1 066 848
Commission Received 2 347 046 - 2 347 046 660 534 (1 686 512) (72)% - 41.4
Licences and permits - - - 3 598 079 3 598 079 100 - 41.5
Other income 27 387 835 17 348 574 44 736 409 257 775 (44 478 634) (99)% - 41.6
Interest received - 2 000 000 - 2 000 000 1 820 125 (179 875) (9)% - 41.7
external investment
Total revenue from
44 277 592 17 348 574 61 626 166 17 730 746 (43 895 420)
exchange transactions
Revenue from non-
exchange transactions
Property rates 14 480 287 - 14 480 287 14 572 846 92 559 1 %
Government grants & 166 180 979 13 055 000 179 235 979 177 221 330 (2 014 649) (1)% -
subsidies
Traffic Fines 7 856 104 - 7 856 104 644 562 (7 211 542) (92)% 41.8
Total revenue from
188 517 370 13 055 000 201 572 370 192 438 738 (9 133 632)
non-exchange
transactions
Total revenue
232 794 962 30 403 574 263 198 536 210 169 484 (53 029 052)
Expenditure
(84 772 673)
7 358 038 10 % - 41.9
Personnel (84 760 535) (12 138) (77 414 635)
Remuneration of (12 865 286) - (12 865 286) (12 365 462) 499 824 4 % -
councillors (8 148 576)
(4 128 585) (34)% -41.10
Depreciation and (8 148 576) - (12 277 161)
amortisation (1 184 232)
29 634 3 %-
Finance costs (1 184 232) - (1 154 598)
Debt Impairment (5 506 700) - (5 506 700) (4 494 247) 1 012 453 23 % - 41.11
Bulk purchases (7 800 000) - (7 800 000) (9 419 063) (1 619 063) (17)%- 41.12
Contracted Services (27 981 801) (4 388 124) (32 369 925) (27 322 893) 5 047 032 18 % - 41.13
General Expenses (34 110 768) (16 402 690) (50 513 458) (46 776 443) 3 737 015 8 % -41.14
Loss on disposal of - - - (1 550 539) (1 550 539) (100)% -41.15
assets and liabilities
-
(1 537 201) (100)% -41.16
Actuarial Losses - - (1 537 201)
Total expenditure
(182 357 898) (20 802 952) (203 160 850) (194 312 242) 8 848 608
Surplus/Deficit
50 437 064 9 600 622 60 037 686 15 857 242 (44 180 444)
10
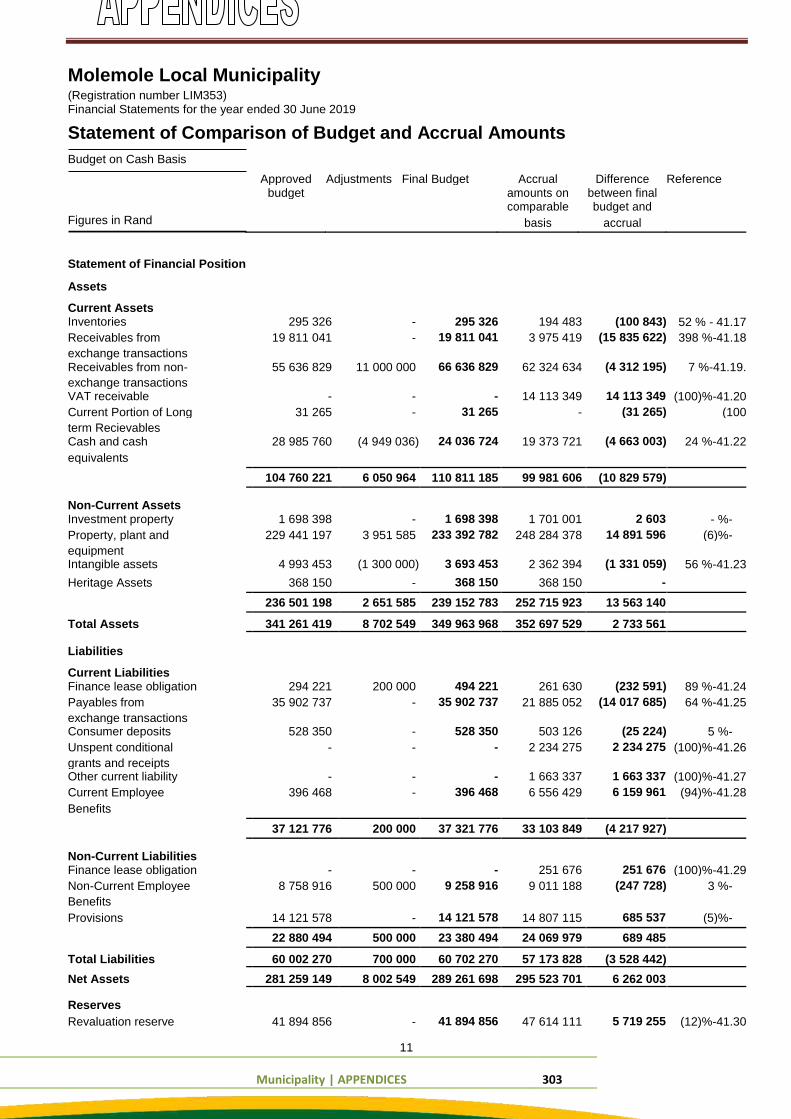
Municipality | APPENDICES 303
Molemole Local Municipality (Registration number LIM353) Financial Statements for the year ended 30 June 2019
Statement of Comparison of Budget and Accrual Amounts Budget on Cash Basis
Figures in Rand
Approved Adjustments Final Budget Accrual Difference Reference budget amounts on between final
comparable budget and
basis accrual
Statement of Financial Position
Assets
Current Assets 295 326
(100 843) 52 % - 41.17
Inventories 295 326 - 194 483
Receivables from 19 811 041 - 19 811 041 3 975 419 (15 835 622) 398 %-41.18
exchange transactions 66 636 829
(4 312 195) 7 %-41.19.
Receivables from non- 55 636 829 11 000 000 62 324 634
exchange transactions -
14 113 349 (100)%-41.20
VAT receivable - - 14 113 349
Current Portion of Long 31 265 - 31 265 - (31 265) (100
term Recievables 24 036 724
(4 663 003) 24 %-41.22
Cash and cash 28 985 760 (4 949 036) 19 373 721
equivalents
104 760 221 6 050 964 110 811 185 99 981 606 (10 829 579)
Non-Current Assets 1 698 398
2 603 - %-
Investment property 1 698 398 - 1 701 001
Property, plant and 229 441 197 3 951 585 233 392 782 248 284 378 14 891 596 (6)%-
equipment 3 693 453
(1 331 059) 56 %-41.23
Intangible assets 4 993 453 (1 300 000) 2 362 394
Heritage Assets 368 150 - 368 150 368 150 -
236 501 198 2 651 585 239 152 783 252 715 923 13 563 140
Total Assets 341 261 419 8 702 549 349 963 968 352 697 529 2 733 561
Liabilities
Current Liabilities 494 221
(232 591) 89 %-41.24
Finance lease obligation 294 221 200 000 261 630
Payables from 35 902 737 - 35 902 737 21 885 052 (14 017 685) 64 %-41.25
exchange transactions 528 350
(25 224) 5 %-
Consumer deposits 528 350 - 503 126
Unspent conditional - - - 2 234 275 2 234 275 (100)%-41.26
grants and receipts -
1 663 337 (100)%-41.27
Other current liability - - 1 663 337
Current Employee 396 468 - 396 468 6 556 429 6 159 961 (94)%-41.28
Benefits
37 121 776 200 000 37 321 776 33 103 849 (4 217 927)
Non-Current Liabilities -
251 676 (100)%-41.29
Finance lease obligation - - 251 676
Non-Current Employee 8 758 916 500 000 9 258 916 9 011 188 (247 728) 3 %-
Benefits
14 121 578
685 537 (5)%-
Provisions 14 121 578 - 14 807 115
22 880 494 500 000 23 380 494 24 069 979 689 485
Total Liabilities 60 002 270 700 000 60 702 270 57 173 828 (3 528 442)
Net Assets 281 259 149 8 002 549 289 261 698 295 523 701 6 262 003
Reserves 41 894 856
5 719 255 (12)%-41.30
Revaluation reserve 41 894 856 - 47 614 111
11
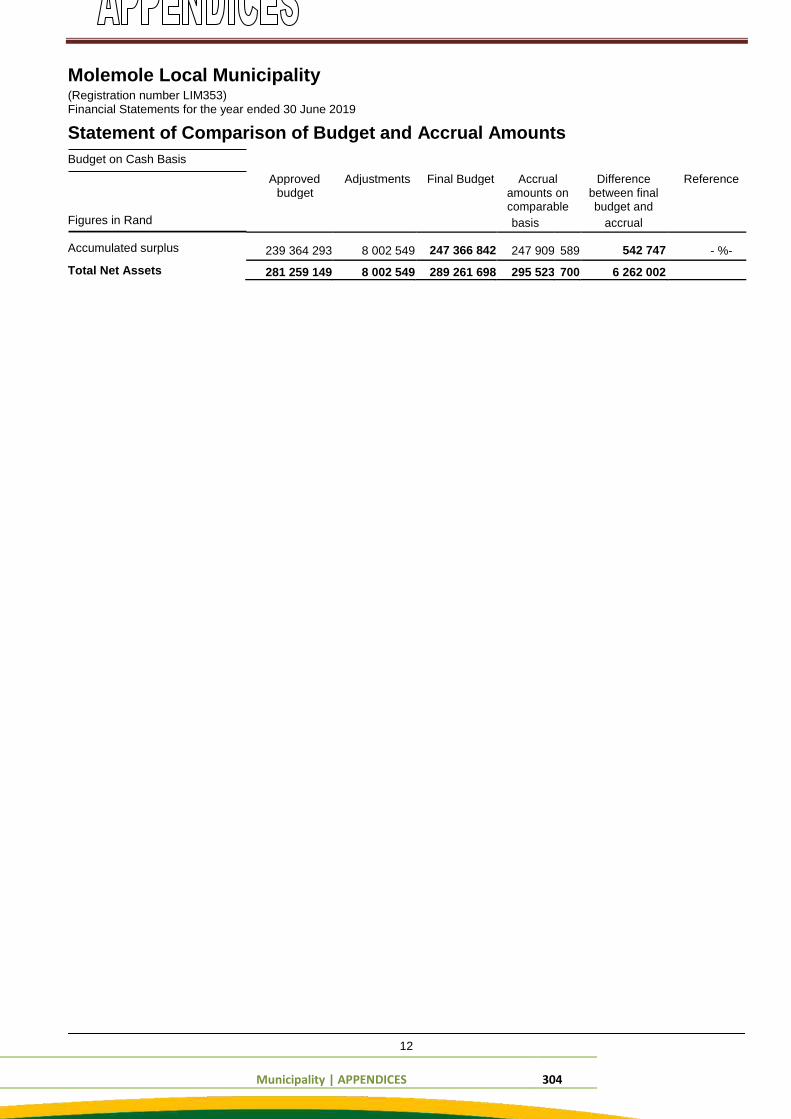
Municipality | APPENDICES 304
Molemole Local Municipality (Registration number LIM353) Financial Statements for the year ended 30 June 2019
Statement of Comparison of Budget and Accrual Amounts Budget on Cash Basis
Figures in Rand Accumulated surplus
Total Net Assets
Approved Adjustments Final Budget Accrual Difference Reference budget amounts on between final
comparable budget and
basis accrual
239 364 293 8 002 549 247 366 842 247 909 589 542 747 - %-
281 259 149 8 002 549 289 261 698 295 523 700 6 262 002
12
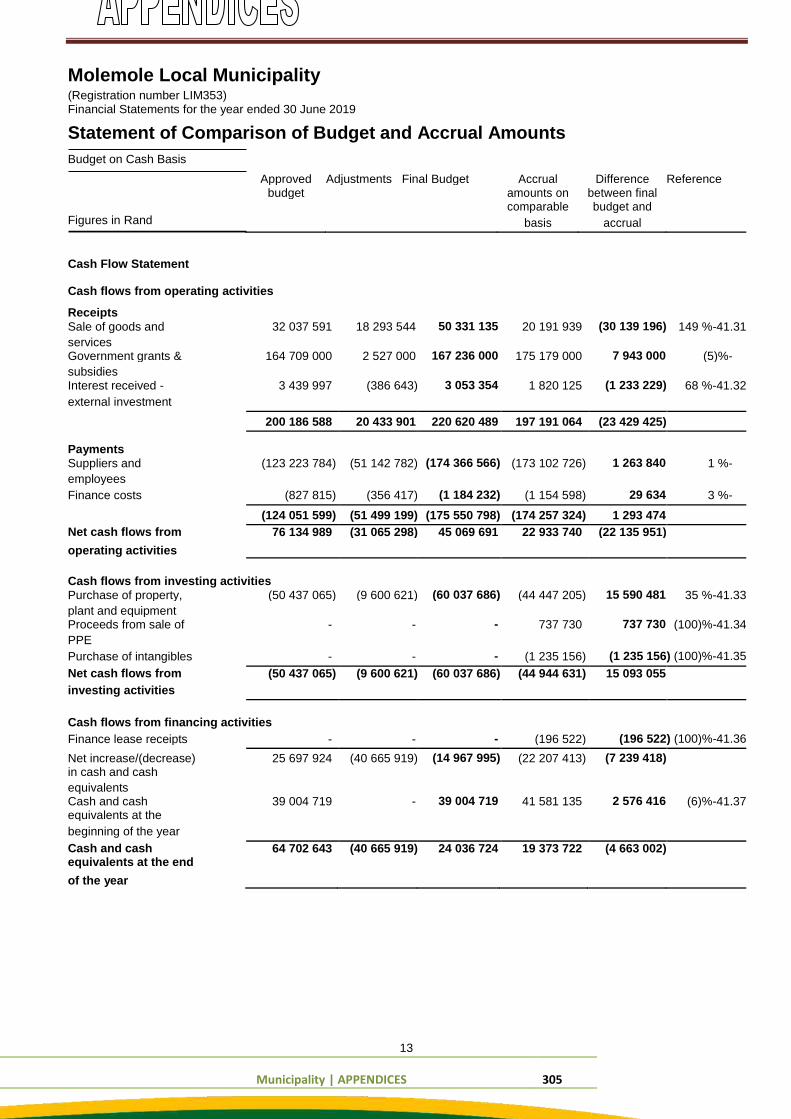
Municipality | APPENDICES 305
Molemole Local Municipality (Registration number LIM353) Financial Statements for the year ended 30 June 2019
Statement of Comparison of Budget and Accrual Amounts Budget on Cash Basis
Figures in Rand
Approved Adjustments Final Budget Accrual Difference Reference budget amounts on between final
comparable budget and
basis accrual
Cash Flow Statement
Cash flows from operating activities
Receipts 50 331 135
(30 139 196) 149 %-41.31
Sale of goods and 32 037 591 18 293 544 20 191 939
services 167 236 000
7 943 000 (5)%-
Government grants & 164 709 000 2 527 000 175 179 000
subsidies 3 053 354
(1 233 229) 68 %-41.32
Interest received - 3 439 997 (386 643) 1 820 125
external investment
200 186 588 20 433 901 220 620 489 197 191 064 (23 429 425)
Payments
(174 366 566)
1 263 840 1 %-
Suppliers and (123 223 784) (51 142 782) (173 102 726)
employees
(1 184 232)
29 634 3 %-
Finance costs (827 815) (356 417) (1 154 598)
(124 051 599) (51 499 199) (175 550 798) (174 257 324) 1 293 474
Net cash flows from
76 134 989 (31 065 298) 45 069 691 22 933 740 (22 135 951)
operating activities
Cash flows from investing activities (60 037 686)
15 590 481 35 %-41.33
Purchase of property, (50 437 065) (9 600 621) (44 447 205)
plant and equipment -
737 730 (100)%-41.34
Proceeds from sale of - - 737 730
PPE
-
(1 235 156) (100)%-41.35
Purchase of intangibles - - (1 235 156)
Net cash flows from
(50 437 065) (9 600 621) (60 037 686) (44 944 631) 15 093 055
investing activities
Cash flows from financing activities -
(196 522) (100)%-41.36
Finance lease receipts - - (196 522)
Net increase/(decrease) 25 697 924 (40 665 919) (14 967 995) (22 207 413) (7 239 418)
in cash and cash
equivalents 39 004 719
2 576 416 (6)%-41.37
Cash and cash 39 004 719 - 41 581 135
equivalents at the
beginning of the year
Cash and cash
64 702 643 (40 665 919) 24 036 724 19 373 722 (4 663 002)
equivalents at the end
of the year
13
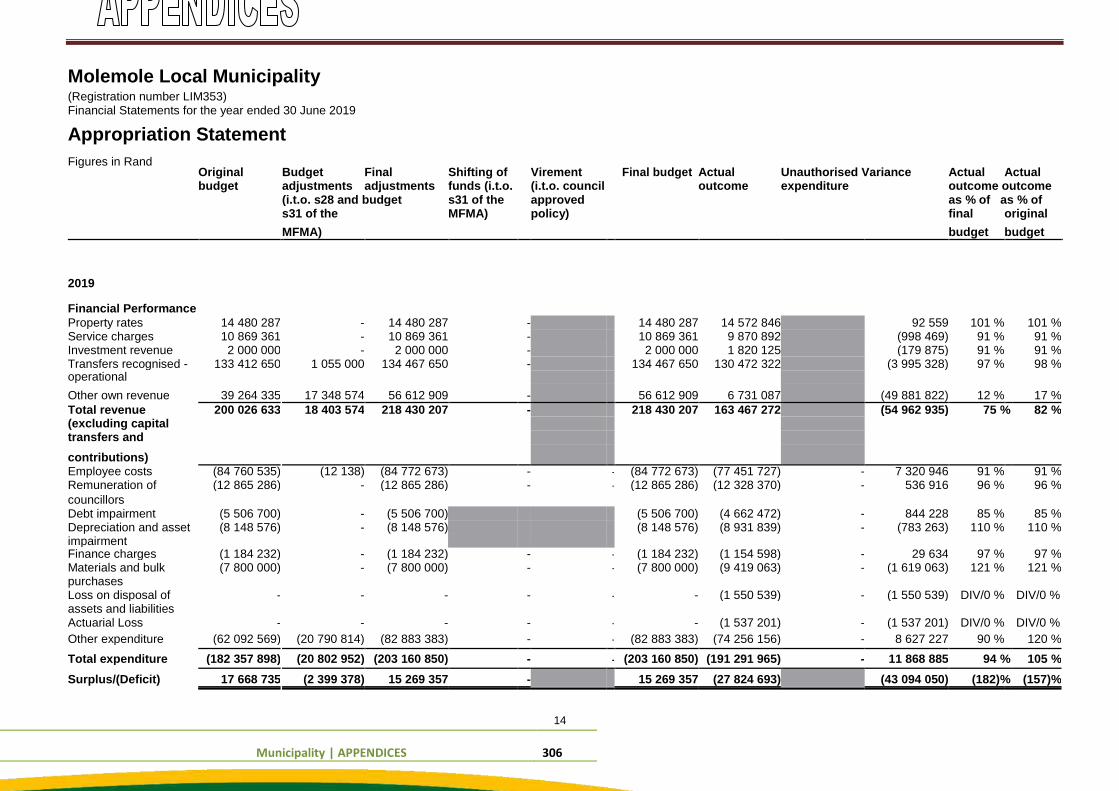
Municipality | APPENDICES 306
Molemole Local Municipality (Registration number LIM353) Financial Statements for the year ended 30 June 2019
Appropriation Statement Figures in Rand
Original Budget Final Shifting of
Virement
Final budget Actual Unauthorised Variance Actual Actual
budget adjustments adjustments funds (i.t.o. (i.t.o. council outcome expenditure outcome outcome
(i.t.o. s28 and budget s31 of the approved as % of as % of
s31 of the MFMA) policy) final original
MFMA) budget budget
2019
Financial Performance
Property rates 14 480 287 - 14 480 287 - 14 480 287 14 572 846 92 559 101 % 101 %
Service charges 10 869 361 - 10 869 361 - 10 869 361 9 870 892 (998 469) 91 % 91 %
Investment revenue 2 000 000 - 2 000 000 - 2 000 000 1 820 125 (179 875) 91 % 91 %
Transfers recognised - 133 412 650 1 055 000 134 467 650 - 134 467 650 130 472 322 (3 995 328) 97 % 98 %
operational
Other own revenue 39 264 335 17 348 574 56 612 909 - 56 612 909 6 731 087 (49 881 822) 12 % 17 %
Total revenue 200 026 633 18 403 574 218 430 207 - 218 430 207 163 467 272 (54 962 935) 75 % 82 %
(excluding capital
transfers and
contributions)
Employee costs (84 760 535) (12 138) (84 772 673) - - (84 772 673) (77 451 727) - 7 320 946 91 % 91 %
Remuneration of (12 865 286) - (12 865 286) - - (12 865 286) (12 328 370) - 536 916 96 % 96 %
councillors
Debt impairment (5 506 700) - (5 506 700) (5 506 700) (4 662 472) - 844 228 85 % 85 %
Depreciation and asset (8 148 576) - (8 148 576) (8 148 576) (8 931 839) - (783 263) 110 % 110 %
impairment
Finance charges (1 184 232) - (1 184 232) - - (1 184 232) (1 154 598) - 29 634 97 % 97 %
Materials and bulk (7 800 000) - (7 800 000) - - (7 800 000) (9 419 063) - (1 619 063) 121 % 121 %
purchases
Loss on disposal of - - - - - - (1 550 539) - (1 550 539) DIV/0 % DIV/0 %
assets and liabilities
Actuarial Loss - - - - - - (1 537 201) - (1 537 201) DIV/0 % DIV/0 %
Other expenditure (62 092 569) (20 790 814) (82 883 383) - - (82 883 383) (74 256 156) - 8 627 227 90 % 120 %
Total expenditure
(182 357 898) (20 802 952) (203 160 850) - - (203 160 850) (191 291 965) - 11 868 885 94 % 105 %
Surplus/(Deficit)
17 668 735 (2 399 378) 15 269 357 - 15 269 357 (27 824 693) (43 094 050) (182)% (157)%
14
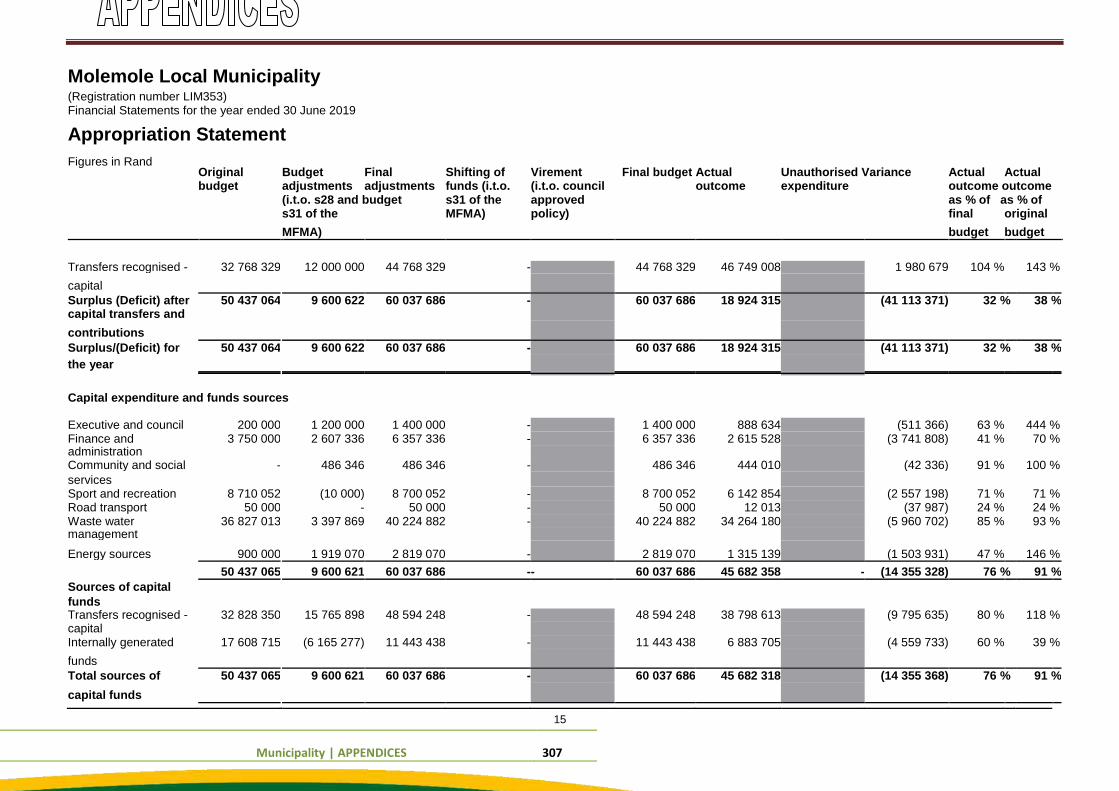
Municipality | APPENDICES 307
Molemole Local Municipality (Registration number LIM353) Financial Statements for the year ended 30 June 2019
Appropriation Statement Figures in Rand
Original Budget Final Shifting of Virement Final budget Actual Unauthorised Variance Actual Actual
budget adjustments adjustments funds (i.t.o. (i.t.o. council outcome expenditure outcome outcome
(i.t.o. s28 and budget s31 of the approved as % of as % of
s31 of the MFMA) policy) final original
MFMA) budget budget
Transfers recognised - 32 768 329 12 000 000 44 768 329 -
44 768 329 46 749 008
1 980 679 104 %
143 %
capital
Surplus (Deficit) after 50 437 064 9 600 622 60 037 686 - 60 037 686 18 924 315 (41 113 371) 32 % 38 %
capital transfers and
contributions
Surplus/(Deficit) for 50 437 064 9 600 622 60 037 686 - 60 037 686 18 924 315 (41 113 371) 32 % 38 %
the year
Capital expenditure and funds sources
Executive and council 200 000 1 200 000 1 400 000 -
1 400 000 888 634
(511 366) 63 %
444 %
Finance and 3 750 000 2 607 336 6 357 336 - 6 357 336 2 615 528 (3 741 808) 41 % 70 %
administration
Community and social - 486 346 486 346 - 486 346 444 010 (42 336) 91 % 100 %
services
Sport and recreation 8 710 052 (10 000) 8 700 052 - 8 700 052 6 142 854 (2 557 198) 71 % 71 %
Road transport 50 000 - 50 000 - 50 000 12 013 (37 987) 24 % 24 %
Waste water 36 827 013 3 397 869 40 224 882 - 40 224 882 34 264 180 (5 960 702) 85 % 93 %
management
Energy sources 900 000 1 919 070 2 819 070 - 2 819 070 1 315 139 (1 503 931) 47 % 146 %
50 437 065 9 600 621 60 037 686 - - 60 037 686 45 682 358 - (14 355 328) 76 % 91 %
Sources of capital
funds
Transfers recognised - 32 828 350 15 765 898 48 594 248 - 48 594 248 38 798 613 (9 795 635) 80 % 118 %
capital
Internally generated 17 608 715 (6 165 277) 11 443 438 - 11 443 438 6 883 705 (4 559 733) 60 % 39 %
funds
Total sources of 50 437 065 9 600 621 60 037 686 - 60 037 686 45 682 318 (14 355 368) 76 % 91 %
capital funds
15
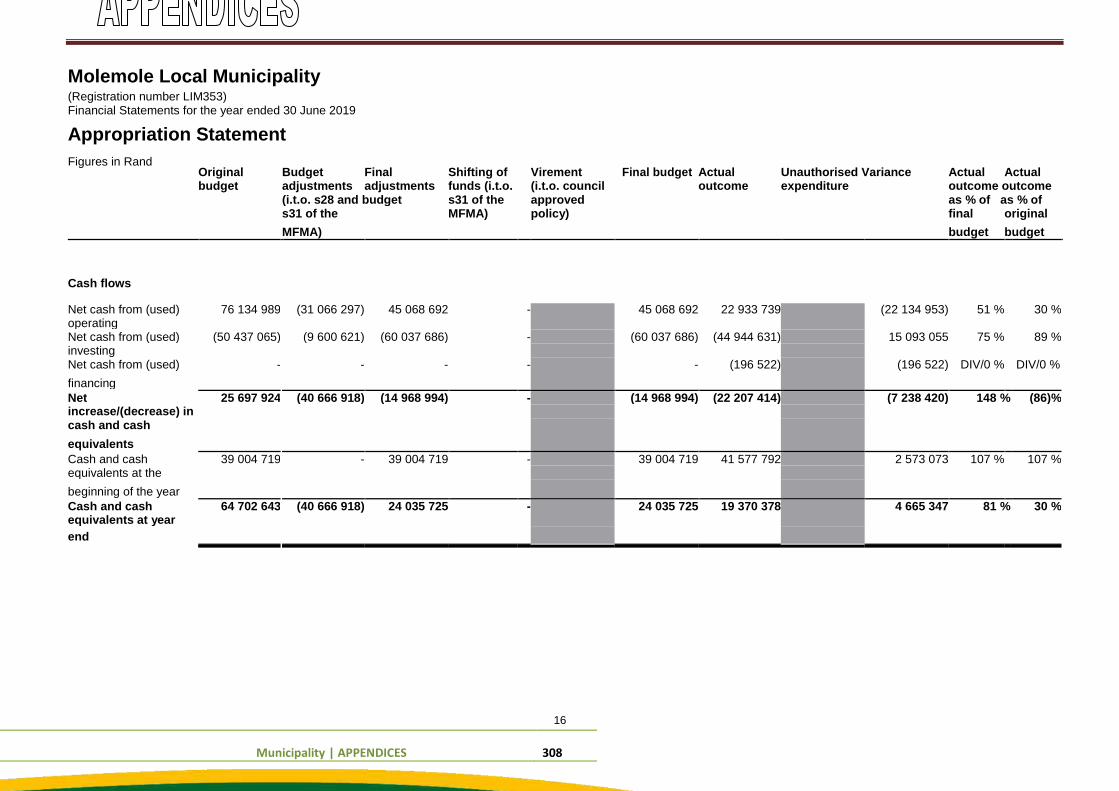
Municipality | APPENDICES 308
Molemole Local Municipality (Registration number LIM353) Financial Statements for the year ended 30 June 2019
Appropriation Statement Figures in Rand
Original Budget Final Shifting of
Virement Final budget Actual Unauthorised Variance Actual Actual
budget adjustments adjustments funds (i.t.o. (i.t.o. council outcome expenditure outcome outcome
(i.t.o. s28 and budget s31 of the approved as % of as % of
s31 of the MFMA) policy) final original
MFMA) budget budget
Cash flows
Net cash from (used) 76 134 989 (31 066 297) 45 068 692
-
45 068 692 22 933 739
(22 134 953) 51 %
30 %
operating
Net cash from (used) (50 437 065) (9 600 621) (60 037 686) - (60 037 686) (44 944 631) 15 093 055 75 % 89 %
investing
Net cash from (used) - - - - - (196 522) (196 522) DIV/0 % DIV/0 %
financing
Net 25 697 924 (40 666 918) (14 968 994) - (14 968 994) (22 207 414) (7 238 420) 148 % (86)%
increase/(decrease) in
cash and cash
equivalents
Cash and cash 39 004 719 - 39 004 719 - 39 004 719 41 577 792 2 573 073 107 % 107 %
equivalents at the
beginning of the year
Cash and cash 64 702 643 (40 666 918) 24 035 725 - 24 035 725 19 370 378 4 665 347 81 % 30 %
equivalents at year
end
16
Municipality | APPENDICES 309
Molemole Local Municipality
(Registration number LIM353)
Financial Statements for the year ended 30 June 2019
Accounting Policies
1. Presentation of Financial Statements
The annual financial statements have been prepared in accordance with the Standards of Generally Recognised Accounting
Practice (GRAP), issued by the Accounting Standards Board in accordance with Section 122(3) of the Municipal Finance
Management Act (Act 56 of 2003).
These financial statements have been prepared on an accrual basis of accounting and are in accordance with historical cost
convention as the basis of measurement, unless specified otherwise.
Assets, liabilities, revenues and expenses were not offset, except where offsetting is either required or permitted by a Standard
of GRAP.
A summary of the significant accounting policies, which have been consistently applied in the preparation of these financial
statements, are disclosed below.
These accounting policies applied are consistent with those used to present the previous year's financial statements, unless
explicitly stated otherwise. The details of any changes in accounting policies are explained in the relevant policy.
1.1 Presentation currency
These annual financial statements are presented in South African Rand, which is the functional currency of the municipality.
1.2 Going concern assumption
These financial statements have been prepared on the assumption that the municipality will continue to operate as a going
concern for at least the next 12 months.
1.3 Comparative Information
When the presentation or classification of items in the annual financial statements is amended, prior period comparative
amounts are restated. The nature and reason for the reclassification is disclosed. Where accounting errors have been identified
in the current year, the correction is made retrospectively as far as is practicable, and the prior year comparatives are restated
accordingly. Where there has been a change in accounting policy in the current year, the adjustment is made retrospectively as
far as is practicable, and the prior year comparatives are restated accordingly.
1.4 Standards, amendments to standards and interpretations issued but not yet effective
The following GRAP standards have been issued but are not yet effective and have not been adopted early by the municipality:
GRAP 25 Employee Benefits
GRAP 105 Transfers of Functions Between Entities Under Common Control
GRAP 106 Transfers of Functions Between Entities Not Under Common Control
GRAP 107 Mergers
Municipality | APPENDICES 310
Nature of impending changes in accounting policy:
None.
Impact on the municipality's financial statements once implemented:
None.
1.5 Use of Estimates
The preparation of annual financial statements in conformity with Generally Recognised Accounting Practice requires the use
of certain critical accounting estimates. It also requires management to exercise its judgment in the process of applying the
municipality’s accounting policies. The areas involving a higher degree of judgment or complexity, or areas where assumptions
and estimates are significant to the annual financial statements are disclosed in the relevant sections of the annual financial
statements. Although these estimates are based on management’s best knowledge of current events and actions they may be
undertaken in the future, actual results ultimately may differ from these estimates.
17
Municipality | APPENDICES 311
Molemole Local Municipality
(Registration number LIM353)
Financial Statements for the year ended 30 June 2019
Accounting Policies
1.6 Transfer of functions between entities under common control
Definitions
An acquirer is the municipality that obtains control of the acquiree or transferor.
Carrying amount of an asset or liability is the amount at which an asset or liability is recognised in the statement of financial
position.
Control is the power to govern the financial and operating policies of another municipality so as to benefit from its activities.
A function is an integrated set of activities that is capable of being conducted and managed for purposes of achieving an
municipality’s objectives, either by providing economic benefits or service potential.
A merger is the establishment of a new combined entity in which none of the former entities obtains control over any other and
no acquirer can be identified.
Transfer date is the date on which the acquirer obtains control of the function and the transferor loses control of that function.
A transfer of functions is the reorganisation and/or the re-allocation of functions between entities by transferring functions
between entities or into another municipality.
A transferor is the municipality that relinquishes control of a function.
Common control - For a transaction or event to occur between entities under common control, the transaction or event needs to
be undertaken between entities within the same sphere of government or between entities that are part of the same economic
entity. Entities that are ultimately controlled by the same entity before and after the transfer of functions are within the same
economic entity.
A function is an integrated set of activities that is capable of being conducted and managed for purposes of achieving an
municipality‘s objectives, either by providing economic benefits or service potential. A function consists of inputs and processes
applied to those inputs that have the ability to create outputs. A function can either be a part or a portion of an entity or can consist of the whole municipality. Although functions may have outputs, outputs are not required to qualify as a function. The
three elements of a function are defined as follows:
Input: Any resource that creates, or has the ability to create, outputs when one or more processes are applied to it. Process: Any system, standard, protocol, convention or rule that when applied to an input or inputs, creates or has the ability to create outputs.
Output: The result of inputs and processes applied to achieve and improve efficiency. This may be in the form of
achieving service delivery objectives, or the delivery of goods and/or services.
Identifying the acquirer and transferor
For each transfer of functions between entities under common control an acquirer and transferor are identified. All relevant
facts and circumstances are considered in identifying the acquirer and transferor.
The terms and conditions of a transfer of functions undertaken between entities under common control are set out in a binding
arrangement. The binding arrangement governing the terms and conditions of a transfer of functions may identify which
municipality to the transaction or event is the transferor(s) and which municipality is the acquirer. Where the binding
arrangement does not clearly identify the acquirer or the transferor, the behaviour or actions of the entities may indicate which
municipality is the acquirer and which municipality is the transferor.

Municipality | APPENDICES 312
Determining the acquirer includes a consideration of, amongst other things, which of the entities involved in the transfer of
functions initiated the transaction or event, the relative size of the entities, as well as whether the assets or revenue of one of
the entities involved in the transaction or event significantly exceed those of the other entities. If no acquirer can be identified,
the transaction or event is accounted for in terms of the Standard of GRAP on Mergers.
Determining the transfer date
The acquirer and the transferor identify the transfer date, which is the date on which the acquirer obtains control and the
transferor loses control of that function.
All relevant facts and circumstances are considered in identifying the transfer date.
18
Municipality | APPENDICES 313
Molemole Local Municipality
(Registration number LIM353)
Financial Statements for the year ended 30 June 2019
Accounting Policies
Assets acquired [transferred] and liabilities assumed [relinquished]
The recognition of assets and liabilities, is subject to the following conditions:
The assets acquired and the liabilities assumed are part of what had been agreed in terms of the binding arrangement (if
applicable), rather than the result of separate transactions.
Determining what is part of the transfer of functions transaction
Where the municipality and the transferor have a pre-existing relationship before or when negotiations for a transfer of
functions began, or where a binding arrangement is entered into during the negotiations that are separate from a transfer of
functions, any amounts that are not part of what were transferred in a transfer of functions are identified. This policy only
applies to the consideration transferred and the assets acquired and liabilities assumed in a transfer of functions as governed
by the terms and conditions of the binding arrangement.
The following factors are considered, which are neither mutually exclusive nor individually conclusive, to determine whether a
transaction is part of a transfer or function or whether the transaction is separate:
the reasons for the transaction
the timing of the transaction
1.7 Investment property
Investment property is property (land or a building - or part of a building - or both) held to earn rentals or for capital appreciation
or both, rather than for:
use in the production or supply of goods or services or for
administrative purposes, or
sale in the ordinary course of operations.
Owner-occupied property is property held for use in the production or supply of goods or services or for administrative
purposes.
Investment property is recognised as an asset when, it is probable that the future economic benefits or service potential that
are associated with the investment property will flow to the municipality, and the cost or fair value of the investment property
can be measured reliably.
Investment property is initially recognised at cost. Transaction costs are included in the initial measurement.
Where investment property is acquired through a non-exchange transaction, its cost is its fair value as at the date of
acquisition. However, where an investment property was acquired through a non-exchange transaction (i.e. where municipality
acquired the investment property for no or a nominal value), its cost is its fair value as at the date of acquisition. The cost of
self-constructed investment property is measured at cost.
Costs include costs incurred initially and costs incurred subsequently to add to, or to replace a part of, or service a property. If a
replacement part is recognised in the carrying amount of the investment property, the carrying amount of the replaced part is
derecognised.
Transfers are made to or from investment property only when there is a change in use.
For a transfer from investment property to owner occupied property, the deemed cost for subsequent accounting is the fair
value at the date of change in use. If owner occupied property becomes an investment property, the municipality accounts for
such property in accordance with the policy stated under property, plant and equipment up to the date of change in use.
19
Municipality | APPENDICES 314
Molemole Local Municipality
(Registration number LIM353)
Financial Statements for the year ended 30 June 2019
Accounting Policies
Cost model
Investment property is carried at cost less accumulated depreciation and any accumulated impairment losses. Land is not
depreciated as it is deemed to have an indefinite useful life.
Depreciation is provided to write down the cost, less estimated residual value over the useful life of the property, which is as
follows:
Item Useful life
Property - land indefinite
Property - buildings 30 years
Investment property is derecognised on disposal or when the investment property is permanently withdrawn from use and no
future economic benefits or service potential are expected from its disposal.
Gains or losses arising from the retirement or disposal of investment property is the difference between the net disposal
proceeds and the carrying amount of the asset and is recognised in surplus or deficit in the period of retirement or disposal.
Compensation from third parties for investment property that was impaired, lost or given up is recognised in surplus or deficit
when the compensation becomes receivable.
1.8 Property, plant and equipment
Property, plant and equipment are tangible non-current assets (including infrastructure assets) that are held for use in the
production or supply of goods or services, rental to others, or for administrative purposes, and are expected to be used during
more than one reporting period.
The cost of an item of property, plant and equipment is recognised as an asset when:
it is probable that future economic benefits or service potential associated with the item will flow to the municipality; and
the cost or fair value of the item can be measured reliably.
Property, plant and equipment is initially measured at cost.
The cost of an item of property, plant and equipment is the purchase price and other costs attributable to bring the asset to the
location and condition necessary for it to be capable of operating in the manner intended by management. Trade discounts and
rebates are deducted in arriving at the cost.
Where an asset is acquired through a non-exchange transaction, its cost is its fair value as at date of acquisition.
Where an item of property, plant and equipment is acquired in exchange for a non -monetary asset or assets, or a combination
of assets and non-monetary assets, the asset acquired is initially measured at fair value (the cost). If the acquired item's fair
value was not determinable, it's deemed cost is the carrying amount of the asset(s) given up.
The initial estimate of the costs of dismantling and removing the item and restoring the site on which it is located is also
included in the cost of property, plant and equipment, where the entity is obligated to incur such expenditure, and where the
obligation arises as a result of acquiring the asset or using it for purposes other than the production of inventories.
Recognition of costs in the carrying amount of an item of property, plant and equipment ceases when the item is in the location
and condition necessary for it to be capable of operating in the manner intended by management.
Municipality | APPENDICES 315
Major spare parts and stand by equipment which are expected to be used for more than one period are included in property,
plant and equipment. In addition, spare parts and stand by equipment which can only be used in connection with an item of
property, plant and equipment are accounted for as property, plant and equipment.
Major inspection costs which are a condition of continuing use of an item of property, plant and equipment and which meet the
recognition criteria above are included as a replacement in the cost of the item of property, plant and equipment. Any remaining
inspection costs from the previous inspection are derecognised.
The following accounting procedures will be followed when the fixed properties are re-valued at an amount that exceeds
the current value carried in the Financial Statements:
.
20
Municipality | APPENDICES 316
Molemole Local Municipality (Registration number LIM353) Financial Statements for the year ended 30 June 2019
Accounting Policies The Accumulated Depreciation at the time of revaluation will be set-off against the gross carrying amount of the
fixed property.
The carrying value on the Balance Sheet will be adjusted to the revalued amount of the fixed property.
The difference between the original amount and the re-valued amount will be credited against a future
depreciation reserve.
All future depreciation on the fixed property will be set off against this future depreciation reserve. Any increase in an asset’s carrying amount, as a result of a revaluation, is credited directly to a revaluation surplus. The
increase is recognised in surplus or deficit to the extent that it reverses a revaluation decrease of the same asset previously
recognised in surplus or deficit. Any decrease in an asset’s carrying amount, as a result of a revaluation, is recognised in surplus or deficit in the current period.
The decrease is debited directly to a revaluation surplus to the extent of any credit balance existing in the revaluation surplus in
respect of that asset. The revaluation surplus included in net assets related to a specific item of property, plant and equipment is transferred directly
to accumulated surplus or deficit when the asset is derecognised. Property, plant and equipment are depreciated on the over their expected useful lives to their estimated residual value. The useful lives of items of property, plant and equipment have been assessed as follows: Item Average useful life Buildings
Municipal Buildings 15-30 years Land Indefinite
Infrastructure
Roads 5 - 30 years Paving on Car Ports 5 - 30 years Electricity Network 4 - 45 years Single Fase Meters 97/98 2 - 20 years Water 2 - 20 years Sewerage 2 - 20 years Stormwater 5 - 30 years
Community
Community Buildings 15 - 30 years Recreational Facilities 20 - 30 years Tennis Courts 20 - 30 years Swimming Pool and Pumps 5 - 10 years Security 5 - 30 years Palisade Fence 3 - 10 years Gaurd Room 2 - 30 years Parks and Gardens 22 - 30 years Taxi Rank 22 - 30 years
Other property, plant and equipment
Gates And Fencing 5 - 10 years Air Conditioners 5 - 15 years Plant and equipment 5 - 30 years Security Measures 5 - 30 years Other Vechiles 5 - 15 years Specialised Vechile 10 - 15 years Office Equipment 5 - 15 years Furniture and fittings 2 - 20 years Bins and containers 2 - 10 years Other items of plant equipment 10 - 15 years Landfill sites 30 - 45 years
Computer equipment 3 - 15 years
21
Municipality | APPENDICES 317
Molemole Local Municipality (Registration number LIM353) Financial Statements for the year ended 30 June 2019
Accounting Policies Finance Leased Assets
Office Equipment 3 - 7 years The residual value, the useful life and depreciation method of each asset are reviewed at least at each reporting date. If the
expectations differ from previous estimates, the change is accounted for as a change in accounting estimate. Reviewing the useful life of an asset on an annual basis does not require the entity to amend the previous estimate unless
expectations differ from the previous estimate. Each part of an item of property, plant and equipment with a cost that is significant in relation to the total cost of the item is
depreciated separately. The depreciation charge for each period is recognised in surplus or deficit unless it is included in the carrying amount of
another asset. Items of property, plant and equipment are derecognised when the asset is disposed of or when there are no further economic
benefits or service potential expected from the use or disposal of the asset. The gain or loss arising from the derecognition of an item of property, plant and equipment is included in surplus or deficit when
the item is derecognised. The gain or loss arising from the derecognition of an item of property, plant and equipment is
determined as the difference between the net disposal proceeds, if any, and the carrying amount of the item. Property, plant and equipment which the municipality holds for rentals to others and subsequently routinely sell as part of the
ordinary course of activities, are transferred to inventories when the rentals end and the assets are available- for-sale. These
assets are not accounted for as non-current assets held for sale. Proceeds from the sale of these assets are recognised as
revenue. All cash flows on these assets are included in cash flows from operating activities in the cash flow statement. 1.9 Intangible assets Initial Recognition An asset is identifiable if it either:
is separable, i.e. is capable of being separated or divided from an entity and sold, transferred, licensed, rented or exchanged, either individually or together with a related contract, identifiable assets or liability, regardless of whether the entity intends to do so; or arises from binding arrangements (including rights from contracts), regardless of whether those rights are
transferable or separable from the municipality or from other rights and obligations. A binding arrangement describes an arrangement that confers similar rights and obligations on the parties to it as if it were in
the form of a contract. An intangible asset is recognised when:
it is probable that the expected future economic benefits or service potential that are attributable to the asset will flow to the municipality; and the cost or fair value of the asset can be measured reliably.
The municipality assesses the probability of expected future economic benefits or service potential using reasonable and
supportable assumptions that represent management’s best estimate of the set of economic conditions that will exist over the
useful life of the asset. Where an intangible asset is acquired through a non-exchange transaction, its initial cost at the date of acquisition is measured
at its fair value as at that date. Expenditure on research (or on the research phase of an internal project) is recognised as an expense when it is incurred. An intangible asset arising from development (or from the development phase of an internal project) is recognised when:
it is technically feasible to complete the asset so that it will be available for use or sale. there is an intention to complete and use or sell it. there is an ability to use or sell it. it will generate probable future economic benefits or service potential. there are available technical, financial and other resources to complete the development and to use or sell the asset. the expenditure attributable to the asset during its development can be measured reliably.
22
Municipality | APPENDICES 318
Molemole Local Municipality
(Registration number LIM353)
Financial Statements for the year ended 30 June 2019
Accounting Policies
Intangible assets are carried at cost less any accumulated amortisation and any impairment losses.
An intangible asset is regarded as having an indefinite useful life when, based on all relevant factors, there is no foreseeable
limit to the period over which the asset is expected to generate net cash inflows or service potential. Amortisation is not
provided for these intangible assets, but they are tested for impairment annually and whenever there is an indication that the
asset may be impaired. For all other intangible assets amortisation is provided on a straight line basis over their useful life.
The amortisation period and the amortisation method for intangible assets are reviewed at each reporting date.
Reassessing the useful life of an intangible asset with a finite useful life after it was classified as indefinite is an indicator that
the asset may be impaired. As a result the asset is tested for impairment and the remaining carrying amount is amortised over
its useful life.
Internally generated brands, mastheads, publishing titles, customer lists and items similar in substance are not recognised as
intangible assets.
Internally generated goodwill is not recognised as an intangible asset.
Amortisation is provided to write down the intangible assets, on a straight line basis, to their residual values as follows:
Item Useful life
Computer software, other 3 - 10years
Intangible assets are derecognised:
on disposal; or
when no future economic benefits or service potential are expected from its use or disposal.
The gain or loss is the difference between the net disposal proceeds, if any, and the carrying amount. It is recognised in
surplus or deficit when the asset is derecognised.
1.10 Heritage assets
Assets are resources controlled by an municipality as a result of past events and from which future economic benefits or
service potential are expected to flow to the municipality.
Carrying amount is the amount at which an asset is recognised after deducting accumulated impairment losses.
Class of heritage assets means a grouping of heritage assets of a similar nature or function in an municipality’s operations that
is shown as a single item for the purpose of disclosure in the financial statements.
Cost is the amount of cash or cash equivalents paid or the fair value of the other consideration given to acquire an asset at the
time of its acquisition or construction or, where applicable, the amount attributed to that asset when initially recognised in
accordance with the specific requirements of other Standards of GRAP.
Depreciation is the systematic allocation of the depreciable amount of an asset over its useful life.
Fair value is the amount for which an asset could be exchanged, or a liability settled, between knowledgeable, willing parties in
an arm’s length transaction.
Heritage assets are assets that have a cultural, environmental, historical, natural, scientific, technological or artistic significance
and are held indefinitely for the benefit of present and future generations.
Municipality | APPENDICES 319
An impairment loss of a cash-generating asset is the amount by which the carrying amount of an asset exceeds its recoverable
amount.
An impairment loss of a non-cash-generating asset is the amount by which the carrying amount of an asset exceeds its
recoverable service amount.
An inalienable item is an asset that an municipality is required by law or otherwise to retain indefinitely and cannot be disposed
of without consent.
Recoverable amount is the higher of a cash-generating asset’s net selling price and its value in use.
23
Municipality | APPENDICES 320
Molemole Local Municipality
(Registration number LIM353)
Financial Statements for the year ended 30 June 2019
Accounting Policies
Recoverable service amount is the higher of a non-cash-generating asset’s fair value less costs to sell and its value in use.
Value in use of a cash-generating asset is the present value of the future cash flows expected to be derived from an asset or
cash-generating unit.
Value in use of a non-cash-generating asset is the present value of the asset’s remaining service potential.
1.11 Financial instruments
Initial recognition and measurement
Financial instruments are recognised initially when the municipality becomes a party to the contractual provisions of the
instruments.
The municipality classifies financial instruments, or their component parts, on initial recognition as a financial asset, a financial
liability or an equity instrument in accordance with the substance of the contractual arrangement.
Financial instruments are measured initially at fair value, except for equity investments for which a fair value is not
determinable, which are measured at cost and are classified as available-for-sale financial assets.
For financial instruments which are not at fair value through surplus or deficit, transaction costs are included in the initial
measurement of the instrument.
Regular way purchases of financial assets are accounted for at trade date.
Subsequent measurement
Financial instruments at fair value through surplus or deficit are subsequently measured at fair value, with gains and losses
arising from changes in fair value being included in surplus or deficit for the period.
Net gains or losses on the financial instruments at fair value through surplus or deficit dividends or similar distributions and
interest.
Dividend or similar distributions income is recognised in surplus or deficit as part of other income when the municipality's right
to receive payment is established.
Loans and receivables are subsequently measured at amortised cost, using the effective interest method, less accumulated
impairment losses.
Held-to-maturity investments are subsequently measured at amortised cost, using the effective interest method, less
accumulated impairment losses.
Available-for-sale financial assets are subsequently measured at fair value. This excludes equity investments for which a fair
value is not determinable, which are measured at cost less accumulated impairment losses.
Gains and losses arising from changes in fair value are recognised in equity until the asset is disposed of or determined to be
impaired. Interest on available-for-sale financial assets calculated using the effective interest method is recognised in surplus
or deficit as part of other income. Dividends or similar distributions received on available-for-sale equity instruments are
recognised in surplus or deficit as part of other income when the municipality's right to receive payment is established.
Changes in fair value of available-for- sale financial assets denominated in a foreign currency are analysed between translation
differences resulting from changes in amortised cost and other changes in the carrying amount. Translation differences on
monetary items are recognised in surplus or deficit, while translation differences on non-monetary items are recognised in
equity.
Financial liabilities at amortised cost are subsequently measured at amortised cost, using the effective interest method.
Municipality | APPENDICES 321
Molemole Local Municipality
(Registration number LIM353)
Financial Statements for the year ended 30 June 2019
Accounting Policies
Fair value determination
The fair values of quoted investments are based on current bid prices. If the market for a financial asset is not active (and for
unlisted securities), the municipality establishes fair value by using valuation techniques. These include the use of recent arm’s
length transactions, reference to other instruments that are substantially the same, discounted cash flow analysis, and option
pricing models making maximum use of market inputs and relying as little as possible on entity-specific inputs.
Investments
Investments, which include listed government bonds, unlisted municipal bonds, fixed deposits and short-term deposits invested
in registered commercial banks, are categorised as either held- to-maturity where the criteria for that categorisation are met, or
as loans and receivables, and are measured at amortised cost. Where investments have been impaired, the carrying value is
adjusted by the impairment loss, which is recognised as an expense in the period that the impairment is identified. Impairments
are calculated as being the difference between the carrying amount and the present value of the expected future cash flows
from the instrument. On disposal of an investment, the difference between the net disposal proceeds and the carrying amount
is charged or credited to the Statement of Financial Performance.
Trade and Other Receivables
Trade and other receivables are categorised as financial assets: loans and receivables and are initially recognised at fair value
and subsequently carried at amortised cost. Amortised cost refers to the initial carrying amount, plus interest, less repayments
and impairments. An estimate is made for doubtful receivables based on a review of all outstanding amounts at year-end.
Significant financial difficulties of the debtor, probability that the debtor will enter bankruptcy or financial reorganisation, and
default or delinquency in payments (more than 30 days overdue) are considered indicators that the trade receivable is
impaired. Impairments are determined by discounting expected future cash flows to their present value. Amounts that are
receivable within 12 months from the reporting date are classified as current.
Impairment Loss
An impairment of trade receivables is accounted for by reducing the carrying amount of trade receivables through the use of an
allowance account, and the amount of the loss is recognised in the Statement of Financial Performance within operating
expenses. When a trade receivable is uncollectible, it is written off. Subsequent recoveries of amounts previously written off are
credited against operating expenses in the Statement of Financial Performance.
The municipality determine impairment of trade receivables in accordance with the debt write off policy.
Trade Payables and Borrowings
Financial liabilities consist of trade payables and borrowings. They are categorised as financial liaibilities held at amortised
cost, are intitially recognised at fair value and subsequently measured at amortised cost which is the initial carrying amount,
less repayments, plus interest.
Cash and Cash Equivalents
Cash and cash equivalents includes cash on hand (including petty cash) and cash with banks (including call deposits). Cash
equivalents are short-term highly liquid investments, readily convertible into known amounts of cash, that are held with
registered banking institutions with maturities of three months or less and are subject to an insignificant risk of change in value.
For the purposes of the cash flow statement, cash and cash equivalents comprise cash on hand, deposits held on call with
banks, net of bank overdrafts. The municipality categorises cash and cash equivalents as financial assets: loans and
receivables.
Bank overdrafts are recorded based on the facility utilised. Finance charges on bank overdraft are expensed as incurred.
Amounts owing in respect of bank overdrafts are categorised as financial liabilities: other financial liabilties carried at amortised
cost.

Municipality | APPENDICES 322
1.12 Leases
A lease is classified as a finance lease if it transfers substantially all the risks and rewards incidental to ownership. A lease is
classified as an operating lease if it does not transfer substantially all the risks and rewards incidental to ownership.
When a lease includes both land and buildings elements, the entity assesses the classification of each element separately.
25
Municipality | APPENDICES 323
Molemole Local Municipality
(Registration number LIM353)
Financial Statements for the year ended 30 June 2019
Accounting Policies
Finance leases - lessor
The municipality recognises finance lease receivables as assets on the statement of financial position. Such assets are
presented as a receivable at an amount equal to the net investment in the lease.
Finance revenue is recognised based on a pattern reflecting a constant periodic rate of return on the municipality’s net
investment in the finance lease.
Finance leases - lessee
Finance leases are recognised as assets and liabilities in the statement of financial position at amounts equal to the fair value
of the leased property or, if lower, the present value of the minimum lease payments. The corresponding liability to the lessor is
included in the statement of financial position as a finance lease obligation.
The discount rate used in calculating the present value of the minimum lease payments is the .
Minimum lease payments are apportioned between the finance charge and reduction of the outstanding liability. The finance
charge is allocated to each period during the lease term so as to produce a constant periodic rate on the remaining balance of
the liability.
Any contingent rents are expensed in the period in which they are incurred.
Operating leases - lessor
Operating lease revenue is recognised as revenue on a straight-line basis over the lease term.
Initial direct costs incurred in negotiating and arranging operating leases are added to the carrying amount of the leased asset
and recognised as an expense over the lease term on the same basis as the lease revenue.
The aggregate cost of incentives is recognised as a reduction of rental revenue over the lease term on a straight-line basis.
The aggregate benefit of incentives is recognised as a reduction of rental expenses over the lease term on a straight-line basis.
Income for leases is disclosed under revenue in the Statement of Financial Performance.
Operating leases - lessee
Operating lease payments are recognised as an expense on a straight -line basis over the lease term. The difference between
the amounts recognised as an expense and the contractual payments are recognised as an operating lease asset or liability.
Municipality as Lessee
Leases are classified as finance leases where substantially all the risks and rewards associated with ownership of an asset are
transferred to the municipality. Property, plant and equipment or intangible assets subject to finance lease agreements are
initially recognised at the lower of the asset's fair value and the present value of the minimum lease payments. The
corresponding liabilities are initially recognised at the inception of the lease and are measured as the sum of the minimum lease
payments due in terms of the lease agreement, discounted for the effect of interest. In discounting the lease payments, the
municipality uses the interest rate that exactly discounts the lease payments and unguaranteed residual value to the fair value
of the asset plus any direct costs incurred.
Subsequent to initial recognition, the leased assets are accounted for in accordance with the stated accounting policies
applicable to property, plant, equipment or intangibles. The lease liability is reduced by the lease payments, which are allocated
between the lease finance cost and the capital repayment using the effective interest rate method. Lease finance costs are
expensed when incurred. The accounting policies relating to derecognition of financial instruments are applied to lease
payables. The lease asset is depreciated over the shorter of the asset's useful life or the lease term.

Municipality | APPENDICES 324
Operating leases are those leases that do not fall within the scope of the above definition. Operating lease rentals are accrued
on a straight-line basis over the term of the relevant lease.
Municipality as Lessor
26
Municipality | APPENDICES 325
Molemole Local Municipality
(Registration number LIM353)
Financial Statements for the year ended 30 June 2019
Accounting Policies
Under a finance lease, the municipality recognises the lease payments to be received in terms of a lease agreement as an
asset (receivable). The receivable is calculated as the sum of all the minimum lease payments to be received, plus any
unguaranteed residual accruing to the municipality, discounted at the interest rate implicit in the lease. The receivable is
reduced by the capital portion of the lease instalments received, with the interest portion being recognised as interest revenue
on a time proportionate basis. The accounting policies relating to derecognition and impairment of financial instruments are
applied to lease receivables.
Rental income from operating leases is recognised on a straight-line basis over the term of the relevant lease.
1.13 Inventories
Inventories are initially measured at cost except where inventories are acquired through a non-exchange transaction, then their
costs are their fair value as at the date of acquisition.
Subsequently inventories are measured at the lower of cost and net realisable value.
Inventories are measured at the lower of cost and current replacement cost where they are held for;
distribution at no charge or for a nominal charge; or
consumption in the production process of goods to be distributed at no charge or for a nominal charge.
Net realisable value is the estimated selling price in the ordinary course of operations less the estimated costs of completion
and the estimated costs necessary to make the sale, exchange or distribution.
Current replacement cost is the cost the municipality incurs to acquire the asset on the reporting date.
The cost of inventories comprises of all costs of purchase, costs of conversion and other costs incurred in bringing the
inventories to their present location and condition.
The cost of inventories of items that are not ordinarily interchangeable and goods or services produced and segregated for
specific projects is assigned using specific identification of the individual costs.
The cost of inventories is assigned using the formula. The same cost formula is used for all inventories having a similar nature
and use to the municipality.
When inventories are sold, the carrying amounts of those inventories are recognised as an expense in the period in which the
related revenue is recognised. If there is no related revenue, the expenses are recognised when the goods are distributed, or
related services are rendered. The amount of any write-down of inventories to net realisable value or current replacement cost
and all losses of inventories are recognised as an expense in the period the write-down or loss occurs. The amount of any
reversal of any write-down of inventories, arising from an increase in net realisable value or current replacement cost, are
recognised as a reduction in the amount of inventories recognised as an expense in the period in which the reversal occurs.
Initial Recognition
Inventories comprise current assets held for sale, consumption or distribution during the ordinary course of business.
Inventories are initially recognised at cost. Cost generally refers to the purchase price, plus taxes, transport costs and any other
costs in bringing the inventories to their current location and condition. Where inventory is manufactured, constructed or
produced, the cost includes the cost of labour, materials and overheads used during the manufacturing process.
Where inventory is acquired by the municipality for no or nominal consideration (i.e. a non-exchange transaction), the cost is
deemed to be equal to the fair value of the item on the date acquired.
Subsequent Measurement
Inventories, consisting of consumable stores, raw materials, work-in-progress and finished goods, are valued at the lower of
cost and net realisable value unless they are to be distributed at no or nominal charge, in which case they are measured at the
lower of cost and current replacement cost. Redundant and slow-moving inventories are identified and written down in this way.

Municipality | APPENDICES 326
Differences arising on the valuation of inventory are recognised in the Statement of Financial Performance in the year in which
they arose. The amount of any reversal of any write-down of inventories arising from an increase in net realisable value or
current replacement cost is recognised as a reduction in the amount of inventories recognised as an expense in the period in
which the reversal occurs.
Subsequent inventories are measured at the lower of cost and net realisable value.
27

Municipality | APPENDICES 327
Molemole Local Municipality
(Registration number LIM353)
Financial Statements for the year ended 30 June 2019
Accounting Policies
Inventories comprise current assets held for sale or for consumption during the ordinary course of business and are measured
at the lower of cost and current replacement cost where they are held for;
a) distribution at no charge or for a nominal charge; or b) consumption in the production process of goods to be distributed at no charge or for a nominal charge
The carrying amount of inventories is recognised as an expense in the period that the inventory was sold, distributed, written off
or consumed, unless that cost qualifies for capitalisation to the cost of another asset.
The basis for allocating cost to inventory items is the first in first out (FIFO) method.
1.14 Employee benefits
Short-term employee benefits
The cost of short-term employee benefits, (those payable within 12 months after the service is rendered, such as paid vacation
leave and sick leave, bonuses, and non-monetary benefits such as medical care), are recognised in the period in which the
service is rendered and are not discounted.
The expected cost of compensated absences is recognised as an expense as the employees render services that increase
their entitlement or, in the case of non-accumulating absences, when the absence occurs.
The expected cost of surplus sharing and bonus payments is recognised as an expense when there is a legal or constructive
obligation to make such payments as a result of past performance.
Post Retirement Medical Obligation
The Municipality provides post-retirement medical benefits by subsidising the medical aid contributions of certain retired staff
according to the rules of the medical aid funds.
Council pays 70% of the contribution and the remaining 30% is paid by the members. The entitlement to these benefits is
usually conditional on the employee remaining in service up to retirement age and the completion of a minimum service period.
The present value of the defined benefit liability is actuarially determined in accordance with GRAP 25 – Employee benefits
(using a discount rate applicable to high quality government bonds). The plan is unfunded.
These contributions are charged to the Statement of Financial Performance when employees have rendered the service
entitling them to the contribution. The liability was calculated by means of the projected unit credit actuarial valuation method.
The liability in respect of current pensioners is regarded as fully accrued, and is therefore not split between a past (or accrued)
and future in-service element. The liability is recognised at the fair value of the obligation. Payments made by the municipality
are set-off against the liability, including notional interest, resulting from the valuation by the actuaries and are charged against
the Statement of Financial Performance as employee benefits upon valuation.
Actuarial gains and losses arising from the experience adjustments and changes in actuarial assumptions, is charged or
credited to the Statement of Financial Performance in the period that it occurs. These obligations are valued periodically by
independent qualified actuaries.
Long Service Awards
Long service awards are provided to employees who achieve certain pre- determined milestones of service within the
municipality. The municipality’s obligation under these plans is valued by independent qualified actuaries periodically and the
corresponding liability is raised. Payments are set-off against the liability, including notional interest, resulting from the
valuation by the actuaries and are charged against the Statement of Financial Performance as employee benefits upon
valuation. Defined benefit plans are post-employment plans other than defined contribution plans.
Actuarial gains and losses arising from the experience adjustments and changes in actuarial assumptions, is charged or
credited to the Statement of Financial Performance in the period that it occurs. These obligations are valued periodically by
independent qualified actuaries.

Municipality | APPENDICES 328
Provision for Staff Leave
28
Municipality | APPENDICES 329
Molemole Local Municipality
(Registration number LIM353)
Financial Statements for the year ended 30 June 2019
Accounting Policies
Liabilities for annual leave are recognised as they accrue to employees. The liability is based on the total amount of leave days
due to employees at year end and also on the total remuneration package of the relevant employee. Accumulated leave is
carried forward and can be used in future periods if the current employee. period’s entitlement is not used in full. An employee’s
accumulated leave cannot exceed 48 days. Any days in excess thereof is forfeited. All unused leave will be paid out to the
specific employee at the end of that employee’s employment term. Accumulated leave is vesting.
Staff Bonusses Accrued
Liabilities for staff bonuses are recognised as they accrue to employees. The liability at year end is based on the bonus
accrued at year end for each employee.
Provision for Performance Bonusses
A provision, in respect of the liability relating to the anticipated costs of performance bonuses payable to Section 57
employees, contract workers and other senior managers, is recognised as it accrues. The performance bonus provisions are
based on the employment contract stipulations as well as previous performance bonus payment trends. This bonus is not
guaranteed.
1.15 Provisions and contingencies
Provisions are recognised when:
the municipality has a present obligation as a result of a past event;
it is probable that an outflow of resources embodying economic benefits or service potential will be required to settle the obligation; and
a reliable estimate can be made of the obligation.
The amount of a provision is the best estimate of the expenditure expected to be required to settle the present obligation at the
reporting date.
Where the effect of time value of money is material, the amount of a provision is the present value of the expenditures
expected to be required to settle the obligation.
The discount rate is a pre-tax rate that reflects current market assessments of the time value of money and the risks specific to
the liability.
Where some or all of the expenditure required to settle a provision is expected to be reimbursed by another party, the
reimbursement is recognised when, and only when, it is virtually certain that reimbursement will be received if the municipality
settles the obligation. The reimbursement is treated as a separate asset. The amount recognised for the reimbursement does
not exceed the amount of the provision.
Provisions are reviewed at each reporting date and adjusted to reflect the current best estimate. Provisions are reversed if it is
no longer probable that an outflow of resources embodying economic benefits or service potential will be required, to settle the
obligation.
Where discounting is used, the carrying amount of a provision increases in each period to reflect the passage of time. This
increase is recognised as an interest expense.
A provision is used only for expenditures for which the provision was originally recognised.
Provisions are not recognised for future operating surplus (deficit).
If an entity has a contract that is onerous, the present obligation (net of recoveries) under the contract is recognised and
measured as a provision.
29
Municipality | APPENDICES 330
Molemole Local Municipality
(Registration number LIM353)
Financial Statements for the year ended 30 June 2019
Accounting Policies
A constructive obligation to restructure arises only when an entity:
has a detailed formal plan for the restructuring, identifying at least:
- the activity/operating unit or part of a activity/operating unit concerned; - the principal locations affected; the location, function, and approximate number of employees who will be compensated for services being
terminated; - the expenditures that will be undertaken; and - when the plan will be implemented; and
has raised a valid expectation in those affected that it will carry out the restructuring by starting to implement that
plan or announcing its main features to those affected by it.
A restructuring provision includes only the direct expenditures arising from the restructuring, which are those that are both:
necessarily entailed by the restructuring; and
not associated with the ongoing activities of the municipality
No obligation arises as a consequence of the sale or transfer of an operation until the municipality is committed to the sale
or transfer, that is, there is a binding arrangement.
After their initial recognition contingent liabilities recognised in entity combinations that are recognised separately are
subsequently measured at the higher of:
the amount that would be recognised as a provision; and
the amount initially recognised less cumulative amortisation.
Contingent assets and contingent liabilities are not recognised. Contingencies are disclosed in note 50.
A financial guarantee contract is a contract that requires the issuer to make specified payments to reimburse the holder for a
loss it incurs because a specified debtor fails to make payment when due in accordance with the original or modified terms of a
debt instrument.
Loan commitment is a firm commitment to provide credit under pre-specified terms and conditions.
The municipality recognises a provision for financial guarantees and loan commitments when it is probable that an outflow of
resources embodying economic benefits and service potential will be required to settle the obligation and a reliable estimate of
the obligation can be made.
Determining whether an outflow of resources is probable in relation to financial guarantees requires judgement. Indications that
an outflow of resources may be probable are:
financial difficulty of the debtor;
defaults or delinquencies in interest and capital repayments by the debtor;
breaches of the terms of the debt instrument that result in it being payable earlier than the agreed term and the ability of the debtor to settle its obligation on the amended terms; and
a decline in prevailing economic circumstances (e.g. high interest rates, inflation and unemployment) that impact on
the ability of entities to repay their obligations.
Where a fee is received by the municipality for issuing a financial guarantee and/or where a fee is charged on loan
commitments, it is considered in determining the best estimate of the amount required to settle the obligation at reporting date.
Municipality | APPENDICES 331
Where a fee is charged and the municipality considers that an outflow of economic resources is probable, an municipality
recognises the obligation at the higher of:
the amount determined using in the Standard of GRAP on Provisions, Contingent Liabilities and Contingent Assets; and
the amount of the fee initially recognised less, where appropriate, cumulative amortisation recognised in accordance
with the Standard of GRAP on Revenue from Exchange Transactions.
1.16 Revenue from exchange transactions
Revenue from exchange transactions refers to revenue that accrued to the municipality directly in return for services rendered /
goods sold, the value of which approximates the consideration received or receivable.
30
Municipality | APPENDICES 332
Molemole Local Municipality
(Registration number LIM353)
Financial Statements for the year ended 30 June 2019
Accounting Policies
Service charges relating to electricity and water are based on consumption. Meters are read on a quarterly basis and are
recognised as revenue when invoiced. Provisional estimates of consumption are made monthly when meter readings have not
been performed. The provisional estimates of consumption are recognised as revenue when invoiced. Adjustments to
provisional estimates of consumption are made in the invoicing period in which meters have been read. These adjustments are
recognised as revenue in the invoicing period.
Revenue from the sale of electricity prepaid meter cards is recognised at the point of sale.
Service charges relating to refuse removal are recognised on a monthly basis in arrears by applying the approved tariff to each
property that has improvements. Tariffs are determined per category of property usage, and are levied monthly based on the
recorded number of refuse containers per property.
Service charges from sewerage and sanitation are based on the number of sewerage connections on each developed property
using the tariffs approved by Council and are levied monthly.
Interest revenue is recognised on a time proportion basis.
Revenue from the rental of facilities and equipment is recognised on a straight-line basis over the term of the lease agreement.
Dividends are recognised on the date that the Municipality becomes entitled to receive the dividend.
Revenue arising from the application of the approved tariff of charges is recognised when the relevant service is rendered by
applying the relevant gazetted tariff. This includes the issuing of licences and permits.
Revenue from the sale of goods is recognised when substantially all the risks and rewards in those goods is passed to the
consumer.
Revenue arising out of situations where the municipality acts as an agent on behalf of another entity (the principal) is limited to
the amount of any fee or commission payable to the municipality as compensation for executing the agreed services.
1.17 Revenue from non-exchange transactions
Revenue is measured at the fair value of the consideration received or receivable, net of trade discounts and volume rebates.
Government grants
Government grants are recognised as revenue when:
it is probable that the economic benefits or service potential associated with the transaction will flow to the municipality
the amount of the revenue can be measured reliably, and
to the extent that there has been compliance with any restrictions associated with the grant.
The municipality assesses the degree of certainty attached to the flow of future economic benefits or service potential on the
basis of the available evidence. Certain grants payable by one level of government to another are subject to the availability of
funds. Revenue from these grants is only recognised when it is probable that the economic benefits or service potential
associated with the transaction will flow to the entity. An announcement at the beginning of a financial year that grants may be
available for qualifying entities in accordance with an agreed programme may not be sufficient evidence of the probability of the
flow. Revenue is then only recognised once evidence of the probability of the flow becomes available.
Restrictions on government grants may result in such revenue being recognised on a time proportion basis. Where there is no
restriction on the period, such revenue is recognised on receipt or when the Act becomes effective, which-ever is earlier.
When government remit grants on a re-imbursement basis, revenue is recognised when the qualifying expense has been
incurred and to the extent that any other restrictions have been complied with.

Municipality | APPENDICES 333
Revenue from non-exchange transactions refers to transactions where the municipality received revenue from another entity
without directly giving approximately equal value in exchange. Revenue from non-exchange transactions is generally
recognised to the extent that the related receipt or receivable qualifies for recognition as an asset and there is no liability to
repay the amount.
Revenue from property rates is recognised when the legal entitlement to this revenue arises. Collection charges are recognised
when such amounts are legally enforceable. Penalty interest on unpaid rates is recognised on a time proportionate basis.
31
Municipality | APPENDICES 334
Molemole Local Municipality
(Registration number LIM353)
Financial Statements for the year ended 30 June 2019
Accounting Policies
Fines constitute both spot fines and summonses. Revenue from spot fines and summonses is recognised when payment is
received, together with an estimate of spot fines and summonses that will be received based on past experience of amounts
collected.
Revenue from public contributions and donations is recognised when all conditions associated with the contribution have been
met or where the contribution is to finance property, plant and equipment, when such items of property, plant and equipment
qualifies for recognition and first becomes available for use by the municipality. Where public contributions have been received
but the municipality has not met the related conditions, a deferred income (liability) is recognised.
Contributed property, plant and equipment is recognised when such items of property, plant and equipment qualifies for
recognition and become available for use by the municipality.
Revenue from the recovery of unauthorised, irregular, fruitless and wasteful expenditure is based on legislated procedures,
including those set out in the Municipal Finance Management Act (Act No.56 of 2003) and is recognised when the recovery
thereof from the responsible councillors or officials is virtually certain.
1.18 Borrowing costs
Borrowing costs that are directly attributable to the acquisition, construction or production of qualifying assets are capitalised to
the cost of that asset unless it is inappropriate to do so. The municipality ceases the capitalisation of borrowing costs when
substantially all the activities to prepare the asset for its intended use or sale are complete. It is considered inappropriate to
capitalise borrowing costs where the link between the funds borrowed and the capital asset acquired cannot be adequately
established.
1.19 Unauthorised expenditure
Unauthorised expenditure means:
overspending of a vote or a main division within a vote; and
expenditure not in accordance with the purpose of a vote or, in the case of a main division, not in accordance with
the purpose of the main division.
All expenditure relating to unauthorised expenditure is recognised as an expense in the Statement of Financial Performance in
the year that the expenditure was incurred. The expenditure is classified in accordance with the nature of the expense, and
where recovered, it is subsequently accounted for as revenue in the Statement of Financial Performance. The Unauthorised
expenditure is disclosed in a note to the Annual Financial Statements.
1.20 Fruitless and wasteful expenditure
Fruitless expenditure means expenditure which was made in vain and would have been avoided had reasonable care been
exercised.
All expenditure relating to fruitless and wasteful expenditure is recognised as an expense in the Statement of Financial
Performance in the year that the expenditure was incurred, unless if it is recoverable (i.e. receivable), it will be raised as an
asset in the Statement of Financial Position. The expenditure is classified in accordance with the nature of the expense, and
where recovered, it is subsequently accounted for as revenue in the Statement of Financial Performance.
Fruitless and wasteful expenditure will be de-recognised as soon as the nature of the fruitless and wasteful expenditure has
been submitted to Council and a formal Council decision has been taken to condone the expenditure. The Fruitless and
Wasteful expenditure is disclosed in a note to the Annual Financial Statements.
1.21 Irregular expenditure
Irregular expenditure as defined in section 1 of the PFMA is expenditure other than unauthorised expenditure, incurred in
contravention of or that is not in accordance with a requirement of any applicable legislation, including -
(a) this Act; or

Municipality | APPENDICES 335
(b) the State Tender Board Act, 1968 (Act No. 86 of 1968), or any regulations made in terms of the Act; or (c) any provincial legislation providing for procurement procedures in that provincial government.
National Treasury practice note no. 4 of 2008/2009 which was issued in terms of sections 76(1) to 76(4) of the PFMA requires
the following (effective from 1 April 2008):
32
Municipality | APPENDICES 336
Molemole Local Municipality
(Registration number LIM353)
Financial Statements for the year ended 30 June 2019
Accounting Policies
Irregular expenditure that was incurred and identified during the current financial year and which was condoned before year
end and/or before finalisation of the financial statements must also be recorded appropriately in the irregular expenditure
register. In such an instance, no further action is also required with the exception of updating the note to the financial
statements.
Irregular expenditure that was incurred and identified during the current financial year and for which condonement is being
awaited at year end must be recorded in the irregular expenditure register. No further action is required with the exception of
updating the note to the financial statements.
Where irregular expenditure was incurred in the previous financial year and is only condoned in the following financial year, the
register and the disclosure note to the financial statements must be updated with the amount condoned.
Irregular expenditure that was incurred and identified during the current financial year and which was not condoned by the
National Treasury or the relevant authority must be recorded appropriately in the irregular expenditure register. If liability for the
irregular expenditure can be attributed to a person, a debt account must be created if such a person is liable in law. Immediate steps must thereafter be taken to recover the amount from the person concerned. If recovery is not possible, the accounting
officer or accounting authority may write off the amount as debt impairment and disclose such in the relevant note to the
financial statements. The irregular expenditure register must also be updated accordingly. If the irregular expenditure has not been condoned and no person is liable in law, the expenditure related thereto must remain against the relevant
programme/expenditure item, be disclosed as such in the note to the financial statements and updated accordingly in the
irregular expenditure register.
Irregular expenditure is expenditure that is contrary to the Municipal Finance Management Act (Act No.56 of 2003), the
Municipal Systems Act (Act No.32 of 2000), and the Public Office Bearers Act (Act No. 20 of 1998) or is in contravention of the
economic entity’s supply chain management policy. Irregular expenditure excludes unauthorised expenditure. Irregular
expenditure is accounted for as expenditure in the Statement of Financial Performance and where recovered, it is subsequently
accounted for as revenue in the Statement of Financial Performance. The Irregular expenditure is disclosed in a note to the
Annual Financial Statements.
1.22 Provisions
Provisions are recognised when the municipality has a present or constructive obligation as a result of past events, it is
probable that an outflow of resources embodying economic benefits will be required to settle the obligation and a reliable
estimate of the provision can be made. Provisions are reviewed at reporting date and adjusted to reflect the current best
estimate. Where the effect is material, non-current provisions are discounted to their present value using a pre-tax discount
rate that reflects the market's current assessment of the time value of money, adjusted for risks specific to the liability (for
example in the case of obligations for the rehabilitation of land).
The municipality does not recognise a contingent liability or contingent asset. A contingent liability is disclosed unless the
possibility of an outflow of resources embodying economic benefits is remote. A contingent asset is disclosed where an inflow
of economic benefits is probable.
Future events that may affect the amount required to settle an obligation are reflected in the amount of a provision where there
is sufficient objective evidence that they will occur. Gains from the expected disposal of assets are not taken into account in
measuring a provision. Provisions are not recognised for future operating losses. The present obligation under an onerous
contract is recognised and measured as a provision.
A provision for restructuring costs is recognised only when the following criteria over and above the recognition criteria of a
provision have been met:
(a) The municipality has a detailed formal plan for the restructuring identifying at least:
the business or part of a business concerned;
the principal locations affected;
the location, function, and approximate number of employees who will be compensated for terminating their services;
the expenditures that will be undertaken; and when the plan will be implemented; and

Municipality | APPENDICES 337
(b) The municipality has raised a valid expectation in those affected that it will carry out the restructuring by starting to
implement that plan or announcing its main features to those affected by it.
33
Municipality | APPENDICES 338
Molemole Local Municipality
(Registration number LIM353)
Financial Statements for the year ended 30 June 2019
Accounting Policies
1.23 Budget information
Municipality are typically subject to budgetary limits in the form of appropriations or budget authorisations (or equivalent), which
is given effect through authorising legislation, appropriation or similar.
General purpose financial reporting by municipality shall provide information on whether resources were obtained and used in
accordance with the legally adopted budget.
The approved budget is prepared on a cash basis and presented by economic classification linked to performance outcome
objectives.
The approved budget covers the fiscal period from 2018-07-01 to 2019-06-30.
The budget for the economic entity includes all the entities approved budgets under its control.
The financial statements and the budget are on the same basis of accounting therefore a comparison with the budgeted
amounts for the reporting period have been included in the Statement of comparison of budget and actual amounts.
1.24 Related parties
The municipality operates in an economic sector currently dominated by entities directly or indirectly owned by the South
African Government. As a consequence of the constitutional independence of the three spheres of government in South Africa,
only entities within the municipality sphere of government are considered to be related parties.
Management are those persons responsible for planning, directing and controlling the activities of the municipality, including
those charged with the governance of the municipality in accordance with legislation, in instances where they are required to
perform such functions.
Close members of the family of a person are considered to be those family members who may be expected to influence, or be
influenced by, that management in their dealings with the municipality.
Only transactions with related parties not at arm’s length or not in the ordinary course of business are disclosed.
1.25 Retirement Benefits
The municipality provides retirement benefits for its employees and councillors. The contributions to fund obligations for the
payment of retirement benefits are charged against revenue in the year they become payable. The defined benefit funds, which
are administered on a provincial basis, are actuarially valued triennially on the projected unit credit method basis. Deficits
identified are recognised as a liability and are recovered through lump sum payments or increased future contributions on a
proportional basis to all participating municipalities.
34
Municipality | APPENDICES 339
Molemole Local Municipality
(Registration number LIM353)
Financial Statements for the year ended 30 June 2019
Accounting Policies
1.26 Impairment of Assets
The municipality assesses at each reporting date whether there is any indication that an asset may be impaired. If any such
indication exists, the municpality estimates the recoverable service amount of the asset.
Irrespective of whether there is any indication of impairment, the municipality also:
tests intangible assets with an indefinite useful life or intangible assets not yet available for use for impairment
annually by comparing their carrying amount with their recoverable amount. This impairment test is performed during
the annual period and at the same time every period.
If there is any indication that an asset may be impaired, the recoverable service amount is estimated for the individual asset. If
it is not possible to estimate the recoverable service amount of the individual asset, the recoverable service amount of the
cash-generating unit to which the asset belongs is determined.
The recoverable service amount of an asset or a cash-generating unit is the higher of its fair value less costs to sell and its
value in use.
If the recoverable service amount of an asset is less than its carrying amount, the carrying amount of the asset is reduced to its
recoverable service amount. That reduction is an impairment loss.
An impairment loss of assets carried at cost less any accumulated depreciation or amortisation is recognised immediately in
surplus or deficit. Any impairment loss of a revalued asset is treated as a revaluation decrease.
An impairment loss is recognised for cash-generating units if the recoverable service amount of the unit is less than the
carrying amount of the unit. The impairment loss is allocated to reduce the carrying amount of the assets of the unit as follows:
to the assets of the unit, pro rata on the basis of the carrying amount of each asset in the unit.
A municipality assesses at each reporting date whether there is any indication that an impairment loss recognised in prior
periods for assets may no longer exist or may have decreased. If any such indication exists, the recoverable service amounts
of those assets are estimated.
The increased carrying amount of an asset attributable to a reversal of an impairment loss does not exceed the carrying
amount that would have been determined had no impairment loss been recognised for the asset in prior periods.
A reversal of an impairment loss of assets carried at cost less accumulated depreciation or amortisation is recognised
immediately in surplus or deficit. Any reversal of an impairment loss of a revalued asset is treated as a revaluation increase.
1.27 Commitments
Items are classified as commitments when an entity has committed itself to future transactions that will normally result in the
outflow of cash.
Disclosures are required in respect of unrecognized contractual commitments.
Commitments for which disclosure is necessary to achieve a fair presentation should be disclosed in a note to the financial
statements, if both the following criteria are met:
Contracts should be non-cancellable or only cancellable at significant cost (for example, contracts for computer or building maintenance services); and
Contracts should relate to something other than the routine, steady, state business of the entity – therefore salary
commitments relating to employment contracts or social security benefit commitments are excluded.
35
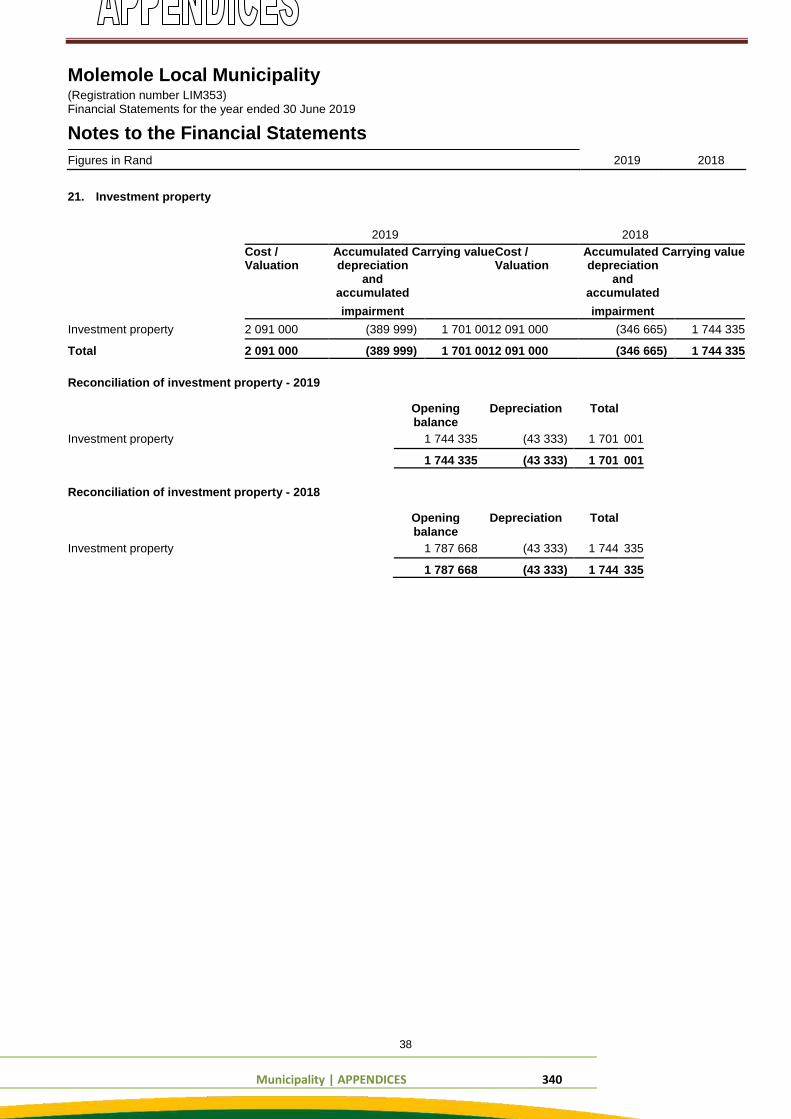
Municipality | APPENDICES 340
Molemole Local Municipality (Registration number LIM353) Financial Statements for the year ended 30 June 2019
Notes to the Financial Statements Figures in Rand 2019 2018
21. Investment property
2019 2018
Cost / Accumulated Carrying value Cost / Accumulated Carrying value
Valuation depreciation Valuation depreciation
and and
accumulated accumulated
impairment impairment
Investment property 2 091 000 (389 999) 1 701 001 2 091 000 (346 665) 1 744 335
Total
2 091 000 (389 999) 1 701 001 2 091 000 (346 665) 1 744 335
Reconciliation of investment property - 2019
Opening Depreciation Total balance
Investment property 1 744 335 (43 333) 1 701 001
1 744 335 (43 333) 1 701 001
Reconciliation of investment property - 2018
Opening Depreciation Total balance
Investment property 1 787 668 (43 333) 1 744 335
1 787 668 (43 333) 1 744 335
38
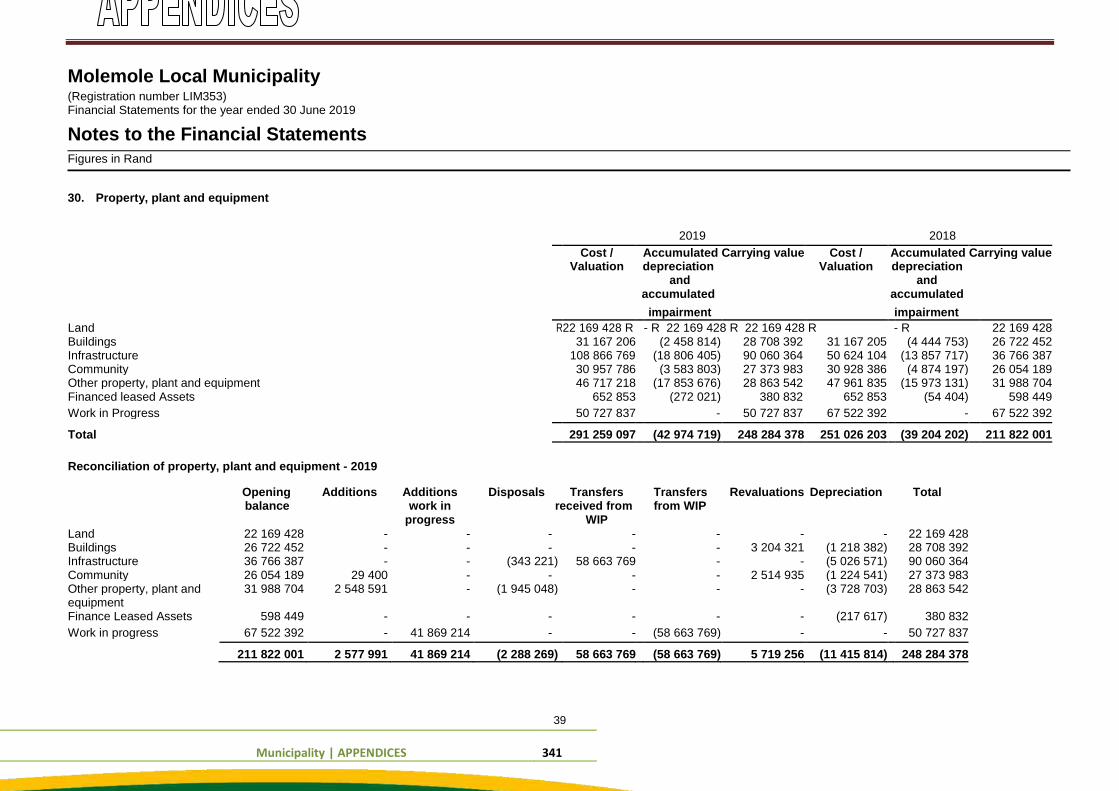
Municipality | APPENDICES 341
Molemole Local Municipality (Registration number LIM353) Financial Statements for the year ended 30 June 2019
Notes to the Financial Statements Figures in Rand
30. Property, plant and equipment
2019 2018
Cost / Accumulated Carrying value Cost / Accumulated Carrying value
Valuation depreciation Valuation depreciation
and and
accumulated accumulated
impairment impairment
Land R 22 169 428 R - R 22 169 428 R 22 169 428 R - R 22 169 428
Buildings 31 167 206 (2 458 814) 28 708 392 31 167 205 (4 444 753) 26 722 452
Infrastructure 108 866 769 (18 806 405) 90 060 364 50 624 104 (13 857 717) 36 766 387
Community 30 957 786 (3 583 803) 27 373 983 30 928 386 (4 874 197) 26 054 189
Other property, plant and equipment 46 717 218 (17 853 676) 28 863 542 47 961 835 (15 973 131) 31 988 704
Financed leased Assets 652 853 (272 021) 380 832 652 853 (54 404) 598 449
Work in Progress 50 727 837 - 50 727 837 67 522 392 - 67 522 392
Total
291 259 097 (42 974 719) 248 284 378 251 026 203 (39 204 202) 211 822 001
Reconciliation of property, plant and equipment - 2019
Opening Additions Additions Disposals Transfers Transfers Revaluations Depreciation Total
balance work in received from from WIP
progress WIP
Land 22 169 428 - - - - - - - 22 169 428
Buildings 26 722 452 - - - - - 3 204 321 (1 218 382) 28 708 392
Infrastructure 36 766 387 - - (343 221) 58 663 769 - - (5 026 571) 90 060 364
Community 26 054 189 29 400 - - - - 2 514 935 (1 224 541) 27 373 983
Other property, plant and 31 988 704 2 548 591 - (1 945 048) - - - (3 728 703) 28 863 542
equipment
Finance Leased Assets 598 449 - - - - - - (217 617) 380 832
Work in progress 67 522 392 - 41 869 214 - - (58 663 769) - - 50 727 837
211 822 001 2 577 991 41 869 214 (2 288 269) 58 663 769 (58 663 769) 5 719 256 (11 415 814) 248 284 378
39
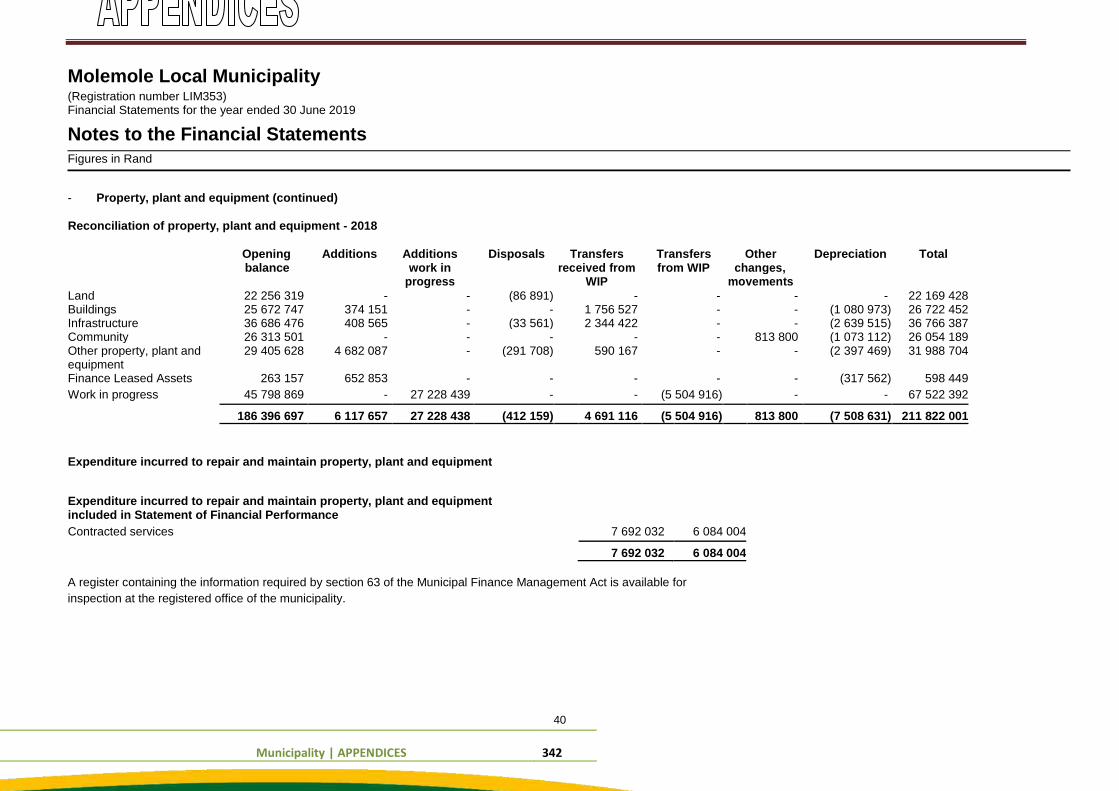
Municipality | APPENDICES 342
Molemole Local Municipality (Registration number LIM353) Financial Statements for the year ended 30 June 2019
Notes to the Financial Statements Figures in Rand
- Property, plant and equipment (continued)
Reconciliation of property, plant and equipment - 2018
Opening Additions Additions Disposals Transfers Transfers Other Depreciation Total balance work in received from from WIP changes,
progress WIP movements
Land 22 256 319 - - (86 891) - - - - 22 169 428 Buildings 25 672 747 374 151 - - 1 756 527 - - (1 080 973) 26 722 452 Infrastructure 36 686 476 408 565 - (33 561) 2 344 422 - - (2 639 515) 36 766 387 Community 26 313 501 - - - - - 813 800 (1 073 112) 26 054 189 Other property, plant and 29 405 628 4 682 087 - (291 708) 590 167 - - (2 397 469) 31 988 704 equipment
Finance Leased Assets 263 157 652 853 - - - - - (317 562) 598 449
Work in progress 45 798 869 - 27 228 439 - - (5 504 916) - - 67 522 392
186 396 697 6 117 657 27 228 438 (412 159) 4 691 116 (5 504 916) 813 800 (7 508 631) 211 822 001
Expenditure incurred to repair and maintain property, plant and equipment
Expenditure incurred to repair and maintain property, plant and equipment included in Statement of Financial Performance
Contracted services 7 692 032 6 084 004
7 692 032 6 084 004 A register containing the information required by section 63 of the Municipal Finance Management Act is available for
inspection at the registered office of the municipality.
40
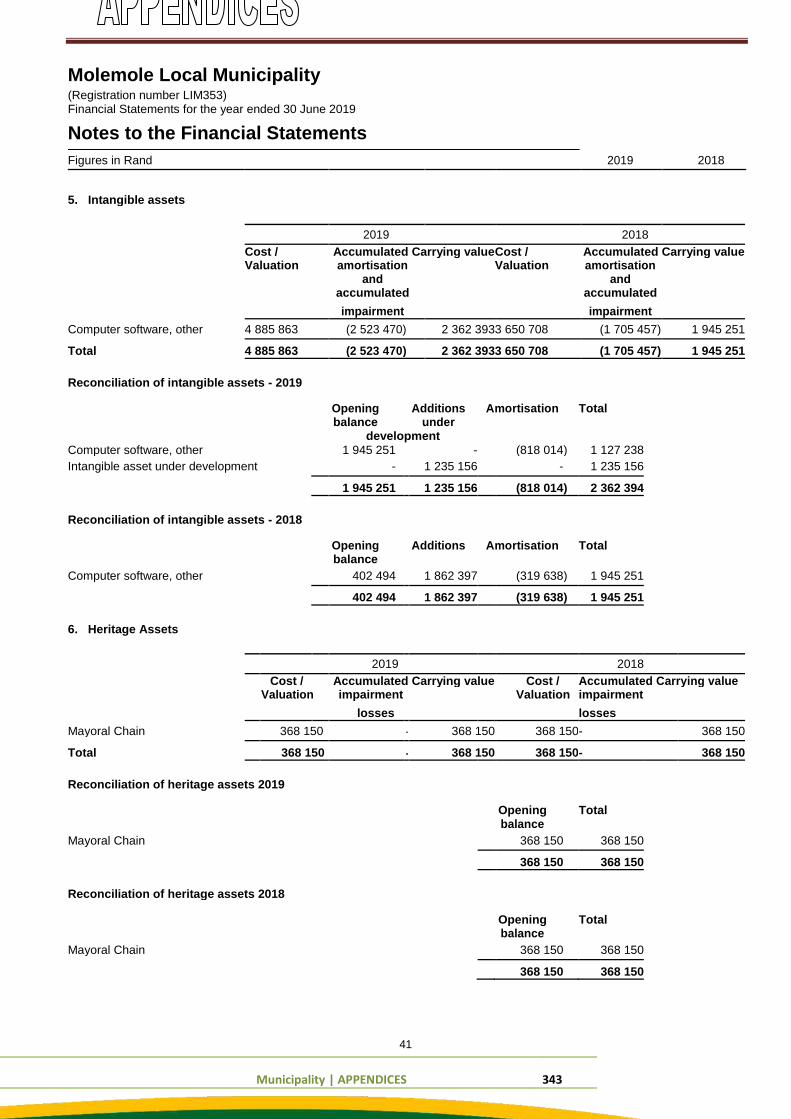
Municipality | APPENDICES 343
Molemole Local Municipality (Registration number LIM353) Financial Statements for the year ended 30 June 2019
Notes to the Financial Statements Figures in Rand 2019 2018
5. Intangible assets
2019 2018
Cost / Accumulated Carrying value Cost / Accumulated Carrying value
Valuation amortisation Valuation amortisation
and and
accumulated accumulated
impairment impairment
Computer software, other 4 885 863 (2 523 470) 2 362 393 3 650 708 (1 705 457) 1 945 251
Total
4 885 863 (2 523 470) 2 362 393 3 650 708 (1 705 457) 1 945 251
Reconciliation of intangible assets - 2019
Opening Additions Amortisation Total balance under
development
Computer software, other 1 945 251 - (818 014) 1 127 238
Intangible asset under development - 1 235 156 - 1 235 156
1 945 251 1 235 156 (818 014) 2 362 394
Reconciliation of intangible assets - 2018
Opening Additions Amortisation Total balance
Computer software, other 402 494 1 862 397 (319 638) 1 945 251
402 494 1 862 397 (319 638) 1 945 251
6. Heritage Assets
2019 2018
Cost / Accumulated Carrying value Cost / Accumulated Carrying value Valuation impairment Valuation impairment
losses losses
Mayoral Chain 368 150 - 368 150 368 150 - 368 150
Total 368 150 - 368 150 368 150 - 368 150
Reconciliation of heritage assets 2019
Opening Total balance
Mayoral Chain 368 150 368 150
368 150 368 150
Reconciliation of heritage assets 2018
Opening Total balance
Mayoral Chain 368 150 368 150
368 150 368 150
41
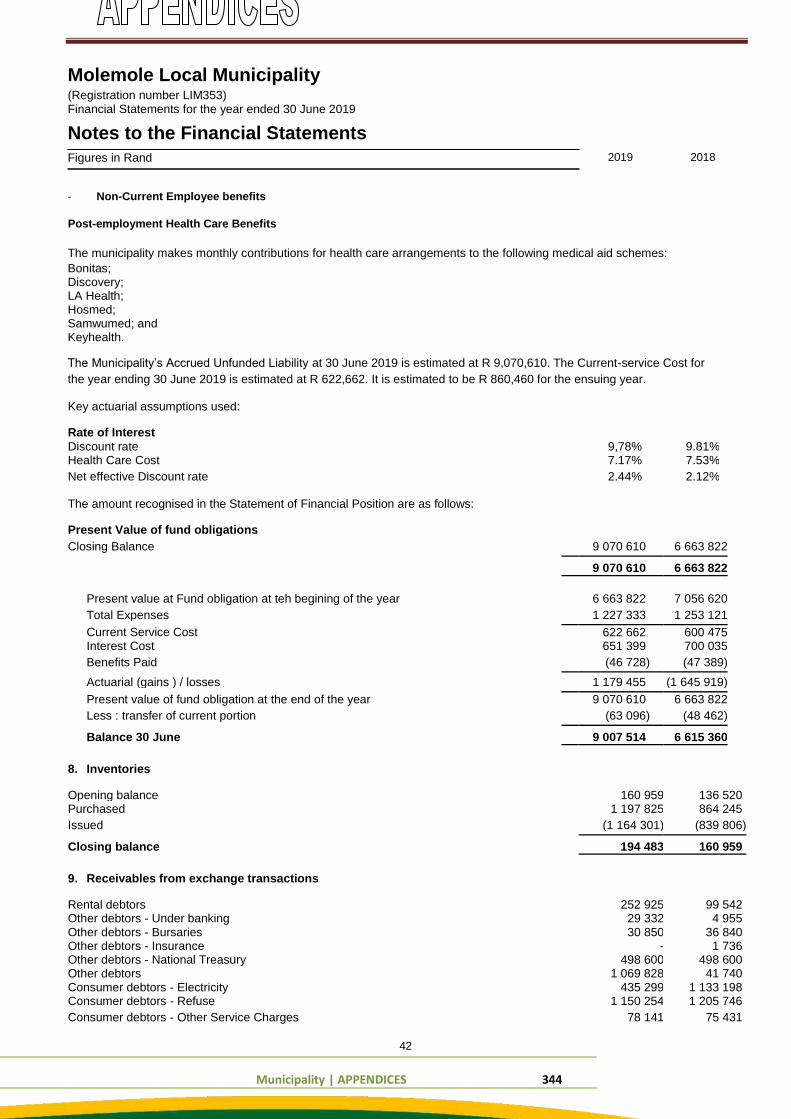
Municipality | APPENDICES 344
Molemole Local Municipality (Registration number LIM353) Financial Statements for the year ended 30 June 2019
Notes to the Financial Statements Figures in Rand
- Non-Current Employee benefits
Post-employment Health Care Benefits
2019 2018
The municipality makes monthly contributions for health care arrangements to the following medical aid schemes: Bonitas; Discovery; LA Health; Hosmed; Samwumed; and Keyhealth. The Municipality’s Accrued Unfunded Liability at 30 June 2019 is estimated at R 9,070,610. The Current-service Cost for
the year ending 30 June 2019 is estimated at R 622,662. It is estimated to be R 860,460 for the ensuing year.
Key actuarial assumptions used:
Rate of Interest Discount rate 9,78% 9.81% Health Care Cost 7.17% 7.53%
Net effective Discount rate 2.44% 2.12%
The amount recognised in the Statement of Financial Position are as follows:
Present Value of fund obligations
Closing Balance 9 070 610 6 663 822
9 070 610 6 663 822
Present value at Fund obligation at teh begining of the year 6 663 822 7 056 620
Total Expenses 1 227 333 1 253 121
Current Service Cost
622 662 600 475
Interest Cost 651 399 700 035
Benefits Paid (46 728) (47 389)
Actuarial (gains ) / losses
1 179 455 (1 645 919)
Present value of fund obligation at the end of the year
9 070 610 6 663 822
Less : transfer of current portion (63 096) (48 462)
Balance 30 June
9 007 514 6 615 360
8. Inventories
Opening balance 160 959 136 520
Purchased 1 197 825 864 245
Issued (1 164 301) (839 806)
Closing balance
194 483 160 959
9. Receivables from exchange transactions
Rental debtors 252 925 99 542
Other debtors - Under banking 29 332 4 955
Other debtors - Bursaries 30 850 36 840
Other debtors - Insurance - 1 736
Other debtors - National Treasury 498 600 498 600
Other debtors 1 069 828 41 740
Consumer debtors - Electricity 435 299 1 133 198
Consumer debtors - Refuse 1 150 254 1 205 746
Consumer debtors - Other Service Charges 78 141 75 431
42
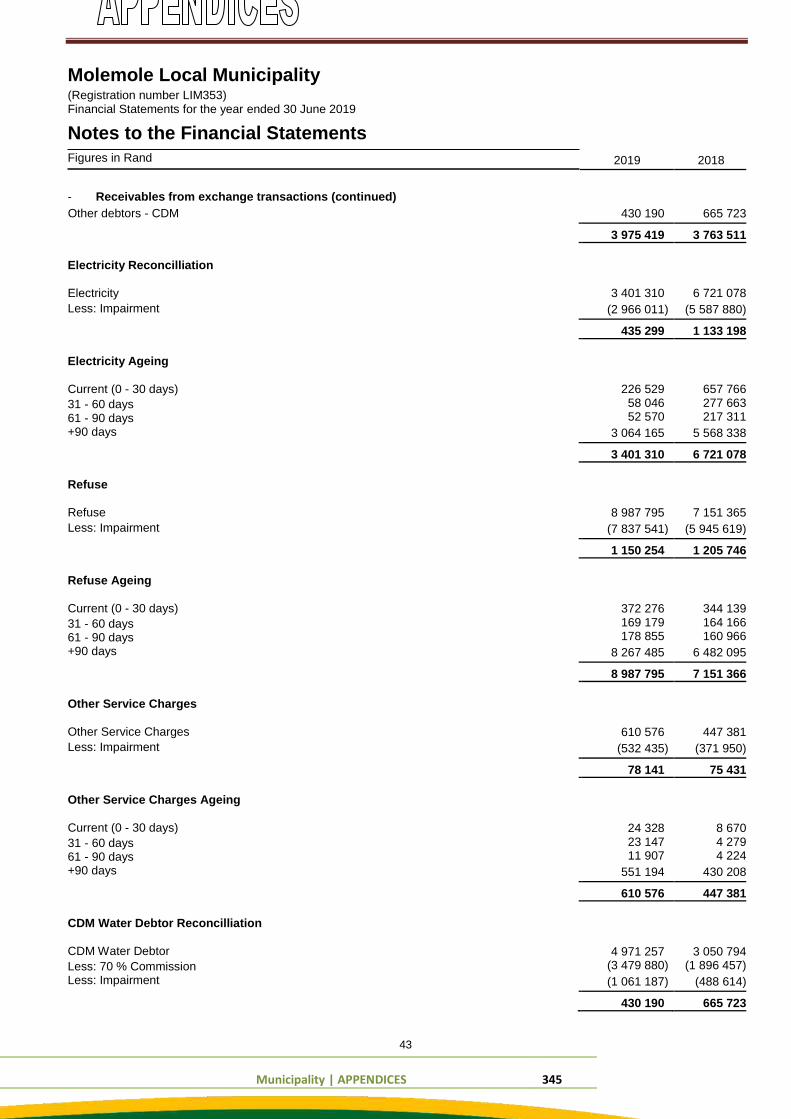
Municipality | APPENDICES 345
Molemole Local Municipality (Registration number LIM353) Financial Statements for the year ended 30 June 2019
Notes to the Financial Statements Figures in Rand
- Receivables from exchange transactions (continued)
Other debtors - CDM
Electricity Reconcilliation Electricity Less: Impairment
Electricity Ageing Current (0 - 30 days) 31 - 60 days 61 - 90 days +90 days
Refuse Refuse Less: Impairment
Refuse Ageing Current (0 - 30 days) 31 - 60 days 61 - 90 days +90 days
Other Service Charges Other Service Charges Less: Impairment
Other Service Charges Ageing Current (0 - 30 days) 31 - 60 days 61 - 90 days +90 days
CDM Water Debtor Reconcilliation CDM Water Debtor Less: 70 % Commission Less: Impairment
2019 2018
430 190 665 723
3 975 419 3 763 511
3 401 310 6 721 078
(2 966 011) (5 587 880)
435 299 1 133 198
226 529 657 766 58 046 277 663 52 570 217 311
3 064 165 5 568 338
3 401 310 6 721 078
8 987 795 7 151 365
(7 837 541) (5 945 619)
1 150 254 1 205 746
372 276 344 139 169 179 164 166 178 855 160 966
8 267 485 6 482 095
8 987 795 7 151 366
610 576 447 381
(532 435) (371 950)
78 141 75 431
24 328 8 670 23 147 4 279 11 907 4 224
551 194 430 208
610 576 447 381
4 971 257 3 050 794 (3 479 880) (1 896 457)
(1 061 187) (488 614)
430 190 665 723
43
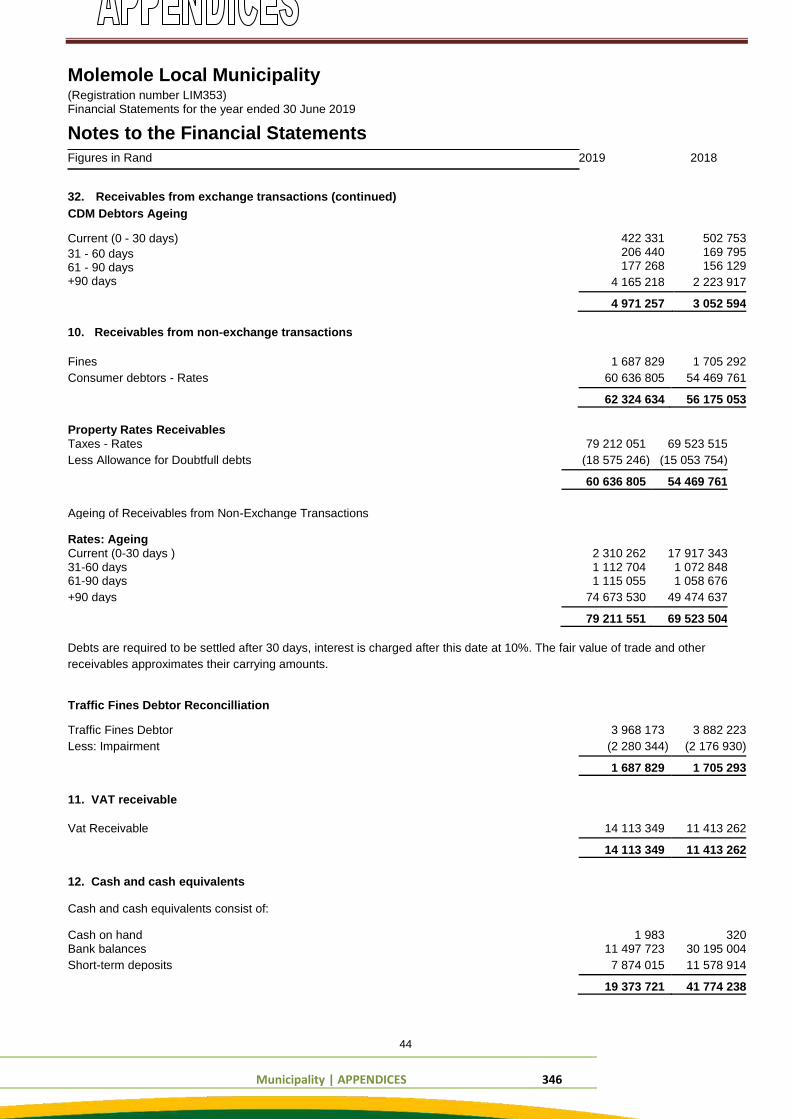
Municipality | APPENDICES 346
Molemole Local Municipality (Registration number LIM353) Financial Statements for the year ended 30 June 2019
Notes to the Financial Statements Figures in Rand
32. Receivables from exchange transactions (continued)
CDM Debtors Ageing Current (0 - 30 days) 31 - 60 days 61 - 90 days +90 days
10. Receivables from non-exchange transactions
2019 2018
422 331 502 753 206 440 169 795 177 268 156 129
4 165 218 2 223 917
4 971 257 3 052 594
Fines 1 687 829 1 705 292
Consumer debtors - Rates 60 636 805 54 469 761
62 324 634 56 175 053
Property Rates Receivables
Taxes - Rates 79 212 051 69 523 515
Less Allowance for Doubtfull debts (18 575 246) (15 053 754)
60 636 805 54 469 761
Ageing of Receivables from Non-Exchange Transactions
Rates: Ageing Current (0-30 days ) 2 310 262 17 917 343 31-60 days 1 112 704 1 072 848 61-90 days 1 115 055 1 058 676
+90 days 74 673 530 49 474 637
79 211 551 69 523 504
Debts are required to be settled after 30 days, interest is charged after this date at 10%. The fair value of trade and other
receivables approximates their carrying amounts.
Traffic Fines Debtor Reconcilliation
Traffic Fines Debtor 3 968 173 3 882 223
Less: Impairment (2 280 344) (2 176 930)
1 687 829 1 705 293
11. VAT receivable
Vat Receivable 14 113 349 11 413 262
14 113 349 11 413 262
12. Cash and cash equivalents
Cash and cash equivalents consist of:
Cash on hand 1 983 320 Bank balances 11 497 723 30 195 004
Short-term deposits 7 874 015 11 578 914
19 373 721 41 774 238
44
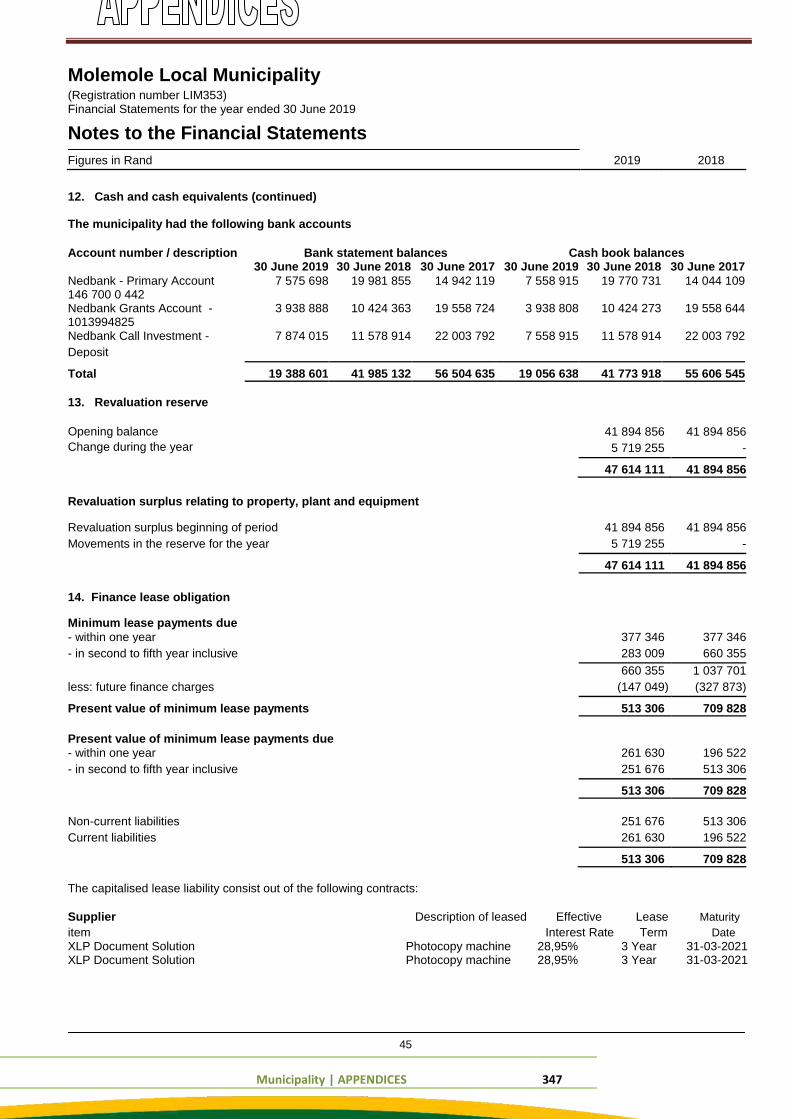
Municipality | APPENDICES 347
Molemole Local Municipality (Registration number LIM353) Financial Statements for the year ended 30 June 2019
Notes to the Financial Statements Figures in Rand 2019 2018
12. Cash and cash equivalents (continued) The municipality had the following bank accounts Account number / description Bank statement balances Cash book balances
30 June 2019 30 June 2018 30 June 2017 30 June 2019 30 June 2018 30 June 2017
Nedbank - Primary Account 7 575 698 19 981 855 14 942 119 7 558 915 19 770 731 14 044 109
146 700 0 442
Nedbank Grants Account - 3 938 888 10 424 363 19 558 724 3 938 808 10 424 273 19 558 644
1013994825
Nedbank Call Investment - 7 874 015 11 578 914 22 003 792 7 558 915 11 578 914 22 003 792
Deposit
Total
19 388 601 41 985 132 56 504 635 19 056 638 41 773 918 55 606 545
13. Revaluation reserve Opening balance Change during the year
41 894 856 41 894 856
5 719 255 -
47 614 111 41 894 856
Revaluation surplus relating to property, plant and equipment
Revaluation surplus beginning of period 41 894 856 41 894 856
Movements in the reserve for the year 5 719 255 -
47 614 111 41 894 856
14. Finance lease obligation
Minimum lease payments due
- within one year 377 346 377 346
- in second to fifth year inclusive 283 009 660 355
660 355 1 037 701
less: future finance charges (147 049) (327 873)
Present value of minimum lease payments
513 306 709 828
Present value of minimum lease payments due
- within one year 261 630 196 522
- in second to fifth year inclusive 251 676 513 306
513 306 709 828
Non-current liabilities 251 676 513 306
Current liabilities 261 630 196 522
513 306 709 828
The capitalised lease liability consist out of the following contracts: Supplier Description of leased Effective Lease Maturity item Interest Rate Term Date XLP Document Solution Photocopy machine 28,95% 3 Year 31-03-2021 XLP Document Solution Photocopy machine 28,95% 3 Year 31-03-2021
45
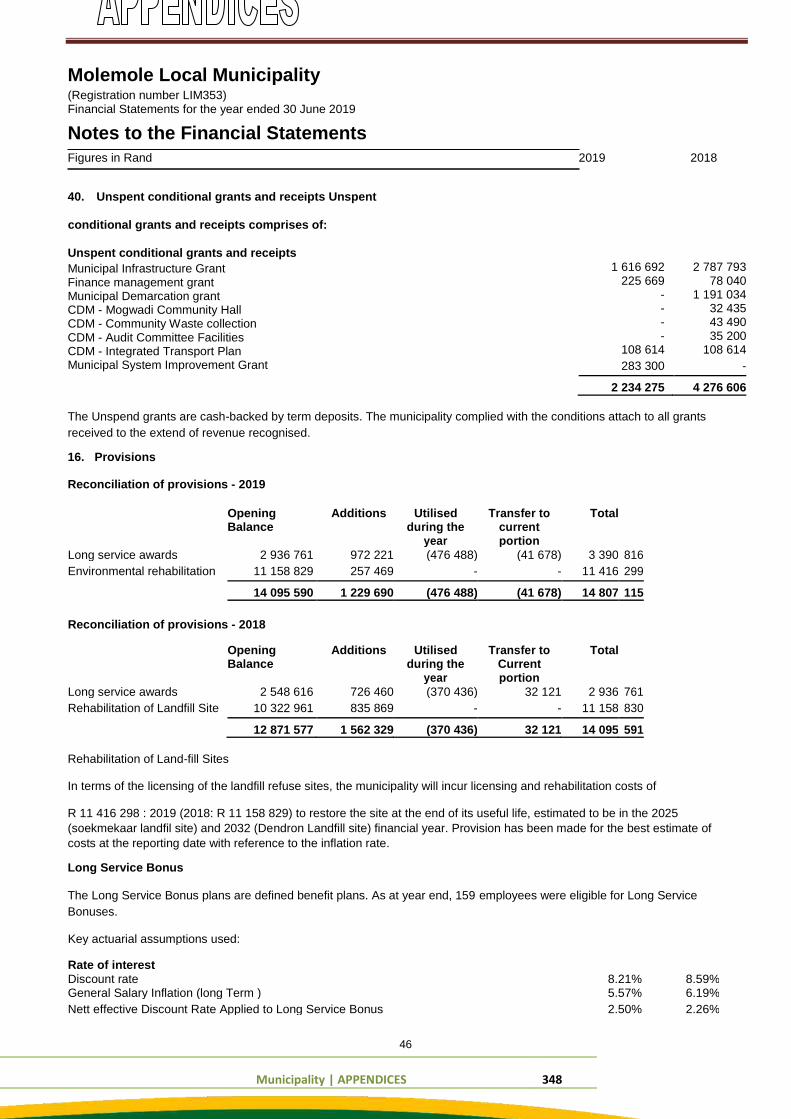
Municipality | APPENDICES 348
Molemole Local Municipality (Registration number LIM353) Financial Statements for the year ended 30 June 2019
Notes to the Financial Statements Figures in Rand
40. Unspent conditional grants and receipts Unspent
conditional grants and receipts comprises of:
Unspent conditional grants and receipts Municipal Infrastructure Grant Finance management grant Municipal Demarcation grant CDM - Mogwadi Community Hall CDM - Community Waste collection CDM - Audit Committee Facilities CDM - Integrated Transport Plan Municipal System Improvement Grant
2019 2018
1 616 692 2 787 793 225 669 78 040
- 1 191 034 - 32 435 - 43 490 - 35 200
108 614 108 614
283 300 -
2 234 275 4 276 606
The Unspend grants are cash-backed by term deposits. The municipality complied with the conditions attach to all grants
received to the extend of revenue recognised. 16. Provisions Reconciliation of provisions - 2019 Opening Additions Utilised Transfer to Total Balance during the current
year portion
Long service awards 2 936 761 972 221 (476 488) (41 678) 3 390 816
Environmental rehabilitation 11 158 829 257 469 - - 11 416 299
14 095 590 1 229 690 (476 488) (41 678) 14 807 115
Reconciliation of provisions - 2018
Opening Additions Utilised Transfer to Total Balance during the Current
year portion
Long service awards 2 548 616 726 460 (370 436) 32 121 2 936 761
Rehabilitation of Landfill Site 10 322 961 835 869 - - 11 158 830
12 871 577 1 562 329 (370 436) 32 121 14 095 591 Rehabilitation of Land-fill Sites In terms of the licensing of the landfill refuse sites, the municipality will incur licensing and rehabilitation costs of R 11 416 298 : 2019 (2018: R 11 158 829) to restore the site at the end of its useful life, estimated to be in the 2025
(soekmekaar landfil site) and 2032 (Dendron Landfill site) financial year. Provision has been made for the best estimate of
costs at the reporting date with reference to the inflation rate. Long Service Bonus The Long Service Bonus plans are defined benefit plans. As at year end, 159 employees were eligible for Long Service
Bonuses.
Key actuarial assumptions used:
Rate of interest Discount rate 8.21% 8.59% General Salary Inflation (long Term ) 5.57% 6.19%
Nett effective Discount Rate Applied to Long Service Bonus 2.50% 2.26%
46
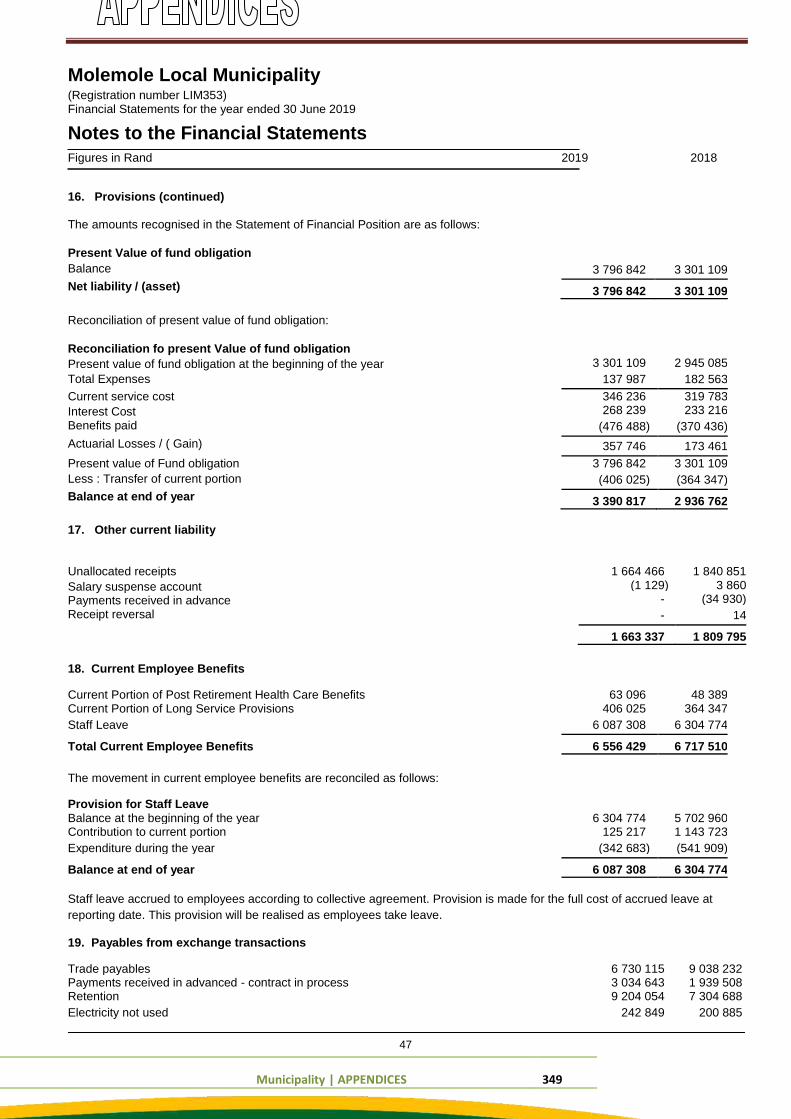
Municipality | APPENDICES 349
Molemole Local Municipality (Registration number LIM353) Financial Statements for the year ended 30 June 2019
Notes to the Financial Statements Figures in Rand
16. Provisions (continued) The amounts recognised in the Statement of Financial Position are as follows: Present Value of fund obligation Balance Net liability / (asset)
Reconciliation of present value of fund obligation: Reconciliation fo present Value of fund obligation
Present value of fund obligation at the beginning of the year
Total Expenses Current service cost Interest Cost Benefits paid Actuarial Losses / ( Gain) Present value of Fund obligation Less : Transfer of current portion Balance at end of year
17. Other current liability
2019 2018
3 796 842 3 301 109
3 796 842 3 301 109
3 301 109 2 945 085
137 987 182 563
346 236 319 783 268 239 233 216
(476 488) (370 436)
357 746 173 461
3 796 842 3 301 109
(406 025) (364 347)
3 390 817 2 936 762
Unallocated receipts Salary suspense account Payments received in advance Receipt reversal
1 664 466 1 840 851 (1 129) 3 860
- (34 930)
- 14
1 663 337 1 809 795
18. Current Employee Benefits
Current Portion of Post Retirement Health Care Benefits 63 096 48 389
Current Portion of Long Service Provisions 406 025 364 347
Staff Leave 6 087 308 6 304 774
Total Current Employee Benefits
6 556 429 6 717 510
The movement in current employee benefits are reconciled as follows:
Provision for Staff Leave
Balance at the beginning of the year 6 304 774 5 702 960
Contribution to current portion 125 217 1 143 723
Expenditure during the year (342 683) (541 909)
Balance at end of year
6 087 308 6 304 774
Staff leave accrued to employees according to collective agreement. Provision is made for the full cost of accrued leave at
reporting date. This provision will be realised as employees take leave.
19. Payables from exchange transactions
Trade payables 6 730 115 9 038 232 Payments received in advanced - contract in process 3 034 643 1 939 508 Retention 9 204 054 7 304 688
Electricity not used 242 849 200 885
47
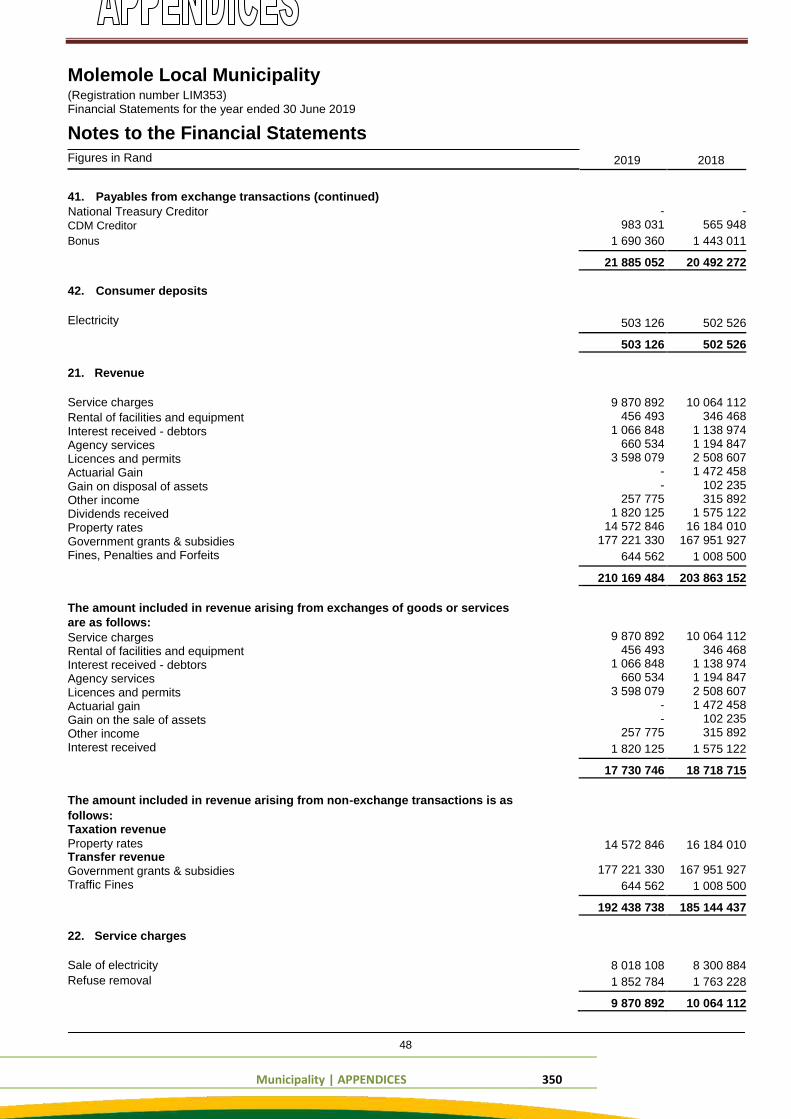
Municipality | APPENDICES 350
Molemole Local Municipality (Registration number LIM353) Financial Statements for the year ended 30 June 2019
Notes to the Financial Statements Figures in Rand
41. Payables from exchange transactions (continued)
National Treasury Creditor CDM Creditor
Bonus
42. Consumer deposits
Electricity
21. Revenue Service charges Rental of facilities and equipment Interest received - debtors Agency services Licences and permits Actuarial Gain Gain on disposal of assets Other income Dividends received Property rates Government grants & subsidies Fines, Penalties and Forfeits
The amount included in revenue arising from exchanges of goods or services
are as follows: Service charges Rental of facilities and equipment Interest received - debtors Agency services Licences and permits Actuarial gain Gain on the sale of assets Other income Interest received
The amount included in revenue arising from non-exchange transactions is as follows: Taxation revenue Property rates Transfer revenue Government grants & subsidies Traffic Fines
22. Service charges Sale of electricity Refuse removal
2019 2018
- - 983 031 565 948
1 690 360 1 443 011
21 885 052 20 492 272
503 126 502 526
503 126 502 526
9 870 892 10 064 112 456 493 346 468 1 066 848 1 138 974 660 534 1 194 847 3 598 079 2 508 607 - 1 472 458 - 102 235 257 775 315 892 1 820 125 1 575 122 14 572 846 16 184 010 177 221 330 167 951 927
644 562 1 008 500
210 169 484 203 863 152
9 870 892 10 064 112 456 493 346 468 1 066 848 1 138 974 660 534 1 194 847 3 598 079 2 508 607 - 1 472 458 - 102 235 257 775 315 892
1 820 125 1 575 122
17 730 746 18 718 715
14 572 846 16 184 010
177 221 330 167 951 927
644 562 1 008 500
192 438 738 185 144 437
8 018 108 8 300 884
1 852 784 1 763 228
9 870 892 10 064 112
48
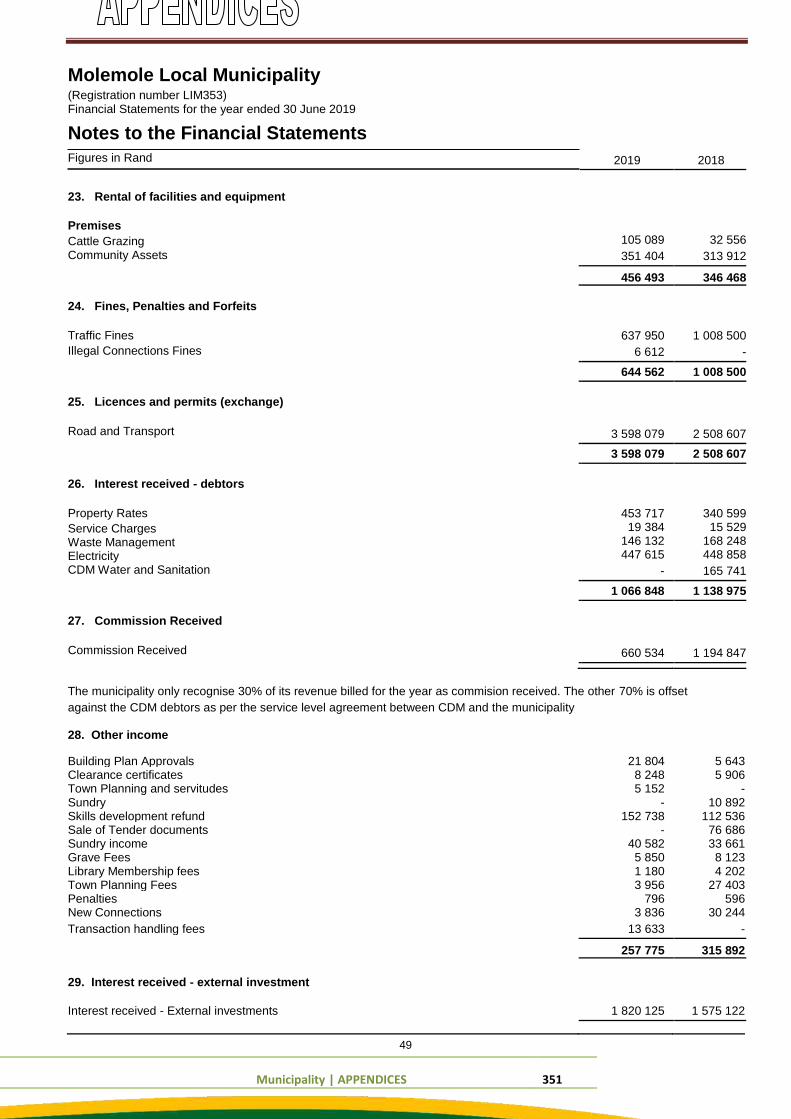
Municipality | APPENDICES 351
Molemole Local Municipality (Registration number LIM353) Financial Statements for the year ended 30 June 2019
Notes to the Financial Statements Figures in Rand
23. Rental of facilities and equipment Premises Cattle Grazing Community Assets
24. Fines, Penalties and Forfeits Traffic Fines Illegal Connections Fines
25. Licences and permits (exchange)
Road and Transport
26. Interest received - debtors Property Rates Service Charges Waste Management Electricity CDM Water and Sanitation
27. Commission Received
Commission Received
2019 2018
105 089 32 556
351 404 313 912
456 493 346 468
637 950 1 008 500
6 612 -
644 562 1 008 500
3 598 079 2 508 607
3 598 079 2 508 607
453 717 340 599 19 384 15 529 146 132 168 248 447 615 448 858
- 165 741
1 066 848 1 138 975
660 534 1 194 847
The municipality only recognise 30% of its revenue billed for the year as commision received. The other 70% is offset
against the CDM debtors as per the service level agreement between CDM and the municipality
28. Other income
Building Plan Approvals 21 804 5 643 Clearance certificates 8 248 5 906 Town Planning and servitudes 5 152 - Sundry - 10 892 Skills development refund 152 738 112 536 Sale of Tender documents - 76 686 Sundry income 40 582 33 661 Grave Fees 5 850 8 123 Library Membership fees 1 180 4 202 Town Planning Fees 3 956 27 403 Penalties 796 596 New Connections 3 836 30 244
Transaction handling fees 13 633 -
257 775 315 892
29. Interest received - external investment
Interest received - External investments 1 820 125 1 575 122
49
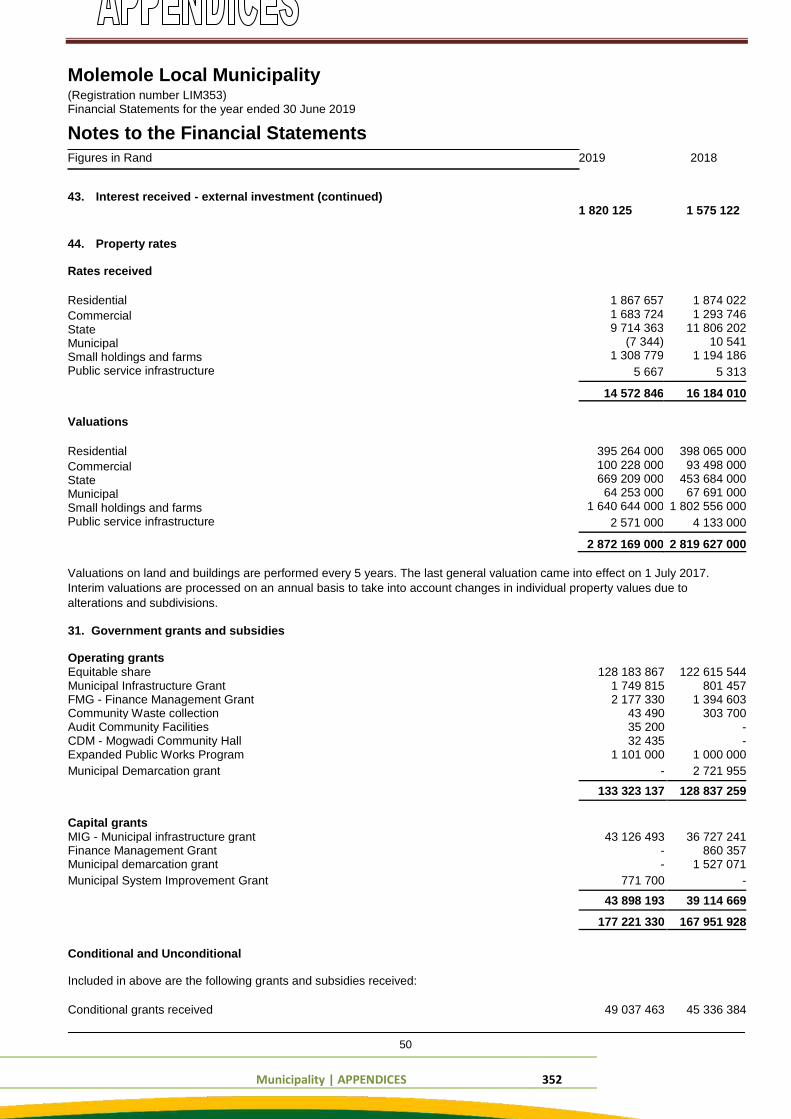
Municipality | APPENDICES 352
Molemole Local Municipality (Registration number LIM353) Financial Statements for the year ended 30 June 2019
Notes to the Financial Statements Figures in Rand
43. Interest received - external investment (continued)
44. Property rates Rates received Residential Commercial State Municipal Small holdings and farms Public service infrastructure
Valuations
Residential Commercial State Municipal Small holdings and farms Public service infrastructure
2019 2018
1 820 125 1 575 122
1 867 657 1 874 022 1 683 724 1 293 746 9 714 363 11 806 202
(7 344) 10 541 1 308 779 1 194 186
5 667 5 313
14 572 846 16 184 010
395 264 000 398 065 000 100 228 000 93 498 000 669 209 000 453 684 000
64 253 000 67 691 000 1 640 644 000 1 802 556 000
2 571 000 4 133 000
2 872 169 000 2 819 627 000
Valuations on land and buildings are performed every 5 years. The last general valuation came into effect on 1 July 2017.
Interim valuations are processed on an annual basis to take into account changes in individual property values due to
alterations and subdivisions.
31. Government grants and subsidies
Operating grants
Equitable share 128 183 867 122 615 544
Municipal Infrastructure Grant 1 749 815 801 457
FMG - Finance Management Grant 2 177 330 1 394 603
Community Waste collection 43 490 303 700
Audit Community Facilities 35 200 -
CDM - Mogwadi Community Hall 32 435 -
Expanded Public Works Program 1 101 000 1 000 000
Municipal Demarcation grant - 2 721 955
133 323 137 128 837 259
Capital grants
MIG - Municipal infrastructure grant 43 126 493 36 727 241
Finance Management Grant - 860 357
Municipal demarcation grant - 1 527 071
Municipal System Improvement Grant 771 700 -
43 898 193 39 114 669
177 221 330 167 951 928
Conditional and Unconditional
Included in above are the following grants and subsidies received:
Conditional grants received 49 037 463 45 336 384
50
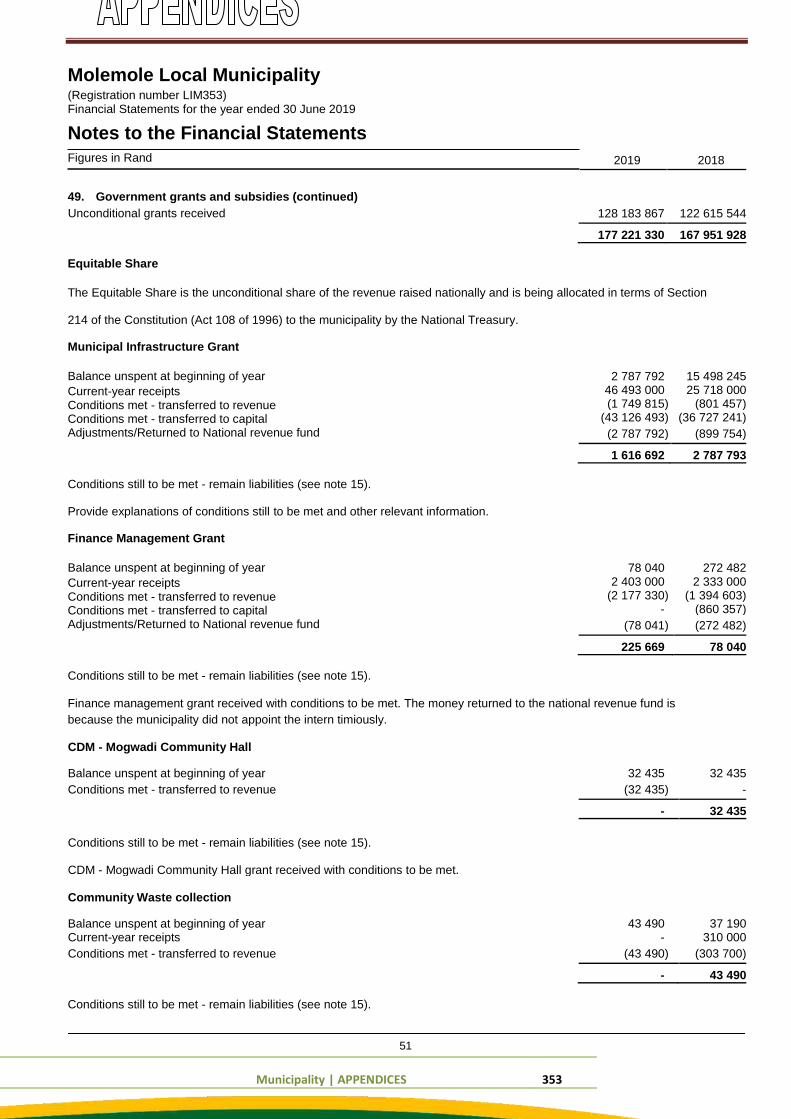
Municipality | APPENDICES 353
Molemole Local Municipality (Registration number LIM353) Financial Statements for the year ended 30 June 2019
Notes to the Financial Statements Figures in Rand
49. Government grants and subsidies (continued)
Unconditional grants received
Equitable Share
2019 2018
128 183 867 122 615 544
177 221 330 167 951 928
The Equitable Share is the unconditional share of the revenue raised nationally and is being allocated in terms of Section 214 of the Constitution (Act 108 of 1996) to the municipality by the National Treasury. Municipal Infrastructure Grant Balance unspent at beginning of year Current-year receipts Conditions met - transferred to revenue Conditions met - transferred to capital Adjustments/Returned to National revenue fund
Conditions still to be met - remain liabilities (see note 15). Provide explanations of conditions still to be met and other relevant information. Finance Management Grant Balance unspent at beginning of year Current-year receipts Conditions met - transferred to revenue Conditions met - transferred to capital Adjustments/Returned to National revenue fund
Conditions still to be met - remain liabilities (see note 15).
2 787 792 15 498 245 46 493 000 25 718 000 (1 749 815) (801 457)
(43 126 493) (36 727 241)
(2 787 792) (899 754)
1 616 692 2 787 793
78 040 272 482
2 403 000 2 333 000 (2 177 330) (1 394 603)
- (860 357)
(78 041) (272 482)
225 669 78 040
Finance management grant received with conditions to be met. The money returned to the national revenue fund is
because the municipality did not appoint the intern timiously.
CDM - Mogwadi Community Hall
Balance unspent at beginning of year 32 435 32 435
Conditions met - transferred to revenue (32 435) -
- 32 435
Conditions still to be met - remain liabilities (see note 15).
CDM - Mogwadi Community Hall grant received with conditions to be met.
Community Waste collection
Balance unspent at beginning of year 43 490 37 190 Current-year receipts - 310 000
Conditions met - transferred to revenue (43 490) (303 700)
- 43 490
Conditions still to be met - remain liabilities (see note 15).
51
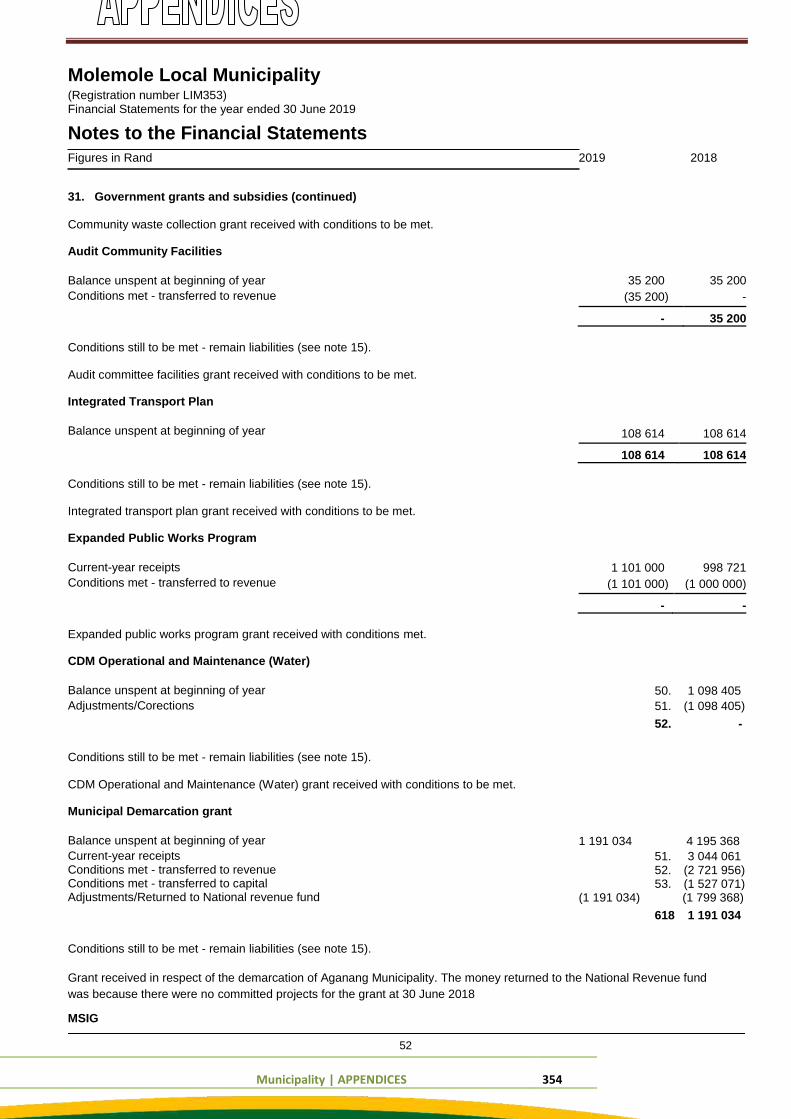
Municipality | APPENDICES 354
Molemole Local Municipality (Registration number LIM353) Financial Statements for the year ended 30 June 2019
Notes to the Financial Statements Figures in Rand
31. Government grants and subsidies (continued) Community waste collection grant received with conditions to be met. Audit Community Facilities Balance unspent at beginning of year Conditions met - transferred to revenue
Conditions still to be met - remain liabilities (see note 15). Audit committee facilities grant received with conditions to be met. Integrated Transport Plan Balance unspent at beginning of year
Conditions still to be met - remain liabilities (see note 15). Integrated transport plan grant received with conditions to be met. Expanded Public Works Program Current-year receipts Conditions met - transferred to revenue
Expanded public works program grant received with conditions met. CDM Operational and Maintenance (Water) Balance unspent at beginning of year Adjustments/Corections
Conditions still to be met - remain liabilities (see note 15). CDM Operational and Maintenance (Water) grant received with conditions to be met. Municipal Demarcation grant Balance unspent at beginning of year Current-year receipts Conditions met - transferred to revenue Conditions met - transferred to capital Adjustments/Returned to National revenue fund
Conditions still to be met - remain liabilities (see note 15).
2019 2018
35 200 35 200
(35 200) -
- 35 200
108 614 108 614
108 614 108 614
1 101 000 998 721
(1 101 000) (1 000 000)
- -
50. 1 098 405 51. (1 098 405)
52. -
1 191 034 4 195 368 51. 3 044 061 52. (2 721 956) 53. (1 527 071)
(1 191 034) (1 799 368) 618 1 191 034
Grant received in respect of the demarcation of Aganang Municipality. The money returned to the National Revenue fund
was because there were no committed projects for the grant at 30 June 2018 MSIG
52
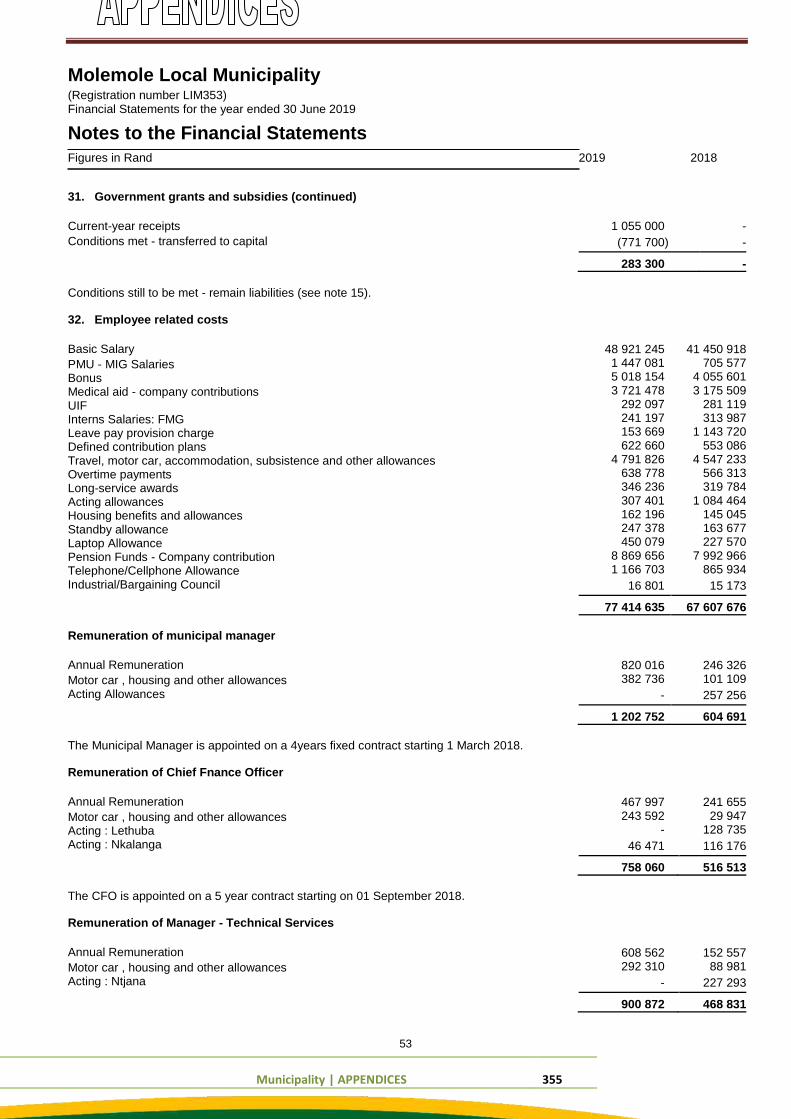
Municipality | APPENDICES 355
Molemole Local Municipality (Registration number LIM353) Financial Statements for the year ended 30 June 2019
Notes to the Financial Statements Figures in Rand
31. Government grants and subsidies (continued) Current-year receipts Conditions met - transferred to capital
Conditions still to be met - remain liabilities (see note 15). 32. Employee related costs
Basic Salary PMU - MIG Salaries Bonus Medical aid - company contributions UIF Interns Salaries: FMG Leave pay provision charge Defined contribution plans Travel, motor car, accommodation, subsistence and other allowances Overtime payments Long-service awards Acting allowances Housing benefits and allowances Standby allowance Laptop Allowance Pension Funds - Company contribution Telephone/Cellphone Allowance Industrial/Bargaining Council
Remuneration of municipal manager Annual Remuneration Motor car , housing and other allowances Acting Allowances
The Municipal Manager is appointed on a 4years fixed contract starting 1 March 2018. Remuneration of Chief Fnance Officer
Annual Remuneration Motor car , housing and other allowances Acting : Lethuba Acting : Nkalanga
The CFO is appointed on a 5 year contract starting on 01 September 2018. Remuneration of Manager - Technical Services
Annual Remuneration Motor car , housing and other allowances Acting : Ntjana
2019 2018
1 055 000 -
(771 700) -
283 300 -
48 921 245 41 450 918 1 447 081 705 577 5 018 154 4 055 601 3 721 478 3 175 509
292 097 281 119 241 197 313 987 153 669 1 143 720 622 660 553 086
4 791 826 4 547 233 638 778 566 313 346 236 319 784 307 401 1 084 464 162 196 145 045 247 378 163 677 450 079 227 570
8 869 656 7 992 966 1 166 703 865 934
16 801 15 173
77 414 635 67 607 676
820 016 246 326 382 736 101 109
- 257 256
1 202 752 604 691
467 997 241 655 243 592 29 947
- 128 735
46 471 116 176
758 060 516 513
608 562 152 557 292 310 88 981
- 227 293
900 872 468 831
53
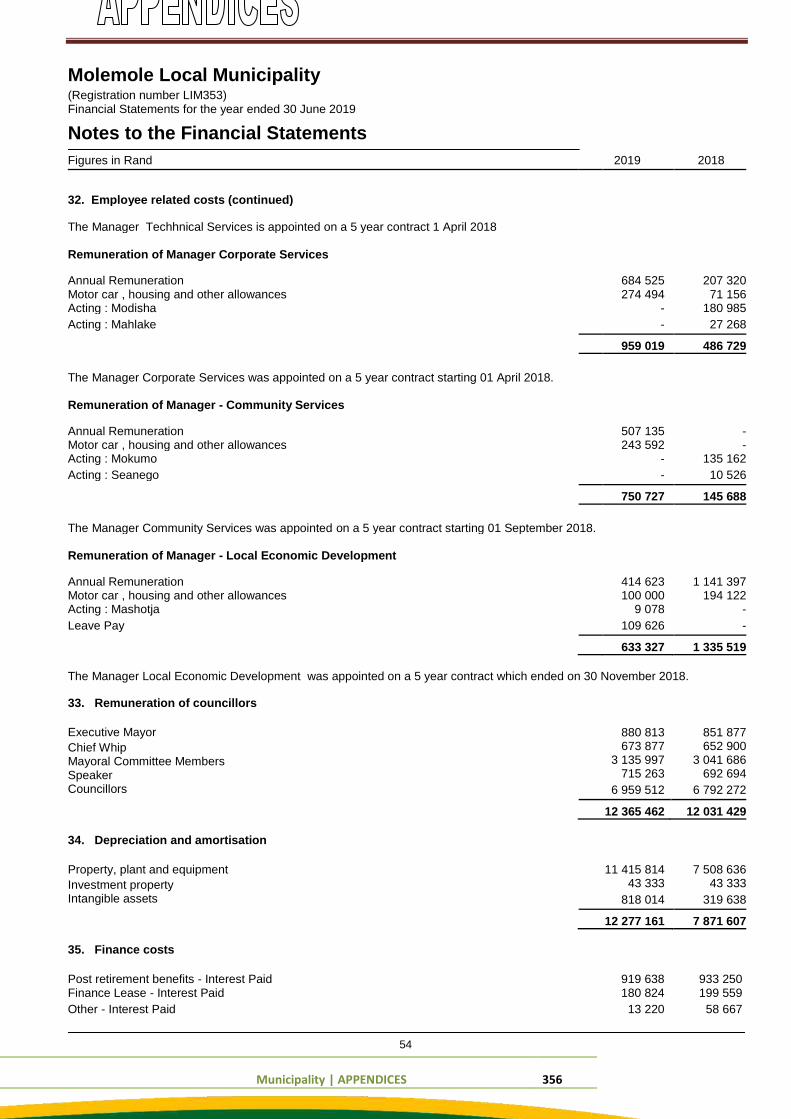
Municipality | APPENDICES 356
Molemole Local Municipality (Registration number LIM353) Financial Statements for the year ended 30 June 2019
Notes to the Financial Statements Figures in Rand 2019 2018
32. Employee related costs (continued)
The Manager Techhnical Services is appointed on a 5 year contract 1 April 2018
Remuneration of Manager Corporate Services
Annual Remuneration 684 525 207 320 Motor car , housing and other allowances 274 494 71 156 Acting : Modisha - 180 985
Acting : Mahlake - 27 268
959 019 486 729
The Manager Corporate Services was appointed on a 5 year contract starting 01 April 2018.
Remuneration of Manager - Community Services
Annual Remuneration 507 135 - Motor car , housing and other allowances 243 592 - Acting : Mokumo - 135 162
Acting : Seanego - 10 526
750 727 145 688
The Manager Community Services was appointed on a 5 year contract starting 01 September 2018.
Remuneration of Manager - Local Economic Development
Annual Remuneration 414 623 1 141 397 Motor car , housing and other allowances 100 000 194 122 Acting : Mashotja 9 078 -
Leave Pay 109 626 -
633 327 1 335 519 The Manager Local Economic Development was appointed on a 5 year contract which ended on 30 November 2018. 33. Remuneration of councillors Executive Mayor Chief Whip Mayoral Committee Members Speaker Councillors
880 813 851 877 673 877 652 900
3 135 997 3 041 686 715 263 692 694
6 959 512 6 792 272
12 365 462 12 031 429
34. Depreciation and amortisation Property, plant and equipment Investment property Intangible assets
35. Finance costs
11 415 814 7 508 636 43 333 43 333
818 014 319 638
12 277 161 7 871 607
Post retirement benefits - Interest Paid 919 638 933 250 Finance Lease - Interest Paid 180 824 199 559
Other - Interest Paid 13 220 58 667
54
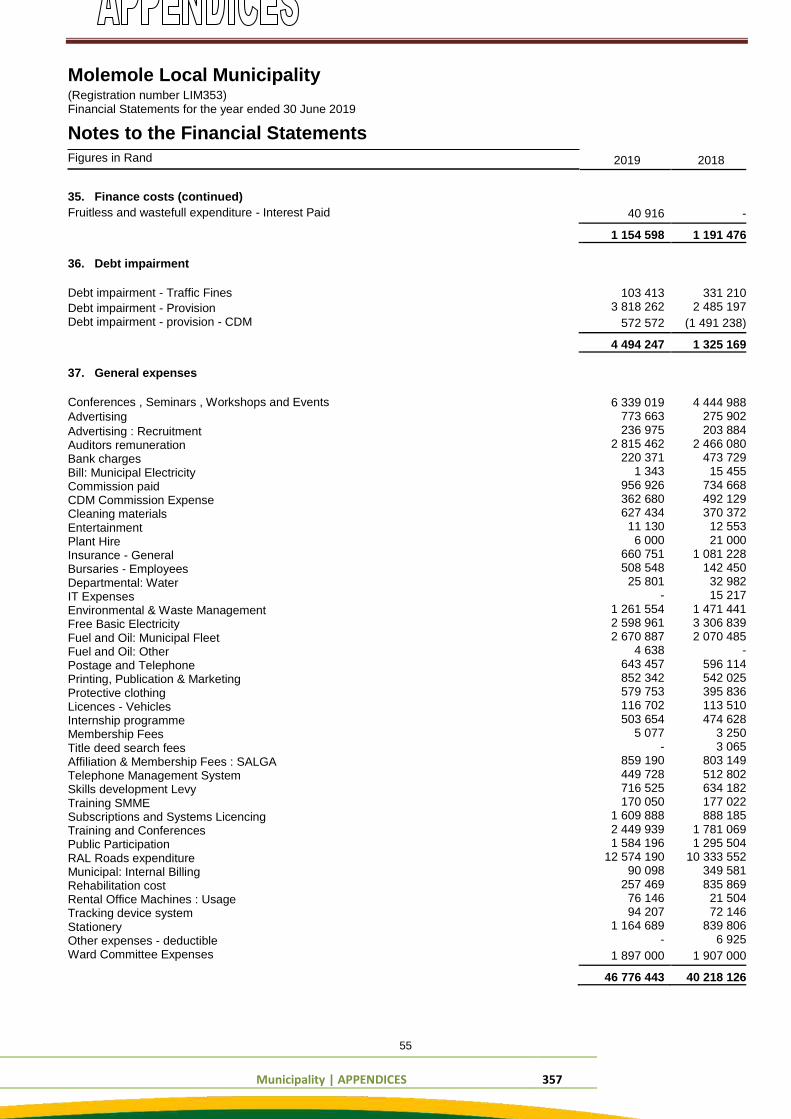
Municipality | APPENDICES 357
Molemole Local Municipality (Registration number LIM353) Financial Statements for the year ended 30 June 2019
Notes to the Financial Statements Figures in Rand
35. Finance costs (continued) Fruitless and wastefull expenditure - Interest Paid
36. Debt impairment Debt impairment - Traffic Fines Debt impairment - Provision Debt impairment - provision - CDM
37. General expenses
Conferences , Seminars , Workshops and Events
Advertising Advertising : Recruitment Auditors remuneration Bank charges Bill: Municipal Electricity Commission paid CDM Commission Expense Cleaning materials Entertainment Plant Hire Insurance - General Bursaries - Employees Departmental: Water IT Expenses Environmental & Waste Management Free Basic Electricity Fuel and Oil: Municipal Fleet Fuel and Oil: Other Postage and Telephone Printing, Publication & Marketing Protective clothing Licences - Vehicles Internship programme Membership Fees Title deed search fees Affiliation & Membership Fees : SALGA Telephone Management System Skills development Levy Training SMME Subscriptions and Systems Licencing Training and Conferences Public Participation RAL Roads expenditure Municipal: Internal Billing Rehabilitation cost Rental Office Machines : Usage Tracking device system Stationery Other expenses - deductible Ward Committee Expenses
2019 2018
40 916 -
1 154 598 1 191 476
103 413 331 210 3 818 262 2 485 197
572 572 (1 491 238)
4 494 247 1 325 169
6 339 019 4 444 988 773 663 275 902 236 975 203 884 2 815 462 2 466 080 220 371 473 729 1 343 15 455 956 926 734 668 362 680 492 129 627 434 370 372 11 130 12 553 6 000 21 000 660 751 1 081 228 508 548 142 450 25 801 32 982 - 15 217 1 261 554 1 471 441 2 598 961 3 306 839 2 670 887 2 070 485 4 638 - 643 457 596 114 852 342 542 025 579 753 395 836 116 702 113 510 503 654 474 628 5 077 3 250 - 3 065 859 190 803 149 449 728 512 802 716 525 634 182 170 050 177 022 1 609 888 888 185 2 449 939 1 781 069 1 584 196 1 295 504 12 574 190 10 333 552 90 098 349 581 257 469 835 869 76 146 21 504 94 207 72 146 1 164 689 839 806 - 6 925
1 897 000 1 907 000
46 776 443 40 218 126
55
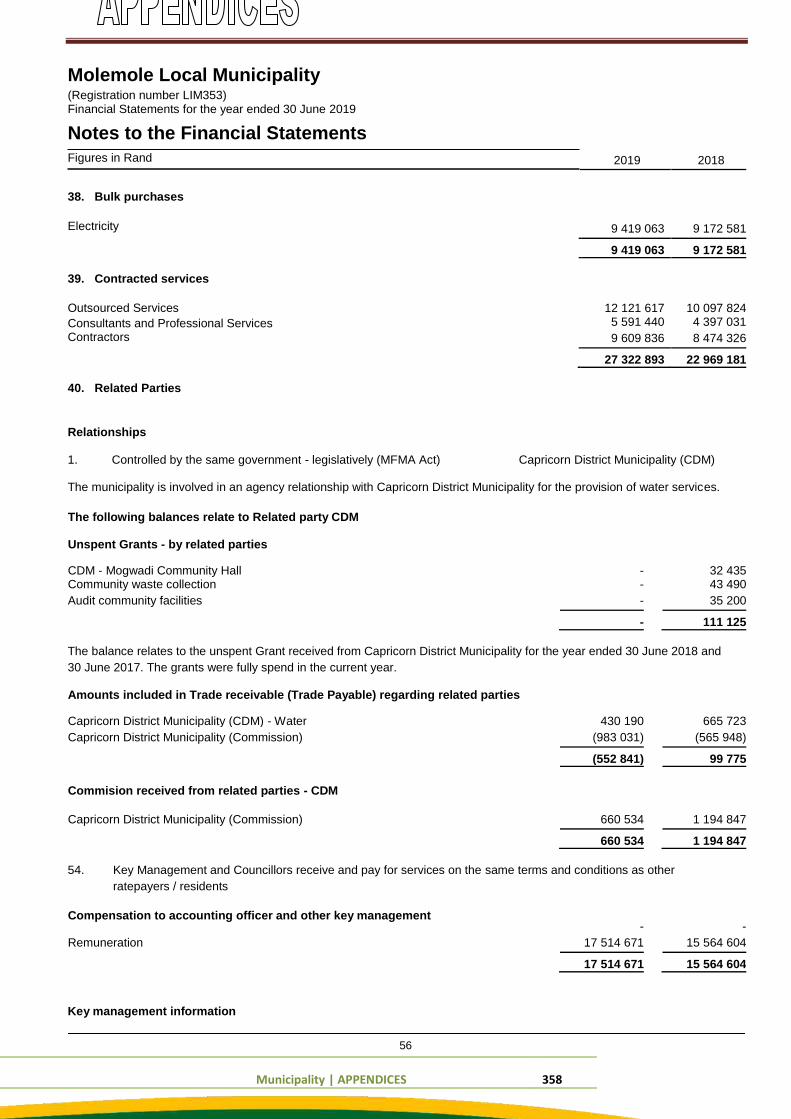
Municipality | APPENDICES 358
Molemole Local Municipality (Registration number LIM353) Financial Statements for the year ended 30 June 2019
Notes to the Financial Statements Figures in Rand
38. Bulk purchases Electricity
39. Contracted services Outsourced Services Consultants and Professional Services Contractors
40. Related Parties
2019 2018
9 419 063 9 172 581
9 419 063 9 172 581
12 121 617 10 097 824 5 591 440 4 397 031
9 609 836 8 474 326
27 322 893 22 969 181
Relationships 1. Controlled by the same government - legislatively (MFMA Act) Capricorn District Municipality (CDM) The municipality is involved in an agency relationship with Capricorn District Municipality for the provision of water services.
The following balances relate to Related party CDM
Unspent Grants - by related parties
CDM - Mogwadi Community Hall - 32 435 Community waste collection - 43 490
Audit community facilities - 35 200
- 111 125
The balance relates to the unspent Grant received from Capricorn District Municipality for the year ended 30 June 2018 and
30 June 2017. The grants were fully spend in the current year.
Amounts included in Trade receivable (Trade Payable) regarding related parties
Capricorn District Municipality (CDM) - Water 430 190 665 723
Capricorn District Municipality (Commission) (983 031) (565 948)
(552 841) 99 775
Commision received from related parties - CDM
Capricorn District Municipality (Commission) 660 534 1 194 847
660 534 1 194 847 54. Key Management and Councillors receive and pay for services on the same terms and conditions as other
ratepayers / residents
Compensation to accounting officer and other key management - -
Remuneration 17 514 671 15 564 604
17 514 671 15 564 604
Key management information
56
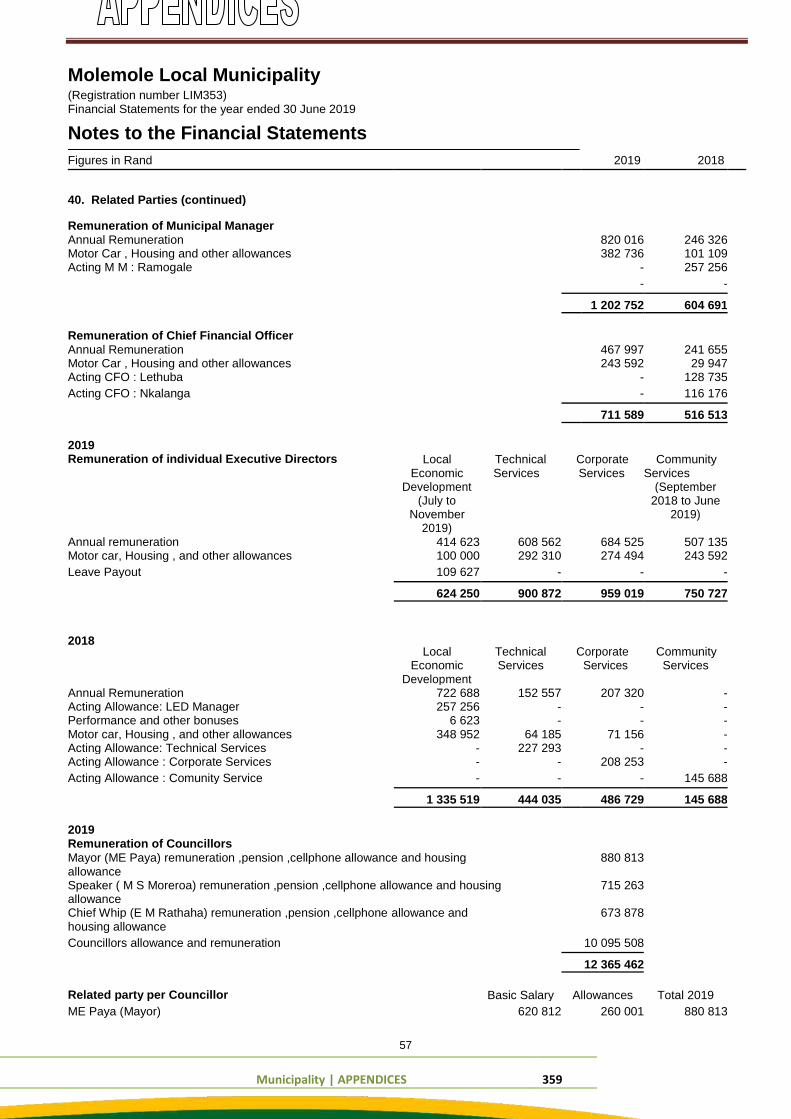
Municipality | APPENDICES 359
Molemole Local Municipality (Registration number LIM353) Financial Statements for the year ended 30 June 2019
Notes to the Financial Statements Figures in Rand 2019 2018
40. Related Parties (continued)
Remuneration of Municipal Manager
Annual Remuneration 820 016 246 326
Motor Car , Housing and other allowances 382 736 101 109
Acting M M : Ramogale - 257 256
- -
1 202 752 604 691
Remuneration of Chief Financial Officer
Annual Remuneration 467 997 241 655
Motor Car , Housing and other allowances 243 592 29 947
Acting CFO : Lethuba - 128 735
Acting CFO : Nkalanga - 116 176
711 589 516 513
2019
Remuneration of individual Executive Directors Local Technical Corporate Community
Economic Services Services Services
Development (September
(July to 2018 to June
November 2019)
2019)
Annual remuneration 414 623 608 562 684 525 507 135
Motor car, Housing , and other allowances 100 000 292 310 274 494 243 592
Leave Payout 109 627 - - -
624 250 900 872 959 019 750 727
2018 Local Technical Corporate Community
Economic Services Services Services
Development
Annual Remuneration 722 688 152 557 207 320 -
Acting Allowance: LED Manager 257 256 - - -
Performance and other bonuses 6 623 - - -
Motor car, Housing , and other allowances 348 952 64 185 71 156 -
Acting Allowance: Technical Services - 227 293 - -
Acting Allowance : Corporate Services - - 208 253 -
Acting Allowance : Comunity Service - - - 145 688
1 335 519 444 035 486 729 145 688
2019
Remuneration of Councillors
Mayor (ME Paya) remuneration ,pension ,cellphone allowance and housing 880 813
allowance
Speaker ( M S Moreroa) remuneration ,pension ,cellphone allowance and housing 715 263
allowance
Chief Whip (E M Rathaha) remuneration ,pension ,cellphone allowance and 673 878
housing allowance
Councillors allowance and remuneration 10 095 508
12 365 462
Related party per Councillor Basic Salary Allowances Total 2019
ME Paya (Mayor) 620 812 260 001 880 813
57
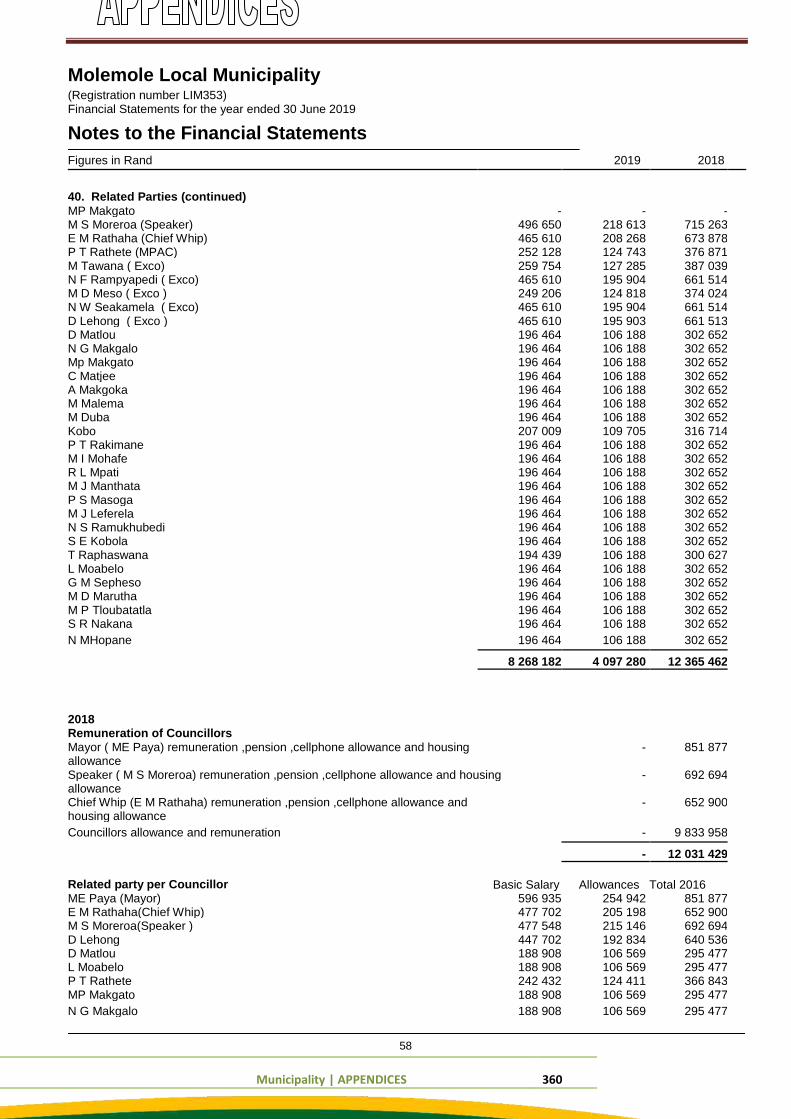
Municipality | APPENDICES 360
Molemole Local Municipality (Registration number LIM353) Financial Statements for the year ended 30 June 2019
Notes to the Financial Statements Figures in Rand 2019 2018
40. Related Parties (continued) MP Makgato - - - M S Moreroa (Speaker) 496 650 218 613 715 263 E M Rathaha (Chief Whip) 465 610 208 268 673 878 P T Rathete (MPAC) 252 128 124 743 376 871 M Tawana ( Exco) 259 754 127 285 387 039 N F Rampyapedi ( Exco) 465 610 195 904 661 514 M D Meso ( Exco ) 249 206 124 818 374 024 N W Seakamela ( Exco) 465 610 195 904 661 514 D Lehong ( Exco ) 465 610 195 903 661 513 D Matlou 196 464 106 188 302 652 N G Makgalo 196 464 106 188 302 652 Mp Makgato 196 464 106 188 302 652 C Matjee 196 464 106 188 302 652 A Makgoka 196 464 106 188 302 652 M Malema 196 464 106 188 302 652 M Duba 196 464 106 188 302 652 Kobo 207 009 109 705 316 714 P T Rakimane 196 464 106 188 302 652 M I Mohafe 196 464 106 188 302 652 R L Mpati 196 464 106 188 302 652 M J Manthata 196 464 106 188 302 652 P S Masoga 196 464 106 188 302 652 M J Leferela 196 464 106 188 302 652 N S Ramukhubedi 196 464 106 188 302 652 S E Kobola 196 464 106 188 302 652 T Raphaswana 194 439 106 188 300 627 L Moabelo 196 464 106 188 302 652 G M Sepheso 196 464 106 188 302 652 M D Marutha 196 464 106 188 302 652 M P Tloubatatla 196 464 106 188 302 652 S R Nakana 196 464 106 188 302 652
N MHopane 196 464 106 188 302 652
8 268 182 4 097 280 12 365 462
2018 Remuneration of Councillors
Mayor ( ME Paya) remuneration ,pension ,cellphone allowance and housing - 851 877 allowance
Speaker ( M S Moreroa) remuneration ,pension ,cellphone allowance and housing - 692 694 allowance
Chief Whip (E M Rathaha) remuneration ,pension ,cellphone allowance and - 652 900 housing allowance
Councillors allowance and remuneration - 9 833 958
- 12 031 429
Related party per Councillor Basic Salary Allowances Total 2016 ME Paya (Mayor) 596 935 254 942 851 877 E M Rathaha(Chief Whip) 477 702 205 198 652 900 M S Moreroa(Speaker ) 477 548 215 146 692 694 D Lehong 447 702 192 834 640 536 D Matlou 188 908 106 569 295 477 L Moabelo 188 908 106 569 295 477 P T Rathete 242 432 124 411 366 843 MP Makgato 188 908 106 569 295 477
N G Makgalo 188 908 106 569 295 477
58
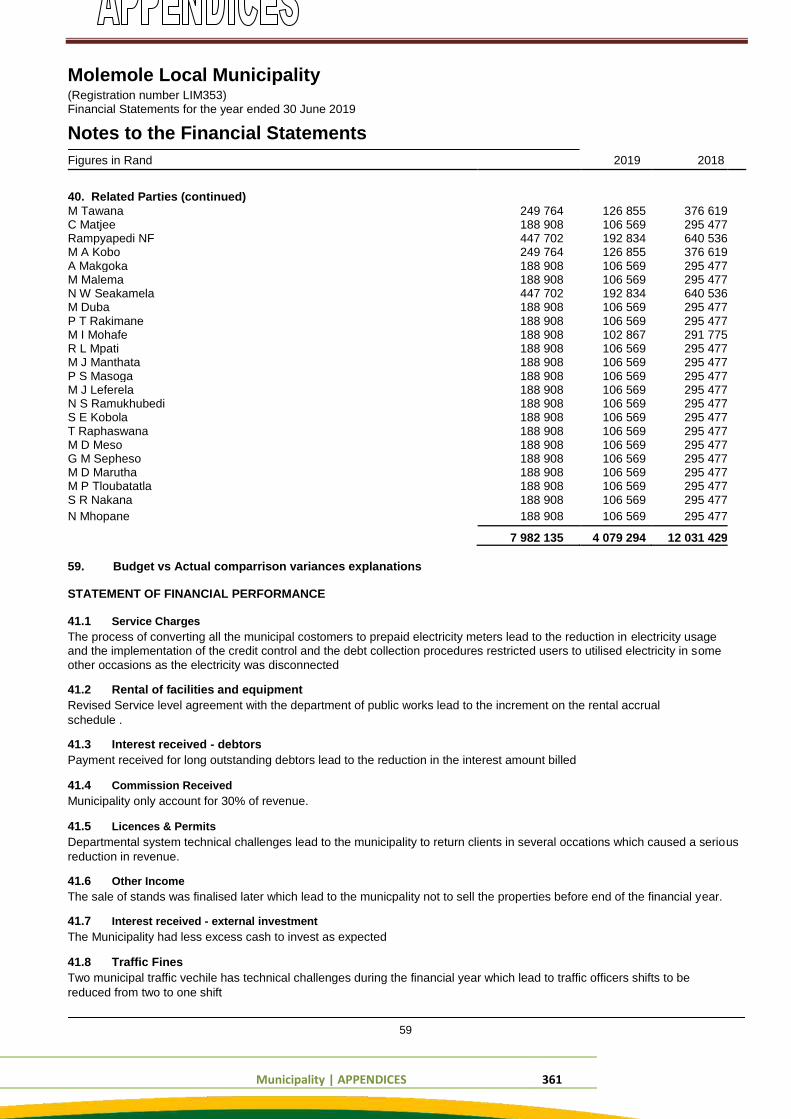
Municipality | APPENDICES 361
Molemole Local Municipality (Registration number LIM353) Financial Statements for the year ended 30 June 2019
Notes to the Financial Statements Figures in Rand 2019 2018
40. Related Parties (continued) M Tawana 249 764 126 855 376 619 C Matjee 188 908 106 569 295 477 Rampyapedi NF 447 702 192 834 640 536 M A Kobo 249 764 126 855 376 619 A Makgoka 188 908 106 569 295 477 M Malema 188 908 106 569 295 477 N W Seakamela 447 702 192 834 640 536 M Duba 188 908 106 569 295 477 P T Rakimane 188 908 106 569 295 477 M I Mohafe 188 908 102 867 291 775 R L Mpati 188 908 106 569 295 477 M J Manthata 188 908 106 569 295 477 P S Masoga 188 908 106 569 295 477 M J Leferela 188 908 106 569 295 477 N S Ramukhubedi 188 908 106 569 295 477 S E Kobola 188 908 106 569 295 477 T Raphaswana 188 908 106 569 295 477 M D Meso 188 908 106 569 295 477 G M Sepheso 188 908 106 569 295 477 M D Marutha 188 908 106 569 295 477 M P Tloubatatla 188 908 106 569 295 477 S R Nakana 188 908 106 569 295 477
N Mhopane 188 908 106 569 295 477
7 982 135 4 079 294 12 031 429 59. Budget vs Actual comparrison variances explanations STATEMENT OF FINANCIAL PERFORMANCE 41.1 Service Charges The process of converting all the municipal costomers to prepaid electricity meters lead to the reduction in electricity usage
and the implementation of the credit control and the debt collection procedures restricted users to utilised electricity in some
other occasions as the electricity was disconnected 41.2 Rental of facilities and equipment Revised Service level agreement with the department of public works lead to the increment on the rental accrual
schedule . 41.3 Interest received - debtors Payment received for long outstanding debtors lead to the reduction in the interest amount billed 41.4 Commission Received Municipality only account for 30% of revenue. 41.5 Licences & Permits Departmental system technical challenges lead to the municipality to return clients in several occations which caused a serious
reduction in revenue. 41.6 Other Income The sale of stands was finalised later which lead to the municpality not to sell the properties before end of the financial year. 41.7 Interest received - external investment The Municipality had less excess cash to invest as expected 41.8 Traffic Fines Two municipal traffic vechile has technical challenges during the financial year which lead to traffic officers shifts to be
reduced from two to one shift
59
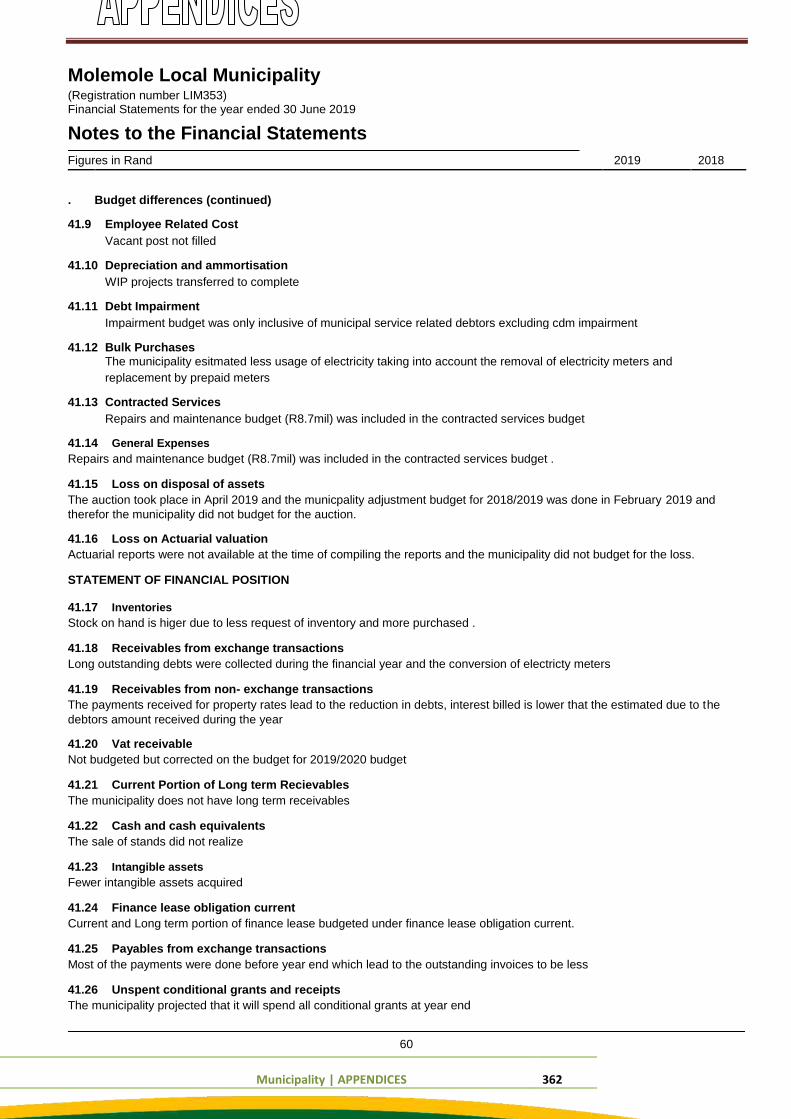
Municipality | APPENDICES 362
Molemole Local Municipality (Registration number LIM353) Financial Statements for the year ended 30 June 2019
Notes to the Financial Statements Figures in Rand 2019 2018
. Budget differences (continued)
41.9 Employee Related Cost Vacant post not filled
41.10 Depreciation and ammortisation WIP projects transferred to complete
41.11 Debt Impairment Impairment budget was only inclusive of municipal service related debtors excluding cdm impairment
41.12 Bulk Purchases The municipality esitmated less usage of electricity taking into account the removal of electricity meters and
replacement by prepaid meters
41.13 Contracted Services Repairs and maintenance budget (R8.7mil) was included in the contracted services budget 41.14 General Expenses Repairs and maintenance budget (R8.7mil) was included in the contracted services budget . 41.15 Loss on disposal of assets The auction took place in April 2019 and the municpality adjustment budget for 2018/2019 was done in February 2019 and
therefor the municipality did not budget for the auction. 41.16 Loss on Actuarial valuation Actuarial reports were not available at the time of compiling the reports and the municipality did not budget for the loss. STATEMENT OF FINANCIAL POSITION 41.17 Inventories Stock on hand is higer due to less request of inventory and more purchased . 41.18 Receivables from exchange transactions Long outstanding debts were collected during the financial year and the conversion of electricty meters 41.19 Receivables from non- exchange transactions The payments received for property rates lead to the reduction in debts, interest billed is lower that the estimated due to the
debtors amount received during the year 41.20 Vat receivable Not budgeted but corrected on the budget for 2019/2020 budget 41.21 Current Portion of Long term Recievables The municipality does not have long term receivables 41.22 Cash and cash equivalents The sale of stands did not realize 41.23 Intangible assets Fewer intangible assets acquired 41.24 Finance lease obligation current Current and Long term portion of finance lease budgeted under finance lease obligation current. 41.25 Payables from exchange transactions Most of the payments were done before year end which lead to the outstanding invoices to be less 41.26 Unspent conditional grants and receipts The municipality projected that it will spend all conditional grants at year end
60
Municipality | APPENDICES 363
Molemole Local Municipality (Registration number LIM353) Financial Statements for the year ended 30 June 2019
Notes to the Financial Statements Figures in Rand 2019 2018
. Budget differences (continued) 41.27 Other current liability The municipality projected that the unallocated receipts should have been resolved before the end of the financial year and the
balance remaining has been disclosed as other current liability. The unallocated amount was not budgeted for as it was
anticipated that the amount will be cleared from the system 41.28 Current Emplyee Benefits Current employee benefit was budgeted as part of non-current employee benefits 41.29 Non-Current Finance lease obligation Current and Long term portion of finance lease budgeted under finance lease obligation current.. 41.30 Non-Current Employee benefit obligation Current employee benefit was budgeted as part of non-current employee benefits 41.31 Revaluation Reserve The land and buildings properties were revalued and the accumulated depreciation due to the incease in carrying values
were credited to the revaluation reserve.
61
Municipality | APPENDICES 364
Molemole Local Municipality (Registration number LIM353) Financial Statements for the year ended 30 June 2019
Notes to the Financial Statements Figures in Rand 2019 2018
. Budget differences (continued) CASH FLOW STATEMENT 41.32 Sale of goods and services Implementation of credit control and Debt Collection procedures which includes the follow up on long outstanding debts for
the previous financial years. The sale of stands process was finalised later which lead to the municipality not to sold the
properties before the end of the financial year. 41.33 Interest received - external investment The municipality had less excess cash to invest as expected 41.34 Purchase of property, plant and equipment The municipality underspend of the budget is mainly due to vat portion which is part of the budget whereas the
expenditure is excluding vat (R7m) 41.35 Proceeds from sale of PPE The municipality did not budget for the sale of council assets via auction. 41.36 Purchase of intangibles The budget for the purchase of intangible assets is part of the Purchase of property plant and equipment (40.45) 41.37 Finance lease receipts The budget for the purchase of intangible assets is part of the Proceeds for sa le of PPE (40.46) 41.38 Cash and cash equivalents at the beginning of the year The audited actual cash at the end of June 2018 were more than anticipated .
42. Cash generated from operations
Surplus for the year 15 857 242 41 475 907 Adjustments for:
Depreciation and amortisation 12 277 161 7 871 607 (Gain) / loss on sale of assets and liabilities 1 550 539 (102 235) Interest income - (1 575 122) Actuarial (Gains) - (1 472 458) Debt impairment - 2 465 270 Movements in long term provisions and retirement benefit liabilities 2 234 674 813 752 Movements in current provisions and retirement benefits 711 525 1 118 195 Changes in working capital:
Inventories (33 524) (24 439) Receivables from exchange transactions (211 908) 5 891 946 Other receivables from non-exchange transactions (6 149 578) (22 314 907) Payables from exchange transactions 1 392 780 4 582 271 VAT (2 700 087) (2 440 669) Unspent conditional grants and receipts (2 042 331) (16 731 332) Consumer deposits 600 1 077
Other current liability (146 458) 984 699
22 740 635 20 543 562
43. Cashflow Statement Receipts - Sale of goods and services
Service Charges - Electricity 8 018 108 8 300 884 Service Charges - Refuse removal 1 852 784 1 763 228 Interest earned - Outstanding debtors 1 066 848 1 138 975 Commission Received 660 534 1 194 847 Property Rates 14 572 846 16 184 010 Traffic Fines 644 562 1 008 500
Rental of facilities and equipment 456 493 346 468
62
Municipality | APPENDICES 365
Molemole Local Municipality (Registration number LIM353) Financial Statements for the year ended 30 June 2019
Notes to the Financial Statements Figures in Rand
1. Cashflow Statement Receipts - Sale of goods and services (continued)
Licenses and permits
Other Income Movement in receivables from exchange transactions Movement in receivables from non exchange transactions Provision for Bad Debts Movements in Consumer deposits
2. Cashflow Statement Receipts - Grants
2019 2018
3 598 079 2 508 607 257 775 315 892 (211 908) 5 891 946 (6 149 578) (22 314 907) (4 494 247) (1 325 169)
600 1 077
20 272 896 15 014 358
Government grant and subsidies 177 221 330 167 951 928
Movements in Unspend conditional grants (2 042 330) (16 731 332)
175 179 000 151 220 596
45. Cashflow Statement Payments - Suppliers
Employee related costs (77 414 635) (67 607 676) Remuneration of councillors (12 365 462) (12 031 429) Actuarial (Gains)/Loss (1 537 201) 1 472 458 Bulk Purchases (9 419 063) (9 172 581) Contracted services (27 322 893) (22 969 181) General Expenses (46 776 443) (40 218 126) Movements in Payables from exchange transactions 1 392 780 4 582 271 Movements in VAT receivable (2 700 087) (2 440 669) Movements in Other current liability (146 458) 984 699 Movements in Employee Benefit - Current (161 081) 537 766 Movement in Employee Benefit - Non Current 2 395 755 (360 871) Movement in Provisions - Non current 711 525 1 172 676
Movement in Inventories (33 524) (24 375)
(173 376 787) (146 075 038)
46. Financial instruments disclosure
Categories of financial instruments
Financial Assets Classification 2019 2018
Investments
Fixed Deposit Held to maturity - -
Consumer Debtors
Trade receivables from exchange transactions Financial instruments at amortised cost 3 975 419 3 763 511
Trade receivables from non-exchange Financial instruments at amortised cost 62 324 634 56 175 056
transactions
Call Deposits Financial instruments at amortised cost 19 371 738 41 773 918
Bank Balances and Cash
Cash Floats and Advances Financial instruments at amortised cost 1 983 320
Summary of Financial Assets
- 85 673 774 101 712 805
Financial Liability Classification 2019 2018
Long-term Liabilities
Finance Lease Liability Financial instruments at amortised cost 251 676 513 306
Trade Payables
Trade Creditors Financial instruments at amortised cost 21 885 052 20 492 272
Current Portion of Long-term Liabilities
Finance Lease Liability Financial instruments at amortised cost 261 630 196 522
Summary of Financial Liability
- 22 398 358 21 202 100
63
Municipality | APPENDICES 366
Molemole Local Municipality (Registration number LIM353) Financial Statements for the year ended 30 June 2019
Notes to the Financial Statements Figures in Rand
2. Financial instruments disclosure (continued) 3. Profit/(Loss) on disposal of Assets
Loss on sale of council assets via auction Profit / (Loss) on write-off of council assets as per council resolution
48. Actuarial Gains / (Losses)
Actuarial Gains (Loss) on Long Service Bonus Actuarial Gains / (Loss) on Post-employment Health Care Benefits 49. Commitments
Capital Commitments
Already contracted for but not provided for Infrastructure
This expenditure will be financed from: Goverment Grants
Operating Commitments Already contracted for but not provided for Operating Expenditure
Not yet contracted for and authorised by accounting officer
Own Revenue
Total commitments Total commitments Capital Commitments Operating Commitments
50. Contingencies Contingent Liability
Contingent Asset
2019 2018
1 491 946 102 235
58 593 -
1 550 539 102 235
(357 746) -
(1 179 455) 1 472 458
(1 537 201) 1 472 458
4 146 311 14 170 429
4 146 311 14 170 429
4 146 311 14 170 429
4 146 311 14 170 429
27 784 305 6 481 198
27 784 305 6 481 198
27 784 305 6 481 198
27 784 305 6 481 198
4 146 311 14 170 429
27 784 305 6 481 198
31 930 616 20 651 627
4 526 269 3 244 637
2 997 550 600 000
64
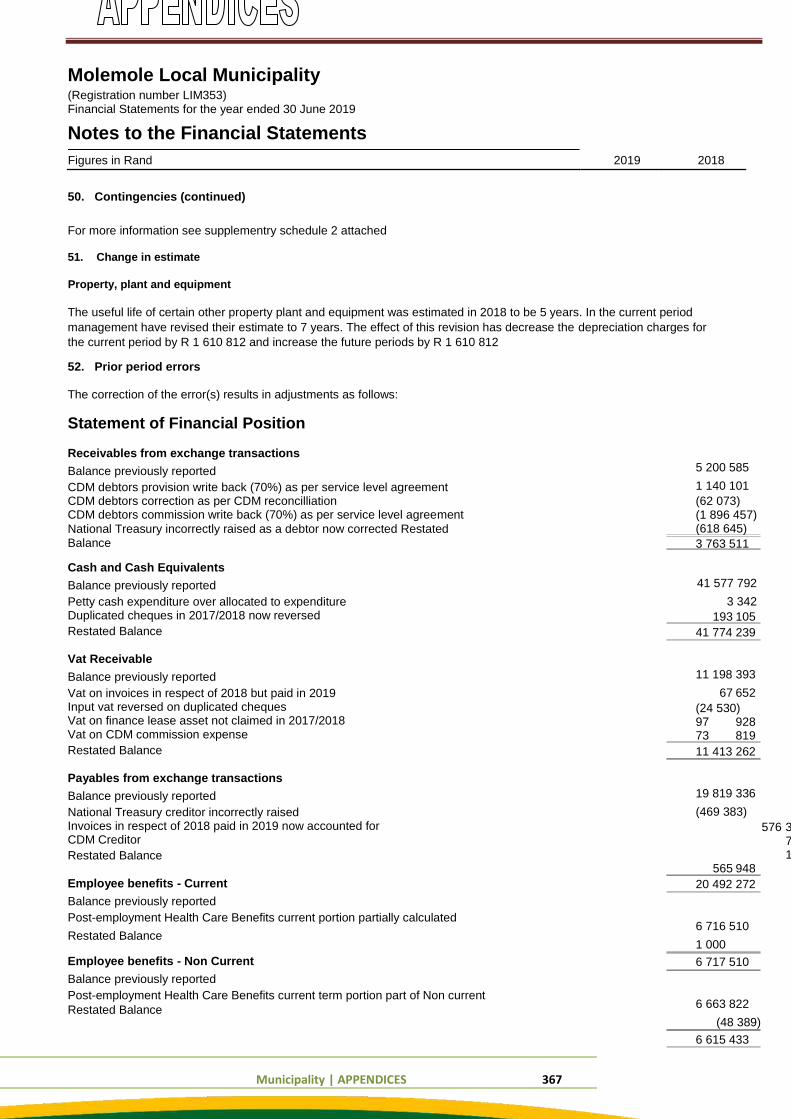
Municipality | APPENDICES 367
Molemole Local Municipality (Registration number LIM353) Financial Statements for the year ended 30 June 2019
Notes to the Financial Statements Figures in Rand 2019 2018
50. Contingencies (continued) For more information see supplementry schedule 2 attached 51. Change in estimate
Property, plant and equipment
The useful life of certain other property plant and equipment was estimated in 2018 to be 5 years. In the current period
management have revised their estimate to 7 years. The effect of this revision has decrease the depreciation charges for
the current period by R 1 610 812 and increase the future periods by R 1 610 812 52. Prior period errors The correction of the error(s) results in adjustments as follows:
Statement of Financial Position Receivables from exchange transactions Balance previously reported CDM debtors provision write back (70%) as per service level agreement CDM debtors correction as per CDM reconcilliation CDM debtors commission write back (70%) as per service level agreement
National Treasury incorrectly raised as a debtor now corrected Restated
Balance Cash and Cash Equivalents Balance previously reported Petty cash expenditure over allocated to expenditure Duplicated cheques in 2017/2018 now reversed Restated Balance Vat Receivable Balance previously reported Vat on invoices in respect of 2018 but paid in 2019 Input vat reversed on duplicated cheques Vat on finance lease asset not claimed in 2017/2018 Vat on CDM commission expense Restated Balance Payables from exchange transactions Balance previously reported National Treasury creditor incorrectly raised Invoices in respect of 2018 paid in 2019 now accounted for CDM Creditor Restated Balance Employee benefits - Current Balance previously reported Post-employment Health Care Benefits current portion partially calculated
Restated Balance Employee benefits - Non Current Balance previously reported Post-employment Health Care Benefits current term portion part of Non current
Restated Balance
5 200 585 1 140 101 (62 073) (1 896 457) (618 645) 3 763 511
41 577 792
3 342 193 105
41 774 239 11 198 393
67 652 (24 530) 97 928 73 819 11 413 262 19 819 336 (469 383)
576 371
565 948 20 492 272 6 716 510 1 000 6 717 510 6 663 822
(48 389) 6 615 433

Municipality | APPENDICES 368
65
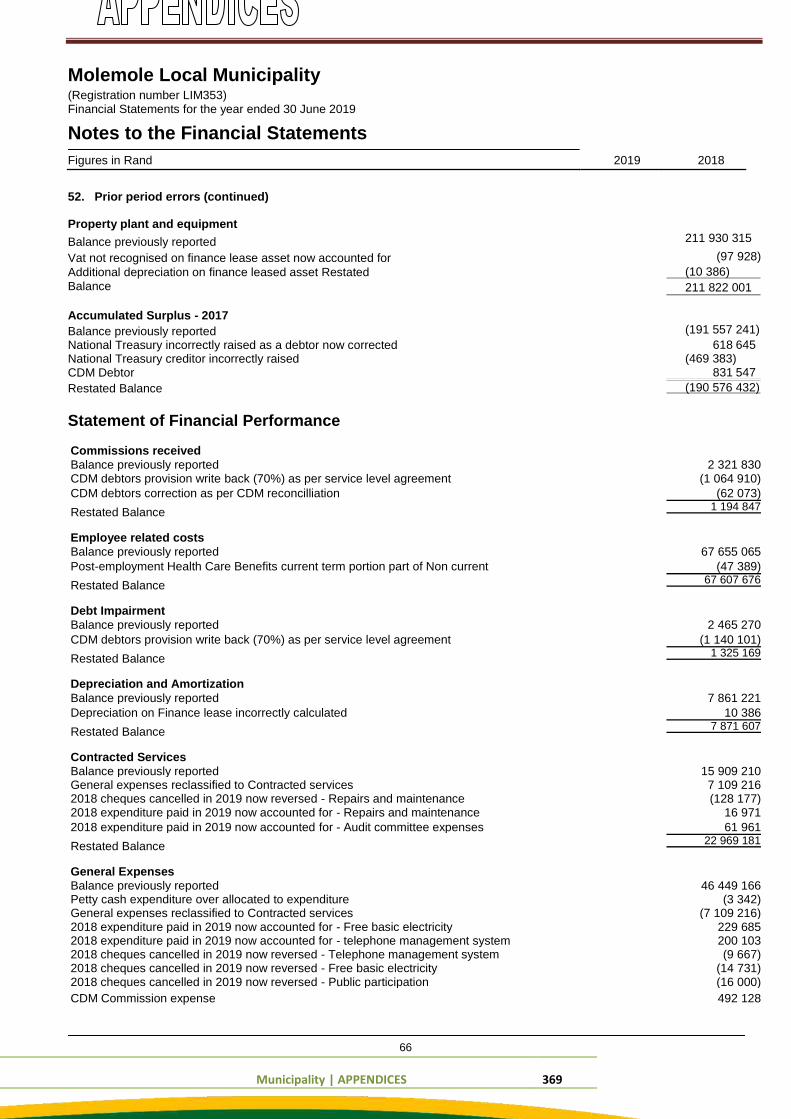
Municipality | APPENDICES 369
Molemole Local Municipality (Registration number LIM353) Financial Statements for the year ended 30 June 2019
Notes to the Financial Statements Figures in Rand 2019 2018
52. Prior period errors (continued) Property plant and equipment Balance previously reported Vat not recognised on finance lease asset now accounted for
Additional depreciation on finance leased asset Restated
Balance
Accumulated Surplus - 2017 Balance previously reported National Treasury incorrectly raised as a debtor now corrected National Treasury creditor incorrectly raised CDM Debtor Restated Balance
211 930 315
(97 928) (10 386) 211 822 001 (191 557 241)
618 645 (469 383)
831 547 (190 576 432)
Statement of Financial Performance Commissions received
Balance previously reported 2 321 830
CDM debtors provision write back (70%) as per service level agreement (1 064 910)
CDM debtors correction as per CDM reconcilliation (62 073)
Restated Balance 1 194 847
Employee related costs
Balance previously reported 67 655 065
Post-employment Health Care Benefits current term portion part of Non current (47 389)
Restated Balance 67 607 676
Debt Impairment
Balance previously reported 2 465 270
CDM debtors provision write back (70%) as per service level agreement (1 140 101)
Restated Balance 1 325 169
Depreciation and Amortization
Balance previously reported 7 861 221
Depreciation on Finance lease incorrectly calculated 10 386
Restated Balance 7 871 607
Contracted Services
Balance previously reported 15 909 210
General expenses reclassified to Contracted services 7 109 216
2018 cheques cancelled in 2019 now reversed - Repairs and maintenance (128 177)
2018 expenditure paid in 2019 now accounted for - Repairs and maintenance 16 971
2018 expenditure paid in 2019 now accounted for - Audit committee expenses 61 961
Restated Balance 22 969 181
General Expenses
Balance previously reported 46 449 166
Petty cash expenditure over allocated to expenditure (3 342)
General expenses reclassified to Contracted services (7 109 216)
2018 expenditure paid in 2019 now accounted for - Free basic electricity 229 685
2018 expenditure paid in 2019 now accounted for - telephone management system 200 103
2018 cheques cancelled in 2019 now reversed - Telephone management system (9 667)
2018 cheques cancelled in 2019 now reversed - Free basic electricity (14 731)
2018 cheques cancelled in 2019 now reversed - Public participation (16 000)
CDM Commission expense 492 128
66
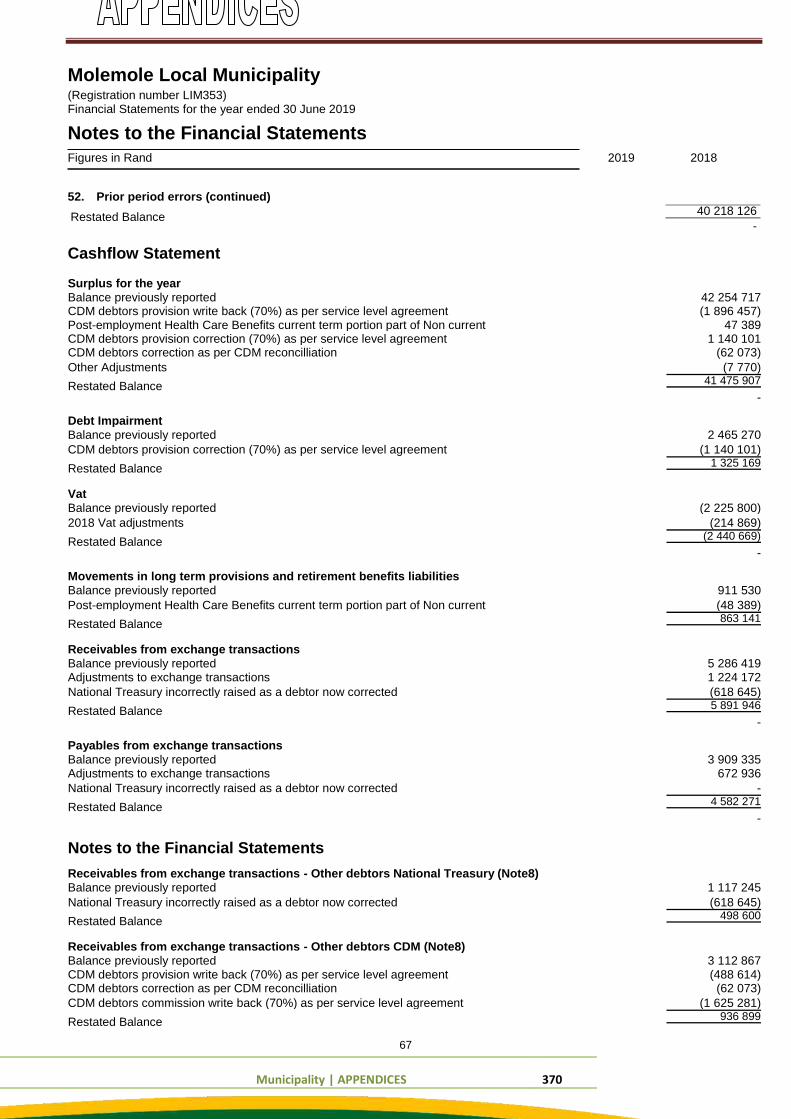
Municipality | APPENDICES 370
Molemole Local Municipality (Registration number LIM353) Financial Statements for the year ended 30 June 2019
Notes to the Financial Statements Figures in Rand
52. Prior period errors (continued)
Restated Balance
Cashflow Statement
2019 2018
40 218 126 -
Surplus for the year
Balance previously reported 42 254 717
CDM debtors provision write back (70%) as per service level agreement (1 896 457)
Post-employment Health Care Benefits current term portion part of Non current 47 389
CDM debtors provision correction (70%) as per service level agreement 1 140 101
CDM debtors correction as per CDM reconcilliation (62 073)
Other Adjustments (7 770)
Restated Balance 41 475 907
-
Debt Impairment
Balance previously reported 2 465 270
CDM debtors provision correction (70%) as per service level agreement (1 140 101)
Restated Balance 1 325 169
Vat
Balance previously reported (2 225 800)
2018 Vat adjustments (214 869)
Restated Balance (2 440 669)
-
Movements in long term provisions and retirement benefits liabilities
Balance previously reported 911 530
Post-employment Health Care Benefits current term portion part of Non current (48 389)
Restated Balance 863 141
Receivables from exchange transactions
Balance previously reported 5 286 419
Adjustments to exchange transactions 1 224 172
National Treasury incorrectly raised as a debtor now corrected (618 645)
Restated Balance 5 891 946
-
Payables from exchange transactions
Balance previously reported 3 909 335
Adjustments to exchange transactions 672 936
National Treasury incorrectly raised as a debtor now corrected -
Restated Balance 4 582 271
-
Notes to the Financial Statements
Receivables from exchange transactions - Other debtors National Treasury (Note8)
Balance previously reported 1 117 245
National Treasury incorrectly raised as a debtor now corrected (618 645)
Restated Balance 498 600
Receivables from exchange transactions - Other debtors CDM (Note8)
Balance previously reported 3 112 867
CDM debtors provision write back (70%) as per service level agreement (488 614)
CDM debtors correction as per CDM reconcilliation (62 073)
CDM debtors commission write back (70%) as per service level agreement (1 625 281)
Restated Balance 936 899
67
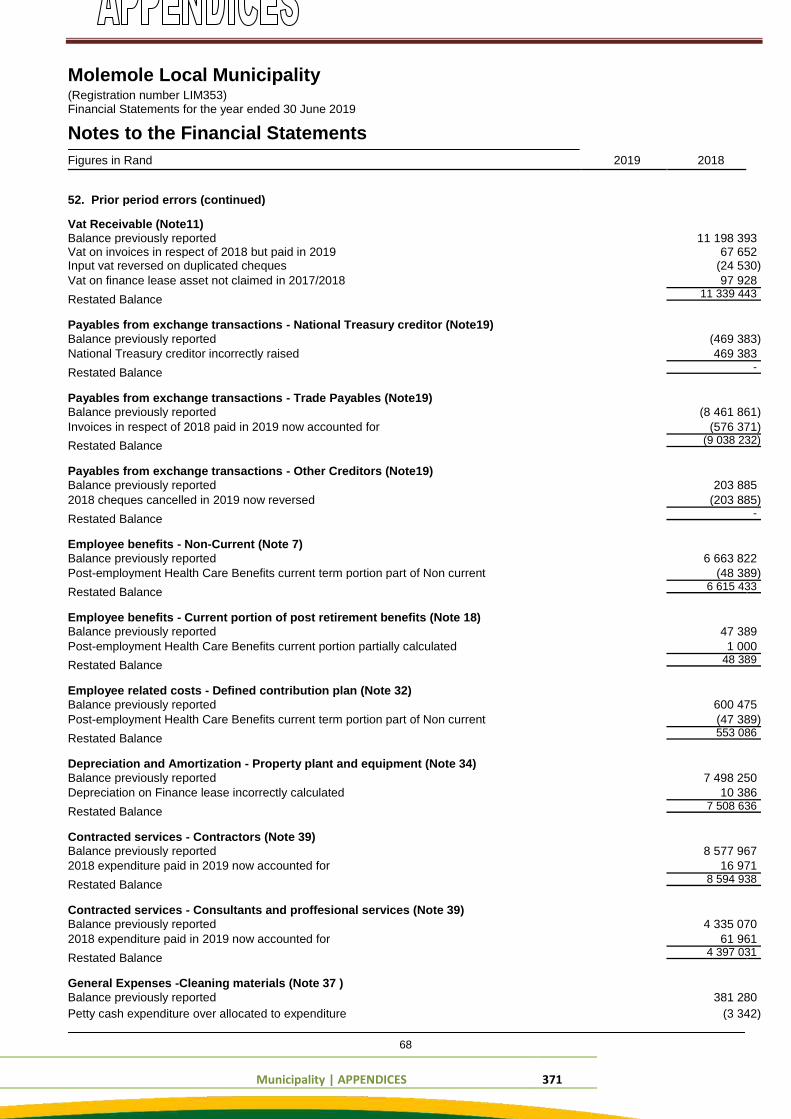
Municipality | APPENDICES 371
Molemole Local Municipality (Registration number LIM353) Financial Statements for the year ended 30 June 2019
Notes to the Financial Statements Figures in Rand 2019 2018
52. Prior period errors (continued)
Vat Receivable (Note11)
Balance previously reported 11 198 393
Vat on invoices in respect of 2018 but paid in 2019 67 652
Input vat reversed on duplicated cheques (24 530)
Vat on finance lease asset not claimed in 2017/2018 97 928
Restated Balance 11 339 443
Payables from exchange transactions - National Treasury creditor (Note19)
Balance previously reported (469 383)
National Treasury creditor incorrectly raised 469 383
Restated Balance -
Payables from exchange transactions - Trade Payables (Note19)
Balance previously reported (8 461 861)
Invoices in respect of 2018 paid in 2019 now accounted for (576 371)
Restated Balance (9 038 232)
Payables from exchange transactions - Other Creditors (Note19)
Balance previously reported 203 885
2018 cheques cancelled in 2019 now reversed (203 885)
Restated Balance -
Employee benefits - Non-Current (Note 7)
Balance previously reported 6 663 822
Post-employment Health Care Benefits current term portion part of Non current (48 389)
Restated Balance 6 615 433
Employee benefits - Current portion of post retirement benefits (Note 18)
Balance previously reported 47 389
Post-employment Health Care Benefits current portion partially calculated 1 000
Restated Balance 48 389
Employee related costs - Defined contribution plan (Note 32)
Balance previously reported 600 475
Post-employment Health Care Benefits current term portion part of Non current (47 389)
Restated Balance 553 086
Depreciation and Amortization - Property plant and equipment (Note 34)
Balance previously reported 7 498 250
Depreciation on Finance lease incorrectly calculated 10 386
Restated Balance 7 508 636
Contracted services - Contractors (Note 39)
Balance previously reported 8 577 967
2018 expenditure paid in 2019 now accounted for 16 971
Restated Balance 8 594 938
Contracted services - Consultants and proffesional services (Note 39)
Balance previously reported 4 335 070
2018 expenditure paid in 2019 now accounted for 61 961
Restated Balance 4 397 031
General Expenses -Cleaning materials (Note 37 )
Balance previously reported 381 280
Petty cash expenditure over allocated to expenditure (3 342)
68
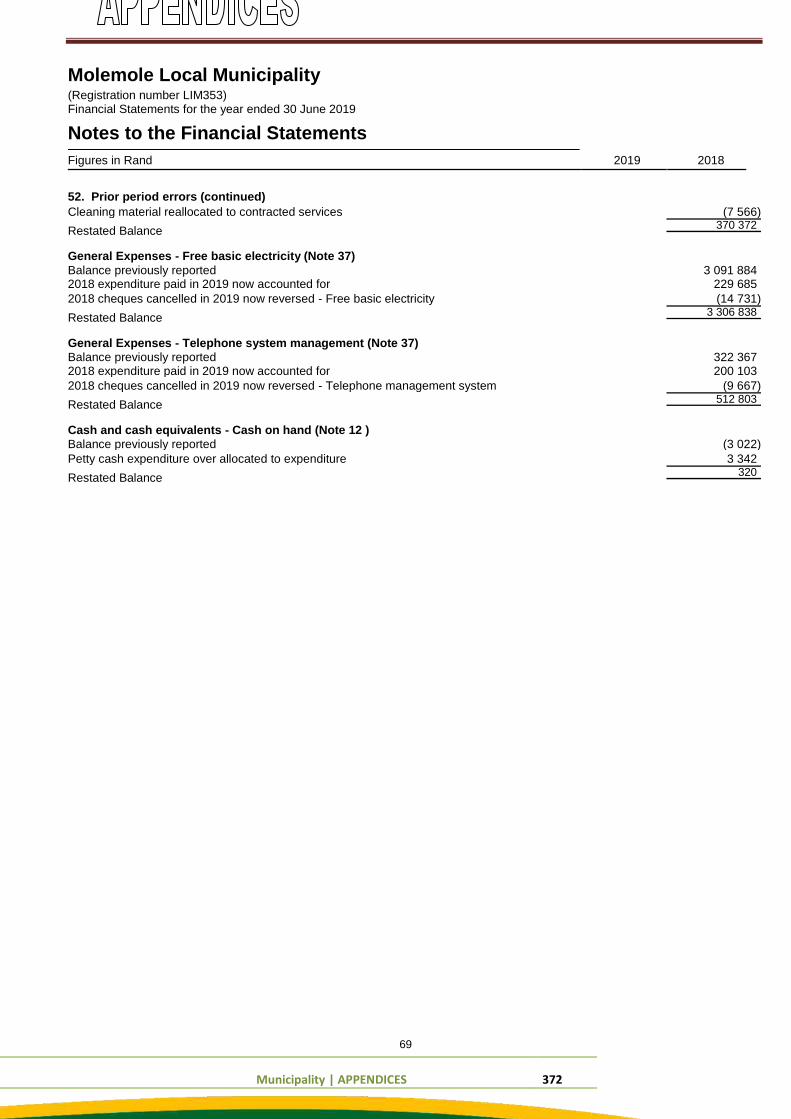
Municipality | APPENDICES 372
Molemole Local Municipality (Registration number LIM353) Financial Statements for the year ended 30 June 2019
Notes to the Financial Statements Figures in Rand 2019 2018
52. Prior period errors (continued)
Cleaning material reallocated to contracted services (7 566)
Restated Balance 370 372
General Expenses - Free basic electricity (Note 37)
Balance previously reported 3 091 884
2018 expenditure paid in 2019 now accounted for 229 685
2018 cheques cancelled in 2019 now reversed - Free basic electricity (14 731)
Restated Balance 3 306 838
General Expenses - Telephone system management (Note 37)
Balance previously reported 322 367
2018 expenditure paid in 2019 now accounted for 200 103
2018 cheques cancelled in 2019 now reversed - Telephone management system (9 667)
Restated Balance 512 803
Cash and cash equivalents - Cash on hand (Note 12 )
Balance previously reported (3 022)
Petty cash expenditure over allocated to expenditure 3 342
Restated Balance 320
69
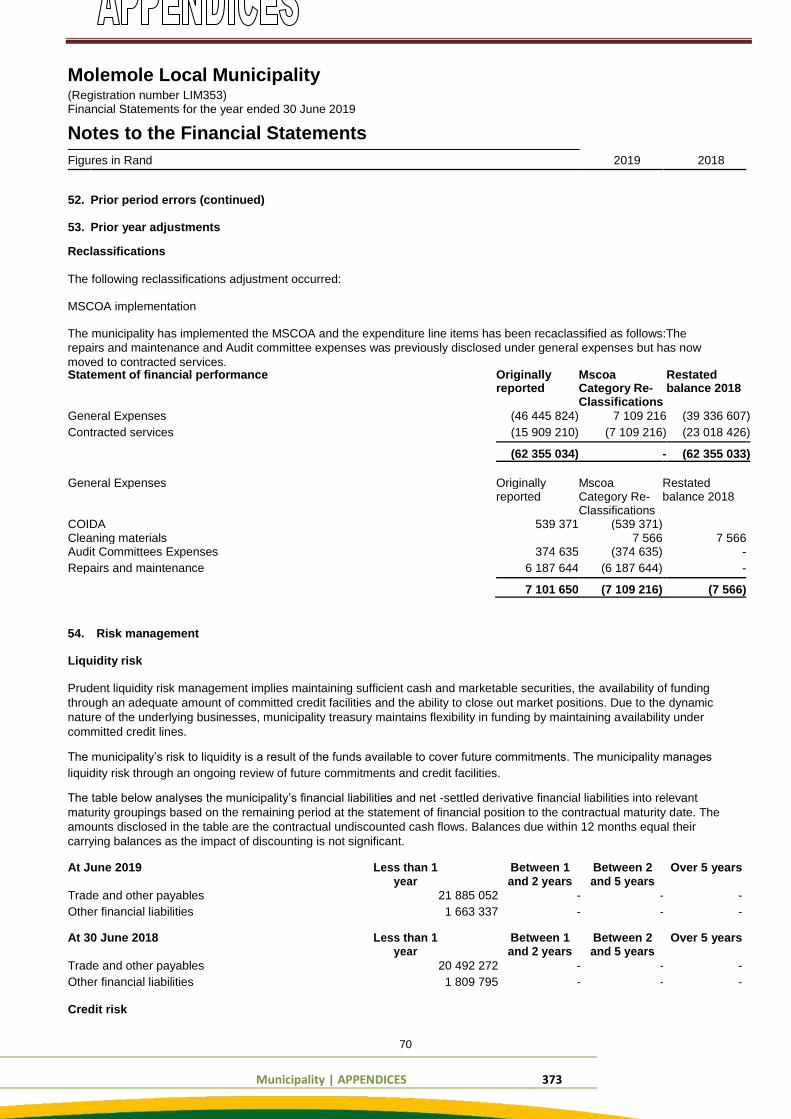
Municipality | APPENDICES 373
Molemole Local Municipality (Registration number LIM353) Financial Statements for the year ended 30 June 2019
Notes to the Financial Statements Figures in Rand 2019 2018
52. Prior period errors (continued)
53. Prior year adjustments Reclassifications The following reclassifications adjustment occurred: MSCOA implementation The municipality has implemented the MSCOA and the expenditure line items has been recaclassified as follows:The
repairs and maintenance and Audit committee expenses was previously disclosed under general expenses but has now
moved to contracted services. Statement of financial performance Originally Mscoa Restated reported Category Re- balance 2018 Classifications
General Expenses (46 445 824) 7 109 216 (39 336 607)
Contracted services (15 909 210) (7 109 216) (23 018 426)
(62 355 034) - (62 355 033)
General Expenses Originally Mscoa Restated reported Category Re- balance 2018 Classifications
COIDA 539 371 (539 371)
Cleaning materials 7 566 7 566 Audit Committees Expenses 374 635 (374 635) -
Repairs and maintenance 6 187 644 (6 187 644) -
7 101 650 (7 109 216) (7 566) 54. Risk management
Liquidity risk
Prudent liquidity risk management implies maintaining sufficient cash and marketable securities, the availability of funding
through an adequate amount of committed credit facilities and the ability to close out market positions. Due to the dynamic
nature of the underlying businesses, municipality treasury maintains flexibility in funding by maintaining availability under
committed credit lines. The municipality’s risk to liquidity is a result of the funds available to cover future commitments. The municipality manages
liquidity risk through an ongoing review of future commitments and credit facilities. The table below analyses the municipality’s financial liabilities and net -settled derivative financial liabilities into relevant
maturity groupings based on the remaining period at the statement of financial position to the contractual maturity date. The
amounts disclosed in the table are the contractual undiscounted cash flows. Balances due within 12 months equal their
carrying balances as the impact of discounting is not significant. At June 2019 Less than 1 Between 1 Between 2 Over 5 years year and 2 years and 5 years
Trade and other payables 21 885 052 - - -
Other financial liabilities 1 663 337 - - -
At 30 June 2018 Less than 1 Between 1 Between 2 Over 5 years year and 2 years and 5 years
Trade and other payables 20 492 272 - - -
Other financial liabilities 1 809 795 - - -
Credit risk
70
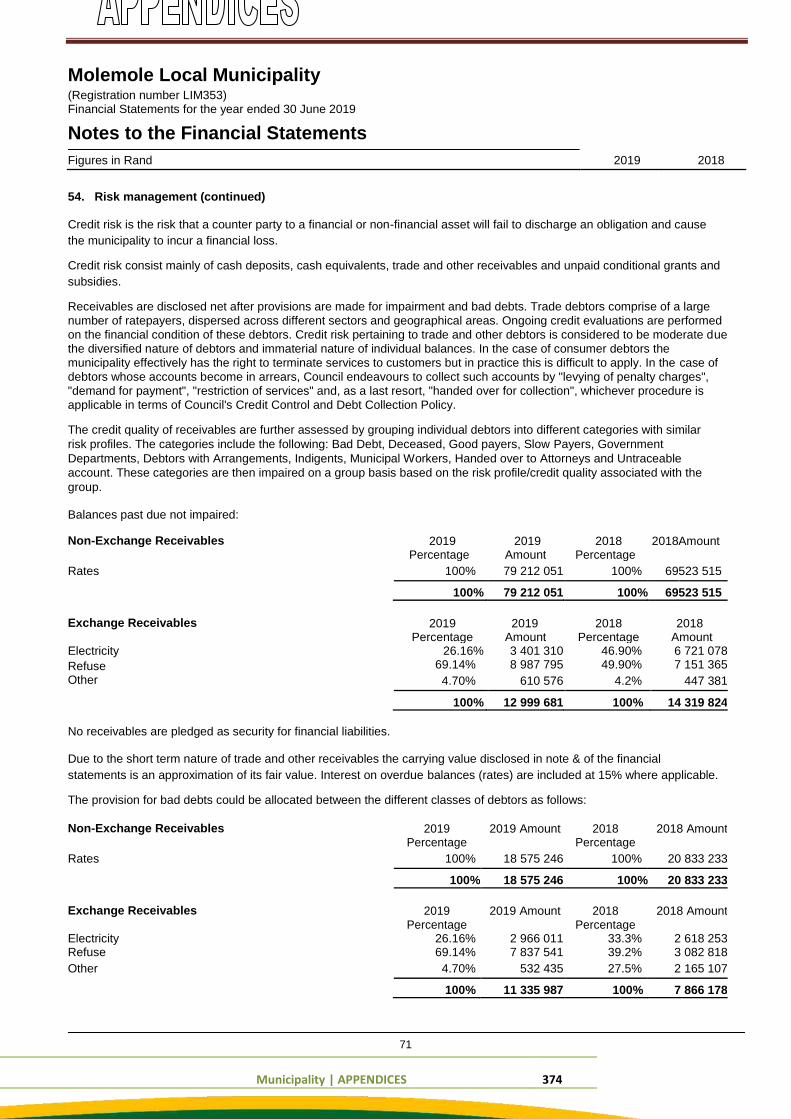
Municipality | APPENDICES 374
Molemole Local Municipality (Registration number LIM353) Financial Statements for the year ended 30 June 2019
Notes to the Financial Statements Figures in Rand 2019 2018
54. Risk management (continued) Credit risk is the risk that a counter party to a financial or non-financial asset will fail to discharge an obligation and cause
the municipality to incur a financial loss. Credit risk consist mainly of cash deposits, cash equivalents, trade and other receivables and unpaid conditional grants and
subsidies. Receivables are disclosed net after provisions are made for impairment and bad debts. Trade debtors comprise of a large
number of ratepayers, dispersed across different sectors and geographical areas. Ongoing credit evaluations are performed
on the financial condition of these debtors. Credit risk pertaining to trade and other debtors is considered to be moderate due
the diversified nature of debtors and immaterial nature of individual balances. In the case of consumer debtors the
municipality effectively has the right to terminate services to customers but in practice this is difficult to apply. In the case of
debtors whose accounts become in arrears, Council endeavours to collect such accounts by "levying of penalty charges",
"demand for payment", "restriction of services" and, as a last resort, "handed over for collection", whichever procedure is
applicable in terms of Council's Credit Control and Debt Collection Policy. The credit quality of receivables are further assessed by grouping individual debtors into different categories with similar
risk profiles. The categories include the following: Bad Debt, Deceased, Good payers, Slow Payers, Government
Departments, Debtors with Arrangements, Indigents, Municipal Workers, Handed over to Attorneys and Untraceable
account. These categories are then impaired on a group basis based on the risk profile/credit quality associated with the
group.
Balances past due not impaired:
Non-Exchange Receivables 2019 2019 2018 2018 Amount Percentage Amount Percentage
Rates 100% 79 212 051 100% 69 523 515
100% 79 212 051 100% 69 523 515 Exchange Receivables Electricity Refuse Other
No receivables are pledged as security for financial liabilities.
2019 2019 2018 2018
Percentage Amount Percentage Amount 26.16% 3 401 310 46.90% 6 721 078
69.14% 8 987 795 49.90% 7 151 365
4.70% 610 576 4.2% 447 381
100% 12 999 681 100% 14 319 824
Due to the short term nature of trade and other receivables the carrying value disclosed in note & of the financial
statements is an approximation of its fair value. Interest on overdue balances (rates) are included at 15% where applicable. The provision for bad debts could be allocated between the different classes of debtors as follows: Non-Exchange Receivables 2019 2019 Amount 2018 2018 Amount Percentage Percentage
Rates 100% 18 575 246 100% 20 833 233
100% 18 575 246 100% 20 833 233
Exchange Receivables 2019 2019 Amount 2018 2018 Amount Percentage Percentage
Electricity 26.16% 2 966 011 33.3% 2 618 253 Refuse 69.14% 7 837 541 39.2% 3 082 818
Other 4.70% 532 435 27.5% 2 165 107
100% 11 335 987 100% 7 866 178
71
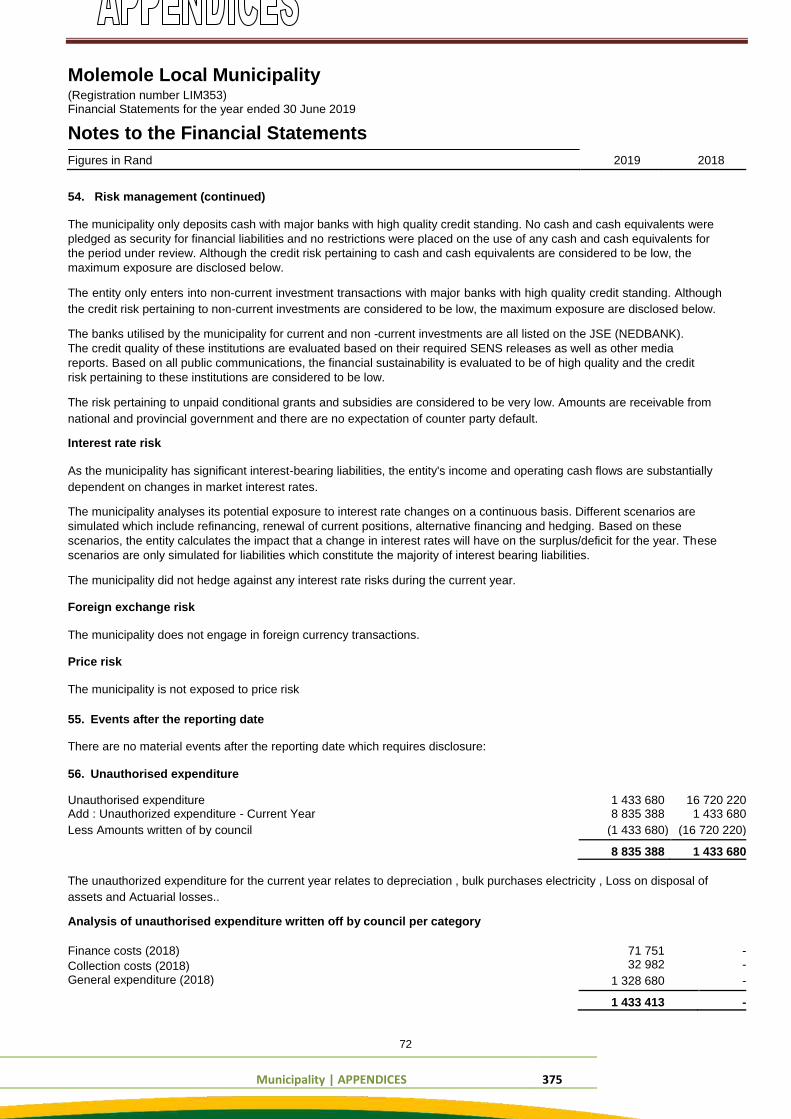
Municipality | APPENDICES 375
Molemole Local Municipality (Registration number LIM353) Financial Statements for the year ended 30 June 2019
Notes to the Financial Statements Figures in Rand 2019 2018
54. Risk management (continued) The municipality only deposits cash with major banks with high quality credit standing. No cash and cash equivalents were
pledged as security for financial liabilities and no restrictions were placed on the use of any cash and cash equivalents for
the period under review. Although the credit risk pertaining to cash and cash equivalents are considered to be low, the
maximum exposure are disclosed below. The entity only enters into non-current investment transactions with major banks with high quality credit standing. Although
the credit risk pertaining to non-current investments are considered to be low, the maximum exposure are disclosed below. The banks utilised by the municipality for current and non -current investments are all listed on the JSE (NEDBANK).
The credit quality of these institutions are evaluated based on their required SENS releases as well as other media
reports. Based on all public communications, the financial sustainability is evaluated to be of high quality and the credit
risk pertaining to these institutions are considered to be low. The risk pertaining to unpaid conditional grants and subsidies are considered to be very low. Amounts are receivable from
national and provincial government and there are no expectation of counter party default. Interest rate risk As the municipality has significant interest-bearing liabilities, the entity's income and operating cash flows are substantially
dependent on changes in market interest rates. The municipality analyses its potential exposure to interest rate changes on a continuous basis. Different scenarios are
simulated which include refinancing, renewal of current positions, alternative financing and hedging. Based on these
scenarios, the entity calculates the impact that a change in interest rates will have on the surplus/deficit for the year. These
scenarios are only simulated for liabilities which constitute the majority of interest bearing liabilities. The municipality did not hedge against any interest rate risks during the current year. Foreign exchange risk The municipality does not engage in foreign currency transactions. Price risk The municipality is not exposed to price risk
55. Events after the reporting date
There are no material events after the reporting date which requires disclosure:
56. Unauthorised expenditure
Unauthorised expenditure 1 433 680 16 720 220 Add : Unauthorized expenditure - Current Year 8 835 388 1 433 680
Less Amounts written of by council (1 433 680) (16 720 220)
8 835 388 1 433 680
The unauthorized expenditure for the current year relates to depreciation , bulk purchases electricity , Loss on disposal of
assets and Actuarial losses.. Analysis of unauthorised expenditure written off by council per category Finance costs (2018) Collection costs (2018) General expenditure (2018)
71 751 - 32 982 -
1 328 680 -
1 433 413 -
72
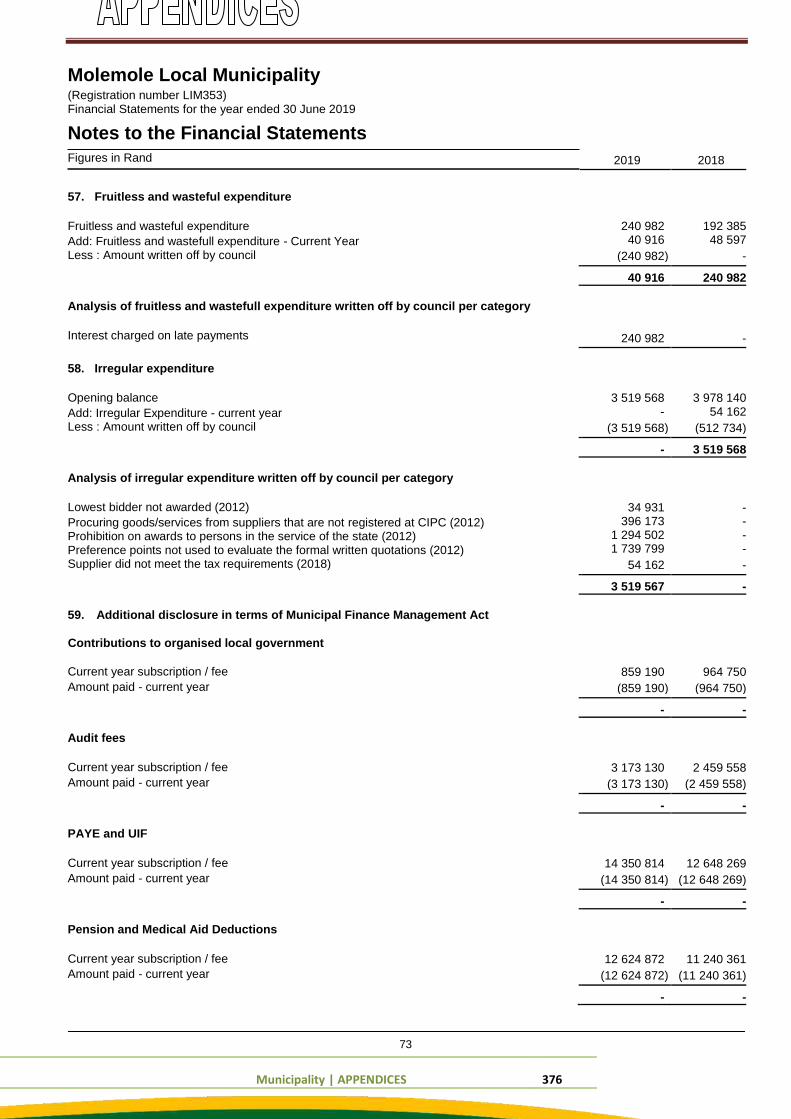
Municipality | APPENDICES 376
Molemole Local Municipality (Registration number LIM353) Financial Statements for the year ended 30 June 2019
Notes to the Financial Statements Figures in Rand
57. Fruitless and wasteful expenditure Fruitless and wasteful expenditure Add: Fruitless and wastefull expenditure - Current Year Less : Amount written off by council
Analysis of fruitless and wastefull expenditure written off by council per category Interest charged on late payments
58. Irregular expenditure Opening balance Add: Irregular Expenditure - current year Less : Amount written off by council
Analysis of irregular expenditure written off by council per category Lowest bidder not awarded (2012) Procuring goods/services from suppliers that are not registered at CIPC (2012) Prohibition on awards to persons in the service of the state (2012) Preference points not used to evaluate the formal written quotations (2012) Supplier did not meet the tax requirements (2018)
59. Additional disclosure in terms of Municipal Finance Management Act
Contributions to organised local government
Current year subscription / fee Amount paid - current year
Audit fees Current year subscription / fee Amount paid - current year
PAYE and UIF
Current year subscription / fee Amount paid - current year
Pension and Medical Aid Deductions Current year subscription / fee Amount paid - current year
2019 2018
240 982 192 385 40 916 48 597
(240 982) -
40 916 240 982
240 982 -
3 519 568 3 978 140 - 54 162
(3 519 568) (512 734)
- 3 519 568
34 931 - 396 173 - 1 294 502 - 1 739 799 -
54 162 -
3 519 567 -
859 190 964 750
(859 190) (964 750)
- -
3 173 130 2 459 558
(3 173 130) (2 459 558)
- -
14 350 814 12 648 269
(14 350 814) (12 648 269)
- -
12 624 872 11 240 361
(12 624 872) (11 240 361)
- -
73
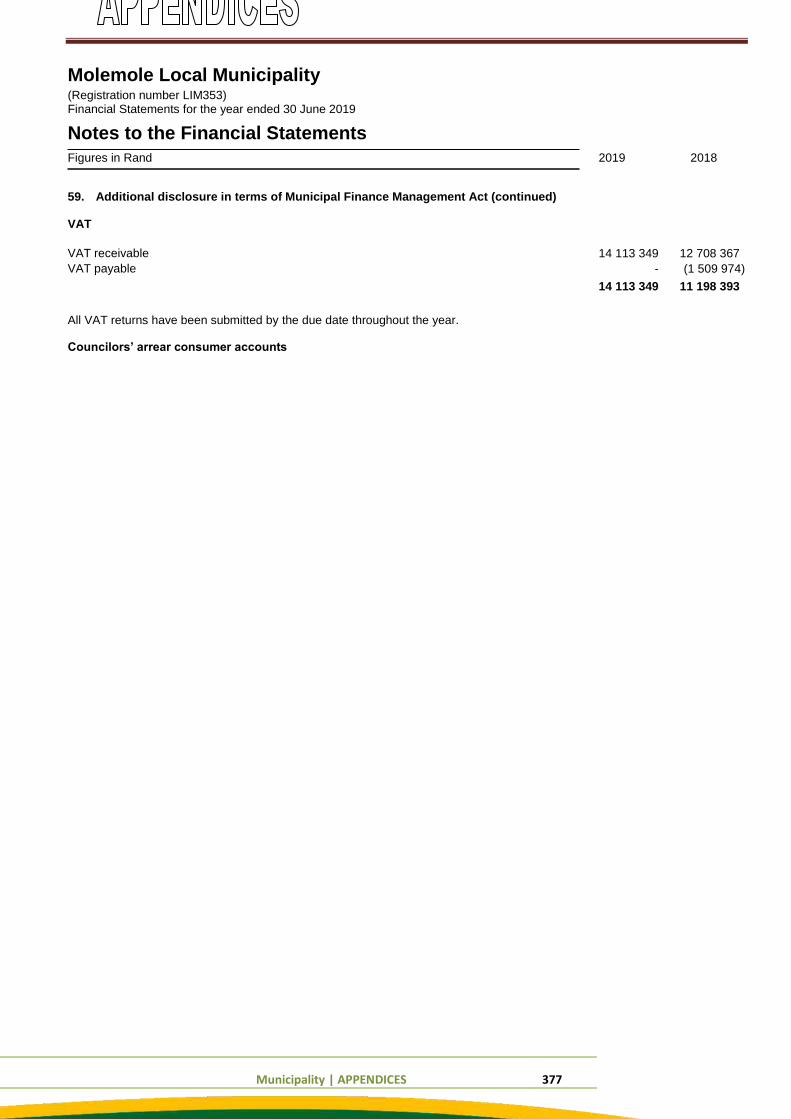
Municipality | APPENDICES 377
Molemole Local Municipality (Registration number LIM353) Financial Statements for the year ended 30 June 2019
Notes to the Financial Statements Figures in Rand
59. Additional disclosure in terms of Municipal Finance Management Act (continued) VAT
VAT receivable VAT payable
All VAT returns have been submitted by the due date throughout the year. Councilors’ arrear consumer accounts
2019 2018 14 113 349 12 708 367
- (1 509 974) 14 113 349 11 198 393
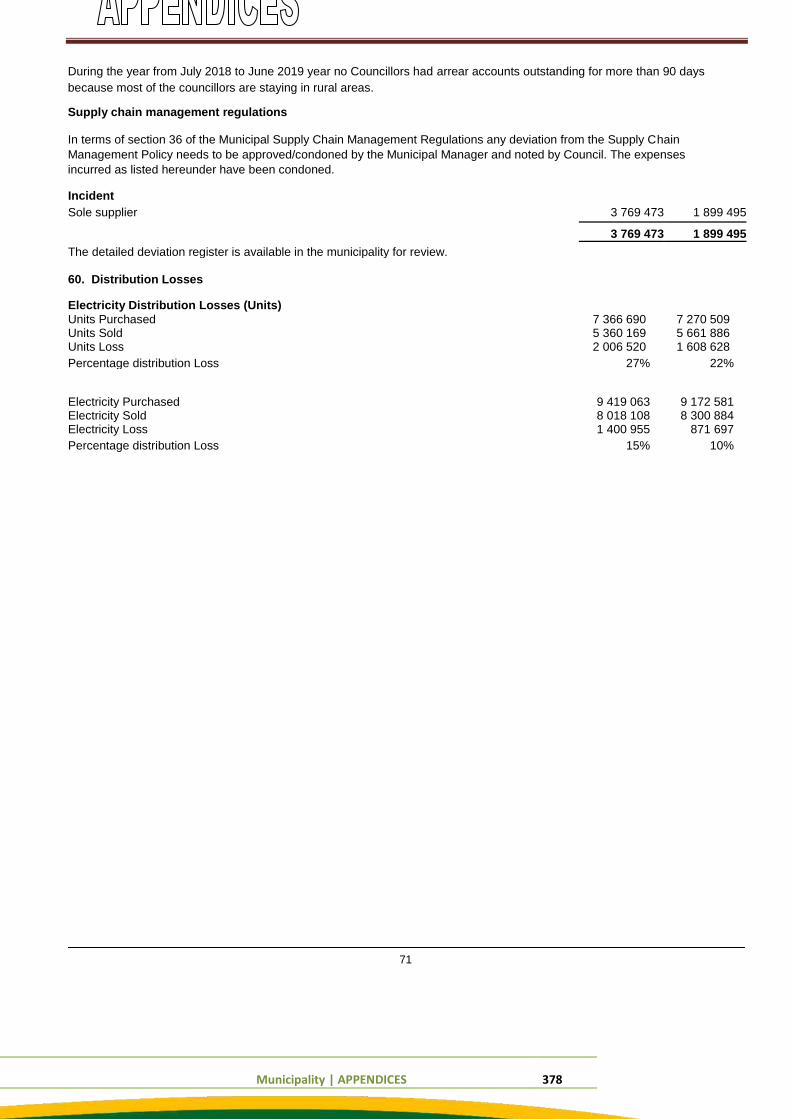
Municipality | APPENDICES 378
During the year from July 2018 to June 2019 year no Councillors had arrear accounts outstanding for more than 90 days
because most of the councillors are staying in rural areas. Supply chain management regulations In terms of section 36 of the Municipal Supply Chain Management Regulations any deviation from the Supply Chain
Management Policy needs to be approved/condoned by the Municipal Manager and noted by Council. The expenses
incurred as listed hereunder have been condoned. Incident
Sole supplier 3 769 473 1 899 495
3 769 473 1 899 495
The detailed deviation register is available in the municipality for review.
60. Distribution Losses
Electricity Distribution Losses (Units) Units Purchased 7 366 690 7 270 509 Units Sold 5 360 169 5 661 886 Units Loss 2 006 520 1 608 628
Percentage distribution Loss 27% 22%
Electricity Purchased 9 419 063 9 172 581 Electricity Sold 8 018 108 8 300 884 Electricity Loss 1 400 955 871 697
Percentage distribution Loss 15% 10%
71
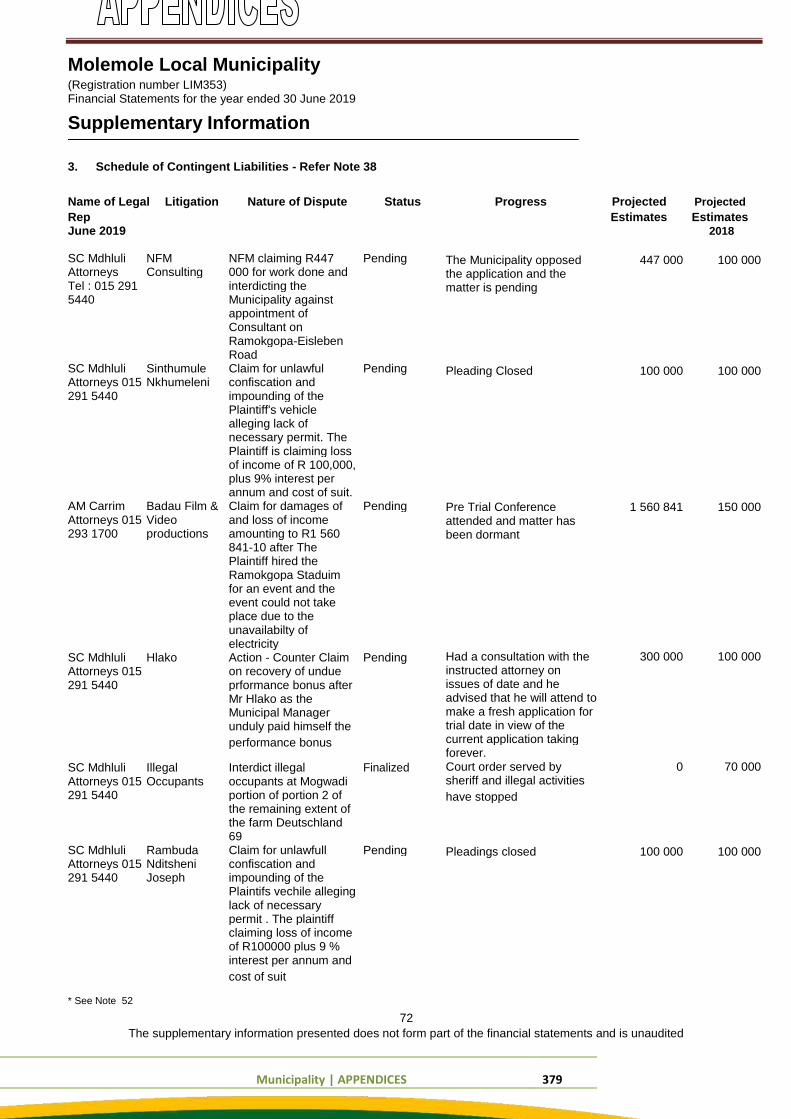
Municipality | APPENDICES 379
Molemole Local Municipality (Registration number LIM353) Financial Statements for the year ended 30 June 2019
Supplementary Information
3. Schedule of Contingent Liabilities - Refer Note 38
Name of Legal Litigation Nature of Dispute Status Progress Projected Projected Rep Estimates Estimates June 2019 2018 SC Mdhluli NFM NFM claiming R447 Pending Attorneys Consulting 000 for work done and
Tel : 015 291 interdicting the
5440 Municipality against
appointment of
Consultant on
Ramokgopa-Eisleben
Road
SC Mdhluli Sinthumule Claim for unlawful Pending Attorneys 015 Nkhumeleni confiscation and
291 5440 impounding of the
Plaintiff's vehicle
alleging lack of
necessary permit. The
Plaintiff is claiming loss
of income of R 100,000,
plus 9% interest per
annum and cost of suit.
AM Carrim Badau Film & Claim for damages of Pending Attorneys 015 Video and loss of income
293 1700 productions amounting to R1 560
841-10 after The
Plaintiff hired the
Ramokgopa Staduim
for an event and the
event could not take
place due to the
unavailabilty of
electricity
SC Mdhluli Hlako Action - Counter Claim Pending Attorneys 015 on recovery of undue
291 5440 prformance bonus after
Mr Hlako as the
Municipal Manager
unduly paid himself the
performance bonus
SC Mdhluli Illegal Interdict illegal Finalized Attorneys 015 Occupants occupants at Mogwadi
291 5440 portion of portion 2 of
the remaining extent of
the farm Deutschland
69
SC Mdhluli Rambuda Claim for unlawfull Pending Attorneys 015 Nditsheni confiscation and
291 5440 Joseph impounding of the
Plaintifs vechile alleging
lack of necessary
permit . The plaintiff
claiming loss of income
of R100000 plus 9 %
interest per annum and
cost of suit
The Municipality opposed 447 000 100 000 the application and the matter is pending
Pleading Closed 100 000 100 000
Pre Trial Conference 1 560 841 150 000 attended and matter has been dormant Had a consultation with the 300 000 100 000 instructed attorney on
issues of date and he
advised that he will attend to
make a fresh application for
trial date in view of the
current application taking
forever.
Court order served by 0 70 000 sheriff and illegal activities
have stopped
Pleadings closed 100 000 100 000
* See Note 52 72
The supplementary information presented does not form part of the financial statements and is unaudited
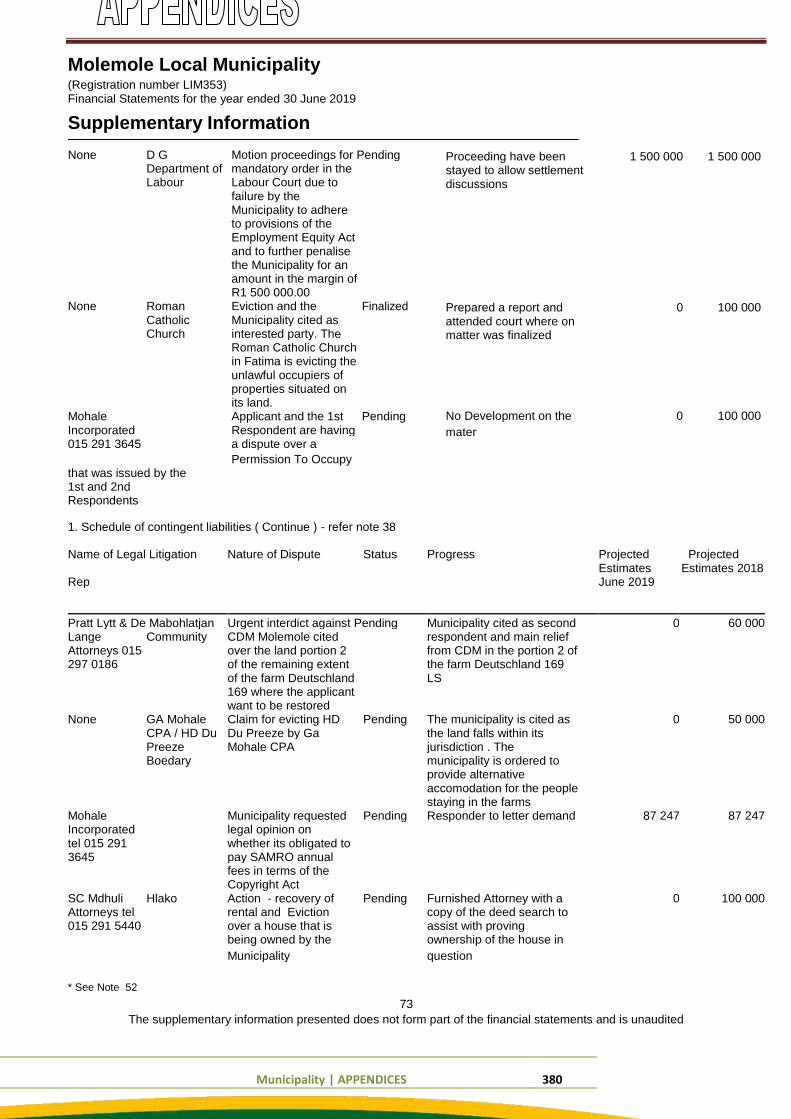
Municipality | APPENDICES 380
Molemole Local Municipality (Registration number LIM353) Financial Statements for the year ended 30 June 2019
Supplementary Information None D G Motion proceedings for Pending Department of mandatory order in the
Labour Labour Court due to
failure by the
Municipality to adhere
to provisions of the
Employment Equity Act
and to further penalise
the Municipality for an
amount in the margin of
R1 500 000.00
None Roman Eviction and the Finalized Catholic Municipality cited as
Church interested party. The
Roman Catholic Church
in Fatima is evicting the
unlawful occupiers of
properties situated on
its land.
Mohale Applicant and the 1st Pending Incorporated Respondent are having
015 291 3645 a dispute over a
Permission To Occupy that was issued by the 1st and 2nd Respondents
Proceeding have been 1 500 000 1 500 000 stayed to allow settlement discussions
Prepared a report and 0 100 000 attended court where on matter was finalized No Development on the 0 100 000
mater
1. Schedule of contingent liabilities ( Continue ) - refer note 38 Name of Legal Litigation Nature of Dispute Status Progress Projected Projected
Rep
Estimates Estimates 2018 June 2019
Pratt Lytt & De Mabohlatjan Urgent interdict against Pending Municipality cited as second 0 60 000 Lange Community CDM Molemole cited respondent and main relief
Attorneys 015 over the land portion 2 from CDM in the portion 2 of
297 0186 of the remaining extent the farm Deutschland 169
of the farm Deutschland LS
169 where the applicant
want to be restored
None GA Mohale Claim for evicting HD Pending The municipality is cited as 0 50 000 CPA / HD Du Du Preeze by Ga the land falls within its
Preeze Mohale CPA jurisdiction . The
Boedary municipality is ordered to
provide alternative
accomodation for the people
staying in the farms
Mohale Municipality requested Pending Responder to letter demand 87 247 87 247 Incorporated legal opinion on
tel 015 291 whether its obligated to
3645 pay SAMRO annual
fees in terms of the
Copyright Act
SC Mdhuli Hlako Action - recovery of Pending Furnished Attorney with a 0 100 000 Attorneys tel rental and Eviction copy of the deed search to
015 291 5440 over a house that is assist with proving
being owned by the ownership of the house in
Municipality question * See Note 52
73 The supplementary information presented does not form part of the financial statements and is unaudited
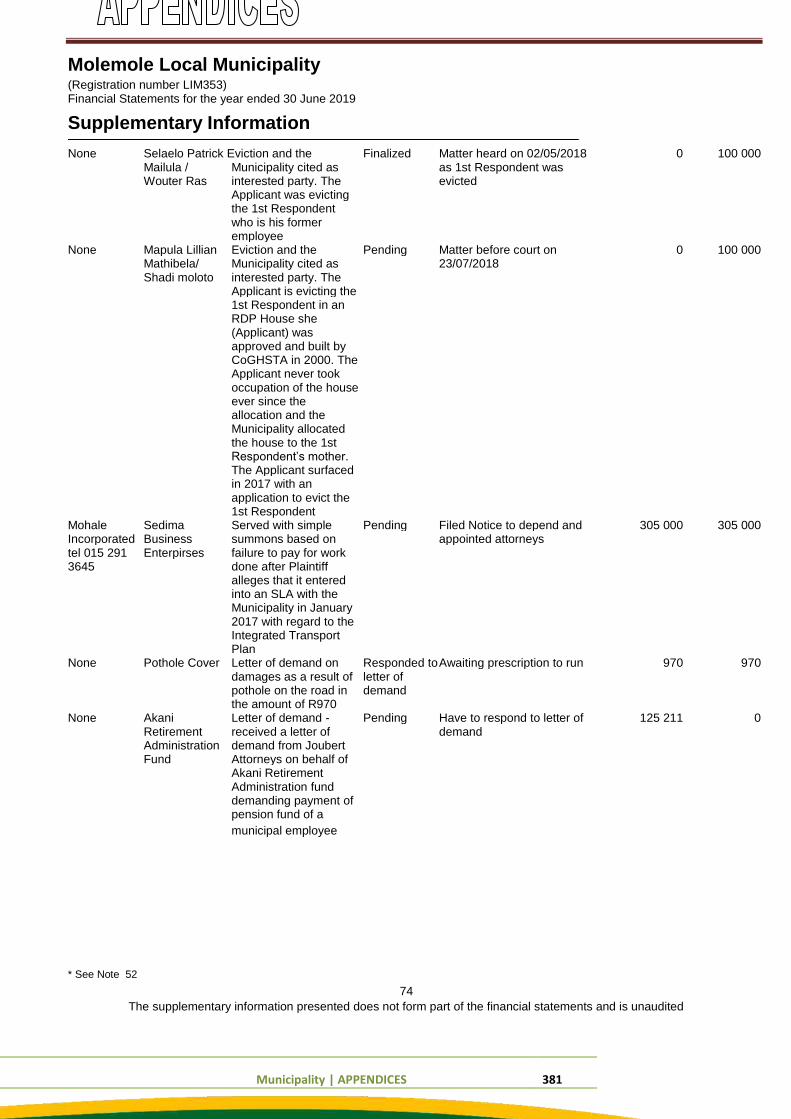
Municipality | APPENDICES 381
Molemole Local Municipality (Registration number LIM353) Financial Statements for the year ended 30 June 2019
Supplementary Information None Selaelo Patrick Eviction and the Finalized Matter heard on 02/05/2018 0 100 000 Mailula / Municipality cited as as 1st Respondent was
Wouter Ras interested party. The evicted
Applicant was evicting
the 1st Respondent
who is his former
employee
None Mapula Lillian Eviction and the Pending Matter before court on 0 100 000 Mathibela/ Municipality cited as 23/07/2018
Shadi moloto interested party. The
Applicant is evicting the
1st Respondent in an
RDP House she
(Applicant) was
approved and built by
CoGHSTA in 2000. The
Applicant never took
occupation of the house
ever since the
allocation and the
Municipality allocated
the house to the 1st
Respondent’s mother.
The Applicant surfaced
in 2017 with an
application to evict the
1st Respondent
Mohale Sedima Served with simple Pending Filed Notice to depend and 305 000 305 000 Incorporated Business summons based on appointed attorneys
tel 015 291 Enterpirses failure to pay for work
3645 done after Plaintiff
alleges that it entered
into an SLA with the
Municipality in January
2017 with regard to the
Integrated Transport
Plan
None Pothole Cover Letter of demand on Responded to Awaiting prescription to run 970 970 damages as a result of letter of
pothole on the road in demand
the amount of R970
None Akani Letter of demand - Pending Have to respond to letter of 125 211 0 Retirement received a letter of demand
Administration demand from Joubert
Fund Attorneys on behalf of
Akani Retirement
Administration fund
demanding payment of
pension fund of a
municipal employee
* See Note 52
74 The supplementary information presented does not form part of the financial statements and is unaudited
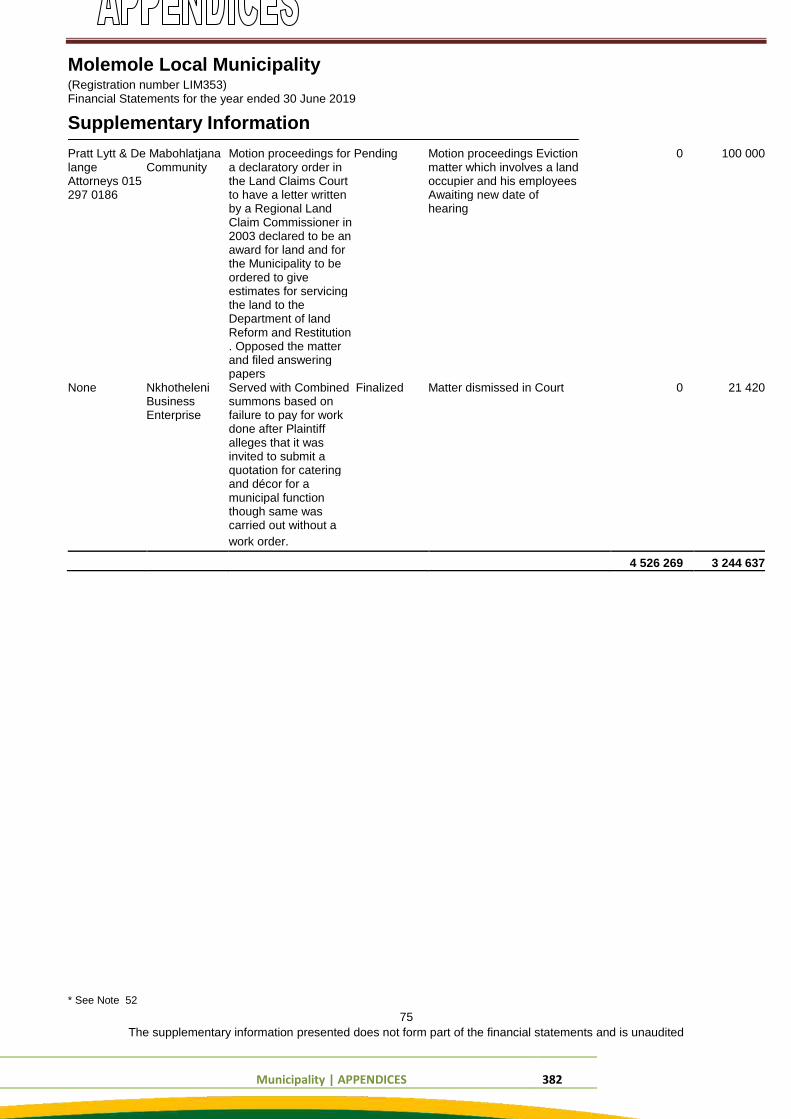
Municipality | APPENDICES 382
Molemole Local Municipality (Registration number LIM353) Financial Statements for the year ended 30 June 2019
Supplementary Information Pratt Lytt & De Mabohlatjana Motion proceedings for Pending Motion proceedings Eviction 0 100 000 lange Community a declaratory order in matter which involves a land
Attorneys 015 the Land Claims Court occupier and his employees
297 0186 to have a letter written Awaiting new date of
by a Regional Land hearing
Claim Commissioner in
2003 declared to be an
award for land and for
the Municipality to be
ordered to give
estimates for servicing
the land to the
Department of land
Reform and Restitution
. Opposed the matter
and filed answering
papers
None Nkhotheleni Served with Combined Finalized Matter dismissed in Court 0 21 420 Business summons based on
Enterprise failure to pay for work
done after Plaintiff
alleges that it was
invited to submit a
quotation for catering
and décor for a
municipal function
though same was
carried out without a
work order.
4 526 269 3 244 637
* See Note 52
75 The supplementary information presented does not form part of the financial statements and is unaudited
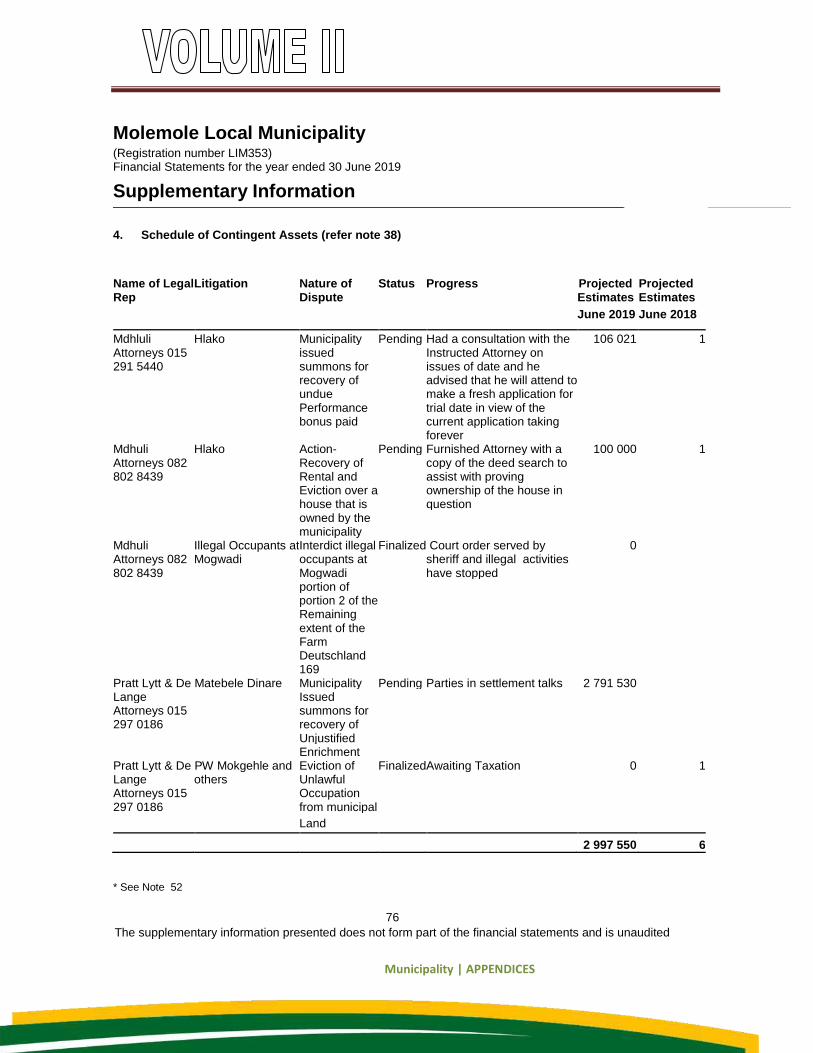
Municipality | APPENDICES
Molemole Local Municipality (Registration number LIM353) Financial Statements for the year ended 30 June 2019
Supplementary Information
4. Schedule of Contingent Assets (refer note 38)
Name of Legal Litigation Nature of Status Progress Projected Projected
Rep Dispute Estimates Estimates
June 2019 June 2018
Mdhluli Hlako Municipality Pending Had a consultation with the 106 021 1 Attorneys 015 issued Instructed Attorney on
291 5440 summons for issues of date and he
recovery of advised that he will attend to
undue make a fresh application for
Performance trial date in view of the
bonus paid current application taking
forever
Mdhuli Hlako Action- Pending Furnished Attorney with a 100 000 1 Attorneys 082 Recovery of copy of the deed search to
802 8439 Rental and assist with proving
Eviction over a ownership of the house in
house that is question
owned by the
municipality
Mdhuli Illegal Occupants at Interdict illegal Finalized Court order served by 0 Attorneys 082 Mogwadi occupants at sheriff and illegal activities
802 8439 Mogwadi have stopped
portion of
portion 2 of the
Remaining
extent of the
Farm
Deutschland
169
Pratt Lytt & De Matebele Dinare Municipality Pending Parties in settlement talks 2 791 530 Lange Issued
Attorneys 015 summons for
297 0186 recovery of
Unjustified
Enrichment
Pratt Lytt & De PW Mokgehle and Eviction of Finalized Awaiting Taxation 0 1 Lange others Unlawful
Attorneys 015 Occupation
297 0186 from municipal
Land
2 997 550 6 * See Note 52
76
The supplementary information presented does not form part of the financial statements and is unaudited
Municipality | Report of the auditor-general to the Limpopo Provincial Legislation and council on Molemole Local Municipality
384
REPORT OF THE AUDITOR-GENERAL TO THE LIMPOPO PROVINCIAL LEGISLATION AND
COUNCIL ON MOLEMOLE LOCAL MUNICIPALITY
REPORT ON THE 2018/19 FINANCIAL STATEMENTS
Municipality | Report of the auditor-general to the Limpopo Provincial Legislation and council on Molemole Local Municipality
385
Municipality | Report of the auditor-general to the Limpopo Provincial Legislation and council on Molemole Local Municipality
386
Municipality | Report of the auditor-general to the Limpopo Provincial Legislation and council on Molemole Local Municipality
387
Municipality | Report of the auditor-general to the Limpopo Provincial Legislation and council on Molemole Local Municipality
388
Municipality | Report of the auditor-general to the Limpopo Provincial Legislation and council on Molemole Local Municipality
389
Municipality | Report of the auditor-general to the Limpopo Provincial Legislation and council on Molemole Local Municipality
390
Municipality | Report of the auditor-general to the Limpopo Provincial Legislation and council on Molemole Local Municipality
391

Municipality | Report of the auditor-general to the Limpopo Provincial Legislation and council on Molemole Local Municipality
392