reviewed idp 2009-10 - mopani district municipality
TRANSCRIPT
1
MOPANI DISTRICT MUNICIPALITY
INTEGRATED DEVELOPMENT PLAN
2006 - 2012 ______________________________________________________________
“To be the Food Basket of Southern Africa and the Tourism Destination of Choice”
May 2009

2
EXECUTIVE MAYOR’S FOREWORD .................................................................................................................................. 6
MOPANI DISTRICT MUNICIPALITY STRATEGIC INTENT.................................................................................................... 7
1. PREPARATORY PHASE ................................................................................................................................... 10
1.1 LEGISLATIVE BACKGROUND ............................................................................................................................... 10 1.2. FRAMING THE 2009/10 – 2012 IDP ................................................................................................................ 11
1.2.1. The National Planning Context ..................................................................................................................... 11 1.2.2 The Provincial Planning Context ................................................................................................................... 11 1.2.3. The Local Planning Context.......................................................................................................................... 12
1.3. BASIS FOR IDP REVIEW PROCESS .............................................................................................................. 13 1.4 INSTITUTIONAL ARRANGEMENTS TO DRIVE THE IDP PROCESS ..................................................................... 14 1.5 PROCESS OVERVIEW: STEPS AND EVENTS .................................................................................................... 14 1.6 PUBLIC PARTICIPATION................................................................................................................................... 15 1.6.1 COMMUNITY DEVELOPMENT WORKERS (CDW) ........................................................................................... 16
1.7 INTER-GOVERNMENTAL RELATIONS............................................................................................................... 16
2. DEVELOPMENTAL ANALYSIS ............................................................................................................................... 18
2.1. BACKGROUND .................................................................................................................................................... 18 2.2 GEOGRAPHIC LOCATION AND KEY FEATURES ............................................................................................... 18 2.3 DEMOGRAPHICS.............................................................................................................................................. 19 2.4 POPULATION CHARACTERISTICS ............................................................................................................................. 20
2.3.2 POPULATION NUMBERS BY GENDER .......................................................................................................... 20 2.3.3 Age and Gender Categories (Number of people)............................................................................................ 21 2.3.4 Population growth/ trends, 2000 - 2006.......................................................................................................... 22 2.3.5 People with disabilities in the district ............................................................................................................ 22 2.3.6 Disability by Gender by Municipalities (No. of Persons)................................................................................. 22 2.3.7 Gender ........................................................................................................................................................ 23 2.3.8 Labour Status by Gender by Municipalities .............................................................................................. 23 2.3.9 Level of Education.................................................................................................................................... 24 2.3.10 CATEGORIES OF EXISTING SCHOOLS ....................................................................................................... 24 2.3.11 Employment............................................................................................................................................ 25 2.3.12 Income Categories .................................................................................................................................. 25 2.3.13 Language Diversity in Mopani District Municipality (as per STATSSA, 2001 Census) ................................. 26
2.4 SPATIAL ANALYSIS ................................................................................................................................................... 26 2.4.1. Background ................................................................................................................................................. 26 2.4.2 DESCRIPTION OF THE MUNICIPAL AREAS AND ECONOMIC GROWTH POINTS.......................................... 26 Greater Tzaneen .................................................................................................................................................... 27 Greater Letaba ...................................................................................................................................................... 27 Greater Giyani ....................................................................................................................................................... 28 Ba- Phalaborwa ..................................................................................................................................................... 28 Table 20: Economic Growth Points of Ba-Phalaborwa ........................................................................................... 28 Table 21: Economic Growth Nodes of Maruleng .................................................................................................... 29 2.4.3 SETTLEMENT PATTERNS IN THE DISTRICT ................................................................................................ 29 2.4.4 LAND CLAIMS AND THEIR SOCIO-ECONOMIC IMPLICATIONS................................................................ 30
2.5 ECONOMIC ANALYSIS ........................................................................................................................................ 31 2.5.1. Background ................................................................................................................................................. 31 2.5.2. A Broad Economic Overview of South Africa .............................................................................................. 31 2.5.3. Locating the Mopani District Economy within the Provincial Economy ......................................................... 32 2.5.4 Economic Sector Analysis........................................................................................................................... 32 2.5.5 Key economic sectors................................................................................................................................... 33 2.5.6. Constraints in the District Economy ........................................................................................................... 35 (i) Greater Giyani ................................................................................................................................................... 35 (ii) Greater Letaba.................................................................................................................................................. 36 (iii) Greater Tzaneen .............................................................................................................................................. 36 (iv) Ba-Phalaborwa ................................................................................................................................................ 36 (v) Maruleng .......................................................................................................................................................... 36 2.5.7. Opportunities in the District Economy.......................................................................................................... 37 (i) Greater Giyani ................................................................................................................................................... 37

3
(ii) Greater Letaba.................................................................................................................................................. 37 (iii) Greater Tzaneen .............................................................................................................................................. 37 (iv) Ba-Phalaborwa ................................................................................................................................................ 37 (v) Maruleng .......................................................................................................................................................... 37
2.6 INFRASTRUCTURE ANALYSIS/ BASIC SERVICES ................................................................................................. 38 2.6.1. BACKGROUND............................................................................................................................................. 38 2.6.2 INDIGENT HOUSEHOLDS RECORD PER MUNICIPALITY ......................................................................... 38 2.6.3 WATER........................................................................................................................................................ 39 2.6.4 SANITATION ................................................................................................................................................. 40 2.6.5 ENERGY AND ELECTRICITY ......................................................................................................................... 41 2.6.6 ROADS AND PUBLIC TRANSPORT.............................................................................................................. 42 (i) Roads Infrastructure........................................................................................................................................ 42 (ii) Provincial and District Roads.......................................................................................................................... 43 (iii) Specific Roads service levels ......................................................................................................................... 44 2.6.7 Taxi Facilities ................................................................................................................................................ 50
(I) GREATER TZANEEN MUNICIPALITY ................................................................................................................................ 50 (ii) Ba-Phalaborwa Municipality......................................................................................................................... 54
(III) GREATER LETABA MUNICIPALITY................................................................................................................... 55
(IV) GREATER GIYANI MUNICIPALITY.................................................................................................................................. 56 (v) Maruleng Municipality.................................................................................................................................. 58
2.6.8 MAJOR TRANSPORT FACILITIES IN THE MOPANI DISTRICT.............................................................................................. 59 2.6.10 Mopani District Taxi Council........................................................................................................................ 60 2.6.11 Powers and functions.................................................................................................................................. 60 2.6.12 Bus Terminus.............................................................................................................................................. 60 2.6.13 Rail Facilities............................................................................................................................................... 61 2.6.14 Public Transport By-Laws ........................................................................................................................... 61 2.6.15 Telecommunications ................................................................................................................................... 61
2.7 ENVIRONMENTAL ANALYSIS ....................................................................................................................................... 61 2.7.1. Background ................................................................................................................................................. 61 2.7.1.1. Air Pollution .............................................................................................................................................. 61 2.7.1.2. Water Pollution .......................................................................................................................................... 62 2.7.1.3. Deforestation............................................................................................................................................. 62 2.7.1.4. Veld Fires .................................................................................................................................................. 62 2.7.1.5. Soil Erosion............................................................................................................................................... 62 2.7.1.6. Chemical Spills And Hazardous Accidents ................................................................................................ 62 2.7.1.7. Overgrazing............................................................................................................................................... 62 2.7.1.8. Informal Settlements ................................................................................................................................. 63
2.7.2 WASTE MANAGEMENT ............................................................................................................................................ 63 2.8 SOCIAL ANALYSIS .................................................................................................................................................... 65
2.8.1. Background ................................................................................................................................................. 65 2.8.2 Housing ........................................................................................................................................................ 65 2.8.3 Education...................................................................................................................................................... 66 (I) Infrastructure Backlog for Schools in Mopani District Municipality ................................................................... 66 (Ii) Adult Based Education ..................................................................................................................................... 67 (Iii) Early Childhood Development (Ecd) ............................................................................................................... 67 (Iv) Disabled Communities.................................................................................................................................... 68 2.8.4. Health and Social Development .................................................................................................................... 68 (I) Prevalent Diseases in Mopani District............................................................................................................... 68 (Iii) Hiv and Aids Prevalence (Tendency)............................................................................................................... 70 2.8.5 SAFETY AND SECURITY ......................................................................................................................... 72 2.8.6 Social Amenities ......................................................................................................................................... 73 (i) Sports and recreation ...................................................................................................................................... 73 (ii) STADIA............................................................................................................................................................ 74 (iii) ARTS AND CULTURE.................................................................................................................................... 75 (iv) LIBRARY FACILITIES .................................................................................................................................... 75 (V) Heritage Sites................................................................................................................................................ 76 (Vi) Thusong Centres (Multi-Purpose Community Centres) .................................................................................. 76
2.9 FINANCIAL VIABILITY................................................................................................................................................. 76 2.10. INSTITUTIONAL ANALYSIS ................................................................................................................................ 77

4
2.10.1. Background................................................................................................................................................ 77 2.10.2 Powers and Functions of the Mopani District Municipality ........................................................................... 77 2.10.3 Political Structures Of Council................................................................................................................... 78 2.10.4 ADMINISTRATIVE STRUCTURE OF COUNCIL ............................................................................................ 80 2.10.5 MDM STAKEHOLDER ANALYSIS .............................................................................................................. 82 2.10.6 SWOT Analysis ........................................................................................................................................... 84
2.12. PRIORITISATION OF KEY DEVELOPMENTAL ISSUES IN MDM .......................................................................... 87 2.12.1 Criteria for determining district-wide priorities........................................................................................... 87 2.12.2 Broad Priorities of Local Municipalities in the district ............................................................................... 87 2.12.3. District-Wide Priority Issues.................................................................................................................... 88
3. IDP STRATEGIES PHASE 2009/10 – 2012 .................................................................................................. 88
3.1 VISION ................................................................................................................................................................. 89 3.2 MISSION .............................................................................................................................................................. 90 3.4 VALUES .............................................................................................................................................................. 90 3.5 LOCALISED STRATEGIC GUIDELINES ............................................................................................................... 91
3.5.1 Localised Spatial Strategic Guidelines .................................................................................................... 91 3.5.2. Localised Environmental Strategic Guidelines ........................................................................................ 92 3.5.3. Localised Economic Strategic Guidelines ............................................................................................... 93 3.5.4. Localised Poverty Alleviation And Gender Equality Strategic Guidelines ................................................ 94 3.5.5. Localised Institutional Strategic Guidelines ............................................................................................ 94
3.6 STRATEGIC DEVELOPMENT CORRIDORS........................................................................................................... 96 3.7 DEVELOPMENT PROFILE ................................................................................................................................... 97 3.8 KEY PERFORMANCE AREAS OR PRIORITIES...................................................................................................... 97
STRATEGY MAP ............................................................................................................................................................. 98
3.9 STRATEGIC OBJECTIVES ................................................................................................................................... 98 3.10 SUMMARY OF KPAS AND STRATEGIC OBJECTIVES ....................................................................................... 100 3.11 STRATEGIC PROGRAMMES AND PROJECTS.................................................................................................... 100 3.12 SHORT, MEDIUM & LONG TERM STRATEGIC OBJECTIVES WITH TIME-FRAMES............................................... 100
4. PROJECTS PHASE ............................................................................................................................................... 112
4.1 PROJECTS PRIORITISATION ............................................................................................................................ 113 4.2. PROJECT IDENTIFICATION AND REGISTRATION ............................................................................................. 114 4.3. PROJECT PRIORITISATION CRITERIA .............................................................................................................. 114
BUDGET SUMMARY 2009/10 - 2012................................................................................................................ 135
5. INTEGRATION ..................................................................................................................................................... 139
5.1. BACKGROUND .................................................................................................................................................. 139 5.2. SECTOR PLANS......................................................................................................................................... 140
5.2.1. SPATIAL DEVELOPMENT FRAMEWORK .................................................................................................... 140 Ba-Phalaborwa spatial development initiative (SDI) ............................................................................................. 142 Tzaneen – Letaba agricultural hub....................................................................................................................... 142 Giyani sub-region................................................................................................................................................ 142 5.2.2. LOCAL ECONOMIC DEVELOPMENT (LED) STRATEGY .............................................................................. 143 5.2.3. TOURISM DEVELOPMENT STRATEGY ....................................................................................................... 146 5.2.4. WATER SERVICES DEVELOPMENT PLAN.................................................................................................. 147 5.2.5. INTEGRATED TRANSPORT PLAN .............................................................................................................. 149 5.2.6. INTEGRATED WASTE MANAGEMENT PLAN .............................................................................................. 150 5.2.7. DISTRICT HEALTH PLAN............................................................................................................................ 151 5.2.8. HIV AND AIDS PLAN................................................................................................................................... 152 5.2.9. POVERTY ALLEVIATION AND GENDER EQUITY PLAN............................................................................... 153 5.2.10. SOCIAL CRIME PREVENTION STRATEGY ................................................................................................ 156 5.2.11. REVIEWED DISASTER MANAGEMENT PLAN ............................................................................. 157 5.2.12. FIVE-YEAR FINANCIAL PLAN ................................................................................................................... 163
5.2.13. INSTITUTIONAL PLAN OF MOPANI DISTRICT MUNICIPALITY......................................................................... 166 CHALLENGES FACED BY THE DISTRICT............................................................................................................................. 166 STRUCTURES OF COUNCIL............................................................................................................................................. 167 INTERVENTION PLAN .................................................................................................................................................... 172

5
5.3. CHILDREN ‘S RIGHTS PLAN OF ACTION....................................................................................................... 174
6. PERFORMANCE MANAGEMENT SYSTEM ........................................................................................................... 174
6. 1 ORGANISATIONAL PERFORMANCE MANAGEMENT .......................................................................................... 176 6.2 GOOD CORPORATE GOVERNANCE ................................................................................................................... 176 6.3 THE 11-STEP APPROACH TO MUNICIPAL EXCELLENCE ................................................................................ 176
Step 1: Public Participation ................................................................................................................................. 177 Step 2: Integrated Development Planning ........................................................................................................... 177 Step 3: SDBIP ..................................................................................................................................................... 177 Step 4: Lower SDBIP .......................................................................................................................................... 177 Step 5: Monitoring, Assessment, Evaluation and Review .................................................................................... 177 Step 6: Performance Auditing............................................................................................................................. 177 Step 7: Municipal Reporting ............................................................................................................................... 178 Step 8: District Integration and Co-ordination ..................................................................................................... 178 Step 9: Leadership and Change Management ..................................................................................................... 178 Step 10: Employee Performance Management System........................................................................................ 178 Step 11: Capacity Building throughout the Development of the System .............................................................. 178
6.4 BALANCED SCORECARD, MOPANI AND THE 11-STEP APPROACH TO MUNICIPAL EXCELLENCE .................... 179 6.5 MONITORING, ASSESSMENT, EVALUATION AND REVIEW ................................................................................ 179
7. CONCLUSION.......................................................................................................................................................... 180

6
EXECUTIVE MAYOR’S FOREWORD
This document - the Integrated Development Plan (IDP) - is the result of many months of consultation within the organs of Mopani
District Council and with various institutions and stakeholder organizations in the district. This consultation has resulted in the District
Policy Framework contained in this document. Thus, this IDP, as reviewed, is a 5-Year developmental, but, politically-driven Plan,
developed to guide socio-economic development in the district. It is an overarching plan that defines the synergy between various
priority needs and the sector plans that addresses these needs in a manner that allows government in three spheres to participate.
The IDP review process of 2008/09, coupled with the District Land summit and the HIV & AIDS summit of 2007, have further
assisted the district municipality to appraise the developmental situation in its area of jurisdiction. It has also assisted in determining
community and stakeholder needs, prioritising developmental objectives and seeking better ways to implement programmes to
achieve key objectives and measuring municipal performance. The municipality has set its focus on addressing the needs of,
particularly, the rural poor, in order to graduate them from the prejudices of poverty into “better life for all”. It has identified its key
priority issues, objectives, strategies, programmes and projects to respond to the institutional and socio-economic challenges facing
the district, all driven by the popular vision; “the food busket of Southern Africa and the Tourism destination of choice”.
The Spatial Development Framework (SDF) and the Local Economic Development (LED) Strategy give us a comprehensive
description of our environment and its spatial characteristics. They also reflect on the district’s comparative advantages and
opportunities as confirmed during the District Growth and Development Summit held on 26 – 27 February 2007. This IDP has a clear
and quantified budget, and implementation plans as well as the Organisational Performance Management System. And to that
effect, there have been ongoing processes to review the institutional arrangements of both the political and administrative structures
of Council to enable the municipality to rise to the developmental challenges as per its Constitutional mandate. Council is also
improving its communication, participatory and decision-making mechanisms to ensure that the IDP remains a popular roadmap to a
better life for all.
We hereby present this Plan as a developmental plan for all government and clear strategical reference to every activity carried out
within the District, by the municipality, private sector, Traditional leaders as well as other organs of the state. It is indeed the living
document that captures aspirations of our communities and it is in no way intended to be static, rather dynamic. This requires an
accelerated degree of intergovernmental action and alignment to ensure that all developmental players in the district align their plans
to government-wide priorities. On behalf of Council, I would once more, like to appreciate and thank all role players for their
commitment, contribution and patience during the review, and amendment of this document.
The horizon lies ahead. It is what we put in today that informs the output of tomorrow.
…………………………………….
Joshua Matlou
Executive Mayor
7
This is the executive summary of what the Mopani District Municipality intends to achieve through its integrated planning process.
The Mopani District Municipality has embarked upon a revolutionary process of integrating the IDP’s, budget and Performance
Management Systems of municipalities within the Mopani District. The issues that will be highlighted will be discussed in more
detail in each of the relevant phases of this IDP document. In terms of the DPLG Guidelines for Performance Management the
relationship between the Integrated Development Planning processes and Performance Management are described as follows:
� The IDP process and the Performance Management System should appear to be seamlessly integrated;
� IDP fulfils the planning stage of Performance Management ; and
� Performance Management fulfils the implementation, management, monitoring and evaluation of the IDP.
Therefore the IDP Review, Performance Management System and Budget processes had to roll out concurrently so that the final
plan is authentic, measurable and realistic. The plan ensures that accountabilities of employees are integrated and sound. The IDP
review process has progressed in alignment with the following phases: Analysis Phase, Strategies Phase, Projects Phase,
Integration Phase and Approval Phase.
During the Analysis Phase, an analysis was conducted in terms of the current developmental status of Mopani District Municipality,
with due consideration of the new delimitation that incorporates Maruleng Local municipality and Kruger National Park (North of
Lepelle river) being part of Mopani District Management area.
Due to the fact that Statistical information is a constraint in that it is outdated and still based on the 2001 Census and 2003
demarcation statistical information, it has been a challenge to identify the current developmental status of Mopani District.
Due to the challenge of baseline information in most developmental focal areas, internal analysis processes took place, namely the
determination of impact made by projects implementation in the past and current years, reports that indicates gaps in various
development needs and other recent researches from national, provincial and internal initiatives. This was followed by identifying
relevant Stakeholders and the voice that they echo to the municipalities as well as the influence which they have on decision-
making. Finally, an analysis was done to determine the internal strengths and weaknesses of the municipality as well as the
external opportunities and threats which may have an impact on service delivery. The analysis is clearly outlined to indicate areas
that need the most and urgent attention, for all role players to allocate resources accordingly. These processes, coupled with data
from Statistics South Africa provide baseline for our planning projections.
During the Strategies Phase, the annual Strategic sessions were held on 20-21 October 2008 to review the overall Strategy of the
municipality, which consists of Strategic Themes (also known as KPAs) and Strategic Objectives. The Strategic Themes and
Objectives are contained in a Strategy Map which indicates how value will be created for stakeholders, communities and citizens
and it provides a visual representation of the Strategy and this Strategy Map is based on the Balanced Scorecard Methodology.
During this process Strategic Key Performance Indicators were reviewed, indicating clearly what the municipality intends to
achieve in a period spanning to year 2011 and over. In order to strengthen impact, strategic developmental corridors have been
MOPANI DISTRICT MUNICIPALITY STRATEGIC INTENT

8
identified where investors and any value adding organ of state, parastatal, etc. could put their resources. The corridors are in
support of the District growth nodes. For implementation purposes, in the Projects Phase, the Operational Strategies of the
municipality were determined by means of identification of projects and initiatives which will ensure the achievement of the Intend
of the municipality. A crucial element of this phase is to ensure that the budget is aligned and integrated through allocating and
provisioning of funds for the programmes/ projects and initiatives identified. The Service Delivery and Budget Implementation Plan
(SDBIP), as prescribed by the Municipal Finance Management Act will be the integral tool for monitoring the implementation of the
IDP, as reviewed.
Performance Management System of MDM is integrated with the IDP and simultaneously take the annual review process and it is
enabler for MDM to Report, Monitor and Review the implementation of IDP for better accountability and benchmarking amongst its
municipalities.
The VISION of the Mopani District Municipality is:
“To be the Food Basket of Southern Africa and the Tourism Destination of Choice”
The MISSION of the Mopani District is:
� To provide integrated sustainable equitable services through democratic responsible and accountable governance
MISSION
The Mission of Mopani District Municipality
To provide integrated sustainable equitable services through democratic responsible and accountable governance
Promoting the sustainable use of resources for economic growth to benefit the community
Mopani District Municipality’s strategy map bears the following Key performance areas and the envisaged outcomes.

9
Table 1: SUMMARY OF KPAs AND STRATEGIC OBJECTIVES
Local Government KPA Strategic Objectives
Municipal Transformation and Organisational
Development
Plan for the future
Manage through information
Build Intellectual Capacity
Develop entrepreneurial capability
Basic Service Delivery Improve Community well-being
Resource manage infrastructure and services for access and
mobility
LED Grow the economy and halve unemployment
Develop partnerships
Municipal Financial Viability and Management Become financially viable
Good Governance and Public Participation Effective and efficient organisation
Spatial Rationale Economic use of land space
The value system of Mopani District municipality includes the following:
innovation
Excellence
Commitment
Care
Ubuntu
Batho-pele principles

10
1. PREPARATORY PHASE
PREPARATORY PHASE: In this section, we provide a brief overview of (1) legislative context within which the 2008/9 IDP review
process took place, (2) the basis for IDP review process, (3) institutional arrangements that are in place to drive the IDP process,
(4) process overview in terms of steps and events, (6) and inter-governmental relations protocol that would assist in the alignment,
coordination and integration of service delivery programs in the district.
_____________________________________________________________
1.1 LEGISLATIVE BACKGROUND
The Constitution of the Republic of South Africa (Act 108 of 1996) is the supreme law of the country and fundamentally aims to
protect human rights and promote democratic governance. It, therefore, provides for a new approach to government on national,
provincial and local government levels. The new constitutional model redefines the relationships between the three spheres of
government by replacing the system of a vertical hierarchy of tiers with three overlapping planning processes and sets of plans,
each relating to a different sphere of government.
The White Paper on Local Government expects from municipalities to be “working with citizens and groups within the community to
find sustainable ways to meet their social, economic and material needs and improve the quality of their lives". Integrated
Development Planning reinforces this aim through the system of government. IDP is, thus, not just another planning exercise, but
will essentially link public expenditure to community priorities which are interpreted through vision, mission and strategies.
The Municipal Systems Act (Act 32 of 2000) defines the IDP as one of the core functions of a municipality and makes it a legal
requirement for every Municipal Council to adopt a single, inclusive and strategic plan for the development of its municipality. This
plan should link, integrate and coordinate plans and take into account proposals for development of the municipality. It should also
align the municipality’s resources and capacity with the implementation of the plan, it should form the policy framework and general
basis on which annual budgets must be based; and be compatible with national and provincial development plans and planning
requirements. Other laws that provide guidelines for the development of IDP’s include:
� The Local Government Transition Act Second Amendment Act 1996 (Act 97 of 1996), which requires each local
authority to compile an Integrated Development Plan for their area of jurisdiction;
� The Municipal Demarcation Act, 1998 that provides the spatial framework for the ongoing demarcation process;
� The Municipal Structures Act, 1998, that defines the institutional setting for municipalities and describes their core
functions and responsibilities;
� Municipal Finance Management Act, 2003
� The National Environmental Management Act, 1998;
� Regulations passed in terms of the National Environmental Management Act, 1998
� The Water Services Act, 1997;
� National Water Act, 32 of 1998
� Minerals and Petroleum Resources Development Act (MPRD) No 28 Of 2002,

11
1.2. FRAMING THE 2009/10 – 2012 IDP
The 2009/10 IDP Review was prepared within the legal and policy requirements, opportunities provided and challenges posed by
the local, provincial and national contexts.
1.2.1. The National Planning Context
The Mopani District Municipality is aware of the critical challenges facing the country as a whole, as well as the national strategies
and Programme of Action to meet them. The national government’s targets for 2014, which were key components in preparing this
IDP, are as follows:
� The reduction of unemployment by half;
� The reduction of poverty by half;
� The provision of skills required by the economy;
� Ensuring that all South Africans are able to fully exercise their constitutional rights and enjoy the full dignity of freedom;
� The provision of a caring government service to the people;
� Reducing the number of serious and priority crimes and cases awaiting trial,
� Improving services to achieve a better national health profile and reduction of preventable causes of death; and
� Positioning South Africa strategically as an effective force in global relations.
In order to achieve these objectives the performance and developmental impact of the State will have to be vastly improved. While
capacity building, better systems, a greater focus on implementation, and improved performance management will play a key part
in this endeavour, greater integration, alignment and synergy between the actions of the three spheres of government is crucial.
As suggested by Cabinet around aligning the NSDP, PGDS and district IDPs, the key to this activity is ensuring that the three
spheres of government use the common platform of (1) “need/ poverty” and (2) “development potential” as espoused in the NSDP
to analyse the space economy of their areas of jurisdiction. In addition to this the proposal calls for the role of the IDPs of district
and metropolitan municipalities in determining and structuring public investment and development spending to be drastically
strengthened. This entails that district municipalities should, in collaboration with the local municipalities play a far greater role in
the determination of district priorities and the allocation of resources. The district IDP has to become far more informative and
decisive on the areas of need and development potential in the district and play a far greater role in decisions on infrastructure
investment and development spending by all three spheres of government. Mopani District through the funding from Presidency
has therefore engaged the service provider to do an in-depth analysis in socio-economy within its area of jurisdiction, with clear
focus on ensuring that NSDP and IDPs are aligned. The output of the project will inform better the IDP for the coming years.
1.2.2 The Provincial Planning Context
The primary influencing factor in the provincial domain is the Limpopo Growth and Development Strategy (LGDS). The LGDS
sees the competitive advantage of the province in mining, agriculture, tourism and manufacturing. Clustering is viewed as key to
success in these sectors. In the case of Mopani, the strategy emphasises investment in agriculture (agro-processing), forestry and
tourism (also golf-tourism), and to a lesser extent, trade.

12
The key objectives of the LGDS, with its focus on the year 2020, are to:
(i) Improve the Quality of Life of the Provincial Population;
(ii) Promote Sustainable Economic Growth;
(iii) Raise the Institutional Efficiency of the Provincial Government; and
(iv) Address Unique Priorities as they arise, including Black Economic Empowerment, HIV/AIDS-TB and poverty reduction.
The LGDS also argues that IDPs should, in addition to the municipal focus, also consider wider provincial and national issues. It
also suggests that IDPs should endeavour to strike a balance between interventions focused on addressing the social needs of
citizens and the promotion of economic growth.
The LGDS emphasises the need for a focus on the spatial dimension when rolling out projects and programmes. This view is tied
up to a so-called “Spatial Rationale”, which has been informed by the National Spatial Development Perspective (NSDP) which
calls for a focus on a few growth points in every district from which economic growth will be spread and benefit the more remote
areas of the district and province. This approach does suggest that over time the migration of a significant number of those
currently residing in villages to larger towns – a process that is already under way – will accelerate.
1.2.3. The Local Planning Context
At the local level, a number of fundamental issues impact on the planning processes of the district municipality. Firstly, as with all
other district municipalities, MDM does not have a distinct area of its own, but shares the same operational area with the Greater
Tzaneen, Greater Letaba, Greater Giyani, Ba-Phalaborwa and Maruleng local municipalities. These local municipalities are also
engaged in integrated development planning in their own respective municipal areas. However Mopani has a District Management
area which is specialized entity, viz nature conservation area. It is part of South African National Parks.
Secondly, the Mopani District Council has distinct roles, powers and functions to those of the local municipalities. Amongst these
is the role of coordinating and supporting service across the three spheres of government. The district municipality is compelled to
involve various stakeholders in its quest to integrate planning, align programmes and projects and ensure coordinated service
delivery. In order to realise this objective the district municipality strives (and is yet) to play its role more effectively and
strategically to ensure that various governmental actors, developmental agencies, private sector and parastatals harmonise their
developmental work through consensus-seeking dialogue during the IDP-preparation, implementation and review processes. The
district municipality is currently expected to play a pro-active coordination and support functions to the local municipalities and
sector departments.
Thirdly, MDM neighbours a range of other districts that impact on delivery within its area of jurisdiction. This is, in some cases, due
to overlapping service delivery areas which do not correspond with district boundaries and which thus require inter-district
alignment. The IDP process is useful in this regard, as it provides an arena to forge greater inter-district planning and
implementation. As such, it will also ensure integrated, cost effective and qualitative delivery of public services. The case in point
is the recent successful incorporation of the Maruleng Local Municipality (Presidential Rural node) and the Kruger National Park
(District Management Area) into the Mopani district. That has added Mozambique and Zimbabwe as the countries bordering
Mopani District Municipality which will also have ripple impact to the development. We are yet to engage meaningfully with these
countries.
13
The 2009/10 Mopani IDP is a continuation of the drive towards the alleviation of poverty over the short term and the elimination of
endemic poverty over the longer term. It takes forward the charge for upliftment as espoused in the previous IDPs. As such it
retains the commitment to being (1) easily accessible to all members of the community and (2) the strategic, developmentally
orientated plan as envisaged in the legislation, policy framework and guidelines, without becoming a futile exercise focused
primarily on ensuring compliance. Subsequent to the recent initiative by the Presidency to align the National Spatial Development
Perspective (NSDP), the Provincial Growth and Development Strategy (PGDS) and the District Municipality IDPs as discussed
above, this IDP also focuses on “need/ poverty” and “development potential” in its Developmental Analysis.
At the core of the 2009/10 IDP is the challenge and commitment to (1) deepen local democracy, (2) enhance political and
economic leadership, (3) accelerate service delivery, (4) build a developmental local government and (5) ensure that municipal
planning and implementation are done in an integrated manner. All of which can only be attended to in an environment of
cooperative governance between MDM and (1) the Local Municipalities in its area of jurisdiction and (2) provincial and national line
departments.
1.3. BASIS FOR IDP REVIEW PROCESS
The preparation and review of the IDP is a continuous process providing a framework for development planning activities in the
district. As such the IDP is not only annually assessed in terms of delivery and the prevailing conditions in the municipality, but
also improved upon each and every year. The following aspects informed the 2009/10 IDP Review process:
• Updating baseline information to ensure sound decision-making in addressing service delivery gaps;
• Meeting the national targets in terms of service provisioning/ Millennium Development Goals;
• Responding to key issues raised in the 2009 State of the Nation Address, State of the Province Address and State of the
District Address;
• Implementation of resolutions attained in the DGDS, Land Summit, Budget Lekgotla, Project Lekgotla and performance in
terms of SDBIP;
• Aligning Sector Departments’ strategic plans to the district-wide priorities and service delivery programmes;
• Meeting targets in terms of the KPAs of the Five year Local government strategic agenda;
• Responding to issues raised during the national, provincial and own assessments (SWOT);
• Strengthening focused community and stakeholder participation in the IDP processes;
• Updating and developing pending sector plans and programmes of the IDP;
• Reviewing the current vision, mission, objectives, strategies, programmes and projects; and
• Alignment of IDP, Budget and PMS activities of the district with those of the local municipalities.

14
1.4 INSTITUTIONAL ARRANGEMENTS TO DRIVE THE IDP PROCESS It is the primary responsibility of Council, its Councilors, officials and staff to ensure that integrated planning is undertaken. The
Mopani District Council is responsible for the approval of the IDP for the district and the responsibility cannot be delegated. Clear
accountability and management of the IDP process belongs to the municipality and thus, should be owned and controlled by the
municipality. Councillors, senior officials, local municipalities, sector departments and parastatals, civil society and trade unions,
amongst others, have distinct roles to play during integrated development planning processes.
The Executive Mayor is responsible for driving the whole IDP process in Mopani. He provides leadership in the development and
reviews of the IDP. The day-to-day management of the IDP process has been delegated to the Office of the Municipal Manager
who consistently chairs the IDP Steering committee. The IDP Manager deals with coordination of the day-to-day issues relating to
the IDP. These include adherence to IDP Framework and Process plan, coordination of stakeholders, support to Local
municipalities and documentation of the IDP (plan). He further chairs the IDP Technical committee which forms the link between
District and Local municipalities in terms of IDP. The IDP Steering Committee is a technical working team of dedicated senior
management officials, who together with the Municipal Manager and/or the IDP Manager must ensure a smooth compilation and
implementation of the IDP.
The IDP Steering Committee compiles the IDP document through consultation with various sets of information and direct their
output to the IDP Representative Forum via Portfolio Committee on Strategy, Planning and IDP, for debates and further inputs and
refinement of the plan. The Portfolio Committee provides political support to the entire IDP process. The municipality has
established three development Clusters and their technical committees to deal with district-wide intergovernmental (alignment)
issues in the IDP implementation, i.e Economic Cluster, Social and Infrastructure and Governance and Administration. The IDP
Technical Committee comprises of IDP Managers/ Coordinators of all municipalities in the district and the middle managers of the
District municipality. It is envisaged the structure will culminate into District Development Planning Forum, embracing
representatives of sector Departments and State-owned enterprises.
The IDP Representative Forum is the structure that provides a platform for public participation through involvement of different
community structure representatives, political leaders, traditional leaders and government entities which provide support. The
profile of representatives in the structure requires the Executive Mayor or his delegate to chair the meetings and control the
debates. The selection of members to the IDP Rep. Forum also ensures geographical, social and functional representation. The
output of the IDP process should be understood by all stakeholders and have public buy-in. The final output (IDP document) is
submitted to the Mayoral Committee for ratification and then to Council for approval.
1.5 PROCESS OVERVIEW: STEPS AND EVENTS
The IDP Review Framework and the Process Plan was approved by the Mopani District Council on 3rd October 2008. Broadly,
Municipalities (including the District) have not fully adhered to the IDP Review Framework and process plans due to the broad
challenges of inter-municipal relations and the demands on IDP implementation by all government. However great improvement
has been noted with the current Review process. Municipalities have been compelled to align their IDPs, budgets and Performance
Management Systems through the district-wide IDP/Budget/PMS Strategic sessions as coordinated by the Institute for
Performance Management on 5 – 7 September 2008. During these sessions, the local municipalities worked together with the
district municipality to review the Strategy Map of the District with clear roles for both the district and the local municipalities.
The activities that transpired during the Mopani IDP review process are presented in Table 2 below:

15
Table 2: 2009/10 IDP Review Activities
Phase Activities and Purpose Date
Preparatory IDP Steering Committee drafting of IDP Framework, Process plan and Code of Conduct
08 July 2008
IDP Technical Committee meeting to look into IDP Framework, Process plan and Code of Conduct
30 July 2008
IDP Steering Committee meeting to finalise the Framework Process Plan and Code of Conduct
07 August 2008
IDP Induction workshop for Traditional Leaders 08 August 2008
IDP Rep. Forum to approve IDP Framework, Process Plan and Code of Conduct
14 August 2008
Analysis phase IDP Steering Committee to develop the Analysis 08 September 2008
IDP Technical Committee look into the Analysis phase 11 September 2008
Council approves IDP/Budget Framework, Process Plan & Code of Conduct 3 October 2008
IDP Steering Committee finalise the Analysis Phase 07 October 2008
IDP Technical Committee update the Analysis Phase 14 October 2008
Strategies phase IDP Steering Committee develops strategies 10 November 2008
IDP Technical Committee update the strategies Phase 13 November 2008
District Ward Committee Forum look into Framework and Process Plan 14 November 2008
Project phase IDP Steering Committee identify projects 09 December 2008
IDP Rep. Forum to look into Analysis and Strategies 21 January 2009
IDP Technical Committee look into Projects 05 February 2009
IDP Steering Committee to finalise projects 09 February 2009
IDP Steering committee: Projects Lekgotla (confirming projects) 20 – 22 February 2009
Integration phase IDP Steering Committee Integrating aproved Sector plans and finalising draft IDP document IDP Representative Forum: Projects & Integration phases (IDP 1st draft)
09 March 2009
Approval phase Council adoption of the Draft 2008/09-2013 IDP, PMS and Budget 31 March 2009
Publication of the draft IDP document 2-30 April 2009
Public Participation road-shows on IDP/ Budget/ PMS: - Greater Tzaneen - Greater Giyani - Greater Letaba
- Ba-Phalaborwa - Maruleng
4-8 May 2009 13 May 2009 14 May 2009 15 May 2009 18 May 2009 19 May 2009
Consolidation of public comments on draft IDP/ Budget/ PMS 11-13 May 2009
IDP Steering Committee discuss first draft Framework and Process plan 14 May 2009
Finalisation of the draft IDP/ Budget/ PMS..IDP Rep. Forum 20th May 2009
Final adoption of the Reviewed IDP
Council approves the 2009/10 reviewed IDP / Budget / PMS and Framework and Process plan
29th May 2009
1.6 PUBLIC PARTICIPATION
In terms of the above process (schedule of IDP meetings), it is apparent that public participation had been entrenched full blast at
the final phase of the process. There has been few Speakers and District Ward Committee meetings where IDP process updates
and issues were presented to community representatives at grass roots level. The local municipalities also held their IDP
Representative Forum meetings whose outputs inform the district IDP process. Local municipalities involved ward committees in
conducting ward surveys in the respective local municipalities. Public participation in respect of IDP, Budget and PMS offered a
good platform for the communities to add value to the final commitment of the Council in the approval phase.
The following gaps are acknowledged:
� Robust engagements and discussions with the IDP Rep. forum in the IDP Process still need strong facilitation.
� There has been some evidence of non-adherence to IDP process schedule by District and Local municipalities;

16
� Limited continuity on the part of local municipalities to engage in the District IDP meetings. and
� There is lack of implementation monitoring of the 2008/9 IDP and its review process.
� There has been poor engagement of sector Department with the District IDP Process
� District Ward Committee forum meetings schedule was not followed and that limited community engagements in the IDP.
MDM has, however, engaged Sector Departments on their infrastructure Plans and projects. The usual challenge has been that
Sector Departments identify projects without addressing issues prevailing in the municipalities. It is hoped that the concern will be
lifted as the Provincial Planning forum visited Mopani on 19th November 2008, interacting with officials with respect to projects
allocated to the District. The inter-governmental monitoring forum has been established to ensure accountability with regard to the
implementation of sector departmental projects as submitted for inclusion in the IDP.
1.6.1 COMMUNITY DEVELOPMENT WORKERS (CDW)
These units or officials are meant to assist communities to participate in issues of governance within their localities. Most often this
is far less achieved. There is need to look closely into their structural arrangement and issues to add value to the intended
responsibility. The current challenge is that of their reporting channel to Province while they are on day to day with municipalities.
Table 3: CDWs in Mopani District Municipality
MUNICIPALITY NUMBER
Greater Tzaneen 31
Greater Giyani 25
Greater Letaba 23
Maruleng 11
Ba-Phalaborwa 13
TOTAL 103
Source: Limpopo Premier’s Office
1.7 INTER-GOVERNMENTAL RELATIONS
MDM is responsible for facilitating inter-governmental relations within its area of jurisdiction. In line with the Intergovernmental
Relations Framework Act, MDM has taken it upon itself to improve intergovernmental engagements to ensure that proper inter-
governmental planning guides public, private and donor investment in the district.
N a t io n a l S p h e r e
P r o v in c ia l S p h e r e
P r io r i t is a t io n
L o c a l S p h e r e
R es o u rc e A l l o c a t io n
Im p le m e n ta t io n
S u p p o r t N a t i o n a l
G o v e r n m e n t P r io r i t i e s
a n d O b j e c t i v e s

17
The district municipality is the convenor of the District Manager’s Forum “a key forum for strategic alignment, coordination and
integration” that serves as an inter-governmental structure where the Sector Departmental Managers in the district meet with their
municipal counterparts.
The relationship between the district municipality, the local municipalities and sector departments in Mopani is improving. There
are also inter-municipal structures (i.e. District Intergovernmental Forum, Speakers’ Forum and Municipal Managers’ Forum) that
discuss and resolve on issues cutting across all municipalities.
There are, however, grey areas on how the hierarchical inter-municipal and inter-governmental structures should cross feed into
each other’s programmes and be measured in terms of performance. For example, MDM cannot hold any sector department
accountable for the non-implementation of projects which are submitted for inclusion in the IDP document. The following are
“political” and non-political inter-governmental structures that facilitates inter-governmental relations within the province, between
the district, province and local municipalities:
Table 4: Key Inter-Governmental Structures
Intergovernmental structures Participants Responsibility
Premier’s Intergovernmental Forum
[Premier/Mayors’ Forum]
Premier
Mayors
Heads of Departments
Municipal Managers
Co-ordination of inter-governmental
relations (Provincial and Local
Government)
District Intergovernmental Forum
[Mayors’ Forum]
Executive Mayor
Mayors
Traditional Leaders
Municipal Managers
Co-ordination of inter-municipal
relations (District and Local
Municipalities)
District Speaker’s Forum and Ward
Committee forum
Speakers, Municipal Managers &
representatives of Ward committees.
Co-ordinate public participation
processes in the municipalities
NON-POLITICAL STRUCTURES
District Managers’ Forum Sector Departments’ District Managers
Municipal Managers
Municipal Senior Managers (Directors)
Co-ordinate inter-governmental
relations at district level between
municipalities and sector departments
Clusters Councillors
Municipal Managers
Municipal Senior Managers (Directors)
Co-ordinate policy issues affecting
government at a district level (between
sector departments and municipalities)
Technical Committees of Clusters Sector Departmental Officials
Municipal Senior Managers (Directors)
Municipal Officials
Provide inter-governmental inputs into
the work of Clusters
Provincial Planners Forum Sector Departmental Planners
IDP Managers
Spatial Planners
Town Planners
Provide for a coherent inter-
governmental planning framework and
alignment and integration of
development plans in the province
District Development Planning Forum Sector Depts, SOEs, MDM and LMs Alignment in the IDP planning process,

18
ANALYSIS PHASE: In this section, we provide an overview of (1) the important demographic indicators of the Mopani District
Municipality, the overall perspective of the area, its trends and tendencies (2) highlighting issues of concerns in terms of the key
performance areas for the developmental local government and (3) identify the strengths and opportunities in realising the District
municipality’s vision.
2.1. BACKGROUND
The Analysis phase of the IDP reflects the status quo of socio-economic and institutional situation within the geographical area of
the Mopani District municipality, defined in terms of the Municipal Demarcation Act. The purpose of undertaking a district status
quo analysis is to ensure that planning decisions are based on people’s priority needs and problems, knowledge on available and
accessible resources; as well as proper information and a profound understanding of the dynamics influencing development in the
district.
Mopani District Municipality like most municipalities in the country, is not immuned from the challenges of baseline information that
address the current service levels in different development categories, as IDP gets reviewed annually. However, the latest
information from Statistics South Africa has been the main source, coupled with empirical data from communities.
Mopani District stakeholders involved in the IDP have been identified from different civic organisations, government department
officials in both national and provincial spheres as well as resource persons from institutions of learning and business sectors.
These, together with the councillors constitute IDP Representative forum. Community representatives often focus on the
community needs and wishes whereas the government representatives advise on the analysis and development strategies that are
supported by the available resources within the legislative framework.
2.2 GEOGRAPHIC LOCATION AND KEY FEATURES
The Mopani District municipality is situated in the North-eastern part of the Limpopo Province, 70 km and 50km from Polokwane
(main City of the Limpopo Province), along provincial roads R81 and R171 respectively. It is bordered in the east by Mozambique,
in the north, by Zimbabwe and Vhembe District Municipality, in the south, by Mpumalanga province through Ehlanzeni District
Municipality and, to the west, by Capricorn District Municipality and, in the south-west, by Sekhukhune District Municipality. The
district has been named Mopani because of abundance of nutritional Mopani worm found in the area. The district spans a total
area of 2 534 413 ha (25 344,13 km²), inclusive of Kruger National Park which occupies 43% There are 14 urban areas (towns and
townships), 352 villages (rural settlements) and a total of 118 wards. The Mopani District, by virtue of the Kruger National Park as
part of the District Management Area, is also part of the Great Limpopo Transfrontier Park, the park that combines South Africa,
Mozambique and Zimbabwe.
The strategic location of the District embodies both advantages and disadvantages. The communities of Mopani should be well
positioned, in order to harness advantages that come with neighbourliness of the two countries. The converse is also true.
Problems are even more apparent than advantages.
2. DEVELOPMENTAL ANALYSIS

19
The map below depicts the local municipalities and the District Management area of Mopani District municipality.
Table 5 below shows the extent of Mopani and its components in terms of Wards, Villages and Urban areas. It will be seen that the
District Management Area, occupying 43% of the entire district municipality, is devoted solely to nature conservation. Both
Maruleng and Ba-Phalaborwa are least in terms of number of wards and villages and they are largely occupied by game farms. It
will also be noted that number of villages has increased from 325 to 352 in a period of seven years imposing a high demand in the
provision of basic services facilities.
2.3 DEMOGRAPHICS
Table 5: Wards per local municipality in Mopani, as revised during 2005 boundaries re-determination
Local Municipality Total Area Wards Villages Urban Areas
Greater Tzaneen 3 240 km² 34 125 5
Greater Letaba 1 891 km² 26 80 3
Greater Giyani 2 967. 27 km² 30 93 1
Ba-Phalaborwa 3 004.88 km² 16 23 4
Maruleng 3 247 km² 12 31 1
District Management area (DMA) 10 993.98 km² 5 main camps of Kruger National Park
Mopani / Total 25 344,13 km² 118 352 14

20
The following analogy provides an overview and critique of the important demographic indicators of the Mopani District. It covers
the population size, age distribution, unemployment, income generation, educational levels and services backlogs in the district.
The socio-economic profile of the district provides an indication of poverty levels and development prospects in the district.
2.4 Population Characteristics The reconciled total population of the Mopani District Municipality STATSSA Survey of 2007 is 1 068 569. The population for each
municipality within Mopani District is presented in Table 6.Out of the entire district population, 81% resides in rural areas, 14%
resides in urban areas and 5% stay on farms. The population densities vary from municipality to another, but the average is 23
people/ ha. It shows that people are sparsely populated with sufficient land around them. The problem of land shortage for
economic development is perpetrated by the vast land occupied for dwelling purposes, leaving much little for economic growth. A
move towards reduction of stands sizes may need due consideration.
The population size differs from one municipality to another and In terms of resource allocations it should be best to consider this
distribution earnestly, albeit with all factors taken into account, e.g service backlogs, identified growth areas, etc.
Statssa, 2007
2.3.2 POPULATION NUMBERS BY GENDER
Table 7: Population numbers by gender
GGM GLM GTM BPM MLM DMA Mopani Male 112770 112280 160466 64852 45953 626 496947 46% Female 134895 135465 188615 62455 49816 366 571612 54% Total 247665 247745 349081 127307 95769 1002 1068569 Statssa, 2007
Table 6: Estimated Population
Municipality Area/ Extent Population Pop. Density
per hectare
Rural
population
Urban
population
Farming
population
Greater Giyani 2 967. 27 km² 247 665 22 89,5% 10,5% 0
Greater Tzaneen 3 240 km² 349 081 24 82% 10,4% 7,6%
Greater Letaba 1 891 km² 247 745 25 94,3% 5,7% 0
Ba-Phalaborwa 3 004.88 km² 127 307 25 36,2% 51,0% 12,8%
Maruleng 3 247 km² 95 769 16 88,7% 2,3% 9,0%
District Management Area 10 993.98 km² 1 002 Nature conservation area
1 068 569 23 81% 14% 5%
Mopani/ Total 25 344,13 km²

21
2.3.3 Age and Gender Categories (Number of people)
Table 8: Age and Gender categories (Community Survey, 2007 STATSSA)
GGM GLM GTM BPM MLM DMA Mopani Age(yrs) Male Female Male Female Male Female Male F emale Male Female Male Female (Persons)
0 – 4 16436 12151 14530 13554 18097 15798 6275 7418 4117 5165 53 31 113625 5 – 9 16424 16004 16506 13572 19590 20534 7456 6660 7469 5796 10 10 130031 10 – 14 14644 17696 16753 18010 22007 23446 6933 6883 7122 5538 3 0 139035 15 – 19 18353 18749 17551 17358 21911 23440 7252 6849 6208 5832 13 6 143522
20 – 24 11360 13071 10236 12735 16251 16792 6731 5612 3869 5564 26 43 102290 25 – 29 7031 8911 6175 7596 11993 14673 6561 4657 3042 3744 68 49 74500 30 – 34 6558 8084 8033 8197 9825 12866 4108 4415 3156 3069 120 50 68481 35 – 39 4436 7166 4388 8237 9076 11410 6014 5339 2647 3086 124 58 61981 40 – 44 3663 7039 3691 7207 6999 9977 3471 3923 1988 3018 76 53 51105
45 – 49 3426 5944 2737 6136 5534 9500 2955 2465 1698 2174 54 38 42661 50 – 54 2602 4825 3525 4334 4664 5727 2120 2793 1480 1594 51 18 33733 55 – 59 2173 3140 2734 3421 3907 5202 1788 1829 800 1317 17 7 26335 60 – 64 1203 2338 1727 3858 3652 4300 1479 1093 1046 1126 5 0 21827 65 – 69 1845 3473 1515 3894 3146 4431 972 1161 426 748 0 0 21611 70 – 74 1079 3026 740 2690 1335 3962 146 397 297 706 0 3 14381
75 – 79 883 1647 1014 1807 559 3045 234 631 297 642 3 0 10762 80 – 84 224 886 69 1249 589 1665 134 278 176 287 3 0 5560 85 + 430 745 356 1610 1331 1847 223 52 115 410 0 0 7119 Total 112770 134895 112280 135465 160466 188615 64852 62455 45953 49816 626 366 1068559
Although the data informing the above population pyramid is from STATSSA 2007, the proportion of population numbers per age
Percentage representaionof Mopani District Demograp hics, 2007
0.1 - 0.2 -
0.3 - 0.3 -
0.9 - 0.7 -
1.1 - 1.4 -
1.5 - 1.9 -
2.5 - 3.0 -
3.3 -
4.5 - 6.7 -
6.3 - 6.3 -
5.6 - 5.1 5.9
6.7 6.8
5.0 3.7
3.4 3.3
2.9 2.5
1.8 1.4 1.2
1.3 1.0 0.7
0.4 0.4
-8.0 -6.0 -4.0 -2.0 0.0 2.0 4.0 6.0 8.0
0 - 4 5 - 9
10 - 1415 - 1920 - 2425 - 2930 - 3435 - 3940 - 4445 - 4950 - 5455 - 5960 - 6465 - 6970 - 7475 - 7980 - 84
85 +
Male Female

22
categories still prevail to date. The highest population number exists in the age category 15-19 years whereas in the previous
years the highest was in the category 10 - 14 years. The average ratio male to female is 46% to 54%. There is proportional
balance between boys and girls from age zero to 20 and thereafter for every age category females out-number males significantly.
An analysis of the demographics of the district indicates that 49,4% of the residents are still at a young age (0-19 years) and
females and males are almost equal. Population numbers decrease with increase in age, i.e the older generation is fewer than the
young one. This implies that programmes geared at developing all people with special emphasis to women and youth will impact
much to Mopani DM. The same is true for taking heed of challenges facing these population categories.
It is also notable that population size of Mopani has been growing steadily at a decreasing rate since the year 2000 to-date. The
growth itself is a threat to the economic growth in terms of available land space. However since the growth is at a decreasing rate,
there is hope that Mopani will experience population decline in size. Already the provincial trends are that population is decreasing.
Since the main source of population growth is birth rate and emigration, programmes geared at combating children pregnancies
and those of dealing with illegal emigration should be strengthened. Already the result from Community Survey, 2007 (statssa)
indicate that the population size has dropped to 1 068 569.
2.3.4 Population growth/ trends, 2000 - 2006
1,000,000
1,020,000
1,040,000
1,060,000
1,080,000
1,100,000
1,120,000
1,140,000
2000 2002 2004 2006
DC33 LIM - DC33 Mopani District Municipality
DC33 LIM - DC33Mopani DistrictMunicipality
2.3.5 People with disabilities in the district
Table 9: Number of disabled persons per municipality
MDM GTM GGM GLM BPM MLM DMA
43 698 14 879 7 396 12 946 5 137 3 340 -
Table 10: Participation of disabled persons in various structures
Political strucures 5,5%
Municipal structures 7,4%
Sector Departments 3,9%
CBOs 5,2%
Non-participating 78%
Source: Empirical data from municipalities through CDWs
2.3.6 Disability by Gender by Municipalities (No. of Persons)
Table 11: Disability by gender (Community Survey, 2007 STATSSA)

23
Type of disability GGM GLM GTM BPM MLM DMA MDM
Male Female Male Female Male Female Male Female Male Female Male Female Persons
Sight 1210 645 1896 1773 1552 1576 643 547 295 116 0 0 10253
Hearing 596 504 839 1293 616 733 312 365 320 57 0 0 5635
Communication 325 293 295 265 459 322 80 57 331 124 0 0 2551
Physical 694 912 1803 1452 2104 3200 926 692 606 465 0 0 12854
Intellectual 164 0 825 195 876 571 422 230 0 57 0 0 3340
Emotional 962 630 1016 932 1321 933 260 460 463 347 0 0 7324
Multiple disabilities 56 405 155 207 256 360 82 61 102 57 0 0 1741
Total 4007 3389 6829 6117 7184 7695 2725 2412 2117 1223 0 0 43698
DMA figures not available from STATSSA There are 3 special schools in the district that caters for learners with special needs, namely the blind, the deaf and the physically
challenged. There are also two flagship life-care centres in the district, namely Vuxakeni and Shiluvana Lifecares that cater for
homeless disabled people and severely disabled people. In addition, there are 171 normal schools that have infrastructure access
facilities for disabled. The total constitutes 24% of all schools in Mopani. So, an endeavour in integrating disabled in the normal
schools is still a challenge in most areas due to shortage of supporting infrastructure.
Yet, the major challenges facing people with disabilities in the district ranges from lack of skills, lack of employment opportunities
as well as assistive devises like wheel chairs, canes (walking sticks), hearing aids, magnified glasses, etc. Other relates to lack of
capacity within public institutions in handling disabled in an integrated manner due to lack of understanding by the majority of
people, lack of Braille resources, lack of sign language interpretation services/ specialists, inaccessibility to government buildings
and inaccessibility of public transport. Again, disabled people are best understood by their family members and they are thus
socially cut off from public, e.g, not many people understand Sign language. Even in public meetings provisions are rarely made for
the deaf and the blind to be on board. Further challenges are apparent in public amenities, e.g lack of facilities at taxi ranks, lack of
walking lanes alongside main roads and general stigma that disabled persons are incomplete persons and would not have leisure needs.
The Mopani District Municipality has established the functional Disability desk in line with the provincial and national functions
located in the Office of the Presidency and Office of the Premier. This function is one of the special programmes in the Office of the
Executive Mayor with its major role of coordinating the implementation of the Integrated National Disability Strategy in the district.
The Disability Desk intends to play advocacy role in highlighting the needs of disabled people with emphasis on the following key
area: mainstreaming, capacity building, civic education and raising awareness on disability issues. The district municipality does
not have a disability policy and strategy. However, there is one disabled official within the staff of Mopani district municipality. One
milestone of the MDM Council is the inclusion of sign language in every Council sitting. The service is offered by one person who is
not the staff member of Mopani, instead he is requested from time to time when need arises. Important documents are also
translated into Braile for the blind members of Council.These facilities are also made available during public participation meetings.
2.3.7 Gender
In view of the fact that in every age category, females outnumber males, it is imperative that even in development, issues of gender
are taken into account. The District has established Men’s forum where issues of men are discussed, ranging from families to
participation in communities and work place.
2.3.8 Labour Status by Gender by Municipalities
Table 12: Labour status (Community Survey, 2007 STATSSA)

24
GGM GLM GTM BPM MLM Mopani
Male Female Male Female Male Female Male Female Male Female Persons
Employed 16206 17360 19438 14598 31722 26142 19462 11110 7970 5660 169668
Unemployed 10919 16178 8815 14125 17820 24965 6749 8055 4521 5166 117313
Not economically active 31701 44720 32025 49663 41836 60910 15129 18668 12866 19218 326736
Not applicable 2247 1833 967 1136 3374 2527 1679 1202 760 603 16328
DMA figures not available from STATSSA, 2007
2.3.9 Level of Education
The literacy levels in the Mopani District are very low. As much as 37.8% of the adult population (other than 20 years of age) has
not received any form of schooling with a further 13.7% only having completed some form of primary education. These figures
imply that more than 50% of the adult population can be regarded as functionally illiterate. Conversely, only 12.7% of the adult
population in the district has completed their matric and 6.5% any form of higher education. Further breakdown on levels of
education is depicted in Section 2.8: SOCIAL ANALYSIS.
Table 13: Learner/ Teacher ratio
Educ. Level Service type MDM GTM GLM GGM MLM Ba-Phal
Learner/ Teacher ratio 37 35 Primary school
Learner/ Classroom ratio 46 39
Learner/ Teacher ratio 32 34
Secondary school Learner/ Classroom ratio 39 53
STATSSA 2001
With regard to the teacher pupil ratio for primary schools, Greater Giyani is the lowest with only 34.2 pupils per teacher while
Greater Letaba is worse off with 37 pupils per teacher. Greater Tzaneen has the lowest pupil to teacher ratio for secondary schools
with only 31.3 pupils per teacher while Greater Letaba is again worse off with 34 pupils per teacher.
The learner/classroom ratio, more specifically the ratio for primary schools, in the district compare very unfavourably to the national
norm used by the Department of Education, which is 1:40 for primary schools (40 students per classroom). The learner to
classroom ratio for primary schools in the Mopani District 1:45.41, with the lowest ratio in the Ba-Phalaborwa Local Municipality
(1:38.15), the only municipality complying with the national norms.
The departmental norm with regard to learner to classroom ratio for secondary schools is 1:35 (35 students per classroom). The
learner to classroom ratio is above the national norm for all four local municipalities with Greater Tzaneen being 1:38,24 learners
per classroom and Ba-Phalaborwa, worse off, with 1:52,23 learners per classroom. The learner to classroom ratios within Mopani
therefore did not comply with the norms of the Department of Education, meaning that there was a serious shortage of classrooms
in the four municipalities for both primary as well as secondary schools in 1996.
The level of education provides an indication of the degree to which the population is employable in specific sectors of the
economy. The Mopani district has a very low, but improving, level of education with 41.9% of the population older than 20 years
having no education in 1996, improving to only 37.8% in 2001. This implies that many people in the district have a poor level of
education and therefore lack proper skills and knowledge needed in the formal labour market. This has a bearing on their
employability, the general economy and their ability to pay for services, etc.
2.3.10 CATEGORIES OF EXISTING SCHOOLS
Table 14: Categories of existing schools

25
SCHOOLS No. of existing schools in Mopani Class rooms needed
Secondary 255
Primary 457
Combined 22
LSEN 2
TOTAL CLASS ROOM 2378
2.3.11 Employment
People in the Mopani district are employed in the following sectors: Farming, Industry, Mining, Trade, Government, Transport,
Tourism, Manufacturing, Construction and Energy. The Government Sector is the largest employer in the district e.g. 39% of the
employed in Greater Giyani work for government. The second largest employer in Mopani district is the farming sector with 25.9%
of the employed people. This, however, is not the case when considering the municipalities separately with the mining sector
employing the second largest portion of the Ba-Phalaborwa population (19.5%). Greater Giyani has the highest level of
unemployment with 36.8% of the population not being employed. The number of people unemployed as a percentage of the total
population is the lowest in Greater Letaba with only 28.0%. It is however important to note that of the unemployed people in the
district, approximately 60% are women.
2.3.12 Income Categories
Table: 15: Monthly income by Geography for Person weighted
Statistics South Africa, Welfare 2007
GreateGiyani Greater Letaba
Greater Tzaneen
Ba-Phalaborwa Maruleng
DMA33: Mopani MOPANI
No income 130 547 114 748 157 491 54 960 50 245 - 507 991 (48%) R 1 – R 400 62 076 71 903 89 530 30 753 23 034 - 277 296 (26%) R 401 – R 800 9 968 20 201 25 205 6 815 4 231 - 66420 (6%) R 801 – R 1 600 24 584 25 784 47 402 13 467 11 753 68 123 058 (12%) R 1 601 - R 3 200 5 010 2 894 6 639 5 893 2 163 337 23 036 R 3201 - R 6 400 5 586 3 195 6457 3 678 1 384 175 20 465 R 6 401 - R 12 800 4 280 3 839 5 138 3 123 905 35 17 320 R 12 801 – R 25 600 773 376 1 497 2 090 384 20 5 140 R 25 601 – R 51 200 56 336 403 587 57 4 1 443 R 51 201– R 102 400 59 - 340 18 69 - 486 R102 401-R 204 800 65 - 63 - - - 128 R 204 801 or more 127 - - - - - 127 Response not given 3 040 3 966 6 200 3 845 863 - 17 914 Institutions 1 490 503 2 722 2 079 687 7 481
Income from employment determines the overall living standards of people and also the households affordability levels . These
levels should be taken into account when setting service level targets. By far the majority of people in the district live in rural areas
(at least 84.1%) and the majority of these rural residents are poor. Income in rural areas is constrained by the rural economy that is
unable to provide people with remunerative jobs or self-employment opportunities. It seems the majority of people in the district
have no income. It should, however, be taken into account that these figures reflect the total population and not only the potentially
economically active portion of the population.
This means that the economically inactive, such as, children and pensioners are also included. It is disturbing to note that, even
for the labour force alone, 89.1% of the population in the Greater Giyani Municipality earns less than R800 per month. The

26
situation is worse in Greater Letaba where 92.2% of the earning population earn less than R800 per month, while the situation is
much better in Ba-Phalaborwa with only 75% of the labour force earning less than R800 per month. This can be attributed to the
high level of urbanisation in Ba-Phalaborwa and the presence of mines.
2.3.13 Language Diversity in Mopani District Municipality (as per STATSSA, 2001 Census)
Table 16: Language diversity in Mopani
Tsonga N.Sotho Afrikaans Sotho English Venda Zulu Swati Tswana Xhosa Ndebele Others
48,6% 46,4% 1.88% 1,4% 0,6% 0.47% 0,22% 0,21% 0.11% 0.09% 0.03% 0.10%
2.4 Spatial Analysis
2.4.1. Background
The spatial analysis exercise provides a visual picture of the existing spatial pattern (that is nodes, networks and areas) that has
emerged in the municipal area. This analysis serves to describe the municipal area in spatial terms and understand how space is
utilized in the district. It looks at settlement patterns and growth points (nodes), population concentration areas, land claims and
their socio-economic implications. All these aspects have a bearing on future land usage, infrastructure investment, establishment
of sustainable human settlements, public transport and local economic development. Hereunder is Map 1. indicating local areas
within the district:
Map 1: Local Municipalities and District Management Area (Kruger National Park) within Mopani District
2.4.2 DESCRIPTION OF THE MUNICIPAL AREAS AND ECONOMIC GROWTH POINTS
The main characteristics of the 5 local municipalities in the district are summarised below:

27
Greater Tzaneen
The Greater Tzaneen Municipality is situated in the eastern quadrant of the Limpopo Province within the district’s area of
Jurisdiction, together with Greater Giyani, Ba-Phalaborwa, Maruleng and Greater Letaba. Polokwane to the west, Greater Letaba
to the north, Ba-Phalaborwa and Maruleng to the east, and Lepelle-Nkumpi to the south, border the Greater Tzaneen Municipality
and Giyani border.The Greater Tzaneen Municipality comprises a land area of approximately 3240 km², and extends from
Haenertsburg in the west, to Rubbervale in the east (85km), and just south of Modjadjiskloof in the north, to Trichardtsdal in the
south (47km). The municipal boundaries form an irregular, inverted T-Shape, which results in certain developmental implications
for the municipality, and more specifically the distance to markets, difficulties in respect of service provision, and constraints to
implementing the development strategy of the municipality.
The Greater Tzaneen Municipality area encompasses the proclaimed towns of Tzaneen, Nkowankowa, Lenyenye, Letsitele and
Haenertsburg. In addition, there are 125 rural villages, concentrated mainly in the south-east, and north-west, of the study area.
Almost 80% of households reside in these rural villages. The municipal area is further characterized by extensive and intensive
farming activities (commercial timber, cash crops, tropical and citrus fruit production); mountainous, inaccessible terrain in the west
and south, and un-even topography (gentle slopes) to the north and east; areas with exceptional natural beauty, with considerable
untapped tourism potential.
Table 17: Economic growth points of Greater Tzaneen municipality
Provincial District Municipal
Tzaneen Nkowankowa Letsitele
Lenyenye Burgersdorp
Haenertzburg
Greater Letaba
The Greater Letaba Municipality area is the smallest local municipality in the district in terms of land area and is situated in the
west of the Mopani District. The Municipality incorporates the proclaimed towns of Modjadjiskloof, Ga-Kgapane and
Senwamokgope, which are situated in the South. The Municipality is furthermore characterized by contrasts such as varied
topography, population densities and vegetation. The population in the municipality is denser in the north-east than in the south,
whereas, vegetation is denser in the south (timber) than in the north (bushveld).
Resources are relatively scarce throughout the municipality. The municipality is, however, situated in close proximity of other
natural resources at its border with Greater Tzaneen. The Tzaneen and Heanertsburg areas attract tourists due to their natural
beauty, dams, waterfalls and nature reserves. The Municipality can capitalize on these resources as well as the more intensive
economic activities in Tzaneen.
The incidence of rural settlements is evenly spaced along the northern boundary, and a lesser concentration of villages along the
south – eastern boundary, of the municipality. The south part of the municipal area comprises mountainous terrain, which
precludes urban development. Approximately 5% of the land area is covered by residential development, whilst 30% of the land
area of the Letaba Municipal area is taken up by agricultural activity. These include tomatoes (central), Timber (south and south
east), game and cattle (central and north west).
Table 18: Economic Growth points of Greater Letaba

28
Provincial District Municipal
Modjadjiskloof Ga-Kgapane Senwamokgope
Mokwakwaila
Greater Giyani
Greater Giyani Municipality is located in the North of the Mopani District Municipality with Giyani as its only town. Giyani is also the
home of the District Municipal offices and previously housed the administrative offices of Gazankulu homeland. Giyani town is the
largest centre of population concentration, employment opportunities, shopping and recreational facilities in the local municipality.
The economic activity that mostly takes place in Greater Giyani both formal/informal are: small-scale agriculture (maize,
vegetables, tomatoes, beef), services, transport and retail development.
There are however, number of factors impacting on the economic growth such as geographical location (distance to markets),
shortage of skills, poor infrastructure, climatic conditions and diseases. The municipality has potential for tourism and conservation
development due to the existing natural heritage sites through the area, mining, latent farming schemes, processing of natural
products (Mopani worm and Marula fruit).
Table 19: Economic Growth points of Greater Giyani
Provincial District Municipal
Giyani Ndhambi Xawela
Nkomo
Xikhumba
Ba- Phalaborwa
The town of Phalaborwa and the nearby Namakgale/ Lulekani towns and surrounding villages constitute the major population
concentration area in Ba- Phalaborwa. Another smaller rural concentration is Seloane/Nondweni with the tourist resort of Eiland
nearby. The area has a unique natural environment comprising conservation areas and eco- tourism development together with
the bordering Kruger National Park. This and the large mining development form a key economic driver.
Although mining is presently the largest sector in Ba-Phalaborwa and created many job opportunities it can also become a
constraint in the future. All mines have certain production expectancy and will eventually close.
There is a large amount of land in Ba-Phalaborwa that is currently under land claims. This is land that can potentially be developed
for especially tourism.
Table 20: Economic Growth Points of Ba-Phalaborwa
Provincial District Municipal
Phalaborwa Namakgale Lulekani
Gravelotte
Maruleng

29
The Maruleng Municipality is situated in the south-eastern quadrant of the Limpopo Province within the Mopani District. The
municipal area extends over 324 699ha and is bordering Kruger National Park to the east, The Ba-Phalaborwa and Greater
Tzaneen to the North, the Lepelle Nkumpi Municipality to the west, and the Tubatse Municipality and Bushbuckridge Municipalities
to the south. The municipal area is characterised by typical Lowveld vegetation and is evenly sloped with isolated kopies and
ridges. To the south, the municipal area also borders the Drakensberg escarpment. Population densities vary from sparse in the
east, to relatively dense in the South – West.
A definite fragmented urban and rural form is evident in all areas throughout the district. This can mainly be attributed to economic
factors and racial segregation induced by past legislation causing artificial fragmentation in the rural and urban areas. The
implementation of the Group Areas Act resulted in the segregated residential development pattern that saw the Black, Asian and
Coloured population groups being removed to peripheral and separate locations. Within Mopani, black people have since been
concentrated in the former homeland areas of Lebowa and Gazankulu.
The fragmented spatial structure where most of the economic activities are concentrated in predominantly white urban
concentrations and farms resulted in the concentrations of the majority of the population within areas severed by distance from
their place of work. These areas experience severe poverty and low human development potential due to high illiteracy rates, low
income and a general low life expectancy, accompanied by low levels of social and engineering services.
Table 21: Economic Growth Nodes of Maruleng
Provincial District Municipal
Hoedspruit Metz
2.4.3 SETTLEMENT PATTERNS IN THE DISTRICT
The district municipality has approximately 352 settlements, which include 81 first order settlements and 30 second order
settlements, 190 third and fourth order settlements. The third and fourth order settlements have 43,6% of the district’s population.
There is limited accessibility to most villages due to inadequate access to roads and internal street networks. The Mopani district is
well-served by major arterial routes which links Giyani to Tzaneen, Polokwane, Modjadjiskloof, Phalaborwa and Lydenburg.
The settlements identified as District growth points in the area include Namakgale, Gravelotte, Mageva, GaKgapane, Nkowankowa
and Lenyenye. The District Growth Points provide some jobs with various high order social facilities and government offices. These
growth points or settlements should include smaller government offices for service delivery. Social facilities such as schools, health
facilities and police stations should also be present at a lower level. In order to ensure economic development in these settlements
basic services and social services should be improved. Although these settlements are small they play an important role in several
sectors such as mining (Gravelotte), retail trade (Namakgale and GaKgapane) and manufacturing (Nkowankowa).
Lulekani, Xawela, Senwamokgope, Haenertsburg, Burgersdorp and Letsitele have been identified as Municipal Growth Points in
the District. The Municipal growth points have a relatively small economic sector providing some employment to a smaller number
of people. These settlements have very few social services and no government offices. People living in these areas have to travel
to larger settlements (Provincial and District Growth Points) to obtain these services. Two of these growth points play an important
role in the economy of the area. Letsitele is one of the most important areas where citrus fruit is produced while Haenertsburg and
surrounds has been identified as a very important tourism area. Both these sectors demand proper basic services of which roads
(transport for fruit and tourist traffic) are the most important. The various municipalities responsible for service delivery in these
areas should ensure that these basic services are of a good standard to support the various economies.
Ten of the sixteen growth points in the District are situated in the Greater Tzaneen Municipality and the Ba-Phalabowa
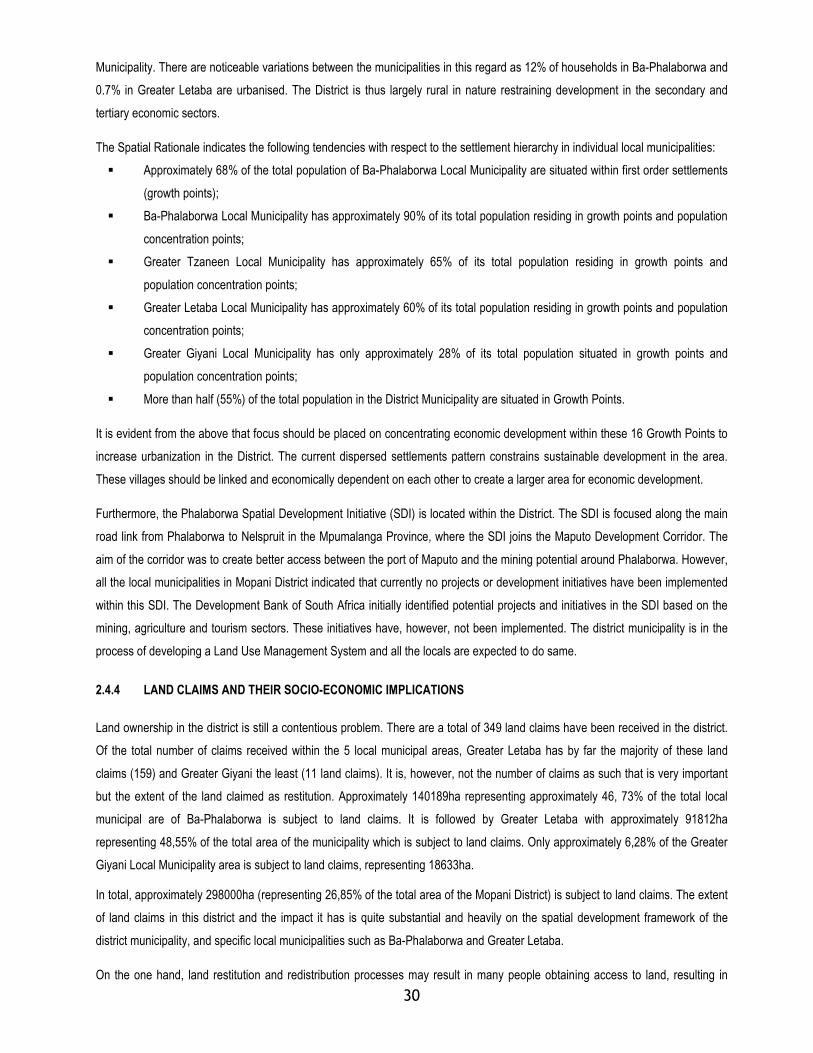
30
Municipality. There are noticeable variations between the municipalities in this regard as 12% of households in Ba-Phalaborwa and
0.7% in Greater Letaba are urbanised. The District is thus largely rural in nature restraining development in the secondary and
tertiary economic sectors.
The Spatial Rationale indicates the following tendencies with respect to the settlement hierarchy in individual local municipalities:
� Approximately 68% of the total population of Ba-Phalaborwa Local Municipality are situated within first order settlements
(growth points);
� Ba-Phalaborwa Local Municipality has approximately 90% of its total population residing in growth points and population
concentration points;
� Greater Tzaneen Local Municipality has approximately 65% of its total population residing in growth points and
population concentration points;
� Greater Letaba Local Municipality has approximately 60% of its total population residing in growth points and population
concentration points;
� Greater Giyani Local Municipality has only approximately 28% of its total population situated in growth points and
population concentration points;
� More than half (55%) of the total population in the District Municipality are situated in Growth Points.
It is evident from the above that focus should be placed on concentrating economic development within these 16 Growth Points to
increase urbanization in the District. The current dispersed settlements pattern constrains sustainable development in the area.
These villages should be linked and economically dependent on each other to create a larger area for economic development.
Furthermore, the Phalaborwa Spatial Development Initiative (SDI) is located within the District. The SDI is focused along the main
road link from Phalaborwa to Nelspruit in the Mpumalanga Province, where the SDI joins the Maputo Development Corridor. The
aim of the corridor was to create better access between the port of Maputo and the mining potential around Phalaborwa. However,
all the local municipalities in Mopani District indicated that currently no projects or development initiatives have been implemented
within this SDI. The Development Bank of South Africa initially identified potential projects and initiatives in the SDI based on the
mining, agriculture and tourism sectors. These initiatives have, however, not been implemented. The district municipality is in the
process of developing a Land Use Management System and all the locals are expected to do same.
2.4.4 LAND CLAIMS AND THEIR SOCIO-ECONOMIC IMPLICATIONS
Land ownership in the district is still a contentious problem. There are a total of 349 land claims have been received in the district.
Of the total number of claims received within the 5 local municipal areas, Greater Letaba has by far the majority of these land
claims (159) and Greater Giyani the least (11 land claims). It is, however, not the number of claims as such that is very important
but the extent of the land claimed as restitution. Approximately 140189ha representing approximately 46, 73% of the total local
municipal are of Ba-Phalaborwa is subject to land claims. It is followed by Greater Letaba with approximately 91812ha
representing 48,55% of the total area of the municipality which is subject to land claims. Only approximately 6,28% of the Greater
Giyani Local Municipality area is subject to land claims, representing 18633ha.
In total, approximately 298000ha (representing 26,85% of the total area of the Mopani District) is subject to land claims. The extent
of land claims in this district and the impact it has is quite substantial and heavily on the spatial development framework of the
district municipality, and specific local municipalities such as Ba-Phalaborwa and Greater Letaba.
On the one hand, land restitution and redistribution processes may result in many people obtaining access to land, resulting in

31
improved living standards and quality of life. On the other hand, it could result in large-scale sterilisation of economically productive
land (e.g. high potential agricultural land, mining of certain minerals, nature conservation areas, etc) and consequential loss of job
opportunities, if not well planned and managed within the context of a spatial development framework that considers all these
factors.
2.5 ECONOMIC ANALYSIS
2.5.1. Background
To undertake a proper analysis of the political economy of the district, it becomes important to consider the background of the
South African economy in general. Thus, the district economy needs to be viewed as an integral part of the provincial economy
that is linked to the national economy. The national economy is part of the Southern African regional economy within the world
economy. Thus, Mopani is a constituent to the global economy positioned to take advantage of its comparative strengths in its
relation to the other regions of the world.
2.5.2. A Broad Economic Overview of South Africa
South Africa is a middle-income developing country with an abundant supply of natural resources, well-developed financial, legal,
communication, energy and transport sectors, a modern infrastructure, and a stock exchange which rank among the 10 largest in
the world. Its economic policy over the past nine years has been shaped by the government’s development strategy in areas of
education, health, social development, security, land reform and poverty alleviation. The government’s policy decisions have been
designed to promote sustainable economic growth, and to ensure that the benefits of growth are shared across an increasingly
greater spectrum of society.
The country’s economic policy is based on the macro-economic policy called Growth, Employment and Redistribution (GEAR). It
aims to find a balance between promoting economic growth on one hand, and social service delivery and job creation on the other.
Gear combines the goals of deficit reduction, reprioritization of government expenditure to enhance poverty reduction, and
embarking on macro-economic reforms to promote job creation. The social transition that has accompanied the demise of
apartheid has seen a vast increase in economic participation. Factors underlying this have included an increase on female
participation in the economy, as well as migration to urban areas by the rural poor. South Africa also has a dual agricultural
economy: a well-developed commercial sector and a predominantly subsistence oriented sector in the traditionally settled rural
areas, of which Mopani district is constituted. This is probably one of the glaring factors that provides for the South African
economy as consisting of the First and the Second Economy. The first and second Economy in our country are separated from
each other by a structural fault. The second economy emerged during the long period of colonialism and apartheid as a result of
the deliberate imposition of social, political and economic exclusion of the African majority by a racist state. Whilst exacerbated by
the imperatives of globalization, the restructuring of the economy also reflect, to some degree the response of capital to the
extension of citizenship and economic rights to the previously disenfranchised. This restructuring has segmented the labour market
into three overlapping zones, namely core workforce, non-core workforce and the peripheral workforce:
The core workforce consist of workers that benefit directly from global integration, advances in worker rights and other forms of
inclusion in social, economic and political institutions. Formal sector workers are generally highly organized in the trade union
movement, although new jobs created in the formal sector tend to be associated with lower levels of worker organization. Though

32
the size of the formal sector workforce has diminished, it still constitutes more than half of the economically active population.
While they enjoy higher salaries, secure employment and good working conditions, growing numbers of people depend on their
wages. Men rather than women are more easily absorbed into this core of labour market.
The restructuring of the workforce is increasing the levels of a typical employment. This includes casualisation, fixed term contracts
and working from home. Those pushed into these more precarious and intensive working conditions become part of non-core
workforce. Because of the temporary nature of their work, union organization is much harder amongst the non-core workforce. The
rights won by workers in the core of the economy are difficult to realize in an environment of poorly organized temporary workers,
where women are more likely to find work.
The peripheral zone consists of those who have been excluded from the formal economy and engage in informal income
generating activities on the margins, or depend on the support of friends and family and/or social grants. This includes the street
traders and hawkers who sell basic commodities to the poor, memorabilia to the tourists and food to urban workers. While some of
those operating in the urban economy are able to secure relatively stable niches in markets created by formal sector economic
activity, others find themselves excluded from such markets altogether and eke out a survival through dependence on welfare
grants and the barter of goods and services.
2.5.3. Locating the Mopani District Economy within the Provincial Economy
Limpopo is the second poorest Province in the country. Approximately 77% of the population lives below the poverty income line,
and the Province also has the lowest HDI (0.485) in the country. Although the number of unemployed people has declined, the
percentage of people with no income in Mopani is still higher than that of the Limpopo Province. With regards to education the
percentage of people with no education has declined from 30% in 1996 to 22% in 2001 in the Mopani District. The Capricorn and
Mopani district are seen as the main economic engines of the province, with Polokwane, Phalaborwa and Greater Tzaneen
identified as the principal economic centres. The provincial development strategy, vision 2020, sees the economic heart of the
province as formed by the circle of towns stretching from Mogalakwena, Polokwane, Makhado, Thohoyandou, Giyani, Phalaborwa,
Tzaneen, Lebowakgomo and other smaller towns and villages within this circle. The area covers one quarter of the province,
accommodates the majority of the population, and accounts for approximately 80% of the Gross Geographic Product (GGP) of the
province.
The provincial economic development study of 2000, identified tourism, agriculture, mining and trade and manufacturing as sectors
with a potential for growth in the Mopani district. The Mopani District also has a large number and of diverse under exploited
tourism assets e.g. the northern portion of the Kruger National Park. A national park, nature reserves and game farms cover
almost half of the district, identified as one of the five best conserved ecosystems in the world, providing ample opportunity for Eco
Tourism and SMME development. The district also has comparative advantages in agriculture, manufacturing and trade.
Hereunder is an analysis of the district economy.
2.5.4 Economic Sector Analysis
A superficial glance at the available statistics suggests that Mopani District has one of Limpopo’s more developed economies.
2006 per capita GGP (R24,056) was above the provincial average (R21,787) and the 2006 Mopani GGP (R27.3 billion) placed the
district third behind Waterberg and Capricorn by way of economic contribution to the province. The Mopani economy grew by 4%,
above the provincial and national average, between 1996 and 2006.

33
Figure 1
The aggregated statistics conceal the fact that economic opportunities in the district are highly concentrated around Phalaborwa
(and to a lesser extent Tzaneen). Outside of these centres, Mopani contains some of the country’s least developed and poorest
communities. In 2006 11% of Mopani residents lived in a state of absolute poverty.
Admittedly poverty is a complex phenomenon, and can be difficult to measure, but a combination of measures all indicate the
same economic features, namely co-existent wealth and underdevelopment and high inequality caused by a concentration of
economic power in certain sectors in certain regions:
• 55%, 48% and 46% of the population of Greater Tzaneen, Greater Letaba and Greater Giyani fall into the provinces
“most deprived 25% of the population” category, while 71% of the population of Ba-Phalaborwa are registered among the
“least deprived 25%” of the provincial population.
• A reported Gini co-efficient for Mopani of 0.65 in 2006 – similar to the national figure (0.64).
• The Human Development Index – a composite of infant mortality, adult literacy and GNP – for Mopani was 0.5 in 2006
(the same as the previous year), which is below the provincial figure (0.52) and the national figure (0.62).
• The dualism and spatial and sectoral concentration of economic power are further reflected in the district’s Tress Index
which has deteriorated from 44.38 in 1996 to 53.08 in 2006 (Global Insight, 2008).
2.5.5 Key economic sectors
Mining: Mining has been the dominant sector in Mopani since 1996, and in 2006 accounted for 31% of the gross value added. The
other large sectors (in descending order) are community service (government employment), trade (which includes tourism) and
finance. Mopani has almost no manufacturing sector.
Mopani mining is concentrated in the Ba-Phalaborwa district. Mining in the district has been through 8 years of rapid expansion
(see Figure 12), but oddly the secondary sectors that one might expect to support mining such as manufacturing, construction and
transport have not experienced any significant growth. I
In Ba-Phalaborwa the formerly state owned mining cluster is now jointly owned by Rio Tinto (58%), Anglo-American (17%) and
Palaborwa Mining Company (25%). In 2007 the mine hoisted over 11,8 million tons of which 0.7% was converted into ore. Copper
accounts for between 75% and 80% of the mines activities, with Magnesite (10%-15%) and Vermiculate (10%) making up the

34
balance. The mine employs over 2,000 people and an additional 450 contractors, and contributes an estimated 80% of Ba-
Phalaborwa Municipality’s GGP (Asubonten, pers. comms)1.
Historically, the international copper price has been notoriously volatile (see Figure 14), but in early 2003 the price of copper began
to rise and is now over 4 times its 2002 level (Figure 15). This has had a marked impact on the viability of the Phalaborwa mine,
allowing it to extend its activities and critically extend the timeframe that it intends to continue to mining in the region. The current
outlook (as of July 2008) was that the mine will be hoisting copper for another 8 years, and vermiculite and magnesite for at least
another 20 years. The mine’s market share is constrained by the availability of rail freight on the existing routes to Richard’s Bay
and Maputo. More wagons and a more reliable service on these routes, it is claimed, would enhance the reach of the Phalaborwa
mining sector and particularly the vermiculite trade (Asubonten, pers. comms).
Figure 2: Economic contribution by sector, Mopani 2006. (Source: Global Insight)
Manufacturing
Figure 3: Contribution to Mopani employment by sector (Source: Global Insight)
Further breakdown of employment statistics are indicated in paragraph 2.3.8 above. Of the total population, 1 068 569, 15% are employed, 11%
are unemployed and 30,6% are not economically active.
1

35
Figure 4: Growth of Mopani sectors 1996-2006 (Source: Global Insights)
Figure 5: Growth in employment by sector (1996-2006)
Employment creation remains one of the key challenges for Mopani. In 2006 an estimated 41.6% of the economically active
population was unemployed. The sectoral analysis suggests that support for value-addition in the agricultural sector and the
retention of primary mineral resources in the district in order to process them, present the most scope for sustainable employment
creation.
By virtue of its mineral wealth, most of which is exported, Mopani maintains a positive trade balance. Between 1996 and 2006
Mopani established a trade surplus of roughly R14 billion. In 2005 and 2006 the trade surplus was R1.8 billion and R2.5 billion
respectively. The vast majority of this surplus – over 65% - emanated from Ba-Phalaborwa. In recent years the tourism revenue
generated by the Kruger Park DMA, which counts as an export, has contributed to the surplus.
2.5.6. Constraints in the District Economy
According to the Limpopo Spatial Rationale (2007), approximately 55% of the 348 settlements in the Mopani District Municipality
area are small. These settlements are scattered throughout mainly the central, south-western, northern and the north-eastern
areas of the Mopani District Municipality. The present scattered settlement pattern (without a proper settlement hierarchy) will
never be able to provide a basis for long-term sustainable development to improve the quality of life of all the inhabitants and
communities in the District. Problem areas leading to development constraints, in each municipality can be summarized as
follows:
(i) Greater Giyani
There is a smaller percentage of economically active population in Greater Giyani than in Greater Tzaneen and Ba-Phalaborwa.
Only 48.2% of the population is economically active. This can also indicate that people from this group might migrate to other local
municipalities inside or outside the District to find work. Giyani has a large number of rural settlements that are scattered and not

36
easily accessible as the road conditions are bad. This can cause problems for economic development as it will concentrate on
economic growth points where there are large concentrations of people. The Greater Giyani Local Municipality has the smallest
villages in the District with an average number of 2639 people per settlement.
Large areas of land in the District forms part of the former Lebowa and Gazankulu homelands and are held in trust for tribal and
community authorities. These traditional authorities play a very important role in terms of their traditional culture and therefore also
have a major influence in the manner in which land is made available to individuals for settlement, as well as the use thereof for
economic purposes (e.g. agriculture, tourism, etc.). Most of these decisions are made on an ad hoc basis and usually without any
consideration of the impact it may have on the spatial pattern and the rendering of cost effective and efficient services to
communities. Nearly 25% of the people in the municipality indicated that they are employed in elementary occupations. This might
indicate a relatively low level of skills with regard to a specific profession.
(ii) Greater Letaba
The percentage of economically active population is relatively small at 49.4%. Nearly 100% of the population (99.4%) resides in
non-urban areas. This indicates that there are few potential growth points for the economy as the largest Town in the municipality
is Modjadjiskloof which is extremely small. The contribution to the GDP in the mining sector has decreased from 0.33% in 1996 to
0.19% in 2001. This sector has thus become less important in the area.
Greater Letaba currently makes the least contribution to the District GDP. Land claims are a major factor influencing development
in the District. Many claims have as yet not been investigated and gazetted as required in terms of the Land Restitution Act. A total
of approximately 297997ha (representing 26,85% of the total area of the District) is subject to land claims. Most of the claims and
land affected by these claims are situated in the Ba-Phalaborwa and Greater Letaba Local Municipality areas.
(iii) Greater Tzaneen
Although most of the people live in and near Tzaneen there are still a large number of people that live in rural areas and scattered
settlements. The Manufacturing sector has decreased from 1996 to 2001. This indicates that processing is being conducted
outside of the area.
(iv) Ba-Phalaborwa
Although Mining is presently the largest sector in Ba-Phalaborwa and created many job opportunities it can also become a
constraint in the future. All mines have certain production expectancy and will eventually close. It is indicated that a large number
of people are skilled in professional and technical occupations and when the mine closes down these people will have to either
move to an area where there is mining activities or have to learn other skills. A large number of people occupied in the
Manufacturing sector might also loose their jobs after the mines have closed as they are inter related. There is a large amount of
land in Ba-Phalaborwa that is currently under land claims. This is land that can potentially be developed for especially tourism.
(v) Maruleng
The majority of people in Maruleng are located far away from the economic hub of the municipality, namely, Hoedspruit. The town
which is the economic node of the municipality is surrounded by privately-owned land which is not readily available for new
development. There is a general shortage of technical skills in the area and most of the rural communities of Maruleng get jobs in
Tzaneen and Phalaborwa and thus promoting economic activities outside their municipality. 18,5% of the municipal area is subject
to 45 registered Land claims. There is also a general infrastructure backlog which hampers potential new economic infrastructure
development in the area.

37
2.5.7. Opportunities in the District Economy
Although there are numerous constraints to the development of the District, there are also strong opportunities for economic
development. These opportunities include:
(i) Greater Giyani
There has been some growth in the agriculture sector from 1996 to 2001. The most noticeable growth was in the Transport and
Communication sector. The GDP percentage grew from 1.12% in 1996 to 12.91% in 2001 in this sector. The population living in
urban areas has also increased from 10.1% in 1996 to 13.8% in 2001.
(ii) Greater Letaba
The GDP of the Agriculture sector including forestry has grown somewhat from 20.81% in 1996 to 21.01% in 2001. Along with this
sector the Transport and communications sector has also grown from 18.34% to 20.68%.These are the only sectors in which
growth was indicated and is thus the most important economic sectors in the area. The Agriculture sector usually creates
opportunities in the Manufacturing sector which might be more exploited in the future.
(iii) Greater Tzaneen
Tzaneen is the municipality with the largest population in the District with 39% of the population residing there. The municipality
also has a high percentage of economically active population of 53.1%. Although Agriculture is by far the most important sector in
this area Greater Tzaneen also has the highest percentage of GDP of each of its sectors, except for mining, of all the
municipalities. The GDP in the Agricultural sector has grown from 55.92% to 59% indicating its growing importance. The
contribution to GDP from the manufacturing sector has decreased although the agricultural sector has grown. This might be due to
the fact that most of the produce is exported out of the area for processing. This creates an opportunity for manufacturing to be
exploited in the area.
(iv) Ba-Phalaborwa
Ba-Phalaborwa has the most concentrated economy of all the local municipalities due to its large mining sector. Linked to this
sector is also the manufacturing sector which has also grown in contribution to the GDP. The transport sector grew by 15% in the
GDP from 1996 to 2001 and the Manufacturing sector grew by 10.8%. The economy of Ba-Phalaborwa is thus very sensitive to
changes in the mining sector and all sectors connected to mining should be exploited for development such as Manufacturing and
Transport and communication.
(v) Maruleng
The Maruleng municipality has large game farms from which the municipality can grow its tax base. It also boast of the East-gate
Airport through which it can promote its tourism status and ensure direct access to other provinces for marketing. The area is also
imbued with agro-products across the seasons from which jobs can be created to ensure poverty alleviation. Its strategic local in
relation to the Maputo Corridor, positions it to can attract investment in its area.

38
2.6 INFRASTRUCTURE ANALYSIS/ BASIC SERVICES
2.6.1. BACKGROUND
The success of local economic development is tied to the provision of basic and other types of infrastructure to the people. All
services under analysis in this section are located in a specific locality (as per SDF) and have potential to boost socio-economic
development (as per LED). Infrastructure analysis focuses on the status quo regarding water supply, sanitation facilities, energy
and housing provision, roads and public transport, waste management and telecommunications – all of which underpins socio-
economic development and determines a people’s quality of life. The provision of adequate municipal infrastructure remains a
challenge throughout the district.
Table 22: Basic needs backlogs in the district
Service Households Access % Access Backlog % Backlogs
Sanitation 71 885 27,1% 193 404 72,9%
Water 124 313 46,9% 140 976 53,1%
Electricity 208 619 78,6% 56 670 21,4%
Housing
265, 289
224 820 84,7% 40 469 15,3%
Roads 3385.47km 1313.64 km 38,8% 2071.83 km 61,2%
STATSSA, 2007, Community Survey & Road Management System (RAL), Municipal information.
2.6.2 INDIGENT HOUSEHOLDS RECORD PER MUNICIPALITY
Table 23: Indigent Households
Local Municipality
Total Households
INDIGENT REGISTER IN PLACE
HOUSEHOLDS (percentage)
Greater Tzaneen 89 832 Yes 28 552 (31,8%)
Greater Giyani 57 538 Yes 21 007 (36,5%)
Greater Letaba 59 539 Yes 27 324 (46,25)
Maruleng 24 589 Yes 8 249 (33,5%)
Ba-Phalaborwa 33 791 Yes 11 744 (34,8%)
Total/ Mopani DM 265 289 Yes 96 876 (36,5%)
Access to Free basic Services (Indigent H/H) GGM GLM GTM BPM MLM DMA MDM
Water 3 711 18 526 11 673 9 735 1 687 0 45 332
Electricity 3 711 1 319 10 961 9 735 8 299 0 34 025
Sanitation 3 711 1 827 1 288 9 735 5 120 0 16 561
39
2.6.3 WATER
The Mopani district is characterized by low rainfall, especially in the lower-lying areas of the district, namely, Greater Giyani and
Ba-Phalaborwa. This results in limited water resources culminating in severe water shortages and regular drought conditions.
Subsequently, there is stiff competition between the different water users such as agriculture, mining and forestry. To this end,
water use for domestic purposes becomes critical. The main surface water resources for Mopani district are Letaba River
catchment and all its tributaries. There is a huge potential for usage of borehole water as an augmentation to the surface water
resources.
There are over 20 large dams in the district with 9 being used for primary consumption (domestic, industrial and commercial) and
most of the other dams are used for irrigation purposes. Some private small dams also exist and are used for irrigation purpose as
well. The total yield from the dams for primary usage is 273 million m3 per annum. The agricultural sector uses the greatest portion
of the available yield in the district, which is estimated at 70%, leaving 30 % for the other water users.
Bulk water supply in Mopani is characterized by numerous surface water schemes in various stages of full development to all
consumer points. Water supply scheme clusters are well defined and the service area boundaries are well established. Major
upgrading and refurbishment are needed at most localities. The Middle Letaba M Sub Scheme area and Modjadji areas are in
need of extensions to the existing bulk supply systems. In general, Mopani District is well provided with bulk water supply
infrastructure. However, the reason why the supply of water is below the RDP level (25 litres per person per day) is the shortage
of pipeline reticulation within villages.
Ba-Phalaborwa municipality has adequate reticulation system, followed by Greater Tzaneen Municipality, Greater Letaba
Municipality and then Greater Giyani Municipality. The limited availability in infrastructure in Greater Giyani is attributed to the fact
that the villages in the Greater Giyani area are spatially scattered, resulting in difficult and expensive processes to provide water
supply pipelines in the villages. It is also deduced that the major factor contributing to shortage of water is related to social aspects.
These aspects are mainly vandalism of infrastructure, especially communal boreholes, lack of willingness from the consumers to
pay for their water services and illegal (unauthorized) connections of pipelines by communities. These problems are primarily
observed in rural areas than the more urban areas. High water usage is generally observed in most of the areas, amounting to
more than 150 litres per person per day in both towns and rural areas.
The majority of households in Ba-Phalaborwa (77.3%) have access to RDP standard water source with households in Greater
Tzaneen at 53.6%, Greater Letaba at 60.7%, Greater Giyani at 57.3%, Maruleng the lowest at 49.9%. However, taking a look at
the households access to the various sources of water per local municipality as a percentage of the district, it becomes clear that
the level of services are higher in Ba-Phalaborwa with 35.3% of the households within the district with access to water inside their
dwellings residing here, especially when taking into consideration that only 12.9% of the households in the district reside in Ba-
Phalaborwa. The smaller population and the absence of many scattered villages in Ba-Phalaborwa, compared to e.g Greater
Giyani, probably contributed to this.
All the municipalities in the district are providing free basic water (6000 litres per household per month) with almost none providing
free basic sanitation. To eradicate the water backlog, Mopani district has prioritised water services as the first service among all the
other services. The Department of Water Affairs and Forestry (DWAF) is currently busy with the building of the Nwamitwa Dam
and the raising of the wall of the Tzaneen Dam to address the water shortage problem in the district.

40
Further breakdown on levels of services is depicted in Table 24 below:
Table 24: ACCESS TO WATER BY MUNICIPALITIES (No. of H/H (Community Survey 2007, STATSSA) Type GGM GLM GTM BPM MLM DMA MDM Piped water inside the dwelling 14031 5820 15301 12251 4271 n/a 51674 Piped water inside the yard 10346 17069 20402 17081 7856 n/a 72754 Piped water from access point outside the yard
23647 32443 40120 3812 9319 n/a 109341
Borehole 4333 1869 4503 413 1122 n/a 12240 Spring 49 714 2653 0 484 n/a 3900 Dam/pool 139 306 1688 0 117 n/a 2250 River/stream 2660 832 4531 0 1361 n/a 9384 Water vendor 535 368 368 0 0 n/a 1271 Rain water tank 0 0 113 0 60 n/a 173 Other 1798 118 153 234 0 n/a 2303 Total 57538 59539 89832 33791 24590 n/a 265290
DMA figures not available from STATSSA, 2007
The optimization and conservation of existing water resources is one of the greatest aspects to be addressed in the development
strategy of the district due to the centrality of water to human well being, agricultural development and economic growth, to
mention but a few examples. This means that, although RDP level should be the minimum, the bulk supply design should cater for
higher levels to avoid unnecessary reconstruction in future. Thus, sound-engineering principles that will be used in the design and
implementation of water services in the district should take into consideration future socio-economic developments.
2.6.4 SANITATION
Lack of access to basic sanitation services has created massive environmental and health problems in both rural and urban areas
in the district. The fact that nearly all villages in the district do not have RDP level sanitation constitutes a major risk in terms of
ground water pollution. The main types of sanitary systems used in the district are water-borne sewerage (flush toilets), septic
tanks, Ventilated Improved Pit latrines (VIP), French drains and ordinary pit latrines to no basic services at all. Water-borne
sewerage is mainly found in towns and townships, septic tanks are mainly on privately owned properties like farms, hotels, etc with
the rest primarily found in rural areas.
Most people in the district use pit latrines, followed by those without any sanitation services at all. The situation is worse in Greater
Giyani with 54% of the households not having access to any sanitation. Greater Letaba has the highest usage of Pit Latrines at
51.5%, while flush toilets are more prevelant in Ba-Phalaborwa with 39.8%, which correlates with the availability of piped water
within the houses. The district municipality has the constitutional responsibility to provide access to sanitation services. To this end
the District is on course to eradicate the sanitation backlog by 2010.
There are many schools and clinics that are without sanitation in the district. Many other schools use pit latrines that are
inadequate, dirty and unsafe. This all adds up to a potential health time bomb for the district. DWAF is responsible for dealing with
school sanitation.

41
Breakdown of levels of services per municipality is depicted in the following Table 25
Table 25: Toilet facilities by Municipalities (No. of H/H) (Community Survey, 2007 STATSSA)
Type GGM GLM GTM BPM MLM DMA MDM Flush toilet (connected to sewerage system) 7618 5299 12115 14056 3659 n/a 42747 Flush toilet (with septic tank) 452 1686 2176 1090 584 n/a 5988 Dry toilet facility 1121 188 5930 208 246 n/a 7693 Pit toilet with ventilation (VIP) 2423 7488 11268 2868 4473 n/a 28520 Pit toilet without ventilation 22230 33752 44338 8958 10656 n/a 119934 Chemical toilet 248 0 306 0 0 n/a 554 Bucket toilet system 0 0 0 0 n/a 123 None 23445 11127 13699 6612 4970 n/a 59853 Total 265289
DMA figures not available from STATSSA, 2007
2.6.5 ENERGY AND ELECTRICITY
Energy distribution has important economic development implications with a potential to make a considerable development impact.
This impact relates to improved living conditions, increased productivity and greater sustainability of the environment. This is an
important consideration in view of the fact that rural households obtain most of their energy requirements from firewood.
In Mopani, electricity is largely generated and distributed by ESKOM as well as local municipalities. The Mopani District
Municipality has a role of providing bulk electricity to the local municipalities. However, this function is yet to be fully undertaken.
National government in consultation with the South African Local Government Association (SALGA), ESKOM and other
stakeholders are engaged in discussions regarding the restructuring of the Electricity Distribution Industry in South Africa with the
aim of ensuring that the industry is able to meet the needs of electricity consumers in the country and improve the roll out of
electricity.
The four local municipalities in the district have signed the service level agreement with ESKOM for the rolling out of Free Basic
Electricity to indigent households in the district. Each poor household is entitled to 50KWh per month. It has been found that most
of the people in rural areas and amongst low income households, continue to use a range of energy sources like wood to meet
their needs, irrespective of whether their houses are electrified or not. In addition, inefficient energy use compounds poverty:
housing without ceilings and a complete lack of accessible information to users on appropriate and efficient energy use condemn
poor households to a future of high energy costs.
A range of alternative sources of energy for different usage is depicted in the Table below:
Table 26: Energy Usage
(i) Energy usage for heating by Municipalities (No. of H/H) GGM GLM GTM BPM MLM DMA MDM
Electricity 12433 13160 34802 20353 6353 0 87101 Gas 0 242 80 149 175 0 646 Paraffin 303 1119 2031 1741 180 0 5374 Wood 43866 44586 50672 11285 17645 0 168054 Coal 59 122 286 60 0 0 527 Animal dung 0 0 0 0 0 0 0 Solar 0 0 187 0 0 0 187 Other 876 310 1773 203 237 0 3399 Total H/H 265288
Community Survey, 2007, STATSSA. *DMA data not available from STATSSA, 2007

42
(ii) Energy usage for cooking by Municipalities (No. of H/H)
(Community Survey 2007, STATSSA) Types GGM GLM GTM BPM MLM DMA MDM Electricity 11266 14621 32821 20315 7219 0 86242 Gas 45 187 201 319 8 0 760 Paraffin 430 2591 3062 2684 539 0 9306 Wood 45669 41713 53507 10413 16823 0 168125 Coal 66 428 179 60 0 0 733 Animal dung 0 0 0 0 0 0 0 Solar 0 0 62 0 0 0 62 Other 61 0 0 0 0 0 61 Total H/H 265289
*DMA data not available from STATSSA, 2007
(iii) Energy usage for Lighti ng by Municipality (No. of H/H) (Community Survey 2007, STATSSA)
Type GGM GLM GTM BPM MLM DMA Mopani Electricity 46562 47813 73404 31012 20697 0 219488 Gas 0 122 181 0 0 0 303 Paraffin 3164 1121 1534 182 836 0 6837 Candles 7445 10299 13922 2541 2997 0 37204 Solar 62 0 63 0 0 0 125 Other 305 184 728 58 60 0 1335 Total 265292
DMA data not available from STATSSA
2.6.6 ROADS AND PUBLIC TRANSPORT
(i) Roads Infrastructure
Road usage is a reflection of a people’s mode of life. The routes, frequency and volume of passengers and goods should basically
inform the criteria for the prioritisation of road works, i.e. roads for which resources should be committed for re-gravelling, tarring,
lining, signage, etc. Roads in Mopani District are classified as National, Provincial, District or local roads.
The Mopani District area has 3135.55 kilometers of roads. In the Greater Tzaneen Municipality the total length of tarred roads is
439.56 km and gravel roads is 593.44 km. The grand total kilometers of roads in the Greater Tzaneen area is 1033 km. For
Greater Letaba Municipality, the distance of tarred roads is 150.5 km, whereas, the distance of gravel roads is 535.65 km; the total
kilometers for the entire municipal area is 657.15 km. The kilometers of tarred roads in the Greater Giyani Municipality are 113 and
the gravel roads distance is 605.8 km, totaling 718 for the entire municipality. The Ba-Phalaborwa Municipality has roads totaling
489.86, with 223.66 km of tarred roads as opposed to 266.2 km of gravel roads. Maruleng has 48.4km of tarred road and 188.7km
of gravel roads and its total kilometers of roads is 237.54km.
This reflection indicates that 975.06km of these roads are tarred and 2149.79 km are gravel. The state of roads in the district have
an impact on the economic development of the area as it is clear that most roads, leading to where the majority of the district
population is, are not tarred, and as such, hinder the proper transportation of people, goods and services to these areas.
The major roads found in Mopani District are highlighted in Table 6 hereunder:

43
Table 27: List of major roads within the district
ID Corridor Description
1 Tzaneen to Nkowankowa and Lenyenye Along road R36 south-west of Tzaneen through Nkowankowa up to Lenyenye
2 Tzaneen to Boyne Along road R71 west of Tzaneen up to Boyne and Polokwane
3 Tzaneen to Modjadjiskloof Along road R36 north-west of Tzaneen to Road R529
4 Tzaneen to N’wamitwa Along a road east of Tzaneen to road R529
5 Giyani to Mooketsi Along road R81 south of Giyani to Mooketsi
6 Modjadjiskloof to Kgapane Along road R36 north of Modjadjiskloof to Kgapane
7 Phalaborwa to Lulekani Along road R71 to the west of Phalaborwa to road R40 Lulekani
8 Giyani to Malamulele Along road R81
9 Giyani to Bungeni Along road R81 south of Giyani into road R578
1 Nkowankowa to Letsitele Nkowankowa through east to Letsitele
11 Giyani to Letsitele/Nkowankowa Road R81 south of Giyani into road R529 to Letsitele
12 Giyani to Mothupa Road R81 south of Giyani, turning at Lebaka Cross to Mothupa
13 Modjadjiskloof to Giyani Road R36 north of Modjadjiskloof into road R81 towards Giyani
14 Kgapane to Mokwakwaila From Kgapane heading north through villages to Mokwakwaila
15 Phalaborwa to Namakgale From Phalaborwa along R71 to Namakgale
The following are national roads under the custodianship of South African National Roads Agency (SANRA):
� Makgobaskloof – Polokwane
� Tzaneen – Hoedspruit
� Tzaneen – Gravelotte – Phalaborwa
� Tzaneen – Modjadjiskloof – Mooketsi
� Sekgopo – Polokwane
� Mooketsi – Giyani
(ii) Provincial and District Roads.
Table 28: Service Levels
Municipality Provincial Roads District Roads Totals
Tarred (km) Gravel (km) Tarred (km) Gravel (km) Tarred (km) Gravel (km)
GTM 169,9 14,4 269,7 579,0 439,6 593,4
GLM 30,24 119,3 535,7 149,54 535,7
BPM 136,56 49,56 87,1 216,6 223,66 266,16
GGM 34,0 79,0 606,8 113,0 606,8
MLM 6,59 42,25 188,7 48,84 188,7
MDM 377,29 63,96 597,35 2 126,8 974,64 2 190,76

44
(iii) Specific Roads service levels
Road No. Description Total kM
Provincial Tar Roads – GTM
P112/2 Letsitele – Rubbervale 17.44
P43/2 Politsi – Tzaneen 8.88
P43/3 Tzaneen - D202 48
P181/1 P17/3 – Afcolaco 8.64
P17/1 Haenertzburg – Sawmeal 13.88
P17/2 P43/2 - Haenertzburg –Magoebaskloof 30.04
P17/3 Tzaneen - P181/1 40
P188/1 Tzaneen station - P43/3 3
Total 169.88
District Tar Roads – GTM
D2499 Merenskyschool road - 0.36
D1267 Risaba – Letsitele 18
D447 D848 - D978 3.8
D548 Tzaneen -Haenertzburg-Georges valley 34.97
D1279 Letsitele valley – Agatha 19.02
D589 Tzaneen – Agatha 12.1
D523 Tzaneen – Agatha 11
D673 Tarentaal rand -Letsitele valley 26.1
D1350 Tarentaal rand –Deerpark 16
D978 Tzaneen – Deerpark 16.65
D848 D447 – Politsi 8.35
D1292 Taarentaal – D1267 18.73
D8 Letsitele - P17/3 19
D5011 Letsitele – Nkowankowa 13
D1801 Politsi - 3.9
D2283 D589 - P17/3 4
D2531 D617 - D668 9
D3890 Maake - C.N Phathudi 8.2
D3889 Sunnyside – Maake 4.4
D3895 Shilubane –Toursdam 7.2
D3889 Rita – Sunnyside 5.3
D3880 Lenyenye - 2.6
D3247 D1292 – Nwamitwa 4
D3184 D3180 - Nature reserve 4
Total 269.68
Provincial Gravel Roads- GTM
P17/3 Leydsdorp – P181/1 14.44
Total 14.44
District Gravel Roads - GTM
D202 P43/3 - P112/2 30.44
D617 Valkrans – Houtbosdorp 10.74
D3187 Lekgwareng – Mawa 10
D3768 D8 – Molati 6.7
D3767 D8 – Bonn 18.3
D3772 Rulani – Bordeaux 5.8
D3771 Hoveni - Juliesburg-Hoveni 40
D3897 Juliesburg – Agriculture 6.3
D3894 Mokgapeng – Solani 4.4
D4120 D4122 - D3892 3
D4122 D3886 – Mokgapeng 1
D3891 Newpapeng - D3770 2

45
D3893 D3890-D5014-Mokgapeng-Pharara-CN Phathudi 7.91
D3769 Myakayaka-Burgersdorp-Mafarane 10
D4139 Ramodike dam -Maake 6
D3888 Sepopo – Mojakaneng 2.3
D5014 Myakayaka-Makudiburg 1
D4062 Sunnyside – P1703 2
D3896 Malilani – Masoma 5.2
D3892 D3893 - D3770 2
D4132 D3890 – Shilubane 5
D3880 Lenyenye – Bokgakga 14.3
D3181 D3880 - D3889 3
D3870 Dan – Khujwana 14
D3762 D3870 - D4157 6.1
D4157 D3880 - P17/3 7
D3766 P17/3 - D8 12
D3767 D3766 – Sedane 6.3
D3763 Mohlaba – Headkraal 2
D3986 D5011 – Petenenge 3
D3770 Tickyline - Solani - Julesburg 13.2
D3764 P17/3 -D3763 9
D3881 D3880 – Lenyenye 1
D1714 P17/3 - P43/3 - D978 10.76
D2355 P43/3- 6.89
D3175 D1350 – Thabane 10.6
D1326 D1350 - D3127 3
D1327 D3175 - D3175 2
D3186 3175 - D3198 19
D3248 Nwamitwa -Mandlakazi 10.8
D3247 Nwamitwa -D3246 -Babanana 8
D3246 Mavele – Mosipana 9.1
D3249 Risava – Mosipana 13.8
D3252 Jopi – Xihoko 8.7
D3253 Xihoko – Xirolorolo 6
D3235 D3252 - D3198 3
D1350 D3180 – Mothabo 21
D1328 Modjadji - D1350 6
D3191 D1350 – Phijaphijamela 3
D3237 Modumane - Morapalala 6.33
D3215 Morapalala - Moogo 6 7
D3198 D3180 – Miragoma 40.12
D3200 Hlohlokwe – Mawa 10.24
D3202 Ramachinyadi - Mokwathi 8
D3984 D3766 – Mariveni 2
D21 Afcolaco - P17/3 7
D1826 D21 - D1827 13
D1402 Politsi road - 2
D591 Grootbosch –D1801 6.68
D668 D882 - P17/2 12.76
D549 P17/1 - D2531 14.1
D1498 P17/2 -D548 10
D1286 D548 - D1498 7
D2239 D548 - 2.09
D1279 D548 – Agatha 6.1
D523 Agatha from D1279 - 4.7
D1354 P17/1 - D558 5.44
D558 P17/1 - D23 0.8
D2531 D668 - D617 1
Total 579.00

46
Provincial Tar Roads - GLM
P43/2 Mooketsi -Modjadjiskloof - Politsi 30.24
Total 30.24
District Tar Roads - GLM
D9 Nwamangena – Mooketsi 53
D1034 D9 - P43/2 19
D1308 Mooketsi –Morebeng 14
D447 P43/2 - Kgapane- D848 20.2
D1380 Modumeleng – Modjadji 14.06
Total 119.26
District Gravel Roads
D617 Mooketsi – Valkrans 12.8
D569 P43/2 - D1308 7
D3221 Lekgwareng – Abel 9.9
D3820 Msengi - Rotterdam - (D3205-D3164) 5
D3232 Ganke - Sekgosese (D15 - D3150) 15.37
D3231 Mamaila - Cross no.1 (D3232 -D3232) 2.82
D3230 Etieleng – Takgalang 4.03
D3734 Ga-Phooko 10
D3205 Maphalle – Blinkwater 7
D3164 Middelwater – Olifanthoek 29
D3160 Itieleng – Senwamokgope 4
D3209 Khani – Rivala 15
D3211 Nakampe – Skhiming 11.45
D3180 Mpepule – Modjadji 43.94
D3229 D3187 – Taulume 10
D3200 Lebaka – Gawela 24
D678 Mooketsi - D1034 16.6
D2673 P43/2 - D1034 6
D2672 D1034 - D1509 3
D1509 D447 - 12.28
D3184 Kgapane - 4
D841 D848 - D1543 9.44
D2674 Modjadjiskloof - D447 11
D839 P43/2 12
D1331 Mothobeki – Boshage 6
D1330 Moshage – Limokwe 2
D3181 Modjadji - 3
D3179 Modjadji - 8
D3197 Sanopelwa – Mothobeki 2
D3195 Maphalle -D3225 13
D3225 D3195 - D3200 4
D3196 D9 – Ditshosing 5
D11 Wholesale – D9 18
D3219 Taululme – Maekwe 4
D3216 Taululme - D3200 8
D3220 Sepharatleng – Mirekoma 14
D3212 Beliew – Mamokgadi 9
D3213 D3200 – Kgaretala 10
D3227 Block 9 – Mamanyoha 9
D3822 Ndengeza – Rivala 8
D3208 D9 - 2
D3207 D3820 – Sidibane 7.4
D3206 Sidibane – Maupa 5
D3243 Jamela - D3242 1
D3242 D3205 - D9 4
D1923 D9 - D11 8.74
D3222 D1923 – Middelwater 7.42

47
D3223 D3150 –Middelwater 5.63
D3210 D3150 – Senwamokgope 3.1
D3233 D3232 - D3150 2.82
D15 D3150 - D3734 23.91
D3241 Jamela – Jamela 1
D3189 Rabokgale - 9
D3191 Madumane – Byabya 3
D2654 D617 - 5
D1350 Thakgalang 2 - Olifanthoek 29
D1329 Sotong- 2
D1548 Modjadjiskloof - D447 7
Total 535.65
Provincial Tar Roads – Ba-Phalaborwa
P11/1 Gravelotte – Phalaborwa 60
P11/2 Rubbervale – Gravelotte 6.56
P17/3 Gravelotte – Mica 33
P43/3 D202 – Eiland 37
Total 136.56
District Tar Roads – Ba- Phalaborwa
D726 Phalaborwa – Mica 19.1
D4424 P112/1 – Madikoshikaya - Lulekani 10
D3782 P112/1 – Namakgale 8
D3790 Namakgale - D726 5
D86 D726 – Phalaborawa 7
D2105 D86 - 2
D3264 Phalaborwa - 7
D1267 Mphagani –Risaba 28
D1597 D1267 - P43/3 1
Total 87.1
Provincial Gravel Roads – Ba- Phalaborwa
P43/3 Eiland - Letaba ranch 37
P17/3 Gravelotte – Leysdorp 12.56
Total 49.56
District Gravel Roads
D202 P112/2 – Leysdorp 12.56
D4424 Matikoshikaya – Benfarm - Humulani 7
D2263 D726 5
D3786 D726 – Mashishimale - Maseke 17
D3794 Mashishimale R3 - Makhushane -R2 9
D3791 Namakgale - Makhushane -R2 2
D3792 D3791 - D3790 2
D3781 Mashishimale - R3 - P112/1 4
D1655 P112/1 – Nondweni 22
D1191 Murchison - D3260 33
D3782 D3790 – Namakgale 4
D3260 P112/2 - Letaba ranch 26
D1597 D1100 - P43/3 12
D1100 D202 - P43/3 36
D1827 Gravelotte – Harmony 19
D2512 Letaba river - P43/3 2.56
D3202 D1267 – Ramochinyadi 3.52
Total 216.64
Provincial Tar Roads – GGM
P99/1 Gaza beef – Sterkrivier dam 34
Total 34

48
District Tar Roads – GGM
D9 Makgakgapatse - Mushwani junction 38
D1267 Kremetart - Constatia(D2512) 32
D3815 Masingita - D3641 4
D3812 D3815 – Vuxakeni 3
D3641 D3815 –Giyani college of education 2
Total 79
District Gravel Roads – GGM
D3641 Giyani college of education - 24
D3812 Vuxakeni - Vuhehli road 20
D3635 D3809 -D3636(Mudavula) 20
D3634 Giyani – Malonga 29
D3810 Thomo -Hlomela road 34
D3802 Thomo –Shangoni 8
D3803 Mninginisi – Shingwedzi 13
D3801 Khakhala -Mhava Willem 8
D3800 Shangoni road - 26
D3809 Manombe - Makosha - Mahlangula 7
D3799 Shingwedzi – Muyexe 6
D3805 D9 - Nwadzekudzeku -Shingwedzi 10
D3816 Siyandhani –Ngalalume -D3635 14
D3807 D3805 – Mavalani 5
D3633 Malonga - Sifasonke -D3635 12
D3804 Xikukwani - Mbatlo -Shangoni 18
D3814 14B - 14A 3
D3813 14A – Mapayeni 4
D3811 Vuhehli -Mahlathi gate 8
D3207 Ximausa – Sedibene 8
D3209 Rivala – Khani 9
D3238 Hlaneki – Gandlanani 8
D3206 Sedibene – Border 8
D3187 Lekwareni – Mbaula 49
D3836 Sikhunyane – Ngove 16
D3840 Kremetart - D3187 46
D3837 Nkomo – Shamriri 15
D2512 Constatia – Shitlakati 24.6
D3849 Matsotsosela –Molototsi 11
D3847 Kheyi – Khashane 16
D3848 Mushiyane – Xitlakati 8
D3981 Mbaula - Letaba river 8
D3982 Kheyi - D3187 2
D3854 Shiawela – Shikhumba 6.2
D3948 Mngongoma – Gidja 2
D3844 Mphagani - D1267 3
D3820 Babangu – Msengi 19
D3843 Mageva road - 3
D3842 Mngongoma – Maphata - Bambeni 10
D3853 Guwela - Shikhumba -Shawela 8
D3980 Makhuva gate – Letaba river 10
D3966 Mbaula – Phalaubeni 6
D3204 Skhiming – Dzingidzingi 9
D3234 Shimange - via - Dingamazi 10
D3211 Skhiming – Nakampe 16
D3983 D1267 – Bambeni 6
Total 606.8
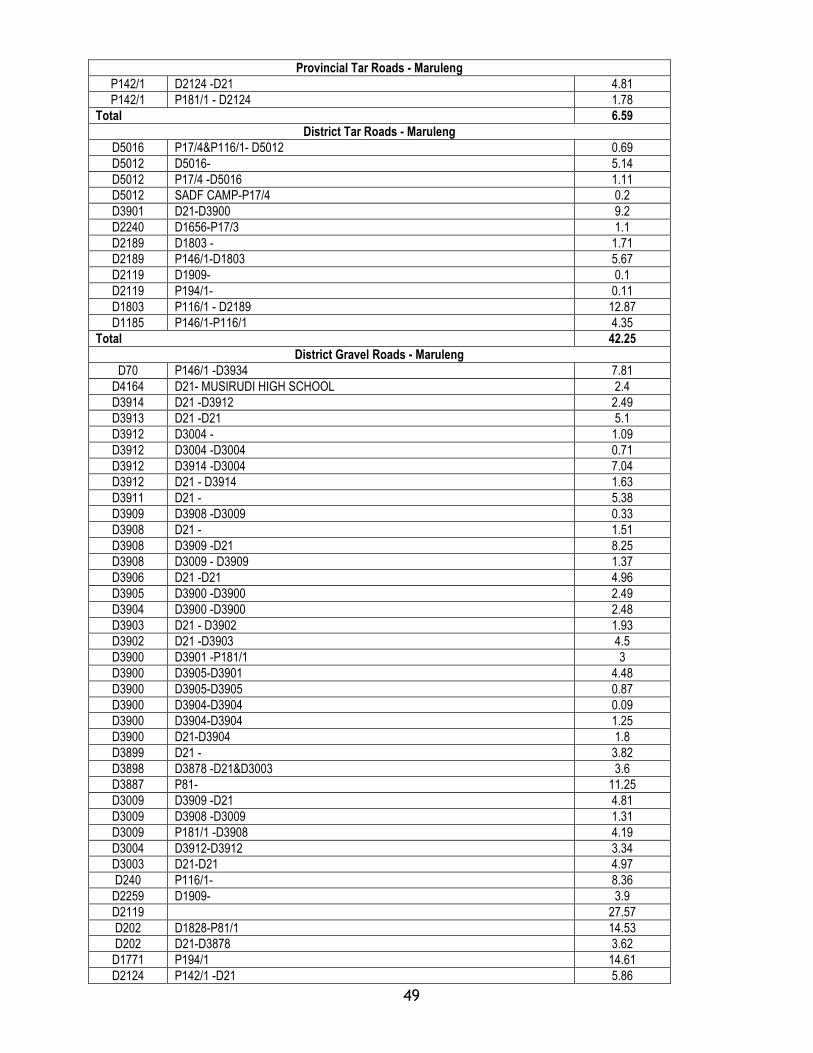
49
Provincial Tar Roads - Maruleng
P142/1 D2124 -D21 4.81
P142/1 P181/1 - D2124 1.78
Total 6.59
District Tar Roads - Maruleng
D5016 P17/4&P116/1- D5012 0.69
D5012 D5016- 5.14
D5012 P17/4 -D5016 1.11
D5012 SADF CAMP-P17/4 0.2
D3901 D21-D3900 9.2
D2240 D1656-P17/3 1.1
D2189 D1803 - 1.71
D2189 P146/1-D1803 5.67
D2119 D1909- 0.1
D2119 P194/1- 0.11
D1803 P116/1 - D2189 12.87
D1185 P146/1-P116/1 4.35
Total 42.25
District Gravel Roads - Maruleng
D70 P146/1 -D3934 7.81
D4164 D21- MUSIRUDI HIGH SCHOOL 2.4
D3914 D21 -D3912 2.49
D3913 D21 -D21 5.1
D3912 D3004 - 1.09
D3912 D3004 -D3004 0.71
D3912 D3914 -D3004 7.04
D3912 D21 - D3914 1.63
D3911 D21 - 5.38
D3909 D3908 -D3009 0.33
D3908 D21 - 1.51
D3908 D3909 -D21 8.25
D3908 D3009 - D3909 1.37
D3906 D21 -D21 4.96
D3905 D3900 -D3900 2.49
D3904 D3900 -D3900 2.48
D3903 D21 - D3902 1.93
D3902 D21 -D3903 4.5
D3900 D3901 -P181/1 3
D3900 D3905-D3901 4.48
D3900 D3905-D3905 0.87
D3900 D3904-D3904 0.09
D3900 D3904-D3904 1.25
D3900 D21-D3904 1.8
D3899 D21 - 3.82
D3898 D3878 -D21&D3003 3.6
D3887 P81- 11.25
D3009 D3909 -D21 4.81
D3009 D3908 -D3009 1.31
D3009 P181/1 -D3908 4.19
D3004 D3912-D3912 3.34
D3003 D21-D21 4.97
D240 P116/1- 8.36
D2259 D1909- 3.9
D2119 27.57
D202 D1828-P81/1 14.53
D202 D21-D3878 3.62
D1771 P194/1 14.61
D2124 P142/1 -D21 5.86

50
Total 188.7
These roads are surfaced (tarred) and continuously maintained. The other areas are serviced by re-graveled roads, gravel roads,
low volume surfacing and rural roads. Most of the gravel roads are not maintained regularly. In addition to that, some of the roads
in the district do not have route names and numbers. They also do not have appropriate road signs (e.g. speed limits) as well as
signs indicating distances between destinations. Another problematic issue on the district roads is that, in most areas, fencing
along the routes has been removed. This has resulted in wild and domestic animals wandering on the roads with detrimental effect
to motorists, and thus, negating our tourism attraction efforts as a region. Many road accidents in the district can be attributed to
animals roaming on the roads. It is interesting to note new roads fencing projects in the district.
The lowly serviced areas are mainly found in Greater Tzaneen Municipality and Greater Giyani Municipality. In Greater Tzaneen
Municipality, the affected areas are the Boyne/Sedan areas and also Julesburg. Another area of concern is the Nwamitwa area.
In Greater Giyani Municipality the affected areas are the Nkomo area and Matsotsosela areas. Compositely, the majority of rural
streets are not well serviced. This provides an opportunity for the application of labour intensive methods (EPWP) in the servicing
of rural streets. This would best apply if all municipalities and sector departments in the district quantify projects that do not need
much capital injection in their implementation and use labour intensive (EPWP) methods. This would require a conscious effort and
strategy to establish community partnerships that would ensure the beneficiaries physical involvement in government’s rendering
of public services.
2.6.7 Taxi Facilities
In the Mopani district, taxis form a high percentage of public transport. In the Greater Tzaneen area there are 24 taxi facilities, of
which only two that are in Tzaneen Town are formal and the rest are informal. Ba-Phalaborwa there is 11 taxi facilities, of which
one in Phalaborwa Town is formal. Greater Letaba they are 11, of which 4 are formal and they are in Modjadjiskloof, Ga-Kgapane,
Sekgosese and Mokwakwaila in Greater Giyani are 18. More than 85% of taxi facilities are informal without necessary facilities.
The state of taxi ranks in Mopani District is reflected below:
� 51.0 % are on-street facilities
� 85.2 % are informal
� 7.4 % have lighting
� 16.0 % are paved
� 9.9 % have public telephones
� 2.5 % have offices
� 14.8 % have shelters
� 14.8 have ablution blocks
(i) Greater Tzaneen Municipality
• Burgersdorp Minibus taxi rank
This Minibus taxi rank is situated in Burgersdorp on road reserve along the R36 Tzaneen Lydenburg Road. It is an informal Minibus taxi rank and has no facilities e.g. Shelter, Toilets, etc. It is operating from the site as a starting point and has several destination points, Julesburg via Ofcolaco, Nkowankowa and Tzaneen via Bridgeway on the R36, road to Tzaneen. The minibus taxi rank is busy during morning and off peak periods. The most utilized route by the taxis from this minibus taxi rank is the R36 TRL.

51
• Gabaza Minibus taxi rank
Gabaza Minibus taxi rank is situated in Gabaza opposite Burgersdorp Minibus taxi rank across the R36 tarred road. It is an informal minibus taxi rank on road reserve. It is operating from the site as a starting point to Letsitele via Mafarana. The minibus taxi rank is busy during morning and off peak periods). The most utilized route by taxis from this minibus taxi rank is the MGB TRL.
• Lenyenye Minibus taxi rank
Lenyenye Minibus taxi rank is situated in Lenyenye entrance opposite the garage. It is an informal minibus taxi rank and operating from the site as a starting point to destinations like Tzaneen, Phalaborwa and Metz. The minibus taxi rank is busy during morning and off peak periods. The most utilized route line is R36 TRL/P17 TRL. There is an informal car wash in the minibus taxi rank.
• Leolo Minibus taxi rank
Leolo Minibus taxi rank is situated in Leolo Settlement. It is an informal minibus taxi rank on road reserve sharing with buses. Is serving people from the village travelling from and to Lenyenye via Rakoma Lenyenye. The minibus taxi rank is busy during morning and off peak periods. There are no facilities.
• Lephephane Minibus taxi rank
It is an informal minibus taxi rank in Lephepane near the market place on the road reserve. Taxis from this minibus taxi rank are operating on LTR TRL and joins the R36 TRL to Tzaneen. There are no facilities.
• Letsitele Minibus taxi rank
Letsitele Minibus taxi rank is situated in Letsitele CBD area. It is a formal minibus taxi rank occupying an area of about 475m2. There are 7 platforms without shelters for loading purposes. There is an office and toilets that are provided and maintained by the Tzaneen Local Municipality. There is also an informal car wash some 150 m away at garage which is utilized by taxi drivers to wash their taxis. Taxis from and into the minibus taxi rank utilizes D8 TRL (see base map) to several destinations like Mulati, Mafarana, Ntsako, Bonn, Sedan, Gabaza and Burgersdorp. D1267 and P43 TRL are utilized for Giyani and Eiland line respectively. D5011 TRL is also utilized from Nkowankowa via Mariveni into and out of the minibus taxi rank. There are no seats at the minibus taxi rank for passengers. The minibus taxi rank is busy during off peak and the afternoon peak periods.
• Letaba Cross Minibus taxi rank
It is a very informal minibus taxi rank situated near the intersection between the roads D673 and R36 on the Lydenburg/Tzaneen road. It is aimed at helping people who resides near Bindzulani shopping centre, Dan and Lusaka settlements. It is busy early in the morning for people going to Tzaneen for work and slow during off peak period and almost no action during afternoon peak period. The most utilized route by taxis from this minibus taxi rank is the R36/P17 leading to Tzaneen. There are no facilities at this minibus taxi rank.
• Letaba Hospital (E) Minibus taxi rank
It is an informal minibus taxi rank opposite Letaba Special School and Letaba Hospital on road reserve D673. This minibus taxi rank is aimed at serving people from N’wamitwa to Letaba Hospital and vice versa. It is not a busy minibus taxi rank. The taxis from and into this rank utilizes the D673 TRL /D 1292 TRL (see base map) to N’wamitwa. There are no facilities.
• Letaba Hospital (W) Minibus taxi rank
It is an informal minibus taxi rank at the entrance of Letaba Hospital utilizing the public parking area meant for visitors to the hospital. The area is paved and has 30 demarcated parking bays. This minibus taxi rank is aimed at serving people coming from and into the hospital to Nkowankowa, Gabaza and Burgersdorp via Bridgeway. The most utilized route from this minibus taxi rank is road D673 and R36.

52
• Mafarana Minibus taxi rank
It is an informal minibus taxi rank at the entrance of Mafarana on road reserve at an intersection of roads D8 and MLB TRL/NBS TRL (see base map). There are no facilities at this minibus taxi rank. It is aimed at serving people from Mafarana to several destinations like Mulati, Bonn, Sedan and Letsitele. The taxis from this minibus taxi rank utilizes mostly road D8 to Letsitele CBD area.
• N’wamitwa Minibus taxi rank
This minibus taxi rank is situated in N’wamitwa near the N’wamitwa Head Kraal. It is an informal minibus taxi rank on the road reserve from N’wamitwa to Mandlakazi. There are no facilities except the pit-latrines which belong to the minibus taxi rank. It is aimed at serving people from N’wamitwa to Mokgwathi via Shihoko, Thapane and Tzaneen. The most utilized route by taxis from this rank is the D3247/D1292/P43 to Tzaneen.
• Madumane Minibus taxi rank
Madumane is an informal minibus taxi rank situated in Madumane on the road splitting to Morapalala, Mohokgo Block 6 and Pakong. There are no facilities at all. It is aimed at serving people from the area to Tzaneen via Mutupa/Relela areas. The most utilized route from this minibus taxi rank is the D1350 leading to Tzaneen. The minibus taxi rank is busy during morning peak and off peak period.
• Moime Minibus taxi rank
It is an informal minibus taxi rank at the South entrance of Moime Village. It is an on street minibus taxi rank and without facilities. Is aimed at taking people from Moime via Bridgeway to town on the road R36/P17.The minibus taxi rank is busy during morning and off peak periods.
• Mokgwathi Minibus taxi rank
Mokgwathi is another type of informal minibus taxi rank at Mokgwathi at the T-Junction of the road from Merekome and D319. There are no facilities. It is aimed at taking people from the village travelling to town via Merekome to Tzaneen and people travelling to N’wamitwa via Shihoko, Hlohlokwe via Mawa.
• Motupa/Relela Minibus taxi rank
Motupa/Relela minibus taxi rank is an informal minibus taxi rank on the road reserve at Mutupa Village. There are no facilities. It is aimed at people from the area to Tzaneen and vice-versa. It is very busy during the morning and the off-peak periods. Taxis from this minibus taxi rank utilize the road D1350 to Tzaneen and back.
• Nkambako Minibus taxi rank
Nkambako minibus taxi rank is situated at Nkambako Risaba junction on the road reserve. It is an informal minibus taxi rank and there are no facilities. Taxis from this minibus taxi rank are destining to Mamitwa, Letsitele, Tzaneen and Giyani. The most utilized route from the minibus taxi rank is the D1267 to Giyani, Letsitele and Tzaneen via Tarentaal.
• Nkowankowa Minibus taxi rank
This minibus taxi rank is situated at the Nkowankowa business area called High Point. It is an on street informal type of minibus taxi rank. It is a busy minibus taxi rank with several destinations, namely; Tzaneen, Phalaborwa, Burgersdorp, Mamitwa, Letsitele, Petanenge, Letaba Hospital and Giyani. There are no facilities. The taxis are sharing the loading area with buses. The most utilized route from this minibus taxi rank is the R36/P17 to Tzaneen and D5011 to Letsitele. The minibus taxi rank is very busy during morning peak period for Tzaneen destination for people going to work. It can also be said that it is more to transfer station than an ordinary minibus taxi rank. There are no facilities.

53
• Nwamahori Minibus taxi rank
Nwamahori is an informal minibus taxi rank situated in Khujwana. It is an on street type of minibus taxi rank but has got a big area which is going to be used for the minibus taxi rank in future next to the road near the Peace Makers Football Club Soccer Field. It is targeted for people mainly from Khujwana travelling to Tzaneen on R36/P17 road. There are no facilities.
• Petanenge Minibus taxi rank
Petanenge minibus taxi rank is an informal minibus taxi rank on the entrance of Petanenge coming from Nkowankowa side under the marula tree. It is not busy minibus taxi rank. It is aimed at people from the village travelling to Nkowankowa and to Tzaneen via Mhlava and Sasekani on R36 road.
• Rita 1 Minibus taxi rank
It is an informal minibus taxi rank on road reserve on the turn off to C.N. Phatudi road from R36 road. It is a very busy minibus taxi rank especially during morning peak hours. The minibus taxi rank stops operating from area at 15h00 as all the taxis rush to Sanlam Centre minibus taxi rank in Tzaneen to take people from town to the homes. There are no facilities at all. At night some of the taxi uses the garage opposite the minibus taxi rank as a holding area. The most utilized road from this minibus taxi rank is the R36 to Tzaneen.
• Rita 2 Minibus taxi rank
It is an informal minibus taxi rank at a turn off to Letsitele via Lefaro/Zangoma from the R36 road. It is an on street type of minibus taxi rank aimed at people travelling to Letsitele via Lefara and Zangoma on road D3766. It is not a busy minibus taxi rank. There are no facilities at all.
• Thapane Minibus taxi rank
It is an informal minibus taxi rank on the road reserve. There are no facilities at this minibus taxi rank. It is aimed at people travelling from the village and Muruji area travelling to Tzaneen using the Deerpark road on D978. The minibus taxi rank is busy during morning peak and off peak period. The most utilized route from the minibus taxi rank is the D978 to Tzaneen.
• Tzaneen Sanlam Centre Minibus taxi rank
It is a formal minibus taxi rank situated next to Sanlam Centre shopping area occupying an area of about 3934 m2. There are 11 loading platforms with shelters but not enough when the minibus taxi rank is too busy. There are some few seats under the shelters. There are some toilets inside the shopping centre for public use. The minibus taxi rank is very busy starting from the off peak period until afternoon peak period which is the busiest. There are several destinations for taxis from this minibus taxi rank utilizing the P17/R36 route line as the most utilized route. The destinations include Nkowankowa, Dan, Lusaka, Mokgolobotho, Khujwana, Lephephane, Lenyenye, Tickeyline, etc.
• Tzaneen Pick ‘n Pay Minibus taxi rank
It is a formal minibus taxi rank situated next to Pick ‘n Pay shopping mall occupying an area of about 4763 m2. There are two separate loading areas in the minibus taxi rank. The one loading area is for local destine and the other one being for far distance like Boyne, Polokwane, Johannesburg, Giyani, Pretoria, etc. There are 14 loading platforms combined in the minibus taxi rank .The local one has several destinations like Modjadjiskloof, Kgapane, Motupa/Relela, N’wamitwa, Acornhoek, etc. This part of the minibus taxi rank is very busy during the off peak period and the afternoon peak period. The most utilized route by taxis from this part is the D978 via Deerpark followed by P43/3 via D1292 to N’wamitwa.
The far destine part of the minibus taxi rank is busy from morning peak until 16h00 as a transfer station. The most utilized route from this part of the minibus taxi rank is the D528 and P17 roads via George’s Valley and Makgoebaskloof to Polokwane respectively.

54
(ii) Ba-Phalaborwa Municipality
• Akanani Minibus taxi rank
Akanani Minibus taxi rank is situated in Lukelani next to Akanani shopping centre. It is an informal minibus taxi rank. The taxis from this rank have several destinations like Acornhoek, Namakgale, Johannesburg, Giyani, Makhutswe, Tzaneen and N’wamitwa. The minibus taxi rank is busy during morning peak hours and off peak hours. During morning peak hours most taxis do not queue at the minibus taxi rank. The most utilized route from this minibus taxi rank is the D762 to Bushbuckridge followed by P112 to Namakgale.
• Lukelani Entrance Minibus taxi rank
Lukelani Entrance minibus taxi rank is an informal minibus taxi rank on entrance of Lukelani from Phalaborwa/Namakgale area. Taxis from this minibus taxi rank are destining to Phalaborwa only. This minibus taxi rank is busy during off peak period taking people to Phalaborwa for shopping. There are no facilities except one concrete shelter structure. The only utilized route to town is the P112 road.
• Majeje Minibus taxi rank
Majeje is an informal minibus taxi rank on road reserve near the soccer field in the Majeje area. Taxis from this minibus taxi rank are destining to Phalaborwa. It is said that the use of the road is temporarily and the minibus taxi rank will be moved to a new place in the future. There are no facilities at all. This minibus taxi rank is little busy during morning peak period. The most utilized route from this minibus taxi rank is the P112 to Phalaborwa.
• Makhushana Minibus taxi rank
Makhushana is an informal minibus taxi rank in Makhushana area. The minibus taxi rank has only one destination being Phalaborwa town. There are no facilities at this minibus taxi rank. The minibus taxi rank only operates during morning peak and off peak periods. The most utilized route from this minibus taxi rank is the D390, D2105 and D86 to Phalaborwa.
• Maseke Minibus taxi rank
It is an informal minibus taxi rank situated at the entrance of Maseke on the road D3786 sharing the loading area with the buses. There are no facilities. The minibus taxi rank has one destine being Phalaborwa. The most utilized routes by the taxis are the D3786, D762, D2105 and D86 to Phalaborwa. It is busy during morning and off peak periods.
• Mashishimale Minibus taxi rank
Mashishimale is an informal minibus taxi rank situated at Mashishimale on the road reserve. There are no facilities at the minibus taxi rank. It has one destination being Phalaborwa on the road MMN TRL (see base map) joining P112/1 tarred road to town. The minibus taxi rank is busy during morning and off peak periods.
• Mica/Acornhoek Minibus taxi rank
Mica/Acornhoek minibus taxi rank is situated on the road reserve next to the T-junction for the roads D3790 and D762. It is an informal minibus taxi rank and serves three destination points namely; Bushbuckridge, De Oaks and Makhutswe. The minibus taxi rank is busy during the morning and off peak periods. The most utilized route from this minibus taxi rank is the D762.
• Mondzweni Minibus taxi rank
It is an informal type of minibus taxi rank presently using the road reserve but there is a stand next to the existing area which is going to be used in future. It has several destination points like, Makhutswi, Tzaneen, Nkowankowa and Giyani. This minibus taxi rank is only busy during off peak hours. There are no facilities at this minibus taxi rank.

55
• Namakgale Entrance Minibus taxi rank
Namakgale Entrance is an informal minibus taxi rank at the entrance of Namakgale on P112/1 Tzaneen/Gravelotte road. This minibus taxi rank is busy during morning and off peak periods. Taxis from this rank are destine to Lukelani and Phalaborwa on the P112/1 tarred road. There are some facilities in the form of toilets and shelters provided and maintained by the Municipality.
• Phalaborwa Minibus taxi rank
Phalaborwa is a formal minibus taxi rank situated in Phalaborwa town. It has four loading platforms with shelters but not enough. The minibus taxi rank serves six destination points, namely Namakgale, Lukelani Mashishimale, Makhushane, Maseke and Majeje. There is public toilet near the minibus taxi rank provided and maintained by the Municipality. The minibus taxi rank is busy during off peak and the afternoon peak period. The most utilized route from the minibus taxi rank is the P112.
• Tzaneen Minibus taxi rank
Tzaneen minibus taxi rank is an informal minibus taxi rank next to Namakgale entrance minibus taxi rank. There are no facilities at all. It serves five destination points namely; Johannesburg, Giyani, Makhutswi, Tzaneen and Selwana. The minibus taxi rank is busy from the morning peak until early hours of the afternoon peak. The most utilized route from this minibus taxi rank is the P112 road.
(iii) Greater Letaba Municipality
• Modjadjiskloof Minibus taxi rank
This is a formal minibus taxi rank, which is on street on a road reserve at Modjadjiskloof shopping complex. The rank has the main following facilities: shelter, loading bays, office and ablution blocks. The condition of ablution blocks is not satisfactory. This is the biggest minibus taxi rank in Greater Letaba area and has the following main destination points: Phaphadi, Maphalle minibus taxi rank, Skhimmini minibus taxi rank, Mooketsi minibus taxi rank, Louis Trichardt, via Morebeng, Tzaneen Pick n Pay minibus taxi rank, Ga – Kgapane minibus taxi rank, Sekgopo minibus taxi rank, Giyani score complex, Rotterdam, Sekgosese minibus taxi rank, Polokwane pick n Pay minibus taxi rank, Sapekoe Middlekop minibus taxi rank. The rank is busy throughout the day. The most utilized route is Tzaneen route.
• Ga – Kgapane Minibus taxi rank
This is a formal minibus taxi rank, which is off street at Ga-Kgapane Township. The rank has the following facilities: shelter, loading bays, ablution blocks which are still under construction. The rank has the following main destination points: Mokwakwaila, Tzaneen Pick n Pay minibus taxi rank, Polokwane Pick Pay minibus taxi rank via Mooketsi minibus taxi rank, Ga-Kgapane minibus taxi rank and Modjadjiskloof minibus taxi rank, Johannesburg, Sehlakong, Medingen. The rank is busy throughout the day but on average becomes busiest during morning and afternoon peak periods. The most utilized route is Tzaneen route.
• Mooketsi Minibus taxi rank
Mooketsi is an informal minibus taxi rank, which is off street at Mooketsi complex. The rank is at two main roads: Giyani – Mooketsi road and Modjadjiskloof - Polokwane road. The rank does not have any facilities and it serves the following destination points: Modjadjiskloof, Phaphadi minibus taxi rank and Sekgopo. The rank is busy during morning peak period. The most utilized route is Modjadjiskloof route.
• Sekgopo Minibus taxi rank
Sekgopo is an informal minibus taxi rank, which is on street at Ga- Sekgopo village on Modjadjiskloof – Polokwane road. The rank does not have any facilities and it serves the following destination points: Ga-Kgapane via Mooketsi Modjadjiskloof and has several pick – up points. The rank is usually busy during the morning peak period. The most utilized route is Modjadjiskloof route.
• Sekgosese Minibus taxi rank
This is a formal minibus taxi rank, which is on street at Sekgosese village. The rank has facilities but are not sufficient and not in good condition. The rank has three main destination points: Modjadjiskloof, Makhado and Polokwane. The rank is usually busy during morning & afternoon peak periods.

56
• Mokwakwaila Minibus taxi rank
Mokwakwaila is an off – street formal minibus taxi rank at Mokwakwaila village. The rank has facilities such as shelter, loading bays and public phones and has the following main destination points: Ga – Kgapane, Skhimmini (Shayamoriri via Skhimmini) Lebaka Cross, Ramotshinyadi and Abel. The rank is busy only during morning peak period. The most utilized Mokwakwaila route.
• Skhimmini Minibus taxi rank
Skhimini is an informal minibus taxi rank. It is an on-street rank at Skhimini village. The rank does not have any facilities and it serves four main destination points: Giyani, Mokwakwaila, Ga-Kgapane and Phaphadi. The rank is usually busy during the morning peak period. The busiest route is Mokwakwaila route.
• Maphalle Minibus taxi rank
Maphalle is an informal minibus taxi rank on the Giyani - Mooketsi road. The rank is situated at Maphalle village. It is an on-street rank on the road reserve. The rank does not have any facilities. It serves the following destinations Modjadjiskloof via Mooketsi. The rank is usually busy during the morning peak period. The busiest route is Modjadjiskloof route.
• Lebaka Minibus taxi rank
Lebaka an informal minibus taxi rank on the Giyani - Mooketsi road. The rank is situated at the cross road of Giyani- Mooketsi and Lebaka. It is an on-street rank on the road reserve. The rank does not have any facilities. It serves two main destination points which are Mokwakwaila and Mooketsi, also as pick up point to Giyani, Modjadjiskloof and Ga- Kgapane. The rank is usually busy during the morning peak period. The busiest route is Giyani route.
• Blinkwater Minibus taxi rank
Blinkwater Taxi is an informal minibus taxi rank on the T-junction of Maphalle road joining Giyani- Rotterdam. The rank is situated at Blinkwater village. It is an on-street rank on the road reserve. The rank does not have any facilities. It serves three main destination points, which are: Giyani, Modjadjiskloof via Maphalle and Tiyani/Magoro via Rotterdam village. The rank is usually busy during the morning peak period.
• Phaphadi Minibus taxi rank
Phaphadi Minibus taxi rank is an informal minibus taxi rank on the at Mamaila village. The rank does not have any facilities and serves three main destination points, which are Giyani Modjadjiskloof and Mooketsi. The rank is usually busy during the morning peak period transporting people to work and shopping.
(v) Greater Giyani Municipality
• Giyani Shoprite Complex Minibus taxi rank
This is a formal minibus taxi rank, which is off-street, along Malamulele to Mooketsi road. It is situated at Giyani Shoprite complex shopping centre. The rank has the following facilities: shelter, loading bays, public toilets provided and maintained by the private company. The rank serves the following destination points: Malamulele, Bungeni and Nkowankowa. The minibus taxi rank is busy during morning peak and afternoon peak periods when most people are to and from work. The most utilized route from the minibus taxi rank is Malamulele.
• Giyani Spar Complex Minibus taxi rank
This is a formal minibus taxi rank, which is off-street, along Malamulele to Mooketsi road. It is situated at Giyani Shoprite complex shopping centre. The rank has the following facilities: shelter, loading bays and office. The rank serves the following destination points: Nkowankowa, Phalaborwa, Tzaneen, Acornhoek and Polokwane. The minibus taxi rank is usually busy during morning peak period. The most utilized route from the minibus taxi rank is Nkowankowa.

57
• Giyani Score Minibus taxi rank
Giyani Score complex minibus taxi rank is a formal rank within Giyani shopping complex it is off-street from Giyani main road turning left at Nkhensani hospital. It is the biggest and the busiest minibus taxi rank within Greater Giyani municipality. The rank has facilities such shelter, loading bays, office and ablution blocks which are provided and maintained by the municipality. The rank is also shared by the local and long distance buses. The rank facilities are old and in a poor condition. The rank has the following destination points: Modjadjiskloof, Johannesburg, Gandlanani, Nkuri, Malamulele, Rotterdam, Ngove, Skhimini, Bungeni, Babagnu, Dzumeri, Gawula, Mapayeni, Mdavula, Shawela, Mtititi, Vuhehli and Giyani Township section A, D1, D2, A Extension, E, F.
• Giyani Metro Complex
The rank is formal and Off-Street at Giyani shopping complex next to Metro wholesalers. It is privately owned minibus taxi rank and it is not yet operational. The rank has basic facilities such as shelter; loading bays, water taps and ablution blocks.
• Babangu Minibus taxi rank
Babangu is an informal minibus taxi rank on the Giyani - Elim road. The rank is situated at Babangu village at the intersection of the road from Blinkwater minibus taxi rank via Ndengenza village. It is an on-street rank on the road reserve. The rank does not have any facilities and it serves one main destination point, which is Giyani and also acts as a pick- up point for taxis from Elim and Blinkwater Minibus taxi ranks. The rank is usually busy during the morning peak period.
• Gandlanani Minibus taxi rank
Gandlanani Minibus taxi rank is an informal minibus taxi rank on the Giyani - Mooketsi road at the junction to Gandlanani and Mashavele villages. It is an on-street rank on the road reserve. The rank does not have any facilities and serves one destination point, which is Giyani and has several pick-up points such as Mashavele, Basani through to Dzingidzingi then to Giyani. The rank is usually busy during the morning peak period transporting people to work and shopping.
• Dzumeri Minibus taxi rank
The Minibus taxi rank is an informal rank on the at Giyani-Tzaneen road. It is an on-street rank on the road reserve. The rank is situated at Dzumeri village. The rank does not have any facilities and serves the following destination points which are: Giyani, Xitlakati , Khaxani, Tzaneen Pick n Pay, Mokgwathi and Letsitele minibus taxi ranks. The rank is usually busy during the morning peak period transporting people to work and shopping. The busiest route is Giyani route.
• Nkomo Minibus taxi rank
It is an informal minibus taxi rank, which is on-street along the Giyani-Phalaborwa road. The rank is situated at Nkomo 22A village. The rank does not have facilities and has the main destination is Giyani minibus taxi rank. The rank is usually busy during morning period.
• Shawela Minibus taxi rank
It is an informal minibus taxi rank, which is on-street along the Giyani-Phalaborwa road. The rank is situated at Shawela village. The rank does not have facilities and has the main destination points is Giyani minibus taxi rank and has several pick –up points. The rank is usually busy during morning period.
• Ngove Minibus taxi rank
It is an informal minibus taxi rank, which is on-street along the Giyani-Phalaborwa road. The rank is situated at Ngove village. The rank does not have facilities and has the main destination points is Giyani minibus taxi rank and has several pick –up points. The rank is usually busy during morning period.
• Thomo Minibus taxi rank
It is an informal minibus taxi rank, which is on-street along the Giyani-Muyexe road. The rank is situated at Thomo village. The rank does not have facilities and has the main destination points is Giyani minibus taxi rank. The rank is usually busy during morning period.

58
• Makosha Minibus taxi rank
It is an informal minibus taxi rank which is on-street. It is situated at Makosha village. The rank does not have facilities and has the main destination points is Giyani minibus taxi rank. The rank is usually busy during morning period.
• Homu 14A Minibus taxi rank
The rank is informal and is situated at Homu 14A village. The rank is off-street and it has no facilities. The main destination point is Giyani Score Complex minibus taxi rank via Giyani section A and has several pick – up points. The rank has turn-around points at Vuhehli village via Mapayeni minibus taxi rank and proceeds to Giyani. It is busy during morning peak period.
• Mapayeni Minibus taxi rank
The rank is informal and is situated at Mapayeni village. It is off-street and has no facilities. The main destination point is Giyani Score Complex minibus taxi rank via Giyani section A and has several pick – up points. The routes emanating from this rank have turn-around points at Vuhehli village via Homu 14A minibus taxi rank and proceed to Giyani. It is busy during morning peak period.
Additional informal minibus taxi ranks emerge due to new settlements or economic developments in the areas. They include:
• Malonga Minibus taxi rank
• Homu 14C Minibus taxi rank
• N’wadzacu –Dzuke Minibus taxi rank
• Vuhehli Minibus taxi rank
• Maswanganyi Minibus taxi rank
• Zava Minibus taxi rank
• Tomu Minibus taxi rank
• Matsostosela Minibus taxi rank
• Makhuva Minibus taxi rank
• Jim – Ngalalume Minibus taxi rank
• Mshiyani Minibus taxi rank
(v) Maruleng Municipality
Maruleng Municipality has a total of three formal minibus taxi ranks and a number of informal ones.
• Metz Minibus taxi rank
The rank is formal and is situated at Metz village. It has the following facilities: shelter, loading bays, ablution blocs which needs water, no seating facilities, paved and has dustbins. Telephone facilities are at the nearby shop. The rank covers the following main destinations Tzaneen, Phalaborwa and Johannesburg.
• De Oaks Minibus taxi rank
The rank is situated at De Oaks. It has the following facilities: paved surface, shelter, information boards, ablution block, telephone facilities, no dust bins and seating facilities. The rank covers the following destinations: Tzaneen, Phalaborwa, Hoedspruit and Johannesburg
• Sekororo Minibus taxi rank
This is a formal rank situated at GaSekororo. It has the following facilities: information boards, shelter, loading bays, lights, ablution blocs which needs proper maintenance, no seating facilities, paved and has dustbins.The rank covers the following destinations:
Tzaneen, Phalaborwa, Hoedspruit and Johannesburg. Adjacent to this rank is another informal one under the trees.

59
• Hoedspruit
Hoedspruit has two informal minibus taxi ranks without any shelter. The routes are Phalaborwa, De Oaks and Acornhoek.The facility surveys conducted indicate that the Mopani District Municipality has a total of 64 minibus taxi facilities. Table 3.8 shows the number of minibus taxi ranks situated in the different local municipality areas, the number of formal ranks and the number of informal minibus taxi facilities per municipal area in relation to the total number of ranks in the Mopani District Municipality.
The major public transport facilities are as follows:
2.6.8 Major Transport Facilities in the Mopani District
Table 29: Transport facilities
Facility Name Facility Status Ownership
Tzaneen Pick ‘n Pay Minibus taxi rank Formal Private
Tzaneen Sanlam Centre Minibus taxi rank Formal Private
Phalaborwa Minibus taxi rank Formal Municipality
Modjadjiskloof Minibus taxi rank Formal Municipality
Giyani Shoprite Minibus taxi rank Formal Private
Giyani Spar Minibus taxi rank Formal Private
Giyani Score Minibus taxi rank Formal Municipality
Rita Minibus taxi rank Informal Taxi Association
Hoedspruit Minibus taxi rank Formal Municipality
Die Oaks Minibus taxi rank Formal Municipality
Metz Minibus taxi rank Formal Municipality
Taxi Associations
Taxi Associations in Mopani are as follows:
� Phalaborwa Taxi Association
� Lulekani Taxi Association
� Hlaneki – Maswanganyi Taxi Association
� Rotterdam Taxi Association
� Giyani Town Taxi Association

60
� Nsami Taxi Association
� Bakgakga Taxi Association
� Nkowankowa Taxi Association
� Twananani 20 & 21
� Mooketsi Taxi Association
� Homu Taxi Association
� N’wamitwa Taxi Association
� Letaba Taxi Association
� De Oaks Taxi Association
� Bolobedu Taxi Association
� Giyani Taxi Association
� Molototsi Taxi Association
� Pusela Taxi Association
� Simajiku Taxi Association
� Tiyimeleni Taxi Association
� Tzaneen – Acornhoek Taxi Association
Many of the facilities in the Mopani District Municipality are informal facilities, implying that it is virtually impossible to determine the
rank utilization.
Taxis are not enough to ferry passengers to their respective places. The South African Transport system is inadequate to meet the
basic accessibility needs (to work, health care, schools, shops), and many developing rural and urban areas. In order to meet the
basic accessibility needs, the transport services offered must be affordable to the user. This demand a flexible transport system
and transport planning process that can respond to customer requirements and requires infrastructure to be tailored to the needs
of the transport operators and customers.
2.6.10 Mopani District Taxi Council
The roles of the Mopani District Taxi Council are as follows:
� It plays a co-ordinating role within the taxi associations,
� Assist in the maintenance of legitimacy of membership to its broader membership per association,
� Assist in dispute resolution between associations, and
� Provides readily available information which will assist in passenger transportation
2.6.11 Powers and functions
In terms of the National Land Transport Transition Act, 22 of 2000, the District is a planning authority and the regulation of public
transport is the responsibility of the Department of Roads and Transport in the particular district.
2.6.12 Bus Terminus
The bus facilities in the Mopani District are limited to Tzaneen, Modjadjiskloof, Giyani and Phalaborwa. Most of these bus terminals
are without adequate facilities (shelters, toilets, ticket sales points etc). It is clear that the public transport demand in the district
cannot be met by the provision of services by the current bus operators due to the vastness of the area and the condition of,
particularly, gravel roads in the district.

61
2.6.13 Rail Facilities
There is minimal usage of railway operations as mode of public transport. Rail is used mainly as goods carriers and is mainly
found in the Greater Tzaneen, Greater Letaba and Ba-Phalaborwa areas. There is a link from Groenhout to Mooketsi, running to
Modjadjiskloof, Tzaneen, Letsitele, Gravelotte through to Maputo. The dominating mode of public transport in Mopani District is the
usage of taxi and bus operations.
2.6.14 Public Transport By-Laws
All Local municipalities of Mopani have not yet developed By-laws as required by legislation.
2.6.15 Telecommunications
Telecommunication is an information infrastructure that plays a crucial role in the development of society. The telecommunication
sector is an indispensable backbone for the development of other socio-economic sectors. Thus, an effective telecommunication
infrastructure, that includes universal access, is essential to enable the delivery of basic services and the reconstruction and
development of deprived areas.
The district is fairly well provided with a public telephone system with more than 53% of all households having access to a public
telephone at a nearly location. As much as 21.6% of households in the area have access to a cell phone but the proportion of
households with an in-house telephone within their dwelling is limited to just over 6%. Generally, the availability of
telecommunication infrastructure is very similar across the various local municipalities. The proportion of households with
telephones in their dwelling in the Ba-Phalaborwa municipality are, however, higher than in the other four municipalities. With
respect to cell phones operation, there are three service providers (MTN, Vodacom and Cell C) whose network covers a sizeable
area in the district. There are, however, some areas where there is no network coverage.
2.7 Environmental Analysis
2.7.1. Background
The Mopani District Municipal area is faced with environmental risks and trends that lead to environmental degradation. The
environmental analysis is a key aspect to determine if there is a balance between environmental considerations, social
development and economic growth in the district. The challenge is, therefore, to regulate development in such a manner that the
disturbance of eco-system is avoided, or where this is not possible, the disturbance be minimized and remedied. Mopani has not
yet commissioned a study for detailed environmental analysis to indicate the environmental conservation requirements,
environmental sensitivity index, population pressure on scenic resources, land cover, soil types, irrigation potential, dry land
potential and rainfall. However, the Spatial Development Framework and the Waste Management Plan of the district provides
glaring information about the state of the environment, upon which our rural district depends. Hereunder is a synopsis of the
environmental situation in the district highlighting existing environmental concerns and risks.
2.7.1.1. Air Pollution
Pollution of the air is a major environmental problem affecting most areas in the Mopani District. Vehicles, mines and industries, as
well as burnings on the refuse dumping sites and onsite incineration by households pollute the air by releasing harmful gasses,
especially in urban areas. In the villages, air pollution is caused by the burning of wood and coal to make fire releasing carbon
dioxide. Another source of air pollution is leakage of sewage and companies burning their waste, causing bad odour.

62
2.7.1.2. Water Pollution
Water pollution in the district affects most people as many of them stay in the rural areas and depend on river water. The major
cause of water pollution is the sewage leakage and release of industrial waste into streams as well as illegal solid waste dumping
along the river system. People washing their clothes in rivers using detergents also cause water pollution. The usage of herbicides
and pesticides by farmers results in these chemicals finding their way into rivers and, thus, increase the growth of algae and
reduces oxygen levels in water. This negatively affects natural plants and marine/aquatic life and the wellbeing of domestic and
wild animals. The lack of water-borne sewerage systems leads to the contamination of ground water. The most noted water
pollution takes place in the Murhogolo stream between Giyani shopping complex and government offices, the Thabina river from
Mogoboya downstream, at the Klein and Greater Letaba rivers as well as Molotodzi which is highly chocked with solid waste.
Further information is needed to determine other problem areas.
2.7.1.3. Deforestation
Deforestation is one of the identified major environmental problems affecting most areas in the district. This is a problem affecting
almost every forest or veld in the District. This problem is caused by irresponsible traditional healers, wood carvers, firewood
collectors, farmers and villagers residing around forest areas. This can be attributed to poverty, lack of knowledge, unemployment,
unclear land policy, lack of law enforcement, traditional practices and economic gains.
2.7.1.4. Veld Fires
The Mopani area often experiences uncontrolled veld fires during winter early summer. These fires have a negative environmental
and economic impact. The veld fires are also a threat to human and animal life. The major cause of this problem is poaching,
firewood collection, uncontrolled burning for green bite, lack of knowledge about veld fire destruction, lightning and negligence, and
lack of fire belts in some instances.
2.7.1.5. Soil Erosion
Soil erosion has a negative effect on the environment as it affects the larger part of the Mopani area. This affects people residing
around eroded areas, by worsening floods and decreasing agricultural production. The major causes of this condition are
deforestation, overgrazing and poor land use management.
2.7.1.6. Chemical Spills And Hazardous Accidents
There are numerous areas in the district that are subject to chemical spills and hazardous accidents that have a detrimental impact
on the lives of people, and the environment. This occurs mainly near industries and along major routes, polluting the air and
ground.
2.7.1.7. Overgrazing
Overgrazing on agricultural land around villages in the district is a common phenomenon. The major cause of this condition is
overstocking by farmers as well as drought and floods.

63
2.7.1.8. Informal Settlements
Informal settlements have major negative effect to the environment in that through its practice the vegetation is destroyed when
buildings are built, and increases the chances of land and water polution. It affects the whole of Mopani District. The major cases of
informal settlements are poverty, unemployment, population growth and urbanization. It is clear from the above that Mopani District
Municipality is faced with many environmental problems. To be successful, development efforts should be cautious not to
exacerbate but reduce environmental degradation in the district. There is also a need to establish integrated human settlements
with proper basic services and thriving local economies that are able to create jobs.
2.7.2 Waste Management
Refuse Removal
Most people in Mopani reside in rural areas where municipalities do not remove waste. Residents in these areas dispose refuse on
their own, often in an uncontrolled way. This practice has adverse consequences for their health. Unlike the rural areas, refuse
removal services in the urban areas are provided by the local municipalities.
The percentage of households whose refuse is removed weekly by the municipality increased from 13.4% in 1996 to 15.2% in
2001. While this figure is very low it should be considered that more than 70% of the population of Mopani District reside in rural
areas, where the municipalities have thus far not delivered such services. It is therefore not surprising that 59.7% of the
households in Mopani district utilized their own dump in 1996, this increased to 61.5% in 2001.
Waste Disposal
All municipalities, except Greater Letaba in the district have their own waste disposal sites and all the sites within the respective
local municipalities are not authorized for operation by DWAF. However, Greater Tzaneen and Ba-Phalaborwa applied for
authorization (permits) and Tzaneen disposal site has been approved by DWAF. In addition to the available disposal sites in the
district, there are numerous illegal dumping sites that are utilized by the community and industries. Most of these illegal dumping
sites are not protected and children and animals easily access them, posing a serious health risk. This is a reflection of poor waste
management practices by municipalities.
Poorly managed waste disposal sites also have adverse impact on the water resources as they cause contamination/pollution of
surface and ground water. It is the responsibility of the Mopani District Council to ensure that there are appropriate and authorized
waste disposal sites in the district. The local municipalities have a responsibility to deal with waste removal in their areas of
jurisdiction.
Ba–Phalaborwa
Despite the fact that Ba-Phalaborwa Municipality won the national cleanest town award for keeping Phalaborwa Town clean, it has
its own waste management challenges as follows:
� Existence of mines which to some extent they contribute to both atmospheric, land and water pollution;
� The current land fill site is full, and needs closure and rehabilitation;
� Problem of delay in the outcome of the Land Claim to the new identified landfill site;
� Dumping site at Namakgale is a health hazards and also needs closure and rehabilitation;

64
� Two identified Wetlands, at Majeje and Mashishimale villages are disturbed by human activities which threatens the
Biodiversity of these important natural resources;
� Three informal settlements with approximately 1143 households without access to basic services like waste
removal, sanitation, water and electricity also contribute to environmental pollution,
� Problem of deforestation which result in most areas being exposed to soil erosion, and
� Lack of waste removal services at rural communities also poses a challenge as these areas are heavily polluted due
to litter and uncontrolled dumps.
Greater Letaba
The waste management problems in the Greater Letaba Municipality revolve around the following:
� There is no general waste landfill site, hence they transport their waste to Greater Tzaneen municipality and this is a
costing service delivery option for the municipality,
� Although a new site has been identified between Modjadjiskloof and Mooketsi, the necessary agreement is yet to be
finalized;
� The garden refuse site which is located at a stream bank causes serious water pollution; There is no proper control
over the site, hence both general waste and waste from motor garages is found dumped in the site, causing more
problems;
� There is one informal settlement with 2792 dwellings that do not have access to basic services like waste removal
services and proper sanitation facilities, these as well threatens the environment, and
� There is one identified wetland at Jamela, which is partially destructed by human activities, which disturbs
biodiversity.
Greater Giyani
The Giyani town is the most polluted in the district, with a lot of shacks and open fires. This is caused by the following factors:
� Uncontrolled and unlicensed street traders;
� There is no proper refuse disposal site and the newly identified landfill site is under land claim;
� There is one wetland at Siyandhani village, which is destructed by pollution, overgrazing and alien invader plants;
� There are three informal settlements with 1134 dwellings that are without access to basic services like water,
sanitation and waste removal, and this has an impact on the environment;
� Deforestation is also a problem.
Greater Tzaneen
Greater Tzaneen is on course with managing waste in its area of jurisdiction, hence it has properly licensed landfill site. The
municipality has contracted out the waste removal services to a private company. The only shortcoming with this municipality, like
other municipalities, is that it does not service rural communities within its area. There is also a problem of street traders who also
contribute to the problem of pollution. There are two informal settlements with 2 493 dwellings who need basic services as well.

65
Maruleng
The municipality provides waste collection services in three urbanised areas: Hoedspruit, Kampersrus and Drakensig for a total of
660 households. This account for collection from about 3% of households and in both commercial and residential areas collection
takes place once a week. There is no refuse removal provided in 29 villages and these households rely mostly on backyard
dumping, burial and burning. These practices adversely impact on human health and the environment, specifically:
� Air pollution from smoke;
� Pollution of ground and surface water resources and home grown fruit and vegetables;
� People breathing in smoke from fires are at risk of contracting disease (cancer, respiratory related illness);
� Fires can destroy property.
2.8 Social Analysis
2.8.1. Background
The historic imbalances in South African society resulted in the majority of our people living without land and housing, access to
safe water and sanitation for all, affordable and sustainable energy sources illiteracy, poor quality of education and training, poor
and inaccessible health services. Here is the socio-analytic reflection of MDM.
2.8.2 Housing
Table30: Housing needs in Mopani
Municipality Total Households No. of H/H with housing at or above minimum standard
No. of H/H in need of housing
GTM 89 832 75 687 14 145
GGM 57 538 44 587 12 951
GLM 59 539 54 416 5 123
BPM 24 589 21 341 3 248
MLM 33 791 28 789 5 002
MDM 265 289 224 820 (84,7%) 40 469 (15,3%) Municipal Information 2008
While housing provisioning has improved to 84,7% of the households in the District residing in housing that meet minimum
standards, there is still significant number that still live and sleep in risk housing, 15,3%. “Better life for all” also covers them.
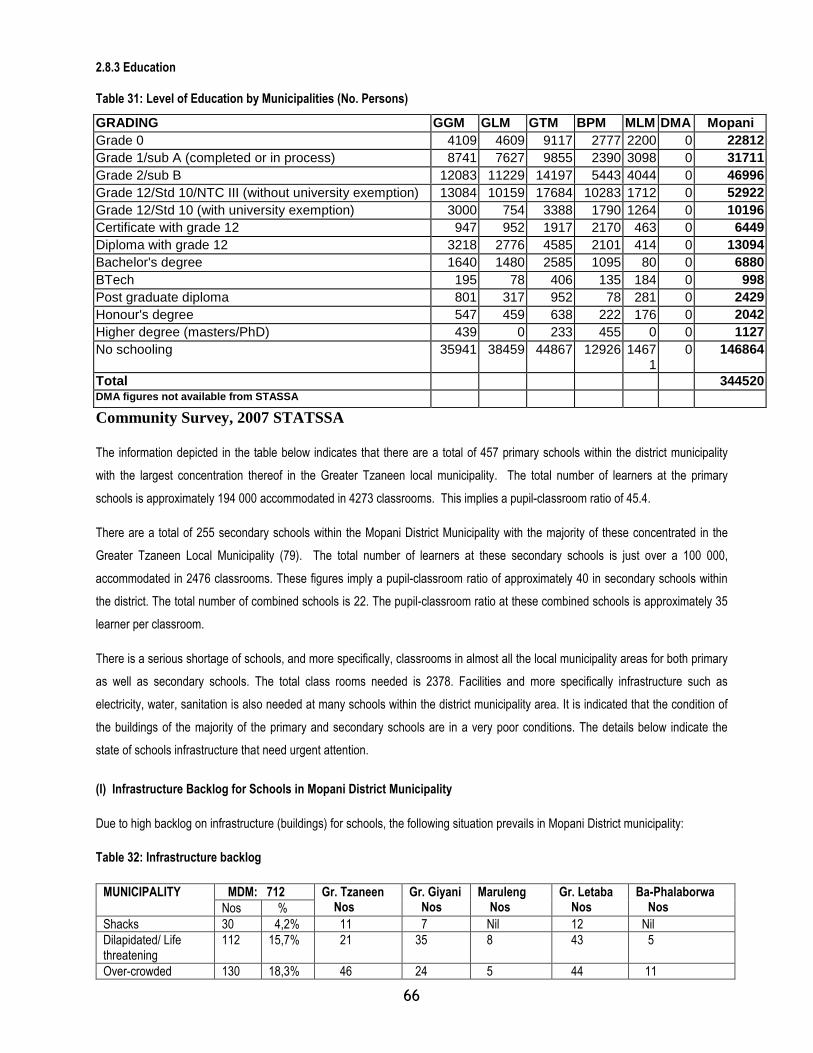
66
2.8.3 Education
Table 31: Level of Education by Municipalities (No. Persons)
Community Survey, 2007 STATSSA The information depicted in the table below indicates that there are a total of 457 primary schools within the district municipality
with the largest concentration thereof in the Greater Tzaneen local municipality. The total number of learners at the primary
schools is approximately 194 000 accommodated in 4273 classrooms. This implies a pupil-classroom ratio of 45.4.
There are a total of 255 secondary schools within the Mopani District Municipality with the majority of these concentrated in the
Greater Tzaneen Local Municipality (79). The total number of learners at these secondary schools is just over a 100 000,
accommodated in 2476 classrooms. These figures imply a pupil-classroom ratio of approximately 40 in secondary schools within
the district. The total number of combined schools is 22. The pupil-classroom ratio at these combined schools is approximately 35
learner per classroom.
There is a serious shortage of schools, and more specifically, classrooms in almost all the local municipality areas for both primary
as well as secondary schools. The total class rooms needed is 2378. Facilities and more specifically infrastructure such as
electricity, water, sanitation is also needed at many schools within the district municipality area. It is indicated that the condition of
the buildings of the majority of the primary and secondary schools are in a very poor conditions. The details below indicate the
state of schools infrastructure that need urgent attention.
(I) Infrastructure Backlog for Schools in Mopani District Municipality
Due to high backlog on infrastructure (buildings) for schools, the following situation prevails in Mopani District municipality:
Table 32: Infrastructure backlog
MDM: 712 MUNICIPALITY Nos %
Gr. Tzaneen Nos
Gr. Giyani Nos
Maruleng Nos
Gr. Letaba Nos
Ba-Phalaborwa Nos
Shacks 30 4,2% 11 7 Nil 12 Nil
Dilapidated/ Life threatening
112 15,7% 21 35 8 43 5
Over-crowded 130 18,3% 46 24 5 44 11
GRADING GGM GLM GTM BPM MLM DMA Mopani Grade 0 4109 4609 9117 2777 2200 0 22812 Grade 1/sub A (completed or in process) 8741 7627 9855 2390 3098 0 31711 Grade 2/sub B 12083 11229 14197 5443 4044 0 46996 Grade 12/Std 10/NTC III (without university exemption) 13084 10159 17684 10283 1712 0 52922 Grade 12/Std 10 (with university exemption) 3000 754 3388 1790 1264 0 10196 Certificate with grade 12 947 952 1917 2170 463 0 6449 Diploma with grade 12 3218 2776 4585 2101 414 0 13094 Bachelor's degree 1640 1480 2585 1095 80 0 6880 BTech 195 78 406 135 184 0 998 Post graduate diploma 801 317 952 78 281 0 2429 Honour's degree 547 459 638 222 176 0 2042 Higher degree (masters/PhD) 439 0 233 455 0 0 1127 No schooling 35941 38459 44867 12926 1467
1 0 146864
Total 344520 DMA figures not available from STASSA

67
(Ii) Adult Based Education
There are 141 ABET centers in Mopani District Municipality, spread as follows:
Table 33: ABET Centres in Mopani
Municipality
MOPANI
Gr. Tzaneen
Gr. Giyani
Maruleng
Gr. Letaba
Ba-Phal
Kruger National Park
ABET centres
141
28
30
12
58
21
Nil
Most of the communities have access to ABET programme within the District. However there is still a substantial number of communities that do not have access to ABET. There is a backlog of 35 ABET centres that need to be established for a fair coverage. The success in Mopani is that for the ABET centres established, Youth is participating effectively. Challenges: Need for funds to establish 35 centres No monitoring of the learners after education hence the input can easily evaporate. Shortage of Educators that is more due to poor conditions of employment service. District Management area (KNP) is not yet served with ABET. Department of Education in partnership with KNP has
started with research for this programme.
(Iii) Early Childhood Development (Ecd)
There are 429 ECD sites that are recognized and the teachers are subsidized by the Dept. of Education within the entire Mopani
District Municipality. They are spread as follows:
Table 34: Early Childhood Centres in Mopani
MUNICIPALITY GTM & Maruleng GTM GGM GLM Ba-Phal Kruger National Park
Learning sites 107 46 98 126 52 Nil
Challenges: - All sites/ centres for Pre-schools have staff that is under qualified. There is a serious need for skilling and educating
them specially for the pre-school level.
- Institutional (organizational) structure is not yet determined.
- There are many privately-owned Pre-schools that are not registered with DoE and thus not accounted for by
government i.t.o health, hygiene, quality of education, etc.
- Under resource of sanitation, water supply
- Lack of toys for kids
- Lack of monitoring of foodstuffs and finance audit.
- Mushrooming of illegal ECD Centres
- For Grades 1 & 2 there are qualified educators but they re very few compared to the need. The ratio is inexplicable.
- ECD is not yet introduced in Kruger National Park. Department of Education has started with research for possible
establishment of ECD in the KNP. Programmes will unfold in the year 2008/09.
The above challenges have far reaching implications to the entire lives of learners. Therefore government and private sector have
to put emphasis on developing this elementary foundation for solid future of learners.

68
(Iv) Disabled Communities
There are three special schools for the Disabled in the District, located at Greater Tzaneen, Ba-Phalaborwa and Greater Giyani. However, in the new schools that have been built recently, there are infrastructure provisions for the disabled. These constitute 24,44 %. While the aim is to have all schools provided with infrastructure facilities for the disabled it is clear that the backlog is serious, 75,56%. Thus, programmes aimed at mainstreaming the disabled in the normal schools will be curtailed if existing schools are not adaptive to disabled’s needs.
Education investments are crucial for sustained economic growth as it directly contributes to increased work productivity, more
rapid technological adaption and innovation, as well as better natural resource management. The key outcomes of education
should be the primary school completion rate, gender disparity in enrolment, adult literacy, student learning outcomes and the
efficiency of the education provisioning system.
2.8.4. Health and Social Development
The challenge of the health sector in South Africa is to develop a unified national health system capable of delivering quality health
care to all citizens efficiently and in a caring environment. The provision of health facilities to all settlements in the district is a
problem because of the large number of settlements (varying in size), with the majority of them being relatively small and scattered
throughout the district. A simplified calculation of the number of people per hospital per local municipality would not provide a true
reflection of the actual situation, as hospitals provide services to communities across municipal boundaries.
The Table below indicates the improvement in the provision of more facilities and thus resulting in reduced number of people
served by one facility. However the backlog is still huge and more resources are still needed to improve the situation even better.
Cognisance should also be taken of the fact that private facilities are not included in the data projected and if such data would be
available the ratios would look much better.
Table 35: HEALTH SERVICE LEVELS (Population no. 1 068 569, STATSSA, 2007)
2007/8 2008/9
No. facilities available People served per a facility No. facilities available People served per a facility
Hospitals 7 133 572 9 118 730
Health Centres 9 152 653 9 118 730
Clinics 87 11 490 99 10 794
(I) Prevalent Diseases in Mopani District
Diarrhea Pneumonia Tuberculosis HIV and AIDS Malaria Cholera Sexually Transmitted Infections (STI)

69
Table 36: Health Amenities/ Facilities and Services By Local Municipalities
MDM Ba-Phal GTM GLM MLM GGM KNP
Available Prov. Hospitals 1 1 - - - -
Available District Hospital 7 1 2 1 1 2 -
No. Clinics + health centres 96 10 32 21 9 24 -
% Facilities providing 24-hour service 90% 80% 85% 96% 100% 90% -
No. of applications for new Clinics 10 1 2 2 2 3 -
No. H/ centres needed 3 - 1 1 1 - -
Clinics with water 77 9 30 15 9 15 -
Without Water 18 0 3 6 0 9 -
Clinics with sanitation 72 7 23 14 6 22 -
Without sanitation 23 2 9 7 3 2 -
Available mobile teams 26 3 11 4 4 4 -
Visiting points 1050 20 459 194 162 195 2
Teams Needed 17 2 5 3 2 3 2
No. visiting points needed - - - - - 3
Satellite clinics 904 15 46 190 163 80 -
No. of Community Home-based care-givers 1160 120 350 150 200 340 -
Backlogs reflected in terms of number of Clinics without water and those without sanitation pose serious concern to the effect that these amenities cannot be utilized to full potential. The conditions under which staff is working do not reflect the image of health services. Not easy to attract and retain skilled personnel under such circumstances. Clear plans have to be sought to clear these backlogs if millennium goals are to be attained.
The mobile teams cannot spend sufficient time at stations for quality service due to high number of stations that need to be covered per time. It will be necessary to have more mobile clinics established for quality service and full coverage to communities. Kruger National Park is currently served with two mobile clinic points whereas it has five camps. Analysis indicate acute shortage of the services for urgent attention in this area of the DMA.
Mopani has progressed considerably with Clinics infrastructure. However five Clinics and one health centre are still needed for the communities to be sufficiently provided. However, those will as well add to the backlog on water and sanitation. It will be seen that Mopani has 90% of its clinics servicing communities 24hours. The remaining 10% is largely attributed to infrastructure and staff management problems. An analysis of the availability of health facilities per municipality indicates that Maruleng Local Municipality is in the best position as
it has 1 clinic for every 6 841, followed by Greater Giyani with 9 526.
Table 37: Clinic/ Health centre: people Ratio
GGM GLM GTM BPM MLM DMA Mopani
Total population 247665 247745 349081 127307 95769 1002 1068569
No of people served by one clinic/ health centre
9 526 17 697 10 268 12 731 6 841 - 10 686
There are mobile clinics based at various sub-districts and have visiting points taking health services to rural areas where there are
no clinics. With the incorporation of Kruger National Park the gap on access to Health services has widened. When annual
initiation schools open, there are often reports on illegal schools that result in initiates getting mutilated, sick and dying. This issue
requires immediate intervention by the relevant government role players.
Other concerns on health services are access in terms of distance and bad state of roads as well as poor supply of medicines.
Such factors, including poor infrastructure that invade people’s rights to privacy, encourage those who can afford, to go to other
service centres like Polokwane, for quality services. Something needs be done. The Health plan has been reviewed and further
details will be unpacked adequately therein.

70
Health facilities that are accredited to provide ARV drugs in Mopani District Municipality:
Dzumeri Health centre, Mugodeni Grace Health centre, Makhuba Clinic,
Sekgopo clinic, Maphutha- Malatji hospital Nkhensani Hospital,
Kgapane hospital, Letaba hospital, Van Velden Hospitals
Dr C.N Phatudi hospital, Evuxakeni hospital,
NB: Evuxakeni hospital is situated in Giyani and is the only one in the Mopani District providing psychiatric services.
(Iii) HIV and AIDS Prevalence (Tendency)
During the past decade, there has been an exponential growth in the number of HIV/AIDS infections in South Africa. This growth
has been accompanied by greater visibility of the epidemic, especially owing to the increasing number of AIDS cases and deaths.
South Africa now faces one of the world’s most severe HIV/AIDS epidemics.
Mopani District Municipality Table38: HIV/AIDS (Progression in 7 years)
Year 2002 2003 2004 2005 2006 2007 2008
Trend 23% 23% 22,5% 29,8% 24,8% 23% 23,8%
Table: Prevalence in year 2006/7 per Municipality
MDM Ba-Phalaborwa GLM GGM GTM Maruleng Kruger National Park
23% 27,3% 17,5% 21,3% 28,5% 26,8% No data
Table 39: List of HIV & Aids Intervention Programmes And Targets
PROGRAMME TARGET SUPPORT NEEDS
Home based care Sick or Terminal patients HR, Funds and Facilities
Condom distribution Prevention of spread, to all sexually active population Resources to manufacture & distribute
Awareness campaigns Schools, work places, clinics, public facilities, NGOs, FBOs, etc.
Resources to intensify the campaigns. Sector Departments to play their part.
Prevention of Mother to Child Transmission (PMTCT)
Pregnant women not to transmit HIV to children Training and skills development support
Voluntary Counseling & Testing (VCT)
All sexually active people to know their status and conduct their lives accordingly.
Infrastructure/ Counseling rooms
ARV Roll out HIV positive people Human Resource and Infrastructure
Table 40: SERVICE LEVEL NEEDS IN VIEW OF 2010
Needs for infrastructure
Available structures to be upgraded to add service (more space)
Services levels/ standards Service levels are generally low. Need for HR training and review of legislation
Equipment/ Resources Low supply of medication. Need funds and speedy deliveries of medicines.
Despite the scale of the epidemic, there is relatively limited data on the impact at personal, community, business or national level.
One reason for this is undoubtedly the enormous stigma that is still attached to HIV infection. It should also be noted that the most
common method of assessing HIV/AIDS prevalence within the country is by conducting a survey of women attending antenatal
clinics. In South Africa, such surveys have been conducted by the National Department of Health since 1990 at a sample of public
antenatal clinics. These surveys are based on anonymous and unlinked samples accompanied by basic demographic data and are
a low-cost tool for regularly monitoring key aspects of the HIV epidemic. The results on these surveys are depicted in Table below.

71
TABLE 41: Statistics on HIV/AIDS Prevalence in South Africa (Antenatal clinic estimates)
Province 2002
prevalence %
2003
prevalence %
2004
prevalence %
2005
prevalence %
2006
prevalence %
2007
prevalence %
2008
prevalence %
KwaZulu-Natal 36.5 37.5 40.7 39.1 39.1 37.4 40
Gauteng 31.6 29.6 33.1 32.4 30.8 30.3 36
Mpumalanga 28.6 32.6 30.8 34.8 32.1 32.0 33
Free State 28.8 30.1 29.5 30.3 31.1 33.5 34
Eastern Cape 23.6 27.1 28 29.5 29.0 26.0 29
North West 26.2 29.9 26.7 31.8 29.0 29.0 30
Limpopo 15.6 17.5 19.3 21.5 20.7 18.5 20
Northern Cape 15.1 16.7 17.6 18.5 15.6 16.1 21
Western Cape 12.4 13.1 15.4 15.7 15.2 12.6 16
The abovementioned table demonstrates that Kwazulu-Natal (KZN) has the highest prevalence rate since 2002. It is noted with
regard to Limpopo province that the infection rate has increased from in 2002 to 2005 and then decreased in 2006-2007.
According to the Provincial Department of Health and Welfare 2005 Summary Report, the Mopani district has decreased from the
highest HIV prevalence of 29.8% in 2005 to 23,8% in year 2008, with Waterberg at 28.5%, Sekhukhune at 17.6%, Capricorn at
22.2% and Vhembe at 13.9%. The prevalence of HIV/AIDS has resulted in the increase of child-headed families without any
source of income.
The most urgent health problems in the five local municipalities are Sexually Transmitted Diseases (STDs), Tuberculosis (TB) and
HIV/AIDS. The contributory factors for high prevalence of HIV/AIDS and related diseases are indicated as:
� Poverty, gender inequality and orphan-hood;
� Rapid urbanization and cultural modernization;
� Cross border gates and national routes;
� Dynamics of a growing economy;
� Increase in the commercialization of sexual activities;
� High unemployment rate;
� Low literacy rate;
� Alcohol and substance abuse; and
� High crime rate.
Although the epidemic affects all sectors of society, poor households carry the greatest burden and have the least resources
available to cope with the impact of the disease. Despite the decrease in pandemic, all institutions (public and private) in the
district have to increase their efforts (individually and collectively) to deal effectively with the pandemic so as to maintain high
productivity and service delivery levels both in the workplace and in the broader society whilst avoiding discrimination of those
infected or affected. Hence partnership between government, private sector and all other stakeholders have to be forged in order
to develop and implement policies and programmes that are aimed at combating the spread of the virus and mitigating the impact
of the AIDS pandemic.
The prevalence of HIV and AIDS has resulted in the increase of child-headed families without any source of income in the
province. However, the Department of Social Development has been proactive in providing child support grants. The Integrated
Food Security Programme continues to play a pivotal role by giving families food packages although many families are still left out.

72
The Mopani District Council acknowledges the serious nature of these diseases and has established an institutional HIV/AIDS
Committee and developed a draft institutional HIV and AIDS policy to manage these diseases within the Mopani District Council.
The District Council has also played a key role in the establishment of Mopani District AIDS Council and the development of a
district-wide HIV/AIDS policy and programme to deal with the HIV and AIDS scourge within the district.
2.8.5 SAFETY AND SECURITY
The Mopani District is characterized by high rate of crimes, such as, murder, attempted murder, rape, robbery with aggravated
circumstances, assault and so forth. The South African Police Service (SAPS) is responsible for the safety and security in the
district.
Although, municipalities have a legislative requirement to provide for safety and security services (municipal policing), currently the
municipalities within the district do not have the capacity to render these services. There are Community Policing Forums (CPFs)
in all the local municipalities who work in partnership with the police to curb crime in the community.
The number of police stations per local municipality is presented in Table below
Table 42: Number of police and civilians per police station in the district
POLICE STATIONS MAGISTERIAL OFFICES
MOTHER SATELITE
Seloane 0 1 0
Gravelotte 1 0 0
Lulekani A & B 1 0 1
Namakgale 1 0 1
Phalaborwa 1 0 1
Ba-Phalaborwa
Sub - Total 4 1 3
Babangu 0 0 0
Dzumeri 0 1 0
Giyani 1 0 1
Hlaneki 0 1 0
Homu- North 0 1 0
Makhuva 0 1 0
Muhlahlandlela 0 1 0
Ndengeza 0 1 0
Nkuri 0 1 0
Greater Giyani
Sub- Total 1 7 1
Bellevue 0 1 0
Modjadjiskloof 1 0 0
Kgapane 1 0 1
Sekgopo 0 1 1
Thakgalane 1 0
Worcester 0 1 0
Greater Letaba
Sub-Total 3 3 2

73
Haenertzburg 1 0 0
Lenyenye 0 0 1
Letsitele 1 0 0
Maake 1 0 0
Matlala 1 0 0
Nkambako 0 1 0
Nkowankowa 1 0 1
Rhelela 0 1 0
Serolorolo 0 1 0
Tzaneen 1 0 1
Greater Tzaneen
Sub-Total 6 3 3
Hoedspruit 1 0 0
Metz 0 1 0
The Oaks 0 1 0
Maruleng
Sub – Total 1 2 0
Mopani
Total
15
16
9
Source: SAPS Mopani Area Office, 2006
According to SAPS in Mopani, there are not enough police officers in the district. It is, however, difficult to quantify the
shortcomings since the population served by each police station is not available. Information regarding the reported cases of crime
(murder, robbery, theft, rape, assault and burglary) received from the SAPS for the period 2004 -2005 indicates that more people
are murdered in Bolobedu, Ritavi and Maake while cases of attempted murder is higher in Maake and Ritavi.
For the district to achieve economic growth, safety and security is required to attract investments and thus create jobs and poverty
alleviation. The Department of Safety, Security and Liaison has accessed donor funding from the Flemish government to assist
district municipalities in the province to develop their Social Crime Prevention Strategies. To this end, the Mopani District has, with
the support of the Safety and Security Department in the province, developed a Social Crime Prevention Strategy that responds to
crime in the district.
2.8.6 Social Amenities
(i) Sports and recreation
Sports and recreational activities are coordinated by the Department of Sports, Arts and Culture in liaison with municipalities and
sector departments. There has been established the Sports and Recreation Councils in all the municipalities. These councils serve
as a link between the department and federations. Apart from the Local Soprts Councils, there is also a district Sports and
Recreation Council (constituted by members of the local Sports and Recreation Councils) which is more of a coordinating structure
between the district municipality, local municipalities and the provincial government, particularly the Department of Sports, Arts and
Culture.
The development of sports in the district is still a challenge. Of all the fifty-three (53) sporting codes, soccer is the most dominant
sport in the district. This is due to the fact that the district is predominantly rural and, as such, the majority of our people do not

74
have access to suitable sporting facilities, equipments and an adequate budget for development programmes. For recreational
purposes, communities also participate in various indigenous games such as: ncuva, morabaraba, kgati, khokho, jukskei. The
municipality is represented internationally in Khokho and Ncuva.
The district population participates in activities organized by the Department of Sports, Arts and Culture, municipalities and sector
departments, namely, the O.R. Tambo games, Indigenous games, Wellness games, Sports Against Crime, Race Against HIV and
AIDS. There are sporting which are still white dominated and the district does not engage in these sporting codes during the O.R.
Tambo games and this is a serious anomaly that needs to be corrected.
Hereunder in Table 9 is a list of sports centres in the Mopani District:
Table 43: Sports Centres in the Mopani District
Name Location Status
T.K. Khuvutlu Sports Centre Giyani Township,
Section A
The centre has 2 tennis courts, a converted basketball court, 4 netball courts,
2 volleyball courts and a clubhouse with toilets. The facility is under
renovations.
Gawula Sports Centre Gawula Village The facility has a soccer field, a grand stand with a carrying capacity of 500
people as well as toilet facilities. It is recommended that the facility be
upgraded, change rooms be provided and be supplied with water and
electricity.
Shawela Sports Centre Shawela Village The status of the centre and the recommendations are the same as above.
Khani Sports Centre Khani Village The centre has one rocky soccer field, ablution block, change rooms and is
well maintained. It is recommended that the soccer field be grassed and the
centre be electrified. It is also recommended that a steel grand stand and other
complimentary sporting facilities be erected
Ndengeza Sports Centre Mavuza Village The status of the centre and the recommendations are the same as above.
Julesburg Sports Centre Julesburg Village This facility is still under construction but already has a soccer field, netball
courts, administration block and change rooms.
Source: Submission by the District Office of the Department of Sport, Arts and Culture, 2006
(ii) STADIA
The following 8 stadia are found in the district municipal area:
Table 44: Stadia in the Mopani District
Name Location Capacity
Giyani Stadium Giyani Township 20 000
Mokwakwaila Stadium Mokwakwaila Village 2 000
Kgapane Stadium Ga-Kgapane Township 5 000
Lenyenye Stadium Lenyenye Township 5 000
Nkowankowa Stadium Nkowankowa Township 10 000
Lulekani Stadium Lulekani Township 10 000
Namakgale Stadium Namakgale Township 5 000
Sekgosese Stadium Senwamokgopi Village 1 500
Source: Submission by the District Office of the Department of Sport, Arts and Culture, 2006

75
All these facilities are in need of major refurbishment ranging from the need to build new grand-stands, turfed soccer fields,
functional irrigation systems, upgrading of soccer fields and athletics tracks, erection of indoor sports facilities, erection of facilities
for netball, basketball, Softball, cricket, hockey, swimming and Volley ball. There is also a general need for constant maintenance
and upgrading of these facilities, Greater Giyani having started with the renovation of Giyani Stadium, there is information to the
effect that no 2010 Soccer World Cup practice sessions will take place at Giyani stadium. Currently there are national priority
sporting codes (13) of which there is serious shortage of trained coaches. Only one football coach is well trained and it would
desirable to get 20 more, including other sporting codes. The following coaches need to be trained as a matter of priority: Football,
Boxing, Cricket, Table tennis, Athletics. The other development that needs urgent attention is the establishment of Fan parks
where soccer fans would be able to watch the games during 2010. However tourism activities are anticipated which may require
improvement on our infrastructure such as access roads, water, health facilities, communication and electricity.
(iii) ARTS AND CULTURE
There are no, known, public art galleries in the municipality with private museums in Greater Tzaneen and Ba-Phalaborwa. There
are public museums at Man’gombe and Hans Merensky Nature Reserves. The Department of Sport, Arts and Culture expressed a
concern that there are no museums representing the cultural diversity in the district. Furthermore, although there are dramatists in
the district, there are no theatres for them to perform in. An Arts and Culture Centre exist in Giyani, however, its management
arrangements needs to be finalized. The well-known sculpture, Samson Makwala, lives in Greater Tzaneen while there are
various poverty alleviation projects that promote the production of beads, cushions and jewelry in Greater Giyani and Greater
Tzaneen.
With regard to culture, there is an annual district Arts and Cultural competition, where locals compete in the various traditional
dances (sekgapa, dinaka, mchongolo, xincayincayi, kuthawuza) and in terms of visual arts (weaving & pottery), among others.
There are also a number of places of cultural significance such as the Tsonga kraal, Modjadji cycads forest (where the Rain Queen
resides), Baleni (where traditional salt is produced) and the commonwealth forest in Greater Tzaneen Municipality.
(iv) LIBRARY FACILITIES
There are 18 libraries in the district municipal area, all managed by the local municipalities except for the one that is managed by
the South African National Defence Force (SANDF). There are three libraries in the Greater Giyani Municipality, five in the Ba-
Phalaborwa Municipality, four in Greater Tzaneen Municipality, four in Greater Letaba Municipality and two in the Maruleng
Municipality, with one managed by SANDF. All the local municipalities have their own libraries and there is an archive in the
basement of the Department of Education in Giyani. There has been an effort by the provincial government (Office of the Premier)
to extend library services to rural areas. The following have been earmarked for Mobile Libraries:
Table 45: Places for Mobile libraries through Office of the Premier, funded through Limpopo First Lady Trust (Premier of Limpopo)
CENTRE
Village/ Municipality
Lehadima Creche Metz/ Maruleng
Ditsepu Creche Loss/Maruleng
Sekgosese Circuit Offices Ga- Mamaila/ Greater Letaba
Mohodiela Day Care Centre Mamokgadi/ Greater Letaba
Hletelo Creche 14C Giyani/ Greater Giyani
Ritavi Circuit Offices Nkowankowa/ Greater Tzaneen
Phephani Day Care Centre Pharare/ Greater Tzaneen

76
Thabina Circuit Offices Lenyenye/ Greater Tzaneen
Phalaborwa Circuit Offices Namakgale/ Ba- Phalaborwa
Majeje Creche Majeje/ Ba- Phalaborwa
(V) Heritage Sites
There are a number of government owned reserves in the district such as Letaba, Lekgalametse and Modjadji. The most important
privately owned reserves are Klaserie, Thorny Bush and Timbavati. Registered natural heritage sites include, Westfalia Estates,
Manotsa and Madrid and Shiluvane. The district also boosts of indigenous forests, biospheres, wetlands, endangered species
(Modjadji cycads) as well as cultural heritage.
(Vi) Thusong Centres (Multi-Purpose Community Centres)
There are 10 Multi-Purpose Community Centres (MPCCs) that have been established in the district. Four are in the Greater
Tzaneen area, one in Ba-Phalaborwa, two in Greater Giyani, two in Greater Tzaneen and one in Maruleng (Metz). Both Greater
Tzaneen and Maruleng MPCCs are the most functional, whereas others are still having various challenges.
The district, local municipalities and sector departments have a critical challenge of ensuring that all these MPCCs are functional
and serves as a conduit for government-community interface. It is of critical importance for the local municipalities (in particular)
and government agencies (in general) to define their role in the management and utilisation of these centres to the benefit of the
people. These centres are intended to bring government closer to the people.
2.9 Financial Viability
Mopani District Municipality is more reliant on grants, with very little funds from own sources. Following the discontinuity of the
RSC levies, the little own sources are; sale of Tender documents, Fire services charges, Registration of service providers,
Interests on call account and miscellaneous like interests on investments. The District municipality does not collect funds from
Property rates in the District Management Area due to the fact that there is already motion from Municipal Demarcation Board that
the Area will fall within the adjacent municipalities at the end of term of the current Council.
The Mopani District municipality has short term investments made with ABSA, FNB and Standard Bank. These Investments were
done at the time when the municipality was able to generate income from RSC levies. Since the municipality did not have major
projects like Office building at that time, it was realised that it would be better to invest the funds so that when there is a need,
withdrawal could be made. Investments are also withdrawn when available funds in the current account cannot cater for the
payments of services rendered at a particular point in time, as all of the investments are short term.
Table 46: Contributions from both Grants and Own source
GRANT BUDGETED AMOUNT OWN REVENUE AMOUNT
EQUITABLE SHARES R234 250 000 Sale of Tenders R 500 000
FMG R 250 000 Registration of service providers
onto Database
R 150 000
MSIG R 735 000 Interest on Call account R 80 000
MIG R164 461 000 Interest on current account R1 200 000
LG SETA R 300 000 Fire Services charges R 300 000
DWAF R 68 303 000 Interest on investments
Mischellaneous
In the current financial year 2008/09, Mopani District municipality has the total Budget of R511 059 119 which caters for;

77
Salaries: R 78 828 432 15,4%
General Expenses: R110 250 067 21,6%
Repairs and maintenance: R 45 368 577 8,9%
Capital expenditure: R 38 774 715 7,6%
Infrastructure : R237 837 328 46,5%
Given the vast amount of community needs versus the amount that the Municipality receives and that which it generates we are
still far to satisfy our community in removing all of our identified developmental backlogs.
2.10.1. Background
The purpose of conducting an institutional analysis is to ensure that the municipal development strategies take existing institutional
capacities into consideration and that institutional shortcomings are addressed. The Mopani District Municipality was established
in 2000 in terms of the Municipal Structures Act, 1998 (Act No. 117 of 1998). The municipal offices of the district are situated in the
government complex in Giyani in the Greater Giyani Municipality.
2.10.2 Powers and Functions of the Mopani District Municipality
The powers and functions of the Mopani District Municipality, tabled in terms of sections 83 and 84 of the Municipal Structures Act,
1998,the Limpopo Provincial Notice No. 309 of 2000, Government Gazette No. 615 of 1st October 2000 and Notice no 356, Gaz.
No. 1195 of 14th October 2005 , are as follows:
(a) Integrated Development Planning for the district municipality as a whole, including a framework for integrated development
plans for the local municipalities within the area of the district municipality, taking into account the integrated developments
plans on those local municipalities,
(b) Bulk supply of water that affects a significant proportion of municipalities in the district
(c) Bulk supply of electricity that affects a significant proportion of municipalities in the district.
(d) Bulk sewerage purification works and main sewage disposal that affects a significant proportion of the municipalities in the district.
(e) Solid waste disposal sites serving the area of the district municipality as a whole.
DVF(f) Municipal roads which form integral part of a road transport system for the area of the district municipality as a whole
(g) Regulation of passenger transport services
(h) Municipal Airport serving the area of the district municipality as a whole
2.10. INSTITUTIONAL ANALYSIS

78
(i) Municipal Health Services serving the area of the district municipality as a whole
(j) Fire Fighting services serving the area of the district municipality as a whole
(k) The establishment conducts and control of fresh produce markets and abattoirs serving the area of the district municipality as a whole
(I) The establishment, conduct and control of cemeteries and crematoria serving the area of the district municipality as a whole
(m) Promotion of I local Tourism for the area of the district municipality as a whole
(n) Municipal public works relating to any of the above functions or any other functions assigned to the district municipality
(o) The receipt, allocation and if applicable, the distribution of grants made to the district municipality
(p) The imposition and collection of taxes, levies and duties as related to the above functions or as may be assigned to the district
municipality in terms of national legislation.
It should be noted that the division of powers and functions between the district municipality and local municipalities were adjusted
by the MEC for Local Government and Housing in terms of sections 16 and 85 of the Municipal Structures Act, 1998 and published
in the Provincial Gazette No. 878, dated 07 March 2003. The following District municipal powers and functions were transferred to
local municipalities:
� Solid waste disposal;
� Municipal roads which form an integral part of a road transport system of the municipal area;
� The establishment, conduct and control of cemeteries and crematoria serving the municipal area;
� Promotion of local tourism for the municipal area;
� Municipal works relating to any of the above functions or any other functions assigned to the local municipality.
2.10.3 Political Structures Of Council
The Mopani District Council comprises of the political and administrative components responsible for decision-making and
implementation respectively. The Executive Mayor and the Speaker head the political component of the municipality. The Mopani
District Council consists of 44 Councilors, of which, 8 are members of the Mayoral Committee. The Municipality has all the powers
assigned to it in terms of the Constitution as well as relevant national and provincial legislation. The municipality has the authority
to take any possible actions to effectively exercise powers assigned to it. The overall executive and legislative authority vests in
Council. The Council must, therefore, take all the major decisions of the Municipality.
MDM has approved and (partially) implemented its Delegations System - “Delegation of Authority and Accountability By-Law” - that
seeks to decentralize and democratize decision-making within the institution, and improve the pace at which services are delivered
to the community. This is intended to maximize administrative and operational efficiency and provide for adequate checks and
balances. In line with the delegations system, some decision-making powers have been cascaded from Council to the Executive
Mayor, Mayoral Committee, its Portfolio Committees and the full-time Councilors. Other powers have been delegated to the
Municipal Manager and Directors. These powers have to be further cascaded to the other management levels in the institution.
The proper application of the delegations system will improve time management within the institution and fast track the pace of
service delivery in the community.

79
Picture 1 : On behalf of the people: Members of Council of the Mopani District Municipality
The Mopani District Council has established Portfolio Committees to discuss and recommend policies to Council. Portfolio
Committees, as the engine room of Council, serve as an interface between the political structures of Council with the administrative
structures of Council. It is in these committees where policy issues are debated thoroughly prior to their submission to the Mayoral
Committee that, in turn, forward them to Council for adoption. Through Portfolio Committees, Councilors are able to give political
direction to the administrative programmes of Council. Table 38 highlights the Portfolio Committees that have been established to
contribute to effective decision-making in processes of governance and ensure effective implementation of service delivery projects
and monitoring thereof:
Table 47: List of Portfolio Committees in Mopani District Municipality
Name of Committee Chairperson & Members Support Department Cluster
Finance Chairperson: Cllr MN Makhurupetji Finance Directorate Governance and Admin
Governance & Admin. Chairperson: Alderman S Ramaremela Corporate Services Governance and Admin
Social Services Chairperson: Cllr NV Mathonsi Community Services Social and Infrastructure
Strategy, Planning & IDP Chairperson: Alderman MM Mukhabele Planning & Development Economic Development
Roads and Transport Chairperson: Cllr S Tindane Technical Directorate Social and Infrastructure
Water and Sanitation Chairperson: Cllr MO Moagi Technical Services Social and Infrastructure
Energy Chairperson: Cllr E Ndlovu Technical Directorate Social and Infrastructure
(I) Full-Time Councillors
The District Council has designated some Councillors to serve Council on a full-time basis. The deployment of Fulltime Councilors
is intended to ensure that Council is “hands-on and politically focused” in influencing and impacting on activities of the
administration. This is based on the understanding that the electorate elected public representatives to govern on their behalf and
with them. But at the same time, Councilors would require the technical advice from the appointed officials who are responsible for
co-initiating (together with Councilors in the Portfolio Committees) and implementing Council resolutions. Hence there has been
identified a need for Councilors to lead from the front.

80
2.10.4 ADMINISTRATIVE STRUCTURE OF COUNCIL
The administration of Mopani District comprises of five Directorate units and respective sub units in diagram 1:
MOPANI DISTRICT MUNICPALITY ORGANOGRAM - MANAGEMENT
Po
MDM Organisational Structure
Portfolio, Finance
Municipal Manager
Portfolio, Governance & Administration
Portfolio, Social Services
Portfolio, Strategy, Planning & IDP
Portfolio, Roads & Transport
Portfolio, Water & Sanitation
Portfolio, Energy
Mayoral Committee
Council
Directorate of Budget & Treasury
Directorate of Corporate Services
Directorate of Technical Services
Directorate of Community
Services
Directorate of Planning &
Development
OPERATIONAL UNITS
Executive Mayor’s office
Gender Desk Youth Desk Disability Desk
Disaster Management Internal Auditor Performance Management System

81
The management arrangements of the institution still need to be consolidated in terms of filling the vacant positions and on going management training. There is also a need to define the distinct roles of the various sub-units in the Municipal Manager’s Office and their collective mandate in ensuring that the Office of the Municipal Manager is able to discharge the following responsibilities with distinction:
� Providing administrative support to the political components of Council;
o Council sittings;
o Executive Mayor’s Office;
o Speaker’s Office;
o Chief Whip’s Office; and
o Portfolio Committees.
� Providing administrative support to the 5 Directorates of Council;
� Providing administrative support to inter-municipal political structures (e.g. the District Mayors Forum);
� Coordinating the activities of the inter-municipal technical structures (e.g. Finance Technical Committee);
� Coordinating the district administrative IGR structures (e.g. the District Manager’s Forum);
In order to establish which areas the organisation needs to improve on, an Improvement Survey was conducted at the beginning of
the Review process, and based on the results of the responses, the institutional analysis shows that the following issues need to
be addressed:
� Baseline information and Business Intelligence – it is no good if the systems are not in place but that the values and
data are in place for monitoring and reporting purposes and to develop trends and scenarios for the data;
� Forward planning and project management – co-ordination and planning is vital for project implementation as well
as the fact that projects be managed and monitored;
� Human Capital Development – appointment of skilled and competent people; and
� Project Prioritisation – it is important that the budget speaks to the projects as identified through the strategic intent
of the municipality as well as the fact that proper costing be done prior to project submission.
A District Area Strategic Planning session was held from 3-5 September 2008. This landmark event was attended by Councillors
of the Mopani District Municipality, Members of the Executive Committees and Executive Management of all the municipalities
within the Mopani District area (Greater Letaba, Giyani and Tzaneen municipalities, Maruleng and Ba-Phalaborwa Municipalities).
The purpose of this session was to establish a strategy for the Mopani District as a whole for integration purposes and to identify
the focus areas for the District area. A strategy map for the district as a whole was developed.
A Strategic Planning session was then held in 20-21 October 2008 by the Mopani District Municipality itself and was attended by
members of Council and Executive Management. During this session the critical success factors were dealt with according to the
Themes which were determined during the District Wide Strategic session and they are:
� Economic Growth
� Social, Environmental sustainability and Infrastructure development
� Good Governance and Administration

82
During the two Strategic Planning sessions a number of critical success factors were dealt with and the outcomes of the different
sessions are dealt with in the following sections. To ensure that Mopani District Municipality is a Performance Driven Organisation,
it was concluded that the ultimate factors contributing to a performing organisation were:
� To practice sound governance;
� To ensure the geographical area experiences economic growth;
� That good skills of employees (human capital) are retained and attracted;
� That effective communication between the different levels of the organisation is introduced;
� That forward planning and project management is introduced to optimise revenue and output to increase
resources;
� That extreme care and focus must lead to the identification of the Strategic Projects;
� Key strategic projects need to be identified to ensure that the economy in Mopani area really grows. For
purposes of Good Governance and Administration, what has been done before must be analysed, to ensure
that human capital support leads to achievement.
The readiness exercise, to analyse whether the Mopani District Municipality is ready to improve on its performance, supported the
critical success factors expressed in the improvement survey as follows:
� Shortcoming in Strategic Intent is in implementation thereof and that local municipalities differ when it comes to
levels of implementing projects according to the strategic intent of the District;
� Proper planning must be informed by what the community needs;
� Baseline information is the key issue hampering planning and progress in service delivery;
� Integration between directorates is needed as well as the implementation of Institutional (Organisational)
Performance Management.
2.10.5 MDM STAKEHOLDER ANALYSIS
It is essential for a municipality to understand the different stakeholder groupings that (may) exert influence in the municipal
decision-making processes. It is important to have the support of these groupings in service delivery and to measure what the
perceived opinions of those groupings are. In the absence of a proper client satisfaction survey an analysis was done on the
different groupings and what their current support to the municipality is. The opinion of stakeholders on the impact and quality of
service delivery is essential for the mere fact that stakeholders are consulted during the IDP processes.
The outcome from the District Area stakeholder analysis regarding the six most common stakeholders was:
Table 48: Outcome of District Area Stakeholder Analysis
Stakeholder Support Influence
High - 3 Medium - 2 Low - 1
Traditional Authorities 2.5 2.0
Community 3.0 3.0
Business Community 2.0 1.5
Political parties 3.0 3.0
Prov Sector Depts 2.0 2.0
Nat Sector Depts 1.8 2.5

83
The outcome was that the Community and Political Parties support and influence decisions appropriately. Traditional Authorities
rated high regarding support to municipalities and above average regarding influence. National and Provincial sector departments
rated fairly high regarding influence, but average regarding support. Business Community rated average on support that they
render to the municipalities and low regarding the influence they have on decision making. The conclusion that can be drawn from
this is that better relationships should be built with National and Provincial Sector Departments as well as with the Business
Community to increase the support that they render to the municipalities. Attention should also be paid to involve Traditional
Authorities, Business Community and Provincial Sector Departments in decision making in order to allow for improved influence on
decisions regarding the relevant areas which have an impact on them.
Stakeholder Analysis specifically relating to the Mopani District Municipality itself was done per Strategic Theme.
Table 49: Stakeholder Analysis relating to Mopani District Municipality
Stakeholder Support Influence
High - 10 Medium - 5 Low - 1
Local Municipalities 2.3 3.7
Traditional Authorities 5.0 2.5
Community 5.2 5.1
Business Community 3.9 2.5
Political parties 5.5 5.3
Prov Sector Depts. 3.3 5.5
Nat Sector Depts 2.5 5.7
Management 4.1 5.1
Employees 2.9 2.8
Mining Forum 1.3 4.7
Agricultural Forums 3.6 5.5
NGO's 4.4 5.0
Youth 5.3 6.5
Women 4.7 6.7
Disabled 4.6 6.9
Religious groupings 2.5 2.3
Civic organisations 4.5 6.3
Tourism Forum 2.9 5.5
From this analysis it can be gathered that relationships with the following Stakeholders should be addressed:
� Local Municipalities: in that the District Municipality needs the support from the local municipalities and their influence
on decision-making should be improved, specifically because Mopani District Municipality is the Water Services Authority
in all local municipal areas and Services Provider for the Project Consolidate Municipalities;
� Business Community: in order to grow the economy, support from and influence by the Business Community is crucial;
� Provincial Sector Departments: due to the fact that the District Municipality is dependent on the support from Provincial
and National Sector Departments;

84
� Employees: in that staff members are the foundation of a municipality and if the municipality does not have the support
of the employees, constraints will be experienced in service delivery to the community;
� Mining Forum: because mining is an important contribution to the economic growth of the District area, it is important to
get them on board in order to support the municipality in its endeavours;
� Agricultural Forums: due to the fact that the vision of the Mopani District area has direct relevance to agriculture, it is
crutial that good relations are established and maintained with Agricultural Forums fo rmutual support;
� Religious groupings: in order to ensure moral regeneration it is important that churches and religious groupings are
involved to ensure support and that their views be considered in decision-making processes;
� Tourism Forums: as the realisation of the Vision of the District as the Tourism destination of choice, good relationships
need to be established with Tourism Forums.
The conclusion is that efforts should be made to increase the influence and support of these groups by building good relationships
with the stakeholders that have a low impact on influence and support, but to foster the good relationships that exist. It is clear that
the starting point in establishing improved relationships would be to develop a Stakeholder Relations Framework and Plan which
will identify the cause of poor relations and outline the Strategies on how to improve on those relationships.
2.10.6 SWOT Analysis
The SWOT analysis is a strategic planning tool used to discuss and evaluate the Strengths, Weaknesses, Opportunities, and
Threats in the municipality. It identifies the internal and external factors that influence the strategic intent by asking the questions
below, the answers to which will enable the municipality to better align itself with existing conditions so as to maximise its ability to
function optimally.
Identification of the SWOT is essential because subsequent steps in the process of planning for the strategic intent of the
municipality are derived from the SWOT. After meaningful participation, the following SWOT revealed the strong and weak points
of the district area, as well as the opportunities and threats in the district area. At the second session additional Strengths,
Weaknesses, Opportunities and Threats were identified. These are indicated with an asterisk(*) in the SWOT table

85
Strengths Weaknesses Weaknesses Opportunities
IDP Compliance Process Plan (Commitment to process plan) Alignment International collaboration, attraction and investment
Intergovernmental relations Projects Integration Transport through road lobbying
Political stability To be a team Intellectual/emotional capacity Funding weaknesses
Planning Planning Fresh produce market
*Commitment IDP Project alignment Tourism, Cultural diversity, Natural beauty, Wildlife, Climatic conditions
*Leadership Participation(focused) Strategic focus and discipline Natural resources
*Systems Project language (how projects reflected)
Retaining skill Agriculture
*Commitment to IDP *Process Plan Project prioritisation Data management Mining
Resource gearing Water management Threats
Co-ordination and alignment *Asset Management Sector contribution and alignment
*Supply Chain Management Policy, *Transport policy compliance
Unemployment
Monitoring and Evaluation *Policy comprehension and implementation Poverty levels
Knowledge *Internal and External Communication Strategy Literacy level
Involvement *Lack of focus, discipline Migration
Policies and procedures *Human Resource Development, Training evaluation Water resources
Ensuring quality standard product and branding *Competency performance review (profiling) Communicable and non-communicable diseases
*Integrated spatial planning implementation *Land claims
*Own Revenue
Table : SWOT analysis *Strengths, Weaknesses, Opportunities, Threats added from second session

86
In analysing the SWOT some areas can be grouped together into definite “pains and enablers” that we call Key Priority Focused
areas.
Table 50 : The Key Prioritised and Focused Areas can be grouped as follows:
Pains
Enablers
Standardised policies and procedures Economic growth potential
Sector integration Agriculture sectoral development
Project alignment Tourism sectoral development
Data management Mining sectoral development
Intellectual / Emotional Capacity Southern Africa mobility
Discipline and Focus Entrepreneurship organisation
Organisation and Communication Planning
Illiteracy Prioritisation model
Skill migration Politician / Administration Exposure (best practices)
Water resources / management Aligned (standardized) policies/procedures
Production centres
Marketing strategies
Tariff and investment standardisation
Economic analysis
Retaining human capital
Vision
Table : Pains and Enablers
The conclusions that can be drawn from this analysis are:
� Utilising the SDF for improved integrated planning;
� Political stability and strong leadership to facilitate increase in revenue base, the enforcement of by-laws, fast tracking of
land restitution and improvement on communication and co-ordination;
� The clear strategic intent to be used as a marketing tool to attract investors and thus grow the economy;
� Using the Water Service Plan in integrated planning to reach national targets, addressing the threat of insufficient bulk
water and to develop a 5 year financial plan;
Exploring the opportunities presented through Agricultural activities and Tourism attractions, the fact that the Mopani District is at
the centre of the Trans-frontier region and adjacent to the Kruger National Park and have considerable range of natural resources
available, in order to create a conducive environment for economic growth to ultimately facilitate job creation and alleviation of
poverty.

87
2.12. PRIORITISATION OF KEY DEVELOPMENTAL ISSUES IN MDM
It is a general understanding that government does not have sufficient resources to address all the issues identified by
communities. Prioritisation of service delivery issues assists government, and in this case, the district municipality, in allocating
scarce resources to those issues and needs highlighted as most urgent.
In order to assist this process, a criterion was developed to guide the municipality in ranking the many issues requiring attention for
(1) the well being of the community and (2) the sustainability of the municipality. This was done in full recognition that the MDM is
not responsible and does not have the means to attend to all the identified issues. However, the fact that provincial and national
line departments and parastatals are, in some cases, the ones that have to provide the service or funding, does not make the issue
more or less worthy of attention.
2.12.1 Criteria for determining district-wide priorities
In light of the fact that the MDM is responsible for the IDP for the district municipality as a whole, and the local municipalities for the
IDPs for their respective municipal areas, it was decided that the district-wide priorities would largely be compiled from priority
issues submitted by the local municipalities as determined during their IDP processes.
The rationale behind this decision is that local planning and district planning differ by role and function rather than by location,
meaning that the district municipality and sector departments deliver services in the same areas as the local municipalities. The
difference lies not in the concern, but in the respective competencies, powers and functions in attending to the identified issues.
This does of course not in any way depart from the key role of the District Municipality in steering and guiding the economic
development and spatial and sectoral focuses/foci of resource allocation in the district. Given these assumptions, the criteria by
which district-wide priorities were decided upon, is/are the following:
� The applicability of an issue to more than one local municipality;
� Issues not identified at local level, but instrumental to service delivery;
� The potential for poverty alleviation, cost recovery and job creation; and
� Key issues falling within the powers and functions of the district municipality.
2.12.2 Broad Priorities of Local Municipalities in the district
The local municipalities and other stakeholders in the district identified the following issues as their priorities:
� Provision of water and sanitation services;
� Curbing HIV and AIDS;
� Local Economic Development (LED);
� Provision of health services;
� Provision of energy;
� Provision of roads and public transport;
� Provision of emergency services;
� Disaster management;
� Institutional development;
� Provision of educational infrastructure and services;

88
� Provision of environmental management services;
� Safety and security;
� Provision of housing; and
� Provision of social amenities.
2.12.3. District-Wide Priority Issues
Based on the priorities identified by the local municipalities, the MDM identified the following issues as district-wide priorities:
� Growing the economy;
� Provision of infrastructure and social services;
� Promoting the interests of marginalized groups;
� Provision of disaster management and emergency services;
� Institutional development;
� Provision of environmental management services; and
� Provision of safety and security.
The municipality has moved away from almost sectoral Key Priority Areas to an integrated objective and KPI approach where all
directorates and municipalities within the Mopani District are bound to work together in achieving the goals, objectives and
strategies of the municipality.
This Developmental Analysis comprises of the technical analysis and needs analysis. Both provide a proper understanding of the
status quo in the district. Having undertaken the various analysis approach to issues (per sector, per locality, per social strata, etc),
the municipality has come to understand the strengths, weaknesses, opportunities and threats (SWOT) of its municipal area. The
needs and technical issues raised in this Developmental Analysis are critical for the way forward because they are the foundation
on which strategies, projects and implementation are based. In this manner, the outputs of the analysis phase serves as inputs for
the strategy formulation phase.
3. IDP STRATEGIES PHASE 2009/10 – 2012

89
INTRODUCTION
In this phase of the IDP, the Mopani District Municipality will reset the direction it intends to take on the short as well as the long
term, to indicate its purpose, values that Councillors and Administration ascribe to, as well as what the municipality intends to
achieve by means of objectives and desired results.
3.1 VISION
At the Commencement of setting the Strategic Intent of the municipality, a picture of the future for that municipality must be
determined. A Vision provides direction, it defines what one hopes to achieve in 5 or 10 years and it is the most ambitious dream
for the organisation. The Vision of Mopani District Municipality as confirmed through the Strategic Planning sessions of 3-5
September and 20-21 October 2008 is:
“To be the Food Basket of Southern Africa and the Tourism Destination of Choice”
This Vision is based on the premise of: “Mopani District as a whole will create a favourable environment to ensure that out of the
whole of Southern Africa, the Mopani District will supply the largest part of food (fruit, vegetables, nuts, meat [mainly game]
produce and products) to the local, national and international markets. This will create extra-ordinary economic growth for the
whole district, emanating in the improvement of the quality of life of all citizens and also enabling the local municipalities to be
financially viable and to provide quality services. Due to the diverse vegetation within the District, ranging from sub-tropical, tropical

90
to bush-veld, as well as the fact that it embraces Kruger National Park with acclaimed Great Limpopo Transfrontier park and two
Border posts to Mozambique, it creates the ideal opportunity to promote the District as the tourist growth point in the Limpopo
Province”. During this review, alignment of visions of Local municipalities was confirmed and it was identified that the vision for
Greater Tzaneen municipality is not fitting into the District one. It was therefore recommended that the vision for GTM be reviewed.
3.2 MISSION The Mission of an organisation defines the core purpose or reason for existence of the organisation and answers the question:
“what is our purpose?”
The Mission as reviewed, aligns with the Constitutional mandates enshrined in the Objects for Local government (section 152 of
the Constitution). The Mission further supports the provisions of the Municipal Systems Act 32/ 2000: “provide for the core
principles, mechanisms and processes that are necessary to enable municipalities to move progressively towards the social and
economic upliftment of local communities and ensure universal access to essential services that are affordable to all”.
Mopani District Municipality has thus confirmed the Mission (without alteration) as being:
To provide integrated sustainable equitable services through democratic responsible and accountable governance
Promoting the sustainable use of resources for economic growth to benefit the community
3.4 VALUES Values are deeply held views that act as guiding principles for individuals and organizations, when declared and followed; they are
the basis of trust. A value system answers the question: “what image do we want to adhere to and portray to our community?”
They strengthen the like-mindedness, commitment and devotion of both councilors and officials to influence their behaviour
positively.
During the above Strategic Planning the Values of Mopani District Municipality, based on what is portrayed through the Vision and
Mission, were reviewed and confirmed as follows:
innovation
Excellence
Commitment
Care
Ubuntu
Batho-pele principles

91
3.5 LOCALISED STRATEGIC GUIDELINES
In developing the development strategies of Mopani District Municipality, cognisance is made, over and above national and
provincial frameworks, of developmental issues that are pertinent to the characteristics and brand of Mopani as a region. The
purpose for this exercise is to ensure that cross cutting dimensions such as spatial development principles, local economy,
environmental sustainability, poverty alleviation, gender equity and institutional aspects are adequately considered when aligning
national and provincial plans to local level situations, to the extent that where need arises customisation may be applied.
3.5.1 Localised Spatial Strategic Guidelines
Despite the awesome development input made by government and all partners in development, to date, the apartheid spatial
legacy still characterizes the spatial pattern of the district with huge disparities in levels of services provided to different areas and
target groups and also in terms of economic activities. The spatial legacy also reflects distance between places of residence and
places of work for the majority of the population in the district. New land development within the district should emphasise an
attempt to minimize the distances between places of residence and work, or when and where possible, should integrate this uses.
The new approach to human settlement development, BREAKING NEW GROUNDS concept, will hopefully address these
developmental distortions.
Secondly, there are currently 394 land claims in the Mopani district. The extent of these claims in the district and the potential
impact they may have, depending on the outcome of investigations, is quite substantial and will impact heavily on the Spatial
Development Framework (SDF) of the district municipality, taking cognisance of the fact that spatial planning in areas whose
claims are not settled, would often be a risk that depend on the outcome of the claim resolutions.
Thirdly, development in Mopani is affected by the fact that most human settlement areas, especially in Greater Giyani municipality
are not surveyed and it if difficult to quantify the number of households and the amount of land occupied versus the areas available
for new development. Every approach in land development compels the process to start from physical planning which is costly to
attain before visible development is started. The same problem applies to strategies to get investors be drawn to our municipalities.
The question of cadastre of the land and the processes involved in accessing those parcels of land for development purposes
leave much to desire and tend to guide how development is to be approached under circumstances as they dictate.
Fourthly, the localized spatial strategic guidelines should take cognizance of the fact that the Mopani District Municipality is faced
with the mushrooming of unplanned settlements because of illegal occupation of land. It is within this context that the municipality
finds it difficult to deliver services such as water, sanitation and roads to unplanned settlement. In most areas there are no land use
management systems in place. A thorough consultative process should be carried out whenever a development is proposed for
every piece of land so that mutual agreements are attained without encroaching into individual rights. Land for settlement should
be provided at a rate that meets the demand and housing needs and land to meet these needs should be identified according to
the guidelines as contained in the Provincial Spatial Rationale and the District Spatial Development Framework.
New land development should promote the establishment of a range of different types of land uses. All land development initiative
should also minimize interference with the natural environment and avoid settlement in places of high risk. The policy framework of
the district municipality should encourage public-private partnerships for land development.

92
3.5.2. Localised Environmental Strategic Guidelines
The rationale behind having localized strategic environmental guidelines is to ensure that environmental features and places are
taken into consideration when strategies and projects are designed. The Mopani District Municipality continues to experience the
problem of air and water pollution, deforestation, uncontrolled fires, and overgrazing, among other environmental problems.
Therefore, the municipal strategies and projects have to comply with the principle of a sustainable development process that would
balance the economic and developmental needs of communities with sound ecological and cultural management of the
environment as a whole.
Firstly, Environmental management must place people and their needs at the forefront of its concern and serve their physical,
psychological, developmental, cultural and social interests equitably. This means that during the planning processes,
environmental concerns of the people and their cultural orientation should be considered, taking into consideration the impact of
their needs on the natural environment. The identification, assessment and management of natural environment require that the
Mopani District Municipality pay attention to the following:
Avoid pollution and degradation of the environment;
Avoid waste by ensuring recycling takes place or that disposal is done in a safe and responsible manner;
Minimize and remedy negative impacts on the environment;
Ensure that the consequences of the exploitation of non-renewable natural resources be adequately considered and
managed;
Avoid jeopardising renewable resources and ecosystems;
Pay specific attention to sensitive, vulnerable, highly dynamic or stressed ecosystems;
Apply bio-diversity planning.
Secondly, Mopani District Municipality is also imbued with a rich cultural heritage. This heritage is under constant threat due to
vandalism and its degradation. There is a need to avoid or minimize the disturbance of landscapes and sites that constitutes the
community’s cultural heritage. Therefore, the identification, assessment and management of heritage resources must:
Take account of all relevant cultural values and indigenous knowledge system (living heritage) within the district;
Take account of material or cultural heritage value and involve the least possible alteration or loss of it;
Promote the use and enjoyment of access to heritage resources in a way consistent with their cultural and conservation
needs;
Contribute to social and economic development;
Safeguard the options of present and future generations;
Be fully researched, documented and recorded.
An Environmental Analysis/Scoping Report based on Environmental Impact Assessment (EIA) and Heritage Impact Assessment
(HIA) should be compiled during the planning of new projects that indicates the impact on the environment and cultural heritage
sites. If the EIA is not done, then an HIA must be conducted in the following circumstances:
Any linear development exceeding 300 meters (a pipeline, powerline, etc);
Any construction of a bridge or structure longer than 50 meters;
Any development exceeding 5000 square meters; and
Any rezoning, change of land use or township establishment in terms of local by-laws or the DFA.

93
Thirdly, environmental justice must be persued so that adverse environmental impact shall not be distributed in such a manner as
to unfairly discriminate against any person, particularly vulnerable and disadvantaged persons. The participation of all interested
and affected parties in environmental governance must be promoted and all people must have the opportunity to develop the
understanding skills and capacity necessary for achieving equitable and effective participation. Participation by vulnerable and
disadvantaged persons must also be ensured. Nature conservation areas that do not allow day visits for environmental awareness
should reconsider this concern.
3.5.3. Localised Economic Strategic Guidelines
The purpose of the “localized economic strategic guidelines” is to ensure that economic development aspects in general and local
economic development (LED) strategies in particular are taken into consideration when strategies are designed and projects are
planned.
The Mopani District Municipality is engaged in LED activities to enhance life in its area of jurisdiction through the creation of jobs
and alleviation of poverty. The LED approach of the municipality capitalizes on the comparative advantages of the municipal area
and should take into account the provincial, national, regional and global context, and be designed in a way that assists the district
municipality to respond to these contexts creatively.
There are a number of economic instruments (strategies) that Mopani District Municipality can utilize to boost its economic activity.
The municipality should consider engaging in place marketing to promote and advertise its local area, so that people, businesses
and industries can see the area as a desirable place to visit, invest, live in and work in. The municipality has to embark on
industrial recruitment to attract new industries to the local area. According to the Provincial Industrial Development Strategy
(PIDS) there are numerous industrial parks in the district that are under-utilised. The strategy indicates that “Nkowankowa has one
of the biggest industrial parks in the province”. It is further indicated in the strategy that “a recent survey by the Directorate: Industry
indicates that there are also vacant industrial sites in Tzaneen and Phalaborwa”.
Industrial recruitment is vital to the Mopani District situation in that it will help reduce the high infrastructure backlog. Industrial
recruitment strategies assume that business and industry locate in areas where production costs are lower, and consider as to
whether there is a local market for their products. In this regard, the Mopani District has relatively adequate road infrastructure in
the key routes which links the area with other part of the province, Gauteng, Mpumalanga, Mozambique as well as Zimbabwe.
MDM has potential in terms of tourism, agriculture, mining, manufacturing and trade. The District municipal area embraces almost
half of Kruger National Park which is directly a gate way to Mozambique, through Pafuri and Giriondo Border Posts. There is also
Great Limpopo Transfrontier park with numerous tourism activities at international level. It also boasts of the Modjadji Cycads
forest, Makgoebaskloof indigenous forest, the Phalaborwa Spatial Development Initiative, all of which have a potentiality for
positive spin-offs for the district. Tapping on international experience, which can apply locally, the district Council can introduce tax
incentives, traditional land incentives (e.g. land acquisition, cleaning and sale), infrastructure support (e.g. water and sewer
infrastructure), transportation (e.g. improved streets parking and security services) to attract investment to benefit local people.

94
The Mopani District Municipality has many Small Micro Medium Enterprises (SMMEs) in its area of jurisdiction that needs the
support of the District Council. The District municipality and the local ones should focus on creating a conducive environment for
SMME to ensure that they develop and grow. These include the provision of business infrastructure (e.g. stalls), the provision of
finance, technical support through business advice centres, involving SMMEs in government contracts, especially on infrastructure
delivery and targeting sectors where SMMEs involvement is enhanced through linkages and networks. This can easily be
enhanced by encouraging SMMEs to enter into co-operatives to venture into new business activities.
The District Council has to consider embarking in human resource development and skills enhancement to ensure the economic
development of communities. This initiative should be biased towards alleviating poverty by improving the capabilities of
disadvantaged communities (especially women, the disabled, and the youth) to create sustainable livelihood for them. The
economic development of the community is very crucial for the Mopani District Municipality in that the majority of women and a
young population characterize the district. The District Council should ensure the growth of the district economy to accommodate
and create employment opportunities for women and the young population. The desks on gender, youth and disability in the
Mayor’s Office (alluded to in the analysis phase) should play a key role in this regard.
3.5.4. Localised Poverty Alleviation And Gender Equality Strategic Guidelines
The purpose of developing “localized poverty alleviation and gender equality” strategic guidelines to ensure that poverty alleviation
and gender equity policies are applied when strategies are designed and projects are planned. Mopani District Municipality is
characterised by a high rate of poverty. A large number of people in the District earn less than R10 000.00 per annum, and there
is a significant proportion of dependency ratio.
This can be attributed to the fact that economic development in the district is constrained by the rural economy, hence high
unemployment and poverty levels. Poverty mainly affects women as they are the ones left behind at home with children when their
husbands have left to major cities to work or look for job opportunities. There is also a substantial number of households which are
headed by females with no income. The youth are also affected by underdevelopment and limited economic space in this district.
Furthermore, it is imperative that municipalities promote poverty alleviation in communities and ensure a safety net to the most
vulnerable. The poverty alleviation strategies of municipalities within the district should take into account the reality that women,
youth and the disabled are the majority of the poor and are particularly vulnerable to poverty. Therefore, the municipalities should
offer services that can improve their quality of life through, for example, affirmative procurement, provision of free basic services
and other social amenities. There is also a need to affirm people with disability, women and youth when employing personnel in the
municipality. There is also a need to consider gender and disability when constructing public facilities and provision of public
service within the district. Although the situation has improved much still need to be done in this aspect.
3.5.5. Localised Institutional Strategic Guidelines
The purpose of developing “localized institutional strategic guidelines” is to ensure that the IDP strategies address the institutional
deficiencies and constraints, which are affecting service delivery, rather than focusing only on physical investment projects. The
Mopani District Municipality has a constitutional responsibility to provide equitable, accessible and affordable quality services to the

95
community. To be able to do so, the municipality is encouraged to develop its own institutional transformation programme and
adopt options, which are best suited to its circumstances.
Taking cognisance of the limited skills resources in the District, the municipality needs to explore the various internal and external
mechanisms, which it could use for the provision of services. The District Council has an option to decide on the different options
for service delivery which Council may use in future such as partnerships with CBO’s and NGO’s, contracting out of services,
leasing and concessions, public-private partnerships, and building on existing capacity. As Council decides on the best options to
render services, it should ensure that the provision of basic services to the public is done without discrimination, whilst taking into
consideration the historically disadvantaged communities. The municipality should ensure the provision of basic services at the
RDP level for the rural communities.
The municipality should also provide political and administrative leadership that is responsive to the emerging needs of the
community. An investigation is currently underway to look into the existing organizational arrangements, cultures, procedures and
practices in line with the developmental priorities to determine and address the level of institutional preparedness for
implementation and service delivery. There is also a need to ensure that the human resource capacity is developed to a level that
enables the municipality to perform its functions and exercise its powers in an economical, effective, efficient and accountable way.
The capacitation of the administration should be done through the implementation of the skills development plan and by accessing
funding from Sector, Education and training authority – Local Government, Water and Related Services (SETA – LG). Mopani
District Municipality should consider developing three set of capacities in order to improve performance, which are:
1 Strategic capacity to assess, plan and develop innovative programmes;
2 Directing or integrating capacity and the resources; and
3 A community orientation to inform a user friendly, relevant and quality service to the community
The development of new capacities and approaches should go hand in hand with measures to enhance accountability of the
administration and build relationships of mutual respect and confidence between Councillors and administration. The municipality
should also ensure that internal communication systems are set in place to ensure that all staff is part of most strategic planning
processes. The administration must carry out its functions assigned to it by Council and be involved in all management decisions
within their competency. The municipality should also provide a working environment which is equitable, fair, open and non
discriminatory.
In project prioritisation Mopani District Municipality should be guided by the institutional readiness or capabilities in as far as
resources, viz. skills, capital, and financial, are available, for the execution or implementation of those projects.
Chapter 6 of the Municipal Systems Act, 2000, makes provision for the establishment of the Performance Management System
(PMS), and outlines the core components of such a system. Performance management is critical in ensuring that plans are being
implemented, have the desired developmental impact and that resources are being used efficiently. The senior management within
the institution should sign performance agreements and the Municipal Manager must provide job descriptions for each post within
the policy framework determined by the Council and subject to any applicable legislation.

96
There is a need for the Mopani District Municipality to develop a culture of municipal governance that encourages active public
participation in the IDP process, monitoring and reviewing the performance of Council, in the preparation of the budgets through
the IDP process, and the provision of municipal services. This would require it to set in place appropriate communication
mechanisms to communicate with the community. The municipality should contribute to building the capacity of the community to
enable it to participate in the affairs of the municipality. That could be achieved through making ample access to necessary
information by the communities. The Mopani District Municipality should establish clear relationships and facilitate co-operation,
co-ordination and communication between political structures, the administration and the community.
3.6 STRATEGIC DEVELOPMENT CORRIDORS
N
Map 2

97
3.7 DEVELOPMENT PROFILE
3.8
Figure 6
3.8 KEY PERFORMANCE AREAS OR PRIORITIES
Before Strategic Objectives can be developed, the Strategic Themes of the municipality must first be determined.
The Strategic Themes / Key Performance Areas are the focus of strategic processes that need to be addressed in line with the
vision and mission. They are the major focus areas: “Pillars of Excellence”, also known as Key Priority Areas.
Themes should be complementary, reflecting both the Growth Strategy as well as the Excellence Strategy of the municipality. The
previous year(s) Strategic Themes of Mopani District Municipality were Economic Growth, Social and Environmental
sustainability and Infrastructure development (as the Growth Strategy) and Good Governance (as the Excellence Strategy).
But during a District Wide strategic planning workshop attended by representatives of all the municipalities within the Mopani
District area, it was resolved, although the direction or Strategy of the municipality has not changed, to broaden the scope by
following the Key Performance Areas for local government as determined by the Five Year Strategic Agenda for local government
which is a national program of the government that was approved by the Cabinet Lekgotla in January 2006 and subject to annual
review. The goal of the program over the medium term is acceleration of basic services provisioning and to meet the targets set for
universal access as outlined in the MDG Vision 2014. The Key Performance Areas have thus been altered as follows to satisfy the
two strategies, EXCELLENCE and GROWTH:

98
Diagramme: KPA’s and Strategic Objectives
KPA’s
Fin
ance
sC
omm
unity
Sat
isfa
ctio
nIn
stitu
tiona
l Pro
cess
es
Lear
ning
an
d G
row
th
STR
ATE
GIC
PER
SPEC
TIVES
Plan for the future
Build intellectual capacity
Become financially
viable
Develop entrepreneurial
capability
Develop partnerships
Improve community well-being
Manage through information
Grow the economy
and halve unemployment
Resource manage
infrastructure and services
for access and mobility
To be the food basket of southern Africa and the Tourism destination of choice
Good Governance Good Governance and Public and Public
ParticipationParticipation
Transformation Transformation and and
Organisational Organisational DevelopmentDevelopment
Financial Financial ViabilityViability
Local Economic Local Economic DevelopmentDevelopment
Service Delivery Service Delivery and and
Infrastructure Infrastructure DevelopmentDevelopment
Effective and
efficient organisation
Strategy Map
3.9 STRATEGIC OBJECTIVES The above Strategy Map was developed by focusing on the Learning and Growth Perspective as point of departure:
Build intellectual capacity – This is a basic need that requires the district to focus effort and resources on programmes
and projects that will uplift the intellectual capabilities of all of its officials. It will also enable the district area to more
effectively focus on the ‘bigger picture’ and to achieve its ambitions.
Develop entrepreneurial capability – Wikipedia describes entrepreneurial capability in the following manner:
“Entrepreneur in English is a term applied to the type of personality who is willing to take upon herself or himself a new
venture or enterprise and accepts full responsibility for the outcome. In common understanding it is taken as describing a
dynamic personality.” It should be an ongoing goal for the district area to foster entrepreneurial spirit in all of its
employees, and will be fundamental to the achievement of the vision of the district area.
Spatial
Rationale

99
Focusing on the above objectives will enable the Municipalities to be better equipped and capacitated and thereby improve the
institutional processes:
Plan for the future – In order for the district area to achieve its vision, it needs to think ahead and even beyond its
borders. It will need to keep its eye firmly on its vision and continuously measure its programmes and projects against
whether they contribute to future growth and achievement of the “bigger picture” envisaged by the area.
Manage information – This objective was highlighted as one of the major challenges facing the area (see comments
under IDP challenges above). Efforts to more effectively manage information, including the development of baseline
information and smart application of information to achieve results, therefore has to be a critical objective for the district
area. Also noted at the strategic planning session of 20 – 21 October 2008 was the fact that the district municipality has
a co-ordination role to ensure alignment of all municipalities within the district and it was estimated that municipalities are
only approximately 70% aligned. The fact that the District Municipality does not have information on the local
municipalities is also indicative of non-alignment and non-integration.
Resource manage infrastructure and services for access and mobility - In order to become an effective and efficient
area, urgent attention needs to be paid to the provision of services (as per the constitutional requirements) to improve the
accessibility of services to all members within the district area. Mopani District has scarce water resources, therefore
special attention should be given to the conservation and management of water resources. To this effect, projects
identified to increase the water supply within the district are Mametja Dam and the raising of the Sami and Tzaneen dam
walls.
Effective and efficient Organisation – To improve effectiveness and efficiency, standardised policies and procedures
need to be established throughout the district area. This will lead to open and transparent decision-making and sound
governance practices throughout the district area.
Improved effectiveness and efficiency within the district area will advance the utilisation and allocation of financial resources:
Become financially viable – Municipalities within the district area need to improve their financial viability position to
ensure optimal utilisation of financial resources. The enhancement of revenue combined with the reduction of
outstanding debtors should provide a platform for the municipalities to move from.
Develop partnerships – The district area will not be able to achieve financial viability on its own. Partnerships will have to
be developed with private enterprises, NGO’s and other agencies with a view to increasing its financial viability.
Grow the economy and halve unemployment – As a result of the high unemployment rate within the district area, special
emphasis should be placed on local economic development and job creation initiatives.
The objectives within the three perspectives discussed above, will lead to community satisfaction and well-being:
Improve community well-being – The main focus will be on the upliftment of the socio economic status of the
communities within the district area.

100
3.10 SUMMARY OF KPAs AND STRATEGIC OBJECTIVES
Table 51: Local Government KPAs
LG KPA Strategic Objectives
Municipal Transformation and Organisational
Development
Plan for the future
Manage through information
Build Intellectual Capacity
Develop entrepreneurial capability
Basic Service Delivery Improve Community well-being
Resource manage infrastructure and services for access and
mobility
LED Grow the economy and halve unemployment
Develop partnerships
Municipal Financial Viability and Management Become financially viable
Good Governance and Public Participation Effective and efficient organisation
3.11 STRATEGIC PROGRAMMES AND PROJECTS
(See Appendix A)
3.12 SHORT, MEDIUM & LONG TERM STRATEGIC OBJECTIVES WITH TIME-FRAMES
(See Appendix B)

101
Appendix A

102
Appendix B
Programmes, Results, KPIs, Short Medium and Long Term Strategies
Strategic Objective
Programme Programme Objectives
Programme Result Programme KPI Short Term Strategies ( 0 - 1 yrs)
Medium Term Strategies (2 - 3 yrs)
Long Term Strategies (3 - 5 yrs)
Improve community well-being
Indigents To ensure that households that qualify as indigent households are registered on the indigent registers of local municipalities
Improved quality of life for the poorest of the community
% households living below R1100 per month
Analysis of local municipalities' indigent registers to establish the status quo
Assist local municipalities with campaigns on indigent registers so that communities are informed of the existence of the indigent registers
Assist local municipalities in updating indigent registers and campaigns to inform communities
Improve community well-being
Environmental Health and Waste Management
To provide a safe, healthy and sustainable environment
A safe and healthy living environment for all community members
% reduction in pollution (land)
Development of standards instrument
Implement environmental standards
Total environmental quality management
Improve community well-being
Health Services: Community Health and Social Development Services
To ensure a healthy community
Healthy society % reduction of communicable diseases, % reduction in non-communicable diseases, % reduction in food poising cases
Review District Health Plan. Include strategies to reduce HIV/Aids and other diseases within the district. Ensure local municipalities support MDM strategies
Ensure implementation of Integrated Health Plan.
Continuous updating and implementation of the District Integrated Health Plan.
Improve community well-being
Sports, Arts and Culture
To ensure a mental and physical healthy community
A mental and physical healthy community
% community satisfaction with quality of life
Establish status quo on sports, arts and culture activities in district. Promotion of sports, arts and culture events and facilities in the district.
Promotion of sports, arts and culture events and facilities in the district. Support national and provincial sports, arts and culture events
Promotion of sports, arts and culture events and facilities in the district. Support national and provincial sports, arts and culture events
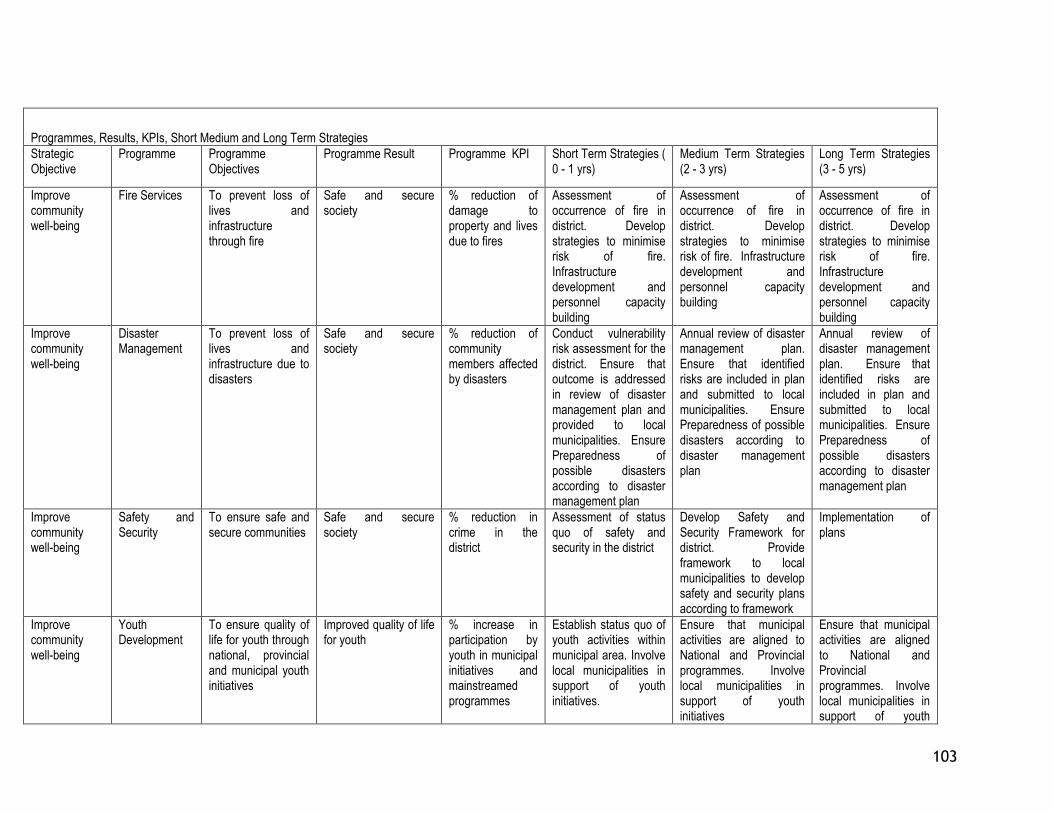
103
Programmes, Results, KPIs, Short Medium and Long Term Strategies
Strategic Objective
Programme Programme Objectives
Programme Result Programme KPI Short Term Strategies ( 0 - 1 yrs)
Medium Term Strategies (2 - 3 yrs)
Long Term Strategies (3 - 5 yrs)
Improve community well-being
Fire Services To prevent loss of lives and infrastructure through fire
Safe and secure society
% reduction of damage to property and lives due to fires
Assessment of occurrence of fire in district. Develop strategies to minimise risk of fire. Infrastructure development and personnel capacity building
Assessment of occurrence of fire in district. Develop strategies to minimise risk of fire. Infrastructure development and personnel capacity building
Assessment of occurrence of fire in district. Develop strategies to minimise risk of fire. Infrastructure development and personnel capacity building
Improve community well-being
Disaster Management
To prevent loss of lives and infrastructure due to disasters
Safe and secure society
% reduction of community members affected by disasters
Conduct vulnerability risk assessment for the district. Ensure that outcome is addressed in review of disaster management plan and provided to local municipalities. Ensure Preparedness of possible disasters according to disaster management plan
Annual review of disaster management plan. Ensure that identified risks are included in plan and submitted to local municipalities. Ensure Preparedness of possible disasters according to disaster management plan
Annual review of disaster management plan. Ensure that identified risks are included in plan and submitted to local municipalities. Ensure Preparedness of possible disasters according to disaster management plan
Improve community well-being
Safety and Security
To ensure safe and secure communities
Safe and secure society
% reduction in crime in the district
Assessment of status quo of safety and security in the district
Develop Safety and Security Framework for district. Provide framework to local municipalities to develop safety and security plans according to framework
Implementation of plans
Improve community well-being
Youth Development
To ensure quality of life for youth through national, provincial and municipal youth initiatives
Improved quality of life for youth
% increase in participation by youth in municipal initiatives and mainstreamed programmes
Establish status quo of youth activities within municipal area. Involve local municipalities in support of youth initiatives.
Ensure that municipal activities are aligned to National and Provincial programmes. Involve local municipalities in support of youth initiatives
Ensure that municipal activities are aligned to National and Provincial programmes. Involve local municipalities in support of youth

104
Programmes, Results, KPIs, Short Medium and Long Term Strategies
Strategic Objective
Programme Programme Objectives
Programme Result Programme KPI Short Term Strategies ( 0 - 1 yrs)
Medium Term Strategies (2 - 3 yrs)
Long Term Strategies (3 - 5 yrs)
initiatives
Improve community well-being
Gender Development
To ensure that gender equality is promoted through national, provincial and municipal initiatives
Increased gender equality
% increase in participation of communities in gender initiatives and mainstreamed programmes
Establish status quo of National and Provincial gender initiatives within district. Ensure alignment of initiatives. Involve local municipalities in support of gender initiatives
Ensure that municipal activities are aligned to National and Provincial programmes. Involve local municipalities in support of gender promotion initiatives
Ensure that municipal activities are aligned to National and Provincial programmes. Involve local municipalities in support of gender promotion initiatives
Improve community well-being
Disability Development
To ensure quality of life for people with disabilities through national, provincial and municipal initiatives
Improved quality of life for people with disabilities
% increase in participation by people with disabilities in municipal initiatives and mainstreamed programmes
Establish status quo of National and Provincial disability initiatives within district. Ensure alignment of initiatives. Involve local municipalities in support of people with disabilities initiatives
Ensure that municipal activities are aligned to National and Provincial programmes. Involve local municipalities in support of people with disabilities initiatives
Ensure that municipal activities are aligned to National and Provincial programmes. Involve local municipalities in support of people with disabilities initiatives
Become financially viable
Expenditure To manage the financial affairs of the municipality to ensure financial viability
To ensure expenditure within budget to become financially sustainable
% decrease in municipal budget variance
Draft budget within benchmark set by National Treasury within guidelines from MFMA. Fully in line with GAMAP legislation, National Treasury benchmark and MFMA. Ensure budget is totally aligned with IDP. Contain personnel
Draft budget within benchmark set by National Treasury within guidelines from MFMA. Fully in line with GAMAP legislation, National Treasury benchmark and MFMA. Ensure budget is totally aligned with IDP. Contain personnel costs within the targets. Timeous compilation and
Continuously keep in line with the guidelines and constantly increase revenue within the parameters set and ensure constant growth on budget. Ensure expenditure within municipal budget. Monitor spending and develop a better ratio

105
Programmes, Results, KPIs, Short Medium and Long Term Strategies
Strategic Objective
Programme Programme Objectives
Programme Result Programme KPI Short Term Strategies ( 0 - 1 yrs)
Medium Term Strategies (2 - 3 yrs)
Long Term Strategies (3 - 5 yrs)
costs within the targets. Timeous compilation and submission of financial statement. Ensure expenditure within municipal budget. Implement and maintain of control system to ensure accurate information of the municipal budget
submission of financial statement. Ensure expenditure within municipal budget. Implement and maintain of control system to ensure accurate information of the municipal budget
between operational and capital expenditure. Implement and maintain of control system to ensure accurate information of the municipal budget
Become financially viable
Revenue To increase revenue to become financially sustainable
Improved revenue generation mechanisms and reduced risks to become financially sustainable
% increase in Rand-value revenue collection,
Implementation of revenue collection strategy, assess the impact of the strategy.
Review revenue collection strategy. Ensure revenue enhancement strategy includes measures to decrease municipal debt
Ensure cost recovery and credit control. Implement measures to reduce municipal debt
Become financially viable
Supply Chain Management
To ensure that procurement processes are 100% within legislation, transparent and equitable
Increased equitable and transparent supply chain procedures to ensure good governance
Supply chain procedure compliant to legislation
Draft supply chain processes and ensure that it is equitable and transparent and in line with legislation. Ensure compliance with all legislation. Maintain service level with all departments. Structuring of committees in line with MFMA
Streamline and optimise procedure processes
Deliver optimal supply chain management services to all departments in the institution in line with departmental needs
Develop partnerships
Inter-governmental relations
To establish and develop sustainable partnerships to ensure economic growth in the district
Good governance and sustainable partnerships
% increase in sustainable co-operative governance index, Degree of
Identify and engage prospective strategic partners, Establish status quo on the implementation of
Establishment of sustainable economic partnerships, Facilitate integration of delivery of critical programmes
Evaluate the impact of the partnership. Continuous identification and establishment of

106
Programmes, Results, KPIs, Short Medium and Long Term Strategies
Strategic Objective
Programme Programme Objectives
Programme Result Programme KPI Short Term Strategies ( 0 - 1 yrs)
Medium Term Strategies (2 - 3 yrs)
Long Term Strategies (3 - 5 yrs)
integration between MDM and other spheres of government in the delivery of critical programmes or initiatives
critical programmes through IGR structures
partnerships, Achieve full integration of the delivery of critical programmes by 2011
Develop partnerships
Communication To promote the District in South Africa and Internationally to ensure economic growth
Successful promotion of the Mopani District Area
% increase in investment in the area, The number of MDM LED initiatives (incl. capital projects) that focus on strategic and growing sectors as a proportion of the total, Rand value of investment in MDM as a direct result of strategic partnerships
Establish status quo of communication vehicles utilised for promotion of Mopani District. Develop strategies according to status quo to promote district. Provide local municipalities with strategy to localise for own marketing purposes
Promote district municipality and assist local municipalities in marketing initiatives
Promote district municipality and assist local municipalities in marketing initiatives
Grow the economy and halve unemployment
LED To alleviate poverty through LED projects and initiatives
Employment for all community members
% decrease in unemployment, 30% of capital projects are EPWP projects,
Analysis of status quo of local economic development. According to report develop strategies/plans to ensure local economic development in district area.
Ensure economic development in nodal points identified in SDF.
Ensure economic development in nodal points identified in SDF.By 2011 all labour intensive initiatives of MDM have 90% local labour,
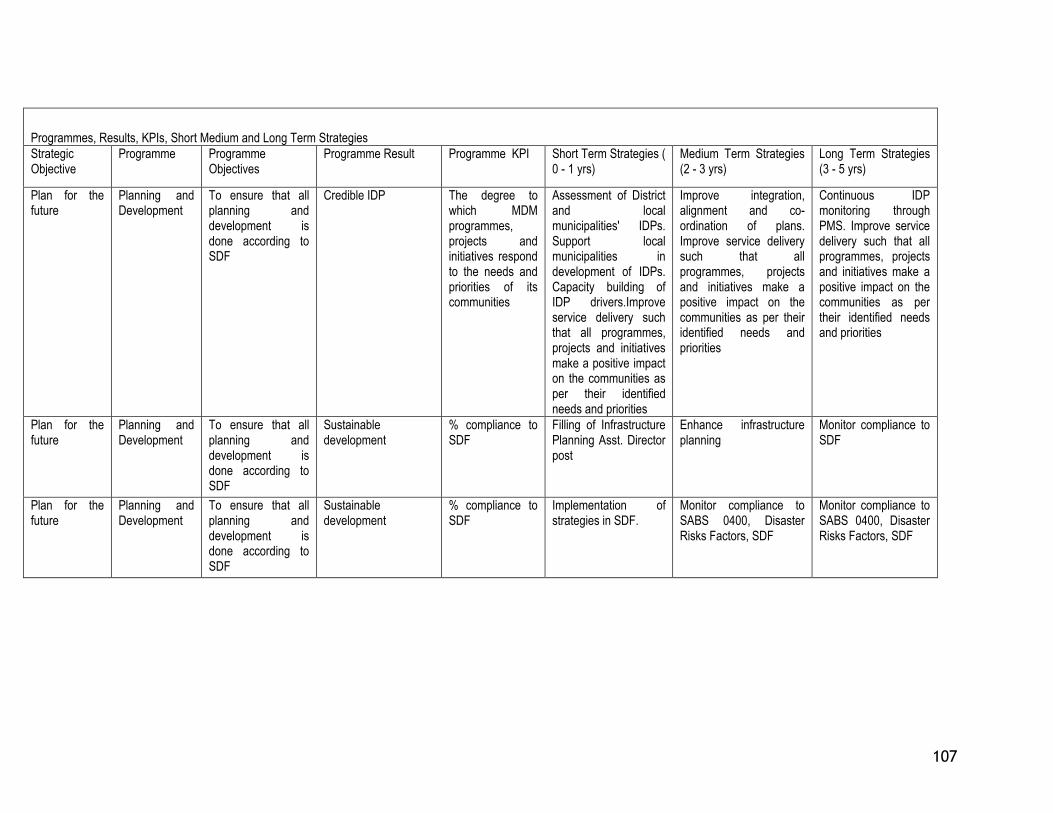
107
Programmes, Results, KPIs, Short Medium and Long Term Strategies
Strategic Objective
Programme Programme Objectives
Programme Result Programme KPI Short Term Strategies ( 0 - 1 yrs)
Medium Term Strategies (2 - 3 yrs)
Long Term Strategies (3 - 5 yrs)
Plan for the future
Planning and Development
To ensure that all planning and development is done according to SDF
Credible IDP The degree to which MDM programmes, projects and initiatives respond to the needs and priorities of its communities
Assessment of District and local municipalities' IDPs. Support local municipalities in development of IDPs. Capacity building of IDP drivers.Improve service delivery such that all programmes, projects and initiatives make a positive impact on the communities as per their identified needs and priorities
Improve integration, alignment and co-ordination of plans. Improve service delivery such that all programmes, projects and initiatives make a positive impact on the communities as per their identified needs and priorities
Continuous IDP monitoring through PMS. Improve service delivery such that all programmes, projects and initiatives make a positive impact on the communities as per their identified needs and priorities
Plan for the future
Planning and Development
To ensure that all planning and development is done according to SDF
Sustainable development
% compliance to SDF
Filling of Infrastructure Planning Asst. Director post
Enhance infrastructure planning
Monitor compliance to SDF
Plan for the future
Planning and Development
To ensure that all planning and development is done according to SDF
Sustainable development
% compliance to SDF
Implementation of strategies in SDF.
Monitor compliance to SABS 0400, Disaster Risks Factors, SDF
Monitor compliance to SABS 0400, Disaster Risks Factors, SDF

108
Programmes, Results, KPIs, Short Medium and Long Term Strategies
Strategic Objective
Programme Programme Objectives
Programme Result Programme KPI Short Term Strategies ( 0 - 1 yrs)
Medium Term Strategies (2 - 3 yrs)
Long Term Strategies (3 - 5 yrs)
Manage through information
Information management , Research and development
To ensure proper data management and record keeping
Improved record keeping and data collection
Nr of reports submitted to Council committees established in terms of the MSA and MFMA
Validate and consolidate available data. Develop systems to collect information. Continuous update of information
Establishment of Research Unit, appointment of researcher
Enhance supervision on record data keeping and collection
Resource manage infrastructure and services for access and mobility
Free Basic Services
To ensure that all indigent households have access tot free basic services
Improved quality of life for the least privileged community members
% increase of indigent households that have access to free basic services
Establish backlog of provision of free basic services to indigent households in district. Develop strategies on how to delivery FBS to indigent households in district
Implement strategies to ensure that all indigent households have access to FBS in district
Implement strategies to ensure that all indigent households have access to FBS in district
Resource manage infrastructure and services for access and mobility
Provision of basic services:
To ensure that all households have access to basic services
Improved quality of life for all community members
% increase of households with access to basic services
Establish backlog for water, sanitation, waste, electricity. Eradicate basic services backlogs equal to or earlier than national targets
Enhance partnerships to speed up eradication of backlogs. Eradicate basic services backlogs equal to or earlier than national targets
Eradicate basic services backlogs equal to or earlier than national targets
Resource manage infrastructure and services for access and mobility
Water and Sanitation Services
To ensure that all households have access to basic level of water
All households have access to basic level of water
% increase of households with access to basic water
Establish status quo of provision of water to all households. Develop strategies on how basic water will be provided to all households by 2010 and sanitation by 2012
50% of all households have access to basic water by 2009. 50% of households have access to sanitation by 2010
All households have access to basic water by 2010. Ensure that all households have access to basic sanitation by 2012

109
Programmes, Results, KPIs, Short Medium and Long Term Strategies
Strategic Objective
Programme Programme Objectives
Programme Result Programme KPI Short Term Strategies ( 0 - 1 yrs)
Medium Term Strategies (2 - 3 yrs)
Long Term Strategies (3 - 5 yrs)
Resource manage infrastructure and services for access and mobility
Roads and transport
To ensure that all households have access to roads and transport
All households have access to roads and transport within the district area
% increase to access to roads and transport
Establish backlog on accessibility to roads. Develop Integrated Transport Plan with strategies to eradicate road backlog by 2020
Implement Integrated Transport Plan. Implement strategies to eradicate road backlog by 2020
Implement Integrated Transport Plan. Implement strategies to eradicate road backlog by 2020
Resource manage infrastructure and services for access and mobility
Energy To ensure that all households have access to electricity
All households have access to electricity by 2014
% increase in access to households to electricity
Establish status quo of provision of electricity to all households. Develop strategies on how electricity will be provided to all households by 2014
50% of all households have access to electricity by 2012.
All households have access to electricity by 2014
Resource manage infrastructure and services for access and mobility
Waste management
To ensure all households have access to waste removal
All households have access to waste removal
% increase in households that have access to waste removal
Establish status quo of waste removal in district. According to report develop plans to ensure that all households have access to waste removal by 2011
Implement strategies to provide all households with waste removal by 2011
Implement strategies to provide all households with waste removal by 2011
Resource manage infrastructure and services for access and mobility
Housing To ensure that all households have access to proper and safe tenure
All households live in at least RDP standard of housing
% increase in households that have access to at least RDP standard of housing
Establish status quo of housing needs within the district
Liaise and negotiate with DLG&H to allocate housing units to eradicate backlog
Liaise and negotiate with DLG&H to allocate housing units to eradicate backlog
Resource manage infrastructure and services for access and mobility
Maintenance and Upgrading of municipal assets
To ensure maintenance and upgrading of municipal assets
Increased lifespan of municipal assets
% maintenance budget spent (R-value budget allocated for maintenance / R-value maintenance budget spent)
Develop Infrastructure Asset Management Plan. Expenditure on infrastructure maintenance is in line with national norms and standards by 2011
Functionality assessment for all infrastructure.Expenditure on infrastructure maintenance is in line with national norms and standards by 2011
Maintenance and upgrading of municipal assets according to Infrastructure Asset Management Plan. Expenditure on infrastructure maintenance is in line

110
Programmes, Results, KPIs, Short Medium and Long Term Strategies
Strategic Objective
Programme Programme Objectives
Programme Result Programme KPI Short Term Strategies ( 0 - 1 yrs)
Medium Term Strategies (2 - 3 yrs)
Long Term Strategies (3 - 5 yrs)
with national norms and standards by 2011
Resource manage infrastructure and services for access and mobility
MIG To ensure optimum utilisation of MIG
Sustainable capital projects for improved quality of life for all community members
% MIG budget allocation spent
Projects costed and prioritised. Project plans approved and monitored
Monitoring of projects plans to ensure that MIG is spent accordingly
Monitoring of projects plans to ensure that MIG is spent accordingly
Effective and Efficient Organisation
Governance and Administration
Corporate Governance
Unqualified audit report
% reduction in audit queries
Internalise organisational policies and implement management/Council decision timeously. Ensure that identified risks according to the Risk Assessment are minimised and addressed
Update existing policies and develop new policies. Review Enterprise Risk Assessment annually. Monitor and report. Ensure review of Enterprise Risk Assessment, ensure that identified risks are minimised and addressed
Ensure compliance to policies, timeous implementation of resolutions, consistent adherence to policies
Build intellectual capacity
Capacity building and Training (HRD)
To ensure a skilled and capacitated workforce
Skilled workforce % increase in supervisor satisfaction
Conduct skills audit and competency profiling. Develop training programmes to address competencies in organisation. Monitor and evaluate the impact of training
Ensure people are training according to competency assessment and skills audit.
Ensure that skilled personnel are retained and awarded. Annual review of Enterprise Risk Assessment, ensure that identified risks are minimised and addressed

111
Programmes, Results, KPIs, Short Medium and Long Term Strategies
Strategic Objective
Programme Programme Objectives
Programme Result Programme KPI Short Term Strategies ( 0 - 1 yrs)
Medium Term Strategies (2 - 3 yrs)
Long Term Strategies (3 - 5 yrs)
Develop entrepreneurial capability
Human Resource Management
To ensure a focused and disciplined workforce
Focused and disciplined workforce
% increase in meeting deadlines
Encourage accountability and responsibility. Develop Change and Diversity Management Programme
Ensure monitoring and coaching and creation of awareness of organisation culture. Implement motivational strategies within the organisation
Monitor and evaluate impact of coaching and mentoring. Monitor whether focused and disciplined workforce has been establish

112
3.13 SPATIAL OBJECTIVES AND STRATEGIES
SPATIAL OBJECTIVES AND STRATEGIES FOR THE MOPANI DI STRICT MUNICIPAL AREA
SPATIAL OBJECTIVE STRATEGY
1 The establishment of an optimal and functional spatial pattern for the municipal area over time.
• Develop settlements in accordance with their development potential. The level of investment in a settlement/settlement area for the provision of housing, economic development (e.g. LED projects), social services (e.g. clinics, schools, etc), physical infrastructure (e.g. level of services), institutional infrastructure (e.g. police stations, municipal offices), etc. should be done in accordance with the development potential of such a settlement/ settlement area.
2 The establishment of a spatial pattern to provide a framework for the provision of social facilities and physical infrastructure on a cost effective basis and to provide a sound basis for economic growth to increase income and employment in both the formal and informal sectors.
• Utilise the hierarchy of settlements as defined in the Spatial Development Framework and the Proposed Norms and Standards for the Provision of Community Facilities and Physical Infrastructure for different settlements.
3 Establish sustainable settlements that are able to generate economic activities and create jobs for their residents.
• Nodal points / areas with development potential in rural areas should receive priority attention in terms of providing a higher level of community facilities and physical infrastructure.
4 Areas currently utilised or earmarked/identified as areas with potential for specific utilisation in future, e.g. areas for mining, agricultural development, tourism, trade and industry, residential development (see Spatial Maps), should be protected from any development that will sterilize or negatively impact on existing and future utilisation of such areas for that specific use.
• No new land development will be allowed in areas that are utilised or earmarked/identified as areas with potential for specific utilisation (e.g. areas for mining, agricultural development, tourism, trade and industry, residential development) in future without lodging a properly motivated application to the relevant authority in terms of the applicable legislation.
• The Mopani District Municipality / local municipalities should comment and make an input regarding any of the afore-mentioned applications for land development.
• A Land Use Management System should formulated and in the process partnerships with Traditional Authorities be forged to ensure smooth implementation
5 Increase residential densities to achieve a more compact “urban” structure to achieve specific threshold values in population to provide for higher levels of social, physical, institutional and economic services.
• Reduced residential erf sizes for new housing projects should be negotiated with rural communities.
• Existing low density residential areas can be dandified by means of infill planning.
• New land development should be concentrated in development nodes and priority should be given to development nodes when new housing projects are allocated.
• This should accommodate rural life styles like backyard ploughing fields and livestock enclosures
6 The existing housing backlog in the Mopani Municipal Area should be addressed.
• Provision should be made for new low-income housing development in the municipal area in consecutive financial years to eradicate housing backlogs and to make provision for future need of housing.
• Recognition should be given to potential economic growth and allow for high and medium income developments –thus, a programme to provide social infrastructure and public amenities should be considered
7 Illegal occupation of land and the allocation of informal residential sites should be discouraged.
• A process should be put in place whereby tribal authorities should request the local authority to assist them to address the housing needs of the tribal communities.
• A collaborative system between the two institutions is required to ensure elimination and management of illegal land occupation

113
4. PROJECTS PHASE 4.1 PROJECTS PRIORITISATION
Project prioritization is a process and not a once off allocation of weights and scores. Successful prioritization is dependent on
all of the steps in a process and the relevancy and appropriateness of a prioritization exercise will be weakened if all of the
steps of the process are not committed to. Prioritisation is also to a large degree focused on financial and budget decisions to
accomplish specific objectives or goals.
It is thus clear that decisions regarding budgets and finances are being taken at different levels of the organization and taking
different issues and dynamics into account. Departmental budget decisions, for example, are operational oriented and doesn’t
always see the importance of strategic inputs. Community input into the budget process is also necessary and legislated.
However, the needs of the community cannot always be translated directly into projects. There is a process needed where
service providers must validated community needs and get at least some indication of accurate budget figures in order not to
create any unfounded expectations. The first point of departure is therefore to identify and agree on a set of principles that will
influence the budget and prioritization process, including the following:
� Simple, transparent and robust. In order to withstand pressures from all role-players it must clearly define roles,
be easily understandable, acceptable and have a transparent logic.
� High information accuracy. It must facilitate informed decisions using only the necessary information which must
be readily available.
� Flexible. It must be able to changing priorities. It should allow for positive feedback from development outcomes
linked to a three-year budget cycle.
� Comprehensive. It needs to cater for differing needs from Services, Municipal Development Map, IDP, Community,
Political leadership, etc.
� Balance. It needs to find the appropriate balance and compromise between technical needs to meet service goals
and political needs.
� Appropriate decision making. Technical decisions are made by the services departments, political decisions are
made by the politicians.
Taking the above into account, a basic prioritization process will at least include the following:
Diagram 3: Mopani Projects Prioritisation Methodology
Project Identification and
Registration
Project Assessment & Evaluation/
Prioritisation
Assessing Implications
and Choices
DecisioN

114
Each of the steps leading up to the final decision is important but the first step of project identification and registration forms
the basis of any prioritization process. By identifying and registering a project the following is assumed:
� The projects are part of comprehensive departmental planning processes where the need and sequence of projects
have been assessed.
� Projects went through a detailed feasibility exercise.
� Project information is accurate
4.2. PROJECT IDENTIFICATION AND REGISTRATION
Project registration is critical for any prioritization process. Without accurate information it is nearly impossible to complete a
relevant and appropriate prioritization process. Accurate profile information and registration will result in the following:
� Accurate financial information;
� It is the first filters that will already commit budgets and indicate what is left for prioritization. In many cases budgets
are already committed for a number of years due to multi year projects or contracts that are entered into;
� Accurate reporting
� Facilitation of sound decision taking and assessment of choices
These are indicated on the left hand side of Diagram 4 below.
4.3. PROJECT PRIORITISATION CRITERIA
The criteria depicted on the right hand side of Diagram 4 are those issues that will be considered during prioritisation with
weightings at each level.
Diagram 4: Project Prioritisation Model

115
Table 52: MDM PROGRAMMES AND PROJECTS 2009/2010 - 2012
IMPLEMENTING DIRECTORATE: COUNCIL (001)
No
Name
Category
Target
Location
Budget
2009/2010
2010/2011
2011/12
Source of funding
1 Training: Council Governance CLLRS MDM MDM
PROGRAMME: IMPLEMENTING DIRECTORATE: OFFICE OF THE SPEAKER (112)
No Name Category Target Location Budget 2009/2010 2010/2011 2011/12 Source of funding
1 Catering MDM
2 Conferences & Congresses
Governance MDM
3 Subsistence & training Governance MDM
4 Public Participation Governance Communities District wide
MDM
5 Printing & Stationery Governance MDM
6 Support to Local Municipalities
Governance Communities District wide
MDM
7 Izimbizo Governance MDM
8 District Ward Committees forum
Governance MDM
TOTAL
STRATEGIC INTENT: SUSTAINABLE QUALITY OF LIFE IMPLEMENTING DIRECTORATE: OFFICE OF THE EXECUTIVE MAYOR (110)
No Name Category Target Location Budget 2009/2010 2010/2011 2011/12 Source of funding
1 District Mayor’s Forum Governance Local Mayors LMs MDM
2 Local House of Traditional Leaders
Governance Traditional Leaders LMs MDM
3 Anti-Corruption Forum Governance Business, Labour & Civil Society LMs MDM
4 Mayor’s Charity Cup Social Football Clubs, Charity Org., Tourists LMs MDM
5 Excellence Awards Governance Stakeholders & Public Servants LMs MDM
6. Mainstreaming monitoring software Governance Designated groups MDM

116
7 Executive Mayor’s Donation Welfare Needy
DISABILITY DESK (116)
No
Name
Category
Target
Location
Budget
2009/2010
2010/2011
2011/12
Source of funding
1 District Disability Forum Social Disabled People’s Organisations LMs MDM
2 Disability Campaigns and Awareness
Social Rural Households LMs MDM
GENDER DESK (118)
No Name Category Target Location Budget 2009/2010 2010/2011 2011/12 Source of funding
1
Elders Day Social Elderly People LMs MDM
2
Elders Forum Social Elderly People LMs MDM
3 Gender Forum Social Gender-Based Organizations LMs
MDM
4
Men’s Forum Social Men and Boys LMs MDM
5
Women’s Month Social Women LMs MDM
6 16 Days of Activism Social Women & Children LMs MDM
7 SAWID Social Women LMs MDM
YOUTH DESK (119)
No Name Category Target Location Budget 2009/2010 2010/2011 2011/12 Source of funding
1 Children’s Rights Parliament Social Children LMs MDM
2 Youth Civic ducation/Campaigns Social Youth LMs MDM
3 Youth Council Social Youth Organisations LMs MDM
4 Youth Month Social Youth LMs MDM
5 District Children’s Rights Day Social Children LMs MDM

117
PROGRAMME: Governance
IMPLEMENTING DIRECTORATE: MUNICIPAL MANAGER’S OFFICE (005)
No
Name
Category
Target
Location
Budget
2009/2010
2010/2011
2011/12
Source of funding
1 Management Lekgotla Governance Managers MDM MDM
2 IDP/Budget/PMS Strategic planning session Governance Management MDM MDM
3 Performance Assessment Governance Managers MDM MDM
4 District Managers Forum Governance Managers MDM MDM 5 Management meetings Governance Managers MDM MDM
INTERNAL AUDIT (005 interim vote)
No Name Category Target Location Budget 2009/2010 2010/2011 2011/12 Source of funding
1 Internal Audit Charter review Governance Institution MDM 2 Risk Assessment Governance Institution MDM 3 3-year Audit Plan Governance Institution MDM 4 Seminars/Conferences Governance Institution MDM
PROGRAMME: Governance IMPLEMENTING DIRECTORATE: BUDGET AND TREASURY (020)
No Name Category
Target Location Budget 2009/2010 2010/2011 2011/12 Source of funding
1 Project Consolidate Funding Institutional Project Consolidate Municipalities
GGM GLM MLM
MDM
2 Upgrading of SCM Database Institutional Service Providers MDM MDM 3 Upgrading of Financial Systems Financial Budget & Treasury MDM MDM 4 Review of Financial Policies and Procedures Institutional Employees MDM MDM 5 Asset Management Implementation Plan Institutional Infrastructure MDM MDM 6 Conversion of GAMAP/GRAP
Implementation Plan Financial MDM MDM MDM
7 Revenue enhancement strategy Financial MDM MDM MDM
8 Free Basic Water Funding Social ALL LMs MDM MDM
9 Local municipalities Indigent Register Review
Budget & Treasury
Poor households LMs MDM
STRATEGIC INTENT: CREATE A STABLE ECONOMIC ENVIRONMENT BY ATTRACTING SUITABLE INVESTORS

118
IMPLEMENTING DIRECTORATE: PLANNING AND DEVELOPMENT (030)
SPATIAL DEVELOPMENT PLANNING (030)
No Name Category Target Location Budget 2009/2010 2010/2011 2011/12 Source of funding
1 Sites Demarcation Support to LMs
R188 R188 R293 R293 R293 R293 R293 R293 R188 R188 R188 R188 R188 R188 R188
250 sites 200 sites 1000 sites 1000 sites 1000 sites 1000 sites 1000 sites 1000 sites 300 sites 200 sites 500 sites 300 sites 300 sites 200 sites 300 sites
Nkambako/ Valoyi (GTM) Mugwazeni/ Valoyi(GTM)
Giyani (GGM) Nkowankowa (GTM) Lenyenye(GTM) Ga-Kgapane (GLM) Namakgale (BPM) Lulekani(BPM) Mahumani/ Xawela(GGM)
Sekororo/ Lorraine(MLM)
Raphahlelo (GLM) Modjadji/ Mohlabaneng (GLM) Mahumani/ Xikhumba (GGM) Mariveni(GTM)
Ga- Ntata(GLM)
MDM (NEW) (NEW) (NEW) (NEW) (NEW)
2 SDF Review Governance Sustainable development
MDM MDM
LOCAL ECONOMIC DEVELOPMENT (035)

119
No Name Category Target Location Budget 2009/2010 2010/2011 2011/12 Source of funding
1 Fresh Produce Market Economic Development
Farmers Nkowankowa MDM
2 Moshupatsela programme:
(- Atchaar Factory - Dried Fruit Factory - Orchard Management - Vegetables and Chilli production)
Economic Development
Emerging Farmers
Tzaneen
MDM
3 GGNRDP: - Beekeeping - Mopani Worms
Economic Development
Local Farmers
Giyani MDM
4 International marketing and exhibitions
Economic Development
International investors
International exhibitions
MDM
5 Formalisation of Informal markets.
Economic Development
Street Hawkers
Letsitele, Giyani, Mooketsi
MDM
6 Alternative source of energy
Economic development
Business MDM MDM
7 Development Agency Economic development
Business MDM MDM
8 Summits: LED, Agric, Tourism and Mining
Economic Development
Farmers, Tourism Operators, Mining houses SMMEs, Investors.
MDM MDM
9 Incorporation of Airport function into District municipality
Economic development
Investors MDM MDM
10 Feedlots Value chain Economic development
Farmers MDM MDM
11 Baleni Fencing Economic development
GGM MDM
INTEGRATED DEVELOPMENT PLANNING (040)

120
No Name Category Target Location Budget 2009/2010 2010/2011 2011/12 Source of funding
1 IDP Review IDP Governance MDM MDM
2. Regional IDP Indaba IDP Governance MDM MDM
COMMUNICATION (045)
1 Marketing and Advertising LED Investors District -wide MDM 2 Quarterly MDM News letter & Publications Communication Communioties MDM MDM 3 Website update Communication Institution MDM MDM 4 Communication strategy review Communication Governance MDM MDM 5 Media Release Communication Governance MDM MDM
6 Communicator’s Forum Communication Governance MDM MDM
7 Communications Conference Communication Governance MDM MDM
STRATEGIC INTENT: IMPROVE ACCESS TO SUSTAINABLE AND AFFORDABLE SERVICES
IMPLEMENTING DIRECTORATE: TECHNICAL SERVICES (050)
No Name Category Target Location Budget 2009/2010 2010/2011 2011/12 Source of funding
1 Extension of Mopani Office Building Governance MDM Tzaneen MDM
2 Kgapane Stadium Socio-Infrastr Sport Ga-Kgapane MDM
3 Lenyenye Stadium Socio-Intrastr Sport Lenyenye MDM
4 Building of Giyane Fire Station Socio-Intrastr Giyani
5 N’wamitwa MPCC (Thusong centre) Socio-Intrastr GTM
6 Building of sleeping quarters/Tower/Storerooms/Workshop – Maruleng Fire station
Social Staff Hoedspruit
7 Erection of carports-Tzaneen fire station Social Staff Tzaneen
WATER SERVICES (055)
No Name Category Target Location Budget 2009/2010 2010/2011 2011/12 Source of funding
1 Thabina RWS S & I Rural H/H GTM MDM 2 Water reticulation to villages in GGM:
extensions & upgrading S & I 20 Villages GGM MDM
3 Mopani Rural Household sanitation S & I BPM: 11 vilges
GTM: 132 MLM: 21 GGM: 75 GLM: 110
All villages in LMs
MDM
4 Mametja Sekororo RWS S & I Rural H/H Mametja Sekororo
MDM

121
5 Sekgosese Ground water development scheme(Township)
S & I Rural H/H Sekgosese MDM
6 Lenyenye sewerage works(plant and outfall sewer)
S & I Rural H/H Lenyenye MDM
7 Extension and upgrading of Giyani water works
S & I Rural H/H GGM MDM
8 Boyelang water supply and reticulation S & I Rural H/H BPL MDM
9 Giyani system N(Mapuve) and bulk supply main Siyandani
S & I Rural H/H GGM MDM
10 Sefofotse - Ditshosine/ Ramahlatshi bulk line and reticulation
S & I Rural H/H GLM MDM
11 Tours bulk water scheme(upgrading of pump station and reservoirs linking Lephephane
S & I Rural H/H GTM MDM
12 Ritavi RWS (upgrading and extension to existing plant, raising weir, additional pump mains)
S & I Rural H/H GTM MDM
13 Jopie- Mawa Block 12- Ramotshinyadi bulk pipeline and reticulation
S & I Rural H/H GTM MDM
14 Kampersrus Bulk Water Supply S & I Rural H/H MLM MDM
15 Upgrade of water reticulation and extension: MLM
S & I Rural H/H MLM MDM
16 Upgrade of water reticulation and extension: BPM
S & I Rural H/H BPL MDM
17 Upgrade of water reticulation and extensions: GTM
S & I Rural H/H GTM MDM
18 Upgrade of water reticulation and extension: GLM
S & I Rural H/H GLM MDM
19 Mbaula Water Supply S& I Rural H/H GGM MDM
20 Nkambako RWS Additional Pumpstation
S & I Rural H/H GGM MDM
21 Extension to Middle Letaba Water Works S& I Rural H/H GLM MDM
22 Extension to Modjadi Water Works S & I Rural H/H GLM MDM
23 Upgrading of Giyani Sewage Works S& I Rural H/H GGM MDM
24 Maruleng Central Bulk S & I Rural H/H MLM MDM
25 Modjadji Outfall Sewer S& I Rural H/H GLM MDM
26 Modjadji Sewer Reticulation S& I Rural H/H GLM MDM
27 Upgrading of Kgapane Sewage Plant S& I Rural H/H GLM MDM
28 Namakgale Sewerage Works upgrade S & I Rural H/H BPM MDM
29 Mamaila Mphothwane borehole Rural H/H GLM
30 Thapane Water Scheme Socio-Infrastr Thapane

122
31 Water Commissioning (pilot study) GGM
32 Selwane Water Scheme BPM
33 Subsidies for transportation of Diesel by communities
LMs
TOTAL Project No. 2: Villages for Water Reticulation in GGM project are listed in DWAF Report dated 4th April 2007 Project No. 3: Villages for Mopani Rural Sanitation are listed in DWAF Report dated 22nd August 2006
Roads and Transport (065) No Name Category Target Location Budget 2009/2010 2010/2011 2011/12 Source of funding
1 Matsotsosela Bridge S & I Road GGM MDM
2 Dzumeri – Kheyi road S & I 24,68 km GGM MDM
3 Xikukwane – Xivulana road S & I 18,55 km GGM MDM
4 Modjadji to Mavele road upgrade S & I 22,69 km GTM MDM
5 Lephepane - Khujwane road S & I 17,15 km GTM MDM
6 Thabina to Maake upgrade S & I 7,61 km GTM MDM
7 Metz – Bismark road S & I 16,41 km MLM MDM
8 Kgweetsi-Tours Access rd S & I 7,99 km GTM MDM
9 D1329(near Rabothata) S & I 16,5 km GLM MDM
10 D1330 (Mabulane- Lenokwe) S& I 2,1 km GLM MDM
11 D1331(Mothobeki- Mabulane) S& I 9,29 km GLM MDM
12 Harmony to gravelotte rd S& I 29,78 km BPM MDM
13 Makhushane-Namakgale rd S& I 2,94 km BPM MDM
14 Upgrading of Maseke to Mashishimale Phase IV
S & I 13 km BPM MDM
15 Sekgopo road (paving & stormwater) GLM
16 Makhushane - Maune road BPM
ELECTRIFICATION
1 Electrification of Metz extension Rural H/H MLM
2 Electrification of Mageva Rural H/H GGM
STRATEGIC INTENT: PROMOTE ENVIRONMENTALLY SOUND PRACTICES AND SOCIAL DEVELOPMENT PROGRAMME: Sport, Arts & Culture

123
IMPLEMENTING DIRECTORATE: COMMUNITY SERVICES (070)
No Name Category Target Location Budget 2009/2010 2010/2011 2011/12 Source of funding
1 Support district O.R. Tambo games Social Youth Phalaborwa MDM
2 Support Indigenous games Social Abled and disabled, youth, men, and women
Ga-Kgapane MDM
3 Support Welness Day Social All people LMs MDM
4 Support district Junior Dipapadi Festival
Social Pre-school learners between the age of 3 and 6 years.
Giyani MDM
5 Support district Arts and Culture activities
Social and Infrastructure
Communities MDM MDM
6 Support district School Sport Activities Social Learners MDM
7 Establishment of Mopani Satellite Sport Academy
Social and Infrastructure
Abled and disabled youth, women and elderly people
(Thomo village) MDM
8 Support district Siyadlala mass participation programme & club development programme
Social Youth, Disabled
LMs MDM
9 Support district library activities Social Youth, Men Women, Disabled
LMs MDM
10 Support District sport and recreation council
Social Sport & Recreation Council
MDM MDM
11 Arts and Culture Council Social Arts & Culture Council
MDM MDM
12 Heritage and museum forum activities Social Youth, Women, Disabled
LMs MDM
13 District moral regeneration forum activities
Social Youth, Women, Disabled , Men
LMs MDM
14 District safety and security forum activities
Social Youth, Women, Disabled
LMs MDM
15 District housing forum activities Social Disabled, Youth, Women
LMs MDM
16 Leretjeng Sports Centre Social Disabled, Youth, Women
GTM
ENVIRONMENT MANAGEMENT (060)

124
No Name Category Target Location Budget 2009/2010 2010/2011 2011/12 Source of funding
1 World environment day celebration Social Women & youth GGM MDM
2 State of School Environment Competition
Social School youth BPM,MLM,GGM,
GTM,GLM MDM
4 Wetlands Awareness Day celebration MDM
5 Development of Environmental status quo report
Governance Institution MDM MDM
6 Development on air quality plan Social Institution MDM
7 Establishment of Waste Disposal Sites Social and Infrastructure
Waste management
GGM, MDM
8 Establishment of Waste Disposal Sites Social and Infrastructure
Waste management
GLM
9 Establishment of Waste Disposal Sites Social and Infrastructure
Waste management
MLM
10 Establishment of site selection forum ( Environmental Management Advisory Forum)
Social and Infrastructure
Youth, Women, Disabled
MDM MDM
11 Development of waste management policy
Social and Infrastructure
Waste management
MDM
12 Determining working conditions for salvagers
Social Waste management
MDM MDM
13 Establishment of cleaner production cleaner
Social Waste management
MDM MDM
14 Capacity building of home use of organics
Social Waste management
MDM MDM
15 Support & monitor Moshupatsela programme
Social Waste management
MDM MDM
16 Conducting of pilot project for an Integrated Rural Waste Management Sysem
Social Waste management
MDM MDM
17 Support and monitor the airport programme
Social Waste management
MDM MDM
18 Support and monitor the District Abattoir programme
Social Waste management
MDM MDM
19 Monitor Water Quality and Sanitation projects
Social Waste management
MDM
HEALTH SERVICES (085)

125
No Name Category Target Location Budget 2009/2010 2010/2011 2011/12 Source of funding
1 World Aids Day celebration Social All people MDM MDM 2 Candlelight memorial celebration Social All people MDM MDM 3 World food day celebration Social Women, disabled
& Children GGM MDM
4 Conduct Health and hygiene Road shows/ workshops
Social Street traders (women& youth)
BPM,MLM,GGM,GTM,GLM
MDM
5 Initiation schools support Social Youth BPM,MLM,GGM,GTM,GLM
MDM
6 World diabetic day/ Cancer month celebraion
Social Chronic clients ,the aged and people with disability
BPM,MLM,GGM,
GTM,GLM
MDM
7 District Health Council activities Social Council members, NGOs, Traditional Healers
MDM MDM
8 District Aids Council activities Social Youth, Women, Disabled
MDM MDM
9 District Food Control Committee activities
Social Youth, Women, Disabled
MDM MDM
10 HIV/AIDS Technical Task Team activities
Social Youth, Women, Disabled
LMs MDM
11 Support Early Childhood Development projects
Social Children under 8 years
BPM,MLM,GGM,
GTM,GLM MDM
IMPLEMENTING DIRECTRATE: COMMUNITY SERVICES PROGRAMME: HOUSING
No Name Category Target Location Budget 2009/2010 2010/2011 2011/12 Source of funding
1. Conduct Housing beneficiaries workshops
Social Homeless, Associations
MDM
IMPLEMENTING DIRECTORATE: COMMUNITY SERVICES (070) PROGRAMME: FIRE SERVICES

126
No Name Category Target Location Budget 2009/2010 2010/2011 2011/12 Source of funding
1 Conduct Awareness Campaigns
Social Communities MDM MDM
2 Control room/Activation system – Tzaneen fire station
Social Staff Tzaneen MDM
3 Provision of blinds – Tzaneen fire station
Social Staff Tzaneen MDM
4 Procurement of Fire Services Equipment/Vehicles
Social Staff All stations MDM
5 Erection of Strategic Emergency services Numbered sign boards
Social Road users Main Roads MDM
STRATEGIC INTENT: PROMOTE ENVIRONMENTALLY SOUND PRACTICES AND SOCIAL DEVELOPMENT IMPLEMENTING DIRECTORATE/ UNIT: DISASTER MANAGEMENT (080)
No Name Category Target Location Budget 2009/2010 2010/2011 2011/12 Source of funding
1 Radio, Communication, Info. Management System
Emergency Services
MDM Households
Tzaneen MDM
2 Awareness Campaigns Emergency Services
MDM Households
All Local Mun. MDM
3 Disaster Relief support Emergency Services
MDM Households
Whole District MDM
4 Early Warning System Emergency Services
MDM Households
Centre & all local municipalities
MDM
5 Vehicle tracking systems Emergency Services
MDM Households
MDM MDM
6 Disaster Management Conference
Emergency Services
DMC Staff MDM
7 Floodlines management Emergency Services
MDM Households
MDM MDM
IMPLEMENTING DIRECTORATE: CORPORATE SERVICES (090) PROGRAMME: ADMINISTRATION

127
No Name Category Target Location Budget 2009/2010 2010/2011 2011/12 Source of funding
1 Electronic filing system Governance Support services
Municipal building
MDM
2 Security Services Main Office & Disaster Centre
Governance Support services
Municipal building
MDM
3 Pool vehicles Governance Support services
MDM MDM
IMPLEMENTING DIRECTORATE: CORPORATE SERVICES (090) PROGRAMME: HUMAN RESOURCE No Name Category Target Location Budget 2009/2010 2010/2011 2011/12 Source of funding
1. Task job evaluation Governance Support services
MDM
2 Employment Equity Plan Governance Support services
MDM
3 Employment Assistant Program
Governance Support services
MDM
4 Retention Strategy and Development
Governance Support services
MDM
5 Development of Competency Framework
Governance Support services
MDM
6 Human Resource PoliciesReview
Governance Support services
MDM
7 Training programme Governance Support services
MDM
Table 53: Sector Departments Projects 2009/2010- 2011/2012
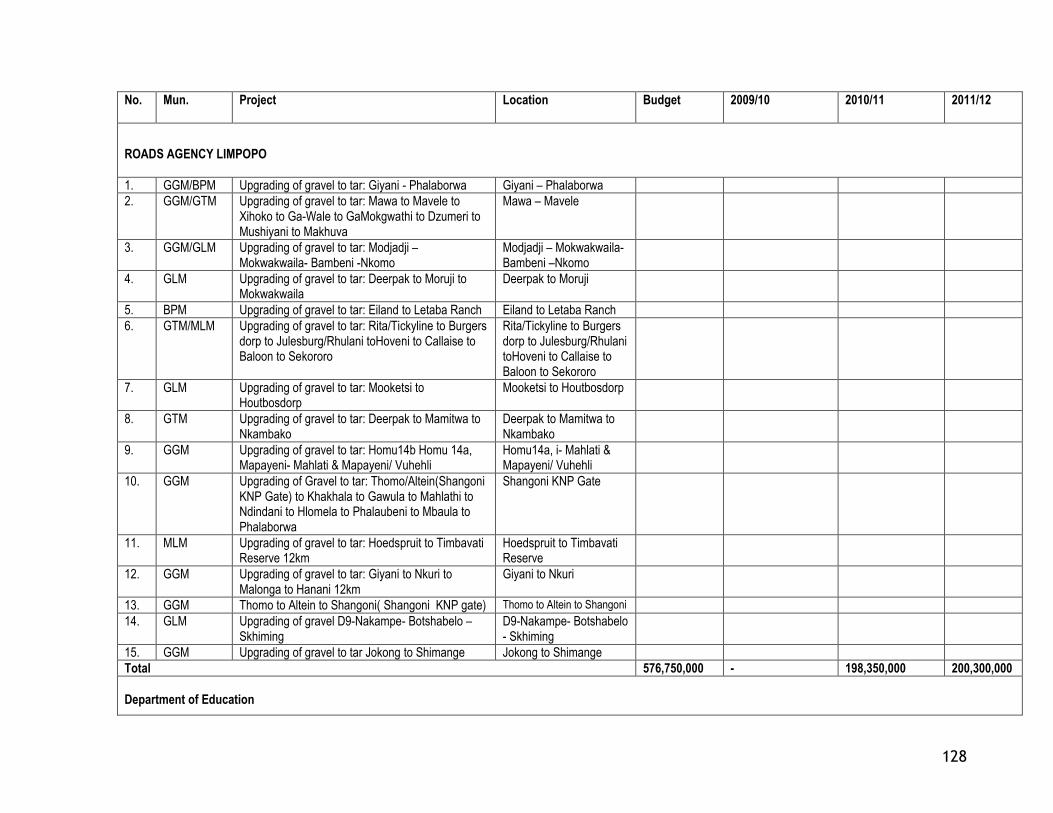
128
No. Mun. Project Location Budget 2009/10 2010/11 2011/12
ROADS AGENCY LIMPOPO
1. GGM/BPM Upgrading of gravel to tar: Giyani - Phalaborwa Giyani – Phalaborwa
2. GGM/GTM Upgrading of gravel to tar: Mawa to Mavele to Xihoko to Ga-Wale to GaMokgwathi to Dzumeri to Mushiyani to Makhuva
Mawa – Mavele
3. GGM/GLM Upgrading of gravel to tar: Modjadji – Mokwakwaila- Bambeni -Nkomo
Modjadji – Mokwakwaila- Bambeni –Nkomo
4. GLM Upgrading of gravel to tar: Deerpak to Moruji to Mokwakwaila
Deerpak to Moruji
5. BPM Upgrading of gravel to tar: Eiland to Letaba Ranch Eiland to Letaba Ranch
6. GTM/MLM Upgrading of gravel to tar: Rita/Tickyline to Burgers dorp to Julesburg/Rhulani toHoveni to Callaise to Baloon to Sekororo
Rita/Tickyline to Burgers dorp to Julesburg/Rhulani toHoveni to Callaise to Baloon to Sekororo
7. GLM Upgrading of gravel to tar: Mooketsi to Houtbosdorp
Mooketsi to Houtbosdorp
8. GTM Upgrading of gravel to tar: Deerpak to Mamitwa to Nkambako
Deerpak to Mamitwa to Nkambako
9. GGM Upgrading of gravel to tar: Homu14b Homu 14a, Mapayeni- Mahlati & Mapayeni/ Vuhehli
Homu14a, i- Mahlati & Mapayeni/ Vuhehli
10. GGM Upgrading of Gravel to tar: Thomo/Altein(Shangoni KNP Gate) to Khakhala to Gawula to Mahlathi to Ndindani to Hlomela to Phalaubeni to Mbaula to Phalaborwa
Shangoni KNP Gate
11. MLM Upgrading of gravel to tar: Hoedspruit to Timbavati Reserve 12km
Hoedspruit to Timbavati Reserve
12. GGM Upgrading of gravel to tar: Giyani to Nkuri to Malonga to Hanani 12km
Giyani to Nkuri
13. GGM Thomo to Altein to Shangoni( Shangoni KNP gate) Thomo to Altein to Shangoni
14. GLM Upgrading of gravel D9-Nakampe- Botshabelo – Skhiming
D9-Nakampe- Botshabelo - Skhiming
15. GGM Upgrading of gravel to tar Jokong to Shimange Jokong to Shimange
Total 576,750,000 - 198,350,000 200,300,000
Department of Education

129
New Constructions
1. BPM Mashavele Primary Majeje village
2. BPM Chuchekani Primary Humulani
3. GLM Mabje a Kgoro Primary Relela village
4. MLM Rakgolokwane High Turkey
5. GTM Sevengwana High Xihoko
6. GTM Xirhulurhulu Primary Xihoko
7. GLM Makoma High Motlakuranta
8. GTM Burgersdorp High Burgersdorp
Total 141,000,000 43,636,000 -
New Circuit Office
1. MLM Makhutswe/Lepelle MLM
2. GGM Giyani Cluster GGM
3. GLM Mamaila GLM
Total 32,521,000 29,192,000 -
New schools/Offshoots
1. MDM New Schools Various MDM
2. MDM Offshoots Various MDM
Total 200,000,000 409,000,000
Upgrading and Additions (Condemned Schools)
1. BPM Schietocht Primary Hebron
2. GLM Northampton Primary Gamamatlepa
3. GLM Ratseke Primary Ga-Ratseke
4. GLM Mpapatla Primary Mmamanoha
5. GLM Mamoding Primary Ga-Mookgo
6. GTM Unity Primary Tzaneen
7. GLM Senwabakgololo High Runnymade
8. GTM Jassi N’wanedzi
9. BPM Prieska Primary Prieska
10. BPM Ntshuxeko High Majeje
11. BPM Namakgale Primary Namakgale
12. GGM Maloba Primary Molototsi
13. GGM Bvuma Primary Loloka
14. GGM Makhuva Primary Makhuva

130
15. GGM Rirhandzu Nkomo
16. GLM Munnik Primary Ga-Sekgopo
17. GLM Makhabeni Primary Ga-Sekgopo
18. GLM WM Kgatla Primary Ga-Kgapane
19. GLM Mamokgadi Primary Mamokgadi
20. GTM Mushoti Primary Mafarana
21. GTM Vhula kanjhani Primary Letsitele
22. GTM Nyavana Primary Xihiko
23. GTM Botludi Primary Botludi
Total 2,320,000 - -
Condemned and Congested Schools (with inappropriate structures)
1. GTM Semarela High GTM
2. GTM Mafarana Primary GTM
3. GTM Mapula Primary GTM
Total 2,619,000 132,000 -
Dinaledi Schools upgrading and revitalization
1. GTM Hudson Ntsanwisi High GTM
2. GTM Tivumbeni EMPC GTM
Total 14,500,000 768,000 -
Condemned and Congested Schools (Dilapidated Schools)/Refurbishment of ELSEN Schools
1. GLM Mokutu High GLM
2. GLM Railela High GLM
3. GGM Edward Homu High GGM
4. GTM Letaba ELSEN GTM
5. MLM Balloon Mantjana Primary MLM
6. GTM Banana Primary GTM
7. GGM Hakka Primary GGM
8. MLM Kgopong Primary MLM
9. MLM Kgwana High MLM
10. GGM Khomani Mbhalati High GGM
11. MLM Lepono High MLM
12. MLM Maaloabane High MLM
13. BPM N’warisenga Primary BPM
Total 16,757,000 65,071,000 -
Maintenance and Repairs (Former Model Schools)

131
1. BPM Fauna Park Primary BPM
2. BPM Hoerskool Frans Du Toit BPM
3. BPM Laerskool Phalaborwa Suid BPM
4. GLM Laerskool Duiwelskloof GLM
5. GTM Laerskool Ben Vorster GTM
6. GTM Laerskool Dr Annecke GTM
7. GTM Laerskool Tzaneen GTM
8. GTM Merensky High GTM
9. MLM Laerskool Mariepskop MLM
10. BPM Laerskool Phalaborwa Noord BPM
11. MLM Laerskool Drakensig MLM
12. GLM Jacob Zuma GLM
Total 3,542,000 - -
Emergency repairs and maintenance of schools (e.g. Storm- damaged Schools)
1. MDM Maintenance & Storm damage various MDM
Total 119,874,000 142,109,000 179,959,000
Department of Roads and Transport
Road Maintenance Plan
1. MDM Routine Maintenance (3150 km) MDM
2. MDM Blading (Total gravel: 1969) MDM 3. MDM Surface (Total Paved roads: 1181 km) MDM 4. MDM Road Reserve (3150 km) MDM 5. MDM Regravelling (66km) MDM
Total
67,316,000 75,989,000 79,788,000
EPWP Plan
1. GGM Upgrading (Gravel to paved) Hanyani Thomo School (4km)
GGM
2. BPM Upgrading (Gravel to paved) Matiko Xikaya (3km) BPM
3. GTM Upgrading of Pedestrian footpath (Tzaneen to Lenyenye)
GTM
Total 23,150,000 15,550,000 26,550,000
Public Transport

132
1. GGM Construction of Intermodal Facility GGM
Total 20,000,000 20,000,000 -
Traffic Management
1. GTM Construction of Tzaneen k53 testing station GTM
Total 5,000,000 - -
Department of Agriculture
CASP Project
1. MLM De Oaks (Irrigation System) MLM
2. GTM Mlangeni-Mapheto (Irrigation infrastructure) GTM
3. BPM Seloane BPM
4. GTM Madidi GTM
5. BPM Waterbok (Seloane) BPM
Total 7,617,435 - -
Food Security
1. GGM Ntshuxeko (Food Security) GGM
2. GGM Hanyani (Food Security) GGM
Total 1,000,000
RESIS Project
1. GTM Julesburg GTM
2. GTM Lephephane GTM
3. GTM Thabina GTM
4. GTM Tours GTM
5. MLM Lorraine A & B MLM
6. MLM Madeira MLM
7. MLM Makgaung MLM
8. MLM Sekororo MLM
Total 26,647 51,000
RESIS and IGP Projects
1. MLM Metz (Statutory dam refurbishment) MLM
2. GTM Mapheto Trust (Banana processing facility) GTM

133
3. GTM Ditubatse (Fruit grading facility) GTM
4. GGM Pet Food Processing Facilities GGM
Total 16,000 29,500 -
National Development Agency
1. GTM Choice Trust GTM
2. MLM Kodumela Area Development Programme MLM
3. BPM Itireleng Education Project BPM
4. GGM Makhuva Community Information Centre GGM
5. GGM Pfuneka Khashane Project GGM
6. GTM Merekome Farmers Co-operative GTM
7. GTM Human Resources Information Centre GTM
8. GGM Ndla-Kheto Youth Co-operation GGM
9. GGM Ndlandlamuka Institute for Sustainable Development GGM
10. GGM Tinghwazi Arts Amalgamation GGM
11. GGM Hlalala Co-operative Limited GGM
Total 10,703,480 - -
Department of Water Affairs 1. MDM Sanitation (7 Schools) MDM
2. MDM Water to Schools MDM
9,370,599 - -
ESKOM
1. GTM Mafarana phase 1: 1020 connections Mafarana phase 1
2. GGM Mushiyani: 403 connections Mushiyani
3. GLM Modjadji phase 6: 768 connections Modjadji phase 6
4. BPM Lulekani B1 EXT: 187 connections Lulekani B1 EXT
5. BPM Makhushane: 1479 connections Makhushane
6. MLM Metz: 126 connections Metz
7. MLM Madeira: 96 connections Madeira
8. MLM Butswana: 98 connections Butswana
TOTAL 38, 873, 803 38, 873, 803
Department of Minerals and Energy – Electrification of Houses
1. GGM Dingamazi (134 Houses) Dingamazi -

134
2. GGM Vuhehli (100 Houses) Vuhehli -
3. GGM Zava (150 Houses) Zava -
4. GGM Nkomo C (100 Houses) Nkomo C -
5. GGM Nwakhuwani (130 Houses) Nwakhuwani -
6. GTM F.J. Du Toit (5 Houses) F.J.Du Toit -
7. GTM Franchoise Voster (13 Houses) Franchoise Voster -
8. GTM H.A. Du Toit (20 Houses) H.A. Du Toit -
9. GTM Heindrich Kubannek (1 House) Heindrich Kubannek -
10. GTM Henk Schoeman A (7 Houses) Henk Schoeman A -
11. GTM Henk Schoeman B (12 Houses) Henk Schoeman B -
12. GTM Henk Schoeman C (3 Houses) HenkSchoeman C -
13. GTM IgVan Rensberg (8 Houses) IgVan Rensberg -
14. GTM Isak Lombaard (11 Houses) Isak Lombaard -
15. GTM JP Kasselman (3 Houses) JP Kasselman -
16. GTM Julius Smuts (3 Houses) Julius Smuts -
17. GTM Maartin Visagie (210 Houses) Maartin Visagie -
18. GTM Neels Osmers (1 House) Neels Osmers -
19. GTM Nic van Schalkwyk A (17 Houses) Nic van Schalkwyk A -
20. GTM Nic van Shalkwyk B (5 Houses) Nic van Schalkwyk B -
21. GTM Nic van Schalkwyk C (2 Houses) Nic van Schalkwyk C -
22. GTM Nico Devillers (4 Houses) Nico Devillers -
23. GTM Peter Waddeelow B (2 Houses) Peter Waddeelow -
24. GTM Pieter Human A (3 Houses) Pieter Human A -
25. GTM Pieter Human B (4 Houses) Pieter Human B -
26. GTM Pieter Venter (2 Houses) Pieter Venter -
27. GTM Piete Vermaak (12 Houses) Piete Vermaak -
28. GTM T. Pasons (2 Houses) T. Pasons -
29. GTM Westfalia Mahupa (65 Houses) Westfalia Mahupa -
30. GTM Westfalia Maruka B (55 Houses) Westfalia Maruka B -
31. GTM Mafarana (1 100 Houses) Mafarana -
32. GTM Miek Walkensaw (2 Houses) Miek Walkensaw -
33. GTM Lefara Village (463 Houses) Lefara Village -
34. GTM Mugwazeni (500 Houses) Mugwazeni -
35. GTM Ntsako (718 Houses) Ntsako -
36. GTM Berlyn – Mulati (870 Houses) Berlyn - Mulati -
37. GTM Amorentia Estate (30 Houses) Amorentia Estate -
38. GTM Chris Willers (1 Houses) Chris Willers -
39. GTM Christo Pretorius (28 Houses) Christo Pretorius -
40. GTM Dewald Pretorius (24 Houses) Dewald Pretorius -
41. GTM Dirk De Nuysen (6 Houses) Dirk De Nuysen -

135
42. GTM Du Toit Welman (9 Houses) Du Toit Welman -
43. GTM Senwamokgope (671 Houses) Senwamokgope -
44. GTM Kgapane (150 Houses) Ga-Kgapane -
17,415,800
BUDGET SUMMARY 2009/10 - 2012
Vote Description Salaries General Exp. O&M C apital 2009/2010 2010/2011 2010/2012
1 Council -
8,912,925 -
-
8,912,925
9,913,749
11,037,207
5 MM 5,229,946
1,263,384 -
-
6,493,330
7,181,032
7,752,786
20
Budget & Treasury Office
10,716,173
78,011,000 40,000
700,000
89,467,173
97,138,215
115,166,967
30 Planning 3,944,704
5,475,000 -
-
9,419,704
11,404,614
15,367,150
35 LED 1,467,547
9,989,000 -
2,500,000
13,956,547
9,010,393
6,751,164
40 IDP 1,022,839
468,500 -
-
1,491,339
1,681,984
1,844,676
45 Communications
1,553,020
3,733,200 -
-
5,286,220
5,871,113
6,308,264
50 Technical 2,777,295
1,706,500 -
55,349,680
59,833,475
26,202,804
1,917,423
55 Water 3,386,446
6,914,000 175,108,000
138,062,405
323,470,851
331,090,369
157,273,695
60 Health Services
4,163,576
2,978,300 -
1,900,000
9,041,876
6,242,543
6,810,473
64 Electrical 1,026,791
47,000 -
-
1,073,791
1,161,835
1,257,121
65 Roads & Transport
2,141,683
49,000 -
36,800,000
38,990,683
116,971,383
191,967,013
70 Community 2,812,150
921,700 -
500,000
4,233,850
4,126,698
4,449,519

136
75 Fire 14,060,708
1,846,000 1,700,000
20,660,000
38,266,708
28,084,986
19,343,149
80 Disaster 6,526,482
1,896,410 133,600
3,294,000
11,850,492
8,928,385
9,664,487
90 Corporate 2,500,634
661,000 -
-
3,161,634
4,050,386
4,355,366
95 HR 2,771,203
8,164,630 -
-
10,935,833
10,843,456
11,791,501
100 Administration
6,662,374
4,405,800 300,000
1,700,000
13,068,174
12,596,202
13,859,126
105 Legal 946,753
5,750,000 -
-
6,696,753
7,001,733
7,303,936
110 Office of Exec. Mayor
2,323,128
2,052,556 -
-
4,375,684
4,791,075
5,153,971
112 Office of Speaker
535,077
566,000 -
-
1,101,077
1,214,488
1,402,585
114 Office of Chief Whip
535,077
28,500 -
-
563,577
611,988
664,085
116 Disability Desk
233,480
375,000 -
-
608,480
655,759
692,846
118 Gender Desk
233,480
1,013,285 -
-
1,246,765
1,349,939
1,423,846
119 Youth Desk 233,480
770,580 -
-
1,004,060
955,273
991,331
TOTALS
77,804,045
147,999,270 177,281,600
261,466,085
664,551,000
709,080,403
604,549,690
OO1-GENERAL COUNCIL
020-General Expenses
VOTE DESCRIPTION 2009/2010 2010/2011
2010/2012
O100 Salaries-Councillors 4,371,070 4,733,869 5,126,780

137
Table 54: MOPANI DISTRICT FUNDING INCOME SOURCES
VOTE DESCRIPTION 2009/2010 2010/2011 2010/2012
3000 Equitable Shares 292,547,000 355,311,000 387,965,000
3150 Commission on Debit Orders Deducted-Payday 40,000 40,000 42,000
O120 Medical aid contribution-Councillors - - -
O140 Cell-phone allowance-Councillors 247,632 268,185 290,445
O155 Locomotive Allowance-Councillors 1,430,023 1,548,715 1,677,259
226 Books and Periodicals 20,000 60,000 75,000
230 Catering 350,000 400,000 450,000
240 Conferences & Congresses 500,000 550,000 600,000
250 Donations : Mayor 400,000 440,000 480,000
263 Entertainment 50,000 60,000 75,000
299 Licenses Fees and Subscription DSTV 1,200 1,400 1,600
318 Printing & Stationary 30,000 31,800 33,708
368 Subsistence & Travelling : Councillors 800,000 1,000,000 1,300,000
395 Training : Councillors 53,000 56,180 60,000
495 Mayor's Forum 60,000 63,600 67,416
Tents & Toilet Facilities 400,000 450,000 500,000
Decorations 200,000 250,000 300,000
Item Total 8,912,925 9,913,749 11,037,207
Department Total 8,912,925 9,913,749 11,037,207

138
3201 FMG 750,000 1,000,000 1,250,000
3212 EXT. Giyani Water Works-Office of the Premier - - -
3213 EXT. Lenyenye Sewerage Plan-Office of the Premier - - -
3214 Ba-Phalaborwa Municipality - - -
3300 Interest on Call Account 100,000 110,000 120,000
3310 Interest on Current Account 1,800,000 2,000,000 2,200,000
3315 Interest on Investments 10,000,000 12,000,000 15,000,000
3335 Registration Suppliers-Database - - -
3355 Tender Documents 150,000 140,000 145,000
3375 O & M (DWAF) 150,108,000 80,900,000 54,630,000
3390 Department of Health - - -
3445 MSIG 735,000 750,000 790,000
3475 M I G 194,985,000 229,946,000 197,414,000
3505 LGW SETA 265,000 225,000 250,000
3510 Donations 500,000 530,000 550,000
3512 Insurance claims 50,000 50,000 50,000
3518 Rent Income-Employees - - -
3525 Interest on Outstanding Debtors - - -
3540 Certificates-Inflambes 6,000 6,200 6,400
3542 Fire Services Charges 15,000 16,000 17,000
3546 Regional Bulk Water (DWAF) - - -
3548 Ba-Phalaborwa Collections 12,000,000 15,000,000 18,000,000
3556 Mayors Charity cup 500,000 520,000 550,000
Total Income 664,551,000 698,544,200 678,979,400
Total Expenditure 664,551,000 709,080,403 604,549,690
(+Surplus/-Deficit) -0 -10,536,203 74,429,710
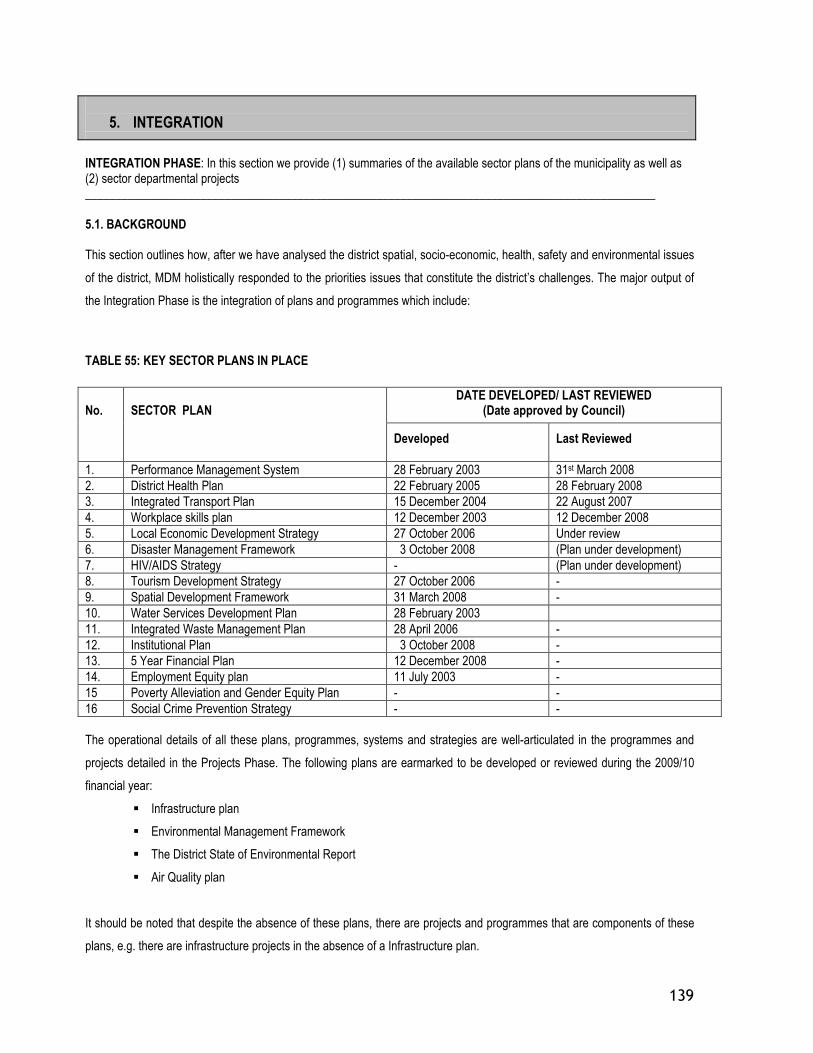
139
5. INTEGRATION
INTEGRATION PHASE: In this section we provide (1) summaries of the available sector plans of the municipality as well as (2) sector departmental projects ______________________________________________________________________________________________ 5.1. BACKGROUND This section outlines how, after we have analysed the district spatial, socio-economic, health, safety and environmental issues
of the district, MDM holistically responded to the priorities issues that constitute the district’s challenges. The major output of
the Integration Phase is the integration of plans and programmes which include:
TABLE 55: KEY SECTOR PLANS IN PLACE
DATE DEVELOPED/ LAST REVIEWED (Date approved by Council)
No.
SECTOR PLAN
Developed
Last Reviewed
1. Performance Management System 28 February 2003 31st March 2008
2. District Health Plan 22 February 2005 28 February 2008
3. Integrated Transport Plan 15 December 2004 22 August 2007
4. Workplace skills plan 12 December 2003 12 December 2008
5. Local Economic Development Strategy 27 October 2006 Under review
6. Disaster Management Framework 3 October 2008 (Plan under development)
7. HIV/AIDS Strategy - (Plan under development)
8. Tourism Development Strategy 27 October 2006 -
9. Spatial Development Framework 31 March 2008 -
10. Water Services Development Plan 28 February 2003
11. Integrated Waste Management Plan 28 April 2006 -
12. Institutional Plan 3 October 2008 -
13. 5 Year Financial Plan 12 December 2008 -
14. Employment Equity plan 11 July 2003 -
15 Poverty Alleviation and Gender Equity Plan - -
16 Social Crime Prevention Strategy - -
The operational details of all these plans, programmes, systems and strategies are well-articulated in the programmes and
projects detailed in the Projects Phase. The following plans are earmarked to be developed or reviewed during the 2009/10
financial year:
� Infrastructure plan
� Environmental Management Framework
� The District State of Environmental Report
� Air Quality plan
It should be noted that despite the absence of these plans, there are projects and programmes that are components of these
plans, e.g. there are infrastructure projects in the absence of a Infrastructure plan.

140
5.2. SECTOR PLANS The Integration Phase outlines how MDM has integrated its plans and programmes, which include:
5.2.1. SPATIAL DEVELOPMENT FRAMEWORK
The spatial fabric of South African society is characterized by displaced urbanization and a settlement pattern that is distorted,
fragmented, unequal, incoherent and inefficient. The legacy of the past spatial policies has left the spatial landscape in South
Africa’s towns, cities and rural settlements fragmented, expensive and difficult to manage, and environmentally unsustainable.
Such policies also had an effect in the Mopani Municipal area, which is clearly seen in the settlement pattern, i.e. fragmented
spatial pattern, resulting in the inefficient duplication of infrastructure networks. Bulk services have to be constructed over long
distances to supply outlying settlements with relatively small population numbers. Spatial reconstruction is required to address
these critical spatial issues and imbalances. It is a known fact that the current spatial pattern is generally inefficient and
expensive. The point of departure is to address the weaknesses of the spatial structure through planning and development of
its future growth.
In response to the fragmented spatial nature of settlements in the district, the municipality commissioned a consultative
process to develop a Spatial Development Framework for the district. A Spatial Development Framework is a key component
to the successful compilation and implementation of the integrated development plan.
The purpose of the SDF is to guide decision-making and action towards the establishment of integrated and habitable
settlement. This involves assessing the position of Mopani District Municipality from the national and provincial perspectives
and to serve as a guide to local municipalities to ensure that their spatial development links with the overall development
perspective of the district. A secondary purpose is to establish a strategic framework for an appropriate land use management
system. This spatial development framework seek to establish a more coherent settlement pattern and improve accessibility to
municipal and social services to all communities within the district including rural areas.
As a point of departure for formulating a vision for the spatial development in the Mopani District Municipality, it is necessary
to reflect on the overall vision for spatial development in the Limpopo Province. The vision of the Provincial Spatial Rationale
is to introduce and establish a spatial development framework for the province. It is anticipated that this guide the district and
local Municipalities to normalize the existing spatial pattern which was distorted by, mainly, past political processes and
forces.
The proposed settlement hierarchy for the province as outlined in the Spatial Rationale can be described as follows:
� First order Settlement (Growth Points) (GP)
Growth points are further divided into three categories, viz:
o Provincial Growth Point (PGP)
o District Growth Point (DGP)
o Municipal Growth Point (MGP)
� Second Order Settlements (Population Concentration Points) (PCP)

141
� Third Order Settlements (Local Service Points) (LSP)
� Fourth Order Settlements (Village Service Areas) (VSA)
� Fifth Order Settlements (Remaining Small Settlements) (SS)
Settlement clusters, therefore, indicate priority development areas/nodes in which primarily first order (three types of growth
points) and second order settlements (population concentration points) are identified. Growth points are, therefore, the
highest order in the settlement hierarchy, with Population Concentration Points being the second order in the proposed
settlement hierarchy.
The application of this hierarchy to the district can be summarized as follows:
� The 13 settlement clusters within the district consists of 3 types of growth points and population concentrations,
which are also referred to as first and second order settlements in terms of the proposed provincial settlement
hierarchy. The first order settlements (growth points) include the following:
� Provincial growth point namely Phalaborwa, Giyani, Tzaneen , Modjadjiskloof and Hoedspruit.
� District growth points namely Namakgale, Gravelotte, Ndhambi, Kgagapane, Nkowankowa & Lenyenye
� Municipal growth points namely Lulekani, Xawela, Senwamokgaope, Haenertsburg, Letsitele and Metz.
Most of the growth points are situated in the Greater Tzaneen Local Municipality (5 growth points) and is followed by Ba-
Phalaborwa Local Municipality (4 growth points). Approximately 25% of the total population is residing in settlements, which
form part of the 3 types of growth points mentioned above.
The district has a total of 8 population concentration points, which accommodates approximately 30% of the total population of
the district. Jointly, the 25 growth points and population concentration points (situated in 13 settlement clusters) contains
approximately 55% of the total population of the Mopani District. The settlement hierarchy reflects the following tendencies
with respect to individual local municipal areas,:
� Approximately 63% of the total population of Ba-Phalaborwa Local Municipality are situated within first order
settlements (growth points)
� Ba-Phalaborwa Local Municiapltiy has 81% of its total population residing in growth points and population
concentration points
� Greater Tzaneen Local Municipality has 59% of its total population residing in growth points and population
concentration points
� Greater Letaba Local Municipality has 59% of its total population residing in growth points and population
concentration points
� Greater Giyani Local municipality has 29% of its total population residing in growth points and population
concentration points
� Another 9% of the total population in the District Municipality are situated in 22 settlements which are classified
as local service points
� Only approximately 30% of the total population in the district municipal area (of which the majority are in the
142
Greater Giyani Local Municipality area) is located in 4th and 5th order settlements (being village service areas
and small settlements)
The Mopani District Municipality is situated within a number of strategic corridors in the Province which have a potential to
offer opportunities for development in the district. The main corridors affecting the district municipality include:
Ba-Phalaborwa spatial development initiative (SDI)
Traversing through the Southern side of the Municipality, this corridor is particularly well endowed with mining deposits with a
number of mining operations already underway. The corridor also offers opportunities in eco-tourism and game farming due to
its proximity to the Kruger National Park. The corridor is anchored on the South-East of the district by Phalaborwa and on the
South-West by Tzaneen.
Tzaneen – Letaba agricultural hub
This is the hub of the extensive activities within the District Municipality where most of the citrus fruit, sub-tropical fruit and
vegetables in the district are produced. This immediately offers opportunities for beneficiation (or processing of secondary
products) from fruit produce. Eco-tourism is also significant in this sub- region.
Giyani sub-region
The sub-region is also potentially rich in good agricultural soils and mining deposits. While the agricultural sector is still largely
based on subsistence farming practices, the mining deposits are beginning to be exploited with huge potential spin-offs such
as job opportunities and infrastructure development. The Eastern part of Greater Giyani offers tourism opportunities in game
farming given its proximity to the Kruger National Park.
“The Mopani District will pursue a spatial development pattern which optimizes the benefits offered by the natural environment
in terms of agricultural, tourism and mining activities. This spatial development pattern will be structured around a network of
key development nodes and corridors corresponding with the provincial spatial rationale and national spatial development
perspectives.
Taking into cognizance of the overall vision for the Limpopo Province, as well as the strategic analysis of key issues in the
Mopani District Municipality, the following municipal vision for spatial development has been formulated:
“The Mopani District will pursue a spatial development pattern which optimizes the benefits offered by the natural
environment in terms of agricultural, tourism and mining activities. This spatial development pattern will be structured around
a network of key development nodes and corridors corresponding with the provincial spatial rationale and national spatial
development perspective. This spatial development framework seek to establish a more coherent settlement pattern and
improve accessibility to municipal and social services to all communities within the district including rural areas.
Implementation of the spatial development framework will take due cognizance of the environmental features of the area to
ensure the longer term sustainability of development within the district”
This vision of an optimal spatial pattern embodies the establishing of a functional hierarchy of settlements (both towns and

143
villages) as an integral part of a macro spatial plan for the province. It must contribute to social stability, economic growth and
development in an equitable and sustainable way to address the problem of rural-urban inequality, but must also support a
normal urbanization process.
The SDF also has spatial development objectives and strategies that suggest the optimum way of ensuring nodal
development and urban integration, bulk infrastructure development, equitable access to social services, land use and
transport integration system, agriculture and environmental sustainability, and housing and sustainable neighbourhoods.
Land Use Management System
The municipality has not yet developed a Land-Use Management System (LUMS) to manage the utilisation of land in the
district. The future LUMS for the district municipality will consider the following general guidelines:
� the LUMS should be consistent with, and support the objectives of, the district SDF, the district IDP, the
provincial SDF, provincial and national environmental and planning legislation and plans;
� the LUMS should ideally determine land uses and conditions for every piece of land within the municipal area;
� the conditions should be rigid enough to effectively control and manage land use and development, but flexible
enough to accommodate various levels of development with varying impact on the land use pattern of the
municipality, and
� the LUMS should incorporate municipal policies in respect of land use, development zones, areas designated
for specific types and intensities of development.
Implementation of the spatial development framework will take due cognizance of the environmental features of the area to
ensure the longer-term sustainability of development within the district”. In the Projects Phase, the spatial development
programmes and projects are highlighted. The spatial picture of the district highlighted, gives us a glimpse of our municipal
area, on where to focus resources to address basic needs backlogs and also on areas where we should focus our capital
investment. This will contribute in developing the local economy.
5.2.2. LOCAL ECONOMIC DEVELOPMENT (LED) STRATEGY
The Mopani District Municipality appointed Kayamandi Development Services (Pty) Ltd to undertake a Local Economic
Development Strategy (LED) for the District. The LED is a component of the Municipality’s overall strategic plan as outlined in
the Integrated Development Planning process. The strategy provides the District Municipality with guidelines to create and
facilitate economic development, realise the underlying economic development potential, and encourage private sector
investment and job creation. The LED Strategy is under review.
Furthermore, as part of the study a survey of 300 formal and informal businesses were undertaken in the District. The majority
of businesses in Ba-Phalaborwa, Greater Giyani and Maruleng are in the retail sector and in Greater Letaba and Greater
Tzaneen there are slightly more businesses in the Agriculture sector. Certain development constraints in the District include
inter alia lack of education and skills, poverty, lack of infrastructure, lack of municipal capacity, access to funding, etc. These
constraints need to be addressed to ensure sustainable economic growth and development in Mopani District.
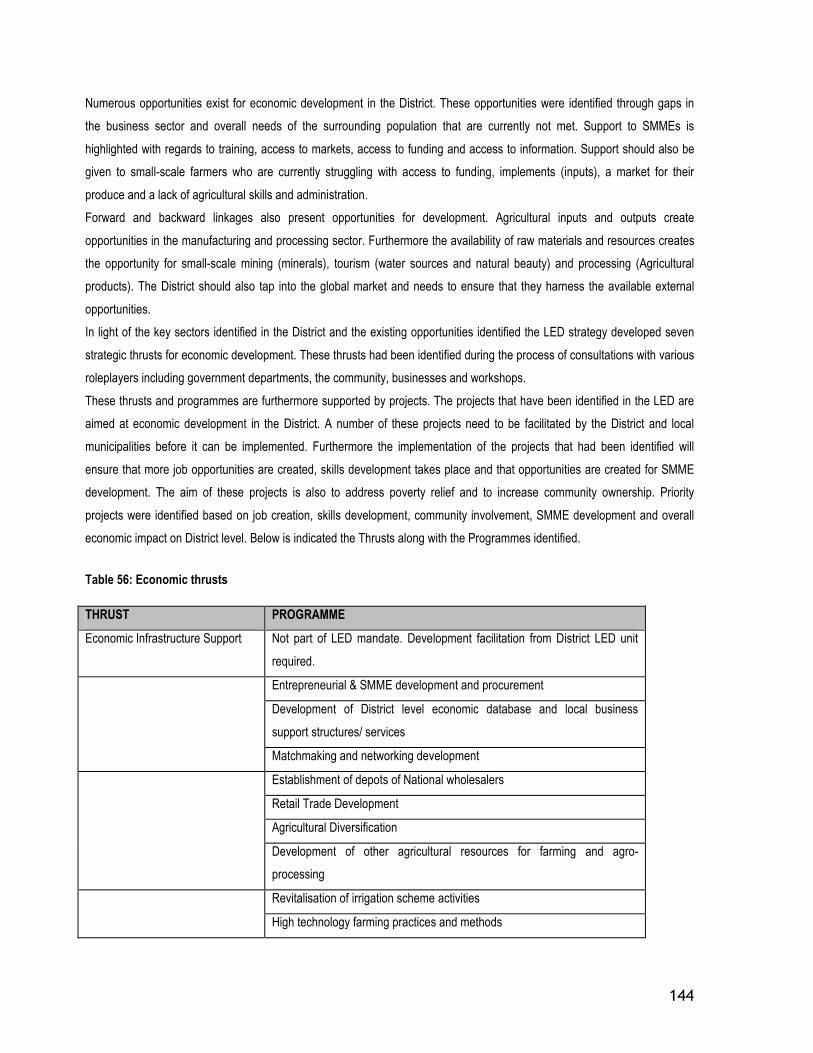
144
Numerous opportunities exist for economic development in the District. These opportunities were identified through gaps in
the business sector and overall needs of the surrounding population that are currently not met. Support to SMMEs is
highlighted with regards to training, access to markets, access to funding and access to information. Support should also be
given to small-scale farmers who are currently struggling with access to funding, implements (inputs), a market for their
produce and a lack of agricultural skills and administration.
Forward and backward linkages also present opportunities for development. Agricultural inputs and outputs create
opportunities in the manufacturing and processing sector. Furthermore the availability of raw materials and resources creates
the opportunity for small-scale mining (minerals), tourism (water sources and natural beauty) and processing (Agricultural
products). The District should also tap into the global market and needs to ensure that they harness the available external
opportunities.
In light of the key sectors identified in the District and the existing opportunities identified the LED strategy developed seven
strategic thrusts for economic development. These thrusts had been identified during the process of consultations with various
roleplayers including government departments, the community, businesses and workshops.
These thrusts and programmes are furthermore supported by projects. The projects that have been identified in the LED are
aimed at economic development in the District. A number of these projects need to be facilitated by the District and local
municipalities before it can be implemented. Furthermore the implementation of the projects that had been identified will
ensure that more job opportunities are created, skills development takes place and that opportunities are created for SMME
development. The aim of these projects is also to address poverty relief and to increase community ownership. Priority
projects were identified based on job creation, skills development, community involvement, SMME development and overall
economic impact on District level. Below is indicated the Thrusts along with the Programmes identified.
Table 56: Economic thrusts
THRUST PROGRAMME
Economic Infrastructure Support Not part of LED mandate. Development facilitation from District LED unit
required.
Entrepreneurial & SMME development and procurement
Development of District level economic database and local business
support structures/ services
Matchmaking and networking development
Establishment of depots of National wholesalers
Retail Trade Development
Agricultural Diversification
Development of other agricultural resources for farming and agro-
processing
Revitalisation of irrigation scheme activities
High technology farming practices and methods

145
Expansion of small-scale farming
Skills development and training
Agro-processing development
Mineral beneficiation and processing development
Mining Service Development
Agriculture service and product development
Ethnic and cultural activity development
Eco- tourism and adventure tourism development
Art and craft development, manufact
uring and promotion
Marketing of tourism potential
Internal LED capacitation
Establishment of a Local Development Agency (LDA)
The following Map indicates the priority projects and their preferred locations. A number of these projects should be located in
urban areas such as the Wholesaler node and the Development Agency while other projects such as the Tomato Processing
and Marula Beer brewery can be located in more rural areas. The projects that will be situated in the more rural areas will give
the community much needed economic growth, and skills development. It is however evident that the priority projects for the
District are well dispersed throughout the whole District.
Map 3: Location of anchor projects
Marula Beer
Wholesaler node Development Agency
Goat Dairy
Agri Training Centre
GREATER
Fresh Produce market Achaar Processing
GREATER TZANEEN
AbattoBA-PHALABORWA
Tomato Processing
Timber packaging
GREATER LETABA
Small-scale mining (Ilmenite)
MARULENG
Marula tree nurseries
Tiles from clay
Revive Mica mine
Small-scale mining (stone crushing)
Fruit and vegetable canning

146
5.2.3. TOURISM DEVELOPMENT STRATEGY
Tourism is internationally recognized as one of the world’s fastest-growing industries. After years of isolation, South Africa has
emerged as a highly attractive tourism destination, full of promises and potential, and striving to position itself as a major
player in this high-growth, global industry.
To this end, municipalities have a legislative mandate to promote their localities in order to attract investment and tourists who
will then inject cash into the local economy, thus create jobs. In line with this mandate, the Mopani District Municipality has
developed the Tourism-marketing strategy for the Mopani area of jurisdiction. The strategy focuses on the important issue of
branding and notes that the creation of an effective and acceptable branding for the Mopani destination, as a whole, is a
process that required full participation by the tourism industry as well as other key stakeholders.
It is proposed that the “Valley of the Olifants” be adopted as the main brand for the Mopani tourism destination, but this still
requires discussion and full acceptance amongst all role players. The tourism strategy also provides a summary of the key
attractions of each local municipality and matches these to the most likely growth markets. There is also an outline plan on
how implementation of the marketing plan could be achieved and this is matched with a summary of the marketing tools that
would be needed as well as the suggested budget for the first three years.
Whilst it is accepted that Mopani has some major competitors and as such there is a suggestion that Mopani could capitalize
on the movement of Gauteng residents, for example, into Vhembe and Mpumalanga by promoting the special or unique
characteristics of Mopani. In this regard, Mopani is encouraged to take a lead in helping establish tourism forums within those
communities that either have sufficient mass of tourism products or that show the most potential for the growth of new
products. This initiative needs to be handled sensitively because there must be no hint of a “heavy hand” trying to impose a
system or process on any community. It is known that the Department of Economic Development, Environment and Tourism
has already tried to establish local tourism forums but without any marked degree of success. Thus, building up a structure
that will work for tourism in Mopani must start, not at the top, but at grassroots level.
Growth of tourism, as a contribution to the district’s well-being, can be achieved in various ways, and the Provincial Growth
and Development Strategy (PGDS) note possible yardsticks or barometers by which the health of the industry could be
measured and monitored.

147
5.2.4. WATER SERVICES DEVELOPMENT PLAN
This Water Services Development Plan (WSDP) has been prepared simulteneuosly with the IDP in compliance with the Water
Services Act. The WSDP is a sectoral plan that falls within the inter-sectoral umbrella plan of the IDP and responds to the
water and sanitation challenges raised in the analysis phase. The Mopani District Municipality is the new Water Service
Authority (WSA) in the district and has appointed EVN Africa Consulting Services (Pty) Ltd. to review its previous WSDP. The
WSDP is not only a legal tool, but also is a tool towards achieving sustainable water services (where water includes both
water supply and sanitation services).
In addressing sustainable water services, there are three major goals that Mopani (as a WSA) has to achieve through:
X Delivery of sustainable water services;
X Integrated water resource management; and
X Efficient and effective water services institutional arrangement (WSA capacity and WSP
arrangements).
The consumer development in the district requires the eradication of backlogs and the establishment of formal housing with
improved services. Increased population numbers coupled with increased economic activities would result in increased levels
of water supply and sanitation, particularly in the fringes surrounding urban towns where such services lag behind those
provided in town. With the exception of Giyani, Modjadjiskloof, Tzaneen, Phalaborwa, Hoedspruit and other urban towns,
most of the settlements do not have adequate access to potable drinking water and sanitary facilities.
Picture 2: Water is Life – Mopani rivers & dams are the source of life in the district (for the environment, people & economy)
The levels of services in these areas are either in terms of RDP standards or below such standards. Contributory factors
include, inadequate infrastructure, malfunctioning of boreholes, on-going poor management and maintenance. Further to that,
some rural settlements do not have access to water at all. These communities fetch drinking water from wells, pits or rivers.
Such lack of access to adequate potable water has a direct effect on the health standards of the community in those areas,

148
thus, increasing the rate of opportunistic diseases like cholera. Care must also be taken that pit latrines are not erected near
locations where ground water is used as a source of drinking water.
Bulk water supply in Mopani is characterized by numerous water schemes in various stages of full development to all
customer points. However, these schemes are not linked and this explains why there might be a shortage of bulk in one area,
while a surplus exists in another. According to the WSDP, the Mopani District water needs at RDP level is 36% technical, 63%
management and 65% sanitation.
It is estimated that more than 70% of the 825 000 in the rural areas of the Mopani District municipal area have water supplies
below acceptable minimum standards, albeit the situation where the technical need is estimated at less than 40%. This is in
the region where the potential exists of regional bulk supply schemes providing water to all localities.
The required water sector cash flow to meet target dates of 2008 for water services and 2010 for sanitation is as follows:
Funding shortfalls are experienced forextentions to the bulk distribution of water from Middle Letaba dam, Silwane Nondweni
towards Giyani, Modjadji and Ritavi (Letaba) to the respective service areas. There is also inadequate management of water
supply systems as well as non-payment of water services. There is a need for urgent management and infrastructural
development of the major Middle Letaba RWS. Mopani District is a joint user of some water sources with Vhembe district and
this necessitate liaison with that adjacent municipality for co-planning and co-funding purposes.
Lepelle Northern Water is the bulk water service provider for:
� Phalaborwa-Namakgale-Lulekani
� Pietersburg Government RSW (Ebenezer Pipeline)
The other water services providers in the district are:
� Ba-Phalaborwa Local Municipality for Phalaborwa and the surrounds
� Greater Tzaneen Local Municipality for Tzaneen, Thabina, Tours
� Lepelle Northern Water for Modjadji, Ga-Kgapane, Nkowankowa and surrounds.
The Water Services Directorate in the Department of Water Affairs and Forestry are still assisting as the Water Services
Provider to all rural areas not described above. All assets are in the process of being transferred to the district municipality as
the new Water Services Authority. Ground water would remain an important source for primary use and to augment the
surface sources in future. The economy of scale makes regional surface water schemes more acceptable with ground water
augmentation as standby source during drought sequences or supply interruptions.
The increasing profile of sanitation within the IDP allows for closer integration across sectors sanitation and water, housing,
health, local economic development, and so on. MDM is now developing strategies for intergrated sanitation improvement,
premised on a long-term vision, secure medium-term funding, and consensus on what the immediate priorities and resources
are.
In conclusion, the district municipality is serious about taking over the water services provision and ensuring a sustainable
supply of these services in the district. However, serious external financial injection is required in order to enable the
municipality to live up to its mandate as a WSA as required by legislation and citizens of the district.

149
5.2.5. INTEGRATED TRANSPORT PLAN
The National Land Transition Transport Act (NLTTA) (Act no 22 of 2000) makes provision for transport authorities to develop
transport plans. The district municipality is in the process of reviewing its Integrated Transport Plan for the district and the
public transport information highlighted in the analysis phase will serves as a basis for the development of a reviewed
Transport Plan that responds to the mobility trends of the district populace.
The policy of apartheid has moved the poor away from job opportunities and access to amenities. This has burdened the
workforce with enormous travel distances to their places of employment and commercial centres, and thus with excessive
costs. There is also inadequate public transport infrequencies and routes coverage, poor coordination, and other
infrequencies. The Mopani District Municipal area is characterised by inadequate public transport despite the fact that the
majority of the population is reliant on busses. Generally the available modes of transport are not up to standard, nor safe,
reliable, affordable or accessible. The public transport needs of the disabled are also not catered for as proposed in the ITP.
There is an oversupply of taxis on tarred roads and an undersupply of taxis on rural gravelled roads; therefore these areas are
fully dependent on bakkies.
Bus services throughout the district are unreliable and not available in certain areas, this is worsened by bad road conditions.
Ba –Phalaborwa, for example, experience a serious scarcity of transport. This is as a result of the withdrawal of the former
subsidised Lebowa Transport Services, leaving the general public reliant on expensive taxis. Formal and informal taxi ranks
needs to be upgraded or refurbished in order to meet the standards of the incoming taxi fleet through the Taxi Recapitalisation
Programme, wherein facilities should be user friendly in terms of catering for the disabled.
The reviewed Integrated Transport Plan has to serve as guide in the municipal and sector departments’ allocation of resource
to meet the public transport needs.
It should:
� Promote coordinated, safe, affordable public transport;
� Be flexible enough to take cognizance of local conditions in order to make use of the available transport
infrastructure;
� Ensure accountability so that people have control over what is provided;
� Take into account the transport needs of disabled people;
� Ensure comprehensive land-use/transport planning
As population increases, the number of travelers will also increase. The majority will be unable to private transport and will be
dependent on public transport. Given the need for increased mobility and the cost and environmental impact of
accommodating private motorists, the future emphasis is on the provision of safe, convenient, affordable public transport. The
components of the transport plan include an Operating Licensing Strategy (OLS), Rationalisation Plan (RP) and the Public
Transport Plan (PTP). The compilation of the components outlined above is informed by other processes such as the route
verification (verification of routes and taxis per permit) per association and later the updating of the Current Public Transport
Record (CPTR). The components outlined above inform processes such as colour coding of taxis and taxi ranks, and the taxi
recapitalisation process.

150
5.2.6. INTEGRATED WASTE MANAGEMENT PLAN
The Mopani District has appointed Bazisa Technical Waste Solutions to develop an Integrated Waste Management Plan for
the district. This is premised on the fact that the district municipality and its local municipalities have reached a crossroads in
the provision of waste management services. To date, all of the municipalities are continuing to pursue traditional practices
that focus on waste after it has been generated. Conditions vary significantly between the four municipalities.
Picture 3: Environmental Degradation - The looming environmental disaster in the Giyani Town
In all municipalities, efforts have been made to expand service and progress has been made in various areas. Ba -
Phalaborwa provide service to the highest percentage of households. Recycling focuses on recovering material from landfills
where there are generally poor conditions for salvagers. Only Tzaneen actively supports recycling. All other activities are
carried out by private companies. Tzaneen promotes composting of garden waste on a limited scale. Some commercial
farmers are increasing their commitment to composting to improve access to European markets.
There are five waste disposal sites, of which only the one in Tzaneen is permitted and properly managed. In total, not more
than 14% of households are serviced. Most families bury and burn their waste in their yards. Health Care Risk Waste (HCRW)
is burned at low temperatures producing hazardous air emissions and ash. Untreated HCRW has been found at many
disposal sites while some ashes is past-entered communities through activity such as road work.
Successful development of an integrated Waste Management System requires the coordinated implementation of all elements
of the strategy. The purpose of this plan is to enable the Mopani District Municipality to progressively develop an Integrated
Waste Management System (IWMS) capable of delivering waste management services to all households and businesses.
The IWMP is within the framework of National Policy and incorporates Mopani's developmental responsibilities including
Broad – Based Black Economic Empowerment.
National policy requires municipalities to implement IWMS with a focus on prevention and minimization of waste, recycling of
waste and treatment that is able to reduce the potentially harmful impacts of waste. Only after these efforts, should remaining
wastes be disposed of at a landfill.

151
The following are the waste management objective of the Mopani District Municipality:
� To enable the Mopani District Municipality to effectively manage, monitor and coordinate waste management
services in the district;
� To provide policies, and guidelines on minimum requirements to enable local municipalities to effectively
manage waste in their territory;
� To regulate minimum required Standards for waste management;
� To provide for the establishment of Waste Management Information System; and
� To provide for the implementation of the National and Provincial Waste Management Strategy.
DISTRICT HEALTH PLAN
In view of the prevailing health hazards, lack of sufficient health services amenities, socio-economic prejudices of majority of
the communities of Mopani, and the government’s focus on “better life for all”, it became apparent that the District take upon
itself to come up with a sector plan that will address the issues as prioritized through the IDP process.
It is in this drive that Mopani District Council has approved the District Health Plan to address the following challenges:
� Low immunization coverage: Ba-Phalaborwa, Tzaneen and Maruleng
� Poor supervision of services: Monthly reporting programmes
� Low TB cure rate: All Health workers to increase the TB cure rate.
� Low VCT uptake: Strengthen the programmes that encourage people for HIV testing
� Cervical cancer screening: Intensify training and implementation
� High teenage pregnancy: Intensify school health awareness and roll out Youth Services Friendly clinics
� Non-functional Clinic Committees: Conduct training and develop clinics support committees.
� CTOP: Support the services in Shiluvana Health Centre
� Low facility delivery coverage: Improve service conditions in Clinics, e.g water.
The plan indicates the various programmes and projects that will be carried out in various municipalities, their locations,
target groups, role players, funders, etc.
The broad vision in the health services is outlined as: “A caring Health and Social Development system, which promotes
quality and sustainability for the people of Mopani”. This serves as the main drive by which the Municipality will endeavor
to satisfy the residents in all health and social services.

152
5.2.8. HIV AND AIDS STRATEGY
The South African Constitution respects the human rights of all people. The reaction to HIV/AIDS in our country has resulted
in the infringement of many of the fundamental freedoms and human rights the Constitution affirms. Discrimination,
degradation, assaults, dehumanization are all important human rights issues for society to be able to address. It is important
for people suffering from HIV/AIDS to be respected as equal human beings. Government, private institutions and individuals
must affirm their dignity and worthiness and offer unconditional support. It is on the basis of the above that the Mopani District
Municipality developed its HIV/AIDS Plan.
The Department of Social Development published a report in 2003, which gives an overview of the HIV and AIDS status, that
the growth and infection of HIV in South Africa has been relentless. The prevalence among women attending antenatal clinics
increased from 1% in 1990 to 25% in 2000. This growth, measured through the Department of Health surveys, is indicative of
the visibility of the epidemic and the increasing rates of infections.
Picture 4: ABC - Assessing HIV/AIDS prevalence is through surveying women attending antenatal clinics
HIV and AIDS are dramatically reshaping our population structure. The epidemic has also been found to influence changes in
the gender patterns of death among adults over the past decade. As a result of the epidemic, there are few people in the
economical and productive years as compared to young children and older persons. The number of orphans as a result of
AIDS related deaths is expected to rise. It is indicated that HIV and AIDS is largely sexually transmitted. It subverts individual
and social reproductive capacity. As a health derived epidemic it has its most serious consequences on the structure and
political organisation of society. It exposes and feeds off social inequalities, most intensely affecting the poorest and the least
powerful. The situation demands compassion, care and social openness.
Mopani District Municipality has the HIV infection rate of 23% in 2002 and 2003, the highest prevalence rate in Limpopo
Province. The infection rate was measured through the annual National Department of Health surveys on women attending
antenatal clinics. The District is characterised by challenges facing the whole country namely; high rate of Sexual Transmitted
Infections, Tuberculosis, pain, suffering, neglect, discrimination, women and child abuse, prostitution, more deaths through
HIV and AIDS related diseases, increased number of patients at hospitals suffering from HIV and AIDS related conditions and
increased number of orphans.

153
As part of its HIV/AIDS Plan, the District came up with the following intervention strategies:
� A District AIDS Council and Local AIDS Council are in place;
� An Interdepartmental committee is also in place. However, these structures are not effective; and
� An institutional HIV/AIDS policy is in place.
Like all the sector plans highlighted in this section, the programme and project content of this plan is outlined in the Projects
Phase.
5.2.9. POVERTY ALLEVIATION AND GENDER EQUITY PLAN
MDM has developed the Poverty Alleviation and Gender Equity Plan” as a multi-sectoral plan that outlines how the institution
responds to poverty and gender issues in the district. The plan deals with a wide range of issues, ranging from gender
relations, poverty, globalisation, HIV and AIDS, violence, access to basic needs, access to basic resources, access to
employment, economic empowerment of women, access to land access to science and technology, women’s access to
political power, implementation of laws and national Gender Machinery.
Poverty is the single greatest burden of South Africa’s people, and is the direct result of the apartheid system and the grossly
skewed nature of business and industrial development, which accompanied it. Poverty affects million of people, the majority of
whom live in rural areas and are women. Since Mopani is a rural district it, by implication, means that the majority of people
who are surviving below the Minimum Living Level in district are living in rural areas. It is not merely the lack of income that
determines poverty. An enormous proportion of very basic needs are presently unmet.
In attacking poverty and gender inequality, the district has, through its strategic plan, programmes and projects, set itself to
contribute in the quest to eliminate hunger, providing sustainable human settlements (with access to safe water and
sanitation, availability of affordable and sustainable energy sources, eliminating illiteracy, raising the quality of education and
training for children and adults, protecting the environment, and improving the health services and making them accessible).
To achieve a society free of want, racism and sexism, there has to be a paradigm shift on how resources are allocated for
service delivery projects as well as impact of cross-cutting issues like HIV/AIDS and LED. Despite MDM’s contribution in
pushing the frontiers of poverty through its poverty alleviation and gender programmes and projects highlighted in the Projects
Phase, there is poor inter-governmental alignment and coordination of poverty alleviation and gender programmes in the
district. Since poverty and gender are cross-cutting issues, the response strategy of the municipality is also cross-cutting in
that all municipal departments have projects that address these two challenges:
The following municipal departments contribute in the promotion of gender equity and alleviation of poverty, namely, Planning
and Development, Community Services and Technical Services whilst Corporate Services seeks to address the equity issues
in the Human Resource plan. The Community Services Directorate contributes towards poverty alleviation within the HIV and
AIDS program in the form of care of orphans and support of CBOs (Community Based Organisations) dealing with HIV and
AIDS. Technical Services ensures that tenders are awarded to service providers who comply with the Preferential
Procurement Regulation 2001. The Gender desk conducted various workshops aimed at empowerment of the previously
disadvantage individuals. The challenge we face under this programme is that gender issues are misinterpreted as issues

154
affecting women only. The Planning and Development Directorate also have poverty alleviation project such as Makosha
Tourism: SMME support and so forth Disaster Management Section plays an important role as the short-term strategy to
relieve poverty during disaster.
The objectives of the Poverty Alleviation and Gender Equity Plan are:
� To ensure transformation of gender relations within the district;
� To develop a district gender policy that will promote gender equality and equity in all spheres of life of an individual;
� To develop a capacity programme which aims at revisiting Human Rights and power balance between men and
women which is the basic for addressing issues such as HIV and AIDS violence and abuse;
� To ensure that there is equality in access to basic needs resources, employment, and land political power;
� To strengthen capacity building to women on access to science and technology and economic empowerment; and
� To develop a District Gender Machinery and Framework to ensure that gender issues are implemented.
The Poverty Alleviation and Gender Equity Strategies of the district are:
� Clarifying the concept – gender – and creating awareness on gender issues at both official and community level;
� Sourcing external capacity building interventions to assist MDM in building its capacity in this regard;
� Implementing the Moral Regeneration Programme which lay a basis for customary, cultural and religious practices
to be subject to the right to equality;
� Implementing appropriate legislation aimed at addressing poverty and gender inequalities such as the Employment
Equity Act, Affirmative Action Programme and Preferential Procurement Regulations, 2001;
� Initiating – with local municipalities – the strengthening and promotion of participation of women in poverty
alleviation initiatives;
� Committing the district, sector departments and their parastatals and local municipalities in mainstreaming gender
issues in all programmes; and
� Monitoring and reporting progress to the District Gender Machinery.
The municipal projects that aim to alleviate poverty and ensure gender equity are, amongst others:
� Municipal (internal) Equity Plan
� Care and support of orphans (HIV and AIDS program)
� Talent Search Project (Sport Recreation, Arts and Culture programme)
� Establishment of District Men in Partnership against AIDS (AMIPAA)
� Establishment of District Women in Partnership Against AIDS (DWIPAA)
� Moral Regeneration Movement
� Multilingualism project
� Social Crime Prevention Strategy
� Awareness campaigns on Education for All
� Awareness campaigns on prevention of Fires
� Erection of Fire Stations and Disaster management centre projects

155
The district also participates in the following events, that seek to create awareness, commemorate, and celebrate our history,
struggles and heritage, and indirectly contributes to raising awareness on poverty alleviation and gender equity issues:
� International Women’s Day Celebration;
� Women’s Day Celebration;
� Women Economic Empowerment Summit;
� 16 Days of Activism on No Violence against Women and Children Abuse;
� Capacity building on gender issues for officials, communities and their organisations;
� Development of the District Gender Policy;
� Youth Month;
� Disability day; etc.
The municipality is also implementing some of its projects using labour intensive methods so as to employ people instead of
machines, develop skills and ensure skills transfer. Municipal service delivery offers considerable opportunities for
implementing Extend Public Works Programme (EPWP), which covers all spheres of government. EPWP aims to bring
significant numbers of unemployed people into productive work and train them so that they can increase their capacity to earn
income.
Most importantly, the objective of EPWP is to re-orientate existing budgets and conditional grants so that government
resources can be used to generate more opportunities, especially for unskilled labour. The EPWP is an important pillar in
governmental overall strategy to deal with unemployment and poverty in South Africa.
Picture 5: Labour intensive methods create jobs and ensure skills transfer to communities
The municipal projects which are implemented using labour intensive methods include:
2 Water Services and Sanitation projects
3 Roads and Public Transport projects
4 Electricity and Housing projects
5 Economic growth projects

156
The various projects that directly and indirectly contributing towards the alleviation of poverty and gender equity are
programatically reflected in the Projects Phase of this IDP. The municipality will ensure that all relevant key performance
indicators on cross-cutting issues are identified and targets set. This will ensure that the municipal performance on cross-
cutting issues - poverty and gender - is measured and improved. The various IGR structures mentioned in the Preparatory
Phase of this IDP should quantify the sectoral projects (outlined in the Projects Phase) that will be implemented through
capital intensive methods and, in future, collectively identify projects across the three spheres of government that could be
implemented using the labour intensive approach.
5.2.10. SOCIAL CRIME PREVENTION STRATEGY
Reducing crime has become one of the leading challenges of South Africa’s democratic government because it has severe
implications through the costs of victimization that undermine economic and social development. The White Paper on Safety
and Security, September 1998, recognizes that the delivery of health, education, and housing, as well as job creation, have an
important role to play in reducing incidence of crime. Within Limpopo Province, the department has adopted a monitoring role,
but also attends to facilitation of social crime prevention programmes and research into the causes of crime and service
delivery impediments.
The SAPS statistics suggest that there is an increase in social crime in the district – rape, assault, domestic violence, murder,
etc. The causes of crime were analysed and, amongst others, being gender inequity, access to firearms, socio-psychological
factors, inadequate support to victims of crime, youth marginalization, economic under-development and inequality, poverty
and unemployment, institutionalized violence in society.
Fundamental to the development of appropriate policing services in South Africa has been a shift from an inheritance of
authoritarian law and order responses, to a broader concept of safety and security. This was envisioned in the White Paper on
Safety and Security and in the National Crime Prevention Strategy released in May 1996. The strategy motivated for a new
paradigm for safety and security: a change in emphasis from an exclusive focus on crime control to include crime prevention.
In line with these principles, the Mopani District Municipality developed a Social Crime Prevention Strategy with donor funding
from the Flemish Government accessed by the Department of Safety, Security and Liaison in Limpopo. The Social Crime
Prevention Strategy views the concept of safety and security in terms of two broad and inter-locked components: that of
policing of law enforcement, and that of crime prevention, and particularly social crime prevention, which is aimed at
undercutting the causes of crime. This twin approach to fighting crime is critical: law enforcement and crime prevention are not
mutually exclusive but reinforce each other. The approach also recognizes the impact of broader government economic
development and social policies for crime prevention. Thus effective delivery of basic services such as housing, education,
health as well as job creation, have in themselves, a critical role to play in ensuring living environments less conducive to
crime.
International experience suggests that it is more cost effective, in the medium to long-term, to invest in projects which prevent
crime than in simply spending more on the institutions of policing, courts and corrections. These reactive responses to crime,

157
in addition to proving more expensive in the long term, also do little to improve the quality of life of the country’s citizens. The
importance of such preventive mechanisms is emphasized by two factors. First, not all crime types can necessarily be
resolved by policing. In particular, crime in poor communities can often be traced to socio-economic circumstances that
cannot be addressed by the police alone. Secondly, as is emphasized in the National Crime Prevention Strategy, the causes
of crime need to be disaggregated for the purpose of preventative interventions.
In line with this strategy, MDM has, identified programmes and projects whose sole objective is to contribute in the fight
against crime - acknowledging that crime is more than a security issue; it is also a socio-economic issue. It affects the health,
wealth and safety of people, it affects the economy and it also affects their future. This strategy has been developed on the
basis that: while the public rightfully demand improvement in the quality of service delivered by the police, members of the
public also have a responsibility to assist the police to deliver a better service.
5.2.11. DISASTER MANAGEMENT STRATEGY
DISASTER MANAGEMENT PLAN INTRODUCTION
This plan has been developed in order to provide key officials, role players and departments in the Mopani District Municipality as a general guideline for the expected initial response to an emergency and an overview of their responsibilities during an emergency or disaster. For this plan to be effective, it is important that all concerned parties be made aware of its provisions and that every official, role player, and department at personnel be prepared to carry out their assigned functions and responsibilities before, during and after emergency. The following paragraphs provide an overview of the background and some of the highlights of this plan.
This plan serves to confirm the arrangements in the Mopani Disaster Management approach to effectively prevent disasters from occurring and to lessen the impact of those hazards that cannot be avoided.
Disaster Management is a continuous and integrated multi-sectoral and multi-disciplinary process of planning and implementation of measures aimed at disaster prevention, mitigation, preparedness, response, recovery, and rehabilitation (Disaster Management Act 57 of 2002)
The preventative elements of this plan must be implemented and maintained on a continuous basis. The emergency or reactive elements of this plan will be implemented in the Mopani District Municipality whenever a major incident or disaster occurs or is threatening in its area of jurisdiction.
The responsibility for the coordination of the overall implementation of the plan is that of the Head of the Disaster Management Centre. The Disaster Management Act requires the District to take the following actions:
• Prepare a disaster management plan for its area according to the circumstances prevailing in the area.
• Co-ordinate and align the implementation of its plan with those of other organs of state and institutional role players, and
• Regularly review and update its plan.(section 48)

158
The plan must:
• Form an integral part of the District IDP
• Anticipate the likely types of disaster that might occur in the District area and their possible effects.
• Identify the communities at risk.
• Provide for appropriate prevention and mitigation strategies.
• Identify and address weaknesses in capacity to deal with possible disasters.
• Facilitate maximum emergency preparedness/prevention/ Mitigation
• Establish the emergency management policy framework and organization that will be utilized to mitigate any significant emergency or disaster affecting the Mopani District.
• Establish the operational concepts & procedures associated with day to day operational response to emergencies by Districts municipal departments.
• Contain contingency plans and emergency procedures in the event of a disaster, providing for-
(i) The allocation and co-ordination of responsibilities allocated to the various role players. (ii) Prompt disaster response and relief, (iii) Disaster recovery and rehabilitation focused on risk elimination or mitigation. (iv) The procurement of essential goods and services, (v) The establishment of strategic communication links. (vi) The dissemination of information.
CURRENT REALITY
The Corporate Plan makes provision in a generic sense of hazards that will impact on the District economy, cultural, welfare, sustainable development and sustainable livelihoods.
Hazard profiles, associated vulnerabilities and risk (probability or lost) will determine the priorities for Disaster Management programmes and projects. The possible cost benefit to be derived from a project in terms of lives protected, livelihoods secured and property or natural resources defended, will be the criteria that determines priorities. In a generic sense, the following hazards on the economic, cultural, welfare, sustained development and sustained livelihoods plans were found to pose the greatest risks in the District.
• Fire Risk
• Natural phenomena
• Technology
• Mass events
• Transport
• Service utility
• Environmental threats
• Health The mentioned hazards should not be viewed in isolation, but cognizance should be taken of the likelihood of compound disasters e.g. flash floods after extensive veld and forest fires, communicable disease spread after floods and job losses after technological disasters. The risk faced are tangible (loss can be quantified in terms of deaths and infrastructure damages) and intangible (psycho-social impact, trauma and social degradation) during and after disasters. Communities in rapid growing informal settlements are the most vulnerable to many of these risks, but proximity to certain installations or hazards also exposes other communities to risks. Environmental degradation, especially deforestation and overgrazing, also pose a major threat to sustainable economic development and sustainable livelihoods. In terms of capacity to address and therefore reduce risks, there currently is a strong emphasis on preparedness and response planning. This means that capacity and planning in terms of mitigation and prevention should be strengthened. The following have been identified as critical Disaster Management issues and should receive priority attention in the IDP especially in terms of local economic development and land use management.

159
Identified hazards for the District Municipality area.
� Aircraft accidents – Tzaneen and Ba Phalaborwa areas. � Explosions – All petrol depots (high risk) and petrol stations all over the District. Two fuel depots particularly at risk are
the BP depots situated in Tzaneen and Phalaborwa. Here, large amounts of fuel, lubricants and gas (Phalaborwa) are stored and transported to and from by road and rail. Both are within close proximity to water sources enhancing the danger of environmental pollution in the event of a large spillage.
� Dam failure – all the dams in the District will have an impact on communities downstream. Two dams for which emergency preparedness plans have been drawn up by DWAF indicate that several communities would be in grave danger should there be a breach of the wall of either of these dams. The dams are Tzaneen Dam and Thabina Dam. Development within the floodlines of all dams must be taken into consideration before any new development is approved.
� Floods – all river systems and communities adjacent to the rivers. Letaba, Thabina, Tours, Middle Letaba, Nsami, Molototsi, Blyde, Olifants and Kudu rivers.
� Drought – the entire District will be affected; people, animals, agriculture, industry and the economy would all suffer as a result of a drought.
� Epidemics – affects all communities; examples are cholera, malaria, diarrhoea, XDR-TB, typhoid etc. � Animal diseases including communicable diseases – foot and mouth disease, rabies, new castle disease, avian
influenza, etc would all have a negative impact on the Mopani District and could all spread with relative ease if not detected within the early stages.
� Fire – the entire District is vulnerable to veld and forest fires as well as structural fires in residential areas, but those areas most vulnerable to fires include the plantation growing areas which dot the landscape within the Greater Tzaneen and Greater Letaba Municipal areas. The eucalyptus plantations in particular are at a greater risk as a result of the Thaumastocoris australicus infestations (louse-like insect)
� Fires in informal settlements – Mokgoba and Talana Villages � Hazardous materials and oil spills – spills on all the main roads railway lines and river systems. � Traffic – accidents on all the main roads. Particular problems were identified on the Magoebaskloof, George’s Valley,
Tzaneen /Mooketsi, and Tzaneen – Lydenburg roads. Also of great concern are the high numbers of accidents on the roads within the Greater Giyani Municipal area which are caused by stray animals on the roads. Within this area, the highest numbers of accidents for 2006 were recorded on the Giyani / Mooketsi and Giyani /Dzumeri roads.
� Mining accidents – Ba Phalaborwa mines and Gravelotte. � Environmental pollution – Giyani, Modjadjiskloof and Kgapane � Power failure – all main power lines and substations. � Fire hydrants: a pilot study of the fire hydrants in a section of a residential area in Phalaborwa, which borders on an
industrial area, showed that just two hydrants were fully functional. This begs the question that if this is the case in Phalaborwa, what is the situation like in the rest of the town and indeed, in the rest of the district. Without sufficient water, fire services are powerless to fight a fire effectively.
� Extreme weather such as windstorms. � Tzaneen Municipality – Lenyenye, Mokgolobotho, Nkambako, Nwamitwa. � Greater Giyani – Mavalani, Xikukwani, N’wamankena. � Ba Phalaborwa – Mashishimale, Belfast, Matikoxikaya. � Greater Letaba – Rotterdam, Mamaila, Belleview, Mthabaneng HAZARD, VULNERABILITY AND RISK ASSESSMENT, DISASTER MANAGEMENT PLAN. The Provincial Disaster Management Centre appoints Africon to develop the District Disaster Management Plan, develop an integrated information and communication system and conduct a hazard, vulnerability and risk assessment. DISASTER MANAGEMENT OBJECTIVES The Act (Act 57 of 2002) forced a change in the approach to the execution of the disaster management function to ensure the application of integrated protective safety strategies:

160
• Responding to reduce personal injury and the loss of life.
• Preventing damage to property and the environment (disaster risk reduction) and
• Assisting society to recover and continue with normal activities (resilience).
In order to successfully implement disaster risk reduction measures and to begin to effectively realize comprehensive and integrated disaster management as a fundamental policy process in Mopani District Municipality the following are immediate objectives of the MDM:
Disaster Management Objectives
• To utilize and maintain existing and the further development of infrastructure that will effectively satisfy disaster management needs.
• To constantly and orderly identify risks and emergencies of potential disaster situations relating to the Mopani District Municipality and to evaluate the possible consequences
• To develop and implement coordinated response and recovery plans to restore normality as rapidly and cost effectively as possible. (Disaster risk reduction plans)
• To develop and implement a training process that involves the acquisition of skills, the understanding of concepts, rules and attitudes to increase preparedness so as to deal effectively with an emergency or potential disaster situation.
• To establish a culture of and creating an understanding of the need for regular evaluation and audit of the disaster management plan.
• To develop and implement a risk mitigation plan to effectively deal with potential losses
• To develop and maintain a district information management system that enhances pre-disaster risk reduction and post disaster recovery and rehabilitation measures.
• To ensure sufficient funding for the implementation of disaster risk reduction measures as well as effective response, recovery and rehabilitation.
These objectives comply with the criteria of being adaptable for evolving problems, measurable, achievable and realistic. Disaster Management centre objectives In order for the Disaster Management Centre to perform their tasks effectively it must ensure that the following actions take place. Pre - Disaster Risk Management. Institutional capacity building.
- Appointment of DMAC. - Establishment of DMC. - Develop a disaster management policy. - Ensure stakeholder participation. - Arrangements for regional cooperation.
Disaster Risk assessment.
- Priorities hazards requiring disaster assessment. - Community based disaster risk assessment. - Develop a disaster risk profile. - Monitoring, updating and dissemination of risk information. - Conducting quality control.

161
Disaster Risk reduction.
- Disaster risk management plans incorporate into IDP. - Priorities for focusing disaster risk protection efforts. - Scoping and development of disaster risk reduction plans, projects and programmes. - Inclusion of disaster risk reduction efforts in other structures and processes.
Post – disaster Response, Recovery and Rehabilitation.
Response.
- Early warnings. - Integrated response. - Impact assessment, classification and declaration.
Recovery.
- Coordination of recovery efforts. - Emergency coordination. - Media liaison. - Regulation of relief measures.
Rehabilitation.
- Implementation of long term mitigation measures. - Ensure stakeholder involvement. - Rehabilitation impact analysis.
Data collection and verification.
- Risk assessment database. - Establishment of an information system that will support all normal line function duties as well ass all special
projects to eliminate and/or reduce loss of life, damage to property and environmental degradation. Education, training, public awareness and research.
- Determining internal and external training education, public awareness needs and resources. - Development of a disaster risk management training and public awareness framework.
DISASTER MANAGEMENT STRATEGIES
In preparing the strategies it was of the utmost importance to:
• Review past practices to determine which activities worked and those that did not work and in both the cases results produced.
• Look at activities employed by other organizations in the same field of practice.
People contribute to, exacerbate and modify hazards. This is brought about by cultural practices, socio-economic factors (predisposition) as well as political influences.
Hazards cannot cause loss, but the extent of vulnerability of communities and eco-systems is in direct relation to the extent of loss. This then implies that most hazards cannot be prevented but circumstances can be managed in order to decrease vulnerability and risk of loss. The question then arises: “What are the factors that lead to greater vulnerability?” These factors are:
• Rapid growth and inadequate planning.
• Overpopulation of certain (especially urban) areas.
• Over-utilization of natural resources (environmental degradation).
• Poor building methods.
• Concentration of resources and economic activity.
• Dependency on infrastructure and services.
• Lack of awareness, education and skills.

162
The listed factors contributing to vulnerability will increase risk. Risk then is the probability that significant losses will be suffered by those affected. From the above it is clear that vulnerability can be defined as the susceptibility to losses due to exposure to a hazard and risk as the convolution of exposure, hazard and vulnerability. Taking the inkling of the Disaster Management Act into consideration there are four strategies that must be followed: Pre-disaster Risk reduction / Offensive approach
• Prevention strategy
• Mitigation strategy
• Preparedness strategy Post disaster / Defensive
• Rehabilitation.
Disaster Management Strategies.
• Establish disaster management committees at district and municipal levels.
• Establish a Disaster Management Centre for Mopani District and local municipalities.
• Establish a communication network in the Mopani District down to ward level.
• Establish a GIS and information management system for Mopani District Municipality to secure efficient base line access.
• Execute hazard vulnerability and risk analysis and as well as continues planning for potential disasters as an ongoing basis.
• Institute appropriate training and awareness for disaster committees, ward representatives and volunteers as an ongoing process
• Develop appropriate disaster management plans ling to identified hazards, vulnerabilities and risks in the District.
• Institute a replacement and maintenance programme for Disaster Management facilities equipment and resources.
• Establish and maintain a Disaster Relieve Fund for Mopani District Municipality on an ongoing basis. DISASTER MANAGEMENT PROJECTS
1. Establish a Disaster Management Centre. 2. Establish a communication network. 3. Establish a GIS and information management system for efficient data base access. 4. Execute hazard, vulnerability and risk analysis for the District. 5. Develop disaster and contingency plans for potential disasters in the District. 6. Institute appropriate training and awareness for disaster committees. 7. Institute a maintenance program to ensure optimum functioning of Disaster Management. 8. Establish and maintain a Disaster relief fund.

163
5.2.12. FIVE-YEAR FINANCIAL PLAN
INTRODUCTION
The five year financial plan of the district serves as a mid-term financial framework for managing revenue management
and expenditure planning. It includes capital and recurrent expenditure and is crucial for ensuring a close planning-
budget link.
FINANCIAL MANAGEMENT ARRANGEMENTS
POLICIES AND PROCEDURES
Policy and procedures manuals were implemented to maintain and adhere to internal control measures and financial
sustainability. The following were implemented:
• Accounting and financial policies;
• Bank reconciliation;
• Books of account fixed assets;
• Asset management;
• Creditors system;
• Receipt, depositing and control over cash funds;
• Cash management and investment;
• Sundry creditors;
• Trade debtors;
• Credit control;
• Indigent;
• Overtime;
• Budgeting procedures and control;
• Travel and subsistence;
• Inventory;
• Status funds, trust funds and reserves;
• Supply Chain Management;
• Risk Management and;

164
• Tariff
FINANCIAL STRATEGY
Revenue rising
The Regional Service Levy was the main source of income for the municipality but since then there has
been no other additional income options for the fire services charges and the grants. The plan is to raise
some income from the water services function as assigned to the local municipalities in terms of retail and
Lepelle Northern Water Board regarding the bulk supply.
Capital expenditure
The financial strategy is to finance capital projects out of income to an amount R 510’000’000.00.
Asset Management Strategy
Assets financed through loans will be financed over expected lifespan of the asset. With effect from the 01 July
2003 all assets will be depreciated over the expected lifespan of the asset.
REVENUE AND EXPENDITURE FORECAST
The financial position of Council stabilised over the past seven years with a positive bank balance. The strategy
for the past seven years was to increase revenue collection when RSC Levies were still applicable and thereby
building a strong reserve. The budget was then planned to equal the amount the municipality was receiving as
income which then assisted in the allocation of more funds for service delivery. The medium term expenditure
framework addresses the estimated income over the next few years on the different services currently rendered.
OPERATING FINANCIAL STRATEGY
The Municipal Systems Act, 2000, makes provision for municipalities to review and decide on mechanisms to
provide municipal services. Municipalities have the following options, which they can decide upon:
• Public-Private Partnerships;
• Public-Public Partnerships with other public institutions including other municipalities and;
• Partnerships with CBO’s and NGO’s.
However when entering into a public-private partnership municipalities should consider the following criteria:
• Strategic development weight;
• Political control;
• Cost-efficiency

165
• Jobs;
• Community influence and;
• Income generation
The partnership can be based according to the following options:
� BOT: Build-operate-transfer which means that the asset or business activity is transferred
back to the municipality after an agreed to timeframe;
� BOOT: Build-own-operate-transfer which means that the contractor owns the asset or business
activity for a particular period of time and then transfers it back to the municipality;
� BOTT: Build-operate-train-transfer means that the contractor is responsible for ensuring that the
staff of the municipality is trained to operate the asset or the function, and then transfer the
function or asset back to the municipality.
FINANCIAL PLAN
DESCRIPTION
2008/09 2009/10 2010/11
Equitable shares
234,250,000
287,983,000
345,878,000
FMG 250,000
750,000
1,000,000
Interest on Call Account
80,000
84,8000
89,888
Interest on Current Account
1,200,000
1,272,000
1,348,320
Registration on Supplier-Database
150,000
159,000
168,540
Tender Documents
500,000
530,000
561,800
DWAF O & M
68,303,000
-
-
Department of Health
10,000,000
10,650,000
11,183,000
MSIG
735,000
-
-
MIG
164,461,000
185,415,000
151,934,000
LGWSETA
300,000
318,000
337,080
Donations
100,000
106,000
112,360
Insurance Claims 50,000 53,000 56,180
Interest on Outstanding debts
10,000
10,600
11,236
Fire Services Charges
300,000
318,000
337,080

166
Executive Mayor’s Charity Cup 500,000 530,000 560,000
Regional Bulk Water (Mametja Sekororo Water Works)
10,000,000
-
21,000,000
Ba-Phalaborwa Connections 20,000,000 25,000,000 30,000,000
Income 511,189,000 513,179,400 564,577,484
Expenditure 509,189,000 507,091,012 554,991,198
Surplus/ Deficit 2,000,000 6,088,388 9,586,286
CONCLUSION
The municipality is currently in the process to establish the Water Entity and the Fresh Produce Market wherein
these options will be thoroughly examined for the municipality to make an informed decision in line with the criteria
outlined.
5.2.13. INSTITUTIONAL PLAN OF MOPANI DISTRICT MUNICIPALITY
INTRODUCTION
Background
The Constitution of the Republic of South Africa, Act 108 of 1996 provides that municipalities must strive, within its financial
and administrative capacity, to achieve the objects set out in section 152. However, the establishment of an effective
administration cannot be over-emphasised for the achievement of the Integrated Development Plan of the municipality.
Challenges Faced by the district
The district municipality was established in 2000 with little or no resources in certain areas. This has been a major challenge
since its establishment however there are other constraints which are listed below.
a) Capacity to review and update municipal policies
� Review of policies: While most policies have been developed, the greatest challenge is to review them so
as to catch up with the changes in legislative and other guidelines.
b) Lack of adequately skilled personnel
� The main function of the district is support and coordination and this requires a high level of competency if
it is to be realised but under the current situation, the district still has to build that required skill on most of
its personnel.
c) Retention of skilled personnel
� Our district is located in one of the rural areas of the province and as result, once staff has acquired some
skills, they get attracted to other institutions within the affluent areas. This is affecting the rate in which the
municipality can retain better qualified people.

167
d) Office accommodation
� The municipality does not own any building and is currently accommodated at the government building
owned by the Department of Public Works. The building is not adequate enough to accommodate the staff
compliment as per the structure. In this regard the municipality is unable to plan properly for an effective
and efficient institution.
Powers and Functions
The powers and functions of the District Municipality in terms of the Provincial Notice No. 309 of 2000, Government Gazette
615 1st October 2000, are as follows:
• Integrated development planning for the district municipality as a whole, including a framework for integrated
development plans for local municipalities within the area of the district municipality, taking into account the
integrated development plans of those local municipalities,
• Bulk water supply that affect a proportion of municipalities in the district,
• Bulk electricity supply that affects a significant proportion of municipalities in the district,
• Bulk sewerage purification works and main sewerage disposal that affects a significant proportion of
municipalities in the district,
• Solid waste disposal sites serving the area of the district municipality as a whole,
• Municipal roads which form an integral part of road transport system for the area of the municipality as a whole,
• Regulation of passenger transport,
• Municipal airports serving the area of the district municipality as a whole,
• Municipal health services serving the area of the district municipality,
• Fire fighting services serving the area of the district municipality as a whole,
• The establishment, conduct and control of fresh produce markets and abattoirs serving the area of the district
municipality,
• The establishment, conduct and control of cemeteries and crematoria serving the area of the district
municipality as a whole,
• Promotion of local tourism for the area of the district municipality as a whole,
• Municipal public works relating to any of the above functions or any other functions assigned to the district
municipality and,
• The receipt, allocation and, if applicable, the distribution of grants made to the district municipality.
INSTITUTIONAL CAPACITY
Structures of Council
The Mopani District Council comprises of the political and administrative components responsible for decision-making and
implementation respectively. The Executive Mayor and the Speaker head the political component of the municipality. The

168
Mopani District Council consists of 44 Councilors, of which, 8 are members of the Mayoral Committee. The Municipality has
all the powers assigned to it in terms of the Constitution as well as relevant national and provincial legislation. The municipality
has the authority to take any possible actions to effectively exercise powers assigned to it. The overall executive and
legislative authority vests in Council. The Council must, therefore, take all the major decisions of the Municipality.
The Mopani District Council has established Portfolio Committees to discuss and recommend policies to Council. Portfolio
Committees, as the engine room of Council, serve as an interface between the political structures of Council with the
administrative structures of Council. It is in these committees where policy issues are debated thoroughly prior to their
submission to the Mayoral Committee that, in turn, forwards them to Council for adoption. Through Portfolio Committees,
Councilors are able to give political direction to the administrative programmes of Council. Table 57 highlights the Portfolio
Committees that have been established to contribute to effective decision-making in processes of governance and ensure
effective implementation of service delivery projects and monitoring thereof:
Table 57: List of Portfolio Committees in Mopani District Municipality
Name of Committee Chairperson & Members Support Department Cluster
Finance Chairperson: Cllr MN Makhurupetji Finance Directorate Governance and Admin
Governance & Admin. Chairperson: Alderman
TP Ramaremela
Corporate Services Governance and Admin
Social Services Chairperson: Cllr NV Mathonsi Community Services Social and Infrastructure
Strategy, Planning & IDP Chairperson: Alderman MM Mukhabele Planning & Development Economic Development
Roads and Transport Chairperson: Cllr S Tindane Technical Directorate Social and Infrastructure
Water and Sanitation Chairperson: Cllr MO Moagi Technical Services Social and Infrastructure
Energy Chairperson: Cllr TE Ndlovu Technical Directorate Social and Infrastructure
FULL-TIME COUNCILLORS
The District Council has designated some Councillors to serve Council on a full-time basis. The deployment of Fulltime
Councilors is intended to ensure that Council is “hands-on and politically focused” in influencing and impacting on activities of
the administration. This is based on the understanding that the electorate elected public representatives to govern on their
behalf and with them. But at the same time, Councilors would require the technical advice from the appointed officials who are
responsible for co-initiating (together with Councilors in the Portfolio Committees) and implementing Council resolutions.
Hence there has been identified a need for Councilors to lead from the front.
MANAGEMENT OF THE MUNICIPALITY
The management of the municipality is led by the Municipal Manager and is made up of all the Directors and their Assistants.
The main focus of the management team is to implement Council resolutions and report on the performance of the
municipality to Council and other government structures as required by legislation.

169
STAFF DATA
In terms of the approved organisational structure, the table below will illustrate the statistics in terms of positions approved,
filled and vacant posts.
TABLE 58: PERSONNEL COMPLIMENT
Approved Positions 283
Filled Positions 133
Vacant Positions 142
Unfunded positions 0
RECRUITMENT
The Municipality is targeting to fill all vacant position by the December 2008.
EMPLOYMENT EQUITY
The municipality has developed its employment equity policy and plan, however both the plan and the policy needs to be
reviewed. In terms of the targets as set in the plan, the municipality has only managed to improve in terms of some targets
while the others are still far behind. The table below will outline the representation within the municipality per category.
Table 59: Staff representation per category
Male Female White Male
Foreign Nationals
Occupation Categories
A C I A C I W W M F
TOTAL
Legislators, Senior Officials & Managers
15 5 1 21
Technicians & Associate Professionals
14 9 23
Clerks 17 30 1 2 5 55
Service & sales workers
Skilled agricultural & fishery workers
Craft and related trades workers
12 6 18
Plant & machine operators and assemblers
Elementary occupations 2 12 14
TOTAL PERMANENT
Non-permanent employees
GRAND TOTAL 60 64 1 2 6 133
As can be noticed from the foregoing figures, compliance have been on other Occupational Categories whilst targeted
recruitment is being made on the appointment of females on Management level as well as disabled in general.

170
ADMINISTRATIVE INFRASTRUCTURE
Since establishment in October 2000 the municipality has been utilizing the government building in Giyani which is owned by
the Department of Public Works. During the early years of its establishment, the building was able to accommodate all the
staff members and Council. However due to the increasing responsibilities as per the Integrated Development Plan of the
municipality, the structure has been reviewed and as such the projected staff compliment will not be accommodated in the
current building.
On the other hand the municipality is busy introducing some new technologies in order to improve on its capacity to achieve
good governance. These includes issues such as electronic record management system, security system and IT systems in
general. In order to become more effective and efficient this municipality needs to construct its own administrative building.
Table 60: LIST OF PROJECTS
Name Target Source of funding
Training: Council CLLRS Equitable share
Management Lekgotla Managers Equitable share
IDP/Budget/PMS Strategic planning session Management Equitable share
Performance Assessment Reports Managers Equitable share
District Managers Forum Managers Equitable share
Project Consolidate Funding Project Consolidate municipality
Equitable share
Upgrading of SCM Database Service Providers Equitable share
Five Year Financial Plan Finance Equitable share
Upgrading of Financial Systems Budget & Treasury Equitable share
Review of Financial Policies and Procedures Employees Equitable share
Asset Management Implementation Plan Staff Equitable share
Master Systems Plan MDM & Locals MSP Grant
Conversion of GAMAP/GRAP Implementation Plan
MDM Provincial Treasury
Free Basic Water ALL LMs MIG
Master Systems Plan MDM Equitable share
IDP Review Government
MSIG
Branding Investors MDM/ Equitable share
O.R. Tambo games Youth MDM
Indigenous games Abled and disabled, youth, men, and women
MDM
Wellness Day Aged people MDM
Junior Dipapadi Festival Pre-school learners between ages 3 and 6 yrs.
MDM
Promotion of multilingualism All the citizens of Mopani MDM
World environment day Women & youth MDM
School of Environment School youth MDM
Development of Air quality Plan All residents of MDM MDM
Environmental management framework MDM MDM
Fire Services: Public Awareness Campaigns All citizens of MDM MDM
World Aids Day All people Equitable Share
Candlelight memorial All people MDM

171
World food day celebration Women, Children Disabled MDM
Food hygiene workshops Street traders (women & youth)
MDM
District Food control Women, youth and disabled persons
MDM
Food sampling All Mopani residents MDM
Water sampling and analyses All Mopani residents MDM
Initiation schools monitoring Youth MDM
Water week celebration Women & children and the disabled
MDM
Cleaning up campaigns Women & youth MDM
Support of NGOs NGO’s dealing with HIV and AIDS
MDM
District Aids Council All citizens of MDM MDM
Moral regeneration movement Community, Youth, People with disability and Aged
MDM
Awareness campaigns –Health promotion -Cancer month & world diabetic day - Wellness Day
Chronic clients ,the aged and people with disability
MDM
Health and Hygiene Awareness All MDM
Victim Empowerment centre support Victims, NGO’s and community
MDM
Housing MDM MDM
Support of drop in centres MDM MDM
Early Childhood Development Early childhood development Associations
MDM
Radio, Communication, Info. Management System
MDM Households Equitable Share
Awareness Campaigns MDM Households Equitable Share
Development of Disaster Management Plans MDM Households Equitable Share
Risk Analysis MDM Households Equitable Share
Disaster Relief support MDM Households Equitable Share
Conference system Support services Equitable Share
Electronic filing system Support services Equitable Share
Security Services Support services Equitable Share
Information Management and GIS MDM (institution) Equitable Share
LGW- SETA LGW- SETA Grant
Retention & Succession Strategy Community and Municipalities
Institutional Plan Community
Employment Equity Plan Designated group MDM/ Equitable share
Long Service Recognition Staff MDM/ Equitable share
Employee Assistance Programme Employees MDM/ Equitable share
Performance Management System Staff/ District Municipality MDM/ Equitable share
Task Job Evaluation Staff Equitable share
Training: Staff Staff Equitable share
District Mayor’s Forum Local Mayors MDM/ Equitable share
Local House of Traditional Leaders Traditional Leaders MDM/ Equitable share
Anti-Corruption Forum Business, Labour & Civil Society
MDM/ Equitable share
Mayor’s Charity Cup Football Clubs, Charity Org., Tourists
MDM/ Equitable share
Excellence Awards Stakeholders & Public Servants
MDM/ Equitable share

172
District Disability Forum Disabled People’s Organisations
MDM/ Equitable share
Disability Campaigns and Awareness Rural Households MDM/ Equitable share
Elders Day Elderly People MDM/ Equitable share
Elders Forum Elderly People MDM/ Equitable share
Gender Forum Gender-Based Organizations
MDM/ Equitable share
Men’s Forum Men and Boys MDM/ Equitable share
Women’s Month Women MDM/ Equitable share
16 Days of Activism Women & Children MDM/ Equitable share
SAWID Women MDM/ Equitable share
Children’s Rights Parliament Children MDM/ Equitable share
Youth Civic Education/Campaigns Youth MDM/ Equitable share
Youth Council Youth Organisations MDM/ Equitable share
Youth Month Youth Equitable share
District Children’s Rights Day Children Equitable share
Public Participation Communities MDM/ Equitable share
Support to LMs-Ward Communities MDM/ Equitable share
INTERGOVERNMENTAL RELATIONS
- Speakers Forum
- Traditional Leadership
- District Managers Forum
- District IGF
- Internal Audit
PERFORMANCE MANAGEMENT SYSTEM Business Plan
Intervention Plan
Given the challenges facing the municipality in terms of building its capacity for the sole purpose of meeting the Constitutional
mandate, it is very important to embark on the programmes and projects identified above. This finding has assisted the
municipality is developing the MTEF budget. The principle underlying the allocation is that for the municipality to deliver quality
services to the community, there is a need to strengthen the capacity of the institution by having policies and the human
resources to ensure implementation.

173
Budgets
The table below outlines the consolidated budget for the district in terms of the areas outlined previously.
Table 61: Consolidated budget for the district
Department Salaries General Expenses
Repairs and maintenance
Capital 2007/08 2008/09 2009/10 2010/11
Council - 10,451,455 - - 8,246,838 10,451,455 11,078,543 11,743,255
MM 2,710,721 1,172,400 - - 2,064,166 3,883,121 4,157,315 4,449,274
PIMS 1,393,789 - - - 580,929 1,393,789 1,477,417 -
Finance 5,263,960 51,172,500 40,000 1,298,140 55,075,033 57,774,600 59,146,078 64,984,492
Planning 2,062,070 1,158,000 - 14,000 2,618,848 3,234,070 5,377,794 8,551,942
LED 788,153 11,749,900 1,800,000 3,350,000 11,350,534 17,688,053 11,132,643 6,298,869
IDP 704,685 502,500 - - 641,518 1,207,185 1,344,716 1,531,784
Communications 1,031,701 440,500 - - 1,047,900 1,472,201 1,559,933 1,652,929
Technical 1,612,249 595,000 - 28,610,000 12,593,115 30,817,249 2,363,484 2,531,473
Water 1,430,797 18,525,000 65,753,026 186,645,953 185,750,647 272,354,776 293,098,903 336,055,717
Environment 10,677,768 1,567,550 - - 5,045,153 12,245,318 11,615,074 12,352,920
Electrical 207,548 - - - 188,950 207,548 - -
Roads & Transport
995,701 220,000 - 39,031,375 43,372,732 40,247,076 50,477,443 46,343,770
Community 1,302,044 437,800 - - 5,782,943 1,739,844 1,830,035 1,969,769
Fire 13,670,741 437,800 978,300 - 18,518,888 15,086,841 17,221,808 18,302,317
Disaster 1,622,088 2,680,510 112,500 2,494,100 13,489,627 6,909,198 7,204,663 7,796,589
Health 1,490,889 1,479,397 - - 3,812,159 2,970,286 2,446,992 2,651,874
Corporate 1,267,044 136,000 - 1,860,000 1,065,851 3,263,044 2,271,267 2,427,951
HR 1,931,112 7,448,300 - - 9,091,946 9,379,412 7,583,479 8,456,598
Administration 3,242,528 2,670,700 - - 4,946,165 5,913,228 6,512,980 7,144,305
Legal 604,800 2,586,000 - - 2,355,000 3,190,800 3,382,248 3,585,183
Office of the Exec. Mayor
2,087,141 1,737,600 - - 1,875,411 3,824,741 4,111,925 4,362,139
Office of Speaker
707,647 442,000 - - 1,052,702 1,149,647 1,218,626 1,291,744
Office of Chief Whip
426,609 24,000 - - 185,798 450,609 477,645 506,304
Disability Desk 176,385 405,000 - - 357,923 581,385 676,968 724,086
Gender Desk 176,385 842,250 - - 443,423 1,018,635 2,059,253 1,195,266
Youth Desk 176,385 558,500 - - 423,923 734,885 899,478 861,445
-
57,760,944 119,440,662 68,683,826 263,303,568 391,978,122 509,189,000 507,091,012 554,991,198
CONCLUSION
The institutional plan takes into consideration the issues around the HIV/AIDS infection within the district and how it will affect
the capacity of the municipality in achieving its developmental goal. It must be noted that given all the resources planned, it is
hoped that the municipality must be able to improve its capacity and the understanding of its community.
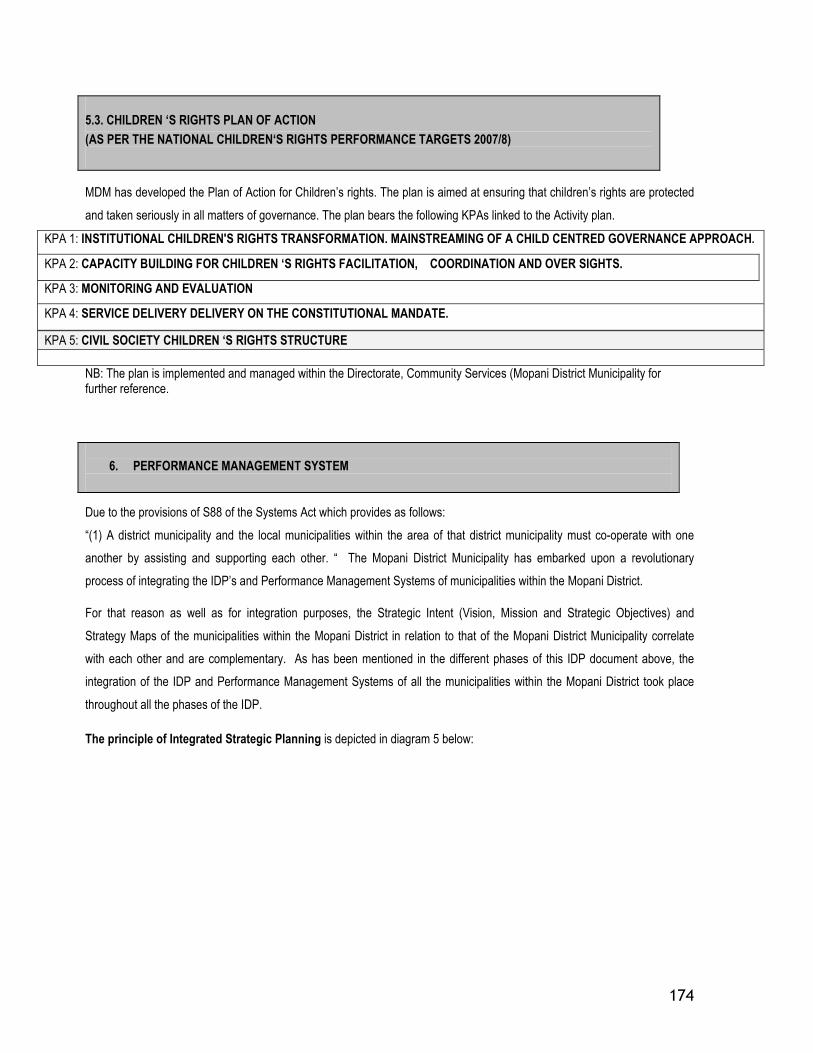
174
5.3. CHILDREN ‘S RIGHTS PLAN OF ACTION
(AS PER THE NATIONAL CHILDREN‘S RIGHTS PERFORMANCE TARGETS 2007/8)
MDM has developed the Plan of Action for Children’s rights. The plan is aimed at ensuring that children’s rights are protected
and taken seriously in all matters of governance. The plan bears the following KPAs linked to the Activity plan.
KPA 1: INSTITUTIONAL CHILDREN'S RIGHTS TRANSFORMATION. MAINSTREAMING OF A CHILD CENTRED GOVERNANCE APPROACH.
KPA 2: CAPACITY BUILDING FOR CHILDREN ‘S RIGHTS FACILITATION, COORDINATION AND OVER SIGHTS.
KPA 3: MONITORING AND EVALUATION
KPA 4: SERVICE DELIVERY DELIVERY ON THE CONSTITUTIONAL MANDATE.
KPA 5: CIVIL SOCIETY CHILDREN ‘S RIGHTS STRUCTURE
NB: The plan is implemented and managed within the Directorate, Community Services (Mopani District Municipality for further reference.
6. PERFORMANCE MANAGEMENT SYSTEM
Due to the provisions of S88 of the Systems Act which provides as follows:
“(1) A district municipality and the local municipalities within the area of that district municipality must co-operate with one
another by assisting and supporting each other. “ The Mopani District Municipality has embarked upon a revolutionary
process of integrating the IDP’s and Performance Management Systems of municipalities within the Mopani District.
For that reason as well as for integration purposes, the Strategic Intent (Vision, Mission and Strategic Objectives) and
Strategy Maps of the municipalities within the Mopani District in relation to that of the Mopani District Municipality correlate
with each other and are complementary. As has been mentioned in the different phases of this IDP document above, the
integration of the IDP and Performance Management Systems of all the municipalities within the Mopani District took place
throughout all the phases of the IDP.
The principle of Integrated Strategic Planning is depicted in diagram 5 below:

175
Visio nM iss io n
S trat M a p
M L M GTM GL MM D M G GM B A -P H
M o p an i D is tr ic t
A re a
In st i tute for P er form a nce M an ag em en t
Performance Management must be seen as one of the instruments whereby the municipal strategy, business plans, IDP
projects, budgeting and employee accountabilities are aligned and integrated. The development and implementation of an
Organisational Performance Management System (OPMS) should be seen as a process that will need time to be developed
and adapted to suit the needs of Mopani District Municipality. The development of the Organisational Performance
Management System will need to progress through the following phases, as prescribed by the Performance Management
Regulations: Planning
� Development
� Implementation
� Reporting
� Monitoring
� Review
During the Planning phase a comprehensive analysis was conducted in terms of the current status at Mopani District
Municipality. This phase provided the basis for understanding and identifying the need for the development of an
Organisational Performance Management System.
As part of the Development phase various workshops were scheduled with all relevant stakeholders whereby the Strategy
(Vision, Mission and Strategy Map) was developed. The strategy is the foundation that will guide and lead the development of
the Performance Management System. During the Development phase Strategic Objectives and Key performance Indicators
were developed to support and ultimately enable the municipality to implement the Strategy. During this process Key
Performance owners were identified who will take responsibility in driving the process through the implementation of the
operational strategies. A crucial element of this phase is to ensure that the budget is aligned and integrated in terms of the
operational strategies through allocating and provisioning of funds for the projects and initiatives identified.

176
6. 1 ORGANISATIONAL PERFORMANCE MANAGEMENT The biggest challenge for any district municipality is to coordinate information in an intelligent manner. Resources are
duplicated, and aims and objectives are not clearly communicated. For any district to be successful, an appropriate
management system needs to be effected.
To address this challenge, the Mopani District Municipality and its five local municipalities have all adopted a common
Performance Management System based on the Balanced Scorecard methodology. Central to the system is its ability to fully
integrate and align the IDP, performance management (both organisational and employee) and budget (SDBIP).
This so-called “Tripod” Integrated Management System for District Governance ©, incorporating the 11-Step
Methodology for Municipal Excellence©2 not only facilitates compliance with all pieces of legislation governing performance
management in South African municipalities, but also good corporate governance.
6.2 GOOD CORPORATE GOVERNANCE
“Good corporate governance can be equated to having clear corporate values which are stated and enacted, and ensure that
the company is governed in a way that is efficient, responsible, accountable, transparent and with probity. It furthermore,
recognises the legitimacy of interest of defined key stakeholders, and engaging in long-term relationships.” (The King Report
on Corporate Governance for South Africa, 2002).
In the municipal environment, corporate governance is all about how municipalities set their priorities (as per the IDP), conduct
their business (through the performance management system and the SDBIP process), and relate to the community they
serve (as per the IDP and performance management system).
The Tripod Integrated Management System©3 ensures co-ordinated planning and development in the district. Data is
collected, monitored, evaluated, assessed, audited and reported on, for informed decision-making and better service delivery
- in other words, for better corporate governance.
THE 11-STEP APPROACH TO MUNICIPAL EXCELLENCE
Within the Tripod Integrated Management System for District Governance©, Mopani has followed the 11-Step Approach to
Municipal Excellence©, a methodology developed by its partners in performance management, the Institute for Performance
Management (IPM). The methodology offers a clear roadmap for municipalities seeking to comply with municipal acts and
regulations.
The 11 Step approach as per the methodology is briefly dealt with below:

177
Step 1: Public Participation
Legislation is clear on the need to deepen democracy, through involving the public in the setting of strategic objectives and
Key Performance Indicators, among others. Through various public forums, including portfolio committees and some ward
committees at local level, Mopani is paving the way for community involvement in Performance Management. On this subject,
a pilot is being implemented whereby ward scorecards have been developed in consultation with identified ward committees in
some of the local municipalities.
Step 2: Integrated Development Planning
The Strategy of the municipality, aligned to the five Key Performance Areas for Local Government are contained in a Strategy
Map which indicates how value will be created for stakeholders, communities and citizens and it provides a visual
representation of the Strategy. Accountability and measurements are developed for each Strategic Objective which are
aligned to the KPA’s. There is full alignment of the projects listed in the Projects phase of the IDP and the budget as well as
the SDBIP. These projects are also aligned with the Strategic Objectives contained on the Strategy Map by means of the
Scorecard.
Step 3: SDBIP
The Service Delivery and Budget Implementation Plan (SDBIP), as prescribed by the Municipal Finance Management Act is
the integral tool for monitoring the implementation of the Strategic and operational strategies, Budget and Performance
Management System.
Clear service delivery indicators are aligned to the Strategy, resulting in a real connection between the IDP and SDBIP.
Step 4: Lower SDBIP
The real breakthrough this year will be the introduction of Performance Based Budgeting and business processes. It is in this
step where specific emphasis will be placed on input, process and output indicators that provide intelligence on outcome,
impact and results.
Step 5: Monitoring, Assessment, Evaluation and Review
The Performance Management System will enable the Mopani District Municipality to Report, Monitor and Review the
implementation of the Strategy through the monitoring of the progress with the strategic and operational strategies and once
an automated Performance Management System has been developed and implemented, benchmarking amongst other
municipalities within the Mopani District will take place.
Step 6: Performance Auditing
A District-wide Performance Audit Committee was appointed in the middle of 2007 and also serves the local municipalities. In
order to ensure accuracy of reporting and transparency, the Institutional and Departmental performance reports are also
audited and verified by Internal Auditing.

178
Step 7: Municipal Reporting
Because of the lack of an automated system, the work to date was done manually through an Excel spread sheet system – in
itself, a remarkable feat considering the scope of the system. This unfortunately hampers the turn-around time of
performance reports.
Different reports can be generated from the same data repository, i.e. monthly management reports, quarterly SDBIP reports,
mid-term and performance reports as part of the annual report. The system has managed to report according to the different
KPA’s and to add scores in terms of the reporting to the Department of Provincial and Local Government (DPLG). The
municipality is able to align its indicators and targets to that which are required by DPLG to be reported on.
The District Municipality, who is currently funding the development of the Performance Management Systems of its own
municipality as well as the local municipalities in the District, has made an assessment of all mid-market performance
management products in South Africa and is lobbying for approval at Provincial level to acquire an electronic system, which
will result in a quantum leap forward in reporting at the municipalities.
Step 8: District Integration and Co-ordination
For the progress of the all the municipalities within the district, coordination and real integrated and forward planning amongst
all the municipalities are necessary. District wide strategic planning sessions occur annually.
Step 9: Leadership and Change Management
Performance management is inseparable from change management. To this end, it is important that Leadership is involved
in the development and implementation of the IDP and also in the monitoring and evaluation of such development and
implementation. Ownership by the Leadership for all the processes of the municipality is vital and this can only be achieved
through the constant facilitation of change management in the organisation. Taking ownership has been witnessed during a
district wide strategic planning session, where the state of the municipalities in the district was discussed and plans were
made together on how to take the whole district area forward.
Step 10: Employee Performance Management System
The Employee Performance Management Policy has been adopted by Council during 2007 and is being implemented. The
essence of this policy is the full alignment of the Organisational and Employee Performance Management System.
Performance Agreements and Plans are developed for and concluded annually by S57 Managers and these Agreements are
totally aligned to the Organisational Strategy and Organisational Performance Management System, with half yearly
organisational as well as employee performance assessments and evaluations.
Step 11: Capacity Building throughout the Development of the System
In the Mopani District Municipality a core group of people have been extensively exposed to Performance Management and
every year that core group is being expanded upon. Capacity building thus far on Performance Management has been
extended to the Mayoral Committee, Portfolio Committee and Extended Management (Directors and Assistant Directors).

179
6.4 BALANCED SCORECARD, MOPANI AND THE 11-STEP APPROACH TO MUNICIPAL EXCELLENCE
The 11-Step Approach to Municipal Excellence© uses the Balanced Scorecard Methodology, trusted by more than 65% of
private and public organisations worldwide to improve performance. (Fortune 500).
The Balanced Scorecard is an approach to strategic management that was developed in the early 1990’s by Drs. Robert
Kaplan and David Norton. It has been used to describe the activities of Mopani District Municipality through a number of
measures for each of four perspectives (Community Satisfaction, Financial Results, Internal Processes and Learning and
Growth).
It is a management system (not only a measurement system) that enables organisations to clarify their vision and strategy and
translate them into action. It provides feedback around both the internal business processes and external outcomes in order to
continuously improve strategic performance and results. When fully deployed, the Balanced Scorecard transforms strategic
planning from an academic exercise into the nerve centre of an enterprise.
Mopani District Municipality is a pioneer in aligning and integrating the Balanced Scorecard methodology and the Key
Performance Areas as identified by the Department of Local Government (DPLG), within the 11-Step Approach.
Balanced Scorecard has also been used to ensure that Mopani complies with legislation governing performance
management, in particular, Chapter 6 of the Local Government Municipal Systems Act 32 (2000), which states: that a
municipality must establish a performance management system that is -
i. within its resources
ii. best suited to its circumstances
iii. in line with the priorities, objectives, indicators and targets contained in its IDP
However, more than ensuring that the performance management system at Mopani is in line with the priorities, objectives,
indicators and targets contained in its IDP, as is prescribed by S38 (3) of the Act, it is the performance management system
itself, that has ensured that the IDP accurately reflects the priorities, objectives and indicators necessary to fulfil its objective of
service delivery to the community it serves.
6.5 MONITORING, ASSESSMENT, EVALUATION AND REVIEW
Monitoring can be defined as the regular observation and recording of activities taking place in a project or programme. It is
a process of routinely gathering of information on all aspects of the objectives, programmes or projects; it also involves giving
feedback about the progress of the project to the donors, implementers and beneficiaries.
At Mopani District Municipality, monitoring is currently being done whereby the Administration on a regular basis, gather
relevant data on progress made with their KPI’s and projects and report such progress to Council. The role of Council is to
scrutinize these reports, verify whether what was reported on actually took place, especially progress with capital projects, and
give feedback to Administration and the Community on their findings. Furthermore, it is an auditing function to also monitor
and verify what was reported on.

180
Assessment can be seen as a process of measuring or quantifying the level of attainment of set targets. Scores are
allocated to see how well the themes, objectives, KPI’s and projects have been achieved. The Regulations of 2006 prescribe
that assessment should take place each quarter, of which two of these assessments can be informal assessments, but
formally assessments should take place half yearly. During these assessments, the performance of the Municipality as a
whole based on the Strategic and Institutional Scorecard is assessed as well as formal assessments of the performance of
individuals (S57 and contractually appointed managers). Quarterly performance assessment reports, based on the SDBIP are
developed and submitted to Council as well as half yearly and annual reports on the outcome of Strategic, Institutional and
individual performance.
Evaluation is the determination of value, or the measurement of value added, in other words if the desired outcomes of the
different processes have been achieved – asking the question: all the work done and money spent, was there an impact on
the community? Annually Council should evaluate, against the identified desired outcomes, whether the activities undertaken
by the municipality and the money spent, had a sufficient impact on the community.
Review means to look at something again critically, to re-examine something to make sure that it is adequate, accurate, or
correct it with an aim of improving the results. Annually, through the IDP and Performance Management processes, based on
the situation of the municipality each year, the Strategy is reviewed as well as the plans to address gaps, with specific focus
on taking the municipality forward. This then culminates into the review of the Scorecard, to improve on the measurements
and to ensure that action is taken in response to actual performance to make outcomes better than they would otherwise be.
!Unexpected End of Formula
7. CONCLUSION
Adherence to supporting legislation and regulations is not an easy task; problems associated with definitions, lack of skills,
lack of funds, automation, and the need for expert advice, has left many South African municipalities lagging behind or not
implementing true performance management at all.
Mopani’s unswerving commitment to compliance with legislation governing municipal management has propelled the
municipality to the forefront of local government in South Africa in the adoption of a district-wide performance management
system, whereby the Performance Management Systems of all the municipalities in the Mopani District area, including that of
the District Municipality itself are standardised and coordinated. The main purpose for that is that the municipalities in the
district can really strategise and plan together in an integrated manner in taking the whole area forward in being: The Food
Basket of Southern Africa and the Tourism Destination of Choice.
The Performance Management System will be reviewed and adapted as needed to ensure continuous improvements and
changes are made according to changing circumstances and actual implementation of projects or initiatives.
The strategy and IDP needs to be translated in measurable Key Performance Indicators that need to ensure achievement and
to optimise service delivery. This will require the municipality to identify targets for each KPI’s wh8ich will be used to manage
and monitor the implementation of strategies as identified.

181
The development of the organisational performance management system therefore had an imminent impact on the IDP
Review process. The performance management system provides the framework to ensure the IDP gets measured and
implemented. The methodology and processes followed within Mopani District Municipality provides for the alignment of the
performance management system with the identification, implementation, measurement, monitoring and reporting on
measurable outcomes not only on employee but also on organisational level. In the development of the scorecard, all analysis
and strategies were taken into consideration.
The Strategic Key Performance Indicators of Mopani District Municipality that are depicted below, will form part of the
Council’s Scorecard which will assist in the reporting of the performance of the municipality as a whole and the Municipal
Manager is being made accountable for the achievement of the identified Targets. The linkage with the DPLG KPA’s are
indicated. The operational Key Performance Indicators will form part of the SDBIP at the higher level and lower level SDBIP
as prescribed by National Treasury.
............................................................................e n d………………………………………………………………………………..