fetal and neonatal maxillary ontogeny in extant humans and the utility of prenatal maxillary...
TRANSCRIPT

R E S E A R CH AR T I C L E
Fetal and neonatal maxillary ontogeny in extant humans andthe utility of prenatal maxillary morphology in predictingancestral affiliation
Christina L. Nicholas
Iowa Institute for Oral Health Research,
University of Iowa, Iowa City, IA 52242-
1322
Correspondence
Christina L. Nicholas, Iowa Institute for
Oral Health Research, N418 Dental Science
Building, University of Iowa, Iowa City, IA
52242-1322, USA.
Email: [email protected]
Funding Information
Grant sponsors: University of Iowa’s
Department of Anthropology and NIH T90
DE023520-02.
Abstract
Objectives: The midface of extant Homo sapiens is known to undergo shape changes through fetal
and neo-natal ontogeny; however, little work has been done to quantify these shape changes. Fur-
ther, while midfacial traits which vary in frequency between populations of extant humans are
presumed to develop prenatally, patterns of population-specific variation maxillary shape across
ontogeny are not well documented. Only one study of fetal ontogeny which included specific dis-
cussion of the midface has taken a three-dimensional geometric morphometric approach, and that
study was limited to one population (Japanese). The present research project seeks to augment our
understanding of fetal maxillary growth patterns, most especially in terms of intraspecific variation.
Materials and Methods: Three-dimensional coordinate landmark data were collected on the right
maxillae of 102 fetal and neo-natal individuals from three groups (Euro-American, African-
American, “Mixed Ancestry”).
Results: Shape changes were seen mainly in the lateral wall of the piriform aperture, the anterior
nasal spine, and the subnasal alveolar region. The greatest difference across age groups (second
trimester, third trimester, neonates) was between the second and third trimester. Euro-Americans
and African-Americans clustered by population and differences in midfacial morphology related to
ancestry could be discerned as early as the second trimester (p 5 .002), indicating that population
variation in maxillary morphology appears very early in ontogeny.
Discussion: The midface is a critical region of the skull for assessing ancestry and these results
indicate that maxillary morphology may be useful for estimating ancestry for prenatal individuals
as young as the second trimester.
K E YWORD S
geometric morphometrics, midface, palatal growth
The midfacial morphology of H. sapiens varies between populations and
this variation is argued to in part reflect climatic adaptations (Churchill,
Shackleford, Georgi, & Black, 2004; Evteev, Cardini, Morozova, &
O’higgins 2014; Holton, Yokley, & Butaric 2013; Yokley, 2009). Differ-
ences between modern human midfaces and Neandertal midfaces have
also been argued to be due to climatic differences. Inter- and intraspe-
cific differences in midfacial traits have been argued to appear early,
often before birth (Schultz, 1918, 1920; Mooney & Siegel, 1986a). For
example, the populational pattern whereby sub-Saharan African popu-
lations have a short or nonexistent anterior nasal spine (ANS) while
European populations tend to have strongly projecting anterior nasal
spines, has been argued to appear as early as the second trimester
(Mooney & Siegel, 1986a). A similar pattern of difference in nasal
dimensions between populations has been recorded as young as fetal
ages (Schultz, 1920).
During prenatal development, the maxilla starts off as two centers
of ossification: the premaxilla and the palatal process of the maxilla
(also known as the “postmaxilla”). These two centers ultimately fuse at
the premaxillary suture which runs across the palatal surface of the
maxilla posterior to the maxillary incisors, between the lateral incisors
and the canines, and superiorly up around the nasal cavity terminating
on the frontal process. The timing of this suture fusion differs between
American Journal of Physical Anthropology 2016; 00: 00-00 wileyonlinelibrary.com/journal/ajpa VC 2016Wiley Periodicals, Inc. | 1
Received: 22 January 2016 | Revised: 9 June 2016 | Accepted: 12 June 2016
DOI 10.1002/ajpa.23043

individuals, populations, and species, with Europeans showing earlier
suture fusion (often in utero) than Africans (typically during the perina-
tal period through the first two years of postnatal growth) (Mooney &
Siegel, 1986b), and Neandertals showing a much later fusion than
extant humans (typically well into childhood, sometimes as late as 6–8
years) (Maureille & Bar, 1999).
The palate forms from three centers of ossification: the midline
median palatine process, and left and right lateral palatine processes.
Anteriorly, the intermaxillary segment forms, which will develop into
the premaxilla (housing the anterior maxillary incisors). The palatine
processes grow such that both shelves fuse at midline with each other
(creating the midpalatal suture), and form a Y-shaped fusion with the
premaxilla anteriorly (creating the premaxillary suture); this occurs by
roughly 8 to 10 weeks fetal (Som & Naidich, 2014). Ossification begins
anteriorly, in the primary palate (premaxilla) and extends posteriorly
(Kim, Park, Kim, & Yoon, 2004; Warbrick, 1960). Most growth of the
face during the prenatal period occurs along the intermaxillary suture
(Scott, 1957; Som & Naidich, 2014).
Most research on variation in prenatal midfacial development has
focused on palatal length. Firstly, this measurement can be reliably
identified in ultrasound data. Secondly, palatal length is an indicator for
normal or anomalous craniofacial growth, and has been argued to
potentially be useful in early detection of malformations and syn-
dromes such as cleft palate (Hermann, Darvann, Sundberg, Kreiborg, &
Joergensen, 2015), Marfan syndrome (De Coster, De Pauw, Marten, &
De Paepe, 2004), Neurofibromatisis Type 1 (Heervae et al., 2011), and
Down syndrome (Alio, Lorenzo, Iglesias, Manso, & Ramirez, 2011).
Qualitative traits, such as anterior nasal spine prominence, have
been documented to vary between populations at prenatal ages. Wein-
berg et al. (2005) investigated a wide range of craniofacial traits to deter-
mine which were most useful for estimating ancestry (African-American
vs. Euro-American) in fetal samples. They found that occipital squamous
shape, ANS prominence, subnasal margin definition, vomer shape, and
temporal squama shape were the most accurate for predicting whether
an individual was of African or European descent. Three of these five
traits are midfacial/nasal, with two of them being maxillary, further
emphasizing the utility of the maxilla in determining ancestral affiliation.
Understanding the three-dimensional (3D) relationship between mid-
facial traits through development is an important aspect of understanding
growth—and the differences in growth between individuals and popula-
tions. To date, only one published study on fetal craniofacial ontogeny
has been conducted using modern 3D geometric morphometrics (Mori-
moto, Ogihara, Katayama, & Shiota, 2008). This study looked at overall
craniofacial ontogeny in a sample of Japanese fetal specimens (n531)
using a 3D geometric morphometric approach. They show that the shape
and relative position of the midface (i.e., the maxillae and zygomatics)
undergo relatively little morphological change prenatally. Based upon
their results, Morimoto et al. (2008) suggest that neurocranial changes (in
particular the lengthening of the skull antero-posteriorly) are the most
noteworthy, which is in agreement with earlier work (Trenouth, 1984).
While Weinberg et al. (2005) have demonstrated that qualitative
trait assessment can be used to estimate ancestry starting at prenatal
ages, quantitative research on this topic is lacking. To get a more accurate
picture of midfacial shape changes through ontogeny, and across popula-
tions, 3D geometric morphometric methodologies should be utilized.
This study expands upon the previous literature and looks specifically at
differences between African-derived and European-derived populations
using 3D coordinate landmark data. Three questions are examined: (1)
what are the 3D patterns of prenatal/neonatal maxillary growth? (2) how
do they differ between African-Americans and Euro-Americans? and
lastly, (3) can these differences in morphology be used to predict ancestry
of individuals from forensics/bioarchaeological contexts?
1 | MATERIALS AND METHODS
Isolated fetal and infant maxillae (n5102) were landmarked using an
Immersion Co. Microscribe. Due to the small size of the anatomical
structures, only 12 coordinate landmarks were chosen to capture shape
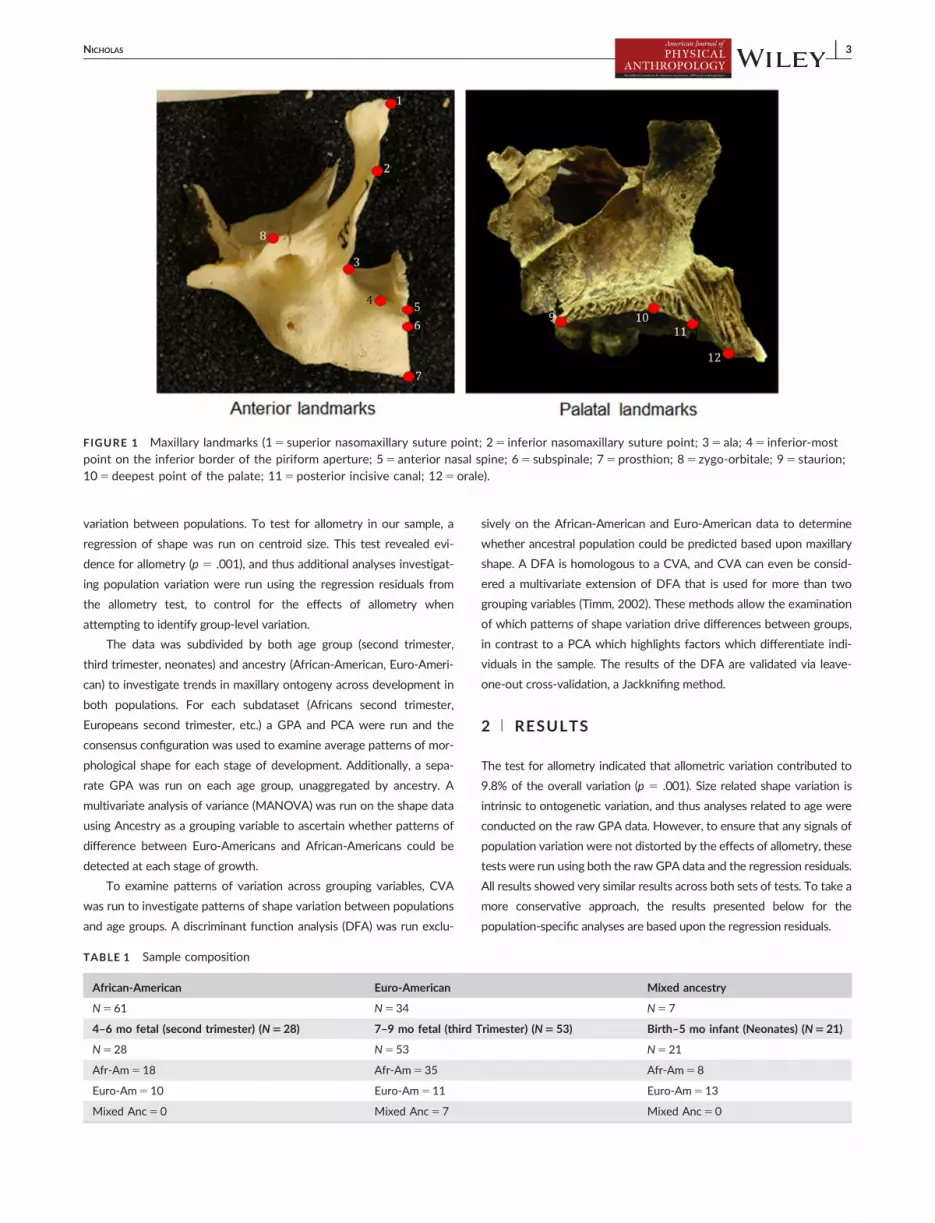
variation, focusing largely on the nasal region (Figure 1).
Samples came from the Mall and Lamb Collection (National
Museum of Natural History) and the Johns Hopkins Collection (Cleve-
land Museum of Natural History). The individuals selected represent
three ancestry groups, as identified by the researchers who compiled
these collections: Euro-American, African-American, and “Mixed Ances-
try” (individuals whose museum records indicate both African-
American and Euro-American ancestry).
Age at death information was gathered from the museum collec-
tions records. Ages ranged from 4 months fetal to 5 months postnatal.
Age groups were then created to aggregate similarly aged individuals,
roughly in line with the final two trimesters of pregnancy, with the third
group representing neonates: second trimester: 4 to 6 months fetal;
third trimester: 7 to 9 months fetal; neonates: birth to 5 months post-
natal (Table 1).
Generalized Procrustes analysis (GPA) was run on the data. A prin-
cipal components analysis (PCA) was run on the Procrustes superim-
posed landmark data using MorphoJ (Klingenberg, 2011). The first six
PCs were found to each represent >5% of the overall variation, and
thus were selected for further analysis.
To examine patterns of maxillary growth, age was regressed
against the first six PCs (derived from the raw GPA data). The sample
was then analyzed by age group (second trimester, third trimester, neo-
nates). These age groupings were compared using canonical variates
analysis (CVA). A form space (shape1 log centroid size) PCA was also
run, to highlight variation across ontogeny (as per Bastir & Rosas,
2009; Mitteroecker, Gunz, & Bookstein, 2005).
Prior research has suggested a multi-pronged approach to analyz-
ing allometry in an ontogenetic sample (Ponce de Leon & Zollikofer,
2001). This approach distinguishes between growth (size vs. age),
development (shape vs. age), and ontogenetic allometry data (shape vs.
size). Thus three regression analyses were run, using the raw age data,
centroid size data, and the GPA data.
Age was regressed on the coordinate landmark data with popula-
tion as a subgrouping in order to test whether differences in ontoge-
netic scaling might be a confounding factor analyses examining
2 | NICHOLAS
variation between populations. To test for allometry in our sample, a
regression of shape was run on centroid size. This test revealed evi-
dence for allometry (p 5 .001), and thus additional analyses investigat-
ing population variation were run using the regression residuals from
the allometry test, to control for the effects of allometry when
attempting to identify group-level variation.
The data was subdivided by both age group (second trimester,
third trimester, neonates) and ancestry (African-American, Euro-Ameri-
can) to investigate trends in maxillary ontogeny across development in
both populations. For each subdataset (Africans second trimester,
Europeans second trimester, etc.) a GPA and PCA were run and the
consensus configuration was used to examine average patterns of mor-
phological shape for each stage of development. Additionally, a sepa-
rate GPA was run on each age group, unaggregated by ancestry. A
multivariate analysis of variance (MANOVA) was run on the shape data
using Ancestry as a grouping variable to ascertain whether patterns of
difference between Euro-Americans and African-Americans could be
detected at each stage of growth.
To examine patterns of variation across grouping variables, CVA
was run to investigate patterns of shape variation between populations
and age groups. A discriminant function analysis (DFA) was run exclu-
sively on the African-American and Euro-American data to determine
whether ancestral population could be predicted based upon maxillary
shape. A DFA is homologous to a CVA, and CVA can even be consid-
ered a multivariate extension of DFA that is used for more than two
grouping variables (Timm, 2002). These methods allow the examination
of which patterns of shape variation drive differences between groups,
in contrast to a PCA which highlights factors which differentiate indi-
viduals in the sample. The results of the DFA are validated via leave-
one-out cross-validation, a Jackknifing method.
2 | RESULTS
The test for allometry indicated that allometric variation contributed to
9.8% of the overall variation (p 5 .001). Size related shape variation is
intrinsic to ontogenetic variation, and thus analyses related to age were
conducted on the raw GPA data. However, to ensure that any signals of
population variation were not distorted by the effects of allometry, these
tests were run using both the raw GPA data and the regression residuals.
All results showed very similar results across both sets of tests. To take a
more conservative approach, the results presented below for the
population-specific analyses are based upon the regression residuals.
TABLE 1 Sample composition
African-American Euro-American Mixed ancestry
N561 N534 N57
4–6 mo fetal (second trimester) (N528) 7–9 mo fetal (third Trimester) (N5 53) Birth–5 mo infant (Neonates) (N521)
N528 N553 N521
Afr-Am518 Afr-Am535 Afr-Am58
Euro-Am510 Euro-Am511 Euro-Am5 13
Mixed Anc50 Mixed Anc5 7 Mixed Anc50
FIGURE 1 Maxillary landmarks (15 superior nasomaxillary suture point; 25 inferior nasomaxillary suture point; 35 ala; 45 inferior-mostpoint on the inferior border of the piriform aperture; 55 anterior nasal spine; 65 subspinale; 75 prosthion; 85 zygo-orbitale; 95 staurion;105 deepest point of the palate; 115 posterior incisive canal; 125orale).
NICHOLAS | 3
2.1 | Pre- and perinatal growth of the maxilla
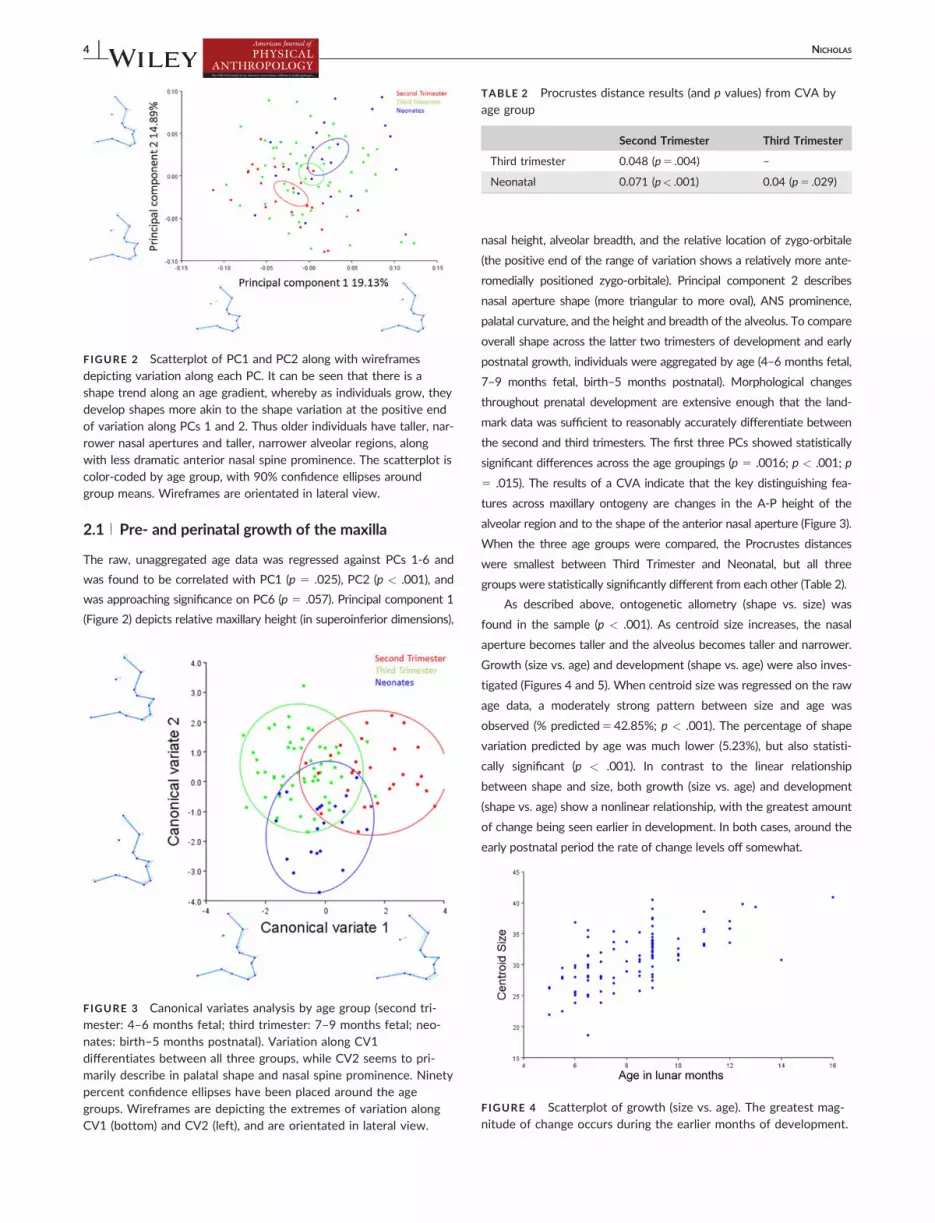
The raw, unaggregated age data was regressed against PCs 1-6 and
was found to be correlated with PC1 (p 5 .025), PC2 (p < .001), and
was approaching significance on PC6 (p 5 .057). Principal component 1
(Figure 2) depicts relative maxillary height (in superoinferior dimensions),
nasal height, alveolar breadth, and the relative location of zygo-orbitale
(the positive end of the range of variation shows a relatively more ante-
romedially positioned zygo-orbitale). Principal component 2 describes
nasal aperture shape (more triangular to more oval), ANS prominence,
palatal curvature, and the height and breadth of the alveolus. To compare
overall shape across the latter two trimesters of development and early
postnatal growth, individuals were aggregated by age (4–6 months fetal,
7–9 months fetal, birth–5 months postnatal). Morphological changes
throughout prenatal development are extensive enough that the land-
mark data was sufficient to reasonably accurately differentiate between
the second and third trimesters. The first three PCs showed statistically
significant differences across the age groupings (p 5 .0016; p < .001; p
5 .015). The results of a CVA indicate that the key distinguishing fea-
tures across maxillary ontogeny are changes in the A-P height of the
alveolar region and to the shape of the anterior nasal aperture (Figure 3).
When the three age groups were compared, the Procrustes distances
were smallest between Third Trimester and Neonatal, but all three
groups were statistically significantly different from each other (Table 2).
As described above, ontogenetic allometry (shape vs. size) was
found in the sample (p < .001). As centroid size increases, the nasal
aperture becomes taller and the alveolus becomes taller and narrower.
Growth (size vs. age) and development (shape vs. age) were also inves-
tigated (Figures 4 and 5). When centroid size was regressed on the raw
age data, a moderately strong pattern between size and age was
observed (% predicted542.85%; p < .001). The percentage of shape
variation predicted by age was much lower (5.23%), but also statisti-
cally significant (p < .001). In contrast to the linear relationship
between shape and size, both growth (size vs. age) and development
(shape vs. age) show a nonlinear relationship, with the greatest amount
of change being seen earlier in development. In both cases, around the
early postnatal period the rate of change levels off somewhat.
FIGURE 2 Scatterplot of PC1 and PC2 along with wireframes
depicting variation along each PC. It can be seen that there is ashape trend along an age gradient, whereby as individuals grow, theydevelop shapes more akin to the shape variation at the positive endof variation along PCs 1 and 2. Thus older individuals have taller, nar-rower nasal apertures and taller, narrower alveolar regions, alongwith less dramatic anterior nasal spine prominence. The scatterplot iscolor-coded by age group, with 90% confidence ellipses aroundgroup means. Wireframes are orientated in lateral view.
FIGURE 3 Canonical variates analysis by age group (second tri-mester: 4–6 months fetal; third trimester: 7–9 months fetal; neo-nates: birth–5 months postnatal). Variation along CV1differentiates between all three groups, while CV2 seems to pri-marily describe in palatal shape and nasal spine prominence. Ninetypercent confidence ellipses have been placed around the agegroups. Wireframes are depicting the extremes of variation alongCV1 (bottom) and CV2 (left), and are orientated in lateral view.
TABLE 2 Procrustes distance results (and p values) from CVA byage group
Second Trimester Third Trimester
Third trimester 0.048 (p5 .004) –
Neonatal 0.071 (p< .001) 0.04 (p5 .029)
FIGURE 4 Scatterplot of growth (size vs. age). The greatest mag-nitude of change occurs during the earlier months of development.
4 | NICHOLAS

When a form space (shape1 log centroid size) PCA was con-
ducted, the first three PCs each represented >5% of the total variance.
Individuals in the youngest age group (first trimester) and those in the
oldest (neonates) fell at opposite ends of the range of variation along
PC1. The scatterplot below (Figure 6) is labeled by both ancestry and
age group. The clear age trend is easy to discern, while there is no
noticeable pattern differentiating the ancestry groups.
Patterns of variation were investigated further by subdividing the
data by both ancestry and age group (Figure 7). At the second trimes-
ter, both Africans and Europeans show a relatively shorter nasal height,
shorter palate, and broader anterior alveolar region. Through develop-
ment the frontal process of the maxilla becomes more anteriorly ori-
ented, the nasal aperture becomes taller, and the alveolar region
becomes both taller and relatively narrower. The positioning of subspi-
nale becomes more superior with each subsequent growth stage.
Differences between the African-American and Euro-American
samples manifest early, with the second trimester showing greater
anterior alveolar prognathism in African-Americans, and greater ante-
rior nasal spine prominence in Euro-Americans. Throughout ontogeny,
differences in subnasal alveolar prognathism magnify, while differences
in anterior nasal spine prominence appear more static.
2.2 | Population variation in fetal/neonatal midfacial
morphology
The PCA run on the regression residuals yielded 36 principal compo-
nents, the first six of which each represented >5% of the total varia-
tion. Of these six PCs, only PC1 (p 5 .0000067) and PC3 (p 5 .0249)
showed statistically significant differences between the three popula-
tions (European-American, African-American, Mixed Ancestry). PC1
described nasal aperture shape (more triangular or more oval), height
of the frontal process of the maxilla, and palatal curvature. PC3
describes ANS prominence, alveolar prognathism, and the relative
height of the frontal process (Figure 8).
The CVA indicated that patterns of shape variation between the
three groups can be identified (p < .001; Table 3; Figure 9). Canonical
variate 1 describes alveolar prognathism, relative nasal height and
depth of palatal curvature; CV1 also clearly separates the two major
ancestry groups (African-American and Euro-American). Canonical vari-
ate 2 describes the curvature and height of the lateral wall of the piri-
form aperture (more oval or more triangular) along with a degree of
ANS prominence. Due to the fact that all the Mixed Ancestry sample is
in the third trimester age group, CV2 may depict age-related morpho-
logical differences.
When a DFA was run on just the African-American and Euro-
American data, shape differences were found to be statistically signifi-
cant between Euro-Americans and African-American (p 5 .0029, Pro-
crustes distance p< .0001), and Euro-Americans and Mixed Ancestry
individuals (p 5 .0001, Procrustes distance p 5 .016). The percentage
of each group correctly classified by the DFA was relatively high (Afri-
can-Americans: 78.7% correct; Euro-Americans: 85.2% correct), and
even though the percentages are lower for the cross-validation (Afri-
can-Americans: 66% correct; Euro-Americans: 62% correct), both are
still above 50% (Table 4).
These population-level differences can be discerned as early as the
second trimester. When MANOVAs were run on the GPA data for
each age group individually (i.e., the data was subdivided by age group
and a separate GPA subdataset) using ancestry as the grouping vari-
able, it was found that there were statistically significant differences
between the populations (second trimester: p 5 .002; third trimester: p
5 .041; neonates: p 5 .0152).
FIGURE 5 Scatterplot of development (shape vs. age). The great-est magnitude of change again appears to occur during the earliermonths of development.
FIGURE 6 Scatterplot of form space (shape1 size) PCA depictingform space PCs 1 and 2. Symbols have been coded by age (color)and ancestry (shape). Wireframes are depicting extremes of varia-tion along PC1 and are oriented in lateral view. In the wireframes,grey circles are the average shape, and the shape variation alongthe axis is depicted via a wireframe. Variation along form PC1 isprimarily age-related variation associated with the development ofa taller, narrower nose, a more superiorly oriented frontal processof the maxilla, and a taller, narrower alveolar region.
NICHOLAS | 5

3 | DISCUSSION
When growth was examined, via a regression of centroid size on age in
months postnatal, a clear developmental trend can be seen. It also
appears that the steepest rate of change occurs in the youngest ages in
the sample, with an apparent leveling out of size in the early postnatal
period. A similar trend of a larger magnitude of change in the prenatal
period can also be seen in the relationship between shape and age (i.e.,
development). In contrast, the relationship between size and shape
(allometry) is predictably much more linear. When the first two PCs of
the form space PCA were examined, it could be seen that there is
more shape variability in the first age group (second trimester) than the
following to age groups (third trimester and neonatal). The third age
group (neonatal) is also completely overlapping in form space with the
second trimester age group. Taken together, this indicates that the
main maxillary growth spurt appears to occur sometime between the
second and third trimester.
Prior research on prenatal and neonatal craniofacial ontogeny (Bastir
& Rosas, 2009; Morimoto et al., 2008) has indicated that allometric
growth of the cranium is not one, continuous pattern across all of devel-
opment. Morimoto et al. (2008) found that prenatal growth of the neuro-
cranium showed the opposite pattern than that seen postnatally (e.g.,
cranial length increases outstripped cranial breadth increases during fetal
growth). Bastir and Rosas (2009) document differential integration
between the units of the basicranium across different periods of prenatal
and postnatal growth. The results of the present study similarly indicate
variation in the timing of growth. Additional research is needed to com-
pare patterns of prenatal and postnatal maxillary growth and
development.
Starting with the youngest age group (second trimester: 4–6 months
fetal), differences can be seen between the Euro-Americans and African-
Americans (p 5 .002). The data in this study is cross-sectional, thus rate
of change cannot be observed. However, the overall pattern of morpho-
logical change is very similar between the two populations, with differen-
ces in ANS prominence appearing early (in agreement with Mooney &
Siegel, 1986a,b) and difference in subnasal alveolar prognathism appear-
ing later. This data would appear to suggest that when attempting to
assess ancestry by traditional visual scoring methods, subnasal alveolar
prognathism may not be useful until perinatal/neonatal ages.
Anterior nasal spine prominence is visually scored based upon the
relationship between the anterior-most tip of the anterior nasal spine
and the point of greatest inflection along the alveolar clivus. This trait
has been shown to exist along a continuum which at one end shows a
morphology that has essentially no prominence/projection, and at the
FIGURE 7 Wireframes depicting consensus morphology of each population broken down by age group. Wireframes are orientated in lat-eral view. Mean wireframe shapes from separate GPA analyses of data subdivided by ancestry and age group (i.e., a GPA of all second tri-mester African-Americans) have been superimposed by hand in order to aid in the visual interpretation of the data.
FIGURE 8 Scatterplot of PC1 and PC3 coded by ancestry, with90% confidence ellipses around the means for each ancestry group.Wireframes depict the extremes of variation along PC1 (bottom)and PC3 (left) and are orientated in lateral view. African-Americansand Euro-Americans can be distinguished quite well along PC1,with African-Americans showing wider nasal apertures and moresubnasal alveolar prognathism.
TABLE 3 Discriminant function and cross validation results forcomparisons across ancestry groups
Af-Am/Eur-Amdiscriminant Fx African-American Euro-American Total
African-American 48 13 61
Euro-American 5 29 34
Af-Am/Eur-Amcross-validation African-American Euro-American Total
African-American 40 21 61
Euro-American 13 21 34
6 | NICHOLAS

other extreme can show several millimeters of projection (Franciscus,
1995; Weinberg, Putz, Mooney, & Siegel, 2005). African-derived pop-
ulations show a higher frequency of less projecting nasal spines, while
European-derived populations tend to have greater ANS prominence,
thus this trait is commonly included in ancestry estimation of unidenti-
fied crania. Interestingly, while ANS prominence is described by PC3,
CV1 from the CVA by ancestral group (which differentiated between
African-Americans and Euro-Americans) did not show pronounced vari-
ation in ANS prominence. This suggests that other aspects of maxillary
shape, perhaps including more complex shape variation that is difficult
to qualitatively assess via visual observation of specimens, may be
important in estimating ancestry (at least for the populations included
in this analysis).
The pattern of morphological variation that seems to differ the most
among the populations was subnasal alveolar prognathism. It is worth
noting that Weinberg et al. (2005) did not find a statistical association
between ancestry and a visual coding of alveolar prognathism. This dis-
crepancy may arise from various potential factors. Firstly, Weinberg
et al.’s primary sample was the Mall and Lamb Collection at the NMNH
with alveolar prognathism scored for 51 individuals (n527 African-
Americans, n524 Euro-Americans). The sample for the current study is
comprised of individuals from the Mall and Lamb sample (n531)
together with individuals from the John Hopkins Collection at the
CMNH (n571), and is both larger in overall size and in the number of
African-American individuals included. It may therefore be that the
Weinberg et al. (2005) sample may not have been large enough to detect
a pattern of variation in this trait, or that the two collections are not
equally representative of the entire pattern of population variation in
midfacial morphology. Another possibility is that subnasal alveolar prog-
nathism, in and of itself, is not as important to distinguishing between
populations as is an overall pattern of shape variation which includes var-
iation in alveolar prognathism. The results presented here do concur with
early reports in the literature that differences in subnasal alveolar progna-
thism could be detected prenatally (e.g., Hauschild, 1937).
The maxilla is one of the most useful single bones in the cranium for
estimating ancestry. This holds true across H. sapiens and genus Homo
more broadly, due to climate-related variation in nasal morphology
coupled with dentofacial variation such as facial prognathism. Recent
work indicates that this midfacial variation arises through differential
deposition and resorption of bone across taxa, which can be seen in early
childhood (Lacruz et al., 2015). An interesting avenue for future research
might compare bone depositional patterns at the fetal/neonatal period of
development, examining whether differences in subnasal alveolar prog-
nathism in modern humans arise from differential depositional patterns.
The current study confirms the results of work by Mooney & Siegel
(1986a,b) and Weinberg et al. (2005) that showed population variation in
maxillary traits developing, in some cases, prenatally. While not all maxil-
lary traits that vary by population follow this pattern (such as the internal
nasal floor, see Nicholas & Franciscus, 2014), there is sufficient shape
variation at these young ages for it to be easily quantified using a rela-
tively restricted set of coordinate landmarks. Geometric morphometric
methods’ ability to quantify continuous variation, along with variation
that may be more difficult to parse due to the physically small size of fetal
material, may help to increase accuracy when trying to estimate ancestry
for fetal or neonatal individuals. Future work in this area should compare
qualitative assessments with a quantitative approach.
Overall, population variation in midfacial morphology in fetal and
neonatal individuals was detectable through the analysis of these 12
standard, and commonly preserved, osteological landmarks. Further-
more, as expected, the individuals of the Mixed Ancestry group clus-
tered most closely with the African-American group. The relative
inaccuracy of the cross-validation analysis in correctly assign shapes to
a population may represent the relatively small sample size included in
this analysis, especially for the Euro-American sample which was much
smaller than the African-American sample.
The use of newer ultrasound technologies have made it increas-
ingly possible to obtain 3D midfacial shape data without relying on dry
specimens (e.g., Chen et al., 2011; De Jong-Pleij, Ribbert, Mantern,
Tromp, & Bilardos, 2011; Faure,Captier, Baeumler, & Boulot, 2007;
Hermann et al., 2015; Roelfsema, Hop, & Wladimiroff, 2007; Rotten,
Levaillant, Martinez, Ducou Le Points, & Vicaut, 2002). Additionally,
retrospective use of MRI might be useful in some instances, and has
successfully been used to study dental arch measurements (Mailath-Pok-
omy et al., 2012). The current study relies on data from two of the largest
collections of fetal individuals in the United States. New work going for-
ward might investigate the utility of assessing anthropologically-relevant
information on fetal growth from ultrasound data.
TABLE 4 Procrustes distance results (and p values) from CVA byancestry
African-Am European-Am
African-Am 0.055 (p< .001) –
Mixed Ancestry 0.049 (p5 .163) 0.0637 (p5 .019)
FIGURE 9 Scatterplot of CVA of the regression residuals, byancestry, with wireframes depicting the extremes of variation alongCV1 and CV2. Wireframes are orientated in lateral view and 90%confidence ellipses have been placed around the three ancestrygroups. It can be noted that African-Americans and mixed ancestryindividuals share the same shape space along CV1.
NICHOLAS | 7

ACKNOWLEDGMENTS
Many thanks to the curators who provided access collections:
Lyman Jellema (Cleveland Museum of Natural History) and David
Hunt (National Museum of Natural History, Smithsonian). Many
thanks also to Steven Miller and Nancy Budd for their proof-reading
and assistance. The author especially appreciates the helpful feed-
back from the two anonymous reviewers and the Associate Editor.
REFERENCES
Alio, J., Lorenzo, J., Iglesias, M. C., Manso, F. J., & Ramirez, E. M. (2011).
Longitudinal maxillary growth in Down syndrome patients. Angle
Orthodontist, 81, 253–259.
Bastir, M., & Rosas, A. (2009). Mosaic evolution of the basicranium in
homo and its relation to modular development. Evolutionary Biology,
36, 57–70.
Chen, M., Wang, H. F., Leung, T. Y., Sahota, D. S., Borenstein, M., Nico-
laides, K., . . . Lau, T. K. (2011). Frontomaxillary facial angle at 111 0
to 13 16 weeks in chinese population. Journal of Maternal-Fetal Med-
icine, 24, 498–501.
Churchill, S. E., Shackleford, L. L., Georgi, J. N., & Black, M. T. (2004).
Morphological variation and airflow dynamics in the human nose.
American Journal of Human Biology, 16, 625–638.
De Coster, P., De Pauw, G., Marten, L., & De Paepe, A. (2004). Craniofa-
cial structure in marfan syndrome: a cephalometric study. American
Journal of Genetics A, 131, 240–248.
De Jong-Pleij, E. A., Ribbert, L. S., Mantern, G. T., Tromp, E., & Bilardos,
C. M. (2011). Maxilla-nasion-mandible angle: a new method to assess
profile anomalies in pregnancy. Ultrasound Obstetrics and Gynecology,
37, 562–569.
Evteev, A., Cardini, A. L., Morozova, I., & O’higgins, P. (2014). Extreme
climate, rather than population history, explains mid-facial morphol-
ogy in northern Asians. American Journal of Physical Anthropology,
153, 449–462.
Faure, J. M., Captier, G., Baeumler, M., & Boulot, P. (2007). Sonographic
assessment of normal fetal palate using three-dimensional imaging: a
new technique. Ultrasound Obstetrics and Gynecology, 29, 159–165.
Franciscus, R. G. (1995). Later pleistocene nasofacial variation in Western
Europe and African and modern human origins. Ph.D. Dissertation.
Albuquerque: University of New Mexico.
Hauschild, R. (1937). Rassenunterscheide zwischen negriden und europi-
den primordial-cranien des 3. Fetalmonats. Zeitschrift fur Morphologie
und Anthropologie, 36, 215–279.
Heervae, E., Peltonen, S., Pirttiniemi, P., Happonen, R. -P., Visnapuu, V.,
& Peltonen, J. (2011). Short mandible, maxilla and cranial base are
common in patients with neurofibromatosis 1. European Journal of
Oral Sciences, 119, 121–127.
Hermann, N. V., Darvann, T. A., Sundberg, K., Kreiborg, S., & Joergensen,
C. (2015). Maxillary length in 11- to 26-week-old normal fetuses
studied by 3D ultrasound. Prenatal Diagnosis, 35, 571.
Holton, N., Yokley, T., & Butaric, L. (2013). The morphological interaction
between the nasal cavity and maxillary sninuses in living humans.
Anatomical Record, 296, 414–426.
Kim, C. H., Park, H. W., Kim, K., & Yoon, J. -H. (2004). Early develop-
ment of the nose in human embryos: a stereomicroscopic and histo-
logic analysis. Laryngoscope, 114, 1791–1800.
Klingenberg, C. P. (2011). MorphoJ: an integrated software package for
geometric morphometrics. Molecular Ecology & Research, 11, 353–357.
Lacruz, R. S., Bromage, T. G., O’higgins, P., Arsuaga, J. -L., Stringer, C.,Godinho, R. M., . . . Carbonell, E. (2015). Ontogeny of the maxilla in
Neanderthals and their ancestors. Nature Communications, 6, 8996.
Mailath-Pokomy, M., Klein, K., Worda, C., Weber, M., Brugger, P. C.,
Czerny, C., . . . Prayer, D. (2012). Maxillary dental arch biometry:
assessment with fetal MR imagining. Prenatal Diagnosis, 32, 530–535.
Maureille, B., & Bar, D. (1999). The premaxilla in Neanderthal and early
modern children: ontogeny and morphology. Journal of Human Evolu-
tion, 37, 137–152.
Mitteroecker, P, Gunz, P., & Bookstein, F. L. (2005). Heterochrony and
geometric morphometrics: a comparison of growth in Pan paniscus
versus Pan troglodytes. Evolution and Development, 7, 244–258.
Morimoto, N., Ogihara, N., Katayama, K., & Shiota, H. (2008). Three-
dimensional ontogenetic shape changes in the human cranium during
the fetal period. Journal of Anatomy, 212, 627–635.
Mooney, M. P., & Siegel, M. I. (1986a). Racial variation in anterior nasal
spine (ANS) formation: testing the traction hypothesis. American Jour-
nal of Physical Anthropology, 69, 242.
Mooney, M. P., & Siegel, M. I. (1986b). Developmental relationship
between premaxillary-maxillary suture patency and anterior nasal
spine morphology. Cleft Palate Journal, 23, 101–107.
Nicholas, C. L., & Franciscus, R. G. (2014). The ontogeny of nasal floor
shape variation in extant humans. American Journal of Physical
Anthropology, 155, 369–378.
Ponce de Leon, M. S., & Zollikofer, C. P. E. (2001). Neanderthal cranial
ontogeny and its implications for late hominid diversity. Nature, 412,
534–538.
Roelfsema, N. M., Hop, W. C., & Wladimiroff, J. W. (2007). Three-dimen-
sional sonographic determination of normal fetal mandibular and
maxillary size during the second half of pregnancy. Ultrasound Obstet-
rics Gynecology, 29, 159–165.
Rotten, D., Levaillant, J. M., Martinez, H., Ducou Le Points, H., & Vicaut,
E. (2002). The fetal mandible: a 2D and 3D sonographic approach to
the diagnosis of retrognathia and micrognathia. Ultrasound Obstetrics
Gynecology, 19, 122–130.
Schultz, A. H. (1918). Relation of the external nose to the bony nose and
nasal cartilages in whites and negroes. American Journal of Physical
Anthropology, 1, 329–341.
Schultz, A. H. (1920). The development of the external nose in whites
and Negroes. Contributions to Embryology, 34, 175–190.
Scott, J. K. (1957). The growth in width of the facial skeleton. American
Journal of Orthodontics, 43, 366–371.
Som, P. M., & Naidich, T. P. (2014). Illustrated review of the embryology
and development of the facial region, part 2: late development of the
fetal face and changes in the face from the newborn to adulthood.
American Journal Neuroradiology, 35, 10–18.
Timm, N. H. (2002). Applied multivariate analysis. New York: Springer.
Trenouth, M. J. (1984). Shape changes during human fetal craniofacial
growth. Journal of Anatomy, 139, 639–651.
Warbrick, J. G. (1960). The early development of the nasal cavity and
upper lip in the human embryo. Journal of Anatomy, 94, 351–362.
Weinberg, S. M., Putz, D. A., Mooney, M. P., & Siegel, M. I. (2005). Eval-
uation of non-metric variation in the crania of black and white peri-
nates. Forensic Science International, 151, 177–185.
Yokley, T. (2009). Ecogeographic variation in human nasal passages.
American Journal of Physical Anthropology, 138, 11–22.
8 | NICHOLAS