logit models for affiliation networks
TRANSCRIPT
8LOGIT MODELS FOR AFFILIATIONNETWORKS
John Skvoretz*Katherine Faust*
Once confined to networks in which dyads could be reasonablyassumed to be independent, the statistical analysis of network datahas blossomed in recent years. New modeling and estimation strat-egies have made it possible to propose and evaluate very complexstructures of dependency between and among ties in social net-works. These advances have focused exclusively on one-modenetworks—that is, networks of direct ties between actors. We gen-eralize these models to affiliation networks, networks in which ac-tors are tied to each other only indirectly through belonging tosome group or event. We formulate models that allow us to studythe (log) odds of an actor’s belonging to an event (or an eventincluding an actor) as a function of properties of the two-modenetwork of actors’ memberships in events. We also provide illus-trative analysis of some classic data sets on affiliation networks.
1. INTRODUCTION
Affiliation networks represent actors’ ties to events. The events may referto well-defined collectivities like membership in country clubs or on cor-porate boards of directors or to more ephemeral collections like the guestsat a party or spectators at a sporting event. Much of network analysis,including the statistical analysis of relational ties, focuses on one-mode
We appreciate the comments of two anonymous reviewers, the editors, and ourcolleagues in the USC Structuralist Group: Vicki Lamb, André Mizell, and ShelleySmith.
*University of South Carolina
253
networks—that is, networks in which the ties are from actors to actors orfrom collectivities to collectivities. In contrast, affiliation networks aretwo-mode networks because the ties link together different types of enti-ties, actors, and collectivities. Affiliation networks have theoretical signif-icance, despite the fact that they are not at the center of network analysis.
Social theorists have long recognized the importance of individu-als’affiliations with groups, including both informal social encounters andmore institutionalized memberships in organizations. Simmel (1950, 1955)forcefully contends that people are defined socially by the intersection ofthe various collectivities (family, occupation, neighborhood, voluntary or-ganizations) to which they belong. Others have argued that participation inthese collectivities heightens the likelihood of direct linkages emergingbetween pairs of individuals (Feld 1981, 1982; McPherson and Smith-Lovin 1982). Patterns of memberships not only define individual socialidentities and facilitate linkages between pairs, but overlapping member-ships constrain individual action and provide the basis for social control(Breiger 1990).
From a different perspective, Homans (1951) argues that the iden-tity of social groups emerges from the patterns of informal interactionsamong collections of people. Such groups can be located by examiningpatterns in people’s participation in informal social activities. Variation inlevels of participation and in comemberships among subsets of peopleindicates internal divisions defining important groups within a population(Breiger 1974; Davis, Gardner, and Gardner 1941; Doreian 1979; Free-man and White 1993; Homans 1951). From the perspective of the collec-tivities, individuals’overlapping memberships allow for flow of informationbetween groups and for potential coordination of groups’ activities. Com-mon members who produce interlocks between organizations allow orga-nizations to monitor one another’s actions, to coopt potential competitors,or to coordinate multifaceted production activities by linking together dif-ferent kinds of organizations.
Affiliation networks, consisting of a set of actors and a collection of“events” (or social occasions) with which subsets of actors are affiliated,have been used to investigate the empirical implications of these theoret-ical insights (Breiger 1974). They have been used in a wide variety ofsubstantive studies, including the following: interlocking boards of direc-tors (Allen 1982; Bearden and Mintz 1987; Levine 1972; Mariolis 1975;Mintz and Schwartz 1981a, b; Mizruchi 1982; Sonquist and Koenig 1975);voluntary organizations (Bonacich 1978; McPherson 1982); informal so-
254 SKVORETZ AND FAUST
cial gatherings (Bernard, Killworth, and Sailer 1980, 1982; Breiger 1974;Davis, Gardner, and Gardner 1941; Freeman and Romney 1987; Freeman,Romney, and Freeman 1987; Freeman, Freeman, and Michaelson 1989;Homans 1950); common political activities (Schweizer 1991, 1996); andceremonial events (Foster and Seidman 1984; Schweizer, Klemm, andSchweizer 1993).
Affiliation networks—also called membership networks (Breiger1974, 1990), hypernetworks (McPherson 1982), or dual networks(Berkowitz 1982)—differ in important ways from the usual social net-works mapping linkages between pairs of actors. First, affiliation net-works consist of two different kinds of entities: actors and events. Thusaffiliation networks are two-mode networks. In addition, pairs of actorsare not directly linked via dyadic ties; rather ties are recorded on subsets ofactors (the members of the events or collectivities) and link these actors tothe events or collectivities to which they belong. Because affiliation net-works are two-mode, nondyadic networks, methods designed to study one-mode networks are not generally appropriate for studying affiliationnetworks. Furthermore, because of the duality in the relationship betweenactors and events, appropriate methods for affiliation networks permit oneto study the linkages between people through shared memberships, thelinkages between groups through common members, and the relationshipbetween people and the groups to which they belong.
Although methodology for one-mode social networks has devel-oped rapidly over the past several decades, there has not been similar de-velopment of methods for studying affiliation networks. Graphical displaysusing concept lattices have been proposed for studying the relationshipsbetween actors and events simultaneously (Freeman and White 1993;Schweizer 1991, 1996; Wasserman and Faust 1994). Centrality measuresfor affiliation networks have been explored (Bonacich 1991; Borgatti andEverett 1997; Faust 1997; Mizruchi, Mariolis, Schwartz, and Mintz 1986),as have methods for finding positions in two-mode networks (Borgatti andEverett 1992).
Despite the theoretical significance of affiliation networks, tech-niques for their statistical analysis have typically lagged behind those forthe analysis of one-mode data. In an early generalization of models forone-mode networks, Snijders and Stokman (1987) extended Holland andLeinhardt’s (1970, 1975) U6MAN model for triads to two-mode networks.One of the first statistical models for one-mode network data was Hollandand Leinhardt’sp1 model (1981). It was an “independent dyad choice”
LOGIT MODELS FOR AFFILIATION NETWORKS 255

model and it proposed that the probability of a tie fromi to j depended onnode level parameters measuring the expansiveness and attractiveness ofnodes and on the tendency for choices to be reciprocated. It was well-known in the literature before similar models for two-mode network datawere published by Galaskiewicz and Wasserman (1989), Iacobucci andWasserman (1990), and Wasserman and Iacobucci (1991). These models,reviewed below, shared thep1 model’s assumption of dyad independence—that is, that the occurrence of a tie betweeni andj was independent of theoccurrence of a tie betweenj andk, or i andk, or any other dyad.
More recent advances in the statistical analysis of one-mode datadiscard the assumption of dyadic independence in favor of more compli-cated and hence more realistic structures of dependency between dyads.These models, termedp* models by Wasserman and Pattison (1996), canbe expressed in logit form and estimated approximately by logistic regres-sion techniques, as demonstrated by the pioneering work of Strauss andIkeda (1990). Frank and Strauss (1986) provided one early type ofp*
model that they called “Markov” graphs. More recently, Wasserman andPattison (1996), Pattison and Wasserman (1999), Robins, Pattison, andWasserman (Forthcoming), andAnderson, Wasserman, and Crouch (Forth-coming) have given general form and characterization to these models. Inall of this recent development, however, little attention has been paid totwo-mode networks.
We generalize these logit models to the analysis of affiliation net-works. These models allow us to study the (log) odds (orlogit) of an ac-tor’s belonging to an event or an event including an actor as a function ofproperties of the two-mode network of actors’ memberships in events. Webegin with a review of the “independent dyad choice” models for affilia-tion data and then introduce the basics of logit models for one-mode data.We then generalize the approach to two-mode data. Finally, we analyzesome classic examples of affiliation networks using the new modelingtechniques and demonstrate how properties of affiliation networks can beincorporated into these models to yield useful insights into the structuralfeatures of these networks.
2. INDEPENDENT DYAD CHOICE MODELS FORTWO-MODE NETWORKS
Following the notation of Wasserman and Faust (1994), we denote the setof actors byG and the set of events byH whereg andh denote the number
256 SKVORETZ AND FAUST

of actors and events, respectively. The matrix representing the affiliationnetwork is denoted byX ~G H!+ Actors may belong to events atc differentlevels of intensity or participationm 5 0,1, . . . ,c2 1. We let P~xij 5 m!denote the probability that actori belongs to eventj at levelm. FollowingIacobucci and Wasserman (1990), under the assumption that the dyads areindependent, a simple dyad choice model has the following log-linear form
log P~xij 5 m! 5 l ij 1 um 1 ai ~m! 1 bj ~m! (1)
for eachm, subject to the constraints
(m50
c21
P~xij 5 m! 5 1
(i
ai ~m! 5 0
(j
bj ~m! 5 0 + (2)
The parameters are also constrained as follows: whenm 5 0, um 5 0,ai ~m! 5 0, andbj ~m! 5 0. The parameterai ~m! measures the tendency foractori to belong to events at levelm, net of other factors—i.e., holding theother parameters constant, larger values ofai ~m! increase the probabilitythat actori belongs to eventj at levelm. The parameterbj ~m! measures thetendency for eventj to be belonged to by actors at levelm, net of otherfactors. The$um% parameters measure general strength effects related tothe overall frequency with which actors belong to events at levelm. The$lij % parameters, finally, are technically required terms that ensure the firstequality in equation set (2) is satisfied. This model is similar to thep1
model in that it assumes the occurrence of a tie at levelm between actoriand eventj is independent of the occurrence of a tie at levelm' betweenactori ' and eventj ' .
Certain special cases of equation (1) are immediately apparent. Forinstance, one could assume homogeneity (i.e., equality) of either theaparameters or theb parameters, or both, for a fixed level of participation atlevel m. An important simplification arises if actors or events or both canbe “blocked” or partitioned into subsets within which equality of the rel-ative parameters is assumed. Usually these subsets are defineda priori
LOGIT MODELS FOR AFFILIATION NETWORKS 257
based on actor or event characteristics, as we illustrate below.1 More im-portantly, though, all of these models are “independent dyad choice” mod-els. This means that the joint probability distribution of the affiliation matrixis a product of the dyadic probabilities (recognizing that certain dyads—namely, all pairs of events and all pairs of actors—are constrained to takeon value 0 with probability 1).
The assumption of dyadic independence is often regarded as sus-pect in analyses of one-mode networks. But, until the work of Frank andStrauss (1986) on Markov graphs, there was little choice but to make thisassumption in order to have statistical models of network data. The as-sumption is equally dubious for affiliation networks, despite the muchsimpler structure of the basic independent dyad choice model. One canthink of reasons why one actor’s level of involvement in a particular eventmay not be independent of another actor’s level of involvement in thatevent and vice-versa. One can also think of various reasons why an actor’slevel of involvement in one event may not be independent of his or herlevel of involvement in another event. These plausible but more complexdependency structures can be addressed within the framework of Markovgraphs and logit models for network data. We now turn to a developmentof these ideas for affiliation networks.
3. LOGIT MODELS, MARKOV GRAPHS, ANDPSEUDO-LIKELIHOOD ESTIMATION
Moving beyond “independent dyad choice” models required innovationsin model building and in estimation. Both of these innovations are sug-gested, but not fully developed, in the work of Frank and Strauss (1986) onMarkov graphs. Full development of the modeling approach is set out inWasserman and Pattison’s (1996) work onp* logit models for social net-works. Strauss and Ikeda (1990) provide the innovation in estimation, theuse of pseudo-likelihood functions and logistic regression estimation pro-cedures. We outline these innovations beginning with thep* modelingframework.
Thep* modeling framework uses a log-linear model to express theprobability of a graphG as a function of vector of parametersu and anassociated vector of graph statisticsx~G!, and a normalizing constantZ~u!:
1Parameter estimates could also be useda posteriorito define subsets of sto-chastically equivalent actors (Wasserman and Anderson 1987).
258 SKVORETZ AND FAUST
P~G! 5exp~u 'x~G!!
Z~u!+ (3)
The normalizing constant simply ensures that the probabilities sum to unityover all graphs. Theu parameters express how various “explanatory” prop-erties of the graph affect the probability of its occurrence. These param-eters must be estimated. However, estimation via maximum likelihoodtechniques is very difficult because ofZ~u! in the denominator of equation(3). We first describe somep* models, and then return to the problem ofestimation at the end of this section.
The approach, proposed by Strauss and Ikeda (1990) and elaboratedby Wasserman and Pattison (1996), first converts equation (3) into an ex-pression for the log of the odds, orlogit, a form that does not involve thenormalizing constant. We use a mathematical identity that specifies theprobability thatxij 51 given the rest of the adjacency matrix. We useG2ij
to denote this complement graph—that is, the graph including all adjacen-cies except thei, j th one. The graphG1 is defined as the adjacency matrixplusxij 51 whileG2 is defined as the adjacency matrix plusxij 5 0. Thenwith P~G1) the probability ofG1 andP~G2! the probability ofG2, theidentity is
P~xij 5 16G2ij ! 5P~G1 !
P~G1 ! 1 P~G2 !+ (4)
Basically this equation expresses the probability thatxij 51 conditional onthe rest of the graph. Note that it does not depend on the normalizingconstant because upon rewriting we get
P~xij 5 16G2ij ! 5exp~u 'x~G1 !!
exp~u 'x~G1 !! 1 exp~u 'x~G2 !+ (5)
If we consider the odds of the presence of a tie fromi to j to its absence, weget
P~xij 5 16G2ij !
P~xij 5 06G2ij !5
exp~u 'x~G1 !!
exp~u 'x~G2 !!+ (6)
From equation (6) we can then derive a simple form for the log of the oddsor logit model:
logit P~xij 5 16G2ij ! 5 u ' @x~G1 ! 2 x~G2 !# + (7)
LOGIT MODELS FOR AFFILIATION NETWORKS 259
The quantity in brackets on the right side is the vector of differences in therelevant graph statistics whenxij changes from 1 to 0.
The specification of ap* logit model requires a selection of networkproperties that area priori assumed to affect the log odds of a tie beingpresent to absent. A particularly simple case is thep1 model expressed inlogit form:
logit P~xij 5 16G2ij ! 5 u 1 rxji 1 ai 1 bj + (8)
The parameters of this model include expansiveness parametersa andattractiveness parametersb. The expansiveness parameters relate to anactor’s tendency to initiate ties and the attractiveness parameters relate toan actor’s tendency to receive ties. In addition, the model includes a reci-procity parameterr that expresses any tendency for a tie fromj to i to bereturned by a tie fromi to j at greater (or lower) than chance levels. Fol-lowing Wasserman and Pattison (1996), the vector of parameters and theassociated vector of graph statistics for this model are
u 5 ~u,a1, + + + ,ag,b1, + + + ,bg,r!'
x~G! 5 ~L, x11, + + + , xg1 , x11, + + + , x1g,M !' + (9)
L is the number of edges in the digraph,M is the number of mutual dyads,and the remaining graph statistics are the set of outdegrees and the set ofindegrees. It is easy to calculate the difference vector of graph statistics forthis simple model.
The same logic works for “dependent dyad choice” models, such asthose proposed in the Markov graph framework by Frank and Strauss(1986). A Markov graph is a random graph with a particular kind of de-pendency structure among its possible edges. The dependency structureobeys the following rule: If two dyads are node-disjoint (that is, they donot share a node), then they are conditionally independent (Frank andStrauss 1986:835). The idea is that the presence or absence of tie in onedyad is independent of the presence or absence of a tie in another dyad onlywhen the dyads have no nodes in common. If they share a node, then thepresence or absence of a tie in one may depend on the presence or absenceof a tie in the other. In contrast to the basic assumption of independent dyadchoice models, only some dyads are assumed to be independent in a Mar-
260 SKVORETZ AND FAUST
kov graph—namely, those that are node-disjoint. The Markov propertygeneralizes in an obvious way to digraphs (Frank and Strauss 1986).
One of the simplest models proposed by Frank and Strauss is therst homogeneous Markov graph model, also called the triad model. Ho-mogeneous models assume that nodes area priori indistinguishable and sono node-specific parameters are necessary. The triad model is a furthersimplification of the basic homogeneous Markov model for graphs. In thebasic model, the probability of a graph is given by a log-linear function ofeffects pertaining to various tie configurations in which different ties havenodes in common. In particular for a nondirectional relation, the relevanttie configurations are triangles and stars from degree 1 up to degreeg21.A triangle is a subset of three nodes where all three ties are present and ak-star is a subset ofk11 nodes where one node has a tie to the remainingk nodes. The basic homogeneous Markov model is
P~G! 5
expStt 1 (k51
g21
skskDZ~t,s1, + + + ,sk!
, (10)
whereZ~t,s1, + + + ,sk! is the normalizing constant,t is the count of trian-gles andsk is the count of stars of degreek. The rst model makes thesimplifying assumption that stars of degreek $ 3 have no effect on the
probability of the graph beyond the effect of theSk2D 2-stars and thek
1-stars embedded in them. Specifically,
P~G! 5exp~tt 1 rr 1 ss!
Z~t,r,s!, (11)
wherer is the number of edges inG—i.e., 1-stars—ands is the number of2-stars. The quantitiesr, s, andt are the sufficient statistics for the model.Frank and Strauss (1986:836) note that an equivalent set of sufficient sta-tistics is any three of the set of triad counts ofG—that is, the number ofsubgraphs of size 3 having 0, 1, 2, or 3 ties.
Strauss and Ikeda (1990:206) give the logit form of this model as
logit P~xij 5 16G2ij ! 5 r 1 sDS1 tDT , (12)
whereDSis the change in the number of 2-stars whenxij changes from 1 to0 andDT is the change in the number of triangles. For a directed graph,
LOGIT MODELS FOR AFFILIATION NETWORKS 261
they note how this model can be made more complicated by including theexpansiveness, attractiveness, and reciprocity parameters of thep1 model
logit P~xij 5 16G2ij ! 5 r 1 cxji 1 ai 1 bj 1 sDS1 tDT , (13)
whereDSandDT change interpretation now that the underlying graph isdirected.2 Finally, they propose a blockmodel form of the basic triad modelin which 2-stars and triangles are counted within blocks andb is the blockindicator:
logit P~xij 5 16G2ij ! 5 r 1 s~b!DSij~b! 1 t~b!DTij
~b! (14)
Finally, Wasserman and Pattison (1996) propose entire family mod-els, referred to asp* models, with various structural aspects of networks asconditioning factors. Possible parameters for logit models of graphs in-clude the triangles and stars already mentioned but, in addition, overallgraph connectivity, various measures of graph centralization, and paths ofvarying length. In fact, any graph property is a candidate for inclusion.They note that some of these quantities assume a more complicated de-pendency structure than the simple Markovian one. For instance, a modelwith a parameter fork-paths assumes that all edges on paths of lengthk areconditionally dependent, even though pairs of these edges may have nonode in common.
Estimation of thep* models relies on pseudo-likelihood estimation,due to difficulty of maximum-likelihood estimation arising from Z(u) inthe denominator of equation (3). Z(u) is a normalizing constant, given bythe equation
Z~u! 5 (exp$u 'x~G!% , (15)
where the summation is over all 2g~g21! graphs (Strauss and Ikeda 1990:205).For small values ofg, Z~u! can be calculated directly. However, asg in-creases (above about 6), direct calculation is all but impossible.
One possibility is to simulate a number of random graphs, each withthe same number of nodes and lines as in the observed network, and esti-mate theu parameters as a function of observed graph statistics, as sug-
2Note that Frank and Strauss’s notation for the reciprocity effect and for theoverall density effect differs from that of Wasserman and colleagues.
262 SKVORETZ AND FAUST
gested and illustrated by Frank and Strauss (1986) and Strauss (1986).However, given the computation intensity, this approach is not really prac-tical (Frank and Strauss, 1986).
To estimate thep* model, we use pseudo-likelihood estimation, astrategy hinted at by Frank and Strauss (1986) and elaborated by Straussand Ikeda (1990) and Wasserman and Pattison (1996). The pseudo-likelihood function is defined as
PL~u! 5 ) P~xij 6G2ij ! (16)
The idea is to maximize equation (16) with respect to the parameters,u,where the maximum pseudo-likelihood estimator (MPE) is a value ofuthat maximizes equation (16) (Strauss and Ikeda 1990:207). As Straussand Ikeda note, “the pseudolikelihood function is simply the product of theprobabilities of the@xij # with each probability conditional on the rest of thedata” (p. 204). This strategy is analogous to the procedure proposed byBesag (1974) in the context of spatial models and rectangular lattices,where pseudo-likelihood estimation is widely used in estimations that alsoinvolve difficult normalizing constants (Hjort and Omre 1994).
The estimation method proposed by Strauss and Ikeda (1990) formsa pseudo-likelihood function for the graph in terms of the conditional prob-abilities forxij as follows:
PL~u! 5 )iÞj
P~xij 5 16G2ij !xij P~xij 5 06G2ij !12xij + (17)
Strauss and Ikeda prove that equation (16) can be maximized using max-imim likelihood estimation of the logistic regression, equation (7), assum-ing thexij ’s are independent observations. Thus thep* family of modelscan be estimated, albeit approximately, using logistic regression routinesin standard statistical packages.3 However, since the logits are not inde-pendent, the model is not a true logistic regression model and statisticsfrom the estimation must be used with caution. Goodness-of-fit statisticsare pseudo-likelihood ratio statistics, and it is questionable whether the
3The data array hasg3 ~g21! rows, one column for the dependent variablexij
and the remaining columns express the change in the graph statistics that constitute theindependent variables in a model. The extraordinary flexibility ofp* models meansthat care must be taken that the vector of independent variables does not unintention-ally have a logically determinate relationship to the dependent variable.
LOGIT MODELS FOR AFFILIATION NETWORKS 263
usual chi-square distributions apply; in addition, standard errors have only“nominal” significance (see Crouch and Wasserman 1998).
In sum, much progress has been made, and made recently, towardstatistical models for networks that abandon the restrictive assumption ofdyadic independence. More complicated dependency structures can be for-mulated and estimated approximately by logistic regression techniques.However, all of this development takes place in the context of one-modegraphs or digraphs. In the next section, we extend these models to two-mode affiliation networks.
4. MODELS FOR AFFILIATION NETWORKS
Our models for affiliation networks focus on simply the presence or ab-sence of a tie rather than its strength. Hence, in terms of earlier notation thenumber of levels of intensity,c, equals two.4 The first model we consideradapts the basic triad model of Frank and Strauss (1986). However, be-cause an affiliation network is a bipartite graph—the nodes can be parti-tioned into two subsets and all ties are between the two sets, so that alltriples of nodes are constrained to have at most two ties—the adaptationproduces a model whose entire structure depends simply on the degreesequences—that is, on the marginals of the adjacency matrix (see footnote5 later). This model has some merit as a basic “baseline” model from whichto address the question of whether a particular affiliation network displaysany “interesting” structure. This question of “interesting structure” wasfirst framed by Holland and Leinhardt (1979) who argued that any networkin which higher-order properties could be adequately modeled using onlythe properties of nodes or dyads had no social structure. By “adequatelymodeled” they meant that the higher-order properties took on values withinthe range expected given chance variation as constrained by the lower-order properties (Skvoretz, Faust, and Fararo 1996). Thus if a particularaffiliation network is fit well by the triad model, its higher-order propertiesare simply expected consequences of the lower-order degree sequences.We then propose additional models that use higher-order properties as“explanatory” variables in predicting the log odds on the presence of a tie.
Frank and Strauss’s triad model has as sufficient statistics the triadcensus of the graph. For an undirected graph, there are four triad equiva-
4We note thatp* models for one-mode networks have been extended to valuedrelations in Robins, Pattison, and Wasserman (forthcoming).
264 SKVORETZ AND FAUST
lence classes: the nonisomorphic three-subgraphs with zero, one, two, orthree edges. But for an affiliation network (and bipartite graphs in gener-al), the census has three, rather than four, equivalence classes since therecan be no triads with three edges because there are no ties between actorsor between events (Snijders and Stokman 1987). Furthermore, the triads inan affiliation network can be further distinguished by the number of actorand event nodes in the triad. All triads with three actors or three events areempty since ties cannot be present between nodes within the same set.Triads in which ties may be present must contain either two actors and oneevent or two events and one actor, and each triad may have zero, one, ortwo ties. Thus, once we distinguish between actors and events in an affil-iation network, there are six equivalence classes of triads.
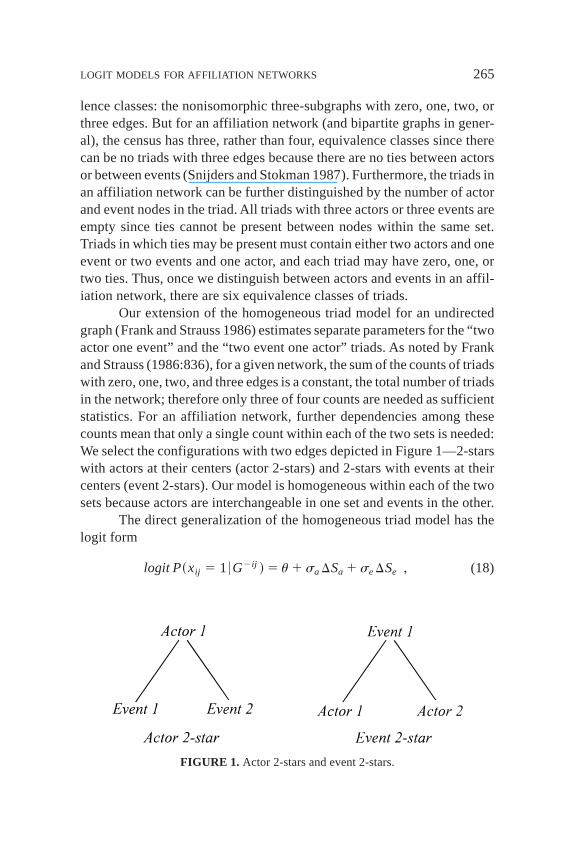
Our extension of the homogeneous triad model for an undirectedgraph (Frank and Strauss 1986) estimates separate parameters for the “twoactor one event” and the “two event one actor” triads. As noted by Frankand Strauss (1986:836), for a given network, the sum of the counts of triadswith zero, one, two, and three edges is a constant, the total number of triadsin the network; therefore only three of four counts are needed as sufficientstatistics. For an affiliation network, further dependencies among thesecounts mean that only a single count within each of the two sets is needed:We select the configurations with two edges depicted in Figure 1—2-starswith actors at their centers (actor 2-stars) and 2-stars with events at theircenters (event 2-stars). Our model is homogeneous within each of the twosets because actors are interchangeable in one set and events in the other.
The direct generalization of the homogeneous triad model has thelogit form
logit P~xij 5 16G2ij ! 5 u 1 sa DSa 1 seDSe , (18)
FIGURE 1. Actor 2-stars and event 2-stars.
LOGIT MODELS FOR AFFILIATION NETWORKS 265

whereu is an overall density effect and the twos parameters refer to theimpacts that actor 2-stars and event 2-stars have on the logit.5 Apositivesa
effect means that the log odds ofxij being present are increased if theabsence of the tie disrupts links between eventj and other events that arecreated through actors’ participation in events. A positivese effect meansthat the log odds ofxij being present are increased if the absence of the tiedisrupts links between actors that are created through an event’s inclusionof multiple actors. These parameters are responsive to the ideas that anactor’s involvement in a particular event may depend on other actors’ in-volvement in that event (captured by the event 2-star count) and that anactor’s involvement in one event may depend on his or her involvement inanother event (captured by the actor 2-star count).
As Wasserman and Pattison (1996) have noted, a wide range ofnetwork structural effects can be incorporated intop* models. Even pa-rameters in the relatively simple Markov random graph models embodyimportant structural properties. Consider the frequent observation that inan affiliation network actors are linked to one another through joint mem-bership in events, and events are linked through joint participation of ac-tors (Breiger 1974). Joint membership for actors is captured in the event2-stars (equivalently in the count of triads with two lines and two actornodes). The parallel effect for event overlap is captured in the actor 2-stars(equivalently in the count of triads with two lines and two event nodes).
The event 2-star effect parametrizes how multiple shared member-ships for actors affect the likelihood of a single actor-event tie. If actoribelongs to many events with other actors, we might hypothesize that thesemultiple memberships influence the probability of actori ’s membership in
5As a reviewer pointed out, the number of actor 2-stars and the number of event2-stars are simple functions of sums of degrees and sums of degree squares. It is easyto verify that
Sa 5 (i
xi12
22 (
i
xi1
2
Se 5 (j
x1j2
22 (
j
x1j
2,
and sinceu is a function of the number of edges in the graph,x11 , the probabilitydistribution depends only on the average degree and the variance of actor degrees andthe event degrees. Therefore the triad model for two-mode networks is a model aboutdispersion of degrees rather than about structure defined as pattern within the adja-cency matrix conditional on the marginals.
266 SKVORETZ AND FAUST
the events shared by these other actors. As a general tendency for actors,this effect is captured in the parameter for event 2-stars. Similarly, wecould consider the extent to which multiple overlapping members amonga set of events would affect the probability of an event-actor tie. This iscaptured in the parameter for the actor 2-stars. All of these structural ef-fects of actor comemberships and event overlaps are incorporated in theMarkov graph model for affiliation networks with nonhomogeneous 2-stareffects, or equivalently with nonhomogeneous triad parameters distinguish-ing between actor 2-stars and event 2-stars.
Some obvious extensions to the basic Markov model include thefollowing ideas. First, we can investigate the effect of higher-order sub-graphs on the presence0absence of tie. That is, we can add parameters thatexpress the effects of various 3-stars, 4-stars, etc., following the full ho-mogeneous Markov graph model proposed by Frank and Strauss (1986).But as Frank and Strauss note, since lower-order stars are embedded inhigher-order stars, interpretation of the parameters is problematic.
Second, we can relax the homogeneity assumption to allow for spe-cific actor and event effects related to the overall number of events an actorparticipates in and to the overall number of actors an event attracts. Thereare three possibilities:
logit P~xij 5 16G2ij ! 5 u 1 ai 1 sa DSa (19)
logit P~xij 5 16G2ij ! 5 u 1 bj 1 seDSe (20)
logit P~xij 5 16G2ij ! 5 u 1 ai 1 bj 1 sa DSa 1 seDSe (21)
whereai parametrizes actori ’s expansiveness andbj parametrizes eventj ’s attractiveness. However, these models are not well-formed and cannotbe estimated since the logits will assume the value1` for ties that areactually present and2` for ties that are actually absent.6
6Echoing the caution in footnote 3, we note that in each case, there is a logicallydeterminate relationship between the observed value ofxij and the corresponding vec-tor of graph statistic differences used as independent variables. For instance, considerequation (20). The vector of difference statistics is of lengthh 1 2. If xij 51, then thevector equals~1,0, + + + ,1, + + + ,0, x1j 2 1!: the first position equals 1, the change in theoverall number of ties asxij goes from present to absent; there are 0s in all but thej th
location in the nexth positions (corresponding to the fact that only the degree of thej th
event changes—and by 1—asxij goes from present to absent), and the last positionequals the degree of eventj minus 1, the number of changes in event 2-stars asxij goesfrom present to absent. Ifxij 50, then only the last entry changes. The last position nowequals just the degree of eventj, since ifxij were to be present,x1j additional event
LOGIT MODELS FOR AFFILIATION NETWORKS 267
Third, we may consider subgroup effects within the basic Markovmodel for affiliation networks. A specific model we estimate in the nextsection blocks only on events. This block diagonal model includes effectsfor actor 2-stars when the events are in the same block:
logit P~xij 5 16G2ij ! 5 u 1 (b
sa~b! DSa
~b! 1 seDSe (22)
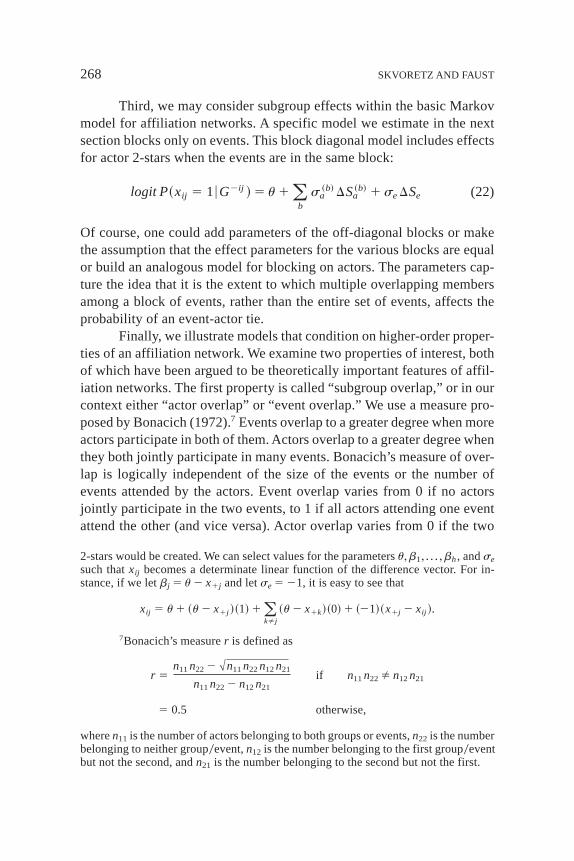
Of course, one could add parameters of the off-diagonal blocks or makethe assumption that the effect parameters for the various blocks are equalor build an analogous model for blocking on actors. The parameters cap-ture the idea that it is the extent to which multiple overlapping membersamong a block of events, rather than the entire set of events, affects theprobability of an event-actor tie.
Finally, we illustrate models that condition on higher-order proper-ties of an affiliation network. We examine two properties of interest, bothof which have been argued to be theoretically important features of affil-iation networks. The first property is called “subgroup overlap,” or in ourcontext either “actor overlap” or “event overlap.” We use a measure pro-posed by Bonacich (1972).7 Events overlap to a greater degree when moreactors participate in both of them. Actors overlap to a greater degree whenthey both jointly participate in many events. Bonacich’s measure of over-lap is logically independent of the size of the events or the number ofevents attended by the actors. Event overlap varies from 0 if no actorsjointly participate in the two events, to 1 if all actors attending one eventattend the other (and vice versa). Actor overlap varies from 0 if the two
2-stars would be created. We can select values for the parametersu,b1, + + + ,bh, andse
such thatxij becomes a determinate linear function of the difference vector. For in-stance, if we letbj 5 u 2 x1j and letse 5 21, it is easy to see that
xij 5 u 1 ~u 2 x1j !~1! 1 (kÞj
~u 2 x1k!~0! 1 ~21!~x1j 2 xij !+
7Bonacich’s measurer is defined as
r 5n11n22 2 #n11n22n12n21
n11n22 2 n12n21
if n11n22 Þ n12n21
5 0+5 otherwise,
wheren11 is the number of actors belonging to both groups or events,n22 is the numberbelonging to neither group0event,n12 is the number belonging to the first group0eventbut not the second, andn21 is the number belonging to the second but not the first.
268 SKVORETZ AND FAUST
actors attend no events together, to 1 if the two attend exactly the same setof events. We explore models that condition the occurrence of a tie on theaverageamount of overlap between events and theaverageamount ofoverlap between actors. In logit form, the log odds of the presence of a tieis modeled as a function of the change in the average amount of overlapbetween events (or between actors) when the tie goes from 1 to 0.
The second property of interest also takes two forms depending onwhether we consider paths from events to events or paths from actors toactors. We consider the path length between actors and between events asmeasured by theaveragenumber of events on the shortest path betweentwo actors and by theaveragenumber of actors on the shortest path be-tween two events. Prevalence of short paths between pairs of actors orpairs of events is indicative of system-level integration, whereas preva-lence of long paths can indicate a tendency for segregation into subgroupswith little connection between them (Granovetter 1973). In logit form, thelog odds of the presence of a tie is modeled as a function of the change inthe average path length when the tie goes from 1 to 0. Note that the changewill always be zero or negative—that is, removing a tie will either leavethe average path length unchanged or increase it. This is not true for thefirst property—removing a tie can increase the average amount of mea-sured overlap.
One reason to examine these properties is that they are not deter-mined by the degree sequences—i.e., by the marginals of the affiliationmatrix. It is possible to construct two affiliation networks with the samedegree sequences but with different values for average event or actor over-laps and for the average path lengths. Furthermore, both of these proper-ties imply that the underlying graph is not Markovian: Models based onthese properties postulate dependencies between dyads that do not share anode. However, such effects can be easily parametrized and approximatelyestimated by a logit model of thep* family. Thus these properties give usan opportunity to illustrate the application ofp* models to affiliationnetworks.
5. TWO ILLUSTRATIONS
We illustrate various models on two data sets. The first is Davis, Gardner,and Gardner’s (1941) classic affiliation network of the participation of 18Southern women in 14 social events (see also Homans 1951 and Breiger1974). The second is Galaskiewicz’s (1985) data on the board and club
LOGIT MODELS FOR AFFILIATION NETWORKS 269

memberships of corporate executive officers (CEOs) in Minneapolis–St.Paul. We use the subset of data on 26 CEOs and 15 boards0clubs reprintedin Wasserman and Faust (1994). This second example includes a four-category subgrouping variable for the type of board or club: country club,metropolitan club, board of FORTUNE 500 firms or FORTUNE 50 banks,and board of cultural or religious organizations.
Table 1 presents the pseudo-likelihood ratio statistics for the fits ofmodels to Davis, Gardner, and Gardner’s Southern women data. The sim-plest interesting model has a homogeneous effect for 2-stars (model 2).Models 3 and 4 consider, separately, effects of event 2-stars and actor2-stars (respectively) ignoring the other type of 2-star. Model 5 includesnonhomogeneous effects for type of 2-star. Interestingly, this model is notan improvement over the homogeneous effect of 2-stars (model 2). Thusfor these data there is no advantage in distinguishing between actor-centered and event-centered 2-stars.
Table 2 gives the parameter estimates for models 2 and 5 for theDavis, Gardner and Gardner data. The parameter estimate for the effect of
TABLE 1Logit Models of Data for Davis, Gardner, and Gardner (1941)
ModelNumber ofParameters
Pseudo-LikelihoodRatio Statistic
1. Choice 1 327.2922. Choice1 2-stars 2 305.3283. Choice1 event 2-stars 2 308.2734. Choice1 actor 2-stars 2 325.6185. Choice1 event 2-stars1 actor 2-stars 3 304.784
TABLE 2Parameter Estimates for Models 2 and 5 from Table 1
Parameter EstimateEffect Model 2 Model 5
Choice 22.503 22.3742-stars 0.175Event 2-stars 0.186Actor 2-stars 0.131
270 SKVORETZ AND FAUST
2-stars is positive, indicating that the greater the number of 2-stars dis-rupted by the absence of a particular actor-event tie, the greater the logodds that the tie is present versus absent. Clearly the type of 2-stars thathave this enhancing effect are event 2-stars. This indicates that it is coat-tendance at events over pairs of actors that is primarily responsible for thepositive 2-star effect.
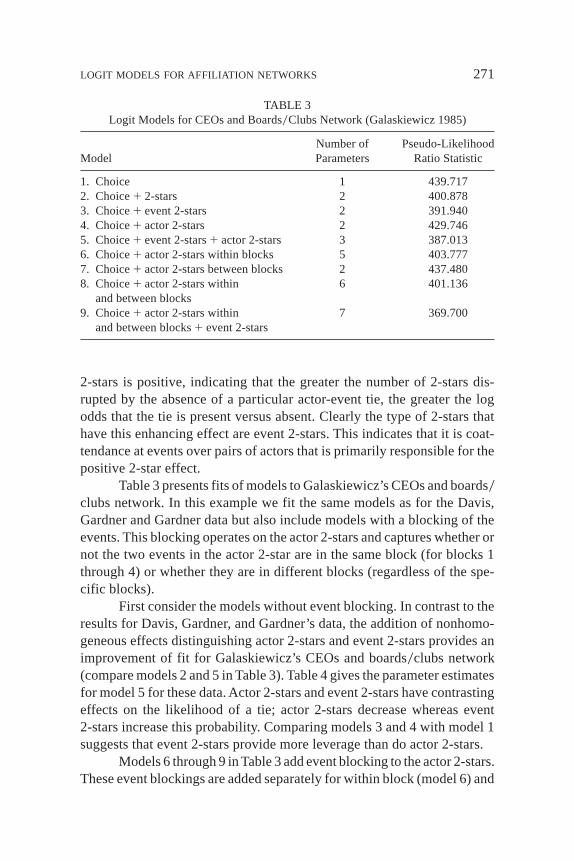
Table 3 presents fits of models to Galaskiewicz’s CEOs and boards0clubs network. In this example we fit the same models as for the Davis,Gardner and Gardner data but also include models with a blocking of theevents. This blocking operates on the actor 2-stars and captures whether ornot the two events in the actor 2-star are in the same block (for blocks 1through 4) or whether they are in different blocks (regardless of the spe-cific blocks).
First consider the models without event blocking. In contrast to theresults for Davis, Gardner, and Gardner’s data, the addition of nonhomo-geneous effects distinguishing actor 2-stars and event 2-stars provides animprovement of fit for Galaskiewicz’s CEOs and boards0clubs network(compare models 2 and 5 in Table 3). Table 4 gives the parameter estimatesfor model 5 for these data. Actor 2-stars and event 2-stars have contrastingeffects on the likelihood of a tie; actor 2-stars decrease whereas event2-stars increase this probability. Comparing models 3 and 4 with model 1suggests that event 2-stars provide more leverage than do actor 2-stars.
Models 6 through 9 in Table 3 add event blocking to the actor 2-stars.These event blockings are added separately for within block (model 6) and
TABLE 3Logit Models for CEOs and Boards0Clubs Network (Galaskiewicz 1985)
ModelNumber ofParameters
Pseudo-LikelihoodRatio Statistic
1. Choice 1 439.7172. Choice1 2-stars 2 400.8783. Choice1 event 2-stars 2 391.9404. Choice1 actor 2-stars 2 429.7465. Choice1 event 2-stars1 actor 2-stars 3 387.0136. Choice1 actor 2-stars within blocks 5 403.7777. Choice1 actor 2-stars between blocks 2 437.4808. Choice1 actor 2-stars within
and between blocks6 401.136
9. Choice1 actor 2-stars withinand between blocks1 event 2-stars
7 369.700
LOGIT MODELS FOR AFFILIATION NETWORKS 271

between block (model 7) actor 2-star effects and then for both within andbetween block actor 2-star effects (model 8). Finally event blocking ofactor 2-stars is considered in combination with event 2-stars (model 9).Comparing model 8 with model 4, and model 5 with model 9 shows theadditional effect that the event blocking has on the actor 2-stars. In bothcases event blocking improves the fit of the model. Parameter estimatesfor model 9 are in Table 4.
Recalling that block 1 is composed of two country clubs, the largenegative effect of actor 2-stars for this block of events means that mem-bership in the clubs tends strongly to being mutually exclusive—that is,actors belong either to one club or to the other, but not both. The nextlargest effect is in block 3, which is composed of boards of Fortune 500firms or Fortune 50 banks. Again the tendency here, although it is not asstrong, is for memberships on some of these boards to depress the likeli-hood of membership on others. The negative effect means that the greaterthe number of actor 2-stars that would be created by a tie from an actor toa board, the lower is the probability of the tie being present. So there is a“ceiling effect” on total number of memberships on boards within a block—the more boards of a given type to which an actor belongs, the lower is thelikelihood that he belongs to one more. That the effect of event 2-stars ispositive indicates the tie connecting an actor to clubs or boards with rela-tively many members is a “stronger” tie than one connecting the actor torelatively small clubs or boards. The first tie creates relatively many event2-stars and so, as compared with the condition in which it is absent, the logodds of it being present are increased substantially. The second tie creates
TABLE 4Parameter Estimates for Models 5 and 9 from Table 3
Parameter EstimateModel 5 Model 9
Choice 21.338 21.284Event 2-stars 0.154 0.144Actor 2-stars 20.238Blocked actor 2-stars:Block 1 27.210Block 2 20.512Block 3 21.102Block 4 20.031Between blocks 20.142
272 SKVORETZ AND FAUST

relatively few event 2-stars and so the “force” of its presence (as measuredby the log odds) is not as strong.
The next set of estimated models condition on the average overlapbetween events and between actors and0or the average minimum path lengthbetween actors and between events. Table 5 presents zero-order correla-tions between relevant variables for the two data sets. The cases here arethe~g3h! dyads, and the variables are the dyad change scores correspond-ing to the independent variables in our models. In both data sets, there aresubstantial positive correlations between the change in actor 2-stars andthe change in event overlap and between the change in event 2-stars andactor overlap. There is also a substantial negative correlation between thechange in the average distance between actors and the change in actoroverlap. The latter, however, is not paralleled by the correlation betweenthe change in the average distance between events and the change in eventoverlap. While these correlations are substantial, they are not perfect, in-dicating that the overlap and distance measures are not simple linear func-tions of the 2-stars and the underlying degree sequences. Finally, we notethat in both data sets there are moderate positive correlations between thepresence of a tie (the dependent variable) and event 2-stars and actor over-lap. In the Davis, Gardner, and Gardner data, there is a moderate positivecorrelation between the dependent variable and the average distance be-tween events while in the Galaskiewicz data, this correlation is essentiallyzero.
The p* models we estimate for these data sets are presented inTables 6 and 7. We begin with the basic model that includes both actor andevent 2-stars and then add the overlap and distance measures. The bestfitting model for the Davis, Gardner, and Gardner data includes effects forevent overlap and for the distance between events as measured by thenumber of actors on the shortest path between them. The best fitting modelfor the Galaskiewicz data only includes an effect for the distance betweenevents. Parameter estimates corresponding to the basic model and the best-fitting models are present in Tables 8 and 9. Interpretation of these effectscan be made either in terms of how the change in the corresponding inde-pendent variable affects the log odds on the presence of a tie or, preferably,in terms of the underlyingp* models in which the independent variableimpacts the probability of a tie being present.
In the Davis, Gardner, and Gardner data, we find that event overlaphas a negative effect on the presence of a tie. The size of the coefficientreflects the scale of the independent variable—in this data set the changescore varies from20.011 to 0.028. The negative effect means that as be-
LOGIT MODELS FOR AFFILIATION NETWORKS 273
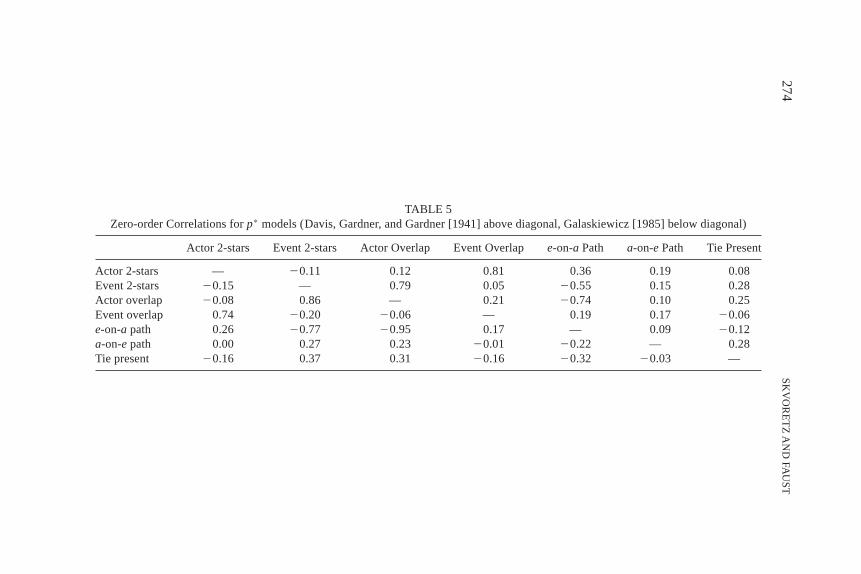
TABLE 5Zero-order Correlations forp* models (Davis, Gardner, and Gardner [1941] above diagonal, Galaskiewicz [1985] below diagonal)
Actor 2-stars Event 2-stars Actor Overlap Event Overlape-on-a Path a-on-e Path Tie Present
Actor 2-stars — 20.11 0.12 0.81 0.36 0.19 0.08Event 2-stars 20.15 — 0.79 0.05 20.55 0.15 0.28Actor overlap 20.08 0.86 — 0.21 20.74 0.10 0.25Event overlap 0.74 20.20 20.06 — 0.19 0.17 20.06e-on-a path 0.26 20.77 20.95 0.17 — 0.09 20.12a-on-e path 0.00 0.27 0.23 20.01 20.22 — 0.28Tie present 20.16 0.37 0.31 20.16 20.32 20.03 —
27
4S
KV
OR
ET
ZA
ND
FAU
ST

tween two ties—say,xij andxkl—the one that has the higher probability ofoccurrence is associated with a lower amount of event overlap. Net ofother considerations, this effect has the consequence that an actor wouldbe less likely to add a tie to an event if the actors already tied to that eventare ones to whom the focal actor is not already tied via coparticipation inother events. Adding such a tie would increase overlap between eventsmore than adding a tie to an event attended mostly by other actors to whomthe focal actor is already tied via common participation in other events.The positive effect of average distance between events means that as be-tween two ties,xij andxkl , the one that has the higher probability of oc-currence is associated with a longer average path length between events. Ineffect, these data exhibit an “anti-bridging” tendency—a tie from an actorto an event that would create shorter paths is less likely to occur than a tie
TABLE 6p* Models for Davis, Gardner, and Gardner Data
ModelNumber ofParameters
Pseudo-LikelihoodRatio Statistic
1. Choice1 event 2-stars1 actor 2-stars 3 304.7842. 11 actor overlap 4 304.6983. 11 event overlap 4 279.0924. 11 actor overlap1 event overlap 5 279.0355. 11 a-on-e path 4 286.1706. 11 e-on-a path 4 304.7837. 11 a-on-e path1 e-on-a path 5 285.8358. 11 event overlap1 a-on-e path 5 263.979
TABLE 7p* Models for Galaskiewicz Data
ModelNumber ofParameters
Pseudo-LikelihoodRatio Statistic
1. Choice1 event 2-stars1 actor 2 stars 3 387.0132. 11 actor overlap 4 386.8043. 11 event overlap 4 386.7114. 11 a-on-e path 4 378.8335. 11 e-on-a path 4 386.989
LOGIT MODELS FOR AFFILIATION NETWORKS 275
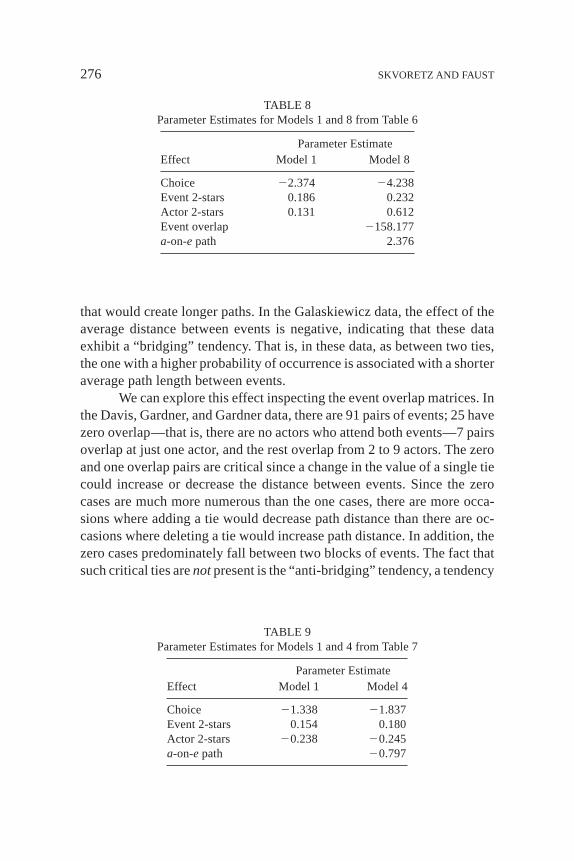
that would create longer paths. In the Galaskiewicz data, the effect of theaverage distance between events is negative, indicating that these dataexhibit a “bridging” tendency. That is, in these data, as between two ties,the one with a higher probability of occurrence is associated with a shorteraverage path length between events.
We can explore this effect inspecting the event overlap matrices. Inthe Davis, Gardner, and Gardner data, there are 91 pairs of events; 25 havezero overlap—that is, there are no actors who attend both events—7 pairsoverlap at just one actor, and the rest overlap from 2 to 9 actors. The zeroand one overlap pairs are critical since a change in the value of a single tiecould increase or decrease the distance between events. Since the zerocases are much more numerous than the one cases, there are more occa-sions where adding a tie would decrease path distance than there are oc-casions where deleting a tie would increase path distance. In addition, thezero cases predominately fall between two blocks of events. The fact thatsuch critical ties arenotpresent is the “anti-bridging” tendency, a tendency
TABLE 8Parameter Estimates for Models 1 and 8 from Table 6
Parameter EstimateEffect Model 1 Model 8
Choice 22.374 24.238Event 2-stars 0.186 0.232Actor 2-stars 0.131 0.612Event overlap 2158.177a-on-e path 2.376
TABLE 9Parameter Estimates for Models 1 and 4 from Table 7
Parameter EstimateEffect Model 1 Model 4
Choice 21.338 21.837Event 2-stars 0.154 0.180Actor 2-stars 20.238 20.245a-on-e path 20.797
276 SKVORETZ AND FAUST
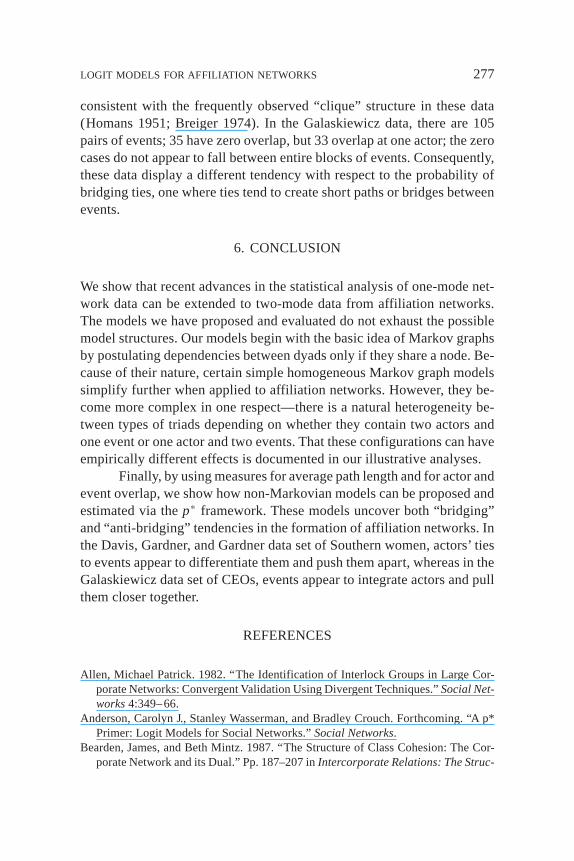
consistent with the frequently observed “clique” structure in these data(Homans 1951; Breiger 1974). In the Galaskiewicz data, there are 105pairs of events; 35 have zero overlap, but 33 overlap at one actor; the zerocases do not appear to fall between entire blocks of events. Consequently,these data display a different tendency with respect to the probability ofbridging ties, one where ties tend to create short paths or bridges betweenevents.
6. CONCLUSION
We show that recent advances in the statistical analysis of one-mode net-work data can be extended to two-mode data from affiliation networks.The models we have proposed and evaluated do not exhaust the possiblemodel structures. Our models begin with the basic idea of Markov graphsby postulating dependencies between dyads only if they share a node. Be-cause of their nature, certain simple homogeneous Markov graph modelssimplify further when applied to affiliation networks. However, they be-come more complex in one respect—there is a natural heterogeneity be-tween types of triads depending on whether they contain two actors andone event or one actor and two events. That these configurations can haveempirically different effects is documented in our illustrative analyses.
Finally, by using measures for average path length and for actor andevent overlap, we show how non-Markovian models can be proposed andestimated via thep* framework. These models uncover both “bridging”and “anti-bridging” tendencies in the formation of affiliation networks. Inthe Davis, Gardner, and Gardner data set of Southern women, actors’ tiesto events appear to differentiate them and push them apart, whereas in theGalaskiewicz data set of CEOs, events appear to integrate actors and pullthem closer together.
REFERENCES
Allen, Michael Patrick. 1982. “The Identification of Interlock Groups in Large Cor-porate Networks: Convergent Validation Using Divergent Techniques.”Social Net-works4:349–66.
Anderson, Carolyn J., Stanley Wasserman, and Bradley Crouch. Forthcoming. “A p*Primer: Logit Models for Social Networks.”Social Networks.
Bearden, James, and Beth Mintz. 1987. “The Structure of Class Cohesion: The Cor-porate Network and its Dual.” Pp. 187–207 inIntercorporate Relations: The Struc-
LOGIT MODELS FOR AFFILIATION NETWORKS 277
tural Analysis of Business, edited by Mark S. Mizruchi and Michael Schwartz.Cambridge, England: Cambridge University Press.
Berkowitz, Stephen D. 1982.An Introduction to Structural Analysis: The NetworkApproach to Social Research. Toronto: Butterworths.
Bernard, H. Russell, Peter Killworth, and Lee D. Sailer. 1980. “Informant Accuracy inSocial Network Data IV: A Comparison of Clique-level Structure in Behavioral andCognitive Network Data.”Social Networks2:191–218.
———. 1982. “Informant Accuracy in Social Network Data V: An Experimental At-tempt to Predict Actual Communication from Recall Data.”Social Science Re-search11:30–66.
Besag, Julian. 1974. “Spatial Interaction and the Statistical Analysis of Lattice Sys-tems.”Journal of the Royal Statistical Society. Series B: Methodological36:192–225.
Bonacich, Phillip. 1972. “Technique for Analyzing Overlapping Memberships.” Pp.176–85 inSociological Methodology 1972, edited by Herbert L. Costner. San Fran-cisco: Jossey-Bass.
———. 1978. “Using Boolean Algebra to Analyze Overlapping Memberships.” Pp.101–15 inSociological Methodology 1978, edited by Karl F. Schuessler. San Fran-cisco: Jossey-Bass.
———. 1991. “Simultaneous Group and Individual Centralities.”Social Networks13:155–68.
Borgatti, Stephen P., and Martin G. Everett. 1992. “Regular Blockmodels of Multiway,Multimode Matrices.”Social Networks14:91–120.
———. 1997. “Network Analysis of 2-mode Data.”Social Networks19:243–69.Breiger, Ronald L. 1974. “The Duality of Persons and Groups.”Social Forces53:181–
90.———. 1990. “Social Control and Social Networks: A Model from Georg Simmel.”
Pp. 453–76 inStructures of Power and Constraint: Papers in Honor of Peter M.Blau, edited by C. Calhoun, M. W. Meyer, and W. R. Scott. Cambridge, England:Cambridge University Press.
Crouch, Bradley, and Stanley Wasserman. 1998. “APractical Guide to Fitting p* SocialNetwork Models.”Connections21:87–101.
Davis, A., B. Gardner, and M.R. Gardner. 1941.Deep South. Chicago: University ofChicago Press.
Doreian, Patrick. 1979. “On the Delineation of Small Group Structures.” Pp. 215–30 inClassifying Social Data, edited by H. C. Hudson. San Francisco: Jossey-Bass.
Faust, Katherine. 1997. “Centrality in Affiliation Networks.”Social Networks19:157–91.
Feld, Scott L. 1981. “The Focused Organization of Social Ties.”American Journal ofSociology86:1015–35.
———. 1982. “Social Structural Determinants of SimilarityAmongAssociates.”Amer-ican Sociological Review47:797–801.
Foster, Brian L., and Stephen B. Seidman. 1984. “Overlap Structure of CeremonialEvents in Two Thai Villages.”Thai Journal of Development Administration24:143–57.
Frank, Ove, and David Strauss. 1986. “Markov Graphs.”Journal of the AmericanStatistical Association81:832–42.
278 SKVORETZ AND FAUST

Freeman, Linton C., Sue C. Freeman, and Alaina G. Michaelson. 1989. “How HumansSee Social Groups: A Test of the Sailer-Gaulin Models.”Journal of QuantitativeAnthropology1:229–38.
Freeman, Linton C., and A. Kimball Romney. 1987. “Words, Deeds and Social Struc-ture: A Preliminary Study of the Reliability of Informants.”Human Organization46:330–34.
Freeman, Linton C.,A. Kimball Romney, and Sue C. Freeman. 1987. “Cognitive Struc-ture and Informant Accuracy.”American Anthropologist89:310–25.
Freeman, Linton C., and Douglas R. White. 1993. “Using Galois Lattices to RepresentNetwork Data.” Pp. 127–46 inSociological Methodology 1993, edited by Peter V.Marsden. Cambridge, MA: Blackwell Publishers.
Galaskiewicz, Joseph. 1985.Social Organization of an Urban Grants Economy. NewYork: Academic Press.
Galaskiewicz, Joseph, and Stanley Wasserman. 1989. “Mimetic Processes within anInterorganizational Field: An Empirical Test.”Administrative Science Quarterly34:454–79.
Granovetter, Mark. 1973. “The Strength of Weak Ties.”American Journal of Sociol-ogy81:1287–1303.
Hjort, Nils Lid, and Henning Omre. 1994. “Topics in Spatial Statistics.”ScandinavianJournal of Statistics21: 289–357.
Holland, Paul W., and Samuel Leinhardt. 1970. “A Method for Detecting Structure inSociometric Data.”American Journal of Sociology70:492–513.
———. 1975. “The Statistical Analysis of Local Structure in Social Networks.” Pp.1–45 inSociological Methodology 1976, edited by D. R. Heise. San Francisco:Jossey-Bass.
———. 1979. “Structural Sociometry.” Pp. 63–83 inPerspectives on Social Net-work Research, edited by P. W. Holland and S. Leinhardt. New York: AcademicPress.
———. 1981. “An Exponential Family of Probability Distributions for Directed Graphs”(with discussion).Journal of the American Statistical Association76:33–65.
Homans, George C. 1950.The Human Group. London, England: Routledge & KeganPaul.
Iacobucci, Dawn, and Stanley Wasserman. 1990. “Social Networks with Two Sets ofActors.” Psychometrika55:707–20.
Levine, Joel. 1972. “The Sphere of Influence.”American Sociological Review37:14–27.
Mariolis, Peter. 1975. “Interlocking Directorates and Control of Corporations: TheTheory of Bank Control.”Sociological Quarterly56:425–39.
McPherson, J. Miller. 1982. “Hypernetwork Sampling: Duality and DifferentiationAmong Voluntary Organizations.”Social Networks3:225–49.
McPherson, J. Miller, and Lynn Smith-Lovin. 1982. “Women and Weak Ties: Differ-ences by Sex in the Size of Voluntary Organizations.”American Journal of Sociol-ogy87:883–904.
Mintz, Beth, and Michael Schwartz. 1981a. “The Structure of Intercorporate Unity inAmerican Business.”Social Problems29:87–103.
———. 1981b. “Interlocking Directorates and Interest Group Formation.”AmericanSociological Review46:851–69.
LOGIT MODELS FOR AFFILIATION NETWORKS 279
Mizruchi, Mark S. 1982.The American Corporate Network 1904–1974.Beverly Hills,CA: Sage.
Mizruchi, Mark S., Peter Mariolis, Michael Schwartz, and Beth Mintz. 1986. “Tech-niques for Disaggregating Centrality Scores in Social Networks.” Pp. 26–48 inSociological Methodology 1986, edited by Nancy B. Tuma. San Francisco: Jossey-Bass.
Pattison, Philippa, and Stanley Wasserman. Forthcoming. “Logit Models and LogisticRegressions for Social Networks: II. Multivariate Relations.”British Journal ofMathematical and Statistical Psychology.
Robins, Garry, Philippa Pattison, and Stanley Wasserman. Forthcoming. “Logit Mod-els and Logistic Regressions for Social Networks: III. Valued Relations.”Psy-chometrika.
Schweizer, Thomas. 1991. “The Power Struggle in a Chinese Community, 1950–1980:A Social Network Analysis of the Duality of Actors and Events.”Journal of Quan-titative Anthropology3:19–44.
———. 1996. “Actor and Event Orderings across Time: Lattice Representation andBoolean Analysis of the Political Disputes in Chen Village, China.”Social Net-works18:247–66.
Schweizer, Thomas, Elmar Klemm, and Margarete Schweizer. 1993. “Ritual as Actionin a Javanese Community: A Network Perspective on Ritual and Social Structure.”Social Networks15:19–48.
Simmel, Georg. 1950.The Sociology of Georg Simmel, edited by K. H. Wolff. Glencoe,IL: Free Press.
———. 1955.Conflict and the Web of Group Affiliations. Glencoe, IL: Free Press.Skvoretz, J., K. Faust, and T. J. Fararo. 1996. “Social Structure, Networks, and E-State
Structuralism Models.”Journal of Mathematical Sociology21:57–76.Snijders, Tom A. B., and Frans N. Stokman. 1987. “Extensions of Triad Counts to
Networks with Different Subsets of Points and Testing Underlying Graph Distri-butions.”Social Networks9:249–75.
Sonquist, John A., and Thomas Koenig. 1975. “Interlocking Directorates in the TopU.S. Corporations: A Graph Theory Approach.”Insurgent Sociologist5:196–230.
Strauss, David. 1986. “On a General Class of Models for Interaction.”Society forIndustrial and Applied Mathematics, Review28:513–27.
Strauss, David, and Michael Ikeda. 1990. “Pseudolikelihood Estimation for SocialNetworks.”Journal of the American Statistical Association85:204–12.
Wasserman, Stanley, and Carolyn J. Anderson. 1987. “Stochastica posterioriBlock-models: Construction and Assessment.”Social Networks9:1–36.
Wasserman, Stanley, and Katherine Faust. 1994.Social Network Analysis: Methodsand Applications. New York: Cambridge University Press.
Wasserman, Stanley, and Dawn Iacobucci. 1991. “Statistical Modelling of One-Modeand Two-Mode Networks: SimultaneousAnalysis of Graphs and Bipartite Graphs.”British Journal of Mathematical and Statistical Psychology44:13–43.
Wasserman, Stanley, and Philippa Pattison. 1996. “Logit Models and Logistic Regres-sions for Social Networks: I. An Introduction to Markov Graphs andp* +” Psy-chometrika61:401–25.
280 SKVORETZ AND FAUST