fatty acid ethyl esters in meconium: are they biomarkers of fetal alcohol exposure and effect?
TRANSCRIPT
Fatty Acid Ethyl Esters in Meconium: Are They Biomarkers ofFetal Alcohol Exposure and Effect?
Enrique M. Ostrea Jr., Joel D. Hernandez, Dawn M. Bielawski, Jack M. Kan, Gregorio M.Leonardo, Michelle Buda Abela, Michael W. Church, John H. Hannigan, James J. Janisse,Joel W. Ager, and Robert J. SokolDepartment of Pediatrics, Hutzel Women’s Hospital and the Mott Center for Human Growth andDevelopment (EMO, JDH, DMB, JMK, GML); and the Department of Obstetrics, (MBA, MWC,JHH, RJS); and the Center for Healthcare Effectiveness Research, Wayne State University,Detroit, Michigan (JJJ, JWA).
AbstractBackground—Biomarkers of fetal exposure to alcohol are important to establish so that earlydetection and intervention can be made on these infants to prevent undesirable outcomes. The aimof this study was to analyze long-chain fatty acid ethyl esters (FAEEs) in meconium as potentialbiomarkers of fetal alcohol exposure and effect.
Methods—Fatty acid ethyl esters were analyzed in the meconium of 124 singleton infants bypositive chemical ionization gas chromatography/mass spectrometry (GC/MS) and correlated tomaternal ethanol use.
Results—A total of 124 mother/infant dyads were enrolled in the study: 31 were in the controlgroup and 93 were in the alcohol-exposed group. The incidence (28% vs 9.7%, p=0.037) of ethyllinoleate detected in meconium was significantly higher in the alcohol-exposed groups than thecontrol groups. Similarly, when the concentrations of ethyl linoleate in meconium were grouped(trichotomized), there was a significant linear by linear association between alcohol exposure andgroup concentrations of ethyl linoleate (p=0.013). Furthermore, only alcohol-exposed infants werefound in the group with the highest ethyl linoleate concentration. The sensitivity of ethyl linoleatein detecting prenatal alcohol exposure was only 26.9%, and its specificity and positive predictivevalue were 96.8 and 96.2%, respectively. There was no significant correlation between theconcentration of ethyl linoleate in meconium and absolute alcohol consumed (oz) per drinking dayacross pregnancy, although a trend toward a positive correlation is seen at lower amounts ofalcohol consumed. Among the polyunsaturated, long-chain FAEEs, there was weak evidence thatthe incidence (21.5% vs 6.5%, p=0.057) and concentration (p=0.064) of ethyl arachidonate (AA)were significantly higher in the alcohol-exposed groups than the control groups. Ethyl linolenateand ethyl docosahexanoate (DHA) in meconium were found only in the alcohol group, althoughnot at statistically significant levels. Highly significant correlations were found among theconcentrations of ethyl linoleate, ethyl linolenate, ethyl AA, and ethyl DHA in meconium(correlations ranged between rs=0.203, p=0.024; and rs=0.594, p<0.001).
Conclusion—We conclude that FAEEs in meconium, particularly ethyl linoleate and ethyl AA,are biomarkers of high specificity for prenatal exposure to alcohol in newborn infants. We alsopropose that ethyl AA and DHA could be potential biomarkers of fetal alcohol effects on thedeveloping fetal brain and should be investigated further.
Copyright © 2006 by the Research Society on Alcoholism.Reprint requests: Enrique M. Ostrea Jr., MD, Department of Pediatrics, Hutzel Women’s Hospital, 3980 John Road, Detroit, MI48201; Fax: 313-993-0198; [email protected].
NIH Public AccessAuthor ManuscriptAlcohol Clin Exp Res. Author manuscript; available in PMC 2011 October 13.
Published in final edited form as:Alcohol Clin Exp Res. 2006 July ; 30(7): 1152–1159. doi:10.1111/j.1530-0277.2006.00131.x.
NIH
-PA Author Manuscript
NIH
-PA Author Manuscript
NIH
-PA Author Manuscript
KeywordsGas Chromatography/Mass Spectroscopy; Fetal Alcohol Syndrome; Maternal Alcoholism; FattyAcid Ethyl Esters; Ethyl Laurate; Ethyl Palmitate; Ethyl Oleate; Ethyl Linoleate; Ethyl Myristate;Ethyl Linolenate; Ethyl Arachidonate; Ethyl Docosahexanoate
Early detection of infants who have been exposed to alcohol during pregnancy is importantso that early intervention can be instituted to prevent the emergence of further undesirableoutcomes (Bearer, 2001; Van Der Leeden et al., 2001). Although a number of alcoholbiomarkers have been identified in pregnant woman, only a few have been reported ininfants. These include urinary dolichol (Wisniewski et al., 1983), serum γ-glutamyltransferase activity (Leonardo et al., 2002; Mirlesse et al., 1996), and certain isoforms ofalcohol dehydrogenase and α1-antitrypsin (Robinson et al., 1995). Fatty acid ethyl esters(FAEEs) are formed principally from the enzymatic esterification of serum fatty acids withethanol, and their increase in the serum of adult alcoholics is proportional to alcohol intake(Laposata, 1997). In animal studies, mouse heart, liver, placenta, and fetal tissues wereshown to accumulate significant amounts of FAEE after maternal ethanol exposure (Beareret al., 1992). The presence of FAEEs in meconium was initially reported by Mac et al.(1994) and subsequently by Klein et al. (1999) and Bearer et al. (1999). These studies havesuggested that FAEEs in meconium may be a useful biomarker of prenatal alcohol exposurein the newborn infant.
Meconium is an ideal matrix to analyze for fetal exposure to many xenobiotic agents forseveral reasons. Meconium is a repository of many agents to which the fetus is exposedduring pregnancy, as both the drugs themselves and their metabolites are deposited inmeconium through bile secretion or fetal swallowing of amniotic fluid. Also, meconium isformed early in gestation (starting at the 12th week of pregnancy), continues to be formeduntil birth, and is not normally excreted by the fetus until after birth. These features indicatethat meconium provides a wide window to detect fetal exposure to various agents. To date,meconium has been analyzed to detect fetal exposure to illicit drugs (Bibb et al., 1995;Ostrea et al., 1988, 1989, 1992, 2001; Ryan et al., 1994), nicotine metabolites (Ostrea et al.,1994), many prescribed and over-the-counter medications, food additives (Ostrea et al.,1998), and environmental toxicants (Ostrea et al., 2002; Whitehall et al., 2000; Whyatt andBarr, 2001).
We report on the analysis of FAEEs in meconium of infants born to a cohort of pregnantwomen for whom levels of alcohol consumption at periconception and during pregnancy arereported. This report includes an extensive analysis of long-chain saturated andpolyunsaturated FAEEs, including ethyl esters of arachidonate (AA) and, for the first time,ethyl DHA.
METHODSFatty acid ethyl esters were analyzed in meconium by positive chemical ionization (PCI) gaschromatography/mass spectrometry (GC/MS) (Bielawski et al., 2003). Briefly, meconium(0.5 g) was weighed and placed in a Sarstedt tube, 3.5 mL of distilled water was added, andthe mixture was vortexed until homogeneous. An internal standard (ethyl heptadecanoate)was added (to make a concentration of 8 μg/g meconium) plus 3.5 mL of hexane. Themixture was placed in a rotary mixer on medium speed for 30 minutes, centrifuged at 2,800r.p.m. (1,600×g) for 30 minutes, and then frozen for several hours at −20 °C to solidify thefree lipids in the hexane layer. The hexane layer was aspirated and added to a solid-phaseextraction column (CUNAX153 columns, United Chemical Technologies, Bristol, PA) that
Ostrea et al. Page 2
Alcohol Clin Exp Res. Author manuscript; available in PMC 2011 October 13.
NIH
-PA Author Manuscript
NIH
-PA Author Manuscript
NIH
-PA Author Manuscript
had been preconditioned with 4 mL of methylene chloride and 4 mL of hexane. The columnwas eluted twice with 4 mL each of hexane and methylene chloride. All eluates werecollected, evaporated under nitrogen, reconstituted with 100 μL of acetone, and vortexed.Samples (1 μL) were injected in splitless mode using an autosampler (Agilent 7683 Series,Agilent Technologies, Wilmington, DE). The GC/MS was an Agilent GC6890/MS5973Nusing PCI in selected ion monitoring (SIM) mode with helium carrier gas at 11.15 psiconstant pressure and a flow rate of 1.0 mL/min. Inlet temperature was 250 °C and detectortemperature was 280 °C. An HP-5MS column (0.25 mm×30 m×0.25 μm) was utilized andthe oven temperature was programmed: initial temperature of 100 °C, increased at a rate of25 °C/min to 200 °C, then 5 °C/min to a final temperature of 300 °C for 5 minutes. Methanewas used as the reagent gas.
Matrix-spiked calibrators, also used for determining the limits of detection (LODs), rangedfrom 0.05 to 8 μg/g FAEEs (ethyl esters of laurate, myristate, palmitate, linoleate, oleate, α-linolenate, stearate, AA, and DHA). For the recovery study, FAEEs were spiked inmeconium at 1, 4, and 8 μg/g concentrations with ethyl heptadecanoate as an internalstandard.
At 1 to 8 μg/g concentrations of the different FAEEs in spiked meconium, the mean (± SD)recovery rate was 101.0 ± 4.6% and the mean (± SD) interassay and intraassay coefficientsof variation were 12.1 ± 5.3 and 4.6 ± 1.1%, respectively. The LODs for the individualFAEEs were determined using the empirical approach (Armbruster et al., 1994) withdecreasing concentrations of matrix-spiked calibrators. Limit of detection was defined as thelowest concentration where (a) the quantitation and qualifier(s) peaks were present and (b)the mass ratios of quantitation versus qualifier(s) were within ± 20% range of uncertainty.Target and qualifier ions for SIM were calculated using the molecular weights of thecompounds. The empirical method of LOD determination consists of measuringprogressively more dilute concentrations of analyte and LOD represents the lowestconcentration at which the results still satisfy our predetermined criteria (Armbruster et al.,1994). The empirical LOD method was chosen as it provides a value that represents theactual limit of the feasibility of our assay, a value that meets all analytical acceptancecriteria (Lawson, 1994). The LODs were 0.05 μg/g for ethyl laurate, ethyl myristate, ethylpalmitate, ethyl linoleate, and ethyl oleate; 0.10 μg/g for ethyl α-linolenate and ethylstearate; 0.20 μg/g for ethyl AA; and 1 μg/g for ethyl DHA. For categorical values (positive/negative groupings) or actual concentrations, FAEEs were considered as “negative or zeroconcentration: if the actual concentration was below the LOD.” The calibration curve ofeach FAEE displayed a linear fit and coefficients of determination (r2) ranged from 0.96 to0.98.
Clinical StudyPregnant women (n=124) were prospectively interviewed for their alcohol use at the time ofconception (periconception) and within pregnancy. Measures of alcohol use included (1)average amount (oz) of absolute alcohol consumed per day or AAD, (2) average amount(oz) of absolute alcohol consumed per drinking day or AADD, and (3) proportion of 7 daysin which alcohol was used or PD. Alcohol consumption at the time of conception was usedbased on the findings of Streissguth et al. (1980) that outcome measures of alcohol effect aremore significantly associated with self-reported drinking before recognition of pregnancy, asit is free from the stigma of drinking around pregnancy. The control group consisted of thosemothers who reported no alcohol intake around the time of conception or in pregnancywhereas the alcohol-exposed group consisted of those who used alcohol at the time ofconception and/or any time during pregnancy. Standard questionnaires to assess alcohol usesuch as the Michigan Alcohol Screening Test (MAST), TACE, and CAGE screens were alsoutilized (Russell et al., 1996). The study was approved by the Human Investigation
Ostrea et al. Page 3
Alcohol Clin Exp Res. Author manuscript; available in PMC 2011 October 13.
NIH
-PA Author Manuscript
NIH
-PA Author Manuscript
NIH
-PA Author Manuscript
Committee of Wayne State University and informed consent was obtained from all subjects.After delivery, meconium was collected from the diapers of the infants, pooled into 1container per infant, and frozen at −20 °C until being analyzed for FAEEs.
Statistical AnalysisComparisons between the alcohol-exposed and control groups were performed. Forcomparison of categorical data, Pearson’s chisquare or Fisher’s exact test was used. Fornormally distributed continuous data, t-tests were performed. For continuous data that didnot meet the normality assumption, Mann–Whitney tests were performed. Associationsbetween variables were based on the Pearson’s chi-square test for categorical data andSpearman’s ρ correlation for continuous data. To calculate the sensitivity and specificity ofthe FAEE in detecting alcohol exposure, a receiving operator curve (ROC) analysis wasperformed. In all of the statistical analyses, the level of significance was taken as p ≤ 0.05.
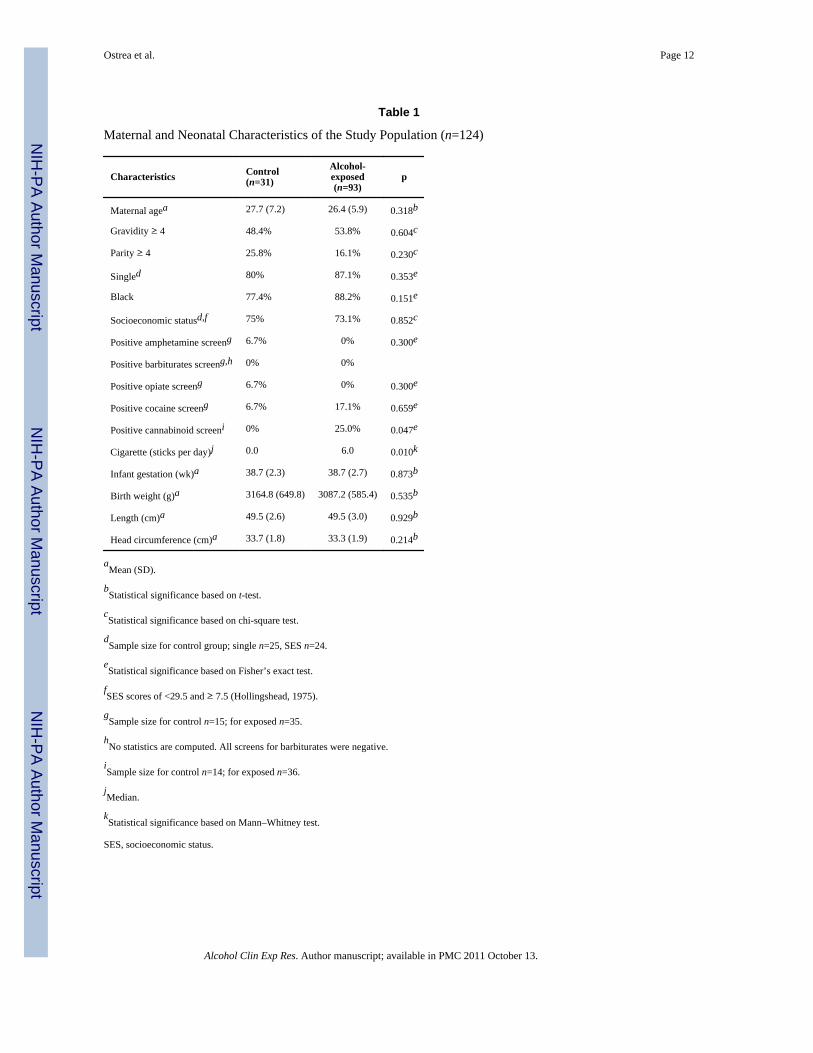
RESULTSA total of 124 mother/infant dyads were included in the study: 31 were in the control groupand 93 were in the alcohol-exposed group. There was no significant difference in maternalage, gravidity, parity, marital status, socioeconomic status (Hollingshead, 1975), or racebetween the 2 groups based on alcohol use during pregnancy (Table 1). There was also nosignificant difference in the rate of positive drug screen for amphetamine, barbiturates,cocaine, or opiates between the 2 groups. However, the rate of positive test for cannabinoids(0% vs 25%, p=0.047) and the number of cigarettes per day (median of 0 vs 6, p=0.01) wereboth significantly higher in the alcohol-exposed group than the control group. There were nosignificant differences in mean gestational age, birth weight, length, or head circumferencebetween the 2 groups (Table 1).
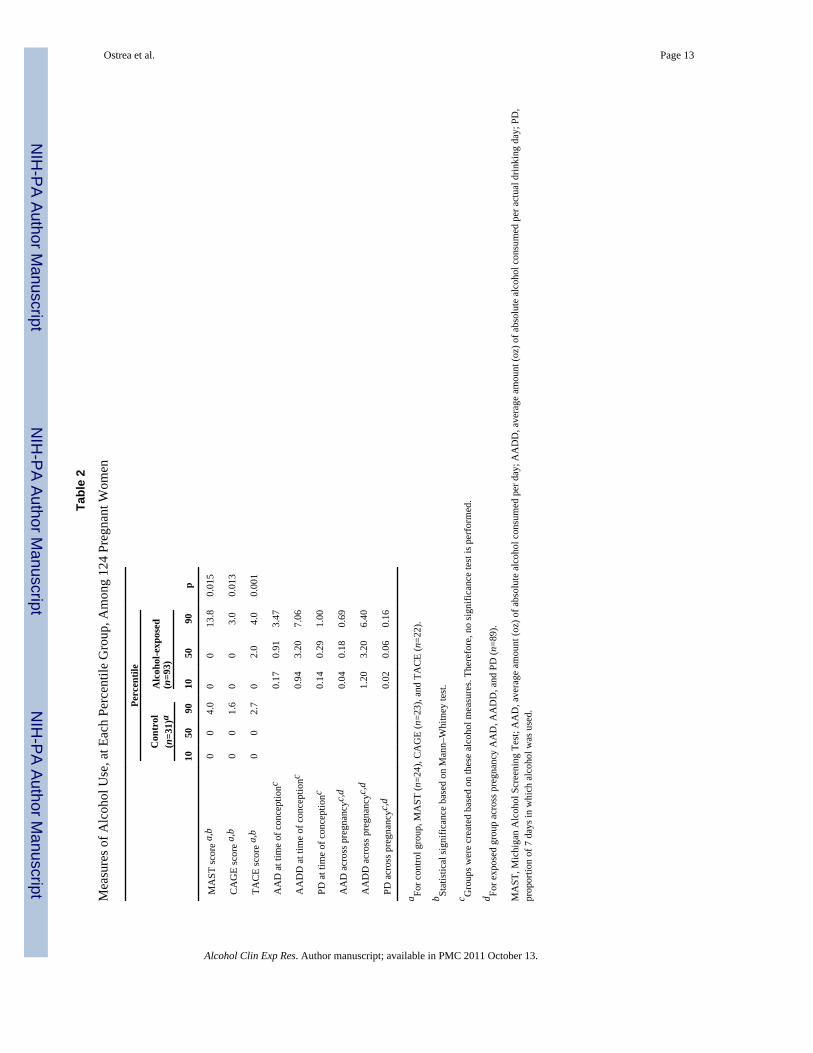
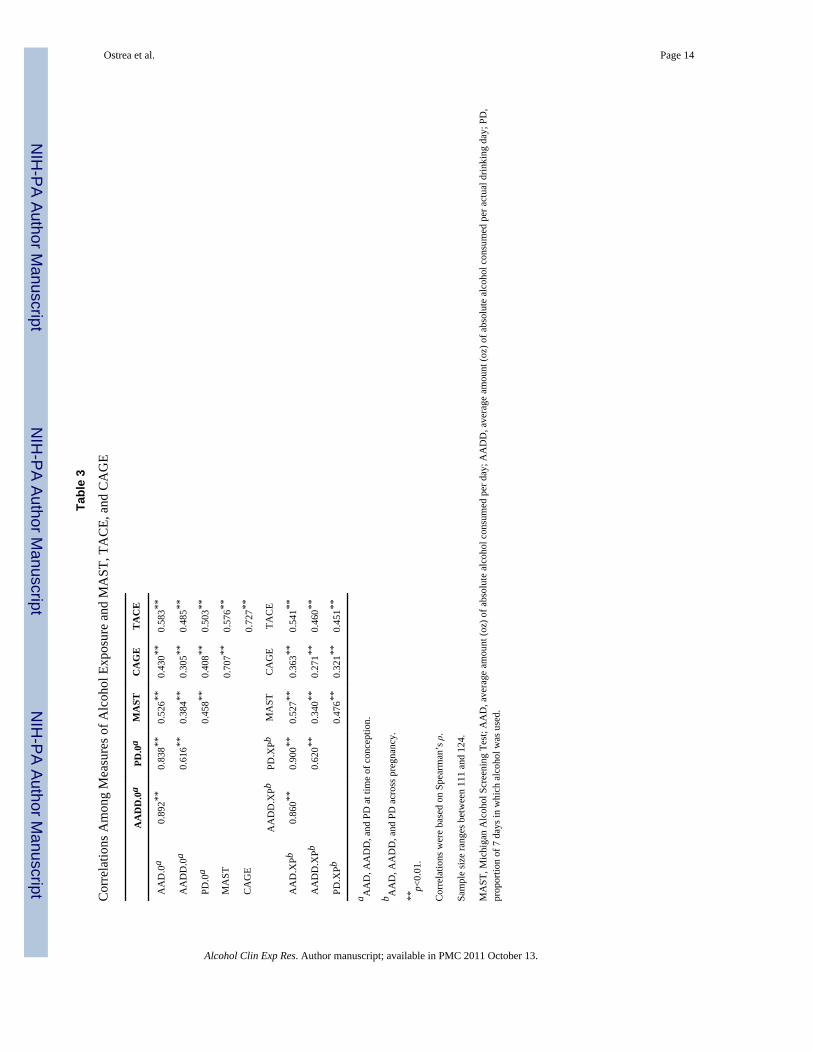
There were significant differences in the MAST, CAGE, and TACE scores between thecontrol and the alcohol-exposed groups (Table 2) and AAD, AADD, and PD weresignificantly correlated to each other, both at the time of conception and in pregnancy, aswell as to MAST, CAGE, and TACE scores (Table 3).
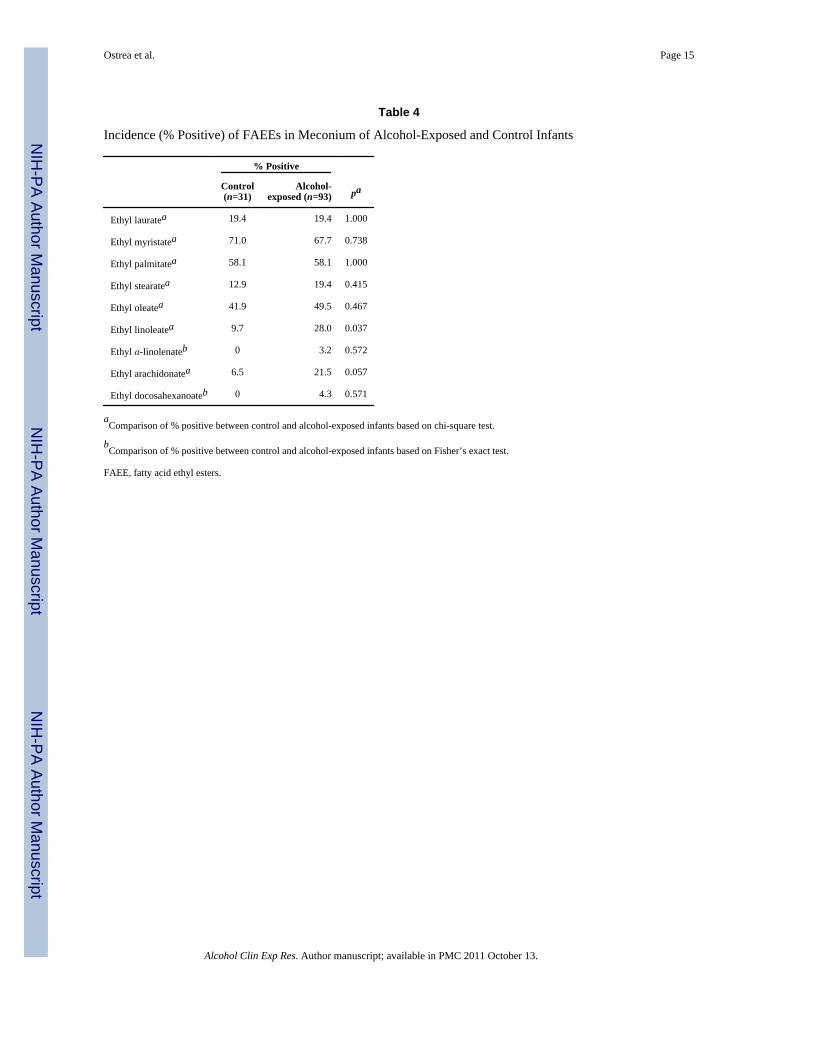
The detection (any amount) and the concentrations (μg/g) of FAEEs in meconium in thecontrol and alcohol-exposed groups are shown in Tables 4 and 5. The incidence (28% vs9.7%, p=0.037 by chi-square analysis) and concentrations of ethyl linoleate weresignificantly higher in the alcohol-exposed groups than the control groups. Specifically, the3 control subjects who had concentrations above 0 had values ranging from 0.15 to 0.82 μg/g and the 26 alcohol-exposed subjects who had concentrations above 0 had ethyl linoleatevalues ranging from 0.25 to 211.72 (p=0.016 by the Mann–Whitney test). An ROC was usedto calculate sensitivity and specificity for no exposure versus some exposure. The area underthe curve was 0.60 for ethyl linoleate with a 96% confidence interval of 0.51 to 0.69. Thecut point that maximized sensitivity and specificity was 0.25. At this level the sensitivitywas 26.9%, the specificity was 96.8%, and the positive predictive value was 96.2%.Although the area under the curve is not very large, it is significantly different from 0.5. Thelow area under the curve is mainly due to the poor sensitivity of the test even though thespecificity is very high.
The scatter plot of ethyl linoleate concentration in relation to average amount (oz) ofabsolute alcohol consumed on actual drinking days (AADD) across pregnancy is shown inFig. 1. For this scatter plot an extreme outlier with an AADD value of 20.0 has been“winsorized” to a value of 10.33, which is just above the next highest value. At low amountsof AADD, there appears to be a positive relationship between concentration of ethyllinoleate and amount of alcohol exposure. At high amounts of AADD, this relationship
Ostrea et al. Page 4
Alcohol Clin Exp Res. Author manuscript; available in PMC 2011 October 13.
NIH
-PA Author Manuscript
NIH
-PA Author Manuscript
NIH
-PA Author Manuscript
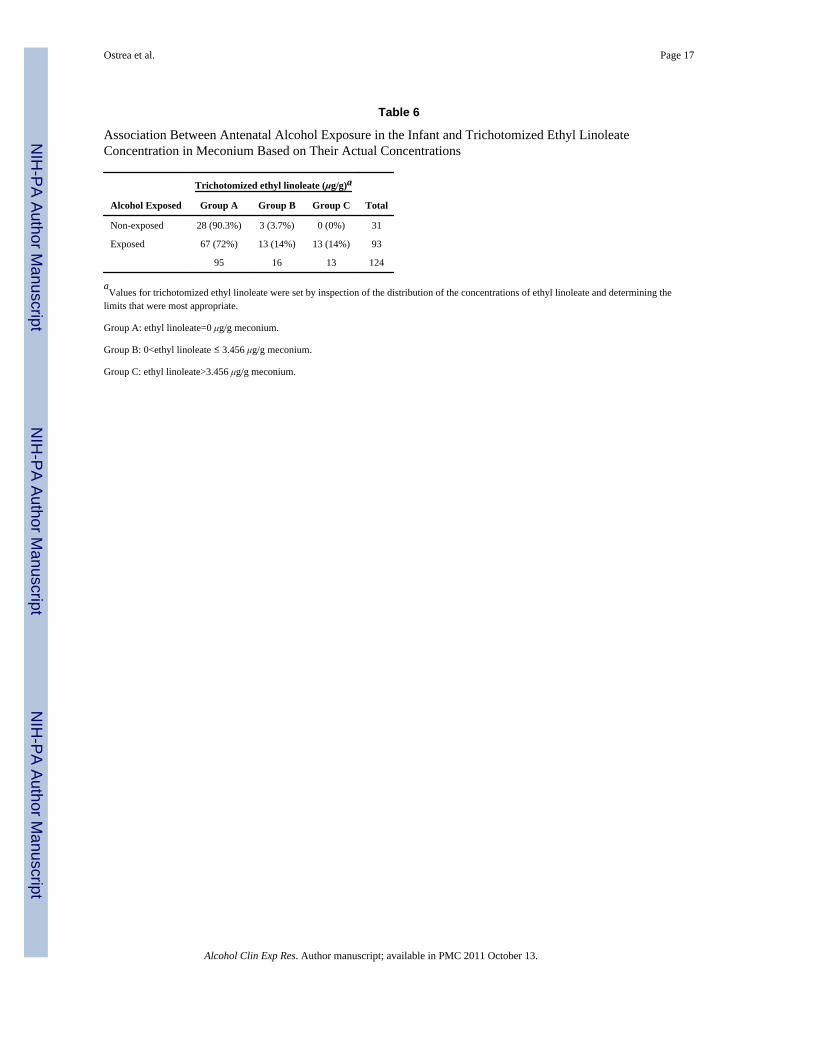
disappears. Overall there was no significant relationship between AADD and ethyl linoleatelevels (rs=0.126, p<0.17). When the concentrations of ethyl linoleate in meconium weregrouped (trichotomized), there was a significant association (Table 6) between alcoholexposure and increasing concentrations of ethyl linoleate (linear-by-linear association,p=0.019). Furthermore, only alcohol-exposed infants were found in group C, the group withthe highest ethyl linoleate concentration. Combinations of FAEEs (ethyl palmitate, stearate,and oleate) did not show any significant association between the FAEEs and alcoholexposure.
Of the polyunsaturated long-chain FAEEs, the incidence (21.5% vs 6.5%, p=0.057 by chi-square analysis) and concentration (2 control subjects had concentrations above 0 withvalues of 0.90 and 3.60 and 20 alcohol-exposed subjects had concentrations above 0 withvalues ranging from 0.81 to 3.19, p=0.064 by the Mann–Whitney test) of ethyl AA showedweak evidence of being higher in the alcohol-exposed groups than the control groups(Tables 4 and 5). An ROC was used to calculate sensitivity and specificity from no exposureversus some exposure. The area under the curve was 0.57 with a 95% confidence interval of0.48 to 0.66. The cut point that maximized sensitivity and specificity was 0.902. At thislevel, the sensitivity was 18.3% and the specificity was 96.8%. The positive predictive valuewas 94.4%. When the concentrations of ethyl AA in meconium were grouped(trichotomized), there was no significant association between alcohol exposure and groupconcentrations of ethyl AA (linear-by-linear association, p=−0.076). Ethyl linolenate andethyl DHA were only found in the meconium of the alcohol-exposed group and not in thecontrol group (Table 4).
As shown in Table 7, the correlations between the concentrations of ethyl linoleate, ethyllinolenate, ethyl AA, and ethyl DHA were all significant. Based on Spearman’s ρ, thecorrelations ranged between rs=0.203 (p=0.024) and rs=0.594 (p<0.001).
DISCUSSIONFatty acid ethyl esters are formed by the nonoxidative esterification of ethanol with freefatty acids through the action of fatty acid synthase and acylcoenzyme, ethanol-O-acyltransferase (Diczfalusy et al., 2001). A number of enzymes have fatty acid synthaseactivity, including lipo-protein lipase, carboxylesterase, and carboxyl ester lipase (Best andLaposata, 2003; Laposata, 1999). In adults, FAEEs have been validated as a biomarker ofalcohol use and have been found in the blood, adipose tissue, liver, heart, brain, and hair ofalcoholics (Best et al., 2003; Calabrese et al., 2001; Hartwig et al., 2003; Laposata et al.,2002; Refaai at al., 2002; Salem et al., 2001). The amount of FAEE is also proportional tothe amount of alcohol intake (Laposata, 1997). Different types or species of FAEEs havebeen identified based on the tissue examined and the acuteness of alcohol intake, i.e., bingeconsumption versus chronic alcoholism (Laposata et al., 2000; Refaai et al., 2002). Fattyacid ethyl esters are toxic in the brain, liver, and heart of alcoholics through their disruptionof mitochondrial and other cell functions (Bora and Lange, 1993; Beckemeier and Bora,1998). In pregnancy, FAEEs have been found in the placenta of infants whose mothers usedalcohol during pregnancy (Bearer et al., 1992). Fatty acid ethyl esters have been detected inthe meconium of newborn infants and suggested as a potential biomarker of fetal alcoholexposure (Bearer et al., 1999, 2003, 2005; Klein et al., 1999; Mac et al., 1994).
Our study shows that the FAEEs in meconium are significantly associated with fetal alcoholexposure, consistent with previously reported observations (Bearer et al., 1999, 2003, 2005;Klein et al., 1999; Mac et al., 1994; Moore and Lewis, 2001). However, these 6 studiesdiffer in the types of FAEE that predominate. The FAEEs detected in these studies includedethyl laurate, ethyl palmitate, ethyl stearate (Klein et al., 1999; Mac et al., 1994), ethyl
Ostrea et al. Page 5
Alcohol Clin Exp Res. Author manuscript; available in PMC 2011 October 13.
NIH
-PA Author Manuscript
NIH
-PA Author Manuscript
NIH
-PA Author Manuscript
linoleate (Bearer et al., 1999; Moore and Lewis, 2001), and ethyl oleate (Bearer et al., 2003;Moore and Lewis, 2001). There is no clear explanation for the differences among thevarious studies and our current findings. It is likely that the maternal diet, which influencesthe composition of serum fatty acids may be an important factor (Stark et al., 2005a, 2005b).Two different populations that were studied by Bearer et al. (1999) showed ethyl linoleate asthe predominant FAEE in meconium in a cohort from Cleveland, Ohio, in contrast to ethyloleate in a cohort from Cape Town, South Africa (Bearer et al., 2003). In vitro studies, usingHep G2 cells, have suggested that the concentration of fatty acids in the extracellularmedium may be an important factor for the synthesis of FAEEs (Dan and Laposata, 1997).Ethanol showed the synthesis of ethyl palmitate and oleate over other FAEEs in the presenceof higher concentrations of palmitate and oleate in the extracellular medium. In anotherstudy, FAEEs were found in meconium even in a nondrinking population, although theFAEE concentrations were much lower than those in the alcohol-exposed group (Chan et al.,2003). Small quantities of ethanol that are present in certain medications or food additiveswere thought to explain these findings (Chan et al., 2004). Lastly, the difference in the typesof FAEE that were noted in the various studies may also be attributed to the difference intechniques used in measuring FAEE (Bearer et al., 1999, 2003, 2005; Chan et al., 2003; Macet al., 1994).
Our study has shown significant association in both incidence (Table 4) and concentrationsof ethyl linoleate in meconium with fetal exposure to alcohol (Tables 5 and 6). Although thesensitivity of ethyl linoleate as a biomarker of exposure was low (26.9%), its specificity andpositive predictive value were >96%. This implies that if ethyl linoleate is found inmeconium, it is highly likely that the fetus was exposed to alcohol. Consistent with thereport by Bearer et al. (2001), we found significant correlation between the concentrations ofethyl linoleate and measures of alcohol consumption (AADD) across pregnancy, but onlywhen linoleate concentration was trichotomized. The scatter plot (Fig. 1) showed a positiverelationship between ethyl linoleate concentration and increasing AADD across pregnancy(up to 2.3 oz/d). However, beyond an AADD of 3.5 oz, there was an abrupt fall or absencein the concentration of ethyl linoleate in meconium. We cannot ascertain the cause of thisphenomenon and propose a number of possibilities. First, it is possible that there may be 2subsets of pregnant mothers: one that produces FAEEs and one that does not upon exposureto ethanol during pregnancy. Second, we strongly feel that this phenomenon may be relatedto maternal nutrition. At high amounts of alcohol intake, maternal nutritional intake may besignificantly reduced and intake of nutrients, specifically fats and fatty acids, may also bediminished (Stark et al., 2005a, 2005b), thus limiting the formation of ethyl esters fromessential fatty acids. Future studies, therefore, detailing nutritional intake in pregnant womenwho abuse alcohol may be an important factor when assessing FAEEs as biomarkers ofprenatal exposure in infants.
As with ethyl linoleate, the sensitivities of ethyl linolenate, ethyl AA, or ethyl DHA asbiomarkers of fetal alcohol exposure were also low (range=3.2% to 21.5%); however, theirspecificities ranged between 93.5 and 100%. Thus, the presence of ethyl linoleate, ethyllinolenate, ethyl AA, or ethyl DHA in meconium is highly indicative of prenatal alcoholexposure.
Of the polyunsaturated long-chain FAEEs, the incidence and concentration of ethyl AAshowed weak evidence of being higher in the alcohol-exposed group than the control group(Tables 4 and 5). However, we feel that this may represent a type II error due to a smallsample size. Enrollment therefore of more subjects to achieve adequate statistical powermay help determine whether ethyl AA is also a good biomarker of alcohol exposure innewborn infants.
Ostrea et al. Page 6
Alcohol Clin Exp Res. Author manuscript; available in PMC 2011 October 13.
NIH
-PA Author Manuscript
NIH
-PA Author Manuscript
NIH
-PA Author Manuscript
This is the first study to report on ethyl DHA in meconium. Gas chromatography/massspectrometry analysis by PCI, in contrast to electron impact ionization, preserves high-molecular-weight ions better and allows for the identification of the very long-chain,polyunsaturated fatty acids of AA and DHA. Our findings, particularly with ethyl DHA, areof great interest as this FAEE was only found in the alcohol-exposed group (Table 4). Weare intrigued by the possibility that ethyl DHA in meconium may also be a biomarker offetal alcohol effect, besides fetal alcohol exposure. This hypothesis is derived from severalobservations. First, DHA is an important fatty acid for normal fetal brain and retinaldevelopment and α-linolenic acid is a precursor of DHA (Carlson, 2001; Uauy-Dagach andMena, 1995). In the present study, ethyl linolenate and ethyl DHA were found only in thealcohol-exposed infants (Table 4). We therefore propose that the presence of ethyl DHA andethyl linolenate in meconium may be significant because the esterification of DHA acid andα-linolenic acid by alcohol may promote the excretion of these important fatty acids assoluble ethyl esters, ultimately limiting the availability of DHA for fetal brain developmentand therefore acting as a potential mechanism of the fetal alcohol syndrome or other fetalalcohol spectrum disorders. The latter is a concept that has been previously suggested in anumber of reports (Beblo et al., 2005; Denkins et al., 2000; Horrocks and Yeo, 1999;Pawlosky et al., 2001; Stark et al., 2005a, 2005b). Another possibility is that ethyl DHA maybe directly toxic to the developing fetal brain. Fatty acid ethyl esters are consideredpotentially toxic in the brain, liver, and heart of alcoholics through their disruption ofmitochondrial and other cell functions (Bora and Lange, 1993; Beckemeier and Bora, 1998).There are also several factors that influence the formation of ethyl DHA, and the lowoccurrence of ethyl DHA detection even among alcohol-exposed infants (unlike ethyllinoleate) may reflect differences in nutrition (Beblo et al., 2005; Denkins et al., 2000; Starket al., 2005a, 2005b) or may be secondary to its higher limit of detection compared withother FAEEs. Of interest, however, is a relatively low incidence of diagnosis of FAS amongalcohol-exposed infants (Abel, 1998). It would be instructive to test how ethyl DHA levelsin meconium parallel the low incidence of alcohol-related complications in infants,reflecting a possible nutritional risk factor for alcohol teratogenesis (Abel and Hannigan,1995). Conversely, our hypothesis is not supported by the fact that none of the 5 infants whowere positive for ethyl DHA in meconium showed features of FAS at birth. Nonetheless,alcohol-exposed infants may only manifest subtle fetal alcohol effects at birth but showneurodevelopmental characteristics at a later time (Bertrand et al., 2004; Little et al., 1990).What is therefore needed is a prospective, case control study of alcohol-exposed infants,with meconium analyzed at birth for FAEEs, and with follow-up of the infants for at least 1year to determine the presence of neurodevelopmental delays that are suggestive of FAS orfetal alcohol effects. Such a clinical study will help establish whether FAEEs can be usednot only as a biomarker of alcohol exposure but also as a biomarker of fetal alcohol effect.These intriguing questions require further investigations, and some of that research is underway in our group.
We conclude that FAEEs in meconium, particularly ethyl linoleate and ethyl AA, arebiomarkers of high specificity for prenatal exposure to alcohol in newborn infants. We alsopropose that ethyl AA and DHA could be potential biomarkers of fetal alcohol effects on thedeveloping fetal brain and should be investigated further.
AcknowledgmentsSupported in part by National Institutes of Health Grants: NIAAA Grant R01AA10941 (MWC—principalinvestigator) and N01AA83019 (JHH—principal investigator).
Ostrea et al. Page 7
Alcohol Clin Exp Res. Author manuscript; available in PMC 2011 October 13.
NIH
-PA Author Manuscript
NIH
-PA Author Manuscript
NIH
-PA Author Manuscript
REFERENCESAbel EL. Fetal alcohol syndrome: the ‘American Paradox’. Alcohol Alcohol. 1998; 33:195–201.
[PubMed: 9632044]Abel EL, Hannigan JH. Maternal risk factors in fetal alcohol syndrome: provocative and permissive
influences. Neurotoxicol Teratol. 1995; 17:445–462. [PubMed: 7565491]Armbruster D, Tillman M, Hubbs L. Limit of detection (LOD)/limit of quantitation (LOQ):
comparison of the empirical and the statistical methods exemplified with GCMS assays of abuseddrugs. Clin Chem. 1994; 40:1233–1238. [PubMed: 8013092]
Bearer C. Markers to detect drinking during pregnancy. Alcohol Res Health. 2001; 25:210–218.[PubMed: 11810960]
Bearer CF, Gould S, Emerson R, Kinnunen P, Cook CS. Fetal alcohol syndrome and fatty acid ethylesters. Pediatr Res. 1992; 31:492–495. [PubMed: 1603626]
Bearer CF, Jacobson JL, Jacobson SW, Barr D, Croxford J, Molteno CD, Viljoen DL, Marais AS,Chiodo LM, Cwik AS. Validation of a new biomarker of fetal exposure to alcohol. J Pediatr. 2003;143:463–469. [PubMed: 14571221]
Bearer CF, Lee S, Salvator AE, Minnes S, Swick A, Yamashita T, Singer LT. Ethyl linoleate inmeconium: a biomarker for prenatal ethanol exposure. Alcohol Clin Exp Res. 1999; 23:487–493.[PubMed: 10195823]
Bearer CF, Santiago LM, O’Riordan MA, Buck K, Lee SC, Singer LT. Fatty acid ethyl esters:quantitative biomarkers for maternal alcohol consumption. J Pediatr. 2005; 146:824–830. [PubMed:15973326]
Beblo S, Stark K, Murthy M, Janisse J, Rockett H, Whitty JE, Buda-Abela M, Martier SS, Sokol RJ,Hannigan JH, Salem N Jr. Effects of alcohol intake during pregnancy on docosahexaenoic acid andarachidonic acid in umbilical cord vessels of Black women. Pediatrics. 2005; 115:194–203.[PubMed: 15630008]
Beckemeier ME, Bora PS. Fatty acid ethyl esters: potentially toxic products of myocardial ethanolmetabolism. J Mol Cell Cardiol. 1998; 30:2487–2494. [PubMed: 9925383]
Bertrand, J.; Floyd, RL.; Weber, MK.; O’Connor, M.; Riley, EP.; Johnson, KA.; Cohen, DE. NationalTask Force on FAS/FAE Fetal Alcohol Syndrome: Guidelines for Referral and Diagnosis. Centersfor Disease Control and Prevention; Atlanta, GA: 2004.
Best CA, Cluette-Brown JE, Teruya M, Teruya A, Laposata M. Red blood cell fatty acid ethyl esters: asignificant component of fatty acid ethyl esters in the blood. J Lipid Res. 2003; 44:612–620.[PubMed: 12562827]
Best CA, Laposata M. Fatty acid ethyl esters: toxic non-oxidative metabolites of ethanol and makers ofethanol intake. Front Biosci. 2003; 8:202–217.
Bibb KW, Stewart DL, Walker JR, Cook VD, Wagener RE. Drug screening in newborns and mothersusing meconium samples, paired urine samples, and interviews. J Perinat Med. 1995; 15:199–202.
Bielawski DM, Ostrea EM, Hernandez JD, Abela MB, Church MW, Hannigan JH, Sokol RJ.Detection of fatty acid ethyl esters in meconium by positive chemical ionization gaschromatography/mass spectrometry (GC/MS). Alcohol Clin Exp Res. 2003; 27:39A.
Bora PS, Lange LG. Molecular mechanism of ethanol metabolism by human brain to fatty acid ethylesters. Alcohol Clin Exp Res. 1993; 17:28–30. [PubMed: 8452205]
Calabrese V, Scapagnini G, Catalano C, Dinotta F, Bates TE, Calvani M, Stella AM. Effects of acetyl-l-carnitine on the formation of fatty acid ethyl esters in brain and peripheral organs after short termethanol administration in rat. Neurochem Res. 2001; 26:167–174. [PubMed: 11478744]
Carlson SE. Docosahexaenoic acid and arachidonic acid in infant development. Semin Neonatol. 2001;6:437–449. [PubMed: 11988033]
Chan D, Bar-Oz B, Pellerin B, Paciorek C, Klein J, Kapur B, Farine D, Koren G. Population baselineof meconium fatty acid ethyl esters among infants of nondrinking women in Jerusalem andToronto. Ther Drug Monit. 2003; 25:271–278. [PubMed: 12766552]
Chan D, Caprara D, Blanchette P, Klein J, Koren G. Recent developments in meconium and hairtesting methods for the confirmation of gestational exposures to alcohol and tobacco smoke. ClinBiochem. 2004; 37:429–428. [PubMed: 15183290]
Ostrea et al. Page 8
Alcohol Clin Exp Res. Author manuscript; available in PMC 2011 October 13.
NIH
-PA Author Manuscript
NIH
-PA Author Manuscript
NIH
-PA Author Manuscript
Dan L, Laposata M. Ethyl palmitate and ethyl oleate are the predominant fatty acid ethyl esters in theblood after ethanol ingestion and their synthesis is differentially influenced by the extracellularconcentrations of their corresponding fatty acids. Alcohol Clin Exp Res. 1997; 21:286–292.[PubMed: 9113265]
Denkins YM, Woods J, Whitty JE, Hannigan JH, Martier SS, Sokol RJ, Salem NE. Effects ofgestational alcohol exposure on the fatty acid composition of umbilical cord serum in humans. AmJ Clin Nutr. 2000; 71:300s–306s. [PubMed: 10617986]
Diczfalusy MA, Bjorkhem I, Einarsson C, Hillebrant CG, Alexson SE. Characterization of enzymesinvolved in formation of ethyl esters of long chain fatty acids in humans. J Lipid Res. 2001;42:1025–1032. [PubMed: 11441128]
Hartwig S, Auwarter V, Pragst F. Fatty acid ethyl esters in scalp, pubic, axillary, beard and body hairas markers for alcohol misuse. Alcohol Alcohol. 2003; 38:163–167. [PubMed: 12634265]
Hollingshead, AB. Four factor index of social status. Department of Social Work, Yale University;New Haven, CT: 1975. Unpublished paper
Horrocks LA, Yeo YK. Health benefits of docosahexaenoic acid (DHA). Pharmacol Res. 1999;40:211–225. [PubMed: 10479465]
Klein J, Karaskov T, Koren G. Fatty acid ethyl esters: a novel biologic marker for heavy in uteroethanol exposure: a case report. Therap Drug Monit. 1999; 21:644–646. [PubMed: 10604826]
Laposata M. Fatty acid ethyl esters: short-term and long-term serum markers of ethanol intake. ClinChem. 1997; 43:1527–1534. [PubMed: 9265904]
Laposata M. Fatty acid ethyl esters: current facts and speculations. Prostaglandins Leukot Essent FattyAcids. 1999; 60:313–315. [PubMed: 10471114]
Laposata M, Hasaba A, Best CA, Yoerger DM, McQuillan BM, Salem RO, Refaai MA, Laposata M,Kabakibi A, Walden MP, Cluette-Brown JE, Nanji AA, Rafaai MA, Werner J. Differences in thefatty acid composition in fatty acid ethyl esters in organs and their secretions. Alcohol Clin ExpRes. 2000; 24:1488–1491. [PubMed: 11045855]
Laposata M, Hasaba A, Best CA, Yoerger DM, McQuillan BM, Salem RO, Refaai MA, SoderbergBL. Fatty acid ethyl esters: recent observations [review]. Prostaglandins Leukot Essent FattyAcids. 2002; 67:193–196. [PubMed: 12324241]
Lawson GM. Defining limit of detection and limit of quantitation as applied to drug of abuse testing:striving for a consensus. Clin Chem. 1994; 40:1218–1219. [PubMed: 8013089]
Leonardo GM, Hernandez JD, Bielawski D, Kan JM, Ostrea EM Jr. Abella MB, Church M, Sokol R.Umbilical cord γ-glutamyl transferase: a potential biomarker of fetal exposure to alcohol. PediatrRes. 2002; 51:360A.
Little BB, Snell LM, Rosenfeld CR, Gilstrap LC, Gant NF. Failure to recognize fetal alcohol syndromein newborn infants. Am J Dis Child. 1990; 144:1142–1146. [PubMed: 2403097]
Mac E, Pacis M, Garcia G, Ostrea EM Jr. A marker of fetal exposure to alcohol by meconium analysis.Pediatr Res. 1994; 35:238A. [PubMed: 8165060]
Mirlesse B, Jacquemard F, Daffos F, Forestier F. Fetal gamma-glutamyl transferase activity: clinicalimplications in fetal medicine. Biol Neonat. 1996; 70:193–198.
Moore CM, Lewis D. Fatty acid ethyl esters in meconium: biomarkers for the detection of alcoholexposure in neonates. Clin Chim Acta. 2001; 312:235–237. [PubMed: 11706815]
Ostrea EM Jr. Brady M, Gause S, Raymundo AL. Drug screening of newborns by meconium analysis:a large-scale, prospective, epidemiologic study. Pediatrics. 1992; 89:107–113. [PubMed: 1727992]
Ostrea EM Jr. Brady M, Parks PM, Asensio DC, Naluz A. Drug screening of meconium in infants ofdrug dependent mothers: an alternative to urine testing. J Pediatr. 1989; 115:474–477. [PubMed:2769510]
Ostrea EM Jr. Knapp DK, Romero A, Montes M, Ostrea AR. Meconium analysis to assess fetalexposure to active and passive maternal smoking. J Pediatr. 1994; 15:471–476. [PubMed:8120724]
Ostrea EM Jr. Knapp K, Tannenbaum L, Ostrea AR, Romero A, Salari V, Ager J. Estimates of illicitdrug use during pregnancy by maternal interview, hair analysis, and meconium analysis. J Pediatr.2001; 138:344–348. [PubMed: 11241040]
Ostrea et al. Page 9
Alcohol Clin Exp Res. Author manuscript; available in PMC 2011 October 13.
NIH
-PA Author Manuscript
NIH
-PA Author Manuscript
NIH
-PA Author Manuscript
Ostrea EM Jr. Matias O, Keane C, Mac E, Utarnachitt R, Ostrea A, Mazhar M. Spectrum of gestationalexposure to illicit drugs and other xenobiotic agents in newborn infants by meconium analysis. JPediatr. 1998; 133:513–515. [PubMed: 9787689]
Ostrea EM Jr. Morales V, Ngoumgna E, Prescilla R, Tan E, Hernandez E, Ramirez GB, Manlapaz M.Prevalence of fetal exposure to environmental toxins as determined by meconium analysis.Neurotoxicology. 2002; 23:329–339. [PubMed: 12389578]
Ostrea EM Jr. Parks P, Brady M. Rapid isolation and detection of drugs in meconium of infants ofdrug dependent mothers. Clin Chem. 1988; 34:2372–2373. [PubMed: 3180439]
Pawlosky RJ, Bacher J, Salem N Jr. Ethanol consumption alters electroretinograms and depletes neuraltissues of docosahexaenoic acid in rhesus monkeys: nutritional consequences of a low n-3 fattyacid diet. Alcohol Clin Exp Res. 2001; 25:1758–1765. [PubMed: 11781509]
Refaai MA, Nguyen PN, Steffensen TS, Evans RJ, Cluette-Brown JE, Laposata M. Liver and adiposetissue fatty acid ethyl esters obtained at autopsy are postmortem markers of premortem ethanolintake. Clin Chem. 2002; 48:77–83. [PubMed: 11751541]
Robinson MK, Myrick JE, Henderson LO, Coles CD, Powell MK, Orr GA, Lemkin PF. Twodimensional protein electrophoresis and multiple hypothesis testing to detect potential serumprotein biomarkers in children with fetal alcohol syndrome. Electrophoresis. 1995; 16:1176–1183.[PubMed: 7498162]
Russell M, Martier SS, Sokol RJ, Mudar P, Jacobson S, Jacobson J. Detecting risk drinking duringpregnancy: a comparison of four screening questionnaires. Am J Public Health. 1996; 86:1435–1439. [PubMed: 8876514]
Ryan RM, Wagner CL, Schultz JM, Varley J, DiPreta J, Sherer DM, Phelps DL, Kwong T. Meconiumanalysis for improved identification of infants exposed to cocaine in utero. J Pediatr. 1994;125:435–440. [PubMed: 8071754]
Salem RO, Refaai MA, Cluette-Brown JE, Russo JW, Laposata M. Fatty acid ethyl esters in liver andadipose tissues as postmortem markers of ethanol intake. Clin Chem. 2001; 47:722–725.[PubMed: 11274023]
Stark KD, Beblo S, Murthy M, Buda-Abela M, Janisse J, Rockett H, Whitty JE, Martier SS, Sokol RJ,Hannigan JH, Salem N Jr. Comparison of plasma and erythrocyte total fatty acid composition fromAfrican-American women at 24 weeks gestation, infant delivery and 3 months postpartum. J LipidRes. 2005a; 46:516–525. [PubMed: 15604519]
Stark K, Beblo S, Murthy M, Whitty JE, Buda-Abela M, Janisse J, Rockett H, Martier SS, Sokol RJ,Hannigan JH, Salem N Jr. Alcohol consumption in pregnant, African-American women isassociated with decreased plasma and erythrocyte docosahexaenoic acid. Alcohol Clin Exp Res.2005b; 29:130–140. [PubMed: 15654301]
Streissguth AP, Barr HM, Martin DC, Henman CS. Effect of maternal alcohol, nicotine and caffeineuse during pregnancy on infant mental and motor development at 8 months. Alcohol Clin Exp Res.1980; 4:152–164. [PubMed: 6990818]
Uauy-Dagach R, Mena P. Nutritional role of omega-3 fatty acids during the perinatal period. ClinPerinatol. 1995; 22:157–175. [PubMed: 7781250]
Van Der Leeden M, Van Dongen K, Kleinhout M, Phaff J, De Groot CJ, De Groot L, Hesseling PB.Infants exposed to alcohol prenatally: outcome at 3 and 7 months of age. Ann Trop Paediatr. 2001;21:127–134. [PubMed: 11471255]
Whitehall J, Ostrea EM, Patole S. Fetal exposure to pollutants in Townesville, Australia as detected inmeconium. Pediatr Res. 2000; 47:299A.
Whyatt RM, Barr DB. Measurement of organophosphate metabolites in postpartum meconium as apotential biomarker of prenatal exposure: a validation study. Environ Health Perspect. 2001;109:417–420. [PubMed: 11335191]
Wisniewski KE, Pullarkat RJ, Harin A, Vartolo M. Increased urinary dolichol in newborns whosemothers were heavy alcohol users. Ann Neurol. 1983; 14:382A.
Ostrea et al. Page 10
Alcohol Clin Exp Res. Author manuscript; available in PMC 2011 October 13.
NIH
-PA Author Manuscript
NIH
-PA Author Manuscript
NIH
-PA Author Manuscript
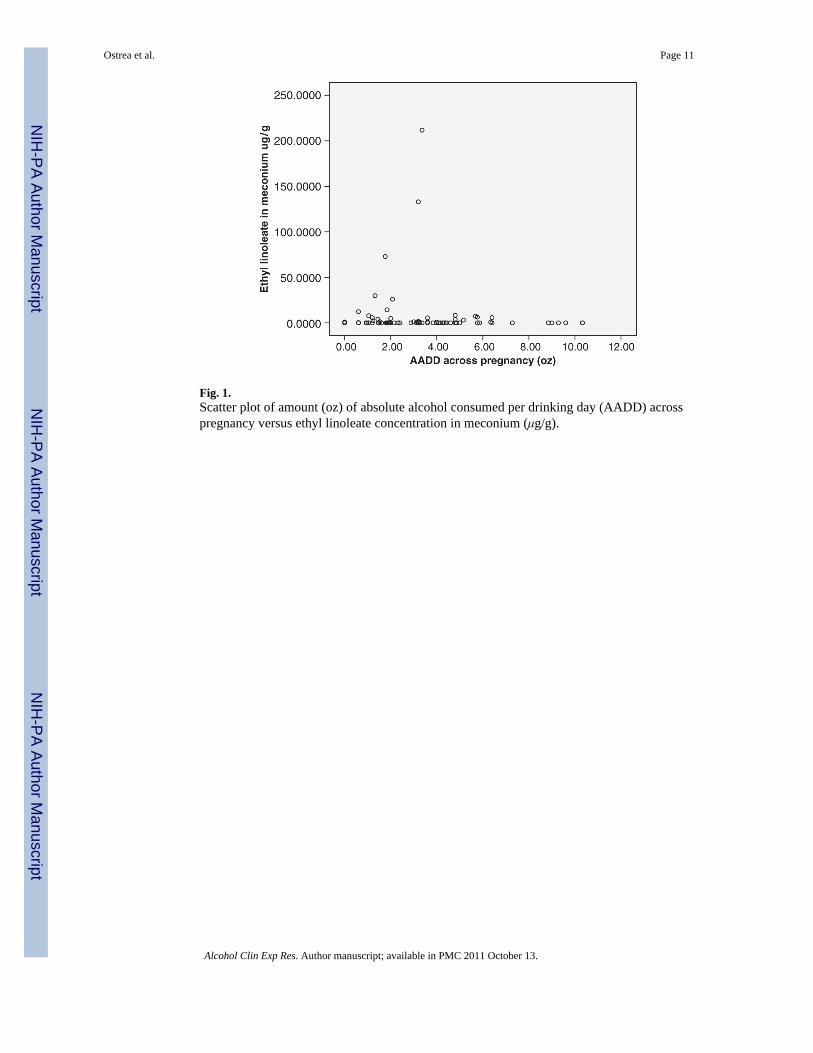
Fig. 1.Scatter plot of amount (oz) of absolute alcohol consumed per drinking day (AADD) acrosspregnancy versus ethyl linoleate concentration in meconium (μg/g).
Ostrea et al. Page 11
Alcohol Clin Exp Res. Author manuscript; available in PMC 2011 October 13.
NIH
-PA Author Manuscript
NIH
-PA Author Manuscript
NIH
-PA Author Manuscript
NIH
-PA Author Manuscript
NIH
-PA Author Manuscript
NIH
-PA Author Manuscript
Ostrea et al. Page 12
Table 1
Maternal and Neonatal Characteristics of the Study Population (n=124)
Characteristics Control(n=31)
Alcohol-exposed(n=93)
p
Maternal agea 27.7 (7.2) 26.4 (5.9) 0.318b
Gravidity ≥ 4 48.4% 53.8% 0.604c
Parity ≥ 4 25.8% 16.1% 0.230c
Singled 80% 87.1% 0.353e
Black 77.4% 88.2% 0.151e
Socioeconomic statusd,f 75% 73.1% 0.852c
Positive amphetamine screeng 6.7% 0% 0.300e
Positive barbiturates screeng,h 0% 0%
Positive opiate screeng 6.7% 0% 0.300e
Positive cocaine screeng 6.7% 17.1% 0.659e
Positive cannabinoid screeni 0% 25.0% 0.047e
Cigarette (sticks per day)j 0.0 6.0 0.010k
Infant gestation (wk)a 38.7 (2.3) 38.7 (2.7) 0.873b
Birth weight (g)a 3164.8 (649.8) 3087.2 (585.4) 0.535b
Length (cm)a 49.5 (2.6) 49.5 (3.0) 0.929b
Head circumference (cm)a 33.7 (1.8) 33.3 (1.9) 0.214b
aMean (SD).
bStatistical significance based on t-test.
cStatistical significance based on chi-square test.
dSample size for control group; single n=25, SES n=24.
eStatistical significance based on Fisher’s exact test.
fSES scores of <29.5 and ≥ 7.5 (Hollingshead, 1975).
gSample size for control n=15; for exposed n=35.
hNo statistics are computed. All screens for barbiturates were negative.
iSample size for control n=14; for exposed n=36.
jMedian.
kStatistical significance based on Mann–Whitney test.
SES, socioeconomic status.
Alcohol Clin Exp Res. Author manuscript; available in PMC 2011 October 13.
NIH
-PA Author Manuscript
NIH
-PA Author Manuscript
NIH
-PA Author Manuscript
Ostrea et al. Page 13
Tabl
e 2
Mea
sure
s of A
lcoh
ol U
se, a
t Eac
h Pe
rcen
tile
Gro
up, A
mon
g 12
4 Pr
egna
nt W
omen
Perc
entil
e
Con
trol
(n=3
1)a
Alc
ohol
-exp
osed
(n=9
3)
1050
9010
5090
p
MA
ST sc
ore
a,b
00
4.0
00
13.8
0.01
5
CA
GE
scor
e a,
b0
01.
60
03.
00.
013
TAC
E sc
ore
a,b
00
2.7
02.
04.
00.
001
AA
D a
t tim
e of
con
cept
ionc
0.17
0.91
3.47
AA
DD
at t
ime
of c
once
ptio
nc0.
943.
207.
06
PD a
t tim
e of
con
cept
ionc
0.14
0.29
1.00
AA
D a
cros
s pre
gnan
cyc,
d0.
040.
180.
69
AA
DD
acr
oss p
regn
ancy
c,d
1.20
3.20
6.40
PD a
cros
s pre
gnan
cyc,
d0.
020.
060.
16
a For c
ontro
l gro
up, M
AST
(n=2
4), C
AG
E (n
=23)
, and
TA
CE
(n=2
2).
b Stat
istic
al si
gnifi
canc
e ba
sed
on M
ann–
Whi
tney
test
.
c Gro
ups w
ere
crea
ted
base
d on
thes
e al
coho
l mea
sure
s. Th
eref
ore,
no
sign
ifica
nce
test
is p
erfo
rmed
.
d For e
xpos
ed g
roup
acr
oss p
regn
ancy
AA
D, A
AD
D, a
nd P
D (n
=89)
.
MA
ST, M
ichi
gan
Alc
ohol
Scr
eeni
ng T
est;
AA
D, a
vera
ge a
mou
nt (o
z) o
f abs
olut
e al
coho
l con
sum
ed p
er d
ay; A
AD
D, a
vera
ge a
mou
nt (o
z) o
f abs
olut
e al
coho
l con
sum
ed p
er a
ctua
l drin
king
day
; PD
,pr
opor
tion
of 7
day
s in
whi
ch a
lcoh
ol w
as u
sed.
Alcohol Clin Exp Res. Author manuscript; available in PMC 2011 October 13.
NIH
-PA Author Manuscript
NIH
-PA Author Manuscript
NIH
-PA Author Manuscript
Ostrea et al. Page 14
Tabl
e 3
Cor
rela
tions
Am
ong
Mea
sure
s of A
lcoh
ol E
xpos
ure
and
MA
ST, T
AC
E, a
nd C
AG
E
AA
DD
.0a
PD.0
aM
AST
CA
GE
TA
CE
AA
D.0
a0.
892*
*0.
838*
*0.
526*
*0.
430*
*0.
583*
*
AA
DD
.0a
0.61
6**
0.38
4**
0.30
5**
0.48
5**
PD.0
a0.
458*
*0.
408*
*0.
503*
*
MA
ST0.
707*
*0.
576*
*
CA
GE
0.72
7**
AA
DD
.XPb
PD.X
PbM
AST
CA
GE
TAC
E
AA
D.X
Pb0.
860*
*0.
900*
*0.
527*
*0.
363*
*0.
541*
*
AA
DD
.XPb
0.62
0**
0.34
0**
0.27
1**
0.46
0**
PD.X
Pb0.
476*
*0.
321*
*0.
451*
*
a AA
D, A
AD
D, a
nd P
D a
t tim
e of
con
cept
ion.
b AA
D, A
AD
D, a
nd P
D a
cros
s pre
gnan
cy.
**p<
0.01
.
Cor
rela
tions
wer
e ba
sed
on S
pear
man
’s ρ
.
Sam
ple
size
rang
es b
etw
een
111
and
124.
MA
ST, M
ichi
gan
Alc
ohol
Scr
eeni
ng T
est;
AA
D, a
vera
ge a
mou
nt (o
z) o
f abs
olut
e al
coho
l con
sum
ed p
er d
ay; A
AD
D, a
vera
ge a
mou
nt (o
z) o
f abs
olut
e al
coho
l con
sum
ed p
er a
ctua
l drin
king
day
; PD
,pr
opor
tion
of 7
day
s in
whi
ch a
lcoh
ol w
as u
sed.
Alcohol Clin Exp Res. Author manuscript; available in PMC 2011 October 13.
NIH
-PA Author Manuscript
NIH
-PA Author Manuscript
NIH
-PA Author Manuscript
Ostrea et al. Page 15
Table 4
Incidence (% Positive) of FAEEs in Meconium of Alcohol-Exposed and Control Infants
% Positive
Control(n=31)
Alcohol-exposed (n=93) pa
Ethyl lauratea 19.4 19.4 1.000
Ethyl myristatea 71.0 67.7 0.738
Ethyl palmitatea 58.1 58.1 1.000
Ethyl stearatea 12.9 19.4 0.415
Ethyl oleatea 41.9 49.5 0.467
Ethyl linoleatea 9.7 28.0 0.037
Ethyl α-linolenateb 0 3.2 0.572
Ethyl arachidonatea 6.5 21.5 0.057
Ethyl docosahexanoateb 0 4.3 0.571
aComparison of % positive between control and alcohol-exposed infants based on chi-square test.
bComparison of % positive between control and alcohol-exposed infants based on Fisher’s exact test.
FAEE, fatty acid ethyl esters.
Alcohol Clin Exp Res. Author manuscript; available in PMC 2011 October 13.

NIH
-PA Author Manuscript
NIH
-PA Author Manuscript
NIH
-PA Author Manuscript
Ostrea et al. Page 16
Tabl
e 5
Con
cent
ratio
ns o
f FA
EEs i
n M
econ
ium
of A
lcoh
ol-E
xpos
ed a
nd C
ontro
l Inf
ants
FAE
E C
once
ntra
tion
(μg/
g m
econ
ium
)a
Perc
entil
e
Con
trol
(n=3
1)A
lcoh
ol-
expo
sed
(n=9
3)
1050
9010
5090
pb
Ethy
l lau
rate
00
0.11
00
00.
429
0.84
0
Ethy
l myr
ista
te0
0.11
40.
874
00.
106
0.79
40.
749
Ethy
l pal
mita
te0.
000.
382
2.40
20
0.40
21.
746
0.48
3
Ethy
l ste
arat
e0
00.
837
00
0.93
40.
391
Ethy
l ole
ate
00
5.54
70
016
.58
0.37
9
Ethy
l lin
olea
te0
00.
123
00
5.71
50.
021
Ethy
l α-li
nole
nate
c0
00
00
00.
313
Ethy
l ara
chid
onat
e0
00
00
1.16
80.
064
Ethy
l doc
osah
exan
oate
d0
00
00
00.
242
a FAEE
con
cent
ratio
n le
vels
are
giv
en a
t the
10t
h, 5
0th,
and
90t
h pe
rcen
tiles
of t
heir
dist
ribut
ions
.
b Stat
istic
al si
gnifi
canc
e ba
sed
on M
ann–
Whi
tney
test
.
c 98%
of a
lcoh
ol-e
xpos
ed su
bjec
ts h
ave
no e
thyl
α-li
nole
nate
.
d 96%
of a
lcoh
ol-e
xpos
ed su
bjec
ts h
ave
no e
thyl
doc
osah
exan
oate
.
FAEE
, fat
ty a
cid
ethy
l est
ers.
Alcohol Clin Exp Res. Author manuscript; available in PMC 2011 October 13.
NIH
-PA Author Manuscript
NIH
-PA Author Manuscript
NIH
-PA Author Manuscript
Ostrea et al. Page 17
Table 6
Association Between Antenatal Alcohol Exposure in the Infant and Trichotomized Ethyl LinoleateConcentration in Meconium Based on Their Actual Concentrations
Trichotomized ethyl linoleate (μg/g)a
Alcohol Exposed Group A Group B Group C Total
Non-exposed 28 (90.3%) 3 (3.7%) 0 (0%) 31
Exposed 67 (72%) 13 (14%) 13 (14%) 93
95 16 13 124
aValues for trichotomized ethyl linoleate were set by inspection of the distribution of the concentrations of ethyl linoleate and determining the
limits that were most appropriate.
Group A: ethyl linoleate=0 μg/g meconium.
Group B: 0<ethyl linoleate ≤ 3.456 μg/g meconium.
Group C: ethyl linoleate>3.456 μg/g meconium.
Alcohol Clin Exp Res. Author manuscript; available in PMC 2011 October 13.

NIH
-PA Author Manuscript
NIH
-PA Author Manuscript
NIH
-PA Author Manuscript
Ostrea et al. Page 18
Table 7
Correlations Among Concentrations of Ethyl Linoleate, Ethyl Linolenate, Ethyl Arachidonate, and EthylDocosahexanoate in Meconium (n=124)
Ethylα-linolenate
(μg/g)
Ethylarachidonate
(μg/g)
Ethyldocosahexanoate
(μg/g)
Ethyl linoleate (μg/g) 0.203* 0.594** 0.320**
Ethyl α-linolenate (μg/g) 0.369** 0.280**
Ethyl arachidonate (μg/g) 0.289**
Correlation based on Spearman’s ρ.
*p ≤ 0.05
**p ≤ 0.01.
Alcohol Clin Exp Res. Author manuscript; available in PMC 2011 October 13.