fast instruction memory hierarchy power exploration for embedded systems
TRANSCRIPT

C. Piguet, R. Reis, and D. Soudris (Eds.): VLSI-SoC 2008, IFIP AICT 313, pp. 251–270, 2010. © IFIP International Federation for Information Processing 2010
Fast Instruction Memory Hierarchy Power Exploration for Embedded Systems
Nikolaos Kroupis1 and Dimitrios Soudris2
1 Department of Information and Telecommunication Technology, Technological Institute of Larisa,
411 10 Larisa, Greece [email protected]
2 School of Electrical & Computer Engineering, Department of Computer Science, National Technical University of Athens,
9 Heroon Polytechneiou, Zographou Campus, 157 80 Athens, Greece [email protected]
Abstract. A typical instruction memory design exploration process using simu-lation tools for various cache parameters is a rather time-consuming process, even for low complexity applications. In order to design a power efficient memory hierarchy of an embedded system, a huge number of system simula-tions are needed for all the different instruction memory hierarchies, because many cache memory parameters should be explored. Exhaustive search of de-sign space using simulation is too slow procedure and needs hundreds of simu-lations to find the optimal cache configuration. This chapter provides fast and accurate estimates of a multi-level instruction memory hierarchy. Using a detail methodology for estimating the number of instruction cache misses of the in-struction cache levels and power models; we estimate within a reasonable time the power consumption among these hierarchies. In order to automate the esti-mation procedure, a novel software tool named FICA implements the proposed methodology, which automatically estimates the total energy in instruction memory hierarchy and reports the optimal one.
1 Introduction to Instruction Caches
Cache memories have become a major factor to bridge the bottleneck between the relatively slow access time to main memory and the faster clock rate of today’s proc-essors. The power consumed by the memory hierarchy of a micro-processor can con-tribute to as much as 50% of the total microprocessor system power [1].
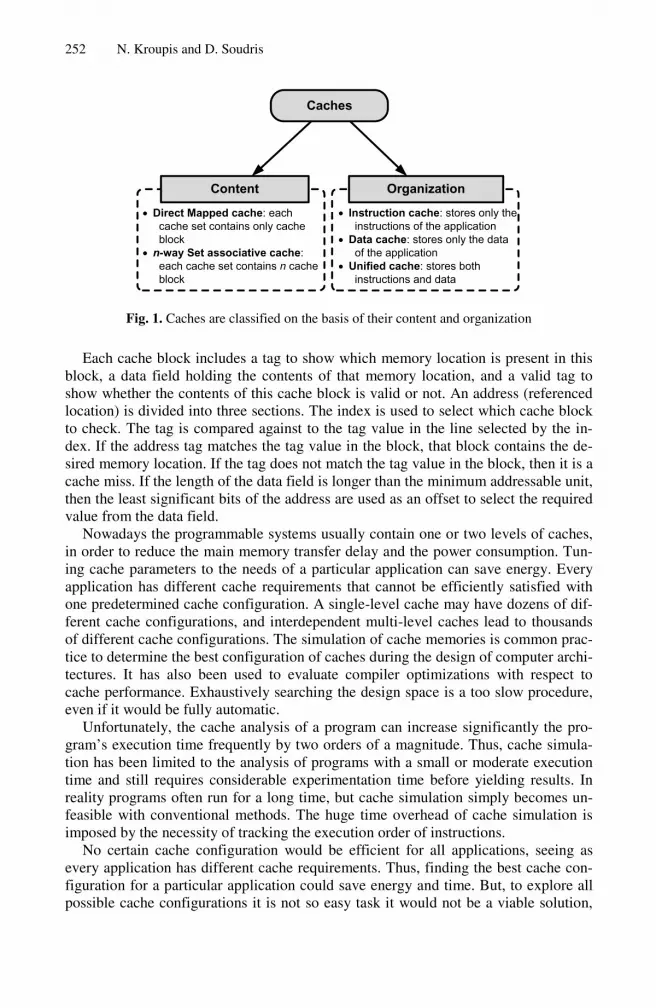
A cache is a small but fast memory and it is placed closer to the CPU. A cache block is the amount of data transferred between the main memory and the cache from any memory operation. A cache can also be divided into sets where each set contains N (usually N is 1,2,4,8 etc.) cache blocks. Fig. 1 classifies a cache on the basis of its contents and organization. For a direct mapped cache, each set contains only one cache block. For an n-way set associative cache each set contains n cache blocks. Fig. 2 shows the implementation of a direct mapped cache.
252 N. Kroupis and D. Soudris
Caches
Direct Mapped cache: each cache set contains only cache block
n-way Set associative cache:each cache set contains n cache block
Instruction cache: stores only the instructions of the application
Data cache: stores only the dataof the application
Unified cache: stores both instructions and data
OrganizationContent
Fig. 1. Caches are classified on the basis of their content and organization
Each cache block includes a tag to show which memory location is present in this block, a data field holding the contents of that memory location, and a valid tag to show whether the contents of this cache block is valid or not. An address (referenced location) is divided into three sections. The index is used to select which cache block to check. The tag is compared against to the tag value in the line selected by the in-dex. If the address tag matches the tag value in the block, that block contains the de-sired memory location. If the tag does not match the tag value in the block, then it is a cache miss. If the length of the data field is longer than the minimum addressable unit, then the least significant bits of the address are used as an offset to select the required value from the data field.
Nowadays the programmable systems usually contain one or two levels of caches, in order to reduce the main memory transfer delay and the power consumption. Tun-ing cache parameters to the needs of a particular application can save energy. Every application has different cache requirements that cannot be efficiently satisfied with one predetermined cache configuration. A single-level cache may have dozens of dif-ferent cache configurations, and interdependent multi-level caches lead to thousands of different cache configurations. The simulation of cache memories is common prac-tice to determine the best configuration of caches during the design of computer archi-tectures. It has also been used to evaluate compiler optimizations with respect to cache performance. Exhaustively searching the design space is a too slow procedure, even if it would be fully automatic.
Unfortunately, the cache analysis of a program can increase significantly the pro-gram’s execution time frequently by two orders of a magnitude. Thus, cache simula-tion has been limited to the analysis of programs with a small or moderate execution time and still requires considerable experimentation time before yielding results. In reality programs often run for a long time, but cache simulation simply becomes un-feasible with conventional methods. The huge time overhead of cache simulation is imposed by the necessity of tracking the execution order of instructions.
No certain cache configuration would be efficient for all applications, seeing as every application has different cache requirements. Thus, finding the best cache con-figuration for a particular application could save energy and time. But, to explore all possible cache configurations it is not so easy task it would not be a viable solution,

Fast Instruction Memory Hierarchy Power Exploration for Embedded Systems 253
Fig. 2. Cache Memory Architecture
due to the prolonged of exploration time involved. For instance, if we consider only variations in the parameters of one level cache such as cache size, block (line) size and associativity, an designspace of dozens of configurations [2] will be explored ed in order to find out the optimal one for a given application. In the case of multilevel memory hierarchies, for instance hat include a second level of cache, where both lev-els have separated instruction and data caches, few hundreds of configurations have to be tested.
Each instruction memory hierarchy has different energy consumption. The energy consumed in the instructions memories is directly-related to the memory architectures parameters (e.g., cache size, block size, associativity) and to the number of accesses to every memory hierarchy level. In order to design an efficient embedded system the total instruction memory energy consumption should be shrank. Defining the instruc-tion memory and the instruction cache parameters, the total energy consumed by the instruction memory hierarchy can be computed.
2 Simulation and Estimation Methods: Overview
Adjusting the parameters of an application’s cache memory can save 60% of energy consumption, on average [2]. By tuning these parameters, the cache can be custom-ized to a particular application. However, no single cache configuration would be ef-fective for all applications. Thus, strategies to explore the cache parameters can be applied to customize the cache structure to a given application. The proposed tech-niques can be classified into two categories. The techniques of the first category are
254 N. Kroupis and D. Soudris
targeting to reduce the exploration search space, while the second one to reduce the miss rate estimation time for simulation of a certain cache hierarchy.
In [3], an automated method for adjusting two-level cache memory hierarchy in order to reduce energy consumption in embedded applications was presented. The proposed method, two-level cache exploration heuristic considering TECH-CYCLES method, make a small search in the space of configurations of the two-level cache hi-erarchy, analyzing the impact of each parameter in terms of energy and number of cy-cles spent for a given application.
Zhang and Vahid [2] presented a cache architecture that can find the optimal set of cache configurations for a given application. Such architecture would be very useful in prototyping platforms, eliminating the need for time-consuming simulations to find optimal cache configurations. Gordon et. al [4] presented an automated method for tuning two-level caches to embedded applications for reducing energy consumption. The method is applicable to both a simulation-based exploration environment and a hardware based system prototyping environment. Platune was introduced by Givargis and Vahid in [5], which is used to explore automatically the large configuration space of such a SoC platform. The power estimation techniques for processors, caches, memories, buses, and peripherals combined with the design space exploration algo-rithm deployed by Platune, form a methodology for design of tuning frameworks for parameterized SOC platforms.
The previously-referred methods are based on the instruction set simulator, which provides cycle accurate estimations, but from the other hand it is a very slow proce-dure. Their main disadvantage is the huge needed time cost when we have to explore a large number of different instruction memory hierarchies.
New techniques have been proposed to reduce the simulation time, which were presented in [6], [7], [8] and [9]. In particular, a technique called inline tracing can be used to generate the trace of addresses with much less overhead than trapping or simulation. Measurement instructions are inserted in the program to record the ad-dresses that are referenced during the execution. Borg, Kessler, and Wall [6] modified some programs at link time to write addresses to a trace buffer, and these addresses were analyzed by a separate higher priority process. The time required to generate the trace of addresses was reduced by reserving five of the general purpose registers to avoid memory references in the trace generation code.
Mueller and Whalley [7] provided a method for instruction cache analysis, which outperforms the conventional trace-driven methods. This method, named static cache simulation, analyzes a program for a given cache configuration and determines, prior to execution time, if an instruction reference will result in a cache hit or miss. The to-tal number of cache hits and misses can be extracted from the frequency counters at program exit. In order to use this technique, the designer should make changes in the compiler of the processor, which are restricted most of the times, when we use commercial tools and compilers.
A simulation-based methodology, focused on an approximate model of the cache and the multi-tasking reactive software, that allows one to trade off-smoothly between accuracy and simulation speed, has been proposed by Lajolo et. al. [8]. The method-ology reduces the simulation time, taking into account the intra-task conflicts and considering only a finite number of previous task executions.

Fast Instruction Memory Hierarchy Power Exploration for Embedded Systems 255
Nohl et. al [9] presented a simulation-based technique, which meets the require-ments for both, the high simulation speed and maximum flexibility. This simulation technique, called just-in-time cache compiled simulation technique, can be utilized for architecture design, as well as for end-user software development. This technique is integrated into the retargetable LISA processor design platform [10].
A brief description of the simulation/estimation methods and techniques were available in [11]. In this chapter, a novel methodology aiming to find the optimal in-struction cache memory hierarchy of the system in terms of the power consumption. High estimation accuracy can be achieved within an affordable estimation time cost. The high-level estimation decisions are very useful for a fast exploration among sev-eral instruction cache configurations. The developed software tool based on the meth-odology explores many instruction cache configurations considering multi-level cache memory hierarchy. The basic concept of the methodology is the straightforward rela-tionship for specific characteristics between the high-level application description code and its corresponding assembly code. The developed tool achieves speedup or-ders of magnitude in the miss rate and power consumption estimation and time cost comparing to existing methods, while the estimation accuracy is higher than 90%. The experimental results show the efficiency of the proposed methodology and the es-timation tool in terms of accuracy and the exploration time for a system consisting by one or two levels of instruction cache.
3 Instruction Cache Miss Rate Estimation
The power consumption of the instruction memory hierarchy depends on the number of accesses to each memory level. The crucial point is to estimate the number of ac-cesses to each cache level and to find the miss rate of each level as well as the total number of executed instructions. A miss rate estimation methodology based on the correlation between the high-level description code (e.g. C) of the application and its associated assembly code was proposed in [12]. In particular, the methodology is based on a set of analytical equations which calculate the number of cache misses of a loop proposed by Liveris et.al. [13]. Using the compiler of the chosen processor, the assembly code of the application can be derived. The crucial point of the methodol-ogy is that the number of conditional branches in both the C code and its assembly code is equal. Thus, executing the C code we can find the number of passes from every branch. The values correspond to the assembly code, and thus we can find how many times each assembly branch instruction is executed. Creating the Control Flow Graph (CFG) of the assembly code, the number of executions of all application’s as-sembly instructions can be calculated. The miss rate estimation is accomplished by the assembly code processing procedure and the data extracted from the application execution. Thus, the estimation time depends on the code (assembly and C) process-ing time and the application execution time in a general-purpose processor. The total estimation time cost is much smaller than that obtained by the trace-driven simulation techniques.
A cache read miss from an instruction cache generally causes increased delay, be-cause the processor has to wait (stall) until the instruction is fetched from main

256 N. Kroupis and D. Soudris
memory. Cache misses can be classified into three categories the compulsory, the capacity and the conflict misses as following:
• Compulsory misses are those misses caused by the first reference to a datum. Cache size and associativity make no difference to the number of compulsory misses. Compulsory misses are sometimes referred to as cold misses.
• Capacity misses are those misses that occur regardless of associativity or block size, solely due to the finite size of the cache. The curve of capacity miss rate ver-sus cache size gives some measure of the temporal locality of a particular reference stream.
• Conflict misses are those misses that could have been avoided, had the cache not evicted an entry earlier. Conflict misses can be further broken down into mapping misses, that are unavoidable given a particular amount of associativity, and replace-ment misses, which are due to the particular victim choice of the replacement policy.
In order to model the number of cache misses of a nested loop, analytical formulas have been proposed in [13]. Given the cache size (cache parameters), these analytical formulas can estimate the number of cache misses. The explanation of these formulas is presented in [13]. Here, we provide only the necessary information regarding with the high-level estimation formulas. Assuming a specific cache, in order to estimate the misses of an application, we split an application into a number of nested loops. For every loop the misses are estimated individually.
Depending on the loop size mapped to the cache size, the assumed loops are cate-gorized in three different types: Loop Type 1, Loop Type 2 and Loop Type 3, each of which the capacity misses, in number of blocks, is shown in Fig. 3.
Given a nested loop with N iterations and a total size of instructions in assembly code, L_s, a cache memory with size, C_s, (in instructions), and a block size, B_s, (cache line length), the number of misses, N_misses, can be calculated by using the following formulas [13]:
Loop Type 1: if sCsL __ ≤ then:
sB
sLmissesNum
_
__ = (1)
Loop Type 2: if sCsLsC _2__ ×<< then:
( )sB
sCsLN
sB
sLmissesNum
_
_mod_21
_
__ ××−+= (2)
Loop Type 3: if sLsC __2 ≤× then:
sB
sLNmissesNum
_
__ ×= (3)
The miss rate is given by the formula:
referencesNum
missesNumrateMiss
_
__ = (4)

Fast Instruction Memory Hierarchy Power Exploration for Embedded Systems 257
Loop Type 2 : C_s < L_s < 2*C_sL_s = 6 blocks
BLOCK 1
BLOCK 2
BLOCK 3
BLOCK 4
BLOCK 5
C_s = 4 blocks
BLOCK 1 / 5
BLOCK 2
BLOCK 3
BLOCK 4
2 Capacity Misses /
Loop Iteration
Loop Type 1 : L_s < C_s
L_s = 3 blocks C_s = 4 blocks
No Capacity Misses
BLOCK 1
BLOCK 2
BLOCK 3
BLOCK 1
BLOCK 2
BLOCK 3
L_s = 9 blocks C_s= 4 blocks
Loop Type 3 : L_s > 2*C_s
9 Capacity Misses /
Loop Iteration
BLOCK 1
BLOCK 2
BLOCK 3
BLOCK 4
BLOCK 5
BLOCK 6
BLOCK 7
BLOCK 8
BLOCK 9
BLOCK 1 / 5 / 9
BLOCK 2 / 6
BLOCK 3 / 7
BLOCK 4 / 8
Fig. 3. Depending on the loop’s size compared to cache size, the nested loops are classified into three categories
where Num_references is the number of memory references from the processor to memory with
NsB
sLreferencesNum ×=
_
__ (5)
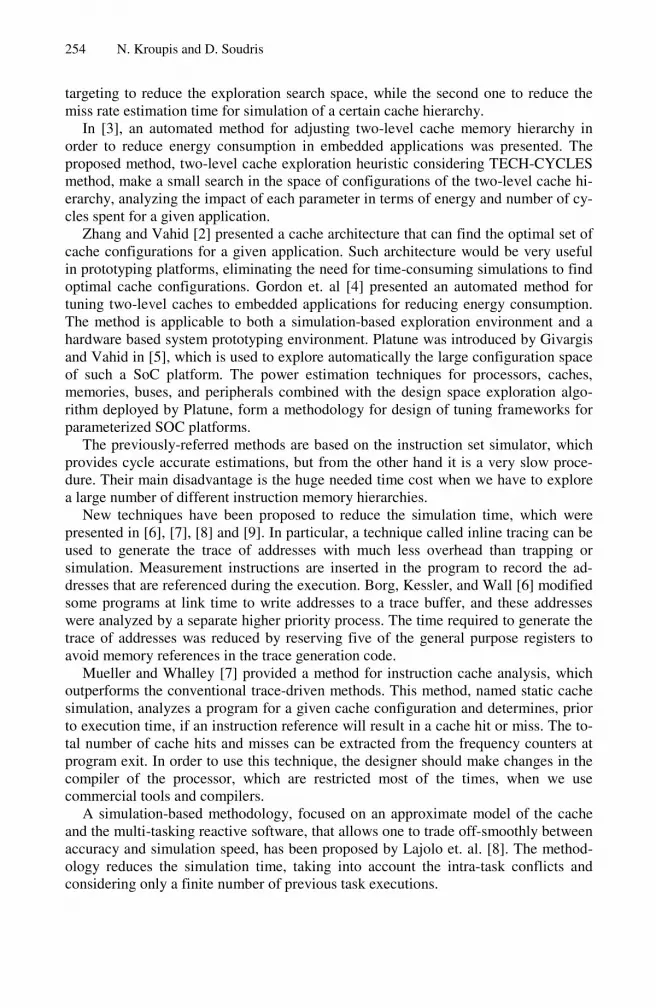
The proposed methodology consists of four stages illustrated in Fig. 4. The first stage aims at the calculation of the number of executions (passes) of all branches of the ap-plication C code. Thus, the number of executions of every leaf of the Control Flow Graph (CFG) is evaluated by the application execution. Determining the branches of the high-level application code, we can find the number of executions within these branches executing the code. This stage is a platform-independent process and thus, its results can be used in any programmable platform.
The second stage estimates the number of executions of each instruction and even-tually, the total number of the executed instructions. Given the assembly code of the application, the second step creates the CFG of the application and associates the number of executions executed from the first stage. It consists of: (i) the determina-tion of assembly code branches, (ii) the creation of CFG, (iii) the assignment of counter values to CFG nodes and (iv) the calculation of the execution cost of the rest CFG nodes.
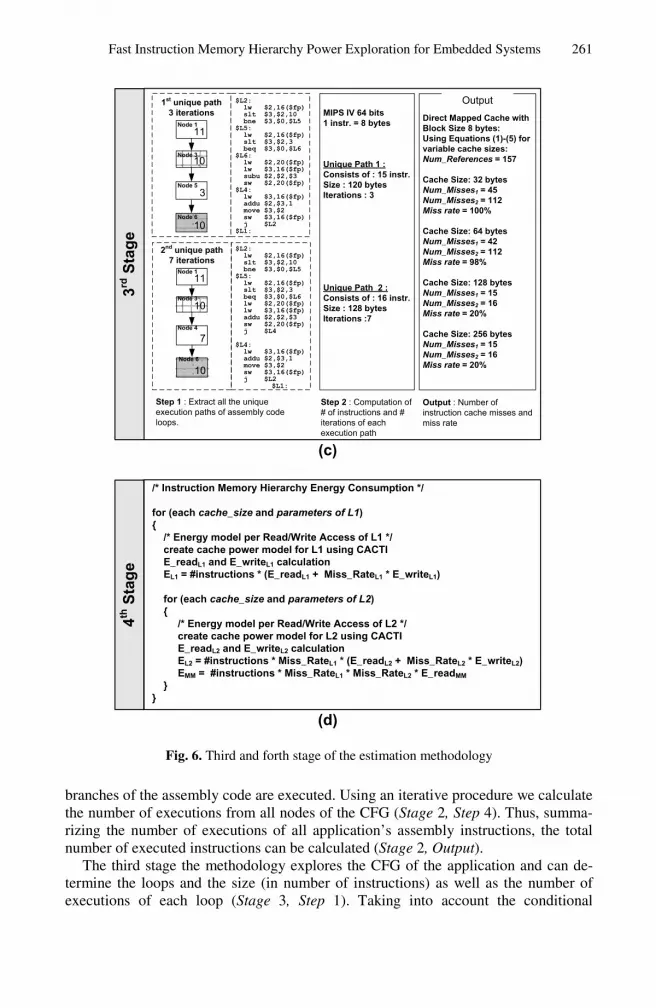
The third stage of the methodology is platform-dependent and contains two steps: (i) the creation of all the unique execution paths of each loop and (ii) the computation of number of instructions and iterations associated with a unique path. Exploring all
258 N. Kroupis and D. Soudris
Fig. 4. The proposed methodology for estimating the miss rate and the power consumption of a multi-level instruction memory cache hierarchy
the paths of the CFG of an application, we determine the loops and the size (in num-bers of instructions), as well as the number of executions of each loop. Furthermore, from the rest of the conditional branches (if / else), we create all the unique execution paths inside every loop, together with the number of executions of each unique path. Comparing the size in terms of number of instruction of every unique path with the instruction cache size the number of cache misses is estimated. The number of cache misses can be computed all together for variable cache sizes and architectures and multi-level memories, by a single run of FICA tool. This is one of the advantages of the methodology. The fourth stage contains the power model of the instruction cache and the memory, which is described in the next paragraph.

Fast Instruction Memory Hierarchy Power Exploration for Embedded Systems 259
4 Instruction Memory Power Consumption
An architecture exploration among the variable instruction cache configurations is needed in order to find the optimal memory hierarchy in terms of power consumption. The power consumption of the memory depends on their characteristics (type, size etc.) and number of accesses. Power consumption models are estimates of the energy consumed by a cache per memory access [14] [15]. Cacti 4.0 power model [14] was developed to estimate the power consumption of on-chip cache memories. Given the basic cache parameters such as size, block size, associativity and design technology, it estimates the energy consumption per access (read and write) to this cache memory. The power model proposed by Micron [15] is targeting to the estimation of off-chip SDRAM and DDR memories based on memory parameters. Such, the most important parameter to estimate the power consumption on a memory is the number of accesses. Based on the cache miss ratio estimation of the third stage, analytical questions define the number of accesses of every cache memory. The last step of the fourth stage as-signs the energy consumption per access to every cache level and computes the appli-cation’s energy consumption of every level. Summing up the energy of each level, the total consumed energy of the instruction memory hierarchy is estimated.
Power models for the memory hierarchy are needed to find the optimal instruction memory hierarchy. Using the number of accesses (read/write) of each cache level, which are computed in the third stage and memory power models, the tool automati-cally estimates the total energy consumed in instruction hierarchy. The number of in-struction cache levels varies from one to n, but typical embedded system contains usually one or two. The developed software tool with one run estimates all the cache miss rates and the energy consumed on them, architectures which contains from one to n and for all cache parameters and combination between the different caches. The tool reports the power consumption of every cache hierarchy and the designer can choose the optimal in terms of energy consumption.
5 The Estimation Methodology Using an Example
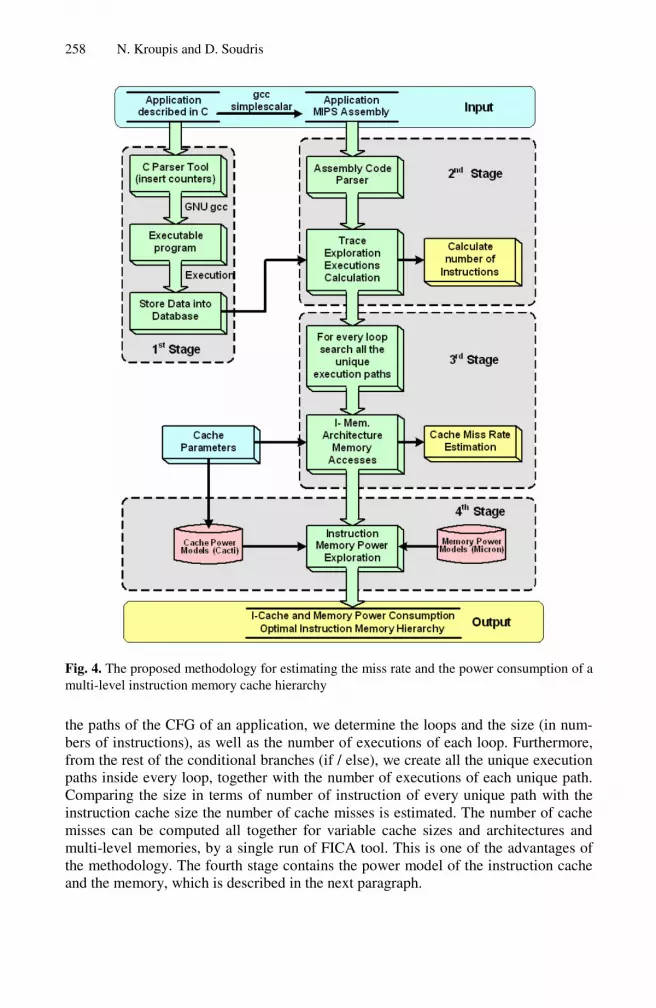
The proposed methodology is based on the correlation between the high-level descrip-tion code (e.g. C) of the application and its corresponding assembly code. Using the compiler of the chosen processor, we can derive the assembly code of the application. Here, we are providing the proposed methodology using an example with a simple C code. The procedure of the four stages of the methodology of the sample C code are presented in detail in Fig. 5-6. The sample code contains one loop and a conditional branch into the loop, such there are two branches. The first stage detects (Stage 1, Step 1) the two branches and automatically inserts counters after every branch in C code (Stage 1, Step 2) and executing the C code (Stage 1, Step 3) we can find the number of executions of every branch (Stage 1, Output). The values of the counters provide the number of executions of every branch of the C code.
The second stage has as input the equivalent assembly code of the application, and parsing the assembly code (Stage 2, Step 1), the Control Flow Graph (CFG) of the ap-plication (Stage 2, Step 2) can be derived. Corresponding the values of the counters to the specific places in the CFG (Stage 2, Step 3), we can calculate how many times the
260 N. Kroupis and D. Soudris
(a)
Results after code execution
Branch 1 :
Type : loop
Counter 1: 10 executions
Branch 2 :
Type : if
Counter 2: 3 executions
Output
Step 2 : Counter insertionStep 3 : Code executions
for(i=0;i<10;i++) { counter[1]++; if(i<3) { counter[2]++; a=a+i; } else { a=a-i; } }
Counter Insertion
Step 1 : Pinpoint the code branches
for(i=0;i<10;i++) { if(i<3) a=a+i; else a=a-i; }
Input: C codeBranch 1
Branch 2
1s
t Sta
ge
(b)
Output : Number of executed instructionsStep 4 : Computation of # executions of every instruction
Step 1 : Pinpoint the assembly code branches
$L2: lw $2,16($fp) slt $3,$2,10 bne $3,$0,$L5 j $L1$L5: lw $2,16($fp) slt $3,$2,3 beq $3,$0,$L6 lw $2,20($fp) lw $3,16($fp) addu$2,$2,$3 sw $2,20($fp) j $L4$L6: lw $2,20($fp) lw $3,16($fp) subu$2,$2,$3 sw $2,20($fp)$L4: lw $3,16($fp) addu$2,$3,1 move$3,$2 sw $3,16($fp) j $L2$L1:
AssemblyCode
Branch 2
Branch 1
Step 2 : Create the Control Flow GraphStep 3 : Associate counter values with the execution tree nodes
2n
d S
tag
e
Total Executed Instructions : 161
111111 1
101010 7 7 7 7 7
3 3 3 3
1010101010
# executions
BEGIN
END
1 pass
Node 1
Node 2 10Node 3
3Node 4
Node 5
Node 6
Branch 1
Branch 2
BEGIN
END
1 pass
11Node 1
1Node 2 10
Node 3
7 3Node 4
Node 5
10Node 6
Branch 1
Branch 2
$L2: lw $2,16($fp) slt $3,$2,10 bne $3,$0,$L5 j $L1$L5: lw $2,16($fp) slt $3,$2,3 beq $3,$0,$L6 lw $2,20($fp) lw $3,16($fp) addu$2,$2,$3 sw $2,20($fp) j $L4$L6: lw $2,20($fp) lw $3,16($fp) subu$2,$2,$3 sw $2,20($fp)$L4: lw $3,16($fp) addu$2,$3,1 move$3,$2 sw $3,16($fp) j $L2$L1:
Fig. 5. First and second stage of the estimation methodology
Fast Instruction Memory Hierarchy Power Exploration for Embedded Systems 261
4th
Sta
ge
/* Instruction Memory Hierarchy Energy Consumption */
for (each cache_size and parameters of L1)
{
/* Energy model per Read/Write Access of L1 */
create cache power model for L1 using CACTI
E_readL1 and E_writeL1 calculation
EL1 = #instructions * (E_readL1 + Miss_RateL1 * E_writeL1)
for (each cache_size and parameters of L2)
{
/* Energy model per Read/Write Access of L2 */
create cache power model for L2 using CACTI
E_readL2 and E_writeL2 calculation
EL2 = #instructions * Miss_RateL1 * (E_readL2 + Miss_RateL2 * E_writeL2)
EMM = #instructions * Miss_RateL1 * Miss_RateL2 * E_readMM
}
}
Step 1 : Extract all the unique execution paths of assembly code loops.
3
11
10
10
1st
unique path
3 iterations
$L2: lw $2,16($fp) slt $3,$2,10 bne $3,$0,$L5$L5: lw $2,16($fp) slt $3,$2,3 beq $3,$0,$L6$L6: lw $2,20($fp) lw $3,16($fp) subu $2,$2,$3 sw $2,20($fp)$L4: lw $3,16($fp) addu $2,$3,1 move $3,$2 sw $3,16($fp) j $L2$L1:
2nd
unique path
7 iterations
11
10
7
10
$L2: lw $2,16($fp) slt $3,$2,10 bne $3,$0,$L5$L5: lw $2,16($fp) slt $3,$2,3 beq $3,$0,$L6 lw $2,20($fp) lw $3,16($fp) addu $2,$2,$3 sw $2,20($fp) j $L4
$L4: lw $3,16($fp) addu $2,$3,1 move $3,$2 sw $3,16($fp) j $L2
$L1:
MIPS IV 64 bits
1 instr. = 8 bytes
Unique Path 1 :
Consists of : 15 instr.
Size : 120 bytes
Iterations : 3
Unique Path 2 :
Consists of : 16 instr.
Size : 128 bytes
Iterations :7
Step 2 : Computation of # of instructions and # iterations of each execution path
Output : Number of instruction cache misses and miss rate
Direct Mapped Cache with
Block Size 8 bytes:
Using Equations (1)-(5) for
variable cache sizes:
Num_References = 157
Cache Size: 32 bytes
Num_Misses1 = 45
Num_Misses2 = 112
Miss rate = 100%
Cache Size: 64 bytes
Num_Misses1 = 42
Num_Misses2 = 112
Miss rate = 98%
Cache Size: 128 bytes
Num_Misses1 = 15
Num_Misses2 = 16
Miss rate = 20%
Cache Size: 256 bytes
Num_Misses1 = 15
Num_Misses2 = 16
Miss rate = 20%
Output
3rd
Sta
ge
(c)
Node 1
Node 3
Node 5
Node 6
Node 1
Node 3
Node 4
Node 6
(d)
Fig. 6. Third and forth stage of the estimation methodology
branches of the assembly code are executed. Using an iterative procedure we calculate the number of executions from all nodes of the CFG (Stage 2, Step 4). Thus, summa-rizing the number of executions of all application’s assembly instructions, the total number of executed instructions can be calculated (Stage 2, Output).
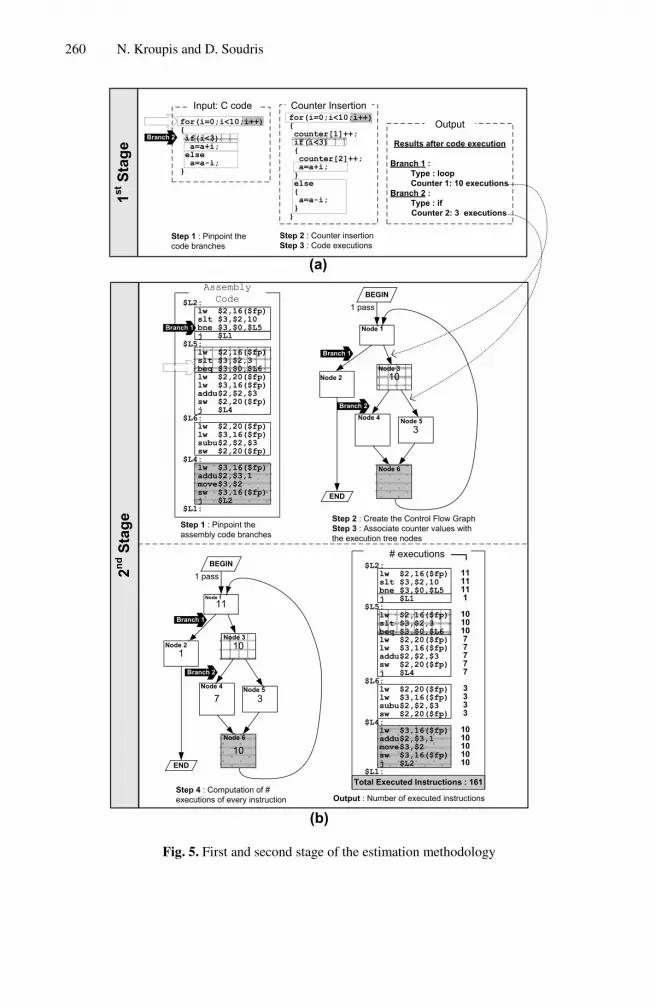
The third stage the methodology explores the CFG of the application and can de-termine the loops and the size (in number of instructions) as well as the number of executions of each loop (Stage 3, Step 1). Taking into account the conditional

262 N. Kroupis and D. Soudris
branches (if / else), we create all the unique execution paths inside every loop and eventually, we calculate the number of executions of every unique path (Stage 3, Step 2). Comparing the size of every unique path in terms of number of instruction with the instruction cache size, the number of cache misses is estimated. The number of cache misses is computed for variable cache memory sizes through a single run of the developed tool (Stage 3, Output), which is one of the main advantages of the proposed methodology.
The forth stage aims at the estimation of energy consumption of the instruction memory hierarchy. The energy consumed by the memory is dependent on the memory technology, the memory type and the number of accesses (reads/writes). Using the CACTI power model for the cache memories, we can create detail power parameters for various cache types. In the case of two levels of instruction cache, we need two loops to cover all the possible combinations between the two caches in terms of size and parameters. Thus, in the Fig. 6 (Stage 4) the outer loop explores all the possible L1 cache architectures, while the second one explores all the possible L2 cache archi-tectures for every L1 architecture. Firstly, we create the power model for each cache architecture using the CACTI power model. Applying the cache parameter to CACTI for each cache architecture, we compute the E_read and E_write power parameters of the cache, for every read and write access, respectively. Secondly, multiplying the number of read and writes of every cache with the power values we compute the total energy consumption to each cache level. Finally, using the power model of memories we can also compute the energy consumed of the system’s main memory.
6 Comparison Results
In order to evaluate the proposed estimation technique we compare the results, which are taken using the developed tool with the simulation-based measurements. We con-sidered as implementation platform the 64-bit processor core MIPS IV, while the measurements were taken by Simplescalar tool [16], the accurate instruction set simulator of MIPS processor. Simplescalar includes instruction set simulator, fast-instruction simulator and cache simulator, and can simulate architectures with instruc-tion, data and mixed instruction-data caches with one or two memory hierarchy layers. In order to evaluate the proposed methodology, a set of benchmarks from vari-ous signal processing applications, such as MPEG-4, JPEG, Filtering and H.263 are used. In particular, we use five Motion Estimation algorithms: (i) Full Search (FS) [17], (ii) Hierarchical Search (HS) [18], (iii) Three Step Logarithmic Step (3SLOG) [17], (iv) Parallel Hierarchical One Dimensional Search (PHODS) [17] and (v) Spiral Search (SS) [19]. It has been noted that their complexity ranged from 60 to 80% of the total complexity of video encoding (MPEG-4) [17]. Also, we have used the 1-D Wavelet transformation [20], the Cavity Detector [21] and the Self Organized Feature Map Color Quantization (CQ) [22]. We assumed L1 instruction cache memory size ranging from 64 bytes to 1024 bytes with block sizes 8 and direct-mapped cache ar-chitecture and L2 instruction cache with sizes varying between 128 bytes and 4 Kbytes. We performed both simulation and estimation computations in terms of the miss rate of instruction cache on L1 and L2. Moreover, we computed the actual time
Fast Instruction Memory Hierarchy Power Exploration for Embedded Systems 263
cost for running the simulation and the estimation-based approaches as well as the average accuracy level of the proposed methodology.
Every cache level has its own local miss rate, which is the misses in this cache divided by the total number of memory accesses to this cache. Average miss rate is the misses in this cache divided by the total number of memory accesses generated by the processor. For example, in the case where there are two level of cache memories the average miss rate is given by the product of the two local miss rates of the two levels, i.e., (Miss-RateL1×MissRateL2). Average miss rate is what matters to overall performance, while local miss rate is a factor for evaluating the effectiveness of every cache level.
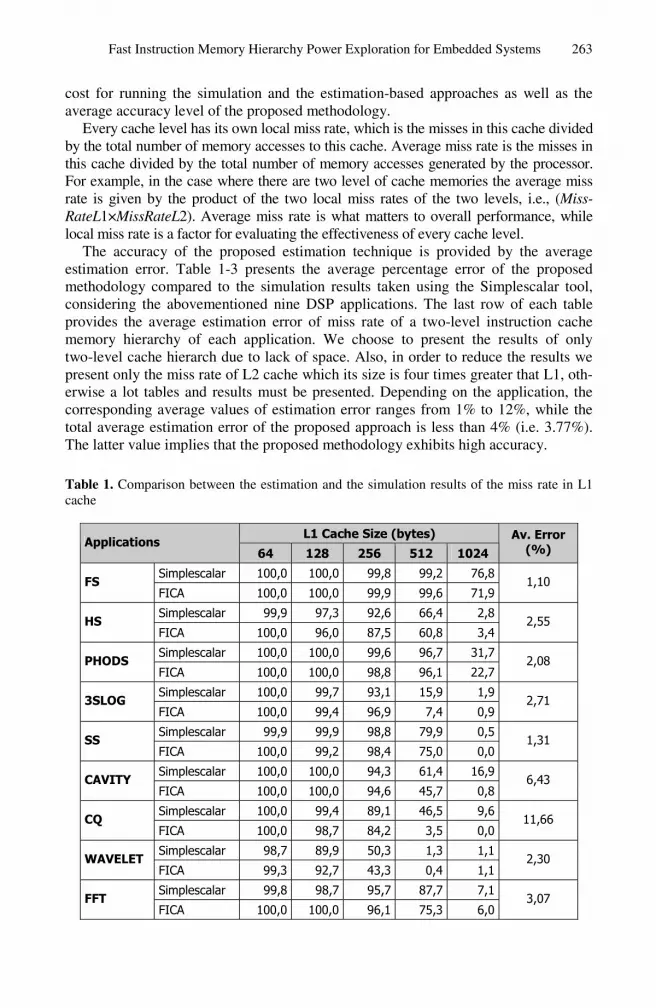
The accuracy of the proposed estimation technique is provided by the average estimation error. Table 1-3 presents the average percentage error of the proposed methodology compared to the simulation results taken using the Simplescalar tool, considering the abovementioned nine DSP applications. The last row of each table provides the average estimation error of miss rate of a two-level instruction cache memory hierarchy of each application. We choose to present the results of only two-level cache hierarch due to lack of space. Also, in order to reduce the results we present only the miss rate of L2 cache which its size is four times greater that L1, oth-erwise a lot tables and results must be presented. Depending on the application, the corresponding average values of estimation error ranges from 1% to 12%, while the total average estimation error of the proposed approach is less than 4% (i.e. 3.77%). The latter value implies that the proposed methodology exhibits high accuracy.
Table 1. Comparison between the estimation and the simulation results of the miss rate in L1 cache
L1 Cache Size (bytes) Applications
64 128 256 512 1024 Av. Error
(%)
Simplescalar 100,0 100,0 99,8 99,2 76,8FS
FICA 100,0 100,0 99,9 99,6 71,91,10
Simplescalar 99,9 97,3 92,6 66,4 2,8HS
FICA 100,0 96,0 87,5 60,8 3,42,55
Simplescalar 100,0 100,0 99,6 96,7 31,7PHODS
FICA 100,0 100,0 98,8 96,1 22,72,08
Simplescalar 100,0 99,7 93,1 15,9 1,93SLOG
FICA 100,0 99,4 96,9 7,4 0,92,71
Simplescalar 99,9 99,9 98,8 79,9 0,5SS
FICA 100,0 99,2 98,4 75,0 0,01,31
Simplescalar 100,0 100,0 94,3 61,4 16,9CAVITY
FICA 100,0 100,0 94,6 45,7 0,86,43
Simplescalar 100,0 99,4 89,1 46,5 9,6CQ
FICA 100,0 98,7 84,2 3,5 0,011,66
Simplescalar 98,7 89,9 50,3 1,3 1,1WAVELET
FICA 99,3 92,7 43,3 0,4 1,12,30
Simplescalar 99,8 98,7 95,7 87,7 7,1FFT
FICA 100,0 100,0 96,1 75,3 6,03,07

264 N. Kroupis and D. Soudris
Table 2. Comparison between the estimation and the simulation results of the miss rate in L2 cache
L2 Cache Size (bytes) Applications 256 512 1024 2048 4096
Av.Error (%)
Simplescalar 99,8 99,2 77,0 0,1 0,0FS FICA 99,9 99,6 72,0 0,2 0,2
1,16
Simplescalar 92,7 68,2 3,0 2,3 53,3HS FICA 87,5 63,3 3,9 5,3 15,9
10,28
Simplescalar 99,6 96,8 31,8 0,8 0,7PHODS FICA 98,8 96,1 23,0 1,0 4,2
2,81
Simplescalar 93,1 15,9 2,0 11,0 0,43SLOG FICA 96,9 7,4 1,0 7,2 2,2
3,79
Simplescalar 99,0 80,0 0,5 0,1 0,1SS FICA 98,4 75,6 0,0 0,0 9,4
2,95
Simplescalar 94,3 61,4 17,9 0,5 0,5CAVITY FICA 94,6 45,7 0,8 0,0 0,0
6,82
Simplescalar 89,2 46,8 10,8 0,8 0,4CQ FICA 84,2 3,5 0,0 0,0 100,0
31,90
Simplescalar 50,9 1,5 2,1 1,5 1,4WAVELET FICA 43,6 0,4 0,2 4,4 14,3
5,22
Simplescalar 96,0 88,8 7,4 0,6 3,1FFT FICA 96,1 75,3 9,8 7,9 63,1
16,68
Table 3. Comparison between the estimation and the simulation results of the global miss rate in instruction cache memory hierarchy
L 1 C a c h e S i z e : L 2 = 4 × L 1 ( b y t e s )Applications 64 128 256 512 1024
Av. Error (%)
Simplescalar 99,8 99,2 76,8 0,1 0,0FS FICA 99,9 99,6 71,9 0,2 0,1
1,13
Simplescalar 92,5 66,4 2,8 1,6 1,5HS FICA 87,5 60,8 3,4 3,2 0,5
2,78
Simplescalar 99,6 96,7 31,7 0,8 0,2PHODS FICA 98,8 96,1 22,7 1,0 1,0
2,26
Simplescalar 93,1 15,9 1,9 1,7 0,03SLOG FICA 96,9 7,4 0,9 0,5 0,0
2,90
Simplescalar 98,8 79,9 0,5 0,1 0,0SS FICA 98,4 75,0 0,0 0,0 0,0
1,16
Simplescalar 94,3 61,4 16,9 0,3 0,1CAVITY FICA 94,6 45,7 0,8 0,0 0,0
6,50
Simplescalar 89,1 46,5 9,6 0,3 0,0CQ FICA 84,2 3,5 0,0 0,0 0,0
11,61
Simplescalar 50,3 1,3 1,1 0,0 0,0WAVELET FICA 43,3 0,4 0,1 0,0 0,2
1,82
Simplescalar 95,7 87,7 7,1 0,5 0,2FFT FICA 96,1 75,3 9,5 6,0 3,8
4,81
Based on the equations and using the number of accesses in each cache memory,
the tool estimates the number of accesses of each cache level. We use CACTI 4.0 [14] power models for the caches design in technology 90nm and Micron [15] model for the off-chip system memory. The fourth stage of the methodology estimates the total
Fast Instruction Memory Hierarchy Power Exploration for Embedded Systems 265
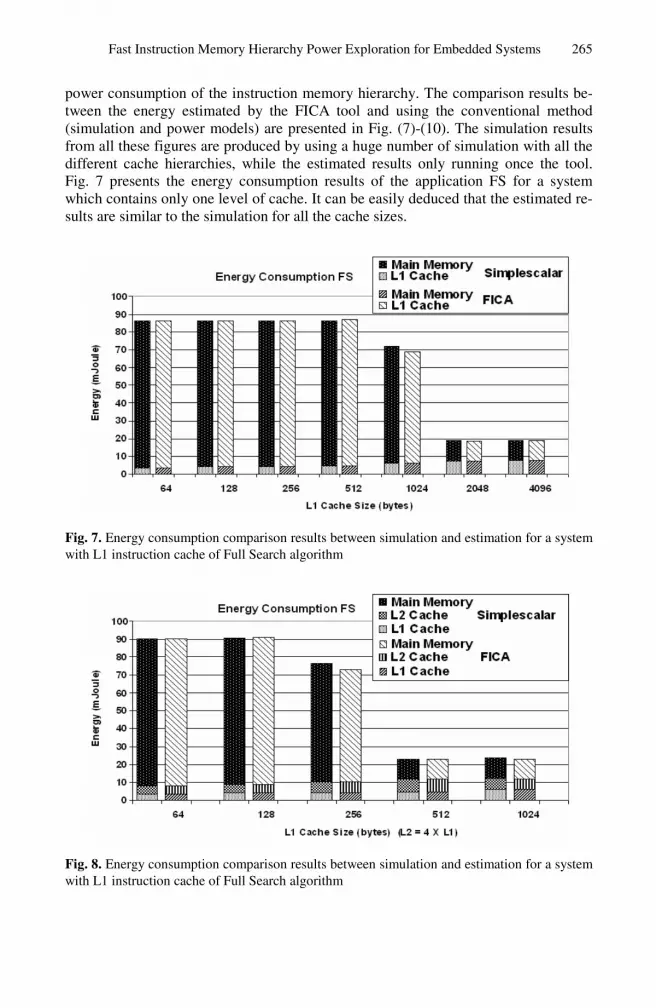
power consumption of the instruction memory hierarchy. The comparison results be-tween the energy estimated by the FICA tool and using the conventional method (simulation and power models) are presented in Fig. (7)-(10). The simulation results from all these figures are produced by using a huge number of simulation with all the different cache hierarchies, while the estimated results only running once the tool. Fig. 7 presents the energy consumption results of the application FS for a system which contains only one level of cache. It can be easily deduced that the estimated re-sults are similar to the simulation for all the cache sizes.
Fig. 7. Energy consumption comparison results between simulation and estimation for a system with L1 instruction cache of Full Search algorithm
Fig. 8. Energy consumption comparison results between simulation and estimation for a system with L1 instruction cache of Full Search algorithm

266 N. Kroupis and D. Soudris
Fig. 9. Energy consumption comparison results between simulation and estimation for a system with L1 instruction cache of Cavity Detector
Fig. 10. Energy consumption comparison results between simulation and estimation for a system with L1 and L2 instruction caches of Cavity Detector
Apart from the accuracy of an estimation methodology (and tool), a second pa-rameter very crucial for its efficiency is the required time cost to obtain the accurate estimates. Table 4 provides the required (average) time cost, in seconds, for perform-ing the simulation and estimation procedure for all benchmarks. It is assumed an ar-chitecture with two levels of instruction cache and cache sizes for L1 from 64 bytes to 1024 bytes and L2 from 128 up to 4096 bytes there are 20 different combinations as-suming that L2>L1. Using variable cache block sizes for L1 and L2 caches from 8 bytes to 32 bytes, there are totally 6 combinations assuming that L1block_size ≤ L2block_size. In order to complete explorer the two-level instruction cache architecture 20×6=120 simulation procedures are needed for every application. The estimation and

Fast Instruction Memory Hierarchy Power Exploration for Embedded Systems 267
Table 4. Speed up comparison results using our proposed methodology compared to the simulation time in a host machine Intel Pentium IV CPU 2GHz
Applications Time (sec) FS HS 3SLOG PHODS SS Wavelet Cavity CQ
Simulation 73,200 1,920 2,760 3,480 77,520 4,320 1,081,080 795,240
Estimation 4.8 27.3 7.2 9.45 7.2 105 15.3 27.45
Speed up 15,250 70 383 368 10,767 41 70,659 28,970
Table 5. Comparisons between existing and proposed methods
Method Tech-nique
Processor type
Tool support Accuracy Time Code Remarks
Processor Simula-tor [16]
MIPS Simplescalar 100% # exec instr.
(GBytes) -
Silva-Filho [3] MIPS - 100% # exec instr.
(GBytes) Reduce the
search space
Zhang [2] MIPS - 100% # exec instr.
(GBytes) Reduce the
search space
Gordon [4] MIPS - 100% # exec instr.
(GBytes) Reduce the
search space
Givargis [5] MIPS Platune 93% # exec instr.
(GBytes) System Simu-
lation
Borg [6] MIPS - - # exec instr.
(GBytes) Trace analysis
Lajolo [8] Motorola
68332 POLIS 98%
# exec instr. (GBytes)
Task level es-timation
Nohl [9] LISA JIT-CCS 100% # exec instr.
(GBytes) Simulator
modifications
FICA MIPS FICA 95% Size of
source code (Kbytes)
-
simulation computations were performed by a personal computer with Pentium IV, 2 GHz and 1 Gbyte RAM. It can be inferred that the proposed methodology offers a huge time speedup (orders of magnitude) compared with the simulation-based approach. Consequently, the new methodology/tool is suitable for performing estimations with a very high accuracy at the early design phases of an application.
The exploration time cost of the simulation-based approach is proportional to the size of the trace file of the application considered (order of GBs). In contrary, the cor-responding time cost of the proposed methodology is (almost) proportional (linear) to the code size of the assembly code (order of KBs). From Table 4, it can be seen that the larger the number of loop iterations in C code (and of course in assembly code) is, the larger is the speedup factor of the new methodology. Regarding the pro-posed approach, we achieved time cost reduction between 40 to 70,000 times (i.e. up to four (4) orders of magnitude), depending on the application characteristics. Thus, accurate estimation within an affordable time cost allows a designer to perform design exploration of larger search space (i.e. exploration of additional design parameters).

268 N. Kroupis and D. Soudris
In addition, the increasing complexity of modern applications, for instance im-age/video frame with higher resolution, will render the usage of simulation tools im-practical. Therefore, the design of such complex systems, the high-level estimation tool will be the only viable and pragmatic solution.
Table 5 presents the comparison results between the methods referred in related work and the proposed one. The first column shows the list of methods, while the second one presents the used processor core on which each method has been devel-oped. The third column provides the name of the software tool that supports the esti-mation/simulation of each method while the forth one shows the estimation accuracy. The most important comparison is presented in the fifth column; the time which needs each method to explore the instruction memory hierarchy is proportional to the num-ber of executed instructions, while the proposed one is proportional to source code of the application. The time cost of the existing methods is increasing with the applica-tion computational complexity, while, the corresponding estimation time of the proposed method is dependent on the application’s source code size.
7 Conclusions
A novel methodology for estimating the cache misses of multilevel instruction caches realized by an embedded programmable platform, was presented. The methodology was based on the straightforward relationship between the application high-level de-scription code and its corresponding assembly code. Having as inputs both types of code, we extract specific features. Using the proposed methodology, we can perform estimation of application critical parameters during the early design phases, avoiding the time-consuming simulation-based approaches. The FICA tool is based on the pro-posed methodology and it is an accurate instruction cache miss rate estimator. The proposed methodology achieved estimations with smaller time cost than the simula-tion process, (i.e. orders of magnitude).
Acknowledgments
This work was partially supported by 03ED593 research project, implemented within the framework of the “Reinforcement Programme of Human Research Manpower” (PENED) and co-financed by National and Community Funds.
Also, it was partially sponsored by MOSART project (Mapping Optimization for Scalable multi-core ARchiTecture) funded by the EU (IST-215244), http://www.mosart-project.org.
References
[1] Segars, S.: Low power design techniques for micro-processors. In: International Solid State Circuit Conference (February 2001)
[2] Zhang, D., Vahid, F.: Cache configuration exploration on prototyping platforms. In: 14th IEEE International Workshop on Rapid System Prototyping, June 2003, pp. 164–170 (2003)

Fast Instruction Memory Hierarchy Power Exploration for Embedded Systems 269
[3] Silva-Filho, A.G., et al.: Heuristic for Two-Level Cache Hierarchy Exploration Consider-ing Energy Consumption and Performance. In: Vounckx, J., Azémard, N., Maurine, P. (eds.) PATMOS 2006. LNCS, vol. 4148, pp. 75–83. Springer, Heidelberg (2006)
[4] Gordon-Ross, A., Vahid, F., Dutt, N.: Automatic Tuning of Two-Level Caches to Em-bedded Applications. In: Design, Automation and Test in Europe, DATE, February 2004, pp. 208–213 (2004)
[5] Givargis, T., Vahid, F.: Platune: A Tuning framework for system-on-a-chip platforms. IEEE Trans. Computer-Aided Design 21, 1–11 (2002)
[6] Borg, A., Kessler, R., Wall, D.: Generation and analysis of very long address traces. In: International Symposium on Computer Architecture, May 1990, pp. 270–279 (1990)
[7] Mueller, F., Whalley, D.: Fast Instruction Cache Analysis via Static Cache Simulation. In: Proc. of 28th Annual Simulation Symposium, pp. 105–114 (1995)
[8] Lajolo, M., Lavagno, L., Sangiovanni-Vincentelli, A.: Fast instruction cache simulation strategies in a hardware/software co-design environment. In: Proc. of the Asian and South Pacific Design Automation Conference, ASP-DAC 1999 (January 1999)
[9] Nohl, A., Braun, G., Schliebusch, O., Leupers, R., Meyr, H.: A Universal Technique for Fast and Flexible Instruction-Set Architecture Simulation. In: Proc. of the 39th confer-ence on Design automation, DAC 2002, New Orleans, Louisiana, USA, pp. 22–27 (2002)
[10] Hoffmann, A., Kogel, T., Nohl, A., Braun, G., Schliebusch, O., Wieferink, A., Meyr, H.: A Novel Methodology for the Design of Application Specific Instruction Set Processors (ASIP) Using a Machine Description Language. IEEE Transactions on Computer-Aided Design 20(11), 1338–1354 (2001)
[11] Balaji, R.: Fast Design Space Exploration of Instruction Caches. Msc Thesis, National University of Singapore (2003)
[12] Kroupis, N., Mamagkakis, S., Soudris, D.: An Estimation Methodology for Designing In-struction Cache Memory of Embedded Systems. In: ESTIMedia 2006, Fourth IEEE Workshop on Embedded Systems for Real Time Multimedia, Seoul, Korea, October 26-27 (2006)
[13] Liveris, N., Zervas, N., Soudris, D., Goutis, C.: A Code Transformation-Based Method-ology for Improving I-Cache Performance of DSP Applications. In: Proc. of DATE, Paris, pp. 977–984 (2002)
[14] Tarjan, D., Shyamkumar, T., Jouppi, N.: CACTI 4.0 HPL Tech. Report HPL-2006-86 (June 2006)
[15] Calculating Memory System Power for DDR2, Technical Note, Micron Technology Inc. (2007)
[16] Austin, T., Larson, E., Ernst, D.: SimpleScalar: An Infrastructure for Computer System Modeling. Computer 35(2), 59–67 (2002)
[17] Kuhn, P.: Algorithms, Complexity Analysis and VLSI Architectures for MPEG-4 Motion Estimation. Kluwer Academic Publisher, Boston (1999)
[18] Nam, K., et al.: A fast hierarchical motion vector estimation algorithm using mean pyra-mid. IEEE Transactions on Circuits and Systems for Video Technology 5(4), 344–351 (1995)
[19] Cheung, C.-K., Po, L.-M.: Normalized Partial Distortion Search Algorithm for Block Mo-tion Estimation. Proc. IEEE Transaction on Circuits and Systems for Video Technol-ogy 10(3), 417–422 (2000)
[20] Lafruit, G., Nachtergaele, L., Vahnhoof, B., Catthoor, F.: The Local Wavelet Transform: A Memory-Efficient, High-Speed Architecture Optimized to a Region-Oriented Zero-Tree Coder. Integrated Computer-Aided Engineering 7(2), 89–103 (2000)

270 N. Kroupis and D. Soudris
[21] Danckaert, K., Catthoor, F., De Man, H.: Platform independent data transfer and storage exploration illustrated on a parallel cavity detection algorithm. In: ACM Conference on Parallel and Distributed Processing Techniques and Applications III, pp. 1669–1675 (1999)
[22] Dekker, A.: Kohonen neural networks for optimal colour quantization. Network: Compu-tation in Neural Systems 5, 351–367 (1994)