exposure to war crimes and implications for peace building in northern uganda
TRANSCRIPT
ORIGINAL CONTRIBUTION
Exposure to War Crimes and Implicationsfor Peace Building in Northern UgandaPatrick Vinck, PhDPhuong N. Pham, MPH, PhDEric Stover, BAHarvey M. Weinstein, MD, MPH
SINCE THE LATE 1980S, THE
Lord’s Resistance Army (LRA),a spiritualist rebel group with noclear political agenda, has waged
a war against the Ugandan People’sDemocratic Army and the people ofnorthern Uganda. Known for its ex-treme brutality, the LRA has killed andmutilated countless civilians and ab-ducted tens of thousands of adults andchildren to serve as soldiers, porters,and sexual partners for its command-ers. Up to a million and a half peoplehave been displaced in camps, wherethey live in poverty and despair.1,2
Ending the conflict and achievingpeace in northern Uganda have provento be challenging tasks. The govern-ment of Uganda has successively andsometimes simultaneously pursued mili-tary actions, peace negotiations, and am-nesty for the rebels. In 2003, UgandanPresident Yoweri Museveni referred thesituation in northern Uganda to the In-ternational Criminal Court, which in Oc-tober 2005 unsealed arrest warrants andindictments against LRA leader JosephKony and 4 of his rebel commanders.3
Recent studies that have examinedthe prevalence of psychological ef-fects after conflict suggest that trau-matic exposure and resultant symp-toms of posttraumatic stress disorder(PTSD) and depression can influence
social functioning and how individu-als perceive mechanisms aimed at pro-moting justice and reconciliation, suchas amnesties, criminal trials, and truthcommissions.4-10 However, few stud-ies have looked at how exposure to warcrimes affects attitudes toward mecha-nisms aimed at peace building. Yet, such
Author Affiliations: Payson Center for InternationalDevelopment, Tulane University, New Orleans, Loui-siana (Drs Vinck and Pham); and Human Rights Cen-ter (Mr Stover and Dr Weinstein), School of PublicHealth (Mr Stover and Dr Weinstein), and Boalt HallSchool of Law (Mr Stover), University of California,Berkeley. Dr Vinck is now with the Human Rights Cen-ter, University of California, Berkeley.Corresponding Author: Patrick Vinck, PhD, HumanRights Center, University of California, Berkeley, 460Stephens Hall #2300, Berkeley, CA 94702-2300([email protected]).
Context Since the late 1980s, the Lord’s Resistance Army has waged war againstthe Ugandan People’s Democratic Army and the people of northern Uganda. Endingthe conflict and achieving peace have proven to be challenges. In this context, it isimportant to examine population-based data on exposure to war crimes to under-stand how survivors perceive mechanisms aimed at achieving a lasting peace.
Objectives To assess the level of exposure to war-related violence and the preva-lence of posttraumatic stress disorder (PTSD) and depression symptoms in northernUganda and to determine how these variables are associated with respondents’ viewsabout peace.
Design, Setting, and Participants Multistage, stratified, random cluster surveyof 2585 adults aged 18 years or older conducted in villages and camps for internallydisplaced persons in 4 districts of northern Uganda in April and May 2005.
Main Outcome Measures Rates and patterns of exposure to trauma; symptomcriteria for PTSD, assessed via the PTSD Checklist–Civilian Version with a total sever-ity score of 44; symptoms of depression, assessed via the Johns Hopkins DepressionSymptom Checklist with a cutoff of 42; and opinions and attitudes about peace.
Results Among the respondents, 1774 of 2389 (74.3%) met PTSD symptom crite-ria and 1151 of 2585 (44.5%) met depression symptom criteria. Four patterns of ex-posure to trauma were distinguished: those with low exposure (group 1; 21.4%), wit-nesses to war-related violence (group 2; 17.8%), those threatened with death and/orphysically injured (group 3; 16.4%), and those abducted (group 4; 44.3%). Respon-dents in groups 3 and 4, who experienced the most traumatic exposures, were morelikely to have PTSD symptoms compared with group 1 (group 3 vs group 1: odds ratio[OR], 7.04 [95% confidence interval {CI}, 5.02-9.87]; group 4 vs group 1: OR, 6.07[95% CI, 4.77-7.71]). Groups 3 and 4 were also more likely to meet depression symp-tom criteria (group 3 vs group 1: OR, 5.76 [95% CI, 4.34-7.65]; group 4 vs group 1:OR, 4.00 [95% CI, 3.16-5.06]). Respondents who met the PTSD symptom criteriawere more likely to identify violence as a means to achieve peace (OR, 1.31; 95% CI,1.05-1.65). Respondents who met the depression symptom criteria were less likely toidentify nonviolence as a means to achieve peace (OR, 0.77; 95% CI, 0.65-0.93).
Conclusions Our study found high prevalence rates for symptoms of PTSD and de-pression in a conflict zone. Respondents reporting symptoms of PTSD and depressionwere more likely to favor violent over nonviolent means to end the conflict.JAMA. 2007;298(5):543-554 www.jama.com
For editorial comment see p 567.
©2007 American Medical Association. All rights reserved. (Reprinted) JAMA, August 1, 2007—Vol 298, No. 5 543
Downloaded From: http://jama.jamanetwork.com/ on 02/25/2013
information has important implica-tions for the rebuilding of societies af-ter mass violence. If psychologicaltrauma affects support for peace build-ing and if no services are provided totreat those affected, then efforts to pro-mote social reconstruction may be un-dermined.
The purpose of this study was toassess the level of exposure to war-related violence and the prevalenceof PTSD and depression symptomsamong study participants in 4 districtsof northern Uganda, and to determineif these factors are associated withrespondents’ views as to whether vio-lent or nonviolent means should bepursued to end the armed conflict innorthern Uganda.
METHODSSurvey Sites and Sample Selection
This research is based on a cross-sectional study conducted in April andMay 2005 in northern Uganda. Threeteams of 20 trained interviewers, eachfamiliar with the local language and rep-resenting a diversity of age and sex, car-
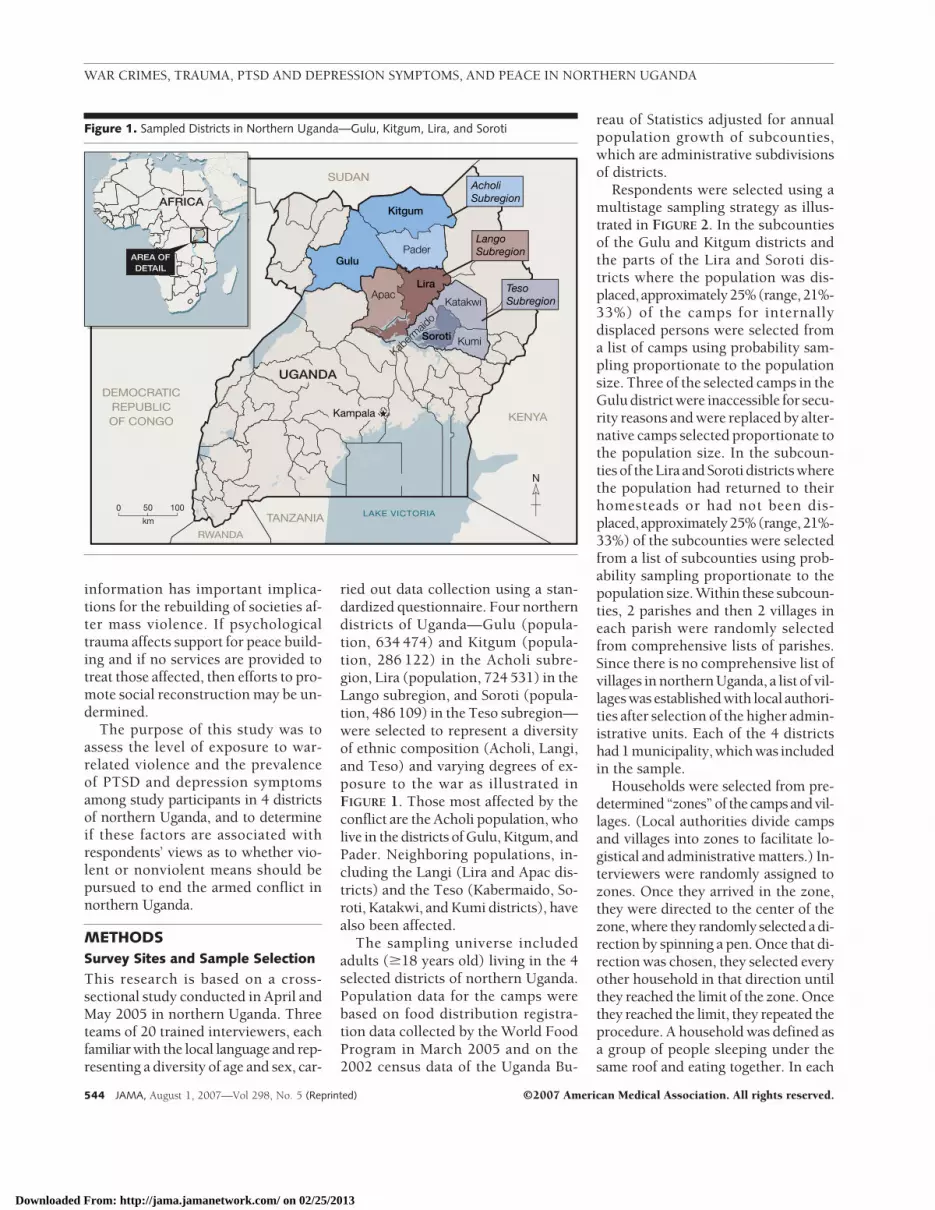
ried out data collection using a stan-dardized questionnaire. Four northerndistricts of Uganda—Gulu (popula-tion, 634 474) and Kitgum (popula-tion, 286 122) in the Acholi subre-gion, Lira (population, 724 531) in theLango subregion, and Soroti (popula-tion, 486 109) in the Teso subregion—were selected to represent a diversityof ethnic composition (Acholi, Langi,and Teso) and varying degrees of ex-posure to the war as illustrated inFIGURE 1. Those most affected by theconflict are the Acholi population, wholive in the districts of Gulu, Kitgum, andPader. Neighboring populations, in-cluding the Langi (Lira and Apac dis-tricts) and the Teso (Kabermaido, So-roti, Katakwi, and Kumi districts), havealso been affected.
The sampling universe includedadults (�18 years old) living in the 4selected districts of northern Uganda.Population data for the camps werebased on food distribution registra-tion data collected by the World FoodProgram in March 2005 and on the2002 census data of the Uganda Bu-
reau of Statistics adjusted for annualpopulation growth of subcounties,which are administrative subdivisionsof districts.
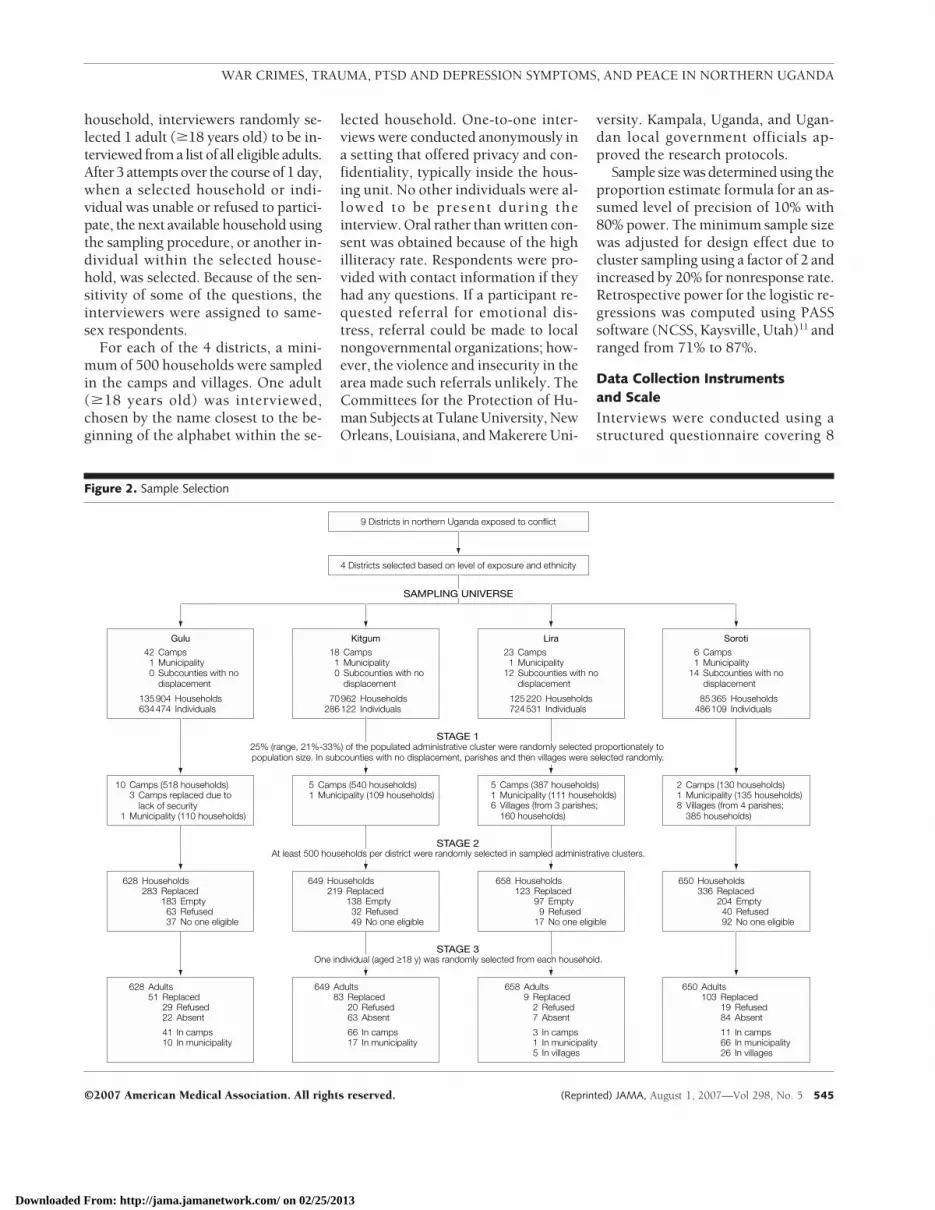
Respondents were selected using amultistage sampling strategy as illus-trated in FIGURE 2. In the subcountiesof the Gulu and Kitgum districts andthe parts of the Lira and Soroti dis-tricts where the population was dis-placed, approximately25%(range,21%-33%) of the camps for internallydisplaced persons were selected froma list of camps using probability sam-pling proportionate to the populationsize. Three of the selected camps in theGulu district were inaccessible for secu-rity reasons and were replaced by alter-native camps selected proportionate tothe population size. In the subcoun-ties of the Lira and Soroti districts wherethe population had returned to theirhomesteads or had not been dis-placed, approximately25%(range,21%-33%) of the subcounties were selectedfrom a list of subcounties using prob-ability sampling proportionate to thepopulation size. Within these subcoun-ties, 2 parishes and then 2 villages ineach parish were randomly selectedfrom comprehensive lists of parishes.Since there is no comprehensive list ofvillages in northern Uganda, a list of vil-lages was established with local authori-ties after selection of the higher admin-istrative units. Each of the 4 districtshad 1 municipality, which was includedin the sample.
Households were selected from pre-determined “zones” of the camps and vil-lages. (Local authorities divide campsand villages into zones to facilitate lo-gistical and administrative matters.) In-terviewers were randomly assigned tozones. Once they arrived in the zone,they were directed to the center of thezone, where they randomly selected a di-rection by spinning a pen. Once that di-rection was chosen, they selected everyother household in that direction untilthey reached the limit of the zone. Oncethey reached the limit, they repeated theprocedure. A household was defined asa group of people sleeping under thesame roof and eating together. In each
Figure 1. Sampled Districts in Northern Uganda—Gulu, Kitgum, Lira, and Soroti
GuluPader
Kampala
Kitgum
LiraApac
Soroti
Katakwi
Kumi
LangoSubregion
KENYA
TANZANIA
RWANDA
DEMOCRATICREPUBLICOF CONGO
SUDAN
UGANDA
LAKE VICTORIA km
0 50 100
N
AcholiSubregion
TesoSubregion
AFRICA
AREA OFDETAIL
Kaberm
aido
WAR CRIMES, TRAUMA, PTSD AND DEPRESSION SYMPTOMS, AND PEACE IN NORTHERN UGANDA
544 JAMA, August 1, 2007—Vol 298, No. 5 (Reprinted) ©2007 American Medical Association. All rights reserved.
Downloaded From: http://jama.jamanetwork.com/ on 02/25/2013
household, interviewers randomly se-lected 1 adult (�18 years old) to be in-terviewed from a list of all eligible adults.After 3 attempts over the course of 1 day,when a selected household or indi-vidual was unable or refused to partici-pate, the next available household usingthe sampling procedure, or another in-dividual within the selected house-hold, was selected. Because of the sen-sitivity of some of the questions, theinterviewers were assigned to same-sex respondents.
For each of the 4 districts, a mini-mum of 500 households were sampledin the camps and villages. One adult(�18 years old) was interviewed,chosen by the name closest to the be-ginning of the alphabet within the se-
lected household. One-to-one inter-views were conducted anonymously ina setting that offered privacy and con-fidentiality, typically inside the hous-ing unit. No other individuals were al-lowed to be present during theinterview. Oral rather than written con-sent was obtained because of the highilliteracy rate. Respondents were pro-vided with contact information if theyhad any questions. If a participant re-quested referral for emotional dis-tress, referral could be made to localnongovernmental organizations; how-ever, the violence and insecurity in thearea made such referrals unlikely. TheCommittees for the Protection of Hu-man Subjects at Tulane University, NewOrleans, Louisiana, and Makerere Uni-
versity. Kampala, Uganda, and Ugan-dan local government officials ap-proved the research protocols.
Sample size was determined using theproportion estimate formula for an as-sumed level of precision of 10% with80% power. The minimum sample sizewas adjusted for design effect due tocluster sampling using a factor of 2 andincreased by 20% for nonresponse rate.Retrospective power for the logistic re-gressions was computed using PASSsoftware (NCSS, Kaysville, Utah)11 andranged from 71% to 87%.
Data Collection Instrumentsand Scale
Interviews were conducted using astructured questionnaire covering 8
Figure 2. Sample Selection
Gulu
42 Camps1 Municipality0 Subcounties with no
displacement
135 904 Households634 474 Individuals
Kitgum
18 Camps1 Municipality0 Subcounties with no
displacement
70 962 Households286 122 Individuals
4 Districts selected based on level of exposure and ethnicity
9 Districts in northern Uganda exposed to conflict
SAMPLING UNIVERSE
Lira
125 220 Households724 531 Individuals
23 Camps1 Municipality
12 Subcounties with nodisplacement
One individual (aged ≥18 y) was randomly selected from each household.
628 Adults51 Replaced
29 Refused22 Absent
41 In camps10 In municipality
649 Adults83 Replaced
20 Refused63 Absent
66 In camps17 In municipality
STAGE 3
658 Adults9 Replaced
2 Refused7 Absent
3 In camps1 In municipality5 In villages
650 Adults103 Replaced
19 Refused84 Absent
11 In camps66 In municipality26 In villages
At least 500 households per district were randomly selected in sampled administrative clusters.
628 Households283 Replaced
183 Empty63 Refused37 No one eligible
649 Households219 Replaced
138 Empty32 Refused49 No one eligible
STAGE 2
658 Households123 Replaced
97 Empty9 Refused
17 No one eligible
650 Households336 Replaced
204 Empty40 Refused92 No one eligible
25% (range, 21%-33%) of the populated administrative cluster were randomly selected proportionately to population size. In subcounties with no displacement, parishes and then villages were selected randomly.
10 Camps (518 households)
1 Municipality (110 households)
3 Camps replaced due tolack of security
5 Camps (540 households)1 Municipality (109 households)
STAGE 1
5 Camps (387 households)1 Municipality (111 households)6 Villages (from 3 parishes;
160 households)
2 Camps (130 households)1 Municipality (135 households)8 Villages (from 4 parishes;
385 households)
Soroti
85 365 Households486 109 Individuals
6 Camps1 Municipality
14 Subcounties with nodisplacement
WAR CRIMES, TRAUMA, PTSD AND DEPRESSION SYMPTOMS, AND PEACE IN NORTHERN UGANDA
©2007 American Medical Association. All rights reserved. (Reprinted) JAMA, August 1, 2007—Vol 298, No. 5 545
Downloaded From: http://jama.jamanetwork.com/ on 02/25/2013
topics: socioeconomic information, pri-orities and peace, human rights and ac-countability, amnesty, justice, recon-ciliation, security and exposure totrauma, and psychological response totrauma. A team with expertise in hu-man rights, law, transitional justice, epi-demiology, psychiatry, anthropology,survey research, and the conflict innorthern Uganda developed and re-viewed the survey instrument. The in-strument was first developed in En-glish and was then translated intoAcholi, Lango, and Ateso by graduatesof the Language Department atMakerere University and local transla-tors. To ensure the quality of the trans-lation, the instrument was back-translated. Discrepancies were resolvedfollowing extensive discussion amongthe translators, back-translators, andsurvey designers. Where agreement ona particular word or phrase could notbe reached, a content expert was con-sulted. The Acholi version was used inGulu and Kitgum, the Lango versionwas used in Lira, and the Ateso ver-sion was used in Soroti. The instru-ment was pilot tested throughout its de-velopment and during the training ofthe interviewers. Revisions were madeaccordingly. Response options wereprovided to the interviewer but not readto the participant unless otherwise in-dicated. An “other” category was avail-able to record responses when neces-sary or when the interviewers wereunsure of the appropriate response op-tion. The “other” category was re-coded during analysis.
Interviewers were university stu-dents or professionals with experi-ence in data collection, working forvarious international agencies such asthe World Food Programme. One groupwas selected for the Acholi districts ofGulu and Kitgum; 1 group for the Liradistrict (Lango); and 1 group for So-roti (Teso). The interviewers were fromthe region in which the survey was con-ducted and, thus, were of the ethnic andlanguage groups being studied. The in-terviewers were trained for 1 week;training included interview tech-niques (stressing issues of privacy and
confidentiality and use of a consentform), respondent selection tech-niques, background on the study ob-jectives and subject matter, and ques-tionnaire content. In addition, apsychologist with experience in north-ern Uganda provided background train-ing on PTSD and depression symp-toms. The questionnaire was firstreviewed in group discussion. It wasthen practiced through mock inter-views among interviewers.
After consultation with local ex-perts and interviews with survivors ofthe conflict living in camps and vil-lages in northern Uganda, a list of 11war-related acts of violence was estab-lished to assess exposure to trauma. Thelist does not represent all possible trau-matic events but rather focuses on com-monly reported events.
After consultation with several psy-chologists and psychiatrists workingwith nongovernmental humanitarianaid agencies in northern Uganda, wechose to use the 17-item PTSDChecklist–Civilian Version (PCL-C)to assess symptoms of PTSD.12 Inves-tigators for this study have previouslyused the PCL-C to assess symptomsof PTSD in Rwanda.7 In this study, weadded all of the ratings of the 17 itemsto determine a total severity score andused a cutoff score of 44 to classifyindividuals as meeting PTSD symp-tom criteria. The estimated Cronbach� (a measure of internal reliability)for the 3 PCL-C symptom clusters inthis study were as follows: reexperi-encing, �=0.85; avoidance, �=0.84;and hyperarousal, �=0.81.
The 15-item depression section of theJohns Hopkins Depression SymptomChecklist was used to assess depres-sion, with a cutoff score of 42.13 The es-timated Cronbach � for the depres-sion scale in this study was 0.90. Theanxiety component of the DepressionSymptom Checklist was not used sincethe PCL-C scale was used to assessPTSD. In addition, some of the word-ing of the Depression Symptom Check-list was adapted to adjust for culturaland language differences. For ex-ample, “loss of sexual interest or plea-
sure” was culturally sensitive. Thewording used in the local version of thequestionnaire would translate in En-glish as “loss of interest in intimate re-lationship with spouse/partner” which,according to the experts consulted, hasthe same meaning as the original sen-tence. Another example is “feelingblue.” We modified it to “feeling sad.”The modifications were minor andmainly associated with translating in amanner that was understandable by thetarget population.
The measure of attitudes towardpeace was conceptualized by 2 indica-tors, respondents’ definition of peaceand how respondents believed peacecould be achieved. Respondents wereasked how they defined peace. The an-swers were recoded at the analysis stagein 3 variables reflecting the range of re-sponses: the absence of violence (yesor no); unity—eg, togetherness, livingtogether (yes or no); and human/social development—eg, education,economic development (yes or no).Respondents were then asked howthey believed peace could be achieved.The range of responses was recodedduring the analysis stage in 2 vari-ables: identified nonviolent mecha-nisms, such as peace talks and amnes-ties (yes or no); and identified violentmechanisms, such as killing enemycombatants and their leaders (yes orno). Respondents had the option toprovide more than 1 response to bothquestions. Some respondents pro-vided definitions of peace that in-cluded various combinations of ab-sence of violence, unity, and human/social development. Some respondentsidentified both violent and nonviolentmechanisms to achieve peace. The vari-ables were therefore treated as sepa-rate outcomes.
Statistical Analysis
Internal reliability measures for thePCL-C and Depression SymptomChecklist were calculated using SPSS,version 13.0 (SPSS Inc, Chicago, Illi-nois). Double data entry was imple-mented with Epi Info software, ver-sion 6.0 (a free data entry and analysis
WAR CRIMES, TRAUMA, PTSD AND DEPRESSION SYMPTOMS, AND PEACE IN NORTHERN UGANDA
546 JAMA, August 1, 2007—Vol 298, No. 5 (Reprinted) ©2007 American Medical Association. All rights reserved.
Downloaded From: http://jama.jamanetwork.com/ on 02/25/2013
software developed by the Centers forDisease Control and Prevention and theWorld Health Organization), and cross-checked with the validate duplicate en-try function. Epi Info C-Sample Analy-sis, version 6.0, which adjusts for designeffect, was used to calculate frequen-cies, means, and proportional sam-pling error. SPSS, version 13.0, was usedto calculate odds ratios (ORs), 95% con-fidence intervals (CIs), and all other sta-tistical analysis. Sampling was con-ducted proportionate to population size;hence, no weighting was used.
Latent class analysis was conductedon the traumatic events using CDAS/MLLSA (Categorical Data Analysis Sys-tem/Maximum Likelihood Latent Struc-ture Analysis).14 Given a number ofcases, latent class analysis explores a se-ries of variables to determine a smallnumber of groups in which those casescan be classified.15 Four classes wereidentified. Distribution of the preva-lence of the 11 traumatic events in the4 classes allowed us to identify the 3pivotal variables characteristic of eachgroup: experiencing abduction, beingthreatened with death, and witnessingviolence. Individuals were then manu-ally assigned to 4 survivor groupsdefined by those 3 pivotal variables:group 1 (low exposure to war-relatedviolence); group 2 (witnesses to war-related violence); group 3 (threatenedwith death and/or physically injured);and group 4 (abducted). The groupsshowed a progression: those whohad been abducted (group 4) had alsotypically been threatened with death(group 3). Those threatened with death(group 3) had typically witnessedviolence (group 2). This method al-lowed reducing the number of vari-ables from 11 traumatic events to 4survivor groups. The groups reflect pat-terns of exposure rather than total ex-posure, as would be the case with sum-mative scales.
Five separate multivariate stepwiselogistic regressions were performed toexamine the relationships among ex-posure to violent events, symptoms ofPTSD and depression, and attitudes to-ward peace. Because the categories for
the definition and mechanisms toachieve peace were nonexclusive cat-egories (eg, respondents could pro-vide �1 response), logistic regressionwas performed separately for each out-come. For the 5 models, the depen-dent (outcome) variables were the 3definitions of peace and the 2 mecha-nisms identified to achieve peace andthe independent (predictor) variableswere age, sex, marital status, educa-tion, income category, pattern of ex-posure by group, PTSD and depres-sion symptoms, and district ofresidence. (District of residence wasused rather than ethnicity because thedistribution of ethnic groups closely fol-lows administrative divisions and be-cause it allowed us to distinguish be-tween Acholi in the district of Gulu andAcholi in the district of Kitgum.) Thepredictors of greatest interest were pat-terns of exposure to trauma, PTSDsymptoms, and depression symp-toms. For each of the logistic regres-sion models, univariate analyses wereperformed for each combination of de-pendent and independent variables toexamine the strength of association.Both forward- and backward-stepwiselogistic regressions were performed bytesting the goodness of fit for each pre-dictor model. Only the statistically sig-nificant predictors were included in thefinal models.
RESULTSThe target sample size for each dis-trict was 500 interviews. A total of 3546households were approached and 2585adults aged 18 years or older were in-terviewed in 4 selected districts ofnorthern Uganda: Gulu (n=628), Kit-gum (n=649), Lira (n=658), and So-roti (n=650), as illustrated in Figure 2.In the sampled camps and villages, 27%of the selected households were re-placed because no one was home(18%), because they refused (4%), orbecause no one was eligible (5%).Within selected households, 246 (9.5%)of the sampled individuals were re-placed by the next sampled individualin that household because they were notavailable or refused to participate.
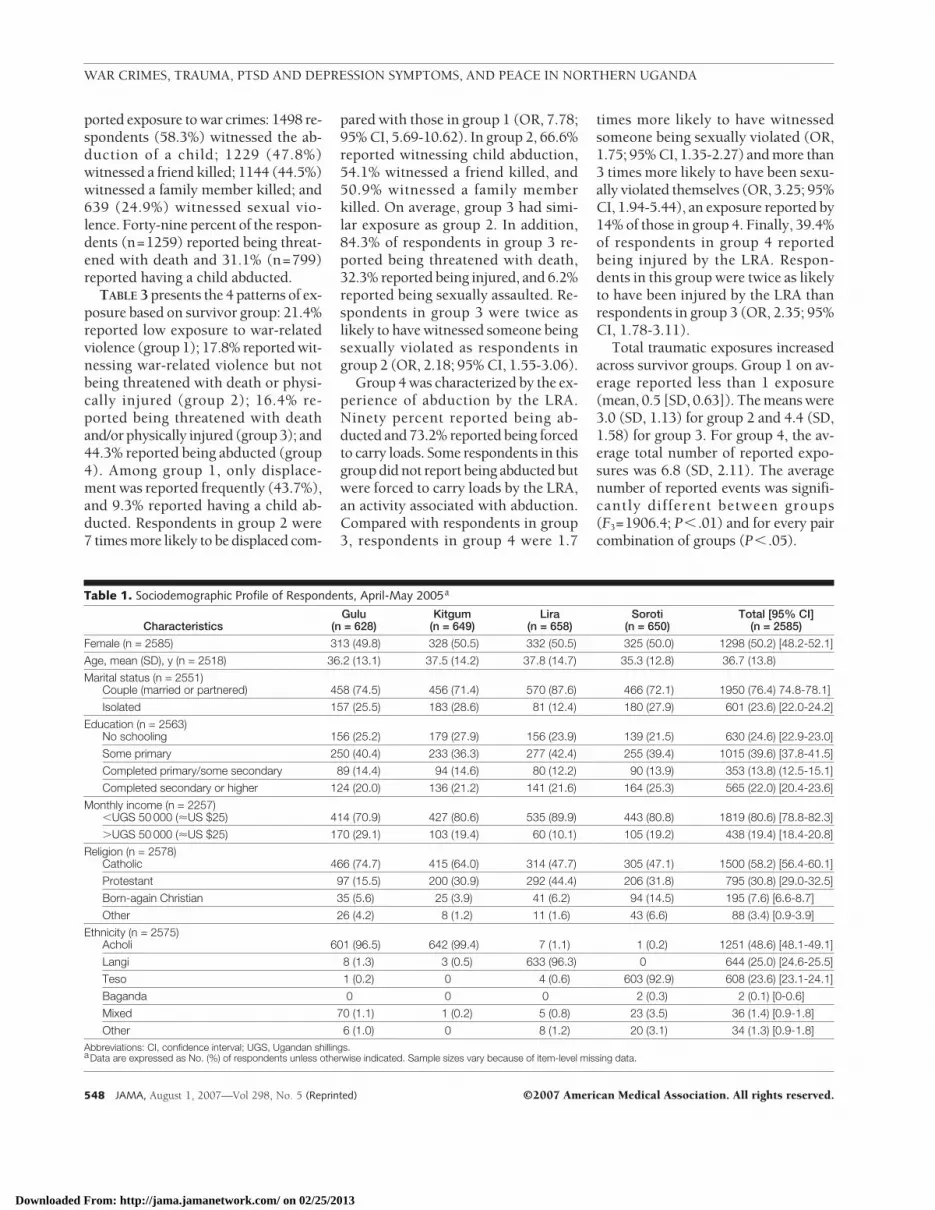
General Characteristicsof RespondentsThe sample (n=2585) was composedof approximately equal numbers of men(49.8%) and women (50.2%) as a re-sult of assigning equal numbers of maleand female interviewers to same-sex re-spondents. Sixty-one percent of thesampled individuals lived in camps,21% in villages, and 18% in munici-palities (capital towns of the dis-tricts). As shown in TABLE 1, the meanage of the respondents was 37 years(SD, 13.8 years) and the median age was34 years, with 95% of the respondentsbetween ages 23 and 45 years. A ma-jority of the respondents were in-volved in a marital relationship, eithermarried (72.8%) or in a partnership(3.6%). The ethnic composition of thesample reflected the stratification in the4 districts, with the main ethnic groupsbeing Acholi in Gulu and Kitgum(96.5% and 99.4%, respectively), Langoin Lira (96.3%), and Teso in Soroti(92.9%). Acholi therefore represented48.6% of the sample; Lango, 25.0%; andTeso, 23.6%. A majority of the respon-dents (58.2%) identified themselves asRoman Catholic and 30.8% as belong-ing to the Anglican Church.
Patterns of Exposure to Trauma
Complete data on exposure to 11 traumaevents were assessed among 2569 re-spondents (99.4% of all 2585 respon-dents) (TABLE 2). Of the respondents,78.5% reported having experienced dis-placement because of the conflict. Thestrategy of the LRA to target civilians isreflected in the frequency of self-reported exposure to war-related vio-lence by the LRA: 1018 respondents(39.6%) reported being abducted, 585(22.8%) being injured, 834 (32.5%)being forced to carry a heavy load, and186 (7.2%) having experienced sexualviolence. In Gulu and Kitgum, morethan 50% of the respondents reportedhaving been abducted by the LRA forvarying periods of time. Some former ab-ductees had been with the LRA for years,while others had been held for only a fewdays or hours. Experiences as a witnesswere among the most frequently re-
WAR CRIMES, TRAUMA, PTSD AND DEPRESSION SYMPTOMS, AND PEACE IN NORTHERN UGANDA
©2007 American Medical Association. All rights reserved. (Reprinted) JAMA, August 1, 2007—Vol 298, No. 5 547
Downloaded From: http://jama.jamanetwork.com/ on 02/25/2013
ported exposure to war crimes: 1498 re-spondents (58.3%) witnessed the ab-duction of a child; 1229 (47.8%)witnessed a friend killed; 1144 (44.5%)witnessed a family member killed; and639 (24.9%) witnessed sexual vio-lence. Forty-nine percent of the respon-dents (n=1259) reported being threat-ened with death and 31.1% (n=799)reported having a child abducted.
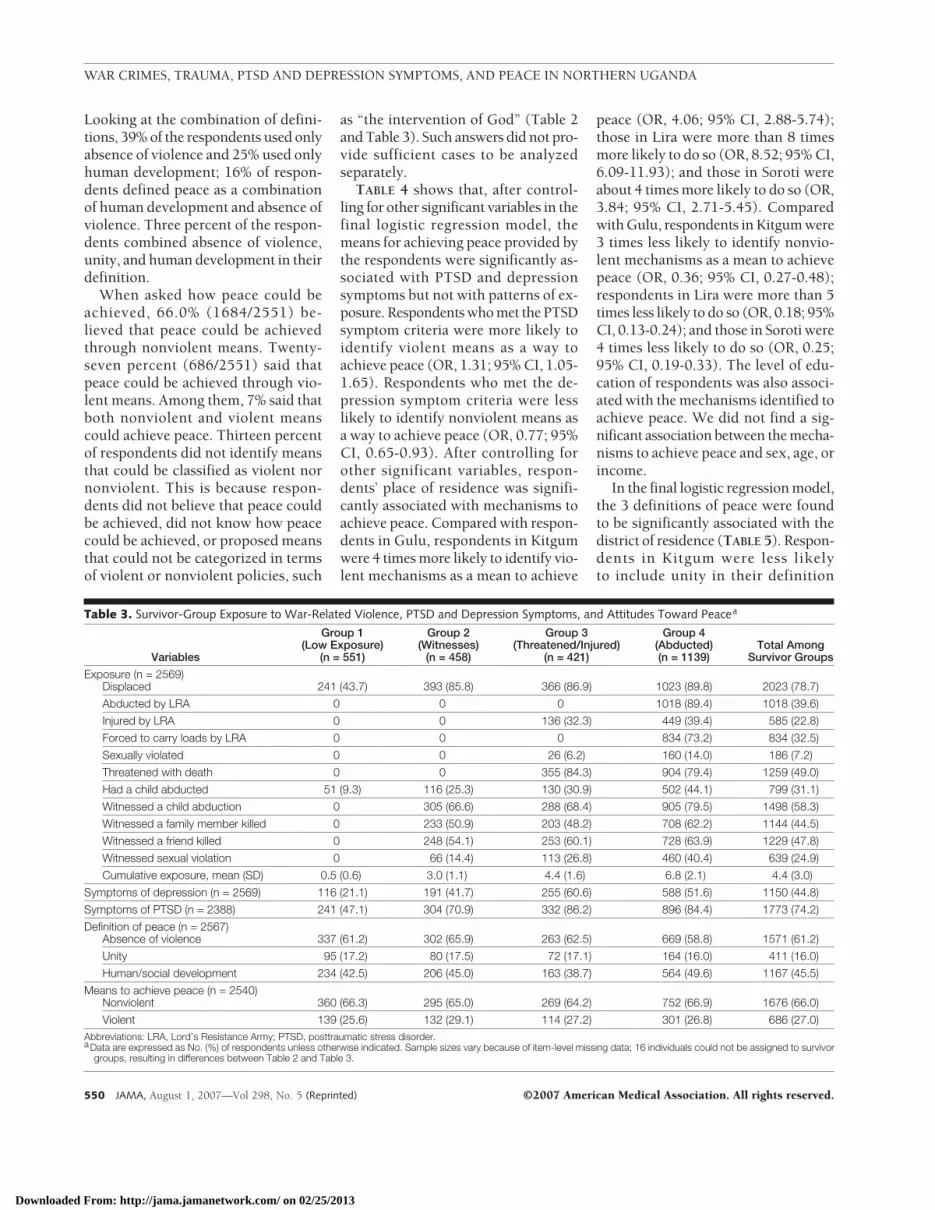
TABLE 3 presents the 4 patterns of ex-posure based on survivor group: 21.4%reported low exposure to war-relatedviolence (group 1); 17.8% reported wit-nessing war-related violence but notbeing threatened with death or physi-cally injured (group 2); 16.4% re-ported being threatened with deathand/or physically injured (group 3); and44.3% reported being abducted (group4). Among group 1, only displace-ment was reported frequently (43.7%),and 9.3% reported having a child ab-ducted. Respondents in group 2 were7 times more likely to be displaced com-
pared with those in group 1 (OR, 7.78;95% CI, 5.69-10.62). In group 2, 66.6%reported witnessing child abduction,54.1% witnessed a friend killed, and50.9% witnessed a family memberkilled. On average, group 3 had simi-lar exposure as group 2. In addition,84.3% of respondents in group 3 re-ported being threatened with death,32.3% reported being injured, and 6.2%reported being sexually assaulted. Re-spondents in group 3 were twice aslikely to have witnessed someone beingsexually violated as respondents ingroup 2 (OR, 2.18; 95% CI, 1.55-3.06).
Group 4 was characterized by the ex-perience of abduction by the LRA.Ninety percent reported being ab-ducted and 73.2% reported being forcedto carry loads. Some respondents in thisgroup did not report being abducted butwere forced to carry loads by the LRA,an activity associated with abduction.Compared with respondents in group3, respondents in group 4 were 1.7
times more likely to have witnessedsomeone being sexually violated (OR,1.75; 95% CI, 1.35-2.27) and more than3 times more likely to have been sexu-ally violated themselves (OR, 3.25; 95%CI, 1.94-5.44), an exposure reported by14% of those in group 4. Finally, 39.4%of respondents in group 4 reportedbeing injured by the LRA. Respon-dents in this group were twice as likelyto have been injured by the LRA thanrespondents in group 3 (OR, 2.35; 95%CI, 1.78-3.11).
Total traumatic exposures increasedacross survivor groups. Group 1 on av-erage reported less than 1 exposure(mean, 0.5 [SD, 0.63]). The means were3.0 (SD, 1.13) for group 2 and 4.4 (SD,1.58) for group 3. For group 4, the av-erage total number of reported expo-sures was 6.8 (SD, 2.11). The averagenumber of reported events was signifi-cantly different between groups(F3=1906.4; P� .01) and for every paircombination of groups (P� .05).
Table 1. Sociodemographic Profile of Respondents, April-May 2005a
CharacteristicsGulu
(n = 628)Kitgum
(n = 649)Lira
(n = 658)Soroti
(n = 650)Total [95% CI]
(n = 2585)
Female (n = 2585) 313 (49.8) 328 (50.5) 332 (50.5) 325 (50.0) 1298 (50.2) [48.2-52.1]
Age, mean (SD), y (n = 2518) 36.2 (13.1) 37.5 (14.2) 37.8 (14.7) 35.3 (12.8) 36.7 (13.8)
Marital status (n = 2551)Couple (married or partnered) 458 (74.5) 456 (71.4) 570 (87.6) 466 (72.1) 1950 (76.4) 74.8-78.1]
Isolated 157 (25.5) 183 (28.6) 81 (12.4) 180 (27.9) 601 (23.6) [22.0-24.2]
Education (n = 2563)No schooling 156 (25.2) 179 (27.9) 156 (23.9) 139 (21.5) 630 (24.6) [22.9-23.0]
Some primary 250 (40.4) 233 (36.3) 277 (42.4) 255 (39.4) 1015 (39.6) [37.8-41.5]
Completed primary/some secondary 89 (14.4) 94 (14.6) 80 (12.2) 90 (13.9) 353 (13.8) (12.5-15.1]
Completed secondary or higher 124 (20.0) 136 (21.2) 141 (21.6) 164 (25.3) 565 (22.0) [20.4-23.6]
Monthly income (n = 2257)�UGS 50 000 (�US $25) 414 (70.9) 427 (80.6) 535 (89.9) 443 (80.8) 1819 (80.6) [78.8-82.3]
�UGS 50 000 (�US $25) 170 (29.1) 103 (19.4) 60 (10.1) 105 (19.2) 438 (19.4) [18.4-20.8]
Religion (n = 2578)Catholic 466 (74.7) 415 (64.0) 314 (47.7) 305 (47.1) 1500 (58.2) [56.4-60.1]
Protestant 97 (15.5) 200 (30.9) 292 (44.4) 206 (31.8) 795 (30.8) [29.0-32.5]
Born-again Christian 35 (5.6) 25 (3.9) 41 (6.2) 94 (14.5) 195 (7.6) [6.6-8.7]
Other 26 (4.2) 8 (1.2) 11 (1.6) 43 (6.6) 88 (3.4) [0.9-3.9]
Ethnicity (n = 2575)Acholi 601 (96.5) 642 (99.4) 7 (1.1) 1 (0.2) 1251 (48.6) [48.1-49.1]
Langi 8 (1.3) 3 (0.5) 633 (96.3) 0 644 (25.0) [24.6-25.5]
Teso 1 (0.2) 0 4 (0.6) 603 (92.9) 608 (23.6) [23.1-24.1]
Baganda 0 0 0 2 (0.3) 2 (0.1) [0-0.6]
Mixed 70 (1.1) 1 (0.2) 5 (0.8) 23 (3.5) 36 (1.4) [0.9-1.8]
Other 6 (1.0) 0 8 (1.2) 20 (3.1) 34 (1.3) [0.9-1.8]Abbreviations: CI, confidence interval; UGS, Ugandan shillings.aData are expressed as No. (%) of respondents unless otherwise indicated. Sample sizes vary because of item-level missing data.
WAR CRIMES, TRAUMA, PTSD AND DEPRESSION SYMPTOMS, AND PEACE IN NORTHERN UGANDA
548 JAMA, August 1, 2007—Vol 298, No. 5 (Reprinted) ©2007 American Medical Association. All rights reserved.
Downloaded From: http://jama.jamanetwork.com/ on 02/25/2013
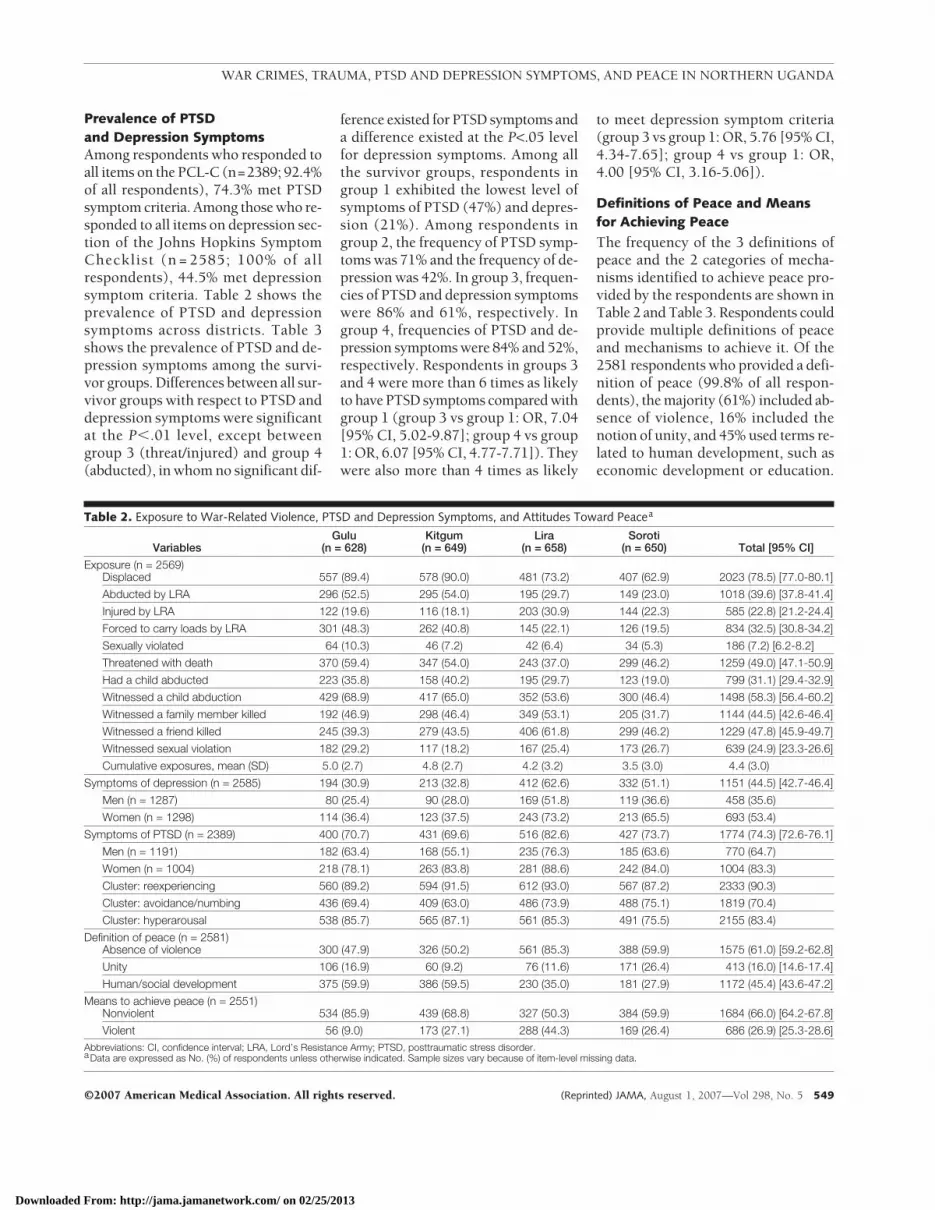
Prevalence of PTSDand Depression SymptomsAmong respondents who responded toall items on the PCL-C (n=2389; 92.4%of all respondents), 74.3% met PTSDsymptom criteria. Among those who re-sponded to all items on depression sec-tion of the Johns Hopkins SymptomChecklist (n = 2585; 100% of allrespondents), 44.5% met depressionsymptom criteria. Table 2 shows theprevalence of PTSD and depressionsymptoms across districts. Table 3shows the prevalence of PTSD and de-pression symptoms among the survi-vor groups. Differences between all sur-vivor groups with respect to PTSD anddepression symptoms were significantat the P�.01 level, except betweengroup 3 (threat/injured) and group 4(abducted), in whom no significant dif-
ference existed for PTSD symptoms anda difference existed at the P<.05 levelfor depression symptoms. Among allthe survivor groups, respondents ingroup 1 exhibited the lowest level ofsymptoms of PTSD (47%) and depres-sion (21%). Among respondents ingroup 2, the frequency of PTSD symp-toms was 71% and the frequency of de-pression was 42%. In group 3, frequen-cies of PTSD and depression symptomswere 86% and 61%, respectively. Ingroup 4, frequencies of PTSD and de-pression symptoms were 84% and 52%,respectively. Respondents in groups 3and 4 were more than 6 times as likelyto have PTSD symptoms compared withgroup 1 (group 3 vs group 1: OR, 7.04[95% CI, 5.02-9.87]; group 4 vs group1: OR, 6.07 [95% CI, 4.77-7.71]). Theywere also more than 4 times as likely
to meet depression symptom criteria(group 3 vs group 1: OR, 5.76 [95% CI,4.34-7.65]; group 4 vs group 1: OR,4.00 [95% CI, 3.16-5.06]).
Definitions of Peace and Meansfor Achieving Peace
The frequency of the 3 definitions ofpeace and the 2 categories of mecha-nisms identified to achieve peace pro-vided by the respondents are shown inTable 2 and Table 3. Respondents couldprovide multiple definitions of peaceand mechanisms to achieve it. Of the2581 respondents who provided a defi-nition of peace (99.8% of all respon-dents), the majority (61%) included ab-sence of violence, 16% included thenotion of unity, and 45% used terms re-lated to human development, such aseconomic development or education.
Table 2. Exposure to War-Related Violence, PTSD and Depression Symptoms, and Attitudes Toward Peacea
VariablesGulu
(n = 628)Kitgum
(n = 649)Lira
(n = 658)Soroti
(n = 650) Total [95% CI]
Exposure (n = 2569)Displaced 557 (89.4) 578 (90.0) 481 (73.2) 407 (62.9) 2023 (78.5) [77.0-80.1]
Abducted by LRA 296 (52.5) 295 (54.0) 195 (29.7) 149 (23.0) 1018 (39.6) [37.8-41.4]
Injured by LRA 122 (19.6) 116 (18.1) 203 (30.9) 144 (22.3) 585 (22.8) [21.2-24.4]
Forced to carry loads by LRA 301 (48.3) 262 (40.8) 145 (22.1) 126 (19.5) 834 (32.5) [30.8-34.2]
Sexually violated 64 (10.3) 46 (7.2) 42 (6.4) 34 (5.3) 186 (7.2) [6.2-8.2]
Threatened with death 370 (59.4) 347 (54.0) 243 (37.0) 299 (46.2) 1259 (49.0) [47.1-50.9]
Had a child abducted 223 (35.8) 158 (40.2) 195 (29.7) 123 (19.0) 799 (31.1) [29.4-32.9]
Witnessed a child abduction 429 (68.9) 417 (65.0) 352 (53.6) 300 (46.4) 1498 (58.3) [56.4-60.2]
Witnessed a family member killed 192 (46.9) 298 (46.4) 349 (53.1) 205 (31.7) 1144 (44.5) [42.6-46.4]
Witnessed a friend killed 245 (39.3) 279 (43.5) 406 (61.8) 299 (46.2) 1229 (47.8) [45.9-49.7]
Witnessed sexual violation 182 (29.2) 117 (18.2) 167 (25.4) 173 (26.7) 639 (24.9) [23.3-26.6]
Cumulative exposures, mean (SD) 5.0 (2.7) 4.8 (2.7) 4.2 (3.2) 3.5 (3.0) 4.4 (3.0)
Symptoms of depression (n = 2585) 194 (30.9) 213 (32.8) 412 (62.6) 332 (51.1) 1151 (44.5) [42.7-46.4]
Men (n = 1287) 80 (25.4) 90 (28.0) 169 (51.8) 119 (36.6) 458 (35.6)
Women (n = 1298) 114 (36.4) 123 (37.5) 243 (73.2) 213 (65.5) 693 (53.4)
Symptoms of PTSD (n = 2389) 400 (70.7) 431 (69.6) 516 (82.6) 427 (73.7) 1774 (74.3) [72.6-76.1]
Men (n = 1191) 182 (63.4) 168 (55.1) 235 (76.3) 185 (63.6) 770 (64.7)
Women (n = 1004) 218 (78.1) 263 (83.8) 281 (88.6) 242 (84.0) 1004 (83.3)
Cluster: reexperiencing 560 (89.2) 594 (91.5) 612 (93.0) 567 (87.2) 2333 (90.3)
Cluster: avoidance/numbing 436 (69.4) 409 (63.0) 486 (73.9) 488 (75.1) 1819 (70.4)
Cluster: hyperarousal 538 (85.7) 565 (87.1) 561 (85.3) 491 (75.5) 2155 (83.4)
Definition of peace (n = 2581)Absence of violence 300 (47.9) 326 (50.2) 561 (85.3) 388 (59.9) 1575 (61.0) [59.2-62.8]
Unity 106 (16.9) 60 (9.2) 76 (11.6) 171 (26.4) 413 (16.0) [14.6-17.4]
Human/social development 375 (59.9) 386 (59.5) 230 (35.0) 181 (27.9) 1172 (45.4) [43.6-47.2]
Means to achieve peace (n = 2551)Nonviolent 534 (85.9) 439 (68.8) 327 (50.3) 384 (59.9) 1684 (66.0) [64.2-67.8]
Violent 56 (9.0) 173 (27.1) 288 (44.3) 169 (26.4) 686 (26.9) [25.3-28.6]Abbreviations: CI, confidence interval; LRA, Lord’s Resistance Army; PTSD, posttraumatic stress disorder.aData are expressed as No. (%) of respondents unless otherwise indicated. Sample sizes vary because of item-level missing data.
WAR CRIMES, TRAUMA, PTSD AND DEPRESSION SYMPTOMS, AND PEACE IN NORTHERN UGANDA
©2007 American Medical Association. All rights reserved. (Reprinted) JAMA, August 1, 2007—Vol 298, No. 5 549
Downloaded From: http://jama.jamanetwork.com/ on 02/25/2013
Looking at the combination of defini-tions, 39% of the respondents used onlyabsence of violence and 25% used onlyhuman development; 16% of respon-dents defined peace as a combinationof human development and absence ofviolence. Three percent of the respon-dents combined absence of violence,unity, and human development in theirdefinition.
When asked how peace could beachieved, 66.0% (1684/2551) be-lieved that peace could be achievedthrough nonviolent means. Twenty-seven percent (686/2551) said thatpeace could be achieved through vio-lent means. Among them, 7% said thatboth nonviolent and violent meanscould achieve peace. Thirteen percentof respondents did not identify meansthat could be classified as violent nornonviolent. This is because respon-dents did not believe that peace couldbe achieved, did not know how peacecould be achieved, or proposed meansthat could not be categorized in termsof violent or nonviolent policies, such
as “the intervention of God” (Table 2and Table 3). Such answers did not pro-vide sufficient cases to be analyzedseparately.
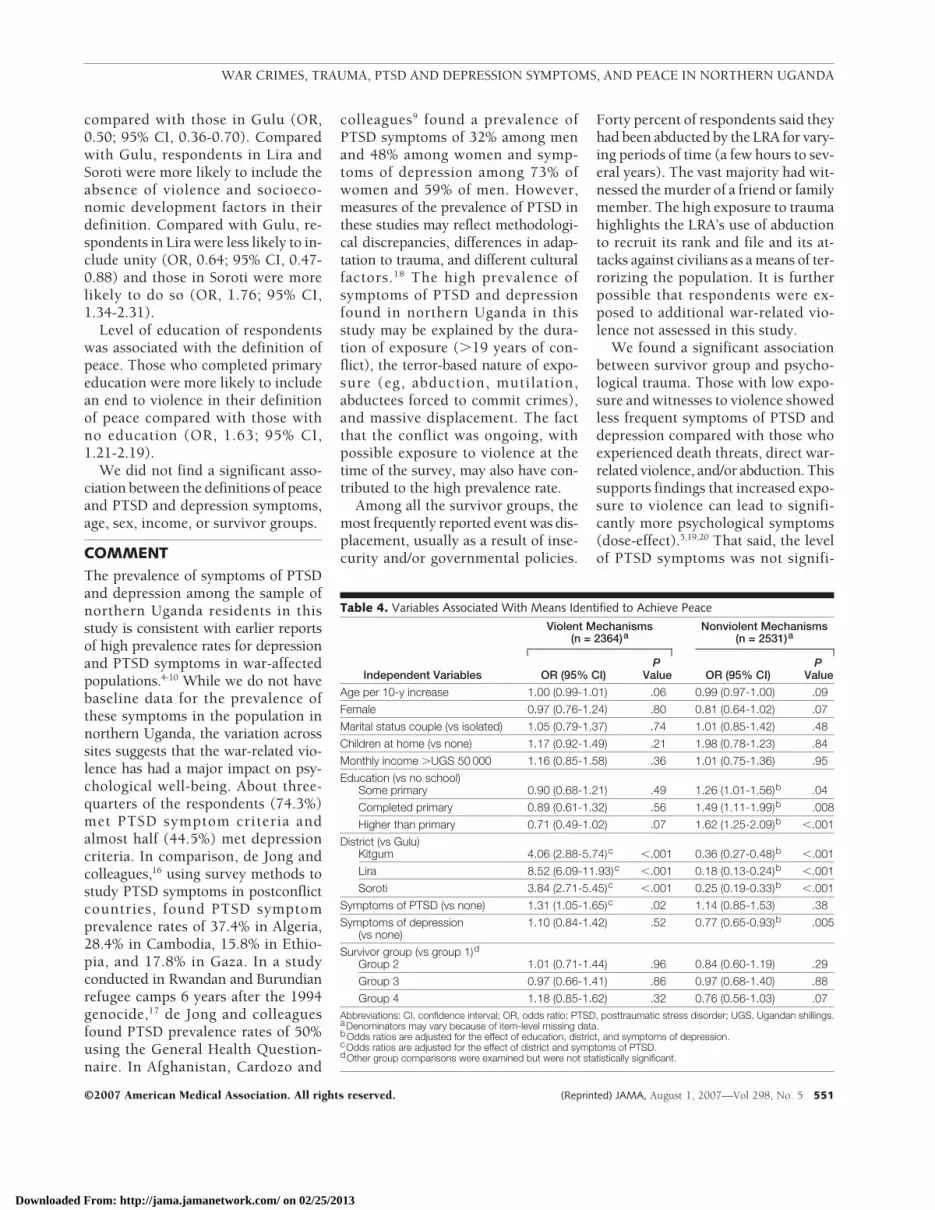
TABLE 4 shows that, after control-ling for other significant variables in thefinal logistic regression model, themeans for achieving peace provided bythe respondents were significantly as-sociated with PTSD and depressionsymptoms but not with patterns of ex-posure. Respondents who met the PTSDsymptom criteria were more likely toidentify violent means as a way toachieve peace (OR, 1.31; 95% CI, 1.05-1.65). Respondents who met the de-pression symptom criteria were lesslikely to identify nonviolent means asa way to achieve peace (OR, 0.77; 95%CI, 0.65-0.93). After controlling forother significant variables, respon-dents’ place of residence was signifi-cantly associated with mechanisms toachieve peace. Compared with respon-dents in Gulu, respondents in Kitgumwere 4 times more likely to identify vio-lent mechanisms as a mean to achieve
peace (OR, 4.06; 95% CI, 2.88-5.74);those in Lira were more than 8 timesmore likely to do so (OR, 8.52; 95% CI,6.09-11.93); and those in Soroti wereabout 4 times more likely to do so (OR,3.84; 95% CI, 2.71-5.45). Comparedwith Gulu, respondents in Kitgum were3 times less likely to identify nonvio-lent mechanisms as a mean to achievepeace (OR, 0.36; 95% CI, 0.27-0.48);respondents in Lira were more than 5times less likely to do so (OR, 0.18; 95%CI, 0.13-0.24); and those in Soroti were4 times less likely to do so (OR, 0.25;95% CI, 0.19-0.33). The level of edu-cation of respondents was also associ-ated with the mechanisms identified toachieve peace. We did not find a sig-nificant association between the mecha-nisms to achieve peace and sex, age, orincome.
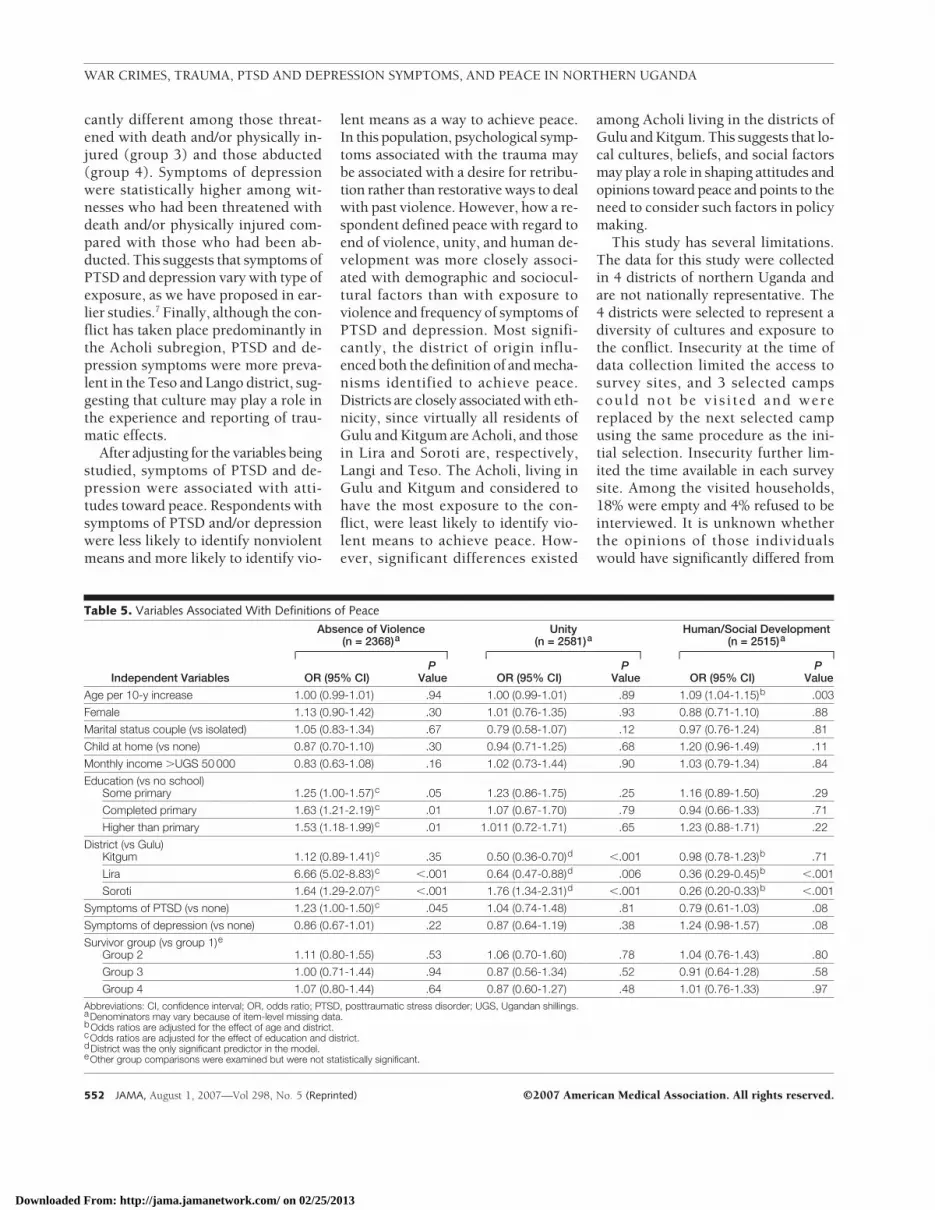
In the final logistic regression model,the 3 definitions of peace were foundto be significantly associated with thedistrict of residence (TABLE 5). Respon-dents in Kitgum were less likelyto include unity in their definition
Table 3. Survivor-Group Exposure to War-Related Violence, PTSD and Depression Symptoms, and Attitudes Toward Peacea
Variables
Group 1(Low Exposure)
(n = 551)
Group 2(Witnesses)
(n = 458)
Group 3(Threatened/Injured)
(n = 421)
Group 4(Abducted)(n = 1139)
Total AmongSurvivor Groups
Exposure (n = 2569)Displaced 241 (43.7) 393 (85.8) 366 (86.9) 1023 (89.8) 2023 (78.7)
Abducted by LRA 0 0 0 1018 (89.4) 1018 (39.6)
Injured by LRA 0 0 136 (32.3) 449 (39.4) 585 (22.8)
Forced to carry loads by LRA 0 0 0 834 (73.2) 834 (32.5)
Sexually violated 0 0 26 (6.2) 160 (14.0) 186 (7.2)
Threatened with death 0 0 355 (84.3) 904 (79.4) 1259 (49.0)
Had a child abducted 51 (9.3) 116 (25.3) 130 (30.9) 502 (44.1) 799 (31.1)
Witnessed a child abduction 0 305 (66.6) 288 (68.4) 905 (79.5) 1498 (58.3)
Witnessed a family member killed 0 233 (50.9) 203 (48.2) 708 (62.2) 1144 (44.5)
Witnessed a friend killed 0 248 (54.1) 253 (60.1) 728 (63.9) 1229 (47.8)
Witnessed sexual violation 0 66 (14.4) 113 (26.8) 460 (40.4) 639 (24.9)
Cumulative exposure, mean (SD) 0.5 (0.6) 3.0 (1.1) 4.4 (1.6) 6.8 (2.1) 4.4 (3.0)
Symptoms of depression (n = 2569) 116 (21.1) 191 (41.7) 255 (60.6) 588 (51.6) 1150 (44.8)
Symptoms of PTSD (n = 2388) 241 (47.1) 304 (70.9) 332 (86.2) 896 (84.4) 1773 (74.2)
Definition of peace (n = 2567)Absence of violence 337 (61.2) 302 (65.9) 263 (62.5) 669 (58.8) 1571 (61.2)
Unity 95 (17.2) 80 (17.5) 72 (17.1) 164 (16.0) 411 (16.0)
Human/social development 234 (42.5) 206 (45.0) 163 (38.7) 564 (49.6) 1167 (45.5)
Means to achieve peace (n = 2540)Nonviolent 360 (66.3) 295 (65.0) 269 (64.2) 752 (66.9) 1676 (66.0)
Violent 139 (25.6) 132 (29.1) 114 (27.2) 301 (26.8) 686 (27.0)Abbreviations: LRA, Lord’s Resistance Army; PTSD, posttraumatic stress disorder.aData are expressed as No. (%) of respondents unless otherwise indicated. Sample sizes vary because of item-level missing data; 16 individuals could not be assigned to survivor
groups, resulting in differences between Table 2 and Table 3.
WAR CRIMES, TRAUMA, PTSD AND DEPRESSION SYMPTOMS, AND PEACE IN NORTHERN UGANDA
550 JAMA, August 1, 2007—Vol 298, No. 5 (Reprinted) ©2007 American Medical Association. All rights reserved.
Downloaded From: http://jama.jamanetwork.com/ on 02/25/2013
compared with those in Gulu (OR,0.50; 95% CI, 0.36-0.70). Comparedwith Gulu, respondents in Lira andSoroti were more likely to include theabsence of violence and socioeco-nomic development factors in theirdefinition. Compared with Gulu, re-spondents in Lira were less likely to in-clude unity (OR, 0.64; 95% CI, 0.47-0.88) and those in Soroti were morelikely to do so (OR, 1.76; 95% CI,1.34-2.31).
Level of education of respondentswas associated with the definition ofpeace. Those who completed primaryeducation were more likely to includean end to violence in their definitionof peace compared with those withno education (OR, 1.63; 95% CI,1.21-2.19).
We did not find a significant asso-ciation between the definitions of peaceand PTSD and depression symptoms,age, sex, income, or survivor groups.
COMMENTThe prevalence of symptoms of PTSDand depression among the sample ofnorthern Uganda residents in thisstudy is consistent with earlier reportsof high prevalence rates for depressionand PTSD symptoms in war-affectedpopulations.4-10 While we do not havebaseline data for the prevalence ofthese symptoms in the population innorthern Uganda, the variation acrosssites suggests that the war-related vio-lence has had a major impact on psy-chological well-being. About three-quarters of the respondents (74.3%)met PTSD symptom criteria andalmost half (44.5%) met depressioncriteria. In comparison, de Jong andcolleagues,16 using survey methods tostudy PTSD symptoms in postconflictcountries, found PTSD symptomprevalence rates of 37.4% in Algeria,28.4% in Cambodia, 15.8% in Ethio-pia, and 17.8% in Gaza. In a studyconducted in Rwandan and Burundianrefugee camps 6 years after the 1994genocide,17 de Jong and colleaguesfound PTSD prevalence rates of 50%using the General Health Question-naire. In Afghanistan, Cardozo and
colleagues9 found a prevalence ofPTSD symptoms of 32% among menand 48% among women and symp-toms of depression among 73% ofwomen and 59% of men. However,measures of the prevalence of PTSD inthese studies may reflect methodologi-cal discrepancies, differences in adap-tation to trauma, and different culturalfactors.18 The high prevalence ofsymptoms of PTSD and depressionfound in northern Uganda in thisstudy may be explained by the dura-tion of exposure (�19 years of con-flict), the terror-based nature of expo-sure (eg, abduction, mutilation,abductees forced to commit crimes),and massive displacement. The factthat the conflict was ongoing, withpossible exposure to violence at thetime of the survey, may also have con-tributed to the high prevalence rate.
Among all the survivor groups, themost frequently reported event was dis-placement, usually as a result of inse-curity and/or governmental policies.
Forty percent of respondents said theyhad been abducted by the LRA for vary-ing periods of time (a few hours to sev-eral years). The vast majority had wit-nessed the murder of a friend or familymember. The high exposure to traumahighlights the LRA’s use of abductionto recruit its rank and file and its at-tacks against civilians as a means of ter-rorizing the population. It is furtherpossible that respondents were ex-posed to additional war-related vio-lence not assessed in this study.
We found a significant associationbetween survivor group and psycho-logical trauma. Those with low expo-sure and witnesses to violence showedless frequent symptoms of PTSD anddepression compared with those whoexperienced death threats, direct war-related violence, and/or abduction. Thissupports findings that increased expo-sure to violence can lead to signifi-cantly more psychological symptoms(dose-effect).5,19,20 That said, the levelof PTSD symptoms was not signifi-
Table 4. Variables Associated With Means Identified to Achieve Peace
Independent Variables
Violent Mechanisms(n = 2364)a
Nonviolent Mechanisms(n = 2531)a
OR (95% CI)P
Value OR (95% CI)P
Value
Age per 10-y increase 1.00 (0.99-1.01) .06 0.99 (0.97-1.00) .09
Female 0.97 (0.76-1.24) .80 0.81 (0.64-1.02) .07
Marital status couple (vs isolated) 1.05 (0.79-1.37) .74 1.01 (0.85-1.42) .48
Children at home (vs none) 1.17 (0.92-1.49) .21 1.98 (0.78-1.23) .84
Monthly income �UGS 50 000 1.16 (0.85-1.58) .36 1.01 (0.75-1.36) .95
Education (vs no school)Some primary 0.90 (0.68-1.21) .49 1.26 (1.01-1.56)b .04
Completed primary 0.89 (0.61-1.32) .56 1.49 (1.11-1.99)b .008
Higher than primary 0.71 (0.49-1.02) .07 1.62 (1.25-2.09)b �.001
District (vs Gulu)Kitgum 4.06 (2.88-5.74)c �.001 0.36 (0.27-0.48)b �.001
Lira 8.52 (6.09-11.93)c �.001 0.18 (0.13-0.24)b �.001
Soroti 3.84 (2.71-5.45)c �.001 0.25 (0.19-0.33)b �.001
Symptoms of PTSD (vs none) 1.31 (1.05-1.65)c .02 1.14 (0.85-1.53) .38
Symptoms of depression(vs none)
1.10 (0.84-1.42) .52 0.77 (0.65-0.93)b .005
Survivor group (vs group 1)dGroup 2 1.01 (0.71-1.44) .96 0.84 (0.60-1.19) .29
Group 3 0.97 (0.66-1.41) .86 0.97 (0.68-1.40) .88
Group 4 1.18 (0.85-1.62) .32 0.76 (0.56-1.03) .07Abbreviations: CI, confidence interval; OR, odds ratio; PTSD, posttraumatic stress disorder; UGS, Ugandan shillings.aDenominators may vary because of item-level missing data.bOdds ratios are adjusted for the effect of education, district, and symptoms of depression.cOdds ratios are adjusted for the effect of district and symptoms of PTSD.dOther group comparisons were examined but were not statistically significant.
WAR CRIMES, TRAUMA, PTSD AND DEPRESSION SYMPTOMS, AND PEACE IN NORTHERN UGANDA
©2007 American Medical Association. All rights reserved. (Reprinted) JAMA, August 1, 2007—Vol 298, No. 5 551
Downloaded From: http://jama.jamanetwork.com/ on 02/25/2013
cantly different among those threat-ened with death and/or physically in-jured (group 3) and those abducted(group 4). Symptoms of depressionwere statistically higher among wit-nesses who had been threatened withdeath and/or physically injured com-pared with those who had been ab-ducted. This suggests that symptoms ofPTSD and depression vary with type ofexposure, as we have proposed in ear-lier studies.7 Finally, although the con-flict has taken place predominantly inthe Acholi subregion, PTSD and de-pression symptoms were more preva-lent in the Teso and Lango district, sug-gesting that culture may play a role inthe experience and reporting of trau-matic effects.
After adjusting for the variables beingstudied, symptoms of PTSD and de-pression were associated with atti-tudes toward peace. Respondents withsymptoms of PTSD and/or depressionwere less likely to identify nonviolentmeans and more likely to identify vio-
lent means as a way to achieve peace.In this population, psychological symp-toms associated with the trauma maybe associated with a desire for retribu-tion rather than restorative ways to dealwith past violence. However, how a re-spondent defined peace with regard toend of violence, unity, and human de-velopment was more closely associ-ated with demographic and sociocul-tural factors than with exposure toviolence and frequency of symptoms ofPTSD and depression. Most signifi-cantly, the district of origin influ-enced both the definition of and mecha-nisms identified to achieve peace.Districts are closely associated with eth-nicity, since virtually all residents ofGulu and Kitgum are Acholi, and thosein Lira and Soroti are, respectively,Langi and Teso. The Acholi, living inGulu and Kitgum and considered tohave the most exposure to the con-flict, were least likely to identify vio-lent means to achieve peace. How-ever, significant differences existed
among Acholi living in the districts ofGulu and Kitgum. This suggests that lo-cal cultures, beliefs, and social factorsmay play a role in shaping attitudes andopinions toward peace and points to theneed to consider such factors in policymaking.
This study has several limitations.The data for this study were collectedin 4 districts of northern Uganda andare not nationally representative. The4 districts were selected to represent adiversity of cultures and exposure tothe conflict. Insecurity at the time ofdata collection limited the access tosurvey sites, and 3 selected campscould not be vis i ted and werereplaced by the next selected campusing the same procedure as the ini-tial selection. Insecurity further lim-ited the time available in each surveysite. Among the visited households,18% were empty and 4% refused to beinterviewed. It is unknown whetherthe opinions of those individualswould have significantly differed from
Table 5. Variables Associated With Definitions of Peace
Independent Variables
Absence of Violence(n = 2368)a
Unity(n = 2581)a
Human/Social Development(n = 2515)a
OR (95% CI)P
Value OR (95% CI)P
Value OR (95% CI)P
Value
Age per 10-y increase 1.00 (0.99-1.01) .94 1.00 (0.99-1.01) .89 1.09 (1.04-1.15)b .003
Female 1.13 (0.90-1.42) .30 1.01 (0.76-1.35) .93 0.88 (0.71-1.10) .88
Marital status couple (vs isolated) 1.05 (0.83-1.34) .67 0.79 (0.58-1.07) .12 0.97 (0.76-1.24) .81
Child at home (vs none) 0.87 (0.70-1.10) .30 0.94 (0.71-1.25) .68 1.20 (0.96-1.49) .11
Monthly income �UGS 50 000 0.83 (0.63-1.08) .16 1.02 (0.73-1.44) .90 1.03 (0.79-1.34) .84
Education (vs no school)Some primary 1.25 (1.00-1.57)c .05 1.23 (0.86-1.75) .25 1.16 (0.89-1.50) .29
Completed primary 1.63 (1.21-2.19)c .01 1.07 (0.67-1.70) .79 0.94 (0.66-1.33) .71
Higher than primary 1.53 (1.18-1.99)c .01 1.011 (0.72-1.71) .65 1.23 (0.88-1.71) .22
District (vs Gulu)Kitgum 1.12 (0.89-1.41)c .35 0.50 (0.36-0.70)d �.001 0.98 (0.78-1.23)b .71
Lira 6.66 (5.02-8.83)c �.001 0.64 (0.47-0.88)d .006 0.36 (0.29-0.45)b �.001
Soroti 1.64 (1.29-2.07)c �.001 1.76 (1.34-2.31)d �.001 0.26 (0.20-0.33)b �.001
Symptoms of PTSD (vs none) 1.23 (1.00-1.50)c .045 1.04 (0.74-1.48) .81 0.79 (0.61-1.03) .08
Symptoms of depression (vs none) 0.86 (0.67-1.01) .22 0.87 (0.64-1.19) .38 1.24 (0.98-1.57) .08
Survivor group (vs group 1)eGroup 2 1.11 (0.80-1.55) .53 1.06 (0.70-1.60) .78 1.04 (0.76-1.43) .80
Group 3 1.00 (0.71-1.44) .94 0.87 (0.56-1.34) .52 0.91 (0.64-1.28) .58
Group 4 1.07 (0.80-1.44) .64 0.87 (0.60-1.27) .48 1.01 (0.76-1.33) .97Abbreviations: CI, confidence interval; OR, odds ratio; PTSD, posttraumatic stress disorder; UGS, Ugandan shillings.aDenominators may vary because of item-level missing data.bOdds ratios are adjusted for the effect of age and district.cOdds ratios are adjusted for the effect of education and district.dDistrict was the only significant predictor in the model.eOther group comparisons were examined but were not statistically significant.
WAR CRIMES, TRAUMA, PTSD AND DEPRESSION SYMPTOMS, AND PEACE IN NORTHERN UGANDA
552 JAMA, August 1, 2007—Vol 298, No. 5 (Reprinted) ©2007 American Medical Association. All rights reserved.
Downloaded From: http://jama.jamanetwork.com/ on 02/25/2013
that of the respondents. At the time ofdata collection (April-May 2005),there was no clear ongoing peace pro-cess. It is possible that opinions andattitudes would have differed if a con-crete peace process had been underway. Exposure to trauma and symp-toms of PTSD and depression wereself-reported, with respondents stat-ing “yes” or “no” to listed traumaevents and a standardized checklist.Inaccurate recall and social desirabil-ity may have affected the validity ofthe response. The use of standardscales to measure the symptoms ofpsychological disorders such as PTSDand depression has been widelydebated. Critics generally stress thelack of validity of those measurementsbecause they are applied in differentcultural environment and in conflictsituations.21-23 Those measures werenevertheless included in our analysisbecause they are validated24,25 mea-sures of psychological trauma outsideclinical diagnostic interviews andhave been applied in war-affectedcountries, such as the former Yugosla-via, Rwanda, Algeria, Cambodia, andEthiopia, among other countries.7-9,16
Threats to the validity of the findingsmay have been reduced through theuse of a consent form emphasizingthat no direct benefit was to beexpected from participating in thestudy, the anonymous character of thesurvey, the extensive training of theinterviewers, and the administrationof the survey in the local languages.
CONCLUSIONSWe found symptoms of PTSD and de-pression to be highly prevalent in 4 dis-tricts in northern Uganda, affectingthree-quarters and about half of the re-spondents to our survey, respectively.Prevalence of PTSD and depressionsymptoms varied significantly amongsurvivor groups exposed to differentlevels of trauma and was associated withattitudes toward peace. Those who metPTSD symptom criteria were morelikely to favor violent means to end theconflict and those who met depres-sion symptom criteria were less likely
to identify nonviolence means toachieve peace.
The study findings have importantimplications for health care profession-als, aid workers, diplomats, and policymakers for several reasons. First, as thefindings suggest, maintaining securityand protecting civilians is imperative intimes of war. It is one of the principaltenets of the Geneva Conventions of1949, which regulate the use of forcein armed conflicts. Security in times ofwar trumps everything: it is the cen-tral pedestal that supports all else. With-out some level of security, the deliv-ery of food aid, health care, and socialprograms is severely hampered.
Second, programs aimed at address-ing psychological trauma should be apriority during conflicts and in post-war settings. Too often, humanitarianorganizations neglect the psychoso-cial needs of war-affected communi-ties because of limited resources or be-cause they regard such programs asbeyond their purview. Our study sug-gests that psychological trauma is a keyhealth indicator in populations ex-posed to high levels of personal vio-lence in protracted armed conflicts. Ourresearch suggests that more collabora-tive research by clinicians, anthropolo-gists, and other experts may be neededto determine which psychosocial pro-grams work and for which subgroupsof the population.
Third, international and nationalpeace-building policies must take intoaccount the psychological well-being ofthose most affected by war-related vio-lence. Psychological trauma may influ-ence whether individuals are optimis-tic about their future, how they willview measures to change their situa-tion, and whether such measures rec-ognize and acknowledge the nature andextent of their suffering during the war.When policy makers introduce poli-cies aimed at building a lasting peace,they should be mindful that a large por-tion of the population may not sup-port such measures. For example, whenamnesties are granted to those respon-sible for war crimes, some individualswith psychological trauma may feel that
the authorities have failed to considertheir desires for reparation or to seethose responsible for such crimes pun-ished or required to apologize pub-licly for their actions. As a result, theymay reject programs aimed at postwarreconciliation or even decide to seek re-venge against those pardoned for pastabuses.
Finally, local cultures, beliefs, andsocial factors play a role in shaping atti-tudes and opinions toward peace.Efforts to establish peace and account-ability mechanisms must be informedby population-based data that reflect theopinions, attitudes, and needs of all sec-tors of a society. Such research shouldidentify how patterns of war-relatedexposure to violence, psychosocialtrauma, and cultural and political fac-tors influence the process of socialreconstruction and peace building in theaftermath of mass violence.
Author Contributions: Drs Vinck and Pham had fullaccess to all of the data in the study and take respon-sibility for the integrity of the data and the accuracyof the data analysis.Study concept and design: Vinck, Pham, Stover,Weinstein.Acquisition of data: Vinck, Pham.Analysis and interpretation of data: Vinck, Pham,Stover, Weinstein.Drafting of the manuscript: Vinck, Pham, Stover,Weinstein.Critical revision of the manuscript for important in-tellectual content: Vinck, Pham, Stover, Weinstein.Statistical analysis: Vinck, Pham.Obtained funding: Stover.Administrative, technical, or material support: Vinck,Pham.Study supervision: Vinck, Pham, Stover, Weinstein.Financial Disclosures: None reported.Funding/Support: This work was supported by grantsfrom the John D. and Catherine T. MacArthur Foun-dation, Chicago, Illinois, and the Sandler Family Sup-porting Foundation, San Francisco, California.Role of the Sponsor: The funding organizations playedno role in the design and conduct of the study, in thecollection, analysis, and interpretation of the data, orin the preparation, review, or approval of the manu-script. The authors are all affiliated with the HumanRights Center at the University of California, Berke-ley, and Payson Center for International Develop-ment, Tulane University, New Orleans, Louisiana. Thesponsoring institutions were not directly involved inany of the above components of the study or manu-script.Additional Contributions: This study was part of a jointproject between the Human Rights Center, Univer-sity of California, Berkeley; the International Centerfor Transitional Justice, New York, New York; and thePayson Center for International Development, Tu-lane University. We are grateful to our colleagues atthe Institute of Public Health, Makerere University, Ka-mpala, Uganda, and at the International Center forTransitional Justice. We are grateful to Janet Rice, PhD,Stanley Samarasinghe, PhD, and Eamon Kelly, PhD,Tulane University, and Andrea Talentino, PhD, Drew
WAR CRIMES, TRAUMA, PTSD AND DEPRESSION SYMPTOMS, AND PEACE IN NORTHERN UGANDA
©2007 American Medical Association. All rights reserved. (Reprinted) JAMA, August 1, 2007—Vol 298, No. 5 553
Downloaded From: http://jama.jamanetwork.com/ on 02/25/2013
University, Madison, Wisconsin, for research assis-tance. None of these individuals received compensa-tion for their contributions.
REFERENCES
1. Baines E, Stover E, Wierda M. War-Affected Chil-dren and Youth in Northern Uganda: Toward a BrighterFuture: An Assessment Report. Chicago, IL: John D.& Catherine T. MacArthur Foundation; May 2006:13-17.2. Allen T. Trial Justice: The International CriminalCourt and the Lord’s Resistance Army. London, En-gland: Zed Books; 2006.3. International Criminal Court Warrant of Arrest un-sealed against five LRA commanders [press release].The Hague, the Netherlands: International CriminalCourt (ICC); October 14, 2005.4. Weine S, Becker DF, McGlashan TH, et al. Psychi-atric consequences of “ethnic cleansing”: clinical as-sessments and trauma testimonies of newly resettledBosnian refugees. Am J Psychiatry. 1995;152(4):536-542.5. Lopes Cardozo B, Vergara A, Agani F, et al. Men-tal health, social functioning, and attitudes of Kos-ovar Albanians following the war in Kosovo. JAMA.2000;284(5):569-577.6. Cardozo BL, Bilukha OO, Gotway CA, et al. Men-tal health, social functioning, and disability in post-war Afghanistan. JAMA. 2004;292(5):575-584.7. Pham PN, Weinstein HM, Longman T. Trauma andPTSD symptoms in Rwanda: implications for atti-
tudes toward justice and reconciliation. JAMA. 2004;292(5):602-612.8. Biro M, Ajdukovic D, Corkalo D, et al. Attitudes to-ward justice and social reconstruction in Bosnia andHerzegovina and Croatia. In: Stover E, Weinstein HM,eds. My Neighbor, My Enemy: Justice in the After-math of Mass Atrocity. Cambridge, England: Cam-bridge University Press; 2004.9. Cardozo BL, Bilukha OO, Gotway CA, et al. Re-port from the CDC: mental health of women in post-war Afghanistan. J Womens Health (Larchmt). 2005;14(4):285-293.10. Marshall GN, Schell TL, Elliott MN, et al. Mentalhealth of Cambodian refugees: 2 decades after re-settlement in the United States JAMA. 2005;294(5):571-579.11. Hsieh FY, Block DA, Larsen MD. A simple methodof sample size calculation for linear and logisticregression Stat Med. 1998;17(14):1623-1634.12. Weathers F, Huska J, Keane T. The PTSD Check-list Military Version (PCL-M). Boston, MA: NationalCenter for PTSD; 1991.13. Parloff MB, Kelman HC, Frank JD. Comfort, ef-fectiveness, and self-awareness as criteria of improve-ment in psychotherapy. Am J Psychiatry. 1954;111(5):343-352.14. Clogg C. Unrestricted and Restricted MaximumLikelihood Latent Structure Analysis: A Manual forUsers. University Park: Population Issues Research Of-fice, Pennsylvania State University; 1977. Working pa-per 1977-09.15. Tabachnick BG, Fidell LS. Using MultivariateStatistics. New York, NY: Allyn & Bacon; 2006.
16. de Jong JT, Komproe IH, Van Ommeren M, et al.Lifetime events and posttraumatic stress disorder in 4postconflict settings. JAMA. 2001;286(5):555-562.17. de Jong JP, Scholte WF, Koeter MWJ, et al. Theprevalence of mental health problems in Rwandan andBurundese refugee camps. Acta Psychiatr Scand. 2000;102(3):171-177.18. Silove D. The psychosocial effects of torture, masshuman rights violations, and refugee trauma: towardan integrated conceptual framework. J Nerv Ment Dis.1999;187(4):200-207.19. Porter M, Haslam N. Forced displacement in Yu-goslavia: a meta analysis of psychological conse-quences and their moderators. J Trauma Stress. 2001;4:817-834.20. Mollica RF, McInnes K, Pham T, Smith Fawzi MC,Murphy E, Lin L. The dose-effect relationships be-tween torture and psychiatric symptoms in Vietnam-ese ex-political detainees and a comparison group.J Nerv Ment Dis. 1998;186(9):543-553.21. Brewin CR. Post-traumatic Stress Disorder: Maladyor Myth? New Haven, CT: Yale University Press; 2003.22. McNally RJ. Remembering Trauma. Cambridge,MA: Harvard University Press; 2003.23. Kleinman A, Das V, Loch M, eds. Social Suffering.Berkeley: University of California Press; 1997.24. Blanchard EB, Jones-Alexander J, Buckley TC, et al.Psychometric properties of the PTSD Checklist (PCL).Behav Res Ther. 1996;34(8):669-673.25. Forbes D, Creamer M, Biddle D. The validity ofthe PTSD Checklist as a measure of symptomaticchange in combat-related PTSD. Behav Res Ther. 2001;39(8):977-986.
The fight against disease has often been likened to war.It is war; it is the one war which is not barbaric. It isthe only valid war. And we have the enemy on the runin so many directions.
—Lord Thomas Horder (1871-1955)
WAR CRIMES, TRAUMA, PTSD AND DEPRESSION SYMPTOMS, AND PEACE IN NORTHERN UGANDA
554 JAMA, August 1, 2007—Vol 298, No. 5 (Reprinted) ©2007 American Medical Association. All rights reserved.
Downloaded From: http://jama.jamanetwork.com/ on 02/25/2013