exploring the influence of biofilm on short-term expansion and contraction of supratidal rock: an...
TRANSCRIPT
EARTH SURFACE PROCESSES AND LANDFORMSEarth Surf. Process. Landforms (2014)Copyright © 2014 John Wiley & Sons, Ltd.Published online in Wiley Online Library(wileyonlinelibrary.com) DOI: 10.1002/esp.3602
Letters to ESEX
Exploring the influence of biofilm on short-termexpansion and contraction of supratidal rock: anexample from the MediterraneanJerome R. Mayaud,* Heather A. Viles and Martin A. CoombesSchool of Geography and the Environment, Oxford University, South Parks Road, OX1 3QY, UK
Received 9 February 2014; Revised 8 May 2014; Accepted 12 May 2014
*Correspondence to: J. R. Mayaud, School of Geography and the Environment, Oxford University, South Parks Road, OX1 3QY, UK. E-mail: [email protected]
ABSTRACT: Previous geomorphological investigations using the traversing micro-erosion meter (TMEM) have identified daily andhourly contractions and expansions of littoral rock on a range of lithologies. While organic influences on these patterns have beeninferred, this has rarely been tested in a controlled way. Here, a TMEMwas used to measure micro-scale (<mm) topographic changeson supratidal limestone of the Massif des Calanques, southern France. Four TMEM monitoring sites (each 64 cm2) were set up intotal, two in the Calanque de Morgiou and two in the Presqu’ile de Cassis. On both shores one TMEM bolt site was positioned onbare rock and the other on colonized rock. TMEM data were collected and the surface micro-topography mapped for each site attwo-hourly intervals from early morning to late evening across one day in mid-summer.Significant relative expansion and contraction was observed between measurement periods at all four sites, regardless of biofilm
colonization (P< 0.001 in all instances), and sometimes between adjacent zones on the rock surface (at a scale of centimetres). Rock withand without biofilm behaved broadly similarly, but the magnitude of topographic change varied: average movement from one interval tothe next was 0.03 mm on bare sites and 0.06 mm on biofilm-colonized sites. As expected, patterns of surface change related largely toinsolation,with greatestmovement occurring in themorning and eveningwhen thermal gradients were steepest. Interestingly, the presenceof a biofilm intensified rock expansion, but delayed surface response to microclimatic variability. We largely attribute this effect to biofilminfluences on surface albedo, and hypothesize that episodes of contraction and expansion are superimposed onto longer (annual todecadal) episodes of surface movement and downwearing. Short-term TMEM studies therefore need to be coupled with longer-termseasonal and annual measurements to improve understanding of rock surface dynamics. Copyright © 2014 John Wiley & Sons, Ltd.
KEYWORDS: traversing micro-erosion meter; biogeomorphology; rock breakdown; biofilm
Introduction
Shore platforms – horizontal or near-horizontal erosional rocksurfaces at the shoreline (Trenhaile, 1980; Stephenson, 2000) –are characteristic of many rocky coasts, and their morphologiesvary significantly over space as a function of lithology and histor-ical and contemporary environmental conditions (Trenhaile,1987; Stephenson et al., 2013). Over the past 40 years, themicro-erosion meter (MEM) and the adapted traversing micro-erosion meter (TMEM) have been commonly used to measureerosion rates on shore platforms (Swantesson et al., 2006;Stephenson and Finlayson, 2009, for reviews). Since their firstapplication to coasts by High and Hanna (1970), TMEMs haveprovided detailed measurements of long-term downwearingwith measurement periods ranging from a year to thirty years.Alongside the importance of waves, a wide variety of subaerialdownwearing mechanisms have been proposed, includingwetting and drying, salt weathering, abrasion, and biologicalweathering and erosion (Kirk, 1977; Stephenson and Kirk,
2000; Trenhaile, 2006; Naylor et al., 2012; Feal-Pérez andBlanco-Chao, 2013; Coombes, 2014). Importantly, climaticand microclimatic influences on many of these processes arethought to be significant, particularly with respect to thermalexpansion and contraction, rock drying, and salt crystal growth(Stephenson and Kirk, 2001).
Recently a number of studies have provided new insight intothe dynamic nature of these processes on rocky shores byincreasing the temporal resolution of TMEM measurements.Over timescales ranging from hourly (Gómez-Pujol et al.,2007) to daily (Stephenson et al., 2004) and monthly (Furlaniand Cucchi, 2013), variations in rock surface elevation havebeen reported in association with significant contraction andswelling events (Stephenson and Kirk, 2001; Hemmingsenet al., 2007). These relationships are complex, however,depending on factors such as tidal position and rock type, anddo not necessarily show clear correlation with microclimaticvariables (Porter and Trenhaile, 2007). In the supratidal zone,where direct wetting by tides is less important (with the
J. R. MAYAUD ET AL.
exception of splash and spray), expansion and contraction canequally occur. In their study at Marengo Bay, Australia,Gómez-Pujol et al. (2007) observed that supradtidal sandstonesurfaces were mostly inactive during the day, when direct solarradiation and air temperature are at their maximum. The rockwas most dynamic in the early morning and late afternoon in as-sociation with changes in humidity. These observations sug-gested that short-term topographic change was largelycontrolled by the dehydration and hydration, respectively, of(endolithic) fungal hyphae in lichen in response to microclimate(Gómez-Pujol et al., 2007). A limitation of this study, however,was that a control site (without organic growth) was not ob-served; it was therefore difficult to conclusively attribute relativechanges in surface elevation to organic factors.Biofilms (communities of microorganisms and associated
extracellular polymeric substances, or EPS) are believed to bekey agents of rock weathering and erosion, particularly oncalcareous substrata (Chen et al., 2000; Naylor et al., 2012). Onrocky shores, including those of the Mediterranean, intertidalbiofilms mainly consist of complex assemblages ofcyanobacteria, diatoms and algae (Furlani et al., 2009). Theseorganisms occupy both surface (epiliths) and subsurface(endoliths) niches (Golubic et al., 1981), having probablegeomorphological significance with respect to the nature of theirinteraction (erosive or protective) with the underlying rock.Indeed, while biofilms are typically well developed on coastalrock, cover is patchy and niche occupation can vary signifi-cantly as a function of tidal height and lithology (Hutchinsonet al., 2006; Coombes et al., 2011; Coombes, 2014). Alongsidethe field study of Gómez-Pujol et al. (2007) for lichens,laboratory-based observations indicate that coastal biofilmsmay influence expansion and contraction mechanisms byaltering rock surface thermal properties (e.g. albedo) andmoisture dynamics (moisture retention) (Coombes and Naylor,2012). However, such observations are rare, and this has neverto our knowledge been explored for biofilms in the field.Demonstrably, there is a need for further data to evaluate or-
ganic influences on the mechanism(s) responsible for short-termrock surface dynamics on rocky shores. Building on the study ofGómez-Pujol et al. (2007), who investigated rock expansion andcontraction on lichen-colonized supratidal sandstone in Australia,we used the TMEM to investigate the influence of biofilm on hourlytopographic change on supratidal limestone in southern France bycomparing bare and colonized rock surfaces at two sites. Weaimed to investigate: (i) the nature of hourly cycles of expansionand contraction of supratidal limestone; (ii) the influence of biofilmcover on the patterns observed; and (iii) the significance of rock-surface microclimates in these relationships.
Study Area
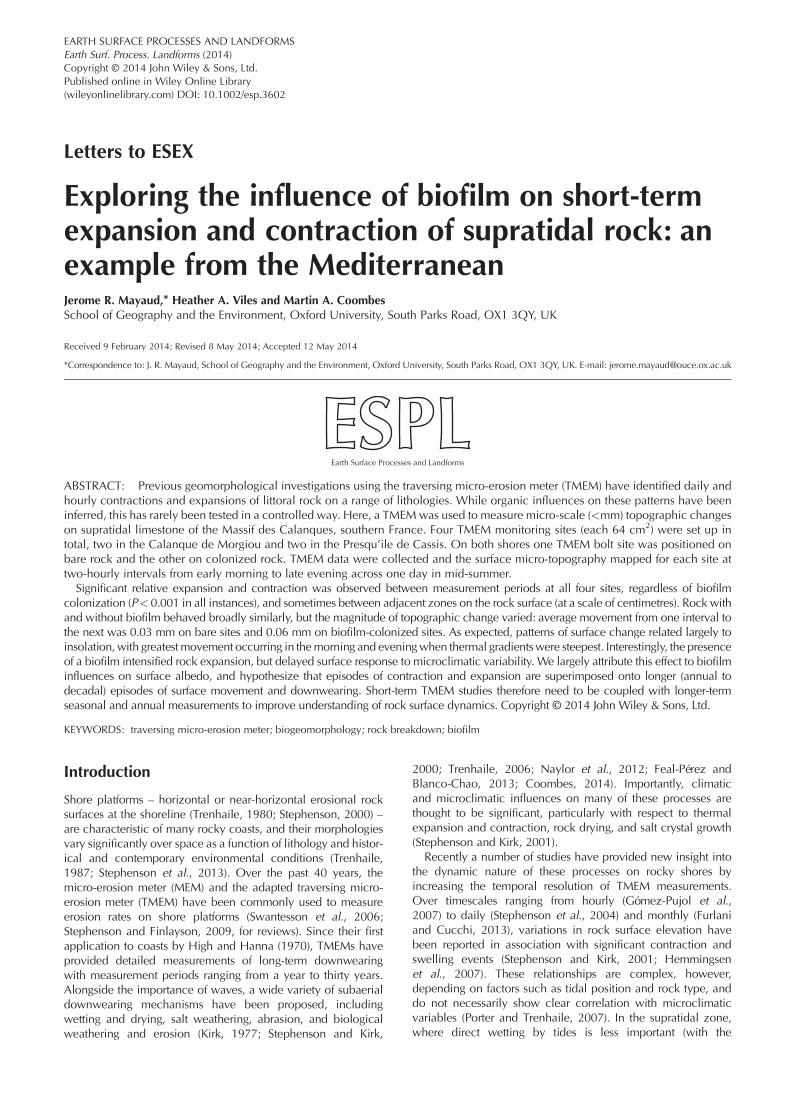
The Massif des Calanques is located on the southeastern coastof France (Figure 1). It extends for 20 km and is composed ofrolling plateaux leading to steep cliffs facing the Mediterranean
Bec de SormiouIle de Jarre
Ile Maire
Massif de Marseilleveyre
Ile Calsereigne
N
Figure 1. Location map of the Calanques area, from Marseilles in the wwileyonlinelibrary.com/journal/espl
Copyright © 2014 John Wiley & Sons, Ltd.
Sea. The coastal profile varies but is generally made up of a se-ries of narrow shore platforms superimposed on relatively steep(<60o) cliffs. The whole zone is made up of brilliant-white, ho-mogeneous Tertiary limestone reaching a thickness of 300 m inplaces (Corbel, 1956). It is generally recognized that thecalanques (inlets) found in southern France are karstic drystream valleys deepened during glacial low stages, and thenpartially drowned by the sea during the Holocenetransgression (Corbel, 1956; Trenhaile, 1997).
The Massif comprises roughly 16 calanques, and thisstudy focuses on two of them, roughly 8 km apart: theCalanque de Morgiou (600 m long and 200 m wide), andthe Presqu’ile de Cassis (making up one side of the 800 m longCalanque de Port-Pin) (Figure 2). Thin section analysis of arock sample from Cassis revealed that the limestone at thesesites is primarily made up of oolitic sparry calcite cement(Folk, 1959), with relatively closed porosity, and containingoccasional shell and fossil fragments. Mean grain size in thethin sections was 0.306 ± 0.0186 mm (n= 30).
The climate of the area comprises mild, humid winters andhot, dry summers. Mean annual rainfall is around 600 mm(BBC weather website, accessed 13/02/14), but humidity variessignificantly on a daily and yearly basis. July and August are thewarmest months in the Massif, averaging temperatures of ~24°C, although summer daily maxima often exceed 35°C (MétéoFrance website, accessed 13/02/14). Frosts do not occur alongthis coast. The Mediterranean coast is a micro-tidal zone withlow-energy swell and storm waves. The mean tidal range is lessthan 1 m, meaning that most of the former shore platforms inthis region remain exposed during the day.
Methodology
Short-term change in the micro-topography of the rock surface inthe Calanques was measured using a manually operated TMEM,consisting of a stainless steel triangular base (150 mm×150mm×140 mm) mounted on three legs, placed on stainless steelthreaded bolts (c. Stephenson and Finlayson, 2009) permanentlyfixed in the rock using marine epoxy (c. Foote et al., 2006). Boltsites were selected on relatively flat surfaces to improve theaccuracy of TMEM readings (Stephenson and Finlayson, 2009).
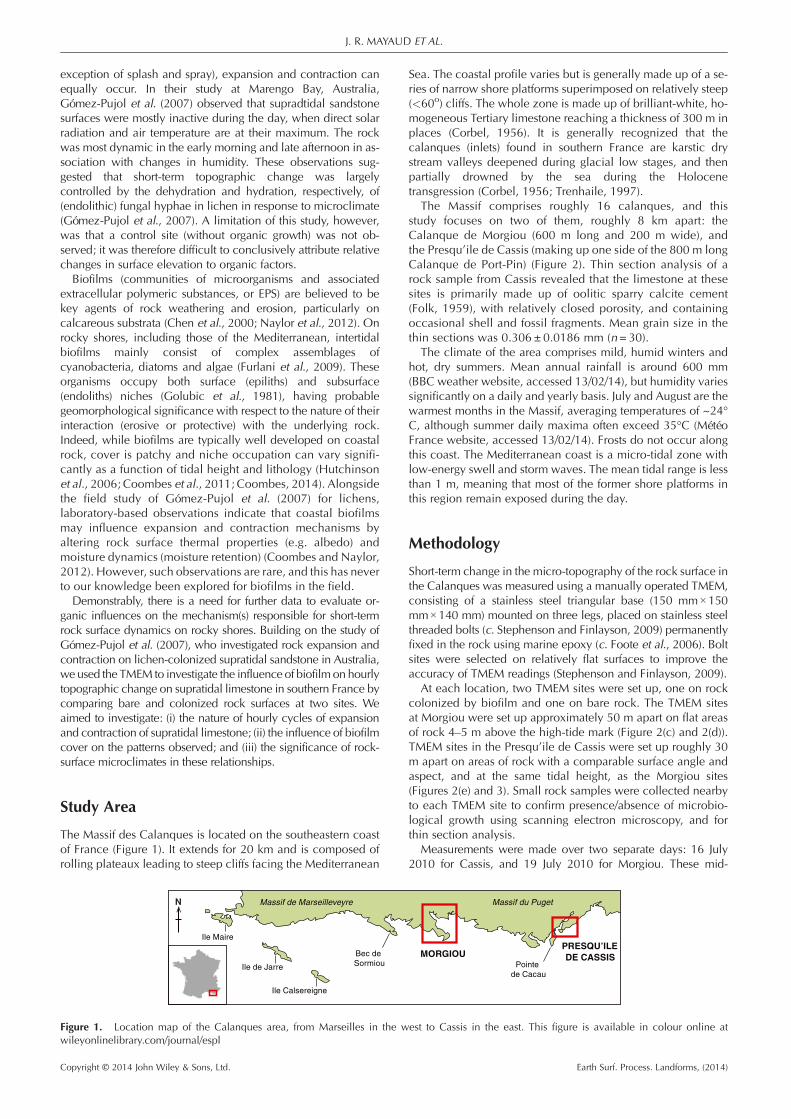
At each location, two TMEM sites were set up, one on rockcolonized by biofilm and one on bare rock. The TMEM sitesat Morgiou were set up approximately 50 m apart on flat areasof rock 4–5 m above the high-tide mark (Figure 2(c) and 2(d)).TMEM sites in the Presqu’ile de Cassis were set up roughly 30m apart on areas of rock with a comparable surface angle andaspect, and at the same tidal height, as the Morgiou sites(Figures 2(e) and 3). Small rock samples were collected nearbyto each TMEM site to confirm presence/absence of microbio-logical growth using scanning electron microscopy, and forthin section analysis.
Measurements were made over two separate days: 16 July2010 for Cassis, and 19 July 2010 for Morgiou. These mid-
MORGIOUPointe
de Cacau
PRESQU’ILE DE CASSIS
Massif du Puget
est to Cassis in the east. This figure is available in colour online at
Earth Surf. Process. Landforms, (2014)
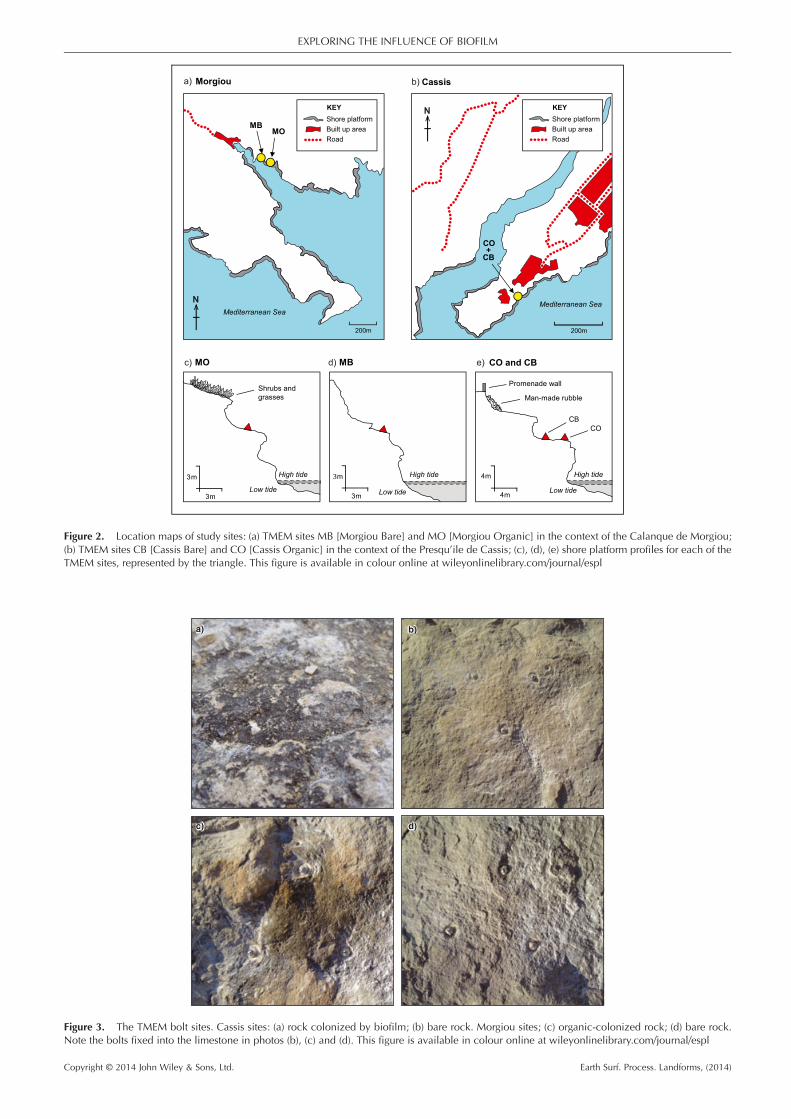
Figure 2. Location maps of study sites: (a) TMEM sites MB [Morgiou Bare] and MO [Morgiou Organic] in the context of the Calanque de Morgiou;(b) TMEM sites CB [Cassis Bare] and CO [Cassis Organic] in the context of the Presqu’ile de Cassis; (c), (d), (e) shore platform profiles for each of theTMEM sites, represented by the triangle. This figure is available in colour online at wileyonlinelibrary.com/journal/espl
Figure 3. The TMEM bolt sites. Cassis sites: (a) rock colonized by biofilm; (b) bare rock. Morgiou sites; (c) organic-colonized rock; (d) bare rock.Note the bolts fixed into the limestone in photos (b), (c) and (d). This figure is available in colour online at wileyonlinelibrary.com/journal/espl
EXPLORING THE INFLUENCE OF BIOFILM
Copyright © 2014 John Wiley & Sons, Ltd. Earth Surf. Process. Landforms, (2014)
a)
b)
20.0
22.0
24.0
26.0
28.0
30.0
32.0
34.0
36.0
38.0
35.0
40.0
45.0
50.0
55.0
60.0
65.0
Rel
ativ
e H
umid
ity (
%)
Time
20.0
22.0
24.0
26.0
28.0
30.0
32.0
34.0
36.0
38.0
35.0
40.0
45.0
50.0
55.0
60.0
65.0
06:00 08:00 10:00 12:00 14:00 16:00 18:00 20:00
06:00 08:00 10:00 12:00 14:00 16:00 18:00 20:00
Tem
pera
ture
(° C
)Te
mpe
ratu
re (
° C)
Rel
ativ
e H
umid
ity (
%)
Time
Humidity Temperature
Humidity Temperature
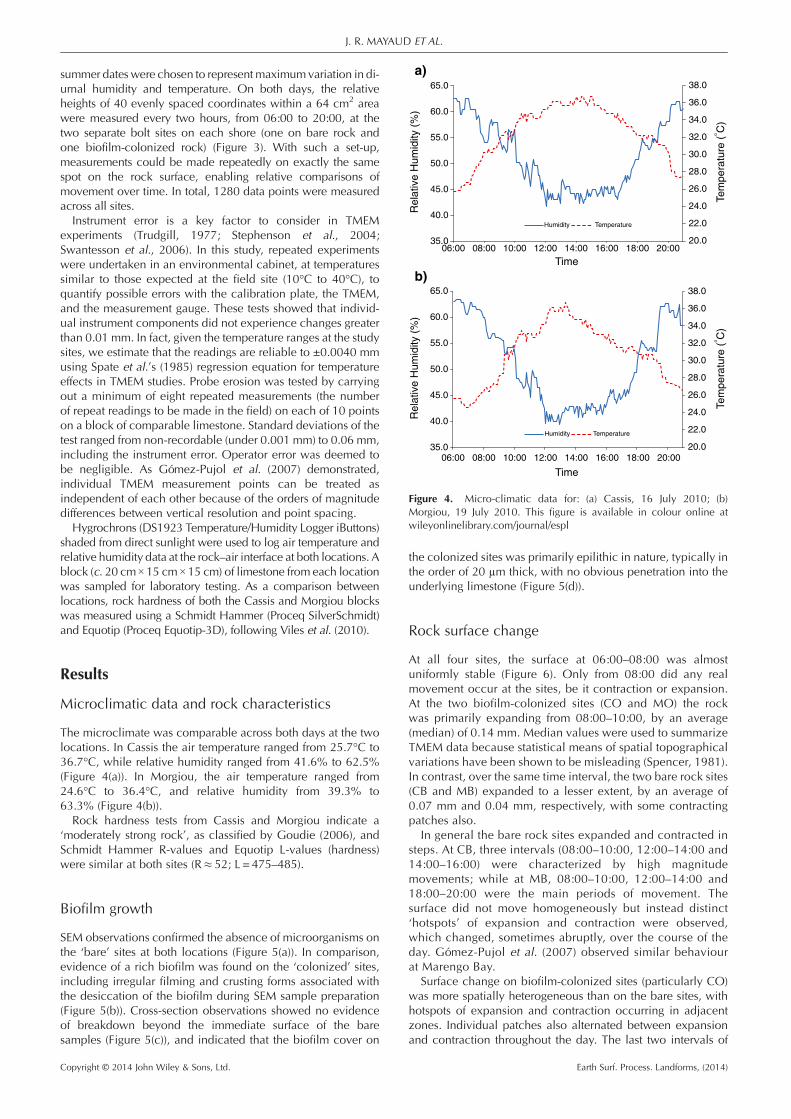
igure 4. Micro-climatic data for: (a) Cassis, 16 July 2010; (b)orgiou, 19 July 2010. This figure is available in colour online atileyonlinelibrary.com/journal/espl
J. R. MAYAUD ET AL.
summer dates were chosen to represent maximumvariation in di-urnal humidity and temperature. On both days, the relativeheights of 40 evenly spaced coordinates within a 64 cm2 areawere measured every two hours, from 06:00 to 20:00, at thetwo separate bolt sites on each shore (one on bare rock andone biofilm-colonized rock) (Figure 3). With such a set-up,measurements could be made repeatedly on exactly the samespot on the rock surface, enabling relative comparisons ofmovement over time. In total, 1280 data points were measuredacross all sites.Instrument error is a key factor to consider in TMEM
experiments (Trudgill, 1977; Stephenson et al., 2004;Swantesson et al., 2006). In this study, repeated experimentswere undertaken in an environmental cabinet, at temperaturessimilar to those expected at the field site (10°C to 40°C), toquantify possible errors with the calibration plate, the TMEM,and the measurement gauge. These tests showed that individ-ual instrument components did not experience changes greaterthan 0.01 mm. In fact, given the temperature ranges at the studysites, we estimate that the readings are reliable to ±0.0040 mmusing Spate et al.’s (1985) regression equation for temperatureeffects in TMEM studies. Probe erosion was tested by carryingout a minimum of eight repeated measurements (the numberof repeat readings to be made in the field) on each of 10 pointson a block of comparable limestone. Standard deviations of thetest ranged from non-recordable (under 0.001 mm) to 0.06 mm,including the instrument error. Operator error was deemed tobe negligible. As Gómez-Pujol et al. (2007) demonstrated,individual TMEM measurement points can be treated asindependent of each other because of the orders of magnitudedifferences between vertical resolution and point spacing.Hygrochrons (DS1923 Temperature/Humidity Logger iButtons)
shaded from direct sunlight were used to log air temperature andrelative humidity data at the rock–air interface at both locations. Ablock (c. 20 cm×15 cm×15 cm) of limestone from each locationwas sampled for laboratory testing. As a comparison betweenlocations, rock hardness of both the Cassis and Morgiou blockswas measured using a Schmidt Hammer (Proceq SilverSchmidt)and Equotip (Proceq Equotip-3D), following Viles et al. (2010).
Results
Microclimatic data and rock characteristics
The microclimate was comparable across both days at the twolocations. In Cassis the air temperature ranged from 25.7°C to36.7°C, while relative humidity ranged from 41.6% to 62.5%(Figure 4(a)). In Morgiou, the air temperature ranged from24.6°C to 36.4°C, and relative humidity from 39.3% to63.3% (Figure 4(b)).Rock hardness tests from Cassis and Morgiou indicate a
‘moderately strong rock’, as classified by Goudie (2006), andSchmidt Hammer R-values and Equotip L-values (hardness)were similar at both sites (R≈ 52; L = 475–485).
Biofilm growth
SEM observations confirmed the absence of microorganisms onthe ‘bare’ sites at both locations (Figure 5(a)). In comparison,evidence of a rich biofilm was found on the ‘colonized’ sites,including irregular filming and crusting forms associated withthe desiccation of the biofilm during SEM sample preparation(Figure 5(b)). Cross-section observations showed no evidenceof breakdown beyond the immediate surface of the baresamples (Figure 5(c)), and indicated that the biofilm cover on
Copyright © 2014 John Wiley & Sons, Ltd.
FMw
the colonized sites was primarily epilithic in nature, typically inthe order of 20 μm thick, with no obvious penetration into theunderlying limestone (Figure 5(d)).
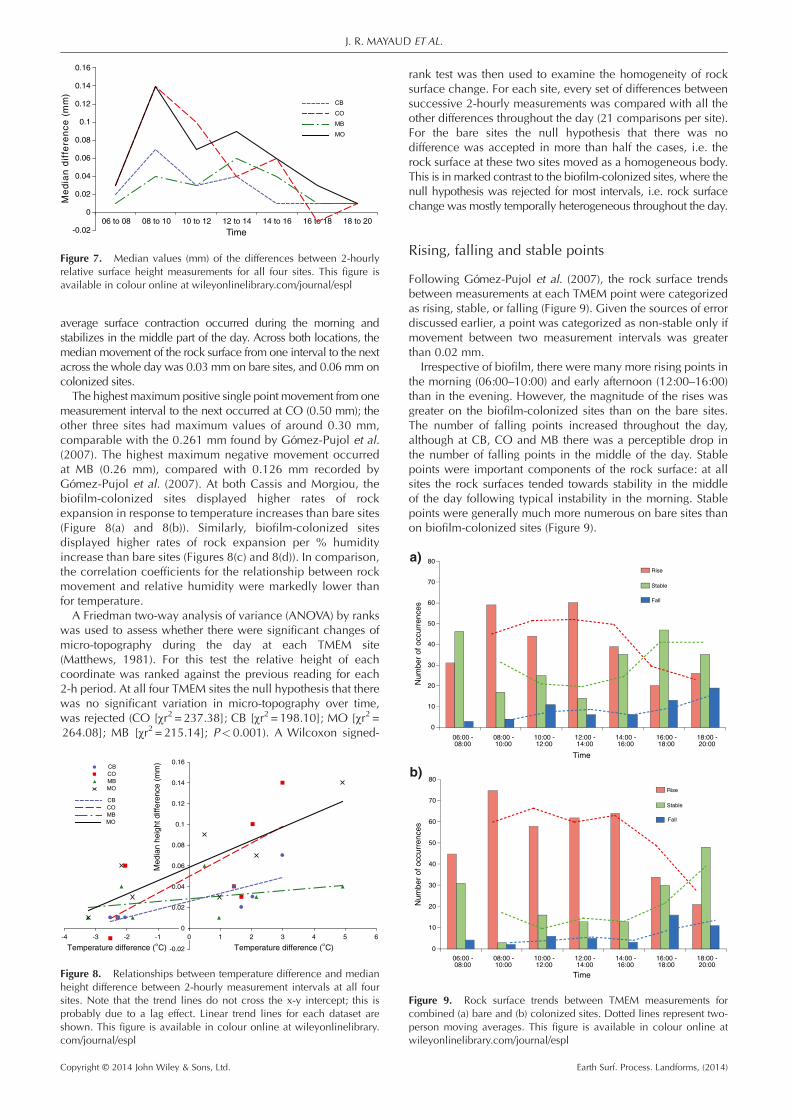
Rock surface change
At all four sites, the surface at 06:00–08:00 was almostuniformly stable (Figure 6). Only from 08:00 did any realmovement occur at the sites, be it contraction or expansion.At the two biofilm-colonized sites (CO and MO) the rockwas primarily expanding from 08:00–10:00, by an average(median) of 0.14 mm. Median values were used to summarizeTMEM data because statistical means of spatial topographicalvariations have been shown to be misleading (Spencer, 1981).In contrast, over the same time interval, the two bare rock sites(CB and MB) expanded to a lesser extent, by an average of0.07 mm and 0.04 mm, respectively, with some contractingpatches also.
In general the bare rock sites expanded and contracted insteps. At CB, three intervals (08:00–10:00, 12:00–14:00 and14:00–16:00) were characterized by high magnitudemovements; while at MB, 08:00–10:00, 12:00–14:00 and18:00–20:00 were the main periods of movement. Thesurface did not move homogeneously but instead distinct‘hotspots’ of expansion and contraction were observed,which changed, sometimes abruptly, over the course of theday. Gómez-Pujol et al. (2007) observed similar behaviourat Marengo Bay.
Surface change on biofilm-colonized sites (particularly CO)was more spatially heterogeneous than on the bare sites, withhotspots of expansion and contraction occurring in adjacentzones. Individual patches also alternated between expansionand contraction throughout the day. The last two intervals of
Earth Surf. Process. Landforms, (2014)
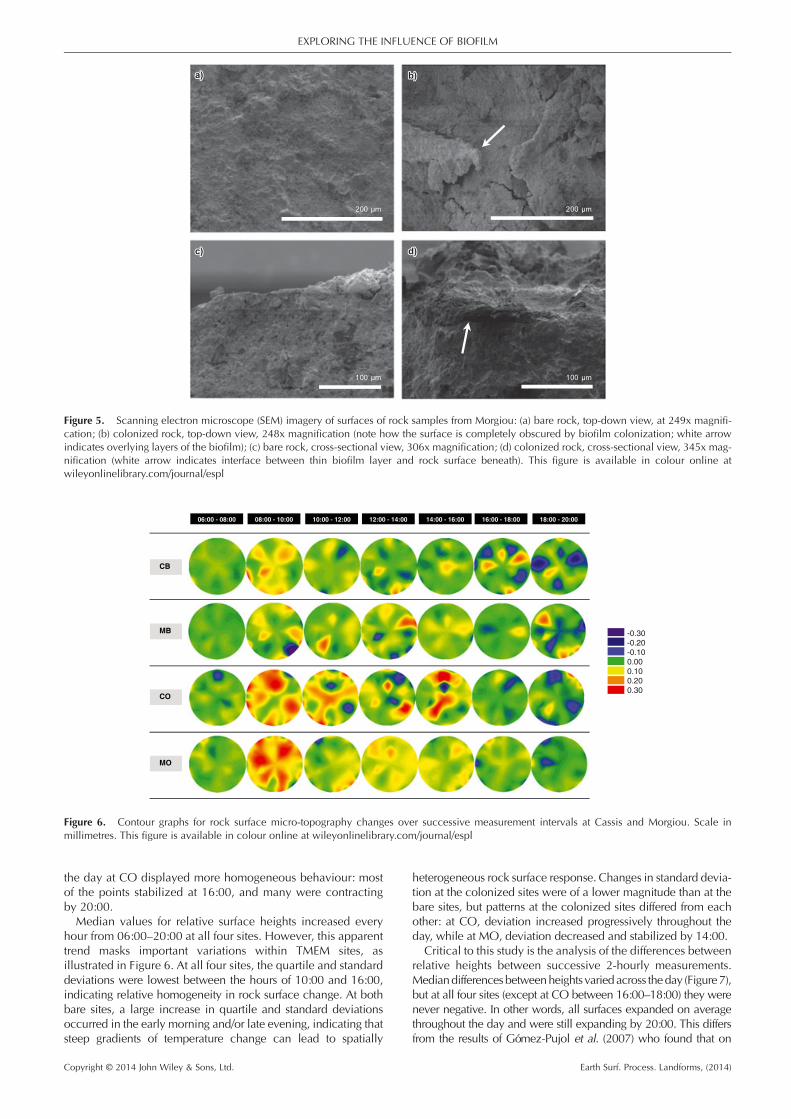
Figure 5. Scanning electron microscope (SEM) imagery of surfaces of rock samples from Morgiou: (a) bare rock, top-down view, at 249x magnifi-cation; (b) colonized rock, top-down view, 248x magnification (note how the surface is completely obscured by biofilm colonization; white arrowindicates overlying layers of the biofilm); (c) bare rock, cross-sectional view, 306x magnification; (d) colonized rock, cross-sectional view, 345x mag-nification (white arrow indicates interface between thin biofilm layer and rock surface beneath). This figure is available in colour online atwileyonlinelibrary.com/journal/espl
CB
MB
CO
MO
06:00 - 08:00 08:00 - 10:00 10:00 - 12:00 12:00 - 14:00 14:00 - 16:00 16:00 - 18:00 18:00 - 20:00
-0.30-0.20-0.100.000.100.200.30
Figure 6. Contour graphs for rock surface micro-topography changes over successive measurement intervals at Cassis and Morgiou. Scale inmillimetres. This figure is available in colour online at wileyonlinelibrary.com/journal/espl
EXPLORING THE INFLUENCE OF BIOFILM
the day at CO displayed more homogeneous behaviour: mostof the points stabilized at 16:00, and many were contractingby 20:00.Median values for relative surface heights increased every
hour from 06:00–20:00 at all four sites. However, this apparenttrend masks important variations within TMEM sites, asillustrated in Figure 6. At all four sites, the quartile and standarddeviations were lowest between the hours of 10:00 and 16:00,indicating relative homogeneity in rock surface change. At bothbare sites, a large increase in quartile and standard deviationsoccurred in the early morning and/or late evening, indicating thatsteep gradients of temperature change can lead to spatially
Copyright © 2014 John Wiley & Sons, Ltd.
heterogeneous rock surface response. Changes in standard devia-tion at the colonized sites were of a lower magnitude than at thebare sites, but patterns at the colonized sites differed from eachother: at CO, deviation increased progressively throughout theday, while at MO, deviation decreased and stabilized by 14:00.
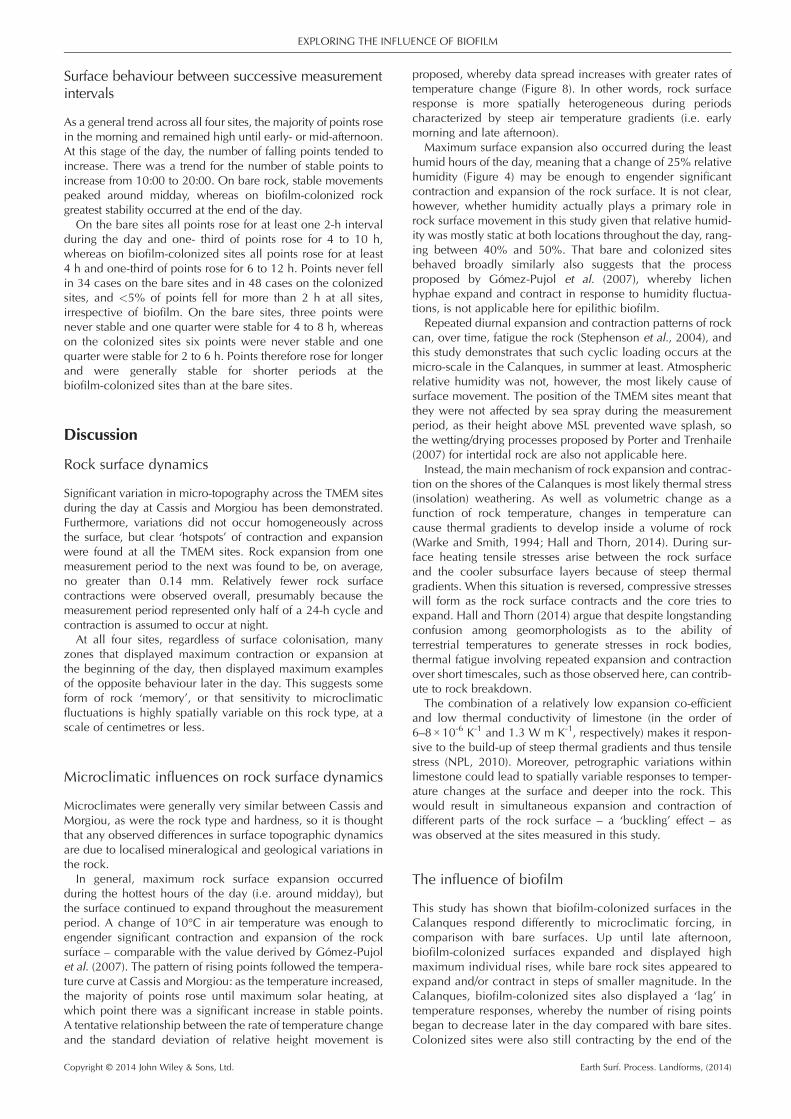
Critical to this study is the analysis of the differences betweenrelative heights between successive 2-hourly measurements.Mediandifferencesbetweenheights variedacross theday (Figure7),but at all four sites (except at CO between 16:00–18:00) they werenever negative. In other words, all surfaces expanded on averagethroughout the day and were still expanding by 20:00. This differsfrom the results of Gómez-Pujol et al. (2007) who found that on
Earth Surf. Process. Landforms, (2014)
-0.02
0
0.02
0.04
0.06
0.08
0.1
0.12
0.14
0.16
06 to 08 08 to 10 10 to 12 12 to 14 14 to 16 16 to 18 18 to 20
Me
dia
n d
iffe
ren
ce (
mm
)
Time
CB
CO
MB
MO
Figure 7. Median values (mm) of the differences between 2-hourlyrelative surface height measurements for all four sites. This figure isavailable in colour online at wileyonlinelibrary.com/journal/espl
0
10
20
30
40
50
60
70
80
Num
ber
of o
ccur
renc
es
06:00 - 08:00 - 10:00 - 12:00 - 14:00 - 16:00 - 18:00 -
a)Rise
Stable
Fall
J. R. MAYAUD ET AL.
average surface contraction occurred during the morning andstabilizes in the middle part of the day. Across both locations, themedian movement of the rock surface from one interval to the nextacross the whole day was 0.03 mm on bare sites, and 0.06 mm oncolonized sites.The highest maximum positive single point movement from one
measurement interval to the next occurred at CO (0.50 mm); theother three sites had maximum values of around 0.30 mm,comparable with the 0.261 mm found by Gómez-Pujol et al.(2007). The highest maximum negative movement occurredat MB (0.26 mm), compared with 0.126 mm recorded byGómez-Pujol et al. (2007). At both Cassis and Morgiou, thebiofilm-colonized sites displayed higher rates of rockexpansion in response to temperature increases than bare sites(Figure 8(a) and 8(b)). Similarly, biofilm-colonized sitesdisplayed higher rates of rock expansion per % humidityincrease than bare sites (Figures 8(c) and 8(d)). In comparison,the correlation coefficients for the relationship between rockmovement and relative humidity were markedly lower thanfor temperature.A Friedman two-way analysis of variance (ANOVA) by ranks
was used to assess whether there were significant changes ofmicro-topography during the day at each TMEM site(Matthews, 1981). For this test the relative height of eachcoordinate was ranked against the previous reading for each2-h period. At all four TMEM sites the null hypothesis that therewas no significant variation in micro-topography over time,was rejected (CO [χr2 = 237.38]; CB [χr2 = 198.10]; MO [χr2 =264.08]; MB [χr2 = 215.14]; P< 0.001). A Wilcoxon signed-
Med
ian
heig
ht d
iffer
ence
(m
m)
0
0.02
0.04
0.06
0.08
0.1
0.12
0.14
0.16
-0.02
-4 -3 -2 -1 0 1 2 3 4 5 6
Temperature difference (°C)Temperature difference (°C)
CBCOMBMO
CBCOMBMO
Figure 8. Relationships between temperature difference and medianheight difference between 2-hourly measurement intervals at all foursites. Note that the trend lines do not cross the x-y intercept; this isprobably due to a lag effect. Linear trend lines for each dataset areshown. This figure is available in colour online at wileyonlinelibrary.com/journal/espl
Copyright © 2014 John Wiley & Sons, Ltd.
rank test was then used to examine the homogeneity of rocksurface change. For each site, every set of differences betweensuccessive 2-hourly measurements was compared with all theother differences throughout the day (21 comparisons per site).For the bare sites the null hypothesis that there was nodifference was accepted in more than half the cases, i.e. therock surface at these two sites moved as a homogeneous body.This is in marked contrast to the biofilm-colonized sites, where thenull hypothesis was rejected for most intervals, i.e. rock surfacechange was mostly temporally heterogeneous throughout the day.
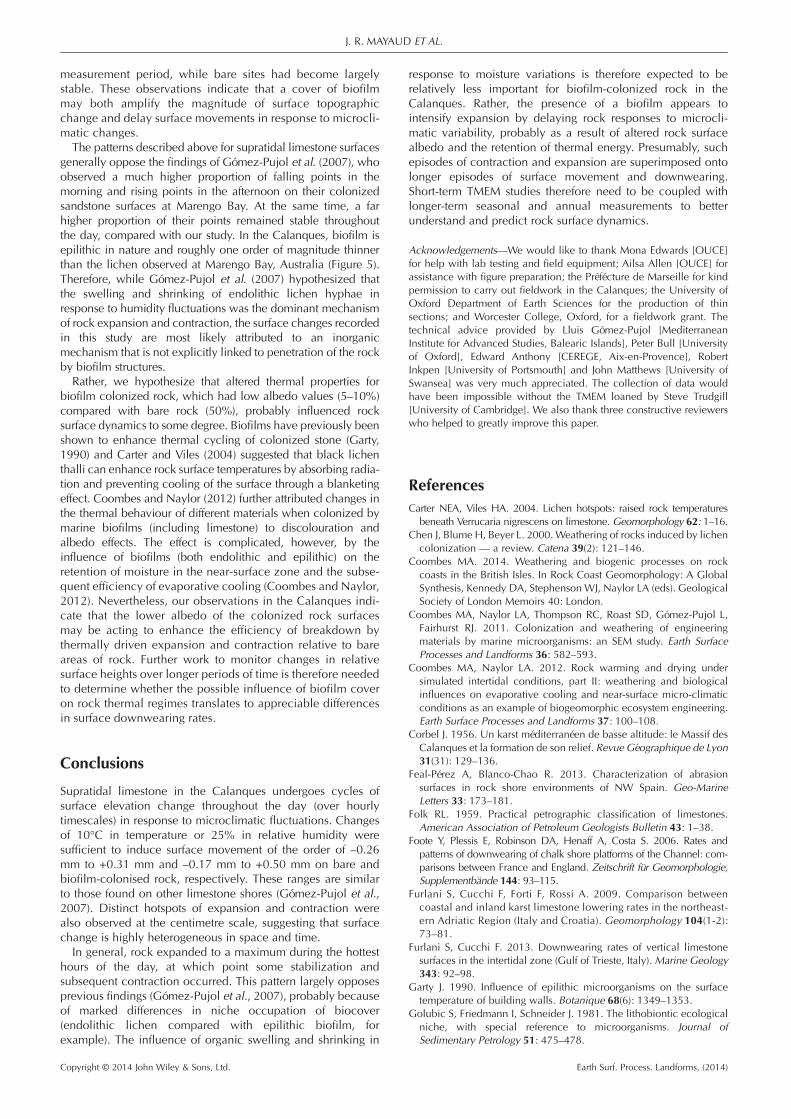
Rising, falling and stable points
Following Gómez-Pujol et al. (2007), the rock surface trendsbetween measurements at each TMEM point were categorizedas rising, stable, or falling (Figure 9). Given the sources of errordiscussed earlier, a point was categorized as non-stable only ifmovement between two measurement intervals was greaterthan 0.02 mm.
Irrespective of biofilm, there were many more rising points inthe morning (06:00–10:00) and early afternoon (12:00–16:00)than in the evening. However, the magnitude of the rises wasgreater on the biofilm-colonized sites than on the bare sites.The number of falling points increased throughout the day,although at CB, CO and MB there was a perceptible drop inthe number of falling points in the middle of the day. Stablepoints were important components of the rock surface: at allsites the rock surfaces tended towards stability in the middleof the day following typical instability in the morning. Stablepoints were generally much more numerous on bare sites thanon biofilm-colonized sites (Figure 9).
0
10
20
30
40
50
60
70
80
Num
ber
of o
ccur
renc
es
Time
08:00 10:00 12:00 14:00 16:00 18:00 20:00
Time
06:00 - 08:00
08:00 - 10:00
10:00 - 12:00
12:00 - 14:00
14:00 - 16:00
16:00 - 18:00
18:00 - 20:00
b)Rise
Stable
Fall
Figure 9. Rock surface trends between TMEM measurements forcombined (a) bare and (b) colonized sites. Dotted lines represent two-person moving averages. This figure is available in colour online atwileyonlinelibrary.com/journal/espl
Earth Surf. Process. Landforms, (2014)
EXPLORING THE INFLUENCE OF BIOFILM
Surface behaviour between successive measurementintervals
As a general trend across all four sites, the majority of points rosein the morning and remained high until early- or mid-afternoon.At this stage of the day, the number of falling points tended toincrease. There was a trend for the number of stable points toincrease from 10:00 to 20:00. On bare rock, stable movementspeaked around midday, whereas on biofilm-colonized rockgreatest stability occurred at the end of the day.On the bare sites all points rose for at least one 2-h interval
during the day and one- third of points rose for 4 to 10 h,whereas on biofilm-colonized sites all points rose for at least4 h and one-third of points rose for 6 to 12 h. Points never fellin 34 cases on the bare sites and in 48 cases on the colonizedsites, and <5% of points fell for more than 2 h at all sites,irrespective of biofilm. On the bare sites, three points werenever stable and one quarter were stable for 4 to 8 h, whereason the colonized sites six points were never stable and onequarter were stable for 2 to 6 h. Points therefore rose for longerand were generally stable for shorter periods at thebiofilm-colonized sites than at the bare sites.
Discussion
Rock surface dynamics
Significant variation in micro-topography across the TMEM sitesduring the day at Cassis and Morgiou has been demonstrated.Furthermore, variations did not occur homogeneously acrossthe surface, but clear ‘hotspots’ of contraction and expansionwere found at all the TMEM sites. Rock expansion from onemeasurement period to the next was found to be, on average,no greater than 0.14 mm. Relatively fewer rock surfacecontractions were observed overall, presumably because themeasurement period represented only half of a 24-h cycle andcontraction is assumed to occur at night.At all four sites, regardless of surface colonisation, many
zones that displayed maximum contraction or expansion atthe beginning of the day, then displayed maximum examplesof the opposite behaviour later in the day. This suggests someform of rock ‘memory’, or that sensitivity to microclimaticfluctuations is highly spatially variable on this rock type, at ascale of centimetres or less.
Microclimatic influences on rock surface dynamics
Microclimates were generally very similar between Cassis andMorgiou, as were the rock type and hardness, so it is thoughtthat any observed differences in surface topographic dynamicsare due to localised mineralogical and geological variations inthe rock.In general, maximum rock surface expansion occurred
during the hottest hours of the day (i.e. around midday), butthe surface continued to expand throughout the measurementperiod. A change of 10°C in air temperature was enough toengender significant contraction and expansion of the rocksurface – comparable with the value derived by Gómez-Pujolet al. (2007). The pattern of rising points followed the tempera-ture curve at Cassis and Morgiou: as the temperature increased,the majority of points rose until maximum solar heating, atwhich point there was a significant increase in stable points.A tentative relationship between the rate of temperature changeand the standard deviation of relative height movement is
Copyright © 2014 John Wiley & Sons, Ltd.
proposed, whereby data spread increases with greater rates oftemperature change (Figure 8). In other words, rock surfaceresponse is more spatially heterogeneous during periodscharacterized by steep air temperature gradients (i.e. earlymorning and late afternoon).
Maximum surface expansion also occurred during the leasthumid hours of the day, meaning that a change of 25% relativehumidity (Figure 4) may be enough to engender significantcontraction and expansion of the rock surface. It is not clear,however, whether humidity actually plays a primary role inrock surface movement in this study given that relative humid-ity was mostly static at both locations throughout the day, rang-ing between 40% and 50%. That bare and colonized sitesbehaved broadly similarly also suggests that the processproposed by Gómez-Pujol et al. (2007), whereby lichenhyphae expand and contract in response to humidity fluctua-tions, is not applicable here for epilithic biofilm.
Repeated diurnal expansion and contraction patterns of rockcan, over time, fatigue the rock (Stephenson et al., 2004), andthis study demonstrates that such cyclic loading occurs at themicro-scale in the Calanques, in summer at least. Atmosphericrelative humidity was not, however, the most likely cause ofsurface movement. The position of the TMEM sites meant thatthey were not affected by sea spray during the measurementperiod, as their height above MSL prevented wave splash, sothe wetting/drying processes proposed by Porter and Trenhaile(2007) for intertidal rock are also not applicable here.
Instead, the main mechanism of rock expansion and contrac-tion on the shores of the Calanques is most likely thermal stress(insolation) weathering. As well as volumetric change as afunction of rock temperature, changes in temperature cancause thermal gradients to develop inside a volume of rock(Warke and Smith, 1994; Hall and Thorn, 2014). During sur-face heating tensile stresses arise between the rock surfaceand the cooler subsurface layers because of steep thermalgradients. When this situation is reversed, compressive stresseswill form as the rock surface contracts and the core tries toexpand. Hall and Thorn (2014) argue that despite longstandingconfusion among geomorphologists as to the ability ofterrestrial temperatures to generate stresses in rock bodies,thermal fatigue involving repeated expansion and contractionover short timescales, such as those observed here, can contrib-ute to rock breakdown.
The combination of a relatively low expansion co-efficientand low thermal conductivity of limestone (in the order of6–8 × 10⁻⁶ K-1 and 1.3 W m K-1, respectively) makes it respon-sive to the build-up of steep thermal gradients and thus tensilestress (NPL, 2010). Moreover, petrographic variations withinlimestone could lead to spatially variable responses to temper-ature changes at the surface and deeper into the rock. Thiswould result in simultaneous expansion and contraction ofdifferent parts of the rock surface – a ‘buckling’ effect – aswas observed at the sites measured in this study.
The influence of biofilm
This study has shown that biofilm-colonized surfaces in theCalanques respond differently to microclimatic forcing, incomparison with bare surfaces. Up until late afternoon,biofilm-colonized surfaces expanded and displayed highmaximum individual rises, while bare rock sites appeared toexpand and/or contract in steps of smaller magnitude. In theCalanques, biofilm-colonized sites also displayed a ‘lag’ intemperature responses, whereby the number of rising pointsbegan to decrease later in the day compared with bare sites.Colonized sites were also still contracting by the end of the
Earth Surf. Process. Landforms, (2014)
J. R. MAYAUD ET AL.
measurement period, while bare sites had become largelystable. These observations indicate that a cover of biofilmmay both amplify the magnitude of surface topographicchange and delay surface movements in response to microcli-matic changes.The patterns described above for supratidal limestone surfaces
generally oppose the findings of Gómez-Pujol et al. (2007), whoobserved a much higher proportion of falling points in themorning and rising points in the afternoon on their colonizedsandstone surfaces at Marengo Bay. At the same time, a farhigher proportion of their points remained stable throughoutthe day, compared with our study. In the Calanques, biofilm isepilithic in nature and roughly one order of magnitude thinnerthan the lichen observed at Marengo Bay, Australia (Figure 5).Therefore, while Gómez-Pujol et al. (2007) hypothesized thatthe swelling and shrinking of endolithic lichen hyphae inresponse to humidity fluctuations was the dominant mechanismof rock expansion and contraction, the surface changes recordedin this study are most likely attributed to an inorganicmechanism that is not explicitly linked to penetration of the rockby biofilm structures.Rather, we hypothesize that altered thermal properties for
biofilm colonized rock, which had low albedo values (5–10%)compared with bare rock (50%), probably influenced rocksurface dynamics to some degree. Biofilms have previously beenshown to enhance thermal cycling of colonized stone (Garty,1990) and Carter and Viles (2004) suggested that black lichenthalli can enhance rock surface temperatures by absorbing radia-tion and preventing cooling of the surface through a blanketingeffect. Coombes and Naylor (2012) further attributed changes inthe thermal behaviour of different materials when colonized bymarine biofilms (including limestone) to discolouration andalbedo effects. The effect is complicated, however, by theinfluence of biofilms (both endolithic and epilithic) on theretention of moisture in the near-surface zone and the subse-quent efficiency of evaporative cooling (Coombes and Naylor,2012). Nevertheless, our observations in the Calanques indi-cate that the lower albedo of the colonized rock surfacesmay be acting to enhance the efficiency of breakdown bythermally driven expansion and contraction relative to bareareas of rock. Further work to monitor changes in relativesurface heights over longer periods of time is therefore neededto determine whether the possible influence of biofilm coveron rock thermal regimes translates to appreciable differencesin surface downwearing rates.
Conclusions
Supratidal limestone in the Calanques undergoes cycles ofsurface elevation change throughout the day (over hourlytimescales) in response to microclimatic fluctuations. Changesof 10°C in temperature or 25% in relative humidity weresufficient to induce surface movement of the order of –0.26mm to +0.31 mm and –0.17 mm to +0.50 mm on bare andbiofilm-colonised rock, respectively. These ranges are similarto those found on other limestone shores (Gómez-Pujol et al.,2007). Distinct hotspots of expansion and contraction werealso observed at the centimetre scale, suggesting that surfacechange is highly heterogeneous in space and time.In general, rock expanded to a maximum during the hottest
hours of the day, at which point some stabilization andsubsequent contraction occurred. This pattern largely opposesprevious findings (Gómez-Pujol et al., 2007), probably becauseof marked differences in niche occupation of biocover(endolithic lichen compared with epilithic biofilm, forexample). The influence of organic swelling and shrinking in
Copyright © 2014 John Wiley & Sons, Ltd.
response to moisture variations is therefore expected to berelatively less important for biofilm-colonized rock in theCalanques. Rather, the presence of a biofilm appears tointensify expansion by delaying rock responses to microcli-matic variability, probably as a result of altered rock surfacealbedo and the retention of thermal energy. Presumably, suchepisodes of contraction and expansion are superimposed ontolonger episodes of surface movement and downwearing.Short-term TMEM studies therefore need to be coupled withlonger-term seasonal and annual measurements to betterunderstand and predict rock surface dynamics.
Acknowledgements—We would like to thank Mona Edwards [OUCE]for help with lab testing and field equipment; Ailsa Allen [OUCE] forassistance with figure preparation; the Préfécture de Marseille for kindpermission to carry out fieldwork in the Calanques; the University ofOxford Department of Earth Sciences for the production of thinsections; and Worcester College, Oxford, for a fieldwork grant. Thetechnical advice provided by Lluis Gómez-Pujol [MediterraneanInstitute for Advanced Studies, Balearic Islands], Peter Bull [Universityof Oxford], Edward Anthony [CEREGE, Aix-en-Provence], RobertInkpen [University of Portsmouth] and John Matthews [University ofSwansea] was very much appreciated. The collection of data wouldhave been impossible without the TMEM loaned by Steve Trudgill[University of Cambridge]. We also thank three constructive reviewerswho helped to greatly improve this paper.
ReferencesCarter NEA, Viles HA. 2004. Lichen hotspots: raised rock temperaturesbeneath Verrucaria nigrescens on limestone. Geomorphology 62: 1–16.
Chen J, Blume H, Beyer L. 2000. Weathering of rocks induced by lichencolonization — a review. Catena 39(2): 121–146.
Coombes MA. 2014. Weathering and biogenic processes on rockcoasts in the British Isles. In Rock Coast Geomorphology: A GlobalSynthesis, Kennedy DA, Stephenson WJ, Naylor LA (eds). GeologicalSociety of London Memoirs 40: London.
Coombes MA, Naylor LA, Thompson RC, Roast SD, Gómez-Pujol L,Fairhurst RJ. 2011. Colonization and weathering of engineeringmaterials by marine microorganisms: an SEM study. Earth SurfaceProcesses and Landforms 36: 582–593.
Coombes MA, Naylor LA. 2012. Rock warming and drying undersimulated intertidal conditions, part II: weathering and biologicalinfluences on evaporative cooling and near-surface micro-climaticconditions as an example of biogeomorphic ecosystem engineering.Earth Surface Processes and Landforms 37: 100–108.
Corbel J. 1956. Un karst méditerranéen de basse altitude: le Massif desCalanques et la formation de son relief. Revue Géographique de Lyon31(31): 129–136.
Feal-Pérez A, Blanco-Chao R. 2013. Characterization of abrasionsurfaces in rock shore environments of NW Spain. Geo-MarineLetters 33: 173–181.
Folk RL. 1959. Practical petrographic classification of limestones.American Association of Petroleum Geologists Bulletin 43: 1–38.
Foote Y, Plessis E, Robinson DA, Henaff A, Costa S. 2006. Rates andpatterns of downwearing of chalk shore platforms of the Channel: com-parisons between France and England. Zeitschrift für Geomorphologie,Supplementbände 144: 93–115.
Furlani S, Cucchi F, Forti F, Rossi A. 2009. Comparison betweencoastal and inland karst limestone lowering rates in the northeast-ern Adriatic Region (Italy and Croatia). Geomorphology 104(1-2):73–81.
Furlani S, Cucchi F. 2013. Downwearing rates of vertical limestonesurfaces in the intertidal zone (Gulf of Trieste, Italy). Marine Geology343: 92–98.
Garty J. 1990. Influence of epilithic microorganisms on the surfacetemperature of building walls. Botanique 68(6): 1349–1353.
Golubic S, Friedmann I, Schneider J. 1981. The lithobiontic ecologicalniche, with special reference to microorganisms. Journal ofSedimentary Petrology 51: 475–478.
Earth Surf. Process. Landforms, (2014)
EXPLORING THE INFLUENCE OF BIOFILM
Gómez-Pujol L, Stephenson WJ, Fornós JJ. 2007. Two-hourly surfacechange on supra-tidal rock (Marengo, Victoria, Australia). EarthSurface Processes and Landforms 32(1): 1–12.
Goudie, AS. 2006. The Schmidt Hammer in geomorphologicalresearch. Progress in Physical Geography 30: 703–718.
Hall K, Thorn CE. 2014. Thermal fatigue and thermal shock in bedrock:an attempt to unravel the geomorphic processes and products.Geomorphology 206: 1–13.
Hemmingsen SA, Eikaas HS, Hemmingsen MA. 2007. The influence ofseasonal and local weather conditions on rock surface changes onshore platforms, Kaikoura Peninsula, South Island, New Zealand.Geomorphology 87: 239–249.
High C, Hanna FK. 1970. A method for direct measurement of erosionon rock surfaces. British Geomorphological Research GroupTechnical Bulletin 5: 24
Hutchinson N, Nagarkar S, Aitchison JC, Williams GA. 2006.Microspatial variation in marine biofilm abundance on intertidalrock surfaces. Aquatic Microbial Ecology 42: 187–197.
Kirk RM. 1977. Rates and forms of erosion on intertidal platforms atKaikoura Peninsula, South Island, New Zealand. New ZealandJournal of Geology and Geophysics 20: 571–613.
Matthews JA. 1981. Quantitative and Statistical Approaches toGeography. Pergamon Press: Oxford.
National Physical Laboratory (NPL), 2010. Kaye and Laby Table ofPhysical and Chemical Components. http://www.kayelaby.npl.co.uk/general_physics/2_3/2_3_5.html. [accessed 19/11/10].
Naylor LA, Coombes MA, Viles HA. 2012. Reconceptualising the roleof organisms in the erosion of rock coasts: a new model. Geomor-phology 157–158: 17–30.
Porter NJ, Trenhaile AS. 2007. Short-term rock surface expansion andcontraction in the intertidal zone. Earth Surface Processes andLandforms 32(9): 1379–1397.
Spate AP, Jennings JN, Smith DI, Greenaway MA. 1985. The micro-erosion meter: use and limitations. Earth Surface Processes andLandforms 10(5): 427–440.
Spencer T. 1981.Micro-topographic change on calcarenites,GrandCaymanIsland, West Indies. Earth Surface Processes and Landforms 6(1): 85–94.
Stephenson WJ. 2000. Shore platforms: a neglected coastal feature?Progress in Physical Geography 24: 311–327.
Copyright © 2014 John Wiley & Sons, Ltd.
Stephenson WJ, Dickson ME, Trenhaile AS. 2013. Rock coasts. InTreatise on Geomorphology, Vol. 10, Shroder JF (ed). AcademicPress: San Diego; 289–307.
StephensonWJ, Finlayson BL. 2009. Measuring erosion with the micro-erosion meter – contributions to understanding landform evolution.Earth-Science Reviews 95(1–2): 53–62.
Stephenson WJ, Kirk RM. 2000. Development of shore platforms onKaikoura Peninsula, South Island, New Zealand: Part II: the role ofsubaerial weathering. Geomorphology 32: 43–56.
Stephenson WJ, Kirk RM. 2001. Surface swelling of coastal bedrock oninter-tidal shore platforms, Kaikoura Peninsula, South Island, NewZealand. Geomorphology 41(1): 5–21.
StephensonWJ, Taylor AJ, Hemmingsen MA, Tsujimoto H, Kirk RM. 2004.Short-term microscale topographic changes of coastal bedrock on shoreplatforms. Earth Surface Processes and Landforms 29(13): 1663–1673.
Swantesson JOH, Moses CA, Berg GE, Jansson KM. 2006. Methods formeasuring shore platform micro erosion: a comparison of the micro-erosion meter and laser scanner. Zeitschrift für Geomorphologie,Supplementbände 144: 1–17.
Trenhaile AS. 1987. The Geomorphology of Rock Coasts. OxfordUniversity Press: Oxford.
Trenhaile AS. 1980. Shore platforms: a neglected coastal feature.Progress in Physical Geography 4: 1–23.
Trenhaile AS. 1997. Coastal Dynamics and Landforms. ClarendonPress: Oxford.
Trenhaile AS. 2006. Tidal wetting and drying on shore platforms: anexperimental study of surface expansion and contraction. Geomor-phology 76(3–4): 316–331.
Trudgill ST. 1977. Problems in the estimation of short-term variations inlimestone erosion processes. Earth Surface Processes and Landforms2: 251–256.
Viles HA, Goudie AS, Grab S, Lalley J. 2010. The use of the SchmidtHammer and Equotip for rock hardness assessment in geomorphol-ogy and heritage science: a comparative analysis. Earth SurfaceProcesses and Landforms 36(3): 323–333.
Warke PA, Smith BJ. 1994. Short-term rock temperature fluctuationsunder simulated hot desert conditions: some preliminary data. InRock Weathering and Landform Evolution, Robinson DA, WilliamsRGB (eds). John Wiley and Sons: Chichester, 57–70.
Earth Surf. Process. Landforms, (2014)