roll and lock mechansim of muscle contraction
TRANSCRIPT
Structure, Vol. 13, 131–141, January, 2005, ©2005 Elsevier Ltd All rights reserved. DOI 10.1016/j.str.2004.11.007
The “Roll and Lock” Mechanismof Force Generation in Muscle
Michael A. Ferenczi,1,6,* Sergey Y. Bershitsky,2,6
Natalia Koubassova,3,6 Verl Siththanandan,1
William I. Helsby,4 Pierre Panine,5 Manfred Roessle,5
Theyencheri Narayanan,5
and Andrey K. Tsaturyan3,6
1Imperial CollegeLondon SW7 2AZUnited Kingdom2Institute of Immunology and PhysiologyUral BranchRussian Academy of SciencesYekaterinburg 620219Russia3 Institute of MechanicsMoscow UniversityMoscow 119992Russia4Daresbury LaboratoryCheshire WA4 4ADUnited Kingdom5ESRFBP 220F-38043 GrenobleFrance
Summary
Muscle force results from the interaction of the globu-lar heads of myosin-II with actin filaments. We studiedthe structure-function relationship in the myosin mo-tor in contracting muscle fibers by using temperaturejumps or length steps combined with time-resolved,low-angle X-ray diffraction. Both perturbations inducedsimultaneous changes in the active muscle force andin the extent of labeling of the actin helix by stereo-specifically bound myosin heads at a constant totalnumber of attached heads. The generally acceptedhypothesis assumes that muscle force is generatedsolely by tilting of the lever arm, or the light chaindomain of the myosin head, about its catalytic do-main firmly bound to actin. Data obtained suggest anadditional force-generating step: the “roll and lock”transition of catalytic domains of non-stereo-specifi-cally attached heads to a stereo-specifically boundstate. A model based on this scheme is described toquantitatively explain the data.
Introduction
The current lever arm hypothesis (Holmes, 1997) sug-gests that the actin-myosin motor in contracting verte-brate skeletal muscle produces force or displacementby a tilt of the light chain, or “neck,” domain of themyosin head (myosin subfragment 1, or S1) with re-spect to its catalytic domain, which remains in a fixed
*Correspondence: [email protected]
6 These authors contributed equally to the work.position on actin. Crystallographic (Smith and Rayment,1996; Houdusse et al., 1999, 2000), electron micro-scopy (Burgess et al., 2002), and spectroscopic data(Yasunaga et al., 2000; Forkey et al., 2003) support thishypothesis and show a nucleotide dependent 40°–75°tilt of the neck domain equivalent to an axial movementof the end of the lever arm of 5–12 nm in myosin-II. Sofar, all atomic S1 structures were obtained in the absenceof actin. For this reason, the possible role of molecularinteractions at the actin-S1 interface in force generationremains obscure. Nucleotide-induced changes in affin-ity of myosin heads for actin have been known for manyyears but remain unexplained at a molecular level. Re-cent crystallographic (Coureux et al., 2003; Reubold etal., 2003) data, results of docking of high-resolutioncrystallographic structures into low-resolution cryo-EMimages (Volkmann et al., 2003; Holmes et al., 2003), andfluorescence measurements (Conibear et al., 2003) re-veal conformational changes in the actin binding do-main of S1. It is hypothesized that these changes areresponsible for the transition from weak to strong bind-ing of S1 to actin and are essential processes for thefunction of the myosin motor.
We previously reported results of experiments withfrog muscle fibers in which we observed a concomitantincrease in force and in the intensity, IA1, of the firstactin layer line, A1, at 1/37 nm−1 in the X-ray diffractionpattern when temperature increased, while fiber stiff-ness was unchanged (Bershitsky et al., 1997; Tsaturyanet al., 1999a). This was interpreted as an increase in thenumber of myosin heads stereo-specifically labelingthe actin helix. EM-tomography of contracting insectflight muscles (Taylor et al., 1999) shows that myosinheads can have different orientations of their motor do-mains with respect to actin in contracting muscle. De-spite this, the simplest assumption that during forcegeneration the motor domain of S1 has a fixed positionon actin and that the major moving part of the motor isthe neck of S1 is commonly used (Irving et al., 2000;Piazzesi et al., 2002). A model calculation showed thatIA1 is insensitive to a tilt of the lever arm if the catalyticdomain remains in a fixed position on actin (Koubas-sova and Tsaturyan, 2002). This supports an involve-ment of a “locking” transition from a non-stereo-spe-cific to a stereo-specific binding of S1 to actin in forcegeneration (Bershitsky et al., 1997; Taylor et al., 1999;Tsaturyan et al., 1999a; Huxley, 2000; Kraft et al., 2002).The term “stereo-specific binding” implies a fixed posi-tion of the catalytic domain of S1 with respect to actin,so that its position in space is fully determined by theposition of the actin monomer(s) it is bound to. “Non-stereo-specific binding” means that the actin-myosininterface has substantial axial stiffness but allows at-tachment of the catalytic domain of S1 to actin at dif-ferent azimuthal and axial angles so that the contribu-tion of myosin heads to the actin layer lines is low. Suchnon-stereo-specific binding probably takes place viaelectrostatic interactions (Rayment et al., 1993). Actinactivation of the myosin ATPase and the affinity of S1to actin depend on charges in loop 2 of S1 and in the
Structure132
subdomain 1 of actin but are not very sensitive to their lposition in the amino acid sequences (Furch et al., p1998; Wong et al., 1999; Joel et al., 2001). These find- hings, as well as the high variability in the length and famino acid sequence of loop 2 among myosins of the wmyosin-II subfamily (Cope et al., 1996), provide evi- ldence that this electrostatic contact is not stereo-spe- hcific. e
Here, we report the results of probing the structure- afunction relationship in muscle myosin-II by using tem- iperature jump (T-jump) in contracting permeabilized lfibers from rabbit muscle. T-jump and length step per- iturbations were used to synchronize force-generating ievents in myosin crossbridges. The response to, and rrelaxation from, these perturbations reveal intrinsic mo- plecular processes in the muscle fiber which are thoseresponsible for muscle contraction under physiological Iconditions. Structural changes were monitored with hlow-angle X-ray diffraction at 1 ms time resolution. The tresults strongly support our hypothesis (Bershitsky et tal., 1997) that force generation is tightly coupled with a t“locking” transition, irrespective of the type of perturba- ption used to synchronize the force-generating events. A snew model in which force generation is a two-step pro- ncess quantitatively explains the data. The first step is a e“roll and lock” transition of non-stereo-specifically at- atached myosin heads to a stereo-specifically bound
rstate. The second step is lever arm tilting. Both pro-cesses are coupled to different stages in the pathway
fof ATP hydrolysis, which is the source of energy for
(muscle contraction.fn
Results ot
Actin Labeling by Bound Myosin Headst
during Low- and High-Tension ContractionA
The T-jump from 5°C to 30°C in permeabilized fibersi
from rabbit muscle induced a 3-fold increase in activelfiber tension. Changes in the 2D, low-angle X-ray dif-cfraction pattern collected with a CCD X-ray detectordduring and after the tension rise are shown in Figurei1. Due to the relatively long read-out time of the CCDmdetector, only three time frames were recorded in thisiseries of experiments: “cold” and “hot” steady-stateaframes on the plateau of contraction at pre- (5°C) andppost-T-jump (30°C) temperatures and an “intermedi-iate,” 5 ms long period occurring half-way during thertension rise after the T-jump (Figure 2A). The differencesbetween the “hot” and “cold” diffraction patterns re-rvealed that the intensities of all actin layer lines fromtA1 to A7 increased with temperature in parallel withttension (Figures 1 and 2A). These layer lines originateifrom diffraction on the actin helix (w37 nm period).sWhen myosin heads bind actin stereo-specifically, theytadopt the symmetry of the actin helix so that the axialtspacing of the layer lines remains the same as in thepabsence of bound myosin heads, but their intensitiescare higher. The intensities of the actin layer lines are(determined by the number of myosin heads incorpo-arated into the actin helix and by their conformation. Theaintensities of the actin-myosin beating layer lines AM−1
rand AM+1 at 1/24 nm−1 and 1/10.4 nm−1, respectively,also increased after the T-jump (Figure 1). These layer p
ines arise from axial modulation of the actin labelingattern by myosin heads that occurs because myosineads bound to an actin filament originate from the dif-erent crowns of myosin molecules separated axially by
14.5 nm along the myosin filaments. These beatingayer lines are specific indicators of binding of myosineads to actin with myosin-based periodicity (Bordast al., 1993; Yagi, 1996; Tsaturyan, 2002; Koubassovand Tsaturyan, 2002). In the “intermediate,” frame the
ntensities of all actin- and actin-myosin-based layerines were approximately half-way between their valuesn the “cold” and “hot” steady states (Figure 1), show-ng that the extent of labeling of the actin helix by ste-eo-specifically bound heads increases approximatelyroportionally to tension.The intensity of the myosin meridional reflection M3,
M3, at w1/14.5 nm−1 in the “hot” frame was w55%igher than that in the “cold” one (Figure 1). In the “in-ermediate,” frame the M3 intensity was approximatelyhe same as that in the “cold” frame (Figure 1), whilehe average tension was half-way between its pre- andost-T-jump steady-state levels (Figure 2A). The inten-ity of the M6 myosin meridional reflection at w1/7.28m−1 decreased after the T-jump (Figure 1). In differ-nt sets of experiments, it was reduced by 15%–20%nd 5%–15% in the “hot” and “intermediate” framesespectively, compared to the “cold” one.
In another set of experiments with the same three-rame protocol (Figure 2A) but with a longer cameraFigure 2B), the A1 actin layer line was clearly separatedrom the neighboring first myosin layer line M1 at 1/43.5m−1. The latter arises from the axial period of helicalrigins of myosin heads on the thick filaments. Whilehe A1 intensity increased 2.5 times with temperature,he M1 intensity changed by less than 10% (Figure 2B).s seen from Figure 2C, the temperature-dependent
ncrease in the intensities of the A6 and A7 actin layerines at w1/5.9 nm−1 and w1/5.1 nm−1, respectively, inontracting muscle occurred at the same reciprocal ra-ii as that at which myosin heads contribute to these
ntensities in rigor, i.e., in the absence of ATP when allyosin heads are strongly bound to actin. The changes
n the intensity of the A6 and A7 layer lines were 9%nd 7%, respectively, for the “intermediate” frame com-ared to the “cold” one. During the “hot” frame, the
ncreases in these intensities were 15% and 17%,espectively, compared to the values at 5°C. The ob-erved position of the peak on the A5 actin layer lineeflection during contraction is closer to the meridianhan in rigor (Figure 2C). This means that the configura-ion of myosin heads stereo-specifically bound to actinn contracting muscle is different from that in rigor. Re-ults of the modeling of the intensity distribution alonghis layer line (Koubassova and Tsaturyan, 2002) showhat the neck domains of the bound heads are moreerpendicular to the filament axis due to a tilt or a bendompared to their rigor configuration observed by EMHolmes et al., 2003). Changes in the diffraction patternfter the T-jump demonstrate that at higher temper-ture and tension the number of myosin heads incorpo-ated into the actin helix increases and this process isrobably essential for force generation in muscle.
“Roll and Lock” Mechanism of Muscle Contraction133
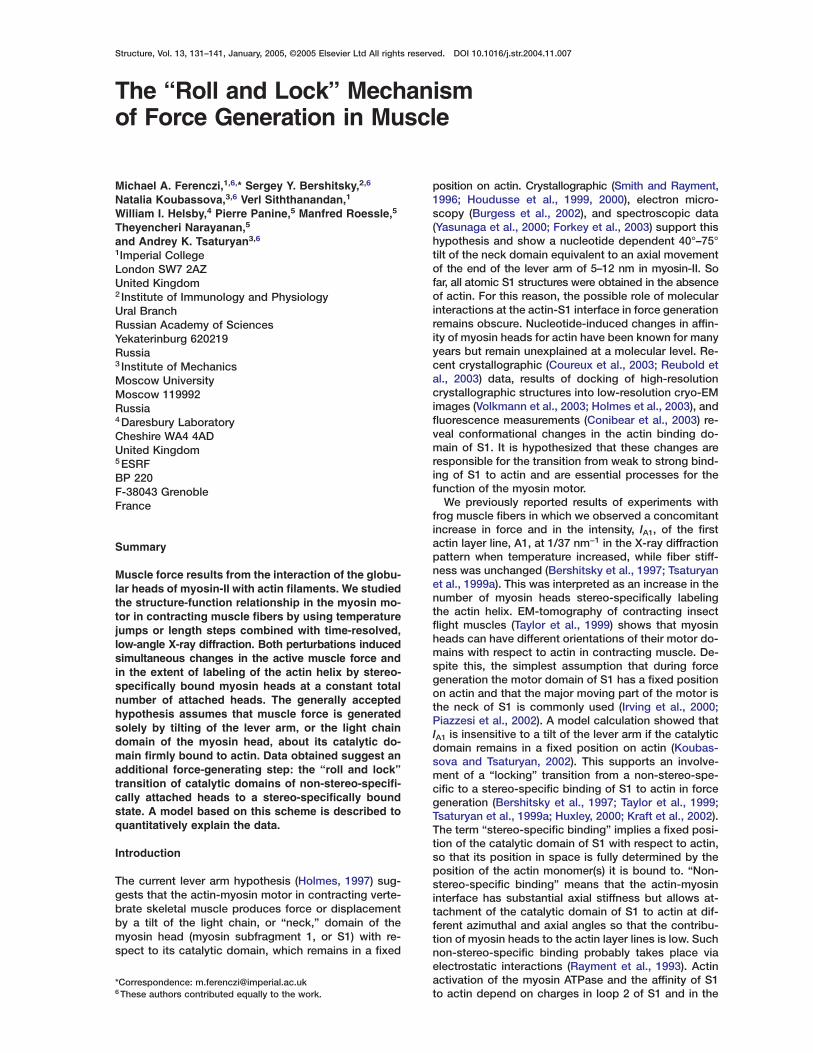
Figure 1. Changes in the 2D X-Ray Diffrac-tion Pattern in the Three-Frame T-Jump Pro-tocol
The differences between the diffraction pat-terns collected in the “hot” (30°C) and “cold”(5°C) frames (upper half) and between the“intermediate” and “cold” frames (lower half)are shown. The diffraction pattern collectedduring the 5 ms-long “cold” period was ar-ithmetically subtracted from the 5 ms-long“hot” diffraction pattern pixel by pixel to ob-tain the difference pattern. The same pro-cedure was used for the “intermediate”frame. Prior to subtraction, the intensities ofthe four quadrants were averaged in eachframe. The timing of the frames in relation tothe tension transient after the T-jump isshown in Figure 2A. The gray-scale indicatesthe magnitude of change in the intensity ofX-ray diffraction, with the highest increase inintensity shown in white, and the largestdecrease shown in black. The equator is ver-tical, and the position of some actin, myosin,and beating actin-myosin layer lines is la-beled with arrows. Data were collected from90 T-jumps in 5 bundles with a 2.5 m longcamera, incident beam flux 1013 pho-tons/s.
of fiber stiffness (Tsaturyan et al., 1999a; Bershitsky andT-jump with an apparent rate constant of 240 ± 18 s ,
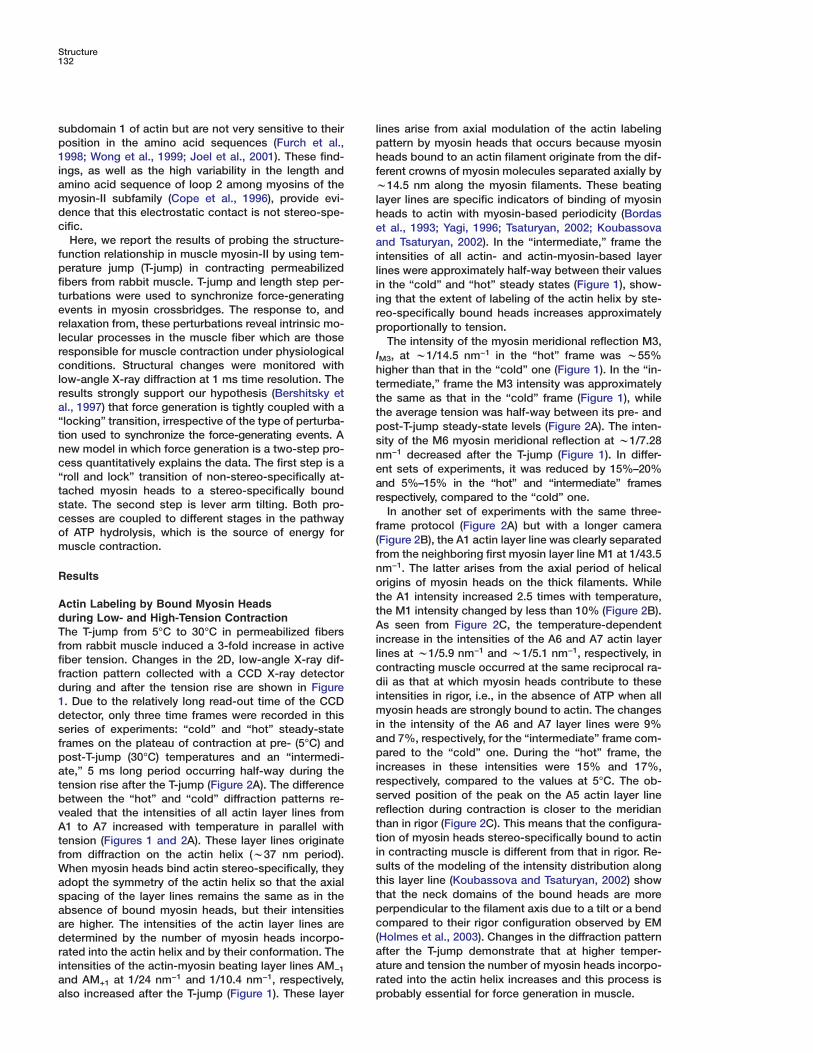
Figure 2. Changes in Tension and IntensityDistribution of Some Layer Lines in theThree-Frame T-Jump Protocol
(A) Average tension trace. Blue, green, andred bars on the tension trace show the tim-ing of the “cold,” “intermediate,” and “hot”frames, respectively.(B) The intensity of the M1 and A1 layerlines (flux 2.4 × 10¹³ photons/s, 77 T-jumps,9 bundles, 10 m long camera). Radial integ-ration was from 0.0269–0.091 nm−1, withsubtracted background intensity. The axialpositions of the A1 and M1 layer lines in rigorand for relaxed fiber bundles are shown.
(C) Intensity profiles of the A5, A6, and A7 actin layer lines (same data set as in Figure 1). Rigor profiles collected from the same bundles areshown in black. Blue, green, and red lines in (B) and (C) correspond to the “cold,” “intermediate,” and “hot” frames, respectively.
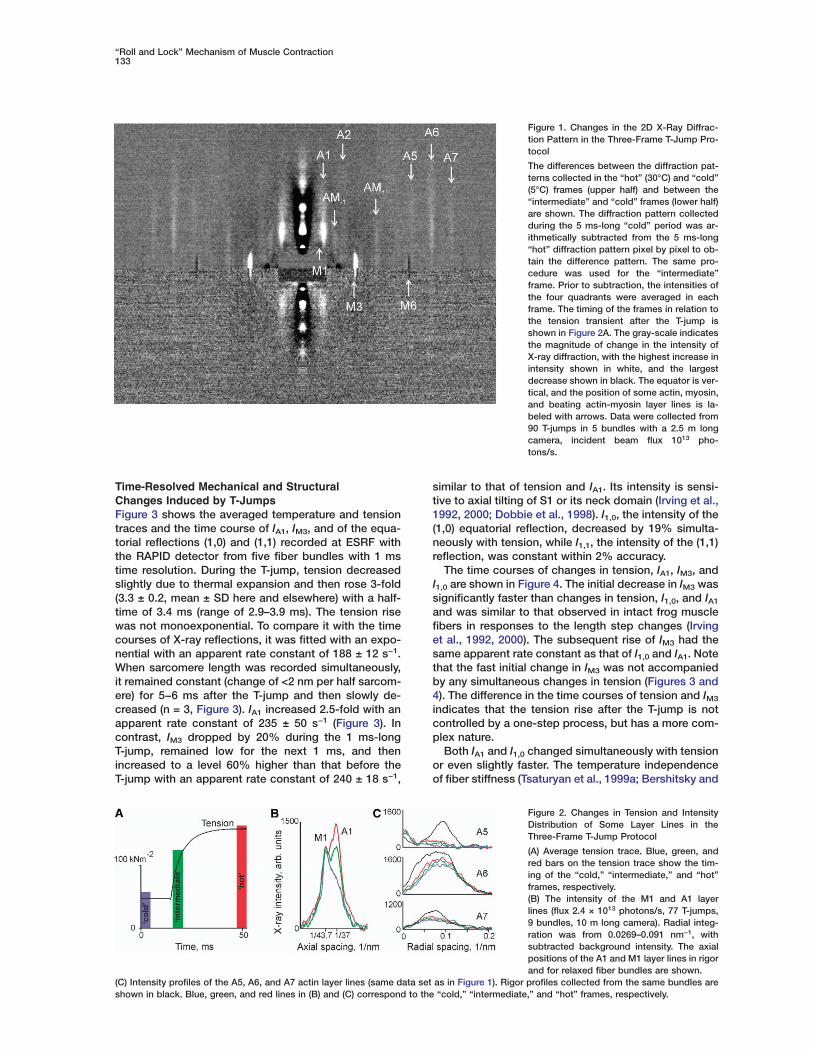
Time-Resolved Mechanical and StructuralChanges Induced by T-JumpsFigure 3 shows the averaged temperature and tensiontraces and the time course of IA1, IM3, and of the equa-torial reflections (1,0) and (1,1) recorded at ESRF withthe RAPID detector from five fiber bundles with 1 mstime resolution. During the T-jump, tension decreasedslightly due to thermal expansion and then rose 3-fold(3.3 ± 0.2, mean ± SD here and elsewhere) with a half-time of 3.4 ms (range of 2.9–3.9 ms). The tension risewas not monoexponential. To compare it with the timecourses of X-ray reflections, it was fitted with an expo-nential with an apparent rate constant of 188 ± 12 s−1.When sarcomere length was recorded simultaneously,it remained constant (change of <2 nm per half sarcom-ere) for 5−6 ms after the T-jump and then slowly de-creased (n = 3, Figure 3). IA1 increased 2.5-fold with anapparent rate constant of 235 ± 50 s−1 (Figure 3). Incontrast, IM3 dropped by 20% during the 1 ms-longT-jump, remained low for the next 1 ms, and thenincreased to a level 60% higher than that before the
−1
similar to that of tension and IA1. Its intensity is sensi-tive to axial tilting of S1 or its neck domain (Irving et al.,1992, 2000; Dobbie et al., 1998). I1,0, the intensity of the(1,0) equatorial reflection, decreased by 19% simulta-neously with tension, while I1,1, the intensity of the (1,1)reflection, was constant within 2% accuracy.
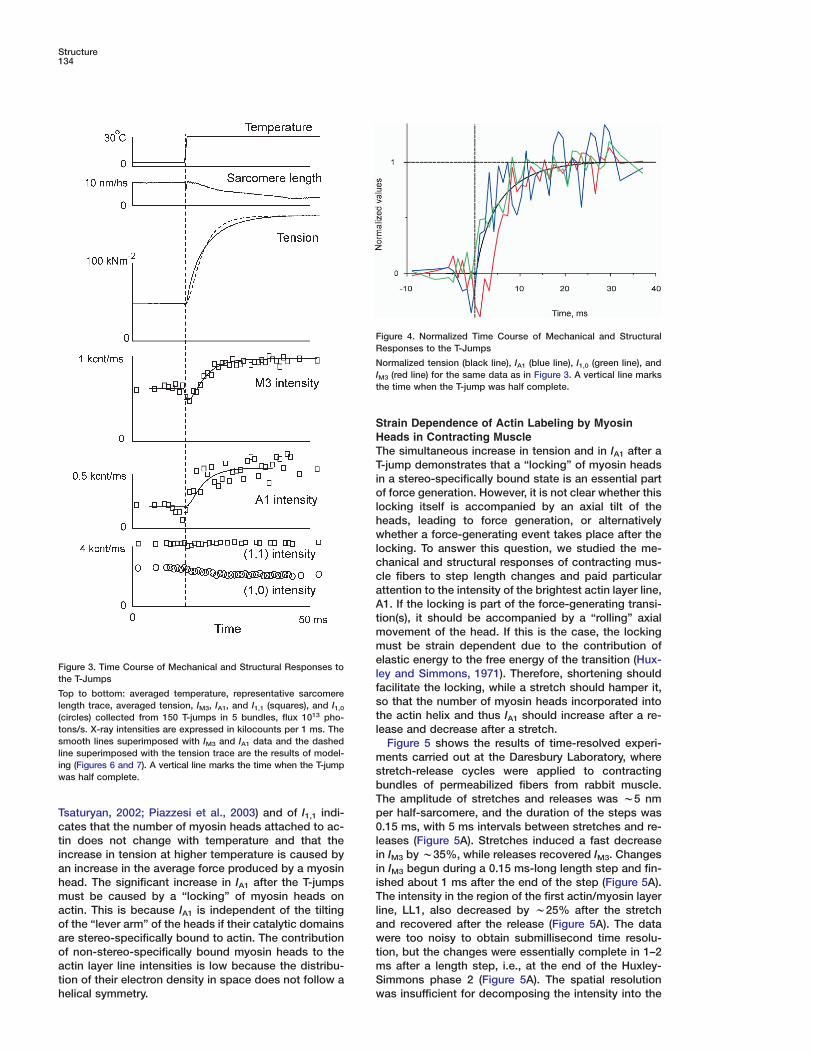
The time courses of changes in tension, IA1, IM3, andI1,0 are shown in Figure 4. The initial decrease in IM3 wassignificantly faster than changes in tension, I1,0, and IA1
and was similar to that observed in intact frog musclefibers in responses to the length step changes (Irvinget al., 1992, 2000). The subsequent rise of IM3 had thesame apparent rate constant as that of I1,0 and IA1. Notethat the fast initial change in IM3 was not accompaniedby any simultaneous changes in tension (Figures 3 and4). The difference in the time courses of tension and IM3
indicates that the tension rise after the T-jump is notcontrolled by a one-step process, but has a more com-plex nature.
Both IA1 and I1,0 changed simultaneously with tensionor even slightly faster. The temperature independence
Structure134
FR
NIt
SHTTiolhwlccaAtmme
Figure 3. Time Course of Mechanical and Structural Responses tolthe T-JumpsfTop to bottom: averaged temperature, representative sarcomereslength trace, averaged tension, IM3, IA1, and I1,1 (squares), and I1,0t(circles) collected from 150 T-jumps in 5 bundles, flux 1013 pho-
tons/s. X-ray intensities are expressed in kilocounts per 1 ms. The lsmooth lines superimposed with IM3 and IA1 data and the dashedline superimposed with the tension trace are the results of model- ming (Figures 6 and 7). A vertical line marks the time when the T-jump swas half complete.
bT
pTsaturyan, 2002; Piazzesi et al., 2003) and of I1,1 indi-cates that the number of myosin heads attached to ac- 0ltin does not change with temperature and that the
increase in tension at higher temperature is caused by iian increase in the average force produced by a myosin
head. The significant increase in IA1 after the T-jumps iTmust be caused by a “locking” of myosin heads on
actin. This is because IA1 is independent of the tilting laof the “lever arm” of the heads if their catalytic domains
are stereo-specifically bound to actin. The contribution wtof non-stereo-specifically bound myosin heads to the
actin layer line intensities is low because the distribu- mStion of their electron density in space does not follow a
helical symmetry. w
train Dependence of Actin Labeling by Myosineads in Contracting Musclehe simultaneous increase in tension and in IA1 after a-jump demonstrates that a “locking” of myosin headsn a stereo-specifically bound state is an essential partf force generation. However, it is not clear whether this
ocking itself is accompanied by an axial tilt of theeads, leading to force generation, or alternativelyhether a force-generating event takes place after the
ocking. To answer this question, we studied the me-hanical and structural responses of contracting mus-le fibers to step length changes and paid particularttention to the intensity of the brightest actin layer line,1. If the locking is part of the force-generating transi-
ion(s), it should be accompanied by a “rolling” axialovement of the head. If this is the case, the lockingust be strain dependent due to the contribution of
lastic energy to the free energy of the transition (Hux-ey and Simmons, 1971). Therefore, shortening shouldacilitate the locking, while a stretch should hamper it,o that the number of myosin heads incorporated intohe actin helix and thus IA1 should increase after a re-ease and decrease after a stretch.
Figure 5 shows the results of time-resolved experi-ents carried out at the Daresbury Laboratory, where
tretch-release cycles were applied to contractingundles of permeabilized fibers from rabbit muscle.he amplitude of stretches and releases was w5 nmer half-sarcomere, and the duration of the steps was.15 ms, with 5 ms intervals between stretches and re-
eases (Figure 5A). Stretches induced a fast decreasen IM3 by w35%, while releases recovered IM3. Changesn IM3 begun during a 0.15 ms-long length step and fin-shed about 1 ms after the end of the step (Figure 5A).he intensity in the region of the first actin/myosin layer
ine, LL1, also decreased by w25% after the stretchnd recovered after the release (Figure 5A). The dataere too noisy to obtain submillisecond time resolu-
ion, but the changes were essentially complete in 1–2s after a length step, i.e., at the end of the Huxley-immons phase 2 (Figure 5A). The spatial resolutionas insufficient for decomposing the intensity into the
igure 4. Normalized Time Course of Mechanical and Structuralesponses to the T-Jumps
ormalized tension (black line), IA1 (blue line), I1,0 (green line), and
M3 (red line) for the same data as in Figure 3. A vertical line markshe time when the T-jump was half complete.
“Roll and Lock” Mechanism of Muscle Contraction135
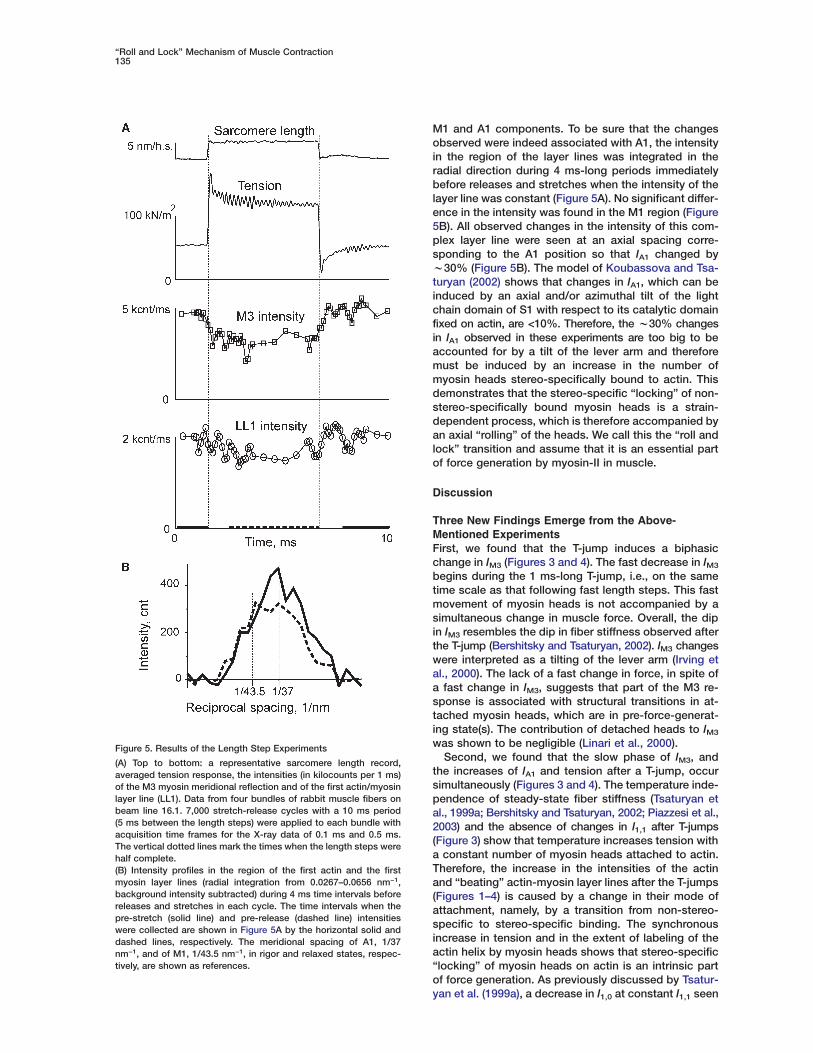
Figure 5. Results of the Length Step Experiments
(A) Top to bottom: a representative sarcomere length record,averaged tension response, the intensities (in kilocounts per 1 ms)of the M3 myosin meridional reflection and of the first actin/myosinlayer line (LL1). Data from four bundles of rabbit muscle fibers onbeam line 16.1. 7,000 stretch-release cycles with a 10 ms period(5 ms between the length steps) were applied to each bundle withacquisition time frames for the X-ray data of 0.1 ms and 0.5 ms.The vertical dotted lines mark the times when the length steps werehalf complete.(B) Intensity profiles in the region of the first actin and the firstmyosin layer lines (radial integration from 0.0267–0.0656 nm−1,background intensity subtracted) during 4 ms time intervals beforereleases and stretches in each cycle. The time intervals when thepre-stretch (solid line) and pre-release (dashed line) intensitieswere collected are shown in Figure 5A by the horizontal solid anddashed lines, respectively. The meridional spacing of A1, 1/37nm−1, and of M1, 1/43.5 nm−1, in rigor and relaxed states, respec-tively, are shown as references.
M1 and A1 components. To be sure that the changesobserved were indeed associated with A1, the intensityin the region of the layer lines was integrated in theradial direction during 4 ms-long periods immediatelybefore releases and stretches when the intensity of thelayer line was constant (Figure 5A). No significant differ-ence in the intensity was found in the M1 region (Figure5B). All observed changes in the intensity of this com-plex layer line were seen at an axial spacing corre-sponding to the A1 position so that IA1 changed byw30% (Figure 5B). The model of Koubassova and Tsa-turyan (2002) shows that changes in IA1, which can beinduced by an axial and/or azimuthal tilt of the lightchain domain of S1 with respect to its catalytic domainfixed on actin, are <10%. Therefore, the w30% changesin IA1 observed in these experiments are too big to beaccounted for by a tilt of the lever arm and thereforemust be induced by an increase in the number ofmyosin heads stereo-specifically bound to actin. Thisdemonstrates that the stereo-specific “locking” of non-stereo-specifically bound myosin heads is a strain-dependent process, which is therefore accompanied byan axial “rolling” of the heads. We call this the “roll andlock” transition and assume that it is an essential partof force generation by myosin-II in muscle.
Discussion
Three New Findings Emerge from the Above-Mentioned ExperimentsFirst, we found that the T-jump induces a biphasicchange in IM3 (Figures 3 and 4). The fast decrease in IM3
begins during the 1 ms-long T-jump, i.e., on the sametime scale as that following fast length steps. This fastmovement of myosin heads is not accompanied by asimultaneous change in muscle force. Overall, the dipin IM3 resembles the dip in fiber stiffness observed afterthe T-jump (Bershitsky and Tsaturyan, 2002). IM3 changeswere interpreted as a tilting of the lever arm (Irving etal., 2000). The lack of a fast change in force, in spite ofa fast change in IM3, suggests that part of the M3 re-sponse is associated with structural transitions in at-tached myosin heads, which are in pre-force-generat-ing state(s). The contribution of detached heads to IM3
was shown to be negligible (Linari et al., 2000).Second, we found that the slow phase of IM3, and
the increases of IA1 and tension after a T-jump, occursimultaneously (Figures 3 and 4). The temperature inde-pendence of steady-state fiber stiffness (Tsaturyan etal., 1999a; Bershitsky and Tsaturyan, 2002; Piazzesi et al.,2003) and the absence of changes in I1,1 after T-jumps(Figure 3) show that temperature increases tension witha constant number of myosin heads attached to actin.Therefore, the increase in the intensities of the actinand “beating” actin-myosin layer lines after the T-jumps(Figures 1–4) is caused by a change in their mode ofattachment, namely, by a transition from non-stereo-specific to stereo-specific binding. The synchronousincrease in tension and in the extent of labeling of theactin helix by myosin heads shows that stereo-specific“locking” of myosin heads on actin is an intrinsic partof force generation. As previously discussed by Tsatur-yan et al. (1999a), a decrease in I at constant I seen
1,0 1,1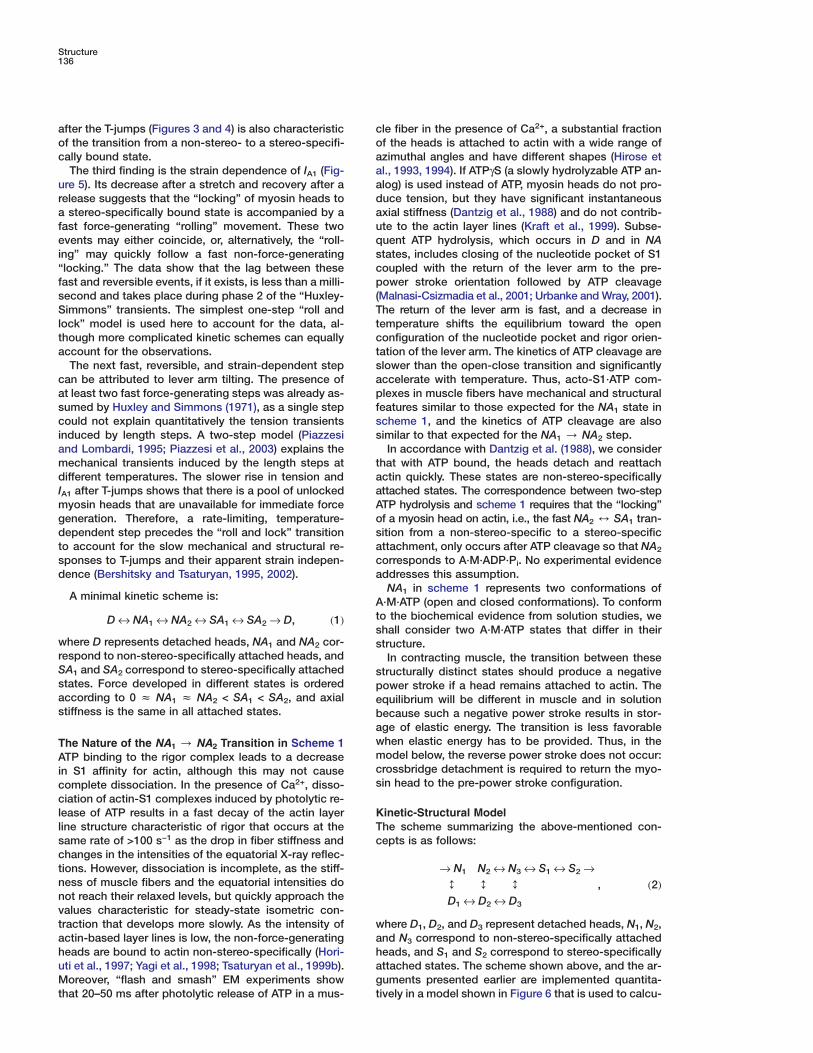
Structure136
after the T-jumps (Figures 3 and 4) is also characteristic coof the transition from a non-stereo- to a stereo-specifi-
cally bound state. aaThe third finding is the strain dependence of IA1 (Fig-
ure 5). Its decrease after a stretch and recovery after a adrelease suggests that the “locking” of myosin heads to
a stereo-specifically bound state is accompanied by a aufast force-generating “rolling” movement. These two
events may either coincide, or, alternatively, the “roll- qsing” may quickly follow a fast non-force-generating
“locking.” The data show that the lag between these cpfast and reversible events, if it exists, is less than a milli-
second and takes place during phase 2 of the “Huxley- (TSimmons” transients. The simplest one-step “roll and
lock” model is used here to account for the data, al- tcthough more complicated kinetic schemes can equally
account for the observations. tsThe next fast, reversible, and strain-dependent step
can be attributed to lever arm tilting. The presence of apat least two fast force-generating steps was already as-
sumed by Huxley and Simmons (1971), as a single step fscould not explain quantitatively the tension transients
induced by length steps. A two-step model (Piazzesi sand Lombardi, 1995; Piazzesi et al., 2003) explains themechanical transients induced by the length steps at t
adifferent temperatures. The slower rise in tension andIA1 after T-jumps shows that there is a pool of unlocked a
Amyosin heads that are unavailable for immediate forcegeneration. Therefore, a rate-limiting, temperature- o
sdependent step precedes the “roll and lock” transitionto account for the slow mechanical and structural re- a
csponses to T-jumps and their apparent strain indepen-dence (Bershitsky and Tsaturyan, 1995, 2002). a
A minimal kinetic scheme is: AtD↔ NA1↔ NA2↔ SA1↔ SA2→ D, (1)s
where D represents detached heads, NA1 and NA2 cor- srespond to non-stereo-specifically attached heads, andSA1 and SA2 correspond to stereo-specifically attached sstates. Force developed in different states is ordered paccording to 0 z NA1 z NA2 < SA1 < SA2, and axial estiffness is the same in all attached states. b
awThe Nature of the NA1 / NA2 Transition in Scheme 1mATP binding to the rigor complex leads to a decreasecin S1 affinity for actin, although this may not causescomplete dissociation. In the presence of Ca2+, disso-
ciation of actin-S1 complexes induced by photolytic re-lease of ATP results in a fast decay of the actin layer K
Tline structure characteristic of rigor that occurs at thesame rate of >100 s−1 as the drop in fiber stiffness and cchanges in the intensities of the equatorial X-ray reflec-tions. However, dissociation is incomplete, as the stiff-ness of muscle fibers and the equatorial intensities donot reach their relaxed levels, but quickly approach thevalues characteristic for steady-state isometric con-traction that develops more slowly. As the intensity of w
aactin-based layer lines is low, the non-force-generatingheads are bound to actin non-stereo-specifically (Hori- h
auti et al., 1997; Yagi et al., 1998; Tsaturyan et al., 1999b).Moreover, “flash and smash” EM experiments show g
tthat 20–50 ms after photolytic release of ATP in a mus-
le fiber in the presence of Ca2+, a substantial fractionf the heads is attached to actin with a wide range ofzimuthal angles and have different shapes (Hirose etl., 1993, 1994). If ATPγS (a slowly hydrolyzable ATP an-log) is used instead of ATP, myosin heads do not pro-uce tension, but they have significant instantaneousxial stiffness (Dantzig et al., 1988) and do not contrib-te to the actin layer lines (Kraft et al., 1999). Subse-uent ATP hydrolysis, which occurs in D and in NAtates, includes closing of the nucleotide pocket of S1oupled with the return of the lever arm to the pre-ower stroke orientation followed by ATP cleavage
Malnasi-Csizmadia et al., 2001; Urbanke and Wray, 2001).he return of the lever arm is fast, and a decrease inemperature shifts the equilibrium toward the openonfiguration of the nucleotide pocket and rigor orien-ation of the lever arm. The kinetics of ATP cleavage arelower than the open-close transition and significantlyccelerate with temperature. Thus, acto-S1·ATP com-lexes in muscle fibers have mechanical and structural
eatures similar to those expected for the NA1 state incheme 1, and the kinetics of ATP cleavage are alsoimilar to that expected for the NA1 / NA2 step.In accordance with Dantzig et al. (1988), we consider
hat with ATP bound, the heads detach and reattachctin quickly. These states are non-stereo-specificallyttached states. The correspondence between two-stepTP hydrolysis and scheme 1 requires that the “locking”f a myosin head on actin, i.e., the fast NA2 4 SA1 tran-ition from a non-stereo-specific to a stereo-specificttachment, only occurs after ATP cleavage so that NA2
orresponds to A·M·ADP·Pi. No experimental evidenceddresses this assumption.NA1 in scheme 1 represents two conformations of
·M·ATP (open and closed conformations). To conformo the biochemical evidence from solution studies, wehall consider two A·M·ATP states that differ in theirtructure.In contracting muscle, the transition between these
tructurally distinct states should produce a negativeower stroke if a head remains attached to actin. Thequilibrium will be different in muscle and in solutionecause such a negative power stroke results in stor-ge of elastic energy. The transition is less favorablehen elastic energy has to be provided. Thus, in theodel below, the reverse power stroke does not occur:
rossbridge detachment is required to return the myo-in head to the pre-power stroke configuration.
inetic-Structural Modelhe scheme summarizing the above-mentioned con-epts is as follows:
→ N1 N2↔ N3↔ S1↔ S2→↕ ↕ ↕D1↔ D2↔ D3
, (2)
here D1, D2, and D3 represent detached heads, N1, N2,nd N3 correspond to non-stereo-specifically attachedeads, and S1 and S2 correspond to stereo-specificallyttached states. The scheme shown above, and the ar-uments presented earlier are implemented quantita-ively in a model shown in Figure 6 that is used to calcu-
“Roll and Lock” Mechanism of Muscle Contraction137
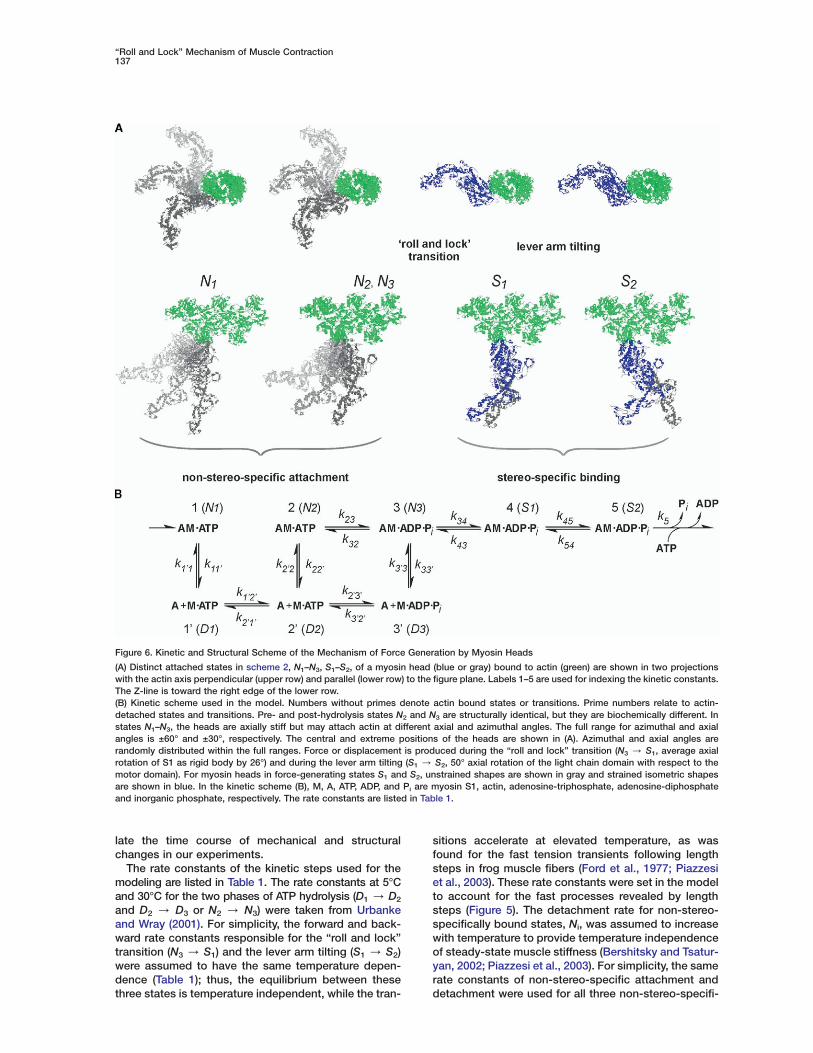
Figure 6. Kinetic and Structural Scheme of the Mechanism of Force Generation by Myosin Heads
(A) Distinct attached states in scheme 2, N1–N3, S1–S2, of a myosin head (blue or gray) bound to actin (green) are shown in two projectionswith the actin axis perpendicular (upper row) and parallel (lower row) to the figure plane. Labels 1–5 are used for indexing the kinetic constants.The Z-line is toward the right edge of the lower row.(B) Kinetic scheme used in the model. Numbers without primes denote actin bound states or transitions. Prime numbers relate to actin-detached states and transitions. Pre- and post-hydrolysis states N2 and N3 are structurally identical, but they are biochemically different. Instates N1–N3, the heads are axially stiff but may attach actin at different axial and azimuthal angles. The full range for azimuthal and axialangles is ±60° and ±30°, respectively. The central and extreme positions of the heads are shown in (A). Azimuthal and axial angles arerandomly distributed within the full ranges. Force or displacement is produced during the “roll and lock” transition (N3 / S1, average axialrotation of S1 as rigid body by 26°) and during the lever arm tilting (S1 / S2, 50° axial rotation of the light chain domain with respect to themotor domain). For myosin heads in force-generating states S1 and S2, unstrained shapes are shown in gray and strained isometric shapesare shown in blue. In the kinetic scheme (B), M, A, ATP, ADP, and Pi are myosin S1, actin, adenosine-triphosphate, adenosine-diphosphateand inorganic phosphate, respectively. The rate constants are listed in Table 1.
late the time course of mechanical and structuralchanges in our experiments.
The rate constants of the kinetic steps used for themodeling are listed in Table 1. The rate constants at 5°Cand 30°C for the two phases of ATP hydrolysis (D1 / D2
and D2 / D3 or N2 / N3) were taken from Urbankeand Wray (2001). For simplicity, the forward and back-ward rate constants responsible for the “roll and lock”transition (N3 / S1) and the lever arm tilting (S1 / S2)were assumed to have the same temperature depen-dence (Table 1); thus, the equilibrium between thesethree states is temperature independent, while the tran-
sitions accelerate at elevated temperature, as wasfound for the fast tension transients following lengthsteps in frog muscle fibers (Ford et al., 1977; Piazzesiet al., 2003). These rate constants were set in the modelto account for the fast processes revealed by lengthsteps (Figure 5). The detachment rate for non-stereo-specifically bound states, Ni, was assumed to increasewith temperature to provide temperature independenceof steady-state muscle stiffness (Bershitsky and Tsatur-yan, 2002; Piazzesi et al., 2003). For simplicity, the samerate constants of non-stereo-specific attachment anddetachment were used for all three non-stereo-specifi-
Structure138
cally attached states, and the rate of ATP cleavage was Thassumed to be the same for D2 / D3 and N2 / N3
(Figure 6; Table 1). The detachment-attachment rate cTconstants of w1000 s−1 were set to account for the
dependence of apparent fiber stiffness on the speed of saits stretch in the presence of ATP or its analogs (Dantzig
et al., 1988). The generalized rate constant for productrelease and ATP-induced break of stereo-specific bind-ing was set arbitrarily to match the steady-state ATPaserate. The assumption that ATP binding induces a S2 /N1, not a S2 / D1, transition is arbitrary and has noeffect on the results of the modeling. This is because aslow transition at the end of the power stroke is fol-lowed by fast, reversible detachment-reattachmentsteps N1 4 D1. So, a new equilibrium between thesenon-stereo-specifically bound non-force-generating statesis established very quickly.
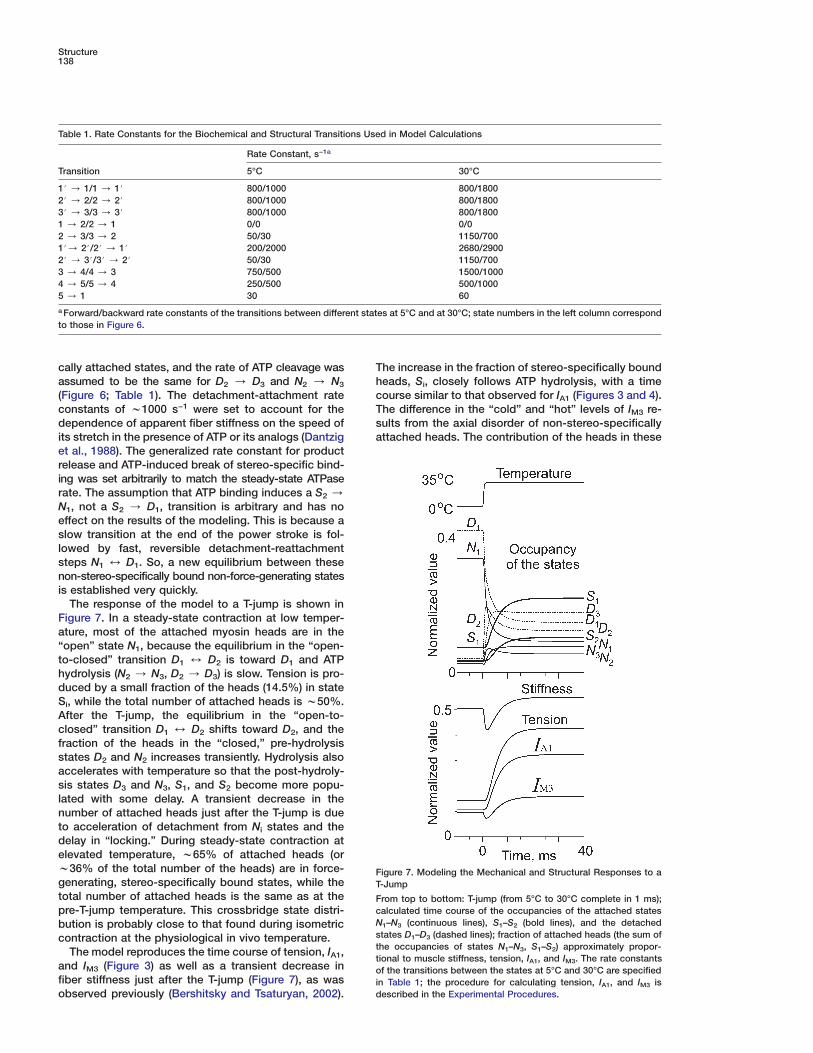
The response of the model to a T-jump is shown inFigure 7. In a steady-state contraction at low temper-ature, most of the attached myosin heads are in the“open” state N1, because the equilibrium in the “open-to-closed” transition D1 4 D2 is toward D1 and ATPhydrolysis (N2 / N3, D2 / D3) is slow. Tension is pro-duced by a small fraction of the heads (14.5%) in stateSi, while the total number of attached heads is w50%.After the T-jump, the equilibrium in the “open-to-closed” transition D1 4 D2 shifts toward D2, and thefraction of the heads in the “closed,” pre-hydrolysisstates D2 and N2 increases transiently. Hydrolysis alsoaccelerates with temperature so that the post-hydroly-sis states D3 and N3, S1, and S2 become more popu-lated with some delay. A transient decrease in thenumber of attached heads just after the T-jump is dueto acceleration of detachment from Ni states and thedelay in “locking.” During steady-state contraction atelevated temperature, w65% of attached heads (orw36% of the total number of the heads) are in force-generating, stereo-specifically bound states, while the
FT
total number of attached heads is the same as at the Fcpre-T-jump temperature. This crossbridge state distri-Nbution is probably close to that found during isometricscontraction at the physiological in vivo temperature.tThe model reproduces the time course of tension, IA1,t
and IM3 (Figure 3) as well as a transient decrease in ofiber stiffness just after the T-jump (Figure 7), as was i
dobserved previously (Bershitsky and Tsaturyan, 2002).
Table 1. Rate Constants for the Biochemical and Structural Transitions Used in Model Calculations
Rate Constant, s−1a
Transition 5°C 30°C
1# / 1/1 / 1# 800/1000 800/18002# / 2/2 / 2# 800/1000 800/18003# / 3/3 / 3# 800/1000 800/18001 / 2/2 / 1 0/0 0/02 / 3/3 / 2 50/30 1150/7001#/ 2#/2# / 1# 200/2000 2680/29002# / 3#/3# / 2# 50/30 1150/7003 / 4/4 / 3 750/500 1500/10004 / 5/5 / 4 250/500 500/10005 / 1 30 60
a Forward/backward rate constants of the transitions between different states at 5°C and at 30°C; state numbers in the left column correspondto those in Figure 6.
ttached heads. The contribution of the heads in these
igure 7. Modeling the Mechanical and Structural Responses to a-Jump
rom top to bottom: T-jump (from 5°C to 30°C complete in 1 ms);alculated time course of the occupancies of the attached states
1–N3 (continuous lines), S1–S2 (bold lines), and the detachedtates D1–D3 (dashed lines); fraction of attached heads (the sum ofhe occupancies of states N1–N3, S1–S2) approximately propor-ional to muscle stiffness, tension, IA1, and IM3. The rate constantsf the transitions between the states at 5°C and 30°C are specified
n Table 1; the procedure for calculating tension, IA1, and IM3 isescribed in the Experimental Procedures.
he increase in the fraction of stereo-specifically boundeads, Si, closely follows ATP hydrolysis, with a timeourse similar to that observed for IA1 (Figures 3 and 4).he difference in the “cold” and “hot” levels of IM3 re-ults from the axial disorder of non-stereo-specifically
“Roll and Lock” Mechanism of Muscle Contraction139
states to IM3 is lower than that in states S1 and S2. Also,heads in the N1 state are assumed to tilt as rigid bodiesby 68° with respect to rigor (S2) and so contribute lessto this intensity than the more perpendicular heads instates N2 and N3 (Figure 6). The drop in IM3 just afterthe T-jump (Figures 3 and 4) is mainly due to a transientdecrease in the fraction of bound heads (seen on thecalculated stiffness trace in Figure 7) and because ofthe nonlinear dependence of IM3 on the fractions of my-osin heads in the various attached states.
The two-step force generation mechanism sug-gested above (N3 to S1, S1 to S2) is consistent with theEM-tomography on insect flight muscles (Taylor et al.,1999) in which myosin heads in configurations similarto those assumed for attached (Ni, Si) states of ourmodel were observed. Namely, some heads had theirlight chain domains tilted at different axial and azi-muthal angles compared to the catalytic domain thatmaintains a fixed near-rigor position on actin. Othermyosin heads were attached to actin with a wide rangeof axial and azimuthal angles between their catalyticdomains and actin. The “roll and lock” mechanism sug-gested here and the kinetic and structural model basedon this mechanism quantitatively explain both the me-chanical and the structural behavior of myosin heads inT-jump experiments and specify structural and kineticcharacteristics of the two-step force generation bymuscle myosin-II. An increase in IA1 after muscle short-ening predicted by the “roll and lock” model was veri-fied experimentally.
Experimental Procedures
Muscle Fibers and T-JumpsBundles of three permeabilized fibers from rabbit psoas musclewere mounted at a sarcomere length of 2.4 �m between a forcetransducer and a motor (Bershitsky et al., 1996). The fibers in abundle were knotted together to improve their mechanical stabilityand to maintain the same sarcomere length in all fibers. In someexperiments, the fibers were knotted with a hair segment of one ofthe authors (N.K.). Bundles were put into low-tension rigor bywashing out ATP in the presence of 2,3-butanedione-monoxime(BDM) as described (Bershitsky et al., 1996) and were then partiallycrosslinked with 10 mM 1-ethyl-3-[3-dimethylamino)propyl]-car-bodiimide (EDC) at 15°C for preserving their structural and me-chanical stability, but the duration of the treatment was decreasedto 5–6 min compared to 10–15 min used by Bershitsky et al. (1996,1997) and Tsaturyan et al. (1999a). Contraction was initiated bybathing the bundle in the following solution: 100 mM 3-[N-morpho-lino]-propanesulfonic acid (MOPS), 5 mM MgATP, 10 mM CaEGTA,20 mM phosphocreatine, 200 U/ml creatine phosphokinase (allchemicals from Sigma-Aldrich Co., St. Louis, MO), 5 mM dithio-threitol (DTT), ionic strength 0.15 M (pH 7.1) at 20°C. T-jumps from5°C to w30°C (range 28.5°C–31.5°C) were produced by passing a1 ms long AC pulse (30 kHz, 2 kV) through the muscle sample whileit was suspended in a wet, cold atmosphere (Bershitsky et al.,1997; Tsaturyan et al., 1999a; Bershitsky and Tsaturyan, 2002).
X-Ray DiffractionMost of the experiments were carried out on the ID02 station at theEuropean Synchrotron Radiation Facility (ESRF, Grenoble, France)by using either the FReLoN CCD detector operating at 1024 × 1024pixel mode or the RAPID multiwire detector (Lewis et al., 1997)operating at 1024 × 1024 pixel mode. The camera length was 2.5or 10 m. The X-ray beam at the sample was 190 or 400 �m hori-zontally and 245 �m vertically (FWHM). In the experiments with theRAPID detector, an aluminum strip providing w3-fold attenuationof photon flux was placed in front of the detector in the equatorial
area to prevent detector saturation by strong equatorial reflections.Experiments on beamline 16.1 at the SRS (Daresbury Laboratory,Cheshire, UK) were performed as described by Bershitsky et al.(1996). Remote control of the experiments and synchronization ofthe length steps and T-jumps with detector framing were alreadydescribed (Bershitsky et al., 1996, 1997; Tsaturyan et al., 1999a).
Data AnalysisX-ray diffraction data were analyzed by using bsl (CCP13 suite) andBS (written by N.K., available at http://muscle.imec.msu.ru/bs_1.htm) software as described (Bershitsky et al., 1996, 1997; Kou-bassova and Tsaturyan, 2002). The time course of IM3 (Figures 3–5)was measured by integrating the total intensity in a region extend-ing ±0.016 nm−1 radially and 0.0664–0.0713 nm−1 axially and subse-quent background subtraction. Changes in IA1 in the T-jump experi-ments are obscured by reciprocal changes in the background level(Bershitsky et al., 1997; Tsaturyan et al., 1999a). The 2D intensitywas integrated along the reciprocal radius in the region from 0.0269to 0.091 nm−1 in each time frame at an axial spacing of 0.0175–0.0372 nm−1; then, the average intensity profile before the T-jumpwas subtracted from those obtained in each time frame; IA1 foreach time frame (Figure 3) was determined from this differentialintensity by using xfit software (CCP13 software suite), assuming aconstant position and width of the A1 peak and a variable ampli-tude and background level. Absolute values of IA1 were determinedfrom steady-state time frames by decomposition of the A1-M1complex (Figures 2A and 2B) into A1 and M1 peaks by using therelaxed and rigor diffraction patterns to determine the position ofM1 and A1 layer lines, respectively.
ModelingA structural-kinetic model was used for data interpretation. Dif-ferential equations for the occupancies, ci(t), of the myosin headsthat populate at time t each of attached (1–5) and detached (1#–3#)states, i, in the kinetic-structural model shown in Figure 6 wereintegrated by the Runge-Kutta method. The rate constants at 5°Cand 30°C are specified in Table 1. The T-jump duration was 1 ms.Normalized stiffness was calculated as the sum of the occupan-cies, ci(t), of all attached states 1–5, assuming the same stiffnessfor stereo-specifically and non-stereo-specifically attached states.Normalized tension was calculated as c4(t) + 2c5(t), assuming thatforce produced by a myosin head in the post-power stroke state 5is twice that in the initially “locked” state 4 and no net force isproduced in the pre-force-generating states 1–3. Normalized IA1
was calculated as the sum of c4(t) and c5(t), assuming that a tilt ofthe lever arm does not affect IA1 (Koubassova and Tsaturyan, 2002)and neglecting any contribution from non-stereo-specifically at-tached heads in states 1–3. Normalized IM3 was calculated as thesquare of the amplitude of the axial Fourier transform at meridionalspacing 1/14.5 nm−1 of the weighted sum of the electron densitiesof the heads in states 1–5, as shown in Figure 6. For this calcula-tion, force-generating myosin heads in states 4 and 5 were as-sumed to be in their strained conformations, as shown in Figure 6,and the weight of the i-th state was equal to the fraction of theheads in this state, ci(t). IM3 was calculated by setting a uniformand random distribution of axial angles between S1 and actin instates N1–N3 (Figure 6A). A model assuming a Gaussian distributionof attachment angle was also tested. With the same SD, it givesapproximately the same result as the model with uniform distribu-tion. The contribution of detached heads to IM3 was neglected.
Acknowledgments
This work was supported by the Medical Research Council, theHoward Hughes Medical Institute, the International Association forthe Promotion of Cooperation with Scientists from the New Inde-pendent States of the Former Soviet Union, the North AtlanticTreaty Organization, the Russian Foundation for Basic Research,the European Synchrotron Radiation Facility, the European Molecu-lar Biology Laboratory, and the Daresbury Laboratory. Authors arevery grateful to Jacques Gorini (ESRF) and Anthony Gleeson
Structure140
(Daresbury Laboratory) for excellent support and to Sir Andrew HcHuxley and Malcolm Irving for helpful comments.
H(Received: June 6, 2004oRevised: November 5, 2004HAccepted: November 5, 2004rPublished: January 11, 2005a
HReferencesam
Bershitsky, S.Y., and Tsaturyan, A.K. (1995). Force generation and swork production by covalently cross-linked actin-myosin cross- Hbridges in rabbit muscle fibers. Biophys. J. 69, 1011–1021. cBershitsky, S.Y., and Tsaturyan, A.K. (2002). The elementary force Ugeneration process probed by temperature and length pertur- Hbations in muscle fibres from the rabbit. J. Physiol. 540, 971–988. PBershitsky, S.Y., Tsaturyan, A.K., Bershitskaya, O.N., Mashanov, HG.I., Brown, P., Webb, M., and Ferenczi, M.A. (1996). Mechanical fand structural properties underlying contraction of skeletal muscle
Ifibers after partial 1-ethyl-3-[(3-dimethylamino)propyl]carbodiimide
ocross-linking. Biophys. J. 71, 1462–1474.
gBershitsky, S.Y., Tsaturyan, A.K., Bershitskaya, O.N., Mashanov,
IG.I., Brown, P., Burns, R., and Ferenczi, M.A. (1997). Muscle force
Iis generated by myosin heads stereospecifically attached to actin.
mNature 388, 186–190.
mBordas, J., Diakun, G.P., Diaz, F.G., Harries, J.E., Lewis, R.A., Lowy,
JJ., Mant, G.R., Martin-Fernandez, M.L., and Towns-Andrews, E.
l(1993). Two-dimensional time-resolved X-ray diffraction studies of
glive isometrically contracting frog sartorius muscle. J. Muscle Res.
KCell Motil. 14, 311–324.X
Burgess, S., Walker, M., Wang, F., Sellers, J.R., White, H.D., Knight, 8P.J., and Trinick, J. (2002). The prepower stroke conformation of
Kmyosin V. J. Cell Biol. 159, 983–991.f
Conibear, P.B., Bagshaw, C.R., Fajer, P.G., Kovacs, M., and Malnasi- bCsizmadia, A. (2003). Myosin cleft movement and its coupling to factomyosin dissociation. Nat. Struct. Biol. 10, 831–835.
KCope, M.J., Whisstock, J., Rayment, I., and Kendrick-Jones, J. B(1996). Conservation within the myosin motor domain: implications cfor structure and function. Structure 4, 969–987.
LCoureux, P.D., Wells, A.L., Ménétrey, J., Yengo, C.M., Morris, C.A., dSweeney, H.L., and Houdusse, A. (2003). A structural state of the Tmyosin V motor without bound nucleotide. Nature 425, 419–423. IDantzig, J.A., Walker, J.W., Trentham, D.R., and Goldman, Y.E. L(1988). Relaxation of muscle fibers with adenosine 5#-[gamma- Nthio]triphosphate (ATP[gamma S]) and by laser photolysis of caged eATP[gamma S]: evidence for Ca2+-dependent affinity of rapidly de- Xtaching zero-force cross-bridges. Proc. Natl. Acad. Sci. USA 85, S6716–6720.
MDobbie, I., Linari, M., Piazzesi, G., Reconditi, M., Koubassova, N., GFerenczi, M.A., Lombardi, V., and Irving, M. (1998). Elastic bending cand active tilting of myosin heads during muscle contraction. Na- ature 396, 383–387. sFord, L.E., Huxley, A.F., and Simmons, R.M. (1977). Tension re- Psponses to sudden length change in stimulated frog muscle fibres anear slack length. J. Physiol. 269, 441–515. mForkey, J.N., Quinlan, M.E., Shaw, M.A., Corrie, J.E., and Goldman, PY.E. (2003). Three-dimensional structural dynamics of myosin V by nsingle-molecule fluorescence polarization. Nature 422, 399–404. n
tFurch, M., Geeves, M.A., and Manstein, D.J. (1998). Modulation ofactin affinity and actomyosin adenosine triphosphatase by charge Pchanges in the myosin motor domain. Biochemistry 37, 6317–6326. L
fHirose, K., Lenart, T.D., Murray, J.M., Franzini-Armstrong, C., andJGoldman, Y.E. (1993). Flash and smash: rapid freezing of muscle
fibers activated by photolysis of caged ATP. Biophys. J. 65, 397– R408. H
sHirose, K., Franzini-Armstrong, C., Goldman, Y.E., and Murray, J.M.2(1994). Structural changes in muscle crossbridges accompanying
force generation. J. Cell Biol. 127, 763–778. R
olmes, K.C. (1997). The swinging lever-arm hypothesis of muscleontraction. Curr. Biol. 7, R112–R118.
olmes, K.C., Angert, I., Kull, F.J., Jahn, W., and Schroder, R.R.2003). Electron cryo-microscopy shows how strong binding of my-sin to actin releases nucleotide. Nature 425, 423–427.
oriuti, K., Yagi, N., and Takemori, S. (1997). Mechanical study ofat soleus muscle using caged ATP and X-ray diffraction: high ADPffinity of slow cross-bridges. J. Physiol. 502, 433–447.
oudusse, A., Kalobokis, V.N., Himmel, D., Szent-Georgyi, A.G.,nd Cohen, C. (1999). Atomic structure of scallop myosin subfrag-ent S1 complexed with MgADP: a novel conformation of the myo-
in head. Cell 97, 459–470.
oudusse, A., Szent-Gyorgyi, A.G., and Cohen, C. (2000). Threeonformational states of scallop myosin S1. Proc. Natl. Acad. Sci.SA 97, 11238–11243.
uxley, A.F. (2000). Mechanics and models of the myosin motor.hilos. Trans. R. Soc. Lond. B Biol. Sci. 355, 433–440.
uxley, A.F., and Simmons, R.M. (1971). Proposed mechanism oforce generation in striated muscle. Nature 233, 533–538.
rving, M., Lombardi, V., Piazzesi, G., and Ferenczi, M.A. (1992). My-sin head movements are synchronous with the elementary force-enerating process in muscle. Nature 357, 156–158.
rving, M., Piazzesi, G., Lucii, L., Sun, Y.-B., Harford, J.J., Dobbie,.M., Ferenczi, M.A., Reconditi, M., and Lombardi, V. (2000). Confor-
ation of the myosin motor during force generation in skeletaluscle. Nat. Struct. Biol. 7, 482–485.
oel, P.B., Trybus, K.M., and Sweeney, H.L. (2001). Two conservedysines at the 50/20-kDa junction of myosin are necessary for trig-ering actin activation. J. Biol. Chem. 276, 2998–3003.
oubassova, N.A., and Tsaturyan, A.K. (2002). Direct modeling of-ray diffraction pattern from skeletal muscle in rigor. Biophys. J.3, 1082–1097.
raft, T., Xu, S., Brenner, B., and Yu, L.C. (1999). The effect of thinilament activation on the attachment of weak binding cross-ridges: a two-dimensional x-ray diffraction study on single muscle
ibers. Biophys. J. 76, 1494–1513.
raft, T., Mattei, T., Radocaj, A., Piep, B., Nocula, C., Furch, M., andrenner, B. (2002). Structural features of cross-bridges in isometri-ally contracting skeletal muscle. Biophys. J. 82, 2536–2547.
ewis, R.A., Helsby, W.I., Jones, A.O., Hall, C.J., Parker, B., Shel-on, J., Clifford, P., Hillen, M., Sumner, I., Fore, N.S., et al. (1997).he “RAPID” high rate large area X-ray detector system. Nucleic
nstrum. Methods Phys. Res. A 392, 32–41.
inari, M., Piazzesi, G., Dobbie, I., Koubassova, N., Reconditi, M.,arayanan, T., Diat, O., Irving, M., and Lombardi, V. (2000). Interfer-nce fine structure and sarcomere length dependence of the axial-ray pattern from active single muscle fibers. Proc. Natl. Acad.ci. USA 97, 7226–7231.
alnasi-Csizmadia, A., Pearson, D.S., Kovacs, M., Woolley, R.J.,eeves, M.A., and Bagshaw, C.R. (2001). Kinetic resolution of aonformational transition and the ATP hydrolysis step using relax-tion methods with a Dictyostelium myosin II mutant containing aingle tryptophan residue. Biochemistry 40, 12727–12737.
iazzesi, G., and Lombardi, V. (1995). A cross-bridge model that isble to explain mechanical and energetic properties of shorteninguscle. Biophys. J. 68, 1966–1979.
iazzesi, G., Reconditi, M., Linari, M., Lucii, L., Sun, Y.-B., Naraya-an, T., Boesecke, P., Lombardi, V., and Irving, M. (2002). Mecha-ism of force generation by myosin heads in skeletal muscle. Na-ure 415, 659–662.
iazzesi, G., Reconditi, M., Koubassova, N., Decostre, V., Linari, M.,ucii, L., and Lombardi, V. (2003). Temperature dependence of theorce-generating process in single fibres from frog skeletal muscle.. Physiol. 549, 93–106.
ayment, I., Holden, H.M., Whittaker, M., Yohn, C.B., Lorenz, M.,olmes, K.C., and Milligan, R.A. (1993). Structure of the actin-myo-in complex and its implications for muscle contraction. Science61, 58–65.
eubold, T.F., Eschenburg, S., Becker, A., Kull, F.J., and Manstein,
“Roll and Lock” Mechanism of Muscle Contraction141
D.J. (2003). A structural model for actin-induced nucleotide releasein myosin. Nat. Struct. Biol. 10, 826–830.
Smith, C.A., and Rayment, I. (1996). X-ray structure of the magne-sium(II).ADP.vanadate complex of the Dictyostelium discoideummyosin motor domain to 1.9 Å resolution. Biochemistry 35, 5404–5417.
Taylor, K.A., Schmitz, H., Reedy, M.C., Goldman, Y.E., Franzini-Arm-strong, С., Sasaki, H., Tregear, R.T., Lucaveche, C., Edwards, R.J.,et al. (1999). Tomographic 3D reconstruction of quick-frozen, Ca2+-activated contracting insect flight muscle. Cell 99, 421–431.
Tsaturyan, A.K. (2002). Diffraction by partially occupied helices.Acta Crystallogr. A 58, 292–294.
Tsaturyan, A.K., Bershitsky, S.Y., Burns, R., and Ferenczi, M.A.(1999a). Structural changes in the actin-myosin cross-bridges as-sociated with force generation induced by temperature jump inpermeabilized frog muscle fibers. Biophys. J. 77, 354–372.
Tsaturyan, A.K., Bershitsky, S.Y., Burns, R., He, Z.-H., and Ferenczi,M.A. (1999b). Structural responses to the photolytic release of ATPin frog muscle fibres observed by time-resolved X-ray diffraction.J. Physiol. 520, 681–696.
Urbanke, C., and Wray, J. (2001). A fluorescence temperature-jumpstudy of conformational transitions in myosin subfragment 1. Bio-chem. J. 358, 165–173.
Volkmann, N., Ouyang, G., Trybus, K.M., DeRosier, D.J., Lowey, S.,and Hanein, D. (2003). Myosin isoforms show unique conformationsin the actin-bound state. Proc. Natl. Acad. Sci. USA 100, 3227–3232.
Wong, W.W., Doyle, T.C., and Reisler, E. (1999). Nonspecific weakactomyosin interactions: relocation of charged residues in subdo-main 1 of actin does not alter actomyosin function. Biochemistry38, 1365–1370.
Yagi, N. (1996). Labelling of thin filaments by myosin heads in con-tracting and rigor vertebrate skeletal muscles. Acta Crystallogr. DBiol. Crystallogr. 52, 1169–1173.
Yagi, N., Horiuti, K., and Takemori, S. (1998). A pre-active attachedstate of myosin heads in rat skeletal muscles. J. Muscle Res. CellMotil. 19, 75–86.
Yasunaga, T., Suzuki, Y., Ohkura, R., Sutoh, K., and Wakabayashi,T. (2000). ATP-induced transconformation of myosin revealed bydetermining three-dimensional positions of fluorophores from fluo-rescence energy transfer measurements. J. Struct. Biol. 132, 6–18.