exchange rates and foreign exchange reserves in turkey: nonlinear and frequency domain causality...
TRANSCRIPT
FFet al
Exchange rates and foreign exchange reserves in Turkey: nonlinear and frequency domain causality approach
Tayfur BAYAT Inonu University, Malatya, Turkey [email protected] Mehmet SENTURK Kilis 7 Aralik University, Kilis, Turkey [email protected] Selim KAYHAN Necmettin Erbakan University, Konya, Turkey [email protected]
Abstract. In this paper aims to investigate the asymmetric relationship between nominal-real exchange rate and foreign exchange reserves of Central Bank in Turkey over the period of 2003:01-2014:01. The study benefits from the recent advance in the nonlinear time series econometric analysis and carries out nonlinear cointegration, causality and frequency domain causality tests. The results find strong evidence of nonlinear cointegration between real exchange rate and Central Bank foreign exchange reserves. Empirical results of both Hansen-Seo (2002) and frequency domain causality analyses imply that there is no relationship from foreign exchange reserves to nominal and real exchange rate, while there is a causal relationship running from nominal and real exchange rate to foreign exchange reserves in Turkey. Diks-Panchenko (2006) non-linear Granger causality test results indicate that there is a causality relationship from foreign exchange reserves to nominal and real exchange rate. By the way of conclusion that Central Bank of Turkish Republic uses the real exchange rate take into account in the context of inflation targeting regime.
Keywords: Exchange Rate, Foreign Exchange Reserves, Nonlinear Causality, Frequency Domain Causality. JEL Classification: E58, F31, O24. REL Classification: 8N, 9E.
Theoretical and Applied Economics Volume XXI (2014), No. 11(600), pp. 27-42
Tayfur Bayat, Mehmet Senturk, Selim Kayhan 28
1. Introduction
Increasing popularity of floating exchange rate regime in especially inflation targeting countries makes the interaction between foreign exchange rate and the amount of exchange reserves hold by Central Bank important topic in the context of monetary policy intervention of Central Banks. Because, the exchange rate is determined due to market conditions in floating exchange rate regime. In this regard, excessive fluctuations in exchange rate could be occurred due to excess demand or decrease in exchange rate supply. In the case of excessive volatility in exchange rate, Central Bank could manage floating exchange rate in order to sustain price stability in the context of “fear of floating” hypothesis suggested by Calvo and Reinhart (2002). Central Bank interfere exchange market by buying the excess amount of foreign exchange in the market or by selling foreign exchange in order to reduce demand in the market, although their announcement emphasizing that the bank does not intervene the exchange market.
Intervention in the market brings up another necessary topic that is foreign exchange reserves hold by Central Banks. Financial integration of economies increases by the last half of the 1990s and Central Banks have to accumulate enough foreign exchange in order to stabilize exchange market against the capital inflows-outflows as a result of financial crises. The Tequila crisis in 1994-1995, the Asian crisis in 1997 and 1998, the Argentinian crisis in 2001 caused big foreign exchange losses of Central Banks in emerging markets especially. After the crises which have encountered two decades, the focus of the Central Banks has changed: Calvo and Reinhart’s (2002) “fear of floating” in exchange reserves substituted with Aizenman and Sun’s (2009) “fear of losing international reserves”. In this regard, many developing countries have begun to accumulate foreign exchange reserves more than before in order to interfere exchange market efficiently like Turkey (Balaylar, 2011, p. 19).
The Turkish economy also lived economic crisis in 1994, 1999, 2000 and 2001 which caused big foreign exchange outflows. The Central Bank of the Republic of Turkey (hereafter, CBRT) interfered the exchange market in order to maintain exchange rate stability. According to official report of the bank, the CBRT lost foreign exchange reserves more than three billion US dollar because of the crisis in 1994. Lastly, the CBRT lost close to five billion US dollar in 2001 as a result of financial market crisis which induced the collapse of a number of private banks (Ardic, 2004, pp. 271-272). By the beginning of inflation targeting in Turkey, the CBRT (2009) stated that the CBRT does not have any exchange rate target under the floating exchange rate regime, it continues to closely monitor exchange rate developments and may inject foreign liquidity into the market through foreign exchange selling auctions in case of any unhealthy price formations in the
Exchange rates and foreign exchange reserves in Turkey
29
29
exchange rate due to a decrease in market depth. Statement of the CBRT indicates that the foreign exchange reserve is an important issue for the bank.
All these information about the CBRT suggest the question whether “fear of losing international reserves” hypothesis is valid for the CBRT or not. Although there is a vast literature examining the relationship between foreign exchange reserves of the CBRT and the different measures of exchange rate in terms of exchange rate market pressure and sterilization (Kibritçioğlu, 2001; Balaylar and Ural, 2007; Şen, 2006; Parlaktuna, 2005; Alper and Ardıç, 2006; Balaylar, 2011), the only study belongs to Kasman and Ayhan (2008) which examines the relationship between nominal and real exchange rate and foreign exchange reserves in the context of “fear of losing international reserves” hypothesis for the period 1982:01 - 2005:11 by employing Gregory and Hansen (1996) cointegration test with structural breaks and Granger (1986) causality tests. They find uni-directional causality running from foreign exchange rate to real exchange rate in the short and long term and causality running from nominal exchange rate to foreign exchange reserves.
Financial crises experienced in the Turkish economy and the exchange rate policy of the CBRT provide room to concentrate on the examining the nature of causal linkages between foreign exchange reserves of the CBRT and nominal-real exchange rate. In order to fill the gap in the literature, this study therefore examines the asymmetric relationship between foreign exchange reserves of the CBRT and nominal-real exchange rate in the Turkish economy by employing monthly data belonging nominal exchange rate from 1990:01 to 2011:12 and real exchange rate from 1990:01 to 2010:05. We analyze the interaction between variables in different time ranges because data absence belonging real exchange rate in the Turkish economy.
We analyze relationship by using nonlinear cointegration, non-linear causality and frequency domain causality methodologies. Initially, Dickey-Fuller (1979) linear unit root test and Hansen-Seo (2002) non-linear cointegration test are applied. Then the nonparametric causality test of Diks and Panchenko (2005, 2006) and frequency domain causality test of Breitung and Candelon (2006) are applied to in order to investigate causal relationship between foreign reserves and exchange rate. The novelty of this paper is twofold. First of all, different from previous studies for Turkey, this paper analyzes nonlinear cointegration and causal relationship between variables. Secondly short, medium and long term causalities are investigated with frequency domain causality test. Therefore, analyzing nonlinear cointegration and causality between the variables in Turkey provides important information in order to determine and implement monetary policies.
Tayfur Bayat, Mehmet Senturk, Selim Kayhan 30
The rest of paper is organized as follows. The econometric methodology is outlined in section 2 and the data is described in section 3. Then the empirical findings are discussed in the following section. Finally some concluding remarks are offered in the last section.
2. Econometric methodology
2.1. Hansen-Seo (2002) Threshold Cointegration (Tvecm) Test
Non-linear studies for long run balance were laid down firstly by Balke and Fomby (1997), and later by Baum and Karasulu (1998), Enders and Falk (1998), Obstfeld and Taylor (1997), Taylor (2002), Lo and Zivot (2001). Traditional cointegration tests show adjustment of variables for the long term relation during whole period (Esteve and Prats, 2010: 406; Enders, 2009: 481). Balke and Fomby (1997) improved Hansen’s (1996) tests for one variable for situations that cointegration vector is known, by using error correction term. On the other hand, Hansen and Seo (2002) improved these models for multi-variables and for the situations that cointegration vector is unknown. Moreover, Hansen and Seo (2002) improved threshold effect on error correction term by forming Threshold Vector Error Correction Model (TVECM). The main logic of the Hansen and Seo (2002) model is testing linear cointegration in null hypothesis and non-linear cointegration in alternative hypothesis by maximum likelihood estimation.
Assume that series tX is first order stationary I(1) for p and px1 dimensional
cointegration vector . ( )i tw x stationary in their levels I(0), error term
1l degree linear error correction model (VECM) can be written as;
1( )t t tX A X u (1)
where;
1
1
21
1
( )
( ).
.
.
t
t
tt
t l
w
x
xX
x
Exchange rates and foreign exchange reserves in Turkey
31
31
(Hansen, Seo, 2002: 295, Kapetanios, Shin, Snell, 2006:282). As 2k pl , esti-
mator 1( )tX is 1kx and estimator A is kxp dimensional. tu error term is based
on the assumption that ( )t tE u u vector martingale difference sequence with
finite covariance matrix (Hansen, Seo, 2002:295). If biases from long term equilibrium are lower than or equal to threshold effect, tX variables will not come
to equilibrium and so will not be cointegrated. If biases are higher than threshold effect then equilibrium and so cointegration will be provided (Esteve et. al. 2006: 1035). Under the assumption that error term is distributed normally, parameters
, A and are estimated with maximum likelihood method ( , ,A and
1( )t t tu x A X ) (Hansen and Seo, 2002: 295). As linear model mentioned
above is taken into consideration, as threshold parameter, threshold cointegration model with two regimes can be written as;
1 1 1
2 1 1
( ) eğer w ( )
( ) eğer w ( )t t t
tt t t
A X ux
A X u
(2)
(Hansen and Seo, 2002: 295-296; Esteve and Prats, 2010: 406). As an alternative expression;
1 1 1 2 1 2( ) ( , ) ( ) ( , )t t t t t tx A X d A X d u (3)
This expression can also be written with (.)I transition function as;
1 1
2 1
( , ) ( ( ) )
( , ) ( ( ) )t t
t t
d I w
d I w
(4)
(Hansen and Seo, 2002: 295-296). This threshold model with two regimes describes error correction term. 1A and 2A coefficients matrices shows dynamics of
each regime. Furthermore this model, except for cointegration matrix, allows all coefficients to change for each regime. Under the assumption of null hypothesis that claims linear cointegration, 1 2A A is denoted (Dutt and Ghosh,
2005: 44). If 10 ( ) 1tP w then it shows non-linear cointegration, in other
circumstances there is linear cointegration (Hansen and Seo, 2002: 295-296). Under these restrictions, 0 0 as trimming parameter, tested as
0 1 0( ) 1tP w (Ihle and Taubadel, 2008: 8). If 10 ( ) 1tP w ,
threshold effect can be seen. In other circumstances it shows linear cointegration.
Under the assumption of independently and identically distributed parameter estimations shown as

Tayfur Bayat, Mehmet Senturk, Selim Kayhan 32
1 2 1 1 1( , , , ) ( ) ( , )t t t tu A A x A X d 2 1 2( ) ( , )t tA X d , using maximum
likelihood method, Gaussians probability is:
1 2 1 2 1 21
1( , , , , ) log ( , , , ) ( , , , )
2 2
n
n t tt
nA A u A A u A A
(5)
Maximum likelihood estimators of parameters of 1 2( , , , , )n A A generated as
1 2ˆˆ ˆ ˆ ˆ( , , , , )MLE A A (Hansen and Seo, 2002, p. 196). In the progress of test
procedure under the assumption that cointegration vector is unknown, in null hypothesis linear cointegration and in alternative hypothesis non-linear cointegration are tested (Hansen and Seo, 2002, p. 300). Two LM (Lagrange Multiplier) tests are used. First one, under the assumption that linear cointegration relation is known (a priori), is;
00( , )sup
L U
SupLM LM
(6)
0 is the known value of . Second test, under the assumption that linear
cointegration relation is unknown is;
( , )supL U
SupLM LM
(7)
In this expression, L is 0 % of 1tw and U is ( 01 )% of 1tw (Hansen and
Seo, 2002, p. 300; Esteve et al. 2006, p. 1035). If 0 is a value approximate to
zero, it will not be chosen, as it will decrease the power of the test (Hansen, Seo, 2002, p. 301). In analysis, like in Hansen and Seo (2002) test, it is assumed that
0 0.05 for L and 01 0.95 for U . In fact size and power of LM test which
estimates threshold cointegration are satisfactory (Dutt and Ghosh, 2005, p. 44). Hansen and Seo (2002) developed two bootstrap methods for asymptotic critical values and probability values)(1).
2.2. Diks-Panchenko (2005, 2006) Non-linear Granger causality analysis
In Diks and Panchenko (2005, 2006) Granger causality test, Hiemstra and Jones (1993,1994) shows that if non-linear sample size increases, possibility of rejecting true null hypothesis increases. Diks and Panchenko (2006) clarified that whether bandwidth converges to zero or not it cannot be neutral. In non-linear null hypothesis that claims there is no Granger causality;

Exchange rates and foreign exchange reserves in Turkey
33
33
, , , ,( , , ) ( , ) ( , )( , , ) 0
( ) ( ) ( )X Y Z X Y Y Z
gY Y Y
f X Y Z f X Y f Y Zq E g X Y Z
f Y f Y f Y
(8)
( , , )g X Y Z is a positive weighted function (Diks and Panchenko, 2006: 1655). As
test statistic is one-way and even gq is not specified as positive, when test statistic
takes high values, the non-linear hypothesis will be rejected. Indicator function as
, ( )wi j i jI I W W and test statistic as nT , depending on BDS test statistic
improved by Brock et. al. (1987) and Brock, et. al. (1996), are shown as;
2
, ,
(2 )( ) ( )
( 1)( 2)
dx dy dzXYZ Y XY YZ
n ik j ik ji k k i j j i
T I I I In n n
(9)
in a more simple expression,
, , , ,
( 1) ˆ ˆ ˆ( ) ( ( , , ) ( , ) ( , ))( 2)n X Y Z i i i X Y i i X Z i i
i
nT f X Y Z f X Y f Y Z
n n
(10)
(Diks and Panchenko, 2006, p. 1656). With the advice of Hiemstra and Jones (1994) that 1, 2,3 or 4Lx Ly and with the condition that value should often
be 0.5, 1 or 1.5 and as nS is an estimator of (.)nT asymptotic variance, test statistic
for 1Lx Ly is distributed as:
( ( ) )(0,1)
dn n
n
T qn N
S
(11)
(Diks and Panchenko, 2006, p. 1656).
2.3. Frequency domain causality test
Frequency domain causality may be used to explain short and long run causality between the variables. This approach were developed by Granger (1969), Geweke (1982), Hosoya (1991), Breitung and Candelon (2006). Frequency domain approach to causality thereby permits to investigate causality dynamics at different frequencies rather than relying on a single statistics as is the case with the conventional time domain analysis (Ciner, 2011). To test for causality based on frequency domain, Geweke (1982) and Hosoya (1991) defined two-dimensional vector of time series [ , ]t t tz x y and tz has a finite-order VAR;
( ) t tL z (12)
Tayfur Bayat, Mehmet Senturk, Selim Kayhan 34
where 1( ) ... ppL I L L and lag polynomial with 1
kt tL z z . Then
Granger causality at different frequencies is defined as:
212
2 211 11
2 ( ) | ( ) |( ) log log 1
| ( ) | | ( ) |
ix
y x i i
f eM
e e
(13)
if 212| ( ) | 0ie that y does not cause x at frequency . If components of tz are
I(1) and cointegrated, then the autoregressive polynomial ( )L has a unit root.
The remaining roots are outside the unit circle. Extracting 1tz from both sides of
equation 9 gives;
1 1 2 2 1( ) ... ( )t t t p t p t t tz I z z z L z (14)
where 1 2( ) ... ppL I L L (Breitung and Candelon, 2006). Geweke
(1982) and Hosoya (1991) proposed a causality measure at a particular frequency based on a decomposition of the spectral density. Breitung and Candelon (2006) who has using a bivariate vector autoregressive model propose a simple test procedure that is based on a set of linear hypothesis on the autoregressive parameters. So that test procedure can be generalized to allow for cointegration relationships and higher-dimensional systems.
Breitung and Candelon (2006) assume that t is white noise with ( ) 0tE and
( , )t tE , where is positive definite. Let G be the lower triangular matrix
of the Cholesky decomposition 1G G such that ( )t tE I and t tG . If
the system is stationary, let 1( ) ( )L L and 1( ) ( )L L G the MA representation;
1 111 12 11 12
21 22 21 222 2
( ) ( ) ( ) ( )( )
( ) ( ) ( ) ( )t t
t tt t
L L L Lz L
L L L L
(15)
Let we can use this representation for the spectral density of tx ;
2 211 12
1( ) {| ( ) | | ( ) | }
2i i
xf e e
(16)
Breitung and Candelon (2006) investigate the causal effect of ( ) 0y xM if 2
12| ( ) | 0ie . The null hypothesis is equivalent to a linear restriction on the
VAR coefficients. 1 1( ) ( )L L G and 22
1212
( )( )
| ( ) |
g LL
L
, with 22g as the

Exchange rates and foreign exchange reserves in Turkey
35
35
lower diagonal element of 1G and | ( ) |L as the determinant of ( )L , it follows y does not cause at frequency if;
12 12, 12,1 1
| ( ) | cos( ) sin( ) 0p p
ik k
k k
e k k i
(17)
with 12,k denoting the (1,2)-element of k . Thus for 12| ( ) | 0ie ,
12,1
cos( ) 0p
kk
k
(18)
12,1
sin( ) 0p
kk
k
(19)
Breitung and Condelon’s (2006) applied to linear restrictions (17) and (18) for
11,j j and 12,j j . Then the VAR equation for tx can be implied as;
1 1 1 1 1... ...t t p t p t p t p tx x x y y (20)
and the null hypothesis ( ) 0y xM is equivalent to the linear restriction with
1[ ,..., ]p
0 : ( ) 0H R (21)
and
cos( ) cos(2 ) ... cos(p )( )
sin( ) sin(2 ) ... sin(p )R
(22)
The causality measure for (0, ) can be tested with the conventional F-test for the linear restrictions imposed by Eq.(15) and Eq. (16). The test procedure follows an F- distribution with (2, T-2p) degrees of freedom.
3. Data
In this study, we employ monthly data spanning the period for foreign exchange reserves (RES) and nominal exchange rate (NEER) and for real exchange rate (REER) 2003:01-2014:01,. All the data are respectively obtained from the Turkey Central Bank Electronic Data Delivery System (EVDS). Relying on the existing literature, natural logarithms of the variables are used in the empirical analysis.
Tayfur Bayat, Mehmet Senturk, Selim Kayhan 36
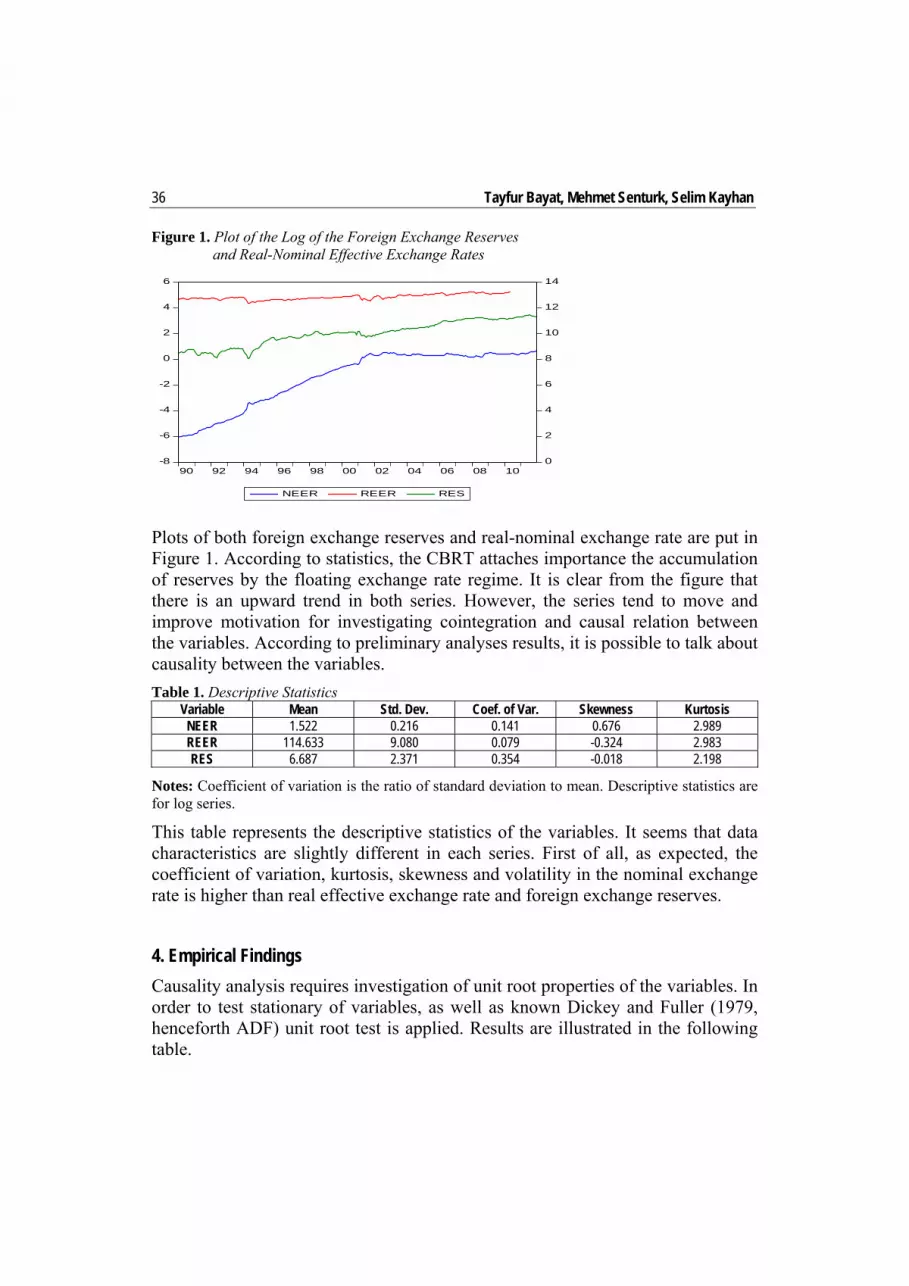
Figure 1. Plot of the Log of the Foreign Exchange Reserves and Real-Nominal Effective Exchange Rates
Plots of both foreign exchange reserves and real-nominal exchange rate are put in Figure 1. According to statistics, the CBRT attaches importance the accumulation of reserves by the floating exchange rate regime. It is clear from the figure that there is an upward trend in both series. However, the series tend to move and improve motivation for investigating cointegration and causal relation between the variables. According to preliminary analyses results, it is possible to talk about causality between the variables.
Table 1. Descriptive Statistics Variable Mean Std. Dev. Coef. of Var. Skewness Kurtosis
NEER 1.522 0.216 0.141 0.676 2.989 REER 114.633 9.080 0.079 -0.324 2.983 RES 6.687 2.371 0.354 -0.018 2.198
Notes: Coefficient of variation is the ratio of standard deviation to mean. Descriptive statistics are for log series.
This table represents the descriptive statistics of the variables. It seems that data characteristics are slightly different in each series. First of all, as expected, the coefficient of variation, kurtosis, skewness and volatility in the nominal exchange rate is higher than real effective exchange rate and foreign exchange reserves.
4. Empirical Findings
Causality analysis requires investigation of unit root properties of the variables. In order to test stationary of variables, as well as known Dickey and Fuller (1979, henceforth ADF) unit root test is applied. Results are illustrated in the following table.
-8
-6
-4
-2
0
2
4
6
0
2
4
6
8
10
12
14
90 92 94 96 98 00 02 04 06 08 10
NEER REER RES
Exchange rates and foreign exchange reserves in Turkey
37
37
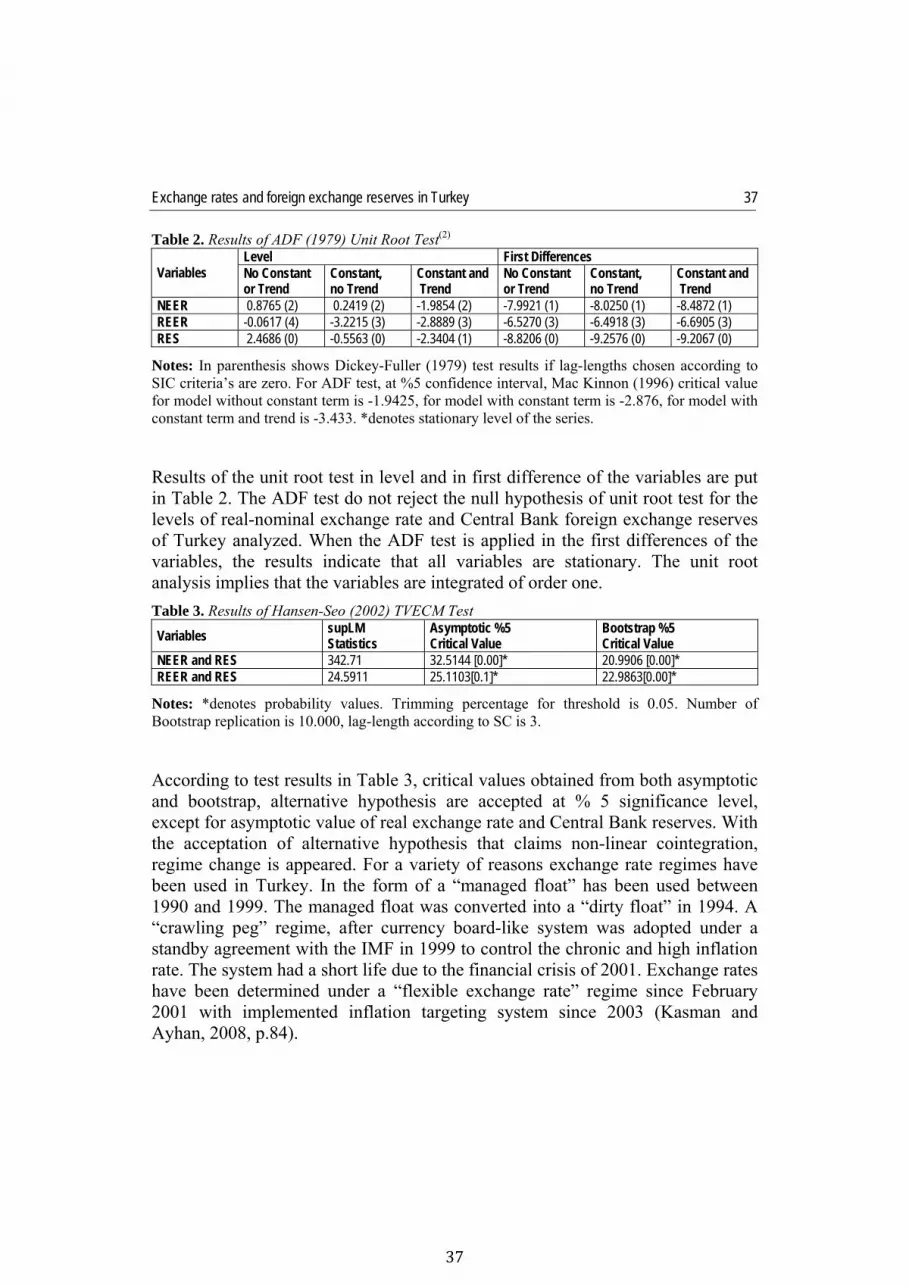
Table 2. Results of ADF (1979) Unit Root Test(2)
Variables Level First DifferencesNo Constant or Trend
Constant, no Trend
Constant and Trend
No Constant or Trend
Constant, no Trend
Constant and Trend
NEER 0.8765 (2) 0.2419 (2) -1.9854 (2) -7.9921 (1) -8.0250 (1) -8.4872 (1) REER -0.0617 (4) -3.2215 (3) -2.8889 (3) -6.5270 (3) -6.4918 (3) -6.6905 (3) RES 2.4686 (0) -0.5563 (0) -2.3404 (1) -8.8206 (0) -9.2576 (0) -9.2067 (0)
Notes: In parenthesis shows Dickey-Fuller (1979) test results if lag-lengths chosen according to SIC criteria’s are zero. For ADF test, at %5 confidence interval, Mac Kinnon (1996) critical value for model without constant term is -1.9425, for model with constant term is -2.876, for model with constant term and trend is -3.433. *denotes stationary level of the series.
Results of the unit root test in level and in first difference of the variables are put in Table 2. The ADF test do not reject the null hypothesis of unit root test for the levels of real-nominal exchange rate and Central Bank foreign exchange reserves of Turkey analyzed. When the ADF test is applied in the first differences of the variables, the results indicate that all variables are stationary. The unit root analysis implies that the variables are integrated of order one.
Table 3. Results of Hansen-Seo (2002) TVECM Test
Variables supLM Statistics
Asymptotic %5 Critical Value
Bootstrap %5 Critical Value
NEER and RES 342.71 32.5144 [0.00]* 20.9906 [0.00]* REER and RES 24.5911 25.1103[0.1]* 22.9863[0.00]*
Notes: *denotes probability values. Trimming percentage for threshold is 0.05. Number of Bootstrap replication is 10.000, lag-length according to SC is 3.
According to test results in Table 3, critical values obtained from both asymptotic and bootstrap, alternative hypothesis are accepted at % 5 significance level, except for asymptotic value of real exchange rate and Central Bank reserves. With the acceptation of alternative hypothesis that claims non-linear cointegration, regime change is appeared. For a variety of reasons exchange rate regimes have been used in Turkey. In the form of a “managed float” has been used between 1990 and 1999. The managed float was converted into a “dirty float” in 1994. A “crawling peg” regime, after currency board-like system was adopted under a standby agreement with the IMF in 1999 to control the chronic and high inflation rate. The system had a short life due to the financial crisis of 2001. Exchange rates have been determined under a “flexible exchange rate” regime since February 2001 with implemented inflation targeting system since 2003 (Kasman and Ayhan, 2008, p.84).
Tayfur Bayat, Mehmet Senturk, Selim Kayhan 38
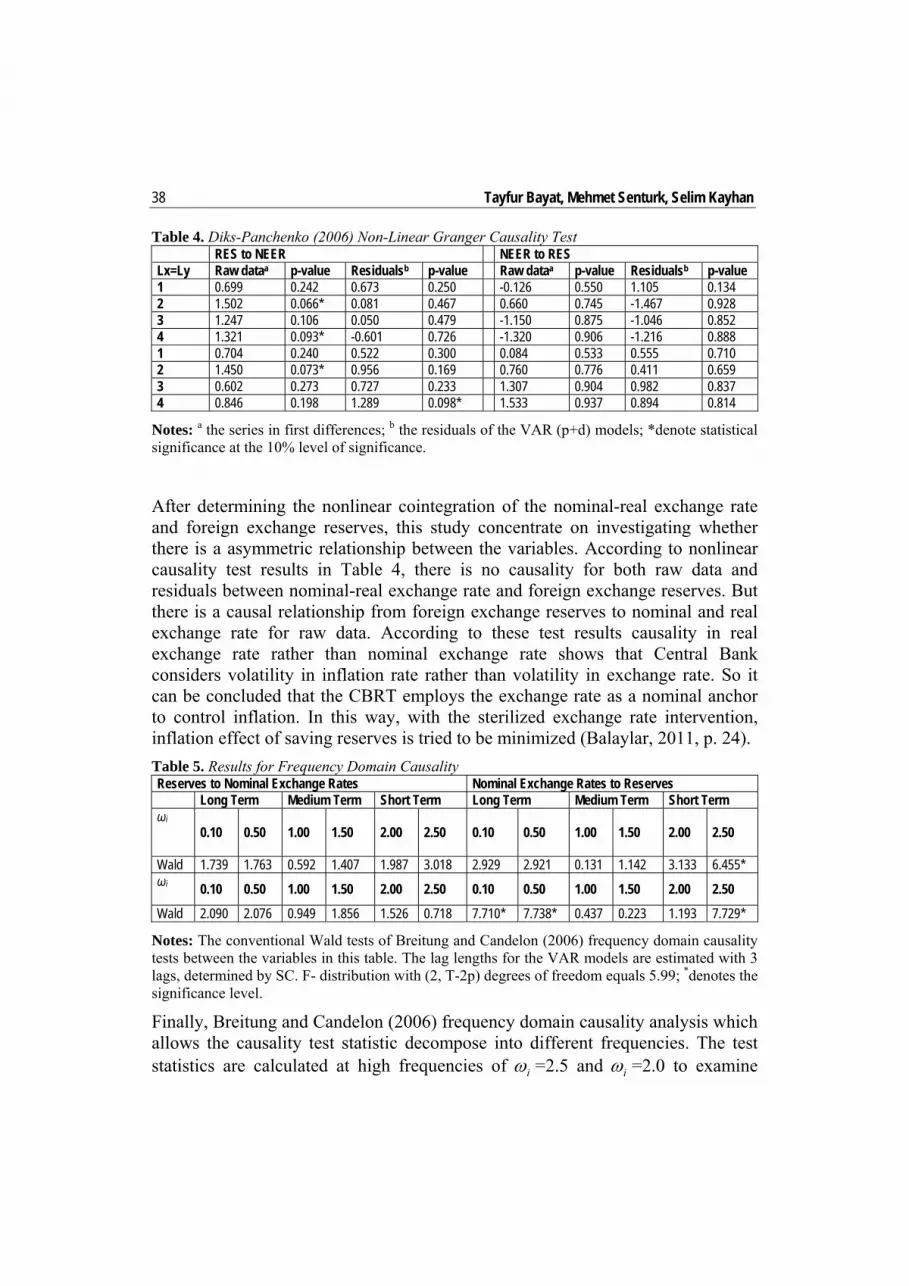
Table 4. Diks-Panchenko (2006) Non-Linear Granger Causality Test RES to NEER NEER to RES
Lx=Ly Raw dataa p-value Residualsb p-value Raw dataa p-value Residualsb p-value 1 0.699 0.242 0.673 0.250 -0.126 0.550 1.105 0.134 2 1.502 0.066* 0.081 0.467 0.660 0.745 -1.467 0.928 3 1.247 0.106 0.050 0.479 -1.150 0.875 -1.046 0.852 4 1.321 0.093* -0.601 0.726 -1.320 0.906 -1.216 0.888 1 0.704 0.240 0.522 0.300 0.084 0.533 0.555 0.710 2 1.450 0.073* 0.956 0.169 0.760 0.776 0.411 0.659 3 0.602 0.273 0.727 0.233 1.307 0.904 0.982 0.837 4 0.846 0.198 1.289 0.098* 1.533 0.937 0.894 0.814
Notes: a the series in first differences; b the residuals of the VAR (p+d) models; *denote statistical significance at the 10% level of significance.
After determining the nonlinear cointegration of the nominal-real exchange rate and foreign exchange reserves, this study concentrate on investigating whether there is a asymmetric relationship between the variables. According to nonlinear causality test results in Table 4, there is no causality for both raw data and residuals between nominal-real exchange rate and foreign exchange reserves. But there is a causal relationship from foreign exchange reserves to nominal and real exchange rate for raw data. According to these test results causality in real exchange rate rather than nominal exchange rate shows that Central Bank considers volatility in inflation rate rather than volatility in exchange rate. So it can be concluded that the CBRT employs the exchange rate as a nominal anchor to control inflation. In this way, with the sterilized exchange rate intervention, inflation effect of saving reserves is tried to be minimized (Balaylar, 2011, p. 24).
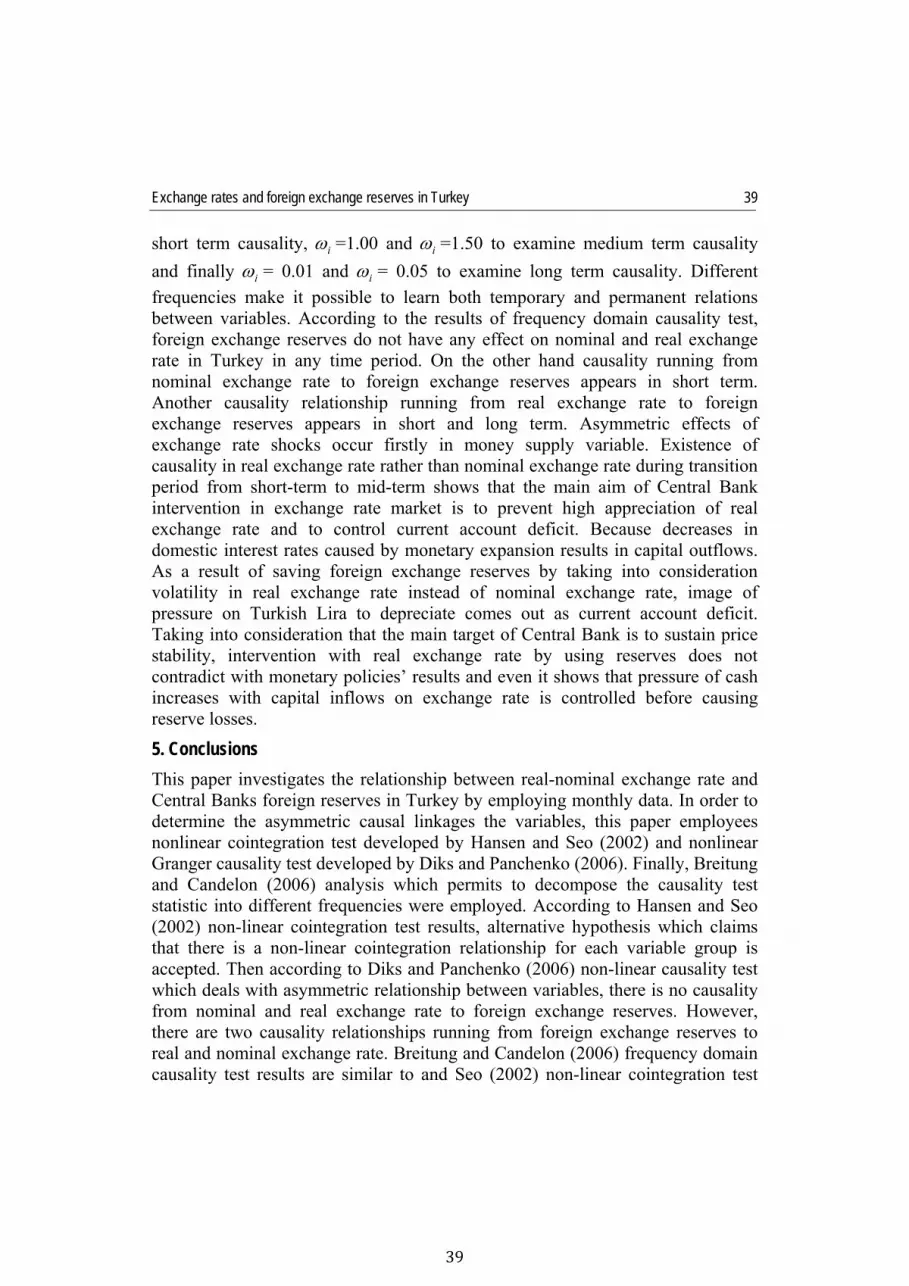
Table 5. Results for Frequency Domain Causality Reserves to Nominal Exchange Rates Nominal Exchange Rates to Reserves
Long Term Medium Term Short Term Long Term Medium Term Short Term ωi
0.10 0.50 1.00 1.50 2.00 2.50 0.10 0.50 1.00 1.50 2.00 2.50
Wald 1.739 1.763 0.592 1.407 1.987 3.018 2.929 2.921 0.131 1.142 3.133 6.455* ωi
0.10 0.50 1.00 1.50 2.00 2.50 0.10 0.50 1.00 1.50 2.00 2.50
Wald 2.090 2.076 0.949 1.856 1.526 0.718 7.710* 7.738* 0.437 0.223 1.193 7.729*
Notes: The conventional Wald tests of Breitung and Candelon (2006) frequency domain causality tests between the variables in this table. The lag lengths for the VAR models are estimated with 3 lags, determined by SC. F- distribution with (2, T-2p) degrees of freedom equals 5.99; *denotes the significance level.
Finally, Breitung and Candelon (2006) frequency domain causality analysis which allows the causality test statistic decompose into different frequencies. The test statistics are calculated at high frequencies of i =2.5 and i =2.0 to examine
Exchange rates and foreign exchange reserves in Turkey
39
39
short term causality, i =1.00 and i =1.50 to examine medium term causality
and finally i = 0.01 and i = 0.05 to examine long term causality. Different
frequencies make it possible to learn both temporary and permanent relations between variables. According to the results of frequency domain causality test, foreign exchange reserves do not have any effect on nominal and real exchange rate in Turkey in any time period. On the other hand causality running from nominal exchange rate to foreign exchange reserves appears in short term. Another causality relationship running from real exchange rate to foreign exchange reserves appears in short and long term. Asymmetric effects of exchange rate shocks occur firstly in money supply variable. Existence of causality in real exchange rate rather than nominal exchange rate during transition period from short-term to mid-term shows that the main aim of Central Bank intervention in exchange rate market is to prevent high appreciation of real exchange rate and to control current account deficit. Because decreases in domestic interest rates caused by monetary expansion results in capital outflows. As a result of saving foreign exchange reserves by taking into consideration volatility in real exchange rate instead of nominal exchange rate, image of pressure on Turkish Lira to depreciate comes out as current account deficit. Taking into consideration that the main target of Central Bank is to sustain price stability, intervention with real exchange rate by using reserves does not contradict with monetary policies’ results and even it shows that pressure of cash increases with capital inflows on exchange rate is controlled before causing reserve losses.
5. Conclusions
This paper investigates the relationship between real-nominal exchange rate and Central Banks foreign reserves in Turkey by employing monthly data. In order to determine the asymmetric causal linkages the variables, this paper employees nonlinear cointegration test developed by Hansen and Seo (2002) and nonlinear Granger causality test developed by Diks and Panchenko (2006). Finally, Breitung and Candelon (2006) analysis which permits to decompose the causality test statistic into different frequencies were employed. According to Hansen and Seo (2002) non-linear cointegration test results, alternative hypothesis which claims that there is a non-linear cointegration relationship for each variable group is accepted. Then according to Diks and Panchenko (2006) non-linear causality test which deals with asymmetric relationship between variables, there is no causality from nominal and real exchange rate to foreign exchange reserves. However, there are two causality relationships running from foreign exchange reserves to real and nominal exchange rate. Breitung and Candelon (2006) frequency domain causality test results are similar to and Seo (2002) non-linear cointegration test

Tayfur Bayat, Mehmet Senturk, Selim Kayhan 40
results. So, there is no causality relationship from foreign exchange reserves to nominal and real exchange rate. On the other hand, there are two uni-directional causality relationships between the variables. First of all, from nominal exchange rate to foreign exchange reserves only short time and the other causality relationship from real exchange rate to foreign exchange reserves both short and long time, but not mid-term. These test results shows that the CBRT wants to sterilize cash increases caused by using foreign exchange reserves. In floating exchange rate system implemented till February 2001 in Turkey, effects of changes in nominal foreign exchange rate on inflation rate have not been evaluated, thus that means inflation target is much more important than volatility in nominal foreign exchange rate.
Notes (1) For detailed information about theorems and proofs of Bootstrap look at Hansen and Seo
(2002). (2) As non-linear cointegration test is applied for error terms, in order to find degree of stationary,
Augmented Dickey-Fuller linear unit-root test is applied like Kapetanios et al. (2006) recommended in their studies.
References Aizenman, J., Sun, Y. (2009). “The Financial Crisis and Sizable International Reserves Depletion:
From 'Fear of Floating' to the 'Fear of Losing International Reserves?”, National Bureau of Economic Resarch Working Paper, 5308, pp. 1-37
Alper, E., Ardıç, P. (2006). “Serbest Kur Rejimi Döneminde Döviz Kuru Öngörüsü: Türkiye’ye Uygulama”, Uluslararası Ekonomi ve Dış Ticaret Politikaları, 1(1), pp. 51-68
Ardic, H. (2004). “1994 ve 2001 Yılı Ekonomik Krizlerinin, Türkiye Cumhuriyeti Merkez Bankası Bilançosunda Yarattıgı Hareketlerin İncelenmesi”, TCMB Uzmanlık Yeterlik Tezi, Ankara
Balaylar N., Ural, M. (2007). “Bankacılık Sektöründe Yüksek Risk ve Baskı Endeksleri”, Finans, Politik ve Ekonomik Yorumlar, 44(509), pp. 47-57
Balaylar, N. (2011). “Türkiye’de Döviz Piyasası Müdahalelerinin Sterilizasyon Maliyeti”, Dokuz Eylül Üniversitesi Sosyal Bilimler Enstitüsü Dergisi, 13(3), pp. 19-38
Balke, N.S., Fomby, T.B. (1997). “Threshold Cointegration”, International Economic Review, 38, pp. 627-645
Baum, C.F., Karasulu, M. (1998). “Modelling Federal Reverve Discount Policy”, Computational Economics, 11, pp. 53-70
Breitung, J., Candelon, B. (2006). “Testing For Short and Long-Run Causality: A Frequency-Domain Approach”, Journal of Econometrics, 132, pp. 363-378
Brock, W.A., Dechert, W., Scheinkman, J. (1987). “A Test for Independence Based on the Correlation Dimension”, University of Wisconsin at Madison, Department of Economics Working Paper, pp. 1-39

Exchange rates and foreign exchange reserves in Turkey
41
41
Brock, W.A., Dechert, W., Scheinkman, J., LeBaron, B. (1996). “A Test for Independence Based on the Correlation Dimension”, Econometric Reviews, 15, pp. 197-235
Calvo, G., Reinhart, C. (2001). “The Twin Crises: The Causes of Balance-of Payments Problems”, George Washington University Department of Economics Working Paper, 89(3), pp. 473-500
Ciner, C. (2011). “Eurocurrency Interest Rate Linkages: A Frequency Domain Analysis”, International Review of Economics and Finance, 20, pp. 498-505
Dickey, D.A., Fuller, W.A. (1979). “Distribution of the Estimators for Autoregressive Time Series with A Unit Root”, Journal of the American Statistical Association, 74, pp. 427-431
Diks, C., Panchenko, V. (2005). “A Note on the Hiemstra-Jones Test for the Granger Non-Causality”,. Studies in Nonlinear Dynamics and Econometrics, 9(2), pp. 1-7
Diks, C., Panchenko, V. (2006). “A New Statistic and Practical Guidelines for Nonparametric Granger Causality Testing”, Journal of Economic Dynamics and Control, 30, pp. 1647-1669
Dutt, S., Ghosh, D. (2005). “A Threshold Cointegration Test of the Fisher Hypothesis: Case Study of 5 European Nations”, Southwestern Economic Review, 31(3), pp. 40-50
Enders, W., Falk, B. (1998). “Threshold-Autoregressive, Median-Unbiased and Cointegration Tests of Purchasing Power Parity”, International Journal of Forecasting, 14, pp. 171-186
Enders, W., (2009). “Applied Econometric Time Series”, 3. Editon, ISBN 978-0-470-57425-6 Esteve, V., Prats, M. (2010). “Threshold Cointegration and Nonlinear Adjustment Between Stock
Prices and Dividends”, Applied Economics Letters, 17(4), pp. 405-410 Esteve, V., Gil-Pajera, S., Martinez-Serrano, A., Llorca-Vivero, R. (2006). “Threshold
Cointegration and Nonlinear Adjustment between Goods and Services Inflation in The United States”, Economic Modeling, 23, pp. 1033-1039
Geweke, J. (1982). “Measurement of Linear Dependence and Feedback between Multiple Time Series”, Journal of the American Statistical Association, 77, pp. 304-324
Granger, C.W.J. (1969). “Investigating Causal Relations by Econometric Models and Cross-Spectral Methods”, Econometrica, 37, pp. 424-438
Granger, C.W.J. (1986). “Developments in the Study of Cointegrated Economic Variables”, Oxford Bulletin of Economics and Statistics, 48, pp. 213-228
Gregory, A.W., Hansen, B.E. (1996). “Residual-Based Tests for Cointegration in Models with Regime Shifts”, Journal of Econometrics, 70, pp. 99-126
Hansen, B.E. (1996). “Inference When a Nuisance Parameter is not Identified under the Null Hypothesis”, Econometrica, 57, pp. 413-430
Hansen, B.E., Seo, B. (2002). “Testing for Two-Regime Threshold Cointegration in Vector Error-Correction Models”, Journal of Econometrics, 110, pp. 293-318
Hiemstra, C., Jones, J. (1993). “Monte Carlo Results for A Modified Version of the Baek and Brock Nonlinear Granger Causality Test”, University of Strathclyde and Securities and Exchange Commission Working Paper, pp. 1-21
Hiemstra, C., Jones, J. (1994). “Testing for Linear and Nonlinear Granger Causality in the Stock Price-Volume Relation”, Journal of Finance, 49(5), pp. 1639-1664
Hosoya, Y. (1991). “The Decomposition and Measurement of the Interdependence between Second-Order Stationary Process”, Probability Theory and Related Fields, 88, pp. 429-444
Ihle, R., Taubadel, S. (2008). “A Comparison of Threshold Cointegration and Markov-Switching Vector Error Correction Models in Price Transmission Analysis”, Proceedings of the NCCC-134 Conference on Applied Commodity Price Analysis Forecasting and Market Risk Management St. Louis MO, pp. 2-47
Kapetanios, G., Yongcheol, S., Andy, S. (2006). “Testing for Cointegration Nonlinear Smooth Transition Error Correction Models”, Econometric Theory, 22, pp. 279-303
Kasman, A., Ayhan, D. (2008). “Foreign Exchange Reserves and Exchange Rates in Turkey: Structural Breaks, Unit Root and Cointegration”, Economic Modeling, 25, pp. 83-92
Tayfur Bayat, Mehmet Senturk, Selim Kayhan 42
Kibritçioğlu, A. (2001). “Türkiye’de Ekonomik Krizler ve Hükümetler: 1969-2001”, Yeni Türkiye Dergisi, pp. 174-182
Lo, M., Zivot, E. (2001). “Threshold Cointegration and Nonlinear Adjustment to the Law of One Price”, Macroeconomic Dynamics, 5, pp. 533-576
MacKinnon, J.G. (1996). “Numerical Distribution Functions for Unit Root and Cointegration Tests”, Journal of Applied Econometrics, 11, pp. 601-618
Obstfeld, M., Taylor, A.M. (1997). “Nonlinear Aspects of Goods Market Arbitrage and Adjustment: Heckscher’s Commodity Points Revisited”, Journal of Japanese and International Economies, 11, pp. 441-479
Parlaktuna, I. (2005). “Exchange Market Pressure in Turkey 1993–2004: An Application of the Girton–Roper Monetary Model”, International Economic Journal, 19 (1), pp. 51-62
Sen, A. (2006). “Parasal Krizlere Neden Olan Faktörler”, Akademik Bakış, 9, pp. 11-12 Taylor, A.M. (2002). “A Century of Purchasing Power Parity”, Review of Economics and
Statistics, 84, pp. 139-150 Central Bank of the Republic of Turkey (2009). “Monetary and Exchange Rate Policy for 2010”.
Ankara