traffic causality graphs: profiling network applications through temporal and spatial causality of...
TRANSCRIPT
Traffic Causality Graphs: Profiling NetworkApplications through Temporal and Spatial
Causality of FlowsHirochika Asai
The University of [email protected]
Kensuke FukudaNII / PRESTO [email protected]
Hiroshi EsakiThe University of Tokyo
Abstract—Traffic causality graphs (TCGs) are proposed forvisualizing and analyzing the temporal and spatial causality offlows to profile network applications without inspecting packetpayload. A key idea of TCGs is to focus on the causality of indi-vidual flows composed of different application protocols ratherthan a set of host flows. This idea enables us to analyze temporalinteractions between flows, such as the temporal manner of flowgeneration by identical application programs and interactionsbetween incoming and outgoing flows. We demonstrate theeffectiveness of TCGs for profiling network applications in casestudies with ground truth datasets. The results show that thesimple features of TCGs are discriminative for profiling networkapplications and that TCGs are also advantageous for profilingapplication programs, such as user agents of Web browsers andproxies that cannot be classified by existing approaches; thisenables us to identify a specific application program that usesthe same protocol as other programs. In addition to the TCGfeatures, the visualization of TCGs reveals the causality of eachflow, which consequently helps network operators to identify theroot causes of other flows, such as malicious ones.
I. INTRODUCTION
Internet usage has become diversified and various networkapplications are run on the Internet. In this environment,traffic classification is one of the key technologies for IPnetwork management tasks, such as analysis of security in-cidents, network topology design, and traffic engineering.The simplest traffic classification method is based on thesource and destination port numbers of the transport layer(e.g., TCP and UDP) [1]. However, a problem for the port-based method is that port numbers are not statically boundto each application. For example, network applications canuse non-standard ports, especially when there are firewallport restrictions. Moreover, some network applications suchas peer-to-peer applications may use a random port. Casessuch as these make it difficult to classify traffic according toport numbers. Many advanced techniques that do not rely onlyon port numbers have been proposed for profiling networkapplication traffic. Signature-based traffic classifiers [2], [3],[4], [5], [6], [7] identify applications from network traffic byinspecting packet payloads (i.e., application data). However,packet inspection creates some privacy concerns, and it isdifficult to conduct when the data is encrypted. To solve theseprivacy and encryption problems, statistical approaches [8],[9], [10] have been proposed to classify applications from
network traffic. These approaches use statistical properties,such as the probability distribution of packet inter-arrival timeand of packet size, instead of packet payload inspection.These properties are useful for detecting anomalies in networkflows, and consequently, they have also been used in anomalydetection methods [11]. An intrinsic approach [12] not relyingon signatures or statistical properties checks IP addressesin flows and Web contents found in search engine resultscorresponding to an IP address to profile end-hosts. However,as the authors mentioned, it cannot profile end-hosts usingP2P applications, and applying it to application profilingis difficult because end-hosts, especially end-user hosts, usemultiple applications. Other approaches [13], [14], [15], [16],[17] use information on spatial interactions between hosts orflows for traffic classification. However, these approaches donot focus on the causality of flows and cannot easily profileapplication programs such as Web browsers/proxies withoutpayload inspection, though they might succeed in profilingcertain application classes, such as the Web browsing and P2Pfile-sharing classes. Moreover, since these approaches neglectthe causality, the root causes of flows cannot be identified.
In summary, the main problem of existing approaches isthat they cannot profile application programs well, althoughapplication program profiling is important in network opera-tion [18]. The existing approaches do not focus on the temporalorder of flows, despite applications generating flows in acertain temporal manner that varies by application type; forexample, Web browsers first resolve a domain name by DNSand then retrieve a content by HTTP. In addition to temporalorder of flows, the approaches also ignore interactions betweenincoming and outgoing flows. For example, a Web proxy partlybehaves like a Web client; it resolves a domain name andretrieves content from the original Web server, after receivingan HTTP request. Therefore, the temporal and spatial causalityof flows is highly significant for profiling network applications.One practical use of this application program profiling is toidentify a specific application program that uses the sameprotocol as other programs but has security problems.
In this work, we focus on the temporal and spatial causalityof individual flows for profiling network applications, withoutlooking at packet payload. Our final goal is to automaticallyprofile application classes and to automatically profile appli-

cation programs. We propose traffic causality graphs (TCGs)that represent temporal and spatial causality of flows forvisualizing and analyzing traffic patterns to profile networkapplications. We discuss a TCG composition method and anetwork application traffic profiling approach using TCGs.The main contribution of this paper is to propose a networkapplication traffic profiling approach that enables us to analyzetemporal and spatial flow causality. Case study results showthe advantage of the proposed approach, which uses the simplefeatures of TCGs, for profiling application programs as wellas application classes. In addition to use of the features, weshow that the TCG visualization helps network operators toidentify the root causes of other flows, e.g., malicious ones.
II. RELATED WORKS
Several works focus on the interactions between hosts orflows to classify traffic. Iliofotou et al. [15], [16], [19] and Jinet al. [17] have proposed graph-based approaches to profileapplication’s activities. They model the social behavior ofhosts by representing hosts and their interactions as verticesand edges in a graph, respectively. In these approaches,temporal activities as well as momentary ones can be analyzedby looking at series of graph snapshots. However, one problemcommon to these approaches is that they do not focus oninteractions between different protocols, such as interactionsbetween DNS and HTTP in Web browsing, because they repre-sent flows by edges, not vertices. Thus, they have difficulty inprofiling the activities of applications using multiple protocols.Karagiannis et al. [13], [14] analyzed spatial five-tuple (flow)interactions and they showed that the characteristics of flowinteractions could be used to identify the application classesof end-hosts such as Web, P2P application, and attack classes.However, the temporal interactions between flows were ig-nored, and more detailed profiling with their approach, suchas application program profiling, is not possible.
Flow dependency has also been researched. Popa et al. [20]proposed an approach to identify network application depen-dencies by using process IDs on operating systems as wellas packet traces. However, this approach requires a processmonitor to be installed at each end-host, so deployment insome networks, such as a campus guest network, is difficultbecause each end-host is owned and administered by eachuser. Kandula et al. focused on flow dependencies to con-struct communication rules for an edge network [21]. Theirfocus was similar to ours in terms of flow interactions, andthey extracted significant communication patterns. However,temporal information, such as the order of consecutive flows,was missed because their approach partitions flows into timewindows to search related flows. Namely, temporal flowcausality is more useful for profiling network applications ifcharacteristics are extracted from the causality. Unlike theirapproach, our proposed approach categorizes temporal flowinteractions into four relationship types. This categorizationhas a significant role when we use the interactions as featuresin TCGs, as shown in §IV-B.
Vladislav et al. [18] investigated signatures of several pop-ular applications, such as Web browsers (Google Chrome,Firefox etc.) and E-mail clients. The motive of their researchis similar to ours in terms of focusing on application programprofiling. They achieved to extract flow signatures of theseapplications, and identify them without deep packet inspectionby using extracted flow signatures. However, they do not buildup any general methods to extract the discriminative flowsignatures. We provide more general method and features toprofile applications.
III. TRAFFIC CAUSALITY GRAPH COMPOSITION
The profiling procedure consists of three steps. The first stepis to aggregate packets into flows based on a conventional five-tuple: 〈proto, srcIP, srcPort, dstIP, dstPort〉. Thismethod does not require the packet payload; instead it usesthe transport layer header. Note that each direction of a flowis processed as a different flow, e.g., one bidirectional TCPconnection is represented as two flows. In this step, we assignthe timestamp of the first packet of each flow to the flow. Thesecond step is to compose a TCG from the flows. All flowsare represented as vertices in the graph, and then related flowsare connected by directed edges. The direction of an edgerepresents temporal transition. The TCG composition consistsof two phases: 1) connecting related flows and 2) reducingedges by heuristics. Finally, we analyze the TCG and profilenetwork applications.
A. Flow causality and visualization of TCGs
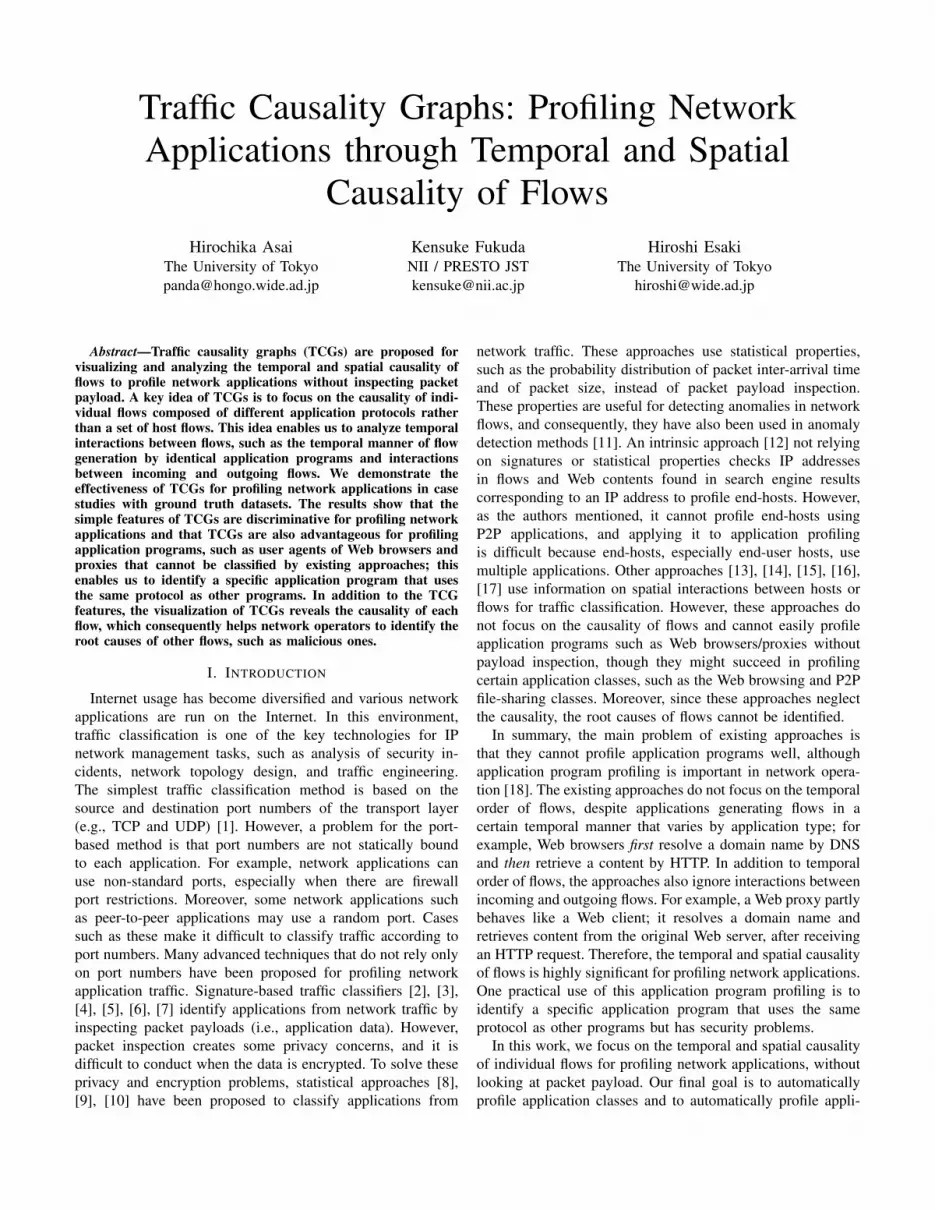
In TCGs, vertices and edges represent flows and flowcausality, respectively. We first define four types of flowcausality relationships to compose TCGs (Fig. 1): 1) commu-nication relationship (CR), 2) propagation relationship (PR), 3)dynamic-port host relationship (DHR), and 4) static-port hostrelationship (SHR). The first two, CR and PR, are relationshipsfrom a flow going to a host (i.e., an IP address) to a flowcoming from the host, representing that a flow causes acorresponding flow. CR is a one-to-one relationship from arequest to its response (i.e., reverse direction of the requestfive-tuple). PR is a many-to-many relationship in which oneflow propagates information into another flow, such as proxyand relay. The other two, DHR and SHR, are many-to-manyrelationships between flows coming from an identical host.DHR is the relationship between flows with the same srcIPbut a different srcPort; e.g., Web browsers create multipleconnections to an identical server with different source portnumbers. SHR is the relationship between flows with thesame srcIP and srcPort, e.g., some port scanners use anidentical srcPort for a sequence of the port scan procedure,and a server uses a static source port for responses. Note thatthere are hundreds of other possible types of relationship offlow causality such as relationship between flows with thesame dstIP and different srcIPs, but we focus on these fourrelationship types as characteristics representing applicationbehavior.
!"#$%$#$!!"#$%$#$#
&'%%%()%*+,
)%(&'%%%*+,
Communication relationship
Time
TCGa
a
bb
(a) CR
!"#$%$#$!!"#$%$#$#
!"#$%$#$&
#%%%%'(&)!*+
(&'(&%%%)!*+
(&'#%%%%)!*+
(&%%%'(&)!*+
Propagation relationship
Time
TCG
a a
b b
cc
d d
(b) PR
!"#$%$#$#!"#$%$#$!
!"#$%$#$&
'&('&%%%)!*+
'#"""(,%)-+
,%('#""")-+
'&%%%('&)!*+
Dynamic-port host relationship
Time
TCGa
a
b b
cc
d d
(c) DHR
!"#$%$#$#!"#$%$#$!
!"#$%$#$&
'%%%()"""*!+,
'%%%()"""*!+,
Static-port host relationship
Time
TCG
aa
bb
(d) SHR
Fig. 1. Examples of four types of flow causality relationships and their TCG visualizations. Each vertex and edge in a TCG represents a flow and relationshipbetween two flows, respectively. Number in parentheses denotes proto; i.e., 1 for ICMP, 6 for TCP, and 17 for UDP. Note we treated all flows as outboundfor the TCG visualization.
A TCG can be visualized as a directed graph. The shapeof vertices represents proto and flow direction; we usetriangles for outbound ICMP, inverted triangles for inboundICMP, double circles for outbound TCP, single circles forinbound TCP, double bordered octagons for outbound UDP,and octagons for inbound UDP1. For the visualization ofedges, we use half arrowheads in indigo, double-headed onesin brown, filled ones in green, and open ones in green for CR,PR, DHR, and SHR, respectively.
Examples of these four types of flow causality relationshipswith their TCGs are shown in Fig. 1; the details of thealgorithm will be introduced in the following subsections.Note that we treat all flows as outbound for the visual-ization, ignoring the real flow direction. Figure 1(a) showsan example of CR with simple server-client communicationthrough HTTP. The client 192.0.2.1 sends a request tothe server 192.0.2.2, and then the server replies. Theseflows are related to each other because the response is ini-tiated by the request. Figure 1(b) shows an example of PRwith a DNS request and response through a DNS cacheserver. The client 192.0.2.1 sends a request to the cacheserver 192.0.2.2, and then the cache server relays therequest to the authoritative server 192.0.2.3. The flowfrom the cache server to the authoritative server is causedby the flow from the client (i.e., the original request), sothese flows are related. Figure 1(c) shows an example ofDHR with single Web page access using DNS and HTTP.The client 192.0.2.1 first resolves the name from theDNS server 192.0.2.2 and then requests the resolvedWeb server 192.0.2.3. The flow (Web request) from theclient to the Web server depends on the flow (DNS request)from the client to the DNS server because DNS lookup isrequired before access to the Web server. Figure 1(d) showsan example of SHR with host scan activities from a host withone static source port number. The host 192.0.2.1 scansthe host 192.0.2.2, and then scans the host 192.0.2.3.This host scanning fixes an identical port through a sequenceof scan activities.
1It may be difficult to distinguish octagons from circles depending on theresolution. In this case, the shape can be ignored because transport layerprotocols are less significant than transport layer ports, which are indicatedby color for the visualization.
Algorithm 1 Get the type of relationship between flows f1
and f2
procedure getRelationship(f1, f2, τ ):1: if timestamp(f2) − timestamp(f1) > τ then2: return Nil3: end if4: if proto(f1) = proto(f2)
and srcIP(f1) = dstIP(f2) and srcPort(f1) = dstPort(f2)and dstIP(f1) = srcIP(f2) and dstPort(f1) = srcPort(f2) then
5: return COMMUNICATION_RELATIONSHIP6: else if dstIP(f1) = srcIP(f2) then7: return PROPAGATION_RELATIONSHIP8: else if srcIP(f1) = srcIP(f2) and srcPort(f1) 6= srcPort(f2) then9: return DYNAMIC_PORT_HOST_RELATIONSHIP
10: else if srcIP(f1) = srcIP(f2) and srcPort(f1) = srcPort(f2) then11: return STATIC_PORT_HOST_RELATIONSHIP12: else13: return Nil14: end ifend procedure
B. Phase 1: Connecting related flows
We compose a TCG from a set of flows with the times-tamp of the flow head and five-tuple parameters by con-necting related flows according to simple rules. These rulesalmost exactly correspond to the definitions of flow rela-tionships in §III-A. We use six parameters, i.e., the fiveelements of the five-tuple and the timestamp, for the TCGcomposition. The functions proto(f), srcIP(f), srcPort(f),dstIP(f), and dstPort(f) return proto, srcIP, srcPort,dstIP, and dstPort of the flow f , respectively. Thefunction timestamp(f) returns the start time of the flow f ,i.e., the timestamp of the first packet of the flow.
The algorithm to determine the type of relationship betweenany two flows is in Algorithm 1. Note that non-consecutiveflows are also processed. Since temporally distant flows can beconsidered as not related, this algorithm first checks a thresh-old τ (lines 1–3). The threshold is defined as a global constantvalue in the algorithm. The threshold works independently ofthe edge reduction rules explained in §III-C, and it is usedto limit the edges generated in order to reduce computationalcomplexity. Then it checks the CR (lines 4–5), PR (lines 6–7), DHR (lines 8–9), and SHR (lines 10–11), in that order. Ifthe input two flows have no relationship, the algorithm returns
DNS request
HTTP request
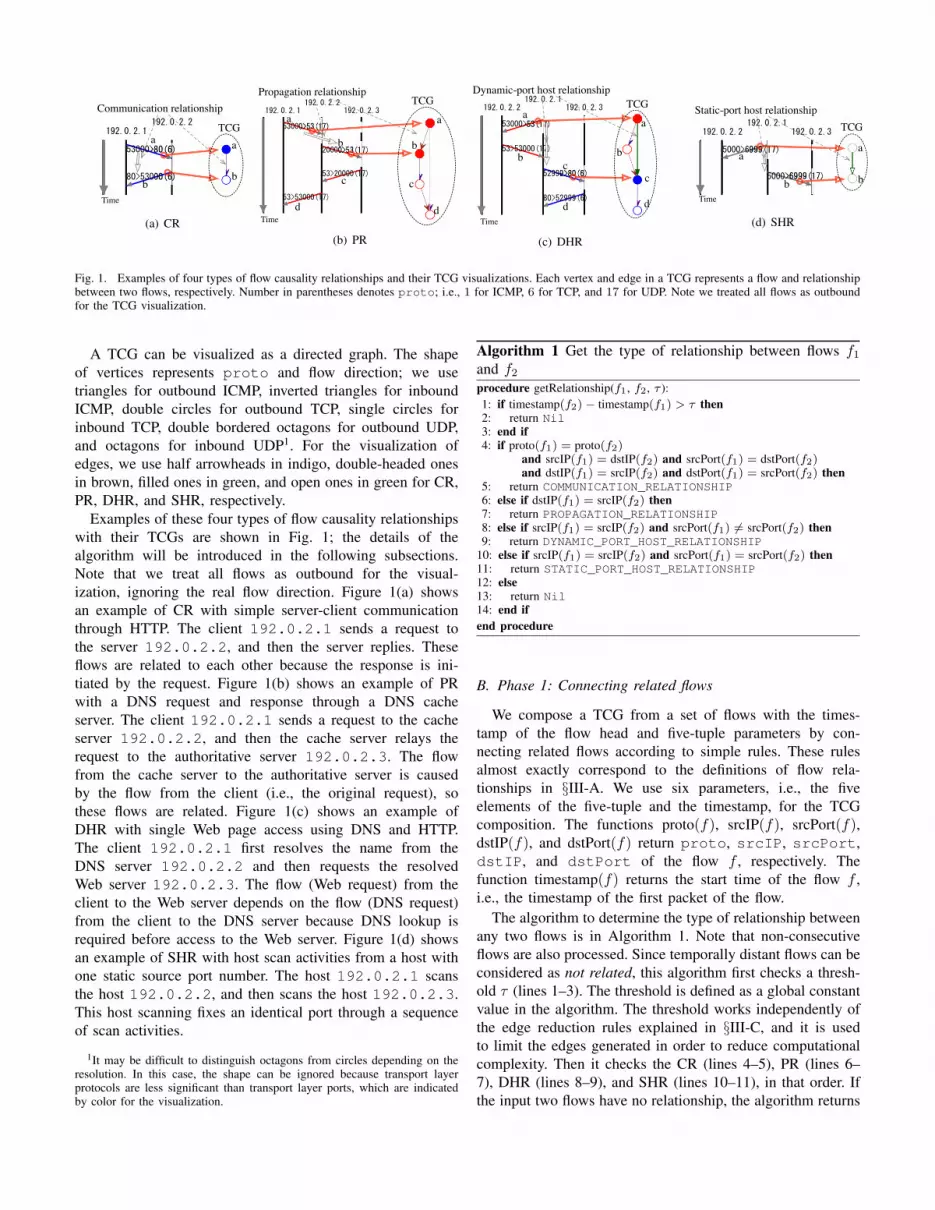
Fig. 2. TCG by Phase 1 without edge reduction (Packet trace: Web accessto page http://www.google.com/ by Microsoft Internet Explorer; τ = 1[s])
Nil (lines 12–13). If the algorithm returns a non-Nil value,an edge from f1 to f2 labeled with the returned relationshipis added to the TCG.
Here, we define the terminology for TCG edges: CR-requestand CR-response are the source and destination vertices ofa CR edge, respectively. In the same way, PR-source, PR-destination, DHR-source, DHR-destination, SHR-source andSHR-destination are the source and destination vertices of aPR edge, a DHR edge, an SHR edge, respectively.
C. Phase 2: Reducing edges by heuristics
Figure 2 demonstrates a TCG composed in Phase 1 from apacket trace. Clearly this figure indicates problems with thesimple algorithm in Phase 1. Flow causality is difficult tounderstand from the visualization of this TCG, and conse-quently, only significant edges should be retained. Algorithm 1produces TCGs with two problems: 1) too many PR, DHR, andSHR edges, most of which do not represent direct causality,and 2) irrelative edges due to the simplicity of the algorithm.The former problem occurs because PR, DHR, and SHR aremany-to-many relationships and an identical host generatesseveral flows within the threshold. We call these edges that donot represent direct causality tenuous edges. The latter problemis caused simply because the Phase 1 algorithm is based onsimple rules thus generates any possible edges even if someedges indicate indirect causality. For example, CR-responsescan also be PR-destinations according to the algorithm, butthey should not be because CR-responses are obviously causedby corresponding CR-requests but not by PR-sources. Wecall these edges that should be removed irrelative edges. Weremove irrelative edges by looking at neighboring edges. Notethat edges that do not represent indirect causality are related(i.e., not irrelative). In addition to these two problems, wemay want to remove insignificant or uninteresting edges. Forexample, when we focus on flow causality within a client host,DHR/SHR edges from any CR-response to any CR-responseare not of interest because these responses are server activitiesand can be removed. Therefore, we introduce three heuristicedge reduction rules (ER-Rules) to solve these two problemsand to remove insignificant or uninteresting edges.
!"#$%$#$!!"#$%$#$#
!"#$%$#$&
'&%%%()%)%*+,
)%)%('&%%%*+,
#%%%%()%*+,
)%(#%%%%*+,
aa
b
b
cc
d d
(a) DHR/SHR edges from CR-response toCR-request
!"#$%$#$!!"#$%$#$&
!"#$%$#$#
'#"""()%*+,
)%(#%%%%*+,
)%('#"""*+,
#%%%%()%*+,
a
a
b b
cc
d
d
(b) PR edges to CR-response and DHR/SHRedges from CR-request to CR-response
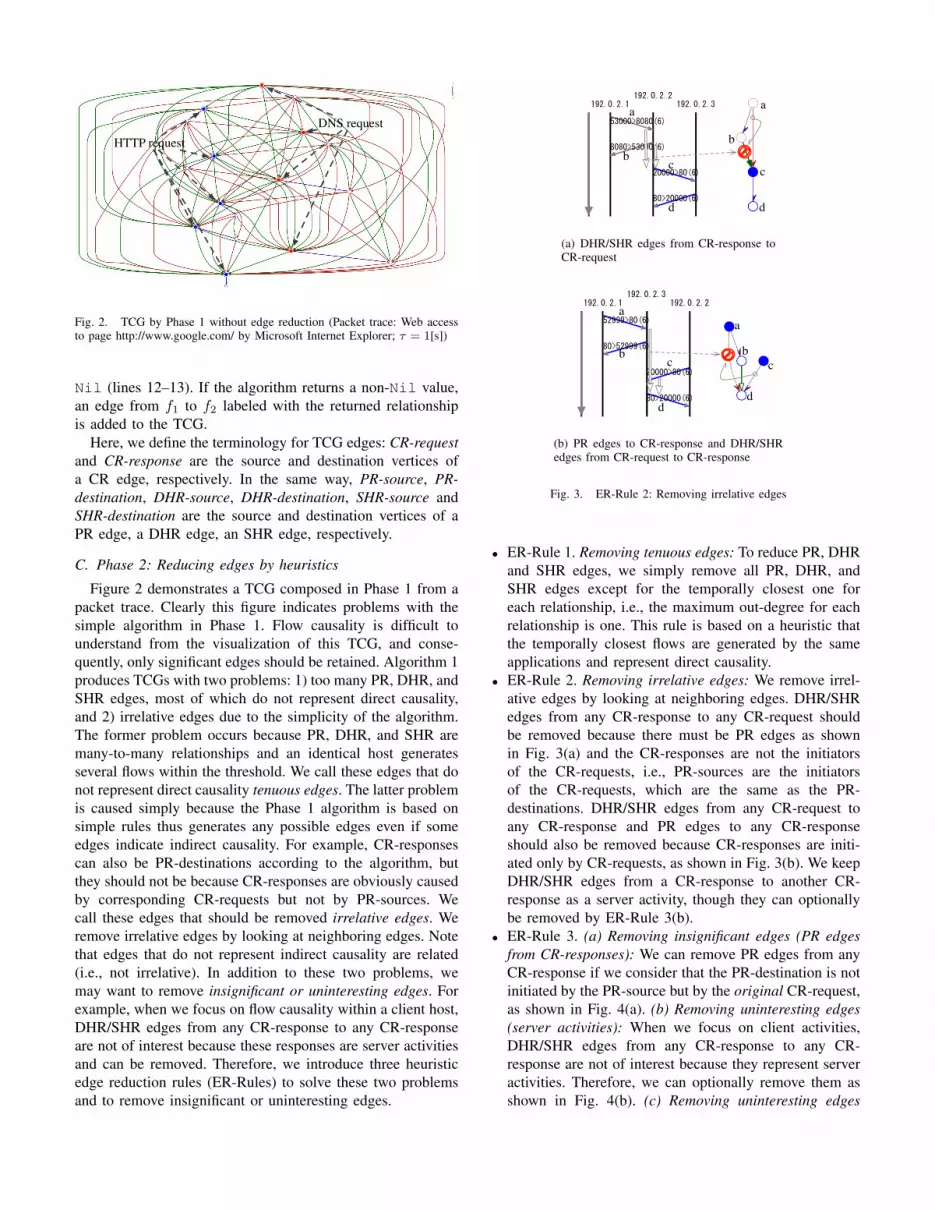
Fig. 3. ER-Rule 2: Removing irrelative edges
• ER-Rule 1. Removing tenuous edges: To reduce PR, DHRand SHR edges, we simply remove all PR, DHR, andSHR edges except for the temporally closest one foreach relationship, i.e., the maximum out-degree for eachrelationship is one. This rule is based on a heuristic thatthe temporally closest flows are generated by the sameapplications and represent direct causality.
• ER-Rule 2. Removing irrelative edges: We remove irrel-ative edges by looking at neighboring edges. DHR/SHRedges from any CR-response to any CR-request shouldbe removed because there must be PR edges as shownin Fig. 3(a) and the CR-responses are not the initiatorsof the CR-requests, i.e., PR-sources are the initiatorsof the CR-requests, which are the same as the PR-destinations. DHR/SHR edges from any CR-request toany CR-response and PR edges to any CR-responseshould also be removed because CR-responses are initi-ated only by CR-requests, as shown in Fig. 3(b). We keepDHR/SHR edges from a CR-response to another CR-response as a server activity, though they can optionallybe removed by ER-Rule 3(b).
• ER-Rule 3. (a) Removing insignificant edges (PR edgesfrom CR-responses): We can remove PR edges from anyCR-response if we consider that the PR-destination is notinitiated by the PR-source but by the original CR-request,as shown in Fig. 4(a). (b) Removing uninteresting edges(server activities): When we focus on client activities,DHR/SHR edges from any CR-response to any CR-response are not of interest because they represent serveractivities. Therefore, we can optionally remove them asshown in Fig. 4(b). (c) Removing uninteresting edges

!"#$%$#$#!"#$%$#$!
!"#$%$#$&
'&('&%%%)!*+
'#"""(,%)-+
,%('#""")-+
'&%%%('&)!*+
Time
aa
b
b
c
d
c
d
(a) PR edges from CR-responses
!"#$%$#$!!"#$%$#$&
!"#$%$#$#
'#"""()%*+,
)%(#%%%%*+,
)%('#"""*+,
#%%%%()%*+,
a
a
b bc
c
dd
(b) Server activities
!"#$%$#$#!"#$%$#$!
!"#$%$#$&
'&('&%%%)!*+
'#"""(,%)-+
,%('#""")-+
'&%%%('&)!*+
Time
a a
b
b
cc
dd
(c) Client activities
Fig. 4. ER-Rule 3: Removing insignificant or uninteresting edges
DNS request
HTTP request
Fig. 5. TCG with Phase 2 edge reduction (Packet trace: same used inFig. 2; τ = 1[s]; ER-Rules: 1, 2, and 3(a)); color indicates difference ofapplication protocols based on port numbers (red for DNS (UDP/53) andblue for HTTP (HTTP/80)).
(client activities): Likewise, when we focus on serveractivities, DHR/SHR edges from CR-requests to CR-requests are not of interest and can optionally be removedas shown in Fig. 4(c). Note that the ER-Rule 3(c) is rarelyapplied because client activities are more significantinformation on an application’s activities.
Figure 5 shows a TCG from the same packet trace usedin Fig. 2 after ER-Rules 1, 2, and 3(a) were applied. Thisfigure clearly depicts that the Web browser looks up thedomain name just before HTTP access. Thus, applying ER-Rules improves the expressivity of flow causality as well as thevisualization. For a detailed analysis, the removed edges mayindicate discriminative characteristics of network applications,but we consider that they are less important than the retainededges.
IV. EVALUATION
We demonstrate the effectiveness of TCGs for applicationprofiling by using real packet traces. We first visualize TCGsof ground truth packet traces to show the significance ofthe proposed method because the visualization enables usto intuitively analyze the temporal and spatial causality offlows. We then show the profiling results obtained usingsimple TCG features. To create ground truth packet traces, wecaptured packet traces of four Web browsers (Microsoft Inter-net Explorer, Mozilla Firefox, Google Chrome, and Opera),three P2P file sharing applications (BitTorrent, LimeWire,and Perfect Dark), and one P2P video streaming application(BBbroadcast) at clean-installed operating systems (WindowsXP SP3). To create other ground truth packet traces fromapplications running on the Internet, we also captured actualtraffic at a laboratory-level network gateway. We used two
DNS prefetchHTTP request
DNS request
Fig. 7. Part of TCG of actual traffic from/to a host (τ = 1[s]; ER-Rules: 1,2, and 3(a, b)). Confirmed as Firefox trace by manual inspection.
Web proxy request DNS request
HTTP request
Fig. 8. Connected component of TCG of Web proxy packet trace (τ = 1[s];ER-Rules: 1, 2, and 3(a, b)).
traces, SSH brute force attacks and Web proxy, that weremanually classified with a server log. We summarize theground truth packet traces of the application programs andthe method for obtaining these traces in TABLE I.
A. Case studies
We first focus on the characteristics of four major Webbrowsers. We browsed the same pages with each browserin the same order. Figure 6 shows parts of the TCGs ofthese browsed packet traces. We used +∞ for the thresholdτ and applied ER-Rules 1, 2, and 3(a) to compose theseTCGs. From these visualized TCGs, we can see one interestingand discriminative activity that Mozilla Firefox and GoogleChrome send DNS queries to resolve domain names beforethey are actually required, while Internet Explorer and Operado not. This activity is the so-called DNS prefetch, and it isapplicable to application program profiling. Figure 7 shows apart of the TCG of actual traffic captured at the laboratory-level gateway. This trace indicated similar Web access activityto a prefetch-enabled Web browser. We confirmed that it wasFirefox by manual inspection. Thus, the temporal causality offlows is advantageous for profiling application programs, i.e.,user agents of Web browsers.
A connected component of the TCG of the Web proxypacket trace is shown in Fig. 8. Unlike the TCGs of Webbrowsers, there is a PR edge before the DNS request, meaning
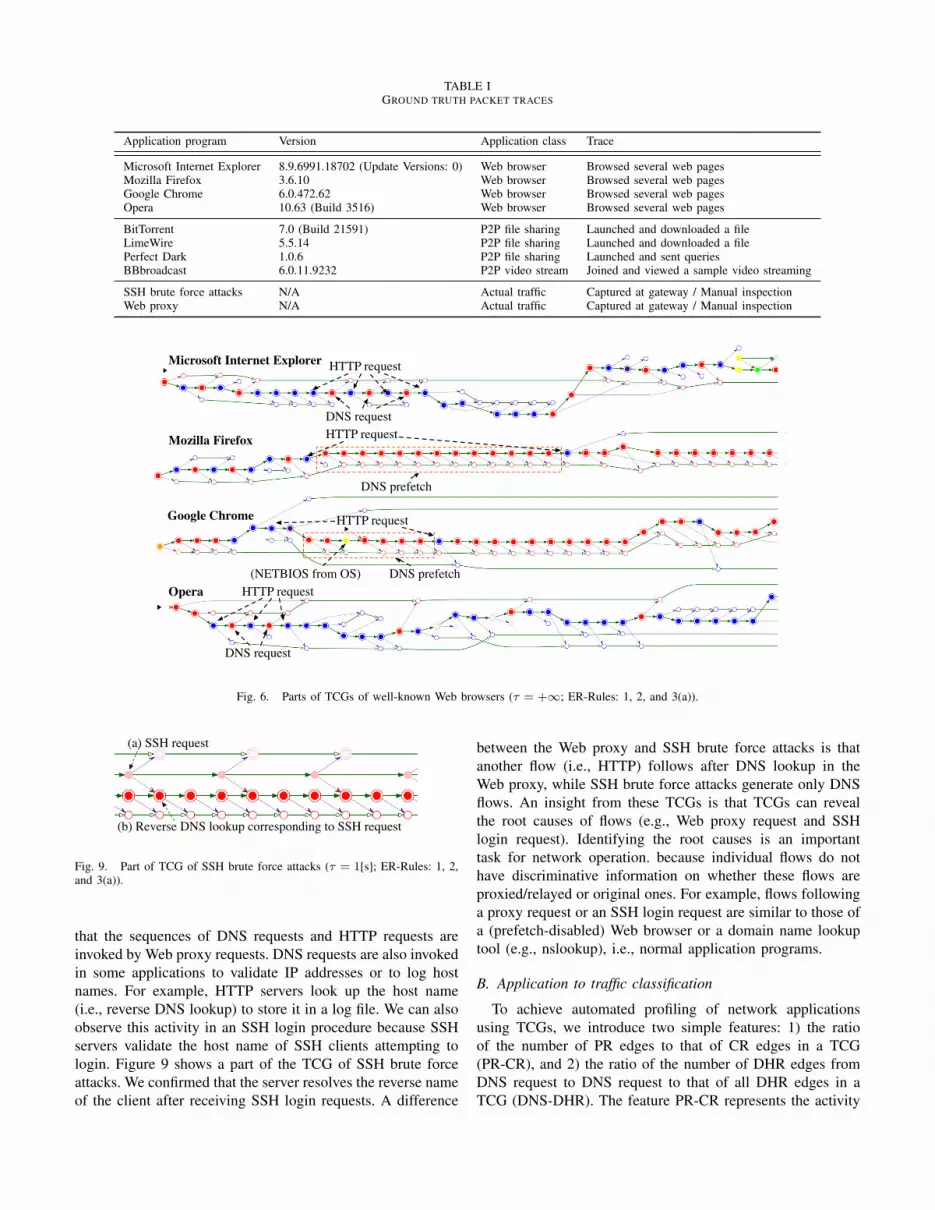
TABLE IGROUND TRUTH PACKET TRACES
Application program Version Application class Trace
Microsoft Internet Explorer 8.9.6991.18702 (Update Versions: 0) Web browser Browsed several web pagesMozilla Firefox 3.6.10 Web browser Browsed several web pagesGoogle Chrome 6.0.472.62 Web browser Browsed several web pagesOpera 10.63 (Build 3516) Web browser Browsed several web pages
BitTorrent 7.0 (Build 21591) P2P file sharing Launched and downloaded a fileLimeWire 5.5.14 P2P file sharing Launched and downloaded a filePerfect Dark 1.0.6 P2P file sharing Launched and sent queriesBBbroadcast 6.0.11.9232 P2P video stream Joined and viewed a sample video streaming
SSH brute force attacks N/A Actual traffic Captured at gateway / Manual inspectionWeb proxy N/A Actual traffic Captured at gateway / Manual inspection
Google Chrome
(cont'd)
(cont'd)
(cont'd)
DNS prefetch
Microsoft Internet Explorer
Mozilla Firefox
(NETBIOS from OS)
Opera
HTTP request
DNS request
HTTP request
HTTP request
DNS prefetch
HTTP request
DNS request
Fig. 6. Parts of TCGs of well-known Web browsers (τ = +∞; ER-Rules: 1, 2, and 3(a)).
(a) SSH request
(b) Reverse DNS lookup corresponding to SSH request
Fig. 9. Part of TCG of SSH brute force attacks (τ = 1[s]; ER-Rules: 1, 2,and 3(a)).
that the sequences of DNS requests and HTTP requests areinvoked by Web proxy requests. DNS requests are also invokedin some applications to validate IP addresses or to log hostnames. For example, HTTP servers look up the host name(i.e., reverse DNS lookup) to store it in a log file. We can alsoobserve this activity in an SSH login procedure because SSHservers validate the host name of SSH clients attempting tologin. Figure 9 shows a part of the TCG of SSH brute forceattacks. We confirmed that the server resolves the reverse nameof the client after receiving SSH login requests. A difference
between the Web proxy and SSH brute force attacks is thatanother flow (i.e., HTTP) follows after DNS lookup in theWeb proxy, while SSH brute force attacks generate only DNSflows. An insight from these TCGs is that TCGs can revealthe root causes of flows (e.g., Web proxy request and SSHlogin request). Identifying the root causes is an importanttask for network operation. because individual flows do nothave discriminative information on whether these flows areproxied/relayed or original ones. For example, flows followinga proxy request or an SSH login request are similar to those ofa (prefetch-disabled) Web browser or a domain name lookuptool (e.g., nslookup), i.e., normal application programs.
B. Application to traffic classification
To achieve automated profiling of network applicationsusing TCGs, we introduce two simple features: 1) the ratioof the number of PR edges to that of CR edges in a TCG(PR-CR), and 2) the ratio of the number of DHR edges fromDNS request to DNS request to that of all DHR edges in aTCG (DNS-DHR). The feature PR-CR represents the activity
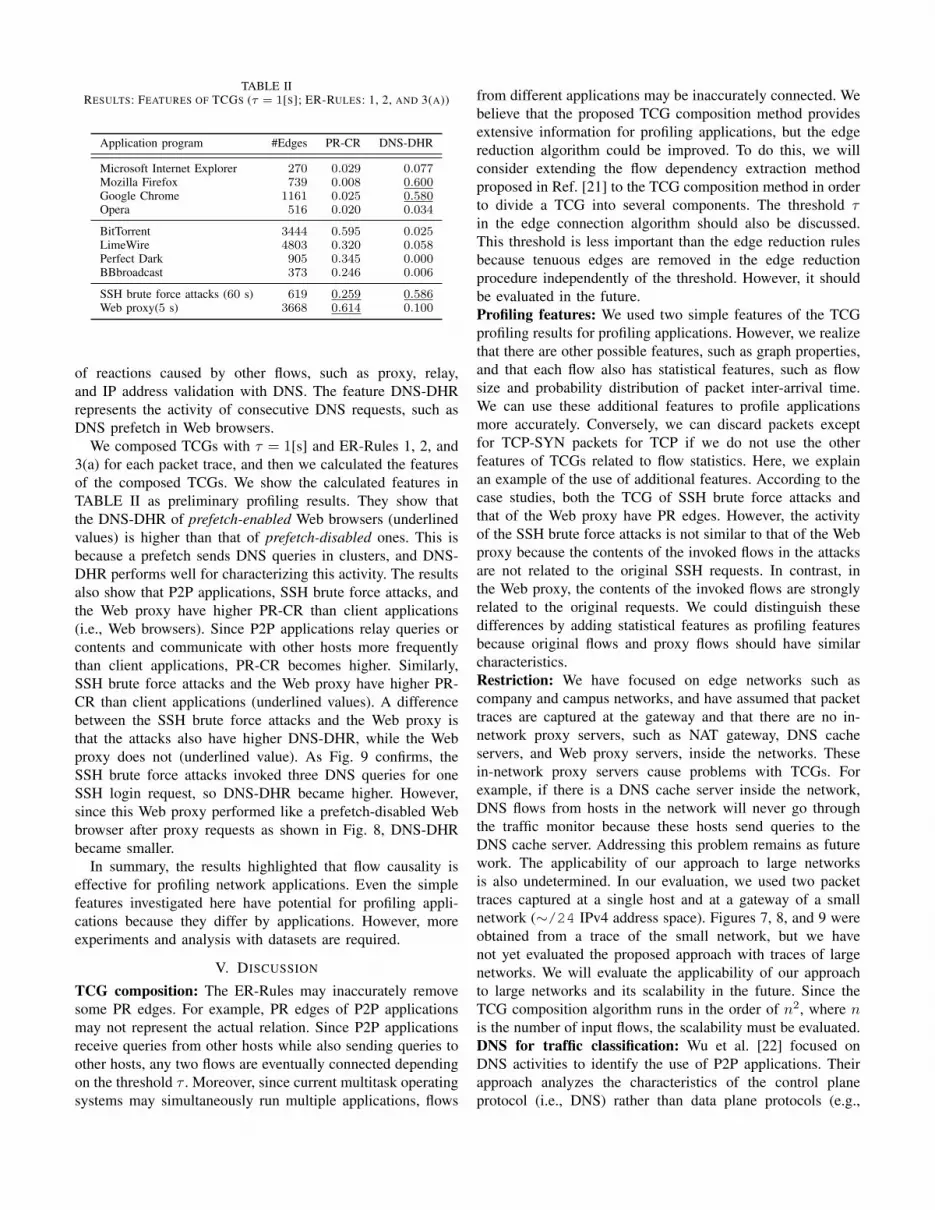
TABLE IIRESULTS: FEATURES OF TCGS (τ = 1[S]; ER-RULES: 1, 2, AND 3(A))
Application program #Edges PR-CR DNS-DHR
Microsoft Internet Explorer 270 0.029 0.077Mozilla Firefox 739 0.008 0.600Google Chrome 1161 0.025 0.580Opera 516 0.020 0.034
BitTorrent 3444 0.595 0.025LimeWire 4803 0.320 0.058Perfect Dark 905 0.345 0.000BBbroadcast 373 0.246 0.006
SSH brute force attacks (60 s) 619 0.259 0.586Web proxy(5 s) 3668 0.614 0.100
of reactions caused by other flows, such as proxy, relay,and IP address validation with DNS. The feature DNS-DHRrepresents the activity of consecutive DNS requests, such asDNS prefetch in Web browsers.
We composed TCGs with τ = 1[s] and ER-Rules 1, 2, and3(a) for each packet trace, and then we calculated the featuresof the composed TCGs. We show the calculated features inTABLE II as preliminary profiling results. They show thatthe DNS-DHR of prefetch-enabled Web browsers (underlinedvalues) is higher than that of prefetch-disabled ones. This isbecause a prefetch sends DNS queries in clusters, and DNS-DHR performs well for characterizing this activity. The resultsalso show that P2P applications, SSH brute force attacks, andthe Web proxy have higher PR-CR than client applications(i.e., Web browsers). Since P2P applications relay queries orcontents and communicate with other hosts more frequentlythan client applications, PR-CR becomes higher. Similarly,SSH brute force attacks and the Web proxy have higher PR-CR than client applications (underlined values). A differencebetween the SSH brute force attacks and the Web proxy isthat the attacks also have higher DNS-DHR, while the Webproxy does not (underlined value). As Fig. 9 confirms, theSSH brute force attacks invoked three DNS queries for oneSSH login request, so DNS-DHR became higher. However,since this Web proxy performed like a prefetch-disabled Webbrowser after proxy requests as shown in Fig. 8, DNS-DHRbecame smaller.
In summary, the results highlighted that flow causality iseffective for profiling network applications. Even the simplefeatures investigated here have potential for profiling appli-cations because they differ by applications. However, moreexperiments and analysis with datasets are required.
V. DISCUSSION
TCG composition: The ER-Rules may inaccurately removesome PR edges. For example, PR edges of P2P applicationsmay not represent the actual relation. Since P2P applicationsreceive queries from other hosts while also sending queries toother hosts, any two flows are eventually connected dependingon the threshold τ . Moreover, since current multitask operatingsystems may simultaneously run multiple applications, flows
from different applications may be inaccurately connected. Webelieve that the proposed TCG composition method providesextensive information for profiling applications, but the edgereduction algorithm could be improved. To do this, we willconsider extending the flow dependency extraction methodproposed in Ref. [21] to the TCG composition method in orderto divide a TCG into several components. The threshold τin the edge connection algorithm should also be discussed.This threshold is less important than the edge reduction rulesbecause tenuous edges are removed in the edge reductionprocedure independently of the threshold. However, it shouldbe evaluated in the future.Profiling features: We used two simple features of the TCGprofiling results for profiling applications. However, we realizethat there are other possible features, such as graph properties,and that each flow also has statistical features, such as flowsize and probability distribution of packet inter-arrival time.We can use these additional features to profile applicationsmore accurately. Conversely, we can discard packets exceptfor TCP-SYN packets for TCP if we do not use the otherfeatures of TCGs related to flow statistics. Here, we explainan example of the use of additional features. According to thecase studies, both the TCG of SSH brute force attacks andthat of the Web proxy have PR edges. However, the activityof the SSH brute force attacks is not similar to that of the Webproxy because the contents of the invoked flows in the attacksare not related to the original SSH requests. In contrast, inthe Web proxy, the contents of the invoked flows are stronglyrelated to the original requests. We could distinguish thesedifferences by adding statistical features as profiling featuresbecause original flows and proxy flows should have similarcharacteristics.Restriction: We have focused on edge networks such ascompany and campus networks, and have assumed that packettraces are captured at the gateway and that there are no in-network proxy servers, such as NAT gateway, DNS cacheservers, and Web proxy servers, inside the networks. Thesein-network proxy servers cause problems with TCGs. Forexample, if there is a DNS cache server inside the network,DNS flows from hosts in the network will never go throughthe traffic monitor because these hosts send queries to theDNS cache server. Addressing this problem remains as futurework. The applicability of our approach to large networksis also undetermined. In our evaluation, we used two packettraces captured at a single host and at a gateway of a smallnetwork (∼/24 IPv4 address space). Figures 7, 8, and 9 wereobtained from a trace of the small network, but we havenot yet evaluated the proposed approach with traces of largenetworks. We will evaluate the applicability of our approachto large networks and its scalability in the future. Since theTCG composition algorithm runs in the order of n2, where nis the number of input flows, the scalability must be evaluated.DNS for traffic classification: Wu et al. [22] focused onDNS activities to identify the use of P2P applications. Theirapproach analyzes the characteristics of the control planeprotocol (i.e., DNS) rather than data plane protocols (e.g.,

HTTP and P2P). Unlike other application protocols, DNSusually uses a statically bound port number (i.e., UDP/53)and no other ports can be available in DNS trees on theInternet because authoritative servers listen only on UDP/53or TCP/53 for DNS queries. We also consider that DNS isone of the best discriminative protocols to use in identifyingapplications, although the Wu et al. approach focused only onidentifying P2P applications. This is why we introduced DNS(i.e., UDP/53) as a feature for TCGs.Applications of TCGs and impact: TCGs illustrate tempo-ral and spatial communication patterns with flow causality.Our approach is quite different from existing graph-basedapproaches [15], [16], [17], [19]. These existing approachesprofile application traffic at the host level (i.e., IP addresslevel) but not at the application program level (i.e., set offlows level). The authors of Ref. [19] indicate that hosts withmultiple application protocols do not have to be consideredbecause only a small number of hosts with multiple applicationprotocols are observed at backbone links. Our main target isedge networks, such as company and campus networks. Thus,we introduce flow causality to take into account applicationprograms that use multiple application protocols. Here, weshow an example of applications of TCGs to network man-agement and the impact. In Fig. 8, DNS and HTTP requestsare initiated by proxy requests, but it is difficult for networkoperators to judge whether these DNS and HTTP requestsare original requests (i.e., without a proxy) because individualflows do not represent the proxy function. In this case, whennetwork operators detect an anomaly in a HTTP response tothe proxy client, network operators possibly identify the causeat the proxy server although the proxy server simply relays theoriginal response. However, TCGs can extract the root causeby profiling application programs with flow causality, i.e.,network operators can identify the root cause and the positionof the detected anomaly if they know the traffic is a part ofWeb proxy traffic and proxy servers propagate flows to otherhosts. Thus, it is important to profile application programs byflow causality, although existing traffic classifiers do not.
VI. CONCLUSION
We proposed TCGs for analyzing temporal and spatialflow causality to profile network applications without payloadinspection. The TCG composition method with four types offlow causality relationships was discussed, as was the conceptof network application profiling. We presented case studies toshow the advantages of flow causality for profiling applicationbehavior. The results of these case studies demonstrated theeffectiveness of TCGs for profiling network application classesand programs. The main contribution of this paper is thatsimple features of TCGs are effective for profiling applicationprograms as well as application classes. Existing approachescannot easily profile application programs. Thus, TCGs area step towards effective network application profiling. Onepractical use of application program profiling is to identifya specific application program that uses the same protocolas other programs but has security problems. In addition to
the simple TCG features, the visualization of TCGs revealsthe causality of each flow, which consequently helps networkoperators to identify the root causes of other flows.
We will look into other features of TCGs with advancedanalysis methods such as pattern matching and graph mining.Although this paper has focused on profiling applicationclasses and programs, we will also evaluate content-relatedcharacteristics such as poor and rich content Web sites withTCG features as well as features of other applications.
REFERENCES
[1] T. Karagiannis, A. Broido, M. Faloutsos, and K. claffy, “Transport layeridentification of P2P traffic,” in ACM IMC ’04, pp. 121–134, 2004.
[2] Sourcefire, Inc., “Snort.” http://www.snort.org/.[3] J. Levandoski, E. Sommer, and M. Strait, “Application Layer Packet
Classifier for Linux.” http://l7-filter.sourceforge.net/.[4] OpenDPI.org, “OpenDPI.” http://www.opendpi.org/.[5] S. Sen, O. Spatscheck, and D. Wang, “Accurate, scalable in-network
identification of P2P traffic using application signatures,” in WWW ’04,pp. 512–521, 2004.
[6] P. Haffner, S. Sen, O. Spatscheck, and D. Wang, “ACAS: Automatedconstruction of application signatures,” in ACM SIGCOMM MineNetWorkshop ’05, MineNet ’05, pp. 197–202, 2005.
[7] A. W. Moore and K. Papagiannaki, “Toward the accurate identificationof network applications,” in PAM ’05, vol. 3431, pp. 41–54, 2005.
[8] A. W. Moore and D. Zuev, “Internet traffic classification using bayesiananalysis techniques,” in ACM SIGMETRICS ’05, pp. 50–60, 2005.
[9] M. Crotti, M. Dusi, F. Gringoli, and L. Salgarelli, “Traffic classificationthrough simple statistical fingerprinting,” ACM SIGCOMM Comput.Commun. Rev., vol. 37, no. 1, pp. 5–16, 2007.
[10] J. Erman, A. Mahanti, M. Arlitt, and C. Williamson, “Identifying anddiscriminating between web and peer-to-peer traffic in the network core,”in WWW ’07, pp. 883–892, 2007.
[11] G. Dewaele, K. Fukuda, P. Borgnat, P. Abry, and K. Cho, “Extractinghidden anomalies using sketch and non gaussian multiresolution statisti-cal detection procedures,” in ACM SIGCOMM LSAD ’07, pp. 145–152,2007.
[12] I. Trestian, S. Ranjan, A. Kuzmanovi, and A. Nucci, “Unconstrainedendpoint profiling (Googling the Internet),” in ACM SIGCOMM ’08,pp. 279–290, 2008.
[13] T. Karagiannis, K. Papagiannaki, and M. Faloutsos, “BLINC: Multileveltraffic classification in the dark,” in ACM SIGCOMM ’05, pp. 229–240,2005.
[14] T. Karagiannis, K. Papagiannaki, N. Taft, and M. Faloutsos, “Profilingthe end host,” in PAM ’07, vol. 4427, pp. 186–196, 2007.
[15] M. Iliofotou, P. Pappu, M. Faloutsos, M. Mitzenmacher, S. Singh,and G. Varghese, “Network monitoring using traffic dispersion graphs(TDGs),” in ACM IMC ’07, pp. 315–320, 2007.
[16] M. Iliofotou, M. Faloutsos, and M. Mitzenmacher, “Exploiting dynam-icity in graph-based traffic analysis: Techniques and applications,” inACM CoNEXT ’09, pp. 241–252, 2009.
[17] Y. Jin, E. Sharafuddin, and Z.-L. Zhang, “Unveiling core network-wide communication patterns through application traffic activity graphdecomposition,” in ACM SIGMETRICS ’09, pp. 49–60, 2009.
[18] V. Perelman, N. Melnikov, and J. Schoenwaelder, “Flow signatures ofpopular applications,” in IFIP/IEEE IM 2011, pp. 9–16, 2011.
[19] M. Iliofotou, B. Gallagher, T. Eliassi-Rad, G. Xie, and M. Faloutsos,“Profiling-by-association: A resilient traffic profiling solution for theInternet backbone,” in CoNEXT ’10, p. 12, ACM, 2010.
[20] L. Popa, B.-G. Chun, I. Stoica, J. Chandrashekar, and N. Taft, “Macro-scope: End-point approach to networked application dependency discov-ery,” in ACM CoNEXT ’09, pp. 229–240, 2009.
[21] S. Kandula, R. Chandra, and D. Katabi, “What’s going on?: Learningcommunication rules in edge networks,” in ACM SIGCOMM ’08,pp. 87–98, 2008.
[22] H.-S. Wu, N.-F. Huang, and G.-H. Lin, “Identifying the use ofdata/voice/video-based P2P traffic by DNS-query behavior,” in IEEEICC ’09, p. 5, 2009.