examining minimum information requirements for electronic
TRANSCRIPT
i
DOT/FAA/AM-21/15 Aviation Safety Office of Aerospace Medicine Washington, DC 20591
Examining Minimum Information Requirements for Electronic Aeronautical Charts
Michelle Yeh1 Joseph M. Jaworski2 Cathy Swider1 Stephanie Chase3 1Federal Aviation Administration Washington, DC 20591 2Cherokee Nation Support, Service, and Solutions Oklahoma City, OK 73125 3Volpe National Transportation Systems Center Cambridge, MA 02142
April 2021 Technical Report

ii
NOTICE
This document is disseminated under the sponsorship of the U.S. Department of Transportation in the interest of
information exchange. The United States Government assumes no liability for the contents thereof.
This publication and all Office of Aerospace Medicine technical reports are available in full-text from the Civil Aerospace Medical Institute’s publications
Web site: (www.faa.gov/go/oamtechreports)
iii
1. Report No.DOT/FAA/AM-21/15
2. Government Accession No. 3. Recipient's Catalog No.
4. Title and SubtitleAnnotated Bibliography (1990 – 2019): Knowledge, Skills, and Tests
for Unmanned Aircraft Systems (UAS) Air Carrier Operations
5. Report DateApril 20216. Performing Organization Code
7. Author(s)
Yeh, M.1 , Jaworski, J. 2, Swider, C. 1, Chase, S. 3
8. Performing Organization Report No.
9. Performing Organization Name and Address1 Federal Aviation Administration Washington, DC 20591
2 Cherokee Nation Support, Service, and Solutions Oklahoma City, OK 73125
3Volpe National Transportation Systems Center Cambridge, MA 02142
10. Work Unit No. (TRAIS)
11. Contract or Grant No.
12. Sponsoring Agency name and Address
Office of Aerospace Medicine Federal Aviation Administration 800 Independence Ave., S.W. Washington, DC 20591
13. Type of Report and Period Covered
14. Sponsoring Agency Code
15. Supplemental Notes
16. AbstractThe purpose of this research was to identify a set of minimum information elements for user- configurable electronic aeronautical charts. The concept examined in this study is that pilots brief with a fixed chart but then fly with a user-configurable aeronautical chart, which may not include all the information elements that were briefed. We conducted a survey to identify a set of minimum information element requirements for this operational concept. We invited 1,351 transport, commuter, military, and general aviation pilots to participate; 326 responded (a 24% response rate), but only 267 pilots met the inclusion criteria. Of these, 229 pilots completed the survey (60 air transport pilots, 60 commuter pilots, 60 general aviation pilots and 49 military pilots).
17. Key Words
aeronautical charting, data-driven charting, information elements, declutter, user- configurable, criticality
18. Distribution StatementDocument is available to the public through
the Internet: (http://www.faa.gov/go/oamtechreports/)
19. Security Classif. (of this report)Unclassified
20. Security Classif. (of this page)Unclassified
21. No. of Pages80
22. Price
iv
Table of Contents
Table of Contents ......................................................................................................................................... iv
List of Figures ............................................................................................................................................... v
List of Tables ............................................................................................................................................... vi
List of Abbreviations .................................................................................................................................. vii
Executive Summary ................................................................................................................................... viii
Introduction ................................................................................................................................................... 1
Previous Research on Aeronautical Chart Design ..................................................................................... 2
Decluttering ............................................................................................................................................... 6
Establishing Information Requirements .................................................................................................... 8
Method .......................................................................................................................................................... 9
Survey Design ........................................................................................................................................... 9
Procedure ................................................................................................................................................. 11
Data Analysis .............................................................................................................................................. 12
Step 1: Chi-Square Test ........................................................................................................................... 12
Step 2: Combined Subject Matter Expert Review + Analysis ................................................................ 13
Results ……………………………………………………………………………………………………..14
Discussion ................................................................................................................................................... 29
Acknowledgments ....................................................................................................................................... 38
References ................................................................................................................................................... 39
Appendix......................................................................................................................................................A-1
v
List of Figures
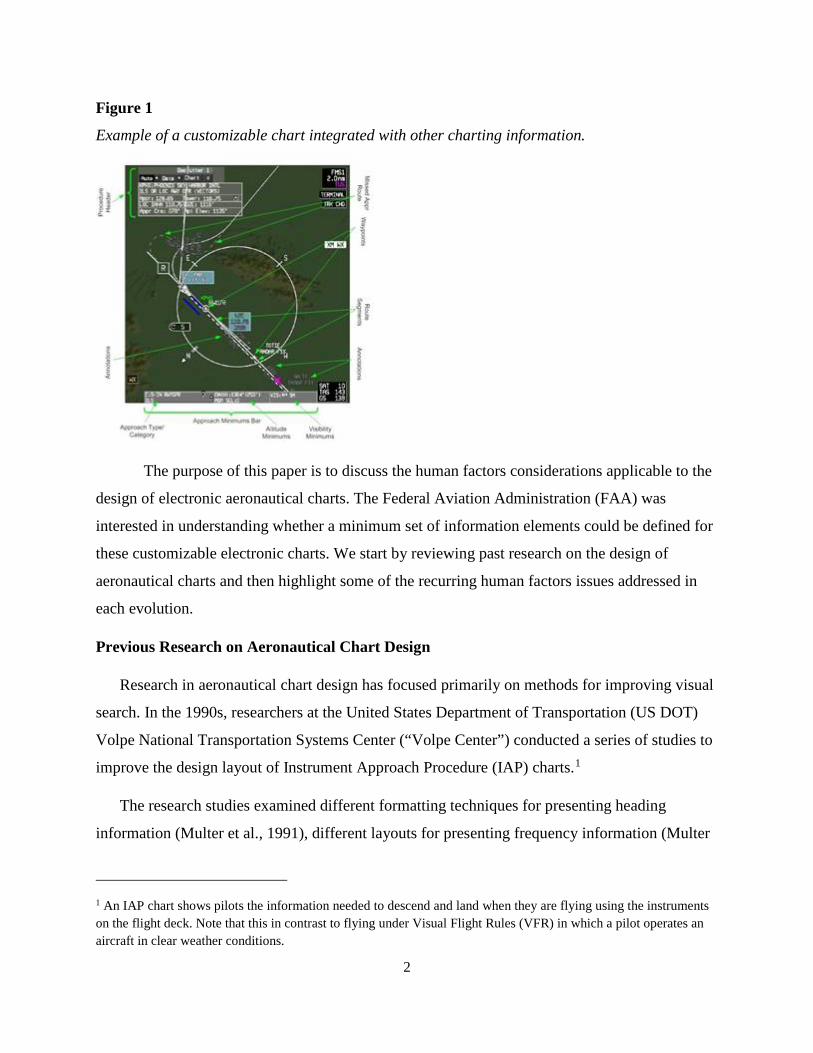
Figure 1 Example of a customizable chart integrated with other charting information............... 2
Figure 2 Comparison of Standard IAP Chart and Volpe/ATA Recommended IAP Chart
(Excerpted from Blomberg et al., 1995). ........................................................................................ 4
Figure 3 Current FAA IAP Chart (Adapted from Blomberg et al., 1995). .................................... 5
Figure 4 Example of STAR survey with response options. ........................................................... 11
Figure 5 Mock-up example of Standard Terminal Arrival Route (STAR) Chart. ........................ 33
Figure 6 Mock-up example of Enroute Instrument Flight Rule (IFR) Chart. .............................. 34
Figure 7 Mock-up example of Standard Instrument Departure (SID) Chart. .............................. 35
Figure 8 Mock-up example of Instrument Approach Procedure (IAP) Chart..............................36
vi
List of Tables
Table 1 Distribution of Participants by Pilot Type ...................................................................... 11
Table 2 Chi-Square Analysis Categorization ............................................................................... 13
Table 3 Number of Information Elements by Importance Level .................................................. 15
Table 4 Survey Results for Instrument Approach Procedure (IAP) Charts ................................. 15
Table 5 Survey Results for Enroute Instrument Flight Rules (IFR) Charts ................................. 19
Table 6 Survey Results for Standard Instrument Departure (SID) Charts .................................. 22
Table 7 Survey Results for Standard Terminal Arrival Route (STAR) Charts ............................. 26
Table 8 Comparison of Information Element Ratings: Results.....................................................31
vii
List of Abbreviations
ARP Aerospace Recommended Practice
ATA Air Transport Association
FAA Federal Aviation Administration
GPS Global Positioning System
IAP Instrument Approach Procedure
ICAO International Civil Aviation Organization
IFR Instrument Flight Rules
NOS National Ocean Service
SID Standard Instrument Departure
SME Subject Matter Expert
STAR Standard Terminal Arrival Route
US DOT United States Department of Transportation
VFR Visual Flight Rules
viii
Executive Summary
The purpose of this research was to identify a set of minimum information elements for user-
configurable electronic aeronautical charts. The concept examined in this study is that pilots brief with a
fixed chart but then fly with a user-configurable aeronautical chart, which may not include all the
information elements that were briefed. We conducted a survey to identify a set of minimum information
element requirements for this operational concept. We invited 1,351 transport, commuter, military, and
general aviation pilots to participate; 326 responded (a 24% response rate), but only 267 pilots met the
inclusion criteria. Of these, 229 pilots completed the survey (60 air transport pilots, 60 commuter pilots,
60 general aviation pilots and 49 military pilots).
The survey was comprised of lists of information elements shown on four types of aeronautical
charts: 1) Instrument Approach Procedure (IAP), 2) Enroute Instrument Flight Rules (IFR), 3) Standard
Terminal Arrival Route (STAR), and 4) Standard Instrument Departure (SID). There were a total of 427
information elements across charts, so to prevent survey fatigue, we divided the information elements into
two surveys. The first survey included information elements on IAP/Enroute IFR charts (221 information
elements), and the second survey included information elements from SID/STAR charts (206 information
elements).
For each survey, participants were instructed to rate the importance of information elements for a new
charting concept, which uses customizable electronic charts that are interactive and customized to display
only information elements needed to execute the procedure. Participants were instructed that for this
charting concept, they would first brief the procedure using a fixed chart showing all the information
elements, but then fly with a customized electronic chart, which may or may not include all the
information elements that were briefed. Additionally, the instructions emphasized that the customizable
electronic chart would show only the information relevant to the procedure being flown.
Participants were given a list of information elements and asked to rate the importance of each
information element when using a customizable electronic chart while executing the procedure and not on
the frequency of use. Ratings were made along a scale with four options for level of importance, with an
additional option for participants who did not know the information element:
• 1 = Required to be displayed continuously for the safe and successful execution of the instrument flight procedure;
• 2 = Displayed initially, but can be removed and recalled for reference, as needed; • 3 = Not displayed initially, but can be displayed manually for reference, as needed; • 4 = Not required to execute the procedure; • Don’t know/Unsure.

ix
We analyzed the data using one-way chi-square tests and consulted with subject matter experts to
identify a criticality level for each information element. Based on this analysis, we were able to categorize
85% of the information elements across all four chart types. (The ratings for each information element are
shown in Tables 4 – 7 by chart type). We then developed prototype charts to visualize what the concept
might look like.

1
Introduction
Aeronautical charting has evolved with changes in display mediums, display technology,
expanded use of the Global Positioning System (GPS), and increased information processing
capabilities. The term “aeronautical chart” refers to a map used to provide air navigation
information for pilots, much like a road map for drivers. The aeronautical chart shows
information such as navigation routes or airways, navigation aids, airspace boundaries,
topographic features, and airports. Pilots are required to fly with aeronautical charts; they
typically use the chart to brief the procedure as part of flight planning, and may then put the chart
away until they need to execute the procedure.
Much like maps that have evolved from paper to electronic media, the aeronautical chart has
evolved from paper to electronic format. There are three types of electronic charts: raster, vector,
and electronic data-driven. Raster charts are electronic images of paper charts, so a raster chart
will show the exact same information as its paper counterpart. Own-aircraft position may be
displayed on aeronautical raster charts only if the chart is georeferenced. Vector charts look
similar to raster charts, but the information elements are mathematically encoded in a database.
This encoding allows functionality such as resizing of symbols and text when the pilot zooms in
(or out) or when information is filtered. A vector chart is computer generated, so it may not look
the same as a paper chart. Finally, electronic data-driven charts may be user-configurable so that
information elements can be added or removed via a manual or automatic decluttering capability.
This third type of charting is the focus of this research.
With each evolution, the usability of the aeronautical chart needs to be considered, as many
of the human factors considerations have remained the same regardless of display medium (e.g.,
display clutter, readability/legibility, symbology, to name a few). As electronic charts become
integrated into flight decks, the design of the electronic chart may diverge depending on the
manufacturer’s design philosophy. For example, the electronic chart symbology can become
more specific to the task at hand, using manual or automatic decluttering methodologies that are
customizable by the pilot, and the chart can be integrated with other map information. An
example of what this type of chart might look like is shown in Figure 1.
2
Figure 1
Example of a customizable chart integrated with other charting information.
The purpose of this paper is to discuss the human factors considerations applicable to the
design of electronic aeronautical charts. The Federal Aviation Administration (FAA) was
interested in understanding whether a minimum set of information elements could be defined for
these customizable electronic charts. We start by reviewing past research on the design of
aeronautical charts and then highlight some of the recurring human factors issues addressed in
each evolution.
Previous Research on Aeronautical Chart Design
Research in aeronautical chart design has focused primarily on methods for improving visual
search. In the 1990s, researchers at the United States Department of Transportation (US DOT)
Volpe National Transportation Systems Center (“Volpe Center”) conducted a series of studies to
improve the design layout of Instrument Approach Procedure (IAP) charts.1
The research studies examined different formatting techniques for presenting heading
information (Multer et al., 1991), different layouts for presenting frequency information (Multer
1 An IAP chart shows pilots the information needed to descend and land when they are flying using the instruments on the flight deck. Note that this in contrast to flying under Visual Flight Rules (VFR) in which a pilot operates an aircraft in clear weather conditions.
3
et al., 1991), use of text or graphical icons for finding missed approach instructions (Osborne &
Huntley, 1992), and different layouts for planning and executing an approach or missed approach
(Blomberg et al.,1995; Osborne et al., 1995).
Multer et al. (1991) examined ways to facilitate visual search on IAPs by evaluating different
formatting for heading information (such as font size, bolding, and highlighting), as well as
different layouts for frequency information. Airline pilots were asked to identify the heading on a
number of fictional IAPs as quickly as possible. In the first study, the text on charts varied in
terms of font size and highlighting method (plain type, bold type, boxed, or reverse video). The
results showed an interaction between font size and highlighting; when text was bolded or boxed,
response time decreased as font size increased, but when text was presented using reverse video,
there was no impact of font size.
In the second study, four different spatial layouts were used for showing frequency
information – two were based on existing US chart provider designs, the third was a boxed
layout used in Canada, and the fourth was a new two-column layout. The results showed that the
use of a boxed format and the two column layout, which used space to organize text placement,
facilitated search relative to the one-column format used by US chart providers.
Osborne and Huntley (1992) examined whether the use of text or graphical icons could help
pilots retrieve missed approach instructions. Pilots were asked to read information from National
Ocean Service (NOS) IAP charts shown at one of three information density levels: low, medium,
and high. Pilot comprehension speed, measured by the number of glances needed for pilots to
read and verbally repeat the instructions, were recorded. Overall, pilots identified information
more quickly and accurately when there was a low level of information density, and the slowest
with a high level of information presented. Pilots expressed preference for icon information
rather than text, but thought that some icons needed clarification.
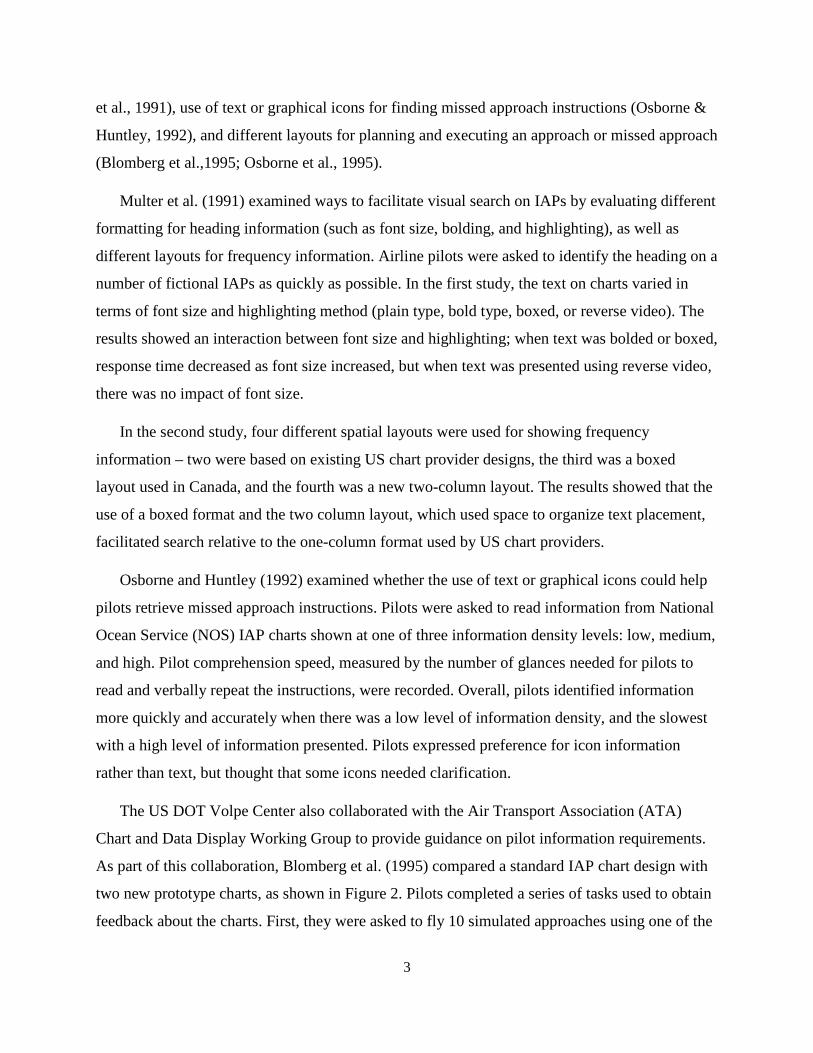
The US DOT Volpe Center also collaborated with the Air Transport Association (ATA)
Chart and Data Display Working Group to provide guidance on pilot information requirements.
As part of this collaboration, Blomberg et al. (1995) compared a standard IAP chart design with
two new prototype charts, as shown in Figure 2. Pilots completed a series of tasks used to obtain
feedback about the charts. First, they were asked to fly 10 simulated approaches using one of the
4
prototype charts and the standard chart and then debriefed about their experiences. Second, pilots
were shown a different prototype chart and asked for their opinions, but they did not fly with this
chart. Third, pilots ranked the three charts on their perceived usefulness for executing an
approach. Finally, pilots were asked to assume that s/he was responsible for making a purchase
decision to be used by all pilots working for his/her airline. Findings showed that despite pilots’
concerns with accepting a new chart design, pilots had a higher preference for the Volpe/ATA
prototype chart.
Figure 2
Comparison of Standard IAP Chart and Volpe/ATA Recommended IAP Chart (Excerpted from
Blomberg et al., 1995).
5
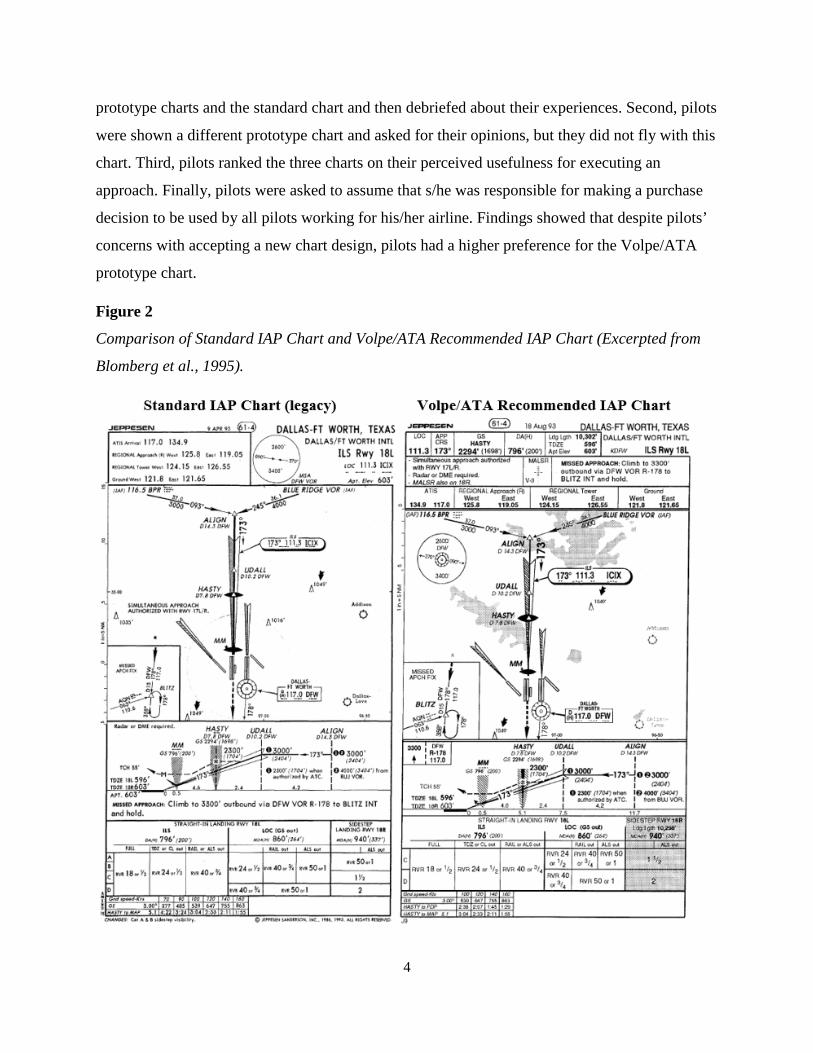
The chart evaluated by Blomberg et al. (1995) was refined during field testing and
subject matter expert reviews, as shown in Figure 3. The addition of the briefing strip at the top
of the chart was intended to promote briefing as a critical component of flying an approach, and
to present the required information in a logical order in one place. A boxed layout was used to
show heading and frequency information and graphical icons were added to depict missed
approach information.
Osborne et al. (1995) evaluated the usability of this new prototype IAP chart by asking
pilots to fly approaches in a simulator. Pilots used a standard IAP chart or the Volpe IAP
prototype. During the flight, pilots were asked questions that required him/her to search for
information located on the chart. Pilots found information much faster on the Volpe prototype
chart than on the standard IAP chart, particularly when that information was located in the
briefing strip. Additionally, pilots’ accuracy did not differ between questions using the standard
and prototype charts. The recommended IAP chart was adopted by Jeppesen and also had a
marked influence on design of the current FAA IAP chart.
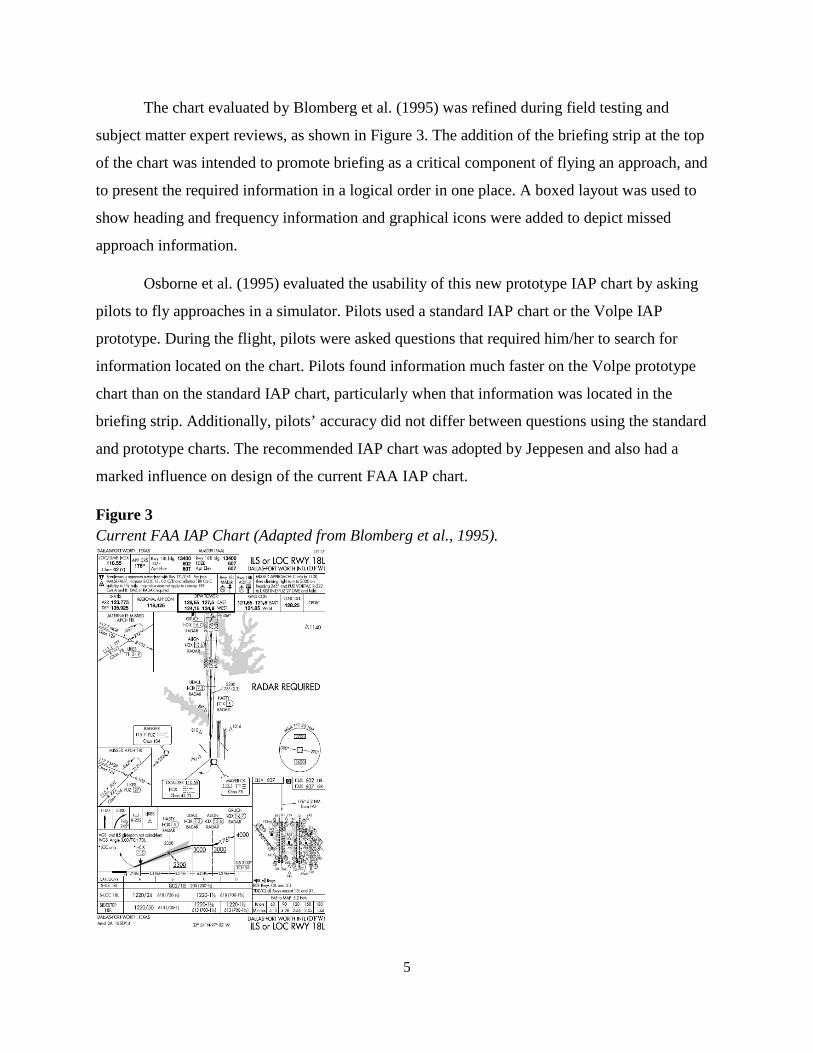
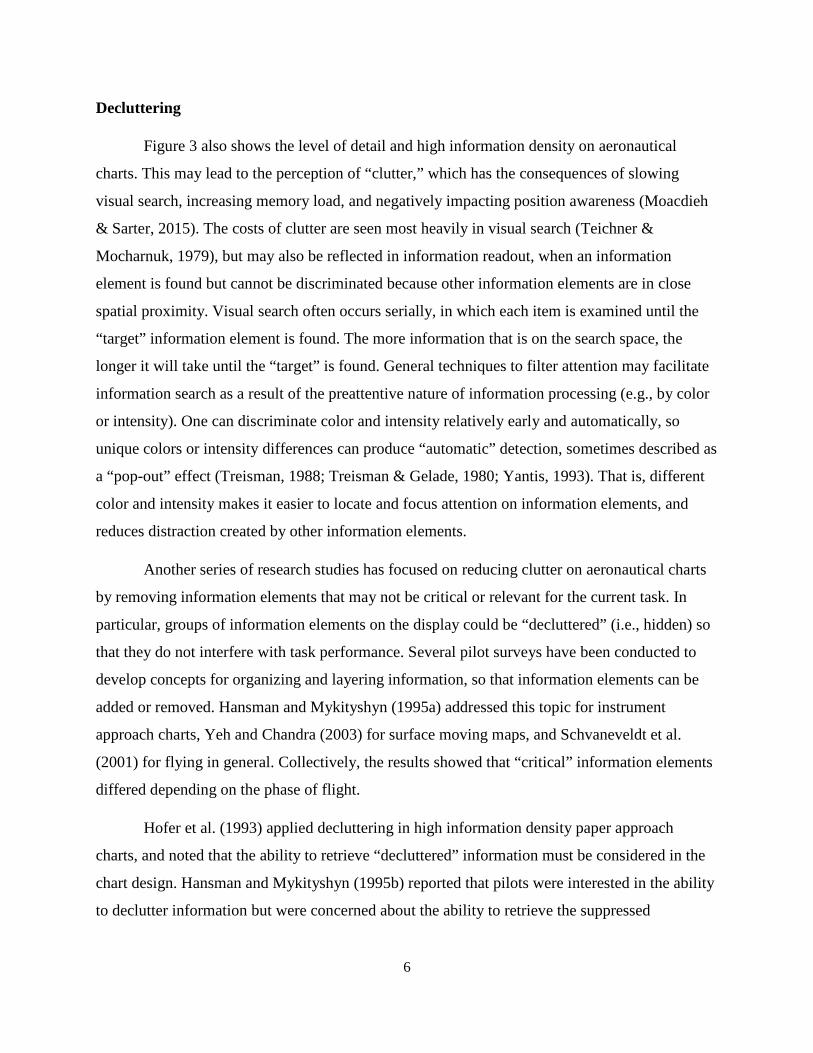
Figure 3 Current FAA IAP Chart (Adapted from Blomberg et al., 1995).
6
Decluttering
Figure 3 also shows the level of detail and high information density on aeronautical
charts. This may lead to the perception of “clutter,” which has the consequences of slowing
visual search, increasing memory load, and negatively impacting position awareness (Moacdieh
& Sarter, 2015). The costs of clutter are seen most heavily in visual search (Teichner &
Mocharnuk, 1979), but may also be reflected in information readout, when an information
element is found but cannot be discriminated because other information elements are in close
spatial proximity. Visual search often occurs serially, in which each item is examined until the
“target” information element is found. The more information that is on the search space, the
longer it will take until the “target” is found. General techniques to filter attention may facilitate
information search as a result of the preattentive nature of information processing (e.g., by color
or intensity). One can discriminate color and intensity relatively early and automatically, so
unique colors or intensity differences can produce “automatic” detection, sometimes described as
a “pop-out” effect (Treisman, 1988; Treisman & Gelade, 1980; Yantis, 1993). That is, different
color and intensity makes it easier to locate and focus attention on information elements, and
reduces distraction created by other information elements.
Another series of research studies has focused on reducing clutter on aeronautical charts
by removing information elements that may not be critical or relevant for the current task. In
particular, groups of information elements on the display could be “decluttered” (i.e., hidden) so
that they do not interfere with task performance. Several pilot surveys have been conducted to
develop concepts for organizing and layering information, so that information elements can be
added or removed. Hansman and Mykityshyn (1995a) addressed this topic for instrument
approach charts, Yeh and Chandra (2003) for surface moving maps, and Schvaneveldt et al.
(2001) for flying in general. Collectively, the results showed that “critical” information elements
differed depending on the phase of flight.
Hofer et al. (1993) applied decluttering in high information density paper approach
charts, and noted that the ability to retrieve “decluttered” information must be considered in the
chart design. Hansman and Mykityshyn (1995b) reported that pilots were interested in the ability
to declutter information but were concerned about the ability to retrieve the suppressed
7
information when needed. Additionally, if information is not visible, the pilot may not remember
it is available and fail to consider the information when it is relevant.
Butchibabu and Hansman (2012) conducted a review of several aeronautical charts to
understand whether each information element contributed to operational issues. The results
indicated that charts that depicted more flight paths resulted in more operational issues than
charts with fewer flight paths, and on those “problematic” charts, each flight path consisted of
more information elements per path than on charts with fewer issues. Butchibabu and Hansman
then conducted a study to examine whether clutter could be mitigated by reducing the number of
flight paths shown on one aeronautical chart, and distributing the information across multiple
pages. They asked pilots to find information on both decluttered electronic aeronautical charts as
well as the standard chart. The results showed that pilots found the information significantly
faster using the decluttered charts, but the information being retrieved was always shown on the
electronic chart (i.e., pilots were never asked to find information about a flight path that was on a
different decluttered chart than the one displayed).
Stewart et al. (2016) also attempted to simplify the depiction of instrument approach
charts by decluttering irrelevant information. Their study focused on the presentation of
approach minimums; specifically, the minimum altitude at which the pilot must see the runway
or execute a missed approach, and the minimum visibility, which is the lowest visibility
authorized for the approach. An approach procedure on an instrument approach chart needs to
accommodate multiple users and aircraft types, but this information density increases the
likelihood that the pilot could select an incorrect minimum.
Stewart et al. (2016) created prototype charts that showed only approach minima relevant
to the specific pilot and specific aircraft type to prevent pilots from selecting incorrect
information. Additionally, they added data labels and color coding, which helped clarify the data
type to increase the likelihood that pilots would select the correct information. Pilots were able to
identify the information they needed on a decluttered prototype chart and standard instrument
approach charts faster and made fewer errors with the decluttered chart. However, it is not clear
if the improved search time was solely attributable to decluttering or if the other changes also
contributed to faster search times.
8
Establishing Information Requirements
Collectively, the results suggest that decluttering facilitates visual search and reduces
errors when combined with other formatting techniques (e.g., by bolding or highlighting). New
concepts are being proposed that incorporate aircraft state or information on flight planning to
create data-driven charting systems and to integrate aeronautical charting information with a
moving map on a single display. We were interested in identifying a minimum set of information
elements for such a concept by examining the criticality of the information elements shown on
the aeronautical charts.
We started by reviewing SAE Aerospace Recommended Practice (ARP) 5621, Electronic
Display of Aeronautical Information (SAE International, 2011), which provides a categorization
of information elements based on subject matter expert opinion for electronic charts intended to
be used as a replacement for paper charts. The SAE Committee considered nine chart types; for
each chart type, the Committee identified a set of information elements shown on the charts and
discussed the criticality of each information element for presentation on a fixed chart for briefing
or a moving map format for flying the procedure. The ratings were based on the following
criteria:
• Level 1: information elements that cannot be removed • Level 2: information elements that should be shown initially but could be removed by
pilot action • Level 3: information elements that do not need to be presented initially and can be
manually selected (or deselected).
SAE ARP 5621 provided only a starting point for this research, as the criticality ratings
were not validated when that document was published. In 2014, Pepitone et al. conducted a
preliminary validation of a subset of the information in SAE ARP 5621. Twenty Honeywell
corporate pilots participated in a card-sorting task in which they rated the criticality of the
information elements for flying an Instrument Flight Rules (IFR) procedure using three rating
levels, similar to the ones used in SAE ARP 5621. Pepitone et al.’s results provided some
validation of the SAE ratings; there were some differences, but the study was limited in that the
9
data reflected the opinions of corporate pilots from one company only, and no statistical analyses
were reported.
Therefore, the purpose of this study was to further examine the criticality ratings provided in
SAE ARP 5621 to try to identify minimum information requirements for electronic data-driven
charts. This study focused on four different chart types- Instrument Approach Procedure (IAP),
Enroute IFR, Standard Terminal Arrival Route (STAR), and Standard Instrument Departure
(SID). We recruited pilots to participate from four different types of operations – air transport,
commuter/business jet, military, and general aviation.
Method
We developed a survey and distributed it to air transport, commuter, military, and general
aviation pilots. The inclusion criteria for participation was that pilots needed to have flown IFR
in the previous 6 months and use FAA/US Government (military) or Jeppesen charts. A total of
1,351 pilots were invited to participate; 326 responded (24% response rate), but only 267 met the
inclusion criteria. Of these, 229 pilots completed the survey (218 male, 10 female, and 1 did not
self-identify): 60 air transport pilots, 60 commuter, 60 general aviation, and 49 military pilots.
The average age was 45 years (Min = 19; Max = 73). For chart usage, 128 pilots indicated that
they primarily used Jeppesen charts, and 101 pilots indicated they primarily used FAA or US
Government charts.
Survey Design
We created a list of information elements shown on four types of charts (IAP, Enroute IFR,
STAR, and SID). There were a total of 427 information elements, so to prevent survey fatigue,
we divided the information elements into two surveys: the first survey included information
elements on IAP/Enroute IFR charts (221 information elements), and the second survey included
information elements from SID/STAR charts (206 information elements).
When completing a survey, participants were instructed to rate the importance of information
elements for a new charting concept, which uses customizable electronic charts that are
interactive and customized to display only information elements needed to execute the
procedure. Participants were instructed that for this charting concept they would first brief the
procedure using a fixed chart showing all the information elements, but then fly with an

10
electronic chart, which may or may not include all the information elements that were briefed.
Additionally, the instructions emphasized that the customizable electronic chart would show only
the information relevant to the procedure being flown.
Participants were given a list of information elements and asked to rate each information
element individually with respect to how the information element would be used operationally
when executing the procedure. Pilots were not asked to rate the information element based on the
frequency of use. Ratings were made along a scale with four levels of importance options with
an additional option level for participants who did not know the information element.
• 1 = Required to be displayed continuously for the safe and successful execution of the instrument flight procedure.
• 2 = Displayed initially, but can be removed and recalled for reference, as needed. • 3 = Not displayed initially, but can be displayed manually for reference, as needed. • 4 = Not required to execute the procedure. • Don’t know/Unsure To help with the task, participants were shown charts that depicted the information elements
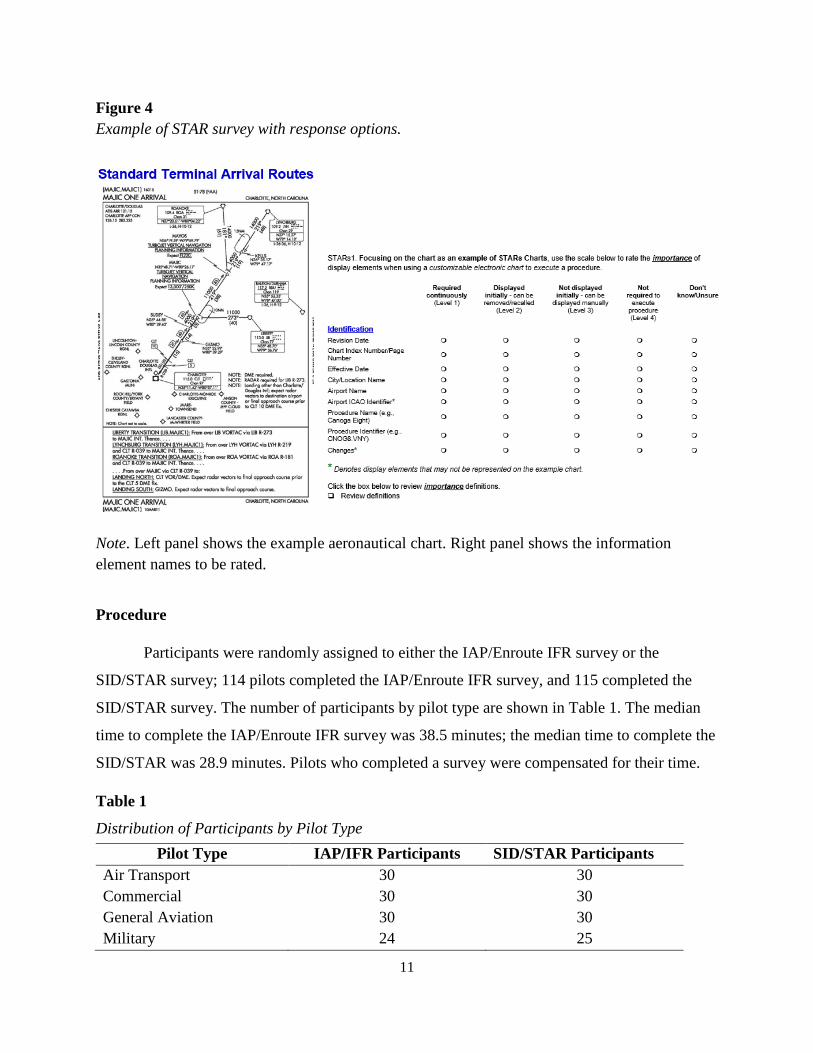
being rated (see Figure 4). Because the symbology for each chart type may differ depending on
the chart provider, participants were shown charts designed by the chart provider the participant
used most (i.e., FAA/US Government charts or Jeppesen charts). However, not all information
elements being rated were depicted on the charts; these information elements were denoted by an
asterisk in the survey.
11
Figure 4 Example of STAR survey with response options.
Note. Left panel shows the example aeronautical chart. Right panel shows the information element names to be rated.
Procedure
Participants were randomly assigned to either the IAP/Enroute IFR survey or the
SID/STAR survey; 114 pilots completed the IAP/Enroute IFR survey, and 115 completed the
SID/STAR survey. The number of participants by pilot type are shown in Table 1. The median
time to complete the IAP/Enroute IFR survey was 38.5 minutes; the median time to complete the
SID/STAR was 28.9 minutes. Pilots who completed a survey were compensated for their time.
Table 1
Distribution of Participants by Pilot Type Pilot Type IAP/IFR Participants SID/STAR Participants
Air Transport 30 30 Commercial 30 30 General Aviation 30 30 Military 24 25
12
Data Analysis
Step 1: Chi-Square Test
We conducted a series of one-way chi-squares for each information element to determine
pilot ratings of importance (p < 0.05). The following questions were used to guide the analysis.
1. Did the majority of pilots feel that the information element should be displayed on thechart to successfully execute the procedure?This was examined using a chi-square test to compare the total number of pilots whochose responses 1, 2, or 3 to the number of pilots who chose response 4 (not required toexecute the procedure).• If the number of pilots who responded 1, 2, or 3 was significantly greater than the
number of pilots who responded 4 (p < 0.05), then we asked question 2.• If the number of pilots who responded 4 was significantly greater than the number of
pilots who responded 1, 2, or 3 (p < 0.05), then we concluded that pilots did not feelthey needed the information element to execute the procedure. No furthercomparisons were conducted.
2. Did the majority of pilots feel that the information element should be displayed at alltimes?This was examined using two chi-square tests: (1) we compared the number of pilots whochose response 1 to the number of pilots who chose response 2, and (2) we compared thenumber of pilots who chose response 1 to the number of pilots who chose response 3.• If the number of pilots who chose response 1 was significantly greater than the
number of pilots who chose responses 2 or 3 (p < 0.05), then the majority of pilotsfelt that the information element should be displayed at all times.
• If the number of pilots who chose response 2 was significantly greater than thenumber of pilots who chose response 1 (p < 0.05), then the majority of pilots felt thatthe information should be displayed initially.
• If the number of pilots who chose response 3 was significantly greater than thenumber of pilots who chose response 1 (p < 0.05), then the majority of pilots felt thatthe information element did not need to be displayed initially.
• If the analysis was not significant (p > 0.05), then we concluded that there was nopreference for whether it needed to be displayed at all times (not yet determined).
3. For pilots who felt information elements were not required to be displayed at all times,did the majority of pilots feel that the information element should be displayed initially?This was examined using chi-square tests comparing the number of pilots who choseresponse 2 to the number of pilots who chose response 3.
13
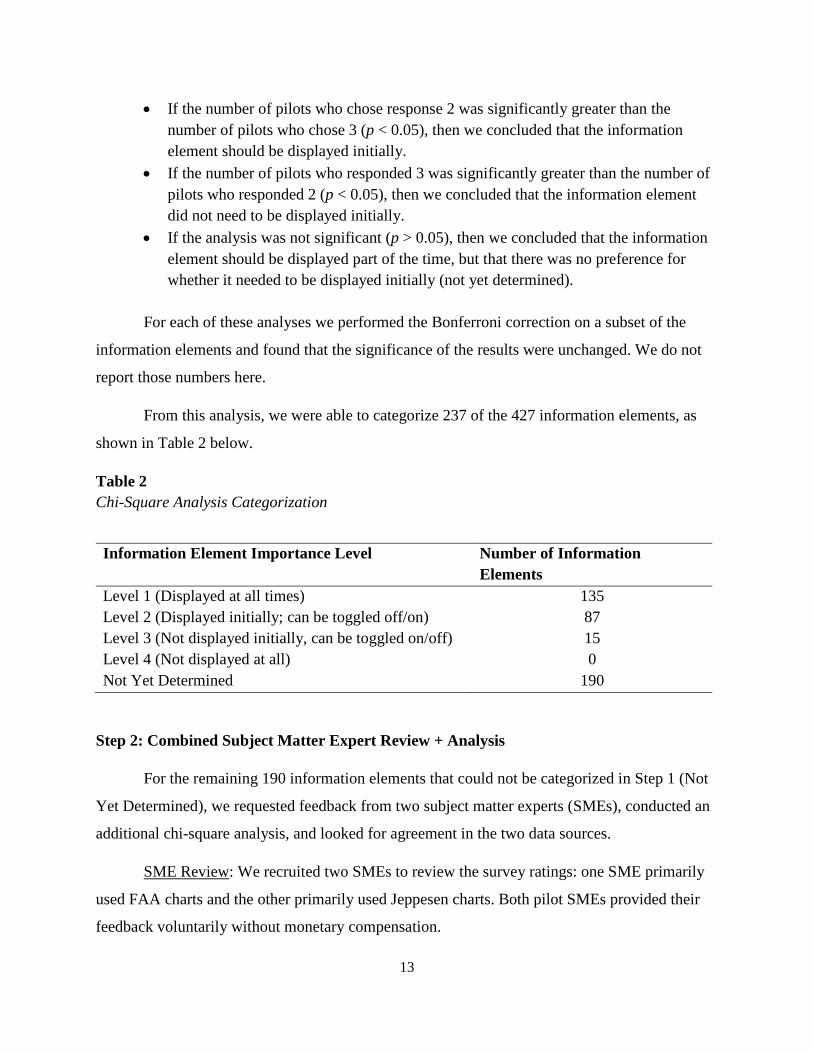
• If the number of pilots who chose response 2 was significantly greater than the number of pilots who chose 3 (p < 0.05), then we concluded that the information element should be displayed initially.
• If the number of pilots who responded 3 was significantly greater than the number of pilots who responded 2 (p < 0.05), then we concluded that the information element did not need to be displayed initially.
• If the analysis was not significant (p > 0.05), then we concluded that the information element should be displayed part of the time, but that there was no preference for whether it needed to be displayed initially (not yet determined).
For each of these analyses we performed the Bonferroni correction on a subset of the
information elements and found that the significance of the results were unchanged. We do not
report those numbers here.
From this analysis, we were able to categorize 237 of the 427 information elements, as
shown in Table 2 below.
Table 2 Chi-Square Analysis Categorization Information Element Importance Level Number of Information
Elements Level 1 (Displayed at all times) 135 Level 2 (Displayed initially; can be toggled off/on) 87 Level 3 (Not displayed initially, can be toggled on/off) 15 Level 4 (Not displayed at all) 0 Not Yet Determined 190
Step 2: Combined Subject Matter Expert Review + Analysis
For the remaining 190 information elements that could not be categorized in Step 1 (Not
Yet Determined), we requested feedback from two subject matter experts (SMEs), conducted an
additional chi-square analysis, and looked for agreement in the two data sources.
SME Review: We recruited two SMEs to review the survey ratings: one SME primarily
used FAA charts and the other primarily used Jeppesen charts. Both pilot SMEs provided their
feedback voluntarily without monetary compensation.
14
We provided each SME individually with the preliminary survey results from Step 1 and
asked them to review the categorization of the information elements to determine if the survey
ratings were consistent with their operational use of the information elements. We also asked the
SMEs to review the information elements that did not clearly fall into one category (Not Yet
Determined) and provide a category recommendation based on the information element’s
relationship with other information elements. For example, some information elements may need
to be displayed together (e.g., airport identifier and airport symbol), but were rated as different
levels of importance.
One SME focused his review on the information elements (n=190) that could not be
placed in a category through the chi-square analysis conducted in Step 1. That SME provided his
recommendation between those levels based on the perceived relationship of the specific
information element with other information elements at the same level. The second SME was
presented with the same task, but rather than focus on the information elements that were
classified as “Not Yet Determined,” he also reviewed information elements that had already been
categorized based on significance.
Analysis: We conducted a second chi-square analysis focused on the two importance
levels with the highest ratings and reduced the level of significance from p < 0.05 to p < 0.10
(marginal significance) to see if we could classify the remaining items in conjunction with the
feedback from the SMEs.
We utilized a flow chart to collectively look at SME feedback, the second chi-square analysis,
and pilot categorization to determine a majority agreement across the sources. Through this
method, we were able to classify an additional 127 of the 190 previously undetermined
information elements.
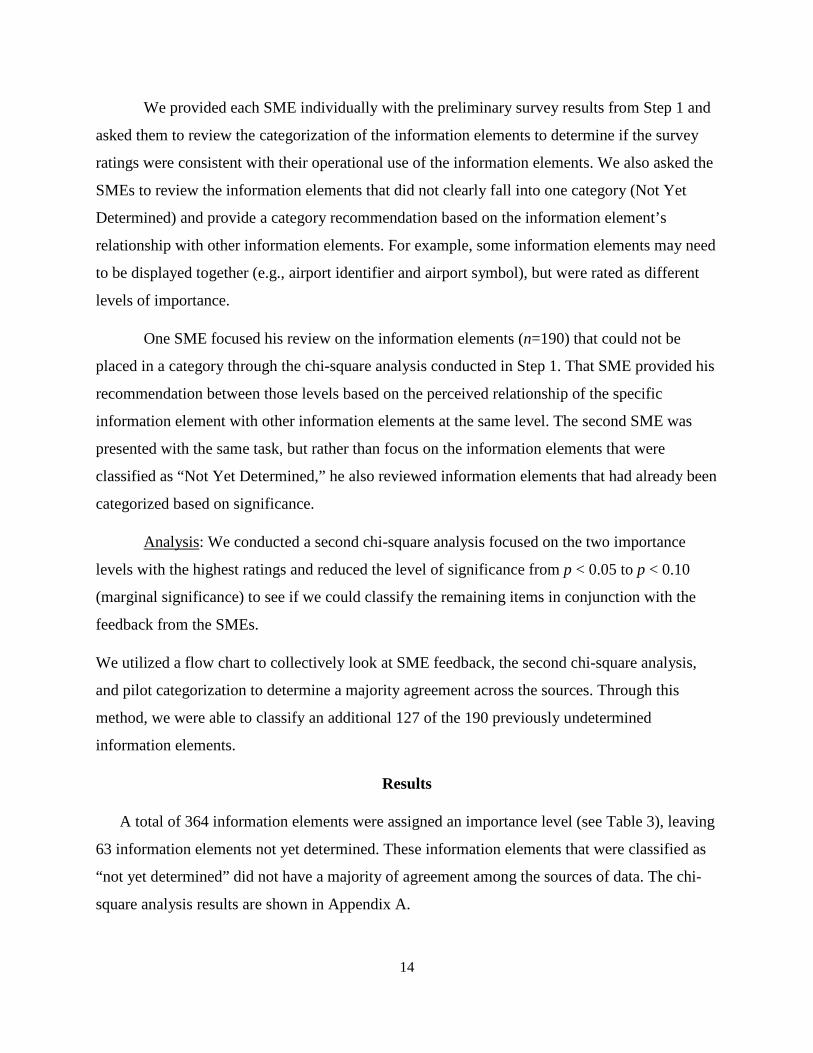
Results
A total of 364 information elements were assigned an importance level (see Table 3), leaving
63 information elements not yet determined. These information elements that were classified as
“not yet determined” did not have a majority of agreement among the sources of data. The chi-
square analysis results are shown in Appendix A.
15
Table 3 Number of Information Elements by Importance Level
Information Element Importance Level Number of Information Elements Level 1 (Displayed at all times) 173 Level 2 (Displayed initially; can be toggled off/on) 156 Level 3 (Not displayed initially, can be toggled on/off) 34 Level 4 (Not displayed at all) 1 Not Yet Determined 63
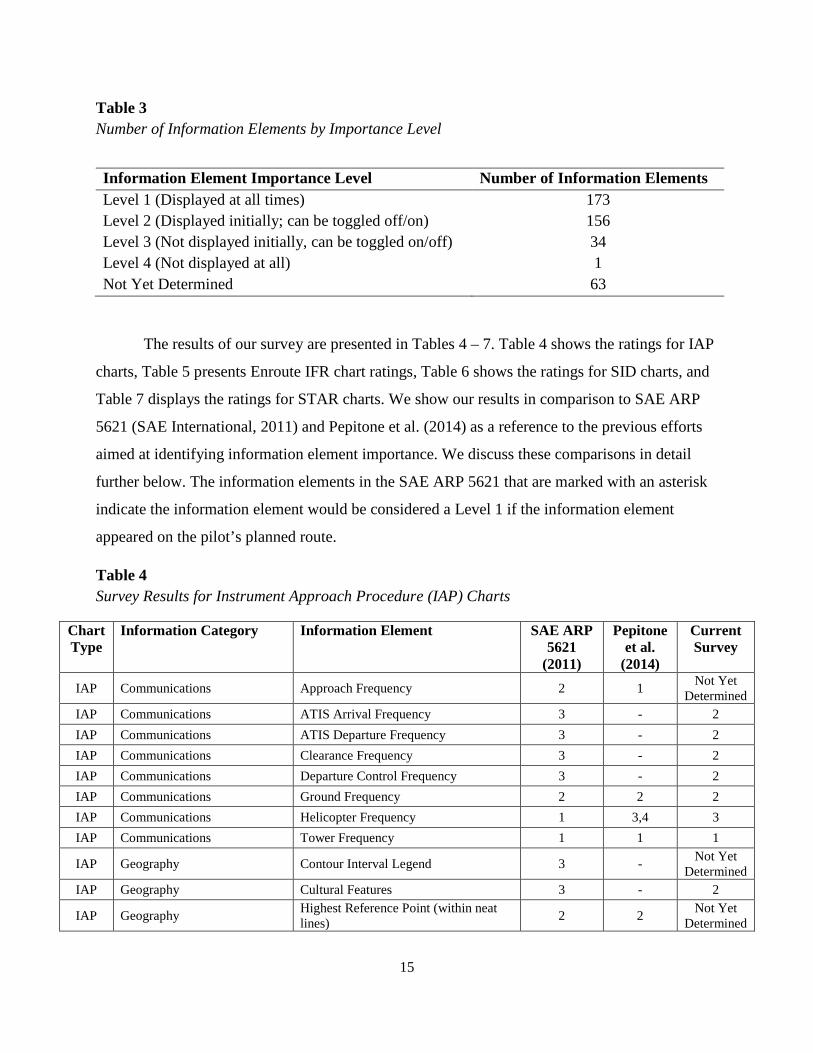
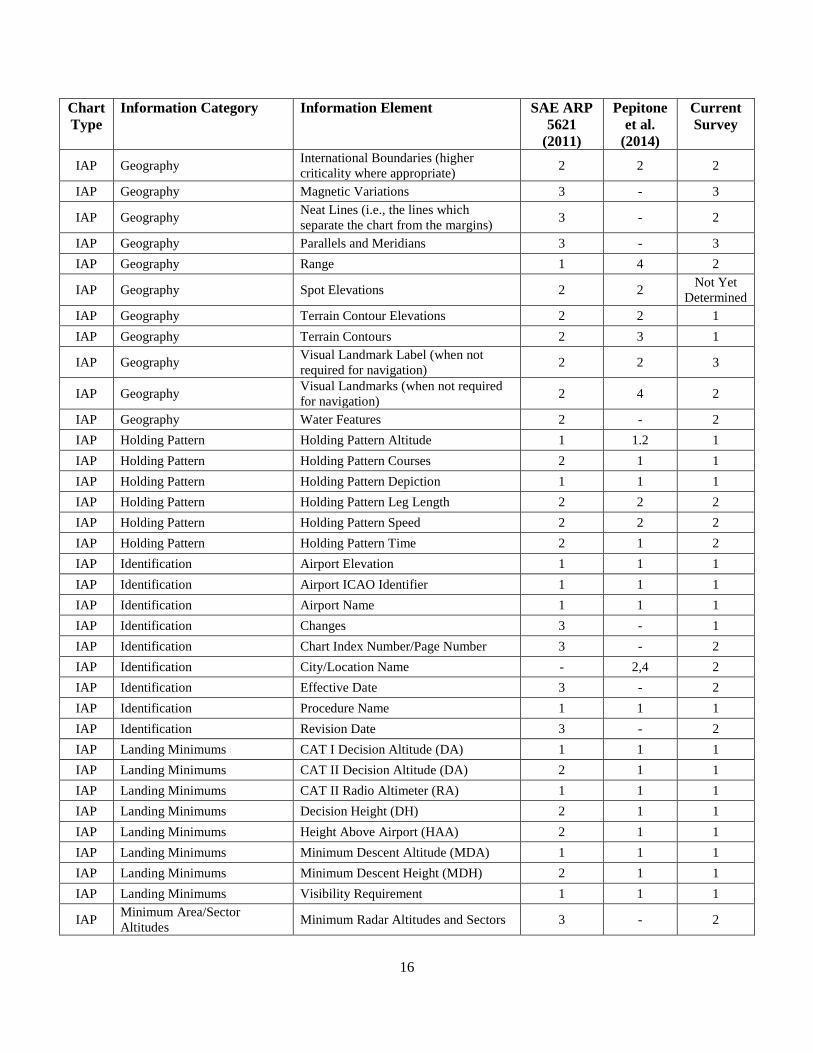
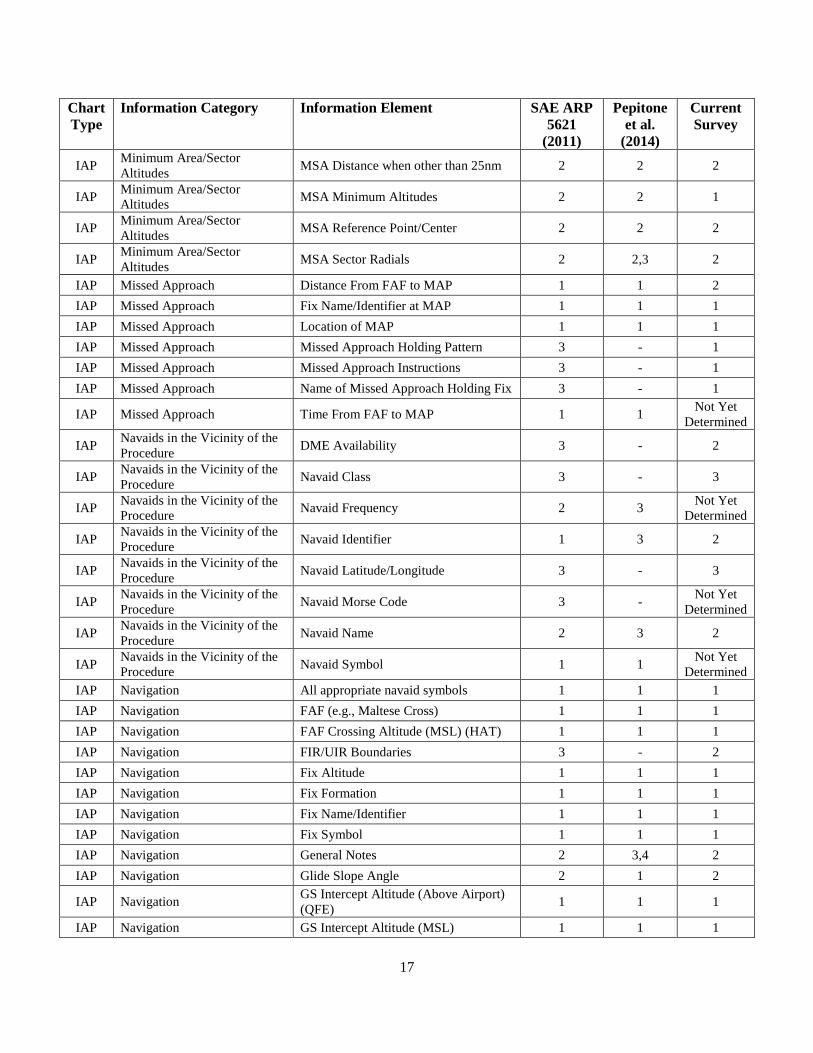
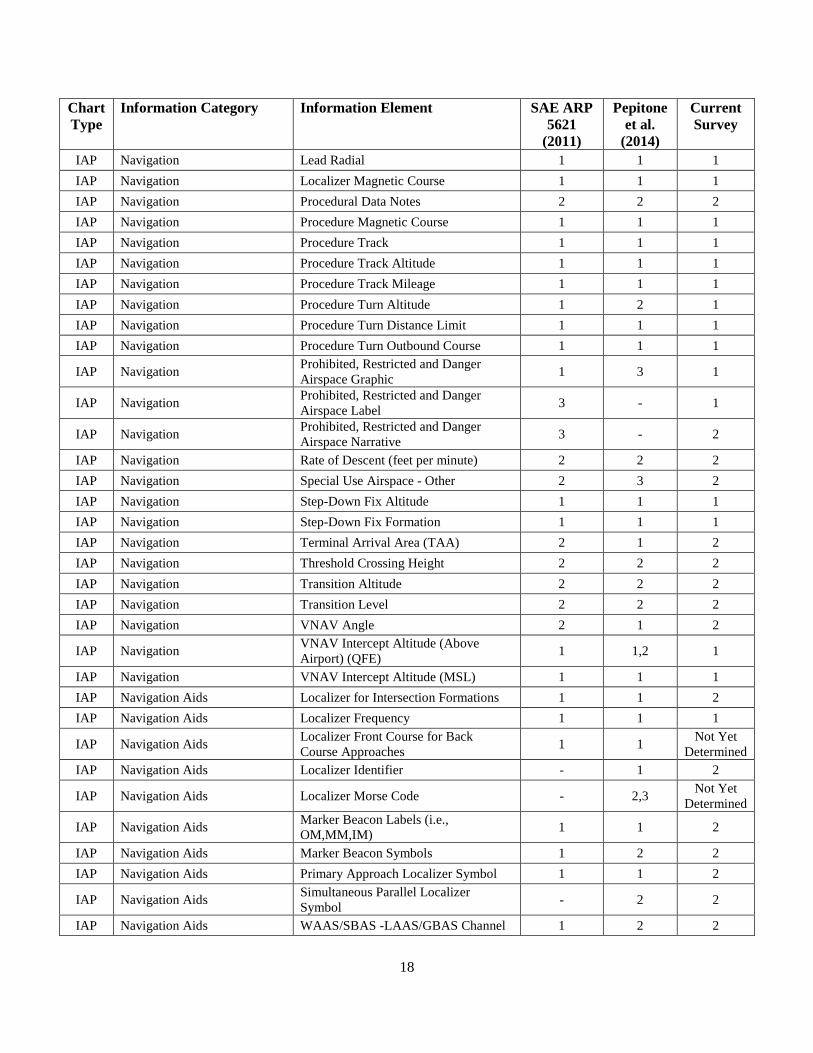
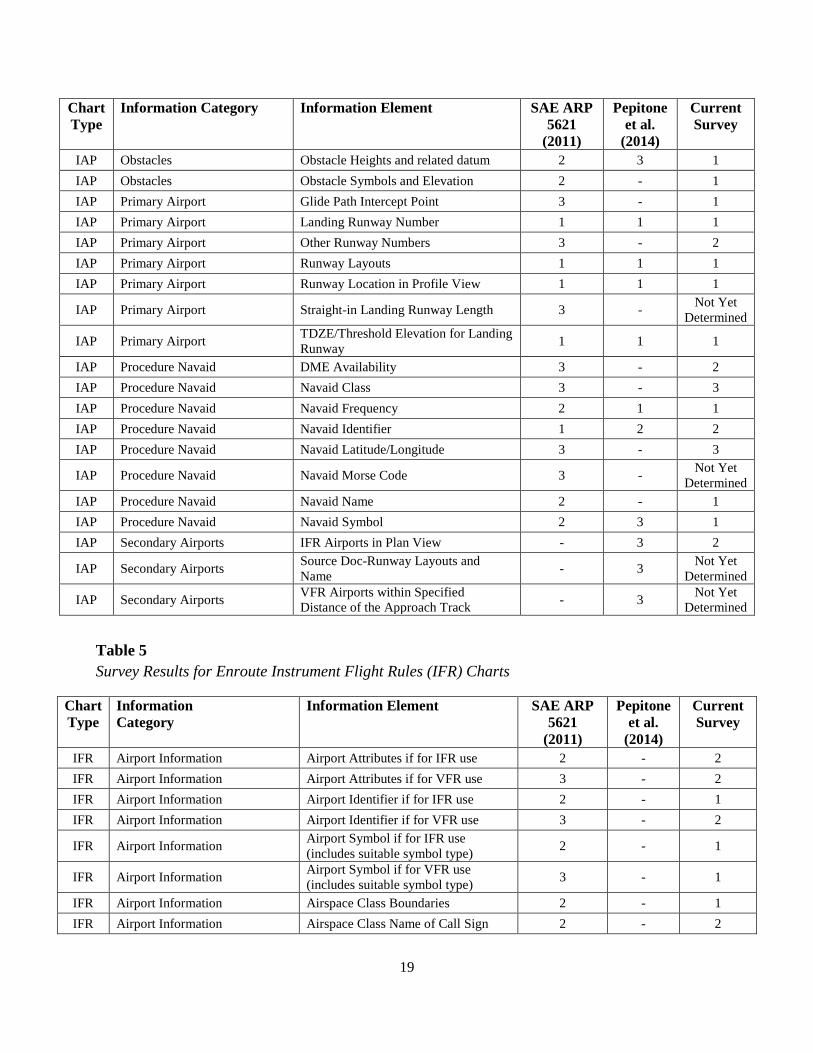
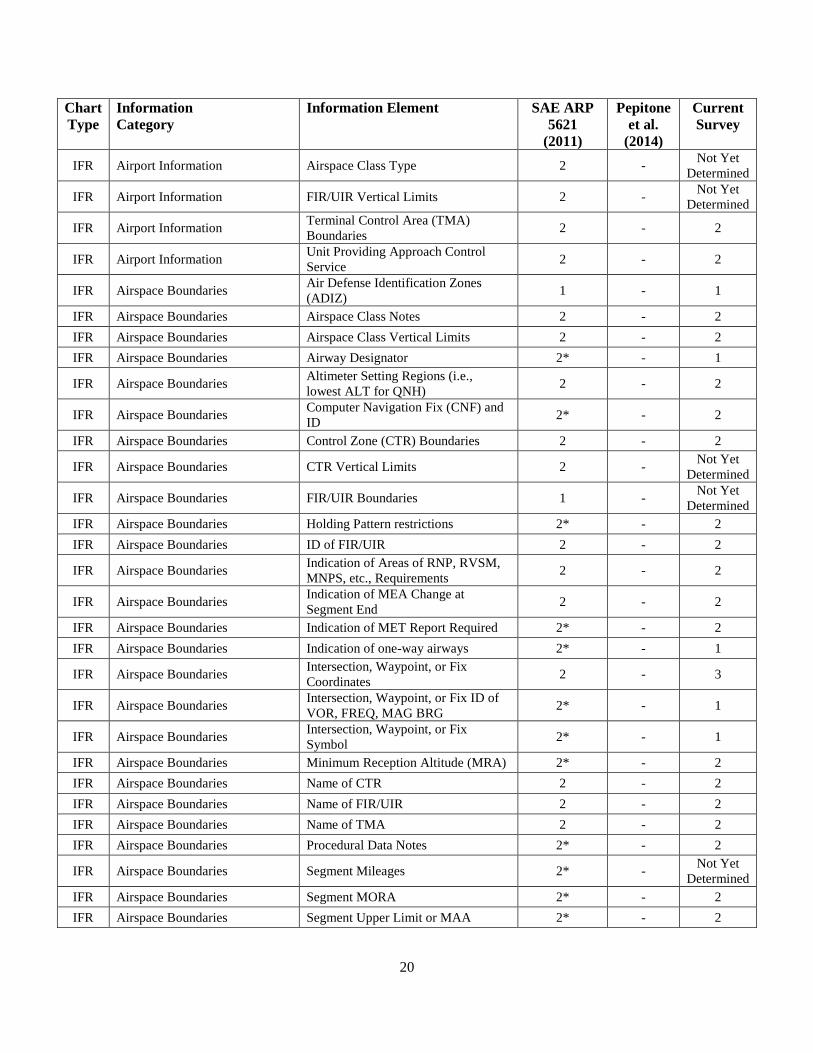
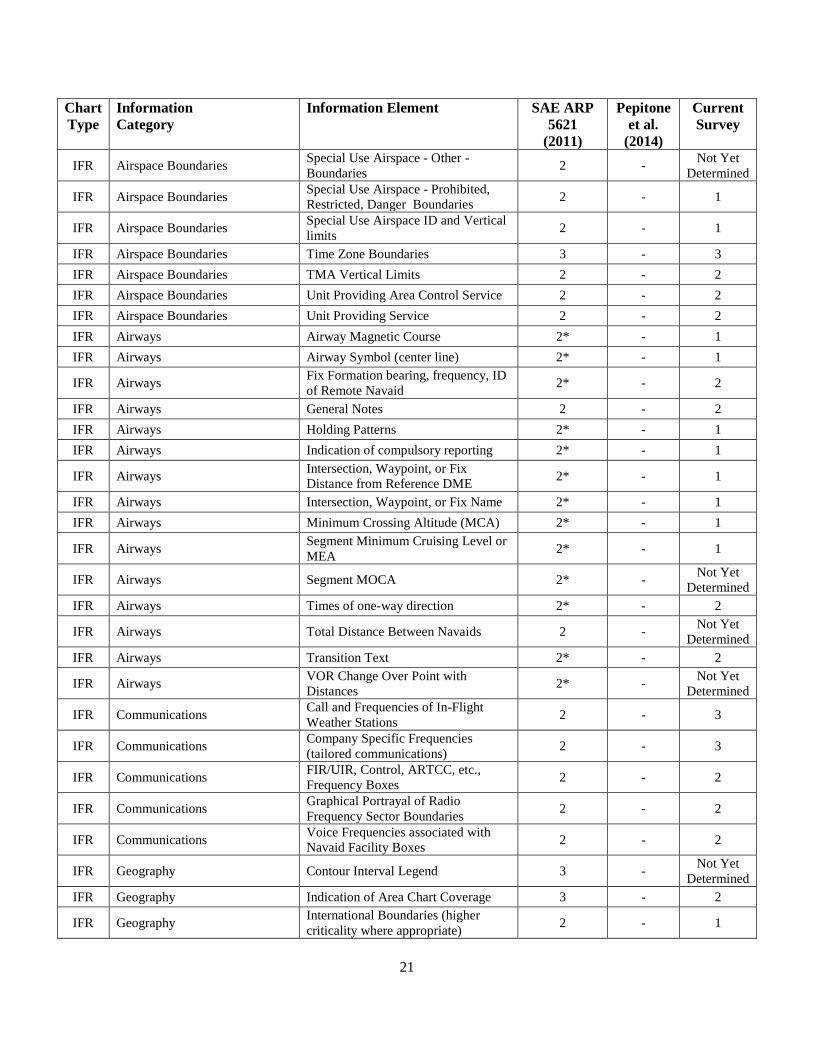
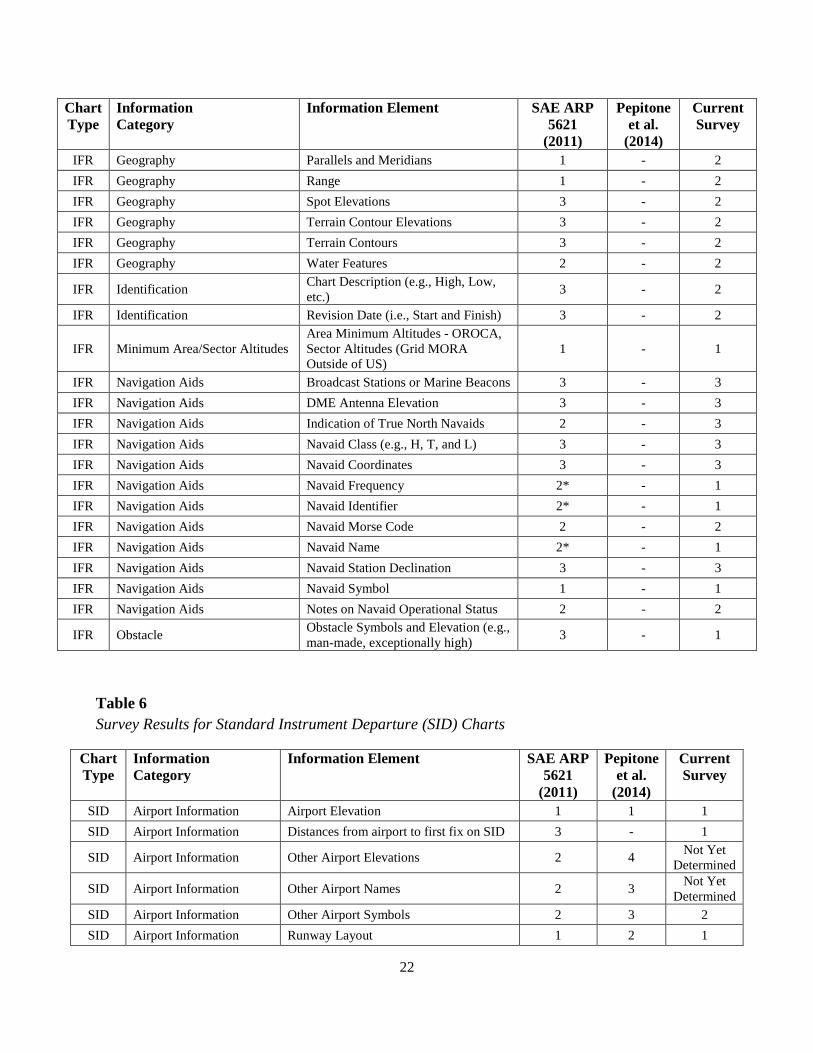
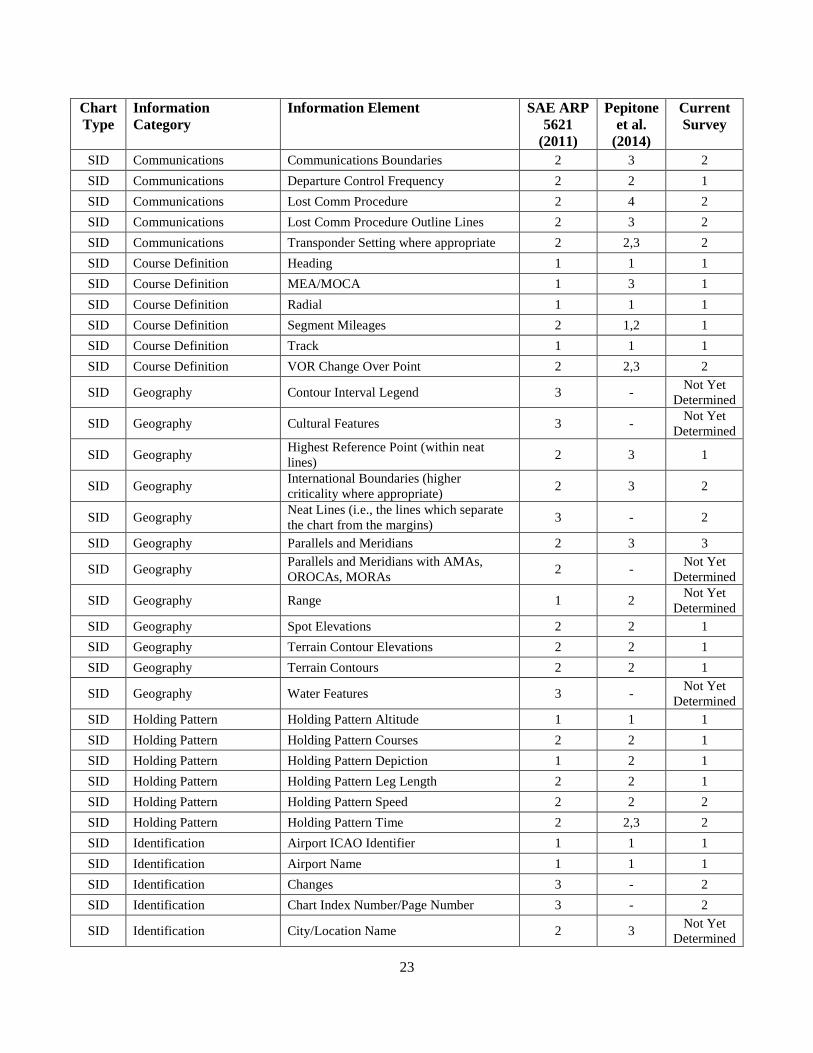
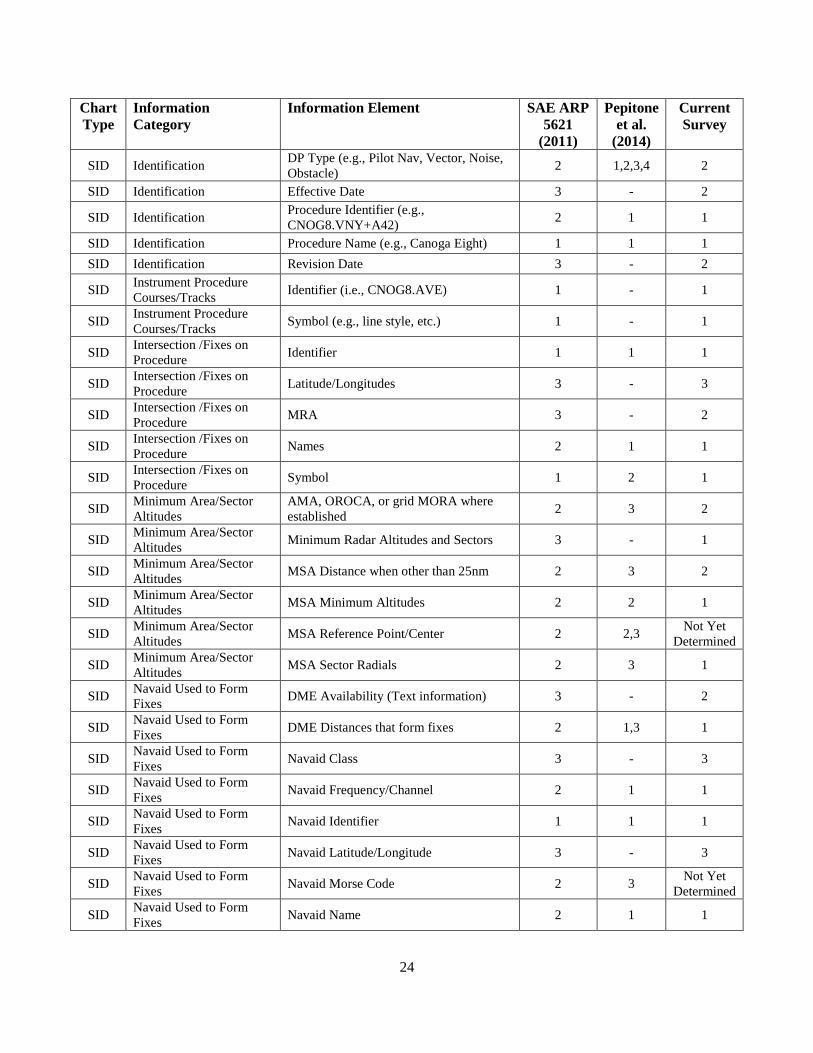
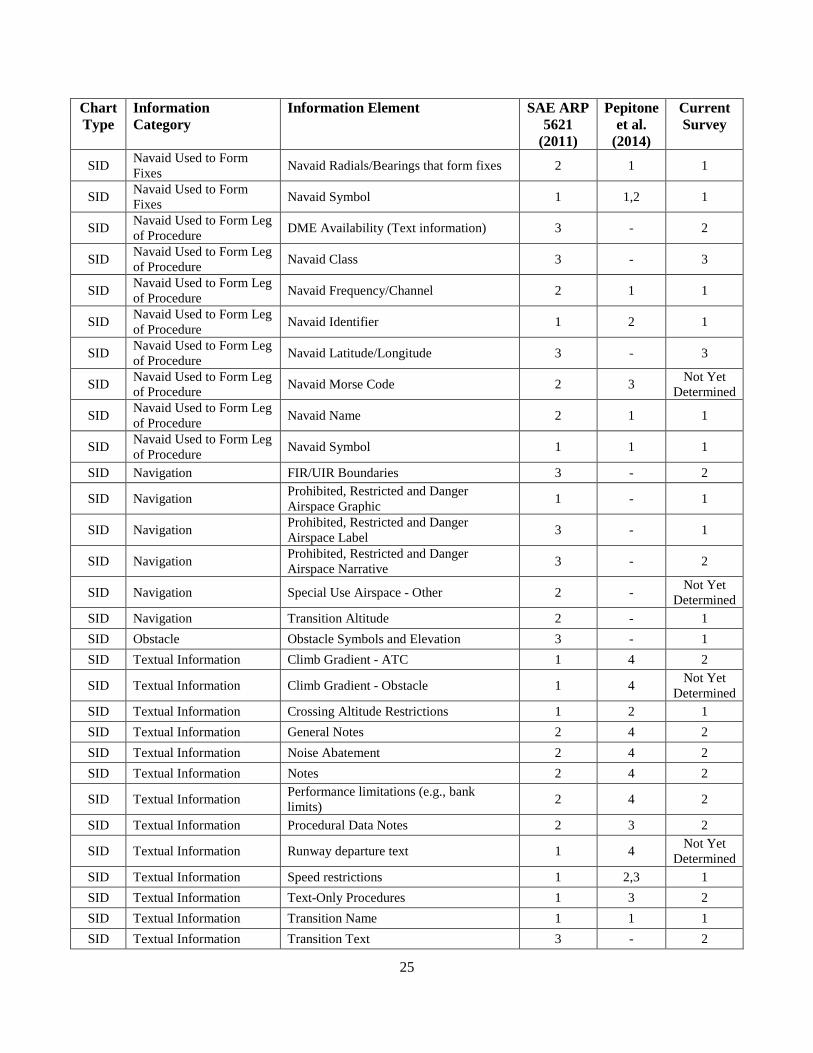
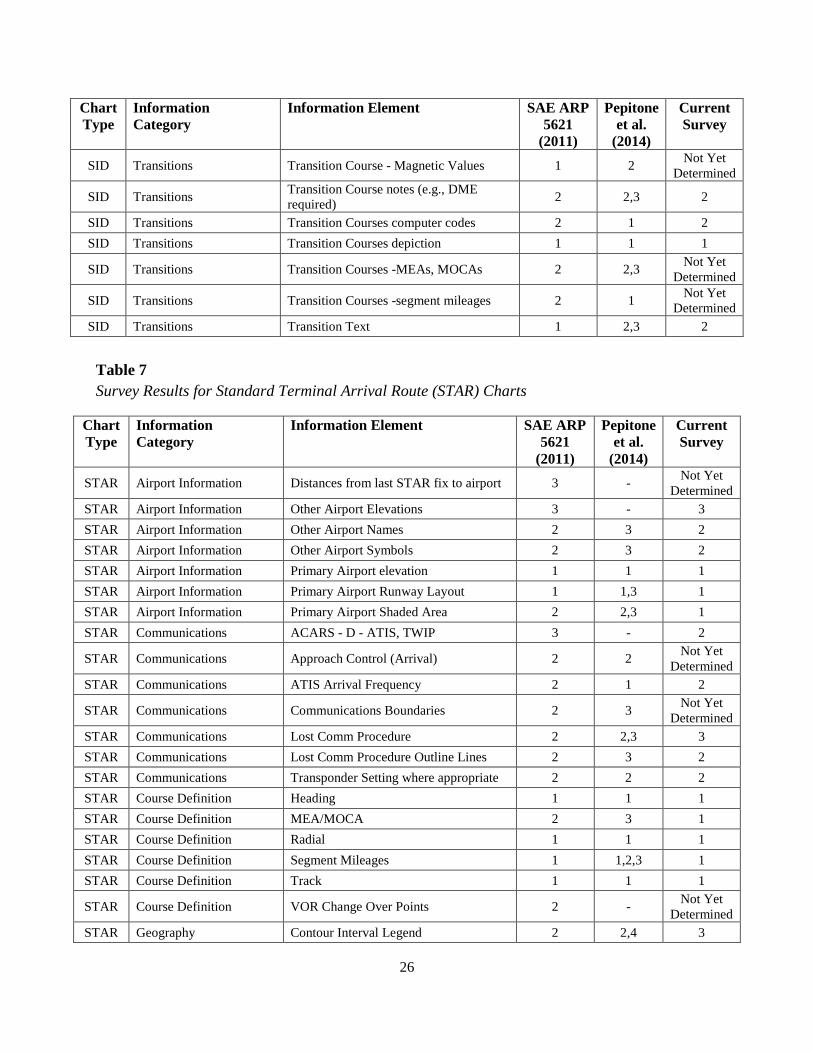
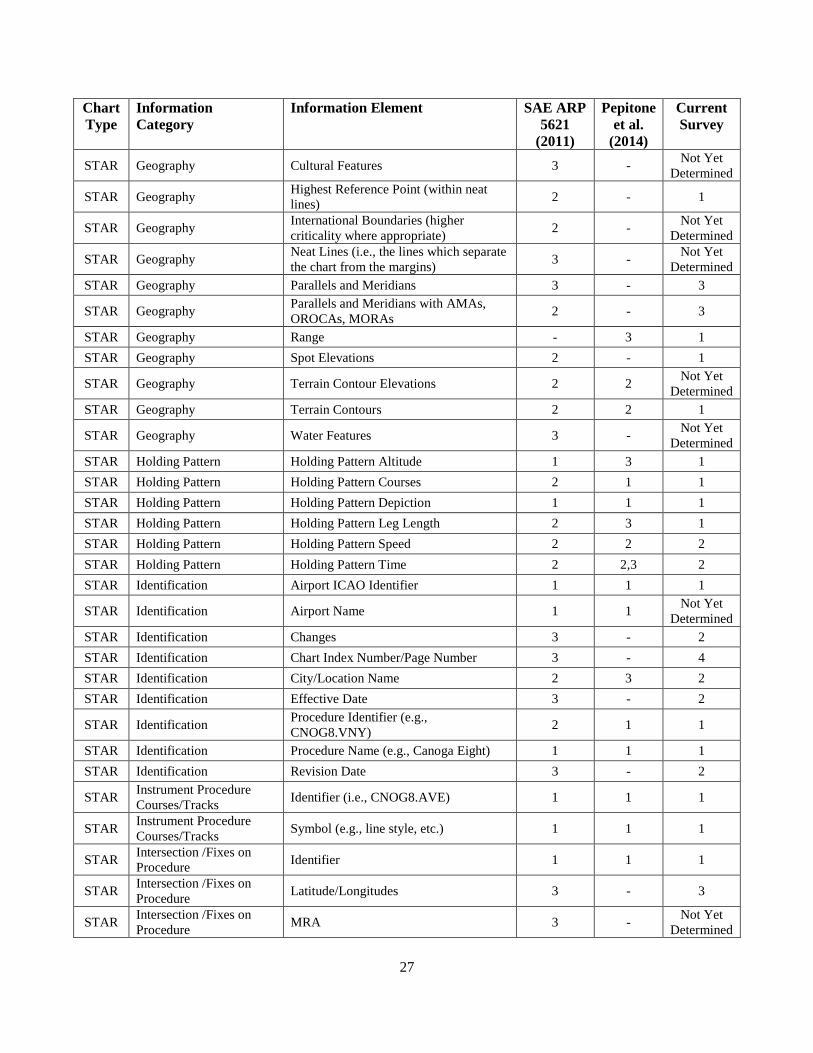
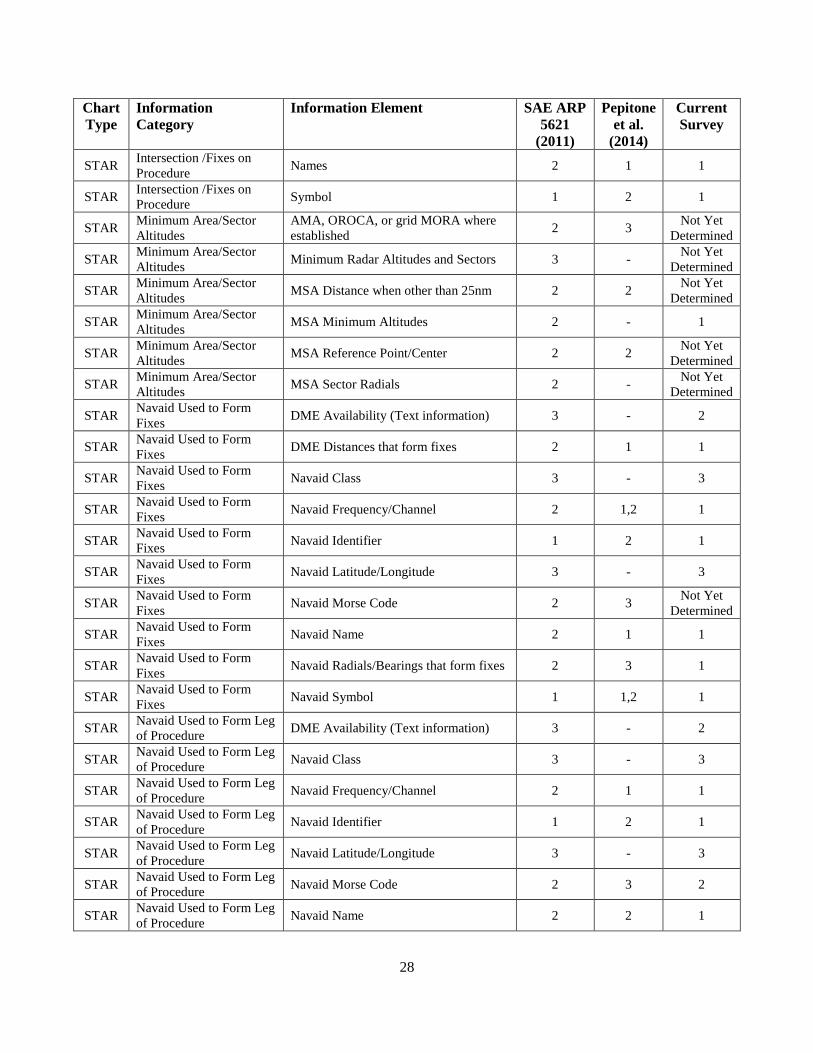
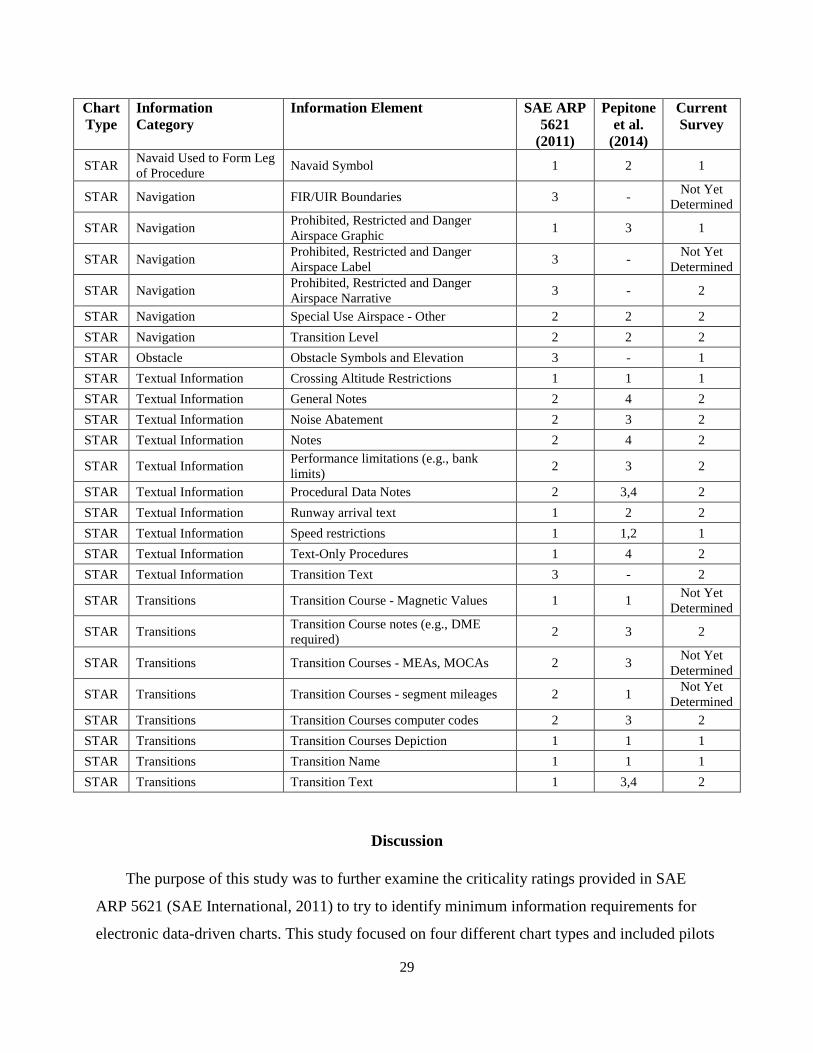
The results of our survey are presented in Tables 4 – 7. Table 4 shows the ratings for IAP
charts, Table 5 presents Enroute IFR chart ratings, Table 6 shows the ratings for SID charts, and
Table 7 displays the ratings for STAR charts. We show our results in comparison to SAE ARP
5621 (SAE International, 2011) and Pepitone et al. (2014) as a reference to the previous efforts
aimed at identifying information element importance. We discuss these comparisons in detail
further below. The information elements in the SAE ARP 5621 that are marked with an asterisk
indicate the information element would be considered a Level 1 if the information element
appeared on the pilot’s planned route.
Table 4 Survey Results for Instrument Approach Procedure (IAP) Charts
Chart Type
Information Category Information Element SAE ARP 5621
(2011)
Pepitone et al.
(2014)
Current Survey
IAP Communications Approach Frequency 2 1 Not Yet Determined
IAP Communications ATIS Arrival Frequency 3 - 2 IAP Communications ATIS Departure Frequency 3 - 2 IAP Communications Clearance Frequency 3 - 2 IAP Communications Departure Control Frequency 3 - 2 IAP Communications Ground Frequency 2 2 2 IAP Communications Helicopter Frequency 1 3,4 3 IAP Communications Tower Frequency 1 1 1
IAP Geography Contour Interval Legend 3 - Not Yet Determined
IAP Geography Cultural Features 3 - 2
IAP Geography Highest Reference Point (within neat lines) 2 2 Not Yet
Determined
16
Chart Type
Information Category Information Element SAE ARP 5621
(2011)
Pepitone et al.
(2014)
Current Survey
IAP Geography International Boundaries (higher criticality where appropriate) 2 2 2
IAP Geography Magnetic Variations 3 - 3
IAP Geography Neat Lines (i.e., the lines which separate the chart from the margins) 3 - 2
IAP Geography Parallels and Meridians 3 - 3 IAP Geography Range 1 4 2
IAP Geography Spot Elevations 2 2 Not Yet Determined
IAP Geography Terrain Contour Elevations 2 2 1 IAP Geography Terrain Contours 2 3 1
IAP Geography Visual Landmark Label (when not required for navigation) 2 2 3
IAP Geography Visual Landmarks (when not required for navigation) 2 4 2
IAP Geography Water Features 2 - 2 IAP Holding Pattern Holding Pattern Altitude 1 1.2 1 IAP Holding Pattern Holding Pattern Courses 2 1 1 IAP Holding Pattern Holding Pattern Depiction 1 1 1 IAP Holding Pattern Holding Pattern Leg Length 2 2 2 IAP Holding Pattern Holding Pattern Speed 2 2 2 IAP Holding Pattern Holding Pattern Time 2 1 2 IAP Identification Airport Elevation 1 1 1 IAP Identification Airport ICAO Identifier 1 1 1 IAP Identification Airport Name 1 1 1 IAP Identification Changes 3 - 1 IAP Identification Chart Index Number/Page Number 3 - 2 IAP Identification City/Location Name - 2,4 2 IAP Identification Effective Date 3 - 2 IAP Identification Procedure Name 1 1 1 IAP Identification Revision Date 3 - 2 IAP Landing Minimums CAT I Decision Altitude (DA) 1 1 1 IAP Landing Minimums CAT II Decision Altitude (DA) 2 1 1 IAP Landing Minimums CAT II Radio Altimeter (RA) 1 1 1 IAP Landing Minimums Decision Height (DH) 2 1 1 IAP Landing Minimums Height Above Airport (HAA) 2 1 1 IAP Landing Minimums Minimum Descent Altitude (MDA) 1 1 1 IAP Landing Minimums Minimum Descent Height (MDH) 2 1 1 IAP Landing Minimums Visibility Requirement 1 1 1
IAP Minimum Area/Sector Altitudes Minimum Radar Altitudes and Sectors 3 - 2
17
Chart Type
Information Category Information Element SAE ARP 5621
(2011)
Pepitone et al.
(2014)
Current Survey
IAP Minimum Area/Sector Altitudes MSA Distance when other than 25nm 2 2 2
IAP Minimum Area/Sector Altitudes MSA Minimum Altitudes 2 2 1
IAP Minimum Area/Sector Altitudes MSA Reference Point/Center 2 2 2
IAP Minimum Area/Sector Altitudes MSA Sector Radials 2 2,3 2
IAP Missed Approach Distance From FAF to MAP 1 1 2 IAP Missed Approach Fix Name/Identifier at MAP 1 1 1 IAP Missed Approach Location of MAP 1 1 1 IAP Missed Approach Missed Approach Holding Pattern 3 - 1 IAP Missed Approach Missed Approach Instructions 3 - 1 IAP Missed Approach Name of Missed Approach Holding Fix 3 - 1
IAP Missed Approach Time From FAF to MAP 1 1 Not Yet Determined
IAP Navaids in the Vicinity of the Procedure DME Availability 3 - 2
IAP Navaids in the Vicinity of the Procedure Navaid Class 3 - 3
IAP Navaids in the Vicinity of the Procedure Navaid Frequency 2 3 Not Yet
Determined
IAP Navaids in the Vicinity of the Procedure Navaid Identifier 1 3 2
IAP Navaids in the Vicinity of the Procedure Navaid Latitude/Longitude 3 - 3
IAP Navaids in the Vicinity of the Procedure Navaid Morse Code 3 - Not Yet
Determined
IAP Navaids in the Vicinity of the Procedure Navaid Name 2 3 2
IAP Navaids in the Vicinity of the Procedure Navaid Symbol 1 1 Not Yet
Determined IAP Navigation All appropriate navaid symbols 1 1 1 IAP Navigation FAF (e.g., Maltese Cross) 1 1 1 IAP Navigation FAF Crossing Altitude (MSL) (HAT) 1 1 1 IAP Navigation FIR/UIR Boundaries 3 - 2 IAP Navigation Fix Altitude 1 1 1 IAP Navigation Fix Formation 1 1 1 IAP Navigation Fix Name/Identifier 1 1 1 IAP Navigation Fix Symbol 1 1 1 IAP Navigation General Notes 2 3,4 2 IAP Navigation Glide Slope Angle 2 1 2
IAP Navigation GS Intercept Altitude (Above Airport) (QFE) 1 1 1
IAP Navigation GS Intercept Altitude (MSL) 1 1 1
18
Chart Type
Information Category Information Element SAE ARP 5621
(2011)
Pepitone et al.
(2014)
Current Survey
IAP Navigation Lead Radial 1 1 1 IAP Navigation Localizer Magnetic Course 1 1 1 IAP Navigation Procedural Data Notes 2 2 2 IAP Navigation Procedure Magnetic Course 1 1 1 IAP Navigation Procedure Track 1 1 1 IAP Navigation Procedure Track Altitude 1 1 1 IAP Navigation Procedure Track Mileage 1 1 1 IAP Navigation Procedure Turn Altitude 1 2 1 IAP Navigation Procedure Turn Distance Limit 1 1 1 IAP Navigation Procedure Turn Outbound Course 1 1 1
IAP Navigation Prohibited, Restricted and Danger Airspace Graphic 1 3 1
IAP Navigation Prohibited, Restricted and Danger Airspace Label 3 - 1
IAP Navigation Prohibited, Restricted and Danger Airspace Narrative 3 - 2
IAP Navigation Rate of Descent (feet per minute) 2 2 2 IAP Navigation Special Use Airspace - Other 2 3 2 IAP Navigation Step-Down Fix Altitude 1 1 1 IAP Navigation Step-Down Fix Formation 1 1 1 IAP Navigation Terminal Arrival Area (TAA) 2 1 2 IAP Navigation Threshold Crossing Height 2 2 2 IAP Navigation Transition Altitude 2 2 2 IAP Navigation Transition Level 2 2 2 IAP Navigation VNAV Angle 2 1 2
IAP Navigation VNAV Intercept Altitude (Above Airport) (QFE) 1 1,2 1
IAP Navigation VNAV Intercept Altitude (MSL) 1 1 1 IAP Navigation Aids Localizer for Intersection Formations 1 1 2 IAP Navigation Aids Localizer Frequency 1 1 1
IAP Navigation Aids Localizer Front Course for Back Course Approaches 1 1 Not Yet
Determined IAP Navigation Aids Localizer Identifier - 1 2
IAP Navigation Aids Localizer Morse Code - 2,3 Not Yet Determined
IAP Navigation Aids Marker Beacon Labels (i.e., OM,MM,IM) 1 1 2
IAP Navigation Aids Marker Beacon Symbols 1 2 2 IAP Navigation Aids Primary Approach Localizer Symbol 1 1 2
IAP Navigation Aids Simultaneous Parallel Localizer Symbol - 2 2
IAP Navigation Aids WAAS/SBAS -LAAS/GBAS Channel 1 2 2
19
Chart Type
Information Category Information Element SAE ARP 5621
(2011)
Pepitone et al.
(2014)
Current Survey
IAP Obstacles Obstacle Heights and related datum 2 3 1 IAP Obstacles Obstacle Symbols and Elevation 2 - 1 IAP Primary Airport Glide Path Intercept Point 3 - 1 IAP Primary Airport Landing Runway Number 1 1 1 IAP Primary Airport Other Runway Numbers 3 - 2 IAP Primary Airport Runway Layouts 1 1 1 IAP Primary Airport Runway Location in Profile View 1 1 1
IAP Primary Airport Straight-in Landing Runway Length 3 - Not Yet Determined
IAP Primary Airport TDZE/Threshold Elevation for Landing Runway 1 1 1
IAP Procedure Navaid DME Availability 3 - 2 IAP Procedure Navaid Navaid Class 3 - 3 IAP Procedure Navaid Navaid Frequency 2 1 1 IAP Procedure Navaid Navaid Identifier 1 2 2 IAP Procedure Navaid Navaid Latitude/Longitude 3 - 3
IAP Procedure Navaid Navaid Morse Code 3 - Not Yet Determined
IAP Procedure Navaid Navaid Name 2 - 1 IAP Procedure Navaid Navaid Symbol 2 3 1 IAP Secondary Airports IFR Airports in Plan View - 3 2
IAP Secondary Airports Source Doc-Runway Layouts and Name - 3 Not Yet
Determined
IAP Secondary Airports VFR Airports within Specified Distance of the Approach Track - 3 Not Yet
Determined Table 5 Survey Results for Enroute Instrument Flight Rules (IFR) Charts
Chart Type
Information Category
Information Element SAE ARP 5621
(2011)
Pepitone et al.
(2014)
Current Survey
IFR Airport Information Airport Attributes if for IFR use 2 - 2 IFR Airport Information Airport Attributes if for VFR use 3 - 2 IFR Airport Information Airport Identifier if for IFR use 2 - 1 IFR Airport Information Airport Identifier if for VFR use 3 - 2
IFR Airport Information Airport Symbol if for IFR use (includes suitable symbol type) 2 - 1
IFR Airport Information Airport Symbol if for VFR use (includes suitable symbol type) 3 - 1
IFR Airport Information Airspace Class Boundaries 2 - 1 IFR Airport Information Airspace Class Name of Call Sign 2 - 2
20
Chart Type
Information Category
Information Element SAE ARP 5621
(2011)
Pepitone et al.
(2014)
Current Survey
IFR Airport Information Airspace Class Type 2 - Not Yet Determined
IFR Airport Information FIR/UIR Vertical Limits 2 - Not Yet Determined
IFR Airport Information Terminal Control Area (TMA) Boundaries 2 - 2
IFR Airport Information Unit Providing Approach Control Service 2 - 2
IFR Airspace Boundaries Air Defense Identification Zones (ADIZ) 1 - 1
IFR Airspace Boundaries Airspace Class Notes 2 - 2 IFR Airspace Boundaries Airspace Class Vertical Limits 2 - 2 IFR Airspace Boundaries Airway Designator 2* - 1
IFR Airspace Boundaries Altimeter Setting Regions (i.e., lowest ALT for QNH) 2 - 2
IFR Airspace Boundaries Computer Navigation Fix (CNF) and ID 2* - 2
IFR Airspace Boundaries Control Zone (CTR) Boundaries 2 - 2
IFR Airspace Boundaries CTR Vertical Limits 2 - Not Yet Determined
IFR Airspace Boundaries FIR/UIR Boundaries 1 - Not Yet Determined
IFR Airspace Boundaries Holding Pattern restrictions 2* - 2 IFR Airspace Boundaries ID of FIR/UIR 2 - 2
IFR Airspace Boundaries Indication of Areas of RNP, RVSM, MNPS, etc., Requirements 2 - 2
IFR Airspace Boundaries Indication of MEA Change at Segment End 2 - 2
IFR Airspace Boundaries Indication of MET Report Required 2* - 2 IFR Airspace Boundaries Indication of one-way airways 2* - 1
IFR Airspace Boundaries Intersection, Waypoint, or Fix Coordinates 2 - 3
IFR Airspace Boundaries Intersection, Waypoint, or Fix ID of VOR, FREQ, MAG BRG 2* - 1
IFR Airspace Boundaries Intersection, Waypoint, or Fix Symbol 2* - 1
IFR Airspace Boundaries Minimum Reception Altitude (MRA) 2* - 2 IFR Airspace Boundaries Name of CTR 2 - 2 IFR Airspace Boundaries Name of FIR/UIR 2 - 2 IFR Airspace Boundaries Name of TMA 2 - 2 IFR Airspace Boundaries Procedural Data Notes 2* - 2
IFR Airspace Boundaries Segment Mileages 2* - Not Yet Determined
IFR Airspace Boundaries Segment MORA 2* - 2 IFR Airspace Boundaries Segment Upper Limit or MAA 2* - 2
21
Chart Type
Information Category
Information Element SAE ARP 5621
(2011)
Pepitone et al.
(2014)
Current Survey
IFR Airspace Boundaries Special Use Airspace - Other - Boundaries 2 - Not Yet
Determined
IFR Airspace Boundaries Special Use Airspace - Prohibited, Restricted, Danger Boundaries 2 - 1
IFR Airspace Boundaries Special Use Airspace ID and Vertical limits 2 - 1
IFR Airspace Boundaries Time Zone Boundaries 3 - 3 IFR Airspace Boundaries TMA Vertical Limits 2 - 2 IFR Airspace Boundaries Unit Providing Area Control Service 2 - 2 IFR Airspace Boundaries Unit Providing Service 2 - 2 IFR Airways Airway Magnetic Course 2* - 1 IFR Airways Airway Symbol (center line) 2* - 1
IFR Airways Fix Formation bearing, frequency, ID of Remote Navaid 2* - 2
IFR Airways General Notes 2 - 2 IFR Airways Holding Patterns 2* - 1 IFR Airways Indication of compulsory reporting 2* - 1
IFR Airways Intersection, Waypoint, or Fix Distance from Reference DME 2* - 1
IFR Airways Intersection, Waypoint, or Fix Name 2* - 1 IFR Airways Minimum Crossing Altitude (MCA) 2* - 1
IFR Airways Segment Minimum Cruising Level or MEA 2* - 1
IFR Airways Segment MOCA 2* - Not Yet Determined
IFR Airways Times of one-way direction 2* - 2
IFR Airways Total Distance Between Navaids 2 - Not Yet Determined
IFR Airways Transition Text 2* - 2
IFR Airways VOR Change Over Point with Distances 2* - Not Yet
Determined
IFR Communications Call and Frequencies of In-Flight Weather Stations 2 - 3
IFR Communications Company Specific Frequencies (tailored communications) 2 - 3
IFR Communications FIR/UIR, Control, ARTCC, etc., Frequency Boxes 2 - 2
IFR Communications Graphical Portrayal of Radio Frequency Sector Boundaries 2 - 2
IFR Communications Voice Frequencies associated with Navaid Facility Boxes 2 - 2
IFR Geography Contour Interval Legend 3 - Not Yet Determined
IFR Geography Indication of Area Chart Coverage 3 - 2
IFR Geography International Boundaries (higher criticality where appropriate) 2 - 1
22
Chart Type
Information Category
Information Element SAE ARP 5621
(2011)
Pepitone et al.
(2014)
Current Survey
IFR Geography Parallels and Meridians 1 - 2 IFR Geography Range 1 - 2 IFR Geography Spot Elevations 3 - 2 IFR Geography Terrain Contour Elevations 3 - 2 IFR Geography Terrain Contours 3 - 2 IFR Geography Water Features 2 - 2
IFR Identification Chart Description (e.g., High, Low, etc.) 3 - 2
IFR Identification Revision Date (i.e., Start and Finish) 3 - 2
IFR Minimum Area/Sector Altitudes Area Minimum Altitudes - OROCA, Sector Altitudes (Grid MORA Outside of US)
1 - 1
IFR Navigation Aids Broadcast Stations or Marine Beacons 3 - 3 IFR Navigation Aids DME Antenna Elevation 3 - 3 IFR Navigation Aids Indication of True North Navaids 2 - 3 IFR Navigation Aids Navaid Class (e.g., H, T, and L) 3 - 3 IFR Navigation Aids Navaid Coordinates 3 - 3 IFR Navigation Aids Navaid Frequency 2* - 1 IFR Navigation Aids Navaid Identifier 2* - 1 IFR Navigation Aids Navaid Morse Code 2 - 2 IFR Navigation Aids Navaid Name 2* - 1 IFR Navigation Aids Navaid Station Declination 3 - 3 IFR Navigation Aids Navaid Symbol 1 - 1 IFR Navigation Aids Notes on Navaid Operational Status 2 - 2
IFR Obstacle Obstacle Symbols and Elevation (e.g., man-made, exceptionally high) 3 - 1
Table 6 Survey Results for Standard Instrument Departure (SID) Charts
Chart Type
Information Category
Information Element SAE ARP 5621
(2011)
Pepitone et al.
(2014)
Current Survey
SID Airport Information Airport Elevation 1 1 1 SID Airport Information Distances from airport to first fix on SID 3 - 1
SID Airport Information Other Airport Elevations 2 4 Not Yet Determined
SID Airport Information Other Airport Names 2 3 Not Yet Determined
SID Airport Information Other Airport Symbols 2 3 2 SID Airport Information Runway Layout 1 2 1
23
Chart Type
Information Category
Information Element SAE ARP 5621
(2011)
Pepitone et al.
(2014)
Current Survey
SID Communications Communications Boundaries 2 3 2 SID Communications Departure Control Frequency 2 2 1 SID Communications Lost Comm Procedure 2 4 2 SID Communications Lost Comm Procedure Outline Lines 2 3 2 SID Communications Transponder Setting where appropriate 2 2,3 2 SID Course Definition Heading 1 1 1 SID Course Definition MEA/MOCA 1 3 1 SID Course Definition Radial 1 1 1 SID Course Definition Segment Mileages 2 1,2 1 SID Course Definition Track 1 1 1 SID Course Definition VOR Change Over Point 2 2,3 2
SID Geography Contour Interval Legend 3 - Not Yet Determined
SID Geography Cultural Features 3 - Not Yet Determined
SID Geography Highest Reference Point (within neat lines) 2 3 1
SID Geography International Boundaries (higher criticality where appropriate) 2 3 2
SID Geography Neat Lines (i.e., the lines which separate the chart from the margins) 3 - 2
SID Geography Parallels and Meridians 2 3 3
SID Geography Parallels and Meridians with AMAs, OROCAs, MORAs 2 - Not Yet
Determined
SID Geography Range 1 2 Not Yet Determined
SID Geography Spot Elevations 2 2 1 SID Geography Terrain Contour Elevations 2 2 1 SID Geography Terrain Contours 2 2 1
SID Geography Water Features 3 - Not Yet Determined
SID Holding Pattern Holding Pattern Altitude 1 1 1 SID Holding Pattern Holding Pattern Courses 2 2 1 SID Holding Pattern Holding Pattern Depiction 1 2 1 SID Holding Pattern Holding Pattern Leg Length 2 2 1 SID Holding Pattern Holding Pattern Speed 2 2 2 SID Holding Pattern Holding Pattern Time 2 2,3 2 SID Identification Airport ICAO Identifier 1 1 1 SID Identification Airport Name 1 1 1 SID Identification Changes 3 - 2 SID Identification Chart Index Number/Page Number 3 - 2
SID Identification City/Location Name 2 3 Not Yet Determined
24
Chart Type
Information Category
Information Element SAE ARP 5621
(2011)
Pepitone et al.
(2014)
Current Survey
SID Identification DP Type (e.g., Pilot Nav, Vector, Noise, Obstacle) 2 1,2,3,4 2
SID Identification Effective Date 3 - 2
SID Identification Procedure Identifier (e.g., CNOG8.VNY+A42) 2 1 1
SID Identification Procedure Name (e.g., Canoga Eight) 1 1 1 SID Identification Revision Date 3 - 2
SID Instrument Procedure Courses/Tracks Identifier (i.e., CNOG8.AVE) 1 - 1
SID Instrument Procedure Courses/Tracks Symbol (e.g., line style, etc.) 1 - 1
SID Intersection /Fixes on Procedure Identifier 1 1 1
SID Intersection /Fixes on Procedure Latitude/Longitudes 3 - 3
SID Intersection /Fixes on Procedure MRA 3 - 2
SID Intersection /Fixes on Procedure Names 2 1 1
SID Intersection /Fixes on Procedure Symbol 1 2 1
SID Minimum Area/Sector Altitudes
AMA, OROCA, or grid MORA where established 2 3 2
SID Minimum Area/Sector Altitudes Minimum Radar Altitudes and Sectors 3 - 1
SID Minimum Area/Sector Altitudes MSA Distance when other than 25nm 2 3 2
SID Minimum Area/Sector Altitudes MSA Minimum Altitudes 2 2 1
SID Minimum Area/Sector Altitudes MSA Reference Point/Center 2 2,3 Not Yet
Determined
SID Minimum Area/Sector Altitudes MSA Sector Radials 2 3 1
SID Navaid Used to Form Fixes DME Availability (Text information) 3 - 2
SID Navaid Used to Form Fixes DME Distances that form fixes 2 1,3 1
SID Navaid Used to Form Fixes Navaid Class 3 - 3
SID Navaid Used to Form Fixes Navaid Frequency/Channel 2 1 1
SID Navaid Used to Form Fixes Navaid Identifier 1 1 1
SID Navaid Used to Form Fixes Navaid Latitude/Longitude 3 - 3
SID Navaid Used to Form Fixes Navaid Morse Code 2 3 Not Yet
Determined
SID Navaid Used to Form Fixes Navaid Name 2 1 1
25
Chart Type
Information Category
Information Element SAE ARP 5621
(2011)
Pepitone et al.
(2014)
Current Survey
SID Navaid Used to Form Fixes Navaid Radials/Bearings that form fixes 2 1 1
SID Navaid Used to Form Fixes Navaid Symbol 1 1,2 1
SID Navaid Used to Form Leg of Procedure DME Availability (Text information) 3 - 2
SID Navaid Used to Form Leg of Procedure Navaid Class 3 - 3
SID Navaid Used to Form Leg of Procedure Navaid Frequency/Channel 2 1 1
SID Navaid Used to Form Leg of Procedure Navaid Identifier 1 2 1
SID Navaid Used to Form Leg of Procedure Navaid Latitude/Longitude 3 - 3
SID Navaid Used to Form Leg of Procedure Navaid Morse Code 2 3 Not Yet
Determined
SID Navaid Used to Form Leg of Procedure Navaid Name 2 1 1
SID Navaid Used to Form Leg of Procedure Navaid Symbol 1 1 1
SID Navigation FIR/UIR Boundaries 3 - 2
SID Navigation Prohibited, Restricted and Danger Airspace Graphic 1 - 1
SID Navigation Prohibited, Restricted and Danger Airspace Label 3 - 1
SID Navigation Prohibited, Restricted and Danger Airspace Narrative 3 - 2
SID Navigation Special Use Airspace - Other 2 - Not Yet Determined
SID Navigation Transition Altitude 2 - 1 SID Obstacle Obstacle Symbols and Elevation 3 - 1 SID Textual Information Climb Gradient - ATC 1 4 2
SID Textual Information Climb Gradient - Obstacle 1 4 Not Yet Determined
SID Textual Information Crossing Altitude Restrictions 1 2 1 SID Textual Information General Notes 2 4 2 SID Textual Information Noise Abatement 2 4 2 SID Textual Information Notes 2 4 2
SID Textual Information Performance limitations (e.g., bank limits) 2 4 2
SID Textual Information Procedural Data Notes 2 3 2
SID Textual Information Runway departure text 1 4 Not Yet Determined
SID Textual Information Speed restrictions 1 2,3 1 SID Textual Information Text-Only Procedures 1 3 2 SID Textual Information Transition Name 1 1 1 SID Textual Information Transition Text 3 - 2
26
Chart Type
Information Category
Information Element SAE ARP 5621
(2011)
Pepitone et al.
(2014)
Current Survey
SID Transitions Transition Course - Magnetic Values 1 2 Not Yet Determined
SID Transitions Transition Course notes (e.g., DME required) 2 2,3 2
SID Transitions Transition Courses computer codes 2 1 2 SID Transitions Transition Courses depiction 1 1 1
SID Transitions Transition Courses -MEAs, MOCAs 2 2,3 Not Yet Determined
SID Transitions Transition Courses -segment mileages 2 1 Not Yet Determined
SID Transitions Transition Text 1 2,3 2
Table 7 Survey Results for Standard Terminal Arrival Route (STAR) Charts
Chart Type
Information Category
Information Element SAE ARP 5621
(2011)
Pepitone et al.
(2014)
Current Survey
STAR Airport Information Distances from last STAR fix to airport 3 - Not Yet Determined
STAR Airport Information Other Airport Elevations 3 - 3 STAR Airport Information Other Airport Names 2 3 2 STAR Airport Information Other Airport Symbols 2 3 2 STAR Airport Information Primary Airport elevation 1 1 1 STAR Airport Information Primary Airport Runway Layout 1 1,3 1 STAR Airport Information Primary Airport Shaded Area 2 2,3 1 STAR Communications ACARS - D - ATIS, TWIP 3 - 2
STAR Communications Approach Control (Arrival) 2 2 Not Yet Determined
STAR Communications ATIS Arrival Frequency 2 1 2
STAR Communications Communications Boundaries 2 3 Not Yet Determined
STAR Communications Lost Comm Procedure 2 2,3 3 STAR Communications Lost Comm Procedure Outline Lines 2 3 2 STAR Communications Transponder Setting where appropriate 2 2 2 STAR Course Definition Heading 1 1 1 STAR Course Definition MEA/MOCA 2 3 1 STAR Course Definition Radial 1 1 1 STAR Course Definition Segment Mileages 1 1,2,3 1 STAR Course Definition Track 1 1 1
STAR Course Definition VOR Change Over Points 2 - Not Yet Determined
STAR Geography Contour Interval Legend 2 2,4 3
27
Chart Type
Information Category
Information Element SAE ARP 5621
(2011)
Pepitone et al.
(2014)
Current Survey
STAR Geography Cultural Features 3 - Not Yet Determined
STAR Geography Highest Reference Point (within neat lines) 2 - 1
STAR Geography International Boundaries (higher criticality where appropriate) 2 - Not Yet
Determined
STAR Geography Neat Lines (i.e., the lines which separate the chart from the margins) 3 - Not Yet
Determined STAR Geography Parallels and Meridians 3 - 3
STAR Geography Parallels and Meridians with AMAs, OROCAs, MORAs 2 - 3
STAR Geography Range - 3 1 STAR Geography Spot Elevations 2 - 1
STAR Geography Terrain Contour Elevations 2 2 Not Yet Determined
STAR Geography Terrain Contours 2 2 1
STAR Geography Water Features 3 - Not Yet Determined
STAR Holding Pattern Holding Pattern Altitude 1 3 1 STAR Holding Pattern Holding Pattern Courses 2 1 1 STAR Holding Pattern Holding Pattern Depiction 1 1 1 STAR Holding Pattern Holding Pattern Leg Length 2 3 1 STAR Holding Pattern Holding Pattern Speed 2 2 2 STAR Holding Pattern Holding Pattern Time 2 2,3 2 STAR Identification Airport ICAO Identifier 1 1 1
STAR Identification Airport Name 1 1 Not Yet Determined
STAR Identification Changes 3 - 2 STAR Identification Chart Index Number/Page Number 3 - 4 STAR Identification City/Location Name 2 3 2 STAR Identification Effective Date 3 - 2
STAR Identification Procedure Identifier (e.g., CNOG8.VNY) 2 1 1
STAR Identification Procedure Name (e.g., Canoga Eight) 1 1 1 STAR Identification Revision Date 3 - 2
STAR Instrument Procedure Courses/Tracks Identifier (i.e., CNOG8.AVE) 1 1 1
STAR Instrument Procedure Courses/Tracks Symbol (e.g., line style, etc.) 1 1 1
STAR Intersection /Fixes on Procedure Identifier 1 1 1
STAR Intersection /Fixes on Procedure Latitude/Longitudes 3 - 3
STAR Intersection /Fixes on Procedure MRA 3 - Not Yet
Determined
28
Chart Type
Information Category
Information Element SAE ARP 5621
(2011)
Pepitone et al.
(2014)
Current Survey
STAR Intersection /Fixes on Procedure Names 2 1 1
STAR Intersection /Fixes on Procedure Symbol 1 2 1
STAR Minimum Area/Sector Altitudes
AMA, OROCA, or grid MORA where established 2 3 Not Yet
Determined
STAR Minimum Area/Sector Altitudes Minimum Radar Altitudes and Sectors 3 - Not Yet
Determined
STAR Minimum Area/Sector Altitudes MSA Distance when other than 25nm 2 2 Not Yet
Determined
STAR Minimum Area/Sector Altitudes MSA Minimum Altitudes 2 - 1
STAR Minimum Area/Sector Altitudes MSA Reference Point/Center 2 2 Not Yet
Determined
STAR Minimum Area/Sector Altitudes MSA Sector Radials 2 - Not Yet
Determined
STAR Navaid Used to Form Fixes DME Availability (Text information) 3 - 2
STAR Navaid Used to Form Fixes DME Distances that form fixes 2 1 1
STAR Navaid Used to Form Fixes Navaid Class 3 - 3
STAR Navaid Used to Form Fixes Navaid Frequency/Channel 2 1,2 1
STAR Navaid Used to Form Fixes Navaid Identifier 1 2 1
STAR Navaid Used to Form Fixes Navaid Latitude/Longitude 3 - 3
STAR Navaid Used to Form Fixes Navaid Morse Code 2 3 Not Yet
Determined
STAR Navaid Used to Form Fixes Navaid Name 2 1 1
STAR Navaid Used to Form Fixes Navaid Radials/Bearings that form fixes 2 3 1
STAR Navaid Used to Form Fixes Navaid Symbol 1 1,2 1
STAR Navaid Used to Form Leg of Procedure DME Availability (Text information) 3 - 2
STAR Navaid Used to Form Leg of Procedure Navaid Class 3 - 3
STAR Navaid Used to Form Leg of Procedure Navaid Frequency/Channel 2 1 1
STAR Navaid Used to Form Leg of Procedure Navaid Identifier 1 2 1
STAR Navaid Used to Form Leg of Procedure Navaid Latitude/Longitude 3 - 3
STAR Navaid Used to Form Leg of Procedure Navaid Morse Code 2 3 2
STAR Navaid Used to Form Leg of Procedure Navaid Name 2 2 1
29
Chart Type
Information Category
Information Element SAE ARP 5621
(2011)
Pepitone et al.
(2014)
Current Survey
STAR Navaid Used to Form Leg of Procedure Navaid Symbol 1 2 1
STAR Navigation FIR/UIR Boundaries 3 - Not Yet Determined
STAR Navigation Prohibited, Restricted and Danger Airspace Graphic 1 3 1
STAR Navigation Prohibited, Restricted and Danger Airspace Label 3 - Not Yet
Determined
STAR Navigation Prohibited, Restricted and Danger Airspace Narrative 3 - 2
STAR Navigation Special Use Airspace - Other 2 2 2 STAR Navigation Transition Level 2 2 2 STAR Obstacle Obstacle Symbols and Elevation 3 - 1 STAR Textual Information Crossing Altitude Restrictions 1 1 1 STAR Textual Information General Notes 2 4 2 STAR Textual Information Noise Abatement 2 3 2 STAR Textual Information Notes 2 4 2
STAR Textual Information Performance limitations (e.g., bank limits) 2 3 2
STAR Textual Information Procedural Data Notes 2 3,4 2 STAR Textual Information Runway arrival text 1 2 2 STAR Textual Information Speed restrictions 1 1,2 1 STAR Textual Information Text-Only Procedures 1 4 2 STAR Textual Information Transition Text 3 - 2
STAR Transitions Transition Course - Magnetic Values 1 1 Not Yet Determined
STAR Transitions Transition Course notes (e.g., DME required) 2 3 2
STAR Transitions Transition Courses - MEAs, MOCAs 2 3 Not Yet Determined
STAR Transitions Transition Courses - segment mileages 2 1 Not Yet Determined
STAR Transitions Transition Courses computer codes 2 3 2 STAR Transitions Transition Courses Depiction 1 1 1 STAR Transitions Transition Name 1 1 1 STAR Transitions Transition Text 1 3,4 2
Discussion
The purpose of this study was to further examine the criticality ratings provided in SAE
ARP 5621 (SAE International, 2011) to try to identify minimum information requirements for
electronic data-driven charts. This study focused on four different chart types and included pilots
30
from four different types of operations. We made several attempts to classify the information
elements identified as “not yet determined.” In reviewing the chi-square analyses, we noticed
that there were differences in the pilot populations classifying the information element – for
example, an information element that was identified as level 1 (displayed at all times) for air
transport and military pilots may have been identified as level 2 (displayed initially; can be
toggled off/on) by general aviation and commuter pilots. We did not pursue these individual
differences, however, because we believed that the design of aeronautical charts needed to be
achieved in a pilot-agnostic fashion. That is, we should not be defining one minimum set of
information elements for air transport operations and another set for general aviation operations,
as the same pilot could fly both types of operations and the lack of consistency in the same
aeronautical charting application could induce error.
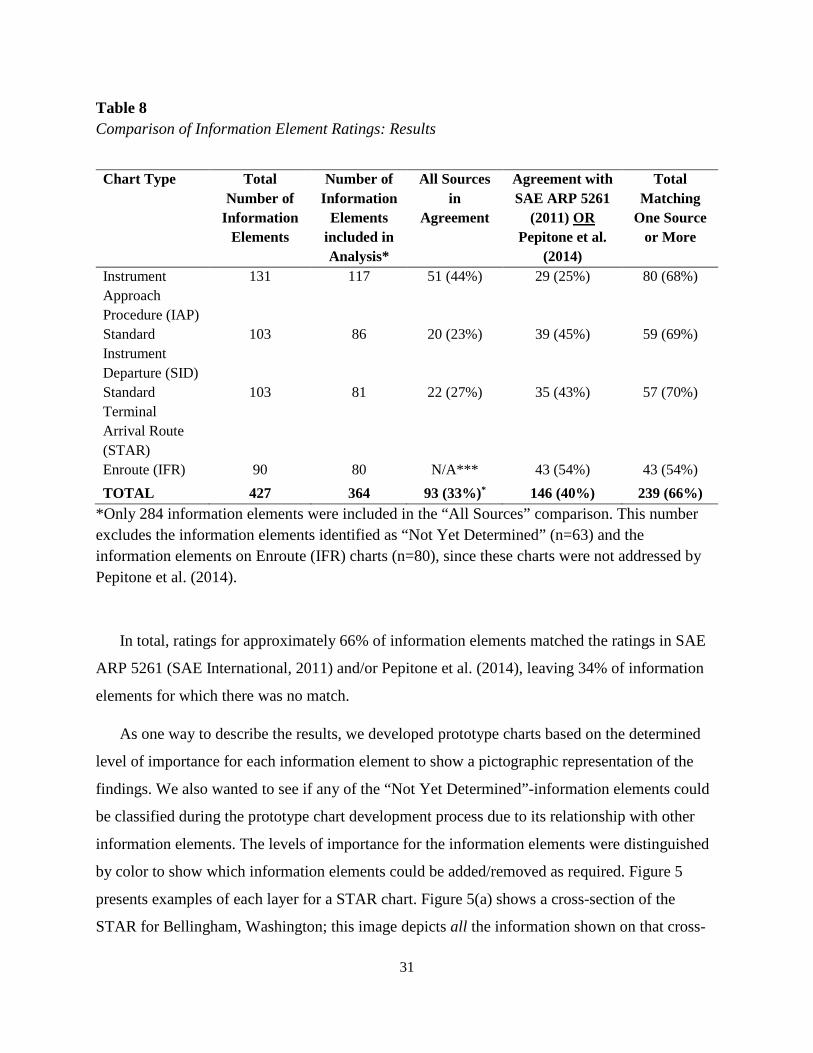
We compared the results of our survey to those ratings in SAE ARP 5621 (SAE
International, 2011) and in Pepitone et al. (2014). We conducted two comparisons. The first
examined the number of information elements with the same rating across all three sources – our
survey, SAE ARP 5621, and Pepitone et al. Because Pepitone et al. did not address IFR/Enroute
charts in their study, we did not make this comparison for that chart type. In examining the
ratings across all the aeronautical chart types addressed in our study, the ratings matched across
all three sources for 33% of the information elements. A breakdown by chart type is shown in
Table 8. The second column of Table 8 shows the number of information elements included in
the comparisons for each aeronautical chart type, and the third column shows the number of
information elements matching across all three sources. We excluded all 63 information
elements identified as “Not Yet Determined” from this comparison, because we could not
classify those information elements.
The second comparison examined the agreement between our ratings and either SAE ARP
5261 (SAE International, 2011) or Pepitone et al. (2014). A comparison of the ratings across all
aeronautical chart types identified that 40% of the information element ratings matched one of
the two sources (see the fourth column of Table 8).
31
Table 8 Comparison of Information Element Ratings: Results Chart Type Total
Number of Information
Elements
Number of Information
Elements included in Analysis*
All Sources in
Agreement
Agreement with SAE ARP 5261
(2011) OR Pepitone et al.
(2014)
Total Matching
One Source or More
Instrument Approach Procedure (IAP)
131 117 51 (44%) 29 (25%) 80 (68%)
Standard Instrument Departure (SID)
103 86 20 (23%) 39 (45%) 59 (69%)
Standard Terminal Arrival Route (STAR)
103 81 22 (27%) 35 (43%) 57 (70%)
Enroute (IFR) 90 80 N/A*** 43 (54%) 43 (54%) TOTAL 427 364 93 (33%)* 146 (40%) 239 (66%)
*Only 284 information elements were included in the “All Sources” comparison. This number excludes the information elements identified as “Not Yet Determined” (n=63) and the information elements on Enroute (IFR) charts (n=80), since these charts were not addressed by Pepitone et al. (2014).
In total, ratings for approximately 66% of information elements matched the ratings in SAE
ARP 5261 (SAE International, 2011) and/or Pepitone et al. (2014), leaving 34% of information
elements for which there was no match.
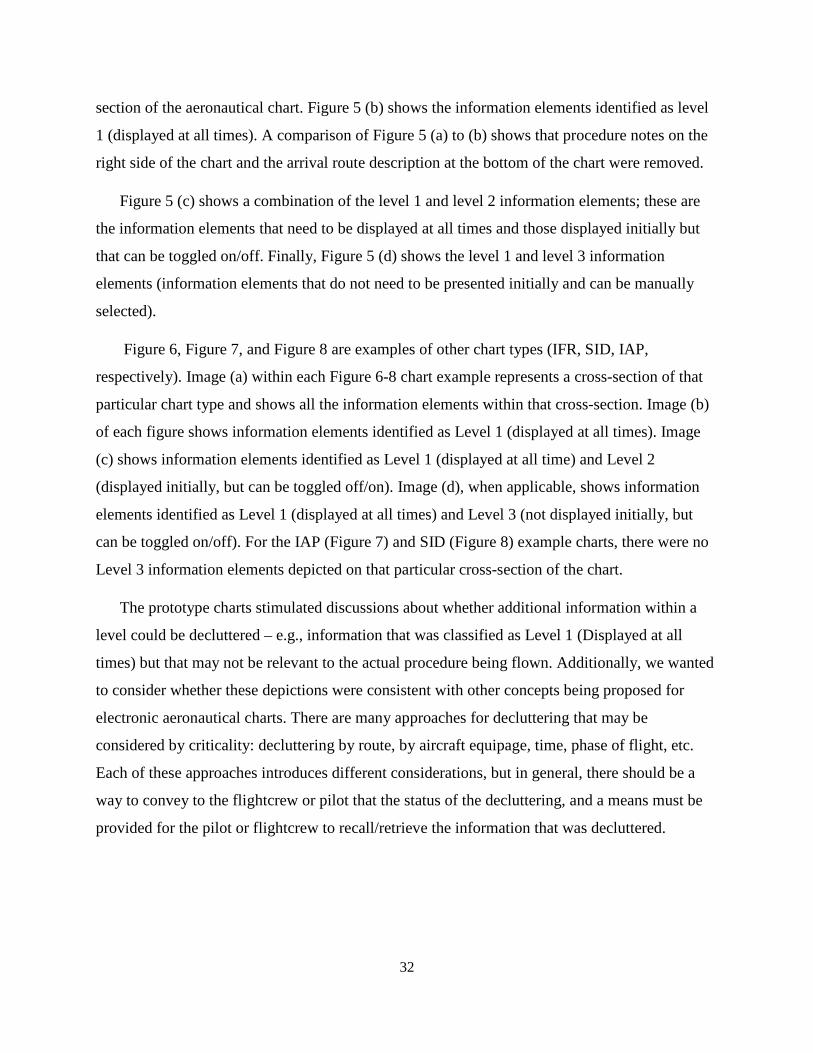
As one way to describe the results, we developed prototype charts based on the determined
level of importance for each information element to show a pictographic representation of the
findings. We also wanted to see if any of the “Not Yet Determined”-information elements could
be classified during the prototype chart development process due to its relationship with other
information elements. The levels of importance for the information elements were distinguished
by color to show which information elements could be added/removed as required. Figure 5
presents examples of each layer for a STAR chart. Figure 5(a) shows a cross-section of the
STAR for Bellingham, Washington; this image depicts all the information shown on that cross-
32
section of the aeronautical chart. Figure 5 (b) shows the information elements identified as level
1 (displayed at all times). A comparison of Figure 5 (a) to (b) shows that procedure notes on the
right side of the chart and the arrival route description at the bottom of the chart were removed.
Figure 5 (c) shows a combination of the level 1 and level 2 information elements; these are
the information elements that need to be displayed at all times and those displayed initially but
that can be toggled on/off. Finally, Figure 5 (d) shows the level 1 and level 3 information
elements (information elements that do not need to be presented initially and can be manually
selected).
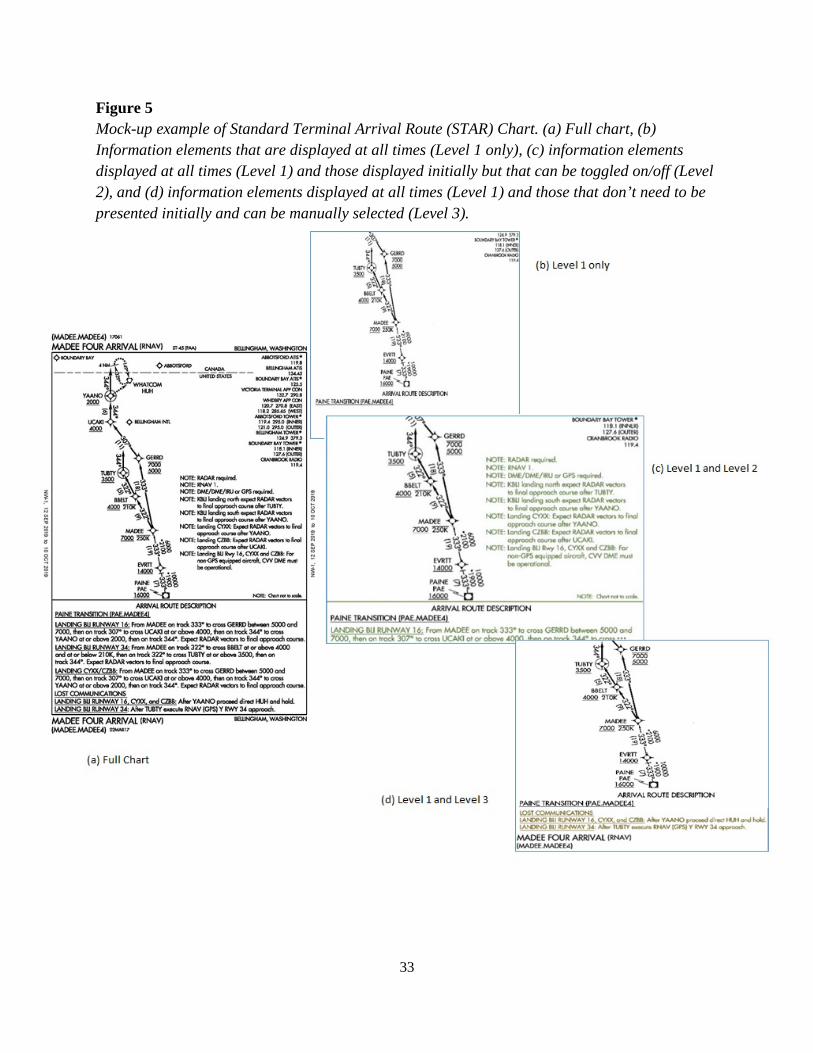
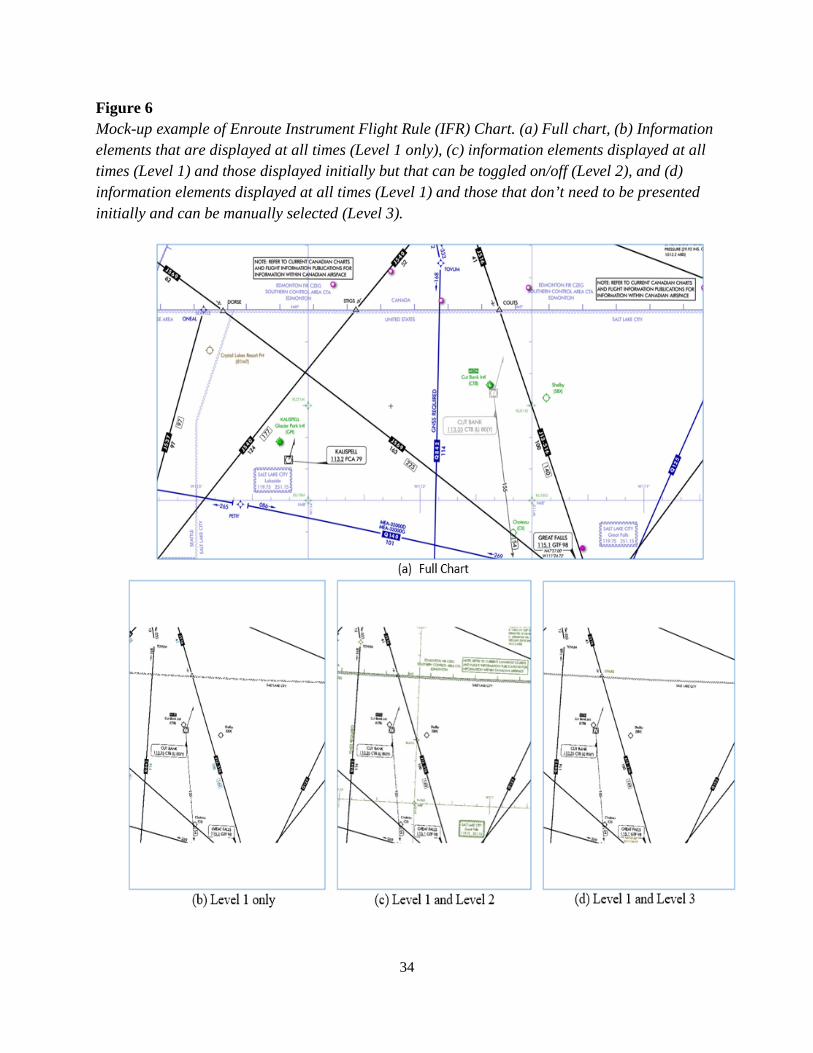
Figure 6, Figure 7, and Figure 8 are examples of other chart types (IFR, SID, IAP,
respectively). Image (a) within each Figure 6-8 chart example represents a cross-section of that
particular chart type and shows all the information elements within that cross-section. Image (b)
of each figure shows information elements identified as Level 1 (displayed at all times). Image
(c) shows information elements identified as Level 1 (displayed at all time) and Level 2
(displayed initially, but can be toggled off/on). Image (d), when applicable, shows information
elements identified as Level 1 (displayed at all times) and Level 3 (not displayed initially, but
can be toggled on/off). For the IAP (Figure 7) and SID (Figure 8) example charts, there were no
Level 3 information elements depicted on that particular cross-section of the chart.
The prototype charts stimulated discussions about whether additional information within a
level could be decluttered – e.g., information that was classified as Level 1 (Displayed at all
times) but that may not be relevant to the actual procedure being flown. Additionally, we wanted
to consider whether these depictions were consistent with other concepts being proposed for
electronic aeronautical charts. There are many approaches for decluttering that may be
considered by criticality: decluttering by route, by aircraft equipage, time, phase of flight, etc.
Each of these approaches introduces different considerations, but in general, there should be a
way to convey to the flightcrew or pilot that the status of the decluttering, and a means must be
provided for the pilot or flightcrew to recall/retrieve the information that was decluttered.
33
Figure 5 Mock-up example of Standard Terminal Arrival Route (STAR) Chart. (a) Full chart, (b) Information elements that are displayed at all times (Level 1 only), (c) information elements displayed at all times (Level 1) and those displayed initially but that can be toggled on/off (Level 2), and (d) information elements displayed at all times (Level 1) and those that don’t need to be presented initially and can be manually selected (Level 3).
34
Figure 6 Mock-up example of Enroute Instrument Flight Rule (IFR) Chart. (a) Full chart, (b) Information elements that are displayed at all times (Level 1 only), (c) information elements displayed at all times (Level 1) and those displayed initially but that can be toggled on/off (Level 2), and (d) information elements displayed at all times (Level 1) and those that don’t need to be presented initially and can be manually selected (Level 3).
35
Figure 7
Mock-up example of Standard Instrument Departure (SID) Chart. (a) Full chart, (b) Information
elements that are displayed at all times (Level 1 only), and (c) information elements displayed at
all times (Level 1) and those displayed initially but that can be toggled on/off (Level 2). There
were no Level 3 information elements displayed on this specific procedure.
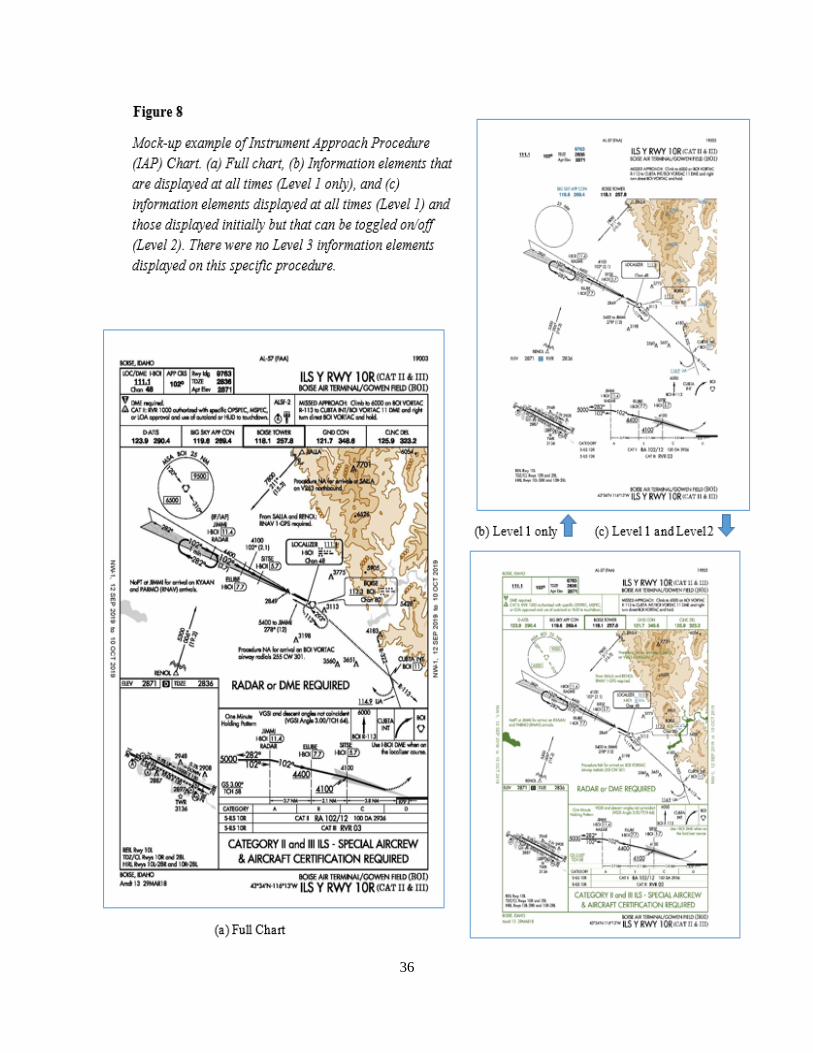
36
37
Conclusions
The purpose of this study was to identify a set of minimum information elements for user-
configurable electronic aeronautical charts. The results are only a first step in identifying critical
information elements for configurable electronic charts. The methodology for this study used a
survey framework, but additional research is needed to validate the survey findings due to the
following limitations. First, the results only reflect pilot opinions; we have not had pilots “fly”
with the prototype charts yet. Second, there was no common definition for each information
element across end users, and the sample charts we provided did not contain all the information
elements. Third, the criticality of an information element may vary depending on the
manufacturer’s intended function. This research focused on scenarios in which pilots brief with a
fixed chart and fly with a reconfigurable electronic chart, but they always have access to the
fixed chart. As flight deck systems become more integrated, it is conceivable that the charting
application may be combined with a moving map-type avionics system as a replacement for the
aeronautical chart. Such a configuration would require a re-evaluation of the criticality of
information elements as well as other human factors considerations.

38
Acknowledgments
The research was conducted under the Flight Deck Program Directive/Level of Effort
Agreement between the FAA NextGen Human Factors Division (ANG-C1) and the Aerospace
Human Factors Research Division (AAM-500) of the FAA Civil Aerospace Medical Institute.
The authors would like to thank our program manager, Katrina Avers. We would also like to
thank Dan Jack, Shijing Liu, Inchul Choi, and Suzanne Thomas of Cherokee Nation Businesses;
and Danielle Hiltunen of the US DOT Volpe Center for their contributions. Finally, we would
like to thank all the pilots who participated.
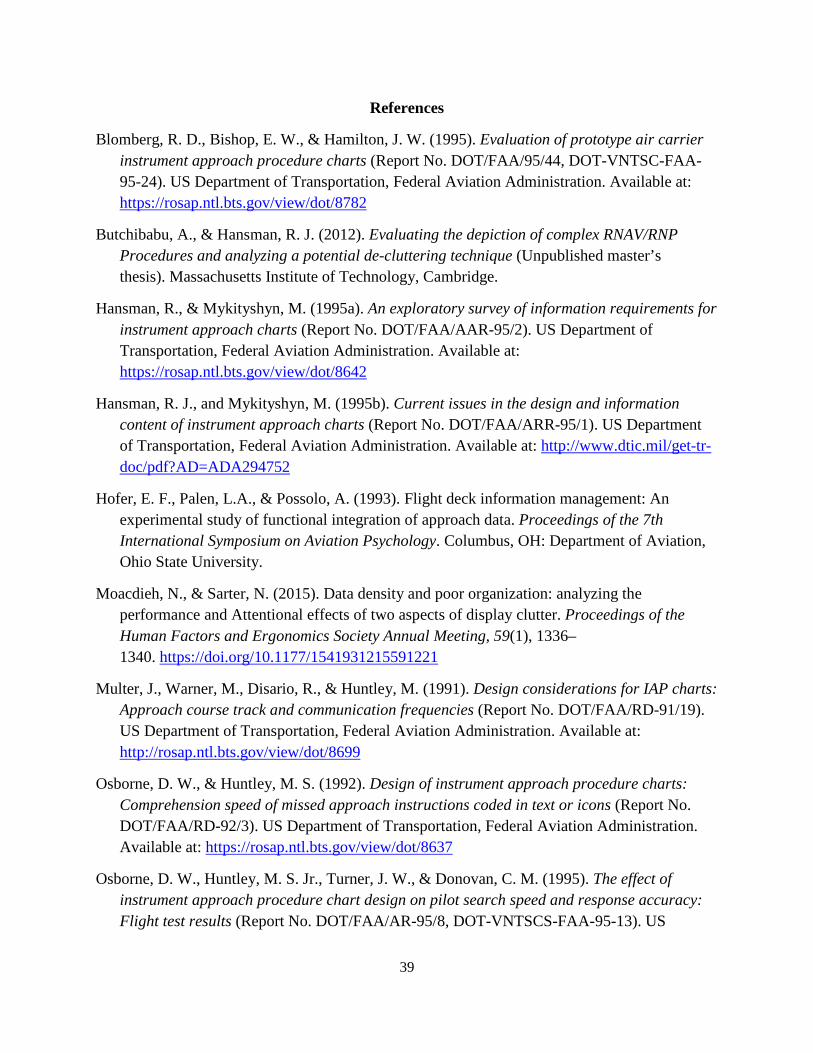
39
References
Blomberg, R. D., Bishop, E. W., & Hamilton, J. W. (1995). Evaluation of prototype air carrier instrument approach procedure charts (Report No. DOT/FAA/95/44, DOT-VNTSC-FAA-95-24). US Department of Transportation, Federal Aviation Administration. Available at: https://rosap.ntl.bts.gov/view/dot/8782
Butchibabu, A., & Hansman, R. J. (2012). Evaluating the depiction of complex RNAV/RNP Procedures and analyzing a potential de-cluttering technique (Unpublished master’s thesis). Massachusetts Institute of Technology, Cambridge.
Hansman, R., & Mykityshyn, M. (1995a). An exploratory survey of information requirements for instrument approach charts (Report No. DOT/FAA/AAR-95/2). US Department of Transportation, Federal Aviation Administration. Available at: https://rosap.ntl.bts.gov/view/dot/8642
Hansman, R. J., and Mykityshyn, M. (1995b). Current issues in the design and information content of instrument approach charts (Report No. DOT/FAA/ARR-95/1). US Department of Transportation, Federal Aviation Administration. Available at: http://www.dtic.mil/get-tr-doc/pdf?AD=ADA294752
Hofer, E. F., Palen, L.A., & Possolo, A. (1993). Flight deck information management: An experimental study of functional integration of approach data. Proceedings of the 7th International Symposium on Aviation Psychology. Columbus, OH: Department of Aviation, Ohio State University.
Moacdieh, N., & Sarter, N. (2015). Data density and poor organization: analyzing the performance and Attentional effects of two aspects of display clutter. Proceedings of the Human Factors and Ergonomics Society Annual Meeting, 59(1), 1336–1340. https://doi.org/10.1177/1541931215591221
Multer, J., Warner, M., Disario, R., & Huntley, M. (1991). Design considerations for IAP charts: Approach course track and communication frequencies (Report No. DOT/FAA/RD-91/19). US Department of Transportation, Federal Aviation Administration. Available at: http://rosap.ntl.bts.gov/view/dot/8699
Osborne, D. W., & Huntley, M. S. (1992). Design of instrument approach procedure charts: Comprehension speed of missed approach instructions coded in text or icons (Report No. DOT/FAA/RD-92/3). US Department of Transportation, Federal Aviation Administration. Available at: https://rosap.ntl.bts.gov/view/dot/8637
Osborne, D. W., Huntley, M. S. Jr., Turner, J. W., & Donovan, C. M. (1995). The effect of instrument approach procedure chart design on pilot search speed and response accuracy: Flight test results (Report No. DOT/FAA/AR-95/8, DOT-VNTSCS-FAA-95-13). US

40
Department of Transportation, Federal Aviation Administration. Available at: https://rosap.ntl.bts.gov/view/dot/8650
Pepitone, D., Ball, J., & Letsu-Dake, E. (2014). NextGen Flight Deck information displays: Recommendations for managing display complexity with electronic chart information (Version 2). Deer Valley, AZ: Honeywell. Available at: http://www.hf.faa.gov/FAAAJP61/Honeywell%20Report%20on%20Electronic%20Charts%20Feb%202014%20Rev%202.0.pdf
SAE International. (2011). Electronic Display of Aeronautical Information (Aerospace Recommended Practice No. 5621). https://www.sae.org/standards/content/arp5621/
Schvaneveldt, R. W., Beringer, D. B., & Lamonica, J. A. (2001). Priority and organization of information accessed by pilots in various phases of flight. The International Journal of Aviation Psychology, 11(3), 253-280. https://doi.org/10.1207/S15327108IJAP1103_02
Stewart, M., Laraway, S., Jordan, K., & Feary, M. S. (2016). Simplified approach charts improve data retrieval performance. Journal of Cognitive Engineering and Decision Making, 11(2), 166-183. https://doi.org/10.1177%2F1555343416675556
Teichner, W. H., & Mocharnuk, J. B. (1979). Visual search for complex targets. Human Factors, 21(3), 259-275. https://doi.org/10.1177/001872087902100302
Treisman, A. (1988). Features and Objects: The Fourteenth Bartlett Memorial Lecture. The Quarterly Journal of Experimental Psychology. 40A(2), 201-237. https://doi.org/10.1080/02724988843000104
Treisman, A. M., & Gelade, G. (1980). A feature-integration theory of attention. Cognitive Psychology, 12(1), 97-136. https://doi.org/10.1016/0010-0285(80)90005-5
Yantis, S. (1993). Stimulus-driven attentional capture. Current Directions in Psychological Science, 2(5), 156-161. https://doi.org/10.1111/1467-8721.ep10768973
Yeh, M., & Chandra, D. C. (2003). Air transport pilots' information priorities for surface moving map displays. Proceedings of the Human Factors and Ergonomics Society 47th Annual Meeting. Santa Monica, CA: Human Factors and Ergonomics Society.
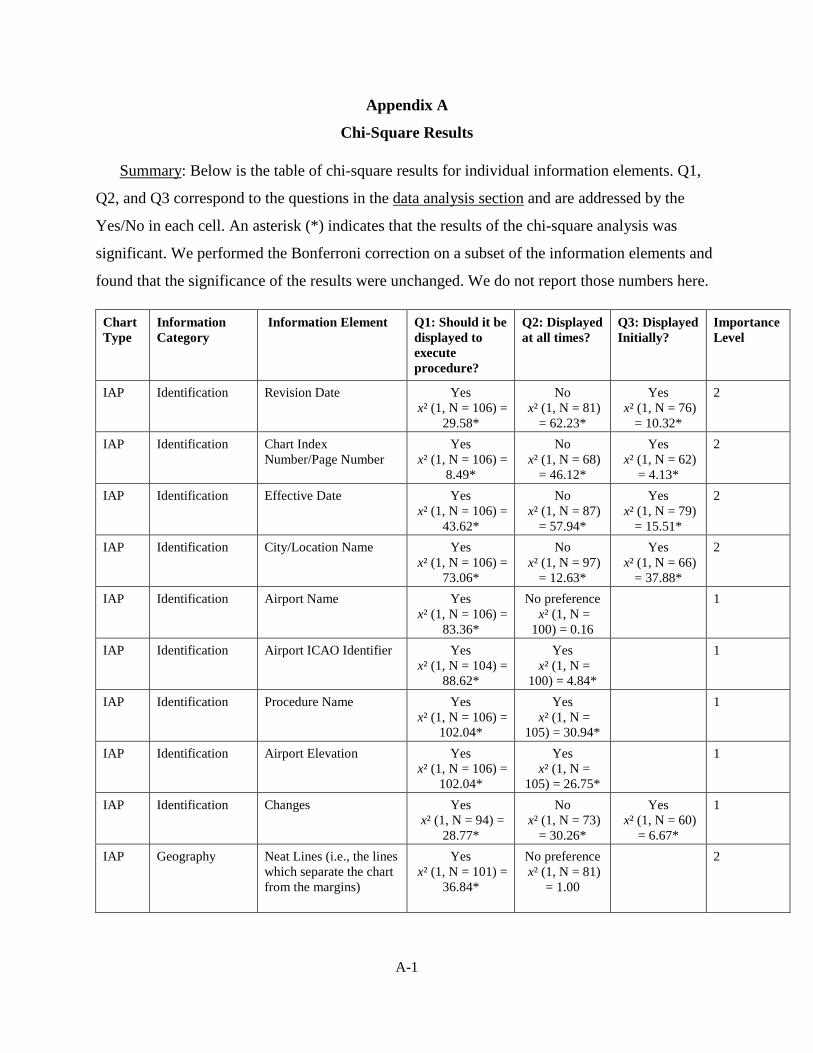
A-1
Appendix A
Chi-Square Results
Summary: Below is the table of chi-square results for individual information elements. Q1,
Q2, and Q3 correspond to the questions in the data analysis section and are addressed by the
Yes/No in each cell. An asterisk (*) indicates that the results of the chi-square analysis was
significant. We performed the Bonferroni correction on a subset of the information elements and
found that the significance of the results were unchanged. We do not report those numbers here.
Chart Type
Information Category
Information Element Q1: Should it be displayed to execute procedure?
Q2: Displayed at all times?
Q3: Displayed Initially?
Importance Level
IAP Identification Revision Date Yes x² (1, N = 106) =
29.58*
No x² (1, N = 81)
= 62.23*
Yes x² (1, N = 76)
= 10.32*
2
IAP Identification Chart Index Number/Page Number
Yes x² (1, N = 106) =
8.49*
No x² (1, N = 68)
= 46.12*
Yes x² (1, N = 62)
= 4.13*
2
IAP Identification Effective Date Yes x² (1, N = 106) =
43.62*
No x² (1, N = 87)
= 57.94*
Yes x² (1, N = 79)
= 15.51*
2
IAP Identification City/Location Name Yes x² (1, N = 106) =
73.06*
No x² (1, N = 97)
= 12.63*
Yes x² (1, N = 66)
= 37.88*
2
IAP Identification Airport Name Yes x² (1, N = 106) =
83.36*
No preference x² (1, N =
100) = 0.16
1
IAP Identification Airport ICAO Identifier Yes x² (1, N = 104) =
88.62*
Yes x² (1, N =
100) = 4.84*
1
IAP Identification Procedure Name Yes x² (1, N = 106) =
102.04*
Yes x² (1, N =
105) = 30.94*
1
IAP Identification Airport Elevation Yes x² (1, N = 106) =
102.04*
Yes x² (1, N =
105) = 26.75*
1
IAP Identification Changes Yes x² (1, N = 94) =
28.77*
No x² (1, N = 73)
= 30.26*
Yes x² (1, N = 60)
= 6.67*
1
IAP Geography Neat Lines (i.e., the lines which separate the chart from the margins)
Yes x² (1, N = 101) =
36.84*
No preference x² (1, N = 81)
= 1.00
2
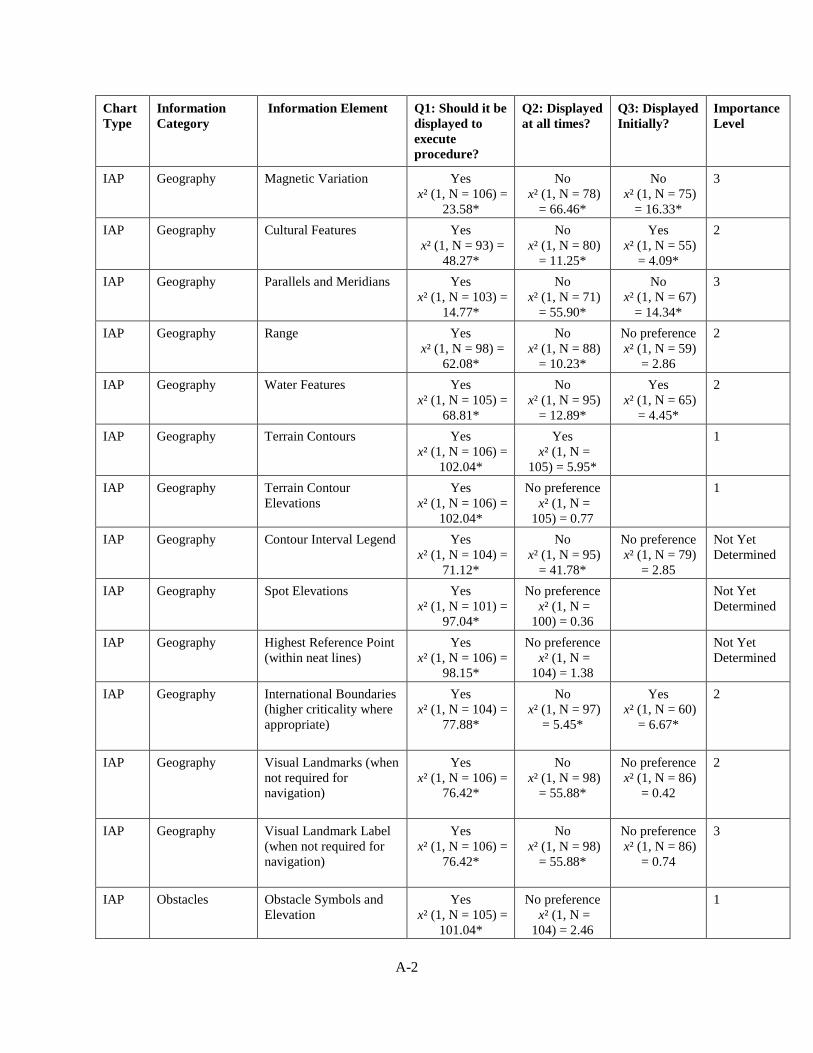
A-2
Chart Type
Information Category
Information Element Q1: Should it be displayed to execute procedure?
Q2: Displayed at all times?
Q3: Displayed Initially?
Importance Level
IAP Geography Magnetic Variation Yes x² (1, N = 106) =
23.58*
No x² (1, N = 78)
= 66.46*
No x² (1, N = 75)
= 16.33*
3
IAP Geography Cultural Features Yes x² (1, N = 93) =
48.27*
No x² (1, N = 80)
= 11.25*
Yes x² (1, N = 55)
= 4.09*
2
IAP Geography Parallels and Meridians Yes x² (1, N = 103) =
14.77*
No x² (1, N = 71)
= 55.90*
No x² (1, N = 67)
= 14.34*
3
IAP Geography Range Yes x² (1, N = 98) =
62.08*
No x² (1, N = 88)
= 10.23*
No preference x² (1, N = 59)
= 2.86
2
IAP Geography Water Features Yes x² (1, N = 105) =
68.81*
No x² (1, N = 95)
= 12.89*
Yes x² (1, N = 65)
= 4.45*
2
IAP Geography Terrain Contours Yes x² (1, N = 106) =
102.04*
Yes x² (1, N =
105) = 5.95*
1
IAP Geography Terrain Contour Elevations
Yes x² (1, N = 106) =
102.04*
No preference x² (1, N =
105) = 0.77
1
IAP Geography Contour Interval Legend Yes x² (1, N = 104) =
71.12*
No x² (1, N = 95)
= 41.78*
No preference x² (1, N = 79)
= 2.85
Not Yet Determined
IAP Geography Spot Elevations Yes x² (1, N = 101) =
97.04*
No preference x² (1, N =
100) = 0.36
Not Yet Determined
IAP Geography Highest Reference Point (within neat lines)
Yes x² (1, N = 106) =
98.15*
No preference x² (1, N =
104) = 1.38
Not Yet Determined
IAP Geography International Boundaries (higher criticality where appropriate)
Yes x² (1, N = 104) =
77.88*
No x² (1, N = 97)
= 5.45*
Yes x² (1, N = 60)
= 6.67*
2
IAP Geography Visual Landmarks (when not required for navigation)
Yes x² (1, N = 106) =
76.42*
No x² (1, N = 98)
= 55.88*
No preference x² (1, N = 86)
= 0.42
2
IAP Geography Visual Landmark Label (when not required for navigation)
Yes x² (1, N = 106) =
76.42*
No x² (1, N = 98)
= 55.88*
No preference x² (1, N = 86)
= 0.74
3
IAP Obstacles Obstacle Symbols and Elevation
Yes x² (1, N = 105) =
101.04*
No preference x² (1, N =
104) = 2.46
1
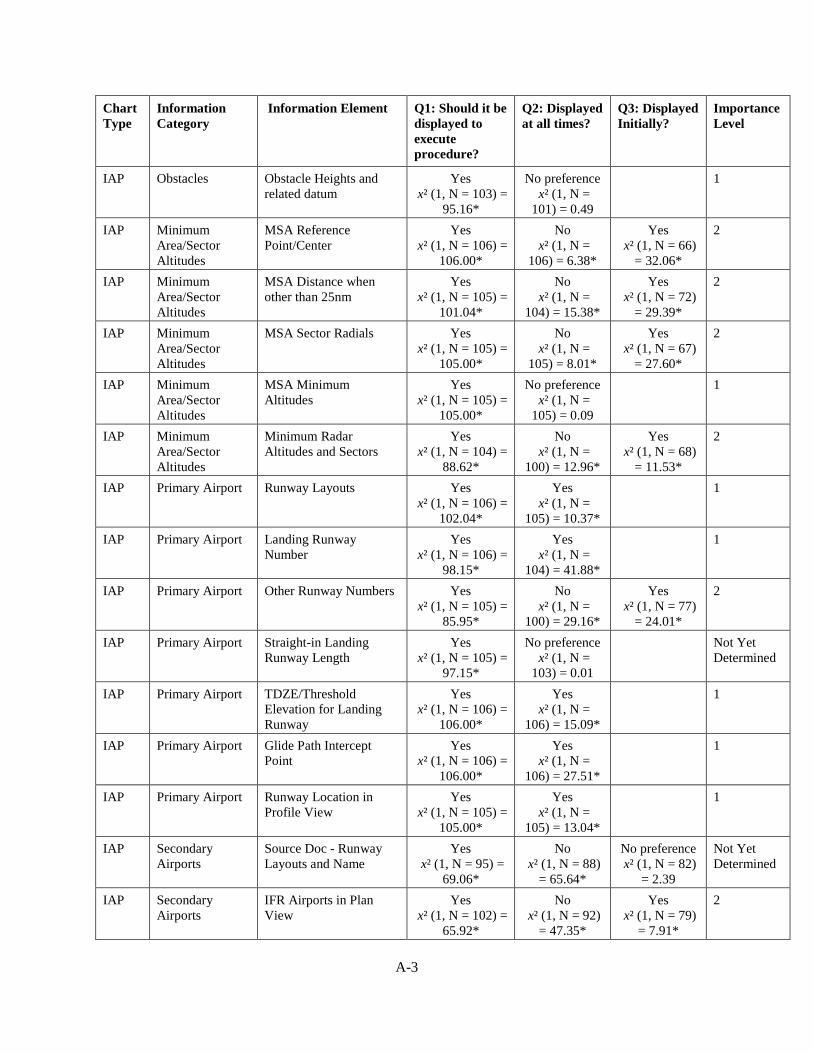
A-3
Chart Type
Information Category
Information Element Q1: Should it be displayed to execute procedure?
Q2: Displayed at all times?
Q3: Displayed Initially?
Importance Level
IAP Obstacles Obstacle Heights and related datum
Yes x² (1, N = 103) =
95.16*
No preference x² (1, N =
101) = 0.49
1
IAP Minimum Area/Sector Altitudes
MSA Reference Point/Center
Yes x² (1, N = 106) =
106.00*
No x² (1, N =
106) = 6.38*
Yes x² (1, N = 66)
= 32.06*
2
IAP Minimum Area/Sector Altitudes
MSA Distance when other than 25nm
Yes x² (1, N = 105) =
101.04*
No x² (1, N =
104) = 15.38*
Yes x² (1, N = 72)
= 29.39*
2
IAP Minimum Area/Sector Altitudes
MSA Sector Radials Yes x² (1, N = 105) =
105.00*
No x² (1, N =
105) = 8.01*
Yes x² (1, N = 67)
= 27.60*
2
IAP Minimum Area/Sector Altitudes
MSA Minimum Altitudes
Yes x² (1, N = 105) =
105.00*
No preference x² (1, N =
105) = 0.09
1
IAP Minimum Area/Sector Altitudes
Minimum Radar Altitudes and Sectors
Yes x² (1, N = 104) =
88.62*
No x² (1, N =
100) = 12.96*
Yes x² (1, N = 68)
= 11.53*
2
IAP Primary Airport Runway Layouts Yes x² (1, N = 106) =
102.04*
Yes x² (1, N =
105) = 10.37*
1
IAP Primary Airport Landing Runway Number
Yes x² (1, N = 106) =
98.15*
Yes x² (1, N =
104) = 41.88*
1
IAP Primary Airport Other Runway Numbers Yes x² (1, N = 105) =
85.95*
No x² (1, N =
100) = 29.16*
Yes x² (1, N = 77)
= 24.01*
2
IAP Primary Airport Straight-in Landing Runway Length
Yes x² (1, N = 105) =
97.15*
No preference x² (1, N =
103) = 0.01
Not Yet Determined
IAP Primary Airport TDZE/Threshold Elevation for Landing Runway
Yes x² (1, N = 106) =
106.00*
Yes x² (1, N =
106) = 15.09*
1
IAP Primary Airport Glide Path Intercept Point
Yes x² (1, N = 106) =
106.00*
Yes x² (1, N =
106) = 27.51*
1
IAP Primary Airport Runway Location in Profile View
Yes x² (1, N = 105) =
105.00*
Yes x² (1, N =
105) = 13.04*
1
IAP Secondary Airports
Source Doc - Runway Layouts and Name
Yes x² (1, N = 95) =
69.06*
No x² (1, N = 88)
= 65.64*
No preference x² (1, N = 82)
= 2.39
Not Yet Determined
IAP Secondary Airports
IFR Airports in Plan View
Yes x² (1, N = 102) =
65.92*
No x² (1, N = 92)
= 47.35*
Yes x² (1, N = 79)
= 7.91*
2
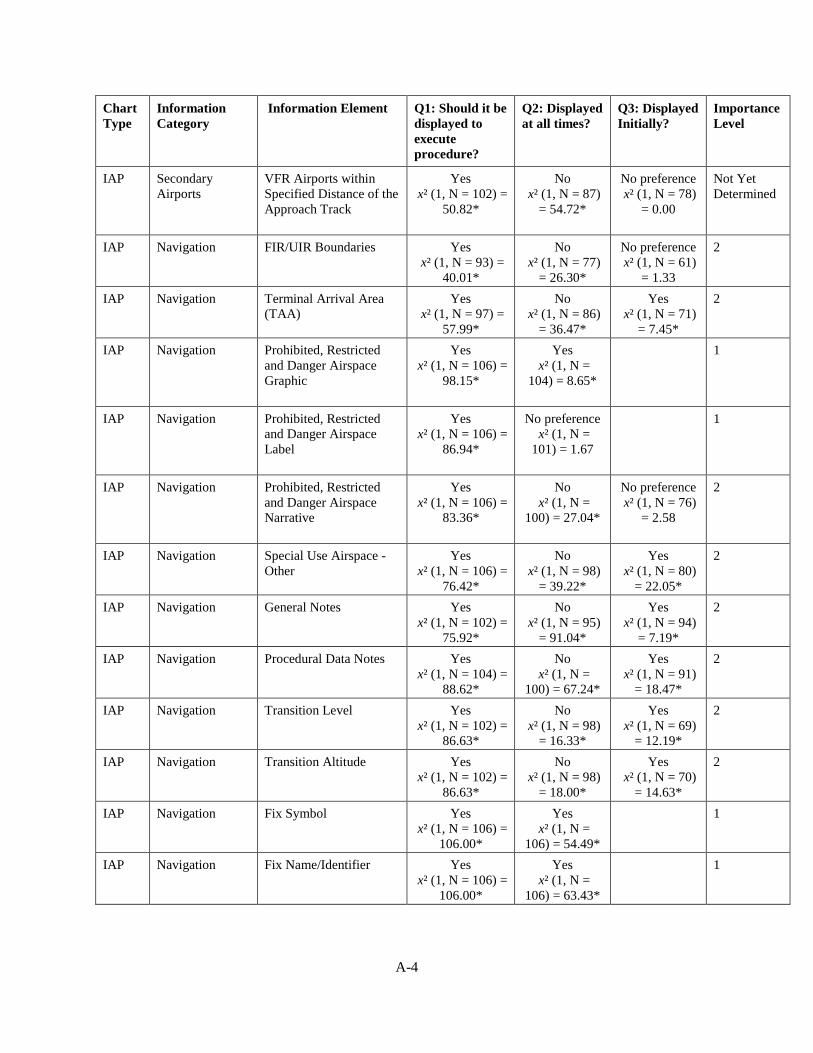
A-4
Chart Type
Information Category
Information Element Q1: Should it be displayed to execute procedure?
Q2: Displayed at all times?
Q3: Displayed Initially?
Importance Level
IAP Secondary Airports
VFR Airports within Specified Distance of the Approach Track
Yes x² (1, N = 102) =
50.82*
No x² (1, N = 87)
= 54.72*
No preference x² (1, N = 78)
= 0.00
Not Yet Determined
IAP Navigation FIR/UIR Boundaries Yes x² (1, N = 93) =
40.01*
No x² (1, N = 77)
= 26.30*
No preference x² (1, N = 61)
= 1.33
2
IAP Navigation Terminal Arrival Area (TAA)
Yes x² (1, N = 97) =
57.99*
No x² (1, N = 86)
= 36.47*
Yes x² (1, N = 71)
= 7.45*
2
IAP Navigation Prohibited, Restricted and Danger Airspace Graphic
Yes x² (1, N = 106) =
98.15*
Yes x² (1, N =
104) = 8.65*
1
IAP Navigation Prohibited, Restricted and Danger Airspace Label
Yes x² (1, N = 106) =
86.94*
No preference x² (1, N =
101) = 1.67
1
IAP Navigation Prohibited, Restricted and Danger Airspace Narrative
Yes x² (1, N = 106) =
83.36*
No x² (1, N =
100) = 27.04*
No preference x² (1, N = 76)
= 2.58
2
IAP Navigation Special Use Airspace - Other
Yes x² (1, N = 106) =
76.42*
No x² (1, N = 98)
= 39.22*
Yes x² (1, N = 80)
= 22.05*
2
IAP Navigation General Notes Yes x² (1, N = 102) =
75.92*
No x² (1, N = 95)
= 91.04*
Yes x² (1, N = 94)
= 7.19*
2
IAP Navigation Procedural Data Notes Yes x² (1, N = 104) =
88.62*
No x² (1, N =
100) = 67.24*
Yes x² (1, N = 91)
= 18.47*
2
IAP Navigation Transition Level Yes x² (1, N = 102) =
86.63*
No x² (1, N = 98)
= 16.33*
Yes x² (1, N = 69)
= 12.19*
2
IAP Navigation Transition Altitude Yes x² (1, N = 102) =
86.63*
No x² (1, N = 98)
= 18.00*
Yes x² (1, N = 70)
= 14.63*
2
IAP Navigation Fix Symbol Yes x² (1, N = 106) =
106.00*
Yes x² (1, N =
106) = 54.49*
1
IAP Navigation Fix Name/Identifier Yes x² (1, N = 106) =
106.00*
Yes x² (1, N =
106) = 63.43*
1
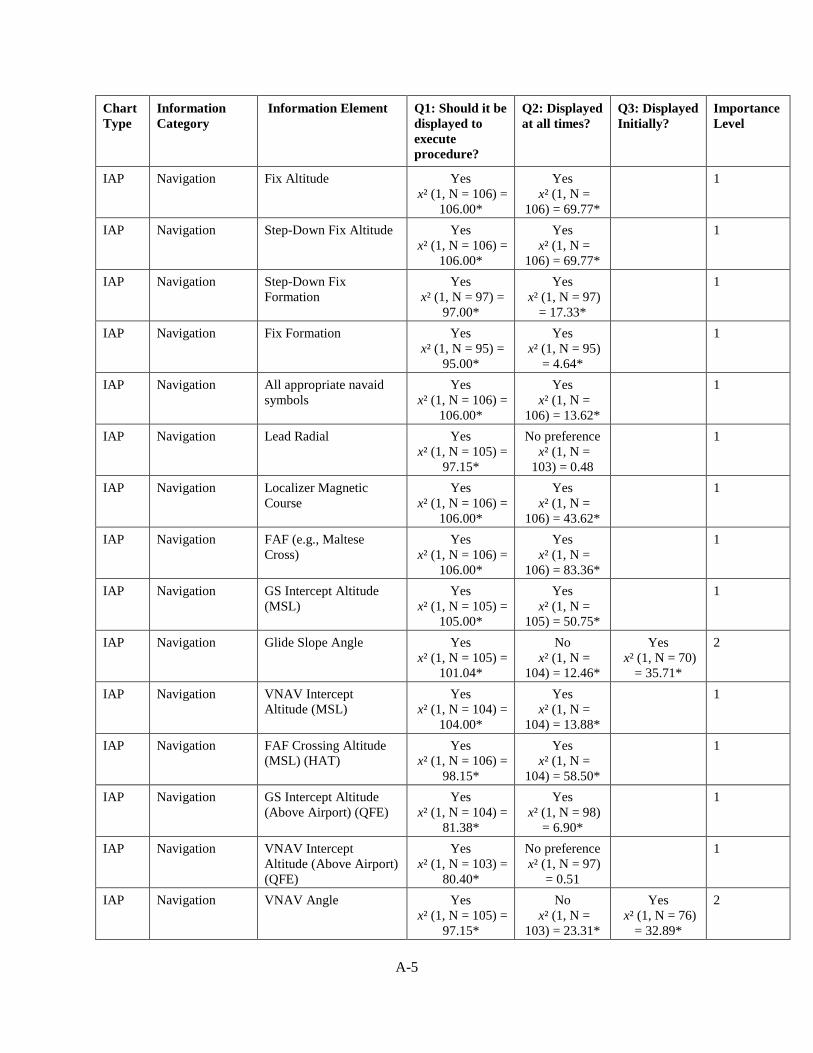
A-5
Chart Type
Information Category
Information Element Q1: Should it be displayed to execute procedure?
Q2: Displayed at all times?
Q3: Displayed Initially?
Importance Level
IAP Navigation Fix Altitude Yes x² (1, N = 106) =
106.00*
Yes x² (1, N =
106) = 69.77*
1
IAP Navigation Step-Down Fix Altitude Yes x² (1, N = 106) =
106.00*
Yes x² (1, N =
106) = 69.77*
1
IAP Navigation Step-Down Fix Formation
Yes x² (1, N = 97) =
97.00*
Yes x² (1, N = 97)
= 17.33*
1
IAP Navigation Fix Formation Yes x² (1, N = 95) =
95.00*
Yes x² (1, N = 95)
= 4.64*
1
IAP Navigation All appropriate navaid symbols
Yes x² (1, N = 106) =
106.00*
Yes x² (1, N =
106) = 13.62*
1
IAP Navigation Lead Radial Yes x² (1, N = 105) =
97.15*
No preference x² (1, N =
103) = 0.48
1
IAP Navigation Localizer Magnetic Course
Yes x² (1, N = 106) =
106.00*
Yes x² (1, N =
106) = 43.62*
1
IAP Navigation FAF (e.g., Maltese Cross)
Yes x² (1, N = 106) =
106.00*
Yes x² (1, N =
106) = 83.36*
1
IAP Navigation GS Intercept Altitude (MSL)
Yes x² (1, N = 105) =
105.00*
Yes x² (1, N =
105) = 50.75*
1
IAP Navigation Glide Slope Angle Yes x² (1, N = 105) =
101.04*
No x² (1, N =
104) = 12.46*
Yes x² (1, N = 70)
= 35.71*
2
IAP Navigation VNAV Intercept Altitude (MSL)
Yes x² (1, N = 104) =
104.00*
Yes x² (1, N =
104) = 13.88*
1
IAP Navigation FAF Crossing Altitude (MSL) (HAT)
Yes x² (1, N = 106) =
98.15*
Yes x² (1, N =
104) = 58.50*
1
IAP Navigation GS Intercept Altitude (Above Airport) (QFE)
Yes x² (1, N = 104) =
81.38*
Yes x² (1, N = 98)
= 6.90*
1
IAP Navigation VNAV Intercept Altitude (Above Airport) (QFE)
Yes x² (1, N = 103) =
80.40*
No preference x² (1, N = 97)
= 0.51
1
IAP Navigation VNAV Angle Yes x² (1, N = 105) =
97.15*
No x² (1, N =
103) = 23.31*
Yes x² (1, N = 76)
= 32.89*
2
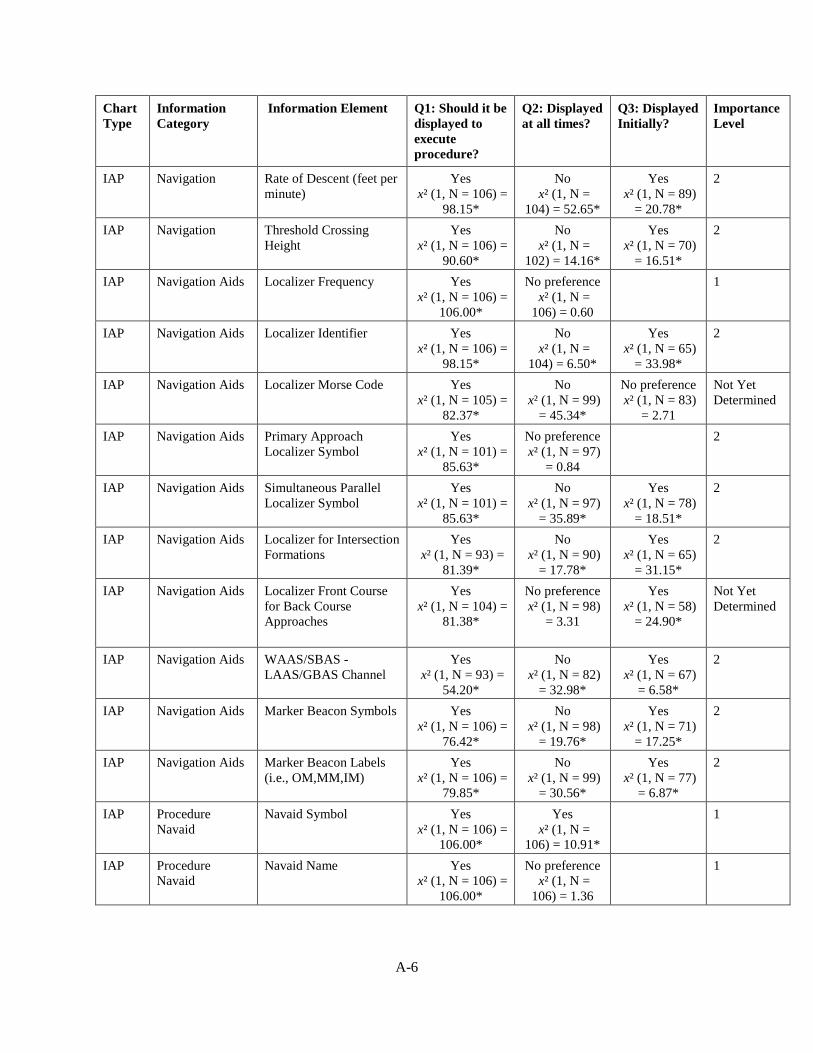
A-6
Chart Type
Information Category
Information Element Q1: Should it be displayed to execute procedure?
Q2: Displayed at all times?
Q3: Displayed Initially?
Importance Level
IAP Navigation Rate of Descent (feet per minute)
Yes x² (1, N = 106) =
98.15*
No x² (1, N =
104) = 52.65*
Yes x² (1, N = 89)
= 20.78*
2
IAP Navigation Threshold Crossing Height
Yes x² (1, N = 106) =
90.60*
No x² (1, N =
102) = 14.16*
Yes x² (1, N = 70)
= 16.51*
2
IAP Navigation Aids Localizer Frequency Yes x² (1, N = 106) =
106.00*
No preference x² (1, N =
106) = 0.60
1
IAP Navigation Aids Localizer Identifier Yes x² (1, N = 106) =
98.15*
No x² (1, N =
104) = 6.50*
Yes x² (1, N = 65)
= 33.98*
2
IAP Navigation Aids Localizer Morse Code Yes x² (1, N = 105) =
82.37*
No x² (1, N = 99)
= 45.34*
No preference x² (1, N = 83)
= 2.71
Not Yet Determined
IAP Navigation Aids Primary Approach Localizer Symbol
Yes x² (1, N = 101) =
85.63*
No preference x² (1, N = 97)
= 0.84
2
IAP Navigation Aids Simultaneous Parallel Localizer Symbol
Yes x² (1, N = 101) =
85.63*
No x² (1, N = 97)
= 35.89*
Yes x² (1, N = 78)
= 18.51*
2
IAP Navigation Aids Localizer for Intersection Formations
Yes x² (1, N = 93) =
81.39*
No x² (1, N = 90)
= 17.78*
Yes x² (1, N = 65)
= 31.15*
2
IAP Navigation Aids Localizer Front Course for Back Course Approaches
Yes x² (1, N = 104) =
81.38*
No preference x² (1, N = 98)
= 3.31
Yes x² (1, N = 58)
= 24.90*
Not Yet Determined
IAP Navigation Aids WAAS/SBAS - LAAS/GBAS Channel
Yes x² (1, N = 93) =
54.20*
No x² (1, N = 82)
= 32.98*
Yes x² (1, N = 67)
= 6.58*
2
IAP Navigation Aids Marker Beacon Symbols Yes x² (1, N = 106) =
76.42*
No x² (1, N = 98)
= 19.76*
Yes x² (1, N = 71)
= 17.25*
2
IAP Navigation Aids Marker Beacon Labels (i.e., OM,MM,IM)
Yes x² (1, N = 106) =
79.85*
No x² (1, N = 99)
= 30.56*
Yes x² (1, N = 77)
= 6.87*
2
IAP Procedure Navaid
Navaid Symbol Yes x² (1, N = 106) =
106.00*
Yes x² (1, N =
106) = 10.91*
1
IAP Procedure Navaid
Navaid Name Yes x² (1, N = 106) =
106.00*
No preference x² (1, N =
106) = 1.36
1
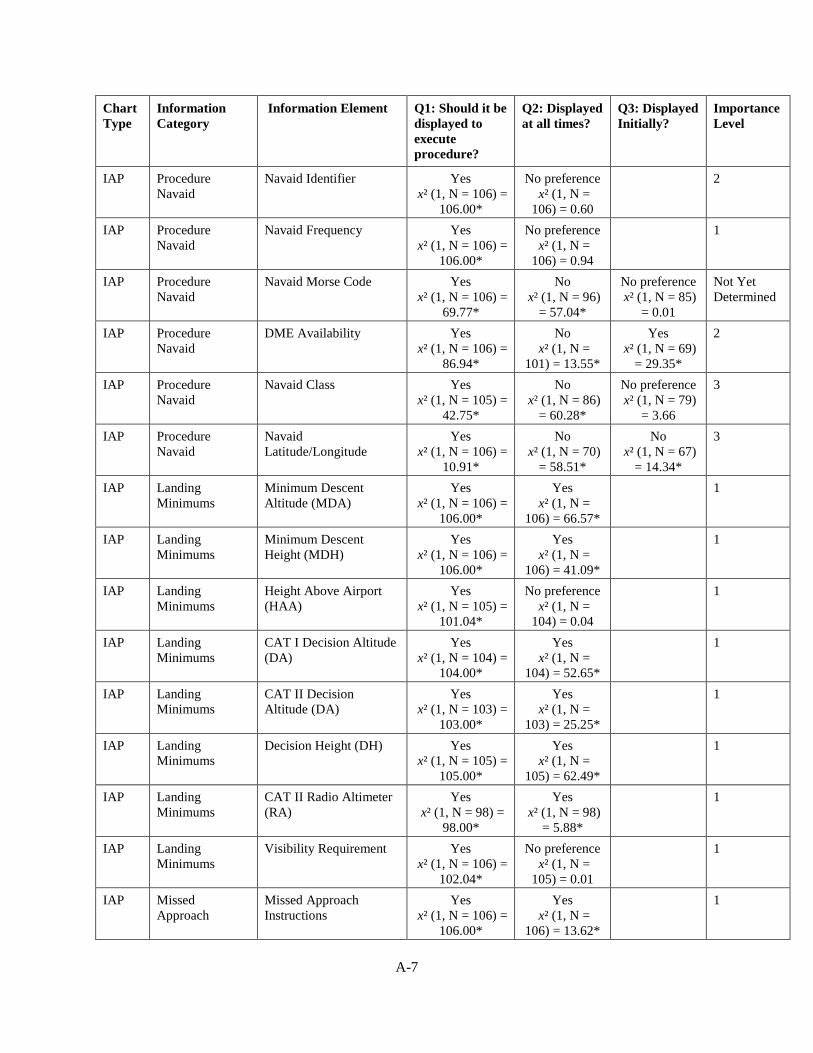
A-7
Chart Type
Information Category
Information Element Q1: Should it be displayed to execute procedure?
Q2: Displayed at all times?
Q3: Displayed Initially?
Importance Level
IAP Procedure Navaid
Navaid Identifier Yes x² (1, N = 106) =
106.00*
No preference x² (1, N =
106) = 0.60
2
IAP Procedure Navaid
Navaid Frequency Yes x² (1, N = 106) =
106.00*
No preference x² (1, N =
106) = 0.94
1
IAP Procedure Navaid
Navaid Morse Code Yes x² (1, N = 106) =
69.77*
No x² (1, N = 96)
= 57.04*
No preference x² (1, N = 85)
= 0.01
Not Yet Determined
IAP Procedure Navaid
DME Availability Yes x² (1, N = 106) =
86.94*
No x² (1, N =
101) = 13.55*
Yes x² (1, N = 69)
= 29.35*
2
IAP Procedure Navaid
Navaid Class Yes x² (1, N = 105) =
42.75*
No x² (1, N = 86)
= 60.28*
No preference x² (1, N = 79)
= 3.66
3
IAP Procedure Navaid
Navaid Latitude/Longitude
Yes x² (1, N = 106) =
10.91*
No x² (1, N = 70)
= 58.51*
No x² (1, N = 67)
= 14.34*
3
IAP Landing Minimums
Minimum Descent Altitude (MDA)
Yes x² (1, N = 106) =
106.00*
Yes x² (1, N =
106) = 66.57*
1
IAP Landing Minimums
Minimum Descent Height (MDH)
Yes x² (1, N = 106) =
106.00*
Yes x² (1, N =
106) = 41.09*
1
IAP Landing Minimums
Height Above Airport (HAA)
Yes x² (1, N = 105) =
101.04*
No preference x² (1, N =
104) = 0.04
1
IAP Landing Minimums
CAT I Decision Altitude (DA)
Yes x² (1, N = 104) =
104.00*
Yes x² (1, N =
104) = 52.65*
1
IAP Landing Minimums
CAT II Decision Altitude (DA)
Yes x² (1, N = 103) =
103.00*
Yes x² (1, N =
103) = 25.25*
1
IAP Landing Minimums
Decision Height (DH) Yes x² (1, N = 105) =
105.00*
Yes x² (1, N =
105) = 62.49*
1
IAP Landing Minimums
CAT II Radio Altimeter (RA)
Yes x² (1, N = 98) =
98.00*
Yes x² (1, N = 98)
= 5.88*
1
IAP Landing Minimums
Visibility Requirement Yes x² (1, N = 106) =
102.04*
No preference x² (1, N =
105) = 0.01
1
IAP Missed Approach
Missed Approach Instructions
Yes x² (1, N = 106) =
106.00*
Yes x² (1, N =
106) = 13.62*
1
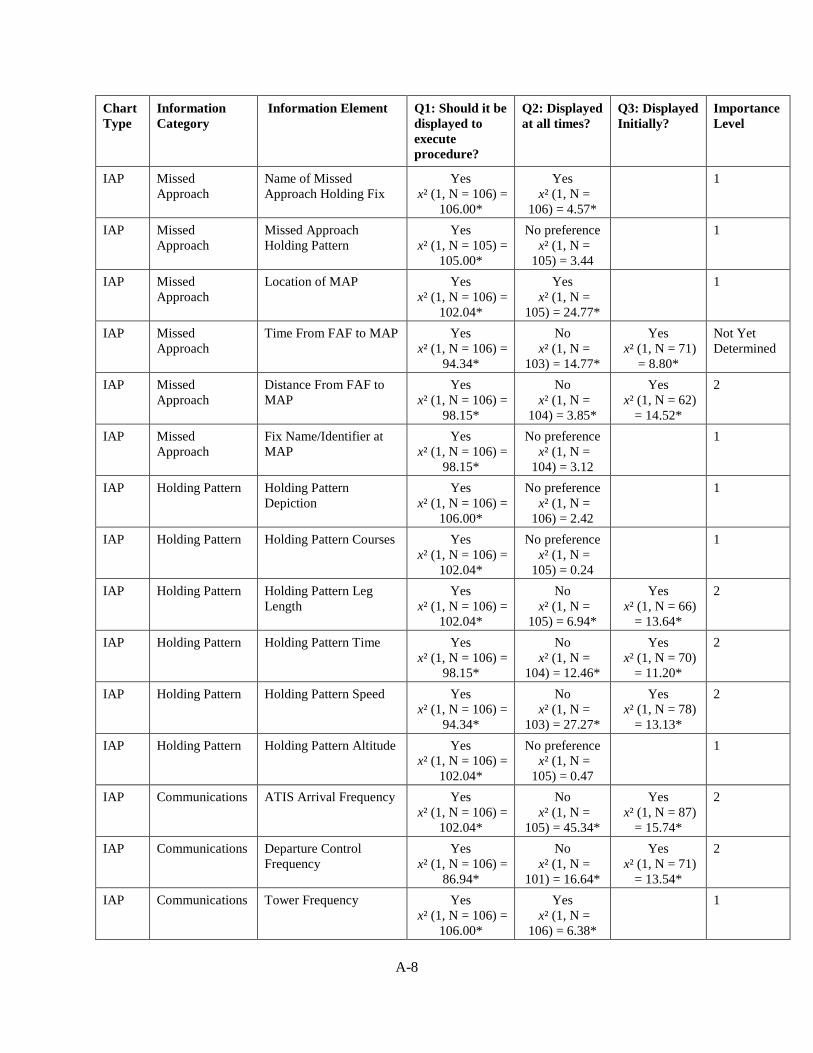
A-8
Chart Type
Information Category
Information Element Q1: Should it be displayed to execute procedure?
Q2: Displayed at all times?
Q3: Displayed Initially?
Importance Level
IAP Missed Approach
Name of Missed Approach Holding Fix
Yes x² (1, N = 106) =
106.00*
Yes x² (1, N =
106) = 4.57*
1
IAP Missed Approach
Missed Approach Holding Pattern
Yes x² (1, N = 105) =
105.00*
No preference x² (1, N =
105) = 3.44
1
IAP Missed Approach
Location of MAP Yes x² (1, N = 106) =
102.04*
Yes x² (1, N =
105) = 24.77*
1
IAP Missed Approach
Time From FAF to MAP Yes x² (1, N = 106) =
94.34*
No x² (1, N =
103) = 14.77*
Yes x² (1, N = 71)
= 8.80*
Not Yet Determined
IAP Missed Approach
Distance From FAF to MAP
Yes x² (1, N = 106) =
98.15*
No x² (1, N =
104) = 3.85*
Yes x² (1, N = 62)
= 14.52*
2
IAP Missed Approach
Fix Name/Identifier at MAP
Yes x² (1, N = 106) =
98.15*
No preference x² (1, N =
104) = 3.12
1
IAP Holding Pattern Holding Pattern Depiction
Yes x² (1, N = 106) =
106.00*
No preference x² (1, N =
106) = 2.42
1
IAP Holding Pattern Holding Pattern Courses Yes x² (1, N = 106) =
102.04*
No preference x² (1, N =
105) = 0.24
1
IAP Holding Pattern Holding Pattern Leg Length
Yes x² (1, N = 106) =
102.04*
No x² (1, N =
105) = 6.94*
Yes x² (1, N = 66)
= 13.64*
2
IAP Holding Pattern Holding Pattern Time Yes x² (1, N = 106) =
98.15*
No x² (1, N =
104) = 12.46*
Yes x² (1, N = 70)
= 11.20*
2
IAP Holding Pattern Holding Pattern Speed Yes x² (1, N = 106) =
94.34*
No x² (1, N =
103) = 27.27*
Yes x² (1, N = 78)
= 13.13*
2
IAP Holding Pattern Holding Pattern Altitude Yes x² (1, N = 106) =
102.04*
No preference x² (1, N =
105) = 0.47
1
IAP Communications ATIS Arrival Frequency Yes x² (1, N = 106) =
102.04*
No x² (1, N =
105) = 45.34*
Yes x² (1, N = 87)
= 15.74*
2
IAP Communications Departure Control Frequency
Yes x² (1, N = 106) =
86.94*
No x² (1, N =
101) = 16.64*
Yes x² (1, N = 71)
= 13.54*
2
IAP Communications Tower Frequency Yes x² (1, N = 106) =
106.00*
Yes x² (1, N =
106) = 6.38*
1
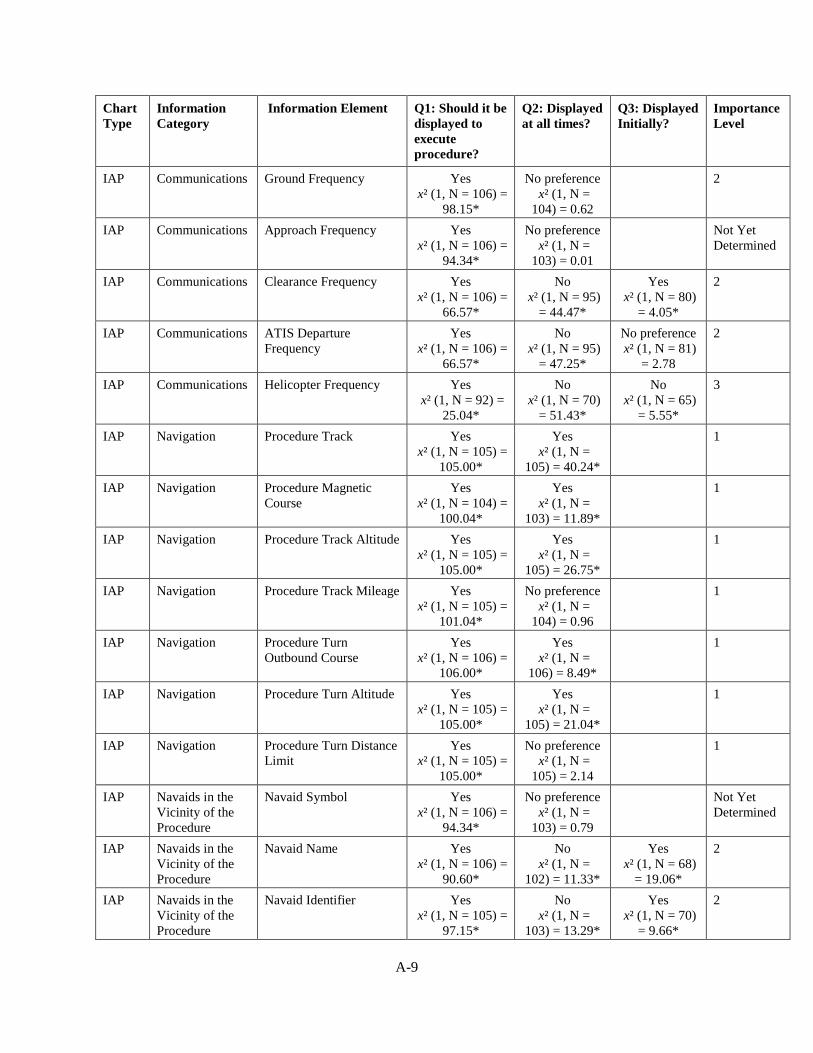
A-9
Chart Type
Information Category
Information Element Q1: Should it be displayed to execute procedure?
Q2: Displayed at all times?
Q3: Displayed Initially?
Importance Level
IAP Communications Ground Frequency Yes x² (1, N = 106) =
98.15*
No preference x² (1, N =
104) = 0.62
2
IAP Communications Approach Frequency Yes x² (1, N = 106) =
94.34*
No preference x² (1, N =
103) = 0.01
Not Yet Determined
IAP Communications Clearance Frequency Yes x² (1, N = 106) =
66.57*
No x² (1, N = 95)
= 44.47*
Yes x² (1, N = 80)
= 4.05*
2
IAP Communications ATIS Departure Frequency
Yes x² (1, N = 106) =
66.57*
No x² (1, N = 95)
= 47.25*
No preference x² (1, N = 81)
= 2.78
2
IAP Communications Helicopter Frequency Yes x² (1, N = 92) =
25.04*
No x² (1, N = 70)
= 51.43*
No x² (1, N = 65)
= 5.55*
3
IAP Navigation Procedure Track Yes x² (1, N = 105) =
105.00*
Yes x² (1, N =
105) = 40.24*
1
IAP Navigation Procedure Magnetic Course
Yes x² (1, N = 104) =
100.04*
Yes x² (1, N =
103) = 11.89*
1
IAP Navigation Procedure Track Altitude Yes x² (1, N = 105) =
105.00*
Yes x² (1, N =
105) = 26.75*
1
IAP Navigation Procedure Track Mileage Yes x² (1, N = 105) =
101.04*
No preference x² (1, N =
104) = 0.96
1
IAP Navigation Procedure Turn Outbound Course
Yes x² (1, N = 106) =
106.00*
Yes x² (1, N =
106) = 8.49*
1
IAP Navigation Procedure Turn Altitude Yes x² (1, N = 105) =
105.00*
Yes x² (1, N =
105) = 21.04*
1
IAP Navigation Procedure Turn Distance Limit
Yes x² (1, N = 105) =
105.00*
No preference x² (1, N =
105) = 2.14
1
IAP Navaids in the Vicinity of the Procedure
Navaid Symbol Yes x² (1, N = 106) =
94.34*
No preference x² (1, N =
103) = 0.79
Not Yet Determined
IAP Navaids in the Vicinity of the Procedure
Navaid Name Yes x² (1, N = 106) =
90.60*
No x² (1, N =
102) = 11.33*
Yes x² (1, N = 68)
= 19.06*
2
IAP Navaids in the Vicinity of the Procedure
Navaid Identifier Yes x² (1, N = 105) =
97.15*
No x² (1, N =
103) = 13.29*
Yes x² (1, N = 70)
= 9.66*
2
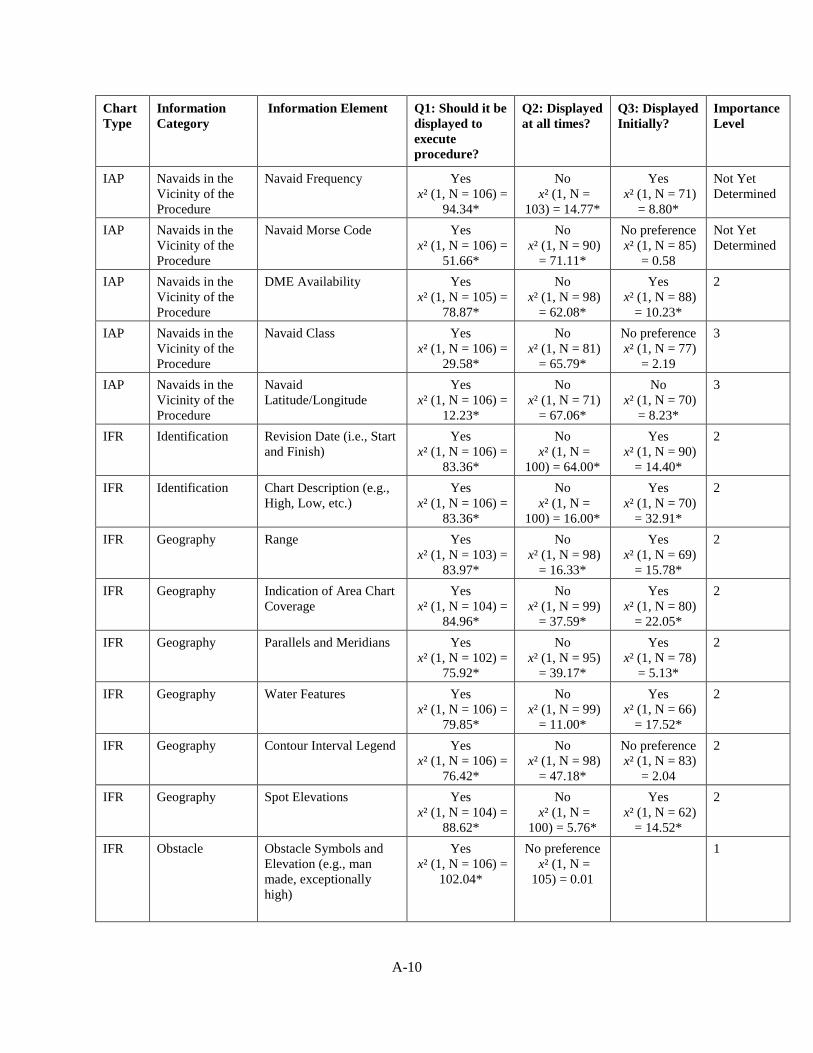
A-10
Chart Type
Information Category
Information Element Q1: Should it be displayed to execute procedure?
Q2: Displayed at all times?
Q3: Displayed Initially?
Importance Level
IAP Navaids in the Vicinity of the Procedure
Navaid Frequency Yes x² (1, N = 106) =
94.34*
No x² (1, N =
103) = 14.77*
Yes x² (1, N = 71)
= 8.80*
Not Yet Determined
IAP Navaids in the Vicinity of the Procedure
Navaid Morse Code Yes x² (1, N = 106) =
51.66*
No x² (1, N = 90)
= 71.11*
No preference x² (1, N = 85)
= 0.58
Not Yet Determined
IAP Navaids in the Vicinity of the Procedure
DME Availability Yes x² (1, N = 105) =
78.87*
No x² (1, N = 98)
= 62.08*
Yes x² (1, N = 88)
= 10.23*
2
IAP Navaids in the Vicinity of the Procedure
Navaid Class Yes x² (1, N = 106) =
29.58*
No x² (1, N = 81)
= 65.79*
No preference x² (1, N = 77)
= 2.19
3
IAP Navaids in the Vicinity of the Procedure
Navaid Latitude/Longitude
Yes x² (1, N = 106) =
12.23*
No x² (1, N = 71)
= 67.06*
No x² (1, N = 70)
= 8.23*
3
IFR Identification Revision Date (i.e., Start and Finish)
Yes x² (1, N = 106) =
83.36*
No x² (1, N =
100) = 64.00*
Yes x² (1, N = 90)
= 14.40*
2
IFR Identification Chart Description (e.g., High, Low, etc.)
Yes x² (1, N = 106) =
83.36*
No x² (1, N =
100) = 16.00*
Yes x² (1, N = 70)
= 32.91*
2
IFR Geography Range Yes x² (1, N = 103) =
83.97*
No x² (1, N = 98)
= 16.33*
Yes x² (1, N = 69)
= 15.78*
2
IFR Geography Indication of Area Chart Coverage
Yes x² (1, N = 104) =
84.96*
No x² (1, N = 99)
= 37.59*
Yes x² (1, N = 80)
= 22.05*
2
IFR Geography Parallels and Meridians Yes x² (1, N = 102) =
75.92*
No x² (1, N = 95)
= 39.17*
Yes x² (1, N = 78)
= 5.13*
2
IFR Geography Water Features Yes x² (1, N = 106) =
79.85*
No x² (1, N = 99)
= 11.00*
Yes x² (1, N = 66)
= 17.52*
2
IFR Geography Contour Interval Legend Yes x² (1, N = 106) =
76.42*
No x² (1, N = 98)
= 47.18*
No preference x² (1, N = 83)
= 2.04
2
IFR Geography Spot Elevations Yes x² (1, N = 104) =
88.62*
No x² (1, N =
100) = 5.76*
Yes x² (1, N = 62)
= 14.52*
2
IFR Obstacle Obstacle Symbols and Elevation (e.g., man made, exceptionally high)
Yes x² (1, N = 106) =
102.04*
No preference x² (1, N =
105) = 0.01
1
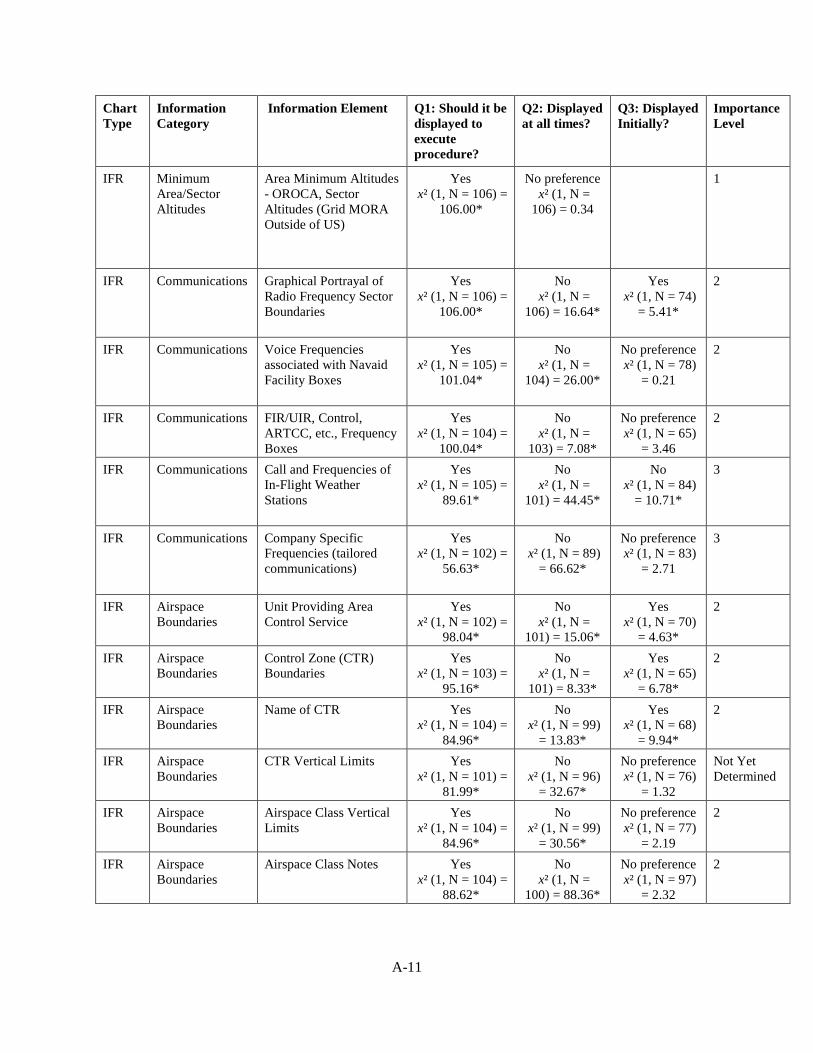
A-11
Chart Type
Information Category
Information Element Q1: Should it be displayed to execute procedure?
Q2: Displayed at all times?
Q3: Displayed Initially?
Importance Level
IFR Minimum Area/Sector Altitudes
Area Minimum Altitudes - OROCA, Sector Altitudes (Grid MORA Outside of US)
Yes x² (1, N = 106) =
106.00*
No preference x² (1, N =
106) = 0.34
1
IFR Communications Graphical Portrayal of Radio Frequency Sector Boundaries
Yes x² (1, N = 106) =
106.00*
No x² (1, N =
106) = 16.64*
Yes x² (1, N = 74)
= 5.41*
2
IFR Communications Voice Frequencies associated with Navaid Facility Boxes
Yes x² (1, N = 105) =
101.04*
No x² (1, N =
104) = 26.00*
No preference x² (1, N = 78)
= 0.21
2
IFR Communications FIR/UIR, Control, ARTCC, etc., Frequency Boxes
Yes x² (1, N = 104) =
100.04*
No x² (1, N =
103) = 7.08*
No preference x² (1, N = 65)
= 3.46
2
IFR Communications Call and Frequencies of In-Flight Weather Stations
Yes x² (1, N = 105) =
89.61*
No x² (1, N =
101) = 44.45*
No x² (1, N = 84)
= 10.71*
3
IFR Communications Company Specific Frequencies (tailored communications)
Yes x² (1, N = 102) =
56.63*
No x² (1, N = 89)
= 66.62*
No preference x² (1, N = 83)
= 2.71
3
IFR Airspace Boundaries
Unit Providing Area Control Service
Yes x² (1, N = 102) =
98.04*
No x² (1, N =
101) = 15.06*
Yes x² (1, N = 70)
= 4.63*
2
IFR Airspace Boundaries
Control Zone (CTR) Boundaries
Yes x² (1, N = 103) =
95.16*
No x² (1, N =
101) = 8.33*
Yes x² (1, N = 65)
= 6.78*
2
IFR Airspace Boundaries
Name of CTR Yes x² (1, N = 104) =
84.96*
No x² (1, N = 99)
= 13.83*
Yes x² (1, N = 68)
= 9.94*
2
IFR Airspace Boundaries
CTR Vertical Limits Yes x² (1, N = 101) =
81.99*
No x² (1, N = 96)
= 32.67*
No preference x² (1, N = 76)
= 1.32
Not Yet Determined
IFR Airspace Boundaries
Airspace Class Vertical Limits
Yes x² (1, N = 104) =
84.96*
No x² (1, N = 99)
= 30.56*
No preference x² (1, N = 77)
= 2.19
2
IFR Airspace Boundaries
Airspace Class Notes Yes x² (1, N = 104) =
88.62*
No x² (1, N =
100) = 88.36*
No preference x² (1, N = 97)
= 2.32
2
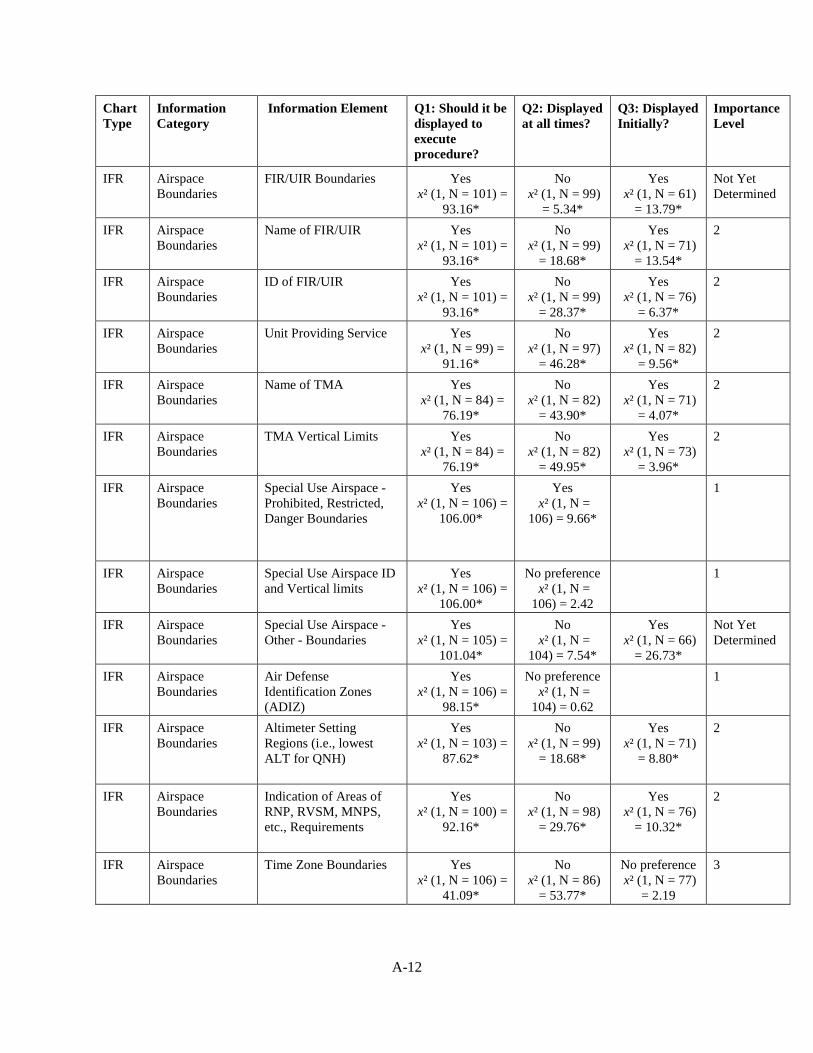
A-12
Chart Type
Information Category
Information Element Q1: Should it be displayed to execute procedure?
Q2: Displayed at all times?
Q3: Displayed Initially?
Importance Level
IFR Airspace Boundaries
FIR/UIR Boundaries Yes x² (1, N = 101) =
93.16*
No x² (1, N = 99)
= 5.34*
Yes x² (1, N = 61)
= 13.79*
Not Yet Determined
IFR Airspace Boundaries
Name of FIR/UIR Yes x² (1, N = 101) =
93.16*
No x² (1, N = 99)
= 18.68*
Yes x² (1, N = 71)
= 13.54*
2
IFR Airspace Boundaries
ID of FIR/UIR Yes x² (1, N = 101) =
93.16*
No x² (1, N = 99)
= 28.37*
Yes x² (1, N = 76)
= 6.37*
2
IFR Airspace Boundaries
Unit Providing Service Yes x² (1, N = 99) =
91.16*
No x² (1, N = 97)
= 46.28*
Yes x² (1, N = 82)
= 9.56*
2
IFR Airspace Boundaries
Name of TMA Yes x² (1, N = 84) =
76.19*
No x² (1, N = 82)
= 43.90*
Yes x² (1, N = 71)
= 4.07*
2
IFR Airspace Boundaries
TMA Vertical Limits Yes x² (1, N = 84) =
76.19*
No x² (1, N = 82)
= 49.95*
Yes x² (1, N = 73)
= 3.96*
2
IFR Airspace Boundaries
Special Use Airspace - Prohibited, Restricted, Danger Boundaries
Yes x² (1, N = 106) =
106.00*
Yes x² (1, N =
106) = 9.66*
1
IFR Airspace Boundaries
Special Use Airspace ID and Vertical limits
Yes x² (1, N = 106) =
106.00*
No preference x² (1, N =
106) = 2.42
1
IFR Airspace Boundaries
Special Use Airspace - Other - Boundaries
Yes x² (1, N = 105) =
101.04*
No x² (1, N =
104) = 7.54*
Yes x² (1, N = 66)
= 26.73*
Not Yet Determined
IFR Airspace Boundaries
Air Defense Identification Zones (ADIZ)
Yes x² (1, N = 106) =
98.15*
No preference x² (1, N =
104) = 0.62
1
IFR Airspace Boundaries
Altimeter Setting Regions (i.e., lowest ALT for QNH)
Yes x² (1, N = 103) =
87.62*
No x² (1, N = 99)
= 18.68*
Yes x² (1, N = 71)
= 8.80*
2
IFR Airspace Boundaries
Indication of Areas of RNP, RVSM, MNPS, etc., Requirements
Yes x² (1, N = 100) =
92.16*
No x² (1, N = 98)
= 29.76*
Yes x² (1, N = 76)
= 10.32*
2
IFR Airspace Boundaries
Time Zone Boundaries Yes x² (1, N = 106) =
41.09*
No x² (1, N = 86)
= 53.77*
No preference x² (1, N = 77)
= 2.19
3
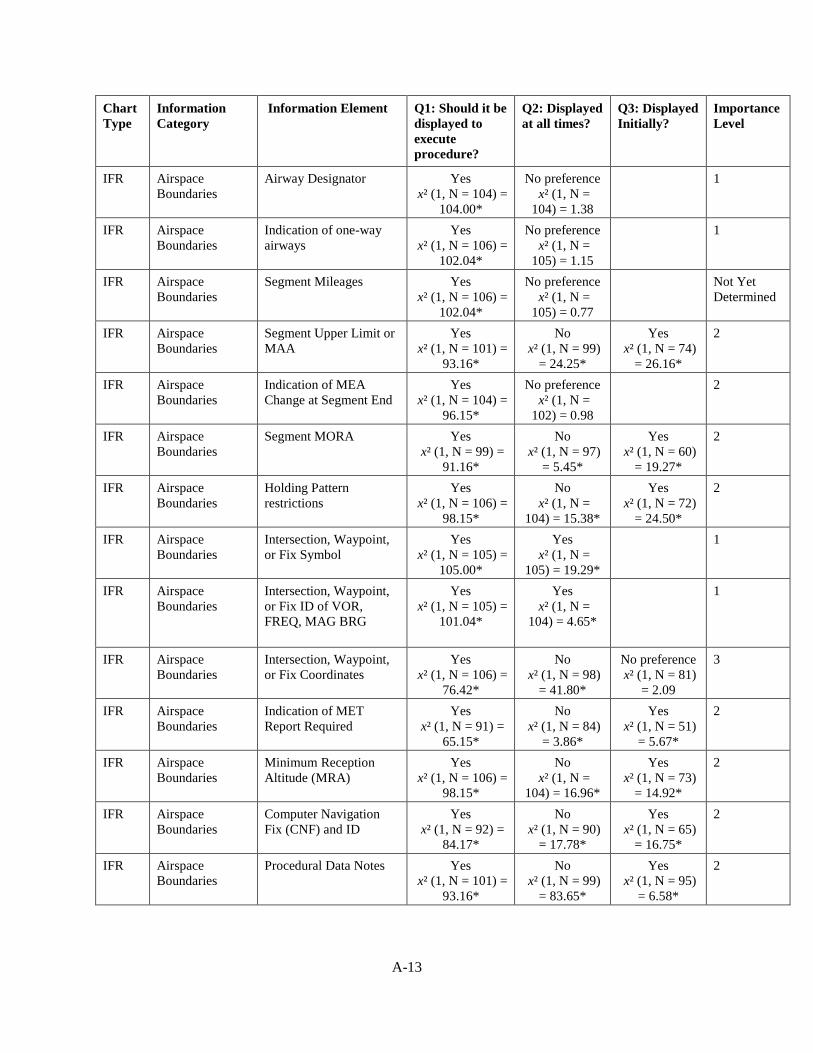
A-13
Chart Type
Information Category
Information Element Q1: Should it be displayed to execute procedure?
Q2: Displayed at all times?
Q3: Displayed Initially?
Importance Level
IFR Airspace Boundaries
Airway Designator Yes x² (1, N = 104) =
104.00*
No preference x² (1, N =
104) = 1.38
1
IFR Airspace Boundaries
Indication of one-way airways
Yes x² (1, N = 106) =
102.04*
No preference x² (1, N =
105) = 1.15
1
IFR Airspace Boundaries
Segment Mileages Yes x² (1, N = 106) =
102.04*
No preference x² (1, N =
105) = 0.77
Not Yet Determined
IFR Airspace Boundaries
Segment Upper Limit or MAA
Yes x² (1, N = 101) =
93.16*
No x² (1, N = 99)
= 24.25*
Yes x² (1, N = 74)
= 26.16*
2
IFR Airspace Boundaries
Indication of MEA Change at Segment End
Yes x² (1, N = 104) =
96.15*
No preference x² (1, N =
102) = 0.98
2
IFR Airspace Boundaries
Segment MORA Yes x² (1, N = 99) =
91.16*
No x² (1, N = 97)
= 5.45*
Yes x² (1, N = 60)
= 19.27*
2
IFR Airspace Boundaries
Holding Pattern restrictions
Yes x² (1, N = 106) =
98.15*
No x² (1, N =
104) = 15.38*
Yes x² (1, N = 72)
= 24.50*
2
IFR Airspace Boundaries
Intersection, Waypoint, or Fix Symbol
Yes x² (1, N = 105) =
105.00*
Yes x² (1, N =
105) = 19.29*
1
IFR Airspace Boundaries
Intersection, Waypoint, or Fix ID of VOR, FREQ, MAG BRG
Yes x² (1, N = 105) =
101.04*
Yes x² (1, N =
104) = 4.65*
1
IFR Airspace Boundaries
Intersection, Waypoint, or Fix Coordinates
Yes x² (1, N = 106) =
76.42*
No x² (1, N = 98)
= 41.80*
No preference x² (1, N = 81)
= 2.09
3
IFR Airspace Boundaries
Indication of MET Report Required
Yes x² (1, N = 91) =
65.15*
No x² (1, N = 84)
= 3.86*
Yes x² (1, N = 51)
= 5.67*
2
IFR Airspace Boundaries
Minimum Reception Altitude (MRA)
Yes x² (1, N = 106) =
98.15*
No x² (1, N =
104) = 16.96*
Yes x² (1, N = 73)
= 14.92*
2
IFR Airspace Boundaries
Computer Navigation Fix (CNF) and ID
Yes x² (1, N = 92) =
84.17*
No x² (1, N = 90)
= 17.78*
Yes x² (1, N = 65)
= 16.75*
2
IFR Airspace Boundaries
Procedural Data Notes Yes x² (1, N = 101) =
93.16*
No x² (1, N = 99)
= 83.65*
Yes x² (1, N = 95)
= 6.58*
2
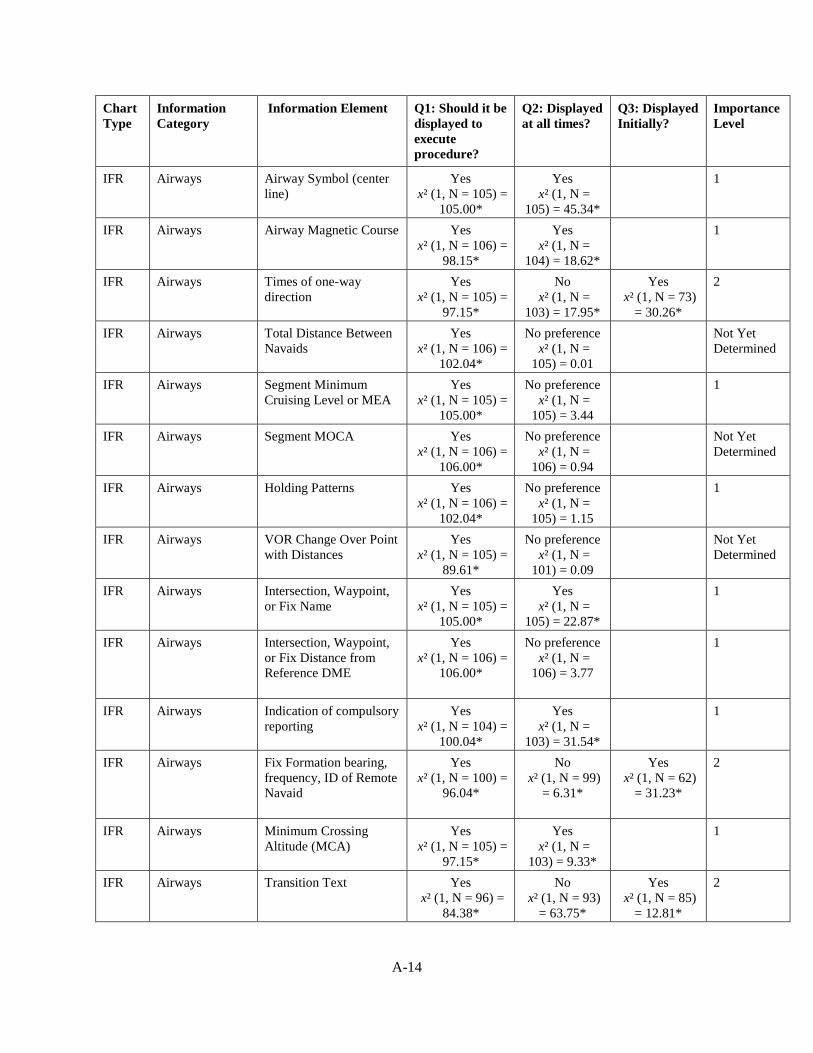
A-14
Chart Type
Information Category
Information Element Q1: Should it be displayed to execute procedure?
Q2: Displayed at all times?
Q3: Displayed Initially?
Importance Level
IFR Airways Airway Symbol (center line)
Yes x² (1, N = 105) =
105.00*
Yes x² (1, N =
105) = 45.34*
1
IFR Airways Airway Magnetic Course Yes x² (1, N = 106) =
98.15*
Yes x² (1, N =
104) = 18.62*
1
IFR Airways Times of one-way direction
Yes x² (1, N = 105) =
97.15*
No x² (1, N =
103) = 17.95*
Yes x² (1, N = 73)
= 30.26*
2
IFR Airways Total Distance Between Navaids
Yes x² (1, N = 106) =
102.04*
No preference x² (1, N =
105) = 0.01
Not Yet Determined
IFR Airways Segment Minimum Cruising Level or MEA
Yes x² (1, N = 105) =
105.00*
No preference x² (1, N =
105) = 3.44
1
IFR Airways Segment MOCA Yes x² (1, N = 106) =
106.00*
No preference x² (1, N =
106) = 0.94
Not Yet Determined
IFR Airways Holding Patterns Yes x² (1, N = 106) =
102.04*
No preference x² (1, N =
105) = 1.15
1
IFR Airways VOR Change Over Point with Distances
Yes x² (1, N = 105) =
89.61*
No preference x² (1, N =
101) = 0.09
Not Yet Determined
IFR Airways Intersection, Waypoint, or Fix Name
Yes x² (1, N = 105) =
105.00*
Yes x² (1, N =
105) = 22.87*
1
IFR Airways Intersection, Waypoint, or Fix Distance from Reference DME
Yes x² (1, N = 106) =
106.00*
No preference x² (1, N =
106) = 3.77
1
IFR Airways Indication of compulsory reporting
Yes x² (1, N = 104) =
100.04*
Yes x² (1, N =
103) = 31.54*
1
IFR Airways Fix Formation bearing, frequency, ID of Remote Navaid
Yes x² (1, N = 100) =
96.04*
No x² (1, N = 99)
= 6.31*
Yes x² (1, N = 62)
= 31.23*
2
IFR Airways Minimum Crossing Altitude (MCA)
Yes x² (1, N = 105) =
97.15*
Yes x² (1, N =
103) = 9.33*
1
IFR Airways Transition Text Yes x² (1, N = 96) =
84.38*
No x² (1, N = 93)
= 63.75*
Yes x² (1, N = 85)
= 12.81*
2
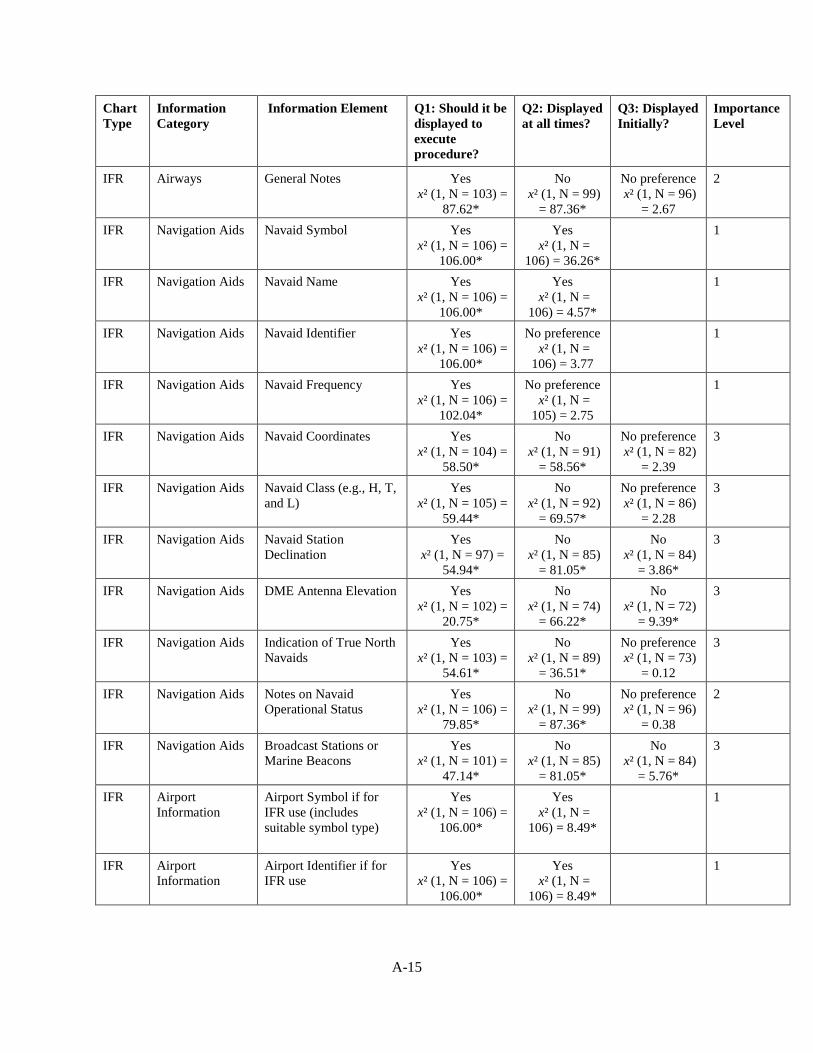
A-15
Chart Type
Information Category
Information Element Q1: Should it be displayed to execute procedure?
Q2: Displayed at all times?
Q3: Displayed Initially?
Importance Level
IFR Airways General Notes Yes x² (1, N = 103) =
87.62*
No x² (1, N = 99)
= 87.36*
No preference x² (1, N = 96)
= 2.67
2
IFR Navigation Aids Navaid Symbol Yes x² (1, N = 106) =
106.00*
Yes x² (1, N =
106) = 36.26*
1
IFR Navigation Aids Navaid Name Yes x² (1, N = 106) =
106.00*
Yes x² (1, N =
106) = 4.57*
1
IFR Navigation Aids Navaid Identifier Yes x² (1, N = 106) =
106.00*
No preference x² (1, N =
106) = 3.77
1
IFR Navigation Aids Navaid Frequency Yes x² (1, N = 106) =
102.04*
No preference x² (1, N =
105) = 2.75
1
IFR Navigation Aids Navaid Coordinates Yes x² (1, N = 104) =
58.50*
No x² (1, N = 91)
= 58.56*
No preference x² (1, N = 82)
= 2.39
3
IFR Navigation Aids Navaid Class (e.g., H, T, and L)
Yes x² (1, N = 105) =
59.44*
No x² (1, N = 92)
= 69.57*
No preference x² (1, N = 86)
= 2.28
3
IFR Navigation Aids Navaid Station Declination
Yes x² (1, N = 97) =
54.94*
No x² (1, N = 85)
= 81.05*
No x² (1, N = 84)
= 3.86*
3
IFR Navigation Aids DME Antenna Elevation Yes x² (1, N = 102) =
20.75*
No x² (1, N = 74)
= 66.22*
No x² (1, N = 72)
= 9.39*
3
IFR Navigation Aids Indication of True North Navaids
Yes x² (1, N = 103) =
54.61*
No x² (1, N = 89)
= 36.51*
No preference x² (1, N = 73)
= 0.12
3
IFR Navigation Aids Notes on Navaid Operational Status
Yes x² (1, N = 106) =
79.85*
No x² (1, N = 99)
= 87.36*
No preference x² (1, N = 96)
= 0.38
2
IFR Navigation Aids Broadcast Stations or Marine Beacons
Yes x² (1, N = 101) =
47.14*
No x² (1, N = 85)
= 81.05*
No x² (1, N = 84)
= 5.76*
3
IFR Airport Information
Airport Symbol if for IFR use (includes suitable symbol type)
Yes x² (1, N = 106) =
106.00*
Yes x² (1, N =
106) = 8.49*
1
IFR Airport Information
Airport Identifier if for IFR use
Yes x² (1, N = 106) =
106.00*
Yes x² (1, N =
106) = 8.49*
1
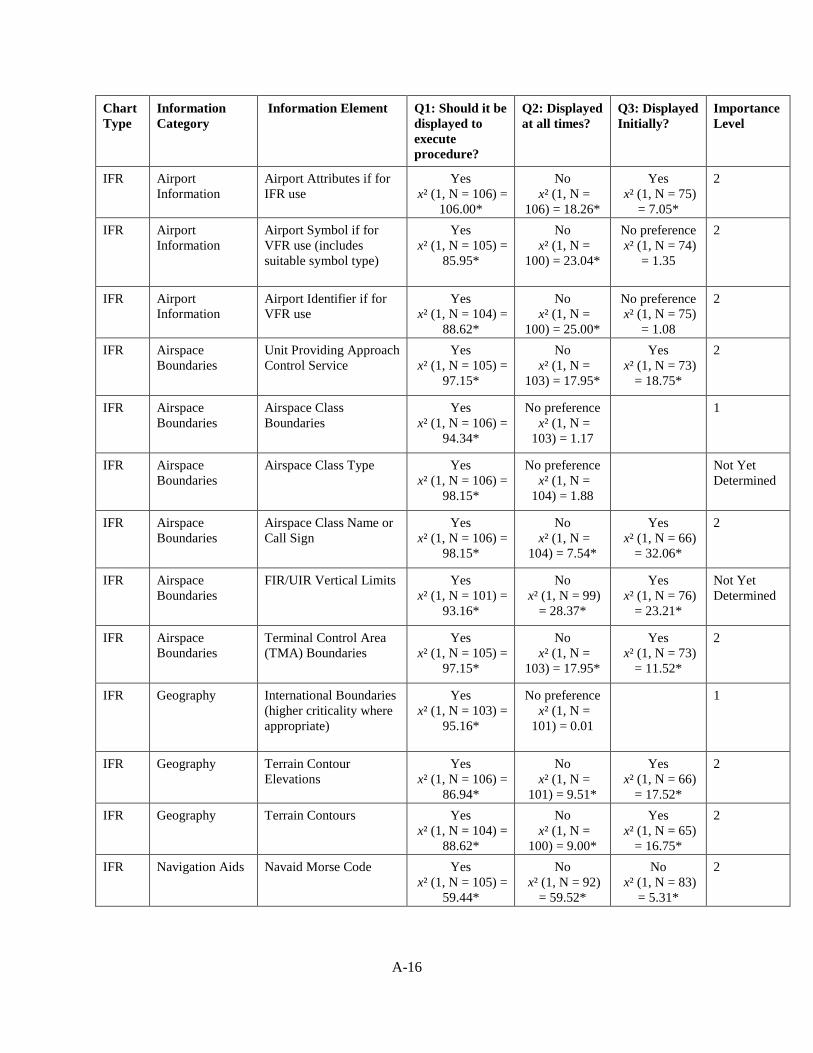
A-16
Chart Type
Information Category
Information Element Q1: Should it be displayed to execute procedure?
Q2: Displayed at all times?
Q3: Displayed Initially?
Importance Level
IFR Airport Information
Airport Attributes if for IFR use
Yes x² (1, N = 106) =
106.00*
No x² (1, N =
106) = 18.26*
Yes x² (1, N = 75)
= 7.05*
2
IFR Airport Information
Airport Symbol if for VFR use (includes suitable symbol type)
Yes x² (1, N = 105) =
85.95*
No x² (1, N =
100) = 23.04*
No preference x² (1, N = 74)
= 1.35
2
IFR Airport Information
Airport Identifier if for VFR use
Yes x² (1, N = 104) =
88.62*
No x² (1, N =
100) = 25.00*
No preference x² (1, N = 75)
= 1.08
2
IFR Airspace Boundaries
Unit Providing Approach Control Service
Yes x² (1, N = 105) =
97.15*
No x² (1, N =
103) = 17.95*
Yes x² (1, N = 73)
= 18.75*
2
IFR Airspace Boundaries
Airspace Class Boundaries
Yes x² (1, N = 106) =
94.34*
No preference x² (1, N =
103) = 1.17
1
IFR Airspace Boundaries
Airspace Class Type Yes x² (1, N = 106) =
98.15*
No preference x² (1, N =
104) = 1.88
Not Yet Determined
IFR Airspace Boundaries
Airspace Class Name or Call Sign
Yes x² (1, N = 106) =
98.15*
No x² (1, N =
104) = 7.54*
Yes x² (1, N = 66)
= 32.06*
2
IFR Airspace Boundaries
FIR/UIR Vertical Limits Yes x² (1, N = 101) =
93.16*
No x² (1, N = 99)
= 28.37*
Yes x² (1, N = 76)
= 23.21*
Not Yet Determined
IFR Airspace Boundaries
Terminal Control Area (TMA) Boundaries
Yes x² (1, N = 105) =
97.15*
No x² (1, N =
103) = 17.95*
Yes x² (1, N = 73)
= 11.52*
2
IFR Geography International Boundaries (higher criticality where appropriate)
Yes x² (1, N = 103) =
95.16*
No preference x² (1, N =
101) = 0.01
1
IFR Geography Terrain Contour Elevations
Yes x² (1, N = 106) =
86.94*
No x² (1, N =
101) = 9.51*
Yes x² (1, N = 66)
= 17.52*
2
IFR Geography Terrain Contours Yes x² (1, N = 104) =
88.62*
No x² (1, N =
100) = 9.00*
Yes x² (1, N = 65)
= 16.75*
2
IFR Navigation Aids Navaid Morse Code Yes x² (1, N = 105) =
59.44*
No x² (1, N = 92)
= 59.52*
No x² (1, N = 83)
= 5.31*
2
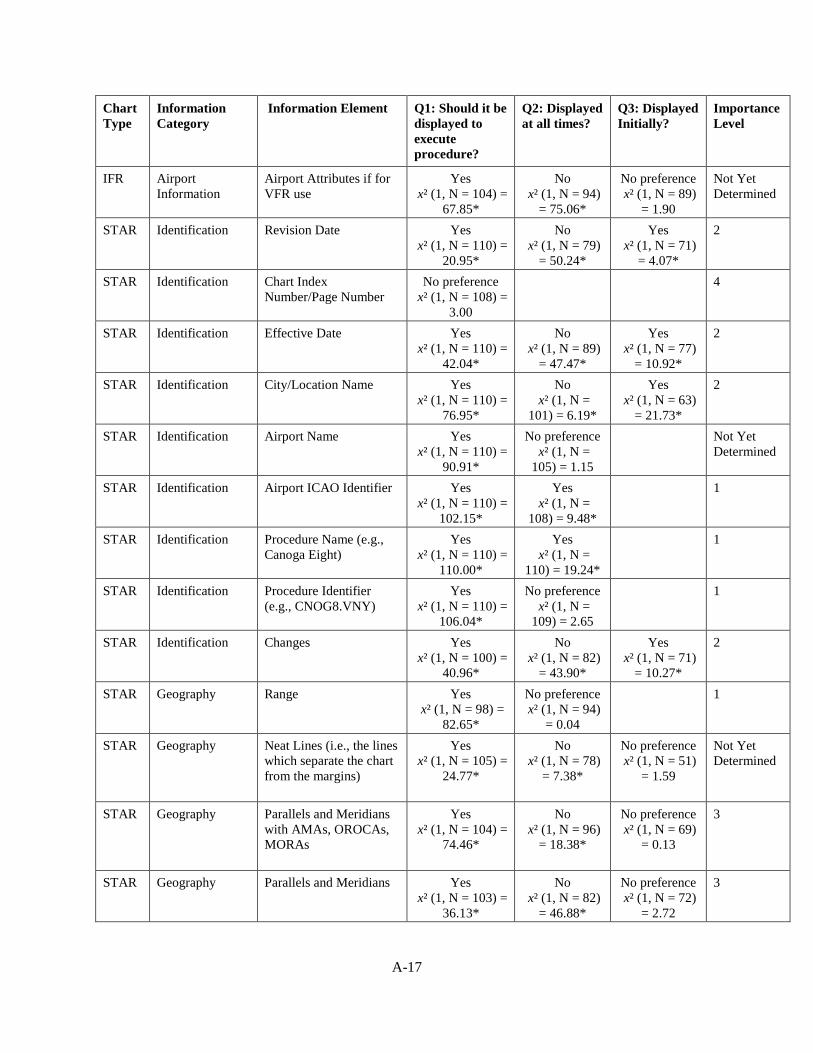
A-17
Chart Type
Information Category
Information Element Q1: Should it be displayed to execute procedure?
Q2: Displayed at all times?
Q3: Displayed Initially?
Importance Level
IFR Airport Information
Airport Attributes if for VFR use
Yes x² (1, N = 104) =
67.85*
No x² (1, N = 94)
= 75.06*
No preference x² (1, N = 89)
= 1.90
Not Yet Determined
STAR Identification Revision Date Yes x² (1, N = 110) =
20.95*
No x² (1, N = 79)
= 50.24*
Yes x² (1, N = 71)
= 4.07*
2
STAR Identification Chart Index Number/Page Number
No preference x² (1, N = 108) =
3.00
4
STAR Identification Effective Date Yes x² (1, N = 110) =
42.04*
No x² (1, N = 89)
= 47.47*
Yes x² (1, N = 77)
= 10.92*
2
STAR Identification City/Location Name Yes x² (1, N = 110) =
76.95*
No x² (1, N =
101) = 6.19*
Yes x² (1, N = 63)
= 21.73*
2
STAR Identification Airport Name Yes x² (1, N = 110) =
90.91*
No preference x² (1, N =
105) = 1.15
Not Yet Determined
STAR Identification Airport ICAO Identifier Yes x² (1, N = 110) =
102.15*
Yes x² (1, N =
108) = 9.48*
1
STAR Identification Procedure Name (e.g., Canoga Eight)
Yes x² (1, N = 110) =
110.00*
Yes x² (1, N =
110) = 19.24*
1
STAR Identification Procedure Identifier (e.g., CNOG8.VNY)
Yes x² (1, N = 110) =
106.04*
No preference x² (1, N =
109) = 2.65
1
STAR Identification Changes Yes x² (1, N = 100) =
40.96*
No x² (1, N = 82)
= 43.90*
Yes x² (1, N = 71)
= 10.27*
2
STAR Geography Range Yes x² (1, N = 98) =
82.65*
No preference x² (1, N = 94)
= 0.04
1
STAR Geography Neat Lines (i.e., the lines which separate the chart from the margins)
Yes x² (1, N = 105) =
24.77*
No x² (1, N = 78)
= 7.38*
No preference x² (1, N = 51)
= 1.59
Not Yet Determined
STAR Geography Parallels and Meridians with AMAs, OROCAs, MORAs
Yes x² (1, N = 104) =
74.46*
No x² (1, N = 96)
= 18.38*
No preference x² (1, N = 69)
= 0.13
3
STAR Geography Parallels and Meridians Yes x² (1, N = 103) =
36.13*
No x² (1, N = 82)
= 46.88*
No preference x² (1, N = 72)
= 2.72
3
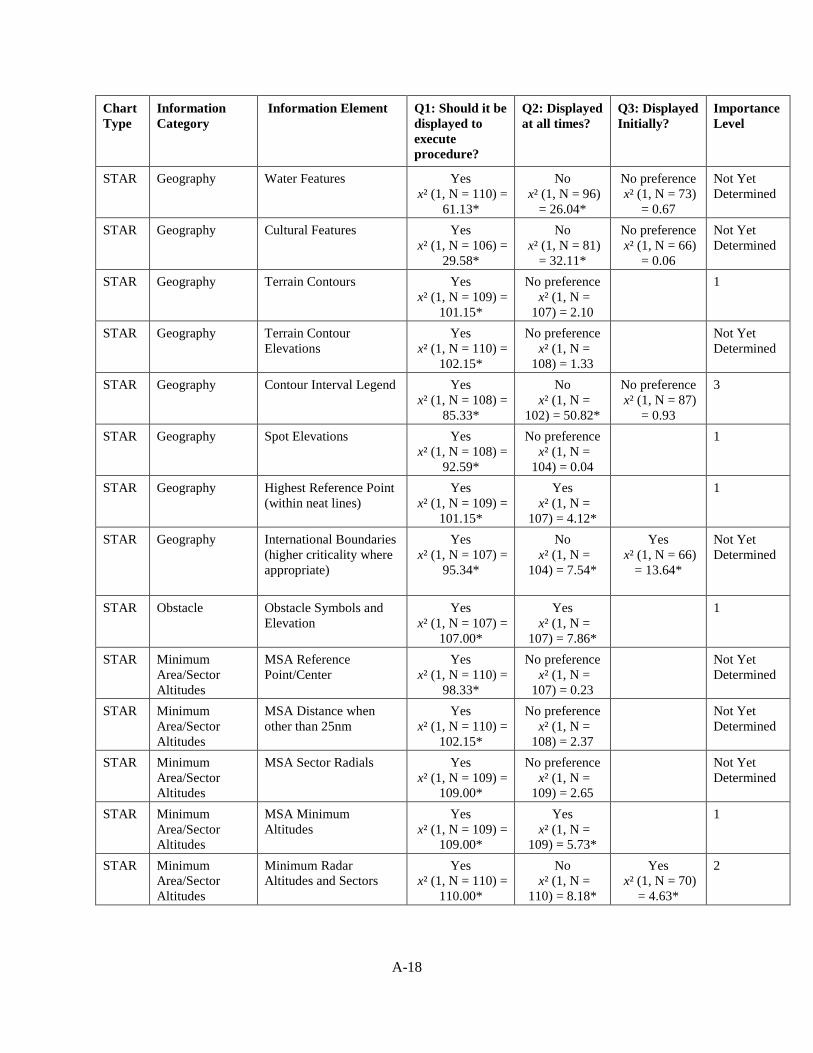
A-18
Chart Type
Information Category
Information Element Q1: Should it be displayed to execute procedure?
Q2: Displayed at all times?
Q3: Displayed Initially?
Importance Level
STAR Geography Water Features Yes x² (1, N = 110) =
61.13*
No x² (1, N = 96)
= 26.04*
No preference x² (1, N = 73)
= 0.67
Not Yet Determined
STAR Geography Cultural Features Yes x² (1, N = 106) =
29.58*
No x² (1, N = 81)
= 32.11*
No preference x² (1, N = 66)
= 0.06
Not Yet Determined
STAR Geography Terrain Contours Yes x² (1, N = 109) =
101.15*
No preference x² (1, N =
107) = 2.10
1
STAR Geography Terrain Contour Elevations
Yes x² (1, N = 110) =
102.15*
No preference x² (1, N =
108) = 1.33
Not Yet Determined
STAR Geography Contour Interval Legend Yes x² (1, N = 108) =
85.33*
No x² (1, N =
102) = 50.82*
No preference x² (1, N = 87)
= 0.93
3
STAR Geography Spot Elevations Yes x² (1, N = 108) =
92.59*
No preference x² (1, N =
104) = 0.04
1
STAR Geography Highest Reference Point (within neat lines)
Yes x² (1, N = 109) =
101.15*
Yes x² (1, N =
107) = 4.12*
1
STAR Geography International Boundaries (higher criticality where appropriate)
Yes x² (1, N = 107) =
95.34*
No x² (1, N =
104) = 7.54*
Yes x² (1, N = 66)
= 13.64*
Not Yet Determined
STAR Obstacle Obstacle Symbols and Elevation
Yes x² (1, N = 107) =
107.00*
Yes x² (1, N =
107) = 7.86*
1
STAR Minimum Area/Sector Altitudes
MSA Reference Point/Center
Yes x² (1, N = 110) =
98.33*
No preference x² (1, N =
107) = 0.23
Not Yet Determined
STAR Minimum Area/Sector Altitudes
MSA Distance when other than 25nm
Yes x² (1, N = 110) =
102.15*
No preference x² (1, N =
108) = 2.37
Not Yet Determined
STAR Minimum Area/Sector Altitudes
MSA Sector Radials Yes x² (1, N = 109) =
109.00*
No preference x² (1, N =
109) = 2.65
Not Yet Determined
STAR Minimum Area/Sector Altitudes
MSA Minimum Altitudes
Yes x² (1, N = 109) =
109.00*
Yes x² (1, N =
109) = 5.73*
1
STAR Minimum Area/Sector Altitudes
Minimum Radar Altitudes and Sectors
Yes x² (1, N = 110) =
110.00*
No x² (1, N =
110) = 8.18*
Yes x² (1, N = 70)
= 4.63*
2
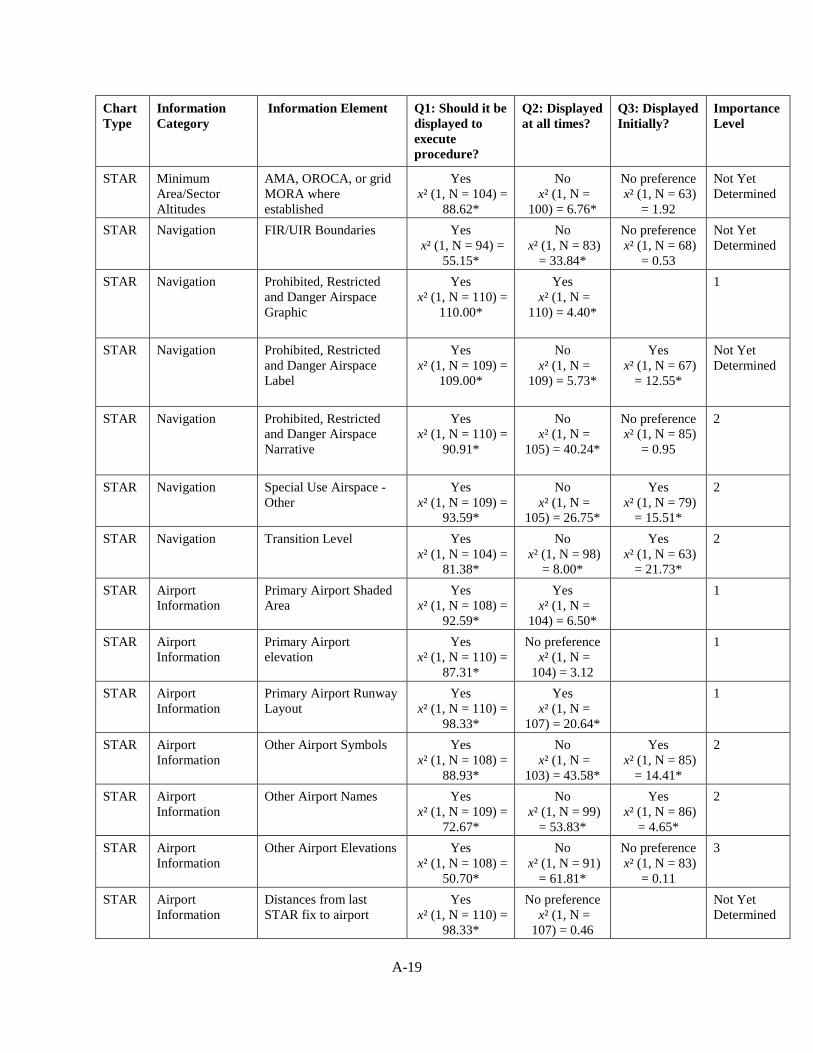
A-19
Chart Type
Information Category
Information Element Q1: Should it be displayed to execute procedure?
Q2: Displayed at all times?
Q3: Displayed Initially?
Importance Level
STAR Minimum Area/Sector Altitudes
AMA, OROCA, or grid MORA where established
Yes x² (1, N = 104) =
88.62*
No x² (1, N =
100) = 6.76*
No preference x² (1, N = 63)
= 1.92
Not Yet Determined
STAR Navigation FIR/UIR Boundaries Yes x² (1, N = 94) =
55.15*
No x² (1, N = 83)
= 33.84*
No preference x² (1, N = 68)
= 0.53
Not Yet Determined
STAR Navigation Prohibited, Restricted and Danger Airspace Graphic
Yes x² (1, N = 110) =
110.00*
Yes x² (1, N =
110) = 4.40*
1
STAR Navigation Prohibited, Restricted and Danger Airspace Label
Yes x² (1, N = 109) =
109.00*
No x² (1, N =
109) = 5.73*
Yes x² (1, N = 67)
= 12.55*
Not Yet Determined
STAR Navigation Prohibited, Restricted and Danger Airspace Narrative
Yes x² (1, N = 110) =
90.91*
No x² (1, N =
105) = 40.24*
No preference x² (1, N = 85)
= 0.95
2
STAR Navigation Special Use Airspace - Other
Yes x² (1, N = 109) =
93.59*
No x² (1, N =
105) = 26.75*
Yes x² (1, N = 79)
= 15.51*
2
STAR Navigation Transition Level Yes x² (1, N = 104) =
81.38*
No x² (1, N = 98)
= 8.00*
Yes x² (1, N = 63)
= 21.73*
2
STAR Airport Information
Primary Airport Shaded Area
Yes x² (1, N = 108) =
92.59*
Yes x² (1, N =
104) = 6.50*
1
STAR Airport Information
Primary Airport elevation
Yes x² (1, N = 110) =
87.31*
No preference x² (1, N =
104) = 3.12
1
STAR Airport Information
Primary Airport Runway Layout
Yes x² (1, N = 110) =
98.33*
Yes x² (1, N =
107) = 20.64*
1
STAR Airport Information
Other Airport Symbols Yes x² (1, N = 108) =
88.93*
No x² (1, N =
103) = 43.58*
Yes x² (1, N = 85)
= 14.41*
2
STAR Airport Information
Other Airport Names Yes x² (1, N = 109) =
72.67*
No x² (1, N = 99)
= 53.83*
Yes x² (1, N = 86)
= 4.65*
2
STAR Airport Information
Other Airport Elevations Yes x² (1, N = 108) =
50.70*
No x² (1, N = 91)
= 61.81*
No preference x² (1, N = 83)
= 0.11
3
STAR Airport Information
Distances from last STAR fix to airport
Yes x² (1, N = 110) =
98.33*
No preference x² (1, N =
107) = 0.46
Not Yet Determined
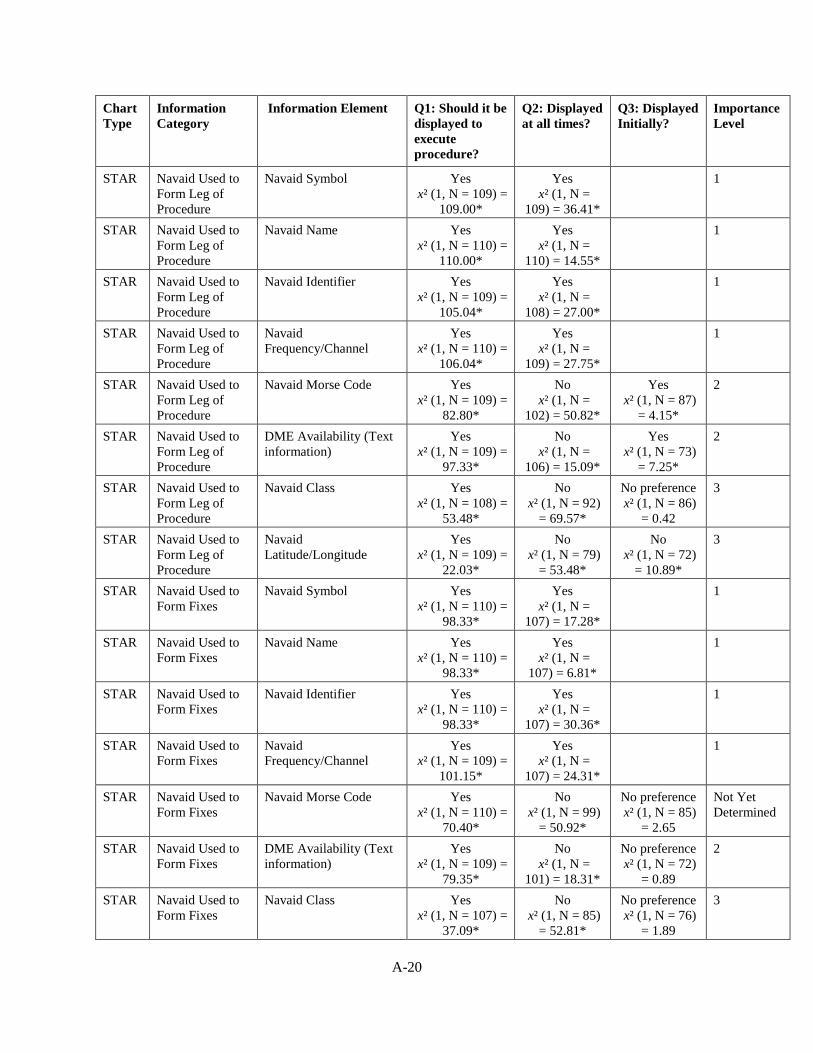
A-20
Chart Type
Information Category
Information Element Q1: Should it be displayed to execute procedure?
Q2: Displayed at all times?
Q3: Displayed Initially?
Importance Level
STAR Navaid Used to Form Leg of Procedure
Navaid Symbol Yes x² (1, N = 109) =
109.00*
Yes x² (1, N =
109) = 36.41*
1
STAR Navaid Used to Form Leg of Procedure
Navaid Name Yes x² (1, N = 110) =
110.00*
Yes x² (1, N =
110) = 14.55*
1
STAR Navaid Used to Form Leg of Procedure
Navaid Identifier Yes x² (1, N = 109) =
105.04*
Yes x² (1, N =
108) = 27.00*
1
STAR Navaid Used to Form Leg of Procedure
Navaid Frequency/Channel
Yes x² (1, N = 110) =
106.04*
Yes x² (1, N =
109) = 27.75*
1
STAR Navaid Used to Form Leg of Procedure
Navaid Morse Code Yes x² (1, N = 109) =
82.80*
No x² (1, N =
102) = 50.82*
Yes x² (1, N = 87)
= 4.15*
2
STAR Navaid Used to Form Leg of Procedure
DME Availability (Text information)
Yes x² (1, N = 109) =
97.33*
No x² (1, N =
106) = 15.09*
Yes x² (1, N = 73)
= 7.25*
2
STAR Navaid Used to Form Leg of Procedure
Navaid Class Yes x² (1, N = 108) =
53.48*
No x² (1, N = 92)
= 69.57*
No preference x² (1, N = 86)
= 0.42
3
STAR Navaid Used to Form Leg of Procedure
Navaid Latitude/Longitude
Yes x² (1, N = 109) =
22.03*
No x² (1, N = 79)
= 53.48*
No x² (1, N = 72)
= 10.89*
3
STAR Navaid Used to Form Fixes
Navaid Symbol Yes x² (1, N = 110) =
98.33*
Yes x² (1, N =
107) = 17.28*
1
STAR Navaid Used to Form Fixes
Navaid Name Yes x² (1, N = 110) =
98.33*
Yes x² (1, N =
107) = 6.81*
1
STAR Navaid Used to Form Fixes
Navaid Identifier Yes x² (1, N = 110) =
98.33*
Yes x² (1, N =
107) = 30.36*
1
STAR Navaid Used to Form Fixes
Navaid Frequency/Channel
Yes x² (1, N = 109) =
101.15*
Yes x² (1, N =
107) = 24.31*
1
STAR Navaid Used to Form Fixes
Navaid Morse Code Yes x² (1, N = 110) =
70.40*
No x² (1, N = 99)
= 50.92*
No preference x² (1, N = 85)
= 2.65
Not Yet Determined
STAR Navaid Used to Form Fixes
DME Availability (Text information)
Yes x² (1, N = 109) =
79.35*
No x² (1, N =
101) = 18.31*
No preference x² (1, N = 72)
= 0.89
2
STAR Navaid Used to Form Fixes
Navaid Class Yes x² (1, N = 107) =
37.09*
No x² (1, N = 85)
= 52.81*
No preference x² (1, N = 76)
= 1.89
3
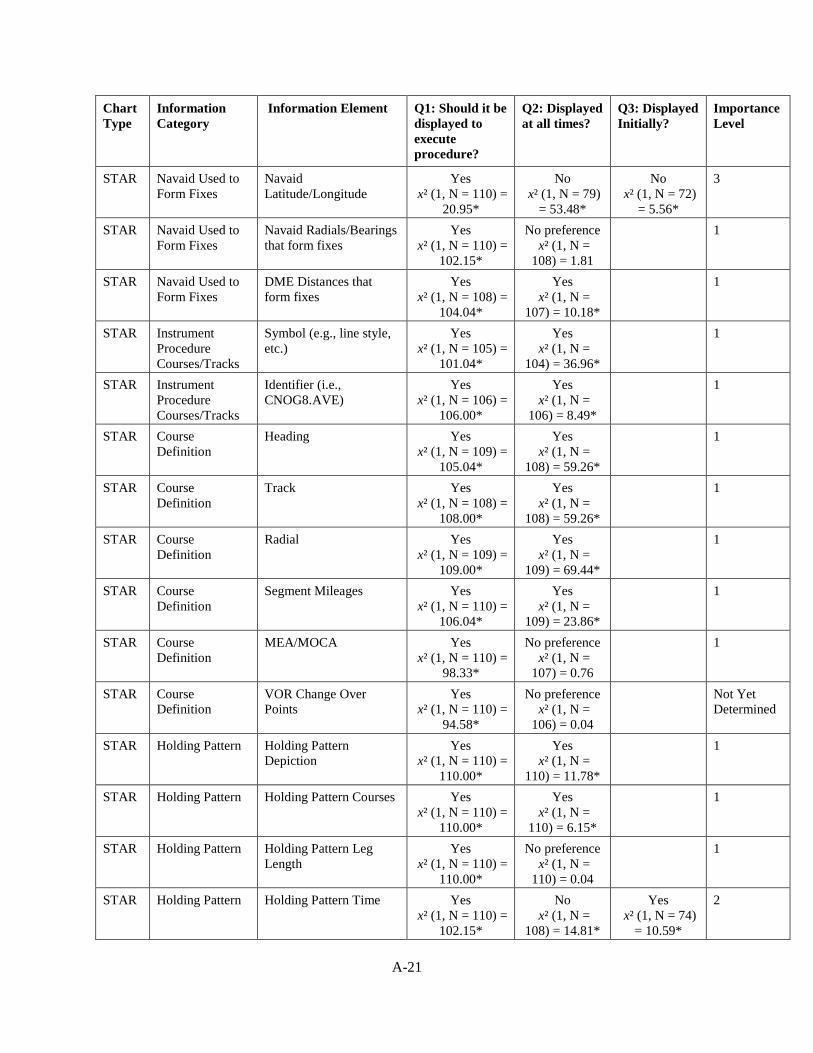
A-21
Chart Type
Information Category
Information Element Q1: Should it be displayed to execute procedure?
Q2: Displayed at all times?
Q3: Displayed Initially?
Importance Level
STAR Navaid Used to Form Fixes
Navaid Latitude/Longitude
Yes x² (1, N = 110) =
20.95*
No x² (1, N = 79)
= 53.48*
No x² (1, N = 72)
= 5.56*
3
STAR Navaid Used to Form Fixes
Navaid Radials/Bearings that form fixes
Yes x² (1, N = 110) =
102.15*
No preference x² (1, N =
108) = 1.81
1
STAR Navaid Used to Form Fixes
DME Distances that form fixes
Yes x² (1, N = 108) =
104.04*
Yes x² (1, N =
107) = 10.18*
1
STAR Instrument Procedure Courses/Tracks
Symbol (e.g., line style, etc.)
Yes x² (1, N = 105) =
101.04*
Yes x² (1, N =
104) = 36.96*
1
STAR Instrument Procedure Courses/Tracks
Identifier (i.e., CNOG8.AVE)
Yes x² (1, N = 106) =
106.00*
Yes x² (1, N =
106) = 8.49*
1
STAR Course Definition
Heading Yes x² (1, N = 109) =
105.04*
Yes x² (1, N =
108) = 59.26*
1
STAR Course Definition
Track Yes x² (1, N = 108) =
108.00*
Yes x² (1, N =
108) = 59.26*
1
STAR Course Definition
Radial Yes x² (1, N = 109) =
109.00*
Yes x² (1, N =
109) = 69.44*
1
STAR Course Definition
Segment Mileages Yes x² (1, N = 110) =
106.04*
Yes x² (1, N =
109) = 23.86*
1
STAR Course Definition
MEA/MOCA Yes x² (1, N = 110) =
98.33*
No preference x² (1, N =
107) = 0.76
1
STAR Course Definition
VOR Change Over Points
Yes x² (1, N = 110) =
94.58*
No preference x² (1, N =
106) = 0.04
Not Yet Determined
STAR Holding Pattern Holding Pattern Depiction
Yes x² (1, N = 110) =
110.00*
Yes x² (1, N =
110) = 11.78*
1
STAR Holding Pattern Holding Pattern Courses Yes x² (1, N = 110) =
110.00*
Yes x² (1, N =
110) = 6.15*
1
STAR Holding Pattern Holding Pattern Leg Length
Yes x² (1, N = 110) =
110.00*
No preference x² (1, N =
110) = 0.04
1
STAR Holding Pattern Holding Pattern Time Yes x² (1, N = 110) =
102.15*
No x² (1, N =
108) = 14.81*
Yes x² (1, N = 74)
= 10.59*
2
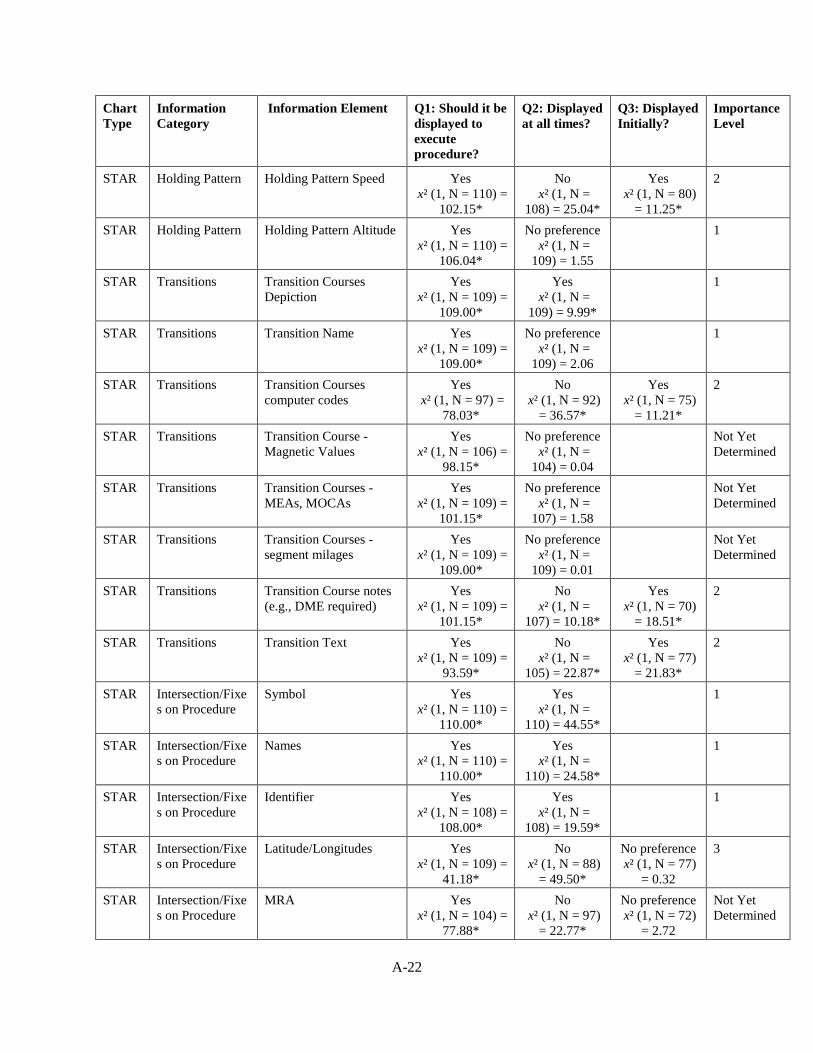
A-22
Chart Type
Information Category
Information Element Q1: Should it be displayed to execute procedure?
Q2: Displayed at all times?
Q3: Displayed Initially?
Importance Level
STAR Holding Pattern Holding Pattern Speed Yes x² (1, N = 110) =
102.15*
No x² (1, N =
108) = 25.04*
Yes x² (1, N = 80)
= 11.25*
2
STAR Holding Pattern Holding Pattern Altitude Yes x² (1, N = 110) =
106.04*
No preference x² (1, N =
109) = 1.55
1
STAR Transitions Transition Courses Depiction
Yes x² (1, N = 109) =
109.00*
Yes x² (1, N =
109) = 9.99*
1
STAR Transitions Transition Name Yes x² (1, N = 109) =
109.00*
No preference x² (1, N =
109) = 2.06
1
STAR Transitions Transition Courses computer codes
Yes x² (1, N = 97) =
78.03*
No x² (1, N = 92)
= 36.57*
Yes x² (1, N = 75)
= 11.21*
2
STAR Transitions Transition Course - Magnetic Values
Yes x² (1, N = 106) =
98.15*
No preference x² (1, N =
104) = 0.04
Not Yet Determined
STAR Transitions Transition Courses - MEAs, MOCAs
Yes x² (1, N = 109) =
101.15*
No preference x² (1, N =
107) = 1.58
Not Yet Determined
STAR Transitions Transition Courses - segment milages
Yes x² (1, N = 109) =
109.00*
No preference x² (1, N =
109) = 0.01
Not Yet Determined
STAR Transitions Transition Course notes (e.g., DME required)
Yes x² (1, N = 109) =
101.15*
No x² (1, N =
107) = 10.18*
Yes x² (1, N = 70)
= 18.51*
2
STAR Transitions Transition Text Yes x² (1, N = 109) =
93.59*
No x² (1, N =
105) = 22.87*
Yes x² (1, N = 77)
= 21.83*
2
STAR Intersection/Fixes on Procedure
Symbol Yes x² (1, N = 110) =
110.00*
Yes x² (1, N =
110) = 44.55*
1
STAR Intersection/Fixes on Procedure
Names Yes x² (1, N = 110) =
110.00*
Yes x² (1, N =
110) = 24.58*
1
STAR Intersection/Fixes on Procedure
Identifier Yes x² (1, N = 108) =
108.00*
Yes x² (1, N =
108) = 19.59*
1
STAR Intersection/Fixes on Procedure
Latitude/Longitudes Yes x² (1, N = 109) =
41.18*
No x² (1, N = 88)
= 49.50*
No preference x² (1, N = 77)
= 0.32
3
STAR Intersection/Fixes on Procedure
MRA Yes x² (1, N = 104) =
77.88*
No x² (1, N = 97)
= 22.77*
No preference x² (1, N = 72)
= 2.72
Not Yet Determined
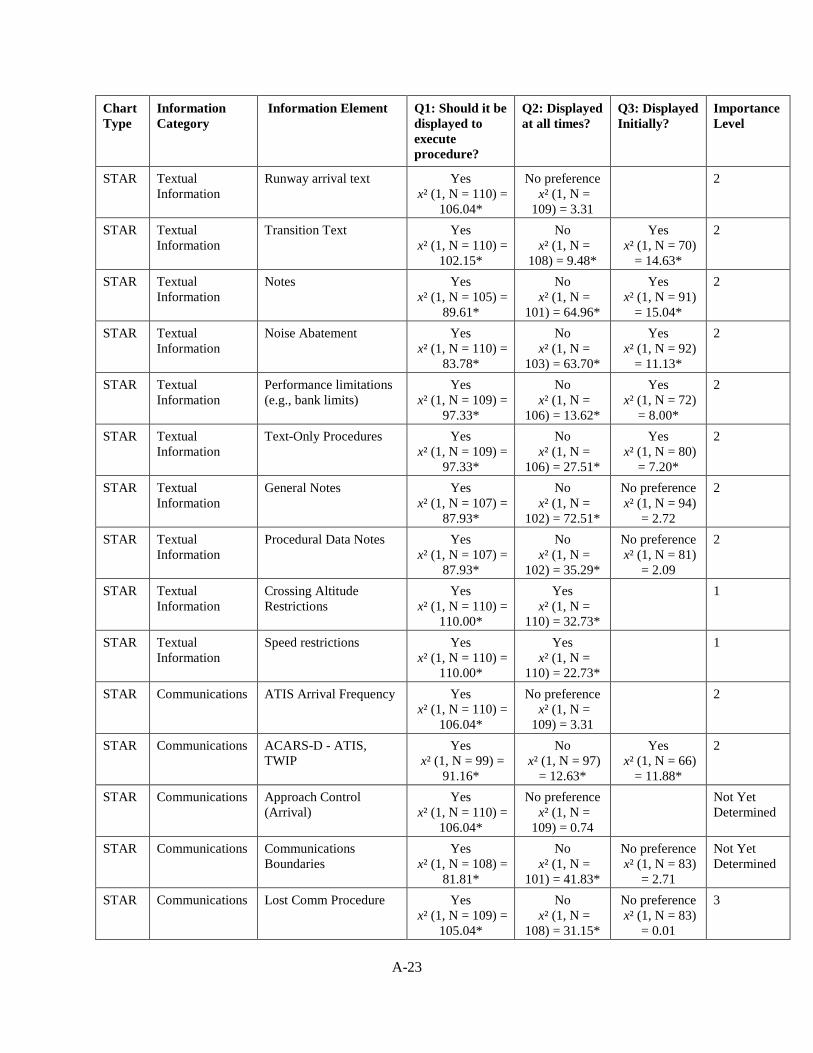
A-23
Chart Type
Information Category
Information Element Q1: Should it be displayed to execute procedure?
Q2: Displayed at all times?
Q3: Displayed Initially?
Importance Level
STAR Textual Information
Runway arrival text Yes x² (1, N = 110) =
106.04*
No preference x² (1, N =
109) = 3.31
2
STAR Textual Information
Transition Text Yes x² (1, N = 110) =
102.15*
No x² (1, N =
108) = 9.48*
Yes x² (1, N = 70)
= 14.63*
2
STAR Textual Information
Notes Yes x² (1, N = 105) =
89.61*
No x² (1, N =
101) = 64.96*
Yes x² (1, N = 91)
= 15.04*
2
STAR Textual Information
Noise Abatement Yes x² (1, N = 110) =
83.78*
No x² (1, N =
103) = 63.70*
Yes x² (1, N = 92)
= 11.13*
2
STAR Textual Information
Performance limitations (e.g., bank limits)
Yes x² (1, N = 109) =
97.33*
No x² (1, N =
106) = 13.62*
Yes x² (1, N = 72)
= 8.00*
2
STAR Textual Information
Text-Only Procedures Yes x² (1, N = 109) =
97.33*
No x² (1, N =
106) = 27.51*
Yes x² (1, N = 80)
= 7.20*
2
STAR Textual Information
General Notes Yes x² (1, N = 107) =
87.93*
No x² (1, N =
102) = 72.51*
No preference x² (1, N = 94)
= 2.72
2
STAR Textual Information
Procedural Data Notes Yes x² (1, N = 107) =
87.93*
No x² (1, N =
102) = 35.29*
No preference x² (1, N = 81)
= 2.09
2
STAR Textual Information
Crossing Altitude Restrictions
Yes x² (1, N = 110) =
110.00*
Yes x² (1, N =
110) = 32.73*
1
STAR Textual Information
Speed restrictions Yes x² (1, N = 110) =
110.00*
Yes x² (1, N =
110) = 22.73*
1
STAR Communications ATIS Arrival Frequency Yes x² (1, N = 110) =
106.04*
No preference x² (1, N =
109) = 3.31
2
STAR Communications ACARS-D - ATIS, TWIP
Yes x² (1, N = 99) =
91.16*
No x² (1, N = 97)
= 12.63*
Yes x² (1, N = 66)
= 11.88*
2
STAR Communications Approach Control (Arrival)
Yes x² (1, N = 110) =
106.04*
No preference x² (1, N =
109) = 0.74
Not Yet Determined
STAR Communications Communications Boundaries
Yes x² (1, N = 108) =
81.81*
No x² (1, N =
101) = 41.83*
No preference x² (1, N = 83)
= 2.71
Not Yet Determined
STAR Communications Lost Comm Procedure Yes x² (1, N = 109) =
105.04*
No x² (1, N =
108) = 31.15*
No preference x² (1, N = 83)
= 0.01
3
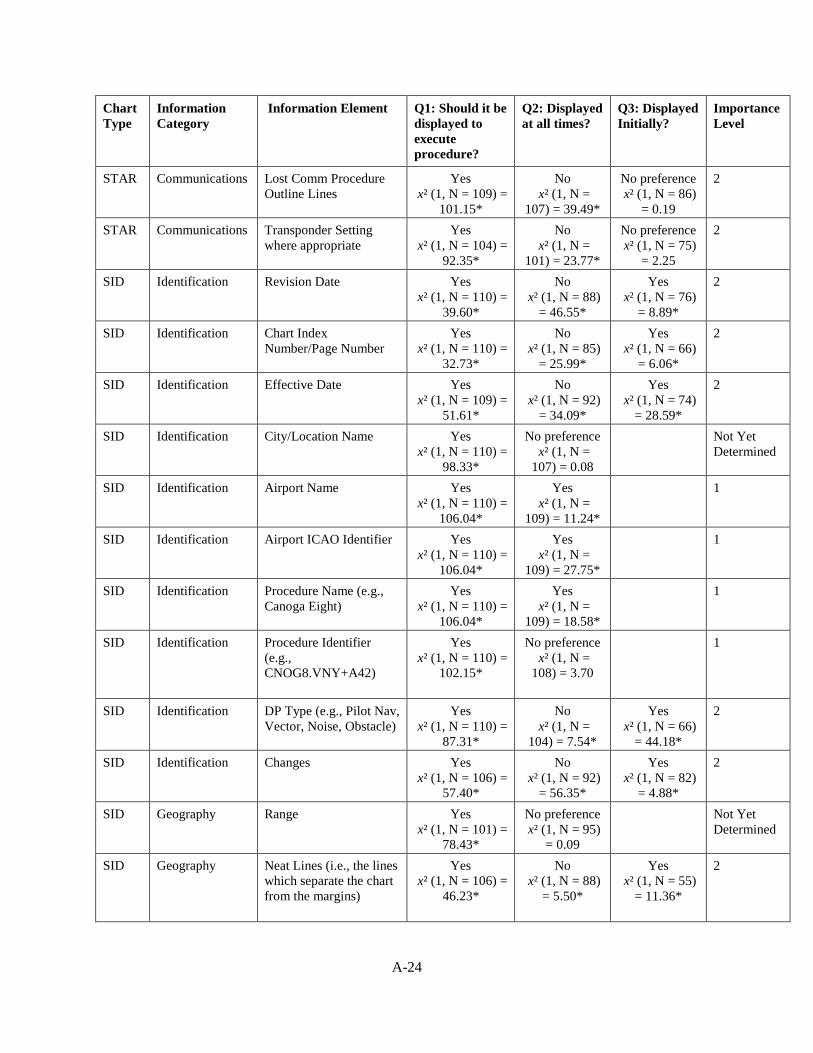
A-24
Chart Type
Information Category
Information Element Q1: Should it be displayed to execute procedure?
Q2: Displayed at all times?
Q3: Displayed Initially?
Importance Level
STAR Communications Lost Comm Procedure Outline Lines
Yes x² (1, N = 109) =
101.15*
No x² (1, N =
107) = 39.49*
No preference x² (1, N = 86)
= 0.19
2
STAR Communications Transponder Setting where appropriate
Yes x² (1, N = 104) =
92.35*
No x² (1, N =
101) = 23.77*
No preference x² (1, N = 75)
= 2.25
2
SID Identification Revision Date Yes x² (1, N = 110) =
39.60*
No x² (1, N = 88)
= 46.55*
Yes x² (1, N = 76)
= 8.89*
2
SID Identification Chart Index Number/Page Number
Yes x² (1, N = 110) =
32.73*
No x² (1, N = 85)
= 25.99*
Yes x² (1, N = 66)
= 6.06*
2
SID Identification Effective Date Yes x² (1, N = 109) =
51.61*
No x² (1, N = 92)
= 34.09*
Yes x² (1, N = 74)
= 28.59*
2
SID Identification City/Location Name Yes x² (1, N = 110) =
98.33*
No preference x² (1, N =
107) = 0.08
Not Yet Determined
SID Identification Airport Name Yes x² (1, N = 110) =
106.04*
Yes x² (1, N =
109) = 11.24*
1
SID Identification Airport ICAO Identifier Yes x² (1, N = 110) =
106.04*
Yes x² (1, N =
109) = 27.75*
1
SID Identification Procedure Name (e.g., Canoga Eight)
Yes x² (1, N = 110) =
106.04*
Yes x² (1, N =
109) = 18.58*
1
SID Identification Procedure Identifier (e.g., CNOG8.VNY+A42)
Yes x² (1, N = 110) =
102.15*
No preference x² (1, N =
108) = 3.70
1
SID Identification DP Type (e.g., Pilot Nav, Vector, Noise, Obstacle)
Yes x² (1, N = 110) =
87.31*
No x² (1, N =
104) = 7.54*
Yes x² (1, N = 66)
= 44.18*
2
SID Identification Changes Yes x² (1, N = 106) =
57.40*
No x² (1, N = 92)
= 56.35*
Yes x² (1, N = 82)
= 4.88*
2
SID Geography Range Yes x² (1, N = 101) =
78.43*
No preference x² (1, N = 95)
= 0.09
Not Yet Determined
SID Geography Neat Lines (i.e., the lines which separate the chart from the margins)
Yes x² (1, N = 106) =
46.23*
No x² (1, N = 88)
= 5.50*
Yes x² (1, N = 55)
= 11.36*
2
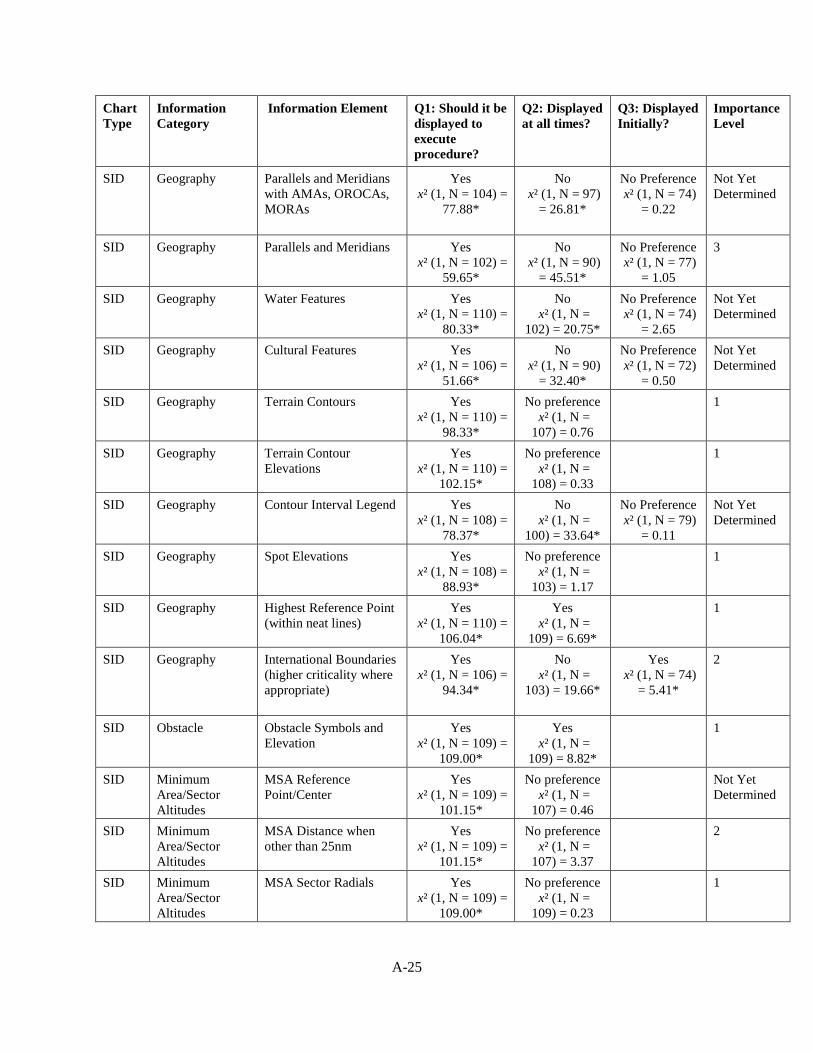
A-25
Chart Type
Information Category
Information Element Q1: Should it be displayed to execute procedure?
Q2: Displayed at all times?
Q3: Displayed Initially?
Importance Level
SID Geography Parallels and Meridians with AMAs, OROCAs, MORAs
Yes x² (1, N = 104) =
77.88*
No x² (1, N = 97)
= 26.81*
No Preference x² (1, N = 74)
= 0.22
Not Yet Determined
SID Geography Parallels and Meridians Yes x² (1, N = 102) =
59.65*
No x² (1, N = 90)
= 45.51*
No Preference x² (1, N = 77)
= 1.05
3
SID Geography Water Features Yes x² (1, N = 110) =
80.33*
No x² (1, N =
102) = 20.75*
No Preference x² (1, N = 74)
= 2.65
Not Yet Determined
SID Geography Cultural Features Yes x² (1, N = 106) =
51.66*
No x² (1, N = 90)
= 32.40*
No Preference x² (1, N = 72)
= 0.50
Not Yet Determined
SID Geography Terrain Contours Yes x² (1, N = 110) =
98.33*
No preference x² (1, N =
107) = 0.76
1
SID Geography Terrain Contour Elevations
Yes x² (1, N = 110) =
102.15*
No preference x² (1, N =
108) = 0.33
1
SID Geography Contour Interval Legend Yes x² (1, N = 108) =
78.37*
No x² (1, N =
100) = 33.64*
No Preference x² (1, N = 79)
= 0.11
Not Yet Determined
SID Geography Spot Elevations Yes x² (1, N = 108) =
88.93*
No preference x² (1, N =
103) = 1.17
1
SID Geography Highest Reference Point (within neat lines)
Yes x² (1, N = 110) =
106.04*
Yes x² (1, N =
109) = 6.69*
1
SID Geography International Boundaries (higher criticality where appropriate)
Yes x² (1, N = 106) =
94.34*
No x² (1, N =
103) = 19.66*
Yes x² (1, N = 74)
= 5.41*
2
SID Obstacle Obstacle Symbols and Elevation
Yes x² (1, N = 109) =
109.00*
Yes x² (1, N =
109) = 8.82*
1
SID Minimum Area/Sector Altitudes
MSA Reference Point/Center
Yes x² (1, N = 109) =
101.15*
No preference x² (1, N =
107) = 0.46
Not Yet Determined
SID Minimum Area/Sector Altitudes
MSA Distance when other than 25nm
Yes x² (1, N = 109) =
101.15*
No preference x² (1, N =
107) = 3.37
2
SID Minimum Area/Sector Altitudes
MSA Sector Radials Yes x² (1, N = 109) =
109.00*
No preference x² (1, N =
109) = 0.23
1
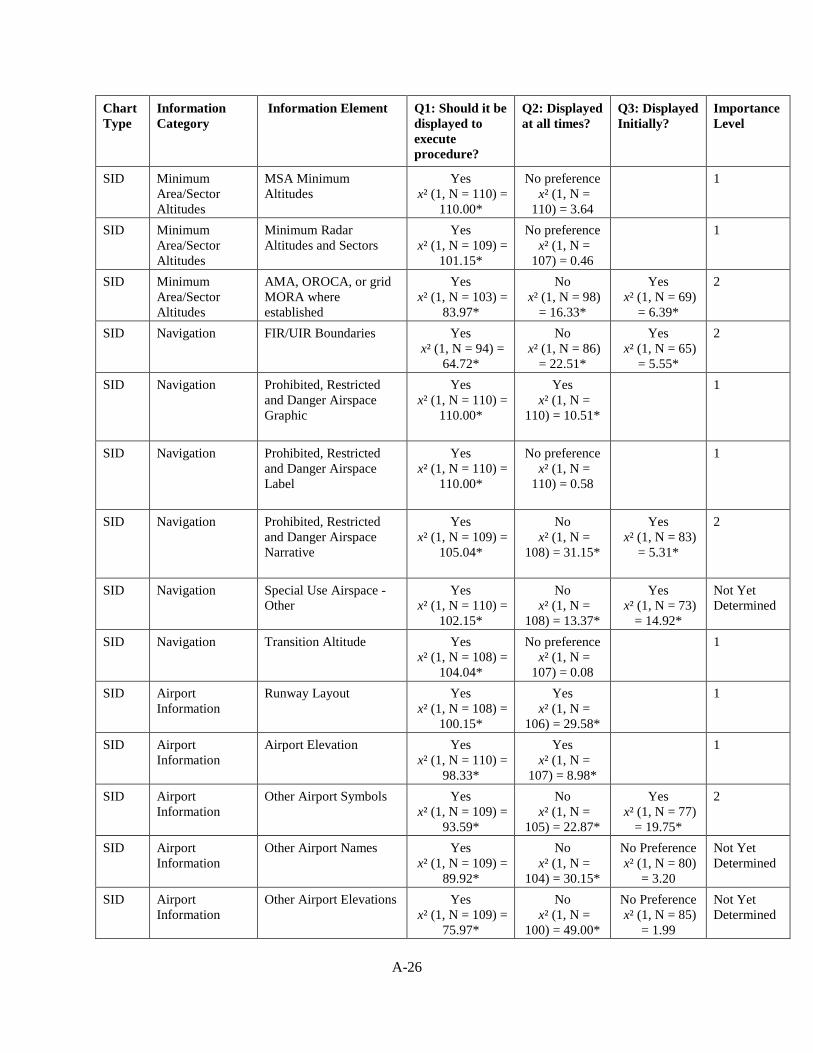
A-26
Chart Type
Information Category
Information Element Q1: Should it be displayed to execute procedure?
Q2: Displayed at all times?
Q3: Displayed Initially?
Importance Level
SID Minimum Area/Sector Altitudes
MSA Minimum Altitudes
Yes x² (1, N = 110) =
110.00*
No preference x² (1, N =
110) = 3.64
1
SID Minimum Area/Sector Altitudes
Minimum Radar Altitudes and Sectors
Yes x² (1, N = 109) =
101.15*
No preference x² (1, N =
107) = 0.46
1
SID Minimum Area/Sector Altitudes
AMA, OROCA, or grid MORA where established
Yes x² (1, N = 103) =
83.97*
No x² (1, N = 98)
= 16.33*
Yes x² (1, N = 69)
= 6.39*
2
SID Navigation FIR/UIR Boundaries Yes x² (1, N = 94) =
64.72*
No x² (1, N = 86)
= 22.51*
Yes x² (1, N = 65)
= 5.55*
2
SID Navigation Prohibited, Restricted and Danger Airspace Graphic
Yes x² (1, N = 110) =
110.00*
Yes x² (1, N =
110) = 10.51*
1
SID Navigation Prohibited, Restricted and Danger Airspace Label
Yes x² (1, N = 110) =
110.00*
No preference x² (1, N =
110) = 0.58
1
SID Navigation Prohibited, Restricted and Danger Airspace Narrative
Yes x² (1, N = 109) =
105.04*
No x² (1, N =
108) = 31.15*
Yes x² (1, N = 83)
= 5.31*
2
SID Navigation Special Use Airspace - Other
Yes x² (1, N = 110) =
102.15*
No x² (1, N =
108) = 13.37*
Yes x² (1, N = 73)
= 14.92*
Not Yet Determined
SID Navigation Transition Altitude Yes x² (1, N = 108) =
104.04*
No preference x² (1, N =
107) = 0.08
1
SID Airport Information
Runway Layout Yes x² (1, N = 108) =
100.15*
Yes x² (1, N =
106) = 29.58*
1
SID Airport Information
Airport Elevation Yes x² (1, N = 110) =
98.33*
Yes x² (1, N =
107) = 8.98*
1
SID Airport Information
Other Airport Symbols Yes x² (1, N = 109) =
93.59*
No x² (1, N =
105) = 22.87*
Yes x² (1, N = 77)
= 19.75*
2
SID Airport Information
Other Airport Names Yes x² (1, N = 109) =
89.92*
No x² (1, N =
104) = 30.15*
No Preference x² (1, N = 80)
= 3.20
Not Yet Determined
SID Airport Information
Other Airport Elevations Yes x² (1, N = 109) =
75.97*
No x² (1, N =
100) = 49.00*
No Preference x² (1, N = 85)
= 1.99
Not Yet Determined
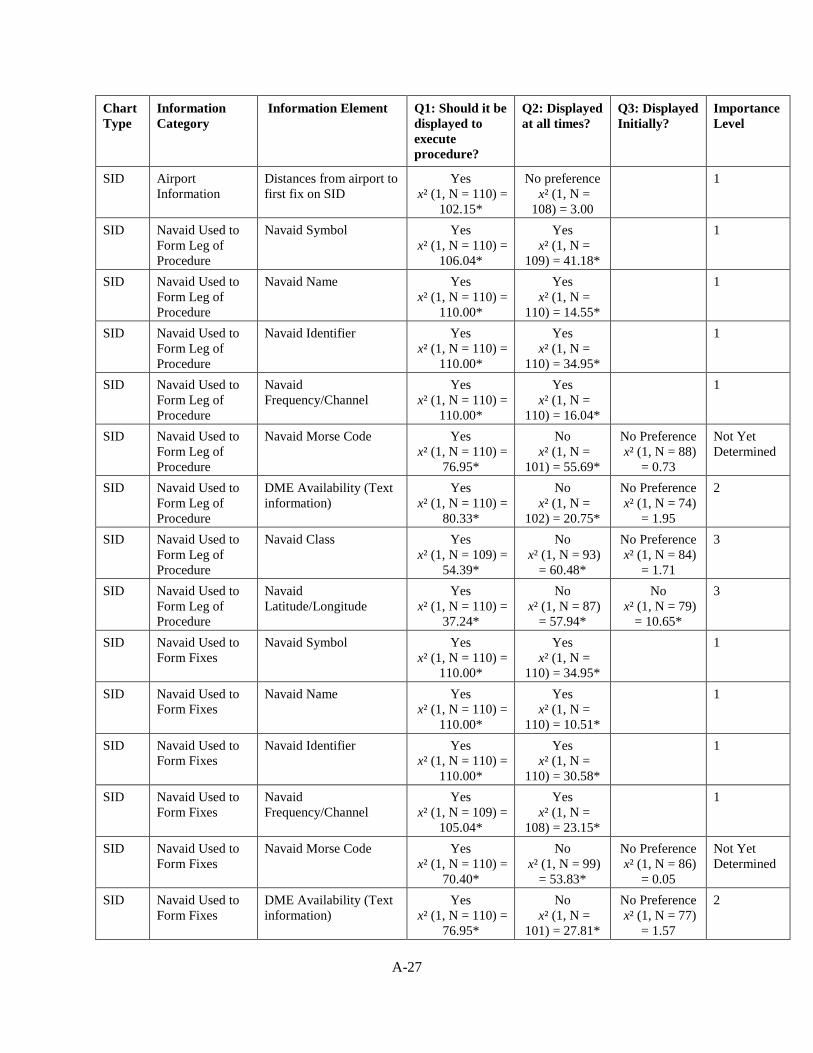
A-27
Chart Type
Information Category
Information Element Q1: Should it be displayed to execute procedure?
Q2: Displayed at all times?
Q3: Displayed Initially?
Importance Level
SID Airport Information
Distances from airport to first fix on SID
Yes x² (1, N = 110) =
102.15*
No preference x² (1, N =
108) = 3.00
1
SID Navaid Used to Form Leg of Procedure
Navaid Symbol Yes x² (1, N = 110) =
106.04*
Yes x² (1, N =
109) = 41.18*
1
SID Navaid Used to Form Leg of Procedure
Navaid Name Yes x² (1, N = 110) =
110.00*
Yes x² (1, N =
110) = 14.55*
1
SID Navaid Used to Form Leg of Procedure
Navaid Identifier Yes x² (1, N = 110) =
110.00*
Yes x² (1, N =
110) = 34.95*
1
SID Navaid Used to Form Leg of Procedure
Navaid Frequency/Channel
Yes x² (1, N = 110) =
110.00*
Yes x² (1, N =
110) = 16.04*
1
SID Navaid Used to Form Leg of Procedure
Navaid Morse Code Yes x² (1, N = 110) =
76.95*
No x² (1, N =
101) = 55.69*
No Preference x² (1, N = 88)
= 0.73
Not Yet Determined
SID Navaid Used to Form Leg of Procedure
DME Availability (Text information)
Yes x² (1, N = 110) =
80.33*
No x² (1, N =
102) = 20.75*
No Preference x² (1, N = 74)
= 1.95
2
SID Navaid Used to Form Leg of Procedure
Navaid Class Yes x² (1, N = 109) =
54.39*
No x² (1, N = 93)
= 60.48*
No Preference x² (1, N = 84)
= 1.71
3
SID Navaid Used to Form Leg of Procedure
Navaid Latitude/Longitude
Yes x² (1, N = 110) =
37.24*
No x² (1, N = 87)
= 57.94*
No x² (1, N = 79)
= 10.65*
3
SID Navaid Used to Form Fixes
Navaid Symbol Yes x² (1, N = 110) =
110.00*
Yes x² (1, N =
110) = 34.95*
1
SID Navaid Used to Form Fixes
Navaid Name Yes x² (1, N = 110) =
110.00*
Yes x² (1, N =
110) = 10.51*
1
SID Navaid Used to Form Fixes
Navaid Identifier Yes x² (1, N = 110) =
110.00*
Yes x² (1, N =
110) = 30.58*
1
SID Navaid Used to Form Fixes
Navaid Frequency/Channel
Yes x² (1, N = 109) =
105.04*
Yes x² (1, N =
108) = 23.15*
1
SID Navaid Used to Form Fixes
Navaid Morse Code Yes x² (1, N = 110) =
70.40*
No x² (1, N = 99)
= 53.83*
No Preference x² (1, N = 86)
= 0.05
Not Yet Determined
SID Navaid Used to Form Fixes
DME Availability (Text information)
Yes x² (1, N = 110) =
76.95*
No x² (1, N =
101) = 27.81*
No Preference x² (1, N = 77)
= 1.57
2
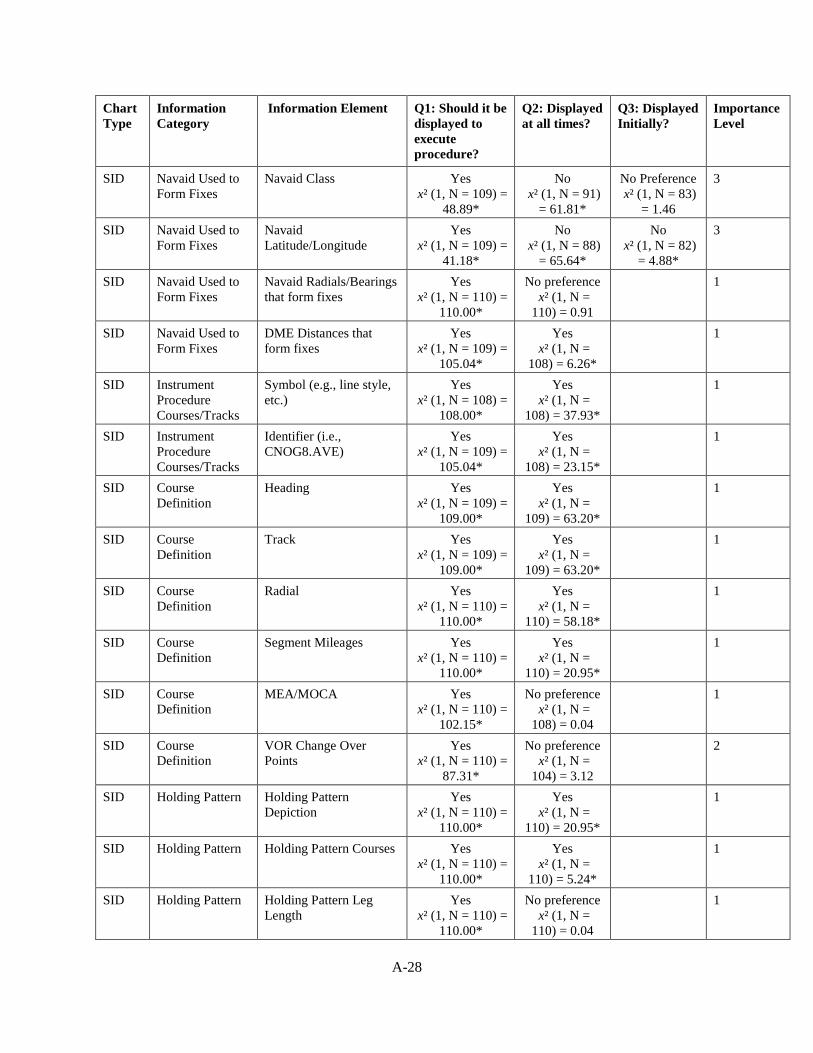
A-28
Chart Type
Information Category
Information Element Q1: Should it be displayed to execute procedure?
Q2: Displayed at all times?
Q3: Displayed Initially?
Importance Level
SID Navaid Used to Form Fixes
Navaid Class Yes x² (1, N = 109) =
48.89*
No x² (1, N = 91)
= 61.81*
No Preference x² (1, N = 83)
= 1.46
3
SID Navaid Used to Form Fixes
Navaid Latitude/Longitude
Yes x² (1, N = 109) =
41.18*
No x² (1, N = 88)
= 65.64*
No x² (1, N = 82)
= 4.88*
3
SID Navaid Used to Form Fixes
Navaid Radials/Bearings that form fixes
Yes x² (1, N = 110) =
110.00*
No preference x² (1, N =
110) = 0.91
1
SID Navaid Used to Form Fixes
DME Distances that form fixes
Yes x² (1, N = 109) =
105.04*
Yes x² (1, N =
108) = 6.26*
1
SID Instrument Procedure Courses/Tracks
Symbol (e.g., line style, etc.)
Yes x² (1, N = 108) =
108.00*
Yes x² (1, N =
108) = 37.93*
1
SID Instrument Procedure Courses/Tracks
Identifier (i.e., CNOG8.AVE)
Yes x² (1, N = 109) =
105.04*
Yes x² (1, N =
108) = 23.15*
1
SID Course Definition
Heading Yes x² (1, N = 109) =
109.00*
Yes x² (1, N =
109) = 63.20*
1
SID Course Definition
Track Yes x² (1, N = 109) =
109.00*
Yes x² (1, N =
109) = 63.20*
1
SID Course Definition
Radial Yes x² (1, N = 110) =
110.00*
Yes x² (1, N =
110) = 58.18*
1
SID Course Definition
Segment Mileages Yes x² (1, N = 110) =
110.00*
Yes x² (1, N =
110) = 20.95*
1
SID Course Definition
MEA/MOCA Yes x² (1, N = 110) =
102.15*
No preference x² (1, N =
108) = 0.04
1
SID Course Definition
VOR Change Over Points
Yes x² (1, N = 110) =
87.31*
No preference x² (1, N =
104) = 3.12
2
SID Holding Pattern Holding Pattern Depiction
Yes x² (1, N = 110) =
110.00*
Yes x² (1, N =
110) = 20.95*
1
SID Holding Pattern Holding Pattern Courses Yes x² (1, N = 110) =
110.00*
Yes x² (1, N =
110) = 5.24*
1
SID Holding Pattern Holding Pattern Leg Length
Yes x² (1, N = 110) =
110.00*
No preference x² (1, N =
110) = 0.04
1
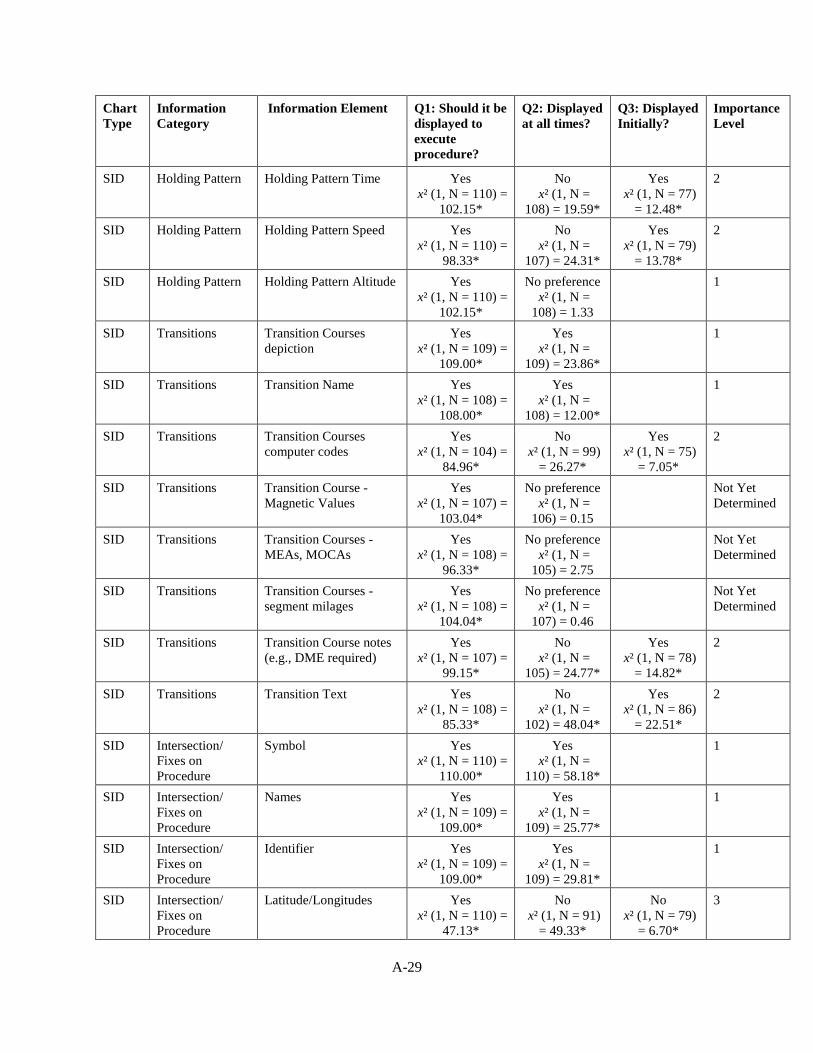
A-29
Chart Type
Information Category
Information Element Q1: Should it be displayed to execute procedure?
Q2: Displayed at all times?
Q3: Displayed Initially?
Importance Level
SID Holding Pattern Holding Pattern Time Yes x² (1, N = 110) =
102.15*
No x² (1, N =
108) = 19.59*
Yes x² (1, N = 77)
= 12.48*
2
SID Holding Pattern Holding Pattern Speed Yes x² (1, N = 110) =
98.33*
No x² (1, N =
107) = 24.31*
Yes x² (1, N = 79)
= 13.78*
2
SID Holding Pattern Holding Pattern Altitude Yes x² (1, N = 110) =
102.15*
No preference x² (1, N =
108) = 1.33
1
SID Transitions Transition Courses depiction
Yes x² (1, N = 109) =
109.00*
Yes x² (1, N =
109) = 23.86*
1
SID Transitions Transition Name Yes x² (1, N = 108) =
108.00*
Yes x² (1, N =
108) = 12.00*
1
SID Transitions Transition Courses computer codes
Yes x² (1, N = 104) =
84.96*
No x² (1, N = 99)
= 26.27*
Yes x² (1, N = 75)
= 7.05*
2
SID Transitions Transition Course - Magnetic Values
Yes x² (1, N = 107) =
103.04*
No preference x² (1, N =
106) = 0.15
Not Yet Determined
SID Transitions Transition Courses - MEAs, MOCAs
Yes x² (1, N = 108) =
96.33*
No preference x² (1, N =
105) = 2.75
Not Yet Determined
SID Transitions Transition Courses - segment milages
Yes x² (1, N = 108) =
104.04*
No preference x² (1, N =
107) = 0.46
Not Yet Determined
SID Transitions Transition Course notes (e.g., DME required)
Yes x² (1, N = 107) =
99.15*
No x² (1, N =
105) = 24.77*
Yes x² (1, N = 78)
= 14.82*
2
SID Transitions Transition Text Yes x² (1, N = 108) =
85.33*
No x² (1, N =
102) = 48.04*
Yes x² (1, N = 86)
= 22.51*
2
SID Intersection/ Fixes on Procedure
Symbol Yes x² (1, N = 110) =
110.00*
Yes x² (1, N =
110) = 58.18*
1
SID Intersection/ Fixes on Procedure
Names Yes x² (1, N = 109) =
109.00*
Yes x² (1, N =
109) = 25.77*
1
SID Intersection/ Fixes on Procedure
Identifier Yes x² (1, N = 109) =
109.00*
Yes x² (1, N =
109) = 29.81*
1
SID Intersection/ Fixes on Procedure
Latitude/Longitudes Yes x² (1, N = 110) =
47.13*
No x² (1, N = 91)
= 49.33*
No x² (1, N = 79)
= 6.70*
3
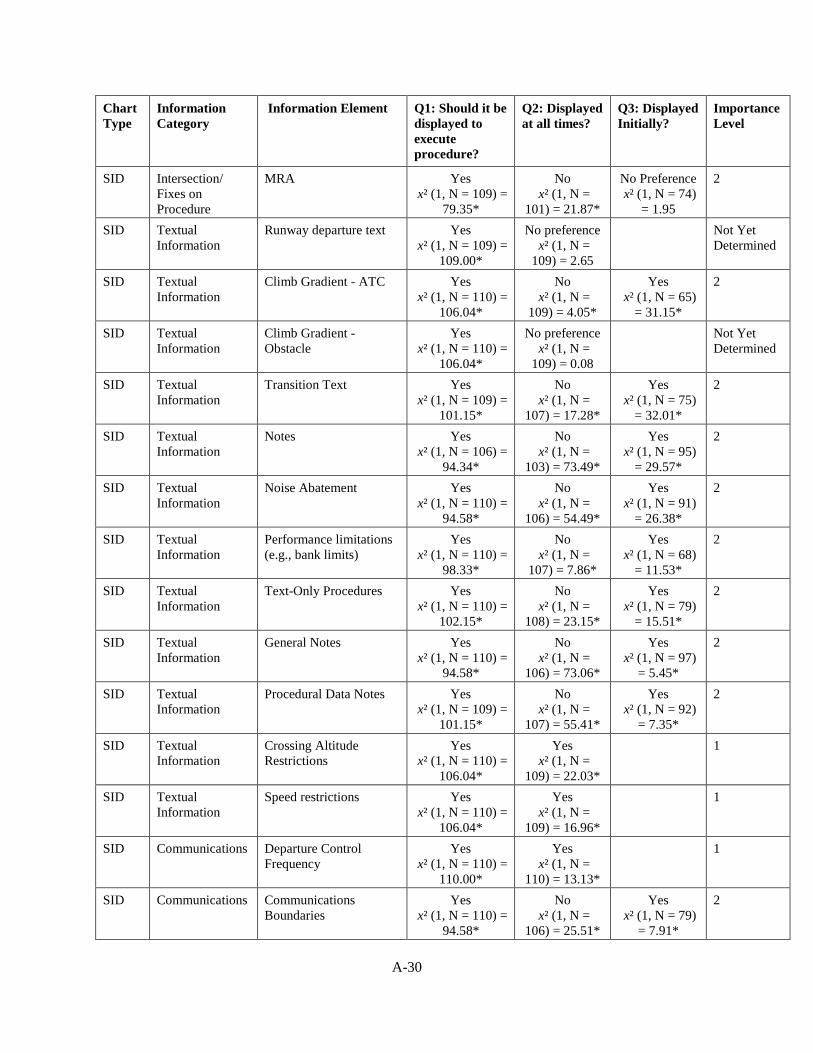
A-30
Chart Type
Information Category
Information Element Q1: Should it be displayed to execute procedure?
Q2: Displayed at all times?
Q3: Displayed Initially?
Importance Level
SID Intersection/ Fixes on Procedure
MRA Yes x² (1, N = 109) =
79.35*
No x² (1, N =
101) = 21.87*
No Preference x² (1, N = 74)
= 1.95
2
SID Textual Information
Runway departure text Yes x² (1, N = 109) =
109.00*
No preference x² (1, N =
109) = 2.65
Not Yet Determined
SID Textual Information
Climb Gradient - ATC Yes x² (1, N = 110) =
106.04*
No x² (1, N =
109) = 4.05*
Yes x² (1, N = 65)
= 31.15*
2
SID Textual Information
Climb Gradient - Obstacle
Yes x² (1, N = 110) =
106.04*
No preference x² (1, N =
109) = 0.08
Not Yet Determined
SID Textual Information
Transition Text Yes x² (1, N = 109) =
101.15*
No x² (1, N =
107) = 17.28*
Yes x² (1, N = 75)
= 32.01*
2
SID Textual Information
Notes Yes x² (1, N = 106) =
94.34*
No x² (1, N =
103) = 73.49*
Yes x² (1, N = 95)
= 29.57*
2
SID Textual Information
Noise Abatement Yes x² (1, N = 110) =
94.58*
No x² (1, N =
106) = 54.49*
Yes x² (1, N = 91)
= 26.38*
2
SID Textual Information
Performance limitations (e.g., bank limits)
Yes x² (1, N = 110) =
98.33*
No x² (1, N =
107) = 7.86*
Yes x² (1, N = 68)
= 11.53*
2
SID Textual Information
Text-Only Procedures Yes x² (1, N = 110) =
102.15*
No x² (1, N =
108) = 23.15*
Yes x² (1, N = 79)
= 15.51*
2
SID Textual Information
General Notes Yes x² (1, N = 110) =
94.58*
No x² (1, N =
106) = 73.06*
Yes x² (1, N = 97)
= 5.45*
2
SID Textual Information
Procedural Data Notes Yes x² (1, N = 109) =
101.15*
No x² (1, N =
107) = 55.41*
Yes x² (1, N = 92)
= 7.35*
2
SID Textual Information
Crossing Altitude Restrictions
Yes x² (1, N = 110) =
106.04*
Yes x² (1, N =
109) = 22.03*
1
SID Textual Information
Speed restrictions Yes x² (1, N = 110) =
106.04*
Yes x² (1, N =
109) = 16.96*
1
SID Communications Departure Control Frequency
Yes x² (1, N = 110) =
110.00*
Yes x² (1, N =
110) = 13.13*
1
SID Communications Communications Boundaries
Yes x² (1, N = 110) =
94.58*
No x² (1, N =
106) = 25.51*
Yes x² (1, N = 79)
= 7.91*
2
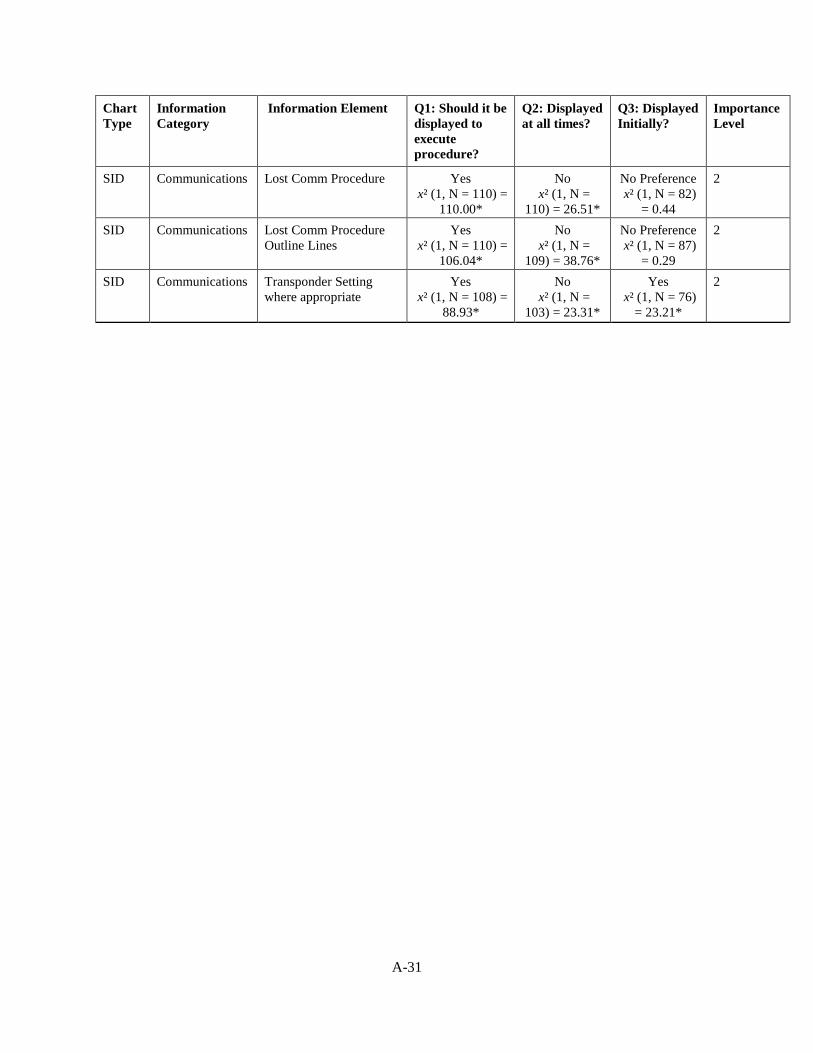
A-31
Chart Type
Information Category
Information Element Q1: Should it be displayed to execute procedure?
Q2: Displayed at all times?
Q3: Displayed Initially?
Importance Level
SID Communications Lost Comm Procedure Yes x² (1, N = 110) =
110.00*
No x² (1, N =
110) = 26.51*
No Preference x² (1, N = 82)
= 0.44
2
SID Communications Lost Comm Procedure Outline Lines
Yes x² (1, N = 110) =
106.04*
No x² (1, N =
109) = 38.76*
No Preference x² (1, N = 87)
= 0.29
2
SID Communications Transponder Setting where appropriate
Yes x² (1, N = 108) =
88.93*
No x² (1, N =
103) = 23.31*
Yes x² (1, N = 76)
= 23.21*
2