evolutionbiodiversity.pdf - squarespace
TRANSCRIPT
Answer all the questions.
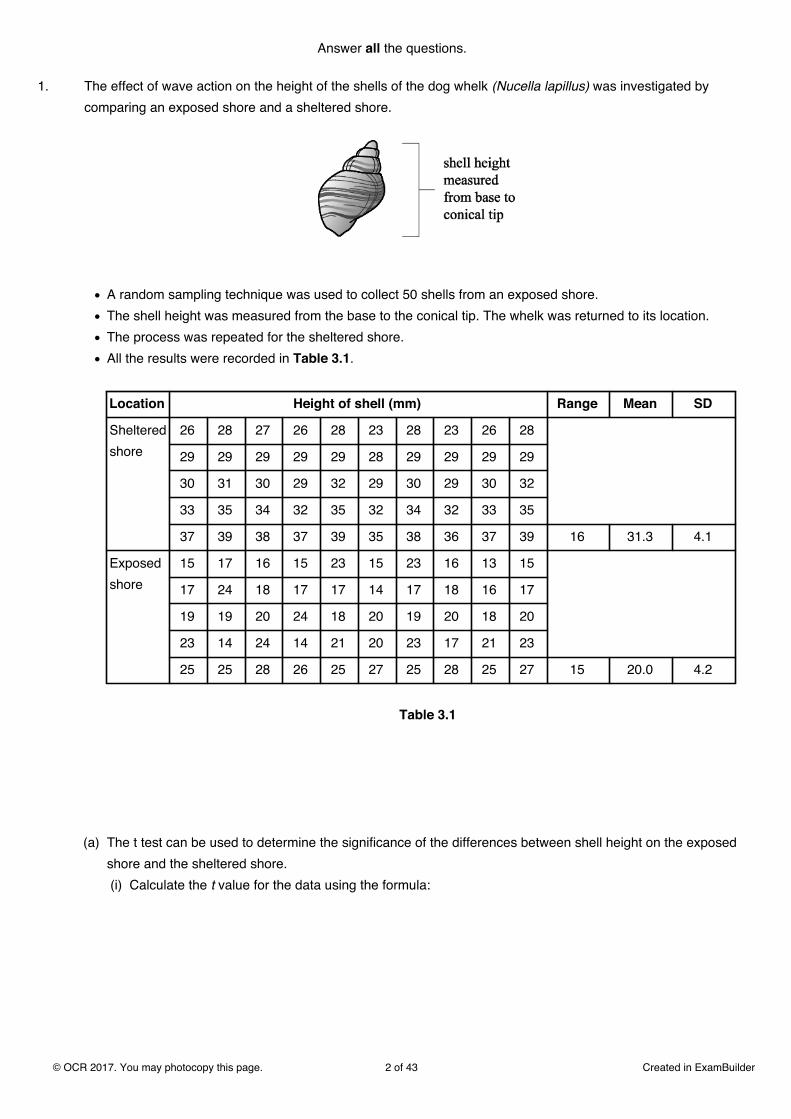
1. The effect of wave action on the height of the shells of the dog whelk (Nucella lapillus) was investigated bycomparing an exposed shore and a sheltered shore.
A random sampling technique was used to collect 50 shells from an exposed shore.The shell height was measured from the base to the conical tip. The whelk was returned to its location.The process was repeated for the sheltered shore.All the results were recorded in Table 3.1.
Location Height of shell (mm) Range Mean SD
Shelteredshore
26 28 27 26 28 23 28 23 26 28
29 29 29 29 29 28 29 29 29 29
30 31 30 29 32 29 30 29 30 32
33 35 34 32 35 32 34 32 33 35
37 39 38 37 39 35 38 36 37 39 16 31.3 4.1
Exposedshore
15 17 16 15 23 15 23 16 13 15
17 24 18 17 17 14 17 18 16 17
19 19 20 24 18 20 19 20 18 20
23 14 24 14 21 20 23 17 21 23
25 25 28 26 25 27 25 28 25 27 15 20.0 4.2
Table 3.1
(a) The t test can be used to determine the significance of the differences between shell height on the exposedshore and the sheltered shore. (i) Calculate the t value for the data using the formula:
© OCR 2017. You may photocopy this page. 2 of 43 Created in ExamBuilder
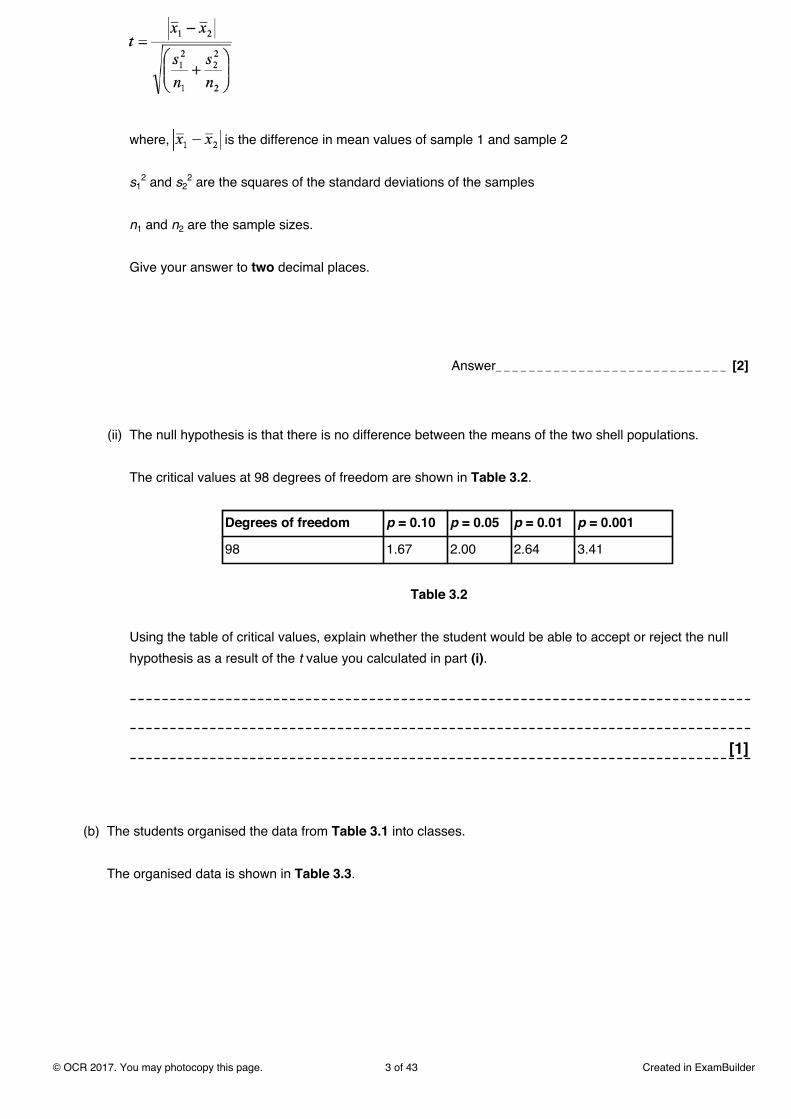
where, is the difference in mean values of sample 1 and sample 2
s12 and s2
2 are the squares of the standard deviations of the samples
n1 and n2 are the sample sizes.
Give your answer to two decimal places.
Answer_ _ _ _ _ _ _ _ _ _ _ _ _ _ _ _ _ _ _ _ _ _ _ _ _ _ _ _ [2]
(ii) The null hypothesis is that there is no difference between the means of the two shell populations.
The critical values at 98 degrees of freedom are shown in Table 3.2.
Degrees of freedom p = 0.10 p = 0.05 p = 0.01 p = 0.001
98 1.67 2.00 2.64 3.41
Table 3.2
Using the table of critical values, explain whether the student would be able to accept or reject the nullhypothesis as a result of the t value you calculated in part (i).
[1]
(b) The students organised the data from Table 3.1 into classes.
The organised data is shown in Table 3.3.
© OCR 2017. You may photocopy this page. 3 of 43 Created in ExamBuilder
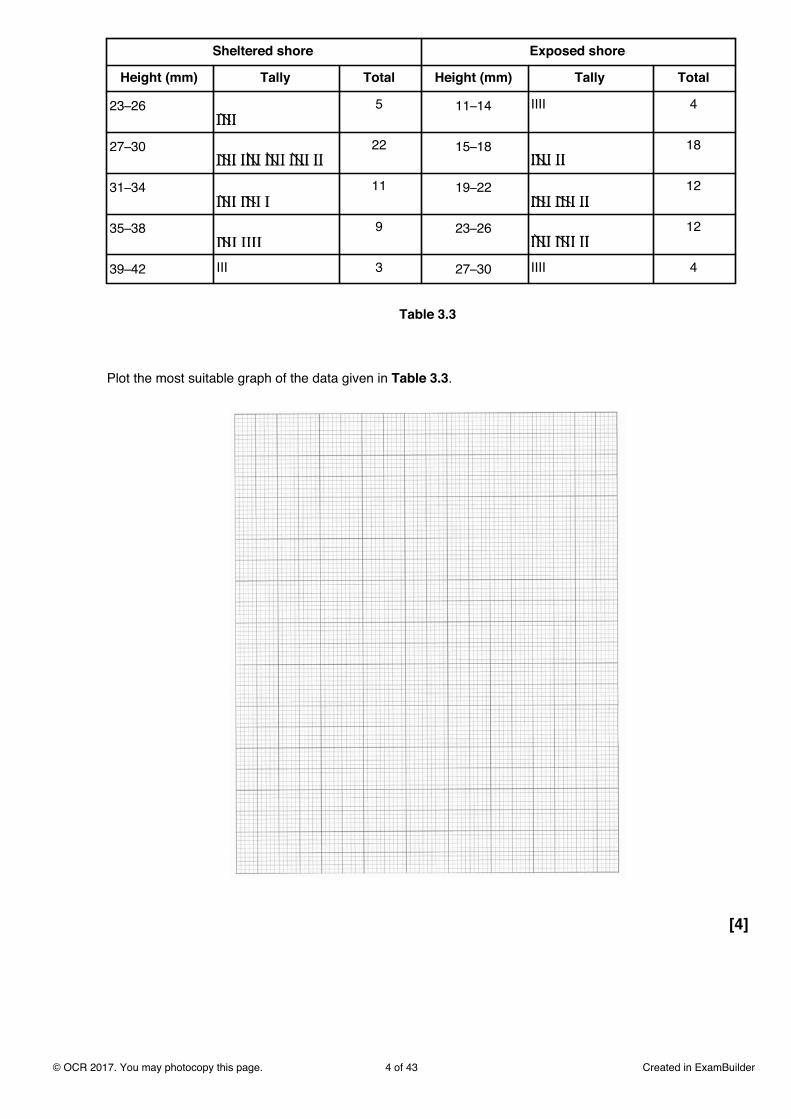
Sheltered shore Exposed shore
Height (mm) Tally Total Height (mm) Tally Total
23–26 5 11–14 IIII 4
27–30 22 15–18 18
31–34 11 19–22 12
35–38 9 23–26 12
39–42 III 3 27–30 IIII 4
Table 3.3
Plot the most suitable graph of the data given in Table 3.3.
[4]
© OCR 2017. You may photocopy this page. 4 of 43 Created in ExamBuilder

(c) Use the data and graph to discuss any correlation between the height of the whelk shell and the type ofshore.
Suggest explanations for your findings.
[3]
(d) Suggest a limitation of the procedure used to gather the data in this experiment and recommend how youcould improve this.
[2]
(e) How could the students improve the accuracy of their data?
[1]
(f) Discuss the validity of the conclusions you have made during this experiment.
[3]
© OCR 2017. You may photocopy this page. 5 of 43 Created in ExamBuilder
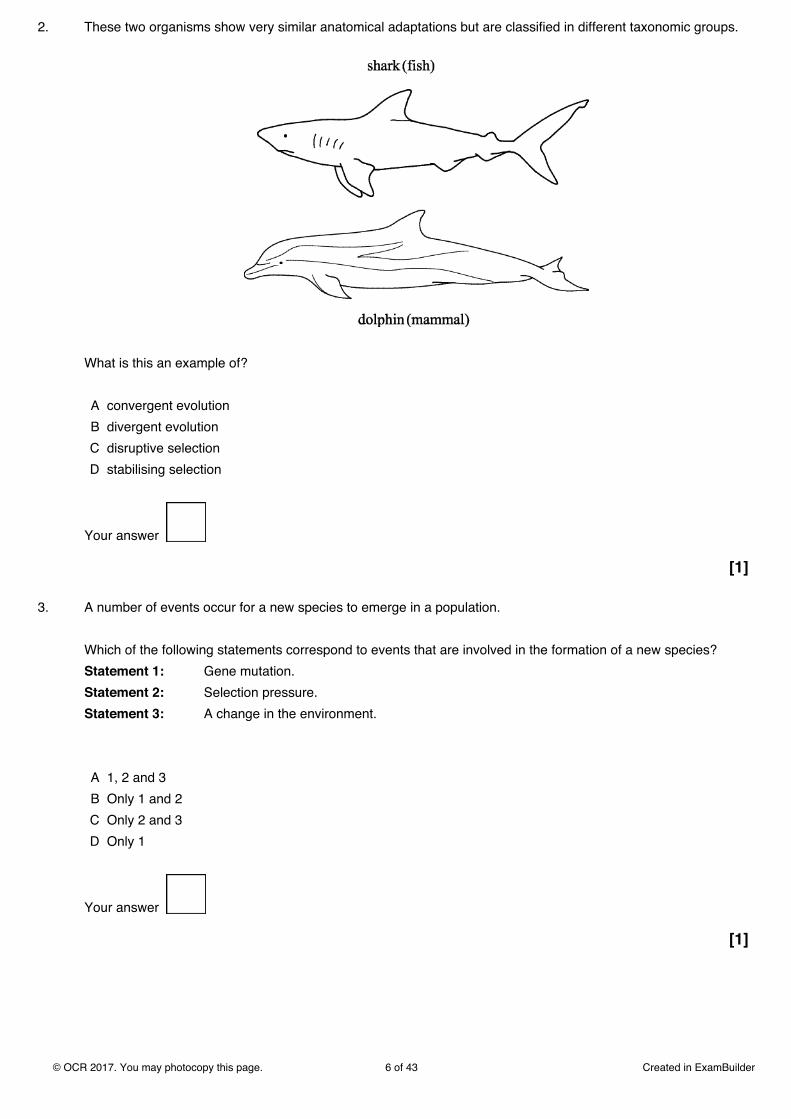
2. These two organisms show very similar anatomical adaptations but are classified in different taxonomic groups.
What is this an example of?
A convergent evolutionB divergent evolutionC disruptive selectionD stabilising selection
Your answer
[1]
3. A number of events occur for a new species to emerge in a population.
Which of the following statements correspond to events that are involved in the formation of a new species?Statement 1: Gene mutation.Statement 2: Selection pressure.Statement 3: A change in the environment.
A 1, 2 and 3B Only 1 and 2C Only 2 and 3D Only 1
Your answer
[1]
© OCR 2017. You may photocopy this page. 6 of 43 Created in ExamBuilder

4. * Read the following five statements.
Mutations preventing lactose intolerance have occurred in humans at various times in the prehistoric past,and in all human races.
The domestication of large lactating mammals like goats and cattle arose in Europe and parts of Africa 5 000to 10 000 years ago.
The lowest levels of lactose intolerance are found in areas that European populations colonised, like NorthAmerica.
The ability of agricultural populations to digest the milk, as well as the meat, of animals, is advantageous. Itadds to their general nutrition.
Until recent times the Australian aborigines had been isolated on their island continent for around 50 000years.
Suggest how the lactose intolerance phenotype came to be present in only 5% of a population like theEuropeans, but came to be present in 97% of the Australian aborigines. Use the information given above andknowledge of Darwin's theory of evolution by natural selection.
© OCR 2017. You may photocopy this page. 7 of 43 Created in ExamBuilder

5. Q, P, R and S are related species of organisms.
Species X is an extinct recent common ancestor of species Q and R.X, Q and R all evolved from species P.Species S is the least related to the others, with extinct species Z being its most recent phylogenetic link to theother species.
Which of the following phylogenetic trees correctly represents the relationships described above?
Your answer
[1]
© OCR 2017. You may photocopy this page. 9 of 43 Created in ExamBuilder
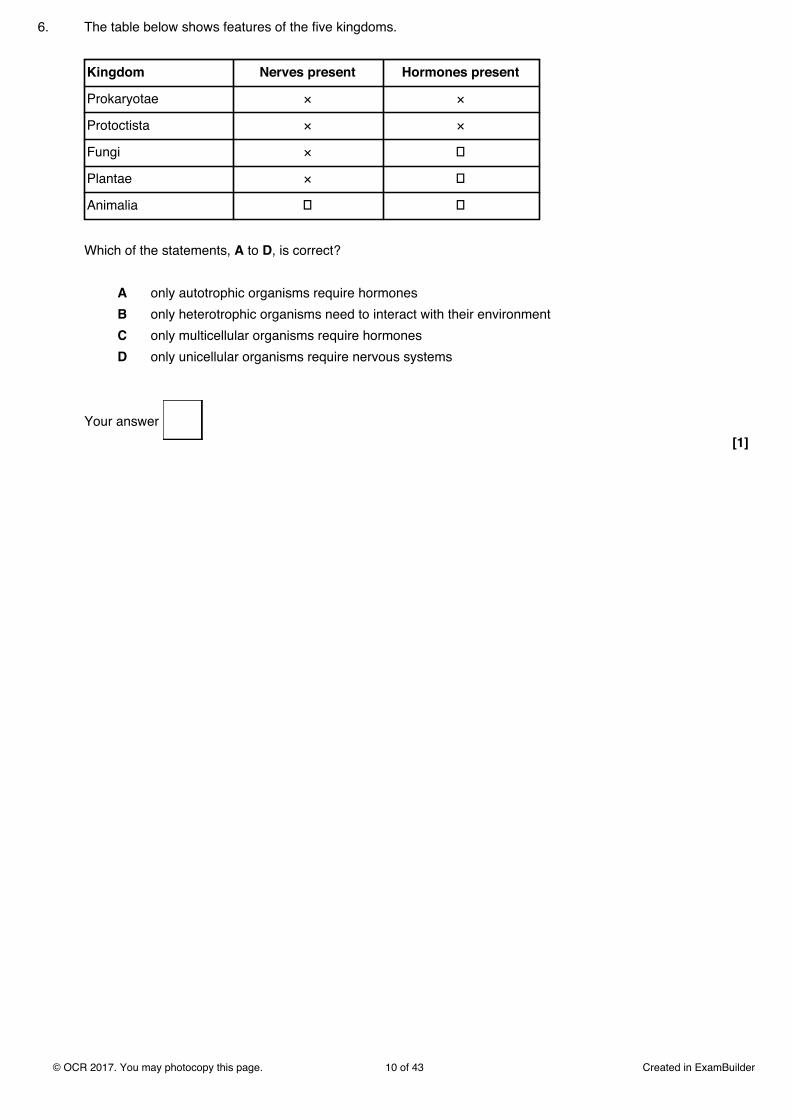
6. The table below shows features of the five kingdoms.
Kingdom Nerves present Hormones present
Prokaryotae × ×
Protoctista × ×
Fungi × ✓
Plantae × ✓
Animalia ✓ ✓
Which of the statements, A to D, is correct?
A only autotrophic organisms require hormonesB only heterotrophic organisms need to interact with their environmentC only multicellular organisms require hormonesD only unicellular organisms require nervous systems
Your answer [1]
© OCR 2017. You may photocopy this page. 10 of 43 Created in ExamBuilder

7.
(i) It takes time for an effective vaccine to be prepared in quantity for a new strain of bacterium.
List two vulnerable groups of people for whom you would advise doctors to prescribe antibiotics althoughthey are not yet showing symptoms of the new disease.
[2]
(ii) Discuss the implications of the over-use of antibiotics when people do not show symptoms.
[4]
© OCR 2017. You may photocopy this page. 11 of 43 Created in ExamBuilder

8. Which statement, A to D, best describes the relationship between classification and phylogeny?
A classification and phylogeny are the same thingB modern classification reflects phylogenyC phylogeny is the science used in classificationD phylogeny is naming the phyla used in classification
Your answer
[1]
© OCR 2017. You may photocopy this page. 12 of 43 Created in ExamBuilder
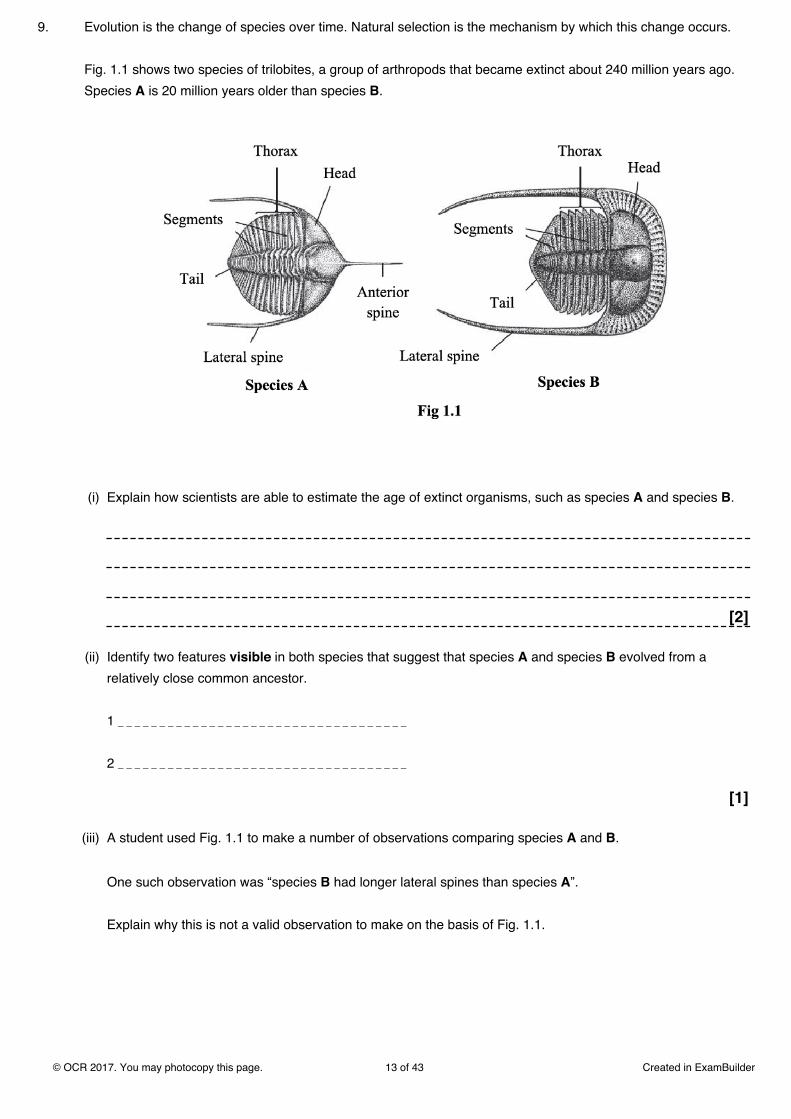
9. Evolution is the change of species over time. Natural selection is the mechanism by which this change occurs.
Fig. 1.1 shows two species of trilobites, a group of arthropods that became extinct about 240 million years ago.Species A is 20 million years older than species B.
(i) Explain how scientists are able to estimate the age of extinct organisms, such as species A and species B.
[2]
(ii) Identify two features visible in both species that suggest that species A and species B evolved from arelatively close common ancestor.
1 _ _ _ _ _ _ _ _ _ _ _ _ _ _ _ _ _ _ _ _ _ _ _ _ _ _ _ _ _ _ _ _ _ _ _
2 _ _ _ _ _ _ _ _ _ _ _ _ _ _ _ _ _ _ _ _ _ _ _ _ _ _ _ _ _ _ _ _ _ _ _
[1]
(iii) A student used Fig. 1.1 to make a number of observations comparing species A and B.
One such observation was “species B had longer lateral spines than species A”.
Explain why this is not a valid observation to make on the basis of Fig. 1.1.
© OCR 2017. You may photocopy this page. 13 of 43 Created in ExamBuilder

[2]
(iv) Fig. 1.2 shows two modern arthropods.
Modern species C and D live in water. The trilobite species, A and B also lived in water.
Identify and briefly explain an adaptation present in all four species, A, B, C and D, that would beadvantageous for an organism that lives in water.
Adaptation _ _ _ _ _ _ _ _ _ _ _ _ _ _ _ _ _ _ _ _ _ _ _ _ _ _ _ _ _ _ _ _ _ _ _ _ _ _ _ _ _ _
Explanation _ _ _ _ _ _ _ _ _ _ _ _ _ _ _ _ _ _ _ _ _ _ _ _ _ _ _ _ _ _ _ _ _ _ _ _ _ _ _ _ _ _
[1]
10. Which of the following best describes the term biodiversity?
A the variety of speciesB the number of individuals of each speciesC the variety of genes, species and habitatsD the variety of genes within a species
Your answer [1]
© OCR 2017. You may photocopy this page. 14 of 43 Created in ExamBuilder

11. Domesticated pigs are descended from Sus scrofa, sometimes called the ‘wild boar’.
(i) In Table 17.1number the levels in the correct sequence andcomplete the name column.
Sequence of levels Level Name
_ _ _ _ _ _ _ _ _ _ Order Artiodactyla
_ _ _ _ _ _ _ _ _ _ Species _ _ _ _ _ _ _ _ _ _
_ _ _ _ _ _ _ _ _ _ Family Suidae
1 Kingdom _ _ _ _ _ _ _ _ _ _
_ _ _ _ _ _ _ _ _ _ Genus _ _ _ _ _ _ _ _ _ _
_ _ _ _ _ _ _ _ _ _ Phylum Chordata
_ _ _ _ _ _ _ _ _ _ Class Mammalia
Table 17.1
[4]
(ii) We now have DNA evidence of how organisms are related to each other. This evidence has helpedbiologists to construct a second classification viewpoint: the Domain system.
Explain what such developments show about the nature of scientific knowledge.
[1]
© OCR 2017. You may photocopy this page. 15 of 43 Created in ExamBuilder

12. Bats are the only mammals that have wings. Many species of bat hunt flying insects at night. Bats are able touse echolocation (sound waves) in order to help them find their prey in the dark.
(i) Explain why bats and birds, despite not being closely related, have both evolved wings.
[3]
(ii) Suggest why the vast majority of bird species have not evolved the ability to echolocate.
[1]
© OCR 2017. You may photocopy this page. 16 of 43 Created in ExamBuilder
13(a). Explain how biological molecules can provide evidence that species have evolved.
You should refer to different types of molecule in your answer.
[4]
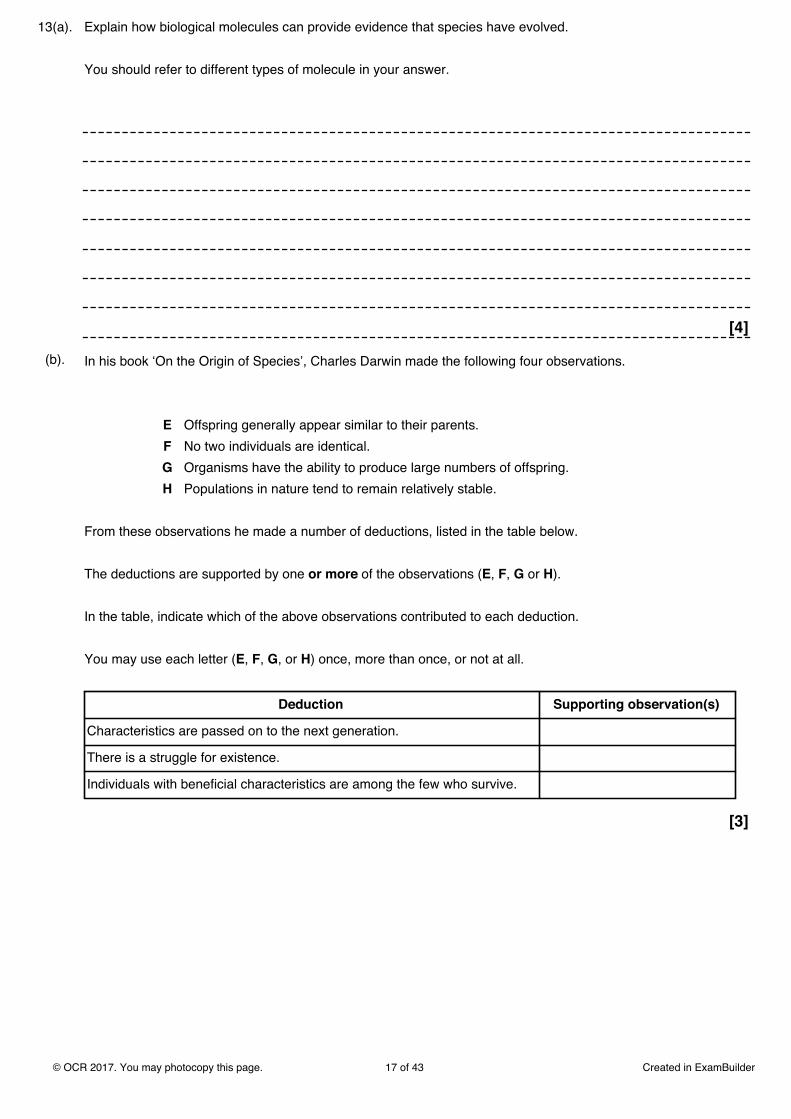
(b). In his book ‘On the Origin of Species’, Charles Darwin made the following four observations.
E Offspring generally appear similar to their parents.F No two individuals are identical.G Organisms have the ability to produce large numbers of offspring.H Populations in nature tend to remain relatively stable.
From these observations he made a number of deductions, listed in the table below.
The deductions are supported by one or more of the observations (E, F, G or H).
In the table, indicate which of the above observations contributed to each deduction.
You may use each letter (E, F, G, or H) once, more than once, or not at all.
Deduction Supporting observation(s)
Characteristics are passed on to the next generation.
There is a struggle for existence.
Individuals with beneficial characteristics are among the few who survive.
[3]
© OCR 2017. You may photocopy this page. 17 of 43 Created in ExamBuilder
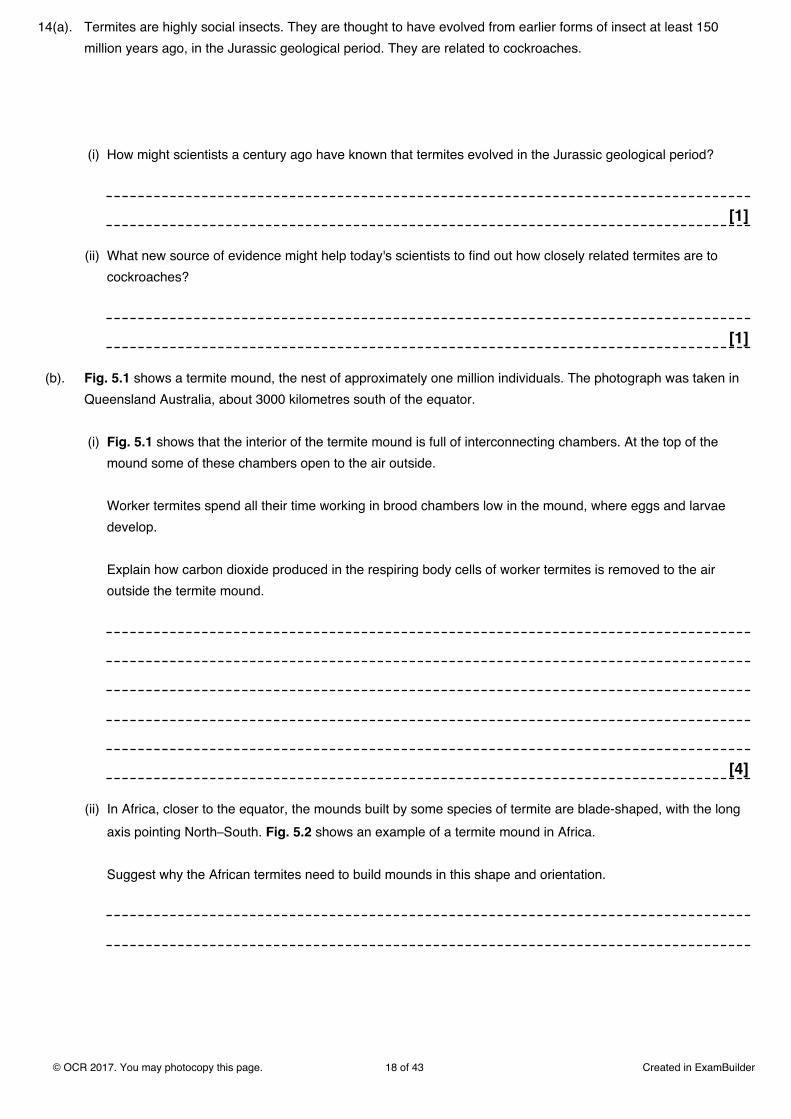
14(a). Termites are highly social insects. They are thought to have evolved from earlier forms of insect at least 150million years ago, in the Jurassic geological period. They are related to cockroaches.
(i) How might scientists a century ago have known that termites evolved in the Jurassic geological period?
[1]
(ii) What new source of evidence might help today's scientists to find out how closely related termites are tocockroaches?
[1]
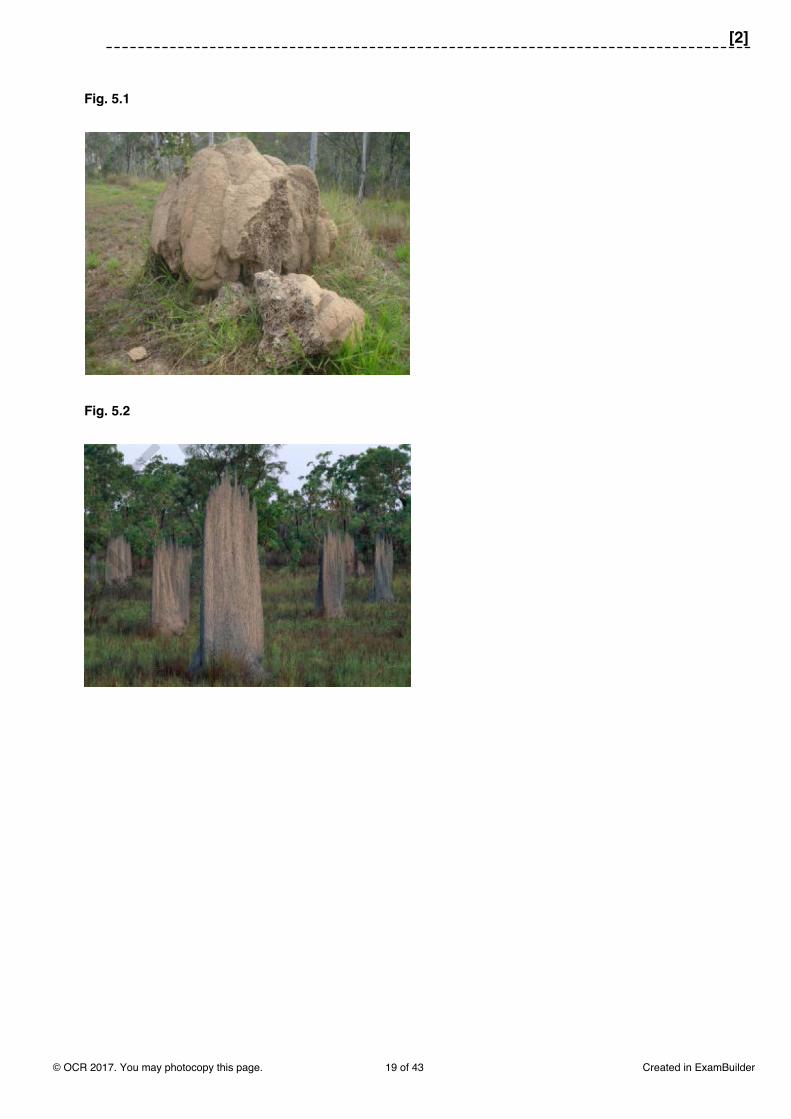
(b). Fig. 5.1 shows a termite mound, the nest of approximately one million individuals. The photograph was taken inQueensland Australia, about 3000 kilometres south of the equator.
(i) Fig. 5.1 shows that the interior of the termite mound is full of interconnecting chambers. At the top of themound some of these chambers open to the air outside.
Worker termites spend all their time working in brood chambers low in the mound, where eggs and larvaedevelop.
Explain how carbon dioxide produced in the respiring body cells of worker termites is removed to the airoutside the termite mound.
[4]
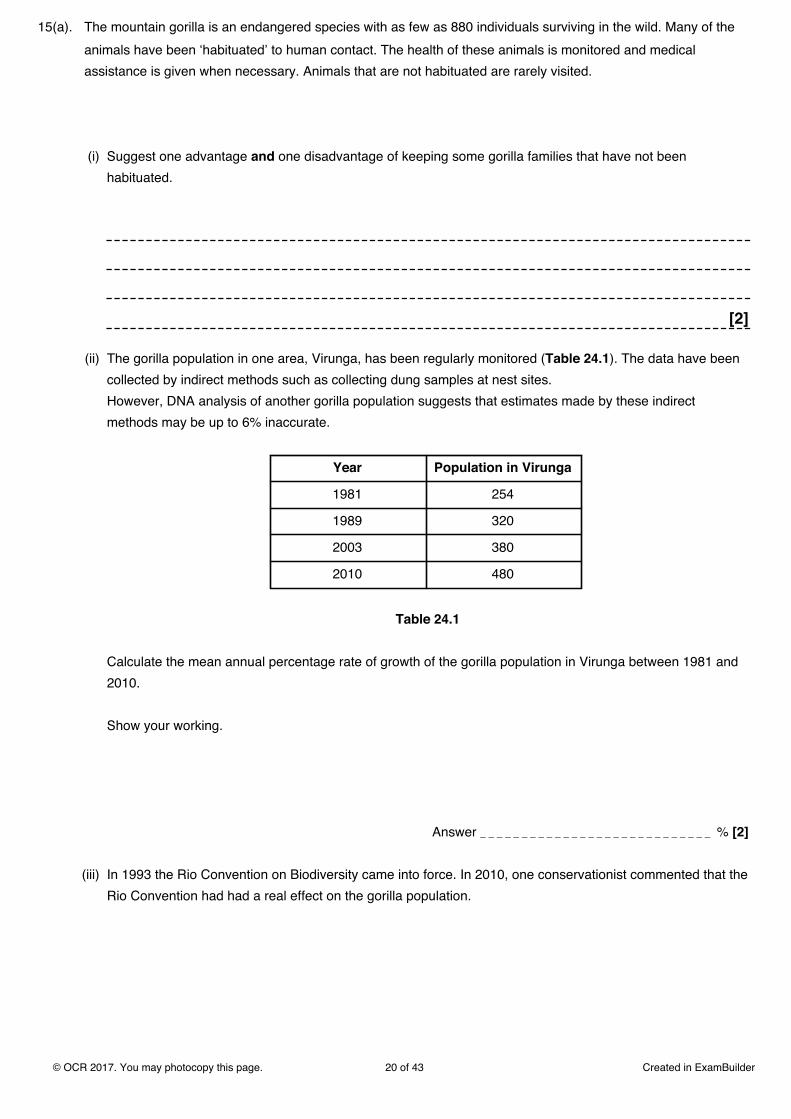
(ii) In Africa, closer to the equator, the mounds built by some species of termite are blade-shaped, with the longaxis pointing North–South. Fig. 5.2 shows an example of a termite mound in Africa.
Suggest why the African termites need to build mounds in this shape and orientation.
© OCR 2017. You may photocopy this page. 18 of 43 Created in ExamBuilder
[2]
Fig. 5.1
Fig. 5.2
© OCR 2017. You may photocopy this page. 19 of 43 Created in ExamBuilder
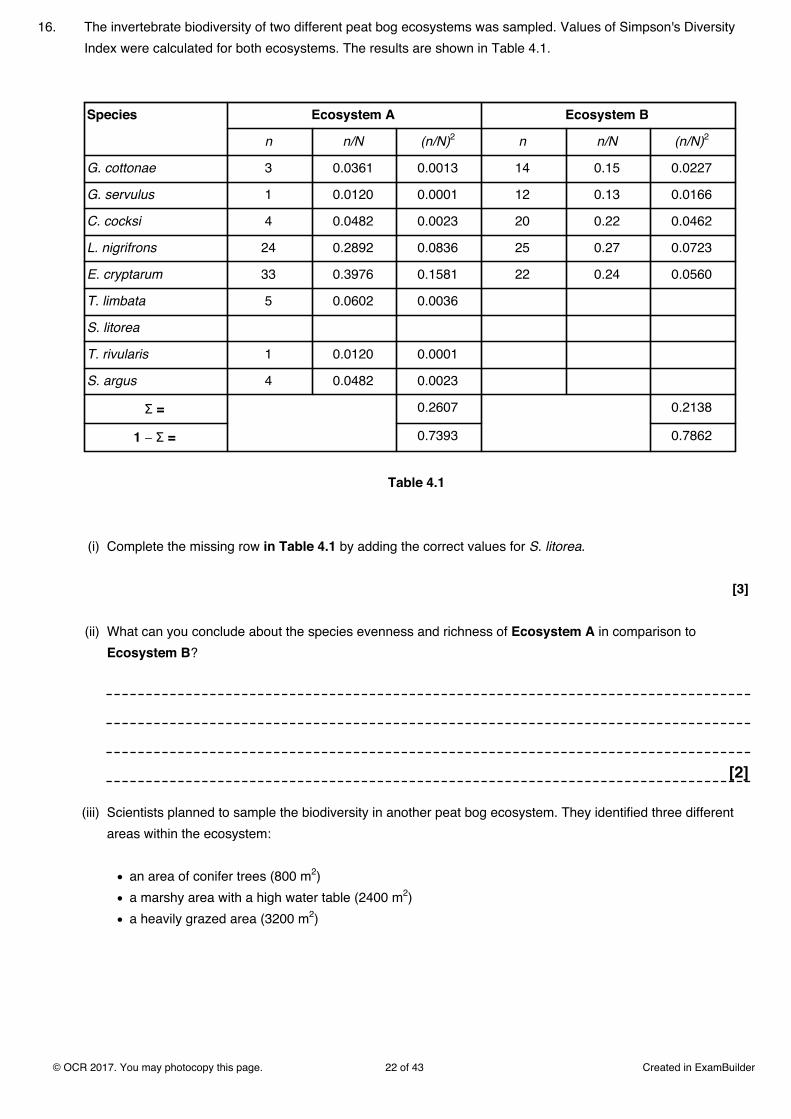
15(a). The mountain gorilla is an endangered species with as few as 880 individuals surviving in the wild. Many of theanimals have been ‘habituated’ to human contact. The health of these animals is monitored and medicalassistance is given when necessary. Animals that are not habituated are rarely visited.
(i) Suggest one advantage and one disadvantage of keeping some gorilla families that have not beenhabituated.
[2]
(ii) The gorilla population in one area, Virunga, has been regularly monitored (Table 24.1). The data have beencollected by indirect methods such as collecting dung samples at nest sites.However, DNA analysis of another gorilla population suggests that estimates made by these indirectmethods may be up to 6% inaccurate.
Year Population in Virunga
1981 254
1989 320
2003 380
2010 480
Table 24.1
Calculate the mean annual percentage rate of growth of the gorilla population in Virunga between 1981 and2010.
Show your working.
Answer _ _ _ _ _ _ _ _ _ _ _ _ _ _ _ _ _ _ _ _ _ _ _ _ _ _ _ _ % [2]
(iii) In 1993 the Rio Convention on Biodiversity came into force. In 2010, one conservationist commented that theRio Convention had had a real effect on the gorilla population.
© OCR 2017. You may photocopy this page. 20 of 43 Created in ExamBuilder

Use the information above to evaluate the effect that the Rio Convention on Biodiversity has had on thegorillas in Virunga.
[3]
(b). The cassowary is a large, flightless bird found in the rainforest in parts of Australia. It feeds mainly on fruit. Theseeds of the fruit are deposited on the rainforest floor.
(i) The cassowary is known as a keystone species. This means it is important for the survival of other species.
Suggest what role the cassowary plays in the survival of other species.
[1]
(ii) The cassowary needs to be conserved for ecological reasons.State two other reasons for maintaining biodiversity.
1
2
[2]
© OCR 2017. You may photocopy this page. 21 of 43 Created in ExamBuilder
16. The invertebrate biodiversity of two different peat bog ecosystems was sampled. Values of Simpson's DiversityIndex were calculated for both ecosystems. The results are shown in Table 4.1.
Species Ecosystem A Ecosystem B
n n/N (n/N)2 n n/N (n/N)2
G. cottonae 3 0.0361 0.0013 14 0.15 0.0227
G. servulus 1 0.0120 0.0001 12 0.13 0.0166
C. cocksi 4 0.0482 0.0023 20 0.22 0.0462
L. nigrifrons 24 0.2892 0.0836 25 0.27 0.0723
E. cryptarum 33 0.3976 0.1581 22 0.24 0.0560
T. limbata 5 0.0602 0.0036
S. litorea
T. rivularis 1 0.0120 0.0001
S. argus 4 0.0482 0.0023
Σ = 0.2607 0.2138
1 − Σ = 0.7393 0.7862
Table 4.1
(i) Complete the missing row in Table 4.1 by adding the correct values for S. litorea.
[3]
(ii) What can you conclude about the species evenness and richness of Ecosystem A in comparison to Ecosystem B?
[2]
(iii) Scientists planned to sample the biodiversity in another peat bog ecosystem. They identified three differentareas within the ecosystem:
an area of conifer trees (800 m2)a marshy area with a high water table (2400 m2)a heavily grazed area (3200 m2)
© OCR 2017. You may photocopy this page. 22 of 43 Created in ExamBuilder

Suggest the sampling strategy that the scientists should use and comment on the number of samples theyshould collect.
[3]
© OCR 2017. You may photocopy this page. 23 of 43 Created in ExamBuilder
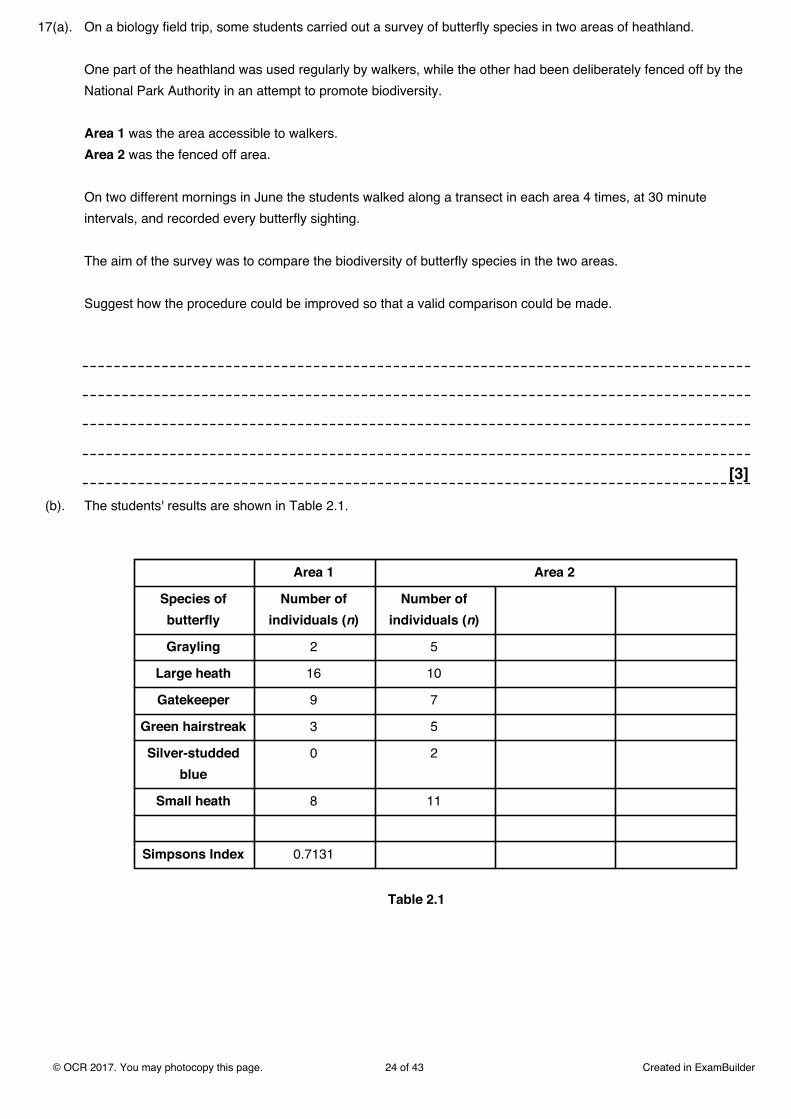
17(a). On a biology field trip, some students carried out a survey of butterfly species in two areas of heathland.
One part of the heathland was used regularly by walkers, while the other had been deliberately fenced off by theNational Park Authority in an attempt to promote biodiversity.
Area 1 was the area accessible to walkers.Area 2 was the fenced off area.
On two different mornings in June the students walked along a transect in each area 4 times, at 30 minuteintervals, and recorded every butterfly sighting.
The aim of the survey was to compare the biodiversity of butterfly species in the two areas.
Suggest how the procedure could be improved so that a valid comparison could be made.
[3]
(b). The students' results are shown in Table 2.1.
Area 1 Area 2
Species ofbutterfly
Number ofindividuals (n)
Number ofindividuals (n)
Grayling 2 5
Large heath 16 10
Gatekeeper 9 7
Green hairstreak 3 5
Silver-studdedblue
0 2
Small heath 8 11
Simpsons Index 0.7131
Table 2.1
© OCR 2017. You may photocopy this page. 24 of 43 Created in ExamBuilder
(i) Identify the area with the higher species richness and justify your answer.
Area_ _ _ _ _ _ _ _ _ _ _ _ _ _ _ _ _
Justification
[1]
(ii) Identify the area with the higher species evenness and justify your answer.
Area_ _ _ _ _ _ _ _ _ _ _ _ _ _ _ _ _ _ _ _ _
Justification
[1]
(iii) Using the formula below, the students calculated Simpsons Index of Diversity in Area 1 to be 0.7131.
D = 1−(Σ(n/N)2)
Where N is the total number of individuals of all species.
Simpson's Index of Diversity in Area 2 is greater than in Area 1.
Use the formula to show that this is the case.
You may use the blank spaces in Table 2.1 to assist in your calculations.
Answer_ _ _ _ _ _ _ _ _ _ _ _ _ _ [4]
© OCR 2017. You may photocopy this page. 25 of 43 Created in ExamBuilder

(c). * The students concluded that “fencing off the area of heathland has increased the biodiversity of butterflies”.
Evaluate the validity of the students' conclusion using all of the information you have been given, including Table2.1.
[6]
© OCR 2017. You may photocopy this page. 26 of 43 Created in ExamBuilder

18.
(i) The biomass of large fish in the Southern Ocean is a food resource for humans. It is increasingly harvestedby powerful, long-distance trawlers. If over-exploited, the Southern Ocean ecosystem may be permanentlyaltered.
Suggest two measures that an international treaty might impose, to prevent fishing from causingpermanent damage to the Southern Ocean.Identify the practical difficulties that might prevent your two measures from being effective.
First measure
Difficulty
Second measure
Difficulty
[4]
(ii) Krill can also be harvested as a human food source.The fishing industry aims to harvest large fish.Some environmentalists say that krill harvesting should be increased.
Use this information and Table 21.1 to put forward arguments for and against harvesting krill instead of largefish as a human food source.
[2]
© OCR 2017. You may photocopy this page. 27 of 43 Created in ExamBuilder
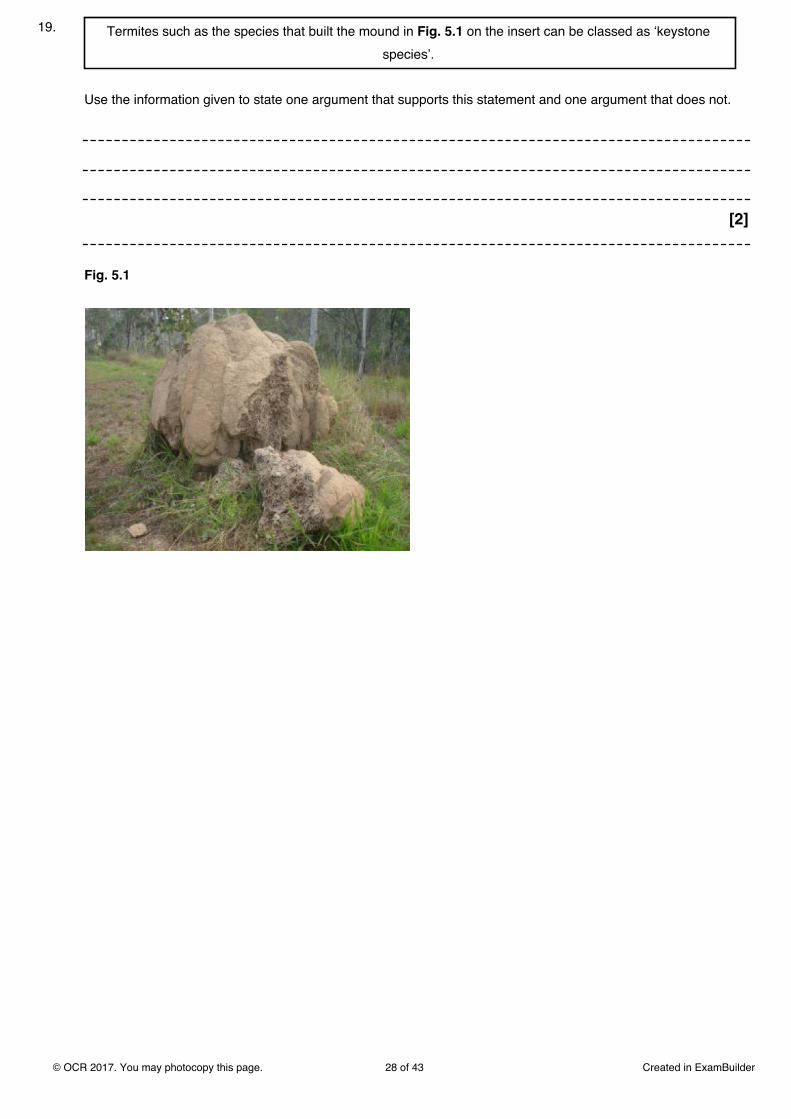
19. Termites such as the species that built the mound in Fig. 5.1 on the insert can be classed as ‘keystonespecies’.
Use the information given to state one argument that supports this statement and one argument that does not.
[2]
Fig. 5.1
© OCR 2017. You may photocopy this page. 28 of 43 Created in ExamBuilder
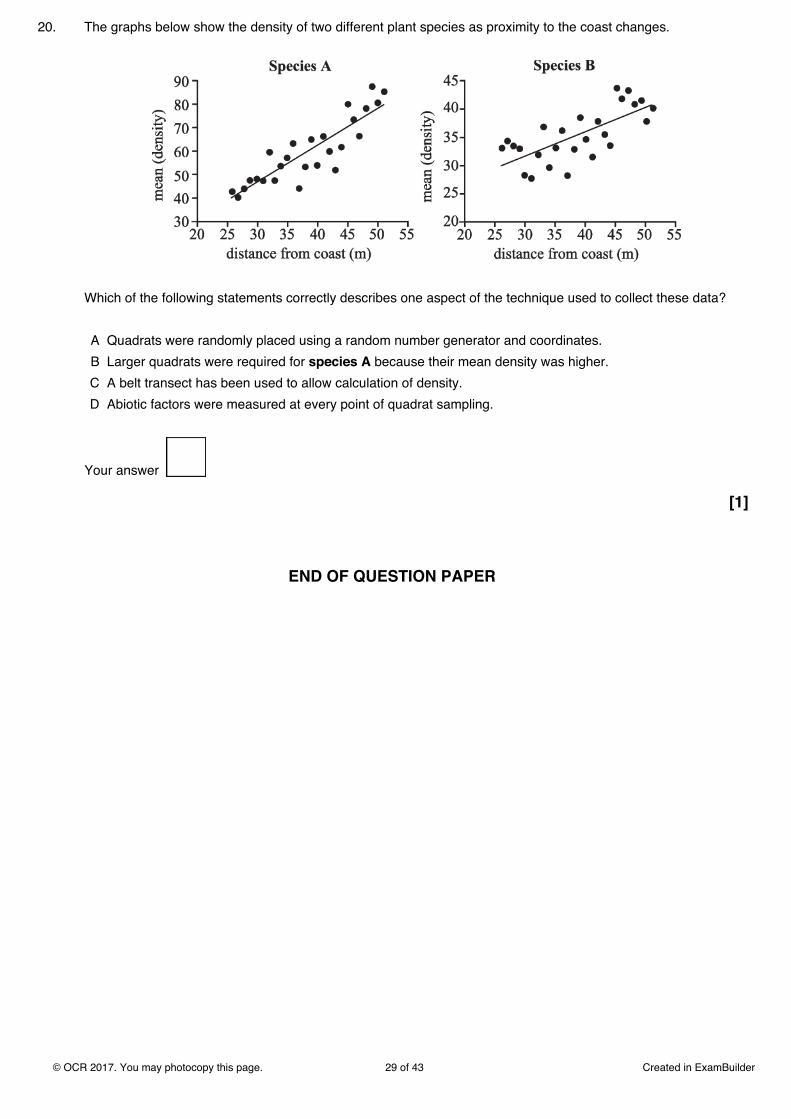
20. The graphs below show the density of two different plant species as proximity to the coast changes.
Which of the following statements correctly describes one aspect of the technique used to collect these data?
A Quadrats were randomly placed using a random number generator and coordinates.B Larger quadrats were required for species A because their mean density was higher.C A belt transect has been used to allow calculation of density.D Abiotic factors were measured at every point of quadrat sampling.
Your answer
[1]
END OF QUESTION PAPER
© OCR 2017. You may photocopy this page. 29 of 43 Created in ExamBuilder

1 a i t = 13.61 (1)(1) 2 ALLOW correct working for 1 mark.
ii probability is highly significant, calculated tvalue is greater than the critical value at0.001 / there is a chance (probability) ofbelow 0.001 that the differences in theshell height seen can be due to chanceandthe null hypothesis can be rejected (1)
1
b histogram correctly plotted for the values(1)
two sets of data distinguished by a key orother suitable method to identify them (1)
x axis labelled ‘height (mm)’andy axis labelled ‘number of dog whelks / Nucella lapillus / shells / class’ (1)
makes good use of the graph paperandboth axes are correctly scaled withascending equidistant intervals (1)
4 DO NOT ALLOW a bar chart or a linegraph as neither would represent the datacorrectly.ALLOW a correlation scattergram.
ALLOW ‘% of the sample’ for the y axis ifthis has been calculated.
c three frompositive correlation between the height ofthe whelk shell and the type of the shore(1)
correct calculation of the correlationcoefficient (1)
(histogram / data, indicates that) shoreexposure has an impact on height (1)
Nucella show adaptation to harsher waveaction (1)
shells measured may not all be exposed towave action (1)
3 ALLOW correlation is strong or a referenceto relationship such as:- taller shell heightand sheltered shore or shorter shell heightand exposed shore.
ALLOW little overlap on the histogrambars.
ALLOW the idea that the differences maybe due to direct wave action or adaptation.
© OCR 2017. You may photocopy this page. 30 of 43 Created in ExamBuilder
Question Answer/Indicative content Marks Guidance
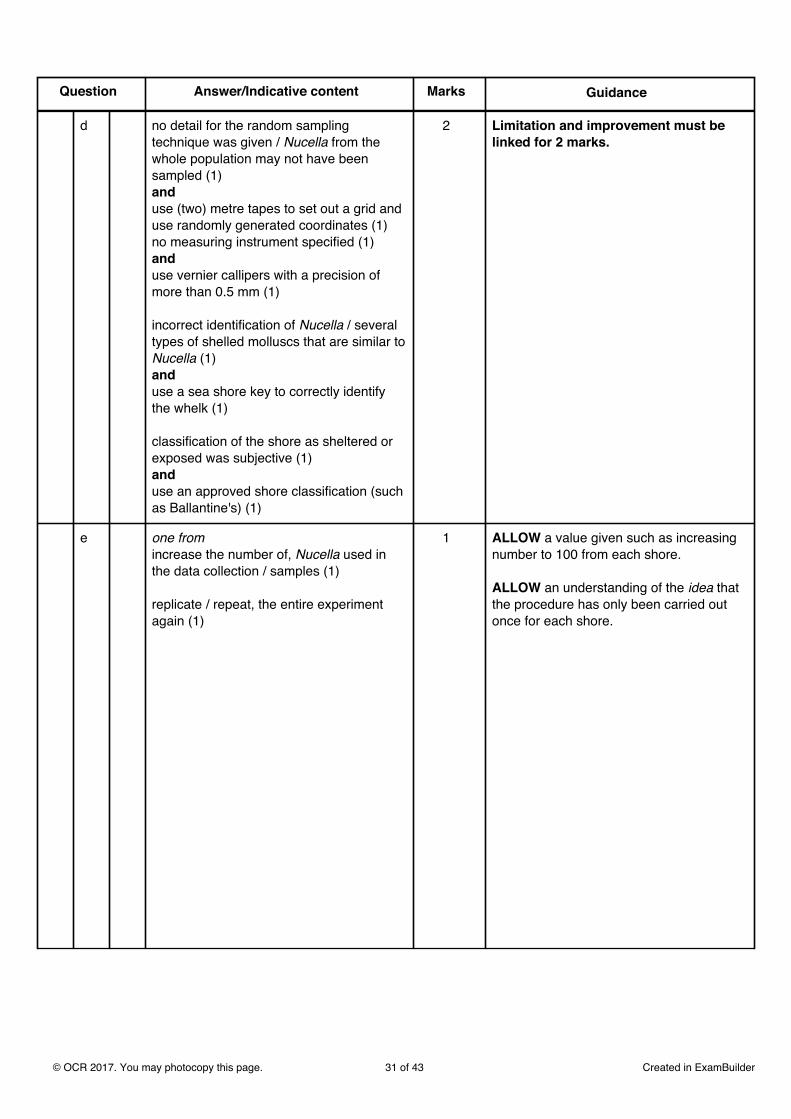
d no detail for the random samplingtechnique was given / Nucella from thewhole population may not have beensampled (1)anduse (two) metre tapes to set out a grid anduse randomly generated coordinates (1)no measuring instrument specified (1)anduse vernier callipers with a precision ofmore than 0.5 mm (1)
incorrect identification of Nucella / severaltypes of shelled molluscs that are similar toNucella (1)anduse a sea shore key to correctly identifythe whelk (1)
classification of the shore as sheltered orexposed was subjective (1)anduse an approved shore classification (suchas Ballantine's) (1)
2 Limitation and improvement must belinked for 2 marks.
e one fromincrease the number of, Nucella used inthe data collection / samples (1)
replicate / repeat, the entire experimentagain (1)
1 ALLOW a value given such as increasingnumber to 100 from each shore.
ALLOW an understanding of the idea thatthe procedure has only been carried outonce for each shore.
© OCR 2017. You may photocopy this page. 31 of 43 Created in ExamBuilder
Question Answer/Indicative content Marks Guidance
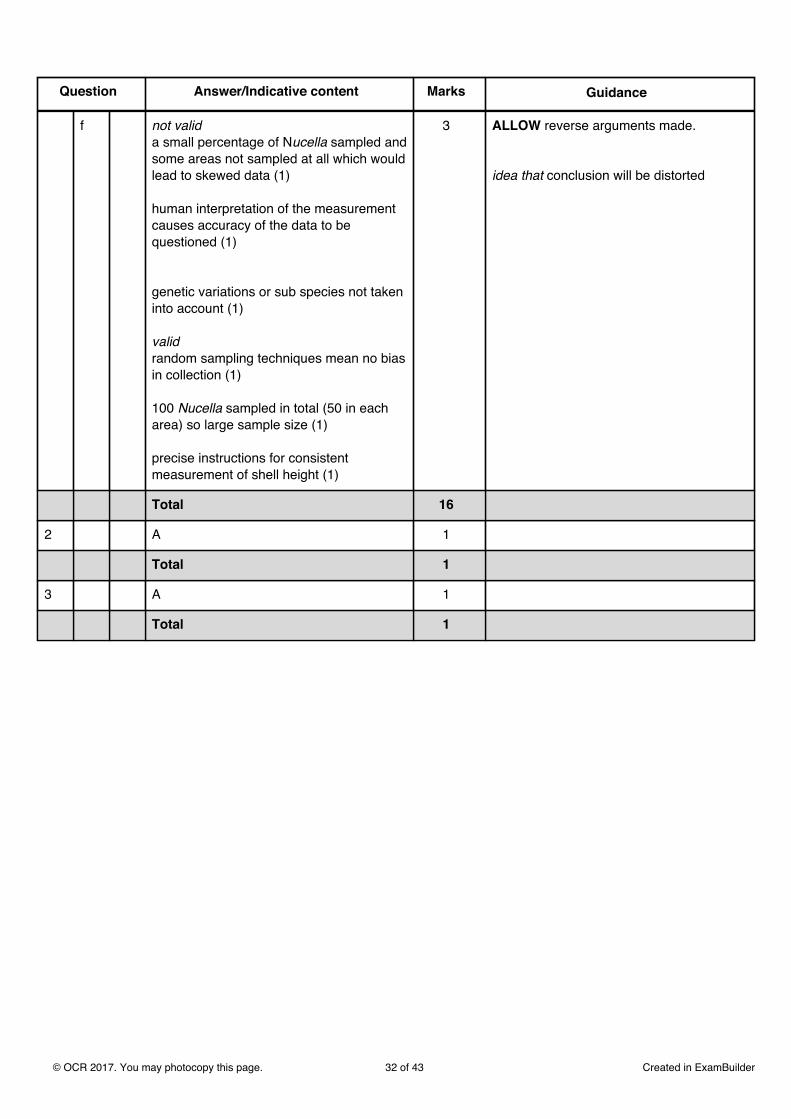
f not valida small percentage of Nucella sampled andsome areas not sampled at all which wouldlead to skewed data (1)
human interpretation of the measurementcauses accuracy of the data to bequestioned (1)
genetic variations or sub species not takeninto account (1)
validrandom sampling techniques mean no biasin collection (1)
100 Nucella sampled in total (50 in eacharea) so large sample size (1)
precise instructions for consistentmeasurement of shell height (1)
3 ALLOW reverse arguments made.
idea that conclusion will be distorted
Total 16
2 A 1
Total 1
3 A 1
Total 1
© OCR 2017. You may photocopy this page. 32 of 43 Created in ExamBuilder
Question Answer/Indicative content Marks Guidance
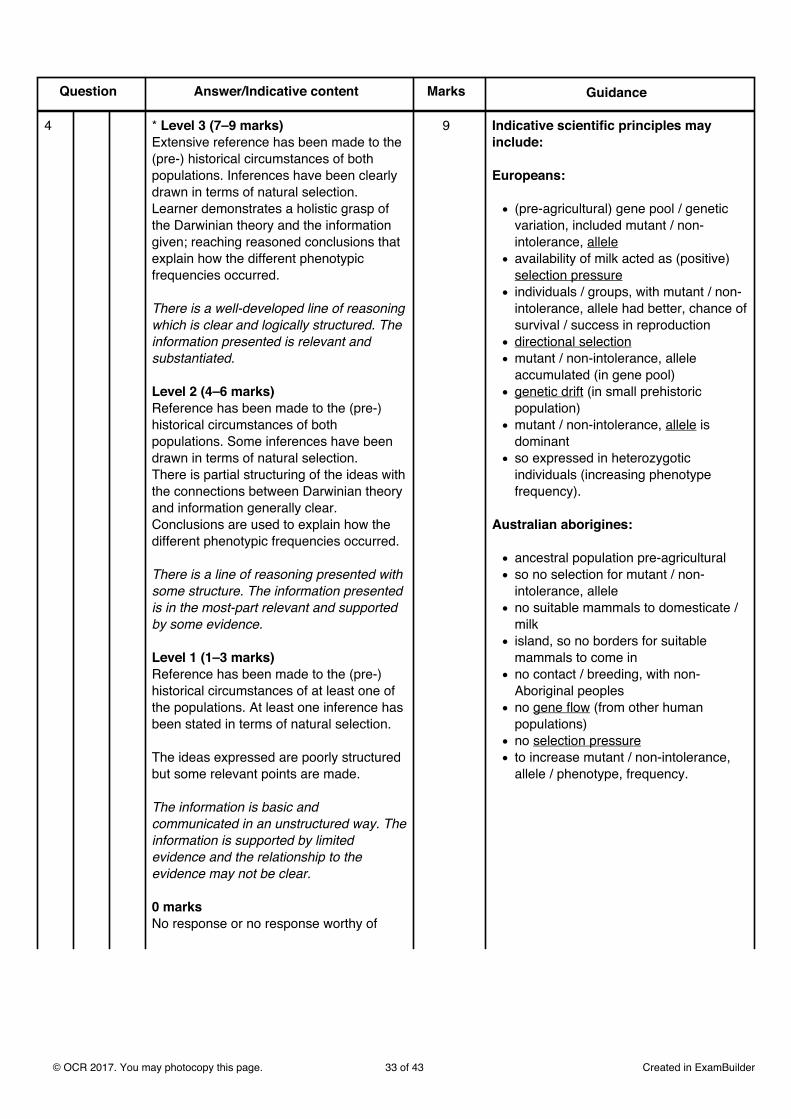
4 * Level 3 (7–9 marks)Extensive reference has been made to the(pre-) historical circumstances of bothpopulations. Inferences have been clearlydrawn in terms of natural selection.Learner demonstrates a holistic grasp ofthe Darwinian theory and the informationgiven; reaching reasoned conclusions thatexplain how the different phenotypicfrequencies occurred.
There is a well-developed line of reasoningwhich is clear and logically structured. Theinformation presented is relevant andsubstantiated.
Level 2 (4–6 marks)Reference has been made to the (pre-)historical circumstances of bothpopulations. Some inferences have beendrawn in terms of natural selection.There is partial structuring of the ideas withthe connections between Darwinian theoryand information generally clear.Conclusions are used to explain how thedifferent phenotypic frequencies occurred.
There is a line of reasoning presented withsome structure. The information presentedis in the most-part relevant and supportedby some evidence.
Level 1 (1–3 marks)Reference has been made to the (pre-)historical circumstances of at least one ofthe populations. At least one inference hasbeen stated in terms of natural selection.
The ideas expressed are poorly structuredbut some relevant points are made.
The information is basic andcommunicated in an unstructured way. Theinformation is supported by limitedevidence and the relationship to theevidence may not be clear.
0 marksNo response or no response worthy of
9 Indicative scientific principles mayinclude:
Europeans:
(pre-agricultural) gene pool / geneticvariation, included mutant / non-intolerance, alleleavailability of milk acted as (positive) selection pressureindividuals / groups, with mutant / non-intolerance, allele had better, chance ofsurvival / success in reproductiondirectional selectionmutant / non-intolerance, alleleaccumulated (in gene pool)genetic drift (in small prehistoricpopulation)mutant / non-intolerance, allele isdominantso expressed in heterozygoticindividuals (increasing phenotypefrequency).
Australian aborigines:
ancestral population pre-agriculturalso no selection for mutant / non-intolerance, alleleno suitable mammals to domesticate /milkisland, so no borders for suitablemammals to come inno contact / breeding, with non-Aboriginal peoplesno gene flow (from other humanpopulations)no selection pressureto increase mutant / non-intolerance,allele / phenotype, frequency.
© OCR 2017. You may photocopy this page. 33 of 43 Created in ExamBuilder
Question Answer/Indicative content Marks Guidance
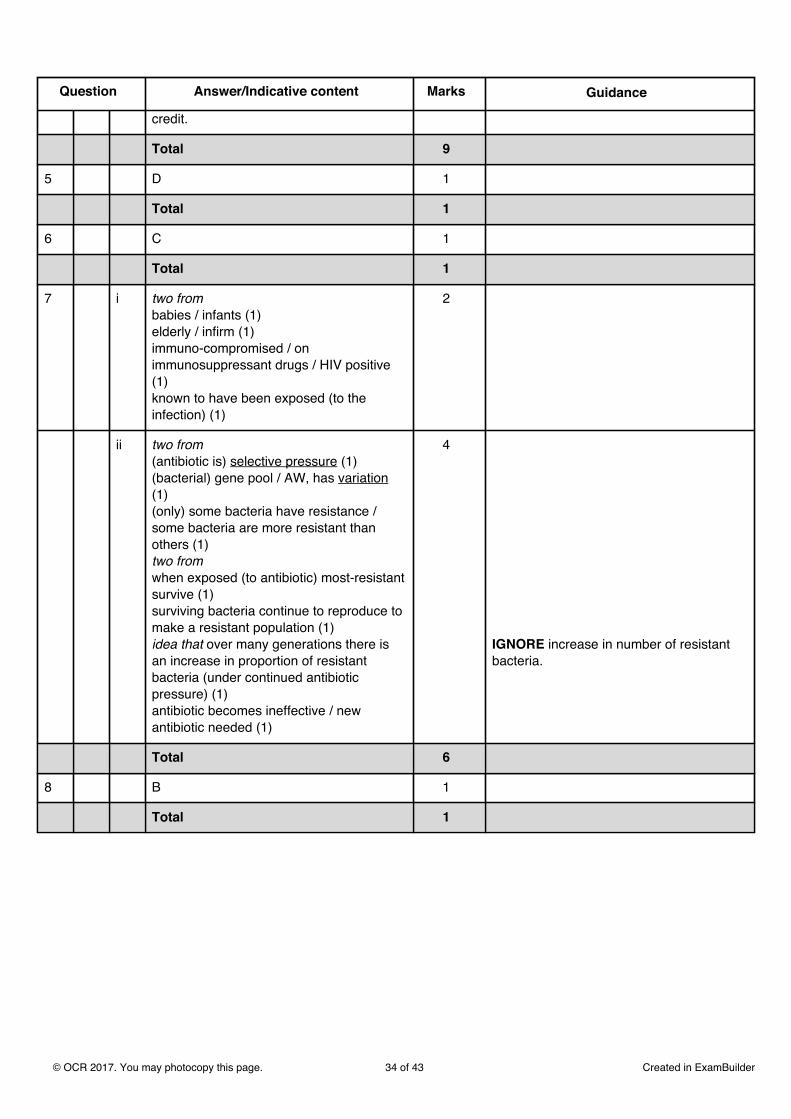
credit.
Total 9
5 D 1
Total 1
6 C 1
Total 1
7 i two frombabies / infants (1)elderly / infirm (1)immuno-compromised / onimmunosuppressant drugs / HIV positive(1)known to have been exposed (to theinfection) (1)
2
ii two from(antibiotic is) selective pressure (1)(bacterial) gene pool / AW, has variation(1)(only) some bacteria have resistance /some bacteria are more resistant thanothers (1)two fromwhen exposed (to antibiotic) most-resistantsurvive (1)surviving bacteria continue to reproduce tomake a resistant population (1)idea that over many generations there isan increase in proportion of resistantbacteria (under continued antibioticpressure) (1)antibiotic becomes ineffective / newantibiotic needed (1)
4
IGNORE increase in number of resistantbacteria.
Total 6
8 B 1
Total 1
© OCR 2017. You may photocopy this page. 34 of 43 Created in ExamBuilder
Question Answer/Indicative content Marks Guidance
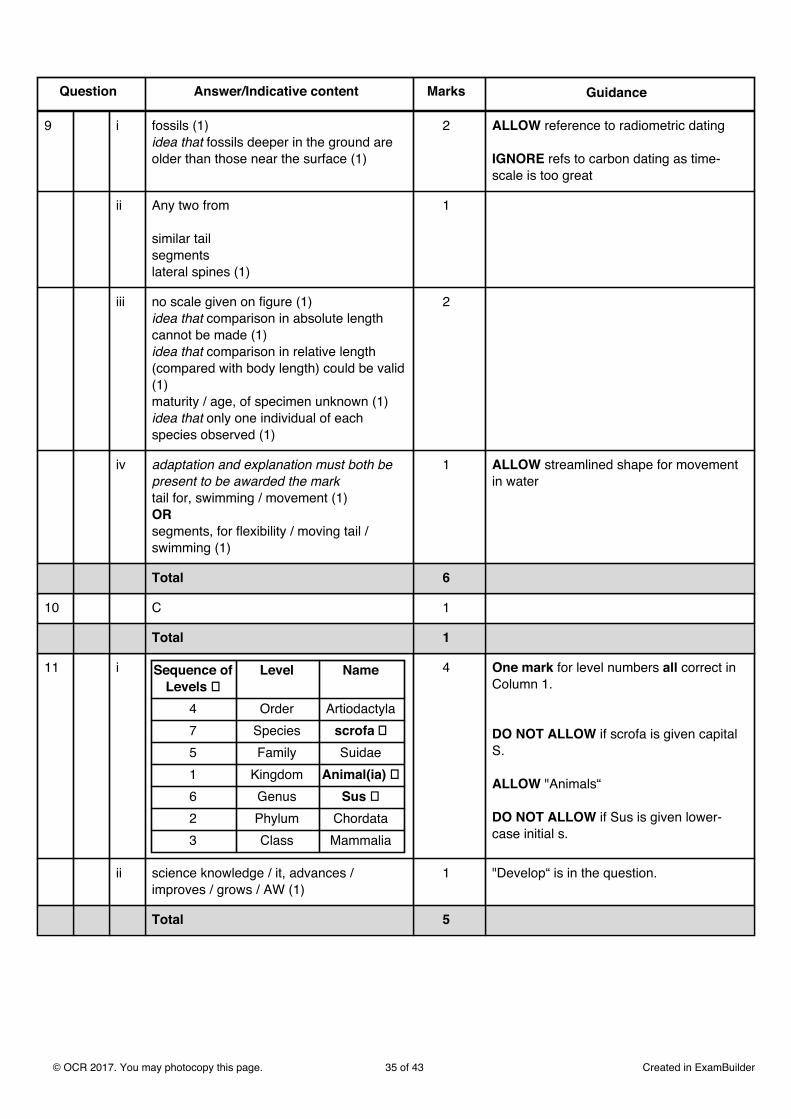
9 i fossils (1)idea that fossils deeper in the ground areolder than those near the surface (1)
2 ALLOW reference to radiometric dating
IGNORE refs to carbon dating as time-scale is too great
ii Any two from
similar tailsegmentslateral spines (1)
1
iii no scale given on figure (1)idea that comparison in absolute lengthcannot be made (1)idea that comparison in relative length(compared with body length) could be valid(1)maturity / age, of specimen unknown (1)idea that only one individual of eachspecies observed (1)
2
iv adaptation and explanation must both bepresent to be awarded the marktail for, swimming / movement (1)ORsegments, for flexibility / moving tail /swimming (1)
1 ALLOW streamlined shape for movementin water
Total 6
10 C 1
Total 1
11 i Sequence ofLevels ✓
Level Name
4 Order Artiodactyla7 Species scrofa ✓5 Family Suidae1 Kingdom Animal(ia) ✓6 Genus Sus ✓2 Phylum Chordata3 Class Mammalia
4 One mark for level numbers all correct inColumn 1.
DO NOT ALLOW if scrofa is given capitalS.
ALLOW "Animals“
DO NOT ALLOW if Sus is given lower-case initial s.
ii science knowledge / it, advances /improves / grows / AW (1)
1 "Develop“ is in the question.
Total 5
© OCR 2017. You may photocopy this page. 35 of 43 Created in ExamBuilder
Question Answer/Indicative content Marks Guidance
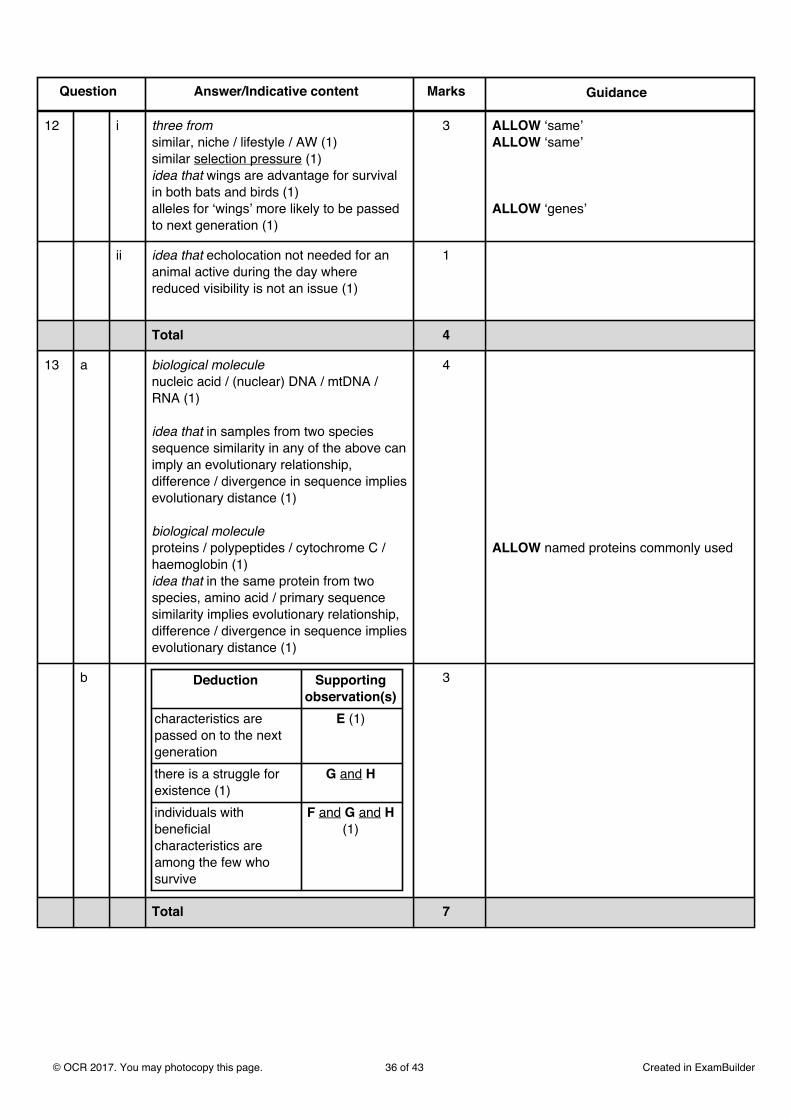
12 i three fromsimilar, niche / lifestyle / AW (1)similar selection pressure (1)idea that wings are advantage for survivalin both bats and birds (1)alleles for ‘wings’ more likely to be passedto next generation (1)
3 ALLOW ‘same’ALLOW ‘same’
ALLOW ‘genes’
ii idea that echolocation not needed for ananimal active during the day wherereduced visibility is not an issue (1)
1
Total 4
13 a biological moleculenucleic acid / (nuclear) DNA / mtDNA /RNA (1)
idea that in samples from two speciessequence similarity in any of the above canimply an evolutionary relationship,difference / divergence in sequence impliesevolutionary distance (1)
biological moleculeproteins / polypeptides / cytochrome C /haemoglobin (1)idea that in the same protein from twospecies, amino acid / primary sequencesimilarity implies evolutionary relationship,difference / divergence in sequence impliesevolutionary distance (1)
4
ALLOW named proteins commonly used
b Deduction Supportingobservation(s)
characteristics arepassed on to the nextgeneration
E (1)
there is a struggle forexistence (1)
G and H
individuals withbeneficialcharacteristics areamong the few whosurvive
F and G and H(1)
3
Total 7
© OCR 2017. You may photocopy this page. 36 of 43 Created in ExamBuilder
Question Answer/Indicative content Marks Guidance

14 a i fossils in, known-age / Jurassic, strata /rocks
1
ii DNA / cytochrome c 1
b i carbon dioxide diffuses down concentrationgradient out of the respiring cell (1)carried through body from cell (totracheoles) by blood passing out viatracheoles / trachea / spiracles (1)respiration generates heat (1)hot gases expand and are less dense sorise up by convection through the mound tovents at mound-top (1)
4
ii shape, large or increased surface area tovolume ratio (1)
smallest area exposed to greatest heat (1)
2 Response must be linked to context ofavoiding overheating / needing to get rid ofheat.
Total 8
© OCR 2017. You may photocopy this page. 37 of 43 Created in ExamBuilder
Question Answer/Indicative content Marks Guidance

15 a i advantage:exhibit natural behaviour / less likely tocatch disease from humans (1)
disadvantage:poaching more likely / could be wiped outby disease / more difficult to count (1)
2 Must give one advantage and onedisadvantage.
ii 3.1 (%) (1)(1) 2 ALLOW one mark if calculation correct butfinal figure incorrect e.g. (480 – 254) / 254× 100 / 29 =
ALLOW 3% or 3.07%
iii three fromno evidence of causal effect (1)the data may be inaccurate as a result of,indirect methods used / unhabituatedanimals hard to find (1)annual growth rate higher after 1993 (1)3.2% (per year) before 1993 against 3.8%after 1993 (1)figures may not be accurate due tocollection technique (1)
3
b i seed dispersal 1
ii (named) economic reason(named) aesthetic reason
2
Total 10
16 i 8 0.0964 0.0093(1) (1) (1)
3
ii A has greater richness (1) ORAB has greater evenness (1) ORA
2
iii stratified AND random (within each area)(1)
idea that the number of samples withineach area should be proportional to theirsize (1)correct suggestion for the number ofsamples taken within each area (1)
3 ALLOW description of stratified
e.g. 8 in conifer area, 24 in marshy area,32 in grazed area
Total 8
© OCR 2017. You may photocopy this page. 38 of 43 Created in ExamBuilder
Question Answer/Indicative content Marks Guidance

17 a idea of more transects in different parts ofarea 1 and 2 (1)(collect at) different, times of day / times ofyear / weather conditions (1)method of ensuring that individuals notcounted again (1)
(use a method to) capture individuals (1)
(use a method to) correctly identify species(1)
3
ALLOW example of appropriate method,e.g. (butterfly) netALLOW e.g. photograph / use of key
b i (Area) 2
(because it) has, more / 6, species (1)
1
ii (Area) 2
idea that the range of n is smaller (1)
1
ALLOW use of figures to exemplify
iii
any successful calculation of (n/N)2 (1)(Σ(n/N)2 =) 0.2024 (1)(1-Σ(n/N)2 =) 0.7976 (1)answer given to 4 significant figures (1)
4 Correct answer given to 4 sig. fig. withno working shown = 4 marks
ALLOW correct answer with different sig.figsALLOW correct answer with different sig.figs
© OCR 2017. You may photocopy this page. 39 of 43 Created in ExamBuilder
Question Answer/Indicative content Marks Guidance
c For answers marked by levels of response:
Read through the whole answer from startto finish, concentrating on features thatmake it a stronger or weaker answer usingthe indicative scientific content asguidance. The indicative scientific contentindicates the expected parameters forcandidates' answers, but be prepared torecognise and credit unexpectedapproaches where they show relevance.
Using a ‘best-fit’ approach based on thescience content of the answer, first decidewhich set of level descriptors, Level 1,Level 2 or Level 3, best describes theoverall quality of the answer using theguidelines described in the leveldescriptors in the mark scheme.
Once the level is located, award the higheror lower mark.
The higher mark should be awardedwhere the level descriptor has beenevidenced and all aspects of thecommunication statement (in italics) havebeen met.
The lower mark should be awarded wherethe level descriptor has been evidencedbut aspects of the communicationstatement (in italics) are missing.
In summary:
The science content determines thelevel.The communication statementdetermines the mark within a level.
© OCR 2017. You may photocopy this page. 40 of 43 Created in ExamBuilder
Question Answer/Indicative content Marks Guidance

Level 3 (5–6 marks)Full and detailed evaluation of thestudents' conclusion taking into accountthe validity of the method used and theimplications of the data collected. Learnerdemonstrates a holistic judgement of theinformation including evidence for andagainst the claim. The candidate makes ajudgement that there is not enoughevidence to support the students'conclusion.
There is a well-developed line of reasoningwhich is clear and logically structured. Theinformation presented is relevant andsubstantiated.
6 Indicative scientific points mayinclude…
Evidence to support the conclusion(that fencing increased biodiversity)
calculated Simpson's Index of Diversityis higher in fenced areahigh Simpson's Index means highbiodiversitygreater number of species / higherspecies richness in fenced areasilver-studded blue only occurs infenced area.
© OCR 2017. You may photocopy this page. 41 of 43 Created in ExamBuilder
Question Answer/Indicative content Marks Guidance

Level 2 (3–4 marks)An evaluation of the students' conclusiontaking into account the validity of themethod used and / or the implications ofthe data collected. Learner demonstrates aholistic judgement of the informationincluding evidence for and against theclaim. The candidate makes a judgementin line with the argument they havepresented.
There is a line of reasoning presented withsome structure. The information presentedis in the most-part relevant and supportedby some evidence.
Level 1 (1–2 marks)An evaluation of the claim is attemptedincluding discussion of either the validity ofthe method or the implications of the data.The answer includes evidence for oragainst the claim. A definitive judgementmay not be present.
A basic structure and some relevantinformation is provided, although a clearline of reasoning may not be present. Theinformation is supported by limitedevidence and the relationship to theevidence may not be clear.
0 marksNo response or no response worthy ofcredit.
Students' conclusion may be overdrawnbecause…
difference in Simpson's Index ofDiversity between two areas is small(12%)range of number of individuals isgreater in Area 1 (0–16) than Area 2(2–11)higher number of individuals of ‘Largeheath’ and ‘Gatekeeper’ butterfliessighted in Area 1.do not know length of time Area 2 hasbeen fenced off.
limitations of methodsamples taken on only two dayssamples only taken in one seasonno method to prevent recountingobservation at a distance mighthave led to mis-identification.
Total 15
© OCR 2017. You may photocopy this page. 42 of 43 Created in ExamBuilder
Question Answer/Indicative content Marks Guidance
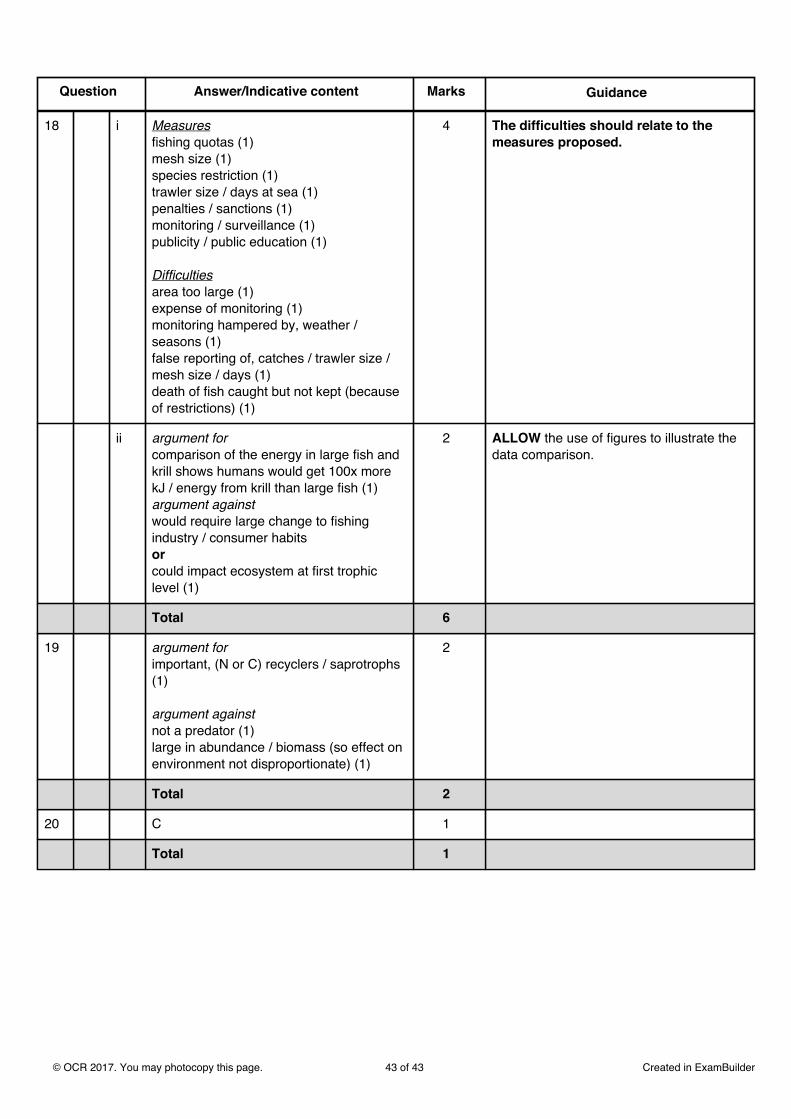
18 i Measuresfishing quotas (1)mesh size (1)species restriction (1)trawler size / days at sea (1)penalties / sanctions (1)monitoring / surveillance (1)publicity / public education (1)
Difficultiesarea too large (1)expense of monitoring (1)monitoring hampered by, weather /seasons (1)false reporting of, catches / trawler size /mesh size / days (1)death of fish caught but not kept (becauseof restrictions) (1)
4 The difficulties should relate to themeasures proposed.
ii argument forcomparison of the energy in large fish andkrill shows humans would get 100x morekJ / energy from krill than large fish (1)argument againstwould require large change to fishingindustry / consumer habitsorcould impact ecosystem at first trophiclevel (1)
2 ALLOW the use of figures to illustrate thedata comparison.
Total 6
19 argument forimportant, (N or C) recyclers / saprotrophs(1)
argument againstnot a predator (1)large in abundance / biomass (so effect onenvironment not disproportionate) (1)
2
Total 2
20 C 1
Total 1
Powered by TCPDF (www.tcpdf.org)
© OCR 2017. You may photocopy this page. 43 of 43 Created in ExamBuilder
Question Answer/Indicative content Marks Guidance