evolution of the chugach metamorphic complex of southern
TRANSCRIPT
DETA GASSER
EVOLUTION OF THE CHUGACHMETAMORPHIC COMPLEX OF SOUTHERN
ALASKA IN SPACE AND TIME
A dissertation submitted to the
Faculty of Natural ScienceKarl Franzens University of Graz
Austria
for the Degree of Doctor of Science
August 2010

"...und zum ersten Mal überfiel mich in diesen verzauberten Reisetagen eine Vorstellung,die mich später immer wieder einmal besucht und beglückt hat: dass Geologie die Musik
der Erde sei."
Hans Cloos in Gespräch mit der Erde, 1947

PREAMBLE
Metamorphic rocks occur at the Earth’s surface all over the world. Many of them are derivedfrom sedimentary rocks, which once formed at the surface, and which were then buried,heated and metamorphosed, before they were finally exhumed back to the surface. In orderto understand the mechanisms which lead to burial, heating, cooling and exhumation ofsuch rocks, it is necessary to know: (a) the exact physical conditions (i.e. pressure andtemperature) the rocks experienced, (b) the structures along which the rocks were buriedand exhumed, and (c) the timescales on which these processes occurred.
The Eocene Chugach Metamorphic Complex (CMC) of southern Alaska is a spectacular ex-ample of a metamorphic complex exposed in a Late Cretaceous to Paleocene accretionaryprism (Hudson & Plafker, 1982). The complex is exposed in a region of extreme topog-raphy: the Chugach-St. Elias mountains, which occur along the southern Alaskan margin.The presence of this metamorphic complex in a fore-arc setting has been interpreted to bethe consequence of an unusual thermal event: the subduction of an oceanic spreading ridgebelow the margin (e.g. Sisson & Pavlis, 1993; Pavlis & Sisson, 1995). Since the CMC isremote and difficult to access, previous metamorphic and structural studies concentrated onthe western and northern parts of the complex (Hudson & Plafker, 1982; Sisson & Hollister,1988; Sisson et al., 1989; Sisson & Pavlis, 1993; Pavlis & Sisson, 1995, 2003). Apart fromK/Ar and a few 40Ar/39Ar cooling ages from magmatic rocks intruding the complex (Hud-son et al., 1979; Sisson et al., 1989; Bradley et al., 1993), the timing of the high-temperaturehistory of the complex has remained largely unconstrained.
The aim of the present thesis is twofold: (1) Revealing variations in internal deformation andin the geometry of bounding fault zones across- and along-strike of the complex. For this,field work along three composite transects covering the CMC from north to south in threeareas of different width of the complex was conducted. (2) Determining the timing of burial,heating, peak metamorphism, cooling and exhumation of the complex. For this, differentgeochronometers were applied to rocks of different metamorphic zones of the complex.Therewith, rates on which these processes occurred were calculated. Finally, structural andtemporal information was integrated to derive a tectonic evolution for the complex. Theresults and interpretations of this thesis are complementary to and influenced by the thesisof Bruand (2010), who investigated the maximum PT conditions reached in the differentmetamorphic zones of the complex.
OUTLINE OF THESIS
This thesis is divided into six chapters and five appendixes.
In Chapter 1, the geological setting of the southern Alaskan margin is reviewed and sum-marized, since an understanding of the regional geological history is crucial for the inter-pretation of the results of this thesis.
In Chapter 2, the results of a detrital zircon study on the metasedimentary rocks of the CMCare described. Detrital zircon cores from four samples covering the CMC from west to eastwere analysed by LA-ICP-MS, in order to reveal (a) the maximum depositional age of thesediments, which gives a starting point for the metamorphic cycle, and (b) the provenanceof the sediments, which gives an idea of the tectonic history prior to metamorphism in theCMC.
In Chapter 3, the applicability of garnet, monazite, allanite and xenotime as geochronome-ters for the prograde history of the CMC is tested. Under given circumstances, all fourminerals are suitable to yield geochronological ages which date prograde points in time.A detailed description of the occurrence of these minerals is presented and the petrologi-cal context is discussed. In addition, the results of limited Sm-Nd garnet dating and U-PbSHRIMP monazite dating are presented.
In Chapter 4, the results of U-Pb SHRIMP dating of metamorphic zircon are presented.The detrital zircon cores present in the rocks of the CMC are surrounded in the high-gradegneisses of the complex by small, metamorphic zircon overgrowths, which grew during par-tial melting under peak metamorphic conditions. Precise U-Pb SHRIMP ages of such meta-morphic overgrowths from seven samples covering the CMC from west to east constrainthe timing of peak metamorphism in the complex. This chapter is submitted to GeologicalSociety of America Bulletin.
In Chapter 5, the results of the structural field work are described, as well as the resultsof 40Ar/39Ar muscovite and biotite dating, Rb/Sr isocron dating and fission track zircondating. This information is then used, together with (a) the results of previous chapters,(b) a compilation of literature data and (c) the results of the thesis of Bruand (2010), toconstruct a model for the tectonic evolution of the CMC in space and time. This chapter issubmitted to Tectonics.
Chapter 6 contains a summary, conclusions and outlook of this work.

Appendix A contains a progress report which was written halfway through the project andwhich summarizes the aims and procedures of this thesis. It was published in Erstausgabe:Veröffentlichungen junger WissenschaftlerInnen der Universität Graz.
Appendix B contains three research abstracts which were presented during the thesis atinternational conferences.
The last three appendices are not directly related to this thesis but contain the results of smallside-studies which I conducted during my employment at the University of Graz, partly dueto the fact that fieldwork in Alaska could only begin 10 months after the employment started.All three appendices are entirely related to my interest for the Alpine orogen.
Appendix C contains a manuscript which deals with the large-scale internal geometry ofthe Paleozoic of Graz. Despite a large amount of very detailed information on stratigraphyand structure of this nappe complex, large-scale profiles throughout the entire complex werelacking. I therefore compiled information on stratigraphy and structural geometry from theliterature and constructed several large-scale profiles through the area. The manuscript ispublished in International Journal of Earth Sciences.
Appendix D contains a conference abstract on the structural geometry of the Paleozoic ofGraz.
Appendix E finally contains a manuscript that resulted from an excursion led by PhD stu-dents for the Doctoral School of Earth Sciences of the Universities of Graz and Leoben. Itcontains a summary of the geological history of Styria, meant to give professional geolo-gists and laymen alike an overview of the fascinating geology of the second-largest provinceof Austria.
The following manuscripts originated from this thesis and are submitted to or are publishedin international journals:
1. Gasser, D., Rubatto, D., Bruand, E., Stüwe, K.: Large-scale, short-lived metamorphism and magma-tism in the Chugach Metamorphic Complex (CMC), southern Alaska: a zircon U-Pb SHRIMP study.Submitted to Geological Society of America Bulletin. Chapter 4
2. Gasser, D., Bruand, E., Stüwe, K., Foster, D., Schuster, R., Fügenschuh, B.: Formation of a metamor-phic complex along an obliquely convergent margin: Structural and thermochronological evolution ofthe Chugach Metamorphic Complex, southern Alaska. Submitted to Tectonics. Chapter 5.
3. Gasser, D., Stüwe K., Fritz, H. (2010) Internal structural geometry of the Paleozoic of Graz. Interna-tional Journal of Earth Sciences, 99, 1067-1081. Appendix C.
Two smaller manuscripts originated from this thesis and are published in local journals:
1. Gasser, D., Bruand, E. (2010) Tectonic and metamorphic evolution of the Chugach Metamorphic Com-plex, Alaska: A progress report. Erstausgabe, Veröffentlichungen junger WissenschaftlerInnen derUniversität Graz. 149-158. Appendix A.
2. Gasser, D., Gusterhuber, J., Krische O., Puhr, B., Scheucher, L., Wagner, T., Stüwe, K. (2009) TheGeology of Styria: An overview. Naturwissenschaftlicher Verein Steiermark, 139, 5-36. Appendix E.
The following conference contributions originated from this thesis:
1. Gasser, D., Stüwe, K. (2007) The Chugach Metamorphic Complex of southern Alaska: A test for wedgeextrusion models? Geological Society of America Abstracts with Programs, Vol. 39, No. 6, p. 232.Appendix B.
2. Gasser, D., Bruand, E., Stüwe, K. (2009) Exhumation of a metamorphic complex in a strike-slip setting:observations from the Chugach Metamorphic Complex (CMC), southern Alaska. Abstract Volume 7thSwiss Geoscience Meeting, Neuchatel, p.79. Appendix B.
3. Gasser, D., Bruand, E., Stüwe, K., Rubatto, D., Foster, D., Schuster, R. (2010) Exhuming MetamorphicRocks: Constraints from Cooling of the Chugach Metamorphic Complex, southern Alaska. GeophysicalResearch Abstracts Vol. 12, EGU2010-11742, 2010. Appendix B.
4. Gasser, D., Stuewe, K., Fritz, H. (2008) Journal of Alpine Geology, Vol. 49, p. 29, PANGEO 08conference, Vienna. Appendix D.
SUMMARY
Metamorphic complexes form by various different processes in many different tectonic set-tings all over the world. In order to distinguish between different processes which formeda particular complex, an understanding of the spatial geometry and the temporal evolutionof the complex is needed. This thesis contains the results of an interdisciplinary study con-ducted on the Chugach Metamorphic Complex (CMC) of southern Alaska, which aimedat constraining the evolution of the complex in space and time. The CMC is a ~10-50 kmwide and ~350 km long upper amphibolite facies metamorphic complex, which consists oftwo macroscopically different zones: a northern schist zone and a southern gneiss zone.The complex developed in the Late Cretaceous accretionary prism of the Chugach terrane,which is exposed along the southern Alaskan margin on ~2200 km along strike.
Three across-strike composite sections were investigated by fieldwork, in order to describethe geometry of the complex in three dimensions. The three sections cover the complexfrom the western part where it is widest to the south-eastern part where it is narrowest.The geometry of the complex is controlled by the presence of three superimposed fabrics:The first fabric (D1) is related to accretion of the sediments and is only recognizable in thephyllite zone surrounding the complex. The second fabric is a flat-lying foliation defined bybiotite ± sillimanite with a horizontal E-W stretching lineation, which is developed in theschist and gneiss zones (D2). The third fabric is a steep foliation defined by biotite and meltlayers with a horizontal E-W stretching lineation in the northern part and a variably W-NW-dipping stretching lineation in the southern part of the complex (D3). It is heterogeneouslydeveloped throughout the schist and gneiss zones and is most intensely developed in thesouthern part of the gneiss zone. D3 defines a foliation fan from north to south with south-dipping foliation planes in the north and north-dipping foliation planes in the south. Thesouthern part of the gneiss zone is overprinted by numerous semi-brittle to brittle N-dippingshear zones and faults with N-side-up and dextral sense of movement, which juxtaposemigmatitic gneisses against greenschist facies phyllites. These faults lead to an asymmetricshape of the complex, with a wide transition from phyllites to gneisses in the north and anabrupt transition from gneisses to phyllites in the south.
The age spectra of detrital zircon populations of four samples were investigated by LA-ICP-MS geochronology, in order to constrain the maximum depositional age of the sedimentsin which the CMC developed. The approach is based on the premise that the depositionalage of a sequence can not be older than the youngest detrital zircon grains present in therocks. The four samples have maximum depositional ages of 58.5±1.6 Ma, 63.6±1.4 Ma,64.8±0.9 Ma and 75.6±0.9 Ma. The first two lie entirely within the Paleocene, whereas thelast two overlap or lie within the Late Cretaceous. The oldest sample stems from deepest
in the prism. The entire age spectra of the samples revealed a predominantly Paleocene andLate Cretaceous source for the sediments, with minor contributions from Early to MiddleMesozoic, Paleozoic and Precambrian sources.
The applicability of garnet, monazite, allanite and xenotime as prograde geochronometerswas investigated in the different zones of the complex. Garnet does not preserve any pro-grade growth zoning. A Sm-Nd age of 47.8±6.3 Ma was calculated based on two garnetfractions from one sample from the gneiss zone. The age is broadly coeval with the timingof peak metamorphism based on U-Pb dating of metamorphic zircon. Monazite is absent inrocks of the phyllite zone, but is abundant as small unzoned grains in the schist zone, indi-cating that they grew at ~550°C and ~3.4 kbar. An attempt of dating these small monaziteswas not successful. Monazite in the gneiss zone is bigger and complexly zoned and prob-ably crystallized during partial melting at the metamorphic peak. U-Pb SHRIMP dating offour monazite samples from the gneiss zone revealed ages ranging from 51.5±0.9 Ma to53.5±0.9 Ma. Allanite is present (a) in the phyllite zone, (b) as peak metamorphic mineralin CaO-rich rocks at pressures >8 kbar, and (c) as large crystals in retrograde shear/fluidflow zones. Xenotime is ubiquitous in rocks of all metamorphic zones and its metamorphicgrowth conditions are difficult to constrain.
The timing of peak metamorphism was investigated by U-Pb SHRIMP dating of metamor-phic zircon. Detrital zircon cores present in all samples are overgrown by narrow, light-grey,unzoned metamorphic zircon rims which probably grew during partial melting at the meta-morphic peak. Six metamorphic and one magmatic zircon ages from the western and centralparts of the complex range between 54.0±0.9 Ma and 52.6±0.8 Ma and are within error ofeach other. One metamorphic zircon age from the south-eastern part is 51.3±0.7 Ma, whichis within error of two of the seven ages from the western and central parts. The zircon agesare within error of the monazite ages from the gneiss zone. Combined with the maximumdepositional age of ~60-65 Ma derived from youngest detrital zircon cores, a total of ~5-10Ma are available for prograde metamorphism. Assuming a starting temperature of 20°C anda peak temperature of ~650-700°C, heating rates of ~60-140°C/Ma result.
In order to constrain the cooling history of the complex, 40Ar/39Ar dating of muscovite andbiotite, Rb/Sr isochron dating and zircon fission track dating was applied, and a compilationof previous 40Ar/39Ar and low-temperature geochronology was assembled. Four 40Ar/39Armuscovite ages from the western and central parts of the complex range from 53.4±2.9Ma to 45.8±2.1 Ma. Three 40Ar/39Ar muscovite ages from the south-eastern part rangefrom 36.2±2.2 Ma to 20.0±1.0 Ma. Eleven 40Ar/39Ar biotite ages from the western andcentral part range from 50.0±2.2 Ma to 46.9±2.1 Ma. One 40Ar/39Ar biotite age from thesouth-eastern part is 15.8±0.8 Ma. Eight Rb/Sr isochron ages based on biotite and wholerock measurements from the different zones are entirely within error of the 40Ar/39Ar bi-otite ages. Four zircon fission track ages from the western and central part of the complexrange from 30.9±8.6 Ma to 26.0±2.8 Ma. Together with 40Ar/39Ar and low-temperaturedata from the literature, these ages define cooling histories for the different sections. Thewestern and central parts of the complex cooled very rapidly after the metamorphic peak
to temperatures of ~350°C with rates of ~30-180°C/Ma. Thereafter, the rocks of the gneisszone cooled very slowly during ~15-20 Ma, until an increase in cooling rate occurred asyn-chronously from north to south during the last ~25 Ma. The rocks of the south-easternpart of the complex cooled slowly and regularly with rates of ~6-10°C/Ma from the peakat ~51 Ma to temperatures of ~200-300°C at ~5-10 Ma, and cooled with increased rates of~20-40°C/Ma during the last ~5-10 Ma.
Based on this newly obtained structural and geochronological data and regional considera-tions, the following scenario for the evolution of the CMC is proposed. Rapid accretion ofsediments to the southern Alaskan margin during dextral convergence led to the formationof a thick accretionary prism during the Late Cretaceous and Paleocene, which probably ex-perienced relatively elevated temperatures due to basal friction and internal strain heating.At ~55 Ma, the deformational regime in the accretionary prism changed due to changingboundary conditions, and a flat-lying fabric with E-W stretching lineations developed (D2),which indicates vertical flattening and margin-parallel stretching. This vertical flatteningprobably led to the compression of isotherms and elevated temperatures of ~600-650°C atdepths of ~15-20 km. Peak metamorphic conditions were probably reached shortly after theonset of the D2 deformation, at ~55-52 Ma. During peak metamorphism, the deformationalregime changed back to dextral convergence (D3). Fast cooling, accompanied by exhuma-tion of parts of the gneiss zone occurred in the western and central parts of the complex.The south-eastern part of the complex experienced slower and more regular cooling afterthe peak, probably due to the already curved margin.
This scenario differs from scenarios previously proposed for the evolution of the CMC,which commonly infer the subduction of an oceanic spreading ridge below the complex.The results of this thesis, namely the contemporaneous peak metamorphism at least ~200-350 km along strike of the complex, together with the fast cooling reported shortly after thecomplex in its western and central part are difficult to explain with the model of a subduct-ing ridge below the complex. Therefore, besides the ridge subduction model, alternativehypotheses explaining the tectonic evolution of the southern Alaskan margin should contin-uously be evaluated as well.

Contents
1 Geology of the southern Alaskan margin: An introduction and literature overview 21
1.1 Chugach and Prince William terranes . . . . . . . . . . . . . . . . . . . . 22
1.2 The Sanak-Baranof plutonic belt . . . . . . . . . . . . . . . . . . . . . . . 28
1.3 Yakutat terrane . . . . . . . . . . . . . . . . . . . . . . . . . . . . . . . . 30
1.4 Plate tectonics of the Pacific basin in the Cenozoic . . . . . . . . . . . . . 32
1.5 Tectonic evolution of the Southern Alaskan margin . . . . . . . . . . . . . 36
2 LA-ICP-MS U-Pb ages of detrital zircons: A Paleocene maximum depositionalage for the protoliths of the CMC? 41
2.1 Introduction . . . . . . . . . . . . . . . . . . . . . . . . . . . . . . . . . . 42
2.2 Depositional age of the CMC protoliths based on regional correlations . . . 43
2.3 In-situ U-Pb dating of detrital zircons from the CMC . . . . . . . . . . . . 44
2.3.1 Analytical technique . . . . . . . . . . . . . . . . . . . . . . . . . 45
2.3.2 Sample description . . . . . . . . . . . . . . . . . . . . . . . . . . 46
2.3.3 U-Pb dating: Results and data assessment . . . . . . . . . . . . . . 48
2.4 Discussion . . . . . . . . . . . . . . . . . . . . . . . . . . . . . . . . . . . 56
2.4.1 Maximum depositional ages . . . . . . . . . . . . . . . . . . . . . 56
13
2.4.2 Provenance of sediments . . . . . . . . . . . . . . . . . . . . . . . 58
2.5 Conclusions . . . . . . . . . . . . . . . . . . . . . . . . . . . . . . . . . . 59
3 Testing the applicability of garnet, monazite, allanite and xenotime as progradegeochronometers in different zones of the Chugach Metamorphic Complex 73
3.1 Introduction . . . . . . . . . . . . . . . . . . . . . . . . . . . . . . . . . . 74
3.2 Metamorphic zones in the Chugach Metamorphic Complex . . . . . . . . . 76
3.3 Garnet as possible prograde geochronometer in the Chugach MetamorphicComplex? . . . . . . . . . . . . . . . . . . . . . . . . . . . . . . . . . . . 78
3.3.1 Sm-Nd dating: Analytical technique . . . . . . . . . . . . . . . . . 79
3.3.2 Sm-Nd dating: Results and interpretation . . . . . . . . . . . . . . 79
3.4 Monazite, allanite or xenotime as prograde geochronometers in the ChugachMetamorphic Complex? . . . . . . . . . . . . . . . . . . . . . . . . . . . 81
3.4.1 Analytical techniques . . . . . . . . . . . . . . . . . . . . . . . . . 81
3.4.2 Distribution of monazite, allanite and xenotime throughout the CMCin varying bulk rock compositions . . . . . . . . . . . . . . . . . . 84
3.4.3 Chemical zoning and composition of monazites from groups 2-5 . . 91
3.4.4 U-Pb SHRIMP dating of monazites from the gneiss zone . . . . . . 96
3.5 Discussion . . . . . . . . . . . . . . . . . . . . . . . . . . . . . . . . . . . 97
3.5.1 Factors controlling the stability of REE-bearing minerals in the dif-ferent groups . . . . . . . . . . . . . . . . . . . . . . . . . . . . . 97
3.5.2 Monazite-in reaction between the phyllite and schist zones . . . . . 101
3.5.3 Complexly zoned monazites in the gneiss zone: the result of (re)-crystal-lization during/after partial melting? . . . . . . . . . . . . . 104
3.5.4 Interpretation of monazite U-Pb ages in a regional context . . . . . 105
3.6 Conclusions . . . . . . . . . . . . . . . . . . . . . . . . . . . . . . . . . . 106
14
4 Large-scale, short-lived metamorphism and magmatism in the Chugach Meta-morphic Complex (CMC), southern Alaska: a zircon U-Pb SHRIMP study 113
4.1 Introduction . . . . . . . . . . . . . . . . . . . . . . . . . . . . . . . . . . 114
4.2 Geology of the southern Alaskan margin . . . . . . . . . . . . . . . . . . . 115
4.3 Timing and duration of metamorphism and magmatism in the ChugachMetamorphic Complex . . . . . . . . . . . . . . . . . . . . . . . . . . . . 119
4.3.1 Analytical techniques . . . . . . . . . . . . . . . . . . . . . . . . . 119
4.3.2 Sample description: field occurrence, whole rock composition andpetrography . . . . . . . . . . . . . . . . . . . . . . . . . . . . . 121
4.3.3 Zircon description . . . . . . . . . . . . . . . . . . . . . . . . . . 123
4.3.4 Zircon composition and Ti-in-zircon thermometry . . . . . . . . . 124
4.3.5 SHRIMP U-Pb dating of zircons . . . . . . . . . . . . . . . . . . . 127
4.4 Discussion . . . . . . . . . . . . . . . . . . . . . . . . . . . . . . . . . . . 130
4.4.1 Growth of metamorphic zircon rims at the metamorphic peak . . . 130
4.4.2 Age and duration of metamorphism in the CMC . . . . . . . . . . . 131
4.4.3 Relationship between Sanak-Baranof belt magmatism and meta-morphism in the CMC . . . . . . . . . . . . . . . . . . . . . . . . 132
4.4.4 Implications for heat transfer into the CMC . . . . . . . . . . . . . 133
4.5 Conclusions . . . . . . . . . . . . . . . . . . . . . . . . . . . . . . . . . . 137
5 Formation of a metamorphic complex along an obliquely convergent margin:Structural and thermochronological evolution of the Chugach MetamorphicComplex, southern Alaska 147
5.1 Introduction . . . . . . . . . . . . . . . . . . . . . . . . . . . . . . . . . . 148
5.2 Geology of the southern Alaska margin . . . . . . . . . . . . . . . . . . . 149
5.3 Geology of the Chugach Metamorphic Complex . . . . . . . . . . . . . . . 155
15
5.4 Structure of the Chugach Metamorphic Complex . . . . . . . . . . . . . . 157
5.4.1 Section 1 . . . . . . . . . . . . . . . . . . . . . . . . . . . . . . . 157
5.4.2 Section 2 . . . . . . . . . . . . . . . . . . . . . . . . . . . . . . . 164
5.4.3 Section 3 . . . . . . . . . . . . . . . . . . . . . . . . . . . . . . . 168
5.4.4 Structural summary and relationship with metamorphic grade . . . 171
5.5 Thermochronology . . . . . . . . . . . . . . . . . . . . . . . . . . . . . . 176
5.5.1 40Ar/39Ar dating of muscovite and biotite . . . . . . . . . . . . . . 178
5.5.2 Rb/Sr isochron dating . . . . . . . . . . . . . . . . . . . . . . . . 179
5.5.3 Fission track zircon dating . . . . . . . . . . . . . . . . . . . . . . 184
5.5.4 40Ar/39Ar and low-temperature geochronology: previous data . . . 184
5.6 Discussion . . . . . . . . . . . . . . . . . . . . . . . . . . . . . . . . . . . 187
5.6.1 The cooling history of the Chugach Metamorphic Complex . . . . . 187
5.6.2 Interpreting the cooling histories in terms of exhumation . . . . . . 191
5.6.3 Integration of the structural record with the metamorphic history ofthe Chugach Metamorphic Complex . . . . . . . . . . . . . . . . . 193
5.7 Conclusions . . . . . . . . . . . . . . . . . . . . . . . . . . . . . . . . . . 196
5.8 Appendix - Analytical techniques . . . . . . . . . . . . . . . . . . . . . . 198
5.8.1 A. 40Ar/39Ar method . . . . . . . . . . . . . . . . . . . . . . . . . 198
5.8.2 B. Rb/Sr isochron method . . . . . . . . . . . . . . . . . . . . . . 199
5.8.3 C. Fission Track zircon method . . . . . . . . . . . . . . . . . . . 200
6 Conclusions 209
6.1 Large-scale three-dimensional geometry of the complex . . . . . . . . . . . 209
16
6.2 Temporal evolution of the complex: rates of tectonic and thermal processes 210
6.3 Tectonic interpretation: Is a subducting ridge needed? . . . . . . . . . . . . 212
6.4 Outlook . . . . . . . . . . . . . . . . . . . . . . . . . . . . . . . . . . . . 214
Appendices 219
A Tectonic and metamorphic evolution of the Chugach Metamorphic Complex,Alaska: A progress report 219
A.1 Introduction . . . . . . . . . . . . . . . . . . . . . . . . . . . . . . . . . . 220
A.2 Geological Setting and Project Aims . . . . . . . . . . . . . . . . . . . . . 220
A.3 Field work . . . . . . . . . . . . . . . . . . . . . . . . . . . . . . . . . . . 222
A.4 Pressure and temperature conditions of metamorphism . . . . . . . . . . . 224
A.5 Geochronology . . . . . . . . . . . . . . . . . . . . . . . . . . . . . . . . 224
A.6 Outlook . . . . . . . . . . . . . . . . . . . . . . . . . . . . . . . . . . . . 225
B Conference abstracts related to this thesis 227
B.1 The Chugach Metamorphic Complex of southern Alaska: A test for wedgeextrusion models? . . . . . . . . . . . . . . . . . . . . . . . . . . . . . . . 228
B.2 Exhumation of a metamorphic complex in a strike-slip setting: observationsfrom the Chugach Metamorphic Complex (CMC), southern Alaska . . . . . 229
B.3 Exhuming Metamorphic Rocks: Constraints from Cooling of the ChugachMetamorphic Complex, southern Alaska . . . . . . . . . . . . . . . . . . . 230
C Internal Structural Geometry of the Paleozoic of Graz 233
C.1 Introduction . . . . . . . . . . . . . . . . . . . . . . . . . . . . . . . . . . 234
C.2 Geological setting . . . . . . . . . . . . . . . . . . . . . . . . . . . . . . . 234
17
C.3 Simplified lithological subdivision . . . . . . . . . . . . . . . . . . . . . . 237
C.4 Structural geometry . . . . . . . . . . . . . . . . . . . . . . . . . . . . . . 240
C.5 Modified tectonostratigraphy and paleogeography . . . . . . . . . . . . . . 245
C.6 Tectonic evolution of the Paleozoic of Graz: A discussion . . . . . . . . . . 247
C.6.1 Age of internal deformation and metamorphism - Variscan or Eo-Alpine? . . . . . . . . . . . . . . . . . . . . . . . . . . . . . . . . 248
C.6.2 Deformation along the borders in the Late Cretaceous and Tertiary . 250
C.7 Conclusions . . . . . . . . . . . . . . . . . . . . . . . . . . . . . . . . . . 252
C.8 Acknowledgments . . . . . . . . . . . . . . . . . . . . . . . . . . . . . . 253
D Conference abstract related to Appendix C 255
D.1 Geological profiles through the poly-phase deformed Paleozoic of Graz . . 256
E Geology of Styria: An overview 257
E.1 Introduction . . . . . . . . . . . . . . . . . . . . . . . . . . . . . . . . . . 258
E.2 Geographical division of Styria . . . . . . . . . . . . . . . . . . . . . . . . 260
E.3 Geological division of Styria . . . . . . . . . . . . . . . . . . . . . . . . . 263
E.3.1 The Austroalpine units . . . . . . . . . . . . . . . . . . . . . . . . 263
E.3.2 Neogene basins . . . . . . . . . . . . . . . . . . . . . . . . . . . . 276
E.4 Geodynamic evolution of Styria . . . . . . . . . . . . . . . . . . . . . . . 277
E.5 Mining in Styria . . . . . . . . . . . . . . . . . . . . . . . . . . . . . . . . 284
E.6 Final remarks . . . . . . . . . . . . . . . . . . . . . . . . . . . . . . . . . 288
E.7 Acknowledgments . . . . . . . . . . . . . . . . . . . . . . . . . . . . . . 288
18

Bibliography 289
Acknowledgments 309
Short CV 311
19

Chapter 1
Geology of the southern Alaskan margin: An introduction andliterature overview
The southern Alaskan margin is part of the outermost tectonic belt of the North AmericanCordillera, which is a vast Phanerozoic orogen stretching from Mexico in the south up toAlaska in the north, and which formed as the result of the convergence between oceanicplates of the Pacific basin and the continent of North America (Fig. 1.1; Oldow et al., 1989;Dickinson, 2009). Large parts of this orogen consist of a vast mosaic of so-called terranes:geological provinces with uncertain paleographical setting relative to North America whichaccreted to the continent mostly during Mesozoic and Cenozoic times, and which weretranslated over several hundreds of kilometers and also significantly rotated relative to eachother after their accretion (e.g. Coney et al., 1980). The southern Alaskan margin is a primeexample for such Cordilleran tectonics, with different terranes being accreted and translated,and with the additional complication that the margin itself is curved probably due to large-scale rotations in the Cenozoic (e.g. Plafker et al., 1994; Johnston, 2001; Redfield et al.,2007). In this chapter the geology and tectonic history of this margin is summarized fromthe Late Cretaceous to the present, since an understanding of this history is crucial for theinterpretation of the results of this thesis.
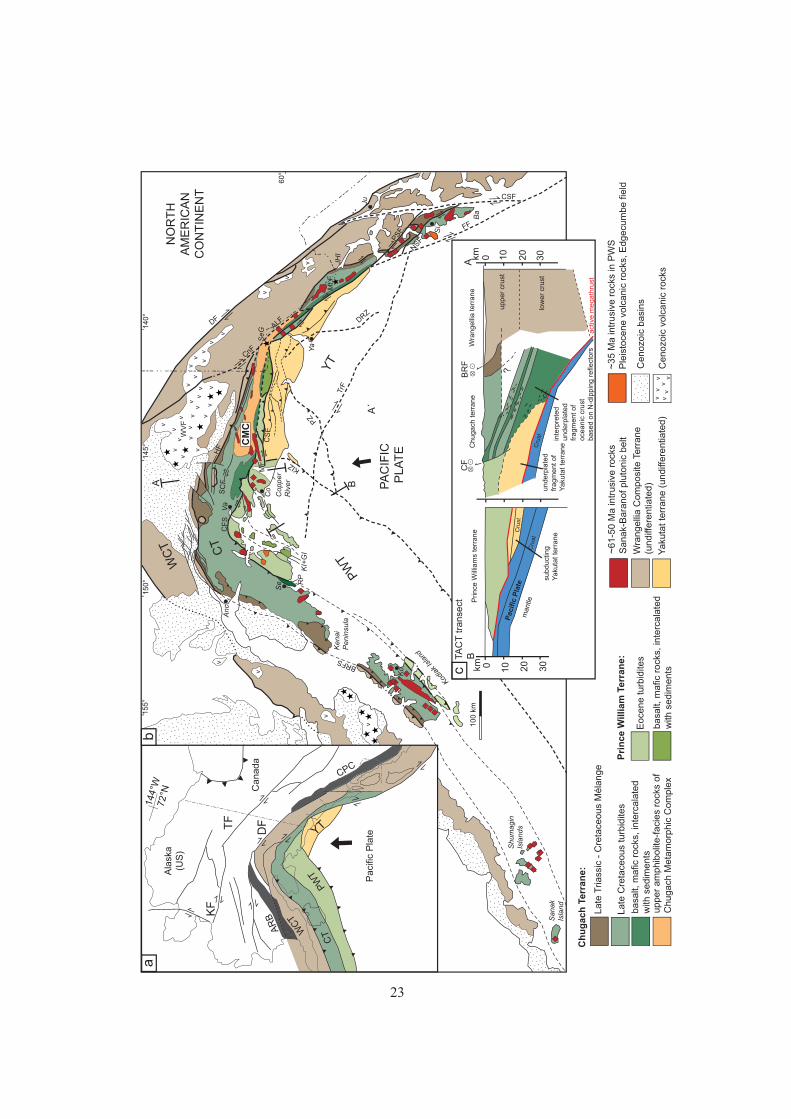
Figure 1.1 is a tectonic map of the southern Alaskan margin, with the fundamental unitsdiscussed in this chapter indicated. The Wrangellia Composite terrane to the north formsthe backstop for the Late Cretaceous to present tectonic history of the southern Alaskanmargin. It consists of Paleozoic to Mesozoic magmatic and metamorphic arc assemblages(Plafker et al., 1994) and is not described further. Outboard of this crystalline compositeterrane, a vast, complexly deformed Mesozoic to Cenozoic accretionary prism extends fromSanak Island in the west to Baranof Island in the south-east. This accretionary prism isseparated by the Contact fault system into the inboard Chugach and the outboard PrinceWilliam terrane (Fig. 1.1). Both terranes are intruded by a magmatic belt: the Sanak-Baranof plutonic belt (Fig. 1.1). Farther outboard, in the corner where the strike of themargin turns from east-west to more southeast-northwest, a younger terrane collides withthe margin, the Yakutat terrane (Fig. 1.1). The geology of these three terranes and of the
21
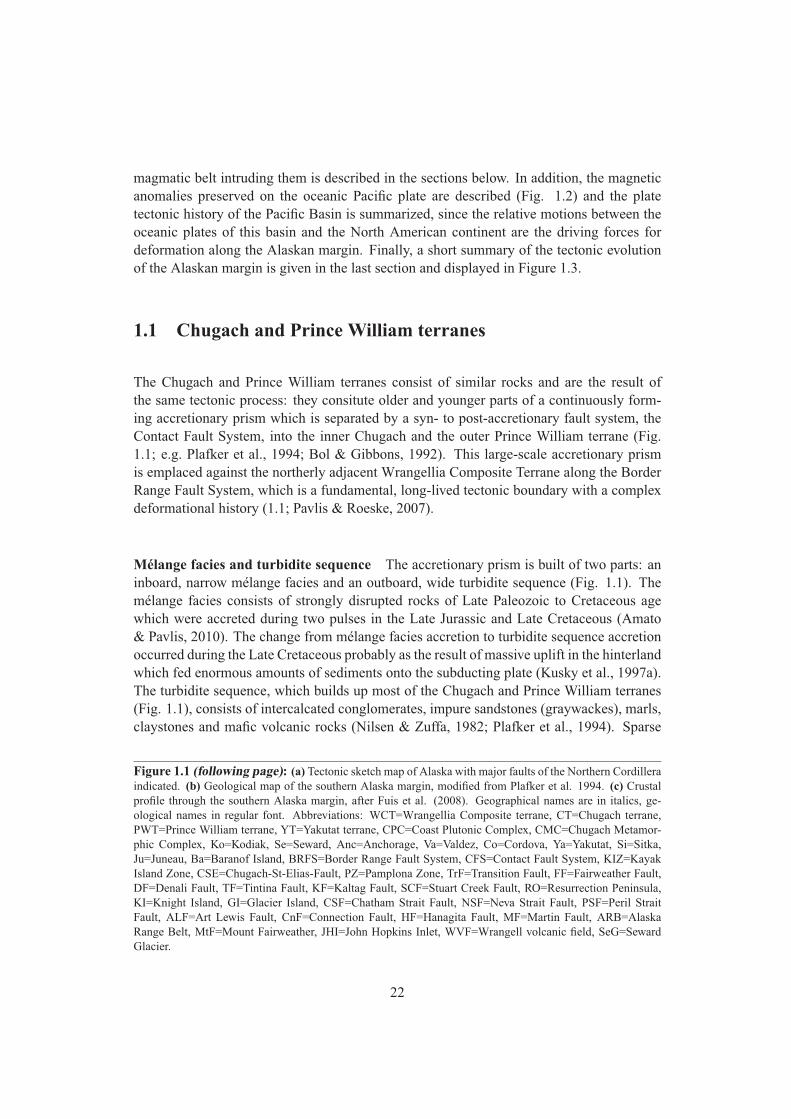
magmatic belt intruding them is described in the sections below. In addition, the magneticanomalies preserved on the oceanic Pacific plate are described (Fig. 1.2) and the platetectonic history of the Pacific Basin is summarized, since the relative motions between theoceanic plates of this basin and the North American continent are the driving forces fordeformation along the Alaskan margin. Finally, a short summary of the tectonic evolutionof the Alaskan margin is given in the last section and displayed in Figure 1.3.
1.1 Chugach and Prince William terranes
The Chugach and Prince William terranes consist of similar rocks and are the result ofthe same tectonic process: they consitute older and younger parts of a continuously form-ing accretionary prism which is separated by a syn- to post-accretionary fault system, theContact Fault System, into the inner Chugach and the outer Prince William terrane (Fig.1.1; e.g. Plafker et al., 1994; Bol & Gibbons, 1992). This large-scale accretionary prismis emplaced against the northerly adjacent Wrangellia Composite Terrane along the BorderRange Fault System, which is a fundamental, long-lived tectonic boundary with a complexdeformational history (1.1; Pavlis & Roeske, 2007).
Mélange facies and turbidite sequence The accretionary prism is built of two parts: aninboard, narrow mélange facies and an outboard, wide turbidite sequence (Fig. 1.1). Themélange facies consists of strongly disrupted rocks of Late Paleozoic to Cretaceous agewhich were accreted during two pulses in the Late Jurassic and Late Cretaceous (Amato& Pavlis, 2010). The change from mélange facies accretion to turbidite sequence accretionoccurred during the Late Cretaceous probably as the result of massive uplift in the hinterlandwhich fed enormous amounts of sediments onto the subducting plate (Kusky et al., 1997a).The turbidite sequence, which builds up most of the Chugach and Prince William terranes(Fig. 1.1), consists of intercalcated conglomerates, impure sandstones (graywackes), marls,claystones and mafic volcanic rocks (Nilsen & Zuffa, 1982; Plafker et al., 1994). Sparse
Figure 1.1 (following page): (a) Tectonic sketch map of Alaska with major faults of the Northern Cordilleraindicated. (b) Geological map of the southern Alaska margin, modified from Plafker et al. 1994. (c) Crustalprofile through the southern Alaska margin, after Fuis et al. (2008). Geographical names are in italics, ge-ological names in regular font. Abbreviations: WCT=Wrangellia Composite terrane, CT=Chugach terrane,PWT=Prince William terrane, YT=Yakutat terrane, CPC=Coast Plutonic Complex, CMC=Chugach Metamor-phic Complex, Ko=Kodiak, Se=Seward, Anc=Anchorage, Va=Valdez, Co=Cordova, Ya=Yakutat, Si=Sitka,Ju=Juneau, Ba=Baranof Island, BRFS=Border Range Fault System, CFS=Contact Fault System, KIZ=KayakIsland Zone, CSE=Chugach-St-Elias-Fault, PZ=Pamplona Zone, TrF=Transition Fault, FF=Fairweather Fault,DF=Denali Fault, TF=Tintina Fault, KF=Kaltag Fault, SCF=Stuart Creek Fault, RO=Resurrection Peninsula,KI=Knight Island, GI=Glacier Island, CSF=Chatham Strait Fault, NSF=Neva Strait Fault, PSF=Peril StraitFault, ALF=Art Lewis Fault, CnF=Connection Fault, HF=Hanagita Fault, MF=Martin Fault, ARB=AlaskaRange Belt, MtF=Mount Fairweather, JHI=John Hopkins Inlet, WVF=Wrangell volcanic field, SeG=SewardGlacier.
22
vv
vv
vv
vvvv
vv v
vv
v
vv
vv
vv
v
v
v
v
v
v
v
Anc
Se
Va
Co
Ya
Si
Ju
Ko
PA
CIF
IC
PLA
TE
CF
SFF
CS
E
DF
TrF
KIZ
PZ
DRZ
15
5°
150°
145°
140°
CM
C
60°
NO
RT
HA
ME
RIC
AN
CO
NT
INE
NT
Ba
Sa
na
k
Isla
nd
Sh
um
ag
in
Isla
nd
s
Kod
iak
Isla
nd
Ke
na
i
Penin
sula
Co
pp
er
Riv
er
RP
SC
F
KI+
GI
ALF
CnF
HF
BRFS
CSF
PSF
NSF
MF
Mt.F.
JH
I
WV
F
SeG
man
tle
up
pe
r cr
ust
CF
BR
F
10 20
300km
km 10
20
300
?
BA
Cru
stC
rust
Cru
st
low
er
cru
st
Prin
ce W
illia
ms
terr
an
eC
hu
ga
ch t
err
an
eW
ran
ge
llia
te
rra
ne
Pac
ific
Pla
te
inte
rpre
ted
un
de
rpla
ted
fra
gm
en
t o
f o
cea
nic
cru
stb
ase
d o
n N
-dip
pin
g r
efle
cto
rs
un
de
rpla
ted
fra
gm
en
t o
f Y
aku
tat
terr
an
e
sub
du
ctin
gY
aku
tat
terr
an
e
TA
CT
tra
nse
ct
act
ive
me
ga
thru
st
A
A´
WC
T CT
PW
T
YT
La
te T
ria
ssic
- C
reta
ceo
us
Mé
lan
ge
La
te C
reta
ceo
us
turb
idite
s
ba
salt,
ma
fic r
ock
s, in
terc
ala
ted
with
se
dim
en
tsu
pp
er
am
ph
ibo
lite
-fa
cie
s ro
cks
of
Ch
ug
ach
Me
tam
orp
hic
Co
mp
lex
Wra
ng
elli
a C
om
po
site
Te
rran
e
(un
diff
ere
ntia
ted
)
Ya
kuta
t te
rra
ne
(u
nd
iffe
ren
tiate
d)
~6
1-5
0 M
a in
tru
sive
ro
cks
Sa
na
k-B
ara
no
f p
luto
nic
be
lt
Ce
no
zoic
ba
sin
s
Ce
no
zoic
vo
lca
nic
ro
cks
vv
vv
vv
v
10
0 k
m
B
Eo
cen
e t
urb
idite
s
ba
salt,
ma
fic r
ock
s, in
terc
ala
ted
with
se
dim
en
ts
Ch
ug
ac
h T
err
an
e:
Pri
nc
e W
illi
am
Te
rra
ne
:~
35
Ma
intr
usi
ve r
ock
s in
PW
SP
leis
toce
ne
vo
lca
nic
ro
cks,
Ed
ge
cum
be
fie
ld
Ala
ska
(US
)
Ca
na
da
DFTF
KF
144°
W72°N
WC
T
CT
PW
T
YT
CPC
Pa
cific
Pla
te
ab
c
AR
B
v
v
v
23

fossil ages in these rocks range from Late Cretaceous in the Chugach terrane to Eocene inthe Prince William terrane (Fig. 1.3). The Late Cretaceous rocks extend from Sanak Islandin the west to Baranof Island in the east (Shumagin Fm, Kodiak Fm, Valdez group and Sitkagreywacke, Fig. 1.3). Detrital zircons from the Sitka Greywacke confirm a Late Cretaceousage for these rocks (Häussler et al., 1995). Paleocene rocks occur on Kodiak Island (GhostRock Fm) and Paleocene to Eocene rocks occur on Kodiak Island (Sitkalidak Fm) and inPrince William Sound (Orca group, Fig. 1.3; Plafker et al., 1994). The sediments showa very narrow range of εNd, Sr and Pb compositions indicating a relatively homogenoussource, probably a fastly exhuming continental magmatic arc (Nilsen & Zuffa, 1982; Farmeret al., 1993; Sample & Reid, 2003).
Belts of mafic rocks Mafic rocks occur intercalated with the sediments all over the accre-tionary prism, but are especially abundant in several areas: Along a narrow belt stretchingfrom Valdez down to Baranof Island, on the Resurrection Peninsula, and on Knight andGlacier Islands in Prince William Sound (Fig. 1.1). (1) The belt from Valdez to Baranof Is-land consists of metamorphosed mafic rocks intercalated with sediments. Since these rocksare highly deformed and partly metamorphosed up to amphibolite-facies, primary texturesare difficult to observe and the exact nature of these rocks is not well known. (2) The maficrocks exposed on the Resurrection Peninsula occur in a 21 km long and up to 6 km widefault-bounded block consisting of gabbro, sheeted mafic dikes and pillow basalts (Tysdalet al., 1977; Crowe et al., 1992; Kusky & Young, 1999; Kusky et al., 2004). The fact thatthe pillow basalts are intercalated with thin turbidites requires that the sequence formed rel-atively close to the margin which shed the sediments. (3) Similar pillow basalts, sheeteddikes and small gabbro plutons are exposed on Knight and Glacier Islands farther outboardin the Prince William terrane, suggesting that similar packages of mafic rocks were ac-creted during two different periods to the margin (Fig. 1.1; e.g. Tysdal et al., 1977). Thegeochemistry of the mafic rocks in the Valdez group, on the Resurrection Peninsula and onthe Knight and Glacier Islands does not uniquely define their source and is compatible witheither a MORB or a primitive-arc source (Lull & Plafker, 1990; Kusky et al., 2004). So theywere interpreted as having formed (a) at an intra-oceanic island-arc (Lull & Plafker, 1990),or (b) at a leaky transform fault (Tysdal et al., 1977) or (c) at a real oceanic spreading ridge,with the arc-like signatures being the result of contamination of the mafic rocks by partialmelting of the overlying sediments (e.g. Lytwyn et al., 1997; Kusky et al., 2004).
The Border Range Fault System The accretionary prism of the Chugach and PrinceWilliam terranes is bounded and transected by major fault zone systems. In the north,the Border Range Fault System (BRFS) juxtaposes the accretionary complex against theWrangellia Composite terrane (Fig. 1.1). The BRFS has a long and complex deformationalhistory which varies greatly along strike (Pavlis & Roeske, 2007). In the west, on KodiakIsland, the BRFS juxtaposes mid-crustal plutonic rocks inboard against Jurassic blueschist-facies sediments of the mélange facies of the Chugach terrane outboard, indicating that the
24
fault has an important thrust component that was active prior to ~150 Ma. In addition, thefault is pinned by ~58-62 Ma old plutons, limiting any strike-slip motion along this partof the fault to before this period (Pavlis & Roeske, 2007). Farther to the north-east, onthe Kenai Peninsula, the BRFS is buried below Tertiary and Quaternary sediments. How-ever, thrust faults with east-side up components follow the trace of the BRFS and suggestMiocene to recent reactivation of it (Bruhn & Häussler, 2006; Pavlis & Roeske, 2007). Fromnorth-east of Anchorage in the west to the Canadian border in the east the BRFS is well-exposed and the kinematics of it are best studied. In the hinge of the Alaskan orocline, acomplex, wide network of brittle dextral faults, probably active from ~55-45 Ma, overprintan older, Late Cretaceous thrust- and strike-slip history related to subduction, leading to acomplex map pattern with units from the inboard arc terrane being mixed with units fromthe outboard accretionary prism (Fig. 1.1). From the Copper River to the Canadian border,several strands of dextral strike-slip faults (the Hanagita fault system of Roeske et al., 2003)overprint the older BRFS and were active from ~85-52 Ma, probably accumulating dextraldisplacements of up to ~500 km or maybe even >1000 km (Pavlis & Roeske, 2007). InCanada the trace of the BRFS turns into a more south-easterly direction and runs south-eastwards down to Baranof Island (Fig. 1.1). In this region, the BRFS is overprinted by amajor dextral Tertiary strike-slip system which was probably active at least until ~42 Ma(Smart et al., 1996; Sisson et al., 2003). In addition it is cut or reactivated by several Neo-gene to recent dextral strike-slip faults such as the Art Lewis and Connection faults, PerilStrait Fault, the Chatham Strait Fault, the Neva Strait Fault or the Fairweather Fault (Fig.1.1; Pavlis & Roeske, 2007).
Internal deformation Outboard of the BRFS, the Chugach and Prince William terranesare internally highly deformed, folded, sheared and cross-cut by many brittle faults (e.g.Häussler & Nelson, 1993; Kusky et al., 1997b; Häussler et al., 2003b). In the north, thedextral Stuart Creek Fault/Bremner shear zone cross-cut rocks of the Chugach terrane (Fig.1.1; Pavlis et al., 2003). Farther south, faults belonging to the Contact Fault System (CFS)separate rocks from the Chugach and Prince William terranes. West of Prince WilliamSound, the CFS consists of steeply to moderately west dipping thrust faults, overprintedby younger dextral strike-slip faults and out-of-sequence thrusts (e.g. Sample & Moore,1987; Bol & Gibbons, 1992; Rowe et al., 2009). In the eastern Prince William Soundthe CFS consists of several syn-to post-accretionary fault strands with different kinematicscompatible with a dextral transpressive system (Fig. 1.1; Bol & Roeske, 1993). One ofthese faults cuts an ~35 Ma old pluton (Häussler & Nelson, 1993). Farther to the east,faults related to the CFS are pinned by a ~54-50 Ma pluton (Fig. 1.1) and disappear belowthe extensive Bagley icefield. However, a dextral fault strand splays off from beneath theBagley icefield towards the SW (Martin fault, Bruhn et al., 2004) indicating that dextraloffset may have occurred still after intrusion of the pluton. Thermochronology suggeststhat faults below the Bagley icefield might have been reactivated during the Pleistoceneas south-dipping backthrusts during the Yaktuat collision (e.g. Berger et al., 2008a). Agradient in metamorphism from greenschist facies to amphibolite facies along the ridge
25
south of Bagley icefield to the Canadian border suggests that considerable dip-slip motionoccurred on parts of the Contact fault system in this area (Plafker et al., 1994). The ContactFault System is completely buried below the Seward glacier in Canada, and is towards SEcut by or joins into several anastomosing dextral shear zones and brittle faults related to theFairweather Fault.
Sub-surface structure Two major seismic reflexion and refraction studies are availablefor the Chugach and Prince William terranes: the EDGE transect crossing the western partof the terranes between Kodiak Island and Kenai Peninsula, and the TACT transect crossingthe eastern part of the terranes west of Copper River and in the Prince William Sound (Fig.1.1c shows the TACT-transect; Fuis & Plafker, 1991; Plafker et al., 1994; Fuis et al., 2008).Both transects show slightly north-dipping reflectors below the Chugach terrane at depthsof ~10-25 km (Fig. 1.1c). These reflectors and their velocity structure have been interpretedas representing underplated sediments in the EDGE transect, and a package of underplatedsediments and offscraped oceanic crust in the TACT transect (Fig. 1.1c; Fuis et al., 1991;Fuis & Plafker, 1991; Plafker et al., 1994; Fuis et al., 2008). The TACT transect furtherreveals that the Prince William terrane is underlain by underplated Yakutat terrane in theCopper River area and subducting Yakutat terrane in the Prince William Sound area (Fig.1.1c; Fuis et al., 2008).
Metamorphism The landward mélange facies of the accretionary prism contains green-schist to blueschist-facies schists (e.g. Plafker et al., 1994). Since most of their metamor-phic history is older than Late Cretaceous, they are not described in more detail further.The turbidite sequence of the accretionary prism is mostly metamorphosed to phrenite-pumpellyite to greenschist-facies grade from Sanak Island in the west to Copper River inthe east. On Kodiak Island, the prism reached temperatures of ~200-250°C at pressures of~3 kbar probably during accretion, and was then exhumed through fission track and apatiteclosure temperatures around ~44-25 Ma (Sample & Moore, 1987; Clendenen et al., 2003).
East of the Copper River, a large-scale metamorphic complex is developed in the accre-tionary prism: the Chugach Metamorphic Complex (CMC, Fig.1.1; Hudson & Plafker,1982). According to Hudson & Plafker (1982), the CMC west of the U.S.-Canadian borderconsists of two macroscopically different zones: An outer schist zone composed of fine-grained biotite-quartz-plagioclase schist, which surrounds an inner gneiss zone composedof layered migmatitic gneisses. Pressure-temperature estimates for the metamorphism inthis complex are sparse. The only values stem from five localities distributed through-out the northern and western parts of the complex: these samples reached temperaturesof ~500-650°C and pressures of ~2.5-3.5 kbar, indicating that metamorphism occurred at~9-13 km depth (Sisson & Hollister, 1988; Sisson et al., 1989). In the absence of morepetrological data from the remaining complex these values have since been cited for theentire complex and the area has been interpreted as resulting from an unusual low-pressure-
26
high-temperature metamorphic event which affected the accretionary prism (e.g. Sisson &Hollister, 1988; Sisson et al., 1989; Sisson & Pavlis, 1993; Pavlis & Sisson, 1995; Bradleyet al., 2003). Structural studies in the northern and western parts of the CMC suggest thatthe metamorphism was accompanied by two distinct fabric generations overprinting theearlier accretionary structures: a first, flat-lying foliation with an orogen-parallel stretchinglineation is overprinted by a second, steep foliation (regionally termed D2 and D3 events;Pavlis & Sisson, 1995, 2003).
Paleomagnetism Paleomagnetic studies of volcanic rocks, sedimentary rocks or dikesallow calculating the latitude at which the rocks were magnetized, and, provided that theexact age of the rocks (i.e. the time of magnetization) is known, relative displacements androtations between rocks with different paleolatitudes can be calculated. Such paleomagneticstudies of Alaska suggest that most terranes inboard of the BRFS were at their presentposition relative to North America by Latest Cretaceous to Paleocene. However, accordingto paleomagnetic studies, the western part of Alaska rotated ~44±11◦ counter clockwisebetween ~65-35 Ma to form the Alaskan orocline (Coe et al., 1985). Several, quite differingmodels have been proposed to explain this rotation: from large-scale mega-kinking arounda vertical axis due to the convergence of Eurasia and North America following the openingof the North Atlantic (Coe et al., 1989), via the buckling and ´derailing´ of a northwardsmoving ribbon continent against stable Eurasia (Johnston, 2001), to an orogenic streamwhich flows upwards from western North America, encounters a back stop and flows arounda corner towards the free surface of the Aleutian subduction zone (Redfield et al., 2007).
Apart from this counter-clockwise rotation of western Alaska, two paleomagnetic studiesalso suggest that large northward displacements of the Chugach and Prince William terranesmay have occurred relative to the inboard terranes after ~62-57 Ma. Volcanic rocks from theGhost Rock Fm on Kodiak Island sampled on two different locations show magnetizationswhich formed 31±9◦ and 16±9◦ farther south relative to North America (Plumley et al.,1983; Coe et al., 1985). Magnetizations of the pillow basalts and sheeted dikes of the Res-urrection ophiolite indicate formation 13±9◦ farther south relative to North America (Bol& Coe, 1992). These two studies suggest that considerable dextral strike-slip displacementmust have occurred between these rocks and the inboard Wrangellia composite terrane since~62-57 Ma. In the case of the Ghost Rock Fm, this must have occurred on dextral faultsoutboard of the BRFS (Sample & Moore, 1987), since the BRFS itself is pinned by ~62 Maplutons (Pavlis & Roeske, 2007). Farther east, such displacement could have been takenup by the dextral Hanagita fault system and several dextral strike-slip faults related to theContact fault system which were probably active after ~62-57 Ma (Fig. 1.3). Nevertheless,the paleomagnetic results have been questioned since the values scatter considerably whichis difficult to explain by differential northward displacement of the three sample locations.Instead the magnetizations could be secondary and not related to the original magnetization(see a discussion in Häussler et al., 2003a). However, a recent study supports evidence fordisplacement of the Ghost Rock Fm after ~62-57 Ma (Roeske et al., 2009).
27
1.2 The Sanak-Baranof plutonic belt
The metasedimentary rocks of the Chugach and Prince William terranes are intruded by asuite of magmatic rocks which occur from Sanak Island in the west down to Baranof Islandin the south-east: the Sanak-Baranof plutonic belt (Fig. 1.1; Hudson et al., 1979). The beltconsists of several widely spaced plutons which are somewhat more frequent in the easternpart of the belt (Farris & Paterson, 2009). Large and well-studied plutons occur on KodiakIsland (Hill et al., 1981; Farris et al., 2006; Ayuso et al., 2009), on the Kenai Peninsula andin eastern Prince William Sound (Barker et al., 1992; Lytwyn et al., 2000), throughout theChugach Metamorphic Complex and in the Fairweather corridor (Harris et al., 1996; Sis-son et al., 2003) and on Baranof Island (Fig. 1.1). The plutonic belt is insofar unusual asit represents magmatic activity in an extreme fore-arc location relative to the coeval mag-matic arc which was active farther landwards. Even though the exact location of the accre-tionary prism relative to the inboard arc terranes at the time of intrusion is not well known,magmatic arcs of similar age extend farther inboard all the way from the Aleutian Islandsdown to British Columbia (the Kuskokwim/Alaska Range and Kluane/Coast Plutonic belts,Fig. 1.1a; Wallace & Engebretson, 1984; Gehrels et al., 2009), suggesting that indeed theSanak-Baranof plutonic belt was somewhere seawards of a more landward ´real´ magmaticarc during its formation.
Petrology and Geochemistry The plutons are dominantly granodiorites, tonalites andquartz diorites. Minor granites and gabbros are present, as well as a range of hypabyssal an-desitic to rhyolitic dikes and sills (Plafker et al., 1994; Bradley et al., 2003). The occurrenceof kyanite and garnet in metapelitic xenolithes found in some plutons point to an origin ofthese melts at depths of ~6-8 kbar (Hill et al., 1981; Ayuso et al., 2009). Most plutonicrocks show calc-alkaline major-element compositions, whereas trace-element compositionsas well as Sr, Pb, Nd and O isotopic compositions vary considerably between the differentplutons. The trace-element and isotopic compositions of some plutons fully overlap withthe trace-element and isotopic compositions of the sediments surrounding them, suggest-ing that they are entirely derived from partial melting of the sediments, e.i. the plutonsin the Cordova area in the eastern Prince William Sound (Barker et al., 1992), or parts ofthe Kodiak batholith (Ayuso et al., 2009). The trace-element and isotopic compositions ofother plutons and many dikes have lower chondrite normalized trace-element compositions,lower 87Sr/86Sr values, lower 207Pb/204Pb values, lower 206Pb/204Pb values, lower δ18O val-ues, and higher εNd values relative to the composition of the surrounding sediments. Thiscould be due to different sedimentary compositions deeper down in the prism where themelts originated (Barker et al., 1992) and/or suggest that besides the partial melting of sed-iments, a second, more mafic and isotopically depleted source for the melts was present(Hill et al., 1981; Harris et al., 1996; Lytwyn et al., 2000; Sisson et al., 2003; Ayuso et al.,2009). A characterization and geodynamic interpretation of this additional mafic sourceis not straigthforward, amongst others due to complex fractionation and assimilation pro-cesses, and several possibilities exist (e.g. Ayuso et al., 2009): The mafic endmember could
28
have originated (1) from partial melting of older mafic rocks intercalated with the sedimentsin deeper parts of the accretionary prism, (2) from the depleted, metasomatized mantle-wedge of the upper plate which was unterlying the accretionary prism, (3) from melting anddevolatization of the subducting oceanic crust (altered MORB and sediments), or (4) fromthe upwelling mantle of the subducting plate during the formation of a slab window. Thereis no clear evidence for the direct contribution of the last possibility, and the calc-alcalicnature similar to island-arc tholeiitic basalt and the trace-element and isotopic compositionof the most mafic plutonic rocks resembles standard sources of continental arcs such as themetasomatized mantle wedge of the upper plate and the oceanic crust of the down-goingplate (Ayuso et al., 2009).
Age relationships A range of K/Ar, 40Ar/39Ar, Rb-Sr and U-Pb ages were obtained onrocks from the Sanak-Baranof plutonic belt (Sisson et al., 1989; Bradley et al., 1993; Häus-sler et al., 1995; Bradley et al., 2000, 2003; Sisson et al., 2003; Farris et al., 2006). Con-cordant U-Pb ages are generally best to date the time of intrusion, since the other systemsrepresent cooling ages below a certain closure temperature range, which can be consider-ably lower than the temperature of intrusion. Therefore, cooling ages always only representminimum ages of intrusion. 15 U-Pb ages of variable quality are published from rocks of theSanak-Baranof belt. They were all obtained by U-Pb TIMS methods and represent eitherconcordant fractions or lower intercepts of discordant fractions, mainly from zircon, butalso from monazites. The Sanak and Shumagin plutons give ages of 61.1±0.5 Ma (Bradleyet al., 2000), the Kodiak pluton gives 6 ages ranging from 58.4±0.2 Ma to 59.1±0.2 Ma(Farris et al., 2006), one discordant monazite from the Kenai Peninsula gives an age of56±0.3 Ma (Bradley et al., 2000), discordant zircons, monazites and xenotimes from a sillin the CMC range from ~50-65 Ma (Sisson et al., 2003), two plutons in the Fairweathercorridor give ages of 49±7 Ma and 54±1 Ma (Sisson et al., 2003) and three plutons onBaranof Island finally give ages of 50.1±0.1, 50.5±0.5 and 51.6±0.3 Ma (Bradley et al.,1993, 2003). These ages reveal a general decrease in age of the intrusions from ~61 Ma inthe west to ~50 Ma in the east, but considerable sections of the belt do not show a decreasein age at all, or some complications with younger ages in the west than in the east. Theage relationships of the Sanak-Baranof belt are discussed in more detail in Chapter 4 of thisthesis.
Younger plutons Several plutons occur in the Chugach and Prince William terranes whichare petrologically or geochronologically not directly related to the Sanak-Baranof plutonicbelt. In western Prince William Sound, a series of mainly granitic rocks have K-Ar ages of~34-38 Ma (Plafker et al., 1994). Even though U-Pb ages of these intrusions are lacking,the K-Ar ages are considerably younger than K-Ar ages of the surrounding rocks, indicatingthat the plutons intruded after that the surrounding rocks cooled below the K-Ar blockingtemperature. Another set of somewhat different plutons occurs in the Fairweather corridor.Several massive bodies of layered gabbros, some of which contain ultramafic cumulates, un-
29
derlie the mountaineous Fairweather Range (Fig.1.1; Loney & Himmelberg, 1983; Plafkeret al., 1994). Only K/Ar and 40Ar/39Ar ages from these rocks exist and scatter widely be-tween 41 and 19 Ma, and an interpreation of these ages in terms of cooling, excess Ar etc.is difficult. A small diorite plug in John Hopkins Inlet which might be related to theseintrusions gave an age of 42±0.1 Ma, suggesting that these rocks might be considerablyyounger than the intrusions of the Sanak-Baranof belt (Sisson et al., 2003). However, U-Pbages from the large-scale gabbro intrusions itself would be needed in order to evaluate apotential relationship with the more felsic Sanak-Baranof intrusions.
1.3 Yakutat terrane
Lithologies The Yakutat terrane is a fault-bound block or micro-plate which actively col-lides with the units farther inboard along the southern Alaskan margin. It consists of aneastern continental and a western oceanic basement which are separated by the Danger-ous River Zone (Fig. 1.1). The continental basement consists of up to greenschist faciesmélange and turbidites intruded by Tertiary plutons, similar to the turbidite sequence of theChugach terrane (Plafker et al., 1994). The oceanic basement consists of thick (~24-27 km)basaltic oceanic crust of Early Eocene age which either represents crust doubled by under-thrusting (e.g. Eberhart-Phillips et al., 2006), or that originated on a thick oceanic plateau(Davis & Plafker, 1986; Christeson et al., in press). Both basement types are unconformablyoverlain by Eocene to Oligocene sedimentary rocks of the Tonkun and Stillwater, Kulthiethand Paul Creek formations. These sediments document the evolution of deep marine, vol-canoclastic strata via slope and shelf deposits to shallow-marine and non-marine strata dur-ing a subtropical climate in the Eocene and Oligocene. These sediments are unconformablyoverlain by the late Miocene to recent Yakataga formation, which documents the influx oflarge amounts of glaci-marine sediments related to uplift and glaciation in the hinterland(e.g. Plafker et al., 1994; Perry et al., 2009). A detrital zircon study on the Eocene to re-cent overlap sequences suggests that the Eocene and Oligocene strata were derived from thesame hinterland - probably the Coast Plutonic Complex - whereas the younger Miocene toPleistocene strata of the Yakataga formation were derived from a different source - probablythe exhuming Chugach-St. Elias mountains (Perry et al., 2009).
Bounding fault zones The Yakutat terrane is bounded by several different fault zones(Fig. 1.1). Coupling between the Pacific plate and the Yakutat block in the south across theTransition fault has been a matter of debate and everything from underthrusting of the Pa-cific plate below the Yakutat terrane, to left-lateral or right-lateral offset has been proposed(e.g. Pavlis et al., 2004; Eberhart-Phillips et al., 2006; Gulick et al., 2007). The most recentseismic survey of the fault suggests that it is a steep dextral strike-slip fault along which nounderthrusting of the Pacific plate below the Yakutat block occurred (Christeson et al., inpress). The Kayak Island Zone in the west is a complexly deformed area where the struc-
30
tures of the Aleutian megathrust (thrusts as well as normal faults) encounter the continentalmargin (Bruhn et al., 2004). The Chugach-St.Elias fault in the north is a N-dipping thrustfault which separates the Yakutat sediments from older rocks of the Prince Williams andChugach terranes to the north (Bruhn et al., 2004). The Fairweather Fault to the east finallyis an active dextral strike-slip fault (McAleer et al., 2009).
Internal deformation The sedimentary rocks overlying the Yakutat basement are rela-tively undeformed south of the Pamplona Zone, but build up a complex fold-and-thrust belt,consisting of serveral thrust-bounded and internally folded sheets, north of the PamplonaZone and along a narrow corridor along the Fairweather Fault (Fig. 1.1; e.g. Meigs et al.,2008). Formation of this fold-and-thrust belt probably started in the late Miocene and in-creased in the Pliocene (at ~5-6 Ma), leading to surface uplift and the formation of the spec-tacular highly-glaciated Chugach-St.Elias mountains with peaks exceeding 5000 m altitudestanding only ~50 km from the coast (e.g. Berger et al., 2008a). Total amount of shorteningis estimated to a minimum of ~82 km in the central part of the belt (Meigs et al., 2008).Pleistocene exhumation revealed by low-temperature thermochronology is strongest in anarrow belt just south of the Chugach-St.Elias fault which corresponds to the glacier equi-librium line altitude, suggesting that glaciers play an important role in focusing the locusof exhumation in this actively deforming wedge (Berger et al., 2008a,b; Berger & Spotila,2008). In addition, thermochronology showed that Pleistocene exhumation also affectedolder rocks north of the Chugach-St.Elias fault south of the Bagley Icefield, indicating thata young structure must be located below this icefield (Fig. 1.1; Berger et al., 2008a). Thethermochronological signal of rivers draining the area below the Seward glacier suggeststhat this area is also strongly affected by young (< ca. 3 Ma) exhumation (Enkelmann et al.,2009, 2010). Similarly, Pleistocene exhumation is also focused in- and outboard of the Fair-weather fault zone farther east, indicating that transpression occurs in this region which ispartitioned into strike-slip along the major fault and diffuse uplift in a corridor surroundingthe fault (McAleer et al., 2009).
Total amount of displacement Two different views about the total amount of displace-ment of the Yakutat terrane relative to the inboard terranes exist. Seismic investigationssuggest that the thick oceanic crust of the Yakutat terrane underthrusts the southern Alaskanmargin at least until the Alaska Range ~650 km farther inboard (Ferris et al., 2003). This isin good agreement with the restoration of the Dangerous River Zone to the Chatham StraitFault, which requires ~600 km of southward restoration (Plafker et al., 1994), and with theprobable origin of the Yakutat cover sediments from the northern Coast Plutonic Complex(Perry et al., 2009). Using the current speed of the Pacific Plate relative to North America(~5-6 mm/y), and assuming that the Yakutat terrane was coupled to the Pacific Plate wouldsuggest that this northward transport of the terrane was ongoing since ~11-13 Ma (Koonset al., in press). However, correlating the thickened oceanic basement of the Yakutat ter-rane with a basaltic oceanic plateau of identical age which occurs along the margin offshore
31
Washington and Oregon (Siletzia, e.g. Häussler et al., 2003a) requires a much larger lateraltransport of the terrane (>1000 km; Davis & Plafker, 1986; Christeson et al., in press). Thissuggests that also more time was needed to accomplish this transport and that northwardtransport of the terrane may have initiated as early as ~25 Ma, which would correspond tothe time of onset of volcanism in the Wrangell volcanic field (Fig. 1.1; e.g. Richter et al.,1990).
1.4 Plate tectonics of the Pacific basin in the Cenozoic
The relative motions between oceanic plates of the Pacific basin and the continent of NorthAmerica are the driving forces for the tectonic evolution of the North American margin. It istherefore crucial to understand these relative motions and how they changed through time.However, understanding relative plate motions is not straightforward. Magnetic anomaliesproduced during seafloor spreading are commonly used to reconstruct the growth history oftwo adjacent oceanic plates and relative motions between these two plates are calculated.However, as soon as subduction zone boundaries are involved, much of this spreading recordgets lost and relative motions between the convergent plates are very difficult to reconstruct.Since the Pacific basin has been surrounded by subduction zone boundaries for most of itsCenozoic history, much information from that oceanic basin is lost and reconstructions relyon several indirect techniques. In order to reveal relative motions between plates which areonly linked by a subduction zone boundary, indirect links are constructed via several otherspreading ridge connections - the most famous connection for the Pacific-North Americancase is the link from the Pacific plate via Antarctica to the North Atlantic spreading system(e.g. Atwater, 1989). Uncertainties in the seafloor record and in within-plate deformationsof course propagate from one connection to the other, ending up in considerable uncertain-ties in the relative motions between the plates of interest.
This so-called plate-circuit technique only allows to investigate relative motions betweenplates, and not their absolute positions on the globe. In order to get more absolute recon-structions, it has been assumed that certain hot-spots are fixed in the mantle, and that thetrace of hot-spot chains (such as the Emperor and Hawaiian chains, Fig. 1.2) are the result ofthe motion of the plate over a fixed hot-spot. Together with the plate-circuit approach, thisallows to fix the entire plate system relative to the hot-spots in the mantle. However, thereis increasing evidence that the hot-spots are actually not fixed relative to each other, but thatthey have relative motions comparable to relative motions between plates, making them notsuitable for absolute plate reconstructions (e.g. Doubrovine & Tarduno, 2008). Other in-formation about the absolute motion of plates on the globe may come from paleomagneticstudies, which can provide the paleolatitude of a sample given its exact age and orientationof bedding is known during its formation and no secondary magnetization occurred after-wards. However, since only paleolatitude and not longitude can be derived, paleomagnetismalone is not sufficient for reconstructing relative plate motions. Finally, relative motions be-
32
tween oceanic and continental plates may be derived from geological evidence preserved onthe continents, such as forearc magmatism, magmatic arcs, accretionary prisms or back-arcbasins, given that those features are correctly interpreted in terms of plate tectonic processeswhich shaped them, which is not always obvious. So keeping all the uncertainties and as-sumptions related with plate tectonic reconstructions in mind, the plate tectonic history ofthe northern Pacific basin during the Cenozoic is summarized below.
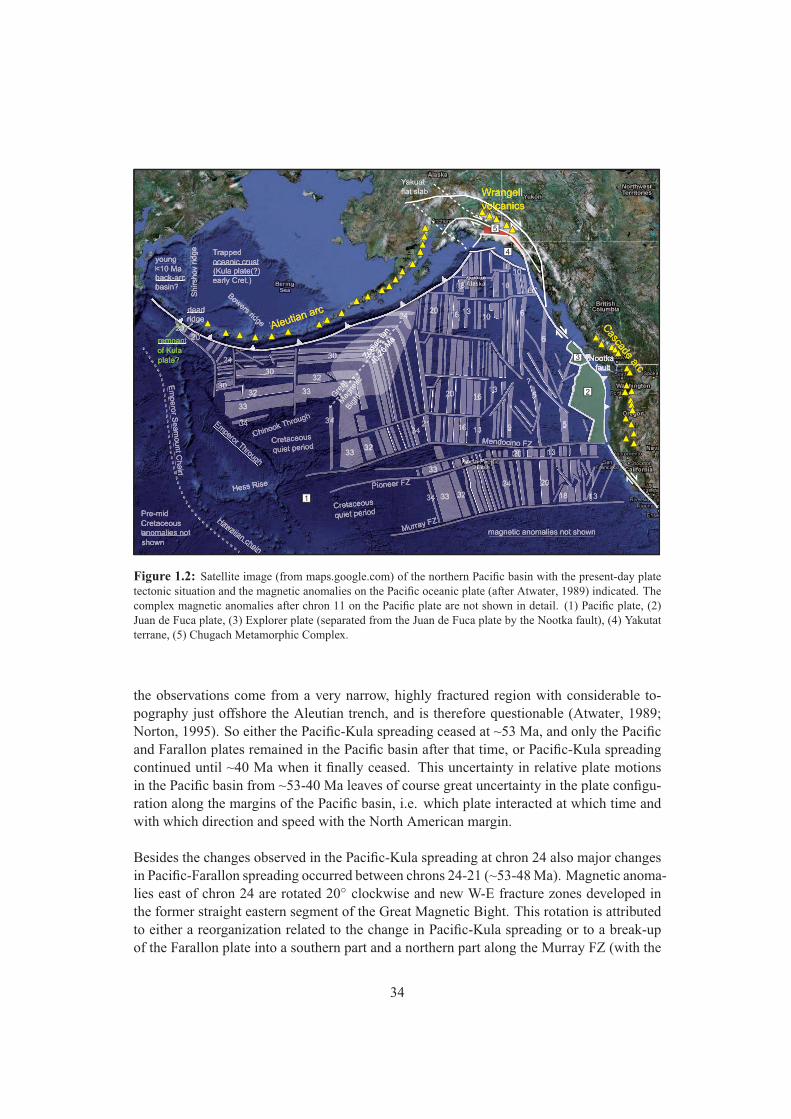
Magnetic anomalies on the Pacific plate Today, the northern Pacific basin is underlainby the vast oceanic Pacific plate, and only offshore southern British Columbia, Washingtonand Oregon small remnants of a once much larger plate are present, the Juan de Fuca andExplorer plates (Fig. 1.2; Atwater, 1989). Information from magnetic anomalies for thenorthern Pacific basin therefore mainly comes from the Pacific oceanic plate (Fig. 1.2).The central part of the northern Pacific plate east of the Emperor-Hawaiian seamount chainis dominated by an absence of magnetic anomalies, the so-called Cretaceous quiet period(Fig. 1.2; Atwater, 1989). The first magnetic anomaly after this quiet period is chron 34,which corresponds to an age of ~84 Ma (Fig. 1.2; chron-age correlations after Muelleret al., 2008). From chron 34 to chron 24 (~84-53 Ma), anomalies are relatively straight andregular, and their geometry points to the existence of three oceanic plates separated by twospreading ridges during that period: the Pacific plate in the southwest, the Farallon plate(now Juan de Fuca and Explorer plates) in the east and the Kula plate (Kula = ‘all gone´inAthapascan) in the north. The Great Magnetic Bight (Fig. 1.2) tracks the location of thetriple junction between the three plates. However, since the anomalies are only preservedon the Pacific plate and not on the Farallon or Kula plates, symmetric spreading has to beassumed to calculate relative plate motions between the three plates for that time period(Engebretson et al., 1984).
The relatively stable spreading situation recorded in chrons 34-24 changed abruptly at chron24 (at ~53 Ma; Fig. 1.2). Changes occurred both in Pacific-Kula and Pacific-Farallonspreading. Most of the information regarding Pacific-Kula spreading is subducted belowthe Aleutian trench, but some critical but controversial observations remain, which lead totwo differing views about Pacific-Kula spreading after ~53 Ma. The T-shaped anomaly 24at the northeastern end of the Great Magnetic Bight could be explained by the cessationof Pacific-Kula spreading at that time (e.g. Byrne, 1979) or by a northeastward jump ofthe triple junction and continuation of Pacific-Kula spreading after that time (Engebretsonet al., 1984; Atwater, 1989). Controversial evidence for the second case comes from a nar-row strip of seafloor exposed at the northwestern end of the Pacific plate just offshore theAleutian trench. There, Pacific-Kula magnetic anomalies rotate anti-clockwise at chron 24and anomalies are preserved until chron 18 (~40 Ma). A fault trending parallel to chron 18is interpreted as representing the Pacific-Kula spreading ridge and an anomaly northwestof this fault is interpreted as anomaly chron 20 from the Kula plate (Fig. 1.2; Lonsdale,1988). If this interpretation is correct, Pacific-Kula spreading would have changed directionat ~53 Ma and would have continued to spread highly assymetric until ~40 Ma. However,
33
Gre
at
Mag
netic
Bight
2
3
1
4
5
volc
Yakuatflat slab
Figure 1.2: Satellite image (from maps.google.com) of the northern Pacific basin with the present-day platetectonic situation and the magnetic anomalies on the Pacific oceanic plate (after Atwater, 1989) indicated. Thecomplex magnetic anomalies after chron 11 on the Pacific plate are not shown in detail. (1) Pacific plate, (2)Juan de Fuca plate, (3) Explorer plate (separated from the Juan de Fuca plate by the Nootka fault), (4) Yakutatterrane, (5) Chugach Metamorphic Complex.
the observations come from a very narrow, highly fractured region with considerable to-pography just offshore the Aleutian trench, and is therefore questionable (Atwater, 1989;Norton, 1995). So either the Pacific-Kula spreading ceased at ~53 Ma, and only the Pacificand Farallon plates remained in the Pacific basin after that time, or Pacific-Kula spreadingcontinued until ~40 Ma when it finally ceased. This uncertainty in relative plate motionsin the Pacific basin from ~53-40 Ma leaves of course great uncertainty in the plate configu-ration along the margins of the Pacific basin, i.e. which plate interacted at which time andwith which direction and speed with the North American margin.
Besides the changes observed in the Pacific-Kula spreading at chron 24 also major changesin Pacific-Farallon spreading occurred between chrons 24-21 (~53-48 Ma). Magnetic anoma-lies east of chron 24 are rotated 20◦ clockwise and new W-E fracture zones developed inthe former straight eastern segment of the Great Magnetic Bight. This rotation is attributedto either a reorganization related to the change in Pacific-Kula spreading or to a break-upof the Farallon plate into a southern part and a northern part along the Murray FZ (with the
34
northern part termed Vancouver plate by some workers; Atwater, 1989). The complex frac-ture zones in chron 18 and younger chrons between the Murray and Pioneer FZ offshore SanFrancisco are attributed to oblique transpression between the southern and northern Farallonplates (Fig. 1.2). After the chron 24-21 reorganization, Pacific-Farallon/Vancouver spread-ing continued relatively undisturbed until at least chron 11 (from ~48-29 Ma, Fig. 1.2).The bend in the Emperor-Hawaiian seamount chain, which occurred between ~43-47 Ma,did not leave an imprint in Pacific Farallon spreading. The proposed cessation of Pacific-Kula spreading at chron 18 (~40 Ma) did not leave an imprint in Pacific-Farallon spreadingeither (Norton, 1995). An important feature dating from that stable spreading time periodis the presence of the massive Zodiak fan, which was deposited ontop of the Great Mag-netic Bight region from ~40-23 Ma (Atwater, 1989). The presence of this huge clastic fanimplies that a continental landmass was close to it during the time of sedimentation, andthat therefore only limited (~500 km) relative displacement between the Fan and adjacentcontinental landmasses (probably Alaska) could have taken place since the deposition ofthe fan (~40-23 Ma Stevenson et al., 1983). This geologic constraint is generally not takeninto account in plate tectonic reconstructions which place the fan >1000 km away from anypotential source areas during the time of its deposition (Atwater, 1989).
After chron 11 (~29 Ma), the magnetic anomalies on the Pacific plate document a complexhistory of spreading between the Farallon/Vancouver (now termed Juan de Fuca) and thePacific plate, involving jumps and clockwise rotation of spreading segments, and spreadingslowed considerably. Finally, the northern Explorer plate broke off from the Juan de Fucaplate along the Nootka fault (Fig. 1.2; Atwater, 1989).
Relative motions between the oceanic plates of the Pacific basin and North Americabased on plate tectonic reconstructions Engebretson et al. (1985) calculated relativeplate motions between the oceanic plates of the Pacific basin and North America based onthe observed magnetic anomalies, assuming symmetric spreading between Pacific, Faral-lon and Kula plates, assuming fixed hot-spots and connecting the Pacific with the Atlanticspreading system via fixed hot-spots. In addition, their reconstruction assumes cessationof Kula-Pacific spreading at chron 18 (~40 Ma), something which could as well have takenplace already at chron 24 (~53 Ma, see discussion above). Their results show that in general,the Farallon plate moved east to north-east relative to North America since at least chron 34(~84 Ma), whereas the Kula plate moved north-northwest with much greater speed relativeto North America. After chron 18 (~40 Ma), the Pacific plate coupled to the Kula plateand moved northwestwards relative to North America, whereas the Farallon plate was stillmoving eastwards. Great uncertainties are associated with the exact location of the inter-section between the Kula-Farallon ridge and the North American margin before chron 18(~40 Ma). Estimations range from southern Mexico to Vancouver Island, with a generalnorthward movement from ~84-40 Ma. The ridge between the Pacific and Farallon platesafter ~40 Ma is shown to have intersected the margin basically at the same location as today,in the vincinity of Vancouver Island (Fig. 1.2).
35
Since the reconstructions of Engebretson et al. (1985), increasing evidence suggests thatthe Pacific and North Atlantic hot-spots are not fixed relative to each other and therefore re-constructions based on this assumption may be incorrect (e.g. Atwater, 1989; Norton, 1995;Doubrovine & Tarduno, 2008). Doubrovine & Tarduno (2008) therefore presented a revisedreconstruction solely based on plate-circuit connections, and they compare their results withthe results of Engebretson et al. (1985). In order to make the models comparable, they alsoassume a chron 18 (~40 Ma) cessation of Pacific-Kula spreading. Differences between thedifferent models are biggest for the time before ~46-39 Ma, where the Engebretson et al.(1985)-model shows northeastward motion of the Pacific plate relative to North America,and the Doubrovine & Tarduno (2008)-model shows northward motion. In addition, theDoubrovine & Tarduno (2008)-model places the Pacific-Farallon-Kula triple junction muchcloser to the North American continent during the time of its existence between chron 34and chron 24 (~84-53 Ma), limiting the possible locations of the intersection of the Kula-Farallon ridge and the North American margin to an area between northern California andsouthern British Columbia. Doubrovine & Tarduno (2008) calculated relative velocities be-tween the oceanic plates and North America from ~84-0 Ma for three locations along themargin: southern Alaska, Vancouver Island and California. For all three locations conver-gence varies between nearly orthogonal and highly dextrally oblique and relative velocitiessignificantly decrease after the cessation of Pacific-Kula spreading (in their model at ~40Ma).
1.5 Tectonic evolution of the Southern Alaskan margin
The geology of the southern Alaskan margin as summarized above allows reconstructingthe tectonic evolution of the margin in several episodes:
Late Cretaceous to Eocene accretion The Late Cretaceous to Eocene turbidite sequenceof the Chugach and Prince William terranes was deposited and accreted probably some-where south of its present location, with the sediments most likely derived from the exhum-ing Coast Plutonic Complex (Nilsen & Zuffa, 1982; Plafker et al., 1994; Sample & Reid,2003). In addition to the high input of clastic sediments into the evolving accretionaryprism, periods of increased mafic volcanism are indicated by the presence of mafic rocksin the prism. The interpretation of these mafic rocks is not unambiguous: some of themcould represent volcanoclastic sediments derived from the arc, others probably representsub-marine basaltic lava-flows and hypabyssal sills either derived from an intra-oceanicisland-arc (Lull & Plafker, 1990), from a leaky transform fault (Tysdal et al., 1977) or froma proper oceanic spreading ridge (e.g. Bradley et al., 2003) which was present close to themargin.
36
Paleoposition and dextral transport of the prism during accretion Contemporaneouswith accretion, dextral northward motion of the prism probably took place along the inboardHanagita fault zone from ~70-51 Ma. The total amount of displacement during that periodis not well constrained and varies from ~500 km to >1000 km (Roeske et al., 2003; Pavlis& Roeske, 2007). The uncertain location of the accretionary prism relative to the inboardmargin produces uncertainties with respect to on which oceanic plate the accretionary prismformed. Plate tectonic reconstructions for the time period of interest show that the Kula-Farallon spreading ridge intersected the margin somewhere between Northern Californiaand Vancouver Island, with the Farallon plate to the south subducting relatively orthogonalbelow the margin, and the Kula plate to the north subducting dextral obliquely below themargin (Engebretson et al., 1985; Doubrovine & Tarduno, 2008). If the accretionary prismwas located north of at least Vancouver Island during its formation, it moved dextrally withthe Kula plate northwards, and if it was located to the south of it (as suggested for exampleby Cowan, 2003) it originated on the Farallon plate and must have overriden the Kula-Farallon boundary in order to reach is present position. A third possibility would be thatthe prism formed on the Resurrection plate introduced by (Häussler et al., 2003a) in orderto explain the Sanak-Baranof plutonic belt as described in the next paragraph.
The Sanak-Baranof plutonic belt and the ridge subduction model The accretionaryprism of the Chugach and Prince William terranes is intruded by the ~2100 km long Sanak-Baranof plutonic belt (Fig. 1.1). These plutons intruded the accretionary prism at a timewhen coeval "normal" arc magmatism was still ongoing farther inboard (e.g. Wallace & En-gebretson, 1984), which suggests that the plutons formed in an extreme fore-arc position.The geochemical composition of the plutons points to an origin from mainly melted sedi-ments, with an additional component derived from a more mafic source. Marshak & Karig(1977) were the first to propose that the subduction of an oceanic spreading ridge below theprism could have been responsible for this near-trench melting event, a model which there-after has been taken up and fine-tuned by many workers (e.g. Bradley et al., 1993; Sissonet al., 1989; Sisson & Pavlis, 1993; Pavlis & Sisson, 1995; Bradley et al., 2003; Häussleret al., 2003a; Farris et al., 2006; Madsen et al., 2006; Farris & Paterson, 2009). However,several uncertainties related to this model remain:
(1) Bradley et al. (1993, 2000, 2003) and Farris et al. (2006) revealed an W-E decreasinggradient in age of the plutons, which they interpreted as tracking the location of the subduct-ing ridge below the margin. However, identical ages of plutons ~200 km apart from eachother (e.g. the Sanak and Shumagin plutons, Chap. 4) and complications with younger agesin the west than in the east, contrary to what would be expected by the simple subductionof an west-east-migrating ridge (Sisson et al., 2003) suggests that the model of a single,punctual west-east migrating ridge might be an oversimplification. (2) The geochemicalcompositions of both the mafic rocks intercalated with the sediments (Lull & Plafker, 1990;Lytwyn et al., 1997) and the mafic end-member in the plutons (Ayuso et al., 2009) are morecalc-alkaline and show different trace-element and isotopic compositions than what would
37
be expected if they originated at an oceanic spreading ridge. So either the mafic componentshave been complexely altered by the assimilation of sediments or they did not originate atan oceanic spreading ridge - but for example in the depleted mantle wedge underlying theaccretionary prism or by partial melting of the subducting oceanic crust (Ayuso et al., 2009).Therefore, the geochemical composition of the plutons does not uniquely require the pres-ence of a subducting spreading ridge. (3) Great uncertainties also exist with respect to whichoceanic spreading ridge actually subducted below the margin. Since plate tectonic recon-structions based on the magnetic anomaly record of the Pacific plate only invoke three platesin the Pacific basin at that time, and only the Kula-Farallon ridge likely intersected the NorthAmerican margin (Engebretson et al., 1985; Doubrovine & Tarduno, 2008), early workers(e.g. Bradley et al., 1993; Sisson & Pavlis, 1993; Pavlis & Sisson, 1995; Harris et al., 1996)inferred that it must have been this Kula-Farallon ridge which produced the plutonic belt.However, this Kula-Farallon ridge probably intersected the margin considerably to the southof the present position of the Sanak-Baranof belt and was slowly north-moving, the contraryto what the age gradient in the plutonic rocks infers. So either the terrane must have beenlocated to the south of this ridge and moved faster northwards than the ridge in order toproduce the southward younging age trend (e.g. Cowan, 2003), or, if the terrane was not lo-cated that far south, a second oceanic spreading ridge must have been present between so farunknown oceanic plates. This second possibility was developed by Häussler et al. (2003a).They assumed that the accretionary prism was in its present position when the intrusions ofthe Sanak-Baranof belt formed, and therefore introduced the additional Resurrection platebetween the Kula and Farallon plates with the Kula-Resurrection ridge being responsiblefor the Sanak-Baranof belt (Fig. 1.3).
In conclusion, the model of a subducting spreading ridge below the southern Alaskan mar-gin in the Eocene includes the following assumptions: (1) the ridge somehow produced anon-linear age distribution along the belt, (2) the geochemical signal of the plutons, which ismore an arc-like than a spreading-ridge signal, was altered by the assimilation of sediments,and (3) either a large northward transport of the accretionary prism occurred after intrusionof the belt or an additional oceanic plate must have been present.
The chron 24-21 (~53-48 Ma) plate reorganization Contemporaneous with the youngerpart of the Sanak-Baranof plutonic belt, a plate reorganization is indicated by the magneticanomalies on the Pacific plate. Unfortunately, what exactly happened during this reorgani-zation of magnetic anomalies is not well constrained and two different interpretations areavailable: either the Kula-Pacific spreading stopped (Byrne, 1979; Atwater, 1989; Norton,1995) or both the Kula-Pacific and the Pacific-Farallon ridges changed their direction andcontinued spreading - in the case of Kula-Pacific spreading until ~40 Ma (Lonsdale, 1988;Atwater, 1989). In the first case, a drop in plate convergence is expected along the mar-gin since the Pacific plate moved much slower northwards relative to North America thanthe Kula plate; in the second case, an increase in plate convergence is predicted due to thereorganization and increased Pacific-Kula spreading (Engebretson et al., 1985; Doubrovine
38
& Tarduno, 2008). These two differing models lead to considerable uncertainties about therelative plate motions between the oceanic plates and the continental margin from ~53-40Ma.
The accretion of the Yakutat terrane After the intrusion of the Sanak-Baranof belt at~61-50 Ma and the plate tectonic reorganization at ~53-48 Ma a less well-defined and lessactive period followed. Some accretion of sediments may have occurred in the outer partsof the Prince William terrane, and the large Zodiac fan was deposited on the Pacific plate.Dextral strike-slip motion may have occurred on the Contact fault. The time at which theYakutat terrane broke off from the continental margin and was transported northwards isnot well defined. Plate tectonic reconstructions show margin-parallel motion of the Pacificplate since at least ~40 Ma (Doubrovine & Tarduno, 2008), Wrangell volcanism initiatedat ~25 Ma (Richter et al., 1990) and retrodeformation of ~650 km of underthrusted Yakutatoceanic crust with current underthrusting rates suggests that this underthrusting is going onsince at least ~11-13 Ma. Finally, the formation of the fold-and-thrust belt of the Yakutatterrane started at ~5-6 Ma (e.g. Berger et al., 2008a; Meigs et al., 2008) which led to theformation of high topography and glaciation in the Chugach-St. Elias Mountains.
Summary The southern Alaskan margin shows a complex Late Cretaceous to recent ge-ological history controlled by oblique convergence between various oceanic plates and thecurved continental margin. Key features involved in the tectonic history of this margin are(1) sedimentation and accretion of large amounts of volcanoclastic detritus shed onto thesubducting oceanic plates, forming the vast accretionary prism of the Chugach and PrinceWilliam terranes, (2) unknown amounts of dextral displacement of this accretionary prismrelative to the inboard crystalline terranes, (3) metamorphism and partial melting of thesesediments at depth and mixing with mafic melts, possibly caused by the interaction of thisaccretionary prism with subducting oceanic ridges or transform faults, and (4) the still-ongoing collision of the Yakutat terrane with the inboard accretionary prism which causesvolcanism, deformation and uplift in the corner of the Alaskan orocline.
In this context, the following chapters of this thesis explore the spatial and temporal evo-lution of a part of this southern Alaskan margin, the Chugach Metamorphic Complex, inmore detail.
39
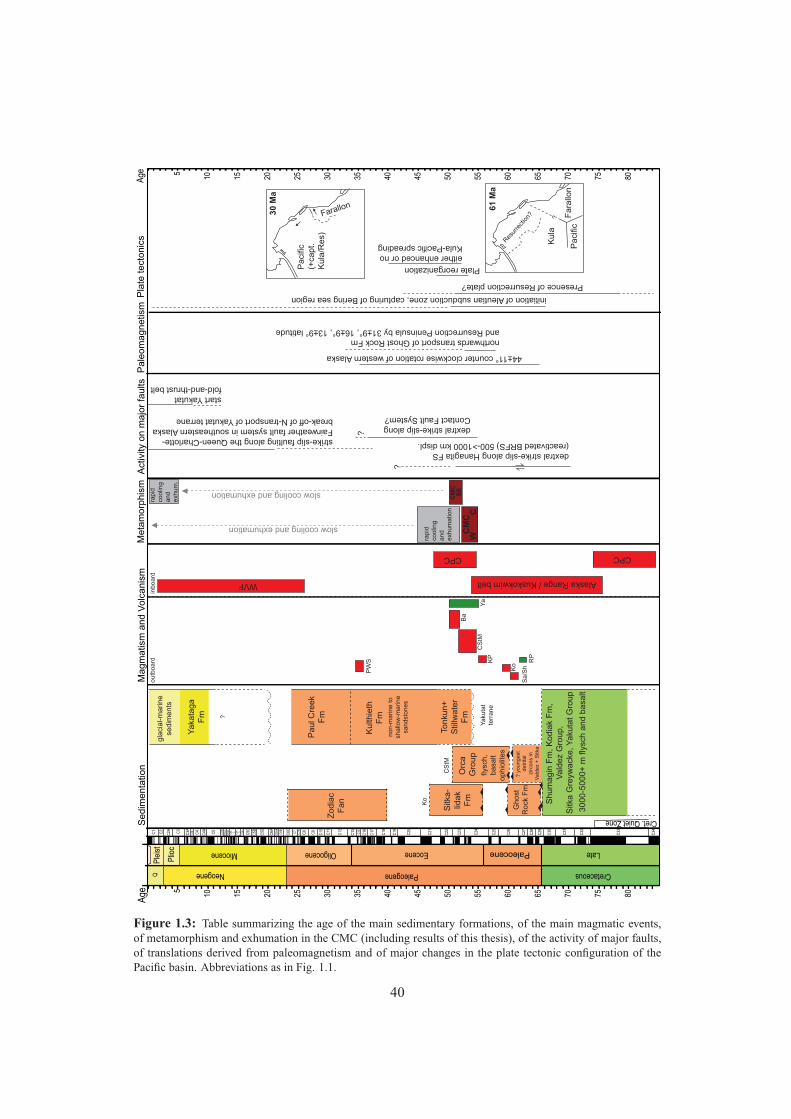
Age 5
10 15 20 25 30 35 40 45 50 55 60 65 70 75 80
CretaceousPaleogeneNeogeneQ
LatePaleoceneEoceneOligoceneMiocene
Plio
c
Ple
ist
C34
C33
C32
C31
C30
C29
C28
C27
C26
C25
C24
C23
C22
C21
C20
C19
C18
C17
C16C15
C13
C12
C11
C10C9
C8
C7AC7
C6C
C6B
C6A
A
C6A
C5E
C5D
C5C
C5B
C5A
D
C5A
C
C5A
B
C5A
A
C5AC5
C4AC4
C3B
C3AC3
C2AC2
C1
Cret. Quiet ZoneSe
dim
en
tatio
nM
ag
ma
tism
an
d V
olc
an
ism
Me
tam
orp
his
mA
ctiv
ity o
n m
ajo
r fa
ults
Pla
te t
ect
on
ics
Pa
leo
ma
gn
etis
mA
ge 5
10 15 20 25 30 35 40 45 50 55 60 65 70 75 80
?K
ula
Paci
ficF
ara
llon
Resur
rect
ion?
61 M
a
Paci
fic(+
capt.
Kula
/Res)
Farallon
30 M
a
CM
CW
C
CM
CS
E
rap
idco
olin
ga
nd
exh
um
atio
n
rap
idco
olin
ga
nd
exh
um
.
slow cooling and exhumation
slow cooling and exhumation
Sa
/ShKo
KP
CS
tM
Ba
Shum
agin
Fm
, K
odia
k F
m,
Vald
ez
Gro
up,
Sitk
a G
reyw
ack
e, Y
aku
tat G
roup
3000-5
000+
m fly
sch a
nd b
asa
lt
? y
oungest
detr
ital
zirc
ons
inV
ald
ez
+ S
itka
Ghost
Rock
Fm
Orc
a
Gro
up
Sitk
a-
lidak
Fm
Kulth
ieth
Fm
Paul C
reek
Fm
Tonku
n+
Stil
lwate
rF
m
Yaka
taga
Fm
Ko
CS
tM
Ya
kuta
tte
rra
ne
flysc
h,
basa
ltophio
lites
no
n-m
arin
e t
osh
allo
w-m
arin
esa
nd
sto
ne
s
gla
cial-m
arine
sedim
ents
?
RP
Ya
dextral strike-slip along Hanagita FS(reactivated BRFS) 500->1000 km displ.
44±11° counter clockwise rotation of western Alaska
?
strike-slip faulting along the Queen-Charlotte-Fairweather fault system in southeastern Alaskabreak-off of N-transport of Yakutat terrane
Zodia
cF
an
initiation of Aleutian subduction zone, capturing of Bering sea region
start Yakutatfold-and-thrust belt
WVF
PW
S
Plate reorganization
either enhanced or no Kula-Pacific spreading
northwards transport of Ghost Rock Fmand Resurrection Peninsula by 31±9°, 16±9°, 13±9° latitude
Presence of Resurrection plate?
Alaska Range / Kuskokwim belt
CPC CPC
ou
tbo
ard
in
bo
ard
dextral strike-slip along Contact Fault System?
?
Figure 1.3: Table summarizing the age of the main sedimentary formations, of the main magmatic events,of metamorphism and exhumation in the CMC (including results of this thesis), of the activity of major faults,of translations derived from paleomagnetism and of major changes in the plate tectonic configuration of thePacific basin. Abbreviations as in Fig. 1.1.
40
Chapter 2
LA-ICP-MS U-Pb ages of detrital zircons: A Paleocenemaximum depositional age for the protoliths of the CMC?
Abstract Knowing the depositional age range of the sediments in which the ChugachMetamorphic Complex developed is crucial for inferring the time available for progrademetamorphism in the metamorphic complex. Since biostratigraphic information from themetamorphic rocks is lacking, four samples covering the CMC from west to east-southeastwere analysed by U-Pb LA-ICP-MS geochronology on detrital zircon. Youngest detritalzircon populations determined by several statistical methods reveal a Paleocene maximumdepositional age for three of the four samples. These ages limit the time available for pro-grade metamorphism in the CMC to ~5-10 Ma. The Paleocene maximum depositional agesare slightly younger than the Late Cretaceous depositional age derived from biostratigra-phy for sediments of the Valdez Group of the Chugach terrane, which are exposed alongstrike of the CMC to the west. They are also slightly younger than the Late Cretaceousmaximum depositional age derived from U-Pb zircon geochronology for sediments of theSitka Greywacke, which are exposed along strike of the CMC to the south-east. The agepopulations of all four samples are dominated by Paleocene and Cretaceous zircon grains,with minor contributions from Jurassic, Triassic, Paleozoic and Precambrian sources.
41
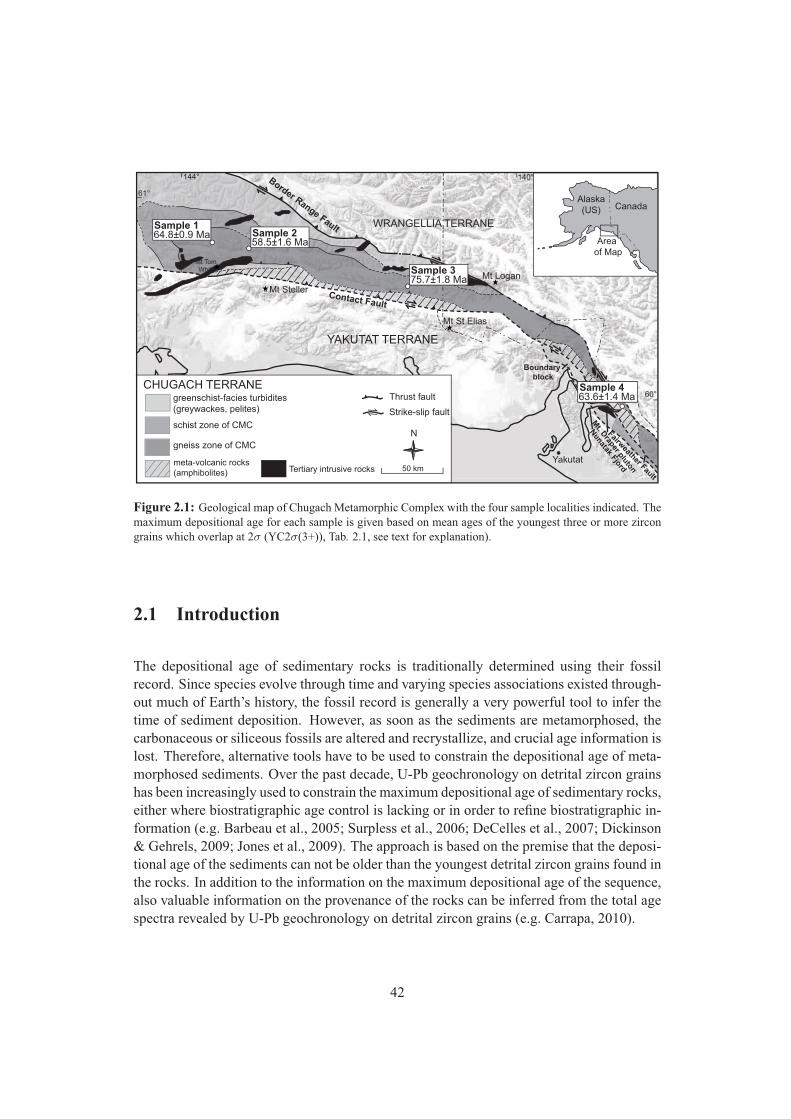
Mt Steller
Mt Tom White
Mt St Elias
Mt Logan
Yakutat
CHUGACH TERRANE
gneiss zone of CMC
greenschist-facies turbidites(greywackes, pelites)
50 km
Thrust fault
Strike-slip fault
schist zone of CMC
meta-volcanic rocks(amphibolites) Tertiary intrusive rocks
N
144° 140°
60°
61°Alaska(US) Canada
Area of Map
Border Range Fault
Contact Fault
Fairweather Fault
YAKUTAT TERRANE
WRANGELLIA TERRANE
Nunatak Fjord
Mt. D
raper pluton
Boundary block
63.6±1.4 Ma
75.7±1.8 Ma
58.5±1.6 Ma64.8±0.9 MaSample 1
Sample 2
Sample 3
Sample 4
Figure 2.1: Geological map of Chugach Metamorphic Complex with the four sample localities indicated. Themaximum depositional age for each sample is given based on mean ages of the youngest three or more zircongrains which overlap at 2σ (YC2σ(3+)), Tab. 2.1, see text for explanation).
2.1 Introduction
The depositional age of sedimentary rocks is traditionally determined using their fossilrecord. Since species evolve through time and varying species associations existed through-out much of Earth’s history, the fossil record is generally a very powerful tool to infer thetime of sediment deposition. However, as soon as the sediments are metamorphosed, thecarbonaceous or siliceous fossils are altered and recrystallize, and crucial age information islost. Therefore, alternative tools have to be used to constrain the depositional age of meta-morphosed sediments. Over the past decade, U-Pb geochronology on detrital zircon grainshas been increasingly used to constrain the maximum depositional age of sedimentary rocks,either where biostratigraphic age control is lacking or in order to refine biostratigraphic in-formation (e.g. Barbeau et al., 2005; Surpless et al., 2006; DeCelles et al., 2007; Dickinson& Gehrels, 2009; Jones et al., 2009). The approach is based on the premise that the deposi-tional age of the sediments can not be older than the youngest detrital zircon grains found inthe rocks. In addition to the information on the maximum depositional age of the sequence,also valuable information on the provenance of the rocks can be inferred from the total agespectra revealed by U-Pb geochronology on detrital zircon grains (e.g. Carrapa, 2010).
42
The Chugach Metamorphic Complex (CMC) of southern Alaska is developed in metased-imentary rocks, but no fossils are preserved in this upper-amphibolite facies metamor-phic complex. Therefore, the depositional age of the sedimentary protolith is not directlyknown and has to be inferred from regional correlations with lower-grade sedimentaryrocks. Knowing the depositional age of the protolith of the CMC is important, since thedepositional age limits the maximum time available for prograde metamorphism in the com-plex. This in turn may help to constrain the mechanisms which led to metamorphism in thecomplex. In this chapter, possible depositional ages of the metasediments of the CMC basedon regional correlations are first reviewed, and then the results of U-Pb geochronology ofdetrital zircons from four samples covering the entire CMC from west to the south-east arepresented.
2.2 Depositional age of the CMC protoliths based on regionalcorrelations
The metamorphic rocks of the CMC plunge below lower-grade (phrenite-pumpellyite- togreenschist-facies) metasedimentary rocks just east of Copper River (Fig. 1.1). Theselower-grade rocks are part of the turbidite sequence of the Chugach terrane, which consistsof intercalcated conglomerates, impure sandstones, marls, claystones and mafic volcanicrocks (e.g. Plafker et al., 1994). In the area west of Copper River, the turbidite sequenceis termed Valdez Group, after outcrops close to Valdez in Prince William Sound (Fig. 1.1;Tysdal & Plafker, 1978). The depositional age of the Valdez Group is constrained by fossilbivalves belonging to different species of the Inoceramidae family, which have been foundat 16 localities within the Valdez Group mostly in the western Chugach Mountains and onthe Kenai Peninsula (Fig. 1.1). The fossils point to a mostly Maastrichtian (Late Cretaceous,~70-65 Ma, timescale after Gradstein et al. (2004) or possibly Campanian (Late Cretaceous,~83-70 Ma) depositional age of the Valdez Group (Plafker et al., 1994). Similar bivalvesof Late Cretaceous age have been found on the Shumagin Islands and on Kodiak Island,suggesting that the Late Cretaceous turbidite sequence is continuous along the margin tothe west. Since the metamorphic rocks of the CMC are exposed along-strike of the ValdezGroup turbidites, a Late Cretaceous depositional age for the protoliths of the metamorphicrocks is generally assumed (e.g. Hudson & Plafker, 1982).
Along-strike of the CMC to the south-east, lower-grade sedimentary rocks similar to theValdez Group are exposed on Baranof Island: the so-called Sitka Greywacke (Plafker et al.,1994). No age-diagnostic fossils have been found in this unit, but Häussler et al. (2005)dated detrital zircons from seven samples along an east-west transect covering the entirewidth of the unit across strike (~15 km). They determined maximum depositional ages of~97-105 Ma for the eastern part and ~72-74 Ma for the western part of the unit, suggestingthat the unit actually consists of an eastern older part, and a western younger part which iscorrelative in age with the Valdez Group farther west.
43
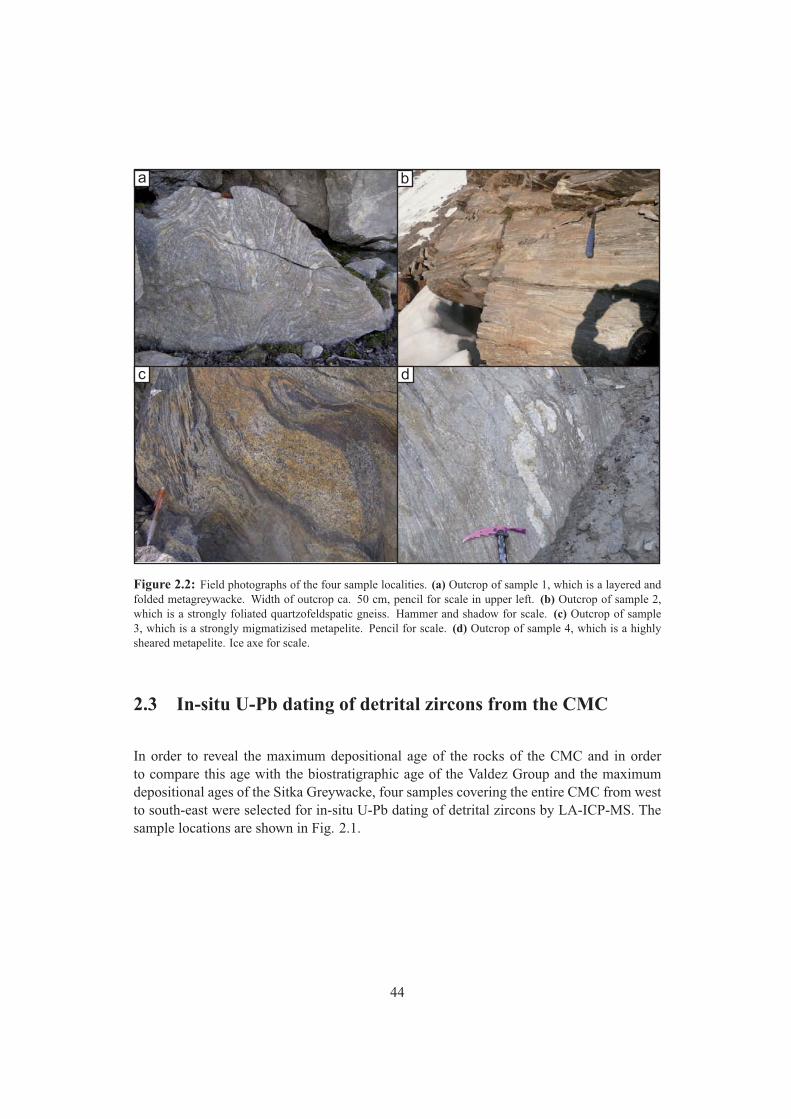
a b
c d
Figure 2.2: Field photographs of the four sample localities. (a) Outcrop of sample 1, which is a layered andfolded metagreywacke. Width of outcrop ca. 50 cm, pencil for scale in upper left. (b) Outcrop of sample 2,which is a strongly foliated quartzofeldspatic gneiss. Hammer and shadow for scale. (c) Outcrop of sample3, which is a strongly migmatizised metapelite. Pencil for scale. (d) Outcrop of sample 4, which is a highlysheared metapelite. Ice axe for scale.
2.3 In-situ U-Pb dating of detrital zircons from the CMC
In order to reveal the maximum depositional age of the rocks of the CMC and in orderto compare this age with the biostratigraphic age of the Valdez Group and the maximumdepositional ages of the Sitka Greywacke, four samples covering the entire CMC from westto south-east were selected for in-situ U-Pb dating of detrital zircons by LA-ICP-MS. Thesample locations are shown in Fig. 2.1.
44
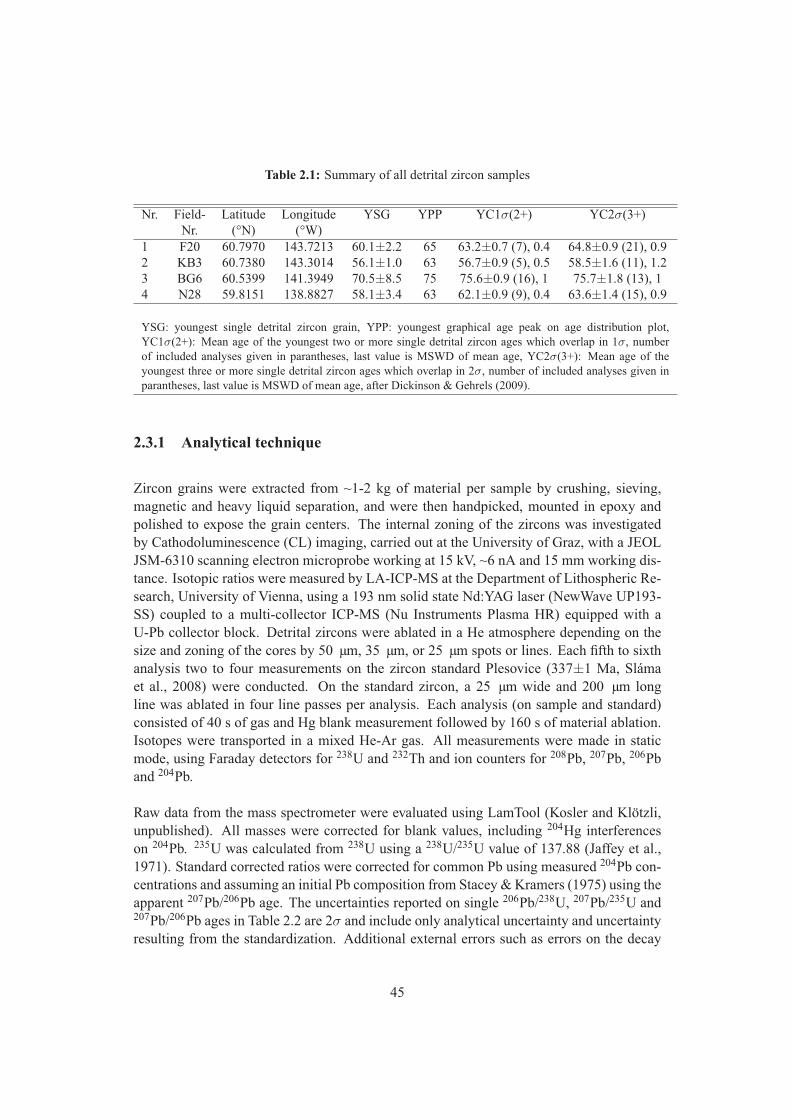
Table 2.1: Summary of all detrital zircon samples
Nr. Field- Latitude Longitude YSG YPP YC1σ(2+) YC2σ(3+)Nr. (°N) (°W)
1 F20 60.7970 143.7213 60.1±2.2 65 63.2±0.7 (7), 0.4 64.8±0.9 (21), 0.92 KB3 60.7380 143.3014 56.1±1.0 63 56.7±0.9 (5), 0.5 58.5±1.6 (11), 1.23 BG6 60.5399 141.3949 70.5±8.5 75 75.6±0.9 (16), 1 75.7±1.8 (13), 14 N28 59.8151 138.8827 58.1±3.4 63 62.1±0.9 (9), 0.4 63.6±1.4 (15), 0.9
YSG: youngest single detrital zircon grain, YPP: youngest graphical age peak on age distribution plot,YC1σ(2+): Mean age of the youngest two or more single detrital zircon ages which overlap in 1σ, numberof included analyses given in parantheses, last value is MSWD of mean age, YC2σ(3+): Mean age of theyoungest three or more single detrital zircon ages which overlap in 2σ, number of included analyses given inparantheses, last value is MSWD of mean age, after Dickinson & Gehrels (2009).
2.3.1 Analytical technique
Zircon grains were extracted from ~1-2 kg of material per sample by crushing, sieving,magnetic and heavy liquid separation, and were then handpicked, mounted in epoxy andpolished to expose the grain centers. The internal zoning of the zircons was investigatedby Cathodoluminescence (CL) imaging, carried out at the University of Graz, with a JEOLJSM-6310 scanning electron microprobe working at 15 kV, ~6 nA and 15 mm working dis-tance. Isotopic ratios were measured by LA-ICP-MS at the Department of Lithospheric Re-search, University of Vienna, using a 193 nm solid state Nd:YAG laser (NewWave UP193-SS) coupled to a multi-collector ICP-MS (Nu Instruments Plasma HR) equipped with aU-Pb collector block. Detrital zircons were ablated in a He atmosphere depending on thesize and zoning of the cores by 50 µm, 35 µm, or 25 µm spots or lines. Each fifth to sixthanalysis two to four measurements on the zircon standard Plesovice (337±1 Ma, Slámaet al., 2008) were conducted. On the standard zircon, a 25 µm wide and 200 µm longline was ablated in four line passes per analysis. Each analysis (on sample and standard)consisted of 40 s of gas and Hg blank measurement followed by 160 s of material ablation.Isotopes were transported in a mixed He-Ar gas. All measurements were made in staticmode, using Faraday detectors for 238U and 232Th and ion counters for 208Pb, 207Pb, 206Pband 204Pb.
Raw data from the mass spectrometer were evaluated using LamTool (Kosler and Klötzli,unpublished). All masses were corrected for blank values, including 204Hg interferenceson 204Pb. 235U was calculated from 238U using a 238U/235U value of 137.88 (Jaffey et al.,1971). Standard corrected ratios were corrected for common Pb using measured 204Pb con-centrations and assuming an initial Pb composition from Stacey & Kramers (1975) using theapparent 207Pb/206Pb age. The uncertainties reported on single 206Pb/238U, 207Pb/235U and207Pb/206Pb ages in Table 2.2 are 2σ and include only analytical uncertainty and uncertaintyresulting from the standardization. Additional external errors such as errors on the decay
45
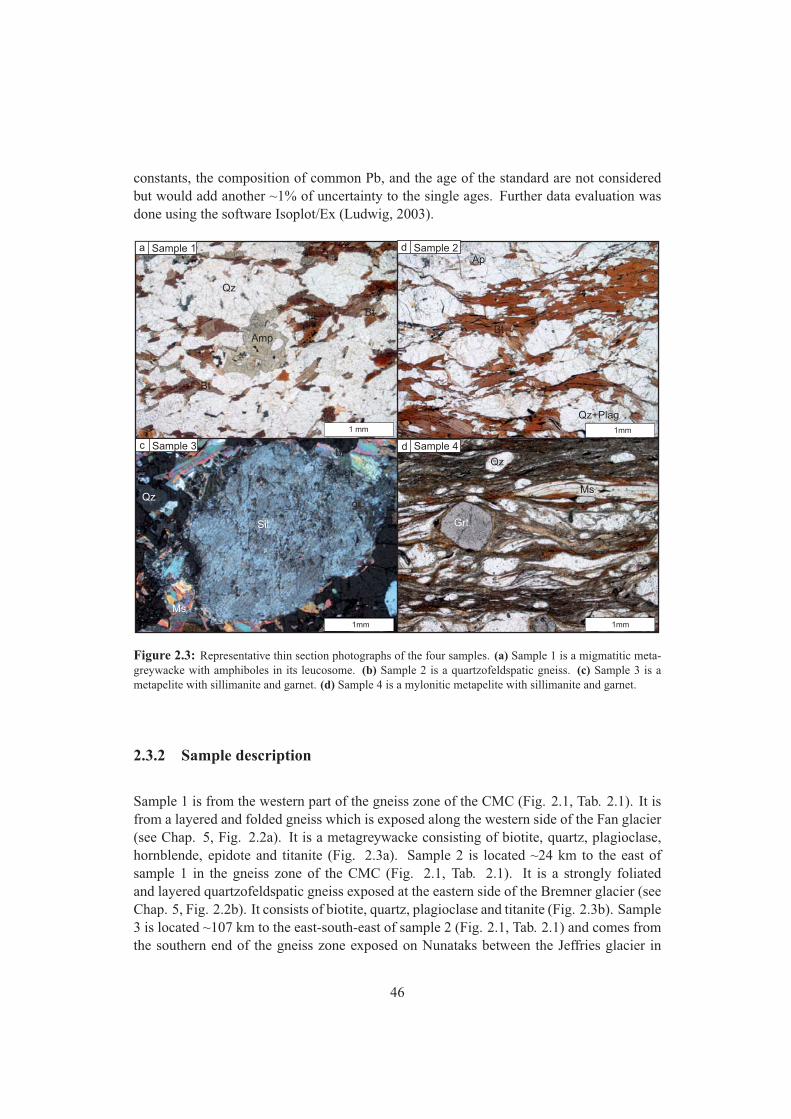
constants, the composition of common Pb, and the age of the standard are not consideredbut would add another ~1% of uncertainty to the single ages. Further data evaluation wasdone using the software Isoplot/Ex (Ludwig, 2003).
1 mm 1mm
1mm1mm
d Sample 2a Sample 1
c Sample 3 d Sample 4
Bt
Qz+Plag
Ms
Grt
gr
gr
Qz
Sil
bi
Ms
Amp
Bt
Bt
Qz
Ap
Qz
Figure 2.3: Representative thin section photographs of the four samples. (a) Sample 1 is a migmatitic meta-greywacke with amphiboles in its leucosome. (b) Sample 2 is a quartzofeldspatic gneiss. (c) Sample 3 is ametapelite with sillimanite and garnet. (d) Sample 4 is a mylonitic metapelite with sillimanite and garnet.
2.3.2 Sample description
Sample 1 is from the western part of the gneiss zone of the CMC (Fig. 2.1, Tab. 2.1). It isfrom a layered and folded gneiss which is exposed along the western side of the Fan glacier(see Chap. 5, Fig. 2.2a). It is a metagreywacke consisting of biotite, quartz, plagioclase,hornblende, epidote and titanite (Fig. 2.3a). Sample 2 is located ~24 km to the east ofsample 1 in the gneiss zone of the CMC (Fig. 2.1, Tab. 2.1). It is a strongly foliatedand layered quartzofeldspatic gneiss exposed at the eastern side of the Bremner glacier (seeChap. 5, Fig. 2.2b). It consists of biotite, quartz, plagioclase and titanite (Fig. 2.3b). Sample3 is located ~107 km to the east-south-east of sample 2 (Fig. 2.1, Tab. 2.1) and comes fromthe southern end of the gneiss zone exposed on Nunataks between the Jeffries glacier in
46
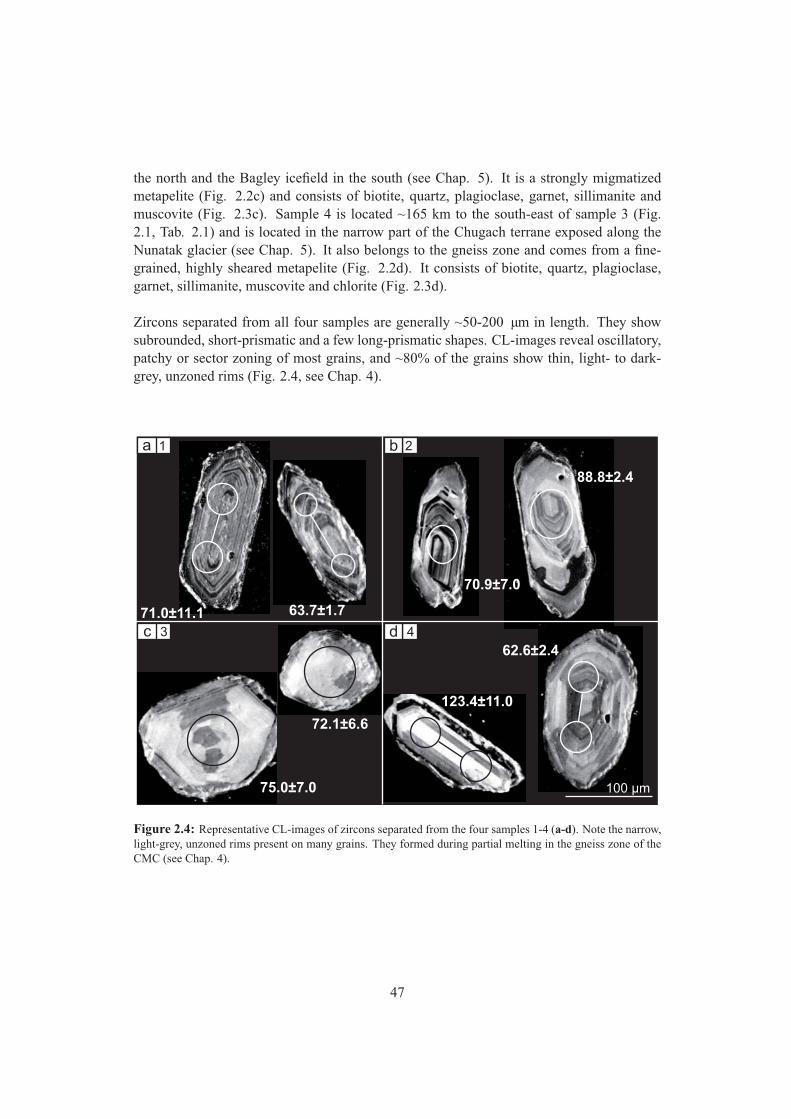
the north and the Bagley icefield in the south (see Chap. 5). It is a strongly migmatizedmetapelite (Fig. 2.2c) and consists of biotite, quartz, plagioclase, garnet, sillimanite andmuscovite (Fig. 2.3c). Sample 4 is located ~165 km to the south-east of sample 3 (Fig.2.1, Tab. 2.1) and is located in the narrow part of the Chugach terrane exposed along theNunatak glacier (see Chap. 5). It also belongs to the gneiss zone and comes from a fine-grained, highly sheared metapelite (Fig. 2.2d). It consists of biotite, quartz, plagioclase,garnet, sillimanite, muscovite and chlorite (Fig. 2.3d).
Zircons separated from all four samples are generally ~50-200 µm in length. They showsubrounded, short-prismatic and a few long-prismatic shapes. CL-images reveal oscillatory,patchy or sector zoning of most grains, and ~80% of the grains show thin, light- to dark-grey, unzoned rims (Fig. 2.4, see Chap. 4).
70.9±7.0
88.8±2.4
62.6±2.4
123.4±11.0
1a 2b
3c 4d
72.1±6.6
75.0±7.0
63.7±1.771.0±11.1
100 μm
Figure 2.4: Representative CL-images of zircons separated from the four samples 1-4 (a-d). Note the narrow,light-grey, unzoned rims present on many grains. They formed during partial melting in the gneiss zone of theCMC (see Chap. 4).
47
2.3.3 U-Pb dating: Results and data assessment
A total of 97-100 zircon cores were analysed from each sample. Standard- and common Pbcorrected isotopic ratios as well as calculated 206Pb/238U, 207Pb/235U and 207Pb/206Pb agesfor each measurement and each sample are given in table 2.2. The low 207Pb intensitiesmeasured in >90% of the grains indicate that most of them are <1000 Ma. These low207Pb intensities produce large analytical errors on 207Pb/204Pb ratios and subsequently oncalculated 207Pb/206Pb and to a lower degree on 207Pb/235U ages. Therefore, for ages <1000Ma, 206Pb/238U ages are generally most precisely measurable and are generally used forthe interpretation of detrital zircon populations, even though they have to be interpreted asminimum ages (e.g. Häussler et al., 2005; Dickinson & Gehrels, 2009; Amato & Pavlis,2010). However, given the large errors on 207Pb/206Pb ages, discordance of the ages cannot be assessed on an individual grain basis and the viability/geological significance ofthe determined 206Pb/235U ages can therefore not be checked. In addition, the 204Pb-basedcommon Pb correction led to large (>10%) corrections on ~50% of all measured 207Pb/204Pbratios, adding an additional uncertainty on these measurements.
We therefore applied the following approach for the assessment of our age data: We first dis-carded all measurements were the common Pb correction on the isotopic ratios was >10% inorder to avoid this additional uncertainty. We then sorted the remaining analyses accordingto the 206Pb/238U ages. For ages >1000 Ma, we evaluated the discordance of the measure-ments by simply comparing the 206Pb/238U to the 207Pb/206Pb ages, and analyses with >10%discordance were discarded. For ages <1000 Ma, we plotted all remaining measurements onConcordia plots using the software Isoplot/Ex (Ludwig, 2003) and excluded measurementswith errors of >30% on the 206Pb/238U ages and measurements with very low probability ofconcordance (i.e. measurements which did not touch the Concordia curve). For the remain-ing analyses, we present Concordia curves as well as age probability plots superimposed onage histograms for each sample and each age group. The histograms give an impression ofhow many analyses are incorporated within one area but they do not consider the individualerrors on each measurement, whereas the age probability plots incorporate each age and itsuncertainty as a normal distribution, and sum all ages from a sample into a single curve.In a second assessment, we analysed the measurements with >10% common Pb correction,also sorted them according to 206Pb/238U age, excluded the analyses with >30% error onthe 206Pb/238U age and excluded the discordant analyses (for grains >1000 Ma by compari-son with the corresponding 207Pb/206Pb age, for grains <1000 Ma graphically by Concordiaplots). The age distribution of the remaining concordant ages was then compared with theage distribution derived from the measurements with <10% common Pb correction. Theresults are discussed for each sample below.
Results for sample 1 A total of 97 analyses were made on zircon cores from sample 1.55 measurements were excluded in a first assessment of the data due to >10% common Pbcorrection. From the remaining 42 analyses, one gave an age of >1000 Ma, but which is
48
>30% discordant. From the other 41 analyses, none has an error of >30% on the 206Pb/238Uage but two do not touch the Concordia line and are therefore excluded. A total of 39concordant analyses remain. The following age distribution is obvious from Fig. 2.5: 97%of all zircon cores (38 measurements) show ages <130 Ma, with a major peak from ~60-85Ma, no ages from ~85-100 Ma and four scattered ages from ~100-130 Ma. The remaining3% (1 measurement) gives an age of ~500 Ma.
In a second assessment, the 55 measurements excluded before due to high common Pb-correction were screened in addition. One analysis was excluded for >30% error on the206Pb/238U age and 44 measurements do not lie on the Concordia line and are thereforeexcluded. From the remaining ten concordant ages two are ~110-140 Ma, the other eightages lie between ~60 and ~70 Ma. They are included in the Histogram/relative age plot inFig. 2.9 and 2.10 and do not alter the age distribution as plotted in Fig. 2.5 significantly(compare Fig. 2.5b with Fig. 2.9a).
Results for sample 2 A total of 100 analyses were made on zircon cores from sample 2.45 measurements were excluded in a first assessment of the data due to >10% common Pbcorrection. From the remaining 55 analyses, two gave an age of >1000 Ma, and both areconcordant. From the other 53 analyses six have errors of >30% on their 206Pb/238U agesand two are discordant and they are therefore excluded. 47 concordant ages are remainingfor sample 2. The Concordia plots, histograms and age probability plots displayed in Fig.2.6 reveal the following: 87% of the zircon cores (41 measurements) lie in the range of ~50-100 Ma with a major peak at ~62 Ma, 9% (4 measurements) lie in the range of ~120-200Ma, and 4% (2 measurements) are ~1800 Ma.
From the 45 measurements excluded before due to high common Pb correction, five mea-surements have >30% error on the 206Pb/238U age and 32 analyses are discordant, leavingeight additional concordant ages. One of these eight ages is ~190 Ma, the other seven liein the range of ~50-70 Ma. They do not alter the age distribution as displayed in Fig. 2.6significantly (compare Fig. 2.6b with Fig. 2.9b).
Results for sample 3 A total of 99 analyses were made on zircon cores from sample3. In 48 measurements, the common Pb correction was >10% on the 207Pb/204Pb ratio,and these measurements were therefore excluded. From the remaining 51 analyses, threegave 206Pb/238U ages of >1000 Ma, with discordance <10%. The other 48 analyses gave206Pb/238U ages of <400 Ma, with 11 analyses having an error of >30% on the 206Pb/238Uage and one analysis plotting off the Concordia curve and being therefore excluded. So a to-tal of three concordant ages >1000 Ma and 36 concordant ages <400 Ma remain for sample3. These analyses are plotted in Fig. 2.7. The following age distribution is obvious: 72%of the zircon cores (28 measurements) show ages of ~60-120 Ma, with a major peak at ~73Ma, and second peaks at ~83 Ma and ~98 Ma. 21% of the zircon cores (8 measurements)
49
show ages of ~160-380 Ma with a broad peak from ~160-230 Ma. The remaining 7% of thezircon cores (3 measurements) give ages of ~1300-1600 Ma and one age of ~2300 Ma.
From the 48 measurements excluded before due to high common Pb correction, one analysisyielded an age of >1000 Ma, but with a discordance of >10%, and is therefore discarded.From the remaining 47 measurements, 12 were excluded due to high errors, and 27 analysesdo not lie on the Concordia line, leaving a total of eight additional concordant analyses. Alleight analyses fall into the dominant ~60-120 Ma interval of sample 3 and do not alter theage distribution significantly (compare Fig. 2.7c with Fig. 2.9c).
Results for sample 4 A total of 99 analyses were made on zircon cores from sample4, and 47 measurements are in a first assessment excluded due to >10% common Pb cor-rection. From the remaining 52 analyses, one has an age of >1000 Ma, and shows >10%discordance. From the other 51 measurements, three have >30% error on their 206Pb/238Uages and one analysis is discordant, leaving 47 concordant ages. From figure 2.8, the fol-lowing age distribution is obvious: From the 47 concordant analyses, 92% (43 analyses)fall in the age range ~60-140 Ma with a pronounced peak at ~64 Ma and a smaller peak at~98 Ma. The remaining 8% (4 analyses) are scattered between ~140 and ~230 Ma.
From the 47 measurements excluded before due to high common Pb correction, one analy-sis yielded an age of >1000 Ma, but with a discordance of >10%, and is therefore discarded.From the remaining 46 measurements, one was excluded due to high errors, and 38 mea-surements are discordant, leaving 8 additional concordant ages for this sample. Two ofthem lie between ~200-360 Ma, and the others between ~60 and ~80 Ma, not changing thegeneral age distribution of sample 4 significantly (compare Fig. 2.8d with Fig. 2.9d).
Summary From the initially 97-100 analyses conducted per sample, 47-55 concordantanalyses per sample remained. A few Precambrian, Paleozoic, Triassic and Jurassic grainsoccur in all samples, but the vast majority of grains are of Lower Cretaceous and Paleoceneage (Fig. 2.10).
50
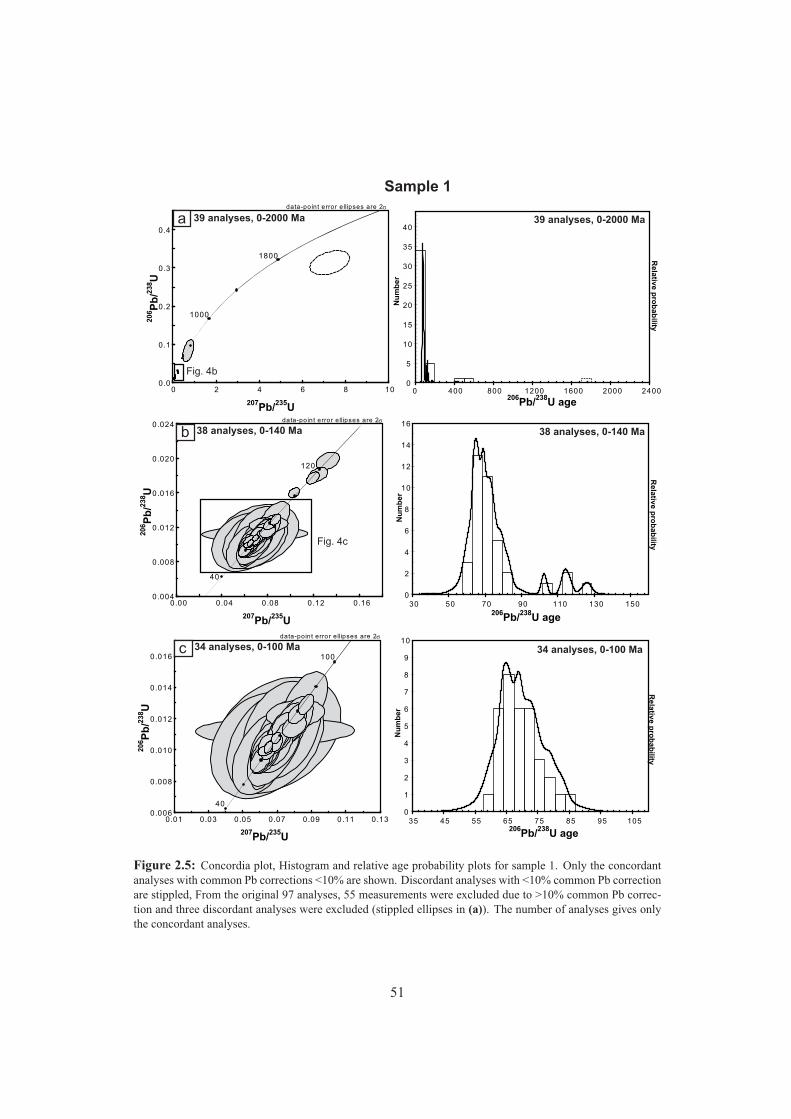
0.0
0.1
0.2
0.3
0.4
0 2 4 6 8 10
1000
1800
Sample 1
207Pb/235U
206 P
b/23
8 U
data-point error ellipses are 2σ
0.004
0.008
0.012
0.016
0.020
0.024
0.00 0.04 0.08 0.12 0.16
40
120
207Pb/235U
206 P
b/23
8 U
data-point error ellipses are 2σ
39 analyses, 0-2000 Maa
38 analyses, 0-140 Mab
206Pb/238U ageN
um
ber
Re
lativ
e p
rob
ab
ility
39 analyses, 0-2000 Ma
206Pb/238U age
Nu
mb
er
Re
lativ
e p
rob
ab
ility
38 analyses, 0-140 Ma
Fig. 4b
0.006
0.008
0.010
0.012
0.014
0.016
0.01 0.03 0.05 0.07 0.09 0.11 0.13
40
100
207Pb/235U
206 P
b/23
8 U
data-point error ellipses are 2σ
34 analyses, 0-100 Mac
206Pb/238U age
Nu
mb
er
Re
lativ
e p
rob
ab
ility
34 analyses, 0-100 Ma
Fig. 4c
0
5
10
15
20
25
30
35
40
0 400 800 1200 1600 2000 2400
0
2
4
6
8
10
12
14
16
30 50 70 90 110 130 150
0
1
2
3
4
5
6
7
8
9
10
35 45 55 65 75 85 95 105
Figure 2.5: Concordia plot, Histogram and relative age probability plots for sample 1. Only the concordantanalyses with common Pb corrections <10% are shown. Discordant analyses with <10% common Pb correctionare stippled, From the original 97 analyses, 55 measurements were excluded due to >10% common Pb correc-tion and three discordant analyses were excluded (stippled ellipses in (a)). The number of analyses gives onlythe concordant analyses.
51
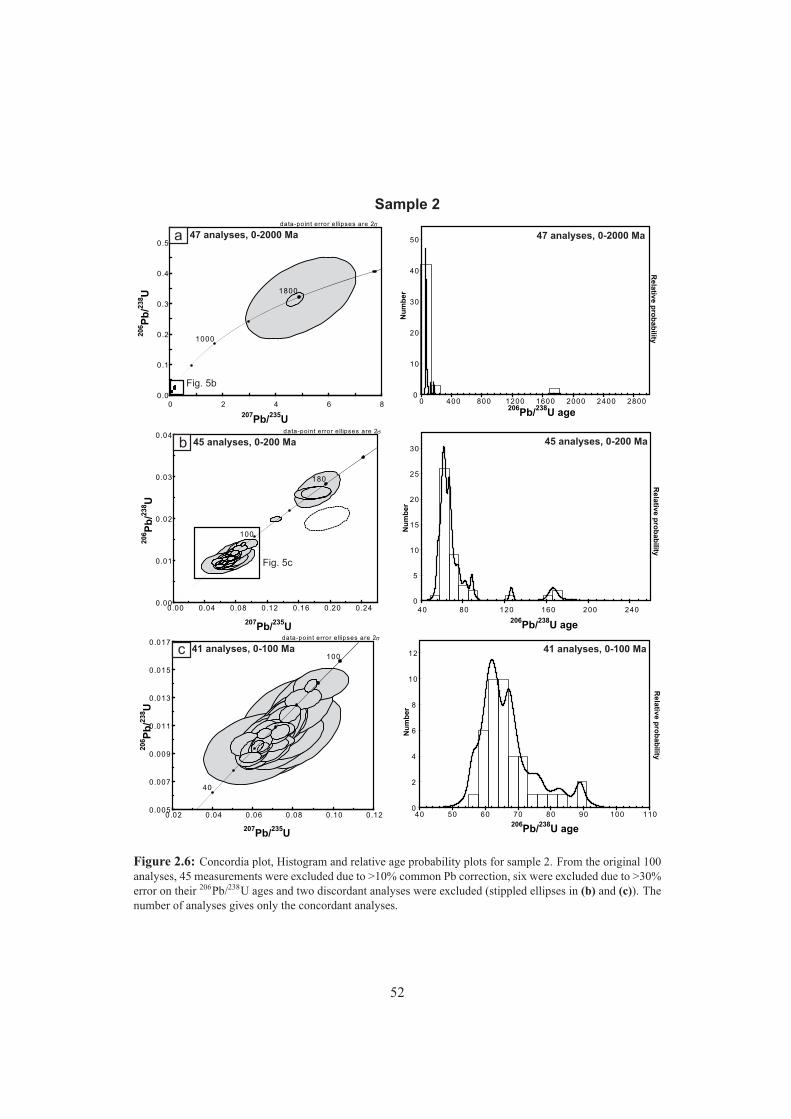
Sample 2
0.0
0.1
0.2
0.3
0.4
0.5
0 2 4 6 8
1000
1800
207Pb/235U
206 P
b/23
8 U
data-point error ellipses are 2σ
47 analyses, 0-2000 Maa
0.00
0.01
0.02
0.03
0.04
0.00 0.04 0.08 0.12 0.16 0.20 0.24
100
180
207Pb/235U
206 P
b/23
8 U
data-point error ellipses are 2σ
45 analyses, 0-200 Mab
0.005
0.007
0.009
0.011
0.013
0.015
0.017
0.02 0.04 0.06 0.08 0.10 0.12
40
100
207Pb/235U
206 P
b/23
8 U
data-point error ellipses are 2σ
41 analyses, 0-100 Mac
0
10
20
30
40
50
0 400 800 1200 1600 2000 2400 2800206Pb/238U age
Nu
mb
er
Re
lativ
e p
rob
ab
ility
0
5
10
15
20
25
30
40 80 120 160 200 240
206Pb/238U age
Nu
mb
er
Re
lativ
e p
rob
ab
ility
0
2
4
6
8
10
12
40 50 60 70 80 90 100 110206Pb/238U age
Nu
mb
er
Re
lativ
e p
rob
ab
ility
45 analyses, 0-200 Ma
41 analyses, 0-100 Ma
Fig. 5b
Fig. 5c
47 analyses, 0-2000 Ma
Figure 2.6: Concordia plot, Histogram and relative age probability plots for sample 2. From the original 100analyses, 45 measurements were excluded due to >10% common Pb correction, six were excluded due to >30%error on their 206Pb/238U ages and two discordant analyses were excluded (stippled ellipses in (b) and (c)). Thenumber of analyses gives only the concordant analyses.
52
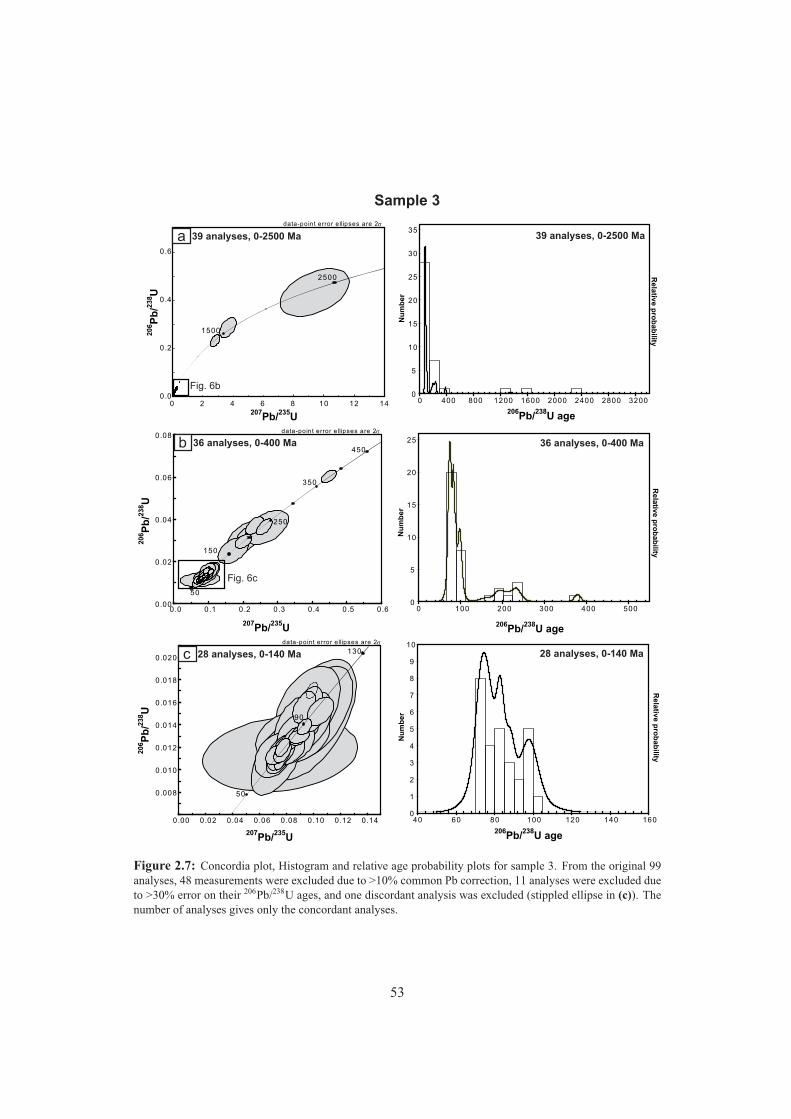
50
0.00
0.02
0.04
0.06
0.08
0.0 0.1 0.2 0.3 0.4 0.5 0.6
50
150
250
350
450
0.0
0.2
0.4
0.6
0 2 4 6 8 10 12 14207Pb/235U
206 P
b/23
8 U
data-point error ellipses are 2σ
1500
2500
0.008
0.010
0.012
0.014
0.016
0.018
0.020
0.00 0.02 0.04 0.06 0.08 0.10 0.12 0.14
90
130
207Pb/235U
206 P
b/23
8 U
207Pb/235U
206 P
b/23
8 U
data-point error ellipses are 2σ
data-point error ellipses are 2σ
206Pb/238U age
0
5
10
15
20
25
30
35
0 400 800 1200 1600 2000 2400 2800 3200N
um
be
r
Re
lativ
e p
rob
ab
ility
0
5
10
15
20
25
0 100 200 300 400 500
Re
lativ
e p
rob
ab
ility
Nu
mb
er
206Pb/238U age
0
1
2
3
4
5
6
7
8
9
10
40 60 80 100 120 140 160
206Pb/238U age
Re
lativ
e p
rob
ab
ility
Nu
mb
er
39 analyses, 0-2500 Maa
36 analyses, 0-400 Mab
28 analyses, 0-140 Mac
Sample 3
39 analyses, 0-2500 Ma
36 analyses, 0-400 Ma
28 analyses, 0-140 Ma
Fig. 6b
Fig. 6c
Figure 2.7: Concordia plot, Histogram and relative age probability plots for sample 3. From the original 99analyses, 48 measurements were excluded due to >10% common Pb correction, 11 analyses were excluded dueto >30% error on their 206Pb/238U ages, and one discordant analysis was excluded (stippled ellipse in (c)). Thenumber of analyses gives only the concordant analyses.
53
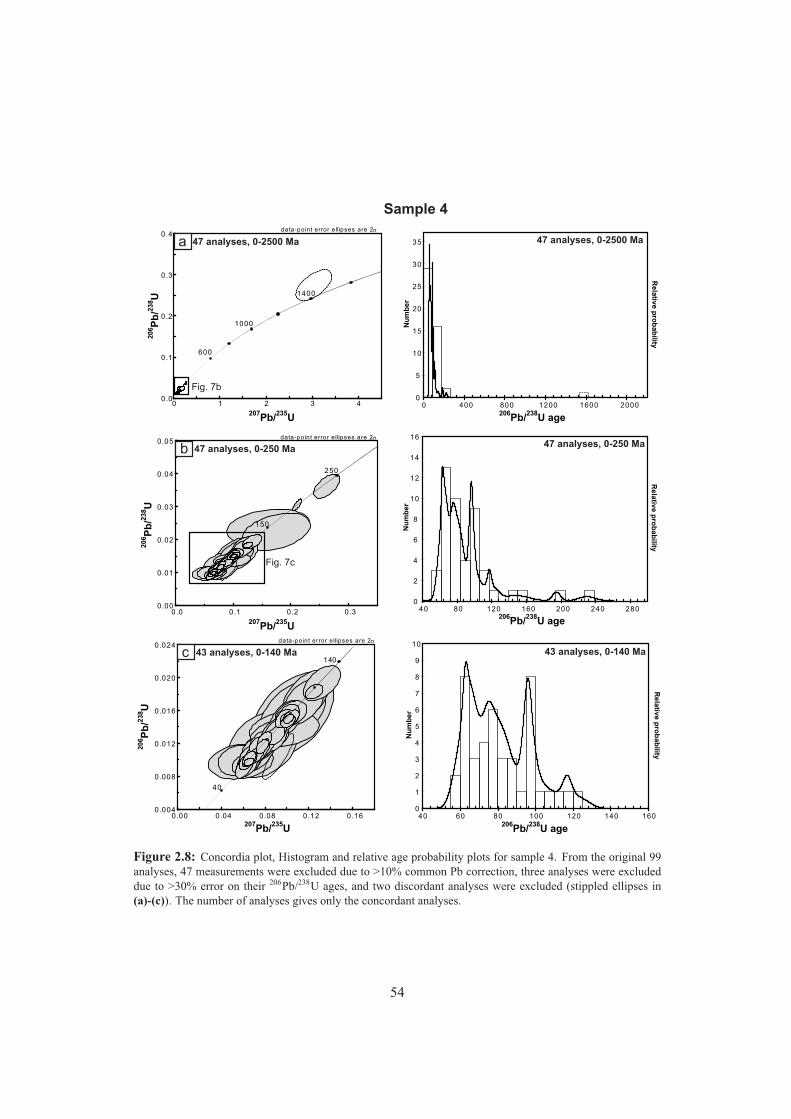
Sample 4
0.0
0.1
0.2
0.3
0.4
0 1 2 3 4
600
1000
1400
207Pb/235U
206 P
b/23
8 U
data-point error ellipses are 2σ
47 analyses, 0-2500 Maa
Fig. 7b
0.00
0.01
0.02
0.03
0.04
0.05
0.0 0.1 0.2 0.3
150
250
207Pb/235U
206 P
b/23
8 U
data-point error ellipses are 2σ
47 analyses, 0-250 Mab
Fig. 7c
0.004
0.008
0.012
0.016
0.020
0.024
0.00 0.04 0.08 0.12 0.16
40
140
207Pb/235U
206 P
b/23
8 U
data-point error ellipses are 2σ
43 analyses, 0-140 Mac
0
5
10
15
20
25
30
35
0 400 800 1200 1600 2000
Re
lativ
e p
rob
ab
ility
Nu
mb
er
206Pb/238U age
47 analyses, 0-2500 Ma
0
2
4
6
8
10
12
14
16
40 80 120 160 200 240 280
Re
lativ
e p
rob
ab
ility
Nu
mb
er
206Pb/238U age
47 analyses, 0-250 Ma
0
1
2
3
4
5
6
7
8
9
10
40 60 80 100 120 140 160
Re
lativ
e p
rob
ab
ility
Nu
mb
er
206Pb/238U age
43 analyses, 0-140 Ma
Figure 2.8: Concordia plot, Histogram and relative age probability plots for sample 4. From the original 99analyses, 47 measurements were excluded due to >10% common Pb correction, three analyses were excludeddue to >30% error on their 206Pb/238U ages, and two discordant analyses were excluded (stippled ellipses in(a)-(c)). The number of analyses gives only the concordant analyses.
54
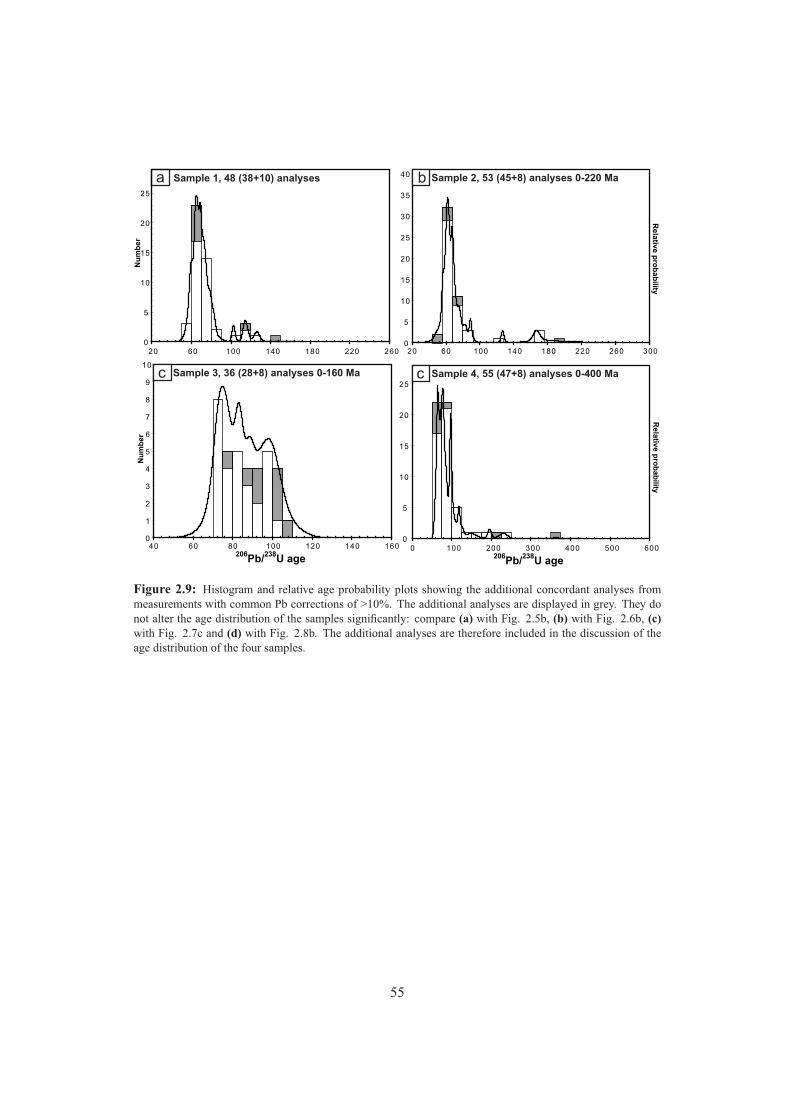
Sample 1, 48 (38+10) analyses a
0
1
2
3
4
5
6
7
8
9
10
40 60 80 100 120 140 160
Nu
mb
er
206Pb/238U age
Nu
mb
er
Sample 3, 36 (28+8) analyses 0-160 Ma c
0
5
10
15
20
25
30
35
40
20 60 100 140 180 220 260 300
Sample 2, 53 (45+8) analyses 0-220 Ma b
Re
lativ
e p
rob
ab
ility
0
5
10
15
20
25
0 100 200 300 400 500 600206Pb/238U age
Re
lativ
e p
rob
ab
ility
Sample 4, 55 (47+8) analyses 0-400 Ma c
0
5
10
15
20
25
20 60 100 140 180 220 260
Figure 2.9: Histogram and relative age probability plots showing the additional concordant analyses frommeasurements with common Pb corrections of >10%. The additional analyses are displayed in grey. They donot alter the age distribution of the samples significantly: compare (a) with Fig. 2.5b, (b) with Fig. 2.6b, (c)with Fig. 2.7c and (d) with Fig. 2.8b. The additional analyses are therefore included in the discussion of theage distribution of the four samples.
55
2.4 Discussion
2.4.1 Maximum depositional ages
The youngest detrital zircon grains found in a sedimentary sequence generally indicate amaximum depositional age for the sequence, since the sequence can not be older thanthe youngest detrital grains (e.g. Barbeau et al., 2005; DeCelles et al., 2007; Jones et al.,2009; Dickinson & Gehrels, 2009). Dickinson & Gehrels (2009) compared youngest detri-tal zircon ages from 58 samples (with a mean of 92 concordant analyses per sample, using206Pb/238U ages and graphically investigated concordance) with depositional ages indepen-dently known from biostratigraphy, and showed that the depositional ages derived from bothmethods overlap indeed very well. However, they also showed that there are statistically lessand more robust methods to define the youngest detrital zircon age. They distinguished fouralternative measures of youngest detrital zircon ages from the least to the most statisticallyrobust: (1) YSG: youngest single grain age with 1σ-uncertainty, statistically least robustsince not reproduced, (2) YPP: youngest graphical age peak on an age-probability plot, sta-tistically more robust than YSG, but can be considerably older than the actual depositionalage, (3) YC1σ(2+): mean age of the youngest two or more grains that overlap in age at1σ, interpreted to be as robust as YPP and can be used interchangeably, and (4) YC2σ(3+):mean age of the youngest three or more grains that overlap in age at 2σ. This value is thestatistically most robust value, but also the most conservative estimate for the depositionalage of the sediments and can therefore be considerably older than the actual depositionalage.
In Table 2.1 we report all four different methods of calculating maximum depositional agesbased on our 206Pb/238U ages with <10% common Pb correction (Figs. 2.5-2.8, Tab. 2.2).For sample 1, the different methods range from 60.1±2.2 Ma to 64.8±0.9 Ma, with the latterbeing based on 21 overlapping analyses (Tab. 2.1). For sample 2, the methods range from56.1±1.0 Ma to 58.5±1.6 Ma, with the latter being based on 11 overlapping measurements(Tab. 2.1). For sample 3, the methods range from 70.5±8.5 Ma to 75.7±1.8 Ma, with thelatter being based on 13 overlapping analyses (Tab. 2.1). For sample 4, the methods rangefrom 58.1±3.4 Ma to 63.6±1.4 Ma, with the latter being based on 15 measurements (Tab.2.1). Since the YC2σ(3+) values are based on multiple analyses overlapping in 2σ (11-21analyses per sample), we consider these values as robust and not influenced by partial leadloss or mixing of different domains. We therefore consider only these values in our furtherdiscussion of maximum depositional ages.
The YC2σ(3+) values for samples 2 and 4 are youngest (59.7±1.5 Ma and 63.6±1.4 Ma,respectively) and fall entirely within the Danian stage of the Paleocene epoch following thetime scale of Gradstein et al. (2004). So for these two samples, a Paleocene maximum de-positional age is indicated by the youngest detrital zircon population. The YC2σ(3+) valuefor sample 1 (64.8±0.9 Ma) overlaps with the YC2σ(3+) value of sample 4, but also with
56
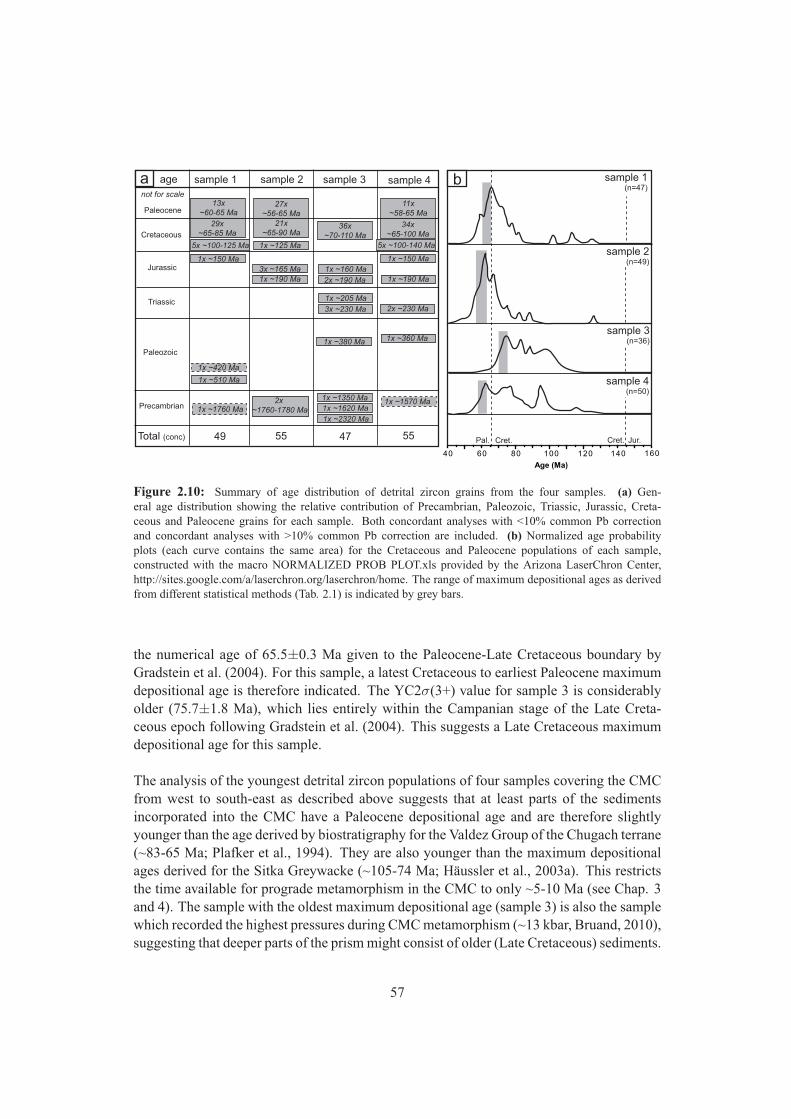
40 60 80 100 120 140 160
Age (Ma)
b sample 1(n=47)
sample 1 sample 2 sample 3 sample 4a
sample 2(n=49)
sample 3(n=36)
sample 4(n=50)
age
not for scale
Precambrian
Paleozoic
Triassic
Jurassic
Cretaceous
Paleocene
Total (conc) 49 55 47 55 Pal. Cret. Cret. Jur.
1x ~1760 Ma 2x
~1760-1780 Ma
1x ~1350 Ma
1x ~1620 Ma
1x ~2320 Ma
1x ~1570 Ma
1x ~510 Ma
1x ~420 Ma
1x ~380 Ma 1x ~360 Ma
1x ~205 Ma
3x ~230 Ma 2x ~230 Ma
1x ~150 Ma
3x ~165 Ma
1x ~190 Ma
1x ~160 Ma
2x ~190 Ma
1x ~150 Ma
1x ~190 Ma
13x
~60-65 Ma
29x
~65-85 Ma
5x ~100-125 Ma
27x
~56-65 Ma
21x
~65-90 Ma
1x ~125 Ma
36x
~70-110 Ma
11x
~58-65 Ma
34x
~65-100 Ma
5x ~100-140 Ma
Figure 2.10: Summary of age distribution of detrital zircon grains from the four samples. (a) Gen-eral age distribution showing the relative contribution of Precambrian, Paleozoic, Triassic, Jurassic, Creta-ceous and Paleocene grains for each sample. Both concordant analyses with <10% common Pb correctionand concordant analyses with >10% common Pb correction are included. (b) Normalized age probabilityplots (each curve contains the same area) for the Cretaceous and Paleocene populations of each sample,constructed with the macro NORMALIZED PROB PLOT.xls provided by the Arizona LaserChron Center,http://sites.google.com/a/laserchron.org/laserchron/home. The range of maximum depositional ages as derivedfrom different statistical methods (Tab. 2.1) is indicated by grey bars.
the numerical age of 65.5±0.3 Ma given to the Paleocene-Late Cretaceous boundary byGradstein et al. (2004). For this sample, a latest Cretaceous to earliest Paleocene maximumdepositional age is therefore indicated. The YC2σ(3+) value for sample 3 is considerablyolder (75.7±1.8 Ma), which lies entirely within the Campanian stage of the Late Creta-ceous epoch following Gradstein et al. (2004). This suggests a Late Cretaceous maximumdepositional age for this sample.
The analysis of the youngest detrital zircon populations of four samples covering the CMCfrom west to south-east as described above suggests that at least parts of the sedimentsincorporated into the CMC have a Paleocene depositional age and are therefore slightlyyounger than the age derived by biostratigraphy for the Valdez Group of the Chugach terrane(~83-65 Ma; Plafker et al., 1994). They are also younger than the maximum depositionalages derived for the Sitka Greywacke (~105-74 Ma; Häussler et al., 2003a). This restrictsthe time available for prograde metamorphism in the CMC to only ~5-10 Ma (see Chap. 3and 4). The sample with the oldest maximum depositional age (sample 3) is also the samplewhich recorded the highest pressures during CMC metamorphism (~13 kbar, Bruand, 2010),suggesting that deeper parts of the prism might consist of older (Late Cretaceous) sediments.
57
2.4.2 Provenance of sediments
In addition to the information on maximum depositional ages, the total age distribution ofdetrital zircon populations may also give some information on the source from which thesediments are derived (e.g. Carrapa, 2010). However, this requires that the age distributionmeasured represents statistically well enough the age distribution actually present in thesample, which generally needs a large (>100) number of single analyses (e.g. Vermeesch,2004). In addition, age probability plots do generally not quantitatively reflect the origi-nal distribution of the sediments, even when >100 analyses are incorporated into the plots(Andersen, 2005). So an age probability plot of a sample with less than 100 analyses atbest describes qualitatively the age distribution in the source of the sediments. In addition,with less than 100 analyses, in general only the presence of a certain population can beproved, whereas it is more difficult to argue for the absence of a certain population, sincethis absence could be just the result of missing it due to limited analyses.
In our case, 55 concordant analyses for samples 2 and 4 and 49 and 47 concordant analysesfor samples 1 and 3 remained (Fig. 2.10a, both concordant analyses with <10% and >10%common Pb correction included). For samples 2 and 4 the 55 measurements are accord-ing to Vermeesch (2004) sufficient to be certain at >95% confidence level that no fractioncontributing more than 10% to the total age fraction was missed. For samples 1 and 3 with49 and 47 analyses we are at >90% confidence level certain that no fraction contributing>10% to the total age fraction was missed. In other words, the age distributions of samples2 and 4 reasonably well describe all age populations which contribute >10% to the totaldistribution, whereas for samples 1 and 3 there is a greater chance that an age populationof >10% is missed. Given these limitations, a qualitative discussion of the age distributionderived from the four samples is given below.
Fig. 2.10a contains a summary of all ages found in the different samples. Each samplecontains 1-3 Precambrian grains indicating that the source terrane(s) for the sediments con-tain(s) at least some Precambrian rocks. Samples 1, 3 and 4 contain 1-2 Paleozoic grainswhich spread in age from Cambrian to Devonian, indicating that a minor part of the sourceterrane(s) probably consisted of variable Paleozoic rocks. Samples 3 and 4 contain 2-4 Tri-assic grains, and all four samples contain 1-4 Jurassic grains indicating minor contributionsfrom Early and Middle Mesozoic rocks. However, the bulk of the grains are Cretaceous andPaleocene in age, notably 95%, 89%, 76% and 90% of all concordant grains for samples 1-4, respectively (Fig. 2.10). In order to compare these Cretaceous to Paleocene populationsbetween the samples, we constructed normalized age probability plots as displayed in Fig.2.10b. From these plots it is qualitatively visible that samples 1 and 2 have a very similardistribution, with a relatively narrow population from ~60-85 Ma and only few ages from~90-140 Ma. Samples 3 and 4 have equally a similar distribution but different from thedistribution of samples 1 and 2: they show a much broader age population from ~60(70)-120 Ma. This could indicate that samples 1 and 2, located more to the west, received theirdetritus mainly from an ~60-85 Ma source, whereas samples 3 and 4, located more to the
58
east-south-east, received their detritus from a source which had in addition to the ~60-85 Macomponent also a slightly older component of ~85-120 Ma. However, in order to resolvethese differences more rigorously, about the double amount of analyses would be necessaryin order to get more representative age probability distributions (Vermeesch, 2004) and thedifferences between the samples could as well be due to the insufficient amount of concor-dant analyses.
2.5 Conclusions
U-Pb LA-ICP-MS dating of detrital zircons from four samples covering the CMC from westto the south-east revealed the following: (1) Three of the four samples show Paleocene (~60-65 Ma) maximum depositional ages based on several overlapping youngest grains. Theseages are slightly younger than the Late Cretaceous depositional age proposed based on bios-tratigraphy for the sediments of the Valdez Group in which the CMC formed, and they arealso slightly younger than the maximum depositional ages proposed for the youngest partof the Sitka Greywacke based on youngest detrital zircon populations. The Paleocene max-imum depositional ages limit the time available for prograde metamorphism in the CMC toonly ~5-10 Ma (see Chap. 4). (2) The age distribution of all samples is dominated by Pale-ocene to Cretaceous ages (~60-140 Ma), with very minor contributions of Jurassic, Triassic,Paleozoic and Precambrian ages. The two westernmost samples seem to have a slightly dif-ferent Paleocene to Cretaceous distribution than the two easternmost samples. This could beeither due to slightly different sources, or be an artefact of insufficient amount of concordantanalyses.
Acknowledgments U. Klötzli is thanked for help with the zircon separation and mounting, the LA-ICP-MS analyses and the data assessment. F. Biedermann helped with the mount preparation. A. Oswald is thankedfor assistance during analytical work - without her the 82 h non-stop analytical session would not have beenpossible. C. Carson is thanked for hints regarding detrital zircon analyses.
59
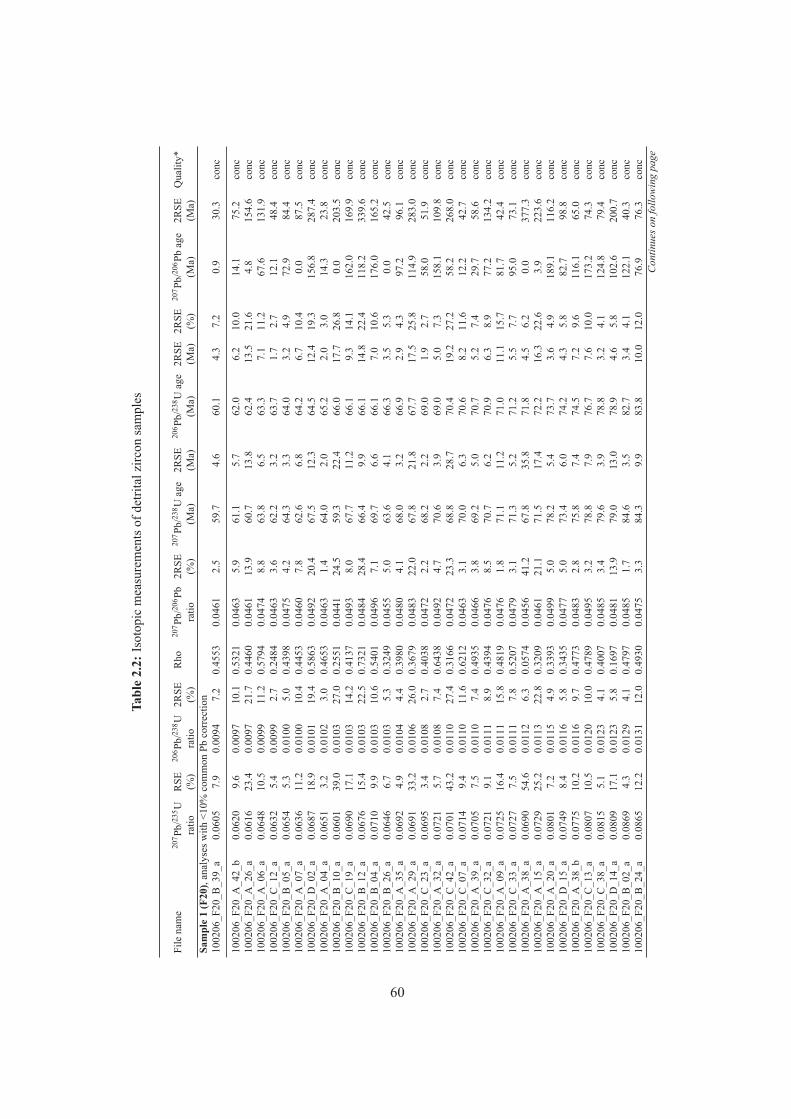
Tabl
e2.
2:Is
otop
icm
easu
rem
ents
ofde
trita
lzirc
onsa
mpl
es
File
nam
e20
7 Pb/
235 U
RSE
206 P
b/23
8 U2R
SER
ho20
7 Pb/
206 P
b2R
SE20
7 Pb/
238 U
age
2RSE
206 P
b/23
8 Uag
e2R
SE2R
SE20
7 Pb/
206 P
bag
e2R
SEQ
ualit
y*ra
tio(%
)ra
tio(%
)ra
tio(%
)(M
a)(M
a)(M
a)(M
a)(%
)(M
a)(M
a)Sa
mpl
e1
(F20
),an
alys
esw
ith<1
0%co
mm
onPb
corr
ectio
n10
0206
_F20
_B_3
9_a
0.06
057.
90.
0094
7.2
0.45
530.
0461
2.5
59.7
4.6
60.1
4.3
7.2
0.9
30.3
conc
1002
06_F
20_A
_42_
b0.
0620
9.6
0.00
9710
.10.
5321
0.04
635.
961
.15.
762
.06.
210
.014
.175
.2co
nc10
0206
_F20
_A_2
6_a
0.06
1623
.40.
0097
21.7
0.44
600.
0461
13.9
60.7
13.8
62.4
13.5
21.6
4.8
154.
6co
nc10
0206
_F20
_A_0
6_a
0.06
4810
.50.
0099
11.2
0.57
940.
0474
8.8
63.8
6.5
63.3
7.1
11.2
67.6
131.
9co
nc10
0206
_F20
_C_1
2_a
0.06
325.
40.
0099
2.7
0.24
840.
0463
3.6
62.2
3.2
63.7
1.7
2.7
12.1
48.4
conc
1002
06_F
20_B
_05_
a0.
0654
5.3
0.01
005.
00.
4398
0.04
754.
264
.33.
364
.03.
24.
972
.984
.4co
nc10
0206
_F20
_A_0
7_a
0.06
3611
.20.
0100
10.4
0.44
530.
0460
7.8
62.6
6.8
64.2
6.7
10.4
0.0
87.5
conc
1002
06_F
20_D
_02_
a0.
0687
18.9
0.01
0119
.40.
5863
0.04
9220
.467
.512
.364
.512
.419
.315
6.8
287.
4co
nc10
0206
_F20
_A_0
4_a
0.06
513.
20.
0102
3.0
0.46
530.
0463
1.4
64.0
2.0
65.2
2.0
3.0
14.3
23.8
conc
1002
06_F
20_B
_10_
a0.
0601
39.0
0.01
0327
.00.
2551
0.04
4124
.559
.322
.466
.017
.726
.80.
020
3.5
conc
1002
06_F
20_C
_19_
a0.
0690
17.1
0.01
0314
.20.
4137
0.04
938.
067
.711
.266
.19.
314
.116
2.0
169.
9co
nc10
0206
_F20
_B_1
2_a
0.06
7615
.40.
0103
22.5
0.73
210.
0484
28.4
66.4
9.9
66.1
14.8
22.4
118.
233
9.6
conc
1002
06_F
20_B
_04_
a0.
0710
9.9
0.01
0310
.60.
5401
0.04
967.
169
.76.
666
.17.
010
.617
6.0
165.
2co
nc10
0206
_F20
_B_2
6_a
0.06
466.
70.
0103
5.3
0.32
490.
0455
5.0
63.6
4.1
66.3
3.5
5.3
0.0
42.5
conc
1002
06_F
20_A
_35_
a0.
0692
4.9
0.01
044.
40.
3980
0.04
804.
168
.03.
266
.92.
94.
397
.296
.1co
nc10
0206
_F20
_A_2
9_a
0.06
9133
.20.
0106
26.0
0.36
790.
0483
22.0
67.8
21.8
67.7
17.5
25.8
114.
928
3.0
conc
1002
06_F
20_C
_23_
a0.
0695
3.4
0.01
082.
70.
4038
0.04
722.
268
.22.
269
.01.
92.
758
.051
.9co
nc10
0206
_F20
_A_3
2_a
0.07
215.
70.
0108
7.4
0.64
380.
0492
4.7
70.6
3.9
69.0
5.0
7.3
158.
110
9.8
conc
1002
06_F
20_C
_42_
a0.
0701
43.2
0.01
1027
.40.
3166
0.04
7223
.368
.828
.770
.419
.227
.258
.226
8.0
conc
1002
06_F
20_C
_07_
a0.
0714
9.4
0.01
1011
.60.
6212
0.04
633.
170
.06.
370
.68.
211
.612
.242
.7co
nc10
0206
_F20
_A_3
9_a
0.07
057.
50.
0110
7.4
0.49
350.
0466
3.8
69.2
5.0
70.7
5.2
7.4
29.7
58.6
conc
1002
06_F
20_C
_32_
a0.
0721
9.1
0.01
118.
90.
4394
0.04
768.
570
.76.
270
.96.
38.
977
.213
4.2
conc
1002
06_F
20_A
_09_
a0.
0725
16.4
0.01
1115
.80.
4819
0.04
761.
871
.111
.271
.011
.115
.781
.742
.4co
nc10
0206
_F20
_C_3
3_a
0.07
277.
50.
0111
7.8
0.52
070.
0479
3.1
71.3
5.2
71.2
5.5
7.7
95.0
73.1
conc
1002
06_F
20_A
_38_
a0.
0690
54.6
0.01
126.
30.
0574
0.04
5641
.267
.835
.871
.84.
56.
20.
037
7.3
conc
1002
06_F
20_A
_15_
a0.
0729
25.2
0.01
1322
.80.
3209
0.04
6121
.171
.517
.472
.216
.322
.63.
922
3.6
conc
1002
06_F
20_A
_20_
a0.
0801
7.2
0.01
154.
90.
3393
0.04
995.
078
.25.
473
.73.
64.
918
9.1
116.
2co
nc10
0206
_F20
_D_1
5_a
0.07
498.
40.
0116
5.8
0.34
350.
0477
5.0
73.4
6.0
74.2
4.3
5.8
82.7
98.8
conc
1002
06_F
20_A
_38_
b0.
0775
10.2
0.01
169.
70.
4773
0.04
832.
875
.87.
474
.57.
29.
611
6.1
65.0
conc
1002
06_F
20_C
_13_
a0.
0807
10.5
0.01
2010
.00.
4789
0.04
953.
278
.87.
976
.77.
610
.017
3.2
74.3
conc
1002
06_F
20_C
_38_
a0.
0815
5.1
0.01
234.
10.
4007
0.04
853.
479
.63.
978
.83.
24.
112
4.8
79.4
conc
1002
06_F
20_D
_14_
a0.
0809
17.1
0.01
235.
80.
1697
0.04
8113
.979
.013
.078
.94.
65.
810
2.6
200.
7co
nc10
0206
_F20
_B_0
2_a
0.08
694.
30.
0129
4.1
0.47
970.
0485
1.7
84.6
3.5
82.7
3.4
4.1
122.
140
.3co
nc10
0206
_F20
_B_2
4_a
0.08
6512
.20.
0131
12.0
0.49
300.
0475
3.3
84.3
9.9
83.8
10.0
12.0
76.9
76.3
conc
Continuesonfollowingpage
60
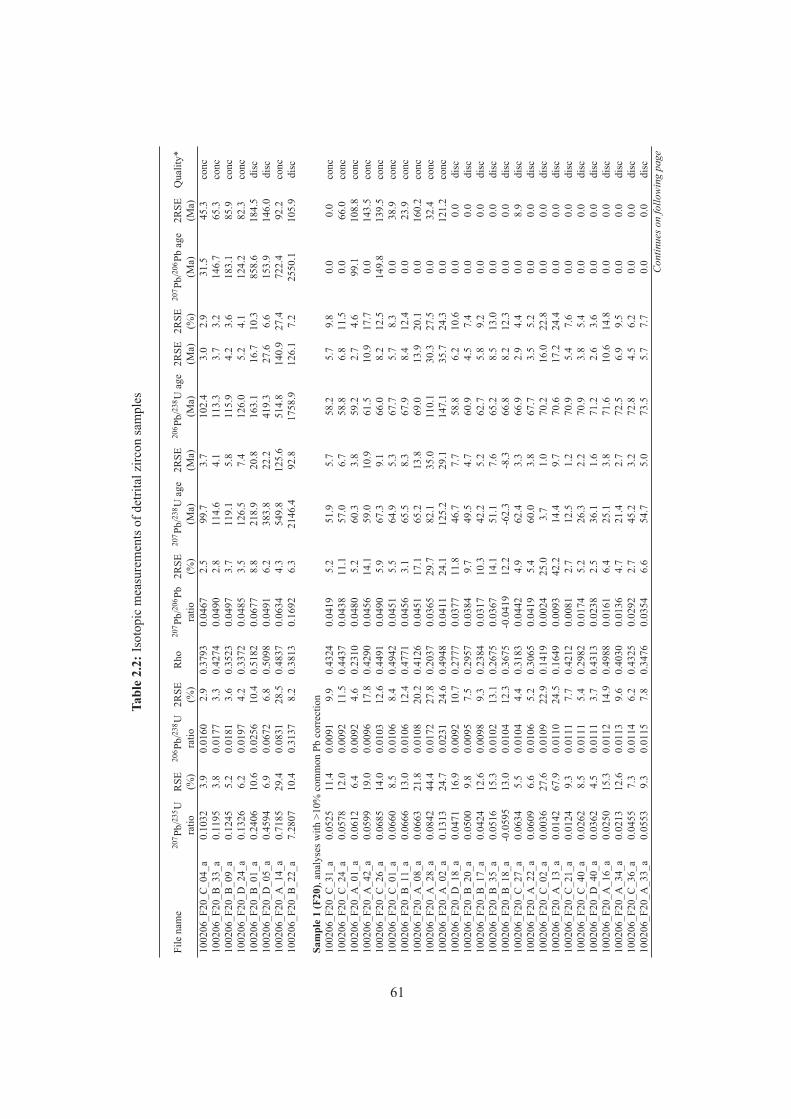
Tabl
e2.
2:Is
otop
icm
easu
rem
ents
ofde
trita
lzirc
onsa
mpl
es
File
nam
e20
7 Pb/
235 U
RSE
206 P
b/23
8 U2R
SER
ho20
7 Pb/
206 P
b2R
SE20
7 Pb/
238 U
age
2RSE
206 P
b/23
8 Uag
e2R
SE2R
SE20
7 Pb/
206 P
bag
e2R
SEQ
ualit
y*ra
tio(%
)ra
tio(%
)ra
tio(%
)(M
a)(M
a)(M
a)(M
a)(%
)(M
a)(M
a)10
0206
_F20
_C_0
4_a
0.10
323.
90.
0160
2.9
0.37
930.
0467
2.5
99.7
3.7
102.
43.
02.
931
.545
.3co
nc10
0206
_F20
_B_3
3_a
0.11
953.
80.
0177
3.3
0.42
740.
0490
2.8
114.
64.
111
3.3
3.7
3.2
146.
765
.3co
nc10
0206
_F20
_B_0
9_a
0.12
455.
20.
0181
3.6
0.35
230.
0497
3.7
119.
15.
811
5.9
4.2
3.6
183.
185
.9co
nc10
0206
_F20
_D_2
4_a
0.13
266.
20.
0197
4.2
0.33
720.
0485
3.5
126.
57.
412
6.0
5.2
4.1
124.
282
.3co
nc10
0206
_F20
_B_0
1_a
0.24
0610
.60.
0256
10.4
0.51
820.
0677
8.8
218.
920
.816
3.1
16.7
10.3
858.
618
4.5
disc
1002
06_F
20_D
_05_
a0.
4594
6.9
0.06
726.
80.
5098
0.04
916.
238
3.8
22.2
419.
327
.66.
615
3.9
146.
0di
sc10
0206
_F20
_A_1
4_a
0.71
8529
.40.
0831
28.5
0.48
370.
0634
4.3
549.
812
5.6
514.
814
0.9
27.4
722.
492
.2co
nc10
0206
_F20
_B_2
2_a
7.28
0710
.40.
3137
8.2
0.38
130.
1692
6.3
2146
.492
.817
58.9
126.
17.
225
50.1
105.
9di
sc
Sam
ple
1(F
20),
anal
yses
with
>10%
com
mon
Pbco
rrec
tion
1002
06_F
20_C
_31_
a0.
0525
11.4
0.00
919.
90.
4324
0.04
195.
251
.95.
758
.25.
79.
80.
00.
0co
nc10
0206
_F20
_C_2
4_a
0.05
7812
.00.
0092
11.5
0.44
370.
0438
11.1
57.0
6.7
58.8
6.8
11.5
0.0
66.0
conc
1002
06_F
20_A
_01_
a0.
0612
6.4
0.00
924.
60.
2310
0.04
805.
260
.33.
859
.22.
74.
699
.110
8.8
conc
1002
06_F
20_A
_42_
a0.
0599
19.0
0.00
9617
.80.
4290
0.04
5614
.159
.010
.961
.510
.917
.70.
014
3.5
conc
1002
06_F
20_C
_26_
a0.
0685
14.0
0.01
0312
.60.
4491
0.04
905.
967
.39.
166
.08.
212
.514
9.8
139.
5co
nc10
0206
_F20
_C_0
1_a
0.06
608.
50.
0106
8.4
0.49
420.
0451
5.5
64.9
5.3
67.7
5.7
8.3
0.0
38.9
conc
1002
06_F
20_B
_11_
a0.
0666
13.0
0.01
0612
.40.
4771
0.04
563.
165
.58.
367
.98.
412
.40.
023
.9co
nc10
0206
_F20
_A_0
8_a
0.06
6321
.80.
0108
20.2
0.41
260.
0451
17.1
65.2
13.8
69.0
13.9
20.1
0.0
160.
2co
nc10
0206
_F20
_A_2
8_a
0.08
4244
.40.
0172
27.8
0.20
370.
0365
29.7
82.1
35.0
110.
130
.327
.50.
032
.4co
nc10
0206
_F20
_A_0
2_a
0.13
1324
.70.
0231
24.6
0.49
480.
0411
24.1
125.
229
.114
7.1
35.7
24.3
0.0
121.
2co
nc10
0206
_F20
_D_1
8_a
0.04
7116
.90.
0092
10.7
0.27
770.
0377
11.8
46.7
7.7
58.8
6.2
10.6
0.0
0.0
disc
1002
06_F
20_B
_20_
a0.
0500
9.8
0.00
957.
50.
2957
0.03
849.
749
.54.
760
.94.
57.
40.
00.
0di
sc10
0206
_F20
_B_1
7_a
0.04
2412
.60.
0098
9.3
0.23
840.
0317
10.3
42.2
5.2
62.7
5.8
9.2
0.0
0.0
disc
1002
06_F
20_B
_35_
a0.
0516
15.3
0.01
0213
.10.
2675
0.03
6714
.151
.17.
665
.28.
513
.00.
00.
0di
sc10
0206
_F20
_B_1
8_a
-0.0
595
13.0
0.01
0412
.30.
3675
-0.0
419
12.2
-62.
3-8
.366
.88.
212
.30.
00.
0di
sc10
0206
_F20
_C_2
7_a
0.06
345.
50.
0104
4.4
0.31
830.
0442
4.9
62.4
3.3
66.9
2.9
4.4
0.0
8.9
disc
1002
06_F
20_A
_22_
a0.
0609
6.6
0.01
065.
20.
3065
0.04
195.
460
.03.
867
.73.
55.
20.
00.
0di
sc10
0206
_F20
_C_0
2_a
0.00
3627
.60.
0109
22.9
0.14
190.
0024
25.0
3.7
1.0
70.2
16.0
22.8
0.0
0.0
disc
1002
06_F
20_A
_13_
a0.
0142
67.9
0.01
1024
.50.
1649
0.00
9342
.214
.49.
770
.617
.224
.40.
00.
0di
sc10
0206
_F20
_C_2
1_a
0.01
249.
30.
0111
7.7
0.42
120.
0081
2.7
12.5
1.2
70.9
5.4
7.6
0.0
0.0
disc
1002
06_F
20_C
_40_
a0.
0262
8.5
0.01
115.
40.
2982
0.01
745.
226
.32.
270
.93.
85.
40.
00.
0di
sc10
0206
_F20
_D_4
0_a
0.03
624.
50.
0111
3.7
0.43
130.
0238
2.5
36.1
1.6
71.2
2.6
3.6
0.0
0.0
disc
1002
06_F
20_A
_16_
a0.
0250
15.3
0.01
1214
.90.
4988
0.01
616.
425
.13.
871
.610
.614
.80.
00.
0di
sc10
0206
_F20
_A_3
4_a
0.02
1312
.60.
0113
9.6
0.40
300.
0136
4.7
21.4
2.7
72.5
6.9
9.5
0.0
0.0
disc
1002
06_F
20_C
_36_
a0.
0455
7.3
0.01
146.
20.
4325
0.02
922.
745
.23.
272
.84.
56.
20.
00.
0di
sc10
0206
_F20
_A_3
3_a
0.05
539.
30.
0115
7.8
0.34
760.
0354
6.6
54.7
5.0
73.5
5.7
7.7
0.0
0.0
disc
Continuesonfollowingpage
61
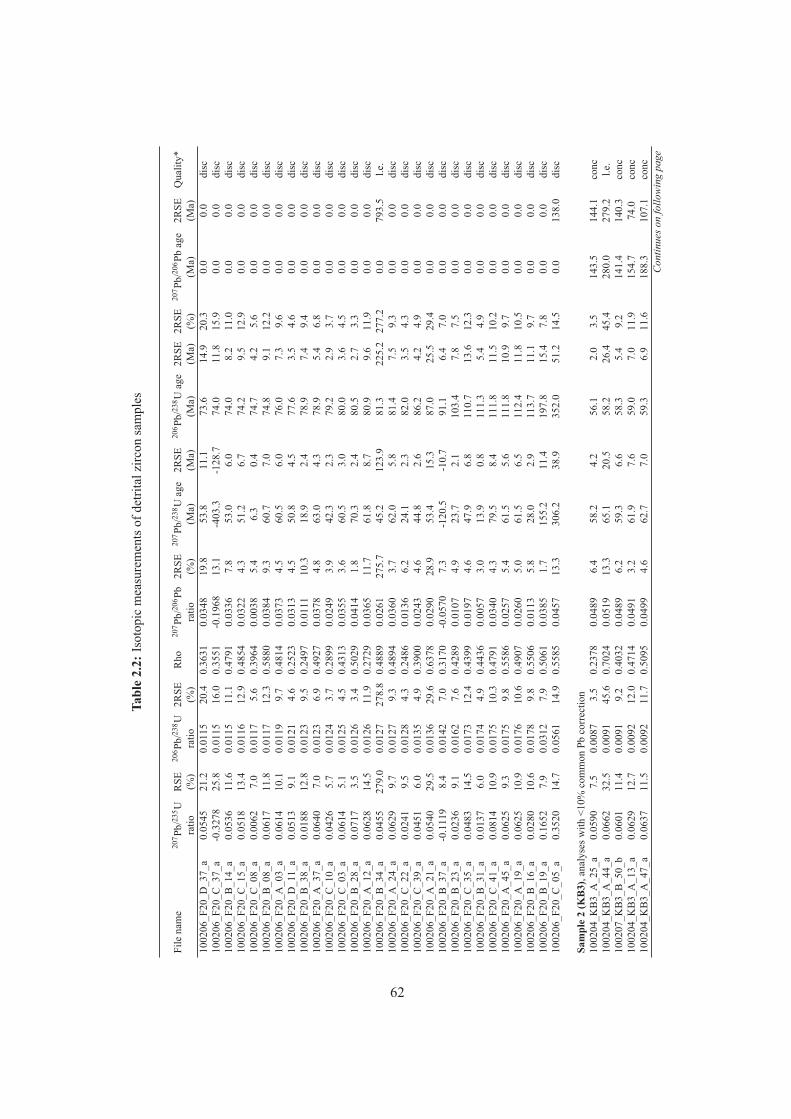
Tabl
e2.
2:Is
otop
icm
easu
rem
ents
ofde
trita
lzirc
onsa
mpl
es
File
nam
e20
7 Pb/
235 U
RSE
206 P
b/23
8 U2R
SER
ho20
7 Pb/
206 P
b2R
SE20
7 Pb/
238 U
age
2RSE
206 P
b/23
8 Uag
e2R
SE2R
SE20
7 Pb/
206 P
bag
e2R
SEQ
ualit
y*ra
tio(%
)ra
tio(%
)ra
tio(%
)(M
a)(M
a)(M
a)(M
a)(%
)(M
a)(M
a)10
0206
_F20
_D_3
7_a
0.05
4521
.20.
0115
20.4
0.36
310.
0348
19.8
53.8
11.1
73.6
14.9
20.3
0.0
0.0
disc
1002
06_F
20_C
_37_
a-0
.327
825
.80.
0115
16.0
0.35
51-0
.196
813
.1-4
03.3
-128
.774
.011
.815
.90.
00.
0di
sc10
0206
_F20
_B_1
4_a
0.05
3611
.60.
0115
11.1
0.47
910.
0336
7.8
53.0
6.0
74.0
8.2
11.0
0.0
0.0
disc
1002
06_F
20_C
_15_
a0.
0518
13.4
0.01
1612
.90.
4854
0.03
224.
351
.26.
774
.29.
512
.90.
00.
0di
sc10
0206
_F20
_C_0
8_a
0.00
627.
00.
0117
5.6
0.39
640.
0038
5.4
6.3
0.4
74.7
4.2
5.6
0.0
0.0
disc
1002
06_F
20_B
_08_
a0.
0617
11.8
0.01
1712
.30.
5880
0.03
849.
360
.77.
074
.89.
112
.20.
00.
0di
sc10
0206
_F20
_A_0
3_a
0.06
1410
.10.
0119
9.7
0.48
140.
0373
4.5
60.5
6.0
76.0
7.3
9.6
0.0
0.0
disc
1002
06_F
20_D
_11_
a0.
0513
9.1
0.01
214.
60.
2523
0.03
134.
550
.84.
577
.63.
54.
60.
00.
0di
sc10
0206
_F20
_B_3
8_a
0.01
8812
.80.
0123
9.5
0.24
970.
0111
10.3
18.9
2.4
78.9
7.4
9.4
0.0
0.0
disc
1002
06_F
20_A
_37_
a0.
0640
7.0
0.01
236.
90.
4927
0.03
784.
863
.04.
378
.95.
46.
80.
00.
0di
sc10
0206
_F20
_C_1
0_a
0.04
265.
70.
0124
3.7
0.28
990.
0249
3.9
42.3
2.3
79.2
2.9
3.7
0.0
0.0
disc
1002
06_F
20_C
_03_
a0.
0614
5.1
0.01
254.
50.
4313
0.03
553.
660
.53.
080
.03.
64.
50.
00.
0di
sc10
0206
_F20
_B_2
8_a
0.07
173.
50.
0126
3.4
0.50
290.
0414
1.8
70.3
2.4
80.5
2.7
3.3
0.0
0.0
disc
1002
06_F
20_A
_12_
a0.
0628
14.5
0.01
2611
.90.
2729
0.03
6511
.761
.88.
780
.99.
611
.90.
00.
0di
sc10
0206
_F20
_B_3
4_a
0.04
5527
9.0
0.01
2727
8.8
0.48
890.
0261
275.
745
.212
3.9
81.3
225.
227
7.2
0.0
793.
5l.e
.10
0206
_F20
_A_2
4_a
0.06
299.
70.
0127
9.3
0.48
940.
0360
3.7
62.0
5.8
81.4
7.5
9.3
0.0
0.0
disc
1002
06_F
20_C
_22_
a0.
0241
9.5
0.01
284.
30.
2486
0.01
366.
224
.12.
382
.03.
54.
30.
00.
0di
sc10
0206
_F20
_C_3
9_a
0.04
516.
00.
0135
4.9
0.39
000.
0243
4.6
44.8
2.6
86.2
4.2
4.9
0.0
0.0
disc
1002
06_F
20_A
_21_
a0.
0540
29.5
0.01
3629
.60.
6378
0.02
9028
.953
.415
.387
.025
.529
.40.
00.
0di
sc10
0206
_F20
_B_3
7_a
-0.1
119
8.4
0.01
427.
00.
3170
-0.0
570
7.3
-120
.5-1
0.7
91.1
6.4
7.0
0.0
0.0
disc
1002
06_F
20_B
_23_
a0.
0236
9.1
0.01
627.
60.
4289
0.01
074.
923
.72.
110
3.4
7.8
7.5
0.0
0.0
disc
1002
06_F
20_C
_35_
a0.
0483
14.5
0.01
7312
.40.
4399
0.01
974.
647
.96.
811
0.7
13.6
12.3
0.0
0.0
disc
1002
06_F
20_B
_31_
a0.
0137
6.0
0.01
744.
90.
4436
0.00
573.
013
.90.
811
1.3
5.4
4.9
0.0
0.0
disc
1002
06_F
20_C
_41_
a0.
0814
10.9
0.01
7510
.30.
4791
0.03
404.
379
.58.
411
1.8
11.5
10.2
0.0
0.0
disc
1002
06_F
20_A
_45_
a0.
0625
9.3
0.01
759.
80.
5586
0.02
575.
461
.55.
611
1.8
10.9
9.7
0.0
0.0
disc
1002
06_F
20_A
_19_
a0.
0625
10.9
0.01
7610
.60.
4907
0.02
605.
061
.56.
511
2.4
11.8
10.5
0.0
0.0
disc
1002
06_F
20_B
_16_
a0.
0280
10.6
0.01
789.
80.
5506
0.01
135.
828
.02.
911
3.7
11.1
9.7
0.0
0.0
disc
1002
06_F
20_B
_19_
a0.
1652
7.9
0.03
127.
90.
5061
0.03
851.
715
5.2
11.4
197.
815
.47.
80.
00.
0di
sc10
0206
_F20
_C_0
5_a
0.35
2014
.70.
0561
14.9
0.55
850.
0457
13.3
306.
238
.935
2.0
51.2
14.5
0.0
138.
0di
sc
Sam
ple
2(K
B3)
,ana
lyse
swith
<10%
com
mon
Pbco
rrec
tion
1002
04_K
B3_
A_2
5_a
0.05
907.
50.
0087
3.5
0.23
780.
0489
6.4
58.2
4.2
56.1
2.0
3.5
143.
514
4.1
conc
1002
04_K
B3_
A_4
4_a
0.06
6232
.50.
0091
45.6
0.70
240.
0519
13.3
65.1
20.5
58.2
26.4
45.4
280.
027
9.2
l.e.
1002
07_K
B3_
B_5
0_b
0.06
0111
.40.
0091
9.2
0.40
320.
0489
6.2
59.3
6.6
58.3
5.4
9.2
141.
414
0.3
conc
1002
04_K
B3_
A_1
3_a
0.06
2912
.70.
0092
12.0
0.47
140.
0491
3.2
61.9
7.6
59.0
7.0
11.9
154.
774
.0co
nc10
0204
_KB
3_A
_47_
a0.
0637
11.5
0.00
9211
.70.
5095
0.04
994.
662
.77.
059
.36.
911
.618
8.3
107.
1co
ncContinuesonfollowingpage
62
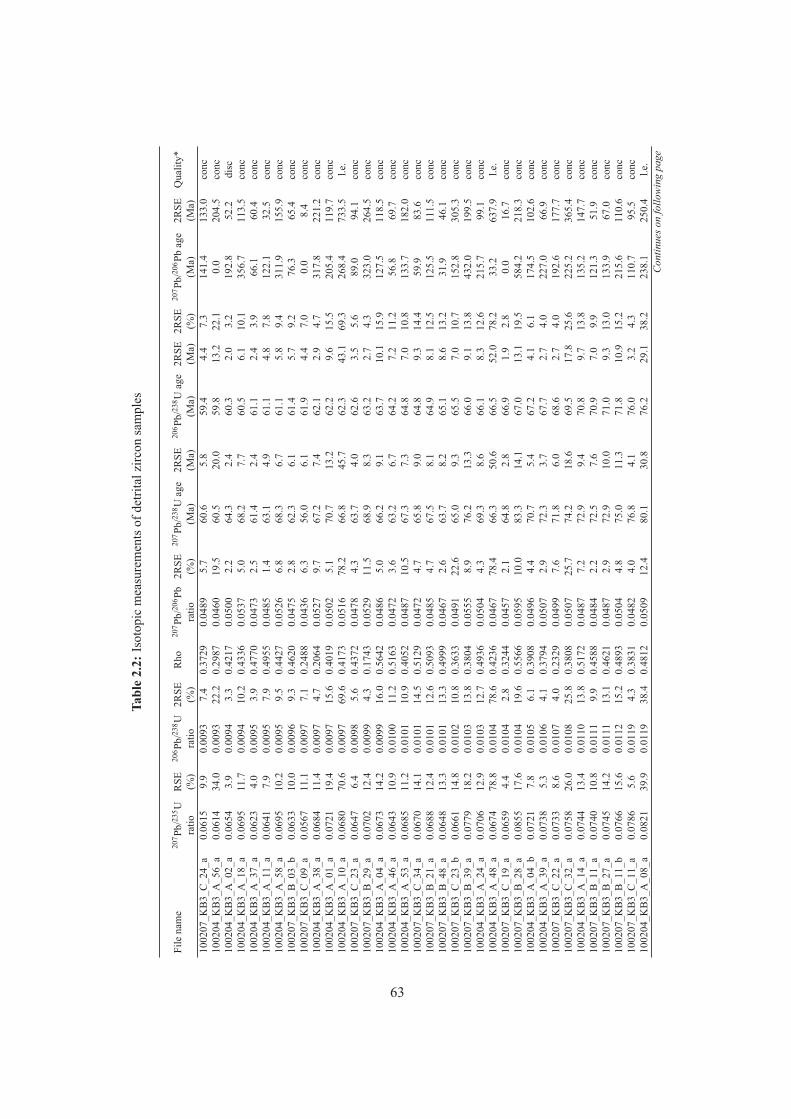
Tabl
e2.
2:Is
otop
icm
easu
rem
ents
ofde
trita
lzirc
onsa
mpl
es
File
nam
e20
7 Pb/
235 U
RSE
206 P
b/23
8 U2R
SER
ho20
7 Pb/
206 P
b2R
SE20
7 Pb/
238 U
age
2RSE
206 P
b/23
8 Uag
e2R
SE2R
SE20
7 Pb/
206 P
bag
e2R
SEQ
ualit
y*ra
tio(%
)ra
tio(%
)ra
tio(%
)(M
a)(M
a)(M
a)(M
a)(%
)(M
a)(M
a)10
0207
_KB
3_C
_24_
a0.
0615
9.9
0.00
937.
40.
3729
0.04
895.
760
.65.
859
.44.
47.
314
1.4
133.
0co
nc10
0204
_KB
3_A
_56_
a0.
0614
34.0
0.00
9322
.20.
2987
0.04
6019
.560
.520
.059
.813
.222
.10.
020
4.5
conc
1002
04_K
B3_
A_0
2_a
0.06
543.
90.
0094
3.3
0.42
170.
0500
2.2
64.3
2.4
60.3
2.0
3.2
192.
852
.2di
sc10
0204
_KB
3_A
_18_
a0.
0695
11.7
0.00
9410
.20.
4336
0.05
375.
068
.27.
760
.56.
110
.135
6.7
113.
5co
nc10
0204
_KB
3_A
_37_
a0.
0623
4.0
0.00
953.
90.
4770
0.04
732.
561
.42.
461
.12.
43.
966
.160
.4co
nc10
0204
_KB
3_A
_11_
a0.
0641
7.9
0.00
957.
90.
4955
0.04
851.
463
.14.
961
.14.
87.
812
2.1
32.5
conc
1002
04_K
B3_
A_5
8_a
0.06
9510
.20.
0095
9.5
0.44
270.
0526
6.8
68.3
6.7
61.1
5.8
9.4
311.
915
5.9
conc
1002
07_K
B3_
B_0
3_b
0.06
3310
.00.
0096
9.3
0.46
200.
0475
2.8
62.3
6.1
61.4
5.7
9.2
76.3
65.4
conc
1002
07_K
B3_
C_0
9_a
0.05
6711
.10.
0097
7.1
0.24
880.
0436
6.3
56.0
6.1
61.9
4.4
7.0
0.0
8.4
conc
1002
04_K
B3_
A_3
8_a
0.06
8411
.40.
0097
4.7
0.20
640.
0527
9.7
67.2
7.4
62.1
2.9
4.7
317.
822
1.2
conc
1002
04_K
B3_
A_0
1_a
0.07
2119
.40.
0097
15.6
0.40
190.
0502
5.1
70.7
13.2
62.2
9.6
15.5
205.
411
9.7
conc
1002
04_K
B3_
A_1
0_a
0.06
8070
.60.
0097
69.6
0.41
730.
0516
78.2
66.8
45.7
62.3
43.1
69.3
268.
473
3.5
l.e.
1002
07_K
B3_
C_2
3_a
0.06
476.
40.
0098
5.6
0.43
720.
0478
4.3
63.7
4.0
62.6
3.5
5.6
89.0
94.1
conc
1002
07_K
B3_
B_2
9_a
0.07
0212
.40.
0099
4.3
0.17
430.
0529
11.5
68.9
8.3
63.2
2.7
4.3
323.
026
4.5
conc
1002
04_K
B3_
A_0
4_a
0.06
7314
.20.
0099
16.0
0.56
420.
0486
5.0
66.2
9.1
63.7
10.1
15.9
127.
511
8.5
conc
1002
04_K
B3_
A_4
6_a
0.06
4310
.90.
0100
11.2
0.51
630.
0472
3.6
63.2
6.7
64.2
7.2
11.2
56.8
69.7
conc
1002
04_K
B3_
A_5
3_a
0.06
8511
.20.
0101
10.9
0.40
520.
0487
10.5
67.3
7.3
64.8
7.0
10.8
133.
718
2.0
conc
1002
07_K
B3_
C_3
4_a
0.06
7014
.10.
0101
14.5
0.51
290.
0472
4.7
65.8
9.0
64.8
9.3
14.4
59.9
83.6
conc
1002
07_K
B3_
B_2
1_a
0.06
8812
.40.
0101
12.6
0.50
930.
0485
4.7
67.5
8.1
64.9
8.1
12.5
125.
511
1.5
conc
1002
07_K
B3_
B_4
8_a
0.06
4813
.30.
0101
13.3
0.49
990.
0467
2.6
63.7
8.2
65.1
8.6
13.2
31.9
46.1
conc
1002
07_K
B3_
C_2
3_b
0.06
6114
.80.
0102
10.8
0.36
330.
0491
22.6
65.0
9.3
65.5
7.0
10.7
152.
830
5.3
conc
1002
07_K
B3_
B_3
9_a
0.07
7918
.20.
0103
13.8
0.38
040.
0555
8.9
76.2
13.3
66.0
9.1
13.8
432.
019
9.5
conc
1002
04_K
B3_
A_2
4_a
0.07
0612
.90.
0103
12.7
0.49
360.
0504
4.3
69.3
8.6
66.1
8.3
12.6
215.
799
.1co
nc10
0204
_KB
3_A
_48_
a0.
0674
78.8
0.01
0478
.60.
4236
0.04
6778
.466
.350
.666
.552
.078
.233
.263
7.9
l.e.
1002
07_K
B3_
C_1
9_a
0.06
594.
40.
0104
2.8
0.32
440.
0457
2.1
64.8
2.8
66.9
1.9
2.8
0.0
16.7
conc
1002
07_K
B3_
B_2
8_a
0.08
5517
.60.
0104
19.6
0.55
660.
0595
10.0
83.3
14.1
67.0
13.1
19.5
584.
221
8.3
conc
1002
04_K
B3_
A_0
4_b
0.07
217.
80.
0105
6.1
0.39
080.
0496
4.4
70.7
5.4
67.2
4.1
6.1
174.
510
2.6
conc
1002
04_K
B3_
A_3
9_a
0.07
385.
30.
0106
4.1
0.37
940.
0507
2.9
72.3
3.7
67.7
2.7
4.0
227.
066
.9co
nc10
0207
_KB
3_C
_22_
a0.
0733
8.6
0.01
074.
00.
2329
0.04
997.
671
.86.
068
.62.
74.
019
2.6
177.
7co
nc10
0207
_KB
3_C
_32_
a0.
0758
26.0
0.01
0825
.80.
3808
0.05
0725
.774
.218
.669
.517
.825
.622
5.2
365.
4co
nc10
0204
_KB
3_A
_14_
a0.
0744
13.4
0.01
1013
.80.
5172
0.04
877.
272
.99.
470
.89.
713
.813
5.2
147.
7co
nc10
0207
_KB
3_B
_11_
a0.
0740
10.8
0.01
119.
90.
4588
0.04
842.
272
.57.
670
.97.
09.
912
1.3
51.9
conc
1002
07_K
B3_
B_2
7_a
0.07
4514
.20.
0111
13.1
0.46
210.
0487
2.9
72.9
10.0
71.0
9.3
13.0
133.
967
.0co
nc10
0207
_KB
3_B
_11_
b0.
0766
15.6
0.01
1215
.20.
4893
0.05
044.
875
.011
.371
.810
.915
.221
5.6
110.
6co
nc10
0207
_KB
3_C
_11_
a0.
0786
5.6
0.01
194.
30.
3831
0.04
824.
076
.84.
176
.03.
24.
311
0.7
95.5
conc
1002
04_K
B3_
A_0
8_a
0.08
2139
.90.
0119
38.4
0.48
120.
0509
12.4
80.1
30.8
76.2
29.1
38.2
238.
125
0.4
l.e.
Continuesonfollowingpage
63
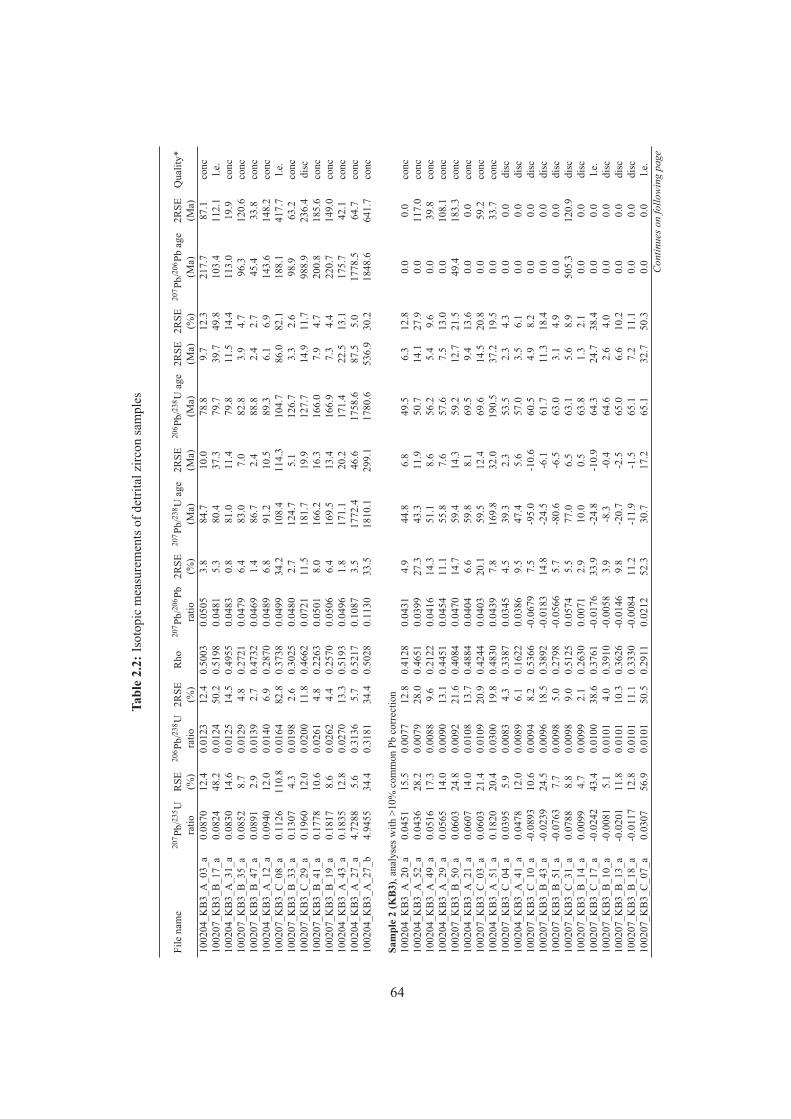
Tabl
e2.
2:Is
otop
icm
easu
rem
ents
ofde
trita
lzirc
onsa
mpl
es
File
nam
e20
7 Pb/
235 U
RSE
206 P
b/23
8 U2R
SER
ho20
7 Pb/
206 P
b2R
SE20
7 Pb/
238 U
age
2RSE
206 P
b/23
8 Uag
e2R
SE2R
SE20
7 Pb/
206 P
bag
e2R
SEQ
ualit
y*ra
tio(%
)ra
tio(%
)ra
tio(%
)(M
a)(M
a)(M
a)(M
a)(%
)(M
a)(M
a)10
0204
_KB
3_A
_03_
a0.
0870
12.4
0.01
2312
.40.
5003
0.05
053.
884
.710
.078
.89.
712
.321
7.7
87.1
conc
1002
07_K
B3_
B_1
7_a
0.08
2448
.20.
0124
50.2
0.51
980.
0481
5.3
80.4
37.3
79.7
39.7
49.8
103.
411
2.1
l.e.
1002
04_K
B3_
A_3
1_a
0.08
3014
.60.
0125
14.5
0.49
550.
0483
0.8
81.0
11.4
79.8
11.5
14.4
113.
019
.9co
nc10
0207
_KB
3_B
_35_
a0.
0852
8.7
0.01
294.
80.
2721
0.04
796.
483
.07.
082
.83.
94.
796
.312
0.6
conc
1002
07_K
B3_
B_4
7_a
0.08
912.
90.
0139
2.7
0.47
320.
0469
1.4
86.7
2.4
88.8
2.4
2.7
45.4
33.8
conc
1002
04_K
B3_
A_1
2_a
0.09
4012
.00.
0140
6.9
0.28
700.
0489
6.8
91.2
10.5
89.3
6.1
6.9
143.
614
8.2
conc
1002
07_K
B3_
C_0
8_a
0.11
2611
0.8
0.01
6482
.80.
3738
0.04
9934
.210
8.4
114.
310
4.7
86.0
82.1
188.
141
7.7
l.e.
1002
07_K
B3_
B_3
3_a
0.13
074.
30.
0198
2.6
0.30
250.
0480
2.7
124.
75.
112
6.7
3.3
2.6
98.9
63.2
conc
1002
07_K
B3_
C_2
9_a
0.19
6012
.00.
0200
11.8
0.46
620.
0721
11.5
181.
719
.912
7.7
14.9
11.7
988.
923
6.4
disc
1002
07_K
B3_
B_4
1_a
0.17
7810
.60.
0261
4.8
0.22
630.
0501
8.0
166.
216
.316
6.0
7.9
4.7
200.
818
5.6
conc
1002
07_K
B3_
B_1
9_a
0.18
178.
60.
0262
4.4
0.25
700.
0506
6.4
169.
513
.416
6.9
7.3
4.4
220.
714
9.0
conc
1002
04_K
B3_
A_4
3_a
0.18
3512
.80.
0270
13.3
0.51
930.
0496
1.8
171.
120
.217
1.4
22.5
13.1
175.
742
.1co
nc10
0204
_KB
3_A
_27_
a4.
7288
5.6
0.31
365.
70.
5217
0.10
873.
517
72.4
46.6
1758
.687
.55.
017
78.5
64.7
conc
1002
04_K
B3_
A_2
7_b
4.94
5534
.40.
3181
34.4
0.50
280.
1130
33.5
1810
.129
9.1
1780
.653
6.9
30.2
1848
.664
1.7
conc
Sam
ple
2(K
B3)
,ana
lyse
swith
>10%
com
mon
Pbco
rrec
tion
1002
04_K
B3_
A_2
0_a
0.04
5115
.50.
0077
12.8
0.41
280.
0431
4.9
44.8
6.8
49.5
6.3
12.8
0.0
0.0
conc
1002
04_K
B3_
A_5
2_a
0.04
3628
.20.
0079
28.0
0.46
510.
0399
27.3
43.3
11.9
50.7
14.1
27.9
0.0
117.
0co
nc10
0204
_KB
3_A
_49_
a0.
0516
17.3
0.00
889.
60.
2122
0.04
1614
.351
.18.
656
.25.
49.
60.
039
.8co
nc10
0204
_KB
3_A
_29_
a0.
0565
14.0
0.00
9013
.10.
4451
0.04
5411
.155
.87.
657
.67.
513
.00.
010
8.1
conc
1002
07_K
B3_
B_5
0_a
0.06
0324
.80.
0092
21.6
0.40
840.
0470
14.7
59.4
14.3
59.2
12.7
21.5
49.4
183.
3co
nc10
0204
_KB
3_A
_21_
a0.
0607
14.0
0.01
0813
.70.
4884
0.04
046.
659
.88.
169
.59.
413
.60.
00.
0co
nc10
0207
_KB
3_C
_03_
a0.
0603
21.4
0.01
0920
.90.
4244
0.04
0320
.159
.512
.469
.614
.520
.80.
059
.2co
nc10
0204
_KB
3_A
_51_
a0.
1820
20.4
0.03
0019
.80.
4830
0.04
397.
816
9.8
32.0
190.
537
.219
.50.
033
.7co
nc10
0207
_KB
3_C
_04_
a0.
0395
5.9
0.00
834.
30.
3387
0.03
454.
539
.32.
353
.52.
34.
30.
00.
0di
sc10
0204
_KB
3_A
_41_
a0.
0478
12.0
0.00
896.
10.
1622
0.03
869.
547
.45.
657
.03.
56.
10.
00.
0di
sc10
0207
_KB
3_C
_10_
a-0
.089
310
.60.
0094
8.2
0.53
66-0
.067
97.
5-9
5.0
-10.
660
.54.
98.
20.
00.
0di
sc10
0207
_KB
3_B
_43_
a-0
.023
924
.50.
0096
18.5
0.38
92-0
.018
314
.8-2
4.5
-6.1
61.7
11.3
18.4
0.0
0.0
disc
1002
07_K
B3_
B_5
1_a
-0.0
763
7.7
0.00
985.
00.
2798
-0.0
566
5.7
-80.
6-6
.563
.03.
14.
90.
00.
0di
sc10
0207
_KB
3_C
_31_
a0.
0788
8.8
0.00
989.
00.
5125
0.05
745.
577
.06.
563
.15.
68.
950
5.3
120.
9di
sc10
0207
_KB
3_B
_14_
a0.
0099
4.7
0.00
992.
10.
2630
0.00
712.
910
.00.
563
.81.
32.
10.
00.
0di
sc10
0207
_KB
3_C
_17_
a-0
.024
243
.40.
0100
38.6
0.37
61-0
.017
633
.9-2
4.8
-10.
964
.324
.738
.40.
00.
0l.e
.10
0207
_KB
3_B
_10_
a-0
.008
15.
10.
0101
4.0
0.39
10-0
.005
83.
9-8
.3-0
.464
.62.
64.
00.
00.
0di
sc10
0207
_KB
3_B
_13_
a-0
.020
111
.80.
0101
10.3
0.36
26-0
.014
69.
8-2
0.7
-2.5
65.0
6.6
10.2
0.0
0.0
disc
1002
07_K
B3_
B_1
8_a
-0.0
117
12.8
0.01
0111
.10.
3330
-0.0
084
11.2
-11.
9-1
.565
.17.
211
.10.
00.
0di
sc10
0207
_KB
3_C
_07_
a0.
0307
56.9
0.01
0150
.50.
2911
0.02
1252
.330
.717
.265
.132
.750
.30.
00.
0l.e
.Continuesonfollowingpage
64
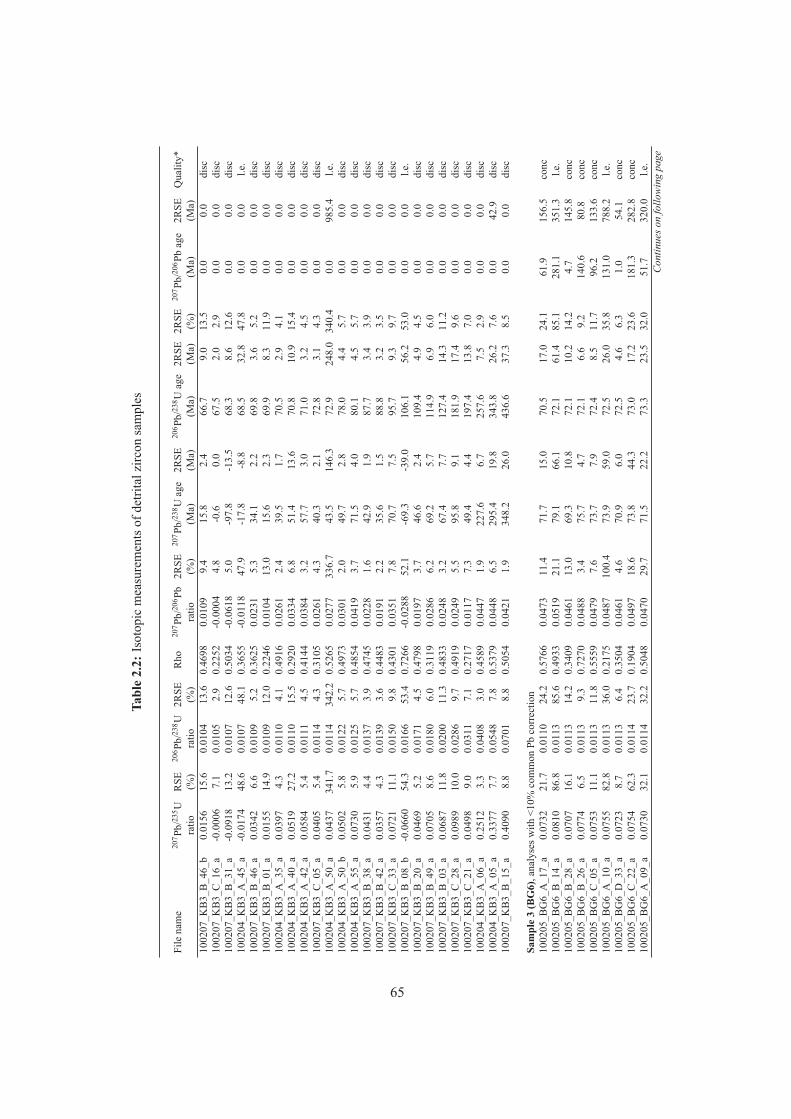
Tabl
e2.
2:Is
otop
icm
easu
rem
ents
ofde
trita
lzirc
onsa
mpl
es
File
nam
e20
7 Pb/
235 U
RSE
206 P
b/23
8 U2R
SER
ho20
7 Pb/
206 P
b2R
SE20
7 Pb/
238 U
age
2RSE
206 P
b/23
8 Uag
e2R
SE2R
SE20
7 Pb/
206 P
bag
e2R
SEQ
ualit
y*ra
tio(%
)ra
tio(%
)ra
tio(%
)(M
a)(M
a)(M
a)(M
a)(%
)(M
a)(M
a)10
0207
_KB
3_B
_46_
b0.
0156
15.6
0.01
0413
.60.
4698
0.01
099.
415
.82.
466
.79.
013
.50.
00.
0di
sc10
0207
_KB
3_C
_16_
a-0
.000
67.
10.
0105
2.9
0.22
52-0
.000
44.
8-0
.60.
067
.52.
02.
90.
00.
0di
sc10
0207
_KB
3_B
_31_
a-0
.091
813
.20.
0107
12.6
0.50
34-0
.061
85.
0-9
7.8
-13.
568
.38.
612
.60.
00.
0di
sc10
0204
_KB
3_A
_45_
a-0
.017
448
.60.
0107
48.1
0.36
55-0
.011
847
.9-1
7.8
-8.8
68.5
32.8
47.8
0.0
0.0
l.e.
1002
07_K
B3_
B_4
6_a
0.03
426.
60.
0109
5.2
0.36
250.
0231
5.3
34.1
2.2
69.8
3.6
5.2
0.0
0.0
disc
1002
07_K
B3_
B_0
1_a
0.01
5514
.90.
0109
12.0
0.22
460.
0104
13.0
15.6
2.3
69.9
8.3
11.9
0.0
0.0
disc
1002
04_K
B3_
A_3
5_a
0.03
974.
30.
0110
4.1
0.49
160.
0261
2.4
39.5
1.7
70.5
2.9
4.1
0.0
0.0
disc
1002
04_K
B3_
A_4
0_a
0.05
1927
.20.
0110
15.5
0.29
200.
0334
6.8
51.4
13.6
70.8
10.9
15.4
0.0
0.0
disc
1002
04_K
B3_
A_4
2_a
0.05
845.
40.
0111
4.5
0.41
440.
0384
3.2
57.7
3.0
71.0
3.2
4.5
0.0
0.0
disc
1002
07_K
B3_
C_0
5_a
0.04
055.
40.
0114
4.3
0.31
050.
0261
4.3
40.3
2.1
72.8
3.1
4.3
0.0
0.0
disc
1002
04_K
B3_
A_5
0_a
0.04
3734
1.7
0.01
1434
2.2
0.52
650.
0277
336.
743
.514
6.3
72.9
248.
034
0.4
0.0
985.
4l.e
.10
0204
_KB
3_A
_50_
b0.
0502
5.8
0.01
225.
70.
4973
0.03
012.
049
.72.
878
.04.
45.
70.
00.
0di
sc10
0204
_KB
3_A
_55_
a0.
0730
5.9
0.01
255.
70.
4854
0.04
193.
771
.54.
080
.14.
55.
70.
00.
0di
sc10
0207
_KB
3_B
_38_
a0.
0431
4.4
0.01
373.
90.
4745
0.02
281.
642
.91.
987
.73.
43.
90.
00.
0di
sc10
0207
_KB
3_B
_42_
a0.
0357
4.3
0.01
393.
60.
4483
0.01
912.
235
.61.
588
.83.
23.
50.
00.
0di
sc10
0207
_KB
3_C
_33_
a0.
0721
11.1
0.01
509.
80.
4301
0.03
517.
870
.77.
595
.79.
39.
70.
00.
0di
sc10
0207
_KB
3_B
_08_
b-0
.066
054
.30.
0166
53.4
0.72
66-0
.028
852
.1-6
9.3
-39.
010
6.1
56.2
53.0
0.0
0.0
l.e.
1002
07_K
B3_
B_2
0_a
0.04
695.
20.
0171
4.5
0.47
980.
0197
3.7
46.6
2.4
109.
44.
94.
50.
00.
0di
sc10
0207
_KB
3_B
_49_
a0.
0705
8.6
0.01
806.
00.
3119
0.02
866.
269
.25.
711
4.9
6.9
6.0
0.0
0.0
disc
1002
07_K
B3_
B_0
3_a
0.06
8711
.80.
0200
11.3
0.48
330.
0248
3.2
67.4
7.7
127.
414
.311
.20.
00.
0di
sc10
0207
_KB
3_C
_28_
a0.
0989
10.0
0.02
869.
70.
4919
0.02
495.
595
.89.
118
1.9
17.4
9.6
0.0
0.0
disc
1002
07_K
B3_
C_2
1_a
0.04
989.
00.
0311
7.1
0.27
170.
0117
7.3
49.4
4.4
197.
413
.87.
00.
00.
0di
sc10
0204
_KB
3_A
_06_
a0.
2512
3.3
0.04
083.
00.
4589
0.04
471.
922
7.6
6.7
257.
67.
52.
90.
00.
0di
sc10
0204
_KB
3_A
_05_
a0.
3377
7.7
0.05
487.
80.
5379
0.04
486.
529
5.4
19.8
343.
826
.27.
60.
042
.9di
sc10
0207
_KB
3_B
_15_
a0.
4090
8.8
0.07
018.
80.
5054
0.04
211.
934
8.2
26.0
436.
637
.38.
50.
00.
0di
sc
Sam
ple
3(B
G6)
,ana
lyse
swith
<10%
com
mon
Pbco
rrec
tion
1002
05_B
G6_
A_1
7_a
0.07
3221
.70.
0110
24.2
0.57
660.
0473
11.4
71.7
15.0
70.5
17.0
24.1
61.9
156.
5co
nc10
0205
_BG
6_B
_14_
a0.
0810
86.8
0.01
1385
.60.
4933
0.05
1921
.179
.166
.172
.161
.485
.128
1.1
351.
3l.e
.10
0205
_BG
6_B
_28_
a0.
0707
16.1
0.01
1314
.20.
3409
0.04
6113
.069
.310
.872
.110
.214
.24.
714
5.8
conc
1002
05_B
G6_
B_2
6_a
0.07
746.
50.
0113
9.3
0.72
700.
0488
3.4
75.7
4.7
72.1
6.6
9.2
140.
680
.8co
nc10
0205
_BG
6_C
_05_
a0.
0753
11.1
0.01
1311
.80.
5559
0.04
797.
673
.77.
972
.48.
511
.796
.213
3.6
conc
1002
05_B
G6_
A_1
0_a
0.07
5582
.80.
0113
36.0
0.21
750.
0487
100.
473
.959
.072
.526
.035
.813
1.0
788.
2l.e
.10
0205
_BG
6_D
_33_
a0.
0723
8.7
0.01
136.
40.
3504
0.04
614.
670
.96.
072
.54.
66.
31.
054
.1co
nc10
0205
_BG
6_C
_22_
a0.
0754
62.3
0.01
1423
.70.
1904
0.04
9718
.673
.844
.373
.017
.223
.618
1.3
282.
8co
nc10
0205
_BG
6_A
_09_
a0.
0730
32.1
0.01
1432
.20.
5048
0.04
7029
.771
.522
.273
.323
.532
.051
.732
0.0
l.e.
Continuesonfollowingpage
65
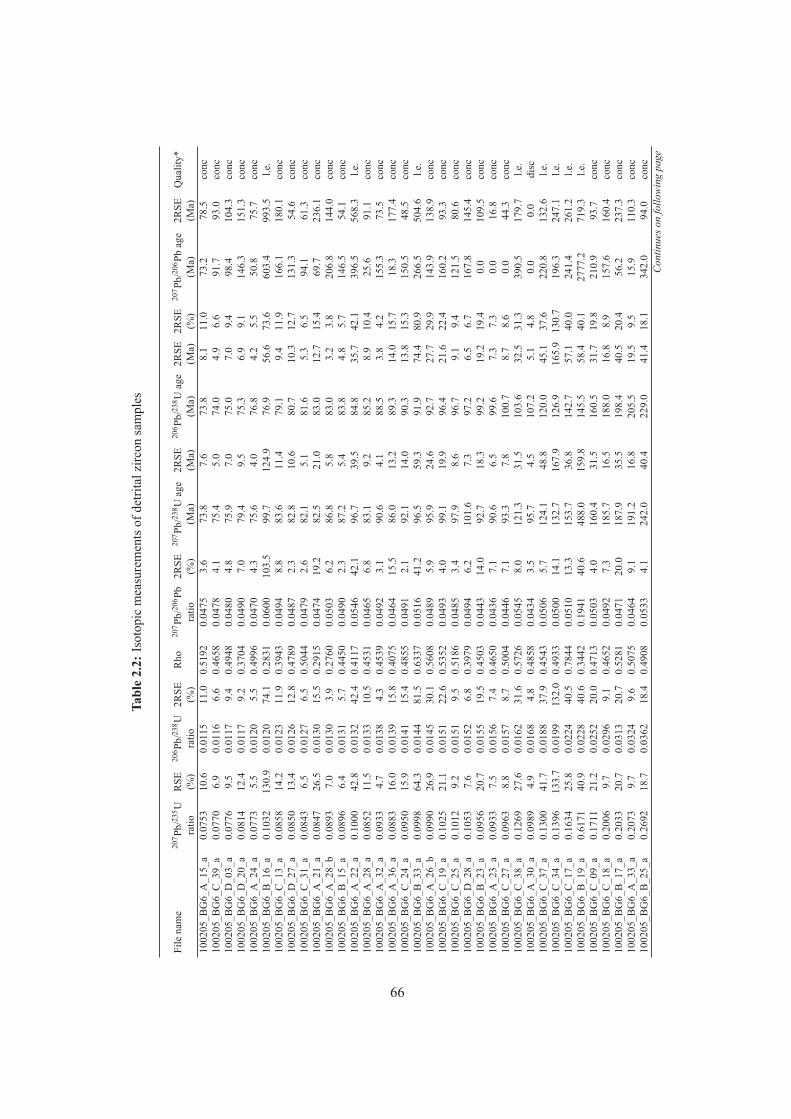
Tabl
e2.
2:Is
otop
icm
easu
rem
ents
ofde
trita
lzirc
onsa
mpl
es
File
nam
e20
7 Pb/
235 U
RSE
206 P
b/23
8 U2R
SER
ho20
7 Pb/
206 P
b2R
SE20
7 Pb/
238 U
age
2RSE
206 P
b/23
8 Uag
e2R
SE2R
SE20
7 Pb/
206 P
bag
e2R
SEQ
ualit
y*ra
tio(%
)ra
tio(%
)ra
tio(%
)(M
a)(M
a)(M
a)(M
a)(%
)(M
a)(M
a)10
0205
_BG
6_A
_15_
a0.
0753
10.6
0.01
1511
.00.
5192
0.04
753.
673
.87.
673
.88.
111
.073
.278
.5co
nc10
0205
_BG
6_C
_39_
a0.
0770
6.9
0.01
166.
60.
4658
0.04
784.
175
.45.
074
.04.
96.
691
.793
.0co
nc10
0205
_BG
6_D
_03_
a0.
0776
9.5
0.01
179.
40.
4948
0.04
804.
875
.97.
075
.07.
09.
498
.410
4.3
conc
1002
05_B
G6_
D_2
0_a
0.08
1412
.40.
0117
9.2
0.37
040.
0490
7.0
79.4
9.5
75.3
6.9
9.1
146.
315
1.3
conc
1002
05_B
G6_
A_2
4_a
0.07
735.
50.
0120
5.5
0.49
960.
0470
4.3
75.6
4.0
76.8
4.2
5.5
50.8
75.7
conc
1002
05_B
G6_
B_1
6_a
0.10
3213
0.9
0.01
2074
.10.
2831
0.06
0010
3.5
99.7
124.
976
.956
.673
.660
3.4
993.
5l.e
.10
0205
_BG
6_C
_13_
a0.
0858
14.2
0.01
2311
.90.
3943
0.04
948.
883
.611
.479
.19.
411
.916
6.1
180.
1co
nc10
0205
_BG
6_D
_27_
a0.
0850
13.4
0.01
2612
.80.
4789
0.04
872.
382
.810
.680
.710
.312
.713
1.3
54.6
conc
1002
05_B
G6_
C_3
1_a
0.08
436.
50.
0127
6.5
0.50
440.
0479
2.6
82.1
5.1
81.6
5.3
6.5
94.1
61.3
conc
1002
05_B
G6_
A_2
1_a
0.08
4726
.50.
0130
15.5
0.29
150.
0474
19.2
82.5
21.0
83.0
12.7
15.4
69.7
236.
1co
nc10
0205
_BG
6_A
_28_
b0.
0893
7.0
0.01
303.
90.
2760
0.05
036.
286
.85.
883
.03.
23.
820
6.8
144.
0co
nc10
0205
_BG
6_B
_15_
a0.
0896
6.4
0.01
315.
70.
4450
0.04
902.
387
.25.
483
.84.
85.
714
6.5
54.1
conc
1002
05_B
G6_
A_2
2_a
0.10
0042
.80.
0132
42.4
0.41
170.
0546
42.1
96.7
39.5
84.8
35.7
42.1
396.
556
8.3
l.e.
1002
05_B
G6_
A_2
8_a
0.08
5211
.50.
0133
10.5
0.45
310.
0465
6.8
83.1
9.2
85.2
8.9
10.4
25.6
91.1
conc
1002
05_B
G6_
A_3
2_a
0.09
334.
70.
0138
4.3
0.45
390.
0492
3.1
90.6
4.1
88.5
3.8
4.2
155.
373
.5co
nc10
0205
_BG
6_A
_36_
a0.
0883
16.0
0.01
3915
.80.
4075
0.04
6415
.586
.013
.289
.314
.015
.718
.317
7.4
conc
1002
05_B
G6_
C_2
4_a
0.09
5015
.90.
0141
15.4
0.48
550.
0491
2.1
92.1
14.0
90.3
13.8
15.3
150.
548
.5co
nc10
0205
_BG
6_B
_33_
a0.
0998
64.3
0.01
4481
.50.
6337
0.05
1641
.296
.559
.391
.974
.480
.926
6.5
504.
6l.e
.10
0205
_BG
6_A
_26_
b0.
0990
26.9
0.01
4530
.10.
5608
0.04
895.
995
.924
.692
.727
.729
.914
3.9
138.
9co
nc10
0205
_BG
6_C
_19_
a0.
1025
21.1
0.01
5122
.60.
5352
0.04
934.
099
.119
.996
.421
.622
.416
0.2
93.3
conc
1002
05_B
G6_
C_2
5_a
0.10
129.
20.
0151
9.5
0.51
860.
0485
3.4
97.9
8.6
96.7
9.1
9.4
121.
580
.6co
nc10
0205
_BG
6_D
_28_
a0.
1053
7.6
0.01
526.
80.
3979
0.04
946.
210
1.6
7.3
97.2
6.5
6.7
167.
814
5.4
conc
1002
05_B
G6_
B_2
3_a
0.09
5620
.70.
0155
19.5
0.45
030.
0443
14.0
92.7
18.3
99.2
19.2
19.4
0.0
109.
5co
nc10
0205
_BG
6_A
_23_
a0.
0933
7.5
0.01
567.
40.
4650
0.04
367.
190
.66.
599
.67.
37.
30.
016
.8co
nc10
0205
_BG
6_C
_27_
a0.
0963
8.8
0.01
578.
70.
5004
0.04
467.
193
.37.
810
0.7
8.7
8.6
0.0
44.3
conc
1002
05_B
G6_
C_3
8_a
0.12
6927
.60.
0162
31.6
0.57
260.
0545
8.0
121.
331
.510
3.6
32.5
31.3
390.
517
9.7
l.e.
1002
05_B
G6_
A_3
0_a
0.09
894.
90.
0168
4.8
0.48
580.
0434
3.5
95.7
4.5
107.
25.
14.
80.
00.
0di
sc10
0205
_BG
6_C
_37_
a0.
1300
41.7
0.01
8837
.90.
4543
0.05
065.
712
4.1
48.8
120.
045
.137
.622
0.8
132.
6l.e
.10
0205
_BG
6_C
_34_
a0.
1396
133.
70.
0199
132.
00.
4933
0.05
0014
.113
2.7
167.
912
6.9
165.
913
0.7
196.
324
7.1
l.e.
1002
05_B
G6_
C_1
7_a
0.16
3425
.80.
0224
40.5
0.78
440.
0510
13.3
153.
736
.814
2.7
57.1
40.0
241.
426
1.2
l.e.
1002
05_B
G6_
B_1
9_a
0.61
7140
.90.
0228
40.6
0.34
420.
1941
40.6
488.
015
9.8
145.
558
.440
.127
77.2
719.
3l.e
.10
0205
_BG
6_C
_09_
a0.
1711
21.2
0.02
5220
.00.
4713
0.05
034.
016
0.4
31.5
160.
531
.719
.821
0.9
93.7
conc
1002
05_B
G6_
C_1
8_a
0.20
069.
70.
0296
9.1
0.46
520.
0492
7.3
185.
716
.518
8.0
16.8
8.9
157.
616
0.4
conc
1002
05_B
G6_
B_1
7_a
0.20
3320
.70.
0313
20.7
0.52
810.
0471
20.0
187.
935
.519
8.4
40.5
20.4
56.2
237.
3co
nc10
0205
_BG
6_A
_33_
a0.
2073
9.7
0.03
249.
60.
5075
0.04
649.
119
1.2
16.8
205.
519
.59.
515
.911
0.3
conc
1002
05_B
G6_
B_2
5_a
0.26
9218
.70.
0362
18.4
0.49
080.
0533
4.1
242.
040
.422
9.0
41.4
18.1
342.
094
.0co
ncContinuesonfollowingpage
66
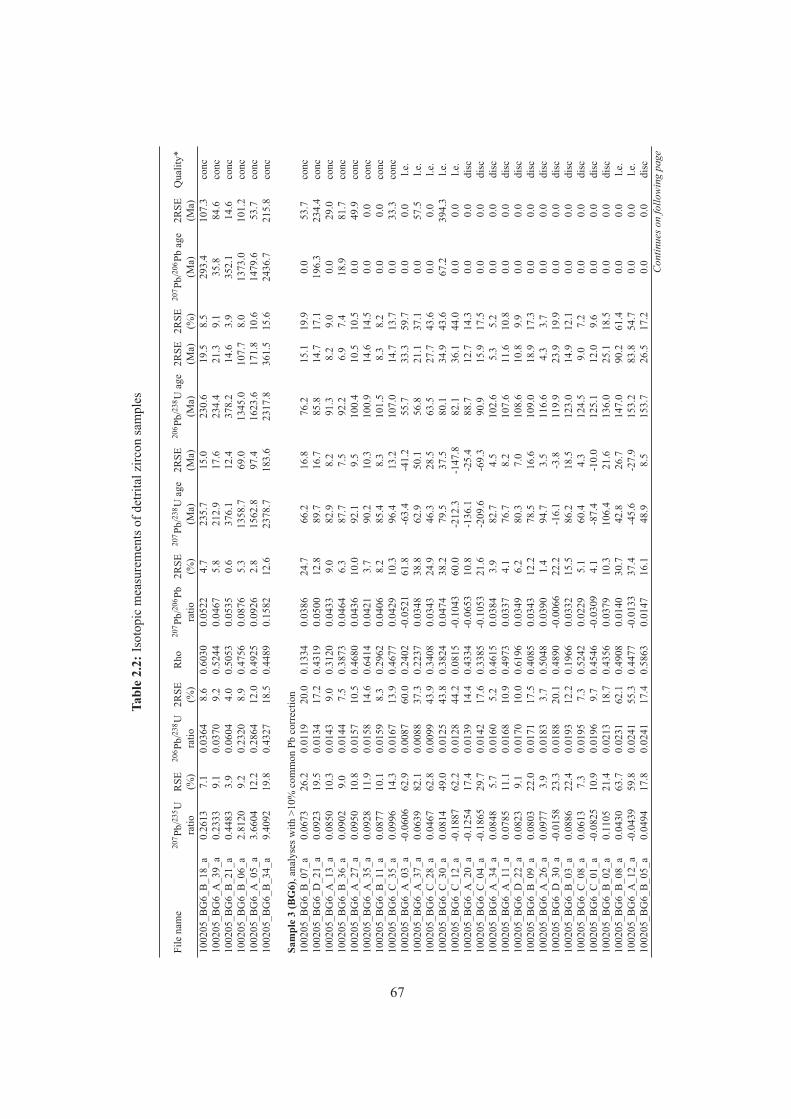
Tabl
e2.
2:Is
otop
icm
easu
rem
ents
ofde
trita
lzirc
onsa
mpl
es
File
nam
e20
7 Pb/
235 U
RSE
206 P
b/23
8 U2R
SER
ho20
7 Pb/
206 P
b2R
SE20
7 Pb/
238 U
age
2RSE
206 P
b/23
8 Uag
e2R
SE2R
SE20
7 Pb/
206 P
bag
e2R
SEQ
ualit
y*ra
tio(%
)ra
tio(%
)ra
tio(%
)(M
a)(M
a)(M
a)(M
a)(%
)(M
a)(M
a)10
0205
_BG
6_B
_18_
a0.
2613
7.1
0.03
648.
60.
6030
0.05
224.
723
5.7
15.0
230.
619
.58.
529
3.4
107.
3co
nc10
0205
_BG
6_A
_39_
a0.
2333
9.1
0.03
709.
20.
5244
0.04
675.
821
2.9
17.6
234.
421
.39.
135
.884
.6co
nc10
0205
_BG
6_B
_21_
a0.
4483
3.9
0.06
044.
00.
5053
0.05
350.
637
6.1
12.4
378.
214
.63.
935
2.1
14.6
conc
1002
05_B
G6_
B_0
6_a
2.81
209.
20.
2320
8.9
0.47
560.
0876
5.3
1358
.769
.013
45.0
107.
78.
013
73.0
101.
2co
nc10
0205
_BG
6_A
_05_
a3.
6604
12.2
0.28
6412
.00.
4925
0.09
262.
815
62.8
97.4
1623
.617
1.8
10.6
1479
.653
.7co
nc10
0205
_BG
6_B
_34_
a9.
4092
19.8
0.43
2718
.50.
4489
0.15
8212
.623
78.7
183.
623
17.8
361.
515
.624
36.7
215.
8co
nc
Sam
ple
3(B
G6)
,ana
lyse
swith
>10%
com
mon
Pbco
rrec
tion
1002
05_B
G6_
B_0
7_a
0.06
7326
.20.
0119
20.0
0.13
340.
0386
24.7
66.2
16.8
76.2
15.1
19.9
0.0
53.7
conc
1002
05_B
G6_
D_2
1_a
0.09
2319
.50.
0134
17.2
0.43
190.
0500
12.8
89.7
16.7
85.8
14.7
17.1
196.
323
4.4
conc
1002
05_B
G6_
A_1
3_a
0.08
5010
.30.
0143
9.0
0.31
200.
0433
9.0
82.9
8.2
91.3
8.2
9.0
0.0
29.0
conc
1002
05_B
G6_
B_3
6_a
0.09
029.
00.
0144
7.5
0.38
730.
0464
6.3
87.7
7.5
92.2
6.9
7.4
18.9
81.7
conc
1002
05_B
G6_
A_2
7_a
0.09
5010
.80.
0157
10.5
0.46
800.
0436
10.0
92.1
9.5
100.
410
.510
.50.
049
.9co
nc10
0205
_BG
6_A
_35_
a0.
0928
11.9
0.01
5814
.60.
6414
0.04
213.
790
.210
.310
0.9
14.6
14.5
0.0
0.0
conc
1002
05_B
G6_
B_1
1_a
0.08
7710
.10.
0159
8.3
0.29
620.
0406
8.2
85.4
8.3
101.
58.
38.
20.
00.
0co
nc10
0205
_BG
6_C
_35_
a0.
0996
14.3
0.01
6713
.90.
4677
0.04
2910
.396
.413
.210
7.0
14.7
13.7
0.0
33.3
conc
1002
05_B
G6_
A_0
3_a
-0.0
606
62.9
0.00
8760
.00.
2402
-0.0
521
61.8
-63.
4-4
1.2
55.7
33.3
59.7
0.0
0.0
l.e.
1002
05_B
G6_
A_3
7_a
0.06
3982
.10.
0088
37.3
0.22
370.
0348
38.8
62.9
50.1
56.8
21.1
37.1
0.0
57.5
l.e.
1002
05_B
G6_
C_2
8_a
0.04
6762
.80.
0099
43.9
0.34
080.
0343
24.9
46.3
28.5
63.5
27.7
43.6
0.0
0.0
l.e.
1002
05_B
G6_
C_3
0_a
0.08
1449
.00.
0125
43.8
0.38
240.
0474
38.2
79.5
37.5
80.1
34.9
43.6
67.2
394.
3l.e
.10
0205
_BG
6_C
_12_
a-0
.188
762
.20.
0128
44.2
0.08
15-0
.104
360
.0-2
12.3
-147
.882
.136
.144
.00.
00.
0l.e
.10
0205
_BG
6_A
_20_
a-0
.125
417
.40.
0139
14.4
0.43
34-0
.065
310
.8-1
36.1
-25.
488
.712
.714
.30.
00.
0di
sc10
0205
_BG
6_C
_04_
a-0
.186
529
.70.
0142
17.6
0.33
85-0
.105
321
.6-2
09.6
-69.
390
.915
.917
.50.
00.
0di
sc10
0205
_BG
6_A
_34_
a0.
0848
5.7
0.01
605.
20.
4615
0.03
843.
982
.74.
510
2.6
5.3
5.2
0.0
0.0
disc
1002
05_B
G6_
A_1
1_a
0.07
8511
.10.
0168
10.9
0.49
730.
0337
4.1
76.7
8.2
107.
611
.610
.80.
00.
0di
sc10
0205
_BG
6_D
_22_
a0.
0823
9.1
0.01
7010
.00.
6196
0.03
496.
280
.37.
010
8.6
10.8
9.9
0.0
0.0
disc
1002
05_B
G6_
B_0
9_a
0.08
0322
.00.
0171
17.5
0.40
850.
0343
12.2
78.5
16.6
109.
018
.917
.30.
00.
0di
sc10
0205
_BG
6_A
_26_
a0.
0977
3.9
0.01
833.
70.
5048
0.03
901.
494
.73.
511
6.6
4.3
3.7
0.0
0.0
disc
1002
05_B
G6_
D_3
0_a
-0.0
158
23.3
0.01
8820
.10.
4890
-0.0
066
22.2
-16.
1-3
.811
9.9
23.9
19.9
0.0
0.0
disc
1002
05_B
G6_
B_0
3_a
0.08
8622
.40.
0193
12.2
0.19
660.
0332
15.5
86.2
18.5
123.
014
.912
.10.
00.
0di
sc10
0205
_BG
6_C
_08_
a0.
0613
7.3
0.01
957.
30.
5242
0.02
295.
160
.44.
312
4.5
9.0
7.2
0.0
0.0
disc
1002
05_B
G6_
C_0
1_a
-0.0
825
10.9
0.01
969.
70.
4546
-0.0
309
4.1
-87.
4-1
0.0
125.
112
.09.
60.
00.
0di
sc10
0205
_BG
6_B
_02_
a0.
1105
21.4
0.02
1318
.70.
4356
0.03
7910
.310
6.4
21.6
136.
025
.118
.50.
00.
0di
sc10
0205
_BG
6_B
_08_
a0.
0430
63.7
0.02
3162
.10.
4908
0.01
4030
.742
.826
.714
7.0
90.2
61.4
0.0
0.0
l.e.
1002
05_B
G6_
A_1
2_a
-0.0
439
59.8
0.02
4155
.30.
4477
-0.0
133
37.4
-45.
6-2
7.9
153.
283
.854
.70.
00.
0l.e
.10
0205
_BG
6_B
_05_
a0.
0494
17.8
0.02
4117
.40.
5863
0.01
4716
.148
.98.
515
3.7
26.5
17.2
0.0
0.0
disc
Continuesonfollowingpage
67
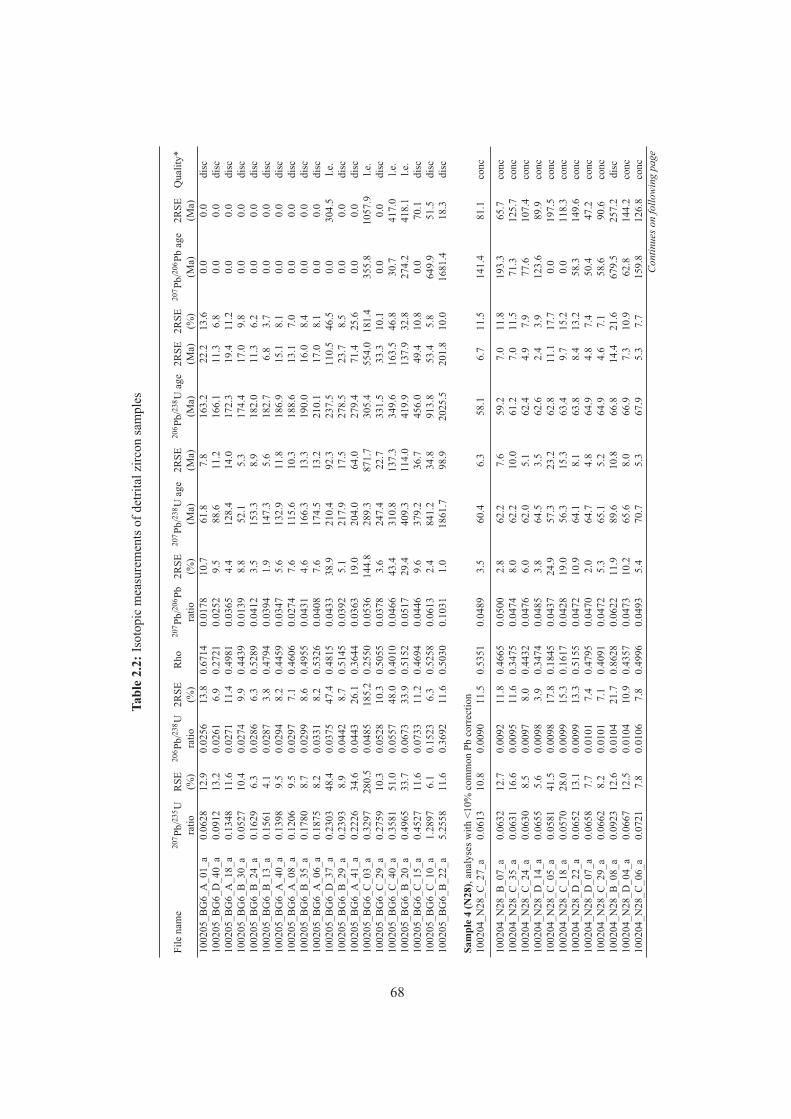
Tabl
e2.
2:Is
otop
icm
easu
rem
ents
ofde
trita
lzirc
onsa
mpl
es
File
nam
e20
7 Pb/
235 U
RSE
206 P
b/23
8 U2R
SER
ho20
7 Pb/
206 P
b2R
SE20
7 Pb/
238 U
age
2RSE
206 P
b/23
8 Uag
e2R
SE2R
SE20
7 Pb/
206 P
bag
e2R
SEQ
ualit
y*ra
tio(%
)ra
tio(%
)ra
tio(%
)(M
a)(M
a)(M
a)(M
a)(%
)(M
a)(M
a)10
0205
_BG
6_A
_01_
a0.
0628
12.9
0.02
5613
.80.
6714
0.01
7810
.761
.87.
816
3.2
22.2
13.6
0.0
0.0
disc
1002
05_B
G6_
D_4
0_a
0.09
1213
.20.
0261
6.9
0.27
210.
0252
9.5
88.6
11.2
166.
111
.36.
80.
00.
0di
sc10
0205
_BG
6_A
_18_
a0.
1348
11.6
0.02
7111
.40.
4981
0.03
654.
412
8.4
14.0
172.
319
.411
.20.
00.
0di
sc10
0205
_BG
6_B
_30_
a0.
0527
10.4
0.02
749.
90.
4439
0.01
398.
852
.15.
317
4.4
17.0
9.8
0.0
0.0
disc
1002
05_B
G6_
B_2
4_a
0.16
296.
30.
0286
6.3
0.52
890.
0412
3.5
153.
38.
918
2.0
11.3
6.2
0.0
0.0
disc
1002
05_B
G6_
B_1
3_a
0.15
614.
10.
0287
3.8
0.47
940.
0394
1.9
147.
35.
618
2.7
6.8
3.7
0.0
0.0
disc
1002
05_B
G6_
A_4
0_a
0.13
989.
50.
0294
8.2
0.44
590.
0347
5.6
132.
911
.818
6.9
15.1
8.1
0.0
0.0
disc
1002
05_B
G6_
A_0
8_a
0.12
069.
50.
0297
7.1
0.46
060.
0274
7.6
115.
610
.318
8.6
13.1
7.0
0.0
0.0
disc
1002
05_B
G6_
B_3
5_a
0.17
808.
70.
0299
8.6
0.49
550.
0431
4.6
166.
313
.319
0.0
16.0
8.4
0.0
0.0
disc
1002
05_B
G6_
A_0
6_a
0.18
758.
20.
0331
8.2
0.53
260.
0408
7.6
174.
513
.221
0.1
17.0
8.1
0.0
0.0
disc
1002
05_B
G6_
D_3
7_a
0.23
0348
.40.
0375
47.4
0.48
150.
0433
38.9
210.
492
.323
7.5
110.
546
.50.
030
4.5
l.e.
1002
05_B
G6_
B_2
9_a
0.23
938.
90.
0442
8.7
0.51
450.
0392
5.1
217.
917
.527
8.5
23.7
8.5
0.0
0.0
disc
1002
05_B
G6_
A_4
1_a
0.22
2634
.60.
0443
26.1
0.36
440.
0363
19.0
204.
064
.027
9.4
71.4
25.6
0.0
0.0
disc
1002
05_B
G6_
C_0
3_a
0.32
9728
0.5
0.04
8518
5.2
0.25
500.
0536
144.
828
9.3
871.
730
5.4
554.
018
1.4
355.
810
57.9
l.e.
1002
05_B
G6_
C_2
9_a
0.27
5910
.30.
0528
10.3
0.50
550.
0378
3.6
247.
422
.733
1.5
33.3
10.1
0.0
0.0
disc
1002
05_B
G6_
C_4
0_a
0.35
8151
.00.
0557
48.0
0.40
100.
0466
43.4
310.
813
7.3
349.
616
3.5
46.8
30.7
417.
0l.e
.10
0205
_BG
6_B
_20_
a0.
4965
33.7
0.06
7333
.90.
5152
0.05
1729
.440
9.3
114.
041
9.9
137.
932
.827
4.2
418.
1l.e
.10
0205
_BG
6_C
_15_
a0.
4527
11.6
0.07
3311
.20.
4694
0.04
469.
637
9.2
36.7
456.
049
.410
.80.
070
.1di
sc10
0205
_BG
6_C
_10_
a1.
2897
6.1
0.15
236.
30.
5258
0.06
132.
484
1.2
34.8
913.
853
.45.
864
9.9
51.5
disc
1002
05_B
G6_
B_2
2_a
5.25
5811
.60.
3692
11.6
0.50
300.
1031
1.0
1861
.798
.920
25.5
201.
810
.016
81.4
18.3
disc
Sam
ple
4(N
28),
anal
yses
with
<10%
com
mon
Pbco
rrec
tion
1002
04_N
28_C
_27_
a0.
0613
10.8
0.00
9011
.50.
5351
0.04
893.
560
.46.
358
.16.
711
.514
1.4
81.1
conc
1002
04_N
28_B
_07_
a0.
0632
12.7
0.00
9211
.80.
4665
0.05
002.
862
.27.
659
.27.
011
.819
3.3
65.7
conc
1002
04_N
28_C
_35_
a0.
0631
16.6
0.00
9511
.60.
3475
0.04
748.
062
.210
.061
.27.
011
.571
.312
5.7
conc
1002
04_N
28_C
_24_
a0.
0630
8.5
0.00
978.
00.
4432
0.04
766.
062
.05.
162
.44.
97.
977
.610
7.4
conc
1002
04_N
28_D
_14_
a0.
0655
5.6
0.00
983.
90.
3474
0.04
853.
864
.53.
562
.62.
43.
912
3.6
89.9
conc
1002
04_N
28_C
_05_
a0.
0581
41.5
0.00
9817
.80.
1845
0.04
3724
.957
.323
.262
.811
.117
.70.
019
7.5
conc
1002
04_N
28_C
_18_
a0.
0570
28.0
0.00
9915
.30.
1617
0.04
2819
.056
.315
.363
.49.
715
.20.
011
8.3
conc
1002
04_N
28_D
_22_
a0.
0652
13.1
0.00
9913
.30.
5155
0.04
7210
.964
.18.
163
.88.
413
.258
.314
9.6
conc
1002
04_N
28_D
_07_
a0.
0658
7.7
0.01
017.
40.
4795
0.04
702.
064
.74.
864
.94.
87.
450
.447
.2co
nc10
0204
_N28
_C_2
9_a
0.06
628.
20.
0101
7.1
0.40
910.
0472
5.3
65.1
5.2
64.9
4.6
7.1
58.6
90.6
conc
1002
04_N
28_B
_08_
a0.
0923
12.6
0.01
0421
.70.
8628
0.06
2211
.989
.610
.866
.814
.421
.667
9.5
257.
2di
sc10
0204
_N28
_D_0
4_a
0.06
6712
.50.
0104
10.9
0.43
570.
0473
10.2
65.6
8.0
66.9
7.3
10.9
62.8
144.
2co
nc10
0204
_N28
_C_0
6_a
0.07
217.
80.
0106
7.8
0.49
960.
0493
5.4
70.7
5.3
67.9
5.3
7.7
159.
812
6.8
conc
Continuesonfollowingpage
68
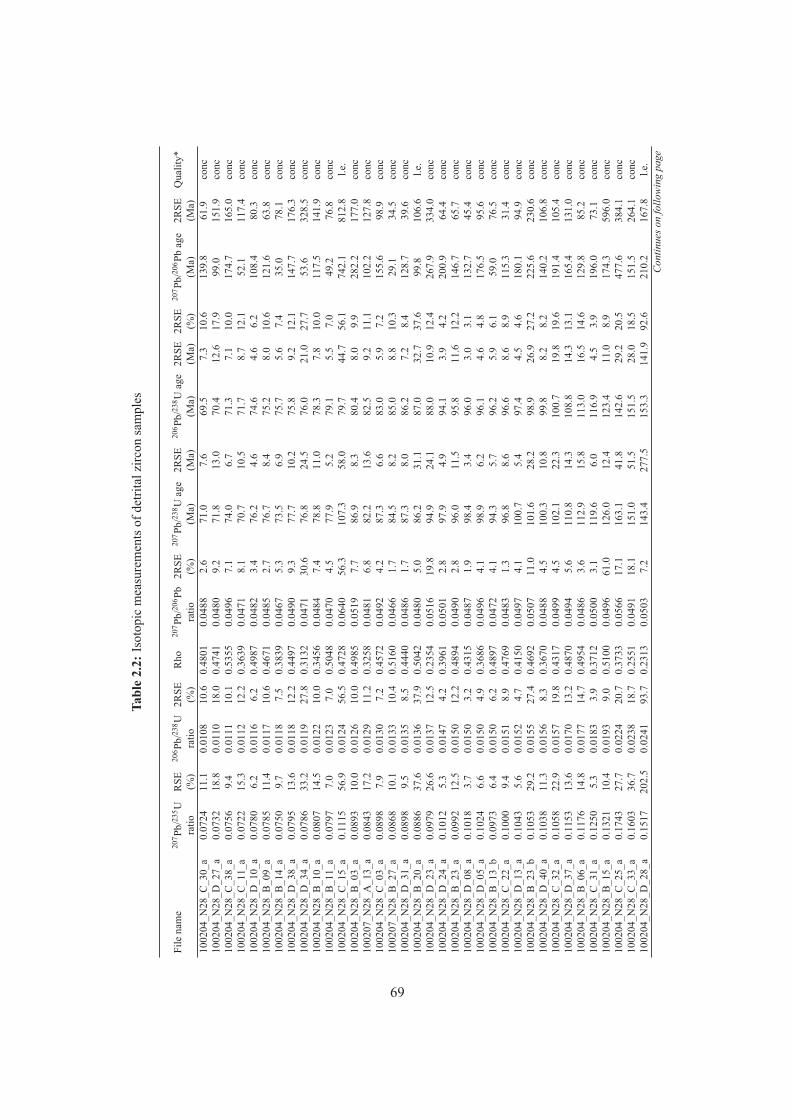
Tabl
e2.
2:Is
otop
icm
easu
rem
ents
ofde
trita
lzirc
onsa
mpl
es
File
nam
e20
7 Pb/
235 U
RSE
206 P
b/23
8 U2R
SER
ho20
7 Pb/
206 P
b2R
SE20
7 Pb/
238 U
age
2RSE
206 P
b/23
8 Uag
e2R
SE2R
SE20
7 Pb/
206 P
bag
e2R
SEQ
ualit
y*ra
tio(%
)ra
tio(%
)ra
tio(%
)(M
a)(M
a)(M
a)(M
a)(%
)(M
a)(M
a)10
0204
_N28
_C_3
0_a
0.07
2411
.10.
0108
10.6
0.48
010.
0488
2.6
71.0
7.6
69.5
7.3
10.6
139.
861
.9co
nc10
0204
_N28
_D_2
7_a
0.07
3218
.80.
0110
18.0
0.47
410.
0480
9.2
71.8
13.0
70.4
12.6
17.9
99.0
151.
9co
nc10
0204
_N28
_C_3
8_a
0.07
569.
40.
0111
10.1
0.53
550.
0496
7.1
74.0
6.7
71.3
7.1
10.0
174.
716
5.0
conc
1002
04_N
28_C
_11_
a0.
0722
15.3
0.01
1212
.20.
3639
0.04
718.
170
.710
.571
.78.
712
.152
.111
7.4
conc
1002
04_N
28_D
_10_
a0.
0780
6.2
0.01
166.
20.
4987
0.04
823.
476
.24.
674
.64.
66.
210
8.4
80.3
conc
1002
04_N
28_B
_09_
a0.
0785
11.4
0.01
1710
.60.
4671
0.04
852.
776
.78.
475
.28.
010
.612
1.6
63.8
conc
1002
04_N
28_B
_14_
a0.
0750
9.7
0.01
187.
50.
3839
0.04
675.
373
.56.
975
.75.
67.
435
.078
.1co
nc10
0204
_N28
_D_3
8_a
0.07
9513
.60.
0118
12.2
0.44
970.
0490
9.3
77.7
10.2
75.8
9.2
12.1
147.
717
6.3
conc
1002
04_N
28_D
_34_
a0.
0786
33.2
0.01
1927
.80.
3132
0.04
7130
.676
.824
.576
.021
.027
.753
.632
8.5
conc
1002
04_N
28_B
_10_
a0.
0807
14.5
0.01
2210
.00.
3456
0.04
847.
478
.811
.078
.37.
810
.011
7.5
141.
9co
nc10
0204
_N28
_B_1
1_a
0.07
977.
00.
0123
7.0
0.50
480.
0470
4.5
77.9
5.2
79.1
5.5
7.0
49.2
76.8
conc
1002
04_N
28_C
_15_
a0.
1115
56.9
0.01
2456
.50.
4728
0.06
4056
.310
7.3
58.0
79.7
44.7
56.1
742.
181
2.8
l.e.
1002
04_N
28_B
_03_
a0.
0893
10.0
0.01
2610
.00.
4985
0.05
197.
786
.98.
380
.48.
09.
928
2.2
177.
0co
nc10
0207
_N28
_A_1
3_a
0.08
4317
.20.
0129
11.2
0.32
580.
0481
6.8
82.2
13.6
82.5
9.2
11.1
102.
212
7.8
conc
1002
04_N
28_C
_03_
a0.
0898
7.9
0.01
307.
20.
4572
0.04
924.
287
.36.
683
.05.
97.
215
5.6
98.9
conc
1002
07_N
28_B
_27_
a0.
0868
10.1
0.01
3310
.40.
5160
0.04
661.
784
.58.
285
.08.
810
.329
.134
.5co
nc10
0204
_N28
_D_3
1_a
0.08
989.
50.
0135
8.5
0.44
400.
0486
1.7
87.3
8.0
86.2
7.2
8.4
128.
739
.6co
nc10
0204
_N28
_B_2
0_a
0.08
8637
.60.
0136
37.9
0.50
420.
0480
5.0
86.2
31.1
87.0
32.7
37.6
99.8
106.
6l.e
.10
0204
_N28
_D_2
3_a
0.09
7926
.60.
0137
12.5
0.23
540.
0516
19.8
94.9
24.1
88.0
10.9
12.4
267.
933
4.0
conc
1002
04_N
28_D
_24_
a0.
1012
5.3
0.01
474.
20.
3961
0.05
012.
897
.94.
994
.13.
94.
220
0.9
64.4
conc
1002
04_N
28_B
_23_
a0.
0992
12.5
0.01
5012
.20.
4894
0.04
902.
896
.011
.595
.811
.612
.214
6.7
65.7
conc
1002
04_N
28_D
_08_
a0.
1018
3.7
0.01
503.
20.
4315
0.04
871.
998
.43.
496
.03.
03.
113
2.7
45.4
conc
1002
04_N
28_D
_05_
a0.
1024
6.6
0.01
504.
90.
3686
0.04
964.
198
.96.
296
.14.
64.
817
6.5
95.6
conc
1002
04_N
28_B
_13_
b0.
0973
6.4
0.01
506.
20.
4897
0.04
724.
194
.35.
796
.25.
96.
159
.076
.5co
nc10
0204
_N28
_C_2
2_a
0.10
009.
40.
0151
8.9
0.47
690.
0483
1.3
96.8
8.6
96.6
8.6
8.9
115.
331
.4co
nc10
0204
_N28
_D_1
3_a
0.10
435.
60.
0152
4.7
0.41
500.
0497
4.1
100.
75.
497
.44.
54.
618
0.1
94.9
conc
1002
04_N
28_B
_23_
b0.
1053
29.2
0.01
5527
.40.
4692
0.05
0711
.010
1.6
28.2
98.9
26.9
27.2
225.
623
0.6
conc
1002
04_N
28_D
_40_
a0.
1038
11.3
0.01
568.
30.
3670
0.04
884.
510
0.3
10.8
99.8
8.2
8.2
140.
210
6.8
conc
1002
04_N
28_C
_32_
a0.
1058
22.9
0.01
5719
.80.
4317
0.04
994.
510
2.1
22.3
100.
719
.819
.619
1.4
105.
4co
nc10
0204
_N28
_D_3
7_a
0.11
5313
.60.
0170
13.2
0.48
700.
0494
5.6
110.
814
.310
8.8
14.3
13.1
165.
413
1.0
conc
1002
04_N
28_B
_06_
a0.
1176
14.8
0.01
7714
.70.
4954
0.04
863.
611
2.9
15.8
113.
016
.514
.612
9.8
85.2
conc
1002
04_N
28_C
_31_
a0.
1250
5.3
0.01
833.
90.
3712
0.05
003.
111
9.6
6.0
116.
94.
53.
919
6.0
73.1
conc
1002
04_N
28_B
_15_
a0.
1321
10.4
0.01
939.
00.
5100
0.04
9661
.012
6.0
12.4
123.
411
.08.
917
4.3
596.
0co
nc10
0204
_N28
_C_2
5_a
0.17
4327
.70.
0224
20.7
0.37
330.
0566
17.1
163.
141
.814
2.6
29.2
20.5
477.
638
4.1
conc
1002
04_N
28_C
_33_
a0.
1603
36.7
0.02
3818
.70.
2551
0.04
9118
.115
1.0
51.5
151.
528
.018
.515
1.5
264.
1co
nc10
0204
_N28
_D_2
8_a
0.15
1720
2.5
0.02
4193
.70.
2313
0.05
037.
214
3.4
277.
515
3.3
141.
992
.621
0.2
167.
8l.e
.Continuesonfollowingpage
69
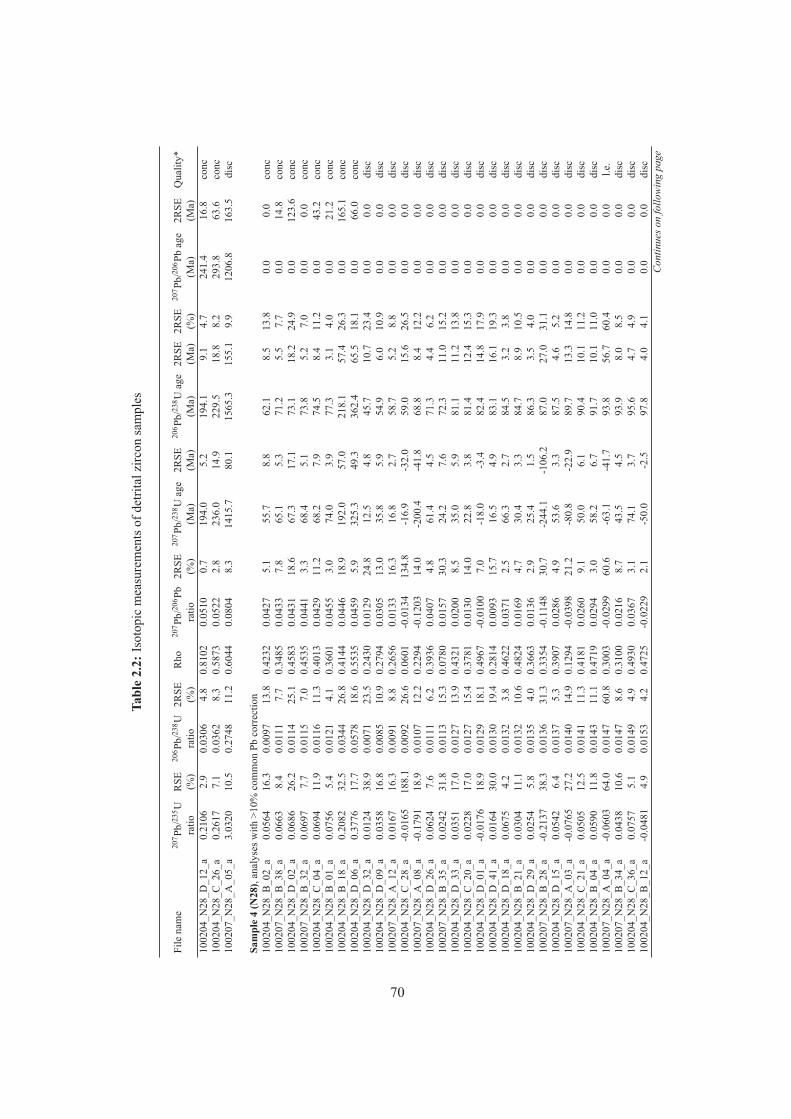
Tabl
e2.
2:Is
otop
icm
easu
rem
ents
ofde
trita
lzirc
onsa
mpl
es
File
nam
e20
7 Pb/
235 U
RSE
206 P
b/23
8 U2R
SER
ho20
7 Pb/
206 P
b2R
SE20
7 Pb/
238 U
age
2RSE
206 P
b/23
8 Uag
e2R
SE2R
SE20
7 Pb/
206 P
bag
e2R
SEQ
ualit
y*ra
tio(%
)ra
tio(%
)ra
tio(%
)(M
a)(M
a)(M
a)(M
a)(%
)(M
a)(M
a)10
0204
_N28
_D_1
2_a
0.21
062.
90.
0306
4.8
0.81
020.
0510
0.7
194.
05.
219
4.1
9.1
4.7
241.
416
.8co
nc10
0204
_N28
_C_2
6_a
0.26
177.
10.
0362
8.3
0.58
730.
0522
2.8
236.
014
.922
9.5
18.8
8.2
293.
863
.6co
nc10
0207
_N28
_A_0
5_a
3.03
2010
.50.
2748
11.2
0.60
440.
0804
8.3
1415
.780
.115
65.3
155.
19.
912
06.8
163.
5di
sc
Sam
ple
4(N
28),
anal
yses
with
>10%
com
mon
Pbco
rrec
tion
1002
04_N
28_B
_02_
a0.
0564
16.3
0.00
9713
.80.
4232
0.04
275.
155
.78.
862
.18.
513
.80.
00.
0co
nc10
0207
_N28
_B_3
8_a
0.06
638.
40.
0111
7.7
0.34
850.
0433
7.8
65.1
5.3
71.2
5.5
7.7
0.0
14.8
conc
1002
04_N
28_D
_02_
a0.
0686
26.2
0.01
1425
.10.
4583
0.04
3118
.667
.317
.173
.118
.224
.90.
012
3.6
conc
1002
07_N
28_B
_32_
a0.
0697
7.7
0.01
157.
00.
4535
0.04
413.
368
.45.
173
.85.
27.
00.
00.
0co
nc10
0204
_N28
_C_0
4_a
0.06
9411
.90.
0116
11.3
0.40
130.
0429
11.2
68.2
7.9
74.5
8.4
11.2
0.0
43.2
conc
1002
04_N
28_B
_01_
a0.
0756
5.4
0.01
214.
10.
3601
0.04
553.
074
.03.
977
.33.
14.
00.
021
.2co
nc10
0204
_N28
_B_1
8_a
0.20
8232
.50.
0344
26.8
0.41
440.
0446
18.9
192.
057
.021
8.1
57.4
26.3
0.0
165.
1co
nc10
0204
_N28
_D_0
6_a
0.37
7617
.70.
0578
18.6
0.55
350.
0459
5.9
325.
349
.336
2.4
65.5
18.1
0.0
66.0
conc
1002
04_N
28_D
_32_
a0.
0124
38.9
0.00
7123
.50.
2430
0.01
2924
.812
.54.
845
.710
.723
.40.
00.
0di
sc10
0204
_N28
_D_0
9_a
0.03
5816
.80.
0085
10.9
0.27
940.
0305
13.0
35.8
5.9
54.9
6.0
10.9
0.0
0.0
disc
1002
07_N
28_A
_12_
a0.
0167
16.3
0.00
918.
80.
2656
0.01
3316
.316
.82.
758
.75.
28.
80.
00.
0di
sc10
0204
_N28
_C_2
8_a
-0.0
165
188.
10.
0092
26.6
0.06
01-0
.013
413
4.8
-16.
9-3
2.0
59.0
15.6
26.5
0.0
0.0
disc
1002
07_N
28_A
_08_
a-0
.179
118
.90.
0107
12.2
0.22
94-0
.120
314
.0-2
00.4
-41.
868
.88.
412
.20.
00.
0di
sc10
0204
_N28
_D_2
6_a
0.06
247.
60.
0111
6.2
0.39
360.
0407
4.8
61.4
4.5
71.3
4.4
6.2
0.0
0.0
disc
1002
07_N
28_B
_35_
a0.
0242
31.8
0.01
1315
.30.
0780
0.01
5730
.324
.27.
672
.311
.015
.20.
00.
0di
sc10
0204
_N28
_D_3
3_a
0.03
5117
.00.
0127
13.9
0.43
210.
0200
8.5
35.0
5.9
81.1
11.2
13.8
0.0
0.0
disc
1002
04_N
28_C
_20_
a0.
0228
17.0
0.01
2715
.40.
3781
0.01
3014
.022
.83.
881
.412
.415
.30.
00.
0di
sc10
0204
_N28
_D_0
1_a
-0.0
176
18.9
0.01
2918
.10.
4967
-0.0
100
7.0
-18.
0-3
.482
.414
.817
.90.
00.
0di
sc10
0204
_N28
_D_4
1_a
0.01
6430
.00.
0130
19.4
0.28
140.
0093
15.7
16.5
4.9
83.1
16.1
19.3
0.0
0.0
disc
1002
04_N
28_D
_18_
a0.
0675
4.2
0.01
323.
80.
4622
0.03
712.
566
.32.
784
.53.
23.
80.
00.
0di
sc10
0204
_N28
_B_2
1_a
0.03
0411
.10.
0132
10.6
0.48
240.
0169
4.7
30.4
3.3
84.7
8.9
10.5
0.0
0.0
disc
1002
04_N
28_D
_29_
a0.
0254
5.8
0.01
354.
00.
3663
0.01
362.
925
.41.
586
.33.
54.
00.
00.
0di
sc10
0207
_N28
_B_2
8_a
-0.2
137
38.3
0.01
3631
.30.
3354
-0.1
148
30.7
-244
.1-1
06.2
87.0
27.0
31.1
0.0
0.0
disc
1002
04_N
28_D
_15_
a0.
0542
6.4
0.01
375.
30.
3907
0.02
864.
953
.63.
387
.54.
65.
20.
00.
0di
sc10
0207
_N28
_A_0
3_a
-0.0
765
27.2
0.01
4014
.90.
1294
-0.0
398
21.2
-80.
8-2
2.9
89.7
13.3
14.8
0.0
0.0
disc
1002
04_N
28_C
_21_
a0.
0505
12.5
0.01
4111
.30.
4181
0.02
609.
150
.06.
190
.410
.111
.20.
00.
0di
sc10
0204
_N28
_B_0
4_a
0.05
9011
.80.
0143
11.1
0.47
190.
0294
3.0
58.2
6.7
91.7
10.1
11.0
0.0
0.0
disc
1002
07_N
28_A
_04_
a-0
.060
364
.00.
0147
60.8
0.30
03-0
.029
960
.6-6
3.1
-41.
793
.856
.760
.40.
00.
0l.e
.10
0207
_N28
_B_3
4_a
0.04
3810
.60.
0147
8.6
0.31
000.
0216
8.7
43.5
4.5
93.9
8.0
8.5
0.0
0.0
disc
1002
04_N
28_C
_36_
a0.
0757
5.1
0.01
494.
90.
4930
0.03
673.
174
.13.
795
.64.
74.
90.
00.
0di
sc10
0204
_N28
_B_1
2_a
-0.0
481
4.9
0.01
534.
20.
4725
-0.0
229
2.1
-50.
0-2
.597
.84.
04.
10.
00.
0di
scContinuesonfollowingpage
70
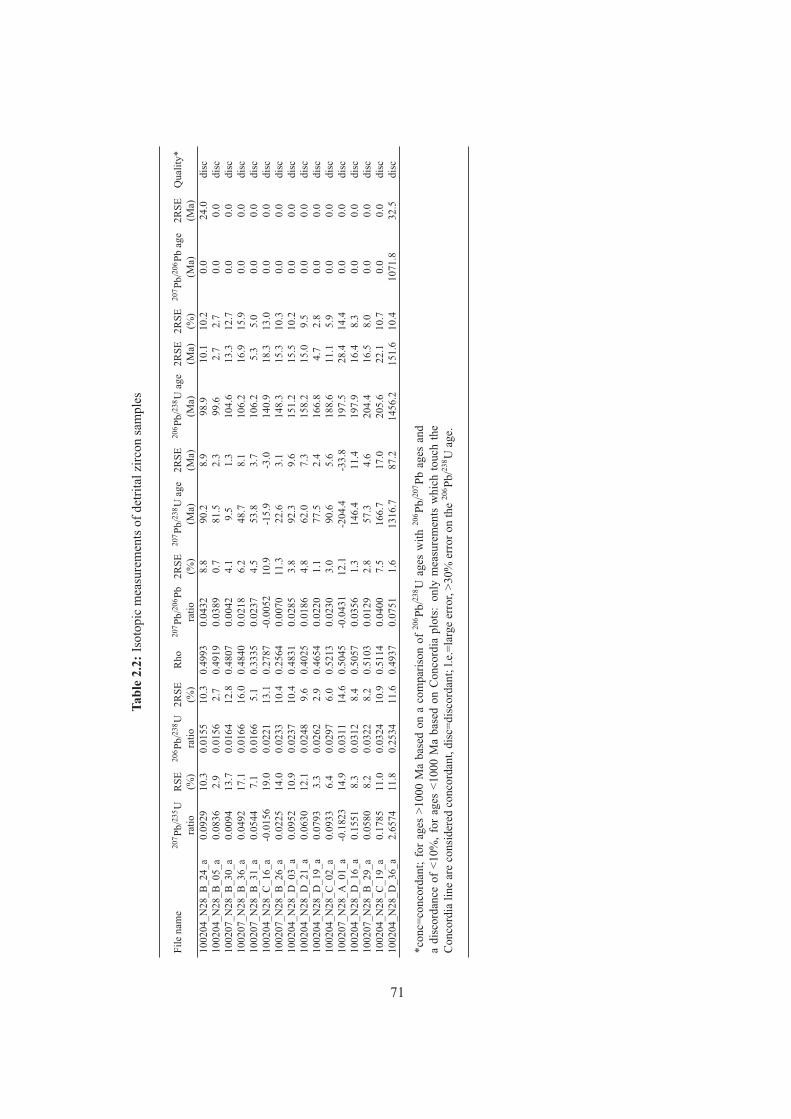
Tabl
e2.
2:Is
otop
icm
easu
rem
ents
ofde
trita
lzirc
onsa
mpl
es
File
nam
e20
7 Pb/
235 U
RSE
206 P
b/23
8 U2R
SER
ho20
7 Pb/
206 P
b2R
SE20
7 Pb/
238 U
age
2RSE
206 P
b/23
8 Uag
e2R
SE2R
SE20
7 Pb/
206 P
bag
e2R
SEQ
ualit
y*ra
tio(%
)ra
tio(%
)ra
tio(%
)(M
a)(M
a)(M
a)(M
a)(%
)(M
a)(M
a)10
0204
_N28
_B_2
4_a
0.09
2910
.30.
0155
10.3
0.49
930.
0432
8.8
90.2
8.9
98.9
10.1
10.2
0.0
24.0
disc
1002
04_N
28_B
_05_
a0.
0836
2.9
0.01
562.
70.
4919
0.03
890.
781
.52.
399
.62.
72.
70.
00.
0di
sc10
0207
_N28
_B_3
0_a
0.00
9413
.70.
0164
12.8
0.48
070.
0042
4.1
9.5
1.3
104.
613
.312
.70.
00.
0di
sc10
0207
_N28
_B_3
6_a
0.04
9217
.10.
0166
16.0
0.48
400.
0218
6.2
48.7
8.1
106.
216
.915
.90.
00.
0di
sc10
0207
_N28
_B_3
1_a
0.05
447.
10.
0166
5.1
0.33
350.
0237
4.5
53.8
3.7
106.
25.
35.
00.
00.
0di
sc10
0204
_N28
_C_1
6_a
-0.0
156
19.0
0.02
2113
.10.
2787
-0.0
052
10.9
-15.
9-3
.014
0.9
18.3
13.0
0.0
0.0
disc
1002
07_N
28_B
_26_
a0.
0225
14.0
0.02
3310
.40.
2564
0.00
7011
.322
.63.
114
8.3
15.3
10.3
0.0
0.0
disc
1002
04_N
28_D
_03_
a0.
0952
10.9
0.02
3710
.40.
4831
0.02
853.
892
.39.
615
1.2
15.5
10.2
0.0
0.0
disc
1002
04_N
28_D
_21_
a0.
0630
12.1
0.02
489.
60.
4025
0.01
864.
862
.07.
315
8.2
15.0
9.5
0.0
0.0
disc
1002
04_N
28_D
_19_
a0.
0793
3.3
0.02
622.
90.
4654
0.02
201.
177
.52.
416
6.8
4.7
2.8
0.0
0.0
disc
1002
04_N
28_C
_02_
a0.
0933
6.4
0.02
976.
00.
5213
0.02
303.
090
.65.
618
8.6
11.1
5.9
0.0
0.0
disc
1002
07_N
28_A
_01_
a-0
.182
314
.90.
0311
14.6
0.50
45-0
.043
112
.1-2
04.4
-33.
819
7.5
28.4
14.4
0.0
0.0
disc
1002
04_N
28_D
_16_
a0.
1551
8.3
0.03
128.
40.
5057
0.03
561.
314
6.4
11.4
197.
916
.48.
30.
00.
0di
sc10
0207
_N28
_B_2
9_a
0.05
808.
20.
0322
8.2
0.51
030.
0129
2.8
57.3
4.6
204.
416
.58.
00.
00.
0di
sc10
0204
_N28
_C_1
9_a
0.17
8511
.00.
0324
10.9
0.51
140.
0400
7.5
166.
717
.020
5.6
22.1
10.7
0.0
0.0
disc
1002
04_N
28_D
_36_
a2.
6574
11.8
0.25
3411
.60.
4937
0.07
511.
613
16.7
87.2
1456
.215
1.6
10.4
1071
.832
.5di
sc
*con
c=co
ncor
dant
;fo
rag
es>1
000
Ma
base
don
aco
mpa
rison
of20
6 Pb/23
8 Uag
esw
ith20
6 Pb/20
7 Pbag
esan
da
disc
orda
nce
of<1
0%,f
orag
es<1
000
Ma
base
don
Con
cord
iapl
ots:
only
mea
sure
men
tsw
hich
touc
hth
eC
onco
rdia
line
are
cons
ider
edco
ncor
dant
,dis
c=di
scor
dant
;l.e
.=la
rge
erro
r,>3
0%er
roro
nth
e20
6 Pb/23
8 Uag
e.
71

Chapter 3
Testing the applicability of garnet, monazite, allanite andxenotime as prograde geochronometers in different zones of the
Chugach Metamorphic Complex
Abstract In this chapter, the occurrence of garnet, monazite, allanite and xenotime inthe Chugach Metamorphic Complex of Alaska is investigated in order to reveal the appli-cability of these minerals as prograde geochronometers. Garnet is ubiquitous throughoutthe complex, but element zoning reveals that the garnets do not preserve prograde growthzoning. Garnets of one sample from the gneiss zone give an Sm-Nd age of 47.8±6.3 Ma,which is within error of U-Pb zircon ages from peak metamorphic zircon overgrowths. Nomonazite is present in the rocks of the phyllite zone. Small, unzoned monazite is abundantabove ~550°C and 3.4 kbar in the schist zone. An attempt of dating these small monaziteswas not successful. Large, complexly zoned monazites are present in the gneiss zone. U-PbSHRIMP dating of four samples from the gneiss zone range from 51.5±0.9 Ma to 53.5±0.9Ma and lie within error of U-Pb zircon peak ages. Allanite is present (a) in the low-gradephyllites, (b) as peak mineral in the gneiss zone at pressures above ~8 kbar in CaO-richbulk compositions, and (c) as retrograde minerals in fluid-flow zones. Allanite might there-fore be a powerful potential geochronometer to date prograde metamorphism in the phyllitezone, the peak pressure in the gneiss zone or retrograde fluid flow. Xenotime is presentin all metamorphic zones, but its growth history is difficult to constrain, which limits itsapplicability as a geochronometer.
73
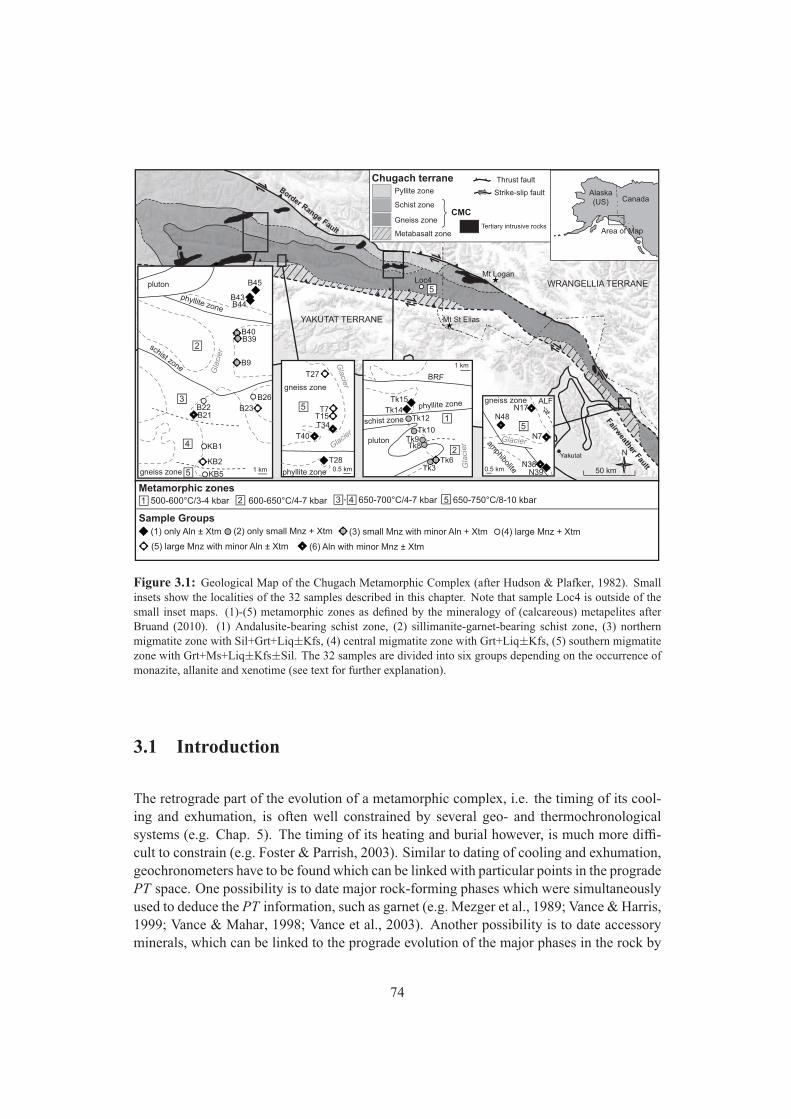
Mt St Elias
Mt Logan
Yakutat
Gneiss zone
Pyllite zone
50 km
Thrust fault
Strike-slip fault
Schist zone
Metabasalt zoneTertiary intrusive rocks
N
CMC
Chugach terraneAlaska(US) Canada
Area of Map
Border Range Fault
Contact Fault
Fairweather Fault
YAKUTAT TERRANE
WRANGELLIA TERRANE
B43B44
B45
Gla
cie
r
B40B39
B9
B26B22
KB1
B23
KB2
pluton
phyllite zone
schist zone
gneiss zone 1 km
Gla
cier
Gla
cie
r
T28
T40
T34T15
T7
T27
gneiss zone
phyllite zone 0.5 km Gla
cie
rpluton
phyllite zone
schist zone
Tk15
Tk14
Tk10
Tk8Tk9
Tk6Tk3
BRF
Loc4
1 km
Glacier
N39N38
N17
N7
N48
amphibolite
gneiss zone
(1) only Aln ± Xtm (2) only small Mnz + Xtm (3) small Mnz with minor Aln + Xtm (4) large Mnz + Xtm
(5) large Mnz with minor Aln ± Xtm (6) Aln with minor Mnz ± Xtm
0.5 km
2
3
4
5
5
1
2
5
5Tk12B21
KB5
ALF
Sample Groups
Metamorphic zones1 500-600°C/3-4 kbar 2 600-650°C/4-7 kbar 650-700°C/4-7 kbar3 4 5 650-750°C/8-10 kbar
Figure 3.1: Geological Map of the Chugach Metamorphic Complex (after Hudson & Plafker, 1982). Smallinsets show the localities of the 32 samples described in this chapter. Note that sample Loc4 is outside of thesmall inset maps. (1)-(5) metamorphic zones as defined by the mineralogy of (calcareous) metapelites afterBruand (2010). (1) Andalusite-bearing schist zone, (2) sillimanite-garnet-bearing schist zone, (3) northernmigmatite zone with Sil+Grt+Liq±Kfs, (4) central migmatite zone with Grt+Liq±Kfs, (5) southern migmatitezone with Grt+Ms+Liq±Kfs±Sil. The 32 samples are divided into six groups depending on the occurrence ofmonazite, allanite and xenotime (see text for further explanation).
3.1 Introduction
The retrograde part of the evolution of a metamorphic complex, i.e. the timing of its cool-ing and exhumation, is often well constrained by several geo- and thermochronologicalsystems (e.g. Chap. 5). The timing of its heating and burial however, is much more diffi-cult to constrain (e.g. Foster & Parrish, 2003). Similar to dating of cooling and exhumation,geochronometers have to be found which can be linked with particular points in the progradePT space. One possibility is to date major rock-forming phases which were simultaneouslyused to deduce the PT information, such as garnet (e.g. Mezger et al., 1989; Vance & Harris,1999; Vance & Mahar, 1998; Vance et al., 2003). Another possibility is to date accessoryminerals, which can be linked to the prograde evolution of the major phases in the rock by
74
textural or microchemical analyses (e.g. Wing et al., 2003; Foster & Parrish, 2003; Vanceet al., 2003; Foster et al., 2004; Janots et al., 2009).
A well-studied and widely-used accessory mineral in the geochronology of prograde meta-morphism is monazite ((LREE, Th, U)PO4), since it incorporates relatively high concentra-tions of U and Th, has typically low concentrations of common Pb and is highly resistant todiffusive Pb-loss, making it suitable for U-Pb geochronology (e.g. Parrish, 1990; Harrisonet al., 2002). However, linking monazite formation ages with the PT evolution of the hostrock is not always straightforward (e.g. Vance et al., 2003). Monazite may occur as detri-tal grains at or below greenschist facies, and may be stable as metamorphic monazite inrocks of appropriate bulk composition at all metamorphic grades at and above greenschistfacies (e.g. Spear & Pyle, 2003). Due to this large potential stability range of monazitein metamorphic rocks, the formation conditions of monazite in a particular sample have tobe investigated prior to or accompanying the geochronological analyses. This can be doneby studying natural samples of similar bulk composition occurring over a range of meta-morphic conditions and/or by studying samples with variable bulk composition but similarmetamorphic grade (e.g. Smith & Barreiro, 1990; Kingsbury et al., 1993; Wing et al., 2003;Foster et al., 2004; Kohn & Malloy, 2004; Fitzsimons et al., 2005; Rasmussen et al., 2006;Janots et al., 2006, 2008; Kim et al., 2009). A different approach is to chemically classifyzoned monazites and to relate the composition and age of these zones to the compositionof major phases such as garnet in the same sample (e.g. Williams et al., 1999; Foster et al.,2000; Pyle et al., 2001; Pyle & Spear, 2003; Gibson et al., 2004; Kohn et al., 2005; Williamset al., 2006, 2007).
Another, but less-studied and less widely-used accessory mineral in the geochronologyof prograde metamorphism is allanite ((Ca,REE,Th)2Al2(Fe,Al)3Si3O12(OH)), an epidote-group mineral. It occurs in a wide range of rock types and under a variety of metamorphicconditions (e.g. Smith & Barreiro, 1990; Finger et al., 1998; Hermann, 2002; Wing et al.,2003; Krenn et al., 2008; Janots et al., 2006, 2007, 2008). It recently became possible to dateallanite in-situ (Gregory et al., 2007), which has proven useful in dating prograde mineralsequences (e.g. Janots et al., 2009). Besides monazite and allanite, xenotime (YPO4) is alsoa wide-spread accessory mineral in metamorphic rocks and may incorporate a considerableamount of REE as well as Th and U, making it a potential geochronometer (e.g. Hether-ington et al., 2008). Indeed, xenotime dating has been successfully applied in a range ofdifferent metamorphic and fluid flow studies (e.g. Rasmussen et al., 2007, 2009; Wall et al.,2008).
In this chapter, the occurrence of garnet, monazite, allanite and xenotime in different zonesof the Chugach Metamorphic Complex is investigated in order to test the applicability ofthese minerals as prograde geochronometers. Firstly, the petrology of garnet in the CMC isshortly reviewed and limited Sm-Nd dating is presented. Secondly, the results of a searchfor monazite, allanite and xenotime in the different metamorphic zones of the CMC and indifferent bulk compositions is presented, followed by a chemical characterization and U-PbSHRIMP dating of monazites from the gneissic core. Finally, the petrological context for
75
the distribution of monazite, allanite and xenotime is discussed and implications for datingthe prograde history of the CMC are evaluated. Mineral abbreviations used throughout thischapter are according to Whitney & Evans (2010).
3.2 Metamorphic zones in the Chugach Metamorphic Complex
The Chugach Metamorphic Complex (CMC) of southern Alaska is a ~10-50 km wide and~350 km long upper amphibolite facies metamorphic complex which developed in a LateCretaceous to Paleocene accretionary prism (Fig. 3.1; Hudson & Plafker, 1982). The accre-tionary prism consists of greenschist-facies conglomerates, impure sandstones, marls andclaystones, which are intercalated with mafic volcanic rocks (e.g. Nilsen & Zuffa, 1982).This original layering of different sedimentary and volcanic rocks in the accretionary prismleads to the presence of pelitic, calcareous, quarzo-feldspatic and basic protoliths withinthe metamorphic complex. The complex consists of two macroscopically different zones: anorthern schist zone composed of fine-grained biotite-quartz-plagioclase schist, and a south-ern gneiss zone composed of layered migmatitic gneisses (Fig. 3.1; Hudson & Plafker,1982).
The mineralogy observed in the CMC varies depending on metamorphic grade and on thebulk rock composition. In the schist zone, metapelitic to CaO-rich metapelitic rocks showtwo different metamorphic zones: a structurally higher andalusite-bearing zone (zone 1,Figs. 3.1, 3.2a) and a structurally lower (western part of the complex, Fig. 3.1) or contact-metamorphic (central part of the complex, Fig. 3.1) garnet-sillimanite-bearing zone (zone 2,Figs. 3.1, 3.2b; Bruand, 2010). In the gneiss zone of the western part of the complex, high-CaO metapelites define three different zones: a northern zone where the peak paragenesis isdefined by garnet, sillimanite, melt and minor K-feldspar (zone 3, Fig. 3.1), a central zonewhere sillimanite disappears and only garnet, melt and minor K-feldspar are stable (zone4, Figs. 3.1, 3.2c) and a southern zone where muscovite appears together with garnet, meltand minor K-feldspar (zone 5, Fig. 3.1; Bruand, 2010). Farther east in the gneiss zone, onlyzone 5 is present, where sillimanite is stable in addition in metapelitic rocks. Staurolite wasfound as small (<50 µm), retrograde crystals in several samples both in the schist and gneisszones, and as large (>1 mm) crystals in one sample of the south-eastern part of the complex(sample N48, Fig. 3.2d; Bruand, 2010). Metabasic rocks occur mainly in the southern andeastern parts of the complex (Fig. 3.1). They contain abundant amphibole and garnet (Fig.3.2e; Bruand, 2010). Close to major faults, rocks are highly altered and destabilized intochlorite, muscovite and epidote (Fig. 3.2f).
76
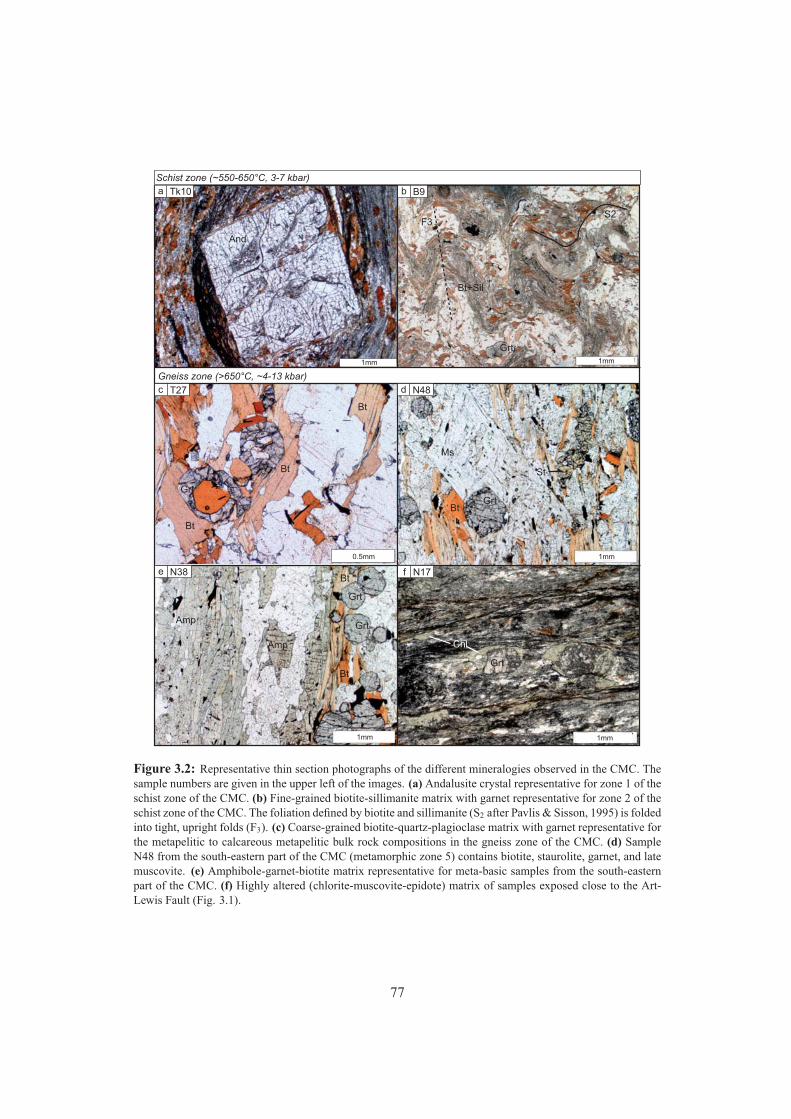
Schist zone (~550-650°C, 3-7 kbar)
Gneiss zone (>650°C, ~4-13 kbar)
1mm 1mm
0.5mm 1mm
1mm1mm
a Tk10 b B9
d N48c T27
e N38 f N17
And
Grt
Bt+Sil
Grt
St
Grt
Chl
Grt
Grt
Amp
Amp
Bt
Bt
Bt
Grt
Ms
Bt
S2F3
Bt
Bt
Figure 3.2: Representative thin section photographs of the different mineralogies observed in the CMC. Thesample numbers are given in the upper left of the images. (a) Andalusite crystal representative for zone 1 of theschist zone of the CMC. (b) Fine-grained biotite-sillimanite matrix with garnet representative for zone 2 of theschist zone of the CMC. The foliation defined by biotite and sillimanite (S2 after Pavlis & Sisson, 1995) is foldedinto tight, upright folds (F3). (c) Coarse-grained biotite-quartz-plagioclase matrix with garnet representative forthe metapelitic to calcareous metapelitic bulk rock compositions in the gneiss zone of the CMC. (d) SampleN48 from the south-eastern part of the CMC (metamorphic zone 5) contains biotite, staurolite, garnet, and latemuscovite. (e) Amphibole-garnet-biotite matrix representative for meta-basic samples from the south-easternpart of the CMC. (f) Highly altered (chlorite-muscovite-epidote) matrix of samples exposed close to the Art-Lewis Fault (Fig. 3.1).
77
Based on the observed mineralogy, PT conditions derived from classical thermobarometry(biotite-garnet, graphite), average PT calculations (THERMOCALC) and pseudosectionmodelling (THERMOCALC) are the following: ~400-550°C in the phyllite zone, ~500-600°C and ~3-4 kbar in zone 1, ~600-650°C and ~4-7 kbar in zone 2, ~650-700°C and ~4-7kbar in zones 3-4 and ~650-750°C and ~8-13 kbar in zone 5 (Fig. 3.1; Bruand, 2010).
3.3 Garnet as possible prograde geochronometer in the ChugachMetamorphic Complex?
During metamorphism, garnet growth may begin before the rocks reach their metamorphicpeak, and under certain circumstances the cores of these garnets may preserve progradegrowth zoning (e.g. Spear, 1993). Dating these prograde garnet cores may reveal temporalinformation on the prograde metamorphic history (e.g. Vance & Mahar, 1998; Vance &Harris, 1999; Vance et al., 2003; Stowell & Tinkham, 2003). However, if the garnets stayedat elevated temperatures (close to or above the solidus), a potential growth zoning may beequilibrated by diffusion and information on the prograde history of the samples may belost (e.g. Spear, 1993).
Garnet is ubiquitous throughout the schist and gneiss zones of the CMC in rocks with appro-priate bulk composition. Element mapping of garnets from the entire CMC revealed con-siderable differences between garnets from the western/central parts and the south-easternpart of the CMC (Bruand, 2010). Garnets from the western and central parts of the com-plex have very homogenous core compositions, and show only a slight decrease in Mg andan increase in Mn in the outermost rims (Bruand, 2010). This suggests that these garnetsequilibrated at high temperatures and do not preserve any information on the prograde partof the metamorphic history. In contrast, garnets from the south-eastern CMC show stronginternal zoning in Fe, Ca, Mg and Mn, suggesting that these garnets conserve growth zoning(Bruand, 2010). However, garnet isopleths (Ca/(Ca+Fe+Mg)), plotted on a pseudosectionfor the bulk composition of these samples, indicate that the growth zoning of these garnetsprobably formed after the metamorphic peak on the retrograde part during decompression(Bruand, 2010). This interpretation is supported by the observation that the garnets growacross the foliation (Figs. 3.2d, 3.3b). Therefore, the garnets of the CMC are probably notsuitable as prograde geochronometers.
Nevertheless, an attempt of obtaining a Sm-Nd garnet age for one sample was made. Sam-ple N48 (Figs. 3.1, 3.2d) contains abundant, relatively inclusion-free garnets and it wastherefore selected for Sm-Nd isotopic dating. The garnets are 0.2-1.5 mm in size, euhedraland grow across the foliation (Figs. 3.2d, 3.3a and b). They conserve growth zoning andcontain ~ µm inclusions of ilmenite and graphite (Figs. 3.3a-b). In a few crystals ~ µminclusions of monazite were observed in BSE mode. No attempt was made of separatinggarnet cores from garnet rims due to the small size of the garnets.
78
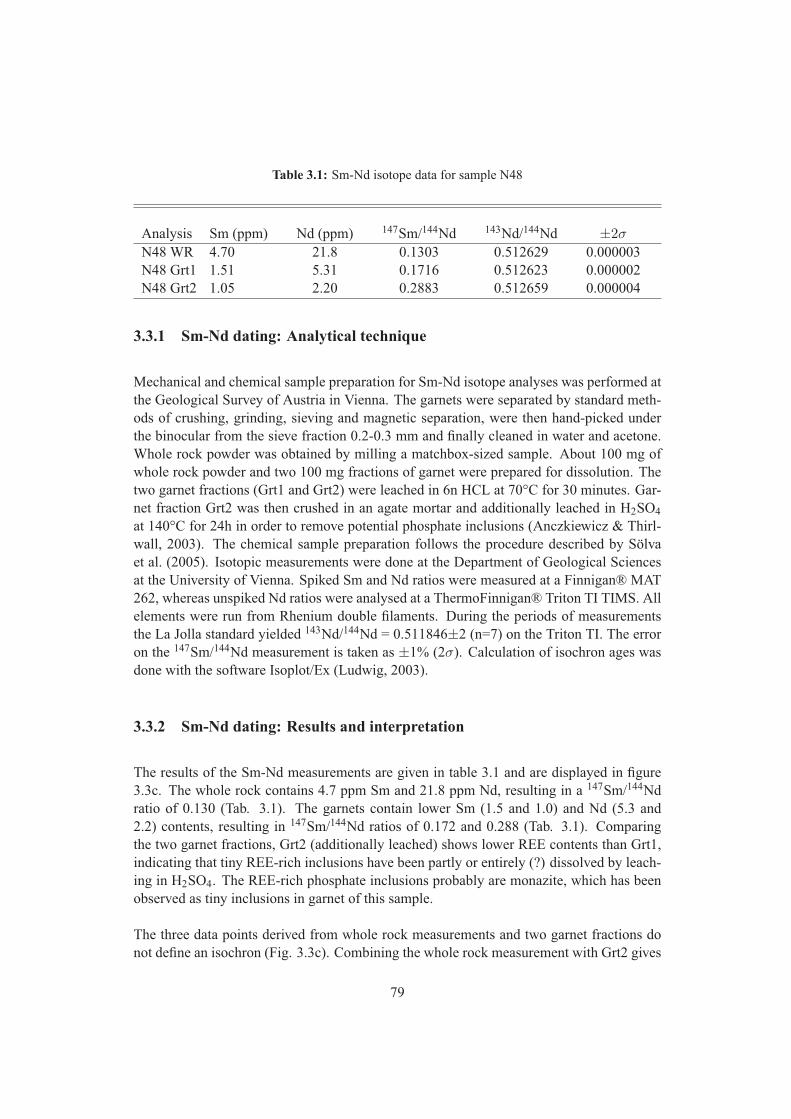
Table 3.1: Sm-Nd isotope data for sample N48
Analysis Sm (ppm) Nd (ppm) 147Sm/144Nd 143Nd/144Nd ±2σ
N48 WR 4.70 21.8 0.1303 0.512629 0.000003N48 Grt1 1.51 5.31 0.1716 0.512623 0.000002N48 Grt2 1.05 2.20 0.2883 0.512659 0.000004
3.3.1 Sm-Nd dating: Analytical technique
Mechanical and chemical sample preparation for Sm-Nd isotope analyses was performed atthe Geological Survey of Austria in Vienna. The garnets were separated by standard meth-ods of crushing, grinding, sieving and magnetic separation, were then hand-picked underthe binocular from the sieve fraction 0.2-0.3 mm and finally cleaned in water and acetone.Whole rock powder was obtained by milling a matchbox-sized sample. About 100 mg ofwhole rock powder and two 100 mg fractions of garnet were prepared for dissolution. Thetwo garnet fractions (Grt1 and Grt2) were leached in 6n HCL at 70°C for 30 minutes. Gar-net fraction Grt2 was then crushed in an agate mortar and additionally leached in H2SO4at 140°C for 24h in order to remove potential phosphate inclusions (Anczkiewicz & Thirl-wall, 2003). The chemical sample preparation follows the procedure described by Sölvaet al. (2005). Isotopic measurements were done at the Department of Geological Sciencesat the University of Vienna. Spiked Sm and Nd ratios were measured at a Finnigan® MAT262, whereas unspiked Nd ratios were analysed at a ThermoFinnigan® Triton TI TIMS. Allelements were run from Rhenium double filaments. During the periods of measurementsthe La Jolla standard yielded 143Nd/144Nd = 0.511846±2 (n=7) on the Triton TI. The erroron the 147Sm/144Nd measurement is taken as ±1% (2σ). Calculation of isochron ages wasdone with the software Isoplot/Ex (Ludwig, 2003).
3.3.2 Sm-Nd dating: Results and interpretation
The results of the Sm-Nd measurements are given in table 3.1 and are displayed in figure3.3c. The whole rock contains 4.7 ppm Sm and 21.8 ppm Nd, resulting in a 147Sm/144Ndratio of 0.130 (Tab. 3.1). The garnets contain lower Sm (1.5 and 1.0) and Nd (5.3 and2.2) contents, resulting in 147Sm/144Nd ratios of 0.172 and 0.288 (Tab. 3.1). Comparingthe two garnet fractions, Grt2 (additionally leached) shows lower REE contents than Grt1,indicating that tiny REE-rich inclusions have been partly or entirely (?) dissolved by leach-ing in H2SO4. The REE-rich phosphate inclusions probably are monazite, which has beenobserved as tiny inclusions in garnet of this sample.
The three data points derived from whole rock measurements and two garnet fractions donot define an isochron (Fig. 3.3c). Combining the whole rock measurement with Grt2 gives
79
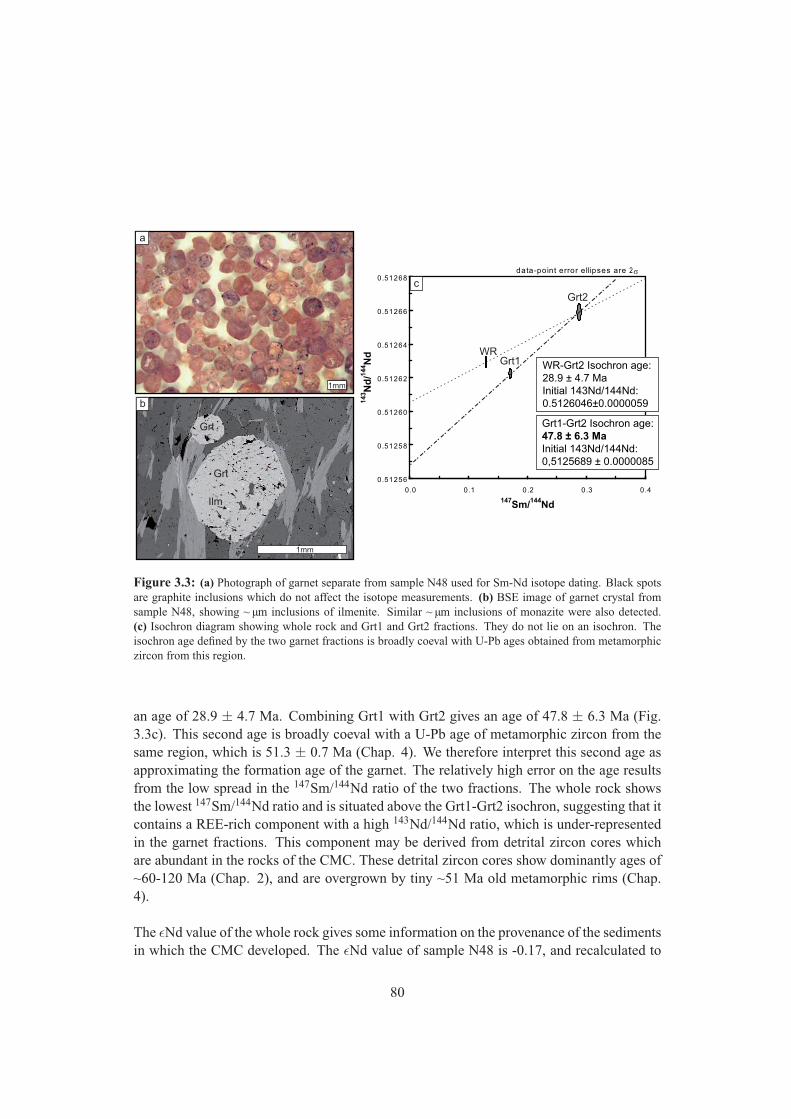
0.51256
0.51258
0.51260
0.51262
0.51264
0.51266
0.51268
0.0 0.1 0.2 0.3 0.4
147Sm/144Nd
143 N
d/14
4 Nd
data-point error ellipses are 2σ
Grt1-Grt2 Isochron age:47.8 ± 6.3 MaInitial 143Nd/144Nd:0,5125689 ± 0.0000085
1mm
1mm
a
b
c
Grt
Grt
Ilm
WR
Grt2
Grt1 WR-Grt2 Isochron age:28.9 ± 4.7 MaInitial 143Nd/144Nd:0.5126046±0.0000059
Figure 3.3: (a) Photograph of garnet separate from sample N48 used for Sm-Nd isotope dating. Black spotsare graphite inclusions which do not affect the isotope measurements. (b) BSE image of garnet crystal fromsample N48, showing ~ µm inclusions of ilmenite. Similar ~ µm inclusions of monazite were also detected.(c) Isochron diagram showing whole rock and Grt1 and Grt2 fractions. They do not lie on an isochron. Theisochron age defined by the two garnet fractions is broadly coeval with U-Pb ages obtained from metamorphiczircon from this region.
an age of 28.9 ± 4.7 Ma. Combining Grt1 with Grt2 gives an age of 47.8 ± 6.3 Ma (Fig.3.3c). This second age is broadly coeval with a U-Pb age of metamorphic zircon from thesame region, which is 51.3 ± 0.7 Ma (Chap. 4). We therefore interpret this second age asapproximating the formation age of the garnet. The relatively high error on the age resultsfrom the low spread in the 147Sm/144Nd ratio of the two fractions. The whole rock showsthe lowest 147Sm/144Nd ratio and is situated above the Grt1-Grt2 isochron, suggesting that itcontains a REE-rich component with a high 143Nd/144Nd ratio, which is under-representedin the garnet fractions. This component may be derived from detrital zircon cores whichare abundant in the rocks of the CMC. These detrital zircon cores show dominantly ages of~60-120 Ma (Chap. 2), and are overgrown by tiny ~51 Ma old metamorphic rims (Chap.4).
The εNd value of the whole rock gives some information on the provenance of the sedimentsin which the CMC developed. The εNd value of sample N48 is -0.17, and recalculated to
80
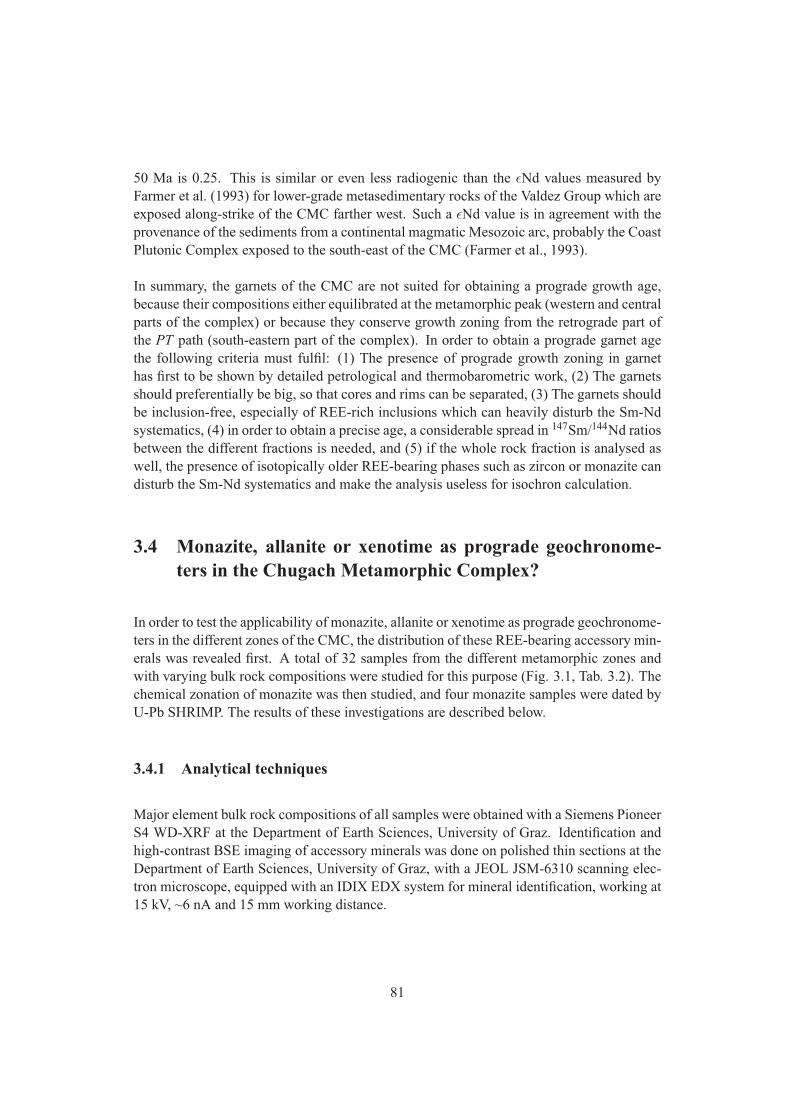
50 Ma is 0.25. This is similar or even less radiogenic than the εNd values measured byFarmer et al. (1993) for lower-grade metasedimentary rocks of the Valdez Group which areexposed along-strike of the CMC farther west. Such a εNd value is in agreement with theprovenance of the sediments from a continental magmatic Mesozoic arc, probably the CoastPlutonic Complex exposed to the south-east of the CMC (Farmer et al., 1993).
In summary, the garnets of the CMC are not suited for obtaining a prograde growth age,because their compositions either equilibrated at the metamorphic peak (western and centralparts of the complex) or because they conserve growth zoning from the retrograde part ofthe PT path (south-eastern part of the complex). In order to obtain a prograde garnet agethe following criteria must fulfil: (1) The presence of prograde growth zoning in garnethas first to be shown by detailed petrological and thermobarometric work, (2) The garnetsshould preferentially be big, so that cores and rims can be separated, (3) The garnets shouldbe inclusion-free, especially of REE-rich inclusions which can heavily disturb the Sm-Ndsystematics, (4) in order to obtain a precise age, a considerable spread in 147Sm/144Nd ratiosbetween the different fractions is needed, and (5) if the whole rock fraction is analysed aswell, the presence of isotopically older REE-bearing phases such as zircon or monazite candisturb the Sm-Nd systematics and make the analysis useless for isochron calculation.
3.4 Monazite, allanite or xenotime as prograde geochronome-ters in the Chugach Metamorphic Complex?
In order to test the applicability of monazite, allanite or xenotime as prograde geochronome-ters in the different zones of the CMC, the distribution of these REE-bearing accessory min-erals was revealed first. A total of 32 samples from the different metamorphic zones andwith varying bulk rock compositions were studied for this purpose (Fig. 3.1, Tab. 3.2). Thechemical zonation of monazite was then studied, and four monazite samples were dated byU-Pb SHRIMP. The results of these investigations are described below.
3.4.1 Analytical techniques
Major element bulk rock compositions of all samples were obtained with a Siemens PioneerS4 WD-XRF at the Department of Earth Sciences, University of Graz. Identification andhigh-contrast BSE imaging of accessory minerals was done on polished thin sections at theDepartment of Earth Sciences, University of Graz, with a JEOL JSM-6310 scanning elec-tron microscope, equipped with an IDIX EDX system for mineral identification, working at15 kV, ~6 nA and 15 mm working distance.
81
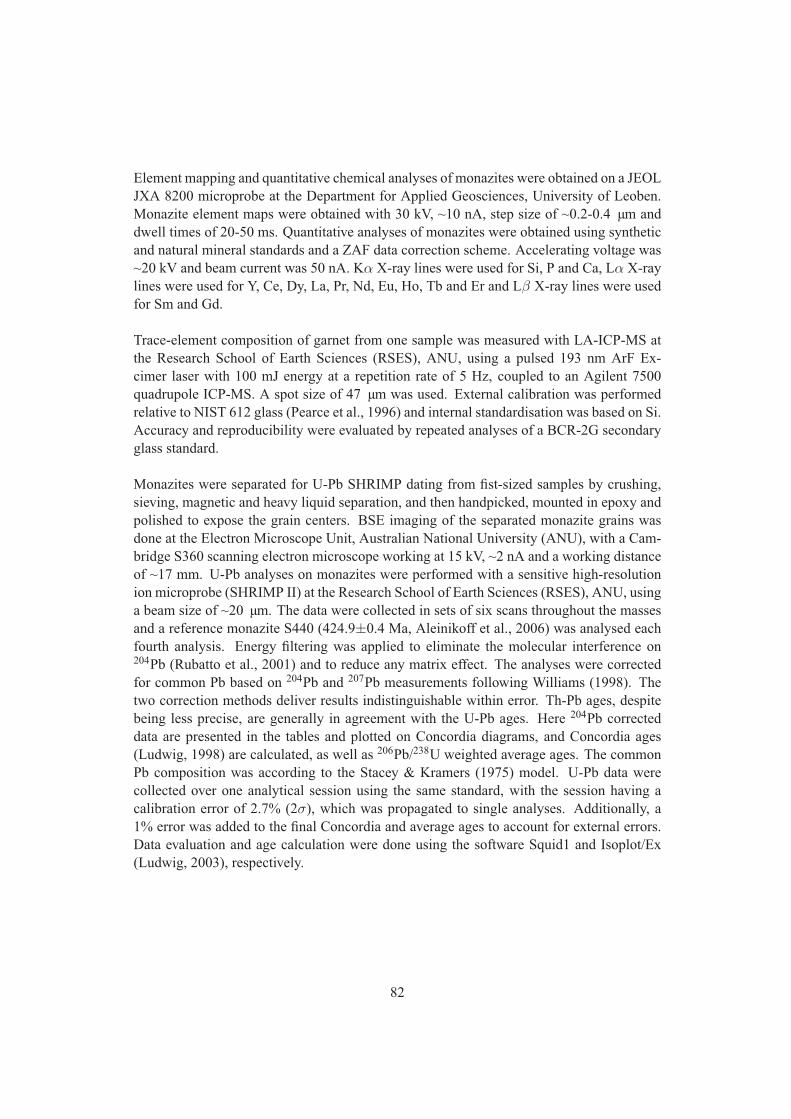
Element mapping and quantitative chemical analyses of monazites were obtained on a JEOLJXA 8200 microprobe at the Department for Applied Geosciences, University of Leoben.Monazite element maps were obtained with 30 kV, ~10 nA, step size of ~0.2-0.4 µm anddwell times of 20-50 ms. Quantitative analyses of monazites were obtained using syntheticand natural mineral standards and a ZAF data correction scheme. Accelerating voltage was~20 kV and beam current was 50 nA. Kα X-ray lines were used for Si, P and Ca, Lα X-raylines were used for Y, Ce, Dy, La, Pr, Nd, Eu, Ho, Tb and Er and Lβ X-ray lines were usedfor Sm and Gd.
Trace-element composition of garnet from one sample was measured with LA-ICP-MS atthe Research School of Earth Sciences (RSES), ANU, using a pulsed 193 nm ArF Ex-cimer laser with 100 mJ energy at a repetition rate of 5 Hz, coupled to an Agilent 7500quadrupole ICP-MS. A spot size of 47 µm was used. External calibration was performedrelative to NIST 612 glass (Pearce et al., 1996) and internal standardisation was based on Si.Accuracy and reproducibility were evaluated by repeated analyses of a BCR-2G secondaryglass standard.
Monazites were separated for U-Pb SHRIMP dating from fist-sized samples by crushing,sieving, magnetic and heavy liquid separation, and then handpicked, mounted in epoxy andpolished to expose the grain centers. BSE imaging of the separated monazite grains wasdone at the Electron Microscope Unit, Australian National University (ANU), with a Cam-bridge S360 scanning electron microscope working at 15 kV, ~2 nA and a working distanceof ~17 mm. U-Pb analyses on monazites were performed with a sensitive high-resolutionion microprobe (SHRIMP II) at the Research School of Earth Sciences (RSES), ANU, usinga beam size of ~20 µm. The data were collected in sets of six scans throughout the massesand a reference monazite S440 (424.9±0.4 Ma, Aleinikoff et al., 2006) was analysed eachfourth analysis. Energy filtering was applied to eliminate the molecular interference on204Pb (Rubatto et al., 2001) and to reduce any matrix effect. The analyses were correctedfor common Pb based on 204Pb and 207Pb measurements following Williams (1998). Thetwo correction methods deliver results indistinguishable within error. Th-Pb ages, despitebeing less precise, are generally in agreement with the U-Pb ages. Here 204Pb correcteddata are presented in the tables and plotted on Concordia diagrams, and Concordia ages(Ludwig, 1998) are calculated, as well as 206Pb/238U weighted average ages. The commonPb composition was according to the Stacey & Kramers (1975) model. U-Pb data werecollected over one analytical session using the same standard, with the session having acalibration error of 2.7% (2σ), which was propagated to single analyses. Additionally, a1% error was added to the final Concordia and average ages to account for external errors.Data evaluation and age calculation were done using the software Squid1 and Isoplot/Ex(Ludwig, 2003), respectively.
82
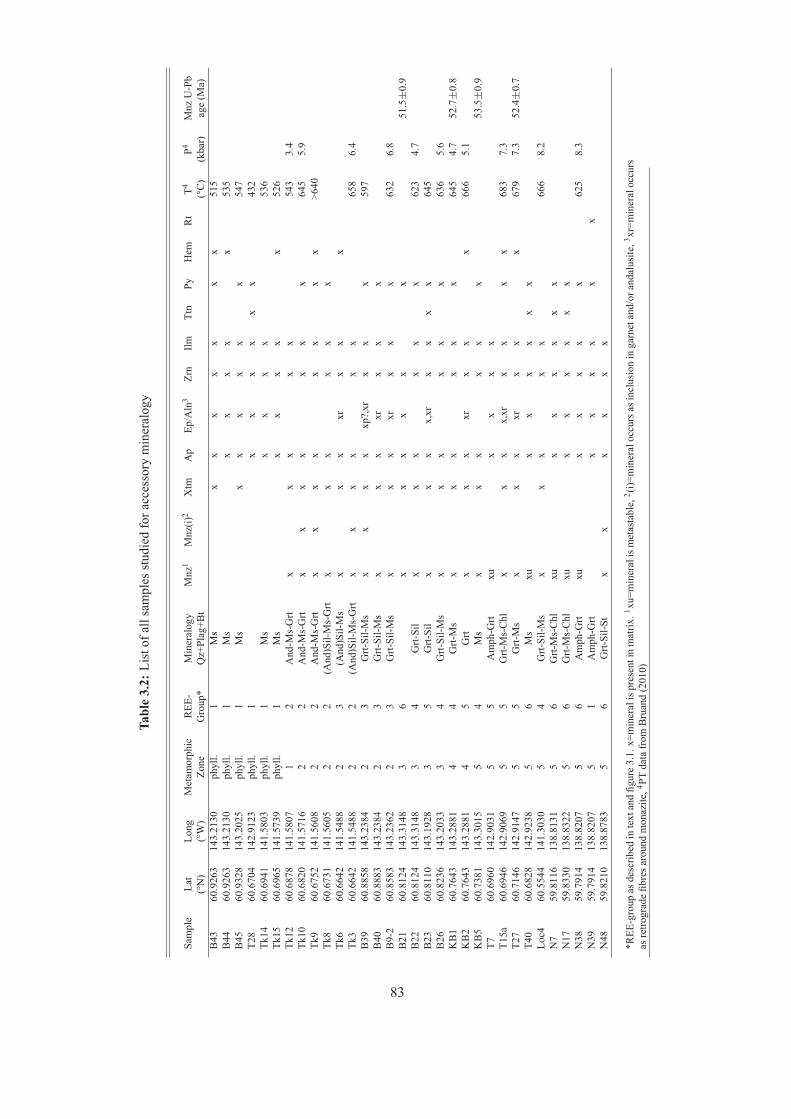
Tabl
e3.
2:Li
stof
alls
ampl
esst
udie
dfo
racc
esso
rym
iner
alog
y
Sam
ple
Lat
Long
Met
amor
phic
REE
-M
iner
alog
yM
nz1
Mnz
(i)2
Xtm
Ap
Ep/A
ln3
Zrn
IlmTt
nPy
Hem
Rt
T4P4
Mnz
U-P
b(°
N)
(°W
)Zo
neG
roup
*Q
z+Pl
ag+B
t(°
C)
(kba
r)ag
e(M
a)B
4360
.926
314
3.21
30ph
yll.
1M
sx
xx
xx
xx
515
B44
60.9
263
143.
2130
phyl
l.1
Ms
xx
xx
x53
5B
4560
.932
814
3.20
25ph
yll.
1M
sx
xx
xx
x54
7T2
860
.670
414
2.91
23ph
yll.
1x
xx
xx
x43
2Tk
1460
.694
114
1.58
03ph
yll.
1M
sx
xx
x53
6Tk
1560
.696
514
1.57
39ph
yll.
1M
sx
xx
xx
526
Tk12
60.6
878
141.
5807
12
And
-Ms-
Grt
xx
xx
x54
33.
4Tk
1060
.682
014
1.57
162
2A
nd-M
s-G
rtx
xx
xx
xx
645
5.9
Tk9
60.6
752
141.
5608
22
And
-Ms-
Grt
xx
xx
xx
xx
>640
Tk8
60.6
731
141.
5605
22
(And
)Sil-
Ms-
Grt
xx
xx
xx
Tk6
60.6
642
141.
5488
23
(And
)Sil-
Ms
xx
xxr
xx
xTk
360
.664
214
1.54
882
2(A
nd)S
il-M
s-G
rtx
xx
xx
x65
86.
4B
3960
.885
814
3.23
842
3G
rt-Si
l-Ms
xx
xx
xp?,
xrx
xx
597
B40
60.8
883
143.
2384
23
Grt-
Sil-M
sx
xx
xrx
xx
B9-
260
.858
314
3.23
622
3G
rt-Si
l-Ms
xx
xxr
xx
x63
26.
8B
2160
.812
414
3.31
483
6x
xx
xx
x51
.5±
0.9
B22
60.8
124
143.
3148
34
Grt-
Sil
xx
xx
xx
623
4.7
B23
60.8
110
143.
1928
35
Grt-
Sil
xx
xx,
xrx
xx
x64
5B
2660
.823
614
3.20
333
4G
rt-Si
l-Ms
xx
xx
xx
636
5.6
KB
160
.764
314
3.28
814
4G
rt-M
sx
xx
xx
x64
54.
752
.7±
0.8
KB
260
.764
314
3.28
814
5G
rtx
xx
xrx
xx
666
5.1
KB
560
.738
114
3.30
155
4M
sx
xx
xx
x53
.5±
0.9
T760
.696
014
2.90
315
5A
mph
-Grt
xux
xx
xT1
5a60
.694
614
2.90
695
5G
rt-M
s-C
hlx
xx
x,xr
xx
xx
683
7.3
T27
60.7
146
142.
9147
55
Grt-
Ms
xx
xxr
xx
x67
97.
352
.4±
0.7
T40
60.6
828
142.
9238
56
Ms
xux
xx
xx
xLo
c460
.554
414
1.30
305
4G
rt-Si
l-Ms
xx
xx
x66
68.
2N
759
.811
613
8.81
315
6G
rt-M
s-C
hlxu
xx
xx
xx
N17
59.8
330
138.
8322
56
Grt-
Ms-
Chl
xux
xx
xx
xN
3859
.791
413
8.82
075
6A
mph
-Grt
xux
xx
xx
625
8.3
N39
59.7
914
138.
8207
51
Am
ph-G
rtx
xx
xx
xN
4859
.821
013
8.87
835
6G
rt-Si
l-St
xx
xx
xx
*REE
-gro
upas
desc
ribed
inte
xtan
dfig
ure
3.1.
x=m
iner
alis
pres
enti
nm
atrix
.1 xu=
min
eral
ism
etas
tabl
e,2 (
i)=m
iner
aloc
curs
asin
clus
ion
inga
rnet
and/
oran
dalu
site
,3 xr=
min
eral
occu
rsas
retro
grad
efib
resa
roun
dm
onaz
ite,4 P
Tda
tafr
omB
ruan
d(2
010)
83
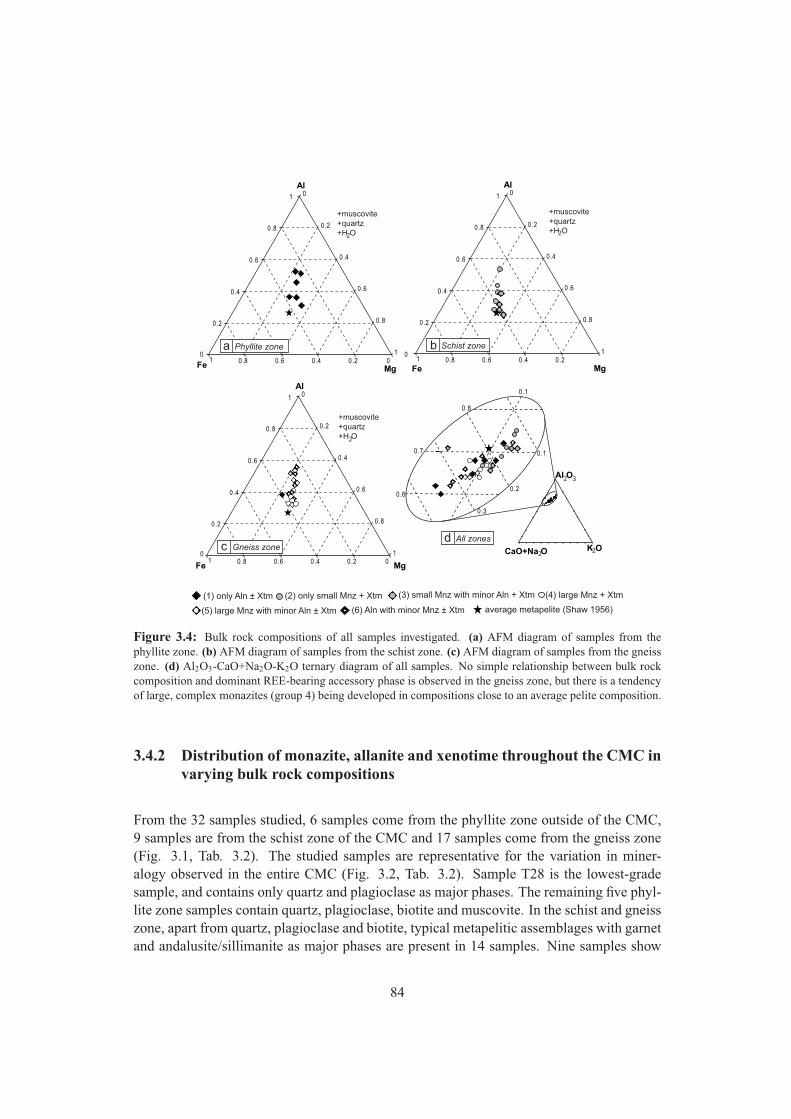
Al1
0.8
0.6
0.4
0.2
0
Mg
1
0.8
0.6
0.4
0.2
0
Fe1 0.8 0.6 0.4 0.2
Al1
0.8
0.6
0.4
0.2
0
Mg
1
0.8
0.6
0.4
0.2
0
Fe1 0.8 0.6 0.4 0.2 0
Al1
0.8
0.6
0.4
0.2
0
Mg
1
0.8
0.6
0.4
0.2
0
Fe1 0.8 0.6 0.4 0.2 0
0.7
CaO+Na O2K O2
2Al O3
0.60.2
0.1
a Phyllite zone
0.8
0.1
0.3
average metapelite (Shaw 1956)
+muscovite+quartz+H O2
+muscovite+quartz+H O2
+muscovite+quartz+H O2
b Schist zone
d All zones
(1) only Aln ± Xtm (2) only small Mnz + Xtm (3) small Mnz with minor Aln + Xtm (4) large Mnz + Xtm
(5) large Mnz with minor Aln ± Xtm (6) Aln with minor Mnz ± Xtm
c Gneiss zone
Figure 3.4: Bulk rock compositions of all samples investigated. (a) AFM diagram of samples from thephyllite zone. (b) AFM diagram of samples from the schist zone. (c) AFM diagram of samples from the gneisszone. (d) Al2O3-CaO+Na2O-K2O ternary diagram of all samples. No simple relationship between bulk rockcomposition and dominant REE-bearing accessory phase is observed in the gneiss zone, but there is a tendencyof large, complex monazites (group 4) being developed in compositions close to an average pelite composition.
3.4.2 Distribution of monazite, allanite and xenotime throughout the CMC invarying bulk rock compositions
From the 32 samples studied, 6 samples come from the phyllite zone outside of the CMC,9 samples are from the schist zone of the CMC and 17 samples come from the gneiss zone(Fig. 3.1, Tab. 3.2). The studied samples are representative for the variation in miner-alogy observed in the entire CMC (Fig. 3.2, Tab. 3.2). Sample T28 is the lowest-gradesample, and contains only quartz and plagioclase as major phases. The remaining five phyl-lite zone samples contain quartz, plagioclase, biotite and muscovite. In the schist and gneisszone, apart from quartz, plagioclase and biotite, typical metapelitic assemblages with garnetand andalusite/sillimanite as major phases are present in 14 samples. Nine samples show
84
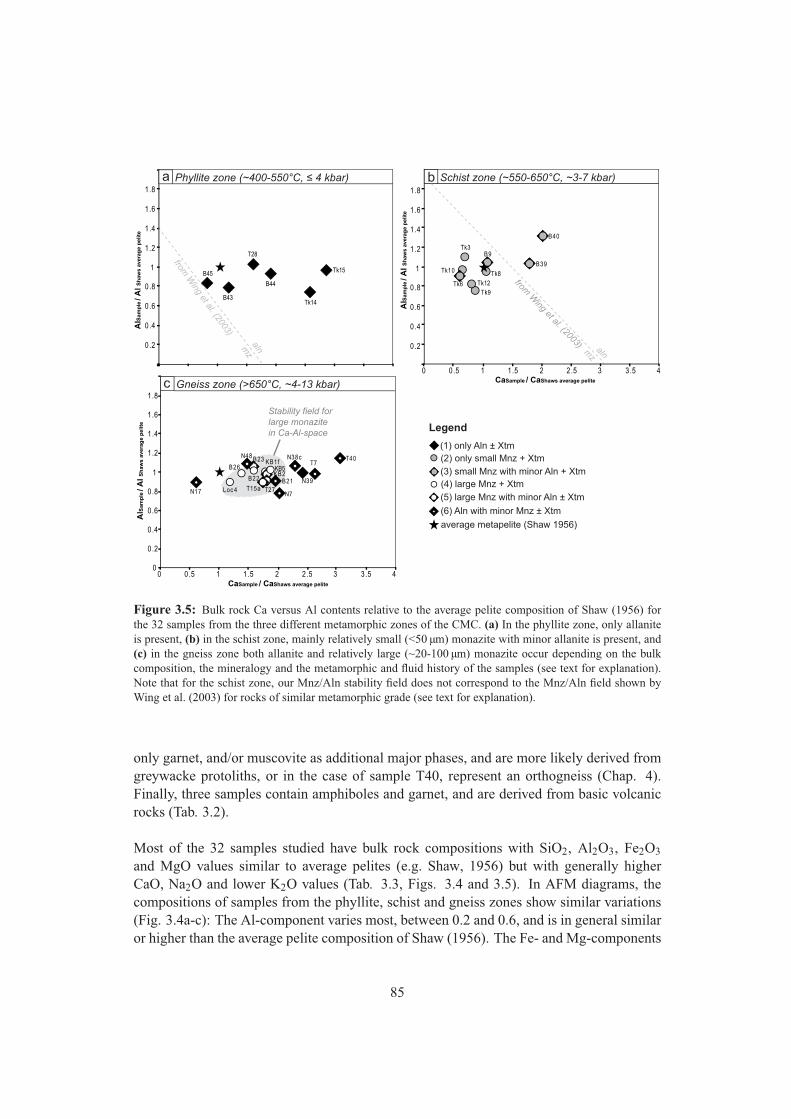
0.2
0.4
0.6
0.8
1
1.2
1.4
1.6
1.8
AlS
am
ple
/ A
l Sh
aw
s a
vera
ge p
elite
a Phyllite zone (~400-550°C, ≤ 4 kbar)
0.2
0.4
0.6
0.8
1
1.2
1.4
1.6
1.8
B39
B40
B9
Tk10
Tk3
Tk6
Tk8
Tk9
b Schist zone (~550-650°C, ~3-7 kbar)
from W
ing et al. (2003)
from W
ing et al. (2003)
mz
aln mz
aln
0
0.2
0.4
0.6
0.8
1
1.2
1.4
1.6
1.8
0 0.5 1 1.5 2 2.5 3 3.5 4
B22
B23
B26KB1f
KB2
T27T15a
T40T7
Loc 4N17
N38c
N39
N7
N48
c Gneiss zone (>650°C, ~4-13 kbar)
Tk14
Tk15
B44
B43
T28
B45
AlS
am
ple
/ A
l Sh
aw
s a
vera
ge p
elite
AlS
am
ple
/ A
l Sh
aw
s a
vera
ge
pelite
CaSample / CaShaws average pelite
Stability field for
large monazite
in Ca-Al-space
Tk12
Legend
average metapelite (Shaw 1956)
0 0.5 1 1.5 2 2.5 3 3.5 4CaSample / CaShaws average pelite
KB5
B21
(1) only Aln ± Xtm
(2) only small Mnz + Xtm
(3) small Mnz with minor Aln + Xtm(4) large Mnz + Xtm
(5) large Mnz with minor Aln ± Xtm
(6) Aln with minor Mnz ± Xtm
Figure 3.5: Bulk rock Ca versus Al contents relative to the average pelite composition of Shaw (1956) forthe 32 samples from the three different metamorphic zones of the CMC. (a) In the phyllite zone, only allaniteis present, (b) in the schist zone, mainly relatively small (<50 µm) monazite with minor allanite is present, and(c) in the gneiss zone both allanite and relatively large (~20-100 µm) monazite occur depending on the bulkcomposition, the mineralogy and the metamorphic and fluid history of the samples (see text for explanation).Note that for the schist zone, our Mnz/Aln stability field does not correspond to the Mnz/Aln field shown byWing et al. (2003) for rocks of similar metamorphic grade (see text for explanation).
only garnet, and/or muscovite as additional major phases, and are more likely derived fromgreywacke protoliths, or in the case of sample T40, represent an orthogneiss (Chap. 4).Finally, three samples contain amphiboles and garnet, and are derived from basic volcanicrocks (Tab. 3.2).
Most of the 32 samples studied have bulk rock compositions with SiO2, Al2O3, Fe2O3and MgO values similar to average pelites (e.g. Shaw, 1956) but with generally higherCaO, Na2O and lower K2O values (Tab. 3.3, Figs. 3.4 and 3.5). In AFM diagrams, thecompositions of samples from the phyllite, schist and gneiss zones show similar variations(Fig. 3.4a-c): The Al-component varies most, between 0.2 and 0.6, and is in general similaror higher than the average pelite composition of Shaw (1956). The Fe- and Mg-components
85
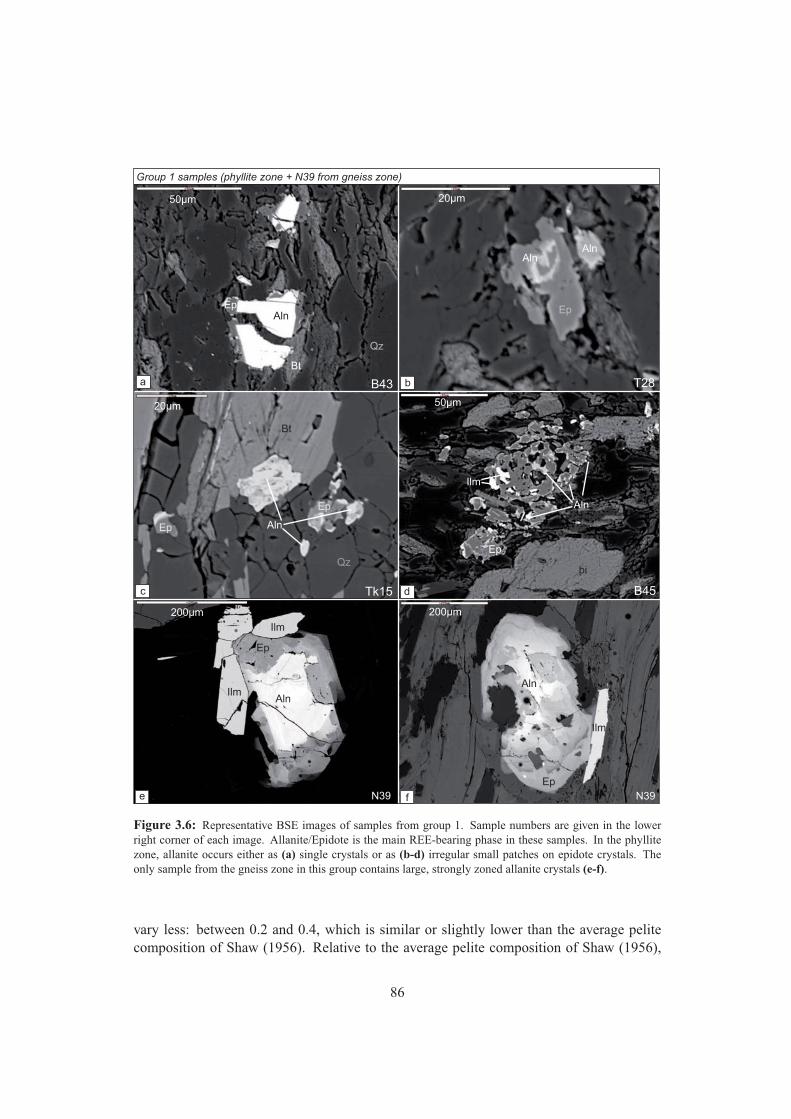
T28
Tk15
N39
Aln
Ep
Ilm
Ilm
200μm
Aln
Ep
Ilm
200μm
N39
Group 1 samples (phyllite zone + N39 from gneiss zone)
AlnEp
Ep
Qz
Bt
Ep
AlnAln
Ep
Aln
Ilm
20μm
20μm
50μm
a b
c d
50μm
Aln
Bt
bi
Ep
Qz
B45
B43
e f
Figure 3.6: Representative BSE images of samples from group 1. Sample numbers are given in the lowerright corner of each image. Allanite/Epidote is the main REE-bearing phase in these samples. In the phyllitezone, allanite occurs either as (a) single crystals or as (b-d) irregular small patches on epidote crystals. Theonly sample from the gneiss zone in this group contains large, strongly zoned allanite crystals (e-f).
vary less: between 0.2 and 0.4, which is similar or slightly lower than the average pelitecomposition of Shaw (1956). Relative to the average pelite composition of Shaw (1956),
86
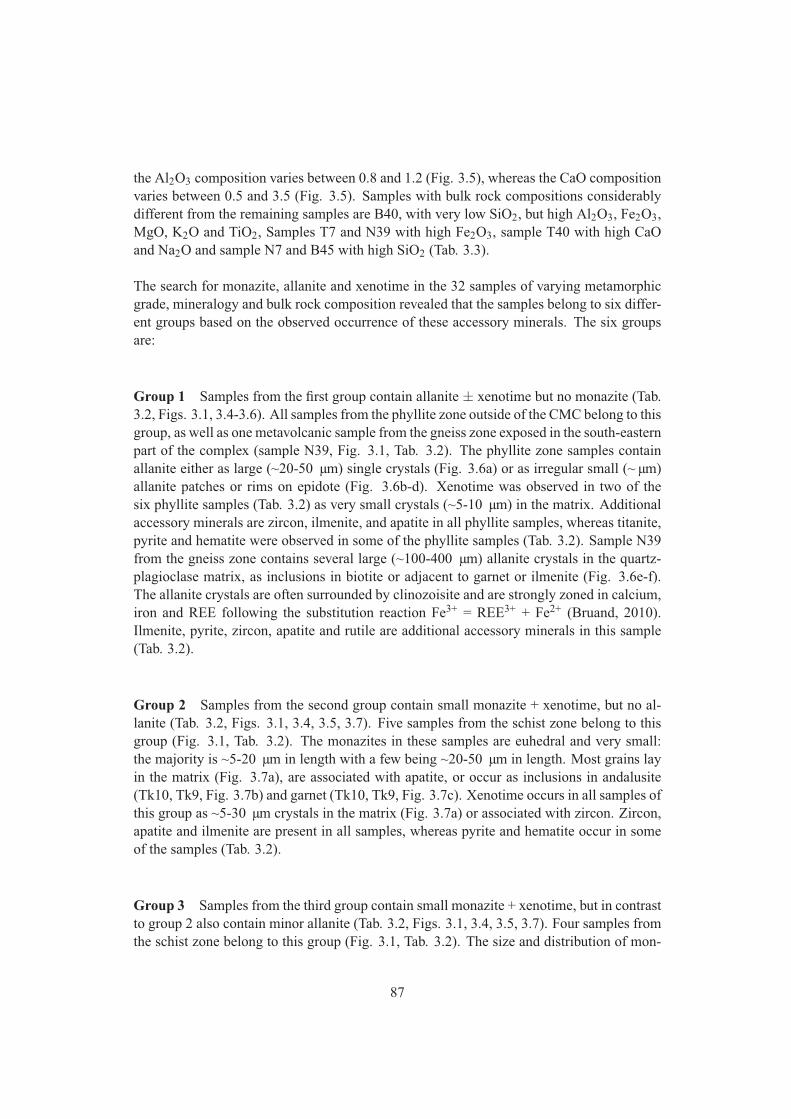
the Al2O3 composition varies between 0.8 and 1.2 (Fig. 3.5), whereas the CaO compositionvaries between 0.5 and 3.5 (Fig. 3.5). Samples with bulk rock compositions considerablydifferent from the remaining samples are B40, with very low SiO2, but high Al2O3, Fe2O3,MgO, K2O and TiO2, Samples T7 and N39 with high Fe2O3, sample T40 with high CaOand Na2O and sample N7 and B45 with high SiO2 (Tab. 3.3).
The search for monazite, allanite and xenotime in the 32 samples of varying metamorphicgrade, mineralogy and bulk rock composition revealed that the samples belong to six differ-ent groups based on the observed occurrence of these accessory minerals. The six groupsare:
Group 1 Samples from the first group contain allanite ± xenotime but no monazite (Tab.3.2, Figs. 3.1, 3.4-3.6). All samples from the phyllite zone outside of the CMC belong to thisgroup, as well as one metavolcanic sample from the gneiss zone exposed in the south-easternpart of the complex (sample N39, Fig. 3.1, Tab. 3.2). The phyllite zone samples containallanite either as large (~20-50 µm) single crystals (Fig. 3.6a) or as irregular small (~ µm)allanite patches or rims on epidote (Fig. 3.6b-d). Xenotime was observed in two of thesix phyllite samples (Tab. 3.2) as very small crystals (~5-10 µm) in the matrix. Additionalaccessory minerals are zircon, ilmenite, and apatite in all phyllite samples, whereas titanite,pyrite and hematite were observed in some of the phyllite samples (Tab. 3.2). Sample N39from the gneiss zone contains several large (~100-400 µm) allanite crystals in the quartz-plagioclase matrix, as inclusions in biotite or adjacent to garnet or ilmenite (Fig. 3.6e-f).The allanite crystals are often surrounded by clinozoisite and are strongly zoned in calcium,iron and REE following the substitution reaction Fe3+ = REE3+ + Fe2+ (Bruand, 2010).Ilmenite, pyrite, zircon, apatite and rutile are additional accessory minerals in this sample(Tab. 3.2).
Group 2 Samples from the second group contain small monazite + xenotime, but no al-lanite (Tab. 3.2, Figs. 3.1, 3.4, 3.5, 3.7). Five samples from the schist zone belong to thisgroup (Fig. 3.1, Tab. 3.2). The monazites in these samples are euhedral and very small:the majority is ~5-20 µm in length with a few being ~20-50 µm in length. Most grains layin the matrix (Fig. 3.7a), are associated with apatite, or occur as inclusions in andalusite(Tk10, Tk9, Fig. 3.7b) and garnet (Tk10, Tk9, Fig. 3.7c). Xenotime occurs in all samples ofthis group as ~5-30 µm crystals in the matrix (Fig. 3.7a) or associated with zircon. Zircon,apatite and ilmenite are present in all samples, whereas pyrite and hematite occur in someof the samples (Tab. 3.2).
Group 3 Samples from the third group contain small monazite + xenotime, but in contrastto group 2 also contain minor allanite (Tab. 3.2, Figs. 3.1, 3.4, 3.5, 3.7). Four samples fromthe schist zone belong to this group (Fig. 3.1, Tab. 3.2). The size and distribution of mon-
87
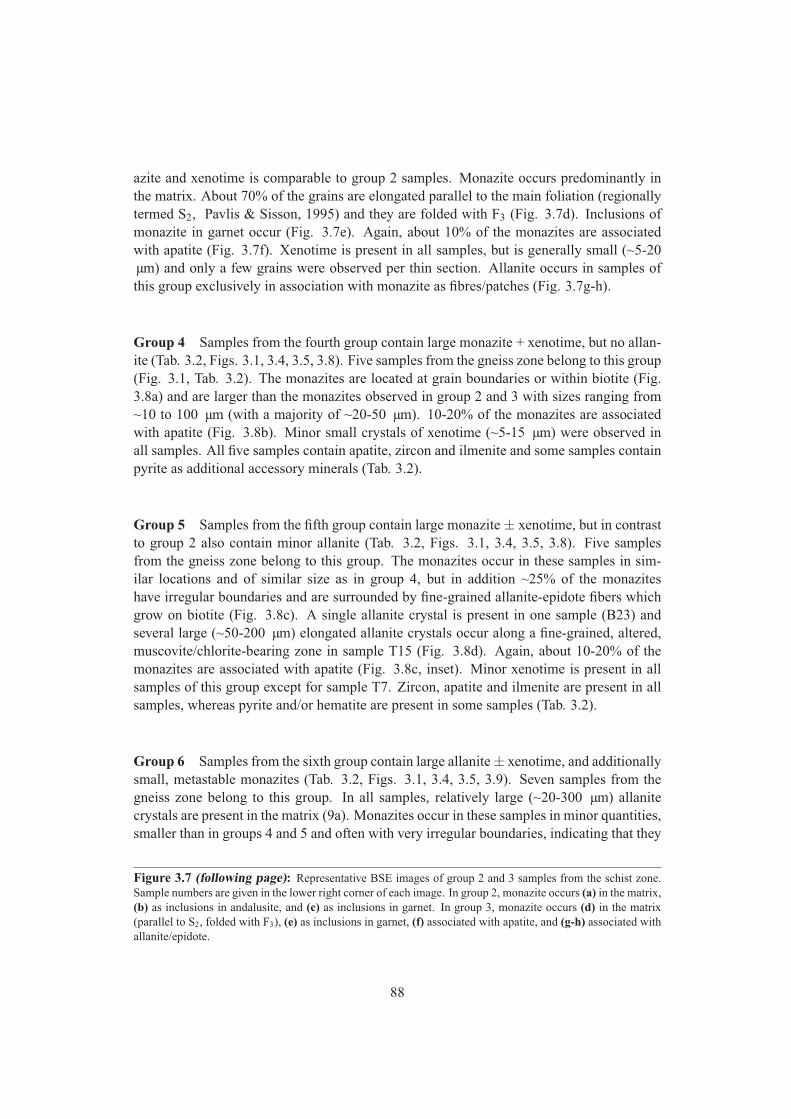
azite and xenotime is comparable to group 2 samples. Monazite occurs predominantly inthe matrix. About 70% of the grains are elongated parallel to the main foliation (regionallytermed S2, Pavlis & Sisson, 1995) and they are folded with F3 (Fig. 3.7d). Inclusions ofmonazite in garnet occur (Fig. 3.7e). Again, about 10% of the monazites are associatedwith apatite (Fig. 3.7f). Xenotime is present in all samples, but is generally small (~5-20µm) and only a few grains were observed per thin section. Allanite occurs in samples ofthis group exclusively in association with monazite as fibres/patches (Fig. 3.7g-h).
Group 4 Samples from the fourth group contain large monazite + xenotime, but no allan-ite (Tab. 3.2, Figs. 3.1, 3.4, 3.5, 3.8). Five samples from the gneiss zone belong to this group(Fig. 3.1, Tab. 3.2). The monazites are located at grain boundaries or within biotite (Fig.3.8a) and are larger than the monazites observed in group 2 and 3 with sizes ranging from~10 to 100 µm (with a majority of ~20-50 µm). 10-20% of the monazites are associatedwith apatite (Fig. 3.8b). Minor small crystals of xenotime (~5-15 µm) were observed inall samples. All five samples contain apatite, zircon and ilmenite and some samples containpyrite as additional accessory minerals (Tab. 3.2).
Group 5 Samples from the fifth group contain large monazite ± xenotime, but in contrastto group 2 also contain minor allanite (Tab. 3.2, Figs. 3.1, 3.4, 3.5, 3.8). Five samplesfrom the gneiss zone belong to this group. The monazites occur in these samples in sim-ilar locations and of similar size as in group 4, but in addition ~25% of the monaziteshave irregular boundaries and are surrounded by fine-grained allanite-epidote fibers whichgrow on biotite (Fig. 3.8c). A single allanite crystal is present in one sample (B23) andseveral large (~50-200 µm) elongated allanite crystals occur along a fine-grained, altered,muscovite/chlorite-bearing zone in sample T15 (Fig. 3.8d). Again, about 10-20% of themonazites are associated with apatite (Fig. 3.8c, inset). Minor xenotime is present in allsamples of this group except for sample T7. Zircon, apatite and ilmenite are present in allsamples, whereas pyrite and/or hematite are present in some samples (Tab. 3.2).
Group 6 Samples from the sixth group contain large allanite ± xenotime, and additionallysmall, metastable monazites (Tab. 3.2, Figs. 3.1, 3.4, 3.5, 3.9). Seven samples from thegneiss zone belong to this group. In all samples, relatively large (~20-300 µm) allanitecrystals are present in the matrix (9a). Monazites occur in these samples in minor quantities,smaller than in groups 4 and 5 and often with very irregular boundaries, indicating that they
Figure 3.7 (following page): Representative BSE images of group 2 and 3 samples from the schist zone.Sample numbers are given in the lower right corner of each image. In group 2, monazite occurs (a) in the matrix,(b) as inclusions in andalusite, and (c) as inclusions in garnet. In group 3, monazite occurs (d) in the matrix(parallel to S2, folded with F3), (e) as inclusions in garnet, (f) associated with apatite, and (g-h) associated withallanite/epidote.
88
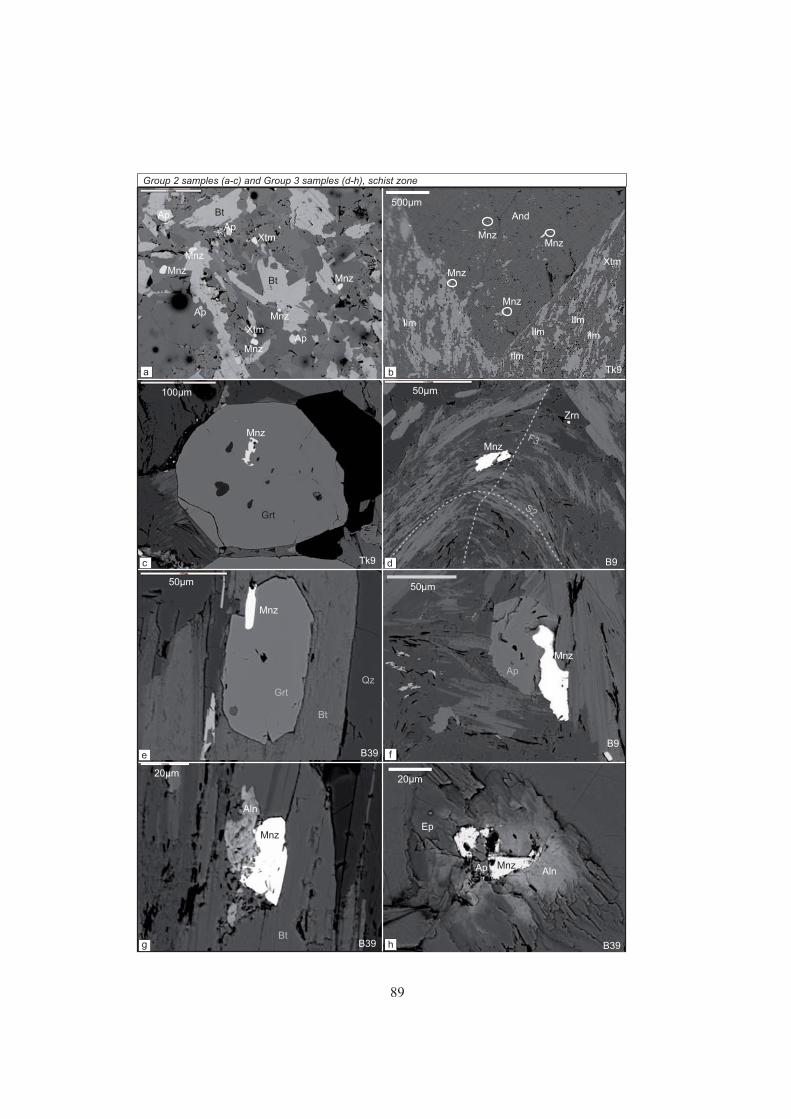
B9Tk9
Tk9
B39
B39
B9
Group 2 samples (a-c) and Group 3 samples (d-h), schist zone
50μm
Mnz
Zrn
S2
F3
Grt
Mnz
100μm
50μm
20μm
500μm
Grt
Mnz
Bt
Qz
And
MnzMnz
Mnz
Mnz
IlmIlm
Xtm
IlmIlm
Ilm
Mnz
Aln
Bt
a
Mnz
Ap
50μm
b
c d
e f
MnzAln
Ep
B39g h
20μm
Ap
Mnz
Mnz
MnzMnz
Mnz
Xtm
Xtm
ApAp
Ap
Ap
Bt
Bt
89
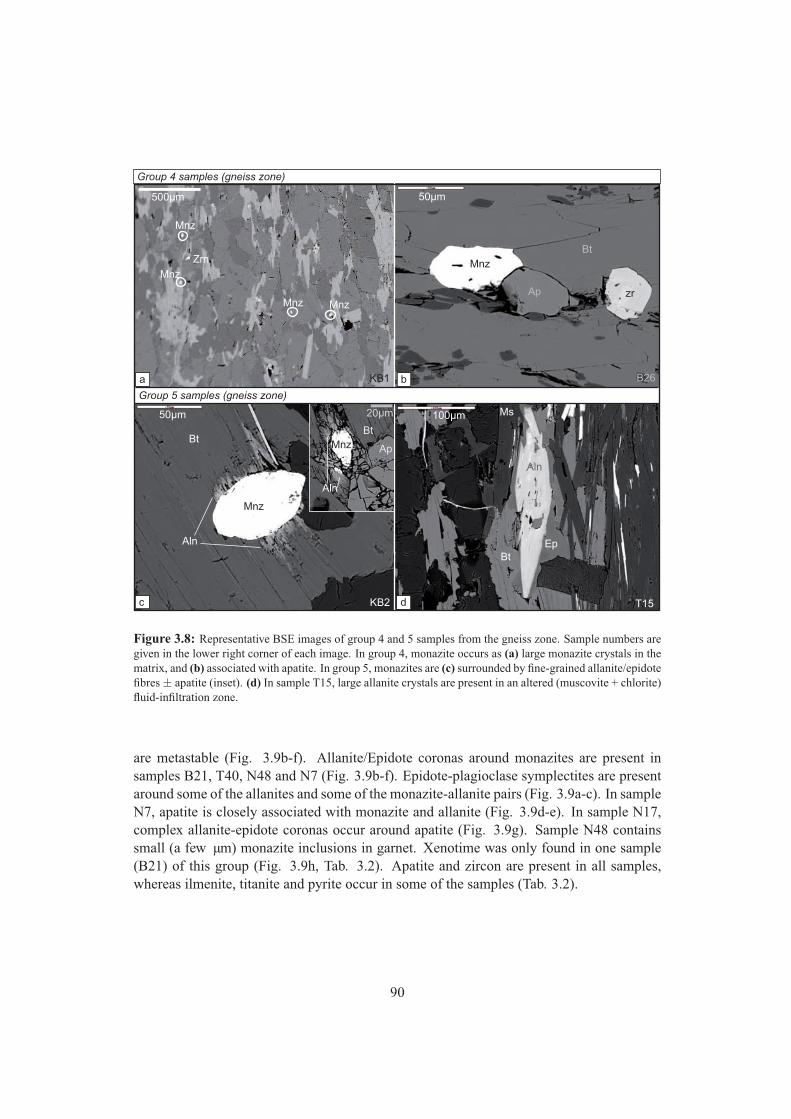
KB2
KB1
Ap
Bt
B26
T15
Group 4 samples (gneiss zone)
Mnz
Bt
Aln
50μm
MnzMnz
Mnz
Mnz
Zrn
Group 5 samples (gneiss zone)
Mnz
zr
50μm500μm
a b
c
Mnz Ap
Aln
Bt
20μm 100μm
Aln
EpBt
Ms
d
Figure 3.8: Representative BSE images of group 4 and 5 samples from the gneiss zone. Sample numbers aregiven in the lower right corner of each image. In group 4, monazite occurs as (a) large monazite crystals in thematrix, and (b) associated with apatite. In group 5, monazites are (c) surrounded by fine-grained allanite/epidotefibres ± apatite (inset). (d) In sample T15, large allanite crystals are present in an altered (muscovite + chlorite)fluid-infiltration zone.
are metastable (Fig. 3.9b-f). Allanite/Epidote coronas around monazites are present insamples B21, T40, N48 and N7 (Fig. 3.9b-f). Epidote-plagioclase symplectites are presentaround some of the allanites and some of the monazite-allanite pairs (Fig. 3.9a-c). In sampleN7, apatite is closely associated with monazite and allanite (Fig. 3.9d-e). In sample N17,complex allanite-epidote coronas occur around apatite (Fig. 3.9g). Sample N48 containssmall (a few µm) monazite inclusions in garnet. Xenotime was only found in one sample(B21) of this group (Fig. 3.9h, Tab. 3.2). Apatite and zircon are present in all samples,whereas ilmenite, titanite and pyrite occur in some of the samples (Tab. 3.2).
90
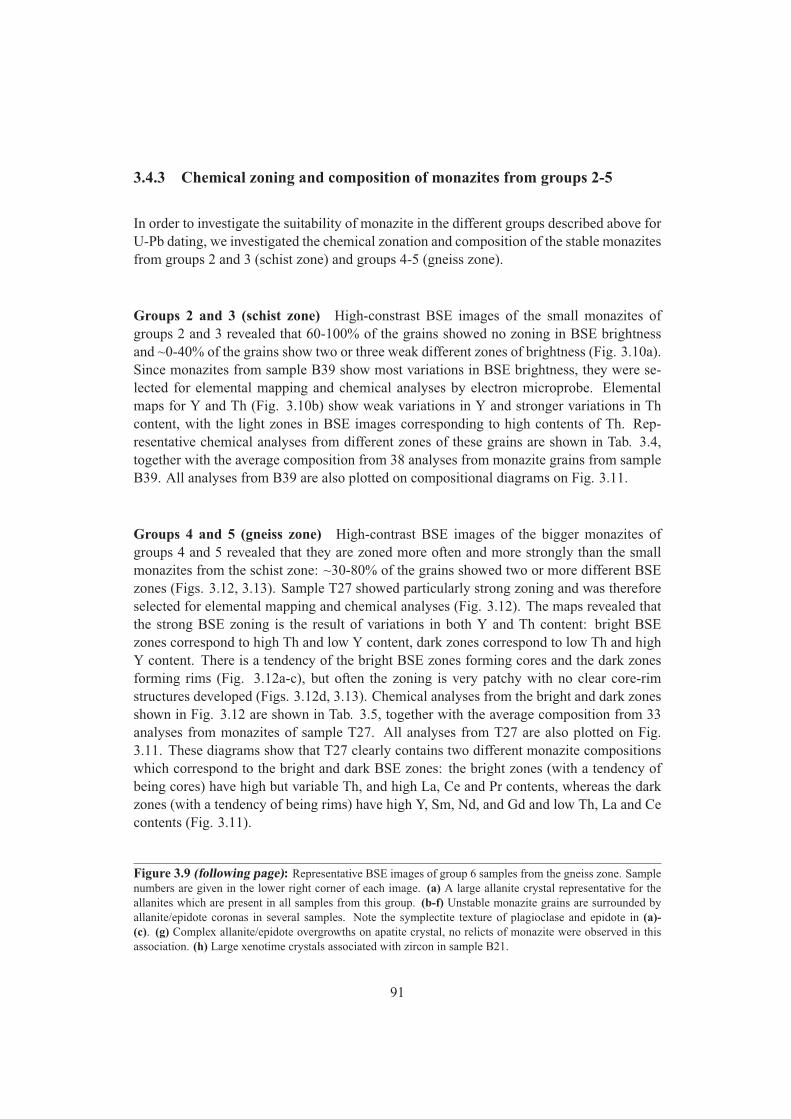
3.4.3 Chemical zoning and composition of monazites from groups 2-5
In order to investigate the suitability of monazite in the different groups described above forU-Pb dating, we investigated the chemical zonation and composition of the stable monazitesfrom groups 2 and 3 (schist zone) and groups 4-5 (gneiss zone).
Groups 2 and 3 (schist zone) High-constrast BSE images of the small monazites ofgroups 2 and 3 revealed that 60-100% of the grains showed no zoning in BSE brightnessand ~0-40% of the grains show two or three weak different zones of brightness (Fig. 3.10a).Since monazites from sample B39 show most variations in BSE brightness, they were se-lected for elemental mapping and chemical analyses by electron microprobe. Elementalmaps for Y and Th (Fig. 3.10b) show weak variations in Y and stronger variations in Thcontent, with the light zones in BSE images corresponding to high contents of Th. Rep-resentative chemical analyses from different zones of these grains are shown in Tab. 3.4,together with the average composition from 38 analyses from monazite grains from sampleB39. All analyses from B39 are also plotted on compositional diagrams on Fig. 3.11.
Groups 4 and 5 (gneiss zone) High-contrast BSE images of the bigger monazites ofgroups 4 and 5 revealed that they are zoned more often and more strongly than the smallmonazites from the schist zone: ~30-80% of the grains showed two or more different BSEzones (Figs. 3.12, 3.13). Sample T27 showed particularly strong zoning and was thereforeselected for elemental mapping and chemical analyses (Fig. 3.12). The maps revealed thatthe strong BSE zoning is the result of variations in both Y and Th content: bright BSEzones correspond to high Th and low Y content, dark zones correspond to low Th and highY content. There is a tendency of the bright BSE zones forming cores and the dark zonesforming rims (Fig. 3.12a-c), but often the zoning is very patchy with no clear core-rimstructures developed (Figs. 3.12d, 3.13). Chemical analyses from the bright and dark zonesshown in Fig. 3.12 are shown in Tab. 3.5, together with the average composition from 33analyses from monazites of sample T27. All analyses from T27 are also plotted on Fig.3.11. These diagrams show that T27 clearly contains two different monazite compositionswhich correspond to the bright and dark BSE zones: the bright zones (with a tendency ofbeing cores) have high but variable Th, and high La, Ce and Pr contents, whereas the darkzones (with a tendency of being rims) have high Y, Sm, Nd, and Gd and low Th, La and Cecontents (Fig. 3.11).
Figure 3.9 (following page): Representative BSE images of group 6 samples from the gneiss zone. Samplenumbers are given in the lower right corner of each image. (a) A large allanite crystal representative for theallanites which are present in all samples from this group. (b-f) Unstable monazite grains are surrounded byallanite/epidote coronas in several samples. Note the symplectite texture of plagioclase and epidote in (a)-(c). (g) Complex allanite/epidote overgrowths on apatite crystal, no relicts of monazite were observed in thisassociation. (h) Large xenotime crystals associated with zircon in sample B21.
91
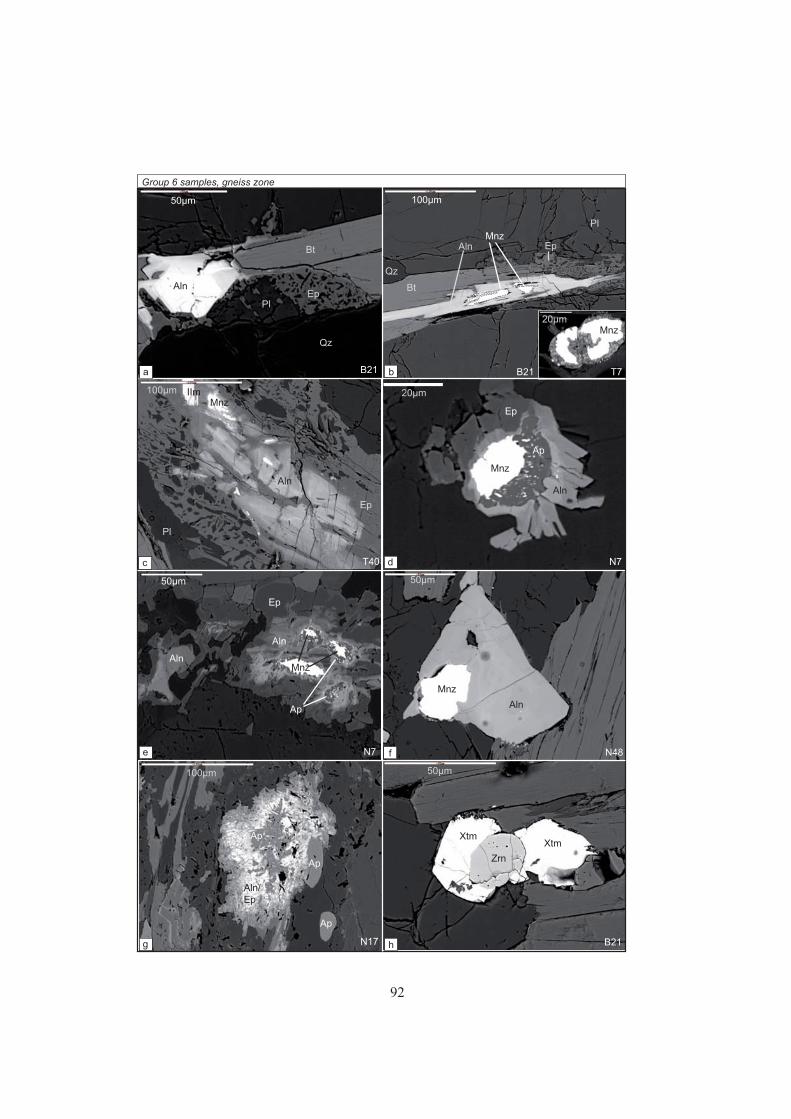
N39
T7
T40 N7
N7
100μm 20μm
50μm
20μm
N17
N48
Ap
Group 6 samples, gneiss zone
IImMnz
Aln
Ep
Mnz
Aln
Ap
Ep
Mnz
Aln
Ep
Aln
Pl
Mnz
T7B21
MnzAln
Pl
Ep
Bt
Qz
100μm
Ap
Ap
Ap
Aln/Ep
Mnz
Aln
100μm
50μm
50μm
XtmXtm
Zrn
B21
a b
c d
e f
g h
50μm
Aln
PlEp
Bt
Qz
B21
92
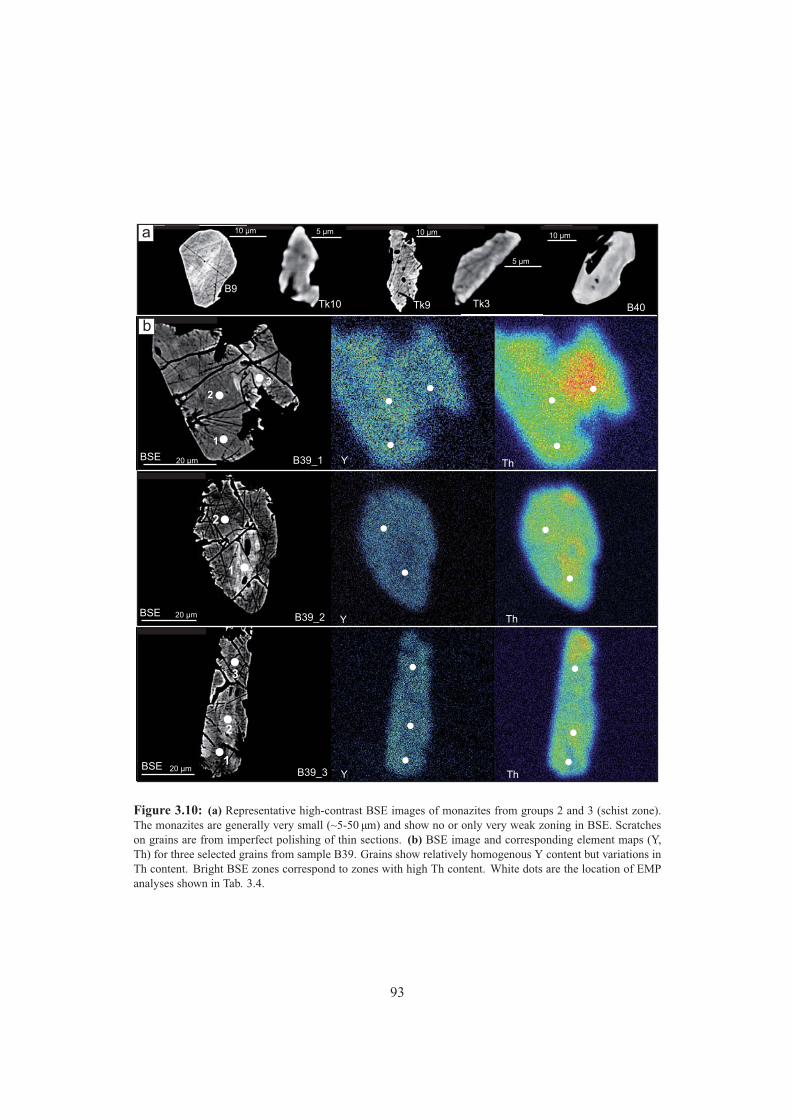
B39_1
B39_2
B39_3
B9
Tk10
20 μm
20 μm
20 μm
10 μm 5 μm 10 μm
5 μm
Tk9 Tk3
Y Th
Y Th
10 μm
B40
a
Y Th
b
BSE
BSE
BSE
1
23
1
2
2
1
3
Figure 3.10: (a) Representative high-contrast BSE images of monazites from groups 2 and 3 (schist zone).The monazites are generally very small (~5-50 µm) and show no or only very weak zoning in BSE. Scratcheson grains are from imperfect polishing of thin sections. (b) BSE image and corresponding element maps (Y,Th) for three selected grains from sample B39. Grains show relatively homogenous Y content but variations inTh content. Bright BSE zones correspond to zones with high Th content. White dots are the location of EMPanalyses shown in Tab. 3.4.
93
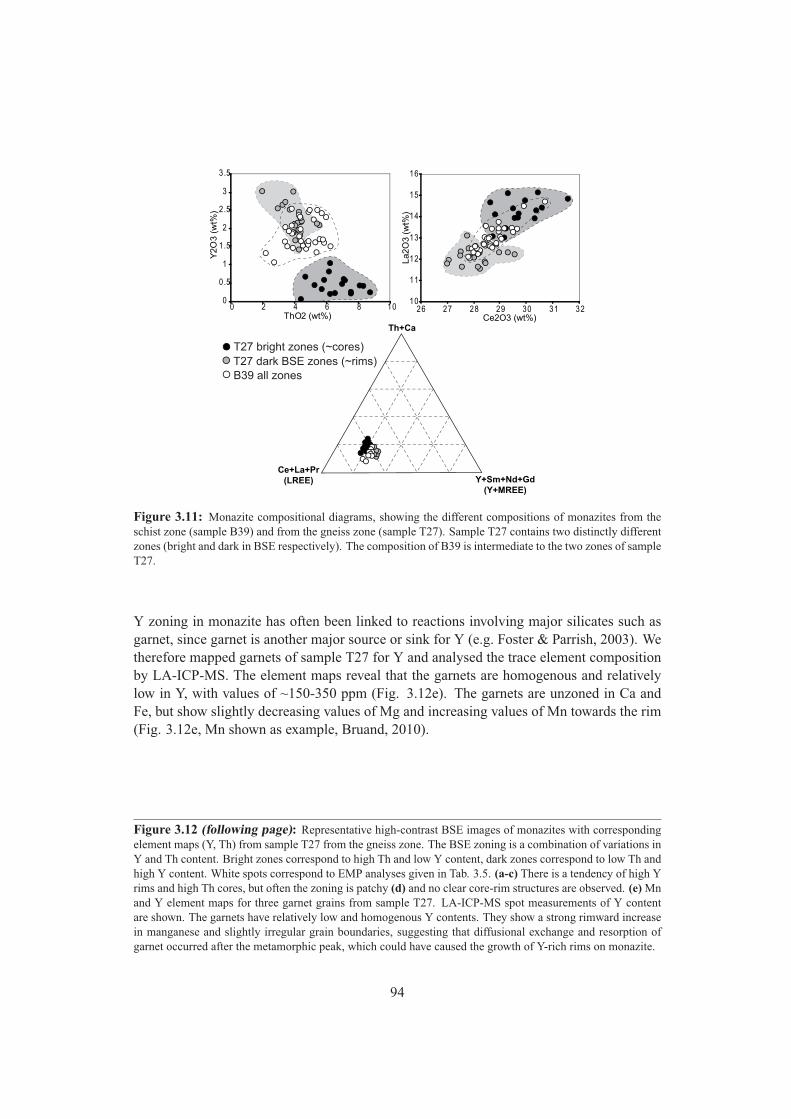
Th+Ca
Ce+La+Pr(LREE) Y+Sm+Nd+Gd
(Y+MREE)
0
0.5
1
1.5
2
2.5
3
3.5
0 2 4 6 8 10ThO2 (wt%)
Y2O
3 (
wt%
)
10
11
12
13
14
15
16
26 27 28 29 30 31 32Ce2O3 (wt%)
La2O
3 (
wt%
)
T27 bright zones (~cores)T27 dark BSE zones (~rims)B39 all zones
Figure 3.11: Monazite compositional diagrams, showing the different compositions of monazites from theschist zone (sample B39) and from the gneiss zone (sample T27). Sample T27 contains two distinctly differentzones (bright and dark in BSE respectively). The composition of B39 is intermediate to the two zones of sampleT27.
Y zoning in monazite has often been linked to reactions involving major silicates such asgarnet, since garnet is another major source or sink for Y (e.g. Foster & Parrish, 2003). Wetherefore mapped garnets of sample T27 for Y and analysed the trace element compositionby LA-ICP-MS. The element maps reveal that the garnets are homogenous and relativelylow in Y, with values of ~150-350 ppm (Fig. 3.12e). The garnets are unzoned in Ca andFe, but show slightly decreasing values of Mg and increasing values of Mn towards the rim(Fig. 3.12e, Mn shown as example, Bruand, 2010).
Figure 3.12 (following page): Representative high-contrast BSE images of monazites with correspondingelement maps (Y, Th) from sample T27 from the gneiss zone. The BSE zoning is a combination of variations inY and Th content. Bright zones correspond to high Th and low Y content, dark zones correspond to low Th andhigh Y content. White spots correspond to EMP analyses given in Tab. 3.5. (a-c) There is a tendency of high Yrims and high Th cores, but often the zoning is patchy (d) and no clear core-rim structures are observed. (e) Mnand Y element maps for three garnet grains from sample T27. LA-ICP-MS spot measurements of Y contentare shown. The garnets have relatively low and homogenous Y contents. They show a strong rimward increasein manganese and slightly irregular grain boundaries, suggesting that diffusional exchange and resorption ofgarnet occurred after the metamorphic peak, which could have caused the growth of Y-rich rims on monazite.
94
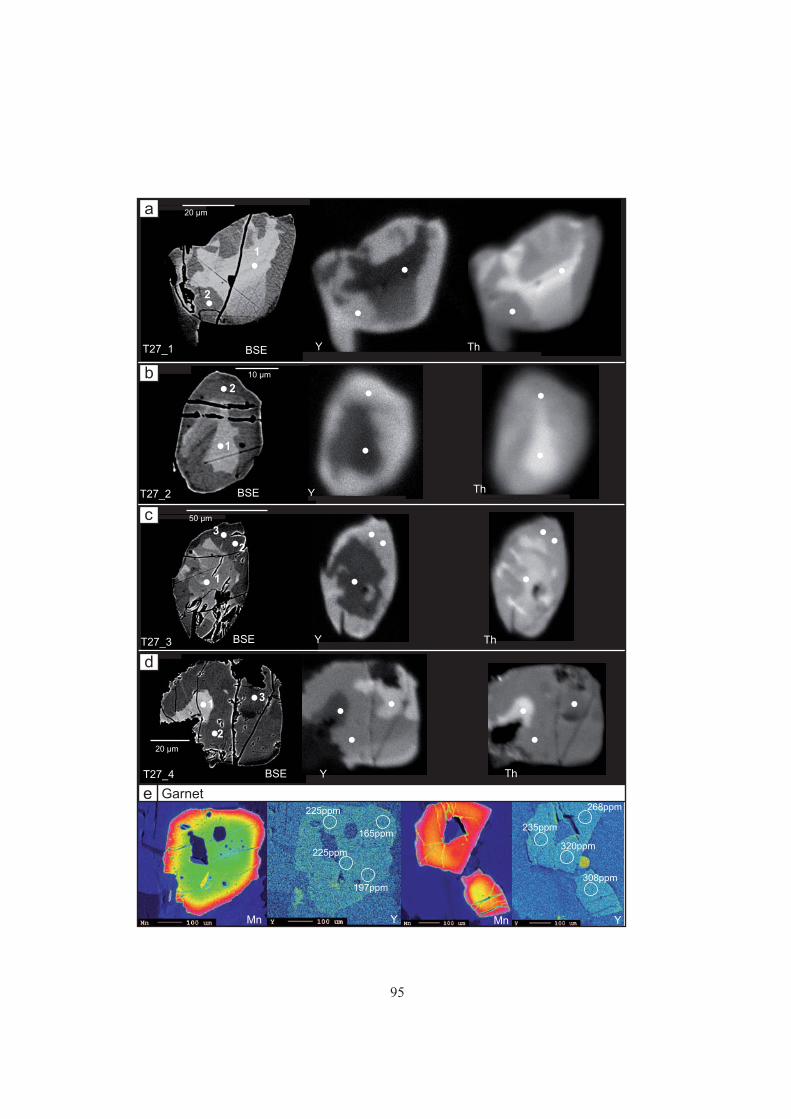
Y ThT27_1 BSE
T27_2
T27_3
T27_4
Y ThBSE
Y ThBSE
Y ThBSE
Y YMn Mn
20 μm
2
1
2
1
2
1
3
2
13
a 20 μm
10 μmb
50 μmc
d
e Garnet225ppm
165ppm
225ppm
197ppm
268ppm
235ppm
320ppm
308ppm
95
3.4.4 U-Pb SHRIMP dating of monazites from the gneiss zone
In order to get precise age information from the monazites grown in the schist and gneisszones of the CMC, three samples from the schist zone (groups 2 and 3) and four samplesfrom the gneiss zone (groups 4 and 5) were selected for U-Pb SHRIMP dating. The attemptof dating the small monazites from the three schist samples (B39, Tk9, Tk10) was not suc-cessful. The heavy mineral separates after sample processing did not contain any monazites,despite having recognized >40 grains/per thin section. There are two possible explanationsfor that: (1) the grains observed in thin sections are mostly <50 µm and they might thereforebe lost during standard mineral separation. (2) Most grains are hosted by biotite - since wedid not mill the samples after crushing, they might have stayed in the biotite. Therefore,additional milling would probably increase the chance of separating monazites from thesefine-grained samples.
The four samples from the gneiss zone (B21, KB5, KB1, T27) all yielded >50 grains ofmonazites per sample, typically ~50-200 µm in size. BSE images of the separated monazitegrains from the four samples are displayed on Fig. 3.13. The separated grains from thefour gneiss samples show a tendency to bright BSE cores and dark BSE rims as alreadyobserved on monazite crystals in thin section from sample T27 (Fig. 3.12). We dated 13-18 spots on 10-11 crystals from each sample covering zones with different BSE brightness(Fig. 3.13). No differences in age between zones of different BSE brightness (and hencecomposition) could be detected at this level of precision (Fig. 3.13). For samples B21 andKB5, one discordant analysis was excluded from the age calculation (Tab. 3.6, Fig. 3.14,the discordant analyses are shown in the table but not in the plots). For sample KB5, fiveanalyses were excluded from the age calculation, due to high common Pb, large error onthe isotopic ratios and/or discordance (Tab. 3.6, Fig. 3.14). For sample T27, two analysesare excluded due to high error on the isotopic ratio (Tab. 3.6). With the remaining analyses,Concordia ages could be calculated for B21, KB1 and KB5, whereas for sample T27 aweighted average 206Pb/238U age is reported (Fig. 3.14). The ages vary between 51.5±0.9Ma and 53.5±0.9 Ma (Fig. 3.14, Tab. 3.2). The ages of KB1, KB5 and T27 are within errorof each other, whereas the age of sample B21 is slightly younger than the age of KB5, butis within error of the ages of KB1 and T27 (Fig. 3.14).
96
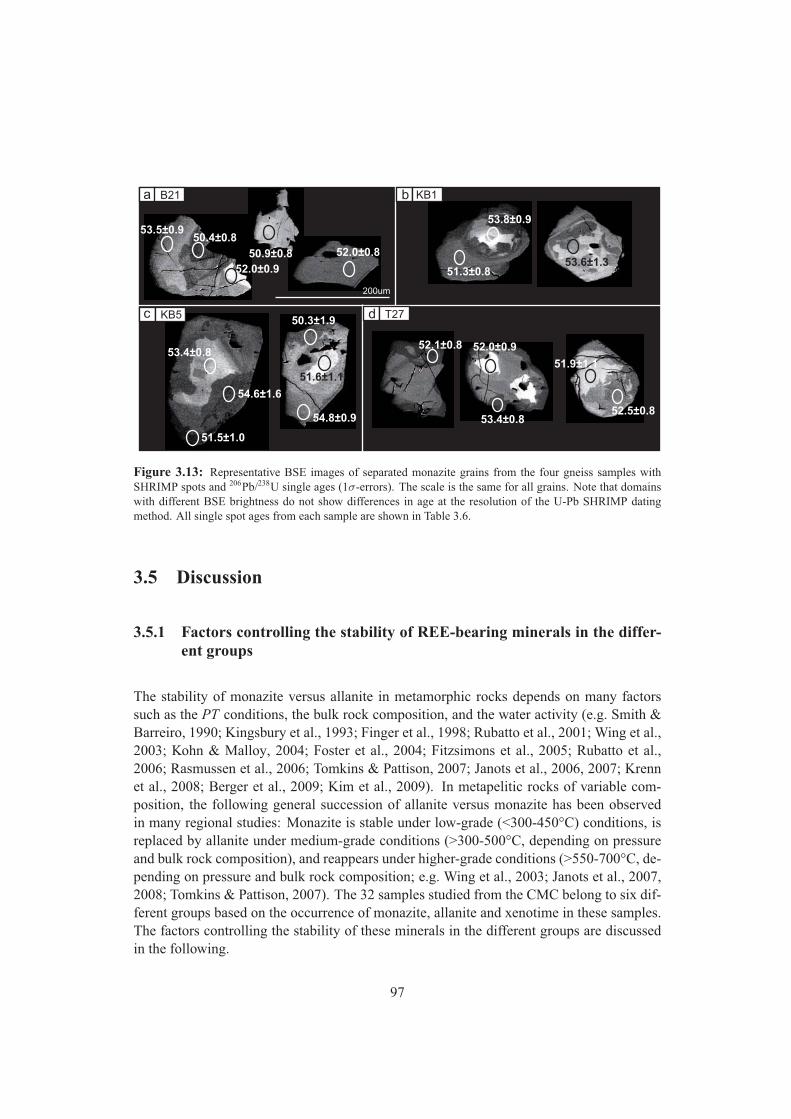
53.5±0.950.4±0.8
51.3±0.8
53.4±0.8
51.6±1.1
50.3±1.9
54.6±1.6
51.9±1.1
53.4±0.8
52.0±0.952.1±0.8
52.5±0.8
53.6±1.352.0±0.8
53.8±0.9
50.9±0.852.0±0.9
51.5±1.0
200um
54.8±0.9
a B21 b KB1
c KB5 d T27
Figure 3.13: Representative BSE images of separated monazite grains from the four gneiss samples withSHRIMP spots and 206Pb/238U single ages (1σ-errors). The scale is the same for all grains. Note that domainswith different BSE brightness do not show differences in age at the resolution of the U-Pb SHRIMP datingmethod. All single spot ages from each sample are shown in Table 3.6.
3.5 Discussion
3.5.1 Factors controlling the stability of REE-bearing minerals in the differ-ent groups
The stability of monazite versus allanite in metamorphic rocks depends on many factorssuch as the PT conditions, the bulk rock composition, and the water activity (e.g. Smith &Barreiro, 1990; Kingsbury et al., 1993; Finger et al., 1998; Rubatto et al., 2001; Wing et al.,2003; Kohn & Malloy, 2004; Foster et al., 2004; Fitzsimons et al., 2005; Rubatto et al.,2006; Rasmussen et al., 2006; Tomkins & Pattison, 2007; Janots et al., 2006, 2007; Krennet al., 2008; Berger et al., 2009; Kim et al., 2009). In metapelitic rocks of variable com-position, the following general succession of allanite versus monazite has been observedin many regional studies: Monazite is stable under low-grade (<300-450°C) conditions, isreplaced by allanite under medium-grade conditions (>300-500°C, depending on pressureand bulk rock composition), and reappears under higher-grade conditions (>550-700°C, de-pending on pressure and bulk rock composition; e.g. Wing et al., 2003; Janots et al., 2007,2008; Tomkins & Pattison, 2007). The 32 samples studied from the CMC belong to six dif-ferent groups based on the occurrence of monazite, allanite and xenotime in these samples.The factors controlling the stability of these minerals in the different groups are discussedin the following.
97
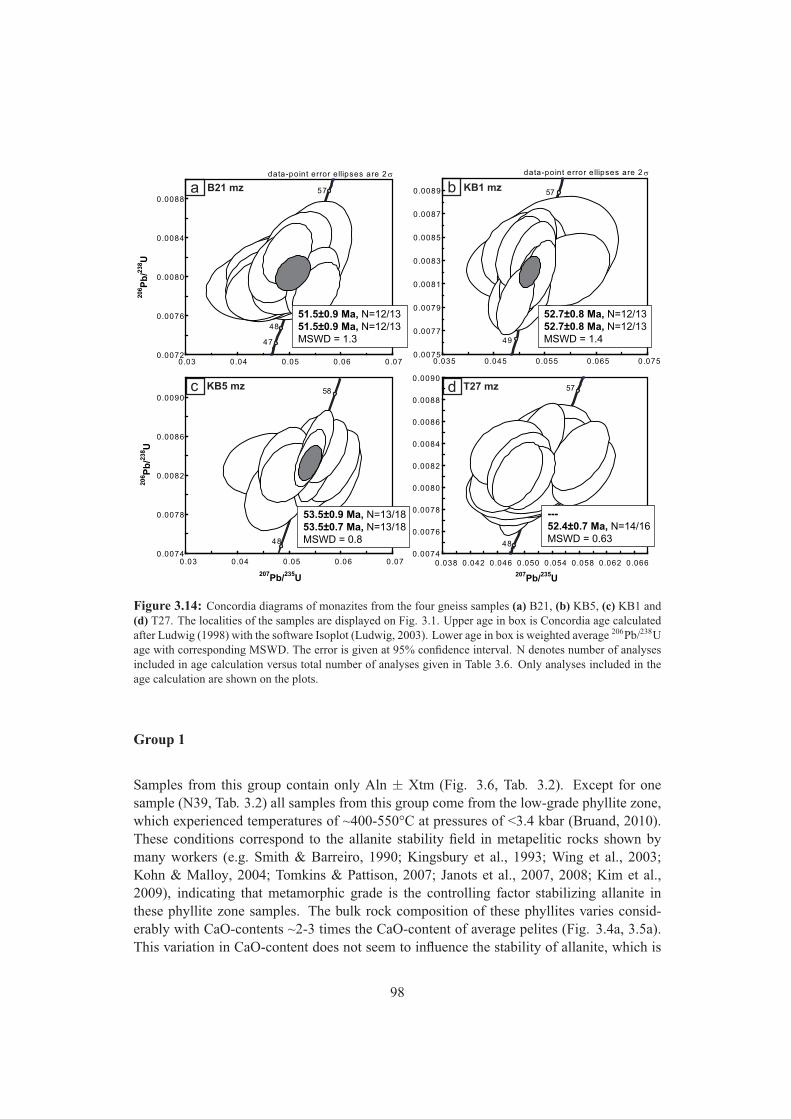
207Pb/235U
T27 mzd
206 P
b/23
8 U
data-point error ellipses are 2σ
B21 mzadata-point error ellipses are 2σ
KB5 mzc
207Pb/235U
206 P
b/23
8 U
KB1 mzb
54
52
50
48
0.0072
0.0076
0.0080
0.0084
0.0088
0.03 0.04 0.05 0.06 0.07
57
47
51.5±0.9 Ma, N=12/13 51.5±0.9 Ma, N=12/13MSWD = 1.3
56
54
52
50
0.0075
0.0077
0.0079
0.0081
0.0083
0.0085
0.0087
0.0089
0.035 0.045 0.055 0.065 0.075
52.7±0.8 Ma, N=12/13 52.7±0.8 Ma, N=12/13MSWD = 1.449
57
54
52
50
480.0074
0.0076
0.0078
0.0080
0.0082
0.0084
0.0086
0.0088
0.0090
0.038 0.042 0.046 0.050 0.054 0.058 0.062 0.066
57
---52.4±0.7 Ma, N=14/16MSWD = 0.63
0.0074
0.0078
0.0082
0.0086
0.0090
0.03 0.04 0.05 0.06 0.07
48
52
56
58
53.5±0.9 Ma, N=13/18 53.5±0.7 Ma, N=13/18MSWD = 0.8
Figure 3.14: Concordia diagrams of monazites from the four gneiss samples (a) B21, (b) KB5, (c) KB1 and(d) T27. The localities of the samples are displayed on Fig. 3.1. Upper age in box is Concordia age calculatedafter Ludwig (1998) with the software Isoplot (Ludwig, 2003). Lower age in box is weighted average 206Pb/238Uage with corresponding MSWD. The error is given at 95% confidence interval. N denotes number of analysesincluded in age calculation versus total number of analyses given in Table 3.6. Only analyses included in theage calculation are shown on the plots.
Group 1
Samples from this group contain only Aln ± Xtm (Fig. 3.6, Tab. 3.2). Except for onesample (N39, Tab. 3.2) all samples from this group come from the low-grade phyllite zone,which experienced temperatures of ~400-550°C at pressures of <3.4 kbar (Bruand, 2010).These conditions correspond to the allanite stability field in metapelitic rocks shown bymany workers (e.g. Smith & Barreiro, 1990; Kingsbury et al., 1993; Wing et al., 2003;Kohn & Malloy, 2004; Tomkins & Pattison, 2007; Janots et al., 2007, 2008; Kim et al.,2009), indicating that metamorphic grade is the controlling factor stabilizing allanite inthese phyllite zone samples. The bulk rock composition of these phyllites varies consid-erably with CaO-contents ~2-3 times the CaO-content of average pelites (Fig. 3.4a, 3.5a).This variation in CaO-content does not seem to influence the stability of allanite, which is
98
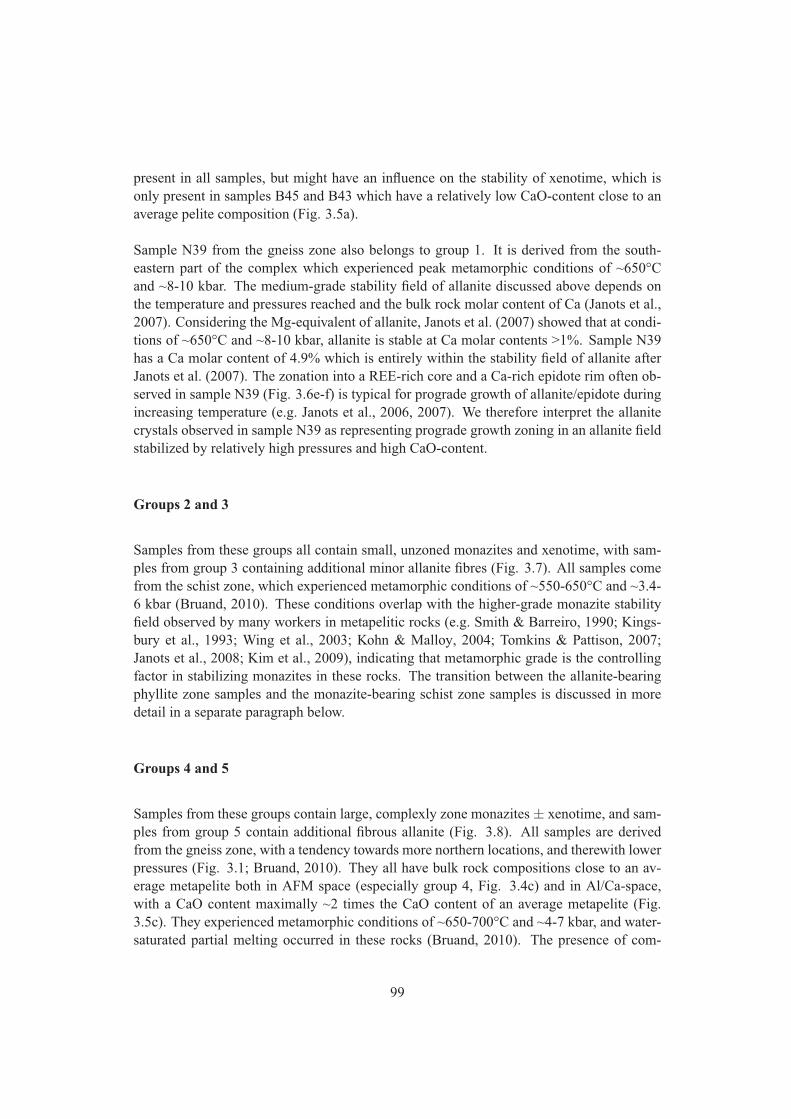
present in all samples, but might have an influence on the stability of xenotime, which isonly present in samples B45 and B43 which have a relatively low CaO-content close to anaverage pelite composition (Fig. 3.5a).
Sample N39 from the gneiss zone also belongs to group 1. It is derived from the south-eastern part of the complex which experienced peak metamorphic conditions of ~650°Cand ~8-10 kbar. The medium-grade stability field of allanite discussed above depends onthe temperature and pressures reached and the bulk rock molar content of Ca (Janots et al.,2007). Considering the Mg-equivalent of allanite, Janots et al. (2007) showed that at condi-tions of ~650°C and ~8-10 kbar, allanite is stable at Ca molar contents >1%. Sample N39has a Ca molar content of 4.9% which is entirely within the stability field of allanite afterJanots et al. (2007). The zonation into a REE-rich core and a Ca-rich epidote rim often ob-served in sample N39 (Fig. 3.6e-f) is typical for prograde growth of allanite/epidote duringincreasing temperature (e.g. Janots et al., 2006, 2007). We therefore interpret the allanitecrystals observed in sample N39 as representing prograde growth zoning in an allanite fieldstabilized by relatively high pressures and high CaO-content.
Groups 2 and 3
Samples from these groups all contain small, unzoned monazites and xenotime, with sam-ples from group 3 containing additional minor allanite fibres (Fig. 3.7). All samples comefrom the schist zone, which experienced metamorphic conditions of ~550-650°C and ~3.4-6 kbar (Bruand, 2010). These conditions overlap with the higher-grade monazite stabilityfield observed by many workers in metapelitic rocks (e.g. Smith & Barreiro, 1990; Kings-bury et al., 1993; Wing et al., 2003; Kohn & Malloy, 2004; Tomkins & Pattison, 2007;Janots et al., 2008; Kim et al., 2009), indicating that metamorphic grade is the controllingfactor in stabilizing monazites in these rocks. The transition between the allanite-bearingphyllite zone samples and the monazite-bearing schist zone samples is discussed in moredetail in a separate paragraph below.
Groups 4 and 5
Samples from these groups contain large, complexly zone monazites ± xenotime, and sam-ples from group 5 contain additional fibrous allanite (Fig. 3.8). All samples are derivedfrom the gneiss zone, with a tendency towards more northern locations, and therewith lowerpressures (Fig. 3.1; Bruand, 2010). They all have bulk rock compositions close to an av-erage metapelite both in AFM space (especially group 4, Fig. 3.4c) and in Al/Ca-space,with a CaO content maximally ~2 times the CaO content of an average metapelite (Fig.3.5c). They experienced metamorphic conditions of ~650-700°C and ~4-7 kbar, and water-saturated partial melting occurred in these rocks (Bruand, 2010). The presence of com-
99
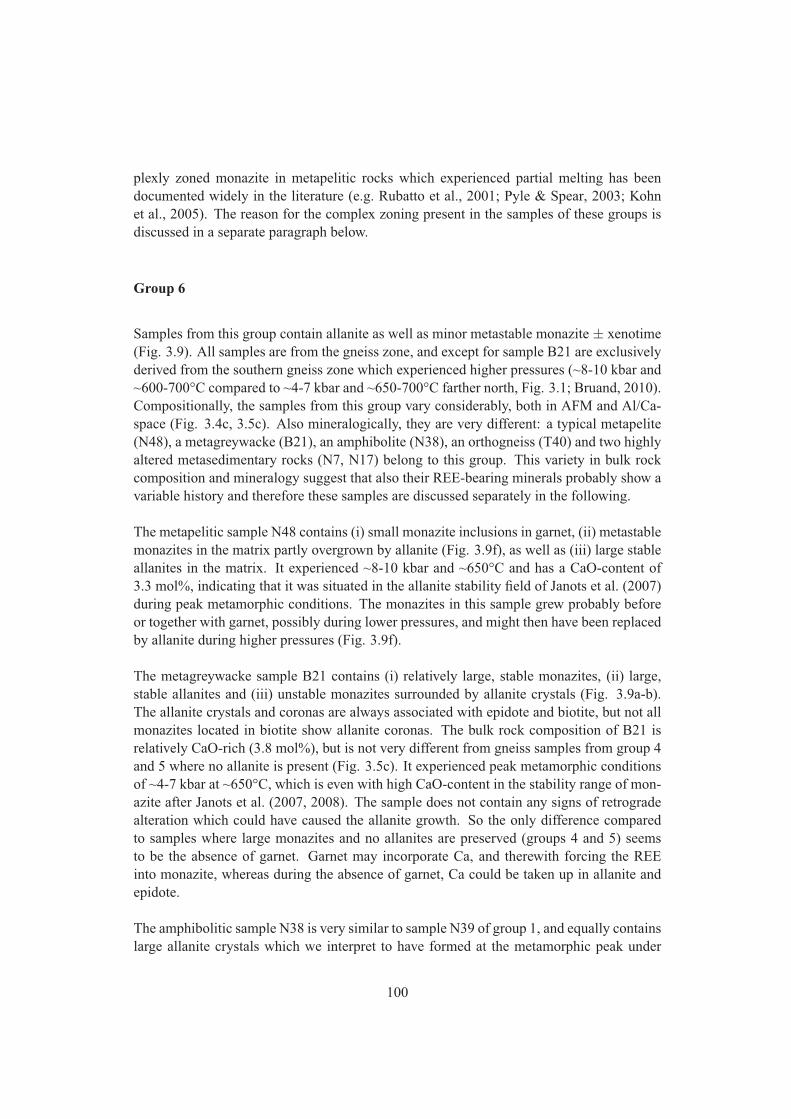
plexly zoned monazite in metapelitic rocks which experienced partial melting has beendocumented widely in the literature (e.g. Rubatto et al., 2001; Pyle & Spear, 2003; Kohnet al., 2005). The reason for the complex zoning present in the samples of these groups isdiscussed in a separate paragraph below.
Group 6
Samples from this group contain allanite as well as minor metastable monazite ± xenotime(Fig. 3.9). All samples are from the gneiss zone, and except for sample B21 are exclusivelyderived from the southern gneiss zone which experienced higher pressures (~8-10 kbar and~600-700°C compared to ~4-7 kbar and ~650-700°C farther north, Fig. 3.1; Bruand, 2010).Compositionally, the samples from this group vary considerably, both in AFM and Al/Ca-space (Fig. 3.4c, 3.5c). Also mineralogically, they are very different: a typical metapelite(N48), a metagreywacke (B21), an amphibolite (N38), an orthogneiss (T40) and two highlyaltered metasedimentary rocks (N7, N17) belong to this group. This variety in bulk rockcomposition and mineralogy suggest that also their REE-bearing minerals probably show avariable history and therefore these samples are discussed separately in the following.
The metapelitic sample N48 contains (i) small monazite inclusions in garnet, (ii) metastablemonazites in the matrix partly overgrown by allanite (Fig. 3.9f), as well as (iii) large stableallanites in the matrix. It experienced ~8-10 kbar and ~650°C and has a CaO-content of3.3 mol%, indicating that it was situated in the allanite stability field of Janots et al. (2007)during peak metamorphic conditions. The monazites in this sample grew probably beforeor together with garnet, possibly during lower pressures, and might then have been replacedby allanite during higher pressures (Fig. 3.9f).
The metagreywacke sample B21 contains (i) relatively large, stable monazites, (ii) large,stable allanites and (iii) unstable monazites surrounded by allanite crystals (Fig. 3.9a-b).The allanite crystals and coronas are always associated with epidote and biotite, but not allmonazites located in biotite show allanite coronas. The bulk rock composition of B21 isrelatively CaO-rich (3.8 mol%), but is not very different from gneiss samples from group 4and 5 where no allanite is present (Fig. 3.5c). It experienced peak metamorphic conditionsof ~4-7 kbar at ~650°C, which is even with high CaO-content in the stability range of mon-azite after Janots et al. (2007, 2008). The sample does not contain any signs of retrogradealteration which could have caused the allanite growth. So the only difference comparedto samples where large monazites and no allanites are preserved (groups 4 and 5) seemsto be the absence of garnet. Garnet may incorporate Ca, and therewith forcing the REEinto monazite, whereas during the absence of garnet, Ca could be taken up in allanite andepidote.
The amphibolitic sample N38 is very similar to sample N39 of group 1, and equally containslarge allanite crystals which we interpret to have formed at the metamorphic peak under
100
conditions of ~650°C and ~8-10 kbar in a CaO-rich bulk composition (Bruand, 2010). Thefew metastable monazites may be remnants of a minor monazite growth episode duringlower pressures.
The orthogneissic sample T40 with its high CaO-content (6.3 mol%) and peak metamorphicconditions of ~7-8 kbar and ~650-700°C (Bruand, 2010) lies in the stability field for allaniteafter Janots et al. (2007). The only present (unstable) monazite grain in this sample (Fig.3.9c) could possibly represent a primary magmatic monazite.
The two altered samples N7 and N17 (Fig. 3.2f) are both derived from close to a major Neo-gene fault (Fig. 3.1). The peak paragenesis of biotite and garnet in these samples is stronglyretrogressed into chlorite, muscovite and epidote, and calcite is present in small fissures,indicating the influx of calcareous fluids. Monazite-apatite-allanite textures as observed insample N7 (Fig. 3.9d-e) were described by Finger et al. (1998) and Krenn et al. (2008).In the first case, they formed during amphibolite-facies on primary magmatic monazite inan orthogneiss, and in the second case they formed retrogradly during greenschist facieson amphibolite-facies monazite. Since samples N7 and N17 show such a strong retrogradeoverprint, we interpret that the apatite-allanite coronas found in these samples probablyformed during this retrograde event. The influx of carbonate-rich fluids could have enabledthe transformation of monazite into apatite, allanite and epidote according to reactions de-scribed in Finger et al. (1998).
In summary, allanite-monazite textures observed in the different samples of group 6 maybe the result of either prograde replacement of monazite by allanite due to an increase inpressure in relatively CaO-rich bulk compositions, or be the result of a retrograde overprintwhich affected the samples due to the activity of a major fault.
3.5.2 Monazite-in reaction between the phyllite and schist zones
Since all phyllite zone samples contain allanite but no monazite, and all schist zone samplescontain mainly monazite with only very minor allanite, a monazite-in reaction, controlledby an increase in metamorphic grade, must have occurred between the two metamorphiczones. Possible reactions and the influence of bulk rock composition on these reactions arediscussed in detail below.
Exact physical conditions and possible reactions
The highest-grade sample of the pyhllite zone containing allanite is sample B45, whichregistered a peak temperature of 547±30°C (Tab. 3.2; Bruand, 2010). The lowest-gradesample of the schist zone in which monazite was detected is sample Tk12, which regis-
101
tered a maximum temperature of 543±23°C at 3.4±0.9 kbar (Tab. 3.2; Bruand, 2010). Thebulk rock composition of both samples is very similar and close to an average metapelitecomposition (Tab. 3.3, Fig. 3.5), indicating that the two samples are comparable. Whereassample B45 only contains quartz, plagioclase, muscovite and biotite as major phases, an-dalusite and garnet occur in addition in sample Tk12. These observations suggest that themonazite-in reaction occurred in these rocks at ~540°C (±30°) close to or at the andalusite-and garnet-in reactions at pressures of <3.4 kbar.
Such a monazite-in reaction close to or at the andalusite- and garnet-in isograds has been re-ported by many workers in metamorphosed metapelitic rocks (e.g. Smith & Barreiro, 1990;Kingsbury et al., 1993; Wing et al., 2003; Kohn & Malloy, 2004; Tomkins & Pattison, 2007;Janots et al., 2008; Kim et al., 2009). However, the exact reactions which lead to monazitegrowth and the role of the major silicate phases versus the role of other accessory phasesduring these reactions is debated and different propositions have been made. Most workersagree that the REE necessary for formation of the monazite probably come from the break-down of allanite (e.g. Smith & Barreiro, 1990; Wing et al., 2003; Tomkins & Pattison, 2007;Janots et al., 2008). However, Kohn & Malloy (2004) suggested that if the major silicatephases (especially micas and garnet) incorporated high but not unrealistic REE contentsduring lower grades, these REE liberated from major phases could be sufficient to producemonazite without another REE-rich precursor.
In our case, only very minor mica and no garnet is present in the phyllites, suggestingthat the REE necessary for monazite formation were probably derived from a REE-richprecursor such as allanite and/or xenotime. However, in our samples no direct breakdownof allanite to monazite was observed. Textures such as described by Wing et al. (2003),Tomkins & Pattison (2007), Janots et al. (2008) or Kim et al. (2009) with pseudomorphs ofsmall monazites after allanite or clusters of monazites with the shape of allanites were notfound in our samples. Only in one sample from the schist zone (B39), a monazite crystalis tightly associated with an allanite crystal (Fig. 3.7g), but it is not unambiguous whetherthe monazite progradly replaces the allanite or whether the allanite retrogradly replaces themonazite. Other monazites in the same sample are surrounded by allanite fibres, indicatingthat this sample probably experienced retrograde allanite growth. The monazites in all theother schist samples are dispersed throughout the matrix of the sample and are generally notassociated with an allanite precursor.
Whether or not the aluminosilicates play a major role in the formation of the monazite isalso debated. Wing et al. (2003) proposed the following reaction for the formation of mon-azite at the aluminosilicate-in isograds: 3 allanite + apatite + muscovite + 4 aluminosilicate+ 3 quartz = 3 monazite + biotite + 8 plagioclase +2 H2O. However, Tomkins & Pattison(2007) observed that the monazite-in reaction in their rocks did occur slightly below thealuminosilicate-in reaction and proposed the following general formation mechanism: al-lanite + apatite = monazite + plagioclase + magnetite. Similarly, Janots et al. (2008) did notobserve a clear link with the aluminosilicate-in reaction and proposed the following gener-alized prograde reaction: allanite + apatite + Al-Fe-Mg phases1 = monazite + anorthite +
102
Al-Fe-Mg phases2. In addition, Wing et al. (2003) and Kim et al. (2009) proposed that Tho-riumsilicate (ThSiO4) may contribute to the relatively high Th-contents of monazite relativeto allanite.
In our case, the rare observation of monazite inclusions both in andalusite (Fig. 3.7b) andgarnet (Fig. 3.7c, e) indicates that the monazite-in reaction probably occurred before theformation of andalusite and garnet, similarly to what has been observed by Tomkins & Pat-tison (2007). In addition, the monazites of sample B39 from the schist zone are relativelyY-rich (1-2.5 wt% Y2O3, Fig. 3.11), indicating that they probably grew before garnet whichalso preferentially incorporates Y (e.g. Foster & Parrish, 2003). Based on these qualita-tive observations it can be assumed that probably a similar reaction as the one proposedby Tomkins & Pattison (2007) or Janots et al. (2008) was responsible for the monazite for-mation in the schist zone samples, including apatite, plagioclase and an Al-Fe-Mg phase(muscovite, biotite) as reactants but probably neither andalusite nor garnet.
The influence of bulk rock composition on the monazite-in reaction
Wing et al. (2003) suggested that in addition to metamorphic grade, the monazite-in reac-tion is controlled by the CaO-content of the bulk rock, and they showed that in samples ofthe andalusite-, kyanite- and sillimanite-zones, allanite can be stable if the bulk rock com-positions contain 2-3 times the average pelite CaO-content. Their dividing line betweenMzn- and Aln-bearing samples in the Ca-Al compositional space for And/Ky/Sil-zone sam-ples is displayed in Fig. 3.5b. Such an influence of the CaO-content is not observed in theschist-zone samples from the CMC (Fig. 3.5b). Sample B39 and B40, which both lie in thestability field for allanite after Wing et al. (2003) do contain abundant stable monazite, andallanite is only present as retrograde fibres or as instable prograde crystals (Fig. 3.7g-h).These retrograde allanite fibres are not restricted to samples from the allanite stability fieldof Wing et al. (2003), but also occur on samples in the monazite stability field (Fig. 3.5b).
Similarly, the equation proposed by Foster & Parrish (2003), which links the temperatureof monazite growth to the CaO/SiO2-ratio of the rock, gives monazite-in temperatures of~670°C and ~760°C for samples B39 and B40, respectively. These temperatures are higherthan the temperatures observed in these samples, suggesting that allanite and not mon-azite should be stable in these samples, which is not observed. This indicates that theCaO bulk rock content and the CaO/SiO2 ratio of our samples did not essentially influ-ence the monazite-in reaction. Janots et al. (2008) suggested that the CaO/Na2O ratio ofa sample might influence the breakdown of allanite to monazite between temperatures of~500-650°C, with allanite being stable to higher temperatures the higher the CaO/Na2Oratio is (their Fig. 13). The CaO/Na2O ratio of all our schist samples is below 1.1 whichis clearly in the field where allanite breaks down to monazite at temperatures of ~550°C -600°C. So compared to the results of Janots et al. (2008) the occurrence of monazite evenin our samples with high CaO content is not surprising.
103
Variations in the AFM space seem not to influence the monazite-in reaction between thephyllite and schist zones: Despite variations of 0.4 in the Al-component and 0.2 in the Fe-and Mg-components all samples from the phyllite zone contain allanite whereas all sam-ples from the schist zone contain monazite (compare Fig. 3.4a with Fig. 3.4b). Similarly,Rasmussen et al. (2006) concluded that monazite growth during amphibolite facies meta-morphism is not influenced by compositional variations in AFM space.
3.5.3 Complexly zoned monazites in the gneiss zone: the result of (re)-crystal-lization during/after partial melting?
The samples from groups 4 and 5 from the gneiss zone contain abundant, large mon-azite which is much more zoned in BSE images than the monazites from the schist zone.Element-mapping and chemical analyses from one representative sample (T27) revealedthe presence of two compositional domains: Th-, La-, Ce-, Pr-rich and Y-poor domains andY-, Sm-, Nd-, Gd-rich, Th-, La-, Ce- and Pr-poor domains (Fig. 3.11). The distributionof the domains is mainly patchy, with a tendency of the former constituting cores and thelatter constituting rims (Fig. 3.12 and 3.13). Within error of U-Pb SHRIMP dating, no agedifference is detected between the different zones (Fig. 3.13, 3.14).
Complex chemical zoning of metamorphic monazite in upper amphibolite-facies rocks andin migmatites has been reported by many workers (e.g. Fitzsimons et al., 1997; Pyle et al.,2001; Rubatto et al., 2001; Foster et al., 2002, 2004; Pyle & Spear, 2003; Gibson et al.,2004; Kohn et al., 2005). Especially the zoning in Y has been investigated extensively sinceY is also incorporated in other phases such as garnet and xenotime. The partitioning of Ybetween the different minerals may allow drawing conclusions on the timing of monazitegrowth relative to garnet and/or xenotime growth (e.g. Pyle et al., 2001).
The monazites in the schist zone (B39) are relatively Y-rich (Fig. 3.11), possibly indicatinggrowth prior to garnet growth. The monazites in the gneiss zone however (T27), show Y-poor zones which form preferentially grain cores (Fig. 3.12, 3.13). In addition, these coresshow complex zoning in Th (Fig. 3.12a and c). The composition of these cores suggests thatthey possibly grew after garnet growth (e.g. Foster & Parrish, 2003). They could thereforerepresent a younger generation of monazites than the Y-rich monazites present in the schistzone. However, this would imply that the older Y-rich monazites were completely dissolvedprior to precipitation of the Y-poor monazites. Samples from groups 4 and 5 experiencedpartial melting under water-saturated conditions (Bruand, 2010) with garnet stable bothbefore and during the melting stage. Monazite solubility in metapelitic melts under water-saturated conditions can be relatively high (e.g. Zeng et al., 2005) suggesting that dissolutionof lower-grade monazite during partial melting might be possible. The Th-rich cores couldthen have been crystallized during melt crystallization, with the high Th-content being theresult of preferential Th incorporation into monazite (e.g. Kohn & Malloy, 2004; Kohnet al., 2005).
104
Y-rich zones/rims similar to the Y-rich zones of sample T27 have been described by otherworkers from migmatitic rocks, and have generally been interpreted as representing a mon-azite generation which grew during breakdown of garnet and/or in equilibrium with xeno-time (e.g. Pyle & Spear, 2003; Foster & Parrish, 2003; Kohn et al., 2005). The garnets ofsample T27 show a strong rimward increase in Mn and a slight decrease in Mg as well assome irregular grain boundaries (Fig. 3.12e; Bruand, 2010). Sharp rimward zoning in Mg,Fe or Mn in otherwise homogenous garnets is commonly attributed to diffusional exchangeand/or net transfer reactions between garnet and biotite during cooling (e.g. Spear, 1993;Kohn et al., 2001). Whereas during diffusional exchange no garnet breakdown occurs, nettransfer reactions may lead to the resorption of garnet and therewith the liberation of Y,which then could lead to the production of high-Y monazite rims (e.g. Spear, 1993; Foster& Parrish, 2003; Kohn et al., 2005). However, whether or not garnet resorption occurredin sample T27 is difficult to judge. The grain boundaries are somewhat irregular and thezoning is truncated in one of the crystals (lower-left of first crystal in Fig. 3.12e), indicatingthat maybe some resorption during cooling occurred. Xenotime is present in the matrix ofthe sample or as overgrowths on zircon, but no textural relationship with the zoned mon-azites or garnet were observed, making it difficult to judge at what time relative to garnet ormonazite the xenotimes grew.
In summary, the complex zoning patterns in monazites of group 4 and 5 from the gneiss zoneare probably the result of complex interactions between monazite, garnet, xenotime, apatiteand partial melting reactions, and fully understanding them would need a more detailedinvestigation of the textural relationships, chemical zoning and composition and reactionhistory in selected samples between these important minerals. Nevertheless, the U-Pb agedating of complexly zoned monazite showed no age differences between the different zones,indicating that any possible growth history within these samples is below the temporal res-olution of U-Pb SHRIMP dating. Unfortunately, no age data is available from the unzonedmonazites from the schist zone, which potentially represent an older grain generation.
3.5.4 Interpretation of monazite U-Pb ages in a regional context
The four U-Pb SHRIMP ages from the zoned monazites of groups 4 and 5 cover a verynarrow age range between 51.5±0.9 Ma and 53.5±0.9 Ma (Fig. 3.13). This indicates thatthe processes which formed these monazites must have occurred over a very restricted timeperiod and, if different processes formed the different metamorphic zones, these processesoccurred during shorter time scales than what is resolvable by the U-Pb SHRIMP method.
For samples KB5 and T27, U-Pb SHRIMP ages of metamorphic zircon rims are available,and they are within error of the monazite ages for the same samples (54.0±0.8 Ma for KB5and 52.6±0.8 Ma for T27, Chap. 4). Four additional U-Pb SHRIMP ages of metamorphiczircons rims from the CMC and one age from a granodioritic intrusion are equally withinerror of all monazite ages (Chap. 4). The formation of the metamorphic zircon rim was
105
interpreted as being related to the partial melting event (chapter zircon), and the conformityof monazite and zircon-rim ages indicates that indeed, the monazite formation probably oc-curred during the same time period as the zircon-rim formation close or at the metamorphicpeak. Together, zircon and monazite ages indicate a short, restricted time period from ~55to ~51 Ma during which partial melting occurred in the CMC at least ~300 km along strike.So even if no independent age on the prograde heating and burial history of the CMC couldbe obtained, the maximum depositional age of ~60-65 Ma derived in the last chapter leavesonly ~5-10 Ma for prograde heating and burial of the CMC. Peak temperatures reached inthe CMC are ~650-700°C, and, with assuming a starting temperature of ~20°C, an averageheating rate of ~60-140°C/Ma can be calculated.
3.6 Conclusions
The search for prograde datable minerals in the different zones of the CMC revealed thefollowing:
(1) Garnet is ubiquitous throughout the CMC in rocks of appropriate bulk composition, butits internal zoning either equilibrated at the metamorphic peak, or represents growth zoningduring the retrograde part of the PT path (Bruand, 2010). Garnet is therefore not suited todate the prograde metamorphic history of the CMC. A Sm-Nd age obtained from two garnetfractions from a sample of the south-eastern part of the CMC gives 47.8±6.3 Ma, whichis broadly coeval with the metamorphic peak dated by the U-Pb method on metamorphiczircon from the same area.
(2) Monazite is absent in rocks of the phyllite zone, but is abundant as small, unzonedgrains in the schist zone. Textural relationships and chemical composition indicate thatthese monazites grew prior to garnet and andalusite due to a reaction of the form allanite+ apatite + Al-Fe-Mg phases1 = monazite + anorthite + Al-Fe-Mg phases2 (Janots et al.,2008) at temperatures of ~550°C and pressures of ~3.5 kbar. The metamorphic conditionsof this monazite-in reaction seem not to be influenced by the CaO-content or the CaO/SiO2ratio of the samples as suggested by Wing et al. (2003) and Foster & Parrish (2003), orby compositional variations in the AFM space. Dating these schist-zone monazites wouldprobably reveal a prograde PT age, but separating the small monazites from their host rockwas not successful.
(3) Samples from the gneiss zone with bulk rock compositions close to average metapelitescontain abundant, large, complexly zoned monazite. The chemical composition of the mon-azites from one of these samples suggest that a first Th-rich, Y-poor generation grew afterthe formation of garnet, possibly due to the crystallization of melt, whereas a second, Th-poor, Y-rich generation possibly formed during retrograde consumption of garnet in an earlystage of the cooling history. U-Pb SHRIMP ages of the two different zones are within error
106
of each other indicating that these complexly zoned monazites formed over a short timeperiod close to or at the metamorphic peak. Combined with the maximum depositional ageof ~60-65 Ma for the sediments in which the CMC developed, these peak metamorphicages reveal an average heating rate of ~60-140°C/Ma for the available ~5-10 Ma betweendeposition and metamorphic peak.
(4) Allanite is present (a) in the low-grade phyllites, (b) as peak metamorphic mineral insamples with high CaO-content and with relatively high peak pressures (~8-10 kbar), and(c) as retrograde crystals in altered zones related to fluid flow in some gneiss samples.Allanite therefore might represent an ideal mineral to date prograde metamorphism in thephyllite zone, the timing of peak pressure metamorphism in the gneiss zone, or the timingof fluid flow related to younger faults.
(5) Xenotime is present in all metamorphic zones in samples with metapelitic bulk rockcompositions. It is often present as idiomorphic overgrowth on zircon. Textural relation-ships between xenotime and monazite, allanite, garnet, andalusite or staurolite have notbeen observed and linking xenotime growth with the reaction history of the other mineralsis therefore not straightforward. Its application as a geochronometer in the rocks of theCMC is therefore probably limited.
Acknowledgments U. Klötzli is thanked for pointing me to the importance of monazite-allanite-xenotimerelationships in prograde metamorphic sequences at the PANGEO conference 2008. R. Schuster proposed todate garnets from the CMC after having seen our mineral separates - he did the entire handpicking, chemicaltreating and isotopic analyses for the Sm-Nd garnet age. Many thanks for that! D. Rubatto is thanked forguidance during U-Pb monazite dating at ANU, Canberra, and for correcting parts of this chapter. C. Carsonis thanked for his hospitality in Canberra. J. Neubauer was always there when there was a problem with theSEM at the University of Graz (even on sunday mornings!). F. Zaccharini is thanked for help with the monaziteanalyses in Leoben.
107
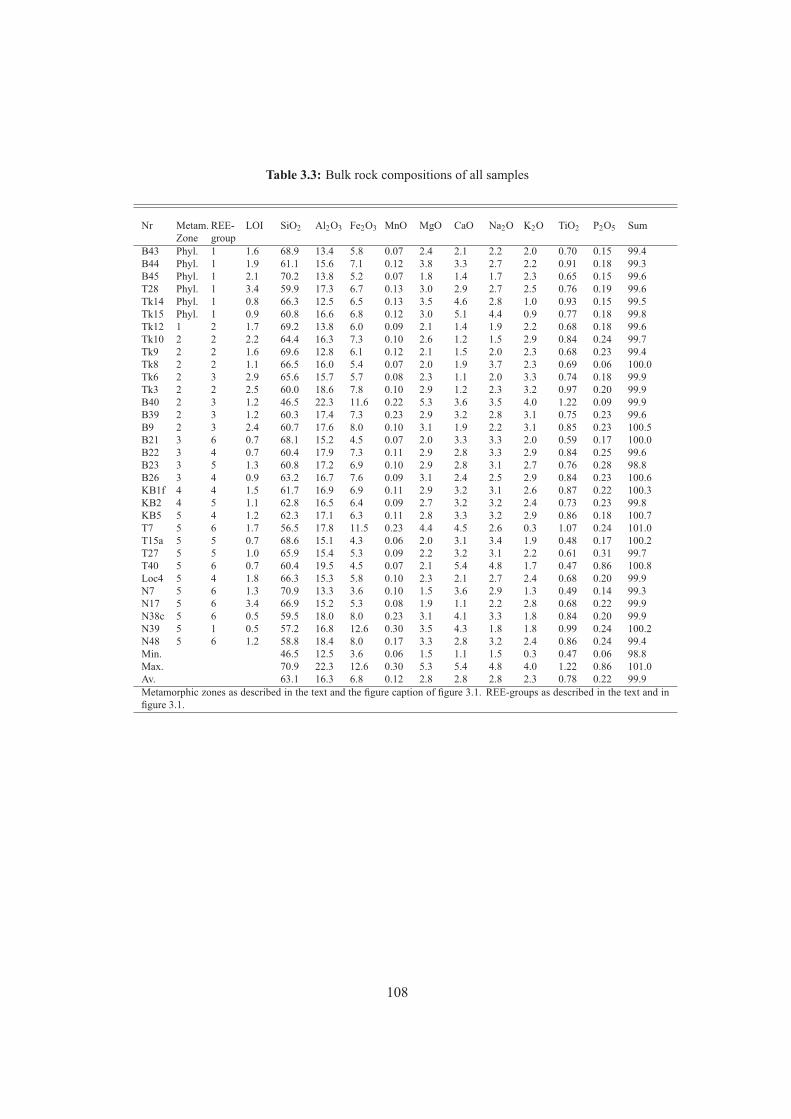
Table 3.3: Bulk rock compositions of all samples
Nr Metam.Zone
REE-group
LOI SiO2 Al2O3 Fe2O3 MnO MgO CaO Na2O K2O TiO2 P2O5 Sum
B43 Phyl. 1 1.6 68.9 13.4 5.8 0.07 2.4 2.1 2.2 2.0 0.70 0.15 99.4B44 Phyl. 1 1.9 61.1 15.6 7.1 0.12 3.8 3.3 2.7 2.2 0.91 0.18 99.3B45 Phyl. 1 2.1 70.2 13.8 5.2 0.07 1.8 1.4 1.7 2.3 0.65 0.15 99.6T28 Phyl. 1 3.4 59.9 17.3 6.7 0.13 3.0 2.9 2.7 2.5 0.76 0.19 99.6Tk14 Phyl. 1 0.8 66.3 12.5 6.5 0.13 3.5 4.6 2.8 1.0 0.93 0.15 99.5Tk15 Phyl. 1 0.9 60.8 16.6 6.8 0.12 3.0 5.1 4.4 0.9 0.77 0.18 99.8Tk12 1 2 1.7 69.2 13.8 6.0 0.09 2.1 1.4 1.9 2.2 0.68 0.18 99.6Tk10 2 2 2.2 64.4 16.3 7.3 0.10 2.6 1.2 1.5 2.9 0.84 0.24 99.7Tk9 2 2 1.6 69.6 12.8 6.1 0.12 2.1 1.5 2.0 2.3 0.68 0.23 99.4Tk8 2 2 1.1 66.5 16.0 5.4 0.07 2.0 1.9 3.7 2.3 0.69 0.06 100.0Tk6 2 3 2.9 65.6 15.7 5.7 0.08 2.3 1.1 2.0 3.3 0.74 0.18 99.9Tk3 2 2 2.5 60.0 18.6 7.8 0.10 2.9 1.2 2.3 3.2 0.97 0.20 99.9B40 2 3 1.2 46.5 22.3 11.6 0.22 5.3 3.6 3.5 4.0 1.22 0.09 99.9B39 2 3 1.2 60.3 17.4 7.3 0.23 2.9 3.2 2.8 3.1 0.75 0.23 99.6B9 2 3 2.4 60.7 17.6 8.0 0.10 3.1 1.9 2.2 3.1 0.85 0.23 100.5B21 3 6 0.7 68.1 15.2 4.5 0.07 2.0 3.3 3.3 2.0 0.59 0.17 100.0B22 3 4 0.7 60.4 17.9 7.3 0.11 2.9 2.8 3.3 2.9 0.84 0.25 99.6B23 3 5 1.3 60.8 17.2 6.9 0.10 2.9 2.8 3.1 2.7 0.76 0.28 98.8B26 3 4 0.9 63.2 16.7 7.6 0.09 3.1 2.4 2.5 2.9 0.84 0.23 100.6KB1f 4 4 1.5 61.7 16.9 6.9 0.11 2.9 3.2 3.1 2.6 0.87 0.22 100.3KB2 4 5 1.1 62.8 16.5 6.4 0.09 2.7 3.2 3.2 2.4 0.73 0.23 99.8KB5 5 4 1.2 62.3 17.1 6.3 0.11 2.8 3.3 3.2 2.9 0.86 0.18 100.7T7 5 6 1.7 56.5 17.8 11.5 0.23 4.4 4.5 2.6 0.3 1.07 0.24 101.0T15a 5 5 0.7 68.6 15.1 4.3 0.06 2.0 3.1 3.4 1.9 0.48 0.17 100.2T27 5 5 1.0 65.9 15.4 5.3 0.09 2.2 3.2 3.1 2.2 0.61 0.31 99.7T40 5 6 0.7 60.4 19.5 4.5 0.07 2.1 5.4 4.8 1.7 0.47 0.86 100.8Loc4 5 4 1.8 66.3 15.3 5.8 0.10 2.3 2.1 2.7 2.4 0.68 0.20 99.9N7 5 6 1.3 70.9 13.3 3.6 0.10 1.5 3.6 2.9 1.3 0.49 0.14 99.3N17 5 6 3.4 66.9 15.2 5.3 0.08 1.9 1.1 2.2 2.8 0.68 0.22 99.9N38c 5 6 0.5 59.5 18.0 8.0 0.23 3.1 4.1 3.3 1.8 0.84 0.20 99.9N39 5 1 0.5 57.2 16.8 12.6 0.30 3.5 4.3 1.8 1.8 0.99 0.24 100.2N48 5 6 1.2 58.8 18.4 8.0 0.17 3.3 2.8 3.2 2.4 0.86 0.24 99.4Min. 46.5 12.5 3.6 0.06 1.5 1.1 1.5 0.3 0.47 0.06 98.8Max. 70.9 22.3 12.6 0.30 5.3 5.4 4.8 4.0 1.22 0.86 101.0Av. 63.1 16.3 6.8 0.12 2.8 2.8 2.8 2.3 0.78 0.22 99.9Metamorphic zones as described in the text and the figure caption of figure 3.1. REE-groups as described in the text and infigure 3.1.
108
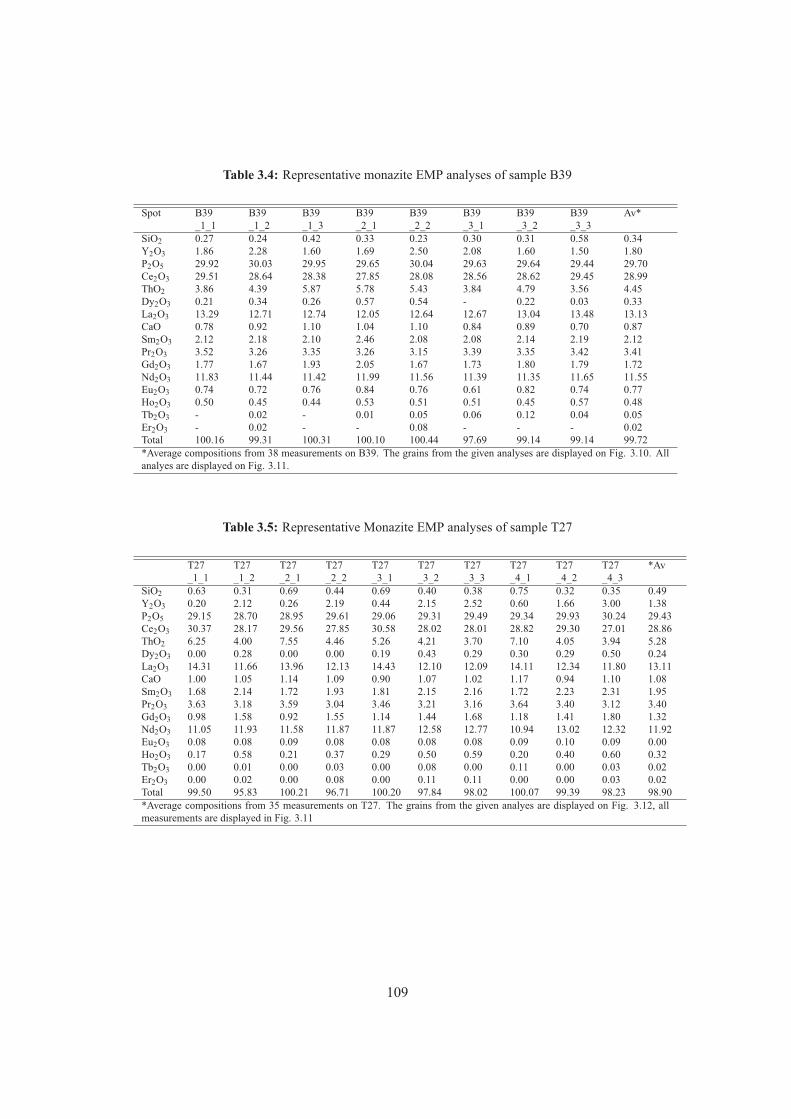
Table 3.4: Representative monazite EMP analyses of sample B39
Spot B39 B39 B39 B39 B39 B39 B39 B39 Av*_1_1 _1_2 _1_3 _2_1 _2_2 _3_1 _3_2 _3_3
SiO2 0.27 0.24 0.42 0.33 0.23 0.30 0.31 0.58 0.34Y2O3 1.86 2.28 1.60 1.69 2.50 2.08 1.60 1.50 1.80P2O5 29.92 30.03 29.95 29.65 30.04 29.63 29.64 29.44 29.70Ce2O3 29.51 28.64 28.38 27.85 28.08 28.56 28.62 29.45 28.99ThO2 3.86 4.39 5.87 5.78 5.43 3.84 4.79 3.56 4.45Dy2O3 0.21 0.34 0.26 0.57 0.54 - 0.22 0.03 0.33La2O3 13.29 12.71 12.74 12.05 12.64 12.67 13.04 13.48 13.13CaO 0.78 0.92 1.10 1.04 1.10 0.84 0.89 0.70 0.87Sm2O3 2.12 2.18 2.10 2.46 2.08 2.08 2.14 2.19 2.12Pr2O3 3.52 3.26 3.35 3.26 3.15 3.39 3.35 3.42 3.41Gd2O3 1.77 1.67 1.93 2.05 1.67 1.73 1.80 1.79 1.72Nd2O3 11.83 11.44 11.42 11.99 11.56 11.39 11.35 11.65 11.55Eu2O3 0.74 0.72 0.76 0.84 0.76 0.61 0.82 0.74 0.77Ho2O3 0.50 0.45 0.44 0.53 0.51 0.51 0.45 0.57 0.48Tb2O3 - 0.02 - 0.01 0.05 0.06 0.12 0.04 0.05Er2O3 - 0.02 - - 0.08 - - - 0.02Total 100.16 99.31 100.31 100.10 100.44 97.69 99.14 99.14 99.72*Average compositions from 38 measurements on B39. The grains from the given analyses are displayed on Fig. 3.10. Allanalyes are displayed on Fig. 3.11.
Table 3.5: Representative Monazite EMP analyses of sample T27
T27 T27 T27 T27 T27 T27 T27 T27 T27 T27 *Av_1_1 _1_2 _2_1 _2_2 _3_1 _3_2 _3_3 _4_1 _4_2 _4_3
SiO2 0.63 0.31 0.69 0.44 0.69 0.40 0.38 0.75 0.32 0.35 0.49Y2O3 0.20 2.12 0.26 2.19 0.44 2.15 2.52 0.60 1.66 3.00 1.38P2O5 29.15 28.70 28.95 29.61 29.06 29.31 29.49 29.34 29.93 30.24 29.43Ce2O3 30.37 28.17 29.56 27.85 30.58 28.02 28.01 28.82 29.30 27.01 28.86ThO2 6.25 4.00 7.55 4.46 5.26 4.21 3.70 7.10 4.05 3.94 5.28Dy2O3 0.00 0.28 0.00 0.00 0.19 0.43 0.29 0.30 0.29 0.50 0.24La2O3 14.31 11.66 13.96 12.13 14.43 12.10 12.09 14.11 12.34 11.80 13.11CaO 1.00 1.05 1.14 1.09 0.90 1.07 1.02 1.17 0.94 1.10 1.08Sm2O3 1.68 2.14 1.72 1.93 1.81 2.15 2.16 1.72 2.23 2.31 1.95Pr2O3 3.63 3.18 3.59 3.04 3.46 3.21 3.16 3.64 3.40 3.12 3.40Gd2O3 0.98 1.58 0.92 1.55 1.14 1.44 1.68 1.18 1.41 1.80 1.32Nd2O3 11.05 11.93 11.58 11.87 11.87 12.58 12.77 10.94 13.02 12.32 11.92Eu2O3 0.08 0.08 0.09 0.08 0.08 0.08 0.08 0.09 0.10 0.09 0.00Ho2O3 0.17 0.58 0.21 0.37 0.29 0.50 0.59 0.20 0.40 0.60 0.32Tb2O3 0.00 0.01 0.00 0.03 0.00 0.08 0.00 0.11 0.00 0.03 0.02Er2O3 0.00 0.02 0.00 0.08 0.00 0.11 0.11 0.00 0.00 0.03 0.02Total 99.50 95.83 100.21 96.71 100.20 97.84 98.02 100.07 99.39 98.23 98.90*Average compositions from 35 measurements on T27. The grains from the given analyes are displayed on Fig. 3.12, allmeasurements are displayed in Fig. 3.11
109
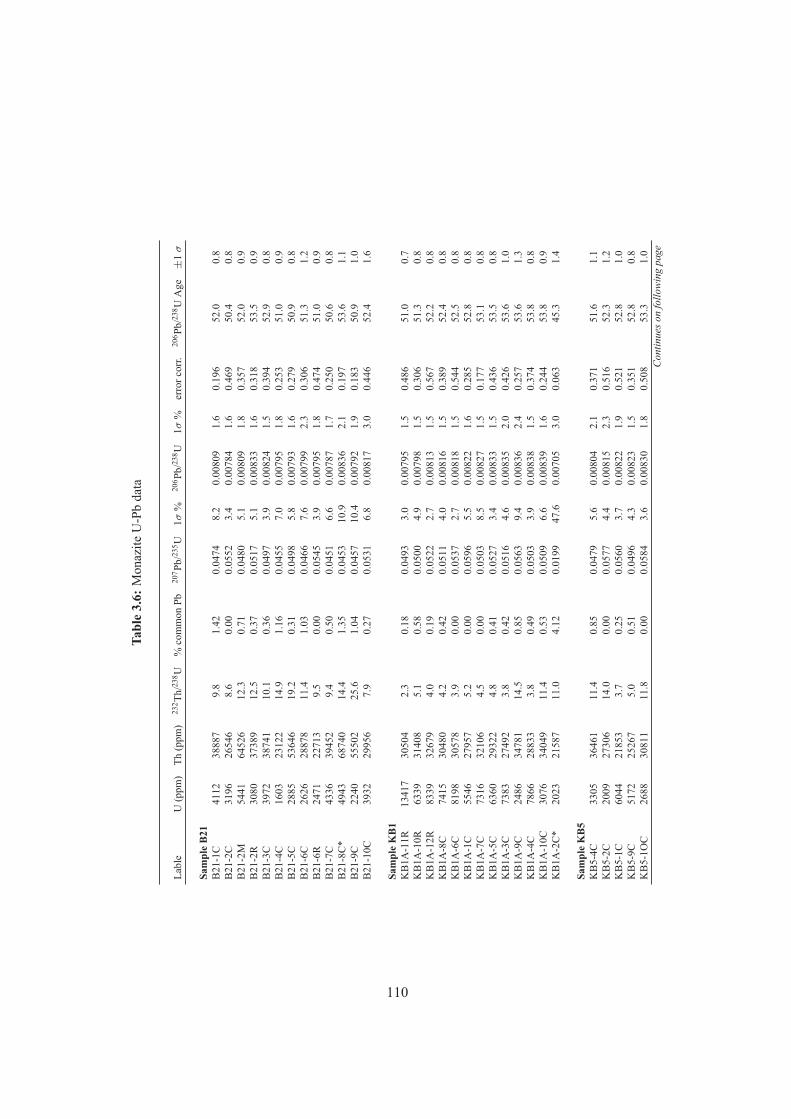
Tabl
e3.
6:M
onaz
iteU
-Pb
data
Labl
eU
(ppm
)Th
(ppm
)23
2 Th/
238 U
%co
mm
onPb
207 P
b/23
5 U1σ
%20
6 Pb/
238 U
1σ%
erro
rcor
r.20
6 Pb/
238 U
Age
±1
σ
Sam
ple
B21
B21
-1C
4112
3888
79.
81.
420.
0474
8.2
0.00
809
1.6
0.19
652
.00.
8B
21-2
C31
9626
546
8.6
0.00
0.05
523.
40.
0078
41.
60.
469
50.4
0.8
B21
-2M
5441
6452
612
.30.
710.
0480
5.1
0.00
809
1.8
0.35
752
.00.
9B
21-2
R30
8037
389
12.5
0.37
0.05
175.
10.
0083
31.
60.
318
53.5
0.9
B21
-3C
3972
3874
110
.10.
360.
0497
3.9
0.00
824
1.5
0.39
452
.90.
8B
21-4
C16
0323
122
14.9
1.16
0.04
557.
00.
0079
51.
80.
253
51.0
0.9
B21
-5C
2885
5364
619
.20.
310.
0498
5.8
0.00
793
1.6
0.27
950
.90.
8B
21-6
C26
2628
878
11.4
1.03
0.04
667.
60.
0079
92.
30.
306
51.3
1.2
B21
-6R
2471
2271
39.
50.
000.
0545
3.9
0.00
795
1.8
0.47
451
.00.
9B
21-7
C43
3639
452
9.4
0.50
0.04
516.
60.
0078
71.
70.
250
50.6
0.8
B21
-8C
*49
4368
740
14.4
1.35
0.04
5310
.90.
0083
62.
10.
197
53.6
1.1
B21
-9C
2240
5550
225
.61.
040.
0457
10.4
0.00
792
1.9
0.18
350
.91.
0B
21-1
0C39
3229
956
7.9
0.27
0.05
316.
80.
0081
73.
00.
446
52.4
1.6
Sam
ple
KB
1K
B1A
-11R
1341
730
504
2.3
0.18
0.04
933.
00.
0079
51.
50.
486
51.0
0.7
KB
1A-1
0R63
3931
408
5.1
0.58
0.05
004.
90.
0079
81.
50.
306
51.3
0.8
KB
1A-1
2R83
3932
679
4.0
0.19
0.05
222.
70.
0081
31.
50.
567
52.2
0.8
KB
1A-8
C74
1530
480
4.2
0.42
0.05
114.
00.
0081
61.
50.
389
52.4
0.8
KB
1A-6
C81
9830
578
3.9
0.00
0.05
372.
70.
0081
81.
50.
544
52.5
0.8
KB
1A-1
C55
4627
957
5.2
0.00
0.05
965.
50.
0082
21.
60.
285
52.8
0.8
KB
1A-7
C73
1632
106
4.5
0.00
0.05
038.
50.
0082
71.
50.
177
53.1
0.8
KB
1A-5
C63
6029
322
4.8
0.41
0.05
273.
40.
0083
31.
50.
436
53.5
0.8
KB
1A-3
C73
8327
492
3.8
0.42
0.05
164.
60.
0083
52.
00.
426
53.6
1.0
KB
1A-9
C24
8634
781
14.5
0.85
0.05
639.
40.
0083
62.
40.
257
53.6
1.3
KB
1A-4
C78
6628
833
3.8
0.49
0.05
033.
90.
0083
81.
50.
374
53.8
0.8
KB
1A-1
0C30
7634
049
11.4
0.53
0.05
096.
60.
0083
91.
60.
244
53.8
0.9
KB
1A-2
C*
2023
2158
711
.04.
120.
0199
47.6
0.00
705
3.0
0.06
345
.31.
4
Sam
ple
KB
5K
B5-
4C33
0536
461
11.4
0.85
0.04
795.
60.
0080
42.
10.
371
51.6
1.1
KB
5-2C
2009
2730
614
.00.
000.
0577
4.4
0.00
815
2.3
0.51
652
.31.
2K
B5-
1C60
4421
853
3.7
0.25
0.05
603.
70.
0082
21.
90.
521
52.8
1.0
KB
5-9C
5172
2526
75.
00.
510.
0496
4.3
0.00
823
1.5
0.35
152
.80.
8K
B5-
1OC
2688
3081
111
.80.
000.
0584
3.6
0.00
830
1.8
0.50
853
.31.
0Continuesonfollowingpage
110
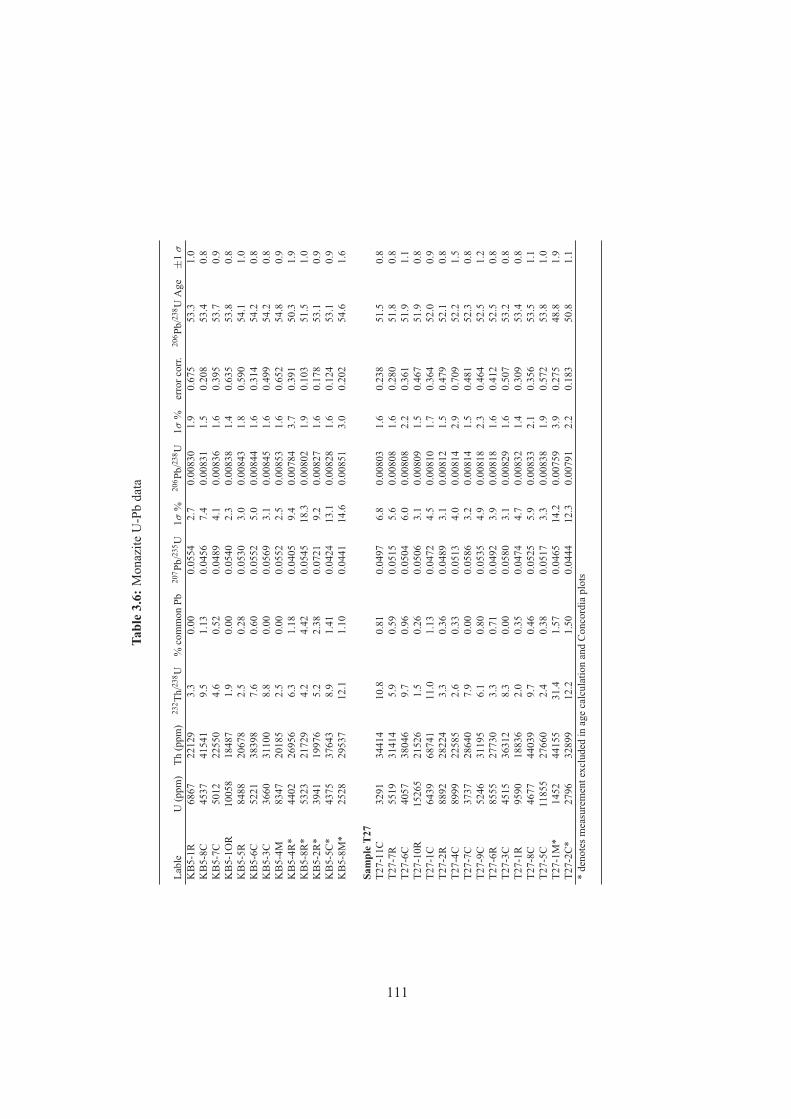
Tabl
e3.
6:M
onaz
iteU
-Pb
data
Labl
eU
(ppm
)Th
(ppm
)23
2 Th/
238 U
%co
mm
onPb
207 P
b/23
5 U1σ
%20
6 Pb/
238 U
1σ%
erro
rcor
r.20
6 Pb/
238 U
Age
±1
σ
KB
5-1R
6867
2212
93.
30.
000.
0554
2.7
0.00
830
1.9
0.67
553
.31.
0K
B5-
8C45
3741
541
9.5
1.13
0.04
567.
40.
0083
11.
50.
208
53.4
0.8
KB
5-7C
5012
2255
04.
60.
520.
0489
4.1
0.00
836
1.6
0.39
553
.70.
9K
B5-
1OR
1005
818
487
1.9
0.00
0.05
402.
30.
0083
81.
40.
635
53.8
0.8
KB
5-5R
8488
2067
82.
50.
280.
0530
3.0
0.00
843
1.8
0.59
054
.11.
0K
B5-
6C52
2138
398
7.6
0.60
0.05
525.
00.
0084
41.
60.
314
54.2
0.8
KB
5-3C
3660
3110
08.
80.
000.
0569
3.1
0.00
845
1.6
0.49
954
.20.
8K
B5-
4M83
4720
185
2.5
0.00
0.05
522.
50.
0085
31.
60.
652
54.8
0.9
KB
5-4R
*44
0226
956
6.3
1.18
0.04
059.
40.
0078
43.
70.
391
50.3
1.9
KB
5-8R
*53
2321
729
4.2
4.42
0.05
4518
.30.
0080
21.
90.
103
51.5
1.0
KB
5-2R
*39
4119
976
5.2
2.38
0.07
219.
20.
0082
71.
60.
178
53.1
0.9
KB
5-5C
*43
7537
643
8.9
1.41
0.04
2413
.10.
0082
81.
60.
124
53.1
0.9
KB
5-8M
*25
2829
537
12.1
1.10
0.04
4114
.60.
0085
13.
00.
202
54.6
1.6
Sam
ple
T27
T27-
11C
3291
3441
410
.80.
810.
0497
6.8
0.00
803
1.6
0.23
851
.50.
8T2
7-7R
5519
3141
45.
90.
590.
0515
5.6
0.00
808
1.6
0.28
051
.80.
8T2
7-6C
4057
3804
69.
70.
960.
0504
6.0
0.00
808
2.2
0.36
151
.91.
1T2
7-10
R15
265
2152
61.
50.
260.
0506
3.1
0.00
809
1.5
0.46
751
.90.
8T2
7-1C
6439
6874
111
.01.
130.
0472
4.5
0.00
810
1.7
0.36
452
.00.
9T2
7-2R
8892
2822
43.
30.
360.
0489
3.1
0.00
812
1.5
0.47
952
.10.
8T2
7-4C
8999
2258
52.
60.
330.
0513
4.0
0.00
814
2.9
0.70
952
.21.
5T2
7-7C
3737
2864
07.
90.
000.
0586
3.2
0.00
814
1.5
0.48
152
.30.
8T2
7-9C
5246
3119
56.
10.
800.
0535
4.9
0.00
818
2.3
0.46
452
.51.
2T2
7-6R
8555
2773
03.
30.
710.
0492
3.9
0.00
818
1.6
0.41
252
.50.
8T2
7-3C
4515
3631
28.
30.
000.
0580
3.1
0.00
829
1.6
0.50
753
.20.
8T2
7-1R
9590
1883
62.
00.
350.
0474
4.7
0.00
832
1.4
0.30
953
.40.
8T2
7-8C
4677
4403
99.
70.
460.
0525
5.9
0.00
833
2.1
0.35
653
.51.
1T2
7-5C
1185
527
660
2.4
0.38
0.05
173.
30.
0083
81.
90.
572
53.8
1.0
T27-
1M*
1452
4415
531
.41.
570.
0465
14.2
0.00
759
3.9
0.27
548
.81.
9T2
7-2C
*27
9632
899
12.2
1.50
0.04
4412
.30.
0079
12.
20.
183
50.8
1.1
*de
note
smea
sure
men
texc
lude
din
age
calc
ulat
ion
and
Con
cord
iapl
ots
111

Chapter 4
Large-scale, short-lived metamorphism and magmatism in theChugach Metamorphic Complex (CMC), southern Alaska: a
zircon U-Pb SHRIMP study
Abstract We present U-Pb SHRIMP geochronology of metamorphic and magmatic zir-cons from the Chugach Metamorphic Complex, southern Alaska. Seven metamorphic andmagmatic zircon ages from the western and central parts of the complex range between54.0±0.9 Ma and 52.6±0.8 Ma and are within error of each other. One metamorphic zir-con age from the south-eastern part is 51.3±0.7 Ma, which is within error of two of theseven samples from the western and central parts. Combined with previous U-Pb ages ofmagmatic rocks of the Sanak-Baranof belt, our data constrain the age and duration of meta-morphism and magmatism to ~3 Ma between ~55-52 Ma on a ~200 km long section in thewestern and central part of the complex, and to ~2 Ma between ~52-50 Ma on a ~400 kmlong section from the south-eastern part of the complex to Baranof Island. Youngest de-trital zircon grains from one of the samples (~63 Ma) limit the time available for progrademetamorphism to only ~8 Ma. Cooling ages of ~53-46 Ma from the literature for the west-ern and central part of the complex point to fast cooling after metamorphism. Such a shortmetamorphic cycle simultaneously occurring over a large distance is difficult to explain byheat conduction, and advective heat sources like fluids or magmas can also be excluded. Wepropose that this cycle is best explained by advection of material during rapid, penetrativedeformation in an actively deforming fold-and-thrust belt aided by internal heat productionfrom strain heating.
submitted to Geological Society of America Bulletin
113
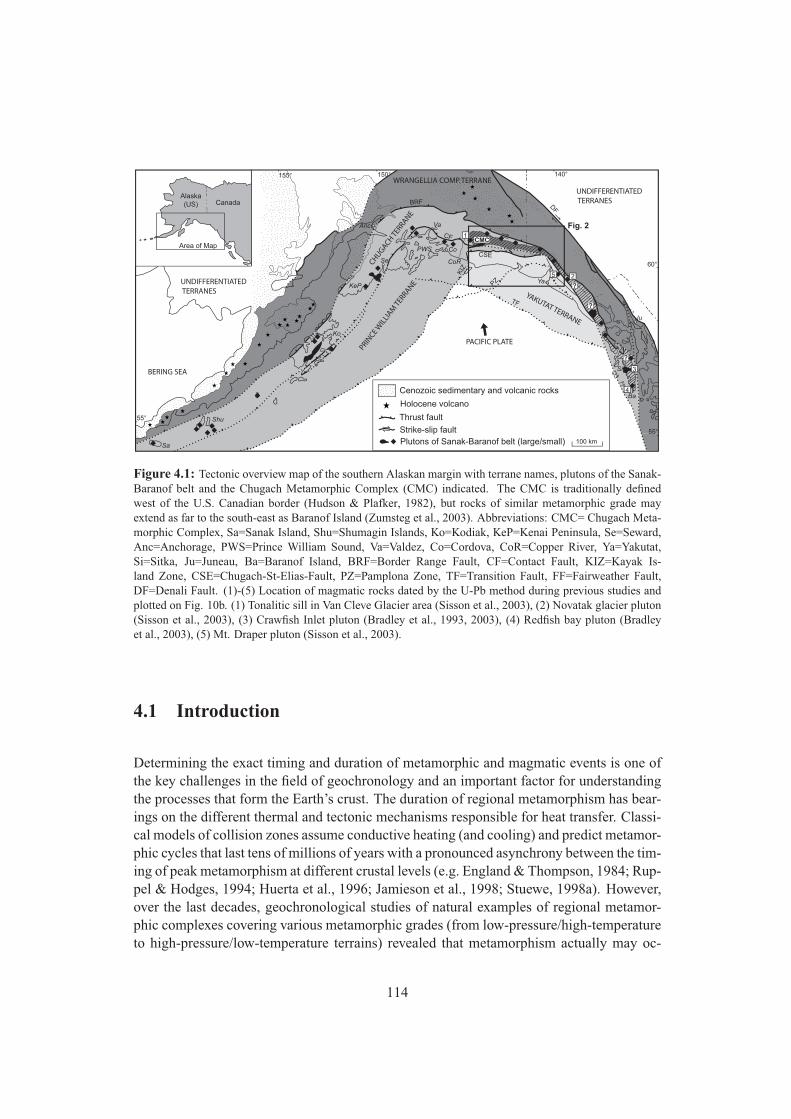
Anc
Se
Va
Co
Ya
Si
Ju
Alaska(US) Canada
Ko
PACIFIC PLATE
CF
BRF
FF
CSE
Area of MapDF
TF
KIZ
PZ
155° 150°145° 140°
60°
55°
PRINCE W
ILLI
AM TE
RRANE
CHUGACH TERRANE
WRANGELLIA COMP. TERRANE
YAKUTAT TERRANE
CMC
?
?
?
Fig. 2
BERING SEA
UNDIFFERENTIATED TERRANES
Sa
Shu
KeP
Ba
55°
UNDIFFERENTIATED TERRANES
PWS
CoR
Holocene volcano
100 km
Cenozoic sedimentary and volcanic rocks
Thrust fault
Strike-slip fault
Plutons of Sanak-Baranof belt (large/small)
1
2
3
4
5
Figure 4.1: Tectonic overview map of the southern Alaskan margin with terrane names, plutons of the Sanak-Baranof belt and the Chugach Metamorphic Complex (CMC) indicated. The CMC is traditionally definedwest of the U.S. Canadian border (Hudson & Plafker, 1982), but rocks of similar metamorphic grade mayextend as far to the south-east as Baranof Island (Zumsteg et al., 2003). Abbreviations: CMC= Chugach Meta-morphic Complex, Sa=Sanak Island, Shu=Shumagin Islands, Ko=Kodiak, KeP=Kenai Peninsula, Se=Seward,Anc=Anchorage, PWS=Prince William Sound, Va=Valdez, Co=Cordova, CoR=Copper River, Ya=Yakutat,Si=Sitka, Ju=Juneau, Ba=Baranof Island, BRF=Border Range Fault, CF=Contact Fault, KIZ=Kayak Is-land Zone, CSE=Chugach-St-Elias-Fault, PZ=Pamplona Zone, TF=Transition Fault, FF=Fairweather Fault,DF=Denali Fault. (1)-(5) Location of magmatic rocks dated by the U-Pb method during previous studies andplotted on Fig. 10b. (1) Tonalitic sill in Van Cleve Glacier area (Sisson et al., 2003), (2) Novatak glacier pluton(Sisson et al., 2003), (3) Crawfish Inlet pluton (Bradley et al., 1993, 2003), (4) Redfish bay pluton (Bradleyet al., 2003), (5) Mt. Draper pluton (Sisson et al., 2003).
4.1 Introduction
Determining the exact timing and duration of metamorphic and magmatic events is one ofthe key challenges in the field of geochronology and an important factor for understandingthe processes that form the Earth’s crust. The duration of regional metamorphism has bear-ings on the different thermal and tectonic mechanisms responsible for heat transfer. Classi-cal models of collision zones assume conductive heating (and cooling) and predict metamor-phic cycles that last tens of millions of years with a pronounced asynchrony between the tim-ing of peak metamorphism at different crustal levels (e.g. England & Thompson, 1984; Rup-pel & Hodges, 1994; Huerta et al., 1996; Jamieson et al., 1998; Stuewe, 1998a). However,over the last decades, geochronological studies of natural examples of regional metamor-phic complexes covering various metamorphic grades (from low-pressure/high-temperatureto high-pressure/low-temperature terrains) revealed that metamorphism actually may oc-
114
cur over much shorter time periods and/or proceed in short-lived episodes (e.g. Wijbrans& McDougall, 1987; Chamberlain & Rumble, 1988; Treolar, 1997; Philippot et al., 2001;Rubatto & Hermann, 2001; Camacho et al., 2005; Dewey, 2005; Forster & Lister, 2005;Ague & Baxter, 2007; Beltrando et al., 2007; Lancaster et al., 2008). Such short thermalspikes associated with high rates of heating and cooling are difficult to explain by conduc-tive processes only, and other processes such as advective ascent of magmas or fluids (e.g.Lux et al., 1986; De Yoreo et al., 1991), tectonic advection via rapid burial or exhumation ofisolated crustal blocks (e.g. Rubatto & Hermann, 2001), or in-situ production of radiogenicand mechanical or chemical heat (e.g. Burg & Gerya, 2005) were postulated to contributeto the formation of regional metamorphic terrains. Metamorphism as the result of such ad-vective or heat-producing processes is not limited by relatively slow heat conduction andcan therefore be fast, short-lived and synchronous over large areas.
In this contribution we present the results of U-Pb SHRIMP zircon geochronology on alarge-scale metamorphic complex which is exposed in the Late Cretaceous to Paleoceneaccretionary prism of southern Alaska: the Chugach Metamorphic Complex (CMC, Fig.4.1 and 4.2; Hudson & Plafker, 1982; Sisson & Hollister, 1988; Sisson et al., 1989). Nogeochronological ages which would document the exact timing and duration of peak meta-morphism in this complex are available so far. The only two K-Ar cooling ages from themetamorphic rocks of the CMC (51.5±2 and 46.7±2 Ma for hornblende and biotite, re-spectively; Hudson et al., 1979) suggest that a relatively short time period was available toproduce the metamorphic complex in Late Cretaceous to Paleocene sedimentary rocks. Ourfirst goal is to constrain the timing and duration of peak metamorphism in the CMC. In ad-dition, the metamorphic rocks of the CMC are associated with magmatic rocks, which arepart of a larger plutonic belt that extends from Sanak Island in the west to Baranof Islandin the south-east: the Sanak-Baranof plutonic belt (Fig. 4.1; Hudson et al., 1979; Farris &Paterson, 2009). Geochronological data from these magmatic rocks suggest that there isan age gradient in the magmatism from ~61 Ma in the west to ~50 Ma in the east (Bradleyet al., 1993, 2000, 2003; Häussler et al., 1995, 2003a; Sisson et al., 2003; Farris et al., 2006).In this context, our second goal is to understand the timing relationships between metamor-phism and magmatism and to determine if the west-east age gradient that is present in themagmatic rocks is also recorded in the metamorphic rocks of the CMC. We finally discussimplications of our results for possible heat transfer mechanisms into the complex.
4.2 Geology of the southern Alaskan margin
The southern Alaskan margin consists of a complexly deformed accretionary prism thatformed from the Late Triassic to the present due to the northward oblique subduction ofoceanic plates of the Pacific basin below the North American continent. South of thepresent-day volcanic arc, this prism is generally subdivided into the Chugach, Prince Williamand Yakutat terranes (Fig. 4.1; Plafker et al., 1994). The most landward terrane - the
115
Chugach terrane - is bound to the north by the Border Range Fault and consists of a north-ern, narrow, Late Triassic to Cretaceous mélange belt (~10% of the terrane) and a southern,more homogenous Late Cretaceous to Paleogene volcano-clastic turbidite sequence (~90%of the terrane). This turbidite sequence extends from Sanak Island in the west to Baranof Is-land in the south-east and consists of greenschist-facies conglomerates, impure sandstones,marls and claystones, which are intercalated with mafic volcanic rocks. The turbidite se-quence has been interpreted to represent a deep marine trench-fill deposit derived from amagmatic arc south-east of the current exposure (Nilsen & Zuffa, 1982; Farmer et al., 1993;Plafker et al., 1994). Several local formation or group names such as Shumagin and Ko-diak Formation, Valdez Group and Sitka Greywacke have been assigned to this turbiditesequence. The Chugach Metamorphic Complex described further below is developed in theValdez Group of the Chugach terrane (Fig. 4.1).
Mafic rocks are especially abundant in the southern Chugach terrane east of Prince WilliamSound and form a narrow (~1-3 km wide) belt of greenschist- to amphibolite-facies rocks,intercalated with sediments, which extends from Valdez in the west down to Baranof Islandin the south-east (Fig. 4.2; Lull & Plafker, 1990). A seismic profile through the PrinceWilliam Sound region suggests that those rocks are the surface expression of an up to 10km thick package of mafic rocks and sediments which dips from the surface northwardsbelow the Chugach terrane down to depths of at least ~20 km (Fuis et al., 1991, 2008).
The Prince-William terrane farther seawards consists of similar turbidites of slightly youngerage (mainly the Eocene Orca group), which are separated from the Chugach terrane by thesyn- to post-accretionary Contact fault system (Fig. 4.1; Plafker et al., 1994). The Yakutatterrane finally consists of an oceanic and continental basement that is overlain by thick,clastic Neogene sediments. The continental basement consists of metamorphosed, Creta-ceous to Paleogene turbiditic rocks similar to the rocks of the Chugach terrane. The Yakutatterrane was dextrally displaced along the Fairweather fault and now actively collides withthe Chugach and Prince William terranes farther inboard (Fig. 4.1; Plafker et al., 1994).
Magmatic rocks of the Sanak-Baranof plutonic belt intrude the Chugach terrane and thenorthernmost part of the Prince William terrane, from Sanak Island in the west to BaranofIsland in the southeast (Fig. 4.1; Hudson et al., 1979; Farris & Paterson, 2009). The beltconsists of a series of tonalitic, granodioritic and granitic intrusions a few hundred meters toseveral kilometers in size. The plutons are insofar unusual as they intrude the accretionaryprism shortly after its accretion and are therefore located in an extreme forearc-position- the corresponding coeval magmatic arc is located a few hundred kilometres farther in-board (Kuskokwim-Alaska-Range belt and Kluane belt/Coast Plutonic Complex, Plafkeret al., 1994). Geochemically, the intrusions consist of sediment-derived and mantle-derivedcomponents. Apart from local complexities, some general trends can be observed in the in-trusions from west to east. The western part from Sanak to Kodiak Island is characterized bywide spacing between magmatic centers, low regional metamorphic grade, and intrusionsmainly derived from melted sediments, with only minor basaltic components. The easternpart from the western CMC to Baranof Island is characterized by narrow spacing between
116
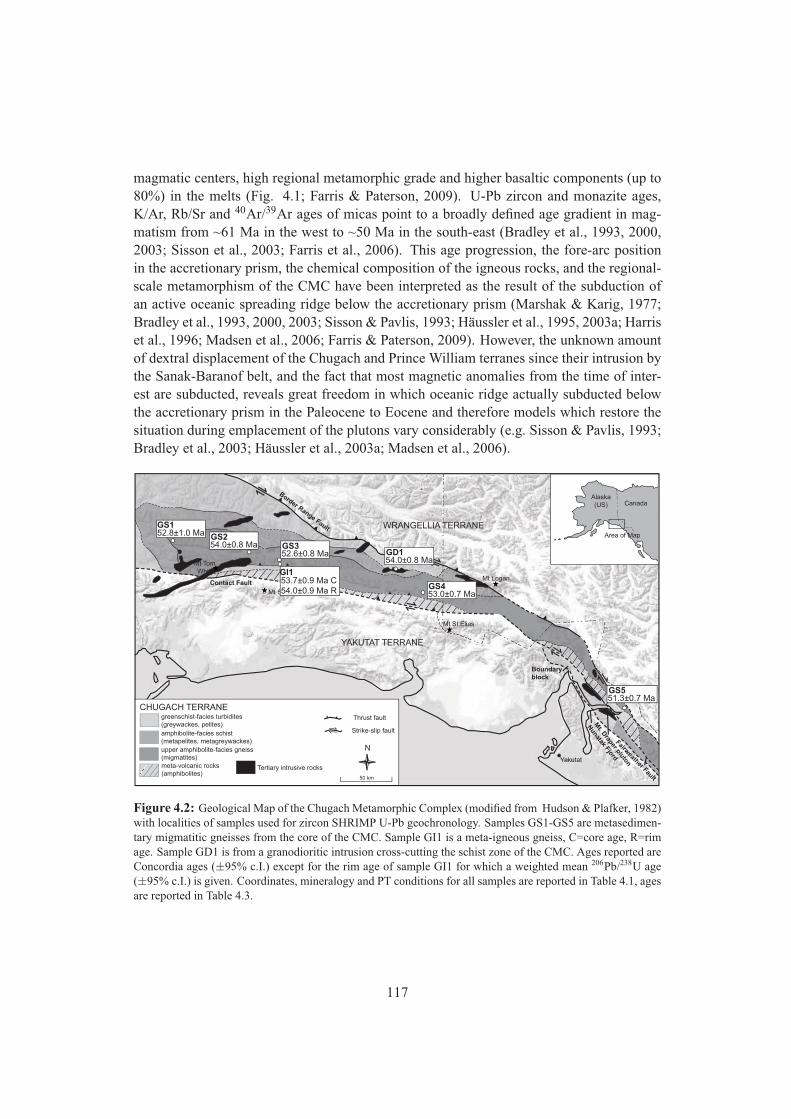
magmatic centers, high regional metamorphic grade and higher basaltic components (up to80%) in the melts (Fig. 4.1; Farris & Paterson, 2009). U-Pb zircon and monazite ages,K/Ar, Rb/Sr and 40Ar/39Ar ages of micas point to a broadly defined age gradient in mag-matism from ~61 Ma in the west to ~50 Ma in the south-east (Bradley et al., 1993, 2000,2003; Sisson et al., 2003; Farris et al., 2006). This age progression, the fore-arc positionin the accretionary prism, the chemical composition of the igneous rocks, and the regional-scale metamorphism of the CMC have been interpreted as the result of the subduction ofan active oceanic spreading ridge below the accretionary prism (Marshak & Karig, 1977;Bradley et al., 1993, 2000, 2003; Sisson & Pavlis, 1993; Häussler et al., 1995, 2003a; Harriset al., 1996; Madsen et al., 2006; Farris & Paterson, 2009). However, the unknown amountof dextral displacement of the Chugach and Prince William terranes since their intrusion bythe Sanak-Baranof belt, and the fact that most magnetic anomalies from the time of inter-est are subducted, reveals great freedom in which oceanic ridge actually subducted belowthe accretionary prism in the Paleocene to Eocene and therefore models which restore thesituation during emplacement of the plutons vary considerably (e.g. Sisson & Pavlis, 1993;Bradley et al., 2003; Häussler et al., 2003a; Madsen et al., 2006).
Mt Steller
Mt Tom White
Mt St Elias
Mt Logan
Yakutat
CHUGACH TERRANE
upper amphibolite-facies gneiss(migmatites)
greenschist-facies turbidites(greywackes, pelites)
50 km
Thrust fault
Strike-slip faultamphibolite-facies schist(metapelites, metagreywackes)
meta-volcanic rocks(amphibolites)
Tertiary intrusive rocks
N
Alaska(US) Canada
Area of Map
Border Range Fault
Contact Fault
Fairweather Fault
YAKUTAT TERRANE
WRANGELLIA TERRANE
Nunatak Fjord
Mt. D
raper pluton
Boundary block
51.3±0.7 Ma
53.0±0.7 Ma
54.0±0.8 Ma52.6±0.8 Ma
54.0±0.8 Ma
GS1
GS2GS3
GD1
GS4
GS5
52.8±1.0 Ma
53.7±0.9 Ma C54.0±0.9 Ma R
GI1
Figure 4.2: Geological Map of the Chugach Metamorphic Complex (modified from Hudson & Plafker, 1982)with localities of samples used for zircon SHRIMP U-Pb geochronology. Samples GS1-GS5 are metasedimen-tary migmatitic gneisses from the core of the CMC. Sample GI1 is a meta-igneous gneiss, C=core age, R=rimage. Sample GD1 is from a granodioritic intrusion cross-cutting the schist zone of the CMC. Ages reported areConcordia ages (±95% c.I.) except for the rim age of sample GI1 for which a weighted mean 206Pb/238U age(±95% c.I.) is given. Coordinates, mineralogy and PT conditions for all samples are reported in Table 4.1, agesare reported in Table 4.3.
117
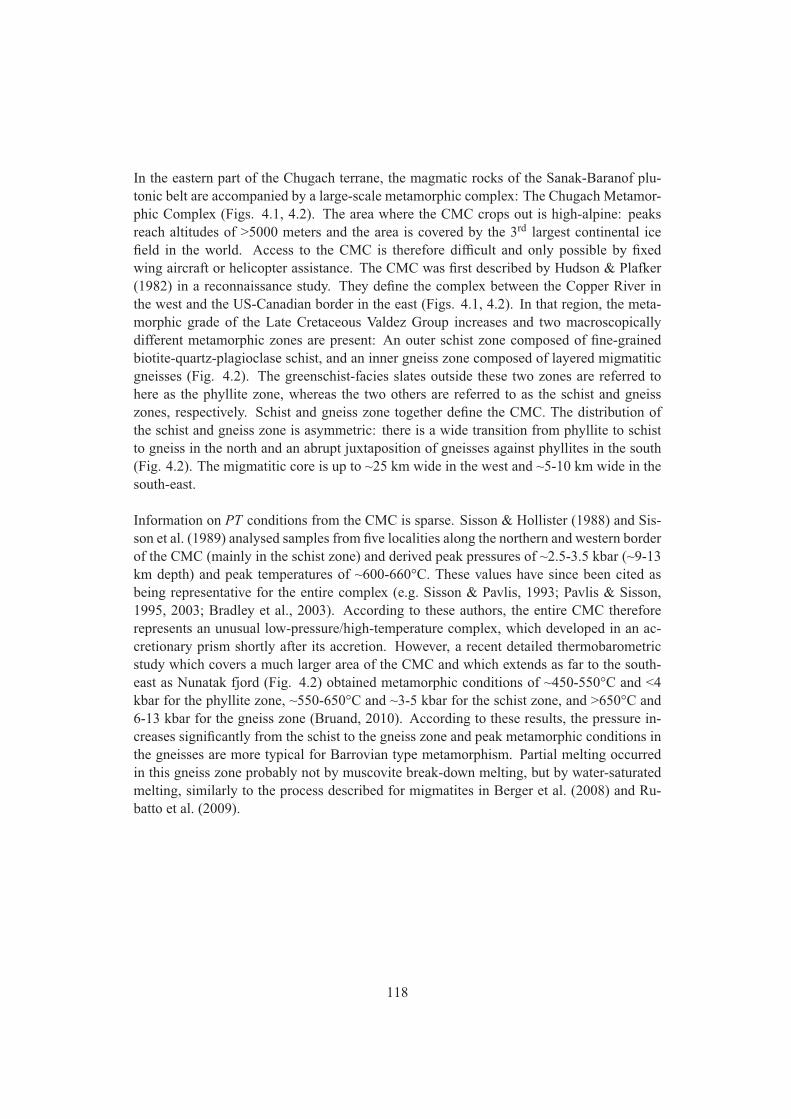
In the eastern part of the Chugach terrane, the magmatic rocks of the Sanak-Baranof plu-tonic belt are accompanied by a large-scale metamorphic complex: The Chugach Metamor-phic Complex (Figs. 4.1, 4.2). The area where the CMC crops out is high-alpine: peaksreach altitudes of >5000 meters and the area is covered by the 3rd largest continental icefield in the world. Access to the CMC is therefore difficult and only possible by fixedwing aircraft or helicopter assistance. The CMC was first described by Hudson & Plafker(1982) in a reconnaissance study. They define the complex between the Copper River inthe west and the US-Canadian border in the east (Figs. 4.1, 4.2). In that region, the meta-morphic grade of the Late Cretaceous Valdez Group increases and two macroscopicallydifferent metamorphic zones are present: An outer schist zone composed of fine-grainedbiotite-quartz-plagioclase schist, and an inner gneiss zone composed of layered migmatiticgneisses (Fig. 4.2). The greenschist-facies slates outside these two zones are referred tohere as the phyllite zone, whereas the two others are referred to as the schist and gneisszones, respectively. Schist and gneiss zone together define the CMC. The distribution ofthe schist and gneiss zone is asymmetric: there is a wide transition from phyllite to schistto gneiss in the north and an abrupt juxtaposition of gneisses against phyllites in the south(Fig. 4.2). The migmatitic core is up to ~25 km wide in the west and ~5-10 km wide in thesouth-east.
Information on PT conditions from the CMC is sparse. Sisson & Hollister (1988) and Sis-son et al. (1989) analysed samples from five localities along the northern and western borderof the CMC (mainly in the schist zone) and derived peak pressures of ~2.5-3.5 kbar (~9-13km depth) and peak temperatures of ~600-660°C. These values have since been cited asbeing representative for the entire complex (e.g. Sisson & Pavlis, 1993; Pavlis & Sisson,1995, 2003; Bradley et al., 2003). According to these authors, the entire CMC thereforerepresents an unusual low-pressure/high-temperature complex, which developed in an ac-cretionary prism shortly after its accretion. However, a recent detailed thermobarometricstudy which covers a much larger area of the CMC and which extends as far to the south-east as Nunatak fjord (Fig. 4.2) obtained metamorphic conditions of ~450-550°C and <4kbar for the phyllite zone, ~550-650°C and ~3-5 kbar for the schist zone, and >650°C and6-13 kbar for the gneiss zone (Bruand, 2010). According to these results, the pressure in-creases significantly from the schist to the gneiss zone and peak metamorphic conditions inthe gneisses are more typical for Barrovian type metamorphism. Partial melting occurredin this gneiss zone probably not by muscovite break-down melting, but by water-saturatedmelting, similarly to the process described for migmatites in Berger et al. (2008) and Ru-batto et al. (2009).
118
4.3 Timing and duration of metamorphism and magmatism inthe Chugach Metamorphic Complex
In order to study the timing and duration of metamorphism and magmatism over the en-tire CMC, seven samples were selected for U-Pb geochronology on zircon. Since the U-Pbclosure temperature in zircon is very high (800-1000°C; Cherniak & Watson, 2003), U-Pbzircon ages generally reflect the time of mineral crystallization. During metamorphism andanatexis, small metamorphic zircon overgrowths may form on older zircon cores. The appli-cation of the SHRIMP ion microprobe allows analysing exceptionally small metamorphicovergrowths (~10 µm). Because zircon growth can occur over a wide range of PT con-ditions we strive to link the ages of such zircon overgrowths with the PT evolution of thehost rock. Petrographic observations, zircon internal structure, Ti-in-zircon thermometryand trace elemental analyses of zircons are used to create this link.
4.3.1 Analytical techniques
Whole rock compositions of the samples used for U-Pb geochronology were obtained with aSiemens Pioneer S4 WD-XRF at the Department of Earth Sciences, University of Graz. Zir-con grains were extracted from the samples by crushing, sieving, magnetic and heavy liquidseparation, and then handpicked, mounted in epoxy and polished to expose the grain centers.The internal zoning of the zircons was investigated by Cathodoluminescence (CL) imaging,carried out at the Electron Microscope Unit, Australian National University (ANU), with aHITACHI S2250-N scanning electron microscope working at 15 kV, ~60 nA and ~20 mmworking distance.
Trace element compositions (including Ti) of zircons were measured with LA-ICP-MS atthe Research School of Earth Sciences (RSES), ANU, using a pulsed 193 nm ArF Excimerlaser with 100mJ energy at a repetition rate of 5 Hz, coupled to an Agilent 7500 quadrupoleICP-MS. Spot sizes of 22 µm and 28 µm were used to analyse rims and cores, respectively.External calibration was performed relative to NIST 612 glass (Pearce et al., 1996) andinternal standardisation was based on Si. Accuracy and reproducibility were evaluated byrepeated analyses of a BCR-2G secondary glass standard and are within 15% and <5% forall elements except for Y. During the time-resolved analysis of the zircons, contaminationresulting from fractures or mineral inclusions was monitored and only the undisturbed partof the signal was integrated.
U-Pb analyses on zircons were performed with a sensitive high-resolution ion microprobe(SHRIMP RG) at the RSES, ANU, using a beam size of ~10-20 µm. Instrumental con-ditions and data acquisition for zircon analysis were generally as described by Williams(1998). The data were collected in sets of six scans throughout the masses and a referencezircon was analysed each fourth to fifth analysis. Reference zircon from a granodiorite
119
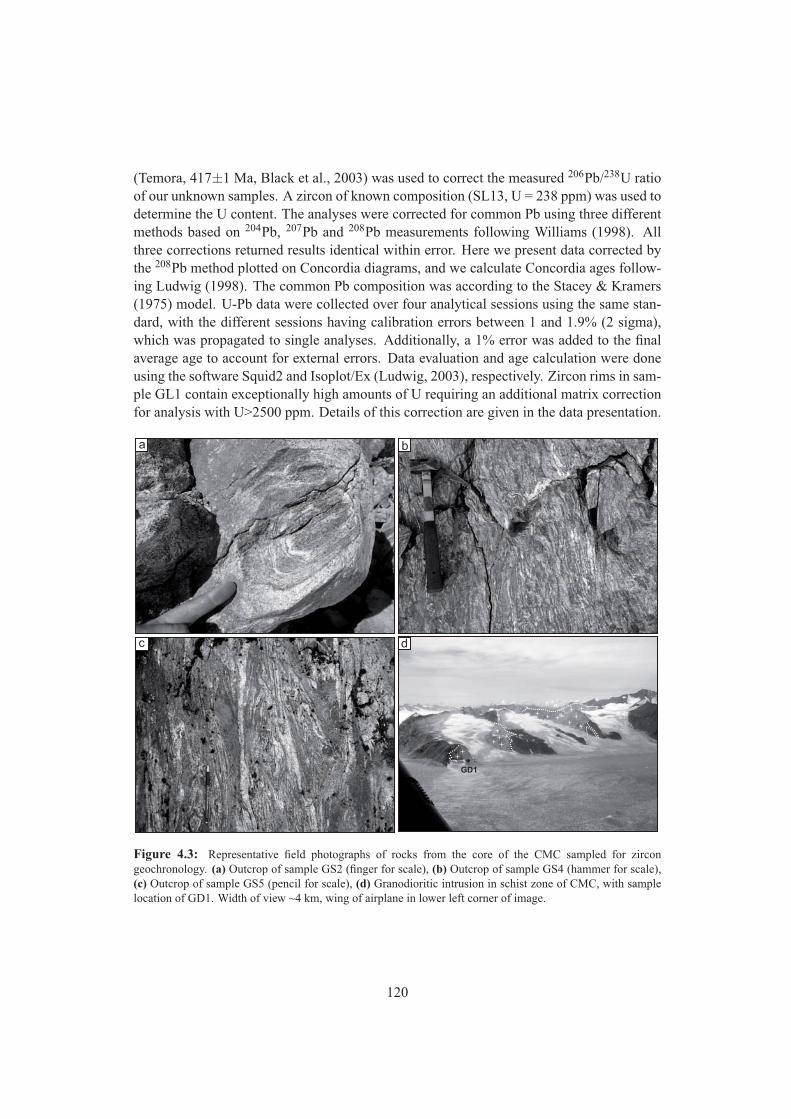
(Temora, 417±1 Ma, Black et al., 2003) was used to correct the measured 206Pb/238U ratioof our unknown samples. A zircon of known composition (SL13, U = 238 ppm) was used todetermine the U content. The analyses were corrected for common Pb using three differentmethods based on 204Pb, 207Pb and 208Pb measurements following Williams (1998). Allthree corrections returned results identical within error. Here we present data corrected bythe 208Pb method plotted on Concordia diagrams, and we calculate Concordia ages follow-ing Ludwig (1998). The common Pb composition was according to the Stacey & Kramers(1975) model. U-Pb data were collected over four analytical sessions using the same stan-dard, with the different sessions having calibration errors between 1 and 1.9% (2 sigma),which was propagated to single analyses. Additionally, a 1% error was added to the finalaverage age to account for external errors. Data evaluation and age calculation were doneusing the software Squid2 and Isoplot/Ex (Ludwig, 2003), respectively. Zircon rims in sam-ple GL1 contain exceptionally high amounts of U requiring an additional matrix correctionfor analysis with U>2500 ppm. Details of this correction are given in the data presentation.
a b
c d
GD1
Figure 4.3: Representative field photographs of rocks from the core of the CMC sampled for zircongeochronology. (a) Outcrop of sample GS2 (finger for scale), (b) Outcrop of sample GS4 (hammer for scale),(c) Outcrop of sample GS5 (pencil for scale), (d) Granodioritic intrusion in schist zone of CMC, with samplelocation of GD1. Width of view ~4 km, wing of airplane in lower left corner of image.
120
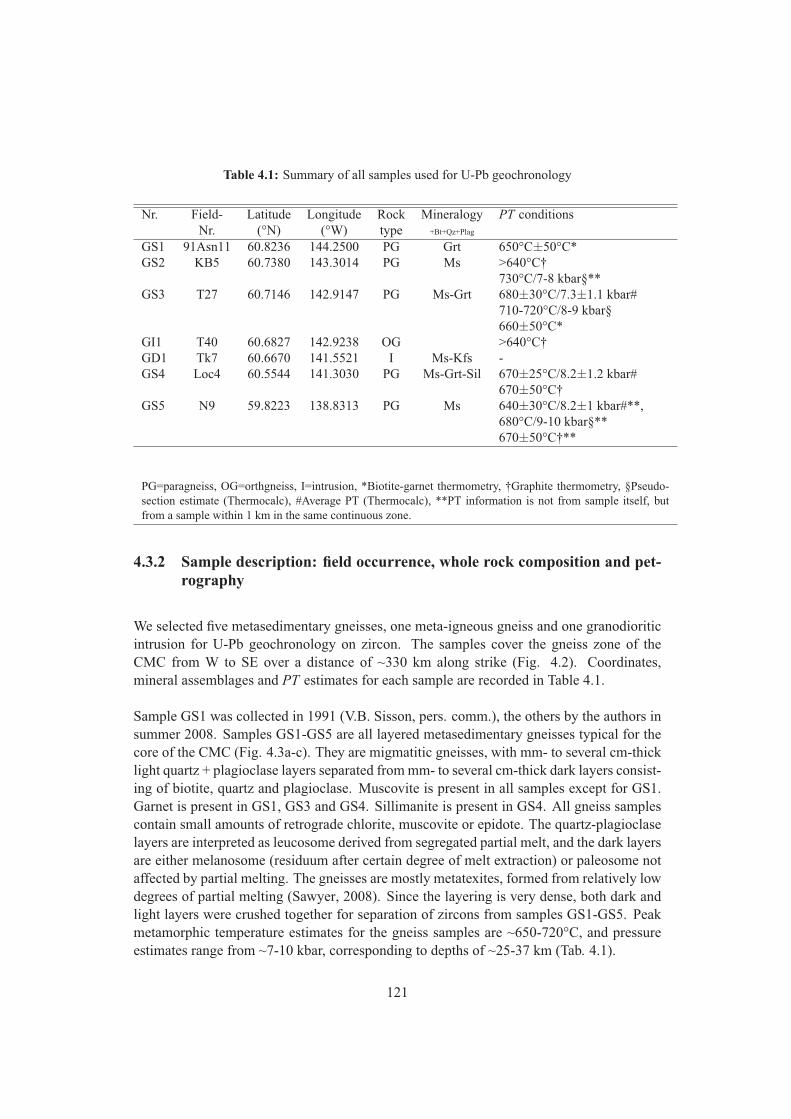
Table 4.1: Summary of all samples used for U-Pb geochronology
Nr. Field- Latitude Longitude Rock Mineralogy PT conditionsNr. (°N) (°W) type +Bt+Qz+Plag
GS1 91Asn11 60.8236 144.2500 PG Grt 650°C±50°C*GS2 KB5 60.7380 143.3014 PG Ms >640°C†
730°C/7-8 kbar§**GS3 T27 60.7146 142.9147 PG Ms-Grt 680±30°C/7.3±1.1 kbar#
710-720°C/8-9 kbar§660±50°C*
GI1 T40 60.6827 142.9238 OG >640°C†GD1 Tk7 60.6670 141.5521 I Ms-Kfs -GS4 Loc4 60.5544 141.3030 PG Ms-Grt-Sil 670±25°C/8.2±1.2 kbar#
670±50°C†GS5 N9 59.8223 138.8313 PG Ms 640±30°C/8.2±1 kbar#**,
680°C/9-10 kbar§**670±50°C†**
PG=paragneiss, OG=orthgneiss, I=intrusion, *Biotite-garnet thermometry, †Graphite thermometry, §Pseudo-section estimate (Thermocalc), #Average PT (Thermocalc), **PT information is not from sample itself, butfrom a sample within 1 km in the same continuous zone.
4.3.2 Sample description: field occurrence, whole rock composition and pet-rography
We selected five metasedimentary gneisses, one meta-igneous gneiss and one granodioriticintrusion for U-Pb geochronology on zircon. The samples cover the gneiss zone of theCMC from W to SE over a distance of ~330 km along strike (Fig. 4.2). Coordinates,mineral assemblages and PT estimates for each sample are recorded in Table 4.1.
Sample GS1 was collected in 1991 (V.B. Sisson, pers. comm.), the others by the authors insummer 2008. Samples GS1-GS5 are all layered metasedimentary gneisses typical for thecore of the CMC (Fig. 4.3a-c). They are migmatitic gneisses, with mm- to several cm-thicklight quartz + plagioclase layers separated from mm- to several cm-thick dark layers consist-ing of biotite, quartz and plagioclase. Muscovite is present in all samples except for GS1.Garnet is present in GS1, GS3 and GS4. Sillimanite is present in GS4. All gneiss samplescontain small amounts of retrograde chlorite, muscovite or epidote. The quartz-plagioclaselayers are interpreted as leucosome derived from segregated partial melt, and the dark layersare either melanosome (residuum after certain degree of melt extraction) or paleosome notaffected by partial melting. The gneisses are mostly metatexites, formed from relatively lowdegrees of partial melting (Sawyer, 2008). Since the layering is very dense, both dark andlight layers were crushed together for separation of zircons from samples GS1-GS5. Peakmetamorphic temperature estimates for the gneiss samples are ~650-720°C, and pressureestimates range from ~7-10 kbar, corresponding to depths of ~25-37 km (Tab. 4.1).
121
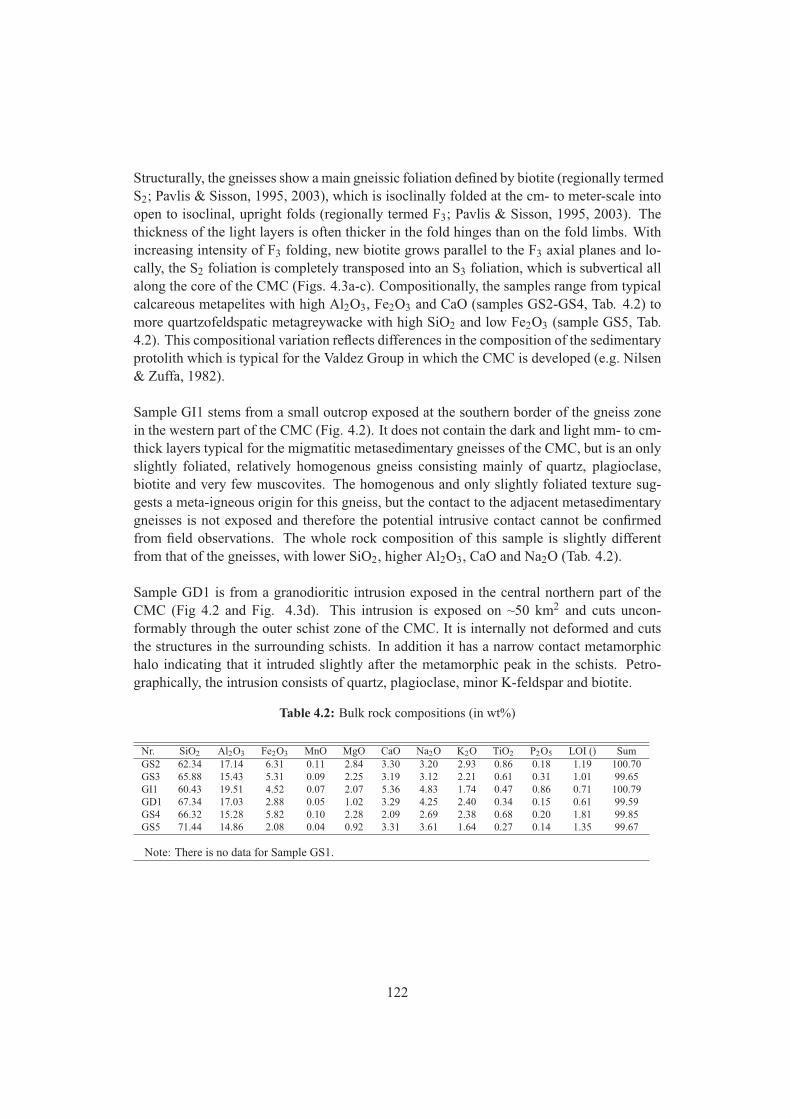
Structurally, the gneisses show a main gneissic foliation defined by biotite (regionally termedS2; Pavlis & Sisson, 1995, 2003), which is isoclinally folded at the cm- to meter-scale intoopen to isoclinal, upright folds (regionally termed F3; Pavlis & Sisson, 1995, 2003). Thethickness of the light layers is often thicker in the fold hinges than on the fold limbs. Withincreasing intensity of F3 folding, new biotite grows parallel to the F3 axial planes and lo-cally, the S2 foliation is completely transposed into an S3 foliation, which is subvertical allalong the core of the CMC (Figs. 4.3a-c). Compositionally, the samples range from typicalcalcareous metapelites with high Al2O3, Fe2O3 and CaO (samples GS2-GS4, Tab. 4.2) tomore quartzofeldspatic metagreywacke with high SiO2 and low Fe2O3 (sample GS5, Tab.4.2). This compositional variation reflects differences in the composition of the sedimentaryprotolith which is typical for the Valdez Group in which the CMC is developed (e.g. Nilsen& Zuffa, 1982).
Sample GI1 stems from a small outcrop exposed at the southern border of the gneiss zonein the western part of the CMC (Fig. 4.2). It does not contain the dark and light mm- to cm-thick layers typical for the migmatitic metasedimentary gneisses of the CMC, but is an onlyslightly foliated, relatively homogenous gneiss consisting mainly of quartz, plagioclase,biotite and very few muscovites. The homogenous and only slightly foliated texture sug-gests a meta-igneous origin for this gneiss, but the contact to the adjacent metasedimentarygneisses is not exposed and therefore the potential intrusive contact cannot be confirmedfrom field observations. The whole rock composition of this sample is slightly differentfrom that of the gneisses, with lower SiO2, higher Al2O3, CaO and Na2O (Tab. 4.2).
Sample GD1 is from a granodioritic intrusion exposed in the central northern part of theCMC (Fig 4.2 and Fig. 4.3d). This intrusion is exposed on ~50 km2 and cuts uncon-formably through the outer schist zone of the CMC. It is internally not deformed and cutsthe structures in the surrounding schists. In addition it has a narrow contact metamorphichalo indicating that it intruded slightly after the metamorphic peak in the schists. Petro-graphically, the intrusion consists of quartz, plagioclase, minor K-feldspar and biotite.
Table 4.2: Bulk rock compositions (in wt%)
Nr. SiO2 Al2O3 Fe2O3 MnO MgO CaO Na2O K2O TiO2 P2O5 LOI () SumGS2 62.34 17.14 6.31 0.11 2.84 3.30 3.20 2.93 0.86 0.18 1.19 100.70GS3 65.88 15.43 5.31 0.09 2.25 3.19 3.12 2.21 0.61 0.31 1.01 99.65GI1 60.43 19.51 4.52 0.07 2.07 5.36 4.83 1.74 0.47 0.86 0.71 100.79GD1 67.34 17.03 2.88 0.05 1.02 3.29 4.25 2.40 0.34 0.15 0.61 99.59GS4 66.32 15.28 5.82 0.10 2.28 2.09 2.69 2.38 0.68 0.20 1.81 99.85GS5 71.44 14.86 2.08 0.04 0.92 3.31 3.61 1.64 0.27 0.14 1.35 99.67
Note: There is no data for Sample GS1.
122
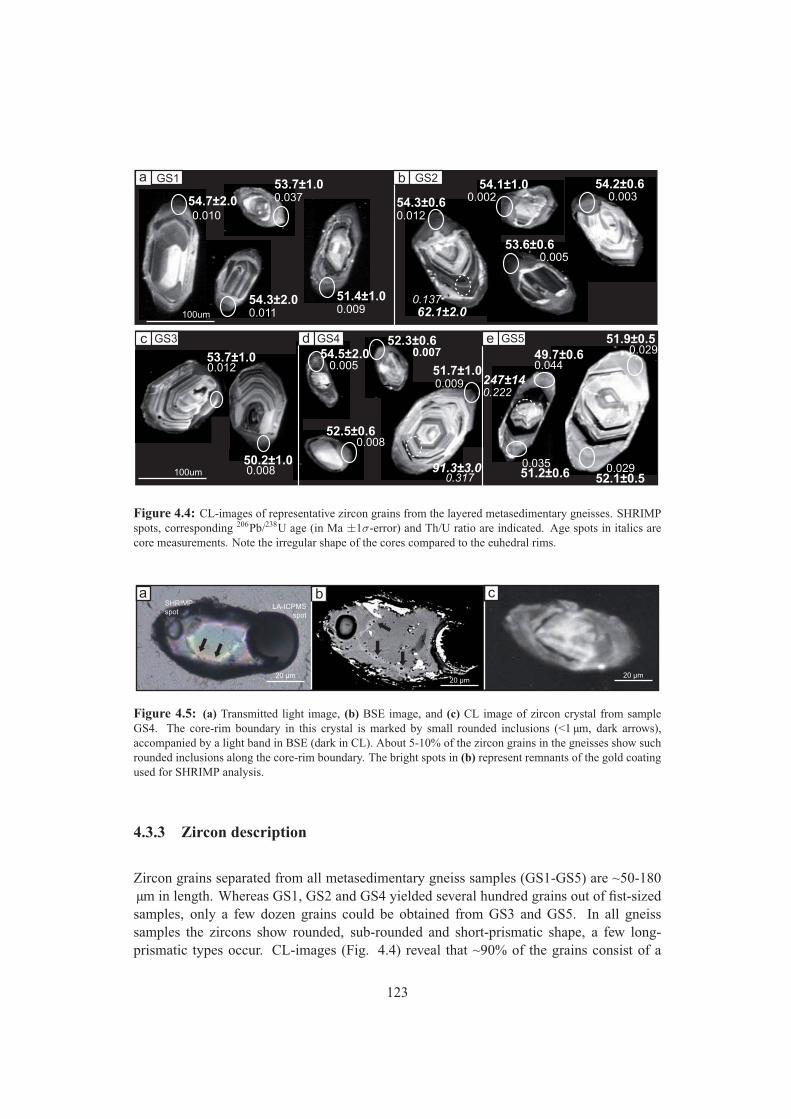
100um
53.7±1.00.037
54.3±2.00.011
54.7±2.00.010
51.4±1.00.009
a GS1 b GS2 54.2±0.60.003
53.6±0.60.005
0.137
54.3±0.60.012
62.1±2.0
54.1±1.00.002
c GS3
50.2±1.00.008
0.00553.7±1.00.012
d GS4
51.7±1.00.009
91.3±3.00.317
52.5±0.60.008
52.3±0.60.00754.5±2.0
e GS5 51.9±0.50.029
52.1±0.50.029
49.7±0.60.044
51.2±0.60.035
247±14
0.222
100um
Figure 4.4: CL-images of representative zircon grains from the layered metasedimentary gneisses. SHRIMPspots, corresponding 206Pb/238U age (in Ma ±1σ-error) and Th/U ratio are indicated. Age spots in italics arecore measurements. Note the irregular shape of the cores compared to the euhedral rims.
a b cSHRIMP spot
20 μm
LA-ICPMSspot
20 μm20 μm
Figure 4.5: (a) Transmitted light image, (b) BSE image, and (c) CL image of zircon crystal from sampleGS4. The core-rim boundary in this crystal is marked by small rounded inclusions (<1 µm, dark arrows),accompanied by a light band in BSE (dark in CL). About 5-10% of the zircon grains in the gneisses show suchrounded inclusions along the core-rim boundary. The bright spots in (b) represent remnants of the gold coatingused for SHRIMP analysis.
4.3.3 Zircon description
Zircon grains separated from all metasedimentary gneiss samples (GS1-GS5) are ~50-180µm in length. Whereas GS1, GS2 and GS4 yielded several hundred grains out of fist-sizedsamples, only a few dozen grains could be obtained from GS3 and GS5. In all gneisssamples the zircons show rounded, sub-rounded and short-prismatic shape, a few long-prismatic types occur. CL-images (Fig. 4.4) reveal that ~90% of the grains consist of a
123
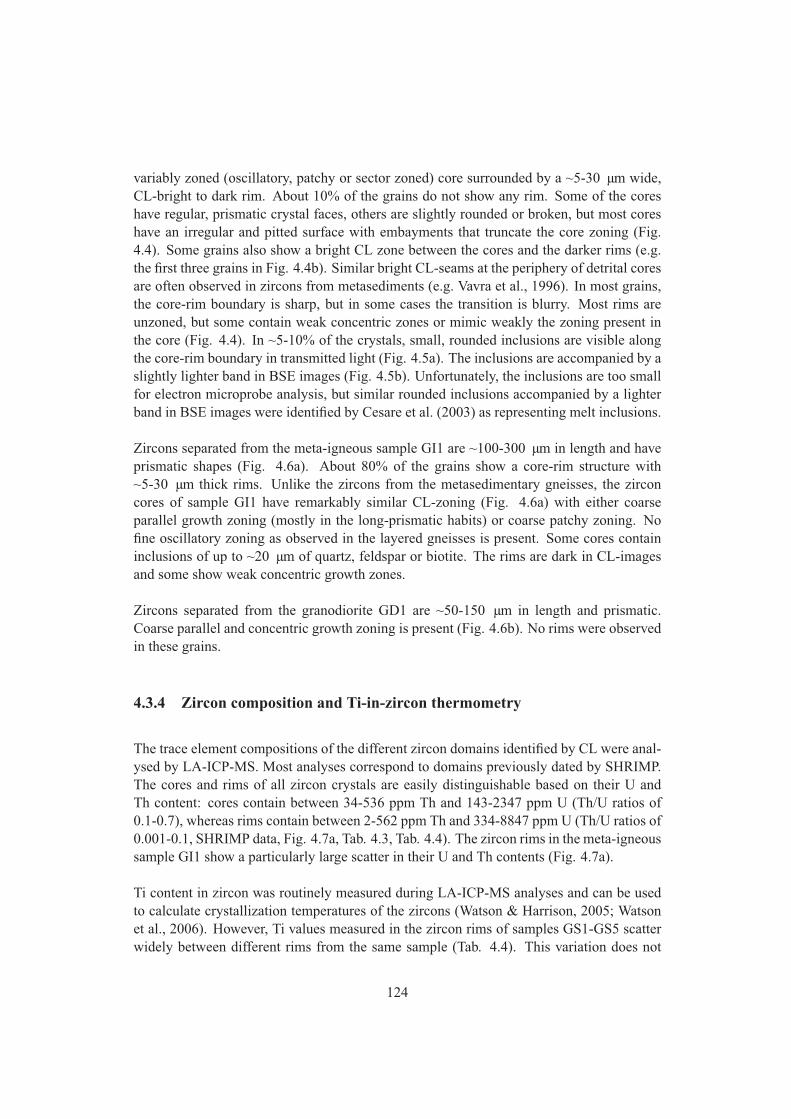
variably zoned (oscillatory, patchy or sector zoned) core surrounded by a ~5-30 µm wide,CL-bright to dark rim. About 10% of the grains do not show any rim. Some of the coreshave regular, prismatic crystal faces, others are slightly rounded or broken, but most coreshave an irregular and pitted surface with embayments that truncate the core zoning (Fig.4.4). Some grains also show a bright CL zone between the cores and the darker rims (e.g.the first three grains in Fig. 4.4b). Similar bright CL-seams at the periphery of detrital coresare often observed in zircons from metasediments (e.g. Vavra et al., 1996). In most grains,the core-rim boundary is sharp, but in some cases the transition is blurry. Most rims areunzoned, but some contain weak concentric zones or mimic weakly the zoning present inthe core (Fig. 4.4). In ~5-10% of the crystals, small, rounded inclusions are visible alongthe core-rim boundary in transmitted light (Fig. 4.5a). The inclusions are accompanied by aslightly lighter band in BSE images (Fig. 4.5b). Unfortunately, the inclusions are too smallfor electron microprobe analysis, but similar rounded inclusions accompanied by a lighterband in BSE images were identified by Cesare et al. (2003) as representing melt inclusions.
Zircons separated from the meta-igneous sample GI1 are ~100-300 µm in length and haveprismatic shapes (Fig. 4.6a). About 80% of the grains show a core-rim structure with~5-30 µm thick rims. Unlike the zircons from the metasedimentary gneisses, the zirconcores of sample GI1 have remarkably similar CL-zoning (Fig. 4.6a) with either coarseparallel growth zoning (mostly in the long-prismatic habits) or coarse patchy zoning. Nofine oscillatory zoning as observed in the layered gneisses is present. Some cores containinclusions of up to ~20 µm of quartz, feldspar or biotite. The rims are dark in CL-imagesand some show weak concentric growth zones.
Zircons separated from the granodiorite GD1 are ~50-150 µm in length and prismatic.Coarse parallel and concentric growth zoning is present (Fig. 4.6b). No rims were observedin these grains.
4.3.4 Zircon composition and Ti-in-zircon thermometry
The trace element compositions of the different zircon domains identified by CL were anal-ysed by LA-ICP-MS. Most analyses correspond to domains previously dated by SHRIMP.The cores and rims of all zircon crystals are easily distinguishable based on their U andTh content: cores contain between 34-536 ppm Th and 143-2347 ppm U (Th/U ratios of0.1-0.7), whereas rims contain between 2-562 ppm Th and 334-8847 ppm U (Th/U ratios of0.001-0.1, SHRIMP data, Fig. 4.7a, Tab. 4.3, Tab. 4.4). The zircon rims in the meta-igneoussample GI1 show a particularly large scatter in their U and Th contents (Fig. 4.7a).
Ti content in zircon was routinely measured during LA-ICP-MS analyses and can be usedto calculate crystallization temperatures of the zircons (Watson & Harrison, 2005; Watsonet al., 2006). However, Ti values measured in the zircon rims of samples GS1-GS5 scatterwidely between different rims from the same sample (Tab. 4.4). This variation does not
124
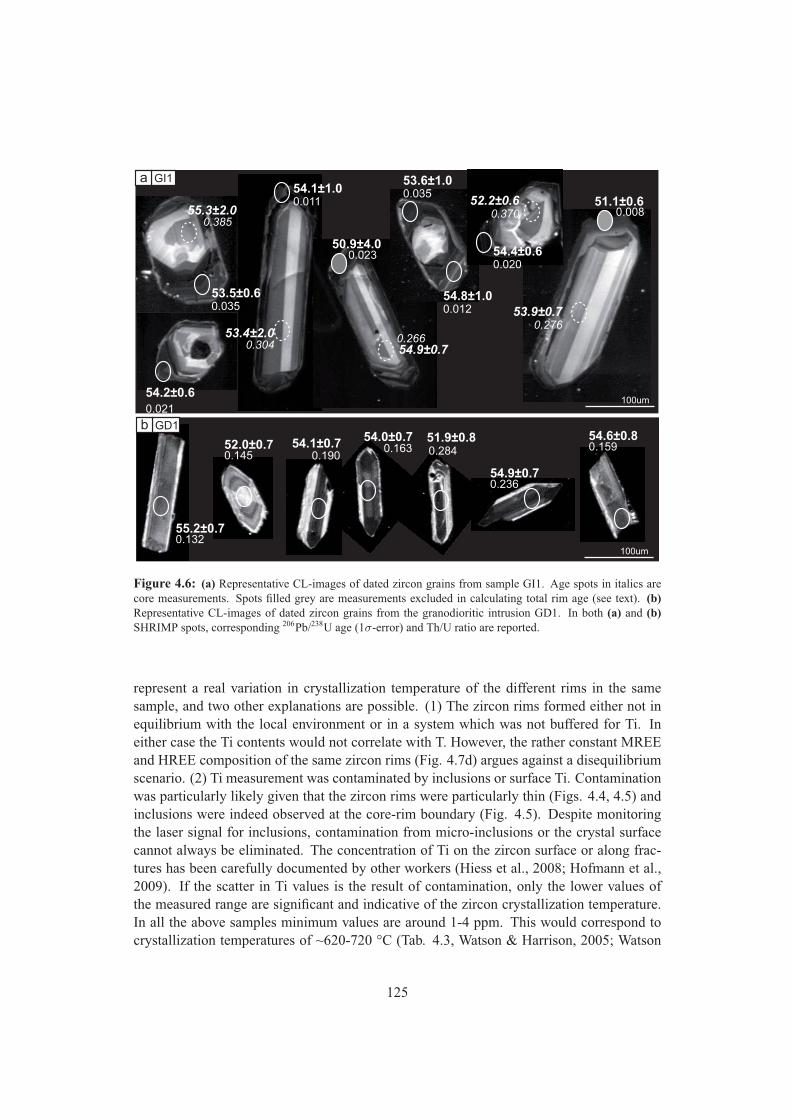
GI1
55.3±2.00.385
0.304
a54.1±1.00.011
53.5±0.6
50.9±4.00.023
0.266
54.8±1.0
53.6±1.00.035
54.2±0.60.021
0.035
53.4±2.0
53.9±0.7
0.276
54.4±0.60.020
54.9±0.7
0.012
0.00851.1±0.6
100um
100um
54.0±0.70.163
55.2±0.70.132
52.0±0.70.145
54.1±0.7
GD1b
0.190
51.9±0.80.284
54.6±0.80.159
52.2±0.6
0.370
54.9±0.70.236
Figure 4.6: (a) Representative CL-images of dated zircon grains from sample GI1. Age spots in italics arecore measurements. Spots filled grey are measurements excluded in calculating total rim age (see text). (b)Representative CL-images of dated zircon grains from the granodioritic intrusion GD1. In both (a) and (b)SHRIMP spots, corresponding 206Pb/238U age (1σ-error) and Th/U ratio are reported.
represent a real variation in crystallization temperature of the different rims in the samesample, and two other explanations are possible. (1) The zircon rims formed either not inequilibrium with the local environment or in a system which was not buffered for Ti. Ineither case the Ti contents would not correlate with T. However, the rather constant MREEand HREE composition of the same zircon rims (Fig. 4.7d) argues against a disequilibriumscenario. (2) Ti measurement was contaminated by inclusions or surface Ti. Contaminationwas particularly likely given that the zircon rims were particularly thin (Figs. 4.4, 4.5) andinclusions were indeed observed at the core-rim boundary (Fig. 4.5). Despite monitoringthe laser signal for inclusions, contamination from micro-inclusions or the crystal surfacecannot always be eliminated. The concentration of Ti on the zircon surface or along frac-tures has been carefully documented by other workers (Hiess et al., 2008; Hofmann et al.,2009). If the scatter in Ti values is the result of contamination, only the lower values ofthe measured range are significant and indicative of the zircon crystallization temperature.In all the above samples minimum values are around 1-4 ppm. This would correspond tocrystallization temperatures of ~620-720 °C (Tab. 4.3, Watson & Harrison, 2005; Watson
125
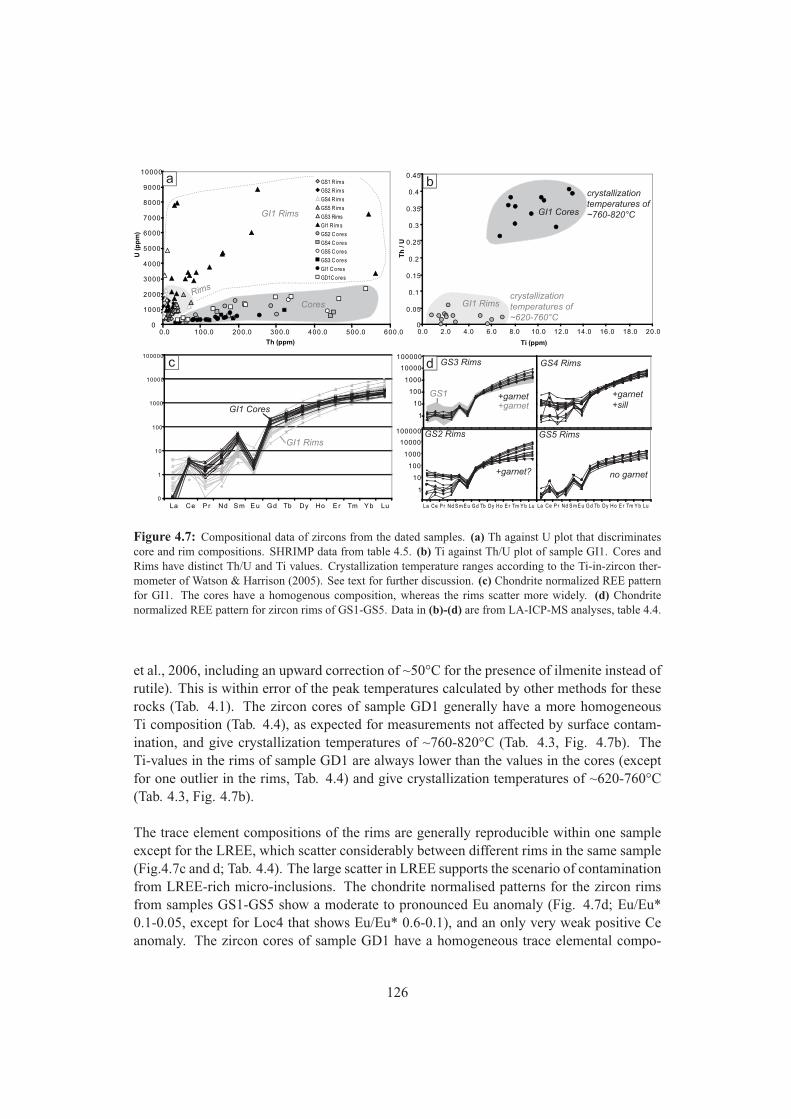
GI1 Rims
Rims
Cores GI1 Rims
GI1 Cores
crystallization
temperatures of
~760-820°C
crystallization
temperatures of
~620-760°C
GI1 Rims
GI1 Cores
GS3 Rims GS4 Rims
GS2 Rims GS5 Rims
0
1000
2000
3000
4000
5000
6000
7000
8000
9000
10000
0.0 100.0 200.0 300.0 400.0 500.0 600.0
Th (ppm)
U (
pp
m)
GS1 Rim s
GS2 Rim s
GS4 Rim s
GS5 Rim s
GS3 Rims
GI1 Rim s
GS2 C ores
GS4 C ores
GS5 C ores
GS3 C ores
GI1 C ores
GD1C ores
a
0
0.05
0.1
0.15
0.2
0.25
0.3
0.35
0.4
0.45
0.0 2.0 4.0 6.0 8.0 10.0 12.0 14.0 16.0 18.0 20.0
Th
/ U
Ti (ppm)
b
0
1
10
100
1000
10000
100000
Ce P r Nd S m E u Gd Tb Dy Ho E r Tm Y b LuLa
c
1
10
100
1000
10000
100000
La Ce P r Nd S m E u G d Tb Dy Ho E r Tm Y b Lu La Ce P r Nd S m E u G d Tb Dy Ho E r Tm Y b Lu
1
10
100
1000
10000
100000
d
+garnet
+garnet?
+garnet
+sill
no garnet
GS1
+garnet
Figure 4.7: Compositional data of zircons from the dated samples. (a) Th against U plot that discriminatescore and rim compositions. SHRIMP data from table 4.5. (b) Ti against Th/U plot of sample GI1. Cores andRims have distinct Th/U and Ti values. Crystallization temperature ranges according to the Ti-in-zircon ther-mometer of Watson & Harrison (2005). See text for further discussion. (c) Chondrite normalized REE patternfor GI1. The cores have a homogenous composition, whereas the rims scatter more widely. (d) Chondritenormalized REE pattern for zircon rims of GS1-GS5. Data in (b)-(d) are from LA-ICP-MS analyses, table 4.4.
et al., 2006, including an upward correction of ~50°C for the presence of ilmenite instead ofrutile). This is within error of the peak temperatures calculated by other methods for theserocks (Tab. 4.1). The zircon cores of sample GD1 generally have a more homogeneousTi composition (Tab. 4.4), as expected for measurements not affected by surface contam-ination, and give crystallization temperatures of ~760-820°C (Tab. 4.3, Fig. 4.7b). TheTi-values in the rims of sample GD1 are always lower than the values in the cores (exceptfor one outlier in the rims, Tab. 4.4) and give crystallization temperatures of ~620-760°C(Tab. 4.3, Fig. 4.7b).
The trace element compositions of the rims are generally reproducible within one sampleexcept for the LREE, which scatter considerably between different rims in the same sample(Fig.4.7c and d; Tab. 4.4). The large scatter in LREE supports the scenario of contaminationfrom LREE-rich micro-inclusions. The chondrite normalised patterns for the zircon rimsfrom samples GS1-GS5 show a moderate to pronounced Eu anomaly (Fig. 4.7d; Eu/Eu*0.1-0.05, except for Loc4 that shows Eu/Eu* 0.6-0.1), and an only very weak positive Ceanomaly. The zircon cores of sample GD1 have a homogeneous trace elemental compo-
126
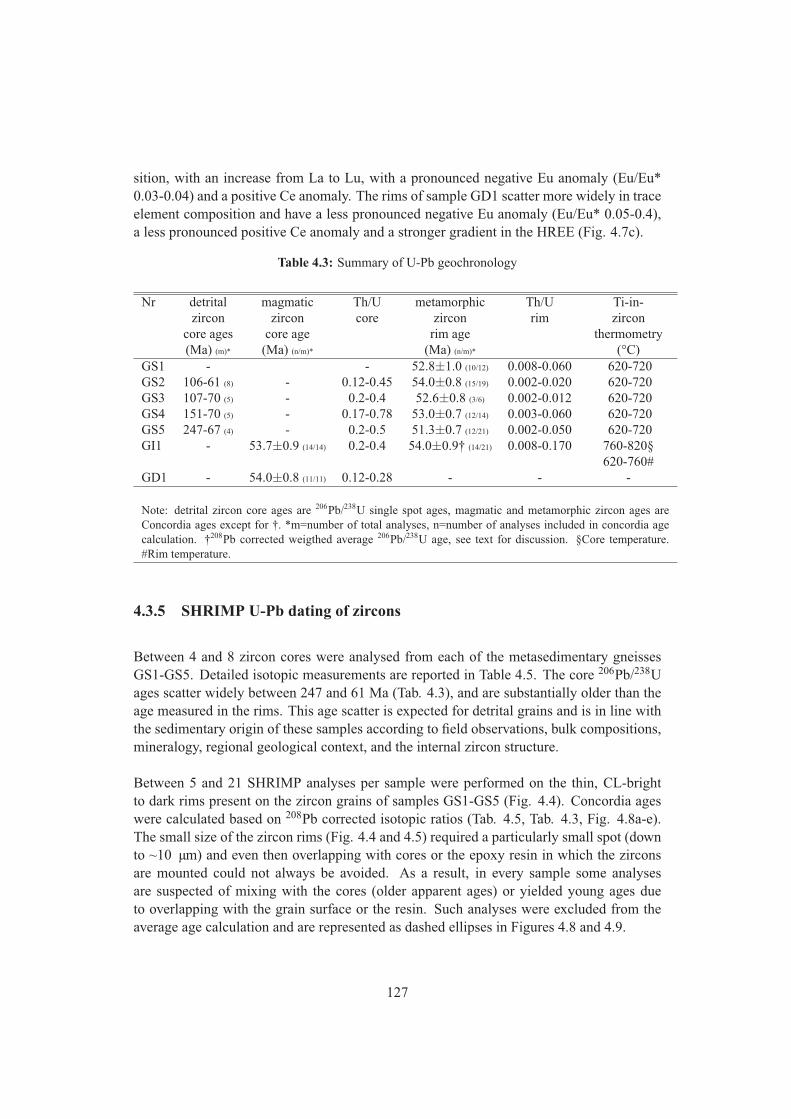
sition, with an increase from La to Lu, with a pronounced negative Eu anomaly (Eu/Eu*0.03-0.04) and a positive Ce anomaly. The rims of sample GD1 scatter more widely in traceelement composition and have a less pronounced negative Eu anomaly (Eu/Eu* 0.05-0.4),a less pronounced positive Ce anomaly and a stronger gradient in the HREE (Fig. 4.7c).
Table 4.3: Summary of U-Pb geochronology
Nr detrital magmatic Th/U metamorphic Th/U Ti-in-zircon zircon core zircon rim zircon
core ages core age rim age thermometry(Ma) (m)* (Ma) (n/m)* (Ma) (n/m)* (°C)
GS1 - - 52.8±1.0 (10/12) 0.008-0.060 620-720GS2 106-61 (8) - 0.12-0.45 54.0±0.8 (15/19) 0.002-0.020 620-720GS3 107-70 (5) - 0.2-0.4 52.6±0.8 (3/6) 0.002-0.012 620-720GS4 151-70 (5) - 0.17-0.78 53.0±0.7 (12/14) 0.003-0.060 620-720GS5 247-67 (4) - 0.2-0.5 51.3±0.7 (12/21) 0.002-0.050 620-720GI1 - 53.7±0.9 (14/14) 0.2-0.4 54.0±0.9† (14/21) 0.008-0.170 760-820§
620-760#GD1 - 54.0±0.8 (11/11) 0.12-0.28 - - -
Note: detrital zircon core ages are 206Pb/238U single spot ages, magmatic and metamorphic zircon ages areConcordia ages except for †. *m=number of total analyses, n=number of analyses included in concordia agecalculation. †208Pb corrected weigthed average 206Pb/238U age, see text for discussion. §Core temperature.#Rim temperature.
4.3.5 SHRIMP U-Pb dating of zircons
Between 4 and 8 zircon cores were analysed from each of the metasedimentary gneissesGS1-GS5. Detailed isotopic measurements are reported in Table 4.5. The core 206Pb/238Uages scatter widely between 247 and 61 Ma (Tab. 4.3), and are substantially older than theage measured in the rims. This age scatter is expected for detrital grains and is in line withthe sedimentary origin of these samples according to field observations, bulk compositions,mineralogy, regional geological context, and the internal zircon structure.
Between 5 and 21 SHRIMP analyses per sample were performed on the thin, CL-brightto dark rims present on the zircon grains of samples GS1-GS5 (Fig. 4.4). Concordia ageswere calculated based on 208Pb corrected isotopic ratios (Tab. 4.5, Tab. 4.3, Fig. 4.8a-e).The small size of the zircon rims (Fig. 4.4 and 4.5) required a particularly small spot (downto ~10 µm) and even then overlapping with cores or the epoxy resin in which the zirconsare mounted could not always be avoided. As a result, in every sample some analysesare suspected of mixing with the cores (older apparent ages) or yielded young ages dueto overlapping with the grain surface or the resin. Such analyses were excluded from theaverage age calculation and are represented as dashed ellipses in Figures 4.8 and 4.9.
127
In sample GS1, a tight cluster of 10 analyses gives a Concordia age of 52.8±1.0 Ma (Fig.4.8a). In sample GS2, 15 analyses give a Concordia age of 54.0±0.8 Ma (Fig. 4.8b).Sample GS3 yielded only few zircons and even fewer with rims, so only 6 analyses couldbe measured. One analysis is discordant, and another is particularly old and sits partlyon epoxy. Of the remaining four analyses, three overlap and define a Concordia age of52.6±0.8 Ma, which is within error of the aforementioned samples (Fig. 4.8c). In sampleGS4 12 rim analyses (two discordant analyses were excluded) yield a Concordia age of53.0±0.7 Ma (Fig. 4.8d). The 21 analyses on sample GS5 show the most scatter arounda major cluster at ~51 Ma (Fig. 4.8e). One particularly old analysis was performed on avery small grain lacking a core-rim structure (analysis N9-10R, Tab. 4.5) and was there-fore excluded. Four analyses were excluded because they represent pairs of old and younganalyses measured on the same rim (compare analysis N9-5.1R with N9-5.2R and N9-1.1Rwith N9-1.2R, Tab. 4.5). Two analyses yielded ages statistically older than the main clus-ter and two analyses yielded statistically younger ages than the main cluster, of which onecorresponds to a fractured grain (analysis N9-2.2R). The remaining cluster of 12 measure-ments gives a Concordia age of 51.3±0.7 Ma (Fig. 4.8e). Particularly for this sample thepossibility of distinct overgrowths of different age within the same sample, as observed inother migmatites (e.g. Rubatto et al., 2009) can not be ruled out completely. Twelve analy-ses were performed on the small, long-prismatic zircons from the granodiorite GD1 and aConcordia age of 54.0±0.8 Ma can be calculated from all analyses (Fig. 4.8f).
The cores of sample GI1 display a similar, oscillatory internal zoning that is distinct fromthe variably zoned detrital cores of the gneiss samples (Fig. 4.6a). 14 analyses on the coresdefine a Concordia age of 53.7±0.9 Ma (Fig. 4.9a). Rims from the same sample show alarge scatter in U and Th content with extreme values of up to 9000 ppm U (Fig. 4.7a). Theapparent 206Pb/238U ages scatter significantly and correlate with U content. This indicatesthat a matrix correction due to the high U content is required as previously documentedfor zircon with U> 2500 ppm (e.g. Butera et al., 2004; Hermann et al., 2006). Even aftercorrection, the data still scatter significantly, but the major cluster has an average 206Pb/238Uage of 54.0 ±0.9 Ma (Fig. 4.9b).
128
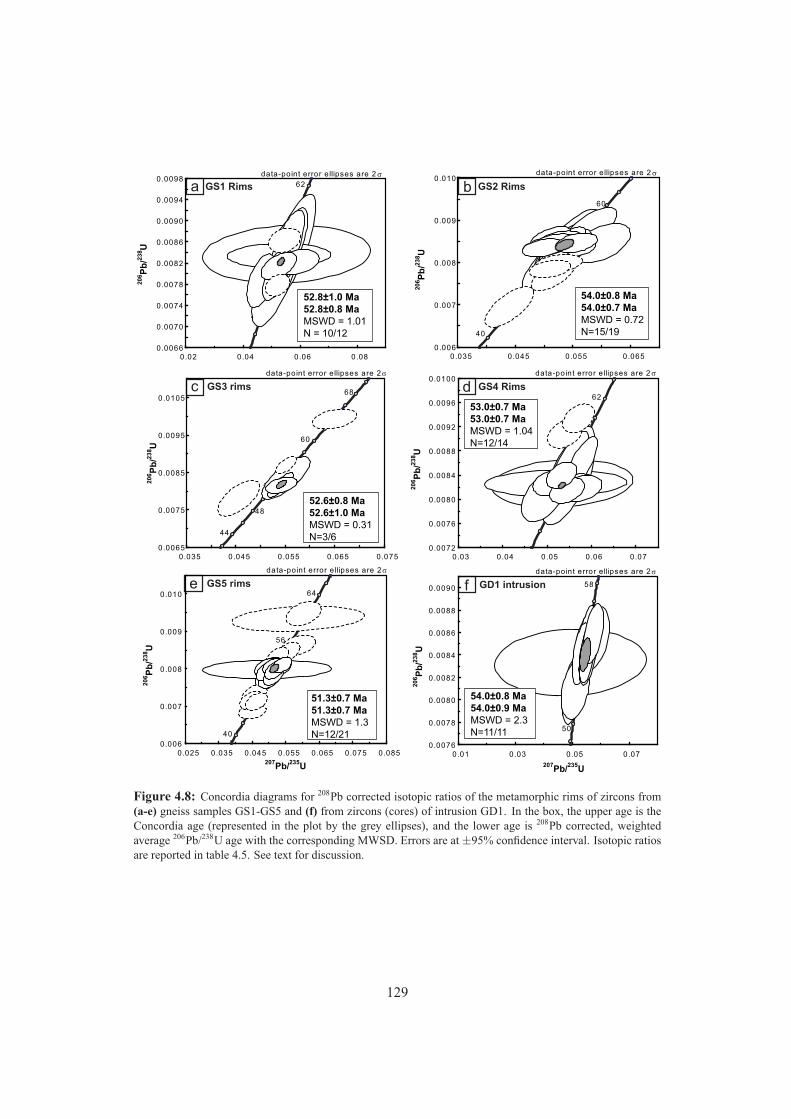
GS1 Rims GS2 Rims
GS3 rims GS4 Rims
GS5 rims GD1 intrusion
a b
c d
e f
62
54
50
46
0.0066
0.0070
0.0074
0.0078
0.0082
0.0086
0.0090
0.0094
0.0098
0.02 0.04 0.06 0.08
206 P
b/23
8 U
data-point error ellipses are 2σ
52.8±1.0 Ma 52.8±0.8 MaMSWD = 1.01N = 10/12
data-point error ellipses are 2σ
60
56
52
48
44
40
0.006
0.007
0.008
0.009
0.010
0.035 0.045 0.055 0.065
54.0±0.8 Ma54.0±0.7 MaMSWD = 0.72N=15/19
data-point error ellipses are 2σ
68
64
60
56
52
48
44
0.0065
0.0075
0.0085
0.0095
0.0105
0.035 0.045 0.055 0.065 0.075
20
6P
b/2
38U
52.6±0.8 Ma52.6±1.0 MaMSWD = 0.31 N=3/6
62
58
54
50
0.0072
0.0076
0.0080
0.0084
0.0088
0.0092
0.0096
0.0100
0.03 0.04 0.05 0.06 0.07
data-point error ellipses are 2σ
53.0±0.7 Ma53.0±0.7 Ma MSWD = 1.04N=12/14
data-point error ellipses are 2σ
20
6P
b/2
38U
64
60
56
52
48
44
40
0.006
0.007
0.008
0.009
0.010
0.025 0.035 0.045 0.055 0.065 0.075 0.085207Pb/235U
51.3±0.7 Ma 51.3±0.7 MaMSWD = 1.3 N=12/21
58
54
52
50
0.0076
0.0078
0.0080
0.0082
0.0084
0.0086
0.0088
0.0090
0.01 0.03 0.05 0.07
207Pb/235U
20
6P
b/2
38U
54.0±0.8 Ma54.0±0.9 Ma MSWD = 2.3N=11/11
206 P
b/23
8 U2
06P
b/2
38U
data-point error ellipses are 2σ
Figure 4.8: Concordia diagrams for 208Pb corrected isotopic ratios of the metamorphic rims of zircons from(a-e) gneiss samples GS1-GS5 and (f) from zircons (cores) of intrusion GD1. In the box, the upper age is theConcordia age (represented in the plot by the grey ellipses), and the lower age is 208Pb corrected, weightedaverage 206Pb/238U age with the corresponding MWSD. Errors are at ±95% confidence interval. Isotopic ratiosare reported in table 4.5. See text for discussion.
129
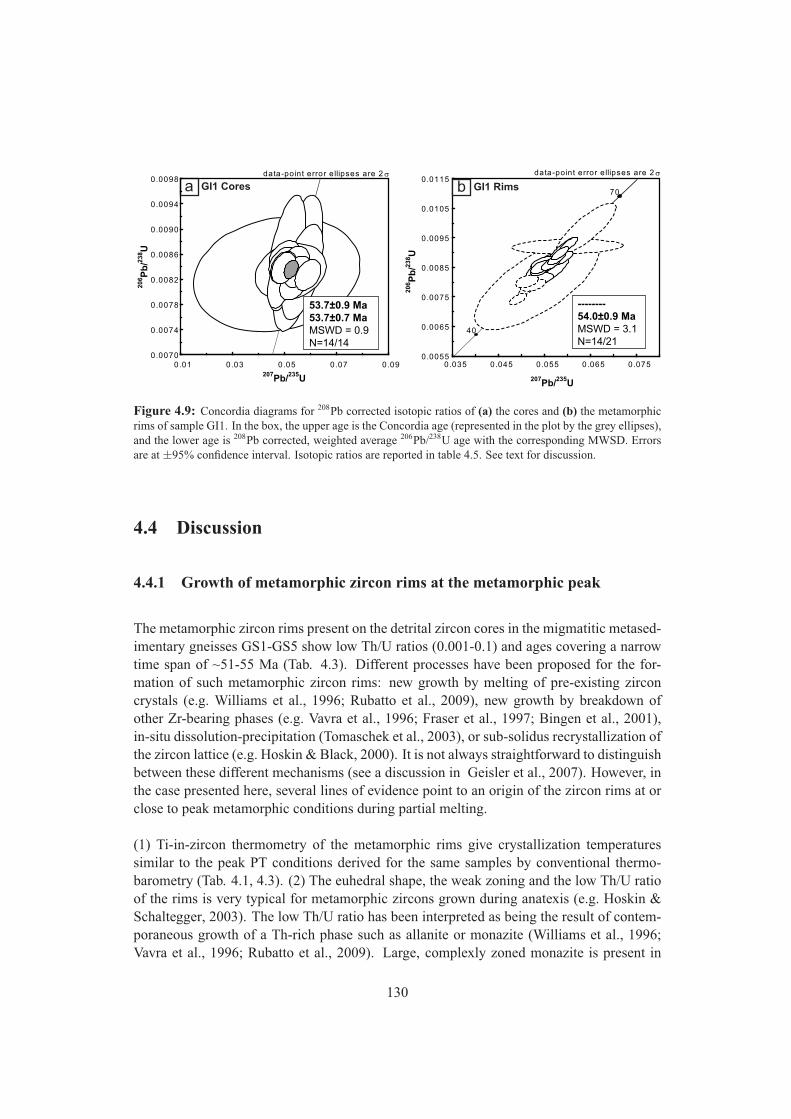
GI1 Coresadata-point error ellipses are 2σ
0.0070
0.0074
0.0078
0.0082
0.0086
0.0090
0.0094
0.0098
0.01 0.03 0.05 0.07 0.09207Pb/235U
20
6P
b/2
38U
48
56
53.7±0.9 Ma 53.7±0.7 MaMSWD = 0.9N=14/14
--------54.0±0.9 MaMSWD = 3.1 N=14/21
0.0055
0.0065
0.0075
0.0085
0.0095
0.0105
0.0115
0.035 0.045 0.055 0.065 0.075
40
70
data-point error ellipses are 2σ
207Pb/235U
20
6P
b/2
38U
GI1 Rimsb
Figure 4.9: Concordia diagrams for 208Pb corrected isotopic ratios of (a) the cores and (b) the metamorphicrims of sample GI1. In the box, the upper age is the Concordia age (represented in the plot by the grey ellipses),and the lower age is 208Pb corrected, weighted average 206Pb/238U age with the corresponding MWSD. Errorsare at ±95% confidence interval. Isotopic ratios are reported in table 4.5. See text for discussion.
4.4 Discussion
4.4.1 Growth of metamorphic zircon rims at the metamorphic peak
The metamorphic zircon rims present on the detrital zircon cores in the migmatitic metased-imentary gneisses GS1-GS5 show low Th/U ratios (0.001-0.1) and ages covering a narrowtime span of ~51-55 Ma (Tab. 4.3). Different processes have been proposed for the for-mation of such metamorphic zircon rims: new growth by melting of pre-existing zirconcrystals (e.g. Williams et al., 1996; Rubatto et al., 2009), new growth by breakdown ofother Zr-bearing phases (e.g. Vavra et al., 1996; Fraser et al., 1997; Bingen et al., 2001),in-situ dissolution-precipitation (Tomaschek et al., 2003), or sub-solidus recrystallization ofthe zircon lattice (e.g. Hoskin & Black, 2000). It is not always straightforward to distinguishbetween these different mechanisms (see a discussion in Geisler et al., 2007). However, inthe case presented here, several lines of evidence point to an origin of the zircon rims at orclose to peak metamorphic conditions during partial melting.
(1) Ti-in-zircon thermometry of the metamorphic rims give crystallization temperaturessimilar to the peak PT conditions derived for the same samples by conventional thermo-barometry (Tab. 4.1, 4.3). (2) The euhedral shape, the weak zoning and the low Th/U ratioof the rims is very typical for metamorphic zircons grown during anatexis (e.g. Hoskin &Schaltegger, 2003). The low Th/U ratio has been interpreted as being the result of contem-poraneous growth of a Th-rich phase such as allanite or monazite (Williams et al., 1996;Vavra et al., 1996; Rubatto et al., 2009). Large, complexly zoned monazite is present in
130
all our investigated samples and is probably the cause for the low Th/U ratios in the zirconrims. (3) The very irregular surface between cores and rims could be the result of chem-ical corrosion by a fluid or melt during metamorphism prior to rim formation, suggestingthat a melt phase was present shortly before rim formation (e.g. Vavra et al., 1996; Cesareet al., 2003). The small, rounded inclusions present along the core-rim boundary in some ofthe grains probably represent melt inclusions (e.g. Cesare et al., 2003) which again wouldsuggest that melt was present during rim formation. The melt inclusions could also be re-sponsible for the scatter of LREE in the rims of samples GS2, GS1 and GS4 (Fig. 4.7d).(4) All five metasedimentary gneiss samples show a moderate to pronounced Eu anomaly(Fig. 4.7d), which has been attributed in the literature to the co-crystallization of a feldsparphase (e.g. Hinton & Upton, 1991; Rubatto, 2002). Our rocks do not contain K-feldspar,but considerable amounts of plagioclase which also preferably incorporates Eu during meltcrystallization. Interestingly, except for sample GS5 and few measurements in GS4 the zir-con rims do not show a positive Ce anomaly (which would be typical for magmatic zircon,e.g. Hinton & Upton, 1991). This could again be due to the contamination from microscopicmelt inclusions, which would have a high La/Ce ratio.
In conclusion, we interpret our metamorphic zircon rims as having formed at or close topeak metamorphic conditions, where they (re-)crystallized from partial melts contempora-neous with the crystallization of plagioclase and monazite. The zircon rims formed in alllithologies present in the gneissic core of the CMC (metapelites, metasandstones, metaig-neous rocks) and they formed in the entire CMC from west to the south-east over a distanceof at least ~330 km.
4.4.2 Age and duration of metamorphism in the CMC
The U-Pb zircon ages presented above allow conclusions regarding the age and duration ofmetamorphism in the CMC (Fig. 4.2; Fig. 4.10a). The metamorphic rim ages in the westernand central CMC range from 52.6±0.8 Ma to 54.0±0.9 Ma (Fig. 4.10a). No consistentvariation in age along strike is visible on this ~200 km long section of the CMC and theages are all within error of each other (Fig. 4.10a). This suggests that metamorphism in thewestern and central CMC occurred simultaneously over a distance of ~200 km along strikeduring a time span of ~3 Ma (51.8-54.8 Ma). Sample GS5 lies ~150 km south-east of theeastern-most sample from the central CMC and gives a Concordia age of 51.3±0.7 Ma (Fig.4.8e, Fig. 4.10a). This is within error of the ages of samples GS1 and GS3, and slightlyyounger (~1.2 Ma) than the ages of samples GS2 and GS4 (Fig. 4.10a). This may suggestthat the metamorphism started slightly later in this south-eastern location. However, sincesingle spot measurements in sample GS5 scattered considerably (see section "SHRIMP U-Pb dating of zircons", Fig. 4.8e), and presence of distinct overgrowths of different agewithin the same sample can not be ruled out completely, it could well be that this single ageunderestimates the timing and duration of metamorphism in this south-eastern part of thecomplex.
131
4.4.3 Relationship between Sanak-Baranof belt magmatism and metamor-phism in the CMC
The two U-Pb ages derived from magmatic samples intruding the metamorphic rocks ofthe CMC lie within error of the ages derived from the metamorphic zircon rims (samplesGI1 and GD1, Tab. 4.3, Fig. 4.10a). Even within one sample (GI1), magmatic cores andmetamorphic rims are identical in age. This suggests that magmatism and metamorphismoccurred simultaneously over the same small time span of ~3 Ma in the western and centralparts of the CMC.
U-Pb ages obtained previously for the magmatic rocks of the Sanak-Baranof plutonic beltmay give some additional information on the timing and duration of regional-scale mag-matism and metamorphism (Fig. 4.10b). For the area examined during our study, U-Pbages from two magmatic samples are available from the literature (Fig. 4.10b). The firstsample is a tonalitic dike from the western end of the CMC (Van Cleve glacier sill, Fig.4.1, Fig. 4.10b). Sisson et al. (2003) dated xenotime, monazite and zircon from this sampleby the U-Pb TIMS method. No Concordia plots, calculated average ages or error estimatesfor these ages are given, but 206Pb/238U and 207Pb/235U ages for different mineral fractionsrange from 52.2-53.4 Ma for xenotime, 54.0-55.8 Ma for monazite and 59.1-64.3 Ma forzircon. The age ranges for xenotime and monazite are within error of our ages and are con-sidered significant. The zircon age range in contrast is possibly too old and may representmixing with inherited cores, which cannot be readily separated from the rim during IsotopeDilution TIMS analysis. The second sample comes from a tonalitic pluton exposed ~40 kmsouth-east of our GS5 sample (Novatak glacier pluton, Fig. 4.1, Fig. 4.10b). Sisson et al.(2003) give a lower intercept age of 49±7 Ma, based on three discordant multigrain zirconfractions, which is within error of all our ages due to its large error. In addition to thesetwo samples from the CMC area, three U-Pb ages are available from plutons exposed onBaranof Island (Fig. 4.10b). They are 51.6±0.3 Ma for the Redfish Bay pluton (Fig. 4.1,Bradley et al., 2000), and 50.5±0.5 Ma and 50.1±0.1 Ma for the Crawfish Inlet pluton (Fig.4.1, Bradley et al., 1993, 2000). The first two ages are within error of our sample GS5, andthe third age is slightly younger due to its particularly small error.
Regarding the resulting age distribution along the belt (Fig. 4.10b), magmatism and meta-morphism seems to have been coeval on a ~200 km long section in the western and centralCMC during a period of ~3 Ma between ~52-55 Ma, and coeval on a ~400 km long sec-tion from Nunatak fjord to Baranof Island during a period of ~2 Ma between ~50-52 Ma.A critical age for this interpretation comes from the Mt. Draper pluton, an intrusive bodysimilar to Sanak-Baranof belt rocks but that sticks in the Boundary block, which is a dex-trally displaced tectonic sliver of the Chugach terrane with unknown dextral displacement(Figs. 4.1, 4.2). Sisson et al. (2003) give a lower intercept age from three discordant zir-con fractions of ~54 Ma, without giving an error. We conservatively assign an error of ±1Ma, which still could be too small, since Sisson et al. (2003) give an error of ±7 Ma fora similar lower intercept age based on three discordant zircon fractions from the Novatak
132
glacier pluton (Fig.4.1, Fig. 4.10b). Depending on the amount of dextral displacement ofthe sliver parallel to the margin, this age would indicate that no gradient in metamorphismand magmatism would be present over an at least ~800 km long section of the belt, and thatmetamorphism and magmatism in this section occurred during a period of ~5 Ma between~50-55 Ma (dashed box in Fig. 4.10b).
Previous workers interpreted the U-Pb ages of the Sanak-Baranof plutonic belt displayed inFig. 4.10b as best approximated by a linear regression trough the data set (e.g. Bradley et al.,1993, 2003; Häussler et al., 2003a; Farris & Paterson, 2009). They interpreted each plutonas the result of a spreading ridge which progressively subducted below the accretionaryprism from west to east, and the linear regression was used to calculate a migration rateof this spreading ridge of ~19 cm/year (Farris & Paterson, 2009). However, our data settogether with previous U-Pb ages shows that, at least for the eastern part of the belt fromthe western CMC to Baranof Island, such a progressive age gradient is not present, andthe belt is characterized by ~200 to up to ~800 km long sections where metamorphism andmagmatism was coeval. A detailed discussion of the ridge subduction model is beyond thescope of this work, but if such a ridge has been present, it must have been subducted witha very small angle or parallel to the south-eastern part of the margin to produce the coevalmagmatism and metamorphism observed. This situation would be in agreement with thefinal subduction of the Resurrection plate at that time as displayed in Häussler et al. (2003a)and Madsen et al. (2006).
4.4.4 Implications for heat transfer into the CMC
The data and discussion presented above limit the duration of peak metamorphism andmagmatism in the CMC to ~3 Ma on a ~200 km long section, or, if the age of the Mt.Draper pluton is considered, to ~5 Ma on a ~800 km long section. This short durationof the metamorphic peak is consistent with the very short duration of the orogenic cycleas a whole. The depositional age of the sediments in which the complex is developed isloosely constrained by fossils present in the lower-grade part of the Valdez group to LateCretaceous to Paleocene (~99-60 Ma, Plafker et al., 1994). In addition, youngest ages ofdetrital zircon cores may be used to estimate maximum depositional ages of a sedimentaryunit (e.g. Dickinson & Gehrels, 2009, Chap. 2). The three youngest detrital core agesfrom sample GS2 overlap within 1σ and give a mean age of 63±3 Ma, which is accordingto Dickinson & Gehrels (2009) an acceptable first-order approximation of the maximumdepositional age of the unit. This age is in agreement with the youngest detrital zircongrains of a much larger data base of detrital zircons from the Sitka greywacke on BaranofIsland, which is correlative along strike with our unit (Häussler et al., 2005). Based on theseconsiderations we assume a ~63 Ma age for the deposition of the sediments in which theCMC developed. This limits the time between sedimentation, accretion, burial to >20 kmand heating to >650°C (reached at ~55 Ma) to only ~8 Ma. A short peak of ~3 Ma (~55-52Ma) is then followed by rapid cooling to below ~300°C, indicated at least in the western
133
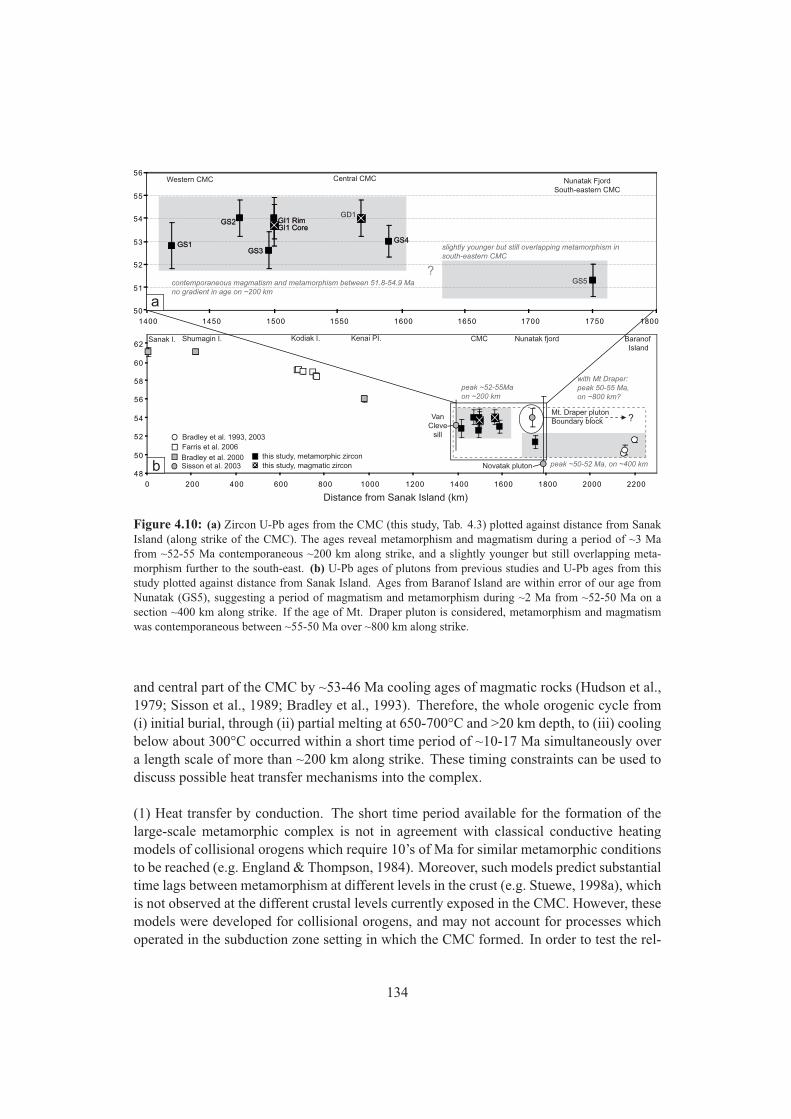
contemporaneous magmatism and metamorphism between 51.8-54.9 Ma
no gradient in age on ~200 km
Distance from Sanak Island (km)
slightly younger but still overlapping metamorphism in
south-eastern CMC
GS5
?Mt. Draper plutonBoundary block
peak ~52-55Ma
on ~200 km
peak ~50-52 Ma, on ~400 km
Bradley et al. 1993, 2003Farris et al. 2006
Bradley et al. 2000Sisson et al. 2003
this study, metamorphic zirconthis study, magmatic zircon
?
with Mt Draper:
peak 50-55 Ma,
on ~800 km?
48
50
52
54
56
58
60
62
0 200 400 600 800 1000 1200 1400 1600 1800 2000 2200
GS4
GI1 RimGI1 Core
GS3
GS2
GS1
Central CMC Nunatak FjordSouth-eastern CMC
CMC Baranof Island
Sanak I. Shumagin I. Kodiak I. Kenai PI.
Western CMC
Nunatak fjord
50
51
52
53
54
55
56
1400 1450 1500 1550 1600 1650 1700 1750 1800
GD1
GS4
GI1 RimGI1 Core
GS3
GS2
GS1
VanCleve
sill
Novatak pluton
a
b
Figure 4.10: (a) Zircon U-Pb ages from the CMC (this study, Tab. 4.3) plotted against distance from SanakIsland (along strike of the CMC). The ages reveal metamorphism and magmatism during a period of ~3 Mafrom ~52-55 Ma contemporaneous ~200 km along strike, and a slightly younger but still overlapping meta-morphism further to the south-east. (b) U-Pb ages of plutons from previous studies and U-Pb ages from thisstudy plotted against distance from Sanak Island. Ages from Baranof Island are within error of our age fromNunatak (GS5), suggesting a period of magmatism and metamorphism during ~2 Ma from ~52-50 Ma on asection ~400 km along strike. If the age of Mt. Draper pluton is considered, metamorphism and magmatismwas contemporaneous between ~55-50 Ma over ~800 km along strike.
and central part of the CMC by ~53-46 Ma cooling ages of magmatic rocks (Hudson et al.,1979; Sisson et al., 1989; Bradley et al., 1993). Therefore, the whole orogenic cycle from(i) initial burial, through (ii) partial melting at 650-700°C and >20 km depth, to (iii) coolingbelow about 300°C occurred within a short time period of ~10-17 Ma simultaneously overa length scale of more than ~200 km along strike. These timing constraints can be used todiscuss possible heat transfer mechanisms into the complex.
(1) Heat transfer by conduction. The short time period available for the formation of thelarge-scale metamorphic complex is not in agreement with classical conductive heatingmodels of collisional orogens which require 10’s of Ma for similar metamorphic conditionsto be reached (e.g. England & Thompson, 1984). Moreover, such models predict substantialtime lags between metamorphism at different levels in the crust (e.g. Stuewe, 1998a), whichis not observed at the different crustal levels currently exposed in the CMC. However, thesemodels were developed for collisional orogens, and may not account for processes whichoperated in the subduction zone setting in which the CMC formed. In order to test the rel-
134
evance of heat conduction in a setting more appropriate to the CMC, James et al. (1989)modelled the thermal evolution of the CMC during the subduction of very young oceaniccrust (<1.5 Ma) or a spreading ridge, since the CMC has for a long time been interpreted asthe result of a subducting spreading ridge below the accretionary prism (e.g. Sisson et al.,1989; Pavlis & Sisson, 1995; Bradley et al., 2003). Based on this modelling, James et al.(1989) concluded that heat conduction alone was not sufficient to produce the metamorphicconditions of the CMC. Their conclusions were based on the lower pressure estimates ofSisson et al. (1989, ~3 kbar, ~10 km depth), but even when considering the newly obtainedhigher pressure estimates for the gneissic core of the CMC (Tab. 4.1), the plots of Jameset al. (1989) reveal that also at depths of ~20 km heat conduction alone is not sufficient toproduce the temperatures observed. Therefore, heat conduction can be ruled out as a primemechanism for the formation of the CMC.
(2) Heat transfer by advection. As an alternative, Sisson et al. (1989) proposed that ad-vective transport of heat by rising magmas or fluids from an underlying hot young oceaniccrust or spreading ridge could have caused the metamorphism of the CMC. In this scenario,the CMC would have been underlain during the time of metamorphism by rocks related tothis subducting ridge, such as underplated mafic melts (e.g. Harris et al., 1996). However,from outcrops along the southernmost part of the Chugach terrane and from a seismic tran-sect located just west of the western end of the CMC (Fuis et al., 1991, 2008), it is knownthat the accretionary prism is underlain by an up to ~10 km thick package of N-dipping,intercalated mafic and sedimentary rocks. They are interpreted as (a) a primary sequenceof sedimentary and basaltic rocks, with the basalts derived from either an intra-oceanic arc(Lull & Plafker, 1990) or an oceanic spreading center (Bradley et al., 2003), or (b) as asecondary tectonic mélange of oceanic crust and sediments which was offscraped from thedown-going plate and underplated below the accretionary prism during subduction (Fuiset al., 2008). The presence of mafic underplated melts as suggested by Harris et al. (1996)is relatively unlikely from both the surface outcrops and the seismic information (Fuis et al.,2008). So if a slab window due to ridge subduction was present below the CMC during thetime of metamorphism, this slab window probably existed below this ~10 km thick pack-age of alternating sediments and mafic rocks, and any magmas or fluids produced by thisslab window originated either at the base or within this thick package and must have risenthrough it without loosing their heat in order to metamorphose the overlying accretionaryprism. This must have happened fast and simultaneously over a large area to produce themetamorphism observed in the CMC.
We consider this model as unlikely because the observed intrusive rocks in the CMC areaare volumetrically relatively minor (<~20%), and large regions of migmatitic gneiss occurwithout signs of larger intrusions present which could have heated the metasedimentaryrocks (Fig. 4.2). In addition, the intrusions are dominantly felsic, and no larger bodies ofmafic intrusions occur, indicating that the melts were not particularly hot and did not releasemuch additional heat during crystallization. Moreover, some of the largest intrusives showcontact metamorphic haloes and they cross-cut fabrics which formed in the metasedimen-tary gneisses at the metamorphic peak (e.g. Fig. 4.3d), indicating that the largest amounts
135
of melt intruded somewhat after the metamorphic peak at least in the schist zone. In addi-tion, heat transported by magmas is expected to produce temporally separated and spatiallylocalized metamorphic events (e.g. De Yoreo et al., 1991) and not regional metamorphismoccurring simultaneously over large areas. Fluids on the other hand are well known to belocally responsible for metasomatism and heating (e.g. Bickle & McKenzie, 1987), but itis equally well known that they are inefficient agents for the transfer of heat on a regionalscale (e.g. Connolly & Thompson, 1989; Barr & Dahlen, 1989). We therefore concludethat heat brought by advection of magmas and fluids to the CMC is unlikely to be the mainmechanism which formed the CMC.
(3) Alternative mechanisms. We suggest that the metamorphic conditions observed in theCMC which were reached over a short time period could have formed without additionalheat input at depth, but as a consequence of the rapid accretion of the complex causingburial and penetrative deformation. It has been shown by theoretical modelling of otheraccretionary prisms that metamorphic conditions similar to the ones recently obtained forthe gneiss zone of the CMC (~650-720°C/ ~7-10 kbar, Tab. 4.1) can be reached in lessthan 5 Ma, if advective transport of material, frictional heating at the basal decollement andinternal strain heating are considered (Dahlen & Barr, 1989; Barr & Dahlen, 1989). Bound-ary conditions which promote high temperatures inside the wedge are high accretion anderosion rates, large amounts of underplating (duplexing of sediments), high coefficients ofbasal friction and low fluid/lithostatic pressure ratios (Dahlen & Barr, 1989; Barr & Dahlen,1989). In addition, amongst others Stuewe (1998b) and Burg & Gerya (2005) showed that ifthe region of concern pervasively and intensely deformed simultaneously over a large areaduring a short time period, viscous heating, i.e. the conversion of mechanical work intoheat, can not be neglected and contributes significantly to the heat budget of the region.
Such a scenario could indeed be realistic for the setting of the CMC. The accretionary prismwithin which the CMC developed, formed as a fold-and-thrust belt due to the subductionof the Kula plate (or Resurrection plate, see discussion in Häussler et al., 2003a) below theAlaskan margin. Even though many features of this original fold-and-thrust belt are nowobliterated by younger faults and by the accretion of the Yaktuat terrane, some constraintson the formation of this fold-and-thrust belt can be made. Plate tectonic reconstructionsfor the time period of interest show orthogonal to dextral oblique convergence between theKula/Farallon and North American plates at high velocities of ~10-15 cm/year for all lo-cations from Vancouver Island up to the Gulf of Alaska (Doubrovine & Tarduno, 2008).So independently of on which plate the accretionary prism actually formed, convergencebetween the down-going and the upper plate was probably very rapid. In addition, erosionrates in the hinterland and accretionary rates in the thrust belt were probably very high, in-dicated by the large amounts of sediments which were deposited in the trench over a veryshort time period (e.g. Sample & Reid, 2003). Peak metamorphic conditions in the CMCare accompanied by two intense, pervasive, ductile deformation phases which affected thewhole complex (D2 and D3 of Pavlis & Sisson, 1995, 2003), suggesting that viscous heatingproduced by intense internal deformation could have contributed to the peak metamorphictemperatures. In addition, the first of the two fabrics is a subhorizontal flattening fabric
136
which probably led to vertical thinning and compression of isotherms, and therewith in-creased the geothermal gradient present at the metamorphic peak (Pavlis & Sisson, 1995).
Based on these qualitative considerations we conclude that neither heat conduction nor heatadvection by rising magmas or fluids sufficiently explain the short time scale of metamor-phism observed simultaneously over a large area in the CMC. We suggest that rapid advec-tive transport of material in an active fold-and-thrust belt, in combination with viscous heat-ing due to intense internal deformation and thinning of isotherms due to vertical flattening,may be sufficient to explain the short time interval available for reaching the metamorphicconditions observed in the CMC.
4.5 Conclusions
New U-Pb ages of metamorphic and magmatic zircons reveal that metamorphism and mag-matism in the western and central CMC occurred during a time period of ~3 Ma between~52-55 Ma simultaneously on a ~200 km long section. Farther to the south-east, the dataset is less dense but suggests that metamorphism and magmatism occurred from Nunatakfjord to Baranof Island during a time period of ~2 Ma between ~52-50 Ma simultaneouslyon a ~400 km long section. If the age of Mt. Draper pluton is considered, metamorphismand magmatism occurred during a time period of ~5 Ma between ~50-55 Ma simultane-ously on a ~800 km long section. The west-east age progression described in the literaturefor the Sanak-Baranof plutonic belt is therefore at least for the eastern part of the belt nota continuous one, but is characterized by sections of ~200 km up to ~800 km long wheremetamorphism and magmatism is coeval. The short time period available for large-scalemetamorphism and magmatism is not in agreement with conductive heating models andadvective heating by magmas or fluids can be excluded for several reasons. We suggestthat fast advective transport of material in a fold-and-thrust belt with appropriate boundaryconditions, supported by internal heat production due to viscous strain heating and by thecompression of isotherms due to vertical thinning during an early phase of deformation,may account for the metamorphic peak conditions reached in the CMC over a short timeperiod simultaneously over a large distance.
Acknowledgments Financial support by the Fonds zur Wissenschaftlichen Förderung FWF project P-19366 is greatly acknowledged. The Electron Microscopy Unit at the Australian National University is thankedfor access to the SEM facilities. C. Carson is thanked for field assistance, his hospitality in Canberra and manySHRIMP discussions. U. Klötzli and F. Biedermann are thanked for help with the mount preparation and accessto the mineral separation facilities at the University of Vienna. P. Claus is thanked for expert flying in the field.
137
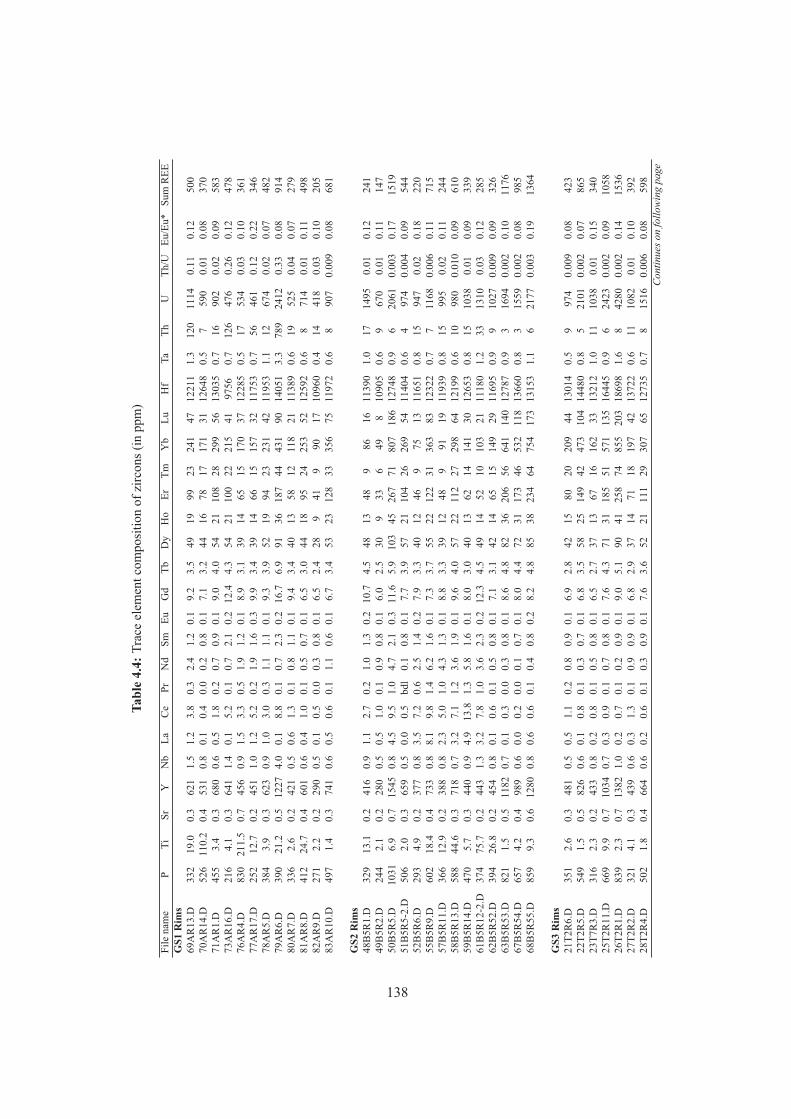
Tabl
e4.
4:Tr
ace
elem
entc
ompo
sitio
nof
zirc
ons(
inpp
m)
File
nam
eP
TiSr
YN
bLa
Ce
PrN
dSm
EuG
dTb
Dy
Ho
ErTm
Yb
LuH
fTa
ThU
Th/U
Eu/E
u*Su
mR
EEG
S1R
ims
69A
R13
.D33
219
.00.
362
11.
51.
23.
80.
32.
41.
20.
19.
23.
549
1999
2324
147
1221
11.
312
011
140.
110.
1250
070
AR
14.D
526
110.
20.
453
10.
80.
10.
40.
00.
20.
80.
17.
13.
244
1678
1717
131
1264
80.
57
590
0.01
0.08
370
71A
R1.
D45
53.
40.
368
00.
60.
51.
80.
20.
70.
90.
19.
04.
054
2110
828
299
5613
035
0.7
1690
20.
020.
0958
373
AR
16.D
216
4.1
0.3
641
1.4
0.1
5.2
0.1
0.7
2.1
0.2
12.4
4.3
5421
100
2221
541
9756
0.7
126
476
0.26
0.12
478
76A
R4.
D83
021
1.5
0.7
456
0.9
1.5
3.3
0.5
1.9
1.2
0.1
8.9
3.1
3914
6515
170
3712
285
0.5
1753
40.
030.
1036
177
AR
17.D
252
12.7
0.2
451
1.0
1.2
5.2
0.2
1.9
1.6
0.3
9.9
3.4
3914
6615
157
3211
753
0.7
5646
10.
120.
2234
678
AR
5.D
384
3.9
0.3
623
0.9
1.0
3.0
0.3
1.1
1.1
0.1
9.3
3.9
5219
9423
231
4211
953
1.1
1267
40.
020.
0748
279
AR
6.D
390
21.2
0.5
1227
4.0
0.1
8.8
0.1
0.7
2.3
0.2
16.7
6.9
9136
187
4443
190
1405
13.
378
924
120.
330.
0891
480
AR
7.D
336
2.6
0.2
421
0.5
0.6
1.3
0.1
0.8
1.1
0.1
9.4
3.4
4013
5812
118
2111
389
0.6
1952
50.
040.
0727
981
AR
8.D
412
24.7
0.4
601
0.6
0.4
1.0
0.1
0.5
0.7
0.1
6.5
3.0
4418
9524
253
5212
592
0.6
871
40.
010.
1149
882
AR
9.D
271
2.2
0.2
290
0.5
0.1
0.5
0.0
0.3
0.8
0.1
6.5
2.4
289
419
9017
1096
00.
414
418
0.03
0.10
205
83A
R10
.D49
71.
40.
374
10.
60.
50.
60.
11.
10.
60.
16.
73.
453
2312
833
356
7511
972
0.6
890
70.
009
0.08
681
GS2
Rim
s48
B5R
1.D
329
13.1
0.2
416
0.9
1.1
2.7
0.2
1.0
1.3
0.2
10.7
4.5
4813
489
8616
1139
01.
017
1495
0.01
0.12
241
49B
5R2.
D24
42.
10.
228
00.
50.
51.
00.
10.
90.
80.
16.
02.
530
933
649
810
905
0.6
967
00.
010.
1114
750
B5R
5.D
1031
6.9
0.7
1545
0.8
4.5
9.5
1.0
4.7
2.1
0.3
11.6
5.9
103
4526
771
807
186
1274
80.
96
2061
0.00
30.
1715
1951
B5R
5-2.
D50
62.
00.
365
90.
50.
00.
5bd
l0.
10.
80.
17.
73.
957
2110
426
269
5411
404
0.6
497
40.
004
0.09
544
52B
5R6.
D29
34.
90.
237
70.
83.
57.
20.
62.
51.
40.
27.
93.
340
1246
975
1311
651
0.8
1594
70.
020.
1822
055
B5R
9.D
602
18.4
0.4
733
0.8
8.1
9.8
1.4
6.2
1.6
0.1
7.3
3.7
5522
122
3136
383
1232
20.
77
1168
0.00
60.
1171
557
B5R
11.D
366
12.9
0.2
388
0.8
2.3
5.0
1.0
4.3
1.3
0.1
8.8
3.3
3912
489
9119
1193
90.
815
995
0.02
0.11
244
58B
5R13
.D58
844
.60.
371
80.
73.
27.
11.
23.
61.
90.
19.
64.
057
2211
227
298
6412
199
0.6
1098
00.
010
0.09
610
59B
5R14
.D47
05.
70.
344
00.
94.
913
.81.
35.
81.
60.
18.
03.
040
1362
1414
130
1265
30.
815
1038
0.01
0.09
339
61B
5R12
-2.D
374
75.7
0.2
443
1.3
3.2
7.8
1.0
3.6
2.3
0.2
12.3
4.5
4914
5210
103
2111
180
1.2
3313
100.
030.
1228
562
B5R
52.D
394
26.8
0.2
454
0.8
0.1
0.6
0.1
0.5
0.8
0.1
7.1
3.1
4214
6515
149
2911
695
0.9
910
270.
009
0.09
326
63B
5R53
.D82
11.
50.
511
820.
70.
10.
30.
00.
30.
80.
18.
64.
882
3620
656
641
140
1278
70.
93
1694
0.00
20.
1011
7667
B5R
54.D
657
4.2
0.4
989
0.6
0.0
0.2
0.0
0.1
0.7
0.1
8.0
4.4
7231
173
4653
211
813
660
0.8
315
590.
002
0.08
985
68B
5R55
.D85
99.
30.
612
800.
80.
60.
60.
10.
40.
80.
28.
24.
885
3823
464
754
173
1315
31.
16
2177
0.00
30.
1913
64
GS3
Rim
s21
T2R
6.D
351
2.6
0.3
481
0.5
0.5
1.1
0.2
0.8
0.9
0.1
6.9
2.8
4215
8020
209
4413
014
0.5
997
40.
009
0.08
423
22T2
R5.
D54
91.
50.
582
60.
60.
10.
80.
10.
30.
70.
16.
83.
558
2514
942
473
104
1448
00.
85
2101
0.00
20.
0786
523
T7R
3.D
316
2.3
0.2
433
0.8
0.2
0.8
0.1
0.5
0.8
0.1
6.5
2.7
3713
6716
162
3313
212
1.0
1110
380.
010.
1534
025
T2R
11.D
669
9.9
0.7
1034
0.7
0.3
0.9
0.1
0.7
0.8
0.1
7.6
4.3
7131
185
5157
113
516
445
0.9
624
230.
002
0.09
1058
26T2
R1.
D83
92.
30.
713
821.
00.
20.
70.
10.
20.
90.
19.
05.
190
4125
874
855
203
1869
81.
68
4280
0.00
20.
1415
3627
T2R
2.D
321
4.1
0.3
439
0.6
0.3
1.3
0.1
0.9
0.9
0.1
6.8
2.9
3714
7118
197
4213
722
0.6
1110
820.
010.
1039
228
T2R
4.D
502
1.8
0.4
664
0.6
0.2
0.6
0.1
0.3
0.9
0.1
7.6
3.6
5221
111
2930
765
1273
50.
78
1516
0.00
60.
0859
8Continuesonfollowingpage
138
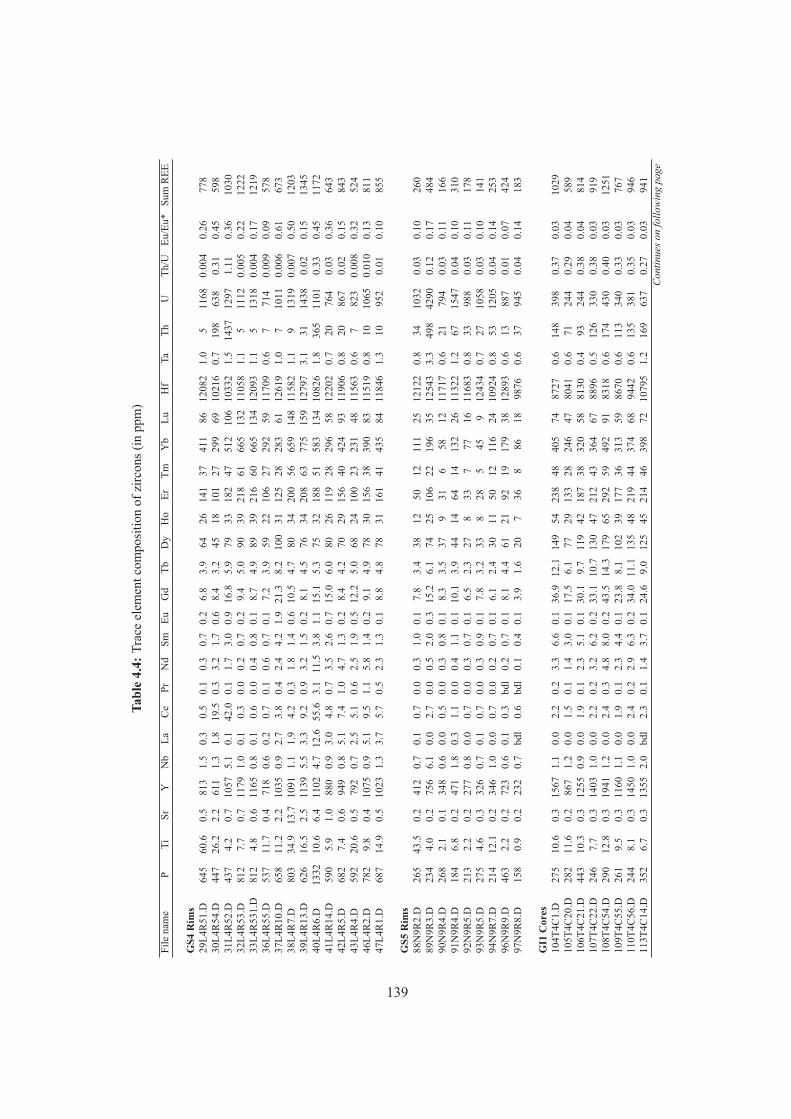
Tabl
e4.
4:Tr
ace
elem
entc
ompo
sitio
nof
zirc
ons(
inpp
m)
File
nam
eP
TiSr
YN
bLa
Ce
PrN
dSm
EuG
dTb
Dy
Ho
ErTm
Yb
LuH
fTa
ThU
Th/U
Eu/E
u*Su
mR
EE
GS4
Rim
s29
L4R
51.D
645
60.6
0.5
813
1.5
0.3
0.5
0.1
0.3
0.7
0.2
6.8
3.9
6426
141
3741
186
1208
21.
05
1168
0.00
40.
2677
830
L4R
54.D
447
26.2
2.2
611
1.3
1.8
19.5
0.3
3.2
1.7
0.6
8.4
3.2
4518
101
2729
969
1021
60.
719
863
80.
310.
4559
831
L4R
52.D
437
4.2
0.7
1057
5.1
0.1
42.0
0.1
1.7
3.0
0.9
16.8
5.9
7933
182
4751
210
610
332
1.5
1437
1297
1.11
0.36
1030
32L4
R53
.D81
27.
70.
711
791.
00.
10.
30.
00.
20.
70.
29.
45.
090
3921
861
665
132
1105
81.
15
1112
0.00
50.
2212
2233
L4R
531.
D81
24.
80.
611
650.
80.
10.
60.
00.
40.
80.
18.
74.
989
3921
660
665
134
1209
31.
15
1318
0.00
40.
1712
1936
L4R
55.D
537
11.7
0.4
718
0.6
0.2
0.7
0.1
0.6
0.7
0.1
7.2
3.9
5922
106
2729
259
1170
90.
67
714
0.00
90.
0957
837
L4R
10.D
658
11.2
2.2
1035
0.9
2.7
3.8
0.4
2.4
4.2
1.9
21.3
8.2
100
3112
528
283
6112
619
1.0
710
110.
006
0.61
673
38L4
R7.
D80
334
.913
.710
911.
11.
94.
20.
31.
81.
40.
610
.54.
780
3420
056
659
148
1158
21.
19
1319
0.00
70.
5012
0339
L4R
13.D
626
16.5
2.5
1139
5.5
3.3
9.2
0.9
3.2
1.5
0.2
8.1
4.5
7634
208
6377
515
912
797
3.1
3114
380.
020.
1513
4540
L4R
6.D
1332
10.6
6.4
1102
4.7
12.6
55.6
3.1
11.5
3.8
1.1
15.1
5.3
7532
188
5158
313
410
826
1.8
365
1101
0.33
0.45
1172
41L4
R14
.D59
05.
91.
088
00.
93.
04.
80.
73.
52.
60.
715
.06.
080
2611
928
296
5812
202
0.7
2076
40.
030.
3664
342
L4R
5.D
682
7.4
0.6
949
0.8
5.1
7.4
1.0
4.7
1.3
0.2
8.4
4.2
7029
156
4042
493
1190
60.
820
867
0.02
0.15
843
43L4
R4.
D59
220
.60.
579
20.
72.
55.
10.
62.
51.
90.
512
.25.
068
2410
023
231
4811
563
0.6
782
30.
008
0.32
524
46L4
R2.
D78
29.
80.
410
750.
95.
19.
51.
15.
81.
40.
29.
14.
978
3015
638
390
8311
519
0.8
1010
650.
010
0.13
811
47L4
R1.
D68
714
.90.
510
231.
33.
75.
70.
52.
31.
30.
18.
84.
878
3116
141
435
8411
846
1.3
1095
20.
010.
1085
5
GS5
Rim
s88
N9R
2.D
265
43.5
0.2
412
0.7
0.1
0.7
0.0
0.3
1.0
0.1
7.8
3.4
3812
5012
111
2512
122
0.8
3410
320.
030.
1026
089
N9R
3.D
234
4.0
0.2
756
6.1
0.0
2.7
0.0
0.5
2.0
0.3
15.2
6.1
7425
106
2219
635
1254
33.
349
842
900.
120.
1748
490
N9R
4.D
268
2.1
0.1
348
0.6
0.0
0.5
0.0
0.3
0.8
0.1
8.3
3.5
379
316
5812
1171
70.
621
794
0.03
0.11
166
91N
9R4.
D18
46.
80.
247
11.
80.
31.
10.
00.
41.
10.
110
.13.
944
1464
1413
226
1132
21.
267
1547
0.04
0.10
310
92N
9R5.
D21
32.
20.
227
70.
80.
00.
70.
00.
30.
70.
16.
52.
327
833
777
1611
683
0.8
3398
80.
030.
1117
893
N9R
5.D
275
4.6
0.3
326
0.7
0.1
0.7
0.0
0.3
0.9
0.1
7.8
3.2
338
285
459
1243
40.
727
1058
0.03
0.10
141
94N
9R7.
D21
412
.10.
234
61.
00.
00.
70.
00.
20.
70.
16.
12.
430
1150
1211
624
1092
40.
853
1205
0.04
0.14
253
96N
9R9.
D46
32.
20.
272
30.
60.
10.
3bd
l0.
20.
70.
18.
14.
461
2192
1917
938
1289
30.
613
887
0.01
0.07
424
97N
9R8.
D15
80.
90.
223
20.
7bd
l0.
6bd
l0.
10.
40.
13.
91.
620
736
886
1898
760.
637
945
0.04
0.14
183
GI1
Cor
es10
4T4C
1.D
275
10.6
0.3
1567
1.1
0.0
2.2
0.2
3.3
6.6
0.1
36.9
12.1
149
5423
848
405
7487
270.
614
839
80.
370.
0310
2910
5T4C
20.D
282
11.6
0.2
867
1.2
0.0
1.5
0.1
1.4
3.0
0.1
17.5
6.1
7729
133
2824
647
8041
0.6
7124
40.
290.
0458
910
6T4C
21.D
443
10.3
0.3
1255
0.9
0.0
1.9
0.1
2.3
5.1
0.1
30.1
9.7
119
4218
738
320
5881
300.
493
244
0.38
0.04
814
107T
4C22
.D24
67.
70.
314
031.
00.
02.
20.
23.
26.
20.
233
.110
.713
047
212
4336
467
8896
0.5
126
330
0.38
0.03
919
108T
4C54
.D29
012
.80.
319
411.
20.
02.
40.
34.
88.
00.
243
.514
.317
965
292
5949
291
8318
0.6
174
430
0.40
0.03
1251
109T
4C55
.D26
19.
50.
311
601.
10.
01.
90.
12.
34.
40.
123
.88.
110
239
177
3631
359
8670
0.6
113
340
0.33
0.03
767
110T
4C56
.D24
48.
10.
314
501.
00.
02.
40.
22.
96.
30.
234
.011
.113
548
219
4437
468
9442
0.6
135
381
0.35
0.03
946
113T
4C14
.D35
26.
70.
313
552.
0bd
l2.
30.
11.
43.
70.
124
.69.
012
545
214
4639
872
1079
51.
216
963
70.
270.
0394
1Continuesonfollowingpage
139
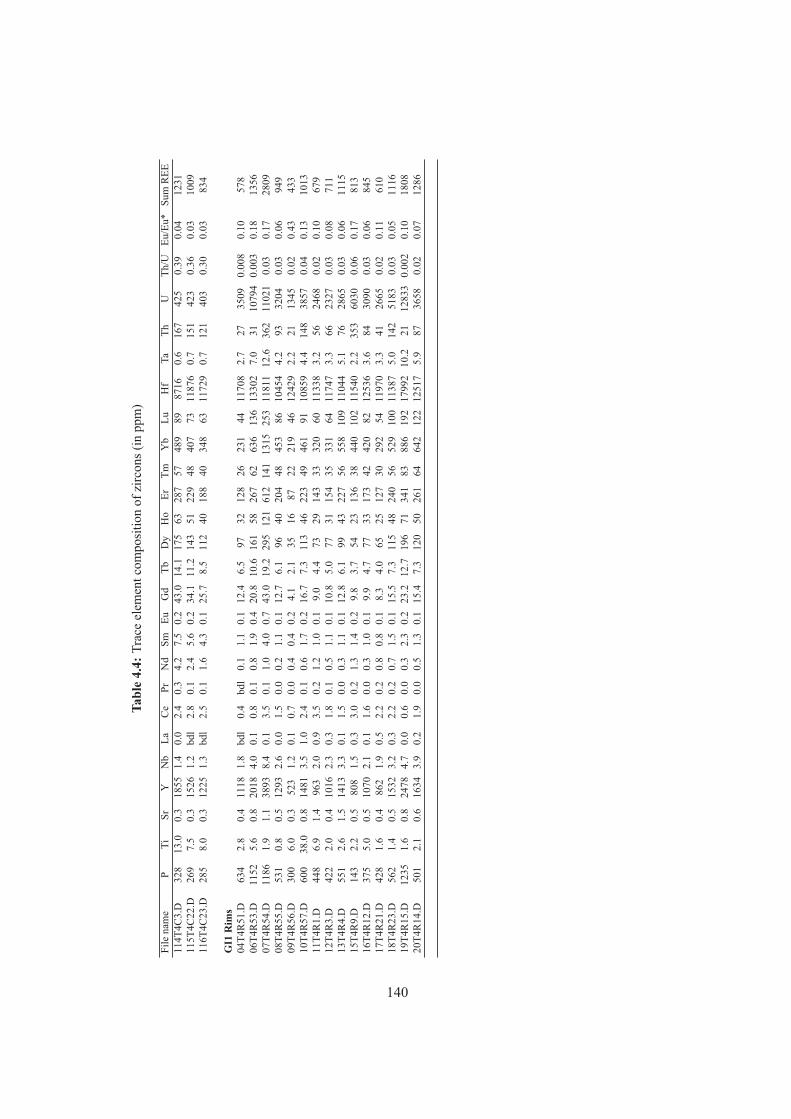
Tabl
e4.
4:Tr
ace
elem
entc
ompo
sitio
nof
zirc
ons(
inpp
m)
File
nam
eP
TiSr
YN
bLa
Ce
PrN
dSm
EuG
dTb
Dy
Ho
ErTm
Yb
LuH
fTa
ThU
Th/U
Eu/E
u*Su
mR
EE11
4T4C
3.D
328
13.0
0.3
1855
1.4
0.0
2.4
0.3
4.2
7.5
0.2
43.0
14.1
175
6328
757
489
8987
160.
616
742
50.
390.
0412
3111
5T4C
22.D
269
7.5
0.3
1526
1.2
bdl
2.8
0.1
2.4
5.6
0.2
34.1
11.2
143
5122
948
407
7311
876
0.7
151
423
0.36
0.03
1009
116T
4C23
.D28
58.
00.
312
251.
3bd
l2.
50.
11.
64.
30.
125
.78.
511
240
188
4034
863
1172
90.
712
140
30.
300.
0383
4
GI1
Rim
s04
T4R
51.D
634
2.8
0.4
1118
1.8
bdl
0.4
bdl
0.1
1.1
0.1
12.4
6.5
9732
128
2623
144
1170
82.
727
3509
0.00
80.
1057
806
T4R
53.D
1152
5.6
0.8
2018
4.0
0.1
0.8
0.1
0.8
1.9
0.4
20.8
10.6
161
5826
762
636
136
1330
27.
031
1079
40.
003
0.18
1356
07T4
R54
.D11
861.
91.
138
938.
40.
13.
50.
11.
04.
00.
743
.019
.229
512
161
214
113
1525
311
811
12.6
362
1102
10.
030.
1728
0908
T4R
55.D
531
0.8
0.5
1293
2.6
0.0
1.5
0.0
0.2
1.1
0.1
12.7
6.1
9640
204
4845
386
1045
44.
293
3204
0.03
0.06
949
09T4
R56
.D30
06.
00.
352
31.
20.
10.
70.
00.
40.
40.
24.
12.
135
1687
2221
946
1242
92.
221
1345
0.02
0.43
433
10T4
R57
.D60
038
.00.
814
813.
51.
02.
40.
10.
61.
70.
216
.77.
311
346
223
4946
191
1085
94.
414
838
570.
040.
1310
1311
T4R
1.D
448
6.9
1.4
963
2.0
0.9
3.5
0.2
1.2
1.0
0.1
9.0
4.4
7329
143
3332
060
1133
83.
256
2468
0.02
0.10
679
12T4
R3.
D42
22.
00.
410
162.
30.
31.
80.
10.
51.
10.
110
.85.
077
3115
435
331
6411
747
3.3
6623
270.
030.
0871
113
T4R
4.D
551
2.6
1.5
1413
3.3
0.1
1.5
0.0
0.3
1.1
0.1
12.8
6.1
9943
227
5655
810
911
044
5.1
7628
650.
030.
0611
1515
T4R
9.D
143
2.2
0.5
808
1.5
0.3
3.0
0.2
1.3
1.4
0.2
9.8
3.7
5423
136
3844
010
211
540
2.2
353
6030
0.06
0.17
813
16T4
R12
.D37
55.
00.
510
702.
10.
11.
60.
00.
31.
00.
19.
94.
777
3317
342
420
8212
536
3.6
8430
900.
030.
0684
517
T4R
21.D
428
1.6
0.4
862
1.9
0.5
2.2
0.2
0.8
0.8
0.1
8.3
4.0
6525
127
3029
254
1197
03.
341
2665
0.02
0.11
610
18T4
R23
.D56
21.
40.
515
323.
20.
32.
20.
20.
71.
50.
115
.57.
311
548
240
5652
910
011
387
5.0
142
5183
0.03
0.05
1116
19T4
R15
.D12
351.
60.
824
784.
70.
00.
60.
00.
32.
30.
223
.212
.719
671
341
8388
619
217
992
10.2
2112
833
0.00
20.
1018
0820
T4R
14.D
501
2.1
0.6
1634
3.9
0.2
1.9
0.0
0.5
1.3
0.1
15.4
7.3
120
5026
164
642
122
1251
75.
987
3658
0.02
0.07
1286
140
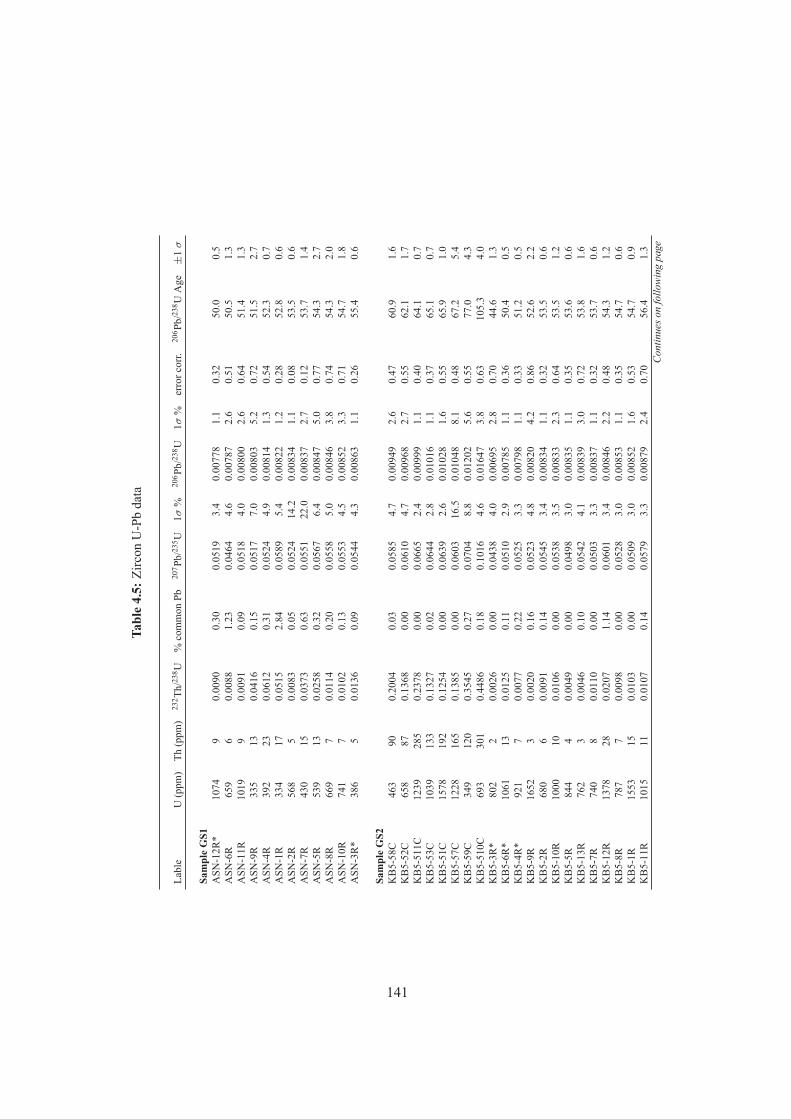
Tabl
e4.
5:Zi
rcon
U-P
bda
ta
Labl
eU
(ppm
)Th
(ppm
)23
2 Th/
238 U
%co
mm
onPb
207 P
b/23
5 U1σ
%20
6 Pb/
238 U
1σ%
erro
rcor
r.20
6 Pb/
238 U
Age
±1
σ
Sam
ple
GS1
ASN
-12R
*10
749
0.00
900.
300.
0519
3.4
0.00
778
1.1
0.32
50.0
0.5
ASN
-6R
659
60.
0088
1.23
0.04
644.
60.
0078
72.
60.
5150
.51.
3A
SN-1
1R10
199
0.00
910.
090.
0518
4.0
0.00
800
2.6
0.64
51.4
1.3
ASN
-9R
335
130.
0416
0.15
0.05
177.
00.
0080
35.
20.
7251
.52.
7A
SN-4
R39
223
0.06
120.
310.
0524
4.9
0.00
814
1.3
0.54
52.3
0.7
ASN
-1R
334
170.
0515
2.84
0.05
895.
40.
0082
21.
20.
2852
.80.
6A
SN-2
R56
85
0.00
830.
050.
0524
14.2
0.00
834
1.1
0.08
53.5
0.6
ASN
-7R
430
150.
0373
0.63
0.05
5122
.00.
0083
72.
70.
1253
.71.
4A
SN-5
R53
913
0.02
580.
320.
0567
6.4
0.00
847
5.0
0.77
54.3
2.7
ASN
-8R
669
70.
0114
0.20
0.05
585.
00.
0084
63.
80.
7454
.32.
0A
SN-1
0R74
17
0.01
020.
130.
0553
4.5
0.00
852
3.3
0.71
54.7
1.8
ASN
-3R
*38
65
0.01
360.
090.
0544
4.3
0.00
863
1.1
0.26
55.4
0.6
Sam
ple
GS2
KB
5-58
C46
390
0.20
040.
030.
0585
4.7
0.00
949
2.6
0.47
60.9
1.6
KB
5-52
C65
887
0.13
680.
000.
0610
4.7
0.00
968
2.7
0.55
62.1
1.7
KB
5-51
1C12
3928
50.
2378
0.00
0.06
652.
40.
0099
91.
10.
4064
.10.
7K
B5-
53C
1039
133
0.13
270.
020.
0644
2.8
0.01
016
1.1
0.37
65.1
0.7
KB
5-51
C15
7819
20.
1254
0.00
0.06
392.
60.
0102
81.
60.
5565
.91.
0K
B5-
57C
1228
165
0.13
850.
000.
0603
16.5
0.01
048
8.1
0.48
67.2
5.4
KB
5-59
C34
912
00.
3545
0.27
0.07
048.
80.
0120
25.
60.
5577
.04.
3K
B5-
510C
693
301
0.44
860.
180.
1016
4.6
0.01
647
3.8
0.63
105.
34.
0K
B5-
3R*
802
20.
0026
0.00
0.04
384.
00.
0069
52.
80.
7044
.61.
3K
B5-
6R*
1061
130.
0125
0.11
0.05
102.
90.
0078
51.
10.
3650
.40.
5K
B5-
4R*
921
70.
0077
0.22
0.05
253.
30.
0079
81.
10.
3351
.20.
5K
B5-
9R16
523
0.00
200.
160.
0523
4.8
0.00
820
4.2
0.86
52.6
2.2
KB
5-2R
680
60.
0091
0.14
0.05
453.
40.
0083
41.
10.
3253
.50.
6K
B5-
10R
1000
100.
0106
0.00
0.05
383.
50.
0083
32.
30.
6453
.51.
2K
B5-
5R84
44
0.00
490.
000.
0498
3.0
0.00
835
1.1
0.35
53.6
0.6
KB
5-13
R76
23
0.00
460.
100.
0542
4.1
0.00
839
3.0
0.72
53.8
1.6
KB
5-7R
740
80.
0110
0.00
0.05
033.
30.
0083
71.
10.
3253
.70.
6K
B5-
12R
1378
280.
0207
1.14
0.06
013.
40.
0084
62.
20.
4854
.31.
2K
B5-
8R78
77
0.00
980.
000.
0528
3.0
0.00
853
1.1
0.35
54.7
0.6
KB
5-1R
1553
150.
0103
0.00
0.05
093.
00.
0085
21.
60.
5354
.70.
9K
B5-
11R
1015
110.
0107
0.14
0.05
793.
30.
0087
92.
40.
7056
.41.
3Continuesonfollowingpage
141
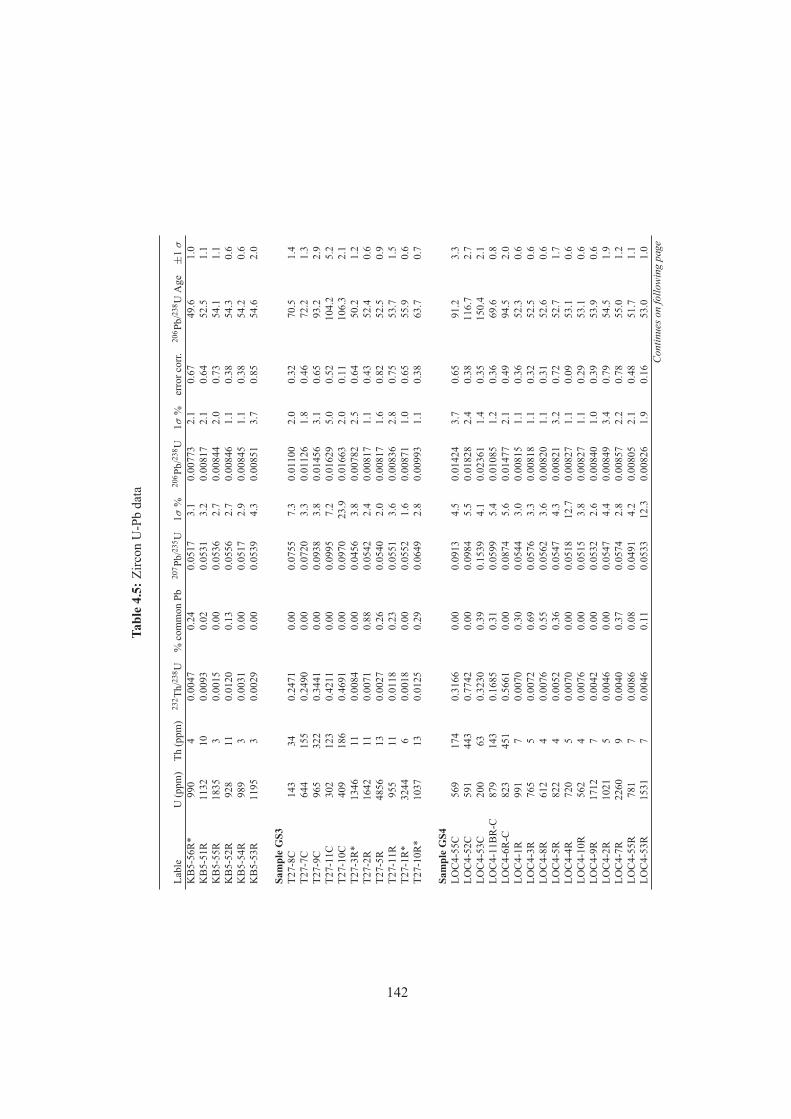
Tabl
e4.
5:Zi
rcon
U-P
bda
ta
Labl
eU
(ppm
)Th
(ppm
)23
2 Th/
238 U
%co
mm
onPb
207 P
b/23
5 U1σ
%20
6 Pb/
238 U
1σ%
erro
rcor
r.20
6 Pb/
238 U
Age
±1
σ
KB
5-56
R*
990
40.
0047
0.24
0.05
173.
10.
0077
32.
10.
6749
.61.
0K
B5-
51R
1132
100.
0093
0.02
0.05
313.
20.
0081
72.
10.
6452
.51.
1K
B5-
55R
1835
30.
0015
0.00
0.05
362.
70.
0084
42.
00.
7354
.11.
1K
B5-
52R
928
110.
0120
0.13
0.05
562.
70.
0084
61.
10.
3854
.30.
6K
B5-
54R
989
30.
0031
0.00
0.05
172.
90.
0084
51.
10.
3854
.20.
6K
B5-
53R
1195
30.
0029
0.00
0.05
394.
30.
0085
13.
70.
8554
.62.
0
Sam
ple
GS3
T27-
8C14
334
0.24
710.
000.
0755
7.3
0.01
100
2.0
0.32
70.5
1.4
T27-
7C64
415
50.
2490
0.00
0.07
203.
30.
0112
61.
80.
4672
.21.
3T2
7-9C
965
322
0.34
410.
000.
0938
3.8
0.01
456
3.1
0.65
93.2
2.9
T27-
11C
302
123
0.42
110.
000.
0995
7.2
0.01
629
5.0
0.52
104.
25.
2T2
7-10
C40
918
60.
4691
0.00
0.09
7023
.90.
0166
32.
00.
1110
6.3
2.1
T27-
3R*
1346
110.
0084
0.00
0.04
563.
80.
0078
22.
50.
6450
.21.
2T2
7-2R
1642
110.
0071
0.88
0.05
422.
40.
0081
71.
10.
4352
.40.
6T2
7-5R
4856
130.
0027
0.26
0.05
402.
00.
0081
71.
60.
8252
.50.
9T2
7-11
R95
511
0.01
180.
230.
0551
3.6
0.00
836
2.8
0.75
53.7
1.5
T27-
1R*
3244
60.
0018
0.00
0.05
521.
60.
0087
11.
00.
6555
.90.
6T2
7-10
R*
1037
130.
0125
0.29
0.06
492.
80.
0099
31.
10.
3863
.70.
7
Sam
ple
GS4
LOC
4-55
C56
917
40.
3166
0.00
0.09
134.
50.
0142
43.
70.
6591
.23.
3LO
C4-
52C
591
443
0.77
420.
000.
0984
5.5
0.01
828
2.4
0.38
116.
72.
7LO
C4-
53C
200
630.
3230
0.39
0.15
394.
10.
0236
11.
40.
3515
0.4
2.1
LOC
4-11
BR
-C87
914
30.
1685
0.31
0.05
995.
40.
0108
51.
20.
3669
.60.
8LO
C4-
6R-C
823
451
0.56
610.
000.
0874
5.6
0.01
477
2.1
0.49
94.5
2.0
LOC
4-1R
991
70.
0070
0.30
0.05
443.
00.
0081
51.
10.
3652
.30.
6LO
C4-
3R76
55
0.00
720.
690.
0576
3.3
0.00
818
1.1
0.32
52.5
0.6
LOC
4-8R
612
40.
0076
0.55
0.05
623.
60.
0082
01.
10.
3152
.60.
6LO
C4-
5R82
24
0.00
520.
360.
0547
4.3
0.00
821
3.2
0.72
52.7
1.7
LOC
4-4R
720
50.
0070
0.00
0.05
1812
.70.
0082
71.
10.
0953
.10.
6LO
C4-
10R
562
40.
0076
0.00
0.05
153.
80.
0082
71.
10.
2953
.10.
6LO
C4-
9R17
127
0.00
420.
000.
0532
2.6
0.00
840
1.0
0.39
53.9
0.6
LOC
4-2R
1021
50.
0046
0.00
0.05
474.
40.
0084
93.
40.
7954
.51.
9LO
C4-
7R22
609
0.00
400.
370.
0574
2.8
0.00
857
2.2
0.78
55.0
1.2
LOC
4-55
R78
17
0.00
860.
080.
0491
4.2
0.00
805
2.1
0.48
51.7
1.1
LOC
4-53
R15
317
0.00
460.
110.
0533
12.3
0.00
826
1.9
0.16
53.0
1.0
Continuesonfollowingpage
142
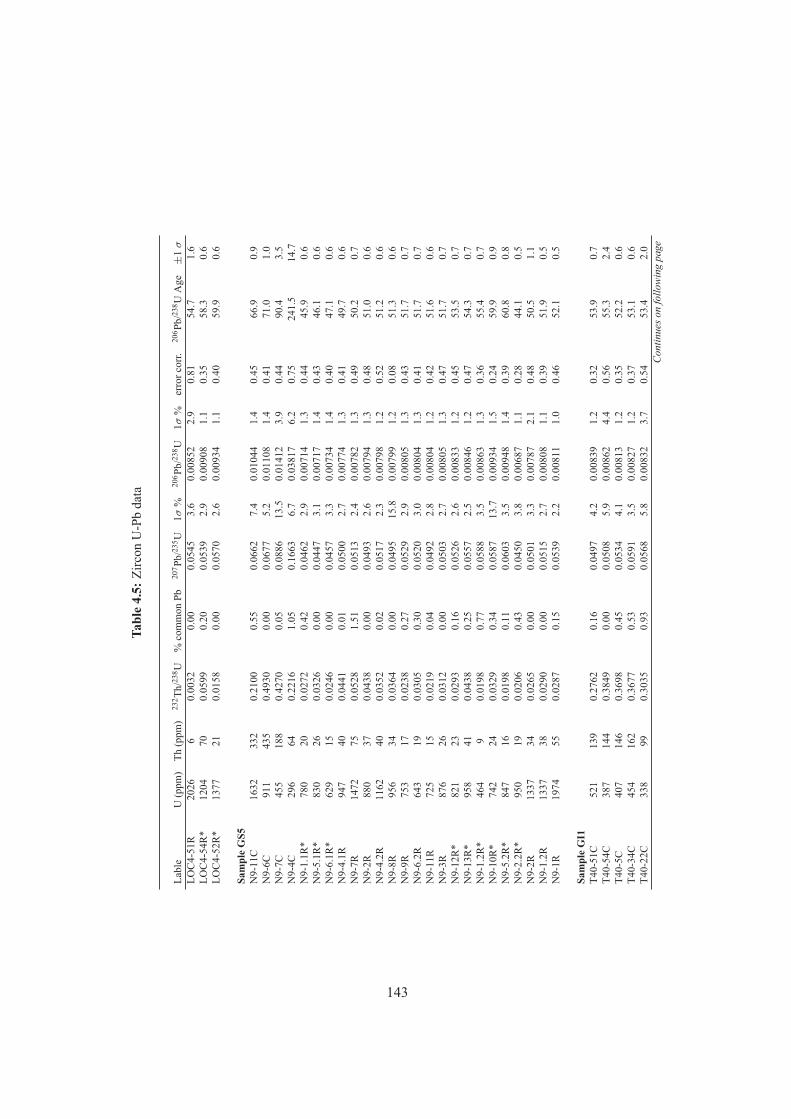
Tabl
e4.
5:Zi
rcon
U-P
bda
ta
Labl
eU
(ppm
)Th
(ppm
)23
2 Th/
238 U
%co
mm
onPb
207 P
b/23
5 U1σ
%20
6 Pb/
238 U
1σ%
erro
rcor
r.20
6 Pb/
238 U
Age
±1
σ
LOC
4-51
R20
266
0.00
320.
000.
0545
3.6
0.00
852
2.9
0.81
54.7
1.6
LOC
4-54
R*
1204
700.
0599
0.20
0.05
392.
90.
0090
81.
10.
3558
.30.
6LO
C4-
52R
*13
7721
0.01
580.
000.
0570
2.6
0.00
934
1.1
0.40
59.9
0.6
Sam
ple
GS5
N9-
11C
1632
332
0.21
000.
550.
0662
7.4
0.01
044
1.4
0.45
66.9
0.9
N9-
6C91
143
50.
4930
0.00
0.06
775.
20.
0110
81.
40.
4171
.01.
0N
9-7C
455
188
0.42
700.
050.
0886
13.5
0.01
412
3.9
0.44
90.4
3.5
N9-
4C29
664
0.22
161.
050.
1663
6.7
0.03
817
6.2
0.75
241.
514
.7N
9-1.
1R*
780
200.
0272
0.42
0.04
622.
90.
0071
41.
30.
4445
.90.
6N
9-5.
1R*
830
260.
0326
0.00
0.04
473.
10.
0071
71.
40.
4346
.10.
6N
9-6.
1R*
629
150.
0246
0.00
0.04
573.
30.
0073
41.
40.
4047
.10.
6N
9-4.
1R94
740
0.04
410.
010.
0500
2.7
0.00
774
1.3
0.41
49.7
0.6
N9-
7R14
7275
0.05
281.
510.
0513
2.4
0.00
782
1.3
0.49
50.2
0.7
N9-
2R88
037
0.04
380.
000.
0493
2.6
0.00
794
1.3
0.48
51.0
0.6
N9-
4.2R
1162
400.
0352
0.02
0.05
172.
30.
0079
81.
20.
5251
.20.
6N
9-8R
956
340.
0364
0.00
0.04
9515
.80.
0079
91.
20.
0851
.30.
6N
9-9R
753
170.
0238
0.27
0.05
292.
90.
0080
51.
30.
4351
.70.
7N
9-6.
2R64
319
0.03
050.
300.
0520
3.0
0.00
804
1.3
0.41
51.7
0.7
N9-
11R
725
150.
0219
0.04
0.04
922.
80.
0080
41.
20.
4251
.60.
6N
9-3R
876
260.
0312
0.00
0.05
032.
70.
0080
51.
30.
4751
.70.
7N
9-12
R*
821
230.
0293
0.16
0.05
262.
60.
0083
31.
20.
4553
.50.
7N
9-13
R*
958
410.
0438
0.25
0.05
572.
50.
0084
61.
20.
4754
.30.
7N
9-1.
2R*
464
90.
0198
0.77
0.05
883.
50.
0086
31.
30.
3655
.40.
7N
9-10
R*
742
240.
0329
0.34
0.05
8713
.70.
0093
41.
50.
2459
.90.
9N
9-5.
2R*
847
160.
0198
0.11
0.06
033.
50.
0094
81.
40.
3960
.80.
8N
9-2.
2R*
950
190.
0206
0.43
0.04
503.
80.
0068
71.
10.
2844
.10.
5N
9-2R
1337
340.
0265
0.00
0.05
013.
30.
0078
72.
10.
4850
.51.
1N
9-1.
2R13
3738
0.02
900.
000.
0515
2.7
0.00
808
1.1
0.39
51.9
0.5
N9-
1R19
7455
0.02
870.
150.
0539
2.2
0.00
811
1.0
0.46
52.1
0.5
Sam
ple
GI1
T40-
51C
521
139
0.27
620.
160.
0497
4.2
0.00
839
1.2
0.32
53.9
0.7
T40-
54C
387
144
0.38
490.
000.
0508
5.9
0.00
862
4.4
0.56
55.3
2.4
T40-
5C40
714
60.
3698
0.45
0.05
344.
10.
0081
31.
20.
3552
.20.
6T4
0-34
C45
416
20.
3677
0.53
0.05
913.
50.
0082
71.
20.
3753
.10.
6T4
0-22
C33
899
0.30
350.
930.
0568
5.8
0.00
832
3.7
0.54
53.4
2.0
Continuesonfollowingpage
143
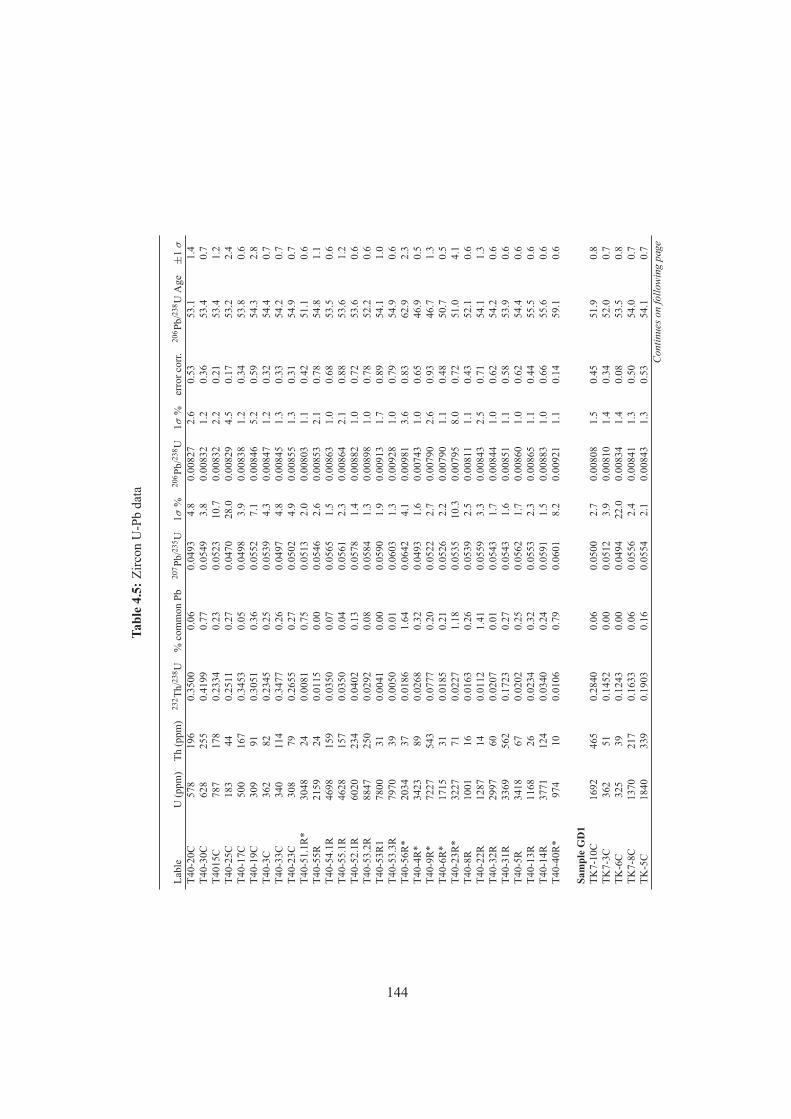
Tabl
e4.
5:Zi
rcon
U-P
bda
ta
Labl
eU
(ppm
)Th
(ppm
)23
2 Th/
238 U
%co
mm
onPb
207 P
b/23
5 U1σ
%20
6 Pb/
238 U
1σ%
erro
rcor
r.20
6 Pb/
238 U
Age
±1
σ
T40-
20C
578
196
0.35
000.
060.
0493
4.8
0.00
827
2.6
0.53
53.1
1.4
T40-
30C
628
255
0.41
990.
770.
0549
3.8
0.00
832
1.2
0.36
53.4
0.7
T401
5C78
717
80.
2334
0.23
0.05
2310
.70.
0083
22.
20.
2153
.41.
2T4
0-25
C18
344
0.25
110.
270.
0470
28.0
0.00
829
4.5
0.17
53.2
2.4
T40-
17C
500
167
0.34
530.
050.
0498
3.9
0.00
838
1.2
0.34
53.8
0.6
T40-
19C
309
910.
3051
0.36
0.05
527.
10.
0084
65.
20.
5954
.32.
8T4
0-3C
362
820.
2345
0.25
0.05
394.
30.
0084
71.
20.
3254
.40.
7T4
0-33
C34
011
40.
3477
0.26
0.04
974.
80.
0084
51.
30.
3354
.20.
7T4
0-23
C30
879
0.26
550.
270.
0502
4.9
0.00
855
1.3
0.31
54.9
0.7
T40-
51.1
R*
3048
240.
0081
0.75
0.05
132.
00.
0080
31.
10.
4251
.10.
6T4
0-55
R21
5924
0.01
150.
000.
0546
2.6
0.00
853
2.1
0.78
54.8
1.1
T40-
54.1
R46
9815
90.
0350
0.07
0.05
651.
50.
0086
31.
00.
6853
.50.
6T4
0-55
.1R
4628
157
0.03
500.
040.
0561
2.3
0.00
864
2.1
0.88
53.6
1.2
T40-
52.1
R60
2023
40.
0402
0.13
0.05
781.
40.
0088
21.
00.
7253
.60.
6T4
0-53
.2R
8847
250
0.02
920.
080.
0584
1.3
0.00
898
1.0
0.78
52.2
0.6
T40-
53R
178
0031
0.00
410.
000.
0590
1.9
0.00
913
1.7
0.89
54.1
1.0
T40-
53.3
R79
7039
0.00
500.
010.
0603
1.3
0.00
928
1.0
0.79
54.9
0.6
T40-
56R
*20
3437
0.01
861.
640.
0642
4.1
0.00
981
3.6
0.83
62.9
2.3
T40-
4R*
3423
890.
0268
0.32
0.04
931.
60.
0074
31.
00.
6546
.90.
5T4
0-9R
*72
2754
30.
0777
0.20
0.05
222.
70.
0079
02.
60.
9346
.71.
3T4
0-6R
*17
1531
0.01
850.
210.
0526
2.2
0.00
790
1.1
0.48
50.7
0.5
T40-
23R
*32
2771
0.02
271.
180.
0535
10.3
0.00
795
8.0
0.72
51.0
4.1
T40-
8R10
0116
0.01
630.
260.
0539
2.5
0.00
811
1.1
0.43
52.1
0.6
T40-
22R
1287
140.
0112
1.41
0.05
593.
30.
0084
32.
50.
7154
.11.
3T4
0-32
R29
9760
0.02
070.
010.
0543
1.7
0.00
844
1.0
0.62
54.2
0.6
T40-
31R
3369
562
0.17
230.
270.
0543
1.6
0.00
851
1.1
0.58
53.9
0.6
T40-
5R34
1867
0.02
020.
250.
0562
1.7
0.00
860
1.0
0.62
54.4
0.6
T40-
13R
1168
260.
0234
0.32
0.05
532.
30.
0086
51.
10.
4455
.50.
6T4
0-14
R37
7112
40.
0340
0.24
0.05
911.
50.
0088
31.
00.
6655
.60.
6T4
0-40
R*
974
100.
0106
0.79
0.06
018.
20.
0092
11.
10.
1459
.10.
6
Sam
ple
GD
1TK
7-10
C16
9246
50.
2840
0.06
0.05
002.
70.
0080
81.
50.
4551
.90.
8TK
7-3C
362
510.
1452
0.00
0.05
123.
90.
0081
01.
40.
3452
.00.
7TK
-6C
325
390.
1243
0.00
0.04
9422
.00.
0083
41.
40.
0853
.50.
8TK
7-8C
1370
217
0.16
330.
060.
0556
2.4
0.00
841
1.3
0.50
54.0
0.7
TK-5
C18
4033
90.
1903
0.16
0.05
542.
10.
0084
31.
30.
5354
.10.
7Continuesonfollowingpage
144
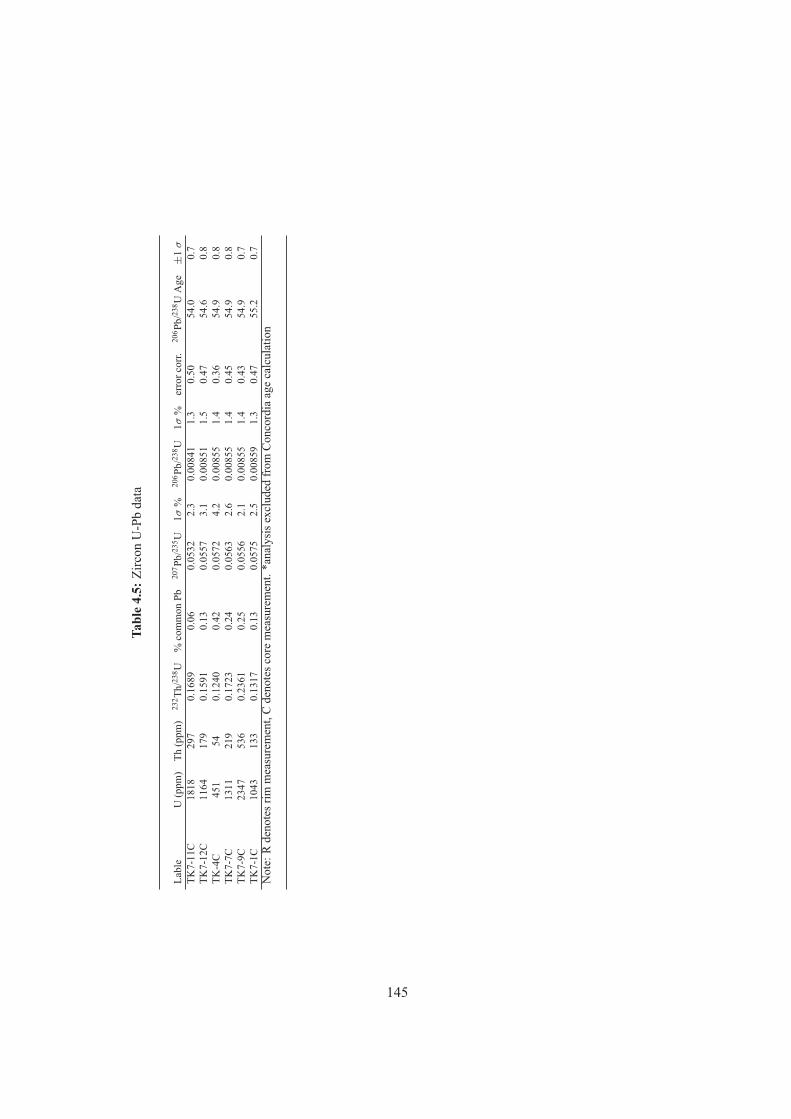
Tabl
e4.
5:Zi
rcon
U-P
bda
ta
Labl
eU
(ppm
)Th
(ppm
)23
2 Th/
238 U
%co
mm
onPb
207 P
b/23
5 U1σ
%20
6 Pb/
238 U
1σ%
erro
rcor
r.20
6 Pb/
238 U
Age
±1
σ
TK7-
11C
1818
297
0.16
890.
060.
0532
2.3
0.00
841
1.3
0.50
54.0
0.7
TK7-
12C
1164
179
0.15
910.
130.
0557
3.1
0.00
851
1.5
0.47
54.6
0.8
TK-4
C45
154
0.12
400.
420.
0572
4.2
0.00
855
1.4
0.36
54.9
0.8
TK7-
7C13
1121
90.
1723
0.24
0.05
632.
60.
0085
51.
40.
4554
.90.
8TK
7-9C
2347
536
0.23
610.
250.
0556
2.1
0.00
855
1.4
0.43
54.9
0.7
TK7-
1C10
4313
30.
1317
0.13
0.05
752.
50.
0085
91.
30.
4755
.20.
7N
ote:
Rde
note
srim
mea
sure
men
t,C
deno
tesc
ore
mea
sure
men
t.*a
naly
sise
xclu
ded
from
Con
cord
iaag
eca
lcul
atio
n
145

Chapter 5
Formation of a metamorphic complex along an obliquelyconvergent margin: Structural and thermochronological
evolution of the Chugach Metamorphic Complex, southernAlaska
Abstract The Chugach Metamorphic Complex of southern Alaska formed during Eocenetime along an obliquely convergent margin. We present structural analyses, 40Ar/39Ar,Rb/Sr, and zircon fission-track ages along three across-strike transects covering the com-plex from W to SE. We integrate our results with the metamorphic history and additionalgeochronology from the literature and derive the following tectonic evolution for the com-plex: Accretion of sediments to the convergent margin led to D1 structures and greenschist-facies metamorphism prior to ~55 Ma. At ~55-51 Ma, a margin-parallel stretching phasewith vertical thinning (D2) affected the margin and led to andalusite-sillimanite grade meta-morphism and the onset of partial melting. A switch back to dextral transpression (D3)shortly after D2 led to rapid cooling of the western and central parts of the complex associ-ated with exhumation of parts of the core of the complex until ~46 Ma. The south-easternpart of the complex cooled and exhumed regularly and slowly until ~5 Ma. An increase incooling and exhumation occurred after ~10-5 Ma in the entire southeastern part of the com-plex, associated with the Neogene collision of the Yakutat terrane. Our study describes theevolution of the metamorphic complex in space and time from the accretion of the sedimentsin which the complex developed to the final exhumation to the surface.
147
5.1 Introduction
Metamorphic complexes are exposed all over the world in various tectonic settings. In orderto produce a metamorphic complex surrounded by lower-grade rocks, differential exhuma-tion and/or differing thermal histories are needed. Exhumation of rocks, i.e. their upwardvertical movement relative to the Earth’s surface (Stuewe & Barr, 1998) is achieved by atleast three general mechanisms: (1) normal faulting, (2) vertical ductile thinning and (3)erosion due to surface uplift (e.g. Ring et al., 1999; Ring & Brandon, 2008). All threemechanisms may be active under both (oblique) divergence and convergence, and, espe-cially in the case of overall convergence, different large-scale tectonic processes such asbuoyancy due to density-differences, thermal softening, gravitation-driven extension, extru-sion between major fault zones, internal channel flow or ductile shear, magmatic or tectonicunderplating, and removal or rollback of lithospheric material have been proposed to facili-tate such exhumation (e.g. England & Holland, 1979; Platt, 1993; Selverstone, 2005; Godinet al., 2006; Brun & Faccenna, 2008; Ring & Brandon, 2008). Many models of rock ex-humation in convergent settings only consider orogen-perpendicular movements, but othersstress the importance of orogen-parallel movements influencing thermal histories and rockexhumation during oblique convergence (e.g. Thompson et al., 1997; Wang & Neubauer,1998; Koons et al., 2003; Whitney et al., 2007; Goscombe & Gray, 2009; Foster et al.,2009). Thermal histories of metamorphic areas may vary due to processes such as localizedadvective heat addition by the ascent of magmas or fluids (e.g. Lux et al., 1986; De Yoreoet al., 1991), the in-situ production of radiogenic, mechanical or chemical heat (e.g. Burg& Gerya, 2005), or large-scale processes such as the formation or removal of slab windowsbelow convergent margins (e.g. Thorkelson, 1996).
In this contribution we present the results of a multi-disciplinary study conducted on theEocene Chugach Metamorphic Complex (CMC) of southern Alaska (Fig. 5.1; Hudson &Plafker, 1982; Sisson et al., 1989; Pavlis & Sisson, 1995). The tectonic history of the south-ern Alaskan margin has been controlled by the variably oblique convergence between theoceanic plates of the Pacific basin and the North American continent throughout the Ceno-zoic, which led to the accretion of several distinct tectonic terranes (e.g. Plafker et al., 1994).Active transpression and terrane accretion is still ongoing today, which leads to the forma-tion of the highly glaciated Chugach-St. Elias Mountains along the south-eastern Alaskancoast (e.g. Berger et al., 2008; Meigs et al., 2008; Enkelmann et al., 2010). In addition, themargin experienced an unusual thermal overprint during the Paleocene and Eocene, whichis widely interpreted to be the result of the subduction of an oceanic spreading ridge be-low the margin (e.g. Bradley et al., 1993, 2003; Häussler et al., 2003a). The CMC is a~10-50 km wide and ~350 km long upper amphibolite facies metamorphic complex whichformed in this convergent environment possibly due to heat input from the inferred sub-ducting spreading ridge (e.g. Sisson et al., 1989; Sisson & Pavlis, 1993; Pavlis & Sisson,1995).
148
In order to constrain the formation and exhumation mechanisms of this complex further, wepresent (1) the results of structural field work along three across-strike composite sectionscovering the western, central and south-eastern parts of the CMC (Fig. 5.2) and (2) theresults of 40Ar/39Ar, Rb-Sr and zircon fission-track thermochronology conducted on thethree structural transects investigated. Based on these new thermochronological data anddata from the literature, we present cooling paths for the different parts of the complex.We then integrate the metamorphic history (Bruand, 2010) with the structural geometry andthermochronology and present a possible tectonic evolution for the entire complex. We thendiscuss the tectonic evolution of the complex in a regional context.
5.2 Geology of the southern Alaska margin
The CMC is exposed along the southern Alaskan margin (Fig. 5.1b). The southern Alaskanmargin is part of the outermost tectonic belt of the North American Cordillera (Fig. 5.1a;Oldow et al., 1989; Dickinson, 2009), which resulted from the (on-going) oblique conver-gence between oceanic plates of the Pacific Basin and North America. The modern marginis highly curved, which leads to dominantly dextral movement along the active Fairweatherfault system in south-eastern Alaska and to thrust-faulting along the Aleutian megathrustfarther west (Fig. 5.1b). A block of continental and oceanic crust, the Yakutat terrane,is currently actively colliding into this curved margin (Fig. 5.1b). This collision leads tothe formation of the Chugach-St. Elias Mountains, which consist of highly glaciated peaksexceeding 5000 m elevation standing only ~50 km from the coast (e.g. Bruhn et al., 2004;Pavlis et al., 2004; Berger et al., 2008; Meigs et al., 2008).
The rocks inboard of the Yakutat terrane are part of a vast, complexly deformed accretionaryprism which extends ~2100 km along the margin from Sanak Island in the west to BaranofIsland in the south-east (Fig. 5.1b; Chugach and Prince William terranes). This accretionaryprism is emplaced along the Border Range Fault System against the Wrangellia compositeterrane to the north (Fig. 5.1b; Plafker et al., 1994; Pavlis & Roeske, 2007). The accre-tionary prism is built of (1) an inboard narrow belt of Late Triassic to Cretaceous mélange(e.g. Amato & Pavlis, 2010) and (2) an outboard Late Cretaceous to Eocene marine turbiditesequence consisting of intercalcated conglomerates, impure sandstones, marls, claystonesand mafic volcanic rocks (Fig. 5.1b; Nilsen & Zuffa, 1982; Plafker et al., 1994). Severallocal group names were assigned to this turbidite sequence: Shumagin Fm, Kodiak Fm,Valdez Group and Sitka Greywacke for the Cretaceous parts, and Ghost Rock Fm, Sitkali-dak Fm and Orca Group for the Eocene parts (Plafker et al., 1994). The accretionary prismis separated into the northern Chugach and the southern Prince William terrane by the Con-tact fault system, which consists of numerous individual faults which probably developedsyn- to post-accretion and show dextral displacement in the eastern and thrust displacementin the western Prince William Sound (Bol & Gibbons, 1992; Bol & Roeske, 1993).
149
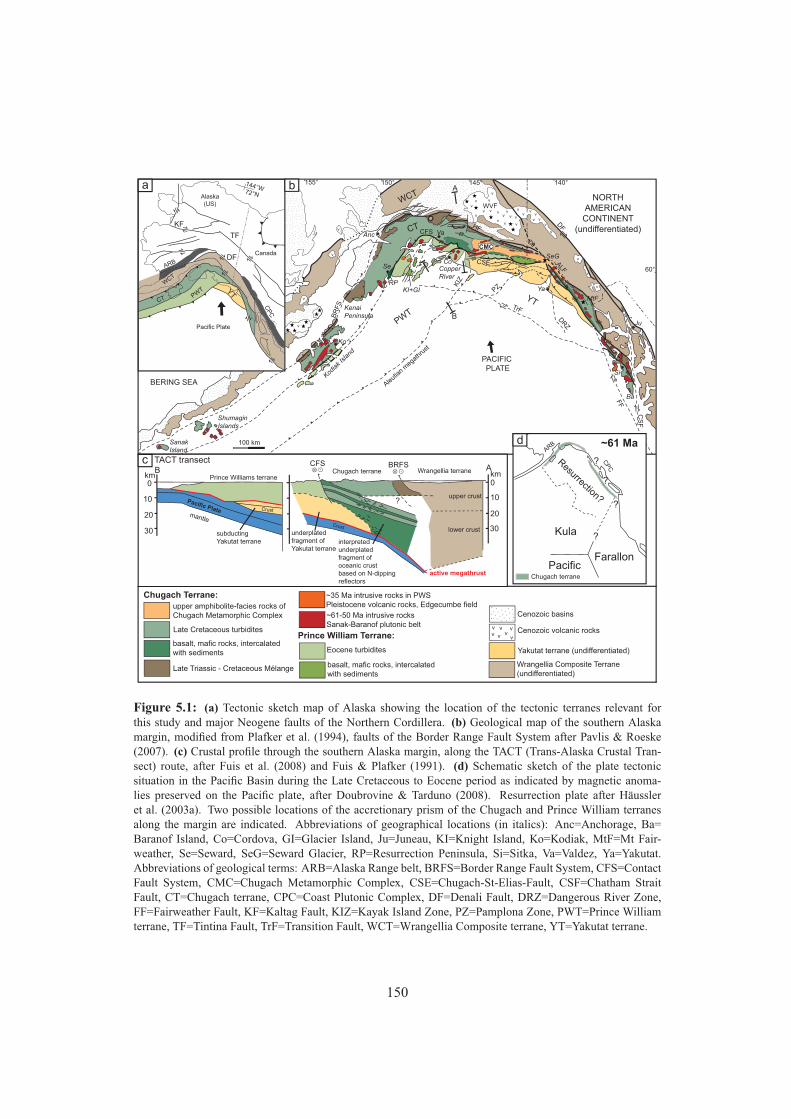
vv
vv
vv
v
v
vv
vv
v vv
v
vvv
vv
v
v
v
v
v
v
Anc
Se
Va
Co
Ya
Si
Ju
Ko
PACIFIC PLATE
CFS
FF
CSE
DF
TrF
KIZ
PZ
DRZ
155° 150° 145° 140°
CMC
60°
NORTHAMERICANCONTINENT
(undifferentiated)
Ba
Sanak
Island
Shumagin
Islands
Kodia
k Is
land
Kenai
Peninsula
Copper
RiverRP
ALFHF
BR
FS
CS
F
WVF
SeG
Aleutia
n m
egat
hrus
t
BERING SEA
KI+GI
MtF
mantle
upper crust
CFS BRFS
10
20
30
0km km
10
20
30
0
?
B A
Crust
Crust
lower crust
Prince Williams terraneChugach terrane Wrangellia terrane
Pacific Plate
interpretedunderplatedfragment of oceanic crustbased on N-dipping reflectors
underplatedfragment of Yakutat terrane
subductingYakutat terrane
TACT transect
active megathrust
A
WCT
CT
PWT
YT
Late Triassic - Cretaceous Mélange
Late Cretaceous turbidites
basalt, mafic rocks, intercalatedwith sediments
upper amphibolite-facies rocks of Chugach Metamorphic Complex
Wrangellia Composite Terrane (undifferentiated)
Yakutat terrane (undifferentiated)
~61-50 Ma intrusive rocksSanak-Baranof plutonic belt
Cenozoic basins
Cenozoic volcanic rocks
?Kula
PacificFarallon
Resurrection?
~61 Ma
v v vv v v
v
100 km
B
Eocene turbidites
basalt, mafic rocks, intercalatedwith sediments
Chugach Terrane:
Prince William Terrane:
~35 Ma intrusive rocks in PWSPleistocene volcanic rocks, Edgecumbe field
?
?
?
Chugach terrane
CPC
ARB
Alaska(US)
CanadaDF
TF
KF
144°W72°N
WCT
CT PWT YT
CP
C
Pacific Plate
c
ARB
a b
d
v
v
v
Figure 5.1: (a) Tectonic sketch map of Alaska showing the location of the tectonic terranes relevant forthis study and major Neogene faults of the Northern Cordillera. (b) Geological map of the southern Alaskamargin, modified from Plafker et al. (1994), faults of the Border Range Fault System after Pavlis & Roeske(2007). (c) Crustal profile through the southern Alaska margin, along the TACT (Trans-Alaska Crustal Tran-sect) route, after Fuis et al. (2008) and Fuis & Plafker (1991). (d) Schematic sketch of the plate tectonicsituation in the Pacific Basin during the Late Cretaceous to Eocene period as indicated by magnetic anoma-lies preserved on the Pacific plate, after Doubrovine & Tarduno (2008). Resurrection plate after Häussleret al. (2003a). Two possible locations of the accretionary prism of the Chugach and Prince William terranesalong the margin are indicated. Abbreviations of geographical locations (in italics): Anc=Anchorage, Ba=Baranof Island, Co=Cordova, GI=Glacier Island, Ju=Juneau, KI=Knight Island, Ko=Kodiak, MtF=Mt Fair-weather, Se=Seward, SeG=Seward Glacier, RP=Resurrection Peninsula, Si=Sitka, Va=Valdez, Ya=Yakutat.Abbreviations of geological terms: ARB=Alaska Range belt, BRFS=Border Range Fault System, CFS=ContactFault System, CMC=Chugach Metamorphic Complex, CSE=Chugach-St-Elias-Fault, CSF=Chatham StraitFault, CT=Chugach terrane, CPC=Coast Plutonic Complex, DF=Denali Fault, DRZ=Dangerous River Zone,FF=Fairweather Fault, KF=Kaltag Fault, KIZ=Kayak Island Zone, PZ=Pamplona Zone, PWT=Prince Williamterrane, TF=Tintina Fault, TrF=Transition Fault, WCT=Wrangellia Composite terrane, YT=Yakutat terrane.
150
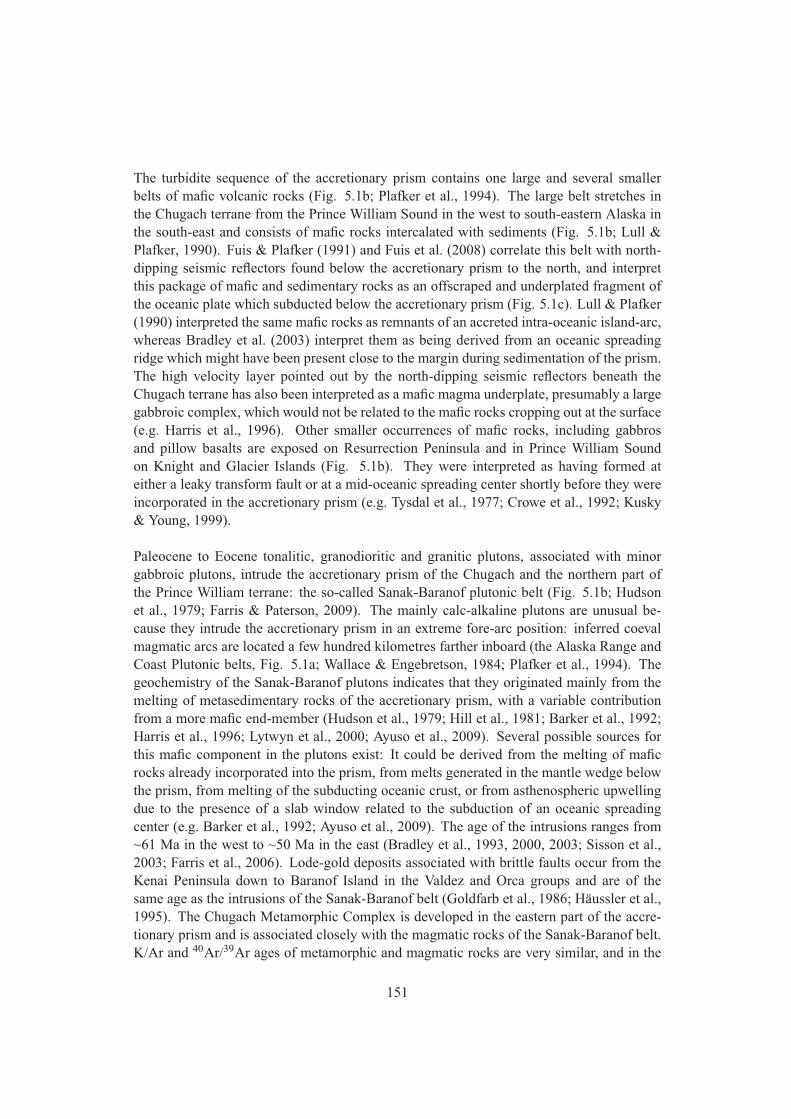
The turbidite sequence of the accretionary prism contains one large and several smallerbelts of mafic volcanic rocks (Fig. 5.1b; Plafker et al., 1994). The large belt stretches inthe Chugach terrane from the Prince William Sound in the west to south-eastern Alaska inthe south-east and consists of mafic rocks intercalated with sediments (Fig. 5.1b; Lull &Plafker, 1990). Fuis & Plafker (1991) and Fuis et al. (2008) correlate this belt with north-dipping seismic reflectors found below the accretionary prism to the north, and interpretthis package of mafic and sedimentary rocks as an offscraped and underplated fragment ofthe oceanic plate which subducted below the accretionary prism (Fig. 5.1c). Lull & Plafker(1990) interpreted the same mafic rocks as remnants of an accreted intra-oceanic island-arc,whereas Bradley et al. (2003) interpret them as being derived from an oceanic spreadingridge which might have been present close to the margin during sedimentation of the prism.The high velocity layer pointed out by the north-dipping seismic reflectors beneath theChugach terrane has also been interpreted as a mafic magma underplate, presumably a largegabbroic complex, which would not be related to the mafic rocks cropping out at the surface(e.g. Harris et al., 1996). Other smaller occurrences of mafic rocks, including gabbrosand pillow basalts are exposed on Resurrection Peninsula and in Prince William Soundon Knight and Glacier Islands (Fig. 5.1b). They were interpreted as having formed ateither a leaky transform fault or at a mid-oceanic spreading center shortly before they wereincorporated in the accretionary prism (e.g. Tysdal et al., 1977; Crowe et al., 1992; Kusky& Young, 1999).
Paleocene to Eocene tonalitic, granodioritic and granitic plutons, associated with minorgabbroic plutons, intrude the accretionary prism of the Chugach and the northern part ofthe Prince William terrane: the so-called Sanak-Baranof plutonic belt (Fig. 5.1b; Hudsonet al., 1979; Farris & Paterson, 2009). The mainly calc-alkaline plutons are unusual be-cause they intrude the accretionary prism in an extreme fore-arc position: inferred coevalmagmatic arcs are located a few hundred kilometres farther inboard (the Alaska Range andCoast Plutonic belts, Fig. 5.1a; Wallace & Engebretson, 1984; Plafker et al., 1994). Thegeochemistry of the Sanak-Baranof plutons indicates that they originated mainly from themelting of metasedimentary rocks of the accretionary prism, with a variable contributionfrom a more mafic end-member (Hudson et al., 1979; Hill et al., 1981; Barker et al., 1992;Harris et al., 1996; Lytwyn et al., 2000; Ayuso et al., 2009). Several possible sources forthis mafic component in the plutons exist: It could be derived from the melting of maficrocks already incorporated into the prism, from melts generated in the mantle wedge belowthe prism, from melting of the subducting oceanic crust, or from asthenospheric upwellingdue to the presence of a slab window related to the subduction of an oceanic spreadingcenter (e.g. Barker et al., 1992; Ayuso et al., 2009). The age of the intrusions ranges from~61 Ma in the west to ~50 Ma in the east (Bradley et al., 1993, 2000, 2003; Sisson et al.,2003; Farris et al., 2006). Lode-gold deposits associated with brittle faults occur from theKenai Peninsula down to Baranof Island in the Valdez and Orca groups and are of thesame age as the intrusions of the Sanak-Baranof belt (Goldfarb et al., 1986; Häussler et al.,1995). The Chugach Metamorphic Complex is developed in the eastern part of the accre-tionary prism and is associated closely with the magmatic rocks of the Sanak-Baranof belt.K/Ar and 40Ar/39Ar ages of metamorphic and magmatic rocks are very similar, and in the
151
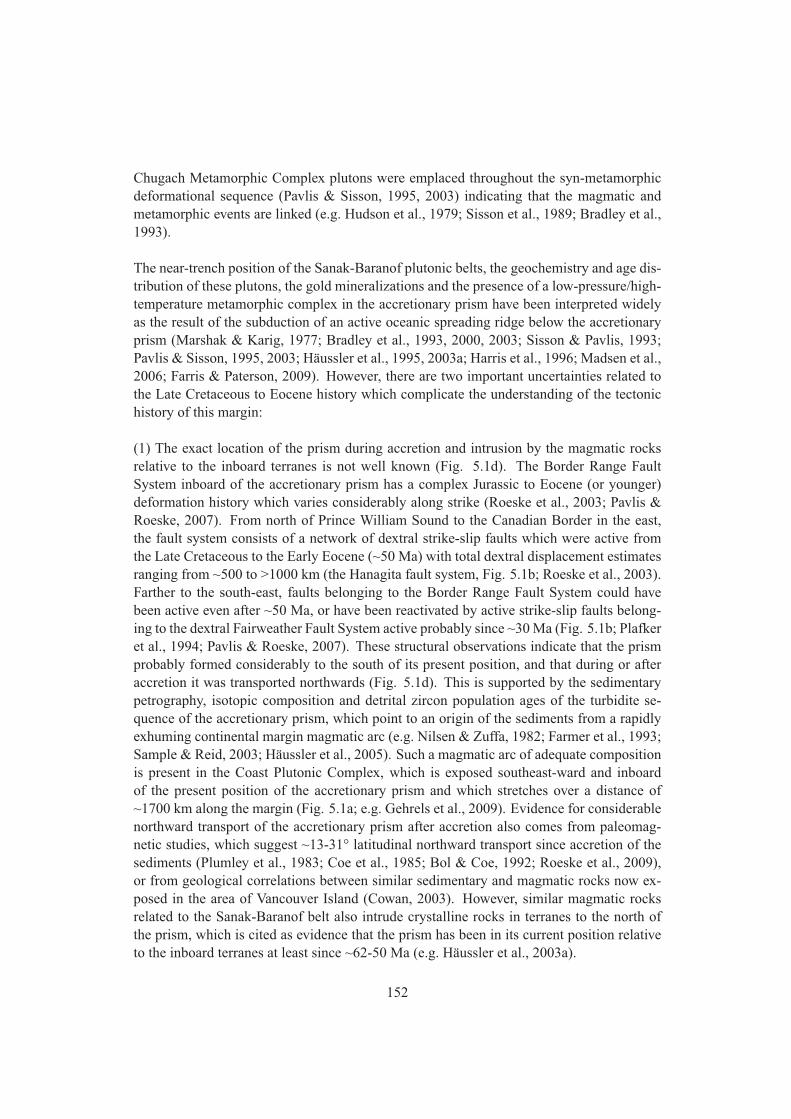
Chugach Metamorphic Complex plutons were emplaced throughout the syn-metamorphicdeformational sequence (Pavlis & Sisson, 1995, 2003) indicating that the magmatic andmetamorphic events are linked (e.g. Hudson et al., 1979; Sisson et al., 1989; Bradley et al.,1993).
The near-trench position of the Sanak-Baranof plutonic belts, the geochemistry and age dis-tribution of these plutons, the gold mineralizations and the presence of a low-pressure/high-temperature metamorphic complex in the accretionary prism have been interpreted widelyas the result of the subduction of an active oceanic spreading ridge below the accretionaryprism (Marshak & Karig, 1977; Bradley et al., 1993, 2000, 2003; Sisson & Pavlis, 1993;Pavlis & Sisson, 1995, 2003; Häussler et al., 1995, 2003a; Harris et al., 1996; Madsen et al.,2006; Farris & Paterson, 2009). However, there are two important uncertainties related tothe Late Cretaceous to Eocene history which complicate the understanding of the tectonichistory of this margin:
(1) The exact location of the prism during accretion and intrusion by the magmatic rocksrelative to the inboard terranes is not well known (Fig. 5.1d). The Border Range FaultSystem inboard of the accretionary prism has a complex Jurassic to Eocene (or younger)deformation history which varies considerably along strike (Roeske et al., 2003; Pavlis &Roeske, 2007). From north of Prince William Sound to the Canadian Border in the east,the fault system consists of a network of dextral strike-slip faults which were active fromthe Late Cretaceous to the Early Eocene (~50 Ma) with total dextral displacement estimatesranging from ~500 to >1000 km (the Hanagita fault system, Fig. 5.1b; Roeske et al., 2003).Farther to the south-east, faults belonging to the Border Range Fault System could havebeen active even after ~50 Ma, or have been reactivated by active strike-slip faults belong-ing to the dextral Fairweather Fault System active probably since ~30 Ma (Fig. 5.1b; Plafkeret al., 1994; Pavlis & Roeske, 2007). These structural observations indicate that the prismprobably formed considerably to the south of its present position, and that during or afteraccretion it was transported northwards (Fig. 5.1d). This is supported by the sedimentarypetrography, isotopic composition and detrital zircon population ages of the turbidite se-quence of the accretionary prism, which point to an origin of the sediments from a rapidlyexhuming continental margin magmatic arc (e.g. Nilsen & Zuffa, 1982; Farmer et al., 1993;Sample & Reid, 2003; Häussler et al., 2005). Such a magmatic arc of adequate compositionis present in the Coast Plutonic Complex, which is exposed southeast-ward and inboardof the present position of the accretionary prism and which stretches over a distance of~1700 km along the margin (Fig. 5.1a; e.g. Gehrels et al., 2009). Evidence for considerablenorthward transport of the accretionary prism after accretion also comes from paleomag-netic studies, which suggest ~13-31° latitudinal northward transport since accretion of thesediments (Plumley et al., 1983; Coe et al., 1985; Bol & Coe, 1992; Roeske et al., 2009),or from geological correlations between similar sedimentary and magmatic rocks now ex-posed in the area of Vancouver Island (Cowan, 2003). However, similar magmatic rocksrelated to the Sanak-Baranof belt also intrude crystalline rocks in terranes to the north ofthe prism, which is cited as evidence that the prism has been in its current position relativeto the inboard terranes at least since ~62-50 Ma (e.g. Häussler et al., 2003a).
152
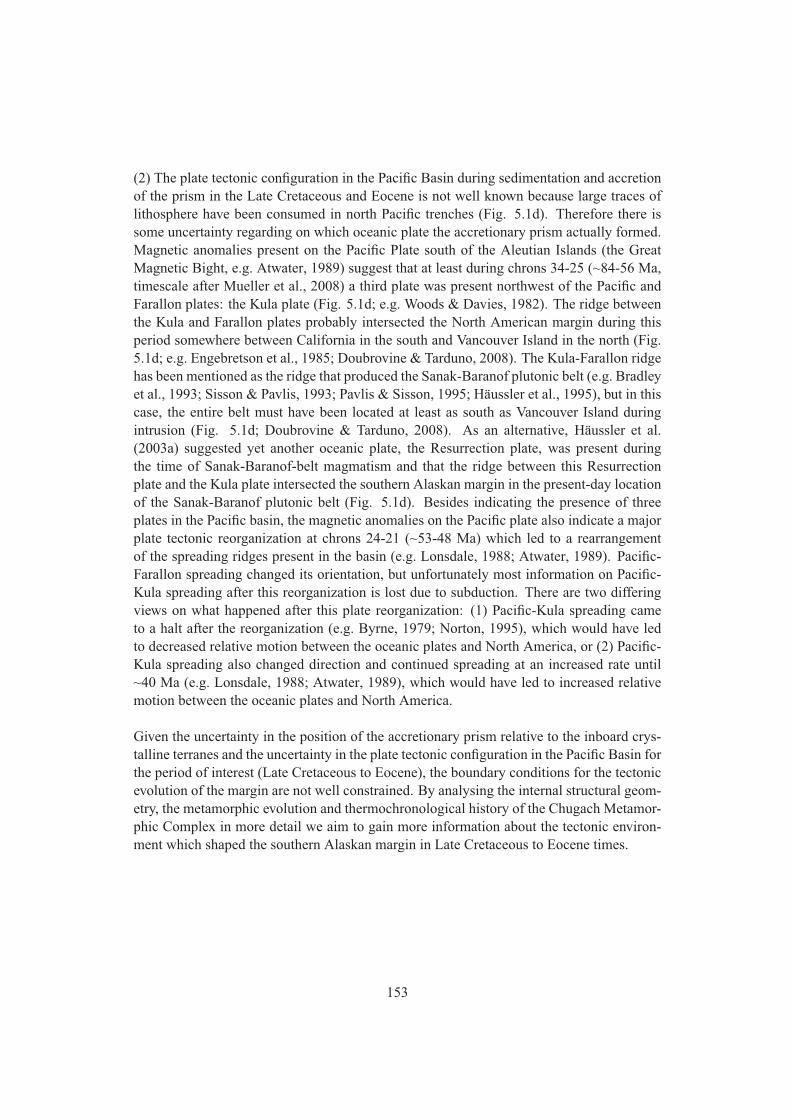
(2) The plate tectonic configuration in the Pacific Basin during sedimentation and accretionof the prism in the Late Cretaceous and Eocene is not well known because large traces oflithosphere have been consumed in north Pacific trenches (Fig. 5.1d). Therefore there issome uncertainty regarding on which oceanic plate the accretionary prism actually formed.Magnetic anomalies present on the Pacific Plate south of the Aleutian Islands (the GreatMagnetic Bight, e.g. Atwater, 1989) suggest that at least during chrons 34-25 (~84-56 Ma,timescale after Mueller et al., 2008) a third plate was present northwest of the Pacific andFarallon plates: the Kula plate (Fig. 5.1d; e.g. Woods & Davies, 1982). The ridge betweenthe Kula and Farallon plates probably intersected the North American margin during thisperiod somewhere between California in the south and Vancouver Island in the north (Fig.5.1d; e.g. Engebretson et al., 1985; Doubrovine & Tarduno, 2008). The Kula-Farallon ridgehas been mentioned as the ridge that produced the Sanak-Baranof plutonic belt (e.g. Bradleyet al., 1993; Sisson & Pavlis, 1993; Pavlis & Sisson, 1995; Häussler et al., 1995), but in thiscase, the entire belt must have been located at least as south as Vancouver Island duringintrusion (Fig. 5.1d; Doubrovine & Tarduno, 2008). As an alternative, Häussler et al.(2003a) suggested yet another oceanic plate, the Resurrection plate, was present duringthe time of Sanak-Baranof-belt magmatism and that the ridge between this Resurrectionplate and the Kula plate intersected the southern Alaskan margin in the present-day locationof the Sanak-Baranof plutonic belt (Fig. 5.1d). Besides indicating the presence of threeplates in the Pacific basin, the magnetic anomalies on the Pacific plate also indicate a majorplate tectonic reorganization at chrons 24-21 (~53-48 Ma) which led to a rearrangementof the spreading ridges present in the basin (e.g. Lonsdale, 1988; Atwater, 1989). Pacific-Farallon spreading changed its orientation, but unfortunately most information on Pacific-Kula spreading after this reorganization is lost due to subduction. There are two differingviews on what happened after this plate reorganization: (1) Pacific-Kula spreading cameto a halt after the reorganization (e.g. Byrne, 1979; Norton, 1995), which would have ledto decreased relative motion between the oceanic plates and North America, or (2) Pacific-Kula spreading also changed direction and continued spreading at an increased rate until~40 Ma (e.g. Lonsdale, 1988; Atwater, 1989), which would have led to increased relativemotion between the oceanic plates and North America.
Given the uncertainty in the position of the accretionary prism relative to the inboard crys-talline terranes and the uncertainty in the plate tectonic configuration in the Pacific Basin forthe period of interest (Late Cretaceous to Eocene), the boundary conditions for the tectonicevolution of the margin are not well constrained. By analysing the internal structural geom-etry, the metamorphic evolution and thermochronological history of the Chugach Metamor-phic Complex in more detail we aim to gain more information about the tectonic environ-ment which shaped the southern Alaskan margin in Late Cretaceous to Eocene times.
153
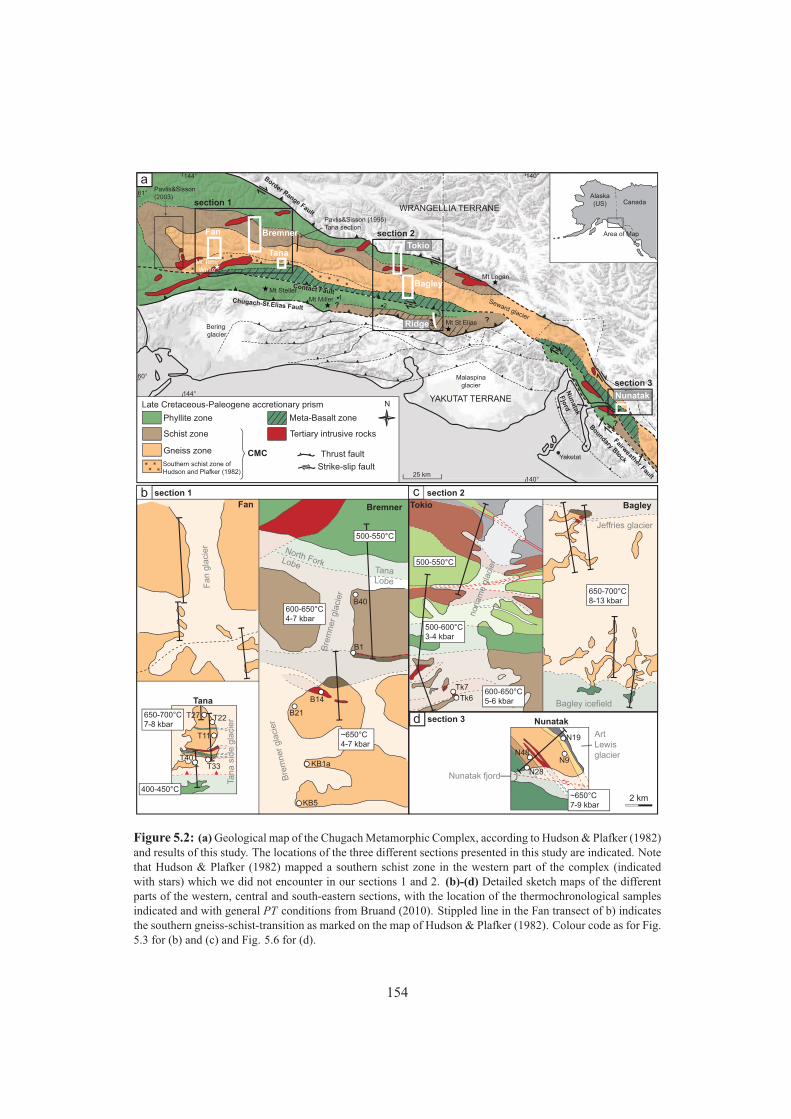
Bering glacier
Malaspinaglacier
Seward glacier?
?
Yakutat terrane?
Mt Steller
Mt Tom White
Mt St Elias
Mt Logan
Yakutat
Mt Miller
Late Cretaceous-Paleogene accretionary prism
Gneiss zone
Phyllite zone
25 km
Thrust fault
Strike-slip fault
Schist zone
Meta-Basalt zone
Tertiary intrusive rocks
N
Southern schist zone of Hudson and Plafker (1982)
CMC
Alaska(US) Canada
Area of Map
Border Range Fault
Contact Fault
Fairweather Fault
YAKUTAT TERRANE
WRANGELLIA TERRANE
Nu
natak
Fjo
rd
Chugach-St.Elias Fault
Boundary Block
12
3
4
section 1
section 2
section 3
Pavlis&Sisson (2003)
Fan
Tana
Bagley
Nunatak
Ridge
Tokio
Pavlis&Sisson (1995)Tana section
Bremner
Bre
mner
gla
cier
Bre
mner
gla
cier
B40
B21
KB1a
KB5
B14
B1
Fan g
laci
er
T27 T22
T11
T33T40
Tan
a s
ide
gla
cie
r
Tk6
Tk7
nona
me
glac
ier
Bagley icefield
Jeffries glacier
N9N48
N19
N28Nunatak fjord
ArtLewisglacier
2 km
North ForkLobeTana Lobe
b c
a
d
section 1 section 2
section 3650-700°C7-8 kbar
400-450°C
500-550°C
600-650°C4-7 kbar
~650°C4-7 kbar
500-600°C3-4 kbar
500-550°C
600-650°C5-6 kbar
~650°C7-9 kbar
650-700°C8-13 kbar
144°
144°
60°
61°
140°
140°
Fan Bremner
Tana
Tokio Bagley
Nunatak
Figure 5.2: (a) Geological map of the Chugach Metamorphic Complex, according to Hudson & Plafker (1982)and results of this study. The locations of the three different sections presented in this study are indicated. Notethat Hudson & Plafker (1982) mapped a southern schist zone in the western part of the complex (indicatedwith stars) which we did not encounter in our sections 1 and 2. (b)-(d) Detailed sketch maps of the differentparts of the western, central and south-eastern sections, with the location of the thermochronological samplesindicated and with general PT conditions from Bruand (2010). Stippled line in the Fan transect of b) indicatesthe southern gneiss-schist-transition as marked on the map of Hudson & Plafker (1982). Colour code as for Fig.5.3 for (b) and (c) and Fig. 5.6 for (d).
154
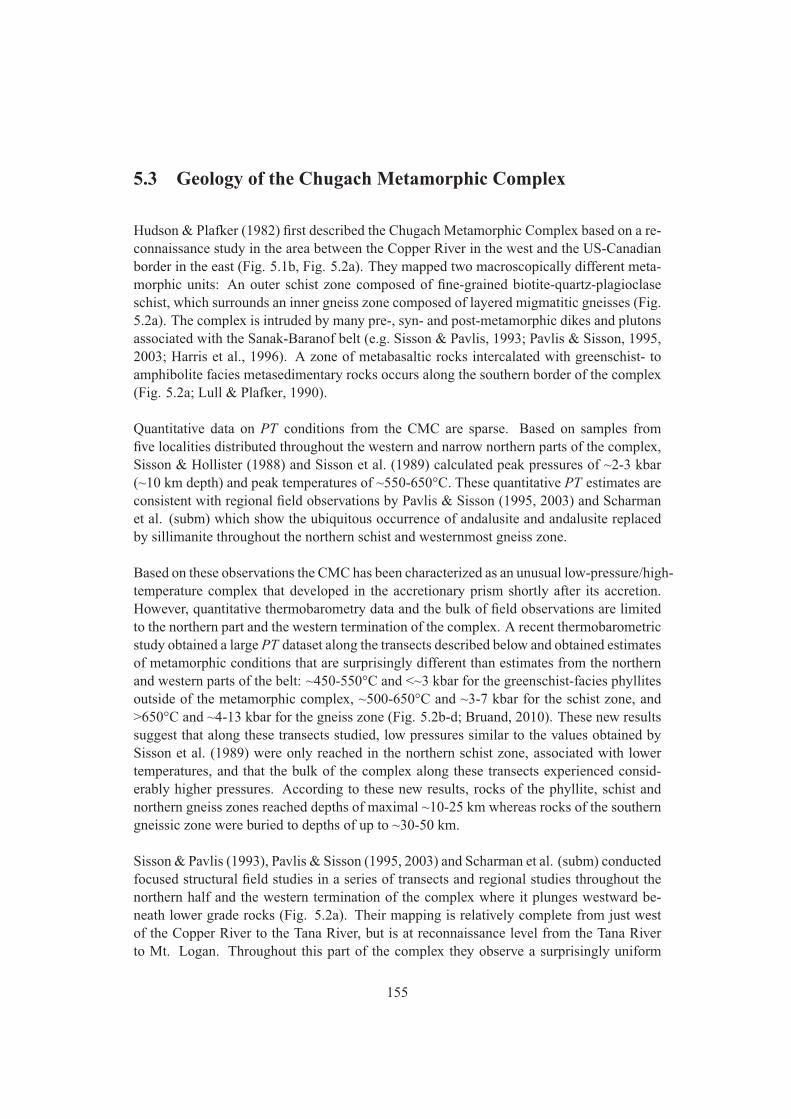
5.3 Geology of the Chugach Metamorphic Complex
Hudson & Plafker (1982) first described the Chugach Metamorphic Complex based on a re-connaissance study in the area between the Copper River in the west and the US-Canadianborder in the east (Fig. 5.1b, Fig. 5.2a). They mapped two macroscopically different meta-morphic units: An outer schist zone composed of fine-grained biotite-quartz-plagioclaseschist, which surrounds an inner gneiss zone composed of layered migmatitic gneisses (Fig.5.2a). The complex is intruded by many pre-, syn- and post-metamorphic dikes and plutonsassociated with the Sanak-Baranof belt (e.g. Sisson & Pavlis, 1993; Pavlis & Sisson, 1995,2003; Harris et al., 1996). A zone of metabasaltic rocks intercalated with greenschist- toamphibolite facies metasedimentary rocks occurs along the southern border of the complex(Fig. 5.2a; Lull & Plafker, 1990).
Quantitative data on PT conditions from the CMC are sparse. Based on samples fromfive localities distributed throughout the western and narrow northern parts of the complex,Sisson & Hollister (1988) and Sisson et al. (1989) calculated peak pressures of ~2-3 kbar(~10 km depth) and peak temperatures of ~550-650°C. These quantitative PT estimates areconsistent with regional field observations by Pavlis & Sisson (1995, 2003) and Scharmanet al. (subm) which show the ubiquitous occurrence of andalusite and andalusite replacedby sillimanite throughout the northern schist and westernmost gneiss zone.
Based on these observations the CMC has been characterized as an unusual low-pressure/high-temperature complex that developed in the accretionary prism shortly after its accretion.However, quantitative thermobarometry data and the bulk of field observations are limitedto the northern part and the western termination of the complex. A recent thermobarometricstudy obtained a large PT dataset along the transects described below and obtained estimatesof metamorphic conditions that are surprisingly different than estimates from the northernand western parts of the belt: ~450-550°C and <~3 kbar for the greenschist-facies phyllitesoutside of the metamorphic complex, ~500-650°C and ~3-7 kbar for the schist zone, and>650°C and ~4-13 kbar for the gneiss zone (Fig. 5.2b-d; Bruand, 2010). These new resultssuggest that along these transects studied, low pressures similar to the values obtained bySisson et al. (1989) were only reached in the northern schist zone, associated with lowertemperatures, and that the bulk of the complex along these transects experienced consid-erably higher pressures. According to these new results, rocks of the phyllite, schist andnorthern gneiss zones reached depths of maximal ~10-25 km whereas rocks of the southerngneissic zone were buried to depths of up to ~30-50 km.
Sisson & Pavlis (1993), Pavlis & Sisson (1995, 2003) and Scharman et al. (subm) conductedfocused structural field studies in a series of transects and regional studies throughout thenorthern half and the western termination of the complex where it plunges westward be-neath lower grade rocks (Fig. 5.2a). Their mapping is relatively complete from just westof the Copper River to the Tana River, but is at reconnaissance level from the Tana Riverto Mt. Logan. Throughout this part of the complex they observe a surprisingly uniform
155
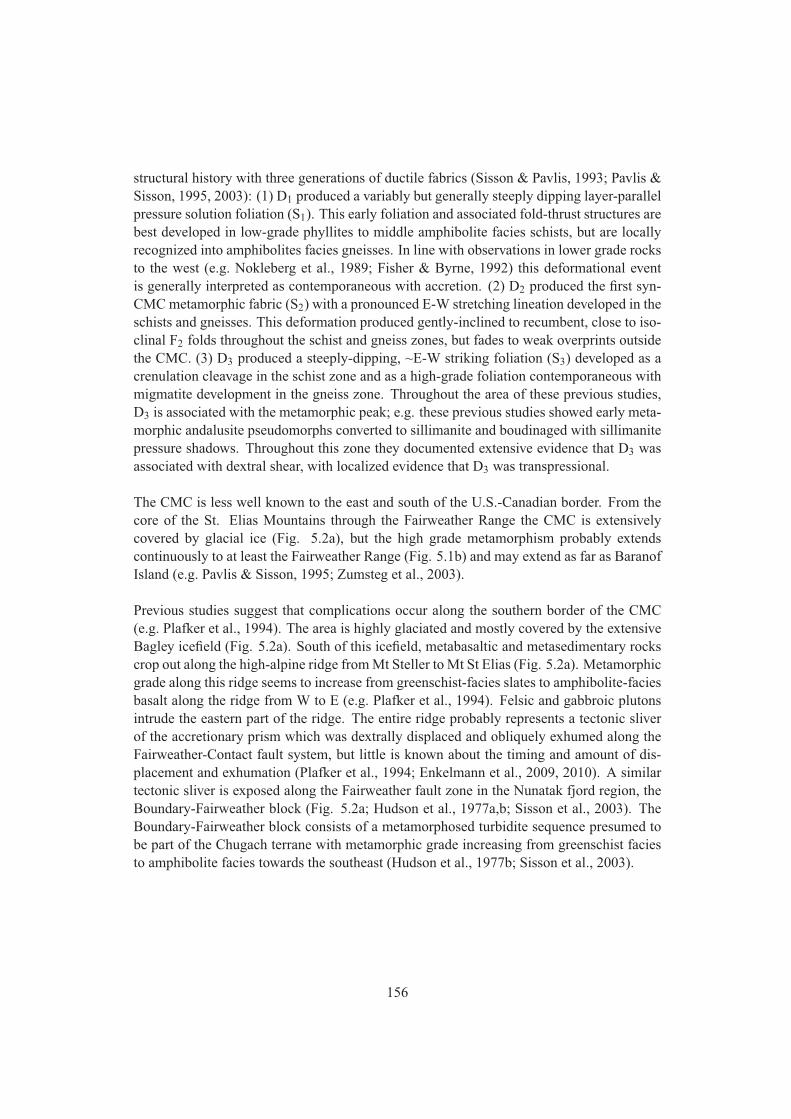
structural history with three generations of ductile fabrics (Sisson & Pavlis, 1993; Pavlis &Sisson, 1995, 2003): (1) D1 produced a variably but generally steeply dipping layer-parallelpressure solution foliation (S1). This early foliation and associated fold-thrust structures arebest developed in low-grade phyllites to middle amphibolite facies schists, but are locallyrecognized into amphibolites facies gneisses. In line with observations in lower grade rocksto the west (e.g. Nokleberg et al., 1989; Fisher & Byrne, 1992) this deformational eventis generally interpreted as contemporaneous with accretion. (2) D2 produced the first syn-CMC metamorphic fabric (S2) with a pronounced E-W stretching lineation developed in theschists and gneisses. This deformation produced gently-inclined to recumbent, close to iso-clinal F2 folds throughout the schist and gneiss zones, but fades to weak overprints outsidethe CMC. (3) D3 produced a steeply-dipping, ~E-W striking foliation (S3) developed as acrenulation cleavage in the schist zone and as a high-grade foliation contemporaneous withmigmatite development in the gneiss zone. Throughout the area of these previous studies,D3 is associated with the metamorphic peak; e.g. these previous studies showed early meta-morphic andalusite pseudomorphs converted to sillimanite and boudinaged with sillimanitepressure shadows. Throughout this zone they documented extensive evidence that D3 wasassociated with dextral shear, with localized evidence that D3 was transpressional.
The CMC is less well known to the east and south of the U.S.-Canadian border. From thecore of the St. Elias Mountains through the Fairweather Range the CMC is extensivelycovered by glacial ice (Fig. 5.2a), but the high grade metamorphism probably extendscontinuously to at least the Fairweather Range (Fig. 5.1b) and may extend as far as BaranofIsland (e.g. Pavlis & Sisson, 1995; Zumsteg et al., 2003).
Previous studies suggest that complications occur along the southern border of the CMC(e.g. Plafker et al., 1994). The area is highly glaciated and mostly covered by the extensiveBagley icefield (Fig. 5.2a). South of this icefield, metabasaltic and metasedimentary rockscrop out along the high-alpine ridge from Mt Steller to Mt St Elias (Fig. 5.2a). Metamorphicgrade along this ridge seems to increase from greenschist-facies slates to amphibolite-faciesbasalt along the ridge from W to E (e.g. Plafker et al., 1994). Felsic and gabbroic plutonsintrude the eastern part of the ridge. The entire ridge probably represents a tectonic sliverof the accretionary prism which was dextrally displaced and obliquely exhumed along theFairweather-Contact fault system, but little is known about the timing and amount of dis-placement and exhumation (Plafker et al., 1994; Enkelmann et al., 2009, 2010). A similartectonic sliver is exposed along the Fairweather fault zone in the Nunatak fjord region, theBoundary-Fairweather block (Fig. 5.2a; Hudson et al., 1977a,b; Sisson et al., 2003). TheBoundary-Fairweather block consists of a metamorphosed turbidite sequence presumed tobe part of the Chugach terrane with metamorphic grade increasing from greenschist faciesto amphibolite facies towards the southeast (Hudson et al., 1977b; Sisson et al., 2003).
156
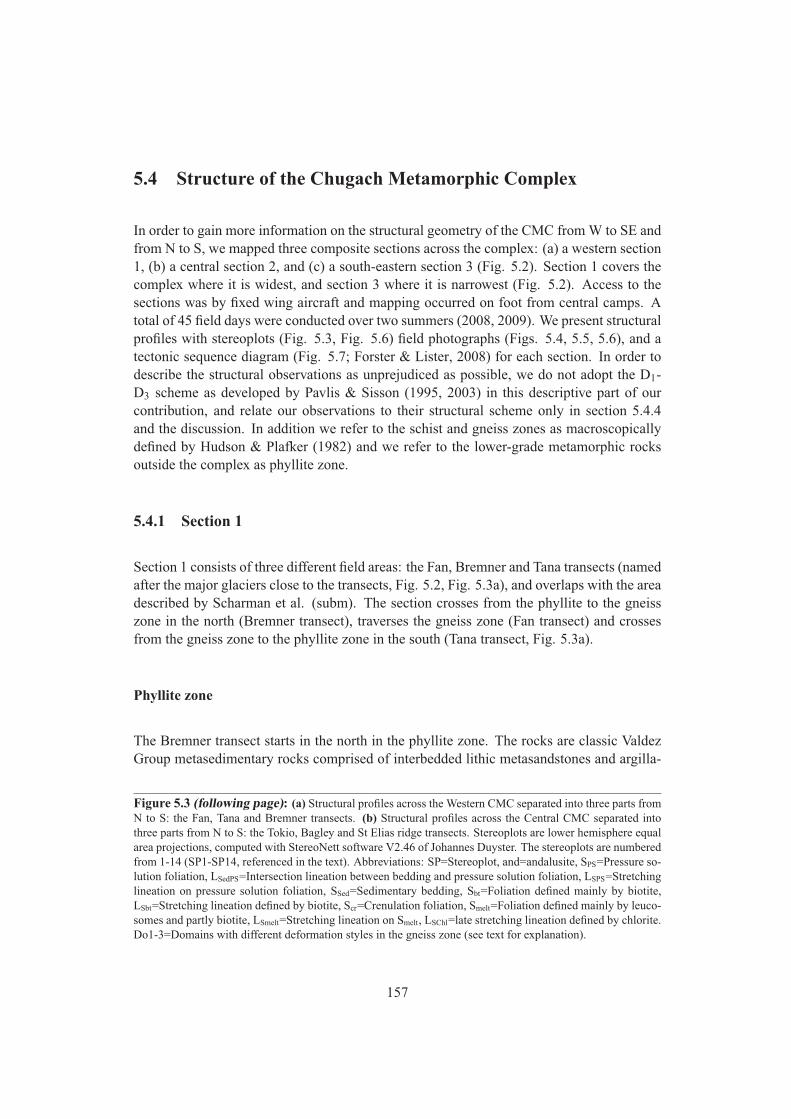
5.4 Structure of the Chugach Metamorphic Complex
In order to gain more information on the structural geometry of the CMC from W to SE andfrom N to S, we mapped three composite sections across the complex: (a) a western section1, (b) a central section 2, and (c) a south-eastern section 3 (Fig. 5.2). Section 1 covers thecomplex where it is widest, and section 3 where it is narrowest (Fig. 5.2). Access to thesections was by fixed wing aircraft and mapping occurred on foot from central camps. Atotal of 45 field days were conducted over two summers (2008, 2009). We present structuralprofiles with stereoplots (Fig. 5.3, Fig. 5.6) field photographs (Figs. 5.4, 5.5, 5.6), and atectonic sequence diagram (Fig. 5.7; Forster & Lister, 2008) for each section. In order todescribe the structural observations as unprejudiced as possible, we do not adopt the D1-D3 scheme as developed by Pavlis & Sisson (1995, 2003) in this descriptive part of ourcontribution, and relate our observations to their structural scheme only in section 5.4.4and the discussion. In addition we refer to the schist and gneiss zones as macroscopicallydefined by Hudson & Plafker (1982) and we refer to the lower-grade metamorphic rocksoutside the complex as phyllite zone.
5.4.1 Section 1
Section 1 consists of three different field areas: the Fan, Bremner and Tana transects (namedafter the major glaciers close to the transects, Fig. 5.2, Fig. 5.3a), and overlaps with the areadescribed by Scharman et al. (subm). The section crosses from the phyllite to the gneisszone in the north (Bremner transect), traverses the gneiss zone (Fan transect) and crossesfrom the gneiss zone to the phyllite zone in the south (Tana transect, Fig. 5.3a).
Phyllite zone
The Bremner transect starts in the north in the phyllite zone. The rocks are classic ValdezGroup metasedimentary rocks comprised of interbedded lithic metasandstones and argilla-
Figure 5.3 (following page): (a) Structural profiles across the Western CMC separated into three parts fromN to S: the Fan, Tana and Bremner transects. (b) Structural profiles across the Central CMC separated intothree parts from N to S: the Tokio, Bagley and St Elias ridge transects. Stereoplots are lower hemisphere equalarea projections, computed with StereoNett software V2.46 of Johannes Duyster. The stereoplots are numberedfrom 1-14 (SP1-SP14, referenced in the text). Abbreviations: SP=Stereoplot, and=andalusite, SPS=Pressure so-lution foliation, LSedPS=Intersection lineation between bedding and pressure solution foliation, LSPS=Stretchinglineation on pressure solution foliation, SSed=Sedimentary bedding, Sbt=Foliation defined mainly by biotite,LSbt=Stretching lineation defined by biotite, Scr=Crenulation foliation, Smelt=Foliation defined mainly by leuco-somes and partly biotite, LSmelt=Stretching lineation on Smelt, LSChl=late stretching lineation defined by chlorite.Do1-3=Domains with different deformation styles in the gneiss zone (see text for explanation).
157
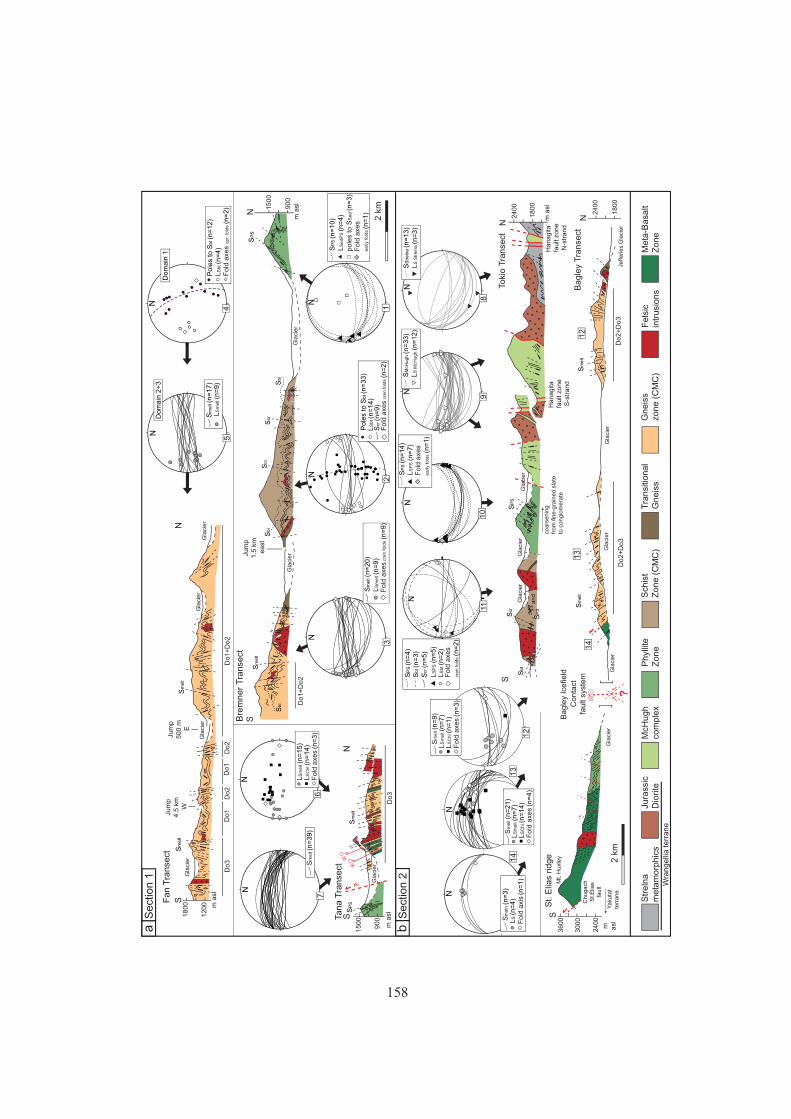
?
?
Gla
cierJu
mp
1.5
km
east
SN
Gla
cier
Ha
na
gita
fa
ult
zon
eS
-str
an
d
Ha
na
gita
fa
ult
zon
eN
-str
an
d
Gla
cier
900
1500
900
1500
SN
N
N2 k
m
2400
1800
18
00
24
00
Gla
cier
Gla
cier
Jefferies
Gla
cier
Bre
mn
er
Tra
nse
ct
Tan
a T
ran
sect
Bagle
y T
ranse
ct
Toki
o T
ranse
ct
1200
1800 m a
sl
Jum
p
4.5
km
W
Jum
p
500 m
E
2 k
m
Fa
n T
ran
sect
SN
Gla
cier
Gla
cie
rG
laci
er
Gla
cier
m a
sl
m a
sl
Gla
cier
Gla
cier
Gla
cier
coa
rse
nin
gfr
om
fin
e-g
rain
ed
sla
teto
co
ng
lom
era
te
m a
sl
S
Gla
cier
24
00
30
00
36
00
St. E
lias
ridge
Mt. H
uxl
ey
Bagle
y Ic
efie
ld
S
Gla
cier
m asl
Chugach
St.
Elia
sfa
ult
Ya
kuta
tte
rrane
Conta
ctfa
ult
syst
em
an
d
Do
1+
Do
2
Do
1+
Do
2D
o2
Do1
Do2
Do1
Do3
Do3
Do
2+
Do
3D
o2
+D
o3
NN
N
NN
N
N
LS
me
lt (n
=9)
Sm
elt (n
=17)
Pole
s to
Sbt (n
=12)
LS
bt (n
=4
)F
old
axe
s upr. fold
s (n
=2)
Sm
elt (n
=39)
LS
me
lt (n
=15)
LS
Chl (
n=
14)
Fold
axe
s (n
=3)
LS
melt (n
=9)
Sm
elt (n
=20)
Fold
axe
s cr
en fold
s (n
=9)
Pole
s to
Sbt (n
=3
3)
LS
bt (n
=1
4)
Fold
axe
s cr
en fold
s (n
=2
)
SP
S (n
=1
0)
LS
ed
PS
(n=
4)
pole
s to
SS
ed
(n=
3)
Fold
axe
searly
fold
s (n
=1
)
NL
S S
tre
lna
(n=
3)
SS
tre
lna
(n=
13)
LS
McH
ug
h (n
=12)
SM
cHugh (n
=33)
NN
SP
S (n
=1
4)
LS
PS
(n=
7)
Fold
axe
searly
fold
s (n
=1
)
NS
PS
(n=
4)
LS
PS
(n=
5)
Fold
axe
scr
en fold
s (n
=2)
Sbt (n
=3
) S
cr (n
=5)
Scr
(n=
9)
5
21
3
67
89
10
11
LS
bt (n
=2
)
N
12
LS
me
lt (n
=7)
LS
Ch
l (n=
1)
Fold
axe
s (n
=3)
Sm
elt (n
=9)
N
LS
me
lt (n
=7)
LS
Ch
l (n=
14)
Fold
axe
s (n
=4)
Sm
elt (n
=2
1)
13
14
LS
(n=
4)
Fo
ld a
xis
(n=
1)
Sm
ain
(n=
3)
N
SP
S
Sbi
Sbi
Scr
Scr
Sm
elt
Sbi
Sm
elt
Sm
elt
Do
ma
in 1
Do
ma
in 2
+3
Sm
elt
SP
S
SP
S
SP
S
Scr
Sbt
12
13
14
Sm
elt
Sm
elt
4
aS
ect
ion
1
bS
ect
ion
2
Str
eln
a
me
tam
orp
hic
sJu
rass
icD
iorite
McH
ug
hco
mp
lex
Ph
yllit
eZ
on
eS
chis
tZ
on
e (
CM
C)
Gn
eis
s zo
ne
(C
MC
)F
els
icin
tru
sio
ns
Me
ta-B
asa
ltZ
on
eT
ran
sitio
na
lG
ne
iss
Wra
ngelli
a terr
ane
158
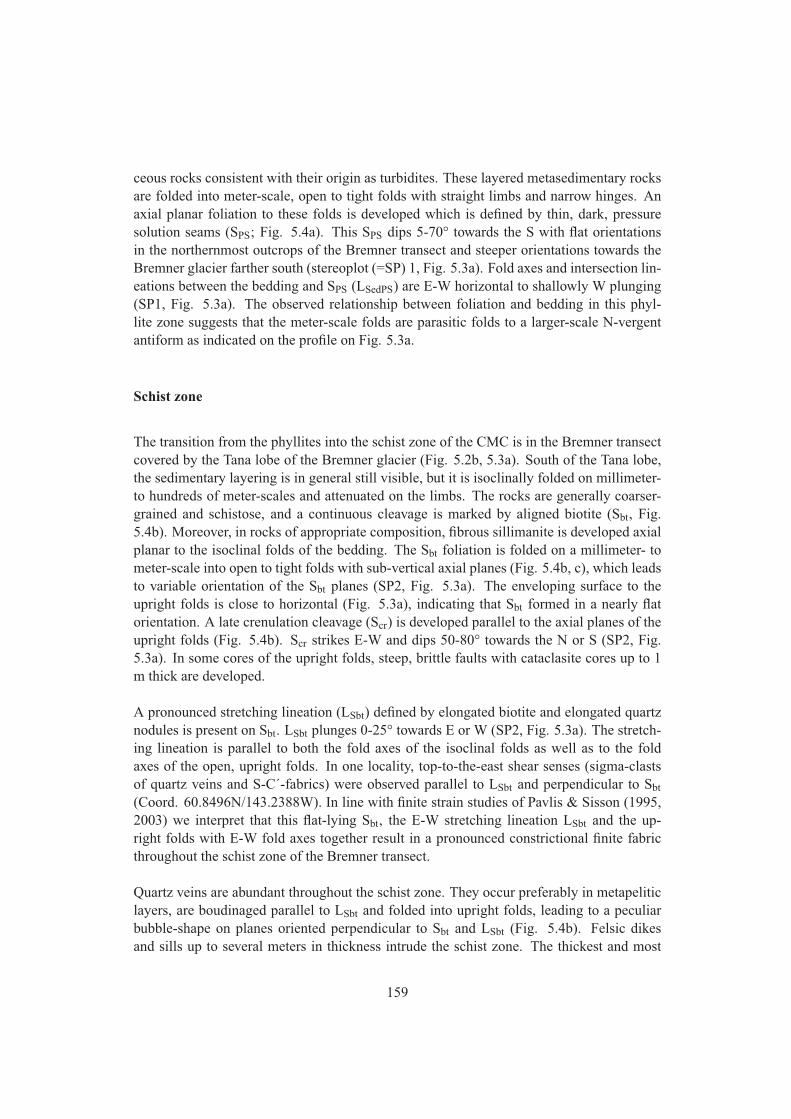
ceous rocks consistent with their origin as turbidites. These layered metasedimentary rocksare folded into meter-scale, open to tight folds with straight limbs and narrow hinges. Anaxial planar foliation to these folds is developed which is defined by thin, dark, pressuresolution seams (SPS; Fig. 5.4a). This SPS dips 5-70° towards the S with flat orientationsin the northernmost outcrops of the Bremner transect and steeper orientations towards theBremner glacier farther south (stereoplot (=SP) 1, Fig. 5.3a). Fold axes and intersection lin-eations between the bedding and SPS (LSedPS) are E-W horizontal to shallowly W plunging(SP1, Fig. 5.3a). The observed relationship between foliation and bedding in this phyl-lite zone suggests that the meter-scale folds are parasitic folds to a larger-scale N-vergentantiform as indicated on the profile on Fig. 5.3a.
Schist zone
The transition from the phyllites into the schist zone of the CMC is in the Bremner transectcovered by the Tana lobe of the Bremner glacier (Fig. 5.2b, 5.3a). South of the Tana lobe,the sedimentary layering is in general still visible, but it is isoclinally folded on millimeter-to hundreds of meter-scales and attenuated on the limbs. The rocks are generally coarser-grained and schistose, and a continuous cleavage is marked by aligned biotite (Sbt, Fig.5.4b). Moreover, in rocks of appropriate composition, fibrous sillimanite is developed axialplanar to the isoclinal folds of the bedding. The Sbt foliation is folded on a millimeter- tometer-scale into open to tight folds with sub-vertical axial planes (Fig. 5.4b, c), which leadsto variable orientation of the Sbt planes (SP2, Fig. 5.3a). The enveloping surface to theupright folds is close to horizontal (Fig. 5.3a), indicating that Sbt formed in a nearly flatorientation. A late crenulation cleavage (Scr) is developed parallel to the axial planes of theupright folds (Fig. 5.4b). Scr strikes E-W and dips 50-80° towards the N or S (SP2, Fig.5.3a). In some cores of the upright folds, steep, brittle faults with cataclasite cores up to 1m thick are developed.
A pronounced stretching lineation (LSbt) defined by elongated biotite and elongated quartznodules is present on Sbt. LSbt plunges 0-25° towards E or W (SP2, Fig. 5.3a). The stretch-ing lineation is parallel to both the fold axes of the isoclinal folds as well as to the foldaxes of the open, upright folds. In one locality, top-to-the-east shear senses (sigma-clastsof quartz veins and S-C´-fabrics) were observed parallel to LSbt and perpendicular to Sbt(Coord. 60.8496N/143.2388W). In line with finite strain studies of Pavlis & Sisson (1995,2003) we interpret that this flat-lying Sbt, the E-W stretching lineation LSbt and the up-right folds with E-W fold axes together result in a pronounced constrictional finite fabricthroughout the schist zone of the Bremner transect.
Quartz veins are abundant throughout the schist zone. They occur preferably in metapeliticlayers, are boudinaged parallel to LSbt and folded into upright folds, leading to a peculiarbubble-shape on planes oriented perpendicular to Sbt and LSbt (Fig. 5.4b). Felsic dikesand sills up to several meters in thickness intrude the schist zone. The thickest and most
159
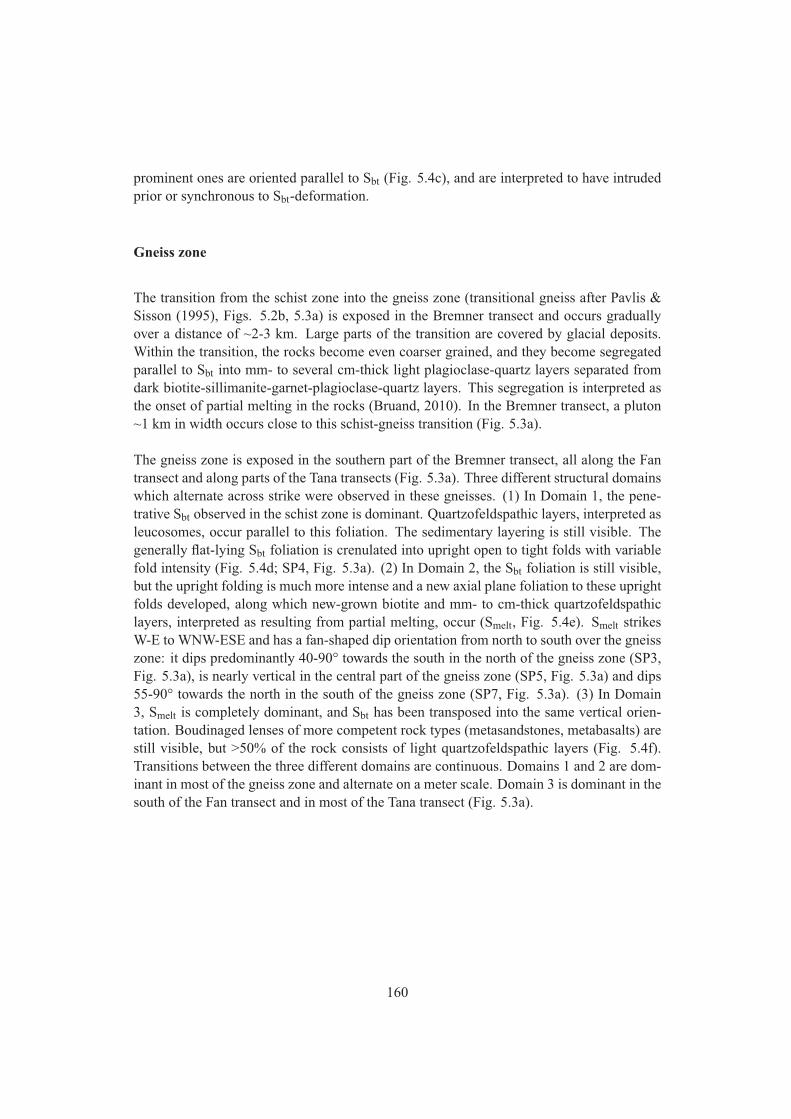
prominent ones are oriented parallel to Sbt (Fig. 5.4c), and are interpreted to have intrudedprior or synchronous to Sbt-deformation.
Gneiss zone
The transition from the schist zone into the gneiss zone (transitional gneiss after Pavlis &Sisson (1995), Figs. 5.2b, 5.3a) is exposed in the Bremner transect and occurs graduallyover a distance of ~2-3 km. Large parts of the transition are covered by glacial deposits.Within the transition, the rocks become even coarser grained, and they become segregatedparallel to Sbt into mm- to several cm-thick light plagioclase-quartz layers separated fromdark biotite-sillimanite-garnet-plagioclase-quartz layers. This segregation is interpreted asthe onset of partial melting in the rocks (Bruand, 2010). In the Bremner transect, a pluton~1 km in width occurs close to this schist-gneiss transition (Fig. 5.3a).
The gneiss zone is exposed in the southern part of the Bremner transect, all along the Fantransect and along parts of the Tana transects (Fig. 5.3a). Three different structural domainswhich alternate across strike were observed in these gneisses. (1) In Domain 1, the pene-trative Sbt observed in the schist zone is dominant. Quartzofeldspathic layers, interpreted asleucosomes, occur parallel to this foliation. The sedimentary layering is still visible. Thegenerally flat-lying Sbt foliation is crenulated into upright open to tight folds with variablefold intensity (Fig. 5.4d; SP4, Fig. 5.3a). (2) In Domain 2, the Sbt foliation is still visible,but the upright folding is much more intense and a new axial plane foliation to these uprightfolds developed, along which new-grown biotite and mm- to cm-thick quartzofeldspathiclayers, interpreted as resulting from partial melting, occur (Smelt, Fig. 5.4e). Smelt strikesW-E to WNW-ESE and has a fan-shaped dip orientation from north to south over the gneisszone: it dips predominantly 40-90° towards the south in the north of the gneiss zone (SP3,Fig. 5.3a), is nearly vertical in the central part of the gneiss zone (SP5, Fig. 5.3a) and dips55-90° towards the north in the south of the gneiss zone (SP7, Fig. 5.3a). (3) In Domain3, Smelt is completely dominant, and Sbt has been transposed into the same vertical orien-tation. Boudinaged lenses of more competent rock types (metasandstones, metabasalts) arestill visible, but >50% of the rock consists of light quartzofeldspathic layers (Fig. 5.4f).Transitions between the three different domains are continuous. Domains 1 and 2 are dom-inant in most of the gneiss zone and alternate on a meter scale. Domain 3 is dominant in thesouth of the Fan transect and in most of the Tana transect (Fig. 5.3a).
160
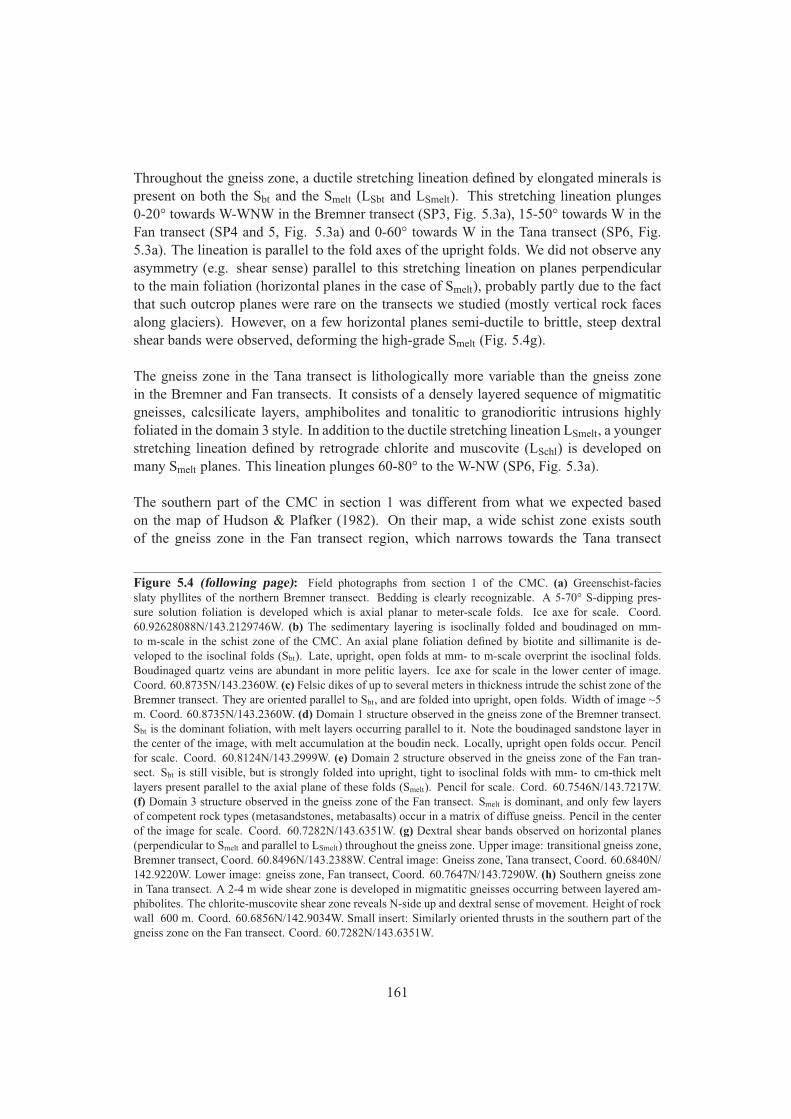
Throughout the gneiss zone, a ductile stretching lineation defined by elongated minerals ispresent on both the Sbt and the Smelt (LSbt and LSmelt). This stretching lineation plunges0-20° towards W-WNW in the Bremner transect (SP3, Fig. 5.3a), 15-50° towards W in theFan transect (SP4 and 5, Fig. 5.3a) and 0-60° towards W in the Tana transect (SP6, Fig.5.3a). The lineation is parallel to the fold axes of the upright folds. We did not observe anyasymmetry (e.g. shear sense) parallel to this stretching lineation on planes perpendicularto the main foliation (horizontal planes in the case of Smelt), probably partly due to the factthat such outcrop planes were rare on the transects we studied (mostly vertical rock facesalong glaciers). However, on a few horizontal planes semi-ductile to brittle, steep dextralshear bands were observed, deforming the high-grade Smelt (Fig. 5.4g).
The gneiss zone in the Tana transect is lithologically more variable than the gneiss zonein the Bremner and Fan transects. It consists of a densely layered sequence of migmatiticgneisses, calcsilicate layers, amphibolites and tonalitic to granodioritic intrusions highlyfoliated in the domain 3 style. In addition to the ductile stretching lineation LSmelt, a youngerstretching lineation defined by retrograde chlorite and muscovite (LSchl) is developed onmany Smelt planes. This lineation plunges 60-80° to the W-NW (SP6, Fig. 5.3a).
The southern part of the CMC in section 1 was different from what we expected basedon the map of Hudson & Plafker (1982). On their map, a wide schist zone exists southof the gneiss zone in the Fan transect region, which narrows towards the Tana transect
Figure 5.4 (following page): Field photographs from section 1 of the CMC. (a) Greenschist-faciesslaty phyllites of the northern Bremner transect. Bedding is clearly recognizable. A 5-70° S-dipping pres-sure solution foliation is developed which is axial planar to meter-scale folds. Ice axe for scale. Coord.60.92628088N/143.2129746W. (b) The sedimentary layering is isoclinally folded and boudinaged on mm-to m-scale in the schist zone of the CMC. An axial plane foliation defined by biotite and sillimanite is de-veloped to the isoclinal folds (Sbt). Late, upright, open folds at mm- to m-scale overprint the isoclinal folds.Boudinaged quartz veins are abundant in more pelitic layers. Ice axe for scale in the lower center of image.Coord. 60.8735N/143.2360W. (c) Felsic dikes of up to several meters in thickness intrude the schist zone of theBremner transect. They are oriented parallel to Sbt, and are folded into upright, open folds. Width of image ~5m. Coord. 60.8735N/143.2360W. (d) Domain 1 structure observed in the gneiss zone of the Bremner transect.Sbt is the dominant foliation, with melt layers occurring parallel to it. Note the boudinaged sandstone layer inthe center of the image, with melt accumulation at the boudin neck. Locally, upright open folds occur. Pencilfor scale. Coord. 60.8124N/143.2999W. (e) Domain 2 structure observed in the gneiss zone of the Fan tran-sect. Sbt is still visible, but is strongly folded into upright, tight to isoclinal folds with mm- to cm-thick meltlayers present parallel to the axial plane of these folds (Smelt). Pencil for scale. Cord. 60.7546N/143.7217W.(f) Domain 3 structure observed in the gneiss zone of the Fan transect. Smelt is dominant, and only few layersof competent rock types (metasandstones, metabasalts) occur in a matrix of diffuse gneiss. Pencil in the centerof the image for scale. Coord. 60.7282N/143.6351W. (g) Dextral shear bands observed on horizontal planes(perpendicular to Smelt and parallel to LSmelt) throughout the gneiss zone. Upper image: transitional gneiss zone,Bremner transect, Coord. 60.8496N/143.2388W. Central image: Gneiss zone, Tana transect, Coord. 60.6840N/142.9220W. Lower image: gneiss zone, Fan transect, Coord. 60.7647N/143.7290W. (h) Southern gneiss zonein Tana transect. A 2-4 m wide shear zone is developed in migmatitic gneisses occurring between layered am-phibolites. The chlorite-muscovite shear zone reveals N-side up and dextral sense of movement. Height of rockwall 600 m. Coord. 60.6856N/142.9034W. Small insert: Similarly oriented thrusts in the southern part of thegneiss zone on the Fan transect. Coord. 60.7282N/143.6351W.
161
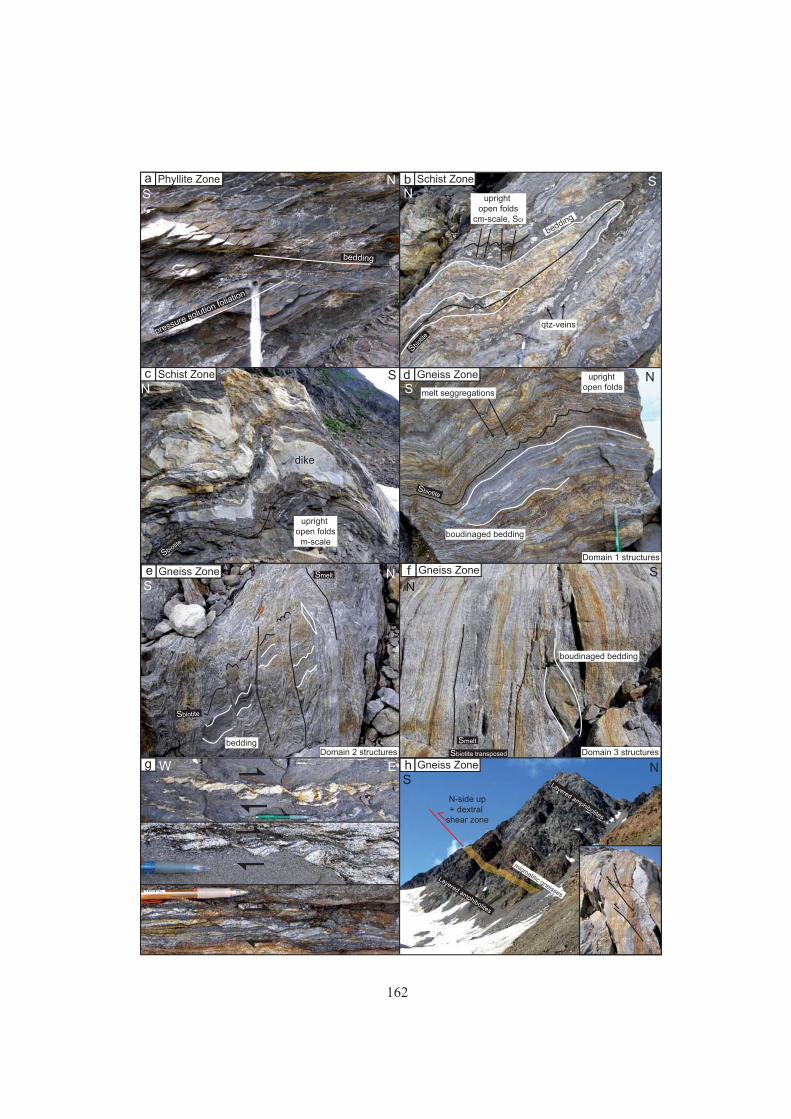
a
bedding
pressure solution foliation
NS
NS
Sbiotite
bPhyllite Zone Schist Zone
dike
N
c Schist Zone
S
Sbiot
ite
bedding
upright open folds
cm-scale, Scr
qtz-veins
Wg E
Sd Gneiss Zone Nupright
open folds
Sbiotite
melt seggregations
boudinaged bedding
e Gneiss Zone f Gneiss Zone
h Gneiss Zone
NS
bedding
Sbiotite
Smelt
boudinaged bedding
NS
Sbiotite transposed
Smelt
Layered amphibolites
Layered amphibolites
migmatitic gneisses
N-side up+ dextral
shear zone
Domain 1 structures
Domain 2 structures Domain 3 structures
NS
upright open folds
m-scale
162
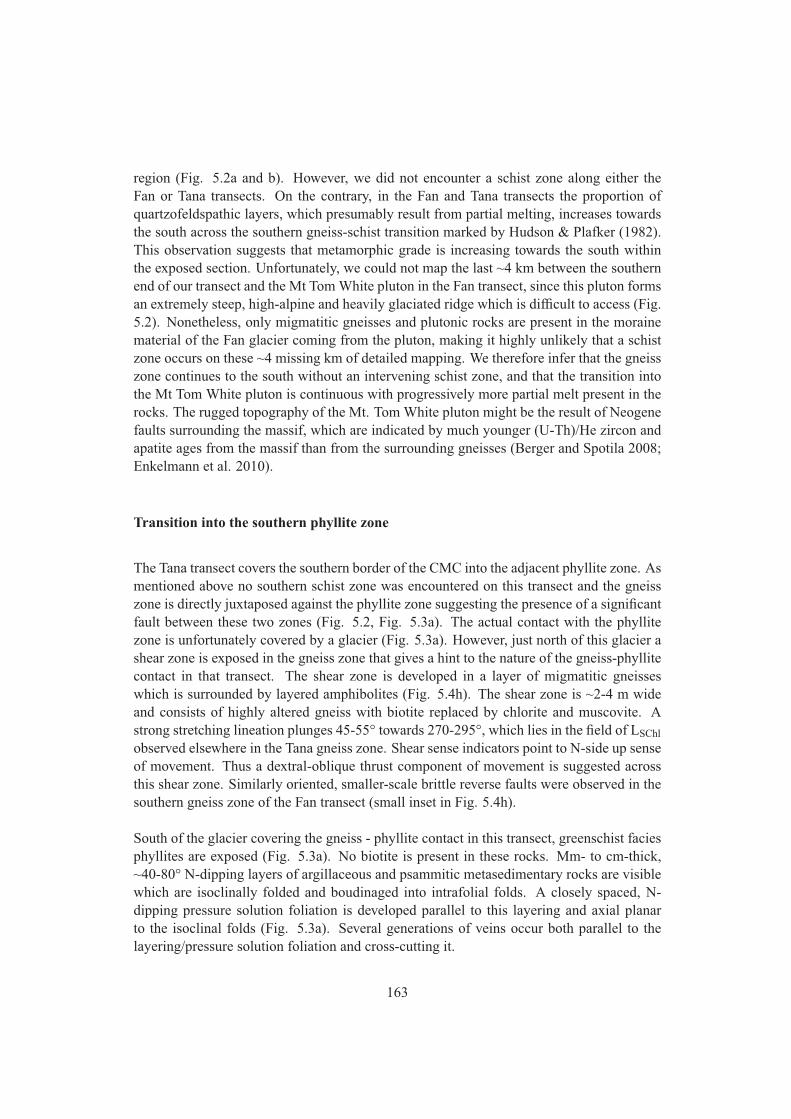
region (Fig. 5.2a and b). However, we did not encounter a schist zone along either theFan or Tana transects. On the contrary, in the Fan and Tana transects the proportion ofquartzofeldspathic layers, which presumably result from partial melting, increases towardsthe south across the southern gneiss-schist transition marked by Hudson & Plafker (1982).This observation suggests that metamorphic grade is increasing towards the south withinthe exposed section. Unfortunately, we could not map the last ~4 km between the southernend of our transect and the Mt Tom White pluton in the Fan transect, since this pluton formsan extremely steep, high-alpine and heavily glaciated ridge which is difficult to access (Fig.5.2). Nonetheless, only migmatitic gneisses and plutonic rocks are present in the morainematerial of the Fan glacier coming from the pluton, making it highly unlikely that a schistzone occurs on these ~4 missing km of detailed mapping. We therefore infer that the gneisszone continues to the south without an intervening schist zone, and that the transition intothe Mt Tom White pluton is continuous with progressively more partial melt present in therocks. The rugged topography of the Mt. Tom White pluton might be the result of Neogenefaults surrounding the massif, which are indicated by much younger (U-Th)/He zircon andapatite ages from the massif than from the surrounding gneisses (Berger and Spotila 2008;Enkelmann et al. 2010).
Transition into the southern phyllite zone
The Tana transect covers the southern border of the CMC into the adjacent phyllite zone. Asmentioned above no southern schist zone was encountered on this transect and the gneisszone is directly juxtaposed against the phyllite zone suggesting the presence of a significantfault between these two zones (Fig. 5.2, Fig. 5.3a). The actual contact with the phyllitezone is unfortunately covered by a glacier (Fig. 5.3a). However, just north of this glacier ashear zone is exposed in the gneiss zone that gives a hint to the nature of the gneiss-phyllitecontact in that transect. The shear zone is developed in a layer of migmatitic gneisseswhich is surrounded by layered amphibolites (Fig. 5.4h). The shear zone is ~2-4 m wideand consists of highly altered gneiss with biotite replaced by chlorite and muscovite. Astrong stretching lineation plunges 45-55° towards 270-295°, which lies in the field of LSChlobserved elsewhere in the Tana gneiss zone. Shear sense indicators point to N-side up senseof movement. Thus a dextral-oblique thrust component of movement is suggested acrossthis shear zone. Similarly oriented, smaller-scale brittle reverse faults were observed in thesouthern gneiss zone of the Fan transect (small inset in Fig. 5.4h).
South of the glacier covering the gneiss - phyllite contact in this transect, greenschist faciesphyllites are exposed (Fig. 5.3a). No biotite is present in these rocks. Mm- to cm-thick,~40-80° N-dipping layers of argillaceous and psammitic metasedimentary rocks are visiblewhich are isoclinally folded and boudinaged into intrafolial folds. A closely spaced, N-dipping pressure solution foliation is developed parallel to this layering and axial planarto the isoclinal folds (Fig. 5.3a). Several generations of veins occur both parallel to thelayering/pressure solution foliation and cross-cutting it.
163
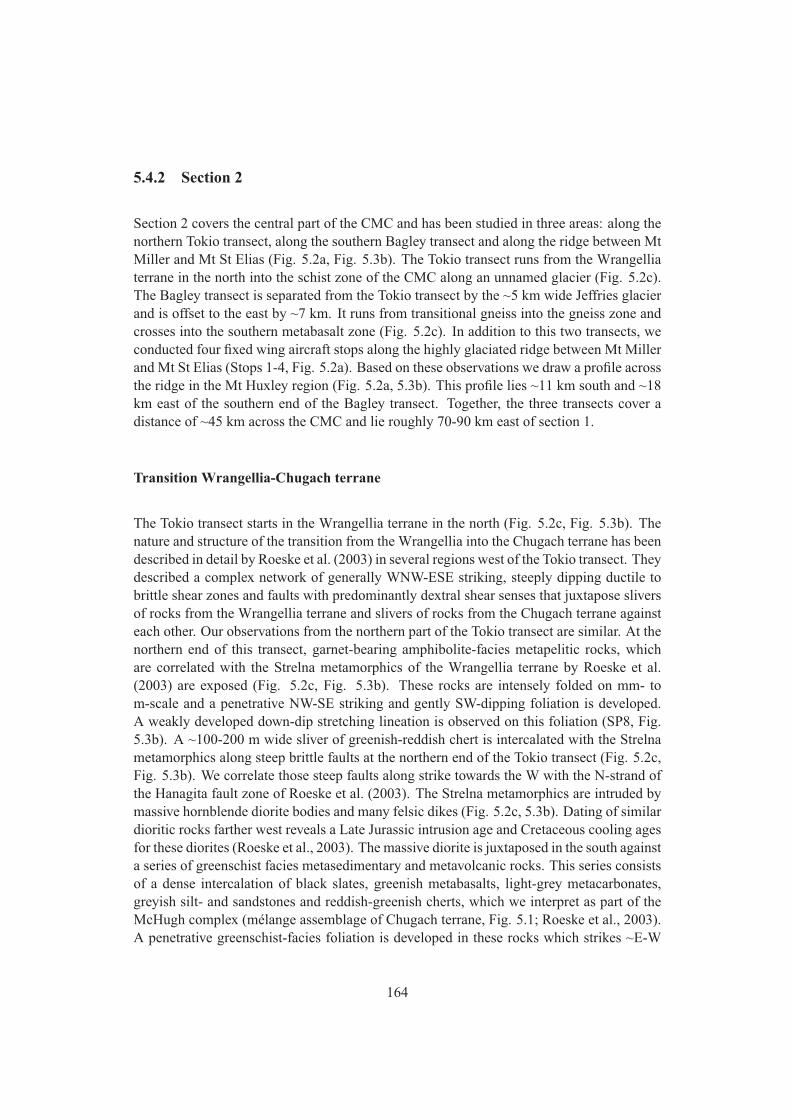
5.4.2 Section 2
Section 2 covers the central part of the CMC and has been studied in three areas: along thenorthern Tokio transect, along the southern Bagley transect and along the ridge between MtMiller and Mt St Elias (Fig. 5.2a, Fig. 5.3b). The Tokio transect runs from the Wrangelliaterrane in the north into the schist zone of the CMC along an unnamed glacier (Fig. 5.2c).The Bagley transect is separated from the Tokio transect by the ~5 km wide Jeffries glacierand is offset to the east by ~7 km. It runs from transitional gneiss into the gneiss zone andcrosses into the southern metabasalt zone (Fig. 5.2c). In addition to this two transects, weconducted four fixed wing aircraft stops along the highly glaciated ridge between Mt Millerand Mt St Elias (Stops 1-4, Fig. 5.2a). Based on these observations we draw a profile acrossthe ridge in the Mt Huxley region (Fig. 5.2a, 5.3b). This profile lies ~11 km south and ~18km east of the southern end of the Bagley transect. Together, the three transects cover adistance of ~45 km across the CMC and lie roughly 70-90 km east of section 1.
Transition Wrangellia-Chugach terrane
The Tokio transect starts in the Wrangellia terrane in the north (Fig. 5.2c, Fig. 5.3b). Thenature and structure of the transition from the Wrangellia into the Chugach terrane has beendescribed in detail by Roeske et al. (2003) in several regions west of the Tokio transect. Theydescribed a complex network of generally WNW-ESE striking, steeply dipping ductile tobrittle shear zones and faults with predominantly dextral shear senses that juxtapose sliversof rocks from the Wrangellia terrane and slivers of rocks from the Chugach terrane againsteach other. Our observations from the northern part of the Tokio transect are similar. At thenorthern end of this transect, garnet-bearing amphibolite-facies metapelitic rocks, whichare correlated with the Strelna metamorphics of the Wrangellia terrane by Roeske et al.(2003) are exposed (Fig. 5.2c, Fig. 5.3b). These rocks are intensely folded on mm- tom-scale and a penetrative NW-SE striking and gently SW-dipping foliation is developed.A weakly developed down-dip stretching lineation is observed on this foliation (SP8, Fig.5.3b). A ~100-200 m wide sliver of greenish-reddish chert is intercalated with the Strelnametamorphics along steep brittle faults at the northern end of the Tokio transect (Fig. 5.2c,Fig. 5.3b). We correlate those steep faults along strike towards the W with the N-strand ofthe Hanagita fault zone of Roeske et al. (2003). The Strelna metamorphics are intruded bymassive hornblende diorite bodies and many felsic dikes (Fig. 5.2c, 5.3b). Dating of similardioritic rocks farther west reveals a Late Jurassic intrusion age and Cretaceous cooling agesfor these diorites (Roeske et al., 2003). The massive diorite is juxtaposed in the south againsta series of greenschist facies metasedimentary and metavolcanic rocks. This series consistsof a dense intercalation of black slates, greenish metabasalts, light-grey metacarbonates,greyish silt- and sandstones and reddish-greenish cherts, which we interpret as part of theMcHugh complex (mélange assemblage of Chugach terrane, Fig. 5.1; Roeske et al., 2003).A penetrative greenschist-facies foliation is developed in these rocks which strikes ~E-W
164
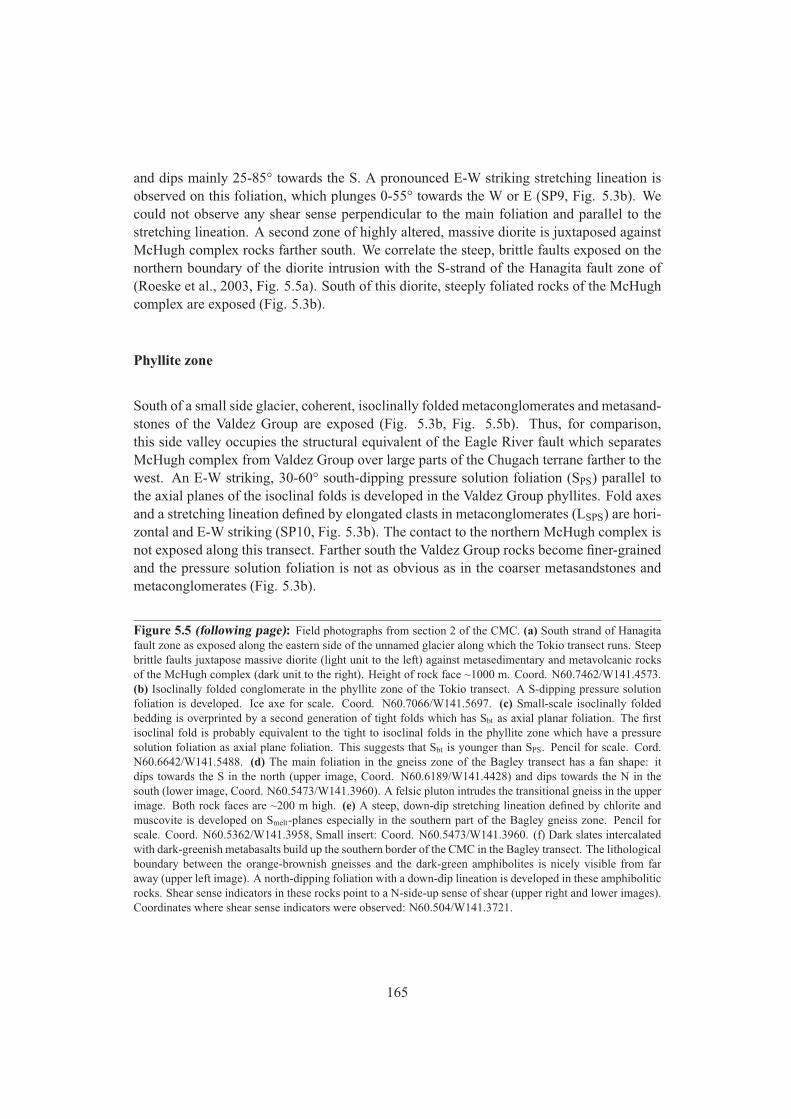
and dips mainly 25-85° towards the S. A pronounced E-W striking stretching lineation isobserved on this foliation, which plunges 0-55° towards the W or E (SP9, Fig. 5.3b). Wecould not observe any shear sense perpendicular to the main foliation and parallel to thestretching lineation. A second zone of highly altered, massive diorite is juxtaposed againstMcHugh complex rocks farther south. We correlate the steep, brittle faults exposed on thenorthern boundary of the diorite intrusion with the S-strand of the Hanagita fault zone of(Roeske et al., 2003, Fig. 5.5a). South of this diorite, steeply foliated rocks of the McHughcomplex are exposed (Fig. 5.3b).
Phyllite zone
South of a small side glacier, coherent, isoclinally folded metaconglomerates and metasand-stones of the Valdez Group are exposed (Fig. 5.3b, Fig. 5.5b). Thus, for comparison,this side valley occupies the structural equivalent of the Eagle River fault which separatesMcHugh complex from Valdez Group over large parts of the Chugach terrane farther to thewest. An E-W striking, 30-60° south-dipping pressure solution foliation (SPS) parallel tothe axial planes of the isoclinal folds is developed in the Valdez Group phyllites. Fold axesand a stretching lineation defined by elongated clasts in metaconglomerates (LSPS) are hori-zontal and E-W striking (SP10, Fig. 5.3b). The contact to the northern McHugh complex isnot exposed along this transect. Farther south the Valdez Group rocks become finer-grainedand the pressure solution foliation is not as obvious as in the coarser metasandstones andmetaconglomerates (Fig. 5.3b).
Figure 5.5 (following page): Field photographs from section 2 of the CMC. (a) South strand of Hanagitafault zone as exposed along the eastern side of the unnamed glacier along which the Tokio transect runs. Steepbrittle faults juxtapose massive diorite (light unit to the left) against metasedimentary and metavolcanic rocksof the McHugh complex (dark unit to the right). Height of rock face ~1000 m. Coord. N60.7462/W141.4573.(b) Isoclinally folded conglomerate in the phyllite zone of the Tokio transect. A S-dipping pressure solutionfoliation is developed. Ice axe for scale. Coord. N60.7066/W141.5697. (c) Small-scale isoclinally foldedbedding is overprinted by a second generation of tight folds which has Sbt as axial planar foliation. The firstisoclinal fold is probably equivalent to the tight to isoclinal folds in the phyllite zone which have a pressuresolution foliation as axial plane foliation. This suggests that Sbt is younger than SPS. Pencil for scale. Cord.N60.6642/W141.5488. (d) The main foliation in the gneiss zone of the Bagley transect has a fan shape: itdips towards the S in the north (upper image, Coord. N60.6189/W141.4428) and dips towards the N in thesouth (lower image, Coord. N60.5473/W141.3960). A felsic pluton intrudes the transitional gneiss in the upperimage. Both rock faces are ~200 m high. (e) A steep, down-dip stretching lineation defined by chlorite andmuscovite is developed on Smelt-planes especially in the southern part of the Bagley gneiss zone. Pencil forscale. Coord. N60.5362/W141.3958, Small insert: Coord. N60.5473/W141.3960. (f) Dark slates intercalatedwith dark-greenish metabasalts build up the southern border of the CMC in the Bagley transect. The lithologicalboundary between the orange-brownish gneisses and the dark-green amphibolites is nicely visible from faraway (upper left image). A north-dipping foliation with a down-dip lineation is developed in these amphiboliticrocks. Shear sense indicators in these rocks point to a N-side-up sense of shear (upper right and lower images).Coordinates where shear sense indicators were observed: N60.504/W141.3721.
165
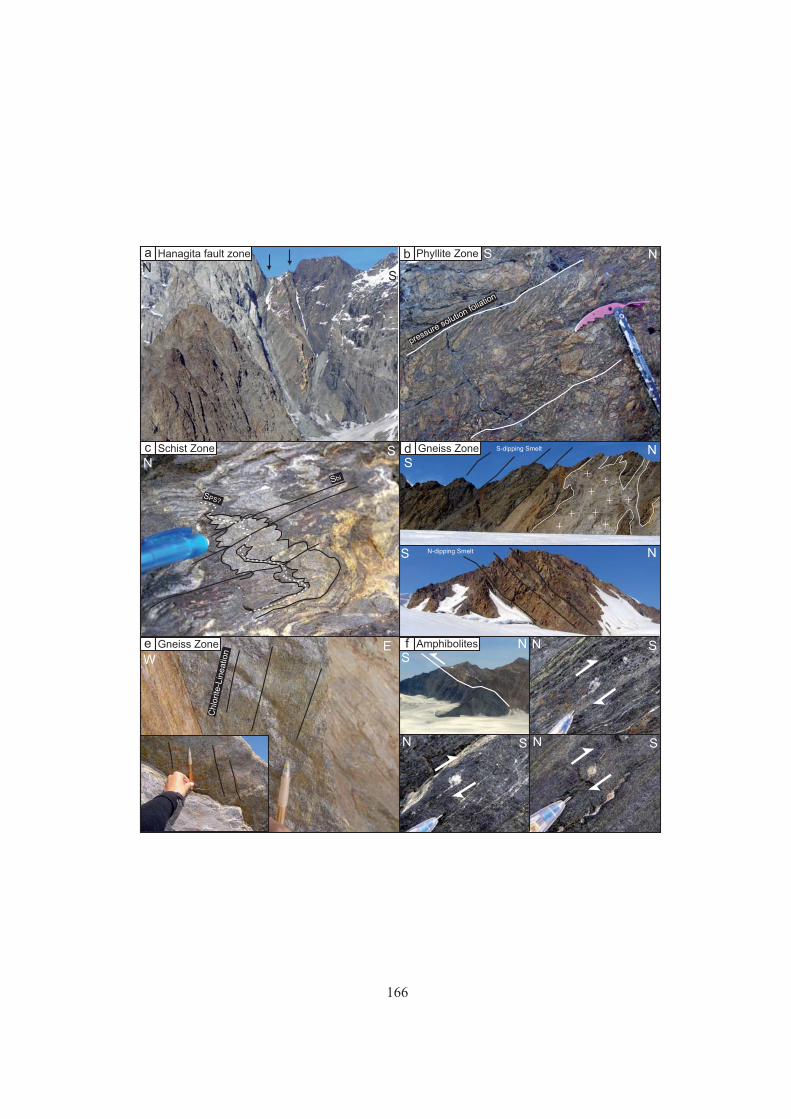
aN
S
S NbHanagita fault zone Phyllite Zone
Nc Schist Zone S
Sd Gneiss Zone N
e Gneiss Zone f AmphibolitesEW
N S
pressure solution foliation
S N
Chlo
rite
-Lin
eatio
n
Sbi
S-dipping Smelt
N-dipping Smelt
SN
SN SN
SPS?
166
Schist zone
South of another side glacier, massive, fine-grained schistose rocks are exposed with mm-to cm-sized pink andalusite crystals growing across SPS. The fabric appears highly con-strictional with a pronounced E-W stretching lineation. South of this outcrop, two felsicplutons each ~500-1000 m in across-strike width intrude the schist zone (Fig. 5.2c, Fig.5.3b) and are separated by two outcrops of andalusite-bearing schist. In both of these schistexposures, folds of the sedimentary layering with asymmetry to the north are visible withan axial planar pressure solution foliation (SPS), similar to the observations in the phyllitezone farther north, but the orientation of this SPS is much more variable (SP11, Fig. 5.3b).In addition, open upright folds with E-W fold axes accompanied by a crenulation cleavage(Scr) similar to the one in the schist zone of the Bremner transect are locally developed, butthis foliation is also more variable in its orientation (SP11, Fig. 5.3b). South of the secondpluton, the schists are coarser-grained, and display a pervasive flat-lying foliation definedby biotite and sillimanite (Sbt, SP11, Fig. 5.3b), similar to the observations in the schistzone of the Bremner transect. A small-scale observation from isoclinally folded bedding,which is overprinted by a second generation of tight to isoclinal folds with the Sbt as axialplane foliation, suggests that Sbt is a younger foliation than SPS, which is axial planar to thefirst generation of folds (Fig. 5.5c). A shallowly W-plunging stretching lineation (LSbt) isdeveloped on Sbt.
Gneiss zone
The Bagley transect starts in the north with transitional gneiss (after Pavlis & Sisson, 1995),which is intruded by an undeformed felsic pluton (Fig. 5.2c, 5.3b). The main foliationdefined by biotite (Sbt) and rare mm-thick quartzofeldspathic layers is isoclinally foldedon mm- to m-scale and a spaced crenulation cleavage (Scr) dipping ~40° to the south isdeveloped. Farther south, quartzofeldspathic layers begin to appear parallel to Scr (=Smelt)and structures analogous to Domains 2 and 3 in section 1 are dominant. Across the entireBagley transect, The Smelt foliation defines a similar but more pronounced fan structure asobserved in the gneiss zone of section 1: the Smelt dips 40-80° towards the S in the northernpart of the Bagley gneiss zone (SP12, Fig. 5.3b; Fig. 5.5d) and 30-80° towards the N inthe southern part of the Bagley gneiss zone (SP13, Fig. 5.3b; Fig. 5.5d). Distinct from thegneiss zone of section 1 however, the ductile stretching lineation developed on Smelt (LSmelt)is not horizontally to shallowly W plunging, but plunges 30-65° towards the W in the north-ern part of the Bagley transect and 30-60° towards the N-NNE in the southern part of theBagley transect (SP12, 13, Fig. 5.3b). Moreover, a younger stretching lineation defined bychlorite and muscovite is present in addition to the high-grade stretching lineation on themain foliation planes in the southern Bagley transect (Fig. 5.5e). This lineation plunges40-80° towards the N and has a similar orientation to the late stretching lineation observedin the Tana transect of section 1 (SP6, 12 and 13, Fig. 5.3b).
167
Transition into Metabasalt zone
The metabasaltic rocks at the southern end of the CMC are visible from afar due to theirdark-green colour which contrasts with the orange-brown gneisses (Fig. 5.5f, Fig. 5.3b).The contact between the gneisses and the amphibolites is exposed in high cliffs but is oftencovered by ice or debris at the foot of these cliffs and is therefore difficult to reach. Two out-crops were visited in these rocks (60.5044N/141.3720W and 60.5079N/141.4152W). Theyconsist of fine-grained greenschist to amphibolite facies slates interlayered with middle-grained amphibolites. A penetrative, north-dipping foliation is developed in these rocks(SP14, Fig. 5.3b). A N-dipping (down-dip) stretching lineation is developed on the fo-liation. Parallel to this lineation and perpendicular to the foliation sigma-clasts of thinquartz-veins reveal a N-side-up sense of shear (Fig. 5.5f).
The Mt Miller -Mt St Elias ridge
We visited the ridge between Mt Miller and Mt St Elias on the south-side of the Bagleyicefield at four localities (Fig. 5.2a). At stops 1-3 the rocks consist of greenschist-faciesmetasedimentary rocks where the original bedding is still easily visible. Light-brown,up to 10 meters thick metasandstone layers alternate with dark-grey slates and dark-greenmetavolcanic rocks. The bedding dips 30-85° towards the N and m-scale to 10’s of meter-scale folds that are asymmetric to the south occur. Steep S-dipping faults disrupt the bed-ding, but displacement directions are not visible. Felsic dikes both parallel to the beddingand parallel to the S-dipping faults also occur. At stop 2, ~45° WNW plunging striae showa dextral and N-side up sense of movement. In summary, stops 1-3 define a narrow strip oflow-grade metasediments which crop out just south of the Bagley ice field (Fig. 5.2a). Atstop 4, on the N-shoulder of Mt Huxley, highly foliated, dark-green to black middle-grainedamphibolites are exposed. The foliation dips steeply towards the N and felsic dikes occurparallel to the foliation. Brittle faults parallel to the foliation with dextral and N-side-upcomponents occur. A felsic intrusion several 100 m in size intrudes the dark amphibolitesin the north-face of Mt Huxley.
5.4.3 Section 3
Section 3 lies ~170 km south-east along strike of section 2. The section lies in the glacialvalley just above Nunatak fjord and is the first relatively easily accessible transect acrossthe CMC southeast of the high St Elias range. Between this section and section 2 the rocksof the CMC are covered by extensive icefields and crop out only in nunataks and on thesouth flank of Mt Logan (Fig. 5.2a). The Chugach terrane in section 3 is limited to anarrow strip ~10 km in width between the Border Range fault system in the northeast andthe Fairweather fault system in the southwest (Fig. 5.6). In addition to this decrease in total
168
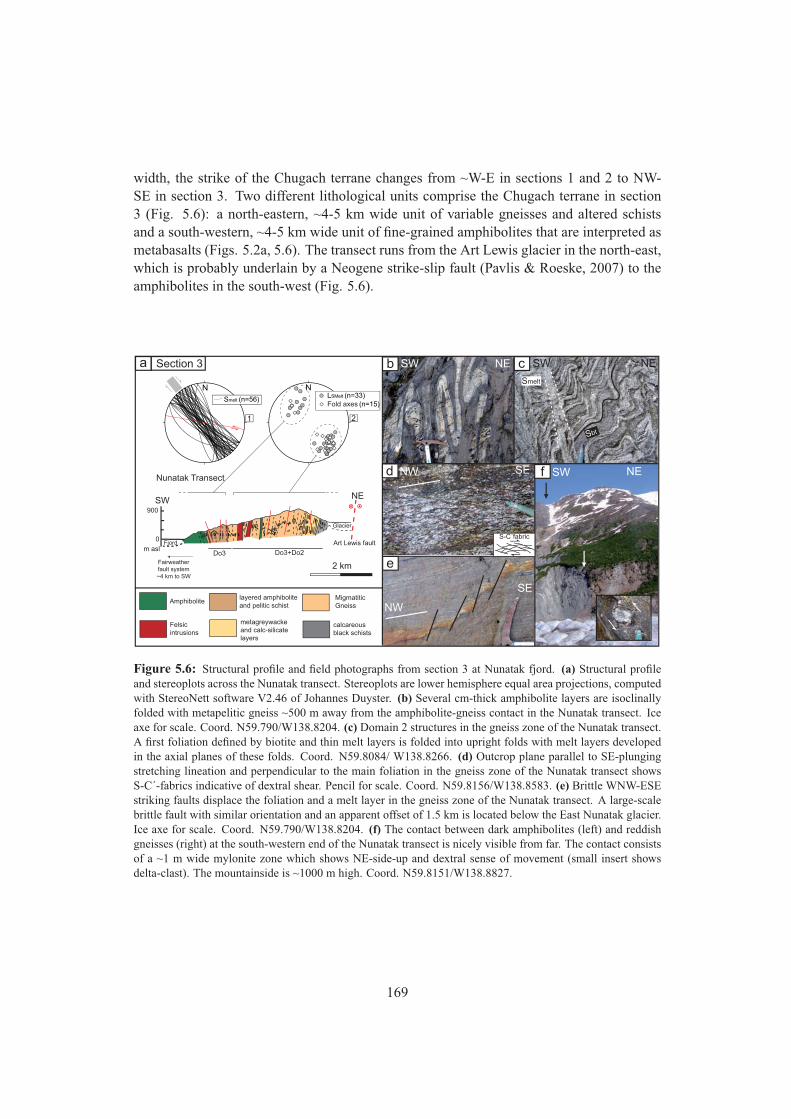
width, the strike of the Chugach terrane changes from ~W-E in sections 1 and 2 to NW-SE in section 3. Two different lithological units comprise the Chugach terrane in section3 (Fig. 5.6): a north-eastern, ~4-5 km wide unit of variable gneisses and altered schistsand a south-western, ~4-5 km wide unit of fine-grained amphibolites that are interpreted asmetabasalts (Figs. 5.2a, 5.6). The transect runs from the Art Lewis glacier in the north-east,which is probably underlain by a Neogene strike-slip fault (Pavlis & Roeske, 2007) to theamphibolites in the south-west (Fig. 5.6).
Glacier
Fjord
Fairweatherfault system~4 km to SW
Art Lewis fault0
900
SW NE
Nunatak Transect
2 km
m asl
layered amphiboliteand pelitic schist
Felsic intrusions
Amphibolite
metagreywackeand calc-silicate layers
MigmatiticGneiss
calcareous black schists
N
Smelt (n=56)
1
N
2
Fold axes (n=15) LSMelt (n=33)
Do3+Do2Do3
Section 3a
fd
c
S-C´fabric
NW SE
NW
SE
e
NESW
NESWb NESW
Sbt
Smelt
Figure 5.6: Structural profile and field photographs from section 3 at Nunatak fjord. (a) Structural profileand stereoplots across the Nunatak transect. Stereoplots are lower hemisphere equal area projections, computedwith StereoNett software V2.46 of Johannes Duyster. (b) Several cm-thick amphibolite layers are isoclinallyfolded with metapelitic gneiss ~500 m away from the amphibolite-gneiss contact in the Nunatak transect. Iceaxe for scale. Coord. N59.790/W138.8204. (c) Domain 2 structures in the gneiss zone of the Nunatak transect.A first foliation defined by biotite and thin melt layers is folded into upright folds with melt layers developedin the axial planes of these folds. Coord. N59.8084/ W138.8266. (d) Outcrop plane parallel to SE-plungingstretching lineation and perpendicular to the main foliation in the gneiss zone of the Nunatak transect showsS-C´-fabrics indicative of dextral shear. Pencil for scale. Coord. N59.8156/W138.8583. (e) Brittle WNW-ESEstriking faults displace the foliation and a melt layer in the gneiss zone of the Nunatak transect. A large-scalebrittle fault with similar orientation and an apparent offset of 1.5 km is located below the East Nunatak glacier.Ice axe for scale. Coord. N59.790/W138.8204. (f) The contact between dark amphibolites (left) and reddishgneisses (right) at the south-western end of the Nunatak transect is nicely visible from far. The contact consistsof a ~1 m wide mylonite zone which shows NE-side-up and dextral sense of movement (small insert showsdelta-clast). The mountainside is ~1000 m high. Coord. N59.8151/W138.8827.
169
Variable gneiss zone
The variable gneisses and altered schists that underlie most of the transect consist from NEto SW of several different lithological units. Calcareous altered schists are exposed in a nar-row strip (~400 m wide) on the northeastern end of the transect along the Art Lewis Glacier(Figs. 5.2d, 5.6). Southwest of these schists, massive metasandstones and calcsilicate layersare exposed. Even farther to the southwest, quartzofeldspatic gneisses typical of the gneisszone elsewhere in the CMC are exposed. Zones of foliated felsic intrusions alternate withthe migmatitic gneisses. About 500 m northeast of the contact with the amphibolites, mm-to m-thick layers of amphibolites are intercalated with the gneisses, due to infolding or pri-mary layering (Fig. 5.6a, b). Structurally, the lithological layering in all units is isoclinallyfolded and a steep, NW-SE trending foliation is developed, which is defined by mm- tocm-thick quartzofeldspathic layers in the gneisses (Smelt, SP1, Fig. 5.6a). In areas whereSmelt is less dominant, structures analogous to Domain 2 in sections 1 and 2 are visiblewith an earlier, generally horizontally oriented foliation defined by biotite and thin quart-zofeldspathic layers folded into upright open to isoclinal folds (Fig. 5.6c). A pronouncedstretching lineation is present on Smelt. This lineation plunges 10-45° towards the SE in thenortheastern part of the transect and 10-60° towards the NW ~1 km away from the amphi-bolite contact. Fold axes of intrafolial and isoclinal to open folds in all units are parallel tothis stretching lineation (SP2, Fig. 5.6a). On outcrop planes ~parallel to the SE-plungingstretching lineation and perpendicular to the foliation, ductile S-C´ fabrics and semi-ductileshear bands are visible which show a dextral sense of movement (Fig. 5.6d). This indicatesthat on a horizontal plane, the movement had a dextral and SW-side-up component.
Contact to amphibolites
The contact between the gneisses and the amphibolites at the south-western end of theNunatak transect is sharp and nearly vertical (Fig. 5.6f). A ~1m wide mylonite zone oc-curs between the amphibolites and the gneisses, where the grain size of both rock types isconsiderably reduced. Sigma- and delta-clasts observed on vertical planes point to a N-sideup sense of movement - however, since these observations were made on planes not par-allel to the NW-dipping lineation their significance is uncertain. No shear sense indicatorswere observed parallel to the NW-dipping lineation due to the lack of correspondingly ori-ented outcrop planes. However, since the area is located between the dextral Fairweatherand the dextral Border Range fault zones, and dextral movement has been observed in thearea where the lineation is SW-plunging, the assumption that the movement parallel to thisNW-plunging stretching lineation is dextral is reasonable. In this case, the movement on ahorizontal plane would have a dextral and NE-side-up component. The SE-plunging stretch-ing lineation farther to the northeast and the NW-plunging lineation farther to the southwest,together with the dextral shear senses point to oblique extrusion of the central zone of thegneisses in a very narrow corridor.
170
Amphibolites
Although the recent field studies did not extend far into the amphibolites, one of us (Pavlis)conducted field studies in these rocks during the 1990’s and part of that effort was summa-rized by Sisson et al. (2003). Those studies indicated that the structural sequence recognizedin the southwestern part of the gneiss extends through the entire zone of amphibolites. Thatis, a prominent NW plunging mineral lineation is developed on a steeply dipping foliationthat is axial planar to isoclinals folds in layering. The origin of the layering in the am-phibolites is uncertain, but includes calcsilicate rich bands that are presumably a primarylayering; either compositional variations in pillow lavas or entrained sedimentary materialswithin a submarine volcanic complex. Shear bands are visible locally within these amphi-bolites on planes parallel to lineation and perpendicular to foliation and consistently showdextral, east-side up, oblique shear. Metamorphic grade also is variable across the amphibo-lites from epidote-amphibolites to the southwest to amphibolites near the contact with thegneisses.
Brittle faults
On horizontal outcrop planes in the gneisses, steep, brittle dextral faults striking WNW-ESE displace the main foliation with mm- to m-scale offsets (Fig. 5.6e, SP1, red line, Fig.5.6a). The location of the lithologic boundary between amphibolites and gneisses mappedon both sides of the East Nunatak glacier suggest that there is a similar oriented fault withan apparent offset of ~1.5 km located below this glacier (Fig. 5.2d). This orientation isnot a typical Riedel orientation for the dextral Fairweather and Border Range fault zonesand the formation of this brittle fault is therefore probably unrelated to the bigger boundingfault zones. Late, muscovite-bearing shear zones and brittle faults which are parallel to thefoliation occur all over the Nunatak transect (thin red lines in profile of Fig. 5.6a) and formsteep gullies where the rocks weather easily. No shear senses or striae were observed onthese shear zones/faults.
5.4.4 Structural summary and relationship with metamorphic grade
A summary of our structural observations is presented in Fig. 5.7 as a tectonic sequencediagram (after Forster & Lister, 2008) where the different observations from each transectare correlated (a) with each other, (b) with the mineral growth events observed in the rocks(Bruand, 2010) and (c) with the deformational sequence observed by Pavlis & Sisson (1995,2003) in the western and northern part of the complex (Fig. 5.2a). A schematic 3D-sketchof the complex is displayed in Fig. 5.8. Our results together with the observations of Pavlis& Sisson (1995, 2003) and the petrological evolution as described by Bruand (2010) revealthe following structural and metamorphic evolution in the CMC.
171
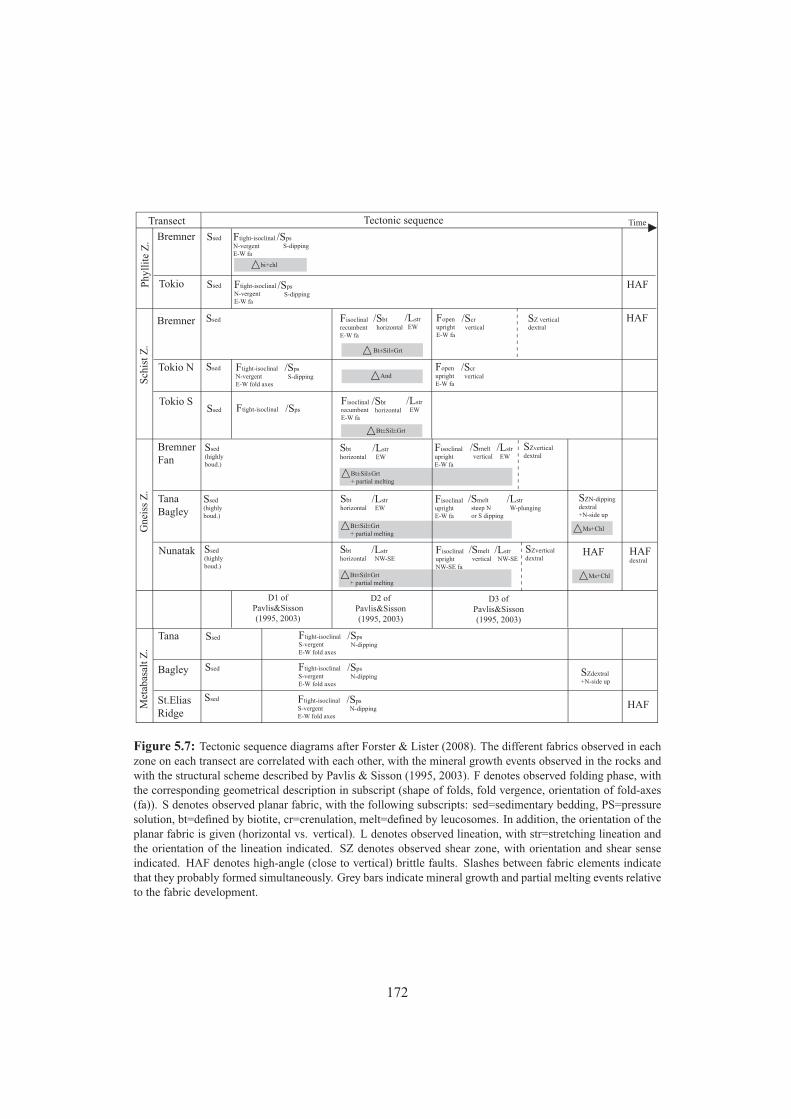
Transect Tectonic sequence
Phyl
lite
Z.
Bremner
Tokio
Ssed
Ssed
Ftight-isoclinalN-vergentE-W fa
/Sps S-dipping
Ftight-isoclinalN-vergentE-W fa
/Sps S-dipping
bi+chl
Schi
st Z
.
Bremner
Tokio N
Ssed
Ssed Ftight-isoclinalN-vergentE-W fold axes
/Sps S-dipping And
FisoclinalrecumbentE-W fa
/Sbt horizontal
/Lstr EW
Bt±Sil±Grt
FisoclinalrecumbentE-W fa
/Sbt horizontal
/Lstr EW
Bt±Sil±Grt
FopenuprightE-W fa
/Scr vertical
SZ verticaldextral
HAF
Gne
iss Z
.
BremnerFan
Ssed(highly boud.)
Sbthorizontal
/Lstr EW
Bt±Sil±Grt+ partial melting
FopenuprightE-W fa
/Scr vertical
FisoclinaluprightE-W fa
/Smelt vertical
/Lstr EW
SZverticaldextral
TanaBagley
Sbthorizontal
/Lstr EW
Bt±Sil±Grt+ partial melting
FisoclinaluprightE-W fa
/Smelt steep N or S dipping
/Lstr W-plunging
SZN-dippingdextral+N-side up
Ms+Chl
Nunatak
Ssed(highly boud.)
Sbthorizontal
/Lstr NW-SE
FisoclinaluprightNW-SE fa
/Smelt vertical
/Lstr NW-SE
Bt±Sil±Grt+ partial melting
SZverticaldextral
HAF
Ms+Chl
HAFdextral
Met
abas
alt Z
.
Tana
Bagley
Ssed Ftight-isoclinalS-vergentE-W fold axes
/Sps N-dipping
St.Elias Ridge
SZdextral+N-side up
HAF
HAF
Ftight-isoclinalS-vergentE-W fold axes
/Sps N-dipping
Ftight-isoclinalS-vergentE-W fold axes
/Sps N-dipping
Ssed
Ssed
Ssed(highly boud.)
D1 ofPavlis&Sisson(1995, 2003)
D2 ofPavlis&Sisson(1995, 2003)
D3 ofPavlis&Sisson(1995, 2003)
Tokio S Ftight-isoclinal /Sps
Time
Ssed
Figure 5.7: Tectonic sequence diagrams after Forster & Lister (2008). The different fabrics observed in eachzone on each transect are correlated with each other, with the mineral growth events observed in the rocks andwith the structural scheme described by Pavlis & Sisson (1995, 2003). F denotes observed folding phase, withthe corresponding geometrical description in subscript (shape of folds, fold vergence, orientation of fold-axes(fa)). S denotes observed planar fabric, with the following subscripts: sed=sedimentary bedding, PS=pressuresolution, bt=defined by biotite, cr=crenulation, melt=defined by leucosomes. In addition, the orientation of theplanar fabric is given (horizontal vs. vertical). L denotes observed lineation, with str=stretching lineation andthe orientation of the lineation indicated. SZ denotes observed shear zone, with orientation and shear senseindicated. HAF denotes high-angle (close to vertical) brittle faults. Slashes between fabric elements indicatethat they probably formed simultaneously. Grey bars indicate mineral growth and partial melting events relativeto the fabric development.
172
D1 In the phyllite zone of sections 1-2 and the northern schist zone of section 2, tight toisoclinal folds with E-W trending fold axes are present, accompanied by an axial planarpressure solution foliation (D1 after Pavlis & Sisson, 1995, 2003). Since this fabric is thefirst which developed in the metasedimentary rocks, it is probably related to the accretionof the sediments. However, it is interesting to note that in sections 1 and 2, these early foldsare asymmetric to the north, and the corresponding axial planar foliation is south-dipping,contrary to D1 structures related to accretion described farther west in the area of PrinceWilliam Sound which are generally north-dipping and asymmetric to the south (e.g. Plafkeret al., 1994). Biotite is growing in the phyllite zone of section 1, whereas only chlorite ispresent in the southern phyllite zone of section 1 and the entire phyllite zone of section 2.Peak metamorphic conditions reached during that stage in the phyllites are ~400-550°C and~2-3 kbar in the north and ~400-450°C in the south (Fig. 5.2b and c; Sisson et al., 1989;Bruand, 2010).
D2 In the southern schist zone of section 2, in the entire schist zone of section 1 and inthe entire gneiss zone of all sections an originally flat-lying penetrative foliation defined bybiotite ± sillimanite is developed, which dips below the D1 fabric domain in the northernschist zone and the phyllites of sections 1 and 2 (D2 after Pavlis & Sisson, 1995, 2003).This fabric is axial planar to isoclinal folds with E-W fold axes, which are parallel to a pro-nounced E-W subhorizontal stretching lineation. Finite strain analyses of Pavlis & Sisson(1995, 2003) indicate that this D2-fabric records margin-parallel stretching accompanied byvertical flattening which affected the lower part of the accretionary prism. Besides this welldefined pure-shear component the amount of simple shear involved in the formation of theD2-fabric is not well constrained. Sparse observations of top-to-the-east shear sense per-pendicular to the S2-planes and parallel to the E-W lineation (Pavlis & Sisson, 1995, 2003,and this study) may point to an unknown amount of simple shear deformation during the D2deformation. The D2 fabric development is clearly contemporaneous with biotite, silliman-ite and garnet growth in the schist zone and with the onset of partial melting in the gneisszone. The andalusite crystals observed in the northern schist zone of section 2 occur justabove the D2 fabric front and we interpret this andalusite growth as contemporaneous withthe bi±sill±gr growth in the D2 fabric domain (Fig. 5.7). Peak metamorphic conditionswere reached in the schist zone contemporaneous with D2 and are ~600-650°C and ~5-7kbar (Figs. 5.2c and d; Bruand, 2010).
D3 Both the schist and the gneiss zones are overprinted by variably open to isoclinal up-right folds with steeply dipping axial planes and E-W fold axes (D3 after Pavlis & Sisson,1995, 2003). In the schist zone, a steeply dipping, spaced crenulation cleavage is developedaxial planar to the folds and often steep brittle fault zones are developed in the core of thesefolds. In the schist zone, the D3 deformation probably set in at or shortly after the metamor-phic peak (Fig. 5.7). In the gneiss zone, the D3 deformation is developed strongly domainal,with domains of low, intermediate and high D3 strain. In the intermediate and high D3 strain
173
domains, a new axial planar foliation to the upright folds is developed, defined by biotite,sillimanite and leucosome layers, indicating that partial melting and metamorphic mineralgrowth was ongoing during D3 in the gneiss zone. This newly formed steep foliation definesa large-scale foliation fan in the entire gneiss zone (Fig. 5.8). In the northern gneiss zonethe ductile stretching lineation associated with this D3 fabric is oriented subhorizontal andE-W, whereas in the southern gneiss zone the ductile stretching lineation on the D3 folia-tion is plunging steeply to the west-north-west (Fig. 5.3). Finite strain measurements ofPavlis & Sisson (1995, 2003) revealed a horizontal shortening component during D3-fabricformation. Their observations as well as ours show that dextral shear bands developed si-multaneous to and overprinting the D3 foliation pointing to an important dextral componentof simple shear during the D3 deformation, indicating that D3 was a dextral transpressiveevent (Fig. 5.7). The gneiss zone probably reached its metamorphic peak mainly duringthis D3 deformation, and experienced temperatures of ~650-700°C and 4-9 kbar in sections1 and 3 and ~650-700°C and ~8-13 kbar in section 2 (Figs. 5.2b, c and d Bruand, 2010).
Post-metamorphic shear zones and brittle faults in the south of the complex Thesouthern border of the CMC west of the U.S. Canadian Border is made up of a series ofductile to brittle post-metamorphic fault zones which juxtapose high-grade gneisses in thenorth against low-grade phyllites in the south (Fig. 5.2a, 5.3). The southern schist zoneas proposed by Hudson & Plafker (1982) between the gneisses and the phyllites probablyhas been cut out by these faults and shear zones. Muscovite and chlorite-coated stretchinglineations in these shear zones plunge to the west-northwest and shear sense indicators re-veal north-side-up and dextral sense of movement along these faults. The presence of theseshear zones and faults in the south of the complex, together with the concentration of highD3 strain domains with down-dip lineations along the southern border produce a highlyasymmetric final shape of the complex, with a wide transition from phyllites to gneisses inthe north and an abrupt juxtaposition of gneisses against lower-grade phyllites in the south(Fig. 5.8).
174
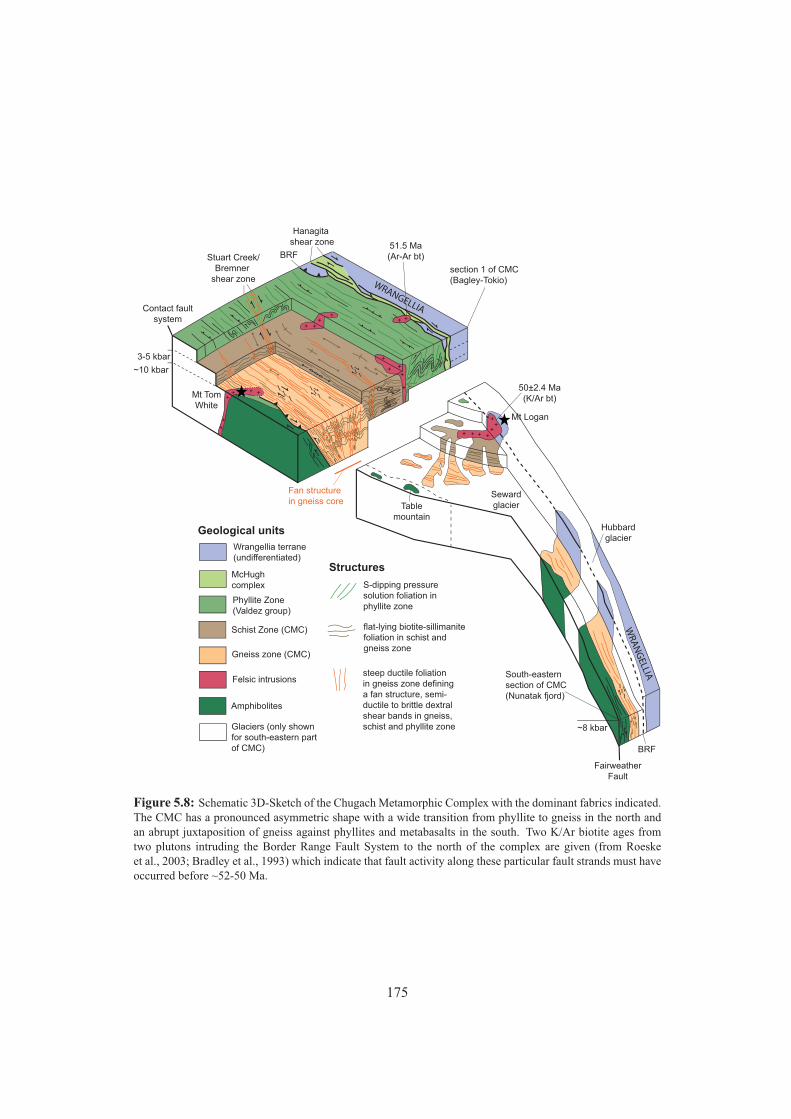
3-5 kbar
~8 kbar
~10 kbar
WRANGELLIA
WRA
NG
ELLIA
Mt Logan
Mt TomWhite
Hanagita shear zone
BRFStuart Creek/Bremner
shear zone
Contact faultsystem
Sewardglacier
BRF
FairweatherFault
Hubbardglacier
Wrangellia terrane(undifferentiated)
McHughcomplex
Phyllite Zone(Valdez group)
Schist Zone (CMC)
Gneiss zone (CMC)
Felsic intrusions
Amphibolites
Fan structurein gneiss core
section 1 of CMC(Bagley-Tokio)
South-eastern section of CMC(Nunatak fjord)
Geological units
Structures
steep ductile foliationin gneiss zone defininga fan structure, semi-ductile to brittle dextralshear bands in gneiss, schist and phyllite zone
S-dipping pressuresolution foliation in phyllite zone
flat-lying biotite-sillimanitefoliation in schist and gneiss zone
50±2.4 Ma(K/Ar bt)
51.5 Ma(Ar-Ar bt)
Tablemountain
Glaciers (only shownfor south-eastern partof CMC)
Figure 5.8: Schematic 3D-Sketch of the Chugach Metamorphic Complex with the dominant fabrics indicated.The CMC has a pronounced asymmetric shape with a wide transition from phyllite to gneiss in the north andan abrupt juxtaposition of gneiss against phyllites and metabasalts in the south. Two K/Ar biotite ages fromtwo plutons intruding the Border Range Fault System to the north of the complex are given (from Roeskeet al., 2003; Bradley et al., 1993) which indicate that fault activity along these particular fault strands must haveoccurred before ~52-50 Ma.
175
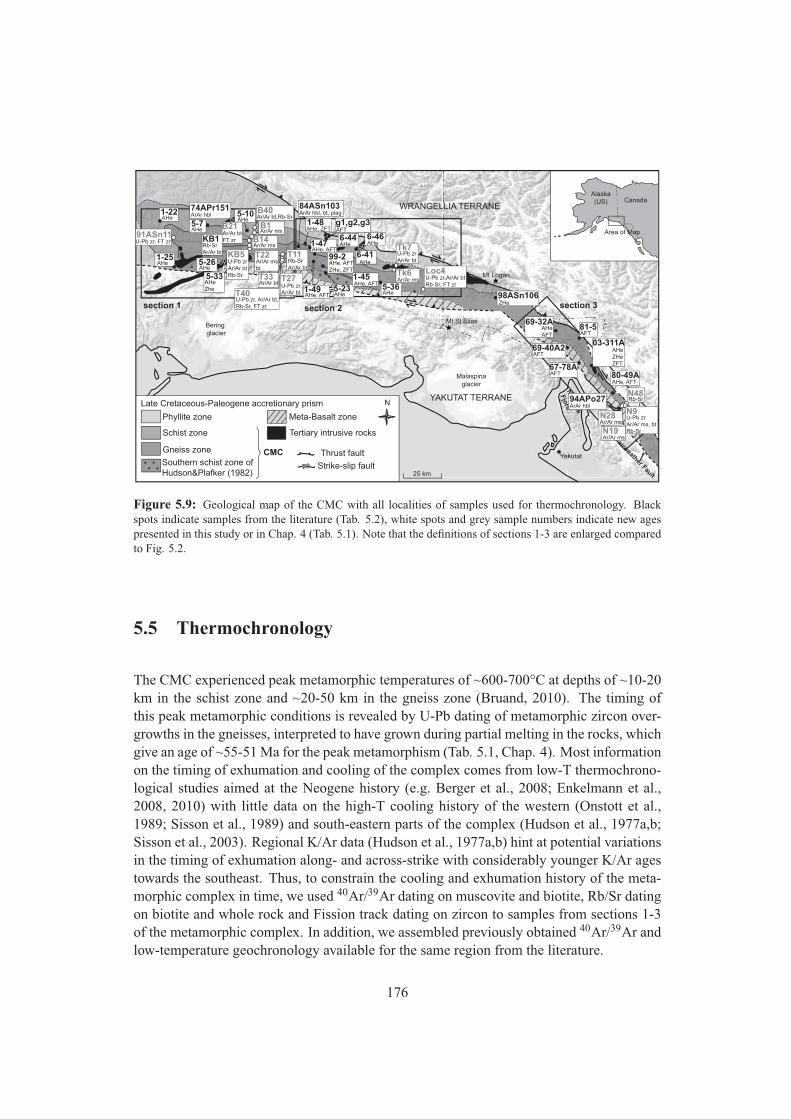
Bering glacier
Malaspinaglacier
Mt St Elias
Mt Logan
Yakutat
Late Cretaceous-Paleogene accretionary prism
Gneiss zone
Phyllite zone
25 km
Thrust fault
Strike-slip fault
Schist zone
Meta-Basalt zone
Tertiary intrusive rocks
N
Southern schist zone of Hudson&Plafker (1982)
CMC
Alaska(US) Canada
Area of Map
Contact Fault
Fairweather Fault
YAKUTAT TERRANE
WRANGELLIA TERRANE
Nunatak
Fjo
rd
section 1 section 2 section 3
5-10
5-23 5-36
6-41
6-44 6-46AHe
AHe
AHe
AHeAHe
AHe
1-45AHe, AFT
1-49AHe, AFT
99-2AHe, AFTZHe, ZFT
1-48AHe, ZFT
1-47AHe, AFT
5-7AHe
1-22AHe
1-25AHe
69-32AAHeAFT
03-311AAHe ZHeZFT
80-49AAHe, AFT
81-5AFT
69-40A2AFT
67-78AAFT
5-26
5-33AHe
AHeZhe
AFTg1,g2,g3
98ASn106ZHe
U-Pb zrAr/Ar ms, btRb-Sr
U-Pb zr,Ar/Ar btRb-Sr, FT zr
U-Pb zrAr/Ar bt
U-Pb zr, Ar/Ar bt
U-Pb zrAr/Ar bt Rb-Sr
91ASn11
KB5
T27
Tk7
Loc4
N9
U-Pb zr, FT zr
U-Pb zr, Ar/Ar bt,Rb-Sr, FT zr
T40
74APr151ArAr hbl
84ASn103ArAr hbl, bt, plag
94APo27ArAr hbl
Ar/Ar ms
Ar/Ar ms
Ar/Ar ms
Ar/Ar msB1
B14
Tk6
T22
N28
N19
Ar/Ar ms
Ar/Ar msbt
Rb-Sr
Rb-SrAr/Ar bt
Ar/Ar bt,Rb-Sr
Rb-SrAr/Ar bt
B40
KB1
T11
N48
Ar/Ar bt
Ar/Ar btFT zr
B21
T33
Figure 5.9: Geological map of the CMC with all localities of samples used for thermochronology. Blackspots indicate samples from the literature (Tab. 5.2), white spots and grey sample numbers indicate new agespresented in this study or in Chap. 4 (Tab. 5.1). Note that the definitions of sections 1-3 are enlarged comparedto Fig. 5.2.
5.5 Thermochronology
The CMC experienced peak metamorphic temperatures of ~600-700°C at depths of ~10-20km in the schist zone and ~20-50 km in the gneiss zone (Bruand, 2010). The timing ofthis peak metamorphic conditions is revealed by U-Pb dating of metamorphic zircon over-growths in the gneisses, interpreted to have grown during partial melting in the rocks, whichgive an age of ~55-51 Ma for the peak metamorphism (Tab. 5.1, Chap. 4). Most informationon the timing of exhumation and cooling of the complex comes from low-T thermochrono-logical studies aimed at the Neogene history (e.g. Berger et al., 2008; Enkelmann et al.,2008, 2010) with little data on the high-T cooling history of the western (Onstott et al.,1989; Sisson et al., 1989) and south-eastern parts of the complex (Hudson et al., 1977a,b;Sisson et al., 2003). Regional K/Ar data (Hudson et al., 1977a,b) hint at potential variationsin the timing of exhumation along- and across-strike with considerably younger K/Ar agestowards the southeast. Thus, to constrain the cooling and exhumation history of the meta-morphic complex in time, we used 40Ar/39Ar dating on muscovite and biotite, Rb/Sr datingon biotite and whole rock and Fission track dating on zircon to samples from sections 1-3of the metamorphic complex. In addition, we assembled previously obtained 40Ar/39Ar andlow-temperature geochronology available for the same region from the literature.
176
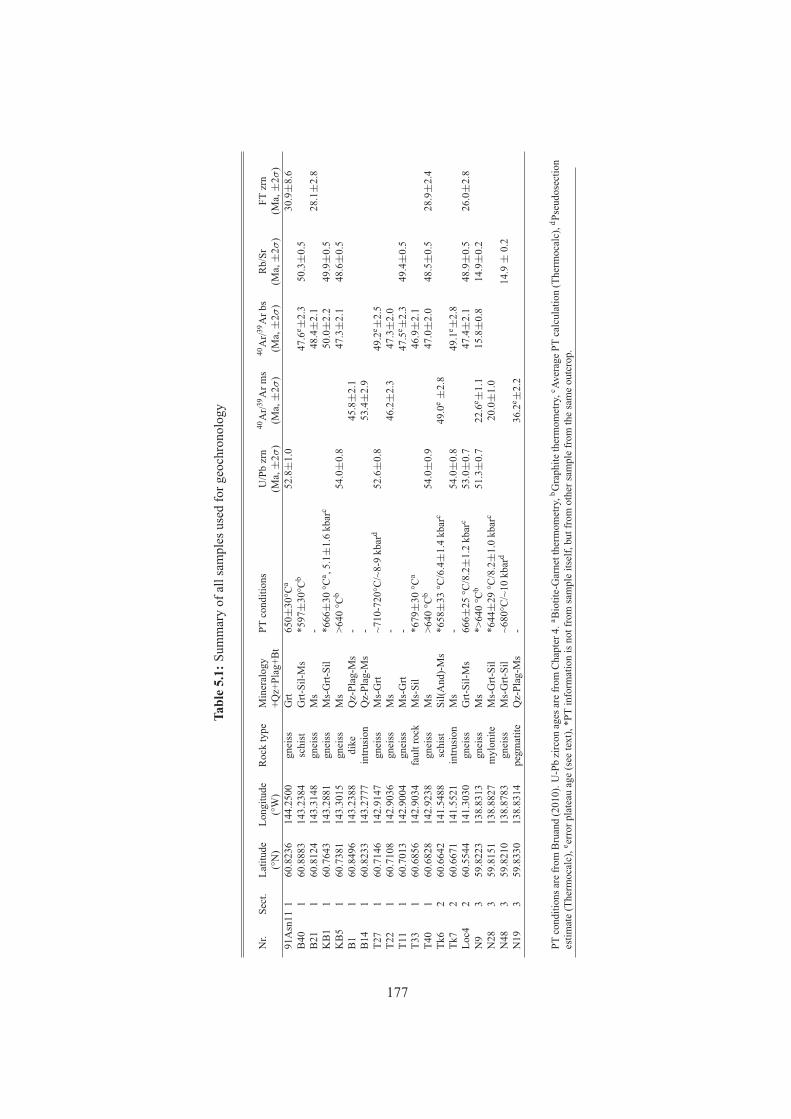
Tabl
e5.
1:Su
mm
ary
ofal
lsam
ples
used
forg
eoch
rono
logy
Nr.
Sect
.La
titud
eLo
ngitu
deR
ock
type
Min
eral
ogy
PTco
nditi
ons
U/P
bzr
n40
Ar/39
Arm
s40
Ar/39
Arb
sR
b/Sr
FTzr
n(°
N)
(°W
)+Q
z+Pl
ag+B
t(M
a,±
2σ)
(Ma,
±2σ
)(M
a,±
2σ)
(Ma,
±2σ
)(M
a,±
2σ)
91A
sn11
160
.823
614
4.25
00gn
eiss
Grt
650±
30°C
a52
.8±
1.0
30.9
±8.
6B
401
60.8
883
143.
2384
schi
stG
rt-Si
l-Ms
*597
±30
°Cb
47.6
e ±2.
350
.3±
0.5
B21
160
.812
414
3.31
48gn
eiss
Ms
-48
.4±
2.1
28.1
±2.
8K
B1
160
.764
314
3.28
81gn
eiss
Ms-
Grt-
Sil
*666
±30
°Ca ,
5.1±
1.6
kbar
c50
.0±
2.2
49.9
±0.
5K
B5
160
.738
114
3.30
15gn
eiss
Ms
>640
°Cb
54.0
±0.
847
.3±
2.1
48.6
±0.
5B
11
60.8
496
143.
2388
dike
Qz-
Plag
-Ms
-45
.8±
2.1
B14
160
.823
314
3.27
77in
trusi
onQ
z-Pl
ag-M
s-
53.4
±2.
9T2
71
60.7
146
142.
9147
gnei
ssM
s-G
rt~7
10-7
20°C
/~8-
9kb
ard
52.6
±0.
849
.2e ±
2.5
T22
160
.710
814
2.90
36gn
eiss
Ms
-46
.2±
2.3
47.3
±2.
0T1
11
60.7
013
142.
9004
gnei
ssM
s-G
rt-
47.5
e ±2.
349
.4±
0.5
T33
160
.685
614
2.90
34fa
ultr
ock
Ms-
Sil
*679
±30
°Ca
46.9
±2.
1T4
01
60.6
828
142.
9238
gnei
ssM
s>6
40°C
b54
.0±
0.9
47.0
±2.
048
.5±
0.5
28.9
±2.
4Tk
62
60.6
642
141.
5488
schi
stSi
l(And
)-M
s*6
58±
33°C
/6.4
±1.
4kb
arc
49.0
e±
2.8
Tk7
260
.667
114
1.55
21in
trusi
onM
s-
54.0
±0.
849
.1e ±
2.8
Loc4
260
.554
414
1.30
30gn
eiss
Grt-
Sil-M
s66
6±25
°C/8
.2±
1.2
kbar
c53
.0±
0.7
47.4
±2.
148
.9±
0.5
26.0
±2.
8N
93
59.8
223
138.
8313
gnei
ssM
s*>
640
°Cb
51.3
±0.
722
.6e ±
1.1
15.8
±0.
814
.9±
0.2
N28
359
.815
113
8.88
27m
ylon
iteM
s-G
rt-Si
l*6
44±
29°C
/8.2
±1.
0kb
arc
20.0
±1.
0N
483
59.8
210
138.
8783
gnei
ssM
s-G
rt-Si
l~6
80°C
/~10
kbar
d14
.9±
0.2
N19
359
.833
013
8.83
14pe
gmat
iteQ
z-Pl
ag-M
s-
36.2
e ±2.
2
PTco
nditi
onsa
refr
omB
ruan
d(2
010)
.U-P
bzi
rcon
ages
are
from
Cha
pter
4.a B
iotit
e-G
arne
tthe
rmom
etry
,b Gra
phite
ther
mom
etry
,c Ave
rage
PTca
lcul
atio
n(T
herm
ocal
c),d P
seud
osec
tion
estim
ate
(The
rmoc
alc)
,e err
orpl
atea
uag
e(s
eete
xt),
*PT
info
rmat
ion
isno
tfro
msa
mpl
eits
elf,
butf
rom
othe
rsam
ple
from
the
sam
eou
tcro
p.
177
5.5.1 40Ar/39Ar dating of muscovite and biotite
Sample description
Seven muscovite-bearing samples and twelve biotite-bearing samples were selected for40Ar/39Ar furnace step heating analyses. The sample locations are displayed on Figures5.2 and 5.9. Sample coordinates, rock type, mineralogy, PT conditions and 40Ar/39Ar agesare summarized in Table 5.1. Three of the seven muscovite samples come from undeformedigneous rocks (B1, B14 and B19). B1 is derived from an up to ~5 m thick felsic dike in-truding the schist zone in the Bremner transect (Fig. 5.2). It is oriented parallel to Sbt,but is internally not deformed. B14 is from a several 100 meters wide felsic intrusion inthe northern gneiss zone of the Bremner transect (Fig. 5.2). B19 is from a ~20 cm widecross-cutting pegmatitic dike exposed in the Nunatak transect (Fig. 5.2). In all three ig-neous samples, coarse muscovite occurs randomly oriented in the matrix and is interpretedto have formed during crystallization of the igneous rocks. One muscovite sample was col-lected from the schist zone in the Tokio transect and is exposed close to a major intrusion(Tk6, Fig. 5.2c). This sample is affected by contact metamorphism and the developmentof its muscovite flakes is contemporary to the intrusion: coarse muscovite and fine-grainedsillimanite statically replace andalusite crystals and grew at the thermal peak in this sample(Bruand, 2010). The other three muscovite samples (T22, N9, N28) were collected from thegneiss zone in the Tana and Nunatak transects (Fig. 5.2). In all three samples, muscovite isaligned parallel to Smelt and probably grew before or at the metamorphic peak.
One of the 12 biotite-bearing samples was collected from the schist zone of the Bremnertransect (B40, Fig. 5.2b). In this sample, fine-grained biotite, containing many opaque in-clusions, defines Sbt. Another biotite-bearing sample was collected from the large intrusionexposed at the southern end of the Tokio transect (Tk7, Fig. 5.2c). In this sample, coarsebiotite is randomly oriented in the matrix. The remaining 10 biotite-bearing samples areall from gneisses distributed through the gneiss zone of the CMC (Fig. 5.2, Fig. 5.9). Inall of these gneiss samples, biotite mainly defines Sbt. In some cases, newly grown biotitealso occurs parallel to Smelt. All biotites have a relatively constant composition of ~50-60%annite and ~40-50% phlogopite (Bruand, 2010).
Age results
The sample preparation process and the analytical technique is described in Appendix A,detailed isotopic measurements can be found in Tables 5.3 and 5.4, and the results of thestep heating experiments are displayed as age spectra on Figures 5.10 and 5.11. Weightedplateau or error plateau ages (Appendix A, Koppers, 2002), the total fusion, normal andinverse isochron ages are given in each diagram. Errors are quoted at 2 sigma.
178
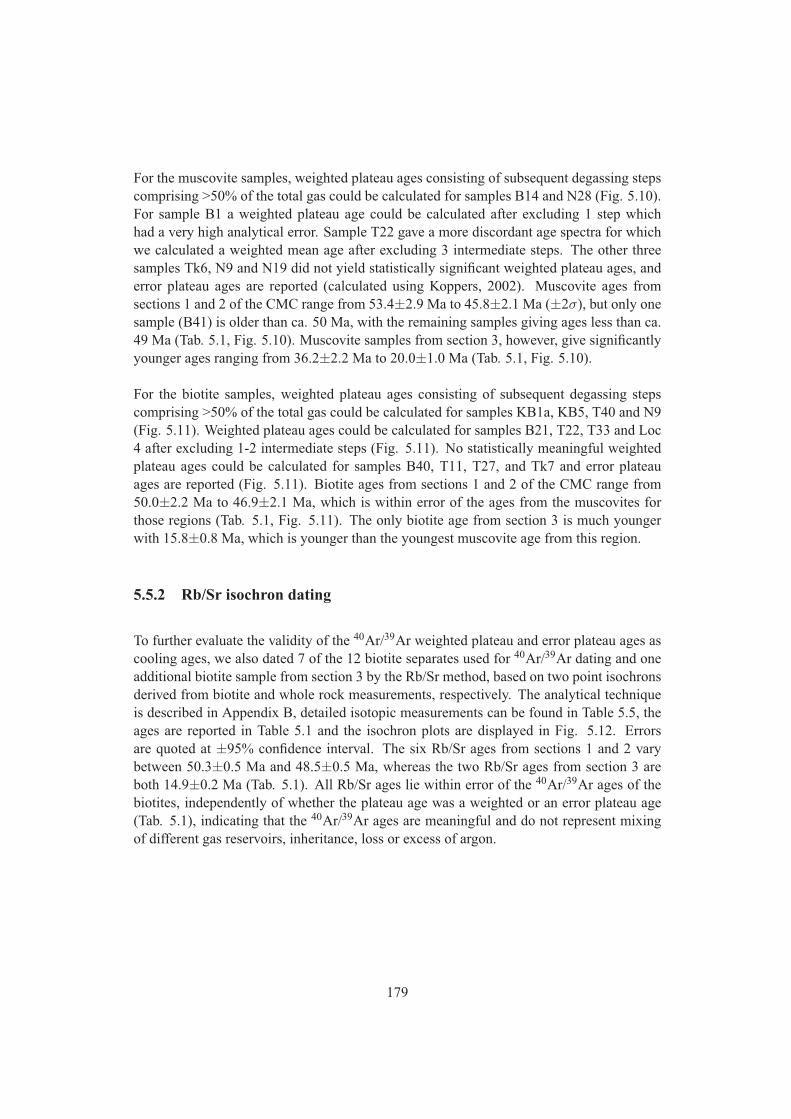
For the muscovite samples, weighted plateau ages consisting of subsequent degassing stepscomprising >50% of the total gas could be calculated for samples B14 and N28 (Fig. 5.10).For sample B1 a weighted plateau age could be calculated after excluding 1 step whichhad a very high analytical error. Sample T22 gave a more discordant age spectra for whichwe calculated a weighted mean age after excluding 3 intermediate steps. The other threesamples Tk6, N9 and N19 did not yield statistically significant weighted plateau ages, anderror plateau ages are reported (calculated using Koppers, 2002). Muscovite ages fromsections 1 and 2 of the CMC range from 53.4±2.9 Ma to 45.8±2.1 Ma (±2σ), but only onesample (B41) is older than ca. 50 Ma, with the remaining samples giving ages less than ca.49 Ma (Tab. 5.1, Fig. 5.10). Muscovite samples from section 3, however, give significantlyyounger ages ranging from 36.2±2.2 Ma to 20.0±1.0 Ma (Tab. 5.1, Fig. 5.10).
For the biotite samples, weighted plateau ages consisting of subsequent degassing stepscomprising >50% of the total gas could be calculated for samples KB1a, KB5, T40 and N9(Fig. 5.11). Weighted plateau ages could be calculated for samples B21, T22, T33 and Loc4 after excluding 1-2 intermediate steps (Fig. 5.11). No statistically meaningful weightedplateau ages could be calculated for samples B40, T11, T27, and Tk7 and error plateauages are reported (Fig. 5.11). Biotite ages from sections 1 and 2 of the CMC range from50.0±2.2 Ma to 46.9±2.1 Ma, which is within error of the ages from the muscovites forthose regions (Tab. 5.1, Fig. 5.11). The only biotite age from section 3 is much youngerwith 15.8±0.8 Ma, which is younger than the youngest muscovite age from this region.
5.5.2 Rb/Sr isochron dating
To further evaluate the validity of the 40Ar/39Ar weighted plateau and error plateau ages ascooling ages, we also dated 7 of the 12 biotite separates used for 40Ar/39Ar dating and oneadditional biotite sample from section 3 by the Rb/Sr method, based on two point isochronsderived from biotite and whole rock measurements, respectively. The analytical techniqueis described in Appendix B, detailed isotopic measurements can be found in Table 5.5, theages are reported in Table 5.1 and the isochron plots are displayed in Fig. 5.12. Errorsare quoted at ±95% confidence interval. The six Rb/Sr ages from sections 1 and 2 varybetween 50.3±0.5 Ma and 48.5±0.5 Ma, whereas the two Rb/Sr ages from section 3 areboth 14.9±0.2 Ma (Tab. 5.1). All Rb/Sr ages lie within error of the 40Ar/39Ar ages of thebiotites, independently of whether the plateau age was a weighted or an error plateau age(Tab. 5.1), indicating that the 40Ar/39Ar ages are meaningful and do not represent mixingof different gas reservoirs, inheritance, loss or excess of argon.
179
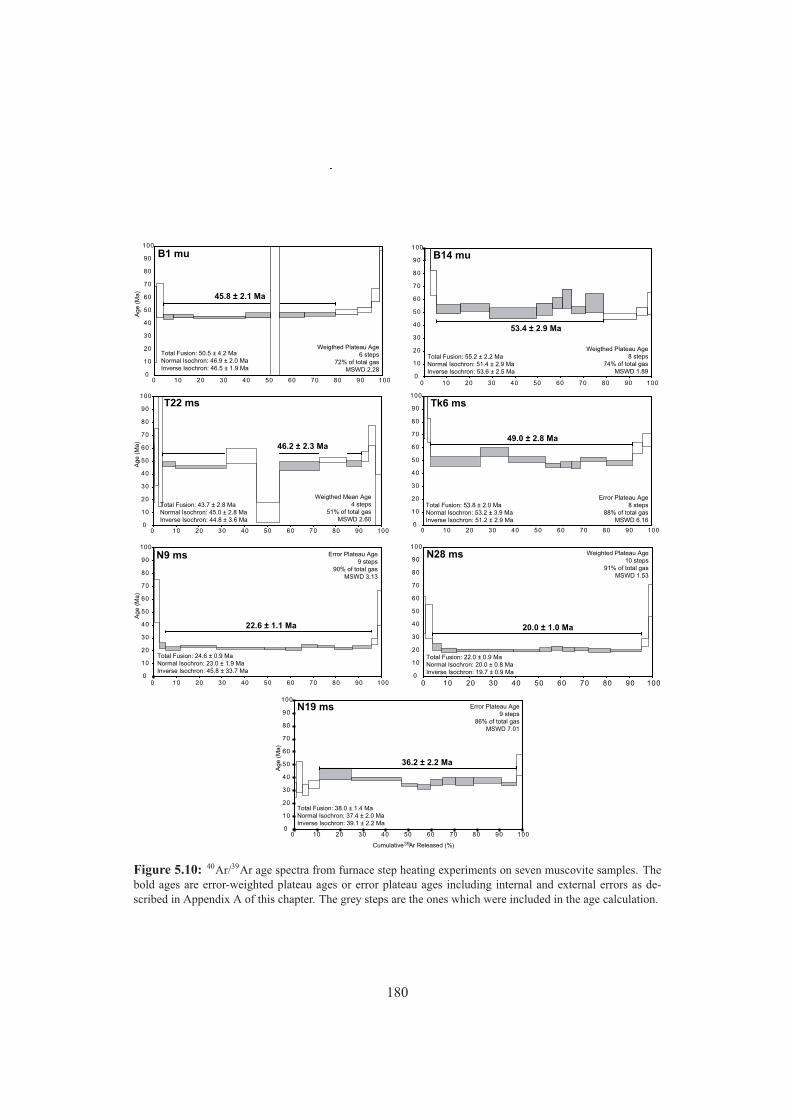
45.8 ± 2.1 Ma
0
10
20
30
40
50
60
70
80
90
100
0 10 20 30 40 50 60 70 80 90 100
Age (
Ma)
B1 mu
Weigthed Plateau Age6 steps
72% of total gasMSWD 2.28
Total Fusion: 50.5 ± 4.2 Ma Normal Isochron: 46.9 ± 2.0 MaInverse Isochron: 46.5 ± 1.9 Ma
53.4 ± 2.9 Ma
0
10
20
30
40
50
60
70
80
90
100
0 10 20 30 40 50 60 70 80 90 100
B14 mu
Weigthed Plateau Age8 steps
74% of total gasMSWD 1.89
Total Fusion: 55.2 ± 2.2 Ma Normal Isochron: 51.4 ± 2.9 MaInverse Isochron: 53.6 ± 2.5 Ma
46.2 ± 2.3 Ma
0
10
20
30
40
50
60
70
80
90
100
0 10 20 30 40 50 60 70 80 90 100
Age (
Ma)
T22 ms
Weigthed Mean Age4 steps
51% of total gasMSWD 2.60
Total Fusion: 43.7 ± 2.8 Ma Normal Isochron: 45.0 ± 2.8 MaInverse Isochron: 44.8 ± 3.6 Ma
49.0 ± 2.8 Ma
0
10
20
30
40
50
60
70
80
90
100
0 10 20 30 40 50 60 70 80 90 100
Tk6 ms
Error Plateau Age8 steps
88% of total gasMSWD 6.16
Total Fusion: 53.8 ± 2.0 Ma Normal Isochron: 53.2 ± 3.9 MaInverse Isochron: 51.2 ± 2.9 Ma
22.6 ± 1.1 Ma
0
10
20
30
40
50
60
70
80
90
100
0 10 20 30 40 50 60 70 80 90 100
Age
(M
a)
N9 ms Error Plateau Age9 steps
90% of total gasMSWD 3.13
Total Fusion: 24.6 ± 0.9 Ma Normal Isochron: 23.0 ± 1.9 MaInverse Isochron: 45.8 ± 33.7 Ma
20.0 ± 1.0 Ma
0
10
20
30
40
50
60
70
80
90
100
0 10 20 30 40 50 60 70 80 90 100
N28 ms Weighted Plateau Age10 steps
91% of total gasMSWD 1.53
Total Fusion: 22.0 ± 0.9 Ma Normal Isochron: 20.0 ± 0.8 MaInverse Isochron: 19.7 ± 0.9 Ma
36.2 ± 2.2 Ma
0
10
20
30
40
50
60
70
80
90
100
0 10 20 30 40 50 60 70 80 90 100
Cumulative Ar Released (%)
Age (
Ma)
N19 ms Error Plateau Age9 steps
86% of total gasMSWD 7.01
Total Fusion: 38.0 ± 1.4 Ma Normal Isochron: 37.4 ± 2.0 MaInverse Isochron: 39.1 ± 2.2 Ma
39
Figure 5.10: 40Ar/39Ar age spectra from furnace step heating experiments on seven muscovite samples. Thebold ages are error-weighted plateau ages or error plateau ages including internal and external errors as de-scribed in Appendix A of this chapter. The grey steps are the ones which were included in the age calculation.
180
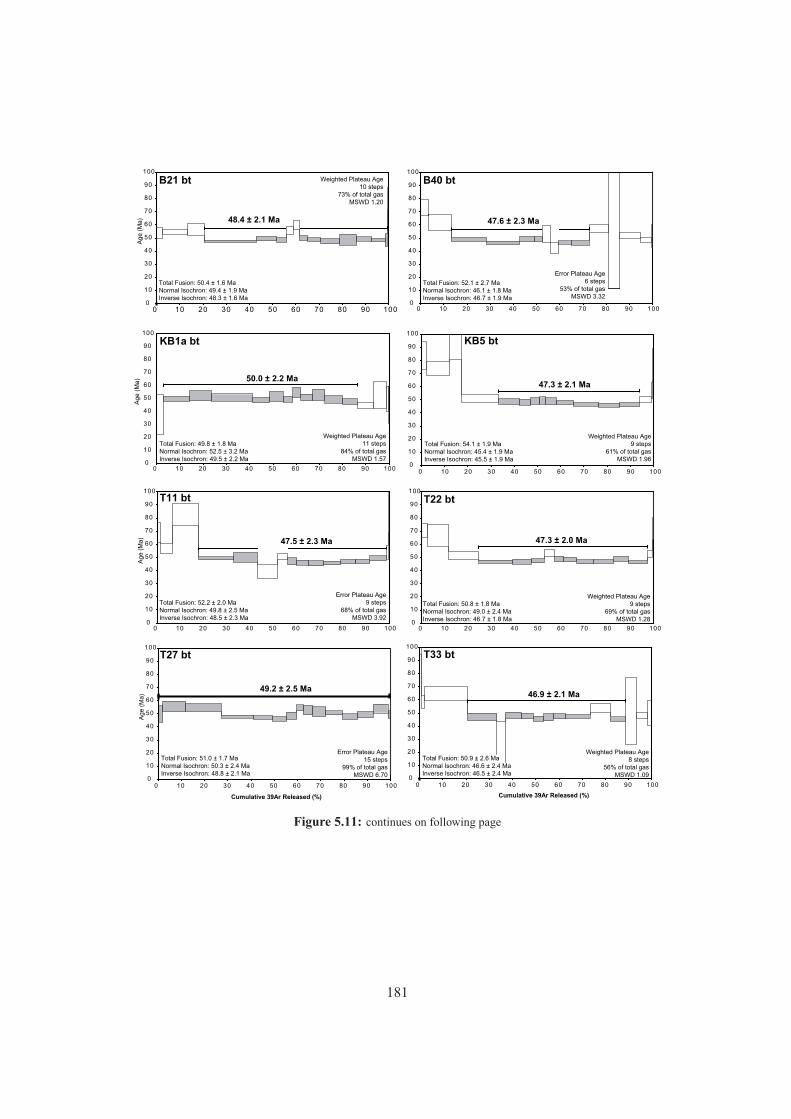
48.4 ± 2.1 Ma
0
10
20
30
40
50
60
70
80
90
100
0 10 20 30 40 50 60 70 80 90 100
Age (
Ma)
B21 bt Weighted Plateau Age10 steps
73% of total gasMSWD 1.20
Total Fusion: 50.4 ± 1.6 Ma Normal Isochron: 49.4 ± 1.9 MaInverse Isochron: 48.3 ± 1.6 Ma
0
10
20
30
40
50
60
70
80
90
100
0 10 20 30 40 50 60 70 80 90 100
B40 bt
Error Plateau Age6 steps
53% of total gasMSWD 3.32
Total Fusion: 52.1 ± 2.7 Ma Normal Isochron: 46.1 ± 1.8 MaInverse Isochron: 46.7 ± 1.9 Ma
47.6 ± 2.3 Ma
50.0 ± 2.2 Ma
0
10
20
30
40
50
60
70
80
90
100
0 10 20 30 40 50 60 70 80 90 100
Age
(M
a)
KB1a bt
Weighted Plateau Age11 steps
84% of total gasMSWD 1.57
Total Fusion: 49.8 ± 1.8 Ma Normal Isochron: 52.5 ± 3.2 MaInverse Isochron: 49.5 ± 2.2 Ma
47.3 ± 2.1 Ma
0
10
20
30
40
50
60
70
80
90
100
0 10 20 30 40 50 60 70 80 90 100
KB5 bt
Weighted Plateau Age9 steps
61% of total gasMSWD 1.96
Total Fusion: 54.1 ± 1.9 Ma Normal Isochron: 45.4 ± 1.9 MaInverse Isochron: 45.5 ± 1.9 Ma
47.5 ± 2.3 Ma
0
10
20
30
40
50
60
70
80
90
100
0 10 20 30 40 50 60 70 80 90 100
Age (
Ma)
T11 bt
Error Plateau Age9 steps
68% of total gasMSWD 3.92
Total Fusion: 52.2 ± 2.0 Ma Normal Isochron: 49.8 ± 2.5 MaInverse Isochron: 48.5 ± 2.3 Ma
47.3 ± 2.0 Ma
0
10
20
30
40
50
60
70
80
90
100
0 10 20 30 40 50 60 70 80 90 100
Cumulative 39Ar Released (%)
T22 bt
Weighted Plateau Age9 steps
69% of total gasMSWD 1.28
Total Fusion: 50.8 ± 1.8 Ma Normal Isochron: 49.0 ± 2.4 MaInverse Isochron: 46.7 ± 1.8 Ma
Cumulative 39Ar Released (%)
49.2 ± 2.5 Ma
0
10
20
30
40
50
60
70
80
90
100
0 10 20 30 40 50 60 70 80 90 100
Age (
Ma)
T27 bt
Error Plateau Age15 steps
99% of total gasMSWD 6.70
Total Fusion: 51.0 ± 1.7 Ma Normal Isochron: 50.3 ± 2.4 MaInverse Isochron: 48.8 ± 2.1 Ma
46.9 ± 2.1 Ma
0
10
20
30
40
50
60
70
80
90
100
0 10 20 30 40 50 60 70 80 90 100
T33 bt
Weighted Plateau Age8 steps
56% of total gasMSWD 1.09
Total Fusion: 50.9 ± 2.6 Ma Normal Isochron: 46.6 ± 2.4 MaInverse Isochron: 46.5 ± 2.4 Ma
Figure 5.11: continues on following page
181
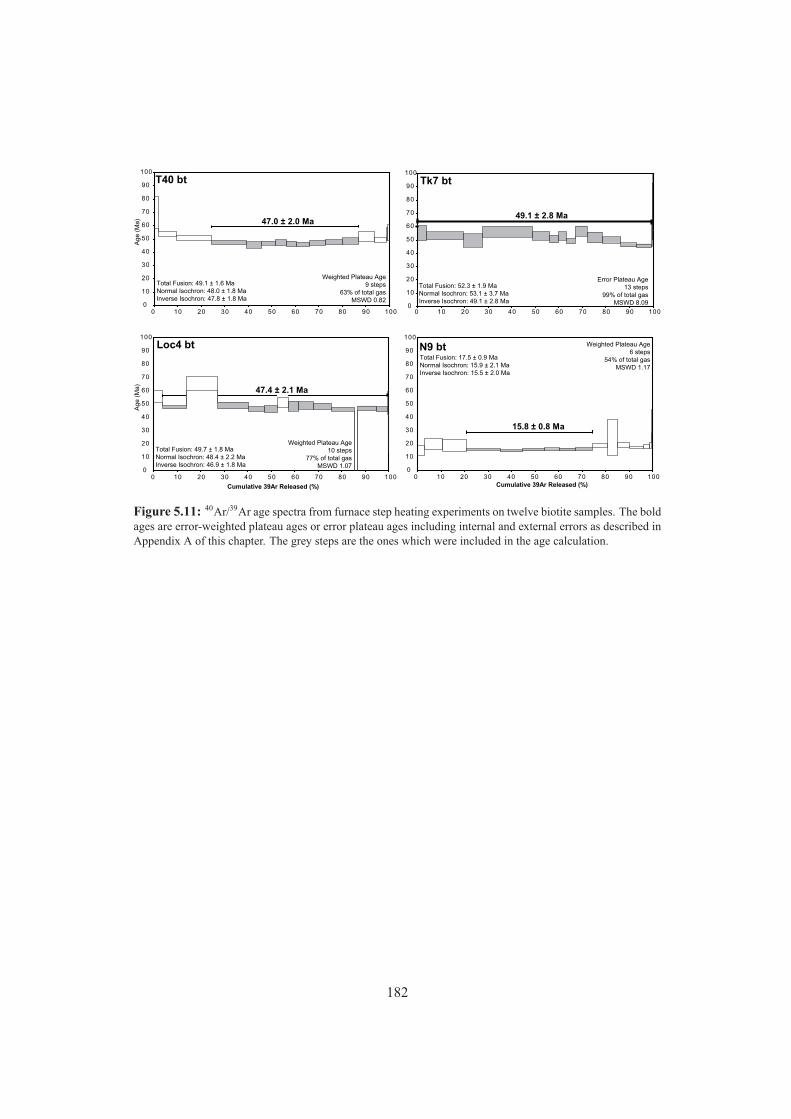
47.4 ± 2.1 Ma
0
10
20
30
40
50
60
70
80
90
100
0 10 20 30 40 50 60 70 80 90 100
Cumulative 39Ar Released (%)
Age (
Ma)
Loc4 bt
Weighted Plateau Age10 steps
77% of total gasMSWD 1.07
Total Fusion: 49.7 ± 1.8 Ma Normal Isochron: 48.4 ± 2.2 MaInverse Isochron: 46.9 ± 1.8 Ma
15.8 ± 0.8 Ma
0
10
20
30
40
50
60
70
80
90
100
0 10 20 30 40 50 60 70 80 90 100Cumulative 39Ar Released (%)
N9 bt Weighted Plateau Age6 steps
54% of total gasMSWD 1.17
Total Fusion: 17.5 ± 0.9 Ma Normal Isochron: 15.9 ± 2.1 MaInverse Isochron: 15.5 ± 2.0 Ma
47.0 ± 2.0 Ma
0
10
20
30
40
50
60
70
80
90
100
0 10 20 30 40 50 60 70 80 90 100
Age (
Ma)
T40 bt
Weighted Plateau Age9 steps
63% of total gasMSWD 0.82
Total Fusion: 49.1 ± 1.6 Ma Normal Isochron: 48.0 ± 1.8 MaInverse Isochron: 47.8 ± 1.8 Ma
49.1 ± 2.8 Ma
0
10
20
30
40
50
60
70
80
90
100
0 10 20 30 40 50 60 70 80 90 100
Tk7 bt
Error Plateau Age13 steps
99% of total gasMSWD 8.09
Total Fusion: 52.3 ± 1.9 Ma Normal Isochron: 53.1 ± 3.7 MaInverse Isochron: 49.1 ± 2.8 Ma
Figure 5.11: 40Ar/39Ar age spectra from furnace step heating experiments on twelve biotite samples. The boldages are error-weighted plateau ages or error plateau ages including internal and external errors as described inAppendix A of this chapter. The grey steps are the ones which were included in the age calculation.
182
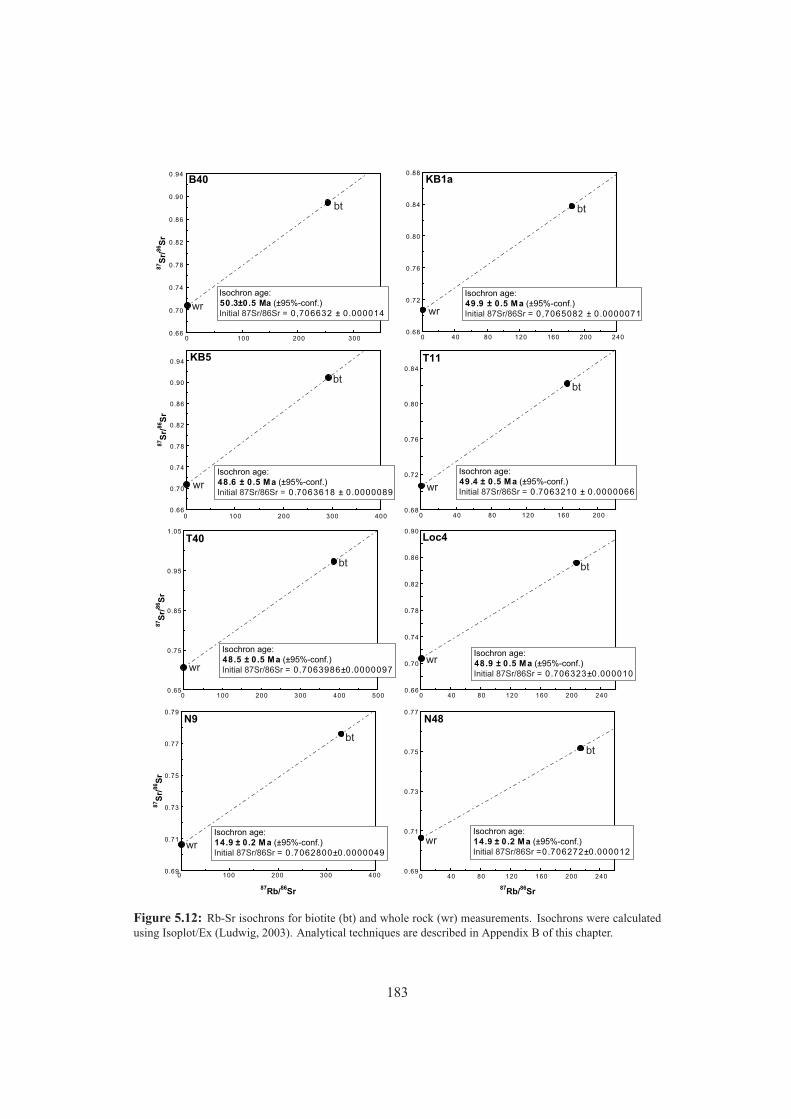
B40
KB5 T11
0.65
0.75
0.85
0.95
1.05
0 100 200 300 400 500
87S
r/86
Sr
0.68
0.72
0.76
0.80
0.84
0.88
0 40 80 120 160 200 240
Isochron age: 49.9 ± 0.5 Ma (±95%-conf.)Initial 87Sr/86Sr = 0,7065082 ± 0.0000071
KB1a
0.66
0.70
0.74
0.78
0.82
0.86
0.90
0.94
0 100 200 300
87S
r/86
Sr
0.66
0.70
0.74
0.78
0.82
0.86
0.90
0.94
0 100 200 300 400
87S
r/86
Sr
Isochron age: 48.6 ± 0.5 Ma (±95%-conf.)Initial 87Sr/86Sr = 0.7063618 ± 0.0000089
Isochron age: 50.3±0.5 Ma (±95%-conf.)Initial 87Sr/86Sr = 0,706632 ± 0.000014
T40
0.68
0.72
0.76
0.80
0.84
0 40 80 120 160 200
Isochron age: 49.4 ± 0.5 Ma (±95%-conf.)Initial 87Sr/86Sr = 0.7063210 ± 0.0000066
Isochron age: 48.5 ± 0.5 Ma (±95%-conf.)Initial 87Sr/86Sr = 0.7063986±0.0000097
0.69
0.71
0.73
0.75
0.77
0.79
0 100 200 300 400
87Rb/86Sr
87S
r/86
Sr
Isochron age: 14.9 ± 0.2 Ma (±95%-conf.)Initial 87Sr/86Sr = 0.7062800±0.0000049
N9
0.69
0.71
0.73
0.75
0.77
0 40 80 120 160 200 240
87Rb/86Sr
N48
Isochron age: 14.9 ± 0.2 Ma (±95%-conf.)Initial 87Sr/86Sr =0.706272±0.000012
0.66
0.70
0.74
0.78
0.82
0.86
0.90
0 40 80 120 160 200 240
Loc4
Isochron age: 48.9 ± 0.5 Ma (±95%-conf.)Initial 87Sr/86Sr = 0.706323±0.000010
bt
wr
bt
wr
bt
wr
bt
wr
bt
wr
bt
wr
bt
wr
bt
wr
Figure 5.12: Rb-Sr isochrons for biotite (bt) and whole rock (wr) measurements. Isochrons were calculatedusing Isoplot/Ex (Ludwig, 2003). Analytical techniques are described in Appendix B of this chapter.
183
5.5.3 Fission track zircon dating
We analyzed four samples from sections 1 and 2 by the zircon fission track method inorder to extrapolate between the U/Pb, 40Ar/39Ar and R/Sr systems and the published low-temperature thermochronology. The analytical technique is described in Appendix C. Agesare reported in Table 5.1, and detailed information is given in Table 5.6. Samples B21, T40and Loc4 yielded 17-20 datable zircon grains. All three samples pass the χ2 test, indicatingthat the grains belong to one single age population, and central ages for all three sampleslie within error of each other (26.0±2.8-28.9±2.4 Ma; Tab. 5.1). Sample 91ASn11 yieldedonly two datable grains (36±6 Ma and 24±5 Ma) which fall well within the single grainage range of the three aforementioned samples.
5.5.4 40Ar/39Ar and low-temperature geochronology: previous data
A compilation of published 40Ar/39Ar and low-temperature geochronology data for the threesections of the CMC is displayed in Figure 5.9 and listed separately in Table 5.2. Since thedata come from throughout the CMC, we extended our definitions of sections 1-3 to includelarger areas (Fig. 5.9).
40Ar/39Ar dating Sisson et al. (1989) dated hornblende from the large pluton exposedjust north-west of our Bremner transect (Fig. 5.2b) and hornblende, biotite and plagioclasefrom a tonalitic sill from their Tana transect (Fig. 5.2a) by the 40Ar/39Ar method (samples74Apr151 and 84ASn103, Tab. 5.2, Fig. 5.9). Their ages correspond well with the ageswe obtained for those regions (Tab. 5.1, Fig. 5.13). Sisson et al. (2003) dated hornblendefrom the amphibolites exposed at the south-western end of our Nunatak transect (sample94Apo27), and the age is in agreement with our younger muscovite and biotite ages fromthis section (Tab. 5.1, Fig. 5.13). These young cooling ages confirm that the relativelyyoung K-Ar ages reported by Hudson et al. (1977a,b) represent a first order, but relativelylow-resolution, record of this Miocene medium to high-T cooling history of the NunatakFiord region.
Zircon fission track dating Two zircon fission track ages from bedrock samples are avail-able for section 2 (Meigs et al., 2008), as well as a large dataset of detrital zircon fissiontrack ages of modern river sands draining the western and central part of the CMC (Enkel-mann et al., 2008, 2010). The two bedrock samples 99-2 and 1-48 come from the gneissand schist zone, respectively (Fig. 5.9; Meigs et al., 2008). These were analysed usingdifferent mounts with different etching times, which allows the relevation of fission tracksin grains with variable radiation damage (e.g. Bernet & Garver, 2005). Both samples failedthe χ2 test, and peak fitting revealed two populations of 28.2±8.2 Ma and 39.6±6.8 Ma for
184
sample 99-2 and three populations of 30.7±9.8 Ma, 57.5±6.8 Ma and 122.6±57.6 Ma forsample 1-48, respectively. These data indicate that probably different grain populations arepresent in these samples which reacted differently during metamorphism and cooling. Onlythe youngest populations are plotted for both samples on Figure 5.13. The zircon fissiontrack ages of modern river sands from the western and central parts of the CMC show amaximum at ~20-35 Ma, corresponding well with the ages derived from the two bedrocksamples 99-2 and 1-48 (Enkelmann et al., 2008, 2010). One bedrock zircon fission track ageis available for section 3, sample 03-311A (Fig. 5.9), which passes the χ2 test and yields awell defined age of 4.5±0.6 Ma based on 15 grains, which is considerably younger than theages from sections 1 and 2 (Tab. 5.2; McAleer et al., 2009). River sand draining the Sewardglacier area shows a very young fission track signal (<3 Ma, with some ages <1 Ma, Enkel-mann et al., 2009). These young ages indicate that the rocks below that glacier only cooledrecently below the zircon fission-track annealing temperature, which corresponds well withthe young bedrock zircon fission track sample 03-311A from section 3 (Fig. 5.9, Tab. 5.2).
(U-Th)/He zircon/apatite and apatite fission track dating Four (U-Th)/He zircon ages,12 apatite fission track ages and 19 (U-Th)/He apatite ages are available in the literature(Fig. 5.9, Fig. 5.13, Tab. 5.2; Spotila et al., 2004; Berger & Spotila, 2008; Berger et al.,2008a; McAleer et al., 2009; Enkelmann et al., 2010). Two main trends can be seen (Fig.5.13). (1) In sections 1 and 2, the ages from all three systems decrease from north to south,with (U-Th)/He apatite ages as old as ~28 Ma in the northern phyllite zone, generally ~15-5Ma in the gneiss zone and as young as 1.7 Ma in the area around Mt Tom White (Figs. 5.2,5.9, Tab. 5.2). (2) In section 3, a zone of very young ages (<10 Ma for all three systems)occurs to the east-south-east from Seward glacier down to Nunatak fjord (Fig. 5.9, Fig.5.13, Tab. 5.2).
185
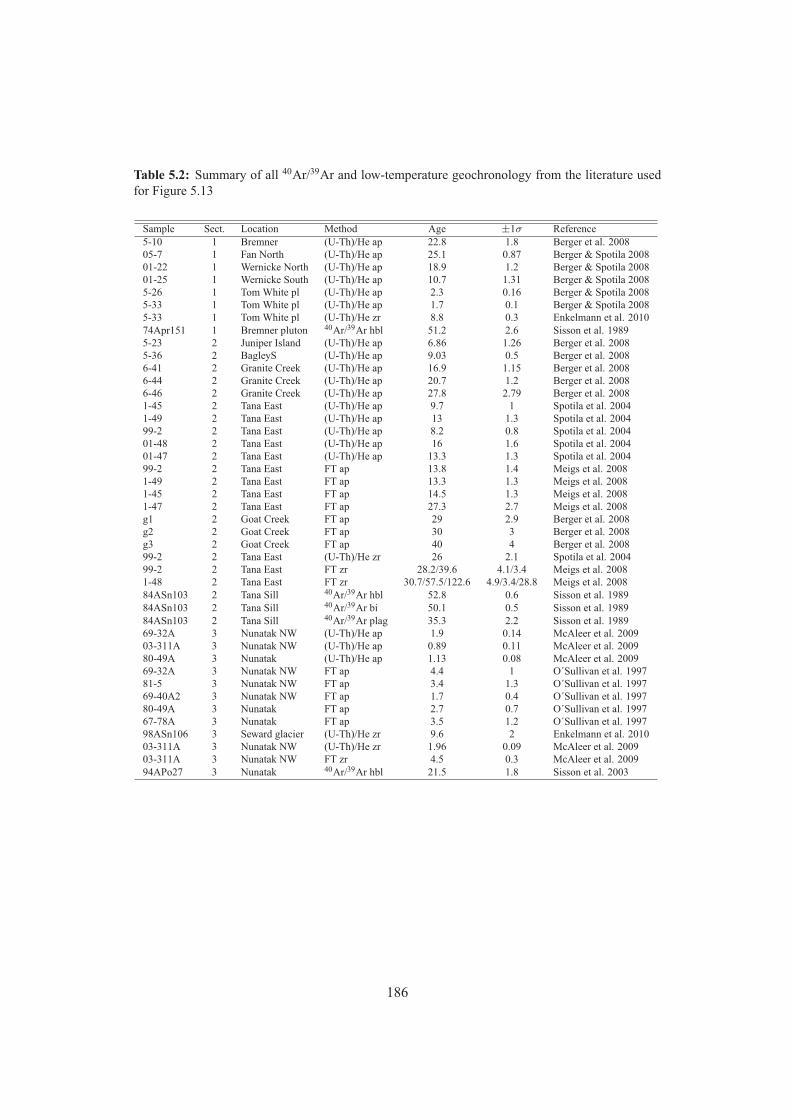
Table 5.2: Summary of all 40Ar/39Ar and low-temperature geochronology from the literature usedfor Figure 5.13
Sample Sect. Location Method Age ±1σ Reference5-10 1 Bremner (U-Th)/He ap 22.8 1.8 Berger et al. 200805-7 1 Fan North (U-Th)/He ap 25.1 0.87 Berger & Spotila 200801-22 1 Wernicke North (U-Th)/He ap 18.9 1.2 Berger & Spotila 200801-25 1 Wernicke South (U-Th)/He ap 10.7 1.31 Berger & Spotila 20085-26 1 Tom White pl (U-Th)/He ap 2.3 0.16 Berger & Spotila 20085-33 1 Tom White pl (U-Th)/He ap 1.7 0.1 Berger & Spotila 20085-33 1 Tom White pl (U-Th)/He zr 8.8 0.3 Enkelmann et al. 201074Apr151 1 Bremner pluton 40Ar/39Ar hbl 51.2 2.6 Sisson et al. 19895-23 2 Juniper Island (U-Th)/He ap 6.86 1.26 Berger et al. 20085-36 2 BagleyS (U-Th)/He ap 9.03 0.5 Berger et al. 20086-41 2 Granite Creek (U-Th)/He ap 16.9 1.15 Berger et al. 20086-44 2 Granite Creek (U-Th)/He ap 20.7 1.2 Berger et al. 20086-46 2 Granite Creek (U-Th)/He ap 27.8 2.79 Berger et al. 20081-45 2 Tana East (U-Th)/He ap 9.7 1 Spotila et al. 20041-49 2 Tana East (U-Th)/He ap 13 1.3 Spotila et al. 200499-2 2 Tana East (U-Th)/He ap 8.2 0.8 Spotila et al. 200401-48 2 Tana East (U-Th)/He ap 16 1.6 Spotila et al. 200401-47 2 Tana East (U-Th)/He ap 13.3 1.3 Spotila et al. 200499-2 2 Tana East FT ap 13.8 1.4 Meigs et al. 20081-49 2 Tana East FT ap 13.3 1.3 Meigs et al. 20081-45 2 Tana East FT ap 14.5 1.3 Meigs et al. 20081-47 2 Tana East FT ap 27.3 2.7 Meigs et al. 2008g1 2 Goat Creek FT ap 29 2.9 Berger et al. 2008g2 2 Goat Creek FT ap 30 3 Berger et al. 2008g3 2 Goat Creek FT ap 40 4 Berger et al. 200899-2 2 Tana East (U-Th)/He zr 26 2.1 Spotila et al. 200499-2 2 Tana East FT zr 28.2/39.6 4.1/3.4 Meigs et al. 20081-48 2 Tana East FT zr 30.7/57.5/122.6 4.9/3.4/28.8 Meigs et al. 200884ASn103 2 Tana Sill 40Ar/39Ar hbl 52.8 0.6 Sisson et al. 198984ASn103 2 Tana Sill 40Ar/39Ar bi 50.1 0.5 Sisson et al. 198984ASn103 2 Tana Sill 40Ar/39Ar plag 35.3 2.2 Sisson et al. 198969-32A 3 Nunatak NW (U-Th)/He ap 1.9 0.14 McAleer et al. 200903-311A 3 Nunatak NW (U-Th)/He ap 0.89 0.11 McAleer et al. 200980-49A 3 Nunatak (U-Th)/He ap 1.13 0.08 McAleer et al. 200969-32A 3 Nunatak NW FT ap 4.4 1 O´Sullivan et al. 199781-5 3 Nunatak NW FT ap 3.4 1.3 O´Sullivan et al. 199769-40A2 3 Nunatak NW FT ap 1.7 0.4 O´Sullivan et al. 199780-49A 3 Nunatak FT ap 2.7 0.7 O´Sullivan et al. 199767-78A 3 Nunatak FT ap 3.5 1.2 O´Sullivan et al. 199798ASn106 3 Seward glacier (U-Th)/He zr 9.6 2 Enkelmann et al. 201003-311A 3 Nunatak NW (U-Th)/He zr 1.96 0.09 McAleer et al. 200903-311A 3 Nunatak NW FT zr 4.5 0.3 McAleer et al. 200994APo27 3 Nunatak 40Ar/39Ar hbl 21.5 1.8 Sisson et al. 2003
186
5.6 Discussion
5.6.1 The cooling history of the Chugach Metamorphic Complex
Closure temperature estimates
The geochronological data presented above (Tab. 5.1, Fig. 5.9) allow constructing coolingpaths for the different parts of the metamorphic complex (Fig. 5.13). The interpretationof 40Ar/39Ar and Rb/Sr ages in deformed metamorphic rocks in terms of cooling is notstraightforward (e.g. Jenkin, 1997; Villa, 1998). The isotopic composition of the mineralsused for dating may be controlled by two major mechanisms: (1) thermally activated dif-fusion, which allows isotopic exchange between the mineral and its surroundings above acertain temperature (called closure temperature, e.g. Dodson, 1973), and/or (2) recrystal-lization of the mineral due to deformation or fluid-rock interaction, which can change theisotopic composition of the mineral even when thermally activated diffusion is slow (e.g.Dunlap, 1997; Villa, 1998). The second case has been documented mainly in myloniticsamples, which deformed below the closure temperature of the system, or samples of lowmetamorphic grade (e.g Dunlap, 1997; Foster et al., 1999; Mulch & Cosca, 2004). In oursamples, thermally activated diffusion was clearly the main process controlling the isotopicsystematics of the samples for two major reasons: 1) the muscovite and biotite ages obtainedfrom undeformed intrusive rocks are indistinguishable from ages in the surrounding coun-try rocks, and these igneous samples show no evidence of retrograde recrystallization orfluid-rock interactions, and 2) most of the samples were obtained from metamorphic rockswith high-grade fabrics which equilibrated at temperatures of >600°C, far above the closuretemperatures for muscovite or biotite, and which show no signs of later recrystallization oralteration due to fluid-flow (Tab. 5.1; see description in section 5.1).
The closure temperature of a particular radiogenic system represents the temperature atwhich diffusion of isotopes out of the crystal becomes insignificant. However, this isotopicclosure depends not only on temperature, but also on cooling rate, grain size (i.e. effec-tive diffusion length scales), pressure, and diffusion coefficients which depend on materialproperties such as mineral structure and chemistry (e.g. Dodson, 1973; Dahl, 1996; Jenkin,1997; McDougall & Harrison, 1999; Harrison et al., 2009). Due to these different factorsexact closure temperatures are difficult to determine and may vary over a considerable tem-perature range (e.g. McDougall & Harrison, 1999).
Harrison et al. (2009) conducted 40Ar diffusion experiments on muscovite and calculated aclosure temperature of 405°C for a 100 µm grain cooling at 10°C/Ma at 5 kbar (425°C at10 kbar, with E=64 kcal/mol and D0=20 cm2/s). Increasing the cooling rate to 100°C/Ma at5 kbar increases the closure temperature to 440°C. Increasing the grain size to 500 µm in-creases the closure temperature to 455°C at 10°C/Ma cooling rate and to 495°C at 100°C/Ma
187
at 5 kbar. In our samples, grain sizes for muscovite and biotites in the separates are ~100-500 µm, the maximum metamorphic pressures are ~5-10 kbar, and their chemistry are ho-mogenous (Bruand, 2010). 40Ar/39Ar cooling ages from section 1 and 2 lie very close tothe U/Pb ages for peak metamorphism, suggesting that the first-order cooling rate to micaclosure was relatively high, on the order of ~50-100°C/Ma. In contrast, 40Ar/39Ar agesfrom section 3 are considerably younger than the peak metamorphic ages estimated fromU/Pb methods, suggesting that the high-temperature cooling rate was slower, on the orderof ~5-10°C/Ma. Thus, based on Harrison et al. (2009)’s experiments, we assume a closuretemperature range for the muscovite samples of section 1 and 2 of 430°C (100 µm grain at50°C/Ma and 5 kbar) to 495°C (500 µm grain at 100°C/Ma and 5 kbar), and for the sam-ples of section 3 of 395°C (100 µm grain at 5°C/Ma and 5 kbar) to 455°C (500 µm grain at10°C/Ma and 5 kbar).
For the closure temperature of 40Ar/39Ar in biotite, we use the equation of Dodson (1973)and the diffusion parameters given in McDougall & Harrison (1999) for biotites of similarcomposition (~Ann60, E=47 kcal/mol, D0=0.075 cm2/s, cylindrical geometry) to estimatethe closure temperature for our samples. For the samples of section 1 and 2 we calculate aclosure temperature range of 340°C (100 µm grain at 50°C/Ma) to 412°C (500 µm grain at100°C/Ma). For the samples of section 3 we calculate a closure temperature range of 307°C(100 µm grain at 5°C/Ma) to 370°C (500 µm grain at 10°C/Ma). Since the Rb/Sr isochronages lie within error of the 40Ar/39Ar biotite ages we assume a similar closure temperaturerange for this system.
For the closure temperatures of the two 40Ar/39Ar hornblende ages from the literature weassume ranges of 500-550°C for sections 1 and 2 (cooling rates of 50-100°C/Ma, grainsize 40-80 µm) and 460-510°C for section 3 (cooling rates of 5-10°C/Ma, grain size 40-80 µm, McDougall & Harrison, 1999). For the only 40Ar/39Ar plagioclase age we assumea range of 150-210°C (Sisson et al., 1989). Closure temperatures for the low-temperaturegeochronological systems similarly depend on different factors and vary over certain ranges;we assume the generally accepted values of 200-300°C for zircon fission track ages (e.g.Wagner & Van Den Haute, 1992), 160-200°C for zircon (U-Th)/He ages (e.g. Reiners et al.,2003), 60-120°C for apatite fission track ages (e.g. Green et al., 1986; Carlson et al., 1999),and 40-80°C for apatite (U-Th)/He ages (e.g. Wolf et al., 1996) for all sections.
Figure 5.13 (following page): Cooling curves for the three different sections of the CMC (Fig. 5.9) asderived from the combination of different thermochronological methods. The sample localities are shown inFig. 5.9. Orange indicates the rapid Eocene cooling phase which occurred in sections 1 and 2 directly after themetamorphic peak. Blue indicates the prolonged period (15-20 Ma) of slow/no cooling in the gneiss zone ofsections 1 and 2 of the CMC. Green indicates the slow, regular cooling from peak conditions down to 200-300°Cin section 3. Grey indicates cooling curves for the final cooling from 200-300° to surface-near temperaturesin all sections. In sections 1 and 2, this grey cooling occurred asynchronous from north to south across thecomplex.
188
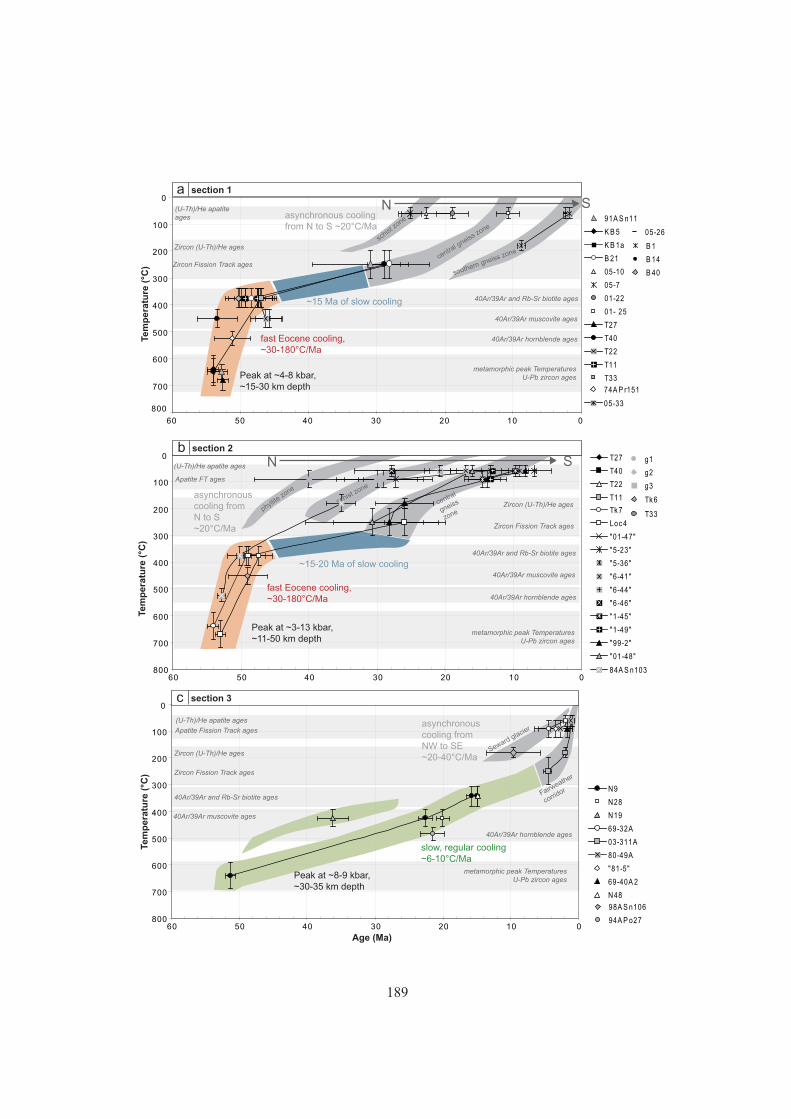
metamorphic peak Temperatures
U-Pb zircon ages
40Ar/39Ar muscovite ages
40Ar/39Ar and Rb-Sr biotite ages
(U-Th)/He apatite
ages
metamorphic peak Temperatures
U-Pb zircon ages
40Ar/39Ar muscovite ages
39Ar/40Ar and Rb-Sr biotite ages
(U-Th)/He apatite ages
Zircon Fission Track ages
Zircon (U-Th)/He ages
Apatite FT ages
metamorphic peak Temperatures
U-Pb zircon ages
40Ar/39Ar muscovite ages
40Ar/39Ar and Rb-Sr biotite ages
(U-Th)/He apatite ages
Zircon Fission Track ages
Zircon (U-Th)/He ages
Apatite Fission Track ages
Tem
pera
ture
(°C
)
Age (Ma)
Tem
pera
ture
(°C
)Te
mp
era
ture
(°C
)
Zircon Fission Track ages
Zircon (U-Th)/He ages
40Ar/39Ar hornblende ages
40Ar/39Ar hornblende ages
40Ar/39Ar and Rb-Sr biotite ages
40Ar/39Ar hornblende ages
40Ar/39Ar muscovite ages
fast Eocene cooling,~30-180°C/Ma
~15 Ma of slow cooling
N Sasynchronous coolingfrom N to S ~20°C/Ma
N S
fast Eocene cooling,~30-180°C/Ma
~15-20 Ma of slow cooling
asynchronous cooling from N to S ~20°C/Ma
slow, regular cooling~6-10°C/Ma
asynchronous cooling from NW to SE ~20-40°C/Ma
schist
zone
central g
neiss zone
southern gneiss zone
schist zone
phyllite
zone
central
gneiss
zone
Seward glacier
Peak at ~4-8 kbar,~15-30 km depth
Peak at ~3-13 kbar,~11-50 km depth
Peak at ~8-9 kbar,~30-35 km depth
Fairweather
corridor
98A S n106
94A P o27
91A S n11
K B 5
K B 1a
B 21
B 1
B 14
B 4005-10
05-7
01-22
01- 25
T27
T40
T22
T11
T33
T27
T40
T22
T11
T33Tk 7
Loc 4
Tk 6
"5-23"
"5-36"
"6-41"
"6-44"
"6-46"
"1-45"
"1-49"
"99-2"
"01-48"
"01-47"
g1
g2
g3
N9
N28
N19
69-32A
03-311A
80-49A
"81-5"
69-40A 2
N48
74A P r151
05-26
05-33
84A S n103
0
100
200
300
400
500
600
700
800
0102030405060
0
100
200
300
400
500
600
700
8000102030405060
0
100
200
300
400
500
600
700
8000102030405060
a section 1
b section 2
c section 3
189
Cooling history of sections 1 and 2
Figs. 5.13a and 5.13b show the cooling curves for sections 1 and 2 of the CMC. U/Pbzircon ages (Tab. 5.1, Chap. 4) together with peak temperatures derived by classical ther-mometry for the dated samples (Fig. 5.2) define the starting point for the cooling history.40Ar/39Ar hornblende, muscovite and biotite ages define a steep cooling curve right afterthe metamorphic peak in both sections (red part of cooling curve, Fig. 5.13a and b). Duringthis phase, the rocks cooled from ~650-700°C at ~55-52 Ma to ~350-400°C at ~50-46 Ma.Taking the upper and lower limits of these values, cooling rates were between 29°C/Ma and180°C/Ma. The second phase of the cooling history shows an evolution from north to southwithin the area of sections 1 and 2. Rocks of the phyllite and schist zones in the north ofthe complex probably cooled relatively rapidly to near-surface temperatures already in theEocene (oldest apatite fission track ages from the schist zone are ~40 Ma). Rocks of thegneiss zone farther south, however, experienced a prolonged period (~15-20 Ma, blue partof cooling history) at temperatures of ~300-400°C and only started cooling through the zir-con fission track closure temperature around ~30-25 Ma. Parts of the southernmost gneisszone even stayed at elevated temperatures of >200°C until ~10 Ma. The slope of the greycooling curves lies in the range of ~20°C/Ma.
Cooling history of section 3
The cooling history for section 3 is significantly different than that of sections 1 and 2 (Fig.5.13c). The starting point is defined by a U/Pb zircon age of ~51 Ma (Tab. 5.1) correspond-ing to a maximum temperature of ~600-700°C (Fig. 5.2). 40Ar/39Ar hornblende, muscovite,biotite and zircon fission track ages define a slow, regular cooling curve from the peak con-ditions down to 200-300°C until ca. 5 Ma (green part of cooling curve, Fig. 5.13c). Thiscorresponds to cooling rates of ~6-10°C/Ma. The young zircon fission track and zircon andapatite (U-Th)/He ages from the Fairweather corridor indicate a strong increase in coolingrate during the last ~5 Ma, with rates of 20-40°C/Ma, consistent with their locations withinthe obliquely convergent part of the St Elias orogen (Pavlis et al., 2004; Enkelmann et al.,2010). The slightly older zircon (U-Th)/He age from Seward glacier indicates a somewhatslower cooling, but the <3 Ma zircon fission track ages found in river sands draining the Se-ward glacier area (Enkelmann et al., 2009, 2010) indicate that the entire strip from Sewardglacier down to Nunatak fjord (Fig. 5.2a) experienced rapid cooling during the last ~5 Ma.
190
5.6.2 Interpreting the cooling histories in terms of exhumation
Translating cooling histories into exhumation histories is not always straightforward, es-pecially if independent pressure information for the retrograde part of the metamorphichistory is not available. In our case, the only independent information on depth comes fromthe peak pressures registered in the metamorphic parageneses of the different sections (Fig.5.2; Bruand, 2010). Generally, cooling histories may be the result of two fundamentallydifferent thermal processes, or a combination of both: (i) passive thermal relaxation fromperturbed thermal conditions to a normal geothermal gradient at depth, i.e., without ad-vection of material by tectonics or erosion, or (ii) active cooling by advection of the rockstowards the surface of the Earth; i.e. exhumation by tectonics, erosion, or both. Clearly,discerning between these two origins for certain sections of the cooling histories is essentialbefore an integrated understanding of the tectonic evolution of the region is possible.
Exhumation histories for sections 1 and 2
The cooling histories of both sections 1 and 2 show very fast cooling after the metamorphicpeak from ~650-700°C to ~350-400°C at peak pressures of 4-13 kbar (Fig. 5.13; Bruand,2010). The interpretation that the CMC may be related to the subduction of a spreadingridge below the margin (e.g. Sisson & Pavlis, 1993; Pavlis & Sisson, 1995; Bradley et al.,2003) suggests that the fast cooling reported after the metamorphic peak in sections 1 and 2could be the result of passive thermal relaxation after the passage of the subducting ridge. Inthis model, the subducting ridge below the margin causes pervasive heating of the complex,aided by the distribution of heat through magmas which formed above the ridge and intrudedhigher crustal levels. For this model, cooling sets in once the ridge has passed under thecomplex and subduction refrigeration together with surface cooling produce rapid cooling.Indeed, this cooling may be substantial as the refrigeration of the complex by the underlyingsubducting slab may lead to temperature gradients substantially below normal geothermalconditions.
However, if passive thermal relaxation is the reason for the fast cooling from ~650-700°Cto ~350-400°C in only ~2-6 Ma at depths of ~20-50 km, a very fast removal of the heatsource at depth is required. This is unlikely in a plate geometry as shown by Häussler et al.(2003a) and Madsen et al. (2006) where the Kula-Resurrection ridge is subducting parallelto the margin below the CMC. Moreover, thermal modelling of Groome & Thorkelson(2009) showed that for a slowly migrating triple junction (10 mm/yr), the effect of ridgesubduction is characterized by a protracted metamorphic heating followed by slow cooling,particularly at depths of >20 km, which is definitively not observed in sections 1 and 2 ofthe CMC. Therefore, if a ridge was subducting below the CMC during Eocene times, itmust have moved fast, and the plate tectonic geometry must have been in such a way thatold and cold lithosphere was subducted shortly after the passage of the ridge in order to
191
cool the rocks quickly. Since subduction velocities at that time were relatively high (100mm/yr or more, Doubrovine & Tarduno, 2008), and a major plate tectonic reorganizationoccurred simultaneously to metamorphism in the CMC, such a scenario with a fast-movingtriple junction could have taken place (Sisson & Pavlis, 1993; Pavlis & Sisson, 1995, 2003),but is constrained poorly because there is no constraint on plate geometry.
However, it is unlikely that the fast cooling after the metamorphic peak was the result of onlya passive relaxation of the geotherm following ridge subduction for the following reason.Peak pressures reported by these rocks correspond to depths of ~20-50 km, and if onlypassive cooling would have occurred after the peak, then all of the exhumation from thisdepth to the surface must have occurred during later stages of the cooling history (from~350°C to the surface), notably after ~25 Ma (Fig. 5.13). This would imply an unrecognizedmassive exhumation of parts of the gneiss zone in the Neogene. In addition it would requirethat exhumation took place during relatively low temperatures and therefore entirely alongsemi-brittle to brittle faults. However, the ductile penetrative steep foliation with down-dip lineations developed in the gneisses where the highest pressures are recorded indicatethat at least parts of the exhumation took place during ductile deformation shortly after themetamorphic peak. Therefore, at least for the zones which report relatively high pressures,the metamorphic peak was followed by exhumation.
The authors of this paper do not entirely agree on the interpretation of the cooling data interms of ridge subduction and further work is needed to clarify this issue. Some of us in-fer that a subducting ridge below the complex as additional heat source is not necessarilyrequired, and that the fast cooling of the rocks could solely be the result of fast exhuma-tion aided by a relaxation of isotherms in response to shallow level processes (i.e. in theschist zone). Others prefer an interpretation that a combination of processes led to the rapidcooling: cooling due to exhumation in a rising anticlinorium within the gneissic core (asshown schematically by Pavlis & Sisson, 1995) combined with quenching by subductionrefrigeration from below following the passage of a triple junction.
In either case, after the fast cooling phase recorded in section 1 and 2 of the CMC both thegneiss and schist zones were probably at similar depths of ~10-15 km, and the remainingexhumation occurred asynchronously from north to south, with the schist zone reachingrelatively shallow depths already in the Eocene, whereas the southern gneiss zone stayedat considerable depths until ~10 Ma ago (e.g. in a mechanism similar to that described byEnkelmann et al., 2008).
Exhumation history for section 3
Despite similar structural observations and similar metamorphic grade, the cooling and ex-humation history of section 3 is significantly different from sections 1 and 2. Sections 1and 2 show a very pronounced cooling and exhumation phase shortly after the metamorphic
192
peak, whereas cooling and exhumation occurred much slower and more regularly in section3 from the metamorphic peak until relatively recent times (Fig. 5.13). We suggest that thisis the result of the post-metamorphic tectonic configuration of these two segments along themargin - an interpretation which has important implications for the paleo-geometry of themargin. Specifically, it has long been suggested from paleomagnetic data (Coe et al., 1985)and the geology of the southern Alaska margin (Nokleberg et al., 1989) that the Alaskanorocline (i.e. the curvature of the present-day margin) was in existence by Eocene time.Our results provide independent support for this interpretation. If the margin was alreadycurved during cooling and exhumation of the three sections, and the Pacific plate movednorthwest-wards relative to North America as indicated by plate tectonic reconstructions(e.g. Doubrovine & Tarduno, 2008), then sections 1 and 2 were under constant convergenceafter peak metamorphism. This ongoing convergence may have led to the initial formationof topography and rapid exhumation of gneissic rocks shortly after the metamorphic peak,followed by an outward jump of deformation and the accretion of outboard terranes, untilthe present-day collision with the Yakutat terrane led to final exhumation. Section 3 how-ever would have been located along the transpressional part of the margin, where highlyoblique transpressional motion would have led to slow, regular cooling and exhumation inwhat Koons et al. (in press) refer to as the "oblique orogen". The increased cooling andexhumation rate during the last ~5-10 Ma could be the result of the final collision of theYakutat terrane with the margin. In our opinion, the different cooling and exhumation his-tories registered by the three different sections nicely reflect the existence of the Alaskanorocline at least since ~50 Ma.
5.6.3 Integration of the structural record with the metamorphic history ofthe Chugach Metamorphic Complex
Our study generally supports the structural succession D1-D3 for the CMC (Fig. 5.7) thathas been recognized previously by Pavlis & Sisson (1995, 2003). D1 is related to the initialaccretion of the sediments, whereas D2 and D3 are related to metamorphism in the CMC.In the following, the structural record, the metamorphic evolution and the cooling and ex-humation histories of the CMC are integrated and a possible tectonic evolution for the entirecomplex is presented in a regional context.
D1 - accretion of sediments
During D1 deformation a relatively thick accretionary prism formed dominated by conver-gent D1 structures such as thrusts and folds. Subduction zone settings are generally rela-tively cold, with typical geothermal gradients of ~10-15°C/km, leading to blueschist faciesmetamorphism at depths of ~15-20 km (e.g. Philpotts & Ague, 2009). However, the thermalstructure of an accretionary prism depends on many factors such as the amount of accre-
193
tion and erosion, the coefficient of basal friction, shear heating at the base, internal strainheating and the pore fluid/lithostatic pressure ratio (e.g. Barr & Dahlen, 1989). Examplesof relatively high thermal gradients of ~20-25°C/km include the Taiwan accretionary prism(Barr & Dahlen, 1989) or the Cascadia accretionary wedge (Booth-Rea et al., 2008), whichlead to greenschist facies conditions of ~300-500°C at depths of ~15-20 km (~4-6 kbar).Given the widespread distribution of subgreenschist facies to greenschist facies conditionsin the Chugach terrane (e.g. Dusel-Bacon, 1994), the initial geothermal gradient in thisaccretionary prism was probably on the order of ~20-25°C/km.
D2 - vertical flattening and margin-parallel extension
After accretion and D1 deformation, the deeper parts of the accretionary prism were sub-jected to D2 deformation: the presence of the flat-lying D2 fabric accompanied by a pro-nounced orogen-parallel stretching lineation indicates that the base of the accretionary prismexperienced vertical thinning and margin-parallel stretching (e.g. Pavlis & Sisson, 1995).The D2 fabric formation was accompanied by andalusite-grade metamorphism just abovethe D2 fabric front, sillimanite-grade metamorphism within the schist and parts of the gneisszone and culminated in the onset of partial melting in the gneiss zone. The vertical thinningduring D2 probably led to the compression of isotherms and to the presence of relativelyhigh geothermal gradients in the schist and gneiss zones. Sisson & Hollister (1988) andSisson et al. (1989) derived thermal gradients of ~35°C/km for the edge and ~65°C/km forthe core of the western part of the complex. Farther east, the data of Bruand (2010) indicatean opposite relationship between the northern schist zone (~35°C/km) and the gneiss zone(~20-25°C/km) of sections 1 and 2 of the complex. An increase from ~25°C/km duringD1 to ~35-65°C/km during D2 at depths of ~10-20 km in the lowermost phyllite zone, theschist and western gneiss zone would require a total vertical thinning of ~6-10 km of thecrustal column. Finite strain modelling of Pavlis & Sisson (1995) showed that depending onthe ratio of pure to simple shear during D2 deformation ~2-7 km of vertical thinning couldhave occurred alone in the D2 fabric of the schist zone, making a total of ~6-10 km thin-ning in the entire D2 zone a realistic value. Based on these considerations, we suggest thatthe D2 vertical shortening probably was sufficient to produce the high geothermal gradientsobserved in the lowermost phyllite zone, the schist zone and the western parts of the gneisszone.
Since the peak metamorphic conditions are constrained to ~55-51 Ma by U/Pb dating ofmetamorphic zircons (Tab. 5.1, Chap. 4), the D2 deformation must have started at about thesame time or shortly before. This period is broadly contemporaneous with the plate tectonicreorganization of the Pacific basin (chron 24-21, ~53-48 Ma, Atwater, 1989) suggesting thatthere might be a relationship between movements of the oceanic plates in the Pacific basinand the strain history along the margin (Sisson & Pavlis, 1993; Pavlis & Sisson, 1995).However, since it is not well constrained what exactly happened during this reorganization,great freedom remains in interpreting the resulting boundary forces which acted on the
194
margin. D2 could, for example, be the result of a short-lived transtensional event due to ashort-term change in movement direction of the plate segment which was subducting belowthe margin, related to the plate reorganization. Or it could be the result of forces whichacted inside the accretionary prism: after a decrease in convergence rate due to the platereorganization, gravitational collapse of the overthickened accretionary prism could haveoccurred leading to the D2 stretching and vertical thinning. However, in this case extensionperpendicular to the margin rather than parallel to it would be expected.
Other possible reasons for D2 deformation are not directly linked with the plate reorga-nization. Sisson & Pavlis (1993) and Pavlis & Sisson (1995) for example suggested thatthe subduction of an oceanic spreading ridge below the margin could have caused the D2deformation, with the subduction of the ridge topography inducing the vertical thinningcomponent. The subduction of a ridge below the margin at the time of interest has beeninferred by many workers and depending on where to restore the accretionary prism alongthe margin, potential candidates are the ridge between the Kula and Farallon plates or theridge between the Kula and Resurrection plates (Fig. 5.1d). Alternatively, Pavlis & Sisson(2003) explored the possibility of D2 and D3 actually being the result of the same dextraltranspressive deformation, with D2 representing a mid-crustal decoupling horizon. Or, D2could be the result of underplating of a buoyant package of offscraped sedimentary rocksand oceanic crust below the accretionary prism (as it is indicated by seismic profiles cross-ing Prince William Sound, Fig. 5.1, e.g. Fuis et al., 2008). As a last possibility, the D2deformation could have been caused by the geometry of the margin itself: it could be theresult of the accretionary prism sliding past a releasing bend in the large-scale strike-slipsystem bordering the prism.
D3 - dextral transpression
From D2 to D3, a switch from vertical thinning to horizontal shortening and the onset ofdextral shearing occurred. A dextral transpressive shear system developed which inho-mogenously affected the entire area. In the schist zone, open folding, crenulation foliationdevelopment and semi-brittle to brittle dextral fault zones developed, probably associatedwith fast cooling due to a relaxation of the isotherms after the thinning of D2 ceased. Inthe gneiss zone, high-temperature deformation continued and domains of high and low D3dextral transpressive shear developed. The D3 deformation is concentrated along the south-ern border of the CMC in sections 1 and 2: in the southern gneiss zone (southern end of theFan transect, the entire Tana transect and large parts of the Bagley transect, Fig. 5.3) D3 isdominant and the D2 fabric is mostly transposed into the steep D3 fabric. In addition to thehigher intensity, the stretching lineation on the D3 fabric also plunges 30-60° to the west-northwest in these southern parts, in contrast to the lineation in the northern parts where it issubhorizontal. Simultaneously to the D3 deformation, partial melting occurred extensivelyin the gneiss zone and melts rose along the D3 foliation planes to form bigger plutons whichintruded the schist zone, and which locally thermally overprinted the andalusite-grade meta-
195
morphism present above the D2 fabric front in the schist zone in section 2.
The domains with high D3 fabric intensity and down-dip lineations correspond to the do-mains which registered higher peak pressures than the rest of the complex (~7-8 kbar at theTana transect, ~8-13 kbar at the Bagley transect, Fig. 5.2b-c), which suggests that the higherpressures are related to this D3 deformation. We therefore interpret that during this dextraltranspressive deformation, rocks of the gneiss zones were partly exhumed along N-dippingD3 foliation planes with down-dip lineations. This process may represent a narrow extru-sion channel in which exhumation occurred due to focused erosion at the surface. Sucherosion might have been a consequence of the shortening component of the D3 deforma-tion, which was concentrated in the southern gneiss zone and along the Contact fault andleading to the formation of topography at the surface. There is, in fact, significant evidencefor erosion during the Early Eocene in the Chugach terrane. Approximately 100 km westof the CMC, small Early Eocene non-marine sedimentary basins unconformably overliethe Chugach terrane (e.g. Little & Naeser, 1989). These sedimentary rocks record a proxi-mal metasedimentary and metavolcanic source from the Chugach Mountains, forming largealluvial fan complexes (Little & Naeser, 1989; Trop & Ridgway, 2007).
The D3 deformation with its dextral transpression is typical for what has been the situationalong the margin already during the formation of the accretionary prism during D1. Ittherefore represents the switch back after the unusual D2 event to a normal deformationalregime with oblique subduction of oceanic plates below the continental margin. Duringaccretion of the sediments, the strike-slip component of deformation was localized mainlyalong the Hanagita Fault System inboard of the accretionary prism (Fig. 5.1b; Roeskeet al., 2003). During the renewed dextral transpression of D3, this deformation concentratedfarther outboard, along the Contact Fault system and within the gneissic core of the CMC.This outboard jump and concentration of dextral transpression could be related to the factthat the accretionary prism was enlarged due to the accretion of the Prince William terranewhich is located outboard of the Chugach terrane.
5.7 Conclusions
Our structural and thermochronological analysis of the Chugach Metamorphic Complexalong three across-strike transects reveals the following:
(1) The structural geometry of the CMC is controlled by the presence of three superimposedfabrics consistent with previous work by Sisson & Pavlis (1993) and Pavlis & Sisson (1995,2003). The first fabric is related to accretion of the sediments and is only recognizablein the phyllite zone surrounding the complex. The second fabric is a flat-lying foliationdefined by biotite ± sillimanite with a horizontal E-W stretching lineation. It is presentin parts of the schist and in the entire gneiss zone of the complex and indicates vertical
196
flattening and margin-parallel stretching. The third fabric is a steep foliation defined bybiotite ± melt layers with a horizontal E-W stretching lineation in the northern part anda variably W-NW-dipping stretching lineation in the southern part of the complex. It isheterogeneously developed throughout the gneiss zone and parts of the schist zone, withthe most intense deformation concentrated along the southern part of the gneiss zone. Inaddition, it defines a foliation fan from north to south with south-dipping foliation planesin the north and north-dipping foliation planes in the south. We interpret this fabric as theresult of a dextral transpressive deformation. In addition to these three ductile fabrics, thesouthern part of the gneiss zone is overprinted by numerous semi-brittle to brittle N-dippingfaults with N-side-up and dextral sense of movement (Fig. 5.7).
(2) Thermochronology reveals different cooling histories for the western/central and south-eastern sections of the complex. The western and central part of the complex rapidly cooledfrom peak temperatures of ~650-700°C at ~55-52 Ma to ~350-400°C around ~50-46 Ma,indicating cooling rates of ~30-180°C/Ma during this time period. This period of rapidcooling was then followed in the gneiss zone by a period of no/slow cooling, before anincrease in cooling affected the schist and gneiss zones progressively from north to south.The south-eastern section of the complex cooled much more regularly and slowly, with acooling rate of ~6-10°C/Ma from ~51-5 Ma, before an increase in cooling rate occurredduring the last ~5 Ma with rates of ~20-40°C/Ma.
(3) Translation of these cooling histories into exhumation histories is not straightforward.However, based on several considerations we interpret that most likely the fast coolingobserved in the western and central sections shortly after the metamorphic peak also corre-sponds to exhumation of parts of the gneiss zone where the highest pressures are recorded.Exhumation of these parts of the gneiss zone was focused in high D3 strain zones. Exhuma-tion of the south-eastern section of the complex occurred slowly and regularly simultane-ously with cooling.
(4) Integrating the structural record with the thermochronological history suggests the fol-lowing possible scenario for the development of the CMC. Formation of the accretionaryprism in which the CMC developed occurred during dextral transpression which was par-titioned into strike-slip along the Hanagita Fault Zone and internal thrusts and folds of theD1 deformation. The geothermal gradient in this accretionary prism was probably in theorder of ~20-25°C/km. Shortly before or at ~55-52 Ma, this accretionary prism was af-fected by D2 deformation (vertical flattening and margin-parallel stretching) which lead tothe compression of isotherms, andalusite-sillimanite-grade metamorphism and the onset ofpartial melting in parts of the complex. This deformation probably led to an increase in thegeothermal gradient to ~35-65°C/km in the schist zone and the western gneiss zone. D2was followed by renewed dextral transpression during D3, which concentrated along theContact fault and inside the southern gneiss zone and which led to partial exhumation of therocks. The already curved margin was probably responsible for the difference in coolingand exhumation timing between the western/central and south-eastern parts of the complex.The collision of the Yakutat terrane led to increased cooling and exhumation in a narrow
197
zone on the north-side of the Contact/Fairweather fault during the last ~5-10 Ma.
(5) The regional boundary conditions which lead to the margin-parallel stretching phase andthe subsequent dextral transpressive deformation at ~55-52 Ma are not well constrained.The incomplete plate tectonic record in the Pacific basin allows a great amount of freedomin assuming the plate forces which acted on the margin at that time. The subduction of aspreading ridge below the complex as it has been suggested in the literature is not uniquelyrequired for the development of the CMC, given our newly obtained metamorphic condi-tions and the structural history described in this contribution.
Acknowledgments Financial support by the Fonds zur Wissenschaftlichen Förderung FWF project P-19366 is greatly acknowledged. C. Carson and J.D. Champagnac are thanked for help in the field. A. Koppers isthanked for help with the ArArCALC-software. J. Gifford is thanked for help in the ArAr-Lab at the Universityof Florida. From the University of Vienna we thank U. Klötzli and F. Biedermann for the help with mineralseparation and M. Horschinegg for help with the Rb-Sr measurements. P. and J. Claus are thanked for flying inthe field.
5.8 Appendix - Analytical techniques
5.8.1 A. 40Ar/39Ar method
Muscovite and biotite separates were obtained by crushing, sieving, short milling and mag-netic separation of fist-sized hand specimens. The separates were then cleaned by hand-picking under a binocular and only transparent, inclusion-free grains were selected. Grainsize of the final separates was ~0.1-0.5 mm. The hand-picked separates were cleaned in dis-tilled water in an ultrasonic bath. Approximately ~5 mg of each sample were packed intoAl-foil and stacked into a silica glass tube shielded by a 0.2 mm thick cadmium liner. Eightsample splits (each ~5 mg) of flux monitor GA-1550 biotite (K/Ar age 98.5±0.8 1σ; Spell& McDougall, 2003) were intercalated in regular intervals between the samples. K glassand CaF2 salts were included in the tube in order to monitor interfering nuclear reactions onpotassium and calcium. The whole tube was irradiated during 15 h in the core of the OregonState University research reactor facility. Step heating experiments were conducted at thegeochronology laboratory at the University of Florida. Samples were loaded into a Modifi-cations Ltd Double vacuum resistance furnace. 14 and 16 heating steps from 600-1350°Cwere conducted for muscovites and biotites, respectively, with total 15 min heating timeper step. The extracted gas was expanded into a stainless steel cleanup line and purifiedwith two 50 L/s SAES getters. Argon isotopes were measured using a MAP215-50 massspectrometer in electron multiplier mode.
The software ArArCALC v2.4 (Koppers, 2002) was used for data reduction. Data werecorrected for system blanks and mass discrimination. Detailed isotopic measurements can
198
be found in Tables 5.3 and 5.4. We report error-weighted plateau ages when more than threehigh temperature heating steps containing >50% of the total released 39ArK have a MSWDthat is smaller than a statistical T-student distribution. If this is not the case, we report errorplateau ages (Koppers, 2002). Traditional calculation of plateau ages based on eq. (17)in Koppers (2002) does only account for analytical uncertainty, uncertainty on the J-valuedetermination and uncertainty on the total decay constant of 40K. In order to also consideruncertainties on the individual λe and λβ decay constants, the 40K/K abundance ratio, theactual measurement of the primary K/Ar standard and the intercalibration of secondary40Ar/39Ar standards an alternative set of age equations has to be used (Renne et al., 1998;Min et al., 2000; Scaillet, 2000; Koppers, 2002; Fraser et al., 2008). We therefore appliedthe recalibration tool incorporated in ArArCALC which calculates plateau ages based on theequations of Karner & Renne (1998), Renne et al. (1998) and Min et al. (2000) which allowincorporating all internal and external errors. The physical constants used for recalculationare given in Min et al. (2000) and Spell & McDougall (2003). Only those recalculated agesare reported in the diagrams, Table 5.1 and the text.
The flux monitor J was determined based on a total of 29 heating steps on 8 sample splitswhich were distributed over the whole irradiation tube. The obtained J-values scatter con-siderably and no gradient was detected over the tube. From the 29 heating steps we excluded(a) the steps with the most scatter in isotopic ratio determination, (b) the steps with only verylittle gas and (c) some visually selected bad steps. We then used the remaining 13 heatingsteps to calculate an error weighted mean of J = 0.00369±0.0001122 (±3.04%, 2σ, onlyanalytical error considered following Koppers, 2002).
5.8.2 B. Rb/Sr isochron method
The biotite separates prepared for 40Ar/39Ar step heating experiments (Appendix A) wereadditionally purified by grinding in an agate mill in alcohol, sieving and magnetic separa-tion. Whole rock powders were obtained by milling of ca. 3 cm3-sized samples. Chemicalsample preparation was performed at the Geological Survey of Austria in Vienna followingthe procedure described by Sölva et al. (2005). Sample weights used for dissolution wereabout 200 mg for biotite and 100 mg for whole rock. Isotopic measurements were doneat the Department of Geological Sciences at the University of Vienna. Spiked Rb ratioswere measured at a Finnigan® MAT 262, whereas unspiked Sr ratios were analysed at aThermoFinnigan® Triton TI TIMS. Sr was run from Re double filaments, whereas Rb wasevaporated from a Ta filament. On the ThermoFinnigan® Triton the 87Sr/86Sr ratio de-termined for the international standard NBS987 was 0.710248±4 (n=17). The error for thecalculated 87Rb/86Sr ratios was taken as ±1% (2σ). Isochron age calculation was performedwith Isoplot/Ex (Ludwig, 2003). All data are given in Table 5.5
199
5.8.3 C. Fission Track zircon method
Zircon grains were extracted by crushing, sieving, magnetic and heavy liquid separation,and finally handpicked. After mounting the zircons in PFA Teflon and polishing them, fossilfission tracks were revealed by etching in a eutectic mixture of NaOH/KOH at 210°C for4 to 8 hours. External synthetic mica detectors were firmly attached and, after irradiation,etched for 40 minutes in 40%HF at 20°C. Thermal neutron irradiation was performed at theGerman Technical University München in Garching (FRM-II reactor). Neutron flux wasmonitored using CN1 dosimeter glasses. All samples have been analysed using the externaldetector method as described by Naeser (1976) and Gleadow (1981). Ages were calculatedusing the zeta calibration method (Hurford & Green, 1983) with a zeta factor of 159 ± 3.6using the software TRACKKEY 4.2.g (Dunkl, 2002). Counting of fission tracks was carriedout using a Zeiss Axio Imager A1m microscope equipped with an AUTOSCAN ™ stage.Only grains with their prism planes parallel to the polished surface were used for age dating.All data are are given in Table 5.6.
200
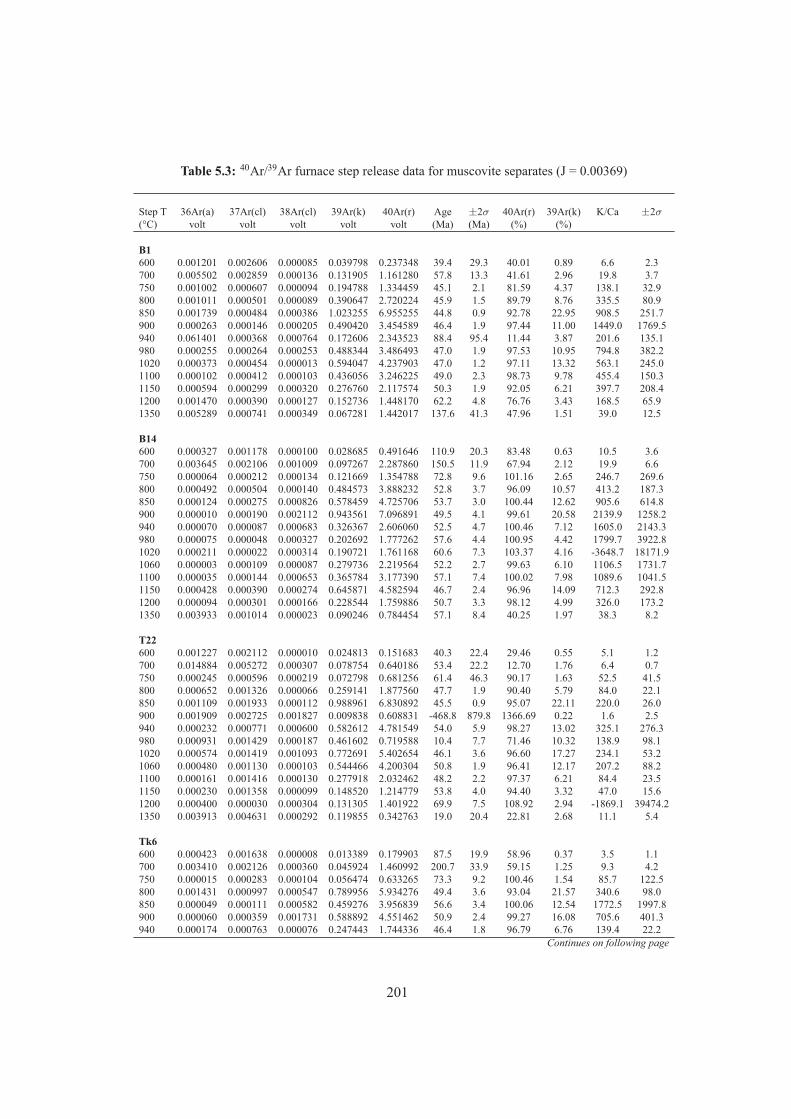
Table 5.3: 40Ar/39Ar furnace step release data for muscovite separates (J = 0.00369)
Step T 36Ar(a) 37Ar(cl) 38Ar(cl) 39Ar(k) 40Ar(r) Age ±2σ 40Ar(r) 39Ar(k) K/Ca ±2σ
(°C) volt volt volt volt volt (Ma) (Ma) (%) (%)
B1600 0.001201 0.002606 0.000085 0.039798 0.237348 39.4 29.3 40.01 0.89 6.6 2.3700 0.005502 0.002859 0.000136 0.131905 1.161280 57.8 13.3 41.61 2.96 19.8 3.7750 0.001002 0.000607 0.000094 0.194788 1.334459 45.1 2.1 81.59 4.37 138.1 32.9800 0.001011 0.000501 0.000089 0.390647 2.720224 45.9 1.5 89.79 8.76 335.5 80.9850 0.001739 0.000484 0.000386 1.023255 6.955255 44.8 0.9 92.78 22.95 908.5 251.7900 0.000263 0.000146 0.000205 0.490420 3.454589 46.4 1.9 97.44 11.00 1449.0 1769.5940 0.061401 0.000368 0.000764 0.172606 2.343523 88.4 95.4 11.44 3.87 201.6 135.1980 0.000255 0.000264 0.000253 0.488344 3.486493 47.0 1.9 97.53 10.95 794.8 382.21020 0.000373 0.000454 0.000013 0.594047 4.237903 47.0 1.2 97.11 13.32 563.1 245.01100 0.000102 0.000412 0.000103 0.436056 3.246225 49.0 2.3 98.73 9.78 455.4 150.31150 0.000594 0.000299 0.000320 0.276760 2.117574 50.3 1.9 92.05 6.21 397.7 208.41200 0.001470 0.000390 0.000127 0.152736 1.448170 62.2 4.8 76.76 3.43 168.5 65.91350 0.005289 0.000741 0.000349 0.067281 1.442017 137.6 41.3 47.96 1.51 39.0 12.5
B14600 0.000327 0.001178 0.000100 0.028685 0.491646 110.9 20.3 83.48 0.63 10.5 3.6700 0.003645 0.002106 0.001009 0.097267 2.287860 150.5 11.9 67.94 2.12 19.9 6.6750 0.000064 0.000212 0.000134 0.121669 1.354788 72.8 9.6 101.16 2.65 246.7 269.6800 0.000492 0.000504 0.000140 0.484573 3.888232 52.8 3.7 96.09 10.57 413.2 187.3850 0.000124 0.000275 0.000826 0.578459 4.725706 53.7 3.0 100.44 12.62 905.6 614.8900 0.000010 0.000190 0.002112 0.943561 7.096891 49.5 4.1 99.61 20.58 2139.9 1258.2940 0.000070 0.000087 0.000683 0.326367 2.606060 52.5 4.7 100.46 7.12 1605.0 2143.3980 0.000075 0.000048 0.000327 0.202692 1.777262 57.6 4.4 100.95 4.42 1799.7 3922.81020 0.000211 0.000022 0.000314 0.190721 1.761168 60.6 7.3 103.37 4.16 -3648.7 18171.91060 0.000003 0.000109 0.000087 0.279736 2.219564 52.2 2.7 99.63 6.10 1106.5 1731.71100 0.000035 0.000144 0.000653 0.365784 3.177390 57.1 7.4 100.02 7.98 1089.6 1041.51150 0.000428 0.000390 0.000274 0.645871 4.582594 46.7 2.4 96.96 14.09 712.3 292.81200 0.000094 0.000301 0.000166 0.228544 1.759886 50.7 3.3 98.12 4.99 326.0 173.21350 0.003933 0.001014 0.000023 0.090246 0.784454 57.1 8.4 40.25 1.97 38.3 8.2
T22600 0.001227 0.002112 0.000010 0.024813 0.151683 40.3 22.4 29.46 0.55 5.1 1.2700 0.014884 0.005272 0.000307 0.078754 0.640186 53.4 22.2 12.70 1.76 6.4 0.7750 0.000245 0.000596 0.000219 0.072798 0.681256 61.4 46.3 90.17 1.63 52.5 41.5800 0.000652 0.001326 0.000066 0.259141 1.877560 47.7 1.9 90.40 5.79 84.0 22.1850 0.001109 0.001933 0.000112 0.988961 6.830892 45.5 0.9 95.07 22.11 220.0 26.0900 0.001909 0.002725 0.001827 0.009838 0.608831 -468.8 879.8 1366.69 0.22 1.6 2.5940 0.000232 0.000771 0.000600 0.582612 4.781549 54.0 5.9 98.27 13.02 325.1 276.3980 0.000931 0.001429 0.000187 0.461602 0.719588 10.4 7.7 71.46 10.32 138.9 98.11020 0.000574 0.001419 0.001093 0.772691 5.402654 46.1 3.6 96.60 17.27 234.1 53.21060 0.000480 0.001130 0.000103 0.544466 4.200304 50.8 1.9 96.41 12.17 207.2 88.21100 0.000161 0.001416 0.000130 0.277918 2.032462 48.2 2.2 97.37 6.21 84.4 23.51150 0.000230 0.001358 0.000099 0.148520 1.214779 53.8 4.0 94.40 3.32 47.0 15.61200 0.000400 0.000030 0.000304 0.131305 1.401922 69.9 7.5 108.92 2.94 -1869.1 39474.21350 0.003913 0.004631 0.000292 0.119855 0.342763 19.0 20.4 22.81 2.68 11.1 5.4
Tk6600 0.000423 0.001638 0.000008 0.013389 0.179903 87.5 19.9 58.96 0.37 3.5 1.1700 0.003410 0.002126 0.000360 0.045924 1.460992 200.7 33.9 59.15 1.25 9.3 4.2750 0.000015 0.000283 0.000104 0.056474 0.633265 73.3 9.2 100.46 1.54 85.7 122.5800 0.001431 0.000997 0.000547 0.789956 5.934276 49.4 3.6 93.04 21.57 340.6 98.0850 0.000049 0.000111 0.000582 0.459276 3.956839 56.6 3.4 100.06 12.54 1772.5 1997.8900 0.000060 0.000359 0.001731 0.588892 4.551462 50.9 2.4 99.27 16.08 705.6 401.3940 0.000174 0.000763 0.000076 0.247443 1.744336 46.4 1.8 96.79 6.76 139.4 22.2
Continues on following page
201
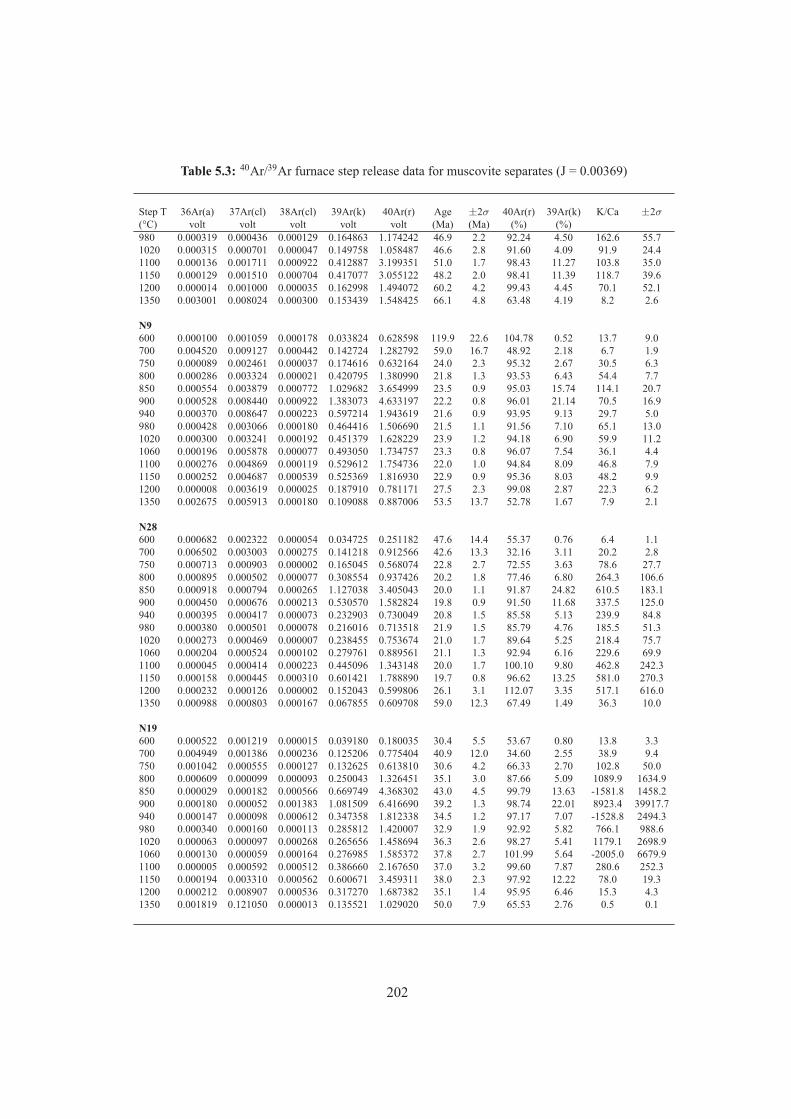
Table 5.3: 40Ar/39Ar furnace step release data for muscovite separates (J = 0.00369)
Step T 36Ar(a) 37Ar(cl) 38Ar(cl) 39Ar(k) 40Ar(r) Age ±2σ 40Ar(r) 39Ar(k) K/Ca ±2σ
(°C) volt volt volt volt volt (Ma) (Ma) (%) (%)980 0.000319 0.000436 0.000129 0.164863 1.174242 46.9 2.2 92.24 4.50 162.6 55.71020 0.000315 0.000701 0.000047 0.149758 1.058487 46.6 2.8 91.60 4.09 91.9 24.41100 0.000136 0.001711 0.000922 0.412887 3.199351 51.0 1.7 98.43 11.27 103.8 35.01150 0.000129 0.001510 0.000704 0.417077 3.055122 48.2 2.0 98.41 11.39 118.7 39.61200 0.000014 0.001000 0.000035 0.162998 1.494072 60.2 4.2 99.43 4.45 70.1 52.11350 0.003001 0.008024 0.000300 0.153439 1.548425 66.1 4.8 63.48 4.19 8.2 2.6
N9600 0.000100 0.001059 0.000178 0.033824 0.628598 119.9 22.6 104.78 0.52 13.7 9.0700 0.004520 0.009127 0.000442 0.142724 1.282792 59.0 16.7 48.92 2.18 6.7 1.9750 0.000089 0.002461 0.000037 0.174616 0.632164 24.0 2.3 95.32 2.67 30.5 6.3800 0.000286 0.003324 0.000021 0.420795 1.380990 21.8 1.3 93.53 6.43 54.4 7.7850 0.000554 0.003879 0.000772 1.029682 3.654999 23.5 0.9 95.03 15.74 114.1 20.7900 0.000528 0.008440 0.000922 1.383073 4.633197 22.2 0.8 96.01 21.14 70.5 16.9940 0.000370 0.008647 0.000223 0.597214 1.943619 21.6 0.9 93.95 9.13 29.7 5.0980 0.000428 0.003066 0.000180 0.464416 1.506690 21.5 1.1 91.56 7.10 65.1 13.01020 0.000300 0.003241 0.000192 0.451379 1.628229 23.9 1.2 94.18 6.90 59.9 11.21060 0.000196 0.005878 0.000077 0.493050 1.734757 23.3 0.8 96.07 7.54 36.1 4.41100 0.000276 0.004869 0.000119 0.529612 1.754736 22.0 1.0 94.84 8.09 46.8 7.91150 0.000252 0.004687 0.000539 0.525369 1.816930 22.9 0.9 95.36 8.03 48.2 9.91200 0.000008 0.003619 0.000025 0.187910 0.781171 27.5 2.3 99.08 2.87 22.3 6.21350 0.002675 0.005913 0.000180 0.109088 0.887006 53.5 13.7 52.78 1.67 7.9 2.1
N28600 0.000682 0.002322 0.000054 0.034725 0.251182 47.6 14.4 55.37 0.76 6.4 1.1700 0.006502 0.003003 0.000275 0.141218 0.912566 42.6 13.3 32.16 3.11 20.2 2.8750 0.000713 0.000903 0.000002 0.165045 0.568074 22.8 2.7 72.55 3.63 78.6 27.7800 0.000895 0.000502 0.000077 0.308554 0.937426 20.2 1.8 77.46 6.80 264.3 106.6850 0.000918 0.000794 0.000265 1.127038 3.405043 20.0 1.1 91.87 24.82 610.5 183.1900 0.000450 0.000676 0.000213 0.530570 1.582824 19.8 0.9 91.50 11.68 337.5 125.0940 0.000395 0.000417 0.000073 0.232903 0.730049 20.8 1.5 85.58 5.13 239.9 84.8980 0.000380 0.000501 0.000078 0.216016 0.713518 21.9 1.5 85.79 4.76 185.5 51.31020 0.000273 0.000469 0.000007 0.238455 0.753674 21.0 1.7 89.64 5.25 218.4 75.71060 0.000204 0.000524 0.000102 0.279761 0.889561 21.1 1.3 92.94 6.16 229.6 69.91100 0.000045 0.000414 0.000223 0.445096 1.343148 20.0 1.7 100.10 9.80 462.8 242.31150 0.000158 0.000445 0.000310 0.601421 1.788890 19.7 0.8 96.62 13.25 581.0 270.31200 0.000232 0.000126 0.000002 0.152043 0.599806 26.1 3.1 112.07 3.35 517.1 616.01350 0.000988 0.000803 0.000167 0.067855 0.609708 59.0 12.3 67.49 1.49 36.3 10.0
N19600 0.000522 0.001219 0.000015 0.039180 0.180035 30.4 5.5 53.67 0.80 13.8 3.3700 0.004949 0.001386 0.000236 0.125206 0.775404 40.9 12.0 34.60 2.55 38.9 9.4750 0.001042 0.000555 0.000127 0.132625 0.613810 30.6 4.2 66.33 2.70 102.8 50.0800 0.000609 0.000099 0.000093 0.250043 1.326451 35.1 3.0 87.66 5.09 1089.9 1634.9850 0.000029 0.000182 0.000566 0.669749 4.368302 43.0 4.5 99.79 13.63 -1581.8 1458.2900 0.000180 0.000052 0.001383 1.081509 6.416690 39.2 1.3 98.74 22.01 8923.4 39917.7940 0.000147 0.000098 0.000612 0.347358 1.812338 34.5 1.2 97.17 7.07 -1528.8 2494.3980 0.000340 0.000160 0.000113 0.285812 1.420007 32.9 1.9 92.92 5.82 766.1 988.61020 0.000063 0.000097 0.000268 0.265656 1.458694 36.3 2.6 98.27 5.41 1179.1 2698.91060 0.000130 0.000059 0.000164 0.276985 1.585372 37.8 2.7 101.99 5.64 -2005.0 6679.91100 0.000005 0.000592 0.000512 0.386660 2.167650 37.0 3.2 99.60 7.87 280.6 252.31150 0.000194 0.003310 0.000562 0.600671 3.459311 38.0 2.3 97.92 12.22 78.0 19.31200 0.000212 0.008907 0.000536 0.317270 1.687382 35.1 1.4 95.95 6.46 15.3 4.31350 0.001819 0.121050 0.000013 0.135521 1.029020 50.0 7.9 65.53 2.76 0.5 0.1
202
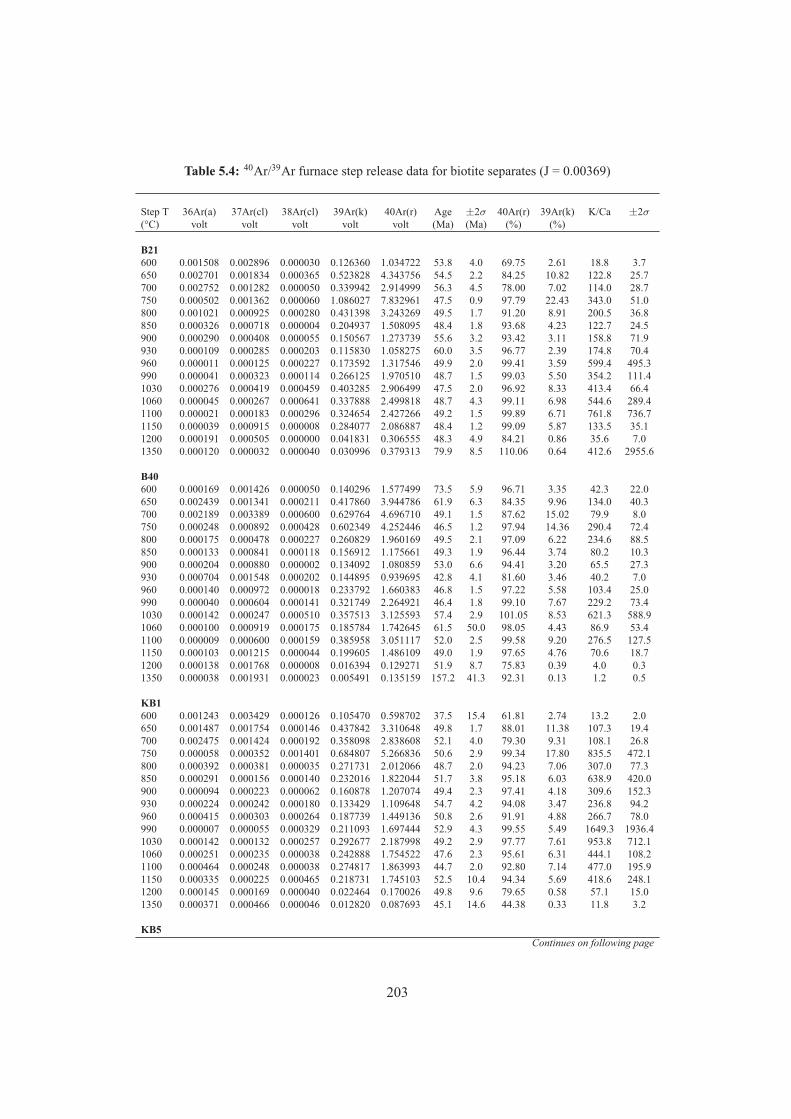
Table 5.4: 40Ar/39Ar furnace step release data for biotite separates (J = 0.00369)
Step T 36Ar(a) 37Ar(cl) 38Ar(cl) 39Ar(k) 40Ar(r) Age ±2σ 40Ar(r) 39Ar(k) K/Ca ±2σ
(°C) volt volt volt volt volt (Ma) (Ma) (%) (%)
B21600 0.001508 0.002896 0.000030 0.126360 1.034722 53.8 4.0 69.75 2.61 18.8 3.7650 0.002701 0.001834 0.000365 0.523828 4.343756 54.5 2.2 84.25 10.82 122.8 25.7700 0.002752 0.001282 0.000050 0.339942 2.914999 56.3 4.5 78.00 7.02 114.0 28.7750 0.000502 0.001362 0.000060 1.086027 7.832961 47.5 0.9 97.79 22.43 343.0 51.0800 0.001021 0.000925 0.000280 0.431398 3.243269 49.5 1.7 91.20 8.91 200.5 36.8850 0.000326 0.000718 0.000004 0.204937 1.508095 48.4 1.8 93.68 4.23 122.7 24.5900 0.000290 0.000408 0.000055 0.150567 1.273739 55.6 3.2 93.42 3.11 158.8 71.9930 0.000109 0.000285 0.000203 0.115830 1.058275 60.0 3.5 96.77 2.39 174.8 70.4960 0.000011 0.000125 0.000227 0.173592 1.317546 49.9 2.0 99.41 3.59 599.4 495.3990 0.000041 0.000323 0.000114 0.266125 1.970510 48.7 1.5 99.03 5.50 354.2 111.41030 0.000276 0.000419 0.000459 0.403285 2.906499 47.5 2.0 96.92 8.33 413.4 66.41060 0.000045 0.000267 0.000641 0.337888 2.499818 48.7 4.3 99.11 6.98 544.6 289.41100 0.000021 0.000183 0.000296 0.324654 2.427266 49.2 1.5 99.89 6.71 761.8 736.71150 0.000039 0.000915 0.000008 0.284077 2.086887 48.4 1.2 99.09 5.87 133.5 35.11200 0.000191 0.000505 0.000000 0.041831 0.306555 48.3 4.9 84.21 0.86 35.6 7.01350 0.000120 0.000032 0.000040 0.030996 0.379313 79.9 8.5 110.06 0.64 412.6 2955.6
B40600 0.000169 0.001426 0.000050 0.140296 1.577499 73.5 5.9 96.71 3.35 42.3 22.0650 0.002439 0.001341 0.000211 0.417860 3.944786 61.9 6.3 84.35 9.96 134.0 40.3700 0.002189 0.003389 0.000600 0.629764 4.696710 49.1 1.5 87.62 15.02 79.9 8.0750 0.000248 0.000892 0.000428 0.602349 4.252446 46.5 1.2 97.94 14.36 290.4 72.4800 0.000175 0.000478 0.000227 0.260829 1.960169 49.5 2.1 97.09 6.22 234.6 88.5850 0.000133 0.000841 0.000118 0.156912 1.175661 49.3 1.9 96.44 3.74 80.2 10.3900 0.000204 0.000880 0.000002 0.134092 1.080859 53.0 6.6 94.41 3.20 65.5 27.3930 0.000704 0.001548 0.000202 0.144895 0.939695 42.8 4.1 81.60 3.46 40.2 7.0960 0.000140 0.000972 0.000018 0.233792 1.660383 46.8 1.5 97.22 5.58 103.4 25.0990 0.000040 0.000604 0.000141 0.321749 2.264921 46.4 1.8 99.10 7.67 229.2 73.41030 0.000142 0.000247 0.000510 0.357513 3.125593 57.4 2.9 101.05 8.53 621.3 588.91060 0.000100 0.000919 0.000175 0.185784 1.742645 61.5 50.0 98.05 4.43 86.9 53.41100 0.000009 0.000600 0.000159 0.385958 3.051117 52.0 2.5 99.58 9.20 276.5 127.51150 0.000103 0.001215 0.000044 0.199605 1.486109 49.0 1.9 97.65 4.76 70.6 18.71200 0.000138 0.001768 0.000008 0.016394 0.129271 51.9 8.7 75.83 0.39 4.0 0.31350 0.000038 0.001931 0.000023 0.005491 0.135159 157.2 41.3 92.31 0.13 1.2 0.5
KB1600 0.001243 0.003429 0.000126 0.105470 0.598702 37.5 15.4 61.81 2.74 13.2 2.0650 0.001487 0.001754 0.000146 0.437842 3.310648 49.8 1.7 88.01 11.38 107.3 19.4700 0.002475 0.001424 0.000192 0.358098 2.838608 52.1 4.0 79.30 9.31 108.1 26.8750 0.000058 0.000352 0.001401 0.684807 5.266836 50.6 2.9 99.34 17.80 835.5 472.1800 0.000392 0.000381 0.000035 0.271731 2.012066 48.7 2.0 94.23 7.06 307.0 77.3850 0.000291 0.000156 0.000140 0.232016 1.822044 51.7 3.8 95.18 6.03 638.9 420.0900 0.000094 0.000223 0.000062 0.160878 1.207074 49.4 2.3 97.41 4.18 309.6 152.3930 0.000224 0.000242 0.000180 0.133429 1.109648 54.7 4.2 94.08 3.47 236.8 94.2960 0.000415 0.000303 0.000264 0.187739 1.449136 50.8 2.6 91.91 4.88 266.7 78.0990 0.000007 0.000055 0.000329 0.211093 1.697444 52.9 4.3 99.55 5.49 1649.3 1936.41030 0.000142 0.000132 0.000257 0.292677 2.187998 49.2 2.9 97.77 7.61 953.8 712.11060 0.000251 0.000235 0.000038 0.242888 1.754522 47.6 2.3 95.61 6.31 444.1 108.21100 0.000464 0.000248 0.000038 0.274817 1.863993 44.7 2.0 92.80 7.14 477.0 195.91150 0.000335 0.000225 0.000465 0.218731 1.745103 52.5 10.4 94.34 5.69 418.6 248.11200 0.000145 0.000169 0.000040 0.022464 0.170026 49.8 9.6 79.65 0.58 57.1 15.01350 0.000371 0.000466 0.000046 0.012820 0.087693 45.1 14.6 44.38 0.33 11.8 3.2
KB5Continues on following page
203
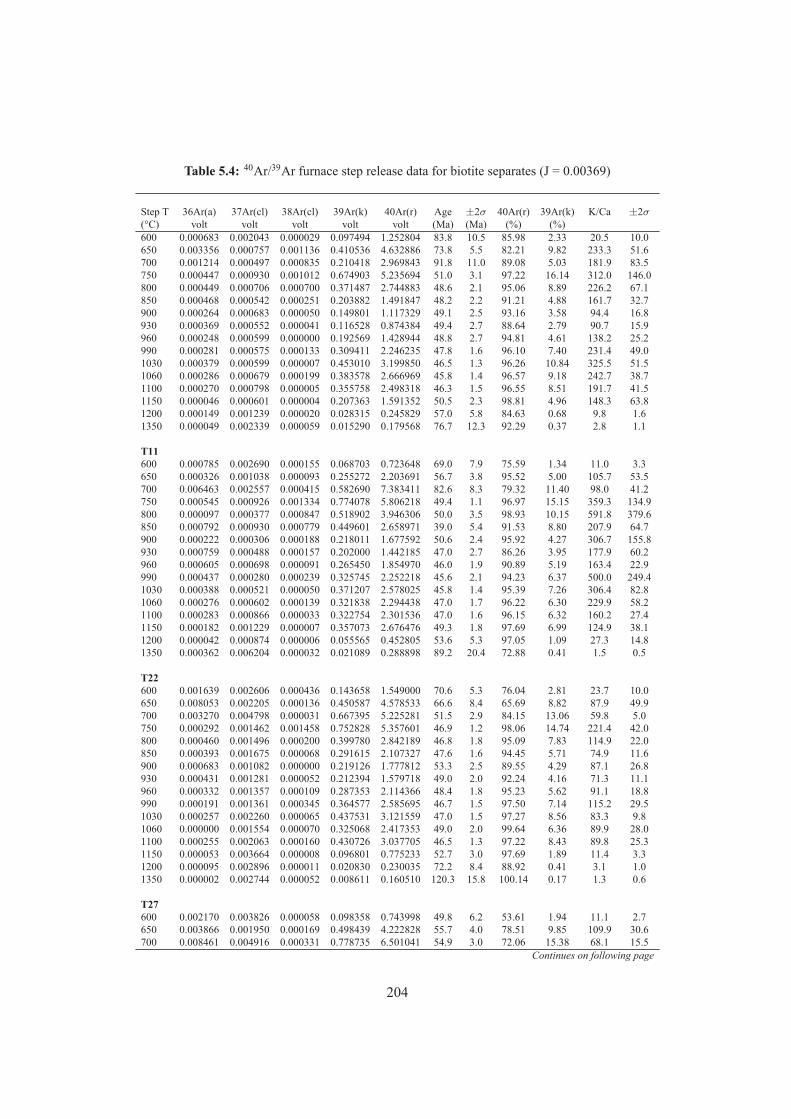
Table 5.4: 40Ar/39Ar furnace step release data for biotite separates (J = 0.00369)
Step T 36Ar(a) 37Ar(cl) 38Ar(cl) 39Ar(k) 40Ar(r) Age ±2σ 40Ar(r) 39Ar(k) K/Ca ±2σ
(°C) volt volt volt volt volt (Ma) (Ma) (%) (%)600 0.000683 0.002043 0.000029 0.097494 1.252804 83.8 10.5 85.98 2.33 20.5 10.0650 0.003356 0.000757 0.001136 0.410536 4.632886 73.8 5.5 82.21 9.82 233.3 51.6700 0.001214 0.000497 0.000835 0.210418 2.969843 91.8 11.0 89.08 5.03 181.9 83.5750 0.000447 0.000930 0.001012 0.674903 5.235694 51.0 3.1 97.22 16.14 312.0 146.0800 0.000449 0.000706 0.000700 0.371487 2.744883 48.6 2.1 95.06 8.89 226.2 67.1850 0.000468 0.000542 0.000251 0.203882 1.491847 48.2 2.2 91.21 4.88 161.7 32.7900 0.000264 0.000683 0.000050 0.149801 1.117329 49.1 2.5 93.16 3.58 94.4 16.8930 0.000369 0.000552 0.000041 0.116528 0.874384 49.4 2.7 88.64 2.79 90.7 15.9960 0.000248 0.000599 0.000000 0.192569 1.428944 48.8 2.7 94.81 4.61 138.2 25.2990 0.000281 0.000575 0.000133 0.309411 2.246235 47.8 1.6 96.10 7.40 231.4 49.01030 0.000379 0.000599 0.000007 0.453010 3.199850 46.5 1.3 96.26 10.84 325.5 51.51060 0.000286 0.000679 0.000199 0.383578 2.666969 45.8 1.4 96.57 9.18 242.7 38.71100 0.000270 0.000798 0.000005 0.355758 2.498318 46.3 1.5 96.55 8.51 191.7 41.51150 0.000046 0.000601 0.000004 0.207363 1.591352 50.5 2.3 98.81 4.96 148.3 63.81200 0.000149 0.001239 0.000020 0.028315 0.245829 57.0 5.8 84.63 0.68 9.8 1.61350 0.000049 0.002339 0.000059 0.015290 0.179568 76.7 12.3 92.29 0.37 2.8 1.1
T11600 0.000785 0.002690 0.000155 0.068703 0.723648 69.0 7.9 75.59 1.34 11.0 3.3650 0.000326 0.001038 0.000093 0.255272 2.203691 56.7 3.8 95.52 5.00 105.7 53.5700 0.006463 0.002557 0.000415 0.582690 7.383411 82.6 8.3 79.32 11.40 98.0 41.2750 0.000545 0.000926 0.001334 0.774078 5.806218 49.4 1.1 96.97 15.15 359.3 134.9800 0.000097 0.000377 0.000847 0.518902 3.946306 50.0 3.5 98.93 10.15 591.8 379.6850 0.000792 0.000930 0.000779 0.449601 2.658971 39.0 5.4 91.53 8.80 207.9 64.7900 0.000222 0.000306 0.000188 0.218011 1.677592 50.6 2.4 95.92 4.27 306.7 155.8930 0.000759 0.000488 0.000157 0.202000 1.442185 47.0 2.7 86.26 3.95 177.9 60.2960 0.000605 0.000698 0.000091 0.265450 1.854970 46.0 1.9 90.89 5.19 163.4 22.9990 0.000437 0.000280 0.000239 0.325745 2.252218 45.6 2.1 94.23 6.37 500.0 249.41030 0.000388 0.000521 0.000050 0.371207 2.578025 45.8 1.4 95.39 7.26 306.4 82.81060 0.000276 0.000602 0.000139 0.321838 2.294438 47.0 1.7 96.22 6.30 229.9 58.21100 0.000283 0.000866 0.000033 0.322754 2.301536 47.0 1.6 96.15 6.32 160.2 27.41150 0.000182 0.001229 0.000007 0.357073 2.676476 49.3 1.8 97.69 6.99 124.9 38.11200 0.000042 0.000874 0.000006 0.055565 0.452805 53.6 5.3 97.05 1.09 27.3 14.81350 0.000362 0.006204 0.000032 0.021089 0.288898 89.2 20.4 72.88 0.41 1.5 0.5
T22600 0.001639 0.002606 0.000436 0.143658 1.549000 70.6 5.3 76.04 2.81 23.7 10.0650 0.008053 0.002205 0.000136 0.450587 4.578533 66.6 8.4 65.69 8.82 87.9 49.9700 0.003270 0.004798 0.000031 0.667395 5.225281 51.5 2.9 84.15 13.06 59.8 5.0750 0.000292 0.001462 0.001458 0.752828 5.357601 46.9 1.2 98.06 14.74 221.4 42.0800 0.000460 0.001496 0.000200 0.399780 2.842189 46.8 1.8 95.09 7.83 114.9 22.0850 0.000393 0.001675 0.000068 0.291615 2.107327 47.6 1.6 94.45 5.71 74.9 11.6900 0.000683 0.001082 0.000000 0.219126 1.777812 53.3 2.5 89.55 4.29 87.1 26.8930 0.000431 0.001281 0.000052 0.212394 1.579718 49.0 2.0 92.24 4.16 71.3 11.1960 0.000332 0.001357 0.000109 0.287353 2.114366 48.4 1.8 95.23 5.62 91.1 18.8990 0.000191 0.001361 0.000345 0.364577 2.585695 46.7 1.5 97.50 7.14 115.2 29.51030 0.000257 0.002260 0.000065 0.437531 3.121559 47.0 1.5 97.27 8.56 83.3 9.81060 0.000000 0.001554 0.000070 0.325068 2.417353 49.0 2.0 99.64 6.36 89.9 28.01100 0.000255 0.002063 0.000160 0.430726 3.037705 46.5 1.3 97.22 8.43 89.8 25.31150 0.000053 0.003664 0.000008 0.096801 0.775233 52.7 3.0 97.69 1.89 11.4 3.31200 0.000095 0.002896 0.000011 0.020830 0.230035 72.2 8.4 88.92 0.41 3.1 1.01350 0.000002 0.002744 0.000052 0.008611 0.160510 120.3 15.8 100.14 0.17 1.3 0.6
T27600 0.002170 0.003826 0.000058 0.098358 0.743998 49.8 6.2 53.61 1.94 11.1 2.7650 0.003866 0.001950 0.000169 0.498439 4.222828 55.7 4.0 78.51 9.85 109.9 30.6700 0.008461 0.004916 0.000331 0.778735 6.501041 54.9 3.0 72.06 15.38 68.1 15.5
Continues on following page
204
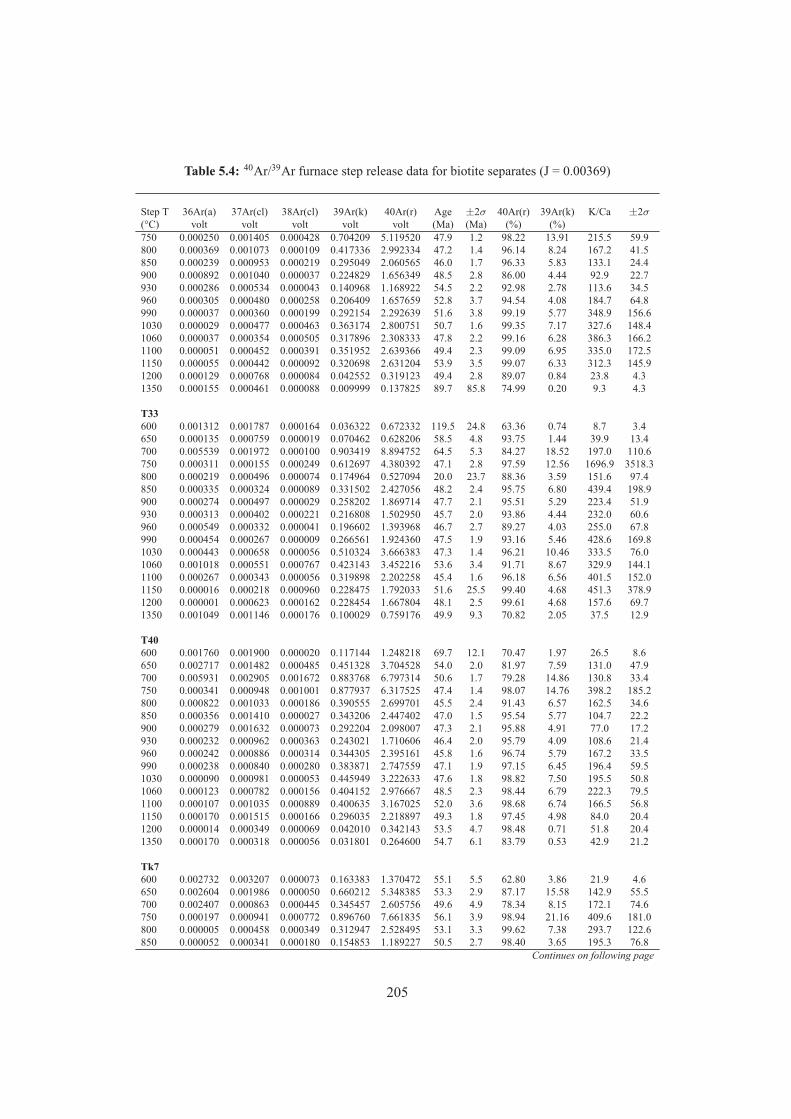
Table 5.4: 40Ar/39Ar furnace step release data for biotite separates (J = 0.00369)
Step T 36Ar(a) 37Ar(cl) 38Ar(cl) 39Ar(k) 40Ar(r) Age ±2σ 40Ar(r) 39Ar(k) K/Ca ±2σ
(°C) volt volt volt volt volt (Ma) (Ma) (%) (%)750 0.000250 0.001405 0.000428 0.704209 5.119520 47.9 1.2 98.22 13.91 215.5 59.9800 0.000369 0.001073 0.000109 0.417336 2.992334 47.2 1.4 96.14 8.24 167.2 41.5850 0.000239 0.000953 0.000219 0.295049 2.060565 46.0 1.7 96.33 5.83 133.1 24.4900 0.000892 0.001040 0.000037 0.224829 1.656349 48.5 2.8 86.00 4.44 92.9 22.7930 0.000286 0.000534 0.000043 0.140968 1.168922 54.5 2.2 92.98 2.78 113.6 34.5960 0.000305 0.000480 0.000258 0.206409 1.657659 52.8 3.7 94.54 4.08 184.7 64.8990 0.000037 0.000360 0.000199 0.292154 2.292639 51.6 3.8 99.19 5.77 348.9 156.61030 0.000029 0.000477 0.000463 0.363174 2.800751 50.7 1.6 99.35 7.17 327.6 148.41060 0.000037 0.000354 0.000505 0.317896 2.308333 47.8 2.2 99.16 6.28 386.3 166.21100 0.000051 0.000452 0.000391 0.351952 2.639366 49.4 2.3 99.09 6.95 335.0 172.51150 0.000055 0.000442 0.000092 0.320698 2.631204 53.9 3.5 99.07 6.33 312.3 145.91200 0.000129 0.000768 0.000084 0.042552 0.319123 49.4 2.8 89.07 0.84 23.8 4.31350 0.000155 0.000461 0.000088 0.009999 0.137825 89.7 85.8 74.99 0.20 9.3 4.3
T33600 0.001312 0.001787 0.000164 0.036322 0.672332 119.5 24.8 63.36 0.74 8.7 3.4650 0.000135 0.000759 0.000019 0.070462 0.628206 58.5 4.8 93.75 1.44 39.9 13.4700 0.005539 0.001972 0.000100 0.903419 8.894752 64.5 5.3 84.27 18.52 197.0 110.6750 0.000311 0.000155 0.000249 0.612697 4.380392 47.1 2.8 97.59 12.56 1696.9 3518.3800 0.000219 0.000496 0.000074 0.174964 0.527094 20.0 23.7 88.36 3.59 151.6 97.4850 0.000335 0.000324 0.000089 0.331502 2.427056 48.2 2.4 95.75 6.80 439.4 198.9900 0.000274 0.000497 0.000029 0.258202 1.869714 47.7 2.1 95.51 5.29 223.4 51.9930 0.000313 0.000402 0.000221 0.216808 1.502950 45.7 2.0 93.86 4.44 232.0 60.6960 0.000549 0.000332 0.000041 0.196602 1.393968 46.7 2.7 89.27 4.03 255.0 67.8990 0.000454 0.000267 0.000009 0.266561 1.924360 47.5 1.9 93.16 5.46 428.6 169.81030 0.000443 0.000658 0.000056 0.510324 3.666383 47.3 1.4 96.21 10.46 333.5 76.01060 0.001018 0.000551 0.000767 0.423143 3.452216 53.6 3.4 91.71 8.67 329.9 144.11100 0.000267 0.000343 0.000056 0.319898 2.202258 45.4 1.6 96.18 6.56 401.5 152.01150 0.000016 0.000218 0.000960 0.228475 1.792033 51.6 25.5 99.40 4.68 451.3 378.91200 0.000001 0.000623 0.000162 0.228454 1.667804 48.1 2.5 99.61 4.68 157.6 69.71350 0.001049 0.001146 0.000176 0.100029 0.759176 49.9 9.3 70.82 2.05 37.5 12.9
T40600 0.001760 0.001900 0.000020 0.117144 1.248218 69.7 12.1 70.47 1.97 26.5 8.6650 0.002717 0.001482 0.000485 0.451328 3.704528 54.0 2.0 81.97 7.59 131.0 47.9700 0.005931 0.002905 0.001672 0.883768 6.797314 50.6 1.7 79.28 14.86 130.8 33.4750 0.000341 0.000948 0.001001 0.877937 6.317525 47.4 1.4 98.07 14.76 398.2 185.2800 0.000822 0.001033 0.000186 0.390555 2.699701 45.5 2.4 91.43 6.57 162.5 34.6850 0.000356 0.001410 0.000027 0.343206 2.447402 47.0 1.5 95.54 5.77 104.7 22.2900 0.000279 0.001632 0.000073 0.292204 2.098007 47.3 2.1 95.88 4.91 77.0 17.2930 0.000232 0.000962 0.000363 0.243021 1.710606 46.4 2.0 95.79 4.09 108.6 21.4960 0.000242 0.000886 0.000314 0.344305 2.395161 45.8 1.6 96.74 5.79 167.2 33.5990 0.000238 0.000840 0.000280 0.383871 2.747559 47.1 1.9 97.15 6.45 196.4 59.51030 0.000090 0.000981 0.000053 0.445949 3.222633 47.6 1.8 98.82 7.50 195.5 50.81060 0.000123 0.000782 0.000156 0.404152 2.976667 48.5 2.3 98.44 6.79 222.3 79.51100 0.000107 0.001035 0.000889 0.400635 3.167025 52.0 3.6 98.68 6.74 166.5 56.81150 0.000170 0.001515 0.000166 0.296035 2.218897 49.3 1.8 97.45 4.98 84.0 20.41200 0.000014 0.000349 0.000069 0.042010 0.342143 53.5 4.7 98.48 0.71 51.8 20.41350 0.000170 0.000318 0.000056 0.031801 0.264600 54.7 6.1 83.79 0.53 42.9 21.2
Tk7600 0.002732 0.003207 0.000073 0.163383 1.370472 55.1 5.5 62.80 3.86 21.9 4.6650 0.002604 0.001986 0.000050 0.660212 5.348385 53.3 2.9 87.17 15.58 142.9 55.5700 0.002407 0.000863 0.000445 0.345457 2.605756 49.6 4.9 78.34 8.15 172.1 74.6750 0.000197 0.000941 0.000772 0.896760 7.661835 56.1 3.9 98.94 21.16 409.6 181.0800 0.000005 0.000458 0.000349 0.312947 2.528495 53.1 3.3 99.62 7.38 293.7 122.6850 0.000052 0.000341 0.000180 0.154853 1.189227 50.5 2.7 98.40 3.65 195.3 76.8
Continues on following page
205
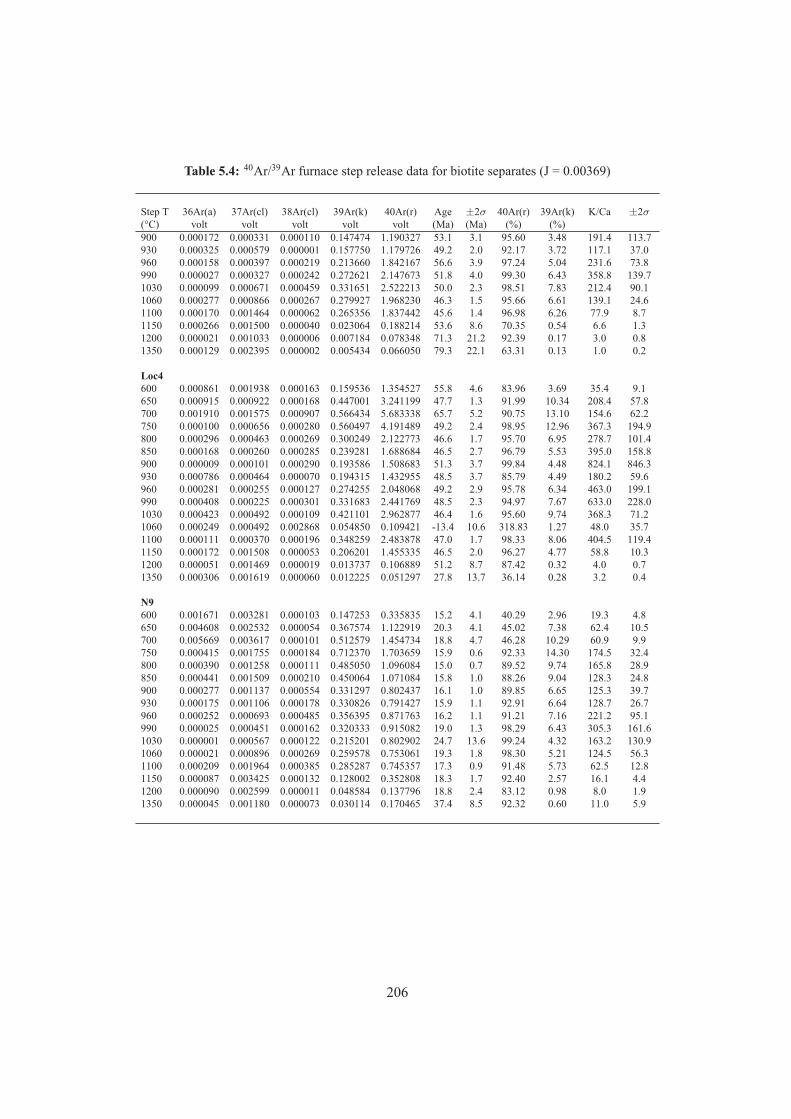
Table 5.4: 40Ar/39Ar furnace step release data for biotite separates (J = 0.00369)
Step T 36Ar(a) 37Ar(cl) 38Ar(cl) 39Ar(k) 40Ar(r) Age ±2σ 40Ar(r) 39Ar(k) K/Ca ±2σ
(°C) volt volt volt volt volt (Ma) (Ma) (%) (%)900 0.000172 0.000331 0.000110 0.147474 1.190327 53.1 3.1 95.60 3.48 191.4 113.7930 0.000325 0.000579 0.000001 0.157750 1.179726 49.2 2.0 92.17 3.72 117.1 37.0960 0.000158 0.000397 0.000219 0.213660 1.842167 56.6 3.9 97.24 5.04 231.6 73.8990 0.000027 0.000327 0.000242 0.272621 2.147673 51.8 4.0 99.30 6.43 358.8 139.71030 0.000099 0.000671 0.000459 0.331651 2.522213 50.0 2.3 98.51 7.83 212.4 90.11060 0.000277 0.000866 0.000267 0.279927 1.968230 46.3 1.5 95.66 6.61 139.1 24.61100 0.000170 0.001464 0.000062 0.265356 1.837442 45.6 1.4 96.98 6.26 77.9 8.71150 0.000266 0.001500 0.000040 0.023064 0.188214 53.6 8.6 70.35 0.54 6.6 1.31200 0.000021 0.001033 0.000006 0.007184 0.078348 71.3 21.2 92.39 0.17 3.0 0.81350 0.000129 0.002395 0.000002 0.005434 0.066050 79.3 22.1 63.31 0.13 1.0 0.2
Loc4600 0.000861 0.001938 0.000163 0.159536 1.354527 55.8 4.6 83.96 3.69 35.4 9.1650 0.000915 0.000922 0.000168 0.447001 3.241199 47.7 1.3 91.99 10.34 208.4 57.8700 0.001910 0.001575 0.000907 0.566434 5.683338 65.7 5.2 90.75 13.10 154.6 62.2750 0.000100 0.000656 0.000280 0.560497 4.191489 49.2 2.4 98.95 12.96 367.3 194.9800 0.000296 0.000463 0.000269 0.300249 2.122773 46.6 1.7 95.70 6.95 278.7 101.4850 0.000168 0.000260 0.000285 0.239281 1.688684 46.5 2.7 96.79 5.53 395.0 158.8900 0.000009 0.000101 0.000290 0.193586 1.508683 51.3 3.7 99.84 4.48 824.1 846.3930 0.000786 0.000464 0.000070 0.194315 1.432955 48.5 3.7 85.79 4.49 180.2 59.6960 0.000281 0.000255 0.000127 0.274255 2.048068 49.2 2.9 95.78 6.34 463.0 199.1990 0.000408 0.000225 0.000301 0.331683 2.441769 48.5 2.3 94.97 7.67 633.0 228.01030 0.000423 0.000492 0.000109 0.421101 2.962877 46.4 1.6 95.60 9.74 368.3 71.21060 0.000249 0.000492 0.002868 0.054850 0.109421 -13.4 10.6 318.83 1.27 48.0 35.71100 0.000111 0.000370 0.000196 0.348259 2.483878 47.0 1.7 98.33 8.06 404.5 119.41150 0.000172 0.001508 0.000053 0.206201 1.455335 46.5 2.0 96.27 4.77 58.8 10.31200 0.000051 0.001469 0.000019 0.013737 0.106889 51.2 8.7 87.42 0.32 4.0 0.71350 0.000306 0.001619 0.000060 0.012225 0.051297 27.8 13.7 36.14 0.28 3.2 0.4
N9600 0.001671 0.003281 0.000103 0.147253 0.335835 15.2 4.1 40.29 2.96 19.3 4.8650 0.004608 0.002532 0.000054 0.367574 1.122919 20.3 4.1 45.02 7.38 62.4 10.5700 0.005669 0.003617 0.000101 0.512579 1.454734 18.8 4.7 46.28 10.29 60.9 9.9750 0.000415 0.001755 0.000184 0.712370 1.703659 15.9 0.6 92.33 14.30 174.5 32.4800 0.000390 0.001258 0.000111 0.485050 1.096084 15.0 0.7 89.52 9.74 165.8 28.9850 0.000441 0.001509 0.000210 0.450064 1.071084 15.8 1.0 88.26 9.04 128.3 24.8900 0.000277 0.001137 0.000554 0.331297 0.802437 16.1 1.0 89.85 6.65 125.3 39.7930 0.000175 0.001106 0.000178 0.330826 0.791427 15.9 1.1 92.91 6.64 128.7 26.7960 0.000252 0.000693 0.000485 0.356395 0.871763 16.2 1.1 91.21 7.16 221.2 95.1990 0.000025 0.000451 0.000162 0.320333 0.915082 19.0 1.3 98.29 6.43 305.3 161.61030 0.000001 0.000567 0.000122 0.215201 0.802902 24.7 13.6 99.24 4.32 163.2 130.91060 0.000021 0.000896 0.000269 0.259578 0.753061 19.3 1.8 98.30 5.21 124.5 56.31100 0.000209 0.001964 0.000385 0.285287 0.745357 17.3 0.9 91.48 5.73 62.5 12.81150 0.000087 0.003425 0.000132 0.128002 0.352808 18.3 1.7 92.40 2.57 16.1 4.41200 0.000090 0.002599 0.000011 0.048584 0.137796 18.8 2.4 83.12 0.98 8.0 1.91350 0.000045 0.001180 0.000073 0.030114 0.170465 37.4 8.5 92.32 0.60 11.0 5.9
206
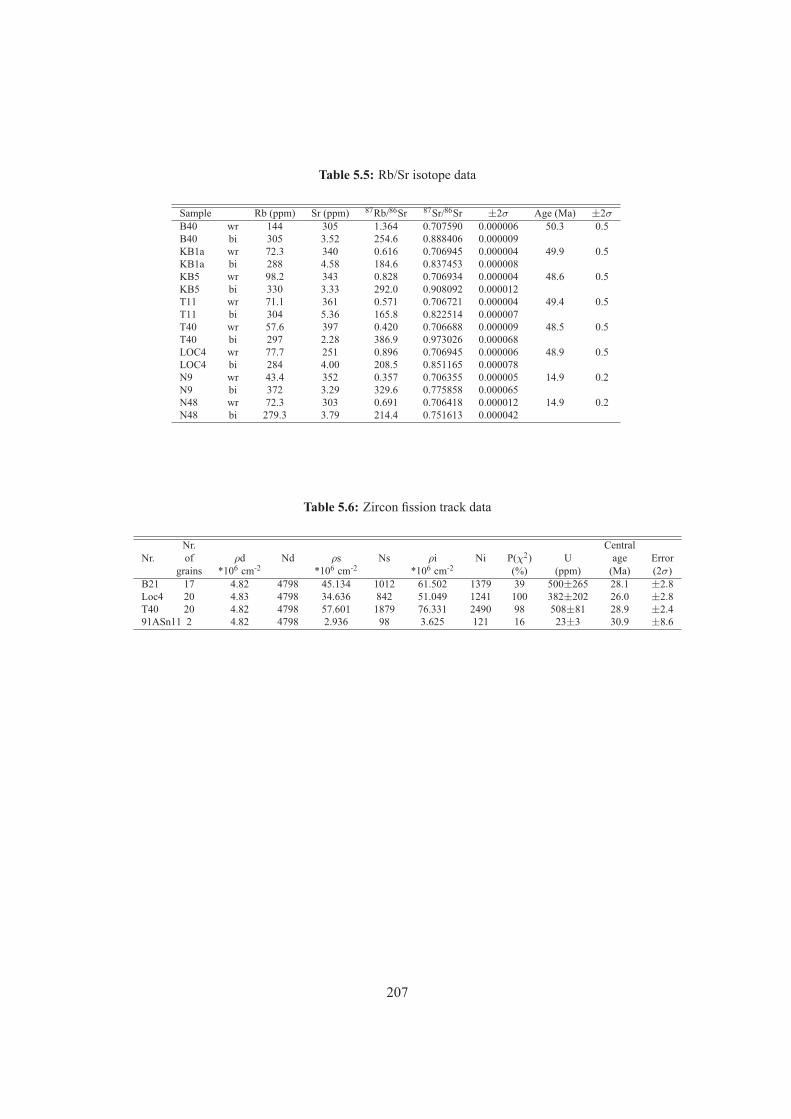
Table 5.5: Rb/Sr isotope data
Sample Rb (ppm) Sr (ppm) 87Rb/86Sr 87Sr/86Sr ±2σ Age (Ma) ±2σ
B40 wr 144 305 1.364 0.707590 0.000006 50.3 0.5B40 bi 305 3.52 254.6 0.888406 0.000009KB1a wr 72.3 340 0.616 0.706945 0.000004 49.9 0.5KB1a bi 288 4.58 184.6 0.837453 0.000008KB5 wr 98.2 343 0.828 0.706934 0.000004 48.6 0.5KB5 bi 330 3.33 292.0 0.908092 0.000012T11 wr 71.1 361 0.571 0.706721 0.000004 49.4 0.5T11 bi 304 5.36 165.8 0.822514 0.000007T40 wr 57.6 397 0.420 0.706688 0.000009 48.5 0.5T40 bi 297 2.28 386.9 0.973026 0.000068LOC4 wr 77.7 251 0.896 0.706945 0.000006 48.9 0.5LOC4 bi 284 4.00 208.5 0.851165 0.000078N9 wr 43.4 352 0.357 0.706355 0.000005 14.9 0.2N9 bi 372 3.29 329.6 0.775858 0.000065N48 wr 72.3 303 0.691 0.706418 0.000012 14.9 0.2N48 bi 279.3 3.79 214.4 0.751613 0.000042
Table 5.6: Zircon fission track data
Nr. CentralNr. of ρd Nd ρs Ns ρi Ni P(χ2) U age Error
grains *106 cm-2 *106 cm-2 *106 cm-2 (%) (ppm) (Ma) (2σ)B21 17 4.82 4798 45.134 1012 61.502 1379 39 500±265 28.1 ±2.8Loc4 20 4.83 4798 34.636 842 51.049 1241 100 382±202 26.0 ±2.8T40 20 4.82 4798 57.601 1879 76.331 2490 98 508±81 28.9 ±2.491ASn11 2 4.82 4798 2.936 98 3.625 121 16 23±3 30.9 ±8.6
207

Chapter 6
Conclusions
The Chugach Metamorphic Complex (CMC) of southern Alaska is a large-scale, short-livedmetamorphic complex which developed in the fore-arc of an active subduction zone shortlyafter the accretion of large amounts of sediments to this convergent margin. Structuralfieldwork, coupled with a range of different geochronological methods allowed to constrainthe spatial and temporal evolution of this complex in more detail. The main results of thisthesis and a comparison with previous results are summarized in this chapter.
6.1 Large-scale three-dimensional geometry of the complex
The geometry of the CMC was first described in a reconnaissance study by Hudson &Plafker (1982). They described the complex between the Copper River in the west and theU.S. Canadian border in the east as consisting of an inner high-grade gneiss zone surroundedby an outer schist zone. Contrary to the map of Hudson & Plafker (1982), no schist zonewas encountered to the south of the gneiss zone along the two transects mapped duringthis study in the western and central parts of the complex. According to the results of thisthesis, the southern border of the CMC is controlled by steeply north-dipping, semi-brittleto brittle shear zones and fault zones with north-side up and dextral sense of movement. Theresults of this thesis reveal a strong asymmetry of the western and central parts of the CMCwith a wide transition from phyllites to gneisses in the north and an abrupt, fault-boundedjuxtaposition of gneisses against phyllites in the south.
Pavlis & Sisson (1995, 2003) studied the transition from the northern phyllite zone to thegneiss zone in the central part of the complex as well as the termination of the complextowards the west. They described three different fabrics, D1-D3, which control the internalgeometry of the complex. The presence of these three fabrics was confirmed during thisstudy. D1 is dominant in the phyllite zone outside of the complex, D2 becomes dominantin the southern part of the schist zone and the entire gneiss zone and D3 is heterogeneously
209
developed throughout the schist and gneiss zone. D3 defines a foliation fan in the gneisszone, with south-dipping foliation planes in the north and north-dipping planes in the south.D3 is most intensely developed along the southern border of the complex, where the asso-ciated ductile stretching lineation is plunging towards the west/northwest, in contrast to thesubhorizontal stretching lineation farther north.
The extension of the metamorphic rocks of the CMC towards the south-east was never ad-dressed during previous studies. Rocks belonging to the gneiss zone of the CMC disappearbelow the extensive Seward glacier east of the U.S. Canadian border. A narrow strip ofChugach terrane rocks extends from this highly-glaciated region south-eastwards to Bara-nof Island. During this study, a transect was mapped across this narrow strip where therocks are accessible along the extension of the Nunatak fjord. The metamorphic grade ofthese rocks is similar to the gneiss zone farther west, the structural geometry is similar witha flat-lying (D2) fabric and a steep (D3) fabric, and the metamorphic peak age is identical,suggesting that the metamorphic rocks of the CMC continue around the bend in strike of theChugach terrane below Seward glacier at least as south-eastward as Nunatak fjord. A studyfrom Baranof Island derived similar metamorphic conditions as we derived for the gneisszone of the CMC (Zumsteg et al., 2003), but whether the rocks between Nunatak fjord andBaranof Island show continuously a relatively high metamorphic grade is not known.
6.2 Temporal evolution of the complex: rates of tectonic andthermal processes
The temporal evolution of the CMC was so far constrained by (a) the biostratigraphic LateCretaceous age of sedimentary rocks exposed along-strike of the complex (e.g. Plafker et al.,1994) and (b) limited K/Ar and 40Ar/39Ar cooling ages of metamorphic and magmatic rocksof the complex (Hudson et al., 1977b, 1979; Sisson et al., 1989; Bradley et al., 1993; Sissonet al., 2003). K/Ar and 40Ar/39Ar cooling ages of hornblende and biotite from the westernand central part of the complex are predominantly ~53-47 Ma, suggesting an Early Eoceneage of metamorphism (Hudson et al., 1979; Sisson et al., 1989; Bradley et al., 1993). K/Arand 40Ar/39Ar cooling ages of hornblende and biotite from magmatic rocks exposed in thenarrow strip of the Chugach terrane between Seward glacier and Baranof Island scatter morewidely and are as young as ~18 Ma (Hudson et al., 1977b; Bradley et al., 1993; Sisson et al.,1989), either suggesting a younger metamorphic peak age or a different cooling historycompared to the western and central parts of the complex.
The geochronological results obtained during this study allow constraining the temporalevolution of the complex in more detail. Firstly, the depositional age of the sediments inwhich the complex developed was determined by LA-ICP-MS dating of detrital zircon pop-ulations. The depositional ages are ~60-65 Ma for three samples, suggesting a Paleocenedepositional age for these parts of the complex, and ~75 Ma for one sample from the deepest
210
part of the complex, suggesting that Late Cretaceous rocks build up lower parts of the com-plex. Secondly, the age of peak metamorphism is constrained by the first U-Pb SHRIMPages of metamorphic zircons and monazites available for the complex to ~55-51 Ma. Theonly zircon age available for the south-eastern part of the complex is within error of two ofseven zircon ages and three of four monazite ages from the western and central parts of thecomplex, suggesting that the peak metamorphic conditions were reached simultaneouslyat least ~350 km along strike. Thirdly, the cooling history of the complex is constrainedby 40Ar/39Ar muscovite and biotite dating, Rb/Sr isochron dating and zircon fission trackdating for different parts of the complex. Cooling ages for the western and central parts ofthe complex are relatively old (~50-25 Ma for the different systems), whereas cooling agesfor the south-eastern part of the complex are relatively young (~35-15 Ma for the differentsystems).
Based on these newly obtained geochronological data, thermal and tectonic rates can becalculated. Assuming a starting temperature of the sediments of 20°C at the time of de-position at ~60-65 Ma, and a peak temperature of ~650-700°C derived from thermometryat the metamorphic peak at ~55-52 Ma, heating rates of ~60-140°C/Ma result. Similarly,assuming no burial at time of deposition, and ~15-50 km burial at the metamorphic peakderived from barometry, burial rates of ~1-10 mm/a result. Cooling rates are different forthe western/central and the south-eastern part of the complex, respectively. In the west-ern and central parts, cooling ages result in cooling rates of ~30-180°C/Ma shortly afterthe peak followed by much slower cooling of ~10-20°C/Ma. Cooling ages from the south-eastern part of the complex result in slow, regular cooling rates of ~6-10°C/Ma for mostof its cooling history, followed by ~20-40°C/Ma during the last ~5-10 Ma. Exhumationrates are more difficult to constrain. Assuming that the slow regular cooling of the south-eastern section also corresponds to exhumation and that the distribution of isotherms did notchange after the metamorphic peak, exhumation rates of ~0.3-0.5 mm/a can be calculatedfor the first ~40-45 Ma of cooling followed by higher exhumation rates of ~1-2 mm/a duringthe last ~5-10 Ma. The situation is more complex for the western and central parts of theCMC, since maximum burial depths derived from barometry vary more widely and there-fore differential exhumation must have occurred. For the schist zone and parts of the gneisszone with moderate burial depths, the fast cooling reported shortly after the metamorphicpeak could simply represent passive cooling without exhumation due to the relaxation ofisotherms after an elevated geothermal gradient. However, the large burial depths derivedfor parts of the gneiss zone implicate that the fast cooling must have been accompanied byexhumation, which probably was very fast, too.
211
6.3 Tectonic interpretation: Is a subducting ridge needed?
The structural and geochronological data derived during this thesis have implications forthe tectonic interpretation of the complex in a regional context. The presence of andalusite-sillimanite-grade metamorphism in an accretionary prism in the fore-arc of a subductionzone has been attributed by many workers to the subduction of an oceanic spreading ridgebelow the margin, which acted as an additional heat source for the metamorphism (e.g.Marshak & Karig, 1977; Bradley et al., 1993, 2003; Sisson et al., 1989; Sisson & Pavlis,1993; Pavlis & Sisson, 1995, 2003; Häussler et al., 1995, 2003a; Madsen et al., 2006; Far-ris & Paterson, 2009). This interpretation is based on the presence, age distribution andgeochemical composition of the Sanak-Baranof plutonic belt in the fore-arc and the low-pressure estimates for the CMC of Sisson et al. (1989; ~2-3 kbar). The Paleocene-Eocenehistory of southern Alaska has even been increasingly cited as representing the most spec-tacular ancient example of a ridge subduction event (e.g. Farris & Paterson, 2009). However,results of this thesis and results of the thesis of Bruand (2010) suggest that this model mayneed to be modified. Several points are exemplarily discussed below.
(1) Age gradient The west-east age gradient which is reported for the Sanak-Baranof in-trusions has been interpreted as tracking the location of the subducting ridge from west toeast, with a mean migration rate of ~19 cm/a (Farris & Paterson, 2009). U/Pb, 40Ar/39Ar,Rb/Sr and K/Ar ages have been used to define this age trend (e.g. Bradley et al., 1993,2000, 2003). However, the results of this study show that 40Ar/39Ar, Rb/Sr and K/Ar agesare cooling ages and can be considerably younger than the metamorphic peak / initial crys-tallization of magmatic rocks. Therefore, only U/Pb ages should be used to study potentialage gradients from west to east since these ages are closest to the metamorphic peak / initialcrystallization of magmatic rocks and are comparable with each other. An analysis of allavailable U/Pb ages for the Sanak-Baranof belt including our newly obtained monazite andzircon U/Pb ages reveals that the age gradient is not continuous, but is characterized by sec-tions ~200-400 km wide on which magmatism and metamorphism was coeval. Therefore,if plutonism occurred simultaneously at places ~200-400 km separated from each other,then either several ridges were present, or the ridge moved so fast that the age differencesbetween the plutons are below the resolution of the dating methods, or the ridge might havesubducted parallel to the margin. This last possibility is implemented in the models of Häus-sler et al. (2003a) and Madsen et al. (2006) at least for the eastern part of the belt, where theridge between the Resurrection and Kula plates is thought to have subducted parallel to themargin.
(2) Fast cooling rates Thermal modelling of the effect of ridge subduction below a marginshowed that depending on the migration rate of the subducting ridge parallel to the margin,heating can be relatively fast in the order of a few million years, but cooling generally
212
occurs over longer time periods due to long thermal decay times along the trailing edgeof the slab window (Groome & Thorkelson, 2009). The fast cooling observed at depthsof 20-50 km in the western and central parts of the CMC is difficult to explain by fastquenching from below after the passage of a subducting ridge, since such a ridge is borderedby young and hot oceanic lithosphere. Moreover, if the ridge subducted parallel to themargin as indicated by the coeval peak metamorphic ages, it is even more difficult to quicklyremove the subducting heat source in order to produce the fast cooling observed after themetamorphic peak. Therefore, the fast cooling rates reported shortly after the metamorphicpeak in the western and central parts of the complex are difficult to explain with the modelof a subducting ridge below the margin.
(3) Which ridge? One of the drawbacks of the ridge subduction model is the uncertaintyabout which ridge actually subducted below the margin. Plate tectonic reconstructionsbased on the magnetic record preserved on the Pacific plate show the presence of threeoceanic plates in the Pacific basin during the Paleocene-Eocene: the Kula, Farallon andPacific plates (e.g. Engebretson et al., 1985; Atwater, 1989; Doubrovine & Tarduno, 2008).The ridge between the Kula and Farallon plates probably intersected the North Americanmargin somewhere between Northern California and British Columbia - an intersection asnorth as the present location of the Sanak-Baranof belt is unlikely (Doubrovine & Tarduno,2008). Therefore, there are three possible interpretations for the formation of the Sanak-Baranof belt and the CMC in this context: (a) the entire belt was farther to the south dur-ing magmatism and metamorphism, somewhere in the region of Vancouver Island, and themagmatic belt is the result of the intersection with the Kula-Farallon spreading ridge (e.g.Cowan, 2003), (b) the belt was already in its present location during intrusion and metamor-phism, and the metamorphic and magmatic event was caused by a spreading ridge betweenthe Kula plate and an additional oceanic plate, which is since then completely subducted(the Resurrection plate, e.g. Häussler et al., 2003a; Madsen et al., 2006), or (c) the mag-matic and metamorphic events are not related to the subduction of a spreading ridge but aredue to a combination of the geometry of the margin and the relative plate motions betweenthe oceanic plates and the continental margin which led to alternating oblique convergenceand divergence.
(4) Alternative model The last possibility from above might be supported by the higherpressure estimates and the structural record reported in Bruand (2010) and this study: thepressure estimates derived by Bruand (2010) for the three transects studied in this thesisare constantly higher than the pressure estimates derived earlier by Sisson et al. (1989) forthe northern and western parts of the complex. Given these higher pressure estimates, themetamorphic grade observed is not that unusual and similar to other metamorphic com-plexes exposed in different parts of the world where no ridge subduction was inferred. Inaddition, if combined with the structural record, the metamorphic conditions observed mightbe explained by the following scenario: (1) accretion of large amounts of sediments which
213
led to relatively high initial geothermal gradients in the accretionary prism, (2) followed byvertical flattening and margin-parallel stretching related to changing boundary conditionsleading to compression of isotherms and the onset of andalusite-sillimanite-grade metamor-phism, (3) followed by renewed dextral transpression which led, aided by erosion at thesurface, to fast cooling and partial exhumation of parts of the gneiss zone. In this scenario,the subduction of a spreading ridge below the complex is not required and the metamor-phism is the result of a vertical thinning event which affected the margin.
Given the uncertainties which accompany the ridge subduction model, and given the newthermobarometric, structural and geochronological data, the subduction of a ridge belowthe Alaskan margin is probably only one of different possible explanations for the tectonichistory of the margin, and has, as other models alike, its pitfalls and drawbacks. There-fore, it should be continuously tested against newly emerging field and laboratory data andalternative options should be continuously evaluated as well.
6.4 Outlook
Understanding the tectonic evolution of a complex region such as the southern Alaskanmargin probably never comes to an end. In the following, a loose collection of open ques-tions and regional problems is given which is meant to provide the reader possible input forfurther work.
(1) The metamorphic pressures obtained for rocks from the south-eastern transect alongNunatak fjord belong to the highest pressures reported for the CMC so far (Bruand, 2010).However, the extension of these higher-pressure rocks towards the south-east is unknown.Especially the metamorphic conditions exposed in the Fairweather corridor would be of in-terest, since large-scale gabbroic bodies intrude these rocks (Loney & Himmelberg, 1983).Neither the metamorphic grade of the country rocks of the plutons nor the age of the gab-broic intrusions is known. Studying structural and metamorphic variations in this narrowcorridor of Chugach terrane rocks may give indications on the behaviour of this obliquetranspressional orogen.
(2) The metamorphic conditions and temporal evolution of the tectonic slivers present tothe south/south-west of the CMC (Boundary block, Mt. Steller-St. Elias ridge) are notconstrained at all. Metamorphic grade seems to increase from west to east/north-west tosouth-east, but neither the exact values nor the timing of burial and exhumation are known.Understanding the evolution of these blocks would help constraining the deformational his-tory of the large-scale Fairweather-Contact fault system, and would reveal the bedrock his-tory of the second highest peak of the United States: Mt St Elias.
(3) The region covered by the Seward glacier, where the strike of the CMC turns from
214
E-W to NW-SE, has recently revealed zircon fission track ages younger than ~3 Ma (e.g.Enkelmann et al., 2009), indicating that considerable exhumation of rocks occurred belowSeward glacier during the last 5 Ma. The maximum pressures experienced by the meta-morphic rocks of the CMC increase from west to east (Bruand, 2010), suggesting that thehighest pressures might have been recorded by rocks underlying the Seward glacier. Ittherefore would be interesting to derive thermobarometric data from rocks exposed as smallnunataks sticking out of Seward glacier.
(4) Whereas concordant U/Pb ages from the western Sanak-Baranof belt are available (Sanak-Island to Kodiak Island, Bradley et al., 2000; Farris et al., 2006), and concordant U/Pb agesfrom the eastern belt were presented in this thesis, concordant U/Pb ages from the magmaticrocks in Prince William Sound are lacking. This is important, since it has been suggestedearlier (e.g. Hudson et al., 1979) that the belt may consist of an older western segment, anda younger eastern segment. Indeed, the concordant ages from the western belt are~61-59Ma, whereas the concordant ages from the eastern belt are~55-50 Ma. Obtaining concor-dant ages from the plutons in between would reveal whether they belong to one of the twogroups or whether they lie in between.
(5) The magmatism of the Sanak-Baranof plutonic belt is always cited as representing fore-arc magmatism relative to a ’real’ magmatic arc located farther inboard. Depending onwhere the Sanak-Baranof belt was located along the margin during the magmatic event,either the Coast Plutonic Belt of British Columbia or the Alaska-Range belt of west-centralAlaska are referred to as representing the contemporaneous real magmatic arc. Whereas forthe Coast Plutonic Belt a large amount of geochronological data exists (e.g. Gehrels et al.,2009), a modern compilation of age information from the Alaska Range belt is lacking.Such a compilation would be needed in order to evaluate the synchronicity of magmatismin the Sanak-Baranof and Alaska Range belts.
215


APPENDICES
217

Appendix A
Tectonic and metamorphic evolution of the ChugachMetamorphic Complex, Alaska: A progress report
Abstract In this contribution we present a progress report of a research project conductedby the authors in the framework of two PhD theses at the Department of Earth Sciencesat the University of Graz. In this project, the tectonic and metamorphic evolution of ametamorphic complex is studied by combining different petrological and geochronologicalapproaches. First petrological results constrain the metamorphic conditions in the core to600-700°C / 4-9 kbar and to <550°C in the outer part of the complex. First geochronologicalresults are expected to be obtained in late 2009. The results will be used to formulate andconstrain a geodynamic model for the evolution of this metamorphic complex.
published as: Gasser, D., Bruand, E. (2009) Tectonic and metamorphic evolution of theChugach Metamorphic Complex, Alaska: A progress report. Erstausgabe, Veröffentlichun-gen junger WissenschafterInnen der Universität Graz, 149-158.
219
A.1 Introduction
Sediments deposited on the surface of the Earth undergo various processes that change theirmineralogical and chemical composition as well as their structure when they are buried andheated up in diverse tectonic settings. These processes are generally summarized under theterm “metamorphism” (e.g. Bucher & Frey, 2002). To observe such metamorphic rocks atthe Earth´s surface, they have to be exhumed from depth after a metamorphic event. Theexact physical conditions (pressure and temperature) and timing of both metamorphismand exhumation events puzzles geologists since the beginning of geological science andunderstanding them needs a strong co-operation between different sub-fields of geologysuch as petrology, tectonics and geochronology (e.g. Stuewe, 2007).
In this contribution we present a progress report of two PhD theses conducted by the authorsat the department of Earth Science at the University of Graz under the supervision of Prof.Kurt Stüwe. In this project we try to quantify physical conditions and timing of both meta-morphism and exhumation of a naturally occurring metamorphic complex in south-easternAlaska. The project started in October 2007 and is funded by FWF project Nr. 19366-N10for a period of three years.
A.2 Geological Setting and Project Aims
The Chugach Metamorphic Complex (CMC) is a ~370 km long and ~10-50 km wide zoneof metamorphic rocks exposed in the Chugach Mountains in south-eastern Alaska (Hud-son & Plafker, 1982, Figs. A.1 and A.2). It developed in meta-sedimentary rocks of theChugach terrane, which mainly consists of greenschist-facies sandstones, slates and minorbasalts of the Valdez group (Nilsen & Zuffa, 1982). The Chugach terrane is bordered by theBorder Ranges Fault in the north and the Contact fault in the south, which are both long-lived, complex fault zones with compressional and dextral strike-slip components (Pavlis& Roeske, 2007). The Chugach terrane is part of a group of similar terranes that have allbeen subsequently accreted to North America in a subduction zone context (eg. Wrangellia,Chugach, Prince William and Yakutat terranes; Fig. A.1). The Yakutat terrane still activelycollides with the Prince William and Chugach terranes in the south-eastern corner of Alaska(Fig. A.1; Berger et al., 2008a). The subduction and collision of this terrane leads to activevolcanism in the Wrangellia terrane and to the creation of major topography and intenseglaciation in the Chugach-St. Elias Mountains (Figs. A.1, A.2 and A.3a).
The CMC itself consists of an outer schist zone of lower amphibolite facies grade and an in-ner gneiss zone of upper amphibolite facies grade including migmatites that are surroundedby lower grade phyllites (Fig. A.2). Numerous plutonic bodies from few meter to severalkilometer size cross-cut both the schist and gneiss zones. The complex is not symmetric in
220
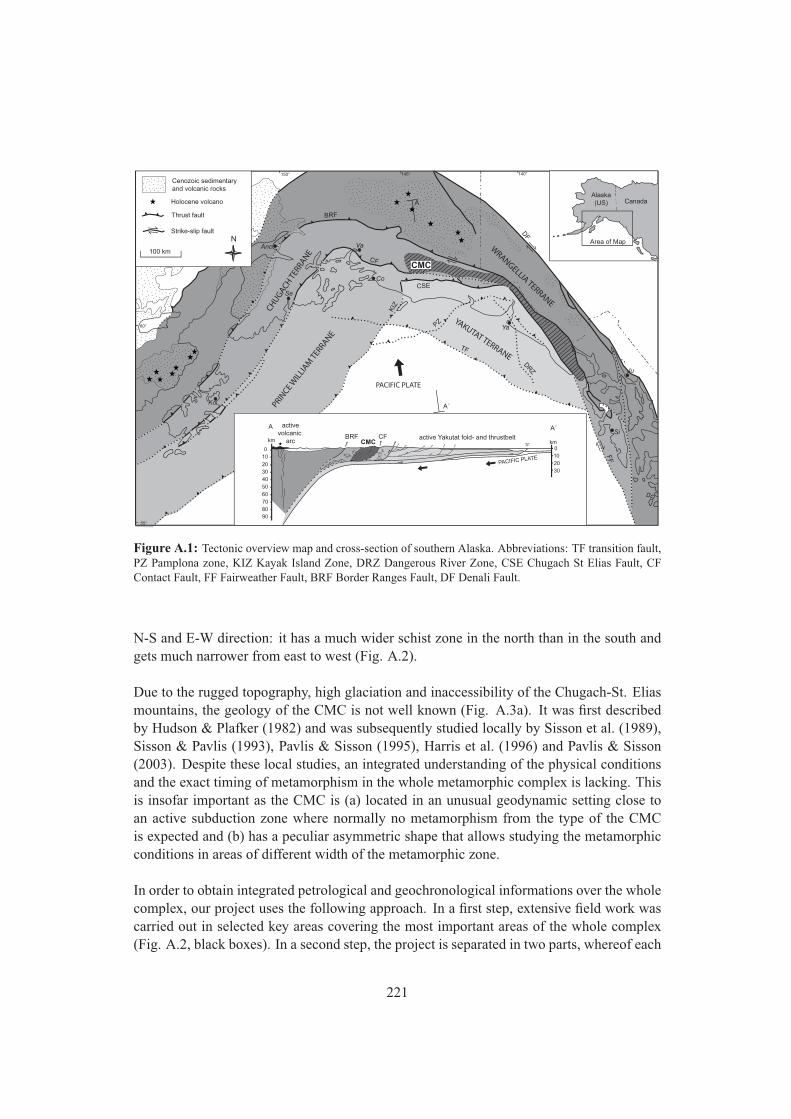
Anc
Se
Va
Co
Ya
Si
Ju
Alaska(US) Canada
Ko
PACIFIC PLATE
CF
BRF
FF
CSE
Area of Map
DF
TF
KIZ
PZ
DRZ
155° 150° 145° 140°
60°
55°
PRINCE W
ILLI
AM TE
RRANE
CHUGACH TER
RANE
WRANGELLIA TERRANE
YAKUTAT TERRANE
CMC
TF
PACIFIC PLATE
active Yakutat fold- and thrustbeltCMC
activevolcanic
arc
10
20
30
40
50
60
70
8090
0
km
10
20
30
0km
A A´CFBRF
Holocene volcano
100 km
Cenozoic sedimentaryand volcanic rocks
Thrust fault
Strike-slip fault
A
A´
N
Figure A.1: Tectonic overview map and cross-section of southern Alaska. Abbreviations: TF transition fault,PZ Pamplona zone, KIZ Kayak Island Zone, DRZ Dangerous River Zone, CSE Chugach St Elias Fault, CFContact Fault, FF Fairweather Fault, BRF Border Ranges Fault, DF Denali Fault.
N-S and E-W direction: it has a much wider schist zone in the north than in the south andgets much narrower from east to west (Fig. A.2).
Due to the rugged topography, high glaciation and inaccessibility of the Chugach-St. Eliasmountains, the geology of the CMC is not well known (Fig. A.3a). It was first describedby Hudson & Plafker (1982) and was subsequently studied locally by Sisson et al. (1989),Sisson & Pavlis (1993), Pavlis & Sisson (1995), Harris et al. (1996) and Pavlis & Sisson(2003). Despite these local studies, an integrated understanding of the physical conditionsand the exact timing of metamorphism in the whole metamorphic complex is lacking. Thisis insofar important as the CMC is (a) located in an unusual geodynamic setting close toan active subduction zone where normally no metamorphism from the type of the CMCis expected and (b) has a peculiar asymmetric shape that allows studying the metamorphicconditions in areas of different width of the metamorphic zone.
In order to obtain integrated petrological and geochronological informations over the wholecomplex, our project uses the following approach. In a first step, extensive field work wascarried out in selected key areas covering the most important areas of the whole complex(Fig. A.2, black boxes). In a second step, the project is separated in two parts, whereof each
221
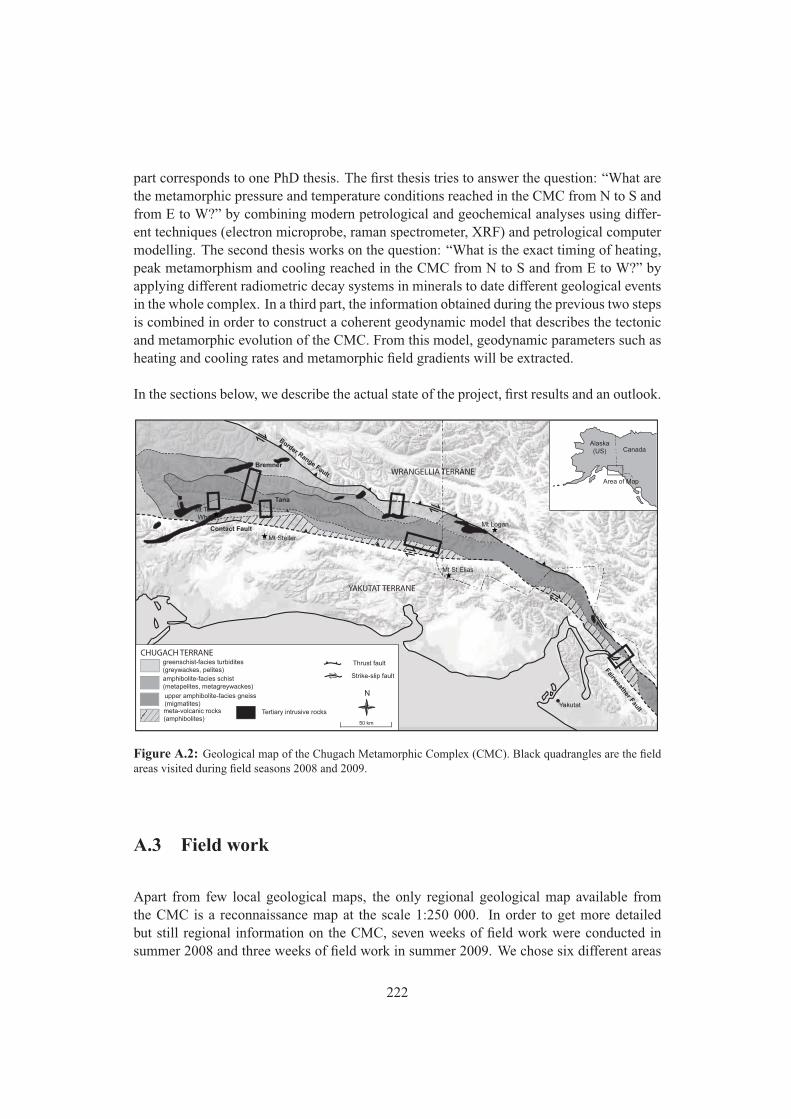
part corresponds to one PhD thesis. The first thesis tries to answer the question: “What arethe metamorphic pressure and temperature conditions reached in the CMC from N to S andfrom E to W?” by combining modern petrological and geochemical analyses using differ-ent techniques (electron microprobe, raman spectrometer, XRF) and petrological computermodelling. The second thesis works on the question: “What is the exact timing of heating,peak metamorphism and cooling reached in the CMC from N to S and from E to W?” byapplying different radiometric decay systems in minerals to date different geological eventsin the whole complex. In a third part, the information obtained during the previous two stepsis combined in order to construct a coherent geodynamic model that describes the tectonicand metamorphic evolution of the CMC. From this model, geodynamic parameters such asheating and cooling rates and metamorphic field gradients will be extracted.
In the sections below, we describe the actual state of the project, first results and an outlook.
Mt Steller
Mt Tom White
Mt St Elias
Mt Logan
Yakutat
CHUGACH TERRANE
upper amphibolite-facies gneiss(migmatites)
greenschist-facies turbidites(greywackes, pelites)
50 km
Thrust fault
Strike-slip faultamphibolite-facies schist(metapelites, metagreywackes)
meta-volcanic rocks(amphibolites)
Tertiary intrusive rocks
N
Alaska(US) Canada
Area of Map
Border Range Fault
Contact Fault
Fairweather Fault
YAKUTAT TERRANE
WRANGELLIA TERRANEBremner
Tana
Figure A.2: Geological map of the Chugach Metamorphic Complex (CMC). Black quadrangles are the fieldareas visited during field seasons 2008 and 2009.
A.3 Field work
Apart from few local geological maps, the only regional geological map available fromthe CMC is a reconnaissance map at the scale 1:250 000. In order to get more detailedbut still regional information on the CMC, seven weeks of field work were conducted insummer 2008 and three weeks of field work in summer 2009. We chose six different areas
222
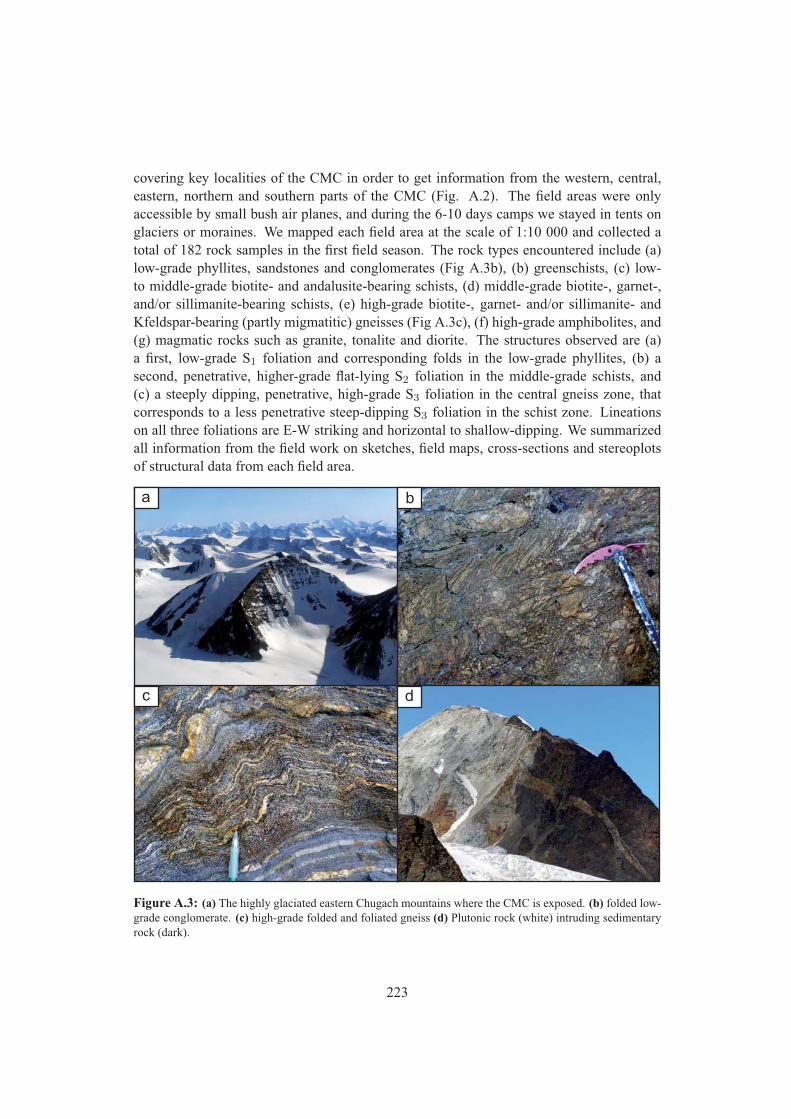
covering key localities of the CMC in order to get information from the western, central,eastern, northern and southern parts of the CMC (Fig. A.2). The field areas were onlyaccessible by small bush air planes, and during the 6-10 days camps we stayed in tents onglaciers or moraines. We mapped each field area at the scale of 1:10 000 and collected atotal of 182 rock samples in the first field season. The rock types encountered include (a)low-grade phyllites, sandstones and conglomerates (Fig A.3b), (b) greenschists, (c) low-to middle-grade biotite- and andalusite-bearing schists, (d) middle-grade biotite-, garnet-,and/or sillimanite-bearing schists, (e) high-grade biotite-, garnet- and/or sillimanite- andKfeldspar-bearing (partly migmatitic) gneisses (Fig A.3c), (f) high-grade amphibolites, and(g) magmatic rocks such as granite, tonalite and diorite. The structures observed are (a)a first, low-grade S1 foliation and corresponding folds in the low-grade phyllites, (b) asecond, penetrative, higher-grade flat-lying S2 foliation in the middle-grade schists, and(c) a steeply dipping, penetrative, high-grade S3 foliation in the central gneiss zone, thatcorresponds to a less penetrative steep-dipping S3 foliation in the schist zone. Lineationson all three foliations are E-W striking and horizontal to shallow-dipping. We summarizedall information from the field work on sketches, field maps, cross-sections and stereoplotsof structural data from each field area.
a b
c d
Figure A.3: (a) The highly glaciated eastern Chugach mountains where the CMC is exposed. (b) folded low-grade conglomerate. (c) high-grade folded and foliated gneiss (d) Plutonic rock (white) intruding sedimentaryrock (dark).
223
A.4 Pressure and temperature conditions of metamorphism
In order to constrain the pressure and temperature of peak metamorphism, the mineralogicalassemblages and chemical compositions of mineral phases of each rock sample collectedduring field work are studied in detail. Thin sections of rock slices are investigated both withoptical and electron microscopy in order to identify all mineral phases present and to mea-sure their exact chemical composition. With the help of several experimentally calibratedthermometers and geobarometers, we calculated the temperatures and pressures present atthe time of mineral crystallization at the metamorphic peak. First temperature results cal-culated by a biotite-garnet thermometer (Kaneko, 2006) are ~600-650°C in the schist zoneand ~650-700°C in the inner gneiss zone (Fig. A.4). Temperatures and pressures calculatedwith the help of an internally consistent thermodynamic data set using the software THER-MOCALC (Holland & Powell, 1998) give as well values of ~600-650°C and ~6.1-6.4 kbarfor the schist zone and ~4.4-9.2 kbar for the gneiss zone (Fig. A.4). A trend of increasingpressure in the gneiss zone from W to E is observed as well as a slight increase in tempera-ture from the schist to the gneiss zone. Temperature for greenschist facies rocks (phyllites)as well as for the entire CMC are calculated with the RSCM thermometer (Beyssac et al.,2002) based on the crystallization degree of graphite measured by Raman spectroscopy.First results for the phyllites in the northern part of the complex give temperatures in therange of 520-550°C, and 430-450° for the phyllites in the southern part of the complex(Fig. A.4). At the moment of writing, those informations are combined on plots coveringthe whole CMC in order to better understand the spatial variations of these variables (e.g.Fig. A.4), and in order to densify the sample network where necessary. In addition, thechemical composition of the whole rocks is measured in order to study the influence of thecomposition of the rock on the mineral reactions occurring.
A.5 Geochronology
In order to constrain the age of peak metamorphism as well as the duration of heating andcooling, a series of radiogenic element decay systems is used to calculate both crystal-lization as well as cooling ages of certain minerals. In our project we concentrate on thefollowing systems:
U/Th-Pb system in monazite: Monazite is a mineral that generally crystallizes during pro-grade metamorphism between 550-650°C depending on the bulk chemistry of the sample.Monazite incorporates both U and Th during crystallization, but no Pb. All Pb measuredin a monazite crystal therefore results from the radiometric decay of U and Th. With thehelp of the decay constants and half-lives of theses systems the age of crystallization of themonazite grain can be calculated (e.g. Williams et al., 2007).
224
U/Th-Pb in zircon: This method is based on the same radiometric decay systems as theone described above. The only difference is that the mineral zircon does not grow duringprograde metamorphism, but generally during melting of the rocks above about 650-700°.Its age therefore is in general a good proxy for the timing of peak metamorphism (e.g.Rubatto et al., 2001).
40Ar/39Ar dating of mica: The 40K isotopes incorporated in micas such as biotite and mus-covite decay to 40Ar after crystallization of the mica. At high temperature, the produced40Ar diffuses out of the crystal and gets lost. However, below a certain temperature (theclosing temperature) the 40Ar gets trapped in the crystal structure of the mineral. The con-centration of 40Ar measured in a mica crystal is therefore a good proxy for the time at whichthe crystal cooled below the closure temperature of the system (e.g. ?).
Obtaining such geochronological ages is time-consuming due to the need of separating thedatable minerals from their rock matrix (in the case of zircon and micas) or document-ing them in detail in thin sections (in the case of monazites). Zircons and monazites aregenerally very small (10-100 ìm) and not easy to handle. Furthermore, expensive massspectrometers not available at the University of Graz are needed to measure the radiometricelement concentrations in the samples. At the stage of writing, ~20 Ar-Ar samples, ~14 zir-con samples and ~17 monazite samples are prepared for mass spectrometer analysis. TheAr-Ar samples will be measured by the first author at the geochronology laboratory of theUniversity of Florida and the zircon samples at the sensitive-ion-microprobe (SHRIMP) atthe Australian National University in Canberra in summer 2009. The monazite sampleswill be measured at the Electron microprobe facility at Montan University Leoben and theLA-ICPMS facility at University of Vienna in autumn 2009. Most age results are expectedto be obtained in late 2009.
A.6 Outlook
The research project presented in this contribution combines different petrological andgeochronological approaches in order to get an integrated interpretation of the tectonic andmetamorphic evolution of a naturally occurring metamorphic complex. Half-way throughthe project, the logistically complex fieldwork, the basic petrological analyses and the min-eral separation for geochronology are successfully conducted. In the remaining time, thepetrological data will be used to calculate and interpret metamorphic field gradients usingphase diagrams, the geochronological ages to calculate and interpret heating and coolingrates. Those informations will help to formulate and constrain geodynamic models to ex-plain the tectonic and metamorphic evolution of the Chugach Metamorphic Complex.
225
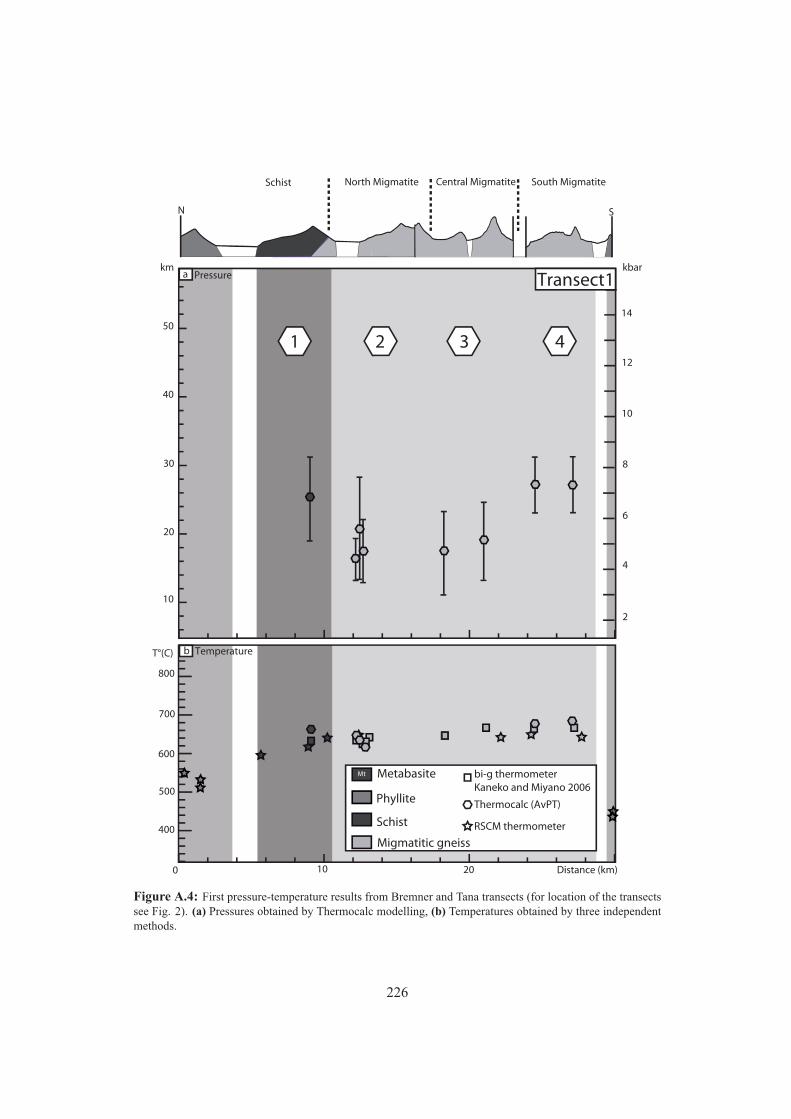
Schist North Migmatite Central Migmatite South Migmatite
500
600
400
700
km kbar
100 20 Distance (km)
N S
Phyllite
Schist
Migmatitic gneiss
a Pressure
b Temperature
20
10
30
40
50
800
2
10
14
4
6
8
12
MetabasiteMt bi-g thermometer Kaneko and Miyano 2006
Thermocalc (AvPT)
RSCM thermometer
T°(C)
Transect1
1 2 3 4
Figure A.4: First pressure-temperature results from Bremner and Tana transects (for location of the transectssee Fig. 2). (a) Pressures obtained by Thermocalc modelling, (b) Temperatures obtained by three independentmethods.
226
Appendix B
Conference abstracts related to this thesis
• Gasser, D., Stüwe, K. (2007)The Chugach Metamorphic Complex of southern Alaska:A test for wedge extrusion models? Geological Society of America Abstracts withPrograms, Vol. 39, No. 6, p. 232.
• Gasser, D., Bruand, E., Stüwe, K. (2009) Exhumation of a metamorphic complex ina strike-slip setting: observations from the Chugach Metamorphic Complex (CMC),southern Alaska. Abstract Volume 7th Swiss Geoscience Meeting, Neuchatel, p.79.
• Gasser, D., Bruand, E., Stüwe, K., Rubatto, D., Foster, D., Schuster, R. (2010) Ex-huming Metamorphic Rocks: Constraints from Cooling of the Chugach MetamorphicComplex, southern Alaska. Geophysical Research Abstracts Vol. 12, EGU2010-11742, 2010.
227
B.1 The Chugach Metamorphic Complex of southern Alaska:A test for wedge extrusion models?
High-grade metamorphic rocks are exposed in many orogenic wedges. They form at greatdepths and were then exhumed to the surface during collision. Several so-called extrusionmodels have been proposed to explain such exhumation: The rocks may have been extruded(a) as a rigid body between bounding fault zones, (b) by internal ductile channel flow, or (c)by general shear. Each of these models predicts a distinct relationship between the exhuma-tion depth of the rocks and the width of the metamorphic complex at the surface. However,most of these models were developed in the Himalayan crystalline complex, which does notvary enough in width laterally to allow a straight forward testing of the predictions of thedifferent models.
The Chugach Metamorphic Complex (CMC) of southern Alaska consists of high-grademetamorphic rocks (including migmatites) which developed in Cretaceous flysch sedimentsduring an Eocene metamorphic event. The CMC is bound by major reverse and strike-slipfault zones, and its width triples from 25 km in the east to 80 km in the west over a distanceof 150 km. The CMC may therefore be an ideal testing ground for different extrusionmodels.
Despite its interesting geometry, only little is known about the Eocene history, including themetamorphic conditions, the age of metamorphism and the exhumation history of the CMC.In a recently granted project we are currently embarking on a study to investigate transectsacross the CMC in parts of different width, in order to analyse the structural, chronologicaland metamorphic field gradients across the wedge. In this contribution we present ideashow along strike variations in field gradients in parts of different widths of the wedge canbe used to constrain the different extrusion models.
Gasser, D., Stüwe, K. (2007) Geological Society of America Abstracts with Programs, Vol.39, No. 6, p. 232.
228
B.2 Exhumation of a metamorphic complex in a strike-slip set-ting: observations from the Chugach Metamorphic Com-plex (CMC), southern Alaska
The exhumation of metamorphic rocks to the surface of the Earth is a much discussedsubject in modern geodynamics. Models involving channel flow, pure and simple shearextrusion and others have been postulated based on observations in the Central HimalayanCrystalline Complex or the eclogite complexes in the Alps. Most of these models focus onthe vertical component in profile view, not considering horizontal movements in plan view.
The CMC of Southern Alaska consists of low-P high-T gneisses that developed duringthe Eocene in a Cretaceous accretionary prism. They are exhumed from 20-35 km depthbetween major crustal-scale dextral shear zones (Fig. 1). Lineations are typically parallel tostrike and sub-horizontal, indicating that horizontal movement in plan view is a vital part ofthe exhumation process. In addition, the complex has a particular triangular shape in planview, indicating that the exhumation history might not be the same all along the complexbut might be different in parts of different width of the complex.
In order to understand the nature of the low-P high-T metamorphism in a accretionary set-ting and its subsequent exhumation history we are currently working on a project combin-ing extended field work, petrological, structural and geochronological methods. During thesummers 2008 and 2009 we mapped six key areas covering the whole complex from northto south and from east to west in order to understand the structural and petrological vari-ations all over the complex. We furthermore calculated detailed pressure and temperatureconditions that occurred during metamorphism in the different parts of the complex. In or-der to better understand the timing and the rates at which heating, cooling and exhumationoccurred, we apply several geochronological methods such as U-Pb dating of monazites andzircons, ArAr and RbSr dating of biotite and muscovite and zircon fission track dating torocks from different parts of the complex.
In this contribution we present an overview of the geology of the CMC, results from ourfield work as well as first geochronological results.
Gasser, D., Bruand, E., Stüwe, K. (2009) Abstract Volume 7th Swiss Geoscience Meeting,Neuchatel, p.79.
229
B.3 Exhuming Metamorphic Rocks: Constraints from Coolingof the Chugach Metamorphic Complex, southern Alaska
Exhumation mechanisms for metamorphic rocks include (a) erosion, (b) extension, (c) ex-trusion by channel flow, simple or pure shear, and - recently suggested - (d) slab extraction.Distinguishing in a particular case of a metamorphic complex between the different ex-humation mechanisms is a much discussed subject in modern geodynamics. In order to addto this discussion, we adopt an interdisciplinary approach combining detailed petrologicaland structural field work with several geochronological and thermochronological systems.
The Chugach Metamorphic Complex of southern Alaska is a 600 km long and 10-30 kmwide zone of upper amphibolite-facies metamorphic rocks. It lies in the outermost tectonicbelt of the North American Cordillera, which is a vast and complex Phanerozoic orogenformed from the oblique collision of the Pacific, Kula and Farallon oceanic plates and theNorth American continent. The Chugach Complex developed in the Eocene in a Cretaceousto Paleocene accretionary prism while the Kula and Pacific plates were obliquely collidingwith North America.We conducted detailed field work, U-Pb and 40Ar-39Ar geochronologyand compiled all other geochronological data from the region in order to construct coolinghistories for the whole metamorphic complex. These cooling histories vary along strike:The western and central parts of the Chugach Metamorphic Complex, where the metamor-phic complex is wide, show very fast cooling to below 300°C between 54-45 Ma, shortlyafter peak metamorphism, and then slowly cool to surface temperatures over the remaining45 Ma. In contrast, the south-eastern part; where the metamorphic complex is very narrow,slowly and steadily cooled between 51-5 Ma only to increase its cooling rate in the lastfew Ma before present. Whether and how these cooling rates can be directly linked withexhumation rates and why they differ so grossly between the wide and the narrow parts ofthe complex is the current focus of our work.
Gasser, D., Bruand, E., Stüwe, K., Rubatto, D., Foster, D., Schuster, R. (2010) GeophysicalResearch Abstracts Vol. 12, EGU2010-11742, 2010.
230
"The scientist does not study nature because it is useful; he studies it because he delights init, and he delights in it because it is beautiful."
Jules Henri Poincaré in Science et méthode, 1908

Appendix C
Internal Structural Geometry of the Paleozoic of Graz
Abstract The Paleozoic of Graz is an isolated nappe complex of about 1500 km2 sizeand belongs to the Austroalpine units of the Eastern European Alps. Despite more than 500publications on stratigraphy, paleontology and local structure, many aspects of the internalgeometry of this complex as a whole remained unclear. In this contribution, we presentintegrated geological profiles through the entire nappe complex. Based on these profileswe present (i) a simplified lithological subdivision into 13 rock associations, (ii) a modifiedtectonostratigraphy where we consider only two major tectonic units: an upper and a lowernappe system and where we abandon the traditionally used facies nappe concept, and (iii) amodified paleogeography for the whole complex. Finally, we discuss whether the internaldeformation of the Paleozoic of Graz is of Variscan or Eo-Alpine age and which of thepublished models best explain the tectonic evolution of the Paleozoic of Graz.
Keywords Paleozoic of Graz, Eastern Alps, Austria, geological profiles, structural geol-ogy
published as: Gasser, D., Stüwe, K., Fritz, H. (2009) International Journal of Earth Science,DOI: 10.1007/s00531-009-0446-0
233
C.1 Introduction
The Paleozoic of Graz is a 30 x 50 km sized nappe complex of mostly low grade carbon-ates, schists and metavolcanics of Paleozoic depositional ages. Together with other lowgrade Paleozoic sedimentary units such as the Gurktal Thrust System and the GreywackeZone it builds up large parts of the Upper Austroalpine units of the Eastern European Alps(Fig. C.1a). The Paleozoic of Graz is surrounded by and lies on top of crystalline rocksthat experienced high grade metamorphism in the Permian and the Cretaceous (Oberhänsliet al., 2004; Schuster & Stuewe, 2008). It is discordantly overlain by a small CretaceousGosau basin and by the Neogene Styrian basin (Fig. C.1b). As such, the Paleozoic of Grazrecords many of the sedimentological, tectonic and metamorphic events that formed theEastern Alps since the early Paleozoic. Stratigraphy, paleontology, internal structure andmetamorphism of the Paleozoic of Graz were extensively studied over the past 180 yearsand resulted in over 500 publications (e.g. Schwinner, 1925; Clar, 1935; Boik, 1950; Flügel& Hubmann, 2000, and references therein). However, no geological profiles through theentire Paleozoic of Graz are published. As a consequence, many aspects of the internalstructure of the complex are poorly understood.
In this study we present integrated geological profiles through the entire Paleozoic of Grazwhich we constructed on the base of a simplified lithological subdivision of the complex.Using these profiles, we discuss the internal structure of the Paleozoic of Graz and presenta modified tectonostratigraphy for the complex. Within this, we discern only two majornappe systems separated by a single thrust: the Rannach thrust. Based on these results wethen discuss the age of internal deformation and metamorphism as well as models proposedin the literature for the final emplacement of the Paleozoic of Graz onto the surroundingcrystalline basement.
C.2 Geological setting
The Paleozoic of Graz consists of Silurian to Carboniferous, poly-phase deformed, diage-netic to greenschist facies rocks. In the literature, five sedimentary facies associations arediscerned: The Rannach, Hochlantsch, Laufnitzdorf, Kalkschiefer and Schöckl facies. Eachfacies has been ascribed to one tectonic nappe (Fig. C.1b; Fritz et al., 1991, 1992; Ebneret al., 2000). These nappes are attributed to an upper (Rannach and Hochlantsch), an inter-mediate (Laufnitzdorf and Kalkschiefer) and a lower nappe system (Fig. C.1b; Fritz et al.,1992). In general, deformation intensity is lowest in the upper nappe system and highest inthe lower nappe system. The fact that the same names have been applied to both sedimen-tary facies as well as tectonic units led to some confusion in the literature, because some ofthe facies occur in more than one tectonic nappe.
234
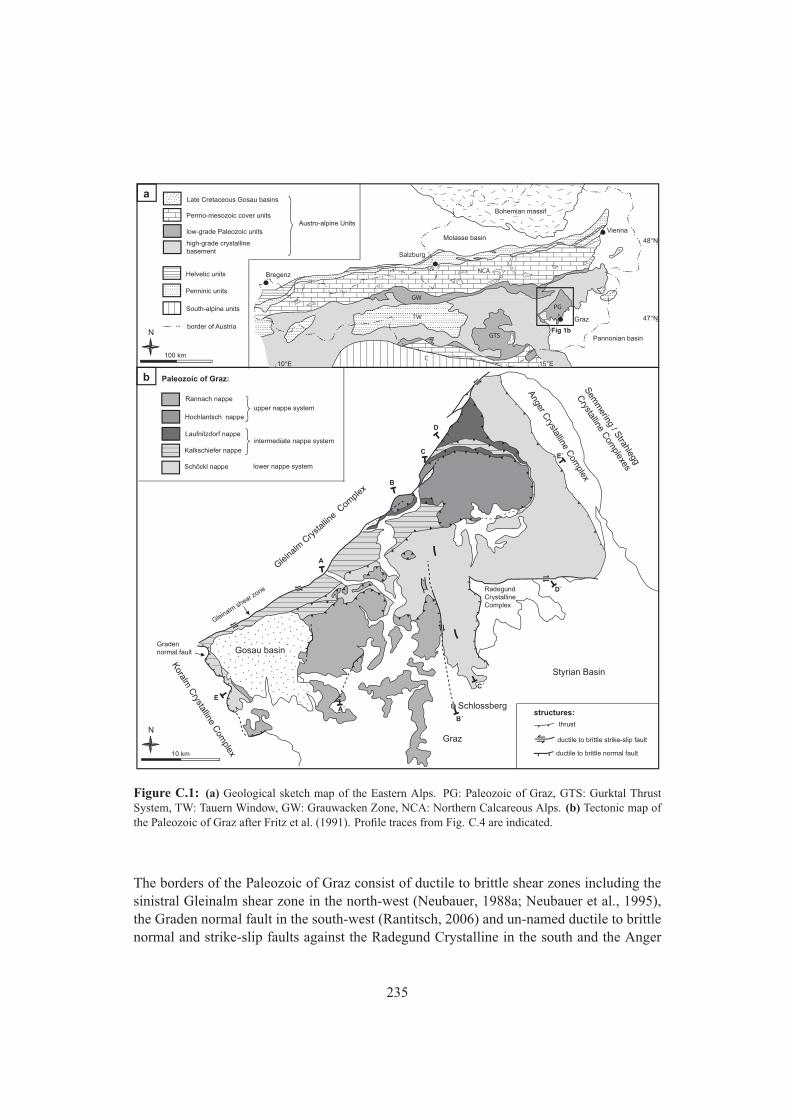
Gosau basin
Radegund Crystalline Complex
Graz
Koralm
Crystalline C
omplex
Sem
mering / S
trahlegg
Crystalline C
omplexes
Gleina
lm C
rysta
lline
Com
plex
Styrian Basin
Schlossberg
Anger C
rystalline Com
plex
Gleinalm shear z
one
Graden normal fault
ductile to brittle strike-slip fault
structures:
thrust
ductile to brittle normal fault 10 km
N
A
A´
B
B´
C´
C
D
D´
b
a
Rannach nappe
Hochlantsch nappe
Laufnitzdorf nappe
Kalkschiefer nappe
Schöckl nappe
upper nappe system
intermediate nappe system
lower nappe system
E
Paleozoic of Graz:
E´
TW
GW
GTS
PG
NCA
C
Salzburg
Vienna
Bregenz
Graz
Helvetic units
Penninic units
Late Cretaceous Gosau basins
Permo-mesozoic cover units
low-grade Paleozoic units
high-grade crystalline basement
South-alpine units
Bohemian massif
Molasse basin
Pannonian basin
border of Austria Fig 1b
100 km
N
10°E 15°E
47°N
48°N
Austro-alpine Units
Figure C.1: (a) Geological sketch map of the Eastern Alps. PG: Paleozoic of Graz, GTS: Gurktal ThrustSystem, TW: Tauern Window, GW: Grauwacken Zone, NCA: Northern Calcareous Alps. (b) Tectonic map ofthe Paleozoic of Graz after Fritz et al. (1991). Profile traces from Fig. C.4 are indicated.
The borders of the Paleozoic of Graz consist of ductile to brittle shear zones including thesinistral Gleinalm shear zone in the north-west (Neubauer, 1988a; Neubauer et al., 1995),the Graden normal fault in the south-west (Rantitsch, 2006) and un-named ductile to brittlenormal and strike-slip faults against the Radegund Crystalline in the south and the Anger
235
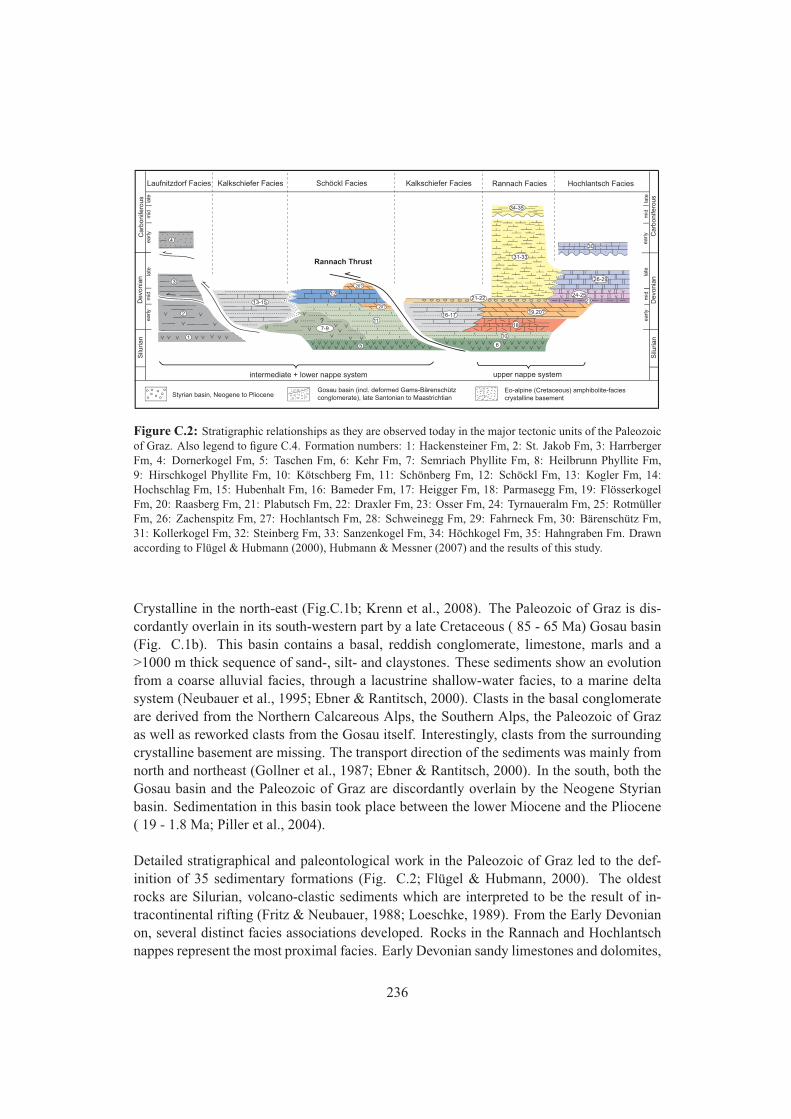
Carb
onife
rous
Devo
nia
n
Silu
rian
early
mid
la
te
early
late
Carb
onife
rous
Devo
nia
n
Silu
rian
early
mid
la
te
early
late
mid
mid
Rannach Facies Schöckl Facies Kalkschiefer Facies Laufnitzdorf Facies Hochlantsch Facies Kalkschiefer Facies
1
2
3
13-15
12
7-9
11
5
16-17
10
6
18
19,20?
21-22
31-33
23 24-25
26-29
30
34-35
4
?
20?
20?
Rannach Thrust
intermediate + lower nappe system upper nappe system
Styrian basin, Neogene to Pliocene
Gosau basin (incl. deformed Gams-Bärenschütz conglomerate), late Santonian to Maastrichtian
Eo-alpine (Cretaceous) amphibolite-facies crystalline basement
Figure C.2: Stratigraphic relationships as they are observed today in the major tectonic units of the Paleozoicof Graz. Also legend to figure C.4. Formation numbers: 1: Hackensteiner Fm, 2: St. Jakob Fm, 3: HarrbergerFm, 4: Dornerkogel Fm, 5: Taschen Fm, 6: Kehr Fm, 7: Semriach Phyllite Fm, 8: Heilbrunn Phyllite Fm,9: Hirschkogel Phyllite Fm, 10: Kötschberg Fm, 11: Schönberg Fm, 12: Schöckl Fm, 13: Kogler Fm, 14:Hochschlag Fm, 15: Hubenhalt Fm, 16: Bameder Fm, 17: Heigger Fm, 18: Parmasegg Fm, 19: FlösserkogelFm, 20: Raasberg Fm, 21: Plabutsch Fm, 22: Draxler Fm, 23: Osser Fm, 24: Tyrnaueralm Fm, 25: RotmüllerFm, 26: Zachenspitz Fm, 27: Hochlantsch Fm, 28: Schweinegg Fm, 29: Fahrneck Fm, 30: Bärenschütz Fm,31: Kollerkogel Fm, 32: Steinberg Fm, 33: Sanzenkogel Fm, 34: Höchkogel Fm, 35: Hahngraben Fm. Drawnaccording to Flügel & Hubmann (2000), Hubmann & Messner (2007) and the results of this study.
Crystalline in the north-east (Fig.C.1b; Krenn et al., 2008). The Paleozoic of Graz is dis-cordantly overlain in its south-western part by a late Cretaceous ( 85 - 65 Ma) Gosau basin(Fig. C.1b). This basin contains a basal, reddish conglomerate, limestone, marls and a>1000 m thick sequence of sand-, silt- and claystones. These sediments show an evolutionfrom a coarse alluvial facies, through a lacustrine shallow-water facies, to a marine deltasystem (Neubauer et al., 1995; Ebner & Rantitsch, 2000). Clasts in the basal conglomerateare derived from the Northern Calcareous Alps, the Southern Alps, the Paleozoic of Grazas well as reworked clasts from the Gosau itself. Interestingly, clasts from the surroundingcrystalline basement are missing. The transport direction of the sediments was mainly fromnorth and northeast (Gollner et al., 1987; Ebner & Rantitsch, 2000). In the south, both theGosau basin and the Paleozoic of Graz are discordantly overlain by the Neogene Styrianbasin. Sedimentation in this basin took place between the lower Miocene and the Pliocene( 19 - 1.8 Ma; Piller et al., 2004).
Detailed stratigraphical and paleontological work in the Paleozoic of Graz led to the def-inition of 35 sedimentary formations (Fig. C.2; Flügel & Hubmann, 2000). The oldestrocks are Silurian, volcano-clastic sediments which are interpreted to be the result of in-tracontinental rifting (Fritz & Neubauer, 1988; Loeschke, 1989). From the Early Devonianon, several distinct facies associations developed. Rocks in the Rannach and Hochlantschnappes represent the most proximal facies. Early Devonian sandy limestones and dolomites,
236
deposited in a coastal environment, are overlain by Middle Devonian platform carbonatesand Late Devonian to Carboniferous pelagic limestones. Erosion and carstification occurredin the Late Devonian and Early Carboniferous (Fig. C.2; Flügel & Hubmann, 2000; Ebneret al., 2000; Hubmann & Messner, 2007). Rocks in the Kalkschiefer and Laufnitzdorfnappes and in the Schöckl nappe experienced epizonal to greenschist facies metamorphism.The internal stratigraphy of those nappes is therefore less well known. The Laufnitzdorfnappe contains carbonates, radiolarites, clay- and sandstones of Devonian age, which weredeposited in a pelagic environment. The Kalkschiefer nappe consists of a uniform sequenceof marls, limestones and sandstones of Devonian age. In the Schöckl nappe, the Silurianvolcano-clastic rocks are overlain by dark-grey carbonates and black schists which wereprobably deposited in a euxinic basin. They are in turn overlain by Middle Devonian plat-form carbonates (Fig. C.2; Flügel & Hubmann, 2000; Ebner et al., 2000). The Schöcklnappe also contains large amounts of greenschist facies phyllites and chlorite schists ofunknown age (Fig. C.2, Fm 10-12). However, their close association with Silurian volcano-clastic rocks and Early Devonian black schists make a pre-Middle-Devonian age probable.
Metamorphic conditions in the Paleozoic of Graz were revealed by illite crystallinity, vit-rinite reflectance and Raman spectroscopy (Hasenhüttl, 1994; Russegger, 1996; Rantitschet al., 2005). In the upper nappe system, estimated metamorphic temperatures lie in therange of 200-300°C. In the intermediate and lower nappe system, rocks of the Laufnitzdorfnappe show temperatures below 300°C, rocks of the Kalkschiefer and Schöckl nappes above300°C. Raman spectroscopy revealed a temperature aureole roughly parallel to the normalfaults along the north-eastern, southern and south-western margins of the Paleozoic of Graz(Rantitsch et al., 2005). At the south-western margin, metamorphic temperatures rise overonly a few kilometres from < 250°C in the Gosau basin to ~500°C in the Paleozoic of Grazand 500-600°C in the Koralm Crystalline (Rantitsch et al., 2005). Krenn et al. (2008) cal-culated conditions of ~500-600°C and ~6-9 kbar at the north-eastern border to the AngerCrystalline. Surprisingly, there is no temperature aureole parallel to the north-western mar-gin to the Gleinalm Crystalline, where temperatures in the crystalline also reached ~500°C.
C.3 Simplified lithological subdivision
In order to construct integrated structural profiles through the entire Paleozoic of Graz itis necessary to reduce the 35 formations described by Flügel & Hubmann (2000) to muchfewer distinct rock associations (Fig. C.2). Each of the rock associations defined here isdisplayed in one colour on figure C.2 and contains one or more formations. We assembled(a) formations that are identical in age and sedimentary facies but occur in different tectonicunits, and (b) formations that are part of a continuous sedimentary sequence but vary slightlyin composition. The following groupings are performed to obtain rock associations whichare displayable on the scale of the profiles:
237
• Dark grey (Fm 1 - Fm 4): The Hackensteiner (Fm 1), St. Jakob (Fm 2), Harrberger(Fm 3), and Dornerkogel (Fm 4) formations correspond to the Laufnitzdorf group ofFlügel & Hubmann (2000). They all occur only in the northern part of the Paleo-zoic of Graz. Formations 1-3 build a Silurian to late Devonian sequence of pelagic,fine-grained clastic sediments intercalated with volcanic ashes and limestones. Theirages overlap; they received their different names mainly from different workers whoobserved them in different places and different structural positions. The Dornerkogelformation (Fm 4) is lithologically different: it consists of coarser-grained silt- andsandstones which were deposited in a turbiditic environment. Detrital micas in thisformation are of Variscan age and it is therefore interpreted as a Flysch deposit infront of the Variscan orogen (Neubauer et al., 2007). However, because it occurs onlyin the northernmost part of the Paleozoic of Graz in close proximity and probably insedimentary contact with Fm 1, we assembled it together with Fm 1-3.
• Dark green (Fm 5 - Fm 6): The Taschen (Fm 5) and Kehr (Fm 6) formations areboth basic metavolcanic rocks of Silurian age. They occur geographically in differ-ent regions: near Taschen in the central part, and near Kehr in the western part ofthe Paleozoic of Graz (Fig. C.3). They occur in two different structural levels: theKehr formation in the upper Rannach nappe and the Taschen formation in the lowerSchöckl nappe. The Taschen formation is slightly higher metamorphosed than theKehr formation. Despite these geographical, structural and metamorphic differences,their lithology and age are very similar and we therefore assume them to be originallypart of the same rock association.
• Intermediate green (Fm 7 - Fm 9): The Semriach (Fm 7), Hirschkogel (Fm 8) andHeilbrunn (Fm 9) formations correspond to the Passail group of (Flügel & Hubmann,2000). They are all greenschist facies, sericite and chlorite bearing phyllites of un-known age. However, their close proximity to the Taschen, Schönberg and Schöcklformations make a Silurian to Early Devonian age probable. They are grouped basedon their position within the sedimentary succession and their lithological similarity.The Semriach and Hirschkogel formations occur both in the region of Semriach andthe Heilbrunn formation crops out in a structurally lower level parallel to the easternborder of the Paleozoic of Graz (Fig. C.3).
• Light green (Fm 10 - Fm 11): The Kötschberg (Fm 10) and Schönberg (Fm 11) forma-tions are both dark limestones and black schists. They occur in sedimentary contacton top of the Kehr and Taschen formations respectively. Grouping them followed thesame logic as grouping the Kehr and Taschen formations (Fm 5-6).
• Blue (Fm 12): The Schöckl formation (Fm 12) consists of a peculiar blue-whitebanded limestone of several 100 m thickness. This limestone is lithologically verydistinct. It is therefore not grouped with other formations.
• Light grey (Fm 13 - Fm 17): The Kogler (Fm 13), Hochschlag (Fm 14), Hubenhalt(Fm 15), Bameder (Fm 16) and Heigger (Fm 17) formations are what has tradition-ally been referred to as Kalkschiefer facies. They are layered calcareous schists, slaty
238
limestones, and minor clay-, silt- and sandstones of early to middle Devonian age.They occur all over the Paleozoic of Graz in different tectonic positions and are inter-nally folded and imbricated. Their different formation names mainly originate fromtheir occurrence in different geographical areas and tectonic levels. Because they arelithologically and stratigraphically similar, we assembled them into one group.
• Dark orange (Fm 18): The Parmasegg formation (Fm 18) is a distinct rock asso-ciation consisting of coastal crinoidal limestones, sandy marls and minor silt- andsandstones with a thickness of up to 200 meters. It is therefore left ungrouped.
• Medium orange (Fm 19 - Fm 20): The Flösserkogel formation (Fm 19) consists ofearly diagenetic, yellow dolomites, limestones and sandstones. It reaches 500 - 1000m thickness and builds up substantial parts of the upper Rannach and Hochlantschnappes. The Raasberg Fm (Fm 20) occurs around Raasberg (Fig. C.3) and consistsof highly deformed and metamorphosed dolomites, limestones and sandstones. Itsstratigraphic and tectonic position is unclear (Fig. C.2; Flügel & Hubmann, 2000).However, because it consists of very similar rocks as the Flösserkogel Fm and becauseit is located on top of the Schöckl Fm we group it together with the Flösserkogel Fmand interpret it as a sheared relict of the upper nappe system on top of the lower nappesystem.
• Light orange (Fm 21 - Fm 22): The Plabutsch (Fm 21) and Draxler (Fm 22) forma-tions are dark, fossil-rich limestones intercalated with marls and claystones of welldefined middle Devonian age. They occur in two different geographic locations butare grouped for their lithological and age equivalence.
• Dark purple (Fm 23): The Osser formation (Fm 23) is lithologically similar to Fm21 and Fm 22 but contains less fossils, is more marly, much more deformed and ofslightly higher metamorphic grade. It is therefore kept separate and is not grouped.
• Light purple (Fm 24 - Fm 25): The Tyrnauer Alm (Fm 24) and Rotmüller (Fm 25) for-mations consist of limestones, sand- and siltstones and intercalated volcanics. Theyoccur in close geographic proximity in the upper Hochlantsch nappe and are of thesame age, they are therefore grouped together.
• Light blue (Fm 26 - Fm 30): The Zachenspitz (Fm 26) and Hochlantsch (Fm 27)formations build up a classical carbonate platform sequence of late Devonian agewith massive to bedded light-grey limestones constituting the major cliffs of theHochlantsch massif. The Schweinegg (Fm 28) and Fahrneck (Fm 29) formationsare both very local occurrences of fossil rich limestones only tens of metres in thick-ness. Both have previously been suggested to correspond to the Zachenspitz and/orHochlantsch formations and they are therefore grouped with them here. The Bären-schütz formation (Fm 30) only occurs locally south of Hochlantsch (Fig. C.3) whereit discordantly overlies Fm 27. It consists of bedded limestones and is significantlyyounger then formations 26-29, but it is grouped with them here as it is too small tofeature as a mappable association of its own.
239
• Yellow (Fm 31 - Fm 35): The Kollerkogel (Fm 31), Steinberg (Fm 32) and Sanzenko-gel (Fm 33) formations are all variegated, pelagic limestones and shales of late De-vonian to Carboniferous age. Each formation is less than 100 meters thick and theyoccur in an undisturbed stratigraphic sequence in the upper Rannach nappe. TheHöchkogel (Fm 34) and Hahngraben (Fm 35) formations are separated from the oth-ers by an erosional unconformity. They consist of limestons and shales and containdetrital mica of Variscan age. They are therefore - similar to the Dornerkogel Fm (Fm4) - interpreted as Variscan flysch deposit (Neubauer et al., 2007). However, they arevery thin and are therefore grouped together with formations 31-33.
In summary, figure C.2 shows the simplified stratigraphic relationships as they are observedtoday in the Paleozoic of Graz in the different tectonic units. The groupings we performedshow clearly the first-order stratigraphic features that are typical for this complex. Thesedimentation started with Silurian metavolcanic rocks. In the early and middle Devonian,platform carbonates and sandy coastal deposits interfinger with fine-grained siliclastic sed-iments, volcanic layers point to an ongoing volcanic activity. In the late Devonian, theenvironment changes from a platform setting to more pelagic sedimentation, which - inter-rupted by two erosional unconformities - continued up to the Carboniferous and finishedwith the deposition of flysch-type clastic sediments. The paleogeographical implications ofthese observations are discussed further below.
C.4 Structural geometry
Using this simplified lithological subdivision, we assembled a structural map (Fig. C.3) andconstructed a series of geological profiles through the entire nappe complex (Fig. C.4). Thetopography for the profiles was extracted from a digital elevation model. Geological infor-mation such as detailed maps, local profiles, drillhole data and written descriptions of struc-ture and stratigraphy was taken from many detailed publications listed in Flügel & Hubmann(2000) and the published geological map sheets 133 Leoben, 134 Passail, 135 Birkfeld, 162Köflach, 163 Voitsberg, 164 Graz and 165 Weiz of the 1:50 000 map series of the Geologi-cal Survey of Austria, which are available for download at http://www.geologie.ac.at/. Thetraces from the profiles in figure C.4 are indicated on figure C.1 and C.3. Profiles A to Drun north-south to northwest-southeast and are chosen to be perpendicular to the major foldaxis orientation in the Paleozoic of Graz. Profile E runs southwest-northeast and is parallelto the late Cretaceous stretching direction reported by Krohe (1987), Neubauer et al. (1995)and Krenn et al. (2008).
Rannach thrust The most prominent tectonic feature in the Paleozoic of Graz is the thrustat the base of the Rannach and Hochlantsch nappes (Fig. C.3 and Fig. C.4, profiles B-E).The thrust, here called Rannach thrust, can be traced through much of the Paleozoic of
240
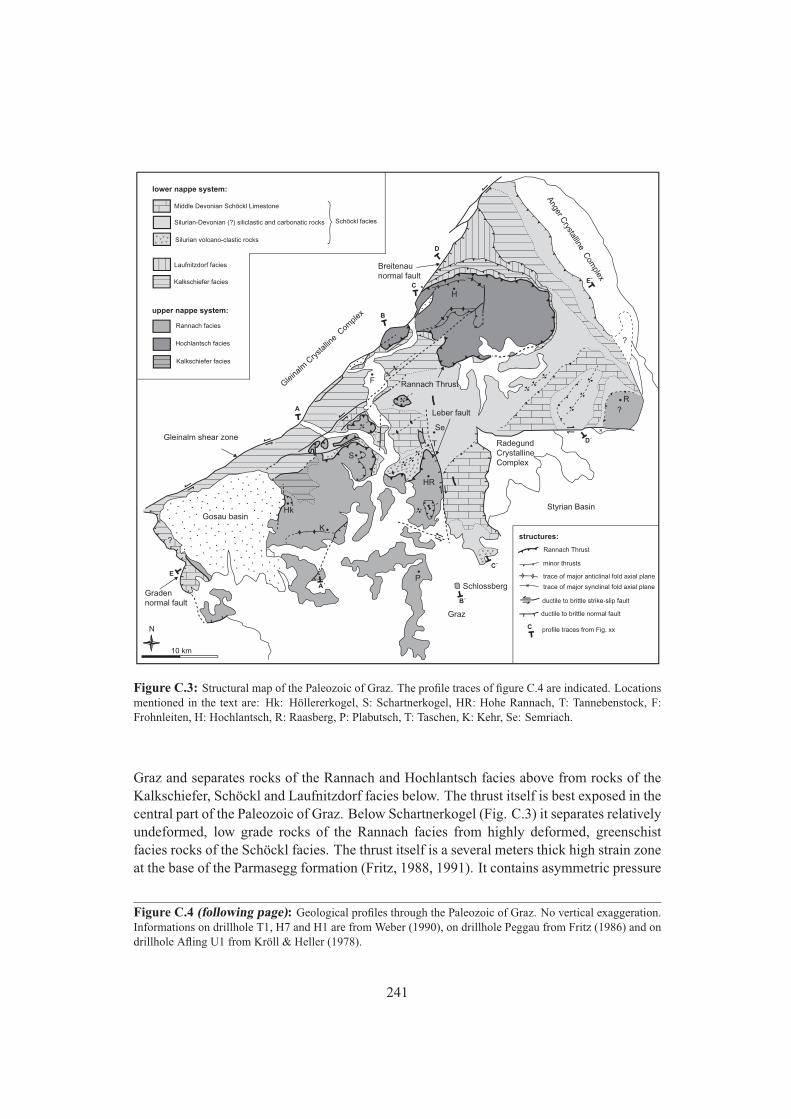
Gosau basin
Radegund Crystalline Complex
Graden normal fault
Leber fault
Graz
Rannach Thrust Gleina
lm C
rysta
lline
Com
plex
Styrian Basin
Gleinalm shear zone
Breitenau normal fault
Schlossberg
H
S
HR
Hk
?
Anger C
rystalline Com
plex
?
? R
P
F
T
K
Se
upper nappe system:
lower nappe system:
Rannach Thrust
ductile to brittle strike-slip fault
structures:
minor thrusts
trace of major anticlinal fold axial plane
trace of major synclinal fold axial plane
ductile to brittle normal fault
10 km
N
A
A´
B
B´
C
D
D´
C profile traces from Fig. xx
Rannach facies
Hochlantsch facies
Laufnitzdorf facies
Kalkschiefer facies
E
E´
Kalkschiefer facies
Middle Devonian Schöckl Limestone
Silurian-Devonian (?) siliclastic and carbonatic rocks
Silurian volcano-clastic rocks
Schöckl facies
C´
Figure C.3: Structural map of the Paleozoic of Graz. The profile traces of figure C.4 are indicated. Locationsmentioned in the text are: Hk: Höllererkogel, S: Schartnerkogel, HR: Hohe Rannach, T: Tannebenstock, F:Frohnleiten, H: Hochlantsch, R: Raasberg, P: Plabutsch, T: Taschen, K: Kehr, Se: Semriach.
Graz and separates rocks of the Rannach and Hochlantsch facies above from rocks of theKalkschiefer, Schöckl and Laufnitzdorf facies below. The thrust itself is best exposed in thecentral part of the Paleozoic of Graz. Below Schartnerkogel (Fig. C.3) it separates relativelyundeformed, low grade rocks of the Rannach facies from highly deformed, greenschistfacies rocks of the Schöckl facies. The thrust itself is a several meters thick high strain zoneat the base of the Parmasegg formation (Fritz, 1988, 1991). It contains asymmetric pressure
Figure C.4 (following page): Geological profiles through the Paleozoic of Graz. No vertical exaggeration.Informations on drillhole T1, H7 and H1 are from Weber (1990), on drillhole Peggau from Fritz (1986) and ondrillhole Afling U1 from Kröll & Heller (1978).
241
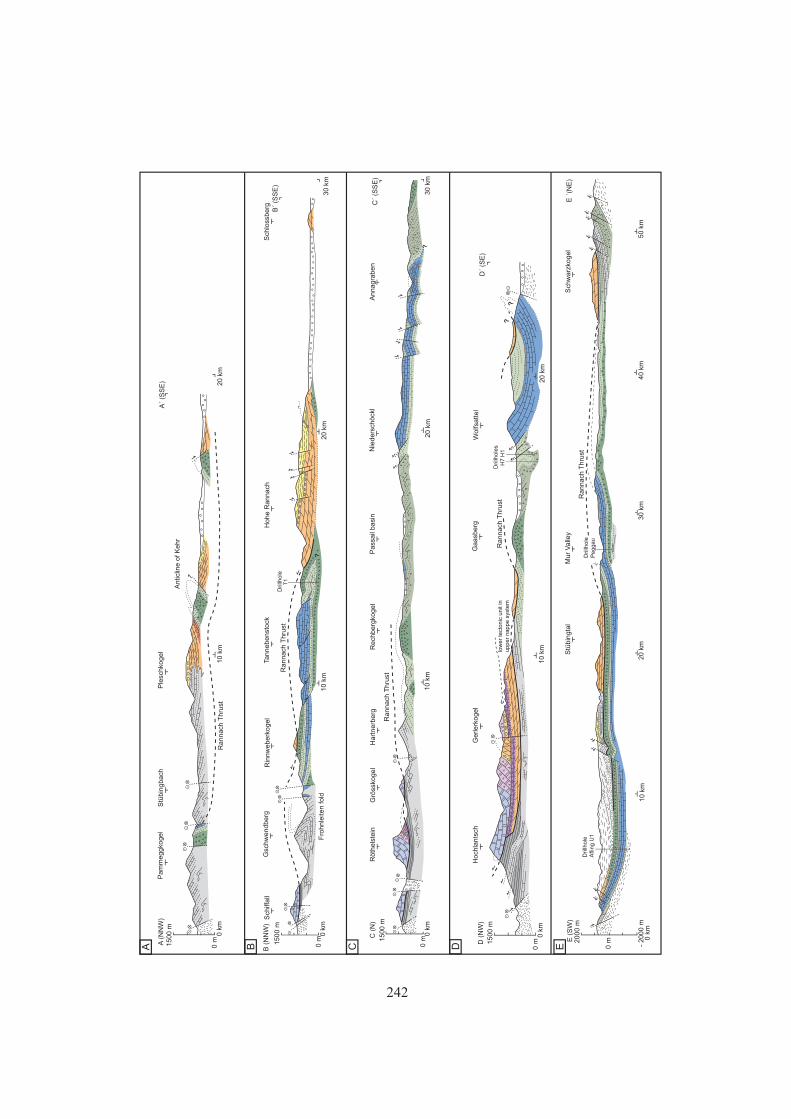
1500 m
0 m
0 k
m
10 k
m
20 k
m
Pam
meggko
gel
Ple
schko
gel
Stü
bin
gbach
1500 m
0 m
0 k
m
10 k
m
20 k
m
30 k
m
Sch
iffall
Gsc
hw
endberg
R
innw
eberk
ogel
Tannebenst
ock
H
ohe R
annach
S
chlo
ssberg
Drillh
ole
30 k
m
20 k
m
10 k
m
1500 m
0 m
0 k
m
Röth
els
tein
G
röss
kogel
Hart
nerb
erg
R
ech
berg
kogel
Pass
ail
basi
n
Nie
ders
chöck
l A
nnagra
ben
20 k
m
10 k
m
1500 m
0 m
0 k
m
Drillh
ole
s H
7 H
1
T1
Wolfs
attel
Gaasb
erg
G
erlerk
ogel
Hoch
lants
ch
A (
NN
W)
A´
(SS
E)
B (
NN
W)
B´
(SS
E)
C (
N)
C´
(SS
E)
D (
NW
) D
´ (S
E)
Antic
line o
f K
ehr
Rannach
Thru
st
Rannach
Thru
st
Rannach
Thru
st
Fro
hnle
iten fold
2000 m
0 m
0 k
m
E (
SW
)
10 k
m
20 k
m
30 k
m
40 k
m
50 k
m
Stü
bin
gta
l M
ur
Valle
y E
´(N
E)
- 2000 m
Drillh
ole
A
flin
g U
1
Drillh
ole
P
eg
ga
u
Sch
warz
kogel
Rannach
Thru
st
Rannach
Thru
st
low
er
tect
on
ic u
nit
in
up
pe
r n
ap
pe
sys
tem
?
?
?
?
?
?
?
?
?
?
?
?
?
?
?
?
?
?
?
A
B
C
D
E
242
shadows around pyrite showing a stretching lineation progressively turning from east-westto southeast-northwest with generally top-west to top-northwest shear sense. Below HoheRannach (Fig. C.4, profile B) the thrust separates rocks of the Rannach facies from highly-deformed greenschist facies rocks of the Schöckl facies. The thrust consists of an up to100 m thick sheared zone with strongly interleaved rock slices of the Laufnitzdorf andRannach facies (Neubauer, 1989). Similarly-sheared Laufnitzdorf facies rocks occur belowthe Rannach thrust at Schiffall and Röthelstein (Fig. C.4, profiles B- C). Below Schiffall,Grösskogel and north of Gaasberg (Fig. C.4, profiles B-D) the Rannach thrust cuts straightthrough highly folded units of the Schöckl and Kalkschiefer facies; it therefore represents athrust that is younger with respect to the internal deformation of the lower nappe system.
In other parts of the Paleozoic of Graz, the location of the Rannach thrust is less obvious. Inthe northwestern part north of Höllererkogel and Stübingbach (Fig. C.3, Fig. C.4 profile A),rocks of the Kalkschiefer and Schöckl facies are juxtaposed against rocks of the Rannachand Kalkschiefer facies along steep, semi-brittle sinistral strike slip zones (Fritz, 1991). Theoriginal geometry of the Rannach thrust is therefore obliterated. In the southwest aroundKehr the oldest rocks of the Rannach facies crop out in a southeast-verging antiform, but athrust zone which could correspond to the Rannach thrust is not exposed (Neubauer, 1991).In the northeastern part around Hochlantsch (Fig. C.3) the location of the Rannach thrust isobvious below Schiffall, Röthelstein and Grösskogel (Fig. C.4, profiles B-C). In the north ofHochlantsch the undeformed and low grade Hochlantsch formation is thrust over imbricatedand highly deformed Kalkschiefer and Laufnitzdorf facies rocks and the Rannach thrust isclearly developed. However, south of Gerlerkogel (Fig. C.4, profile D) a tectonic unit ofhigher deformed rocks consisting of the Flösserkogel and Osser formations (Fm 19 and 23)reveals a similar metamorphic grade as the underlying Kalkschiefer and Laufnitzdorf faciesrocks and the Rannach thrust could therefore be also located on top of this unit (Hasenhüttl,1994). Because the Flösserkogel and equivalents of the Osser formation are elsewhereclearly located above the Rannach thrust, we interpret this tectonic unit as a local thrustinside the upper nappe system. The Raasberg formation occurs in the southeastern partaround Raasberg on top of and sheared together with rocks of the Schöckl facies (Fm 20;Fig. C.3 and C.4, profile D). We interpret it as an equivalent of the Flösserkogel formationand therefore as a small relict of the Rannach thrust zone on top of Schöckl facies rocks.
Despite some local difficulties in determining the location of the Rannach thrust, it is amajor first-order tectonic boundary in most of the Paleozoic of Graz. It splits the Paleozoicof Graz into an upper nappe system and a lower nappe system which differ from each othersignificantly in deformation style and metamorphic grade. Rocks of different sedimentaryfacies occur both above and below this thrust: Rannach, Hochlantsch and Kalkschieferfacies rocks above, Schöckl, Kalkschiefer and Laufnitzdorf facies rocks below.
Upper nappe system Deformation in the upper nappe system above the Rannach thrust ischaracterised by large scale open folds, local imbrications and steep brittle faults. Variable
243
fold axis orientations occur but the general trend of the axes is E-W to NE-SW. A prominentfold example is the southeast-verging anticline of Kehr (Fig. C.4, profile A; Neubauer,1991). Other large scale folds occur in the Hochlantsch massif (Fig. C.4, profile D; Gollner& Zier, 1985). The Hochlantsch massif consists of two smaller thrust sheets which we bothassign to the upper nappe system: an upper, less deformed unit which contains formations26-30 and a lower more deformed unit consisting of formations 19 and 23. Smaller localimbrications in the upper nappe system are known from east of Schartnerkogel (Fig. C.3;Fritz, 1991), from south of Hohe Rannach (Fig. C.4, profile B) and around Höllererkogel(Fig. C.3). Steep brittle normal and strike slip faults cross-cut the whole upper nappesystem.
Lower nappe system Deformation in the lower nappe system is much more intense anddiffers in style from deformation in the upper nappe system. The Schöckl facies rocksin the lower nappe system are intensely deformed and show a penetrative foliation witha pronounced, asymmetric E-W stretching lineation with top-W shear sense. At micro-to meso-scale, two generations of isoclinal folds occur: (i) isoclinally folded quartz veinswhich have the penetrative foliation as axial plane foliation, and (ii) isoclinal folds of thepenetrative foliation itself with a spaced second cleavage developed in the hinges. Thestretching lineation is folded around these second generation folds (Agnoli, 1987; Fritz,1988, 1991; Reisinger, 1988; Neubauer, 1989, 1991).
Apart from this strong deformation at micro- and meso-scale, also large-scale repetitions ofstratigraphy occur. In the northern part, rocks of the Kalkschiefer and Laufnitzdorf faciesare imbricated and thrust on top of each other. At the eastern border of the Paleozoic of Graz,phyllites of the Heilbrunn formation (Fm 9), calcareous schists of the Hochschlag formation(Fm 8), phyllites of the Semriach formation (Fm 7) and limestone of the Schöckl formation(Fm 12) lie on top of each other (Fig. C.4, profile E). In the central part of the Paleozoic ofGraz, the Schöckl formation is symmetrically both under- and overlain by the Taschen (Fm5) and Schönberg (Fm 11) formations (eg. south of Tannebenstock, south of Annagrabenand below Schartnerkogel, Fig. C.3 and C.4). Schwinner (1925) interpreted this repetitionof stratigraphy as the result of multiple thrusting. Clar (1933) and Boik (1950) proposed theexistence of large-scale isoclinal folds with the Schöckl formation in the core of the folds.The symmetric occurrence of the same lithologies below and above the Schöckl formation,as well as isoclinal folds at micro- and meso-scale point to the possible existence of suchlarge-scale folds. That is why we draw this possibility on Fig. C.4, profiles B-D, Fig. C.5and Fig. C.6d. However, hinges of such possible large-scale folds are nowhere exposedand no proofs for overturned sequences in the inverted limbs such as top-bottom criteriaare known. In addition, it is not known if the repetition of stratigraphy occurred prior to,contemporaneously with, or after the formation of the penetrative foliation, the stretchinglineation and the two generations of micro- to meso-scale isoclinal folds.
These isoclinally folded and foliated rocks are further overprinted by open to tight, NW to
244
SE-verging folds with a steep axial planar crenulation cleavage and NE-SW trending axes.These folds are associated with brittle fore- and backthrusts. Rocks underlying the basin ofPassail (Fig. C.4, profile C) as well as the northern border of the Schöckl limestone (Fig.C.4, profile C and D) are strongly overprinted by such tight folds and thrusts. The large-scale open synform south of Wolfsattel belongs to this generation of folds (Fig. C.4, profileD).
C.5 Modified tectonostratigraphy and paleogeography
Our tectonostratigraphic interpretation is displayed in figure C.6. In this interpretation,the structure of the Paleozoic of Graz is described in terms of an upper, less deformednappe system, which is separated by the Rannach thrust from a lower, more deformed andgenerally higher metamorphic nappe system. The upper nappe system consists of weaklydeformed Rannach, Hochlantsch and Kalkschiefer facies rocks. The lower nappe systemconsists of complexly and poly-phase deformed Laufnitzdorf, Kalkschiefer and Schöcklfacies rocks, where several repetitions of stratigraphy occur. The reason for this large-scalerepetition of stratigraphy is not well-known - it could be either thrusting or isoclinal folding.
Our tectonostratigraphy differs from the one previously published in the literature. Tradi-tionally, the Kalkschiefer and Laufnitzdorf facies rocks were attributed to an intermediatenappe system (Fig. C.1b, Fig. C.6c; Fritz et al., 1991, 1992). However, no first-ordertectonic boundary such as the Rannach thrust is observed between the Kalkschiefer andLaufnitzdorf facies rocks on one side and the Schöckl facies rocks on the other side. Aclose investigation of existing maps and our profiles reveals that the Kalkschiefer faciesrocks lie stratigraphically on top of the Schönberg formation (Fm 11) and laterally replacerocks of the Schöckl formation (Fm 12). This can be seen for example on figure C.4, profileC south of Hartnerberg. Rocks of the Schöckl formation are nowhere overthrust by rocks ofthe Kalkschiefer and Laufnitzdorf facies and a tectonic boundary between them (except forlate steep sinistral strike slip faults on Fig. C.4, profile B) is not known. We therefore preferto interpret the Kalkschiefer and Laufnitzdorf facies rocks as lateral facies equivalents ofthe Schöckl formation and not as an own intermediate tectonic nappe system.
Traditionally, tectonic nappes in the Paleozoic of Graz (and in other low-grade sedimen-tary units of the Alps) have been defined on the basis of sedimentary facies with eachidentified facies being ascribed to an own tectonic nappe. In the Paleozoic of Graz, theterms Laufnitzdorf, Kalkschiefer, Schöckl, Rannach and Hochlantsch have been used inter-changeably for sedimentary facies as well as tectonic units. Here, we have shown that rocksof the Kalkschiefer facies occur both in the upper and lower nappe system. It is thereforeconfusing to use the term Kalkschiefer nappe in a tectonic sense because it is not explicit.Similarly, the terms Rannach and Hochlantsch nappes do not really describe tectonic units,but different facies associations occurring on the same tectonic level, namely in the upper
245
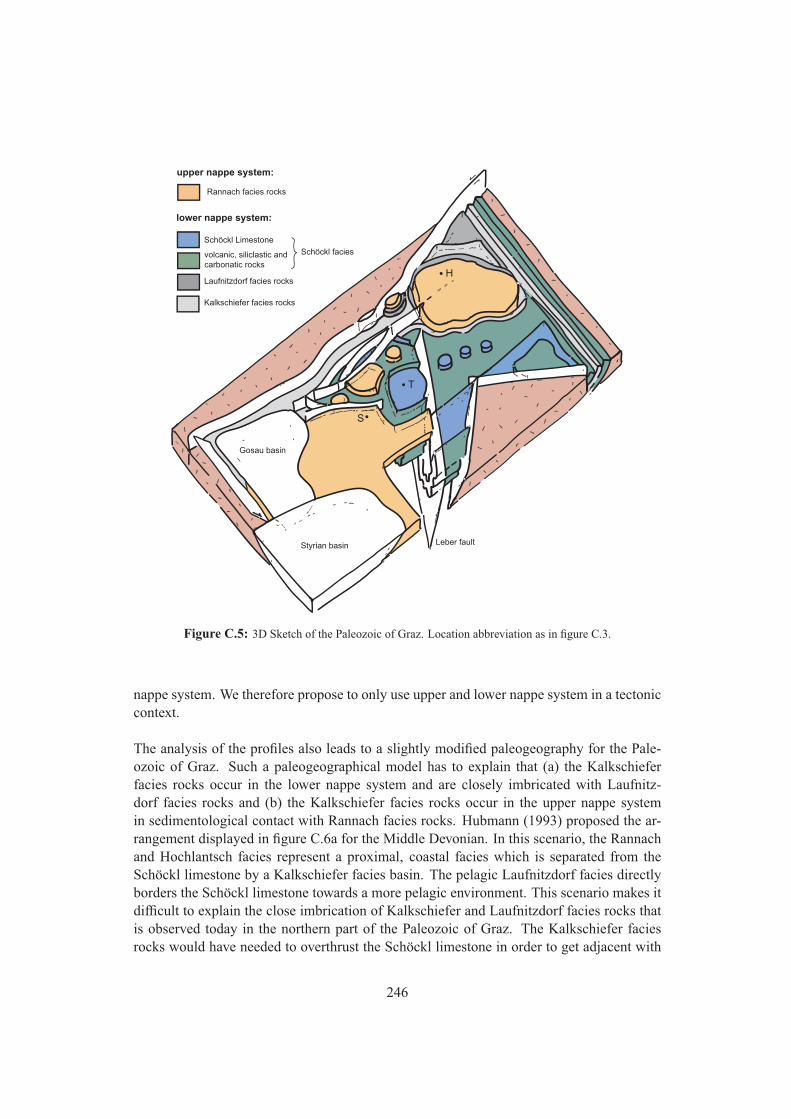
Styrian basin
Gosau basin
Leber fault
H
S
T
upper nappe system:
lower nappe system:
Rannach facies rocks
Laufnitzdorf facies rocks
Kalkschiefer facies rocks
Schöckl Limestone
volcanic, siliclastic and carbonatic rocks
Schöckl facies
Figure C.5: 3D Sketch of the Paleozoic of Graz. Location abbreviation as in figure C.3.
nappe system. We therefore propose to only use upper and lower nappe system in a tectoniccontext.
The analysis of the profiles also leads to a slightly modified paleogeography for the Pale-ozoic of Graz. Such a paleogeographical model has to explain that (a) the Kalkschieferfacies rocks occur in the lower nappe system and are closely imbricated with Laufnitz-dorf facies rocks and (b) the Kalkschiefer facies rocks occur in the upper nappe systemin sedimentological contact with Rannach facies rocks. Hubmann (1993) proposed the ar-rangement displayed in figure C.6a for the Middle Devonian. In this scenario, the Rannachand Hochlantsch facies represent a proximal, coastal facies which is separated from theSchöckl limestone by a Kalkschiefer facies basin. The pelagic Laufnitzdorf facies directlyborders the Schöckl limestone towards a more pelagic environment. This scenario makes itdifficult to explain the close imbrication of Kalkschiefer and Laufnitzdorf facies rocks thatis observed today in the northern part of the Paleozoic of Graz. The Kalkschiefer faciesrocks would have needed to overthrust the Schöckl limestone in order to get adjacent with
246
the Laufnitzdorf facies rocks. We therefore propose a modified arrangement which does notrequire such a complicated deformation (Fig. C.2 and Fig. C.6b). We suggest that therewere two basins of Kalkschiefer facies rocks that flanked the Schöckl facies on both sidesand were therefore - in part - adjacent to the Laufnitzdorf facies rocks. This is sedimen-tologically reasonable as the Kalkschiefer facies represents an intermediate facies betweenthe pelagic Laufnitzdorf facies and the carbonate platform of the Schöckl facies. However,the two Kalkschiefer facies basins are postulated entirely on tectonic considerations. A sec-ond difference between the model proposed by (Hubmann, 1993, Fig. C.6a) and the modelproposed here (Fig. C.6b) is that we do not directly link the stratigraphy we observe inthe upper tectonic nappe system with the stratigraphy in the lower tectonic nappe system.We do not know how much displacement occurred along the Rannach thrust and if the twonappe systems were directly adjacent during sedimentation or not. The stratigraphy in thetwo nappe systems shows some differences: Whereas in the upper nappe system dolomitic,carbonaceous, sandy and marly sediments dominate, the lower nappe system is dominatedby fine-grained siliclastic rocks and more pelagic sediments. However, both nappe systemsshare the volcanic rocks at the base. In fact, these basal volcanic rocks may have served asa detachment horizon for the later Rannach thrust.
Despite these modifications in the paleogeographical interpretation and the uncertainitiesthat remain due to later deformation, we suggest that the Paleozoic of Graz nicely fits inother larger-scale models for the paleogeographical evolution of the Austroalpine duringthe Paleozoic. In the Silurian, the Paleozoic of Graz was located at the northern border ofGondwana, where spreading led to volcanism and the deposition of volcano-clastic rocks.In the Devonian, the Paleotethys opened and shallow-water, carbonate platform and basinsediments were deposited, followed by deeper-water and more pelagic sediments in theupper Devonian. In the Carboniferous, a change from an extensional setting towards a com-pressional setting occurred with the deposition of flysch-type deposits, erosion and carstifi-cation. Similar evolutions are observed in several other low-grade Paleozoic units such asthe Carnic Alps or the Greywacke Zone (e.g. Fritz & Neubauer, 1988; Schönlaub, 1992;Neubauer & Sassi, 1993; Schönlaub & Histon, 1999; Von Raumer & Stampfli, 2008).
C.6 Tectonic evolution of the Paleozoic of Graz: A discussion
According to the profiles and structural map shown in figure C.3 and C.4, the internal geom-etry of the Paleozoic of Graz is best described in terms of an upper and a lower nappe systemseparated by the Rannach thrust. Deformation in the lower nappe system is dominated bya ductile penetrative foliation, isoclinal folds and an E-W stretching lineation. Deformationin the Rannach thrust zone is dominated by a stretching lineation that progressively turnsfrom E-W to SE-NW. In both the lower and upper nappe systems open folds with NE-SWtrending fold axes occur. Several brittle strike-slip faults cross-cut the Paleozoic of Graz,but major normal faults inside the complex are not known. The whole complex is bordered
247
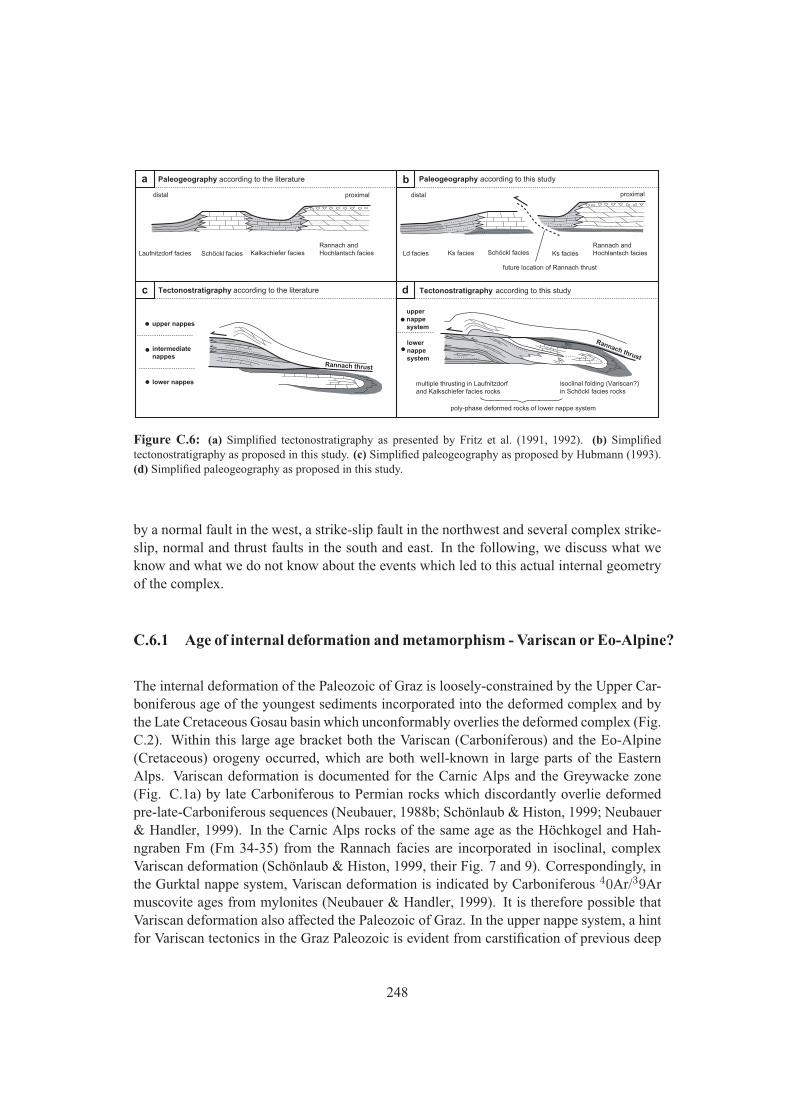
a b
c d Tectonostratigraphy according to the literature
Paleogeography according to the literature
Tectonostratigraphy according to this study
Paleogeography according to this study
Ld facies Ks facies Schöckl facies Ks facies Rannach and Hochlantsch facies
proximal distal
future location of Rannach thrust
upper nappe system
lower nappe system
poly-phase deformed rocks of lower nappe system
isoclinal folding (Variscan?) in Schöckl facies rocks
multiple thrusting in Laufnitzdorf and Kalkschiefer facies rocks
Rannach thrust
intermediate nappes
lower nappes
upper nappes
Laufnitzdorf facies Schöckl facies Kalkschiefer facies Rannach and Hochlantsch facies
proximal distal
Rannach thrust
Figure C.6: (a) Simplified tectonostratigraphy as presented by Fritz et al. (1991, 1992). (b) Simplifiedtectonostratigraphy as proposed in this study. (c) Simplified paleogeography as proposed by Hubmann (1993).(d) Simplified paleogeography as proposed in this study.
by a normal fault in the west, a strike-slip fault in the northwest and several complex strike-slip, normal and thrust faults in the south and east. In the following, we discuss what weknow and what we do not know about the events which led to this actual internal geometryof the complex.
C.6.1 Age of internal deformation and metamorphism - Variscan or Eo-Alpine?
The internal deformation of the Paleozoic of Graz is loosely-constrained by the Upper Car-boniferous age of the youngest sediments incorporated into the deformed complex and bythe Late Cretaceous Gosau basin which unconformably overlies the deformed complex (Fig.C.2). Within this large age bracket both the Variscan (Carboniferous) and the Eo-Alpine(Cretaceous) orogeny occurred, which are both well-known in large parts of the EasternAlps. Variscan deformation is documented for the Carnic Alps and the Greywacke zone(Fig. C.1a) by late Carboniferous to Permian rocks which discordantly overlie deformedpre-late-Carboniferous sequences (Neubauer, 1988b; Schönlaub & Histon, 1999; Neubauer& Handler, 1999). In the Carnic Alps rocks of the same age as the Höchkogel and Hah-ngraben Fm (Fm 34-35) from the Rannach facies are incorporated in isoclinal, complexVariscan deformation (Schönlaub & Histon, 1999, their Fig. 7 and 9). Correspondingly, inthe Gurktal nappe system, Variscan deformation is indicated by Carboniferous 4
0Ar/39Armuscovite ages from mylonites (Neubauer & Handler, 1999). It is therefore possible thatVariscan deformation also affected the Paleozoic of Graz. In the upper nappe system, a hintfor Variscan tectonics in the Graz Paleozoic is evident from carstification of previous deep
248
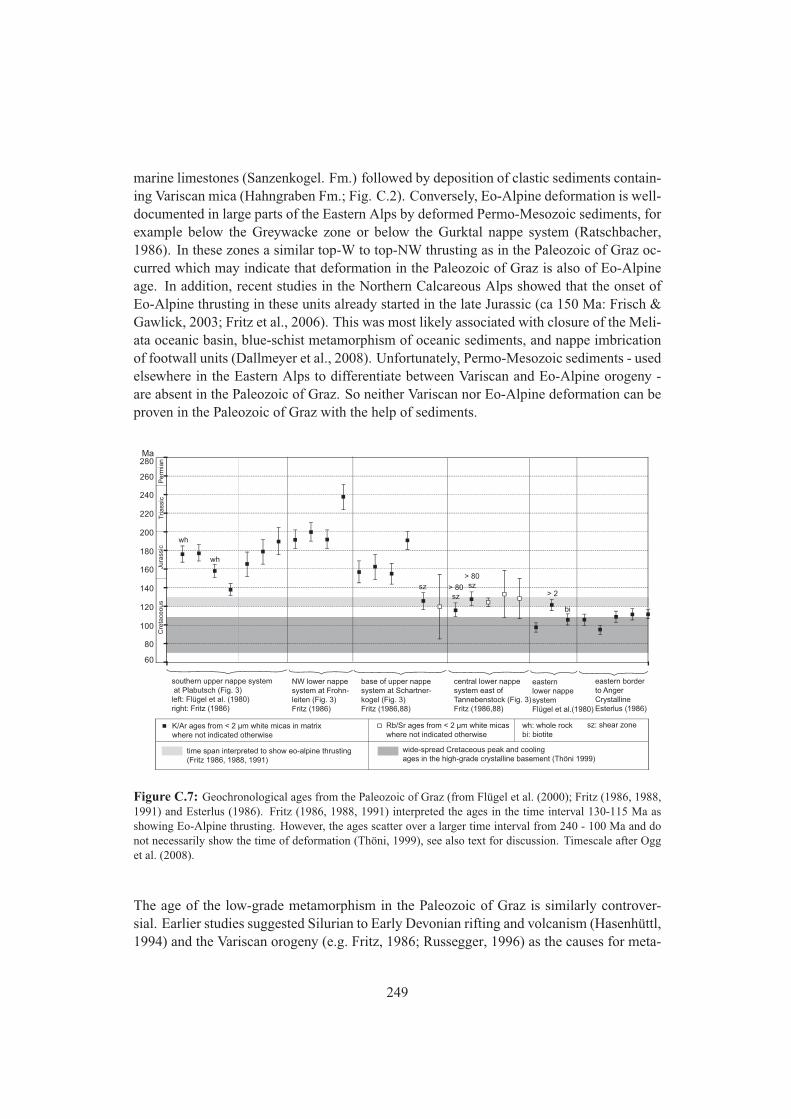
marine limestones (Sanzenkogel. Fm.) followed by deposition of clastic sediments contain-ing Variscan mica (Hahngraben Fm.; Fig. C.2). Conversely, Eo-Alpine deformation is well-documented in large parts of the Eastern Alps by deformed Permo-Mesozoic sediments, forexample below the Greywacke zone or below the Gurktal nappe system (Ratschbacher,1986). In these zones a similar top-W to top-NW thrusting as in the Paleozoic of Graz oc-curred which may indicate that deformation in the Paleozoic of Graz is also of Eo-Alpineage. In addition, recent studies in the Northern Calcareous Alps showed that the onset ofEo-Alpine thrusting in these units already started in the late Jurassic (ca 150 Ma: Frisch &Gawlick, 2003; Fritz et al., 2006). This was most likely associated with closure of the Meli-ata oceanic basin, blue-schist metamorphism of oceanic sediments, and nappe imbricationof footwall units (Dallmeyer et al., 2008). Unfortunately, Permo-Mesozoic sediments - usedelsewhere in the Eastern Alps to differentiate between Variscan and Eo-Alpine orogeny -are absent in the Paleozoic of Graz. So neither Variscan nor Eo-Alpine deformation can beproven in the Paleozoic of Graz with the help of sediments.
60
80
100
120
140
160
180
200
220
240
260
280 Ma
southern upper nappe system at Plabutsch (Fig. 3) left: Flügel et al. (1980) right: Fritz (1986)
NW lower nappe system at Frohn- leiten (Fig. 3) Fritz (1986)
base of upper nappe system at Schartner- kogel (Fig. 3) Fritz (1986,88)
central lower nappe system east of Tannebenstock (Fig. 3) Fritz (1986,88)
eastern lower nappe system Flügel et al.(1980)
eastern border to Anger Crystalline Esterlus (1986)
K/Ar ages from < 2 μm white micas in matrix where not indicated otherwise
Rb/Sr ages from < 2 μm white micas where not indicated otherwise
wide-spread Cretaceous peak and cooling ages in the high-grade crystalline basement (Thöni 1999)
time span interpreted to show eo-alpine thrusting (Fritz 1986, 1988, 1991)
wh
wh
> 2
bi
> 80 sz
wh: whole rock bi: biotite
> 80 sz
sz
sz: shear zone
Perm
ian
Triass
ic
Jura
ssic
C
reta
ceous
Figure C.7: Geochronological ages from the Paleozoic of Graz (from Flügel et al. (2000); Fritz (1986, 1988,1991) and Esterlus (1986). Fritz (1986, 1988, 1991) interpreted the ages in the time interval 130-115 Ma asshowing Eo-Alpine thrusting. However, the ages scatter over a larger time interval from 240 - 100 Ma and donot necessarily show the time of deformation (Thöni, 1999), see also text for discussion. Timescale after Ogget al. (2008).
The age of the low-grade metamorphism in the Paleozoic of Graz is similarly controver-sial. Earlier studies suggested Silurian to Early Devonian rifting and volcanism (Hasenhüttl,1994) and the Variscan orogeny (e.g. Fritz, 1986; Russegger, 1996) as the causes for meta-
249
morphism. In view of the rising evidence for a Permian thermal event (Schuster & Stuewe,2008) ? also suggested that the overall metamorphism of the Paleozoic of Graz could bethe result of Permian burial. Fritz (1988, 1991) interpreted K/Ar and Rb/Sr ages from whitemicas in both pressure shadows and the matrix as being the result of an Eo-Alpine thrustingevent around 125 Ma and concluded, that all deformation in the Paleozoic of Graz tookplace during the Cretaceous. However, a plot of all published isotopic ages from the Pa-leozoic of Graz shows that they scatter over a large time interval from ~240 Ma down to~90 Ma (Fig. C.7) and that only a few ages lie in the range Fritz (1988, 1991) attributedto the age of deformation. A similar scatter of ages was recorded from other low-gradeUpper Austroalpine Units in the Eastern Alps such as the base of the Northern CalcareousAlps and the Greywacke Zone (Kralik et al., 1987; Thöni, 1999). The interpretation ofall these scattering ages is difficult: They could (a) represent mixed ages between an old,Variscan and a younger (~100 Ma) Eo-Alpine event, (b) be related to hot fluids circulatingafter Triassic-Jurassic spreading, or (c) represent crystallisation ages during a Jurassic toEarly Cretaceous deformation (Thöni, 1999). In view of these difficulties in interpretingisotopic ages in low grade rocks we are not convinced that the few isotopic ages that liein the range of 130-115 Ma in the Paleozoic of Graz are sufficient to conclude that all de-formation in the Paleozoic of Graz took place during the Cretaceous. We suggest that theactual state of knowledge about deformation and metamorphism and the lack of a modern,detailed geochronological analysis of the region do not allow judging unequivocally whichof the two major events (Variscan or Eo-Alpine) was (and to which extent) responsible forthe actual internal geometry of the Paleozoic of Graz.
C.6.2 Deformation along the borders in the Late Cretaceous and Tertiary
The Paleozoic of Graz is not only internally deformed and metamorphosed; it is also spec-tacularly juxtaposed against high grade crystalline units such as the Koralm Crystallinealong its south-western and the Gleinalm Crystalline along its north-western borders (Fig.C.1b). Several models have been proposed to explain the emplacement of the Paleozoic ofGraz on top of these crystalline units. The following observations have to be included inthese models:
(i) the Paleozoic of Graz is only 1-2 km thick: the crystalline rocks below the Paleozoicof Graz were reached in a drill hole in the Gosau basin at a depth of only about 1000 mbelow sea level (Kröll & Heller, 1978, Fig. C.4, profile E). Based on the very low grademetamorphism of the uppermost units it can be argued that the complex was never morethan 5-8 km thick.
(ii) Geochronological data from the surrounding crystalline units constrain the age of am-phibolite to eclogite facies metamorphism to around 100-80 Ma and subsequent cooling tobelow 100°C to around ~60-50 Ma (Neubauer et al., 1995; Heijl, 1997; Thöni, 1999).
250
(iii) Simultaneously to metamorphism and cooling, sedimentation occurred in the alluvialto marine Gosau basin on top of the Paleozoic of Graz. This suggests that exhumation ofthe crystalline units was not accompanied by major topography.
iv) The profiles in Fig. C.4 show that the internal structure of the Paleozoic of Graz isdominated by compressional structures; apart from brittle normal and strike slip faults alongthe borders extensional structures inside the Paleozoic of Graz are rare.
(v) The Paleozoic of Graz is bounded by several ductile to brittle fault zones: The north-western border towards the Gleinalm Crystalline is made up by a sinistral fault zone dip-ping 50-80° towards SSE and showing a stretching lineation dipping ~10° towards the NE(Neubauer, 1988a; Neubauer et al., 1995). The south-western border towards the KoralmCrystalline is a steep, brittle, NE dipping normal fault (Graden normal fault) which over-prints a gently NE dipping mylonitic foliation with a down-dip lineation and top-NE shearsense in the crystalline rocks (Krohe, 1987; Rantitsch, 2006). The eastern border to theRadegund Crystalline is made up of a several 100 m broad zone of highly-deformed rocksof the Paleozoic of Graz which show both top-E and top-W shear sense (Krenn, 2001). Thesouthern border towards the Radegund Crystalline consists of a steep, brittle dextral strikeslip fault (Krenn, 2001). The north-eastern border towards the Anger Crystalline is lesspronounced and the metamorphic grade increases continuously. A tectonic foliation is de-veloped, which dips 35-55° towards SW and shows both top-NE and top-SW shear sense.This foliation is overprinted by steep SW dipping brittle normal faults (Neubauer, 1981,1982; Gsellmann, 1987; Krenn, 2001; Krenn et al., 2008).
Ratschbacher et al. (1991) interpret the mylonitic fault rocks found in several of the borderfaults as part of a single belt of mylonitic rocks which underlie the Paleozoic of Graz.According to them, exhumation of the surrounding crystalline rocks took place due to agravitational instability caused by the thickened Early Cretaceous orogenic wedge, and theentire nappe stack of the Paleozoic of Graz was sheared off from its basement along a basal,spoon-shaped high-strain zone towards the north-east. In contrast, Neubauer et al. (1995)proposed that the Glein- and Koralm Crystalline were exhumed in an overall transpressionalsetting in a sinistral wrench corridor, where the Paleozoic of Graz and the Gosau basin werelocated in a releasing bend of this corridor. This model does not require a connected shearzone at the base of the whole Paleozoic of Graz and interprets the extensional structuresat the borders and the Gosau basin formation as the result of oblique shortening ratherthan gravitational collapse. In consistency with that, Rantitsch et al. (2005) modelled thethermal influence of the exhuming crystalline rocks onto the Paleozoic of Graz and theGosau basin along the Graden normal fault and concluded that a normal fault which rootsin a flat lying detachment at ~20 km depth best fits the observations. Consequently, from athermal point of view no shallow flat lying detachment along the base of the Paleozoic ofGraz is needed. Krenn et al. (2008) returned to the model proposed by Ratschbacher et al.(1991) and refined it to a two stage process: in a first event the Paleozoic of Graz extrudedas a block together with the underlying crystalline rocks to the NE. In a second event thePaleozoic of Graz decoupled from the underlying crystalline rocks and pure extension led
251
to the formation of normal faults at the borders whereas the underlying crystalline rockswere ductilely stretched.
The models explaining the exhumation of the surrounding crystalline basement either in-voke a continuous shear zone at the base of the Paleozoic of Graz (which decouples it fromthe underlying crystalline rocks) or brittle to ductile faults which go much deeper than theactual base of the Paleozoic units. Considering the internal geometry of the Paleozoic rocks(Fig. C.4), we suggest that decoupling along the base in an overall extensional setting (assuggested by Ratschbacher et al., 1991; Krenn et al., 2008) is mechanically highly unlikely.If extension and stretching of the underlying crystalline basement occurred, the whole in-ternal Paleozoic of Graz would have dismembered. In contrast, no substantial extensionalstructures are observed in the Paleozoic of Graz and the profiles on figure C.4 suggest thatthere is a minimum of extensional strain. We therefore suggest that exhumation of the Kor-and Gleinalm Crystalline in an overall transpressional regime (as suggested by Neubaueret al., 1995) provides a good explanation that is consistent with the observations in thePaleozoic of Graz.
C.7 Conclusions
Re-evaluation of an abundance of local literature and the compilation of this informationin form of integrated profiles leads to the following conclusions about the internal struc-ture of the Paleozoic of Graz: (1) The 35 sedimentary formations defined by Flügel &Hubmann (2000) can be summarized into 13 distinct rock associations belonging to fivedifferent sedimentological facies termed the Laufnitzdorf, Kalkschiefer, Schöckl, Rannachand Hochlantsch facies. (2) The Paleozoic of Graz consists of an upper and a lower nappesystem which are separated by a thrust, the Rannach thrust. Kalkschiefer, Rannach andHochlantsch facies rocks occur in the upper nappe system, Kalkschiefer, Laufnitzdorf andSchöckl facies rocks occur in the lower nappe system. Upper and lower nappe system differin deformation style and metamorphic grade. (3) In the literature, the same names were ap-plied for both sedimentary facies as well as tectonic units. Because sedimentary facies andtectonic units do not correlate this should be avoided. (4) The age of internal deformationremains badly constrained. Compared with other Paleozoic units of the Eastern Alps, bothVariscan and Eo-Alpine events may have contributed to the internal structure of the Paleo-zoic of Graz. (5) The exhumation of the surrounding crystalline basement during the LateCretaceous led to deformation along the borders of the Paleozoic of Graz. For mechanicalreasons we favour models that invoke a deep-seated detachment in the crystalline rocks rel-ative to models that invoke a shallow, flat-lying detachment at the base of the Paleozoic ofGraz.
252

C.8 Acknowledgments
The project was funded by Project Nr. 19366-N10 of the Fonds zur Förderung der wissenschaftlichen ForschungFWF. We thank K. Krenn and R. Schuster for helpful discussions and W. Frisch and J. von Raumer for con-structive reviews.
253

Appendix D
Conference abstract related to Appendix C
• Gasser, D., Stuewe, K., Fritz, H. (2008) Geological profiles through the poly-phasedeformed Paleozoic of Graz. Journal of Alpine Geology, Vol. 49, p. 29, PANGEO08 conference, Vienna.
255
D.1 Geological profiles through the poly-phase deformed Paleo-zoic of Graz
The Upper Austroalpine / Upper Central Austroalpine Paleozoic of Graz consists of a 30 x50 km sized nappe complex built up mainly of low-grade carbonates and schist of Silurianto Carboniferous age. It lies on top of high-grade Middle Austroalpine / Lower CentralAustroalpine crystalline basement, and it is discordantly overlain by a small CretaceousGosau Basin and by the Neogene Styrian Basin. As such, the Paleozoic of Graz recordsmany of the sedimentological, tectonic and metamorphic events that formed the presentEastern Alps since the early Paleozoic.
Stratigraphy, palaeontology, internal structure and metamorphism of the Paleozoic of Grazwere extensively studied over the past 180 years, and resulted in over 500 publications (eg.Flügel and Hubmann, 2000 and references therein). However, remarkably no geologicalprofiles through the entire Paleozoic of Graz are published and the complex, poly-phasetectonic history is still not fully understood. We present geological profiles through theentire Paleozoic of Graz in order to understand the actual 3D geometry of this complex.As a base, we use 1:50 000 geological maps, a 10 m digital elevation model, local detailedmaps and profiles, drillhole data and descriptions of structure and stratigraphy from variouspublications listed in Flügel and Hubmann (2000).
The structure of the Paleozoic of Graz, as revealed by the profiles, is dominated by the fol-lowing elements: (i) a probably Variscan (?) large-scale isoclinal fold with an E-W trendingaxis in the lower nappe complex bringing Silurian schist on top of Devonian limestone, (ii)early Cretaceous W to NW directed thrusts and open to tight folds separating the Paleozoicof Graz into an upper and a lower nappe system, and (iii) late Cretaceous to Tertiary ductileto brittle normal and strike-slip faults defining the borders against the surrounding crys-talline basement. Which of these events could have led to the emplacement of the Paleozoicof Graz on top of the crystalline basement is discussed
Gasser, D., Stuewe, K., Fritz, H. (2008)Journal of Alpine Geology, Vol. 49, p. 29, PANGEO08 conference, Vienna.
256
Appendix E
Geology of Styria: An overview
Abstract In 2009 the Styrian Doctoral School of Earth Sciences organised a field work-shop on the geology of Styria. The field trip was led by PhD students of the three partic-ipating universities: KFU Graz, TU Graz and MU Leoben. As an outcome of this fieldtrip, we present here the geology of the entire province in a simplified way, taking into ac-count modern concepts of the tectonic evolution. In a first part, the tectonic units buildingup Styria are presented; in a second part the geodynamic evolution of these units throughtime is described. A third part deals with the economic significance of mineral resourcesin Styria. The figures of this contribution are available online on the pages of the naturwis-senschaftlicher Verein and at http://wegener.uni-graz.at.
published as: Gasser, D., Gusterhuber, J., Krische, O., Puhr, B., Scheucher, L., Wagner,T. and Stüwe, K. (2009) Mitteilungen des naturwissenschaftlichen Vereins Steiermark 139,5-36.
257
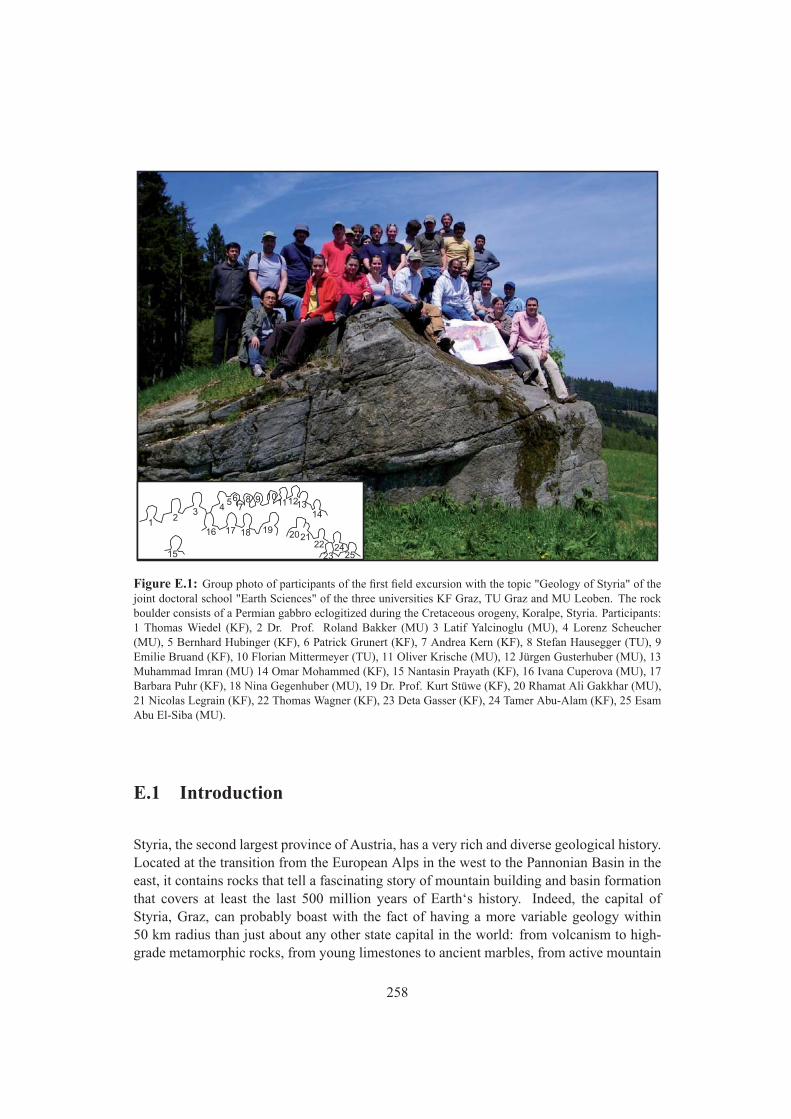
11
23 4
567
8 9 10111213
14
15
16 17 18 19 202122
2324
25
Figure E.1: Group photo of participants of the first field excursion with the topic "Geology of Styria" of thejoint doctoral school "Earth Sciences" of the three universities KF Graz, TU Graz and MU Leoben. The rockboulder consists of a Permian gabbro eclogitized during the Cretaceous orogeny, Koralpe, Styria. Participants:1 Thomas Wiedel (KF), 2 Dr. Prof. Roland Bakker (MU) 3 Latif Yalcinoglu (MU), 4 Lorenz Scheucher(MU), 5 Bernhard Hubinger (KF), 6 Patrick Grunert (KF), 7 Andrea Kern (KF), 8 Stefan Hausegger (TU), 9Emilie Bruand (KF), 10 Florian Mittermeyer (TU), 11 Oliver Krische (MU), 12 Jürgen Gusterhuber (MU), 13Muhammad Imran (MU) 14 Omar Mohammed (KF), 15 Nantasin Prayath (KF), 16 Ivana Cuperova (MU), 17Barbara Puhr (KF), 18 Nina Gegenhuber (MU), 19 Dr. Prof. Kurt Stüwe (KF), 20 Rhamat Ali Gakkhar (MU),21 Nicolas Legrain (KF), 22 Thomas Wagner (KF), 23 Deta Gasser (KF), 24 Tamer Abu-Alam (KF), 25 EsamAbu El-Siba (MU).
E.1 Introduction
Styria, the second largest province of Austria, has a very rich and diverse geological history.Located at the transition from the European Alps in the west to the Pannonian Basin in theeast, it contains rocks that tell a fascinating story of mountain building and basin formationthat covers at least the last 500 million years of Earth‘s history. Indeed, the capital ofStyria, Graz, can probably boast with the fact of having a more variable geology within50 km radius than just about any other state capital in the world: from volcanism to high-grade metamorphic rocks, from young limestones to ancient marbles, from active mountain
258
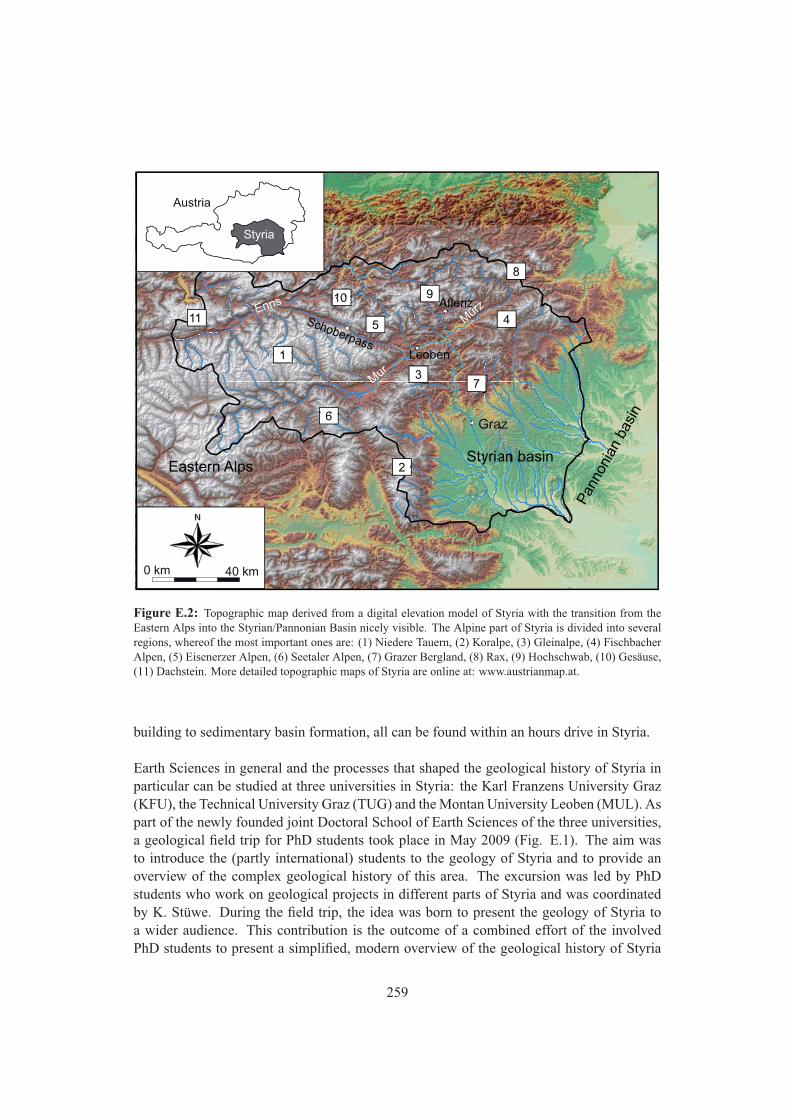
Styria
Austria
1
9
3
2
7
45
6
Mur
MürzEnns
11
Styrian basin
Pan
noni
an b
asin
Eastern Alps
40 km
Schoberpass
0 km
8
Leoben
Aflenz10
Figure E.2: Topographic map derived from a digital elevation model of Styria with the transition from theEastern Alps into the Styrian/Pannonian Basin nicely visible. The Alpine part of Styria is divided into severalregions, whereof the most important ones are: (1) Niedere Tauern, (2) Koralpe, (3) Gleinalpe, (4) FischbacherAlpen, (5) Eisenerzer Alpen, (6) Seetaler Alpen, (7) Grazer Bergland, (8) Rax, (9) Hochschwab, (10) Gesäuse,(11) Dachstein. More detailed topographic maps of Styria are online at: www.austrianmap.at.
building to sedimentary basin formation, all can be found within an hours drive in Styria.
Earth Sciences in general and the processes that shaped the geological history of Styria inparticular can be studied at three universities in Styria: the Karl Franzens University Graz(KFU), the Technical University Graz (TUG) and the Montan University Leoben (MUL). Aspart of the newly founded joint Doctoral School of Earth Sciences of the three universities,a geological field trip for PhD students took place in May 2009 (Fig. E.1). The aim wasto introduce the (partly international) students to the geology of Styria and to provide anoverview of the complex geological history of this area. The excursion was led by PhDstudents who work on geological projects in different parts of Styria and was coordinatedby K. Stüwe. During the field trip, the idea was born to present the geology of Styria toa wider audience. This contribution is the outcome of a combined effort of the involvedPhD students to present a simplified, modern overview of the geological history of Styria
259
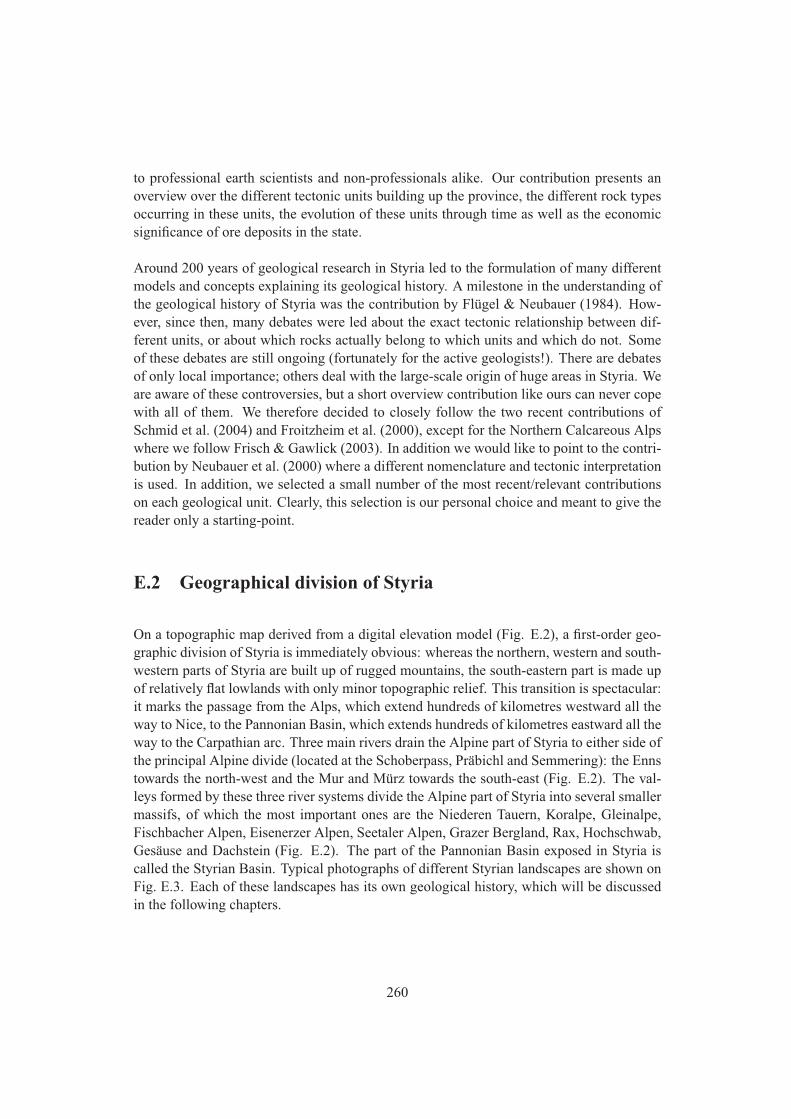
to professional earth scientists and non-professionals alike. Our contribution presents anoverview over the different tectonic units building up the province, the different rock typesoccurring in these units, the evolution of these units through time as well as the economicsignificance of ore deposits in the state.
Around 200 years of geological research in Styria led to the formulation of many differentmodels and concepts explaining its geological history. A milestone in the understanding ofthe geological history of Styria was the contribution by Flügel & Neubauer (1984). How-ever, since then, many debates were led about the exact tectonic relationship between dif-ferent units, or about which rocks actually belong to which units and which do not. Someof these debates are still ongoing (fortunately for the active geologists!). There are debatesof only local importance; others deal with the large-scale origin of huge areas in Styria. Weare aware of these controversies, but a short overview contribution like ours can never copewith all of them. We therefore decided to closely follow the two recent contributions ofSchmid et al. (2004) and Froitzheim et al. (2000), except for the Northern Calcareous Alpswhere we follow Frisch & Gawlick (2003). In addition we would like to point to the contri-bution by Neubauer et al. (2000) where a different nomenclature and tectonic interpretationis used. In addition, we selected a small number of the most recent/relevant contributionson each geological unit. Clearly, this selection is our personal choice and meant to give thereader only a starting-point.
E.2 Geographical division of Styria
On a topographic map derived from a digital elevation model (Fig. E.2), a first-order geo-graphic division of Styria is immediately obvious: whereas the northern, western and south-western parts of Styria are built up of rugged mountains, the south-eastern part is made upof relatively flat lowlands with only minor topographic relief. This transition is spectacular:it marks the passage from the Alps, which extend hundreds of kilometres westward all theway to Nice, to the Pannonian Basin, which extends hundreds of kilometres eastward all theway to the Carpathian arc. Three main rivers drain the Alpine part of Styria to either side ofthe principal Alpine divide (located at the Schoberpass, Präbichl and Semmering): the Ennstowards the north-west and the Mur and Mürz towards the south-east (Fig. E.2). The val-leys formed by these three river systems divide the Alpine part of Styria into several smallermassifs, of which the most important ones are the Niederen Tauern, Koralpe, Gleinalpe,Fischbacher Alpen, Eisenerzer Alpen, Seetaler Alpen, Grazer Bergland, Rax, Hochschwab,Gesäuse and Dachstein (Fig. E.2). The part of the Pannonian Basin exposed in Styria iscalled the Styrian Basin. Typical photographs of different Styrian landscapes are shown onFig. E.3. Each of these landscapes has its own geological history, which will be discussedin the following chapters.
260
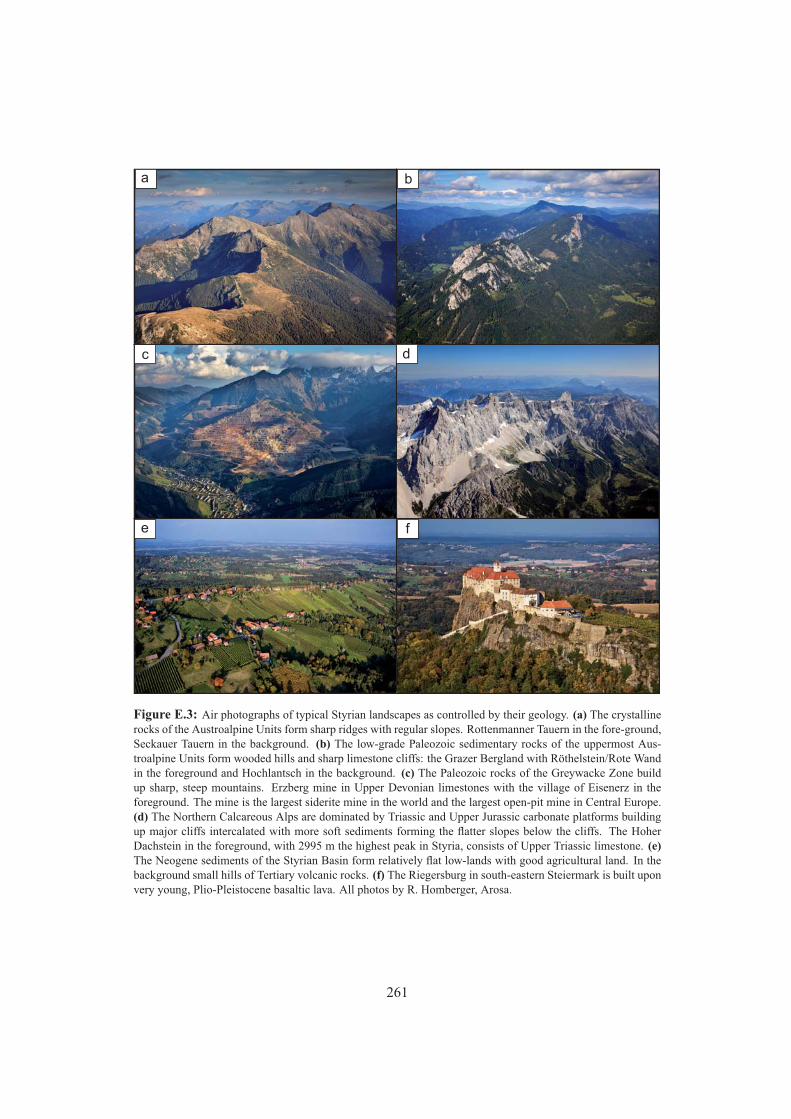
a b
c d
e f
Figure E.3: Air photographs of typical Styrian landscapes as controlled by their geology. (a) The crystallinerocks of the Austroalpine Units form sharp ridges with regular slopes. Rottenmanner Tauern in the fore-ground,Seckauer Tauern in the background. (b) The low-grade Paleozoic sedimentary rocks of the uppermost Aus-troalpine Units form wooded hills and sharp limestone cliffs: the Grazer Bergland with Röthelstein/Rote Wandin the foreground and Hochlantsch in the background. (c) The Paleozoic rocks of the Greywacke Zone buildup sharp, steep mountains. Erzberg mine in Upper Devonian limestones with the village of Eisenerz in theforeground. The mine is the largest siderite mine in the world and the largest open-pit mine in Central Europe.(d) The Northern Calcareous Alps are dominated by Triassic and Upper Jurassic carbonate platforms buildingup major cliffs intercalated with more soft sediments forming the flatter slopes below the cliffs. The HoherDachstein in the foreground, with 2995 m the highest peak in Styria, consists of Upper Triassic limestone. (e)The Neogene sediments of the Styrian Basin form relatively flat low-lands with good agricultural land. In thebackground small hills of Tertiary volcanic rocks. (f) The Riegersburg in south-eastern Steiermark is built uponvery young, Plio-Pleistocene basaltic lava. All photos by R. Homberger, Arosa.
261
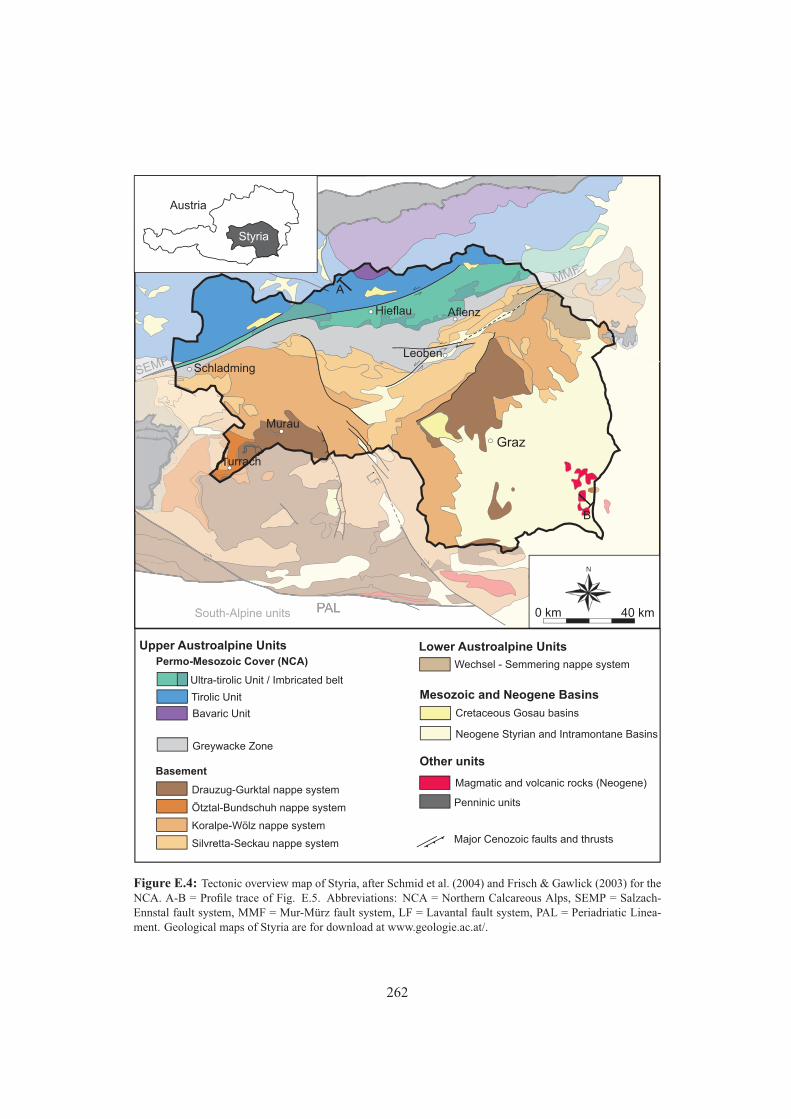
Upper Austroalpine Units
Basement
Permo-Mesozoic Cover (NCA)
Bavaric Unit
Tirolic Unit
Ultra-tirolic Unit / Imbricated belt
Lower Austroalpine Units
Mesozoic and Neogene Basins
Cretaceous Gosau basins
Wechsel - Semmering nappe system
Neogene Styrian and Intramontane Basins
Other units
Leoben
Hieflau
Magmatic and volcanic rocks (Neogene)
South-Alpine units
LF
MMF
SEMP
Major Cenozoic faults and thrusts
Schladming
Aflenz
Murau
South-Alpine units
LF
SEMPMPMPMP
FMMMFMMFMMMFMMFMMF
Turrach
A
B
0 km 40 km
Styria
Austria
Figure E.4: Tectonic overview map of Styria, after Schmid et al. (2004) and Frisch & Gawlick (2003) for theNCA. A-B = Profile trace of Fig. E.5. Abbreviations: NCA = Northern Calcareous Alps, SEMP = Salzach-Ennstal fault system, MMF = Mur-Mürz fault system, LF = Lavantal fault system, PAL = Periadriatic Linea-ment. Geological maps of Styria are for download at www.geologie.ac.at/.
262
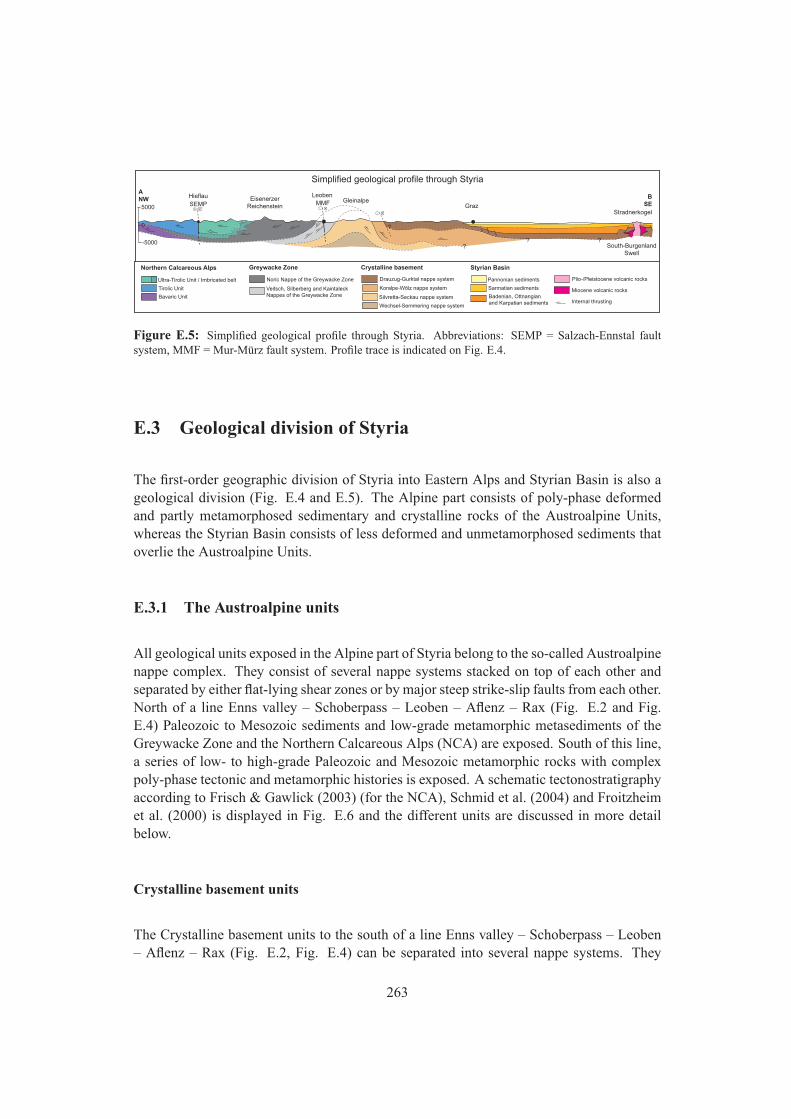
EisenerzerReichenstein
GleinalpeLeobenHieflau
-5000
5000
0
Stradnerkogel
?
??
Graz
?
SEMP MMF
South-BurgenlandSwell
ANW B
SE
Bavaric Unit
Tirolic Unit
Ultra-Tirolic Unit / Imbricated belt Noric Nappe of the Greywacke Zone
Veitsch, Silberberg and Kaintaleck Nappes of the Greywacke Zone Badenian, Ottnangian
and Karpatian sediments
Sarmatian sediments
Pannonian sediments Plio-/Pleistocene volcanic rocks
Miocene volcanic rocks
Simplified geological profile through Styria
Northern Calcareous Alps Greywacke Zone Crystalline basement Styrian Basin
Internal thrustingWechsel-Semmering nappe system
Drauzug-Gurktal nappe system
Koralpe-Wölz nappe system
Silvretta-Seckau nappe system
Figure E.5: Simplified geological profile through Styria. Abbreviations: SEMP = Salzach-Ennstal faultsystem, MMF = Mur-Mürz fault system. Profile trace is indicated on Fig. E.4.
E.3 Geological division of Styria
The first-order geographic division of Styria into Eastern Alps and Styrian Basin is also ageological division (Fig. E.4 and E.5). The Alpine part consists of poly-phase deformedand partly metamorphosed sedimentary and crystalline rocks of the Austroalpine Units,whereas the Styrian Basin consists of less deformed and unmetamorphosed sediments thatoverlie the Austroalpine Units.
E.3.1 The Austroalpine units
All geological units exposed in the Alpine part of Styria belong to the so-called Austroalpinenappe complex. They consist of several nappe systems stacked on top of each other andseparated by either flat-lying shear zones or by major steep strike-slip faults from each other.North of a line Enns valley – Schoberpass – Leoben – Aflenz – Rax (Fig. E.2 and Fig.E.4) Paleozoic to Mesozoic sediments and low-grade metamorphic metasediments of theGreywacke Zone and the Northern Calcareous Alps (NCA) are exposed. South of this line,a series of low- to high-grade Paleozoic and Mesozoic metamorphic rocks with complexpoly-phase tectonic and metamorphic histories is exposed. A schematic tectonostratigraphyaccording to Frisch & Gawlick (2003) (for the NCA), Schmid et al. (2004) and Froitzheimet al. (2000) is displayed in Fig. E.6 and the different units are discussed in more detailbelow.
Crystalline basement units
The Crystalline basement units to the south of a line Enns valley – Schoberpass – Leoben– Aflenz – Rax (Fig. E.2, Fig. E.4) can be separated into several nappe systems. They
263
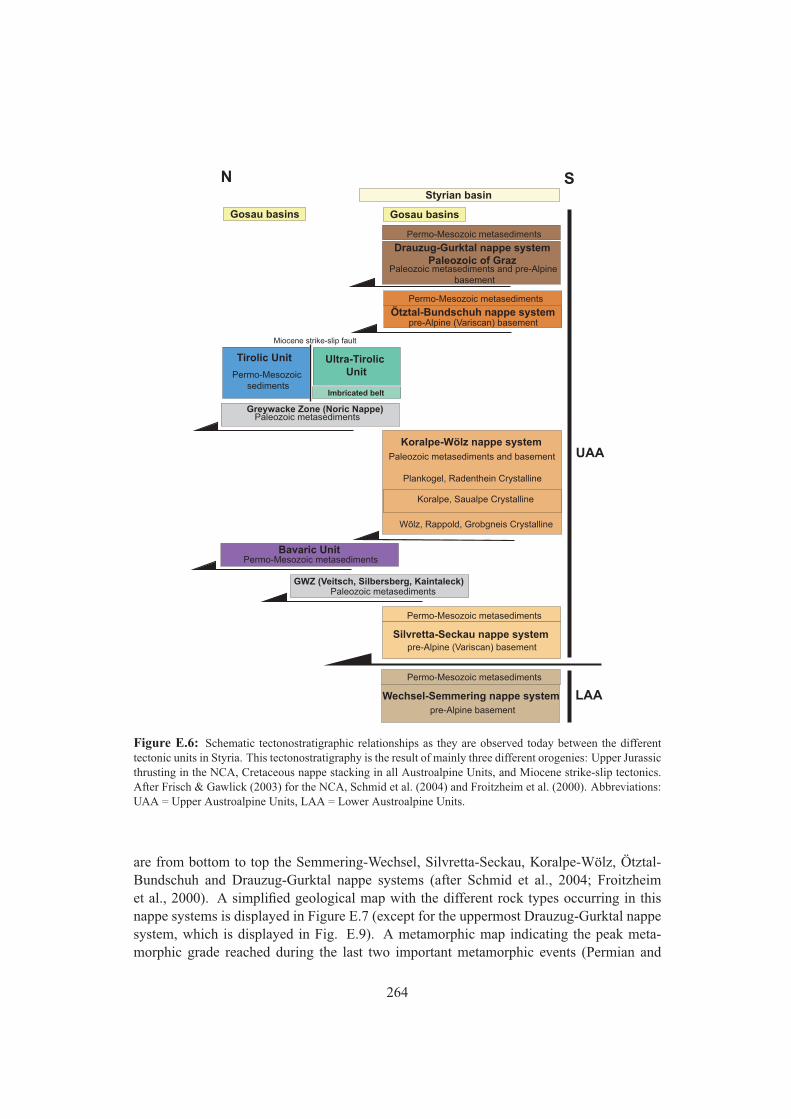
Wechsel-Semmering nappe system
Silvretta-Seckau nappe system
Permo-Mesozoic metasediments
pre-Alpine basement
Permo-Mesozoic metasediments
pre-Alpine (Variscan) basement
Bavaric UnitPermo-Mesozoic metasediments
Koralpe-Wölz nappe system
Plankogel, Radenthein Crystalline
Koralpe, Saualpe Crystalline
Wölz, Rappold, Grobgneis Crystalline
Paleozoic metasediments and basement
Ötztal-Bundschuh nappe systemPermo-Mesozoic metasediments
pre-Alpine (Variscan) basement
GWZ (Veitsch, Silbersberg, Kaintaleck)
Tirolic Unit
Paleozoic metasediments
Permo-Mesozoic sediments
Drauzug-Gurktal nappe systemPaleozoic of Graz
Permo-Mesozoic metasediments
Paleozoic metasediments and pre-Alpine basement
LAA
UAA
N S
Gosau basins Gosau basins
Styrian basin
Ultra-Tirolic Unit
Imbricated belt
Miocene strike-slip fault
Greywacke Zone (Noric Nappe) Paleozoic metasediments
Figure E.6: Schematic tectonostratigraphic relationships as they are observed today between the differenttectonic units in Styria. This tectonostratigraphy is the result of mainly three different orogenies: Upper Jurassicthrusting in the NCA, Cretaceous nappe stacking in all Austroalpine Units, and Miocene strike-slip tectonics.After Frisch & Gawlick (2003) for the NCA, Schmid et al. (2004) and Froitzheim et al. (2000). Abbreviations:UAA = Upper Austroalpine Units, LAA = Lower Austroalpine Units.
are from bottom to top the Semmering-Wechsel, Silvretta-Seckau, Koralpe-Wölz, Ötztal-Bundschuh and Drauzug-Gurktal nappe systems (after Schmid et al., 2004; Froitzheimet al., 2000). A simplified geological map with the different rock types occurring in thisnappe systems is displayed in Figure E.7 (except for the uppermost Drauzug-Gurktal nappesystem, which is displayed in Fig. E.9). A metamorphic map indicating the peak meta-morphic grade reached during the last two important metamorphic events (Permian and
264
Eo-Alpine) is displayed on Figure E.8. The different nappe systems are described in moredetail below.
Semmering-Wechsel nappe system (Lower Austroalpine Units LAA) The Semmering-Wechsel nappe system is only exposed in a small area in northwestern Styria close to theSemmering pass and in the Wechsel mountains (Fig. E.2, Fig. E.4). It consists mainly ofparagneisses and phyllitic micaschists, but orthogneisses, greenschists, amphibolites andquartzites are also present (Fig. E.7). Permo-Mesozoic carbonaceous, siliciclastic andvolcanoclastic metasediments partly overlie and are folded into the crystalline basement.As in all crystalline units of the Austroalpine nappe stack the metamorphic history in theSemmering-Wechsel nappe system is complex. Relics of a Variscan (Carboniferous) and aPermo-Triassic metamorphic event are overprinted by a greenschist facies Eo-Alpine event(Fig. E.8; Schuster et al., 2001, 2004).
Silvretta-Seckau nappe system (Upper Austroalpine Units UAA) The Silvretta-Seckaunappe system builds up a small region south of Schladming, the Rottenmanner and SeckauerTauern which are part of the Niedere Tauern, the Gleinalpe region in central Styria and anelongated region north of the Mürz valley between Kapfenberg and Rax (Troiseck-FloningZug) (Fig. E.2; Fig. E.4). It consists of biotite-plagioclase gneisses and mica schists,hornblende gneisses, amphibolites and orthogneisses (Fig. E.7). Migmatites and ultramaficcomplexes locally occur. Remnants of Permo-Mesozoic cover sequences, such as siliciclas-tic, volcanoclastic and carbonaceous sediments are locally present. Variscan tectonics andmetamorphism is widely distributed in this nappe system, but no Permo-Triassic metamor-phism is recorded (Fig. E.8a). The whole nappe system is overprinted by a greenschist toepidote-amphibolite facies Eo-Alpine metamorphism (Fig. E.8b; Scharbert, 1981; Scher-maier et al., 1997; Neubauer et al., 1995; Faryad et al., 2002; Faryad & Hoinkes, 2003).
Koralpe-Wölz nappe system (UAA) The Koralpe-Wölz nappe system is exposed in muchof the western Niederen Tauern, the Seetaler Alpen, the Koralpe and the Fischbacher Alpenand therefore builds up large parts of Styria (Fig. E.2, Fig. E.4). In contrast to the othercrystalline units, it lacks Permo-Mesozoic metasediments (Fig. E.6, E.7). It consists mainlyof micaschists and paragneisses, pegmatites and orthogneisses. Locally marbles, amphi-bolites and eclogites occur (Fig. E.7). A wide-spread Permo-Triassic metamorphic imprintup to amphibolite facies and local anatexis is recorded, accompanied by Permian gabbros,granites and volcanic rocks (Fig. E.8a). The Eo-Alpine imprint rises from north to southfrom greenschist/epidote-amphibolite facies (Wölz complex, Fig. E.6) to eclogite facies(Koralpe complex, Stuewe & Powell, 1995; Bruand et al., 2010). Across the so-called BUP(base of the Eo-Alpine upper plate) on top of the Koralpe-Wölz nappe system a decreasein metamorphic grade down to lower greenschist facies is recorded (Fig. 8b; Tenczer &Stuewe, 2003; Schmid et al., 2004; Schuster et al., 2004).
265
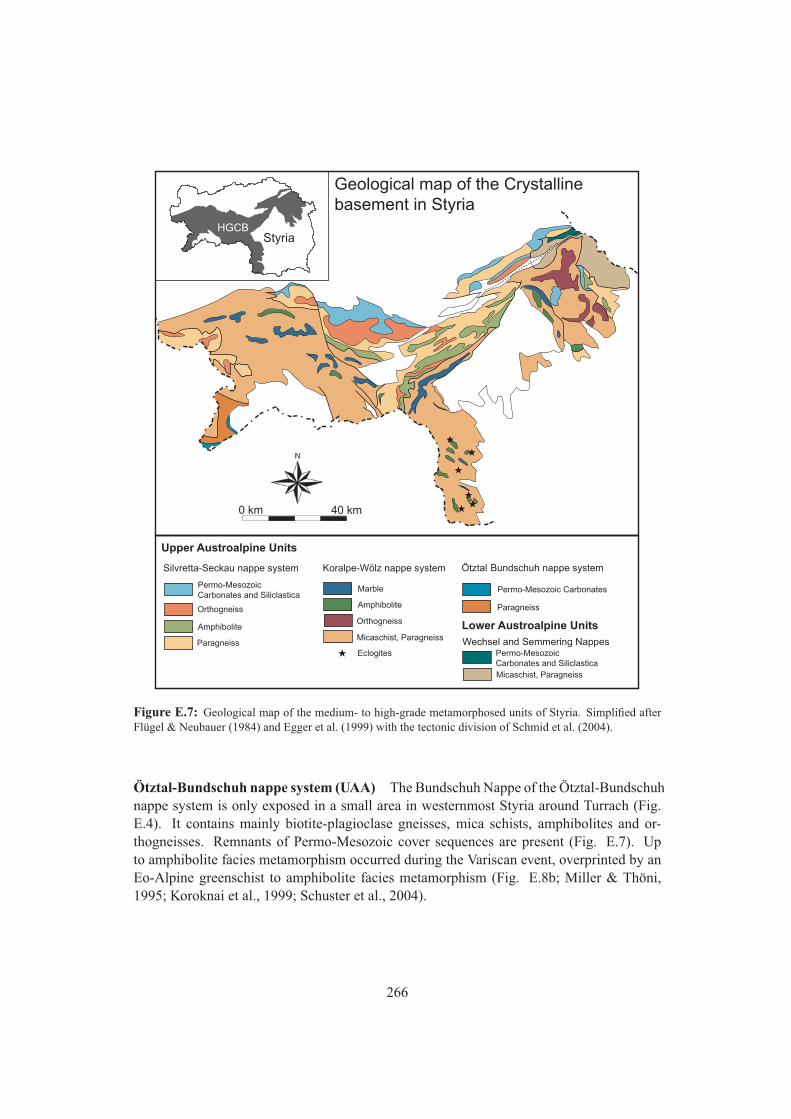
0 km 40 km
Geological map of the Crystalline basement in Styria
HGCB
Upper Austroalpine Units
Lower Austroalpine Units
Wechsel and Semmering Nappes
Permo-MesozoicCarbonates and Siliclastica
Orthogneiss
Amphibolite
ParagneissMicaschist, Paragneiss
Orthogneiss
Amphibolite
Marble
Eclogites
Permo-Mesozoic Carbonates
Paragneiss
Permo-MesozoicCarbonates and Siliclastica
Micaschist, Paragneiss
Figure E.7: Geological map of the medium- to high-grade metamorphosed units of Styria. Simplified afterFlügel & Neubauer (1984) and Egger et al. (1999) with the tectonic division of Schmid et al. (2004).
Ötztal-Bundschuh nappe system (UAA) The Bundschuh Nappe of the Ötztal-Bundschuhnappe system is only exposed in a small area in westernmost Styria around Turrach (Fig.E.4). It contains mainly biotite-plagioclase gneisses, mica schists, amphibolites and or-thogneisses. Remnants of Permo-Mesozoic cover sequences are present (Fig. E.7). Upto amphibolite facies metamorphism occurred during the Variscan event, overprinted by anEo-Alpine greenschist to amphibolite facies metamorphism (Fig. E.8b; Miller & Thöni,1995; Koroknai et al., 1999; Schuster et al., 2004).
266
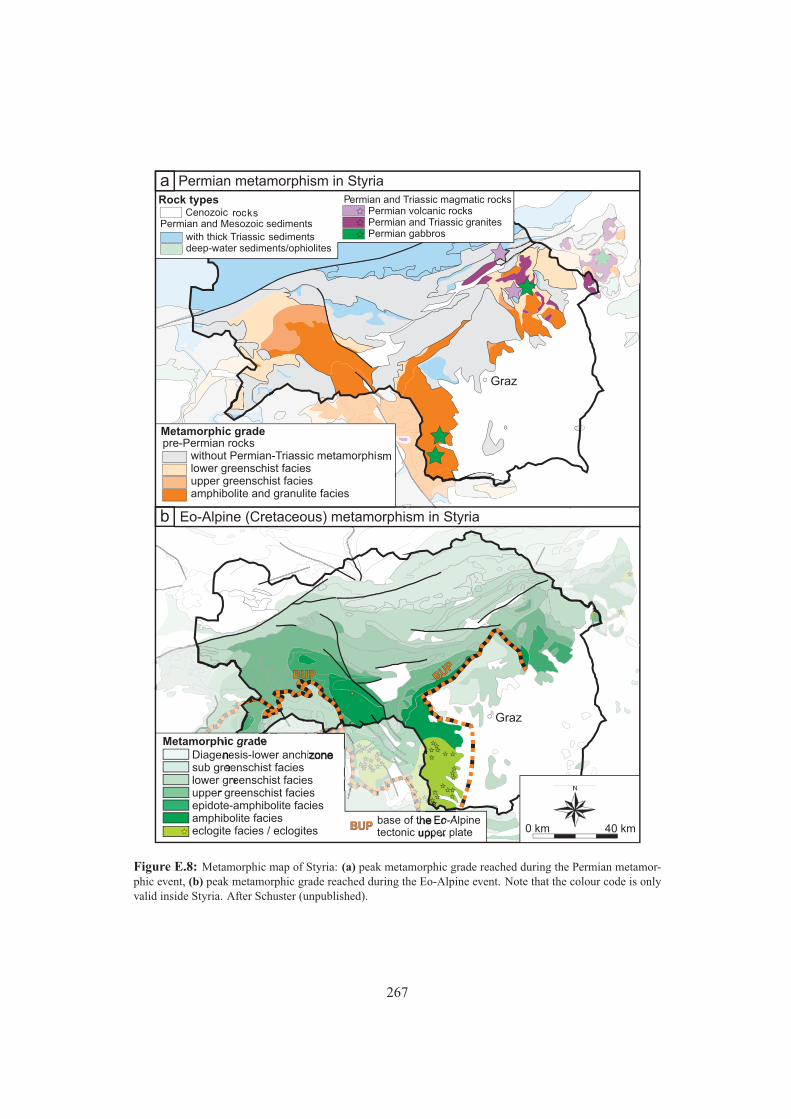
Rock types
Metamorphic grade
Metamorphic grade
-E
Permian metamorphism in Styria
Eo-Alpine (Cretaceous) metamorphism in Styria
a
b
0 km 40 km
Figure E.8: Metamorphic map of Styria: (a) peak metamorphic grade reached during the Permian metamor-phic event, (b) peak metamorphic grade reached during the Eo-Alpine event. Note that the colour code is onlyvalid inside Styria. After Schuster (unpublished).
267
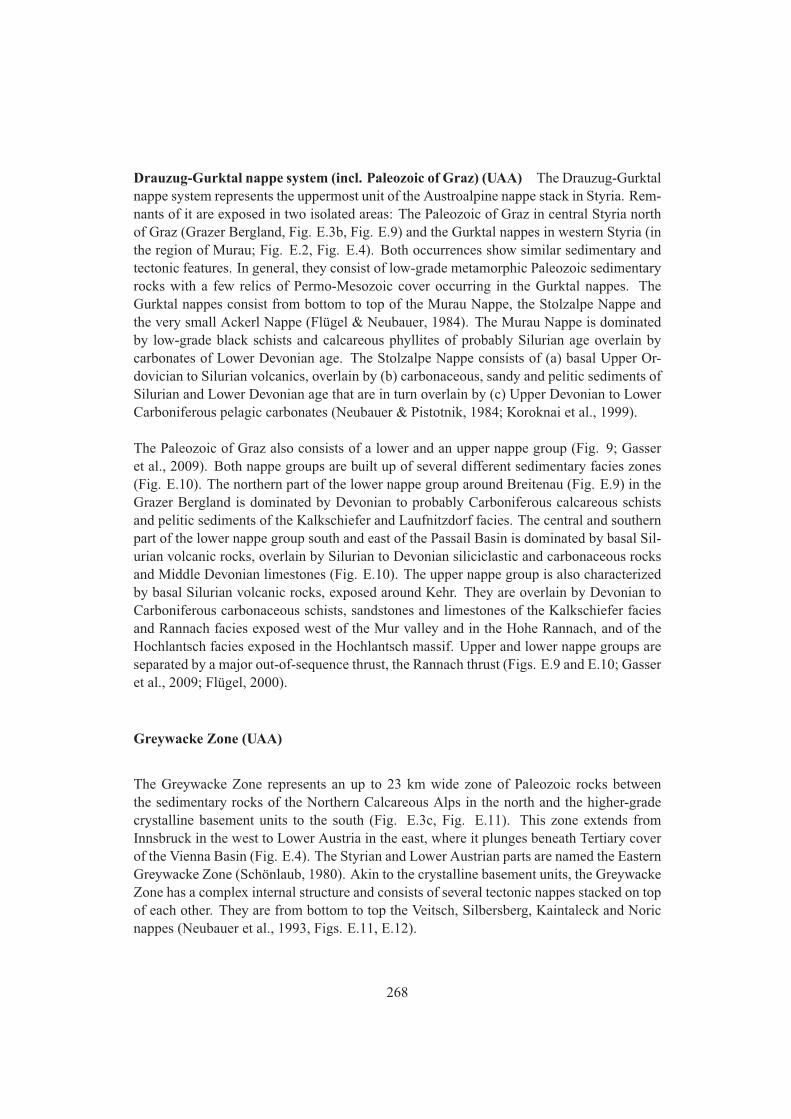
Drauzug-Gurktal nappe system (incl. Paleozoic of Graz) (UAA) The Drauzug-Gurktalnappe system represents the uppermost unit of the Austroalpine nappe stack in Styria. Rem-nants of it are exposed in two isolated areas: The Paleozoic of Graz in central Styria northof Graz (Grazer Bergland, Fig. E.3b, Fig. E.9) and the Gurktal nappes in western Styria (inthe region of Murau; Fig. E.2, Fig. E.4). Both occurrences show similar sedimentary andtectonic features. In general, they consist of low-grade metamorphic Paleozoic sedimentaryrocks with a few relics of Permo-Mesozoic cover occurring in the Gurktal nappes. TheGurktal nappes consist from bottom to top of the Murau Nappe, the Stolzalpe Nappe andthe very small Ackerl Nappe (Flügel & Neubauer, 1984). The Murau Nappe is dominatedby low-grade black schists and calcareous phyllites of probably Silurian age overlain bycarbonates of Lower Devonian age. The Stolzalpe Nappe consists of (a) basal Upper Or-dovician to Silurian volcanics, overlain by (b) carbonaceous, sandy and pelitic sediments ofSilurian and Lower Devonian age that are in turn overlain by (c) Upper Devonian to LowerCarboniferous pelagic carbonates (Neubauer & Pistotnik, 1984; Koroknai et al., 1999).
The Paleozoic of Graz also consists of a lower and an upper nappe group (Fig. 9; Gasseret al., 2009). Both nappe groups are built up of several different sedimentary facies zones(Fig. E.10). The northern part of the lower nappe group around Breitenau (Fig. E.9) in theGrazer Bergland is dominated by Devonian to probably Carboniferous calcareous schistsand pelitic sediments of the Kalkschiefer and Laufnitzdorf facies. The central and southernpart of the lower nappe group south and east of the Passail Basin is dominated by basal Sil-urian volcanic rocks, overlain by Silurian to Devonian siliciclastic and carbonaceous rocksand Middle Devonian limestones (Fig. E.10). The upper nappe group is also characterizedby basal Silurian volcanic rocks, exposed around Kehr. They are overlain by Devonian toCarboniferous carbonaceous schists, sandstones and limestones of the Kalkschiefer faciesand Rannach facies exposed west of the Mur valley and in the Hohe Rannach, and of theHochlantsch facies exposed in the Hochlantsch massif. Upper and lower nappe groups areseparated by a major out-of-sequence thrust, the Rannach thrust (Figs. E.9 and E.10; Gasseret al., 2009; Flügel, 2000).
Greywacke Zone (UAA)
The Greywacke Zone represents an up to 23 km wide zone of Paleozoic rocks betweenthe sedimentary rocks of the Northern Calcareous Alps in the north and the higher-gradecrystalline basement units to the south (Fig. E.3c, Fig. E.11). This zone extends fromInnsbruck in the west to Lower Austria in the east, where it plunges beneath Tertiary coverof the Vienna Basin (Fig. E.4). The Styrian and Lower Austrian parts are named the EasternGreywacke Zone (Schönlaub, 1980). Akin to the crystalline basement units, the GreywackeZone has a complex internal structure and consists of several tectonic nappes stacked on topof each other. They are from bottom to top the Veitsch, Silbersberg, Kaintaleck and Noricnappes (Neubauer et al., 1993, Figs. E.11, E.12).
268
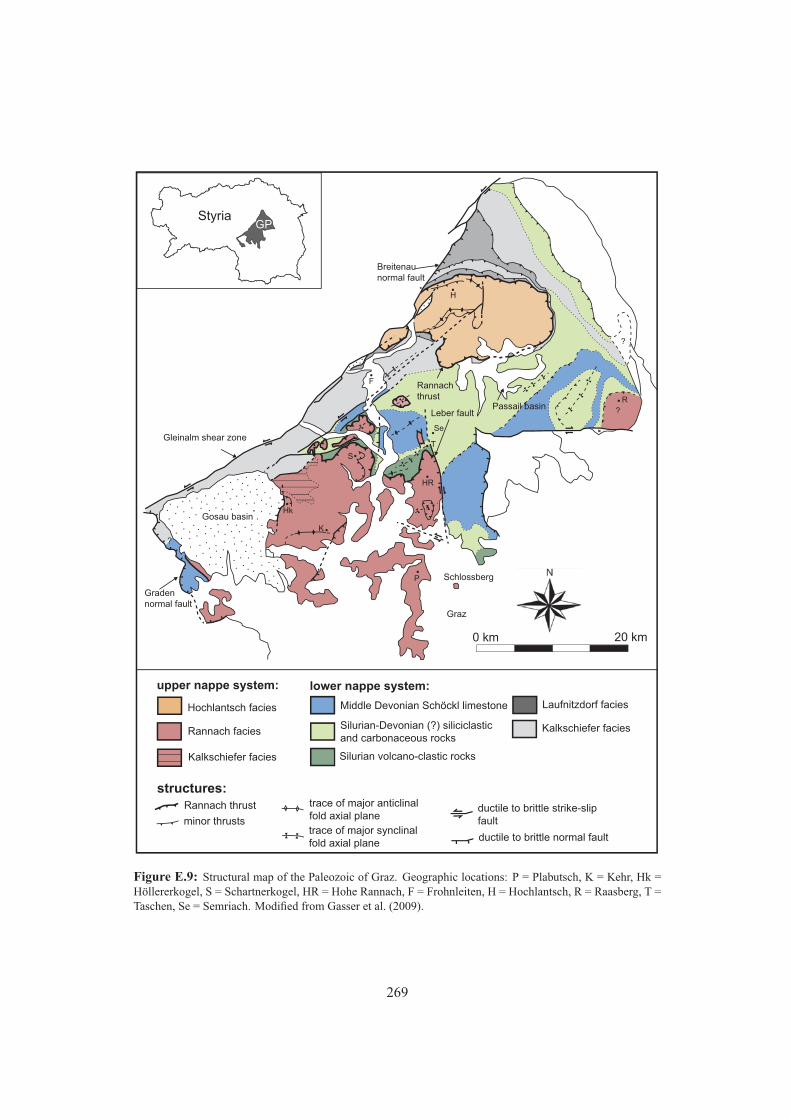
Gosau basin
Graden normal fault
Leber fault
Graz
Rannach thrust
Gleinalm shear zone
Breitenau normal fault
Schlossberg
H
S
HR
Hk
?
?
?R
P
F
T
K
Se
GP
Passail basin
upper nappe system: lower nappe system:
Rannach thrust ductile to brittle strike-slip fault
structures:
minor thrusts
trace of major anticlinal fold axial plane
trace of major synclinal fold axial plane
ductile to brittle normal fault
Hochlantsch facies
Rannach facies
Laufnitzdorf facies
Kalkschiefer facies
Kalkschiefer facies
Middle Devonian Schöckl limestone
Silurian-Devonian (?) siliciclastic and carbonaceous rocks
Silurian volcano-clastic rocks
0 km 20 km
Figure E.9: Structural map of the Paleozoic of Graz. Geographic locations: P = Plabutsch, K = Kehr, Hk =Höllererkogel, S = Schartnerkogel, HR = Hohe Rannach, F = Frohnleiten, H = Hochlantsch, R = Raasberg, T =Taschen, Se = Semriach. Modified from Gasser et al. (2009).
269
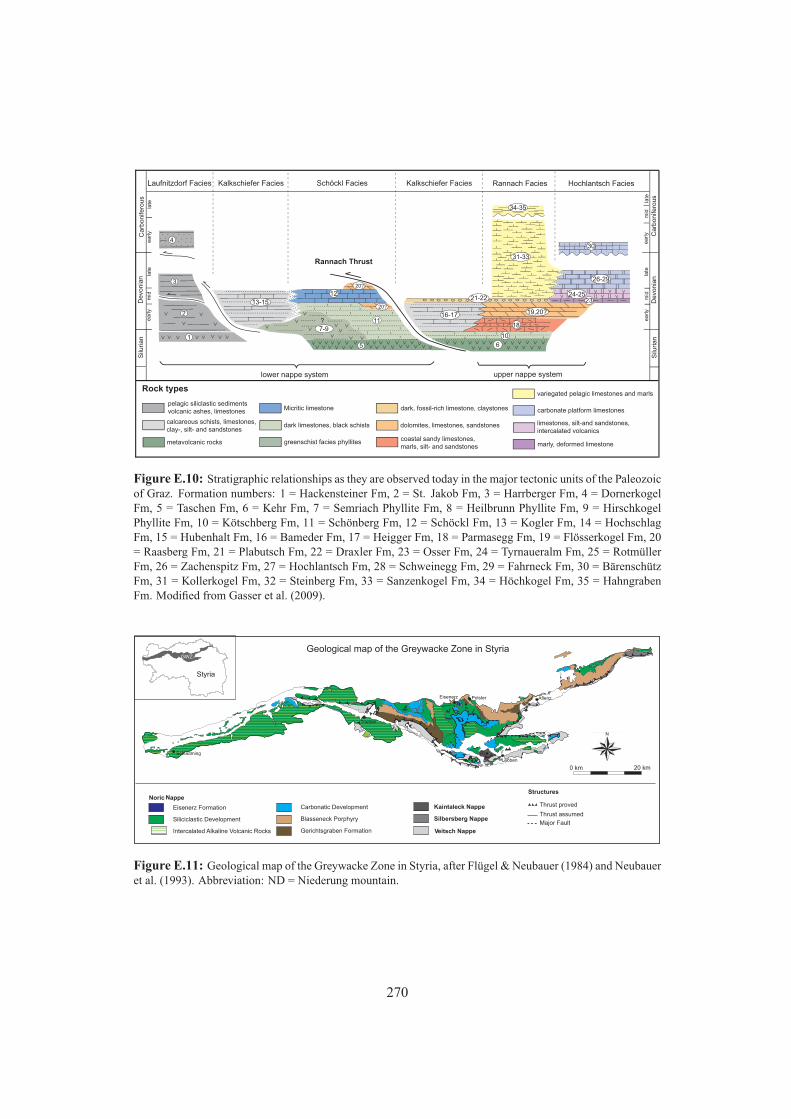
Carb
onife
rous
Devo
nia
nS
ilurian
early
mid
late
early
late
Carb
onife
rous
Devo
nia
nS
ilurian
early
mid
late
early
late
mid
pelagic siliclastic sedimentsvolcanic ashes, limestones
calcareous schists, limestones,clay-, silt- and sandstones
greenschist facies phyllitesmetavolcanic rocks
Micritic limestone
dark limestones, black schists
coastal sandy limestones,marls, silt- and sandstones
dark, fossil-rich limestone, claystones
dolomites, limestones, sandstones
marly, deformed limestone
carbonate platform limestones
limestones, silt-and sandstones,intercalated volcanics
Rock typesvariegated pelagic limestones and marls
Rannach FaciesSchöckl FaciesKalkschiefer FaciesLaufnitzdorf Facies Hochlantsch FaciesKalkschiefer Facies
1
2
3
13-1512
7-911
5
16-17
10
6
18
19,20?
21-22
31-33
2324-25
26-29
30
34-35
4
?
20?
20?
Rannach Thrust
lower nappe system upper nappe system
Figure E.10: Stratigraphic relationships as they are observed today in the major tectonic units of the Paleozoicof Graz. Formation numbers: 1 = Hackensteiner Fm, 2 = St. Jakob Fm, 3 = Harrberger Fm, 4 = DornerkogelFm, 5 = Taschen Fm, 6 = Kehr Fm, 7 = Semriach Phyllite Fm, 8 = Heilbrunn Phyllite Fm, 9 = HirschkogelPhyllite Fm, 10 = Kötschberg Fm, 11 = Schönberg Fm, 12 = Schöckl Fm, 13 = Kogler Fm, 14 = HochschlagFm, 15 = Hubenhalt Fm, 16 = Bameder Fm, 17 = Heigger Fm, 18 = Parmasegg Fm, 19 = Flösserkogel Fm, 20= Raasberg Fm, 21 = Plabutsch Fm, 22 = Draxler Fm, 23 = Osser Fm, 24 = Tyrnaueralm Fm, 25 = RotmüllerFm, 26 = Zachenspitz Fm, 27 = Hochlantsch Fm, 28 = Schweinegg Fm, 29 = Fahrneck Fm, 30 = BärenschützFm, 31 = Kollerkogel Fm, 32 = Steinberg Fm, 33 = Sanzenkogel Fm, 34 = Höchkogel Fm, 35 = HahngrabenFm. Modified from Gasser et al. (2009).
Schladming
Trieben
Leoben
AflenzEisenerz
0 km 20 km
ND
Polster
Figure E.11: Geological map of the Greywacke Zone in Styria, after Flügel & Neubauer (1984) and Neubaueret al. (1993). Abbreviation: ND = Niederung mountain.
270
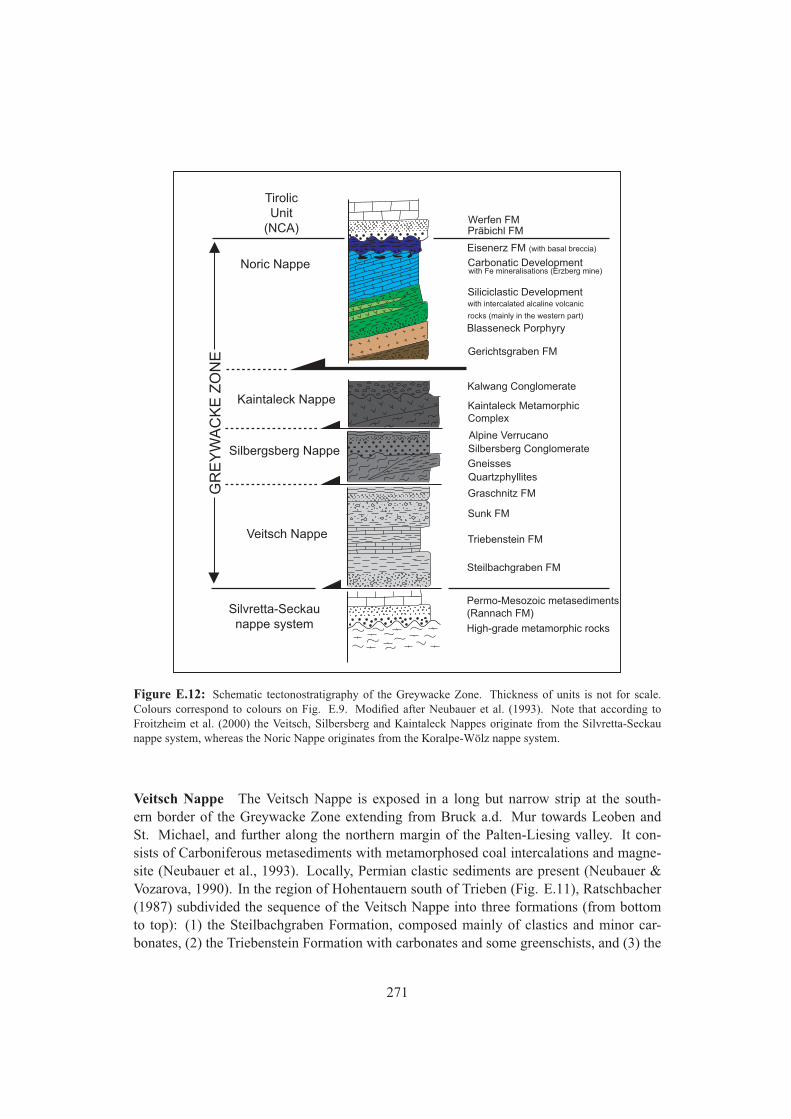
Noric Nappe
Kaintaleck Nappe
Silbergsberg Nappe
Veitsch Nappe
High-grade metamorphic rocks
Steilbachgraben FM
Triebenstein FM
Sunk FM
Graschnitz FM
QuartzphyllitesGneisses
Silbersberg ConglomerateAlpine Verrucano
Kaintaleck Metamorphic Complex
Kalwang Conglomerate
Gerichtsgraben FM
Blasseneck Porphyry
Siliciclastic Development
Carbonatic Development
Eisenerz FM (with basal breccia)
with Fe mineralisations (Erzberg mine)
with intercalated alcaline volcanic
rocks (mainly in the western part)
Permo-Mesozoic metasediments(Rannach FM)Silvretta-Seckau
nappe system
TirolicUnit
(NCA) Präbichl FMWerfen FM
GR
EY
WA
CK
E Z
ON
E
Figure E.12: Schematic tectonostratigraphy of the Greywacke Zone. Thickness of units is not for scale.Colours correspond to colours on Fig. E.9. Modified after Neubauer et al. (1993). Note that according toFroitzheim et al. (2000) the Veitsch, Silbersberg and Kaintaleck Nappes originate from the Silvretta-Seckaunappe system, whereas the Noric Nappe originates from the Koralpe-Wölz nappe system.
Veitsch Nappe The Veitsch Nappe is exposed in a long but narrow strip at the south-ern border of the Greywacke Zone extending from Bruck a.d. Mur towards Leoben andSt. Michael, and further along the northern margin of the Palten-Liesing valley. It con-sists of Carboniferous metasediments with metamorphosed coal intercalations and magne-site (Neubauer et al., 1993). Locally, Permian clastic sediments are present (Neubauer &Vozarova, 1990). In the region of Hohentauern south of Trieben (Fig. E.11), Ratschbacher(1987) subdivided the sequence of the Veitsch Nappe into three formations (from bottomto top): (1) the Steilbachgraben Formation, composed mainly of clastics and minor car-bonates, (2) the Triebenstein Formation with carbonates and some greenschists, and (3) the
271
Sunk Formation with quartz conglomerates and anthracite/graphite deposits (exploited inthe Sunk mine). Locally, in the Mürz valley close to St. Marein, the hanging wall of theSunk Formation is built up by the Graschnitz Formation (Neubauer & Vozarova, 1990),which contains brownish to reddish sandstones and phyllites (Fig. E.12).
Silbersberg Nappe The Silbersberg Nappe is only exposed in a narrow strip in the east-ernmost part of the Greywacke Zone in Styria (Fig. E.11). As well as the other nappes,the Silbersberg Nappe consists of a number of formations that are clearly tectonically sep-arated from all other footwall and hanging wall formations. At the base, these formationsinclude early Paleozoic carbonate-chlorite schists, quartz phyllites and gneisses. The mainconstituents of the Silbersberg Nappe are the Silbersberg conglomerate and the Alpine Ver-rucano Formation (light-coloured greenish quartzitic phyllites) on the top. The Silbersbergconglomerate is characterized by interspersions of reddish coloured quartz pebbles (Her-mann, 1992). After Neubauer et al. (1993) the succession of the Silbersberg Nappe is prob-ably of Permian age.
Kaintaleck Nappe The Kaintaleck Nappe is exposed north-west of Leoben on the moun-tain Nieder-ung (Fig. E.11). Different structural and geochronological investigations sug-gest that the Kaintaleck Nappe consist of various allochthonous flakes from over- and un-derlying stratigraphic members. The subdivision was introduced after studies of Neubauer& Frisch (1993): the succession starts with mica schists, amphibolites and paragneisses andpasses into the transgressive overlying Kalwang Conglomerate (Fig. E.12). The crystallinerocks in the lower part of the nappe show an early Variscan amphibolite facies imprint ataround 360 Ma (Neubauer et al., 1993).
Noric Nappe The Noric Nappe constitutes the main part of the Greywacke Zone in Styria.It forms a sedimentary-volcanogenic nappe stack (Hermann, 1992). At the base, The Gerichts-graben Formation is composed of greyish sandy, phyllitic and mica bearing schists, sand-stones quartzites and banded limestones (Fig. E.12). Conodonts investigations withinthese limestones indicate a Middle Ordovician age. The overlying lower Upper OrdovicianBlasseneck porphyry is of ignimbritic origin (rhyolitic rock), mainly composed of quartz,sericite and chlorite (as conversion products of feldspars and biotite). It reaches thicknessesof up to 1000 m. During the Upper Ordovician, Silurian and Devonian both a carbona-ceous and a siliciclastic development was deposited. Within the siliciclastic sequence, Sil-urian alkaline volcanic rocks, predominantly in the western part of the Greywacke Zone inStyria, are intercalated. The Devonian limestones are occasionally mineralized with siderite(mined at the Erzberg, Fig. E.3c). After an erosional event during the Lower Carbonifer-ous with thin karst filling breccias, the Eisenerz Formation was deposited. It representsthe uppermost stratigraphic member of the Variscan succession, before Variscan orogenystarted at the Lower/upper Carboniferous border (Schönlaub, 1982). The Noric Nappe is
272
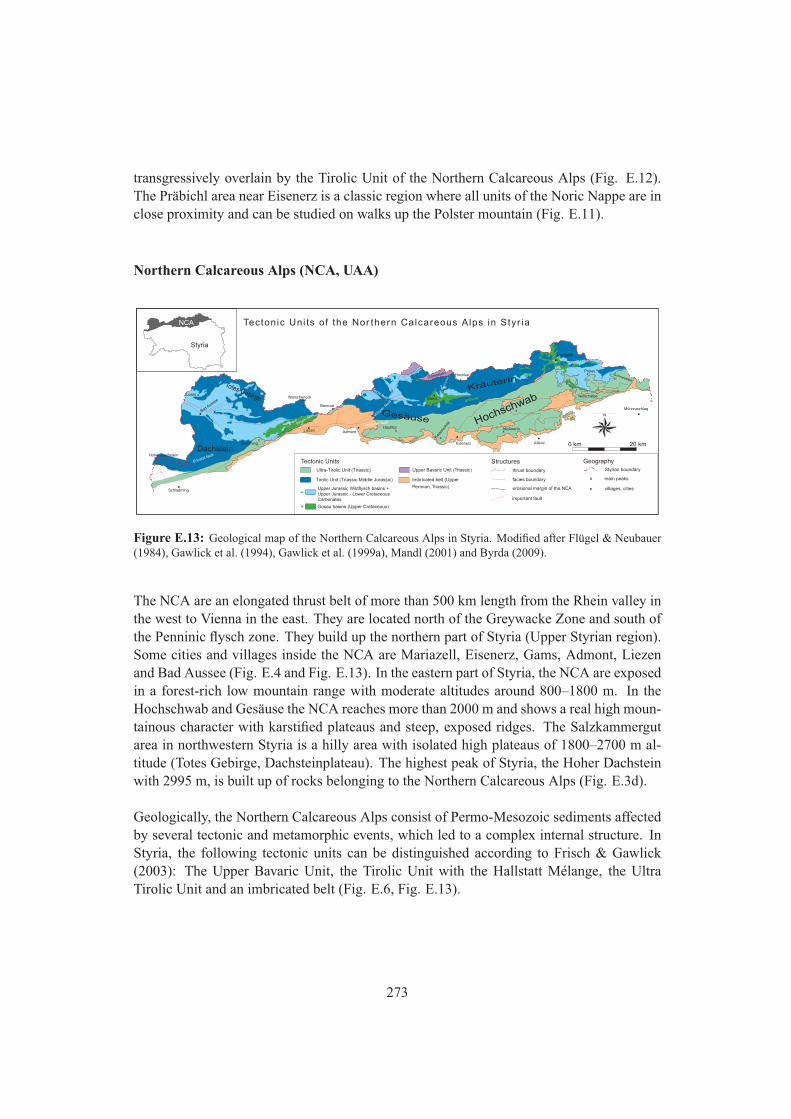
transgressively overlain by the Tirolic Unit of the Northern Calcareous Alps (Fig. E.12).The Präbichl area near Eisenerz is a classic region where all units of the Noric Nappe are inclose proximity and can be studied on walks up the Polster mountain (Fig. E.11).
Northern Calcareous Alps (NCA, UAA)
x
Bad Aussee
Hoher Dachstein
Schladming
xGrimming
Hochschwabx
Mariazell
Veitschalpe
GesäuseMürzzuschlag
Aflenz
Gams
Eisenerz
Liezen
Teichl fault
Gesäuse fault
Dachstein
xLoser
xBosruck
Schneealpe
Kräuterin
Ennstal fault
Ausee fault zone
Totes Gebirge
Prolesx
xMeßnerin
xHochkar
Hochtorx
xWarscheneck
Admont
xKaise
rsch
ild
Gamsstein
Weye
r fa
ult
Phyrn fa
ult
Göstlin
g fault
0 km 20 km
important fault
thrust boundary
Tirolic Unit (Triassic-Middle Jurassic)
Gosau basins (Upper Cretaceous)
Ultra-Tirolic Unit (Triassic)
Imbricated belt (Upper
Permian, Triassic)
Upper Bavaric Unit (Triassic)
facies boundary
erosional margin of the NCA
StructuresTectonic UnitsStyrian boundary
+
+
Geography
x main peaks
villages, cities
Tectonic Uni ts of the Nor thern Calcareous Alps in Styr ia
Upper Jurassic Wildflysch basins +Upper Jurassic - Lower Cretaceous Carbonates
NCA
Figure E.13: Geological map of the Northern Calcareous Alps in Styria. Modified after Flügel & Neubauer(1984), Gawlick et al. (1994), Gawlick et al. (1999a), Mandl (2001) and Byrda (2009).
The NCA are an elongated thrust belt of more than 500 km length from the Rhein valley inthe west to Vienna in the east. They are located north of the Greywacke Zone and south ofthe Penninic flysch zone. They build up the northern part of Styria (Upper Styrian region).Some cities and villages inside the NCA are Mariazell, Eisenerz, Gams, Admont, Liezenand Bad Aussee (Fig. E.4 and Fig. E.13). In the eastern part of Styria, the NCA are exposedin a forest-rich low mountain range with moderate altitudes around 800–1800 m. In theHochschwab and Gesäuse the NCA reaches more than 2000 m and shows a real high moun-tainous character with karstified plateaus and steep, exposed ridges. The Salzkammergutarea in northwestern Styria is a hilly area with isolated high plateaus of 1800–2700 m al-titude (Totes Gebirge, Dachsteinplateau). The highest peak of Styria, the Hoher Dachsteinwith 2995 m, is built up of rocks belonging to the Northern Calcareous Alps (Fig. E.3d).
Geologically, the Northern Calcareous Alps consist of Permo-Mesozoic sediments affectedby several tectonic and metamorphic events, which led to a complex internal structure. InStyria, the following tectonic units can be distinguished according to Frisch & Gawlick(2003): The Upper Bavaric Unit, the Tirolic Unit with the Hallstatt Mélange, the UltraTirolic Unit and an imbricated belt (Fig. E.6, Fig. E.13).
273
Upper Bavaric Unit According to Krystyn et al. (2008) the Upper Bavaric Unit is onlyexposed in a small tectonic isolated area around the Gamsstein in northern Styria (Fig.E.13). It consists of a sedimentary sequence from lower Middle Triassic carbonate rampsediments (Gutenstein and Steinalm Formations), overlain by the Middle Triassic ReiflingFormation (hemipelagic carbonates) and the Partnach Formation (marls, claystones, platylimestones), to the lower Upper Triassic Wetterstein Platform (allodapic limestones of theRaming Formation), forereef, reef and lagunal facies of the Wetterstein Formation). Thesiliciclastic sediments in the hanging wall show the drowning of the Wetterstein platformduring the so-called Lunz Event. The Gamsstein was brought into its actual position duringyounger, tectonic movements because its sedimentary features and the facies conditions donot fit with the surrounding Tirolic blocks (Krystyn et al., 2008).
Tirolic Unit The Tirolic Unit builds up the northern half of the NCA in Styria (Fig. E.4,E.13). It consists of two Upper Jurassic nappes: the upper and the lower Tirolic Unit (Frisch& Gawlick, 2003), but the database in central and eastern Styria is too scarce to differenti-ate them on the map scale (Fig. E.13). In general the sedimentary succession of the TirolicUnits can be separated into a Permo-Triassic to Middle Jurassic part deposited on a pas-sive continental margin, and an Middle Jurassic to Eocene part dominated by convergenttectonics (Fig. E.13).
The Permo-Triassic to Middle Jurassic succession starts with Permian siliciclastics and Up-per Permian evaporites (anhydrite, salt, gypsum; generally known under the term “AlpinesHaselgebirge”). These Permian evaporites formed preferential shear horizons during youngertectonic movements and are therefore today mostly found tectonically separated from theirsurroundings. The Upper Permian evaporites, mined today in the Salzkammergut (see sec-tion E.5) were transferred into Upper Jurassic basins during the Upper Jurassic deforma-tion (see section E.4) and occur now in a matrix of Upper Jurassic radiolarites (Wildflyschbasins, Fig. E.13). In the Lower Triassic, red, green and violet siliciclastic rocks with anincreasing amount of shallow-marine carbonates towards the hanging wall were deposited(Werfen Formation). The Werfen Formation is overlain by shallow marine carbonate rampsediments of the Gutenstein and Steinalm Formations (dolomites and limestones), whichare in turn overlain by pelagic carbonates intercalated with volcano-clastic rocks (Rei-fling Formation). In Middle and Upper Triassic times sediments of a classically structuredcarbonate-dominated continental margin build up the succession. A shallow-marine car-bonate platform (Wetterstein Formation) and hemipelagic carbonates from the deeper shelf(Hallstatt Formation) occur. Upper Triassic siliciclastic and mixed siliciclastic-carbonaticrocks (Raibl and Leckkogel Formation) drowned the platform and lie between the Wetter-stein Platform and the Upper Triassic Hauptdolomit and Dachstein Platform. The Tirolicsuccession can be observed in the steep cliffs of the Gesäuse and the Dachstein mountains.In the hemipelagic shelf to the SE of the platform the Pötschen (dolomites, limestones)and Hallstatt Formations (limestones) were sedimented. The Hauptdolomit-Dachstein Plat-form is again overlain by fine-grained siliciclastic rocks of the Kössen Formation, and in
274
the basin the sediments changed to the Zlambach Formation (marls, marly limestone). TheTriassic/Jurassic boundary is marked by the transition from the Triassic shallow-marinecarbonate platform to Lower Jurassic hemipelagic grey and red limestones and marls (e.g.Adnet and Allgäu Formation, Dürnberg Formation, to name only a few). Lower Jurassicbreccias related to contemporaneous normal faults occur (e.g. Adneter Scheck). The Mid-dle Jurassic rocks are characterized by hardgrounds (gaps) or condensed limestones (e.g.Klaus Formation).
In the upper Middle Jurassic the sedimentation changed rapidly from a calcareous to a ra-diolaritic one. Typical sediments are red, black and grey radiolarites and cherty limestones.In front of the Upper Jurassic nappe stack (see section E.4) different radiolaritic Wildflyschbasins such as the Sandlingalm (Gawlick et al., 2007), Lammer (Gawlick, 1996) and theTauglboden Basin (Gawlick et al., 1999a) were deposited. Simultaneously with thrustingand syn-deformational basin formation, isolated carbonate platforms of Upper Jurassic toLower Cretaceous age occur (Plassen Carbonate Platform, Fritz et al., 2006) with adjacentsediments (mass flows: Barmstein Formation, pelagic micrites: Oberalm Formation) de-posited in the former radiolaritic basins. They are in turn overlain by Lower Cretaceoussiliciclastic molasse-type rocks that coarsen upwards (Schrambach Formation, RossfeldFormation). Above a Middle Cretaceous unconformity Upper Cretaceous to Eocene, terres-trial to deep marine sediments of the Gosau group were deposited (Wagreich et al., 2009).These Gosau sediments are today only preserved along younger tectonic faults and in frontof overthrusts, for example along the Miocene Salzach-Ennstal fault north of Liezen or inthe area of Gams in the central NCA of Styria (Fig. E.13).
Ultra-Tirolic Unit The Ultra-Tirolic Unit builds up the southern half of the NCA in Styria(Fig. E.4, E.13). It consists of strongly deformed nappes with olistholitic megablocksin a melange like matrix affected by greenschist facies metamorphism in Upper Jurassictimes (Gawlick et al., 1994; Frisch & Gawlick, 2003) or in late Early Cretaceous times(e.g. Frank & Schlager, 2005). It lies on top of an imbricated belt (described below) and isseparated from the Tirolic Unit by Miocene strike slip faults or Eocene southvergent thrusts.In the western part between Schladming and Grimming, the Ultra-Tirolic Unit is termedthe Mandling Unit, whereas in the eastern part (southern part of the Gesäuse, Hochschwab,Veitsch and Schneealpe) the name Mürzalpen Nappe is in use (Fig. E.13). The Ultra-TirolicUnit consists of Middle Triassic Gutenstein dolomite, Reifling dolomite, Upper TriassicWetterstein dolomite, Leckkogel beds and Waxeneck dolomite up to Dachstein limestoneand Aflenz Formation. It shows a thermal overprint investigated by Conodont AlterationIndices (CAI) values from 5.5 to 6.0. Some parts in the Mürzalpen Nappe reach CAI valuesof 6.5–7.0 (300 °C).
Imbricated belt This tectonic unit is part of the Hallstatt Mélange (Frisch & Gawlick,2003) crops out in a small narrow zone at the southern rim of the NCA and in some windows
275
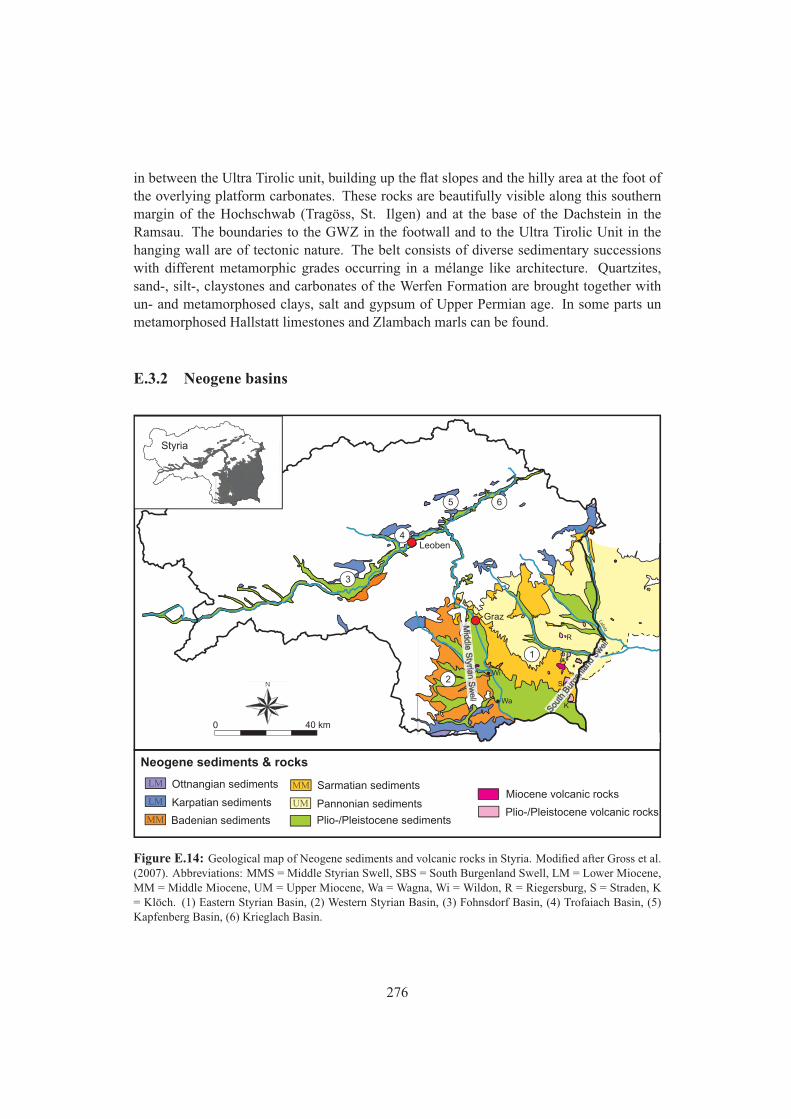
in between the Ultra Tirolic unit, building up the flat slopes and the hilly area at the foot ofthe overlying platform carbonates. These rocks are beautifully visible along this southernmargin of the Hochschwab (Tragöss, St. Ilgen) and at the base of the Dachstein in theRamsau. The boundaries to the GWZ in the footwall and to the Ultra Tirolic Unit in thehanging wall are of tectonic nature. The belt consists of diverse sedimentary successionswith different metamorphic grades occurring in a mélange like architecture. Quartzites,sand-, silt-, claystones and carbonates of the Werfen Formation are brought together withun- and metamorphosed clays, salt and gypsum of Upper Permian age. In some parts unmetamorphosed Hallstatt limestones and Zlambach marls can be found.
E.3.2 Neogene basins
Wa
Wi
R
K
S
Figure E.14: Geological map of Neogene sediments and volcanic rocks in Styria. Modified after Gross et al.(2007). Abbreviations: MMS = Middle Styrian Swell, SBS = South Burgenland Swell, LM = Lower Miocene,MM = Middle Miocene, UM = Upper Miocene, Wa = Wagna, Wi = Wildon, R = Riegersburg, S = Straden, K= Klöch. (1) Eastern Styrian Basin, (2) Western Styrian Basin, (3) Fohnsdorf Basin, (4) Trofaiach Basin, (5)Kapfenberg Basin, (6) Krieglach Basin.
276
Several basins filled with Neogene sediments occur in Styria (Fig. E.14). They range fromOttnangian to Badenian and rarely to Upper Pannonian in age with partial Plio-/ Pleistocenecover sediments (Fig. E.15). There are marine, brackish and limnic-fluviatile develop-ments. The Styrian Basin is the largest of the Neogene basins in Styria. It represents thewestern-most lobe of the Pannonian Basin at the south-eastern margin of the Eastern Alpsand forms the orogen – basin transition zone. It is separated from the Pannonian Basin bythe northeast-southwest striking South Burgenland Swell. It is an east-west elongated basin,where the easternmost part is situated in the province of Burgenland. Whereas in the StyrianBasin thick Miocene and minor Pliocene sediments occur, the adjacent Western PannonianBasin shows the contrary: thin Miocene and thick (up to 2 km) Pliocene sediments aredeposited. The Styrian Basin itself can be subdivided into a deep (~4 km) Eastern and arather shallow (~1km) Western Styrian Basin, separated by the Middle Styrian Swell. TheEastern Styrian Basin shows three distinctive depocentres. A hilly landscape characterizesthe topography of the basin, showing a general south-east trending drainage system. Somevolcanic cones of Plio- and Pleistocene age in south-eastern Styria (Fig. E.3f) add to thebasins special geomorphological appearance which attracted researchers at all times (e.g.Winkler-Hermaden, 1957; Ebner & Sachsenhofer, 1995; Sachsenhofer et al., 2000; Grosset al., 2007).
There are a number of other smaller intramontane Neogene basins in Styria, for example theFohnsdorf and Seckau Basin, the Trofaiach Basin, the Kapfenberg Basin and the KrieglachBasin. All of these basins are exposed along the Mur-Mürz fault system (Fig. E.14; Sach-senhofer et al., 2000). In contrast to the Styrian Basin, the Intramontane Basins only con-tain the syn-extensional sediments of Karpatian – Badenian age (Fig. E.14, E.15). Manyof them contain coal deposits (see section E.5). Other related pull-apart basins outside ofStyria are the Tamsweg and the Vienna Basin and the Ennstal and Lavanttal depressions.All show a rather similar evolution related to Miocene brittle tectonics (see section E.4).Today’s drainage pattern is mostly governed by these prominent and still active strike-slipfault systems highlighting their importance for shaping the present landscape.
E.4 Geodynamic evolution of Styria
All the geological units described in the previous chapter allow reconstructing the evolutionof Styria over at least the last 500 million years from the beginning of the Paleozoic totoday. The processes of plate tectonics changed the distribution of continents and oceans:continents broke apart and oceans formed; continents collided and mountain chains grew.Several distinct time periods influenced the evolution of Styria in particular – a simplifiedsummary of what happened where and when is given in Fig. E.16 and is discussed in detailbelow. The amount of knowledge clearly increases towards the present: whereas not muchis known about the oldest events at the beginning of the Paleozoic, detailed reconstructionsof landscape evolution are possible for the last few millions of years.
277
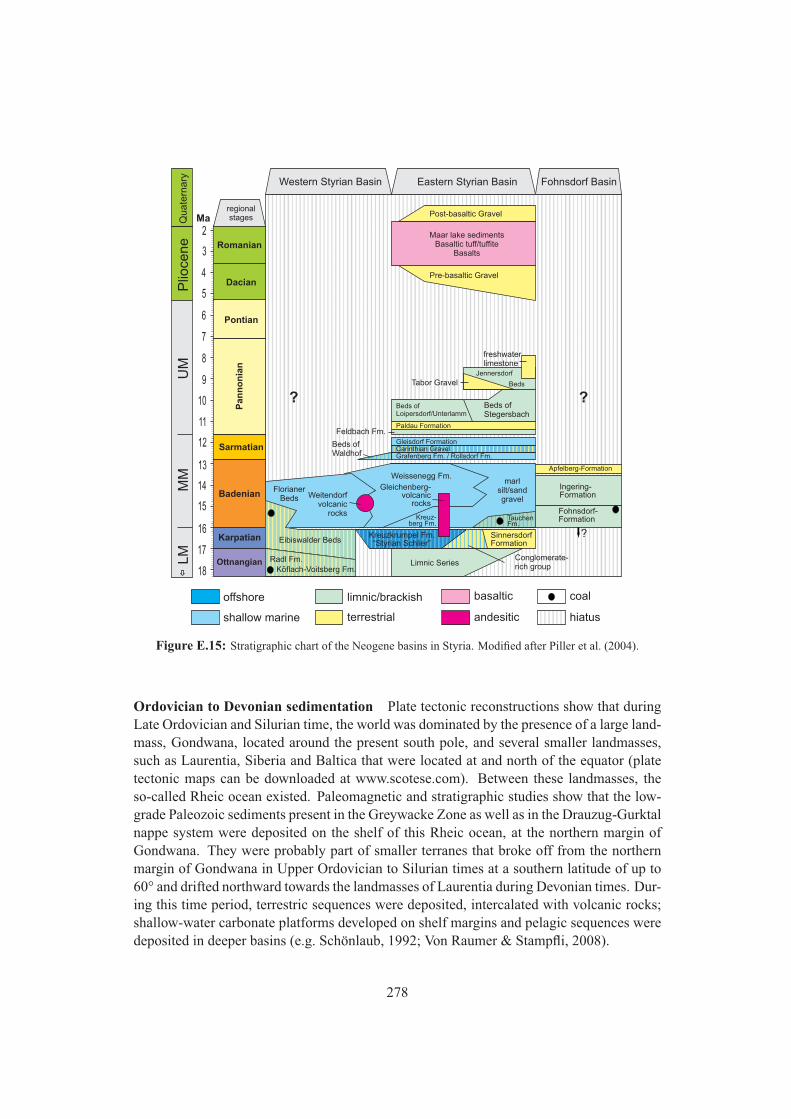
Figure E.15: Stratigraphic chart of the Neogene basins in Styria. Modified after Piller et al. (2004).
Ordovician to Devonian sedimentation Plate tectonic reconstructions show that duringLate Ordovician and Silurian time, the world was dominated by the presence of a large land-mass, Gondwana, located around the present south pole, and several smaller landmasses,such as Laurentia, Siberia and Baltica that were located at and north of the equator (platetectonic maps can be downloaded at www.scotese.com). Between these landmasses, theso-called Rheic ocean existed. Paleomagnetic and stratigraphic studies show that the low-grade Paleozoic sediments present in the Greywacke Zone as well as in the Drauzug-Gurktalnappe system were deposited on the shelf of this Rheic ocean, at the northern margin ofGondwana. They were probably part of smaller terranes that broke off from the northernmargin of Gondwana in Upper Ordovician to Silurian times at a southern latitude of up to60° and drifted northward towards the landmasses of Laurentia during Devonian times. Dur-ing this time period, terrestric sequences were deposited, intercalated with volcanic rocks;shallow-water carbonate platforms developed on shelf margins and pelagic sequences weredeposited in deeper basins (e.g. Schönlaub, 1992; Von Raumer & Stampfli, 2008).
278
Variscan orogeny during the Carboniferous During Late Devonian to Carboniferoustime, the situation changed. The terranes originally broken-off from the southern Gond-wana continent were located close to the equator and collided with the landmass of Lau-rentia. This collision led to a belt of complex deformation and metamorphism that canbe followed through entire Central Europe: the Variscan orogen. The low-grade Paleo-zoic rocks of the Greywacke Zone and the Drauzug-Gurktal nappe systems escaped seriousmetamorphic and magmatic overprint during this collision and sedimentation partly wenton into the Lower Carboniferous. But erosional unconformities, a low-grade metamorphicoverprint and deformation structures such as thrusts and folds related to the Variscan orogenare present. The higher-grade crystalline basement units below the Drauzug-Gurktal nappesystem show a more intense overprint related to the collision: high pressure – low tempera-ture metamorphism occurred around 350 Ma, followed by a thermal peak at around 340 Maand cooling until 310 Ma. Intrusions of Variscan age also occur. However, the metamorphicand tectonic overprint related to two later events (Permo-Triassic and Eo-Alpine, see below)make an unequivocal interpretation of the Variscan history of the crystalline basement unitsdifficult (e.g. Tait et al., 1997; Neubauer & Handler, 2000; Schuster et al., 2004).
Permo-Triassic metamorphism and Permo-Mesozoic sedimentation At the beginningof the Permian, terrestrial to shallow-marine sediments (e.g.: siliciclastics, carbonates andevaporites), today exposed at the base of the NCA and as remnants on the crystalline base-ment units, were deposited in graben structures on top of the eroded Variscan nappe stackNeubaueretal:2007. They indicate that Variscan deformation ceased and topography de-creased to sea level. Today, these units are exposed as the monometamorphic units foundalong the northern margin of the Seckauer Tauern and in the Schladminger Tauern. Simulta-neously, low pressure – high temperature metamorphism affected the basement, especiallythe future Koralpe-Wölz nappe system (Fig. E.8a). This metamorphism was accompaniedby mafic intrusions and abundant pegmatites, indicating that the basement was thinned andstretched in north-south direction. At the beginning of the Triassic, this thinning and stretch-ing finally led to the opening of a new oceanic basin, the Meliata ocean, and the subsidenceof the adjacent margins (e.g. Schuster et al., 2001, 2004; Schuster & Stuewe, 2008).
On the northwestern passive margin of this new Meliata ocean, the Triassic to Middle Juras-sic sedimentary succession of the NCA developed. Remnants of this succession are alsolocally present on the crystalline basement units. During the Triassic, siliciclastic and vol-canic sediments were shed onto this margin from a continental landmass to the northwest,carbonate platforms developed on the shelf and were drowned again, marls and pelagiclimestones were deposited in deeper parts of the margin towards the southeast. A globalmass extinction at the Triassic/Jurassic boundary marked the transition into more pelagic
Figure E.16 (following page): Geodynamic evolution of Styria through time with the most importantsediment accumulation events (light grey) and metamorphic and deformational events (dark grey) indicated.Abbreviation: IMB = Intramontane Basins.
279
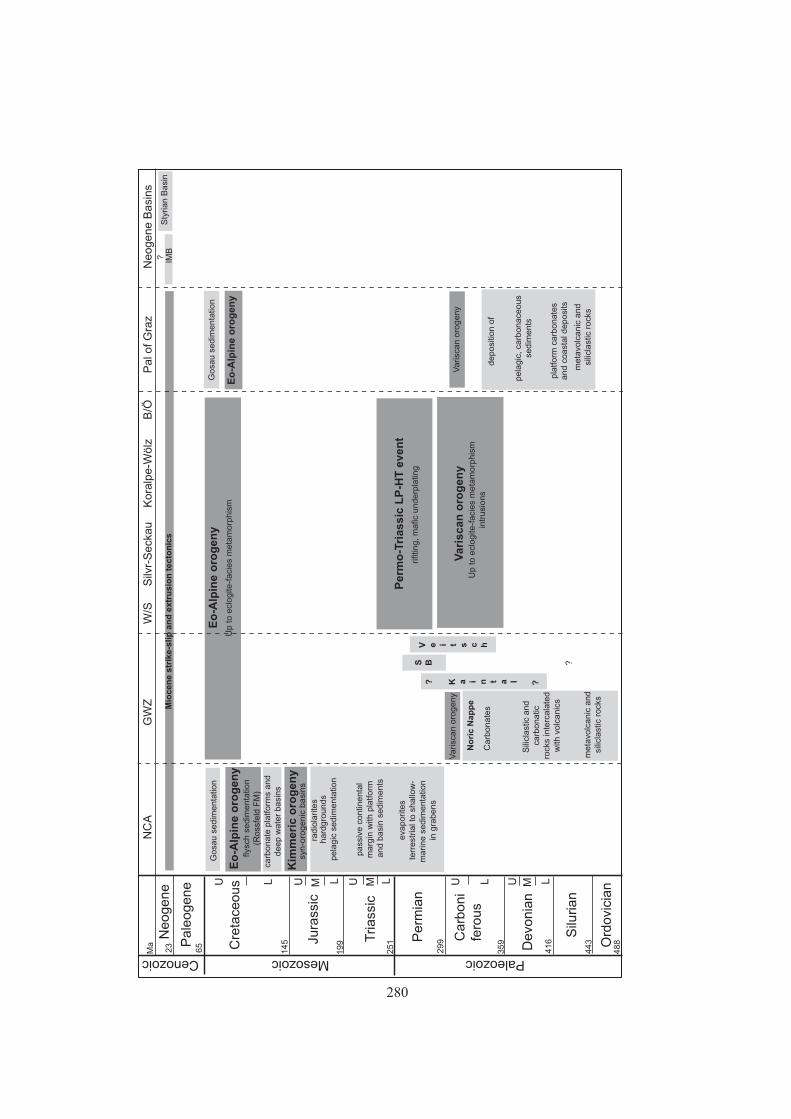
Carb
onate
sdeposi
tion o
f
meta
volc
anic
and
silic
last
ic r
ock
s
pla
tform
carb
onate
sand c
oast
al d
eposi
ts
pela
gic
, ca
rbonace
ous
sedim
ents
meta
volc
anic
and
silic
last
ic r
ock
s
Sili
clast
ic a
nd
carb
onatic
rock
s in
terc
ala
ted
with
volc
anic
s
Carb
onate
s
No
ric N
ap
pe
V e i t s c h
S B
K a i n t a l ??
Vari
scan
oro
gen
yU
p to e
clogite
-faci
es
meta
morp
his
min
trusi
ons
Perm
o-T
riassic
LP
-HT
even
t
Eo
-Alp
ine o
rog
en
y
Mio
cen
e s
trik
e-s
lip
an
d e
xtr
usio
n t
ecto
nic
s
Kim
meri
c o
rog
en
y
Varisc
an o
rogeny
Varisc
an o
rogeny
Sty
rian B
asi
nIM
B
Gosa
u s
edim
enta
tion
Gosa
u s
edim
enta
tion
488
443
416
359
299
251
199
145
65
23
pass
ive c
ontin
enta
l m
arg
in w
ith p
latform
and b
asi
n s
edim
ents
eva
porite
ste
rrest
rial t
o s
hallo
w-
marine s
edim
enta
tion
in g
rabens
hard
gro
unds
pela
gic
sedim
enta
tion
radio
larite
s
syn-o
rogenic
basi
ns
carb
onate
pla
tform
s and
deep w
ate
r basi
ns
Eo
-Alp
ine o
rog
en
yfly
sch s
edim
enta
tion
(Ross
feld
FM
)
rifit
ing, m
afic
underp
latin
g
Eo
-Alp
ine
oro
ge
ny
Up to e
clogite
-faci
es
meta
morp
his
m
?
?
Silu
ria
n
De
von
ian
Ca
rbo
ni
fero
us
Pe
rmia
n
Tria
ssic
Jura
ssic
Cre
tace
ou
s
Pa
leo
ge
ne
Ne
og
en
e
LMULUUUU M M LLL
NC
AG
WZ
Silv
r-S
eck
au
Kora
lpe-W
ölz
W/S
B/Ö
Pal o
f G
raz
Neogene B
asi
ns
PaleozoicMesozoicCenozoic
Ord
ovi
cia
n
Ma
280
sedimentation with less continental input during the Jurassic. Normal faulting and brecciaformation, followed by deep-water pelagic sediments on northwestern parts of the margin(today represented by the Bavaric nappes) documented the opening of another oceanic basinto the north: the Penninic ocean. This ocean began to separate a northern European con-tinent from the southern African continent, including the Adriatic micro-continent whichseparated from Africa during the Cretaceous (Schmid et al., 2008). On the central andsouthern parts of the shelf, pelagic carbonates are typical in Lower and Middle Jurassictimes. In Middle Jurassic times also sedimentary ommissions, hardgrounds and condensedsediments are common (Frisch & Gawlick, 2003).
Middle to Upper Jurassic deformation In the upper Middle Jurassic, conditions on theshelf described above changed completely. Compressive to transpressive deformation af-fected the sediments deposited on this shelf progressively from SE towards NW. An accre-tionary prism formed with the deposition of elongated, syn-orogenic basins in front of theadvancing nappe stack. These basins were filled with small to huge (up to km-sized) blocksof eroded Triassic to Middle Jurassic carbonatic and siliciclastic rocks of the former passivemargin which was now broken into pieces and thrust on top of each other. Multiple sets oferosion, deposition, re-erosion and re-deposition of such basins can be documented (Fig.E.13, Upper Jurassic Wildflysch basins; Gawlick, 1996). Parts of the nappe stack wereaffected by an up to greenschist facies metamorphism according to Gawlick et al. (1994,1999a) (Ultra Tirolic Unit). The compressional structures (nappe piles, thrust fronts, basins)are sealed by uppermost Jurassic to Lower Cretaceous carbonate platforms and basinal se-quences. Gawlick et al. (1999a) and Frisch & Gawlick (2003) interpret this deformation asthe result of subduction of the shelf sediments below oceanic crust or below an unknownpart of contincental crust. In contrast, Frank & Schlager (2005) interpret this deformationas being the result of a transpressive regime along major-scale strike-slip zones.
Cretaceous (Eo-Alpine) orogeny Compressional tectonics re-started on the previouslydeformed shelf in the Lower Cretaceous and now also seriously affected the underlyingcrystalline basement. An intra-continental subduction zone started inside the Adriatic micro-continent around 145 Ma between the later Koralpe-Wölz nappe system and the ÖtztalBundschuh nappe system. It successively consumed more and more parts of the Adriaticplate until ultimately the Penninic ocean in the north started to subduct in the Upper Creta-ceous (e.g. Froitzheim et al., 2000; Stuewe & Schuster, in press). The main nappe stack ofthe Austroalpine Units as displayed in Fig. E.6 formed. The Drauzug-Gurktal nappe systemthrust on top of the Koralpe-Wölz nappe system. The Koralpe-Wölz nappe system was sub-ducted and metamorphosed up to eclogite-facies grade (Fig. E.8b). During this time one ofthe largest shear zones of the Alps formed as one of the major shear horizons during nappestacking: the Plattengneiss shear zone inside the Koralpe-Wölz nappe system. The alreadyformed nappe stack of the Tirolic and Ultratirolic Units together with the underlying Paleo-zoic rocks of the Noric nappe were sheared off from the Koralpe-Wölz nappe system. The
281
Silvretta-Seckau nappe system was thrust on top of the Lower Austroalpine Semmering-Wechsel nappe system. The lower nappes of the Greywacke Zone (Veitsch, Silbersberg,Kaintaleck) as well as the Bavaric nappes were sheared off from the Silvretta-Seckau nappesystem and transported northwestwards. Molasse-type sediments were deposited in front ofthe Tirolic nappe systems.
The whole nappe stacking process is reflected in the metamorphic gradient developed (Fig.E.8b; Tenczer & Stuewe, 2003). The peak of this activity is marked by the peak meta-morphic conditions in the Koralpe-Wölz nappe system that were reached around 92 Ma inthe central Koralpe. After about 90 Ma, cooling and exhumation of the high-grade rocksoccurred between 90–60 Ma during the Upper Cretaceous. Final exhumation of the meta-morphic rocks occurred around 40–50 Ma. Simultaneously to cooling and exhumation, theentire region was warped on a 10 km long wavelength (Putz et al., 2006) and normal andstrike-slip faults formed. These faults are associated with sedimentary basins filled withterrestrial to marine sediments (Gosau group, Wagreich et al., 2009). These basins are lo-cated on top of the Tirolic Unit and the Drauzug-Gurktal nappe system north and east ofthe Dachstein region and west of Graz, respectively. In the Upper Cretaceous, the Pen-ninic ocean located to the north of the Adriatic continent entered the subduction zone andnappe stacking and exhumation in the Austroalpine Units ceased. The Bavaric, Tirolic, Ul-tra Tirolic Units and the imbricated belt at their base were thrust out of sequence to the northand also simultaneously backthrust to the south. Only the Bavaric Unit was finally thrustover the northern Rhenodanubian flysch zone in Eocene times. This thrusting was followedby peneplanisation and deposition of the Oligocene to Lower Miocene fluvatile sedimentsof the Augenstein Formation (Frisch & Gawlick, 2003).
Miocene tectonics and Neogene basin formation In the Lower Miocene, north-southconvergence between the Adriatic and the European continent in the Penninic domain wasstill ongoing. However, beside continuing nappe stacking (in the Molasse zone in the northand in the Klagenfurt Basin), the convergence was compensated by strike-slip faults alongwhich individual blocks could escape eastwards towards the Pannonian realm where spacewas created by a retreating subduction zone in the Carpathians (Ratschbacher et al., 1991;Frisch et al., 1998). Thus, the Miocene is generally considered to be the period of lateralextrusion. Major conjugated fault systems developed such as the Mur-Mürz fault system(MMF), the Lavanttal fault system (LF), the Salzach-Enns fault system (SEMP) and thePeriadric Lineament (PAL) (Fig. E.4). The nappe stack of the NCA was fragmented intoindividual smaller fault-bounded blocks with rotations and displacements in the order oftens of kilometres during this phase (paleostress analysis by Peresson & Decker, 1997;Decker et al., 1994). Along these fault systems, the formation of intramontane pull-apartbasins led to local subsidence. These basins were filled with syn-rift sediments (Martonet al., 2000) and bear the coal deposits of Styria. Especially along the MMF, the so-calledNoric Depression developed (Sachsenhofer et al., 2000). The most important of these smallpull-apart basins are the Fohnsdorf Basin (at the junction between Lavanttal fault system
282
and MMF), the Leoben Basin, the Krieglach Basin and several others along the Mur-Mürzlineament. The Styrian Basin evolved simultaneously to the Intramontane basins on topof one of the extruding blocks due to extensional normal faulting (Ebner & Sachsenhofer,1995). Extension favored the ascent of magmas, which generated andesitic shield volcanoesduring Lower and up to Middle Miocene times. Volcanic rocks from this time are foundtoday in Weitendorf near Wildon and Bad Gleichenberg (Fig. E.14).
At the Karpatian/Badenian boundary (Fig. E.14, Fig. E.15), strike-slip and extensionalfaulting ceased and an unconformity due to a tectonic event and contemporaneous sea levellow stand developed: the so-called “Styrian Phase” may be observed in quarries near Wagnain western Styria. In the Badenian, post-extensional regional subsidence due to cooling ofthe lithosphere was ongoing in the Styrian Basin and marine sediments were deposited.One of the last fully marine sediments that were deposited in the basin was the ~13 Ma oldLeitha limestone that builds up the white limestone cliffs near Wildon and Leibnitz. DuringSarmatian and Pannonian times, the basin experienced a transition from marine to brackishand eventually to terrestrial sedimentation. The reconstruction of the depositional historyfor this time interval is complicated by the fact that there are no Sarmatian and Pannoniansediments present in the Western Styrian Basin or the Noric depression (Fig. E.15). It isnot known if such sediments were deposited and if they were eroded subsequently or nodeposition happened at this time. Indications for the erosion of at least some hundredsof meters of sediments suggest the former (Dunkl & Frisch, 2002; Dunkl et al., 2005).In Pliocene to Pleistocene times a major change in the stress field led to basin inversion,and consequential young tectonic uplift of the whole Styrian Basin and erosion of a fewhundred meters of sediments. A contemporaneous tilting of the basin by 1–2 degrees tothe east leads to the map scale distribution of the sedimentary units with the oldest beingexposed at the western margin of the basin and the youngest in the very east of the state(Fig. E.14). During the Pliocene to Early Pleistocene a second (basaltic) volcanic phaseerupted forming volcanoes for example at Riegersburg (Fig. E.3f), Straden and Klöch (Fig.E.14). An elevated heat flow since Sarmatian times is related to thinned lithosphere belowthe Styrian Basin and is currently being exploited in terms of thermal springs and spas insouth-eastern Styria. In the last few million years karstification of the mountains dominatedby limestones in Styria (Grazer Bergland, NCA) led to the formation of large caves (f.ex.Lurgrotte, north of Graz). The youngest sediments present in Styria are glaciation-relatedPleistocene deposits mostly present along the major drainage pattern. The Pleistocene icesheets itself never reached beyond Judenburg in the Mur Valley and Völkermarkt in theDrau Valley leaving much of Styria ice-free during the entire Pleistocene.
283
E.5 Mining in Styria
Styria has many natural resources of economic importance which are currently mined. TableE.18 and Fig. E.17 show an overview of all raw materials mined in Styria in 2007 andcorresponding locations of the mines (data from Österreichisches Montanhandbuch 2008).Production data of 2006, including information on historical mining in Styria back to 1950,are given by Ebner (2008). There are several raw materials where Styria has a leadingposition in Austria. In the case of iron, all of the Austrian production is mined in Styria(The small specularite mine near Waldenstein (Carinthia), which produces a few thousandtons of platty hematite is not regarded as an iron mine because specularite is not used asa source for iron). In addition, more than 50 percent of the total Austrian production oftalc/leucophyllite, magnesite, quartz/quartzite, basaltic rocks and ultramafic rocks are minedin Styria. Styria also produces the majority of gypsum/anhydrite, limestone and diabase inAustria. Production data and percentages of the most important natural resources mined inStyria are shown in Table E.18 and a short description of the deposits is given below. Furtherinformation on Austria´s natural resources (with corresponding geologic framework) can befound in Ebner (1997) and Weber et al. (1997).
Iron The only Fe-mine in Austria is located at the “Steirischer Erzberg” in Eisenerz (Fig.E.3c). The Erzberg is the largest siderite mine of the world and the largest open-pit mine onmetallic ores in Central Europe (according to 2007 production; the siderite mine in Bakal(Russia) produced 1.7 Mio. t of siderite in 2007, compared to 2.15 Mio. t produced at theErzberg). The main Fe-bearing minerals are siderite, ankerite and Fe-dolomite. Other min-erals like pyrite, hematite and magnetite only occur in very small proportions (Schönlaub,1982). The host rocks of the iron ores are Devonian limestones of the Noric Nappe (Fig.E.12). In 2007, the Voest Alpine Erzberg mined approx. 5.6 Mio. t of crude ore. Afterprocessing, about 2.15 Mio. t of iron ore, containing about 34 percent Fe, were produced.A recent overview of the Fe-mineralisation and the genesis of the Erzberg deposit (and alsoother Fe-mineralisations within the Noric Nappe and the Northern Calcareous Alps) is givenby Prochaska & Henjes-Kunst (2009).
Evaporites Gypsum, anhydrite and salt deposits, which are economically important, oc-cur in the “Alpines Haselgebirge” in the Northern Calcareous Alps (see section E.3, NCA).In Styria, salt (halite) is mined at the underground mine in Altausee. The halite is extractedfrom the host rock using water, which dissolves the salt. About 1.16 Mio. m3 of brine wereproduced in 2007. In addition, 1172 t of solid salt were mined at Altaussee. Gypsum andanhydrite are mined in the areas of Grundlsee, Tragöß and Admont. Together, these minesproduced 477201 t of gypsum and 13 448 t of anhydrite in 2007. Schauberger (1986) givesan overview of evaporitic deposits in the Eastern Alps.
284
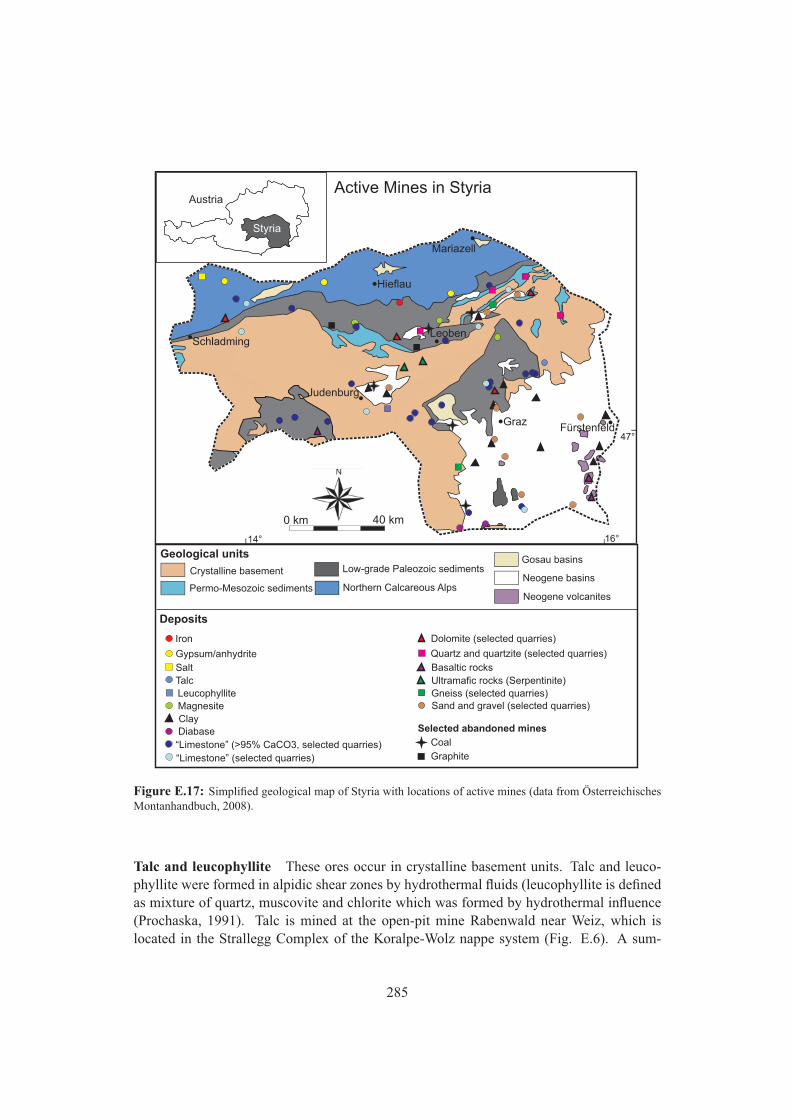
Geological units
Deposits
Crystalline basement
Permo-Mesozoic sediments
Low-grade Paleozoic sediments
Northern Calcareous Alps
Gosau basins
Neogene basins
Neogene volcanites
Iron
Gypsum/anhydrite
Talc
MagnesiteClayDiabase“Limestone” (>95% CaCO3, selected quarries)“Limestone” (selected quarries)
Dolomite (selected quarries)
Quartz and quartzite (selected quarries)
Basaltic rocksUltramafic rocks (Serpentinite)Gneiss (selected quarries)Sand and gravel (selected quarries)
Coal
Graphite
Selected abandoned mines
Salt
Leucophyllite
0 km 40 km
Styria
AustriaActive Mines in Styria
Figure E.17: Simplified geological map of Styria with locations of active mines (data from ÖsterreichischesMontanhandbuch, 2008).
Talc and leucophyllite These ores occur in crystalline basement units. Talc and leuco-phyllite were formed in alpidic shear zones by hydrothermal fluids (leucophyllite is definedas mixture of quartz, muscovite and chlorite which was formed by hydrothermal influence(Prochaska, 1991). Talc is mined at the open-pit mine Rabenwald near Weiz, which islocated in the Strallegg Complex of the Koralpe-Wolz nappe system (Fig. E.6). A sum-
285
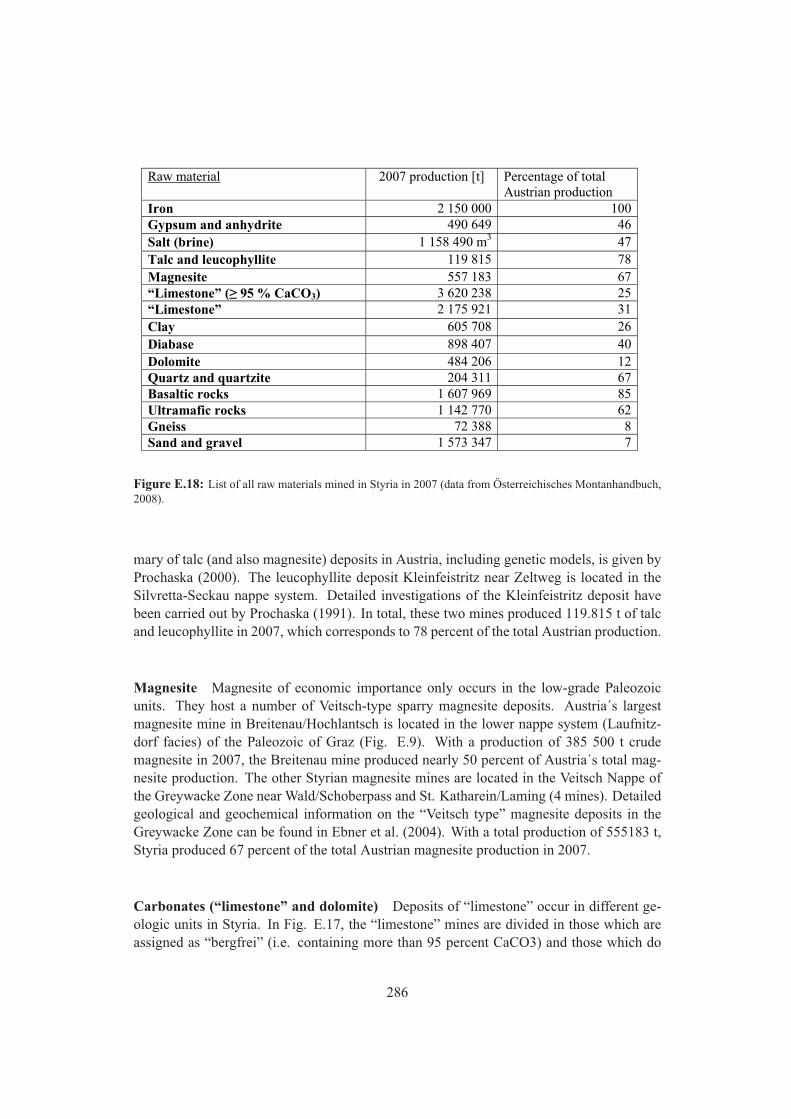
Raw material 2007 production [t] Percentage of total Austrian production
Iron 2 150 000 100 Gypsum and anhydrite 490 649 46 Salt (brine) 1 158 490 m3 47 Talc and leucophyllite 119 815 78 Magnesite 557 183 67 “Limestone” (≥ 95 % CaCO3) 3 620 238 25 “Limestone” 2 175 921 31 Clay 605 708 26 Diabase 898 407 40 Dolomite 484 206 12 Quartz and quartzite 204 311 67 Basaltic rocks 1 607 969 85 Ultramafic rocks 1 142 770 62 Gneiss 72 388 8 Sand and gravel 1 573 347 7
Figure E.18: List of all raw materials mined in Styria in 2007 (data from Österreichisches Montanhandbuch,2008).
mary of talc (and also magnesite) deposits in Austria, including genetic models, is given byProchaska (2000). The leucophyllite deposit Kleinfeistritz near Zeltweg is located in theSilvretta-Seckau nappe system. Detailed investigations of the Kleinfeistritz deposit havebeen carried out by Prochaska (1991). In total, these two mines produced 119.815 t of talcand leucophyllite in 2007, which corresponds to 78 percent of the total Austrian production.
Magnesite Magnesite of economic importance only occurs in the low-grade Paleozoicunits. They host a number of Veitsch-type sparry magnesite deposits. Austria´s largestmagnesite mine in Breitenau/Hochlantsch is located in the lower nappe system (Laufnitz-dorf facies) of the Paleozoic of Graz (Fig. E.9). With a production of 385 500 t crudemagnesite in 2007, the Breitenau mine produced nearly 50 percent of Austria´s total mag-nesite production. The other Styrian magnesite mines are located in the Veitsch Nappe ofthe Greywacke Zone near Wald/Schoberpass and St. Katharein/Laming (4 mines). Detailedgeological and geochemical information on the “Veitsch type” magnesite deposits in theGreywacke Zone can be found in Ebner et al. (2004). With a total production of 555183 t,Styria produced 67 percent of the total Austrian magnesite production in 2007.
Carbonates (“limestone” and dolomite) Deposits of “limestone” occur in different ge-ologic units in Styria. In Fig. E.17, the “limestone” mines are divided in those which areassigned as “bergfrei” (i.e. containing more than 95 percent CaCO3) and those which do
286
not fulfil this criterion. Most of the mines are located in the low-grade Paleozoic units (Pa-leozoic of Graz, Greywacke Zone and Gurktal nappes). However, “limestone” deposits alsooccur in other geologic units like the Styrian Basin, the Northern Calcareous Alps and theCrystalline Basement (including their Permo-Mesozoic cover). In the Crystalline Basementthe “limestones” are metamorphosed and should therefore be named as marbles (for thatreason the term “limestone” was put in quotation marks). Dolomite of economic impor-tance mainly occurs in the low-grade Paleozoic units, but also in the Northern CalcareousAlps and the Permo-Mesozoic cover of the Crystalline Basement. In total, 5796159 t of“limestone” and 484206 t of dolomite were mined in Styria in 2007.
Clay Clay pits occur in the sedimentary sequences of the Neogene basins (Styrian Basin,Fohnsdorf Basin, Mürz valley). Several pits in these basins mined 605708 t of clay in 2007.
Diabase Diabase, which is defined as a low-grade metamorphosed basaltic rock, is minedin two quarries at the southern Styrian border (Lieschengraben near Oberhaag and Radl-pass). Both are located in low-grade Paleozoic units of the Gurktal nappe system. Styriaproduced 898407 t of diabase in 2007.
Quartz and quartzite The bulk of the quartzite mines are located in the Permo-Mesozoiccover of the Crystalline basement in northeastern Styria. The quarry located near Trofaiachmines quartz from the low-grade Greywacke Zone. 204311 t of quartz/quartzite were minedin Styria in 2007, which is about two third of the total Austrian production.
Basaltic and ultramafic rocks Mines for basaltic rocks are located in Neogene volcanitesof the Styrian Basin in southeastern Styria (e.g.: Klöch) and in the Gurktal nappes. Ultra-mafic rocks (serpentinite, dunite) are mined in the area of Kraubath, where they occur inophiolite-like sequences of the Speik-Complex (Silvretta-Seckau nappe system). In 2007,1607969 t of basaltic rocks and 1142770 t of ultramafic rocks, which corresponds to 85percent and 62 percent of the total Austrian production, respectively, were mined.
Gneiss Gneiss is mined in several quarries in two areas, near Stainz and near St. Marein/ Mürztal. Both areas are located in the crystalline basement, but in different units. In thearea of Stainz, gneisses from the Koralpe complex (Koralpe-Wölz nappe system) is mined.In the area of St. Marein, the quarries are located in the Silvretta-Seckau nappe system. Intotal, 72388 t of gneiss were mined in 2007.
287
Sand and gravel Sand and gravel deposits of economic importance occur in fillings of theNeogene basins (most of them in the Styrian Basin) and in Quaternary sediments. There aremore than 20 quarries mining sand and gravel in Styria with a total production of 1 573 347 tin 2007.
E.6 Final remarks
Styria has a rich and diverse geological history, and the mineral resources mined in Styriaare an important economic sector in the province. The three Styrian universities which offerstudies in Earth Sciences are ideally located to learn more about the geological formationand evolution of that fascinating region on our doorstep.
E.7 Acknowledgments
The joint Doctoral School of Earth Sciences in combination with GASS (Graz Advanced School of Science) andUZAG (Universitätszentrum für angewandte Geowissenschaften Steiermark) is thanked for financial support ofthe field trip 2009. R. Schuster (GBA Vienna) is thanked for many discussions and a thorough review of thisarticle. R. Bakker, H.-J. Gawlick, S. Matthäi and W. Kurz are thanked for attending and leading parts of thefield trip. F. Ebner, H.-J. Gawlick, G. Hoinkes, R. Sachsenhofer and W. Vortisch are thanked for support andadvice during writing. All PhD students that attended the workshop are thanked for their interest and support.
288
Bibliography
AGNOLI, F. (1987) Geologie des Stross nordwestlichvon Weiz. PhD thesis, Graz, 144 p.
AGUE, J.; BAXTER, E. (2007) Brief thermal pulsesduring mountain building recorded by Sr diffusionin apatite and multicomponent diffusion in garnet.Earth and Planetary Science Letters, 261:500–516.
ALEINIKOFF, J.N.; SCHENCK, W.; PLANK, M.;SROGI, L.; FANNING, C.; KAMO, S.; BOS-BYSHELL, H. (2006) Deciphering igneous andmetamorphic events in high-grade rocks of theWilmington Complex, Delaware: Morphology,cathodoluminescence and backscattered electronzoning, and SHRIMP U-Pb geochronology of zir-con and monazite. Geolocial Society of AmericaBulletin, 118:39–64.
AMATO, J.; PAVLIS, T. (2010) Detrital zircon agesfrom the Chugach terrane, southern Alaska, revealmultiple episodes of accretion and erosion in a sub-duction complex. Geology, 38:459–462.
ANCZKIEWICZ, R.; THIRLWALL, M. (2003) Improv-ing precision of Sm-Nd garnet dating by H2SO4leaching: a simple solution to the phosphate inclu-sion problem. Geological Society of London, Spe-cial Publication, 220:83–91.
ANDERSEN, T. (2005) Detrital zircons as tracers ofsedimentary provenance: limiting conditions fromstatistics and numerical simulation. Chemical Ge-ology, 216:249–270.
ATWATER, T. (1989) The Eastern Pacific Ocean andHawaii. E. Winterer; D. Hussong; R. Decker,(eds.), Geology of a transpressional orogen de-veloped during ridge-trench interaction along theNorth Pacific margin, Boulder, Colorado, Geolog-ical Society of America, The Geology of NorthAmerica, Vol. N:21-72.
AYUSO, R.; HÄUSSLER, P.; BRADLEY, D.; FARRIS,D.; FOLEY, N.; WANDLESS, G. (2009) The role
of ridge subduction in determining the geochem-istry and Nd–Sr–Pb isotopic evolution of the Ko-diak batholith in southern Alaska. Tectonophysics,464:137–163.
BARBEAU, D.; DUCEA, M.; GEHRELS, G.; KID-DER, S.; WETMORE, P.; SALEEBY, J. (2005)U-Pb detrital-zircon geochronology of northernSalinian basement and cover rocks. Geological So-ciety of America Bulletin, 117:466–481.
BARKER, F.; FARMER, G.; AYUSO, R.; PLAFKER,G.; LULL, J. (1992) The 50 Ma granodiorite of theEastern Gulf of Alaska: Melting in an accretionaryprism in the Forearc. Journal of Geophysical Re-search, 97:6757–6778.
BARR, T.; DAHLEN, F. (1989) Brittle FrictionalMountain Building 2. Thermal structure andheat budget. Journal of Geophysical Research,94:3923–3947.
BELTRANDO, M.; HERMANN, J.; LISTER, G.;COMPAGNONI, R. (2007) On the evolution oforogens: Pressure cycles and deformation modeswitches. Earth and Planetary Science Letters,256:372–388.
BERGER, A.; BURRI, T.; ALT-EPPING, P.; ENGI, M.(2008) Tectonically controlled fluid flow and water-assisted melting in the middle crust: An examplefrom the Central Alps. Lithos, 102:598–615.
BERGER, A.; ROSENBERG, C.; SCHALTEGGER,U. (2009) Stability and isotopic dating of mon-azite and allanite in partially molten rocks: Exam-ples from the Central Alps. Swiss Journal of Geo-sciences, 102:15–29.
BERGER, A.; GULICK, S.; SPOTILA, J.; UPTON,P.; JAEGER, J.; CHAPMAN, J.; WORTHINGTON,L.; PAVLIS, T.; RIDGWAY, K.; WILLEMS, B.;MCALEER, R. (2008b) Quaternary tectonic re-sponse to intensified glacial erosion in an orogenicwedge. Nature Geoscience:doi:10.1038/ngeo334.
289
BERGER, A.; SPOTILA, J. (2008) Denudation and de-formation in a glaciated orogenic wedge: The St.Elias orogen, Alaska. Geology, 36:523–526.
BERGER, A.; SPOTILA, J.; CHAPMAN, J.; PAVLIS,T.; ENKELMANN, E.; RUPPERT, N.; BUSCHER,J. (2008a) Architecture, kinematics, and exhuma-tion of a convergent orogenic wedge: A ther-mochronological investigation of tectonic-climaticinteractions within the central St. Elias orogen,Alaska. Earth and Planetary Science Letters,270:13–24.
BERNET, M.; GARVER, J. (2005) Fission-TrackAnalysis of detrital Zircon. Reviews in Mineralogyand Geochemistry, 58:205–237.
BEYSSAC, O.; GOFFÉ, B.; CHOPIN, C.; ROUZAUD,J. (2002) Raman spectra of carbonaceous materialin metasediments: a new geothermometer. Journalof Metamorphic Geology, 20:859–871.
BICKLE, M.; MCKENZIE, D. (1987) The trans-port of heat and matter by fluids during metamor-phism. Contributions to Mineralogy and Petrology,95:384–392.
BINGEN, B.; AUSTRHEIM, H.; WHITEHOUSE, M.(2001) Ilmenite as a source for zirconium dur-ing high-grade metamorphism? Textural evidencefrom the Caledonides of western Norway and im-plications for zircon geochronology. Journal ofPetrology, 42:355–375.
BLACK, L.; KAMO, S.; WILLIAMS, I.; MUNDIL,R.; DAVIS, D.; KORSCH, R.; C., F. (2003)The application of SHRIMP to phanerozoicgeochronology: a critical appraisal of four zirconstandards. Chemical Geology, 200:171–188.
BOIK, H. (1950) Zum Bau der Grazer Decken.Zeitschrift der Deutschen Gesellschaft für Geowis-senschaften, 102/1:247–271.
BOL, A.; COE, R. (1992) Paleomagnetism of theResurrection Peninsula, Alaska: Implications forthe tectonics of southern Alaska and the Kula-Farallon Ridge. Journal of Geophysical Research,97:17213–17232.
BOL, A.; GIBBONS, H. (1992) Tectonic implica-tions of out-of-sequence faults in an accretionaryprism, Prince William Sound, Alaska. Tectonics,11:1288–1300.
BOL, A.; ROESKE, S. (1993) Strike-slip faultingand block rotation along the contact fault system,eastern Prince William Sound, Alaska. Tectonics,12:49–62.
BOOTH-REA, G.; KLAESCHEN, D.; GREVE-MEYER, I.; RESTON, T. (2008) Heterogenousdeformation in the Cascadia convergent marginand its relation to thermal gradient. Tectonics,doi:10.1029/2007TC002209.
BRADLEY, D.; HÄUSSLER, P.; KUSKY, T. (1993)Timing of Early Tertiary ridge subduction insouthern Alaska. US Geological Survey Bulletin,2068:163–177.
BRADLEY, D.; KUSKY, T.; HÄUSSLER, P.; GOLD-FARB, R.; MILLER, M.; DUMOULIN, J.; NEL-SON, S.; KARL, S. (2003) Geologic signature ofearly Tertiary ridge subduction in Alaska. V. Sis-son; S. Roeske; T. Pavlis, (eds.), Geology of atranspressional orogen developed during ridge-trench interaction along the North Pacific margin,Geological Society of America Special Paper, 371:5-21.
BRADLEY, D.; PARRISH, R.; CLENDENEN, W.;LUX, D.; LAYER, P.; HEIZLER, M.; DON-LEY, T. (2000) New geochronological evidence forthe Timing of Early Tertiary Ridge Subduction inSouthern Alaska. US Geological Survey Profes-sional Paper, 1615:5–21.
BRUAND, E. (2010) Petrology of the Chugach Meta-morphic Complex, southern Alaska. PhD, Univer-sity of Graz.
BRUAND, E.; STUEWE, K.; PROYER, A. (2010)Pseudosection modelling for a selected eclogitebody from the Koralpe (Hohl), Eastern Alps. Min-eralogy and Petrology, doi 10.1007/s00710-009-0097-7.
BRUHN, R.; HÄUSSLER, P. (2006) Deformationdriven by subduction and microplate collision:Geodynamics of Cook Inlet basin, Alaska. Geolog-ical Society of America Bulletin, 118:289–303.
BRUHN, R.; PAVLIS, T.; PLAFKER, G.; SERPA,L. (2004) Deformation during terrane accretion inthe St. Elias orogen, Alaska. Geological Society ofAmerica Bulletin, 116:771–787.
BRUN, J.; FACCENNA, C. (2008) Exhumation ofhigh-pressure rocks by slab-rollback. Earth andPlanetary Science Letters, 272:1–7.
290
BUCHER, K.; FREY, M. (2002) Petrogenesis of Meta-morphic Rocks. Springer Verlag, 341 p.
BURG, J.; GERYA, T. (2005) The role of viscous heat-ing in Barrovian metamorphism of collisional oro-gens: thermomechanical models and application tothe Lepontine Dome in the Central Alps. Journal ofMetamorphic Geology, 23:75–95.
BUTERA, K.; WILLIAMS, I.; BLEVIN, P.; SIMPSON,C. (2004) Zircon U-Pb dating of Early Palaeozoicmonzonitic intrusives from the Goonumbla area,New South Wales. Australian Journal of Earth Sci-ences, 48:457–464.
BYRDA, G. (2009) Arbeitstagung der GeologischenBundesanstalt Blatt 101 Eisenerz, Leoben, 31.08 -04.09.2009.Wien, 252 p.
BYRNE, T. (1979) Late Paleocene demise of the Kula-Pacific spreading center. Geology, 7:341–344.
CAMACHO, A.; LEE, J.; HENSEN, B.; BRAUN, J.(2005) Short-lived orogenic cycles and the eclogi-tization of cold crust by spasmodic hot fluids. Na-ture, 435:1191–1196.
CARLSON, W.D.; DONELICK, R.A.; ; KETCHAM,R.A. (1999) Variability of apatite fission track an-nealing kinetics: I. Experimental Results. Ameri-can Mineralogist, 84:1213–1223.
CARRAPA, B. (2010) Resolving tectonic problems bydating detrital minerals. Geology, 38:191–192.
CESARE, B.; GOMEZ-PUGNAIRE, M.; RUBATTO,D. (2003) Residence time of S-type anatectic mag-mas beneath the Neogene Volcanic Province of SEspain: a zircon and monazite SHRIMP study. Con-tributions to Mineralogy and Petrology, 146:28–43.
CHAMBERLAIN, C.; RUMBLE, D. (1988) ThermalAnomalies In A Regional Metamorphic Terrane:An Isotopic Study of the Role of Fluids. Journalof Petrology, 29:1215–1232.
CHERNIAK, D.; WATSON, E. (2003) Diffusion in Zir-con. J. Hanchar; P. Hoskin, (eds.), Zircon, Reviewsin Mineralogy and Geochemistry, 53: 113-139.
CHRISTESON, G.; GULICK, S.; AVENDONK, H.;WORTHINGTON, L.; REECE, R.; PAVLIS, T. (inpress) The Yakutat terrane: Dramatic change incrustal thickness across the transition fault, Alaska.Geology.
CLAR, E. (1933) Zur Geologie des Schöcklgebi-etes bei Graz. Jahrbuch der Geologischen Bunde-sanstalt, 83:113–136.
CLAR, E. (1935) Vom Bau des Grazer Paläozoikumsöstlich der Mur. Neues Jahrbuch Min Geol PaläontAbt, B 73:1–39.
CLENDENEN, W.; FISHER, D.; BYRNE, T. (2003)Cooling and exhumation history of the Kodiakaccretionary prism, southwest Alaska. V. Sisson;S. Roeske; T. Pavlis, (eds.),Geology of a transpres-sional orogen developed during ridge-trench inter-action along the North Pacific margin, GeologicalSociety of America Special Paper, 371:71-88.
COE, R.; GLOBERMAN, B.; PLUMLEY, P.;THRUPP, G. (1985) Paleomagnetic results fromAlaska and their tectonic implications. D. Howell,(ed.), Tectonostratigraphic terranes of the Circum-Pacific region, Earth Science Series 1, 85-108.
COE, R.; GLOBERMAN, B.; THRUPP, G. (1989)Rotation of central and southern Alaska in theearly Tertiary: oroclinal bending by megakinking?C. Kissel; C. Laj, (eds.), Tectonostratigraphic ter-ranes of the Circum-Pacific region, Paleomagneticrotations and continental deformation, 327-342.
CONEY, P.; JONES, D.; MONGER, J. (1980)Cordilleran suspect terranes. Nature, 288:329–333.
CONNOLLY, J.; THOMPSON, A. (1989) Fluid andenthalpy production during regional metamor-phism. Contributions to Mineralogy and Petrology,102:346–366.
COWAN, D. (2003) Revisiting the Baranof-LeechRiver hypothesis for early Tertiary coastwise trans-port of the Chugach-Prince William terrane. Earthand Planetary Science Letters, 213:463–475.
CROWE, D.; NELSON, S.; BROWN, P.; SHANKS,W.; VALLEY, J. (1992) Geology and Geochemistryof volcanogenic massive sulfide deposits and re-lated igneous rocks, Prince William Sound, South-Central Alaska. Economic Geology, 87:1722–1746.
DAHL, P. (1996) The crystal-chemical basis for Ar re-tention in micas: inferences from interlayer parti-tioning and implications for geochronology. Con-tributions to Mineralogy and Petrology, 123:22–39.
291
DAHLEN, F.; BARR, T. (1989) Brittle FrictionalMountain Building. 1. Deformation and Mechan-ical Energy Budget. Journal of Geophysical Re-search, 94:3906–3922.
DALLMEYER, R.; NEUBAUER, F.; FRITZ, H. (2008)The Meliata suture in the Carpathians: regionalsignificance and implications for the evolution ofhigh-pressure wedges within collisional orogens.S. Siegesmund; B. Fügenschuh; N. Froitzheim,(eds.), Tectonic Aspects of the Alpine-Dinaride-Carpathian System, Geological Society, London,Special Publications, 298, 101-115.
DAVIS, A.; PLAFKER, G. (1986) Eocene basalts fromthe Yakutat terrane: Evidence for the origin ofan accreting terrane in southern Alaska. Geology,14:963–966.
DE YOREO, J.; LUX, D.; GUIDOTTI, C. (1991) Ther-mal modelling in low-pressure/high-temperaturemetamorphic belts. Tectonophysics, 188:209–238.
DECELLES, G.; B., C.; GEHRELS, G. (2007) De-trital zircon U-Pb ages provide provenance andchronostratigraphic information from Eocene syn-orogenic deposits in northwestern Argentina. Geol-ogy, 35:323–326.
DECKER, K.; PERESSON, H.; FAUPL, P. (1994)Die miozäne Tektonik der östlichen Kalkalpen:Kinematik, Paläospannungen und Deformation-saufteilung während der "lateralen Extrusion" derZentralalpen. Jahrbuch der Geologischen Bunde-sanstalt, 137/1:5–18.
DEWEY, J. (2005) Orogeny can be very short. Pro-ceedings of the National Academy of Science,102:15286–15293.
DICKINSON, W. (2009) Anatomy and global con-text of the North American Cordillera. S. Kay;V. Ramos; W. Dickinson, (eds.), Backbone of theAmericas: Shallow subduction, plateau uplift, andridge and terrane collision, Geological Society ofAmerica Memoir 204:1-29.
DICKINSON, W.; GEHRELS, G. (2009) Use of U-Pbages of detrital zircons to infer maximum depo-sitional ages of strata: A test against a ColoradoPlateau Mesozoic database. Earth and PlanetaryScience Letters, 288:115–125.
DODSON, M. (1973) Closure temperature in coolinggeochronological and petrological systems. Contri-butions to Mineralogy and Petrology, 40:259–274.
DOUBROVINE, P.; TARDUNO, J. (2008) A revisitedkinematic model for the relative motion betweenPacific oceanic plates and North America since theLate Cretaceous. Journal of Geophysical Research,113, B12101:doi:10.1029/2008JB005585.
DUNKL, I. (2002) Trackkey: a Windows programfor calculation and graphical presentation of fissiontrack data. Computers and Geosciences, 28:3–12.
DUNKL, I.; FRISCH, W. (2002) Thermochronologi-cal constraints on the Late Cenozoic exhumationalong the Alpine and West Carpathian margins ofthe Pannonian Basin. EGU Stephan Mueller Spe-cial Publication Series, 3:135–147.
DUNKL, I.; KUHLEMANN, J.; REINECKER, J.;FRISCH, W. (2005) Cenozoic relief evolution ofthe Eastern Alps - constraints from apatite fissiontrack age-provenance of neogene intramontane sed-iments. Austrian Journal of Earth Sciences, 98:92–105.
DUNLAP, W. (1997) Neocrystallization or cooling?40Ar/39Ar ages of white micas from low-grade my-lonites. Chemical Geology, 143:181–203.
DUSEL-BACON, C. (1994) Metamorphic history ofAlaska. G. Plafker; H. Berg, (eds.), The Geologyof Alaska, Boulder, Colorado, Geological Societyof America, The Geology of North America G-1,495-533.
EBERHART-PHILLIPS, D.; CHRISTENSEN, D.;BROCHER, T.; HANSEN, R.; RUPPERT, N.; P.J.,H.; ABERS, G. (2006) Imaging the transitionfrom Aleutian subduction to Yakutat collision incentral Alaska, with local earthquakes and ac-tive source data. Journal of Geophysical Research,111:B11303, doi:10.1029/2005JB004240.
EBNER, F. (1997) Die geologischen Einheiten Öster-reichs und ihre Rohstoffe. Archiv für Lager-stättenforschung der Geologischen Bundesanstalt,19:49–229.
EBNER, F. (2008) Die aktuelle Produktion mineralis-cher Rohstoffe in der Steiermark. Joannea Geol.Paläont., 10:39–48.
EBNER, F.; HUBMANN, B.; WEBER, L. (2000) DieRannach- und Schöckl-Decke des Grazer Paläo-zoikums.Mitt Ges Geol Bergbaustud Österr, 44:1–44.
292
EBNER, F.; PROCHASKA, W.; TROBY, J.;M AZIM ZADEH, A. (2004) Carbonate hostedsparry magnesite of the Greywacke zone, Aus-tria/Eastern Alps. Acta Petrologica Sinica,20(4):791–802.
EBNER, F.; RANTITSCH, G. (2000) DasGosaubecken von Kainach - ein Überblick.Mitt Ges Geol Bergbaustud Österr, 44:157–172.
EBNER, F.; SACHSENHOFER, R. (1995) Paleogeog-raphy, subsidence and thermal history of the Neo-gene Styrian Basin (Pannonian Basin System, Aus-tria). Tectonophysics, 242:133–150.
EGGER, H.; KRENMAYR, H.; MANDL, G.;MATURA, A.; NOWOTNY, A.; PASCHER, G.;PESTAL, G.; PISTONIK, J.; ROCKENSCHAUB,M.; SCHNABEL, W. (1999) Geologische Ueber-sichtskarte der Republik Österreich 1:1.500.000.Geologische Bundesanstalt, Wien.
ENGEBRETSON, D.; COX, A.; GORDON, R. (1984)Relative motions between oceanic plates of thePacific basin. Journal of Geophysical Research,89:10291–10310.
ENGEBRETSON, D.; COX, A.; GORDON, R. (1985)Relative motions between oceanic and continentalplates in the Pacific basin. Geological Society ofAmerica Special Paper, 206:1–59.
ENGLAND, P.; HOLLAND, T. (1979) Archimedes andthe Tauern eclogites: the role of buoyancy in thepreservation of excotic eclogite blocks. Earth andPlanetary Science Letters, 44:287–294.
ENGLAND, P.; THOMPSON, A. (1984) Pressure-Temperature-Time Paths of regional metamor-phism I. Heat transfer during the evolution of re-gions of thickened contintental crust. Journal ofPetrology, 25:894–928.
ENKELMANN, E.; GARVER, J.; PAVLIS, T. (2008)Rapid exhumation of ice-covered rocks of theChugach-St. Elias orogen, southeast Alaska. Geol-ogy, 36:915–918.
ENKELMANN, E.; ZEITLER, P.; GARVER, J.;PAVLIS, T.; HOOKS, B. (2010) The thermochrono-logical record of tectonic and surface process in-teraction at the Yakutat-North American collisionzone in southeast Alaska. American Journal of Sci-ence, in press.
ENKELMANN, E.; ZEITLER, P.; PAVLIS,T.L.AND GARVER, J.; RIDGWAY, K. (2009)Intense localized rock uplift and erosion in theSt. Elias orogen of Alaska. Nature Geoscience,doi:10.1038/NGEO502.
ESTERLUS, M. (1986) Kristallisationsgeschichte undStrukturprägung im Kristallin E des Grazer Paläo-zoikums. PhD thesis, University of Vienna, 187 p.
FARMER, G.; AYUSO, R.; PLAFKER, G. (1993) ACoast Mountains provenance for the Valdez andOrca groups, southern Alaska, based on Nd, Sr andPb isotopic evidence. Earth and Planetary ScienceLetters, 116:9–21.
FARRIS, D.; HÄUSSLER, P.; FRIEDMAN, R.; PA-TERSON, S.; SALTUS, R.; R., A. (2006) Em-placement of the Kodiak batholith and slab-windowmigration. Geological Society of America Bulletin,118:1360–1376.
FARRIS, D.; PATERSON, S. (2009) Subduction of asegmented ridge along a curved continental mar-gin: Variations between the western and east-ern Sanak-Baranof belt, southern Alaska. Tectono-physics, 464:100–117.
FARYAD, S.; HOINKES, G. (2003) P-T gradient ofEo-Alpine metamorphism within the Austroalpinebasement units east of the Tauern Window (Aus-tria).Mineralogy and Petrology, 77:129–159.
FARYAD, S.; MELCHER, F.; HOINKES, G.; PUHL,J.; MEISEL, T.; FRANK, W. (2002) Relics ofeclogite facies metamorphism in the Austroalpinebasement, Hochgrössen (Speik complex), Austria.Mineralogy and Petrology, 74:49–73.
FERRIS, A.; ABERS, G.; CHRISTENSEN, D.; VEEN-STRA, E. (2003) High-resolution image of the sub-ducted Pacific (?) plate beneath central Alaska, 50-150 km depth. Earth and Planetary Sciences Let-ters, 214:575–588.
FINGER, F.; BROSKA, I.; ROBERTS, M.; SCHER-MAIER, A. (1998) Replacement of primary mon-azite by apatite-allanite-epidote coronas in an am-phibolite facies granite gneiss from the easternAlps. American Mineralogist, 83:248–258.
FISHER, D.; BYRNE, T. (1992) Strain variations inan ancient accretionary complex: implications forforearc evolution. Tectonics, 11:330–347.
293
FITZSIMONS, I.; KINNY, P.; HARLEY, S. (1997) Twostages of zircon and monazite growth in anatec-tic leucogneiss: SHRIMP constraints on the dura-tion and intensity of Pan-African metamorphism inPrydz Bay, East Antarctica. Terra Nova, 9:47–51.
FITZSIMONS, I.; KINNY, P.; WETHERLEY, S.;HOLLINGSWORTH, D. (2005) Bulk chemical con-trol on metamorphic monazite growth in peliticschists and implications for U-Pb age data. Journalof Metamorphic Geology, 23:261–277.
FLÜGEL, H.; HUBMANN, B. (2000) Das Paläo-zoikum von Graz: Stratigraphie und Bibliographie.Österr Akad Wiss Schr der Erdw Komm 13, 118 p.
FLÜGEL, H.; MAURITSCH, H.; HEINZ, H.; FRANK,W. (2000) Paläomagnetische und radiometrischeDaten aus dem Grazer Paläozoikum.Mitt Ges GeolBergbaustud Österr, 44:1–44.
FLÜGEL, H. (2000) Die lithostratigraphischeGliederung des Paläozoikums von Graz (Österre-ich). H. Flügel; B. Hubmann, (eds.), Das Paläo-zoikum von Graz, Stratigraphie und Bibliographie,Österreichische Akademie der Wissenschaften,Schriftenreihe der Erdwissenschaftlichen Kommis-sionen 13, 7-59.
FLÜGEL, H.; NEUBAUER, F. (1984) Erläuterungenzur Geologischen Karte der Steiermark, 1:200 000.Geologische Bundesanstalt, Wien.
FORSTER, M.; LISTER, G. (2005) Several dis-tinct tectono-metamorphic slices in the Cycladiceclogite-blueschist belt, Greece. Contributions toMineralogy and Petrology, 150:523–545.
FORSTER, M.; LISTER, G. (2008) Tectonic sequencediagrams and the structural evolution of schists andgneisses in multiply deformed terranes. Journal ofthe Geological Society of London, 165:923–939.
FOSTER, D.; GOSCOMBE, B.; GRAY, D. (2009)Rapid exhumation of deepcrust in an obliquelyconvergent orogen: The Kaoko Belt of theDamara Orogen. Tectonics, 28:TC4002,doi:10.1029/2008TC002317.
FOSTER, D.; GRAY, D.; BUCHER, M. (1999)Chronology of deformation within the turbidite-dominated Lachlan orogen: implications for thetectonic evolution of eastern Australia and Gond-wana. Tectonics, 18:452–485.
FOSTER, G.; GIBSON, H.; PARRISH, R.;HORSTWOOD, M.; FRASER, J.; TINDLE, A.(2002) Textural, chemical and isotopic insightsinto the nature and behaviour of metamorphicmonazite. Chemical Geology, 191:183–207.
FOSTER, G.; KINNY, P.; VANCE, D.; PRINCE, C.;HARRIS, N. (2000) The significance of monaziteU-Th-Pb age data in metamorphic assemblages; acombined study of monazite and garnet chronome-try. Earth and Planetary Science Letters, 181:327–340.
FOSTER, G.; PARRISH, R. (2003) Metamorphic mon-azite and the generation of P-T-t paths. D. Vance;W. Müller; I. Villa, (eds.), Geochronology: Link-ing the Isotopic record with Petrology and Textures,Geological Society of London Special Publication220, 25-47.
FOSTER, G.; PARRISH, R.; HORSTWOOD, M.; CH-ENERY, S.; PYLE, J.; GIBSON, H. (2004) Thegeneration of prograde P-T-t points and paths; atextural, compositional, and chronological study ofmetamorphic monazite. Earth and Planetary Sci-ence Letters, 228:125–142.
FRANK, W.; SCHLAGER, W. (2005) Jurassic strike-slip versus subduction in the Eastern Alps. Int JEarth Sci, 95:431–450.
FRASER, G.; ELLIS, D.; EGGINS, S. (1997) Zirco-nium abundance in granulite-facies minerals, withimplications for zircon geochronology in high-grade rocks. Geology, 25:607–610.
FRASER, G.; HUSSEY, K.; COMPSTON, D. (2008)Timing of Paleoproterozoic Au-Cu-Bi and W-mineralization in the Tennant Creek region, north-ern Australia: Improved constraints via intercali-bration of 40Ar/39Ar and U-Pb ages. Precambrianresearch, 164:50–65.
FRISCH, W.; GAWLICK, H.J. (2003) The nappestructure of the central Northern Calcareous Alpsand its disintegration during Miocene tectonicextrusion-a contribution to understanding the oro-genic evolution of the Eastern Alps. Int J Earth Sci,92:712–727.
FRISCH, W.; KUHLEMANN, J.; DUNKL, I.;BRÜGEL, A. (1998) A Palinspastic reconstructionand topographic evolution of the Eastern Alps dur-ing late Tertiary tectonic extrusion. Tectonophysics,297:1–15.
294
FRITZ, H. (1986) Zur Geologie des nordwestlichenGrazer Paläozoikums (im Bereich Schartnerkogel- Parmaseggkogel). PhD thesis, University of Graz,202 p.
FRITZ, H. (1988) Kinematics and geochronology ofEarly Cretaceous thrusting in the northwestern Pa-leozoic of Graz (Eastern Alps). Geod Acta, 2/2:53–62.
FRITZ, H. (1991) Stratigraphie, Fazies und Tektonikim nordwestlichen Grazer Paläozoikum (Ostalpen).Jahrb der Geol Bundesanst, 134/2:227–255.
FRITZ, H.; EBNER, F.; NEUBAUER, F. (1992) TheGraz Thrust-Complex (Paleozoic of Graz). Alpacafield guide, KFU Graz:83–92.
FRITZ, H.; EBNER, F.; NEUBAUER, F. (2006) Berri-asian drowning of the Plassen carbonate platformat the type-locality and its bearing on the earlyEoalpine orogenic dynamics in the Northern Cal-careous Alps (Austria). Int J Earth Sci, 95:451–462.
FRITZ, H.; NEUBAUER, F. (1988) Geodynamic as-pects of the Silurian and Early Devonian Sedi-mentation in the Paleozoic of Graz (Eastern Alps).Schweiz Mineral Petrogr Mitt, 68:359–367.
FRITZ, H.; NEUBAUER, F.; RATSCHBACHER, L.(1991) Compression versus extension in the Pale-ozoic of Graz (Eastern Alps, Austria). Zbl GeolPaläont, 1/1:55–68.
FROITZHEIM, N.; PLASIENKA, D.; SCHUSTER, R.(2000) Alpine tectonics of the Alps and WesternCarpathians. T. McCann, (ed.), The Geology ofCentral Europe, Volume 2: Mesozoic and Ceno-zoic. - Geological Society, London, 1141-1232.
FUIS, G.; AMBOS, E.; MOONEY, W. (1991) Crustalstructure of accreted terranes in southern Alaska,Chugach Mountains and Copper River Basin, fromseismic refraction results. Journal of GeophysicalResearch, 96:4187–4227.
FUIS, G.; MOORE, T.; PLAFKER, G.; BROCHER, T.;FISHER, M.; MOONEY, W.; NOKLEBERG, W.;PAGE, R.; BEAUDOIN, B.; CHRISTENSEN, N.;LEVANDER, A.; LUTTER, W.; SALTUS, W.; RUP-PERT, N. (2008) Trans-Alaska Crustal Transect andcontinental evolution involving subduction under-plating and synchronous foreland thrusting. Geol-ogy, 36:267–270.
FUIS, G.; PLAFKER, G. (1991) Evolution of deepstructure along the Trans-Alaska Crustal Tran-sect, Chugach Mountains and Copper River Basin,southern Alaska. Journal of Geophysical Research,96:4229–4253.
GASSER, D.; STÜWE, K.; FRITZ, H. (2009) Internalstructural geometry of the Paleozoic of Graz. Int JEarth Sci, DOI 10.1007/s00531-009-0446-0.
GAWLICK, H. (1996) Die früh-oberjurassischenBrekzien der Strubbergschichten im Lam-mertal - Analyse und tektonische Bedeutung(Nördliche Kalkalpen, Österreich). Mitteilungender Gesellschaft der Geologie- und Bergbaustu-denten Österreich, 39/49:119–186.
GAWLICK, H.; FRISCH, W.; VECSEI, A.; STEIGER,T.; BÖHM, F. (1999a) The change from riftingto thrusting in the Northern Calcareous Alps asrecorded in Jurassic sediments. Int J Earth Sci,87:664–657.
GAWLICK, H.; KRYSTYN, L.; LEIN, R. (1994) Con-odont colour alteration indices: Palaeotempera-tures and metamorphism in the Northern Calcare-ous Alps - a general view. Int J Earth Sci, 83:660–664.
GAWLICK, H.; SCHLAGINTWEIT, F.; SUZUKI,H. (2007) Die Ober-Jura bis Unter-KreideSchichtfolge des Gebietes Höherstein-Sandling(Salzkammergut, Österreich) - Implikationenzur Rekonstruktion des Block-Puzzles der zen-tralen Nördlichen Kalkalpen, der Gliederungder Radiolaritflyschbecken und der Plassen-Karbonatplattform. Neues Jahrbuch für Geologieund Paläontologie Abhandlungen, 243/1:1–70.
GEHRELS, G.; RUSMORE, M.; WOODSWORTH, G.;CRAWFORD, M.; ANDRONICOS, C.; HOLLIS-TER, L.; PATCHETT, J.; DUCEA, M.; BUTLER,R.; KLEPEIS, K.; DAVIDSON, C.; FRIEDMAN,R.; HAGGART, J.; MAHONEY, B.; CRAWFORD,W.; PEARSON, D.; GIRARDI, J. (2009) U-Th-Pbgeochronology of the Coast Mountains batholith innorth-coastal British Columbia: Constraints on ageand tectonic evolution.Geological Society of Amer-ica Bulletin, 121:1341–1361.
GEISLER, T.; SCHALTEGGER, U.; TOMASCHEK, F.(2007) Re-equilibration of zircon in acqueous flu-ids and melts. Elements, 3:43–50.
GIBSON, H.; CARR, S.; BROWN, R.; HAMILTON,M. (2004) Correlation between chemical and age
295
domains in monazite, and metamorphic reactionsinvolving major pelitic phases: an integration ofID-TIMS and SHRIMP geochronology with Y-Th-U X-ray mapping. Chemical Geology, 211:237–260.
GLEADOW, A. (1981) Fission-track dating methods:what are the real alternatives? Nuclear Tracks,5:3–14.
GODIN, L.; D., G.; LAW, R.; SEARLE, M. (2006)Channel flow, ductile extrusion and exhumationin continental collision zones: An introduction.R. Law; M. Searle; L. Godin, (eds.), Channelflow, ductile extrusion and exhumation in continen-tal collision zones., Geological Society of LondonSpecial Publication 268, 1-23.
GOLDFARB, R.; LEACH, D.; MILLER, M.; PICK-THORN, W. (1986) Geology, metamorphic set-ting, and genetic constraints of epigenetic lode-gold mineralization within the Cretaceous ValdezGroup, south-central Alaska. Geological Associa-tion of Canada Special Paper, 32:87–105.
GOLLNER, H.; SCHIRNIK, D.; TSCHELAUT, W.(1987) The Problem of the Southalpine Clasts inthe "Mittelsteirische Gosau". H. Flügel; P. Faupl,(eds.), Geodynamics of the Eastern Alps, Deuticke,Vienna (1987), pp. 156–163.
GOLLNER, H.; ZIER, C. (1985) Zur Geologie desHochlantsch (Grazer Paläozoikum, Steiermark).Jahrb der Geol Bundesanst, 128/1:43–73.
GOSCOMBE, B.; GRAY, D. (2009) Metamorphic re-sponse in orogens of different obliquity, scale andgeometry. Gondwana Research, 15:151–167.
GRADSTEIN, F.; OGG, J.; SMITH, A. (2004) AGeologic Time Scale 2004. Cambridge UniversityPress, Cambridge. 589 pp.
GREEN, P.; DUDDY, I.; GLEADOW, A.; TINGATE,P.; LASLETT, G. (1986) Thermal annealing of fis-sion tracks in apatite 1. A qualitative description.Chemical Geology, 59:237–253.
GREGORY, C.; RUBATTO, D.; ALLEN, C.;WILLIAMS, I.; HERMANN, J.; IRELAND, T.(2007) Allanite micro-geochronology: A LA-ICP-MS and SHRIMP U-Th-Pb study. Chemical Geol-ogy, 245:162–182.
GROOME, W.; THORKELSON, D. (2009) The three-dimensional thermo-mechanical signature of ridge
subduction and slab window migration. Tectono-physics, 464:70–83.
GROSS, M.; FRITZ, I.; PILLER, W.; SOLIMAN, A.;HARZHAUSER, M.; HUBMANN, B.; MOSER, B.;SCHOLGER, R.; SUTTNER, T.; BOJAR, H. (2007)The Neogene of the Styrian Basin: Guide to Ex-cursion. Joannea - Geologie und Paläontologie,9:117–193.
GSELLMANN, H. (1987) Zur Geologie am Nordos-trand des Grazer Paläozoikums. PhD thesis, Uni-versity of Graz, 202 p.
GULICK, S.; LOWE, L.; PAVLIS, T.; GARDNER, J.;MAYER, L. (2007) Geophysical insights into theTransition Fault debate: Propagating strike-slip inresponse to stalling Yakutat block subduction in theGulf of Alaska. Geology, 35:763–766.
HARRIS, N.; SISSON, V.; WRIGHT, J.; PAVLIS,T. (1996) Evidence for Eocene mafic underplatingduring fore-arc intrusive activity, eastern Chugachmountains, Alaska. Geology, 24:263–266.
HARRISON, T.; CATLOS, E.; MONTEL, J. (2002)U-Th-Pb dating of phosphate minerals. Reviews inMineralogy and Geochemistry, 48:523–558.
HARRISON, T.; CÉLÉRIER, J.; AIKMAN, A.; HER-MANN, J.; HEIZLER, M. (2009) Diffusion of 40Arin muscovite. Geochimica et Cosmochimica Acta,73:1039–1051.
HASENHÜTTL, C. (1994) Eine Wärmegeschichte desGrazer Berglandes. Inkohlung, Illitkristallinität,Tonmineralogie und Condont Color Alteration In-dex im nördlichen Teil des Grazer Deckenkomplex.PhD thesis, University of Graz, 192 p.
HEIJL, C. (1997) ‘Cold spots‘ during the Cenozoicevolution of the Eastern Alps: thermochronologicalinterpretation of apatite fission-track data. Tectono-phys, 272:159–173.
HERMANN, J. (2002) Allanite: thorium and light rareelement carrier in subducted crust. Chemical Geol-ogy, 192:289–306.
HERMANN, J.; RUBATTO, D.; TROMMSDORFF, V.(2006) Sub-solidus Oligocene zircon formation ingarnet peridotite during fast decompression andfluid infiltration (Duria, Central Alps). Mineralogyand Petrology, 88:181–206.
296
HERMANN, S. (1992) Die Steirische Grauwacken-zone am Kaintaleck: Geologie, Petrographie,Struktur, Geochemie und Rb-Sr-Datierungen.Diplomarbeit, Graz, 225 p.
HETHERINGTON, C.; JERCINOVIC, M.; WILLIAMS,M.; MAHAN, K. (2008) Understanding geologicalprocesses with xenotime: composition, chronologyand a protocol for electron probe microanalysis.Chemical Geology, 254:133–147.
HIESS, J.; NUTMAN, A.; BENNETT, V.; HOLDEN,P. (2008) Ti-in-zircon thermometry applied to con-trasting Archean metamorphic and igneous sys-tems. Chemical Geology, 247:323–338.
HILL, M.; MORRIS, J.; WHELAN, J. (1981) Hy-brid granodiorites intruding the accretionary prism,Kodiak, Shumagin, and Sanak Islands, south-west Alaska. Journal of Geophysical Research,86:10569–10590.
HINTON, H.; UPTON, B. (1991) The chemistry of zir-con: Variations within and between large crystalsfrom syenite and alkali basalt xenoliths. Geochim-ica et Cosmochimica Acta, 55:3287–3302.
HOFMANN, A.; VALLEY, J.; WATSON, E.;CAVOSIE, A.; EILER, J. (2009) Sub-micron scaledistributions of trace elements in zircon. Contribu-tions to Mineralogy and Petrology, 158:317–335.
HOLLAND, T.; POWELL, R. (1998) An internallyconsistent thermodynamic data set for phases ofpetrological interest. Journal of Metamorphic Ge-ology, 16:309–343.
HOSKIN, P.; BLACK, L. (2000) Metamorphic zirconformation by solid-state recrystallization of pro-tolith igneous zircon. Journal of metamorphic ge-ology, 18:423–439.
HOSKIN, P.; SCHALTEGGER, U. (2003) The com-position of zircon and igneous and metamorphicpetrogenesis. J. Hanchar; P. Hoskin, (eds.), Zircon,Reviews in Mineralogy and Geochemistry, 53: 27-55.
HUBMANN, B. (1993) Ablagerungsraum, Mikro-fazies und Paläoökologie der Barrandeikalk-Formation (Eifelium) des Grazer Paläozoikums.Jahrb der Geol Bundesanst, 136/2:393–461.
HUBMANN, B.; MESSNER, F. (2007) "Stein imBild", die fazielle Entwicklung der Rannachdecke(Grazer Paläozoikum). Jahrb der Geol Bundesanst,147:277–299.
HUDSON, T.; PLAFKER, G. (1982) Paleogene meta-morphism of an accretionary flysch terrane, easternGulf of Alaska.Geological Society of America Bul-letin, 93:1280–1290.
HUDSON, T.; PLAFKER, G.; LANPHERE, M. (1977a)Intrusive rocks of the Yakutat-St. Elias area, south-central Alaska. U.S. Geological Survey Journal ofResearch, 5:155–172.
HUDSON, T.; PLAFKER, G.; LANPHERE, M.(1977b) Metamorphic rocks of the Yakutat-St.Elias area, south-central Alaska. U.S. GeologicalSurvey Journal of Research, 5:173–184.
HUDSON, T.; PLAFKER, G.; PETERMAN, Z. (1979)Paleogene anatexis along the Gulf of Alaska mar-gin. Geology, 7:573–577.
HUERTA, A.; ROYDEN, L.; HODGES, K. (1996) Theinterdependence of deformational and thermal pro-cesses in mountain belts. Science, 273:637–639.
HURFORD, A.; GREEN, P. (1983) The zeta age cali-bration of fission track dating. Isotope Geoscience,1:285–317.
HÄUSSLER, P.; BRADLEY, D.; GOLDFARB, R.;SNEE, L.; TAYLOR, C. (1995) Link between ridgesubduction and gold mineralization in southernAlaska. Geology, 23:995–998.
HÄUSSLER, P.; BRADLEY, D.; GOLDFARB, R.(2003b) Brittle deformation along the Gulf ofAlaska margin in response to Paleocene-Eocenetriple junction migration. V. Sisson; S. Roeske;T. Pavlis, (eds.), Geology of a transpressionalorogen developed during ridge-trench interactionalong the North Pacific margin, Geological Societyof America Special Paper, 371:119-140.
HÄUSSLER, P.; BRADLEY, D.; WELLS, R.;MILLER, M. (2003a) Life and death of the Resur-rection plate: Evidence for its existence and sub-duction in the northeastern Pacific in Paleocene-Eocene time. Geological Society of America Bul-letin, 115:867–880.
HÄUSSLER, P.; GEHRELS, G.; KARL, S. (2005)Constraints on the Age and Provenance of theChugach Accretionary Complex from detrital zir-cons in the Sitka Greywacke near Sitka, Alaska.Studies by the U.S. Geological Survey in Alaska,2004, U.S. Geological Survey Professional Paper,1709-F:1–11.
297
HÄUSSLER, P.; NELSON, S. (1993) Structural evo-lution of the Chugach-Prince William terrane atthe hinge of the orocline in Prince William Sound,and implications for ore deposits. C. Dusel-Bacon;A. Till, (eds.), Geological Studies in Alaska by theU.S. Geological Survey, 1992, U.S. Geological Sur-vey Bulletin 2068:143-162.
JAFFEY, A.; FLYNN, K.; GENDENIN, L.; BENTLEY,W.; ESSLING, A. (1971) Precision measurementof half-lives and specific activities of 235U and238U. Physical Review C, 4/5:1889–1906.
JAMES, T.; HOLLISTER, L.; MORGAN, W. (1989)Thermal modelling of the Chugach Metamor-phic Complex. Journal of Geophysical Research,94:4411–4423.
JAMIESON, R.; BEAUMONT, C.; FULLSACK, P.;LEE, B. (1998) Barrovian regional metamorphism:where´s the heat? C. Beaumont; P. Fullsack, (eds.),What drives metamorphism and metamorphic reac-tions?, Geological Society of London Special Pub-lication, vol. 138, p. 23-51.
JANOTS, E.; BRUNET, F.; GOFFÉ, B.; POINSSOT,C.; BURCHARD, M.; CEMIC, L. (2007) Ther-mochemistry of monazite-(La) and dissakite-(La): implications for monazite and allanite stabilityin metapelites. Contributions to Mineralogy andPetrology, 154:1–14.
JANOTS, E.; ENGI, M.; BERGER, A.; ALLAZ, J.;SCHWARZ, J.; SPANDLER, C. (2008) Progrademetamorphic sequence of REE minerals in peliticrocks of the Central Alps: implications for allanite-monazite-xenotime phase relations from 250 to610°C. Journal of metamorphic Geology, 26:509–526.
JANOTS, E.; ENGI, M.; RUBATTO, D.; BERGER, A.;GREGORY, C.; RAHN, M. (2009) Metamorphicrates in collisional orogeny from in situ allanite andmonazite dating. Geology, 37:11–14.
JANOTS, E.; NEGRO, F.; BRUNET, F.; GOFFÉ, B.;ENGI, M.; BOUYBAOUENE, M. (2006) Evolutionof the REE mineralogy in HP-LT metapelites of theSebtide complex, Rif, Morocco: Monazite stabilityand geochronology. Lithos, 87:214–234.
JENKIN, G. (1997) Do cooling paths derived frommica Rb-Sr data reflect true cooling paths? Geol-ogy, 25:907–910.
JOHNSTON, S. (2001) The Great Alaskan TerraneWreck: reconciliation of paleomagnetic and geo-logical data in the northern Cordillera. Earth andPlanetary Science Letters, 193:259–272.
JONES, J.; CONNELLY, J.; KARLSTROM, K.;WILLIAMS, M.; DOE, M. (2009) Age, prove-nance, and tectonic setting of Paleoproterozoicquartzite successions in the southwestern UnitedStates. Geological Society of America Bulletin,121:247–264.
KANEKO, Y., M.T. (2006) Erratum to “recalibrationof mutually consistent garnet-biotite and garnet-cordierite geothermomethers”. Lithos, 86:347.
KARNER, D.; RENNE, R. (1998) 40Ar/39Argeochronology of Roman volcanic province tephrain the Tiber river valley: age calibration of middlePleistocene sea-level changes. Geophysical societyof America Bulletin, 110:740–747.
KIM, Y.; YI, K.; CHO, M. (2009) Paragenesesand Th-U distributions among allanite, monazite,and xenotime in Barrovian-type metapelites, Imjin-gang belt, central Korea. American Mineralogist,94:430–438.
KINGSBURY, J.; MILLER, C.; WOODEN, J.; HAR-RISON, T. (1993) Monazite paragenesis and U-Pbsystematics in rocks of the eastern Mojave desert,California, USA: implications for thermochronom-etry. Chemical Geology, 110:147–167.
KOHN, M.J.; CATLOS, E.; RYERSON, F.; HAR-RISON, T. (2001) Pressure-temperature-time pathdiscontinuity in the Maine Central thrust zone, cen-tral Nepal. Geology, 29:571–574.
KOHN, M.J.; MALLOY, M. (2004) Formationof monazite via prograde metamorphic reactionsamong common silicates: Implications for age de-terminations. Geochimica et Cosmochimica Acta,68:101–113.
KOHN, M.; WIELAND, M.; PARKINSON, C.; UP-RETI, B. (2005) Five generations of monazite inLangtang gneisses: implications for chronology ofthe Himalayan metamorphic core. Journal of Meta-morphic Geology, 23:399–406.
KOONS, P.; HOOKS, B.; PAVLIS, T.; UPTON, P.;BARKER, A. (in press) Three dimensional mechan-ics of Yaktuat convergence in the southern Alaskanplate corner. Tectonics.
298
KOONS, P.; NORRIS, R.; CRAW, D.; COOPER, A.(2003) Influence of exhumation on the structuralevolution of transpressional plate boundaries: Anexample from the Southern Alps, New Zealand.Geology, 31:3–6.
KOPPERS, A. (2002) ArArCALC - software for40Ar/39Ar age calculations. Computers Geo-sciences, 28:605–619.
KOROKNAI, B.; NEUBAUER, F.; GENSER, J.; TOPA,D. (1999) Metamorphic and tectonic evolution ofAustroalpine Units at the western margin of theGurktal nappe complex, Eastern Alps. Schweiz.Mineral. Petrogr. Mitt., 79:277–295.
KRALIK, M.; KRUMM, H.; SCHRAMM, J. (1987)Low grade and very low grade metamorphismin the Northern Calcareous Alps and in theGreywacke Zone: Illite-Crystallinity data and iso-topic ages. H. Flügel; P. Faupl, (eds.), Geodynam-ics of the Eastern Alps, Deuticke, Vienna (1987),pp. 164–178.
KRENN, E.; USTASZEWSKI, U.; FINGER, F. (2008)Detrital and newly formed metamorphic monazitein amphibolite-facies metapelites from the Mota-jica massif, Bosnia. Chemical Geology, 254:164–174.
KRENN, K. (2001) Structural and thermal control ofore deposits in the Graz Paleozoic. PhD thesis, Uni-versity of Graz, 115 p.
KRÖLL, A.; HELLER, R. (1978) Die TiefbohrungAfling U1 in der Kainacher Gosau. Verh der GeolBundesanst, 2:23–34.
KROHE, A. (1987) Kinematics of Cretaceous nappetectonics in the Austroalpine basement of theKoralpe region (eastern Austria). Tectonophys,136:171–196.
KRYSTYN, L.; LEIN, R.; RICHOZ, S. (2008)Der Gamsstein: Werden und Vergehen einerWettersteinkalk-Plattform. Journal of Alpine Geol-ogy, 49:157–172.
KUSKY, T.; BRADLEY, D.; HÄUSSLER, P. (1997b)Progressive deformation of the Chugach accre-tionary complex, Alaska, during a Paleogene ridge-trench encounter. Journal of Structural Geology,19:139–157.
KUSKY, T.; BRADLEY, D.; HÄUSSLER, P.; KARL,S. (1997a) Controls on accretion of flysch and
mélange belts at convergent margins: Evidencefrom the Chugach Bay thrust and Icewormmélange, Chugach accretionary wedge, Alaska.Tectonics, 16:855–578.
KUSKY, T.; GANLEY, R.; LYTWYN, J.; POLAT,A. (2004) The Resurrection Peninsula ophiolite,mélange and accreted flysch belts of southernAlaska as an analog for trench-forearc systems inPrecambrian orogens. T. Kusky, (ed.), Precambrianophiolites and related rocks, Developments in Pre-cambrian Geology, Vol. 13:627-674.
KUSKY, T.; YOUNG, C. (1999) Emplacement ofthe Resurrection Peninsula ophiolite in the south-ern Alaska forearc during a ridge-trench encounter.Journal of Geophysical Research, 104:29025–29054.
LANCASTER, P.; BAXTER, E.; AGUE, J.; BREED-ING, C.; OWENS, T. (2008) Synchronous peakBarrovian metamorphism driven by syn-orogenicmagmatism and fluid flow in southern Connecticut,USA. Journal of Metamorphic Geology, 26:527–538.
LITTLE, T.; NAESER, C. (1989) Tertiary tecton-ics of the Border Ranges Fault System, ChugachMountains, Alaska: Deformation and Uplift in aforearc setting. Journal of Geophysical Research,94:4333–4359.
LOESCHKE, J. (1989) Lower Paleozoic volcanism ofthe Eastern Alps and ist geodynamic implications.Geol Rundsch, 78:599–616.
LONEY, R.; HIMMELBERG, G. (1983) Structure andPetrology of the La Perouse Gabbro Intrusion, Fair-weather Range, Southeastern Alaska. Journal ofPetrology, 24:377–423.
LONSDALE, P. (1988) Paleogene history of the Kulaplate: Offshore evidence and onshore implications.Geological Society of America Bulletin, 100:733–754.
LUDWIG, K. (1998) On the treatment of concordanturanium-lead ages. Geochimica et CosmochimicaActa, 62:665–676.
LUDWIG, K. (2003) Isoplot/Ex version 3.0. Ageochronological toolkit for Microsoft Excel.Berkeley Geochronological Centre Special Publi-cation:70 p.
299
LULL, J.; PLAFKER, G. (1990) Geochemistry andPaleotectonic Implications of Metabasaltic Rocksin the Valdez Group, Southern Alaska. J. Dover;J. Galloway, (eds.), Geological Studies in Alaskaby the U.S. Geological Survey, 1989, U.S. Geolog-ical Survey Bulletin 1946: 29-38.
LUX, D.; DE YOREO, J.; GUIDOTTI, C.; DECKER,E. (1986) Role of plutonism in low-pressure meta-morphic belt formation. Nature, 323:794–797.
LYTWYN, J.; CASEY, J.; GILBERT, S.; KUSKY, T.(1997) Arc-like mid-ocean ridge basalt formed sea-ward of a trench-forearc system just prior to ridgesubduction: An example from subaccreted ophi-olites in southern Alaska. Journal of GeophysicalResearch, 102:10225–10243.
LYTWYN, J.; LOCKHART, S.; CASEY, J.; KUSKY, T.(2000) AGeochemistry of near-trench intrusives as-sociated with ridge subduction, Seldovia Quadran-gle, southern Alaska. Journal of Geophysical Re-search, 105:27957–27978.
MADSEN, J.; THORKELSON, D.; FRIEDMAN, R.;MARSHALL, D. (2006) Cenozoic to Recent plateconfigurations in the Pacific Basin: Ridge subduc-tion and slab window magmatism in western NorthAmerica. Geosphere, 2:11–34.
MANDL, G. (2001) Geologische BundesanstaltArbeitstagung 2001 Blatt 103/Kindberg, Blatt104/Mürzzuschlag, Neuberg a.d. Mürz, 3. - 7.September. Wien, 351 p.
MARSHAK, R.; KARIG, D. (1977) Triple junctions asa cause for anomalously near-trench igneous activ-ity between the trench and volcanic arc. Geology,5:233–236.
MARTON, E.; KUHLEMANN, J.; FRISCH, W.;DUNKL, I. (2000) Miocene rotations in the East-ern Alps - paleomagnetic results from intramontanebasin sediments. Tectonophysics, 323:163–182.
MCALEER, R.; J.A., S.; ENKELMANN, E.;BERGER, L. (2009) Exhumation along the Fair-weather fault, southeastern Alaska, based onlow-temperature thermochronometry. Tectonics,28:TC1007, doi:10.1029/2007TC002240.
MCDOUGALL, I.; HARRISON, T. (1999)Geochronology and Thermochronology by the40Ar/39Ar Method. Oxford University Press, 2ndedition, 269 pp.
MEIGS, A.; JOHNSTON, S.; GARVER, J.; SPOTILA,J. (2008) Crustal-scale structural architec-ture, shortening, and exhumation of an active,eroding orogenic wedge (Chugach/St.EliasRange, southern Alaska. Tectonics, 27:TC4003,doi:10.1029/2007TC002168.
MEZGER, K.; HANSON, G.; BOHLEN, S. (1989) U-Pb systematics of garnet: dating the growth of gar-net in the Late Archean Pikwitonei granulite do-main at Cauchon and Natawahunan Lakes, Man-itoba, Canada. Contributions to Mineralogy andPetrology, 101:136–148.
MILLER, C.; THÖNI, M. (1995) Origin of eclogitesfrom the Austroalpine Ötztal basement (Tirol, Aus-tria): geochemistry and Sm-Nd vs. Rb-Sr isotopesystematics. Chemical Geology, 122:199–225.
MIN, K.; MUNDIL, R.; RENNE, P.; LUDWIG, K.(2000) A test for systematic errors in 40Ar/39Argeochronology through comparison with U/Pbanalysis of a 1.1-Ga rhyolite. Geochimica et Cos-mochimica Acta, 64/1:73–98.
MUELLER, R.; SDROLIAS, M.; GAINA, C.;ROEST, W. (2008) Age, spreading rates, andspreading asymmetry of the worlds oceancrust. Geochemistry, Geophysics, Geosystems,9:doi:10.1029/2007GC001743.
MULCH, A.; COSCA, M. (2004) Recrystalliza-tion or cooling ages: In situ UV-laser 40Ar-39Argeochronology of muscovite in mylonitic rocks.Journal of the Geological Society of London,161:573–583, doi:10.1144/0016–764903–110.
NAESER, C.W. (1976) Fission-track dating. US Geol.Surv. Open File Report, 76-190:1–65.
NEUBAUER, F. (1981) Untersuchungen zur Ge-ologie, Tektonik und Metamorphose des"Angerkristallins" und des E-Randes desGrazer Paläozoikums. Jber Hochschulschwerpkt,S15:114–121.
NEUBAUER, F. (1982) Untersuchungen zur Tek-tonik, Metamorphose und Stellung des GrazerPaläozoikum-Ostrandes. Jber Hochschulschw-erpkt, S15:93–101.
NEUBAUER, F. (1988a) Bau und Entwicklungs-geschichte des Rennfeld-Mugel- und des Gleinalm-Kristallins (Ostalpen). Abh der Geol Bundesanst,42:128 p.
300
NEUBAUER, F. (1988b) The Variscan orogeny in theAustroalpine and Southalpine domains of the East-ern Alps. Schweiz Mineral Petrogr Mitt, 68:339–349.
NEUBAUER, F. (1989) Lower Paleozoic volcanism ofthe Eastern Alps and ist geodynamic implications.Geol Rundsch, 78:599–616.
NEUBAUER, F. (1991) Stratigraphie und Strukturder Rannachdecke bei Kehr (Grazer Paläozoikum).Jahrb der Geol Bundesanst, 134/1:101–116.
NEUBAUER, F.; DALLMEYER, R.; DUNKL, I.;SCHIRNIK, D. (1995) Late Cretaceous exhuma-tion of the metamorphic Gleinalm dome, EasternAlps: kinematics, cooling history and sedimentaryresponse in a sinistral wrench corridor. Tectono-phys, 242:79–98.
NEUBAUER, F.; FRIEDL, G.; GENSER, J.; HAN-DLER, R.; MADER, D.; SCHNEIDER, D. (2007)Origin and tectonic evolution of the eastern Alpsdeduced from dating of detrital white mica: A re-view. Mitt Österr Geol Ges, 100:8–23.
NEUBAUER, F.; FRISCH, W. (1993) The Austroalpinemetamorphic basement east of the Tauern Window.J. von Raumer; F. Neubauer, (eds.), Pre-MesozoicGeology in the Alps, Springer-Verlag, Berlin, 515-536.
NEUBAUER, F.; GENSER, J.; HANDLER, R. (2000)The Eastern Alps: the result of a two-stage colli-sion process.Mitt Österr Geol Ges, 92:117–134.
NEUBAUER, F.; HANDLER, R. (1999) Variscanorogeny in the Eastern Alps and Bohemian Mas-sif: How do these units correlate? Mitt Österr GeolGes, 92:35–59.
NEUBAUER, F.; HANDLER, R. (2000) Variscanorogeny in the Eastern Alps and Bohemian Mas-sif: How do these units correlate? Mitt Österr GeolGes, 92:35–59.
NEUBAUER, F.; HANDLER, R.; HERMANN, S.;PAULUS, G. (1993) Revised Lithostratigraphy andStructure of the Eastern Greywacke Zone (EasternAlps).Mitt. Österr. Geol. Ges, 86:61–74.
NEUBAUER, F.; PISTOTNIK, J. (1984) Das Altpaläo-zoikum und Unterkarbon des Gurktaler Decken-systems (Ostalpen) und ihre paläogeographischenBeziehungen. Geol. Rundschau, 73/1:143–174.
NEUBAUER, F.; SASSI, F. (1993) The Austro-AlpineQuartzphyllites and Related Paleozoic Formations.J. von Raumer; F. Neubauer, (eds.), Pre-MesozoicGeology in the Alps, Springer Verlag, 423-440.
NEUBAUER, F.; VOZAROVA, A. (1990) The Noetsch-Veitsch-North Gemeric Zone of Alps and Carpathi-ans: correlation, paleogeography and significancefor Variscan orogeny. D. Minarikova; H. Lobitzer,(eds.), Thirty Years of Geological Cooperation be-tween Austria and Czechoslovakia, Federal Geo-logical Survey Vienna, Geological Survey Prague,167-171.
NILSEN, T.; ZUFFA, G. (1982) The Chugach terrane,a Cretaceous trench-fill deposit, southern Alaska.J. Laggett, (ed.), Trench-forearc Geology: Sed-imentation and Tectonics on Modern and ActivePlate Margins, Blackwell Science, p. 213-227.
NOKLEBERG, W.; PLAFKER, G.; LULL, J.; WAL-LACE, W.; WINKLER, G. (1989) Structural Anal-ysis of the southern Peninsular, southern Wrangel-lia, and northern Chugach terranes along the Trans-Alaska Crustal Transect, Northern Chugach Moun-tains, Alaska. Journal of Geophysical Research,94:4297–4320.
NORTON, I. (1995) Plate motions in the North Pacific:the 43 Ma nonevent. Tectonics, 14:1080–1094.
OBERHÄNSLI, R.; BOUSQUET, R.; ENGI, M.;GOFFÉ, B.; GOSSO, G.; HANDY, M.; KOLLER,F.; LARDEAUX, J.; POLINO, R.; ROSSI, P.;SCHUSTER, R.; SCHWARTZ, S.; SPALLA, I.;AGARD, P.; BABIST, J.; BERGER, A.; BERTLE,R.; BUCHER, S.; BURRI, T.; HEITZMANN,P.; HOINKES, G.; JOLIVET, L.; KELLER, L.;LINNER, M.; LOMBARDO, B.; MARTINOTTI,G.; MICHARD, A.; PESTAL, G.; PROYER, A.;RANTISCH, G.; ROSENBERG, C.; SCHRAMM, J.;SOELVA, H.; THOENI, M.; ZUCALI, M. (2004)Metamorphic structure of the Alps. 1:1’000000.Paris, CGMW.
OGG, J.; OGG, G.; GRADSTEIN, F. (2008) Theconcise geologic time-scale. Cambridge UniversityPress, 184 p.
OLDOW, J.; BALLY, A.; LALLEMANT, H.; W.P., L.(1989) Phanerozoic evolution of the North Ameri-can Cordillera; United States and Canada. A. Bally;A. Palmer, (eds.), The Geology of North America -An overview, Boulder, Colorado, 139-232.
301
ONSTOTT, T.; SISSON, V.; TURNER, D. (1989) Ini-tial argon in amphiboles from the Chugach Moun-tains, southern Alaska. Journal of Geophysical Re-search, 94:4361–4372.
PARRISH, R. (1990) U-Pb dating of monazite andits applications to geological problems. CanadianJournal of Earth Sciences, 27:1431–1454.
PAVLIS, T.; MARTY, K.; SISSON, V. (2003) Con-strictional flow within the Eocene forearc of south-ern Alaska: An effect of dextral shear during ridgesubduction. V. Sisson; S. Roeske; T. Pavlis, (eds.),Geology of a transpressional orogen developedduring ridge-trench interaction along the North Pa-cific margin, Geological Society of America Spe-cial Paper, 371:171-190.
PAVLIS, T.; PICORNELL, C.; SERPA, L.; BRUHN,R.; PLAFKER, G. (2004) Tectonic processes dur-ing oblique collision: Insights from the St.Eliasorogen, northern North American Cordillera. Tec-tonics, 23:TC3001,doi:10.1029/2003TC001557.
PAVLIS, T.; ROESKE, S. (2007) The Border RangeFault System, southern Alaska. K. Ridgway;J. Trop; J. Glen; J. O´Neill, (eds.), Tectonic Growthof a Collisional Continental Margin: Crustal Evo-lution of southern Alaska, Geological Society ofAmerica Special Paper 431:95-128.
PAVLIS, T.; SISSON, V. (1995) Structural history ofthe Chugach metamorphic complex in the TanaRiver region, eastern Alaska: A record of Eoceneridge subduction. Geological Society of AmericaBulletin, 107:1333–1355.
PAVLIS, T.; SISSON, V. (2003) Development of a sub-horizontal decoupling horizon in a transpressionalsystem, Chugach metamorphic complex, Alaska:Evidence for rheological stratification of the crust.V. Sisson; S. Roeske; T. Pavlis, (eds.), Geology ofa transpressional orogen developed during ridge-trench interaction along the North Pacific mar-gin, Geological Society of America Special Paper371:191-216.
PEARCE, N.; PERKINS, W.; WESTGATE, J.; GOR-TON, M.; JACKSON, S.; NEAL, C.; CHENERY,S. (1996) A compilation of new and published ma-jor and trace element data for NIST SRM 610 andNIST SRM 612 glass reference materials.Geostan-dard Newsletter, 21:115–144.
PERESSON, H.; DECKER, K. (1997) The Tertiarydynamics of the northern Eastern Alps (Aus-tria): changing palaeostresses in a collisional plateboundary. Tectonophysics, 272:125–157.
PERRY, S.; GARVER, J.; RIDGWAY, K. (2009) Trans-port of the Yakutat terrane, southern Alaska: Evi-dence from sediment petrology and detrital zirconfission-track and U/Pb double dating. Journal ofGeology, 117:156–173.
PHILIPPOT, P.; BLICHERT-TOFT, J.; PERCHUK,A.; COSTA, S.; GERASIMOV, V. (2001) Lu-Hf and Ar-Ar chronometry supports extreme rateof subduction zone metamorphism deduced fromgeospeedometry. Tectonophysics, 342:23–38.
PHILPOTTS, A.; AGUE, J. (2009) Principles ofIgneous and Metamorphic Petrology. CambridgeUniversity Press, Second Edition, 667 p.
PILLER, W.; EGGER, H.; ERHART, C.; GROSS, M.;HARZHAUSER, M.; HUBMANN, B.; VAN HUSEN,D.; KRENMAYR, H.; KRYSTYN, L.; LEIN, R.;LUKENEDER, A.; MANDL, G.; RÖGL, F.; ROET-ZEL, R.; RUPP, C.; SCHNABEL, W.; SCHÖN-LAUB, H.; SUMMESBERGER, H.; WAGREICH, M.(2004) Die Stratigraphische Tabelle von Österre-ich 2004 (sedimentäre Schichtfolgen). Österr stratKomm und Komm für die paläont und strat Er-forsch Österr.
PLAFKER, G.; MOORE, J.; WINKLER, G. (1994) Ge-ology of the southern Alaska margin. G. Plafker;H. Berg, (eds.), The Geology of Alaska, GeologicalSociety of America, The Geology of North Amer-ica, v G-1, p. 389-449.
PLATT, J. (1993) Exhumation of high-pressure rocks:a review of concepts and processes. Terra Nova,5:119–133.
PLUMLEY, P.; COE, R.; BYRNE, T. (1983) Paleo-magnetism of the Paleocene Ghost Rock Forma-tion, Prince William terrane, Alaska. Tectonics,2:295–314.
PROCHASKA, W. (1991) Leukophyllitbildung undAlteration in Scherzonen am Beispiel der Lager-stätte Kleinfeistritz (Steiermark). Archiv für Lager-stättenforschung der Geologischen Bundesanstalt,13:111–122.
PROCHASKA, W. (2000) Magnesite and talc depositsin Austria. Mineralia Slovaca, 32:543–548.
302
PROCHASKA, W.; HENJES-KUNST, F. (2009)Genese der Sideritvererzungen der ÖstlichenGrauwackenzone - aktueller Stand der Forschung.Arbeitstagung 2009 der Geologischen Bunde-sanstalt Blatt 101 Eisenerz:153–169.
PUTZ, M.; STÜWE, K.; JESSEL, M.; CALCAGNO,P. (2006) Three-dimensional model and late-stagewarping of the Plattengneiss shear zone in the East-ern Alps. Tectonophysics, 412:87–103.
PYLE, J.; SPEAR, F. (2003) Four generationsof accessory-phase growth in low-pressuremigmatites from SW New Hampshire. AmericanMineralogist, 88:338–351.
PYLE, J.; SPEAR, F.; RUDNICK, R.L.; MC-DONOUGH, W. (2001) Monazite-xenotime-garnet equilibrium in metapelites and a newmonazite-garnet thermometer. Journal of Petrol-ogy, 42:2083–2107.
RANTITSCH, G.; SACHSENHOFER, R.; HASEN-HÜTTL, C.; RUSSEGGER, B.; RAINER, T. (2005)Thermal evolution of an extensional detachment asconstrained by organic metamorphic data and ther-mal modelling: Graz Paleozoic Nappe Complex(Eastern Alps). Tectonophys, 411:57–72.
RANTITSCH, G. MALI, H. (2006) The geologicalstructure of the Late Cretaceous Graden normalfault (Eastern Alps). Mitt Naturwiss Ver Steier-mark, 135:25–31.
RASMUSSEN, B.; FLETCHER, I.; MUHLING, J.;MUELLER, A.; HALL, G. (2007) Bushveld-agedfluid flow, peak metamorphism, and gold mobiliza-tion in the Witwatersrand basin, South Africa: Con-straints from in situ SHRIMP U-Pb dating of mon-azite and xenotime. Geology, 35:931–934.
RASMUSSEN, B.; MUELLER, A.; FLETCHER, I.(2009) Zirconolite and xenotime U-Pb age con-straints on the emplacement of the Golden MileDolerite sill and gold mineralization at the MtCharlotte mine, Eastern Goldfields Province, Yil-garn Craton, Western Australia. Contributions toMineralogy and Petrology, 157:559–572.
RASMUSSEN, B.; MUHLING, J.; FLETCHER, I.;WINGATE, M. (2006) In situ SHRIMP U-Pb datingof monazite integrated with petrology and textures:Does bulk composition control whether monaziteforms in low-Ca pelitic rocks during amphibolitefacies metamorphism? Geochimica et Cosmochim-ica Acta, 70:3040–3058.
RATSCHBACHER, L. (1986) Kinematics of austro-alpine cover nappes: changing translation path dueto transpression. Tectonophys, 125:335–356.
RATSCHBACHER, L. (1987) Stratigraphy, tecton-ics and paleogeography of the Veitsch Nappe(Greywacke Zone, Eastern Alps): A rearrange-ment. H. Flügel; F. Sassi; P. Grecula, (eds.),Pre-Variscan and Variscan events in the Alpine-Mediterranean mountain belts, Bratislava (Alfa),407-414.
RATSCHBACHER, L.; WENK, H.; SINTUBIN,M. (1991) Calcite textures: examples fromnappes with strain-path partitioning. J Struct Geol,13/4:369–384.
REDFIELD, T.; SCHOLL, D.; FITZGERALD, P.;BECK, M. (2007) Escape tectonics and the extru-sion of Alaska: Past, present, and future. Geology,35:1039–1042.
REINERS, W.; ZHOU, Z.; EHLERS, T.; XU, C.;BRANDON, M.; DONELICK, R.; NICOLESCU, S.(2003) Post-orogenic evolution of the Dabie Shan,Eastern China, from (U Th)/He and Fission trackthermochronology. American Journal of Science,303:489–518.
REISINGER, J. (1988) Geologie des Hirschkogel -Landscha Berges nördlich von Weiz. PhD thesis,Graz, 176 p.
RENNE, P.; SWISHER, C.; DEINO, A.; KARNER, D.;OWENS, T.; DEPAOLO, D. (1998) Intercalibra-tion of standards, absolute ages and uncertaintiesin 40Ar/39Ar dating. Chemical Geology, 145:117–152.
RICHTER, D.; SMITH, J.; LANPHERE, M.; DAL-RYMPLE, G.; REED, B.; SHEW, N. (1990) Ageand progression of volcanism, Wrangell volcanicfield, Alaska. Bulletin of Volcanology, 53:29–44.
RING, U.; BRANDON, M. (2008) Exhumation Set-tings, Part 1: Relatively simple cases. InternationalGeology Review, 50:97–120.
RING, U.; BRANDON, M.; WILLET, S.; LISTER, G.(1999) Exhumation processes. U. Ring; M. Bran-don; G. Lister; S. Willet, (eds.), Exhumation Pro-cesses: Normal faulting, ductile flow and erosion,Geological Society of London Special Publication154, 1-27.
303
ROESKE, S.M.; HOUSEN, B.A.; O’CONNELL, K.;GALLEN, S. (2009) Paleocene - early Eocene dis-placement of terranes along the northern Cordilleramargin. Geological Society of America Abstractswith Programs, 41/7:518.
ROESKE, S.; SNEE, L.; PAVLIS, T. (2003) Dextral-slip reactivation of an arc-forearc boundary dur-ing Late Cretaceous-Early Eocene oblique con-vergence in the northern Cordillera. V. Sisson;S. Roeske; T. Pavlis, (eds.),Geology of a transpres-sional orogen developed during ridge-trench inter-action along the North Pacific margin, GeologicalSociety of America Special Paper 371:141-169.
ROWE, C.; MENEGHINI, F.; MOORE, C. (2009)Fluid-rich damage zone of an ancient out-of-sequence thrust, Kodiak Islands, Alaska. Tectonics,28:doi:10.1029/2007TC002126.
RUBATTO, D. (2002) Zircon trace element geochem-istry: partitioning with garnet and the link betweenU-Pb ages and metamorphism. Chemical Geology,184:123–138.
RUBATTO, D.; HERMANN, J. (2001) Exhumation asfast as subduction? Geology, 29:3–6.
RUBATTO, D.; HERMANN, J.; BERGER, A.; M.,E. (2009) Protracted fluid-induced melting dur-ing Barrovian metamorphism in the Central Alps.Contribution to Mineralogy and Petrology, DOI10.1007/s00410-009-0406-5.
RUBATTO, D.; HERMANN, J.; BUICK, I. (2006)Temperature and Bulk Composition Control onthe Growth of Monazite and Zircon during Low-pressure Anatexis (Mount Stafford, Central Aus-tralia). Journal of Petrology, 47:1973–1966.
RUBATTO, D.; WILLIAMS, I.; BUICK, I. (2001)Zircon and monazite response to prograde meta-morphism in the Reynolds Range, central Aus-tralia. Contributions to Mineralogy and Petrology,140:458–468.
RUPPEL, C.; HODGES, K. (1994) Pressure-temperature-time paths from two-dimensional ther-mal models: Prograde, retrograde, and invertedmetamorphism. Tectonics, 13:17–44.
RUSSEGGER, B. (1996) Niedrigst- bis niedriggradigeMetamorphose im südlichen Grazer Paläozoikum(Ostalpen). Jahrb der Geol Bundesanst, 139/1:93–100.
SACHSENHOFER, R.; KOGLER, A.; POLESNY, H.;STRAUSS, P.; WAGREICH, M. (2000) The Neo-gene Fohnsdorf Basin: basin formation and basininversion during lateral extrusion in the EasternAlps (Austria). International journal of Earth Sci-ences, 89:415–430.
SAMPLE, J.; MOORE, J. (1987) Structural style andkinematics of an underplated slate belt, Kodiakand adjacent islands, Alaska. Geological Society ofAmerica Bulletin, 99:7–20.
SAMPLE, J.; REID, M. (2003) Large-scale, latestCretaceous uplift along the northeast Pacific Rim:evidence from sediment volume, sandstone pet-rography, and Nd isotope signatures of the Ko-diak Formation, Kodiak Islands, Alaska. V. Sisson;S. Roeske; T. Pavlis, (eds.),Geology of a transpres-sional orogen developed during ridge-trench inter-action along the North Pacific margin, GeologicalSociety of America Special Paper, 371:51-70.
SAWYER, E. (2008) Atlas of Migmatites. The Cana-dian Mineralogist, Special Publication 9, 317 p.
SCAILLET, S. (2000) Numerical error analysis in40Ar/39Ar dating. Chemical Geology, 162:269–298.
SCHARBERT, S. (1981) Untersuchungen zum Alterdes Seckauer Kristallins. Mitt. Ges. Geol. Berg-baustud. Österr., 27:173–188.
SCHAUBERGER, O. (1986) Bau und Bildung der Sal-zlagerstätten des ostalpinen Salinars. Archiv fürLagerstättenforschung der Geologischen Bunde-sanstalt, 7:217–254.
SCHERMAIER, A.; HAUNSCHMID, B.; FINGER,F. (1997) Distribution of Variscan I- and S-typegranites in the Eastern Alps: a possible clue tounravel pre-Alpine basement structures. Tectono-physics, 272:315–333.
SCHMID, S.; BERNOULLI, D.; FÜGENSCHUH, B.;MATENCO, R.; SCHEFER, S.; SCHUSTER, R.;TISCHLER, M.; USTASZEWSKI, K. (2008) TheAlps-Carpathians-Dinarides-connection: a corre-lation of tectonic units. Swiss Journal of Geo-sciences, 101:139–183.
SCHMID, S.; FÜGENSCHUH, B.; KISSLING, E.;SCHUSTER, R. (2004) Tectonic map and overall ar-chitecture of the Alpine orogen. Eclog. Geol. Helv,97:93–117.
304
SCHÖNLAUB, H. (1980) Die Grauwackenzone.R. Oberhauser, (ed.), Der geologische AufbauÖsterreichs, Springer Verlag, Wien, 265-289.
SCHÖNLAUB, H. (1982) Die Grauwackenzone in denEisenerzer Alpen (Österreich). Jahrbuch der Geol-ogischen Bundesanstalt, 124/2:361–423.
SCHÖNLAUB, H. (1992) Stratigraphy, biogeographyand paleoclimatology of the Alpine Paleozoic andits implications for plate movements. Jahrb derGeol Bundesanst, 135/1:381–418.
SCHÖNLAUB, H.; HISTON, K. (1999) The Paleozoicevolution of the Southern Alps. Mitt Österr GeolGes, 92:15–34.
SCHUSTER, R.; KOLLER, F.; HOECK, V.; HOINKES,G.; BOUSQUET, R. (2004) Explanatory notesto the map: Metamorphic structure of the Alps- Metamorphic evolution of the Eastern Alps.Mitteilungen der Österreichischen GeologischenGesellschaft, 149:175–199.
SCHUSTER, R.; SCHARBERT, S.; ABART, R.;FRANK, W. (2001) Permo-Triassic extension andrelated HT/LP metamorphism in the Austroalpine- Southalpine realm. Mitt. Geol. Bergbau Stud.Österr, 44:111–141.
SCHUSTER, R.; STUEWE, K. (2008) Permian meta-morphic event in the Alps. Geology, 36/8:603–608.
SCHWINNER, R. (1925) Das Bergland nordöstlichvon Graz. Sitzungsber Akad Wiss Wien, 134:219–276.
SELVERSTONE, J. (2005) Are the Alps collapsing?Annual Reviews in Earth and Planetary Sciences,33:113–133.
SHAW, D. (1956) Geochemistry of pelitic rocks. PartIII: Major elements and general geochemistry. Bul-letin of the Geological Society of America, 67:919–934.
SISSON, V.; HOLLISTER, L. (1988) Low-pressure fa-cies series metamorphism in an accretionary sedi-mentary prism, southern Alaska.Geology, 16:358–361.
SISSON, V.; HOLLISTER, L.; ONSTOTT, T. (1989)Petrologic and age constraints on the origin of alow-pressure/high-temperature metamorphic com-plex, southern Alaska. Journal of Geophysical Re-search, 94:4392–4410.
SISSON, V.; PAVLIS, T. (1993) Geologic conse-quences of plate reorganization: An example fromthe Eocene southern Alaska fore-arc. Geology,21:913–916.
SISSON, V.; POOLE, A.; HARRIS, N.; BURNER, H.;COPELAND, P.; RAYMOND, A.; MCLELLAND,W. (2003) Geochemical and geochronologic con-straints for genesis of a tonalite-trondhjemite suiteand associated mafic intrusive rocks in the east-ern Chugach Mountains, Alaska: A record ofridge transform subduction. V. Sisson; S. Roeske;T. Pavlis, (eds.), Geology of a transpressionalorogen developed during ridge-trench interactionalong the North Pacific margin, Geological Societyof America Special Paper, 371: 293-326.
SLÁMA, J.; KOSLER, J.; CONDON, D.; CROWLEY,J.; GERDES, A.; HANCHAR, J.; HORSTWOOD,M.; MORRIS, G.; NASDALA, L.; NORBERG, N.;SCHALTEGGER, U.; SCHOENE, B.; TUBRETT,M.; WHITEHOUSE, M. (2008) Plesovice zircon -A new natural reference material for U-Pb and Hfisotopic microanalysis. Chemical Geology, 249:1–35.
SÖLVA, H.; GRASEMANN, B.; THÖNI, M.; THIEDE,R.; HABLER, G. (2005) The Schneeberg normalfault zone: normal faulting associated with Cre-taceous SE-directed extrusion in the Eastern Alps(Italy/Austria). Tectonophysics, 401:143–166.
SMART, K.; PAVLIS, T.; SISSON, V.; ROESKE, S.;SNEE, L. (1996) The Border Range fault systemin Glacier Bay National Park, Alaska: evidencefor major early Cenozoic dextral strike-slip motion.Canadian Journal of Earth Sciences, 33:1268–1282.
SMITH, H.; BARREIRO, B. (1990) Monazite U-Pbdating of staurolite-grade metamorphism in peliticschists. Contributions to Mineralogy and Petrol-ogy, 105:602–615.
SPEAR, F. (1993) Metamorphic phase equilibriaand pressure-temperature-time paths. Mineralogi-cal Society of America Monograph, 799 pp.
SPEAR, F.; PYLE, J. (2003) Apatite, Monaziteand Xenotime in metamorphic rocks. M. Kohn;J. Rakovan; J. Hughes, (eds.), Phospates. Geo-chemical, geobiological and materials importance,Reviews in Mineralogy and Geochemistry 48: 293-335.
305
SPELL, T.; MCDOUGALL, I. (2003) Characteriza-tion and calibration of 40Ar/39Ar dating standards.Chemical Geology, 198:189–211.
SPOTILA, J.; BUSCHER, J.; MEIGS, A.; REINERS, P.(2004) Long-term glacial erosion of active moun-tain belts: Example of the Chugach-St.Elias Range,Alaska. Geology, 32:501–504.
STACEY, J.; KRAMERS, J. (1975) Approximationof terrestrial lead evolution by a two-stage model.Earth and Planetary Science Letters, 26:207–221.
STEVENSON, A.; SCHOLL, D.; VALLIER, T. (1983)Tectonic and geologic implications of the Zodiacfan, Aleutian Abyssal Plain, northeast Pacific. Ge-ological Society of America Bulletin, 94:259–273.
STOWELL, H.; TINKHAM, D. (2003) Integrationof phase equilibria modelling and garnet Sm-Ndchronology for construction of P-T-t paths: exam-ples from the Cordilleran Coast Plutonic Complex,USA. Geological Society of London Special Publi-cation, 220:119–145.
STUEWE, K. (1998a) Tectonic constraints on the tim-ing relationships of metamorphism, fluid produc-tion and gold-bearing quartz vein emplacement.Ore Geology Reviews, 13:219–228.
STUEWE, K. (1998b) Heat sources of Cretaceousmetamorphism in the Eastern Alps - A discussion.Tectonophysics, 287:251–269.
STUEWE, K. (2007) Geodynamics of the Lithosphere.Springer Verlag, 2nd edition, 493 p.
STUEWE, K.; BARR, T.D. (1998) On uplift and ex-humation during convergence. Tectonics, 17:80–88.
STUEWE, K.; POWELL, R. (1995) Geothermobarom-etry from modal proportions. Application to a PTpath of the Koralm complex, Eastern Alps. Contri-butions to Mineralogy and Petrology, 119:83–93.
STUEWE, K.; SCHUSTER, R. (in press) Initiation ofsubduction in the Alps: Continent or Ocean? Geol-ogy.
SURPLESS, K.; GRAHAM, S.; COVAULT, J.;WOODEN, J. (2006) Does the Great Valley Groupcontain Jurassic strata? Reevaluation of the age andearly evolution of a classic foreland basin.Geology,34:21–24.
TAIT, J.; BACHTADSE, V.; FRANKE, W.; SOFFEL,C. (1997) Geodynamic evolution of the EuropeanVariscan fold belt: paleomagnetic and geologicalconstraints. Geologische Rundschau, 86:585–598.
TENCZER, V.; STUEWE, K. (2003) The metamorphicfield gradient in the eclogite type locality. Journalof Metamorphic Geology, 21:377–393.
THÖNI, M. (1999) A review of geochronological datafrom the Eastern Alps. Schweiz Mineral PetrogrMitt, 79:209–230.
THOMPSON, A.; SCHULMANN, K.; JEZEK, J.(1997) Thermal evolution and exhumation inobliquely convergent (transpressive) orogens.Tectonophysics, 280:171–184.
THORKELSON, D.J. (1996) Subduction of divergingplates and the principles of slab window formation.Tectonophysics, 255:47–63.
TOMASCHEK, F.; KENNEDY, A.; VILLA, I.; LAGOS,M.; BALLHAUS, C. (2003) Zircons from Syros,Cyclades, Greece - Recrystallization and Mobiliza-tion of zircon during high-pressure metamorphism.Journal of Petrology, 44:1977–2002.
TOMKINS, H.; PATTISON, D. (2007) Accessoryphase petrogenesis in relation to major phase as-semblages in pelites from the Nelson contact aure-ole, southern British Columbia. Journal of Meta-morphic Geology, 25:401–421.
TREOLAR, P. (1997) Thermal controls on early-Tertiary, short-lived, rapid regional metamorphismin the NW Himalaya, Pakistan. Tectonophysics,273:77–104.
TROP, J.; RIDGWAY, K. (2007) Mesozoic and Ceno-zoic tectonic growth of southern Alaska: A sedi-mentary perspective. K. Ridgway; J. Trop; J. Glen;J. O’Neill, (eds.), Tectonic Growth of a collisionalcontinental margin: Crustal evolution of southernAlaska, Geological Society of America Special Pa-per 431, 55-94.
TYSDAL, R.; CASE, J.; WINKLER, G.; CLARK, S.(1977) Sheeted dikes, grabbro, and pillow basalt inflysch of coastal southern Alaska.Geology, 5:377–383.
TYSDAL, R.; PLAFKER, G. (1978) Age and continu-ity of the Valdez Group, southern Alaska. N. Sohl;W. Wright, (eds.), Changes in stratigraphic nomen-clature by the U.S. Geological Survey 1977, U.S.Geologial Survey Bulletin 1457-A, 120-131.
306
VANCE, D.; HARRIS, N. (1999) Timing of progrademetamorphism in the Zanskar Himalaya. Geology,27:395–398.
VANCE, D.; MAHAR, E. (1998) Pressure-temperaturepaths from P-T pseudosections and zoned garnets:potential, limitations and examples from the Zan-skar Himalaya, NW India. Contributions to Miner-alogy and Petrology, 132:225–245.
VANCE, D.; MÜLLER, W.; VILLA, I. (2003)Geochronology: linking the isotopic record withpetrology and textures - an introduction. M.W.V.I.Vance D., (ed.), Geochronology: Linking the iso-topic record with petrology and textures, Geologi-cal Society of London Special Publication 220: 1-24.
VAVRA, G.; GEBAUER, D.; SCHMID, R. (1996)Multiple zircon growth and recrystallization dur-ing polyphase Late Carboniferous to Triassic meta-morphism in granulites of the Ivrea Zone (SouthernAlps): and ion microprobe (SHRIMP) study. Con-tributions to Mineralogy and Petrology, 122:337–358.
VERMEESCH, P. (2004) How many grains are neededfor a provenance study? Earth and Planetary Sci-ence Letters, 224:441–451.
VILLA, I. (1998) Isotopic closure. Terra Nova,10:42–47.
VON RAUMER, J.; STAMPFLI, G. (2008) The birthof the Rheic Ocean - Early Paleozoic subsidencepatterns and subsequent tectonic plate scenarios.Tectonophys, 461:9–20.
WAGNER, G.; VAN DEN HAUTE, P. (1992) FissionTrack Dating. Enke Verlag, Stuttgart, Germany,285 p.
WAGREICH, M.; KOLLMANN, H.; SUMMES-BERGER, H.; EGGER, H.; SANDERS, D.; HO-BIGER, G.; MOHAMED, O.; PRIEWALDER, H.(2009) Stratigraphie der Gosau Gruppe von Gamsbei Hieflau (Oberkreide-Paläogen, Österreich).Geologisches Kartenblatt 101 Eisenerz, Arbeit-stagung der Geologischen Bundesanstalt 2009 -Leoben, 81-105, Wien.
WALL, F.; NIKU-PAAVOLA, V.; C., S.; MÜLLER,A.; JEFFERIES, T. (2008) Xenotime-(Y) from car-bonatite dykes at lofdal, Namibia: unusually lowLREE:HREE ratio in carbonatite, and the first dat-ing of xenotime overgrowths on zircon. The Cana-dian Mineralogist, 46:861–877.
WALLACE, W.; ENGEBRETSON, D. (1984) Relation-ships between plate motions and late Cretaceousto Paleogene magmatism in southwestern Alaska.Tectonics, 3:295–315.
WANG, X.; NEUBAUER, F. (1998) Orogen-parallelstrike-slip faults bordering metamorphic core com-plexes: the Salzach-Enns fault zone in the EasternAlps. Journal of Structural Geology, 20:799–818.
WATSON, E.; HARRISON, T. (2005) Zircon ther-mometer reveals minimum melting conditions onearliest Earth. Science, 308:841–844.
WATSON, E.; WARK, D.; THOMAS, J. (2006) Crys-tallization thermometers for zircon and rutile. Con-tributions to Mineralogy and Petrology, 151:413–433.
WEBER, L. (1990) Die Blei-Zinkerzlagerstätten desGrazer Paläozoikums und ihr geologischer Rah-men. Arch für Lagerstättenforschg der Geol Bun-desanst Bd 12, 289 p.
WEBER, L.; GÖTZINGER, M.; GÖD, R.; SCHULZ,O.; EBNER, F.; SACHSENHOFER, R.; VATAR,F.; PAAR, W.; BRIEGLEB, D.; HÖLL, R.;EICHHORN, R.; SEEMANN, R.; KIRCHNER,E.; CERNY, I.; SCHROLL, E.; RAITH, J.;PROCHASKA, W.; TUFAR, W.; MALI, H.;GÜNTHER, W.; SPIELER, A.; MELCHER, F.;GRÄF, W. (1997) Die metallogenetischen Ein-heiten Österreichs. L. Weber, (ed.), Archiv fürLagerstättenforschung der Geologischen Bunde-sanstalt, 19:230-394.
WHITNEY, D.; EVANS, B. (2010) Abbreviation fornames of rock-forming minerals. American Miner-alogist, 95:185–187.
WHITNEY, D.; TEYSSIER, C.; HEIZLER, M.(2007) Gneiss domes, metamorphic complexes,and wrench zones: thermal and structural evolu-tion of the Nidge massif, central Anatolia. Tecton-ics, 26:doi:10.1029/2006TC002040.
WIJBRANS, J.; MCDOUGALL, I. (1987) 40Ar/39Ardating of white micas from an Alpine high-pressuremetamorphic belt on Naxos (Greece): the resettingof the argon isotopic system. Contributions to Min-eralogy and Petrology, 93:187–194.
WILLIAMS, I. (1998) U-Th-Pb geochronology by ionmicroprobe. M. McKibben; W. Shanks; W. Ridley,(eds.), Application of microanalytical techniques tounderstanding mineralizing processes, Reviews inEconomic Geology, vol. 7, p. 1-35.
307
WILLIAMS, I.; BUICK, I.; CARTWRIGHT, I. (1996)An extended episode of early Mesoproterozoicmetamorphic fluid flow in the Reynolds Range,central Australia. Journal of Metamorphic Geol-ogy, 14:29–47.
WILLIAMS, M.; JERCINOVIC, M.; GONCALVES, P.;MAHAN, K. (2006) Format and philosophy for col-lecting, compiling and reporting microprobe mon-azite ages. Chemical Geology, 225:1–15.
WILLIAMS, M.; JERCINOVIC, M.; HETHERING-TON, C. (2007) Microprobe Monazite Geochronol-ogy: Understanding Geologic Processes by inte-grating composition and chronology. Annual Re-views in Earth and Planetary Sciences, 35:137–175.
WILLIAMS, M.; JERCINOVIC, M.; TERRY, M.P.(1999) Age mapping and dating of monazite on theelectron microprobe: deconvoluting multistage tec-tonic histories. Geology, 27:1023–1026.
WING, B.; FERRY, J.; HARRISON, T. (2003) Pro-grade destruction and formation of monazite andallanite during contact and regional metamorphismof pelites: petrology and geochronology. Contribu-tions to Mineralogy and Petrology, 145:228–250.
WINKLER-HERMADEN, A. (1957) GeologischesKräftespiel und Landformung. 822 p., Springer-Verlag, Wien.
WOLF, R.; FARLEY, K.; SILVER, L. (1996) Heliumdiffusion and low temperature thermochronometryof apatite. Geochim. Cosmochim. Acta, 60:4231–4240.
WOODS, M.; DAVIES, G. (1982) Late Cretaceousgenesis of the Kula plate. Earth and Planetary Sci-ence Letters, 58:161–166.
ZENG, L.; ADIMOW, D.; SALEEBY, J. (2005) Cou-pling of anatectic reactions and dissolution of ac-cessory phases and the Sr and Nd isotope sys-tematics of anatectic melts from a metasedimen-tary source. Geochimica et Cosmochimica Acta,69:3671–3682.
ZUMSTEG, C.; HIMMELBERG, G.; KARL, S.;HÄUSSLER, P. (2003) Metamorphism within theChugach accretionary complex on Baranof is-land, southeastern Alaska. V. Sisson; S. Roeske;T. Pavlis, (eds.), Geology of a transpressionalorogen developed during ridge-trench interactionalong the North Pacific margin, Geological Societyof America Special Paper, 371: 253-267.
308
THANKS TO..."L’union des talents dépasse leur simple addition."
anonymous
This thesis would not have been possible without the help of numerous people. Thanks to:
Kurt Stüwe: for initiating this project and introducing me to his way about thinking of "Kristallingeologie",for always supporting my financial, material and travelling wishes (including an all-around-the-world-trip), forletting me work independently and for letting me ski on Bagley icefield!
Emilie Bruand: without her this thesis would have never been the same. She did all the detailed petrology onthe CMC, on which I based large parts of my work and interpretation. Her generosity in sharing her resultswith me, and her continuous interest in discussing possible interpretations of the tectonic history made workingon this thesis a pleasure. Merci Emilie pour les derniers trois années, pour bavarder, manger, sortir, voyager,rigoler, faire des randonnées, camper, chanter, balader, parler français, nager, cuisiner, danser, râler, souffriravec moi!
T. Pavlis: for continuous interest in the outcome of this work, for extended email-discussions, for promptreplies, for a few joint days in the field, for sharing my interest for the regional geology of southern Alaska andfor examining the final thesis.
U. Klötzli, D. Rubatto, R. Schuster, B. Fügenschuh, D. Foster and A. Koppers: for scientific discussions, bothin person and via extended email-contact, for help in the lab, for introducing me to the world of geochronologyand for correcting parts of my thesis.
My office mates Tom, Tamer and Nico, as well as Alex, Angela, Flo and Patrick for discussions and sharedlunches, and the staff of the Department of Earth Sciences for technical support: J. Neubauer for help with theSEM, G. Zmugg and A. Pock for thin sections, W. Becke for assistance in the lab, E. Kober for printing and S.Umschaden for administration. F. Biedermann from the University of Vienna for help with mineral separationand mount preparation.
On my trip around the world the following people were of great help: P. and J. Claus, our pilots in Alaska, C.Carson, JD Champagnac, T., T. and K. Stüwe assisted in the field, J. Gifford hosted me in Florida, learnt mehow to crochet and assisted in the ArAr-Lab, C. Carson hosted me in Canberra and bought a great birthday cakefor me, D. Rubatto spent hours at the SHRIMP with me and rescued my zircon mounts, and T. Ewing took meout for climbing - thank you all for that!
The last months were lightened by Unionbad, Augartenpark, Murradweg, Juice to Choose, Asiamensa, PosaunePizza and the Spar supermarket in the Hans-Sachs-Gasse which is open until 21.
My friends Bas and Sabine were always there for me - even though they are currently spread all over the world.Thanks!
Andri, Bernd, Cecile, Conny and Conae, Dani, Ellinore, Johanna, Lars Axel, Laurent, Lea, Lilli, Marco,Markus, Martin, Roland, Sämi, Stoffi - thanks for visiting me, climbing with me, skiing with me, skypingwith me, hosting me, travelling with me over the past three years.
And finally, my family, Anna-Katharina, Ulrich, Nora and Nina (with Sofie, Samuel and Martin) for love andsupport!
309

SHORT CV
Personal informationFull name: Deta GasserDate of birth: 26.09.1982Place of birth: Frauenfeld, SwitzerlandCitizenship: Swiss
Education2007-2010: PhD student, University of Graz, Austria
Thesis title: "Evolution of the Chugach Metamorphic Complexof southern Alaska in space and time"Supervisor: Dr. Prof. Kurt Stuewe
2006-2007: PhD student and teaching assistant, University of Neuchatel, SwitzerlandProject title: "Deep penetration of meteoric waters into the rising Alps"Supervisor: Dr. Prof. Martin Burkhard †
2001-2006: MSc studies of Earth Science, ETH Zurich, SwitzerlandMaster thesis: "From the seafloor to the roof top: Tectonic evolutionof the Engi Slates, Glarus Alps, Switzerland"supervisors: Dr. Prof. Neil Mancktelow, Dr. Bas den Brok
2004-2005 ERASMUS exchange year, NTNU Trondheim, NorwayGraduate studies in Engineering Geology and Petroleum Geology
311

Perfect moments 2008
313

Perfect moments 2009
315