myron g. best igneous and metamorphic petrology
TRANSCRIPT

Myron G. BestBrigham Young University
IGNEOUS AND METAMORPHIC PETROLOGY
SECOND EDITION

IGNEOUS AND METAMORPHIC PETROLOGY

ToVivKarl, Richard, TylerKaren, Jenny, Teresa, Katrina, Laura
Myron G. BestBrigham Young University
IGNEOUS AND METAMORPHIC PETROLOGY
SECOND EDITION
© 2003 by Blackwell Science Ltda Blackwell Publishing company
Editorial Offices:350 Main Street, Malden, MA 02148-5018, USA108 Cowley Road, Oxford OX4 1JF, UK550 Swanston Street, Carlton South, Melbourne, Victoria 3053, AustraliaKurfürstendamm 57, 10707 Berlin, Germany
The right of Myron G. Best to be identified as the Author of this Work has been asserted in accordance with the UK Copyright, Designs and Patents Act 1988.
All rights reserved. No part of this publication may be reproduced, stored in a retrievalsystem, or transmitted, in any form or by any means, electronic, mechanical, photocopying,recording or otherwise, except as permitted by the UK Copyright, Designs and Patents Act1988, without the prior permission of the publisher.
First published 2003 by Blackwell Science Ltd
Library of Congress Cataloging-in-Publication Data
Best, Myron G.Igneous and metamorphic petrology / Myron G. Best.—2nd ed.
p. cm.Includes bibliographical references and index.
ISBN 1-40510-588-7 (alk. paper)1. Rocks, Igneous. 2. Rocks, Metamorphic. I. Title.QE461 .B53 2002552′.1—dc21
A catalogue record for this title is available from the British Library.
On the cover: Photographs of rock from the upper mantle and deep continental crust. Beneath the lettering is a photomicrograph of peridotite viewed in cross-polarized light. The other rock lies in an outcrop in Swaziland along the Ngwempezi River and is Archean mafic gneiss that was probably derived from a basaltic protolith initially metamorphosed at 3.5 Ga, making it one of the oldest rocks exposed on the African continent. The gneiss was subjected to at least three episodes of deformation and nine intrusive events, the youngest product being a 2.6 Ga felsic pegmatite seen here. Photograph courtesy of Cees Passchier.
Set in 10/12pt Simoncini Garamondby Graphicraft Limited, Hong KongPrinted and bound inItaly by G. Canale & C. S.p.A., Turin
For further information onBlackwell Science, visit our website:www.blackwellpublishing.com
v
CONTENTS
PREFACE XIX
CHAPTER 1: Overview of Fundamental Concepts . . . . . . . . . . . . . . . . . . . . . . . . . . . . . 1
CHAPTER 2: Composition and Classification of Magmatic Rocks . . . . . . . . . . . . . . . . 16
CHAPTER 3: Thermodynamics and Kinetics: An Introduction . . . . . . . . . . . . . . . . . . . 51
CHAPTER 4: Silicate Melts and Volatile Fluids in Magma Systems . . . . . . . . . . . . . . . . 72
CHAPTER 5: Crystal-Melt Equilibria in Magmatic Systems . . . . . . . . . . . . . . . . . . . . . 87
CHAPTER 6: Chemical Dynamics of Melts and Crystals . . . . . . . . . . . . . . . . . . . . . . . 122
CHAPTER 7: Kinetic Paths and Fabric of Magmatic Rocks . . . . . . . . . . . . . . . . . . . . 148
CHAPTER 8: Physical and Thermal Dynamics of Bodies of Magma . . . . . . . . . . . . . . 183
CHAPTER 9: Magma Ascent and Emplacement: Field Relations of Intrusions . . . . . . 210
CHAPTER 10: Magma Extrusion: Field Relations of Volcanic Rock Bodies . . . . . . . . . 241
CHAPTER 11: Generation of Magma . . . . . . . . . . . . . . . . . . . . . . . . . . . . . . . . . . . . . . 283
CHAPTER 12: Differentiation of Magmas . . . . . . . . . . . . . . . . . . . . . . . . . . . . . . . . . . . 316
CHAPTER 13: Magmatic Petrotectonic Associations . . . . . . . . . . . . . . . . . . . . . . . . . . . 348
CHAPTER 14: Metamorphic Rocks and Metamorphism: An Overview . . . . . . . . . . . . 404
CHAPTER 15: Petrography of Metamorphic Rocks: Fabric, Composition, and Classification . . . . . . . . . . . . . . . . . . . . . . . . . . . . . . . . . . . . . . . . . . 447
CHAPTER 16: Metamorphic Mineral Reactions and Equilibria . . . . . . . . . . . . . . . . . . 473
CHAPTER 17: Evolution of Imposed Metamorphic Fabrics: Processes and Kinetics . . 520
CHAPTER 18: Metamorphism at Convergent Plate Margins: P–T–t Paths, Facies,and Zones . . . . . . . . . . . . . . . . . . . . . . . . . . . . . . . . . . . . . . . . . . . . . . . 564
CHAPTER 19: Precambrian Rock Associations . . . . . . . . . . . . . . . . . . . . . . . . . . . . . . . 610
APPENDIX A 657
APPENDIX B 661
REFERENCES CITED 666
GLOSSARY 691
INDEX 717

vii
PREFACE
CHAPTER 1
OVERVIEW OF FUNDAMENTAL CONCEPTS1.1 ENERGY AND THE MANTLE HEAT ENGINE . . . . . . . . . . . . 2
1.1.1 Forms of Energy . . . . . . . . . . . . . . . . . . . . . . . . . . . . . . . . . . . . . . . 21.1.2 Flow and Transformation of Energy . . . . . . . . . . . . . . . . . . . . . . . . 31.1.3 Heat Flow in the Earth . . . . . . . . . . . . . . . . . . . . . . . . . . . . . . . . . . 31.1.4 Implications of Mantle Convection . . . . . . . . . . . . . . . . . . . . . . . . . 81.1.5 Energy Budget of the Earth . . . . . . . . . . . . . . . . . . . . . . . . . . . . . . . 9
1.2 GRAVITY, PRESSURE, AND GEOBARIC GRADIENT . . . . . . 101.3 ROCK-FORMING PROCESSES AS CHANGING STATES
OF GEOLOGIC SYSTEMS . . . . . . . . . . . . . . . . . . . . . . . . . . . . . 101.4 ROCK PROPERTIES AND THEIR SIGNIFICANCE . . . . . . . . 11
1.4.1 Composition . . . . . . . . . . . . . . . . . . . . . . . . . . . . . . . . . . . . . . . . . 121.4.2 Field Relations . . . . . . . . . . . . . . . . . . . . . . . . . . . . . . . . . . . . . . . . 131.4.3 Fabric . . . . . . . . . . . . . . . . . . . . . . . . . . . . . . . . . . . . . . . . . . . . . . 14
1.5 HOW PETROLOGISTS STUDY ROCKS . . . . . . . . . . . . . . . . . 14
CHAPTER 2
COMPOSITION AND CLASSIFICATION OF MAGMATIC ROCKS2.1 ANALYTICAL PROCEDURES . . . . . . . . . . . . . . . . . . . . . . . . . . 16
2.1.1 Sampling . . . . . . . . . . . . . . . . . . . . . . . . . . . . . . . . . . . . . . . . . . . . 162.1.2 Analyses . . . . . . . . . . . . . . . . . . . . . . . . . . . . . . . . . . . . . . . . . . . . . 17
2.2 MINERAL COMPOSITION OF MAGMATIC ROCKS . . . . . . . 222.2.1 Glass . . . . . . . . . . . . . . . . . . . . . . . . . . . . . . . . . . . . . . . . . . . . . . . 22
2.3 CHEMICAL COMPOSITION OF MAGMATIC ROCKS . . . . . 232.3.1 Variation Diagrams . . . . . . . . . . . . . . . . . . . . . . . . . . . . . . . . . . . . 232.3.2 Continuous Spectrum of Rock Compositions . . . . . . . . . . . . . . . . 24
2.4 CLASSIFICATION OF MAGMATIC ROCKS . . . . . . . . . . . . . . 252.4.1 Classification Based on Fabric . . . . . . . . . . . . . . . . . . . . . . . . . . . . 272.4.2 Classification Based on Field Relations . . . . . . . . . . . . . . . . . . . . . 272.4.3 Classification Based on Mineralogical and
Modal Composition . . . . . . . . . . . . . . . . . . . . . . . . . . . . . . . . . . . . 282.4.4 Classification Based on Whole-Rock Chemical Composition . . . . 302.4.5 Rock Suites . . . . . . . . . . . . . . . . . . . . . . . . . . . . . . . . . . . . . . . . . . 352.4.6 Classification of Basalt . . . . . . . . . . . . . . . . . . . . . . . . . . . . . . . . . . 37
2.5 TRACE ELEMENTS . . . . . . . . . . . . . . . . . . . . . . . . . . . . . . . . . . 372.5.1 Partition Coefficients and Trace Element Compatibility . . . . . . . . 382.5.2 Rare Earth Elements . . . . . . . . . . . . . . . . . . . . . . . . . . . . . . . . . . . 402.5.3 Other Normalized Trace Element Diagrams . . . . . . . . . . . . . . . . . 42
2.6 ISOTOPES . . . . . . . . . . . . . . . . . . . . . . . . . . . . . . . . . . . . . . . . . . 442.6.1 Stable Isotopes . . . . . . . . . . . . . . . . . . . . . . . . . . . . . . . . . . . . . . . . 44
CONTENTS
viii
2.6.2 Radiogenic Isotopes . . . . . . . . . . . . . . . . . . . . . . . . . . . . . . . . . . . . 452.6.3 Cosmogenic Isotopes: Beryllium . . . . . . . . . . . . . . . . . . . . . . . . . . 47
CHAPTER 3
THERMODYNAMICS AND KINETICS: AN INTRODUCTION3.1 WHY IS THERMODYNAMICS IMPORTANT? . . . . . . . . . . . . 513.2 ELEMENTARY CONCEPTS OF THERMODYNAMICS . . . . . 52
3.2.1 Thermodynamic States, Processes, and State Variables . . . . . . . . . 523.2.2 First Law of Thermodynamics . . . . . . . . . . . . . . . . . . . . . . . . . . . . 533.2.3 Enthalpy . . . . . . . . . . . . . . . . . . . . . . . . . . . . . . . . . . . . . . . . . . . . 533.2.4 Entropy and the Second and Third Laws of Thermodynamics . . . . . 543.2.5 Gibbs Free Energy . . . . . . . . . . . . . . . . . . . . . . . . . . . . . . . . . . . . 55
3.3 STABILITY (PHASE) DIAGRAMS . . . . . . . . . . . . . . . . . . . . . . . 563.3.1 Slope of the Melting Curve . . . . . . . . . . . . . . . . . . . . . . . . . . . . . . 573.3.2 Determination of Phase Diagrams . . . . . . . . . . . . . . . . . . . . . . . . . 58
3.4 THERMODYNAMICS OF SOLUTIONS: SOME BASIC CONCEPTS . . . . . . . . . . . . . . . . . . . . . . . . . . . . . . . . . . . . 59
3.4.1 Components and Mole Fractions . . . . . . . . . . . . . . . . . . . . . . . . . . 593.4.2 Partial Molar Volume . . . . . . . . . . . . . . . . . . . . . . . . . . . . . . . . . . 593.4.3 Partial Molar Gibbs Free Energy: The Chemical Potential . . . . . . 603.4.4 P-T-X Phase Diagram . . . . . . . . . . . . . . . . . . . . . . . . . . . . . . . . . . 61
3.5 APPLICATION OF THERMODYNAMICS TO SOLUTIONS . . . . . . . . . . . . . . . . . . . . . . . . . . . . . . . . . . . . . 61
3.5.1 Fugacity and Activity . . . . . . . . . . . . . . . . . . . . . . . . . . . . . . . . . . . 613.5.2 Equilibrium Constants . . . . . . . . . . . . . . . . . . . . . . . . . . . . . . . . . . 623.5.3 Silica Activity, Silica Buffers, and Silica Saturation . . . . . . . . . . . . 633.5.4 Oxygen Buffers . . . . . . . . . . . . . . . . . . . . . . . . . . . . . . . . . . . . . . . 643.5.5 Fe-Ti Oxide Buffers: Oxygen Geobarometers
and Geothermometers . . . . . . . . . . . . . . . . . . . . . . . . . . . . . . . . . . 663.6 KINETICS . . . . . . . . . . . . . . . . . . . . . . . . . . . . . . . . . . . . . . . . . . 66
3.6.1 Activation Energy . . . . . . . . . . . . . . . . . . . . . . . . . . . . . . . . . . . . . 673.6.2 Overstepping and Metastable Persistence and Growth . . . . . . . . . 68
CHAPTER 4
SILICATE MELTS AND VOLATILE FLUIDS IN MAGMA SYSTEMS4.1 NATURE OF MAGMA . . . . . . . . . . . . . . . . . . . . . . . . . . . . . . . . 72
4.1.1 Atomic Structure of Melts . . . . . . . . . . . . . . . . . . . . . . . . . . . . . . . 734.2 VOLATILE FLUIDS IN MELTS . . . . . . . . . . . . . . . . . . . . . . . . . 75
4.2.1 Nature of Volatiles . . . . . . . . . . . . . . . . . . . . . . . . . . . . . . . . . . . . . 754.2.2 Solubilities of Volatiles in Silicate Melts . . . . . . . . . . . . . . . . . . . . 764.2.3 Exsolution of Volatiles from a Melt . . . . . . . . . . . . . . . . . . . . . . . . . 79
4.3 CONSEQUENCES OF FLUID EXSOLUTION FROM MELTS . . . . . . . . . . . . . . . . . . . . . . . . . . . . . . . . . . . . . . . 80
4.3.1 Explosive Volcanism . . . . . . . . . . . . . . . . . . . . . . . . . . . . . . . . . . . 804.3.2 Global Atmosphere and Climate . . . . . . . . . . . . . . . . . . . . . . . . . . 824.3.3 Fumaroles, Hydrothermal Solutions, Ore Deposits, and
Geothermal Reservoirs . . . . . . . . . . . . . . . . . . . . . . . . . . . . . . . . . . 84
ix
CHAPTER 5
CRYSTAL-MELT EQUILIBRIA IN MAGMATIC SYSTEMS5.1 PHASE DIAGRAMS . . . . . . . . . . . . . . . . . . . . . . . . . . . . . . . . . . 87
5.1.1 Phase Rule . . . . . . . . . . . . . . . . . . . . . . . . . . . . . . . . . . . . . . . . . . . 875.2 MELTING OF A PURE MINERAL
AND POLYMORPHISM . . . . . . . . . . . . . . . . . . . . . . . . . . . . . . . 895.2.1 Volatile-Free Equilibria . . . . . . . . . . . . . . . . . . . . . . . . . . . . . . . . . 895.2.2 Melting of a Pure Mineral in the Presence of Volatiles . . . . . . . . . 89
5.3 PHASE RELATIONS IN BINARY SYSTEMS . . . . . . . . . . . . . . 905.3.1 Basic Concepts: CaMgSi2O6 (Di)-CaAl2Si2O8 (An)
System at P � 1 atm . . . . . . . . . . . . . . . . . . . . . . . . . . . . . . . . . . . 905.3.2 Mg2SiO4-SiO2 System at 1 atm . . . . . . . . . . . . . . . . . . . . . . . . . . . 93
5.4 CRYSTAL-MELT EQUILIBRIA IN REAL BASALT MAGMAS . . . . . . . . . . . . . . . . . . . . . . . . . . . . . . . . . . . 98
5.4.1 Makaopuhi Basalt . . . . . . . . . . . . . . . . . . . . . . . . . . . . . . . . . . . . . 985.4.2 Basalt Magmas at High Pressures and High
Water Concentrations . . . . . . . . . . . . . . . . . . . . . . . . . . . . . . . . . . 995.5 FELDSPAR-MELT EQUILIBRIA . . . . . . . . . . . . . . . . . . . . . . . 100
5.5.1 KAlSi3O8 (Kf)-CaAl2Si2O8 (An) Binary System: Limited Solid Solution . . . . . . . . . . . . . . . . . . . . . . . . . . . . . . . . . . . . . . . 100
5.5.2 NaAlSi3O8 (Ab)-CaAl2Si2O8 (An) Binary Plagioclase System: Complete Solid Solution . . . . . . . . . . . . . . . . . . . . . . . . . 101
5.5.3 NaAlSi3O8 (Ab)-KAlSi3O8 (Kf ) Binary Alkali Feldspar System . . . . . . . . . . . . . . . . . . . . . . . . . . . . . . . . . . . . . . 102
5.5.4 KAlSi3O8 (Kf)-NaAlSi3O8 (Ab)-CaAl2Si2O8 (An) Ternary Feldspar System . . . . . . . . . . . . . . . . . . . . . . . . . . . . . . . 104
5.5.5 KAlSi3O8 (Kf)-NaAlSi3O8 (Ab)-SiO2 (silica)-H2O:The Granite System . . . . . . . . . . . . . . . . . . . . . . . . . . . . . . . . . . . 108
5.6 CRYSTAL-MELT EQUILIBRIA INVOLVING ANHYDROUSMAFIC MINERALS: OLIVINE AND PYROXENE . . . . . . . . . . 112
5.7 CRYSTAL-MELT EQUILIBRIA IN HYDROUS MAGMA SYSTEMS . . . . . . . . . . . . . . . . . . . . . . . . . . . . . . . . . . 113
5.7.1 Equilibria in the Granodiorite-Water System . . . . . . . . . . . . . . . 1135.7.2 Equilibria Involving Melt and Micas and Amphiboles . . . . . . . . 114
5.8 GEOTHERMOMETERS AND GEOBAROMETERS . . . . . . . 1175.8.1 Assessing States of Equilibrium in Rocks . . . . . . . . . . . . . . . . . . . 117
5.9 A BRIEF COMMENT REGARDING SUBSOLIDUS REACTIONS IN MAGMATIC ROCKS . . . . . . . . . . . . . . . . . . 118
CHAPTER 6
CHEMICAL DYNAMICS OF MELTS AND CRYSTALS6.1 VISCOSITY OF MELTS . . . . . . . . . . . . . . . . . . . . . . . . . . . . . . 1226.2 CHEMICAL DIFFUSION . . . . . . . . . . . . . . . . . . . . . . . . . . . . . 126
6.2.1 Types of Diffusion . . . . . . . . . . . . . . . . . . . . . . . . . . . . . . . . . . . . 1266.2.2 Theory and Measurement . . . . . . . . . . . . . . . . . . . . . . . . . . . . . . 1276.2.3 Factors Governing Diffusivities . . . . . . . . . . . . . . . . . . . . . . . . . . 1286.2.4 Average Diffusion Distance . . . . . . . . . . . . . . . . . . . . . . . . . . . . . . 129
6.2.5 Soret Diffusion . . . . . . . . . . . . . . . . . . . . . . . . . . . . . . . . . . . . . . 1296.3 DIFFUSION OF HEAT . . . . . . . . . . . . . . . . . . . . . . . . . . . . . . . 130
6.3.1 The Role of Body Shape on Conductive Cooling . . . . . . . . . . . . . 1316.4 INTERFACIAL ENERGY . . . . . . . . . . . . . . . . . . . . . . . . . . . . . . 1316.5 CRYSTALLIZATION . . . . . . . . . . . . . . . . . . . . . . . . . . . . . . . . . 133
6.5.1 Why Is It Important to Study Nucleation and Crystallization? . . . . 1336.5.2 Nucleation . . . . . . . . . . . . . . . . . . . . . . . . . . . . . . . . . . . . . . . . . . 1336.5.3 Crystal Growth . . . . . . . . . . . . . . . . . . . . . . . . . . . . . . . . . . . . . . 1356.5.4 Crystal Size in Magmatic Rocks . . . . . . . . . . . . . . . . . . . . . . . . . . 137
6.6 SECONDARY OVERPRINTING PROCESSES MODIFYING PRI-MARY CRYSTAL SIZE AND SHAPE . . . . . . . . . . . . . . . . . . . . 139
6.6.1 Crystal Dissolution . . . . . . . . . . . . . . . . . . . . . . . . . . . . . . . . . . . . 1396.6.2 Textural Equilibration: Grain Boundary Modification . . . . . . . . . 140
6.7 VESICULATION AND FRAGMENTATION OF MAGMA . . 1426.7.1 Nucleation and Growth of Bubbles—Vesiculation . . . . . . . . . . . 1426.7.2 Melt Fragmentation and Explosive Volcanism . . . . . . . . . . . . . . . 145
CHAPTER 7
KINETIC PATHS AND FABRIC OF MAGMATIC ROCKS7.1 FABRICS RELATED TO CRYSTALLIZATION PATH: CRYS-
TALLINITY AND GRAIN SIZE . . . . . . . . . . . . . . . . . . . . . . . . 1517.1.1 Glassy Texture . . . . . . . . . . . . . . . . . . . . . . . . . . . . . . . . . . . . . . . 1517.1.2 Aphanitic Texture . . . . . . . . . . . . . . . . . . . . . . . . . . . . . . . . . . . . 1537.1.3 Phaneritic Texture . . . . . . . . . . . . . . . . . . . . . . . . . . . . . . . . . . . . 1557.1.4 Porphyritic Texture . . . . . . . . . . . . . . . . . . . . . . . . . . . . . . . . . . . 1577.1.5 Poikilitic and Ophitic Textures . . . . . . . . . . . . . . . . . . . . . . . . . . . 158
7.2 FABRICS RELATED TO CRYSTALLIZATION PATH:GRAIN SHAPE . . . . . . . . . . . . . . . . . . . . . . . . . . . . . . . . . . . . . 158
7.3 FABRICS RELATED TO CRYSTALLIZATION PATH: INHOMO-GENEOUS GRAINS . . . . . . . . . . . . . . . . . . . . . . . . . . . . . . . . . . 160
7.3.1 Zoned Crystals . . . . . . . . . . . . . . . . . . . . . . . . . . . . . . . . . . . . . . . 1607.3.2 Reaction Rims . . . . . . . . . . . . . . . . . . . . . . . . . . . . . . . . . . . . . . . 1607.3.3 Subsolidus Decomposition and Exsolution in
Unstable Minerals . . . . . . . . . . . . . . . . . . . . . . . . . . . . . . . . . . . . 1617.4 FABRIC RELATED TO TEXTURAL EQUILIBRATION: SEC-
ONDARY GRAIN-BOUNDARY MODIFICATION . . . . . . . . . 1627.5 A WORD OF CAUTION ON THE INTERPRETATION
OF CRYSTALLINE TEXTURES . . . . . . . . . . . . . . . . . . . . . . . . 1637.5.1 Magmatic Rock Texture and Order of Crystallization . . . . . . . . . . 163
7.6 FABRICS RELATED TO NONEXPLOSIVE EXSOLUTION OF VOLATILE FLUIDS . . . . . . . . . . . . . . . . . . . . . . . . . . . . . . . 165
7.7 VOLCANICLASTIC FABRICS RELATED TO FRAGMENTA-TION OF MAGMA . . . . . . . . . . . . . . . . . . . . . . . . . . . . . . . . . . 166
7.7.1 Pyroclastic Processes . . . . . . . . . . . . . . . . . . . . . . . . . . . . . . . . . . 1677.7.2 Autoclastic Processes . . . . . . . . . . . . . . . . . . . . . . . . . . . . . . . . . . 169
7.8 FABRICS RELATED TO CONSOLIDATION OF VOLCANI-CLASTS INTO SOLID ROCK . . . . . . . . . . . . . . . . . . . . . . . . . . 171
7.9 ANISOTROPIC FABRICS . . . . . . . . . . . . . . . . . . . . . . . . . . . . . 1717.9.1 Descriptive Geometric Aspects . . . . . . . . . . . . . . . . . . . . . . . . . . 1717.9.2 Origin . . . . . . . . . . . . . . . . . . . . . . . . . . . . . . . . . . . . . . . . . . . . . 1757.10 INCLUSIONS . . . . . . . . . . . . . . . . . . . . . . . . . . . . . . . . . . . . . . . 181
x
xi
CHAPTER 8
PHYSICAL AND THERMAL DYNAMICS OF BODIES OF MAGMA8.1 STRESS AND DEFORMATION . . . . . . . . . . . . . . . . . . . . . . . . 183
8.1.1 Concepts of Stress . . . . . . . . . . . . . . . . . . . . . . . . . . . . . . . . . . . . 1838.1.2 Deformation . . . . . . . . . . . . . . . . . . . . . . . . . . . . . . . . . . . . . . . . 1848.1.3 Ideal Response to Stress . . . . . . . . . . . . . . . . . . . . . . . . . . . . . . . . 185
8.2 RHEOLOGY OF ROCKS AND MAGMAS . . . . . . . . . . . . . . . 1868.2.1 Rheology of Rocks . . . . . . . . . . . . . . . . . . . . . . . . . . . . . . . . . . . . 1878.2.2 Non-Newtonian Rheology of Magma . . . . . . . . . . . . . . . . . . . . . 1908.2.3 Deformation and Flow of Magma . . . . . . . . . . . . . . . . . . . . . . . . 191
8.3 DENSITY OF MAGMA AND BUOYANCY . . . . . . . . . . . . . . 1948.3.1 Density Determinations . . . . . . . . . . . . . . . . . . . . . . . . . . . . . . . . 1948.3.2 Densities of Minerals and Melts . . . . . . . . . . . . . . . . . . . . . . . . . . 1958.3.3 Buoyancy . . . . . . . . . . . . . . . . . . . . . . . . . . . . . . . . . . . . . . . . . . . 196
8.4 CONDUCTIVE HEAT TRANSFER . . . . . . . . . . . . . . . . . . . . . 1978.4.1 Conductive Cooling Models . . . . . . . . . . . . . . . . . . . . . . . . . . . . 198
8.5 ADVECTIVE HEAT TRANSFER . . . . . . . . . . . . . . . . . . . . . . . 1998.6 MAGMA CONVECTION . . . . . . . . . . . . . . . . . . . . . . . . . . . . . 201
8.6.1 Thermal Convection in a Completely Molten Body of Melt . . . . 2018.6.2 Thermochemical Convection in Crystallizing Magmas . . . . . . . . 2038.6.3 Replenishment in Evolving Magma Chambers . . . . . . . . . . . . . . 205
CHAPTER 9
MAGMA ASCENT AND EMPLACEMENT: FIELD RELATIONS OF INTRUSIONS
9.1 MOVEMENT OF MAGMA IN THE EARTH . . . . . . . . . . . . . 2109.1.1 Neutral Buoyancy and the Crustal Density Filter . . . . . . . . . . . . 2109.1.2 Magma Overpressure . . . . . . . . . . . . . . . . . . . . . . . . . . . . . . . . . . 2129.1.3 Mechanisms of Magma Ascent . . . . . . . . . . . . . . . . . . . . . . . . . . 213
9.2 SHEET INTRUSIONS (DIKES) . . . . . . . . . . . . . . . . . . . . . . . . 2139.2.1 Description and Terminology . . . . . . . . . . . . . . . . . . . . . . . . . . . 2139.2.2 Some Thermomechanical Concepts Pertaining to
Emplacement of Sheet Intrusions . . . . . . . . . . . . . . . . . . . . . . . . 2169.2.3 Geometry and Orientation of Sheet Intrusions . . . . . . . . . . . . . . 2189.2.4 Basalt Diking in Extensional Regimes . . . . . . . . . . . . . . . . . . . . . 220
9.3 DIAPIRS . . . . . . . . . . . . . . . . . . . . . . . . . . . . . . . . . . . . . . . . . . . 2229.4 MAGMA EMPLACEMENT IN THE CRUST:
PROVIDING THE SPACE . . . . . . . . . . . . . . . . . . . . . . . . . . . . 2249.4.1 Some Aspects of Granitic Plutons . . . . . . . . . . . . . . . . . . . . . . . . 2259.4.2 Emplacement Processes and Factors . . . . . . . . . . . . . . . . . . . . . . 2269.4.3 The Intrusion–Host Rock Interface . . . . . . . . . . . . . . . . . . . . . . . 236
CHAPTER 10
MAGMA EXTRUSION: FIELD RELATIONS OF VOLCANIC ROCK BODIES
10.1 OVERVIEW OF EXTRUSION: CONTROLS AND FACTORS . . . . . . . . . . . . . . . . . . . . . . . . . . . . . . . . . . . . . 241
10.1.1 Moving Magma to the Surface: What Allows Extrusion . . . . . . . 242
10.1.2 Two Types of Extrusions: Explosive and Effusive . . . . . . . . . . . . 24210.2 EFFUSIONS OF BASALTIC LAVA . . . . . . . . . . . . . . . . . . . . . . 245
10.2.1 Types of Basaltic Lava Flows . . . . . . . . . . . . . . . . . . . . . . . . . . . . 24510.2.2 Columnar Joints . . . . . . . . . . . . . . . . . . . . . . . . . . . . . . . . . . . . . . 24910.2.3 Subaerial Lava Accumulations . . . . . . . . . . . . . . . . . . . . . . . . . . . 25010.2.4 Submarine Basaltic Accumulations . . . . . . . . . . . . . . . . . . . . . . . 252
10.3 EFFUSIONS OF SILICIC LAVA . . . . . . . . . . . . . . . . . . . . . . . . 25410.3.1 Morphological Characteristics and Growth . . . . . . . . . . . . . . . . . 25410.3.2 Internal Fabric . . . . . . . . . . . . . . . . . . . . . . . . . . . . . . . . . . . . . . . 256
10.4 EXPLOSIVE ERUPTIONS . . . . . . . . . . . . . . . . . . . . . . . . . . . . 25910.4.1 Explosive Mechanisms: Production of Pyroclasts . . . . . . . . . . . . 25910.4.2 Pyroclasts in Volcanic Plumes . . . . . . . . . . . . . . . . . . . . . . . . . . . 26210.4.3 Pyroclast Transport and Deposition . . . . . . . . . . . . . . . . . . . . . . 26210.4.4 Explosive Style . . . . . . . . . . . . . . . . . . . . . . . . . . . . . . . . . . . . . . . 26710.4.5 Pyroclastic Flows and Deposits: Overview . . . . . . . . . . . . . . . . . 27010.4.6 Block-and-Ash Flows . . . . . . . . . . . . . . . . . . . . . . . . . . . . . . . . . . 27110.4.7 Ignimbrite-Forming Ash Flows . . . . . . . . . . . . . . . . . . . . . . . . . . 27110.4.8 Calderas . . . . . . . . . . . . . . . . . . . . . . . . . . . . . . . . . . . . . . . . . . . . 27510.4.9 Subaqueous Pyroclastic Flows . . . . . . . . . . . . . . . . . . . . . . . . . . . 277
10.5 OTHER VOLCANICLASTIC DEPOSITS . . . . . . . . . . . . . . . . 27810.5.1 Epiclastic Processes and Deposits . . . . . . . . . . . . . . . . . . . . . . . . 27810.5.2 Volcanic Debris Flows: Lahars . . . . . . . . . . . . . . . . . . . . . . . . . . 27810.5.3 Composite Volcanoes . . . . . . . . . . . . . . . . . . . . . . . . . . . . . . . . . . 279
CHAPTER 11
GENERATION OF MAGMA11.1 MELTING OF SOLID ROCK: CHANGES IN P, T,
AND X . . . . . . . . . . . . . . . . . . . . . . . . . . . . . . . . . . . . . . . . . . . . 28311.1.1 Temperature Increase, ��T . . . . . . . . . . . . . . . . . . . . . . . . . . . . 28411.1.2 Decompression, ��P . . . . . . . . . . . . . . . . . . . . . . . . . . . . . . . . . 28611.1.3 Changes in Water Concentration, ��Xwater . . . . . . . . . . . . . . . . 287
11.2 MANTLE SOURCE ROCK . . . . . . . . . . . . . . . . . . . . . . . . . . . . 28811.2.1 Mantle-Derived Inclusions . . . . . . . . . . . . . . . . . . . . . . . . . . . . . . 28911.2.2 Metasomatized and Enriched Mantle Rock . . . . . . . . . . . . . . . . . 291
11.3 GENERATION OF MAGMA IN MANTLE PERIDOTITE . . . . . . . . . . . . . . . . . . . . . . . . . . . . . . 295
11.3.1 Equilibrium (Batch) Partial Melting of Lherzolite . . . . . . . . . . . . 29511.3.2 Fractional Partial Melting of Lherzolite . . . . . . . . . . . . . . . . . . . . 29711.3.3 Factors Controlling Partial Melt Composition . . . . . . . . . . . . . . . 29711.3.4 Modeling Partial Melting Using Trace Elements . . . . . . . . . . . . . 29911.3.5 Characteristics of Primary Magma . . . . . . . . . . . . . . . . . . . . . . . . 300
11.4 MAGMA GENERATION IN SUBARC MANTLE WEDGE . . . . . . . . . . . . . . . . . . . . . . . . . . . . . . . . . . 300
11.4.1 Dehydration of Subducting Oceanic Crust . . . . . . . . . . . . . . . . . 30111.4.2 Magma Generation in the Mantle Wedge . . . . . . . . . . . . . . . . . . 30311.4.3 Partial Melting of Subducted Basaltic Oceanic Crust: Adakite . . . . 305
11.5 GENERATION OF ALKALINE MAGMAS IN METASOMATI-CALLY ENRICHED MANTLE PERIDOTITE . . . . . . . . . . . . . 306
xii
xiii
11.5.1 The Metasomatized Mantle Connection . . . . . . . . . . . . . . . . . . . 30711.6 MAGMA GENERATION IN THE
CONTINENTAL CRUST . . . . . . . . . . . . . . . . . . . . . . . . . . . . . . 30811.6.1 Partial Melting of Continental Source Rocks . . . . . . . . . . . . . . . . 30911.6.2 “Alphabet” Granitic Magmas: Contrasting Sources . . . . . . . . . . . 31111.6.3 Crystalline Residues . . . . . . . . . . . . . . . . . . . . . . . . . . . . . . . . . . . 31211.6.4 Melt Segregation . . . . . . . . . . . . . . . . . . . . . . . . . . . . . . . . . . . . . 31311.6.5 Felsic Magma Generation and the Mantle Connection . . . . . . . . 313
CHAPTER 12
DIFFERENTIATION OF MAGMAS12.1 USING VARIATION DIAGRAMS TO CHARACTERIZE
DIFFERENTIATION PROCESSES . . . . . . . . . . . . . . . . . . . . . . 31712.2 CLOSED-SYSTEM MAGMATIC DIFFERENTIATION . . . . . 318
12.2.1 Crystal-Melt Fractionation . . . . . . . . . . . . . . . . . . . . . . . . . . . . . . 31812.2.2 Physical Separation of Immiscible Melts . . . . . . . . . . . . . . . . . . . 32212.2.3 Fluid-Melt Separation: Pegmatites . . . . . . . . . . . . . . . . . . . . . . . . 324
12.3 OPEN-SYSTEM DIFFERENTIATION:HYBRID MAGMAS . . . . . . . . . . . . . . . . . . . . . . . . . . . . . . . . . . 325
12.3.1 Magma Mixing . . . . . . . . . . . . . . . . . . . . . . . . . . . . . . . . . . . . . . . 32512.3.2 Assimilation . . . . . . . . . . . . . . . . . . . . . . . . . . . . . . . . . . . . . . . . . 328
12.4 DIFFERENTIATION IN BASALTIC INTRUSIONS . . . . . . . . 32912.4.1 Palisades Sill . . . . . . . . . . . . . . . . . . . . . . . . . . . . . . . . . . . . . . . . 32912.4.2 Layered Intrusions . . . . . . . . . . . . . . . . . . . . . . . . . . . . . . . . . . . . 33112.4.3 Oceanic-Ridge Magma Chambers . . . . . . . . . . . . . . . . . . . . . . . . . 337
12.5 ORIGIN OF THE CALC-ALKALINE DIFFERENTIATION TREND . . . . . . . . . . . . . . . . . . . . . . . . . . 338
12.5.1 Tonga–Kermadec–New Zealand Arc . . . . . . . . . . . . . . . . . . . . . . 33912.5.2 Factors Controlling Development of the Calc-Alkaline Trend . . . 339
CHAPTER 13
MAGMATIC PETROTECTONIC ASSOCIATIONS13.1 OCEANIC SPREADING RIDGES AND RELATED
BASALTIC ROCKS . . . . . . . . . . . . . . . . . . . . . . . . . . . . . . . . . . . 34913.1.1 Mid-Ocean Ridge Basalt (MORB) . . . . . . . . . . . . . . . . . . . . . . . . 35013.1.2 Iceland . . . . . . . . . . . . . . . . . . . . . . . . . . . . . . . . . . . . . . . . . . . . . 35313.1.3 Mantle Reservoirs . . . . . . . . . . . . . . . . . . . . . . . . . . . . . . . . . . . . 354
13.2 MANTLE PLUMES AND OCEANIC ISLAND VOLCANIC ROCKS . . . . . . . . . . . . . . . . . . . . . . . . . . . . . . . . . 354
13.2.1 Character of Volcanic Rocks . . . . . . . . . . . . . . . . . . . . . . . . . . . . 35613.2.2 Hawaiian Islands: Tholeiitic and Alkaline Associations . . . . . . . . 35913.2.3 Highly Alkaline Rocks on Other Oceanic Islands . . . . . . . . . . . . 362
13.3 PLUME HEADS AND BASALT FLOOD PLATEAU LAVAS . . 36413.3.1 Oceanic Plateaus . . . . . . . . . . . . . . . . . . . . . . . . . . . . . . . . . . . . . 36413.3.2 Continental Flood Basalt Plateaus . . . . . . . . . . . . . . . . . . . . . . . . 36513.3.3 Continental Breakup . . . . . . . . . . . . . . . . . . . . . . . . . . . . . . . . . . 369
13.4 ARC MAGMATISM: OVERVIEW . . . . . . . . . . . . . . . . . . . . . . . 370
13.5 OCEANIC ISLAND ARCS . . . . . . . . . . . . . . . . . . . . . . . . . . . . 37113.5.1 Rock Associations . . . . . . . . . . . . . . . . . . . . . . . . . . . . . . . . . . . . 37213.5.2 Magma Evolution . . . . . . . . . . . . . . . . . . . . . . . . . . . . . . . . . . . . 37413.5.3 Back-Arc Basins . . . . . . . . . . . . . . . . . . . . . . . . . . . . . . . . . . . . . . 375
13.6 OPHIOLITE . . . . . . . . . . . . . . . . . . . . . . . . . . . . . . . . . . . . . . . . 37613.6.1 Characteristics . . . . . . . . . . . . . . . . . . . . . . . . . . . . . . . . . . . . . . . 37613.6.2 Origin and Emplacement . . . . . . . . . . . . . . . . . . . . . . . . . . . . . . . 377
13.7 CALC-ALKALINE CONTINENTAL MARGIN MAGMATIC ARCS . . . . . . . . . . . . . . . . . . . . . . . . . . . . . . . . . . 377
13.7.1 Volcanic Arcs on Continental Margins . . . . . . . . . . . . . . . . . . . . 37813.7.2 Plutonic Arcs on Continental Margins: Granitic Batholiths . . . . . 382
13.8 GRANITES IN CONTINENT-CONTINENT COLLISION ZONES . . . . . . . . . . . . . . . . . . . . . . . . . . . . . . . . . 386
13.9 ANOROGENIC A-TYPE FELSIC ROCKS . . . . . . . . . . . . . . . . 38713.9.1 Characteristics . . . . . . . . . . . . . . . . . . . . . . . . . . . . . . . . . . . . . . . 38813.9.2 Petrogenesis . . . . . . . . . . . . . . . . . . . . . . . . . . . . . . . . . . . . . . . . . 38913.9.3 Anorogenic Ring Complexes in Nigeria and Niger . . . . . . . . . . . 39013.10 GRANITES AND GRANITES . . . . . . . . . . . . . . . . . . . . . . . . . . 39013.11 CONTINENTAL RIFT ASSOCIATIONS: BIMODAL AND ALKA-
LINE ROCKS . . . . . . . . . . . . . . . . . . . . . . . . . . . . . . . . . . . . . . . 39213.11.1 Transitions from Continental Arc to Rift Associations
in Western North America . . . . . . . . . . . . . . . . . . . . . . . . . . . . . . 39413.11.2 Magmatism in the East African Rift System . . . . . . . . . . . . . . . . . 395
13.12 ALKALINE ORPHANS, MOSTLY IN STABLE CRATONS . . 39713.12.1 Lamprophyres . . . . . . . . . . . . . . . . . . . . . . . . . . . . . . . . . . . . . . . 39813.12.2 Lamproite, Orangeite, and Kimberlite Clans . . . . . . . . . . . . . . . . 398
CHAPTER 14
METAMORPHIC ROCKS AND METAMORPHISM: AN OVERVIEW14.1 EXAMPLES OF EQUILIBRATION IN
METAMORPHIC ROCKS . . . . . . . . . . . . . . . . . . . . . . . . . . . . . 40514.1.1 Incipient Metamorphism: Crystallization of New Minerals and
Preservation of Relict Protolith Fabrics . . . . . . . . . . . . . . . . . . . . 40514.1.2 Recrystallization under Hydrostatic Conditions: Newly Imposed
Granoblastic Fabric . . . . . . . . . . . . . . . . . . . . . . . . . . . . . . . . . . . 41014.1.3 Recrystallization under Nonhydrostatic States of Stress:
Tectonite Fabric . . . . . . . . . . . . . . . . . . . . . . . . . . . . . . . . . . . . . . 41414.1.4 Crystalloblastic Series . . . . . . . . . . . . . . . . . . . . . . . . . . . . . . . . . 42114.1.5 Metasomatism . . . . . . . . . . . . . . . . . . . . . . . . . . . . . . . . . . . . . . . 422
14.2 THE NATURE OF METAMORPHISM . . . . . . . . . . . . . . . . . . 42414.2.1 The Nature of the Protolith . . . . . . . . . . . . . . . . . . . . . . . . . . . . . 42414.2.2 Types of Metamorphism Based on Metamorphic Conditions . . . 42614.2.3 Geologic Field Settings: Metamorphic Terranes . . . . . . . . . . . . . 42614.2.4 Metamorphic Grade . . . . . . . . . . . . . . . . . . . . . . . . . . . . . . . . . . 43014.2.5 Metamorphic Zones . . . . . . . . . . . . . . . . . . . . . . . . . . . . . . . . . . . 43114.2.6 Intensive Variables and Stable Mineral Assemblages . . . . . . . . . . 43614.2.7 Metamorphic Facies . . . . . . . . . . . . . . . . . . . . . . . . . . . . . . . . . . . 43714.2.8 Metamorphic Facies Series . . . . . . . . . . . . . . . . . . . . . . . . . . . . . 43814.2.9 Metamorphic Field Gradients and P–T–t Paths . . . . . . . . . . . . . 438
xiv
xv
14.3 WHY STUDY METAMORPHIC ROCKS? METAMORPHICPETROLOGY AND CONTINENTAL EVOLUTION ANDTECTONICS . . . . . . . . . . . . . . . . . . . . . . . . . . . . . . . . . . . . . . . 441
CHAPTER 15
PETROGRAPHY OF METAMORPHIC ROCKS: FABRIC, COMPOSITION, AND CLASSIFICATION
15.1 METAMORPHIC FABRICS . . . . . . . . . . . . . . . . . . . . . . . . . . . . 44715.1.1 Anisotropic Fabrics of Tectonites . . . . . . . . . . . . . . . . . . . . . . . . 44815.1.2 Summary List of Metamorphic Textures . . . . . . . . . . . . . . . . . . . 452
15.2 CLASSIFICATION AND DESCRIPTION OF METAMORPHIC ROCKS . . . . . . . . . . . . . . . . . . . . . . . . . . . . . 455
15.2.1 Metamorphic Rock Names Based on Fabric . . . . . . . . . . . . . . . . 45515.2.2 Strongly Foliated Rocks . . . . . . . . . . . . . . . . . . . . . . . . . . . . . . . . 45615.2.3 Weakly Foliated Rocks . . . . . . . . . . . . . . . . . . . . . . . . . . . . . . . . . 45715.2.4 Nonfoliated Mafic Rocks . . . . . . . . . . . . . . . . . . . . . . . . . . . . . . . 46015.2.5 Nonfoliated High-Grade Felsic Rocks . . . . . . . . . . . . . . . . . . . . . 46115.2.6 Other Nonfoliated Metamorphic Rocks . . . . . . . . . . . . . . . . . . . 46215.2.7 Serpentinite . . . . . . . . . . . . . . . . . . . . . . . . . . . . . . . . . . . . . . . . . 46315.2.8 Metasomatic Rock Types . . . . . . . . . . . . . . . . . . . . . . . . . . . . . . . 46515.2.9 Misfits . . . . . . . . . . . . . . . . . . . . . . . . . . . . . . . . . . . . . . . . . . . . . 465
15.2.10 High-Strain-Rate Rocks in Fault and Shear Zones . . . . . . . . . . . . 46515.2.11 Veins . . . . . . . . . . . . . . . . . . . . . . . . . . . . . . . . . . . . . . . . . . . . . . 466
15.3 GRAPHICAL REPRESENTATION OF MINERALASSEMBLAGES IN COMPOSITION DIAGRAMS . . . . . . . . . 466
15.3.1 Fundamentals . . . . . . . . . . . . . . . . . . . . . . . . . . . . . . . . . . . . . . . 46615.3.2 Examples of Composition Diagrams in Hypothetical
Three-Component Systems . . . . . . . . . . . . . . . . . . . . . . . . . . . . . 46715.3.3 Compatibility Diagrams for Metamorphic Rocks . . . . . . . . . . . . 469
CHAPTER 16
METAMORPHIC MINERAL REACTIONS AND EQUILIBRIA16.1 EQUILIBRIUM MINERAL ASSEMBLAGES . . . . . . . . . . . . . . 47416.2 OVERVIEW OF METAMORPHIC MINERAL
REACTIONS . . . . . . . . . . . . . . . . . . . . . . . . . . . . . . . . . . . . . . . 47516.3 POLYMORPHIC TRANSITIONS . . . . . . . . . . . . . . . . . . . . . . . 475
16.3.1 The Al2SiO5 System . . . . . . . . . . . . . . . . . . . . . . . . . . . . . . . . . . . 47616.4 NET TRANSFER SOLID–SOLID REACTIONS . . . . . . . . . . . 479
16.4.1 Basic Relations in a System of Pure End-Member Phases . . . . . . 47916.4.2 Model Reactions in the Basalt–Granulite–Eclogite Transition . . . 481
16.5 CONTINUOUS REACTIONS BETWEEN CRYSTALLINESOLID SOLUTIONS . . . . . . . . . . . . . . . . . . . . . . . . . . . . . . . . . 484
16.5.1 Solid Solution in the Continuous Net Transfer ReactionPlagioclase � Jadeitic Clinopyroxene + Quartz . . . . . . . . . . . . . . 485
16.5.2 Continuous Exchange Reactions in Fe–Mg Solid Solutions . . . . . 48516.6 SOLID–FLUID MINERAL REACTIONS . . . . . . . . . . . . . . . . . 488
16.6.1 Fluids in the Crust of the Earth . . . . . . . . . . . . . . . . . . . . . . . . . . 48816.6.2 Fundamental Concepts of Solid–Fluid Reactions . . . . . . . . . . . . 49116.6.3 Equilibria with Mixed-Volatile Fluids . . . . . . . . . . . . . . . . . . . . . 493
16.6.4 Local versus External Control of Fluid Composition duringDevolatilization Reactions . . . . . . . . . . . . . . . . . . . . . . . . . . . . . . 495
16.7 FLUID FLOW DURING METAMORPHISM OF THECONTINENTAL CRUST . . . . . . . . . . . . . . . . . . . . . . . . . . . . . . 498
16.7.1 Evidence for Fluid Flow . . . . . . . . . . . . . . . . . . . . . . . . . . . . . . . 49816.7.2 Mechanics of Fluid Flow . . . . . . . . . . . . . . . . . . . . . . . . . . . . . . . 500
16.8 METASOMATISM . . . . . . . . . . . . . . . . . . . . . . . . . . . . . . . . . . . 50416.8.1 Ion Exchange Reactions in Open Metasomatic Systems . . . . . . . 50416.8.2 The Thompson Model of Metasomatic Zoning and Local
Equilibrium . . . . . . . . . . . . . . . . . . . . . . . . . . . . . . . . . . . . . . . . . 50516.8.3 Low-Variance Assemblages in Metasomatic Rocks . . . . . . . . . . . 50616.8.4 Frames of Reference and the Isocon Diagram . . . . . . . . . . . . . . . 506
16.9 REDOX MINERAL EQUILIBRIA . . . . . . . . . . . . . . . . . . . . . . 50816.10 KINETICS AND MINERAL REACTIONS: WHAT
ACTUALLY HAPPENS IN METAMORPHIC ROCKS . . . . . . 50916.10.1 Role of Fluids in the Mechanism of Metamorphic Reactions . . . . 509
16.11 PUTTING MINERAL EQUILIBRIA TO WORK:BROADER PETROLOGIC IMPLICATIONS . . . . . . . . . . . . . . 511
16.11.1 Isograds . . . . . . . . . . . . . . . . . . . . . . . . . . . . . . . . . . . . . . . . . . . . 51116.11.2 Evaluation of Intensive Variables during Metamorphism . . . . . . 51316.11.3 Mineral Thermobarometers . . . . . . . . . . . . . . . . . . . . . . . . . . . . . 514
CHAPTER 17
EVOLUTION OF IMPOSED METAMORPHIC FABRICS: PROCESSES AND KINETICS
17.1 SOLID-STATE CRYSTALLIZATION UNDER STATICCONDITIONS . . . . . . . . . . . . . . . . . . . . . . . . . . . . . . . . . . . . . . 521
17.1.1 Nucleation and Growth . . . . . . . . . . . . . . . . . . . . . . . . . . . . . . . . 52217.1.2 Equilibration of Grain Size and Shape . . . . . . . . . . . . . . . . . . . . 52417.1.3 Intragrain Textural Features . . . . . . . . . . . . . . . . . . . . . . . . . . . . 526
17.2 DUCTILE FLOW . . . . . . . . . . . . . . . . . . . . . . . . . . . . . . . . . . . . 52817.2.1 Diffusive Creep . . . . . . . . . . . . . . . . . . . . . . . . . . . . . . . . . . . . . . 52917.2.2 Intracrystalline Plastic Deformation . . . . . . . . . . . . . . . . . . . . . . 53217.2.3 Crystal Defects . . . . . . . . . . . . . . . . . . . . . . . . . . . . . . . . . . . . . . . 53817.2.4 Recovery during Dislocation Creep . . . . . . . . . . . . . . . . . . . . . . . 54117.2.5 Hydrolytic Weakening of Silicates during Plastic Slip . . . . . . . . . 54117.2.6 Power Law in Ductile Flow . . . . . . . . . . . . . . . . . . . . . . . . . . . . . 543
17.3 INTERACTIONS BETWEEN DEFORMATION,CRYSTALLIZATION, AND FLUIDS IN TECTONITES . . . . . 543
17.3.1 Role of Fluids in Tectonite Fabric Development . . . . . . . . . . . . . 54517.3.2 Timing of Deformation and Crystallization:
Larger Scale Implications . . . . . . . . . . . . . . . . . . . . . . . . . . . . . . 54517.3.3 Pre-, Syn-, and Postkinematic Fabrics . . . . . . . . . . . . . . . . . . . . . 54617.3.4 Polymetamorphism . . . . . . . . . . . . . . . . . . . . . . . . . . . . . . . . . . . 54917.3.5 Shear-Sense Indicators . . . . . . . . . . . . . . . . . . . . . . . . . . . . . . . . . 55117.3.6 Patterns of Deformation and Flow: Tectonic Significance of
Fabric Geometry . . . . . . . . . . . . . . . . . . . . . . . . . . . . . . . . . . . . . 55417.4 ORIGIN OF ANISOTROPIC FABRIC IN
METAMORPHIC TECTONITES . . . . . . . . . . . . . . . . . . . . . . . 55517.4.1 Preferred Dimensional Orientation of Mineral Grains . . . . . . . . 55617.4.2 Preferred Orientation of Crystal Lattices in Tectonites . . . . . . . . 55617.4.3 Cleavage, Schistosity, and Compositional Layering . . . . . . . . . . . 558
xvi
xvii
CHAPTER 18
METAMORPHISM AT CONVERGENT PLATE MARGINS: P T t PATHS, FACIES, AND ZONES
18.1 P–T–t PATHS . . . . . . . . . . . . . . . . . . . . . . . . . . . . . . . . . . . . . . . 56518.1.1 Thermal Considerations . . . . . . . . . . . . . . . . . . . . . . . . . . . . . . . . 56518.1.2 Petrologic Determination of P–T–t Paths . . . . . . . . . . . . . . . . . . 566
18.2 A BRIEF ANATOMICAL OVERVIEW OFMETAMORPHISM IN OROGENS . . . . . . . . . . . . . . . . . . . . . . 569
18.2.1 Specific Regional Metamorphic Terranes . . . . . . . . . . . . . . . . . . . 57018.3 INTERMEDIATE- TO LOW-P METAMORPHIC ZONES
AND FACIES . . . . . . . . . . . . . . . . . . . . . . . . . . . . . . . . . . . . . . . 57618.3.1 Pelitic Rocks in Typical Barrovian Zones at Intermediate
Pressures . . . . . . . . . . . . . . . . . . . . . . . . . . . . . . . . . . . . . . . . . . . 57618.3.2 P–T–t Paths and Chronology of Barrovian Metamorphism . . . . . 58218.3.3 Buchan Metamorphism . . . . . . . . . . . . . . . . . . . . . . . . . . . . . . . . 58318.3.4 Mineral Assemblages in Mafic Protoliths: A Brief Overview . . . . 58718.3.5 Metabasites at Intermediate Pressures . . . . . . . . . . . . . . . . . . . . . 587
18.4 OCEAN-RIDGE METAMORPHISM . . . . . . . . . . . . . . . . . . . . 58918.4.1 Petrology of Metamorphosed Seafloor Rocks . . . . . . . . . . . . . . . 590
18.5 INTACT SLABS OF OPHIOLITE . . . . . . . . . . . . . . . . . . . . . . 59218.6 NEAR-TRENCH METAMORPHIC ASSOCIATIONS . . . . . . . 594
18.6.1 The Franciscan Complex, California . . . . . . . . . . . . . . . . . . . . . . 59418.6.2 Mélange . . . . . . . . . . . . . . . . . . . . . . . . . . . . . . . . . . . . . . . . . . . . 59418.6.3 Serpentinite . . . . . . . . . . . . . . . . . . . . . . . . . . . . . . . . . . . . . . . . . 59618.6.4 Subgreenschist Facies Rocks . . . . . . . . . . . . . . . . . . . . . . . . . . . . 59718.6.5 Metabasites at High Pressures . . . . . . . . . . . . . . . . . . . . . . . . . . . 59918.6.6 P–T–t Paths and Tectonic Evolution of High P/T Terranes . . . . 600
18.7 ULTRAHIGH-P METAMORPHIC ROCKS . . . . . . . . . . . . . . . 60118.7.1 Coesite and Diamond: Diagnostic UHP Minerals . . . . . . . . . . . . 60218.7.2 Dora Maira Massif in the Western Alps . . . . . . . . . . . . . . . . . . . . 60318.7.3 Dabie–Sulu Terrane . . . . . . . . . . . . . . . . . . . . . . . . . . . . . . . . . . . 60518.7.4 Evolution of UHP Terranes . . . . . . . . . . . . . . . . . . . . . . . . . . . . . 606
CHAPTER 19
PRECAMBRIAN ROCK ASSOCIATIONS19.1 THE YOUNG EARTH—A BRIEF OVERVIEW . . . . . . . . . . . 61219.2 ARCHEAN GRANITOID–GREENSTONE TERRANES . . . . . 613
19.2.1 General Character of Greenstone Belts . . . . . . . . . . . . . . . . . . . . 61419.2.2 Itsaq Gneiss Complex, West Greenland: Earliest Record of
Crustal Process at 3900–3600 Ma . . . . . . . . . . . . . . . . . . . . . . . . 61719.2.3 Kaapvaal Craton . . . . . . . . . . . . . . . . . . . . . . . . . . . . . . . . . . . . . 62019.2.4 Yilgarn Craton . . . . . . . . . . . . . . . . . . . . . . . . . . . . . . . . . . . . . . . 62119.2.5 Superior Province . . . . . . . . . . . . . . . . . . . . . . . . . . . . . . . . . . . . 622
19.3 ARCHEAN VOLCANIC ROCKS . . . . . . . . . . . . . . . . . . . . . . . 62319.3.1 Komatiite . . . . . . . . . . . . . . . . . . . . . . . . . . . . . . . . . . . . . . . . . . . 62319.3.2 Basalts . . . . . . . . . . . . . . . . . . . . . . . . . . . . . . . . . . . . . . . . . . . . . 62919.3.3 Archean Megacrystic Anorthosite . . . . . . . . . . . . . . . . . . . . . . . . 63019.3.4 Other Volcanic Rocks in Greenstone Belts . . . . . . . . . . . . . . . . . 632
19.4 ARCHEAN GRANITOIDS . . . . . . . . . . . . . . . . . . . . . . . . . . . . 633
19.4.1 Tonalite–Trondhjemite–Granodiorite (TTG) Gneisses . . . . . . . . 63319.4.2 High-Mg Granitoids . . . . . . . . . . . . . . . . . . . . . . . . . . . . . . . . . . 63619.4.3 Granite . . . . . . . . . . . . . . . . . . . . . . . . . . . . . . . . . . . . . . . . . . . . 636
19.5 MID-PROTEROZOIC TECTONISM AND MAGMATISM . . . 63619.5.1 Grenville Province . . . . . . . . . . . . . . . . . . . . . . . . . . . . . . . . . . . . 63619.5.2 Massif-Type Anorthosite . . . . . . . . . . . . . . . . . . . . . . . . . . . . . . . 63719.5.3 Rapakivi Granites . . . . . . . . . . . . . . . . . . . . . . . . . . . . . . . . . . . . 644
19.6 GRANULITE-FACIES TERRANES IN ARCHEANAND PROTEROZOIC CRATONS . . . . . . . . . . . . . . . . . . . . . . 645
19.6.1 Mineral Assemblages and Reactions . . . . . . . . . . . . . . . . . . . . . . 64519.6.2 P–T Paths and Tectonic Evolution of
Granulite-Facies Terranes . . . . . . . . . . . . . . . . . . . . . . . . . . . . . . 64619.7 PRECAMBRIAN BASALTIC INTRUSIONS . . . . . . . . . . . . . . . 64819.8 MODELS FOR THE EVOLUTION OF
THE PRECAMBRIAN CRUST . . . . . . . . . . . . . . . . . . . . . . . . . 64919.8.1 Evolution of the Continental Crust . . . . . . . . . . . . . . . . . . . . . . . 651
Appendix A . . . . . . . . . . . . . . . . . . . . . . . . . . . . . . . . . . . . . . . . . 657Appendix B . . . . . . . . . . . . . . . . . . . . . . . . . . . . . . . . . . . . . . . . . 661References Cited . . . . . . . . . . . . . . . . . . . . . . . . . . . . . . . . . . . . . 666Glossary . . . . . . . . . . . . . . . . . . . . . . . . . . . . . . . . . . . . . . . . . . . . 691Index . . . . . . . . . . . . . . . . . . . . . . . . . . . . . . . . . . . . . . . . . . . . . . 717
xviii
xix
Igneous and metamorphic petrology in the last decadesof the twentieth century exploded into a broad, multi-faceted, increasingly quantitative science. Advances in physical and field petrology and geochemistry haveforever changed our thinking about the origin and evolu-tion of magmas, their dynamic behavior, and the way inwhich they are intruded and explosively extruded. De-velopments in geochronology, quantitative evaluationof the role of heat and fluid transfer in crustal rocks,and new field discoveries have impacted our under-standing of the evolution of metamorphic systems andtheir dynamic interaction with tectonic processes. Geo-physics and mineral physics have provided new insightsinto the nature of the convecting mantle and its role asa giant heat engine driving magmatic and metamorphicprocesses. New tools of all kinds allow new ways ofgathering petrologic data, while phenomenal develop-ments in computers and computer software permitdata to be stored, processed, and modeled in waysunimaginable as recently as a couple of decades ago.
It has been a very daunting challenge to create withinone book of reasonable length a balanced comprehens-ive coverage of topics that embodies the classical aswell as the new advances. I hope that this textbook will provide a foundation for future geologists that not onlyinforms but furnishes the intellectual mindset enablingthem to pursue higher levels of professional endeavor.I have attempted to emphasize controlling petrologicprocesses in the formation of rocks, while not sacri-ficing basic descriptive information about them, onwhich interpretations of their origin must be firmlybased. The organization of chapters is essentially byprocess rather than by rock type or association. Theoverarching themes of this textbook are the dynamicinteractions between matter and energy and the ways inwhich transfers and transformations of gravitational andthermal energy drive changes in rock-forming systems.
This textbook has been designed as a balanced instructional tool for the college sophomore or junior.It is assumed that the student is acquainted with basicchemistry, physics, mineralogy, and physical and his-torical geology. A background in optical mineralogy is desirable. As for mathematical background, a course in calculus will be helpful but not essential. The math-ematical inclination and capability of geology studentsvary widely and so as to avoid intimidating some at theoutset, I have generally limited the more quantitativematerial to certain chapters, set-aside boxes, and problems at the end of most chapters. The intent is not to minimize the growing importance of the quantitativefacets of petrology. Some of the problems are amenableto attack by computers and spreadsheets. I assume that
PREFACE
instructors have their own favorite computer-basedteaching exercises. “Fundamental questions consideredin the chapter” provide a brief preview of each chapter.“Critical thinking questions” at the end of each chap-ter provide an incentive for the student to think aboutthe chapter contents. A comprehensive glossary and in-dex are included at the end of the textbook togetherwith a list of references cited. Space limitations permitcitation of only the most crucial references or recent lucid summaries and select early classical works.
I am indebted to many persons who assisted in craft-ing this textbook over its five and one-half year gesta-tion. Before starting, evaluations of the first edition andconstructive advice on the course to take in the secondwere provided by William D. Carlson, Colin Donaldson,Michael O. Garcia, Edward Ghent, Scott S. Hughes,Douglas Smith, and Ron Vernon. Eric H. Christiansenthoroughly critiqued Chapters 1–13, greatly improvingtheir clarity and accuracy, and in addition provided manyhours of beneficial discussion and computer assistance.Stephen T. Nelson and Ron Harris offered valuablehelp. Bill Carlson and Douglas Smith also provided anopportunity to study the metamorphic rock collectionat the University of Texas at Austin and helped in capturing images of thin sections. Dan Barker, FredMcDowell and especially Doug and Jean Smith weregracious hosts. Individual chapters were constructivelyreviewed by Katherine Cashman (University of Oregon),Mihai Ducea (California Institute of Technology),Michael Garcia (University of Hawaii), Charles Lesher(University of California at Davis), Calvin Miller (Van-derbilt University), Raj Sharma (Western Michigan),Suki Smaglik (Metro State College of Denver), DouglasSmith (University of Texas at Austin), Marian B. Hol-ness, G. T. R. Droop. Without their input this textbookwould be much less than it is. At Blackwell Science, Simon Rallison first contacted me about doing a newedition and Jane Humphreys followed up. Nancy Duffysaw the work almost throughout its lengthy gestation;her good-natured patience and forebearance and posit-ive interactions and advice will forever be appreciated.Jill Connor, Rosie Hayden, and Delia Sandford were always cheerfully available for help and information.Irene Herlihy patiently responded to endless queriesand tactfully coordinated the illustrations and manu-script for the igneous chapters. I am also indebted to IanFrancis, Lisa Flanagan, Manufacturing Manager, NancyWhilton, Publisher/Science Books, and GraphicraftLtd, who labeled the illustrations and typeset the text.
Myron G. BestProvo, Utah
xx
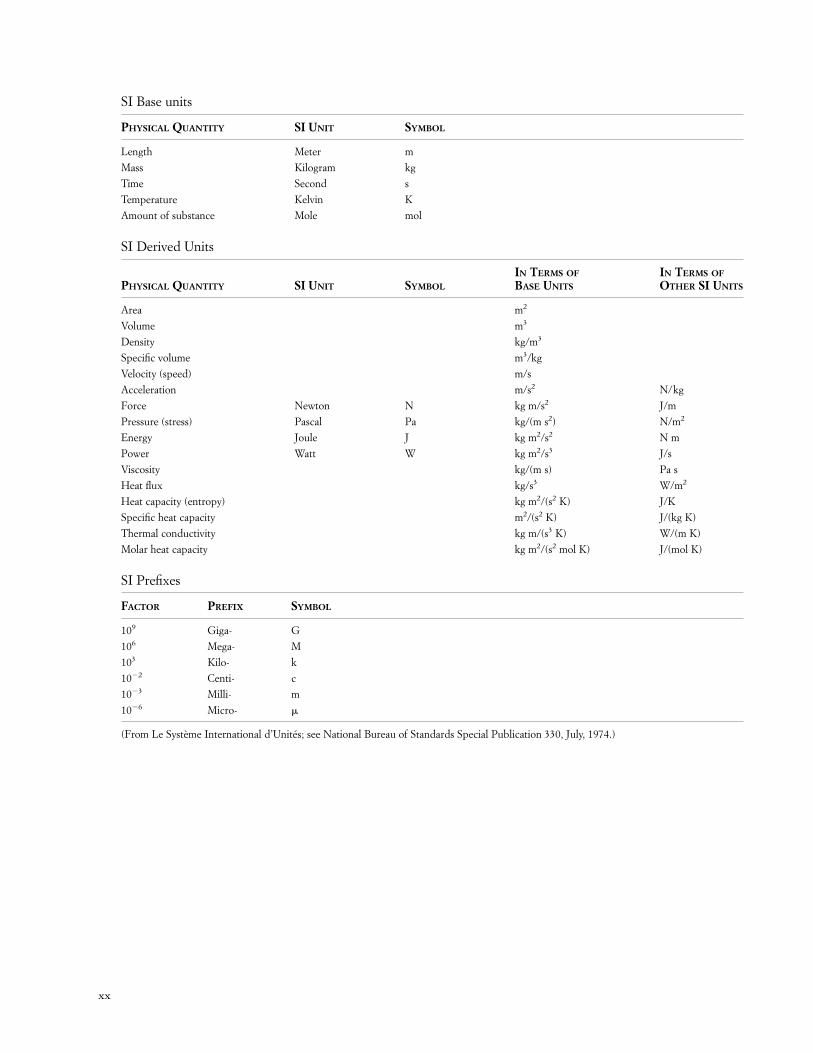
SI Base units
PHYSICAL QUANTITY SI UNIT SYMBOL
Length Meter m
Mass Kilogram kg
Time Second s
Temperature Kelvin K
Amount of substance Mole mol
SI Derived Units
IN TERMS OF IN TERMS OFPHYSICAL QUANTITY SI UNIT SYMBOL BASE UNITS OTHER SI UNITS
Area m2
Volume m3
Density kg/m3
Specific volume m3/kg
Velocity (speed) m/s
Acceleration m/s2 N/kg
Force Newton N kg m/s2 J/m
Pressure (stress) Pascal Pa kg/(m s2) N/m2
Energy Joule J kg m2/s2 N m
Power Watt W kg m2/s3 J/s
Viscosity kg/(m s) Pa s
Heat flux kg/s3 W/m2
Heat capacity (entropy) kg m2/(s2 K) J/K
Specific heat capacity m2/(s2 K) J/(kg K)
Thermal conductivity kg m/(s3 K) W/(m K)
Molar heat capacity kg m2/(s2 mol K) J/(mol K)
SI Prefixes
FACTOR PREFIX SYMBOL
109 Giga- G
106 Mega- M
103 Kilo- k
10�2 Centi- c
10�3 Milli- m
10�6 Micro- �
(From Le Système International d’Unités; see National Bureau of Standards Special Publication 330, July, 1974.)
xxi
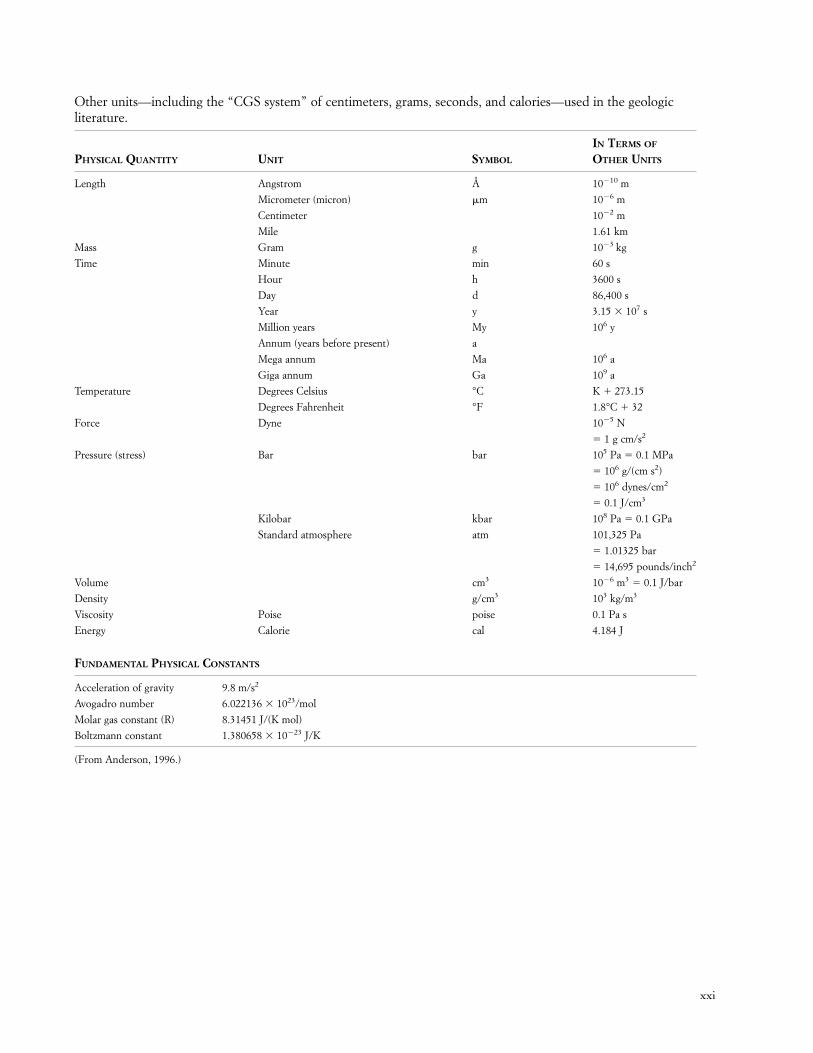
Other units—including the “CGS system” of centimeters, grams, seconds, and calories—used in the geologicliterature.
IN TERMS OF
PHYSICAL QUANTITY UNIT SYMBOL OTHER UNITS
Length Angstrom Å 10�10 m
Micrometer (micron) �m 10�6 m
Centimeter 10�2 m
Mile 1.61 km
Mass Gram g 10�3 kg
Time Minute min 60 s
Hour h 3600 s
Day d 86,400 s
Year y 3.15 � 107 s
Million years My 106 y
Annum (years before present) a
Mega annum Ma 106 a
Giga annum Ga 109 a
Temperature Degrees Celsius °C K � 273.15
Degrees Fahrenheit °F 1.8°C � 32
Force Dyne 10�5 N
� 1 g cm/s2
Pressure (stress) Bar bar 105 Pa � 0.1 MPa
� 106 g/(cm s2)
� 106 dynes/cm2
� 0.1 J/cm3
Kilobar kbar 108 Pa � 0.1 GPa
Standard atmosphere atm 101,325 Pa
� 1.01325 bar
� 14,695 pounds/inch2
Volume cm3 10�6 m3 � 0.1 J/bar
Density g/cm3 103 kg/m3
Viscosity Poise poise 0.1 Pa s
Energy Calorie cal 4.184 J
FUNDAMENTAL PHYSICAL CONSTANTS
Acceleration of gravity 9.8 m/s2
Avogadro number 6.022136 � 1023/mol
Molar gas constant (R) 8.31451 J/(K mol)
Boltzmann constant 1.380658 � 10�23 J/K
(From Anderson, 1996.)

FUNDAMENTAL QUESTIONSCONSIDERED IN THIS CHAPTER
1. What role is played by energy in its various formsto create magmatic and metamorphic rocks?
2. What is the source of internal thermal energy inthe Earth; and how does it function as a giant heatengine to drive rock-forming processes?
3. What is the role of the mantle of the Earth inrock-forming processes?
4. In what way does mantle convection focus rock-forming processes in specific tectonic settings?
5. What do changes in geologic systems have to dowith the formation of rocks?
6. What are the most significant properties of rocks,and what specific information does each propertyprovide about rock-forming processes?
7. How does a petrologist study rocks to determinetheir nature and origin?
INTRODUCTION
This book is about rocks that were once hot. Magmaticrocks, also called igneous rocks, form by cooling andsolidification of magma, which is mobile molten rockmaterial whose temperature is generally in the range of700–1200°C (about 1300–2200°F) near the surface ofthe Earth. Metamorphic rocks form by reconstitutionof pre-existing rocks at elevated temperatures well be-neath the surface of the Earth. Both classes of rockspossess textures, structures, and mineral constituents
indicative of their high-temperature ancestry. Whensampled and studied by geologists, these rocks not onlyhave cooled, but in many cases have been brought bygeologic processes to the surface from some consider-able depth in the crust or mantle. Obviously, the originof these once-hot rocks, and their exposure at the surface, involves flow of heat as well as movement ofrock mass in the gravitational field of the Earth. Thus,interactions between heat and gravity are involved intheir creation. Understanding the nature of magmaticand metamorphic rocks and the related interactionsbetween matter and energy is to understand, in a majorway, how the planet Earth works.
With the development of concepts of plate tectonicsin the 1960s all concepts of a static Earth became ob-solete. Plate motion—a basic facet of the way the Earthworks—manifests the interaction between gravity andoutward flow of heat from the hot interior of a cooling,dynamic Earth. Oceanic lithosphere that is cooler andtherefore denser than the underlying asthenospheresinks at subduction zones. Plumes of hot mantle rockrising from near the core–mantle boundary and up-welling mantle beneath oceanic spreading juncturesconstitute the return circuit in the global mantle con-vection system. Seafloor spreading from the oceanicjunctures maintains a constant global surface area,compensating for subduction.
Most magmatism and metamorphism in planetEarth occurs along the two linear tectonic regimes ofplate convergence and divergence because that iswhere most interactions between energy and mattertake place. Active volcanism and related but hidden in-trusive magmatism is focused over less than 0.6% ofthe surface of the Earth, assuming a modest width of 100km along the boundaries of converging and divergingplates (Plate I). Hidden from view beneath the sea,
1CHAPTER
Overview ofFundamentalConcepts
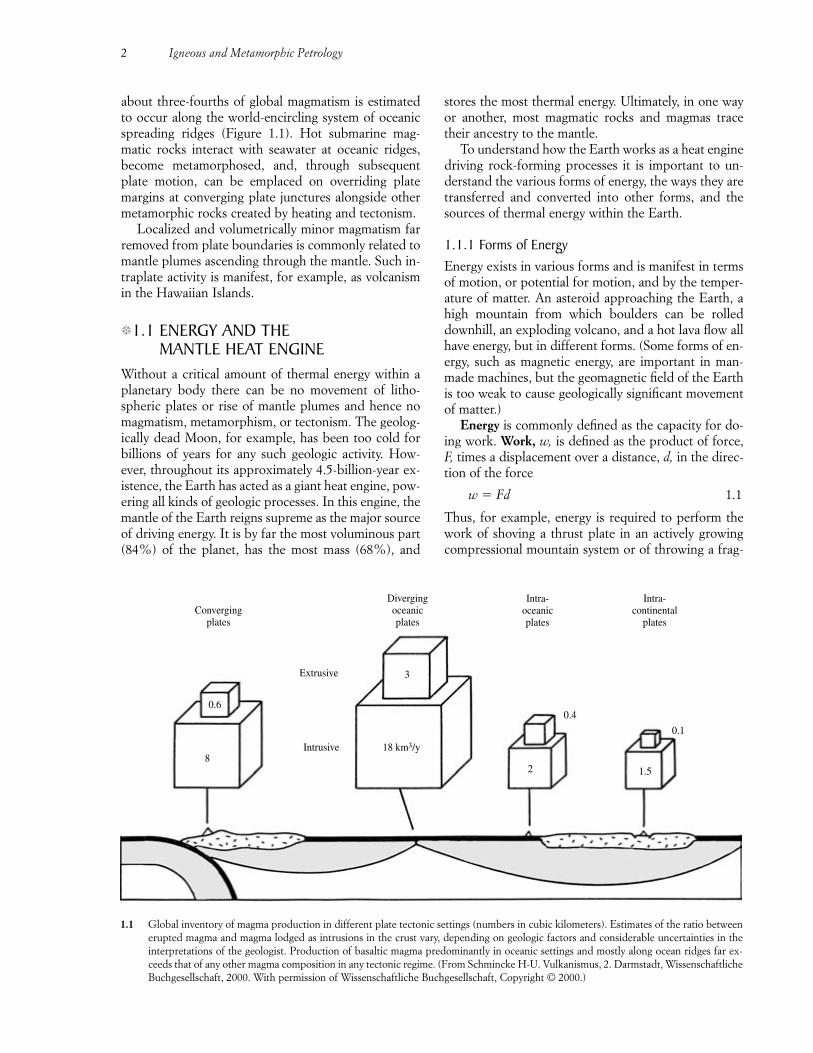
about three-fourths of global magmatism is estimatedto occur along the world-encircling system of oceanicspreading ridges (Figure 1.1). Hot submarine mag-matic rocks interact with seawater at oceanic ridges,become metamorphosed, and, through subsequentplate motion, can be emplaced on overriding platemargins at converging plate junctures alongside othermetamorphic rocks created by heating and tectonism.
Localized and volumetrically minor magmatism farremoved from plate boundaries is commonly related tomantle plumes ascending through the mantle. Such in-traplate activity is manifest, for example, as volcanismin the Hawaiian Islands.
�1.1 ENERGY AND THE MANTLE HEAT ENGINE
Without a critical amount of thermal energy within aplanetary body there can be no movement of litho-spheric plates or rise of mantle plumes and hence nomagmatism, metamorphism, or tectonism. The geolog-ically dead Moon, for example, has been too cold forbillions of years for any such geologic activity. How-ever, throughout its approximately 4.5-billion-year ex-istence, the Earth has acted as a giant heat engine, pow-ering all kinds of geologic processes. In this engine, themantle of the Earth reigns supreme as the major sourceof driving energy. It is by far the most voluminous part(84%) of the planet, has the most mass (68%), and
stores the most thermal energy. Ultimately, in one wayor another, most magmatic rocks and magmas tracetheir ancestry to the mantle.
To understand how the Earth works as a heat enginedriving rock-forming processes it is important to un-derstand the various forms of energy, the ways they aretransferred and converted into other forms, and thesources of thermal energy within the Earth.
1.1.1 Forms of EnergyEnergy exists in various forms and is manifest in termsof motion, or potential for motion, and by the temper-ature of matter. An asteroid approaching the Earth, ahigh mountain from which boulders can be rolleddownhill, an exploding volcano, and a hot lava flow allhave energy, but in different forms. (Some forms of en-ergy, such as magnetic energy, are important in man-made machines, but the geomagnetic field of the Earthis too weak to cause geologically significant movementof matter.)
Energy is commonly defined as the capacity for do-ing work. Work, w, is defined as the product of force,F, times a displacement over a distance, d, in the direc-tion of the force
w � Fd 1.1
Thus, for example, energy is required to perform thework of shoving a thrust plate in an actively growingcompressional mountain system or of throwing a frag-
2 Igneous and Metamorphic Petrology
Extrusive
Intrusive8
0.6
3
2 1.5
0.4
0.1
18 km3/y
Convergingplates
Divergingoceanicplates
Intra-oceanicplates
Intra-continental
plates
1.1 Global inventory of magma production in different plate tectonic settings (numbers in cubic kilometers). Estimates of the ratio betweenerupted magma and magma lodged as intrusions in the crust vary, depending on geologic factors and considerable uncertainties in theinterpretations of the geologist. Production of basaltic magma predominantly in oceanic settings and mostly along ocean ridges far ex-ceeds that of any other magma composition in any tectonic regime. (From Schmincke H-U. Vulkanismus, 2. Darmstadt, WissenschaftlicheBuchgesellschaft, 2000. With permission of Wissenschaftliche Buchgesellschaft, Copyright © 2000.)
ment of rock from an explosive volcanic vent. An im-portant type of work in geologic systems is called PVwork, where P is the pressure, such as possessed by avolcanic gas, and V is the volume of the gas. Expansionof pressurized gas does work in displacing magma outof a volcanic vent, creating an explosive eruption. Be-cause pressure is defined as a force divided by the areaover which it acts, P � F/area, and because volume, V � area � d, then PV � Fd � w.
Kinetic energy is associated with the motion of abody. A body of mass, m, moving with a velocity, v, haskinetic energy
FK � 1⁄2mv2 1.2A moving lava flow, ejecta thrown from an explodingvolcano, and agitating molecules in a gas all have ki-netic energy.
Potential energy is energy of position; it is potentialin the sense that it can be converted, or transformed,into kinetic energy. A boulder cascading down a hillslope gains velocity and, therefore, kinetic energy as itloses potential energy. Potential energy can be equatedwith the amount of work required to move a body fromone position to another in a potential field, in this in-stance, the gravitational field of the Earth. In lifting aboulder of mass m through a vertical distance z in thegravitational field of the Earth, whose acceleration is g ,the amount of work equivalent to the gravitational po-tential energy is
EP � mgz 1.3The distance z is measured outward from the Earthabove some reference level. Thermal energy within theEarth is expended to do the work of uplifting a moun-tain range, which imparts increased gravitational po-tential energy to the mountain mass.
Operating a bicycle tire pump demonstrates that me-chanical work can be converted, or transformed, intothermal energy. As the pump handle is repeatedly de-pressed, the pump piston’s rubbing on the inside of thecylinder produces frictional heating of the pump cylin-
der; in addition, the work of compressing the air in thecylinder heats the air. The increased temperature of thetire pump is a manifestation of an increase in the ther-mal energy internally within the metal parts of thepump. The thermal energy of a body resides in the mo-tions—kinetic energy—and the attractions—potentialenergy—of the atomic particles within it. An increase inthe internal thermal energy of a solid is associated withgreater kinetic energy via faster motion of the atoms andis manifest in a greater temperature, T. This motion canbecome sufficiently vigorous to break atomic bondsmomentarily so that the solid becomes a flowing liquid,or, if bonds are fully broken, a gas. The term heat issometimes used synonymously with thermal energy, but,strictly speaking, heat is transferred thermal energycaused by a difference in temperature between bodies.For example, the thermal energy of a magmatic intru-sion is reduced as heat moves into the surroundingcooler wall rocks, heating them to a higher T.
The joule, J, is the fundamental unit of energy (seethe inside cover for units used throughout this text-book).
1.1.2 Flow and Transformation of EnergyIn nature, energy moves, is transferred, or flows fromplace to place. Energy is also exchanged, converted, ortransformed, from one form into another. Thus, decayof an unstable radioactive U nucleus emits high-speedsmaller particles whose kinetic energy is transformedinto thermal energy that heats the mineral hosting theU atom. As rocks adjacent to a magmatic intrusion areheated, they expand and exert an increased pressure onadjacent rocks, displacing them outward and doing PVwork on them. Thermal energy and work are, there-fore, interconvertible. And work can be converted intothermal energy—such as in a tire pump. PV work is atransfer of energy due to a difference in pressure; heatis a transfer of thermal energy due to a difference intemperature, T. In all such flows and transformations ofenergy the total amount is rigorously and quantitativelyconserved in agreement with the law of conservation ofenergy, also called the first law of thermodynamics.
This law claims that the total amount of energy andmass in the universe is constant. The total amount of energy is not added to or subtracted from; it onlymoves about and is converted to other, perhaps lessobvious, forms. In all such flows and transformationswe are concerned with changes in the amount of energy.In contrast, the total, or absolute, amount of energy residing in a system is difficult to evaluate and generallyis unimportant.
1.1.3 Heat Flow in the EarthWithin Earth systems the transfer of thermal energy, orflow of heat, is especially important and is therefore
Overview of Fundamental Concepts 3
Worked Problem Box 1.1 How much energy isrequired to lift this textbook 1 meter above thetable?
Assume the book weighs 1 kg and the accelera-tion of gravity is 9.8 m/s2. The increase in gravita-tional potential energy equivalent to the work, w, isEP � w � mgz � 1 kg � 9.8 m/s2 � 1 m � 9.8 J.(See the inside cover for units and conversions be-tween them.) For comparison, one beat of the hu-man heart consumes about 1 J and a small cup ofwater, 3.7 cm � 3.7 cm � 3.7 cm � 50 cm3 in vol-ume, heated by 1000 J � 1 kJ of thermal energyraises its temperature by 5°C.
considered further here. Movement of thermal energyis obviously involved in magmatic rock-formingprocesses, such as heating solid rock so it melts, form-ing magma. On a larger scale, cooling oceanic litho-sphere becomes denser and sinks as subducting slabsinto the hotter, less dense upper mantle. Without heat,the Earth would be geologically dead.
An increment of heat, �q, transferrred into a bodyproduces a proportional incremental rise in its temper-ature, �T, given by
�q � CP �T 1.4
where the proportionality constant, CP, is the molarheat capacity, with units of J/(mol degree). The sub-script in CP indicates the heat capacity is for a conditionof constant pressure, a common geologic situation, asfor example, when rock is being heated by a nearbymagmatic intrusion at a particular pressure in the Earth.The heat capacity based on mass is the specific heat,with units of J/(g degree). Because 1 calorie of heat (1cal � 4.184 J) raises the T of 1 g of water 1 degree (Cel-sius or Kelvin), the specific heat of water is 1 cal/g de-gree. However, rocks generally have specific heats of0.25–0.3 cal/g degree, which means that a given amountof heat, �q, can raise the T of a mass of rock three tofour times more than it can an equal mass of water. Inother words, water absorbs relatively large amounts ofheat per unit of mass for a particular T increase, �T; itis an effective thermal transfer agent and moderator.Use of water in building heating systems and in auto-mobile radiators is serendipitous because water is alsoinexpensive and readily available. In geologic systems,water absorbs considerable heat from nearby magmaticintrusions and as it moves through cracks can effectivelytransport this heat to distant rock, changing its T.
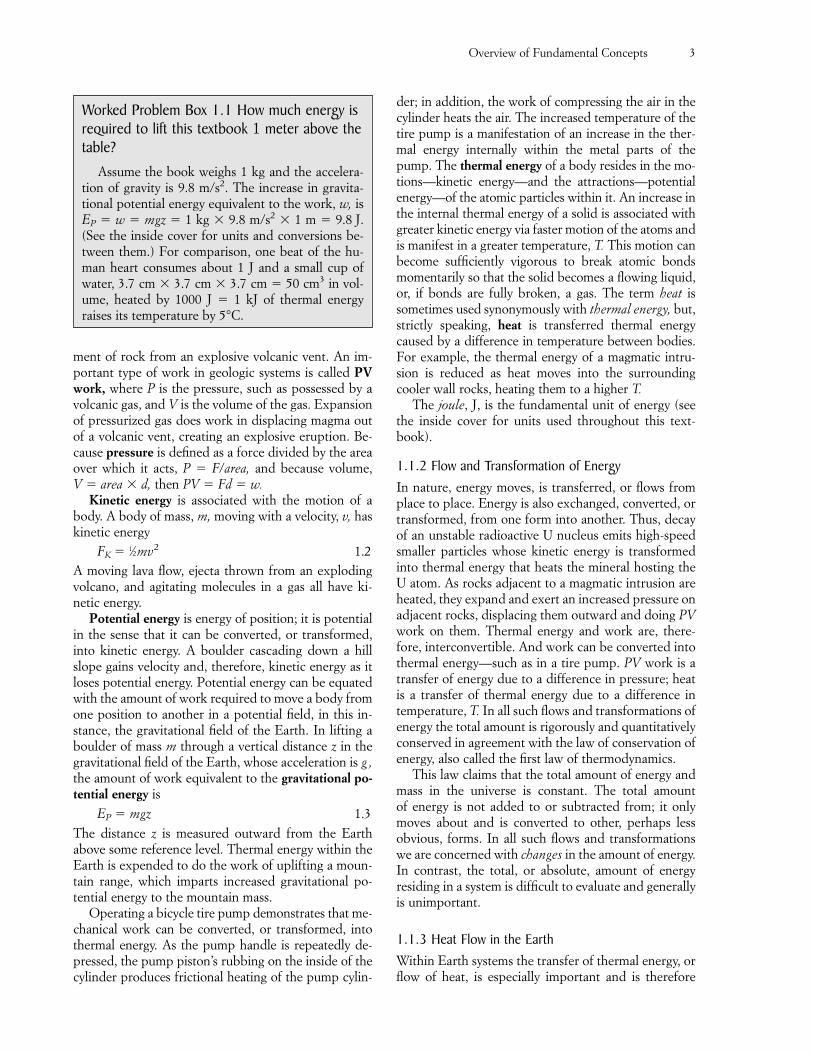
Heat can be transferred in four different ways: radi-ation, advection, conduction, and convection. Com-monly, two or three of these act in unison, as in thecooling of the lava flow in Figure 1.2. Radiation in-volves emission of electromagnetic energy from thesurface of a hot body into transparent cooler sur-roundings, such as the Sun into surrounding space or ahot lava into the atmosphere. In a vacuum, this energymoves at 277,800 km/s, the speed of light. Radiation isinsignificant in cool rocks because they are opaque, butthe effectiveness of radiative transfer increases expo-nentially with T as rocks become more transparentabove about 1200�C. Advection involves flow of a liq-uid through openings in a rock whose T is differentfrom that of the liquid. Because all rocks near the sur-face of the Earth are fractured on some scale and be-cause these fractures are, at least partly, filled with wa-ter, advection is a significant heat transfer process. Forexample, hot water heated by a nearby magmatic in-trusion advects through cracks in cooler rock, heatingit while moderating the T of the water. The greater heat
capacity of water than of rock makes advective heattransport more effective. Advective heat transfer is alsoimportant where magma penetrates cooler rock.
Conduction. Transfer of kinetic energy by vibratingatoms in any material is called conduction of heat. Heatcannot be conducted through a perfect vacuum be-cause of the absence of atoms. Imagine a box filledwith rigid balls (representing atoms) all interconnectedby springs (representing atomic bonds). If a ball in onecorner of the box is set into motion (i.e., is given kineticor internal thermal energy) all of the balls in the boxeventually will be set into motion and given kinetic en-ergy, but the motion and energy of any individual ballare less than those for the ball in the corner because theinitial energy input is dissipated throughout the box.Internal kinetic energy moves throughout the box,manifest in heat conduction. Heat always flows from ahotter region, where atomic motion is greater, to acooler region, where motion is less. A cool metal panon a hot stove becomes hot as a result of conduction
4 Igneous and Metamorphic Petrology
Extruded lava
Fractured
rock
Intrudedmagma
Radiation Convection Conduction
1.2 Schematic diagram (not to scale) showing four modes of heattransfer. Heat from an intrusive body of magma, in which con-vection may occur, conducts into the cooler wall rock, whereheat is further transferred away by advective flow of heatedgroundwater through interconnected cracks. Heat is mainlydissipated from the top of the lava by conductive and radiativetransfer into the overlying air, which expands and buoyantlyconvects upward so that cooler air descends, is heated, ex-pands, and ascends.
through the metal. Heat from a magmatic intrusionconducts into the enclosing cooler rocks, which be-come hotter and may be metamorphosed, while themagma cools. (In this instance, conduction acts in con-cert with advection of water moving through cracks inthe wall rocks.) For a given volume, a hot body con-ducts heat away faster if its enclosing surface area islarger; this is why air-cooled engines have attached finsto dissipate the heat faster.
The difference in T between adjacent hotter andcooler masses, called the thermal gradient, is reducedand may eventually be eliminated over sufficient time,provided heat is not restored to the hotter mass. Therate at which heat is conducted over time from a unitsurface area, called the heat flux or heat flow, is theproduct of the thermal gradient and the thermal con-ductivity, or
heat flow � thermal conductivity � thermal gradient 1.5
Because of their extremely low thermal conductivity,compared with that of familiar metals, rocks are con-sidered to be thermal insulators. All other factors beingequal, copper conducts heat nearly 200 times fasterthan rock. Because of the low thermal conductivity ofrock and the large dimension of the Earth (radiusabout 6370 km), little heat has been conducted fromthe deep interior over the lifetime (4.5 Ga) of the Earth(Verhoogen, 1980).
Thousands of measurements all over the planetsince the 1950s reveal that the surface heat flow fromthe hotter interior averages about 0.09 watt/meter2
(W/m2). If one recalls the wattage of a common incan-descent light bulb, say 60–100 W, this is an extremelysmall quantity of heat! Significant variations in the heatflow and corresponding geothermal gradient dependon the plate tectonic setting. The geothermal gradient,or geotherm, expressed as the change in temperaturedivided by the depth interval over which it occurs, or�T/�z, has been found to vary from hundreds of de-grees per kilometer beneath oceanic spreading ridgesto about 20–30�C/km in active orogenic belts alongsideconvergent plate junctures to as low as 7�C/km in thenearby deep-sea trench. These variations in gradientmight reflect lateral variations around the globe inthermal conductivity of rocks, in their radiative trans-parency, or in heat transferred by another mechanism.As the first two possibilites involving lateral variationsin rock properties are unreasonable, the possibility ofanother mechanism of heat transfer should be consid-ered.
Another argument illustrates that global heat flowmay not be solely by conduction. If a modest geothermof 20�C/km is extrapolated to a depth of, say, 200 km,the temperature there would be 200 km � 20°C/km �4000°C. This is an impossible T because it exceeds the
Overview of Fundamental Concepts 5
Special Interest Box 1.2 Experimental petrol-ogy of the deep interior of the earth.
Laboratory devices that can create the P-T condi-tions prevailing to the center of the Earth provide im-portant information on which minerals might consti-tute the deep interior. All of the devices produce highpressures in basically the same manner by squeezinga sample between opposing pistons or anvils towhich force is applied. Various gasket materials areused to contain the sample between the anvils.Bench-top piston-cylinder devices can create pres-sures as much as 40 kbar (4 GPa) equivalent todepths of roughly 120 km. These consist of two op-posing hard-metal pistons, one driven against theother by a hydraulic jack, and the sample is con-strained within a cylinder into which the pistonsmove. The sample is heated by a furnace that sur-rounds the cylinder and can be opened at the end ofthe experiment so a blast of cool air can be directedat the sample assembly to “quench” the high P-T runproducts. Multianvil presses can achieve pressures toas much as 35 GPa (roughly 850-km depth), weighseveral tons, and consist of four or six hydraulic pis-tons that move from their rigidly supported cylindersand converge symmetrically upon a tetrahedral or cu-bic sample assembly. This can be a block of soap-stone that serves as an extrudable gasket between thecarbide anvils at the ends of the pistons. Inside theblock is the sample surrounded by a small electricalresistance furnace that is destroyed during the exper-iment. The third and most intriguing device consistsof two small faceted diamonds held between the jawsof a hand-size “nutcracker” device (Jayaraman,1984). The mechanical leverage exerted by the nut-cracker arms pulled together by a large screw and thesmall diameter (about 100 micrometers � 100 mi-crons) of the faces of the opposing gem diamondscan create pressures exceeding those at the center ofthe Earth. Not only are the diamond anvils verystrong, they are also transparent to a laser beam forheating the sample, to light used for directly observ-ing the sample, and to X rays to do diffraction analy-sis of the sample while under high P and T. Yet an-other high-P-T technique employs shock wavescreated by firing a projectile at a fixed target.
Information provided by high-P-T devices hasrevolutionized understanding of the mineralogicalcomposition of the interior of the Earth and has an-swered questions posed by seismic data. Althoughmuch remains to be learned, the upper mantle ap-pears to consist of peridotite—a rock made mostlyof Mg-rich olivine and subordinate monoclinic andorthorhombic pyroxenes, and Mg-rich garnet, or atshallow depths a complex Cr-Fe-Mg-Al spinel. At a
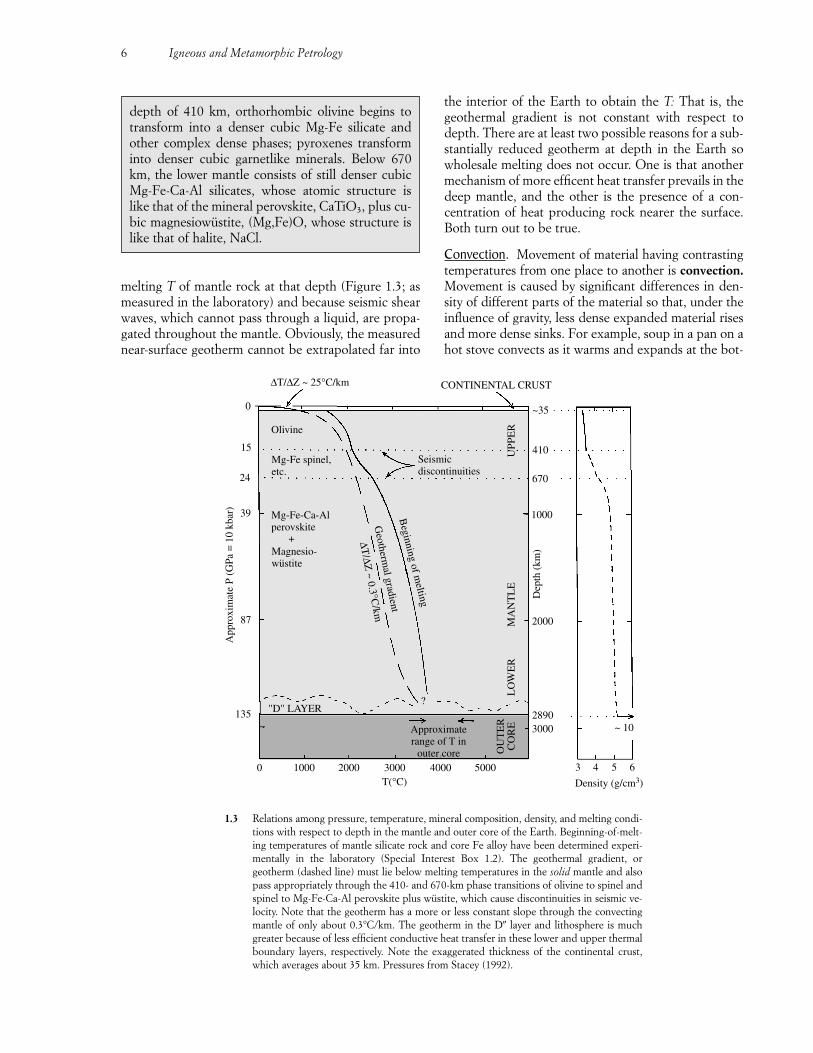
melting T of mantle rock at that depth (Figure 1.3; asmeasured in the laboratory) and because seismic shearwaves, which cannot pass through a liquid, are propa-gated throughout the mantle. Obviously, the measurednear-surface geotherm cannot be extrapolated far into
6 Igneous and Metamorphic Petrology
depth of 410 km, orthorhombic olivine begins totransform into a denser cubic Mg-Fe silicate andother complex dense phases; pyroxenes transforminto denser cubic garnetlike minerals. Below 670km, the lower mantle consists of still denser cubicMg-Fe-Ca-Al silicates, whose atomic structure islike that of the mineral perovskite, CaTiO3, plus cu-bic magnesiowüstite, (Mg,Fe)O, whose structure islike that of halite, NaCl.
LO
WE
RM
AN
TL
EU
PPE
R
Seismicdiscontinuities
Olivine
Mg-Fe spinel,etc.
Mg-Fe-Ca-Alperovskite
+Magnesio-wustite
"D" LAYER
0 1000 2000 3000 4000 5000T(°C)
3 4 5 6
30002890
2000
1000
App
roxi
mat
e P
(GPa
= 1
0 kb
ar)
CONTINENTAL CRUST
Approximaterange of T in
outer core OU
TE
RC
OR
E
Beginning of m
elting
Geotherm
al gradient0
410
670
~35
Density (g/cm3)
∆T
/∆Z
~ 0.3°C/km
∆T/∆Z ~ 25°C/km
?
~ 10
Dep
th (
km)
135
87
39
15
24
1.3 Relations among pressure, temperature, mineral composition, density, and melting condi-tions with respect to depth in the mantle and outer core of the Earth. Beginning-of-melt-ing temperatures of mantle silicate rock and core Fe alloy have been determined experi-mentally in the laboratory (Special Interest Box 1.2). The geothermal gradient, orgeotherm (dashed line) must lie below melting temperatures in the solid mantle and alsopass appropriately through the 410- and 670-km phase transitions of olivine to spinel andspinel to Mg-Fe-Ca-Al perovskite plus wüstite, which cause discontinuities in seismic ve-locity. Note that the geotherm has a more or less constant slope through the convectingmantle of only about 0.3�C/km. The geotherm in the D� layer and lithosphere is muchgreater because of less efficient conductive heat transfer in these lower and upper thermalboundary layers, respectively. Note the exaggerated thickness of the continental crust,which averages about 35 km. Pressures from Stacey (1992).
the interior of the Earth to obtain the T: That is, the geothermal gradient is not constant with respect todepth. There are at least two possible reasons for a sub-stantially reduced geotherm at depth in the Earth sowholesale melting does not occur. One is that anothermechanism of more efficent heat transfer prevails in thedeep mantle, and the other is the presence of a con-centration of heat producing rock nearer the surface.Both turn out to be true.
Convection. Movement of material having contrastingtemperatures from one place to another is convection.Movement is caused by significant differences in den-sity of different parts of the material so that, under theinfluence of gravity, less dense expanded material risesand more dense sinks. For example, soup in a pan on ahot stove convects as it warms and expands at the bot-
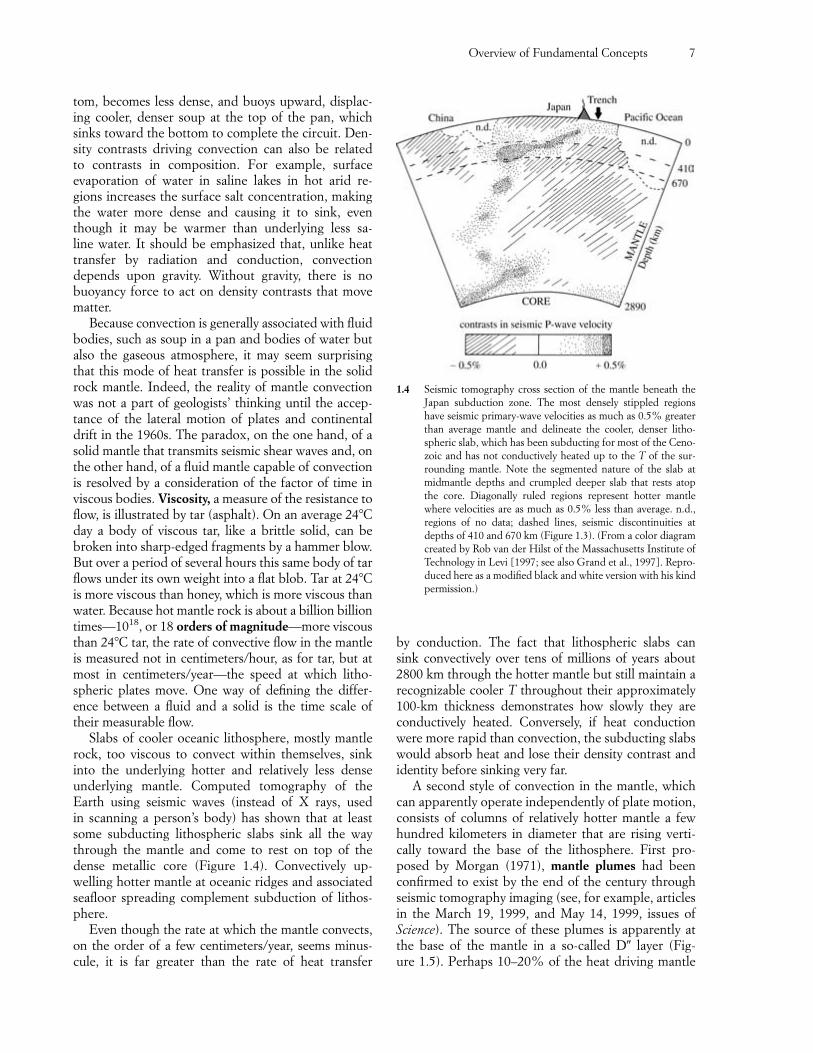
tom, becomes less dense, and buoys upward, displac-ing cooler, denser soup at the top of the pan, whichsinks toward the bottom to complete the circuit. Den-sity contrasts driving convection can also be related to contrasts in composition. For example, surface evaporation of water in saline lakes in hot arid re-gions increases the surface salt concentration, makingthe water more dense and causing it to sink, eventhough it may be warmer than underlying less sa-line water. It should be emphasized that, unlike heattransfer by radiation and conduction, convection depends upon gravity. Without gravity, there is nobuoyancy force to act on density contrasts that movematter.
Because convection is generally associated with fluidbodies, such as soup in a pan and bodies of water butalso the gaseous atmosphere, it may seem surprisingthat this mode of heat transfer is possible in the solidrock mantle. Indeed, the reality of mantle convectionwas not a part of geologists’ thinking until the accep-tance of the lateral motion of plates and continentaldrift in the 1960s. The paradox, on the one hand, of asolid mantle that transmits seismic shear waves and, onthe other hand, of a fluid mantle capable of convectionis resolved by a consideration of the factor of time inviscous bodies. Viscosity, a measure of the resistance toflow, is illustrated by tar (asphalt). On an average 24�Cday a body of viscous tar, like a brittle solid, can be broken into sharp-edged fragments by a hammer blow.But over a period of several hours this same body of tarflows under its own weight into a flat blob. Tar at 24�Cis more viscous than honey, which is more viscous thanwater. Because hot mantle rock is about a billion billiontimes—1018, or 18 orders of magnitude—more viscousthan 24�C tar, the rate of convective flow in the mantleis measured not in centimeters/hour, as for tar, but atmost in centimeters/year—the speed at which litho-spheric plates move. One way of defining the differ-ence between a fluid and a solid is the time scale oftheir measurable flow.
Slabs of cooler oceanic lithosphere, mostly mantlerock, too viscous to convect within themselves, sinkinto the underlying hotter and relatively less dense underlying mantle. Computed tomography of theEarth using seismic waves (instead of X rays, used in scanning a person’s body) has shown that at leastsome subducting lithospheric slabs sink all the waythrough the mantle and come to rest on top of thedense metallic core (Figure 1.4). Convectively up-welling hotter mantle at oceanic ridges and associatedseafloor spreading complement subduction of lithos-phere.
Even though the rate at which the mantle convects,on the order of a few centimeters/year, seems minus-cule, it is far greater than the rate of heat transfer
by conduction. The fact that lithospheric slabs cansink convectively over tens of millions of years about2800 km through the hotter mantle but still maintain arecognizable cooler T throughout their approximately100-km thickness demonstrates how slowly they areconductively heated. Conversely, if heat conductionwere more rapid than convection, the subducting slabswould absorb heat and lose their density contrast andidentity before sinking very far.
A second style of convection in the mantle, whichcan apparently operate independently of plate motion,consists of columns of relatively hotter mantle a fewhundred kilometers in diameter that are rising verti-cally toward the base of the lithosphere. First pro-posed by Morgan (1971), mantle plumes had beenconfirmed to exist by the end of the century throughseismic tomography imaging (see, for example, articlesin the March 19, 1999, and May 14, 1999, issues of Science). The source of these plumes is apparently atthe base of the mantle in a so-called D� layer (Fig-ure 1.5). Perhaps 10–20% of the heat driving mantle
Overview of Fundamental Concepts 7
1.4 Seismic tomography cross section of the mantle beneath theJapan subduction zone. The most densely stippled regionshave seismic primary-wave velocities as much as 0.5% greaterthan average mantle and delineate the cooler, denser litho-spheric slab, which has been subducting for most of the Ceno-zoic and has not conductively heated up to the T of the sur-rounding mantle. Note the segmented nature of the slab atmidmantle depths and crumpled deeper slab that rests atopthe core. Diagonally ruled regions represent hotter mantlewhere velocities are as much as 0.5% less than average. n.d.,regions of no data; dashed lines, seismic discontinuities atdepths of 410 and 670 km (Figure 1.3). (From a color diagramcreated by Rob van der Hilst of the Massachusetts Institute ofTechnology in Levi [1997; see also Grand et al., 1997]. Repro-duced here as a modified black and white version with his kindpermission.)
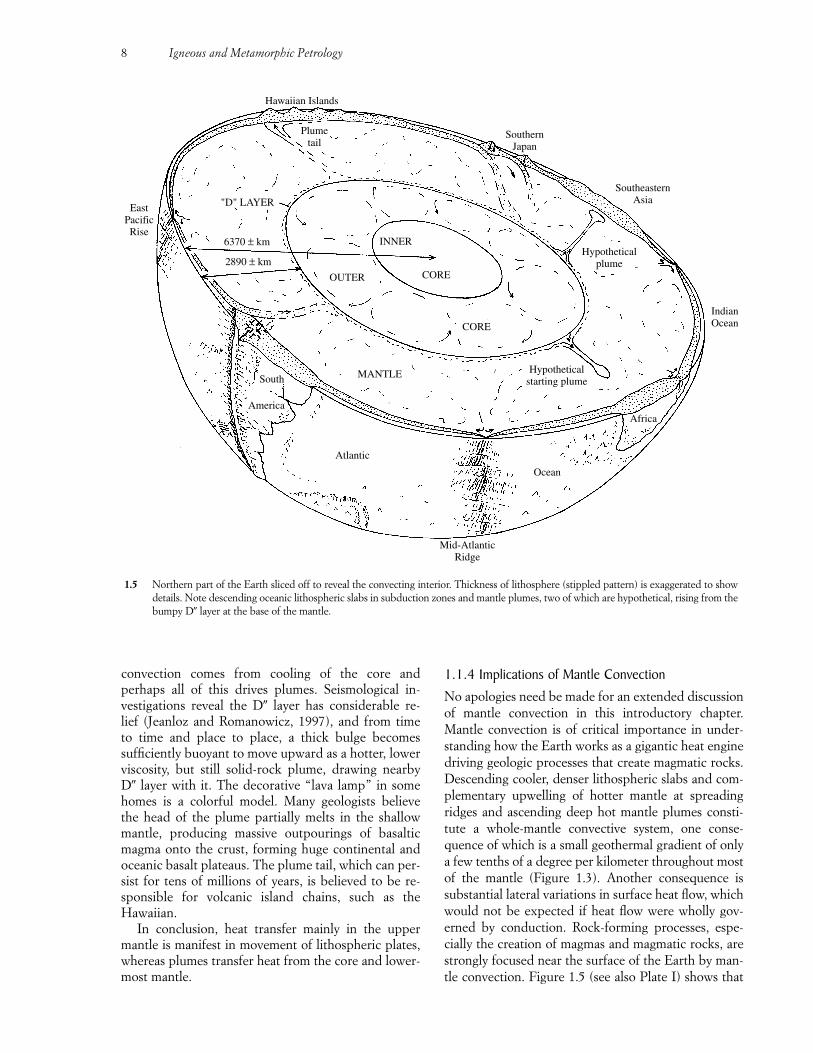
convection comes from cooling of the core and perhaps all of this drives plumes. Seismological in-vestigations reveal the D� layer has considerable re-lief (Jeanloz and Romanowicz, 1997), and from time to time and place to place, a thick bulge becomes sufficiently buoyant to move upward as a hotter, lowerviscosity, but still solid-rock plume, drawing nearby D� layer with it. The decorative “lava lamp” in somehomes is a colorful model. Many geologists believe the head of the plume partially melts in the shallowmantle, producing massive outpourings of basalticmagma onto the crust, forming huge continental andoceanic basalt plateaus. The plume tail, which can per-sist for tens of millions of years, is believed to be re-sponsible for volcanic island chains, such as theHawaiian.
In conclusion, heat transfer mainly in the uppermantle is manifest in movement of lithospheric plates,whereas plumes transfer heat from the core and lower-most mantle.
1.1.4 Implications of Mantle ConvectionNo apologies need be made for an extended discussionof mantle convection in this introductory chapter.Mantle convection is of critical importance in under-standing how the Earth works as a gigantic heat enginedriving geologic processes that create magmatic rocks.Descending cooler, denser lithospheric slabs and com-plementary upwelling of hotter mantle at spreadingridges and ascending deep hot mantle plumes consti-tute a whole-mantle convective system, one conse-quence of which is a small geothermal gradient of onlya few tenths of a degree per kilometer throughout mostof the mantle (Figure 1.3). Another consequence issubstantial lateral variations in surface heat flow, whichwould not be expected if heat flow were wholly gov-erned by conduction. Rock-forming processes, espe-cially the creation of magmas and magmatic rocks, arestrongly focused near the surface of the Earth by man-tle convection. Figure 1.5 (see also Plate I) shows that
8 Igneous and Metamorphic Petrology
INNER
CORE
CORE
Hypotheticalplume
Hypotheticalstarting plume
IndianOcean
Ocean
Africa
SoutheasternAsia
SouthernJapan
Hawaiian Islands
Plumetail
"D" LAYER
OUTER
MANTLE
Atlantic
2890 ± km
6370 ± km
EastPacificRise
South
America
Mid-AtlanticRidge
1.5 Northern part of the Earth sliced off to reveal the convecting interior. Thickness of lithosphere (stippled pattern) is exaggerated to showdetails. Note descending oceanic lithospheric slabs in subduction zones and mantle plumes, two of which are hypothetical, rising from thebumpy D� layer at the base of the mantle.
magmatism is localized in relatively narrow belts alongconvergent and divergent plate boundaries and in so-called hot spots above mantle plumes, virtually to theexclusion of any other surface area of the Earth.
Associated with focused magmatic activity is theconcept of petrotectonic associations: that specifictypes of rocks are found together in specific tectonicregimes. Although basaltic rocks composed mostly ofplagioclase and pyroxene are created in most of the tec-tonic settings diagrammed in Figure 1.5, there are sig-nificant differences from one tectonic regime to an-other in their chemical compositions, particularly inso-called trace elements such as Sr, Ba, Ta, and Nb.Also, the types of associated rocks are different. For ex-ample, andesites are common in convergent plate sub-duction zones but are essentially absent at oceanicspreading ridges. Rhyolites and their plutonic graniticrock counterparts are widespread along continentalmargin subduction zones but rare where two oceaniclithospheric plates converge, as in the island arcs of thewestern Pacific. These petrotectonic associations arediscussed further in Chapter 13.
1.1.5 Energy Budget of the EarthWith all of this heat within the Earth one cannot butwonder, What is its origin? Is the thermal energy in theEarth the result of a one-time investiture, or is it beingreplenished somewhere as it is being expended else-where? Are energy sources being exhausted, or arethey still operative to compensate for energy sinks?Countless volcanic eruptions mainly from oceanicridges over eons of geologic time have dissipated heatfrom the interior of the Earth into the oceans and at-mosphere, from which it is radiated into outer space,the ultimate heat sink. So why are volcanic eruptionsstill occurring?
The largest source of energy driving terrestrialprocesses, roughly 50,000 times all other sources, is ra-diant thermal energy from the Sun. The 70% trappedin the atmosphere drives the global hydrologic systemof moving masses of air, water, and sediment. Radiantsolar energy does not conduct very far into the ground,perhaps only a few meters in sunny areas. Although thesurface heat flow from the interior of the Earth isminute compared to the solar influx, it is perhaps 20times greater than all of the energy dissipated in mag-matism, metamorphism, and tectonism.
A major source of internal heat within the Earth isthe radioactive decay of the long-lived isotopes 238U,235U, 232Th, 40K, and 87Rb, which have half-lives of bil-lions of years. Most investigators (e.g., Stacey, 1992;Verhoogen, 1980) calculate that this heat source isprobably at least half and possibly approaching 100%of the total for the Earth. The uncertainty stems fromthe fact that concentrations of these isotopes are highlyvariable in different types of rock and where and in
what quantity these isotopes occur are poorly known.Overall, concentrations are greatest in the continentalcrust in granites, lower in basalt, in minute but uncer-tain amounts in the much more voluminous peridotiticmantle, and probably nonexistent in the core. Becauseof radioactive decay over eons of Earth history, thethermal energy produced when Archean rocks werecreated, 2.5–4.0 Ga, was roughly three times that of to-day; at 4.5 Ga, when the Earth was born, the rate wassix times greater. Additionally, in that youthful Earth,decay of short-lived radioactive elements, such as 26Al(half-life of 0.7 My), may have been significant.
Other important sources of internal thermal energyin the Earth (Verhoogen, 1980) are due to tides and to“original” heat. Tidal deformation of the solid Earthand oceans due to the gravitational pull of the Sun andMoon is dissipated as thermal energy, but this contri-bution is estimated to be an order of magnitude lessthan that of radioactive decay. In addition to currentheat production by radioactive decay and dissipationfrom tides, some original heat inherited from the for-mation of the Earth at 4.5 Ga remains. Formation ofthe Earth is now generally believed to involve accretionof solid particles from a hot but cooling solar nebula ofcondensing gas and dust. As these particles and largerbodies (planetismals), themselves formed by collectionof dust in the nebula, accreted into a proto-Earth, theirgravitational potential energy was transformed into ki-netic and then into thermal energy. Compression ofthese particles by additional accretion of more solidson top added more thermal energy. Compression doeswork on rock in the interior of the Earth, which istransformed into thermal energy, raising the rock T.Once the rock is compressed, no more thermal energyis created because no more work is done. Continuingcapture of Sun-orbiting debris and impact of thesefragments as asteroids onto the Earth for about 600million years raised T further. The total energy in thisgrowth process is estimated to have been sufficient toraise the T of the Earth tens of thousands of degrees.But the actual T increase was less, by some unknownamount, because heat was radiating and convectingaway in the primitive atmosphere during accretion.
If, as is generally believed, the accreted Earth wasinitially chemically homogeneous, a large amount ofthermal energy was generated during formation of thecore as dense iron particles segregated from themolten silicate mantle by gravity settling. The calcu-lated thermal energy gained from the loss of gravita-tional potential energy in core segregation is morethan sufficient to produce the current surface heatflow, throughout the history of the Earth. Yet anothersource of heat related to the core is the ongoing solid-ification of the liquid outer core, releasing latent heatof crystallization. In other words, the core is currentlyheating the mantle.
Overview of Fundamental Concepts 9
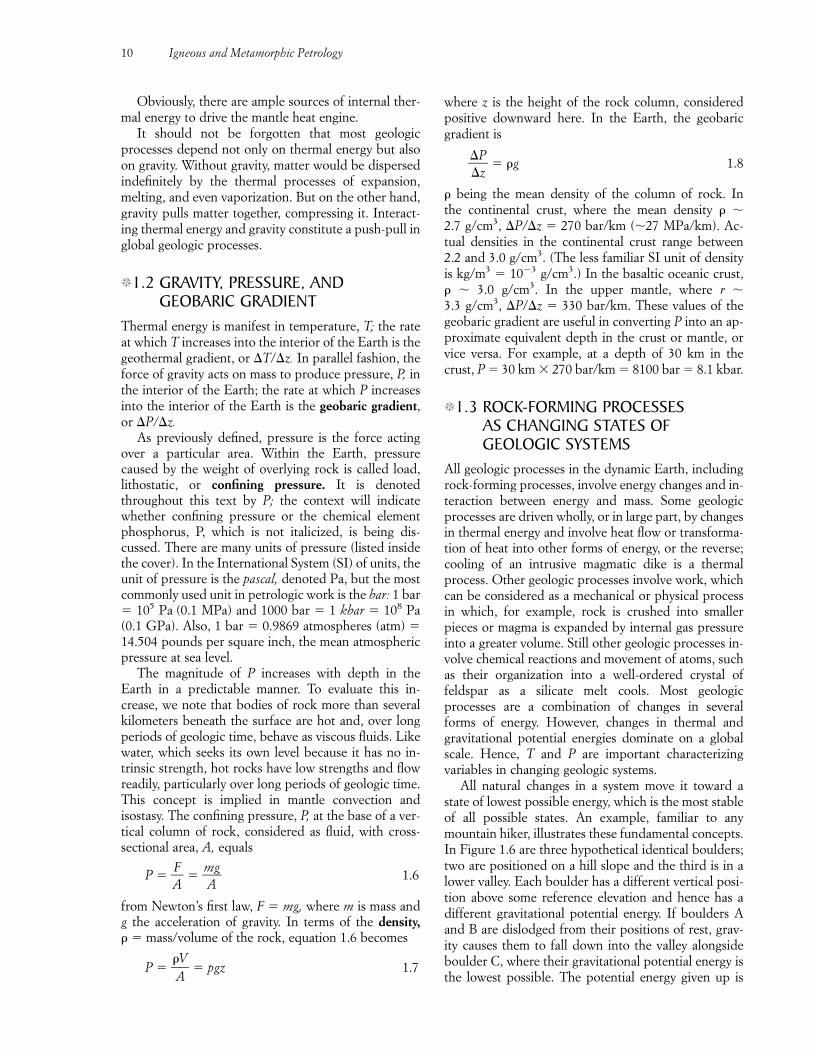
Obviously, there are ample sources of internal ther-mal energy to drive the mantle heat engine.
It should not be forgotten that most geologicprocesses depend not only on thermal energy but alsoon gravity. Without gravity, matter would be dispersedindefinitely by the thermal processes of expansion,melting, and even vaporization. But on the other hand,gravity pulls matter together, compressing it. Interact-ing thermal energy and gravity constitute a push-pull inglobal geologic processes.
�1.2 GRAVITY, PRESSURE, ANDGEOBARIC GRADIENT
Thermal energy is manifest in temperature, T; the rateat which T increases into the interior of the Earth is thegeothermal gradient, or �T/�z. In parallel fashion, theforce of gravity acts on mass to produce pressure, P, inthe interior of the Earth; the rate at which P increasesinto the interior of the Earth is the geobaric gradient,or �P/�z.
As previously defined, pressure is the force actingover a particular area. Within the Earth, pressurecaused by the weight of overlying rock is called load,lithostatic, or confining pressure. It is denotedthroughout this text by P; the context will indicatewhether confining pressure or the chemical elementphosphorus, P, which is not italicized, is being dis-cussed. There are many units of pressure (listed insidethe cover). In the International System (SI) of units, theunit of pressure is the pascal, denoted Pa, but the mostcommonly used unit in petrologic work is the bar: 1 bar� 105 Pa (0.1 MPa) and 1000 bar � 1 kbar � 108 Pa(0.1 GPa). Also, 1 bar � 0.9869 atmospheres (atm) �14.504 pounds per square inch, the mean atmosphericpressure at sea level.
The magnitude of P increases with depth in theEarth in a predictable manner. To evaluate this in-crease, we note that bodies of rock more than severalkilometers beneath the surface are hot and, over longperiods of geologic time, behave as viscous fluids. Likewater, which seeks its own level because it has no in-trinsic strength, hot rocks have low strengths and flowreadily, particularly over long periods of geologic time.This concept is implied in mantle convection andisostasy. The confining pressure, P, at the base of a ver-tical column of rock, considered as fluid, with cross-sectional area, A, equals
P � �AF
� � �mA
g� 1.6
from Newton’s first law, F � mg, where m is mass andg the acceleration of gravity. In terms of the density, � � mass/volume of the rock, equation 1.6 becomes
P � ��
AV� � pgz 1.7
where z is the height of the rock column, consideredpositive downward here. In the Earth, the geobaricgradient is
��
�
Pz� � �g 1.8
� being the mean density of the column of rock. In the continental crust, where the mean density � �2.7 g/cm3, �P/�z � 270 bar/km (�27 MPa/km). Ac-tual densities in the continental crust range between2.2 and 3.0 g/cm3. (The less familiar SI unit of densityis kg/m3 � 103 g/cm3.) In the basaltic oceanic crust, � � 3.0 g/cm3. In the upper mantle, where r �3.3 g/cm3, �P/�z � 330 bar/km. These values of thegeobaric gradient are useful in converting P into an ap-proximate equivalent depth in the crust or mantle, orvice versa. For example, at a depth of 30 km in thecrust, P � 30 km � 270 bar/km � 8100 bar � 8.1 kbar.
�1.3 ROCK-FORMING PROCESSES AS CHANGING STATES OF GEOLOGIC SYSTEMS
All geologic processes in the dynamic Earth, includingrock-forming processes, involve energy changes and in-teraction between energy and mass. Some geologicprocesses are driven wholly, or in large part, by changesin thermal energy and involve heat flow or transforma-tion of heat into other forms of energy, or the reverse;cooling of an intrusive magmatic dike is a thermalprocess. Other geologic processes involve work, whichcan be considered as a mechanical or physical processin which, for example, rock is crushed into smallerpieces or magma is expanded by internal gas pressureinto a greater volume. Still other geologic processes in-volve chemical reactions and movement of atoms, suchas their organization into a well-ordered crystal offeldspar as a silicate melt cools. Most geologicprocesses are a combination of changes in severalforms of energy. However, changes in thermal andgravitational potential energies dominate on a globalscale. Hence, T and P are important characterizingvariables in changing geologic systems.
All natural changes in a system move it toward astate of lowest possible energy, which is the most stableof all possible states. An example, familiar to anymountain hiker, illustrates these fundamental concepts.In Figure 1.6 are three hypothetical identical boulders;two are positioned on a hill slope and the third is in alower valley. Each boulder has a different vertical posi-tion above some reference elevation and hence has adifferent gravitational potential energy. If boulders Aand B are dislodged from their positions of rest, grav-ity causes them to fall down into the valley alongsideboulder C, where their gravitational potential energy isthe lowest possible. The potential energy given up is
10 Igneous and Metamorphic Petrology
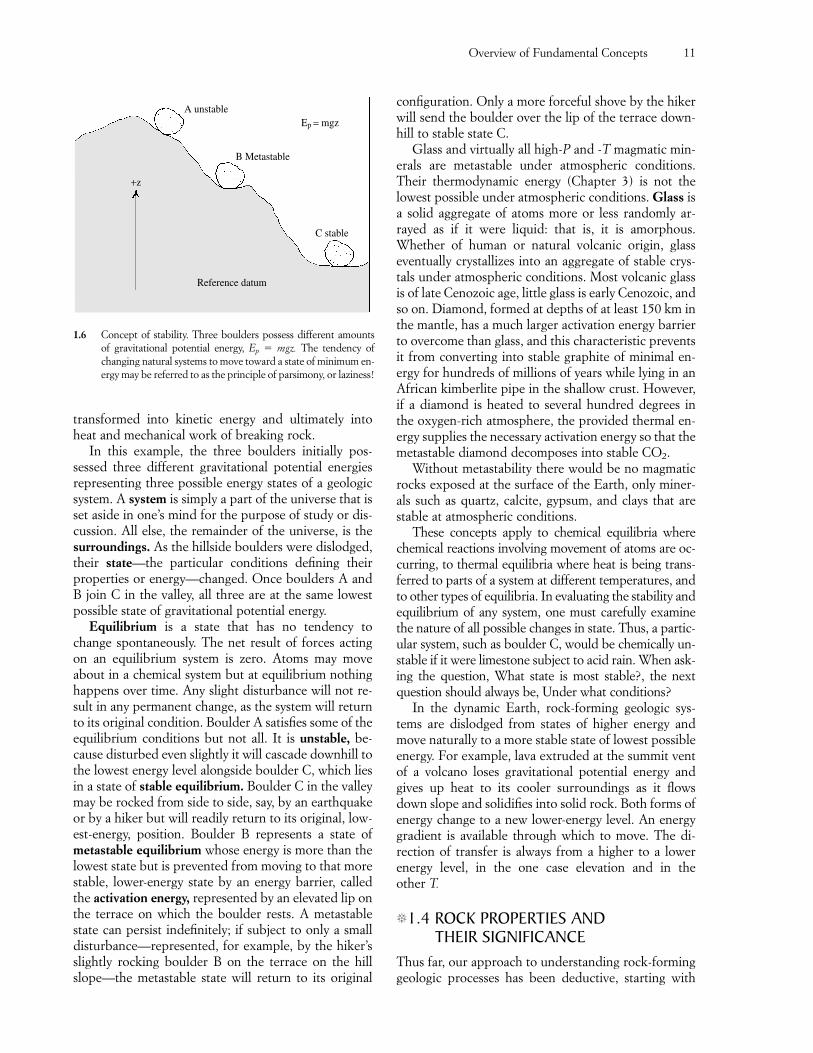
transformed into kinetic energy and ultimately intoheat and mechanical work of breaking rock.
In this example, the three boulders initially pos-sessed three different gravitational potential energiesrepresenting three possible energy states of a geologicsystem. A system is simply a part of the universe that isset aside in one’s mind for the purpose of study or dis-cussion. All else, the remainder of the universe, is thesurroundings. As the hillside boulders were dislodged,their state—the particular conditions defining theirproperties or energy—changed. Once boulders A andB join C in the valley, all three are at the same lowestpossible state of gravitational potential energy.
Equilibrium is a state that has no tendency tochange spontaneously. The net result of forces actingon an equilibrium system is zero. Atoms may moveabout in a chemical system but at equilibrium nothinghappens over time. Any slight disturbance will not re-sult in any permanent change, as the system will returnto its original condition. Boulder A satisfies some of theequilibrium conditions but not all. It is unstable, be-cause disturbed even slightly it will cascade downhill tothe lowest energy level alongside boulder C, which liesin a state of stable equilibrium. Boulder C in the valleymay be rocked from side to side, say, by an earthquakeor by a hiker but will readily return to its original, low-est-energy, position. Boulder B represents a state ofmetastable equilibrium whose energy is more than thelowest state but is prevented from moving to that morestable, lower-energy state by an energy barrier, calledthe activation energy, represented by an elevated lip onthe terrace on which the boulder rests. A metastablestate can persist indefinitely; if subject to only a smalldisturbance—represented, for example, by the hiker’sslightly rocking boulder B on the terrace on the hillslope—the metastable state will return to its original
configuration. Only a more forceful shove by the hikerwill send the boulder over the lip of the terrace down-hill to stable state C.
Glass and virtually all high-P and -T magmatic min-erals are metastable under atmospheric conditions.Their thermodynamic energy (Chapter 3) is not thelowest possible under atmospheric conditions. Glass isa solid aggregate of atoms more or less randomly ar-rayed as if it were liquid: that is, it is amorphous.Whether of human or natural volcanic origin, glasseventually crystallizes into an aggregate of stable crys-tals under atmospheric conditions. Most volcanic glassis of late Cenozoic age, little glass is early Cenozoic, andso on. Diamond, formed at depths of at least 150 km inthe mantle, has a much larger activation energy barrierto overcome than glass, and this characteristic preventsit from converting into stable graphite of minimal en-ergy for hundreds of millions of years while lying in anAfrican kimberlite pipe in the shallow crust. However,if a diamond is heated to several hundred degrees inthe oxygen-rich atmosphere, the provided thermal en-ergy supplies the necessary activation energy so that themetastable diamond decomposes into stable CO2.
Without metastability there would be no magmaticrocks exposed at the surface of the Earth, only miner-als such as quartz, calcite, gypsum, and clays that arestable at atmospheric conditions.
These concepts apply to chemical equilibria wherechemical reactions involving movement of atoms are oc-curring, to thermal equilibria where heat is being trans-ferred to parts of a system at different temperatures, andto other types of equilibria. In evaluating the stability andequilibrium of any system, one must carefully examinethe nature of all possible changes in state. Thus, a partic-ular system, such as boulder C, would be chemically un-stable if it were limestone subject to acid rain. When ask-ing the question, What state is most stable?, the nextquestion should always be, Under what conditions?
In the dynamic Earth, rock-forming geologic sys-tems are dislodged from states of higher energy andmove naturally to a more stable state of lowest possibleenergy. For example, lava extruded at the summit ventof a volcano loses gravitational potential energy andgives up heat to its cooler surroundings as it flowsdown slope and solidifies into solid rock. Both forms ofenergy change to a new lower-energy level. An energygradient is available through which to move. The di-rection of transfer is always from a higher to a lower energy level, in the one case elevation and in the other T.
�1.4 ROCK PROPERTIES AND THEIR SIGNIFICANCE
Thus far, our approach to understanding rock-forminggeologic processes has been deductive, starting with
Overview of Fundamental Concepts 11
+z
Reference datum
C stable
A unstable
B Metastable
Ep = mgz
1.6 Concept of stability. Three boulders possess different amountsof gravitational potential energy, Ep � mgz. The tendency ofchanging natural systems to move toward a state of minimum en-ergy may be referred to as the principle of parsimony, or laziness!
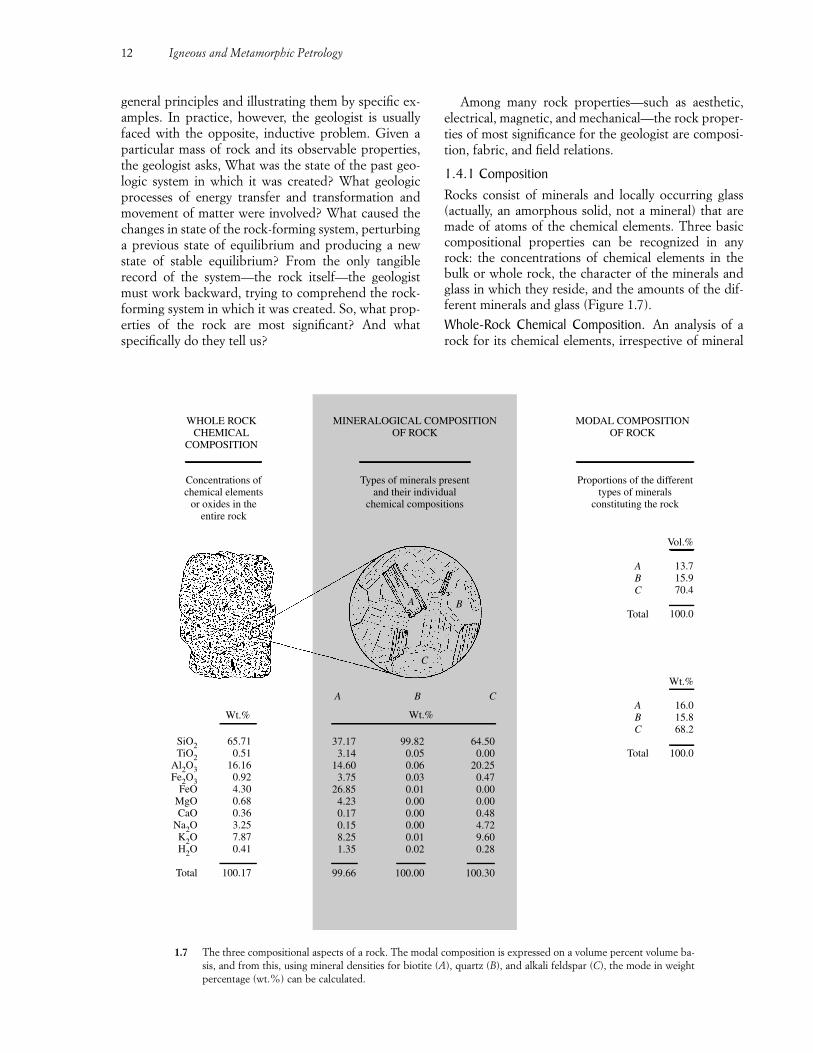
general principles and illustrating them by specific ex-amples. In practice, however, the geologist is usuallyfaced with the opposite, inductive problem. Given aparticular mass of rock and its observable properties,the geologist asks, What was the state of the past geo-logic system in which it was created? What geologicprocesses of energy transfer and transformation andmovement of matter were involved? What caused thechanges in state of the rock-forming system, perturbinga previous state of equilibrium and producing a newstate of stable equilibrium? From the only tangiblerecord of the system—the rock itself—the geologistmust work backward, trying to comprehend the rock-forming system in which it was created. So, what prop-erties of the rock are most significant? And whatspecifically do they tell us?
Among many rock properties—such as aesthetic,electrical, magnetic, and mechanical—the rock proper-ties of most significance for the geologist are composi-tion, fabric, and field relations.
1.4.1 CompositionRocks consist of minerals and locally occurring glass(actually, an amorphous solid, not a mineral) that aremade of atoms of the chemical elements. Three basiccompositional properties can be recognized in anyrock: the concentrations of chemical elements in thebulk or whole rock, the character of the minerals andglass in which they reside, and the amounts of the dif-ferent minerals and glass (Figure 1.7).
Whole-Rock Chemical Composition. An analysis of arock for its chemical elements, irrespective of mineral
12 Igneous and Metamorphic Petrology
MINERALOGICAL COMPOSITIONOF ROCK
WHOLE ROCKCHEMICAL
COMPOSITION
MODAL COMPOSITIONOF ROCK
Concentrations ofchemical elements
or oxides in theentire rock
Types of minerals presentand their individual
chemical compositions
Proportions of the differenttypes of minerals
constituting the rock
A B C
Wt.% Wt.%
SiO2TiO2
Al2O3Fe2O3
FeOMgOCaO
Na2OK2OH2O
Total
65.710.51
16.160.924.300.680.363.257.870.41
100.17
99.820.050.060.030.010.000.000.000.010.02
100.00
64.500.00
20.250.470.000.000.484.729.600.28
100.30
37.173.14
14.603.75
26.854.230.170.158.251.35
99.66
Vol.%
13.715.970.4
100.0
ABC
Total
Wt.%
16.015.868.2
100.0
ABC
Total
A B
C
1.7 The three compositional aspects of a rock. The modal composition is expressed on a volume percent volume ba-sis, and from this, using mineral densities for biotite (A), quartz (B), and alkali feldspar (C), the mode in weightpercentage (wt.%) can be calculated.
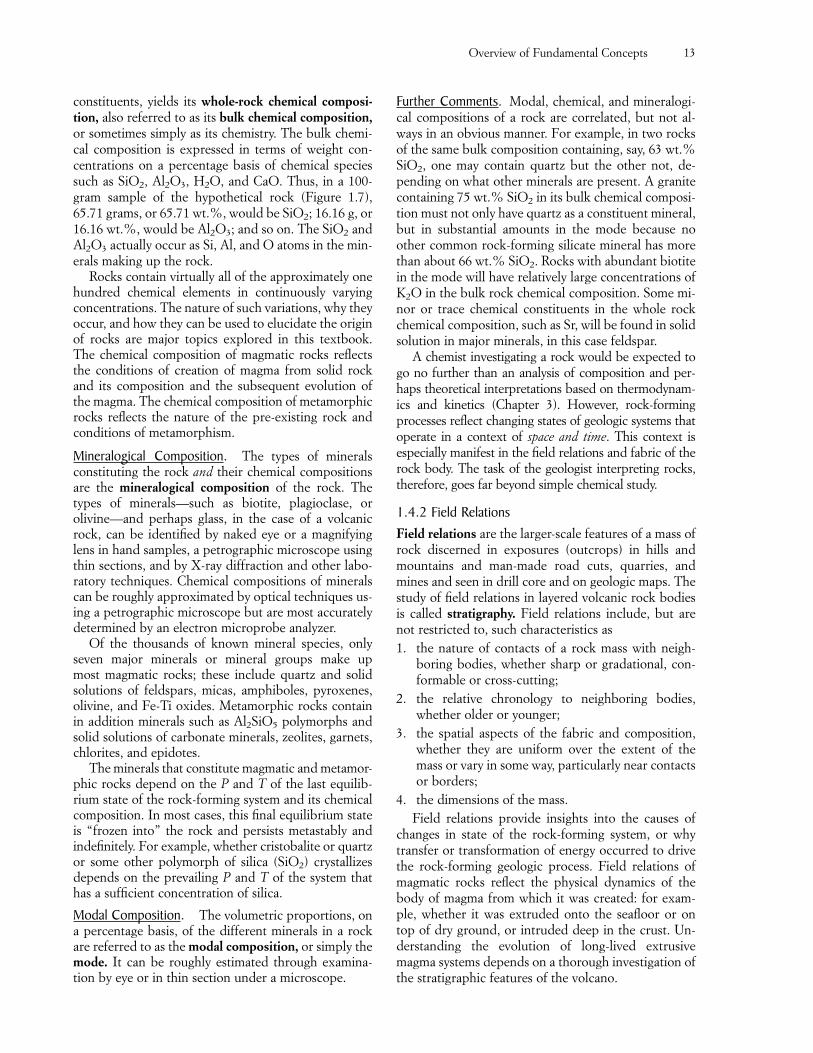
constituents, yields its whole-rock chemical composi-tion, also referred to as its bulk chemical composition,or sometimes simply as its chemistry. The bulk chemi-cal composition is expressed in terms of weight con-centrations on a percentage basis of chemical speciessuch as SiO2, Al2O3, H2O, and CaO. Thus, in a 100-gram sample of the hypothetical rock (Figure 1.7),65.71 grams, or 65.71 wt.%, would be SiO2; 16.16 g, or16.16 wt.%, would be Al2O3; and so on. The SiO2 andAl2O3 actually occur as Si, Al, and O atoms in the min-erals making up the rock.
Rocks contain virtually all of the approximately onehundred chemical elements in continuously varyingconcentrations. The nature of such variations, why theyoccur, and how they can be used to elucidate the originof rocks are major topics explored in this textbook.The chemical composition of magmatic rocks reflectsthe conditions of creation of magma from solid rockand its composition and the subsequent evolution ofthe magma. The chemical composition of metamorphicrocks reflects the nature of the pre-existing rock andconditions of metamorphism.
Mineralogical Composition. The types of mineralsconstituting the rock and their chemical compositionsare the mineralogical composition of the rock. Thetypes of minerals—such as biotite, plagioclase, orolivine—and perhaps glass, in the case of a volcanicrock, can be identified by naked eye or a magnifyinglens in hand samples, a petrographic microscope usingthin sections, and by X-ray diffraction and other labo-ratory techniques. Chemical compositions of mineralscan be roughly approximated by optical techniques us-ing a petrographic microscope but are most accuratelydetermined by an electron microprobe analyzer.
Of the thousands of known mineral species, onlyseven major minerals or mineral groups make up most magmatic rocks; these include quartz and solidsolutions of feldspars, micas, amphiboles, pyroxenes,olivine, and Fe-Ti oxides. Metamorphic rocks containin addition minerals such as Al2SiO5 polymorphs andsolid solutions of carbonate minerals, zeolites, garnets,chlorites, and epidotes.
The minerals that constitute magmatic and metamor-phic rocks depend on the P and T of the last equilib-rium state of the rock-forming system and its chemicalcomposition. In most cases, this final equilibrium stateis “frozen into” the rock and persists metastably andindefinitely. For example, whether cristobalite or quartzor some other polymorph of silica (SiO2) crystallizesdepends on the prevailing P and T of the system thathas a sufficient concentration of silica.
Modal Composition. The volumetric proportions, ona percentage basis, of the different minerals in a rockare referred to as the modal composition, or simply themode. It can be roughly estimated through examina-tion by eye or in thin section under a microscope.
Further Comments. Modal, chemical, and mineralogi-cal compositions of a rock are correlated, but not al-ways in an obvious manner. For example, in two rocksof the same bulk composition containing, say, 63 wt.%SiO2, one may contain quartz but the other not, de-pending on what other minerals are present. A granitecontaining 75 wt.% SiO2 in its bulk chemical composi-tion must not only have quartz as a constituent mineral,but in substantial amounts in the mode because noother common rock-forming silicate mineral has morethan about 66 wt.% SiO2. Rocks with abundant biotitein the mode will have relatively large concentrations ofK2O in the bulk rock chemical composition. Some mi-nor or trace chemical constituents in the whole rockchemical composition, such as Sr, will be found in solidsolution in major minerals, in this case feldspar.
A chemist investigating a rock would be expected togo no further than an analysis of composition and per-haps theoretical interpretations based on thermodynam-ics and kinetics (Chapter 3). However, rock-formingprocesses reflect changing states of geologic systems thatoperate in a context of space and time. This context is especially manifest in the field relations and fabric of therock body. The task of the geologist interpreting rocks,therefore, goes far beyond simple chemical study.
1.4.2 Field RelationsField relations are the larger-scale features of a mass ofrock discerned in exposures (outcrops) in hills andmountains and man-made road cuts, quarries, andmines and seen in drill core and on geologic maps. Thestudy of field relations in layered volcanic rock bodiesis called stratigraphy. Field relations include, but arenot restricted to, such characteristics as1. the nature of contacts of a rock mass with neigh-
boring bodies, whether sharp or gradational, con-formable or cross-cutting;
2. the relative chronology to neighboring bodies,whether older or younger;
3. the spatial aspects of the fabric and composition,whether they are uniform over the extent of themass or vary in some way, particularly near contactsor borders;
4. the dimensions of the mass.Field relations provide insights into the causes of
changes in state of the rock-forming system, or whytransfer or transformation of energy occurred to drivethe rock-forming geologic process. Field relations ofmagmatic rocks reflect the physical dynamics of thebody of magma from which it was created: for exam-ple, whether it was extruded onto the seafloor or ontop of dry ground, or intruded deep in the crust. Un-derstanding the evolution of long-lived extrusivemagma systems depends on a thorough investigation ofthe stratigraphic features of the volcano.
Overview of Fundamental Concepts 13
1.4.3 FabricIn this textbook, the term fabric is used for all of thenoncompositional properties of a mass of rock dis-cernible on scales of observation from the outcrop andhand sample to the microscopic. Fabric encompassesboth texture (sometimes called microstructure) andstructure. Texture refers to grain characteristics—in-cluding grain size and shape, intergrain relations, andamount of glass—generally seen at the scale of a handsample or smaller. Structure refers to features seen at ascale of a hand sample or larger, such as bedding in apyroclastic deposit from an explosive volcano, colum-nar joints in a lava flow, or chunks of foreign wall rockwithin a magmatic intrusion. Tectonic and structuralgeologists also refer to folds in metamorphic rocks asstructures. A sharp distinction between texture andstructure is not always possible to make, hence the utilityof the all-inclusive term fabric. Also, there is no sharpdistinction between some structures and field relations.
Fabric chiefly reflects the time-dependent path ofchange in state of the rock-forming system. The rate ofshearing in a deep crustal fault zone strongly influencesthe fabric of the metamorphic rock. How fast magmarises in the crust and boils can determine whether iterupts placidly as vesicular lava or violently explodes tocreate far-flung pyroclastic particles. Successive changesin state are commonly recorded in overprinted fabrics.In detail, the variety of time-dependent paths and theresulting fabrics are virtually infinite.
�1.5 HOW PETROLOGISTS STUDY ROCKSAs a subdiscipline of geology, petrology seeks to un-derstand the nature of rocks and their origin. Pastrock-forming processes in dynamic geologic systems arerecorded in the observable rock product—its field rela-tions, fabric, and composition. Sometimes, petrologistsapproach the cause-effect, process-product correspon-dence in the opposite way by creating models or doingexperiments simulating rock-forming, or petrologic,systems and then making comparisons with propertiesof real rocks.
In their attempts to understand the origin of rocksand explain how the mostly inaccessible Earth hasworked through billions of years of geologic historyrecorded in rocks, petrologists theorize, using paper-and-pencil and computer models, and experiment, us-ing simple model magmatic systems in the laboratory.In his presidential address to the Geochemical Societyin 1969, James B. Thompson, Jr. (1970) had this to sayregarding petrology:
We who are concerned with such [petrologic] matters fallmainly in one or more of three categories: (1) those whocollect rocks and study them; (2) those who try to dupli-cate rocks in the laboratory; and (3) those who worry
about rocks. All three facets, the observational, the exper-imental, and the theoretical should clearly be integrated ina healthy science. Description as an end in itself is sterile,experiments that answer unasked questions are irrelevant,and theory unchecked by fact is useless. Theory, at its best,is in many ways a link between the other two. Good theorycan thus be used to interpret or reinterpret the results ofobservation in order to ask more significant questions ofexperiment and vice versa.
Petrologists study rocks as interpretive historianswho try to “solve” or explain geologic problems andpuzzles. They ponder and try to answer fundamentalquestions, such as the following:
1. Where and how did a particular magma originate?
2. How was the magma transported from its source andemplaced where the magmatic rock is now found?
3. What physical, chemical, and thermal processes operated on the rock-forming system during crystallization?
4. What was the nature of the rock prior to meta-morphism and its history of deformation and recrystallization?
5. How do petrologic processes control evolution ofthe crust and relate to global tectonic setting?
6. How can modern petrotectonic associations beused to infer tectonic processes and regimes in ancient rocks?
7. How did the planet Earth originate and evolve?
8. What is the effect of petrologic processes on our so-ciety and life in general?
The intent of this textbook is to provide a back-ground sufficient to begin to answer these petrologicquestions, and many others of a more specific nature.Interpretations of the origin of rocks, or petrogenesis,must be based on accurate petrographic data (modalcomposition and fabric) as well as field, chemical, iso-topic, experimental, and theoretical data.
Petrology has become a global science that is findingincreasing integration into other fields of Earth science.An understanding of petrology leads to a better under-standing of how the Earth works.
In his presidential address to the Mineralogical Soci-ety of America, Peter Robinson (1991, p. 1781) said:
In petrologic studies . . . the observations that are possi-ble are conditioned by the experience and training of theobserver. Petrologic research is an attempt to define the se-quence of events in the formation of the rocks, the condi-tions under which the events happened, and why they hap-pened. Petrology can never be totally quantitative, i.e.,“getting numbers out of rocks” . . . observational and de-scriptive petrography from the atomic through the micro-scopic and macroscopic to the petrologic map scale [areessential in] providing the framework for interpretations.
14 Igneous and Metamorphic Petrology
Careful observation and innovative ways of thinkingabout rocks can lead to new discoveries and overturnestablished dogma. That an interpretation is espousedby esteemed experts is no guarantee of its validity. Con-tinual reassessment and well-documented criticism ofestablished truths make for better science.
Petrology at the dawn of the 21st century is a vi-brant, dynamic discipline in which unsolved problemsand controversies abound. Numerous puzzles remainto be explained and resolved. Many have not even beendiscovered!
SUMMARY
The central themes of this textbook developed in moredetail in subsequent chapters are these: On a globalscale, rock-forming geologic processes are driven by in-teractions between matter and energy, chiefly thermaland gravitational. These interactions are strongly fo-cused along convergent and divergent plate boundariesand above ascending mantle plumes, the two expres-sions of a convecting mantle, which is the major heatengine driving geologic processes. Without thermal en-ergy in the Earth it would be geologically dead. Majorsources of thermal energy in the interior of the Earthare radioactive decay and “original” heat generated atthe time of its creation. Rock-forming processes fo-cused by mantle convection create characteristic petro-tectonic associations of magmatic rocks that are moreor less unique to each tectonic setting in which they occur.
In the dynamic Earth, transfers and transforma-tions of different forms of energy and movement ofmatter cause changes in states of geologic systems.The direction of change tends toward the lowest pos-sible energy state of stable equilibrium. However (bygood fortune!), metastable states can persist indefi-nitely, allowing the petrologist to study magmaticmineral assemblages stabilized at high P and T andthus gain insight into rock-forming processes. Otherclues to petrogenesis are found in the chemical, iso-topic, and modal composition of the rock body andits fabric and field relations. Aspects of the time-dependent path taken during changing states of therock-forming system are recorded in the rock fabric,such as the rate of cooling of the magma. Field rela-tions provide insights into the flow of matter and en-ergy in the system, for example, whether the magmawas extruded explosively from a volcano or intrudedinto the deep crust.
Petrology seeks to understand the nature and originof rocks and the way the whole Earth works by makingcritical observations, asking relevant questions, and in-tegrating all available information into a self-consistentinterpretive petrogenetic model.
Overview of Fundamental Concepts 15
CRITICAL THINKING QUESTIONSThese questions may not have definite, specific an-swers. More than one answer may be valid.1.1 Describe examples of interaction between energy
and matter that create magmatic rocks.1.2 Where do rock-forming processes occur in rela-
tion to global tectonics?1.3 Describe and give examples of the different
forms of energy.1.4 Cite an example of how energy is transferred,
transformed, and conserved in a geologic system.1.5 Characterize four modes of heat transfer and in-
dicate their significance in different geologic sys-tems and for the whole Earth. Why is less heattransferred into the substrate beneath a lava flowthan out of the top of the flow?
1.6 In what way is the Earth a heat engine capable ofdoing work?
1.7 Why is the mantle important in creation of mag-matic rocks?
1.8 Describe two modes of convection in the mantleand indicate one example that provides specificevidence for each.
1.9 Contrast the heat capacity of water and that ofrock. Why is this contrast important?
1.10 Account for the inflections in the geotherm fromthe surface to the mantle-core boundary.
1.11 Account for the paradox of fluidlike convectionin the solid rock mantle.
1.12 What is a petrotectonic association?1.13 What are sources of internal heat in the Earth?1.14 Why does T increase with depth in the Earth? P?1.15 Characterize a geologic system that is in an un-
stable state. In a state of stable equilibrium. Ofmetastable equilibrium. How can these states bechanged?
1.16 Briefly describe the significant properties of rockmasses and tell how each property provides partic-ular information about the rock-forming process.
1.17 Contrast the three different compositional prop-erties of a rock.
1.18 Discuss the goals of petrology and the way apetrologist accomplishes them.
PROBLEM1.1 What is the confining pressure, P, at the base of
the oceanic crust 4 km below the seafloor? Whatis P 30 km below the base of this crust, assumingthe density of peridotite is 3.3 g/cm3? Assume thatthe ocean is 5 km deep and the density of seawa-ter is 1 g/cm3. Express your answers in bars, kilo-bars, megapascals, and gigapascals. (Answers: 1700 bars � 1.7 kbar � 170 MPa � 0.17 GPa; 11,600bars � 11.6 kbar � 1160 MPa � 1.16 GPa)
2CHAPTER
Composition andClassification ofMagmatic Rocks
FUNDAMENTAL QUESTIONSCONSIDERED IN THIS CHAPTER
1. How are rocks sampled in the field and analyzedin the laboratory to determine their chemical,modal, and mineralogical composition?
2. What do these analyses disclose regarding thecomposition of magmatic rocks?
3. How can analytical data be presented to revealpetrogenetically significant similarities, patterns,and contrasts?
4. How are magmatic rocks classified so as to conveymeaningful petrogenetic information concerningthe origin and evolution of the magmas fromwhich they solidified?
5. What special petrogenetic information do thetrace element and isotopic compositions ofmagmatic rocks provide?
INTRODUCTION
Magmatic rocks possess a seemingly endless variety ofchemical, modal, and mineralogical compositions fromwhich the petrologist must extract information abouthow rocks form. Samples can be collected, laboratoryanalyses made, similarities and contrasts in composi-tion sought through graphed data and classification,compositional patterns found, and interpretive modelshypothesized.
Compositions of magmatic rocks, together with theirfabrics and field relations (Chapters 7, 9, and 10), arethe essential “nuts and bolts” from which interpretivemodels (Chapters 11–13) can be constructed. After a
brief introduction to sampling and analytical techniquesfor obtaining compositional data on rocks the chapterfocuses on three compositional attributes of rocks: 1. Mineralogical, modal, and major element composi-
tions that are the bases for different classificationsof magmatic rocks
2. Trace element compositions3. Isotope ratios
All of these compositions provide crucial informationregarding the sources and evolutionary paths of magmas.
�2.1 ANALYTICAL PROCEDURESModern petrology relies heavily on quantitative, or nu-merical, data on rock and mineral compositions ob-tained by a variety of analytical devices and techniques.Data can be stored and processed and interpretivemodels created by using computers.
2.1.1 SamplingThe validity and usefulness of any compositional dataare crucially dependent upon the quality of the samplecollected in the field. “Garbage” samples collected inthe field are liable to yield “garbage” analytical results.The importance of this crucial first step cannot be ig-nored or minimized. If the analysis of the sample is tobe truly representative of the body of rock, the sampleshould be as free as possible of overprinting effects ofalteration and weathering. This is especially importantfor chemical and isotopic analyses. Virtually all primary,high-temperature (high-T ) minerals and glasses aremetastable near-atmospheric conditions. Except forquartz, they are subject to replacement by secondaryminerals more stable at near atmospheric temperaturessuch as carbonates, clays, and ferric oxides. This weath-
Composition and Classification of Magmatic Rocks 17
ering is especially common in warm, wet climates and insubaqueous environments. The chemical compositionof the rock also changes during these secondary re-placement processes, including but not restricted to theaddition of water and oxidation of ferrous iron. It is dif-ficult to know to what extent mobile chemical elementsin the original rock have experienced gains or losses intheir concentration. Hence, the sample must be as freshand unweathered as possible. Silicate minerals shouldhave vitreous luster with distinct grain boundaries andwell-defined cleavage or fracture surfaces. The rocksample should be free of patchy discoloration due tofilms of secondary manganese or iron oxide, or awhitish clouding of feldspar caused by conversion toclay minerals. Secondary carbonate and silica (e.g., chal-cedony) should be absent. Pervasively weathered sam-ples crumble from the outcrop, whereas unweatheredrock breaks with difficulty under the hammer and yieldssharp-edged pieces. At an outcrop, a hammer may beunable to break far enough into the rock through aweathered rind to obtain a fresh sample. A portable di-amond core drill may be required. As a final test for thequality of a sample, a thin section should be examinedwith a petrographic microscope.
Many rocks have also experienced alteration by hotgases around volcanic vents and by hot aqueous (hy-drothermal) solutions farther beneath the surface. Al-teration can create many of the same secondary miner-als as does weathering but also includes conversion ofprimary magmatic minerals to somewhat higher T zeo-lites, chlorite, serpentine, epidote, and others.
If a fresh sample can be obtained, the petrologist mustnext determine how large it should be and where itshould be taken from a heterogeneous rock body. Differ-ent sampling plans must be adopted to solve differentproblems. In most plans, the size of the sample should berepresentative of the outcrop; therefore, it must be manytimes larger than the dimensions of the coarsest grains.Obviously, a representative sample of a coarse phaneriticgranite containing phenocrysts of alkali feldspar 3 cm inlength must be considerably larger than a representativesample of an aphanitic, nonporphyritic basalt.
For chemical analyses, samples should be pulverizedto at least 200 mesh to ensure homogeneity of the pow-der. Rock powders are contaminated by pulverizingmachines. Alloy steel pulverizers add contaminating Feas well as possible Cr, Co, Ni, and Mn. Ceramic pul-verizers add Al. Agate adds Si. Corrections may be ap-plied to analytical results for such contaminants.
2.1.2 AnalysesAccuracy and Precision. Any measured value shouldbe accompanied by a statement of accuracy and preci-sion indicating the reliability of the value; otherwise, ithas little meaning.
Precision, or reproducibility, is a number that indi-cates how much statistical variation from the average ormean value occurs in replicate determinations (see, forexample, Le Maitre, 1982). The greater the number ofdeterminations of a particular quantity in a sample thesmaller is the precision and the more reliable is the av-erage value. Suppose, for example, the precision ofanalysis of, say, CaO in basalt samples is �0.25 wt.%. If analysis of one sample yields an average value of 8.45wt.% and of another yields 8.75 wt.% it might be sup-posed that these two values are significantly different.However, if the � uncertainties are taken into consid-eration the first analysis actually lies between 8.45 �0.25 � 8.70 and 8.45 � 0.25 � 8.20 wt.% and the sec-ond lies between 8.75 � 0.25 � 9.00 and 8.75 � 0.25 �8.50 wt.% Hence, the two analyses actually overlap inthe range of 8.50 to 8.70 wt.% and it is possible the two samples have the same CaO concentration in thatrange. Additional replicating analyses to reduce theprecision would be necessary to resolve the questionwhether or not the two samples have the same CaOvalue.
Accuracy is less easily determined; it is an indicationof how close the measurement is to the “true” value.But what is the true value? For chemical analyses, ac-curacy is an expression of how the result for a standardsample analyzed in a petrologist’s laboratory compareswith the “accepted” value (Govindaraju, 1989) for thestandard sample.
Modal Analyses. Determination of the volumetric pro-portions of the minerals that make up a rock—itsmodal composition or mode—can be done by varioustechniques, yielding different degrees of precision andaccuracy (van der Plas and Tobi, 1965). The quickest,but least accurate technique, adequate for preliminarywork, is a visual estimate of mineral proportions in ahand sample or thin section (Figure 2.1). Greater accu-racy and precision can be obtained on sawn, polishedslabs on which a transparent overlying grid is placed.The proportion (or percentage) of grid intersectionsfalling on a particular mineral indicates its proportionin the rock. The same concept underlies commerciallyavailable electromechanical point counters used onthin sections of rocks. Sometimes troublesome distinc-tions between alkali feldspar, plagioclase, and quartzcan be overcome by selective staining (e.g., Bailey andStevens, 1960).
Because the volumetric proportions of minerals in arock are based on their proportions on a surface area,the modal composition of a rock having a preferredorientation of inequant mineral grains that is basedonly on one surface generally will be inaccurate. Forexample, the mode of a rock in which biotite flakes arestrongly oriented in planar fashion would yield, on asurface parallel to that plane, an apparent overabun-
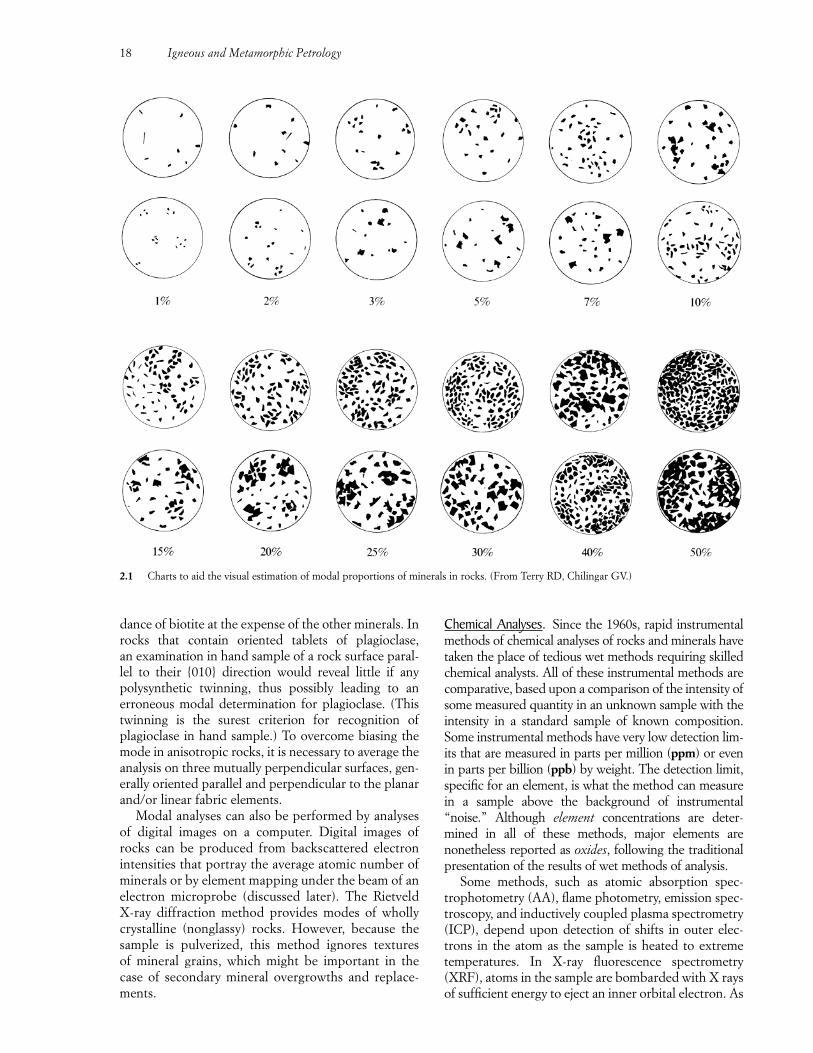
18 Igneous and Metamorphic Petrology
dance of biotite at the expense of the other minerals. Inrocks that contain oriented tablets of plagioclase, an examination in hand sample of a rock surface paral-lel to their {010} direction would reveal little if anypolysynthetic twinning, thus possibly leading to an erroneous modal determination for plagioclase. (Thistwinning is the surest criterion for recognition of plagioclase in hand sample.) To overcome biasing themode in anisotropic rocks, it is necessary to average theanalysis on three mutually perpendicular surfaces, gen-erally oriented parallel and perpendicular to the planarand/or linear fabric elements.
Modal analyses can also be performed by analysesof digital images on a computer. Digital images ofrocks can be produced from backscattered electronintensities that portray the average atomic number ofminerals or by element mapping under the beam of anelectron microprobe (discussed later). The RietveldX-ray diffraction method provides modes of whollycrystalline (nonglassy) rocks. However, because thesample is pulverized, this method ignores textures of mineral grains, which might be important in thecase of secondary mineral overgrowths and replace-ments.
Chemical Analyses. Since the 1960s, rapid instrumentalmethods of chemical analyses of rocks and minerals havetaken the place of tedious wet methods requiring skilledchemical analysts. All of these instrumental methods arecomparative, based upon a comparison of the intensity ofsome measured quantity in an unknown sample with theintensity in a standard sample of known composition.Some instrumental methods have very low detection lim-its that are measured in parts per million (ppm) or evenin parts per billion (ppb) by weight. The detection limit,specific for an element, is what the method can measurein a sample above the background of instrumental“noise.” Although element concentrations are deter-mined in all of these methods, major elements arenonetheless reported as oxides, following the traditionalpresentation of the results of wet methods of analysis.
Some methods, such as atomic absorption spec-trophotometry (AA), flame photometry, emission spec-troscopy, and inductively coupled plasma spectrometry(ICP), depend upon detection of shifts in outer elec-trons in the atom as the sample is heated to extremetemperatures. In X-ray fluorescence spectrometry(XRF), atoms in the sample are bombarded with X raysof sufficient energy to eject an inner orbital electron. As
2.1 Charts to aid the visual estimation of modal proportions of minerals in rocks. (From Terry RD, Chilingar GV.)
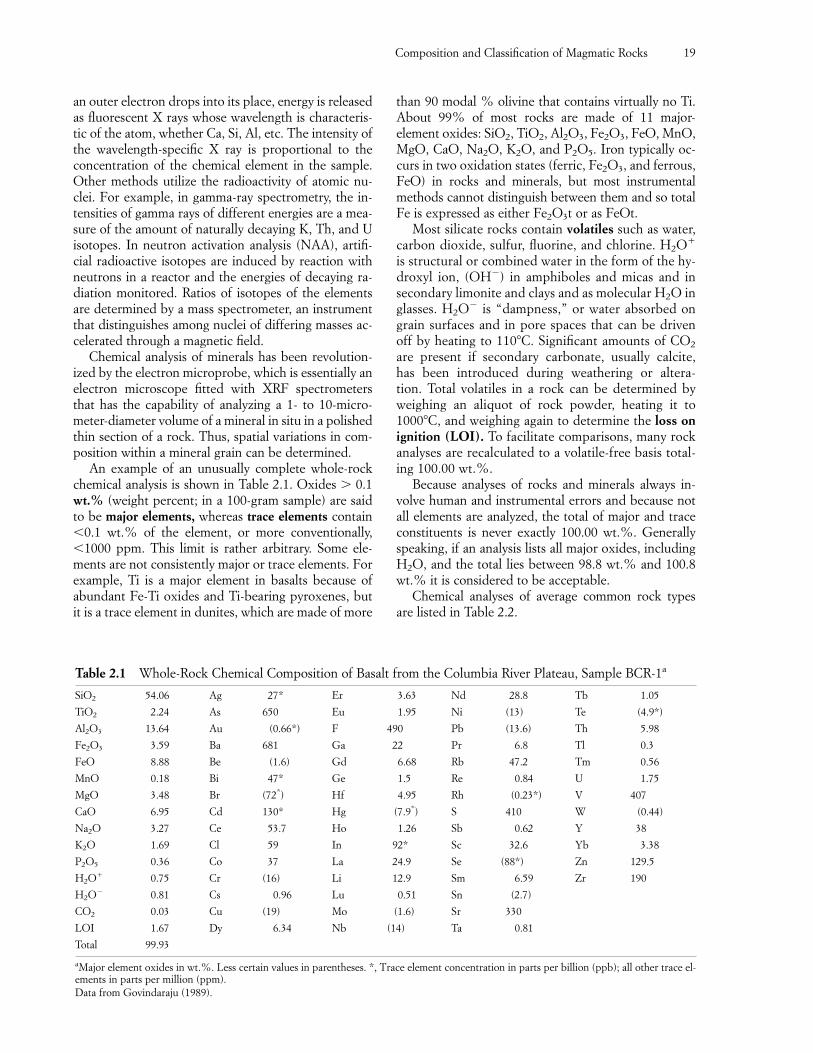
Composition and Classification of Magmatic Rocks 19
an outer electron drops into its place, energy is releasedas fluorescent X rays whose wavelength is characteris-tic of the atom, whether Ca, Si, Al, etc. The intensity ofthe wavelength-specific X ray is proportional to theconcentration of the chemical element in the sample.Other methods utilize the radioactivity of atomic nu-clei. For example, in gamma-ray spectrometry, the in-tensities of gamma rays of different energies are a mea-sure of the amount of naturally decaying K, Th, and Uisotopes. In neutron activation analysis (NAA), artifi-cial radioactive isotopes are induced by reaction withneutrons in a reactor and the energies of decaying ra-diation monitored. Ratios of isotopes of the elementsare determined by a mass spectrometer, an instrumentthat distinguishes among nuclei of differing masses ac-celerated through a magnetic field.
Chemical analysis of minerals has been revolution-ized by the electron microprobe, which is essentially anelectron microscope fitted with XRF spectrometersthat has the capability of analyzing a 1- to 10-micro-meter-diameter volume of a mineral in situ in a polishedthin section of a rock. Thus, spatial variations in com-position within a mineral grain can be determined.
An example of an unusually complete whole-rockchemical analysis is shown in Table 2.1. Oxides � 0.1wt.% (weight percent; in a 100-gram sample) are saidto be major elements, whereas trace elements contain�0.1 wt.% of the element, or more conventionally,�1000 ppm. This limit is rather arbitrary. Some ele-ments are not consistently major or trace elements. Forexample, Ti is a major element in basalts because ofabundant Fe-Ti oxides and Ti-bearing pyroxenes, butit is a trace element in dunites, which are made of more
than 90 modal % olivine that contains virtually no Ti.About 99% of most rocks are made of 11 major-element oxides: SiO2, TiO2, Al2O3, Fe2O3, FeO, MnO,MgO, CaO, Na2O, K2O, and P2O5. Iron typically oc-curs in two oxidation states (ferric, Fe2O3, and ferrous,FeO) in rocks and minerals, but most instrumentalmethods cannot distinguish between them and so totalFe is expressed as either Fe2O3t or as FeOt.
Most silicate rocks contain volatiles such as water,carbon dioxide, sulfur, fluorine, and chlorine. H2O�
is structural or combined water in the form of the hy-droxyl ion, (OH�) in amphiboles and micas and insecondary limonite and clays and as molecular H2O inglasses. H2O� is “dampness,” or water absorbed ongrain surfaces and in pore spaces that can be drivenoff by heating to 110�C. Significant amounts of CO2
are present if secondary carbonate, usually calcite, has been introduced during weathering or altera-tion. Total volatiles in a rock can be determined byweighing an aliquot of rock powder, heating it to1000�C, and weighing again to determine the loss onignition (LOI). To facilitate comparisons, many rockanalyses are recalculated to a volatile-free basis total-ing 100.00 wt.%.
Because analyses of rocks and minerals always in-volve human and instrumental errors and because notall elements are analyzed, the total of major and traceconstituents is never exactly 100.00 wt.%. Generallyspeaking, if an analysis lists all major oxides, includingH2O, and the total lies between 98.8 wt.% and 100.8wt.% it is considered to be acceptable.
Chemical analyses of average common rock typesare listed in Table 2.2.
Table 2.1 Whole-Rock Chemical Composition of Basalt from the Columbia River Plateau, Sample BCR-1a
SiO2 54.06 Ag 27* Er 3.63 Nd 28.8 Tb 1.05
TiO2 2.24 As 650 Eu 1.95 Ni (13) Te (4.9*)
Al2O3 13.64 Au (0.66*) F 490 Pb (13.6) Th 5.98
Fe2O3 3.59 Ba 681 Ga 22 Pr 6.8 Tl 0.3
FeO 8.88 Be (1.6) Gd 6.68 Rb 47.2 Tm 0.56
MnO 0.18 Bi 47* Ge 1.5 Re 0.84 U 1.75
MgO 3.48 Br (72*) Hf 4.95 Rh (0.23*) V 407
CaO 6.95 Cd 130* Hg (7.9*) S 410 W (0.44)
Na2O 3.27 Ce 53.7 Ho 1.26 Sb 0.62 Y 38
K2O 1.69 Cl 59 In 92* Sc 32.6 Yb 3.38
P2O5 0.36 Co 37 La 24.9 Se (88*) Zn 129.5
H2O� 0.75 Cr (16) Li 12.9 Sm 6.59 Zr 190
H2O� 0.81 Cs 0.96 Lu 0.51 Sn (2.7)
CO2 0.03 Cu (19) Mo (1.6) Sr 330
LOI 1.67 Dy 6.34 Nb (14) Ta 0.81
Total 99.93
aMajor element oxides in wt.%. Less certain values in parentheses. *, Trace element concentration in parts per billion (ppb); all other trace el-ements in parts per million (ppm).Data from Govindaraju (1989).
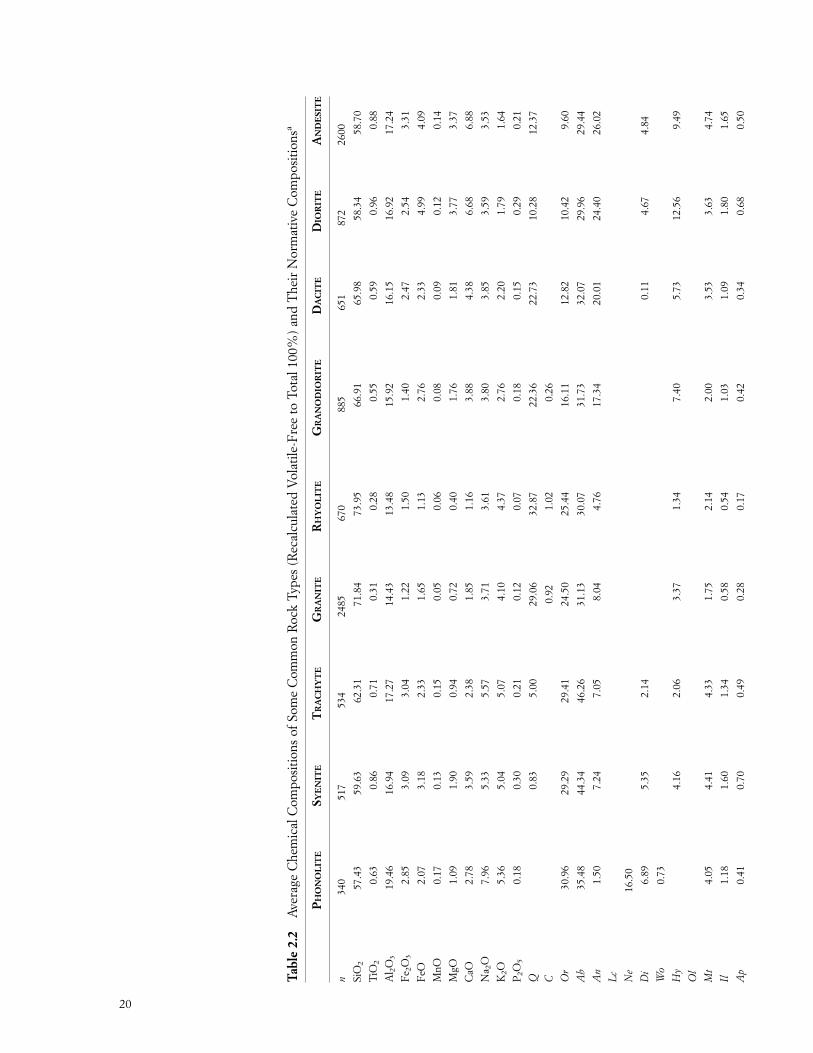
Tabl
e 2.
2A
vera
ge C
hem
ical
Com
posi
tions
of S
ome
Com
mon
Roc
k Ty
pes
(Rec
alcu
late
d V
olat
ile-F
ree
to T
otal
100
%)
and
The
ir N
orm
ativ
e C
ompo
sitio
nsa
PHO
NO
LIT
ESY
EN
ITE
TR
AC
HY
TE
GR
AN
ITE
RH
YO
LIT
EG
RA
NO
DIO
RIT
ED
AC
ITE
DIO
RIT
EA
ND
ESI
TE
n34
051
753
424
8567
088
565
187
226
00
SiO
257
.43
59.6
362
.31
71.8
473
.95
66.9
165
.98
58.3
458
.70
TiO
20.
630.
860.
710.
310.
280.
550.
590.
960.
88
Al 2
O3
19.4
616
.94
17.2
714
.43
13.4
815
.92
16.1
516
.92
17.2
4
Fe 2
O3
2.85
3.09
3.04
1.22
1.50
1.40
2.47
2.54
3.31
FeO
2.07
3.18
2.33
1.65
1.13
2.76
2.33
4.99
4.09
MnO
0.17
0.13
0.15
0.05
0.06
0.08
0.09
0.12
0.14
MgO
1.09
1.90
0.94
0.72
0.40
1.76
1.81
3.77
3.37
CaO
2.78
3.59
2.38
1.85
1.16
3.88
4.38
6.68
6.88
Na 2
O7.
965.
335.
573.
713.
613.
803.
853.
593.
53
K2O
5.36
5.04
5.07
4.10
4.37
2.76
2.20
1.79
1.64
P2O
50.
180.
300.
210.
120.
070.
180.
150.
290.
21
Q0.
835.
0029
.06
32.8
722
.36
22.7
310
.28
12.3
7
C0.
921.
020.
26
Or
30.9
629
.29
29.4
124
.50
25.4
416
.11
12.8
210
.42
9.60
Ab
35.4
844
.34
46.2
631
.13
30.0
731
.73
32.0
729
.96
29.4
4
An
1.50
7.24
7.05
8.04
4.76
17.3
420
.01
24.4
026
.02
Lc
Ne
16.5
0
Di
6.89
5.35
2.14
0.11
4.67
4.84
Wo
0.73
Hy
4.16
2.06
3.37
1.34
7.40
5.73
12.5
69.
49
Ol
Mt
4.05
4.41
4.33
1.75
2.14
2.00
3.53
3.63
4.74
Il1.
181.
601.
340.
580.
541.
031.
091.
801.
65
Ap
0.41
0.70
0.49
0.28
0.17
0.42
0.34
0.68
0.50
20
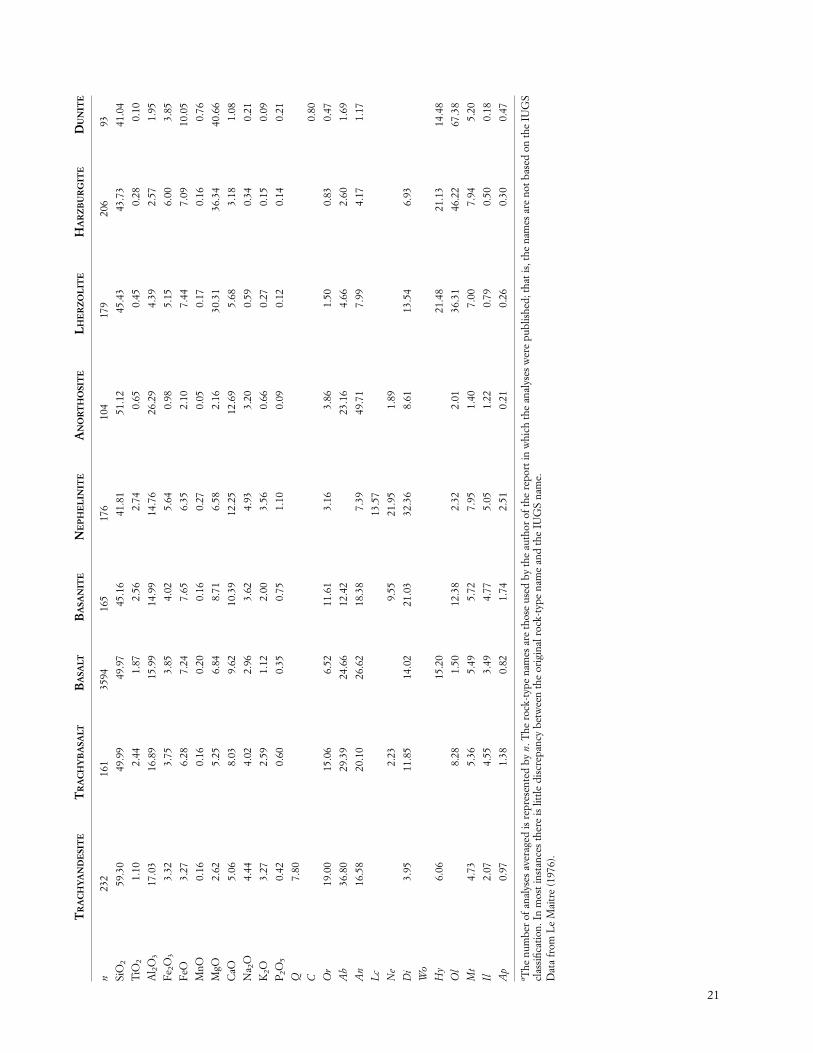
TR
AC
HY
AN
DE
SIT
ET
RA
CH
YB
ASA
LTB
ASA
LTB
ASA
NIT
EN
EP
HE
LIN
ITE
AN
OR
TH
OSI
TE
LHE
RZ
OL
ITE
HA
RZ
BU
RG
ITE
DU
NIT
E
n23
216
135
9416
517
610
417
920
693
SiO
259
.30
49.9
949
.97
45.1
641
.81
51.1
245
.43
43.7
341
.04
TiO
21.
102.
441.
872.
562.
740.
650.
450.
280.
10
Al 2
O3
17.0
316
.89
15.9
914
.99
14.7
626
.29
4.39
2.57
1.95
Fe 2
O3
3.32
3.75
3.85
4.02
5.64
0.98
5.15
6.00
3.85
FeO
3.27
6.28
7.24
7.65
6.35
2.10
7.44
7.09
10.0
5
MnO
0.16
0.16
0.20
0.16
0.27
0.05
0.17
0.16
0.76
MgO
2.62
5.25
6.84
8.71
6.58
2.16
30.3
136
.34
40.6
6
CaO
5.06
8.03
9.62
10.3
912
.25
12.6
95.
683.
181.
08
Na 2
O4.
444.
022.
963.
624.
933.
200.
590.
340.
21
K2O
3.27
2.59
1.12
2.00
3.56
0.66
0.27
0.15
0.09
P2O
50.
420.
600.
350.
751.
100.
090.
120.
140.
21
Q7.
80
C0.
80
Or
19.0
015
.06
6.52
11.6
13.
163.
861.
500.
830.
47
Ab
36.8
029
.39
24.6
612
.42
23.1
64.
662.
601.
69
An
16.5
820
.10
26.6
218
.38
7.39
49.7
17.
994.
171.
17
Lc
13.5
7
Ne
2.23
9.55
21.9
51.
89
Di
3.95
11.8
514
.02
21.0
332
.36
8.61
13.5
46.
93
Wo
Hy
6.06
15.2
021
.48
21.1
314
.48
Ol
8.28
1.50
12.3
82.
322.
0136
.31
46.2
267
.38
Mt
4.73
5.36
5.49
5.72
7.95
1.40
7.00
7.94
5.20
Il2.
074.
553.
494.
775.
051.
220.
790.
500.
18
Ap
0.97
1.38
0.82
1.74
2.51
0.21
0.26
0.30
0.47
a The
num
ber
of a
naly
ses
aver
aged
is r
epre
sent
ed b
y n.
The
roc
k-ty
pe n
ames
are
thos
e us
ed b
y th
e au
thor
of t
he r
epor
t in
whi
ch th
e an
alys
es w
ere
publ
ishe
d; th
at is
, the
nam
es a
re n
ot b
ased
on
the
IUG
Scl
assi
ficat
ion.
In
mos
t ins
tanc
es th
ere
is li
ttle
dis
crep
ancy
bet
wee
n th
e or
igin
al r
ock-
type
nam
e an
d th
e IU
GS
nam
e.D
ata
from
Le
Mai
tre
(197
6).
21
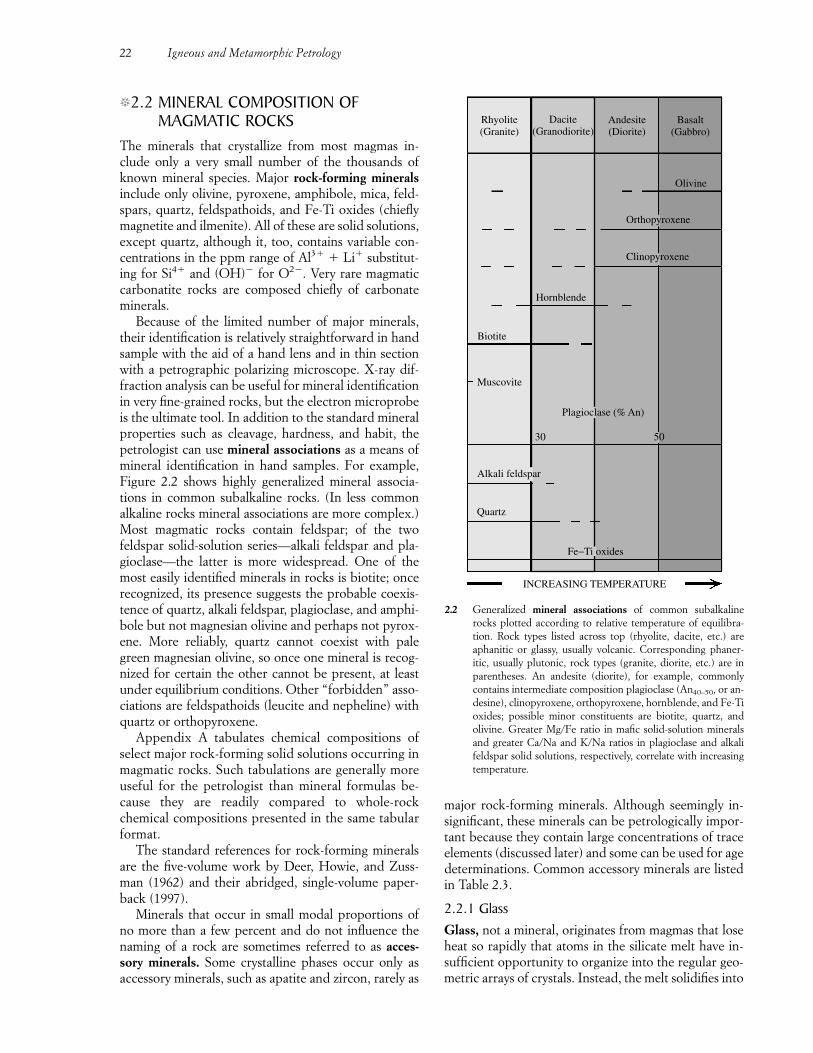
�2.2 MINERAL COMPOSITION OFMAGMATIC ROCKS
The minerals that crystallize from most magmas in-clude only a very small number of the thousands ofknown mineral species. Major rock-forming mineralsinclude only olivine, pyroxene, amphibole, mica, feld-spars, quartz, feldspathoids, and Fe-Ti oxides (chieflymagnetite and ilmenite). All of these are solid solutions,except quartz, although it, too, contains variable con-centrations in the ppm range of Al3� � Li� substitut-ing for Si4� and (OH)� for O2�. Very rare magmaticcarbonatite rocks are composed chiefly of carbonateminerals.
Because of the limited number of major minerals,their identification is relatively straightforward in handsample with the aid of a hand lens and in thin sectionwith a petrographic polarizing microscope. X-ray dif-fraction analysis can be useful for mineral identificationin very fine-grained rocks, but the electron microprobeis the ultimate tool. In addition to the standard mineralproperties such as cleavage, hardness, and habit, thepetrologist can use mineral associations as a means ofmineral identification in hand samples. For example,Figure 2.2 shows highly generalized mineral associa-tions in common subalkaline rocks. (In less commonalkaline rocks mineral associations are more complex.)Most magmatic rocks contain feldspar; of the twofeldspar solid-solution series—alkali feldspar and pla-gioclase—the latter is more widespread. One of themost easily identified minerals in rocks is biotite; oncerecognized, its presence suggests the probable coexis-tence of quartz, alkali feldspar, plagioclase, and amphi-bole but not magnesian olivine and perhaps not pyrox-ene. More reliably, quartz cannot coexist with palegreen magnesian olivine, so once one mineral is recog-nized for certain the other cannot be present, at leastunder equilibrium conditions. Other “forbidden” asso-ciations are feldspathoids (leucite and nepheline) withquartz or orthopyroxene.
Appendix A tabulates chemical compositions ofselect major rock-forming solid solutions occurring inmagmatic rocks. Such tabulations are generally moreuseful for the petrologist than mineral formulas be-cause they are readily compared to whole-rock chemical compositions presented in the same tabularformat.
The standard references for rock-forming mineralsare the five-volume work by Deer, Howie, and Zuss-man (1962) and their abridged, single-volume paper-back (1997).
Minerals that occur in small modal proportions ofno more than a few percent and do not influence thenaming of a rock are sometimes referred to as acces-sory minerals. Some crystalline phases occur only asaccessory minerals, such as apatite and zircon, rarely as
22 Igneous and Metamorphic Petrology
Rhyolite(Granite)
Andesite(Diorite)
Basalt(Gabbro)
Dacite(Granodiorite)
Olivine
Hornblende
Biotite
Muscovite
Quartz
30 50
INCREASING TEMPERATURE
Clinopyroxene
Orthopyroxene
Plagioclase (% An)
Fe−Ti oxides
Alkali feldspar
2.2 Generalized mineral associations of common subalkalinerocks plotted according to relative temperature of equilibra-tion. Rock types listed across top (rhyolite, dacite, etc.) areaphanitic or glassy, usually volcanic. Corresponding phaner-itic, usually plutonic, rock types (granite, diorite, etc.) are inparentheses. An andesite (diorite), for example, commonlycontains intermediate composition plagioclase (An40–50, or an-desine), clinopyroxene, orthopyroxene, hornblende, and Fe-Tioxides; possible minor constituents are biotite, quartz, andolivine. Greater Mg/Fe ratio in mafic solid-solution mineralsand greater Ca/Na and K/Na ratios in plagioclase and alkalifeldspar solid solutions, respectively, correlate with increasingtemperature.
major rock-forming minerals. Although seemingly in-significant, these minerals can be petrologically impor-tant because they contain large concentrations of traceelements (discussed later) and some can be used for agedeterminations. Common accessory minerals are listedin Table 2.3.
2.2.1 GlassGlass, not a mineral, originates from magmas that loseheat so rapidly that atoms in the silicate melt have in-sufficient opportunity to organize into the regular geo-metric arrays of crystals. Instead, the melt solidifies into
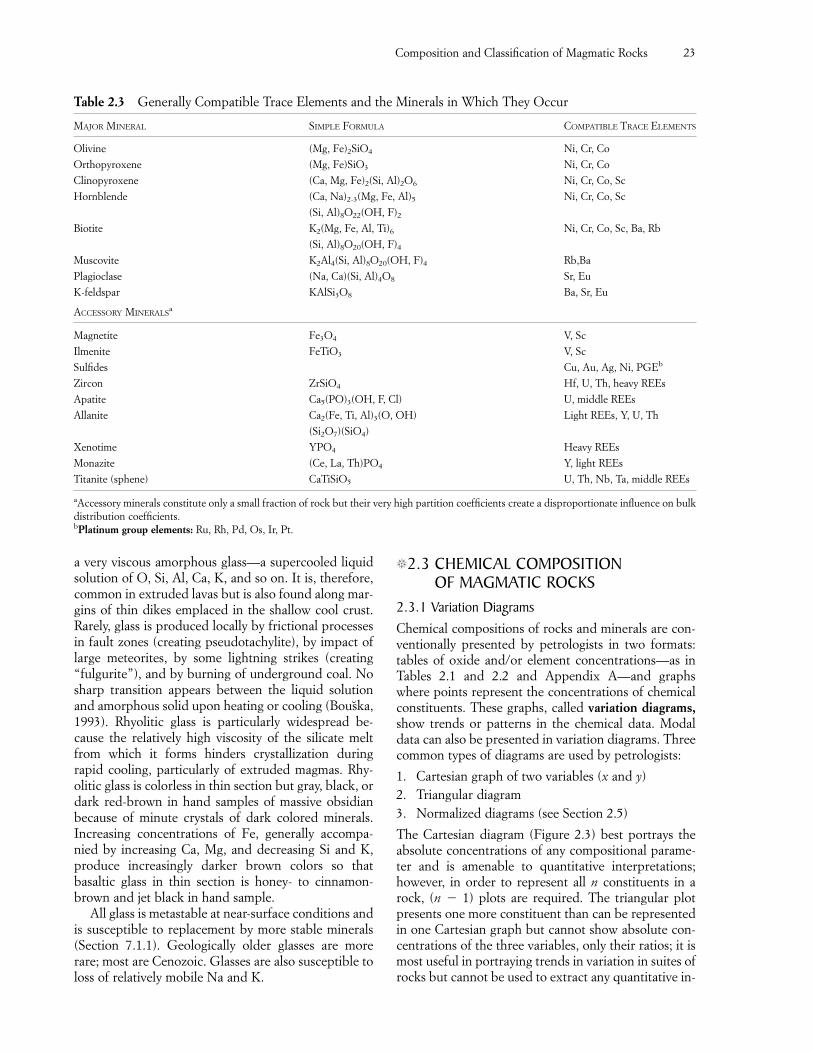
Composition and Classification of Magmatic Rocks 23
Table 2.3 Generally Compatible Trace Elements and the Minerals in Which They Occur
MAJOR MINERAL SIMPLE FORMULA COMPATIBLE TRACE ELEMENTS
Olivine (Mg, Fe)2SiO4 Ni, Cr, Co
Orthopyroxene (Mg, Fe)SiO3 Ni, Cr, Co
Clinopyroxene (Ca, Mg, Fe)2(Si, Al)2O6 Ni, Cr, Co, Sc
Hornblende (Ca, Na)2-3(Mg, Fe, Al)5 Ni, Cr, Co, Sc
(Si, Al)8O22(OH, F)2
Biotite K2(Mg, Fe, Al, Ti)6 Ni, Cr, Co, Sc, Ba, Rb
(Si, Al)8O20(OH, F)4
Muscovite K2Al4(Si, Al)8O20(OH, F)4 Rb,Ba
Plagioclase (Na, Ca)(Si, Al)4O8 Sr, Eu
K-feldspar KAlSi3O8 Ba, Sr, Eu
ACCESSORY MINERALSa
Magnetite Fe3O4 V, Sc
Ilmenite FeTiO3 V, Sc
Sulfides Cu, Au, Ag, Ni, PGEb
Zircon ZrSiO4 Hf, U, Th, heavy REEs
Apatite Ca5(PO)3(OH, F, Cl) U, middle REEs
Allanite Ca2(Fe, Ti, Al)3(O, OH) Light REEs, Y, U, Th
(Si2O7)(SiO4)
Xenotime YPO4 Heavy REEs
Monazite (Ce, La, Th)PO4 Y, light REEs
Titanite (sphene) CaTiSiO5 U, Th, Nb, Ta, middle REEs
aAccessory minerals constitute only a small fraction of rock but their very high partition coefficients create a disproportionate influence on bulkdistribution coefficients. bPlatinum group elements: Ru, Rh, Pd, Os, Ir, Pt.
a very viscous amorphous glass—a supercooled liquidsolution of O, Si, Al, Ca, K, and so on. It is, therefore,common in extruded lavas but is also found along mar-gins of thin dikes emplaced in the shallow cool crust.Rarely, glass is produced locally by frictional processesin fault zones (creating pseudotachylite), by impact oflarge meteorites, by some lightning strikes (creating“fulgurite”), and by burning of underground coal. Nosharp transition appears between the liquid solutionand amorphous solid upon heating or cooling (Bous̆ka,1993). Rhyolitic glass is particularly widespread be-cause the relatively high viscosity of the silicate meltfrom which it forms hinders crystallization duringrapid cooling, particularly of extruded magmas. Rhy-olitic glass is colorless in thin section but gray, black, ordark red-brown in hand samples of massive obsidianbecause of minute crystals of dark colored minerals.Increasing concentrations of Fe, generally accompa-nied by increasing Ca, Mg, and decreasing Si and K,produce increasingly darker brown colors so thatbasaltic glass in thin section is honey- to cinnamon-brown and jet black in hand sample.
All glass is metastable at near-surface conditions andis susceptible to replacement by more stable minerals(Section 7.1.1). Geologically older glasses are morerare; most are Cenozoic. Glasses are also susceptible toloss of relatively mobile Na and K.
�2.3 CHEMICAL COMPOSITION OF MAGMATIC ROCKS
2.3.1 Variation DiagramsChemical compositions of rocks and minerals are con-ventionally presented by petrologists in two formats:tables of oxide and/or element concentrations—as inTables 2.1 and 2.2 and Appendix A—and graphswhere points represent the concentrations of chemicalconstituents. These graphs, called variation diagrams,show trends or patterns in the chemical data. Modaldata can also be presented in variation diagrams. Threecommon types of diagrams are used by petrologists:
1. Cartesian graph of two variables (x and y)2. Triangular diagram3. Normalized diagrams (see Section 2.5)
The Cartesian diagram (Figure 2.3) best portrays theabsolute concentrations of any compositional parame-ter and is amenable to quantitative interpretations;however, in order to represent all n constituents in arock, (n � 1) plots are required. The triangular plotpresents one more constituent than can be representedin one Cartesian graph but cannot show absolute con-centrations of the three variables, only their ratios; it ismost useful in portraying trends in variation in suites ofrocks but cannot be used to extract any quantitative in-
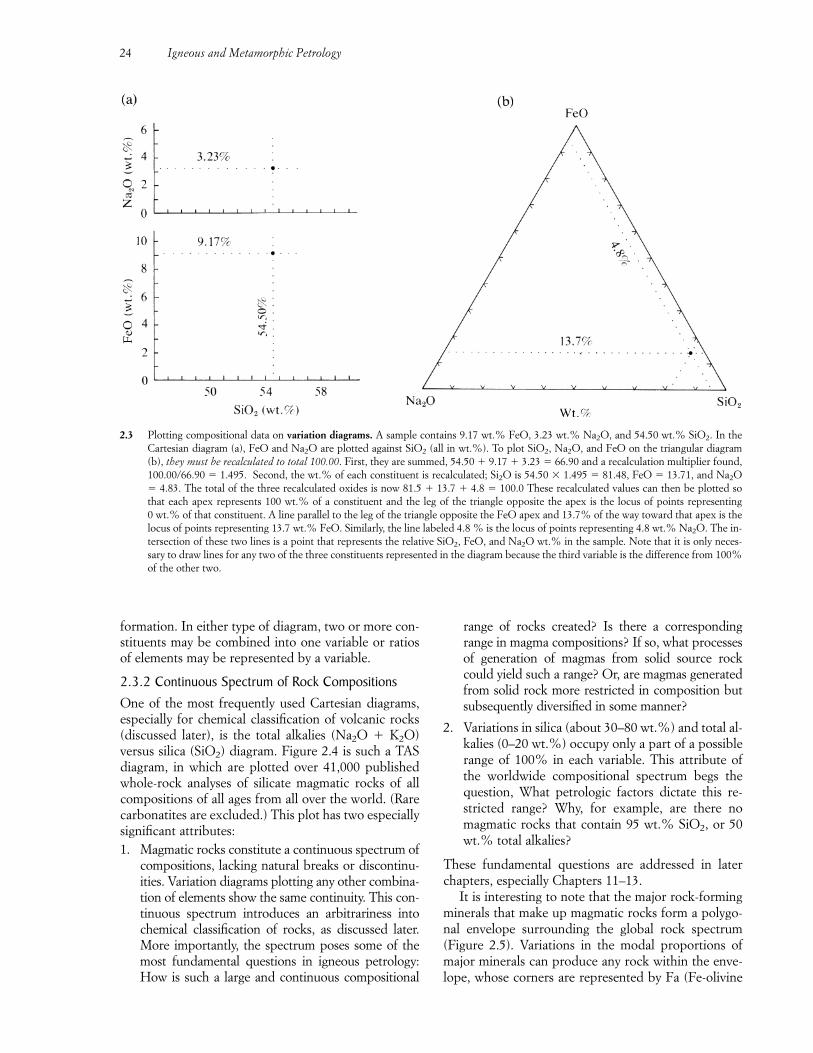
24 Igneous and Metamorphic Petrology
2.3 Plotting compositional data on variation diagrams. A sample contains 9.17 wt.% FeO, 3.23 wt.% Na2O, and 54.50 wt.% SiO2. In theCartesian diagram (a), FeO and Na2O are plotted against SiO2 (all in wt.%). To plot SiO2, Na2O, and FeO on the triangular diagram(b), they must be recalculated to total 100.00. First, they are summed, 54.50 � 9.17 � 3.23 � 66.90 and a recalculation multiplier found,100.00/66.90 � 1.495. Second, the wt.% of each constituent is recalculated; Si2O is 54.50 1.495 � 81.48, FeO � 13.71, and Na2O� 4.83. The total of the three recalculated oxides is now 81.5 � 13.7 � 4.8 � 100.0 These recalculated values can then be plotted sothat each apex represents 100 wt.% of a constituent and the leg of the triangle opposite the apex is the locus of points representing 0 wt.% of that constituent. A line parallel to the leg of the triangle opposite the FeO apex and 13.7% of the way toward that apex is thelocus of points representing 13.7 wt.% FeO. Similarly, the line labeled 4.8 % is the locus of points representing 4.8 wt.% Na2O. The in-tersection of these two lines is a point that represents the relative SiO2, FeO, and Na2O wt.% in the sample. Note that it is only neces-sary to draw lines for any two of the three constituents represented in the diagram because the third variable is the difference from 100%of the other two.
formation. In either type of diagram, two or more con-stituents may be combined into one variable or ratiosof elements may be represented by a variable.
2.3.2 Continuous Spectrum of Rock CompositionsOne of the most frequently used Cartesian diagrams,especially for chemical classification of volcanic rocks(discussed later), is the total alkalies (Na2O � K2O)versus silica (SiO2) diagram. Figure 2.4 is such a TASdiagram, in which are plotted over 41,000 publishedwhole-rock analyses of silicate magmatic rocks of allcompositions of all ages from all over the world. (Rarecarbonatites are excluded.) This plot has two especiallysignificant attributes:1. Magmatic rocks constitute a continuous spectrum of
compositions, lacking natural breaks or discontinu-ities. Variation diagrams plotting any other combina-tion of elements show the same continuity. This con-tinuous spectrum introduces an arbitrariness intochemical classification of rocks, as discussed later.More importantly, the spectrum poses some of themost fundamental questions in igneous petrology:How is such a large and continuous compositional
range of rocks created? Is there a correspondingrange in magma compositions? If so, what processesof generation of magmas from solid source rockcould yield such a range? Or, are magmas generatedfrom solid rock more restricted in composition butsubsequently diversified in some manner?
2. Variations in silica (about 30–80 wt.%) and total al-kalies (0–20 wt.%) occupy only a part of a possiblerange of 100% in each variable. This attribute ofthe worldwide compositional spectrum begs thequestion, What petrologic factors dictate this re-stricted range? Why, for example, are there nomagmatic rocks that contain 95 wt.% SiO2, or 50wt.% total alkalies?
These fundamental questions are addressed in laterchapters, especially Chapters 11–13.
It is interesting to note that the major rock-formingminerals that make up magmatic rocks form a polygo-nal envelope surrounding the global rock spectrum(Figure 2.5). Variations in the modal proportions ofmajor minerals can produce any rock within the enve-lope, whose corners are represented by Fa (Fe-olivine
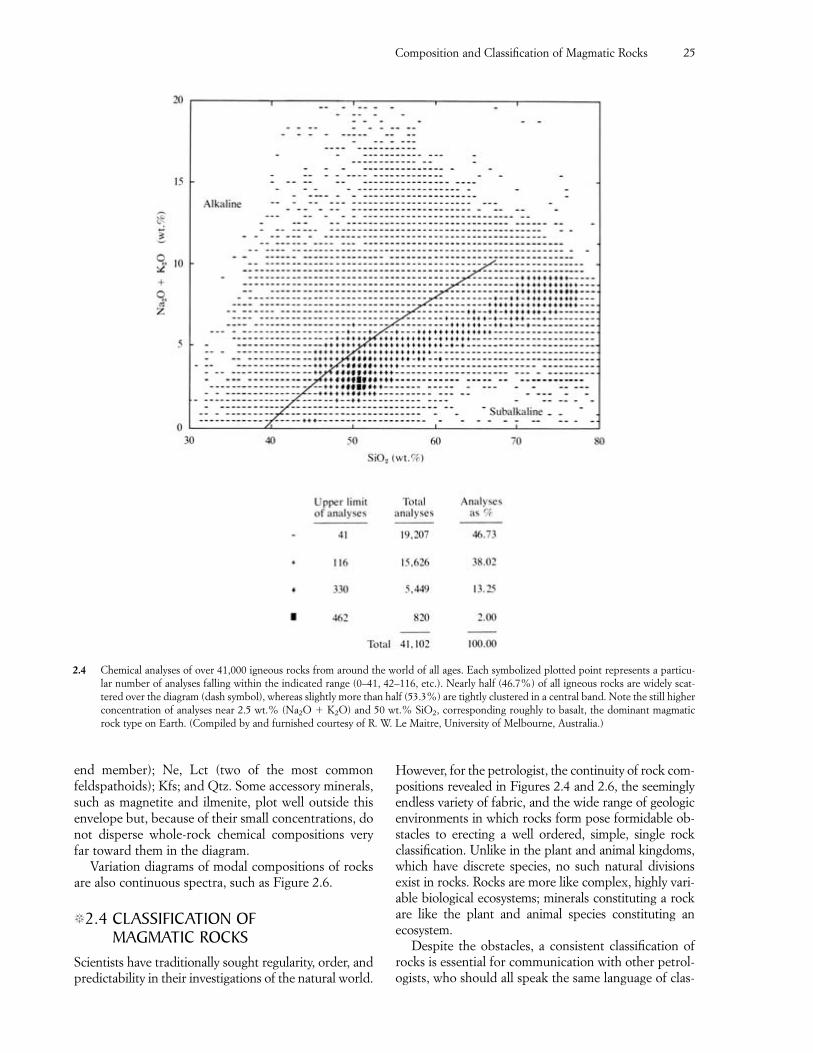
Composition and Classification of Magmatic Rocks 25
2.4 Chemical analyses of over 41,000 igneous rocks from around the world of all ages. Each symbolized plotted point represents a particu-lar number of analyses falling within the indicated range (0–41, 42–116, etc.). Nearly half (46.7%) of all igneous rocks are widely scat-tered over the diagram (dash symbol), whereas slightly more than half (53.3%) are tightly clustered in a central band. Note the still higherconcentration of analyses near 2.5 wt.% (Na2O � K2O) and 50 wt.% SiO2, corresponding roughly to basalt, the dominant magmaticrock type on Earth. (Compiled by and furnished courtesy of R. W. Le Maitre, University of Melbourne, Australia.)
end member); Ne, Lct (two of the most commonfeldspathoids); Kfs; and Qtz. Some accessory minerals,such as magnetite and ilmenite, plot well outside thisenvelope but, because of their small concentrations, donot disperse whole-rock chemical compositions veryfar toward them in the diagram.
Variation diagrams of modal compositions of rocksare also continuous spectra, such as Figure 2.6.
�2.4 CLASSIFICATION OF MAGMATIC ROCKS
Scientists have traditionally sought regularity, order, andpredictability in their investigations of the natural world.
However, for the petrologist, the continuity of rock com-positions revealed in Figures 2.4 and 2.6, the seeminglyendless variety of fabric, and the wide range of geologicenvironments in which rocks form pose formidable ob-stacles to erecting a well ordered, simple, single rockclassification. Unlike in the plant and animal kingdoms,which have discrete species, no such natural divisionsexist in rocks. Rocks are more like complex, highly vari-able biological ecosystems; minerals constituting a rockare like the plant and animal species constituting anecosystem.
Despite the obstacles, a consistent classification ofrocks is essential for communication with other petrol-ogists, who should all speak the same language of clas-
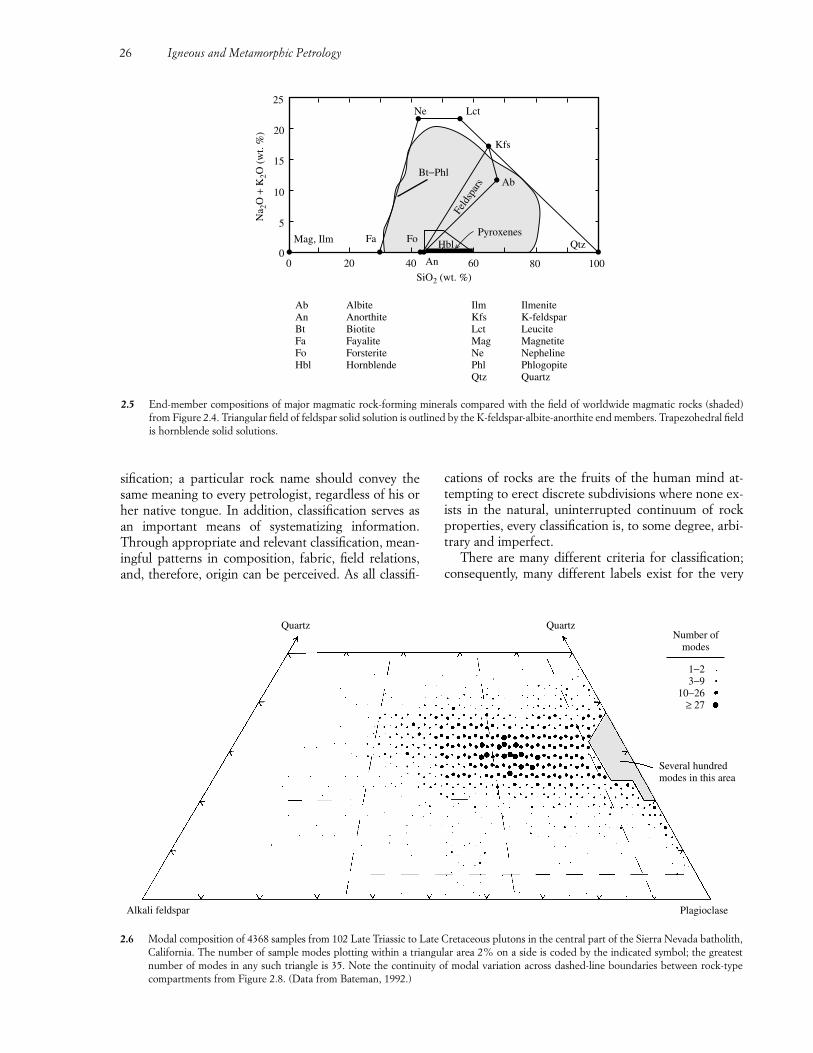
26 Igneous and Metamorphic Petrology
2.5 End-member compositions of major magmatic rock-forming minerals compared with the field of worldwide magmatic rocks (shaded)from Figure 2.4. Triangular field of feldspar solid solution is outlined by the K-feldspar-albite-anorthite end members. Trapezohedral fieldis hornblende solid solutions.
25
20
15
10
5
00 20 40 60 80 100
Na 2
O +
K2O
(w
t. %
)
SiO2 (wt. %)
Ne
Bt−Phl
Lct
Mag, Ilm Fa Fo Hbl Qtz
Ab Albite Ilm IlmeniteAn Anorthite Kfs K-feldsparBt Biotite Lct LeuciteFa Fayalite Mag MagnetiteFo Forsterite Ne NephelineHbl Hornblende Phl Phlogopite
Qtz Quartz
An
Kfs
Pyroxenes
Feld
spar
s Ab
Quartz QuartzNumber of
modes
Several hundredmodes in this area
1−23−9
10−26≥ 27
PlagioclaseAlkali feldspar
2.6 Modal composition of 4368 samples from 102 Late Triassic to Late Cretaceous plutons in the central part of the Sierra Nevada batholith,California. The number of sample modes plotting within a triangular area 2% on a side is coded by the indicated symbol; the greatestnumber of modes in any such triangle is 35. Note the continuity of modal variation across dashed-line boundaries between rock-typecompartments from Figure 2.8. (Data from Bateman, 1992.)
sification; a particular rock name should convey thesame meaning to every petrologist, regardless of his orher native tongue. In addition, classification serves asan important means of systematizing information.Through appropriate and relevant classification, mean-ingful patterns in composition, fabric, field relations,and, therefore, origin can be perceived. As all classifi-
cations of rocks are the fruits of the human mind at-tempting to erect discrete subdivisions where none ex-ists in the natural, uninterrupted continuum of rockproperties, every classification is, to some degree, arbi-trary and imperfect.
There are many different criteria for classification;consequently, many different labels exist for the very
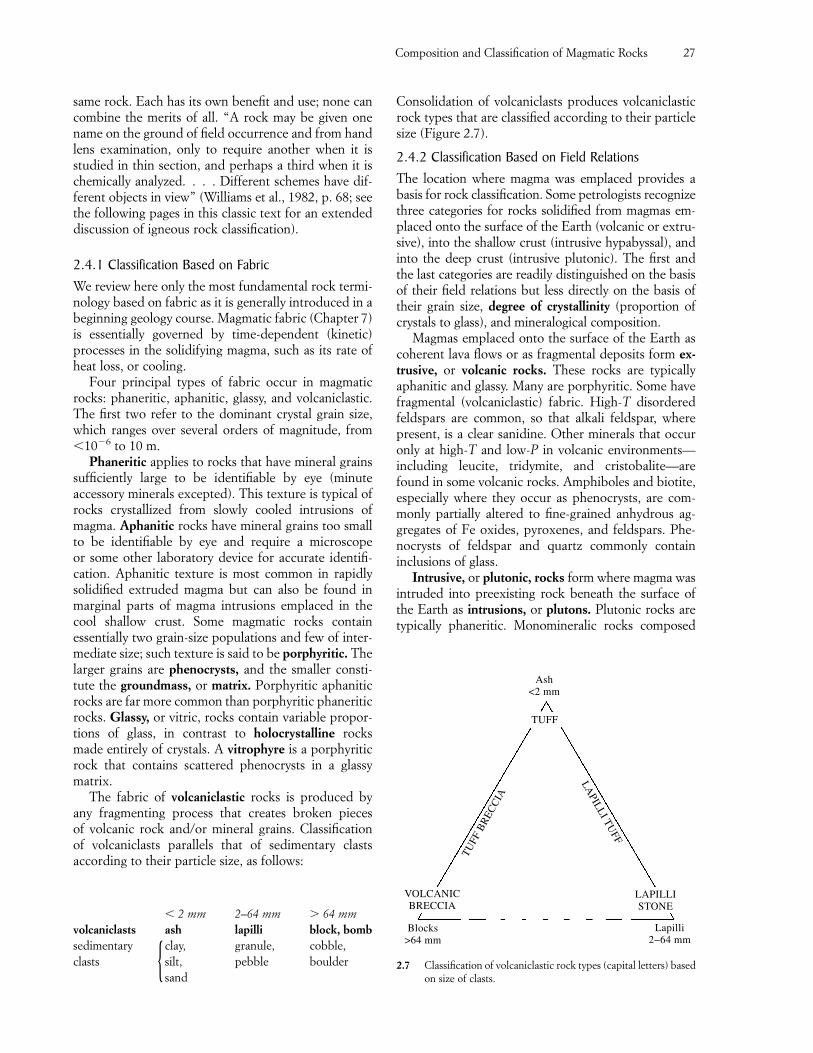
same rock. Each has its own benefit and use; none cancombine the merits of all. “A rock may be given onename on the ground of field occurrence and from handlens examination, only to require another when it isstudied in thin section, and perhaps a third when it ischemically analyzed. . . . Different schemes have dif-ferent objects in view” (Williams et al., 1982, p. 68; seethe following pages in this classic text for an extendeddiscussion of igneous rock classification).
2.4.1 Classification Based on FabricWe review here only the most fundamental rock termi-nology based on fabric as it is generally introduced in abeginning geology course. Magmatic fabric (Chapter 7)is essentially governed by time-dependent (kinetic)processes in the solidifying magma, such as its rate ofheat loss, or cooling.
Four principal types of fabric occur in magmaticrocks: phaneritic, aphanitic, glassy, and volcaniclastic.The first two refer to the dominant crystal grain size,which ranges over several orders of magnitude, from�10�6 to 10 m.
Phaneritic applies to rocks that have mineral grainssufficiently large to be identifiable by eye (minute accessory minerals excepted). This texture is typical ofrocks crystallized from slowly cooled intrusions ofmagma. Aphanitic rocks have mineral grains too smallto be identifiable by eye and require a microscope or some other laboratory device for accurate identifi-cation. Aphanitic texture is most common in rapidlysolidified extruded magma but can also be found inmarginal parts of magma intrusions emplaced in thecool shallow crust. Some magmatic rocks contain essentially two grain-size populations and few of inter-mediate size; such texture is said to be porphyritic. Thelarger grains are phenocrysts, and the smaller consti-tute the groundmass, or matrix. Porphyritic aphaniticrocks are far more common than porphyritic phaneriticrocks. Glassy, or vitric, rocks contain variable propor-tions of glass, in contrast to holocrystalline rocks made entirely of crystals. A vitrophyre is a porphyriticrock that contains scattered phenocrysts in a glassy matrix.
The fabric of volcaniclastic rocks is produced byany fragmenting process that creates broken pieces of volcanic rock and/or mineral grains. Classification of volcaniclasts parallels that of sedimentary clasts according to their particle size, as follows:
� 2 mm 2–64 mm � 64 mmvolcaniclasts ash lapilli block, bombsedimentary clay, granule, cobble,clasts silt, pebble boulder
sand
Consolidation of volcaniclasts produces volcaniclasticrock types that are classified according to their particlesize (Figure 2.7).
2.4.2 Classification Based on Field Relations The location where magma was emplaced provides abasis for rock classification. Some petrologists recognizethree categories for rocks solidified from magmas em-placed onto the surface of the Earth (volcanic or extru-sive), into the shallow crust (intrusive hypabyssal), andinto the deep crust (intrusive plutonic). The first andthe last categories are readily distinguished on the basisof their field relations but less directly on the basis oftheir grain size, degree of crystallinity (proportion ofcrystals to glass), and mineralogical composition.
Magmas emplaced onto the surface of the Earth ascoherent lava flows or as fragmental deposits form ex-trusive, or volcanic rocks. These rocks are typicallyaphanitic and glassy. Many are porphyritic. Some havefragmental (volcaniclastic) fabric. High-T disorderedfeldspars are common, so that alkali feldspar, wherepresent, is a clear sanidine. Other minerals that occuronly at high-T and low-P in volcanic environments—including leucite, tridymite, and cristobalite—arefound in some volcanic rocks. Amphiboles and biotite,especially where they occur as phenocrysts, are com-monly partially altered to fine-grained anhydrous ag-gregates of Fe oxides, pyroxenes, and feldspars. Phe-nocrysts of feldspar and quartz commonly containinclusions of glass.
Intrusive, or plutonic, rocks form where magma wasintruded into preexisting rock beneath the surface ofthe Earth as intrusions, or plutons. Plutonic rocks aretypically phaneritic. Monomineralic rocks composed
Composition and Classification of Magmatic Rocks 27
Blocks>64 mm
VOLCANICBRECCIA
TUFF
BR
ECC
IA
TUFF
Ash<2 mm
LAPILLI TU
FF
Lapilli2−64 mm
LAPILLISTONE
2.7 Classification of volcaniclastic rock types (capital letters) basedon size of clasts.{
only of plagioclase, or olivine, or pyroxene are wellknown but rare. Amphiboles and biotite are commonlypartially altered, usually to chlorite. Some granites con-tain muscovite, which is exceedingly rare in volcanicrocks. Perthite—an intergrowth of sodic and potassicfeldspar—is widespread and reflects slow cooling andexsolution in initially homogeneous alkali feldspar.
Characteristics of intermediate-depth hypabyssalrocks are not clearly distinct from those of volcanic andplutonic rocks. Many occur in shallow crustal dikes,sills, and plugs that represent feeding conduits for sur-face extrusions of magma. But dikes and sills are alsointruded deep in the crust. Hypabyssal rocks can havefabric similar to that of plutonic and volcanic rocks.Because of these ambiguities, many petrologists tend tocategorize magmatic rocks in the field simply as plu-tonic or volcanic.
2.4.3 Classification Based on Mineralogical and Modal Composition
Mineralogical Mnemonics. Felsic is a mnemonic adjec-tive derived from the words feldspar and silica. It is auseful appellation for rocks that contain large propor-tions of feldspar with or without quartz and/or its poly-morphs, tridymite and cristobalite. Granite and rhyo-lite made mostly of feldspar and quartz are examples offelsic rocks. The term felsic also applies to rocks con-taining abundant feldspathoids, such as nepheline, andto these rock-forming minerals as well. Mafic is amnemonic adjective derived from the words magne-sium and ferrous/ferric. Mafic is a less cumbersometerm than the synonymous ferromagnesian. It refers tomajor rock-forming biotite, amphibole, pyroxene,olivine, and Fe-Ti oxide solid solutions as well as rocksthat contain large proportions of them, such as basalt.Ultramafic rocks are especially rich in Mg and Fe andgenerally have little or no feldspar; an example is theolivine-pyroxene rock called peridotite. Silicic rockscontain large concentrations of silica, manifested by anabundance of alkali feldspar, quartz, or glass rich inSiO2. Examples are rhyolite and granite. The termsialic is used less frequently for rocks rich in Si and Althat contain abundant feldspar and is used especiallywith reference to the continental crust.
Color is usually the first rock property noticed bythe novice. However, a particular rock type can possessa wide range of colors; granites, as just one example,can be nearly white, shades of gray, green, red, andbrown. These widely ranging colors reflect equallywidely variable colors of the dominant rock-formingfeldspars, whose pigmentation is a complex function ofminute mineral inclusions, exsolution, and small con-centrations of elements such as Fe in solid solution;none of these factors may be petrologically very signif-icant and in any case may be difficult to determine.
Color is not a valid basis of rock classification and can,in fact, be highly misleading. Color index has been de-fined as the modal proportion of dark-colored mineralsin a rock. But, in view of the fact that dominant rock-forming feldspars can be light- to dark-colored, a moreaccurate index should be defined on the basis of theproportion of mafic minerals. Leucocratic and melano-cratic rocks can be defined as having 0–30% and60–100% modal mafic minerals, respectively.
Rock Types. The classification of magmatic rocks mostfamiliar to the beginning geology student is that of rocktypes. In contrast to the broadly defined compositionallabels just described, a rock type has a narrowly de-fined composition and a particular fabric. Familiarrock types include rhyolite, andesite, and basalt (allaphanitic) and granite and diorite (both phaneritic).Many rock-type labels have a long and obscure historystemming from miners’ jargon (Mitchell, 1985); manyare coined from geographic locales, such as andesitefrom the Andes Mountains of western South America.About 800 igneous rock-type names are listed in theclassic four-volume work of Johannsen (1931–1938),written toward the end of an era when petrology wasmostly descriptive petrography and the coining of newrock names was in vogue. Today, most of these nameshave, fortunately, been abandoned and petrologistsneed have only a working knowledge of a few dozenmajor igneous rock-type names (Le Maitre, 1989).
Regrettably, however, few of these major names havehad consistent usage among petrologists. One petrolo-gist’s andesite has been another’s basalt. Personal bi-ases and backgrounds have been strong factors inschemes of classification. If rock compositions wereclustered into isolated clumps on any variation diagramit would be a simple matter to draw a line around eachcluster and append a rock-type name to it. However, asFigures 2.4 and 2.6 show, compositions are not clus-tered but consist of a continuum. There are at least twoapproaches to nomenclature within this continuum:
1. Flexible, loosely defined limits could be defined,leaving the details to the individual petrologistguided by the circumstances and need at hand.However, this approach has over the decades re-sulted in considerable confusion in the geologic lit-erature.
2. The continuous spectrum could be subdividedalong specific, well-defined limits that follow asclosely as possible a usage agreed upon by as manypetrologists as possible. This is the approach of theInternational Union of Geological Sciences Sub-commission on the Systematics of Igneous Rocks,hereafter referred to as the IUGS. The IUGS sys-tem of classification (Le Maitre, 1989) is a universalstandard that can eliminate individual biases andcontradictions among petrologists.
28 Igneous and Metamorphic Petrology
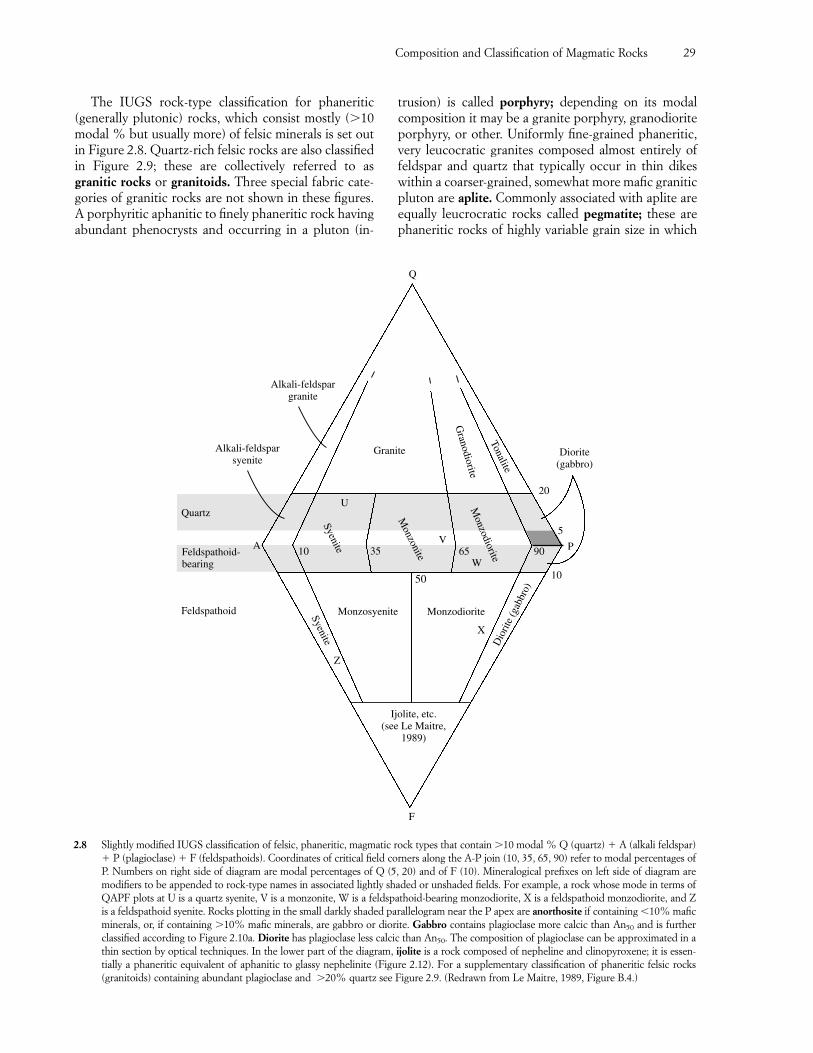
Composition and Classification of Magmatic Rocks 29
The IUGS rock-type classification for phaneritic(generally plutonic) rocks, which consist mostly (�10modal % but usually more) of felsic minerals is set outin Figure 2.8. Quartz-rich felsic rocks are also classifiedin Figure 2.9; these are collectively referred to asgranitic rocks or granitoids. Three special fabric cate-gories of granitic rocks are not shown in these figures.A porphyritic aphanitic to finely phaneritic rock havingabundant phenocrysts and occurring in a pluton (in-
trusion) is called porphyry; depending on its modalcomposition it may be a granite porphyry, granodioriteporphyry, or other. Uniformly fine-grained phaneritic,very leucocratic granites composed almost entirely offeldspar and quartz that typically occur in thin dikeswithin a coarser-grained, somewhat more mafic graniticpluton are aplite. Commonly associated with aplite areequally leucrocratic rocks called pegmatite; these arephaneritic rocks of highly variable grain size in which
Alkali-feldspargranite
Alkali-feldsparsyenite
Quartz
Feldspathoid-bearing
Feldspathoid
Granite Diorite(gabbro)
20
5
P
10
Dio
rite
(gab
bro)
Ijolite, etc.(see Le Maitre,
1989)
F
Monzosyenite
Monzonite
Monzodiorite
Monzodiorite
Syenite
Syenite
Z
X
10V
65 90W
Q
35
U
Granodiorite
Tonalite
50
A
2.8 Slightly modified IUGS classification of felsic, phaneritic, magmatic rock types that contain �10 modal % Q (quartz) � A (alkali feldspar)� P (plagioclase) � F (feldspathoids). Coordinates of critical field corners along the A-P join (10, 35, 65, 90) refer to modal percentages ofP. Numbers on right side of diagram are modal percentages of Q (5, 20) and of F (10). Mineralogical prefixes on left side of diagram aremodifiers to be appended to rock-type names in associated lightly shaded or unshaded fields. For example, a rock whose mode in terms ofQAPF plots at U is a quartz syenite, V is a monzonite, W is a feldspathoid-bearing monzodiorite, X is a feldspathoid monzodiorite, and Zis a feldspathoid syenite. Rocks plotting in the small darkly shaded parallelogram near the P apex are anorthosite if containing �10% maficminerals, or, if containing �10% mafic minerals, are gabbro or diorite. Gabbro contains plagioclase more calcic than An50 and is furtherclassified according to Figure 2.10a. Diorite has plagioclase less calcic than An50. The composition of plagioclase can be approximated in athin section by optical techniques. In the lower part of the diagram, ijolite is a rock composed of nepheline and clinopyroxene; it is essen-tially a phaneritic equivalent of aphanitic to glassy nephelinite (Figure 2.12). For a supplementary classification of phaneritic felsic rocks(granitoids) containing abundant plagioclase and �20% quartz see Figure 2.9. (Redrawn from Le Maitre, 1989, Figure B.4.)
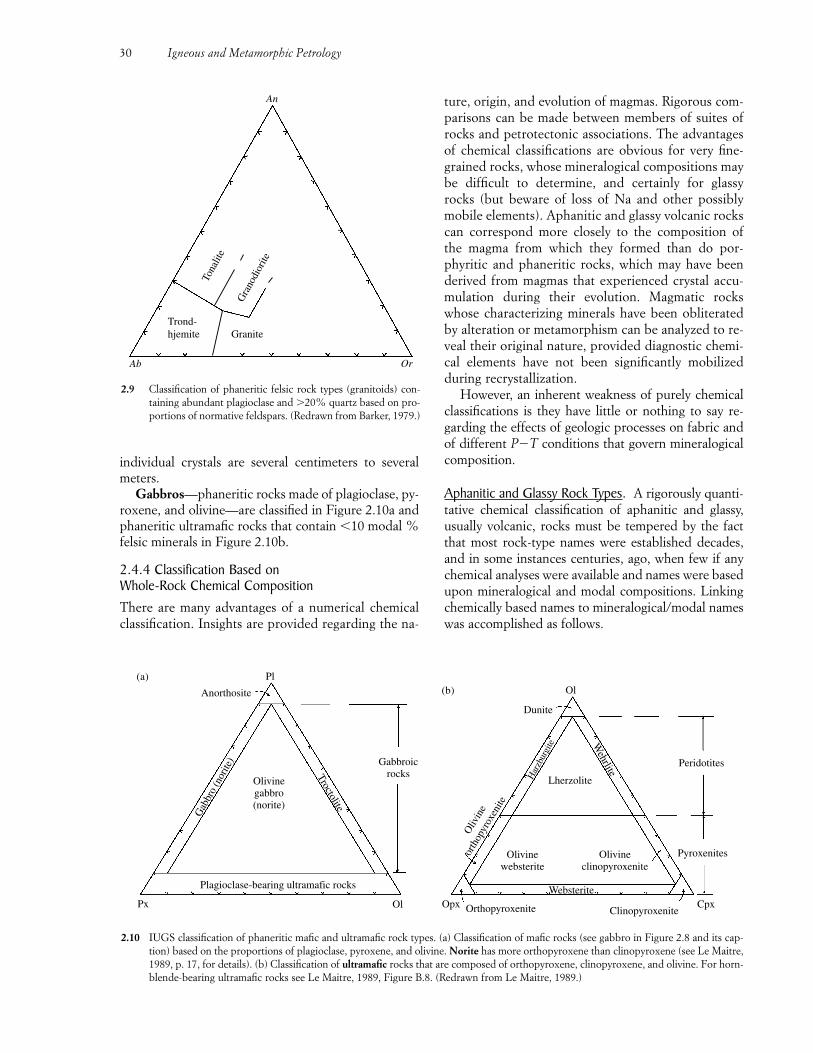
individual crystals are several centimeters to severalmeters.
Gabbros—phaneritic rocks made of plagioclase, py-roxene, and olivine—are classified in Figure 2.10a andphaneritic ultramafic rocks that contain �10 modal %felsic minerals in Figure 2.10b.
2.4.4 Classification Based on Whole-Rock Chemical CompositionThere are many advantages of a numerical chemicalclassification. Insights are provided regarding the na-
ture, origin, and evolution of magmas. Rigorous com-parisons can be made between members of suites ofrocks and petrotectonic associations. The advantagesof chemical classifications are obvious for very fine-grained rocks, whose mineralogical compositions maybe difficult to determine, and certainly for glassyrocks (but beware of loss of Na and other possiblymobile elements). Aphanitic and glassy volcanic rockscan correspond more closely to the composition ofthe magma from which they formed than do por-phyritic and phaneritic rocks, which may have beenderived from magmas that experienced crystal accu-mulation during their evolution. Magmatic rockswhose characterizing minerals have been obliteratedby alteration or metamorphism can be analyzed to re-veal their original nature, provided diagnostic chemi-cal elements have not been significantly mobilizedduring recrystallization.
However, an inherent weakness of purely chemicalclassifications is they have little or nothing to say re-garding the effects of geologic processes on fabric andof different P�T conditions that govern mineralogicalcomposition.
Aphanitic and Glassy Rock Types. A rigorously quanti-tative chemical classification of aphanitic and glassy,usually volcanic, rocks must be tempered by the factthat most rock-type names were established decades,and in some instances centuries, ago, when few if anychemical analyses were available and names were basedupon mineralogical and modal compositions. Linkingchemically based names to mineralogical/modal nameswas accomplished as follows.
30 Igneous and Metamorphic Petrology
Tona
lite
Gra
nodi
orite
GraniteTrond-hjemite
OrAb
An
2.9 Classification of phaneritic felsic rock types (granitoids) con-taining abundant plagioclase and �20% quartz based on pro-portions of normative feldspars. (Redrawn from Barker, 1979.)
OpxWebsterite
Cpx
Pyroxenites
Peridotites
Ol
Dunite
Har
zbur
gite
Olivinewebsterite
Olivineclinopyroxenite
Lherzolite
Wehrlite
Orthopyroxenite Clinopyroxenite
Oliv
ine
orth
opyr
oxen
ite
Px Ol
Plagioclase-bearing ultramafic rocks
Olivinegabbro(norite)
Troctolite
Gab
bro
(nor
ite) Gabbroic
rocks
Pl
Anorthosite
(a)(b)
2.10 IUGS classification of phaneritic mafic and ultramafic rock types. (a) Classification of mafic rocks (see gabbro in Figure 2.8 and its cap-tion) based on the proportions of plagioclase, pyroxene, and olivine. Norite has more orthopyroxene than clinopyroxene (see Le Maitre,1989, p. 17, for details). (b) Classification of ultramafic rocks that are composed of orthopyroxene, clinopyroxene, and olivine. For horn-blende-bearing ultramafic rocks see Le Maitre, 1989, Figure B.8. (Redrawn from Le Maitre, 1989.)
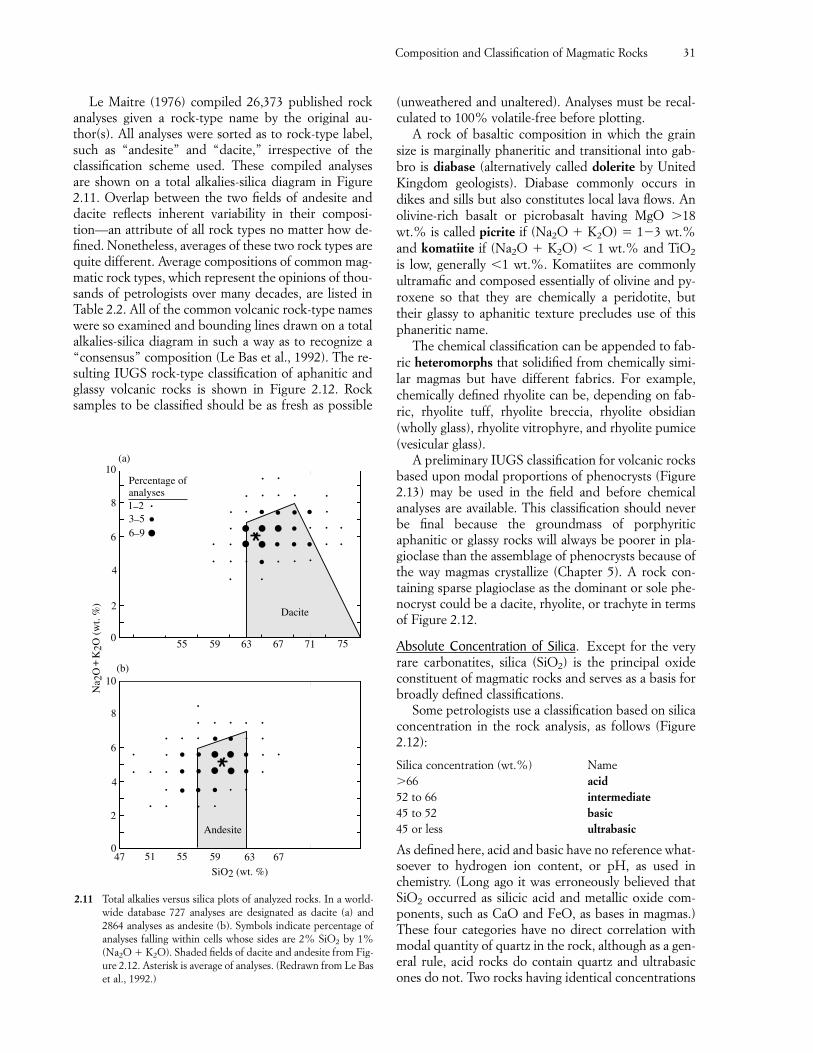
Le Maitre (1976) compiled 26,373 published rockanalyses given a rock-type name by the original au-thor(s). All analyses were sorted as to rock-type label,such as “andesite” and “dacite,” irrespective of theclassification scheme used. These compiled analysesare shown on a total alkalies-silica diagram in Figure2.11. Overlap between the two fields of andesite anddacite reflects inherent variability in their composi-tion—an attribute of all rock types no matter how de-fined. Nonetheless, averages of these two rock types arequite different. Average compositions of common mag-matic rock types, which represent the opinions of thou-sands of petrologists over many decades, are listed inTable 2.2. All of the common volcanic rock-type nameswere so examined and bounding lines drawn on a totalalkalies-silica diagram in such a way as to recognize a“consensus” composition (Le Bas et al., 1992). The re-sulting IUGS rock-type classification of aphanitic andglassy volcanic rocks is shown in Figure 2.12. Rocksamples to be classified should be as fresh as possible
(unweathered and unaltered). Analyses must be recal-culated to 100% volatile-free before plotting.
A rock of basaltic composition in which the grainsize is marginally phaneritic and transitional into gab-bro is diabase (alternatively called dolerite by UnitedKingdom geologists). Diabase commonly occurs indikes and sills but also constitutes local lava flows. Anolivine-rich basalt or picrobasalt having MgO �18 wt.% is called picrite if (Na2O � K2O) � 1�3 wt.%and komatiite if (Na2O � K2O) � 1 wt.% and TiO2
is low, generally �1 wt.%. Komatiites are commonlyultramafic and composed essentially of olivine and py-roxene so that they are chemically a peridotite, buttheir glassy to aphanitic texture precludes use of thisphaneritic name.
The chemical classification can be appended to fab-ric heteromorphs that solidified from chemically simi-lar magmas but have different fabrics. For example,chemically defined rhyolite can be, depending on fab-ric, rhyolite tuff, rhyolite breccia, rhyolite obsidian(wholly glass), rhyolite vitrophyre, and rhyolite pumice(vesicular glass).
A preliminary IUGS classification for volcanic rocksbased upon modal proportions of phenocrysts (Figure2.13) may be used in the field and before chemicalanalyses are available. This classification should neverbe final because the groundmass of porphyriticaphanitic or glassy rocks will always be poorer in pla-gioclase than the assemblage of phenocrysts because ofthe way magmas crystallize (Chapter 5). A rock con-taining sparse plagioclase as the dominant or sole phe-nocryst could be a dacite, rhyolite, or trachyte in termsof Figure 2.12.
Absolute Concentration of Silica. Except for the veryrare carbonatites, silica (SiO2) is the principal oxideconstituent of magmatic rocks and serves as a basis forbroadly defined classifications.
Some petrologists use a classification based on silicaconcentration in the rock analysis, as follows (Figure2.12):
Silica concentration (wt.%) Name�66 acid52 to 66 intermediate45 to 52 basic45 or less ultrabasic
As defined here, acid and basic have no reference what-soever to hydrogen ion content, or pH, as used inchemistry. (Long ago it was erroneously believed thatSiO2 occurred as silicic acid and metallic oxide com-ponents, such as CaO and FeO, as bases in magmas.)These four categories have no direct correlation withmodal quantity of quartz in the rock, although as a gen-eral rule, acid rocks do contain quartz and ultrabasicones do not. Two rocks having identical concentrations
Composition and Classification of Magmatic Rocks 31
Andesite
Dacite
10
8
6
4
2
0
10
8
6
4
2
047 51 55 59 63 67
55 59 63 67 71 75
SiO2 (wt. %)
(b)
(a)
Percentage ofanalyses1_23_56_9
Na 2
OK
2O (
wt.
%)
+
2.11 Total alkalies versus silica plots of analyzed rocks. In a world-wide database 727 analyses are designated as dacite (a) and2864 analyses as andesite (b). Symbols indicate percentage ofanalyses falling within cells whose sides are 2% SiO2 by 1%(Na2O � K2O). Shaded fields of dacite and andesite from Fig-ure 2.12. Asterisk is average of analyses. (Redrawn from Le Baset al., 1992.)
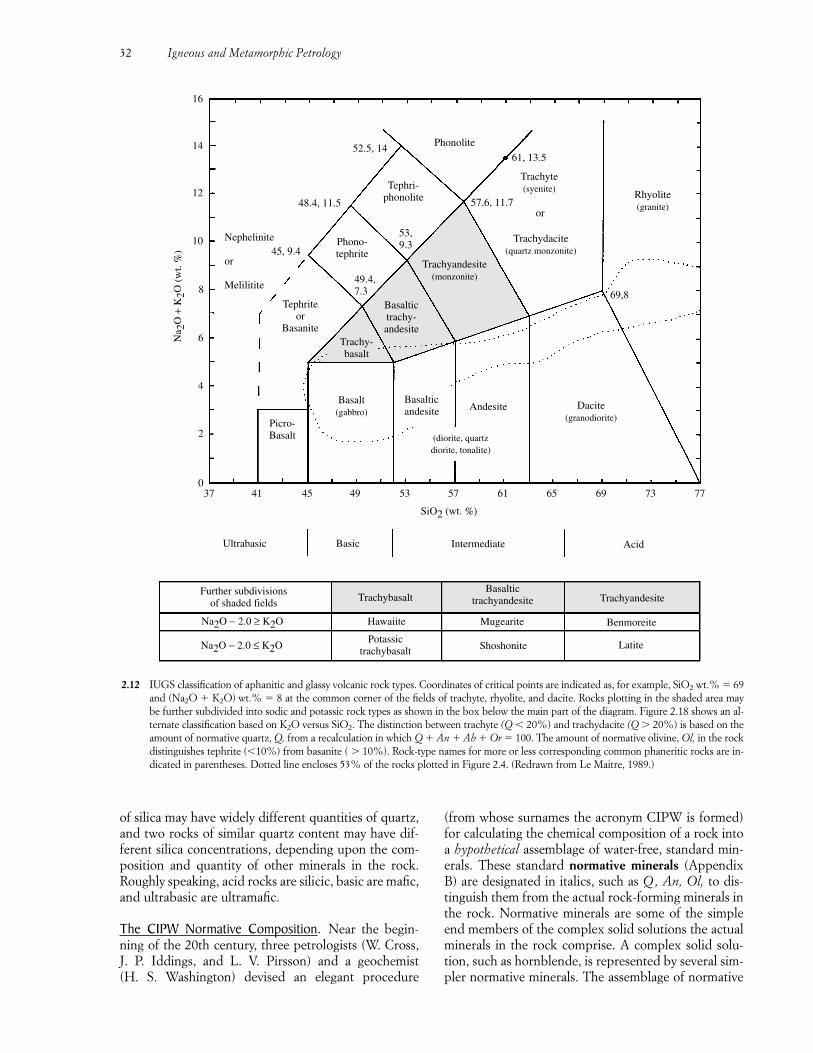
of silica may have widely different quantities of quartz,and two rocks of similar quartz content may have dif-ferent silica concentrations, depending upon the com-position and quantity of other minerals in the rock.Roughly speaking, acid rocks are silicic, basic are mafic,and ultrabasic are ultramafic.
The CIPW Normative Composition. Near the begin-ning of the 20th century, three petrologists (W. Cross,J. P. Iddings, and L. V. Pirsson) and a geochemist (H. S. Washington) devised an elegant procedure
(from whose surnames the acronym CIPW is formed)for calculating the chemical composition of a rock intoa hypothetical assemblage of water-free, standard min-erals. These standard normative minerals (AppendixB) are designated in italics, such as Q , An, Ol, to dis-tinguish them from the actual rock-forming minerals inthe rock. Normative minerals are some of the simpleend members of the complex solid solutions the actualminerals in the rock comprise. A complex solid solu-tion, such as hornblende, is represented by several sim-pler normative minerals. The assemblage of normative
32 Igneous and Metamorphic Petrology
Further subdivisionsof shaded fields
Na2O − 2.0 ≥ K2O
Na2O − 2.0 ≤ K2O
ΤrachybasaltBasaltic
trachyandesite Trachyandesite
Benmoreite
Latite
Hawaiite
Potassictrachybasalt
Mugearite
Shoshonite
Ultrabasic Basic AcidIntermediate
37 41 45 49 53 57 61 65 69 73 77
SiO2 (wt. %)
Basalt(gabbro)
Basalticandesite Andesite Dacite
(granodiorite)Picro-Basalt (diorite, quartz
diorite, tonalite)
69,8
Rhyolite(granite)
61, 13.5
57.6, 11.7
52.5, 14
48.4, 11.5
45, 9.4
49.4,7.3
53,9.3
Trachyte(syenite)
Trachydacite
(quartz monzonite)
Trachyandesite(monzonite)
Basaltictrachy-andesite
Trachy-basalt
Tephriteor
Basanite
Phono-tephrite
Tephri-phonolite
Phonolite
Nephelinite
or
Melilitite
0
2
4
6
8
10
12
14
16
Na 2
O +
K2O
(w
t. %
)
or
2.12 IUGS classification of aphanitic and glassy volcanic rock types. Coordinates of critical points are indicated as, for example, SiO2 wt.% � 69and (Na2O � K2O) wt.% � 8 at the common corner of the fields of trachyte, rhyolite, and dacite. Rocks plotting in the shaded area maybe further subdivided into sodic and potassic rock types as shown in the box below the main part of the diagram. Figure 2.18 shows an al-ternate classification based on K2O versus SiO2. The distinction between trachyte (Q � 20%) and trachydacite (Q � 20%) is based on theamount of normative quartz, Q, from a recalculation in which Q � An � Ab � Or � 100. The amount of normative olivine, Ol, in the rockdistinguishes tephrite (�10%) from basanite ( � 10%). Rock-type names for more or less corresponding common phaneritic rocks are in-dicated in parentheses. Dotted line encloses 53% of the rocks plotted in Figure 2.4. (Redrawn from Le Maitre, 1989.)
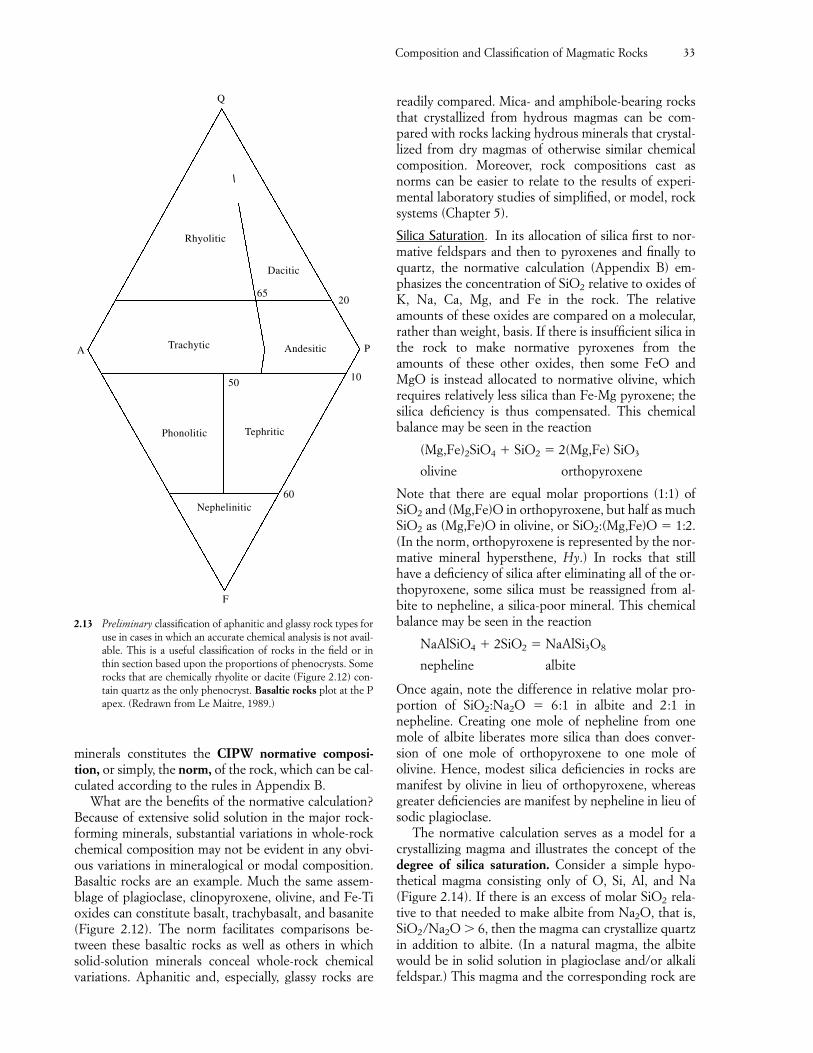
Composition and Classification of Magmatic Rocks 33
minerals constitutes the CIPW normative composi-tion, or simply, the norm, of the rock, which can be cal-culated according to the rules in Appendix B.
What are the benefits of the normative calculation?Because of extensive solid solution in the major rock-forming minerals, substantial variations in whole-rockchemical composition may not be evident in any obvi-ous variations in mineralogical or modal composition.Basaltic rocks are an example. Much the same assem-blage of plagioclase, clinopyroxene, olivine, and Fe-Tioxides can constitute basalt, trachybasalt, and basanite(Figure 2.12). The norm facilitates comparisons be-tween these basaltic rocks as well as others in whichsolid-solution minerals conceal whole-rock chemicalvariations. Aphanitic and, especially, glassy rocks are
readily compared. Mica- and amphibole-bearing rocksthat crystallized from hydrous magmas can be com-pared with rocks lacking hydrous minerals that crystal-lized from dry magmas of otherwise similar chemicalcomposition. Moreover, rock compositions cast asnorms can be easier to relate to the results of experi-mental laboratory studies of simplified, or model, rocksystems (Chapter 5).
Silica Saturation. In its allocation of silica first to nor-mative feldspars and then to pyroxenes and finally toquartz, the normative calculation (Appendix B) em-phasizes the concentration of SiO2 relative to oxides ofK, Na, Ca, Mg, and Fe in the rock. The relativeamounts of these oxides are compared on a molecular,rather than weight, basis. If there is insufficient silica inthe rock to make normative pyroxenes from theamounts of these other oxides, then some FeO andMgO is instead allocated to normative olivine, whichrequires relatively less silica than Fe-Mg pyroxene; thesilica deficiency is thus compensated. This chemicalbalance may be seen in the reaction
(Mg,Fe)2SiO4 � SiO2 � 2(Mg,Fe) SiO3
olivine orthopyroxene
Note that there are equal molar proportions (1:1) ofSiO2 and (Mg,Fe)O in orthopyroxene, but half as muchSiO2 as (Mg,Fe)O in olivine, or SiO2:(Mg,Fe)O � 1:2.(In the norm, orthopyroxene is represented by the nor-mative mineral hypersthene, Hy.) In rocks that stillhave a deficiency of silica after eliminating all of the or-thopyroxene, some silica must be reassigned from al-bite to nepheline, a silica-poor mineral. This chemicalbalance may be seen in the reaction
NaAlSiO4 � 2SiO2 � NaAlSi3O8
nepheline albite
Once again, note the difference in relative molar pro-portion of SiO2:Na2O � 6:1 in albite and 2:1 innepheline. Creating one mole of nepheline from onemole of albite liberates more silica than does conver-sion of one mole of orthopyroxene to one mole ofolivine. Hence, modest silica deficiencies in rocks aremanifest by olivine in lieu of orthopyroxene, whereasgreater deficiencies are manifest by nepheline in lieu ofsodic plagioclase.
The normative calculation serves as a model for acrystallizing magma and illustrates the concept of thedegree of silica saturation. Consider a simple hypo-thetical magma consisting only of O, Si, Al, and Na(Figure 2.14). If there is an excess of molar SiO2 rela-tive to that needed to make albite from Na2O, that is,SiO2/Na2O � 6, then the magma can crystallize quartzin addition to albite. (In a natural magma, the albitewould be in solid solution in plagioclase and/or alkalifeldspar.) This magma and the corresponding rock are
Q
A P
Rhyolitic
Dacitic
Andesitic
Tephritic
Trachytic
Phonolitic
Nephelinitic60
1050
6520
F
2.13 Preliminary classification of aphanitic and glassy rock types foruse in cases in which an accurate chemical analysis is not avail-able. This is a useful classification of rocks in the field or inthin section based upon the proportions of phenocrysts. Somerocks that are chemically rhyolite or dacite (Figure 2.12) con-tain quartz as the only phenocryst. Basaltic rocks plot at the Papex. (Redrawn from Le Maitre, 1989.)
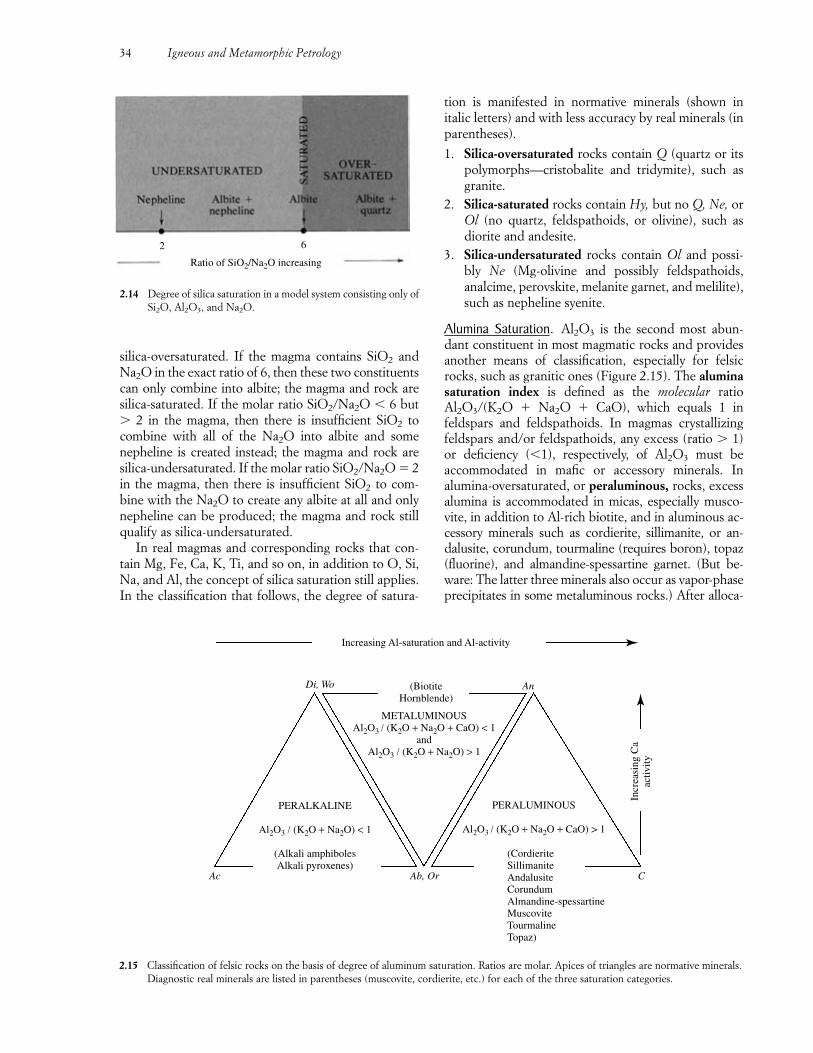
silica-oversaturated. If the magma contains SiO2 andNa2O in the exact ratio of 6, then these two constituentscan only combine into albite; the magma and rock aresilica-saturated. If the molar ratio SiO2/Na2O � 6 but� 2 in the magma, then there is insufficient SiO2 tocombine with all of the Na2O into albite and somenepheline is created instead; the magma and rock aresilica-undersaturated. If the molar ratio SiO2/Na2O � 2in the magma, then there is insufficient SiO2 to com-bine with the Na2O to create any albite at all and onlynepheline can be produced; the magma and rock stillqualify as silica-undersaturated.
In real magmas and corresponding rocks that con-tain Mg, Fe, Ca, K, Ti, and so on, in addition to O, Si,Na, and Al, the concept of silica saturation still applies.In the classification that follows, the degree of satura-
tion is manifested in normative minerals (shown initalic letters) and with less accuracy by real minerals (inparentheses).
1. Silica-oversaturated rocks contain Q (quartz or itspolymorphs—cristobalite and tridymite), such asgranite.
2. Silica-saturated rocks contain Hy, but no Q, Ne, orOl (no quartz, feldspathoids, or olivine), such asdiorite and andesite.
3. Silica-undersaturated rocks contain Ol and possi-bly Ne (Mg-olivine and possibly feldspathoids,analcime, perovskite, melanite garnet, and melilite),such as nepheline syenite.
Alumina Saturation. Al2O3 is the second most abun-dant constituent in most magmatic rocks and providesanother means of classification, especially for felsicrocks, such as granitic ones (Figure 2.15). The aluminasaturation index is defined as the molecular ratioAl2O3/(K2O � Na2O � CaO), which equals 1 infeldspars and feldspathoids. In magmas crystallizingfeldspars and/or feldspathoids, any excess (ratio � 1)or deficiency (�1), respectively, of Al2O3 must be accommodated in mafic or accessory minerals. In alumina-oversaturated, or peraluminous, rocks, excessalumina is accommodated in micas, especially musco-vite, in addition to Al-rich biotite, and in aluminous ac-cessory minerals such as cordierite, sillimanite, or an-dalusite, corundum, tourmaline (requires boron), topaz(fluorine), and almandine-spessartine garnet. (But be-ware: The latter three minerals also occur as vapor-phaseprecipitates in some metaluminous rocks.) After alloca-
34 Igneous and Metamorphic Petrology
2 6
Ratio of SiO2/Na2O increasing
2.14 Degree of silica saturation in a model system consisting only ofSi2O, Al2O3, and Na2O.
Di, Wo An (BiotiteHornblende)
METALUMINOUSAl2O3 / (K2O + Na2O + CaO) < 1
andAl2O3 / (K2O + Na2O) > 1
PERALKALINE
Al2O3 / (K2O + Na2O) < 1
(Alkali amphibolesAlkali pyroxenes)
PERALUMINOUS
Al2O3 / (K2O + Na2O + CaO) > 1
(Cordierite SillimaniteAndalusiteCorundumAlmandine-spessartineMuscoviteTourmalineTopaz)
Ab, Or CAc
Incr
easi
ng C
aac
tivity
Increasing Al-saturation and Al-activity
2.15 Classification of felsic rocks on the basis of degree of aluminum saturation. Ratios are molar. Apices of triangles are normative minerals.Diagnostic real minerals are listed in parentheses (muscovite, cordierite, etc.) for each of the three saturation categories.
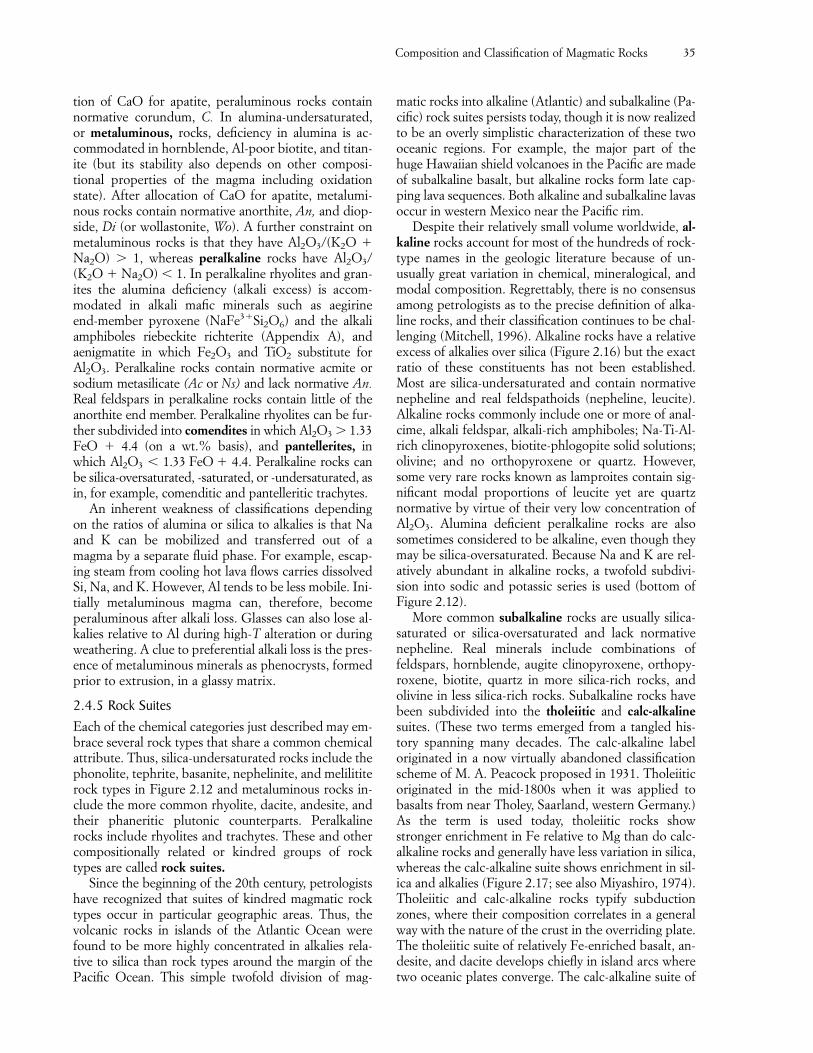
tion of CaO for apatite, peraluminous rocks containnormative corundum, C. In alumina-undersaturated,or metaluminous, rocks, deficiency in alumina is ac-commodated in hornblende, Al-poor biotite, and titan-ite (but its stability also depends on other composi-tional properties of the magma including oxidationstate). After allocation of CaO for apatite, metalumi-nous rocks contain normative anorthite, An, and diop-side, Di (or wollastonite, Wo). A further constraint onmetaluminous rocks is that they have Al2O3/(K2O �Na2O) � 1, whereas peralkaline rocks have Al2O3/(K2O � Na2O) � 1. In peralkaline rhyolites and gran-ites the alumina deficiency (alkali excess) is accom-modated in alkali mafic minerals such as aegirine end-member pyroxene (NaFe3�Si2O6) and the alkaliamphiboles riebeckite richterite (Appendix A), andaenigmatite in which Fe2O3 and TiO2 substitute forAl2O3. Peralkaline rocks contain normative acmite orsodium metasilicate (Ac or Ns) and lack normative An.Real feldspars in peralkaline rocks contain little of theanorthite end member. Peralkaline rhyolites can be fur-ther subdivided into comendites in which Al2O3 � 1.33FeO � 4.4 (on a wt.% basis), and pantellerites, inwhich Al2O3 � 1.33 FeO � 4.4. Peralkaline rocks canbe silica-oversaturated, -saturated, or -undersaturated, asin, for example, comenditic and pantelleritic trachytes.
An inherent weakness of classifications dependingon the ratios of alumina or silica to alkalies is that Naand K can be mobilized and transferred out of amagma by a separate fluid phase. For example, escap-ing steam from cooling hot lava flows carries dissolvedSi, Na, and K. However, Al tends to be less mobile. Ini-tially metaluminous magma can, therefore, becomeperaluminous after alkali loss. Glasses can also lose al-kalies relative to Al during high-T alteration or duringweathering. A clue to preferential alkali loss is the pres-ence of metaluminous minerals as phenocrysts, formedprior to extrusion, in a glassy matrix.
2.4.5 Rock SuitesEach of the chemical categories just described may em-brace several rock types that share a common chemicalattribute. Thus, silica-undersaturated rocks include thephonolite, tephrite, basanite, nephelinite, and melilititerock types in Figure 2.12 and metaluminous rocks in-clude the more common rhyolite, dacite, andesite, andtheir phaneritic plutonic counterparts. Peralkalinerocks include rhyolites and trachytes. These and othercompositionally related or kindred groups of rocktypes are called rock suites.
Since the beginning of the 20th century, petrologistshave recognized that suites of kindred magmatic rocktypes occur in particular geographic areas. Thus, thevolcanic rocks in islands of the Atlantic Ocean werefound to be more highly concentrated in alkalies rela-tive to silica than rock types around the margin of thePacific Ocean. This simple twofold division of mag-
matic rocks into alkaline (Atlantic) and subalkaline (Pa-cific) rock suites persists today, though it is now realizedto be an overly simplistic characterization of these twooceanic regions. For example, the major part of thehuge Hawaiian shield volcanoes in the Pacific are madeof subalkaline basalt, but alkaline rocks form late cap-ping lava sequences. Both alkaline and subalkaline lavasoccur in western Mexico near the Pacific rim.
Despite their relatively small volume worldwide, al-kaline rocks account for most of the hundreds of rock-type names in the geologic literature because of un-usually great variation in chemical, mineralogical, andmodal composition. Regrettably, there is no consensusamong petrologists as to the precise definition of alka-line rocks, and their classification continues to be chal-lenging (Mitchell, 1996). Alkaline rocks have a relativeexcess of alkalies over silica (Figure 2.16) but the exactratio of these constituents has not been established.Most are silica-undersaturated and contain normativenepheline and real feldspathoids (nepheline, leucite).Alkaline rocks commonly include one or more of anal-cime, alkali feldspar, alkali-rich amphiboles; Na-Ti-Al-rich clinopyroxenes, biotite-phlogopite solid solutions;olivine; and no orthopyroxene or quartz. However,some very rare rocks known as lamproites contain sig-nificant modal proportions of leucite yet are quartznormative by virtue of their very low concentration ofAl2O3. Alumina deficient peralkaline rocks are alsosometimes considered to be alkaline, even though theymay be silica-oversaturated. Because Na and K are rel-atively abundant in alkaline rocks, a twofold subdivi-sion into sodic and potassic series is used (bottom ofFigure 2.12).
More common subalkaline rocks are usually silica-saturated or silica-oversaturated and lack normativenepheline. Real minerals include combinations offeldspars, hornblende, augite clinopyroxene, orthopy-roxene, biotite, quartz in more silica-rich rocks, andolivine in less silica-rich rocks. Subalkaline rocks havebeen subdivided into the tholeiitic and calc-alkalinesuites. (These two terms emerged from a tangled his-tory spanning many decades. The calc-alkaline labeloriginated in a now virtually abandoned classificationscheme of M. A. Peacock proposed in 1931. Tholeiiticoriginated in the mid-1800s when it was applied tobasalts from near Tholey, Saarland, western Germany.)As the term is used today, tholeiitic rocks showstronger enrichment in Fe relative to Mg than do calc-alkaline rocks and generally have less variation in silica,whereas the calc-alkaline suite shows enrichment in sil-ica and alkalies (Figure 2.17; see also Miyashiro, 1974).Tholeiitic and calc-alkaline rocks typify subductionzones, where their composition correlates in a generalway with the nature of the crust in the overriding plate.The tholeiitic suite of relatively Fe-enriched basalt, an-desite, and dacite develops chiefly in island arcs wheretwo oceanic plates converge. The calc-alkaline suite of
Composition and Classification of Magmatic Rocks 35
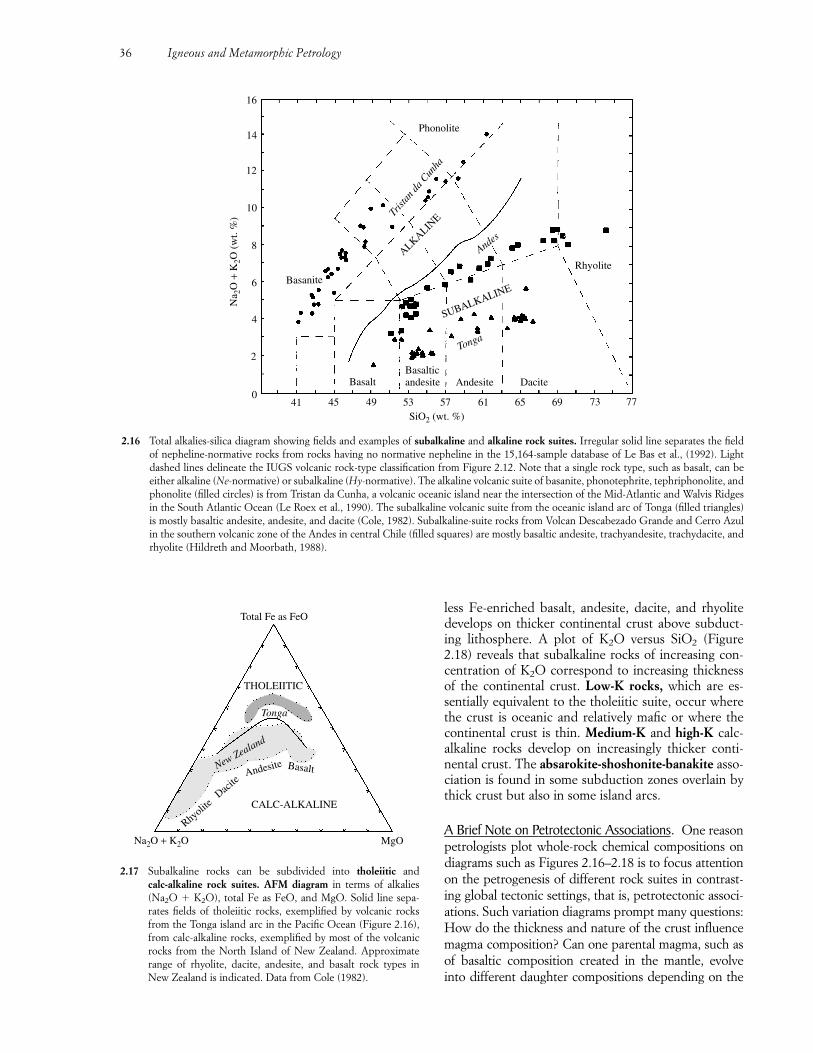
less Fe-enriched basalt, andesite, dacite, and rhyolitedevelops on thicker continental crust above subduct-ing lithosphere. A plot of K2O versus SiO2 (Figure2.18) reveals that subalkaline rocks of increasing con-centration of K2O correspond to increasing thicknessof the continental crust. Low-K rocks, which are es-sentially equivalent to the tholeiitic suite, occur wherethe crust is oceanic and relatively mafic or where thecontinental crust is thin. Medium-K and high-K calc-alkaline rocks develop on increasingly thicker conti-nental crust. The absarokite-shoshonite-banakite asso-ciation is found in some subduction zones overlain bythick crust but also in some island arcs.
A Brief Note on Petrotectonic Associations. One reasonpetrologists plot whole-rock chemical compositions ondiagrams such as Figures 2.16–2.18 is to focus attentionon the petrogenesis of different rock suites in contrast-ing global tectonic settings, that is, petrotectonic associ-ations. Such variation diagrams prompt many questions:How do the thickness and nature of the crust influencemagma composition? Can one parental magma, such asof basaltic composition created in the mantle, evolveinto different daughter compositions depending on the
36 Igneous and Metamorphic Petrology
SUBALKALINE
Andes
Trist
an d
a Cun
ha
Tonga
Rhyolite
Andesite Dacite
Basanite
BasaltBasalticandesite
Na 2
O +
K2O
(w
t. %
)
41 45 49 53 57 61 65 69 73 770
2
4
6
8
10
12
14
16
SiO2 (wt. %)
Phonolite
ALKALINE
2.16 Total alkalies-silica diagram showing fields and examples of subalkaline and alkaline rock suites. Irregular solid line separates the fieldof nepheline-normative rocks from rocks having no normative nepheline in the 15,164-sample database of Le Bas et al., (1992). Lightdashed lines delineate the IUGS volcanic rock-type classification from Figure 2.12. Note that a single rock type, such as basalt, can beeither alkaline (Ne-normative) or subalkaline (Hy-normative). The alkaline volcanic suite of basanite, phonotephrite, tephriphonolite, andphonolite (filled circles) is from Tristan da Cunha, a volcanic oceanic island near the intersection of the Mid-Atlantic and Walvis Ridgesin the South Atlantic Ocean (Le Roex et al., 1990). The subalkaline volcanic suite from the oceanic island arc of Tonga (filled triangles)is mostly basaltic andesite, andesite, and dacite (Cole, 1982). Subalkaline-suite rocks from Volcan Descabezado Grande and Cerro Azulin the southern volcanic zone of the Andes in central Chile (filled squares) are mostly basaltic andesite, trachyandesite, trachydacite, andrhyolite (Hildreth and Moorbath, 1988).
New Zealand
Rhyolite D
acite
CALC-ALKALINE
THOLEIITIC
Na2O + K2O MgO
Total Fe as FeO
Tonga
Andesite Basalt
2.17 Subalkaline rocks can be subdivided into tholeiitic and calc-alkaline rock suites. AFM diagram in terms of alkalies (Na2O � K2O), total Fe as FeO, and MgO. Solid line sepa-rates fields of tholeiitic rocks, exemplified by volcanic rocksfrom the Tonga island arc in the Pacific Ocean (Figure 2.16),from calc-alkaline rocks, exemplified by most of the volcanicrocks from the North Island of New Zealand. Approximaterange of rhyolite, dacite, andesite, and basalt rock types inNew Zealand is indicated. Data from Cole (1982).
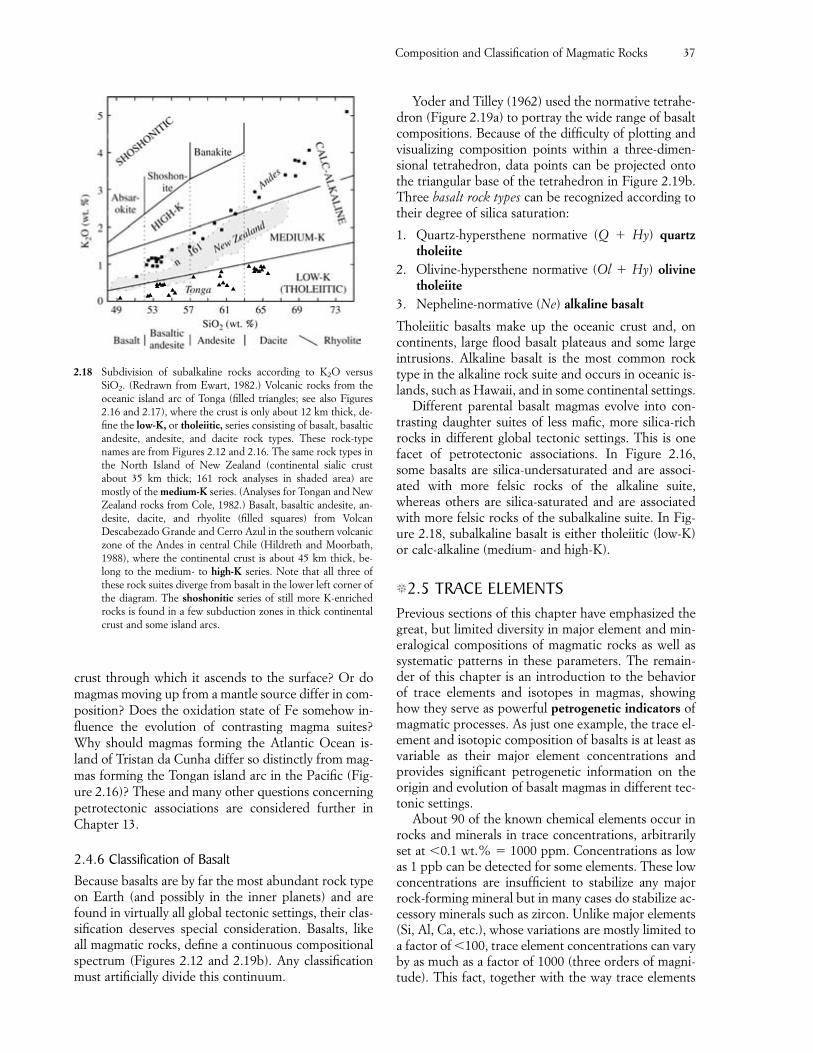
crust through which it ascends to the surface? Or domagmas moving up from a mantle source differ in com-position? Does the oxidation state of Fe somehow in-fluence the evolution of contrasting magma suites?Why should magmas forming the Atlantic Ocean is-land of Tristan da Cunha differ so distinctly from mag-mas forming the Tongan island arc in the Pacific (Fig-ure 2.16)? These and many other questions concerningpetrotectonic associations are considered further inChapter 13.
2.4.6 Classification of BasaltBecause basalts are by far the most abundant rock typeon Earth (and possibly in the inner planets) and arefound in virtually all global tectonic settings, their clas-sification deserves special consideration. Basalts, likeall magmatic rocks, define a continuous compositionalspectrum (Figures 2.12 and 2.19b). Any classificationmust artificially divide this continuum.
Yoder and Tilley (1962) used the normative tetrahe-dron (Figure 2.19a) to portray the wide range of basaltcompositions. Because of the difficulty of plotting andvisualizing composition points within a three-dimen-sional tetrahedron, data points can be projected ontothe triangular base of the tetrahedron in Figure 2.19b.Three basalt rock types can be recognized according totheir degree of silica saturation:
1. Quartz-hypersthene normative (Q � Hy) quartztholeiite
2. Olivine-hypersthene normative (Ol � Hy) olivinetholeiite
3. Nepheline-normative (Ne) alkaline basalt
Tholeiitic basalts make up the oceanic crust and, oncontinents, large flood basalt plateaus and some largeintrusions. Alkaline basalt is the most common rocktype in the alkaline rock suite and occurs in oceanic is-lands, such as Hawaii, and in some continental settings.
Different parental basalt magmas evolve into con-trasting daughter suites of less mafic, more silica-richrocks in different global tectonic settings. This is onefacet of petrotectonic associations. In Figure 2.16,some basalts are silica-undersaturated and are associ-ated with more felsic rocks of the alkaline suite,whereas others are silica-saturated and are associatedwith more felsic rocks of the subalkaline suite. In Fig-ure 2.18, subalkaline basalt is either tholeiitic (low-K)or calc-alkaline (medium- and high-K).
�2.5 TRACE ELEMENTSPrevious sections of this chapter have emphasized thegreat, but limited diversity in major element and min-eralogical compositions of magmatic rocks as well assystematic patterns in these parameters. The remain-der of this chapter is an introduction to the behaviorof trace elements and isotopes in magmas, showinghow they serve as powerful petrogenetic indicators ofmagmatic processes. As just one example, the trace el-ement and isotopic composition of basalts is at least asvariable as their major element concentrations andprovides significant petrogenetic information on theorigin and evolution of basalt magmas in different tec-tonic settings.
About 90 of the known chemical elements occur inrocks and minerals in trace concentrations, arbitrarilyset at �0.1 wt.% � 1000 ppm. Concentrations as lowas 1 ppb can be detected for some elements. These lowconcentrations are insufficient to stabilize any majorrock-forming mineral but in many cases do stabilize ac-cessory minerals such as zircon. Unlike major elements(Si, Al, Ca, etc.), whose variations are mostly limited toa factor of �100, trace element concentrations can varyby as much as a factor of 1000 (three orders of magni-tude). This fact, together with the way trace elements
Composition and Classification of Magmatic Rocks 37
2.18 Subdivision of subalkaline rocks according to K2O versusSiO2. (Redrawn from Ewart, 1982.) Volcanic rocks from theoceanic island arc of Tonga (filled triangles; see also Figures2.16 and 2.17), where the crust is only about 12 km thick, de-fine the low-K, or tholeiitic, series consisting of basalt, basalticandesite, andesite, and dacite rock types. These rock-typenames are from Figures 2.12 and 2.16. The same rock types inthe North Island of New Zealand (continental sialic crustabout 35 km thick; 161 rock analyses in shaded area) aremostly of the medium-K series. (Analyses for Tongan and NewZealand rocks from Cole, 1982.) Basalt, basaltic andesite, an-desite, dacite, and rhyolite (filled squares) from VolcanDescabezado Grande and Cerro Azul in the southern volcaniczone of the Andes in central Chile (Hildreth and Moorbath,1988), where the continental crust is about 45 km thick, be-long to the medium- to high-K series. Note that all three ofthese rock suites diverge from basalt in the lower left corner ofthe diagram. The shoshonitic series of still more K-enrichedrocks is found in a few subduction zones in thick continentalcrust and some island arcs.
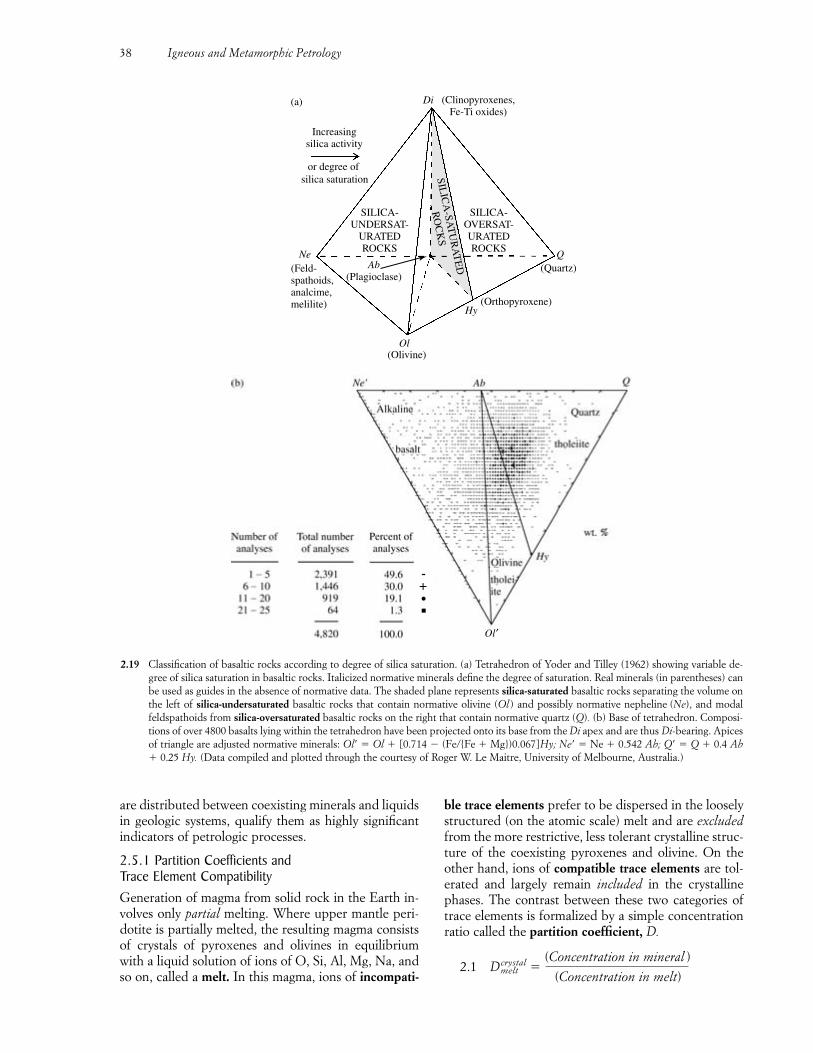
are distributed between coexisting minerals and liquidsin geologic systems, qualify them as highly significantindicators of petrologic processes.
2.5.1 Partition Coefficients and Trace Element CompatibilityGeneration of magma from solid rock in the Earth in-volves only partial melting. Where upper mantle peri-dotite is partially melted, the resulting magma consistsof crystals of pyroxenes and olivines in equilibriumwith a liquid solution of ions of O, Si, Al, Mg, Na, andso on, called a melt. In this magma, ions of incompati-
ble trace elements prefer to be dispersed in the looselystructured (on the atomic scale) melt and are excludedfrom the more restrictive, less tolerant crystalline struc-ture of the coexisting pyroxenes and olivine. On theother hand, ions of compatible trace elements are tol-erated and largely remain included in the crystallinephases. The contrast between these two categories oftrace elements is formalized by a simple concentrationratio called the partition coefficient, D.
2.1 Dmeltcrystal �
(Concentration in mineral )
(Concentration in melt)
38 Igneous and Metamorphic Petrology
2.19 Classification of basaltic rocks according to degree of silica saturation. (a) Tetrahedron of Yoder and Tilley (1962) showing variable de-gree of silica saturation in basaltic rocks. Italicized normative minerals define the degree of saturation. Real minerals (in parentheses) canbe used as guides in the absence of normative data. The shaded plane represents silica-saturated basaltic rocks separating the volume onthe left of silica-undersaturated basaltic rocks that contain normative olivine (Ol ) and possibly normative nepheline (Ne), and modalfeldspathoids from silica-oversaturated basaltic rocks on the right that contain normative quartz (Q). (b) Base of tetrahedron. Composi-tions of over 4800 basalts lying within the tetrahedron have been projected onto its base from the Di apex and are thus Di-bearing. Apicesof triangle are adjusted normative minerals: Ol � Ol � [0.714 � (Fe/{Fe � Mg})0.067]Hy; Ne � Ne � 0.542 Ab; Q � Q � 0.4 Ab� 0.25 Hy. (Data compiled and plotted through the courtesy of Roger W. Le Maitre, University of Melbourne, Australia.)
Di
Hy
Ne Q
(Clinopyroxenes,Fe-Ti oxides)
Increasingsilica activity
(Feld-spathoids,analcime,melilite)
(Olivine)
(Orthopyroxene)
(Quartz)
SILIC
A-SA
TU
RA
TE
D
RO
CK
S
Ab(Plagioclase)
SILICA-UNDERSAT-
URATEDROCKS
SILICA-OVERSAT-URATEDROCKS
Ol
(a)
or degree of silica saturation
-+
Ol′
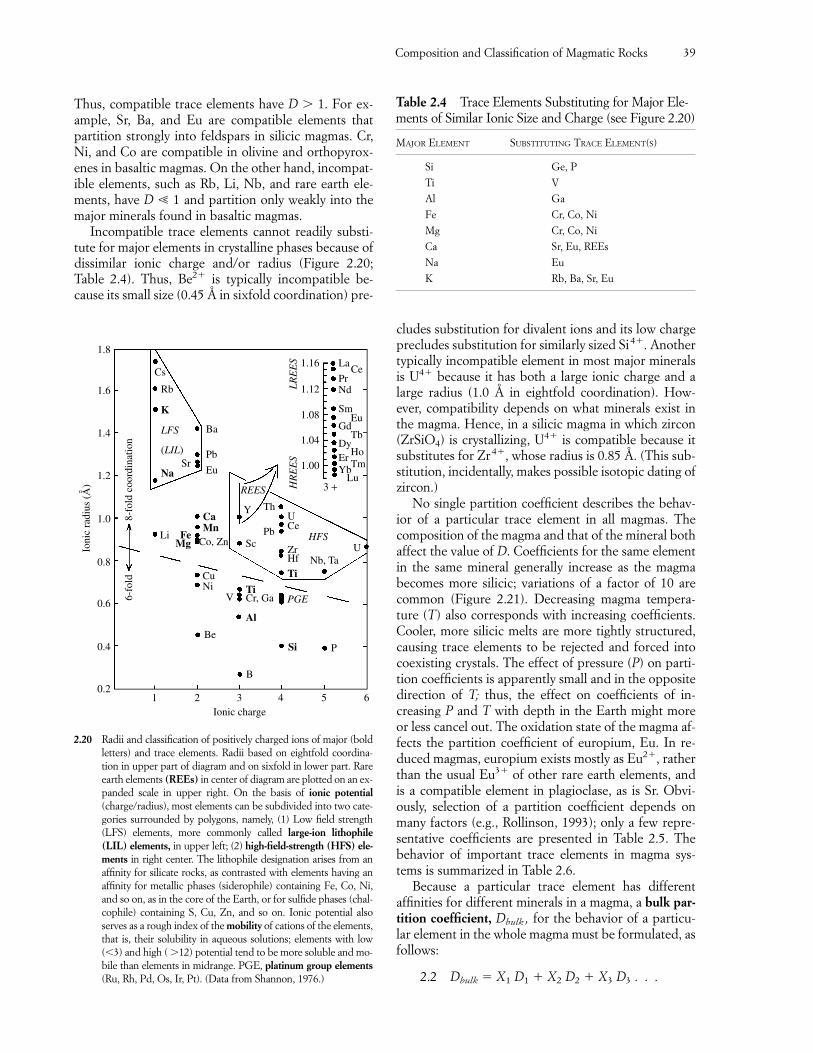
cludes substitution for divalent ions and its low chargeprecludes substitution for similarly sized Si4�. Anothertypically incompatible element in most major mineralsis U4� because it has both a large ionic charge and alarge radius (1.0 Å in eightfold coordination). How-ever, compatibility depends on what minerals exist inthe magma. Hence, in a silicic magma in which zircon(ZrSiO4) is crystallizing, U4� is compatible because itsubstitutes for Zr4�, whose radius is 0.85 Å. (This sub-stitution, incidentally, makes possible isotopic dating ofzircon.)
No single partition coefficient describes the behav-ior of a particular trace element in all magmas. Thecomposition of the magma and that of the mineral bothaffect the value of D. Coefficients for the same elementin the same mineral generally increase as the magmabecomes more silicic; variations of a factor of 10 arecommon (Figure 2.21). Decreasing magma tempera-ture (T) also corresponds with increasing coefficients.Cooler, more silicic melts are more tightly structured,causing trace elements to be rejected and forced intocoexisting crystals. The effect of pressure (P) on parti-tion coefficients is apparently small and in the oppositedirection of T; thus, the effect on coefficients of in-creasing P and T with depth in the Earth might moreor less cancel out. The oxidation state of the magma af-fects the partition coefficient of europium, Eu. In re-duced magmas, europium exists mostly as Eu2�, ratherthan the usual Eu3� of other rare earth elements, andis a compatible element in plagioclase, as is Sr. Obvi-ously, selection of a partition coefficient depends onmany factors (e.g., Rollinson, 1993); only a few repre-sentative coefficients are presented in Table 2.5. Thebehavior of important trace elements in magma sys-tems is summarized in Table 2.6.
Because a particular trace element has differentaffinities for different minerals in a magma, a bulk par-tition coefficient, Dbulk , for the behavior of a particu-lar element in the whole magma must be formulated, asfollows:
2.2 Dbulk � X1 D1 � X2 D2 � X3 D3 . . .
Composition and Classification of Magmatic Rocks 39
Table 2.4 Trace Elements Substituting for Major Ele-ments of Similar Ionic Size and Charge (see Figure 2.20)
MAJOR ELEMENT SUBSTITUTING TRACE ELEMENT(S)
Si Ge, P
Ti V
Al Ga
Fe Cr, Co, Ni
Mg Cr, Co, Ni
Ca Sr, Eu, REEs
Na Eu
K Rb, Ba, Sr, Eu
Thus, compatible trace elements have D � 1. For ex-ample, Sr, Ba, and Eu are compatible elements thatpartition strongly into feldspars in silicic magmas. Cr,Ni, and Co are compatible in olivine and orthopyrox-enes in basaltic magmas. On the other hand, incompat-ible elements, such as Rb, Li, Nb, and rare earth ele-ments, have D � 1 and partition only weakly into themajor minerals found in basaltic magmas.
Incompatible trace elements cannot readily substi-tute for major elements in crystalline phases because ofdissimilar ionic charge and/or radius (Figure 2.20;Table 2.4). Thus, Be2� is typically incompatible be-cause its small size (0.45 Å in sixfold coordination) pre-
1 2 3 4 5 60.2
0.4
0.6
0.8
1.0
1.2
1.4
1.6
1.8
Ioni
c ra
dius
(A
)
Ionic charge
6-fo
ld8-
fold
coo
rdin
atio
n
Cs
Rb
K
LFS
(LIL)
NaSr
Eu
Pb
Ba
La
PrNd
SmEu
Tb
HoTm
Lu
Gd
DyErYb
Ce1.16
1.12
1.08
1.04
1.00
HR
EE
SL
RE
ES
REES
Y
Sc
ThU
U
Ce
ZrHf Nb, TaTi
CaMn
Co, ZnFeLi
CuTi
PGECr, Ga
B
BeP
Al
Si
NiV
MgHFSPb
3 +o
2.20 Radii and classification of positively charged ions of major (boldletters) and trace elements. Radii based on eightfold coordina-tion in upper part of diagram and on sixfold in lower part. Rareearth elements (REEs) in center of diagram are plotted on an ex-panded scale in upper right. On the basis of ionic potential(charge/radius), most elements can be subdivided into two cate-gories surrounded by polygons, namely, (1) Low field strength(LFS) elements, more commonly called large-ion lithophile(LIL) elements, in upper left; (2) high-field-strength (HFS) ele-ments in right center. The lithophile designation arises from anaffinity for silicate rocks, as contrasted with elements having anaffinity for metallic phases (siderophile) containing Fe, Co, Ni,and so on, as in the core of the Earth, or for sulfide phases (chal-cophile) containing S, Cu, Zn, and so on. Ionic potential alsoserves as a rough index of the mobility of cations of the elements,that is, their solubility in aqueous solutions; elements with low(�3) and high ( �12) potential tend to be more soluble and mo-bile than elements in midrange. PGE, platinum group elements(Ru, Rh, Pd, Os, Ir, Pt). (Data from Shannon, 1976.)
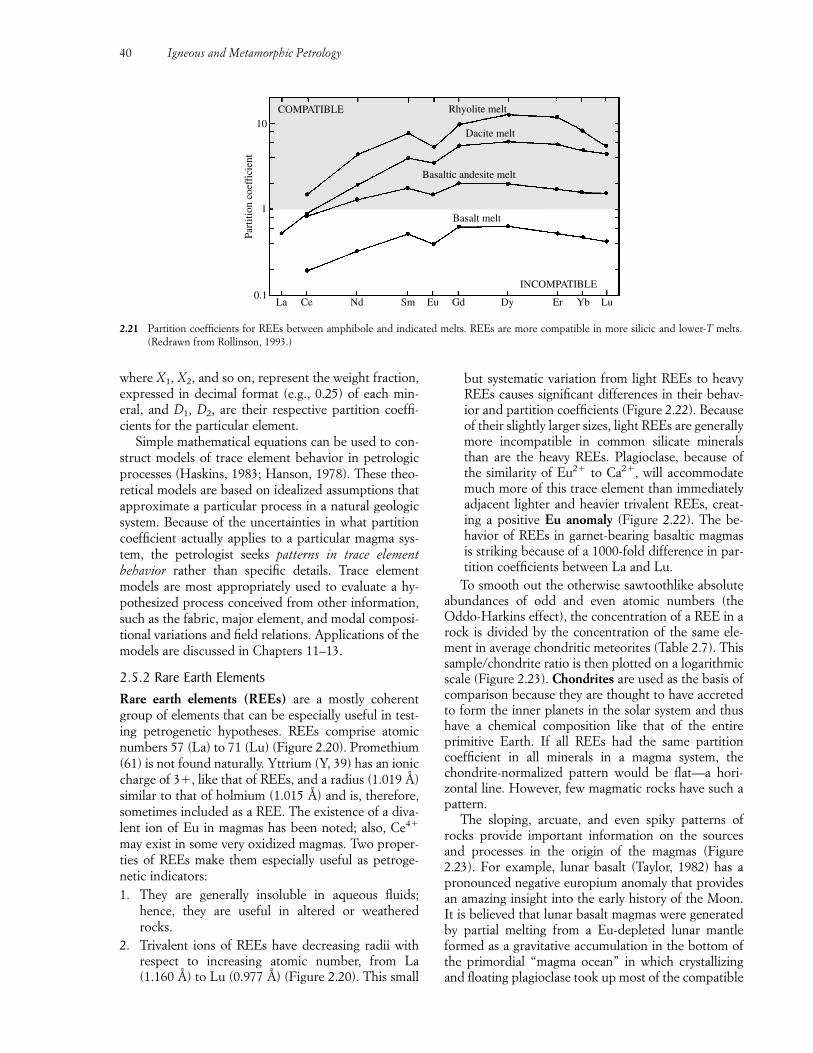
where X1, X2, and so on, represent the weight fraction,expressed in decimal format (e.g., 0.25) of each min-eral, and D1, D2, are their respective partition coeffi-cients for the particular element.
Simple mathematical equations can be used to con-struct models of trace element behavior in petrologicprocesses (Haskins, 1983; Hanson, 1978). These theo-retical models are based on idealized assumptions thatapproximate a particular process in a natural geologicsystem. Because of the uncertainties in what partitioncoefficient actually applies to a particular magma sys-tem, the petrologist seeks patterns in trace element behavior rather than specific details. Trace elementmodels are most appropriately used to evaluate a hy-pothesized process conceived from other information,such as the fabric, major element, and modal composi-tional variations and field relations. Applications of themodels are discussed in Chapters 11–13.
2.5.2 Rare Earth Elements Rare earth elements (REEs) are a mostly coherentgroup of elements that can be especially useful in test-ing petrogenetic hypotheses. REEs comprise atomicnumbers 57 (La) to 71 (Lu) (Figure 2.20). Promethium(61) is not found naturally. Yttrium (Y, 39) has an ioniccharge of 3�, like that of REEs, and a radius (1.019 Å)similar to that of holmium (1.015 Å) and is, therefore,sometimes included as a REE. The existence of a diva-lent ion of Eu in magmas has been noted; also, Ce4�
may exist in some very oxidized magmas. Two proper-ties of REEs make them especially useful as petroge-netic indicators:1. They are generally insoluble in aqueous fluids;
hence, they are useful in altered or weatheredrocks.
2. Trivalent ions of REEs have decreasing radii withrespect to increasing atomic number, from La(1.160 Å) to Lu (0.977 Å) (Figure 2.20). This small
but systematic variation from light REEs to heavyREEs causes significant differences in their behav-ior and partition coefficients (Figure 2.22). Becauseof their slightly larger sizes, light REEs are generallymore incompatible in common silicate mineralsthan are the heavy REEs. Plagioclase, because ofthe similarity of Eu2� to Ca2�, will accommodatemuch more of this trace element than immediatelyadjacent lighter and heavier trivalent REEs, creat-ing a positive Eu anomaly (Figure 2.22). The be-havior of REEs in garnet-bearing basaltic magmasis striking because of a 1000-fold difference in par-tition coefficients between La and Lu.
To smooth out the otherwise sawtoothlike absoluteabundances of odd and even atomic numbers (theOddo-Harkins effect), the concentration of a REE in arock is divided by the concentration of the same ele-ment in average chondritic meteorites (Table 2.7). Thissample/chondrite ratio is then plotted on a logarithmicscale (Figure 2.23). Chondrites are used as the basis ofcomparison because they are thought to have accretedto form the inner planets in the solar system and thushave a chemical composition like that of the entireprimitive Earth. If all REEs had the same partition coefficient in all minerals in a magma system, the chondrite-normalized pattern would be flat—a hori-zontal line. However, few magmatic rocks have such apattern.
The sloping, arcuate, and even spiky patterns ofrocks provide important information on the sourcesand processes in the origin of the magmas (Figure2.23). For example, lunar basalt (Taylor, 1982) has apronounced negative europium anomaly that providesan amazing insight into the early history of the Moon.It is believed that lunar basalt magmas were generatedby partial melting from a Eu-depleted lunar mantleformed as a gravitative accumulation in the bottom ofthe primordial “magma ocean” in which crystallizingand floating plagioclase took up most of the compatible
40 Igneous and Metamorphic Petrology
COMPATIBLE Rhyolite melt
Dacite melt
Basaltic andesite melt
Basalt melt
INCOMPATIBLE
La0.1
1
10
Ce Nd Sm Eu Gd Dy Er Yb Lu
Part
ition
coe
ffic
ient
2.21 Partition coefficients for REEs between amphibole and indicated melts. REEs are more compatible in more silicic and lower-T melts.(Redrawn from Rollinson, 1993.)
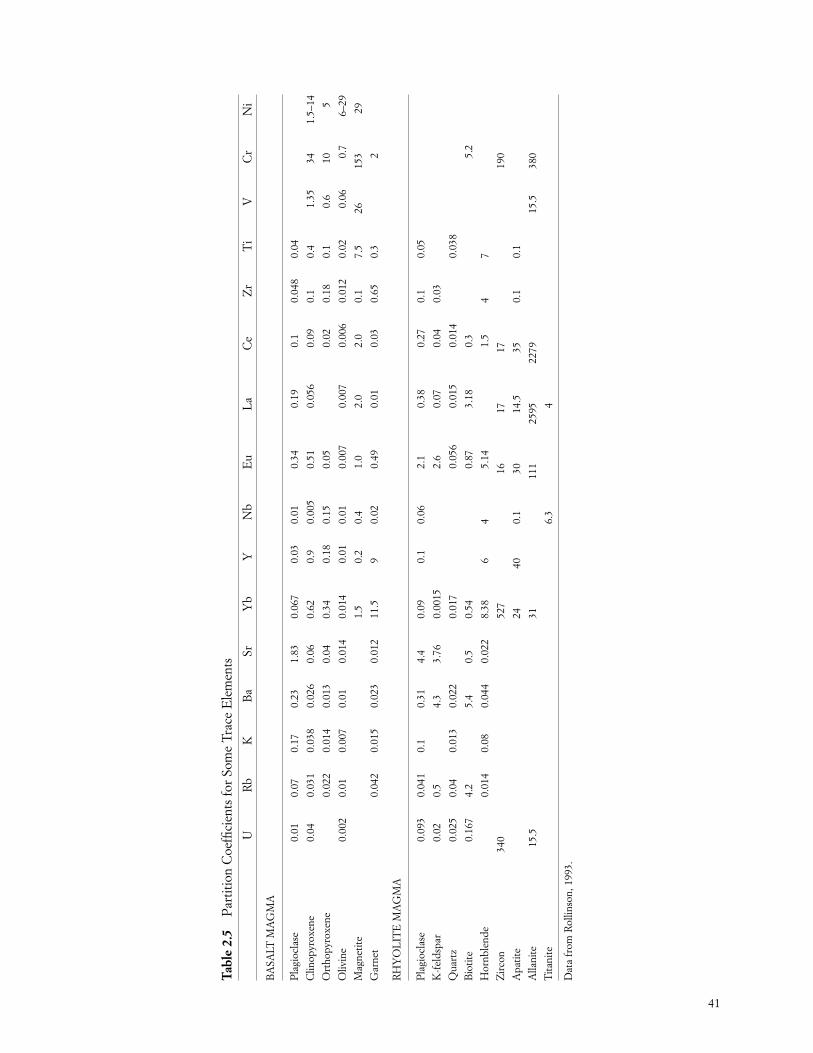
Tabl
e 2.
5P
artit
ion
Coe
ffici
ents
for
Som
e Tr
ace
Ele
men
ts
UR
bK
Ba
SrY
bY
Nb
Eu
La
Ce
Zr
Ti
VC
rN
i
BA
SALT
MA
GM
A
Pla
gioc
lase
0.01
0.07
0.17
0.23
1.83
0.06
70.
030.
010.
340.
190.
10.
048
0.04
Clin
opyr
oxen
e0.
040.
031
0.03
80.
026
0.06
0.62
0.9
0.00
50.
510.
056
0.09
0.1
0.4
1.35
341.
5–14
Ort
hopy
roxe
ne0.
022
0.01
40.
013
0.04
0.34
0.18
0.15
0.05
0.02
0.18
0.1
0.6
105
Oliv
ine
0.00
20.
010.
007
0.01
0.01
40.
014
0.01
0.01
0.00
70.
007
0.00
60.
012
0.02
0.06
0.7
6–29
Mag
netit
e1.
50.
20.
41.
02.
02.
00.
17.
526
153
29
Gar
net
0.04
20.
015
0.02
30.
012
11.5
90.
020.
490.
010.
030.
650.
32
RH
YO
LIT
E M
AG
MA
Pla
gioc
lase
0.09
30.
041
0.1
0.31
4.4
0.09
0.1
0.06
2.1
0.38
0.27
0.1
0.05
K-f
elds
par
0.02
0.5
4.3
3.76
0.00
152.
60.
070.
040.
03
Qua
rtz
0.02
50.
040.
013
0.02
20.
017
0.05
60.
015
0.01
40.
038
Bio
tite
0.16
74.
25.
40.
50.
540.
873.
180.
35.
2
Hor
nble
nde
0.01
40.
080.
044
0.02
28.
386
45.
141.
54
7
Zir
con
340
527
1617
1719
0
Apa
tite
2440
0.1
3014
.535
0.1
0.1
Alla
nite
15.5
3111
125
9522
7915
.538
0
Tita
nite
6.3
4
Dat
a fr
om R
ollin
son,
199
3.
41
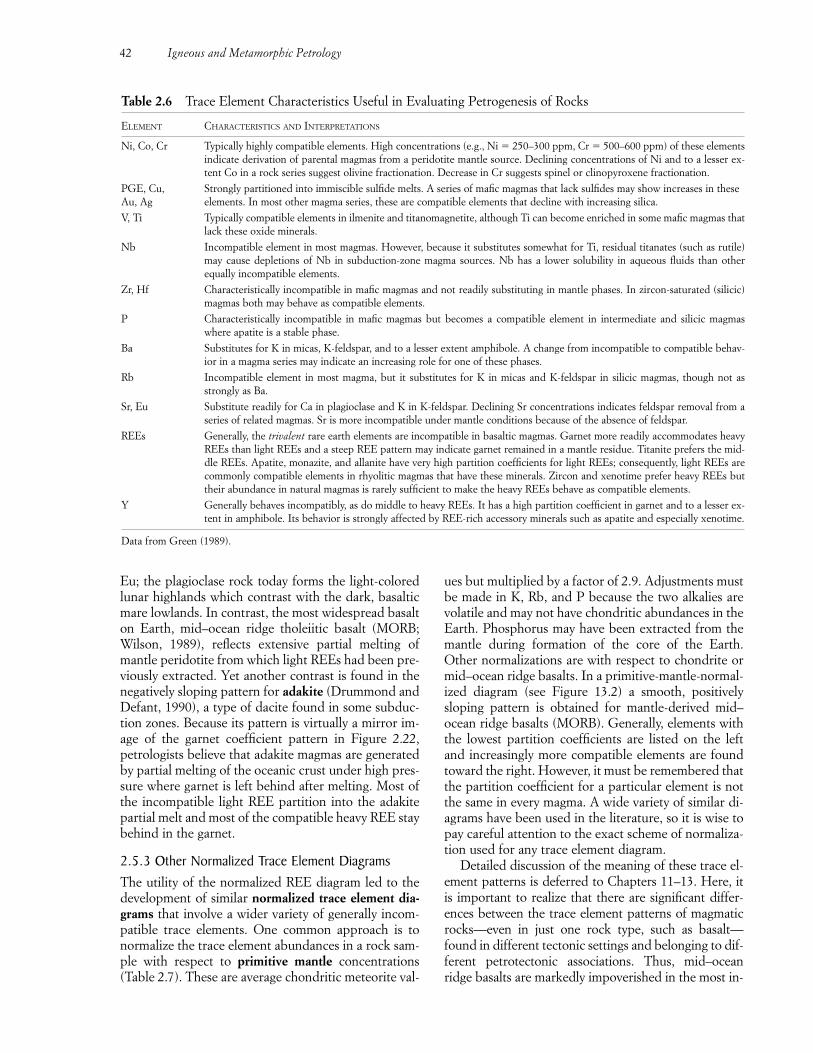
ues but multiplied by a factor of 2.9. Adjustments mustbe made in K, Rb, and P because the two alkalies arevolatile and may not have chondritic abundances in theEarth. Phosphorus may have been extracted from themantle during formation of the core of the Earth.Other normalizations are with respect to chondrite ormid–ocean ridge basalts. In a primitive-mantle-normal-ized diagram (see Figure 13.2) a smooth, positivelysloping pattern is obtained for mantle-derived mid–ocean ridge basalts (MORB). Generally, elements withthe lowest partition coefficients are listed on the leftand increasingly more compatible elements are foundtoward the right. However, it must be remembered thatthe partition coefficient for a particular element is notthe same in every magma. A wide variety of similar di-agrams have been used in the literature, so it is wise topay careful attention to the exact scheme of normaliza-tion used for any trace element diagram.
Detailed discussion of the meaning of these trace el-ement patterns is deferred to Chapters 11–13. Here, itis important to realize that there are significant differ-ences between the trace element patterns of magmaticrocks—even in just one rock type, such as basalt—found in different tectonic settings and belonging to dif-ferent petrotectonic associations. Thus, mid–oceanridge basalts are markedly impoverished in the most in-
42 Igneous and Metamorphic Petrology
Table 2.6 Trace Element Characteristics Useful in Evaluating Petrogenesis of Rocks
ELEMENT CHARACTERISTICS AND INTERPRETATIONS
Ni, Co, Cr Typically highly compatible elements. High concentrations (e.g., Ni � 250–300 ppm, Cr � 500–600 ppm) of these elementsindicate derivation of parental magmas from a peridotite mantle source. Declining concentrations of Ni and to a lesser ex-tent Co in a rock series suggest olivine fractionation. Decrease in Cr suggests spinel or clinopyroxene fractionation.
PGE, Cu, Strongly partitioned into immiscible sulfide melts. A series of mafic magmas that lack sulfides may show increases in theseAu, Ag elements. In most other magma series, these are compatible elements that decline with increasing silica.
V, Ti Typically compatible elements in ilmenite and titanomagnetite, although Ti can become enriched in some mafic magmas thatlack these oxide minerals.
Nb Incompatible element in most magmas. However, because it substitutes somewhat for Ti, residual titanates (such as rutile)may cause depletions of Nb in subduction-zone magma sources. Nb has a lower solubility in aqueous fluids than otherequally incompatible elements.
Zr, Hf Characteristically incompatible in mafic magmas and not readily substituting in mantle phases. In zircon-saturated (silicic)magmas both may behave as compatible elements.
P Characteristically incompatible in mafic magmas but becomes a compatible element in intermediate and silicic magmaswhere apatite is a stable phase.
Ba Substitutes for K in micas, K-feldspar, and to a lesser extent amphibole. A change from incompatible to compatible behav-ior in a magma series may indicate an increasing role for one of these phases.
Rb Incompatible element in most magma, but it substitutes for K in micas and K-feldspar in silicic magmas, though not asstrongly as Ba.
Sr, Eu Substitute readily for Ca in plagioclase and K in K-feldspar. Declining Sr concentrations indicates feldspar removal from aseries of related magmas. Sr is more incompatible under mantle conditions because of the absence of feldspar.
REEs Generally, the trivalent rare earth elements are incompatible in basaltic magmas. Garnet more readily accommodates heavyREEs than light REEs and a steep REE pattern may indicate garnet remained in a mantle residue. Titanite prefers the mid-dle REEs. Apatite, monazite, and allanite have very high partition coefficients for light REEs; consequently, light REEs arecommonly compatible elements in rhyolitic magmas that have these minerals. Zircon and xenotime prefer heavy REEs buttheir abundance in natural magmas is rarely sufficient to make the heavy REEs behave as compatible elements.
Y Generally behaves incompatibly, as do middle to heavy REEs. It has a high partition coefficient in garnet and to a lesser ex-tent in amphibole. Its behavior is strongly affected by REE-rich accessory minerals such as apatite and especially xenotime.
Data from Green (1989).
Eu; the plagioclase rock today forms the light-coloredlunar highlands which contrast with the dark, basalticmare lowlands. In contrast, the most widespread basalton Earth, mid–ocean ridge tholeiitic basalt (MORB;Wilson, 1989), reflects extensive partial melting ofmantle peridotite from which light REEs had been pre-viously extracted. Yet another contrast is found in thenegatively sloping pattern for adakite (Drummond andDefant, 1990), a type of dacite found in some subduc-tion zones. Because its pattern is virtually a mirror im-age of the garnet coefficient pattern in Figure 2.22,petrologists believe that adakite magmas are generatedby partial melting of the oceanic crust under high pres-sure where garnet is left behind after melting. Most ofthe incompatible light REE partition into the adakitepartial melt and most of the compatible heavy REE staybehind in the garnet.
2.5.3 Other Normalized Trace Element DiagramsThe utility of the normalized REE diagram led to thedevelopment of similar normalized trace element dia-grams that involve a wider variety of generally incom-patible trace elements. One common approach is tonormalize the trace element abundances in a rock sam-ple with respect to primitive mantle concentrations(Table 2.7). These are average chondritic meteorite val-
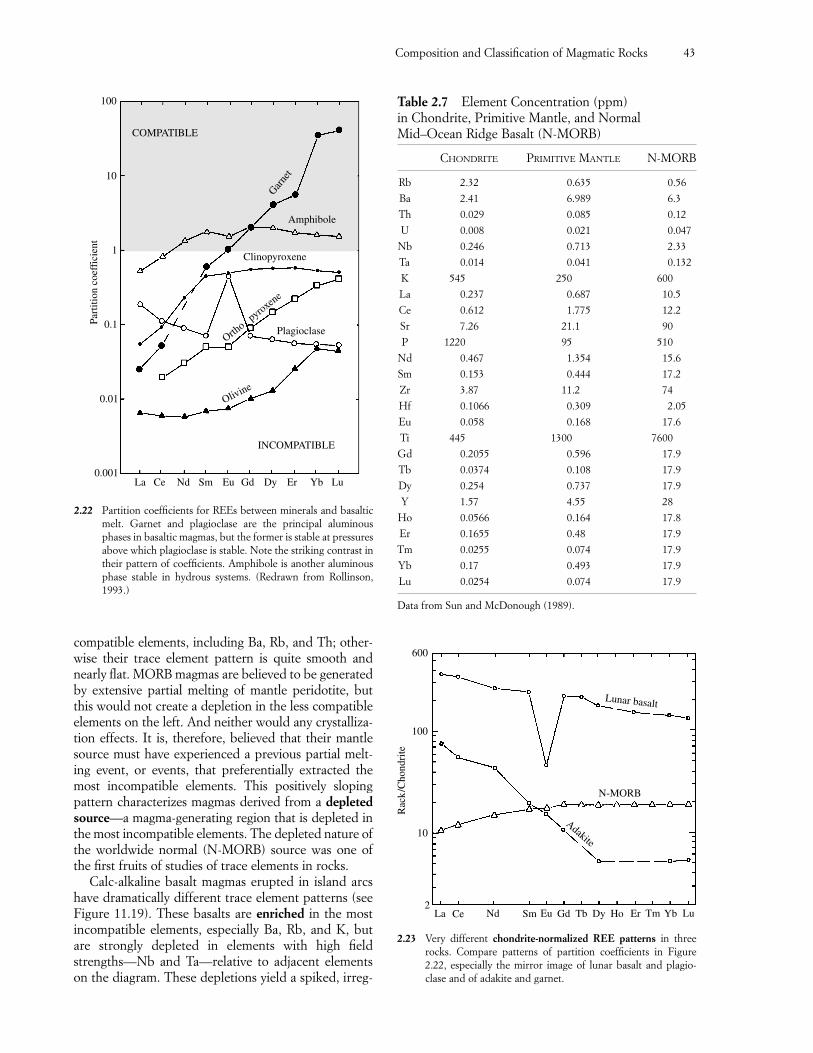
Composition and Classification of Magmatic Rocks 43
Table 2.7 Element Concentration (ppm) in Chondrite, Primitive Mantle, and NormalMid–Ocean Ridge Basalt (N-MORB)
CHONDRITE PRIMITIVE MANTLE N-MORB
Rb 2.32 0.635 0.56
Ba 2.41 6.989 6.3
Th 0.029 0.085 0.12
U 0.008 0.021 0.047
Nb 0.246 0.713 2.33
Ta 0.014 0.041 0.132
K 545 250 600
La 0.237 0.687 10.5
Ce 0.612 1.775 12.2
Sr 7.26 21.1 90
P 1220 95 510
Nd 0.467 1.354 15.6
Sm 0.153 0.444 17.2
Zr 3.87 11.2 74
Hf 0.1066 0.309 2.05
Eu 0.058 0.168 17.6
Ti 445 1300 7600
Gd 0.2055 0.596 17.9
Tb 0.0374 0.108 17.9
Dy 0.254 0.737 17.9
Y 1.57 4.55 28
Ho 0.0566 0.164 17.8
Er 0.1655 0.48 17.9
Tm 0.0255 0.074 17.9
Yb 0.17 0.493 17.9
Lu 0.0254 0.074 17.9
Data from Sun and McDonough (1989).
2.22 Partition coefficients for REEs between minerals and basalticmelt. Garnet and plagioclase are the principal aluminousphases in basaltic magmas, but the former is stable at pressuresabove which plagioclase is stable. Note the striking contrast intheir pattern of coefficients. Amphibole is another aluminousphase stable in hydrous systems. (Redrawn from Rollinson,1993.)
Clinopyroxene
Ortho p
yroxene
Plagioclase
Olivine
COMPATIBLE
Garne
t
La Ce Nd Sm Eu Gd Dy Er Yb Lu
INCOMPATIBLE
0.001
0.01
0.1
1
10
100Pa
rtiti
on c
oeff
icie
nt
Amphibole
600
10
2La Ce Nd Sm Eu Gd Tb Dy Ho Er Tm Yb Lu
Lunar basalt
N-MORB
Adakite
Rac
k/C
hond
rite
100
2.23 Very different chondrite-normalized REE patterns in threerocks. Compare patterns of partition coefficients in Figure2.22, especially the mirror image of lunar basalt and plagio-clase and of adakite and garnet.
compatible elements, including Ba, Rb, and Th; other-wise their trace element pattern is quite smooth andnearly flat. MORB magmas are believed to be generatedby extensive partial melting of mantle peridotite, butthis would not create a depletion in the less compatibleelements on the left. And neither would any crystalliza-tion effects. It is, therefore, believed that their mantlesource must have experienced a previous partial melt-ing event, or events, that preferentially extracted themost incompatible elements. This positively slopingpattern characterizes magmas derived from a depletedsource—a magma-generating region that is depleted inthe most incompatible elements. The depleted nature ofthe worldwide normal (N-MORB) source was one ofthe first fruits of studies of trace elements in rocks.
Calc-alkaline basalt magmas erupted in island arcshave dramatically different trace element patterns (seeFigure 11.19). These basalts are enriched in the mostincompatible elements, especially Ba, Rb, and K, butare strongly depleted in elements with high fieldstrengths—Nb and Ta—relative to adjacent elementson the diagram. These depletions yield a spiked, irreg-
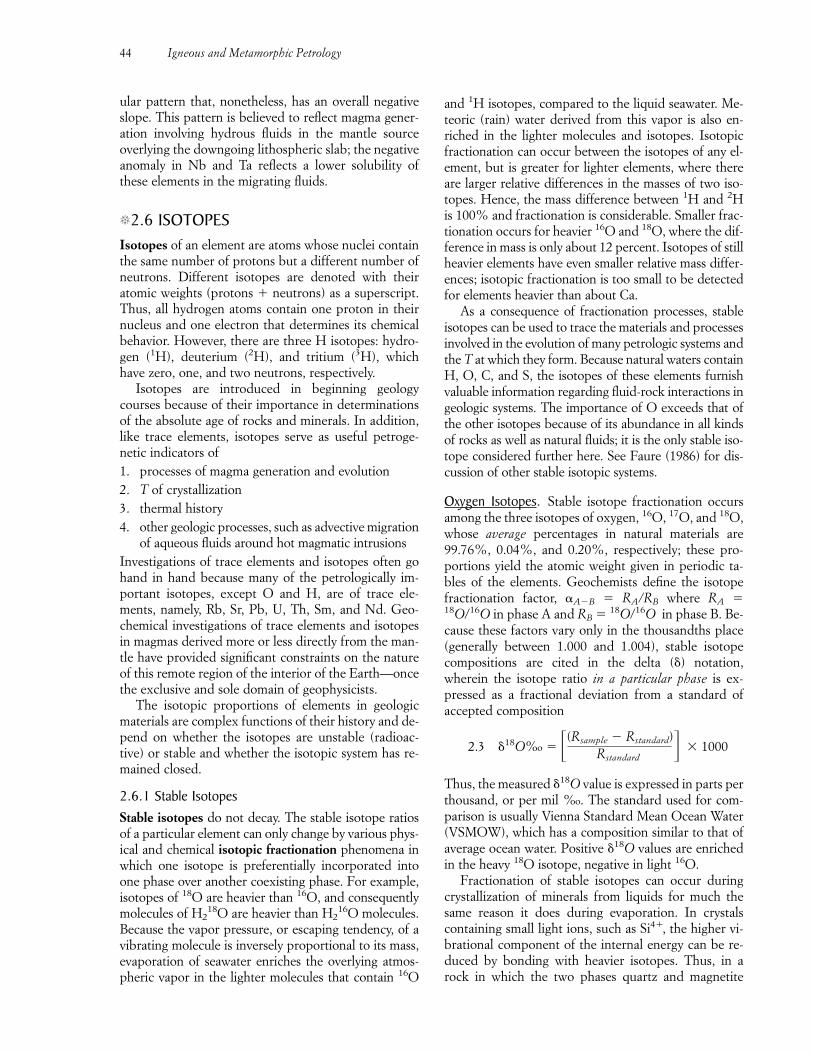
ular pattern that, nonetheless, has an overall negativeslope. This pattern is believed to reflect magma gener-ation involving hydrous fluids in the mantle sourceoverlying the downgoing lithospheric slab; the negativeanomaly in Nb and Ta reflects a lower solubility ofthese elements in the migrating fluids.
�2.6 ISOTOPESIsotopes of an element are atoms whose nuclei containthe same number of protons but a different number ofneutrons. Different isotopes are denoted with theiratomic weights (protons � neutrons) as a superscript.Thus, all hydrogen atoms contain one proton in theirnucleus and one electron that determines its chemicalbehavior. However, there are three H isotopes: hydro-gen (1H), deuterium (2H), and tritium (3H), whichhave zero, one, and two neutrons, respectively.
Isotopes are introduced in beginning geologycourses because of their importance in determinationsof the absolute age of rocks and minerals. In addition,like trace elements, isotopes serve as useful petroge-netic indicators of1. processes of magma generation and evolution2. T of crystallization3. thermal history4. other geologic processes, such as advective migration
of aqueous fluids around hot magmatic intrusionsInvestigations of trace elements and isotopes often gohand in hand because many of the petrologically im-portant isotopes, except O and H, are of trace ele-ments, namely, Rb, Sr, Pb, U, Th, Sm, and Nd. Geo-chemical investigations of trace elements and isotopesin magmas derived more or less directly from the man-tle have provided significant constraints on the natureof this remote region of the interior of the Earth—oncethe exclusive and sole domain of geophysicists.
The isotopic proportions of elements in geologicmaterials are complex functions of their history and de-pend on whether the isotopes are unstable (radioac-tive) or stable and whether the isotopic system has re-mained closed.
2.6.1 Stable IsotopesStable isotopes do not decay. The stable isotope ratiosof a particular element can only change by various phys-ical and chemical isotopic fractionation phenomena inwhich one isotope is preferentially incorporated intoone phase over another coexisting phase. For example,isotopes of 18O are heavier than 16O, and consequentlymolecules of H2
18O are heavier than H216O molecules.
Because the vapor pressure, or escaping tendency, of avibrating molecule is inversely proportional to its mass,evaporation of seawater enriches the overlying atmos-pheric vapor in the lighter molecules that contain 16O
and 1H isotopes, compared to the liquid seawater. Me-teoric (rain) water derived from this vapor is also en-riched in the lighter molecules and isotopes. Isotopicfractionation can occur between the isotopes of any el-ement, but is greater for lighter elements, where thereare larger relative differences in the masses of two iso-topes. Hence, the mass difference between 1H and 2His 100% and fractionation is considerable. Smaller frac-tionation occurs for heavier 16O and 18O, where the dif-ference in mass is only about 12 percent. Isotopes of stillheavier elements have even smaller relative mass differ-ences; isotopic fractionation is too small to be detectedfor elements heavier than about Ca.
As a consequence of fractionation processes, stableisotopes can be used to trace the materials and processesinvolved in the evolution of many petrologic systems andthe T at which they form. Because natural waters containH, O, C, and S, the isotopes of these elements furnishvaluable information regarding fluid-rock interactions ingeologic systems. The importance of O exceeds that ofthe other isotopes because of its abundance in all kindsof rocks as well as natural fluids; it is the only stable iso-tope considered further here. See Faure (1986) for dis-cussion of other stable isotopic systems.
Oxygen Isotopes. Stable isotope fractionation occursamong the three isotopes of oxygen, 16O, 17O, and 18O,whose average percentages in natural materials are99.76%, 0.04%, and 0.20%, respectively; these pro-portions yield the atomic weight given in periodic ta-bles of the elements. Geochemists define the isotopefractionation factor, �A�B � RA/RB where RA �18O/16O in phase A and RB � 18O/16O in phase B. Be-cause these factors vary only in the thousandths place(generally between 1.000 and 1.004), stable isotopecompositions are cited in the delta ( ) notation,wherein the isotope ratio in a particular phase is ex-pressed as a fractional deviation from a standard of accepted composition
2.3 18O%o � �(Rsample � Rstandard) 1000Rstandard
�Thus, the measured 18O value is expressed in parts perthousand, or per mil %o. The standard used for com-parison is usually Vienna Standard Mean Ocean Water(VSMOW), which has a composition similar to that ofaverage ocean water. Positive 18O values are enrichedin the heavy 18O isotope, negative in light 16O.
Fractionation of stable isotopes can occur duringcrystallization of minerals from liquids for much thesame reason it does during evaporation. In crystalscontaining small light ions, such as Si4�, the higher vi-brational component of the internal energy can be re-duced by bonding with heavier isotopes. Thus, in arock in which the two phases quartz and magnetite
44 Igneous and Metamorphic Petrology
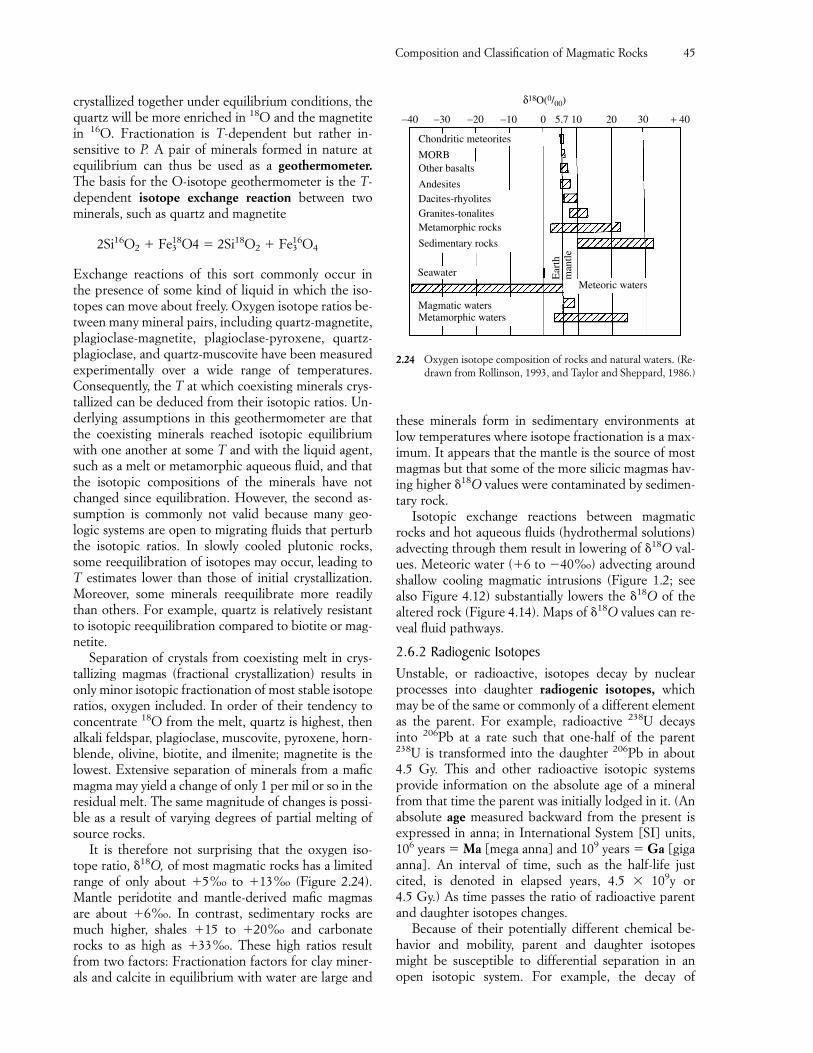
crystallized together under equilibrium conditions, thequartz will be more enriched in 18O and the magnetitein 16O. Fractionation is T-dependent but rather in-sensitive to P. A pair of minerals formed in nature atequilibrium can thus be used as a geothermometer.The basis for the O-isotope geothermometer is the T-dependent isotope exchange reaction between twominerals, such as quartz and magnetite
2Si16O2 � Fe318O4 � 2Si18O2 � Fe3
16O4
Exchange reactions of this sort commonly occur in the presence of some kind of liquid in which the iso-topes can move about freely. Oxygen isotope ratios be-tween many mineral pairs, including quartz-magnetite, plagioclase-magnetite, plagioclase-pyroxene, quartz-plagioclase, and quartz-muscovite have been measuredexperimentally over a wide range of temperatures.Consequently, the T at which coexisting minerals crys-tallized can be deduced from their isotopic ratios. Un-derlying assumptions in this geothermometer are thatthe coexisting minerals reached isotopic equilibriumwith one another at some T and with the liquid agent,such as a melt or metamorphic aqueous fluid, and thatthe isotopic compositions of the minerals have notchanged since equilibration. However, the second as-sumption is commonly not valid because many geo-logic systems are open to migrating fluids that perturbthe isotopic ratios. In slowly cooled plutonic rocks,some reequilibration of isotopes may occur, leading toT estimates lower than those of initial crystallization.Moreover, some minerals reequilibrate more readilythan others. For example, quartz is relatively resistantto isotopic reequilibration compared to biotite or mag-netite.
Separation of crystals from coexisting melt in crys-tallizing magmas (fractional crystallization) results inonly minor isotopic fractionation of most stable isotoperatios, oxygen included. In order of their tendency toconcentrate 18O from the melt, quartz is highest, thenalkali feldspar, plagioclase, muscovite, pyroxene, horn-blende, olivine, biotite, and ilmenite; magnetite is thelowest. Extensive separation of minerals from a maficmagma may yield a change of only 1 per mil or so in theresidual melt. The same magnitude of changes is possi-ble as a result of varying degrees of partial melting ofsource rocks.
It is therefore not surprising that the oxygen iso-tope ratio, 18O, of most magmatic rocks has a limitedrange of only about �5%o to �13%o (Figure 2.24).Mantle peridotite and mantle-derived mafic magmasare about �6%o. In contrast, sedimentary rocks aremuch higher, shales �15 to �20%o and carbonaterocks to as high as �33%o. These high ratios resultfrom two factors: Fractionation factors for clay miner-als and calcite in equilibrium with water are large and
Composition and Classification of Magmatic Rocks 45
−40 −30 −20 −10 0 5.7 10 20 30 + 40
δ18O(0/00)
Chondritic meteorites
MORBOther basalts
AndesitesDacites-rhyolitesGranites-tonalitesMetamorphic rocks
Sedimentary rocks
Seawater
Magmatic watersMetamorphic waters
Meteoric waters
Ear
thm
antle
2.24 Oxygen isotope composition of rocks and natural waters. (Re-drawn from Rollinson, 1993, and Taylor and Sheppard, 1986.)
these minerals form in sedimentary environments atlow temperatures where isotope fractionation is a max-imum. It appears that the mantle is the source of mostmagmas but that some of the more silicic magmas hav-ing higher 18O values were contaminated by sedimen-tary rock.
Isotopic exchange reactions between magmaticrocks and hot aqueous fluids (hydrothermal solutions)advecting through them result in lowering of 18O val-ues. Meteoric water (�6 to �40%o) advecting aroundshallow cooling magmatic intrusions (Figure 1.2; seealso Figure 4.12) substantially lowers the 18O of thealtered rock (Figure 4.14). Maps of 18O values can re-veal fluid pathways.
2.6.2 Radiogenic IsotopesUnstable, or radioactive, isotopes decay by nuclearprocesses into daughter radiogenic isotopes, whichmay be of the same or commonly of a different elementas the parent. For example, radioactive 238U decaysinto 206Pb at a rate such that one-half of the parent238U is transformed into the daughter 206Pb in about4.5 Gy. This and other radioactive isotopic systemsprovide information on the absolute age of a mineralfrom that time the parent was initially lodged in it. (Anabsolute age measured backward from the present isexpressed in anna; in International System [SI] units,106 years � Ma [mega anna] and 109 years � Ga [gigaanna]. An interval of time, such as the half-life justcited, is denoted in elapsed years, 4.5 109y or 4.5 Gy.) As time passes the ratio of radioactive parentand daughter isotopes changes.
Because of their potentially different chemical be-havior and mobility, parent and daughter isotopesmight be susceptible to differential separation in anopen isotopic system. For example, the decay of
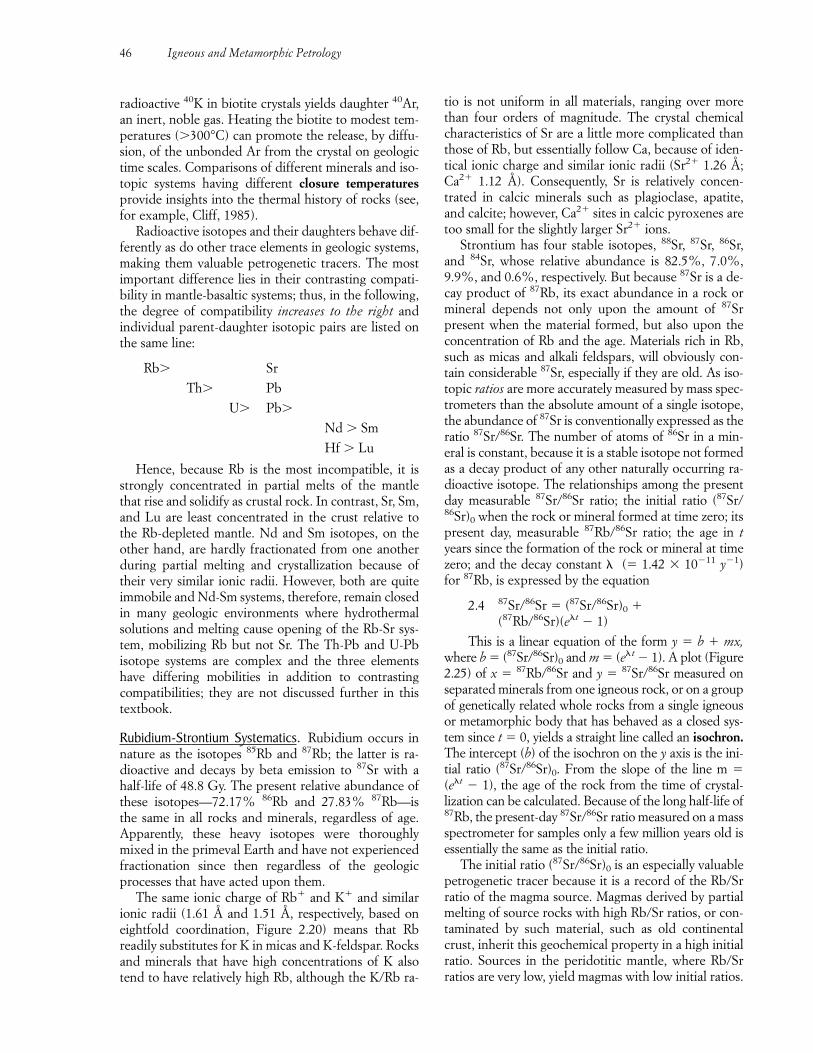
radioactive 40K in biotite crystals yields daughter 40Ar,an inert, noble gas. Heating the biotite to modest tem-peratures (�300°C) can promote the release, by diffu-sion, of the unbonded Ar from the crystal on geologictime scales. Comparisons of different minerals and iso-topic systems having different closure temperaturesprovide insights into the thermal history of rocks (see,for example, Cliff, 1985).
Radioactive isotopes and their daughters behave dif-ferently as do other trace elements in geologic systems,making them valuable petrogenetic tracers. The mostimportant difference lies in their contrasting compati-bility in mantle-basaltic systems; thus, in the following,the degree of compatibility increases to the right andindividual parent-daughter isotopic pairs are listed onthe same line:
Rb� Sr
Th� Pb
U� Pb�
Nd � Sm
Hf � Lu
Hence, because Rb is the most incompatible, it isstrongly concentrated in partial melts of the mantlethat rise and solidify as crustal rock. In contrast, Sr, Sm,and Lu are least concentrated in the crust relative tothe Rb-depleted mantle. Nd and Sm isotopes, on theother hand, are hardly fractionated from one anotherduring partial melting and crystallization because oftheir very similar ionic radii. However, both are quiteimmobile and Nd-Sm systems, therefore, remain closedin many geologic environments where hydrothermalsolutions and melting cause opening of the Rb-Sr sys-tem, mobilizing Rb but not Sr. The Th-Pb and U-Pbisotope systems are complex and the three elementshave differing mobilities in addition to contrastingcompatibilities; they are not discussed further in thistextbook.
Rubidium-Strontium Systematics. Rubidium occurs innature as the isotopes 85Rb and 87Rb; the latter is ra-dioactive and decays by beta emission to 87Sr with ahalf-life of 48.8 Gy. The present relative abundance ofthese isotopes—72.17% 86Rb and 27.83% 87Rb—isthe same in all rocks and minerals, regardless of age.Apparently, these heavy isotopes were thoroughlymixed in the primeval Earth and have not experiencedfractionation since then regardless of the geologicprocesses that have acted upon them.
The same ionic charge of Rb� and K� and similarionic radii (1.61 Å and 1.51 Å, respectively, based oneightfold coordination, Figure 2.20) means that Rbreadily substitutes for K in micas and K-feldspar. Rocksand minerals that have high concentrations of K alsotend to have relatively high Rb, although the K/Rb ra-
tio is not uniform in all materials, ranging over morethan four orders of magnitude. The crystal chemicalcharacteristics of Sr are a little more complicated thanthose of Rb, but essentially follow Ca, because of iden-tical ionic charge and similar ionic radii (Sr2� 1.26 Å;Ca2� 1.12 Å). Consequently, Sr is relatively concen-trated in calcic minerals such as plagioclase, apatite,and calcite; however, Ca2� sites in calcic pyroxenes aretoo small for the slightly larger Sr2� ions.
Strontium has four stable isotopes, 88Sr, 87Sr, 86Sr,and 84Sr, whose relative abundance is 82.5%, 7.0%,9.9%, and 0.6%, respectively. But because 87Sr is a de-cay product of 87Rb, its exact abundance in a rock ormineral depends not only upon the amount of 87Sr present when the material formed, but also upon theconcentration of Rb and the age. Materials rich in Rb,such as micas and alkali feldspars, will obviously con-tain considerable 87Sr, especially if they are old. As iso-topic ratios are more accurately measured by mass spec-trometers than the absolute amount of a single isotope,the abundance of 87Sr is conventionally expressed as theratio 87Sr/86Sr. The number of atoms of 86Sr in a min-eral is constant, because it is a stable isotope not formedas a decay product of any other naturally occurring ra-dioactive isotope. The relationships among the presentday measurable 87Sr/86Sr ratio; the initial ratio (87Sr/86Sr)0 when the rock or mineral formed at time zero; itspresent day, measurable 87Rb/86Sr ratio; the age in tyears since the formation of the rock or mineral at timezero; and the decay constant � (� 1.42 10�11 y�1)for 87Rb, is expressed by the equation
2.4 87Sr/86Sr � (87Sr/86Sr)0 �(87Rb/86Sr)(e�t � 1)
This is a linear equation of the form y � b � mx,where b � (87Sr/86Sr)0 and m � (e�t � 1). A plot (Figure2.25) of x � 87Rb/86Sr and y � 87Sr/86Sr measured onseparated minerals from one igneous rock, or on a groupof genetically related whole rocks from a single igneousor metamorphic body that has behaved as a closed sys-tem since t � 0, yields a straight line called an isochron.The intercept (b) of the isochron on the y axis is the ini-tial ratio (87Sr/86Sr)0. From the slope of the line m �(e�t � 1), the age of the rock from the time of crystal-lization can be calculated. Because of the long half-life of87Rb, the present-day 87Sr/86Sr ratio measured on a massspectrometer for samples only a few million years old isessentially the same as the initial ratio.
The initial ratio (87Sr/86Sr)0 is an especially valuablepetrogenetic tracer because it is a record of the Rb/Srratio of the magma source. Magmas derived by partialmelting of source rocks with high Rb/Sr ratios, or con-taminated by such material, such as old continentalcrust, inherit this geochemical property in a high initialratio. Sources in the peridotitic mantle, where Rb/Srratios are very low, yield magmas with low initial ratios.
46 Igneous and Metamorphic Petrology
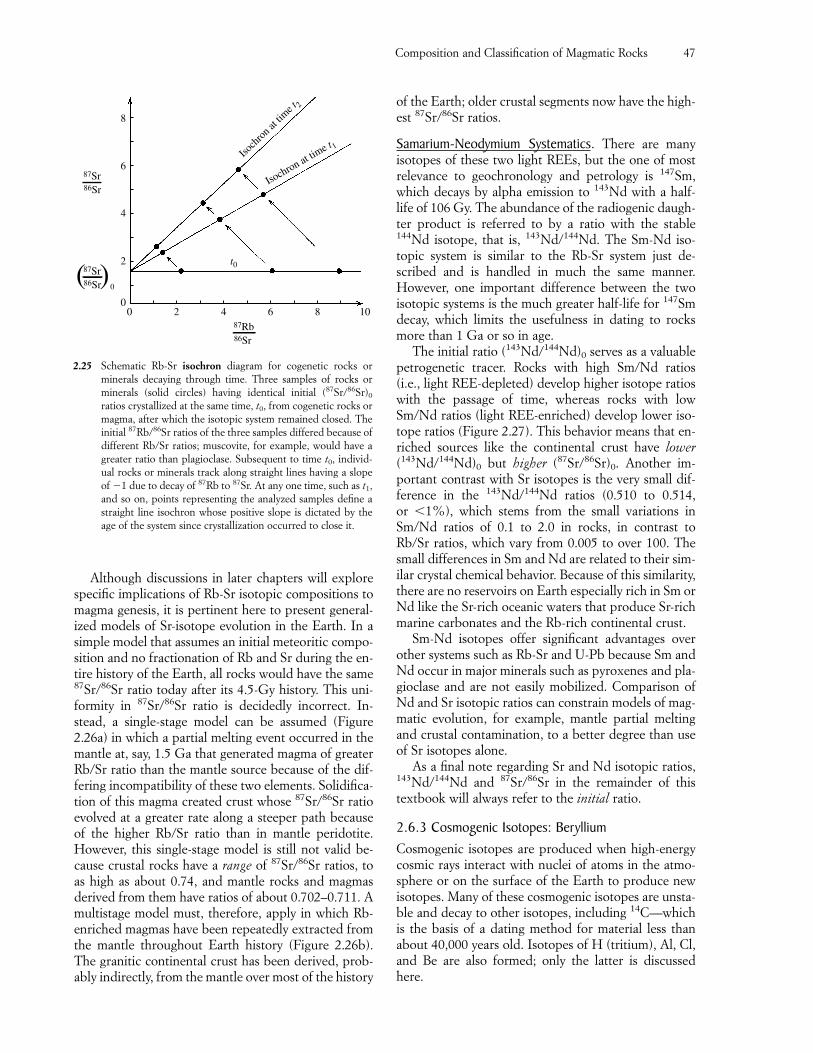
Although discussions in later chapters will explorespecific implications of Rb-Sr isotopic compositions tomagma genesis, it is pertinent here to present general-ized models of Sr-isotope evolution in the Earth. In asimple model that assumes an initial meteoritic compo-sition and no fractionation of Rb and Sr during the en-tire history of the Earth, all rocks would have the same87Sr/86Sr ratio today after its 4.5-Gy history. This uni-formity in 87Sr/86Sr ratio is decidedly incorrect. In-stead, a single-stage model can be assumed (Figure2.26a) in which a partial melting event occurred in themantle at, say, 1.5 Ga that generated magma of greaterRb/Sr ratio than the mantle source because of the dif-fering incompatibility of these two elements. Solidifica-tion of this magma created crust whose 87Sr/86Sr ratioevolved at a greater rate along a steeper path becauseof the higher Rb/Sr ratio than in mantle peridotite.However, this single-stage model is still not valid be-cause crustal rocks have a range of 87Sr/86Sr ratios, toas high as about 0.74, and mantle rocks and magmasderived from them have ratios of about 0.702–0.711. Amultistage model must, therefore, apply in which Rb-enriched magmas have been repeatedly extracted fromthe mantle throughout Earth history (Figure 2.26b).The granitic continental crust has been derived, prob-ably indirectly, from the mantle over most of the history
of the Earth; older crustal segments now have the high-est 87Sr/86Sr ratios.
Samarium-Neodymium Systematics. There are manyisotopes of these two light REEs, but the one of mostrelevance to geochronology and petrology is 147Sm,which decays by alpha emission to 143Nd with a half-life of 106 Gy. The abundance of the radiogenic daugh-ter product is referred to by a ratio with the stable144Nd isotope, that is, 143Nd/144Nd. The Sm-Nd iso-topic system is similar to the Rb-Sr system just de-scribed and is handled in much the same manner.However, one important difference between the twoisotopic systems is the much greater half-life for 147Smdecay, which limits the usefulness in dating to rocksmore than 1 Ga or so in age.
The initial ratio (143Nd/144Nd)0 serves as a valuablepetrogenetic tracer. Rocks with high Sm/Nd ratios (i.e., light REE-depleted) develop higher isotope ratioswith the passage of time, whereas rocks with lowSm/Nd ratios (light REE-enriched) develop lower iso-tope ratios (Figure 2.27). This behavior means that en-riched sources like the continental crust have lower(143Nd/144Nd)0 but higher (87Sr/86Sr)0. Another im-portant contrast with Sr isotopes is the very small dif-ference in the 143Nd/144Nd ratios (0.510 to 0.514, or �1%), which stems from the small variations inSm/Nd ratios of 0.1 to 2.0 in rocks, in contrast toRb/Sr ratios, which vary from 0.005 to over 100. Thesmall differences in Sm and Nd are related to their sim-ilar crystal chemical behavior. Because of this similarity,there are no reservoirs on Earth especially rich in Sm orNd like the Sr-rich oceanic waters that produce Sr-richmarine carbonates and the Rb-rich continental crust.
Sm-Nd isotopes offer significant advantages overother systems such as Rb-Sr and U-Pb because Sm andNd occur in major minerals such as pyroxenes and pla-gioclase and are not easily mobilized. Comparison ofNd and Sr isotopic ratios can constrain models of mag-matic evolution, for example, mantle partial meltingand crustal contamination, to a better degree than useof Sr isotopes alone.
As a final note regarding Sr and Nd isotopic ratios,143Nd/144Nd and 87Sr/86Sr in the remainder of thistextbook will always refer to the initial ratio.
2.6.3 Cosmogenic Isotopes: BerylliumCosmogenic isotopes are produced when high-energycosmic rays interact with nuclei of atoms in the atmo-sphere or on the surface of the Earth to produce newisotopes. Many of these cosmogenic isotopes are unsta-ble and decay to other isotopes, including 14C—whichis the basis of a dating method for material less thanabout 40,000 years old. Isotopes of H (tritium), Al, Cl,and Be are also formed; only the latter is discussedhere.
Composition and Classification of Magmatic Rocks 47
0
2
0
4
6
8
2 4 6 8 10
Isoch
ron a
t time t 2
Isochron at tim
e t 1
t0
87Rb86Sr
87Sr86Sr( (
0
87Sr86Sr
2.25 Schematic Rb-Sr isochron diagram for cogenetic rocks or minerals decaying through time. Three samples of rocks orminerals (solid circles) having identical initial (87Sr/86Sr)0
ratios crystallized at the same time, t0, from cogenetic rocks ormagma, after which the isotopic system remained closed. Theinitial 87Rb/86Sr ratios of the three samples differed because ofdifferent Rb/Sr ratios; muscovite, for example, would have agreater ratio than plagioclase. Subsequent to time t0, individ-ual rocks or minerals track along straight lines having a slopeof �1 due to decay of 87Rb to 87Sr. At any one time, such as t1,and so on, points representing the analyzed samples define astraight line isochron whose positive slope is dictated by theage of the system since crystallization occurred to close it.
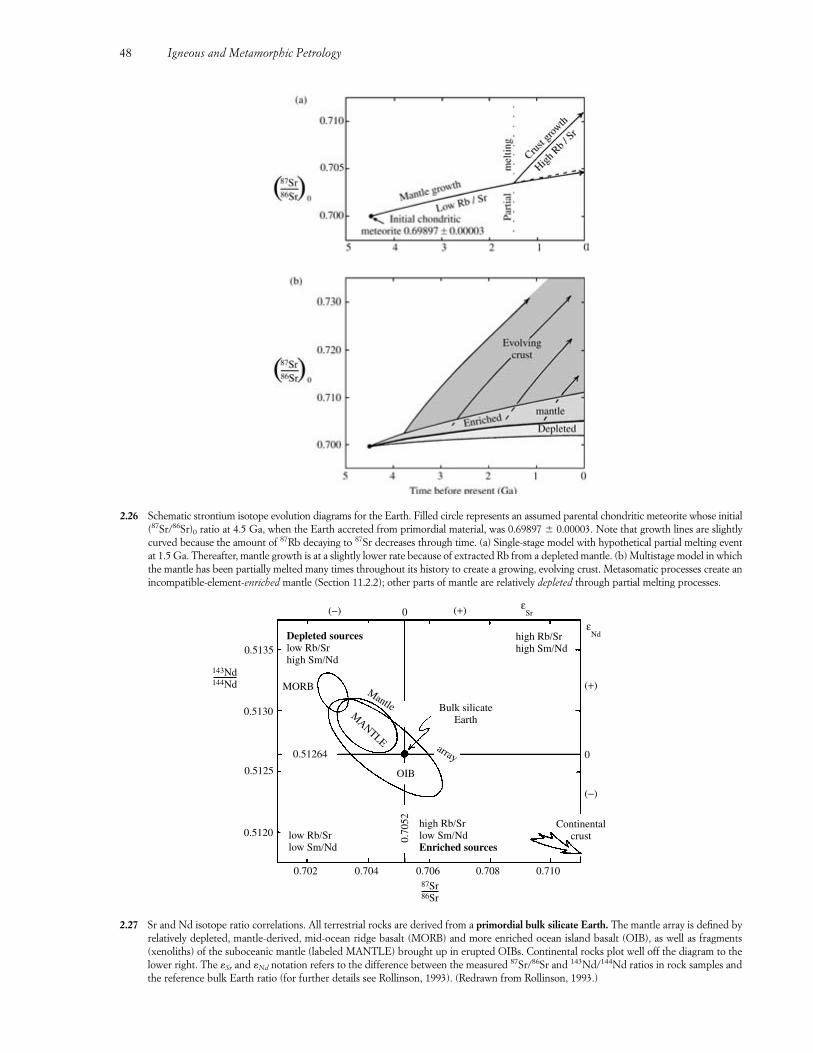
48 Igneous and Metamorphic Petrology
2.26 Schematic strontium isotope evolution diagrams for the Earth. Filled circle represents an assumed parental chondritic meteorite whose initial(87Sr/86Sr)0 ratio at 4.5 Ga, when the Earth accreted from primordial material, was 0.69897 � 0.00003. Note that growth lines are slightlycurved because the amount of 87Rb decaying to 87Sr decreases through time. (a) Single-stage model with hypothetical partial melting eventat 1.5 Ga. Thereafter, mantle growth is at a slightly lower rate because of extracted Rb from a depleted mantle. (b) Multistage model in whichthe mantle has been partially melted many times throughout its history to create a growing, evolving crust. Metasomatic processes create anincompatible-element-enriched mantle (Section 11.2.2); other parts of mantle are relatively depleted through partial melting processes.
0.5135
0.5130
0.51264
0.5125
0.5120
0.702 0.704 0.706
0.70
52
0.708 0.710
Continentalcrust
0
0
(−) (+) ε
Sr
εNd
(+)
(−)
high Rb/Srhigh Sm/Nd
low Rb/Srlow Sm/Nd
high Rb/Srlow Sm/NdEnriched sources
Depleted sourceslow Rb/Srhigh Sm/Nd
MANTLE
Mantle
array
OΙB
MORB
Bulk silicateEarth
87Sr86Sr
143Nd144Nd
2.27 Sr and Nd isotope ratio correlations. All terrestrial rocks are derived from a primordial bulk silicate Earth. The mantle array is defined byrelatively depleted, mantle-derived, mid-ocean ridge basalt (MORB) and more enriched ocean island basalt (OIB), as well as fragments(xenoliths) of the suboceanic mantle (labeled MANTLE) brought up in erupted OIBs. Continental rocks plot well off the diagram to thelower right. The �Sr and �Nd notation refers to the difference between the measured 87Sr/86Sr and 143Nd/144Nd ratios in rock samples andthe reference bulk Earth ratio (for further details see Rollinson, 1993). (Redrawn from Rollinson, 1993.)
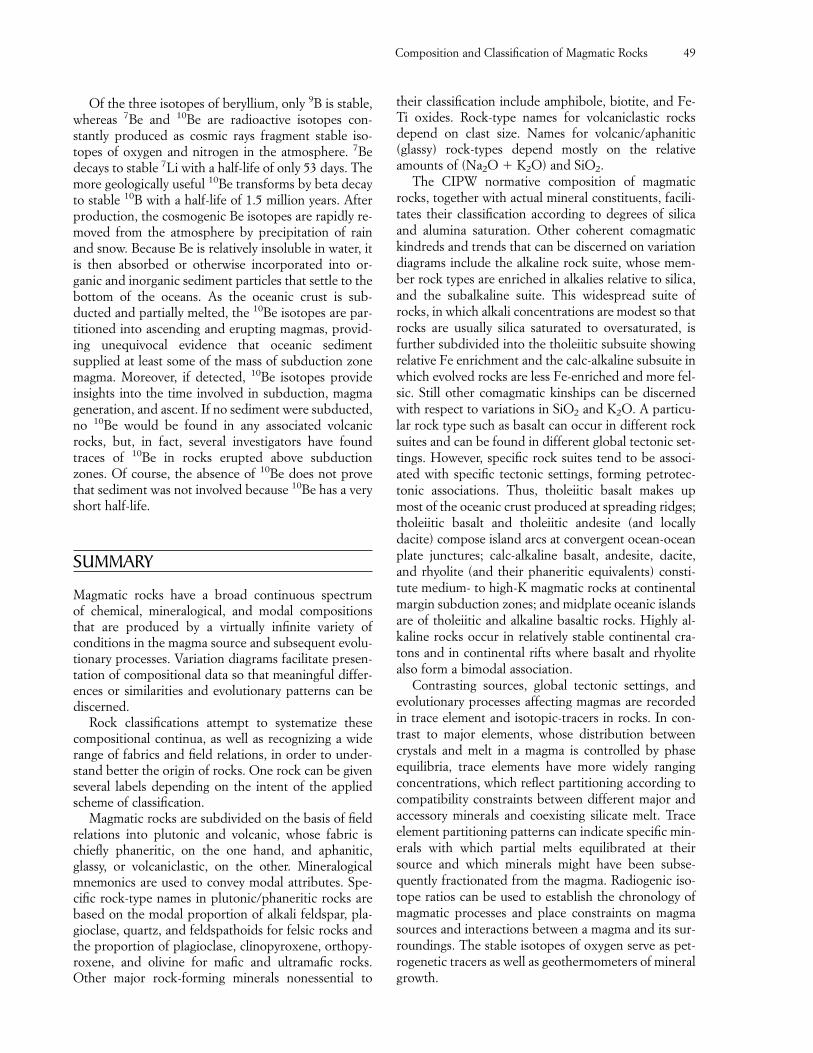
Of the three isotopes of beryllium, only 9B is stable,whereas 7Be and 10Be are radioactive isotopes con-stantly produced as cosmic rays fragment stable iso-topes of oxygen and nitrogen in the atmosphere. 7Bedecays to stable 7Li with a half-life of only 53 days. Themore geologically useful 10Be transforms by beta decayto stable 10B with a half-life of 1.5 million years. Afterproduction, the cosmogenic Be isotopes are rapidly re-moved from the atmosphere by precipitation of rainand snow. Because Be is relatively insoluble in water, itis then absorbed or otherwise incorporated into or-ganic and inorganic sediment particles that settle to thebottom of the oceans. As the oceanic crust is sub-ducted and partially melted, the 10Be isotopes are par-titioned into ascending and erupting magmas, provid-ing unequivocal evidence that oceanic sedimentsupplied at least some of the mass of subduction zonemagma. Moreover, if detected, 10Be isotopes provideinsights into the time involved in subduction, magmageneration, and ascent. If no sediment were subducted,no 10Be would be found in any associated volcanicrocks, but, in fact, several investigators have foundtraces of 10Be in rocks erupted above subductionzones. Of course, the absence of 10Be does not provethat sediment was not involved because 10Be has a veryshort half-life.
SUMMARY
Magmatic rocks have a broad continuous spectrum of chemical, mineralogical, and modal compositionsthat are produced by a virtually infinite variety of conditions in the magma source and subsequent evolu-tionary processes. Variation diagrams facilitate presen-tation of compositional data so that meaningful differ-ences or similarities and evolutionary patterns can bediscerned.
Rock classifications attempt to systematize thesecompositional continua, as well as recognizing a widerange of fabrics and field relations, in order to under-stand better the origin of rocks. One rock can be givenseveral labels depending on the intent of the appliedscheme of classification.
Magmatic rocks are subdivided on the basis of fieldrelations into plutonic and volcanic, whose fabric ischiefly phaneritic, on the one hand, and aphanitic,glassy, or volcaniclastic, on the other. Mineralogicalmnemonics are used to convey modal attributes. Spe-cific rock-type names in plutonic/phaneritic rocks arebased on the modal proportion of alkali feldspar, pla-gioclase, quartz, and feldspathoids for felsic rocks andthe proportion of plagioclase, clinopyroxene, orthopy-roxene, and olivine for mafic and ultramafic rocks.Other major rock-forming minerals nonessential to
their classification include amphibole, biotite, and Fe-Ti oxides. Rock-type names for volcaniclastic rocks depend on clast size. Names for volcanic/aphanitic(glassy) rock-types depend mostly on the relativeamounts of (Na2O � K2O) and SiO2.
The CIPW normative composition of magmaticrocks, together with actual mineral constituents, facili-tates their classification according to degrees of silicaand alumina saturation. Other coherent comagmatickindreds and trends that can be discerned on variationdiagrams include the alkaline rock suite, whose mem-ber rock types are enriched in alkalies relative to silica,and the subalkaline suite. This widespread suite ofrocks, in which alkali concentrations are modest so thatrocks are usually silica saturated to oversaturated, isfurther subdivided into the tholeiitic subsuite showingrelative Fe enrichment and the calc-alkaline subsuite inwhich evolved rocks are less Fe-enriched and more fel-sic. Still other comagmatic kinships can be discernedwith respect to variations in SiO2 and K2O. A particu-lar rock type such as basalt can occur in different rocksuites and can be found in different global tectonic set-tings. However, specific rock suites tend to be associ-ated with specific tectonic settings, forming petrotec-tonic associations. Thus, tholeiitic basalt makes upmost of the oceanic crust produced at spreading ridges;tholeiitic basalt and tholeiitic andesite (and locallydacite) compose island arcs at convergent ocean-oceanplate junctures; calc-alkaline basalt, andesite, dacite,and rhyolite (and their phaneritic equivalents) consti-tute medium- to high-K magmatic rocks at continentalmargin subduction zones; and midplate oceanic islandsare of tholeiitic and alkaline basaltic rocks. Highly al-kaline rocks occur in relatively stable continental cra-tons and in continental rifts where basalt and rhyolitealso form a bimodal association.
Contrasting sources, global tectonic settings, andevolutionary processes affecting magmas are recordedin trace element and isotopic-tracers in rocks. In con-trast to major elements, whose distribution betweencrystals and melt in a magma is controlled by phaseequilibria, trace elements have more widely rangingconcentrations, which reflect partitioning according tocompatibility constraints between different major andaccessory minerals and coexisting silicate melt. Traceelement partitioning patterns can indicate specific min-erals with which partial melts equilibrated at theirsource and which minerals might have been subse-quently fractionated from the magma. Radiogenic iso-tope ratios can be used to establish the chronology ofmagmatic processes and place constraints on magmasources and interactions between a magma and its sur-roundings. The stable isotopes of oxygen serve as pet-rogenetic tracers as well as geothermometers of mineralgrowth.
Composition and Classification of Magmatic Rocks 49
CRITICAL THINKING QUESTIONS2.1 What are the hindrances, rationale, and justifica-
tion for classification of magmatic rocks? Is clas-sification just meaningless busywork?
2.2 Briefly indicate the basis for each of the severalclassifications of magmatic rocks described inthis chapter.
2.3 Contrast rock types with rock suites.2.4 What are three fabric heteromorphs of granite?2.5 From Figures 2.8 and 2.12, describe systematic
variations in mode and silica among granite, granodiorite, and diorite. From Table 2.2, de-scribe and explain systematic changes in majoroxides.
2.6 Explain in detail how it is possible for a quartz-normative basalt to contain no real quartz in itsmode, only plagioclase, pyroxene, olivine, andFe-Ti oxides. A nepheline normative basalt ofthe same mode containing no actual nepheline.What is the role of pyroxene?
2.7 Discuss silica saturation in a simple modelmagma consisting of O, Si, Al, and K, which canpotentially crystallize quartz, K-feldspar, leucite(KAlSi2O6), and kalsilite (KAlSiO4). Create adiagram for this hypothetical system like Figure2.14.
2.8 Discuss differences in the major and trace ele-ment compositions of basalt and relate these dif-ferences to global tectonic setting.
2.9 What is the relation between crustal thicknessand K2O at a given SiO2 content for magmaticrocks in subduction zones?
2.10 What are the bases for distinguishing betweencompatible and incompatible trace elements?Give examples of each in rhyolitic and inbasaltic magmas.
2.11 What are the rationale and the goal of investiga-tions of trace elements in magmatic rocks? Ofisotopes?
2.12 What factors control variations in the ratios ofstable isotopes? Radiogenic isotopes?
2.13 Contrast the behavior and implications of Sm-Nd and Rb-Sr isotope systems.
PROBLEMS2.1 Classify the garnet and spinel peridotites from
Table 11.1 using Figure 2.10b.
2.2 Plot average granite and granodiorite in Table2.2 in an enlarged photocopy of Figure 2.8 us-ing the amounts of normative Q, Or, and Ab inlieu of modal Q, A, and P.
2.3 Calculate the normative composition of a mag-matic biotite and hornblende from Appendix A.Classify these minerals, as if they were rocks, asto degree of silica saturation. Discuss how crys-tallization of these minerals in magmas controlsthe availability of silica for potential crystalliza-tion of quartz.
2.4 From problem 2.3 classify the selected biotiteand amphibole as to degree of alumina satura-tion.
2.5 Calculate the normative compositions of thepantellerite in Table 13.10, the phlogopite-richleucite lamproite in Table 13.11, and theshoshonite in Table 13.6. Classify these rocks inthe total alkali-silica diagram (Figure 2.12). Dis-cuss whether these rocks belong to the alkalinerock suite.
2.6 Calculate the bulk partition coefficients for Niand for Rb in the garnet peridotite in Table 11.1using partition coefficients in Table 2.5.
2.7 Construct a chondrite-normalized diagram forthe spinel peridotite in Table 11.1. Describe thisdiagram. What rock in Figure 2.23 does the pattern of the spinel peridotite most closely re-semble?
50 Igneous and Metamorphic Petrology
FUNDAMENTAL QUESTIONSCONSIDERED IN THIS CHAPTER
1. What are the basic concepts of thermodynamicsand why is thermodynamics important inpetrology?
2. How can the flows of matter and energy inchanging rock-forming systems be predicted andinterpreted using thermodynamic models?
3. How do phase diagrams reflect the thermo-dynamic stability of different states of matter?
4. What is kinetics, why is it important in petrology,and in what ways do kinetic factors limit theapplication of thermodynamics to rock-formingsystems?
INTRODUCTION
Unlike sedimentary systems, in which many flows ofenergy and matter are readily observed and studied inmodern environments, natural magmatic and meta-morphic systems are usually not amenable to direct investigation. Only a few nonexplosively extrudedmagmas can be examined at close range. Accordingly,igneous petrologists have turned to controlled labor-atory experiments and theoretical models to enhancetheir understanding of the behavior of rock-formingsystems, supplementing inferences from rocks. Theoryand experiment can often demonstrate what is impos-sible and what is possible in a geologic system. At aminimum, they provide fruitful insights.
However, despite their advantages, such investiga-tions of natural geologic systems have inherent weak-nesses. Laboratory studies can never duplicate thelarge dimensions and long time scales of geologic sys-tems—as large as the entire Earth and commonly mil-lions of years. Natural systems are always more com-plex than the experiment or model used to simulatethem, necessitating simplifying assumptions that maydeviate from the real world to varying degrees. The ul-timate test of the validity of any petrologic interpreta-tion lies in the fabric, composition, and field relationsof real rocks. Nature does not lie, but our interpreta-tions of it can.
With these caveats in mind, we consider in thischapter one of the foundation stones of petrogenetictheory—thermodynamics—and the kinetic factors thatlimit its application to real petrologic systems.
�3.1 WHY IS THERMODYNAMICSIMPORTANT?
In Section 1.3, the concepts of stability and equilibriumwere introduced, showing that rock-forming processesin changing geologic systems tend toward a state of sta-ble equilibrium in which the energy is the lowest possi-ble. Metastable states having less than the minimal pos-sible energy can persist indefinitely because of anactivation energy barrier impeding the change. Stabil-ity and equilibrium were illustrated by hypothetical ex-amples of three boulders that have differing amountsof gravitational potential energy because of their differ-ent position on hilly terrain and of hot lava flowingdownhill and losing heat, thus reducing its gravita-tional potential and thermal energy.
3CHAPTER
Thermodynamicsand Kinetics: An Introduction
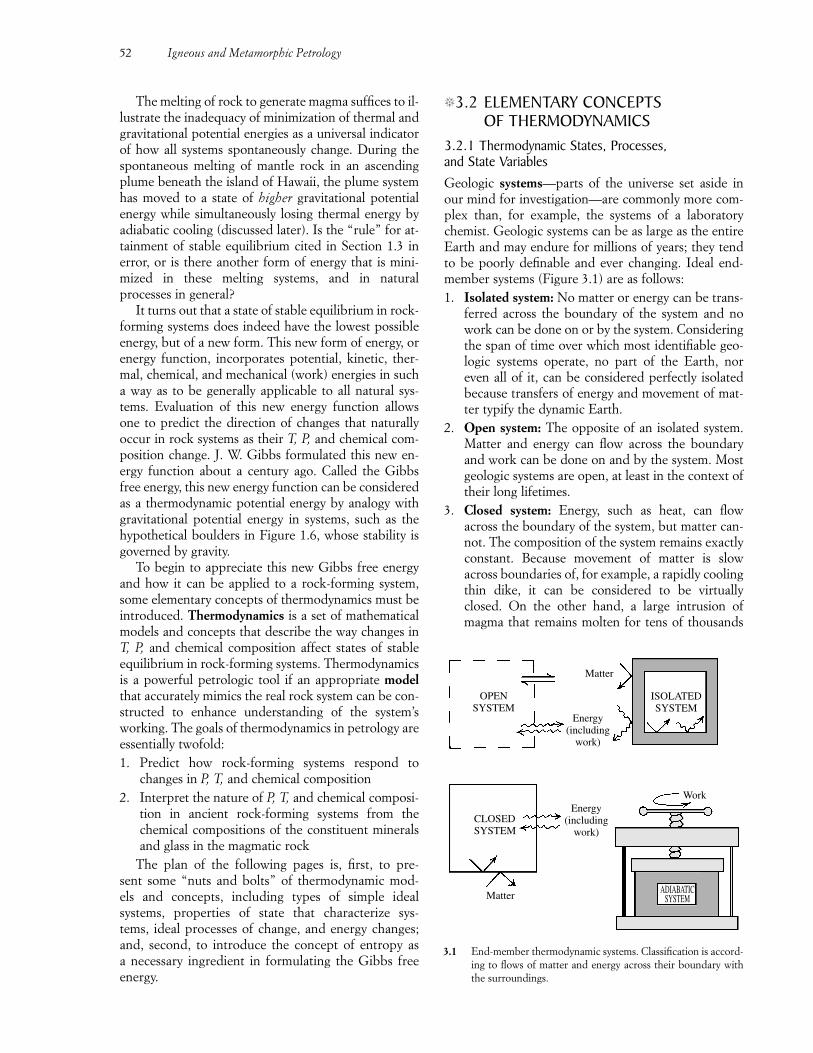
The melting of rock to generate magma suffices to il-lustrate the inadequacy of minimization of thermal andgravitational potential energies as a universal indicatorof how all systems spontaneously change. During thespontaneous melting of mantle rock in an ascendingplume beneath the island of Hawaii, the plume systemhas moved to a state of higher gravitational potentialenergy while simultaneously losing thermal energy byadiabatic cooling (discussed later). Is the “rule” for at-tainment of stable equilibrium cited in Section 1.3 inerror, or is there another form of energy that is mini-mized in these melting systems, and in naturalprocesses in general?
It turns out that a state of stable equilibrium in rock-forming systems does indeed have the lowest possibleenergy, but of a new form. This new form of energy, orenergy function, incorporates potential, kinetic, ther-mal, chemical, and mechanical (work) energies in sucha way as to be generally applicable to all natural sys-tems. Evaluation of this new energy function allowsone to predict the direction of changes that naturallyoccur in rock systems as their T, P, and chemical com-position change. J. W. Gibbs formulated this new en-ergy function about a century ago. Called the Gibbsfree energy, this new energy function can be consideredas a thermodynamic potential energy by analogy withgravitational potential energy in systems, such as thehypothetical boulders in Figure 1.6, whose stability isgoverned by gravity.
To begin to appreciate this new Gibbs free energyand how it can be applied to a rock-forming system,some elementary concepts of thermodynamics must beintroduced. Thermodynamics is a set of mathematicalmodels and concepts that describe the way changes inT, P, and chemical composition affect states of stableequilibrium in rock-forming systems. Thermodynamicsis a powerful petrologic tool if an appropriate modelthat accurately mimics the real rock system can be con-structed to enhance understanding of the system’sworking. The goals of thermodynamics in petrology areessentially twofold:1. Predict how rock-forming systems respond to
changes in P, T, and chemical composition2. Interpret the nature of P, T, and chemical composi-
tion in ancient rock-forming systems from thechemical compositions of the constituent mineralsand glass in the magmatic rock
The plan of the following pages is, first, to pre-sent some “nuts and bolts” of thermodynamic mod-els and concepts, including types of simple ideal systems, properties of state that characterize sys-tems, ideal processes of change, and energy changes;and, second, to introduce the concept of entropy as a necessary ingredient in formulating the Gibbs freeenergy.
�3.2 ELEMENTARY CONCEPTS OF THERMODYNAMICS
3.2.1 Thermodynamic States, Processes, and State VariablesGeologic systems—parts of the universe set aside inour mind for investigation—are commonly more com-plex than, for example, the systems of a laboratorychemist. Geologic systems can be as large as the entireEarth and may endure for millions of years; they tendto be poorly definable and ever changing. Ideal end-member systems (Figure 3.1) are as follows:1. Isolated system: No matter or energy can be trans-
ferred across the boundary of the system and nowork can be done on or by the system. Consideringthe span of time over which most identifiable geo-logic systems operate, no part of the Earth, noreven all of it, can be considered perfectly isolatedbecause transfers of energy and movement of mat-ter typify the dynamic Earth.
2. Open system: The opposite of an isolated system.Matter and energy can flow across the boundaryand work can be done on and by the system. Mostgeologic systems are open, at least in the context oftheir long lifetimes.
3. Closed system: Energy, such as heat, can flowacross the boundary of the system, but matter can-not. The composition of the system remains exactlyconstant. Because movement of matter is slowacross boundaries of, for example, a rapidly coolingthin dike, it can be considered to be virtuallyclosed. On the other hand, a large intrusion ofmagma that remains molten for tens of thousands
52 Igneous and Metamorphic Petrology
ISOLATEDSYSTEM
Energy(including
work)
Energy(including
work)
Matter
OPENSYSTEM
CLOSEDSYSTEM
ADIABATICSYSTEMMatter
Work
3.1 End-member thermodynamic systems. Classification is accord-ing to flows of matter and energy across their boundary withthe surroundings.
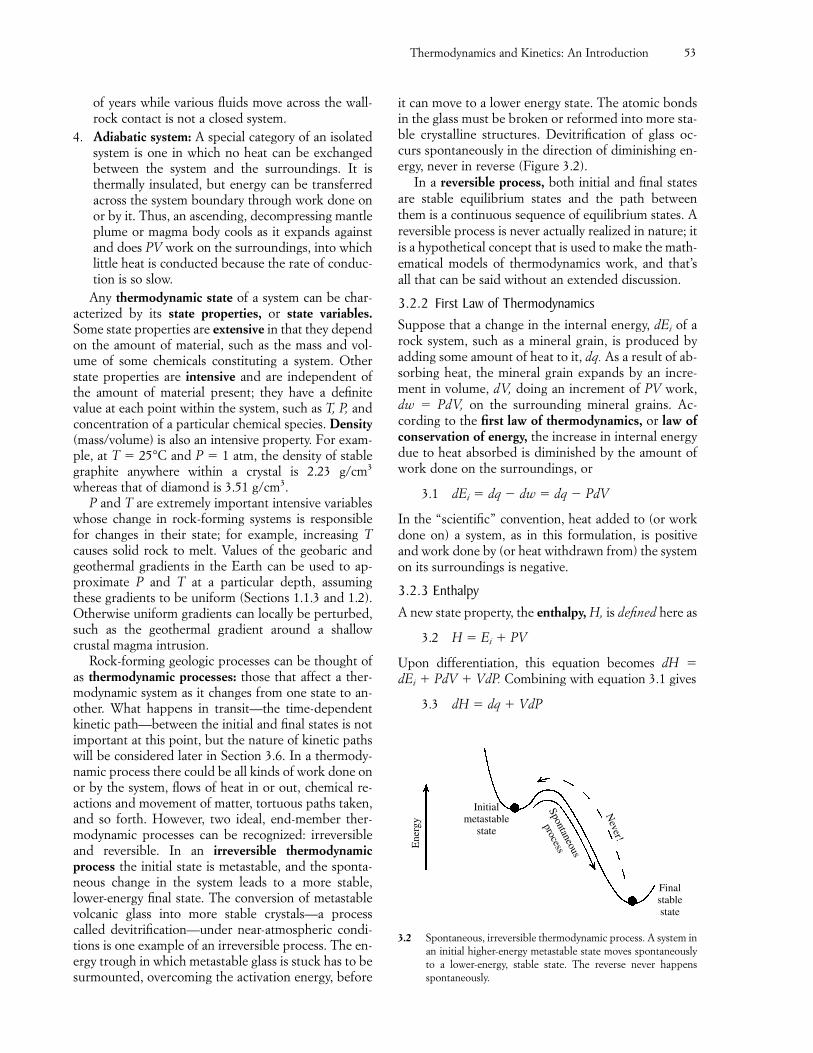
of years while various fluids move across the wall-rock contact is not a closed system.
4. Adiabatic system: A special category of an isolatedsystem is one in which no heat can be exchangedbetween the system and the surroundings. It isthermally insulated, but energy can be transferredacross the system boundary through work done onor by it. Thus, an ascending, decompressing mantleplume or magma body cools as it expands againstand does PV work on the surroundings, into whichlittle heat is conducted because the rate of conduc-tion is so slow.
Any thermodynamic state of a system can be char-acterized by its state properties, or state variables.Some state properties are extensive in that they dependon the amount of material, such as the mass and vol-ume of some chemicals constituting a system. Otherstate properties are intensive and are independent ofthe amount of material present; they have a definitevalue at each point within the system, such as T, P, andconcentration of a particular chemical species. Density(mass/volume) is also an intensive property. For exam-ple, at T � 25°C and P � 1 atm, the density of stablegraphite anywhere within a crystal is 2.23 g/cm3
whereas that of diamond is 3.51 g/cm3.P and T are extremely important intensive variables
whose change in rock-forming systems is responsiblefor changes in their state; for example, increasing Tcauses solid rock to melt. Values of the geobaric andgeothermal gradients in the Earth can be used to ap-proximate P and T at a particular depth, assumingthese gradients to be uniform (Sections 1.1.3 and 1.2).Otherwise uniform gradients can locally be perturbed,such as the geothermal gradient around a shallowcrustal magma intrusion.
Rock-forming geologic processes can be thought ofas thermodynamic processes: those that affect a ther-modynamic system as it changes from one state to an-other. What happens in transit—the time-dependentkinetic path—between the initial and final states is notimportant at this point, but the nature of kinetic pathswill be considered later in Section 3.6. In a thermody-namic process there could be all kinds of work done onor by the system, flows of heat in or out, chemical re-actions and movement of matter, tortuous paths taken,and so forth. However, two ideal, end-member ther-modynamic processes can be recognized: irreversibleand reversible. In an irreversible thermodynamicprocess the initial state is metastable, and the sponta-neous change in the system leads to a more stable,lower-energy final state. The conversion of metastablevolcanic glass into more stable crystals—a processcalled devitrification—under near-atmospheric condi-tions is one example of an irreversible process. The en-ergy trough in which metastable glass is stuck has to besurmounted, overcoming the activation energy, before
it can move to a lower energy state. The atomic bondsin the glass must be broken or reformed into more sta-ble crystalline structures. Devitrification of glass oc-curs spontaneously in the direction of diminishing en-ergy, never in reverse (Figure 3.2).
In a reversible process, both initial and final statesare stable equilibrium states and the path betweenthem is a continuous sequence of equilibrium states. Areversible process is never actually realized in nature; itis a hypothetical concept that is used to make the math-ematical models of thermodynamics work, and that’sall that can be said without an extended discussion.
3.2.2 First Law of ThermodynamicsSuppose that a change in the internal energy, dEi of arock system, such as a mineral grain, is produced byadding some amount of heat to it, dq. As a result of ab-sorbing heat, the mineral grain expands by an incre-ment in volume, dV, doing an increment of PV work,dw � PdV, on the surrounding mineral grains. Ac-cording to the first law of thermodynamics, or law ofconservation of energy, the increase in internal energydue to heat absorbed is diminished by the amount ofwork done on the surroundings, or
3.1 dEi � dq � dw � dq � PdV
In the “scientific” convention, heat added to (or workdone on) a system, as in this formulation, is positiveand work done by (or heat withdrawn from) the systemon its surroundings is negative.
3.2.3 EnthalpyA new state property, the enthalpy, H, is defined here as
3.2 H � Ei � PV
Upon differentiation, this equation becomes dH �dEi � PdV � VdP. Combining with equation 3.1 gives
3.3 dH � dq � VdP
Thermodynamics and Kinetics: An Introduction 53
Ene
rgy
Finalstablestate
Initialmetastable
state
Spontaneous
process
Never!
3.2 Spontaneous, irreversible thermodynamic process. A system inan initial higher-energy metastable state moves spontaneouslyto a lower-energy, stable state. The reverse never happensspontaneously.
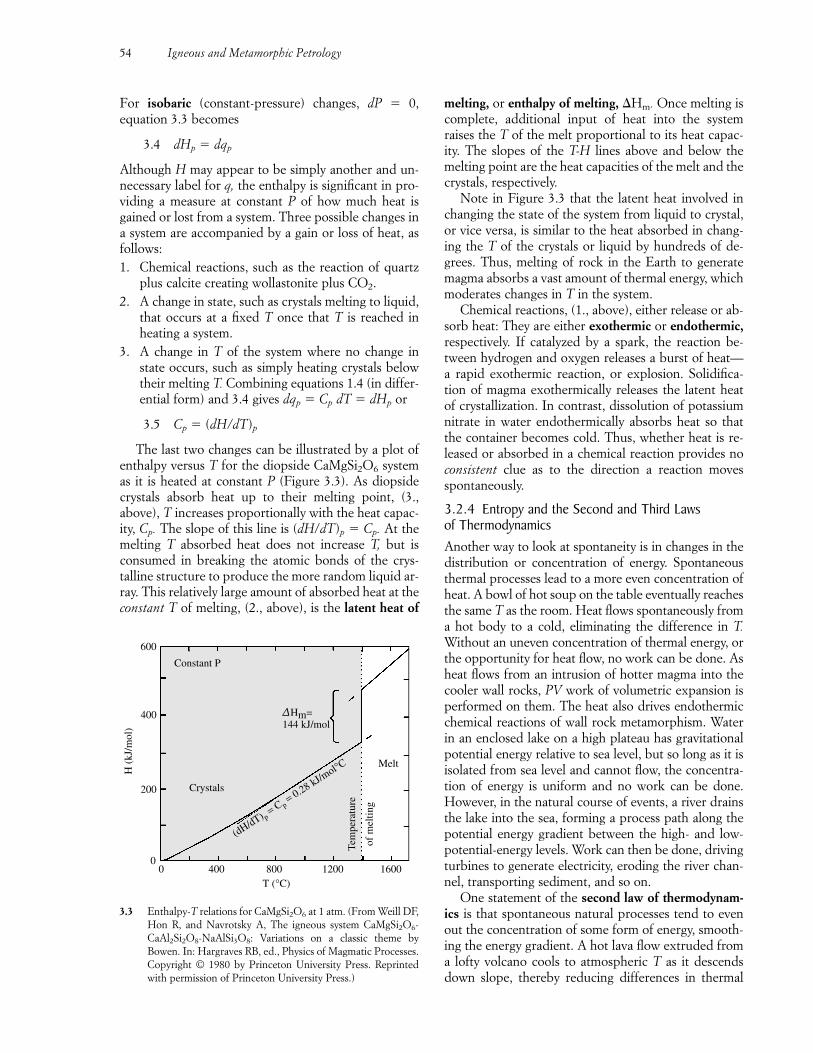
For isobaric (constant-pressure) changes, dP � 0,equation 3.3 becomes
3.4 dHp � dqp
Although H may appear to be simply another and un-necessary label for q, the enthalpy is significant in pro-viding a measure at constant P of how much heat isgained or lost from a system. Three possible changes ina system are accompanied by a gain or loss of heat, asfollows:1. Chemical reactions, such as the reaction of quartz
plus calcite creating wollastonite plus CO2.2. A change in state, such as crystals melting to liquid,
that occurs at a fixed T once that T is reached inheating a system.
3. A change in T of the system where no change instate occurs, such as simply heating crystals belowtheir melting T. Combining equations 1.4 (in differ-ential form) and 3.4 gives dqp � Cp dT � dHp or
3.5 Cp � (dH/dT)p
The last two changes can be illustrated by a plot ofenthalpy versus T for the diopside CaMgSi2O6 systemas it is heated at constant P (Figure 3.3). As diopsidecrystals absorb heat up to their melting point, (3.,above), T increases proportionally with the heat capac-ity, Cp. The slope of this line is (dH/dT)p � Cp. At themelting T absorbed heat does not increase T, but isconsumed in breaking the atomic bonds of the crys-talline structure to produce the more random liquid ar-ray. This relatively large amount of absorbed heat at theconstant T of melting, (2., above), is the latent heat of
melting, or enthalpy of melting, �Hm. Once melting iscomplete, additional input of heat into the systemraises the T of the melt proportional to its heat capac-ity. The slopes of the T-H lines above and below themelting point are the heat capacities of the melt and thecrystals, respectively.
Note in Figure 3.3 that the latent heat involved inchanging the state of the system from liquid to crystal,or vice versa, is similar to the heat absorbed in chang-ing the T of the crystals or liquid by hundreds of de-grees. Thus, melting of rock in the Earth to generatemagma absorbs a vast amount of thermal energy, whichmoderates changes in T in the system.
Chemical reactions, (1., above), either release or ab-sorb heat: They are either exothermic or endothermic,respectively. If catalyzed by a spark, the reaction be-tween hydrogen and oxygen releases a burst of heat—a rapid exothermic reaction, or explosion. Solidifica-tion of magma exothermically releases the latent heatof crystallization. In contrast, dissolution of potassiumnitrate in water endothermically absorbs heat so thatthe container becomes cold. Thus, whether heat is re-leased or absorbed in a chemical reaction provides noconsistent clue as to the direction a reaction movesspontaneously.
3.2.4 Entropy and the Second and Third Laws of ThermodynamicsAnother way to look at spontaneity is in changes in thedistribution or concentration of energy. Spontaneousthermal processes lead to a more even concentration ofheat. A bowl of hot soup on the table eventually reachesthe same T as the room. Heat flows spontaneously froma hot body to a cold, eliminating the difference in T.Without an uneven concentration of thermal energy, orthe opportunity for heat flow, no work can be done. Asheat flows from an intrusion of hotter magma into thecooler wall rocks, PV work of volumetric expansion isperformed on them. The heat also drives endothermicchemical reactions of wall rock metamorphism. Waterin an enclosed lake on a high plateau has gravitationalpotential energy relative to sea level, but so long as it isisolated from sea level and cannot flow, the concentra-tion of energy is uniform and no work can be done.However, in the natural course of events, a river drainsthe lake into the sea, forming a process path along thepotential energy gradient between the high- and low-potential-energy levels. Work can then be done, drivingturbines to generate electricity, eroding the river chan-nel, transporting sediment, and so on.
One statement of the second law of thermodynam-ics is that spontaneous natural processes tend to evenout the concentration of some form of energy, smooth-ing the energy gradient. A hot lava flow extruded froma lofty volcano cools to atmospheric T as it descendsdown slope, thereby reducing differences in thermal
54 Igneous and Metamorphic Petrology
Constant P
Crystals
0 400 800 1200 1600
∆Hm=144 kJ/mol
Melt
Tem
pera
ture
of m
eltin
g
(dH/dT) p = C p =
0.28 kJ/mol°C
T (°C)
600
400
200
H (
kJ/m
ol)
0
3.3 Enthalpy-T relations for CaMgSi2O6 at 1 atm. (From Weill DF,Hon R, and Navrotsky A, The igneous system CaMgSi2O6-CaAl2Si2O8-NaAlSi3O8: Variations on a classic theme byBowen. In: Hargraves RB, ed., Physics of Magmatic Processes.Copyright © 1980 by Princeton University Press. Reprintedwith permission of Princeton University Press.)
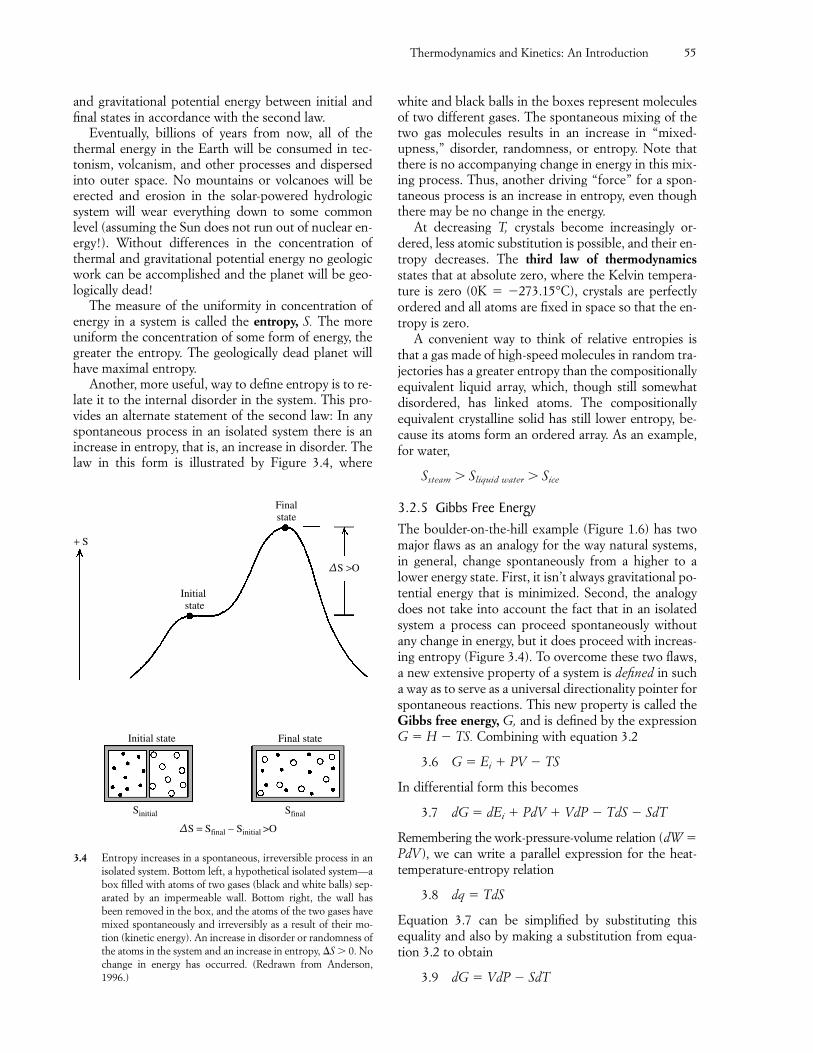
and gravitational potential energy between initial andfinal states in accordance with the second law.
Eventually, billions of years from now, all of thethermal energy in the Earth will be consumed in tec-tonism, volcanism, and other processes and dispersedinto outer space. No mountains or volcanoes will beerected and erosion in the solar-powered hydrologicsystem will wear everything down to some commonlevel (assuming the Sun does not run out of nuclear en-ergy!). Without differences in the concentration ofthermal and gravitational potential energy no geologicwork can be accomplished and the planet will be geo-logically dead!
The measure of the uniformity in concentration ofenergy in a system is called the entropy, S. The moreuniform the concentration of some form of energy, thegreater the entropy. The geologically dead planet willhave maximal entropy.
Another, more useful, way to define entropy is to re-late it to the internal disorder in the system. This pro-vides an alternate statement of the second law: In anyspontaneous process in an isolated system there is anincrease in entropy, that is, an increase in disorder. Thelaw in this form is illustrated by Figure 3.4, where
white and black balls in the boxes represent moleculesof two different gases. The spontaneous mixing of thetwo gas molecules results in an increase in “mixed-upness,” disorder, randomness, or entropy. Note thatthere is no accompanying change in energy in this mix-ing process. Thus, another driving “force” for a spon-taneous process is an increase in entropy, even thoughthere may be no change in the energy.
At decreasing T, crystals become increasingly or-dered, less atomic substitution is possible, and their en-tropy decreases. The third law of thermodynamicsstates that at absolute zero, where the Kelvin tempera-ture is zero (0K � �273.15°C), crystals are perfectlyordered and all atoms are fixed in space so that the en-tropy is zero.
A convenient way to think of relative entropies isthat a gas made of high-speed molecules in random tra-jectories has a greater entropy than the compositionallyequivalent liquid array, which, though still somewhatdisordered, has linked atoms. The compositionallyequivalent crystalline solid has still lower entropy, be-cause its atoms form an ordered array. As an example,for water,
Ssteam � Sliquid water � Sice
3.2.5 Gibbs Free EnergyThe boulder-on-the-hill example (Figure 1.6) has twomajor flaws as an analogy for the way natural systems,in general, change spontaneously from a higher to alower energy state. First, it isn’t always gravitational po-tential energy that is minimized. Second, the analogydoes not take into account the fact that in an isolatedsystem a process can proceed spontaneously withoutany change in energy, but it does proceed with increas-ing entropy (Figure 3.4). To overcome these two flaws,a new extensive property of a system is defined in sucha way as to serve as a universal directionality pointer forspontaneous reactions. This new property is called theGibbs free energy, G, and is defined by the expressionG � H � TS. Combining with equation 3.2
3.6 G � Ei � PV � TS
In differential form this becomes
3.7 dG � dEi � PdV � VdP � TdS � SdT
Remembering the work-pressure-volume relation (dW �PdV), we can write a parallel expression for the heat-temperature-entropy relation
3.8 dq � TdS
Equation 3.7 can be simplified by substituting thisequality and also by making a substitution from equa-tion 3.2 to obtain
3.9 dG � VdP � SdT
Thermodynamics and Kinetics: An Introduction 55
Final state
Finalstate
Initial state
Sinitial Sfinal
∆S >O
+ S
∆S = Sfinal − Sinitial >O
Initial state
3.4 Entropy increases in a spontaneous, irreversible process in anisolated system. Bottom left, a hypothetical isolated system—abox filled with atoms of two gases (black and white balls) sep-arated by an impermeable wall. Bottom right, the wall hasbeen removed in the box, and the atoms of the two gases havemixed spontaneously and irreversibly as a result of their mo-tion (kinetic energy). An increase in disorder or randomness ofthe atoms in the system and an increase in entropy, �S � 0. Nochange in energy has occurred. (Redrawn from Anderson,1996.)
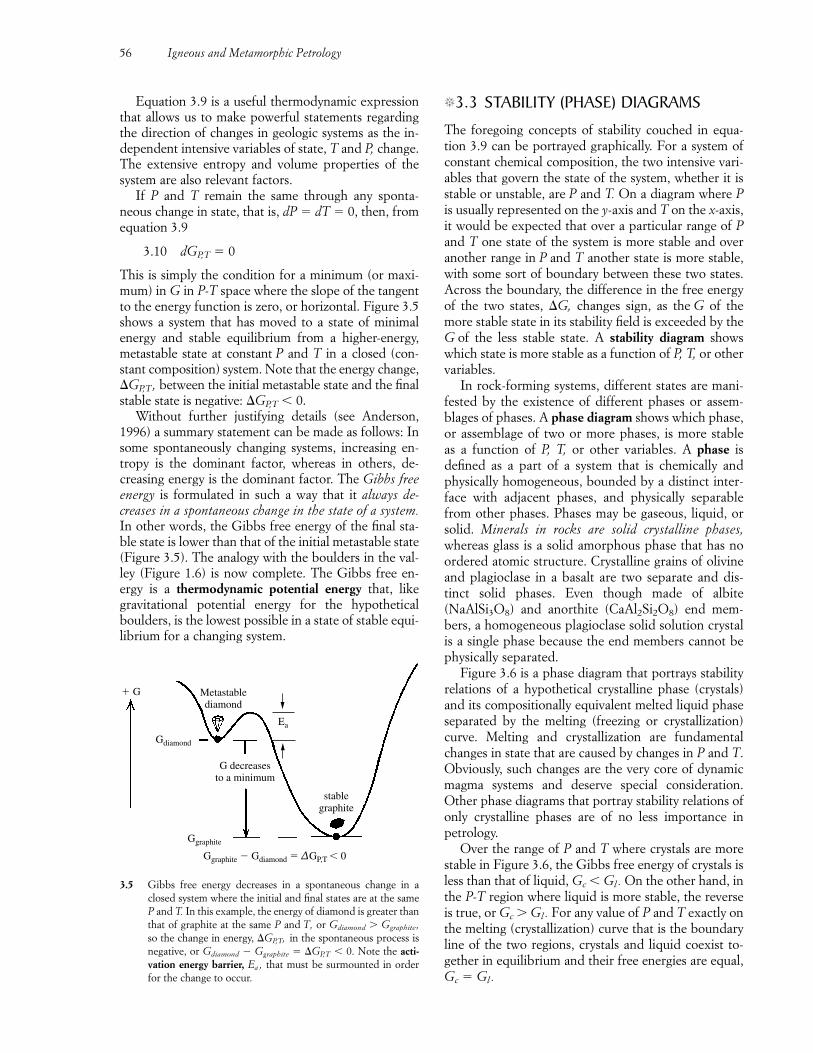
Equation 3.9 is a useful thermodynamic expressionthat allows us to make powerful statements regardingthe direction of changes in geologic systems as the in-dependent intensive variables of state, T and P, change.The extensive entropy and volume properties of thesystem are also relevant factors.
If P and T remain the same through any sponta-neous change in state, that is, dP � dT � 0, then, fromequation 3.9
3.10 dGP,T � 0
This is simply the condition for a minimum (or maxi-mum) in G in P-T space where the slope of the tangentto the energy function is zero, or horizontal. Figure 3.5shows a system that has moved to a state of minimal energy and stable equilibrium from a higher-energy,metastable state at constant P and T in a closed (con-stant composition) system. Note that the energy change,�GP,T, between the initial metastable state and the finalstable state is negative: �GP,T � 0.
Without further justifying details (see Anderson,1996) a summary statement can be made as follows: Insome spontaneously changing systems, increasing en-tropy is the dominant factor, whereas in others, de-creasing energy is the dominant factor. The Gibbs freeenergy is formulated in such a way that it always de-creases in a spontaneous change in the state of a system.In other words, the Gibbs free energy of the final sta-ble state is lower than that of the initial metastable state(Figure 3.5). The analogy with the boulders in the val-ley (Figure 1.6) is now complete. The Gibbs free en-ergy is a thermodynamic potential energy that, likegravitational potential energy for the hypotheticalboulders, is the lowest possible in a state of stable equi-librium for a changing system.
�3.3 STABILITY (PHASE) DIAGRAMS
The foregoing concepts of stability couched in equa-tion 3.9 can be portrayed graphically. For a system ofconstant chemical composition, the two intensive vari-ables that govern the state of the system, whether it isstable or unstable, are P and T. On a diagram where Pis usually represented on the y-axis and T on the x-axis,it would be expected that over a particular range of Pand T one state of the system is more stable and overanother range in P and T another state is more stable,with some sort of boundary between these two states.Across the boundary, the difference in the free energyof the two states, �G, changes sign, as the G of themore stable state in its stability field is exceeded by theG of the less stable state. A stability diagram showswhich state is more stable as a function of P, T, or othervariables.
In rock-forming systems, different states are mani-fested by the existence of different phases or assem-blages of phases. A phase diagram shows which phase,or assemblage of two or more phases, is more stable as a function of P, T, or other variables. A phase is defined as a part of a system that is chemically andphysically homogeneous, bounded by a distinct inter-face with adjacent phases, and physically separablefrom other phases. Phases may be gaseous, liquid, orsolid. Minerals in rocks are solid crystalline phases,whereas glass is a solid amorphous phase that has noordered atomic structure. Crystalline grains of olivineand plagioclase in a basalt are two separate and dis-tinct solid phases. Even though made of albite(NaAlSi3O8) and anorthite (CaAl2Si2O8) end mem-bers, a homogeneous plagioclase solid solution crystalis a single phase because the end members cannot bephysically separated.
Figure 3.6 is a phase diagram that portrays stabilityrelations of a hypothetical crystalline phase (crystals)and its compositionally equivalent melted liquid phaseseparated by the melting (freezing or crystallization)curve. Melting and crystallization are fundamentalchanges in state that are caused by changes in P and T.Obviously, such changes are the very core of dynamicmagma systems and deserve special consideration.Other phase diagrams that portray stability relations ofonly crystalline phases are of no less importance inpetrology.
Over the range of P and T where crystals are morestable in Figure 3.6, the Gibbs free energy of crystals isless than that of liquid, Gc � Gl. On the other hand, inthe P-T region where liquid is more stable, the reverseis true, or Gc � Gl. For any value of P and T exactly onthe melting (crystallization) curve that is the boundaryline of the two regions, crystals and liquid coexist to-gether in equilibrium and their free energies are equal,Gc � Gl.
56 Igneous and Metamorphic Petrology
� G Metastablediamond
Gdiamond
G decreasesto a minimum
Ggraphite
stablegraphite
Ggraphite � Gdiamond � ∆GP,T � 0
Ea
3.5 Gibbs free energy decreases in a spontaneous change in aclosed system where the initial and final states are at the sameP and T. In this example, the energy of diamond is greater thanthat of graphite at the same P and T, or Gdiamond � Ggraphite,so the change in energy, �GP,T, in the spontaneous process isnegative, or Gdiamond � Ggraphite � �GP,T � 0. Note the acti-vation energy barrier, Ea , that must be surmounted in orderfor the change to occur.
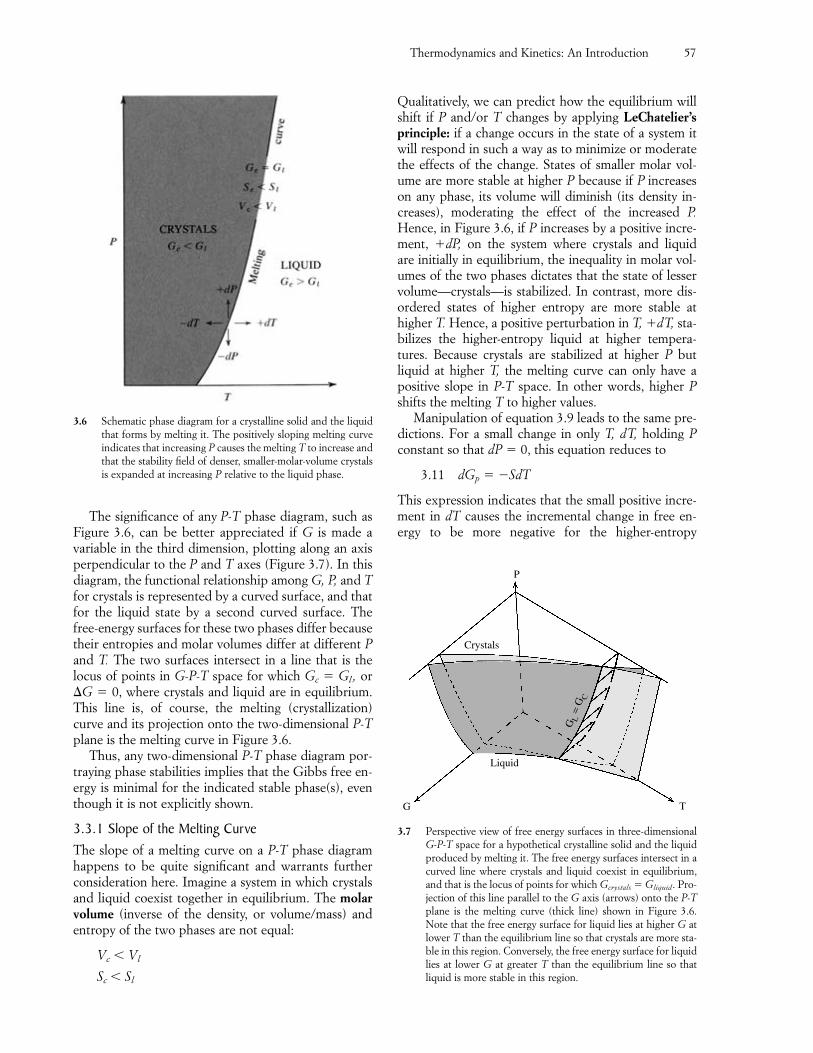
The significance of any P-T phase diagram, such asFigure 3.6, can be better appreciated if G is made avariable in the third dimension, plotting along an axisperpendicular to the P and T axes (Figure 3.7). In thisdiagram, the functional relationship among G, P, and Tfor crystals is represented by a curved surface, and thatfor the liquid state by a second curved surface. Thefree-energy surfaces for these two phases differ becausetheir entropies and molar volumes differ at different Pand T. The two surfaces intersect in a line that is the locus of points in G-P-T space for which Gc � Gl, or�G � 0, where crystals and liquid are in equilibrium.This line is, of course, the melting (crystallization)curve and its projection onto the two-dimensional P-Tplane is the melting curve in Figure 3.6.
Thus, any two-dimensional P-T phase diagram por-traying phase stabilities implies that the Gibbs free en-ergy is minimal for the indicated stable phase(s), eventhough it is not explicitly shown.
3.3.1 Slope of the Melting CurveThe slope of a melting curve on a P-T phase diagramhappens to be quite significant and warrants furtherconsideration here. Imagine a system in which crystalsand liquid coexist together in equilibrium. The molarvolume (inverse of the density, or volume/mass) andentropy of the two phases are not equal:
Vc � Vl
Sc � Sl
Qualitatively, we can predict how the equilibrium willshift if P and/or T changes by applying LeChatelier’sprinciple: if a change occurs in the state of a system itwill respond in such a way as to minimize or moderatethe effects of the change. States of smaller molar vol-ume are more stable at higher P because if P increaseson any phase, its volume will diminish (its density in-creases), moderating the effect of the increased P.Hence, in Figure 3.6, if P increases by a positive incre-ment, �dP, on the system where crystals and liquid are initially in equilibrium, the inequality in molar vol-umes of the two phases dictates that the state of lesservolume—crystals—is stabilized. In contrast, more dis-ordered states of higher entropy are more stable athigher T. Hence, a positive perturbation in T, �dT, sta-bilizes the higher-entropy liquid at higher tempera-tures. Because crystals are stabilized at higher P but liquid at higher T, the melting curve can only have apositive slope in P-T space. In other words, higher Pshifts the melting T to higher values.
Manipulation of equation 3.9 leads to the same pre-dictions. For a small change in only T, dT, holding Pconstant so that dP � 0, this equation reduces to
3.11 dGp � �SdT
This expression indicates that the small positive incre-ment in dT causes the incremental change in free en-ergy to be more negative for the higher-entropy
Thermodynamics and Kinetics: An Introduction 57
3.6 Schematic phase diagram for a crystalline solid and the liquidthat forms by melting it. The positively sloping melting curveindicates that increasing P causes the melting T to increase andthat the stability field of denser, smaller-molar-volume crystalsis expanded at increasing P relative to the liquid phase.
Liquid
GL
= G
C
TG
Crystals
P
3.7 Perspective view of free energy surfaces in three-dimensionalG-P-T space for a hypothetical crystalline solid and the liquidproduced by melting it. The free energy surfaces intersect in acurved line where crystals and liquid coexist in equilibrium,and that is the locus of points for which Gcrystals � Gliquid. Pro-jection of this line parallel to the G axis (arrows) onto the P-Tplane is the melting curve (thick line) shown in Figure 3.6.Note that the free energy surface for liquid lies at higher G atlower T than the equilibrium line so that crystals are more sta-ble in this region. Conversely, the free energy surface for liquidlies at lower G at greater T than the equilibrium line so thatliquid is more stable in this region.
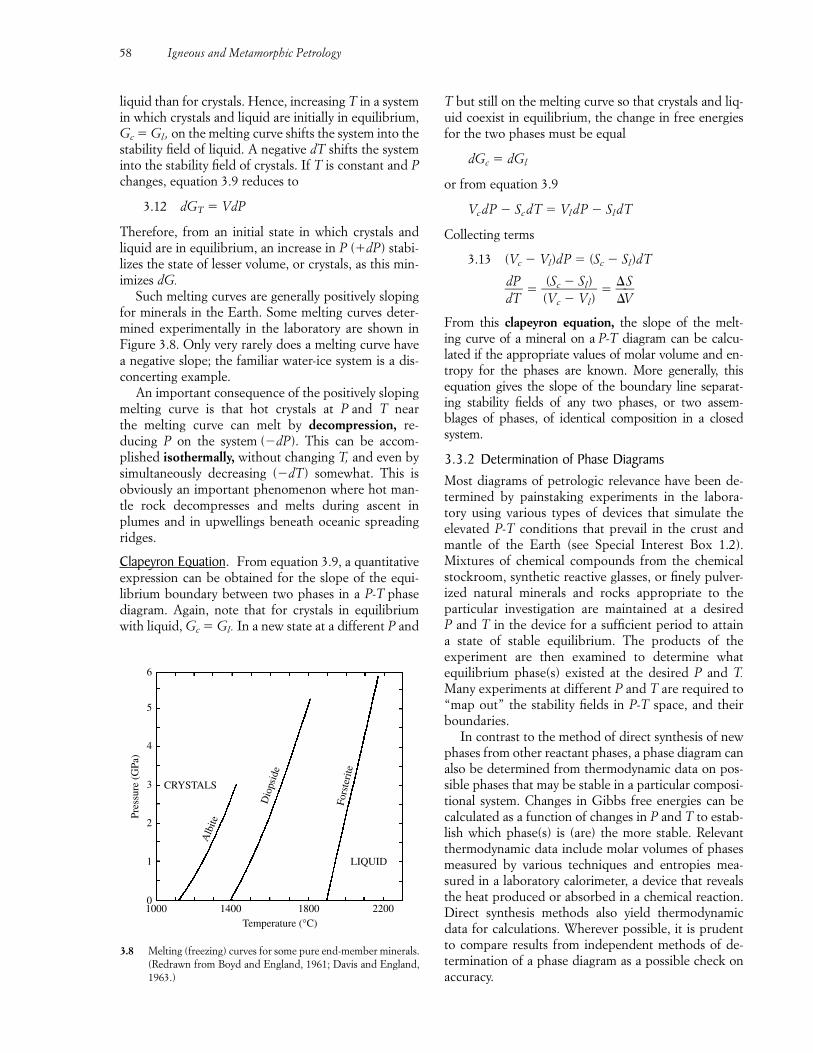
liquid than for crystals. Hence, increasing T in a system in which crystals and liquid are initially in equilibrium,Gc � Gl, on the melting curve shifts the system into thestability field of liquid. A negative dT shifts the systeminto the stability field of crystals. If T is constant and Pchanges, equation 3.9 reduces to
3.12 dGT � VdP
Therefore, from an initial state in which crystals andliquid are in equilibrium, an increase in P (�dP) stabi-lizes the state of lesser volume, or crystals, as this min-imizes dG.
Such melting curves are generally positively slopingfor minerals in the Earth. Some melting curves deter-mined experimentally in the laboratory are shown inFigure 3.8. Only very rarely does a melting curve havea negative slope; the familiar water-ice system is a dis-concerting example.
An important consequence of the positively slopingmelting curve is that hot crystals at P and T near the melting curve can melt by decompression, re-ducing P on the system (�dP). This can be accom-plished isothermally, without changing T, and even bysimultaneously decreasing (�dT) somewhat. This isobviously an important phenomenon where hot man-tle rock decompresses and melts during ascent inplumes and in upwellings beneath oceanic spreadingridges.
Clapeyron Equation. From equation 3.9, a quantitativeexpression can be obtained for the slope of the equi-librium boundary between two phases in a P-T phasediagram. Again, note that for crystals in equilibriumwith liquid, Gc � Gl. In a new state at a different P and
T but still on the melting curve so that crystals and liq-uid coexist in equilibrium, the change in free energiesfor the two phases must be equal
dGc � dGl
or from equation 3.9
VcdP � ScdT � VldP � SldT
Collecting terms
3.13 (Vc � Vl)dP � (Sc � Sl)dT
�ddTP� � �
((VSc
c
�
�
SV
l
l
))
� � ��
�
VS�
From this clapeyron equation, the slope of the melt-ing curve of a mineral on a P-T diagram can be calcu-lated if the appropriate values of molar volume and en-tropy for the phases are known. More generally, thisequation gives the slope of the boundary line separat-ing stability fields of any two phases, or two assem-blages of phases, of identical composition in a closed system.
3.3.2 Determination of Phase DiagramsMost diagrams of petrologic relevance have been de-termined by painstaking experiments in the labora-tory using various types of devices that simulate the elevated P-T conditions that prevail in the crust andmantle of the Earth (see Special Interest Box 1.2).Mixtures of chemical compounds from the chemicalstockroom, synthetic reactive glasses, or finely pulver-ized natural minerals and rocks appropriate to the particular investigation are maintained at a desiredP and T in the device for a sufficient period to attain a state of stable equilibrium. The products of the experiment are then examined to determine whatequilibrium phase(s) existed at the desired P and T.Many experiments at different P and T are required to“map out” the stability fields in P-T space, and theirboundaries.
In contrast to the method of direct synthesis of newphases from other reactant phases, a phase diagram canalso be determined from thermodynamic data on pos-sible phases that may be stable in a particular composi-tional system. Changes in Gibbs free energies can becalculated as a function of changes in P and T to estab-lish which phase(s) is (are) the more stable. Relevantthermodynamic data include molar volumes of phasesmeasured by various techniques and entropies mea-sured in a laboratory calorimeter, a device that revealsthe heat produced or absorbed in a chemical reaction.Direct synthesis methods also yield thermodynamicdata for calculations. Wherever possible, it is prudentto compare results from independent methods of de-termination of a phase diagram as a possible check onaccuracy.
58 Igneous and Metamorphic Petrology
1000 1400 1800 22000
1
2
3
Pres
sure
(G
Pa)
Temperature (°C)
LIQUID
Fors
teri
te
Dio
psid
e
Alb
ite
CRYSTALS
4
5
6
3.8 Melting (freezing) curves for some pure end-member minerals.(Redrawn from Boyd and England, 1961; Davis and England,1963.)
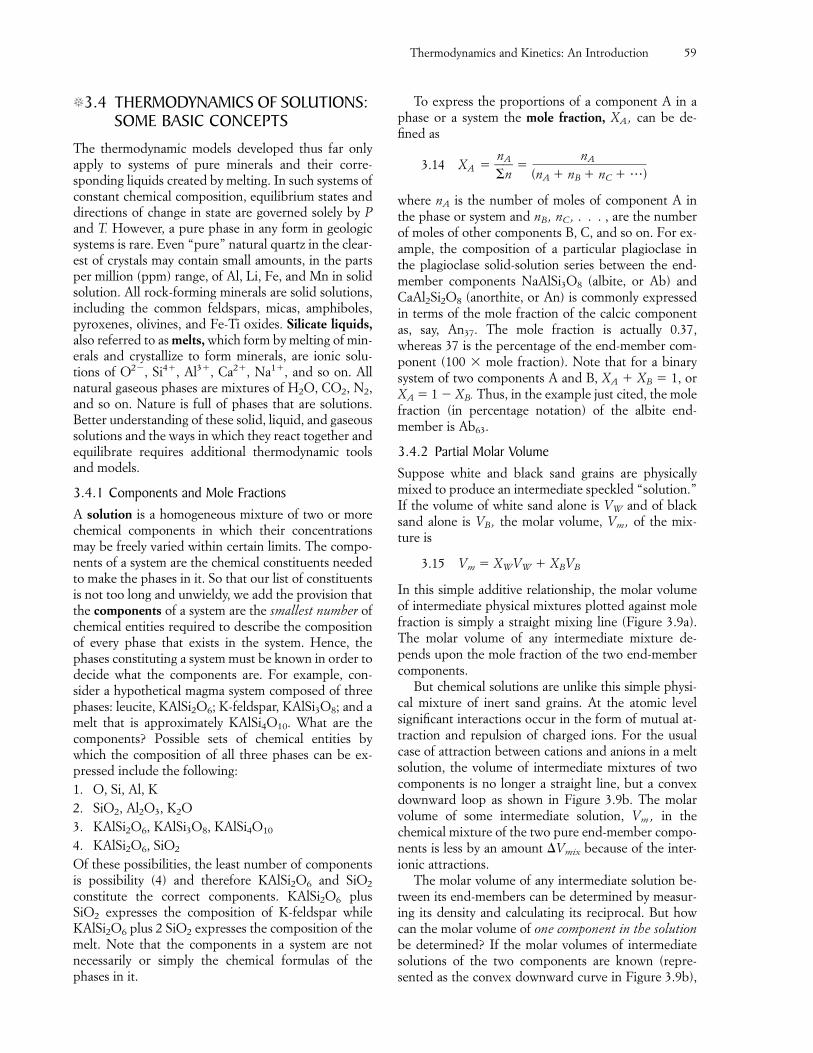
�3.4 THERMODYNAMICS OF SOLUTIONS: SOME BASIC CONCEPTS
The thermodynamic models developed thus far onlyapply to systems of pure minerals and their corre-sponding liquids created by melting. In such systems ofconstant chemical composition, equilibrium states anddirections of change in state are governed solely by Pand T. However, a pure phase in any form in geologicsystems is rare. Even “pure” natural quartz in the clear-est of crystals may contain small amounts, in the partsper million (ppm) range, of Al, Li, Fe, and Mn in solidsolution. All rock-forming minerals are solid solutions,including the common feldspars, micas, amphiboles,pyroxenes, olivines, and Fe-Ti oxides. Silicate liquids,also referred to as melts, which form by melting of min-erals and crystallize to form minerals, are ionic solu-tions of O2�, Si4�, Al3�, Ca2�, Na1�, and so on. Allnatural gaseous phases are mixtures of H2O, CO2, N2,and so on. Nature is full of phases that are solutions.Better understanding of these solid, liquid, and gaseoussolutions and the ways in which they react together andequilibrate requires additional thermodynamic toolsand models.
3.4.1 Components and Mole FractionsA solution is a homogeneous mixture of two or morechemical components in which their concentrationsmay be freely varied within certain limits. The compo-nents of a system are the chemical constituents neededto make the phases in it. So that our list of constituentsis not too long and unwieldy, we add the provision thatthe components of a system are the smallest number ofchemical entities required to describe the compositionof every phase that exists in the system. Hence, thephases constituting a system must be known in order todecide what the components are. For example, con-sider a hypothetical magma system composed of threephases: leucite, KAlSi2O6; K-feldspar, KAlSi3O8; and amelt that is approximately KAlSi4O10. What are thecomponents? Possible sets of chemical entities bywhich the composition of all three phases can be ex-pressed include the following:1. O, Si, Al, K2. SiO2, Al2O3, K2O3. KAlSi2O6, KAlSi3O8, KAlSi4O10
4. KAlSi2O6, SiO2
Of these possibilities, the least number of componentsis possibility (4) and therefore KAlSi2O6 and SiO2
constitute the correct components. KAlSi2O6 plusSiO2 expresses the composition of K-feldspar whileKAlSi2O6 plus 2 SiO2 expresses the composition of themelt. Note that the components in a system are notnecessarily or simply the chemical formulas of thephases in it.
To express the proportions of a component A in aphase or a system the mole fraction, XA, can be de-fined as
3.14 XA � �
nA
n� �
nA
(nA � nB � nC � )
where nA is the number of moles of component A inthe phase or system and nB, nC , . . . , are the numberof moles of other components B, C, and so on. For ex-ample, the composition of a particular plagioclase inthe plagioclase solid-solution series between the end-member components NaAlSi3O8 (albite, or Ab) andCaAl2Si2O8 (anorthite, or An) is commonly expressedin terms of the mole fraction of the calcic componentas, say, An37. The mole fraction is actually 0.37,whereas 37 is the percentage of the end-member com-ponent (100 � mole fraction). Note that for a binarysystem of two components A and B, XA � XB � 1, orXA � 1 � XB. Thus, in the example just cited, the molefraction (in percentage notation) of the albite end-member is Ab63.
3.4.2 Partial Molar VolumeSuppose white and black sand grains are physicallymixed to produce an intermediate speckled “solution.”If the volume of white sand alone is VW and of blacksand alone is VB, the molar volume, Vm, of the mix-ture is
3.15 Vm � XWVW � XBVB
In this simple additive relationship, the molar volumeof intermediate physical mixtures plotted against molefraction is simply a straight mixing line (Figure 3.9a).The molar volume of any intermediate mixture de-pends upon the mole fraction of the two end-membercomponents.
But chemical solutions are unlike this simple physi-cal mixture of inert sand grains. At the atomic levelsignificant interactions occur in the form of mutual at-traction and repulsion of charged ions. For the usualcase of attraction between cations and anions in a meltsolution, the volume of intermediate mixtures of twocomponents is no longer a straight line, but a convexdownward loop as shown in Figure 3.9b. The molarvolume of some intermediate solution, Vm , in thechemical mixture of the two pure end-member compo-nents is less by an amount �Vmix because of the inter-ionic attractions.
The molar volume of any intermediate solution be-tween its end-members can be determined by measur-ing its density and calculating its reciprocal. But howcan the molar volume of one component in the solutionbe determined? If the molar volumes of intermediatesolutions of the two components are known (repre-sented as the convex downward curve in Figure 3.9b),
Thermodynamics and Kinetics: An Introduction 59
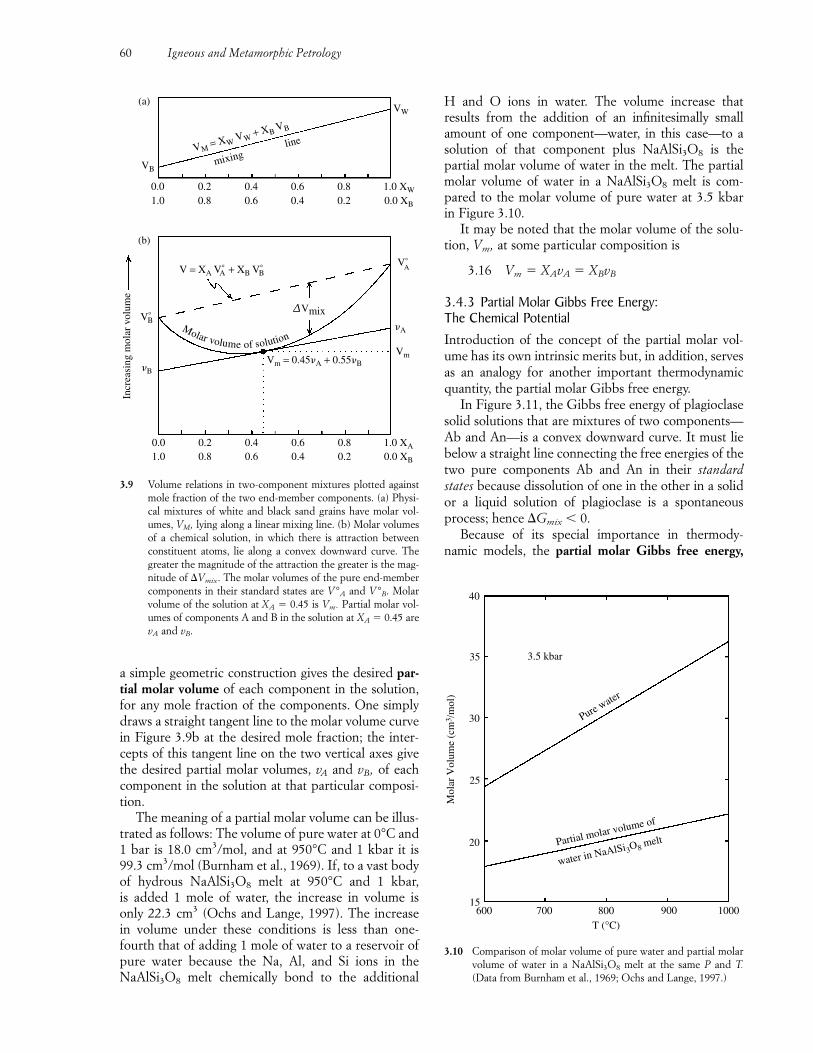
a simple geometric construction gives the desired par-tial molar volume of each component in the solution,for any mole fraction of the components. One simplydraws a straight tangent line to the molar volume curvein Figure 3.9b at the desired mole fraction; the inter-cepts of this tangent line on the two vertical axes givethe desired partial molar volumes, vA and vB, of eachcomponent in the solution at that particular composi-tion.
The meaning of a partial molar volume can be illus-trated as follows: The volume of pure water at 0°C and1 bar is 18.0 cm3/mol, and at 950°C and 1 kbar it is99.3 cm3/mol (Burnham et al., 1969). If, to a vast bodyof hydrous NaAlSi3O8 melt at 950°C and 1 kbar, is added 1 mole of water, the increase in volume is only 22.3 cm3 (Ochs and Lange, 1997). The increase in volume under these conditions is less than one-fourth that of adding 1 mole of water to a reservoir ofpure water because the Na, Al, and Si ions in theNaAlSi3O8 melt chemically bond to the additional
H and O ions in water. The volume increase that results from the addition of an infinitesimally smallamount of one component—water, in this case—to asolution of that component plus NaAlSi3O8 is the partial molar volume of water in the melt. The partialmolar volume of water in a NaAlSi3O8 melt is com-pared to the molar volume of pure water at 3.5 kbar in Figure 3.10.
It may be noted that the molar volume of the solu-tion, Vm, at some particular composition is
3.16 Vm � XAvA � XBvB
3.4.3 Partial Molar Gibbs Free Energy: The Chemical PotentialIntroduction of the concept of the partial molar vol-ume has its own intrinsic merits but, in addition, servesas an analogy for another important thermodynamicquantity, the partial molar Gibbs free energy.
In Figure 3.11, the Gibbs free energy of plagioclasesolid solutions that are mixtures of two components—Ab and An—is a convex downward curve. It must liebelow a straight line connecting the free energies of thetwo pure components Ab and An in their standardstates because dissolution of one in the other in a solidor a liquid solution of plagioclase is a spontaneousprocess; hence �Gmix � 0.
Because of its special importance in thermody-namic models, the partial molar Gibbs free energy,
60 Igneous and Metamorphic Petrology
0.0 0.2 0.4 0.6 0.8 1.0 XW
1.0 0.8 0.6 0.4 0.2 0.0 XB
VB
V°
�B
VW
V°
Vm
�A
mixingVM = XW VW + XB VB
line
(a)
(b)
Incr
easi
ng m
olar
vol
ume
V = XA V° + XB V°
∆Vmix
Vm = 0.45�A + 0.55�B
0.0 0.2 0.4 0.6 0.8 1.0 XA
1.0 0.8 0.6 0.4 0.2 0.0 XB
A BA
ΒMolar volume of solution
3.9 Volume relations in two-component mixtures plotted againstmole fraction of the two end-member components. (a) Physi-cal mixtures of white and black sand grains have molar vol-umes, VM, lying along a linear mixing line. (b) Molar volumesof a chemical solution, in which there is attraction betweenconstituent atoms, lie along a convex downward curve. Thegreater the magnitude of the attraction the greater is the mag-nitude of �Vmix. The molar volumes of the pure end-membercomponents in their standard states are V°A and V°B. Molarvolume of the solution at XA � 0.45 is Vm. Partial molar vol-umes of components A and B in the solution at XA � 0.45 arevA and vB.
15
20
25
30
35
40
Mol
ar V
olum
e (c
m3 /
mol
)
3.5 kbar
Pure water
water in NaAlSi3O8 melt
600 700 800 900 1000T (°C)
Partial molar volume of
3.10 Comparison of molar volume of pure water and partial molarvolume of water in a NaAlSi3O8 melt at the same P and T.(Data from Burnham et al., 1969; Ochs and Lange, 1997.)
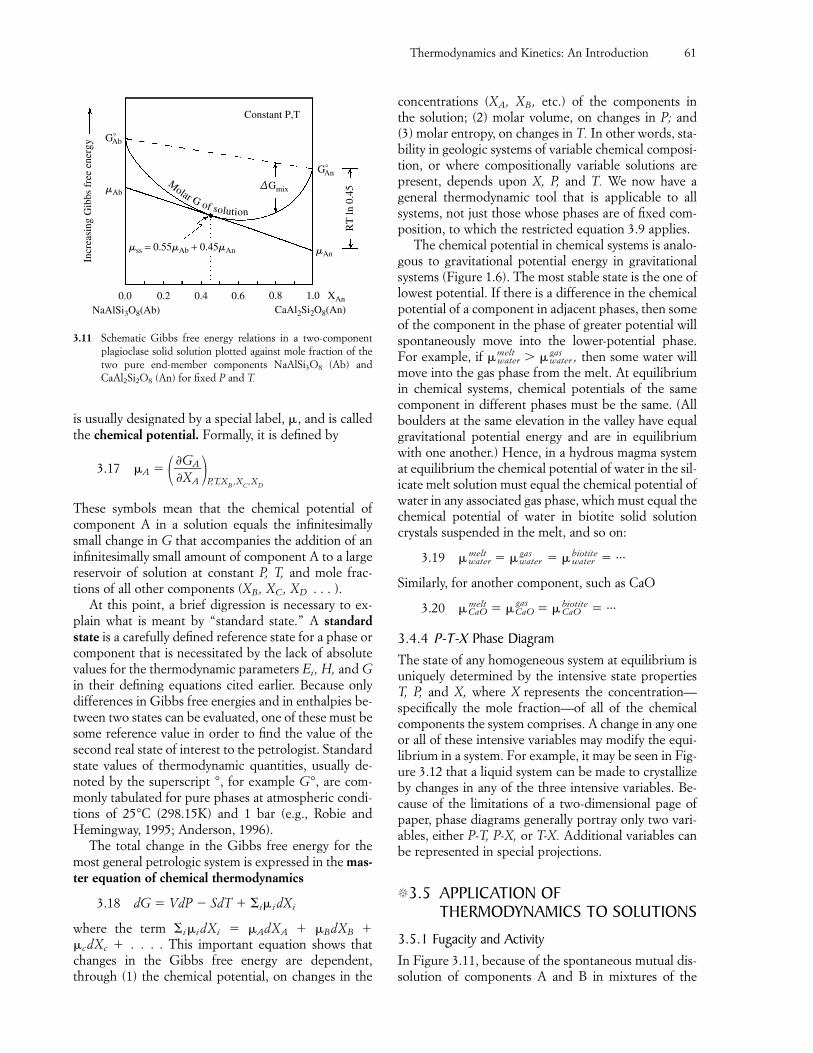
is usually designated by a special label, , and is calledthe chemical potential. Formally, it is defined by
3.17 A � ����GXA
A��P,T,XB ,XC,XD
These symbols mean that the chemical potential ofcomponent A in a solution equals the infinitesimallysmall change in G that accompanies the addition of aninfinitesimally small amount of component A to a largereservoir of solution at constant P, T, and mole frac-tions of all other components (XB, XC, XD . . . ).
At this point, a brief digression is necessary to ex-plain what is meant by “standard state.” A standardstate is a carefully defined reference state for a phase orcomponent that is necessitated by the lack of absolutevalues for the thermodynamic parameters Ei, H, and Gin their defining equations cited earlier. Because onlydifferences in Gibbs free energies and in enthalpies be-tween two states can be evaluated, one of these must besome reference value in order to find the value of thesecond real state of interest to the petrologist. Standardstate values of thermodynamic quantities, usually de-noted by the superscript °, for example G°, are com-monly tabulated for pure phases at atmospheric condi-tions of 25°C (298.15K) and 1 bar (e.g., Robie andHemingway, 1995; Anderson, 1996).
The total change in the Gibbs free energy for themost general petrologic system is expressed in the mas-ter equation of chemical thermodynamics
3.18 dG � VdP � SdT � i idXi
where the term i idXi � AdXA � BdXB � cdXc � . . . . This important equation shows thatchanges in the Gibbs free energy are dependent,through (1) the chemical potential, on changes in the
concentrations (XA, XB, etc.) of the components in the solution; (2) molar volume, on changes in P; and (3) molar entropy, on changes in T. In other words, sta-bility in geologic systems of variable chemical composi-tion, or where compositionally variable solutions arepresent, depends upon X, P, and T. We now have ageneral thermodynamic tool that is applicable to allsystems, not just those whose phases are of fixed com-position, to which the restricted equation 3.9 applies.
The chemical potential in chemical systems is analo-gous to gravitational potential energy in gravitationalsystems (Figure 1.6). The most stable state is the one oflowest potential. If there is a difference in the chemicalpotential of a component in adjacent phases, then someof the component in the phase of greater potential willspontaneously move into the lower-potential phase.For example, if melt
water � gaswater , then some water will
move into the gas phase from the melt. At equilibriumin chemical systems, chemical potentials of the samecomponent in different phases must be the same. (Allboulders at the same elevation in the valley have equalgravitational potential energy and are in equilibriumwith one another.) Hence, in a hydrous magma systemat equilibrium the chemical potential of water in the sil-icate melt solution must equal the chemical potential ofwater in any associated gas phase, which must equal thechemical potential of water in biotite solid solutioncrystals suspended in the melt, and so on:
3.19 meltwater � gas
water � biotitewater � ···
Similarly, for another component, such as CaO
3.20 meltCaO �
gasCaO � biotite
CaO � ···
3.4.4 P-T-X Phase DiagramThe state of any homogeneous system at equilibrium isuniquely determined by the intensive state propertiesT, P, and X, where X represents the concentration—specifically the mole fraction—of all of the chemicalcomponents the system comprises. A change in any oneor all of these intensive variables may modify the equi-librium in a system. For example, it may be seen in Fig-ure 3.12 that a liquid system can be made to crystallizeby changes in any of the three intensive variables. Be-cause of the limitations of a two-dimensional page ofpaper, phase diagrams generally portray only two vari-ables, either P-T, P-X, or T-X. Additional variables canbe represented in special projections.
�3.5 APPLICATION OFTHERMODYNAMICS TO SOLUTIONS
3.5.1 Fugacity and ActivityIn Figure 3.11, because of the spontaneous mutual dis-solution of components A and B in mixtures of the
Thermodynamics and Kinetics: An Introduction 61
G°
�Ab
0.0 0.2 0.4 0.6 0.8 1.0 XAn
NaAlSi3O8(Ab) CaAl2Si2O8(An)
Incr
easi
ng G
ibbs
fre
e en
ergy
∆Gmix
�An
RT
ln 0
.45
Constant P,T
Ab
G°An
Molar G of solution
�ss = 0.55�Ab + 0.45�An
3.11 Schematic Gibbs free energy relations in a two-componentplagioclase solid solution plotted against mole fraction of thetwo pure end-member components NaAlSi3O8 (Ab) andCaAl2Si2O8 (An) for fixed P and T.
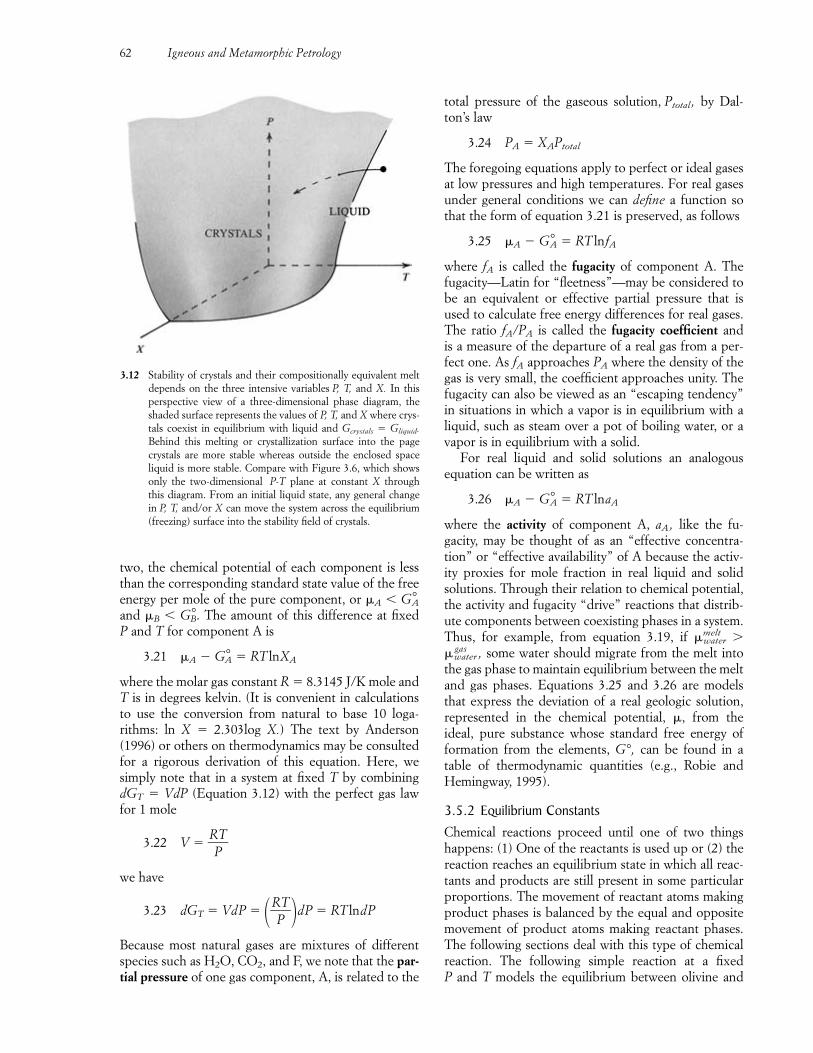
two, the chemical potential of each component is lessthan the corresponding standard state value of the freeenergy per mole of the pure component, or A � G°Aand B � G°B. The amount of this difference at fixed P and T for component A is
3.21 A � G°A � RT lnXA
where the molar gas constant R � 8.3145 J/K mole andT is in degrees kelvin. (It is convenient in calculationsto use the conversion from natural to base 10 loga-rithms: ln X � 2.303log X.) The text by Anderson(1996) or others on thermodynamics may be consultedfor a rigorous derivation of this equation. Here, wesimply note that in a system at fixed T by combiningdGT � VdP (Equation 3.12) with the perfect gas lawfor 1 mole
3.22 V � �RPT�
we have
3.23 dGT � VdP � ��RPT��dP � RT lndP
Because most natural gases are mixtures of differentspecies such as H2O, CO2, and F, we note that the par-tial pressure of one gas component, A, is related to the
total pressure of the gaseous solution, Ptotal , by Dal-ton’s law
3.24 PA � XAPtotal
The foregoing equations apply to perfect or ideal gasesat low pressures and high temperatures. For real gasesunder general conditions we can define a function sothat the form of equation 3.21 is preserved, as follows
3.25 A � G°A � RT lnfA
where fA is called the fugacity of component A. The fugacity—Latin for “fleetness”—may be considered tobe an equivalent or effective partial pressure that isused to calculate free energy differences for real gases.The ratio fA/PA is called the fugacity coefficient and is a measure of the departure of a real gas from a per-fect one. As fA approaches PA where the density of thegas is very small, the coefficient approaches unity. The fugacity can also be viewed as an “escaping tendency”in situations in which a vapor is in equilibrium with aliquid, such as steam over a pot of boiling water, or avapor is in equilibrium with a solid.
For real liquid and solid solutions an analogousequation can be written as
3.26 A � G°A � RT lnaA
where the activity of component A, aA, like the fu-gacity, may be thought of as an “effective concentra-tion” or “effective availability” of A because the activ-ity proxies for mole fraction in real liquid and solid solutions. Through their relation to chemical potential,the activity and fugacity “drive” reactions that distrib-ute components between coexisting phases in a system.Thus, for example, from equation 3.19, if melt
water � gas
water , some water should migrate from the melt intothe gas phase to maintain equilibrium between the meltand gas phases. Equations 3.25 and 3.26 are modelsthat express the deviation of a real geologic solution,represented in the chemical potential, , from theideal, pure substance whose standard free energy offormation from the elements, G°, can be found in atable of thermodynamic quantities (e.g., Robie andHemingway, 1995).
3.5.2 Equilibrium ConstantsChemical reactions proceed until one of two thingshappens: (1) One of the reactants is used up or (2) thereaction reaches an equilibrium state in which all reac-tants and products are still present in some particularproportions. The movement of reactant atoms makingproduct phases is balanced by the equal and oppositemovement of product atoms making reactant phases.The following sections deal with this type of chemicalreaction. The following simple reaction at a fixed P and T models the equilibrium between olivine and
62 Igneous and Metamorphic Petrology
3.12 Stability of crystals and their compositionally equivalent meltdepends on the three intensive variables P, T, and X. In thisperspective view of a three-dimensional phase diagram, theshaded surface represents the values of P, T, and X where crys-tals coexist in equilibrium with liquid and Gcrystals � Gliquid.Behind this melting or crystallization surface into the pagecrystals are more stable whereas outside the enclosed spaceliquid is more stable. Compare with Figure 3.6, which showsonly the two-dimensional P-T plane at constant X throughthis diagram. From an initial liquid state, any general changein P, T, and/or X can move the system across the equilibrium(freezing) surface into the stability field of crystals.
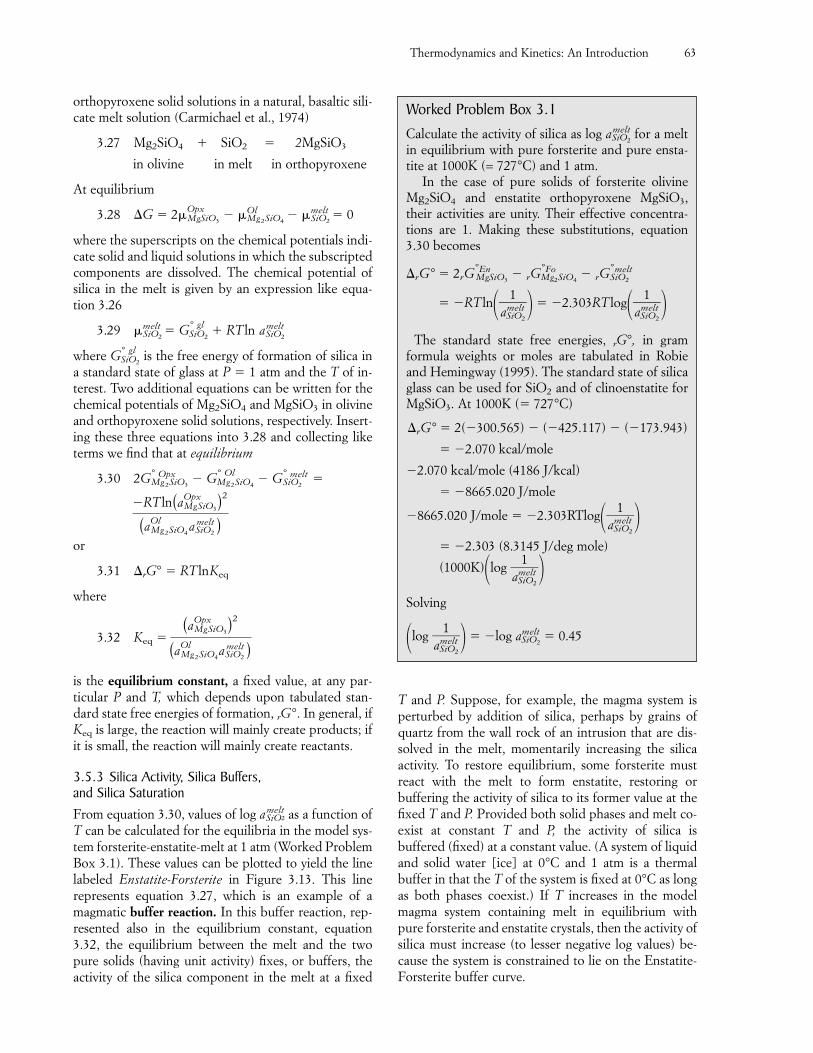
orthopyroxene solid solutions in a natural, basaltic sili-cate melt solution (Carmichael et al., 1974)
3.27 Mg2SiO4 � SiO2 � 2MgSiO3
in olivine in melt in orthopyroxene
At equilibrium
3.28 �G � 2 OpxMgSiO3
� OlMg2SiO4
� meltSiO2
� 0
where the superscripts on the chemical potentials indi-cate solid and liquid solutions in which the subscriptedcomponents are dissolved. The chemical potential ofsilica in the melt is given by an expression like equa-tion 3.26
3.29 meltSiO2
� G° glSiO2
� RT ln ameltSiO2
where G° glSiO2
is the free energy of formation of silica ina standard state of glass at P � 1 atm and the T of in-terest. Two additional equations can be written for thechemical potentials of Mg2SiO4 and MgSiO3 in olivineand orthopyroxene solid solutions, respectively. Insert-ing these three equations into 3.28 and collecting liketerms we find that at equilibrium
3.30 2G° OpxMg2SiO3
� G° OlMg2SiO4
� G° meltSiO2
�
�RT ln(aOpxMgSiO3)
2
(aOlMg2SiO4
ameltSiO2 )
or
3.31 �rG° � RT lnKeq
where
3.32 Keq �(aOpx
MgSiO3)2
(aOlMg2SiO4
ameltSiO2 )
is the equilibrium constant, a fixed value, at any par-ticular P and T, which depends upon tabulated stan-dard state free energies of formation, rG°. In general, ifKeq is large, the reaction will mainly create products; ifit is small, the reaction will mainly create reactants.
3.5.3 Silica Activity, Silica Buffers, and Silica SaturationFrom equation 3.30, values of log amelt
SiO2 as a function ofT can be calculated for the equilibria in the model sys-tem forsterite-enstatite-melt at 1 atm (Worked ProblemBox 3.1). These values can be plotted to yield the linelabeled Enstatite-Forsterite in Figure 3.13. This linerepresents equation 3.27, which is an example of amagmatic buffer reaction. In this buffer reaction, rep-resented also in the equilibrium constant, equation3.32, the equilibrium between the melt and the twopure solids (having unit activity) fixes, or buffers, theactivity of the silica component in the melt at a fixed
Thermodynamics and Kinetics: An Introduction 63
Worked Problem Box 3.1Calculate the activity of silica as log amelt
SiO2for a melt
in equilibrium with pure forsterite and pure ensta-tite at 1000K (= 727°C) and 1 atm.
In the case of pure solids of forsterite olivineMg2SiO4 and enstatite orthopyroxene MgSiO3,their activities are unity. Their effective concentra-tions are 1. Making these substitutions, equation3.30 becomes
�rG° � 2rG°EnMgSiO3
� rG°FoMg2SiO4
� rG°meltSiO2
� �RT ln��am1elt
SiO2
�� � �2.303RT log��am1elt
SiO2
��The standard state free energies, rG°, in gram
formula weights or moles are tabulated in Robieand Hemingway (1995). The standard state of silicaglass can be used for SiO2 and of clinoenstatite for MgSiO3. At 1000K (� 727°C)
�rG° � 2(�300.565) � (�425.117) � (�173.943)
� �2.070 kcal/mole
�2.070 kcal/mole (4186 J/kcal)
� �8665.020 J/mole
�8665.020 J/mole � �2.303RTlog��am1elt
SiO2
��� �2.303 (8.3145 J/deg mole)
(1000K)�log �am
1elt
SiO2
��Solving
�log �am
1elt
SiO2
�� � �log ameltSiO2
� 0.45
T and P. Suppose, for example, the magma system isperturbed by addition of silica, perhaps by grains ofquartz from the wall rock of an intrusion that are dis-solved in the melt, momentarily increasing the silica activity. To restore equilibrium, some forsterite mustreact with the melt to form enstatite, restoring orbuffering the activity of silica to its former value at thefixed T and P. Provided both solid phases and melt co-exist at constant T and P, the activity of silica isbuffered (fixed) at a constant value. (A system of liquidand solid water [ice] at 0°C and 1 atm is a thermalbuffer in that the T of the system is fixed at 0°C as longas both phases coexist.) If T increases in the modelmagma system containing melt in equilibrium withpure forsterite and enstatite crystals, then the activity ofsilica must increase (to lesser negative log values) be-cause the system is constrained to lie on the Enstatite-Forsterite buffer curve.
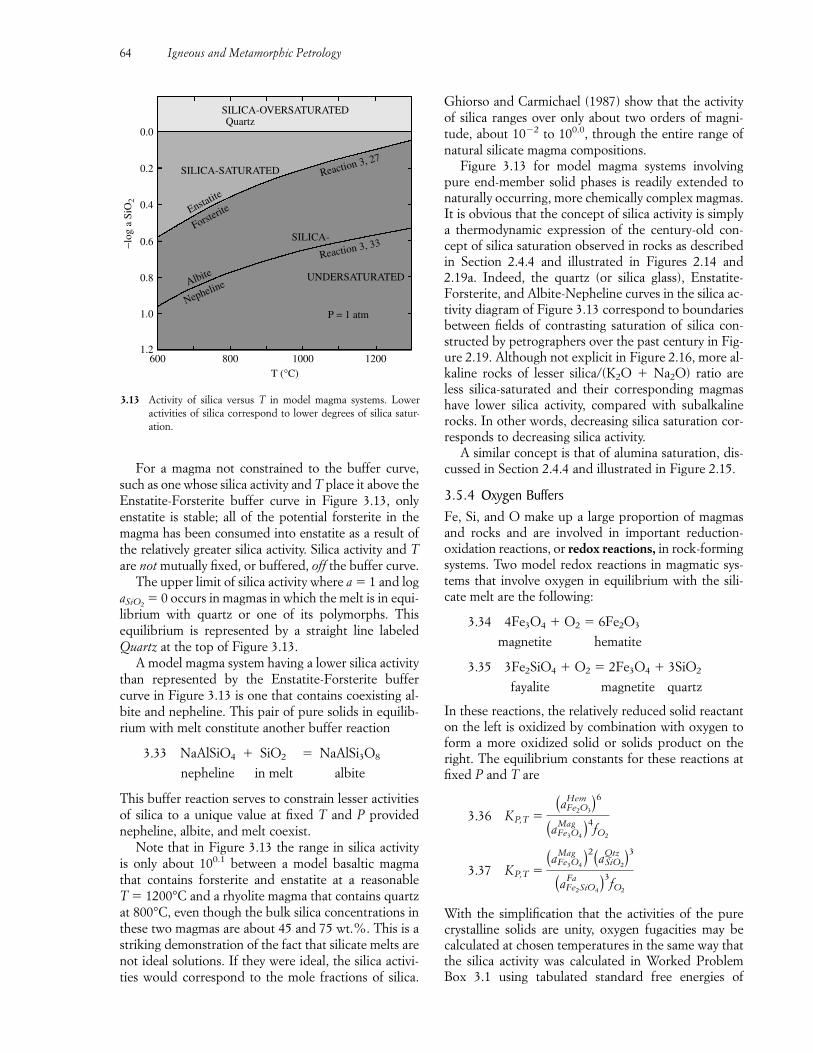
Ghiorso and Carmichael (1987) show that the activityof silica ranges over only about two orders of magni-tude, about 10�2 to 100.0, through the entire range ofnatural silicate magma compositions.
Figure 3.13 for model magma systems involvingpure end-member solid phases is readily extended tonaturally occurring, more chemically complex magmas.It is obvious that the concept of silica activity is simplya thermodynamic expression of the century-old con-cept of silica saturation observed in rocks as describedin Section 2.4.4 and illustrated in Figures 2.14 and2.19a. Indeed, the quartz (or silica glass), Enstatite-Forsterite, and Albite-Nepheline curves in the silica ac-tivity diagram of Figure 3.13 correspond to boundariesbetween fields of contrasting saturation of silica con-structed by petrographers over the past century in Fig-ure 2.19. Although not explicit in Figure 2.16, more al-kaline rocks of lesser silica/(K2O � Na2O) ratio areless silica-saturated and their corresponding magmashave lower silica activity, compared with subalkalinerocks. In other words, decreasing silica saturation cor-responds to decreasing silica activity.
A similar concept is that of alumina saturation, dis-cussed in Section 2.4.4 and illustrated in Figure 2.15.
3.5.4 Oxygen BuffersFe, Si, and O make up a large proportion of magmasand rocks and are involved in important reduction-oxidation reactions, or redox reactions, in rock-formingsystems. Two model redox reactions in magmatic sys-tems that involve oxygen in equilibrium with the sili-cate melt are the following:
3.34 4Fe3O4 � O2 � 6Fe2O3
magnetite hematite
3.35 3Fe2SiO4 � O2 � 2Fe3O4 � 3SiO2
fayalite magnetite quartz
In these reactions, the relatively reduced solid reactanton the left is oxidized by combination with oxygen toform a more oxidized solid or solids product on theright. The equilibrium constants for these reactions atfixed P and T are
3.36 KP,T �(aHem
Fe2O3)6
(aMagFe3O4)
4fO2
3.37 KP,T �(aMag
Fe3O4)2(aQtz
SiO2)3
(aFaFe2SiO4)
3fO2
With the simplification that the activities of the purecrystalline solids are unity, oxygen fugacities may becalculated at chosen temperatures in the same way thatthe silica activity was calculated in Worked ProblemBox 3.1 using tabulated standard free energies of
64 Igneous and Metamorphic Petrology
For a magma not constrained to the buffer curve,such as one whose silica activity and T place it above theEnstatite-Forsterite buffer curve in Figure 3.13, only enstatite is stable; all of the potential forsterite in themagma has been consumed into enstatite as a result ofthe relatively greater silica activity. Silica activity and Tare not mutually fixed, or buffered, off the buffer curve.
The upper limit of silica activity where a � 1 and logaSiO2
� 0 occurs in magmas in which the melt is in equi-librium with quartz or one of its polymorphs. Thisequilibrium is represented by a straight line labeledQuartz at the top of Figure 3.13.
A model magma system having a lower silica activitythan represented by the Enstatite-Forsterite buffercurve in Figure 3.13 is one that contains coexisting al-bite and nepheline. This pair of pure solids in equilib-rium with melt constitute another buffer reaction
3.33 NaAlSiO4 � SiO2 � NaAlSi3O8
nepheline in melt albite
This buffer reaction serves to constrain lesser activitiesof silica to a unique value at fixed T and P providednepheline, albite, and melt coexist.
Note that in Figure 3.13 the range in silica activity is only about 100.1 between a model basaltic magmathat contains forsterite and enstatite at a reasonable T � 1200°C and a rhyolite magma that contains quartzat 800°C, even though the bulk silica concentrations inthese two magmas are about 45 and 75 wt.%. This is astriking demonstration of the fact that silicate melts arenot ideal solutions. If they were ideal, the silica activi-ties would correspond to the mole fractions of silica.
600 800 1000 1200T (°C)
1.2
1.0
0.8
0.6
0.4
0.2
0.0−l
og a
SiO
2
SILICA-OVERSATURATED
SILICA-SATURATED
Enstatite
Forsterite
Reaction 3, 27
Reaction 3, 33SILICA-
Albite
NephelineUNDERSATURATED
P = 1 atm
Quartz
3.13 Activity of silica versus T in model magma systems. Lower activities of silica correspond to lower degrees of silica satur-ation.
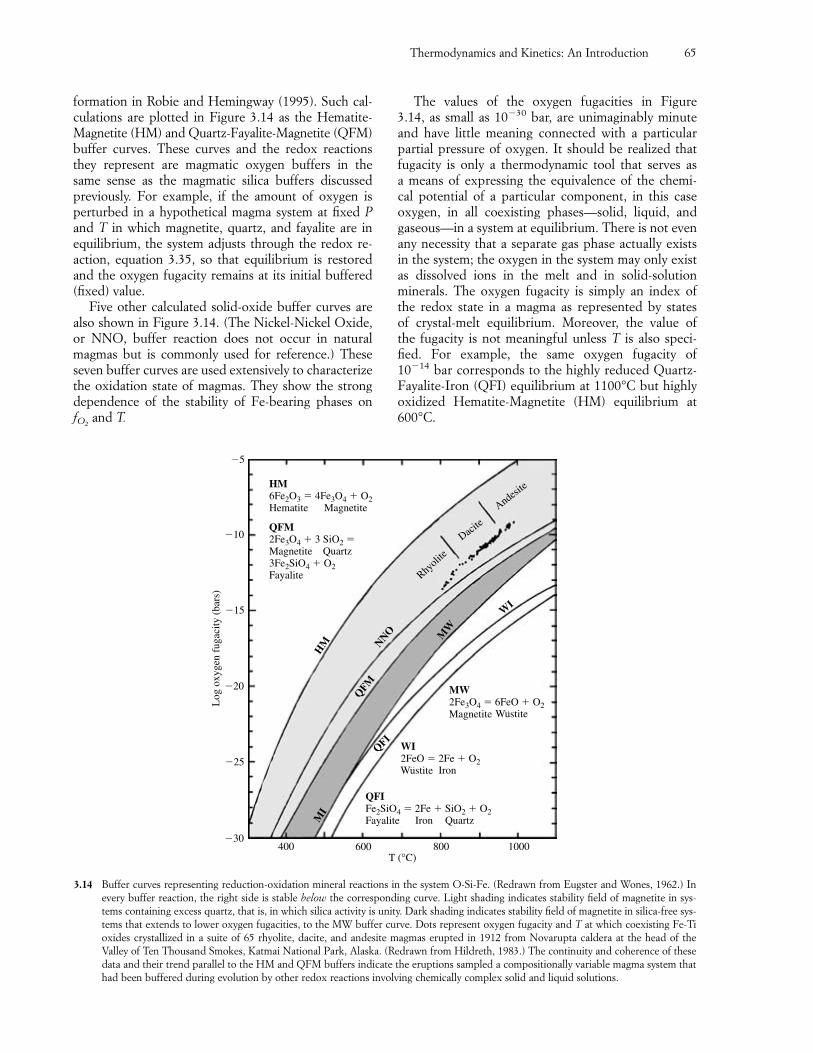
formation in Robie and Hemingway (1995). Such cal-culations are plotted in Figure 3.14 as the Hematite-Magnetite (HM) and Quartz-Fayalite-Magnetite (QFM)buffer curves. These curves and the redox reactionsthey represent are magmatic oxygen buffers in thesame sense as the magmatic silica buffers discussedpreviously. For example, if the amount of oxygen isperturbed in a hypothetical magma system at fixed Pand T in which magnetite, quartz, and fayalite are inequilibrium, the system adjusts through the redox re-action, equation 3.35, so that equilibrium is restoredand the oxygen fugacity remains at its initial buffered(fixed) value.
Five other calculated solid-oxide buffer curves arealso shown in Figure 3.14. (The Nickel-Nickel Oxide,or NNO, buffer reaction does not occur in naturalmagmas but is commonly used for reference.) Theseseven buffer curves are used extensively to characterizethe oxidation state of magmas. They show the strongdependence of the stability of Fe-bearing phases onfO2
and T.
The values of the oxygen fugacities in Figure 3.14, as small as 10�30 bar, are unimaginably minuteand have little meaning connected with a particularpartial pressure of oxygen. It should be realized thatfugacity is only a thermodynamic tool that serves as a means of expressing the equivalence of the chemi-cal potential of a particular component, in this caseoxygen, in all coexisting phases—solid, liquid, andgaseous—in a system at equilibrium. There is not evenany necessity that a separate gas phase actually existsin the system; the oxygen in the system may only existas dissolved ions in the melt and in solid-solution minerals. The oxygen fugacity is simply an index of the redox state in a magma as represented by states of crystal-melt equilibrium. Moreover, the value of the fugacity is not meaningful unless T is also speci-fied. For example, the same oxygen fugacity of 10�14 bar corresponds to the highly reduced Quartz-Fayalite-Iron (QFI) equilibrium at 1100°C but highlyoxidized Hematite-Magnetite (HM) equilibrium at600°C.
Thermodynamics and Kinetics: An Introduction 65
400 600 800 1000T (°C)
�30
�25
�20
�15
�10
�5
Log
oxy
gen
fuga
city
(ba
rs)
QFM2Fe3O4 � 3 SiO2 �Magnetite Quartz3Fe2SiO4 � O2 Fayalite
MW2Fe3O4 � 6FeO � O2
WI2FeO � 2Fe � O2
QFIFe2SiO4 � 2Fe � SiO2 � O2Fayalite
HM NNO
QFM
MI
MW
WI
QFI
Rhyoli
te
Dacite
Andesite
Magnetite Wustite
Iron
Quartz
Wustite
Iron
HM6Fe2O3 � 4Fe3O4 � O2Hematite Magnetite
3.14 Buffer curves representing reduction-oxidation mineral reactions in the system O-Si-Fe. (Redrawn from Eugster and Wones, 1962.) Inevery buffer reaction, the right side is stable below the corresponding curve. Light shading indicates stability field of magnetite in sys-tems containing excess quartz, that is, in which silica activity is unity. Dark shading indicates stability field of magnetite in silica-free sys-tems that extends to lower oxygen fugacities, to the MW buffer curve. Dots represent oxygen fugacity and T at which coexisting Fe-Tioxides crystallized in a suite of 65 rhyolite, dacite, and andesite magmas erupted in 1912 from Novarupta caldera at the head of the Valley of Ten Thousand Smokes, Katmai National Park, Alaska. (Redrawn from Hildreth, 1983.) The continuity and coherence of thesedata and their trend parallel to the HM and QFM buffers indicate the eruptions sampled a compositionally variable magma system thathad been buffered during evolution by other redox reactions involving chemically complex solid and liquid solutions.
The Earth as a whole has a wide range of redox conditions, from the metallic iron (Fe)-nickel core,through the ferrous (Fe2�) silicate mantle, to the hy-drosphere and oxygen-rich atmosphere, where ferric(Fe3�) minerals such as hematite and goethite are sta-ble. At sea level, Ptotal � 1 bar approximately for airand, because the mole fraction of oxygen in it is 0.21,from Dalton’s law (equation 3.24) the partial pressureof oxygen PO2
� 0.21 bar. At equilibrium, this PO2
must be equal to the fugacity of oxygen in a melt at thesurface of the Earth, thus setting an upper limit of fO2
� 0.21 bar (10�0.68 bar) on the oxygen fugacity innatural melts. Only in lunar basalts and in very rare ter-restrial basalts that formed from magma intruded intoand reduced by interaction with coal does iron occur inthe metallic state, or as wüstite (FeO). Most magmashave oxygen fugacities such that magnetite is the stablephase, that is, the shaded region of Figure 3.14. As as-cending magmas contact near-surface meteoric groundwaters or the oxygen-rich atmosphere, Fe2� in themagma can be at least partly oxidized to Fe3�, de-pending on kinetic factors. At highest oxygen fugaci-ties hematite is stable. Hence, iron-rich basaltic lavasextruded onto the surface are locally red because of thepresence of very finely divided particles of hematite.Provided magnetite persists in equilibrium withhematite in an HM buffer, decreasing T results in thesystem’s experiencing decreasing oxygen fugacity asoxygen is consumed in production of hematite. Onceall of the magnetite is gone, the system leaves the buffercurve and enters the field of stable hematite, and T andfO2
are no longer interdependent variables.How do other factors, such as confining pressure
(P) and PH2O, in magmatic systems influence redoxequilibria? As for P, Kress and Carmichael (1991) showthat, provided the magma system remains closed, anychange in P less than 30 kbar (i.e., depths above the up-per mantle) changes the oxygen fugacity by less thanone-half of a log unit. Therefore, the oxidation state ofa closed magma system rising from a source in the up-per mantle will essentially reflect the oxidation state ofthat source. For example, if a closed magma systemoriginates on the QFM buffer, it virtually stays on itduring ascent. As for dissolved water in melts, it hascommonly been assumed that more water-rich meltswould be more oxidized because of the thermal disso-ciation of water into oxygen and hydrogen ions and theloss of the more easily diffusing hydrogen. However,there is increasing evidence (Moore et al., 1995) thatdissolved water by itself has no effect on the oxidationstate of iron in natural melts.
3.5.5 Fe-Ti Oxide Buffers: Oxygen Geobarometers and GeothermometersBuffer reactions like the ones just described providethe means of evaluating the intensive variables in mag-
matic systems at which minerals crystallized underequilibrium conditions using their chemical composi-tions and thermodynamic models. Equilibria involvingoxygen and minerals are the basis for oxygen geo-barometers (indicating fO2
of crystallization) and geo-thermometers (T ).
Since the pioneering and now classic publication ofBuddington and Lindsley (1964), the chemical compo-sition of coexisting oxide phases in the system FeO-Fe2O3-TiO2 has been an important source of informa-tion on the fO2
and T of the magma in which they havecrystallized. Two major solid-solution series occur inthis system: cubic, or isometric, ulvöspinel-magnetitesolid solutions essentially between Fe2TiO4 and Fe3O4
and rhombohedral ilmenite-hematite solid solutions essentially between FeTiO3 and Fe2O3. The composi-tions of the two solid solutions are strongly dependenton fO2
and T. Hence, determinations of the composi-tions of an equilibrium pair of cubic and rhombohedralFe-Ti oxides in a rock, usually by electron microprobeanalysis, give the values of the fO2
and T at which theyequilibrated. This is the method used by Hildreth(1983) to determine fO2
and T in the rhyolite-dacite-andesite magma sequence plotted in Figure 3.14.
Ghiorso and Sack (1991) provide detailed instruc-tions for recalculating the compositions of natural ox-ides, which always contain Mn, Al, V, and so on, insolid solution, before plotting in terms of Fe and Ti,and for evaluating whether the coexisting compositionsrepresent equilibrium. Carmichael et al. (1974, p. 87)demonstrate that confining pressure, P, has little effecton the equilibrium compositions; an increase in P from1 to 5000 bars on the solid phases at 1000°C only in-creases log fO2
by 0.073.
�3.6 KINETICS
The basic questions with regard to changes in the statesof petrologic systems are: In what direction does a spon-taneous process proceed, and how fast will it proceed?The answer to the first question is that systems move to-ward a more stable state of lower Gibbs free energy orchemical potential. With regard to the second question,there is usually some inertia or resistance to the chang-ing of a state. A metastable state seldom has unre-stricted access to a lower energy more stable state be-cause of an activation energy barrier or hump betweenthe initial and final states (Figure 3.5). High-T minerals,such as diamond and olivine, are mostly metastable at the cool, wet, oxygen-rich surface of the Earth. Yetthese minerals do not convert into stable minerals, suchas clays, carbonates, gypsum, and hematite, while sittingin museum drawers in a human lifetime, and they hadnot done so for millennia before they were collectedfrom exposures at the surface of the Earth.
66 Igneous and Metamorphic Petrology
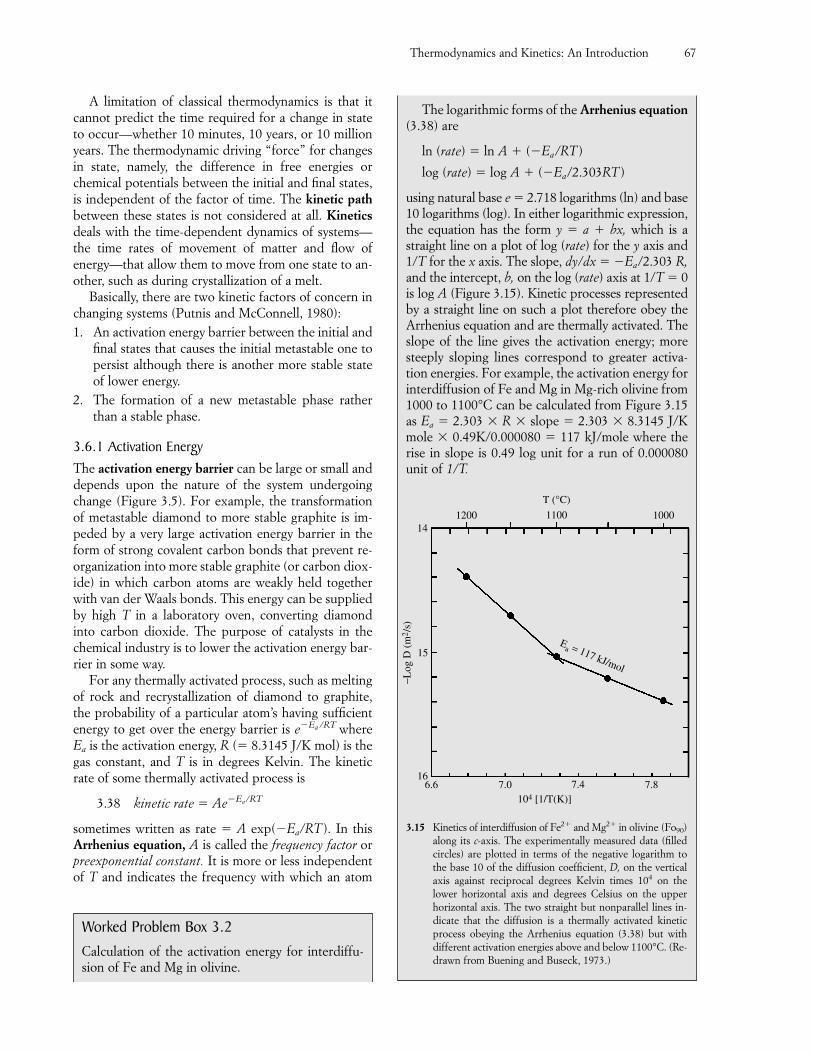
The logarithmic forms of the Arrhenius equation(3.38) are
ln (rate) � ln A � (�Ea/RT )
log (rate) � log A � (�Ea/2.303RT)
using natural base e � 2.718 logarithms (ln) and base10 logarithms (log). In either logarithmic expression,the equation has the form y � a � bx, which is astraight line on a plot of log (rate) for the y axis and1/T for the x axis. The slope, dy/dx � �Ea/2.303 R,and the intercept, b, on the log (rate) axis at 1/T � 0is log A (Figure 3.15). Kinetic processes representedby a straight line on such a plot therefore obey theArrhenius equation and are thermally activated. Theslope of the line gives the activation energy; moresteeply sloping lines correspond to greater activa-tion energies. For example, the activation energy forinterdiffusion of Fe and Mg in Mg-rich olivine from1000 to 1100°C can be calculated from Figure 3.15as Ea � 2.303 � R � slope � 2.303 � 8.3145 J/Kmole � 0.49K/0.000080 � 117 kJ/mole where therise in slope is 0.49 log unit for a run of 0.000080unit of 1/T.
A limitation of classical thermodynamics is that itcannot predict the time required for a change in stateto occur—whether 10 minutes, 10 years, or 10 millionyears. The thermodynamic driving “force” for changesin state, namely, the difference in free energies orchemical potentials between the initial and final states,is independent of the factor of time. The kinetic pathbetween these states is not considered at all. Kineticsdeals with the time-dependent dynamics of systems—the time rates of movement of matter and flow of energy—that allow them to move from one state to an-other, such as during crystallization of a melt.
Basically, there are two kinetic factors of concern inchanging systems (Putnis and McConnell, 1980):1. An activation energy barrier between the initial and
final states that causes the initial metastable one topersist although there is another more stable stateof lower energy.
2. The formation of a new metastable phase ratherthan a stable phase.
3.6.1 Activation EnergyThe activation energy barrier can be large or small anddepends upon the nature of the system undergoingchange (Figure 3.5). For example, the transformationof metastable diamond to more stable graphite is im-peded by a very large activation energy barrier in theform of strong covalent carbon bonds that prevent re-organization into more stable graphite (or carbon diox-ide) in which carbon atoms are weakly held togetherwith van der Waals bonds. This energy can be suppliedby high T in a laboratory oven, converting diamondinto carbon dioxide. The purpose of catalysts in thechemical industry is to lower the activation energy bar-rier in some way.
For any thermally activated process, such as meltingof rock and recrystallization of diamond to graphite,the probability of a particular atom’s having sufficientenergy to get over the energy barrier is e�Ea/RT whereEa is the activation energy, R (� 8.3145 J/K mol) is thegas constant, and T is in degrees Kelvin. The kineticrate of some thermally activated process is
3.38 kinetic rate � Ae�Ea/RT
sometimes written as rate � A exp(�Ea/RT ). In thisArrhenius equation, A is called the frequency factor orpreexponential constant. It is more or less independentof T and indicates the frequency with which an atom
Thermodynamics and Kinetics: An Introduction 67
Worked Problem Box 3.2Calculation of the activation energy for interdiffu-sion of Fe and Mg in olivine.
1200 1000
Ea = 117 kJ/mol
14
15
16
−Log
D (
m2 /
s)
6.6 7.0 7.4 7.8104 [1/T(K)]
1100
T (°C)
3.15 Kinetics of interdiffusion of Fe2� and Mg2� in olivine (Fo90)along its c-axis. The experimentally measured data (filledcircles) are plotted in terms of the negative logarithm tothe base 10 of the diffusion coefficient, D, on the verticalaxis against reciprocal degrees Kelvin times 104 on thelower horizontal axis and degrees Celsius on the upperhorizontal axis. The two straight but nonparallel lines in-dicate that the diffusion is a thermally activated kineticprocess obeying the Arrhenius equation (3.38) but withdifferent activation energies above and below 1100°C. (Re-drawn from Buening and Buseck, 1973.)
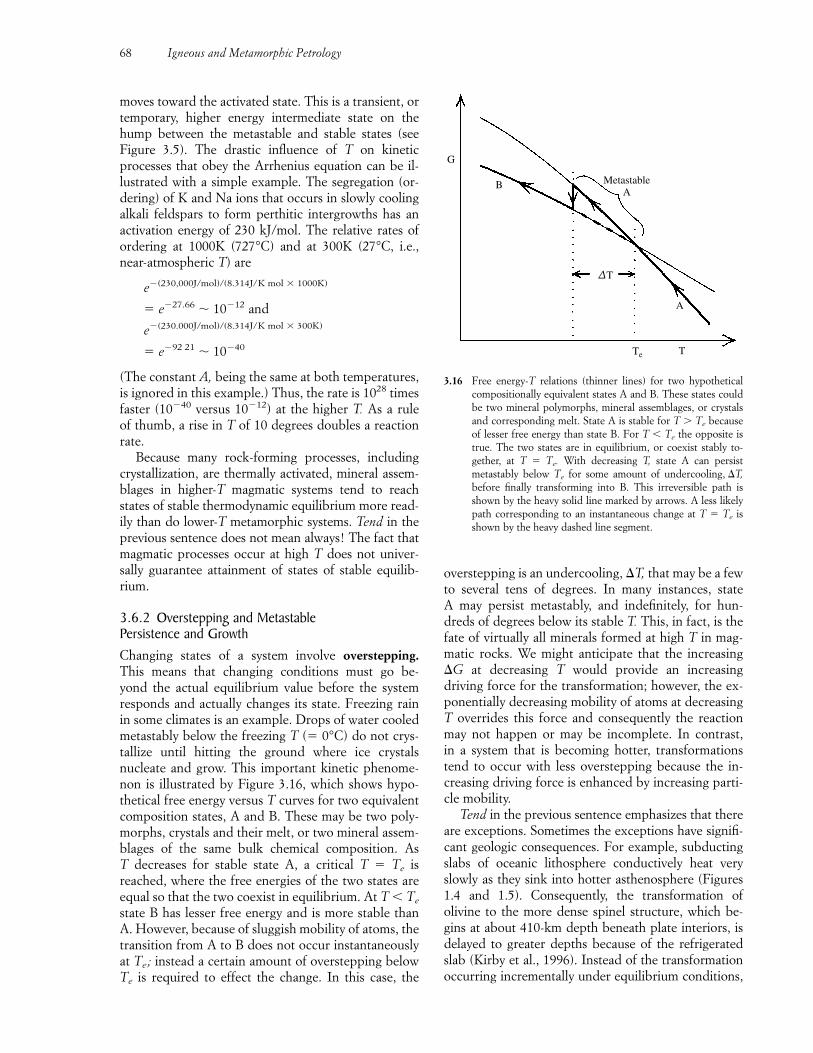
moves toward the activated state. This is a transient, ortemporary, higher energy intermediate state on thehump between the metastable and stable states (seeFigure 3.5). The drastic influence of T on kineticprocesses that obey the Arrhenius equation can be il-lustrated with a simple example. The segregation (or-dering) of K and Na ions that occurs in slowly coolingalkali feldspars to form perthitic intergrowths has anactivation energy of 230 kJ/mol. The relative rates ofordering at 1000K (727°C) and at 300K (27°C, i.e.,near-atmospheric T) are
e�(230,000J/mol)/(8.314J/K mol � 1000K)
� e�27.66 � 10�12 and
e�(230.000J/mol)/(8.314J/K mol � 300K)
� e�92 21 � 10�40
(The constant A, being the same at both temperatures,is ignored in this example.) Thus, the rate is 1028 timesfaster (10�40 versus 10�12) at the higher T. As a rule of thumb, a rise in T of 10 degrees doubles a reactionrate.
Because many rock-forming processes, includingcrystallization, are thermally activated, mineral assem-blages in higher-T magmatic systems tend to reachstates of stable thermodynamic equilibrium more read-ily than do lower-T metamorphic systems. Tend in theprevious sentence does not mean always! The fact thatmagmatic processes occur at high T does not univer-sally guarantee attainment of states of stable equilib-rium.
3.6.2 Overstepping and Metastable Persistence and GrowthChanging states of a system involve overstepping.This means that changing conditions must go be-yond the actual equilibrium value before the systemresponds and actually changes its state. Freezing rainin some climates is an example. Drops of water cooledmetastably below the freezing T (� 0°C) do not crys-tallize until hitting the ground where ice crystals nucleate and grow. This important kinetic phenome-non is illustrated by Figure 3.16, which shows hypo-thetical free energy versus T curves for two equivalentcomposition states, A and B. These may be two poly-morphs, crystals and their melt, or two mineral assem-blages of the same bulk chemical composition. As T decreases for stable state A, a critical T � Te isreached, where the free energies of the two states areequal so that the two coexist in equilibrium. At T � Te
state B has lesser free energy and is more stable thanA. However, because of sluggish mobility of atoms, thetransition from A to B does not occur instantaneouslyat Te; instead a certain amount of overstepping belowTe is required to effect the change. In this case, the
overstepping is an undercooling, �T, that may be a fewto several tens of degrees. In many instances, state A may persist metastably, and indefinitely, for hun-dreds of degrees below its stable T. This, in fact, is thefate of virtually all minerals formed at high T in mag-matic rocks. We might anticipate that the increasing�G at decreasing T would provide an increasing driving force for the transformation; however, the ex-ponentially decreasing mobility of atoms at decreasing T overrides this force and consequently the reactionmay not happen or may be incomplete. In contrast, in a system that is becoming hotter, transformationstend to occur with less overstepping because the in-creasing driving force is enhanced by increasing parti-cle mobility.
Tend in the previous sentence emphasizes that thereare exceptions. Sometimes the exceptions have signifi-cant geologic consequences. For example, subductingslabs of oceanic lithosphere conductively heat veryslowly as they sink into hotter asthenosphere (Figures1.4 and 1.5). Consequently, the transformation ofolivine to the more dense spinel structure, which be-gins at about 410-km depth beneath plate interiors, isdelayed to greater depths because of the refrigeratedslab (Kirby et al., 1996). Instead of the transformationoccurring incrementally under equilibrium conditions,
68 Igneous and Metamorphic Petrology
MetastableA
G
B
∆T
Te T
A
3.16 Free energy-T relations (thinner lines) for two hypotheticalcompositionally equivalent states A and B. These states couldbe two mineral polymorphs, mineral assemblages, or crystalsand corresponding melt. State A is stable for T � Te becauseof lesser free energy than state B. For T � Te the opposite istrue. The two states are in equilibrium, or coexist stably to-gether, at T � Te. With decreasing T, state A can persistmetastably below Te for some amount of undercooling, �T,before finally transforming into B. This irreversible path isshown by the heavy solid line marked by arrows. A less likelypath corresponding to an instantaneous change at T � Te isshown by the heavy dashed line segment.
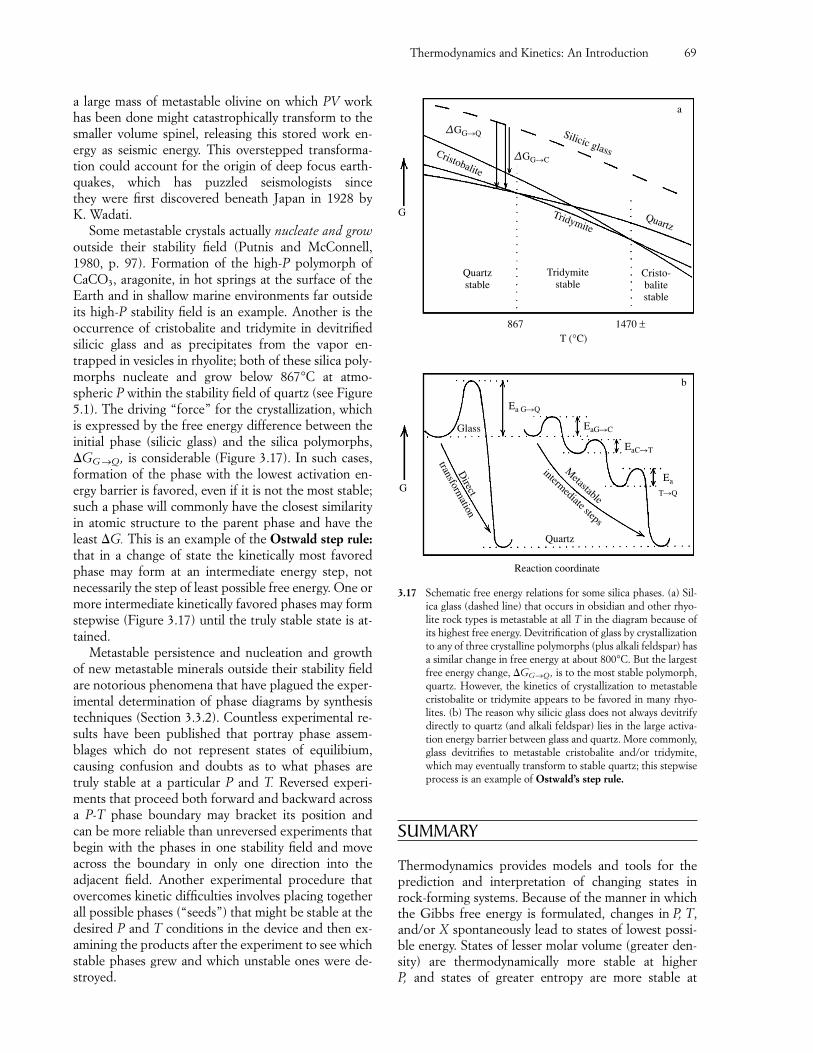
a large mass of metastable olivine on which PV workhas been done might catastrophically transform to thesmaller volume spinel, releasing this stored work en-ergy as seismic energy. This overstepped transforma-tion could account for the origin of deep focus earth-quakes, which has puzzled seismologists since they were first discovered beneath Japan in 1928 by K. Wadati.
Some metastable crystals actually nucleate and growoutside their stability field (Putnis and McConnell,1980, p. 97). Formation of the high-P polymorph ofCaCO3, aragonite, in hot springs at the surface of theEarth and in shallow marine environments far outsideits high-P stability field is an example. Another is theoccurrence of cristobalite and tridymite in devitrifiedsilicic glass and as precipitates from the vapor en-trapped in vesicles in rhyolite; both of these silica poly-morphs nucleate and grow below 867°C at atmo-spheric P within the stability field of quartz (see Figure5.1). The driving “force” for the crystallization, whichis expressed by the free energy difference between theinitial phase (silicic glass) and the silica polymorphs,�GG →Q, is considerable (Figure 3.17). In such cases,formation of the phase with the lowest activation en-ergy barrier is favored, even if it is not the most stable;such a phase will commonly have the closest similarityin atomic structure to the parent phase and have theleast �G. This is an example of the Ostwald step rule:that in a change of state the kinetically most favoredphase may form at an intermediate energy step, notnecessarily the step of least possible free energy. One ormore intermediate kinetically favored phases may formstepwise (Figure 3.17) until the truly stable state is at-tained.
Metastable persistence and nucleation and growthof new metastable minerals outside their stability fieldare notorious phenomena that have plagued the exper-imental determination of phase diagrams by synthesistechniques (Section 3.3.2). Countless experimental re-sults have been published that portray phase assem-blages which do not represent states of equilibium,causing confusion and doubts as to what phases aretruly stable at a particular P and T. Reversed experi-ments that proceed both forward and backward acrossa P-T phase boundary may bracket its position and can be more reliable than unreversed experiments thatbegin with the phases in one stability field and moveacross the boundary in only one direction into the adjacent field. Another experimental procedure thatovercomes kinetic difficulties involves placing togetherall possible phases (“seeds”) that might be stable at thedesired P and T conditions in the device and then ex-amining the products after the experiment to see whichstable phases grew and which unstable ones were de-stroyed.
SUMMARY
Thermodynamics provides models and tools for theprediction and interpretation of changing states inrock-forming systems. Because of the manner in whichthe Gibbs free energy is formulated, changes in P, T,and/or X spontaneously lead to states of lowest possi-ble energy. States of lesser molar volume (greater den-sity) are thermodynamically more stable at higher P, and states of greater entropy are more stable at
Thermodynamics and Kinetics: An Introduction 69
∆GG�Q
∆GG�C
Silicic glass
Quartz
Cristo-balitestable
Tridymite
Tridymitestable
Quartzstable
G
Cristobalite
867 1470 ±T (°C)
a
Ea G�Q
EaG�C
EaC�T
Glass
Direct
transformation
Quartz
Ea
T�Q
b
G
Metastable
intermediate steps
Reaction coordinate
3.17 Schematic free energy relations for some silica phases. (a) Sil-ica glass (dashed line) that occurs in obsidian and other rhyo-lite rock types is metastable at all T in the diagram because ofits highest free energy. Devitrification of glass by crystallizationto any of three crystalline polymorphs (plus alkali feldspar) hasa similar change in free energy at about 800°C. But the largestfree energy change, �GG→Q, is to the most stable polymorph,quartz. However, the kinetics of crystallization to metastablecristobalite or tridymite appears to be favored in many rhyo-lites. (b) The reason why silicic glass does not always devitrifydirectly to quartz (and alkali feldspar) lies in the large activa-tion energy barrier between glass and quartz. More commonly,glass devitrifies to metastable cristobalite and/or tridymite,which may eventually transform to stable quartz; this stepwiseprocess is an example of Ostwald’s step rule.
3.6 Contrast heat, molar heat capacity, T, and en-thalpy and explain how they are interrelated (re-view Section 1.1.3).
3.7 Explain the concept of entropy and give exam-ples of entropy changes in natural processes.
3.8 In what way is the Gibbs free energy a thermo-dynamic potential energy?
3.9 What is a phase diagram, and how can it beread to provide information concerning the sta-bility of different states of a system?
3.10 In a P-T phase diagram, why does the slope ofthe melting curve of a pure mineral such as al-bite (Figure 3.8; see also Figure 3.6) increaseslightly with increasing P? (Hint: What is the ef-fect of increasing P on the difference in molarvolume, �V, between liquid NaAlSi3O8 andcrystalline albite? Does one of these two phasescompress more than the other so that �Vchanges with increasing P?)
3.11 Explain the meaning of the master equation ofchemical thermodynamics (3.18) and of thechemical potential.
3.12 What thermodynamic quantities are used to de-scribe solutions? Give examples.
3.13 What is meant by the activity of a component?The fugacity?
3.14 What is a buffer reaction? Give an example.3.15 Describe how the activity of silica in a melt can
be related to the degree of silica saturation inmagmas and rocks.
3.16 In Figure 2.15, how does increasing Ca activitystabilize calcic pyroxene, hornblende, and anor-thite?
3.17 Describe redox buffer reactions applicable tomagma systems and what they tell about theiroxygen fugacity.
3.18 On photocopies of Figure 3.14, color shade thestability fields of the following mineral equilibriain the system O-Si-Fe: (a) fayalite as the solephase; (b) fayalite plus magnetite; (c) metalliciron plus fayalite.
3.19 Describe the Fe-Ti oxide geothermobarometer.3.20 What is kinetics?3.21 Discuss the kinetic obstacles to attainment of
stable equilibrium in changing states of thermo-dynamic systems.
PROBLEMS3.1 The amount of heat required to melt 1 mole of
diopside crystals at atmospheric P is the molarenthalpy of melting, �Hm � 144 kJ/mol. Thisamount of heat would raise the T of 1 mole of
higher T. Phase (stability) diagrams are a convenientgraphical device to portray stability relations amongdifferent states of a particular system as a function of P, T, and X.
Most rock-forming minerals and, of course, all meltsand gases are solutions or mixtures of two or morechemical components whose mole fractions XA, XB,XC, . . . can be varied within certain limits, producingsmoothly varying properties of these phases withoutdestroying their integrity. The partial molar Gibbs freeenergy (chemical potential) is minimized in sponta-neous changes in a system. At equilibrium, the chemi-cal potential of the same component must be the samein whichever phases it occurs in the system.
The fugacity and activity can be considered as effec-tive or equivalent concentrations of components in realsolutions in geologic systems that deviate from ideal so-lutions. If a magmatic system is buffered by a state ofequilibrium between coexisting solid phases, the activ-ity of some component, such as silica, is fixed at con-stant P and T. Other solid redox equilibria buffer theoxygen fugacity in magma systems. Compositions ofFe-Ti oxides are especially useful in providing values ofthe oxygen fugacity and T at which they crystallized atequilibrium.
In all natural systems, there is a contest betweenchanging intensive variables which prompt a change inthe state of a system, and time, which controls throughkinetic phenomena whether a state of equilibrium is ac-tually attained. Despite the driving “force” provided bydifferences in free energy, higher-energy metastablestates do not instantaneously move to lower-energymore stable states because of activation energy barriers.Hence, metastable states persist in changing systems in the form of minerals existing well outside theirP-T-X stability field. P-T-X variables must overstep fieldboundaries by a certain amount in order to create themost stable phase(s). New metastable phases may actu-ally nucleate and grow outside their stability field.
CRITICAL THINKING QUESTIONS3.1 How does an understanding of the basic con-
cepts of thermodynamics provide insights intothe behavior of rock-forming systems?
3.2 What types of flows of matter and energy occurin end-member thermodynamic systems?
3.3 Why is the Earth and its atmosphere not an iso-lated system?
3.4 Contrast intensive and extensive state proper-ties. Changes in what properties are petrologi-cally most important?
3.5 State the first, second, and third laws of thermo-dynamics and discuss their application to petrol-ogy.
70 Igneous and Metamorphic Petrology
diopside crystals just below the melting temper-ature by how many degrees Celsius? (Answer:514°C)
3.2 Using densities from a mineralogy text, deter-mine the relative molar volumes of diamond andgraphite. What does the positive slope of the diamond-graphite equilibrium boundary line inP-T space tell about the relative entropies ofgraphite and diamond? Predict the relative com-pressibility, that is, how much the molar volumechanges with increasing P, of graphite and dia-mond. Then show in a P-T diagram how theslope of the equilibrium curve changes at in-creasing P. Justify your answer, indicating anyassumptions made.
3.3 Sketch the melting curve in P-T space for thewater system. This will require you to decide onthe relative entropies of liquid and solid waterand their relative molar volumes. Isothermally,what change in P (increasing or decreasing)causes ice to melt? What possible implicationmight this have for the interior of a planetarysatellite, such as Europa, that has an ice crust?
3.4 In T-G space the free energy lines for crystalsand liquid have negative slopes and the slope ofthe liquid line is greater than that of crystals(Figure 3.7). Why? Why is the opposite true ofthe lines in P-G space?
3.5 At the center of the Earth, P is probably �3 �106 bar and T is possibly about 5000°C. Makean approximate calculation for the relative ef-fects of P and T on the change in free energy(�Gcenter � �Gsurface) of a mineral reaction forwhich �V � 1 cm3/mol and �S � 2 J/K mol
in going from the surface to the center of theEarth (Atkins, 1978, p.157). (Hint: Base the approximation on equation 3.9 that �Gcenter ��Gsurface � �V[Pcenter � Psurface] � �S[Tcenter �Tsurface].) Discuss your result, especially in thelight of the mineralogical changes within themantle shown in Figure 1.3.
3.6 In a photocopy of Figure 3.9 show the partialmolar volumes of the two components A and Bin a solution whose composition is XA � 0.2.
3.7 From Figure 3.11, express the chemical po-tential of component Ab in a solution whosecomposition is XAb � 0.7 in terms of a Gibbsstandard state free energy of formation and an(RT ln) term. Show the value of this chemicalpotential on the appropriate axis of the diagram.Also show and give an algebraic expression for the chemical potential of the solution atXAb � 0.7.
3.8 From tabulated free energies of formation fromthe elements in Robie and Hemingway (1995)calculate the activity of silica at 600, 900, and1200°C in the reaction nepheline � silica �(high) albite to verify the corresponding buffercurve in Figure 3.13.
3.9 From tabulated free energies of formation fromthe elements in Robie and Hemingway (1995)calculate the fugacity of oxygen at 600, 900, and1200°C in the reaction 6 hematite � 4 mag-netite � O2 to verify the corresponding buffercurve in Figure 3.14.
3.10 Calculate the activation energy for interdiffusionof Fe and Mg in Mg-rich olivine from 1100 to1200°C in Figure 3.15. (Answer: 239 kJ/mol)
Thermodynamics and Kinetics: An Introduction 71
FUNDAMENTAL QUESTIONSCONSIDERED IN THIS CHAPTER
1. What is the nature of magma and its essential meltfraction?
2. What volatiles exist in magma systems and howare they dissolved in the melt?
3. How does the release of dissolved volatiles frommelts impact magmatic behavior and that ofgeologic systems in general?
INTRODUCTION
Everyone is familiar with glowing extrusions of incan-descent magma and explosions of gas-charged magmafrom volcanoes. Hidden from direct observation are in-trusions of magma beneath the surface of the Earth.Nothing is more fundamental to the behavior of thesemagma systems and the origin of magmatic rocks thanthe nature and behavior of magma. The key ingredientin this mobile molten material is a liquid silicate solu-tion, or melt. In this chapter, the basic atomic structureof melts is introduced as a means to understand the dy-namic behavior of bodies of magma discussed in moredetail in Chapter 8. Especially important in this dy-namic behavior is the role of volatiles that are dissolvedin melts and can be released to cause explosive volcan-ism and many other important geologic phenomena.
�4.1 NATURE OF MAGMA
Magma is a term first introduced into geologic litera-ture in 1825 by Scope, who referred to it as a “com-
pound liquid” consisting of solid particles suspendedin a liquid, like mud. Measurements on extrudedmagma (lava), together with evaluations of mineral geo-thermometers in magmatic rocks and experimental de-terminations of their melting relations, indicate thattemperatures of magmas near the surface of the Earthgenerally range from about 1200°C to 700°C; thehigher values pertain to mafic compositions, the lowerto silicic. Very rare alkali carbonatitic lavas that containalmost no silica have eruptive temperatures of about600°C. Extruded magmas are rarely free of crystals, in-dicating that they rarely are superheated above tem-peratures of crystallization. Densities of magmas rangefrom about 2.2 to 3.0 g/cm3 and are generally about90% of that of the equivalent crystalline rock.
Magma in general consists of a mobile mixture ofsolid, liquid, and gaseous phases. The number and na-ture of the phases constituting a magma depend, understable equilibrium conditions, on the three intensivevariables—P, T, and X (concentrations of chemicalcomponents in the magma). At sufficiently high T, anyrock melts completely to form a homogeneous liquidsolution, or melt. Except for carbonatite magmas,melts consist mostly of ions of O and Si—hence the al-ternate appellation silicate liquid—but always containin addition significant amounts of Al, Ca, H, Na, andso on.
Examples of different types of magmas are shownschematically in Figure 4.1. Only in some unusually hotsystems will a magma consist wholly of melt and noother phases. In most instances, a melt is only part ofthe whole magma, but is always present and gives itmobility. Hence, melt and magma are generally not thesame. To a significant extent, the properties of the meltlargely govern the overall dynamic behavior of thewhole magma. Rare magma systems consist at equilib-
4CHAPTER
Silicate Melts andVolatile Fluids inMagma Systems
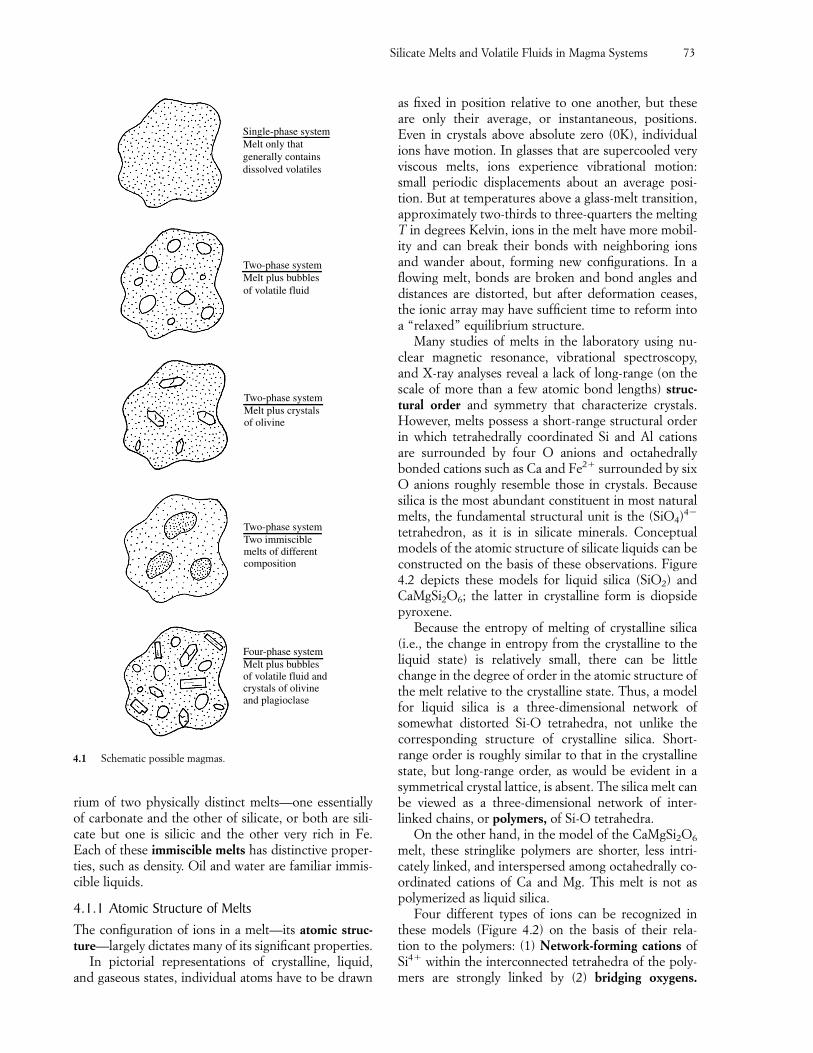
Silicate Melts and Volatile Fluids in Magma Systems 73
rium of two physically distinct melts—one essentiallyof carbonate and the other of silicate, or both are sili-cate but one is silicic and the other very rich in Fe.Each of these immiscible melts has distinctive proper-ties, such as density. Oil and water are familiar immis-cible liquids.
4.1.1 Atomic Structure of MeltsThe configuration of ions in a melt—its atomic struc-ture—largely dictates many of its significant properties.
In pictorial representations of crystalline, liquid,and gaseous states, individual atoms have to be drawn
as fixed in position relative to one another, but theseare only their average, or instantaneous, positions.Even in crystals above absolute zero (0K), individualions have motion. In glasses that are supercooled veryviscous melts, ions experience vibrational motion:small periodic displacements about an average posi-tion. But at temperatures above a glass-melt transition,approximately two-thirds to three-quarters the meltingT in degrees Kelvin, ions in the melt have more mobil-ity and can break their bonds with neighboring ionsand wander about, forming new configurations. In aflowing melt, bonds are broken and bond angles anddistances are distorted, but after deformation ceases,the ionic array may have sufficient time to reform intoa “relaxed” equilibrium structure.
Many studies of melts in the laboratory using nu-clear magnetic resonance, vibrational spectroscopy,and X-ray analyses reveal a lack of long-range (on thescale of more than a few atomic bond lengths) struc-tural order and symmetry that characterize crystals.However, melts possess a short-range structural orderin which tetrahedrally coordinated Si and Al cationsare surrounded by four O anions and octahedrallybonded cations such as Ca and Fe2� surrounded by sixO anions roughly resemble those in crystals. Becausesilica is the most abundant constituent in most naturalmelts, the fundamental structural unit is the (SiO4)4�
tetrahedron, as it is in silicate minerals. Conceptualmodels of the atomic structure of silicate liquids can beconstructed on the basis of these observations. Figure4.2 depicts these models for liquid silica (SiO2) andCaMgSi2O6; the latter in crystalline form is diopsidepyroxene.
Because the entropy of melting of crystalline silica(i.e., the change in entropy from the crystalline to theliquid state) is relatively small, there can be littlechange in the degree of order in the atomic structure ofthe melt relative to the crystalline state. Thus, a modelfor liquid silica is a three-dimensional network ofsomewhat distorted Si-O tetrahedra, not unlike thecorresponding structure of crystalline silica. Short-range order is roughly similar to that in the crystallinestate, but long-range order, as would be evident in asymmetrical crystal lattice, is absent. The silica melt canbe viewed as a three-dimensional network of inter-linked chains, or polymers, of Si-O tetrahedra.
On the other hand, in the model of the CaMgSi2O6
melt, these stringlike polymers are shorter, less intri-cately linked, and interspersed among octahedrally co-ordinated cations of Ca and Mg. This melt is not aspolymerized as liquid silica.
Four different types of ions can be recognized inthese models (Figure 4.2) on the basis of their rela-tion to the polymers: (1) Network-forming cations ofSi4� within the interconnected tetrahedra of the poly-mers are strongly linked by (2) bridging oxygens.
Single-phase systemMelt only thatgenerally containsdissolved volatiles
Two-phase systemMelt plus bubblesof volatile fluid
Two-phase systemMelt plus crystalsof olivine
Two-phase systemTwo immiscible melts of differentcomposition
Four-phase systemMelt plus bubblesof volatile fluid andcrystals of olivineand plagioclase
4.1 Schematic possible magmas.
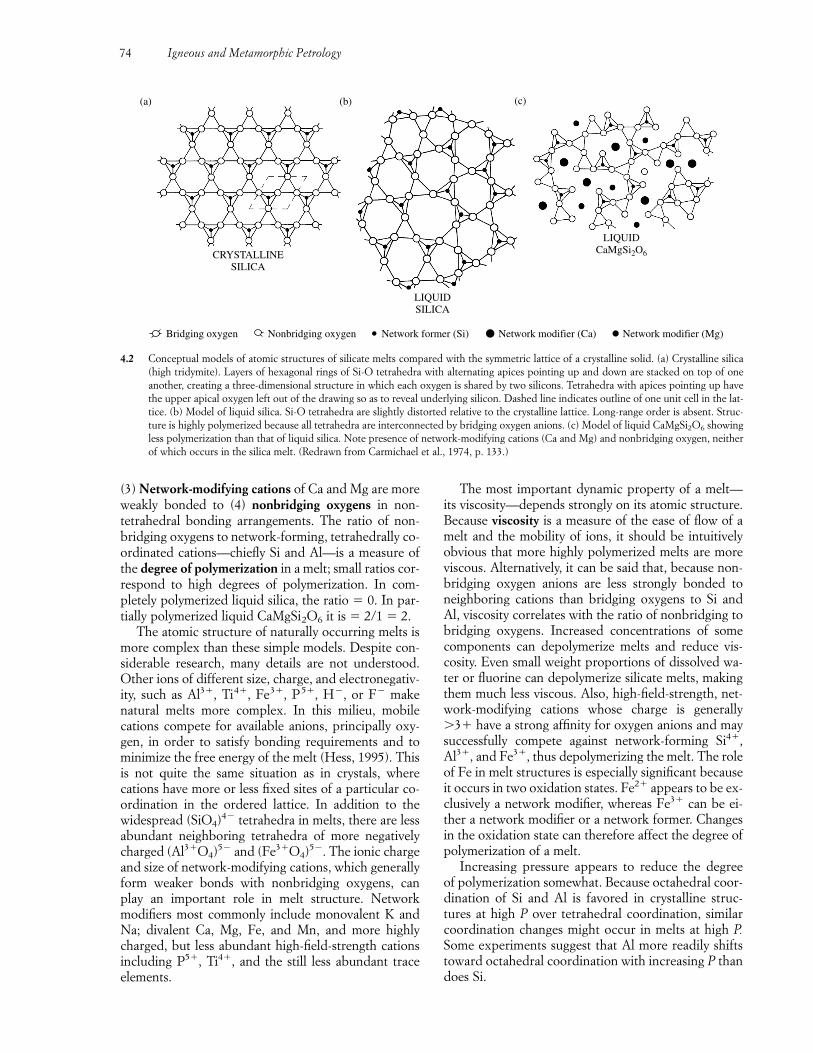
(3) Network-modifying cations of Ca and Mg are moreweakly bonded to (4) nonbridging oxygens in non-tetrahedral bonding arrangements. The ratio of non-bridging oxygens to network-forming, tetrahedrally co-ordinated cations—chiefly Si and Al—is a measure ofthe degree of polymerization in a melt; small ratios cor-respond to high degrees of polymerization. In com-pletely polymerized liquid silica, the ratio � 0. In par-tially polymerized liquid CaMgSi2O6 it is � 2/1 � 2.
The atomic structure of naturally occurring melts ismore complex than these simple models. Despite con-siderable research, many details are not understood.Other ions of different size, charge, and electronegativ-ity, such as Al3�, Ti4�, Fe3�, P5�, H�, or F� makenatural melts more complex. In this milieu, mobilecations compete for available anions, principally oxy-gen, in order to satisfy bonding requirements and tominimize the free energy of the melt (Hess, 1995). Thisis not quite the same situation as in crystals, wherecations have more or less fixed sites of a particular co-ordination in the ordered lattice. In addition to thewidespread (SiO4)4� tetrahedra in melts, there are lessabundant neighboring tetrahedra of more negativelycharged (Al3�O4)5� and (Fe3�O4)5�. The ionic chargeand size of network-modifying cations, which generallyform weaker bonds with nonbridging oxygens, canplay an important role in melt structure. Networkmodifiers most commonly include monovalent K andNa; divalent Ca, Mg, Fe, and Mn, and more highlycharged, but less abundant high-field-strength cationsincluding P5�, Ti4�, and the still less abundant trace elements.
The most important dynamic property of a melt—its viscosity—depends strongly on its atomic structure.Because viscosity is a measure of the ease of flow of amelt and the mobility of ions, it should be intuitivelyobvious that more highly polymerized melts are moreviscous. Alternatively, it can be said that, because non-bridging oxygen anions are less strongly bonded toneighboring cations than bridging oxygens to Si andAl, viscosity correlates with the ratio of nonbridging tobridging oxygens. Increased concentrations of somecomponents can depolymerize melts and reduce vis-cosity. Even small weight proportions of dissolved wa-ter or fluorine can depolymerize silicate melts, makingthem much less viscous. Also, high-field-strength, net-work-modifying cations whose charge is generally�3� have a strong affinity for oxygen anions and maysuccessfully compete against network-forming Si4�,Al3�, and Fe3�, thus depolymerizing the melt. The roleof Fe in melt structures is especially significant becauseit occurs in two oxidation states. Fe2� appears to be ex-clusively a network modifier, whereas Fe3� can be ei-ther a network modifier or a network former. Changesin the oxidation state can therefore affect the degree ofpolymerization of a melt.
Increasing pressure appears to reduce the degree of polymerization somewhat. Because octahedral coor-dination of Si and Al is favored in crystalline struc-tures at high P over tetrahedral coordination, similarcoordination changes might occur in melts at high P.Some experiments suggest that Al more readily shiftstoward octahedral coordination with increasing P thandoes Si.
74 Igneous and Metamorphic Petrology
CRYSTALLINESILICA
LIQUIDSILICA
LIQUIDCaMgSi2O6
Bridging oxygen Nonbridging oxygen Network former (Si) Network modifier (Ca) Network modifier (Mg)
(a) (b) (c)
4.2 Conceptual models of atomic structures of silicate melts compared with the symmetric lattice of a crystalline solid. (a) Crystalline silica(high tridymite). Layers of hexagonal rings of Si-O tetrahedra with alternating apices pointing up and down are stacked on top of oneanother, creating a three-dimensional structure in which each oxygen is shared by two silicons. Tetrahedra with apices pointing up havethe upper apical oxygen left out of the drawing so as to reveal underlying silicon. Dashed line indicates outline of one unit cell in the lat-tice. (b) Model of liquid silica. Si-O tetrahedra are slightly distorted relative to the crystalline lattice. Long-range order is absent. Struc-ture is highly polymerized because all tetrahedra are interconnected by bridging oxygen anions. (c) Model of liquid CaMgSi2O6 showingless polymerization than that of liquid silica. Note presence of network-modifying cations (Ca and Mg) and nonbridging oxygen, neitherof which occurs in the silica melt. (Redrawn from Carmichael et al., 1974, p. 133.)
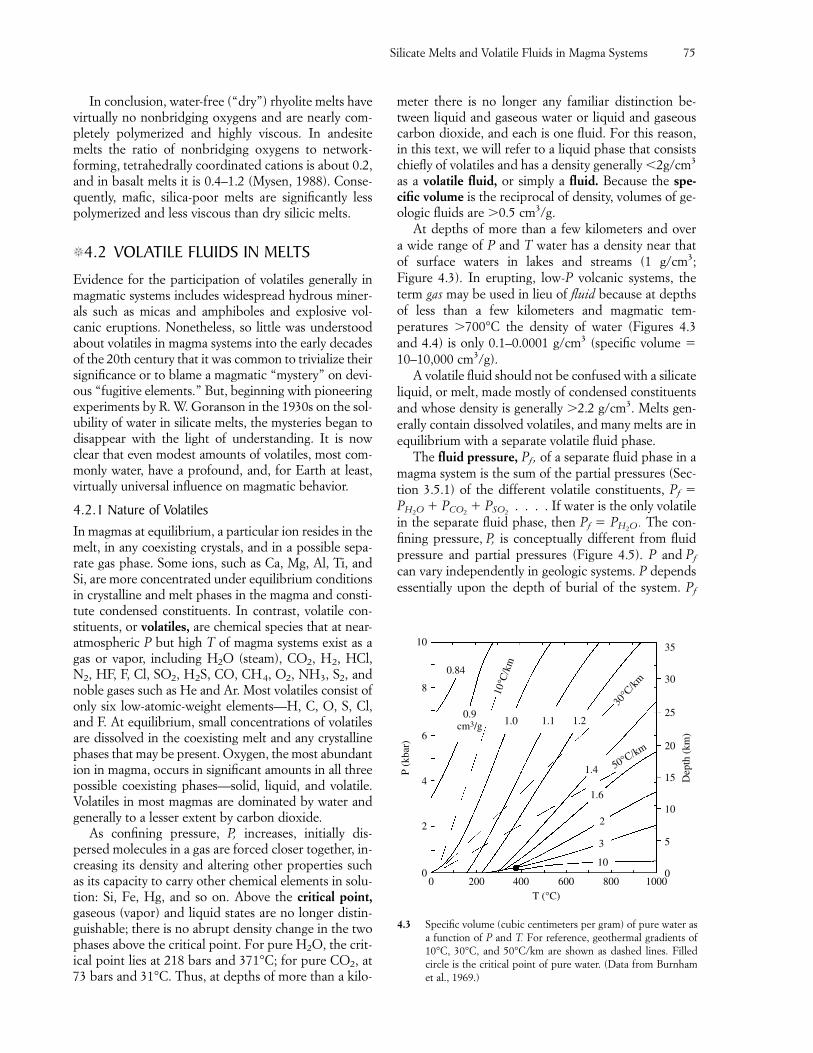
Silicate Melts and Volatile Fluids in Magma Systems 75
In conclusion, water-free (“dry”) rhyolite melts havevirtually no nonbridging oxygens and are nearly com-pletely polymerized and highly viscous. In andesitemelts the ratio of nonbridging oxygens to network-forming, tetrahedrally coordinated cations is about 0.2,and in basalt melts it is 0.4–1.2 (Mysen, 1988). Conse-quently, mafic, silica-poor melts are significantly lesspolymerized and less viscous than dry silicic melts.
�4.2 VOLATILE FLUIDS IN MELTS
Evidence for the participation of volatiles generally inmagmatic systems includes widespread hydrous miner-als such as micas and amphiboles and explosive vol-canic eruptions. Nonetheless, so little was understoodabout volatiles in magma systems into the early decadesof the 20th century that it was common to trivialize theirsignificance or to blame a magmatic “mystery” on devi-ous “fugitive elements.” But, beginning with pioneeringexperiments by R. W. Goranson in the 1930s on the sol-ubility of water in silicate melts, the mysteries began todisappear with the light of understanding. It is nowclear that even modest amounts of volatiles, most com-monly water, have a profound, and, for Earth at least,virtually universal influence on magmatic behavior.
4.2.1 Nature of VolatilesIn magmas at equilibrium, a particular ion resides in themelt, in any coexisting crystals, and in a possible sepa-rate gas phase. Some ions, such as Ca, Mg, Al, Ti, andSi, are more concentrated under equilibrium conditionsin crystalline and melt phases in the magma and consti-tute condensed constituents. In contrast, volatile con-stituents, or volatiles, are chemical species that at near-atmospheric P but high T of magma systems exist as agas or vapor, including H2O (steam), CO2, H2, HCl,N2, HF, F, Cl, SO2, H2S, CO, CH4, O2, NH3, S2, andnoble gases such as He and Ar. Most volatiles consist ofonly six low-atomic-weight elements—H, C, O, S, Cl,and F. At equilibrium, small concentrations of volatilesare dissolved in the coexisting melt and any crystallinephases that may be present. Oxygen, the most abundantion in magma, occurs in significant amounts in all threepossible coexisting phases—solid, liquid, and volatile.Volatiles in most magmas are dominated by water andgenerally to a lesser extent by carbon dioxide.
As confining pressure, P, increases, initially dis-persed molecules in a gas are forced closer together, in-creasing its density and altering other properties suchas its capacity to carry other chemical elements in solu-tion: Si, Fe, Hg, and so on. Above the critical point,gaseous (vapor) and liquid states are no longer distin-guishable; there is no abrupt density change in the twophases above the critical point. For pure H2O, the crit-ical point lies at 218 bars and 371°C; for pure CO2, at73 bars and 31°C. Thus, at depths of more than a kilo-
meter there is no longer any familiar distinction be-tween liquid and gaseous water or liquid and gaseouscarbon dioxide, and each is one fluid. For this reason,in this text, we will refer to a liquid phase that consistschiefly of volatiles and has a density generally �2g/cm3
as a volatile fluid, or simply a fluid. Because the spe-cific volume is the reciprocal of density, volumes of ge-ologic fluids are �0.5 cm3/g.
At depths of more than a few kilometers and over a wide range of P and T water has a density near that of surface waters in lakes and streams (1 g/cm3; Figure 4.3). In erupting, low-P volcanic systems, theterm gas may be used in lieu of fluid because at depthsof less than a few kilometers and magmatic tem-peratures �700°C the density of water (Figures 4.3 and 4.4) is only 0.1–0.0001 g/cm3 (specific volume �10–10,000 cm3/g).
A volatile fluid should not be confused with a silicateliquid, or melt, made mostly of condensed constituentsand whose density is generally �2.2 g/cm3. Melts gen-erally contain dissolved volatiles, and many melts are inequilibrium with a separate volatile fluid phase.
The fluid pressure, Pf , of a separate fluid phase in amagma system is the sum of the partial pressures (Sec-tion 3.5.1) of the different volatile constituents, Pf �PH2O � PCO2
� PSO2. . . . If water is the only volatile
in the separate fluid phase, then Pf � PH2O. The con-fining pressure, P, is conceptually different from fluidpressure and partial pressures (Figure 4.5). P and Pf
can vary independently in geologic systems. P dependsessentially upon the depth of burial of the system. Pf
00
200 400 600 800 1000T (°C)
0
2
4
6
8
10
P (k
bar)
35
30
25
20
15
10
5
10
3
2
1.6
1.4 50°C/km
1.2
30°C
/km
1.11.00.9
cm3/g
10°C
/km
0.84D
epth
(km
)
4.3 Specific volume (cubic centimeters per gram) of pure water asa function of P and T. For reference, geothermal gradients of10°C, 30°C, and 50°C/km are shown as dashed lines. Filledcircle is the critical point of pure water. (Data from Burnhamet al., 1969.)
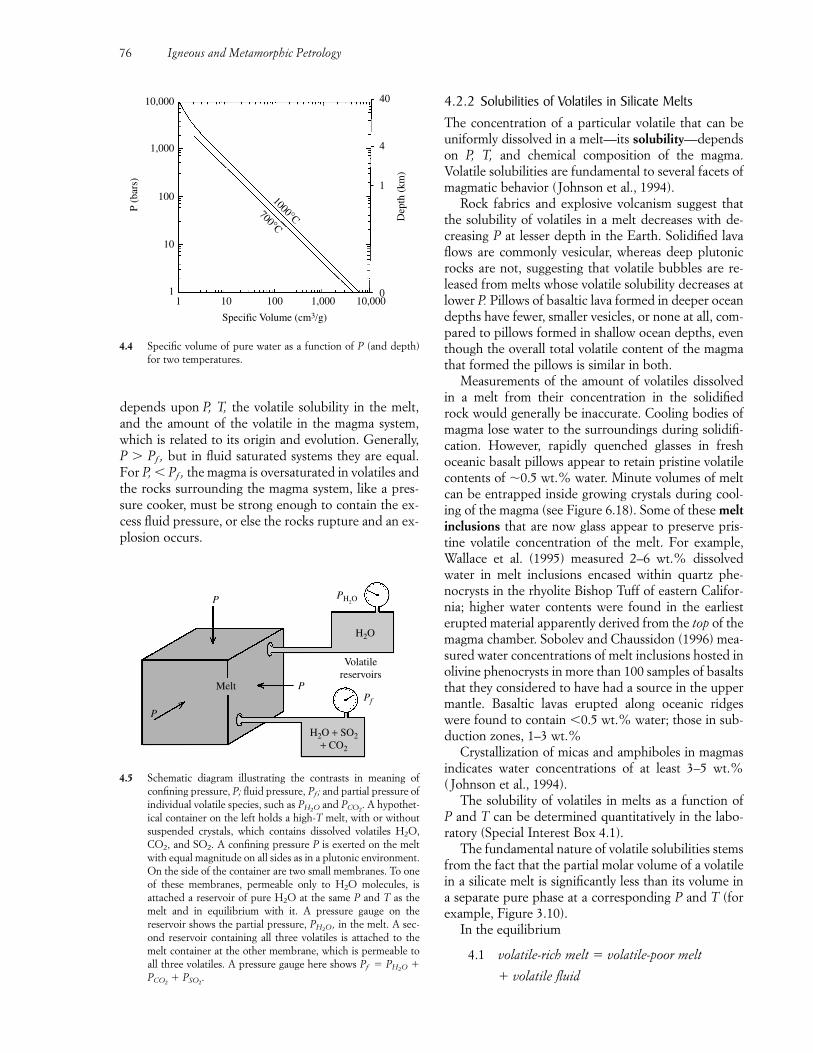
depends upon P, T, the volatile solubility in the melt,and the amount of the volatile in the magma system,which is related to its origin and evolution. Generally,P � Pf , but in fluid saturated systems they are equal.For P, � Pf , the magma is oversaturated in volatiles andthe rocks surrounding the magma system, like a pres-sure cooker, must be strong enough to contain the ex-cess fluid pressure, or else the rocks rupture and an ex-plosion occurs.
4.2.2 Solubilities of Volatiles in Silicate MeltsThe concentration of a particular volatile that can beuniformly dissolved in a melt—its solubility—dependson P, T, and chemical composition of the magma.Volatile solubilities are fundamental to several facets ofmagmatic behavior (Johnson et al., 1994).
Rock fabrics and explosive volcanism suggest thatthe solubility of volatiles in a melt decreases with de-creasing P at lesser depth in the Earth. Solidified lavaflows are commonly vesicular, whereas deep plutonicrocks are not, suggesting that volatile bubbles are re-leased from melts whose volatile solubility decreases atlower P. Pillows of basaltic lava formed in deeper oceandepths have fewer, smaller vesicles, or none at all, com-pared to pillows formed in shallow ocean depths, eventhough the overall total volatile content of the magmathat formed the pillows is similar in both.
Measurements of the amount of volatiles dissolvedin a melt from their concentration in the solidified rock would generally be inaccurate. Cooling bodies ofmagma lose water to the surroundings during solidifi-cation. However, rapidly quenched glasses in freshoceanic basalt pillows appear to retain pristine volatilecontents of �0.5 wt.% water. Minute volumes of meltcan be entrapped inside growing crystals during cool-ing of the magma (see Figure 6.18). Some of these meltinclusions that are now glass appear to preserve pris-tine volatile concentration of the melt. For example,Wallace et al. (1995) measured 2–6 wt.% dissolved water in melt inclusions encased within quartz phe-nocrysts in the rhyolite Bishop Tuff of eastern Califor-nia; higher water contents were found in the earliesterupted material apparently derived from the top of themagma chamber. Sobolev and Chaussidon (1996) mea-sured water concentrations of melt inclusions hosted inolivine phenocrysts in more than 100 samples of basaltsthat they considered to have had a source in the uppermantle. Basaltic lavas erupted along oceanic ridgeswere found to contain �0.5 wt.% water; those in sub-duction zones, 1–3 wt.%
Crystallization of micas and amphiboles in magmasindicates water concentrations of at least 3–5 wt.%( Johnson et al., 1994).
The solubility of volatiles in melts as a function of P and T can be determined quantitatively in the labo-ratory (Special Interest Box 4.1).
The fundamental nature of volatile solubilities stemsfrom the fact that the partial molar volume of a volatilein a silicate melt is significantly less than its volume ina separate pure phase at a corresponding P and T (forexample, Figure 3.10).
In the equilibrium
4.1 volatile-rich melt � volatile-poor melt
� volatile fluid
76 Igneous and Metamorphic Petrology
10,000
1,000
100
10
11 10 100 1,000 10,000
P (b
ars)
Specific Volume (cm3/g)
40
4
1
0
Dep
th (
km)
1000°C700°C
4.4 Specific volume of pure water as a function of P (and depth)for two temperatures.
Melt
P
P
P
Pf
H2O
Volatilereservoirs
PH2O
H2O + SO2+ CO2
4.5 Schematic diagram illustrating the contrasts in meaning ofconfining pressure, P; fluid pressure, Pf ; and partial pressure ofindividual volatile species, such as PH2O and PCO2
. A hypothet-ical container on the left holds a high-T melt, with or withoutsuspended crystals, which contains dissolved volatiles H2O,CO2, and SO2. A confining pressure P is exerted on the meltwith equal magnitude on all sides as in a plutonic environment.On the side of the container are two small membranes. To oneof these membranes, permeable only to H2O molecules, is attached a reservoir of pure H2O at the same P and T as themelt and in equilibrium with it. A pressure gauge on the reservoir shows the partial pressure, PH2O, in the melt. A sec-ond reservoir containing all three volatiles is attached to themelt container at the other membrane, which is permeable toall three volatiles. A pressure gauge here shows Pf � PH2O �
PCO2� PSO2
.
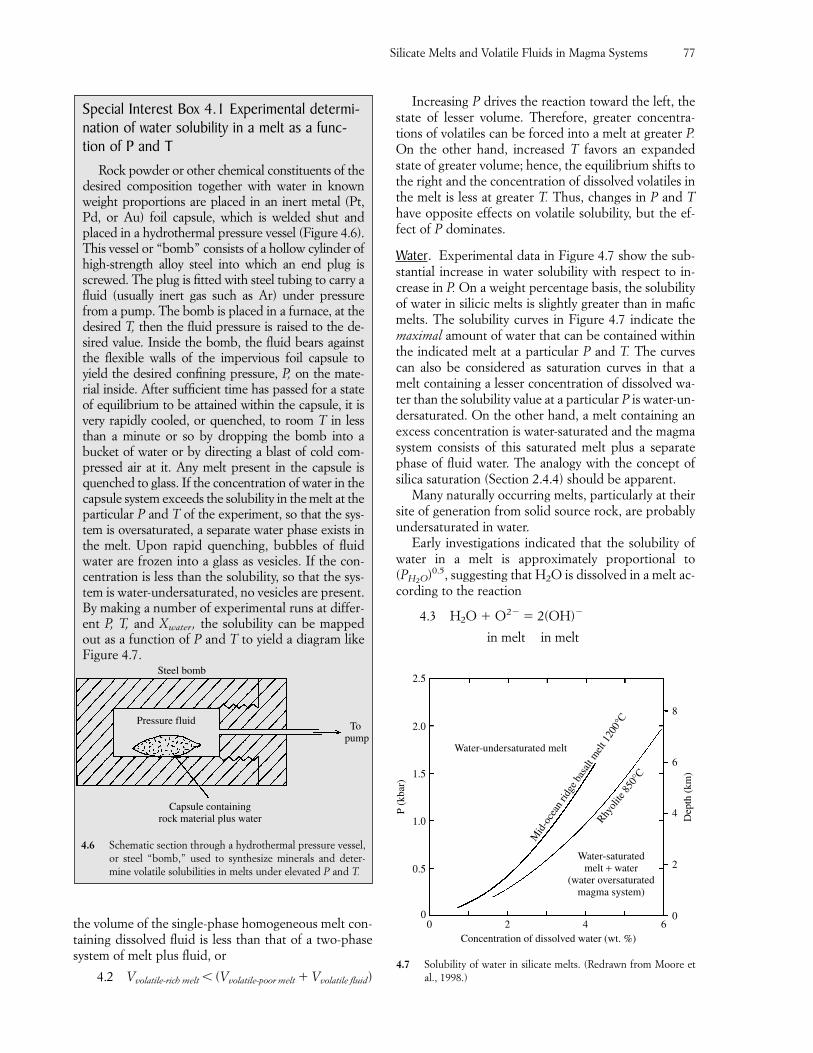
Increasing P drives the reaction toward the left, thestate of lesser volume. Therefore, greater concentra-tions of volatiles can be forced into a melt at greater P.On the other hand, increased T favors an expandedstate of greater volume; hence, the equilibrium shifts tothe right and the concentration of dissolved volatiles inthe melt is less at greater T. Thus, changes in P and Thave opposite effects on volatile solubility, but the ef-fect of P dominates.
Water. Experimental data in Figure 4.7 show the sub-stantial increase in water solubility with respect to in-crease in P. On a weight percentage basis, the solubilityof water in silicic melts is slightly greater than in maficmelts. The solubility curves in Figure 4.7 indicate themaximal amount of water that can be contained withinthe indicated melt at a particular P and T. The curvescan also be considered as saturation curves in that amelt containing a lesser concentration of dissolved wa-ter than the solubility value at a particular P is water-un-dersaturated. On the other hand, a melt containing anexcess concentration is water-saturated and the magmasystem consists of this saturated melt plus a separatephase of fluid water. The analogy with the concept ofsilica saturation (Section 2.4.4) should be apparent.
Many naturally occurring melts, particularly at theirsite of generation from solid source rock, are probablyundersaturated in water.
Early investigations indicated that the solubility ofwater in a melt is approximately proportional to(PH2O)0.5, suggesting that H2O is dissolved in a melt ac-cording to the reaction
4.3 H2O � O2� � 2(OH)�
in melt in melt
Silicate Melts and Volatile Fluids in Magma Systems 77
Special Interest Box 4.1 Experimental determi-nation of water solubility in a melt as a func-tion of P and T
Rock powder or other chemical constituents of thedesired composition together with water in knownweight proportions are placed in an inert metal (Pt,Pd, or Au) foil capsule, which is welded shut andplaced in a hydrothermal pressure vessel (Figure 4.6).This vessel or “bomb” consists of a hollow cylinder ofhigh-strength alloy steel into which an end plug isscrewed. The plug is fitted with steel tubing to carry afluid (usually inert gas such as Ar) under pressurefrom a pump. The bomb is placed in a furnace, at thedesired T, then the fluid pressure is raised to the de-sired value. Inside the bomb, the fluid bears againstthe flexible walls of the impervious foil capsule toyield the desired confining pressure, P, on the mate-rial inside. After sufficient time has passed for a stateof equilibrium to be attained within the capsule, it isvery rapidly cooled, or quenched, to room T in lessthan a minute or so by dropping the bomb into abucket of water or by directing a blast of cold com-pressed air at it. Any melt present in the capsule isquenched to glass. If the concentration of water in thecapsule system exceeds the solubility in the melt at theparticular P and T of the experiment, so that the sys-tem is oversaturated, a separate water phase exists inthe melt. Upon rapid quenching, bubbles of fluidwater are frozen into a glass as vesicles. If the con-centration is less than the solubility, so that the sys-tem is water-undersaturated, no vesicles are present.By making a number of experimental runs at differ-ent P, T, and Xwater , the solubility can be mappedout as a function of P and T to yield a diagram likeFigure 4.7.
To pump
Capsule containingrock material plus water
Steel bomb
Pressure fluid
4.6 Schematic section through a hydrothermal pressure vessel,or steel “bomb,” used to synthesize minerals and deter-mine volatile solubilities in melts under elevated P and T.
the volume of the single-phase homogeneous melt con-taining dissolved fluid is less than that of a two-phasesystem of melt plus fluid, or
4.2 Vvolatile-rich melt � (Vvolatile-poor melt � Vvolatile fluid)
0 2 4 6Concentration of dissolved water (wt. %)
2.5
2.0
1.5
1.0
0.5
0
P (k
bar)
0
2
4
6
8
Dep
th (
km)
Water-undersaturated melt
Mid
-oce
an ri
dge
basa
lt m
elt 1
200°
C
Rhyol
ite 8
50°C
Water-saturatedmelt + water
(water oversaturatedmagma system)
4.7 Solubility of water in silicate melts. (Redrawn from Moore etal., 1998.)
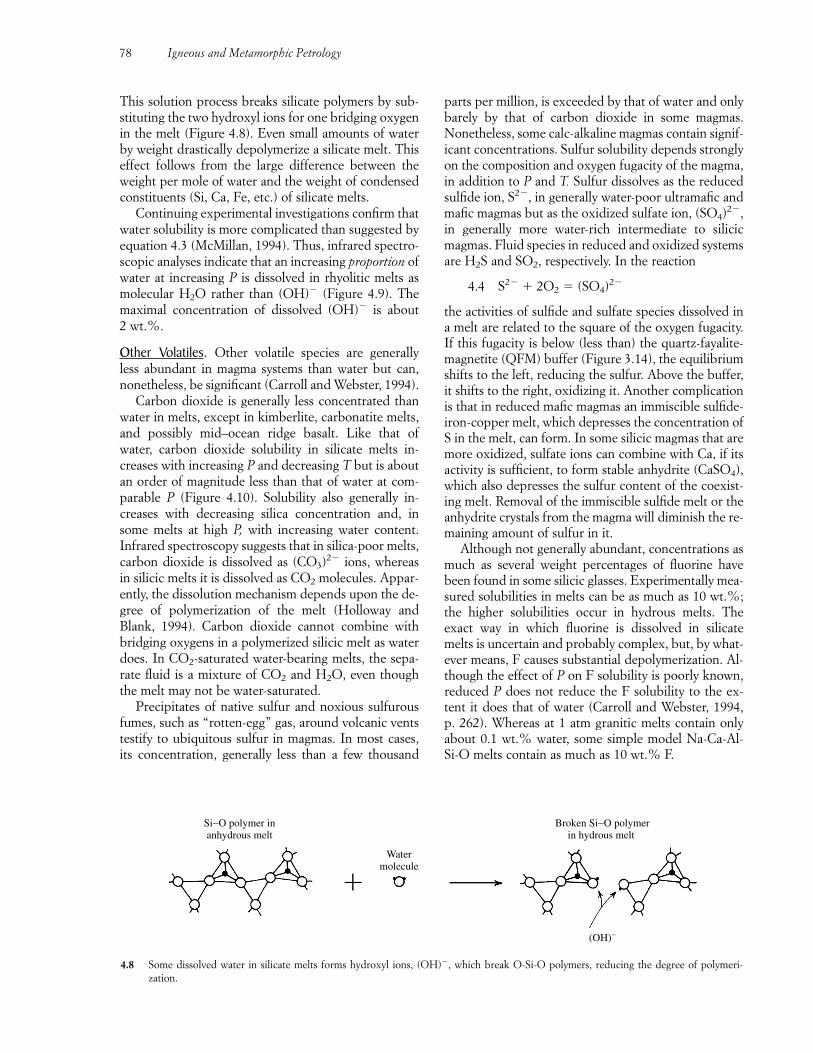
This solution process breaks silicate polymers by sub-stituting the two hydroxyl ions for one bridging oxygenin the melt (Figure 4.8). Even small amounts of waterby weight drastically depolymerize a silicate melt. Thiseffect follows from the large difference between theweight per mole of water and the weight of condensedconstituents (Si, Ca, Fe, etc.) of silicate melts.
Continuing experimental investigations confirm thatwater solubility is more complicated than suggested byequation 4.3 (McMillan, 1994). Thus, infrared spectro-scopic analyses indicate that an increasing proportion ofwater at increasing P is dissolved in rhyolitic melts asmolecular H2O rather than (OH)� (Figure 4.9). Themaximal concentration of dissolved (OH)� is about 2 wt.%.
Other Volatiles. Other volatile species are generallyless abundant in magma systems than water but can,nonetheless, be significant (Carroll and Webster, 1994).
Carbon dioxide is generally less concentrated thanwater in melts, except in kimberlite, carbonatite melts,and possibly mid–ocean ridge basalt. Like that of water, carbon dioxide solubility in silicate melts in-creases with increasing P and decreasing T but is aboutan order of magnitude less than that of water at com-parable P (Figure 4.10). Solubility also generally in-creases with decreasing silica concentration and, insome melts at high P, with increasing water content. Infrared spectroscopy suggests that in silica-poor melts,carbon dioxide is dissolved as (CO3)2� ions, whereasin silicic melts it is dissolved as CO2 molecules. Appar-ently, the dissolution mechanism depends upon the de-gree of polymerization of the melt (Holloway andBlank, 1994). Carbon dioxide cannot combine withbridging oxygens in a polymerized silicic melt as waterdoes. In CO2-saturated water-bearing melts, the sepa-rate fluid is a mixture of CO2 and H2O, even thoughthe melt may not be water-saturated.
Precipitates of native sulfur and noxious sulfurousfumes, such as “rotten-egg” gas, around volcanic ventstestify to ubiquitous sulfur in magmas. In most cases,its concentration, generally less than a few thousand
parts per million, is exceeded by that of water and onlybarely by that of carbon dioxide in some magmas.Nonetheless, some calc-alkaline magmas contain signif-icant concentrations. Sulfur solubility depends stronglyon the composition and oxygen fugacity of the magma,in addition to P and T. Sulfur dissolves as the reducedsulfide ion, S2�, in generally water-poor ultramafic andmafic magmas but as the oxidized sulfate ion, (SO4)2�,in generally more water-rich intermediate to silicicmagmas. Fluid species in reduced and oxidized systemsare H2S and SO2, respectively. In the reaction
4.4 S2� � 2O2 � (SO4)2�
the activities of sulfide and sulfate species dissolved ina melt are related to the square of the oxygen fugacity.If this fugacity is below (less than) the quartz-fayalite-magnetite (QFM) buffer (Figure 3.14), the equilibriumshifts to the left, reducing the sulfur. Above the buffer,it shifts to the right, oxidizing it. Another complicationis that in reduced mafic magmas an immiscible sulfide-iron-copper melt, which depresses the concentration ofS in the melt, can form. In some silicic magmas that aremore oxidized, sulfate ions can combine with Ca, if itsactivity is sufficient, to form stable anhydrite (CaSO4),which also depresses the sulfur content of the coexist-ing melt. Removal of the immiscible sulfide melt or theanhydrite crystals from the magma will diminish the re-maining amount of sulfur in it.
Although not generally abundant, concentrations asmuch as several weight percentages of fluorine havebeen found in some silicic glasses. Experimentally mea-sured solubilities in melts can be as much as 10 wt.%;the higher solubilities occur in hydrous melts. The exact way in which fluorine is dissolved in silicate melts is uncertain and probably complex, but, by what-ever means, F causes substantial depolymerization. Al-though the effect of P on F solubility is poorly known,reduced P does not reduce the F solubility to the ex-tent it does that of water (Carroll and Webster, 1994, p. 262). Whereas at 1 atm granitic melts contain onlyabout 0.1 wt.% water, some simple model Na-Ca-Al-Si-O melts contain as much as 10 wt.% F.
78 Igneous and Metamorphic Petrology
Si−O polymer inanhydrous melt
Watermolecule
Broken Si−O polymerin hydrous melt
(OH)−
4.8 Some dissolved water in silicate melts forms hydroxyl ions, (OH)�, which break O-Si-O polymers, reducing the degree of polymeri-zation.
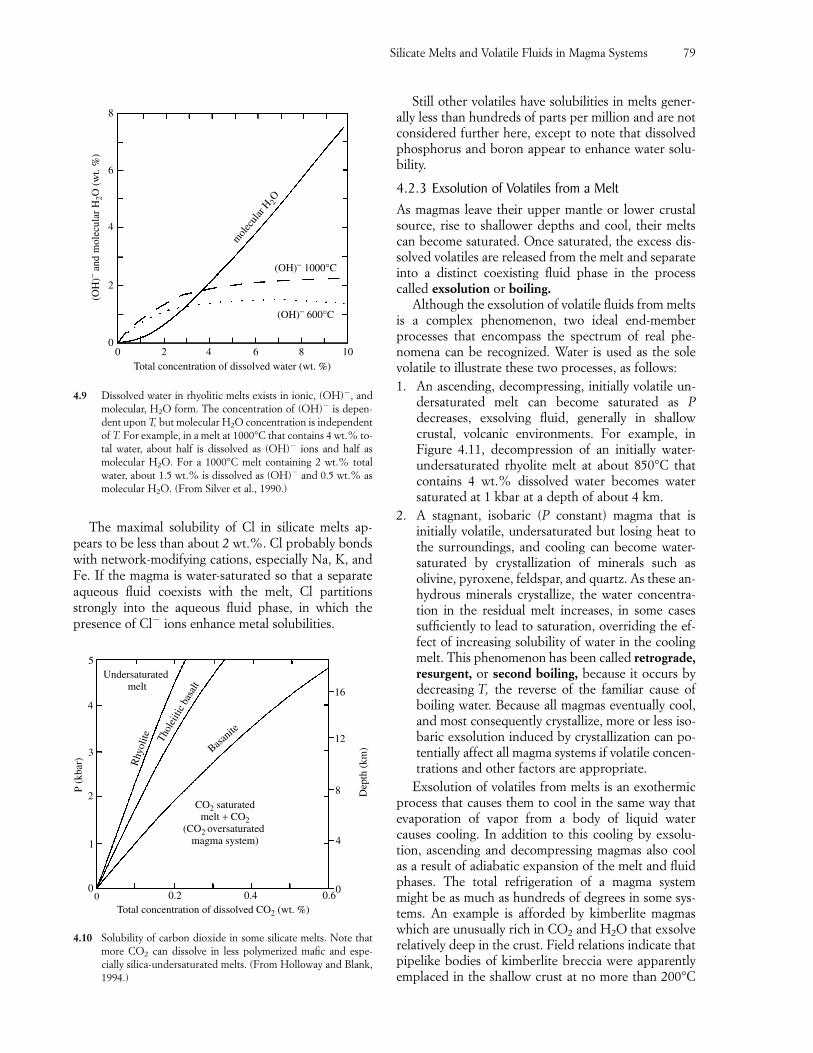
The maximal solubility of Cl in silicate melts ap-pears to be less than about 2 wt.%. Cl probably bondswith network-modifying cations, especially Na, K, andFe. If the magma is water-saturated so that a separateaqueous fluid coexists with the melt, Cl partitionsstrongly into the aqueous fluid phase, in which thepresence of Cl� ions enhance metal solubilities.
Still other volatiles have solubilities in melts gener-ally less than hundreds of parts per million and are notconsidered further here, except to note that dissolvedphosphorus and boron appear to enhance water solu-bility.
4.2.3 Exsolution of Volatiles from a MeltAs magmas leave their upper mantle or lower crustalsource, rise to shallower depths and cool, their meltscan become saturated. Once saturated, the excess dis-solved volatiles are released from the melt and separateinto a distinct coexisting fluid phase in the processcalled exsolution or boiling.
Although the exsolution of volatile fluids from meltsis a complex phenomenon, two ideal end-memberprocesses that encompass the spectrum of real phe-nomena can be recognized. Water is used as the solevolatile to illustrate these two processes, as follows:1. An ascending, decompressing, initially volatile un-
dersaturated melt can become saturated as Pdecreases, exsolving fluid, generally in shallowcrustal, volcanic environments. For example, inFigure 4.11, decompression of an initially water-undersaturated rhyolite melt at about 850°C thatcontains 4 wt.% dissolved water becomes watersaturated at 1 kbar at a depth of about 4 km.
2. A stagnant, isobaric (P constant) magma that is initially volatile, undersaturated but losing heat tothe surroundings, and cooling can become water-saturated by crystallization of minerals such asolivine, pyroxene, feldspar, and quartz. As these an-hydrous minerals crystallize, the water concentra-tion in the residual melt increases, in some casessufficiently to lead to saturation, overriding the ef-fect of increasing solubility of water in the coolingmelt. This phenomenon has been called retrograde,resurgent, or second boiling, because it occurs bydecreasing T, the reverse of the familiar cause ofboiling water. Because all magmas eventually cool,and most consequently crystallize, more or less iso-baric exsolution induced by crystallization can po-tentially affect all magma systems if volatile concen-trations and other factors are appropriate.
Exsolution of volatiles from melts is an exothermicprocess that causes them to cool in the same way thatevaporation of vapor from a body of liquid watercauses cooling. In addition to this cooling by exsolu-tion, ascending and decompressing magmas also coolas a result of adiabatic expansion of the melt and fluidphases. The total refrigeration of a magma systemmight be as much as hundreds of degrees in some sys-tems. An example is afforded by kimberlite magmaswhich are unusually rich in CO2 and H2O that exsolverelatively deep in the crust. Field relations indicate thatpipelike bodies of kimberlite breccia were apparentlyemplaced in the shallow crust at no more than 200°C
Silicate Melts and Volatile Fluids in Magma Systems 79
00
2
4
6
8
2 4 6 8 10
(OH
)− and
mol
ecul
ar H
2O (
wt.
%)
Total concentration of dissolved water (wt. %)
mol
ecul
ar H
2O
(OH)− 1000°C
(OH)− 600°C
4.9 Dissolved water in rhyolitic melts exists in ionic, (OH)�, andmolecular, H2O form. The concentration of (OH)� is depen-dent upon T, but molecular H2O concentration is independentof T. For example, in a melt at 1000°C that contains 4 wt.% to-tal water, about half is dissolved as (OH)� ions and half asmolecular H2O. For a 1000°C melt containing 2 wt.% totalwater, about 1.5 wt.% is dissolved as (OH)� and 0.5 wt.% asmolecular H2O. (From Silver et al., 1990.)
5
4
3
2
1
00 0.2 0.4 0.6
P (k
bar)
4
0
8
12
16
Dep
th (
km)
Total concentration of dissolved CO2 (wt. %)
Undersaturated melt
Rhy
olite Th
olei
itic
basa
lt
Basanit
e
CO2 saturatedmelt + CO2
(CO2 oversaturated magma system)
4.10 Solubility of carbon dioxide in some silicate melts. Note thatmore CO2 can dissolve in less polymerized mafic and espe-cially silica-undersaturated melts. (From Holloway and Blank,1994.)
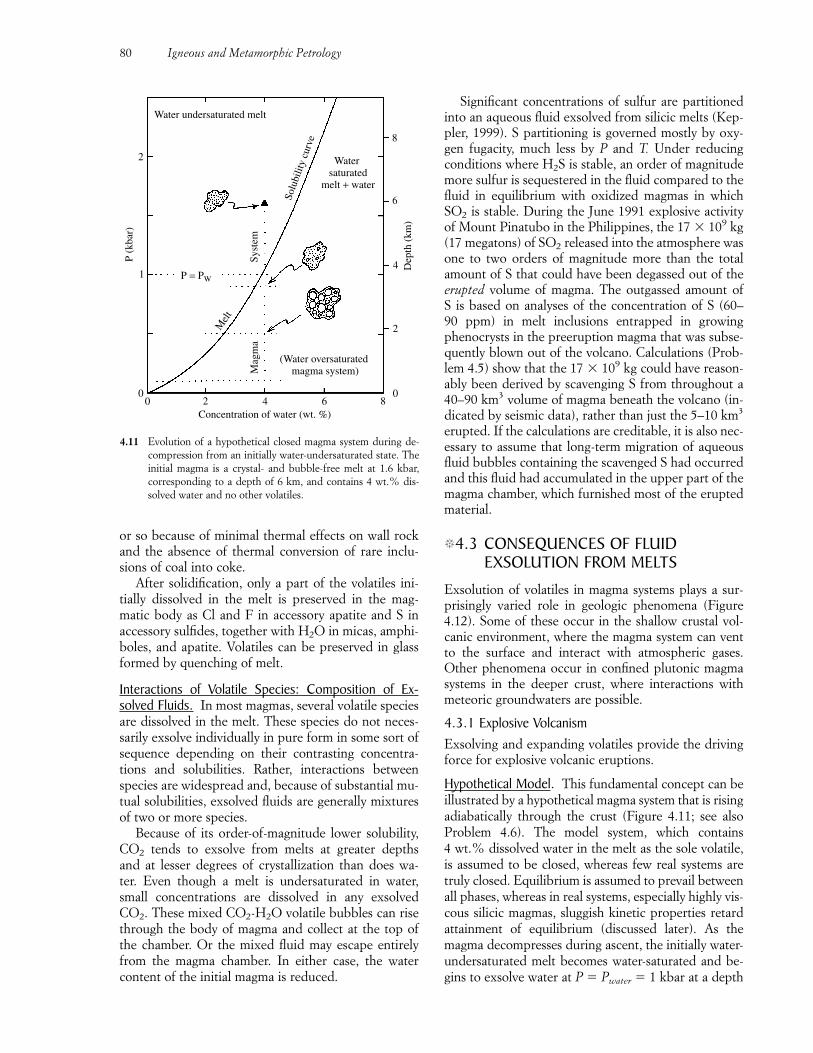
or so because of minimal thermal effects on wall rockand the absence of thermal conversion of rare inclu-sions of coal into coke.
After solidification, only a part of the volatiles ini-tially dissolved in the melt is preserved in the mag-matic body as Cl and F in accessory apatite and S in accessory sulfides, together with H2O in micas, amphi-boles, and apatite. Volatiles can be preserved in glassformed by quenching of melt.
Interactions of Volatile Species: Composition of Ex-solved Fluids. In most magmas, several volatile speciesare dissolved in the melt. These species do not neces-sarily exsolve individually in pure form in some sort ofsequence depending on their contrasting concentra-tions and solubilities. Rather, interactions betweenspecies are widespread and, because of substantial mu-tual solubilities, exsolved fluids are generally mixturesof two or more species.
Because of its order-of-magnitude lower solubility,CO2 tends to exsolve from melts at greater depths and at lesser degrees of crystallization than does wa-ter. Even though a melt is undersaturated in water,small concentrations are dissolved in any exsolvedCO2. These mixed CO2-H2O volatile bubbles can risethrough the body of magma and collect at the top ofthe chamber. Or the mixed fluid may escape entirelyfrom the magma chamber. In either case, the watercontent of the initial magma is reduced.
Significant concentrations of sulfur are partitionedinto an aqueous fluid exsolved from silicic melts (Kep-pler, 1999). S partitioning is governed mostly by oxy-gen fugacity, much less by P and T. Under reducingconditions where H2S is stable, an order of magnitudemore sulfur is sequestered in the fluid compared to thefluid in equilibrium with oxidized magmas in whichSO2 is stable. During the June 1991 explosive activityof Mount Pinatubo in the Philippines, the 17 � 109 kg(17 megatons) of SO2 released into the atmosphere wasone to two orders of magnitude more than the totalamount of S that could have been degassed out of theerupted volume of magma. The outgassed amount of S is based on analyses of the concentration of S (60–90 ppm) in melt inclusions entrapped in growing phenocrysts in the preeruption magma that was subse-quently blown out of the volcano. Calculations (Prob-lem 4.5) show that the 17 � 109 kg could have reason-ably been derived by scavenging S from throughout a40–90 km3 volume of magma beneath the volcano (in-dicated by seismic data), rather than just the 5–10 km3
erupted. If the calculations are creditable, it is also nec-essary to assume that long-term migration of aqueousfluid bubbles containing the scavenged S had occurredand this fluid had accumulated in the upper part of themagma chamber, which furnished most of the eruptedmaterial.
�4.3 CONSEQUENCES OF FLUIDEXSOLUTION FROM MELTS
Exsolution of volatiles in magma systems plays a sur-prisingly varied role in geologic phenomena (Figure4.12). Some of these occur in the shallow crustal vol-canic environment, where the magma system can ventto the surface and interact with atmospheric gases.Other phenomena occur in confined plutonic magmasystems in the deeper crust, where interactions withmeteoric groundwaters are possible.
4.3.1 Explosive VolcanismExsolving and expanding volatiles provide the drivingforce for explosive volcanic eruptions.
Hypothetical Model. This fundamental concept can beillustrated by a hypothetical magma system that is risingadiabatically through the crust (Figure 4.11; see alsoProblem 4.6). The model system, which contains 4 wt.% dissolved water in the melt as the sole volatile,is assumed to be closed, whereas few real systems aretruly closed. Equilibrium is assumed to prevail betweenall phases, whereas in real systems, especially highly vis-cous silicic magmas, sluggish kinetic properties retardattainment of equilibrium (discussed later). As themagma decompresses during ascent, the initially water-undersaturated melt becomes water-saturated and be-gins to exsolve water at P � Pwater � 1 kbar at a depth
80 Igneous and Metamorphic Petrology
00 2 4 6 8
0
2
4
6
8
1
2
P (k
bar)
Concentration of water (wt. %)D
epth
(km
)
P = PW
Water undersaturated melt
Mel
t
Syst
emM
agm
a
(Water oversaturated magma system)
Water saturated
melt + water
Solu
bilit
y cu
rve
4.11 Evolution of a hypothetical closed magma system during de-compression from an initially water-undersaturated state. Theinitial magma is a crystal- and bubble-free melt at 1.6 kbar,corresponding to a depth of 6 km, and contains 4 wt.% dis-solved water and no other volatiles.
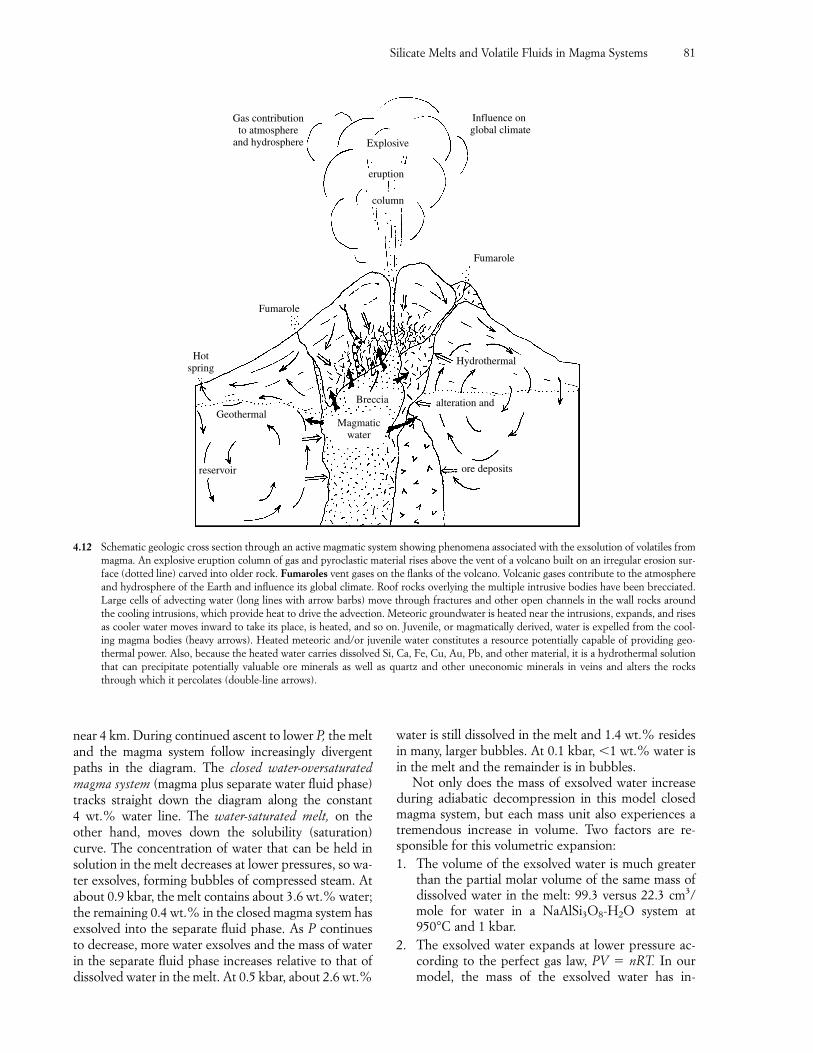
near 4 km. During continued ascent to lower P, the meltand the magma system follow increasingly divergentpaths in the diagram. The closed water-oversaturatedmagma system (magma plus separate water fluid phase)tracks straight down the diagram along the constant 4 wt.% water line. The water-saturated melt, on theother hand, moves down the solubility (saturation)curve. The concentration of water that can be held insolution in the melt decreases at lower pressures, so wa-ter exsolves, forming bubbles of compressed steam. Atabout 0.9 kbar, the melt contains about 3.6 wt.% water;the remaining 0.4 wt.% in the closed magma system hasexsolved into the separate fluid phase. As P continuesto decrease, more water exsolves and the mass of waterin the separate fluid phase increases relative to that ofdissolved water in the melt. At 0.5 kbar, about 2.6 wt.%
water is still dissolved in the melt and 1.4 wt.% residesin many, larger bubbles. At 0.1 kbar, �1 wt.% water isin the melt and the remainder is in bubbles.
Not only does the mass of exsolved water increaseduring adiabatic decompression in this model closedmagma system, but each mass unit also experiences atremendous increase in volume. Two factors are re-sponsible for this volumetric expansion:1. The volume of the exsolved water is much greater
than the partial molar volume of the same mass ofdissolved water in the melt: 99.3 versus 22.3 cm3/mole for water in a NaAlSi3O8-H2O system at950°C and 1 kbar.
2. The exsolved water expands at lower pressure ac-cording to the perfect gas law, PV � nRT. In ourmodel, the mass of the exsolved water has in-
Silicate Melts and Volatile Fluids in Magma Systems 81
reservoir
Gas contributionto atmosphere
and hydrosphere
Influence on global climate
Fumarole
Hydrothermal
alteration and
ore deposits
Magmaticwater
Breccia
Geothermal
Hotspring
Fumarole
column
eruption
Explosive
4.12 Schematic geologic cross section through an active magmatic system showing phenomena associated with the exsolution of volatiles frommagma. An explosive eruption column of gas and pyroclastic material rises above the vent of a volcano built on an irregular erosion sur-face (dotted line) carved into older rock. Fumaroles vent gases on the flanks of the volcano. Volcanic gases contribute to the atmosphereand hydrosphere of the Earth and influence its global climate. Roof rocks overlying the multiple intrusive bodies have been brecciated.Large cells of advecting water (long lines with arrow barbs) move through fractures and other open channels in the wall rocks aroundthe cooling intrusions, which provide heat to drive the advection. Meteoric groundwater is heated near the intrusions, expands, and risesas cooler water moves inward to take its place, is heated, and so on. Juvenile, or magmatically derived, water is expelled from the cool-ing magma bodies (heavy arrows). Heated meteoric and/or juvenile water constitutes a resource potentially capable of providing geo-thermal power. Also, because the heated water carries dissolved Si, Ca, Fe, Cu, Au, Pb, and other material, it is a hydrothermal solutionthat can precipitate potentially valuable ore minerals as well as quartz and other uneconomic minerals in veins and alters the rocksthrough which it percolates (double-line arrows).
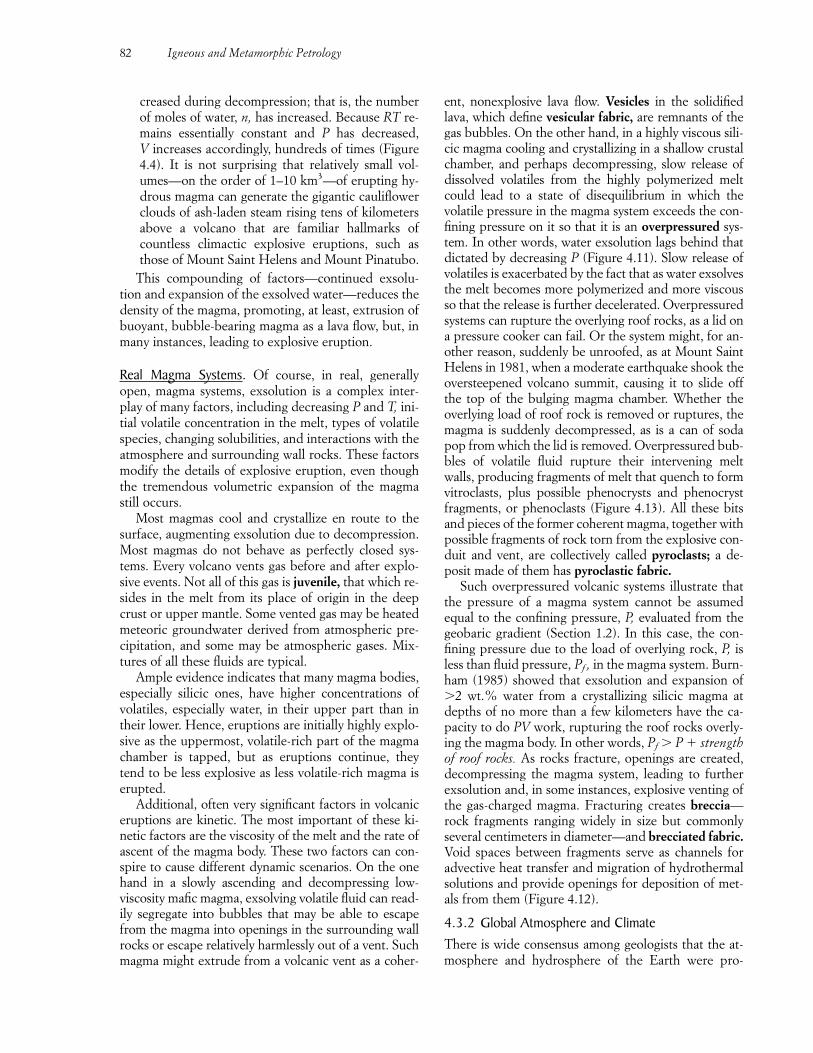
ent, nonexplosive lava flow. Vesicles in the solidifiedlava, which define vesicular fabric, are remnants of thegas bubbles. On the other hand, in a highly viscous sili-cic magma cooling and crystallizing in a shallow crustalchamber, and perhaps decompressing, slow release ofdissolved volatiles from the highly polymerized meltcould lead to a state of disequilibrium in which thevolatile pressure in the magma system exceeds the con-fining pressure on it so that it is an overpressured sys-tem. In other words, water exsolution lags behind thatdictated by decreasing P (Figure 4.11). Slow release ofvolatiles is exacerbated by the fact that as water exsolvesthe melt becomes more polymerized and more viscousso that the release is further decelerated. Overpressuredsystems can rupture the overlying roof rocks, as a lid ona pressure cooker can fail. Or the system might, for an-other reason, suddenly be unroofed, as at Mount SaintHelens in 1981, when a moderate earthquake shook theoversteepened volcano summit, causing it to slide offthe top of the bulging magma chamber. Whether theoverlying load of roof rock is removed or ruptures, themagma is suddenly decompressed, as is a can of sodapop from which the lid is removed. Overpressured bub-bles of volatile fluid rupture their intervening meltwalls, producing fragments of melt that quench to formvitroclasts, plus possible phenocrysts and phenocrystfragments, or phenoclasts (Figure 4.13). All these bitsand pieces of the former coherent magma, together withpossible fragments of rock torn from the explosive con-duit and vent, are collectively called pyroclasts; a de-posit made of them has pyroclastic fabric.
Such overpressured volcanic systems illustrate thatthe pressure of a magma system cannot be assumedequal to the confining pressure, P, evaluated from thegeobaric gradient (Section 1.2). In this case, the con-fining pressure due to the load of overlying rock, P, isless than fluid pressure, Pf , in the magma system. Burn-ham (1985) showed that exsolution and expansion of�2 wt.% water from a crystallizing silicic magma atdepths of no more than a few kilometers have the ca-pacity to do PV work, rupturing the roof rocks overly-ing the magma body. In other words, Pf � P � strengthof roof rocks. As rocks fracture, openings are created,decompressing the magma system, leading to furtherexsolution and, in some instances, explosive venting ofthe gas-charged magma. Fracturing creates breccia—rock fragments ranging widely in size but commonlyseveral centimeters in diameter—and brecciated fabric.Void spaces between fragments serve as channels foradvective heat transfer and migration of hydrothermalsolutions and provide openings for deposition of met-als from them (Figure 4.12).
4.3.2 Global Atmosphere and ClimateThere is wide consensus among geologists that the at-mosphere and hydrosphere of the Earth were pro-
creased during decompression; that is, the numberof moles of water, n, has increased. Because RT re-mains essentially constant and P has decreased, V increases accordingly, hundreds of times (Figure4.4). It is not surprising that relatively small vol-umes—on the order of 1–10 km3—of erupting hy-drous magma can generate the gigantic cauliflowerclouds of ash-laden steam rising tens of kilometersabove a volcano that are familiar hallmarks ofcountless climactic explosive eruptions, such asthose of Mount Saint Helens and Mount Pinatubo.
This compounding of factors—continued exsolu-tion and expansion of the exsolved water—reduces thedensity of the magma, promoting, at least, extrusion ofbuoyant, bubble-bearing magma as a lava flow, but, inmany instances, leading to explosive eruption.
Real Magma Systems. Of course, in real, generallyopen, magma systems, exsolution is a complex inter-play of many factors, including decreasing P and T, ini-tial volatile concentration in the melt, types of volatilespecies, changing solubilities, and interactions with theatmosphere and surrounding wall rocks. These factorsmodify the details of explosive eruption, even thoughthe tremendous volumetric expansion of the magmastill occurs.
Most magmas cool and crystallize en route to thesurface, augmenting exsolution due to decompression.Most magmas do not behave as perfectly closed sys-tems. Every volcano vents gas before and after explo-sive events. Not all of this gas is juvenile, that which re-sides in the melt from its place of origin in the deepcrust or upper mantle. Some vented gas may be heatedmeteoric groundwater derived from atmospheric pre-cipitation, and some may be atmospheric gases. Mix-tures of all these fluids are typical.
Ample evidence indicates that many magma bodies,especially silicic ones, have higher concentrations ofvolatiles, especially water, in their upper part than intheir lower. Hence, eruptions are initially highly explo-sive as the uppermost, volatile-rich part of the magmachamber is tapped, but as eruptions continue, theytend to be less explosive as less volatile-rich magma iserupted.
Additional, often very significant factors in volcaniceruptions are kinetic. The most important of these ki-netic factors are the viscosity of the melt and the rate ofascent of the magma body. These two factors can con-spire to cause different dynamic scenarios. On the onehand in a slowly ascending and decompressing low-viscosity mafic magma, exsolving volatile fluid can read-ily segregate into bubbles that may be able to escapefrom the magma into openings in the surrounding wallrocks or escape relatively harmlessly out of a vent. Suchmagma might extrude from a volcanic vent as a coher-
82 Igneous and Metamorphic Petrology
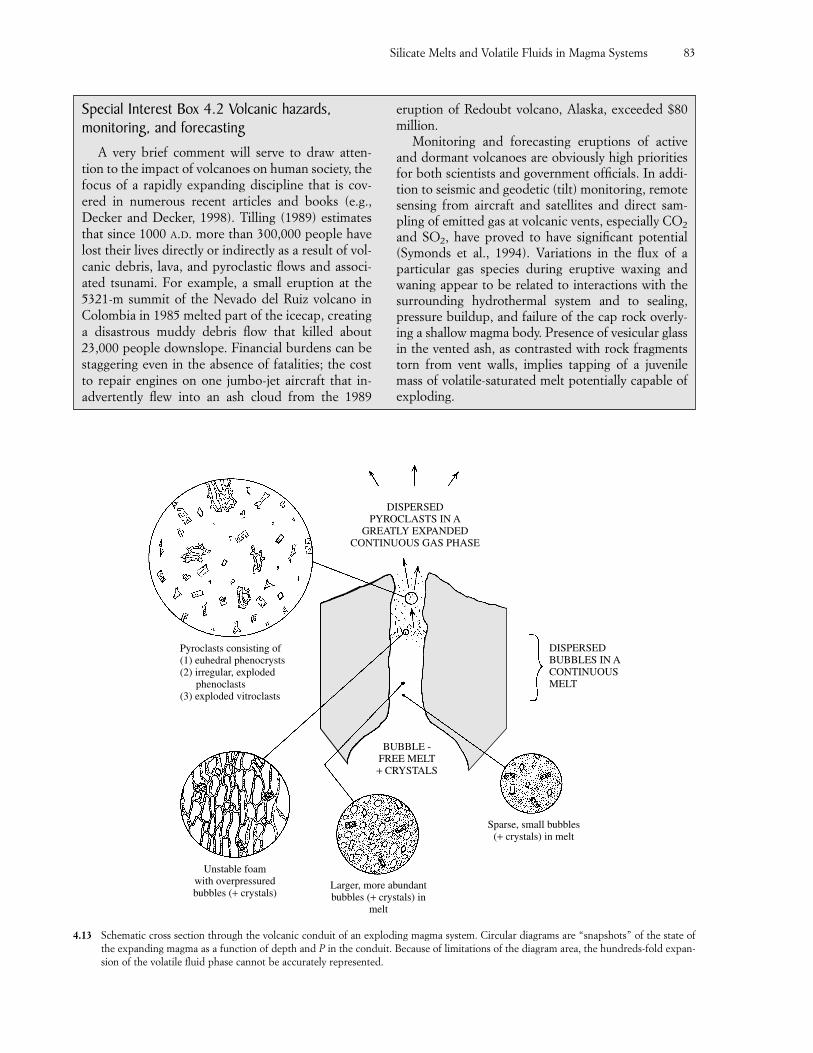
Silicate Melts and Volatile Fluids in Magma Systems 83
DISPERSEDPYROCLASTS IN A
GREATLY EXPANDEDCONTINUOUS GAS PHASE
Unstable foamwith overpressuredbubbles (+ crystals)
Larger, more abundantbubbles (+ crystals) in
melt
Sparse, small bubbles(+ crystals) in melt
DISPERSEDBUBBLES IN ACONTINUOUSMELT
BUBBLE -FREE MELT+ CRYSTALS
Pyroclasts consisting of(1) euhedral phenocrysts(2) irregular, exploded phenoclasts(3) exploded vitroclasts
4.13 Schematic cross section through the volcanic conduit of an exploding magma system. Circular diagrams are “snapshots” of the state ofthe expanding magma as a function of depth and P in the conduit. Because of limitations of the diagram area, the hundreds-fold expan-sion of the volatile fluid phase cannot be accurately represented.
Special Interest Box 4.2 Volcanic hazards,monitoring, and forecasting
A very brief comment will serve to draw atten-tion to the impact of volcanoes on human society, thefocus of a rapidly expanding discipline that is cov-ered in numerous recent articles and books (e.g.,Decker and Decker, 1998). Tilling (1989) estimatesthat since 1000 A.D. more than 300,000 people havelost their lives directly or indirectly as a result of vol-canic debris, lava, and pyroclastic flows and associ-ated tsunami. For example, a small eruption at the5321-m summit of the Nevado del Ruiz volcano inColombia in 1985 melted part of the icecap, creatinga disastrous muddy debris flow that killed about23,000 people downslope. Financial burdens can bestaggering even in the absence of fatalities; the costto repair engines on one jumbo-jet aircraft that in-advertently flew into an ash cloud from the 1989
eruption of Redoubt volcano, Alaska, exceeded $80million.
Monitoring and forecasting eruptions of activeand dormant volcanoes are obviously high prioritiesfor both scientists and government officials. In addi-tion to seismic and geodetic (tilt) monitoring, remotesensing from aircraft and satellites and direct sam-pling of emitted gas at volcanic vents, especially CO2
and SO2, have proved to have significant potential(Symonds et al., 1994). Variations in the flux of a particular gas species during eruptive waxing andwaning appear to be related to interactions with thesurrounding hydrothermal system and to sealing,pressure buildup, and failure of the cap rock overly-ing a shallow magma body. Presence of vesicular glassin the vented ash, as contrasted with rock fragmentstorn from vent walls, implies tapping of a juvenilemass of volatile-saturated melt potentially capable ofexploding.
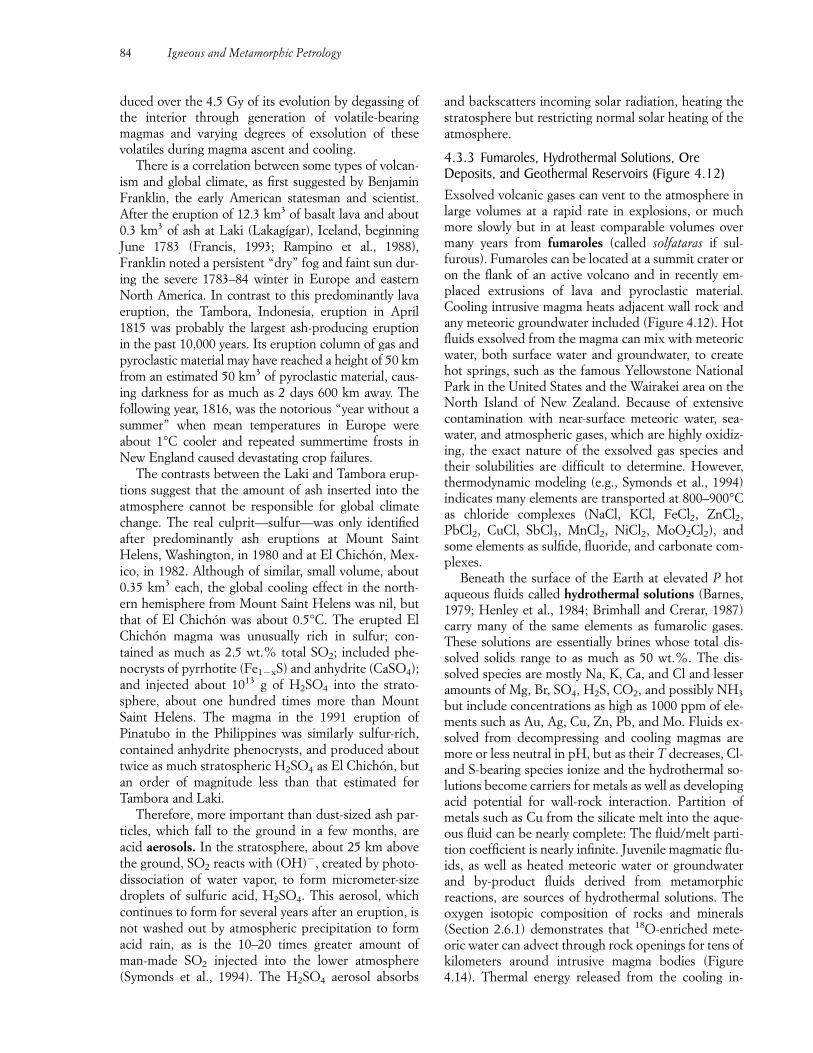
duced over the 4.5 Gy of its evolution by degassing ofthe interior through generation of volatile-bearingmagmas and varying degrees of exsolution of thesevolatiles during magma ascent and cooling.
There is a correlation between some types of volcan-ism and global climate, as first suggested by BenjaminFranklin, the early American statesman and scientist.After the eruption of 12.3 km3 of basalt lava and about0.3 km3 of ash at Laki (Lakagígar), Iceland, beginningJune 1783 (Francis, 1993; Rampino et al., 1988),Franklin noted a persistent “dry” fog and faint sun dur-ing the severe 1783–84 winter in Europe and easternNorth America. In contrast to this predominantly lavaeruption, the Tambora, Indonesia, eruption in April1815 was probably the largest ash-producing eruptionin the past 10,000 years. Its eruption column of gas andpyroclastic material may have reached a height of 50 kmfrom an estimated 50 km3 of pyroclastic material, caus-ing darkness for as much as 2 days 600 km away. Thefollowing year, 1816, was the notorious “year without asummer” when mean temperatures in Europe wereabout 1°C cooler and repeated summertime frosts inNew England caused devastating crop failures.
The contrasts between the Laki and Tambora erup-tions suggest that the amount of ash inserted into theatmosphere cannot be responsible for global climatechange. The real culprit—sulfur—was only identifiedafter predominantly ash eruptions at Mount Saint Helens, Washington, in 1980 and at El Chichón, Mex-ico, in 1982. Although of similar, small volume, about 0.35 km3 each, the global cooling effect in the north-ern hemisphere from Mount Saint Helens was nil, butthat of El Chichón was about 0.5°C. The erupted ElChichón magma was unusually rich in sulfur; con-tained as much as 2.5 wt.% total SO2; included phe-nocrysts of pyrrhotite (Fe1�xS) and anhydrite (CaSO4);and injected about 1013 g of H2SO4 into the strato-sphere, about one hundred times more than MountSaint Helens. The magma in the 1991 eruption ofPinatubo in the Philippines was similarly sulfur-rich,contained anhydrite phenocrysts, and produced abouttwice as much stratospheric H2SO4 as El Chichón, butan order of magnitude less than that estimated forTambora and Laki.
Therefore, more important than dust-sized ash par-ticles, which fall to the ground in a few months, areacid aerosols. In the stratosphere, about 25 km abovethe ground, SO2 reacts with (OH)�, created by photo-dissociation of water vapor, to form micrometer-sizedroplets of sulfuric acid, H2SO4. This aerosol, whichcontinues to form for several years after an eruption, isnot washed out by atmospheric precipitation to formacid rain, as is the 10–20 times greater amount of man-made SO2 injected into the lower atmosphere(Symonds et al., 1994). The H2SO4 aerosol absorbs
and backscatters incoming solar radiation, heating thestratosphere but restricting normal solar heating of theatmosphere.
4.3.3 Fumaroles, Hydrothermal Solutions, OreDeposits, and Geothermal Reservoirs (Figure 4.12)Exsolved volcanic gases can vent to the atmosphere inlarge volumes at a rapid rate in explosions, or muchmore slowly but in at least comparable volumes overmany years from fumaroles (called solfataras if sul-furous). Fumaroles can be located at a summit crater oron the flank of an active volcano and in recently em-placed extrusions of lava and pyroclastic material.Cooling intrusive magma heats adjacent wall rock andany meteoric groundwater included (Figure 4.12). Hotfluids exsolved from the magma can mix with meteoricwater, both surface water and groundwater, to createhot springs, such as the famous Yellowstone NationalPark in the United States and the Wairakei area on theNorth Island of New Zealand. Because of extensivecontamination with near-surface meteoric water, sea-water, and atmospheric gases, which are highly oxidiz-ing, the exact nature of the exsolved gas species andtheir solubilities are difficult to determine. However,thermodynamic modeling (e.g., Symonds et al., 1994)indicates many elements are transported at 800–900°Cas chloride complexes (NaCl, KCl, FeCl2, ZnCl2,PbCl2, CuCl, SbCl3, MnCl2, NiCl2, MoO2Cl2), andsome elements as sulfide, fluoride, and carbonate com-plexes.
Beneath the surface of the Earth at elevated P hotaqueous fluids called hydrothermal solutions (Barnes,1979; Henley et al., 1984; Brimhall and Crerar, 1987)carry many of the same elements as fumarolic gases.These solutions are essentially brines whose total dis-solved solids range to as much as 50 wt.%. The dis-solved species are mostly Na, K, Ca, and Cl and lesseramounts of Mg, Br, SO4, H2S, CO2, and possibly NH3
but include concentrations as high as 1000 ppm of ele-ments such as Au, Ag, Cu, Zn, Pb, and Mo. Fluids ex-solved from decompressing and cooling magmas aremore or less neutral in pH, but as their T decreases, Cl-and S-bearing species ionize and the hydrothermal so-lutions become carriers for metals as well as developingacid potential for wall-rock interaction. Partition ofmetals such as Cu from the silicate melt into the aque-ous fluid can be nearly complete: The fluid/melt parti-tion coefficient is nearly infinite. Juvenile magmatic flu-ids, as well as heated meteoric water or groundwaterand by-product fluids derived from metamorphic reactions, are sources of hydrothermal solutions. Theoxygen isotopic composition of rocks and minerals(Section 2.6.1) demonstrates that 18O-enriched mete-oric water can advect through rock openings for tens ofkilometers around intrusive magma bodies (Figure4.14). Thermal energy released from the cooling in-
84 Igneous and Metamorphic Petrology
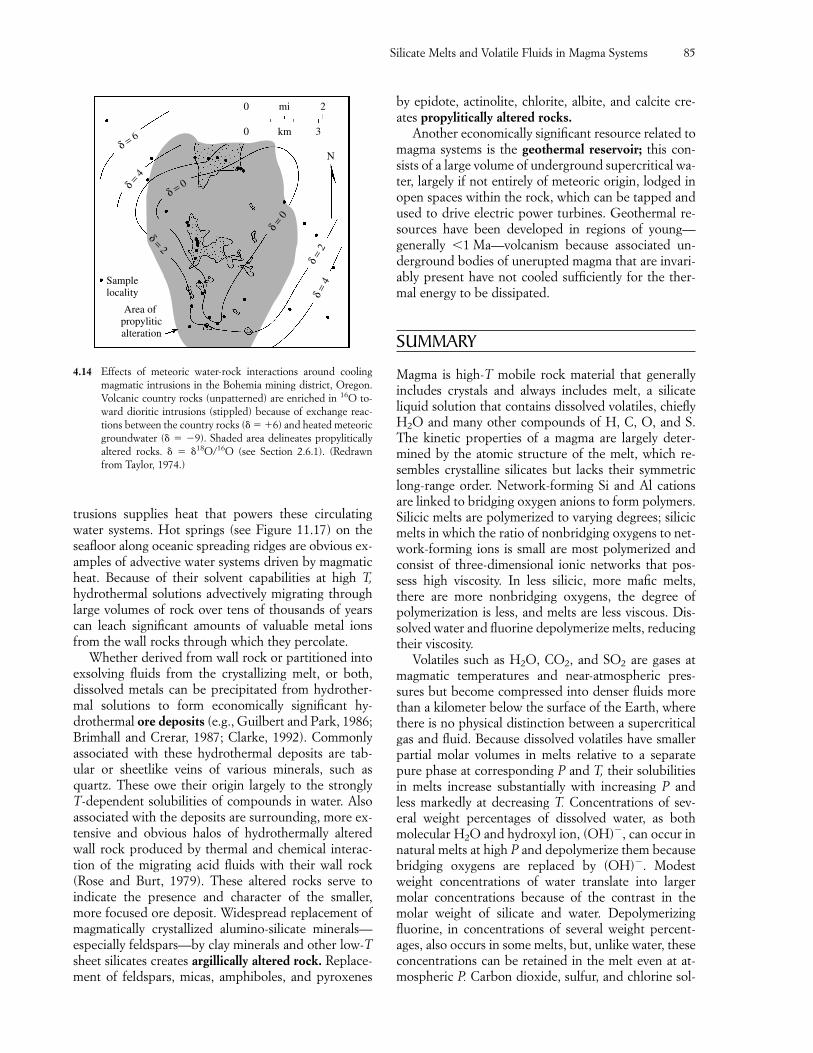
trusions supplies heat that powers these circulating water systems. Hot springs (see Figure 11.17) on theseafloor along oceanic spreading ridges are obvious ex-amples of advective water systems driven by magmaticheat. Because of their solvent capabilities at high T,hydrothermal solutions advectively migrating throughlarge volumes of rock over tens of thousands of yearscan leach significant amounts of valuable metal ionsfrom the wall rocks through which they percolate.
Whether derived from wall rock or partitioned intoexsolving fluids from the crystallizing melt, or both,dissolved metals can be precipitated from hydrother-mal solutions to form economically significant hy-drothermal ore deposits (e.g., Guilbert and Park, 1986;Brimhall and Crerar, 1987; Clarke, 1992). Commonlyassociated with these hydrothermal deposits are tab-ular or sheetlike veins of various minerals, such asquartz. These owe their origin largely to the strongly T-dependent solubilities of compounds in water. Alsoassociated with the deposits are surrounding, more ex-tensive and obvious halos of hydrothermally alteredwall rock produced by thermal and chemical interac-tion of the migrating acid fluids with their wall rock(Rose and Burt, 1979). These altered rocks serve to indicate the presence and character of the smaller,more focused ore deposit. Widespread replacement ofmagmatically crystallized alumino-silicate minerals—especially feldspars—by clay minerals and other low-Tsheet silicates creates argillically altered rock. Replace-ment of feldspars, micas, amphiboles, and pyroxenes
by epidote, actinolite, chlorite, albite, and calcite cre-ates propylitically altered rocks.
Another economically significant resource related tomagma systems is the geothermal reservoir; this con-sists of a large volume of underground supercritical wa-ter, largely if not entirely of meteoric origin, lodged inopen spaces within the rock, which can be tapped andused to drive electric power turbines. Geothermal re-sources have been developed in regions of young—generally �1 Ma—volcanism because associated un-derground bodies of unerupted magma that are invari-ably present have not cooled sufficiently for the ther-mal energy to be dissipated.
SUMMARY
Magma is high-T mobile rock material that generallyincludes crystals and always includes melt, a silicate liquid solution that contains dissolved volatiles, chieflyH2O and many other compounds of H, C, O, and S.The kinetic properties of a magma are largely deter-mined by the atomic structure of the melt, which re-sembles crystalline silicates but lacks their symmetriclong-range order. Network-forming Si and Al cationsare linked to bridging oxygen anions to form polymers.Silicic melts are polymerized to varying degrees; silicicmelts in which the ratio of nonbridging oxygens to net-work-forming ions is small are most polymerized andconsist of three-dimensional ionic networks that pos-sess high viscosity. In less silicic, more mafic melts,there are more nonbridging oxygens, the degree ofpolymerization is less, and melts are less viscous. Dis-solved water and fluorine depolymerize melts, reducingtheir viscosity.
Volatiles such as H2O, CO2, and SO2 are gases atmagmatic temperatures and near-atmospheric pres-sures but become compressed into denser fluids morethan a kilometer below the surface of the Earth, wherethere is no physical distinction between a supercriticalgas and fluid. Because dissolved volatiles have smallerpartial molar volumes in melts relative to a separatepure phase at corresponding P and T, their solubilitiesin melts increase substantially with increasing P andless markedly at decreasing T. Concentrations of sev-eral weight percentages of dissolved water, as bothmolecular H2O and hydroxyl ion, (OH)�, can occur innatural melts at high P and depolymerize them becausebridging oxygens are replaced by (OH)�. Modestweight concentrations of water translate into largermolar concentrations because of the contrast in themolar weight of silicate and water. Depolymerizing fluorine, in concentrations of several weight percent-ages, also occurs in some melts, but, unlike water, theseconcentrations can be retained in the melt even at at-mospheric P. Carbon dioxide, sulfur, and chlorine sol-
Silicate Melts and Volatile Fluids in Magma Systems 85
δ = 6δ =
4
δ = 0
δ = 2
δ = 0
δ = 2
δ = 4Sample
locality
Area of propyliticalteration
N
30 km
0 mi 2
4.14 Effects of meteoric water-rock interactions around coolingmagmatic intrusions in the Bohemia mining district, Oregon.Volcanic country rocks (unpatterned) are enriched in 16O to-ward dioritic intrusions (stippled) because of exchange reac-tions between the country rocks (� � �6) and heated meteoricgroundwater (� � �9). Shaded area delineates propyliticallyaltered rocks. � � �18O/16O (see Section 2.6.1). (Redrawnfrom Taylor, 1974.)
4.9 How does volatile exsolution from magmas in-fluence global climate?
4.10 What economic benefits accrue from volatilefluids?
PROBLEMS4.1 Make a schematic sketch of three different five-
phase magma systems after the style of Figure4.1. Label the phases represented.
4.2 Verify that 5 wt.% water in a NaAlSi3O8 melt isequivalent to 15 wt.% on a molar basis. (Hint:Convert the chemical analyses in weight per-centage of albite [Appendix A] plus 5 wt.% wa-ter to mole percentage by dividing each oxideweight by its formula weight. Recalculate the to-tal molar weight to 100.00%.)
4.3 Show from equation 4.3 why the solubility ofwater, as (OH)�, should be proportional to(PH2O)0.5.
4.4 In a plot of P versus concentration of dissolvedvolatiles in melt draw schematic solubilitycurves for CO2 and H2O. If an initially volatile-undersaturated melt decompresses at more orless constant T, which volatile, CO2 or H2O, ex-solves first?
4.5 In the erupting 1991 Mount Pinatubo magmaassume that the partition coefficient of SO2 is D � Cfluid/Cmelt � 47, appropriate to a rela-tively oxidized state (Keppler, 1999). From the maximal concentration of S in the melt (90 ppm), what was the weight percentage SO2
in the coexisting aqueous fluid phase? If it is as-sumed that 1 wt.% water was released from anall-melt magma body whose volume was 90km3, how many kilograms of SO2 was released?(Use 2.2 g/cm3 for the melt density.) Discussyour results.
4.6 A body of silicic melt that contains 5 wt.% wa-ter and has a density of 2.2 g/cm3 occupies avolume of 1 km3 at 1000°C in a crustal magmachamber. What is the volume of melt plus ex-solved water at the surface (1 atm), assuming all5 wt.% water exsolves and T remains 1000°C?What is the ratio of the volume of steam to meltat the surface? What is the ratio if T � 700°Cupon eruption? What is the ratio if only 4 wt.%water has exsolved in a nonequilibrium systemat 1 atm and 700°C? Discuss your answers interms of the gigantic “cauliflower” clouds of ashand steam that typically develop over explodingvolcanoes.
ubilities are about an order of magnitude less thanthose of water and fluorine.
Most melts are probably initially undersaturated involatiles where magmas are generated in the crust orupper mantle. However, as magmas ascend, decom-press, cool, and crystallize, melts become volatile satu-rated and a separate volatile fluid phase exsolves fromthe melt. Ascending melts saturate in CO2, S, F, and Clat greater depth than they do in H2O because of theirlesser solubilty.
Exsolution of volatile fluids from magmas is associ-ated with several significant geologic phenomena. Ex-plosive volcanism is driven by volatile exsolution anddrastic volumetric expansion of the exsolved volatilefluid. These processes create pyroclastic deposits andfabrics, have contributed to the formation of the at-mosphere and hydrosphere of the Earth throughout itslong history, and can influence global climate, chieflybecause of SO2 ejected high into the stratosphere,where it forms H2SO4 aerosols that block solar heatingof the surface of the Earth. Volatile exsolution in shal-low magma bodies can generate sufficient PV energy tofracture overlying roof rocks, producing a mass of brec-ciated rock or at least channelways for emplacement ofveins of quartz and ore minerals. Hydrothermal solu-tions alter preexisting rocks and form ore deposits.
CRITICAL THINKING QUESTIONS4.1 Describe the nature of magmas and the combi-
nations of solid, liquid, and gaseous phases thatare possible.
4.2 Describe the atomic structure of silicate meltsand the role played by different ions in govern-ing the degree of polymerization.
4.3 Describe the polymerization of Mg2SiO4 melt.(You may need to consult a mineralogy text torefresh your memory of the atomic structure offorsterite olivine.)
4.4 Characterize volatile fluids and indicate howthey are distinguished from silicate liquids(melts).
4.5 Describe the volatile species that are commonlydissolved in silicate melts, their concentrations,the factors that control their solubilities, andtheir effects on the atomic structure of the melt.
4.6 Discuss how volatiles exsolve from melts andvariations in the concentrations of H2O, CO2, F,Cl, and S in mixed volatile fluid phases exsolvedfrom melts.
4.7 Describe factors governing explosive volcanism.4.8 Describe fabrics that are a direct consequence
of volatile exsolution.
86 Igneous and Metamorphic Petrology
FUNDAMENTAL QUESTIONSCONSIDERED IN THIS CHAPTER
1. How are crystal-melt equilibria portrayed in phasediagrams?
2. What do phase diagrams tell about crystallizationand melting in magma-rock systems as intensivevariables change?
3. How are chemical variations created in evolvingmelts and in associated crystalline products duringcrystallization of magmas?
4. How do stabilities of major rock-forming mineralsdepend on intensive variables in magmas?
INTRODUCTION
Knowledge of the nature of chemical interactions be-tween coexisting melt and crystals in magmas as inten-sive parameters change is essential to an understandingof how magmas are generated from solid rock at theirsources, how magmas evolve and crystallize during as-cent and cooling, and how the composition of an ig-neous rock can provide information on these parame-ters. This chapter deals with equilibrium relationsbetween major rock-forming minerals and their associ-ated melts in simple model and more complex multi-component systems under controlled conditions. Suchequilibria indicate what is possible and impossible inreal magmas and serve as guides for their behavior.
Crystal-melt equilibria are represented in phase dia-grams that have been determined in the laboratory forhundreds of systems of a wide range of composition atcrustal and upper mantle pressures and temperatures.
Useful summaries and discussions of phase diagramsand crystal-melt equilibria can be found in Ernst(1976), Morse (1980), and Hess (1989).
�5.1 PHASE DIAGRAMS
Phase diagrams were introduced in Section 3.3 asgraphical models that portray states of stable equilib-rium in terms of the intensive variables P, T, and X.Though not explicitly shown, any phase diagram im-plies the following (Figure 3.7):1. A stable state represented in a stability field has the
lowest possible Gibbs free energy or chemical po-tential for the values of the intensive variables de-lineating the field.
2. A boundary line between stability fields of differ-ent phases is the locus of points representing in-tensive parameters for which the phases are inequilibrium.
Because of experimental constraints and the limita-tions of a two-dimensional page of paper, phase dia-grams generally portray only two variables, either P-T,P-X, or T-X. Three or more variables can be repre-sented in special projections.
5.1.1 Phase RuleA useful formulation that aids in the interpretation ofphase diagrams is the phase rule, which provides an in-ventory of the number of phases, components, and de-grees of freedom in a system at equilibrium. For defin-itions and examples of phases refer to Sections 3.3 andFigure 4.1 and for components Section 3.4.1. The de-grees of freedom, or the variance, of a system is thenumber of independent intensive variables that must bespecified to characterize the state of equilibrium fully.
5CHAPTER
Crystal-MeltEquilibria inMagmatic Systems
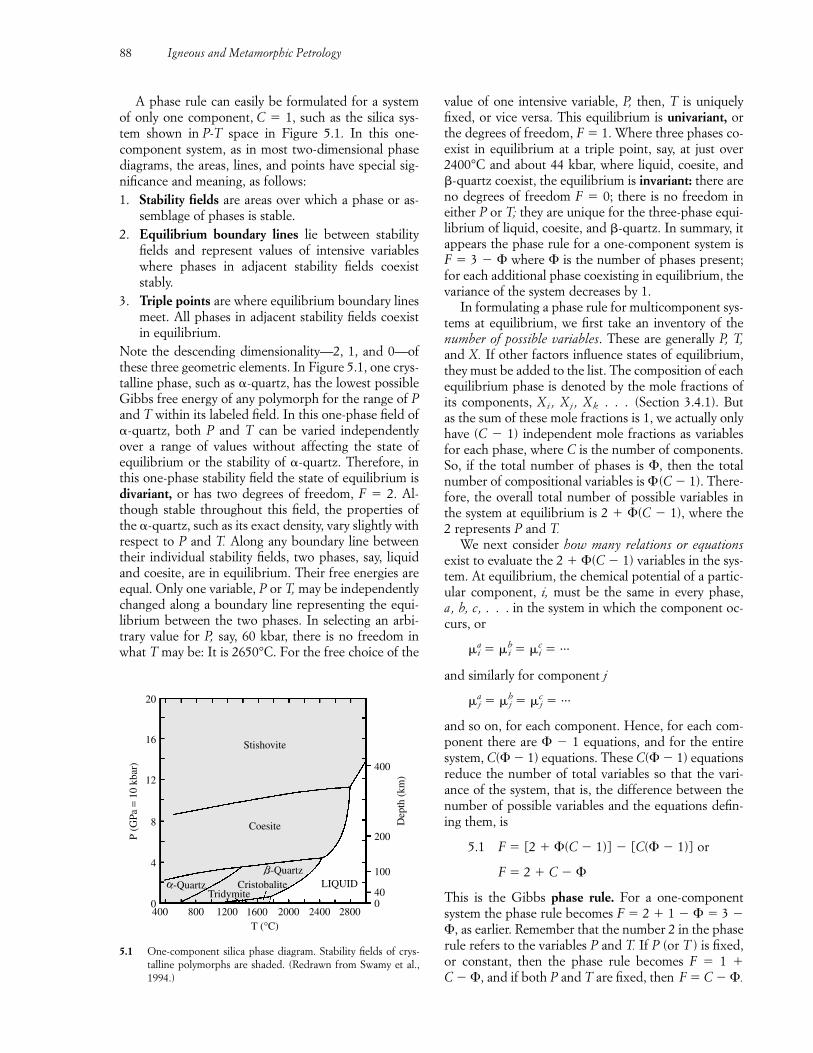
A phase rule can easily be formulated for a system of only one component, C � 1, such as the silica sys-tem shown in P-T space in Figure 5.1. In this one-component system, as in most two-dimensional phasediagrams, the areas, lines, and points have special sig-nificance and meaning, as follows:1. Stability fields are areas over which a phase or as-
semblage of phases is stable.2. Equilibrium boundary lines lie between stability
fields and represent values of intensive variableswhere phases in adjacent stability fields coexist stably.
3. Triple points are where equilibrium boundary linesmeet. All phases in adjacent stability fields coexistin equilibrium.
Note the descending dimensionality—2, 1, and 0—ofthese three geometric elements. In Figure 5.1, one crys-talline phase, such as �-quartz, has the lowest possibleGibbs free energy of any polymorph for the range of Pand T within its labeled field. In this one-phase field of�-quartz, both P and T can be varied independentlyover a range of values without affecting the state ofequilibrium or the stability of �-quartz. Therefore, inthis one-phase stability field the state of equilibrium isdivariant, or has two degrees of freedom, F � 2. Al-though stable throughout this field, the properties ofthe �-quartz, such as its exact density, vary slightly withrespect to P and T. Along any boundary line betweentheir individual stability fields, two phases, say, liquidand coesite, are in equilibrium. Their free energies areequal. Only one variable, P or T, may be independentlychanged along a boundary line representing the equi-librium between the two phases. In selecting an arbi-trary value for P, say, 60 kbar, there is no freedom inwhat T may be: It is 2650°C. For the free choice of the
value of one intensive variable, P, then, T is uniquelyfixed, or vice versa. This equilibrium is univariant, orthe degrees of freedom, F � 1. Where three phases co-exist in equilibrium at a triple point, say, at just over2400°C and about 44 kbar, where liquid, coesite, and�-quartz coexist, the equilibrium is invariant: there areno degrees of freedom F � 0; there is no freedom in either P or T; they are unique for the three-phase equi-librium of liquid, coesite, and �-quartz. In summary, itappears the phase rule for a one-component system isF � 3 � � where � is the number of phases present;for each additional phase coexisting in equilibrium, thevariance of the system decreases by 1.
In formulating a phase rule for multicomponent sys-tems at equilibrium, we first take an inventory of thenumber of possible variables. These are generally P, T,and X. If other factors influence states of equilibrium,they must be added to the list. The composition of eachequilibrium phase is denoted by the mole fractions ofits components, Xi , Xj , Xk . . . (Section 3.4.1). Butas the sum of these mole fractions is 1, we actually onlyhave (C � 1) independent mole fractions as variablesfor each phase, where C is the number of components.So, if the total number of phases is �, then the totalnumber of compositional variables is �(C � 1). There-fore, the overall total number of possible variables inthe system at equilibrium is 2 � �(C � 1), where the 2 represents P and T.
We next consider how many relations or equationsexist to evaluate the 2 � �(C � 1) variables in the sys-tem. At equilibrium, the chemical potential of a partic-ular component, i, must be the same in every phase, a, b, c , . . . in the system in which the component oc-curs, or
�ai � �b
i � �ci � ···
and similarly for component j
�aj � �b
j � �cj � ···
and so on, for each component. Hence, for each com-ponent there are � � 1 equations, and for the entiresystem, C(� � 1) equations. These C(� � 1) equationsreduce the number of total variables so that the vari-ance of the system, that is, the difference between thenumber of possible variables and the equations defin-ing them, is
5.1 F � [2 � �(C � 1)] � [C(� � 1)] or
F � 2 � C � �
This is the Gibbs phase rule. For a one-componentsystem the phase rule becomes F � 2 � 1 � � � 3 ��, as earlier. Remember that the number 2 in the phaserule refers to the variables P and T. If P (or T ) is fixed,or constant, then the phase rule becomes F � 1 �C � �, and if both P and T are fixed, then F � C � �.
88 Igneous and Metamorphic Petrology
20
16
12
8
4
0400 800 1200 1600 2000 2400 2800
P (G
Pa =
10
kbar
)
T (°C)
040
100
200
400
Dep
th (
km)
Stishovite
Coesite
CristobaliteTridymite
LIQUID
β -Quartzα-Quartz
5.1 One-component silica phase diagram. Stability fields of crys-talline polymorphs are shaded. (Redrawn from Swamy et al.,1994.)
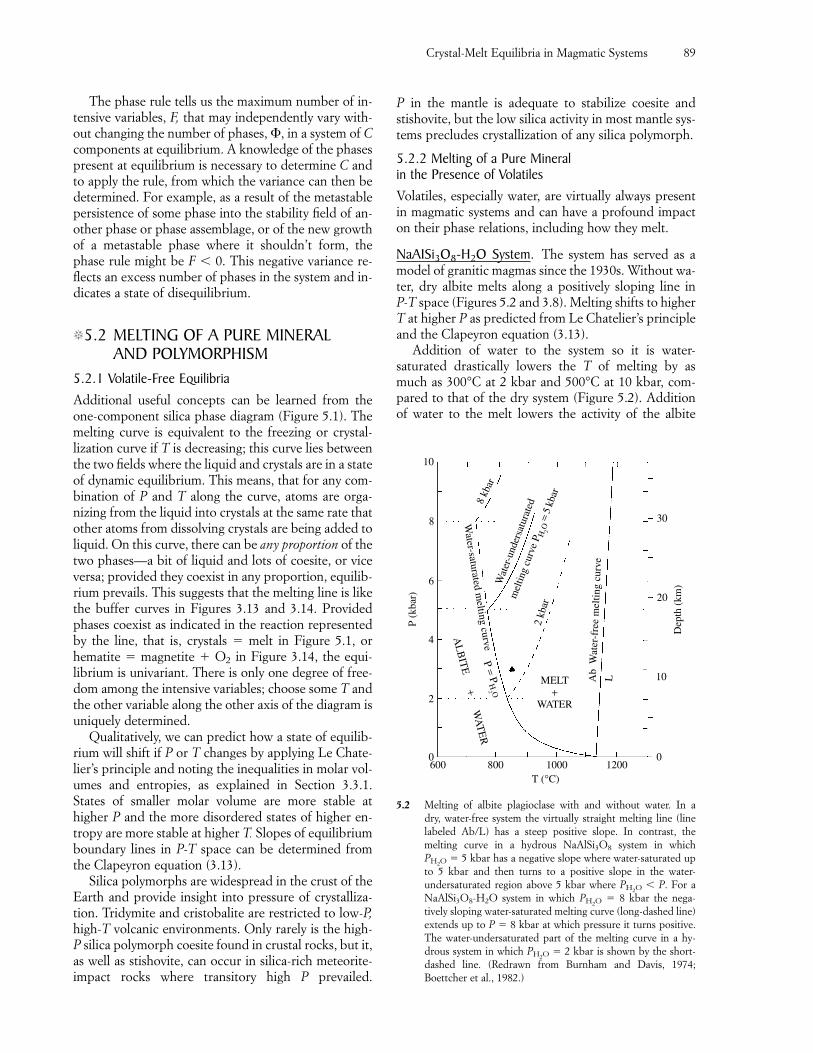
The phase rule tells us the maximum number of in-tensive variables, F, that may independently vary with-out changing the number of phases, �, in a system of Ccomponents at equilibrium. A knowledge of the phasespresent at equilibrium is necessary to determine C andto apply the rule, from which the variance can then bedetermined. For example, as a result of the metastablepersistence of some phase into the stability field of an-other phase or phase assemblage, or of the new growthof a metastable phase where it shouldn’t form, thephase rule might be F 0. This negative variance re-flects an excess number of phases in the system and in-dicates a state of disequilibrium.
�5.2 MELTING OF A PURE MINERAL AND POLYMORPHISM
5.2.1 Volatile-Free EquilibriaAdditional useful concepts can be learned from theone-component silica phase diagram (Figure 5.1). Themelting curve is equivalent to the freezing or crystal-lization curve if T is decreasing; this curve lies betweenthe two fields where the liquid and crystals are in a stateof dynamic equilibrium. This means, that for any com-bination of P and T along the curve, atoms are orga-nizing from the liquid into crystals at the same rate thatother atoms from dissolving crystals are being added toliquid. On this curve, there can be any proportion of thetwo phases—a bit of liquid and lots of coesite, or viceversa; provided they coexist in any proportion, equilib-rium prevails. This suggests that the melting line is likethe buffer curves in Figures 3.13 and 3.14. Providedphases coexist as indicated in the reaction representedby the line, that is, crystals � melt in Figure 5.1, orhematite � magnetite � O2 in Figure 3.14, the equi-librium is univariant. There is only one degree of free-dom among the intensive variables; choose some T andthe other variable along the other axis of the diagram isuniquely determined.
Qualitatively, we can predict how a state of equilib-rium will shift if P or T changes by applying Le Chate-lier’s principle and noting the inequalities in molar vol-umes and entropies, as explained in Section 3.3.1.States of smaller molar volume are more stable athigher P and the more disordered states of higher en-tropy are more stable at higher T. Slopes of equilibriumboundary lines in P-T space can be determined fromthe Clapeyron equation (3.13).
Silica polymorphs are widespread in the crust of theEarth and provide insight into pressure of crystalliza-tion. Tridymite and cristobalite are restricted to low-P,high-T volcanic environments. Only rarely is the high-P silica polymorph coesite found in crustal rocks, but it,as well as stishovite, can occur in silica-rich meteorite-impact rocks where transitory high P prevailed.
P in the mantle is adequate to stabilize coesite andstishovite, but the low silica activity in most mantle sys-tems precludes crystallization of any silica polymorph.
5.2.2 Melting of a Pure Mineral in the Presence of VolatilesVolatiles, especially water, are virtually always presentin magmatic systems and can have a profound impacton their phase relations, including how they melt.
NaAISi3O8-H2O System. The system has served as amodel of granitic magmas since the 1930s. Without wa-ter, dry albite melts along a positively sloping line in P-T space (Figures 5.2 and 3.8). Melting shifts to higherT at higher P as predicted from Le Chatelier’s principleand the Clapeyron equation (3.13).
Addition of water to the system so it is water-saturated drastically lowers the T of melting by asmuch as 300°C at 2 kbar and 500°C at 10 kbar, com-pared to that of the dry system (Figure 5.2). Additionof water to the melt lowers the activity of the albite
Crystal-Melt Equilibria in Magmatic Systems 89
600 800 1000 1200T (°C)
0
2
4
6
8
10
0
10
20
30
Dep
th (
km)
MELT+
WATER
2 kb
ar
Ab
Wat
er-f
ree
mel
ting
curv
eL
Wat
er-u
nder
satu
rate
d
mel
ting
curv
e P H 2
O =
5 k
bar
8 kb
ar
Water-saturated m
elting curveP = P
H2 O
AL
BIT
E + W
AT
ER
P (k
bar)
5.2 Melting of albite plagioclase with and without water. In a dry, water-free system the virtually straight melting line (line labeled Ab/L) has a steep positive slope. In contrast, the melting curve in a hydrous NaAlSi3O8 system in whichPH2O � 5 kbar has a negative slope where water-saturated upto 5 kbar and then turns to a positive slope in the water-undersaturated region above 5 kbar where PH2O P. For aNaAlSi3O8-H2O system in which PH2O � 8 kbar the nega-tively sloping water-saturated melting curve (long-dashed line)extends up to P � 8 kbar at which pressure it turns positive.The water-undersaturated part of the melting curve in a hy-drous system in which PH2O � 2 kbar is shown by the short-dashed line. (Redrawn from Burnham and Davis, 1974;Boettcher et al., 1982.)
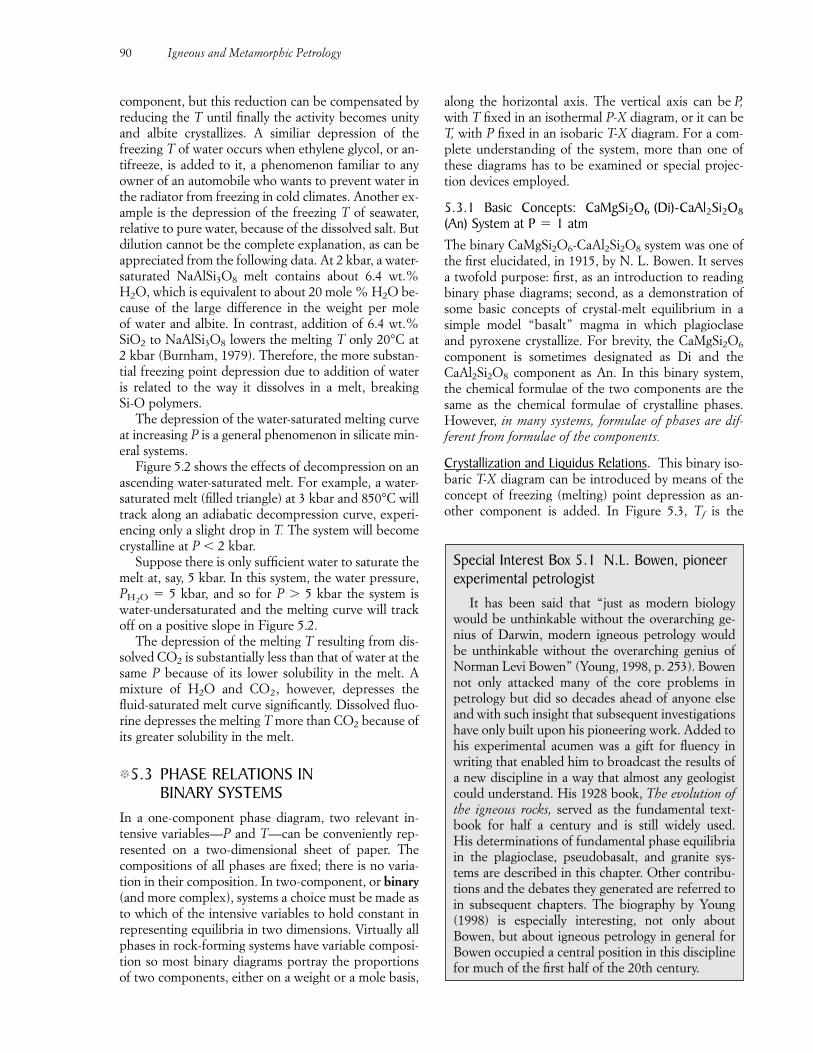
component, but this reduction can be compensated byreducing the T until finally the activity becomes unityand albite crystallizes. A similiar depression of thefreezing T of water occurs when ethylene glycol, or an-tifreeze, is added to it, a phenomenon familiar to anyowner of an automobile who wants to prevent water inthe radiator from freezing in cold climates. Another ex-ample is the depression of the freezing T of seawater,relative to pure water, because of the dissolved salt. Butdilution cannot be the complete explanation, as can beappreciated from the following data. At 2 kbar, a water-saturated NaAlSi3O8 melt contains about 6.4 wt.%H2O, which is equivalent to about 20 mole % H2O be-cause of the large difference in the weight per mole of water and albite. In contrast, addition of 6.4 wt.%SiO2 to NaAlSi3O8 lowers the melting T only 20°C at 2 kbar (Burnham, 1979). Therefore, the more substan-tial freezing point depression due to addition of wateris related to the way it dissolves in a melt, breaking Si-O polymers.
The depression of the water-saturated melting curveat increasing P is a general phenomenon in silicate min-eral systems.
Figure 5.2 shows the effects of decompression on anascending water-saturated melt. For example, a water-saturated melt (filled triangle) at 3 kbar and 850°C willtrack along an adiabatic decompression curve, experi-encing only a slight drop in T. The system will becomecrystalline at P 2 kbar.
Suppose there is only sufficient water to saturate themelt at, say, 5 kbar. In this system, the water pressure,PH2O � 5 kbar, and so for P 5 kbar the system is water-undersaturated and the melting curve will trackoff on a positive slope in Figure 5.2.
The depression of the melting T resulting from dis-solved CO2 is substantially less than that of water at thesame P because of its lower solubility in the melt. Amixture of H2O and CO2, however, depresses thefluid-saturated melt curve significantly. Dissolved fluo-rine depresses the melting T more than CO2 because ofits greater solubility in the melt.
�5.3 PHASE RELATIONS IN BINARY SYSTEMS
In a one-component phase diagram, two relevant in-tensive variables—P and T—can be conveniently rep-resented on a two-dimensional sheet of paper. Thecompositions of all phases are fixed; there is no varia-tion in their composition. In two-component, or binary(and more complex), systems a choice must be made asto which of the intensive variables to hold constant inrepresenting equilibria in two dimensions. Virtually allphases in rock-forming systems have variable composi-tion so most binary diagrams portray the proportionsof two components, either on a weight or a mole basis,
along the horizontal axis. The vertical axis can be P,with T fixed in an isothermal P-X diagram, or it can beT, with P fixed in an isobaric T-X diagram. For a com-plete understanding of the system, more than one ofthese diagrams has to be examined or special projec-tion devices employed.
5.3.1 Basic Concepts: CaMgSi2O6 (Di)-CaAl2Si2O8(An) System at P � 1 atmThe binary CaMgSi2O6-CaAl2Si2O8 system was one ofthe first elucidated, in 1915, by N. L. Bowen. It servesa twofold purpose: first, as an introduction to readingbinary phase diagrams; second, as a demonstration ofsome basic concepts of crystal-melt equilibrium in asimple model “basalt” magma in which plagioclase and pyroxene crystallize. For brevity, the CaMgSi2O6
component is sometimes designated as Di and theCaAl2Si2O8 component as An. In this binary system,the chemical formulae of the two components are thesame as the chemical formulae of crystalline phases.However, in many systems, formulae of phases are dif-ferent from formulae of the components.
Crystallization and Liquidus Relations. This binary iso-baric T-X diagram can be introduced by means of theconcept of freezing (melting) point depression as an-other component is added. In Figure 5.3, Tf is the
90 Igneous and Metamorphic Petrology
Special Interest Box 5.1 N.L. Bowen, pioneerexperimental petrologist
It has been said that “just as modern biologywould be unthinkable without the overarching ge-nius of Darwin, modern igneous petrology wouldbe unthinkable without the overarching genius ofNorman Levi Bowen” (Young, 1998, p. 253). Bowennot only attacked many of the core problems inpetrology but did so decades ahead of anyone elseand with such insight that subsequent investigationshave only built upon his pioneering work. Added tohis experimental acumen was a gift for fluency inwriting that enabled him to broadcast the results ofa new discipline in a way that almost any geologistcould understand. His 1928 book, The evolution ofthe igneous rocks, served as the fundamental text-book for half a century and is still widely used. His determinations of fundamental phase equilibriain the plagioclase, pseudobasalt, and granite sys-tems are described in this chapter. Other contribu-tions and the debates they generated are referred toin subsequent chapters. The biography by Young(1998) is especially interesting, not only aboutBowen, but about igneous petrology in general forBowen occupied a central position in this disciplinefor much of the first half of the 20th century.
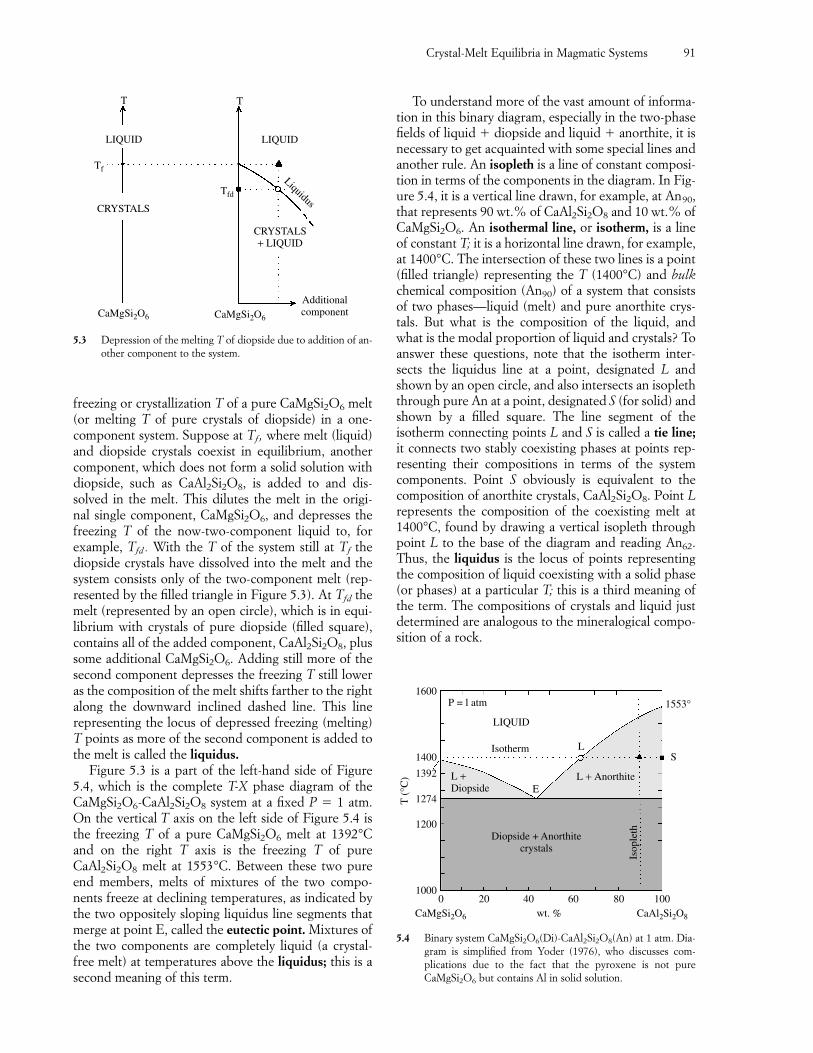
freezing or crystallization T of a pure CaMgSi2O6 melt(or melting T of pure crystals of diopside) in a one-component system. Suppose at Tf, where melt (liquid)and diopside crystals coexist in equilibrium, anothercomponent, which does not form a solid solution withdiopside, such as CaAl2Si2O8, is added to and dis-solved in the melt. This dilutes the melt in the origi-nal single component, CaMgSi2O6, and depresses thefreezing T of the now-two-component liquid to, for example, Tfd . With the T of the system still at Tf thediopside crystals have dissolved into the melt and thesystem consists only of the two-component melt (rep-resented by the filled triangle in Figure 5.3). At Tfd themelt (represented by an open circle), which is in equi-librium with crystals of pure diopside (filled square),contains all of the added component, CaAl2Si2O8, plussome additional CaMgSi2O6. Adding still more of thesecond component depresses the freezing T still loweras the composition of the melt shifts farther to the rightalong the downward inclined dashed line. This linerepresenting the locus of depressed freezing (melting)T points as more of the second component is added tothe melt is called the liquidus.
Figure 5.3 is a part of the left-hand side of Figure5.4, which is the complete T-X phase diagram of theCaMgSi2O6-CaAl2Si2O8 system at a fixed P � 1 atm.On the vertical T axis on the left side of Figure 5.4 isthe freezing T of a pure CaMgSi2O6 melt at 1392°Cand on the right T axis is the freezing T of pureCaAl2Si2O8 melt at 1553°C. Between these two pureend members, melts of mixtures of the two compo-nents freeze at declining temperatures, as indicated bythe two oppositely sloping liquidus line segments thatmerge at point E, called the eutectic point. Mixtures ofthe two components are completely liquid (a crystal-free melt) at temperatures above the liquidus; this is asecond meaning of this term.
To understand more of the vast amount of informa-tion in this binary diagram, especially in the two-phasefields of liquid � diopside and liquid � anorthite, it isnecessary to get acquainted with some special lines andanother rule. An isopleth is a line of constant composi-tion in terms of the components in the diagram. In Fig-ure 5.4, it is a vertical line drawn, for example, at An90,that represents 90 wt.% of CaAl2Si2O8 and 10 wt.% ofCaMgSi2O6. An isothermal line, or isotherm, is a lineof constant T; it is a horizontal line drawn, for example,at 1400°C. The intersection of these two lines is a point(filled triangle) representing the T (1400°C) and bulkchemical composition (An90) of a system that consistsof two phases—liquid (melt) and pure anorthite crys-tals. But what is the composition of the liquid, andwhat is the modal proportion of liquid and crystals? Toanswer these questions, note that the isotherm inter-sects the liquidus line at a point, designated L andshown by an open circle, and also intersects an isopleththrough pure An at a point, designated S (for solid) andshown by a filled square. The line segment of theisotherm connecting points L and S is called a tie line;it connects two stably coexisting phases at points rep-resenting their compositions in terms of the systemcomponents. Point S obviously is equivalent to thecomposition of anorthite crystals, CaAl2Si2O8. Point Lrepresents the composition of the coexisting melt at1400°C, found by drawing a vertical isopleth throughpoint L to the base of the diagram and reading An62.Thus, the liquidus is the locus of points representingthe composition of liquid coexisting with a solid phase(or phases) at a particular T; this is a third meaning ofthe term. The compositions of crystals and liquid justdetermined are analogous to the mineralogical compo-sition of a rock.
Crystal-Melt Equilibria in Magmatic Systems 91
CaMgSi2O6
CRYSTALS
LIQUID
Tf
Tfd
T T
LIQUID
CRYSTALS+ LIQUID
AdditionalcomponentCaMgSi2O6
Liquidus
5.3 Depression of the melting T of diopside due to addition of an-other component to the system.
01000
1274
1392
1400
1600
1200
20 40 60 80 100
T (
°C)
1553°
S
CaMgSi2O6 wt. % CaAl2Si2O8
P = l atm
E
Isotherm
LIQUID
L
L +Diopside
L + Anorthite
Diopside + Anorthitecrystals
Isop
leth
5.4 Binary system CaMgSi2O6(Di)-CaAl2Si2O8(An) at 1 atm. Dia-gram is simplified from Yoder (1976), who discusses com-plications due to the fact that the pyroxene is not pureCaMgSi2O6 but contains Al in solid solution.
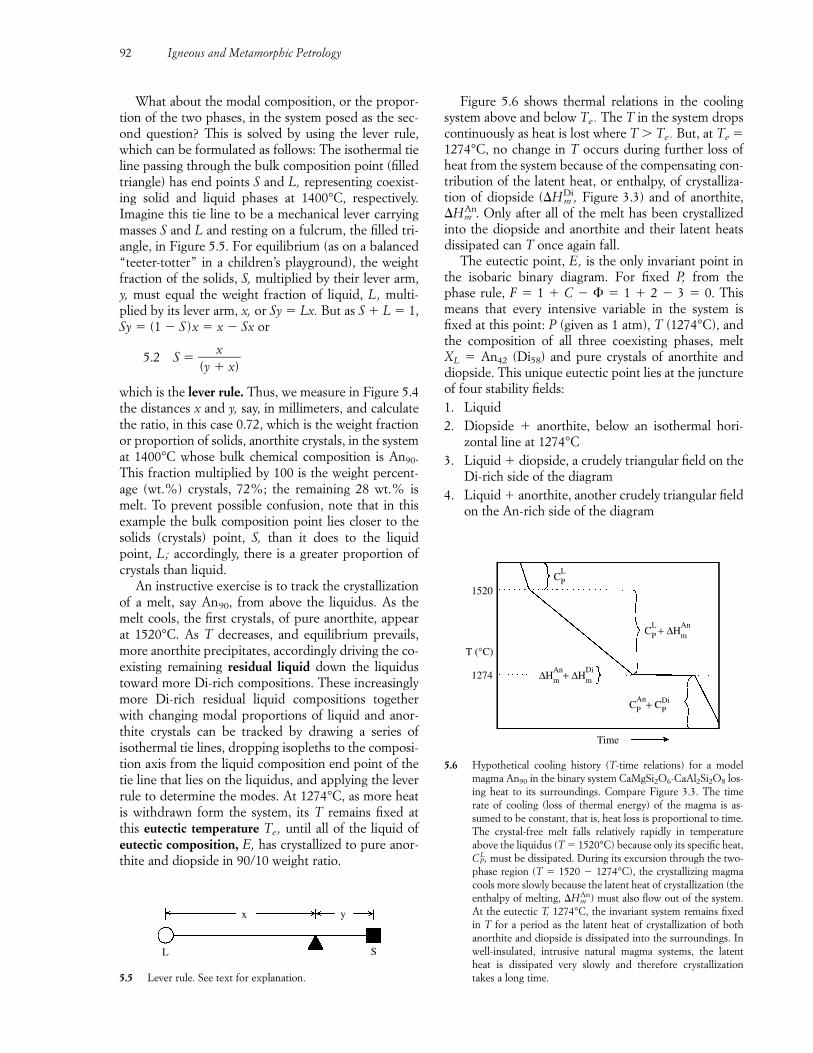
What about the modal composition, or the propor-tion of the two phases, in the system posed as the sec-ond question? This is solved by using the lever rule,which can be formulated as follows: The isothermal tieline passing through the bulk composition point (filledtriangle) has end points S and L, representing coexist-ing solid and liquid phases at 1400°C, respectively.Imagine this tie line to be a mechanical lever carryingmasses S and L and resting on a fulcrum, the filled tri-angle, in Figure 5.5. For equilibrium (as on a balanced“teeter-totter” in a children’s playground), the weightfraction of the solids, S, multiplied by their lever arm,y, must equal the weight fraction of liquid, L, multi-plied by its lever arm, x, or Sy � Lx. But as S � L � 1,Sy � (1 � S )x � x � Sx or
5.2 S � �(y �
xx)
�
which is the lever rule. Thus, we measure in Figure 5.4the distances x and y, say, in millimeters, and calculatethe ratio, in this case 0.72, which is the weight fractionor proportion of solids, anorthite crystals, in the systemat 1400°C whose bulk chemical composition is An90.This fraction multiplied by 100 is the weight percent-age (wt.%) crystals, 72%; the remaining 28 wt.% ismelt. To prevent possible confusion, note that in thisexample the bulk composition point lies closer to thesolids (crystals) point, S, than it does to the liquidpoint, L; accordingly, there is a greater proportion ofcrystals than liquid.
An instructive exercise is to track the crystallizationof a melt, say An90, from above the liquidus. As themelt cools, the first crystals, of pure anorthite, appearat 1520°C. As T decreases, and equilibrium prevails,more anorthite precipitates, accordingly driving the co-existing remaining residual liquid down the liquidustoward more Di-rich compositions. These increasinglymore Di-rich residual liquid compositions togetherwith changing modal proportions of liquid and anor-thite crystals can be tracked by drawing a series ofisothermal tie lines, dropping isopleths to the composi-tion axis from the liquid composition end point of thetie line that lies on the liquidus, and applying the leverrule to determine the modes. At 1274°C, as more heatis withdrawn form the system, its T remains fixed atthis eutectic temperature Te, until all of the liquid ofeutectic composition, E, has crystallized to pure anor-thite and diopside in 90/10 weight ratio.
Figure 5.6 shows thermal relations in the coolingsystem above and below Te. The T in the system dropscontinuously as heat is lost where T Te. But, at Te �1274°C, no change in T occurs during further loss ofheat from the system because of the compensating con-tribution of the latent heat, or enthalpy, of crystalliza-tion of diopside (�HDi
m , Figure 3.3) and of anorthite,�HAn
m . Only after all of the melt has been crystallizedinto the diopside and anorthite and their latent heatsdissipated can T once again fall.
The eutectic point, E, is the only invariant point inthe isobaric binary diagram. For fixed P, from thephase rule, F � 1 � C � � � 1 � 2 � 3 � 0. Thismeans that every intensive variable in the system isfixed at this point: P (given as 1 atm), T (1274°C), andthe composition of all three coexisting phases, meltXL � An42 (Di58) and pure crystals of anorthite anddiopside. This unique eutectic point lies at the junctureof four stability fields:1. Liquid2. Diopside � anorthite, below an isothermal hori-
zontal line at 1274°C3. Liquid � diopside, a crudely triangular field on the
Di-rich side of the diagram4. Liquid � anorthite, another crudely triangular field
on the An-rich side of the diagram
92 Igneous and Metamorphic Petrology
L S
yx
5.5 Lever rule. See text for explanation.
CLP
CLP + ∆Hm
An
∆HmAn+ ∆Hm
Di
CPAn+ CDi
1274
1520
T (°C)
Time
P
5.6 Hypothetical cooling history (T-time relations) for a modelmagma An90 in the binary system CaMgSi2O6-CaAl2Si2O8 los-ing heat to its surroundings. Compare Figure 3.3. The timerate of cooling (loss of thermal energy) of the magma is as-sumed to be constant, that is, heat loss is proportional to time.The crystal-free melt falls relatively rapidly in temperatureabove the liquidus (T � 1520°C) because only its specific heat,CL
P, must be dissipated. During its excursion through the two-phase region (T � 1520 � 1274°C), the crystallizing magmacools more slowly because the latent heat of crystallization (theenthalpy of melting, �HAn
m ) must also flow out of the system.At the eutectic T, 1274°C, the invariant system remains fixedin T for a period as the latent heat of crystallization of bothanorthite and diopside is dissipated into the surroundings. Inwell-insulated, intrusive natural magma systems, the latentheat is dissipated very slowly and therefore crystallizationtakes a long time.
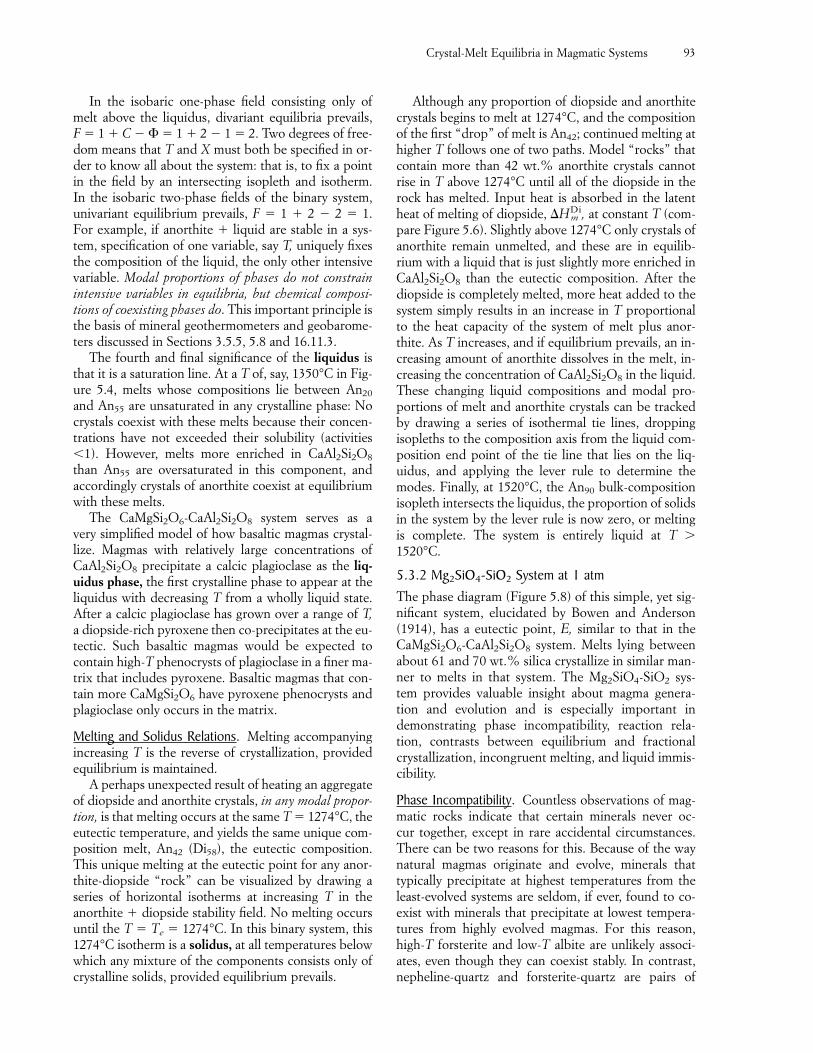
In the isobaric one-phase field consisting only ofmelt above the liquidus, divariant equilibria prevails, F � 1 � C � � � 1 � 2 � 1 � 2. Two degrees of free-dom means that T and X must both be specified in or-der to know all about the system: that is, to fix a pointin the field by an intersecting isopleth and isotherm. In the isobaric two-phase fields of the binary system,univariant equilibrium prevails, F � 1 � 2 � 2 � 1.For example, if anorthite � liquid are stable in a sys-tem, specification of one variable, say T, uniquely fixesthe composition of the liquid, the only other intensivevariable. Modal proportions of phases do not constrainintensive variables in equilibria, but chemical composi-tions of coexisting phases do. This important principle isthe basis of mineral geothermometers and geobarome-ters discussed in Sections 3.5.5, 5.8 and 16.11.3.
The fourth and final significance of the liquidus isthat it is a saturation line. At a T of, say, 1350°C in Fig-ure 5.4, melts whose compositions lie between An20
and An55 are unsaturated in any crystalline phase: Nocrystals coexist with these melts because their concen-trations have not exceeded their solubility (activities1). However, melts more enriched in CaAl2Si2O8
than An55 are oversaturated in this component, and accordingly crystals of anorthite coexist at equilibriumwith these melts.
The CaMgSi2O6-CaAl2Si2O8 system serves as a very simplified model of how basaltic magmas crystal-lize. Magmas with relatively large concentrations ofCaAl2Si2O8 precipitate a calcic plagioclase as the liq-uidus phase, the first crystalline phase to appear at theliquidus with decreasing T from a wholly liquid state.After a calcic plagioclase has grown over a range of T,a diopside-rich pyroxene then co-precipitates at the eu-tectic. Such basaltic magmas would be expected tocontain high-T phenocrysts of plagioclase in a finer ma-trix that includes pyroxene. Basaltic magmas that con-tain more CaMgSi2O6 have pyroxene phenocrysts andplagioclase only occurs in the matrix.
Melting and Solidus Relations. Melting accompanyingincreasing T is the reverse of crystallization, providedequilibrium is maintained.
A perhaps unexpected result of heating an aggregateof diopside and anorthite crystals, in any modal propor-tion, is that melting occurs at the same T � 1274°C, theeutectic temperature, and yields the same unique com-position melt, An42 (Di58), the eutectic composition.This unique melting at the eutectic point for any anor-thite-diopside “rock” can be visualized by drawing aseries of horizontal isotherms at increasing T in theanorthite � diopside stability field. No melting occursuntil the T � Te � 1274°C. In this binary system, this1274°C isotherm is a solidus, at all temperatures belowwhich any mixture of the components consists only ofcrystalline solids, provided equilibrium prevails.
Although any proportion of diopside and anorthitecrystals begins to melt at 1274°C, and the compositionof the first “drop” of melt is An42; continued melting athigher T follows one of two paths. Model “rocks” thatcontain more than 42 wt.% anorthite crystals cannotrise in T above 1274°C until all of the diopside in therock has melted. Input heat is absorbed in the latentheat of melting of diopside, �HDi
m , at constant T (com-pare Figure 5.6). Slightly above 1274°C only crystals ofanorthite remain unmelted, and these are in equilib-rium with a liquid that is just slightly more enriched inCaAl2Si2O8 than the eutectic composition. After thediopside is completely melted, more heat added to thesystem simply results in an increase in T proportionalto the heat capacity of the system of melt plus anor-thite. As T increases, and if equilibrium prevails, an in-creasing amount of anorthite dissolves in the melt, in-creasing the concentration of CaAl2Si2O8 in the liquid.These changing liquid compositions and modal pro-portions of melt and anorthite crystals can be trackedby drawing a series of isothermal tie lines, droppingisopleths to the composition axis from the liquid com-position end point of the tie line that lies on the liq-uidus, and applying the lever rule to determine themodes. Finally, at 1520°C, the An90 bulk-compositionisopleth intersects the liquidus, the proportion of solidsin the system by the lever rule is now zero, or meltingis complete. The system is entirely liquid at T 1520°C.
5.3.2 Mg2SiO4-SiO2 System at 1 atmThe phase diagram (Figure 5.8) of this simple, yet sig-nificant system, elucidated by Bowen and Anderson(1914), has a eutectic point, E, similar to that in theCaMgSi2O6-CaAl2Si2O8 system. Melts lying betweenabout 61 and 70 wt.% silica crystallize in similar man-ner to melts in that system. The Mg2SiO4-SiO2 sys-tem provides valuable insight about magma genera-tion and evolution and is especially important indemonstrating phase incompatibility, reaction rela-tion, contrasts between equilibrium and fractionalcrystallization, incongruent melting, and liquid immis-cibility.
Phase Incompatibility. Countless observations of mag-matic rocks indicate that certain minerals never oc-cur together, except in rare accidental circumstances.There can be two reasons for this. Because of the waynatural magmas originate and evolve, minerals that typically precipitate at highest temperatures from theleast-evolved systems are seldom, if ever, found to co-exist with minerals that precipitate at lowest tempera-tures from highly evolved magmas. For this reason,high-T forsterite and low-T albite are unlikely associ-ates, even though they can coexist stably. In contrast,nepheline-quartz and forsterite-quartz are pairs of
Crystal-Melt Equilibria in Magmatic Systems 93
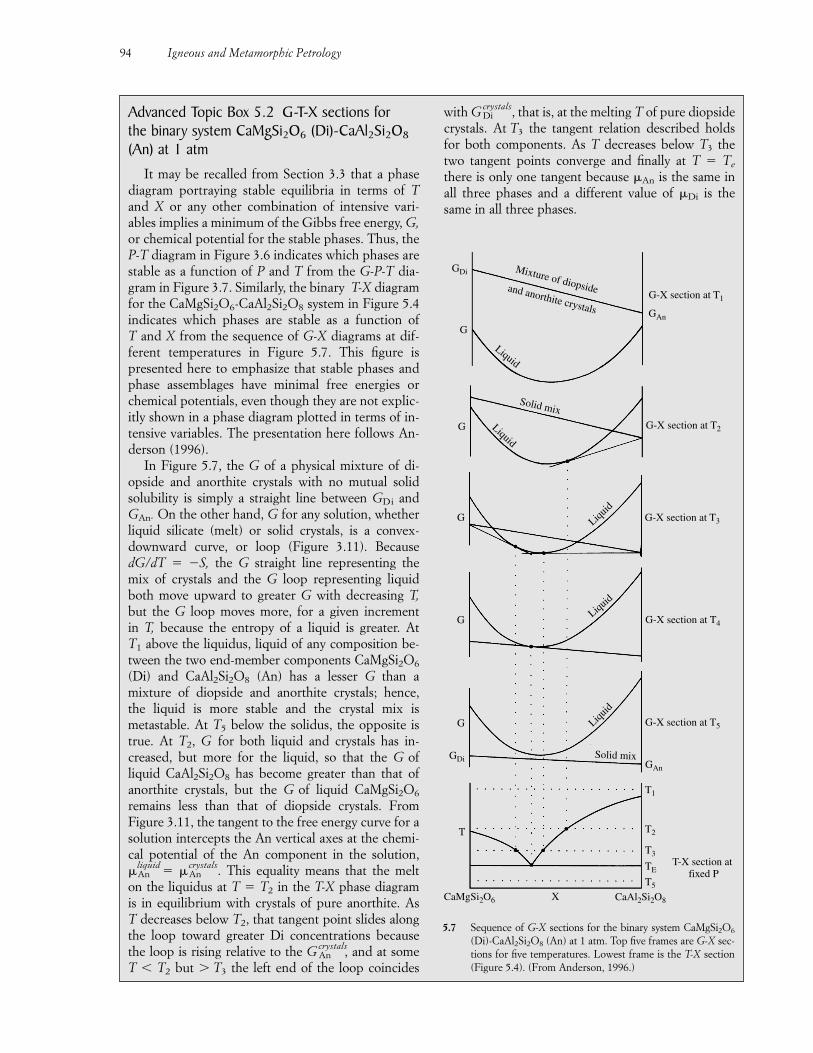
94 Igneous and Metamorphic Petrology
with GcrystalsDi , that is, at the melting T of pure diopside
crystals. At T3 the tangent relation described holdsfor both components. As T decreases below T3 thetwo tangent points converge and finally at T � Te
there is only one tangent because �An is the same inall three phases and a different value of �Di is thesame in all three phases.
Advanced Topic Box 5.2 G-T-X sections forthe binary system CaMgSi2O6 (Di)-CaAl2Si2O8
(An) at 1 atm
It may be recalled from Section 3.3 that a phasediagram portraying stable equilibria in terms of Tand X or any other combination of intensive vari-ables implies a minimum of the Gibbs free energy, G,or chemical potential for the stable phases. Thus, theP-T diagram in Figure 3.6 indicates which phases arestable as a function of P and T from the G-P-T dia-gram in Figure 3.7. Similarly, the binary T-X diagramfor the CaMgSi2O6-CaAl2Si2O8 system in Figure 5.4indicates which phases are stable as a function of T and X from the sequence of G-X diagrams at dif-ferent temperatures in Figure 5.7. This figure is presented here to emphasize that stable phases andphase assemblages have minimal free energies orchemical potentials, even though they are not explic-itly shown in a phase diagram plotted in terms of in-tensive variables. The presentation here follows An-derson (1996).
In Figure 5.7, the G of a physical mixture of di-opside and anorthite crystals with no mutual solid solubility is simply a straight line between GDi andGAn. On the other hand, G for any solution, whetherliquid silicate (melt) or solid crystals, is a convex-downward curve, or loop (Figure 3.11). BecausedG/dT � �S, the G straight line representing the mix of crystals and the G loop representing liquidboth move upward to greater G with decreasing T,but the G loop moves more, for a given increment in T, because the entropy of a liquid is greater. At T1 above the liquidus, liquid of any composition be-tween the two end-member components CaMgSi2O6
(Di) and CaAl2Si2O8 (An) has a lesser G than a mixture of diopside and anorthite crystals; hence, the liquid is more stable and the crystal mix ismetastable. At T5 below the solidus, the opposite istrue. At T2, G for both liquid and crystals has in-creased, but more for the liquid, so that the G of liquid CaAl2Si2O8 has become greater than that ofanorthite crystals, but the G of liquid CaMgSi2O6
remains less than that of diopside crystals. From Figure 3.11, the tangent to the free energy curve for asolution intercepts the An vertical axes at the chemi-cal potential of the An component in the solution,�
liquidAn � �
crystalsAn . This equality means that the melt
on the liquidus at T � T2 in the T-X phase diagram is in equilibrium with crystals of pure anorthite. As T decreases below T2, that tangent point slides alongthe loop toward greater Di concentrations becausethe loop is rising relative to the Gcrystals
An , and at some T T2 but T3 the left end of the loop coincides
GDi
G
G
G
G
G
T
GDi
CaMgSi2O6 X CaAl2Si2O8
T5
TE
T3
T2
T1
GAn
Solid mix
Liquid
Liquid
Liquid
Liquid
Liquid
Solid mix
and anorthite crystals
Mixture of diopside
GAn
G-X section at T1
G-X section at T2
G-X section at T3
G-X section at T4
G-X section at T5
T-X section at fixed P
5.7 Sequence of G-X sections for the binary system CaMgSi2O6
(Di)-CaAl2Si2O8 (An) at 1 atm. Top five frames are G-X sec-tions for five temperatures. Lowest frame is the T-X section(Figure 5.4). (From Anderson, 1996.)
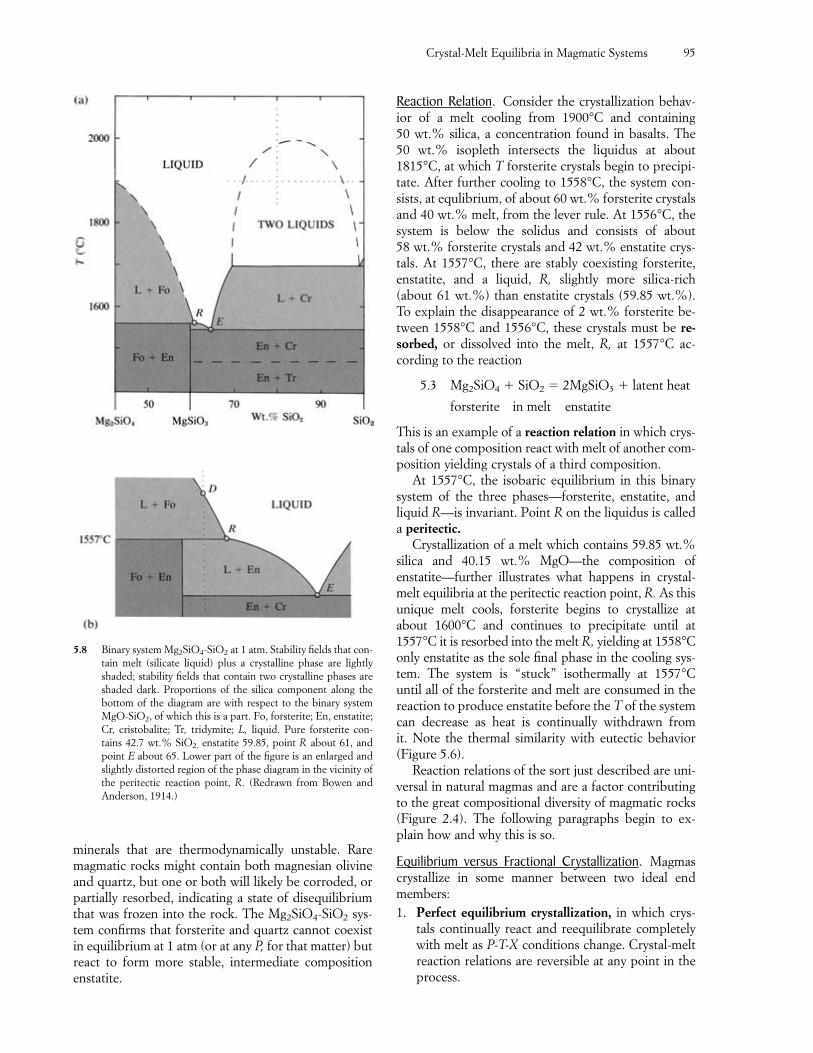
minerals that are thermodynamically unstable. Raremagmatic rocks might contain both magnesian olivineand quartz, but one or both will likely be corroded, orpartially resorbed, indicating a state of disequilibriumthat was frozen into the rock. The Mg2SiO4-SiO2 sys-tem confirms that forsterite and quartz cannot coexistin equilibrium at 1 atm (or at any P, for that matter) butreact to form more stable, intermediate compositionenstatite.
Reaction Relation. Consider the crystallization behav-ior of a melt cooling from 1900°C and containing 50 wt.% silica, a concentration found in basalts. The 50 wt.% isopleth intersects the liquidus at about1815°C, at which T forsterite crystals begin to precipi-tate. After further cooling to 1558°C, the system con-sists, at equlibrium, of about 60 wt.% forsterite crystalsand 40 wt.% melt, from the lever rule. At 1556°C, thesystem is below the solidus and consists of about 58 wt.% forsterite crystals and 42 wt.% enstatite crys-tals. At 1557°C, there are stably coexisting forsterite,enstatite, and a liquid, R, slightly more silica-rich(about 61 wt.%) than enstatite crystals (59.85 wt.%).To explain the disappearance of 2 wt.% forsterite be-tween 1558°C and 1556°C, these crystals must be re-sorbed, or dissolved into the melt, R, at 1557°C ac-cording to the reaction
5.3 Mg2SiO4 � SiO2 � 2MgSiO3 � latent heat
forsterite in melt enstatite
This is an example of a reaction relation in which crys-tals of one composition react with melt of another com-position yielding crystals of a third composition.
At 1557°C, the isobaric equilibrium in this binarysystem of the three phases—forsterite, enstatite, andliquid R—is invariant. Point R on the liquidus is calleda peritectic.
Crystallization of a melt which contains 59.85 wt.%silica and 40.15 wt.% MgO—the composition of enstatite—further illustrates what happens in crystal-melt equilibria at the peritectic reaction point, R. As thisunique melt cools, forsterite begins to crystallize atabout 1600°C and continues to precipitate until at1557°C it is resorbed into the melt R, yielding at 1558°Conly enstatite as the sole final phase in the cooling sys-tem. The system is “stuck” isothermally at 1557°C until all of the forsterite and melt are consumed in thereaction to produce enstatite before the T of the system can decrease as heat is continually withdrawn from it. Note the thermal similarity with eutectic behavior(Figure 5.6).
Reaction relations of the sort just described are uni-versal in natural magmas and are a factor contributingto the great compositional diversity of magmatic rocks(Figure 2.4). The following paragraphs begin to ex-plain how and why this is so.
Equilibrium versus Fractional Crystallization. Magmascrystallize in some manner between two ideal endmembers:1. Perfect equilibrium crystallization, in which crys-
tals continually react and reequilibrate completelywith melt as P-T-X conditions change. Crystal-meltreaction relations are reversible at any point in theprocess.
Crystal-Melt Equilibria in Magmatic Systems 95
5.8 Binary system Mg2SiO4-SiO2 at 1 atm. Stability fields that con-tain melt (silicate liquid) plus a crystalline phase are lightlyshaded; stability fields that contain two crystalline phases areshaded dark. Proportions of the silica component along thebottom of the diagram are with respect to the binary systemMgO-SiO2, of which this is a part. Fo, forsterite; En, enstatite;Cr, cristobalite; Tr, tridymite; L, liquid. Pure forsterite con-tains 42.7 wt.% SiO2, enstatite 59.85, point R about 61, andpoint E about 65. Lower part of the figure is an enlarged andslightly distorted region of the phase diagram in the vicinity ofthe peritectic reaction point, R. (Redrawn from Bowen andAnderson, 1914.)
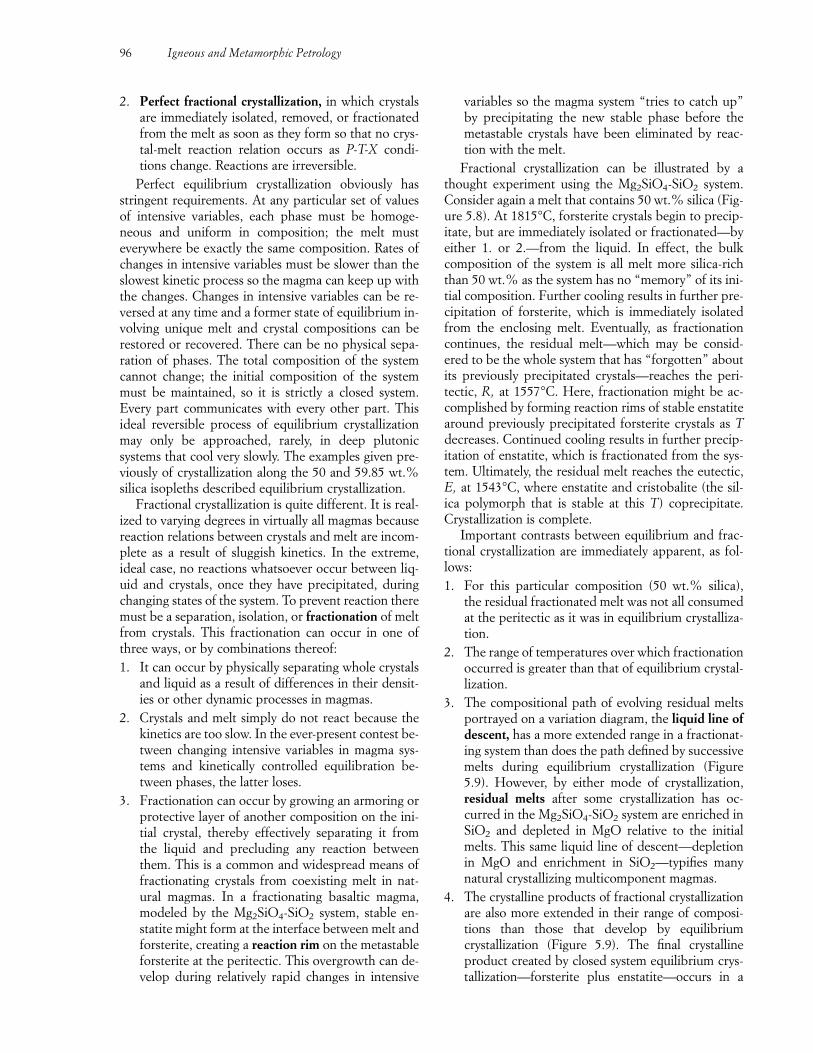
2. Perfect fractional crystallization, in which crystalsare immediately isolated, removed, or fractionatedfrom the melt as soon as they form so that no crys-tal-melt reaction relation occurs as P-T-X condi-tions change. Reactions are irreversible.
Perfect equilibrium crystallization obviously hasstringent requirements. At any particular set of valuesof intensive variables, each phase must be homoge-neous and uniform in composition; the melt musteverywhere be exactly the same composition. Rates ofchanges in intensive variables must be slower than theslowest kinetic process so the magma can keep up withthe changes. Changes in intensive variables can be re-versed at any time and a former state of equilibrium in-volving unique melt and crystal compositions can berestored or recovered. There can be no physical sepa-ration of phases. The total composition of the systemcannot change; the initial composition of the systemmust be maintained, so it is strictly a closed system.Every part communicates with every other part. Thisideal reversible process of equilibrium crystallizationmay only be approached, rarely, in deep plutonic systems that cool very slowly. The examples given pre-viously of crystallization along the 50 and 59.85 wt.%silica isopleths described equilibrium crystallization.
Fractional crystallization is quite different. It is real-ized to varying degrees in virtually all magmas becausereaction relations between crystals and melt are incom-plete as a result of sluggish kinetics. In the extreme,ideal case, no reactions whatsoever occur between liq-uid and crystals, once they have precipitated, duringchanging states of the system. To prevent reaction theremust be a separation, isolation, or fractionation of meltfrom crystals. This fractionation can occur in one ofthree ways, or by combinations thereof:1. It can occur by physically separating whole crystals
and liquid as a result of differences in their densit-ies or other dynamic processes in magmas.
2. Crystals and melt simply do not react because thekinetics are too slow. In the ever-present contest be-tween changing intensive variables in magma sys-tems and kinetically controlled equilibration be-tween phases, the latter loses.
3. Fractionation can occur by growing an armoring orprotective layer of another composition on the ini-tial crystal, thereby effectively separating it fromthe liquid and precluding any reaction betweenthem. This is a common and widespread means offractionating crystals from coexisting melt in nat-ural magmas. In a fractionating basaltic magma,modeled by the Mg2SiO4-SiO2 system, stable en-statite might form at the interface between melt andforsterite, creating a reaction rim on the metastableforsterite at the peritectic. This overgrowth can de-velop during relatively rapid changes in intensive
variables so the magma system “tries to catch up”by precipitating the new stable phase before themetastable crystals have been eliminated by reac-tion with the melt.
Fractional crystallization can be illustrated by athought experiment using the Mg2SiO4-SiO2 system.Consider again a melt that contains 50 wt.% silica (Fig-ure 5.8). At 1815°C, forsterite crystals begin to precip-itate, but are immediately isolated or fractionated—byeither 1. or 2.—from the liquid. In effect, the bulkcomposition of the system is all melt more silica-richthan 50 wt.% as the system has no “memory” of its ini-tial composition. Further cooling results in further pre-cipitation of forsterite, which is immediately isolatedfrom the enclosing melt. Eventually, as fractionationcontinues, the residual melt—which may be consid-ered to be the whole system that has “forgotten” aboutits previously precipitated crystals—reaches the peri-tectic, R, at 1557°C. Here, fractionation might be ac-complished by forming reaction rims of stable enstatitearound previously precipitated forsterite crystals as Tdecreases. Continued cooling results in further precip-itation of enstatite, which is fractionated from the sys-tem. Ultimately, the residual melt reaches the eutectic,E, at 1543°C, where enstatite and cristobalite (the sil-ica polymorph that is stable at this T) coprecipitate.Crystallization is complete.
Important contrasts between equilibrium and frac-tional crystallization are immediately apparent, as fol-lows:1. For this particular composition (50 wt.% silica),
the residual fractionated melt was not all consumedat the peritectic as it was in equilibrium crystalliza-tion.
2. The range of temperatures over which fractionationoccurred is greater than that of equilibrium crystal-lization.
3. The compositional path of evolving residual meltsportrayed on a variation diagram, the liquid line ofdescent, has a more extended range in a fractionat-ing system than does the path defined by successivemelts during equilibrium crystallization (Figure5.9). However, by either mode of crystallization,residual melts after some crystallization has oc-curred in the Mg2SiO4-SiO2 system are enriched inSiO2 and depleted in MgO relative to the initialmelts. This same liquid line of descent—depletionin MgO and enrichment in SiO2—typifies manynatural crystallizing multicomponent magmas.
4. The crystalline products of fractional crystallizationare also more extended in their range of composi-tions than those that develop by equilibrium crystallization (Figure 5.9). The final crystallineproduct created by closed system equilibrium crys-tallization—forsterite plus enstatite—occurs in a
96 Igneous and Metamorphic Petrology
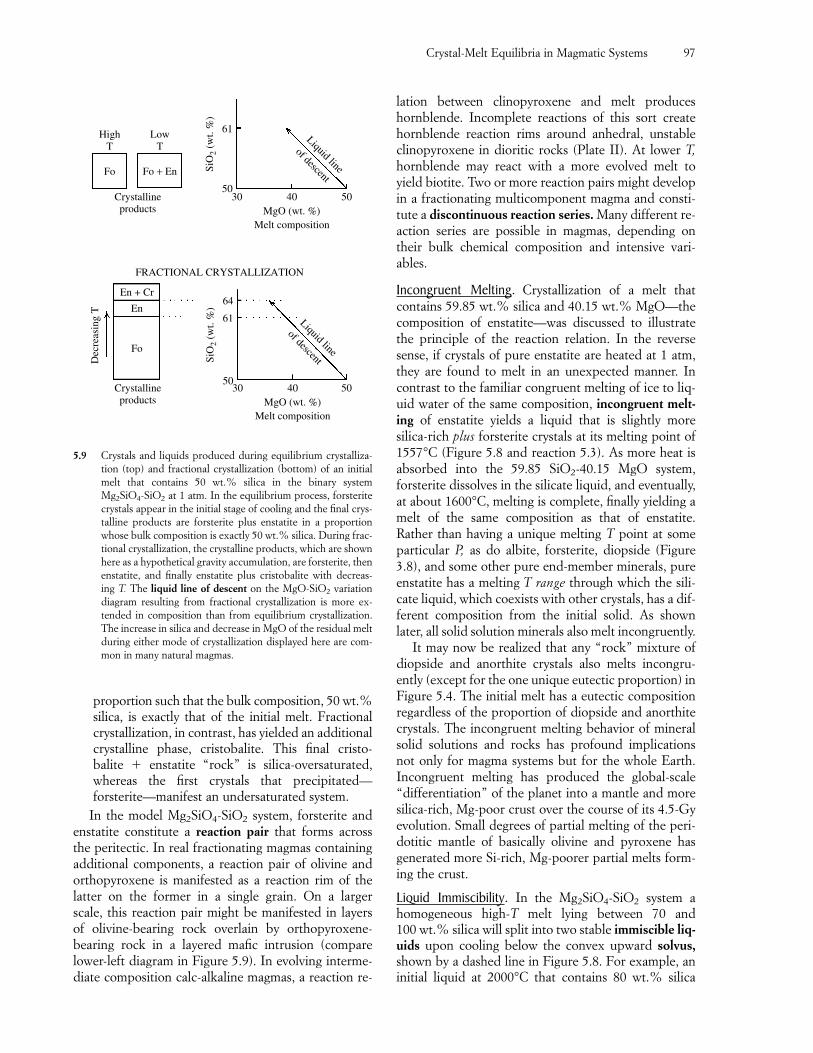
proportion such that the bulk composition, 50 wt.%silica, is exactly that of the initial melt. Fractionalcrystallization, in contrast, has yielded an additionalcrystalline phase, cristobalite. This final cristo-balite � enstatite “rock” is silica-oversaturated,whereas the first crystals that precipitated—forsterite—manifest an undersaturated system.
In the model Mg2SiO4-SiO2 system, forsterite andenstatite constitute a reaction pair that forms across the peritectic. In real fractionating magmas containing additional components, a reaction pair of olivine andorthopyroxene is manifested as a reaction rim of thelatter on the former in a single grain. On a larger scale, this reaction pair might be manifested in layers of olivine-bearing rock overlain by orthopyroxene-bearing rock in a layered mafic intrusion (comparelower-left diagram in Figure 5.9). In evolving interme-diate composition calc-alkaline magmas, a reaction re-
lation between clinopyroxene and melt produces hornblende. Incomplete reactions of this sort createhornblende reaction rims around anhedral, unstableclinopyroxene in dioritic rocks (Plate II). At lower T,hornblende may react with a more evolved melt toyield biotite. Two or more reaction pairs might developin a fractionating multicomponent magma and consti-tute a discontinuous reaction series. Many different re-action series are possible in magmas, depending ontheir bulk chemical composition and intensive vari-ables.
Incongruent Melting. Crystallization of a melt thatcontains 59.85 wt.% silica and 40.15 wt.% MgO—thecomposition of enstatite—was discussed to illustratethe principle of the reaction relation. In the reversesense, if crystals of pure enstatite are heated at 1 atm,they are found to melt in an unexpected manner. Incontrast to the familiar congruent melting of ice to liq-uid water of the same composition, incongruent melt-ing of enstatite yields a liquid that is slightly more silica-rich plus forsterite crystals at its melting point of1557°C (Figure 5.8 and reaction 5.3). As more heat isabsorbed into the 59.85 SiO2-40.15 MgO system,forsterite dissolves in the silicate liquid, and eventually,at about 1600°C, melting is complete, finally yielding amelt of the same composition as that of enstatite.Rather than having a unique melting T point at someparticular P, as do albite, forsterite, diopside (Figure3.8), and some other pure end-member minerals, pureenstatite has a melting T range through which the sili-cate liquid, which coexists with other crystals, has a dif-ferent composition from the initial solid. As shownlater, all solid solution minerals also melt incongruently.
It may now be realized that any “rock” mixture ofdiopside and anorthite crystals also melts incongru-ently (except for the one unique eutectic proportion) inFigure 5.4. The initial melt has a eutectic compositionregardless of the proportion of diopside and anorthitecrystals. The incongruent melting behavior of mineralsolid solutions and rocks has profound implicationsnot only for magma systems but for the whole Earth.Incongruent melting has produced the global-scale“differentiation” of the planet into a mantle and moresilica-rich, Mg-poor crust over the course of its 4.5-Gyevolution. Small degrees of partial melting of the peri-dotitic mantle of basically olivine and pyroxene hasgenerated more Si-rich, Mg-poorer partial melts form-ing the crust.
Liquid Immiscibility. In the Mg2SiO4-SiO2 system a homogeneous high-T melt lying between 70 and 100 wt.% silica will split into two stable immiscible liq-uids upon cooling below the convex upward solvus,shown by a dashed line in Figure 5.8. For example, aninitial liquid at 2000°C that contains 80 wt.% silica
Crystal-Melt Equilibria in Magmatic Systems 97
Fo Fo + En
HighT
LowT
Crystallineproducts
61
50
SiO
2 (w
t. %
)30 40 50
MgO (wt. %)Melt composition
FRACTIONAL CRYSTALLIZATION
En + Cr
En
Fo
Dec
reas
ing
T
Crystallineproducts
64
61
50
SiO
2 (w
t. %
)
30 40 50MgO (wt. %)
Melt composition
Liquid line
of descent
Liquid line
of descent
5.9 Crystals and liquids produced during equilibrium crystalliza-tion (top) and fractional crystallization (bottom) of an initialmelt that contains 50 wt.% silica in the binary systemMg2SiO4-SiO2 at 1 atm. In the equilibrium process, forsteritecrystals appear in the initial stage of cooling and the final crys-talline products are forsterite plus enstatite in a proportionwhose bulk composition is exactly 50 wt.% silica. During frac-tional crystallization, the crystalline products, which are shownhere as a hypothetical gravity accumulation, are forsterite, thenenstatite, and finally enstatite plus cristobalite with decreas-ing T. The liquid line of descent on the MgO-SiO2 variationdiagram resulting from fractional crystallization is more ex-tended in composition than from equilibrium crystallization.The increase in silica and decrease in MgO of the residual meltduring either mode of crystallization displayed here are com-mon in many natural magmas.
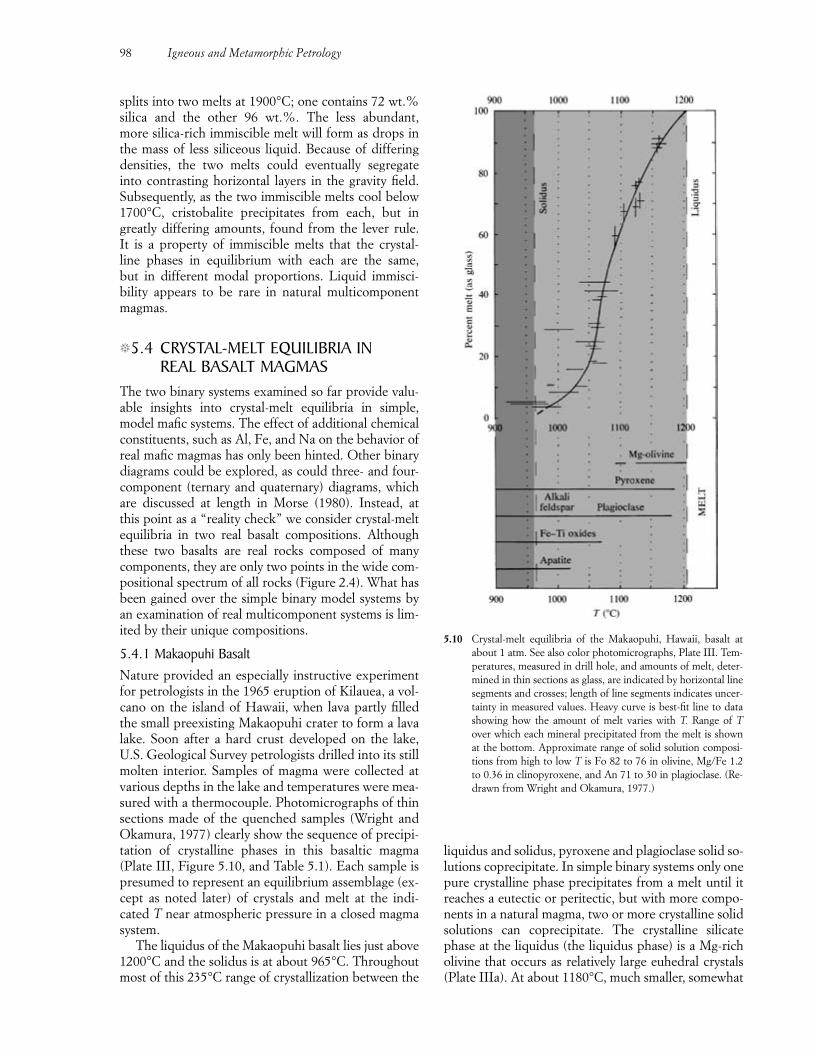
splits into two melts at 1900°C; one contains 72 wt.%silica and the other 96 wt.%. The less abundant, more silica-rich immiscible melt will form as drops inthe mass of less siliceous liquid. Because of differingdensities, the two melts could eventually segregate into contrasting horizontal layers in the gravity field.Subsequently, as the two immiscible melts cool below1700°C, cristobalite precipitates from each, but ingreatly differing amounts, found from the lever rule. It is a property of immiscible melts that the crystal-line phases in equilibrium with each are the same, but in different modal proportions. Liquid immisci-bility appears to be rare in natural multicomponentmagmas.
�5.4 CRYSTAL-MELT EQUILIBRIA IN REAL BASALT MAGMAS
The two binary systems examined so far provide valu-able insights into crystal-melt equilibria in simple,model mafic systems. The effect of additional chemicalconstituents, such as Al, Fe, and Na on the behavior ofreal mafic magmas has only been hinted. Other binarydiagrams could be explored, as could three- and four-component (ternary and quaternary) diagrams, whichare discussed at length in Morse (1980). Instead, at this point as a “reality check” we consider crystal-meltequilibria in two real basalt compositions. Althoughthese two basalts are real rocks composed of manycomponents, they are only two points in the wide com-positional spectrum of all rocks (Figure 2.4). What hasbeen gained over the simple binary model systems byan examination of real multicomponent systems is lim-ited by their unique compositions.
5.4.1 Makaopuhi BasaltNature provided an especially instructive experimentfor petrologists in the 1965 eruption of Kilauea, a vol-cano on the island of Hawaii, when lava partly filledthe small preexisting Makaopuhi crater to form a lavalake. Soon after a hard crust developed on the lake,U.S. Geological Survey petrologists drilled into its stillmolten interior. Samples of magma were collected atvarious depths in the lake and temperatures were mea-sured with a thermocouple. Photomicrographs of thinsections made of the quenched samples (Wright andOkamura, 1977) clearly show the sequence of precipi-tation of crystalline phases in this basaltic magma(Plate III, Figure 5.10, and Table 5.1). Each sample ispresumed to represent an equilibrium assemblage (ex-cept as noted later) of crystals and melt at the indi-cated T near atmospheric pressure in a closed magmasystem.
The liquidus of the Makaopuhi basalt lies just above1200°C and the solidus is at about 965°C. Throughoutmost of this 235°C range of crystallization between the
98 Igneous and Metamorphic Petrology
5.10 Crystal-melt equilibria of the Makaopuhi, Hawaii, basalt atabout 1 atm. See also color photomicrographs, Plate III. Tem-peratures, measured in drill hole, and amounts of melt, deter-mined in thin sections as glass, are indicated by horizontal linesegments and crosses; length of line segments indicates uncer-tainty in measured values. Heavy curve is best-fit line to datashowing how the amount of melt varies with T. Range of Tover which each mineral precipitated from the melt is shownat the bottom. Approximate range of solid solution composi-tions from high to low T is Fo 82 to 76 in olivine, Mg/Fe 1.2to 0.36 in clinopyroxene, and An 71 to 30 in plagioclase. (Re-drawn from Wright and Okamura, 1977.)
liquidus and solidus, pyroxene and plagioclase solid so-lutions coprecipitate. In simple binary systems only onepure crystalline phase precipitates from a melt until itreaches a eutectic or peritectic, but with more compo-nents in a natural magma, two or more crystalline solidsolutions can coprecipitate. The crystalline silicatephase at the liquidus (the liquidus phase) is a Mg-richolivine that occurs as relatively large euhedral crystals(Plate IIIa). At about 1180°C, much smaller, somewhat
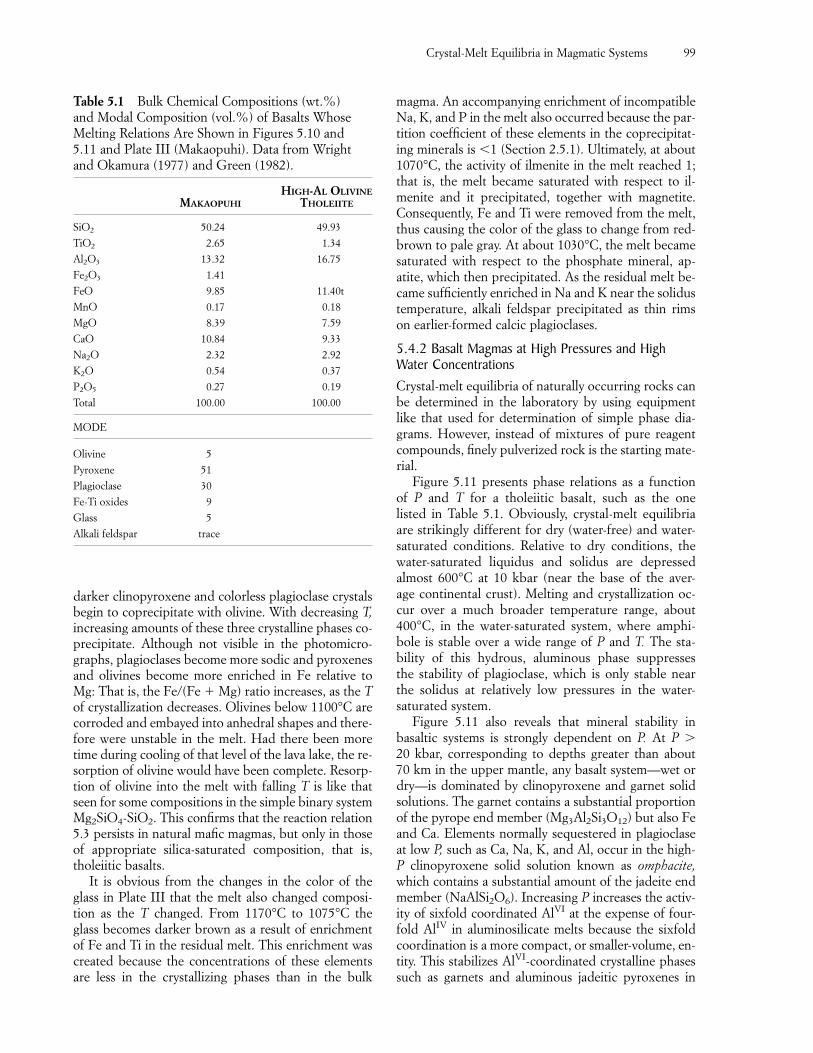
darker clinopyroxene and colorless plagioclase crystalsbegin to coprecipitate with olivine. With decreasing T,increasing amounts of these three crystalline phases co-precipitate. Although not visible in the photomicro-graphs, plagioclases become more sodic and pyroxenesand olivines become more enriched in Fe relative toMg: That is, the Fe/(Fe � Mg) ratio increases, as the Tof crystallization decreases. Olivines below 1100°C arecorroded and embayed into anhedral shapes and there-fore were unstable in the melt. Had there been moretime during cooling of that level of the lava lake, the re-sorption of olivine would have been complete. Resorp-tion of olivine into the melt with falling T is like thatseen for some compositions in the simple binary systemMg2SiO4-SiO2. This confirms that the reaction relation5.3 persists in natural mafic magmas, but only in thoseof appropriate silica-saturated composition, that is,tholeiitic basalts.
It is obvious from the changes in the color of theglass in Plate III that the melt also changed composi-tion as the T changed. From 1170°C to 1075°C theglass becomes darker brown as a result of enrichmentof Fe and Ti in the residual melt. This enrichment wascreated because the concentrations of these elementsare less in the crystallizing phases than in the bulk
magma. An accompanying enrichment of incompatibleNa, K, and P in the melt also occurred because the par-tition coefficient of these elements in the coprecipitat-ing minerals is 1 (Section 2.5.1). Ultimately, at about1070°C, the activity of ilmenite in the melt reached 1;that is, the melt became saturated with respect to il-menite and it precipitated, together with magnetite.Consequently, Fe and Ti were removed from the melt,thus causing the color of the glass to change from red-brown to pale gray. At about 1030°C, the melt becamesaturated with respect to the phosphate mineral, ap-atite, which then precipitated. As the residual melt be-came sufficiently enriched in Na and K near the solidustemperature, alkali feldspar precipitated as thin rimson earlier-formed calcic plagioclases.
5.4.2 Basalt Magmas at High Pressures and HighWater ConcentrationsCrystal-melt equilibria of naturally occurring rocks canbe determined in the laboratory by using equipmentlike that used for determination of simple phase dia-grams. However, instead of mixtures of pure reagentcompounds, finely pulverized rock is the starting mate-rial.
Figure 5.11 presents phase relations as a function of P and T for a tholeiitic basalt, such as the one listed in Table 5.1. Obviously, crystal-melt equilibriaare strikingly different for dry (water-free) and water-saturated conditions. Relative to dry conditions, thewater-saturated liquidus and solidus are depressed almost 600°C at 10 kbar (near the base of the aver-age continental crust). Melting and crystallization oc-cur over a much broader temperature range, about400°C, in the water-saturated system, where amphi-bole is stable over a wide range of P and T. The sta-bility of this hydrous, aluminous phase suppresses the stability of plagioclase, which is only stable nearthe solidus at relatively low pressures in the water-saturated system.
Figure 5.11 also reveals that mineral stability inbasaltic systems is strongly dependent on P. At P 20 kbar, corresponding to depths greater than about 70 km in the upper mantle, any basalt system—wet ordry—is dominated by clinopyroxene and garnet solidsolutions. The garnet contains a substantial proportionof the pyrope end member (Mg3Al2Si3O12) but also Feand Ca. Elements normally sequestered in plagioclaseat low P, such as Ca, Na, K, and Al, occur in the high-P clinopyroxene solid solution known as omphacite,which contains a substantial amount of the jadeite endmember (NaAlSi2O6). Increasing P increases the activ-ity of sixfold coordinated AlVI at the expense of four-fold AlIV in aluminosilicate melts because the sixfoldcoordination is a more compact, or smaller-volume, en-tity. This stabilizes AlVI-coordinated crystalline phasessuch as garnets and aluminous jadeitic pyroxenes in
Crystal-Melt Equilibria in Magmatic Systems 99
Table 5.1 Bulk Chemical Compositions (wt.%) and Modal Composition (vol.%) of Basalts WhoseMelting Relations Are Shown in Figures 5.10 and 5.11 and Plate III (Makaopuhi). Data from Wrightand Okamura (1977) and Green (1982).
HIGH-AL OLIVINEMAKAOPUHI THOLEIITE
SiO2 50.24 49.93
TiO2 2.65 1.34
Al2O3 13.32 16.75
Fe2O3 1.41
FeO 9.85 11.40t
MnO 0.17 0.18
MgO 8.39 7.59
CaO 10.84 9.33
Na2O 2.32 2.92
K2O 0.54 0.37
P2O5 0.27 0.19
Total 100.00 100.00
MODE
Olivine 5
Pyroxene 51
Plagioclase 30
Fe-Ti oxides 9
Glass 5
Alkali feldspar trace
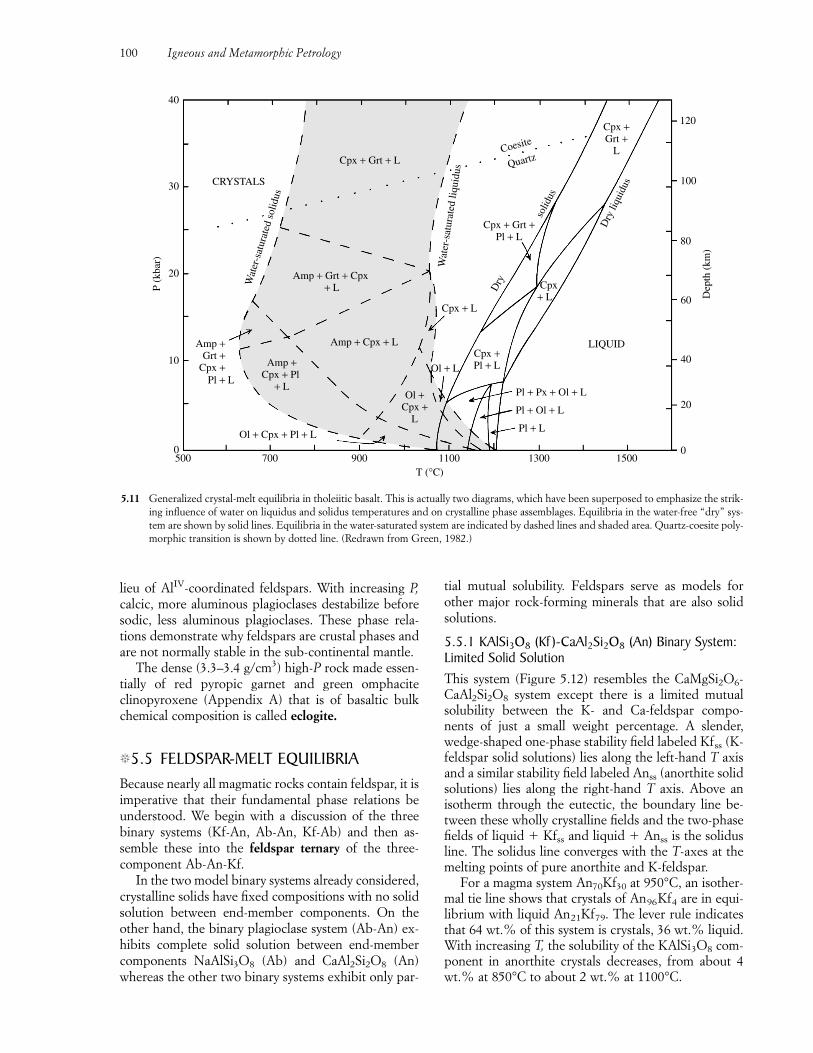
lieu of AlIV-coordinated feldspars. With increasing P,calcic, more aluminous plagioclases destabilize beforesodic, less aluminous plagioclases. These phase rela-tions demonstrate why feldspars are crustal phases andare not normally stable in the sub-continental mantle.
The dense (3.3–3.4 g/cm3) high-P rock made essen-tially of red pyropic garnet and green omphaciteclinopyroxene (Appendix A) that is of basaltic bulkchemical composition is called eclogite.
�5.5 FELDSPAR-MELT EQUILIBRIABecause nearly all magmatic rocks contain feldspar, it isimperative that their fundamental phase relations beunderstood. We begin with a discussion of the three binary systems (Kf-An, Ab-An, Kf-Ab) and then as-semble these into the feldspar ternary of the three-component Ab-An-Kf.
In the two model binary systems already considered,crystalline solids have fixed compositions with no solidsolution between end-member components. On theother hand, the binary plagioclase system (Ab-An) ex-hibits complete solid solution between end-membercomponents NaAlSi3O8 (Ab) and CaAl2Si2O8 (An)whereas the other two binary systems exhibit only par-
tial mutual solubility. Feldspars serve as models forother major rock-forming minerals that are also solidsolutions.
5.5.1 KAlSi3O8 (Kf )-CaAl2Si2O8 (An) Binary System:Limited Solid SolutionThis system (Figure 5.12) resembles the CaMgSi2O6-CaAl2Si2O8 system except there is a limited mutual solubility between the K- and Ca-feldspar compo-nents of just a small weight percentage. A slender,wedge-shaped one-phase stability field labeled Kfss (K-feldspar solid solutions) lies along the left-hand T axisand a similar stability field labeled Anss (anorthite solidsolutions) lies along the right-hand T axis. Above anisotherm through the eutectic, the boundary line be-tween these wholly crystalline fields and the two-phasefields of liquid � Kfss and liquid � Anss is the solidusline. The solidus line converges with the T-axes at themelting points of pure anorthite and K-feldspar.
For a magma system An70Kf30 at 950°C, an isother-mal tie line shows that crystals of An96Kf4 are in equi-librium with liquid An21Kf79. The lever rule indicatesthat 64 wt.% of this system is crystals, 36 wt.% liquid.With increasing T, the solubility of the KAlSi3O8 com-ponent in anorthite crystals decreases, from about 4wt.% at 850°C to about 2 wt.% at 1100°C.
100 Igneous and Metamorphic Petrology
500 700 900 1100 1300 15000
20
40
60
80
100
120
Pl + Px + Ol + L
Pl + Ol + L
Pl + L
LIQUID
Dry
liqu
idus
Cpx +Grt +
L
solid
us
Cpx + Grt +Pl + L
Dry
Cpx +Pl + L
Cpx + L
Ol + L
Ol +Cpx +
L
Ol + Cpx + Pl + L
10
20
30
40
0
Amp +Grt +
Cpx + Amp +Cpx + Pl
+ L
Amp + Cpx + L
Amp + Grt + Cpx + L
CRYSTALS
Cpx + Grt + LCoesite
Quartz
Wat
er-s
atur
ated
sol
idus
Wat
er-s
atur
ated
liqu
idus
T (°C)
Dep
th (
km)
P (k
bar)
Pl + L
Cpx+ L
5.11 Generalized crystal-melt equilibria in tholeiitic basalt. This is actually two diagrams, which have been superposed to emphasize the strik-ing influence of water on liquidus and solidus temperatures and on crystalline phase assemblages. Equilibria in the water-free “dry” sys-tem are shown by solid lines. Equilibria in the water-saturated system are indicated by dashed lines and shaded area. Quartz-coesite poly-morphic transition is shown by dotted line. (Redrawn from Green, 1982.)
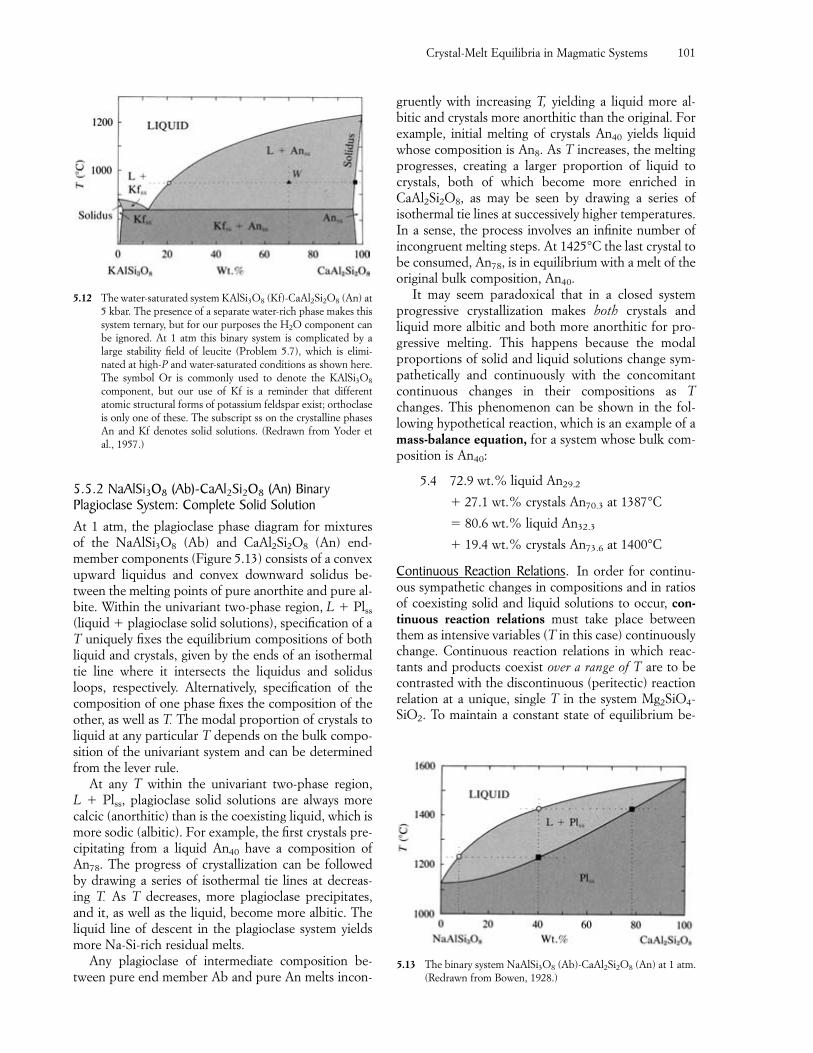
5.5.2 NaAlSi3O8 (Ab)-CaAl2Si2O8 (An) BinaryPlagioclase System: Complete Solid SolutionAt 1 atm, the plagioclase phase diagram for mixtures of the NaAlSi3O8 (Ab) and CaAl2Si2O8 (An) end-member components (Figure 5.13) consists of a convexupward liquidus and convex downward solidus be-tween the melting points of pure anorthite and pure al-bite. Within the univariant two-phase region, L � Plss(liquid � plagioclase solid solutions), specification of aT uniquely fixes the equilibrium compositions of bothliquid and crystals, given by the ends of an isothermaltie line where it intersects the liquidus and solidusloops, respectively. Alternatively, specification of thecomposition of one phase fixes the composition of theother, as well as T. The modal proportion of crystals toliquid at any particular T depends on the bulk compo-sition of the univariant system and can be determinedfrom the lever rule.
At any T within the univariant two-phase region, L � Plss, plagioclase solid solutions are always morecalcic (anorthitic) than is the coexisting liquid, which ismore sodic (albitic). For example, the first crystals pre-cipitating from a liquid An40 have a composition ofAn78. The progress of crystallization can be followedby drawing a series of isothermal tie lines at decreas-ing T. As T decreases, more plagioclase precipitates,and it, as well as the liquid, become more albitic. Theliquid line of descent in the plagioclase system yieldsmore Na-Si-rich residual melts.
Any plagioclase of intermediate composition be-tween pure end member Ab and pure An melts incon-
gruently with increasing T, yielding a liquid more al-bitic and crystals more anorthitic than the original. Forexample, initial melting of crystals An40 yields liquidwhose composition is An8. As T increases, the meltingprogresses, creating a larger proportion of liquid tocrystals, both of which become more enriched inCaAl2Si2O8, as may be seen by drawing a series ofisothermal tie lines at successively higher temperatures.In a sense, the process involves an infinite number ofincongruent melting steps. At 1425°C the last crystal tobe consumed, An78, is in equilibrium with a melt of theoriginal bulk composition, An40.
It may seem paradoxical that in a closed systemprogressive crystallization makes both crystals and liquid more albitic and both more anorthitic for pro-gressive melting. This happens because the modal proportions of solid and liquid solutions change sym-pathetically and continuously with the concomitantcontinuous changes in their compositions as Tchanges. This phenomenon can be shown in the fol-lowing hypothetical reaction, which is an example of amass-balance equation, for a system whose bulk com-position is An40:
5.4 72.9 wt.% liquid An29.2
� 27.1 wt.% crystals An70.3 at 1387°C
� 80.6 wt.% liquid An32.3
� 19.4 wt.% crystals An73.6 at 1400°C
Continuous Reaction Relations. In order for continu-ous sympathetic changes in compositions and in ratiosof coexisting solid and liquid solutions to occur, con-tinuous reaction relations must take place betweenthem as intensive variables (T in this case) continuouslychange. Continuous reaction relations in which reac-tants and products coexist over a range of T are to becontrasted with the discontinuous (peritectic) reactionrelation at a unique, single T in the system Mg2SiO4-SiO2. To maintain a constant state of equilibrium be-
Crystal-Melt Equilibria in Magmatic Systems 101
5.12 The water-saturated system KAlSi3O8 (Kf)-CaAl2Si2O8 (An) at5 kbar. The presence of a separate water-rich phase makes thissystem ternary, but for our purposes the H2O component canbe ignored. At 1 atm this binary system is complicated by alarge stability field of leucite (Problem 5.7), which is elimi-nated at high-P and water-saturated conditions as shown here.The symbol Or is commonly used to denote the KAlSi3O8
component, but our use of Kf is a reminder that differentatomic structural forms of potassium feldspar exist; orthoclaseis only one of these. The subscript ss on the crystalline phasesAn and Kf denotes solid solutions. (Redrawn from Yoder etal., 1957.)
5.13 The binary system NaAlSi3O8 (Ab)-CaAl2Si2O8 (An) at 1 atm.(Redrawn from Bowen, 1928.)
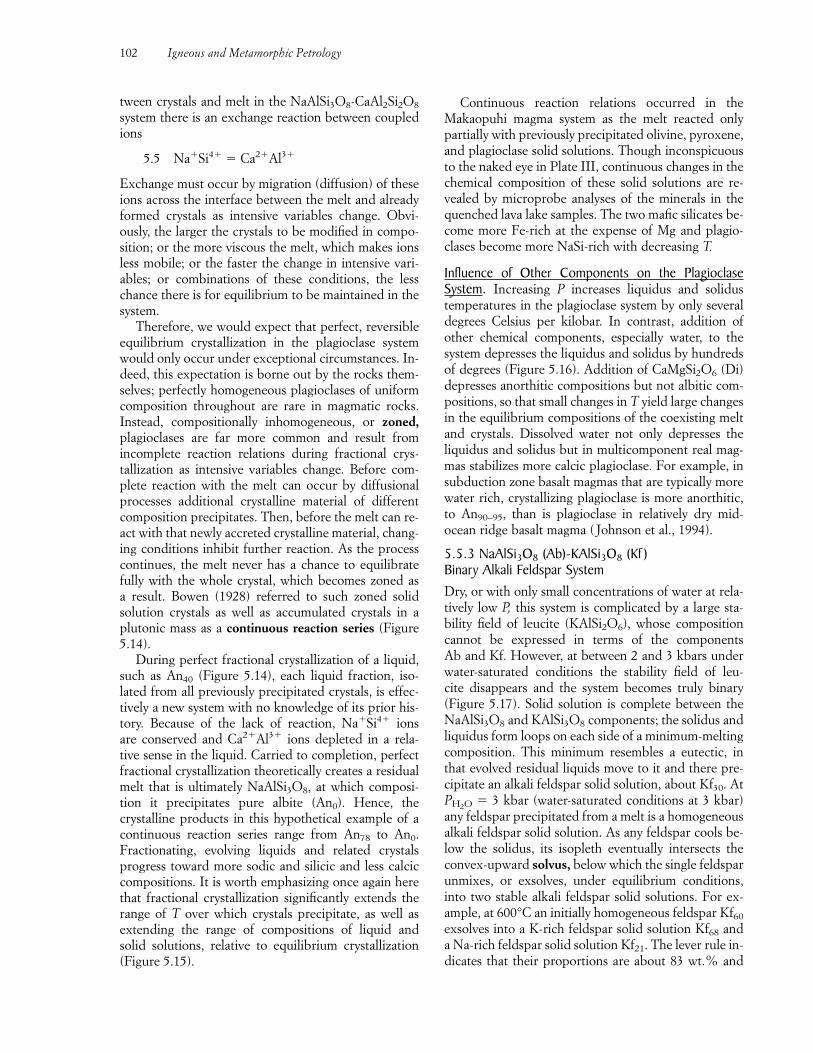
tween crystals and melt in the NaAlSi3O8-CaAl2Si2O8
system there is an exchange reaction between coupledions
5.5 Na�Si4� � Ca2�Al3�
Exchange must occur by migration (diffusion) of theseions across the interface between the melt and alreadyformed crystals as intensive variables change. Obvi-ously, the larger the crystals to be modified in compo-sition; or the more viscous the melt, which makes ionsless mobile; or the faster the change in intensive vari-ables; or combinations of these conditions, the lesschance there is for equilibrium to be maintained in thesystem.
Therefore, we would expect that perfect, reversibleequilibrium crystallization in the plagioclase systemwould only occur under exceptional circumstances. In-deed, this expectation is borne out by the rocks them-selves; perfectly homogeneous plagioclases of uniformcomposition throughout are rare in magmatic rocks.Instead, compositionally inhomogeneous, or zoned,plagioclases are far more common and result from incomplete reaction relations during fractional crys-tallization as intensive variables change. Before com-plete reaction with the melt can occur by diffusionalprocesses additional crystalline material of differentcomposition precipitates. Then, before the melt can re-act with that newly accreted crystalline material, chang-ing conditions inhibit further reaction. As the processcontinues, the melt never has a chance to equilibratefully with the whole crystal, which becomes zoned as a result. Bowen (1928) referred to such zoned solid solution crystals as well as accumulated crystals in aplutonic mass as a continuous reaction series (Figure5.14).
During perfect fractional crystallization of a liquid,such as An40 (Figure 5.14), each liquid fraction, iso-lated from all previously precipitated crystals, is effec-tively a new system with no knowledge of its prior his-tory. Because of the lack of reaction, Na�Si4� ions are conserved and Ca2�Al3� ions depleted in a rela-tive sense in the liquid. Carried to completion, perfectfractional crystallization theoretically creates a residualmelt that is ultimately NaAlSi3O8, at which composi-tion it precipitates pure albite (An0). Hence, the crystalline products in this hypothetical example of acontinuous reaction series range from An78 to An0.Fractionating, evolving liquids and related crystalsprogress toward more sodic and silicic and less calciccompositions. It is worth emphasizing once again herethat fractional crystallization significantly extends therange of T over which crystals precipitate, as well as extending the range of compositions of liquid and solid solutions, relative to equilibrium crystallization(Figure 5.15).
Continuous reaction relations occurred in theMakaopuhi magma system as the melt reacted onlypartially with previously precipitated olivine, pyroxene,and plagioclase solid solutions. Though inconspicuousto the naked eye in Plate III, continuous changes in thechemical composition of these solid solutions are re-vealed by microprobe analyses of the minerals in thequenched lava lake samples. The two mafic silicates be-come more Fe-rich at the expense of Mg and plagio-clases become more NaSi-rich with decreasing T.
Influence of Other Components on the PlagioclaseSystem. Increasing P increases liquidus and solidustemperatures in the plagioclase system by only severaldegrees Celsius per kilobar. In contrast, addition ofother chemical components, especially water, to thesystem depresses the liquidus and solidus by hundredsof degrees (Figure 5.16). Addition of CaMgSi2O6 (Di)depresses anorthitic compositions but not albitic com-positions, so that small changes in T yield large changesin the equilibrium compositions of the coexisting meltand crystals. Dissolved water not only depresses theliquidus and solidus but in multicomponent real mag-mas stabilizes more calcic plagioclase. For example, insubduction zone basalt magmas that are typically morewater rich, crystallizing plagioclase is more anorthitic,to An90–95, than is plagioclase in relatively dry mid-ocean ridge basalt magma ( Johnson et al., 1994).
5.5.3 NaAlSi3O8 (Ab)-KAlSi3O8 (Kf ) Binary Alkali Feldspar SystemDry, or with only small concentrations of water at rela-tively low P, this system is complicated by a large sta-bility field of leucite (KAlSi2O6), whose compositioncannot be expressed in terms of the components Ab and Kf. However, at between 2 and 3 kbars underwater-saturated conditions the stability field of leu-cite disappears and the system becomes truly binary (Figure 5.17). Solid solution is complete between theNaAlSi3O8 and KAlSi3O8 components; the solidus andliquidus form loops on each side of a minimum-meltingcomposition. This minimum resembles a eutectic, inthat evolved residual liquids move to it and there pre-cipitate an alkali feldspar solid solution, about Kf30. AtPH2O � 3 kbar (water-saturated conditions at 3 kbar)any feldspar precipitated from a melt is a homogeneousalkali feldspar solid solution. As any feldspar cools be-low the solidus, its isopleth eventually intersects theconvex-upward solvus, below which the single feldsparunmixes, or exsolves, under equilibrium conditions,into two stable alkali feldspar solid solutions. For ex-ample, at 600°C an initially homogeneous feldspar Kf60
exsolves into a K-rich feldspar solid solution Kf68 anda Na-rich feldspar solid solution Kf21. The lever rule in-dicates that their proportions are about 83 wt.% and
102 Igneous and Metamorphic Petrology
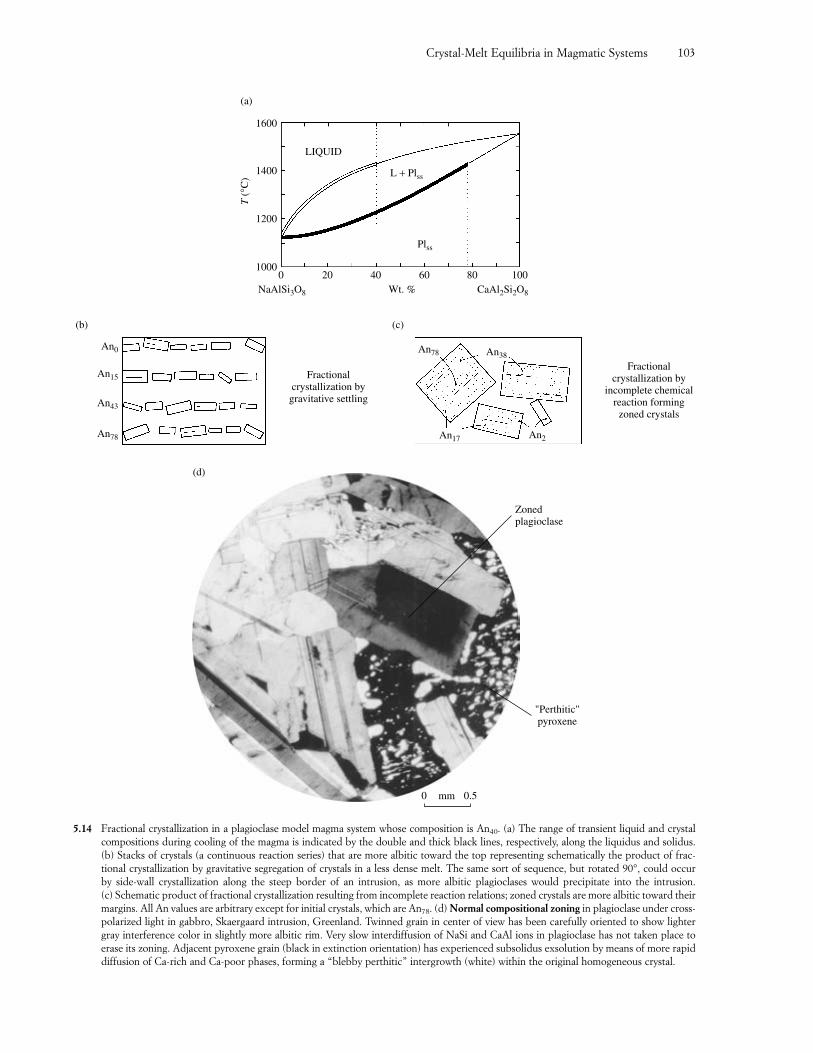
Crystal-Melt Equilibria in Magmatic Systems 103
An78
An43
An15
An0
Fractionalcrystallization bygravitative settling
(b)
5.14 Fractional crystallization in a plagioclase model magma system whose composition is An40. (a) The range of transient liquid and crystalcompositions during cooling of the magma is indicated by the double and thick black lines, respectively, along the liquidus and solidus.(b) Stacks of crystals (a continuous reaction series) that are more albitic toward the top representing schematically the product of frac-tional crystallization by gravitative segregation of crystals in a less dense melt. The same sort of sequence, but rotated 90°, could occur by side-wall crystallization along the steep border of an intrusion, as more albitic plagioclases would precipitate into the intrusion. (c) Schematic product of fractional crystallization resulting from incomplete reaction relations; zoned crystals are more albitic toward theirmargins. All An values are arbitrary except for initial crystals, which are An78. (d) Normal compositional zoning in plagioclase under cross-polarized light in gabbro, Skaergaard intrusion, Greenland. Twinned grain in center of view has been carefully oriented to show lightergray interference color in slightly more albitic rim. Very slow interdiffusion of NaSi and CaAl ions in plagioclase has not taken place toerase its zoning. Adjacent pyroxene grain (black in extinction orientation) has experienced subsolidus exsolution by means of more rapiddiffusion of Ca-rich and Ca-poor phases, forming a “blebby perthitic” intergrowth (white) within the original homogeneous crystal.
"Perthitic"pyroxene
Zonedplagioclase
0 0.5mm
(d)
An17 An2
An38An78
Fractionalcrystallization by
incomplete chemicalreaction formingzoned crystals
(c)
01000
1200
1400
1600
20 40 60 80 100Wt. % CaAl2Si2O8NaAlSi3O8
T (
°C)
(a)
L + Plss
LIQUID
Plss
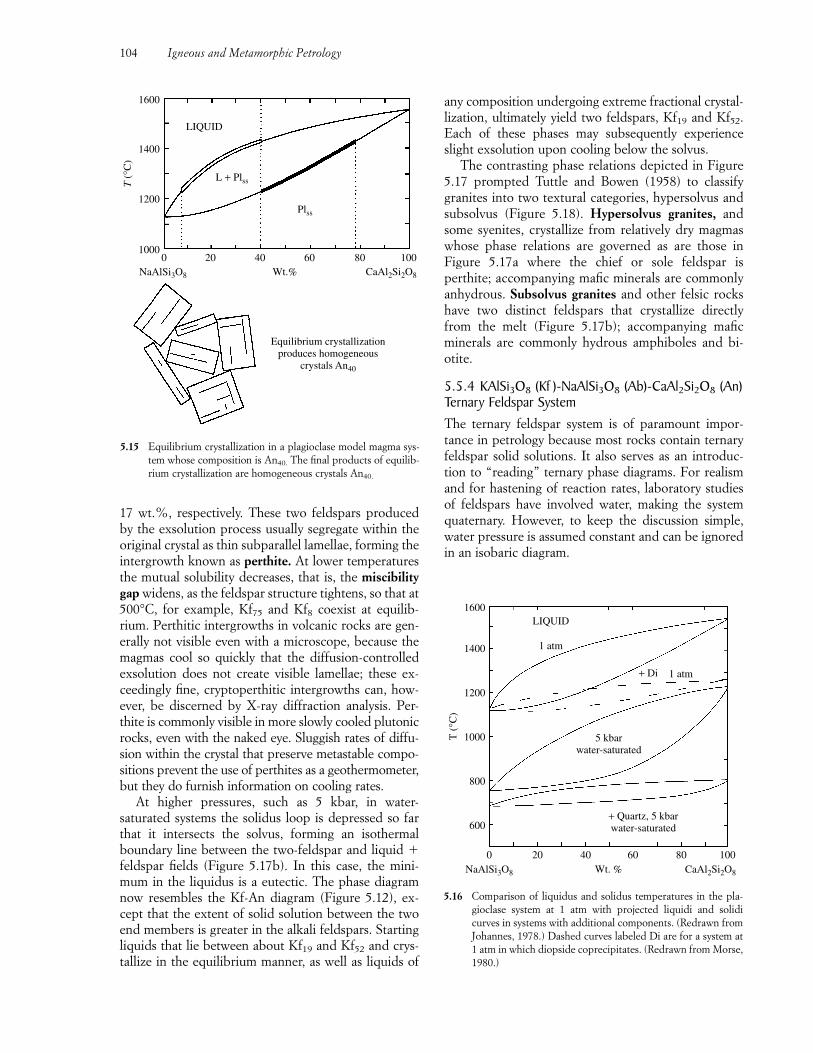
17 wt.%, respectively. These two feldspars producedby the exsolution process usually segregate within theoriginal crystal as thin subparallel lamellae, forming theintergrowth known as perthite. At lower temperaturesthe mutual solubility decreases, that is, the miscibilitygap widens, as the feldspar structure tightens, so that at500°C, for example, Kf75 and Kf8 coexist at equilib-rium. Perthitic intergrowths in volcanic rocks are gen-erally not visible even with a microscope, because themagmas cool so quickly that the diffusion-controlledexsolution does not create visible lamellae; these ex-ceedingly fine, cryptoperthitic intergrowths can, how-ever, be discerned by X-ray diffraction analysis. Per-thite is commonly visible in more slowly cooled plutonicrocks, even with the naked eye. Sluggish rates of diffu-sion within the crystal that preserve metastable compo-sitions prevent the use of perthites as a geothermometer,but they do furnish information on cooling rates.
At higher pressures, such as 5 kbar, in water-saturated systems the solidus loop is depressed so farthat it intersects the solvus, forming an isothermalboundary line between the two-feldspar and liquid �feldspar fields (Figure 5.17b). In this case, the mini-mum in the liquidus is a eutectic. The phase diagramnow resembles the Kf-An diagram (Figure 5.12), ex-cept that the extent of solid solution between the twoend members is greater in the alkali feldspars. Startingliquids that lie between about Kf19 and Kf52 and crys-tallize in the equilibrium manner, as well as liquids of
any composition undergoing extreme fractional crystal-lization, ultimately yield two feldspars, Kf19 and Kf52.Each of these phases may subsequently experienceslight exsolution upon cooling below the solvus.
The contrasting phase relations depicted in Figure5.17 prompted Tuttle and Bowen (1958) to classifygranites into two textural categories, hypersolvus andsubsolvus (Figure 5.18). Hypersolvus granites, andsome syenites, crystallize from relatively dry magmaswhose phase relations are governed as are those in Figure 5.17a where the chief or sole feldspar isperthite; accompanying mafic minerals are commonlyanhydrous. Subsolvus granites and other felsic rockshave two distinct feldspars that crystallize directlyfrom the melt (Figure 5.17b); accompanying maficminerals are commonly hydrous amphiboles and bi-otite.
5.5.4 KAlSi3O8 (Kf )-NaAlSi3O8 (Ab)-CaAl2Si2O8 (An)Ternary Feldspar SystemThe ternary feldspar system is of paramount impor-tance in petrology because most rocks contain ternaryfeldspar solid solutions. It also serves as an introduc-tion to “reading” ternary phase diagrams. For realismand for hastening of reaction rates, laboratory studiesof feldspars have involved water, making the systemquaternary. However, to keep the discussion simple,water pressure is assumed constant and can be ignoredin an isobaric diagram.
104 Igneous and Metamorphic Petrology
01000
1200
1400
1600
20 40 60 80 100Wt.%
T (
°C)
LIQUID
L + Plss
Plss
Equilibrium crystallizationproduces homogeneous
crystals An40
CaAl2Si2O8NaAlSi3O8
5.15 Equilibrium crystallization in a plagioclase model magma sys-tem whose composition is An40. The final products of equilib-rium crystallization are homogeneous crystals An40.
0
600
800
1000
1200
1400
1600
20 40 60 80 100NaAlSi3O8 Wt. % CaAl2Si2O8
T (
°C)
LIQUID
1 atm
1 atm+ Di
5 kbarwater-saturated
+ Quartz, 5 kbarwater-saturated
5.16 Comparison of liquidus and solidus temperatures in the pla-gioclase system at 1 atm with projected liquidi and solidicurves in systems with additional components. (Redrawn fromJohannes, 1978.) Dashed curves labeled Di are for a system at1 atm in which diopside coprecipitates. (Redrawn from Morse,1980.)
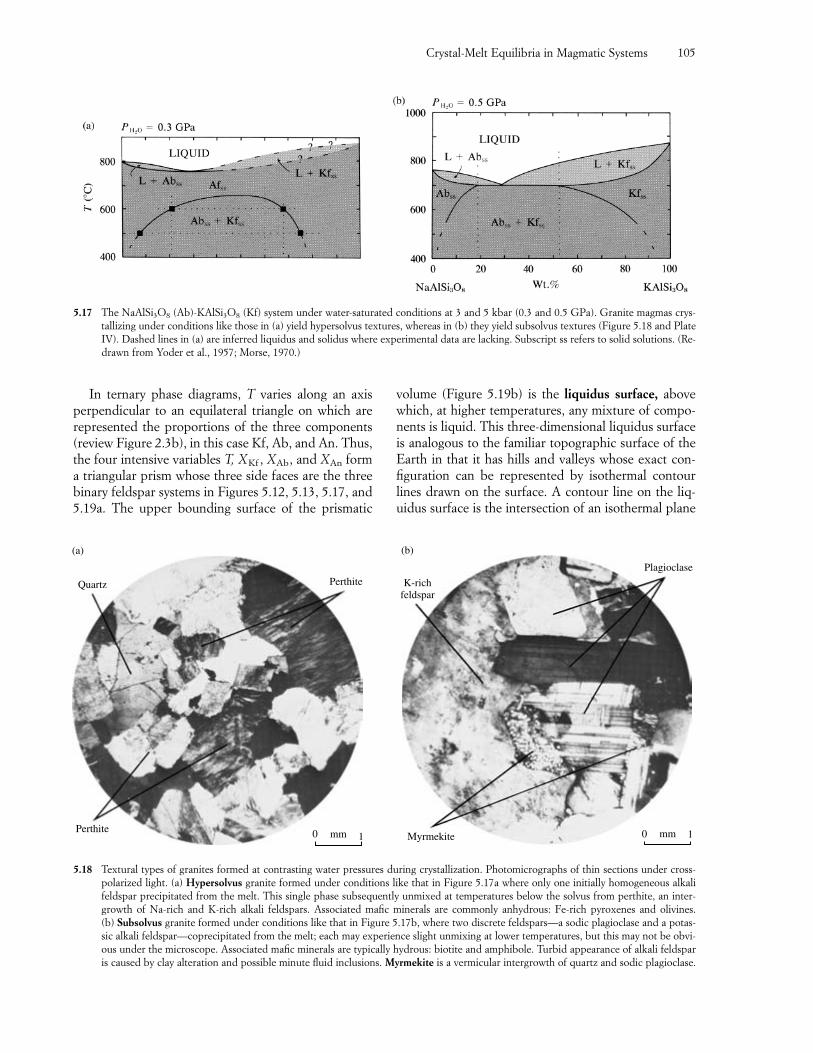
In ternary phase diagrams, T varies along an axisperpendicular to an equilateral triangle on which arerepresented the proportions of the three components(review Figure 2.3b), in this case Kf, Ab, and An. Thus,the four intensive variables T, XKf , XAb, and XAn forma triangular prism whose three side faces are the threebinary feldspar systems in Figures 5.12, 5.13, 5.17, and5.19a. The upper bounding surface of the prismatic
volume (Figure 5.19b) is the liquidus surface, abovewhich, at higher temperatures, any mixture of compo-nents is liquid. This three-dimensional liquidus surfaceis analogous to the familiar topographic surface of theEarth in that it has hills and valleys whose exact con-figuration can be represented by isothermal contourlines drawn on the surface. A contour line on the liq-uidus surface is the intersection of an isothermal plane
Crystal-Melt Equilibria in Magmatic Systems 105
5.17 The NaAlSi3O8 (Ab)-KAlSi3O8 (Kf) system under water-saturated conditions at 3 and 5 kbar (0.3 and 0.5 GPa). Granite magmas crys-tallizing under conditions like those in (a) yield hypersolvus textures, whereas in (b) they yield subsolvus textures (Figure 5.18 and PlateIV). Dashed lines in (a) are inferred liquidus and solidus where experimental data are lacking. Subscript ss refers to solid solutions. (Re-drawn from Yoder et al., 1957; Morse, 1970.)
Perthite
Quartz Perthite
0 1mm
(a)
Myrmekite
Plagioclase
0 1mm
(b)
K-richfeldspar
5.18 Textural types of granites formed at contrasting water pressures during crystallization. Photomicrographs of thin sections under cross-polarized light. (a) Hypersolvus granite formed under conditions like that in Figure 5.17a where only one initially homogeneous alkalifeldspar precipitated from the melt. This single phase subsequently unmixed at temperatures below the solvus from perthite, an inter-growth of Na-rich and K-rich alkali feldspars. Associated mafic minerals are commonly anhydrous: Fe-rich pyroxenes and olivines. (b) Subsolvus granite formed under conditions like that in Figure 5.17b, where two discrete feldspars—a sodic plagioclase and a potas-sic alkali feldspar—coprecipitated from the melt; each may experience slight unmixing at lower temperatures, but this may not be obvi-ous under the microscope. Associated mafic minerals are typically hydrous: biotite and amphibole. Turbid appearance of alkali feldsparis caused by clay alteration and possible minute fluid inclusions. Myrmekite is a vermicular intergrowth of quartz and sodic plagioclase.
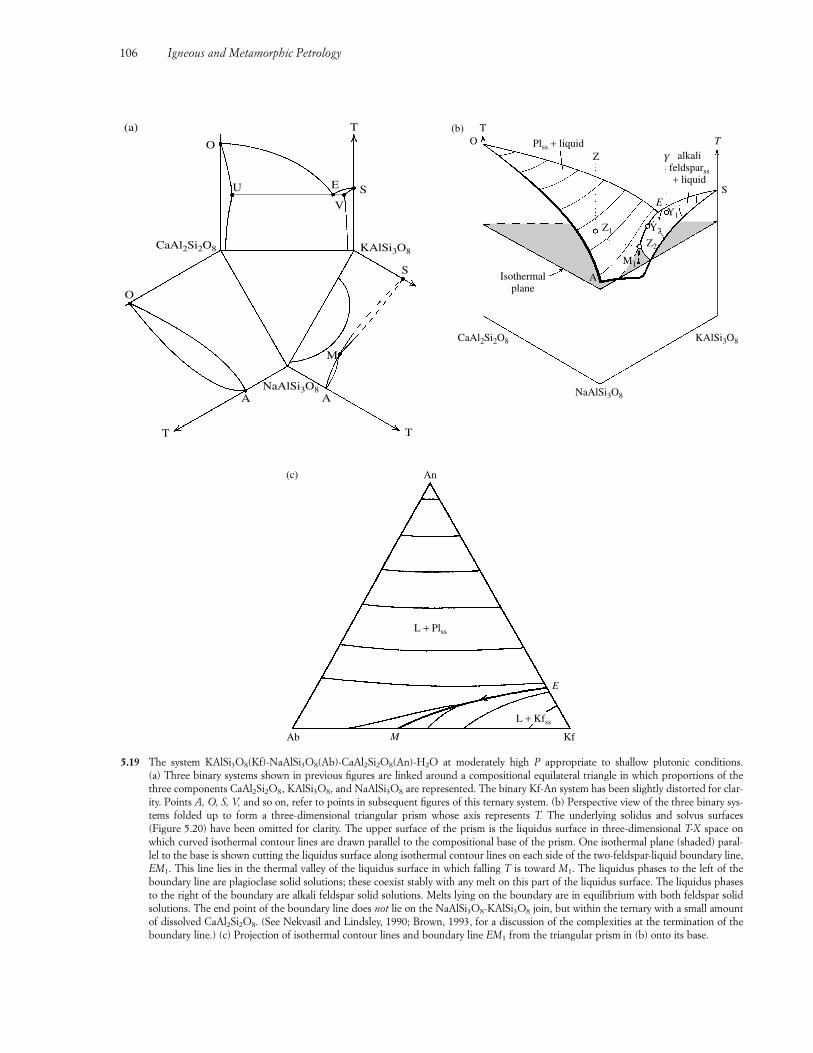
106 Igneous and Metamorphic Petrology
T
O
U E
V
S
KAlSi3O8
S
M
A
T
NaAlSi3O8A
T
O
CaAl2Si2O8
(a)
5.19 The system KAlSi3O8(Kf)-NaAlSi3O8(Ab)-CaAl2Si2O8(An)-H2O at moderately high P appropriate to shallow plutonic conditions. (a) Three binary systems shown in previous figures are linked around a compositional equilateral triangle in which proportions of thethree components CaAl2Si2O8, KAlSi3O8, and NaAlSi3O8 are represented. The binary Kf-An system has been slightly distorted for clar-ity. Points A, O, S, V, and so on, refer to points in subsequent figures of this ternary system. (b) Perspective view of the three binary sys-tems folded up to form a three-dimensional triangular prism whose axis represents T. The underlying solidus and solvus surfaces (Figure 5.20) have been omitted for clarity. The upper surface of the prism is the liquidus surface in three-dimensional T-X space onwhich curved isothermal contour lines are drawn parallel to the compositional base of the prism. One isothermal plane (shaded) paral-lel to the base is shown cutting the liquidus surface along isothermal contour lines on each side of the two-feldspar-liquid boundary line,EM1. This line lies in the thermal valley of the liquidus surface in which falling T is toward M1. The liquidus phases to the left of theboundary line are plagioclase solid solutions; these coexist stably with any melt on this part of the liquidus surface. The liquidus phasesto the right of the boundary are alkali feldspar solid solutions. Melts lying on the boundary are in equilibrium with both feldspar solidsolutions. The end point of the boundary line does not lie on the NaAlSi3O8-KAlSi3O8 join, but within the ternary with a small amountof dissolved CaAl2Si2O8. (See Nekvasil and Lindsley, 1990; Brown, 1993, for a discussion of the complexities at the termination of theboundary line.) (c) Projection of isothermal contour lines and boundary line EM1 from the triangular prism in (b) onto its base.
TO
CaAl2Si2O8
NaAlSi3O8
KAlSi3O8
S
Plss + liquid alkali
feldsparss+ liquid
Z
Z1
Z2
Y2
Y1
Isothermalplane
M1
E
Y
T
A
(b)
An
L + Plss
Ab M Kf
L + Kfss
E
(c)
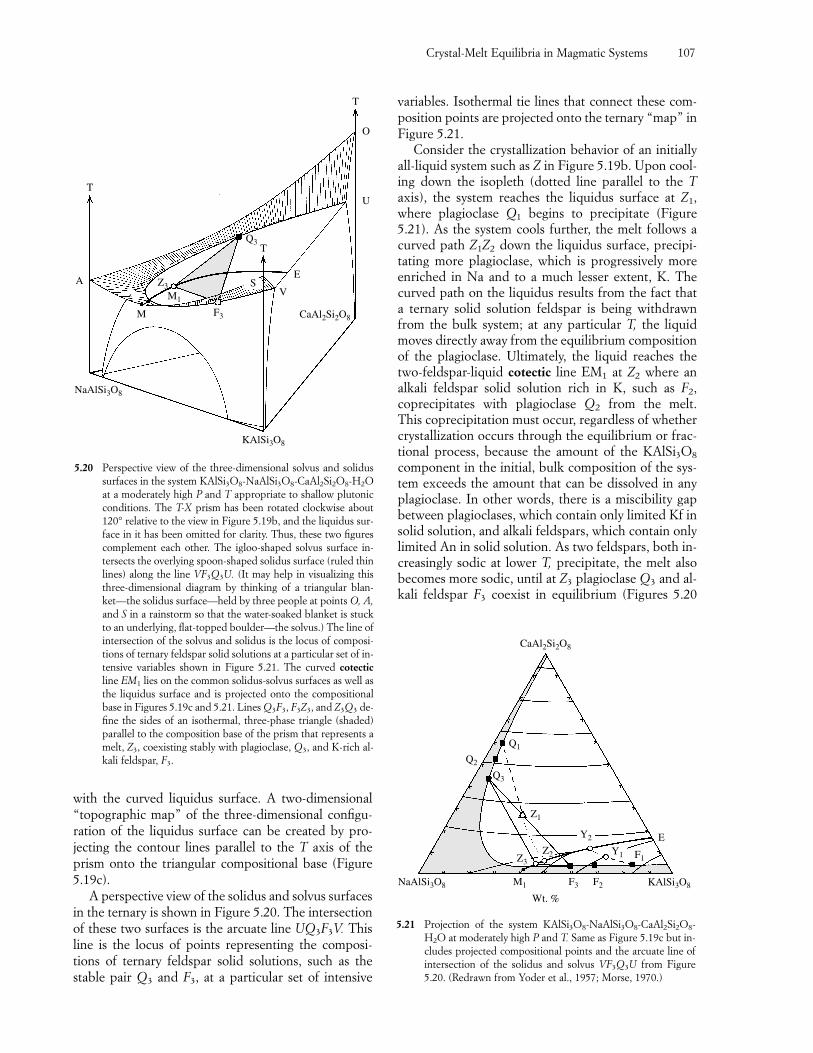
Crystal-Melt Equilibria in Magmatic Systems 107
with the curved liquidus surface. A two-dimensional“topographic map” of the three-dimensional configu-ration of the liquidus surface can be created by pro-jecting the contour lines parallel to the T axis of theprism onto the triangular compositional base (Figure5.19c).
A perspective view of the solidus and solvus surfacesin the ternary is shown in Figure 5.20. The intersectionof these two surfaces is the arcuate line UQ3F3V. Thisline is the locus of points representing the composi-tions of ternary feldspar solid solutions, such as the stable pair Q3 and F3, at a particular set of intensive
variables. Isothermal tie lines that connect these com-position points are projected onto the ternary “map” inFigure 5.21.
Consider the crystallization behavior of an initiallyall-liquid system such as Z in Figure 5.19b. Upon cool-ing down the isopleth (dotted line parallel to the Taxis), the system reaches the liquidus surface at Z1,where plagioclase Q1 begins to precipitate (Figure5.21). As the system cools further, the melt follows acurved path Z1Z2 down the liquidus surface, precipi-tating more plagioclase, which is progressively moreenriched in Na and to a much lesser extent, K. Thecurved path on the liquidus results from the fact that a ternary solid solution feldspar is being withdrawnfrom the bulk system; at any particular T, the liquidmoves directly away from the equilibrium compositionof the plagioclase. Ultimately, the liquid reaches thetwo-feldspar-liquid cotectic line EM1 at Z2 where analkali feldspar solid solution rich in K, such as F2, coprecipitates with plagioclase Q2 from the melt. This coprecipitation must occur, regardless of whethercrystallization occurs through the equilibrium or frac-tional process, because the amount of the KAlSi3O8
component in the initial, bulk composition of the sys-tem exceeds the amount that can be dissolved in anyplagioclase. In other words, there is a miscibility gapbetween plagioclases, which contain only limited Kf insolid solution, and alkali feldspars, which contain onlylimited An in solid solution. As two feldspars, both in-creasingly sodic at lower T, precipitate, the melt alsobecomes more sodic, until at Z3 plagioclase Q3 and al-kali feldspar F3 coexist in equilibrium (Figures 5.20
KAlSi3O8
NaAlSi3O8
A
T
T
O
U
CaAl2Si2O8
V
E
F3
M1
Z3
Q3T
S
M
5.20 Perspective view of the three-dimensional solvus and solidussurfaces in the system KAlSi3O8-NaAlSi3O8-CaAl2Si2O8-H2Oat a moderately high P and T appropriate to shallow plutonicconditions. The T-X prism has been rotated clockwise about120° relative to the view in Figure 5.19b, and the liquidus sur-face in it has been omitted for clarity. Thus, these two figurescomplement each other. The igloo-shaped solvus surface in-tersects the overlying spoon-shaped solidus surface (ruled thinlines) along the line VF3Q3U. (It may help in visualizing thisthree-dimensional diagram by thinking of a triangular blan-ket—the solidus surface—held by three people at points O, A,and S in a rainstorm so that the water-soaked blanket is stuckto an underlying, flat-topped boulder—the solvus.) The line ofintersection of the solvus and solidus is the locus of composi-tions of ternary feldspar solid solutions at a particular set of in-tensive variables shown in Figure 5.21. The curved cotecticline EM1 lies on the common solidus-solvus surfaces as well asthe liquidus surface and is projected onto the compositionalbase in Figures 5.19c and 5.21. Lines Q3F3, F3Z3, and Z3Q3 de-fine the sides of an isothermal, three-phase triangle (shaded)parallel to the composition base of the prism that represents amelt, Z3, coexisting stably with plagioclase, Q3, and K-rich al-kali feldspar, F3.
NaAlSi3O8
Wt. %KAlSi3O8M1 F3 F2
E
CaAl2Si2O8
Q1
Q2
Q3
Z1
Z3Z2
Y2
Y1 F1
5.21 Projection of the system KAlSi3O8-NaAlSi3O8-CaAl2Si2O8-H2O at moderately high P and T. Same as Figure 5.19c but in-cludes projected compositional points and the arcuate line ofintersection of the solidus and solvus VF3Q3U from Figure5.20. (Redrawn from Yoder et al., 1957; Morse, 1970.)
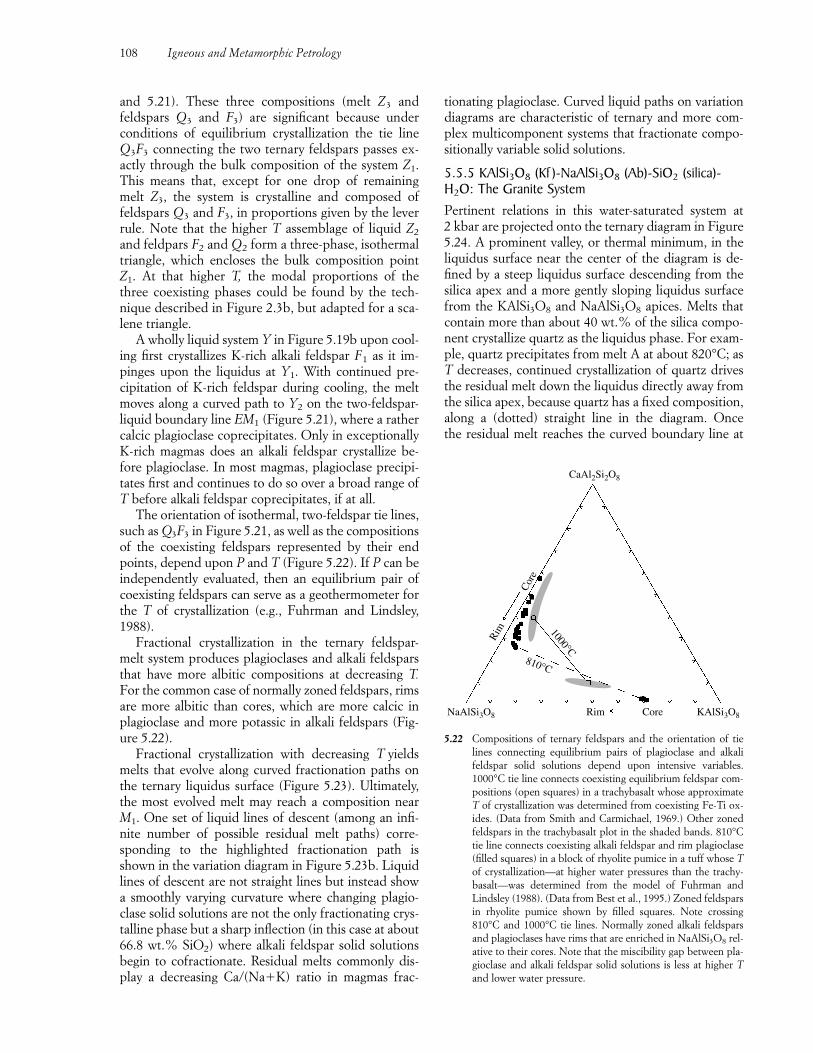
tionating plagioclase. Curved liquid paths on variationdiagrams are characteristic of ternary and more com-plex multicomponent systems that fractionate compo-sitionally variable solid solutions.
5.5.5 KAlSi3O8 (Kf )-NaAlSi3O8 (Ab)-SiO2 (silica)-H2O: The Granite SystemPertinent relations in this water-saturated system at 2 kbar are projected onto the ternary diagram in Figure5.24. A prominent valley, or thermal minimum, in theliquidus surface near the center of the diagram is de-fined by a steep liquidus surface descending from thesilica apex and a more gently sloping liquidus surfacefrom the KAlSi3O8 and NaAlSi3O8 apices. Melts thatcontain more than about 40 wt.% of the silica compo-nent crystallize quartz as the liquidus phase. For exam-ple, quartz precipitates from melt A at about 820°C; asT decreases, continued crystallization of quartz drivesthe residual melt down the liquidus directly away fromthe silica apex, because quartz has a fixed composition,along a (dotted) straight line in the diagram. Once the residual melt reaches the curved boundary line at
and 5.21). These three compositions (melt Z3 andfeldspars Q3 and F3) are significant because underconditions of equilibrium crystallization the tie lineQ3F3 connecting the two ternary feldspars passes ex-actly through the bulk composition of the system Z1.This means that, except for one drop of remainingmelt Z3, the system is crystalline and composed offeldspars Q3 and F3, in proportions given by the leverrule. Note that the higher T assemblage of liquid Z2
and feldpars F2 and Q2 form a three-phase, isothermaltriangle, which encloses the bulk composition pointZ1. At that higher T, the modal proportions of thethree coexisting phases could be found by the tech-nique described in Figure 2.3b, but adapted for a sca-lene triangle.
A wholly liquid system Y in Figure 5.19b upon cool-ing first crystallizes K-rich alkali feldspar F1 as it im-pinges upon the liquidus at Y1. With continued pre-cipitation of K-rich feldspar during cooling, the meltmoves along a curved path to Y2 on the two-feldspar-liquid boundary line EM1 (Figure 5.21), where a rathercalcic plagioclase coprecipitates. Only in exceptionallyK-rich magmas does an alkali feldspar crystallize be-fore plagioclase. In most magmas, plagioclase precipi-tates first and continues to do so over a broad range ofT before alkali feldspar coprecipitates, if at all.
The orientation of isothermal, two-feldspar tie lines,such as Q3F3 in Figure 5.21, as well as the compositionsof the coexisting feldspars represented by their endpoints, depend upon P and T (Figure 5.22). If P can beindependently evaluated, then an equilibrium pair ofcoexisting feldspars can serve as a geothermometer forthe T of crystallization (e.g., Fuhrman and Lindsley,1988).
Fractional crystallization in the ternary feldspar-melt system produces plagioclases and alkali feldsparsthat have more albitic compositions at decreasing T.For the common case of normally zoned feldspars, rimsare more albitic than cores, which are more calcic inplagioclase and more potassic in alkali feldspars (Fig-ure 5.22).
Fractional crystallization with decreasing T yieldsmelts that evolve along curved fractionation paths onthe ternary liquidus surface (Figure 5.23). Ultimately,the most evolved melt may reach a composition nearM1. One set of liquid lines of descent (among an infi-nite number of possible residual melt paths) corre-sponding to the highlighted fractionation path isshown in the variation diagram in Figure 5.23b. Liquidlines of descent are not straight lines but instead showa smoothly varying curvature where changing plagio-clase solid solutions are not the only fractionating crys-talline phase but a sharp inflection (in this case at about66.8 wt.% SiO2) where alkali feldspar solid solutionsbegin to cofractionate. Residual melts commonly dis-play a decreasing Ca/(Na�K) ratio in magmas frac-
108 Igneous and Metamorphic Petrology
Rim Core KAlSi3O8NaAlSi3O8
Rim
Cor
e
810°C
1000°C
CaAl2Si2O8
5.22 Compositions of ternary feldspars and the orientation of tielines connecting equilibrium pairs of plagioclase and alkalifeldspar solid solutions depend upon intensive variables.1000°C tie line connects coexisting equilibrium feldspar com-positions (open squares) in a trachybasalt whose approximateT of crystallization was determined from coexisting Fe-Ti ox-ides. (Data from Smith and Carmichael, 1969.) Other zonedfeldspars in the trachybasalt plot in the shaded bands. 810°Ctie line connects coexisting alkali feldspar and rim plagioclase(filled squares) in a block of rhyolite pumice in a tuff whose Tof crystallization—at higher water pressures than the trachy-basalt—was determined from the model of Fuhrman and Lindsley (1988). (Data from Best et al., 1995.) Zoned feldsparsin rhyolite pumice shown by filled squares. Note crossing810°C and 1000°C tie lines. Normally zoned alkali feldsparsand plagioclases have rims that are enriched in NaAlSi3O8 rel-ative to their cores. Note that the miscibility gap between pla-gioclase and alkali feldspar solid solutions is less at higher Tand lower water pressure.
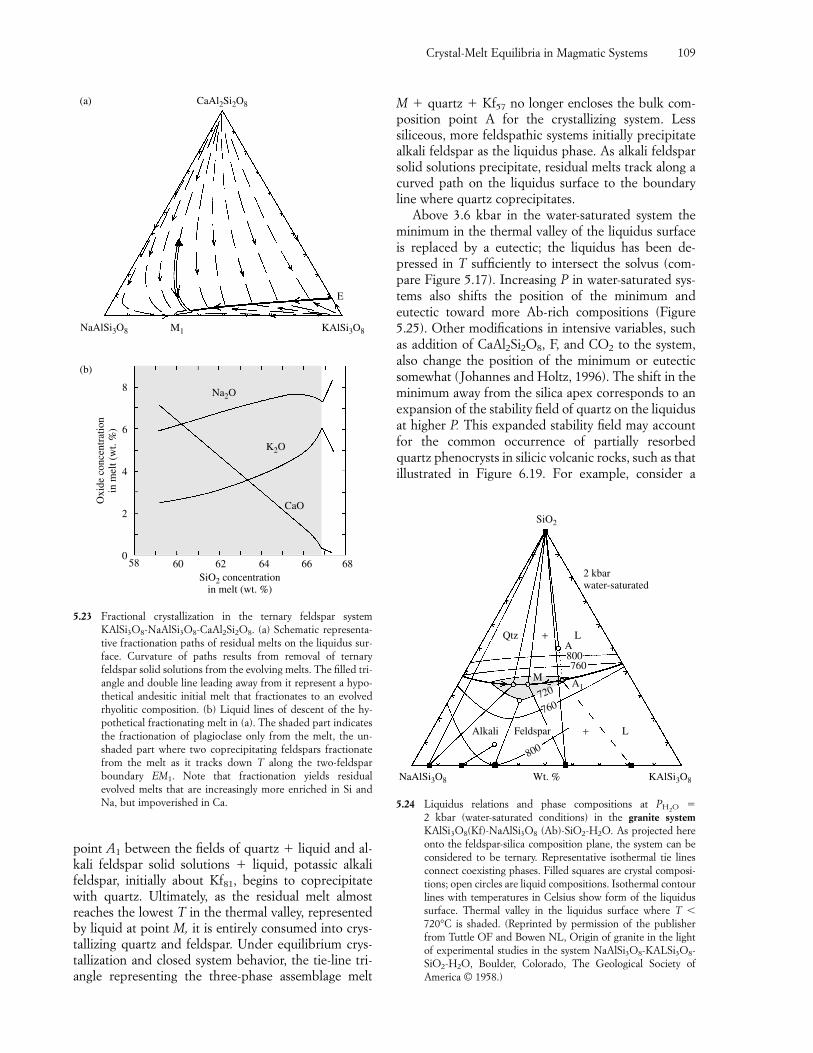
point A1 between the fields of quartz � liquid and al-kali feldspar solid solutions � liquid, potassic alkalifeldspar, initially about Kf81, begins to coprecipitatewith quartz. Ultimately, as the residual melt almostreaches the lowest T in the thermal valley, representedby liquid at point M, it is entirely consumed into crys-tallizing quartz and feldspar. Under equilibrium crys-tallization and closed system behavior, the tie-line tri-angle representing the three-phase assemblage melt
M � quartz � Kf57 no longer encloses the bulk com-position point A for the crystallizing system. Lesssiliceous, more feldspathic systems initially precipitatealkali feldspar as the liquidus phase. As alkali feldsparsolid solutions precipitate, residual melts track along acurved path on the liquidus surface to the boundaryline where quartz coprecipitates.
Above 3.6 kbar in the water-saturated system theminimum in the thermal valley of the liquidus surfaceis replaced by a eutectic; the liquidus has been de-pressed in T sufficiently to intersect the solvus (com-pare Figure 5.17). Increasing P in water-saturated sys-tems also shifts the position of the minimum andeutectic toward more Ab-rich compositions (Figure5.25). Other modifications in intensive variables, suchas addition of CaAl2Si2O8, F, and CO2 to the system,also change the position of the minimum or eutecticsomewhat (Johannes and Holtz, 1996). The shift in theminimum away from the silica apex corresponds to anexpansion of the stability field of quartz on the liquidusat higher P. This expanded stability field may accountfor the common occurrence of partially resorbedquartz phenocrysts in silicic volcanic rocks, such as thatillustrated in Figure 6.19. For example, consider a
Crystal-Melt Equilibria in Magmatic Systems 109
580
2
4
6
8
60 62 64 66 68
Oxi
de c
once
ntra
tion
in m
elt (
wt.
%)
(b)
SiO2 concentrationin melt (wt. %)
Na2O
K2O
CaO
NaAlSi3O8 M1 KAlSi3O8
E
CaAl2Si2O8(a)
5.23 Fractional crystallization in the ternary feldspar systemKAlSi3O8-NaAlSi3O8-CaAl2Si2O8. (a) Schematic representa-tive fractionation paths of residual melts on the liquidus sur-face. Curvature of paths results from removal of ternaryfeldspar solid solutions from the evolving melts. The filled tri-angle and double line leading away from it represent a hypo-thetical andesitic initial melt that fractionates to an evolvedrhyolitic composition. (b) Liquid lines of descent of the hy-pothetical fractionating melt in (a). The shaded part indicatesthe fractionation of plagioclase only from the melt, the un-shaded part where two coprecipitating feldspars fractionatefrom the melt as it tracks down T along the two-feldsparboundary EM1. Note that fractionation yields residualevolved melts that are increasingly more enriched in Si andNa, but impoverished in Ca.
NaAlSi3O8 Wt. % KAlSi3O8
Alkali Feldspar
800
760720
MA1
760800A
Qtz + L
+ L
2 kbarwater-saturated
SiO2
5.24 Liquidus relations and phase compositions at PH2O �
2 kbar (water-saturated conditions) in the granite systemKAlSi3O8(Kf)-NaAlSi3O8 (Ab)-SiO2-H2O. As projected hereonto the feldspar-silica composition plane, the system can beconsidered to be ternary. Representative isothermal tie linesconnect coexisting phases. Filled squares are crystal composi-tions; open circles are liquid compositions. Isothermal contourlines with temperatures in Celsius show form of the liquidussurface. Thermal valley in the liquidus surface where T
720°C is shaded. (Reprinted by permission of the publisherfrom Tuttle OF and Bowen NL, Origin of granite in the lightof experimental studies in the system NaAlSi3O8-KALSi3O8-SiO2-H2O, Boulder, Colorado, The Geological Society ofAmerica © 1958.)
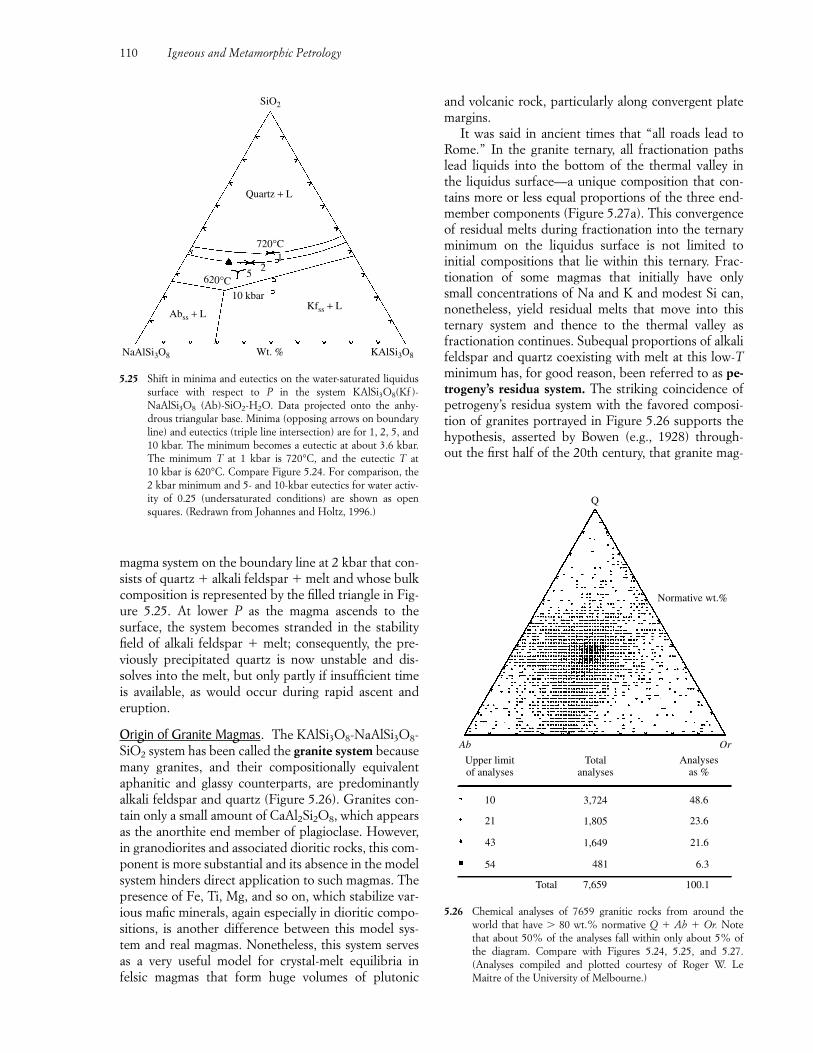
magma system on the boundary line at 2 kbar that con-sists of quartz � alkali feldspar � melt and whose bulkcomposition is represented by the filled triangle in Fig-ure 5.25. At lower P as the magma ascends to the surface, the system becomes stranded in the stabilityfield of alkali feldspar � melt; consequently, the pre-viously precipitated quartz is now unstable and dis-solves into the melt, but only partly if insufficient timeis available, as would occur during rapid ascent anderuption.
Origin of Granite Magmas. The KAlSi3O8-NaAlSi3O8-SiO2 system has been called the granite system becausemany granites, and their compositionally equivalentaphanitic and glassy counterparts, are predominantlyalkali feldspar and quartz (Figure 5.26). Granites con-tain only a small amount of CaAl2Si2O8, which appearsas the anorthite end member of plagioclase. However,in granodiorites and associated dioritic rocks, this com-ponent is more substantial and its absence in the modelsystem hinders direct application to such magmas. Thepresence of Fe, Ti, Mg, and so on, which stabilize var-ious mafic minerals, again especially in dioritic compo-sitions, is another difference between this model sys-tem and real magmas. Nonetheless, this system servesas a very useful model for crystal-melt equilibria in felsic magmas that form huge volumes of plutonic
and volcanic rock, particularly along convergent platemargins.
It was said in ancient times that “all roads lead toRome.” In the granite ternary, all fractionation pathslead liquids into the bottom of the thermal valley in the liquidus surface—a unique composition that con-tains more or less equal proportions of the three end-member components (Figure 5.27a). This convergenceof residual melts during fractionation into the ternaryminimum on the liquidus surface is not limited to initial compositions that lie within this ternary. Frac-tionation of some magmas that initially have only small concentrations of Na and K and modest Si can,nonetheless, yield residual melts that move into thisternary system and thence to the thermal valley as fractionation continues. Subequal proportions of alkalifeldspar and quartz coexisting with melt at this low-Tminimum has, for good reason, been referred to as pe-trogeny’s residua system. The striking coincidence ofpetrogeny’s residua system with the favored composi-tion of granites portrayed in Figure 5.26 supports thehypothesis, asserted by Bowen (e.g., 1928) through-out the first half of the 20th century, that granite mag-
110 Igneous and Metamorphic Petrology
NaAlSi3O8 Wt. % KAlSi3O8
Abss + L
10 kbarKfss + L
620°C5 2
1720°C
Quartz + L
SiO2
5.25 Shift in minima and eutectics on the water-saturated liquidussurface with respect to P in the system KAlSi3O8(Kf )-NaAlSi3O8 (Ab)-SiO2-H2O. Data projected onto the anhy-drous triangular base. Minima (opposing arrows on boundaryline) and eutectics (triple line intersection) are for 1, 2, 5, and10 kbar. The minimum becomes a eutectic at about 3.6 kbar.The minimum T at 1 kbar is 720°C, and the eutectic T at 10 kbar is 620°C. Compare Figure 5.24. For comparison, the2 kbar minimum and 5- and 10-kbar eutectics for water activ-ity of 0.25 (undersaturated conditions) are shown as opensquares. (Redrawn from Johannes and Holtz, 1996.)
Q
Ab Or
Normative wt.%
Upper limitof analyses
Totalanalyses
Analysesas %
10
21
43
54
3,724
1,805
1,649
481
48.6
23.6
21.6
6.3
Total 7,659 100.1
5.26 Chemical analyses of 7659 granitic rocks from around theworld that have 80 wt.% normative Q � Ab � Or. Notethat about 50% of the analyses fall within only about 5% ofthe diagram. Compare with Figures 5.24, 5.25, and 5.27.(Analyses compiled and plotted courtesy of Roger W. LeMaitre of the University of Melbourne.)
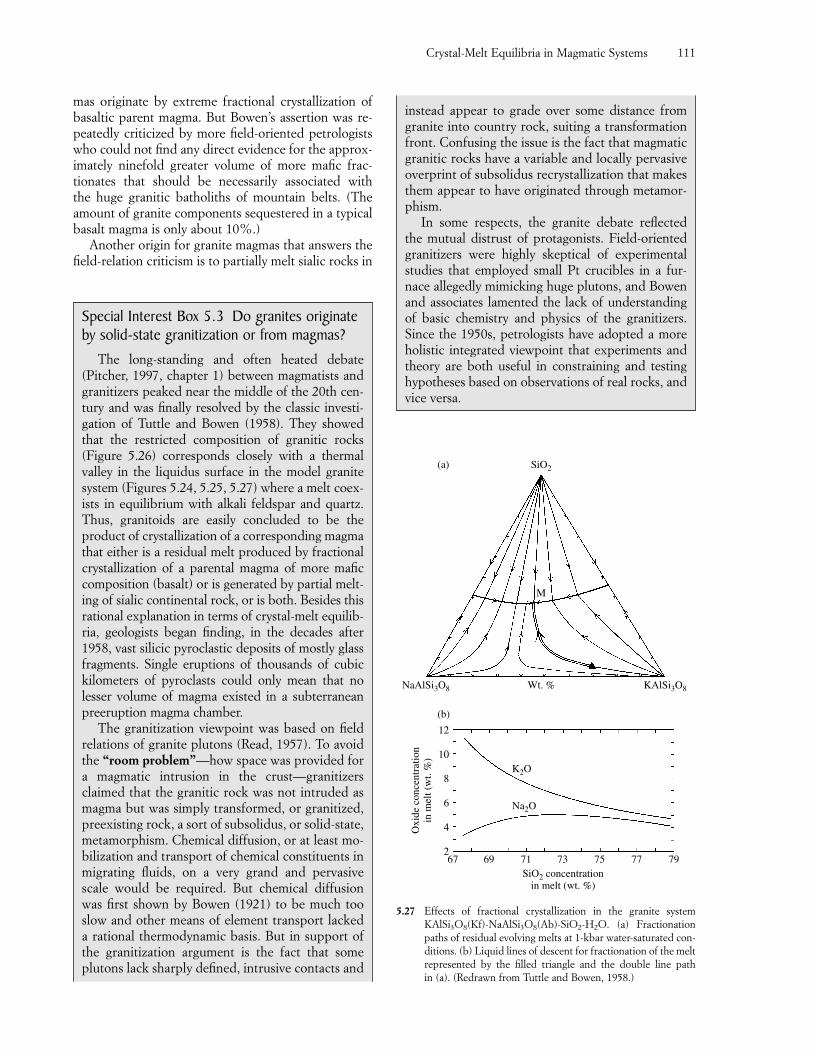
mas originate by extreme fractional crystallization ofbasaltic parent magma. But Bowen’s assertion was re-peatedly criticized by more field-oriented petrologistswho could not find any direct evidence for the approx-imately ninefold greater volume of more mafic frac-tionates that should be necessarily associated with the huge granitic batholiths of mountain belts. (Theamount of granite components sequestered in a typicalbasalt magma is only about 10%.)
Another origin for granite magmas that answers thefield-relation criticism is to partially melt sialic rocks in
Crystal-Melt Equilibria in Magmatic Systems 111
Special Interest Box 5.3 Do granites originateby solid-state granitization or from magmas?
The long-standing and often heated debate(Pitcher, 1997, chapter 1) between magmatists andgranitizers peaked near the middle of the 20th cen-tury and was finally resolved by the classic investi-gation of Tuttle and Bowen (1958). They showedthat the restricted composition of granitic rocks(Figure 5.26) corresponds closely with a thermalvalley in the liquidus surface in the model granitesystem (Figures 5.24, 5.25, 5.27) where a melt coex-ists in equilibrium with alkali feldspar and quartz.Thus, granitoids are easily concluded to be theproduct of crystallization of a corresponding magmathat either is a residual melt produced by fractionalcrystallization of a parental magma of more maficcomposition (basalt) or is generated by partial melt-ing of sialic continental rock, or is both. Besides thisrational explanation in terms of crystal-melt equilib-ria, geologists began finding, in the decades after1958, vast silicic pyroclastic deposits of mostly glassfragments. Single eruptions of thousands of cubickilometers of pyroclasts could only mean that nolesser volume of magma existed in a subterraneanpreeruption magma chamber.
The granitization viewpoint was based on fieldrelations of granite plutons (Read, 1957). To avoidthe “room problem”—how space was provided fora magmatic intrusion in the crust—granitizersclaimed that the granitic rock was not intruded asmagma but was simply transformed, or granitized,preexisting rock, a sort of subsolidus, or solid-state,metamorphism. Chemical diffusion, or at least mo-bilization and transport of chemical constituents inmigrating fluids, on a very grand and pervasivescale would be required. But chemical diffusionwas first shown by Bowen (1921) to be much tooslow and other means of element transport lackeda rational thermodynamic basis. But in support ofthe granitization argument is the fact that someplutons lack sharply defined, intrusive contacts and
instead appear to grade over some distance fromgranite into country rock, suiting a transformationfront. Confusing the issue is the fact that magmaticgranitic rocks have a variable and locally pervasiveoverprint of subsolidus recrystallization that makesthem appear to have originated through metamor-phism.
In some respects, the granite debate reflected the mutual distrust of protagonists. Field-orientedgranitizers were highly skeptical of experimentalstudies that employed small Pt crucibles in a fur-nace allegedly mimicking huge plutons, and Bowenand associates lamented the lack of understandingof basic chemistry and physics of the granitizers.Since the 1950s, petrologists have adopted a moreholistic integrated viewpoint that experiments andtheory are both useful in constraining and testinghypotheses based on observations of real rocks, andvice versa.
67 69 71 73 75 77 79SiO2 concentration
in melt (wt. %)
2
4
6
8
10
12
Oxi
de c
once
ntra
tion
in m
elt (
wt.
%)
(b)
Na2O
K2O
NaAlSi3O8 Wt. % KAlSi3O8
M
SiO2(a)
5.27 Effects of fractional crystallization in the granite systemKAlSi3O8(Kf)-NaAlSi3O8(Ab)-SiO2-H2O. (a) Fractionationpaths of residual evolving melts at 1-kbar water-saturated con-ditions. (b) Liquid lines of descent for fractionation of the meltrepresented by the filled triangle and the double line path in (a). (Redrawn from Tuttle and Bowen, 1958.)
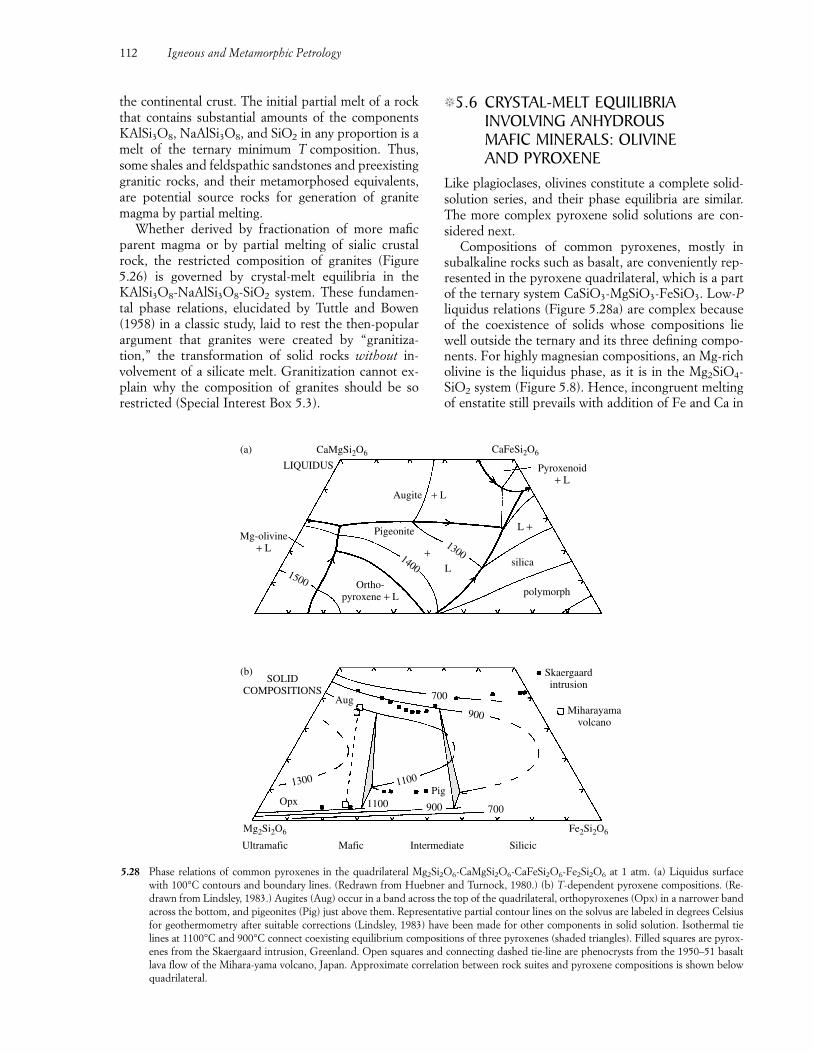
�5.6 CRYSTAL-MELT EQUILIBRIAINVOLVING ANHYDROUS MAFIC MINERALS: OLIVINE AND PYROXENE
Like plagioclases, olivines constitute a complete solid-solution series, and their phase equilibria are similar.The more complex pyroxene solid solutions are con-sidered next.
Compositions of common pyroxenes, mostly insubalkaline rocks such as basalt, are conveniently rep-resented in the pyroxene quadrilateral, which is a partof the ternary system CaSiO3-MgSiO3-FeSiO3. Low-Pliquidus relations (Figure 5.28a) are complex becauseof the coexistence of solids whose compositions liewell outside the ternary and its three defining compo-nents. For highly magnesian compositions, an Mg-richolivine is the liquidus phase, as it is in the Mg2SiO4-SiO2 system (Figure 5.8). Hence, incongruent meltingof enstatite still prevails with addition of Fe and Ca in
112 Igneous and Metamorphic Petrology
the continental crust. The initial partial melt of a rockthat contains substantial amounts of the componentsKAlSi3O8, NaAlSi3O8, and SiO2 in any proportion is amelt of the ternary minimum T composition. Thus,some shales and feldspathic sandstones and preexistinggranitic rocks, and their metamorphosed equivalents,are potential source rocks for generation of granitemagma by partial melting.
Whether derived by fractionation of more maficparent magma or by partial melting of sialic crustalrock, the restricted composition of granites (Figure5.26) is governed by crystal-melt equilibria in theKAlSi3O8-NaAlSi3O8-SiO2 system. These fundamen-tal phase relations, elucidated by Tuttle and Bowen(1958) in a classic study, laid to rest the then-popularargument that granites were created by “granitiza-tion,” the transformation of solid rocks without in-volvement of a silicate melt. Granitization cannot ex-plain why the composition of granites should be sorestricted (Special Interest Box 5.3).
1500 Ortho-pyroxene + L
1400
1300
Pigeonite
L
+
polymorph
silica
L +
Pyroxenoid+ L
CaFeSi2O6CaMgSi2O6
LIQUIDUS
Mg-olivine+ L
Augite + L
(a)
(b)SOLID
COMPOSITIONSAug 700
900
7009001100Opx
1300 1100Pig
Mg2Si2O6 Fe2Si2O6
Skaergaardintrusion
Miharayamavolcano
Ultramafic Mafic Intermediate Silicic
5.28 Phase relations of common pyroxenes in the quadrilateral Mg2Si2O6-CaMgSi2O6-CaFeSi2O6-Fe2Si2O6 at 1 atm. (a) Liquidus surface with 100°C contours and boundary lines. (Redrawn from Huebner and Turnock, 1980.) (b) T-dependent pyroxene compositions. (Re-drawn from Lindsley, 1983.) Augites (Aug) occur in a band across the top of the quadrilateral, orthopyroxenes (Opx) in a narrower bandacross the bottom, and pigeonites (Pig) just above them. Representative partial contour lines on the solvus are labeled in degrees Celsiusfor geothermometry after suitable corrections (Lindsley, 1983) have been made for other components in solid solution. Isothermal tielines at 1100°C and 900°C connect coexisting equilibrium compositions of three pyroxenes (shaded triangles). Filled squares are pyrox-enes from the Skaergaard intrusion, Greenland. Open squares and connecting dashed tie-line are phenocrysts from the 1950–51 basaltlava flow of the Mihara-yama volcano, Japan. Approximate correlation between rock suites and pyroxene compositions is shown belowquadrilateral.
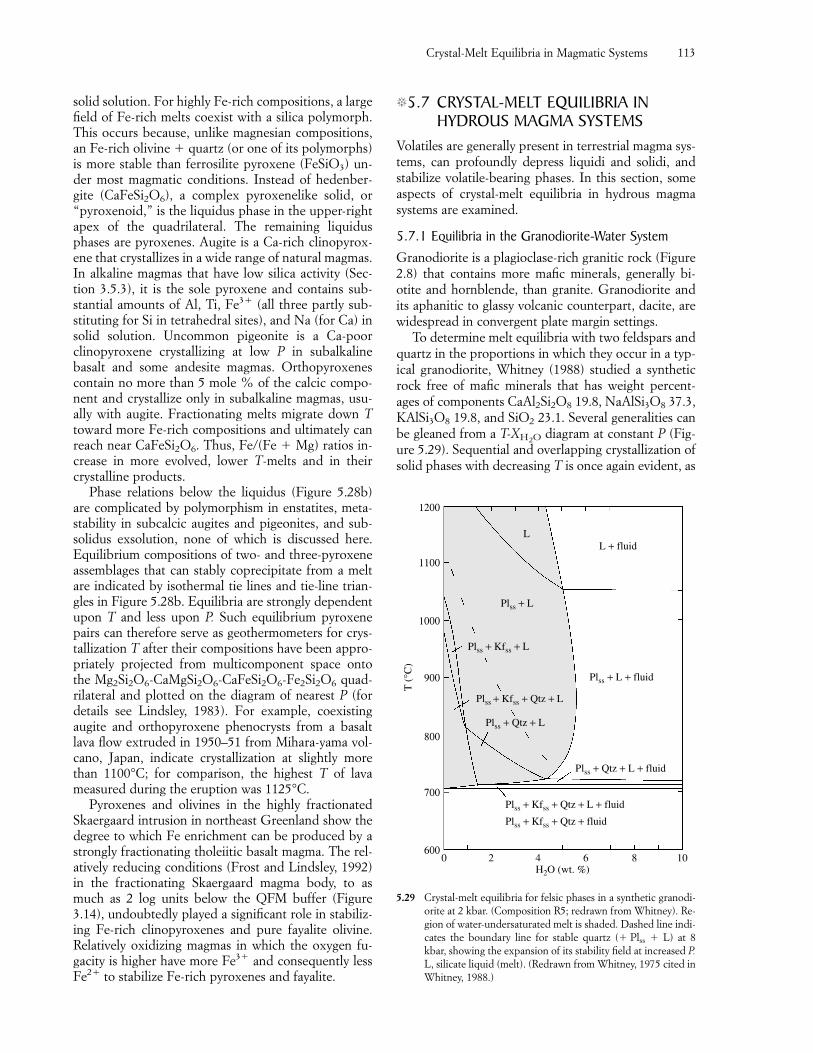
solid solution. For highly Fe-rich compositions, a largefield of Fe-rich melts coexist with a silica polymorph.This occurs because, unlike magnesian compositions,an Fe-rich olivine � quartz (or one of its polymorphs)is more stable than ferrosilite pyroxene (FeSiO3) un-der most magmatic conditions. Instead of hedenber-gite (CaFeSi2O6), a complex pyroxenelike solid, or“pyroxenoid,” is the liquidus phase in the upper-rightapex of the quadrilateral. The remaining liquidusphases are pyroxenes. Augite is a Ca-rich clinopyrox-ene that crystallizes in a wide range of natural magmas.In alkaline magmas that have low silica activity (Sec-tion 3.5.3), it is the sole pyroxene and contains sub-stantial amounts of Al, Ti, Fe3� (all three partly sub-stituting for Si in tetrahedral sites), and Na (for Ca) insolid solution. Uncommon pigeonite is a Ca-poorclinopyroxene crystallizing at low P in subalkalinebasalt and some andesite magmas. Orthopyroxenescontain no more than 5 mole % of the calcic compo-nent and crystallize only in subalkaline magmas, usu-ally with augite. Fractionating melts migrate down Ttoward more Fe-rich compositions and ultimately canreach near CaFeSi2O6. Thus, Fe/(Fe � Mg) ratios in-crease in more evolved, lower T-melts and in theircrystalline products.
Phase relations below the liquidus (Figure 5.28b)are complicated by polymorphism in enstatites, meta-stability in subcalcic augites and pigeonites, and sub-solidus exsolution, none of which is discussed here.Equilibrium compositions of two- and three-pyroxeneassemblages that can stably coprecipitate from a meltare indicated by isothermal tie lines and tie-line trian-gles in Figure 5.28b. Equilibria are strongly dependentupon T and less upon P. Such equilibrium pyroxenepairs can therefore serve as geothermometers for crys-tallization T after their compositions have been appro-priately projected from multicomponent space ontothe Mg2Si2O6-CaMgSi2O6-CaFeSi2O6-Fe2Si2O6 quad-rilateral and plotted on the diagram of nearest P (fordetails see Lindsley, 1983). For example, coexistingaugite and orthopyroxene phenocrysts from a basaltlava flow extruded in 1950–51 from Mihara-yama vol-cano, Japan, indicate crystallization at slightly morethan 1100°C; for comparison, the highest T of lavameasured during the eruption was 1125°C.
Pyroxenes and olivines in the highly fractionatedSkaergaard intrusion in northeast Greenland show thedegree to which Fe enrichment can be produced by astrongly fractionating tholeiitic basalt magma. The rel-atively reducing conditions (Frost and Lindsley, 1992)in the fractionating Skaergaard magma body, to asmuch as 2 log units below the QFM buffer (Figure3.14), undoubtedly played a significant role in stabiliz-ing Fe-rich clinopyroxenes and pure fayalite olivine.Relatively oxidizing magmas in which the oxygen fu-gacity is higher have more Fe3� and consequently lessFe2� to stabilize Fe-rich pyroxenes and fayalite.
�5.7 CRYSTAL-MELT EQUILIBRIA INHYDROUS MAGMA SYSTEMS
Volatiles are generally present in terrestrial magma sys-tems, can profoundly depress liquidi and solidi, andstabilize volatile-bearing phases. In this section, someaspects of crystal-melt equilibria in hydrous magmasystems are examined.
5.7.1 Equilibria in the Granodiorite-Water SystemGranodiorite is a plagioclase-rich granitic rock (Figure2.8) that contains more mafic minerals, generally bi-otite and hornblende, than granite. Granodiorite andits aphanitic to glassy volcanic counterpart, dacite, arewidespread in convergent plate margin settings.
To determine melt equilibria with two feldspars andquartz in the proportions in which they occur in a typ-ical granodiorite, Whitney (1988) studied a syntheticrock free of mafic minerals that has weight percent-ages of components CaAl2Si2O8 19.8, NaAlSi3O8 37.3,KAlSi3O8 19.8, and SiO2 23.1. Several generalities canbe gleaned from a T-XH2O diagram at constant P (Fig-ure 5.29). Sequential and overlapping crystallization ofsolid phases with decreasing T is once again evident, as
Crystal-Melt Equilibria in Magmatic Systems 113
0 2 4 6 8 10H2O (wt. %)
600
700
800
900
1000
1100
1200
T (
°C)
Plss + Kfss + Qtz + L + fluid
Plss + Qtz + L + fluid
Plss + L + fluid
L + fluidL
Plss + L
Plss + Kfss + L
Plss + Kfss + Qtz + L
Plss + Qtz + L
Plss + Kfss + Qtz + fluid
5.29 Crystal-melt equilibria for felsic phases in a synthetic granodi-orite at 2 kbar. (Composition R5; redrawn from Whitney). Re-gion of water-undersaturated melt is shaded. Dashed line indi-cates the boundary line for stable quartz (� Plss � L) at 8kbar, showing the expansion of its stability field at increased P.L, silicate liquid (melt). (Redrawn from Whitney, 1975 cited inWhitney, 1988.)
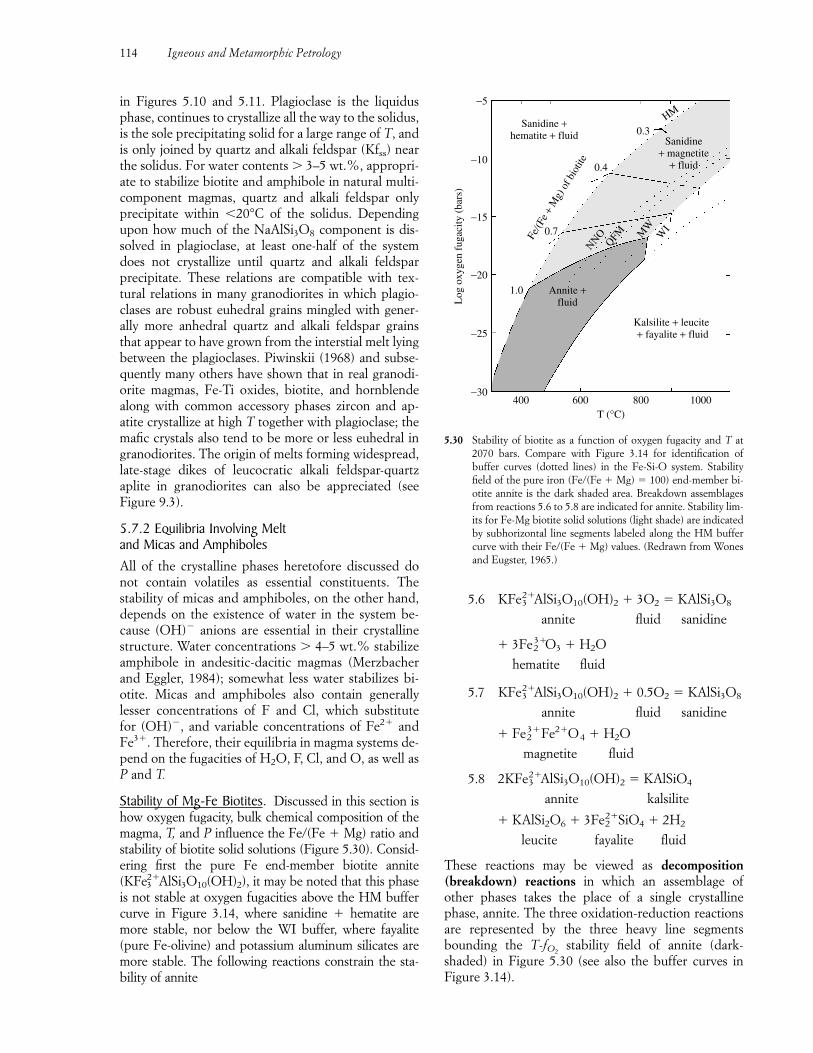
in Figures 5.10 and 5.11. Plagioclase is the liquidusphase, continues to crystallize all the way to the solidus,is the sole precipitating solid for a large range of T, andis only joined by quartz and alkali feldspar (Kfss) nearthe solidus. For water contents 3–5 wt.%, appropri-ate to stabilize biotite and amphibole in natural multi-component magmas, quartz and alkali feldspar onlyprecipitate within 20°C of the solidus. Dependingupon how much of the NaAlSi3O8 component is dis-solved in plagioclase, at least one-half of the systemdoes not crystallize until quartz and alkali feldspar precipitate. These relations are compatible with tex-tural relations in many granodiorites in which plagio-clases are robust euhedral grains mingled with gener-ally more anhedral quartz and alkali feldspar grainsthat appear to have grown from the interstial melt lyingbetween the plagioclases. Piwinskii (1968) and subse-quently many others have shown that in real granodi-orite magmas, Fe-Ti oxides, biotite, and hornblendealong with common accessory phases zircon and ap-atite crystallize at high T together with plagioclase; themafic crystals also tend to be more or less euhedral ingranodiorites. The origin of melts forming widespread,late-stage dikes of leucocratic alkali feldspar-quartzaplite in granodiorites can also be appreciated (see Figure 9.3).
5.7.2 Equilibria Involving Melt and Micas and AmphibolesAll of the crystalline phases heretofore discussed donot contain volatiles as essential constituents. The stability of micas and amphiboles, on the other hand,depends on the existence of water in the system be-cause (OH)� anions are essential in their crystallinestructure. Water concentrations 4–5 wt.% stabilizeamphibole in andesitic-dacitic magmas (Merzbacherand Eggler, 1984); somewhat less water stabilizes bi-otite. Micas and amphiboles also contain generallylesser concentrations of F and Cl, which substitute for (OH)�, and variable concentrations of Fe2� andFe3�. Therefore, their equilibria in magma systems de-pend on the fugacities of H2O, F, Cl, and O, as well asP and T.
Stability of Mg-Fe Biotites. Discussed in this section ishow oxygen fugacity, bulk chemical composition of themagma, T, and P influence the Fe/(Fe � Mg) ratio andstability of biotite solid solutions (Figure 5.30). Consid-ering first the pure Fe end-member biotite annite(KFe2�
3 AlSi3O10(OH)2), it may be noted that this phaseis not stable at oxygen fugacities above the HM buffercurve in Figure 3.14, where sanidine � hematite aremore stable, nor below the WI buffer, where fayalite(pure Fe-olivine) and potassium aluminum silicates aremore stable. The following reactions constrain the sta-bility of annite
5.6 KFe2�3 AlSi3O10(OH)2 � 3O2 � KAlSi3O8
annite fluid sanidine
� 3Fe3�2 O3 � H2O
hematite fluid
5.7 KFe2�3 AlSi3O10(OH)2 � 0.5O2 � KAlSi3O8
annite fluid sanidine
� Fe3�2 Fe2�O4 � H2O
magnetite fluid
5.8 2KFe2�3 AlSi3O10(OH)2 � KAlSiO4
annite kalsilite
� KAlSi2O6 � 3Fe2�2 SiO4 � 2H2
leucite fayalite fluid
These reactions may be viewed as decomposition(breakdown) reactions in which an assemblage ofother phases takes the place of a single crystallinephase, annite. The three oxidation-reduction reactionsare represented by the three heavy line segmentsbounding the T-fO2
stability field of annite (dark-shaded) in Figure 5.30 (see also the buffer curves inFigure 3.14).
114 Igneous and Metamorphic Petrology
−30
−25
−20
−15
−10
−5
Log
oxy
gen
fuga
city
(ba
rs)
400 600 800 1000T (°C)
ΗΜ
0.3
0.4
0.7
1.0
Fe/(F
e +
Mg)
of b
iotit
e
Sanidine +hematite + fluid
Annite +fluid
Kalsilite + leucite + fayalite + fluid
NNOQFM M
WW
I
Sanidine+ magnetite
+ fluid
5.30 Stability of biotite as a function of oxygen fugacity and T at2070 bars. Compare with Figure 3.14 for identification ofbuffer curves (dotted lines) in the Fe-Si-O system. Stabilityfield of the pure iron (Fe/(Fe � Mg) � 100) end-member bi-otite annite is the dark shaded area. Breakdown assemblagesfrom reactions 5.6 to 5.8 are indicated for annite. Stability lim-its for Fe-Mg biotite solid solutions (light shade) are indicatedby subhorizontal line segments labeled along the HM buffercurve with their Fe/(Fe � Mg) values. (Redrawn from Wonesand Eugster, 1965.)
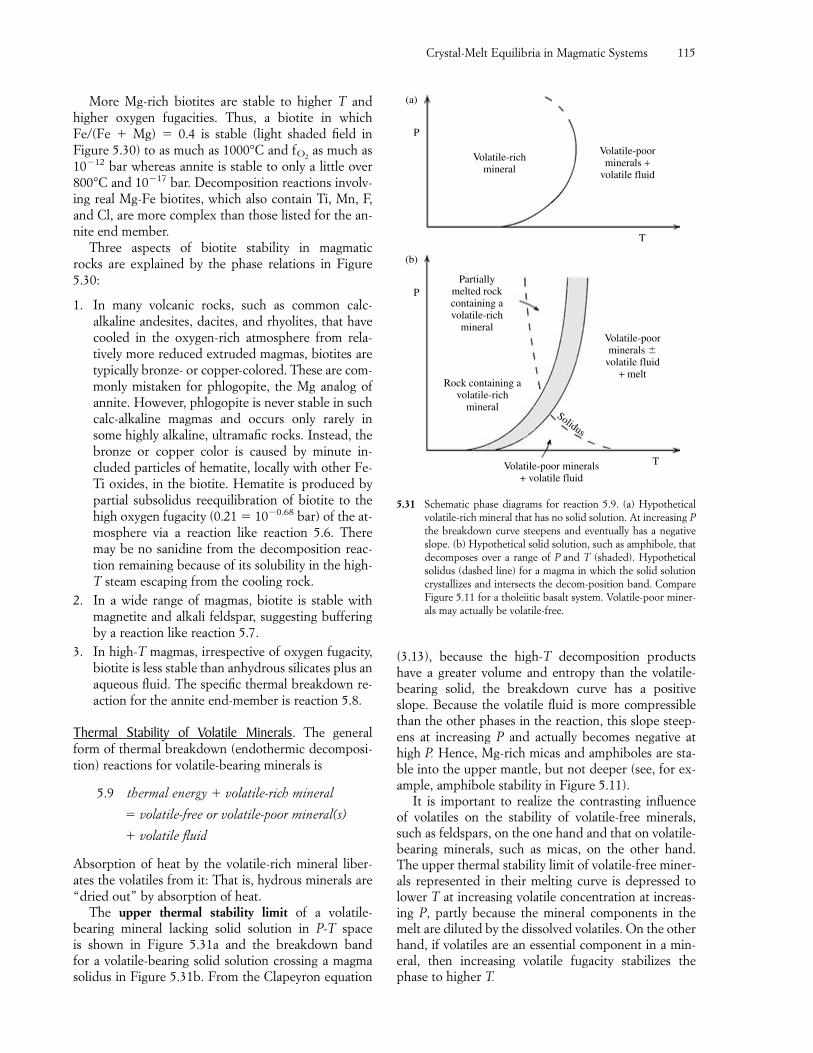
More Mg-rich biotites are stable to higher T andhigher oxygen fugacities. Thus, a biotite in whichFe/(Fe � Mg) � 0.4 is stable (light shaded field in Figure 5.30) to as much as 1000°C and fO2
as much as10�12 bar whereas annite is stable to only a little over800°C and 10�17 bar. Decomposition reactions involv-ing real Mg-Fe biotites, which also contain Ti, Mn, F,and Cl, are more complex than those listed for the an-nite end member.
Three aspects of biotite stability in magmatic rocks are explained by the phase relations in Figure5.30:
1. In many volcanic rocks, such as common calc-alkaline andesites, dacites, and rhyolites, that havecooled in the oxygen-rich atmosphere from rela-tively more reduced extruded magmas, biotites aretypically bronze- or copper-colored. These are com-monly mistaken for phlogopite, the Mg analog ofannite. However, phlogopite is never stable in suchcalc-alkaline magmas and occurs only rarely insome highly alkaline, ultramafic rocks. Instead, thebronze or copper color is caused by minute in-cluded particles of hematite, locally with other Fe-Ti oxides, in the biotite. Hematite is produced bypartial subsolidus reequilibration of biotite to thehigh oxygen fugacity (0.21 � 10�0.68 bar) of the at-mosphere via a reaction like reaction 5.6. Theremay be no sanidine from the decomposition reac-tion remaining because of its solubility in the high-T steam escaping from the cooling rock.
2. In a wide range of magmas, biotite is stable withmagnetite and alkali feldspar, suggesting bufferingby a reaction like reaction 5.7.
3. In high-T magmas, irrespective of oxygen fugacity,biotite is less stable than anhydrous silicates plus anaqueous fluid. The specific thermal breakdown re-action for the annite end-member is reaction 5.8.
Thermal Stability of Volatile Minerals. The generalform of thermal breakdown (endothermic decomposi-tion) reactions for volatile-bearing minerals is
5.9 thermal energy � volatile-rich mineral
� volatile-free or volatile-poor mineral(s)
� volatile fluid
Absorption of heat by the volatile-rich mineral liber-ates the volatiles from it: That is, hydrous minerals are“dried out” by absorption of heat.
The upper thermal stability limit of a volatile-bearing mineral lacking solid solution in P-T space is shown in Figure 5.31a and the breakdown band for a volatile-bearing solid solution crossing a magmasolidus in Figure 5.31b. From the Clapeyron equation
(3.13), because the high-T decomposition productshave a greater volume and entropy than the volatile-bearing solid, the breakdown curve has a positiveslope. Because the volatile fluid is more compressiblethan the other phases in the reaction, this slope steep-ens at increasing P and actually becomes negative athigh P. Hence, Mg-rich micas and amphiboles are sta-ble into the upper mantle, but not deeper (see, for ex-ample, amphibole stability in Figure 5.11).
It is important to realize the contrasting influence of volatiles on the stability of volatile-free minerals,such as feldspars, on the one hand and that on volatile-bearing minerals, such as micas, on the other hand. The upper thermal stability limit of volatile-free miner-als represented in their melting curve is depressed tolower T at increasing volatile concentration at increas-ing P, partly because the mineral components in themelt are diluted by the dissolved volatiles. On the otherhand, if volatiles are an essential component in a min-eral, then increasing volatile fugacity stabilizes thephase to higher T.
Crystal-Melt Equilibria in Magmatic Systems 115
P
P
(a)
(b)
Volatile-richmineral
Volatile-poorminerals +
volatile fluid
Τ
Volatile-poor minerals+ volatile fluid
T
Solidus
Rock containing avolatile-rich
mineral
Partiallymelted rockcontaining avolatile-rich
mineralVolatile-poorminerals
volatile fluid+ melt
5.31 Schematic phase diagrams for reaction 5.9. (a) Hypotheticalvolatile-rich mineral that has no solid solution. At increasing Pthe breakdown curve steepens and eventually has a negativeslope. (b) Hypothetical solid solution, such as amphibole, thatdecomposes over a range of P and T (shaded). Hypotheticalsolidus (dashed line) for a magma in which the solid solutioncrystallizes and intersects the decom-position band. CompareFigure 5.11 for a tholeiitic basalt system. Volatile-poor miner-als may actually be volatile-free.
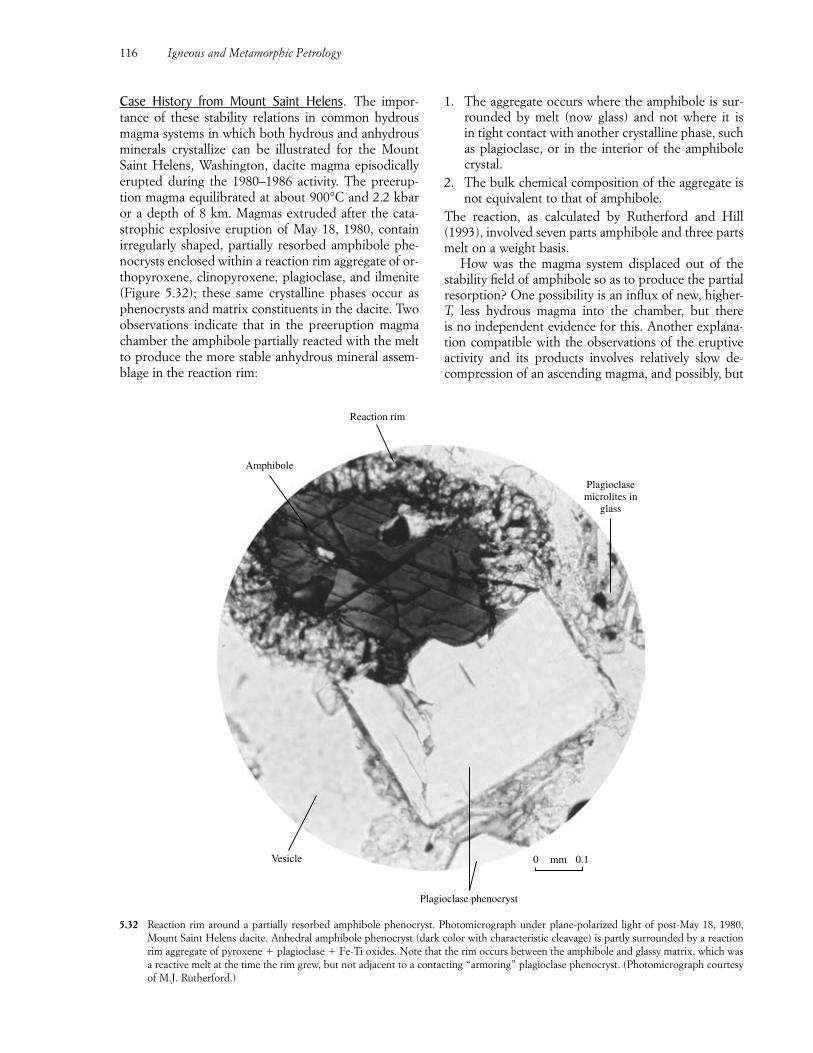
Case History from Mount Saint Helens. The impor-tance of these stability relations in common hydrousmagma systems in which both hydrous and anhydrousminerals crystallize can be illustrated for the MountSaint Helens, Washington, dacite magma episodicallyerupted during the 1980–1986 activity. The preerup-tion magma equilibrated at about 900°C and 2.2 kbaror a depth of 8 km. Magmas extruded after the cata-strophic explosive eruption of May 18, 1980, containirregularly shaped, partially resorbed amphibole phe-nocrysts enclosed within a reaction rim aggregate of or-thopyroxene, clinopyroxene, plagioclase, and ilmenite(Figure 5.32); these same crystalline phases occur asphenocrysts and matrix constituents in the dacite. Twoobservations indicate that in the preeruption magmachamber the amphibole partially reacted with the meltto produce the more stable anhydrous mineral assem-blage in the reaction rim:
1. The aggregate occurs where the amphibole is sur-rounded by melt (now glass) and not where it is in tight contact with another crystalline phase, suchas plagioclase, or in the interior of the amphibolecrystal.
2. The bulk chemical composition of the aggregate isnot equivalent to that of amphibole.
The reaction, as calculated by Rutherford and Hill(1993), involved seven parts amphibole and three partsmelt on a weight basis.
How was the magma system displaced out of thestability field of amphibole so as to produce the partialresorption? One possibility is an influx of new, higher-T, less hydrous magma into the chamber, but there is no independent evidence for this. Another explana-tion compatible with the observations of the eruptiveactivity and its products involves relatively slow de-compression of an ascending magma, and possibly, but
116 Igneous and Metamorphic Petrology
Plagioclasemicrolites in
glass
Reaction rim
Amphibole
Vesicle
Plagioclase phenocryst
0 0.1mm
5.32 Reaction rim around a partially resorbed amphibole phenocryst. Photomicrograph under plane-polarized light of post-May 18, 1980,Mount Saint Helens dacite. Anhedral amphibole phenocryst (dark color with characteristic cleavage) is partly surrounded by a reactionrim aggregate of pyroxene � plagioclase � Fe-Ti oxides. Note that the rim occurs between the amphibole and glassy matrix, which wasa reactive melt at the time the rim grew, but not adjacent to a contacting “armoring” plagioclase phenocryst. (Photomicrograph courtesyof M.J. Rutherford.)
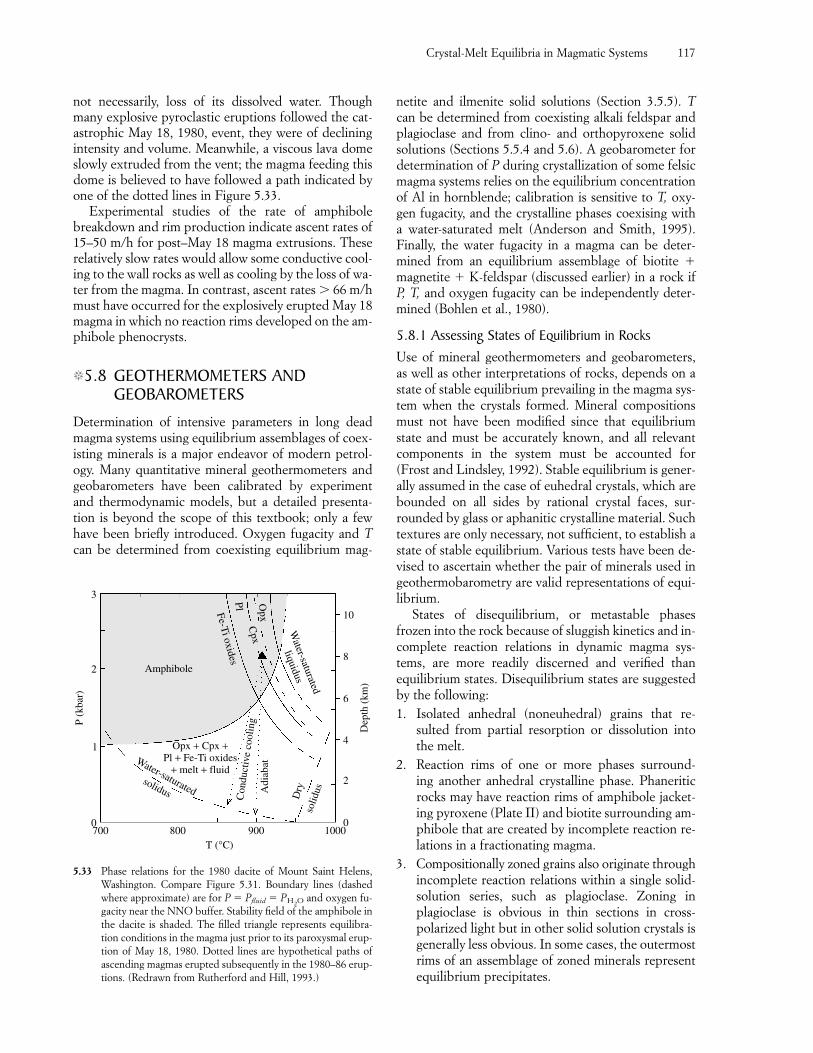
not necessarily, loss of its dissolved water. Thoughmany explosive pyroclastic eruptions followed the cat-astrophic May 18, 1980, event, they were of decliningintensity and volume. Meanwhile, a viscous lava domeslowly extruded from the vent; the magma feeding thisdome is believed to have followed a path indicated byone of the dotted lines in Figure 5.33.
Experimental studies of the rate of amphibolebreakdown and rim production indicate ascent rates of15–50 m/h for post–May 18 magma extrusions. Theserelatively slow rates would allow some conductive cool-ing to the wall rocks as well as cooling by the loss of wa-ter from the magma. In contrast, ascent rates 66 m/hmust have occurred for the explosively erupted May 18magma in which no reaction rims developed on the am-phibole phenocrysts.
�5.8 GEOTHERMOMETERS ANDGEOBAROMETERS
Determination of intensive parameters in long deadmagma systems using equilibrium assemblages of coex-isting minerals is a major endeavor of modern petrol-ogy. Many quantitative mineral geothermometers andgeobarometers have been calibrated by experimentand thermodynamic models, but a detailed presenta-tion is beyond the scope of this textbook; only a fewhave been briefly introduced. Oxygen fugacity and Tcan be determined from coexisting equilibrium mag-
netite and ilmenite solid solutions (Section 3.5.5). Tcan be determined from coexisting alkali feldspar andplagioclase and from clino- and orthopyroxene solidsolutions (Sections 5.5.4 and 5.6). A geobarometer fordetermination of P during crystallization of some felsicmagma systems relies on the equilibrium concentrationof Al in hornblende; calibration is sensitive to T, oxy-gen fugacity, and the crystalline phases coexising with a water-saturated melt (Anderson and Smith, 1995). Finally, the water fugacity in a magma can be deter-mined from an equilibrium assemblage of biotite �magnetite � K-feldspar (discussed earlier) in a rock ifP, T, and oxygen fugacity can be independently deter-mined (Bohlen et al., 1980).
5.8.1 Assessing States of Equilibrium in RocksUse of mineral geothermometers and geobarometers,as well as other interpretations of rocks, depends on astate of stable equilibrium prevailing in the magma sys-tem when the crystals formed. Mineral compositionsmust not have been modified since that equilibriumstate and must be accurately known, and all relevantcomponents in the system must be accounted for(Frost and Lindsley, 1992). Stable equilibrium is gener-ally assumed in the case of euhedral crystals, which arebounded on all sides by rational crystal faces, sur-rounded by glass or aphanitic crystalline material. Suchtextures are only necessary, not sufficient, to establish astate of stable equilibrium. Various tests have been de-vised to ascertain whether the pair of minerals used ingeothermobarometry are valid representations of equi-librium.
States of disequilibrium, or metastable phasesfrozen into the rock because of sluggish kinetics and in-complete reaction relations in dynamic magma sys-tems, are more readily discerned and verified thanequilibrium states. Disequilibrium states are suggestedby the following:1. Isolated anhedral (noneuhedral) grains that re-
sulted from partial resorption or dissolution intothe melt.
2. Reaction rims of one or more phases surround-ing another anhedral crystalline phase. Phaneriticrocks may have reaction rims of amphibole jacket-ing pyroxene (Plate II) and biotite surrounding am-phibole that are created by incomplete reaction re-lations in a fractionating magma.
3. Compositionally zoned grains also originate throughincomplete reaction relations within a single solid-solution series, such as plagioclase. Zoning in plagioclase is obvious in thin sections in cross-polarized light but in other solid solution crystals isgenerally less obvious. In some cases, the outermostrims of an assemblage of zoned minerals representequilibrium precipitates.
Crystal-Melt Equilibria in Magmatic Systems 117
700 800 900 1000T (°C)
0
1
2
3
P (k
bar)
0
2
4
6
8
10
Dep
th (
km)
Amphibole
Fe-Ti oxidesPl
Cpx
Opx
Water-saturated
liquidus
Dry
solid
usAdi
abat
Con
duct
ive
cool
ing
Opx + Cpx +Pl + Fe-Ti oxides
+ melt + fluidWater-saturated
solidus
5.33 Phase relations for the 1980 dacite of Mount Saint Helens,Washington. Compare Figure 5.31. Boundary lines (dashedwhere approximate) are for P � Pfluid � PH2O and oxygen fu-gacity near the NNO buffer. Stability field of the amphibole inthe dacite is shaded. The filled triangle represents equilibra-tion conditions in the magma just prior to its paroxysmal erup-tion of May 18, 1980. Dotted lines are hypothetical paths of ascending magmas erupted subsequently in the 1980–86 erup-tions. (Redrawn from Rutherford and Hill, 1993.)
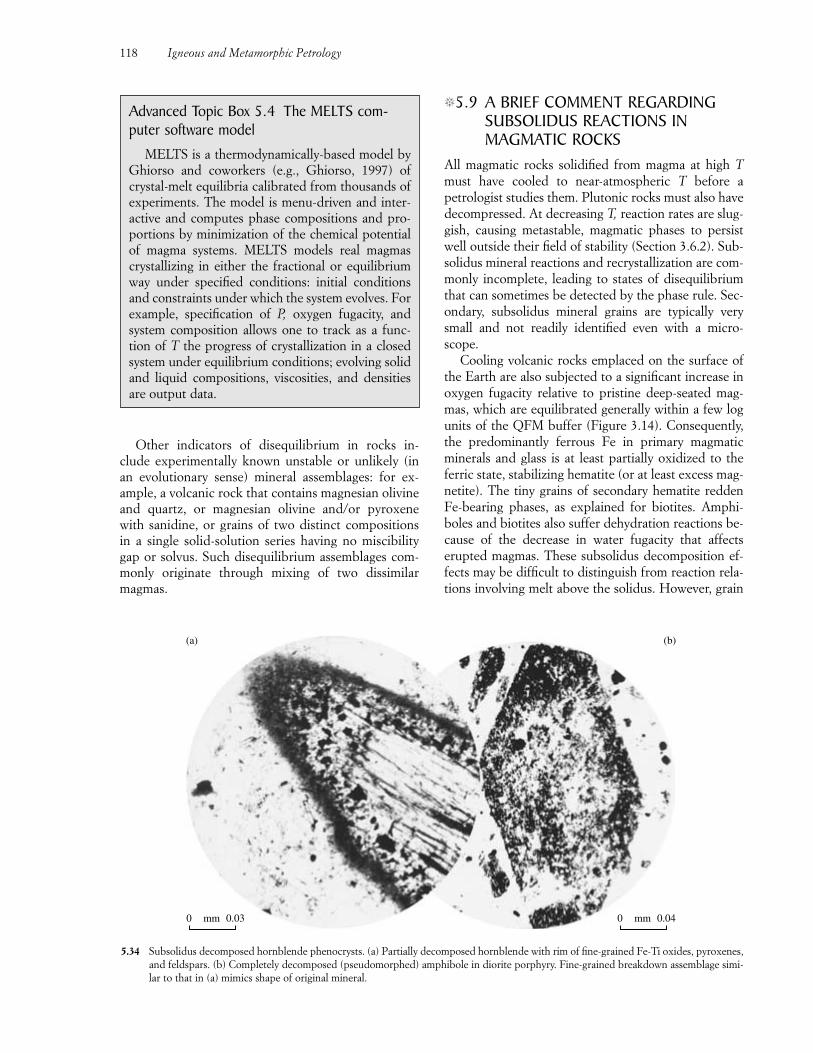
Other indicators of disequilibrium in rocks in-clude experimentally known unstable or unlikely (in an evolutionary sense) mineral assemblages: for ex-ample, a volcanic rock that contains magnesian olivineand quartz, or magnesian olivine and/or pyroxenewith sanidine, or grains of two distinct compositions in a single solid-solution series having no miscibilitygap or solvus. Such disequilibrium assemblages com-monly originate through mixing of two dissimilar magmas.
�5.9 A BRIEF COMMENT REGARDINGSUBSOLIDUS REACTIONS INMAGMATIC ROCKS
All magmatic rocks solidified from magma at high Tmust have cooled to near-atmospheric T before apetrologist studies them. Plutonic rocks must also havedecompressed. At decreasing T, reaction rates are slug-gish, causing metastable, magmatic phases to persistwell outside their field of stability (Section 3.6.2). Sub-solidus mineral reactions and recrystallization are com-monly incomplete, leading to states of disequilibriumthat can sometimes be detected by the phase rule. Sec-ondary, subsolidus mineral grains are typically verysmall and not readily identified even with a micro-scope.
Cooling volcanic rocks emplaced on the surface ofthe Earth are also subjected to a significant increase inoxygen fugacity relative to pristine deep-seated mag-mas, which are equilibrated generally within a few logunits of the QFM buffer (Figure 3.14). Consequently,the predominantly ferrous Fe in primary magmaticminerals and glass is at least partially oxidized to theferric state, stabilizing hematite (or at least excess mag-netite). The tiny grains of secondary hematite reddenFe-bearing phases, as explained for biotites. Amphi-boles and biotites also suffer dehydration reactions be-cause of the decrease in water fugacity that affectserupted magmas. These subsolidus decomposition ef-fects may be difficult to distinguish from reaction rela-tions involving melt above the solidus. However, grain
118 Igneous and Metamorphic Petrology
Advanced Topic Box 5.4 The MELTS com-puter software model
MELTS is a thermodynamically-based model byGhiorso and coworkers (e.g., Ghiorso, 1997) ofcrystal-melt equilibria calibrated from thousands ofexperiments. The model is menu-driven and inter-active and computes phase compositions and pro-portions by minimization of the chemical potentialof magma systems. MELTS models real magmascrystallizing in either the fractional or equilibriumway under specified conditions: initial conditionsand constraints under which the system evolves. Forexample, specification of P, oxygen fugacity, andsystem composition allows one to track as a func-tion of T the progress of crystallization in a closedsystem under equilibrium conditions; evolving solidand liquid compositions, viscosities, and densitiesare output data.
0 0.03mm 0 0.04mm
(a) (b)
5.34 Subsolidus decomposed hornblende phenocrysts. (a) Partially decomposed hornblende with rim of fine-grained Fe-Ti oxides, pyroxenes,and feldspars. (b) Completely decomposed (pseudomorphed) amphibole in diorite porphyry. Fine-grained breakdown assemblage simi-lar to that in (a) mimics shape of original mineral.
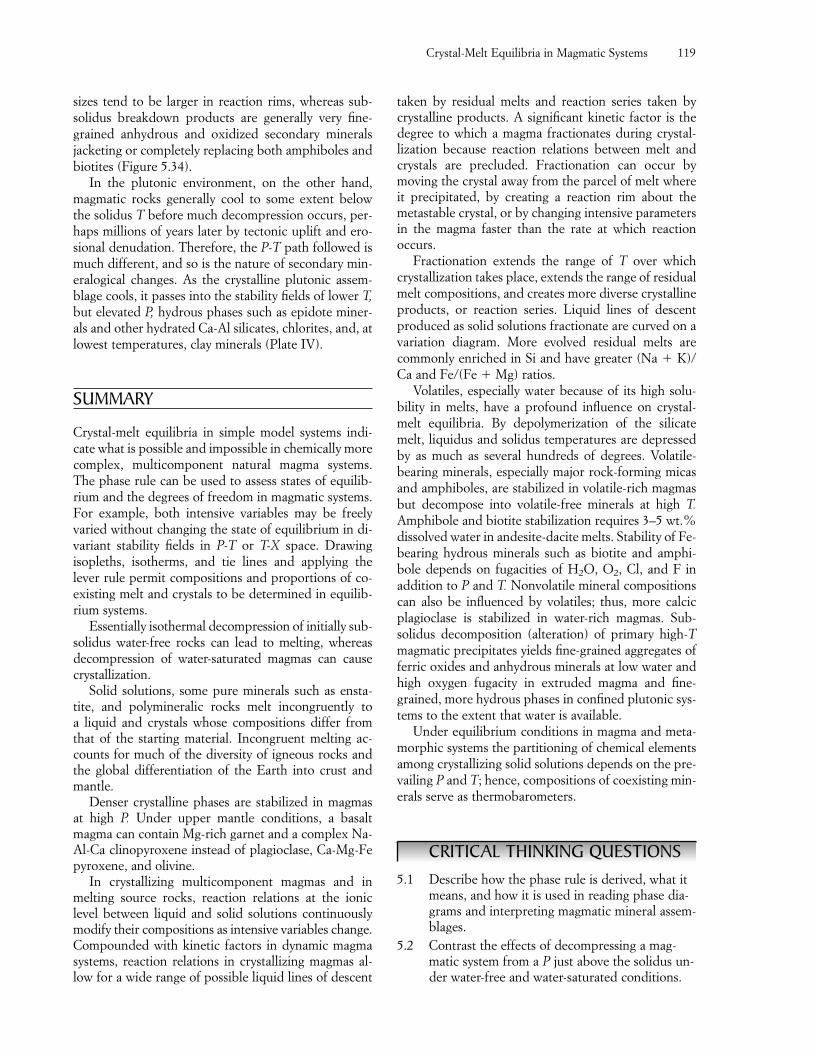
sizes tend to be larger in reaction rims, whereas sub-solidus breakdown products are generally very fine-grained anhydrous and oxidized secondary mineralsjacketing or completely replacing both amphiboles andbiotites (Figure 5.34).
In the plutonic environment, on the other hand,magmatic rocks generally cool to some extent belowthe solidus T before much decompression occurs, per-haps millions of years later by tectonic uplift and ero-sional denudation. Therefore, the P-T path followed ismuch different, and so is the nature of secondary min-eralogical changes. As the crystalline plutonic assem-blage cools, it passes into the stability fields of lower T,but elevated P, hydrous phases such as epidote miner-als and other hydrated Ca-Al silicates, chlorites, and, atlowest temperatures, clay minerals (Plate IV).
SUMMARY
Crystal-melt equilibria in simple model systems indi-cate what is possible and impossible in chemically morecomplex, multicomponent natural magma systems.The phase rule can be used to assess states of equilib-rium and the degrees of freedom in magmatic systems.For example, both intensive variables may be freelyvaried without changing the state of equilibrium in di-variant stability fields in P-T or T-X space. Drawingisopleths, isotherms, and tie lines and applying thelever rule permit compositions and proportions of co-existing melt and crystals to be determined in equilib-rium systems.
Essentially isothermal decompression of initially sub-solidus water-free rocks can lead to melting, whereasdecompression of water-saturated magmas can causecrystallization.
Solid solutions, some pure minerals such as ensta-tite, and polymineralic rocks melt incongruently to a liquid and crystals whose compositions differ fromthat of the starting material. Incongruent melting ac-counts for much of the diversity of igneous rocks andthe global differentiation of the Earth into crust andmantle.
Denser crystalline phases are stabilized in magmasat high P. Under upper mantle conditions, a basaltmagma can contain Mg-rich garnet and a complex Na-Al-Ca clinopyroxene instead of plagioclase, Ca-Mg-Fepyroxene, and olivine.
In crystallizing multicomponent magmas and inmelting source rocks, reaction relations at the ioniclevel between liquid and solid solutions continuouslymodify their compositions as intensive variables change.Compounded with kinetic factors in dynamic magmasystems, reaction relations in crystallizing magmas al-low for a wide range of possible liquid lines of descent
taken by residual melts and reaction series taken bycrystalline products. A significant kinetic factor is thedegree to which a magma fractionates during crystal-lization because reaction relations between melt andcrystals are precluded. Fractionation can occur bymoving the crystal away from the parcel of melt whereit precipitated, by creating a reaction rim about themetastable crystal, or by changing intensive parametersin the magma faster than the rate at which reaction occurs.
Fractionation extends the range of T over whichcrystallization takes place, extends the range of residualmelt compositions, and creates more diverse crystallineproducts, or reaction series. Liquid lines of descentproduced as solid solutions fractionate are curved on avariation diagram. More evolved residual melts arecommonly enriched in Si and have greater (Na � K)/Ca and Fe/(Fe � Mg) ratios.
Volatiles, especially water because of its high solu-bility in melts, have a profound influence on crystal-melt equilibria. By depolymerization of the silicatemelt, liquidus and solidus temperatures are depressedby as much as several hundreds of degrees. Volatile-bearing minerals, especially major rock-forming micasand amphiboles, are stabilized in volatile-rich magmasbut decompose into volatile-free minerals at high T.Amphibole and biotite stabilization requires 3–5 wt.%dissolved water in andesite-dacite melts. Stability of Fe-bearing hydrous minerals such as biotite and amphi-bole depends on fugacities of H2O, O2, Cl, and F in addition to P and T. Nonvolatile mineral compositionscan also be influenced by volatiles; thus, more calcicplagioclase is stabilized in water-rich magmas. Sub-solidus decomposition (alteration) of primary high-Tmagmatic precipitates yields fine-grained aggregates offerric oxides and anhydrous minerals at low water andhigh oxygen fugacity in extruded magma and fine-grained, more hydrous phases in confined plutonic sys-tems to the extent that water is available.
Under equilibrium conditions in magma and meta-morphic systems the partitioning of chemical elementsamong crystallizing solid solutions depends on the pre-vailing P and T; hence, compositions of coexisting min-erals serve as thermobarometers.
CRITICAL THINKING QUESTIONS5.1 Describe how the phase rule is derived, what it
means, and how it is used in reading phase dia-grams and interpreting magmatic mineral assem-blages.
5.2 Contrast the effects of decompressing a mag-matic system from a P just above the solidus un-der water-free and water-saturated conditions.
Crystal-Melt Equilibria in Magmatic Systems 119
granitic rocks? (Hint: Write a balanced miner-alogical reaction involving these three minerals.)
5.17 Is it true that minerals having higher meltingtemperatures crystallize from magmas at rela-tively higher temperatures? Critically evaluatethis by examining the relative melting tempera-tures of quartz (�-form in Figure 5.1), forsteriteolivine, diopside pyroxene, and albite feldspar(Figure 3.8). With what mineral(s) does quartzcommonly coprecipitate (Figure 2.2)? What re-ally controls crystallization temperatures of min-erals from melts?
5.18 On the basis of the concepts of crystal-meltequilibria set out in this chapter, how shouldFigure 3.12 be modified?
PROBLEMS5.1 Describe the crystallization and melting of a
bulk composition An20 from above the liquidusand from below the solidus, respectively, in theCaMgSi2O6-CaAl2Si2O8 system at 1 atm. Whatare the proportions of phases at 1300°C?
5.2 Thousands of basaltic deposits worldwide con-tain fragments of phaneritic rock composed ofabout 65% magnesian olivine, 25% enstatite,8% diopside, and 2% Mg-Al-Cr spinel. Namethis rock from Chapter 2, recalculate its modeso that olivine plus enstatite equals 100%, anddraw an appropriate isopleth on Figure 5.8 fortheir recalculated proportions. (Because thedensities of the two minerals are nearly thesame, no correction is needed to convert modalvolume into weight percentage.) Because thesefragments are pieces of the upper mantle fromwhich basalt magmas are derived by partialmelting, describe the melting relations of this re-calculated model mantle rock. How much meltis produced at the initial melting T? What is thecomposition of the first partial melt? How doesit compare in composition with an averagebasalt (Table 2.2)?
5.3 Using MELTS (Advanced Topic Box 5.4) on theMakaopuhi basalt magma, (a) confirm thatresidual melts become more enriched in Fe andTi until Fe-Ti oxides precipitate; (b) determinethe chemical composition of the residual meltjust above the solidus; (c) track the changingchemical compositions of major solid solutionsduring crystallization. Discuss your results.
5.4 Make photocopies of Figure 5.11. Color the sta-bility field of amphibole. Is amphibole a stablephase in extruded basalt magmas? Discuss. Inthe dry system, contrast (by colors) the stabilityfields with plagioclase and with garnet. What
5.3 Liquidus temperatures in simple binary systems(e.g., Figures 5.4 and 5.8) used to model multi-component magma systems are hundreds of de-grees higher than the temperatures at which liq-uidus phases precipitate in real magmas (e.g.,Figures 5.10 and 5.11). Why?
5.4 A liquidus line in a binary phase diagram hasfour meanings. Describe them.
5.5 Contrast the state of a water-free and a water-saturated tholeiite system at 1100°C and 10 kbar(Figure 5.11).
5.6 Cite two scenarios that would allow a thermallyinsulated, water-rich intrusive magma to crystal-lize rapidly—developing a fine-grained tex-ture—as if it were extruded onto the surface ofthe Earth into the cool atmosphere.
5.7 In a magmatic rock, what compositional as-pect—modal or mineral—defines the intensiveparameters prevailing at the time the magmacrystallized? Explain.
5.8 Contrast crystallization in a magma system dom-inated by a eutectic versus a system in whichcontinuous reaction relations take place over arange of P-T conditions. Which has the poten-tial to develop the most diverse crystalline prod-ucts? Which do you think prevails in real mag-mas? Discuss.
5.9 Describe all of the ways in which a crystallizingmagma can fractionate crystals from melt.
5.10 Contrast equilibrium versus fractional crystal-lization with respect to operative range of T,range of residual melt compositions, and natureof crystalline products. Cite examples.
5.11 Describe incongruent melting and its significance.5.12 Account for the contrasting mineralogical com-
positions of basalt and eclogite.5.13 Why are liquid lines of descent on variation dia-
grams curved for fractionating systems involvingsolid solutions?
5.14 Partially resorbed anhedral phenocrysts in vol-canic rocks are not uncommon. Describe possi-ble origins in both open and closed magma sys-tems.
5.15 Contrast the changes in the magmatic systemthat created the breakdown of amphibole inFigures 5.32 and 5.34.
5.16 How common are water-saturated granitic mag-mas? Most of the experimentally determinedphase relations for granite systems are for water-saturated conditions. Does this necessarily meanreal magmas are water-saturated? What texturescan be found in water-saturated magmas? Whatis the implication of the widespread assemblageof biotite � alkali feldspar � magnetite in
120 Igneous and Metamorphic Petrology
Crystal-Melt Equilibria in Magmatic Systems 121
controls these contrasting stabilities? What isthe maximum depth to which olivine is stable inwater-free or water-saturated tholeiitic basalt?How do you reconcile this limited stability ofolivine in basalt relative to what it is in uppermantle peridotite (Figure 1.3)?
5.5 Prove that the mass balance equation 5.4 is validby multiplying the weight percentages of liquidand crystalline phases by the weight fractions ofthe NaAlSi3O8 and CaAl2Si2O8 components oneach side of the equation.
5.6 On a photocopy of Figure 5.27a, draw the pathof a fractionating melt whose initial compositionis 5 wt.% SiO2 and 25 wt.% KAlSi3O8. Con-struct lines of liquid descent for Na2O and K2Oversus SiO2 for this fractionating melt. Compareyour diagram with Figure 5.27b.
5.7 Sketch the binary KAlSi2O6-SiO2 phase diagramat 1 atm on the basis of the following informa-tion: Pure K-feldspar melts incongruently at1150°C to equal amounts of liquid and leucitecrystals; melting is complete at about 1560°C.Pure leucite (KAlSi2O6) melts at 1685°C andpure silica at 1713°C. A binary eutectic lies atabout 990°C and 54 wt.% silica where a silicapolymorph, K-feldspar, and melt are in equilib-rium. Describe equilibrium and fractional crys-tallization of a system that contains 30 wt.% silica.
5.8 Sketch the phase diagram for the binary systemMg2SiO4 (forsterite)-Fe2SiO4 (fayalite) at 1 atmkeeping in mind that solid solution is complete,as it is in the plagioclase system. The melting Tof pure fayalite is 1205°C and of pure forsterite(Figure 3.8) about 1890°C. Describe the liquidand crystalline products of perfect fractionalcrystallization of a selected melt composition,including a statement about the Fe/(Fe � Mg)ratio.
5.9 On a P-T diagram, sketch approximate relativepositions and slopes of liquidus and soliduscurves for a water-saturated granitic magma. Superpose on this diagram the relative approxi-mate positions of the breakdown curves formuscovite, biotite, and hornblende, using thefollowing observations for guidelines: Pheno-crysts of muscovite almost never occur in rhyo-lite, but fine-grained muscovite does form as asubsolidus alteration product. Primary mus-covite occurs only in some peraluminous gran-ites. Biotite and hornblende are common ingranite and as phenocrysts in rhyolite anddacite. Amphibole is abundant in higher-Tdiorites.
5.10 Using Advanced Topic Box 5.2 and Figure 5.7as guides, draw a sequence of G-X diagrams atdifferent temperatures for the NaAlSi3O8-CaAl2Si2O8 system.
FUNDAMENTAL QUESTIONSCONSIDERED IN THIS CHAPTER
1. How do atomic-scale, time-dependent kineticphenomena govern changing states of melts? Howdo melts flow as viscous liquids?
2. What is viscosity, what factors control the viscosityof melts, and how does viscosity impact thedynamic behavior of melts?
3. What is diffusion, what factors control rates ofatomic and thermal diffusion, and how do theserates impact crystallization and vesiculation ofmelts?
4. How do crystals nucleate, grow, and modify theirshape and size?
5. How do exsolved volatile bubbles nucleate, grow,and fragment melts?
INTRODUCTION
In dynamic magmatic systems, changing intensive pa-rameters and energy conditions cause the state of thesystem to change, but only insofar as kinetic factors al-low. Thus, the rate at which the T of a magma decreasesis commonly faster than the rate at which kineticallycontrolled crystallization can progress, creating com-positionally zoned crystals and reaction rims in thefractionating magma. Sluggish kinetic rates prevent ho-mogenization of the zoned crystal and equilibration viareaction relations with the enclosing melt, even thoughtemperatures may be relatively high. Instantaneouschange from an initial metastable state to a new state of
more stable, perfect equilibrium almost never takesplace in magmatic systems because of slow kinetics.
In this chapter, we focus on kinetic factors that operate on the atomic level in controlling two basic dy-namic aspects of melts—solidification and vesiculation-fragmentation. Whether the same granitic melt solidi-fies to a massive metastable glass; to an aphanitic or toa phaneritic aggregate of quartz, feldspar, and biotitecrystals; to highly vesicular pumice; or to fine ash par-ticles depends on the interplay between rates of chang-ing environmental conditions, such as T, and kinetic(time-dependent) process rates. The nature of the ki-netic history, or kinetic path, taken by the changingmelt during solidification or vesiculation is recorded inthe fabric of the resulting rock, discussed in the fol-lowing chapter.
Section 3.6 introduced kinetic phenomena. A com-prehensive treatment is Lasaga (1998).
The first three sections of this chapter deal withthree so-called transport phenomena (Figure 6.1):1. Transport of viscous material, sometimes referred
to as a transfer of momentum (mass � velocity)2. Transfer of atoms, usually referred to as chemical
diffusion3. Transfer of heat by conduction (Section 1.1.3)Each of these three transport processes has a drivingforce and a proportionality constant that is an intrinsicproperty of the material. Each depends in some way onthe movement of atoms.
�6.1 VISCOSITY OF MELTS
On an atomic scale in melts, viscosity is a measure ofthe mobility of atoms, how readily atomic bonds can be stretched, broken, and reformed with neighboring
6CHAPTER
Chemical Dynamics of Meltsand Crystals
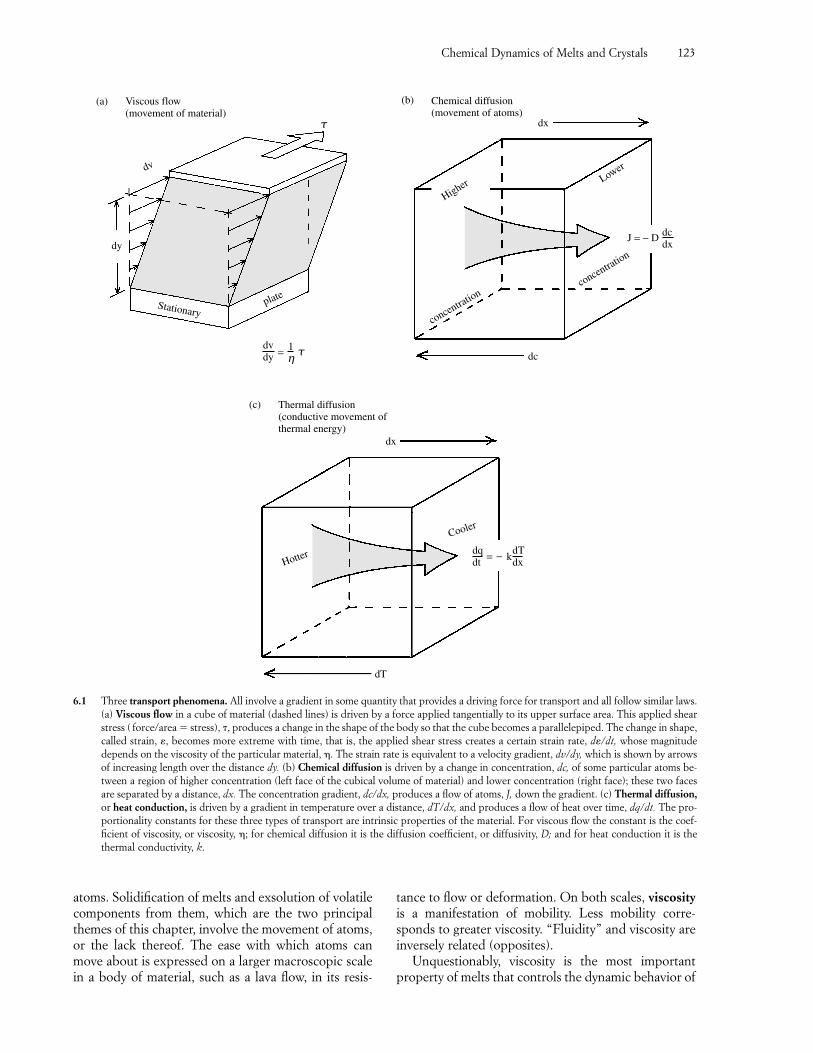
Chemical Dynamics of Melts and Crystals 123
atoms. Solidification of melts and exsolution of volatilecomponents from them, which are the two principalthemes of this chapter, involve the movement of atoms,or the lack thereof. The ease with which atoms canmove about is expressed on a larger macroscopic scalein a body of material, such as a lava flow, in its resis-
Stationaryplate
dy
dv
Viscous flow(movement of material)
τ
τ
dvdy
1η
=
(a)
6.1 Three transport phenomena. All involve a gradient in some quantity that provides a driving force for transport and all follow similar laws.(a) Viscous flow in a cube of material (dashed lines) is driven by a force applied tangentially to its upper surface area. This applied shearstress ( force/area � stress), �, produces a change in the shape of the body so that the cube becomes a parallelepiped. The change in shape,called strain, �, becomes more extreme with time, that is, the applied shear stress creates a certain strain rate, d�/dt, whose magnitudedepends on the viscosity of the particular material, �. The strain rate is equivalent to a velocity gradient, dv/dy, which is shown by arrowsof increasing length over the distance dy. (b) Chemical diffusion is driven by a change in concentration, dc, of some particular atoms be-tween a region of higher concentration (left face of the cubical volume of material) and lower concentration (right face); these two facesare separated by a distance, dx. The concentration gradient, dc/dx, produces a flow of atoms, J, down the gradient. (c) Thermal diffusion,or heat conduction, is driven by a gradient in temperature over a distance, dT/dx, and produces a flow of heat over time, dq/dt. The pro-portionality constants for these three types of transport are intrinsic properties of the material. For viscous flow the constant is the coef-ficient of viscosity, or viscosity, �; for chemical diffusion it is the diffusion coefficient, or diffusivity, D; and for heat conduction it is thethermal conductivity, k.
(b)
dx
Lower
concentration
concentration
dcdx
J = − D
Higher
dc
Chemical diffusion(movement of atoms)
Cooler
dqdt = dΤ
dx− kHotter
dT
dx
Thermal diffusion(conductive movement of thermal energy)
(c)
tance to flow or deformation. On both scales, viscosityis a manifestation of mobility. Less mobility corre-sponds to greater viscosity. “Fluidity” and viscosity areinversely related (opposites).
Unquestionably, viscosity is the most importantproperty of melts that controls the dynamic behavior of
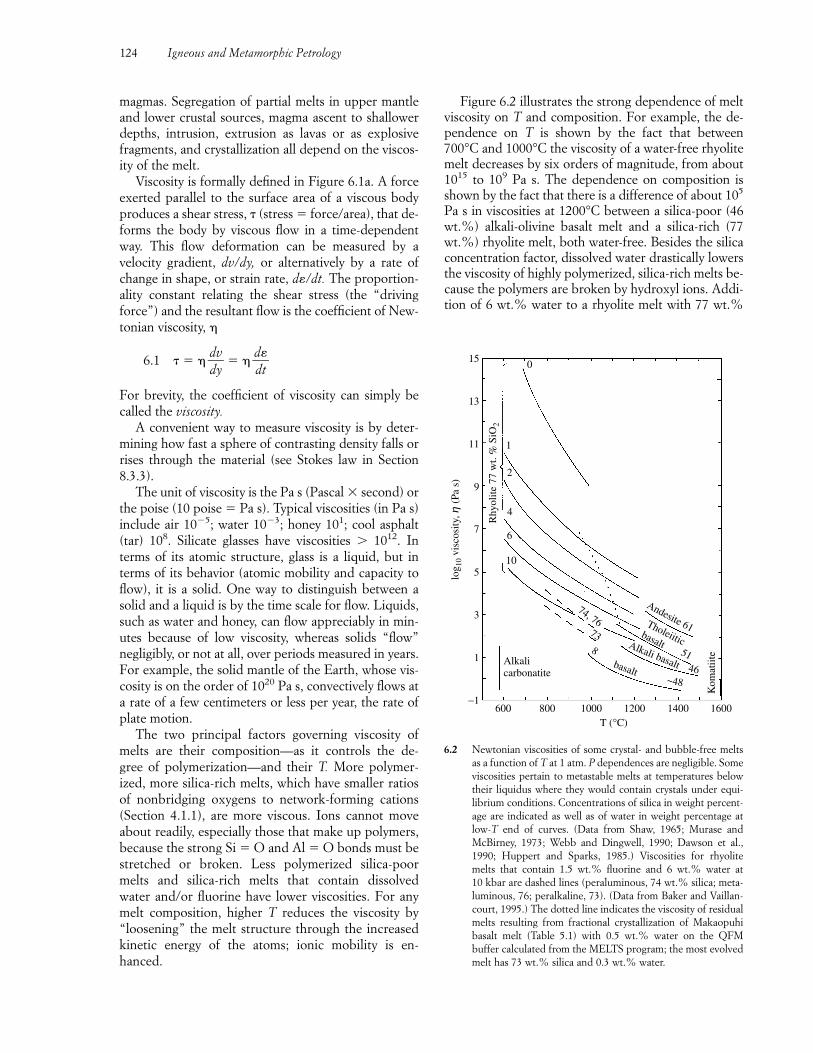
magmas. Segregation of partial melts in upper mantleand lower crustal sources, magma ascent to shallowerdepths, intrusion, extrusion as lavas or as explosivefragments, and crystallization all depend on the viscos-ity of the melt.
Viscosity is formally defined in Figure 6.1a. A forceexerted parallel to the surface area of a viscous bodyproduces a shear stress, � (stress � force/area), that de-forms the body by viscous flow in a time-dependentway. This flow deformation can be measured by a velocity gradient, dv/dy, or alternatively by a rate ofchange in shape, or strain rate, d�/dt. The proportion-ality constant relating the shear stress (the “drivingforce”) and the resultant flow is the coefficient of New-tonian viscosity, �
6.1 � � � �ddvy� � � �
dd�
t�
For brevity, the coefficient of viscosity can simply becalled the viscosity.
A convenient way to measure viscosity is by deter-mining how fast a sphere of contrasting density falls orrises through the material (see Stokes law in Section8.3.3).
The unit of viscosity is the Pa s (Pascal � second) orthe poise (10 poise � Pa s). Typical viscosities (in Pa s)include air 10�5; water 10�3; honey 101; cool asphalt(tar) 108. Silicate glasses have viscosities 1012. Interms of its atomic structure, glass is a liquid, but interms of its behavior (atomic mobility and capacity toflow), it is a solid. One way to distinguish between asolid and a liquid is by the time scale for flow. Liquids,such as water and honey, can flow appreciably in min-utes because of low viscosity, whereas solids “flow”negligibly, or not at all, over periods measured in years.For example, the solid mantle of the Earth, whose vis-cosity is on the order of 1020 Pa s, convectively flows ata rate of a few centimeters or less per year, the rate ofplate motion.
The two principal factors governing viscosity ofmelts are their composition—as it controls the de-gree of polymerization—and their T. More polymer-ized, more silica-rich melts, which have smaller ratiosof nonbridging oxygens to network-forming cations(Section 4.1.1), are more viscous. Ions cannot moveabout readily, especially those that make up polymers,because the strong Si � O and Al � O bonds must bestretched or broken. Less polymerized silica-poormelts and silica-rich melts that contain dissolved water and/or fluorine have lower viscosities. For anymelt composition, higher T reduces the viscosity by“loosening” the melt structure through the increasedkinetic energy of the atoms; ionic mobility is en-hanced.
Figure 6.2 illustrates the strong dependence of meltviscosity on T and composition. For example, the de-pendence on T is shown by the fact that between700°C and 1000°C the viscosity of a water-free rhyolitemelt decreases by six orders of magnitude, from about1015 to 109 Pa s. The dependence on composition isshown by the fact that there is a difference of about 105
Pa s in viscosities at 1200°C between a silica-poor (46wt.%) alkali-olivine basalt melt and a silica-rich (77wt.%) rhyolite melt, both water-free. Besides the silicaconcentration factor, dissolved water drastically lowersthe viscosity of highly polymerized, silica-rich melts be-cause the polymers are broken by hydroxyl ions. Addi-tion of 6 wt.% water to a rhyolite melt with 77 wt.%
124 Igneous and Metamorphic Petrology
600−1
1
3
5
7
9
11
13
15
800 1000 1200 1400 1600T (°C)
log 1
0 vi
scos
ity, η
(Pa
s)
Alkalicarbonatite
Rhy
olite
77
wt.
% S
iO2
1
2
4
10
6
0
74, 76738
Andesite 61Tholeiiticbasalt
51Alkali basalt 46basalt
~48
Kom
atiit
e
6.2 Newtonian viscosities of some crystal- and bubble-free meltsas a function of T at 1 atm. P dependences are negligible. Someviscosities pertain to metastable melts at temperatures belowtheir liquidus where they would contain crystals under equi-librium conditions. Concentrations of silica in weight percent-age are indicated as well as of water in weight percentage atlow-T end of curves. (Data from Shaw, 1965; Murase andMcBirney, 1973; Webb and Dingwell, 1990; Dawson et al.,1990; Huppert and Sparks, 1985.) Viscosities for rhyolitemelts that contain 1.5 wt.% fluorine and 6 wt.% water at 10 kbar are dashed lines (peraluminous, 74 wt.% silica; meta-luminous, 76; peralkaline, 73). (Data from Baker and Vaillan-court, 1995.) The dotted line indicates the viscosity of residualmelts resulting from fractional crystallization of Makaopuhibasalt melt (Table 5.1) with 0.5 wt.% water on the QFMbuffer calculated from the MELTS program; the most evolvedmelt has 73 wt.% silica and 0.3 wt.% water.
Chemical Dynamics of Melts and Crystals 125
silica at 800°C lowers the viscosity by seven orders ofmagnitude, from about 1012 to 105 Pa s. Most of the re-duction in viscosity in hydrous silicic melts occurs inthe first 2 wt.% or so of added dissolved water becausethat first 2% is mostly (OH)� (Section 4.2.2). Dis-solved water has less effect on basalt melts because theyare less polymerized regardless of volatile content. Dis-solved fluorine also reduces polymerization and viscos-ity, but, unlike water, which has very limited solubilityin melts at low P, fluorine can remain in solution in themelt and can therefore enhance the mobility of lavasextruded onto the surface of the Earth. Rhyolite meltshaving the lowest viscosity are those that contain bothdissolved water and fluorine. The lowest viscosities ofany known terrestrial melts are found in ultramafichigh-T komatiites and essentially silica-free, alkali car-bonatites extruded at about 585°C from OldoinyoLengai volcano in the East African Rift (Dawson et al.,1990). The 15 orders of magnitude difference in vis-cosity between carbonatite and dry rhyolite melts ex-truded near 600°C is illustrated by the contrastingmorphological characteristics of their extruded lavas—the former having the appearance of muddy water andthe latter forming steep bulbous domes that can behigher than their horizontal diameter. Widespreadbasaltic lavas that are no more than a couple of ordersof magnitude more viscous than cooler carbonatitiemelts form sheetlike flows, again in striking contrastwith mushroom-shaped rhyolite extrusions.
Melt viscosity is only weakly dependent on P. Anisothermal increase in P of 20 kbar reduces the viscos-ity of mafic melts by less than 50% and silicic melts bya slightly greater factor (Richet and Bottinga, 1995).This negative dependence on P follows because bridg-ing oxygens have a greater molar volume than non-bridging, and, therefore, from Le Chatelier’s principle,a positive increment in P increases the ratio of non-bridging to bridging oxygens that depolymerizes themelt, reducing the viscosity.
The viscosity of melts that carry suspended crystals(i.e., magma) and contain bubbles of volatile fluid, aswell as those that have an intrinsic yield strength do notfollow the form of Equation 6.1 (see Section 8.2.2 for adiscussion of non-Newtonian magmas).
If a melt is deformed slowly, its distorted atomicstructure has time to adjust or relax; it behaves as a liq-uid. However, for increasingly rapid deformation (in-creasing strain rate) at constant T, particularly in coolermore viscous polymerized melts, the melt crosses athreshold between liquid and solid behavior, called theglass transition, defined as the T at which � � 1012 Pa s.If rapid deformation takes place at viscosities abovethis glass transition, the melt cannot adjust: its relax-ation “time” is exceeded. It behaves as if it were asolid, breaking as any brittle solid does if the appliedstress is excessive.
Advanced Topic Box 6.1 Calculation of melt viscosity
Shaw (1972) developed a model from which theviscosity of homogeneous melts can be calculatedfrom their chemical composition. This model as-sumes the viscosity follows an Arrhenius relation � � A exp (�Ea/RT) where A is a constant, Ea isthe activation energy of viscous flow, R is the gasconstant, and T is in degrees Kelvin. Although manymelts depart to varying degrees from Arrhenian be-havior, Shaw’s model has nonetheless proved useful.The full details cannot be dealt with here; only a“cookbook” presentation is given. The viscosity, � , is found from the equation
2.303 log10� � s(104/T ) � 1.5s � 6.4
For example, calculation of the viscosity of a hydrous rhyolite (granite) melt at T � 1073K(�800°C) is presented in Table 6.1, where determi-nation of the value of s is described (minor con-stituents, such as MnO and P2O5, are ignored).Numbers in the Moles column are found by di-viding the Wt.% values by the Formula wt. of the corresponding oxide. Note that the moles ofAl2O3 and Fe2O3 are doubled. The mole fraction,X, is found by dividing the Moles value by the sum of Moles, or 1.908. In the next column, Xi, themole fractions of Fe2O3, FeO, and MgO are addedtogether (giving 0.009), as are CaO and TiO2
(0.004), and Na2O and K2O (0.057). Shaw’s valuesof the partial molar activation energies of SiO2 inbinary systems with categories of other oxides, si
o,are listed in the next column. These values multi-plied by the mole fraction of SiO2 in the particularmelt are listed in the si
o XSiO2column. Finally, at the
bottom of Table 6.1, the sum of the Xi(sio XSiO2
)values listed in the last column is divided by (1 �XSiO2
) to give s, which is inserted into the viscosityequation. The viscosity calculated from this equa-tion is 105.24 poise � 104.24 Pa s. The viscosity mea-sured by Shaw (reference in his 1972 paper) is104.63 Pa s.
Hess and Dingwell (1996) and Baker (1996) havedevised models based on experimental data that ac-count for the non-Arrhenian T dependence of vis-cosity for hydrous rhyolite (granite) melts.
In the Shaw, Hess-Dingwell, and Baker modelsno dependence on P is included, as this is negli-gible.
Ryan and Blevins (1987) have compiled experi-mentally determined viscosities of a wide range ofmelt compositions.
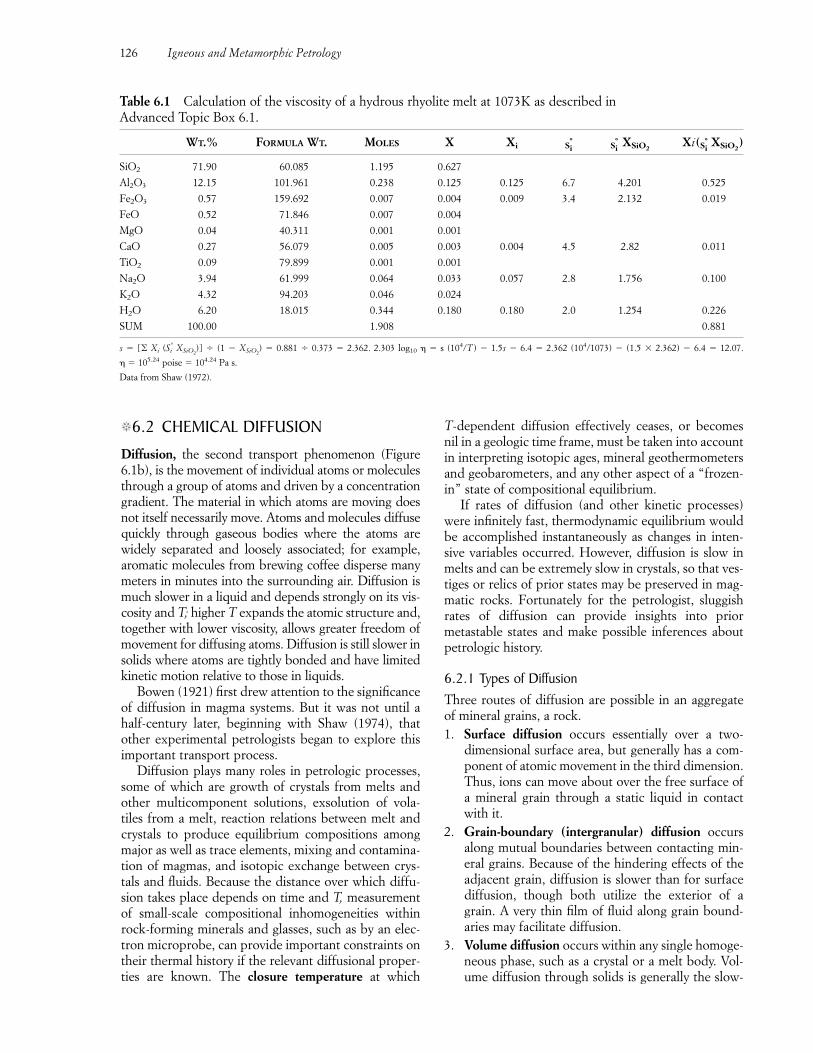
�6.2 CHEMICAL DIFFUSION
Diffusion, the second transport phenomenon (Figure6.1b), is the movement of individual atoms or moleculesthrough a group of atoms and driven by a concentrationgradient. The material in which atoms are moving doesnot itself necessarily move. Atoms and molecules diffusequickly through gaseous bodies where the atoms arewidely separated and loosely associated; for example,aromatic molecules from brewing coffee disperse manymeters in minutes into the surrounding air. Diffusion ismuch slower in a liquid and depends strongly on its vis-cosity and T; higher T expands the atomic structure and,together with lower viscosity, allows greater freedom ofmovement for diffusing atoms. Diffusion is still slower insolids where atoms are tightly bonded and have limitedkinetic motion relative to those in liquids.
Bowen (1921) first drew attention to the significanceof diffusion in magma systems. But it was not until ahalf-century later, beginning with Shaw (1974), thatother experimental petrologists began to explore thisimportant transport process.
Diffusion plays many roles in petrologic processes,some of which are growth of crystals from melts andother multicomponent solutions, exsolution of vola-tiles from a melt, reaction relations between melt andcrystals to produce equilibrium compositions amongmajor as well as trace elements, mixing and contamina-tion of magmas, and isotopic exchange between crys-tals and fluids. Because the distance over which diffu-sion takes place depends on time and T, measurementof small-scale compositional inhomogeneities withinrock-forming minerals and glasses, such as by an elec-tron microprobe, can provide important constraints ontheir thermal history if the relevant diffusional proper-ties are known. The closure temperature at which
T-dependent diffusion effectively ceases, or becomesnil in a geologic time frame, must be taken into accountin interpreting isotopic ages, mineral geothermometersand geobarometers, and any other aspect of a “frozen-in” state of compositional equilibrium.
If rates of diffusion (and other kinetic processes)were infinitely fast, thermodynamic equilibrium wouldbe accomplished instantaneously as changes in inten-sive variables occurred. However, diffusion is slow inmelts and can be extremely slow in crystals, so that ves-tiges or relics of prior states may be preserved in mag-matic rocks. Fortunately for the petrologist, sluggishrates of diffusion can provide insights into priormetastable states and make possible inferences aboutpetrologic history.
6.2.1 Types of DiffusionThree routes of diffusion are possible in an aggregateof mineral grains, a rock.1. Surface diffusion occurs essentially over a two-
dimensional surface area, but generally has a com-ponent of atomic movement in the third dimension.Thus, ions can move about over the free surface ofa mineral grain through a static liquid in contactwith it.
2. Grain-boundary (intergranular) diffusion occursalong mutual boundaries between contacting min-eral grains. Because of the hindering effects of theadjacent grain, diffusion is slower than for surfacediffusion, though both utilize the exterior of agrain. A very thin film of fluid along grain bound-aries may facilitate diffusion.
3. Volume diffusion occurs within any single homoge-neous phase, such as a crystal or a melt body. Vol-ume diffusion through solids is generally the slow-
126 Igneous and Metamorphic Petrology
Table 6.1 Calculation of the viscosity of a hydrous rhyolite melt at 1073K as described in Advanced Topic Box 6.1.
WT.% FORMULA WT. MOLES X Xi Si° Si
° XSiO2Xi(Si
° XSiO2)
SiO2 71.90 60.085 1.195 0.627
Al2O3 12.15 101.961 0.238 0.125 0.125 6.7 4.201 0.525
Fe2O3 0.57 159.692 0.007 0.004 0.009 3.4 2.132 0.019
FeO 0.52 71.846 0.007 0.004
MgO 0.04 40.311 0.001 0.001
CaO 0.27 56.079 0.005 0.003 0.004 4.5 2.82 0.011
TiO2 0.09 79.899 0.001 0.001
Na2O 3.94 61.999 0.064 0.033 0.057 2.8 1.756 0.100
K2O 4.32 94.203 0.046 0.024
H2O 6.20 18.015 0.344 0.180 0.180 2.0 1.254 0.226
SUM 100.00 1.908 0.881
s � [� Xi (Si° XSiO2
)] (1 � XSiO2) � 0.881 0.373 � 2.362. 2.303 log10 � � s (104/T ) � 1.5s � 6.4 � 2.362 (104/1073) � (1.5 � 2.362) � 6.4 � 12.07.
� � 105.24 poise � 104.24 Pa s.
Data from Shaw (1972).
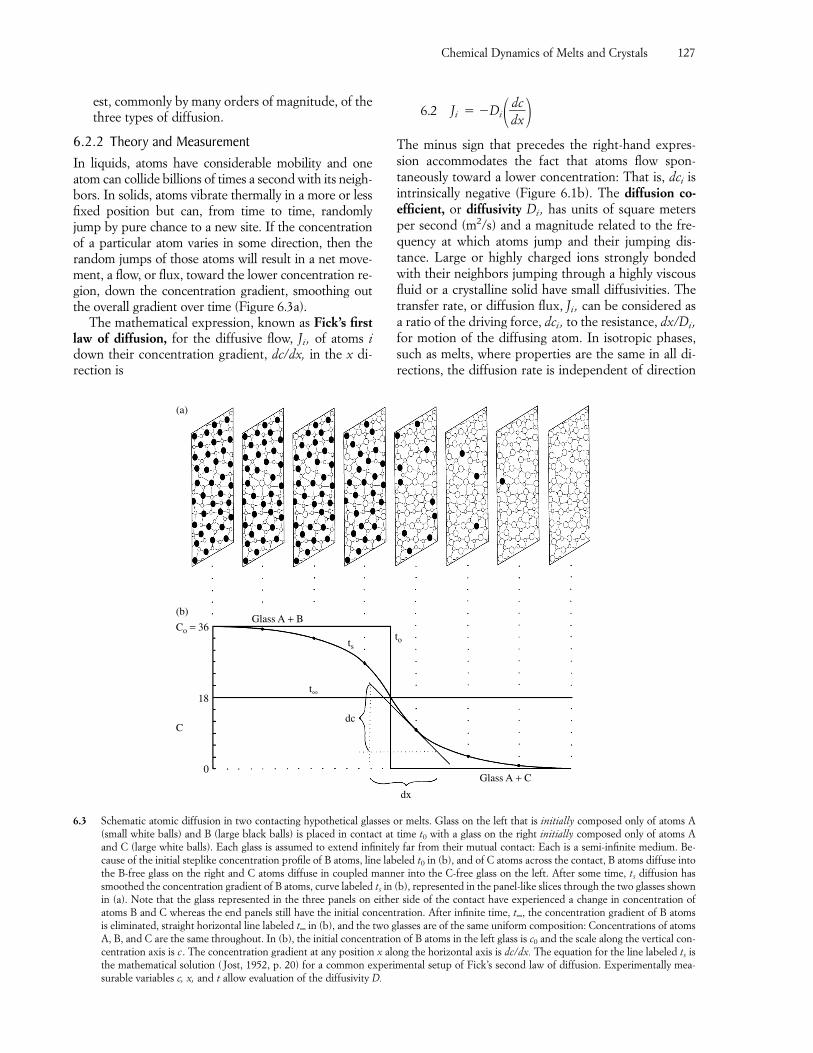
Chemical Dynamics of Melts and Crystals 127
est, commonly by many orders of magnitude, of thethree types of diffusion.
6.2.2 Theory and MeasurementIn liquids, atoms have considerable mobility and oneatom can collide billions of times a second with its neigh-bors. In solids, atoms vibrate thermally in a more or lessfixed position but can, from time to time, randomlyjump by pure chance to a new site. If the concentrationof a particular atom varies in some direction, then therandom jumps of those atoms will result in a net move-ment, a flow, or flux, toward the lower concentration re-gion, down the concentration gradient, smoothing outthe overall gradient over time (Figure 6.3a).
The mathematical expression, known as Fick’s firstlaw of diffusion, for the diffusive flow, Ji , of atoms idown their concentration gradient, dc/dx, in the x di-rection is
6.2 Ji � �Di��ddxc��
The minus sign that precedes the right-hand expres-sion accommodates the fact that atoms flow spon-taneously toward a lower concentration: That is, dci isintrinsically negative (Figure 6.1b). The diffusion co-efficient, or diffusivity Di, has units of square meters per second (m2/s) and a magnitude related to the fre-quency at which atoms jump and their jumping dis-tance. Large or highly charged ions strongly bondedwith their neighbors jumping through a highly viscousfluid or a crystalline solid have small diffusivities. Thetransfer rate, or diffusion flux, Ji , can be considered asa ratio of the driving force, dci , to the resistance, dx/Di ,for motion of the diffusing atom. In isotropic phases,such as melts, where properties are the same in all di-rections, the diffusion rate is independent of direction
0
18
Co = 36
C
Glass A + B
Glass A + C
t∞
dc
dx
tots
(b)
(a)
6.3 Schematic atomic diffusion in two contacting hypothetical glasses or melts. Glass on the left that is initially composed only of atoms A(small white balls) and B (large black balls) is placed in contact at time t0 with a glass on the right initially composed only of atoms Aand C (large white balls). Each glass is assumed to extend infinitely far from their mutual contact: Each is a semi-infinite medium. Be-cause of the initial steplike concentration profile of B atoms, line labeled t0 in (b), and of C atoms across the contact, B atoms diffuse intothe B-free glass on the right and C atoms diffuse in coupled manner into the C-free glass on the left. After some time, ts diffusion hassmoothed the concentration gradient of B atoms, curve labeled ts in (b), represented in the panel-like slices through the two glasses shownin (a). Note that the glass represented in the three panels on either side of the contact have experienced a change in concentration ofatoms B and C whereas the end panels still have the initial concentration. After infinite time, t∞, the concentration gradient of B atomsis eliminated, straight horizontal line labeled t∞ in (b), and the two glasses are of the same uniform composition: Concentrations of atomsA, B, and C are the same throughout. In (b), the initial concentration of B atoms in the left glass is c0 and the scale along the vertical con-centration axis is c . The concentration gradient at any position x along the horizontal axis is dc/dx. The equation for the line labeled ts isthe mathematical solution ( Jost, 1952, p. 20) for a common experimental setup of Fick’s second law of diffusion. Experimentally mea-surable variables c, x, and t allow evaluation of the diffusivity D.
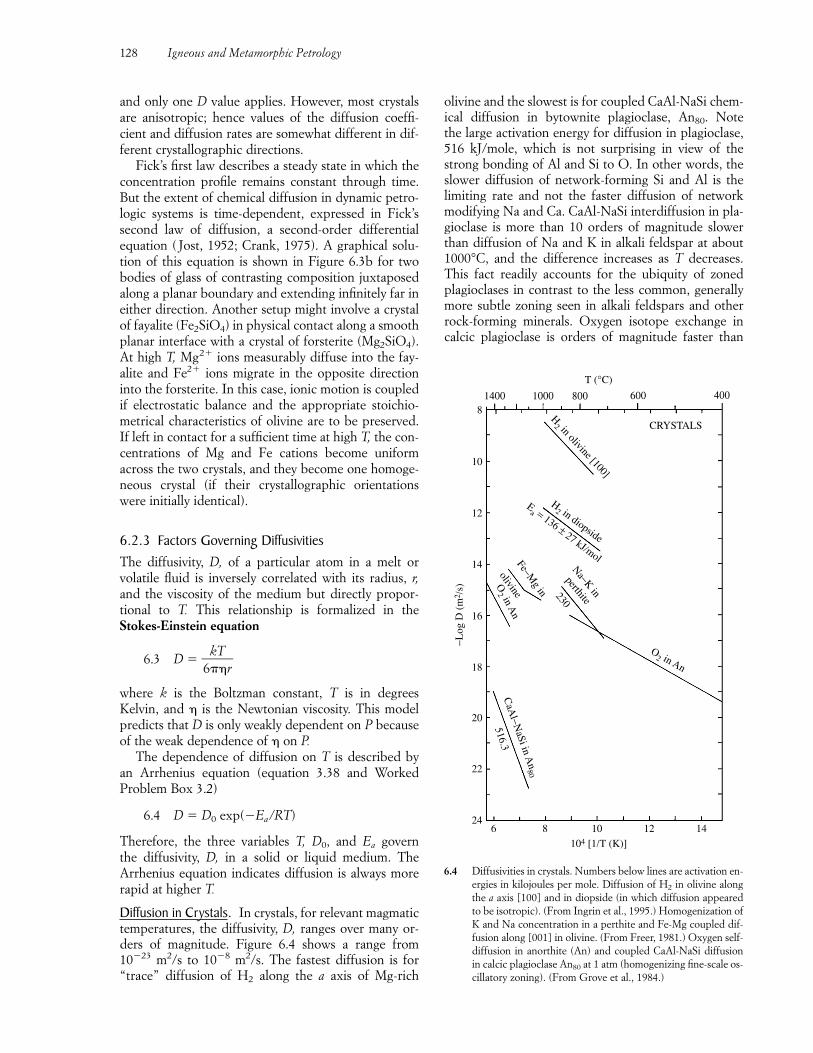
and only one D value applies. However, most crystalsare anisotropic; hence values of the diffusion coeffi-cient and diffusion rates are somewhat different in dif-ferent crystallographic directions.
Fick’s first law describes a steady state in which theconcentration profile remains constant through time.But the extent of chemical diffusion in dynamic petro-logic systems is time-dependent, expressed in Fick’ssecond law of diffusion, a second-order differentialequation ( Jost, 1952; Crank, 1975). A graphical solu-tion of this equation is shown in Figure 6.3b for twobodies of glass of contrasting composition juxtaposedalong a planar boundary and extending infinitely far ineither direction. Another setup might involve a crystalof fayalite (Fe2SiO4) in physical contact along a smoothplanar interface with a crystal of forsterite (Mg2SiO4).At high T, Mg2� ions measurably diffuse into the fay-alite and Fe2� ions migrate in the opposite directioninto the forsterite. In this case, ionic motion is coupledif electrostatic balance and the appropriate stoichio-metrical characteristics of olivine are to be preserved. If left in contact for a sufficient time at high T, the con-centrations of Mg and Fe cations become uniformacross the two crystals, and they become one homoge-neous crystal (if their crystallographic orientationswere initially identical).
6.2.3 Factors Governing DiffusivitiesThe diffusivity, D, of a particular atom in a melt orvolatile fluid is inversely correlated with its radius, r,and the viscosity of the medium but directly propor-tional to T. This relationship is formalized in theStokes-Einstein equation
6.3 D � �6k�
T�r�
where k is the Boltzman constant, T is in degreesKelvin, and � is the Newtonian viscosity. This modelpredicts that D is only weakly dependent on P becauseof the weak dependence of � on P.
The dependence of diffusion on T is described byan Arrhenius equation (equation 3.38 and WorkedProblem Box 3.2)
6.4 D � D0 exp(�Ea/RT)
Therefore, the three variables T, D0, and Ea govern the diffusivity, D, in a solid or liquid medium. The Arrhenius equation indicates diffusion is always morerapid at higher T.
Diffusion in Crystals. In crystals, for relevant magmatictemperatures, the diffusivity, D, ranges over many or-ders of magnitude. Figure 6.4 shows a range from10�23 m2/s to 10�8 m2/s. The fastest diffusion is for“trace” diffusion of H2 along the a axis of Mg-rich
olivine and the slowest is for coupled CaAl-NaSi chem-ical diffusion in bytownite plagioclase, An80. Note the large activation energy for diffusion in plagioclase,516 kJ/mole, which is not surprising in view of thestrong bonding of Al and Si to O. In other words, theslower diffusion of network-forming Si and Al is thelimiting rate and not the faster diffusion of networkmodifying Na and Ca. CaAl-NaSi interdiffusion in pla-gioclase is more than 10 orders of magnitude slowerthan diffusion of Na and K in alkali feldspar at about1000°C, and the difference increases as T decreases.This fact readily accounts for the ubiquity of zoned plagioclases in contrast to the less common, generallymore subtle zoning seen in alkali feldspars and otherrock-forming minerals. Oxygen isotope exchange incalcic plagioclase is orders of magnitude faster than
128 Igneous and Metamorphic Petrology
6 8 10 12 14
104 [1/T (K)]
24
22
20
18
16
14
12
10
8
−Log
D (
m2 /
s)
1400 1000 800 600 400
516.3C
aAl−N
aSi in An
80
O2 in A
nolivine
Fe−Mg in 230
Na−K in
perthite
O2 in An
Ea = 136 ± 27 kJ/mol
H2 in diopside
H2 in olivine [100]
CRYSTALS
T (°C)
6.4 Diffusivities in crystals. Numbers below lines are activation en-ergies in kilojoules per mole. Diffusion of H2 in olivine alongthe a axis [100] and in diopside (in which diffusion appearedto be isotropic). (From Ingrin et al., 1995.) Homogenization ofK and Na concentration in a perthite and Fe-Mg coupled dif-fusion along [001] in olivine. (From Freer, 1981.) Oxygen self-diffusion in anorthite (An) and coupled CaAl-NaSi diffusionin calcic plagioclase An80 at 1 atm (homogenizing fine-scale os-cillatory zoning). (From Grove et al., 1984.)
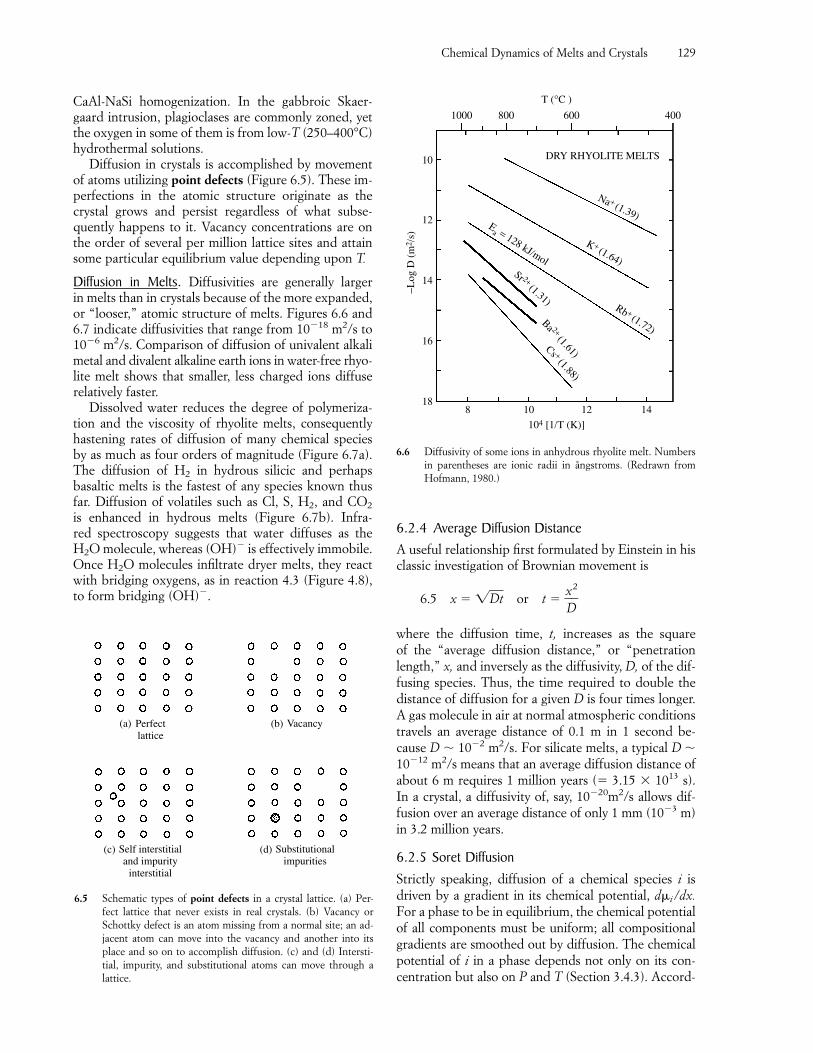
CaAl-NaSi homogenization. In the gabbroic Skaer-gaard intrusion, plagioclases are commonly zoned, yetthe oxygen in some of them is from low-T (250–400°C)hydrothermal solutions.
Diffusion in crystals is accomplished by movementof atoms utilizing point defects (Figure 6.5). These im-perfections in the atomic structure originate as thecrystal grows and persist regardless of what subse-quently happens to it. Vacancy concentrations are onthe order of several per million lattice sites and attainsome particular equilibrium value depending upon T.
Diffusion in Melts. Diffusivities are generally larger in melts than in crystals because of the more expanded,or “looser,” atomic structure of melts. Figures 6.6 and 6.7 indicate diffusivities that range from 10�18 m2/s to10�6 m2/s. Comparison of diffusion of univalent alkalimetal and divalent alkaline earth ions in water-free rhyo-lite melt shows that smaller, less charged ions diffuserelatively faster.
Dissolved water reduces the degree of polymeriza-tion and the viscosity of rhyolite melts, consequentlyhastening rates of diffusion of many chemical speciesby as much as four orders of magnitude (Figure 6.7a).The diffusion of H2 in hydrous silicic and perhapsbasaltic melts is the fastest of any species known thusfar. Diffusion of volatiles such as Cl, S, H2, and CO2
is enhanced in hydrous melts (Figure 6.7b). Infra-red spectroscopy suggests that water diffuses as the H2O molecule, whereas (OH)� is effectively immobile.Once H2O molecules infiltrate dryer melts, they reactwith bridging oxygens, as in reaction 4.3 (Figure 4.8),to form bridging (OH)�.
6.2.4 Average Diffusion DistanceA useful relationship first formulated by Einstein in hisclassic investigation of Brownian movement is
6.5 x � �D�t� or t � �xD
2
�
where the diffusion time, t, increases as the square of the “average diffusion distance,” or “penetrationlength,” x, and inversely as the diffusivity, D, of the dif-fusing species. Thus, the time required to double thedistance of diffusion for a given D is four times longer.A gas molecule in air at normal atmospheric conditionstravels an average distance of 0.1 m in 1 second be-cause D � 10�2 m2/s. For silicate melts, a typical D �10�12 m2/s means that an average diffusion distance ofabout 6 m requires 1 million years (� 3.15 � 1013 s).In a crystal, a diffusivity of, say, 10�20m2/s allows dif-fusion over an average distance of only 1 mm (10�3 m)in 3.2 million years.
6.2.5 Soret DiffusionStrictly speaking, diffusion of a chemical species i is driven by a gradient in its chemical potential, d i /dx.For a phase to be in equilibrium, the chemical potentialof all components must be uniform; all compositionalgradients are smoothed out by diffusion. The chemicalpotential of i in a phase depends not only on its con-centration but also on P and T (Section 3.4.3). Accord-
Chemical Dynamics of Melts and Crystals 129
(c) (d)
(b) (a) Perfectlattice
Vacancy
Substitutionalimpurities
Self interstitialand impurity
interstitial
6.5 Schematic types of point defects in a crystal lattice. (a) Per-fect lattice that never exists in real crystals. (b) Vacancy orSchottky defect is an atom missing from a normal site; an ad-jacent atom can move into the vacancy and another into itsplace and so on to accomplish diffusion. (c) and (d) Intersti-tial, impurity, and substitutional atoms can move through a lattice.
818
16
14
12
10
10 12 14−L
og D
(m
2 /s)
104 [1/T (K)]
1000 800 600 400
T (°C )
Cs + (1.88)
Ba 2+ (1.61)
Sr 2+ (1.31)
Ea = 128 kJ/mol
Rb + (1.72)
K + (1.64)
Na + (1.39)
DRY RHYOLITE MELTS
6.6 Diffusivity of some ions in anhydrous rhyolite melt. Numbersin parentheses are ionic radii in ångstroms. (Redrawn fromHofmann, 1980.)
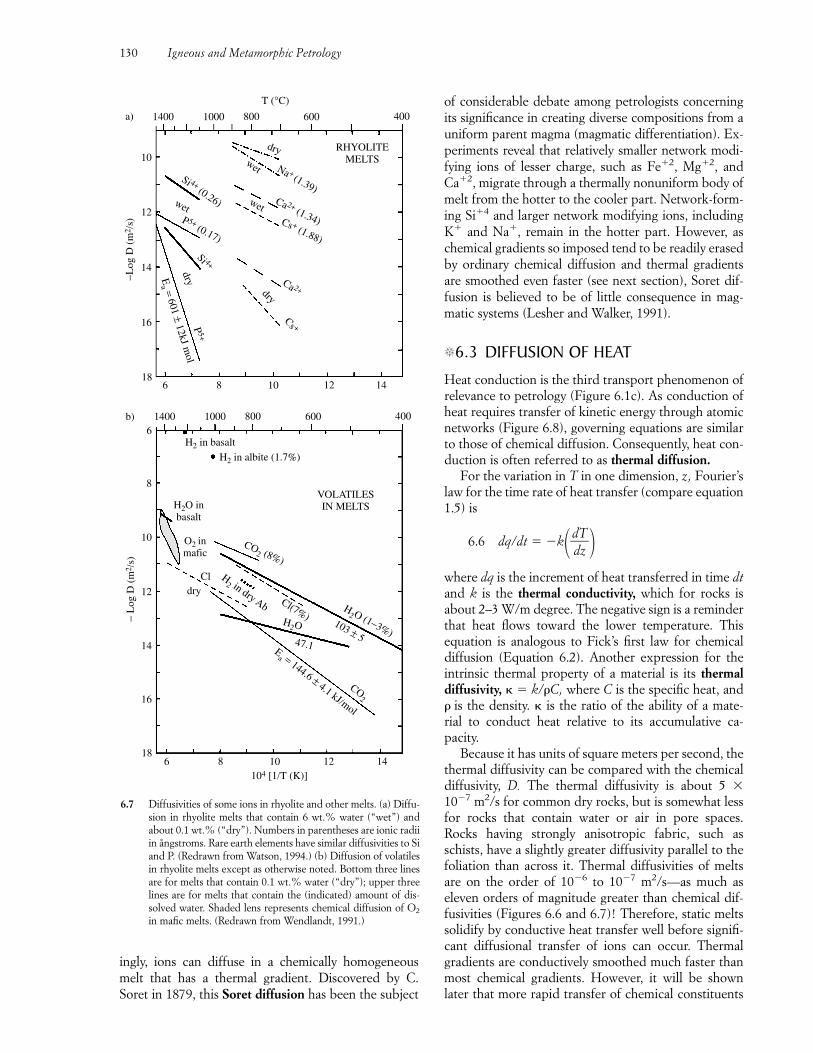
ingly, ions can diffuse in a chemically homogeneousmelt that has a thermal gradient. Discovered by C.Soret in 1879, this Soret diffusion has been the subject
130 Igneous and Metamorphic Petrology
6 8 10 12 1418
16
14
12
10
1400 1000 800 600 400
RHYOLITEMELTS
dry
dry
dry
Na + (1.39)
wet
wetwetCa 2+ (1.34)Cs + (1.88)
Si 4+ (0.26)
P 5+ (0.17)
Si 4+
Ea = 601 ± 12kJ
mol
Cs +
Ca 2+
P5+
b)
6 8 10 12 14
1400 1000 800 600 400
18
16
12
14
10
8
6H2 in basalt
H2 in albite (1.7%)
VOLATILESIN MELTS
CO2 (8%)
H2 O (1−3%)
103 ± 5Ea = 144.6 ± 4.1 kJ/mol
dryCl H
2 in dry Ab Cl(7%)
H2O inbasalt
104 [1/T (K)]
− L
og D
(m
2 /s)
O2 inmafic
a)
T (°C)
−Log
D (
m2 /
s)
H2O
CO2
47.1
6.7 Diffusivities of some ions in rhyolite and other melts. (a) Diffu-sion in rhyolite melts that contain 6 wt.% water (“wet”) andabout 0.1 wt.% (“dry”). Numbers in parentheses are ionic radiiin ångstroms. Rare earth elements have similar diffusivities to Siand P. (Redrawn from Watson, 1994.) (b) Diffusion of volatilesin rhyolite melts except as otherwise noted. Bottom three linesare for melts that contain 0.1 wt.% water (“dry”); upper threelines are for melts that contain the (indicated) amount of dis-solved water. Shaded lens represents chemical diffusion of O2
in mafic melts. (Redrawn from Wendlandt, 1991.)
of considerable debate among petrologists concerningits significance in creating diverse compositions from auniform parent magma (magmatic differentiation). Ex-periments reveal that relatively smaller network modi-fying ions of lesser charge, such as Fe�2, Mg�2, andCa�2, migrate through a thermally nonuniform body ofmelt from the hotter to the cooler part. Network-form-ing Si�4 and larger network modifying ions, includingK� and Na�, remain in the hotter part. However, aschemical gradients so imposed tend to be readily erasedby ordinary chemical diffusion and thermal gradientsare smoothed even faster (see next section), Soret dif-fusion is believed to be of little consequence in mag-matic systems (Lesher and Walker, 1991).
�6.3 DIFFUSION OF HEAT
Heat conduction is the third transport phenomenon ofrelevance to petrology (Figure 6.1c). As conduction ofheat requires transfer of kinetic energy through atomicnetworks (Figure 6.8), governing equations are similarto those of chemical diffusion. Consequently, heat con-duction is often referred to as thermal diffusion.
For the variation in T in one dimension, z , Fourier’slaw for the time rate of heat transfer (compare equation1.5) is
6.6 dq/dt � �k��ddTz��
where dq is the increment of heat transferred in time dtand k is the thermal conductivity, which for rocks isabout 2–3 W/m degree. The negative sign is a reminderthat heat flows toward the lower temperature. Thisequation is analogous to Fick’s first law for chemicaldiffusion (Equation 6.2). Another expression for theintrinsic thermal property of a material is its thermaldiffusivity, � � k/�C, where C is the specific heat, and� is the density. � is the ratio of the ability of a mate-rial to conduct heat relative to its accumulative ca-pacity.
Because it has units of square meters per second, thethermal diffusivity can be compared with the chemicaldiffusivity, D. The thermal diffusivity is about 5 �10�7 m2/s for common dry rocks, but is somewhat lessfor rocks that contain water or air in pore spaces.Rocks having strongly anisotropic fabric, such asschists, have a slightly greater diffusivity parallel to thefoliation than across it. Thermal diffusivities of meltsare on the order of 10�6 to 10�7 m2/s—as much aseleven orders of magnitude greater than chemical dif-fusivities (Figures 6.6 and 6.7)! Therefore, static meltssolidify by conductive heat transfer well before signifi-cant diffusional transfer of ions can occur. Thermalgradients are conductively smoothed much faster thanmost chemical gradients. However, it will be shownlater that more rapid transfer of chemical constituents
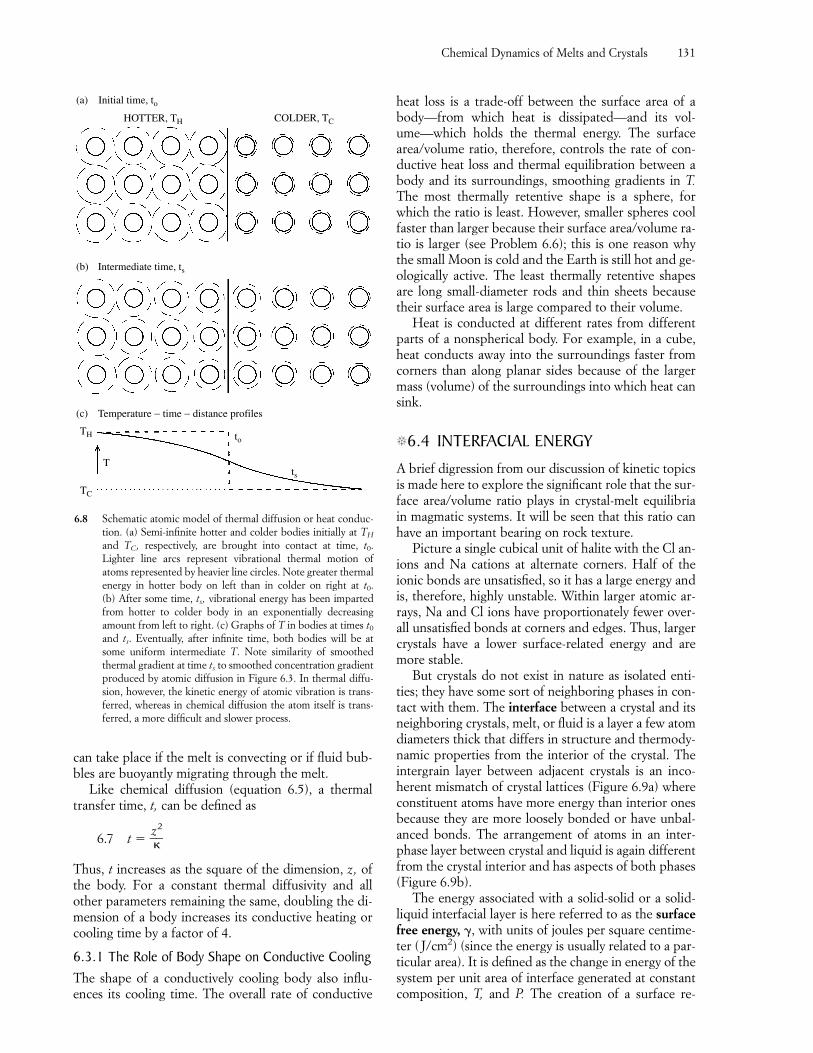
can take place if the melt is convecting or if fluid bub-bles are buoyantly migrating through the melt.
Like chemical diffusion (equation 6.5), a thermaltransfer time, t, can be defined as
6.7 t � �z�
2
�
Thus, t increases as the square of the dimension, z , ofthe body. For a constant thermal diffusivity and allother parameters remaining the same, doubling the di-mension of a body increases its conductive heating orcooling time by a factor of 4.
6.3.1 The Role of Body Shape on Conductive CoolingThe shape of a conductively cooling body also influ-ences its cooling time. The overall rate of conductive
heat loss is a trade-off between the surface area of abody—from which heat is dissipated—and its vol-ume—which holds the thermal energy. The surfacearea/volume ratio, therefore, controls the rate of con-ductive heat loss and thermal equilibration between abody and its surroundings, smoothing gradients in T.The most thermally retentive shape is a sphere, forwhich the ratio is least. However, smaller spheres coolfaster than larger because their surface area/volume ra-tio is larger (see Problem 6.6); this is one reason whythe small Moon is cold and the Earth is still hot and ge-ologically active. The least thermally retentive shapesare long small-diameter rods and thin sheets becausetheir surface area is large compared to their volume.
Heat is conducted at different rates from differentparts of a nonspherical body. For example, in a cube,heat conducts away into the surroundings faster fromcorners than along planar sides because of the largermass (volume) of the surroundings into which heat cansink.
�6.4 INTERFACIAL ENERGY
A brief digression from our discussion of kinetic topicsis made here to explore the significant role that the sur-face area/volume ratio plays in crystal-melt equilibriain magmatic systems. It will be seen that this ratio canhave an important bearing on rock texture.
Picture a single cubical unit of halite with the Cl an-ions and Na cations at alternate corners. Half of theionic bonds are unsatisfied, so it has a large energy andis, therefore, highly unstable. Within larger atomic ar-rays, Na and Cl ions have proportionately fewer over-all unsatisfied bonds at corners and edges. Thus, largercrystals have a lower surface-related energy and aremore stable.
But crystals do not exist in nature as isolated enti-ties; they have some sort of neighboring phases in con-tact with them. The interface between a crystal and itsneighboring crystals, melt, or fluid is a layer a few atomdiameters thick that differs in structure and thermody-namic properties from the interior of the crystal. Theintergrain layer between adjacent crystals is an inco-herent mismatch of crystal lattices (Figure 6.9a) whereconstituent atoms have more energy than interior onesbecause they are more loosely bonded or have unbal-anced bonds. The arrangement of atoms in an inter-phase layer between crystal and liquid is again differentfrom the crystal interior and has aspects of both phases(Figure 6.9b).
The energy associated with a solid-solid or a solid-liquid interfacial layer is here referred to as the surfacefree energy, �, with units of joules per square centime-ter ( J/cm2) (since the energy is usually related to a par-ticular area). It is defined as the change in energy of thesystem per unit area of interface generated at constantcomposition, T, and P. The creation of a surface re-
Chemical Dynamics of Melts and Crystals 131
Temperature − time − distance profiles
TH
TC
T
to
ts
(c)
Intermediate time, ts(b)
HOTTER, TH COLDER, TC
Initial time, to(a)
6.8 Schematic atomic model of thermal diffusion or heat conduc-tion. (a) Semi-infinite hotter and colder bodies initially at TH
and TC, respectively, are brought into contact at time, t0.Lighter line arcs represent vibrational thermal motion ofatoms represented by heavier line circles. Note greater thermalenergy in hotter body on left than in colder on right at t0. (b) After some time, ts, vibrational energy has been impartedfrom hotter to colder body in an exponentially decreasingamount from left to right. (c) Graphs of T in bodies at times t0
and ts. Eventually, after infinite time, both bodies will be atsome uniform intermediate T. Note similarity of smoothedthermal gradient at time ts to smoothed concentration gradientproduced by atomic diffusion in Figure 6.3. In thermal diffu-sion, however, the kinetic energy of atomic vibration is trans-ferred, whereas in chemical diffusion the atom itself is trans-ferred, a more difficult and slower process.
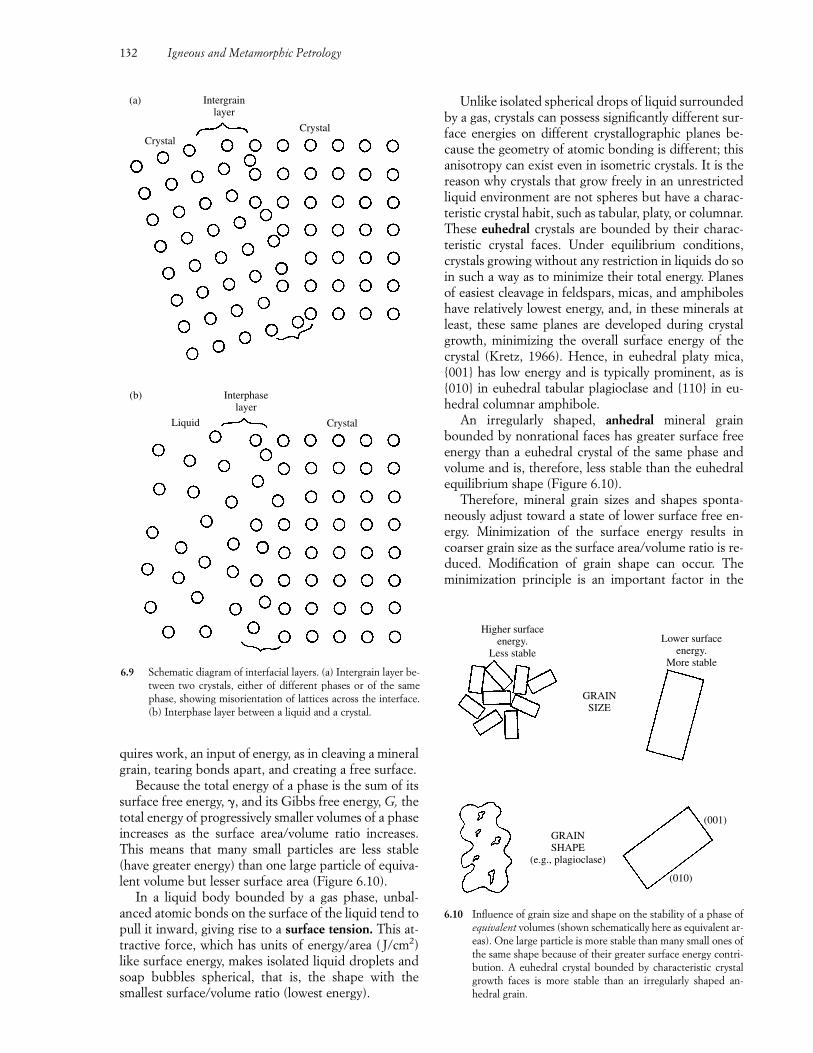
quires work, an input of energy, as in cleaving a mineralgrain, tearing bonds apart, and creating a free surface.
Because the total energy of a phase is the sum of itssurface free energy, �, and its Gibbs free energy, G, thetotal energy of progressively smaller volumes of a phaseincreases as the surface area/volume ratio increases.This means that many small particles are less stable(have greater energy) than one large particle of equiva-lent volume but lesser surface area (Figure 6.10).
In a liquid body bounded by a gas phase, unbal-anced atomic bonds on the surface of the liquid tend topull it inward, giving rise to a surface tension. This at-tractive force, which has units of energy/area ( J/cm2)like surface energy, makes isolated liquid droplets andsoap bubbles spherical, that is, the shape with thesmallest surface/volume ratio (lowest energy).
Unlike isolated spherical drops of liquid surroundedby a gas, crystals can possess significantly different sur-face energies on different crystallographic planes be-cause the geometry of atomic bonding is different; thisanisotropy can exist even in isometric crystals. It is thereason why crystals that grow freely in an unrestrictedliquid environment are not spheres but have a charac-teristic crystal habit, such as tabular, platy, or columnar.These euhedral crystals are bounded by their charac-teristic crystal faces. Under equilibrium conditions,crystals growing without any restriction in liquids do soin such a way as to minimize their total energy. Planesof easiest cleavage in feldspars, micas, and amphiboleshave relatively lowest energy, and, in these minerals atleast, these same planes are developed during crystalgrowth, minimizing the overall surface energy of thecrystal (Kretz, 1966). Hence, in euhedral platy mica,{001} has low energy and is typically prominent, as is{010} in euhedral tabular plagioclase and {110} in eu-hedral columnar amphibole.
An irregularly shaped, anhedral mineral grainbounded by nonrational faces has greater surface freeenergy than a euhedral crystal of the same phase andvolume and is, therefore, less stable than the euhedralequilibrium shape (Figure 6.10).
Therefore, mineral grain sizes and shapes sponta-neously adjust toward a state of lower surface free en-ergy. Minimization of the surface energy results incoarser grain size as the surface area/volume ratio is re-duced. Modification of grain shape can occur. Theminimization principle is an important factor in the
132 Igneous and Metamorphic Petrology
GRAINSHAPE
(e.g., plagioclase)
GRAINSIZE
(010)
(001)
Higher surfaceenergy.
Less stableLower surface
energy.More stable
6.10 Influence of grain size and shape on the stability of a phase ofequivalent volumes (shown schematically here as equivalent ar-eas). One large particle is more stable than many small ones ofthe same shape because of their greater surface energy contri-bution. A euhedral crystal bounded by characteristic crystalgrowth faces is more stable than an irregularly shaped an-hedral grain.
Intergrainlayer
CrystalCrystal
Interphaselayer
CrystalLiquid
(b)
(a)
6.9 Schematic diagram of interfacial layers. (a) Intergrain layer be-tween two crystals, either of different phases or of the samephase, showing misorientation of lattices across the interface.(b) Interphase layer between a liquid and a crystal.
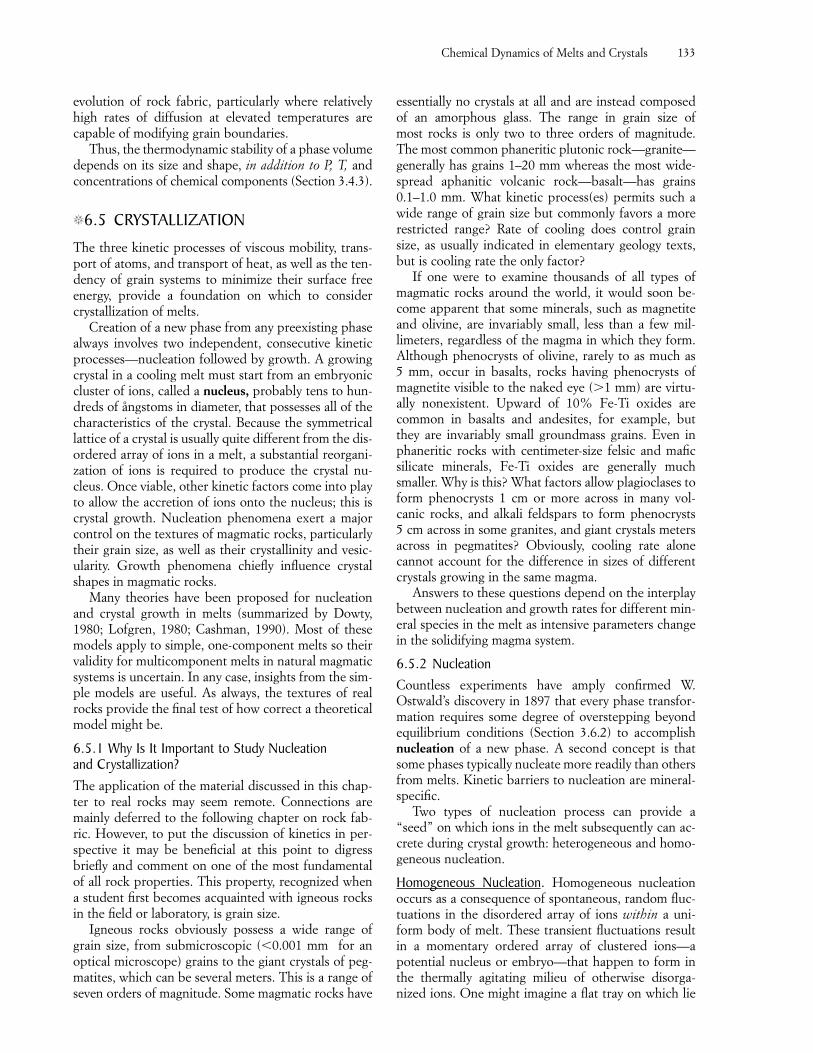
evolution of rock fabric, particularly where relativelyhigh rates of diffusion at elevated temperatures are capable of modifying grain boundaries.
Thus, the thermodynamic stability of a phase volumedepends on its size and shape, in addition to P, T, andconcentrations of chemical components (Section 3.4.3).
�6.5 CRYSTALLIZATION
The three kinetic processes of viscous mobility, trans-port of atoms, and transport of heat, as well as the ten-dency of grain systems to minimize their surface freeenergy, provide a foundation on which to considercrystallization of melts.
Creation of a new phase from any preexisting phasealways involves two independent, consecutive kineticprocesses—nucleation followed by growth. A growingcrystal in a cooling melt must start from an embryoniccluster of ions, called a nucleus, probably tens to hun-dreds of ångstoms in diameter, that possesses all of thecharacteristics of the crystal. Because the symmetricallattice of a crystal is usually quite different from the dis-ordered array of ions in a melt, a substantial reorgani-zation of ions is required to produce the crystal nu-cleus. Once viable, other kinetic factors come into playto allow the accretion of ions onto the nucleus; this iscrystal growth. Nucleation phenomena exert a majorcontrol on the textures of magmatic rocks, particularlytheir grain size, as well as their crystallinity and vesic-ularity. Growth phenomena chiefly influence crystalshapes in magmatic rocks.
Many theories have been proposed for nucleationand crystal growth in melts (summarized by Dowty,1980; Lofgren, 1980; Cashman, 1990). Most of thesemodels apply to simple, one-component melts so theirvalidity for multicomponent melts in natural magmaticsystems is uncertain. In any case, insights from the sim-ple models are useful. As always, the textures of realrocks provide the final test of how correct a theoreticalmodel might be.
6.5.1 Why Is It Important to Study Nucleation and Crystallization?The application of the material discussed in this chap-ter to real rocks may seem remote. Connections aremainly deferred to the following chapter on rock fab-ric. However, to put the discussion of kinetics in per-spective it may be beneficial at this point to digressbriefly and comment on one of the most fundamentalof all rock properties. This property, recognized whena student first becomes acquainted with igneous rocksin the field or laboratory, is grain size.
Igneous rocks obviously possess a wide range ofgrain size, from submicroscopic (�0.001 mm for anoptical microscope) grains to the giant crystals of peg-matites, which can be several meters. This is a range ofseven orders of magnitude. Some magmatic rocks have
essentially no crystals at all and are instead composedof an amorphous glass. The range in grain size of most rocks is only two to three orders of magnitude.The most common phaneritic plutonic rock—granite—generally has grains 1–20 mm whereas the most wide-spread aphanitic volcanic rock—basalt—has grains0.1–1.0 mm. What kinetic process(es) permits such awide range of grain size but commonly favors a morerestricted range? Rate of cooling does control grainsize, as usually indicated in elementary geology texts,but is cooling rate the only factor?
If one were to examine thousands of all types ofmagmatic rocks around the world, it would soon be-come apparent that some minerals, such as magnetiteand olivine, are invariably small, less than a few mil-limeters, regardless of the magma in which they form.Although phenocrysts of olivine, rarely to as much as 5 mm, occur in basalts, rocks having phenocrysts ofmagnetite visible to the naked eye (1 mm) are virtu-ally nonexistent. Upward of 10% Fe-Ti oxides arecommon in basalts and andesites, for example, but they are invariably small groundmass grains. Even inphaneritic rocks with centimeter-size felsic and maficsilicate minerals, Fe-Ti oxides are generally muchsmaller. Why is this? What factors allow plagioclases toform phenocrysts 1 cm or more across in many vol-canic rocks, and alkali feldspars to form phenocrysts 5 cm across in some granites, and giant crystals metersacross in pegmatites? Obviously, cooling rate alonecannot account for the difference in sizes of differentcrystals growing in the same magma.
Answers to these questions depend on the interplaybetween nucleation and growth rates for different min-eral species in the melt as intensive parameters changein the solidifying magma system.
6.5.2 NucleationCountless experiments have amply confirmed W. Ostwald’s discovery in 1897 that every phase transfor-mation requires some degree of overstepping beyondequilibrium conditions (Section 3.6.2) to accomplishnucleation of a new phase. A second concept is thatsome phases typically nucleate more readily than othersfrom melts. Kinetic barriers to nucleation are mineral-specific.
Two types of nucleation process can provide a“seed” on which ions in the melt subsequently can ac-crete during crystal growth: heterogeneous and homo-geneous nucleation.
Homogeneous Nucleation. Homogeneous nucleationoccurs as a consequence of spontaneous, random fluc-tuations in the disordered array of ions within a uni-form body of melt. These transient fluctuations resultin a momentary ordered array of clustered ions—a potential nucleus or embryo—that happen to form inthe thermally agitating milieu of otherwise disorga-nized ions. One might imagine a flat tray on which lie
Chemical Dynamics of Melts and Crystals 133
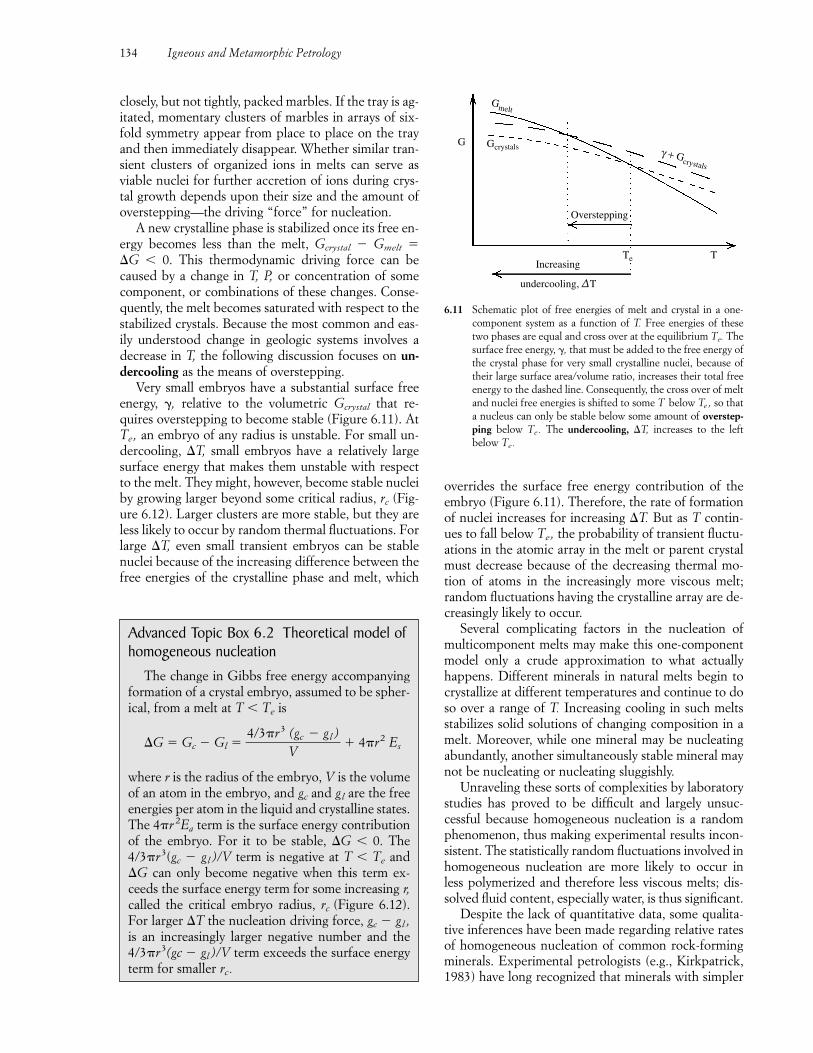
closely, but not tightly, packed marbles. If the tray is ag-itated, momentary clusters of marbles in arrays of six-fold symmetry appear from place to place on the trayand then immediately disappear. Whether similar tran-sient clusters of organized ions in melts can serve as viable nuclei for further accretion of ions during crys-tal growth depends upon their size and the amount ofoverstepping—the driving “force” for nucleation.
A new crystalline phase is stabilized once its free en-ergy becomes less than the melt, Gcrystal � Gmelt ��G � 0. This thermodynamic driving force can becaused by a change in T, P, or concentration of somecomponent, or combinations of these changes. Conse-quently, the melt becomes saturated with respect to thestabilized crystals. Because the most common and eas-ily understood change in geologic systems involves adecrease in T, the following discussion focuses on un-dercooling as the means of overstepping.
Very small embryos have a substantial surface freeenergy, �, relative to the volumetric Gcrystal that re-quires overstepping to become stable (Figure 6.11). AtTe, an embryo of any radius is unstable. For small un-dercooling, �T, small embryos have a relatively largesurface energy that makes them unstable with respectto the melt. They might, however, become stable nucleiby growing larger beyond some critical radius, rc (Fig-ure 6.12). Larger clusters are more stable, but they areless likely to occur by random thermal fluctuations. Forlarge �T, even small transient embryos can be stablenuclei because of the increasing difference between thefree energies of the crystalline phase and melt, which
overrides the surface free energy contribution of theembryo (Figure 6.11). Therefore, the rate of formationof nuclei increases for increasing �T. But as T contin-ues to fall below Te, the probability of transient fluctu-ations in the atomic array in the melt or parent crystalmust decrease because of the decreasing thermal mo-tion of atoms in the increasingly more viscous melt;random fluctuations having the crystalline array are de-creasingly likely to occur.
Several complicating factors in the nucleation ofmulticomponent melts may make this one-componentmodel only a crude approximation to what actuallyhappens. Different minerals in natural melts begin tocrystallize at different temperatures and continue to doso over a range of T. Increasing cooling in such meltsstabilizes solid solutions of changing composition in amelt. Moreover, while one mineral may be nucleatingabundantly, another simultaneously stable mineral maynot be nucleating or nucleating sluggishly.
Unraveling these sorts of complexities by laboratorystudies has proved to be difficult and largely unsuc-cessful because homogeneous nucleation is a randomphenomenon, thus making experimental results incon-sistent. The statistically random fluctuations involved inhomogeneous nucleation are more likely to occur inless polymerized and therefore less viscous melts; dis-solved fluid content, especially water, is thus significant.
Despite the lack of quantitative data, some qualita-tive inferences have been made regarding relative ratesof homogeneous nucleation of common rock-formingminerals. Experimental petrologists (e.g., Kirkpatrick,1983) have long recognized that minerals with simpler
134 Igneous and Metamorphic Petrology
Overstepping
undercooling, ∆T
Te T
Gcrystals
Gmelt
γ + Gcrystals
G
Increasing
6.11 Schematic plot of free energies of melt and crystal in a one-component system as a function of T. Free energies of thesetwo phases are equal and cross over at the equilibrium Te. Thesurface free energy, �, that must be added to the free energy ofthe crystal phase for very small crystalline nuclei, because oftheir large surface area/volume ratio, increases their total freeenergy to the dashed line. Consequently, the cross over of meltand nuclei free energies is shifted to some T below Te , so thata nucleus can only be stable below some amount of overstep-ping below Te. The undercooling, �T, increases to the left below Te.
Advanced Topic Box 6.2 Theoretical model ofhomogeneous nucleation
The change in Gibbs free energy accompanyingformation of a crystal embryo, assumed to be spher-ical, from a melt at T � Te is
�G � Gc � Gl ��4/3�r3
V(gc � gl )�� 4�r2 Es
where r is the radius of the embryo, V is the volumeof an atom in the embryo, and gc and gl are the freeenergies per atom in the liquid and crystalline states.The 4�r 2Ea term is the surface energy contributionof the embryo. For it to be stable, �G � 0. The4/3�r3(gc � gl )/V term is negative at T � Te and�G can only become negative when this term ex-ceeds the surface energy term for some increasing r,called the critical embryo radius, rc (Figure 6.12).For larger �T the nucleation driving force, gc � gl ,is an increasingly larger negative number and the4/3�r3(gc � gl )/V term exceeds the surface energyterm for smaller rc .
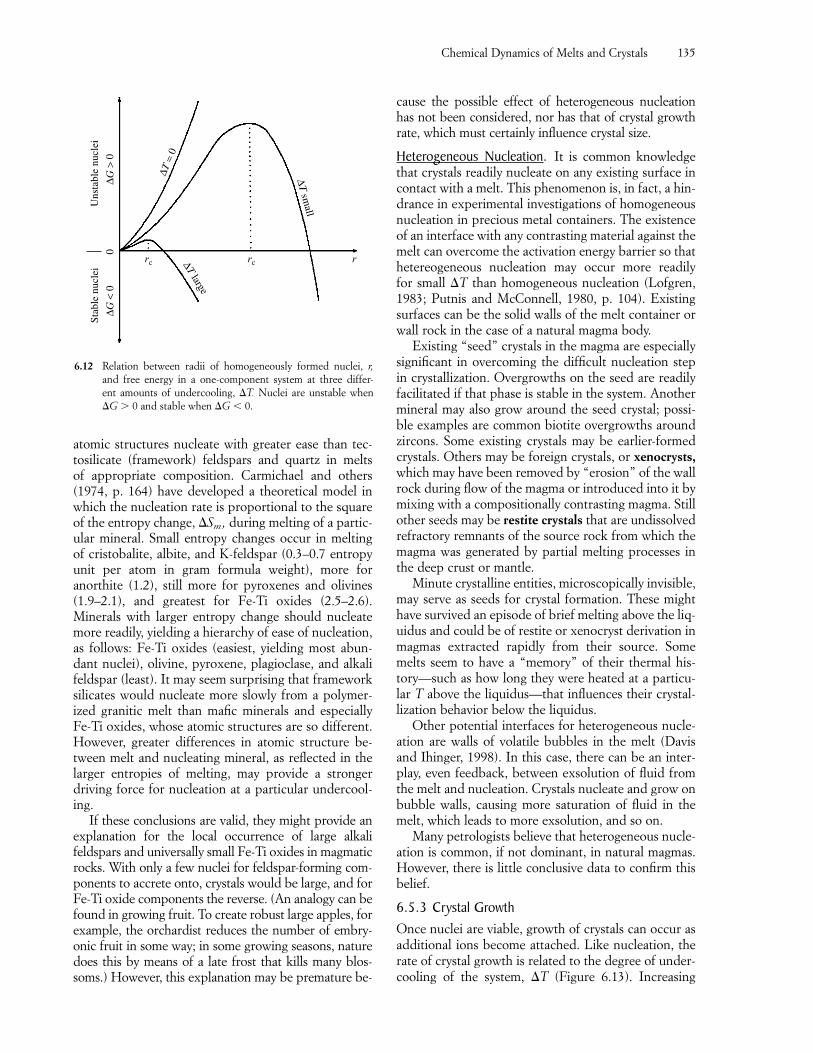
atomic structures nucleate with greater ease than tec-tosilicate (framework) feldspars and quartz in melts of appropriate composition. Carmichael and others(1974, p. 164) have developed a theoretical model inwhich the nucleation rate is proportional to the squareof the entropy change, �Sm, during melting of a partic-ular mineral. Small entropy changes occur in melting of cristobalite, albite, and K-feldspar (0.3–0.7 entropyunit per atom in gram formula weight), more for anorthite (1.2), still more for pyroxenes and olivines(1.9–2.1), and greatest for Fe-Ti oxides (2.5–2.6). Minerals with larger entropy change should nucleatemore readily, yielding a hierarchy of ease of nucleation,as follows: Fe-Ti oxides (easiest, yielding most abun-dant nuclei), olivine, pyroxene, plagioclase, and alkalifeldspar (least). It may seem surprising that frameworksilicates would nucleate more slowly from a polymer-ized granitic melt than mafic minerals and especiallyFe-Ti oxides, whose atomic structures are so different.However, greater differences in atomic structure be-tween melt and nucleating mineral, as reflected in thelarger entropies of melting, may provide a stronger driving force for nucleation at a particular undercool-ing.
If these conclusions are valid, they might provide anexplanation for the local occurrence of large alkalifeldspars and universally small Fe-Ti oxides in magmaticrocks. With only a few nuclei for feldspar-forming com-ponents to accrete onto, crystals would be large, and forFe-Ti oxide components the reverse. (An analogy can befound in growing fruit. To create robust large apples, forexample, the orchardist reduces the number of embry-onic fruit in some way; in some growing seasons, naturedoes this by means of a late frost that kills many blos-soms.) However, this explanation may be premature be-
cause the possible effect of heterogeneous nucleationhas not been considered, nor has that of crystal growthrate, which must certainly influence crystal size.
Heterogeneous Nucleation. It is common knowledgethat crystals readily nucleate on any existing surface incontact with a melt. This phenomenon is, in fact, a hin-drance in experimental investigations of homogeneousnucleation in precious metal containers. The existenceof an interface with any contrasting material against themelt can overcome the activation energy barrier so thathetereogeneous nucleation may occur more readily for small �T than homogeneous nucleation (Lofgren,1983; Putnis and McConnell, 1980, p. 104). Existingsurfaces can be the solid walls of the melt container orwall rock in the case of a natural magma body.
Existing “seed” crystals in the magma are especiallysignificant in overcoming the difficult nucleation stepin crystallization. Overgrowths on the seed are readilyfacilitated if that phase is stable in the system. Anothermineral may also grow around the seed crystal; possi-ble examples are common biotite overgrowths aroundzircons. Some existing crystals may be earlier-formedcrystals. Others may be foreign crystals, or xenocrysts,which may have been removed by “erosion” of the wallrock during flow of the magma or introduced into it bymixing with a compositionally contrasting magma. Stillother seeds may be restite crystals that are undissolvedrefractory remnants of the source rock from which themagma was generated by partial melting processes inthe deep crust or mantle.
Minute crystalline entities, microscopically invisible,may serve as seeds for crystal formation. These mighthave survived an episode of brief melting above the liq-uidus and could be of restite or xenocryst derivation inmagmas extracted rapidly from their source. Somemelts seem to have a “memory” of their thermal his-tory—such as how long they were heated at a particu-lar T above the liquidus—that influences their crystal-lization behavior below the liquidus.
Other potential interfaces for heterogeneous nucle-ation are walls of volatile bubbles in the melt (Davisand Ihinger, 1998). In this case, there can be an inter-play, even feedback, between exsolution of fluid fromthe melt and nucleation. Crystals nucleate and grow onbubble walls, causing more saturation of fluid in themelt, which leads to more exsolution, and so on.
Many petrologists believe that heterogeneous nucle-ation is common, if not dominant, in natural magmas.However, there is little conclusive data to confirm thisbelief.
6.5.3 Crystal GrowthOnce nuclei are viable, growth of crystals can occur asadditional ions become attached. Like nucleation, therate of crystal growth is related to the degree of under-cooling of the system, �T (Figure 6.13). Increasing
Chemical Dynamics of Melts and Crystals 135
rcrc r
0∆G
< 0
∆T large
∆G >
0
∆T =
0
∆T sm
all
Uns
tabl
e nu
clei
Stab
le n
ucle
i
6.12 Relation between radii of homogeneously formed nuclei, r,and free energy in a one-component system at three differ-ent amounts of undercooling, �T. Nuclei are unstable when�G 0 and stable when �G � 0.
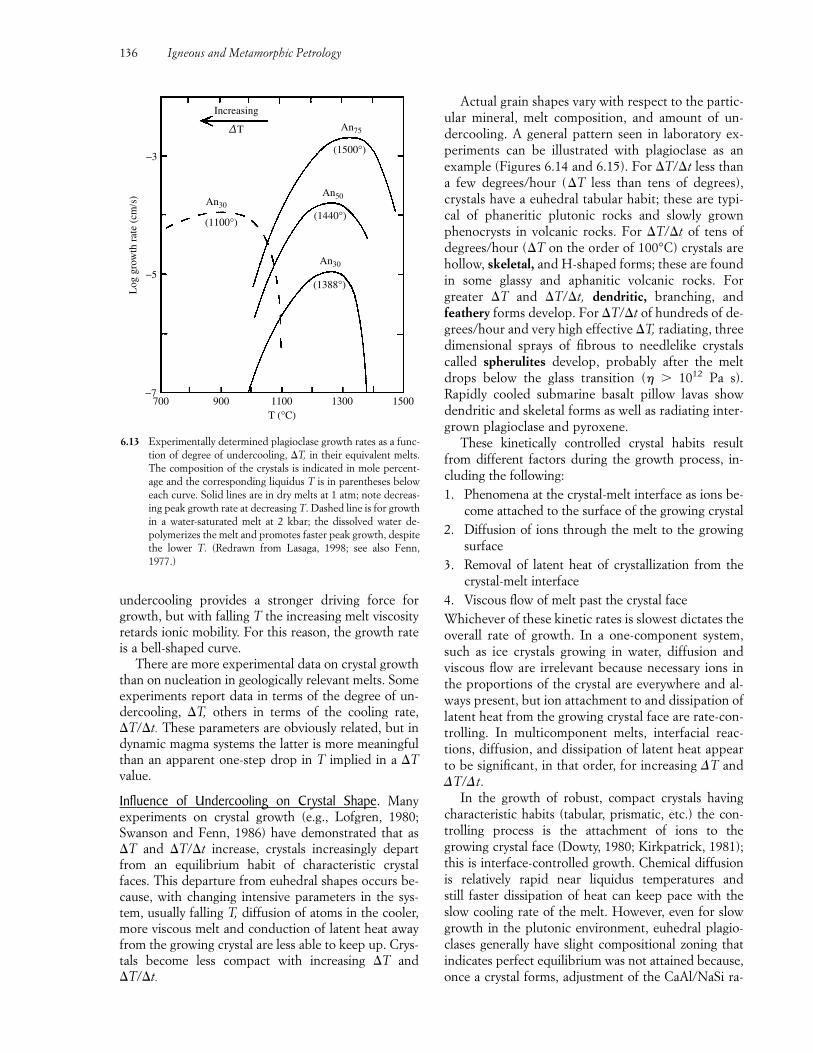
undercooling provides a stronger driving force forgrowth, but with falling T the increasing melt viscosityretards ionic mobility. For this reason, the growth rateis a bell-shaped curve.
There are more experimental data on crystal growththan on nucleation in geologically relevant melts. Someexperiments report data in terms of the degree of un-dercooling, �T, others in terms of the cooling rate,�T/�t. These parameters are obviously related, but indynamic magma systems the latter is more meaningfulthan an apparent one-step drop in T implied in a �Tvalue.
Influence of Undercooling on Crystal Shape. Many experiments on crystal growth (e.g., Lofgren, 1980;Swanson and Fenn, 1986) have demonstrated that as�T and �T/�t increase, crystals increasingly departfrom an equilibrium habit of characteristic crystalfaces. This departure from euhedral shapes occurs be-cause, with changing intensive parameters in the sys-tem, usually falling T, diffusion of atoms in the cooler,more viscous melt and conduction of latent heat awayfrom the growing crystal are less able to keep up. Crys-tals become less compact with increasing �T and�T/�t.
Actual grain shapes vary with respect to the partic-ular mineral, melt composition, and amount of un-dercooling. A general pattern seen in laboratory ex-periments can be illustrated with plagioclase as anexample (Figures 6.14 and 6.15). For �T/�t less thana few degrees/hour (�T less than tens of degrees),crystals have a euhedral tabular habit; these are typi-cal of phaneritic plutonic rocks and slowly grownphenocrysts in volcanic rocks. For �T/�t of tens ofdegrees/hour (�T on the order of 100°C) crystals arehollow, skeletal, and H-shaped forms; these are foundin some glassy and aphanitic volcanic rocks. Forgreater �T and �T/�t, dendritic, branching, andfeathery forms develop. For �T/�t of hundreds of de-grees/hour and very high effective �T, radiating, threedimensional sprays of fibrous to needlelike crystalscalled spherulites develop, probably after the meltdrops below the glass transition (� 1012 Pa s).Rapidly cooled submarine basalt pillow lavas showdendritic and skeletal forms as well as radiating inter-grown plagioclase and pyroxene.
These kinetically controlled crystal habits resultfrom different factors during the growth process, in-cluding the following:1. Phenomena at the crystal-melt interface as ions be-
come attached to the surface of the growing crystal2. Diffusion of ions through the melt to the growing
surface3. Removal of latent heat of crystallization from the
crystal-melt interface4. Viscous flow of melt past the crystal faceWhichever of these kinetic rates is slowest dictates theoverall rate of growth. In a one-component system,such as ice crystals growing in water, diffusion andviscous flow are irrelevant because necessary ions inthe proportions of the crystal are everywhere and al-ways present, but ion attachment to and dissipation oflatent heat from the growing crystal face are rate-con-trolling. In multicomponent melts, interfacial reac-tions, diffusion, and dissipation of latent heat appearto be significant, in that order, for increasing �T and�T/�t.
In the growth of robust, compact crystals havingcharacteristic habits (tabular, prismatic, etc.) the con-trolling process is the attachment of ions to the growing crystal face (Dowty, 1980; Kirkpatrick, 1981);this is interface-controlled growth. Chemical diffusionis relatively rapid near liquidus temperatures and still faster dissipation of heat can keep pace with theslow cooling rate of the melt. However, even for slowgrowth in the plutonic environment, euhedral plagio-clases generally have slight compositional zoning thatindicates perfect equilibrium was not attained because,once a crystal forms, adjustment of the CaAl/NaSi ra-
136 Igneous and Metamorphic Petrology
700 900 1100 1300 1500−7
−5
−3
(1388°)
(1100°)
(1500°)
(1440°)
An50An30
An30
An75
T (°C)
Increasing
∆TL
og g
row
th r
ate
(cm
/s)
6.13 Experimentally determined plagioclase growth rates as a func-tion of degree of undercooling, �T, in their equivalent melts.The composition of the crystals is indicated in mole percent-age and the corresponding liquidus T is in parentheses beloweach curve. Solid lines are in dry melts at 1 atm; note decreas-ing peak growth rate at decreasing T. Dashed line is for growthin a water-saturated melt at 2 kbar; the dissolved water de-polymerizes the melt and promotes faster peak growth, despitethe lower T. (Redrawn from Lasaga, 1998; see also Fenn,1977.)
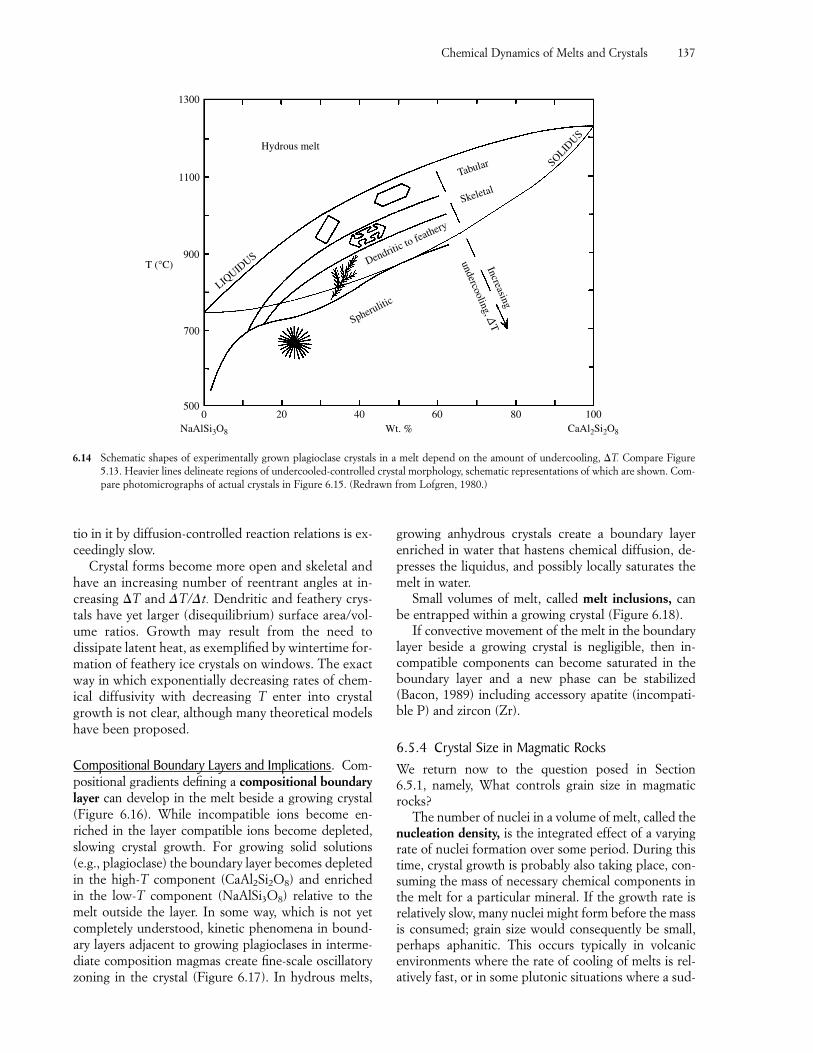
tio in it by diffusion-controlled reaction relations is ex-ceedingly slow.
Crystal forms become more open and skeletal andhave an increasing number of reentrant angles at in-creasing �T and �T/�t. Dendritic and feathery crys-tals have yet larger (disequilibrium) surface area/vol-ume ratios. Growth may result from the need todissipate latent heat, as exemplified by wintertime for-mation of feathery ice crystals on windows. The exactway in which exponentially decreasing rates of chem-ical diffusivity with decreasing T enter into crystalgrowth is not clear, although many theoretical modelshave been proposed.
Compositional Boundary Layers and Implications. Com-positional gradients defining a compositional boundarylayer can develop in the melt beside a growing crystal(Figure 6.16). While incompatible ions become en-riched in the layer compatible ions become depleted,slowing crystal growth. For growing solid solutions(e.g., plagioclase) the boundary layer becomes depletedin the high-T component (CaAl2Si2O8) and enriched in the low-T component (NaAlSi3O8) relative to themelt outside the layer. In some way, which is not yetcompletely understood, kinetic phenomena in bound-ary layers adjacent to growing plagioclases in interme-diate composition magmas create fine-scale oscillatoryzoning in the crystal (Figure 6.17). In hydrous melts,
growing anhydrous crystals create a boundary layer enriched in water that hastens chemical diffusion, de-presses the liquidus, and possibly locally saturates themelt in water.
Small volumes of melt, called melt inclusions, canbe entrapped within a growing crystal (Figure 6.18).
If convective movement of the melt in the boundarylayer beside a growing crystal is negligible, then in-compatible components can become saturated in theboundary layer and a new phase can be stabilized (Bacon, 1989) including accessory apatite (incompati-ble P) and zircon (Zr).
6.5.4 Crystal Size in Magmatic RocksWe return now to the question posed in Section 6.5.1, namely, What controls grain size in magmaticrocks?
The number of nuclei in a volume of melt, called thenucleation density, is the integrated effect of a varyingrate of nuclei formation over some period. During thistime, crystal growth is probably also taking place, con-suming the mass of necessary chemical components inthe melt for a particular mineral. If the growth rate isrelatively slow, many nuclei might form before the massis consumed; grain size would consequently be small,perhaps aphanitic. This occurs typically in volcanic environments where the rate of cooling of melts is rel-atively fast, or in some plutonic situations where a sud-
Chemical Dynamics of Melts and Crystals 137
Spherulitic
Increasing
undercooling, ∆T
Dendritic to feathery
Skeletal
Tabular SOLIDUS
Hydrous melt
LIQUID
US
0 20 40 60 80 100Wt. %
500
700
900
1100
1300
NaAlSi3O8 CaAl2Si2O8
T (°C)
6.14 Schematic shapes of experimentally grown plagioclase crystals in a melt depend on the amount of undercooling, �T. Compare Figure5.13. Heavier lines delineate regions of undercooled-controlled crystal morphology, schematic representations of which are shown. Com-pare photomicrographs of actual crystals in Figure 6.15. (Redrawn from Lofgren, 1980.)
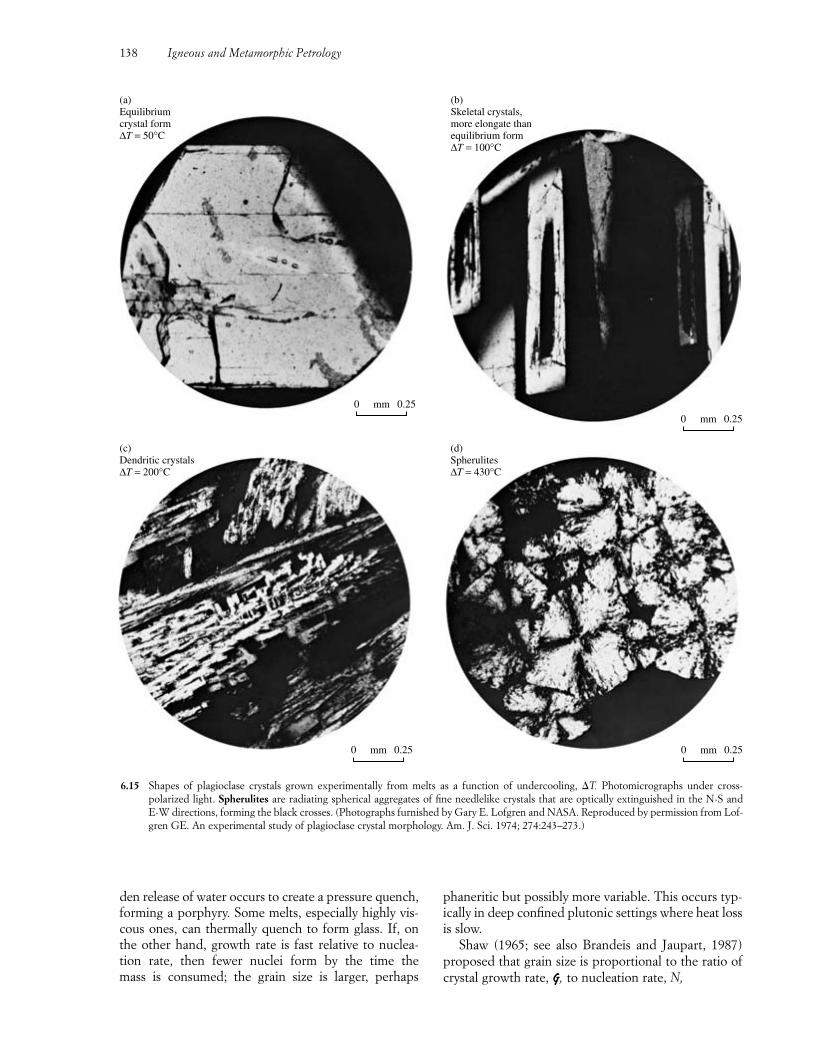
den release of water occurs to create a pressure quench,forming a porphyry. Some melts, especially highly vis-cous ones, can thermally quench to form glass. If, onthe other hand, growth rate is fast relative to nuclea-tion rate, then fewer nuclei form by the time the mass is consumed; the grain size is larger, perhaps
phaneritic but possibly more variable. This occurs typ-ically in deep confined plutonic settings where heat lossis slow.
Shaw (1965; see also Brandeis and Jaupart, 1987)proposed that grain size is proportional to the ratio ofcrystal growth rate, G, to nucleation rate, N,
138 Igneous and Metamorphic Petrology
0 mm 0.250 mm 0.25
0 mm 0.25
0 mm 0.25
(a)Equilibriumcrystal form∆T = 50°C
(c)Dendritic crystals∆T = 200°C
(d)Spherulites∆T = 430°C
(b)Skeletal crystals,more elongate thanequilibrium form∆T = 100°C
6.15 Shapes of plagioclase crystals grown experimentally from melts as a function of undercooling, �T. Photomicrographs under cross-polarized light. Spherulites are radiating spherical aggregates of fine needlelike crystals that are optically extinguished in the N-S and E-W directions, forming the black crosses. (Photographs furnished by Gary E. Lofgren and NASA. Reproduced by permission from Lof-gren GE. An experimental study of plagioclase crystal morphology. Am. J. Sci. 1974; 274:243–273.)
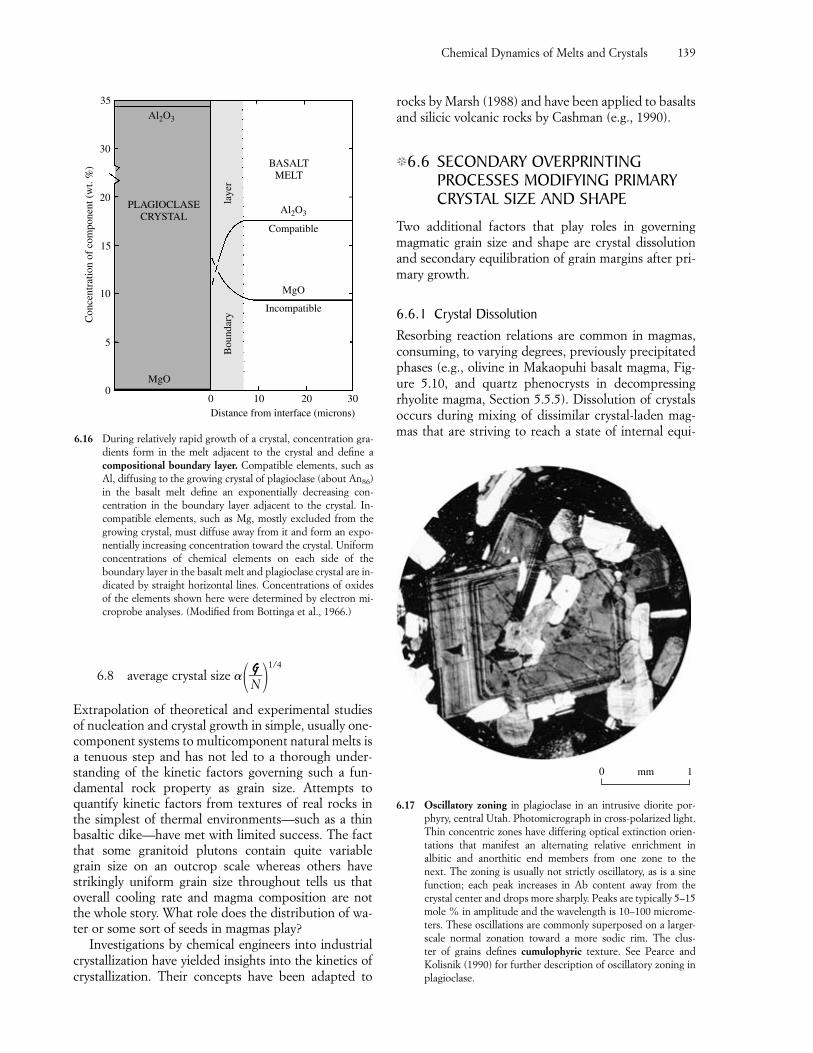
6.8 average crystal size ���NG
��1/4
Extrapolation of theoretical and experimental studiesof nucleation and crystal growth in simple, usually one-component systems to multicomponent natural melts isa tenuous step and has not led to a thorough under-standing of the kinetic factors governing such a fun-damental rock property as grain size. Attempts toquantify kinetic factors from textures of real rocks inthe simplest of thermal environments—such as a thinbasaltic dike—have met with limited success. The factthat some granitoid plutons contain quite variablegrain size on an outcrop scale whereas others havestrikingly uniform grain size throughout tells us thatoverall cooling rate and magma composition are notthe whole story. What role does the distribution of wa-ter or some sort of seeds in magmas play?
Investigations by chemical engineers into industrialcrystallization have yielded insights into the kinetics ofcrystallization. Their concepts have been adapted to
rocks by Marsh (1988) and have been applied to basaltsand silicic volcanic rocks by Cashman (e.g., 1990).
�6.6 SECONDARY OVERPRINTINGPROCESSES MODIFYING PRIMARYCRYSTAL SIZE AND SHAPE
Two additional factors that play roles in governingmagmatic grain size and shape are crystal dissolutionand secondary equilibration of grain margins after pri-mary growth.
6.6.1 Crystal DissolutionResorbing reaction relations are common in magmas,consuming, to varying degrees, previously precipitatedphases (e.g., olivine in Makaopuhi basalt magma, Fig-ure 5.10, and quartz phenocrysts in decompressingrhyolite magma, Section 5.5.5). Dissolution of crystalsoccurs during mixing of dissimilar crystal-laden mag-mas that are striving to reach a state of internal equi-
Chemical Dynamics of Melts and Crystals 139
MgO
0 10 20 30
Bou
ndar
yla
yer
MgO
Incompatible
Al2O3
Compatible
BASALTMELT
Al2O3
PLAGIOCLASECRYSTAL
Distance from interface (microns)
0
5
10
15
20
30
35C
once
ntra
tion
of c
ompo
nent
(w
t. %
)
6.16 During relatively rapid growth of a crystal, concentration gra-dients form in the melt adjacent to the crystal and define acompositional boundary layer. Compatible elements, such asAl, diffusing to the growing crystal of plagioclase (about An86)in the basalt melt define an exponentially decreasing con-centration in the boundary layer adjacent to the crystal. In-compatible elements, such as Mg, mostly excluded from thegrowing crystal, must diffuse away from it and form an expo-nentially increasing concentration toward the crystal. Uniformconcentrations of chemical elements on each side of theboundary layer in the basalt melt and plagioclase crystal are in-dicated by straight horizontal lines. Concentrations of oxidesof the elements shown here were determined by electron mi-croprobe analyses. (Modified from Bottinga et al., 1966.)
0 1mm
6.17 Oscillatory zoning in plagioclase in an intrusive diorite por-phyry, central Utah. Photomicrograph in cross-polarized light.Thin concentric zones have differing optical extinction orien-tations that manifest an alternating relative enrichment in albitic and anorthitic end members from one zone to the next. The zoning is usually not strictly oscillatory, as is a sinefunction; each peak increases in Ab content away from thecrystal center and drops more sharply. Peaks are typically 5–15mole % in amplitude and the wavelength is 10–100 microme-ters. These oscillations are commonly superposed on a larger-scale normal zonation toward a more sodic rim. The clus-ter of grains defines cumulophyric texture. See Pearce and Kolisnik (1990) for further description of oscillatory zoning inplagioclase.
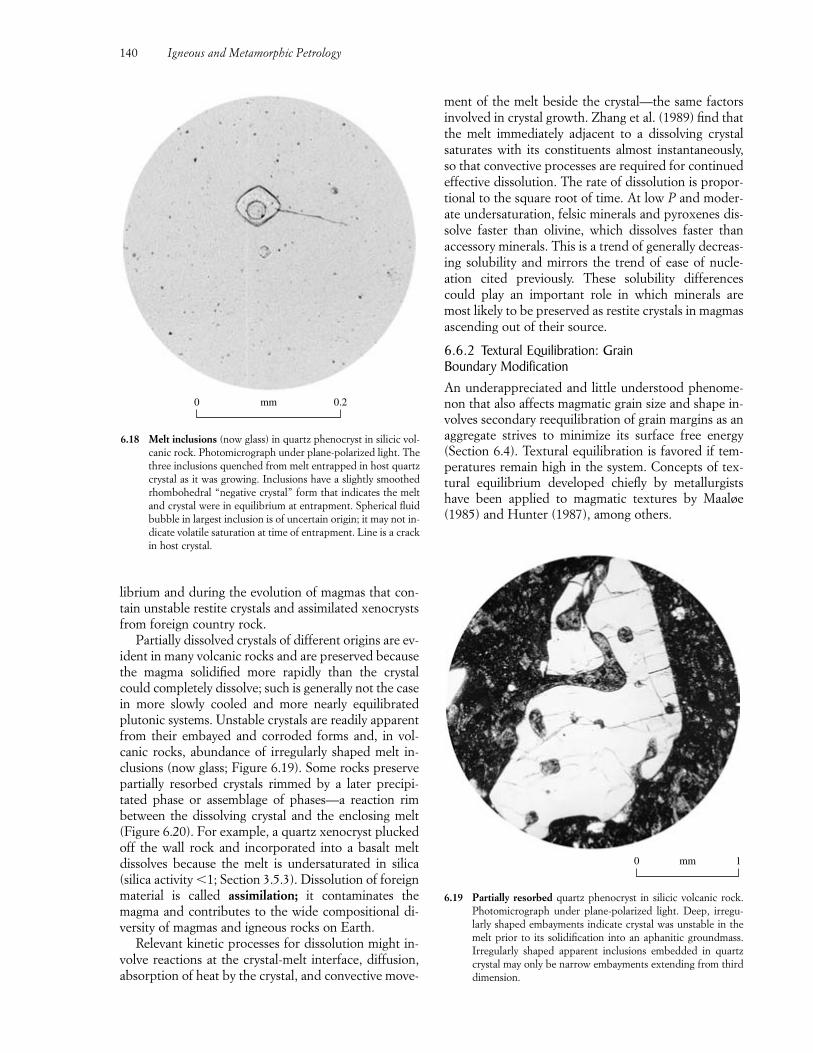
librium and during the evolution of magmas that con-tain unstable restite crystals and assimilated xenocrystsfrom foreign country rock.
Partially dissolved crystals of different origins are ev-ident in many volcanic rocks and are preserved becausethe magma solidified more rapidly than the crystalcould completely dissolve; such is generally not the casein more slowly cooled and more nearly equilibratedplutonic systems. Unstable crystals are readily apparentfrom their embayed and corroded forms and, in vol-canic rocks, abundance of irregularly shaped melt in-clusions (now glass; Figure 6.19). Some rocks preservepartially resorbed crystals rimmed by a later precipi-tated phase or assemblage of phases—a reaction rimbetween the dissolving crystal and the enclosing melt(Figure 6.20). For example, a quartz xenocryst pluckedoff the wall rock and incorporated into a basalt meltdissolves because the melt is undersaturated in silica(silica activity �1; Section 3.5.3). Dissolution of foreignmaterial is called assimilation; it contaminates themagma and contributes to the wide compositional di-versity of magmas and igneous rocks on Earth.
Relevant kinetic processes for dissolution might in-volve reactions at the crystal-melt interface, diffusion,absorption of heat by the crystal, and convective move-
ment of the melt beside the crystal—the same factorsinvolved in crystal growth. Zhang et al. (1989) find thatthe melt immediately adjacent to a dissolving crystalsaturates with its constituents almost instantaneously,so that convective processes are required for continuedeffective dissolution. The rate of dissolution is propor-tional to the square root of time. At low P and moder-ate undersaturation, felsic minerals and pyroxenes dis-solve faster than olivine, which dissolves faster thanaccessory minerals. This is a trend of generally decreas-ing solubility and mirrors the trend of ease of nucle-ation cited previously. These solubility differencescould play an important role in which minerals aremost likely to be preserved as restite crystals in magmasascending out of their source.
6.6.2 Textural Equilibration: Grain Boundary ModificationAn underappreciated and little understood phenome-non that also affects magmatic grain size and shape in-volves secondary reequilibration of grain margins as anaggregate strives to minimize its surface free energy(Section 6.4). Textural equilibration is favored if tem-peratures remain high in the system. Concepts of tex-tural equilibrium developed chiefly by metallurgistshave been applied to magmatic textures by Maaløe(1985) and Hunter (1987), among others.
140 Igneous and Metamorphic Petrology
0 1mm
6.19 Partially resorbed quartz phenocryst in silicic volcanic rock.Photomicrograph under plane-polarized light. Deep, irregu-larly shaped embayments indicate crystal was unstable in themelt prior to its solidification into an aphanitic groundmass.Irregularly shaped apparent inclusions embedded in quartzcrystal may only be narrow embayments extending from thirddimension.
0 0.2mm
6.18 Melt inclusions (now glass) in quartz phenocryst in silicic vol-canic rock. Photomicrograph under plane-polarized light. Thethree inclusions quenched from melt entrapped in host quartzcrystal as it was growing. Inclusions have a slightly smoothedrhombohedral “negative crystal” form that indicates the meltand crystal were in equilibrium at entrapment. Spherical fluidbubble in largest inclusion is of uncertain origin; it may not in-dicate volatile saturation at time of entrapment. Line is a crackin host crystal.
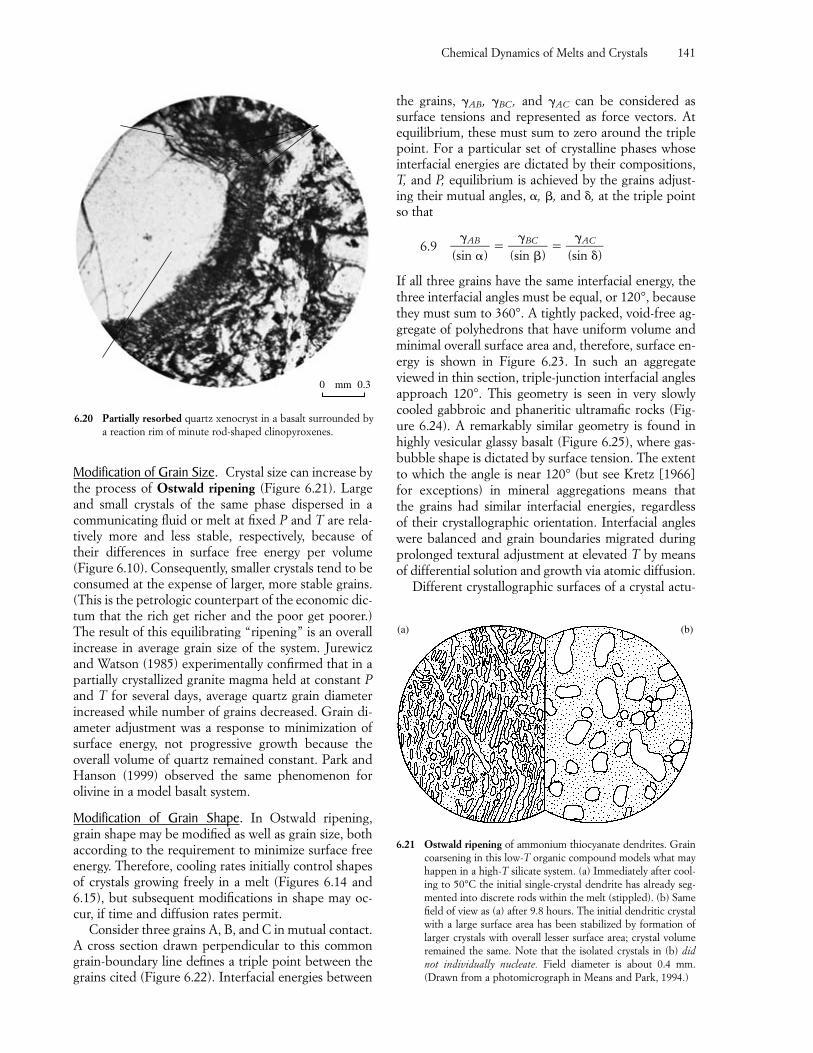
Modification of Grain Size. Crystal size can increase bythe process of Ostwald ripening (Figure 6.21). Largeand small crystals of the same phase dispersed in acommunicating fluid or melt at fixed P and T are rela-tively more and less stable, respectively, because oftheir differences in surface free energy per volume(Figure 6.10). Consequently, smaller crystals tend to beconsumed at the expense of larger, more stable grains.(This is the petrologic counterpart of the economic dic-tum that the rich get richer and the poor get poorer.)The result of this equilibrating “ripening” is an overallincrease in average grain size of the system. Jurewiczand Watson (1985) experimentally confirmed that in apartially crystallized granite magma held at constant Pand T for several days, average quartz grain diameterincreased while number of grains decreased. Grain di-ameter adjustment was a response to minimization ofsurface energy, not progressive growth because theoverall volume of quartz remained constant. Park andHanson (1999) observed the same phenomenon forolivine in a model basalt system.
Modification of Grain Shape. In Ostwald ripening,grain shape may be modified as well as grain size, bothaccording to the requirement to minimize surface freeenergy. Therefore, cooling rates initially control shapesof crystals growing freely in a melt (Figures 6.14 and6.15), but subsequent modifications in shape may oc-cur, if time and diffusion rates permit.
Consider three grains A, B, and C in mutual contact.A cross section drawn perpendicular to this commongrain-boundary line defines a triple point between thegrains cited (Figure 6.22). Interfacial energies between
the grains, �AB, �BC, and �AC can be considered as surface tensions and represented as force vectors. Atequilibrium, these must sum to zero around the triplepoint. For a particular set of crystalline phases whoseinterfacial energies are dictated by their compositions,T, and P, equilibrium is achieved by the grains adjust-ing their mutual angles, �, �, and �, at the triple pointso that
6.9 �(s
�
inAB
�)� � �
(s�
inBC
�)� � �
(s�
inAC
�)�
If all three grains have the same interfacial energy, thethree interfacial angles must be equal, or 120°, becausethey must sum to 360°. A tightly packed, void-free ag-gregate of polyhedrons that have uniform volume andminimal overall surface area and, therefore, surface en-ergy is shown in Figure 6.23. In such an aggregateviewed in thin section, triple-junction interfacial anglesapproach 120°. This geometry is seen in very slowlycooled gabbroic and phaneritic ultramafic rocks (Fig-ure 6.24). A remarkably similar geometry is found inhighly vesicular glassy basalt (Figure 6.25), where gas-bubble shape is dictated by surface tension. The extentto which the angle is near 120° (but see Kretz [1966]for exceptions) in mineral aggregations means that the grains had similar interfacial energies, regardless of their crystallographic orientation. Interfacial angleswere balanced and grain boundaries migrated duringprolonged textural adjustment at elevated T by meansof differential solution and growth via atomic diffusion.
Different crystallographic surfaces of a crystal actu-
Chemical Dynamics of Melts and Crystals 141
0 mm 0.3
6.20 Partially resorbed quartz xenocryst in a basalt surrounded bya reaction rim of minute rod-shaped clinopyroxenes.
(b)(a)
6.21 Ostwald ripening of ammonium thiocyanate dendrites. Graincoarsening in this low-T organic compound models what mayhappen in a high-T silicate system. (a) Immediately after cool-ing to 50°C the initial single-crystal dendrite has already seg-mented into discrete rods within the melt (stippled). (b) Samefield of view as (a) after 9.8 hours. The initial dendritic crystalwith a large surface area has been stabilized by formation oflarger crystals with overall lesser surface area; crystal volumeremained the same. Note that the isolated crystals in (b) didnot individually nucleate. Field diameter is about 0.4 mm.(Drawn from a photomicrograph in Means and Park, 1994.)
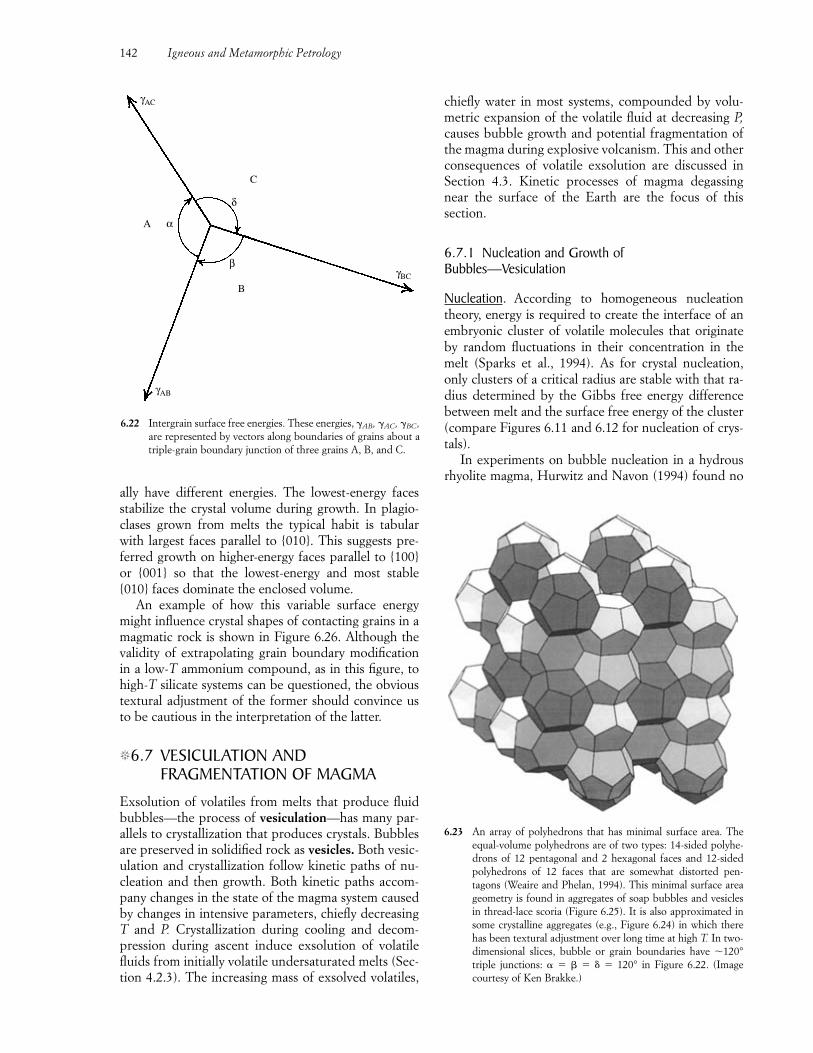
ally have different energies. The lowest-energy facesstabilize the crystal volume during growth. In plagio-clases grown from melts the typical habit is tabularwith largest faces parallel to {010}. This suggests pre-ferred growth on higher-energy faces parallel to {100}or {001} so that the lowest-energy and most stable{010} faces dominate the enclosed volume.
An example of how this variable surface energymight influence crystal shapes of contacting grains in amagmatic rock is shown in Figure 6.26. Although thevalidity of extrapolating grain boundary modificationin a low-T ammonium compound, as in this figure, tohigh-T silicate systems can be questioned, the obvioustextural adjustment of the former should convince usto be cautious in the interpretation of the latter.
�6.7 VESICULATION ANDFRAGMENTATION OF MAGMA
Exsolution of volatiles from melts that produce fluidbubbles—the process of vesiculation—has many par-allels to crystallization that produces crystals. Bubblesare preserved in solidified rock as vesicles. Both vesic-ulation and crystallization follow kinetic paths of nu-cleation and then growth. Both kinetic paths accom-pany changes in the state of the magma system causedby changes in intensive parameters, chiefly decreasingT and P. Crystallization during cooling and decom-pression during ascent induce exsolution of volatilefluids from initially volatile undersaturated melts (Sec-tion 4.2.3). The increasing mass of exsolved volatiles,
chiefly water in most systems, compounded by volu-metric expansion of the volatile fluid at decreasing P,causes bubble growth and potential fragmentation ofthe magma during explosive volcanism. This and otherconsequences of volatile exsolution are discussed inSection 4.3. Kinetic processes of magma degassingnear the surface of the Earth are the focus of this section.
6.7.1 Nucleation and Growth of Bubbles—Vesiculation
Nucleation. According to homogeneous nucleationtheory, energy is required to create the interface of anembryonic cluster of volatile molecules that originateby random fluctuations in their concentration in themelt (Sparks et al., 1994). As for crystal nucleation,only clusters of a critical radius are stable with that ra-dius determined by the Gibbs free energy differencebetween melt and the surface free energy of the cluster(compare Figures 6.11 and 6.12 for nucleation of crys-tals).
In experiments on bubble nucleation in a hydrousrhyolite magma, Hurwitz and Navon (1994) found no
142 Igneous and Metamorphic Petrology
6.23 An array of polyhedrons that has minimal surface area. Theequal-volume polyhedrons are of two types: 14-sided polyhe-drons of 12 pentagonal and 2 hexagonal faces and 12-sidedpolyhedrons of 12 faces that are somewhat distorted pen-tagons (Weaire and Phelan, 1994). This minimal surface areageometry is found in aggregates of soap bubbles and vesiclesin thread-lace scoria (Figure 6.25). It is also approximated insome crystalline aggregates (e.g., Figure 6.24) in which therehas been textural adjustment over long time at high T. In two-dimensional slices, bubble or grain boundaries have �120°triple junctions: � � � � � � 120° in Figure 6.22. (Imagecourtesy of Ken Brakke.)
αΑ
β
B
δ
C
γAC
γAB
γBC
6.22 Intergrain surface free energies. These energies, �AB, �AC, �BC,are represented by vectors along boundaries of grains about atriple-grain boundary junction of three grains A, B, and C.
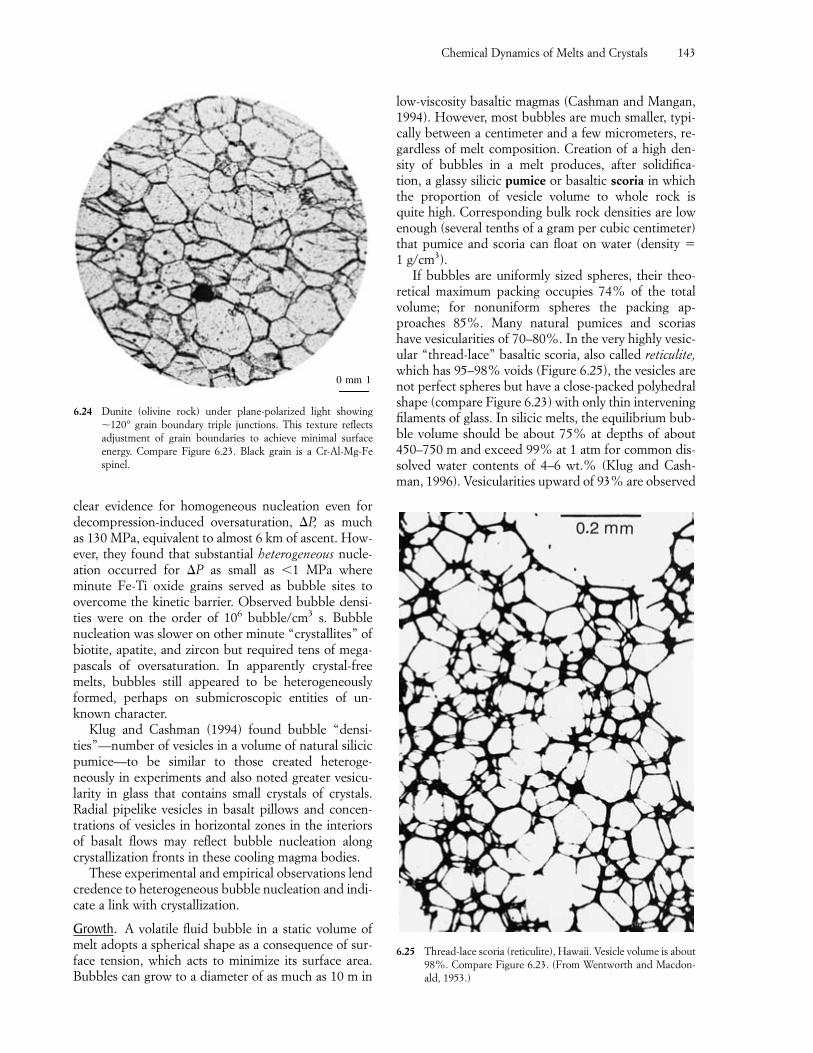
clear evidence for homogeneous nucleation even fordecompression-induced oversaturation, �P, as much as 130 MPa, equivalent to almost 6 km of ascent. How-ever, they found that substantial heterogeneous nucle-ation occurred for �P as small as �1 MPa whereminute Fe-Ti oxide grains served as bubble sites toovercome the kinetic barrier. Observed bubble densi-ties were on the order of 106 bubble/cm3 s. Bubble nucleation was slower on other minute “crystallites” ofbiotite, apatite, and zircon but required tens of mega-pascals of oversaturation. In apparently crystal-freemelts, bubbles still appeared to be heterogeneouslyformed, perhaps on submicroscopic entities of un-known character.
Klug and Cashman (1994) found bubble “densi-ties”—number of vesicles in a volume of natural silicicpumice—to be similar to those created heteroge-neously in experiments and also noted greater vesicu-larity in glass that contains small crystals of crystals. Radial pipelike vesicles in basalt pillows and concen-trations of vesicles in horizontal zones in the interiorsof basalt flows may reflect bubble nucleation alongcrystallization fronts in these cooling magma bodies.
These experimental and empirical observations lendcredence to heterogeneous bubble nucleation and indi-cate a link with crystallization.
Growth. A volatile fluid bubble in a static volume ofmelt adopts a spherical shape as a consequence of sur-face tension, which acts to minimize its surface area.Bubbles can grow to a diameter of as much as 10 m in
low-viscosity basaltic magmas (Cashman and Mangan,1994). However, most bubbles are much smaller, typi-cally between a centimeter and a few micrometers, re-gardless of melt composition. Creation of a high den-sity of bubbles in a melt produces, after solidifica-tion, a glassy silicic pumice or basaltic scoria in whichthe proportion of vesicle volume to whole rock is quite high. Corresponding bulk rock densities are lowenough (several tenths of a gram per cubic centimeter)that pumice and scoria can float on water (density �1 g/cm3).
If bubbles are uniformly sized spheres, their theo-retical maximum packing occupies 74% of the totalvolume; for nonuniform spheres the packing ap-proaches 85%. Many natural pumices and scorias have vesicularities of 70–80%. In the very highly vesic-ular “thread-lace” basaltic scoria, also called reticulite,which has 95–98% voids (Figure 6.25), the vesicles arenot perfect spheres but have a close-packed polyhedralshape (compare Figure 6.23) with only thin interveningfilaments of glass. In silicic melts, the equilibrium bub-ble volume should be about 75% at depths of about450–750 m and exceed 99% at 1 atm for common dis-solved water contents of 4–6 wt.% (Klug and Cash-man, 1996). Vesicularities upward of 93% are observed
Chemical Dynamics of Melts and Crystals 143
0 mm 1
6.24 Dunite (olivine rock) under plane-polarized light showing�120° grain boundary triple junctions. This texture reflectsadjustment of grain boundaries to achieve minimal surface energy. Compare Figure 6.23. Black grain is a Cr-Al-Mg-Fespinel.
6.25 Thread-lace scoria (reticulite), Hawaii. Vesicle volume is about98%. Compare Figure 6.23. (From Wentworth and Macdon-ald, 1953.)
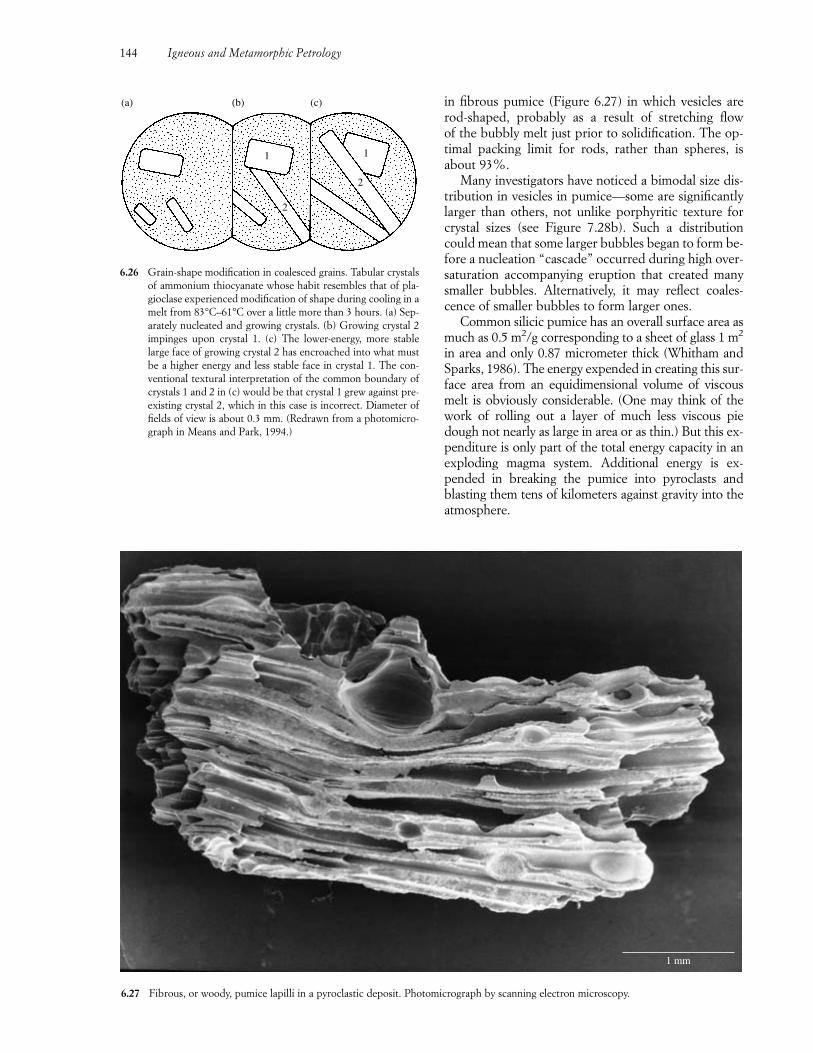
in fibrous pumice (Figure 6.27) in which vesicles arerod-shaped, probably as a result of stretching flow of the bubbly melt just prior to solidification. The op-timal packing limit for rods, rather than spheres, isabout 93%.
Many investigators have noticed a bimodal size dis-tribution in vesicles in pumice—some are significantlylarger than others, not unlike porphyritic texture forcrystal sizes (see Figure 7.28b). Such a distributioncould mean that some larger bubbles began to form be-fore a nucleation “cascade” occurred during high over-saturation accompanying eruption that created manysmaller bubbles. Alternatively, it may reflect coales-cence of smaller bubbles to form larger ones.
Common silicic pumice has an overall surface area asmuch as 0.5 m2/g corresponding to a sheet of glass 1 m2
in area and only 0.87 micrometer thick (Whitham andSparks, 1986). The energy expended in creating this sur-face area from an equidimensional volume of viscousmelt is obviously considerable. (One may think of thework of rolling out a layer of much less viscous piedough not nearly as large in area or as thin.) But this ex-penditure is only part of the total energy capacity in anexploding magma system. Additional energy is ex-pended in breaking the pumice into pyroclasts andblasting them tens of kilometers against gravity into theatmosphere.
144 Igneous and Metamorphic Petrology
1 mm
6.27 Fibrous, or woody, pumice lapilli in a pyroclastic deposit. Photomicrograph by scanning electron microscopy.
(c)(b)(a)
1 1
2
2
6.26 Grain-shape modification in coalesced grains. Tabular crystalsof ammonium thiocyanate whose habit resembles that of pla-gioclase experienced modification of shape during cooling in amelt from 83°C–61°C over a little more than 3 hours. (a) Sep-arately nucleated and growing crystals. (b) Growing crystal 2impinges upon crystal 1. (c) The lower-energy, more stablelarge face of growing crystal 2 has encroached into what mustbe a higher energy and less stable face in crystal 1. The con-ventional textural interpretation of the common boundary ofcrystals 1 and 2 in (c) would be that crystal 1 grew against pre-existing crystal 2, which in this case is incorrect. Diameter offields of view is about 0.3 mm. (Redrawn from a photomicro-graph in Means and Park, 1994.)
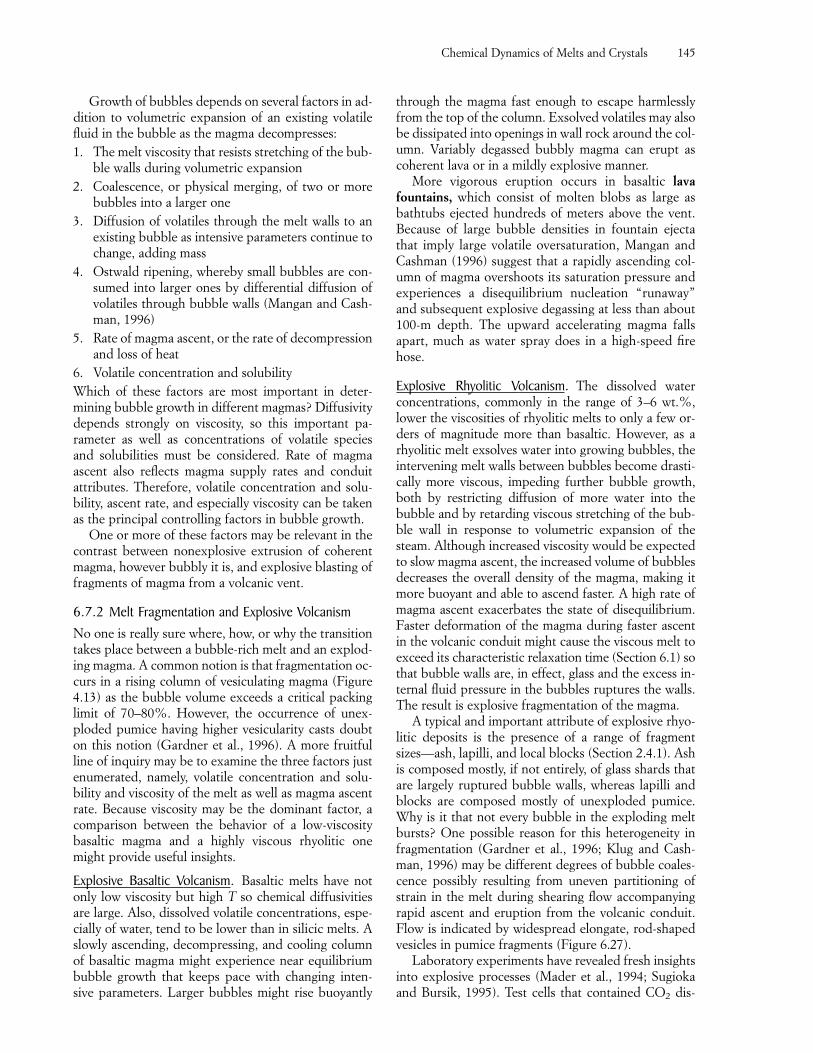
Chemical Dynamics of Melts and Crystals 145
Growth of bubbles depends on several factors in ad-dition to volumetric expansion of an existing volatilefluid in the bubble as the magma decompresses:1. The melt viscosity that resists stretching of the bub-
ble walls during volumetric expansion2. Coalescence, or physical merging, of two or more
bubbles into a larger one3. Diffusion of volatiles through the melt walls to an
existing bubble as intensive parameters continue tochange, adding mass
4. Ostwald ripening, whereby small bubbles are con-sumed into larger ones by differential diffusion ofvolatiles through bubble walls (Mangan and Cash-man, 1996)
5. Rate of magma ascent, or the rate of decompressionand loss of heat
6. Volatile concentration and solubilityWhich of these factors are most important in deter-mining bubble growth in different magmas? Diffusivitydepends strongly on viscosity, so this important pa-rameter as well as concentrations of volatile species and solubilities must be considered. Rate of magma ascent also reflects magma supply rates and conduit attributes. Therefore, volatile concentration and solu-bility, ascent rate, and especially viscosity can be takenas the principal controlling factors in bubble growth.
One or more of these factors may be relevant in thecontrast between nonexplosive extrusion of coherentmagma, however bubbly it is, and explosive blasting offragments of magma from a volcanic vent.
6.7.2 Melt Fragmentation and Explosive VolcanismNo one is really sure where, how, or why the transitiontakes place between a bubble-rich melt and an explod-ing magma. A common notion is that fragmentation oc-curs in a rising column of vesiculating magma (Figure4.13) as the bubble volume exceeds a critical packinglimit of 70–80%. However, the occurrence of unex-ploded pumice having higher vesicularity casts doubton this notion (Gardner et al., 1996). A more fruitfulline of inquiry may be to examine the three factors justenumerated, namely, volatile concentration and solu-bility and viscosity of the melt as well as magma ascentrate. Because viscosity may be the dominant factor, acomparison between the behavior of a low-viscositybasaltic magma and a highly viscous rhyolitic onemight provide useful insights.
Explosive Basaltic Volcanism. Basaltic melts have notonly low viscosity but high T so chemical diffusivitiesare large. Also, dissolved volatile concentrations, espe-cially of water, tend to be lower than in silicic melts. Aslowly ascending, decompressing, and cooling columnof basaltic magma might experience near equilibriumbubble growth that keeps pace with changing inten-sive parameters. Larger bubbles might rise buoyantly
through the magma fast enough to escape harmlesslyfrom the top of the column. Exsolved volatiles may alsobe dissipated into openings in wall rock around the col-umn. Variably degassed bubbly magma can erupt ascoherent lava or in a mildly explosive manner.
More vigorous eruption occurs in basaltic lavafountains, which consist of molten blobs as large asbathtubs ejected hundreds of meters above the vent.Because of large bubble densities in fountain ejectathat imply large volatile oversaturation, Mangan andCashman (1996) suggest that a rapidly ascending col-umn of magma overshoots its saturation pressure andexperiences a disequilibrium nucleation “runaway”and subsequent explosive degassing at less than about100-m depth. The upward accelerating magma fallsapart, much as water spray does in a high-speed firehose.
Explosive Rhyolitic Volcanism. The dissolved waterconcentrations, commonly in the range of 3–6 wt.%,lower the viscosities of rhyolitic melts to only a few or-ders of magnitude more than basaltic. However, as arhyolitic melt exsolves water into growing bubbles, theintervening melt walls between bubbles become drasti-cally more viscous, impeding further bubble growth,both by restricting diffusion of more water into thebubble and by retarding viscous stretching of the bub-ble wall in response to volumetric expansion of thesteam. Although increased viscosity would be expectedto slow magma ascent, the increased volume of bubblesdecreases the overall density of the magma, making itmore buoyant and able to ascend faster. A high rate ofmagma ascent exacerbates the state of disequilibrium.Faster deformation of the magma during faster ascentin the volcanic conduit might cause the viscous melt toexceed its characteristic relaxation time (Section 6.1) sothat bubble walls are, in effect, glass and the excess in-ternal fluid pressure in the bubbles ruptures the walls.The result is explosive fragmentation of the magma.
A typical and important attribute of explosive rhyo-litic deposits is the presence of a range of fragmentsizes—ash, lapilli, and local blocks (Section 2.4.1). Ashis composed mostly, if not entirely, of glass shards thatare largely ruptured bubble walls, whereas lapilli andblocks are composed mostly of unexploded pumice.Why is it that not every bubble in the exploding meltbursts? One possible reason for this heterogeneity infragmentation (Gardner et al., 1996; Klug and Cash-man, 1996) may be different degrees of bubble coales-cence possibly resulting from uneven partitioning ofstrain in the melt during shearing flow accompanyingrapid ascent and eruption from the volcanic conduit.Flow is indicated by widespread elongate, rod-shapedvesicles in pumice fragments (Figure 6.27).
Laboratory experiments have revealed fresh insightsinto explosive processes (Mader et al., 1994; Sugiokaand Bursik, 1995). Test cells that contained CO2 dis-
crystals having characteristic faces grow just belowtheir liquidus T, but with increasing undercooling,crystals become less compact and are skeletal, thendendritic and feathery, and finally spherulitic for hun-dreds of degrees undercooling. If crystals grow fasterthan rates of diffusion, a compositional boundary layerdevelops at the crystal-melt interface.
Grain size in magmatic rocks is a compound func-tion of nucleation and crystal growth rates. For similargrowth rates, high nucleation density (integrated nu-cleation rate) yields small grains and low nucleationdensity large grains. A hierarchy in ease of nucleationdepends on mineral structure and solubility in melts;among rock-forming minerals, Fe-Ti oxides nucleatereadily and form small grain-size populations, mafic sil-icates nucleate somewhat more slowly, and commonlysluggish nucleation of felsic minerals, especially alkalifeldspar, creates larger crystals.
Primary grain sizes can be increased (Ostwaldripening) and grain shapes modified because of the ten-dency for minimization of surface free energy.
Like crystallization, vesiculation is a kinetic phenom-enon controlled by nucleation and growth of volatilebubbles in melts. Bubble nucleation, at least in silicicmelts, appears to occur heterogeneously on minutecrystals (crystallites). Bubble growth depends mostly on volatile concentration and solubility, ascent rate of magma in the crust, and, especially, viscosity. Low-viscosity basalt magmas are usually extruded as some-what bubbly lava flows because vesiculation keeps pacewith the rate of ascent in the conduit. Mildly explosivelava fountaining occurs locally, apparently as a result ofrapid ascent and delayed catastrophic nucleation andgrowth of bubbles. Greater departure from equilibriumoccurs during vesiculation of rhyolitic melts, especiallyduring rapid ascent, because of their much greater vis-cosity, which increases as volatiles exsolve into bubbles.Exactly how factors such as excessive internal gas pres-sure in bubbles, viscosity and strength of bubble walls,melt relaxation time, bubble concentration, and shearflow during eruption interact to produce explosive vol-canism has yet to be fully elucidated.
CRITICAL THINKING QUESTIONS6.1 Contrast and characterize the three time-
dependent transport phenomena with regard tomechanisms at the atomic scale, governing equa-tions, driving forces, and proportionality con-stants.
6.2 Characterize and account for the viscosity ofmelts in terms of their composition, T, P, andconcentration of dissolved volatiles.
6.3 List and discuss factors that govern the rate ofdiffusion of ions through liquids and solids.
solved in HCl-K2CO3 solutions to mimic a volatile-richsilicate melt were monitored by high-speed photogra-phy. During decompression of the test-cell system,bubbles rapidly nucleated uniformly throughout thesolution over a diffuse region, rather than at a well-defined, downward-propagating disruption surface.The expanding foam fragments heterogeneously wherethe bubble density and expansion rate conspire to rup-ture bubble walls.
SUMMARY
A change from some initial metastable state to a finalmore stable state is never instantaneous because it de-pends on time-dependent kinetic factors. The kineticpath between initial and final states of a melt depends,ultimately, on the mobility of ions. Melt viscosity anddiffusion of ions are the two most important ionictransport phenomena because their time-dependentrates range over many orders of magnitude.
Melt viscosity is a measure of the resistance to flow,which depends on the mobility of atoms in it. Viscosityis less at high T because of the loosened atomic struc-ture and in less polymerized melts that have less silicaand/or more dissolved water and fluorine. Viscousmelts have large relaxation times so that rapid defor-mation may cause them to break as if they were solid.
Atomic diffusion is net migration down a concen-tration gradient via random jumps. Diffusion is en-hanced at high T and is generally fastest in gases, less inmelts, and slowest in crystals. Large and highly chargedions diffuse slowly through more viscous melts, on theorder of a few meters in 1 million years. Diffusionthrough crystals depends on the existence of point defects. The slowest diffusion involves exchange ofNa�Si4� for Ca2�Al3� in plagioclases even at highmagmatic temperatures, preserving fine-scale (micro-meter) compositional zoning indefinitely.
Thermal diffusivities are generally several orders of magnitude faster than chemical diffusivities. Conse-quently, static, nonconvecting bodies of melt cool andsolidify before atoms can migrate more than a meter or so.
Crystallization is a two-step kinetic process that be-gins by formation of a nucleus and follows by accretionof ions onto it (crystal growth). Homogeneous nucle-ation requires significant undercooling so that the in-creasing difference between the free energies of thecrystal and melt overcomes the surface energy contri-bution. Heterogeneous nucleation on various sorts ofpreexisting surfaces—solid and fluid—in the meltlargely bypasses the kinetic barrier and could be therule rather than the exception in magmatic systems.Shapes of crystals growing freely in melts depend onthe degree of undercooling (cooling rate). Euhedral
146 Igneous and Metamorphic Petrology
6.4 Describe the role of diffusion in petrologicprocesses and how a knowledge of diffusionrates can provide insight into rock-forming phenomena.
6.5 Account for the large contrast in rates of chemi-cal and thermal diffusion.
6.6 Discuss the nature of a phase interface and theimportance of surface free energy in the kineticpaths and textural equilibria that influence rockfabric.
6.7 Contrast homogeneous and heterogeneous nu-cleation.
6.8 Describe a homogeneous nucleation model for aone-component melt and indicate limitations inapplying this model to natural multicomponentmelts.
6.9 Comment on the apparent relative nucleationrates of olivine, pyroxene, and plagioclase in theMakaopuhi basalt (Plate III), assuming growthrates are uniform.
6.10 Describe factors that control the growth anddissolution of crystals in a melt.
6.11 Discuss factors that govern grain size in mag-matic rocks; grain shape.
6.12 What similarities and contrasts exist betweennucleation and growth of bubbles and crystals?
6.13 Describe possible kinetic controls on fragmenta-tion of melts and explosive volcanism.
6.14 What kinetic factors might be responsible forthe highly explosive eruptions of some silicicmagmas?
PROBLEMS6.1 From Figure 6.2: (a) Plot viscosities, extrapo-
lated if necessary, at 1100°C versus weight per-centage silica for dry silicate melts. Explain yourplot relative to the chemical composition of the
melts and their atomic structure. (b) Plot vis-cosities of rhyolite melts with 77 wt.% silica at800°C versus dissolved water concentration. Ex-plain the drastic decrease in viscosity in the first2 wt.% or so of dissolved water, followed by alesser effect at higher water concentrations.How does the speciation of dissolved water, as(OH)� or as molecular H2O, enter into your ex-planation?
6.2 Calculate the viscosity of Makaopuhi basalt meltat 1200°C using the chemical composition listedin Table 5.1 and the Shaw equation in AdvancedTopic Box 6.1. How does your answer comparewith the viscosity of 101.51 Pa s measured exper-imentally by Shaw (1969)?
6.3 Calculate the activation energy of diffusion ofO2 through anorthite crystals (Figure 6.4).
6.4 Compare the diffusivities of water, H2, and O2
in a basalt melt at 1200°C. Calculate the averagediffusion distance for these three species over 1day. Could this have any bearing on the com-mon red color of basaltic lapilli around explo-sive vents? Explain.
6.5 Freer (1981) cites D � 9.66 � 10�16 m2/s at1373K (�1100°C) for interdiffusion of Fe andMg in Mg-rich olivine. Calculate the order oftime to homogenize a compositionally zonedolivine crystal whose radius is 2 mm.
6.6 Demonstrate graphically that the ratio of surfacearea to volume, 4�r2/(4/3)�r3, for spheres in-creases rapidly as the radius, r, diminishes tosubmillimeter dimensions. (Suggestion: Plot se-lect values of r from 0.0002 to 0.015 mm againstcorresponding values of the ratio.)
6.7 Draw hypothetical homogeneous nucleation and crystal growth rate curves for a single min-eral as a function of undercooling, and use these to illustrate the contrasts in the kineticpaths of glassy, aphanitic, and phaneritic textures.
Chemical Dynamics of Melts and Crystals 147
FUNDAMENTAL QUESTIONSCONSIDERED IN THIS CHAPTER
1. How do the time-dependent kinetic phenomenadiscussed in the previous chapter control thefabric of magmatic rocks?
2. How can the fabric of a magmatic rock be used toobtain insights and sometimes specific informationregarding the kinetic path that the magmafollowed during creation of the rock?
INTRODUCTIONLike magmatic rock compositions, magmatic rock fab-rics comprise a wide and continuous spectrum of at-tributes. Fabrics provide rich petrologic informationregarding the time-dependent kinetic path of the tran-sition between the magmatic state and the final solidi-fied rock, as well as its subsolidus history after solid-ification. The kinetic history recorded in rock fabricstakes different paths (Figure 7.1). In human affairs,there are many possible “paths” for a journey (i.e., achange in a person’s “state”) between San Franciscoand Paris, but an observer in Paris (at the final “state”)can readily differentiate the relaxed, well-tanned trav-eler who made a week-long stopover on the beach of aCaribbean island from the haggard red-eyed overnighttraveler. In similar manner, the appearance of a rock—its fabric—is predominantly a record of the kineticpath taken during the solidification of the magmaticsystem. Other factors can influence fabric besides ki-netics, as in the contrast in water pressure in develop-ment of hypersolvus versus subsolvus texture in granite(Figure 5.18). Of course, contrasting kinetic paths canresult from contrasting magma compositions, as in the
contrast between paths in highly viscous silicic versusmuch less viscous basaltic magma.
The importance of diverse kinetic paths in devel-opment of fabric is most obvious when comparing fab-rics in one type of solidifying magma. For example, the same identical granitic (rhyolitic) magma can solid-ify into the following fabric heteromorphs: phaneritic,porphyritic phaneritic, aphanitic, porphyritic aphanitic,glassy, vitrophyric, pumiceous, or pyroclastic. As thischapter will show, additional distinct fabrics can befound in the granitic-rhyolitic composition type. Fabricsrecord kinetic paths in much the same way that mineralcompositions record intensive variables in the finalthermodynamic state of the system.
Some kinetic paths recorded in rocks are relativelysimple, such as the creation of glassy fabric by drasticundercooling of a melt. Other paths involve more thanone kinetic process operating simultaneously or inclose sequence, such as rather rapid crystallization andvolatile exsolution that result in an aphanitic vesicularfabric. A particular fabric attribute, such as grain size,can evolve along multiple paths, including crystalliza-tion, crystal dissolution, textural equilibration, and frag-mentation processes.
Fabric encompasses noncompositional properties ofa rock that comprise textures and generally larger-scalestructures. There is no sharp distinction between thesetwo. Textures, also called microstructures, are basedon the proportions of glass relative to mineral grainsand their sizes, shapes, and mutual arrangements thatare observable on the scale of a hand sample or thinsection under a microscope. Structures are larger-sizefeatures generally seen in an outcrop, such as beddingin a pyroclastic deposit or pillows in a submarine lavaflow. Features related to exsolution of volatiles andfragmentation of magma can occur on a wide range ofscales. One rock can have more than one texture andone or more structures. Altogether, textures and struc-
7CHAPTER
Kinetic Paths and Fabric ofMagmatic Rocks
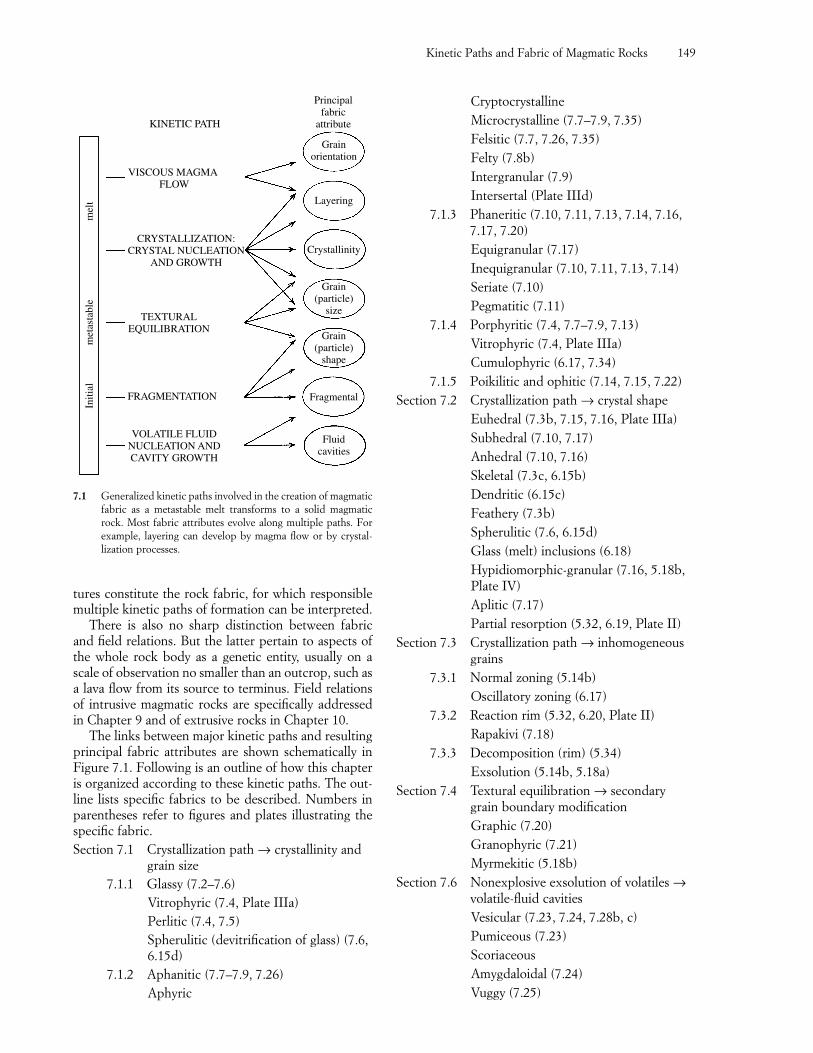
tures constitute the rock fabric, for which responsiblemultiple kinetic paths of formation can be interpreted.
There is also no sharp distinction between fabricand field relations. But the latter pertain to aspects ofthe whole rock body as a genetic entity, usually on ascale of observation no smaller than an outcrop, such asa lava flow from its source to terminus. Field relationsof intrusive magmatic rocks are specifically addressedin Chapter 9 and of extrusive rocks in Chapter 10.
The links between major kinetic paths and resultingprincipal fabric attributes are shown schematically inFigure 7.1. Following is an outline of how this chapteris organized according to these kinetic paths. The out-line lists specific fabrics to be described. Numbers inparentheses refer to figures and plates illustrating thespecific fabric.Section 7.1 Crystallization path → crystallinity and
grain size7.1.1 Glassy (7.2–7.6)
Vitrophyric (7.4, Plate IIIa)Perlitic (7.4, 7.5)Spherulitic (devitrification of glass) (7.6,6.15d)
7.1.2 Aphanitic (7.7–7.9, 7.26)Aphyric
CryptocrystallineMicrocrystalline (7.7–7.9, 7.35)Felsitic (7.7, 7.26, 7.35)Felty (7.8b)Intergranular (7.9)Intersertal (Plate IIId)
7.1.3 Phaneritic (7.10, 7.11, 7.13, 7.14, 7.16,7.17, 7.20)Equigranular (7.17)Inequigranular (7.10, 7.11, 7.13, 7.14)Seriate (7.10)Pegmatitic (7.11)
7.1.4 Porphyritic (7.4, 7.7–7.9, 7.13)Vitrophyric (7.4, Plate IIIa)Cumulophyric (6.17, 7.34)
7.1.5 Poikilitic and ophitic (7.14, 7.15, 7.22)Section 7.2 Crystallization path → crystal shape
Euhedral (7.3b, 7.15, 7.16, Plate IIIa)Subhedral (7.10, 7.17)Anhedral (7.10, 7.16)Skeletal (7.3c, 6.15b)Dendritic (6.15c)Feathery (7.3b)Spherulitic (7.6, 6.15d)Glass (melt) inclusions (6.18)Hypidiomorphic-granular (7.16, 5.18b,Plate IV)Aplitic (7.17)Partial resorption (5.32, 6.19, Plate II)
Section 7.3 Crystallization path → inhomogeneousgrains
7.3.1 Normal zoning (5.14b)Oscillatory zoning (6.17)
7.3.2 Reaction rim (5.32, 6.20, Plate II)Rapakivi (7.18)
7.3.3 Decomposition (rim) (5.34)Exsolution (5.14b, 5.18a)
Section 7.4 Textural equilibration → secondarygrain boundary modificationGraphic (7.20)Granophyric (7.21)Myrmekitic (5.18b)
Section 7.6 Nonexplosive exsolution of volatiles →volatile-fluid cavitiesVesicular (7.23, 7.24, 7.28b, c)Pumiceous (7.23)ScoriaceousAmygdaloidal (7.24)Vuggy (7.25)
Kinetic Paths and Fabric of Magmatic Rocks 149
VOLATILE FLUIDNUCLEATION ANDCAVITY GROWTH
FRAGMENTATION
TEXTURALEQUILIBRATION
CRYSTALLIZATION:CRYSTAL NUCLEATION
AND GROWTH
VISCOUS MAGMA FLOW
Principalfabric
attribute
Grainorientation
Layering
Crystallinity
Grain(particle)
size
Grain(particle)
shape
Fragmental
Fluidcavities
KINETIC PATH
met
asta
ble
Initi
alm
elt
7.1 Generalized kinetic paths involved in the creation of magmaticfabric as a metastable melt transforms to a solid magmaticrock. Most fabric attributes evolve along multiple paths. Forexample, layering can develop by magma flow or by crystal-lization processes.
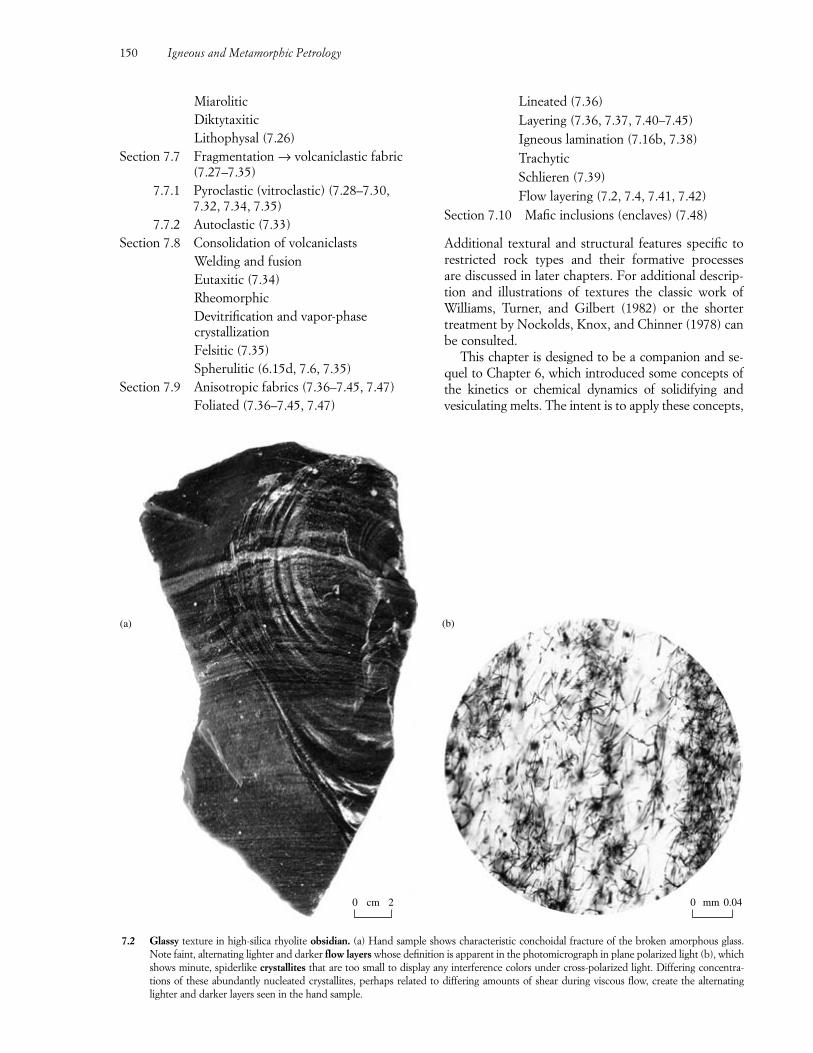
MiaroliticDiktytaxiticLithophysal (7.26)
Section 7.7 Fragmentation → volcaniclastic fabric(7.27–7.35)
7.7.1 Pyroclastic (vitroclastic) (7.28–7.30,7.32, 7.34, 7.35)
7.7.2 Autoclastic (7.33)Section 7.8 Consolidation of volcaniclasts
Welding and fusionEutaxitic (7.34)RheomorphicDevitrification and vapor-phasecrystallizationFelsitic (7.35)Spherulitic (6.15d, 7.6, 7.35)
Section 7.9 Anisotropic fabrics (7.36–7.45, 7.47)Foliated (7.36–7.45, 7.47)
Lineated (7.36)Layering (7.36, 7.37, 7.40–7.45)Igneous lamination (7.16b, 7.38)TrachyticSchlieren (7.39)Flow layering (7.2, 7.4, 7.41, 7.42)
Section 7.10 Mafic inclusions (enclaves) (7.48)
Additional textural and structural features specific torestricted rock types and their formative processes are discussed in later chapters. For additional descrip-tion and illustrations of textures the classic work ofWilliams, Turner, and Gilbert (1982) or the shortertreatment by Nockolds, Knox, and Chinner (1978) canbe consulted.
This chapter is designed to be a companion and se-quel to Chapter 6, which introduced some concepts ofthe kinetics or chemical dynamics of solidifying andvesiculating melts. The intent is to apply these concepts,
150 Igneous and Metamorphic Petrology
(b)(a)
0 2cm 0 0.04mm
7.2 Glassy texture in high-silica rhyolite obsidian. (a) Hand sample shows characteristic conchoidal fracture of the broken amorphous glass.Note faint, alternating lighter and darker flow layers whose definition is apparent in the photomicrograph in plane polarized light (b), whichshows minute, spiderlike crystallites that are too small to display any interference colors under cross-polarized light. Differing concentra-tions of these abundantly nucleated crystallites, perhaps related to differing amounts of shear during viscous flow, create the alternatinglighter and darker layers seen in the hand sample.
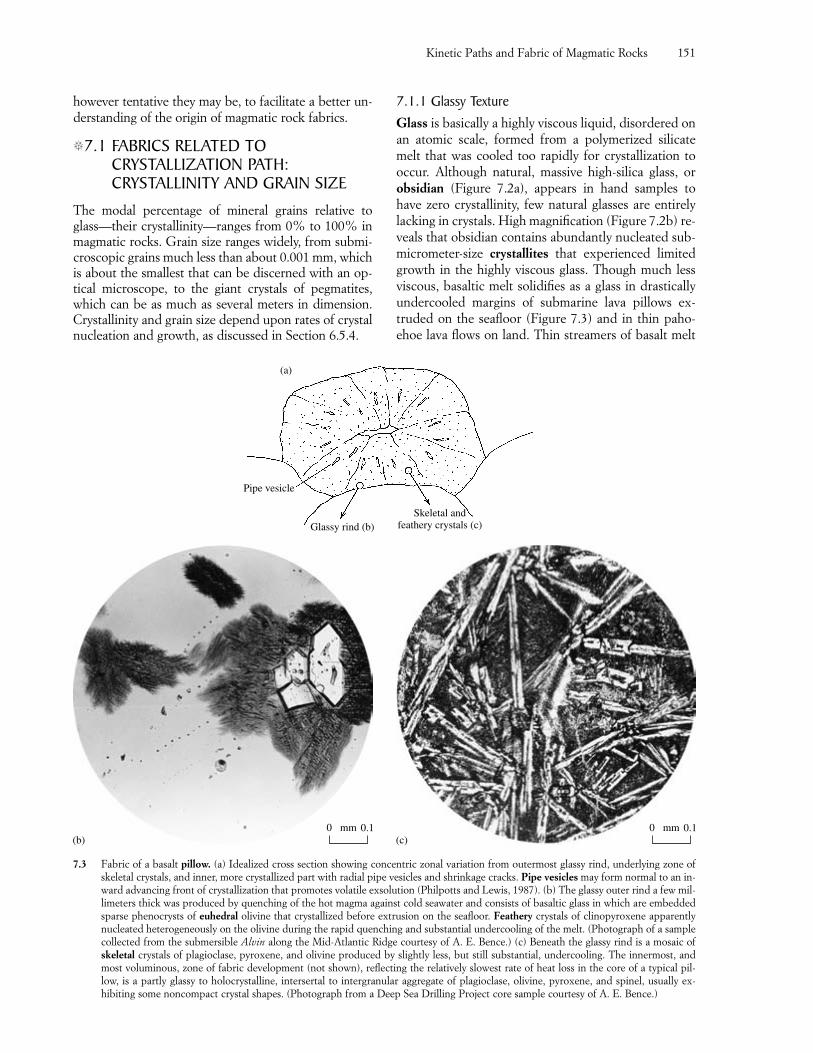
however tentative they may be, to facilitate a better un-derstanding of the origin of magmatic rock fabrics.
�7.1 FABRICS RELATED TO CRYSTALLIZATION PATH: CRYSTALLINITY AND GRAIN SIZE
The modal percentage of mineral grains relative toglass—their crystallinity—ranges from 0% to 100% inmagmatic rocks. Grain size ranges widely, from submi-croscopic grains much less than about 0.001 mm, whichis about the smallest that can be discerned with an op-tical microscope, to the giant crystals of pegmatites,which can be as much as several meters in dimension.Crystallinity and grain size depend upon rates of crystalnucleation and growth, as discussed in Section 6.5.4.
7.1.1 Glassy TextureGlass is basically a highly viscous liquid, disordered onan atomic scale, formed from a polymerized silicatemelt that was cooled too rapidly for crystallization tooccur. Although natural, massive high-silica glass, orobsidian (Figure 7.2a), appears in hand samples tohave zero crystallinity, few natural glasses are entirelylacking in crystals. High magnification (Figure 7.2b) re-veals that obsidian contains abundantly nucleated sub-micrometer-size crystallites that experienced limitedgrowth in the highly viscous glass. Though much lessviscous, basaltic melt solidifies as a glass in drasticallyundercooled margins of submarine lava pillows ex-truded on the seafloor (Figure 7.3) and in thin paho-ehoe lava flows on land. Thin streamers of basalt melt
Kinetic Paths and Fabric of Magmatic Rocks 151
Skeletal andfeathery crystals (c)Glassy rind (b)
Pipe vesicle
(a)
7.3 Fabric of a basalt pillow. (a) Idealized cross section showing concentric zonal variation from outermost glassy rind, underlying zone ofskeletal crystals, and inner, more crystallized part with radial pipe vesicles and shrinkage cracks. Pipe vesicles may form normal to an in-ward advancing front of crystallization that promotes volatile exsolution (Philpotts and Lewis, 1987). (b) The glassy outer rind a few mil-limeters thick was produced by quenching of the hot magma against cold seawater and consists of basaltic glass in which are embeddedsparse phenocrysts of euhedral olivine that crystallized before extrusion on the seafloor. Feathery crystals of clinopyroxene apparentlynucleated heterogeneously on the olivine during the rapid quenching and substantial undercooling of the melt. (Photograph of a samplecollected from the submersible Alvin along the Mid-Atlantic Ridge courtesy of A. E. Bence.) (c) Beneath the glassy rind is a mosaic ofskeletal crystals of plagioclase, pyroxene, and olivine produced by slightly less, but still substantial, undercooling. The innermost, andmost voluminous, zone of fabric development (not shown), reflecting the relatively slowest rate of heat loss in the core of a typical pil-low, is a partly glassy to holocrystalline, intersertal to intergranular aggregate of plagioclase, olivine, pyroxene, and spinel, usually ex-hibiting some noncompact crystal shapes. (Photograph from a Deep Sea Drilling Project core sample courtesy of A. E. Bence.)
0 0.1mm 0 0.1mm(b) (c)
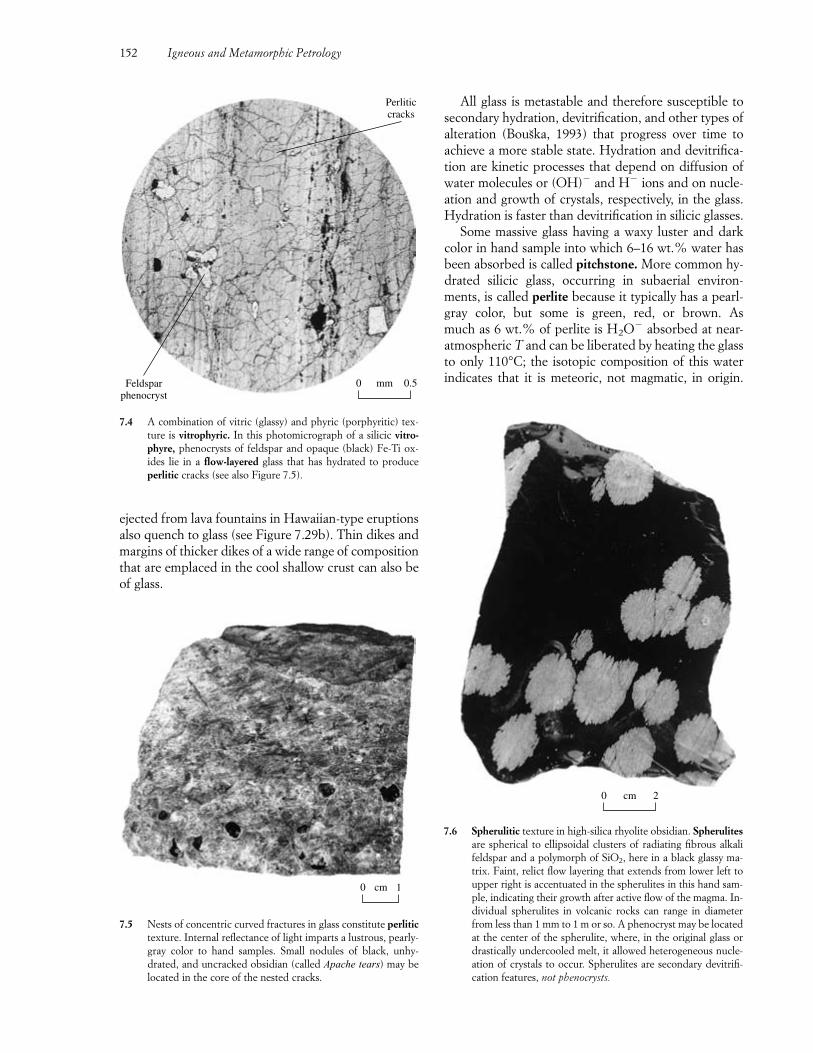
ejected from lava fountains in Hawaiian-type eruptionsalso quench to glass (see Figure 7.29b). Thin dikes andmargins of thicker dikes of a wide range of compositionthat are emplaced in the cool shallow crust can also beof glass.
All glass is metastable and therefore susceptible tosecondary hydration, devitrification, and other types ofalteration (Bous̆ka, 1993) that progress over time toachieve a more stable state. Hydration and devitrifica-tion are kinetic processes that depend on diffusion ofwater molecules or (OH)� and H� ions and on nucle-ation and growth of crystals, respectively, in the glass.Hydration is faster than devitrification in silicic glasses.
Some massive glass having a waxy luster and darkcolor in hand sample into which 6–16 wt.% water hasbeen absorbed is called pitchstone. More common hy-drated silicic glass, occurring in subaerial environ-ments, is called perlite because it typically has a pearl-gray color, but some is green, red, or brown. As much as 6 wt.% of perlite is H2O� absorbed at near-atmospheric T and can be liberated by heating the glassto only 110°C; the isotopic composition of this waterindicates that it is meteoric, not magmatic, in origin.
152 Igneous and Metamorphic Petrology
0 0.5mmFeldsparphenocryst
Perliticcracks
7.4 A combination of vitric (glassy) and phyric (porphyritic) tex-ture is vitrophyric. In this photomicrograph of a silicic vitro-phyre, phenocrysts of feldspar and opaque (black) Fe-Ti ox-ides lie in a flow-layered glass that has hydrated to produceperlitic cracks (see also Figure 7.5).
0 1cm
7.5 Nests of concentric curved fractures in glass constitute perlitictexture. Internal reflectance of light imparts a lustrous, pearly-gray color to hand samples. Small nodules of black, unhy-drated, and uncracked obsidian (called Apache tears) may belocated in the core of the nested cracks.
0 2cm
7.6 Spherulitic texture in high-silica rhyolite obsidian. Spherulitesare spherical to ellipsoidal clusters of radiating fibrous alkalifeldspar and a polymorph of SiO2, here in a black glassy ma-trix. Faint, relict flow layering that extends from lower left toupper right is accentuated in the spherulites in this hand sam-ple, indicating their growth after active flow of the magma. In-dividual spherulites in volcanic rocks can range in diameterfrom less than 1 mm to 1 m or so. A phenocryst may be locatedat the center of the spherulite, where, in the original glass ordrastically undercooled melt, it allowed heterogeneous nucle-ation of crystals to occur. Spherulites are secondary devitrifi-cation features, not phenocrysts.
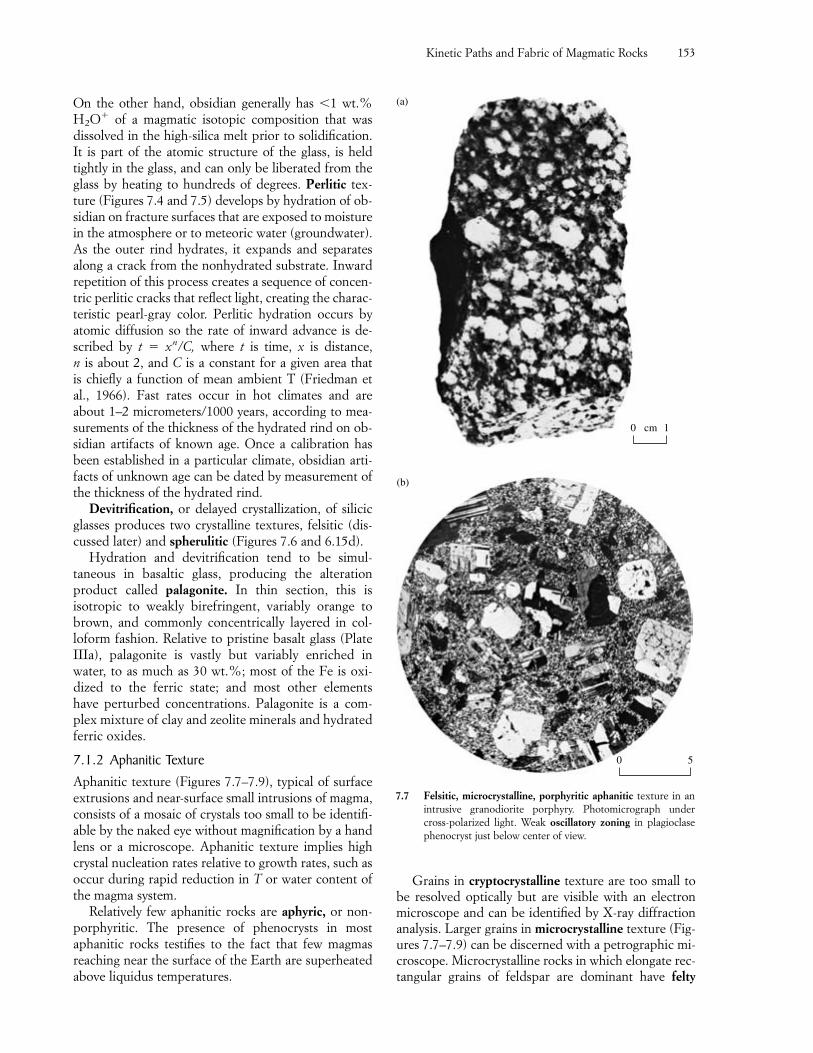
Grains in cryptocrystalline texture are too small tobe resolved optically but are visible with an electronmicroscope and can be identified by X-ray diffractionanalysis. Larger grains in microcrystalline texture (Fig-ures 7.7–7.9) can be discerned with a petrographic mi-croscope. Microcrystalline rocks in which elongate rec-tangular grains of feldspar are dominant have felty
Kinetic Paths and Fabric of Magmatic Rocks 153
0 5
0 1cm
(a)
(b)
7.7 Felsitic, microcrystalline, porphyritic aphanitic texture in anintrusive granodiorite porphyry. Photomicrograph undercross-polarized light. Weak oscillatory zoning in plagioclasephenocryst just below center of view.
On the other hand, obsidian generally has �1 wt.%H2O� of a magmatic isotopic composition that wasdissolved in the high-silica melt prior to solidification.It is part of the atomic structure of the glass, is heldtightly in the glass, and can only be liberated from theglass by heating to hundreds of degrees. Perlitic tex-ture (Figures 7.4 and 7.5) develops by hydration of ob-sidian on fracture surfaces that are exposed to moisturein the atmosphere or to meteoric water (groundwater).As the outer rind hydrates, it expands and separatesalong a crack from the nonhydrated substrate. Inwardrepetition of this process creates a sequence of concen-tric perlitic cracks that reflect light, creating the charac-teristic pearl-gray color. Perlitic hydration occurs byatomic diffusion so the rate of inward advance is de-scribed by t � xn/C, where t is time, x is distance, n is about 2, and C is a constant for a given area that is chiefly a function of mean ambient T (Friedman etal., 1966). Fast rates occur in hot climates and areabout 1–2 micrometers/1000 years, according to mea-surements of the thickness of the hydrated rind on ob-sidian artifacts of known age. Once a calibration hasbeen established in a particular climate, obsidian arti-facts of unknown age can be dated by measurement ofthe thickness of the hydrated rind.
Devitrification, or delayed crystallization, of silicicglasses produces two crystalline textures, felsitic (dis-cussed later) and spherulitic (Figures 7.6 and 6.15d).
Hydration and devitrification tend to be simul-taneous in basaltic glass, producing the alterationproduct called palagonite. In thin section, this isisotropic to weakly birefringent, variably orange tobrown, and commonly concentrically layered in col-loform fashion. Relative to pristine basalt glass (PlateIIIa), palagonite is vastly but variably enriched in water, to as much as 30 wt.%; most of the Fe is oxi-dized to the ferric state; and most other elements have perturbed concentrations. Palagonite is a com-plex mixture of clay and zeolite minerals and hydratedferric oxides.
7.1.2 Aphanitic TextureAphanitic texture (Figures 7.7–7.9), typical of surfaceextrusions and near-surface small intrusions of magma,consists of a mosaic of crystals too small to be identifi-able by the naked eye without magnification by a handlens or a microscope. Aphanitic texture implies highcrystal nucleation rates relative to growth rates, such asoccur during rapid reduction in T or water content ofthe magma system.
Relatively few aphanitic rocks are aphyric, or non-porphyritic. The presence of phenocrysts in mostaphanitic rocks testifies to the fact that few magmasreaching near the surface of the Earth are superheatedabove liquidus temperatures.
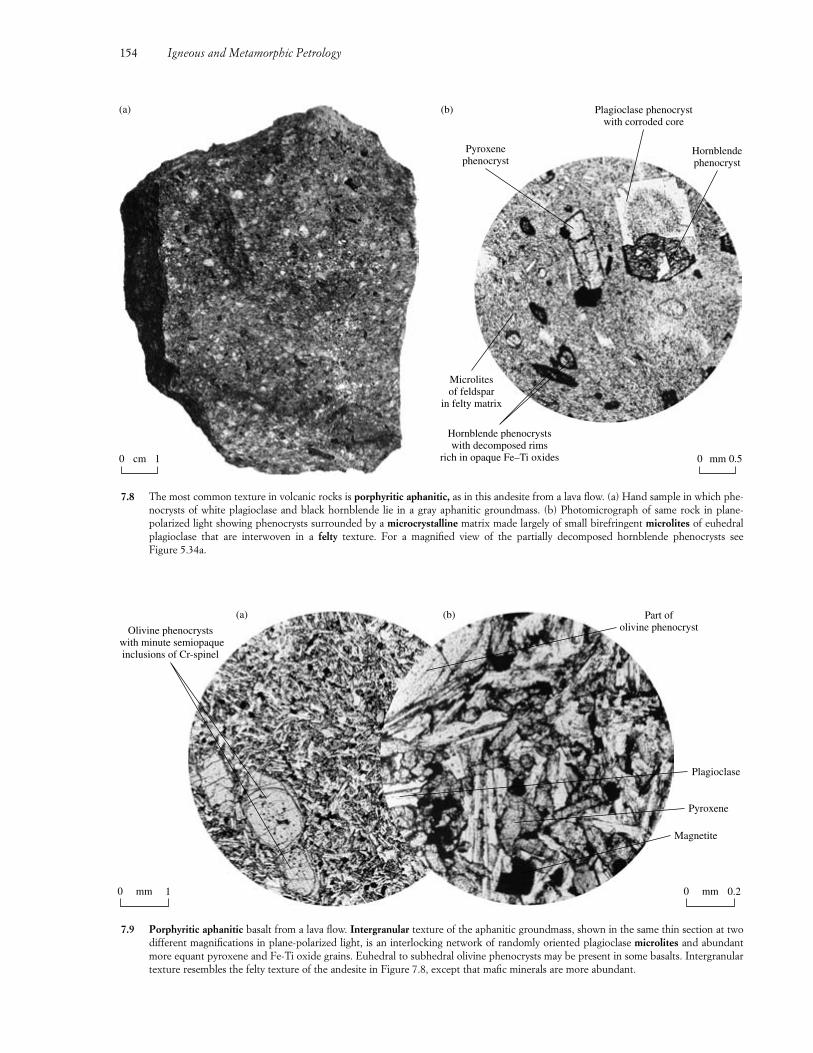
154 Igneous and Metamorphic Petrology
Hornblendephenocryst
Plagioclase phenocrystwith corroded core
Pyroxenephenocryst
Microlitesof feldspar
in felty matrix
Hornblende phenocrystswith decomposed rims
rich in opaque Fe–Ti oxides
(a) (b)
0 1cm 0 0.5mm
7.8 The most common texture in volcanic rocks is porphyritic aphanitic, as in this andesite from a lava flow. (a) Hand sample in which phe-nocrysts of white plagioclase and black hornblende lie in a gray aphanitic groundmass. (b) Photomicrograph of same rock in plane-polarized light showing phenocrysts surrounded by a microcrystalline matrix made largely of small birefringent microlites of euhedralplagioclase that are interwoven in a felty texture. For a magnified view of the partially decomposed hornblende phenocrysts see Figure 5.34a.
Olivine phenocrysts with minute semiopaqueinclusions of Cr-spinel
Part ofolivine phenocryst
Plagioclase
Pyroxene
Magnetite
0 1mm 0 0.2mm
(a) (b)
7.9 Porphyritic aphanitic basalt from a lava flow. Intergranular texture of the aphanitic groundmass, shown in the same thin section at twodifferent magnifications in plane-polarized light, is an interlocking network of randomly oriented plagioclase microlites and abundantmore equant pyroxene and Fe-Ti oxide grains. Euhedral to subhedral olivine phenocrysts may be present in some basalts. Intergranulartexture resembles the felty texture of the andesite in Figure 7.8, except that mafic minerals are more abundant.
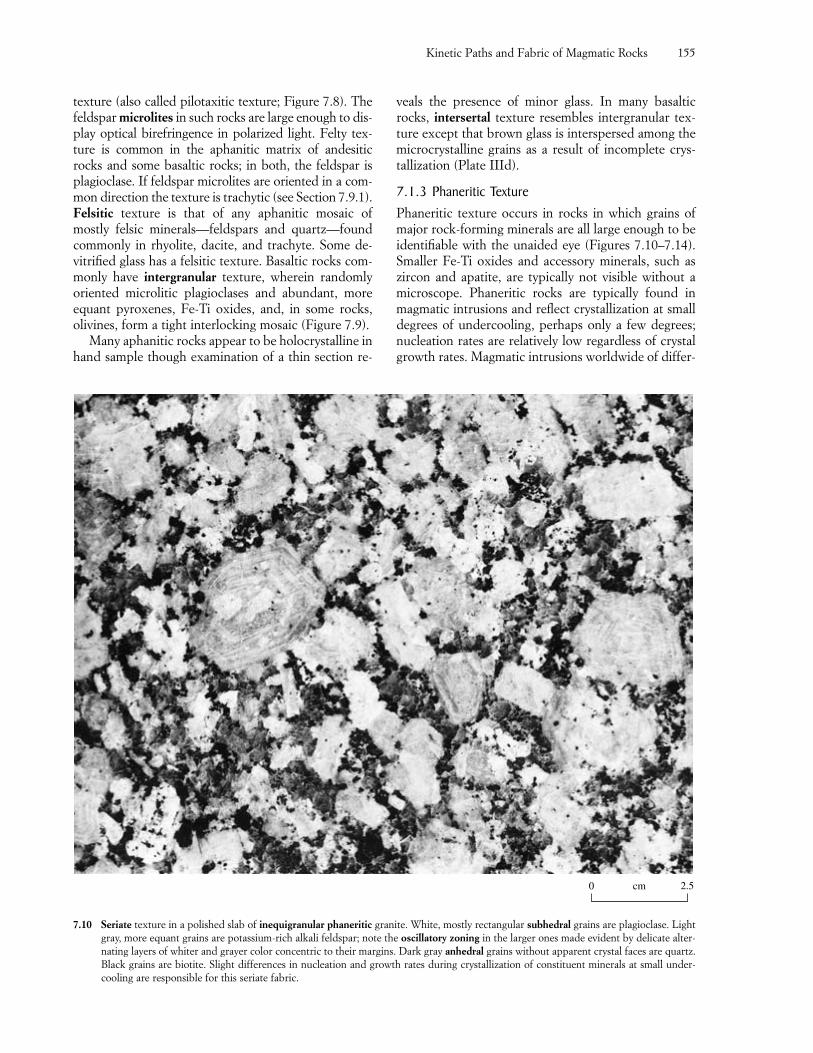
texture (also called pilotaxitic texture; Figure 7.8). Thefeldspar microlites in such rocks are large enough to dis-play optical birefringence in polarized light. Felty tex-ture is common in the aphanitic matrix of andesiticrocks and some basaltic rocks; in both, the feldspar isplagioclase. If feldspar microlites are oriented in a com-mon direction the texture is trachytic (see Section 7.9.1).Felsitic texture is that of any aphanitic mosaic ofmostly felsic minerals—feldspars and quartz—foundcommonly in rhyolite, dacite, and trachyte. Some de-vitrified glass has a felsitic texture. Basaltic rocks com-monly have intergranular texture, wherein randomlyoriented microlitic plagioclases and abundant, moreequant pyroxenes, Fe-Ti oxides, and, in some rocks,olivines, form a tight interlocking mosaic (Figure 7.9).
Many aphanitic rocks appear to be holocrystalline inhand sample though examination of a thin section re-
veals the presence of minor glass. In many basalticrocks, intersertal texture resembles intergranular tex-ture except that brown glass is interspersed among themicrocrystalline grains as a result of incomplete crys-tallization (Plate IIId).
7.1.3 Phaneritic TexturePhaneritic texture occurs in rocks in which grains ofmajor rock-forming minerals are all large enough to beidentifiable with the unaided eye (Figures 7.10–7.14).Smaller Fe-Ti oxides and accessory minerals, such aszircon and apatite, are typically not visible without amicroscope. Phaneritic rocks are typically found inmagmatic intrusions and reflect crystallization at smalldegrees of undercooling, perhaps only a few degrees;nucleation rates are relatively low regardless of crystalgrowth rates. Magmatic intrusions worldwide of differ-
Kinetic Paths and Fabric of Magmatic Rocks 155
2.50 cm
7.10 Seriate texture in a polished slab of inequigranular phaneritic granite. White, mostly rectangular subhedral grains are plagioclase. Lightgray, more equant grains are potassium-rich alkali feldspar; note the oscillatory zoning in the larger ones made evident by delicate alter-nating layers of whiter and grayer color concentric to their margins. Dark gray anhedral grains without apparent crystal faces are quartz.Black grains are biotite. Slight differences in nucleation and growth rates during crystallization of constituent minerals at small under-cooling are responsible for this seriate fabric.
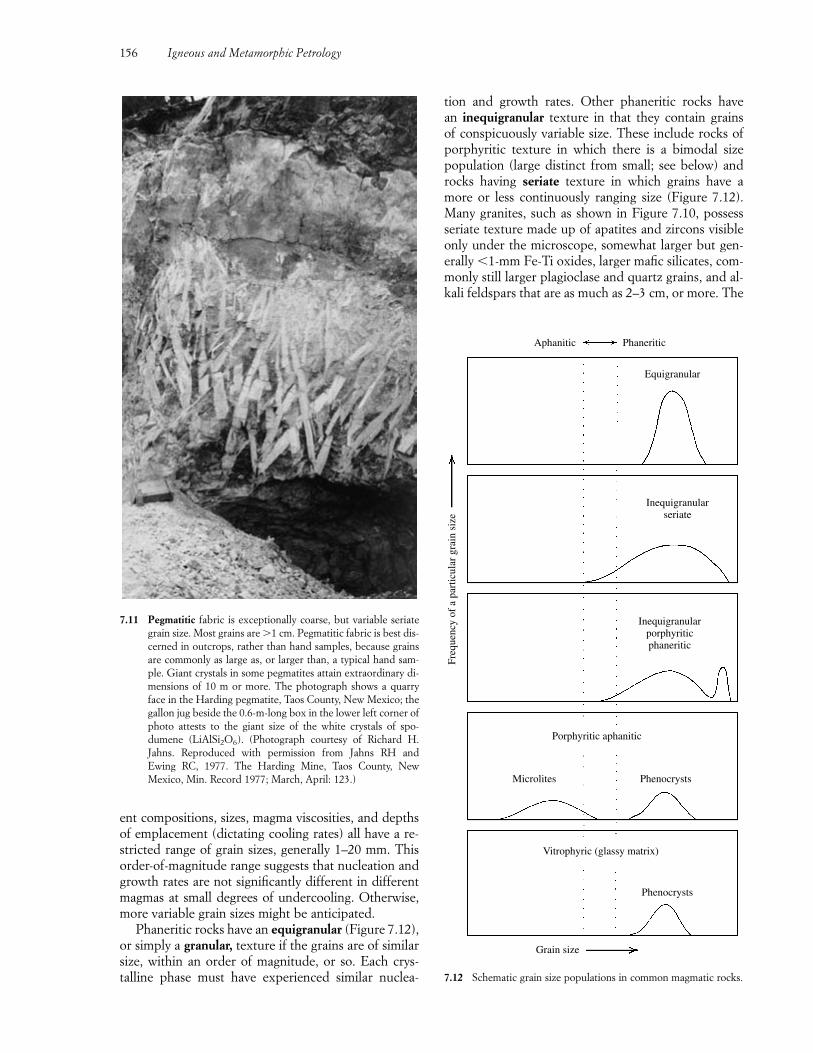
ent compositions, sizes, magma viscosities, and depthsof emplacement (dictating cooling rates) all have a re-stricted range of grain sizes, generally 1–20 mm. Thisorder-of-magnitude range suggests that nucleation andgrowth rates are not significantly different in differentmagmas at small degrees of undercooling. Otherwise,more variable grain sizes might be anticipated.
Phaneritic rocks have an equigranular (Figure 7.12),or simply a granular, texture if the grains are of similarsize, within an order of magnitude, or so. Each crys-talline phase must have experienced similar nuclea-
tion and growth rates. Other phaneritic rocks have an inequigranular texture in that they contain grains of conspicuously variable size. These include rocks ofporphyritic texture in which there is a bimodal sizepopulation (large distinct from small; see below) androcks having seriate texture in which grains have amore or less continuously ranging size (Figure 7.12).Many granites, such as shown in Figure 7.10, possessseriate texture made up of apatites and zircons visibleonly under the microscope, somewhat larger but gen-erally �1-mm Fe-Ti oxides, larger mafic silicates, com-monly still larger plagioclase and quartz grains, and al-kali feldspars that are as much as 2–3 cm, or more. The
156 Igneous and Metamorphic Petrology
7.11 Pegmatitic fabric is exceptionally coarse, but variable seriategrain size. Most grains are �1 cm. Pegmatitic fabric is best dis-cerned in outcrops, rather than hand samples, because grainsare commonly as large as, or larger than, a typical hand sam-ple. Giant crystals in some pegmatites attain extraordinary di-mensions of 10 m or more. The photograph shows a quarryface in the Harding pegmatite, Taos County, New Mexico; thegallon jug beside the 0.6-m-long box in the lower left corner ofphoto attests to the giant size of the white crystals of spo-dumene (LiAlSi2O6). (Photograph courtesy of Richard H.Jahns. Reproduced with permission from Jahns RH and Ewing RC, 1977. The Harding Mine, Taos County, New Mexico, Min. Record 1977; March, April: 123.)
Aphanitic Phaneritic
Equigranular
Inequigranularseriate
Inequigranularporphyriticphaneritic
Porphyritic aphanitic
Vitrophyric (glassy matrix)
Phenocrysts
PhenocrystsMicrolites
Grain size
Freq
uenc
y of
a p
artic
ular
gra
in s
ize
7.12 Schematic grain size populations in common magmatic rocks.
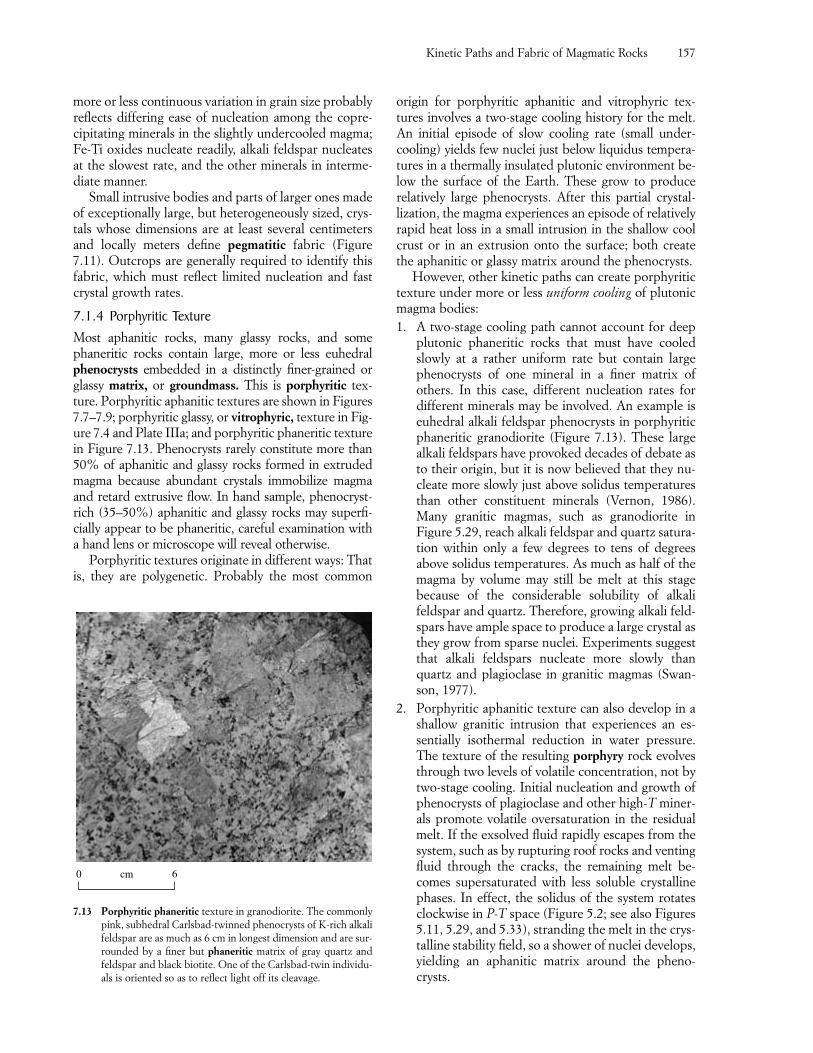
more or less continuous variation in grain size probablyreflects differing ease of nucleation among the copre-cipitating minerals in the slightly undercooled magma;Fe-Ti oxides nucleate readily, alkali feldspar nucleatesat the slowest rate, and the other minerals in interme-diate manner.
Small intrusive bodies and parts of larger ones madeof exceptionally large, but heterogeneously sized, crys-tals whose dimensions are at least several centimetersand locally meters define pegmatitic fabric (Figure7.11). Outcrops are generally required to identify thisfabric, which must reflect limited nucleation and fastcrystal growth rates.
7.1.4 Porphyritic TextureMost aphanitic rocks, many glassy rocks, and somephaneritic rocks contain large, more or less euhedralphenocrysts embedded in a distinctly finer-grained orglassy matrix, or groundmass. This is porphyritic tex-ture. Porphyritic aphanitic textures are shown in Figures7.7–7.9; porphyritic glassy, or vitrophyric, texture in Fig-ure 7.4 and Plate IIIa; and porphyritic phaneritic texturein Figure 7.13. Phenocrysts rarely constitute more than50% of aphanitic and glassy rocks formed in extrudedmagma because abundant crystals immobilize magmaand retard extrusive flow. In hand sample, phenocryst-rich (35–50%) aphanitic and glassy rocks may superfi-cially appear to be phaneritic, careful examination witha hand lens or microscope will reveal otherwise.
Porphyritic textures originate in different ways: Thatis, they are polygenetic. Probably the most common
origin for porphyritic aphanitic and vitrophyric tex-tures involves a two-stage cooling history for the melt.An initial episode of slow cooling rate (small under-cooling) yields few nuclei just below liquidus tempera-tures in a thermally insulated plutonic environment be-low the surface of the Earth. These grow to producerelatively large phenocrysts. After this partial crystal-lization, the magma experiences an episode of relativelyrapid heat loss in a small intrusion in the shallow coolcrust or in an extrusion onto the surface; both createthe aphanitic or glassy matrix around the phenocrysts.
However, other kinetic paths can create porphyritictexture under more or less uniform cooling of plutonicmagma bodies:1. A two-stage cooling path cannot account for deep
plutonic phaneritic rocks that must have cooledslowly at a rather uniform rate but contain largephenocrysts of one mineral in a finer matrix of others. In this case, different nucleation rates fordifferent minerals may be involved. An example is euhedral alkali feldspar phenocrysts in porphyriticphaneritic granodiorite (Figure 7.13). These largealkali feldspars have provoked decades of debate asto their origin, but it is now believed that they nu-cleate more slowly just above solidus temperaturesthan other constituent minerals (Vernon, 1986).Many granitic magmas, such as granodiorite in Figure 5.29, reach alkali feldspar and quartz satura-tion within only a few degrees to tens of degreesabove solidus temperatures. As much as half of themagma by volume may still be melt at this stage because of the considerable solubility of alkalifeldspar and quartz. Therefore, growing alkali feld-spars have ample space to produce a large crystal asthey grow from sparse nuclei. Experiments suggestthat alkali feldspars nucleate more slowly thanquartz and plagioclase in granitic magmas (Swan-son, 1977).
2. Porphyritic aphanitic texture can also develop in ashallow granitic intrusion that experiences an es-sentially isothermal reduction in water pressure.The texture of the resulting porphyry rock evolvesthrough two levels of volatile concentration, not bytwo-stage cooling. Initial nucleation and growth ofphenocrysts of plagioclase and other high-T miner-als promote volatile oversaturation in the residualmelt. If the exsolved fluid rapidly escapes from thesystem, such as by rupturing roof rocks and ventingfluid through the cracks, the remaining melt be-comes supersaturated with less soluble crystallinephases. In effect, the solidus of the system rotatesclockwise in P-T space (Figure 5.2; see also Figures5.11, 5.29, and 5.33), stranding the melt in the crys-talline stability field, so a shower of nuclei develops,yielding an aphanitic matrix around the pheno-crysts.
Kinetic Paths and Fabric of Magmatic Rocks 157
60 cm
7.13 Porphyritic phaneritic texture in granodiorite. The commonlypink, subhedral Carlsbad-twinned phenocrysts of K-rich alkalifeldspar are as much as 6 cm in longest dimension and are sur-rounded by a finer but phaneritic matrix of gray quartz andfeldspar and black biotite. One of the Carlsbad-twin individu-als is oriented so as to reflect light off its cleavage.
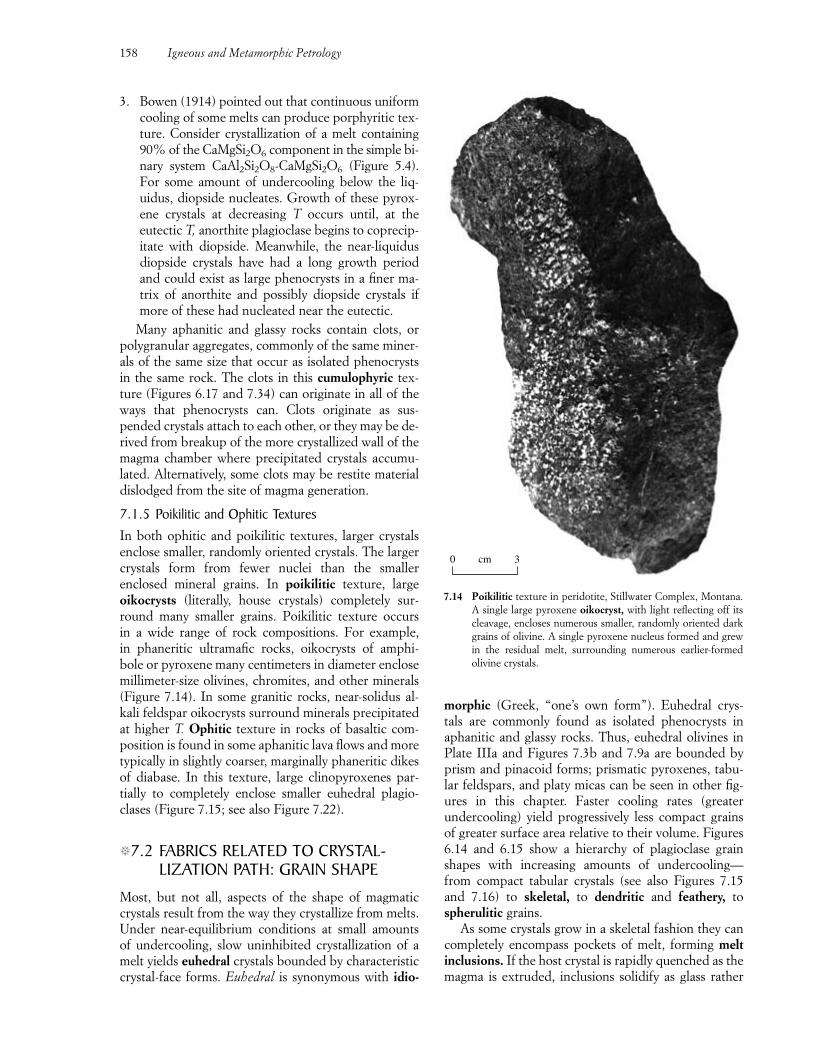
3. Bowen (1914) pointed out that continuous uniformcooling of some melts can produce porphyritic tex-ture. Consider crystallization of a melt containing90% of the CaMgSi2O6 component in the simple bi-nary system CaAl2Si2O8-CaMgSi2O6 (Figure 5.4).For some amount of undercooling below the liq-uidus, diopside nucleates. Growth of these pyrox-ene crystals at decreasing T occurs until, at the eutectic T, anorthite plagioclase begins to coprecip-itate with diopside. Meanwhile, the near-liquidusdiopside crystals have had a long growth periodand could exist as large phenocrysts in a finer ma-trix of anorthite and possibly diopside crystals ifmore of these had nucleated near the eutectic.
Many aphanitic and glassy rocks contain clots, orpolygranular aggregates, commonly of the same miner-als of the same size that occur as isolated phenocrystsin the same rock. The clots in this cumulophyric tex-ture (Figures 6.17 and 7.34) can originate in all of theways that phenocrysts can. Clots originate as sus-pended crystals attach to each other, or they may be de-rived from breakup of the more crystallized wall of themagma chamber where precipitated crystals accumu-lated. Alternatively, some clots may be restite materialdislodged from the site of magma generation.
7.1.5 Poikilitic and Ophitic TexturesIn both ophitic and poikilitic textures, larger crystalsenclose smaller, randomly oriented crystals. The largercrystals form from fewer nuclei than the smaller enclosed mineral grains. In poikilitic texture, largeoikocrysts (literally, house crystals) completely sur-round many smaller grains. Poikilitic texture occurs in a wide range of rock compositions. For example, in phaneritic ultramafic rocks, oikocrysts of amphi-bole or pyroxene many centimeters in diameter enclosemillimeter-size olivines, chromites, and other minerals(Figure 7.14). In some granitic rocks, near-solidus al-kali feldspar oikocrysts surround minerals precipitatedat higher T. Ophitic texture in rocks of basaltic com-position is found in some aphanitic lava flows and moretypically in slightly coarser, marginally phaneritic dikesof diabase. In this texture, large clinopyroxenes par-tially to completely enclose smaller euhedral plagio-clases (Figure 7.15; see also Figure 7.22).
�7.2 FABRICS RELATED TO CRYSTAL-LIZATION PATH: GRAIN SHAPE
Most, but not all, aspects of the shape of magmaticcrystals result from the way they crystallize from melts.Under near-equilibrium conditions at small amounts of undercooling, slow uninhibited crystallization of amelt yields euhedral crystals bounded by characteristiccrystal-face forms. Euhedral is synonymous with idio-
morphic (Greek, “one’s own form”). Euhedral crys-tals are commonly found as isolated phenocrysts inaphanitic and glassy rocks. Thus, euhedral olivines inPlate IIIa and Figures 7.3b and 7.9a are bounded byprism and pinacoid forms; prismatic pyroxenes, tabu-lar feldspars, and platy micas can be seen in other fig-ures in this chapter. Faster cooling rates (greater undercooling) yield progressively less compact grainsof greater surface area relative to their volume. Figures6.14 and 6.15 show a hierarchy of plagioclase grainshapes with increasing amounts of undercooling—from compact tabular crystals (see also Figures 7.15and 7.16) to skeletal, to dendritic and feathery, tospherulitic grains.
As some crystals grow in a skeletal fashion they cancompletely encompass pockets of melt, forming meltinclusions. If the host crystal is rapidly quenched as themagma is extruded, inclusions solidify as glass rather
158 Igneous and Metamorphic Petrology
0 3cm
7.14 Poikilitic texture in peridotite, Stillwater Complex, Montana.A single large pyroxene oikocryst, with light reflecting off itscleavage, encloses numerous smaller, randomly oriented darkgrains of olivine. A single pyroxene nucleus formed and grewin the residual melt, surrounding numerous earlier-formedolivine crystals.
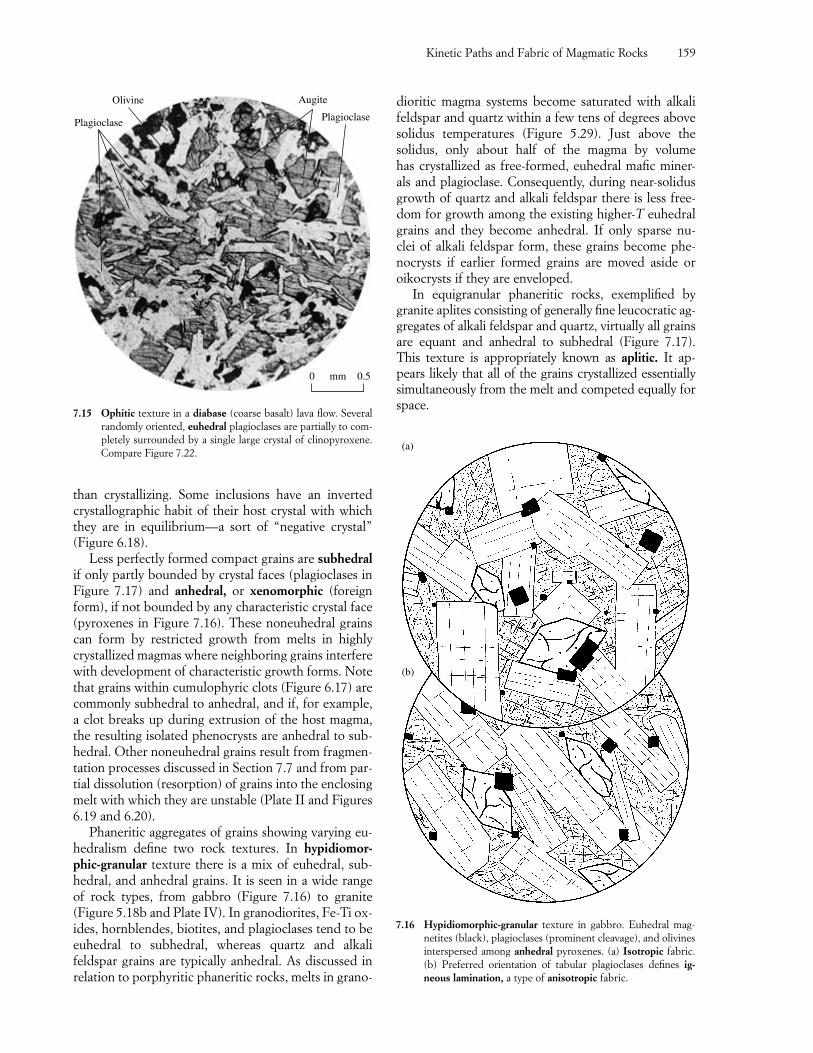
than crystallizing. Some inclusions have an invertedcrystallographic habit of their host crystal with whichthey are in equilibrium—a sort of “negative crystal”(Figure 6.18).
Less perfectly formed compact grains are subhedralif only partly bounded by crystal faces (plagioclases inFigure 7.17) and anhedral, or xenomorphic (foreignform), if not bounded by any characteristic crystal face(pyroxenes in Figure 7.16). These noneuhedral grainscan form by restricted growth from melts in highlycrystallized magmas where neighboring grains interferewith development of characteristic growth forms. Notethat grains within cumulophyric clots (Figure 6.17) arecommonly subhedral to anhedral, and if, for example,a clot breaks up during extrusion of the host magma,the resulting isolated phenocrysts are anhedral to sub-hedral. Other noneuhedral grains result from fragmen-tation processes discussed in Section 7.7 and from par-tial dissolution (resorption) of grains into the enclosingmelt with which they are unstable (Plate II and Figures6.19 and 6.20).
Phaneritic aggregates of grains showing varying eu-hedralism define two rock textures. In hypidiomor-phic-granular texture there is a mix of euhedral, sub-hedral, and anhedral grains. It is seen in a wide rangeof rock types, from gabbro (Figure 7.16) to granite(Figure 5.18b and Plate IV). In granodiorites, Fe-Ti ox-ides, hornblendes, biotites, and plagioclases tend to beeuhedral to subhedral, whereas quartz and alkalifeldspar grains are typically anhedral. As discussed inrelation to porphyritic phaneritic rocks, melts in grano-
dioritic magma systems become saturated with alkalifeldspar and quartz within a few tens of degrees abovesolidus temperatures (Figure 5.29). Just above thesolidus, only about half of the magma by volume has crystallized as free-formed, euhedral mafic miner-als and plagioclase. Consequently, during near-solidusgrowth of quartz and alkali feldspar there is less free-dom for growth among the existing higher-T euhedralgrains and they become anhedral. If only sparse nu-clei of alkali feldspar form, these grains become phe-nocrysts if earlier formed grains are moved aside oroikocrysts if they are enveloped.
In equigranular phaneritic rocks, exemplified bygranite aplites consisting of generally fine leucocratic ag-gregates of alkali feldspar and quartz, virtually all grainsare equant and anhedral to subhedral (Figure 7.17).This texture is appropriately known as aplitic. It ap-pears likely that all of the grains crystallized essentiallysimultaneously from the melt and competed equally forspace.
Kinetic Paths and Fabric of Magmatic Rocks 159
0 0.5mm
Plagioclase
Olivine Augite
Plagioclase
7.15 Ophitic texture in a diabase (coarse basalt) lava flow. Severalrandomly oriented, euhedral plagioclases are partially to com-pletely surrounded by a single large crystal of clinopyroxene.Compare Figure 7.22.
(a)
(b)
7.16 Hypidiomorphic-granular texture in gabbro. Euhedral mag-netites (black), plagioclases (prominent cleavage), and olivinesinterspersed among anhedral pyroxenes. (a) Isotropic fabric.(b) Preferred orientation of tabular plagioclases defines ig-neous lamination, a type of anisotropic fabric.
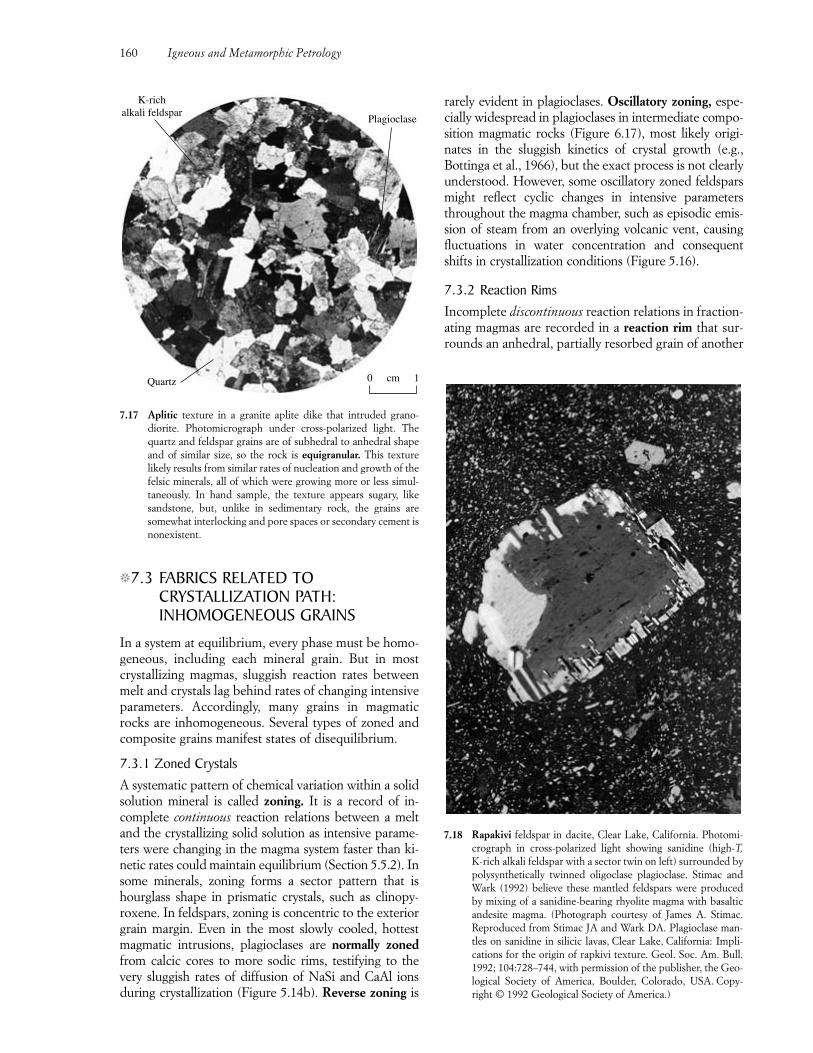
�7.3 FABRICS RELATED TO CRYSTALLIZATION PATH: INHOMOGENEOUS GRAINS
In a system at equilibrium, every phase must be homo-geneous, including each mineral grain. But in mostcrystallizing magmas, sluggish reaction rates betweenmelt and crystals lag behind rates of changing intensiveparameters. Accordingly, many grains in magmaticrocks are inhomogeneous. Several types of zoned andcomposite grains manifest states of disequilibrium.
7.3.1 Zoned CrystalsA systematic pattern of chemical variation within a solidsolution mineral is called zoning. It is a record of in-complete continuous reaction relations between a meltand the crystallizing solid solution as intensive parame-ters were changing in the magma system faster than ki-netic rates could maintain equilibrium (Section 5.5.2). Insome minerals, zoning forms a sector pattern that ishourglass shape in prismatic crystals, such as clinopy-roxene. In feldspars, zoning is concentric to the exteriorgrain margin. Even in the most slowly cooled, hottestmagmatic intrusions, plagioclases are normally zonedfrom calcic cores to more sodic rims, testifying to thevery sluggish rates of diffusion of NaSi and CaAl ionsduring crystallization (Figure 5.14b). Reverse zoning is
rarely evident in plagioclases. Oscillatory zoning, espe-cially widespread in plagioclases in intermediate compo-sition magmatic rocks (Figure 6.17), most likely origi-nates in the sluggish kinetics of crystal growth (e.g.,Bottinga et al., 1966), but the exact process is not clearlyunderstood. However, some oscillatory zoned feldsparsmight reflect cyclic changes in intensive parametersthroughout the magma chamber, such as episodic emis-sion of steam from an overlying volcanic vent, causingfluctuations in water concentration and consequentshifts in crystallization conditions (Figure 5.16).
7.3.2 Reaction RimsIncomplete discontinuous reaction relations in fraction-ating magmas are recorded in a reaction rim that sur-rounds an anhedral, partially resorbed grain of another
160 Igneous and Metamorphic Petrology
K-richalkali feldspar
Quartz
Plagioclase
0 1cm
7.17 Aplitic texture in a granite aplite dike that intruded grano-diorite. Photomicrograph under cross-polarized light. Thequartz and feldspar grains are of subhedral to anhedral shapeand of similar size, so the rock is equigranular. This texturelikely results from similar rates of nucleation and growth of thefelsic minerals, all of which were growing more or less simul-taneously. In hand sample, the texture appears sugary, likesandstone, but, unlike in sedimentary rock, the grains aresomewhat interlocking and pore spaces or secondary cement isnonexistent.
7.18 Rapakivi feldspar in dacite, Clear Lake, California. Photomi-crograph in cross-polarized light showing sanidine (high-T,K-rich alkali feldspar with a sector twin on left) surrounded bypolysynthetically twinned oligoclase plagioclase. Stimac andWark (1992) believe these mantled feldspars were producedby mixing of a sanidine-bearing rhyolite magma with basalticandesite magma. (Photograph courtesy of James A. Stimac.Reproduced from Stimac JA and Wark DA. Plagioclase man-tles on sanidine in silicic lavas, Clear Lake, California: Impli-cations for the origin of rapkivi texture. Geol. Soc. Am. Bull.1992; 104:728–744, with permission of the publisher, the Geo-logical Society of America, Boulder, Colorado, USA. Copy-right © 1992 Geological Society of America.)
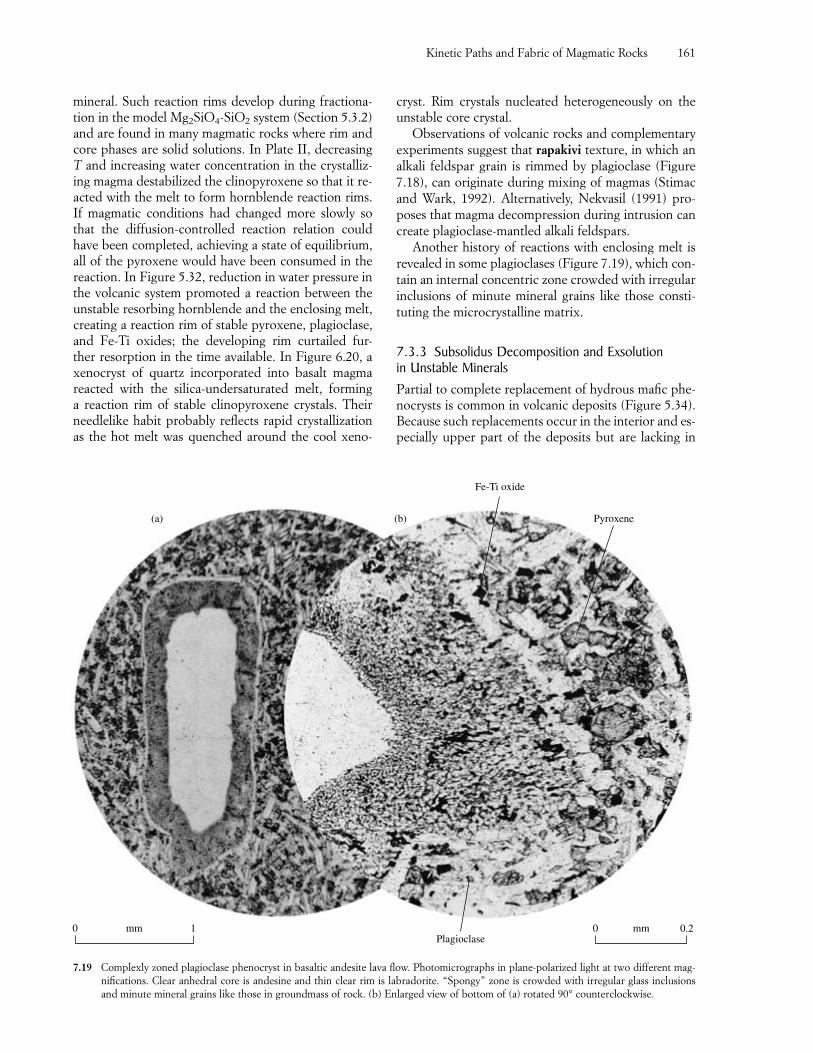
mineral. Such reaction rims develop during fractiona-tion in the model Mg2SiO4-SiO2 system (Section 5.3.2)and are found in many magmatic rocks where rim andcore phases are solid solutions. In Plate II, decreasingT and increasing water concentration in the crystalliz-ing magma destabilized the clinopyroxene so that it re-acted with the melt to form hornblende reaction rims.If magmatic conditions had changed more slowly sothat the diffusion-controlled reaction relation couldhave been completed, achieving a state of equilibrium,all of the pyroxene would have been consumed in thereaction. In Figure 5.32, reduction in water pressure inthe volcanic system promoted a reaction between theunstable resorbing hornblende and the enclosing melt,creating a reaction rim of stable pyroxene, plagioclase,and Fe-Ti oxides; the developing rim curtailed fur-ther resorption in the time available. In Figure 6.20, axenocryst of quartz incorporated into basalt magma reacted with the silica-undersaturated melt, forming a reaction rim of stable clinopyroxene crystals. Theirneedlelike habit probably reflects rapid crystallizationas the hot melt was quenched around the cool xeno-
cryst. Rim crystals nucleated heterogeneously on theunstable core crystal.
Observations of volcanic rocks and complementaryexperiments suggest that rapakivi texture, in which analkali feldspar grain is rimmed by plagioclase (Figure7.18), can originate during mixing of magmas (Stimacand Wark, 1992). Alternatively, Nekvasil (1991) pro-poses that magma decompression during intrusion cancreate plagioclase-mantled alkali feldspars.
Another history of reactions with enclosing melt isrevealed in some plagioclases (Figure 7.19), which con-tain an internal concentric zone crowded with irregularinclusions of minute mineral grains like those consti-tuting the microcrystalline matrix.
7.3.3 Subsolidus Decomposition and Exsolution in Unstable MineralsPartial to complete replacement of hydrous mafic phe-nocrysts is common in volcanic deposits (Figure 5.34).Because such replacements occur in the interior and es-pecially upper part of the deposits but are lacking in
Kinetic Paths and Fabric of Magmatic Rocks 161
0 1mm 0 0.2mm
(a) (b)
Fe-Ti oxide
Pyroxene
Plagioclase
7.19 Complexly zoned plagioclase phenocryst in basaltic andesite lava flow. Photomicrographs in plane-polarized light at two different mag-nifications. Clear anhedral core is andesine and thin clear rim is labradorite. “Spongy” zone is crowded with irregular glass inclusionsand minute mineral grains like those in groundmass of rock. (b) Enlarged view of bottom of (a) rotated 90° counterclockwise.
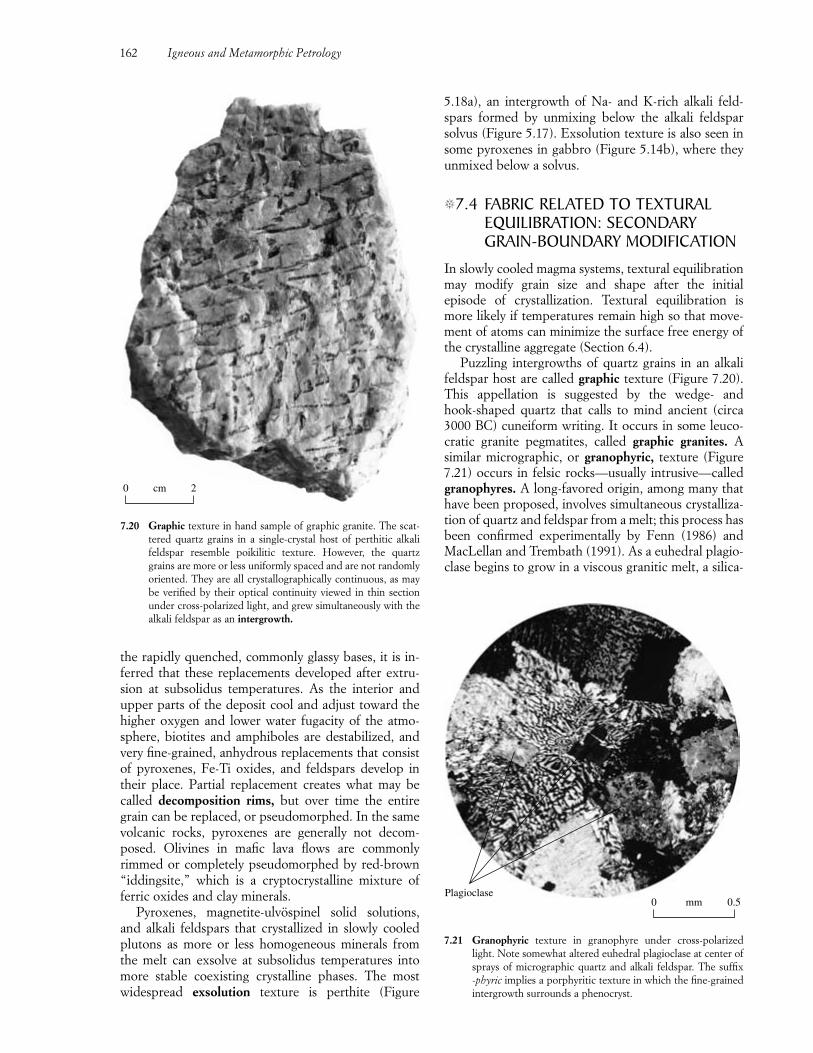
the rapidly quenched, commonly glassy bases, it is in-ferred that these replacements developed after extru-sion at subsolidus temperatures. As the interior andupper parts of the deposit cool and adjust toward thehigher oxygen and lower water fugacity of the atmo-sphere, biotites and amphiboles are destabilized, andvery fine-grained, anhydrous replacements that consistof pyroxenes, Fe-Ti oxides, and feldspars develop intheir place. Partial replacement creates what may becalled decomposition rims, but over time the entiregrain can be replaced, or pseudomorphed. In the samevolcanic rocks, pyroxenes are generally not decom-posed. Olivines in mafic lava flows are commonlyrimmed or completely pseudomorphed by red-brown“iddingsite,” which is a cryptocrystalline mixture offerric oxides and clay minerals.
Pyroxenes, magnetite-ulvöspinel solid solutions,and alkali feldspars that crystallized in slowly cooledplutons as more or less homogeneous minerals fromthe melt can exsolve at subsolidus temperatures intomore stable coexisting crystalline phases. The mostwidespread exsolution texture is perthite (Figure
5.18a), an intergrowth of Na- and K-rich alkali feld-spars formed by unmixing below the alkali feldsparsolvus (Figure 5.17). Exsolution texture is also seen insome pyroxenes in gabbro (Figure 5.14b), where theyunmixed below a solvus.
�7.4 FABRIC RELATED TO TEXTURAL EQUILIBRATION: SECONDARYGRAIN-BOUNDARY MODIFICATION
In slowly cooled magma systems, textural equilibrationmay modify grain size and shape after the initialepisode of crystallization. Textural equilibration ismore likely if temperatures remain high so that move-ment of atoms can minimize the surface free energy ofthe crystalline aggregate (Section 6.4).
Puzzling intergrowths of quartz grains in an alkalifeldspar host are called graphic texture (Figure 7.20).This appellation is suggested by the wedge- and hook-shaped quartz that calls to mind ancient (circa3000 BC) cuneiform writing. It occurs in some leuco-cratic granite pegmatites, called graphic granites. Asimilar micrographic, or granophyric, texture (Figure7.21) occurs in felsic rocks—usually intrusive—calledgranophyres. A long-favored origin, among many thathave been proposed, involves simultaneous crystalliza-tion of quartz and feldspar from a melt; this process hasbeen confirmed experimentally by Fenn (1986) andMacLellan and Trembath (1991). As a euhedral plagio-clase begins to grow in a viscous granitic melt, a silica-
162 Igneous and Metamorphic Petrology
0 2cm
7.20 Graphic texture in hand sample of graphic granite. The scat-tered quartz grains in a single-crystal host of perthitic alkalifeldspar resemble poikilitic texture. However, the quartzgrains are more or less uniformly spaced and are not randomlyoriented. They are all crystallographically continuous, as maybe verified by their optical continuity viewed in thin sectionunder cross-polarized light, and grew simultaneously with thealkali feldspar as an intergrowth.
Plagioclase0.50 mm
7.21 Granophyric texture in granophyre under cross-polarizedlight. Note somewhat altered euhedral plagioclase at center ofsprays of micrographic quartz and alkali feldspar. The suffix -phyric implies a porphyritic texture in which the fine-grainedintergrowth surrounds a phenocryst.
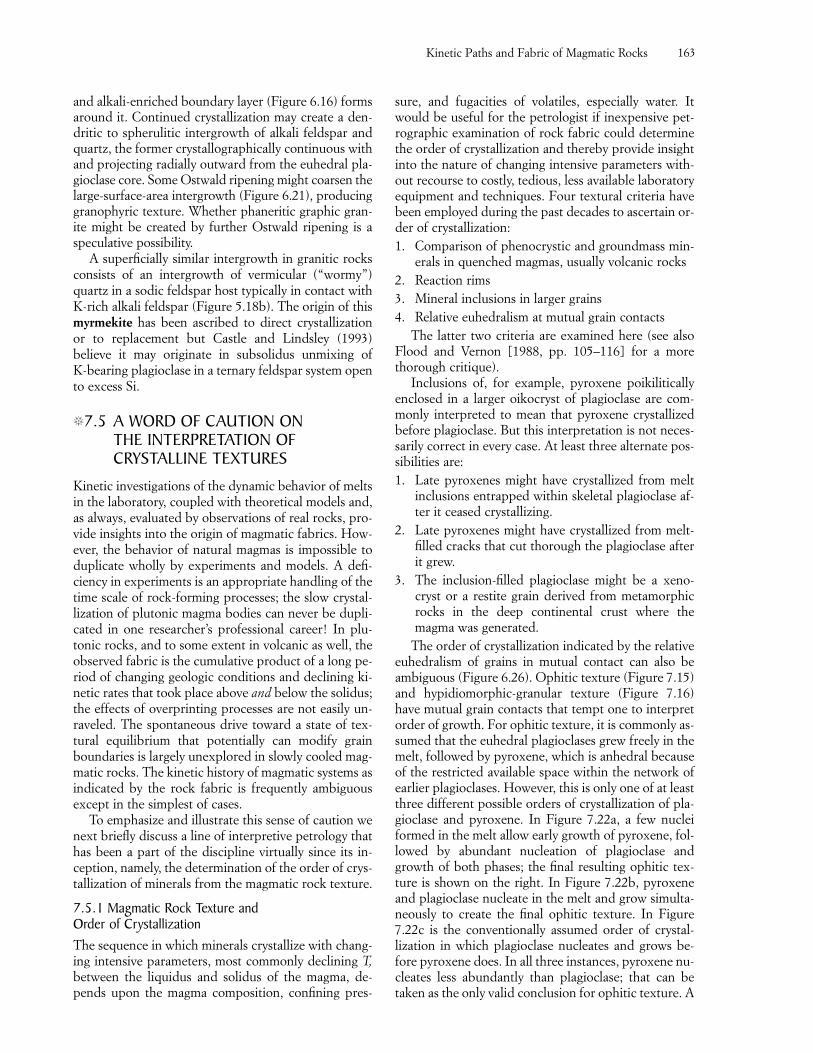
sure, and fugacities of volatiles, especially water. Itwould be useful for the petrologist if inexpensive pet-rographic examination of rock fabric could determinethe order of crystallization and thereby provide insightinto the nature of changing intensive parameters with-out recourse to costly, tedious, less available laboratoryequipment and techniques. Four textural criteria havebeen employed during the past decades to ascertain or-der of crystallization:1. Comparison of phenocrystic and groundmass min-
erals in quenched magmas, usually volcanic rocks2. Reaction rims3. Mineral inclusions in larger grains4. Relative euhedralism at mutual grain contacts
The latter two criteria are examined here (see alsoFlood and Vernon [1988, pp. 105–116] for a morethorough critique).
Inclusions of, for example, pyroxene poikiliticallyenclosed in a larger oikocryst of plagioclase are com-monly interpreted to mean that pyroxene crystallizedbefore plagioclase. But this interpretation is not neces-sarily correct in every case. At least three alternate pos-sibilities are:1. Late pyroxenes might have crystallized from melt
inclusions entrapped within skeletal plagioclase af-ter it ceased crystallizing.
2. Late pyroxenes might have crystallized from melt-filled cracks that cut thorough the plagioclase afterit grew.
3. The inclusion-filled plagioclase might be a xeno-cryst or a restite grain derived from metamorphicrocks in the deep continental crust where themagma was generated.
The order of crystallization indicated by the relativeeuhedralism of grains in mutual contact can also beambiguous (Figure 6.26). Ophitic texture (Figure 7.15)and hypidiomorphic-granular texture (Figure 7.16)have mutual grain contacts that tempt one to interpretorder of growth. For ophitic texture, it is commonly as-sumed that the euhedral plagioclases grew freely in themelt, followed by pyroxene, which is anhedral becauseof the restricted available space within the network ofearlier plagioclases. However, this is only one of at leastthree different possible orders of crystallization of pla-gioclase and pyroxene. In Figure 7.22a, a few nucleiformed in the melt allow early growth of pyroxene, fol-lowed by abundant nucleation of plagioclase andgrowth of both phases; the final resulting ophitic tex-ture is shown on the right. In Figure 7.22b, pyroxeneand plagioclase nucleate in the melt and grow simulta-neously to create the final ophitic texture. In Figure7.22c is the conventionally assumed order of crystal-lization in which plagioclase nucleates and grows be-fore pyroxene does. In all three instances, pyroxene nu-cleates less abundantly than plagioclase; that can betaken as the only valid conclusion for ophitic texture. A
and alkali-enriched boundary layer (Figure 6.16) formsaround it. Continued crystallization may create a den-dritic to spherulitic intergrowth of alkali feldspar andquartz, the former crystallographically continuous withand projecting radially outward from the euhedral pla-gioclase core. Some Ostwald ripening might coarsen thelarge-surface-area intergrowth (Figure 6.21), producinggranophyric texture. Whether phaneritic graphic gran-ite might be created by further Ostwald ripening is aspeculative possibility.
A superficially similar intergrowth in granitic rocksconsists of an intergrowth of vermicular (“wormy”)quartz in a sodic feldspar host typically in contact withK-rich alkali feldspar (Figure 5.18b). The origin of thismyrmekite has been ascribed to direct crystallizationor to replacement but Castle and Lindsley (1993) believe it may originate in subsolidus unmixing of K-bearing plagioclase in a ternary feldspar system opento excess Si.
�7.5 A WORD OF CAUTION ON THE INTERPRETATION OF CRYSTALLINE TEXTURES
Kinetic investigations of the dynamic behavior of meltsin the laboratory, coupled with theoretical models and,as always, evaluated by observations of real rocks, pro-vide insights into the origin of magmatic fabrics. How-ever, the behavior of natural magmas is impossible toduplicate wholly by experiments and models. A defi-ciency in experiments is an appropriate handling of thetime scale of rock-forming processes; the slow crystal-lization of plutonic magma bodies can never be dupli-cated in one researcher’s professional career! In plu-tonic rocks, and to some extent in volcanic as well, theobserved fabric is the cumulative product of a long pe-riod of changing geologic conditions and declining ki-netic rates that took place above and below the solidus;the effects of overprinting processes are not easily un-raveled. The spontaneous drive toward a state of tex-tural equilibrium that potentially can modify grainboundaries is largely unexplored in slowly cooled mag-matic rocks. The kinetic history of magmatic systems asindicated by the rock fabric is frequently ambiguousexcept in the simplest of cases.
To emphasize and illustrate this sense of caution wenext briefly discuss a line of interpretive petrology thathas been a part of the discipline virtually since its in-ception, namely, the determination of the order of crys-tallization of minerals from the magmatic rock texture.
7.5.1 Magmatic Rock Texture and Order of CrystallizationThe sequence in which minerals crystallize with chang-ing intensive parameters, most commonly declining T,between the liquidus and solidus of the magma, de-pends upon the magma composition, confining pres-
Kinetic Paths and Fabric of Magmatic Rocks 163
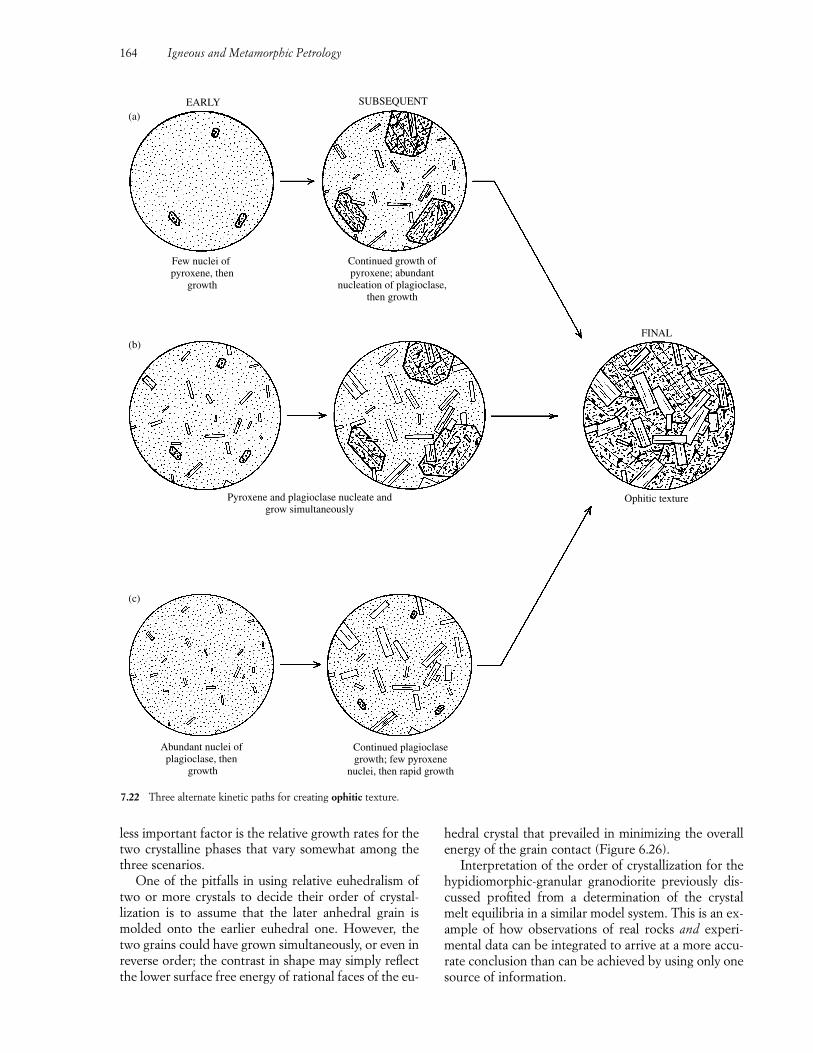
less important factor is the relative growth rates for thetwo crystalline phases that vary somewhat among thethree scenarios.
One of the pitfalls in using relative euhedralism oftwo or more crystals to decide their order of crystal-lization is to assume that the later anhedral grain ismolded onto the earlier euhedral one. However, thetwo grains could have grown simultaneously, or even inreverse order; the contrast in shape may simply reflectthe lower surface free energy of rational faces of the eu-
164 Igneous and Metamorphic Petrology
hedral crystal that prevailed in minimizing the overallenergy of the grain contact (Figure 6.26).
Interpretation of the order of crystallization for thehypidiomorphic-granular granodiorite previously dis-cussed profited from a determination of the crystalmelt equilibria in a similar model system. This is an ex-ample of how observations of real rocks and experi-mental data can be integrated to arrive at a more accu-rate conclusion than can be achieved by using only onesource of information.
Pyroxene and plagioclase nucleate andgrow simultaneously
FINAL
Ophitic texture
Few nuclei of pyroxene, then
growth
Continued growth ofpyroxene; abundant
nucleation of plagioclase,then growth
EARLY SUBSEQUENT
(a)
(b)
Abundant nuclei of plagioclase, then
growth
Continued plagioclasegrowth; few pyroxene
nuclei, then rapid growth
(c)
7.22 Three alternate kinetic paths for creating ophitic texture.
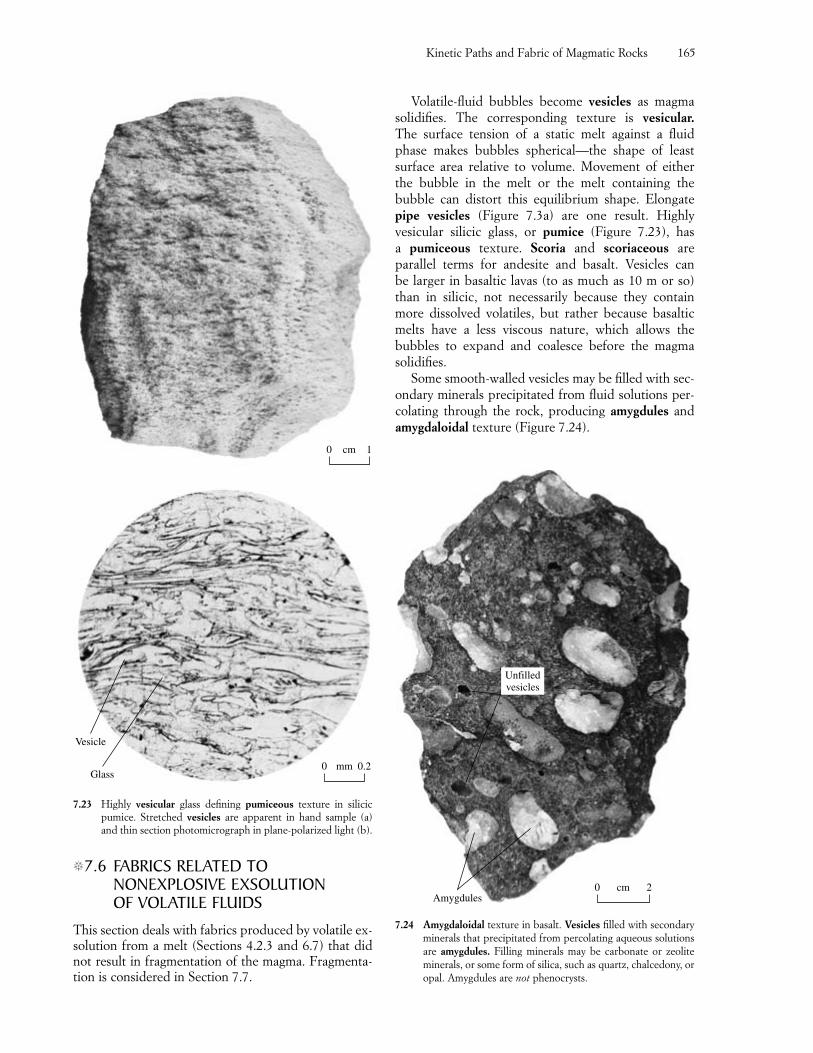
Kinetic Paths and Fabric of Magmatic Rocks 165
�7.6 FABRICS RELATED TONONEXPLOSIVE EXSOLUTION OF VOLATILE FLUIDS
This section deals with fabrics produced by volatile ex-solution from a melt (Sections 4.2.3 and 6.7) that didnot result in fragmentation of the magma. Fragmenta-tion is considered in Section 7.7.
Volatile-fluid bubbles become vesicles as magmasolidifies. The corresponding texture is vesicular.The surface tension of a static melt against a fluidphase makes bubbles spherical—the shape of least surface area relative to volume. Movement of eitherthe bubble in the melt or the melt containing the bubble can distort this equilibrium shape. Elongatepipe vesicles (Figure 7.3a) are one result. Highly vesicular silicic glass, or pumice (Figure 7.23), has a pumiceous texture. Scoria and scoriaceous are parallel terms for andesite and basalt. Vesicles can be larger in basaltic lavas (to as much as 10 m or so)than in silicic, not necessarily because they containmore dissolved volatiles, but rather because basalticmelts have a less viscous nature, which allows the bubbles to expand and coalesce before the magma solidifies.
Some smooth-walled vesicles may be filled with sec-ondary minerals precipitated from fluid solutions per-colating through the rock, producing amygdules andamygdaloidal texture (Figure 7.24).
10 cm
0.20 mmGlass
Vesicle
7.23 Highly vesicular glass defining pumiceous texture in silicicpumice. Stretched vesicles are apparent in hand sample (a)and thin section photomicrograph in plane-polarized light (b).
0 2cmAmygdules
Unfilledvesicles
7.24 Amygdaloidal texture in basalt. Vesicles filled with secondaryminerals that precipitated from percolating aqueous solutionsare amygdules. Filling minerals may be carbonate or zeoliteminerals, or some form of silica, such as quartz, chalcedony, oropal. Amygdules are not phenocrysts.
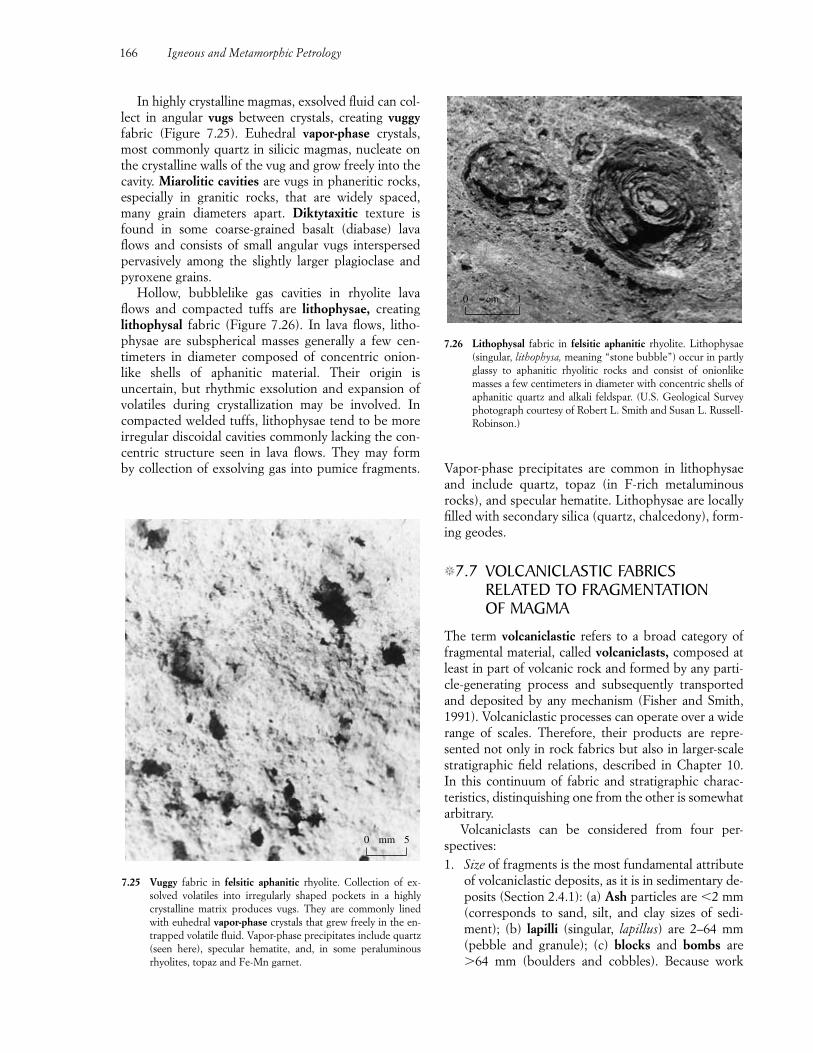
166 Igneous and Metamorphic Petrology
Vapor-phase precipitates are common in lithophysaeand include quartz, topaz (in F-rich metaluminousrocks), and specular hematite. Lithophysae are locallyfilled with secondary silica (quartz, chalcedony), form-ing geodes.
�7.7 VOLCANICLASTIC FABRICSRELATED TO FRAGMENTATION OF MAGMA
The term volcaniclastic refers to a broad category offragmental material, called volcaniclasts, composed atleast in part of volcanic rock and formed by any parti-cle-generating process and subsequently transportedand deposited by any mechanism (Fisher and Smith,1991). Volcaniclastic processes can operate over a widerange of scales. Therefore, their products are repre-sented not only in rock fabrics but also in larger-scalestratigraphic field relations, described in Chapter 10.In this continuum of fabric and stratigraphic charac-teristics, distinquishing one from the other is somewhatarbitrary.
Volcaniclasts can be considered from four per-spectives:1. Size of fragments is the most fundamental attribute
of volcaniclastic deposits, as it is in sedimentary de-posits (Section 2.4.1): (a) Ash particles are �2 mm(corresponds to sand, silt, and clay sizes of sedi-ment); (b) lapilli (singular, lapillus) are 2–64 mm(pebble and granule); (c) blocks and bombs are�64 mm (boulders and cobbles). Because work
In highly crystalline magmas, exsolved fluid can col-lect in angular vugs between crystals, creating vuggyfabric (Figure 7.25). Euhedral vapor-phase crystals,most commonly quartz in silicic magmas, nucleate onthe crystalline walls of the vug and grow freely into thecavity. Miarolitic cavities are vugs in phaneritic rocks,especially in granitic rocks, that are widely spaced,many grain diameters apart. Diktytaxitic texture isfound in some coarse-grained basalt (diabase) lavaflows and consists of small angular vugs interspersedpervasively among the slightly larger plagioclase andpyroxene grains.
Hollow, bubblelike gas cavities in rhyolite lavaflows and compacted tuffs are lithophysae, creatinglithophysal fabric (Figure 7.26). In lava flows, litho-physae are subspherical masses generally a few cen-timeters in diameter composed of concentric onion-like shells of aphanitic material. Their origin is uncertain, but rhythmic exsolution and expansion ofvolatiles during crystallization may be involved. Incompacted welded tuffs, lithophysae tend to be moreirregular discoidal cavities commonly lacking the con-centric structure seen in lava flows. They may form by collection of exsolving gas into pumice fragments.
0 mm 5
7.25 Vuggy fabric in felsitic aphanitic rhyolite. Collection of ex-solved volatiles into irregularly shaped pockets in a highlycrystalline matrix produces vugs. They are commonly linedwith euhedral vapor-phase crystals that grew freely in the en-trapped volatile fluid. Vapor-phase precipitates include quartz(seen here), specular hematite, and, in some peraluminous rhyolites, topaz and Fe-Mn garnet.
0 cm 1
7.26 Lithophysal fabric in felsitic aphanitic rhyolite. Lithophysae(singular, lithophysa, meaning “stone bubble”) occur in partlyglassy to aphanitic rhyolitic rocks and consist of onionlikemasses a few centimeters in diameter with concentric shells ofaphanitic quartz and alkali feldspar. (U.S. Geological Surveyphotograph courtesy of Robert L. Smith and Susan L. Russell-Robinson.)
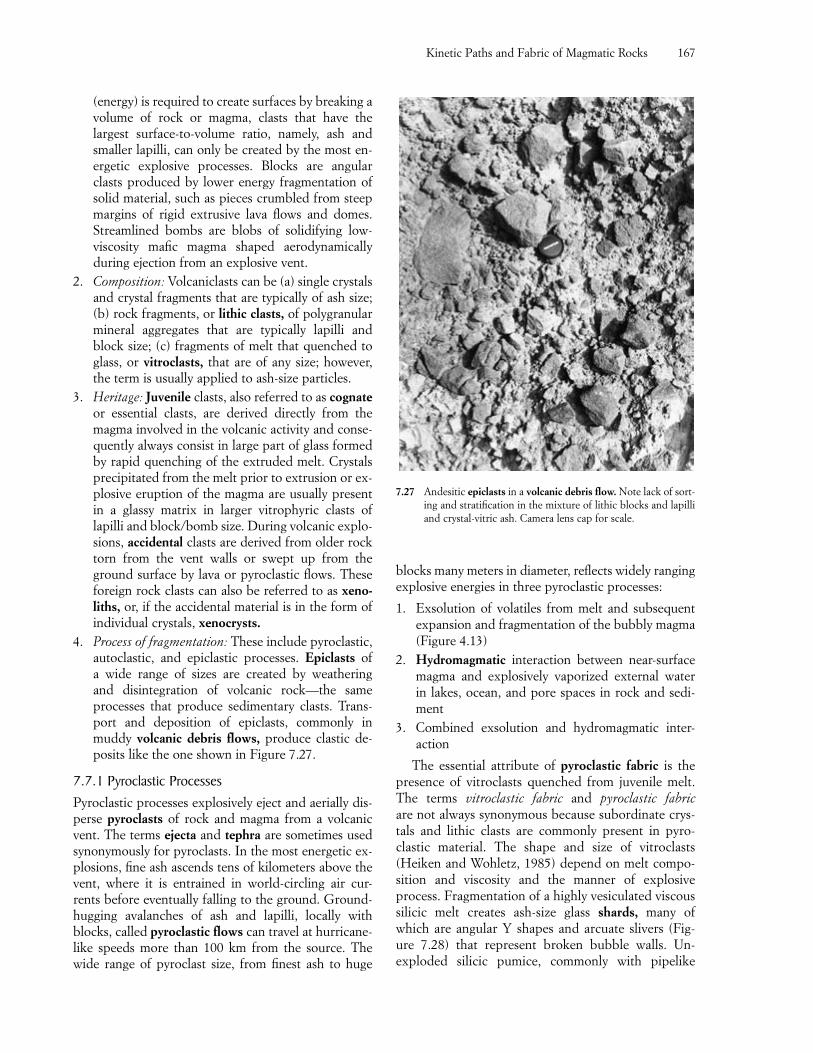
(energy) is required to create surfaces by breaking avolume of rock or magma, clasts that have thelargest surface-to-volume ratio, namely, ash andsmaller lapilli, can only be created by the most en-ergetic explosive processes. Blocks are angularclasts produced by lower energy fragmentation ofsolid material, such as pieces crumbled from steepmargins of rigid extrusive lava flows and domes.Streamlined bombs are blobs of solidifying low-viscosity mafic magma shaped aerodynamicallyduring ejection from an explosive vent.
2. Composition: Volcaniclasts can be (a) single crystalsand crystal fragments that are typically of ash size;(b) rock fragments, or lithic clasts, of polygranularmineral aggregates that are typically lapilli andblock size; (c) fragments of melt that quenched toglass, or vitroclasts, that are of any size; however,the term is usually applied to ash-size particles.
3. Heritage: Juvenile clasts, also referred to as cognateor essential clasts, are derived directly from themagma involved in the volcanic activity and conse-quently always consist in large part of glass formedby rapid quenching of the extruded melt. Crystalsprecipitated from the melt prior to extrusion or ex-plosive eruption of the magma are usually presentin a glassy matrix in larger vitrophyric clasts oflapilli and block/bomb size. During volcanic explo-sions, accidental clasts are derived from older rocktorn from the vent walls or swept up from theground surface by lava or pyroclastic flows. Theseforeign rock clasts can also be referred to as xeno-liths, or, if the accidental material is in the form ofindividual crystals, xenocrysts.
4. Process of fragmentation: These include pyroclastic,autoclastic, and epiclastic processes. Epiclasts of a wide range of sizes are created by weathering and disintegration of volcanic rock—the sameprocesses that produce sedimentary clasts. Trans-port and deposition of epiclasts, commonly inmuddy volcanic debris flows, produce clastic de-posits like the one shown in Figure 7.27.
7.7.1 Pyroclastic ProcessesPyroclastic processes explosively eject and aerially dis-perse pyroclasts of rock and magma from a volcanicvent. The terms ejecta and tephra are sometimes usedsynonymously for pyroclasts. In the most energetic ex-plosions, fine ash ascends tens of kilometers above thevent, where it is entrained in world-circling air cur-rents before eventually falling to the ground. Ground-hugging avalanches of ash and lapilli, locally withblocks, called pyroclastic flows can travel at hurricane-like speeds more than 100 km from the source. Thewide range of pyroclast size, from finest ash to huge
Kinetic Paths and Fabric of Magmatic Rocks 167
7.27 Andesitic epiclasts in a volcanic debris flow. Note lack of sort-ing and stratification in the mixture of lithic blocks and lapilliand crystal-vitric ash. Camera lens cap for scale.
blocks many meters in diameter, reflects widely rangingexplosive energies in three pyroclastic processes:
1. Exsolution of volatiles from melt and subsequentexpansion and fragmentation of the bubbly magma(Figure 4.13)
2. Hydromagmatic interaction between near-surfacemagma and explosively vaporized external water in lakes, ocean, and pore spaces in rock and sedi-ment
3. Combined exsolution and hydromagmatic inter-action
The essential attribute of pyroclastic fabric is thepresence of vitroclasts quenched from juvenile melt.The terms vitroclastic fabric and pyroclastic fabricare not always synonymous because subordinate crys-tals and lithic clasts are commonly present in pyro-clastic material. The shape and size of vitroclasts(Heiken and Wohletz, 1985) depend on melt compo-sition and viscosity and the manner of explosiveprocess. Fragmentation of a highly vesiculated viscoussilicic melt creates ash-size glass shards, many ofwhich are angular Y shapes and arcuate slivers (Fig-ure 7.28) that represent broken bubble walls. Un-exploded silicic pumice, commonly with pipelike
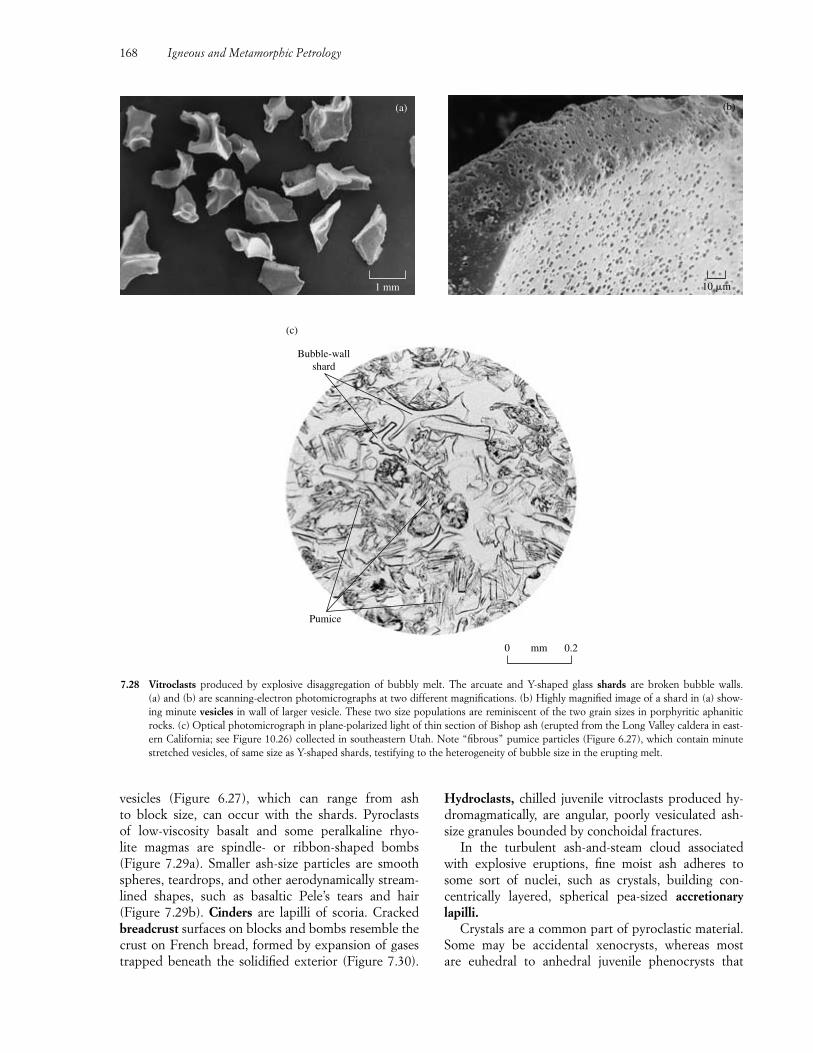
vesicles (Figure 6.27), which can range from ash to block size, can occur with the shards. Pyroclasts of low-viscosity basalt and some peralkaline rhyo-lite magmas are spindle- or ribbon-shaped bombs(Figure 7.29a). Smaller ash-size particles are smoothspheres, teardrops, and other aerodynamically stream-lined shapes, such as basaltic Pele’s tears and hair (Figure 7.29b). Cinders are lapilli of scoria. Crackedbreadcrust surfaces on blocks and bombs resemble thecrust on French bread, formed by expansion of gasestrapped beneath the solidified exterior (Figure 7.30).
Hydroclasts, chilled juvenile vitroclasts produced hy-dromagmatically, are angular, poorly vesiculated ash-size granules bounded by conchoidal fractures.
In the turbulent ash-and-steam cloud associatedwith explosive eruptions, fine moist ash adheres tosome sort of nuclei, such as crystals, building con-centrically layered, spherical pea-sized accretionarylapilli.
Crystals are a common part of pyroclastic material.Some may be accidental xenocrysts, whereas most are euhedral to anhedral juvenile phenocrysts that
168 Igneous and Metamorphic Petrology
(a)
1 mm
7.28 Vitroclasts produced by explosive disaggregation of bubbly melt. The arcuate and Y-shaped glass shards are broken bubble walls. (a) and (b) are scanning-electron photomicrographs at two different magnifications. (b) Highly magnified image of a shard in (a) show-ing minute vesicles in wall of larger vesicle. These two size populations are reminiscent of the two grain sizes in porphyritic aphaniticrocks. (c) Optical photomicrograph in plane-polarized light of thin section of Bishop ash (erupted from the Long Valley caldera in east-ern California; see Figure 10.26) collected in southeastern Utah. Note “fibrous” pumice particles (Figure 6.27), which contain minutestretched vesicles, of same size as Y-shaped shards, testifying to the heterogeneity of bubble size in the erupting melt.
0 0.2mm
Bubble-wallshard
Pumice
(c)
(b)
10 �m
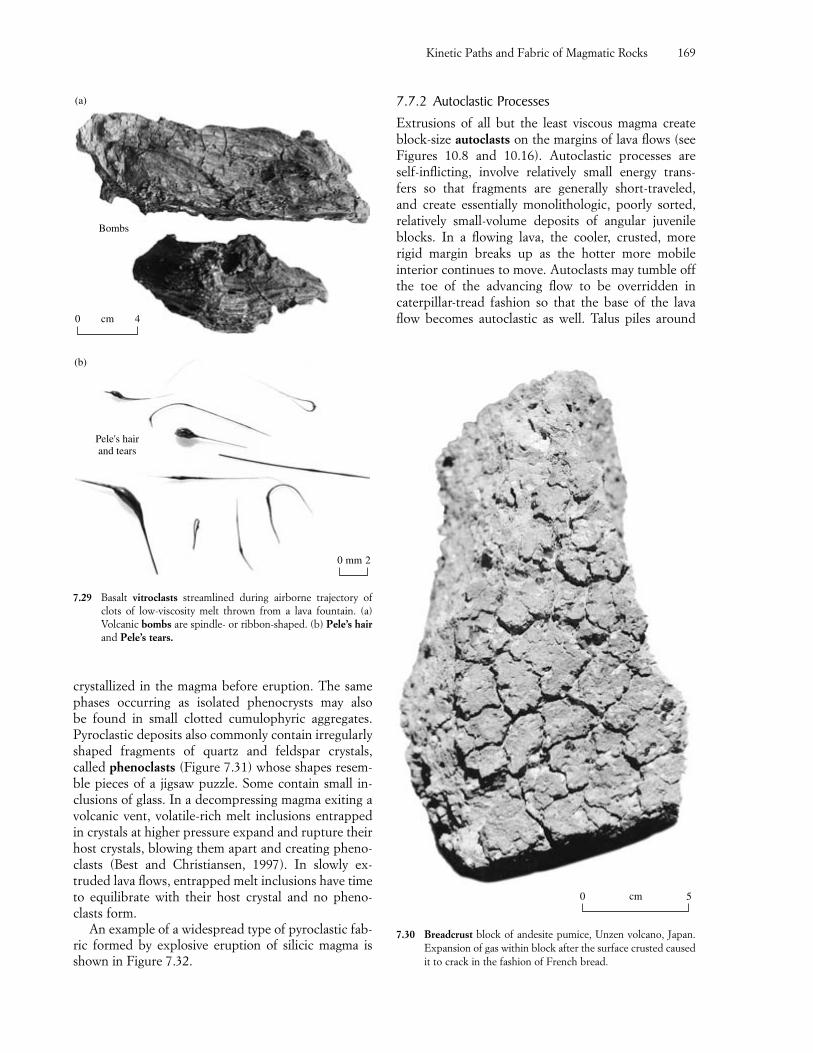
crystallized in the magma before eruption. The samephases occurring as isolated phenocrysts may also be found in small clotted cumulophyric aggregates.Pyroclastic deposits also commonly contain irregularlyshaped fragments of quartz and feldspar crystals,called phenoclasts (Figure 7.31) whose shapes resem-ble pieces of a jigsaw puzzle. Some contain small in-clusions of glass. In a decompressing magma exiting avolcanic vent, volatile-rich melt inclusions entrappedin crystals at higher pressure expand and rupture theirhost crystals, blowing them apart and creating pheno-clasts (Best and Christiansen, 1997). In slowly ex-truded lava flows, entrapped melt inclusions have timeto equilibrate with their host crystal and no pheno-clasts form.
An example of a widespread type of pyroclastic fab-ric formed by explosive eruption of silicic magma isshown in Figure 7.32.
7.7.2 Autoclastic ProcessesExtrusions of all but the least viscous magma createblock-size autoclasts on the margins of lava flows (seeFigures 10.8 and 10.16). Autoclastic processes are self-inflicting, involve relatively small energy trans-fers so that fragments are generally short-traveled, and create essentially monolithologic, poorly sorted,relatively small-volume deposits of angular juvenileblocks. In a flowing lava, the cooler, crusted, morerigid margin breaks up as the hotter more mobile interior continues to move. Autoclasts may tumble offthe toe of the advancing flow to be overridden incaterpillar-tread fashion so that the base of the lavaflow becomes autoclastic as well. Talus piles around
Kinetic Paths and Fabric of Magmatic Rocks 169
(a)
(b)
Bombs
0 4cm
Pele's hairand tears
0 2mm
7.29 Basalt vitroclasts streamlined during airborne trajectory ofclots of low-viscosity melt thrown from a lava fountain. (a)Volcanic bombs are spindle- or ribbon-shaped. (b) Pele’s hairand Pele’s tears.
0 5cm
7.30 Breadcrust block of andesite pumice, Unzen volcano, Japan.Expansion of gas within block after the surface crusted causedit to crack in the fashion of French bread.
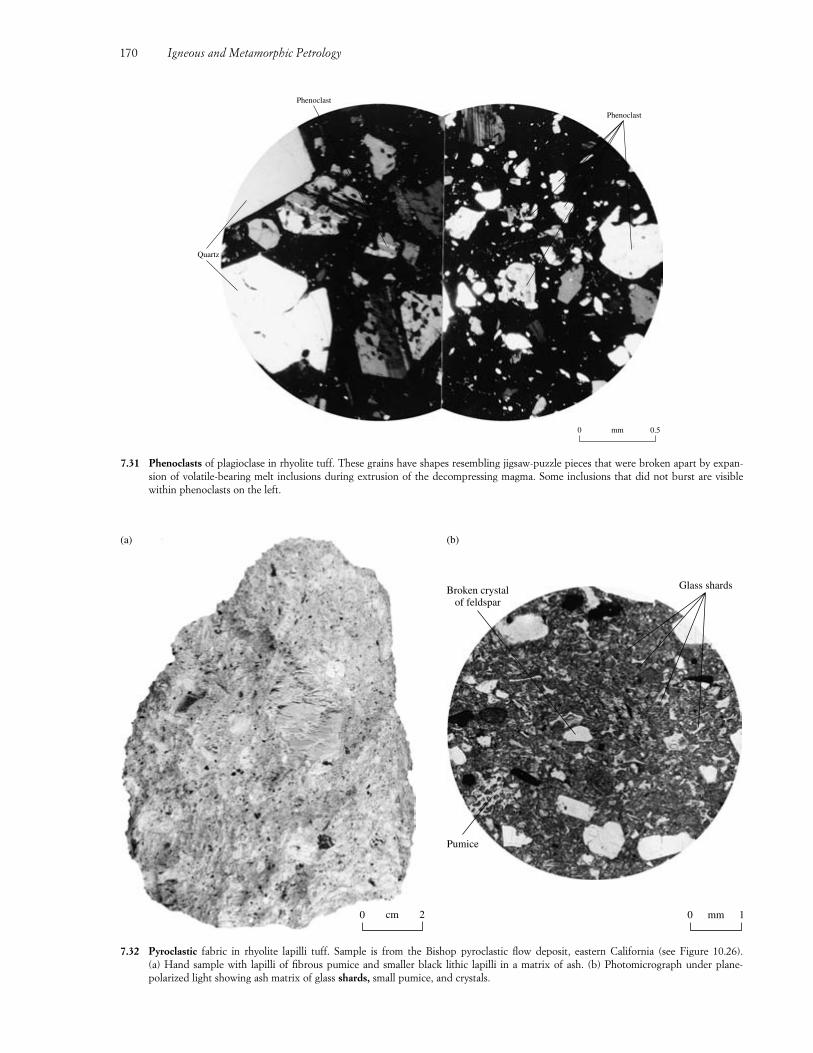
170 Igneous and Metamorphic Petrology
0 0.5mm
Phenoclast
Phenoclast
Quartz
7.31 Phenoclasts of plagioclase in rhyolite tuff. These grains have shapes resembling jigsaw-puzzle pieces that were broken apart by expan-sion of volatile-bearing melt inclusions during extrusion of the decompressing magma. Some inclusions that did not burst are visiblewithin phenoclasts on the left.
(a)
0 2cm 0 1mm
(b)
Glass shards
Pumice
Broken crystalof feldspar
7.32 Pyroclastic fabric in rhyolite lapilli tuff. Sample is from the Bishop pyroclastic flow deposit, eastern California (see Figure 10.26). (a) Hand sample with lapilli of fibrous pumice and smaller black lithic lapilli in a matrix of ash. (b) Photomicrograph under plane-polarized light showing ash matrix of glass shards, small pumice, and crystals.
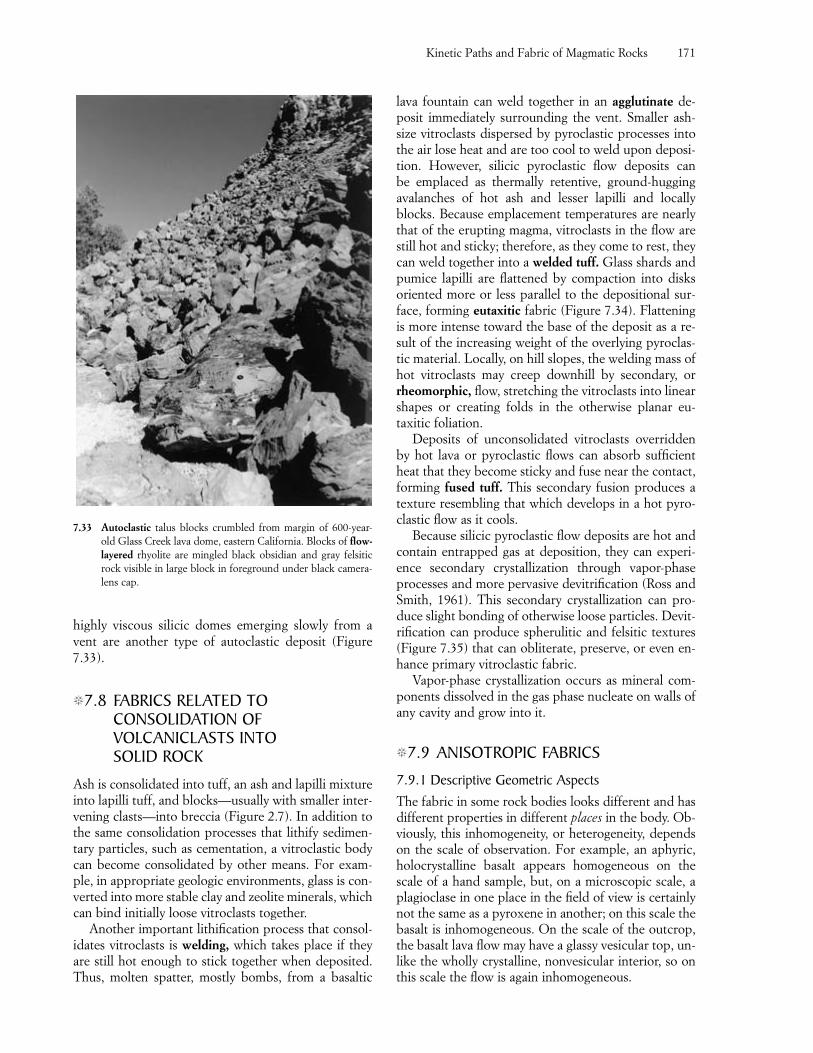
highly viscous silicic domes emerging slowly from avent are another type of autoclastic deposit (Figure7.33).
�7.8 FABRICS RELATED TOCONSOLIDATION OFVOLCANICLASTS INTO SOLID ROCK
Ash is consolidated into tuff, an ash and lapilli mixtureinto lapilli tuff, and blocks—usually with smaller inter-vening clasts—into breccia (Figure 2.7). In addition tothe same consolidation processes that lithify sedimen-tary particles, such as cementation, a vitroclastic bodycan become consolidated by other means. For exam-ple, in appropriate geologic environments, glass is con-verted into more stable clay and zeolite minerals, whichcan bind initially loose vitroclasts together.
Another important lithification process that consol-idates vitroclasts is welding, which takes place if theyare still hot enough to stick together when deposited.Thus, molten spatter, mostly bombs, from a basaltic
lava fountain can weld together in an agglutinate de-posit immediately surrounding the vent. Smaller ash-size vitroclasts dispersed by pyroclastic processes intothe air lose heat and are too cool to weld upon deposi-tion. However, silicic pyroclastic flow deposits can be emplaced as thermally retentive, ground-huggingavalanches of hot ash and lesser lapilli and locallyblocks. Because emplacement temperatures are nearlythat of the erupting magma, vitroclasts in the flow arestill hot and sticky; therefore, as they come to rest, theycan weld together into a welded tuff. Glass shards andpumice lapilli are flattened by compaction into disksoriented more or less parallel to the depositional sur-face, forming eutaxitic fabric (Figure 7.34). Flatteningis more intense toward the base of the deposit as a re-sult of the increasing weight of the overlying pyroclas-tic material. Locally, on hill slopes, the welding mass ofhot vitroclasts may creep downhill by secondary, orrheomorphic, flow, stretching the vitroclasts into linearshapes or creating folds in the otherwise planar eu-taxitic foliation.
Deposits of unconsolidated vitroclasts overriddenby hot lava or pyroclastic flows can absorb sufficientheat that they become sticky and fuse near the contact,forming fused tuff. This secondary fusion produces atexture resembling that which develops in a hot pyro-clastic flow as it cools.
Because silicic pyroclastic flow deposits are hot andcontain entrapped gas at deposition, they can experi-ence secondary crystallization through vapor-phaseprocesses and more pervasive devitrification (Ross andSmith, 1961). This secondary crystallization can pro-duce slight bonding of otherwise loose particles. Devit-rification can produce spherulitic and felsitic textures(Figure 7.35) that can obliterate, preserve, or even en-hance primary vitroclastic fabric.
Vapor-phase crystallization occurs as mineral com-ponents dissolved in the gas phase nucleate on walls ofany cavity and grow into it.
�7.9 ANISOTROPIC FABRICS
7.9.1 Descriptive Geometric AspectsThe fabric in some rock bodies looks different and hasdifferent properties in different places in the body. Ob-viously, this inhomogeneity, or heterogeneity, dependson the scale of observation. For example, an aphyric,holocrystalline basalt appears homogeneous on thescale of a hand sample, but, on a microscopic scale, aplagioclase in one place in the field of view is certainlynot the same as a pyroxene in another; on this scale thebasalt is inhomogeneous. On the scale of the outcrop,the basalt lava flow may have a glassy vesicular top, un-like the wholly crystalline, nonvesicular interior, so onthis scale the flow is again inhomogeneous.
Kinetic Paths and Fabric of Magmatic Rocks 171
7.33 Autoclastic talus blocks crumbled from margin of 600-year-old Glass Creek lava dome, eastern California. Blocks of flow-layered rhyolite are mingled black obsidian and gray felsiticrock visible in large block in foreground under black camera-lens cap.
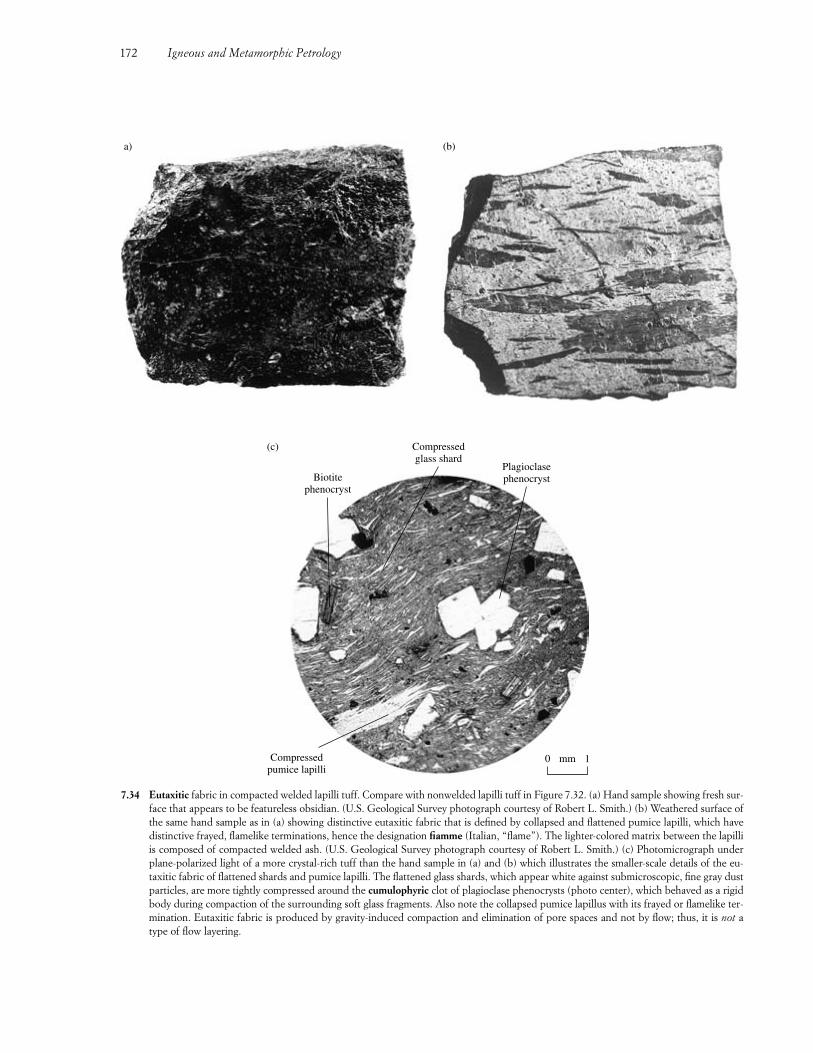
172 Igneous and Metamorphic Petrology
a) (b)
7.34 Eutaxitic fabric in compacted welded lapilli tuff. Compare with nonwelded lapilli tuff in Figure 7.32. (a) Hand sample showing fresh sur-face that appears to be featureless obsidian. (U.S. Geological Survey photograph courtesy of Robert L. Smith.) (b) Weathered surface ofthe same hand sample as in (a) showing distinctive eutaxitic fabric that is defined by collapsed and flattened pumice lapilli, which havedistinctive frayed, flamelike terminations, hence the designation fiamme (Italian, “flame”). The lighter-colored matrix between the lapilliis composed of compacted welded ash. (U.S. Geological Survey photograph courtesy of Robert L. Smith.) (c) Photomicrograph underplane-polarized light of a more crystal-rich tuff than the hand sample in (a) and (b) which illustrates the smaller-scale details of the eu-taxitic fabric of flattened shards and pumice lapilli. The flattened glass shards, which appear white against submicroscopic, fine gray dustparticles, are more tightly compressed around the cumulophyric clot of plagioclase phenocrysts (photo center), which behaved as a rigidbody during compaction of the surrounding soft glass fragments. Also note the collapsed pumice lapillus with its frayed or flamelike ter-mination. Eutaxitic fabric is produced by gravity-induced compaction and elimination of pore spaces and not by flow; thus, it is not atype of flow layering.
0 1mm
Biotitephenocryst
Compressedglass shard
Plagioclasephenocryst
Compressedpumice lapilli
(c)
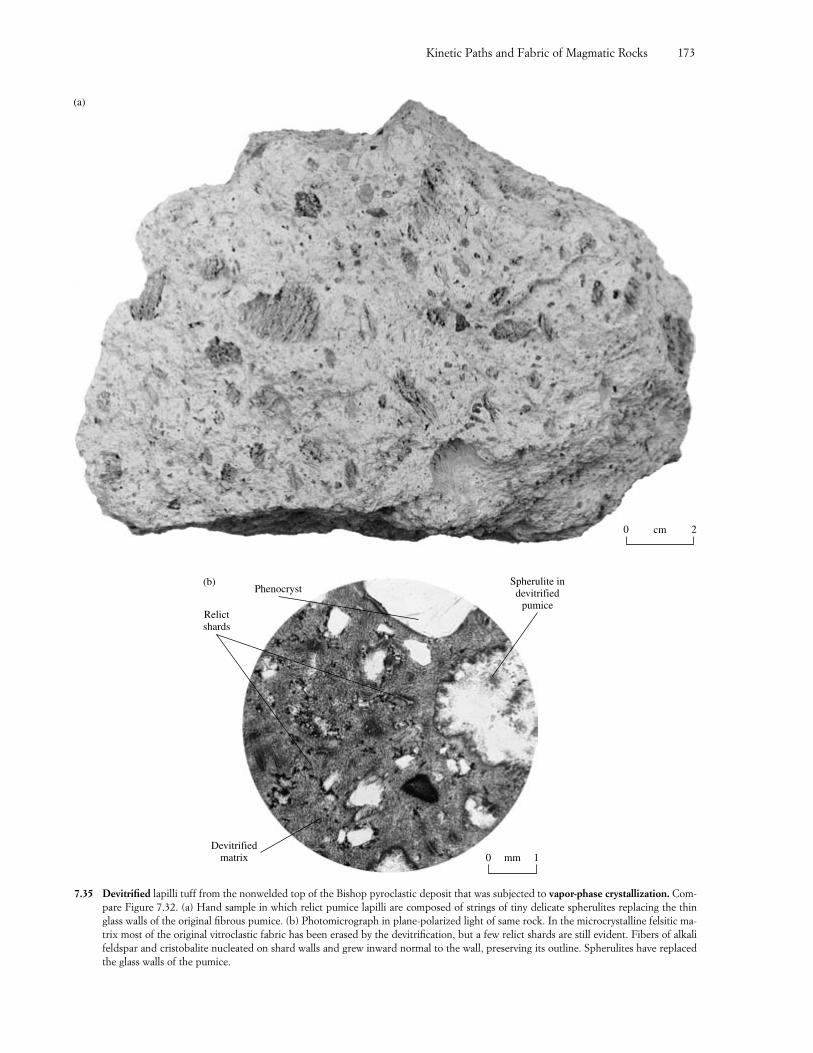
Kinetic Paths and Fabric of Magmatic Rocks 173
(a)
0 2cm
7.35 Devitrified lapilli tuff from the nonwelded top of the Bishop pyroclastic deposit that was subjected to vapor-phase crystallization. Com-pare Figure 7.32. (a) Hand sample in which relict pumice lapilli are composed of strings of tiny delicate spherulites replacing the thinglass walls of the original fibrous pumice. (b) Photomicrograph in plane-polarized light of same rock. In the microcrystalline felsitic ma-trix most of the original vitroclastic fabric has been erased by the devitrification, but a few relict shards are still evident. Fibers of alkalifeldspar and cristobalite nucleated on shard walls and grew inward normal to the wall, preserving its outline. Spherulites have replacedthe glass walls of the pumice.
Spherulite indevitrified
pumice
Phenocryst
Relictshards
Devitrifiedmatrix
(b)
0 1mm
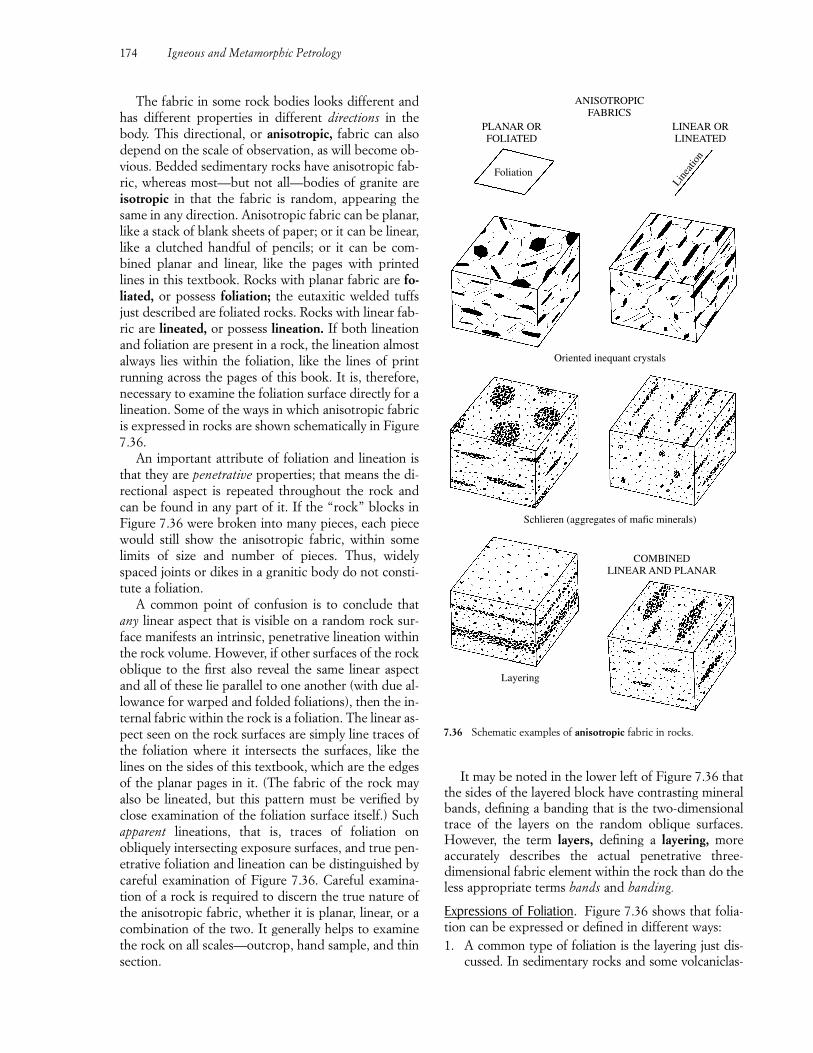
The fabric in some rock bodies looks different andhas different properties in different directions in thebody. This directional, or anisotropic, fabric can alsodepend on the scale of observation, as will become ob-vious. Bedded sedimentary rocks have anisotropic fab-ric, whereas most—but not all—bodies of granite areisotropic in that the fabric is random, appearing thesame in any direction. Anisotropic fabric can be planar,like a stack of blank sheets of paper; or it can be linear,like a clutched handful of pencils; or it can be com-bined planar and linear, like the pages with printedlines in this textbook. Rocks with planar fabric are fo-liated, or possess foliation; the eutaxitic welded tuffsjust described are foliated rocks. Rocks with linear fab-ric are lineated, or possess lineation. If both lineationand foliation are present in a rock, the lineation almostalways lies within the foliation, like the lines of printrunning across the pages of this book. It is, therefore,necessary to examine the foliation surface directly for alineation. Some of the ways in which anisotropic fabricis expressed in rocks are shown schematically in Figure7.36.
An important attribute of foliation and lineation isthat they are penetrative properties; that means the di-rectional aspect is repeated throughout the rock andcan be found in any part of it. If the “rock” blocks inFigure 7.36 were broken into many pieces, each piecewould still show the anisotropic fabric, within somelimits of size and number of pieces. Thus, widelyspaced joints or dikes in a granitic body do not consti-tute a foliation.
A common point of confusion is to conclude thatany linear aspect that is visible on a random rock sur-face manifests an intrinsic, penetrative lineation withinthe rock volume. However, if other surfaces of the rockoblique to the first also reveal the same linear aspectand all of these lie parallel to one another (with due al-lowance for warped and folded foliations), then the in-ternal fabric within the rock is a foliation. The linear as-pect seen on the rock surfaces are simply line traces ofthe foliation where it intersects the surfaces, like thelines on the sides of this textbook, which are the edgesof the planar pages in it. (The fabric of the rock mayalso be lineated, but this pattern must be verified byclose examination of the foliation surface itself.) Suchapparent lineations, that is, traces of foliation onobliquely intersecting exposure surfaces, and true pen-etrative foliation and lineation can be distinguished bycareful examination of Figure 7.36. Careful examina-tion of a rock is required to discern the true nature ofthe anisotropic fabric, whether it is planar, linear, or acombination of the two. It generally helps to examinethe rock on all scales—outcrop, hand sample, and thinsection.
It may be noted in the lower left of Figure 7.36 thatthe sides of the layered block have contrasting mineralbands, defining a banding that is the two-dimensionaltrace of the layers on the random oblique surfaces.However, the term layers, defining a layering, more accurately describes the actual penetrative three-dimensional fabric element within the rock than do theless appropriate terms bands and banding.
Expressions of Foliation. Figure 7.36 shows that folia-tion can be expressed or defined in different ways:1. A common type of foliation is the layering just dis-
cussed. In sedimentary rocks and some volcaniclas-
174 Igneous and Metamorphic Petrology
Foliation
Linea
tion
LINEAR ORLINEATED
PLANAR ORFOLIATED
ANISOTROPICFABRICS
Oriented inequant crystals
Schlieren (aggregates of mafic minerals)
Layering
COMBINEDLINEAR AND PLANAR
7.36 Schematic examples of anisotropic fabric in rocks.
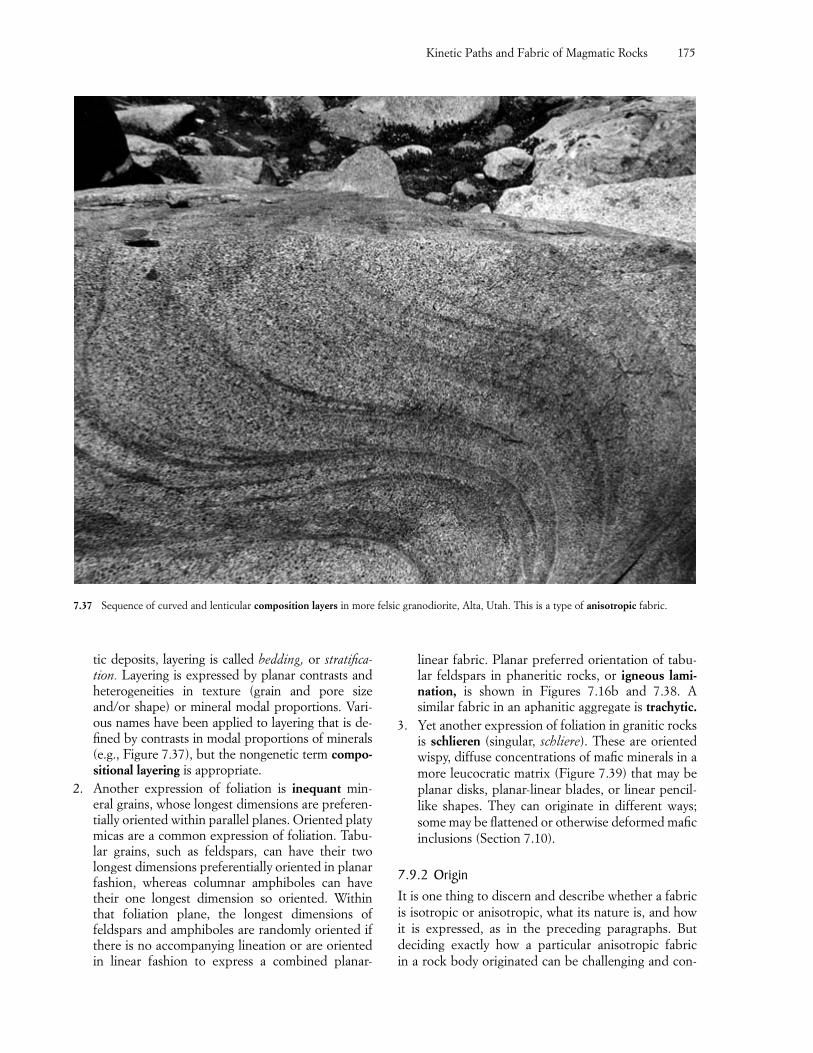
Kinetic Paths and Fabric of Magmatic Rocks 175
7.37 Sequence of curved and lenticular composition layers in more felsic granodiorite, Alta, Utah. This is a type of anisotropic fabric.
tic deposits, layering is called bedding, or stratifica-tion. Layering is expressed by planar contrasts andheterogeneities in texture (grain and pore sizeand/or shape) or mineral modal proportions. Vari-ous names have been applied to layering that is de-fined by contrasts in modal proportions of minerals(e.g., Figure 7.37), but the nongenetic term compo-sitional layering is appropriate.
2. Another expression of foliation is inequant min-eral grains, whose longest dimensions are preferen-tially oriented within parallel planes. Oriented platymicas are a common expression of foliation. Tabu-lar grains, such as feldspars, can have their twolongest dimensions preferentially oriented in planarfashion, whereas columnar amphiboles can havetheir one longest dimension so oriented. Withinthat foliation plane, the longest dimensions offeldspars and amphiboles are randomly oriented ifthere is no accompanying lineation or are orientedin linear fashion to express a combined planar-
linear fabric. Planar preferred orientation of tabu-lar feldspars in phaneritic rocks, or igneous lami-nation, is shown in Figures 7.16b and 7.38. A similar fabric in an aphanitic aggregate is trachytic.
3. Yet another expression of foliation in granitic rocksis schlieren (singular, schliere). These are orientedwispy, diffuse concentrations of mafic minerals in a more leucocratic matrix (Figure 7.39) that may beplanar disks, planar-linear blades, or linear pencil-like shapes. They can originate in different ways;some may be flattened or otherwise deformed maficinclusions (Section 7.10).
7.9.2 OriginIt is one thing to discern and describe whether a fabricis isotropic or anisotropic, what its nature is, and howit is expressed, as in the preceding paragraphs. But deciding exactly how a particular anisotropic fabric in a rock body originated can be challenging and con-
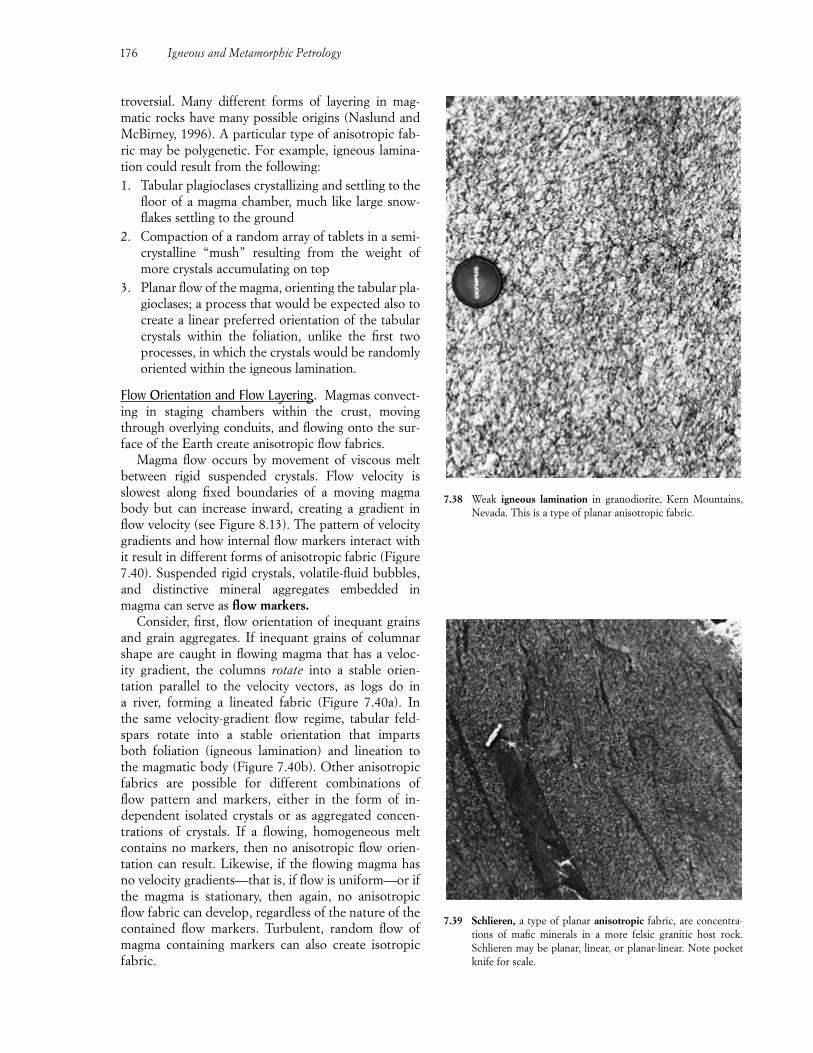
troversial. Many different forms of layering in mag-matic rocks have many possible origins (Naslund andMcBirney, 1996). A particular type of anisotropic fab-ric may be polygenetic. For example, igneous lamina-tion could result from the following:1. Tabular plagioclases crystallizing and settling to the
floor of a magma chamber, much like large snow-flakes settling to the ground
2. Compaction of a random array of tablets in a semi-crystalline “mush” resulting from the weight ofmore crystals accumulating on top
3. Planar flow of the magma, orienting the tabular pla-gioclases; a process that would be expected also tocreate a linear preferred orientation of the tabularcrystals within the foliation, unlike the first twoprocesses, in which the crystals would be randomlyoriented within the igneous lamination.
Flow Orientation and Flow Layering. Magmas convect-ing in staging chambers within the crust, movingthrough overlying conduits, and flowing onto the sur-face of the Earth create anisotropic flow fabrics.
Magma flow occurs by movement of viscous meltbetween rigid suspended crystals. Flow velocity isslowest along fixed boundaries of a moving magmabody but can increase inward, creating a gradient inflow velocity (see Figure 8.13). The pattern of velocitygradients and how internal flow markers interact withit result in different forms of anisotropic fabric (Figure7.40). Suspended rigid crystals, volatile-fluid bubbles,and distinctive mineral aggregates embedded inmagma can serve as flow markers.
Consider, first, flow orientation of inequant grainsand grain aggregates. If inequant grains of columnarshape are caught in flowing magma that has a veloc-ity gradient, the columns rotate into a stable orien-tation parallel to the velocity vectors, as logs do in a river, forming a lineated fabric (Figure 7.40a). In the same velocity-gradient flow regime, tabular feld-spars rotate into a stable orientation that imparts both foliation (igneous lamination) and lineation tothe magmatic body (Figure 7.40b). Other anisotropicfabrics are possible for different combinations of flow pattern and markers, either in the form of in-dependent isolated crystals or as aggregated concen-trations of crystals. If a flowing, homogeneous meltcontains no markers, then no anisotropic flow orien-tation can result. Likewise, if the flowing magma hasno velocity gradients—that is, if flow is uniform—or ifthe magma is stationary, then again, no anisotropicflow fabric can develop, regardless of the nature of thecontained flow markers. Turbulent, random flow ofmagma containing markers can also create isotropicfabric.
176 Igneous and Metamorphic Petrology
7.38 Weak igneous lamination in granodiorite, Kern Mountains,Nevada. This is a type of planar anisotropic fabric.
7.39 Schlieren, a type of planar anisotropic fabric, are concentra-tions of mafic minerals in a more felsic granitic host rock.Schlieren may be planar, linear, or planar-linear. Note pocketknife for scale.
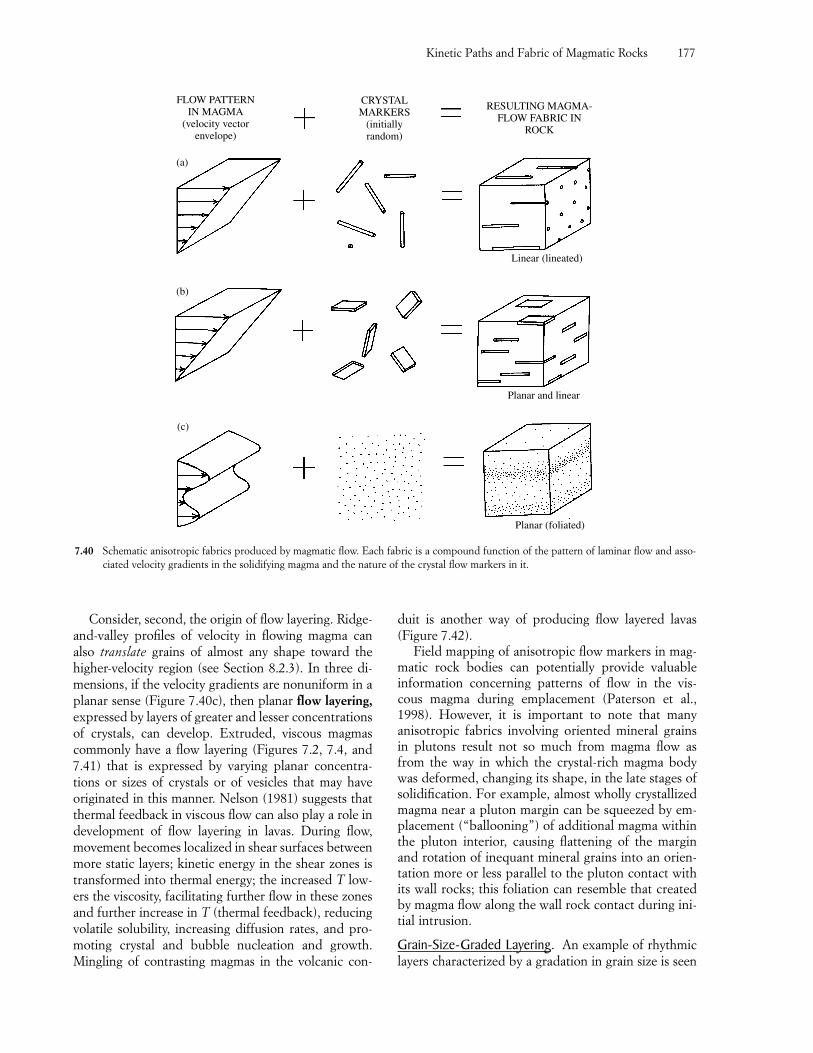
Kinetic Paths and Fabric of Magmatic Rocks 177
Consider, second, the origin of flow layering. Ridge-and-valley profiles of velocity in flowing magma canalso translate grains of almost any shape toward thehigher-velocity region (see Section 8.2.3). In three di-mensions, if the velocity gradients are nonuniform in aplanar sense (Figure 7.40c), then planar flow layering,expressed by layers of greater and lesser concentrationsof crystals, can develop. Extruded, viscous magmascommonly have a flow layering (Figures 7.2, 7.4, and7.41) that is expressed by varying planar concentra-tions or sizes of crystals or of vesicles that may haveoriginated in this manner. Nelson (1981) suggests thatthermal feedback in viscous flow can also play a role indevelopment of flow layering in lavas. During flow,movement becomes localized in shear surfaces betweenmore static layers; kinetic energy in the shear zones istransformed into thermal energy; the increased T low-ers the viscosity, facilitating further flow in these zonesand further increase in T (thermal feedback), reducingvolatile solubility, increasing diffusion rates, and pro-moting crystal and bubble nucleation and growth.Mingling of contrasting magmas in the volcanic con-
duit is another way of producing flow layered lavas(Figure 7.42).
Field mapping of anisotropic flow markers in mag-matic rock bodies can potentially provide valuable information concerning patterns of flow in the vis-cous magma during emplacement (Paterson et al.,1998). However, it is important to note that manyanisotropic fabrics involving oriented mineral grains in plutons result not so much from magma flow asfrom the way in which the crystal-rich magma bodywas deformed, changing its shape, in the late stages ofsolidification. For example, almost wholly crystallizedmagma near a pluton margin can be squeezed by em-placement (“ballooning”) of additional magma withinthe pluton interior, causing flattening of the marginand rotation of inequant mineral grains into an orien-tation more or less parallel to the pluton contact withits wall rocks; this foliation can resemble that createdby magma flow along the wall rock contact during ini-tial intrusion.
Grain-Size-Graded Layering. An example of rhythmiclayers characterized by a gradation in grain size is seen
FLOW PATTERNIN MAGMA
(velocity vectorenvelope)
CRYSTALMARKERS
(initiallyrandom)
RESULTING MAGMA-FLOW FABRIC IN
ROCK
Linear (lineated)
Planar and linear
Planar (foliated)
(a)
(b)
(c)
7.40 Schematic anisotropic fabrics produced by magmatic flow. Each fabric is a compound function of the pattern of laminar flow and asso-ciated velocity gradients in the solidifying magma and the nature of the crystal flow markers in it.
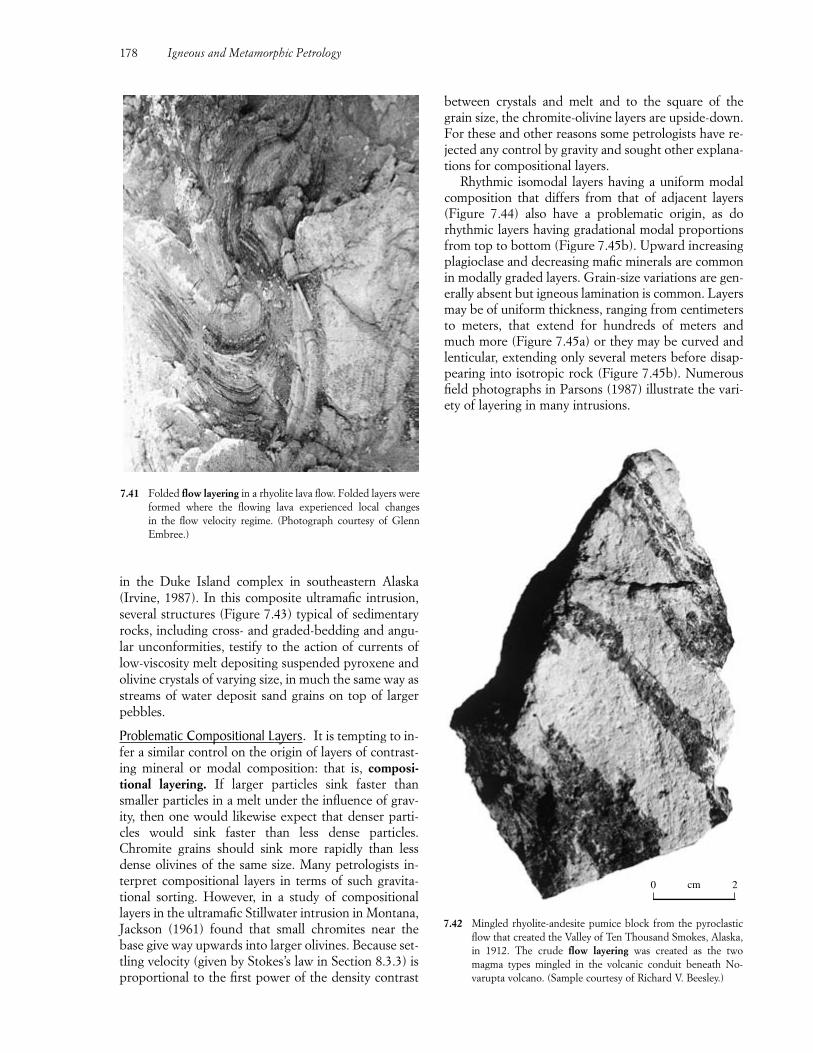
in the Duke Island complex in southeastern Alaska(Irvine, 1987). In this composite ultramafic intrusion,several structures (Figure 7.43) typical of sedimentaryrocks, including cross- and graded-bedding and angu-lar unconformities, testify to the action of currents oflow-viscosity melt depositing suspended pyroxene andolivine crystals of varying size, in much the same way asstreams of water deposit sand grains on top of largerpebbles.
Problematic Compositional Layers. It is tempting to in-fer a similar control on the origin of layers of contrast-ing mineral or modal composition: that is, composi-tional layering. If larger particles sink faster thansmaller particles in a melt under the influence of grav-ity, then one would likewise expect that denser parti-cles would sink faster than less dense particles.Chromite grains should sink more rapidly than lessdense olivines of the same size. Many petrologists in-terpret compositional layers in terms of such gravita-tional sorting. However, in a study of compositionallayers in the ultramafic Stillwater intrusion in Montana,Jackson (1961) found that small chromites near thebase give way upwards into larger olivines. Because set-tling velocity (given by Stokes’s law in Section 8.3.3) isproportional to the first power of the density contrast
178 Igneous and Metamorphic Petrology
7.41 Folded flow layering in a rhyolite lava flow. Folded layers wereformed where the flowing lava experienced local changes in the flow velocity regime. (Photograph courtesy of Glenn Embree.)
0 2cm
7.42 Mingled rhyolite-andesite pumice block from the pyroclasticflow that created the Valley of Ten Thousand Smokes, Alaska,in 1912. The crude flow layering was created as the twomagma types mingled in the volcanic conduit beneath No-varupta volcano. (Sample courtesy of Richard V. Beesley.)
between crystals and melt and to the square of thegrain size, the chromite-olivine layers are upside-down.For these and other reasons some petrologists have re-jected any control by gravity and sought other explana-tions for compositional layers.
Rhythmic isomodal layers having a uniform modalcomposition that differs from that of adjacent layers(Figure 7.44) also have a problematic origin, as dorhythmic layers having gradational modal proportionsfrom top to bottom (Figure 7.45b). Upward increasingplagioclase and decreasing mafic minerals are commonin modally graded layers. Grain-size variations are gen-erally absent but igneous lamination is common. Layersmay be of uniform thickness, ranging from centimetersto meters, that extend for hundreds of meters andmuch more (Figure 7.45a) or they may be curved andlenticular, extending only several meters before disap-pearing into isotropic rock (Figure 7.45b). Numerousfield photographs in Parsons (1987) illustrate the vari-ety of layering in many intrusions.
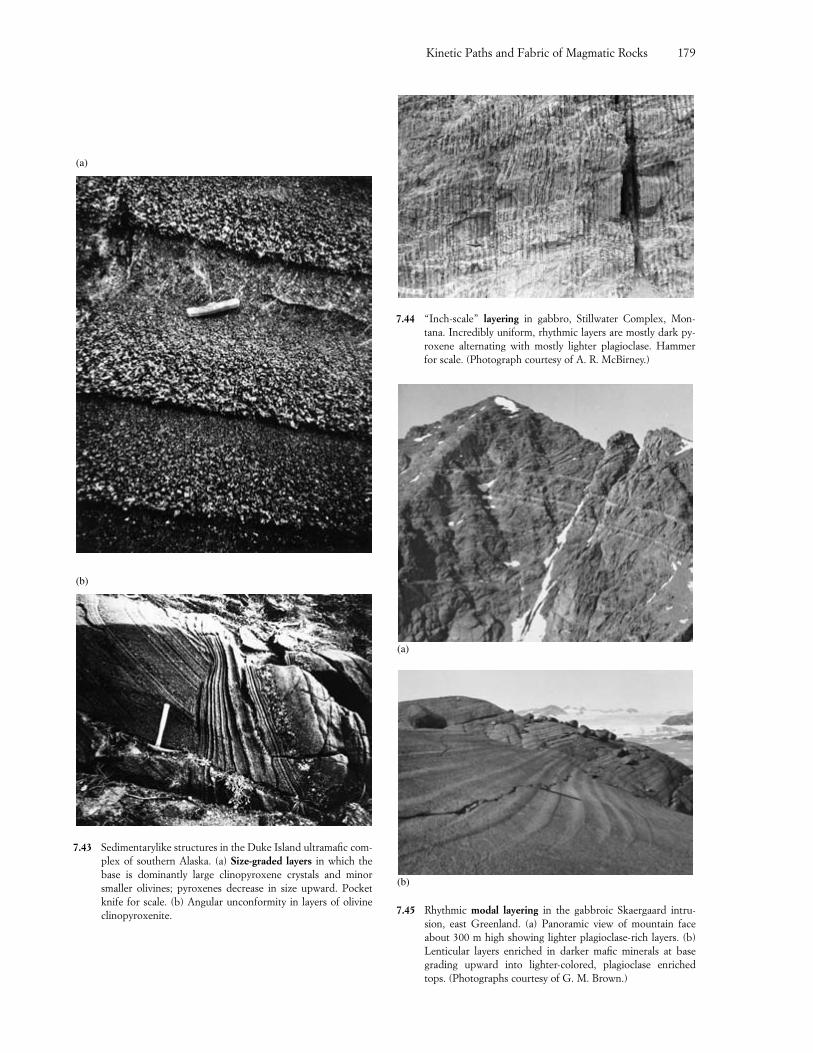
Kinetic Paths and Fabric of Magmatic Rocks 179
(a)
(b)
7.43 Sedimentarylike structures in the Duke Island ultramafic com-plex of southern Alaska. (a) Size-graded layers in which thebase is dominantly large clinopyroxene crystals and minorsmaller olivines; pyroxenes decrease in size upward. Pocketknife for scale. (b) Angular unconformity in layers of olivineclinopyroxenite.
7.44 “Inch-scale” layering in gabbro, Stillwater Complex, Mon-tana. Incredibly uniform, rhythmic layers are mostly dark py-roxene alternating with mostly lighter plagioclase. Hammerfor scale. (Photograph courtesy of A. R. McBirney.)
(a)
7.45 Rhythmic modal layering in the gabbroic Skaergaard intru-sion, east Greenland. (a) Panoramic view of mountain faceabout 300 m high showing lighter plagioclase-rich layers. (b)Lenticular layers enriched in darker mafic minerals at basegrading upward into lighter-colored, plagioclase enrichedtops. (Photographs courtesy of G. M. Brown.)
(b)
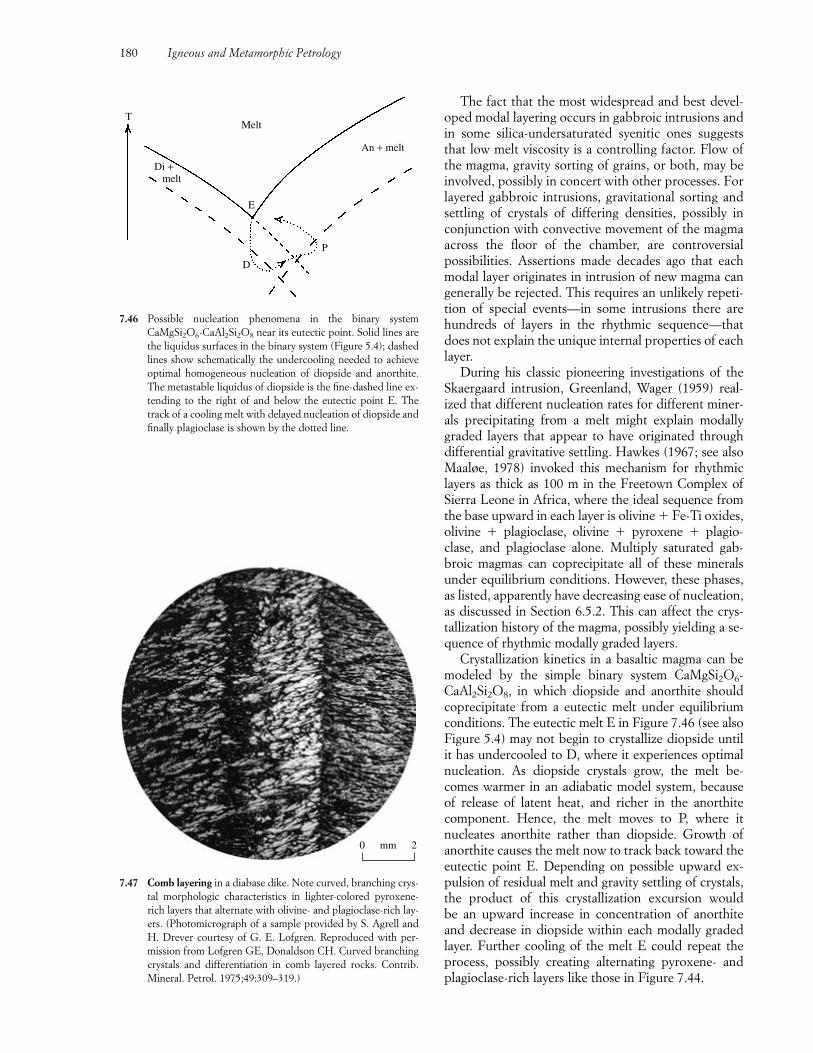
180 Igneous and Metamorphic Petrology
E
D
P
An + melt
MeltT
Di + melt
7.46 Possible nucleation phenomena in the binary systemCaMgSi2O6-CaAl2Si2O8 near its eutectic point. Solid lines arethe liquidus surfaces in the binary system (Figure 5.4); dashedlines show schematically the undercooling needed to achieveoptimal homogeneous nucleation of diopside and anorthite.The metastable liquidus of diopside is the fine-dashed line ex-tending to the right of and below the eutectic point E. Thetrack of a cooling melt with delayed nucleation of diopside andfinally plagioclase is shown by the dotted line.
0 2mm
7.47 Comb layering in a diabase dike. Note curved, branching crys-tal morphologic characteristics in lighter-colored pyroxene-rich layers that alternate with olivine- and plagioclase-rich lay-ers. (Photomicrograph of a sample provided by S. Agrell andH. Drever courtesy of G. E. Lofgren. Reproduced with per-mission from Lofgren GE, Donaldson CH. Curved branchingcrystals and differentiation in comb layered rocks. Contrib.Mineral. Petrol. 1975;49:309–319.)
The fact that the most widespread and best devel-oped modal layering occurs in gabbroic intrusions andin some silica-undersaturated syenitic ones suggeststhat low melt viscosity is a controlling factor. Flow ofthe magma, gravity sorting of grains, or both, may beinvolved, possibly in concert with other processes. Forlayered gabbroic intrusions, gravitational sorting andsettling of crystals of differing densities, possibly inconjunction with convective movement of the magmaacross the floor of the chamber, are controversial possibilities. Assertions made decades ago that eachmodal layer originates in intrusion of new magma cangenerally be rejected. This requires an unlikely repeti-tion of special events—in some intrusions there arehundreds of layers in the rhythmic sequence—thatdoes not explain the unique internal properties of eachlayer.
During his classic pioneering investigations of theSkaergaard intrusion, Greenland, Wager (1959) real-ized that different nucleation rates for different miner-als precipitating from a melt might explain modallygraded layers that appear to have originated throughdifferential gravitative settling. Hawkes (1967; see alsoMaaløe, 1978) invoked this mechanism for rhythmiclayers as thick as 100 m in the Freetown Complex ofSierra Leone in Africa, where the ideal sequence fromthe base upward in each layer is olivine � Fe-Ti oxides,olivine � plagioclase, olivine � pyroxene � plagio-clase, and plagioclase alone. Multiply saturated gab-broic magmas can coprecipitate all of these mineralsunder equilibrium conditions. However, these phases,as listed, apparently have decreasing ease of nucleation,as discussed in Section 6.5.2. This can affect the crys-tallization history of the magma, possibly yielding a se-quence of rhythmic modally graded layers.
Crystallization kinetics in a basaltic magma can bemodeled by the simple binary system CaMgSi2O6-CaAl2Si2O8, in which diopside and anorthite shouldcoprecipitate from a eutectic melt under equilibriumconditions. The eutectic melt E in Figure 7.46 (see alsoFigure 5.4) may not begin to crystallize diopside untilit has undercooled to D, where it experiences optimalnucleation. As diopside crystals grow, the melt be-comes warmer in an adiabatic model system, becauseof release of latent heat, and richer in the anorthitecomponent. Hence, the melt moves to P, where it nucleates anorthite rather than diopside. Growth ofanorthite causes the melt now to track back toward theeutectic point E. Depending on possible upward ex-pulsion of residual melt and gravity settling of crystals,the product of this crystallization excursion would be an upward increase in concentration of anorthiteand decrease in diopside within each modally gradedlayer. Further cooling of the melt E could repeat theprocess, possibly creating alternating pyroxene- andplagioclase-rich layers like those in Figure 7.44.
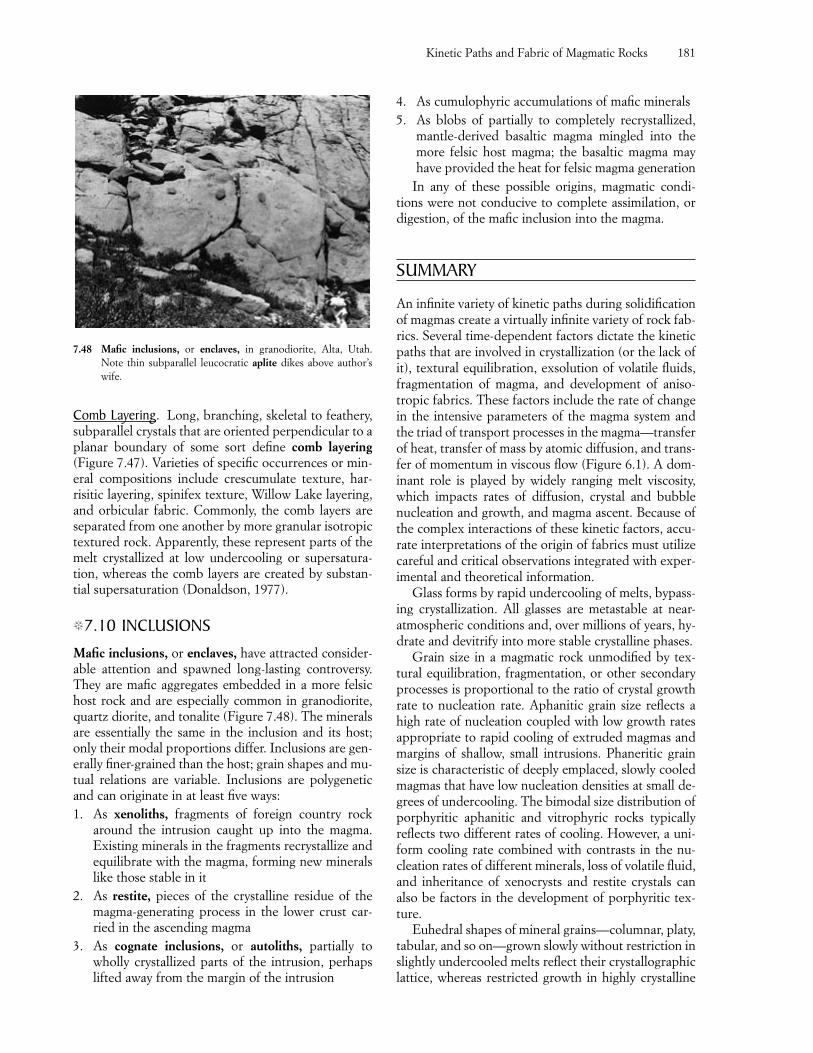
Kinetic Paths and Fabric of Magmatic Rocks 181
7.48 Mafic inclusions, or enclaves, in granodiorite, Alta, Utah.Note thin subparallel leucocratic aplite dikes above author’swife.
Comb Layering. Long, branching, skeletal to feathery,subparallel crystals that are oriented perpendicular to aplanar boundary of some sort define comb layering(Figure 7.47). Varieties of specific occurrences or min-eral compositions include crescumulate texture, har-risitic layering, spinifex texture, Willow Lake layering,and orbicular fabric. Commonly, the comb layers areseparated from one another by more granular isotropictextured rock. Apparently, these represent parts of themelt crystallized at low undercooling or supersatura-tion, whereas the comb layers are created by substan-tial supersaturation (Donaldson, 1977).
�7.10 INCLUSIONS
Mafic inclusions, or enclaves, have attracted consider-able attention and spawned long-lasting controversy.They are mafic aggregates embedded in a more felsichost rock and are especially common in granodiorite,quartz diorite, and tonalite (Figure 7.48). The mineralsare essentially the same in the inclusion and its host;only their modal proportions differ. Inclusions are gen-erally finer-grained than the host; grain shapes and mu-tual relations are variable. Inclusions are polygeneticand can originate in at least five ways:1. As xenoliths, fragments of foreign country rock
around the intrusion caught up into the magma.Existing minerals in the fragments recrystallize andequilibrate with the magma, forming new mineralslike those stable in it
2. As restite, pieces of the crystalline residue of themagma-generating process in the lower crust car-ried in the ascending magma
3. As cognate inclusions, or autoliths, partially towholly crystallized parts of the intrusion, perhapslifted away from the margin of the intrusion
4. As cumulophyric accumulations of mafic minerals5. As blobs of partially to completely recrystallized,
mantle-derived basaltic magma mingled into themore felsic host magma; the basaltic magma mayhave provided the heat for felsic magma generation
In any of these possible origins, magmatic condi-tions were not conducive to complete assimilation, ordigestion, of the mafic inclusion into the magma.
SUMMARY
An infinite variety of kinetic paths during solidificationof magmas create a virtually infinite variety of rock fab-rics. Several time-dependent factors dictate the kineticpaths that are involved in crystallization (or the lack ofit), textural equilibration, exsolution of volatile fluids,fragmentation of magma, and development of aniso-tropic fabrics. These factors include the rate of changein the intensive parameters of the magma system andthe triad of transport processes in the magma—transferof heat, transfer of mass by atomic diffusion, and trans-fer of momentum in viscous flow (Figure 6.1). A dom-inant role is played by widely ranging melt viscosity,which impacts rates of diffusion, crystal and bubblenucleation and growth, and magma ascent. Because ofthe complex interactions of these kinetic factors, accu-rate interpretations of the origin of fabrics must utilizecareful and critical observations integrated with exper-imental and theoretical information.
Glass forms by rapid undercooling of melts, bypass-ing crystallization. All glasses are metastable at near-atmospheric conditions and, over millions of years, hy-drate and devitrify into more stable crystalline phases.
Grain size in a magmatic rock unmodified by tex-tural equilibration, fragmentation, or other secondaryprocesses is proportional to the ratio of crystal growthrate to nucleation rate. Aphanitic grain size reflects ahigh rate of nucleation coupled with low growth ratesappropriate to rapid cooling of extruded magmas andmargins of shallow, small intrusions. Phaneritic grainsize is characteristic of deeply emplaced, slowly cooledmagmas that have low nucleation densities at small de-grees of undercooling. The bimodal size distribution ofporphyritic aphanitic and vitrophyric rocks typicallyreflects two different rates of cooling. However, a uni-form cooling rate combined with contrasts in the nu-cleation rates of different minerals, loss of volatile fluid,and inheritance of xenocrysts and restite crystals canalso be factors in the development of porphyritic tex-ture.
Euhedral shapes of mineral grains—columnar, platy,tabular, and so on—grown slowly without restriction inslightly undercooled melts reflect their crystallographiclattice, whereas restricted growth in highly crystalline
magmas creates subhedral to anhedral grains. Freelygrown crystals in melts are increasingly less compactand have greater surface areas at increasing degrees of undercooling, or rate of cooling, creating skeletal,dendritic, feathery, and finally spherulitic morphologiccharacteristics.
After their initial growth, crystals can adjust theirshapes and increase their sizes via Ostwald ripening,which minimizes the surface free energy of the aggre-gate. This textural equilibration is more likely to occurin more slowly cooled magmas.
Unstable crystals are dissolved in a melt. Partial dis-solution creates anhedral, embayed grains that may besurrounded by a more stable reaction rim. Chemicallyzoned solid solutions, exemplified especially by plagio-clase grains, are created in crystallizing magmas, whererates of diffusion are so slow that the system cannotequilibrate as intensive parameters change.
Exsolution of volatiles from melts in decompressingand crystallizing magmas creates vesicular and vuggyfabric in rocks.
Volcaniclasts are produced by autoclastic breakupof solidifying margins of lava flows and by explosivepyroclastic fragmentation of magmas where they inter-act with external surface water (hydromagmatic activ-ity) and where volatiles exsolve from the melt as themagma decompresses or crystallizes. Volcaniclasts areclassified according to whether they are juvenile piecesof the magma or accidental rock and crystals; whetherthey are crystals, lithic fragments, or vitroclasts ofquenched melt; and according to their size. Finer vol-caniclasts (ash and lapilli) are produced in more ener-getic explosive pyroclastic eruptions, whereas less ex-plosive activity yields larger volcaniclasts (blocks andbombs).
Deposits of vitroclasts that remain sufficiently hotundergo compaction and welding, in addition to possi-ble devitrification and vapor-phase crystallization.
Anisotropic fabric is geometrically planar, linear, orboth planar and linear and is expressed by preferredorientation of inequant mineral grains and mineral ag-gregates and by, for planar fabric, various types ofrhythmic textural and compositional layering. Layeringis polygenetic, and the origin of a particular sequencecan challenge the petrologist’s powers of observationand ability to conceive viable physical-chemical mod-els. Possible mechanisms include magma flow, crystalsedimentation in low-viscosity melts, and crystalliza-tion controlled by differing ease of nucleation in differ-ent minerals.
CRITICAL THINKING QUESTIONS7.1 Contrast texture, structure, fabric, and field re-
lations.
7.2 Describe the different fabrics of glassy rocksand indicate their origin.
7.3 List all possible fabrics that can develop from agranitic (rhyolitic) magma. Comment on these.
7.4 Thoroughly discuss the origin of the fabric ofthe andesite in Figure 7.8.
7.5 Suppose there are no groundmass olivines in thebasalt in Figure 7.9. Propose two possible ori-gins for the porphyritic fabric. What bearingdoes your answer have on the order of crystal-lization of olivine from the magma with respectto the other constituent minerals?
7.6 In Figure 7.11, why might the spodumene crys-tals have a preferred subvertical orientation,rather than being random?
7.7 Propose an origin for the complex plagioclase inFigure 7.19.
7.8 What contrasts between the fabrics of rhyolitesand basalts are dependent on the difference inthe viscosity of their melts?
7.9 Critically discuss factors controlling grain shapein magmatic rocks. What evidence would allowthe different factors to be distinguished?
7.10 What are possible mechanisms for the origin ofigneous lamination? Do they differ from thosefor trachytic texture? Discuss evidence for con-trasting mechanisms.
7.11 How does flow layering develop in extrudedlavas? What evidence could be used to decidewhich process was involved in a particular rock?
7.12 How might oscillatory zoned plagioclasesformed by kinetic processes in the growth ofan individual crystal be distinguished fromzoned crystals formed by cyclic fluctuations inintensive variables throughout the magmachamber?
7.13 How might reverse zoning develop in plagio-clase?
7.14 Can a fused tuff and a welded tuff be distin-guished in hand sample? In the field? Discuss.
7.15 Examine the variety of phaneritic fabrics evi-dent in several samples of granitic rock. Pol-ished rock slabs are an excellent means forstudy and can be examined on a “poor-man’sfield trip” in a cemetery, a commercial monu-ment or tile establishment, and facades onbuildings. Describe and sketch the variety offabrics, and discuss how it might be possible forsuch a wide variety to originate between differ-ent granitic intrusions and even within a singleintrusion (e.g. Clarke, 1992, Fig. 1.1).
182 Igneous and Metamorphic Petrology
FUNDAMENTAL QUESTIONSCONSIDERED IN THIS CHAPTER
1. How do magmas and rocks respond to geologicforces, formulated as states of stress?
2. What physical and compositional properties of bodies of magma are most important incontrolling their dynamic behavior?
3. How do dynamic physical processes and heattransfer interact in magmatic systems?
4. How do these physical-thermal interactionsinfluence the compositional evolution of magmas?
INTRODUCTIONChapters 6 and 7 dealt mostly with atomic-scale chem-ical dynamics and the resulting kinetic paths in solidi-fying melts that control the evolution of magmatic fab-ric. This chapter and the next two deal with larger-scalephysical and thermal dynamics of bodies of magma, in-cluding their response to states of stress, and the waysthey flow, cool, and convect. The basic driving force ofmagma movement in the Earth is buoyancy. Actingagainst the buoyant force is viscous resistance to flow.As viscosity is partly dependent on magma tempera-ture, the thermal evolution of the magma system be-comes important.
Crystallizing and convectively cooling magma bod-ies evolve through time, unmixing into compositionallycontrasting parts by fractionation of crystals and melt.Mixing of magmas of contrasting composition dependson their contrasting densities and viscosities. Magmasare contaminated by assimilation of wall rock if suffi-
8CHAPTER
Physical andThermal Dynamicsof Bodies of Magma
cient thermal energy and time are available. Hence,chemical differentiation of magmas is intimately inter-twined with their dynamic physical and thermal be-havior.
�8.1 STRESS AND DEFORMATION
8.1.1 Concepts of StressIn buried rock and magma bodies, forces arise as a result of the weight of overlying rock material and oftectonism, mostly associated with lithospheric platespushing together or a plate being stretched apart.Stress is the magnitude of a force, divided by the areaover which it is applied. Hence, both stress and pres-sure have the same units of pascals or bars. When thesame force acts over a smaller area, a greater stress orpressure results.
Suppose a body is acted upon by forces (Figure 8.1)so that it is in a state of stress. On any arbitrarily ori-ented planar surface through the body, there will be, inthe general case, one normal stress, �, perpendicular tothe plane and two shear stresses, �1 and �2, perpendic-ular to one another and tangential (parallel) to theplane. These three orthogonal (mutually perpendicu-lar) stresses constitute the components of the totalstress on the plane. For a particular state of stress, themagnitude of these three surface stresses varies with re-spect to the orientation of the plane through the body.The general state of total stress in the body at a point,which may be considered to be an infinitesimally smallcube, is specified by these three surface stresses oneach of three orthogonal planes, parallel to the faces ofthe cube, or nine stresses altogether. However, it can beproved mathematically that it is always possible to ori-ent a coordinate system so that no shear stresses exist
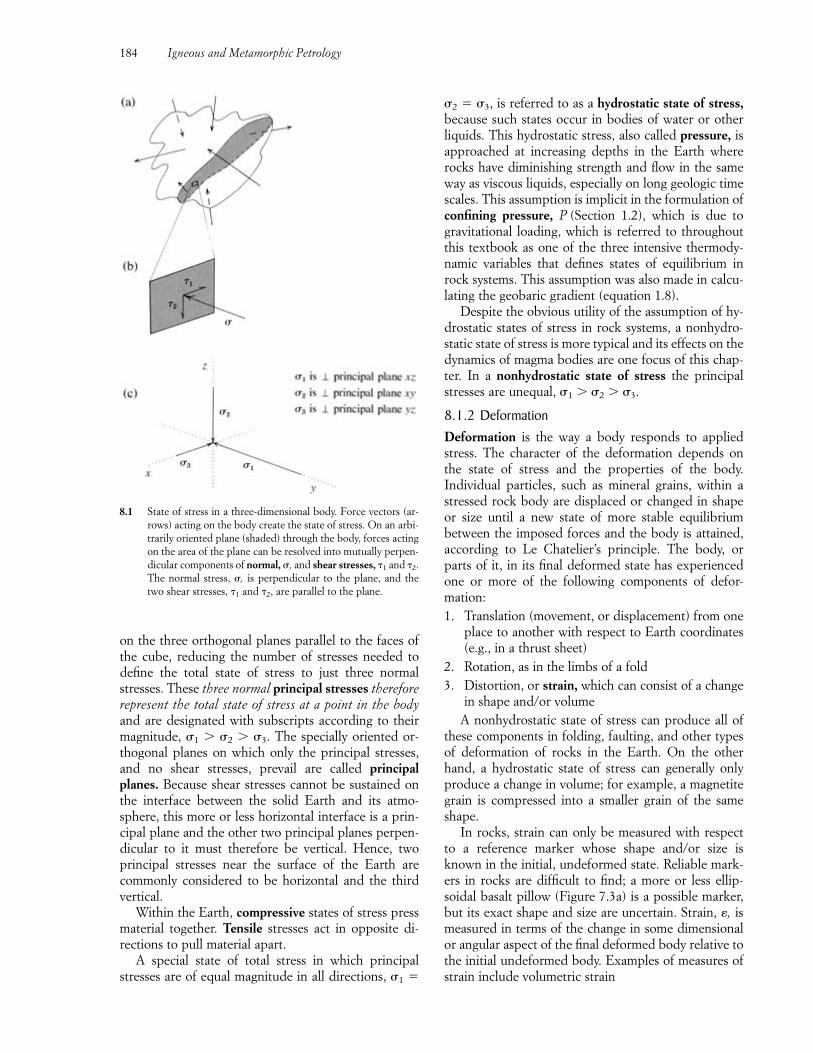
on the three orthogonal planes parallel to the faces ofthe cube, reducing the number of stresses needed todefine the total state of stress to just three normalstresses. These three normal principal stresses thereforerepresent the total state of stress at a point in the bodyand are designated with subscripts according to theirmagnitude, �1 � �2 � �3. The specially oriented or-thogonal planes on which only the principal stresses,and no shear stresses, prevail are called principalplanes. Because shear stresses cannot be sustained onthe interface between the solid Earth and its atmo-sphere, this more or less horizontal interface is a prin-cipal plane and the other two principal planes perpen-dicular to it must therefore be vertical. Hence, twoprincipal stresses near the surface of the Earth are commonly considered to be horizontal and the thirdvertical.
Within the Earth, compressive states of stress pressmaterial together. Tensile stresses act in opposite di-rections to pull material apart.
A special state of total stress in which principalstresses are of equal magnitude in all directions, �1 �
�2 � �3, is referred to as a hydrostatic state of stress,because such states occur in bodies of water or otherliquids. This hydrostatic stress, also called pressure, isapproached at increasing depths in the Earth whererocks have diminishing strength and flow in the sameway as viscous liquids, especially on long geologic timescales. This assumption is implicit in the formulation ofconfining pressure, P (Section 1.2), which is due togravitational loading, which is referred to throughoutthis textbook as one of the three intensive thermody-namic variables that defines states of equilibrium inrock systems. This assumption was also made in calcu-lating the geobaric gradient (equation 1.8).
Despite the obvious utility of the assumption of hy-drostatic states of stress in rock systems, a nonhydro-static state of stress is more typical and its effects on thedynamics of magma bodies are one focus of this chap-ter. In a nonhydrostatic state of stress the principalstresses are unequal, �1 � �2 � �3.
8.1.2 DeformationDeformation is the way a body responds to appliedstress. The character of the deformation depends onthe state of stress and the properties of the body. Individual particles, such as mineral grains, within astressed rock body are displaced or changed in shapeor size until a new state of more stable equilibrium between the imposed forces and the body is attained,according to Le Chatelier’s principle. The body, orparts of it, in its final deformed state has experiencedone or more of the following components of defor-mation:1. Translation (movement, or displacement) from one
place to another with respect to Earth coordinates(e.g., in a thrust sheet)
2. Rotation, as in the limbs of a fold3. Distortion, or strain, which can consist of a change
in shape and/or volumeA nonhydrostatic state of stress can produce all of
these components in folding, faulting, and other typesof deformation of rocks in the Earth. On the otherhand, a hydrostatic state of stress can generally onlyproduce a change in volume; for example, a magnetitegrain is compressed into a smaller grain of the sameshape.
In rocks, strain can only be measured with respectto a reference marker whose shape and/or size isknown in the initial, undeformed state. Reliable mark-ers in rocks are difficult to find; a more or less ellip-soidal basalt pillow (Figure 7.3a) is a possible marker,but its exact shape and size are uncertain. Strain, �, ismeasured in terms of the change in some dimensionalor angular aspect of the final deformed body relative tothe initial undeformed body. Examples of measures ofstrain include volumetric strain
184 Igneous and Metamorphic Petrology
8.1 State of stress in a three-dimensional body. Force vectors (ar-rows) acting on the body create the state of stress. On an arbi-trarily oriented plane (shaded) through the body, forces actingon the area of the plane can be resolved into mutually perpen-dicular components of normal, �, and shear stresses, �1 and �2.The normal stress, �, is perpendicular to the plane, and thetwo shear stresses, �1 and �2, are parallel to the plane.
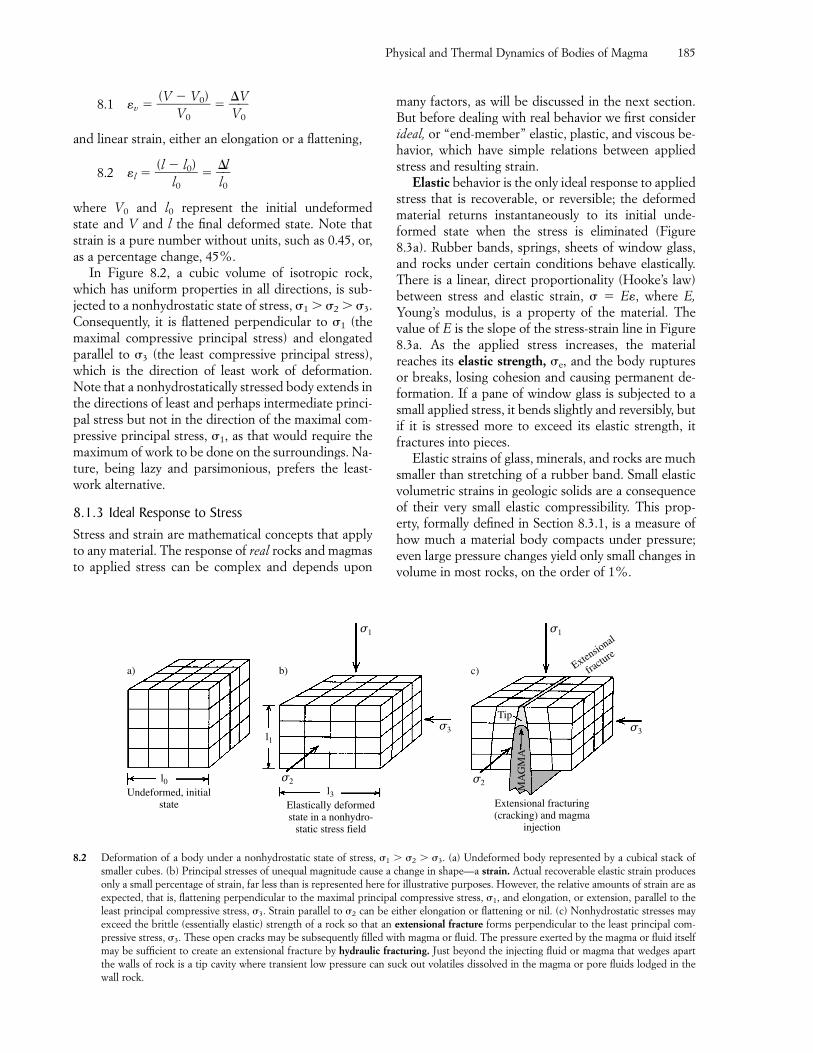
8.1 �v � �(V �
V0
V0)� � �
VV
0�
and linear strain, either an elongation or a flattening,
8.2 �l � �(l �
l0
l0)� � �
l0
l�
where V0 and l0 represent the initial undeformedstate and V and l the final deformed state. Note thatstrain is a pure number without units, such as 0.45, or,as a percentage change, 45%.
In Figure 8.2, a cubic volume of isotropic rock,which has uniform properties in all directions, is sub-jected to a nonhydrostatic state of stress, �1 � �2 � �3.Consequently, it is flattened perpendicular to �1 (themaximal compressive principal stress) and elongatedparallel to �3 (the least compressive principal stress),which is the direction of least work of deformation.Note that a nonhydrostatically stressed body extends inthe directions of least and perhaps intermediate princi-pal stress but not in the direction of the maximal com-pressive principal stress, �1, as that would require themaximum of work to be done on the surroundings. Na-ture, being lazy and parsimonious, prefers the least-work alternative.
8.1.3 Ideal Response to StressStress and strain are mathematical concepts that applyto any material. The response of real rocks and magmasto applied stress can be complex and depends upon
many factors, as will be discussed in the next section.But before dealing with real behavior we first considerideal, or “end-member” elastic, plastic, and viscous be-havior, which have simple relations between appliedstress and resulting strain.
Elastic behavior is the only ideal response to appliedstress that is recoverable, or reversible; the deformedmaterial returns instantaneously to its initial unde-formed state when the stress is eliminated (Figure8.3a). Rubber bands, springs, sheets of window glass,and rocks under certain conditions behave elastically.There is a linear, direct proportionality (Hooke’s law)between stress and elastic strain, � � E�, where E,Young’s modulus, is a property of the material. Thevalue of E is the slope of the stress-strain line in Figure8.3a. As the applied stress increases, the materialreaches its elastic strength, �e, and the body rupturesor breaks, losing cohesion and causing permanent de-formation. If a pane of window glass is subjected to asmall applied stress, it bends slightly and reversibly, butif it is stressed more to exceed its elastic strength, itfractures into pieces.
Elastic strains of glass, minerals, and rocks are muchsmaller than stretching of a rubber band. Small elasticvolumetric strains in geologic solids are a consequenceof their very small elastic compressibility. This prop-erty, formally defined in Section 8.3.1, is a measure ofhow much a material body compacts under pressure;even large pressure changes yield only small changes involume in most rocks, on the order of 1%.
Physical and Thermal Dynamics of Bodies of Magma 185
Extensio
nal
fractu
re
Extensional fracturing(cracking) and magma
injection
Elastically deformedstate in a nonhydro-
static stress field
Undeformed, initialstate
σ2σ2
σ3
σ1
σ3
σ1
c)
Tip
b)
l1
l0l3
a)
MA
GM
A
8.2 Deformation of a body under a nonhydrostatic state of stress, �1 � �2 � �3. (a) Undeformed body represented by a cubical stack ofsmaller cubes. (b) Principal stresses of unequal magnitude cause a change in shape—a strain. Actual recoverable elastic strain producesonly a small percentage of strain, far less than is represented here for illustrative purposes. However, the relative amounts of strain are asexpected, that is, flattening perpendicular to the maximal principal compressive stress, �1, and elongation, or extension, parallel to theleast principal compressive stress, �3. Strain parallel to �2 can be either elongation or flattening or nil. (c) Nonhydrostatic stresses mayexceed the brittle (essentially elastic) strength of a rock so that an extensional fracture forms perpendicular to the least principal com-pressive stress, �3. These open cracks may be subsequently filled with magma or fluid. The pressure exerted by the magma or fluid itselfmay be sufficient to create an extensional fracture by hydraulic fracturing. Just beyond the injecting fluid or magma that wedges apartthe walls of rock is a tip cavity where transient low pressure can suck out volatiles dissolved in the magma or pore fluids lodged in thewall rock.
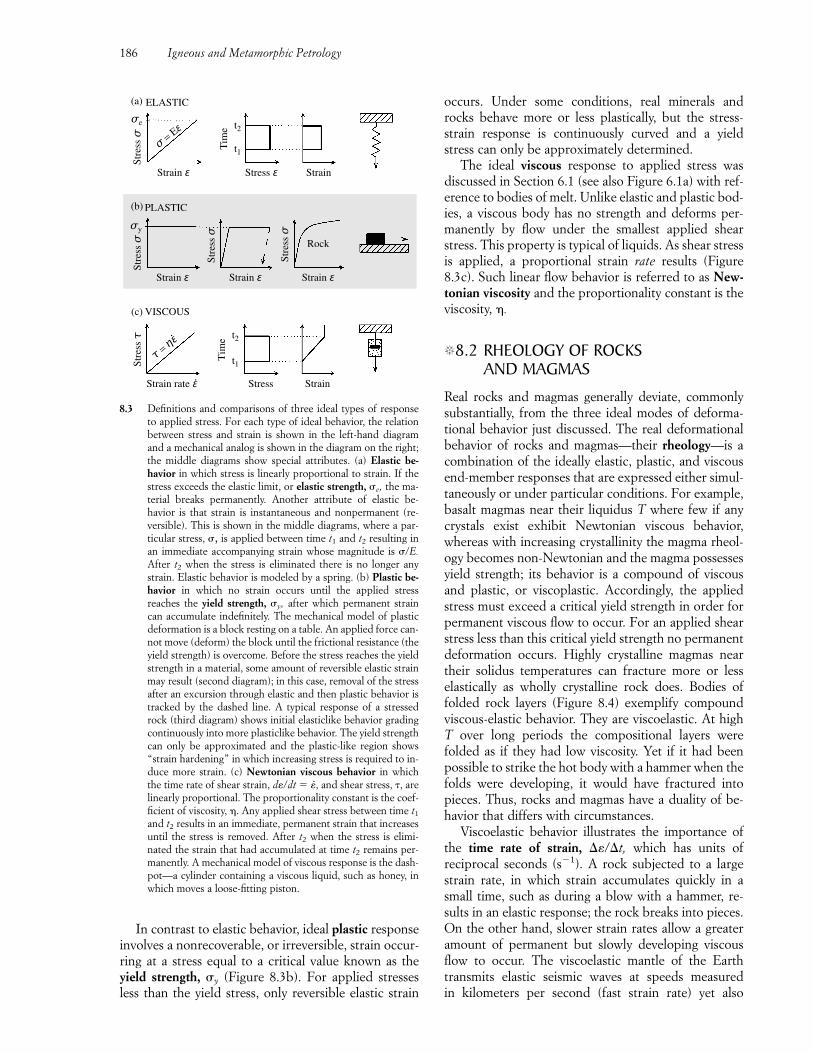
occurs. Under some conditions, real minerals androcks behave more or less plastically, but the stress-strain response is continuously curved and a yieldstress can only be approximately determined.
The ideal viscous response to applied stress was discussed in Section 6.1 (see also Figure 6.1a) with ref-erence to bodies of melt. Unlike elastic and plastic bod-ies, a viscous body has no strength and deforms per-manently by flow under the smallest applied shearstress. This property is typical of liquids. As shear stressis applied, a proportional strain rate results (Figure8.3c). Such linear flow behavior is referred to as New-tonian viscosity and the proportionality constant is theviscosity, .
�8.2 RHEOLOGY OF ROCKS AND MAGMAS
Real rocks and magmas generally deviate, commonlysubstantially, from the three ideal modes of deforma-tional behavior just discussed. The real deformationalbehavior of rocks and magmas—their rheology—is acombination of the ideally elastic, plastic, and viscousend-member responses that are expressed either simul-taneously or under particular conditions. For example,basalt magmas near their liquidus T where few if anycrystals exist exhibit Newtonian viscous behavior,whereas with increasing crystallinity the magma rheol-ogy becomes non-Newtonian and the magma possessesyield strength; its behavior is a compound of viscousand plastic, or viscoplastic. Accordingly, the appliedstress must exceed a critical yield strength in order forpermanent viscous flow to occur. For an applied shearstress less than this critical yield strength no permanentdeformation occurs. Highly crystalline magmas neartheir solidus temperatures can fracture more or lesselastically as wholly crystalline rock does. Bodies offolded rock layers (Figure 8.4) exemplify compoundviscous-elastic behavior. They are viscoelastic. At highT over long periods the compositional layers werefolded as if they had low viscosity. Yet if it had beenpossible to strike the hot body with a hammer when thefolds were developing, it would have fractured intopieces. Thus, rocks and magmas have a duality of be-havior that differs with circumstances.
Viscoelastic behavior illustrates the importance ofthe time rate of strain, �/t, which has units of reciprocal seconds (s�1). A rock subjected to a largestrain rate, in which strain accumulates quickly in asmall time, such as during a blow with a hammer, re-sults in an elastic response; the rock breaks into pieces.On the other hand, slower strain rates allow a greateramount of permanent but slowly developing viscousflow to occur. The viscoelastic mantle of the Earthtransmits elastic seismic waves at speeds measured in kilometers per second (fast strain rate) yet also
186 Igneous and Metamorphic Petrology
In contrast to elastic behavior, ideal plastic responseinvolves a nonrecoverable, or irreversible, strain occur-ring at a stress equal to a critical value known as theyield strength, �y (Figure 8.3b). For applied stressesless than the yield stress, only reversible elastic strain
ELASTIC
σe
Stre
ss σ
σ = Eε
Strain ε Stress ε Strain
t2
t1Tim
e
(a)
(b)
(c) VISCOUS
Stre
ss σ
σy
PLASTIC
Strain ε Strain ε Strain ε
Rock
Stre
ss σ
Stre
ss σ
Stre
ss τ
Strain rate ε Stress Strain
τ = ηε t2
t1Tim
e
8.3 Definitions and comparisons of three ideal types of responseto applied stress. For each type of ideal behavior, the relationbetween stress and strain is shown in the left-hand diagramand a mechanical analog is shown in the diagram on the right;the middle diagrams show special attributes. (a) Elastic be-havior in which stress is linearly proportional to strain. If thestress exceeds the elastic limit, or elastic strength, �e, the ma-terial breaks permanently. Another attribute of elastic be-havior is that strain is instantaneous and nonpermanent (re-versible). This is shown in the middle diagrams, where a par-ticular stress, �, is applied between time t1 and t2 resulting inan immediate accompanying strain whose magnitude is �/E.After t2 when the stress is eliminated there is no longer anystrain. Elastic behavior is modeled by a spring. (b) Plastic be-havior in which no strain occurs until the applied stressreaches the yield strength, �y, after which permanent straincan accumulate indefinitely. The mechanical model of plasticdeformation is a block resting on a table. An applied force can-not move (deform) the block until the frictional resistance (theyield strength) is overcome. Before the stress reaches the yieldstrength in a material, some amount of reversible elastic strainmay result (second diagram); in this case, removal of the stressafter an excursion through elastic and then plastic behavior istracked by the dashed line. A typical response of a stressedrock (third diagram) shows initial elasticlike behavior gradingcontinuously into more plasticlike behavior. The yield strengthcan only be approximated and the plastic-like region shows“strain hardening” in which increasing stress is required to in-duce more strain. (c) Newtonian viscous behavior in whichthe time rate of shear strain, d�/dt � ��, and shear stress, �, arelinearly proportional. The proportionality constant is the coef-ficient of viscosity, . Any applied shear stress between time t1
and t2 results in an immediate, permanent strain that increasesuntil the stress is removed. After t2 when the stress is elimi-nated the strain that had accumulated at time t2 remains per-manently. A mechanical model of viscous response is the dash-pot—a cylinder containing a viscous liquid, such as honey, inwhich moves a loose-fitting piston.
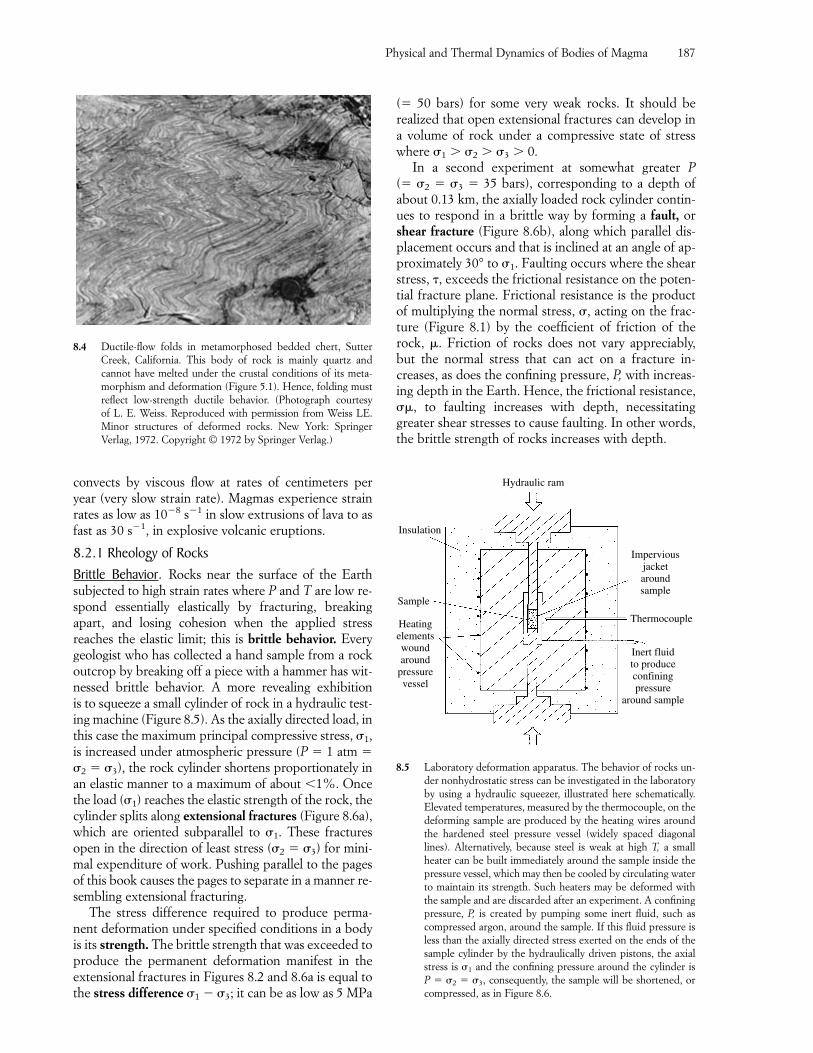
convects by viscous flow at rates of centimeters peryear (very slow strain rate). Magmas experience strainrates as low as 10�8 s�1 in slow extrusions of lava to asfast as 30 s�1, in explosive volcanic eruptions.
8.2.1 Rheology of RocksBrittle Behavior. Rocks near the surface of the Earthsubjected to high strain rates where P and T are low re-spond essentially elastically by fracturing, breakingapart, and losing cohesion when the applied stressreaches the elastic limit; this is brittle behavior. Everygeologist who has collected a hand sample from a rockoutcrop by breaking off a piece with a hammer has wit-nessed brittle behavior. A more revealing exhibition is to squeeze a small cylinder of rock in a hydraulic test-ing machine (Figure 8.5). As the axially directed load, inthis case the maximum principal compressive stress, �1,is increased under atmospheric pressure (P � 1 atm ��2 � �3), the rock cylinder shortens proportionately inan elastic manner to a maximum of about �1%. Oncethe load (�1) reaches the elastic strength of the rock, thecylinder splits along extensional fractures (Figure 8.6a),which are oriented subparallel to �1. These fracturesopen in the direction of least stress (�2 � �3) for mini-mal expenditure of work. Pushing parallel to the pagesof this book causes the pages to separate in a manner re-sembling extensional fracturing.
The stress difference required to produce perma-nent deformation under specified conditions in a bodyis its strength. The brittle strength that was exceeded toproduce the permanent deformation manifest in theextensional fractures in Figures 8.2 and 8.6a is equal tothe stress difference �1 � �3; it can be as low as 5 MPa
(� 50 bars) for some very weak rocks. It should be realized that open extensional fractures can develop ina volume of rock under a compressive state of stresswhere �1 � �2 � �3 � 0.
In a second experiment at somewhat greater P(� �2 � �3 � 35 bars), corresponding to a depth ofabout 0.13 km, the axially loaded rock cylinder contin-ues to respond in a brittle way by forming a fault, orshear fracture (Figure 8.6b), along which parallel dis-placement occurs and that is inclined at an angle of ap-proximately 30° to �1. Faulting occurs where the shearstress, �, exceeds the frictional resistance on the poten-tial fracture plane. Frictional resistance is the productof multiplying the normal stress, �, acting on the frac-ture (Figure 8.1) by the coefficient of friction of therock, . Friction of rocks does not vary appreciably,but the normal stress that can act on a fracture in-creases, as does the confining pressure, P, with increas-ing depth in the Earth. Hence, the frictional resistance,� , to faulting increases with depth, necessitatinggreater shear stresses to cause faulting. In other words,the brittle strength of rocks increases with depth.
Physical and Thermal Dynamics of Bodies of Magma 187
8.4 Ductile-flow folds in metamorphosed bedded chert, SutterCreek, California. This body of rock is mainly quartz and cannot have melted under the crustal conditions of its meta-morphism and deformation (Figure 5.1). Hence, folding mustreflect low-strength ductile behavior. (Photograph courtesy of L. E. Weiss. Reproduced with permission from Weiss LE.Minor structures of deformed rocks. New York: Springer Verlag, 1972. Copyright © 1972 by Springer Verlag.)
Heatingelementswoundaround
pressurevessel
Sample
Insulation
Hydraulic ram
Imperviousjacketaroundsample
Thermocouple
Inert fluidto produceconfiningpressure
around sample
8.5 Laboratory deformation apparatus. The behavior of rocks un-der nonhydrostatic stress can be investigated in the laboratoryby using a hydraulic squeezer, illustrated here schematically.Elevated temperatures, measured by the thermocouple, on thedeforming sample are produced by the heating wires aroundthe hardened steel pressure vessel (widely spaced diagonallines). Alternatively, because steel is weak at high T, a smallheater can be built immediately around the sample inside thepressure vessel, which may then be cooled by circulating waterto maintain its strength. Such heaters may be deformed withthe sample and are discarded after an experiment. A confiningpressure, P, is created by pumping some inert fluid, such ascompressed argon, around the sample. If this fluid pressure isless than the axially directed stress exerted on the ends of thesample cylinder by the hydraulically driven pistons, the axialstress is �1 and the confining pressure around the cylinder is P � �2 � �3, consequently, the sample will be shortened, orcompressed, as in Figure 8.6.
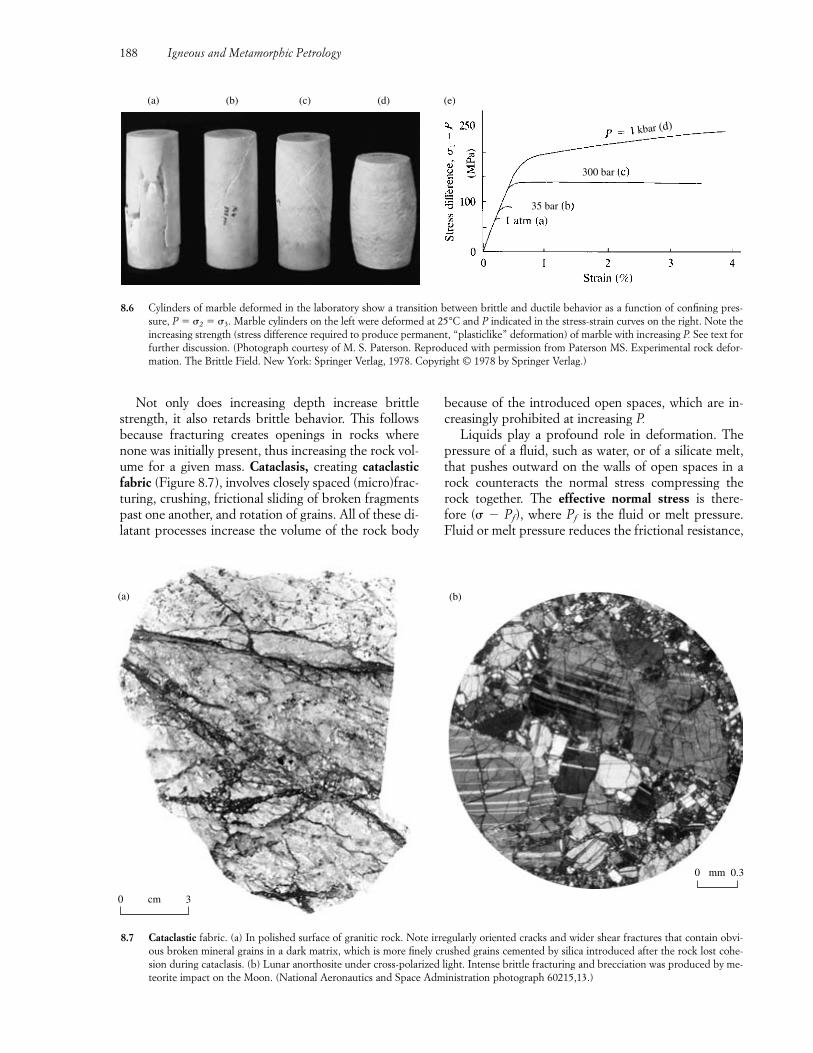
Not only does increasing depth increase brittlestrength, it also retards brittle behavior. This followsbecause fracturing creates openings in rocks wherenone was initially present, thus increasing the rock vol-ume for a given mass. Cataclasis, creating cataclasticfabric (Figure 8.7), involves closely spaced (micro)frac-turing, crushing, frictional sliding of broken fragmentspast one another, and rotation of grains. All of these di-latant processes increase the volume of the rock body
because of the introduced open spaces, which are in-creasingly prohibited at increasing P.
Liquids play a profound role in deformation. Thepressure of a fluid, such as water, or of a silicate melt,that pushes outward on the walls of open spaces in arock counteracts the normal stress compressing therock together. The effective normal stress is there-fore (� � Pf), where Pf is the fluid or melt pressure.Fluid or melt pressure reduces the frictional resistance,
188 Igneous and Metamorphic Petrology
(a) (b) (c) (d) (e)
35 bar
kbar (d)
300 bar
8.6 Cylinders of marble deformed in the laboratory show a transition between brittle and ductile behavior as a function of confining pres-sure, P � �2 � �3. Marble cylinders on the left were deformed at 25°C and P indicated in the stress-strain curves on the right. Note theincreasing strength (stress difference required to produce permanent, “plasticlike” deformation) of marble with increasing P. See text forfurther discussion. (Photograph courtesy of M. S. Paterson. Reproduced with permission from Paterson MS. Experimental rock defor-mation. The Brittle Field. New York: Springer Verlag, 1978. Copyright © 1978 by Springer Verlag.)
0
(a)
3cm
8.7 Cataclastic fabric. (a) In polished surface of granitic rock. Note irregularly oriented cracks and wider shear fractures that contain obvi-ous broken mineral grains in a dark matrix, which is more finely crushed grains cemented by silica introduced after the rock lost cohe-sion during cataclasis. (b) Lunar anorthosite under cross-polarized light. Intense brittle fracturing and brecciation was produced by me-teorite impact on the Moon. (National Aeronautics and Space Administration photograph 60215,13.)
0 0.3mm
(b)
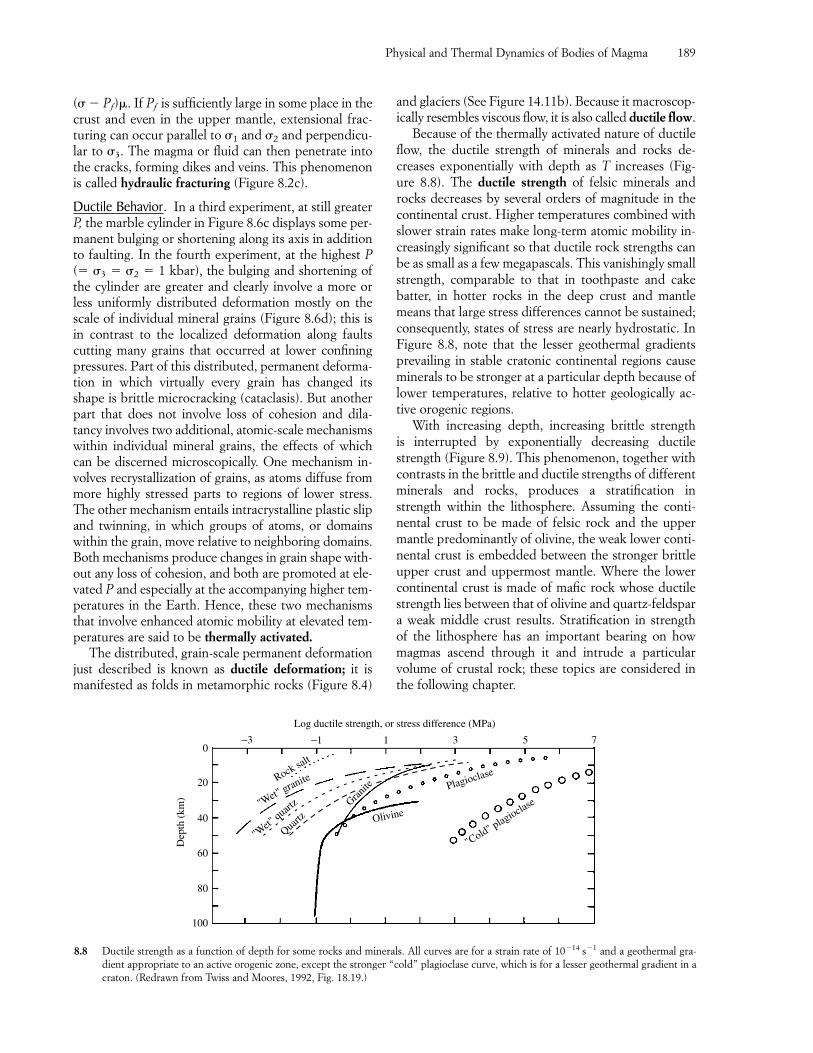
(� � Pf) . If Pf is sufficiently large in some place in thecrust and even in the upper mantle, extensional frac-turing can occur parallel to �1 and �2 and perpendicu-lar to �3. The magma or fluid can then penetrate intothe cracks, forming dikes and veins. This phenomenonis called hydraulic fracturing (Figure 8.2c).
Ductile Behavior. In a third experiment, at still greaterP, the marble cylinder in Figure 8.6c displays some per-manent bulging or shortening along its axis in additionto faulting. In the fourth experiment, at the highest P(� �3 � �2 � 1 kbar), the bulging and shortening ofthe cylinder are greater and clearly involve a more orless uniformly distributed deformation mostly on thescale of individual mineral grains (Figure 8.6d); this isin contrast to the localized deformation along faultscutting many grains that occurred at lower confiningpressures. Part of this distributed, permanent deforma-tion in which virtually every grain has changed itsshape is brittle microcracking (cataclasis). But anotherpart that does not involve loss of cohesion and dila-tancy involves two additional, atomic-scale mechanismswithin individual mineral grains, the effects of whichcan be discerned microscopically. One mechanism in-volves recrystallization of grains, as atoms diffuse frommore highly stressed parts to regions of lower stress.The other mechanism entails intracrystalline plastic slipand twinning, in which groups of atoms, or domainswithin the grain, move relative to neighboring domains.Both mechanisms produce changes in grain shape with-out any loss of cohesion, and both are promoted at ele-vated P and especially at the accompanying higher tem-peratures in the Earth. Hence, these two mechanismsthat involve enhanced atomic mobility at elevated tem-peratures are said to be thermally activated.
The distributed, grain-scale permanent deformationjust described is known as ductile deformation; it ismanifested as folds in metamorphic rocks (Figure 8.4)
and glaciers (See Figure 14.11b). Because it macroscop-ically resembles viscous flow, it is also called ductile flow.
Because of the thermally activated nature of ductileflow, the ductile strength of minerals and rocks de-creases exponentially with depth as T increases (Fig-ure 8.8). The ductile strength of felsic minerals androcks decreases by several orders of magnitude in thecontinental crust. Higher temperatures combined withslower strain rates make long-term atomic mobility in-creasingly significant so that ductile rock strengths canbe as small as a few megapascals. This vanishingly smallstrength, comparable to that in toothpaste and cakebatter, in hotter rocks in the deep crust and mantlemeans that large stress differences cannot be sustained;consequently, states of stress are nearly hydrostatic. InFigure 8.8, note that the lesser geothermal gradientsprevailing in stable cratonic continental regions causeminerals to be stronger at a particular depth because oflower temperatures, relative to hotter geologically ac-tive orogenic regions.
With increasing depth, increasing brittle strength is interrupted by exponentially decreasing ductilestrength (Figure 8.9). This phenomenon, together withcontrasts in the brittle and ductile strengths of differentminerals and rocks, produces a stratification instrength within the lithosphere. Assuming the conti-nental crust to be made of felsic rock and the uppermantle predominantly of olivine, the weak lower conti-nental crust is embedded between the stronger brittleupper crust and uppermost mantle. Where the lowercontinental crust is made of mafic rock whose ductilestrength lies between that of olivine and quartz-feldspara weak middle crust results. Stratification in strength of the lithosphere has an important bearing on howmagmas ascend through it and intrude a particular volume of crustal rock; these topics are considered inthe following chapter.
Physical and Thermal Dynamics of Bodies of Magma 189
100
80
60
40
20
0−3 −1 1 3 5 7
Rock salt
Olivine
Plagioclase
"Cold" p
lagioclase
Log ductile strength, or stress difference (MPa)
Dep
th (
km) "W
et" granite
Granite
"Wet"
quartz
Quartz
8.8 Ductile strength as a function of depth for some rocks and minerals. All curves are for a strain rate of 10�14 s�1 and a geothermal gra-dient appropriate to an active orogenic zone, except the stronger “cold” plagioclase curve, which is for a lesser geothermal gradient in acraton. (Redrawn from Twiss and Moores, 1992, Fig. 18.19.)
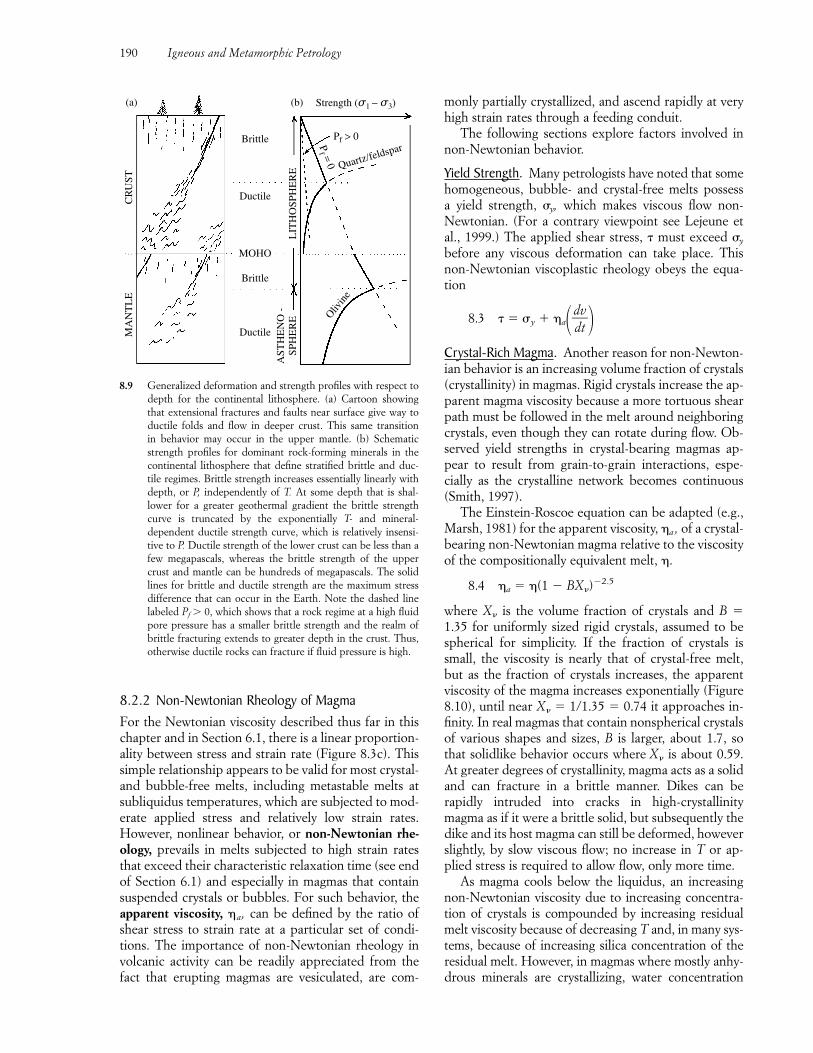
8.2.2 Non-Newtonian Rheology of MagmaFor the Newtonian viscosity described thus far in thischapter and in Section 6.1, there is a linear proportion-ality between stress and strain rate (Figure 8.3c). Thissimple relationship appears to be valid for most crystal-and bubble-free melts, including metastable melts atsubliquidus temperatures, which are subjected to mod-erate applied stress and relatively low strain rates.However, nonlinear behavior, or non-Newtonian rhe-ology, prevails in melts subjected to high strain ratesthat exceed their characteristic relaxation time (see endof Section 6.1) and especially in magmas that containsuspended crystals or bubbles. For such behavior, theapparent viscosity, a, can be defined by the ratio ofshear stress to strain rate at a particular set of condi-tions. The importance of non-Newtonian rheology involcanic activity can be readily appreciated from thefact that erupting magmas are vesiculated, are com-
monly partially crystallized, and ascend rapidly at veryhigh strain rates through a feeding conduit.
The following sections explore factors involved innon-Newtonian behavior.
Yield Strength. Many petrologists have noted that somehomogeneous, bubble- and crystal-free melts possess a yield strength, �y, which makes viscous flow non-Newtonian. (For a contrary viewpoint see Lejeune etal., 1999.) The applied shear stress, � must exceed �y
before any viscous deformation can take place. Thisnon-Newtonian viscoplastic rheology obeys the equa-tion
8.3 � � �y � a��ddvt��
Crystal-Rich Magma. Another reason for non-Newton-ian behavior is an increasing volume fraction of crystals(crystallinity) in magmas. Rigid crystals increase the ap-parent magma viscosity because a more tortuous shearpath must be followed in the melt around neighboringcrystals, even though they can rotate during flow. Ob-served yield strengths in crystal-bearing magmas ap-pear to result from grain-to-grain interactions, espe-cially as the crystalline network becomes continuous(Smith, 1997).
The Einstein-Roscoe equation can be adapted (e.g.,Marsh, 1981) for the apparent viscosity, a , of a crystal-bearing non-Newtonian magma relative to the viscosityof the compositionally equivalent melt, .
8.4 a � (1 � BX�)�2.5
where X� is the volume fraction of crystals and B �1.35 for uniformly sized rigid crystals, assumed to bespherical for simplicity. If the fraction of crystals issmall, the viscosity is nearly that of crystal-free melt,but as the fraction of crystals increases, the apparentviscosity of the magma increases exponentially (Figure8.10), until near X� � 1/1.35 � 0.74 it approaches in-finity. In real magmas that contain nonspherical crystalsof various shapes and sizes, B is larger, about 1.7, sothat solidlike behavior occurs where X� is about 0.59.At greater degrees of crystallinity, magma acts as a solidand can fracture in a brittle manner. Dikes can berapidly intruded into cracks in high-crystallinitymagma as if it were a brittle solid, but subsequently thedike and its host magma can still be deformed, howeverslightly, by slow viscous flow; no increase in T or ap-plied stress is required to allow flow, only more time.
As magma cools below the liquidus, an increasingnon-Newtonian viscosity due to increasing concentra-tion of crystals is compounded by increasing residualmelt viscosity because of decreasing T and, in many sys-tems, because of increasing silica concentration of theresidual melt. However, in magmas where mostly anhy-drous minerals are crystallizing, water concentration
190 Igneous and Metamorphic Petrology
Olivin
e
AST
HE
NO
-SP
HE
RE
LIT
HO
SPH
ER
E
Strength (σ1 − σ3)(b)(a)
Pf > 0
Pf = 0 Quartz/feldspar
Ductile
Ductile
MOHO
Brittle
BrittleC
RU
STM
AN
TL
E
8.9 Generalized deformation and strength profiles with respect todepth for the continental lithosphere. (a) Cartoon showingthat extensional fractures and faults near surface give way toductile folds and flow in deeper crust. This same transition in behavior may occur in the upper mantle. (b) Schematicstrength profiles for dominant rock-forming minerals in thecontinental lithosphere that define stratified brittle and duc-tile regimes. Brittle strength increases essentially linearly withdepth, or P, independently of T. At some depth that is shal-lower for a greater geothermal gradient the brittle strengthcurve is truncated by the exponentially T- and mineral-dependent ductile strength curve, which is relatively insensi-tive to P. Ductile strength of the lower crust can be less than afew megapascals, whereas the brittle strength of the uppercrust and mantle can be hundreds of megapascals. The solidlines for brittle and ductile strength are the maximum stressdifference that can occur in the Earth. Note the dashed line labeled Pf � 0, which shows that a rock regime at a high fluidpore pressure has a smaller brittle strength and the realm ofbrittle fracturing extends to greater depth in the crust. Thus,otherwise ductile rocks can fracture if fluid pressure is high.
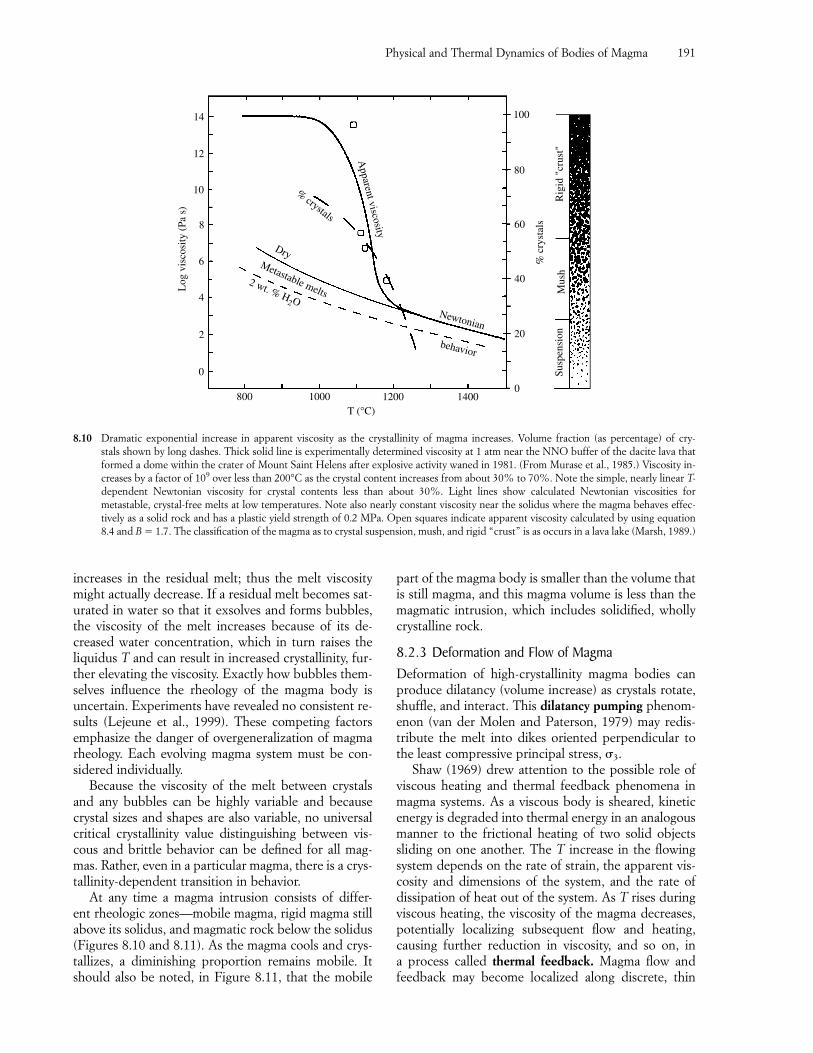
increases in the residual melt; thus the melt viscositymight actually decrease. If a residual melt becomes sat-urated in water so that it exsolves and forms bubbles,the viscosity of the melt increases because of its de-creased water concentration, which in turn raises theliquidus T and can result in increased crystallinity, fur-ther elevating the viscosity. Exactly how bubbles them-selves influence the rheology of the magma body is uncertain. Experiments have revealed no consistent re-sults (Lejeune et al., 1999). These competing factorsemphasize the danger of overgeneralization of magmarheology. Each evolving magma system must be con-sidered individually.
Because the viscosity of the melt between crystalsand any bubbles can be highly variable and becausecrystal sizes and shapes are also variable, no universalcritical crystallinity value distinguishing between vis-cous and brittle behavior can be defined for all mag-mas. Rather, even in a particular magma, there is a crys-tallinity-dependent transition in behavior.
At any time a magma intrusion consists of differ-ent rheologic zones—mobile magma, rigid magma stillabove its solidus, and magmatic rock below the solidus(Figures 8.10 and 8.11). As the magma cools and crys-tallizes, a diminishing proportion remains mobile. Itshould also be noted, in Figure 8.11, that the mobile
part of the magma body is smaller than the volume thatis still magma, and this magma volume is less than themagmatic intrusion, which includes solidified, whollycrystalline rock.
8.2.3 Deformation and Flow of MagmaDeformation of high-crystallinity magma bodies canproduce dilatancy (volume increase) as crystals rotate,shuffle, and interact. This dilatancy pumping phenom-enon (van der Molen and Paterson, 1979) may redis-tribute the melt into dikes oriented perpendicular tothe least compressive principal stress, �3.
Shaw (1969) drew attention to the possible role ofviscous heating and thermal feedback phenomena inmagma systems. As a viscous body is sheared, kineticenergy is degraded into thermal energy in an analogousmanner to the frictional heating of two solid objectssliding on one another. The T increase in the flowingsystem depends on the rate of strain, the apparent vis-cosity and dimensions of the system, and the rate ofdissipation of heat out of the system. As T rises duringviscous heating, the viscosity of the magma decreases,potentially localizing subsequent flow and heating,causing further reduction in viscosity, and so on, in a process called thermal feedback. Magma flow andfeedback may become localized along discrete, thin
Physical and Thermal Dynamics of Bodies of Magma 191
800 1000 1200 14000
20
40
60
80
10014
12
10
8
6
4
2
0
Log
vis
cosi
ty (
Pa s
)
Apparent viscosity
Newtonian
behavior
Metastable melts2 wt. % H
2O
Dry
% crystals
T (°C)
% c
ryst
als
Susp
ensi
onM
ush
Rig
id "
crus
t"
8.10 Dramatic exponential increase in apparent viscosity as the crystallinity of magma increases. Volume fraction (as percentage) of cry-stals shown by long dashes. Thick solid line is experimentally determined viscosity at 1 atm near the NNO buffer of the dacite lava thatformed a dome within the crater of Mount Saint Helens after explosive activity waned in 1981. (From Murase et al., 1985.) Viscosity in-creases by a factor of 109 over less than 200°C as the crystal content increases from about 30% to 70%. Note the simple, nearly linear T-dependent Newtonian viscosity for crystal contents less than about 30%. Light lines show calculated Newtonian viscosities formetastable, crystal-free melts at low temperatures. Note also nearly constant viscosity near the solidus where the magma behaves effec-tively as a solid rock and has a plastic yield strength of 0.2 MPa. Open squares indicate apparent viscosity calculated by using equation8.4 and B � 1.7. The classification of the magma as to crystal suspension, mush, and rigid “crust” is as occurs in a lava lake (Marsh, 1989.)
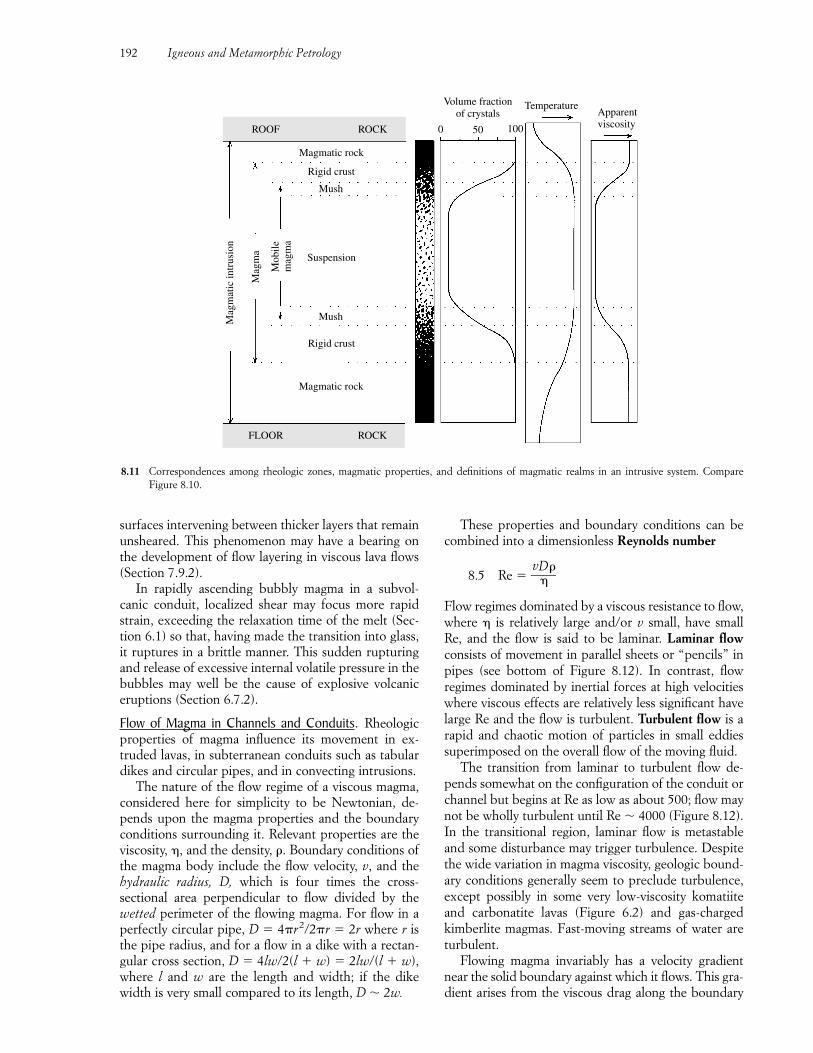
surfaces intervening between thicker layers that remainunsheared. This phenomenon may have a bearing onthe development of flow layering in viscous lava flows(Section 7.9.2).
In rapidly ascending bubbly magma in a subvol-canic conduit, localized shear may focus more rapidstrain, exceeding the relaxation time of the melt (Sec-tion 6.1) so that, having made the transition into glass,it ruptures in a brittle manner. This sudden rupturingand release of excessive internal volatile pressure in thebubbles may well be the cause of explosive volcaniceruptions (Section 6.7.2).
Flow of Magma in Channels and Conduits. Rheologicproperties of magma influence its movement in ex-truded lavas, in subterranean conduits such as tabulardikes and circular pipes, and in convecting intrusions.
The nature of the flow regime of a viscous magma,considered here for simplicity to be Newtonian, de-pends upon the magma properties and the boundaryconditions surrounding it. Relevant properties are theviscosity, , and the density, �. Boundary conditions ofthe magma body include the flow velocity, v, and thehydraulic radius, D, which is four times the cross-sectional area perpendicular to flow divided by the wetted perimeter of the flowing magma. For flow in aperfectly circular pipe, D � 4�r2/2�r � 2r where r isthe pipe radius, and for a flow in a dike with a rectan-gular cross section, D � 4lw/2(l � w) � 2lw/(l � w),where l and w are the length and width; if the dikewidth is very small compared to its length, D � 2w.
These properties and boundary conditions can becombined into a dimensionless Reynolds number
8.5 Re � �vD
�
�
Flow regimes dominated by a viscous resistance to flow,where is relatively large and/or v small, have small Re, and the flow is said to be laminar. Laminar flowconsists of movement in parallel sheets or “pencils” inpipes (see bottom of Figure 8.12). In contrast, flowregimes dominated by inertial forces at high velocitieswhere viscous effects are relatively less significant havelarge Re and the flow is turbulent. Turbulent flow is arapid and chaotic motion of particles in small eddies superimposed on the overall flow of the moving fluid.
The transition from laminar to turbulent flow de-pends somewhat on the configuration of the conduit orchannel but begins at Re as low as about 500; flow maynot be wholly turbulent until Re � 4000 (Figure 8.12).In the transitional region, laminar flow is metastableand some disturbance may trigger turbulence. Despitethe wide variation in magma viscosity, geologic bound-ary conditions generally seem to preclude turbulence,except possibly in some very low-viscosity komatiiteand carbonatite lavas (Figure 6.2) and gas-chargedkimberlite magmas. Fast-moving streams of water areturbulent.
Flowing magma invariably has a velocity gradientnear the solid boundary against which it flows. This gra-dient arises from the viscous drag along the boundary
192 Igneous and Metamorphic Petrology
Magmatic rock
Magmatic rock
Rigid crust
Mush
Suspension
Mush
Rigid crust
Mag
ma
Mob
ilem
agm
a
Mag
mat
ic in
trus
ion
Volume fractionof crystals
0 50 100
TemperatureApparentviscosity
FLOOR ROCK
ROOF ROCK
8.11 Correspondences among rheologic zones, magmatic properties, and definitions of magmatic realms in an intrusive system. Compare Figure 8.10.
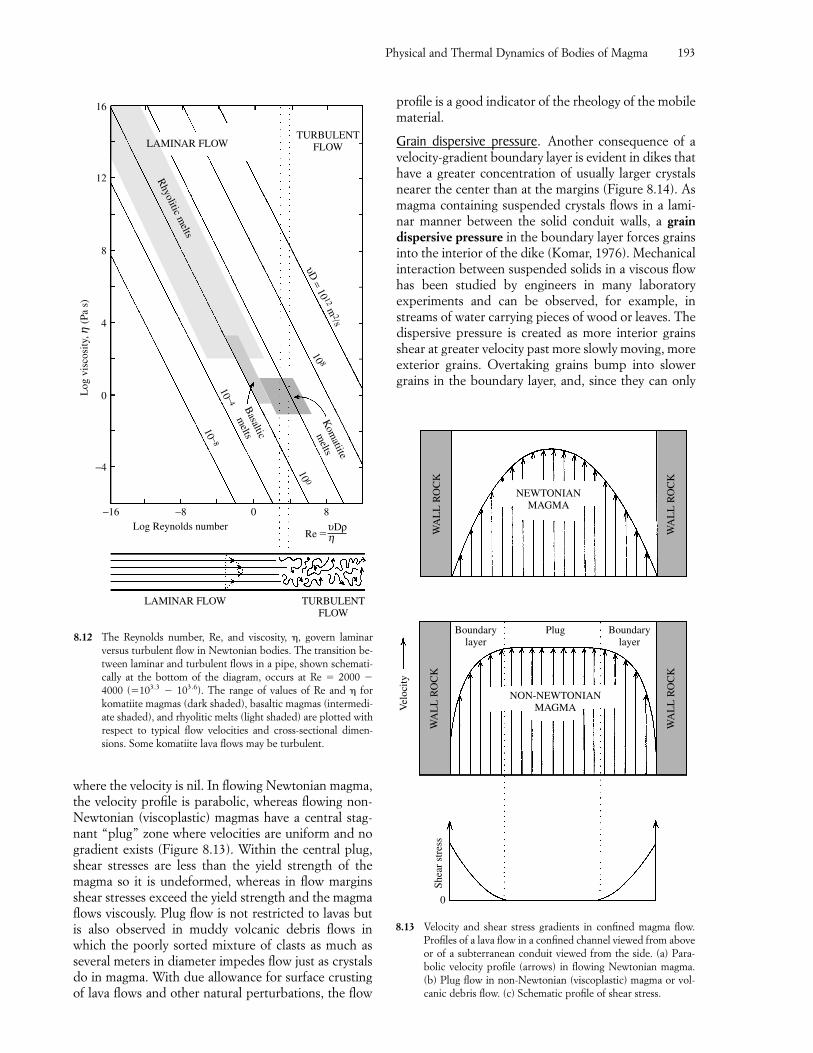
where the velocity is nil. In flowing Newtonian magma,the velocity profile is parabolic, whereas flowing non-Newtonian (viscoplastic) magmas have a central stag-nant “plug” zone where velocities are uniform and nogradient exists (Figure 8.13). Within the central plug,shear stresses are less than the yield strength of themagma so it is undeformed, whereas in flow marginsshear stresses exceed the yield strength and the magmaflows viscously. Plug flow is not restricted to lavas butis also observed in muddy volcanic debris flows inwhich the poorly sorted mixture of clasts as much asseveral meters in diameter impedes flow just as crystalsdo in magma. With due allowance for surface crustingof lava flows and other natural perturbations, the flow
profile is a good indicator of the rheology of the mobilematerial.
Grain dispersive pressure. Another consequence of avelocity-gradient boundary layer is evident in dikes thathave a greater concentration of usually larger crystalsnearer the center than at the margins (Figure 8.14). Asmagma containing suspended crystals flows in a lami-nar manner between the solid conduit walls, a graindispersive pressure in the boundary layer forces grainsinto the interior of the dike (Komar, 1976). Mechanicalinteraction between suspended solids in a viscous flowhas been studied by engineers in many laboratory experiments and can be observed, for example, instreams of water carrying pieces of wood or leaves. Thedispersive pressure is created as more interior grainsshear at greater velocity past more slowly moving, moreexterior grains. Overtaking grains bump into slowergrains in the boundary layer, and, since they can only
Physical and Thermal Dynamics of Bodies of Magma 193
LAMINAR FLOW TURBULENTFLOW
−16
−4
0
4
8
12
16
−8 0 8Log Reynolds number
Log
vis
cosi
ty, η
(Pa
s)
LAMINAR FLOWTURBULENT
FLOW
υD = 10 12 m
2/s
10 8
10 −4
10 0
10 −8
Kom
atiite
melts
Basaltic
melts
Rhyolitic m
elts
Re �Dρ
ηυ
8.12 The Reynolds number, Re, and viscosity, , govern laminarversus turbulent flow in Newtonian bodies. The transition be-tween laminar and turbulent flows in a pipe, shown schemati-cally at the bottom of the diagram, occurs at Re � 2000 �
4000 (�103.3 � 103.6). The range of values of Re and for komatiite magmas (dark shaded), basaltic magmas (intermedi-ate shaded), and rhyolitic melts (light shaded) are plotted withrespect to typical flow velocities and cross-sectional dimen-sions. Some komatiite lava flows may be turbulent.
NEWTONIANMAGMA
WA
LL
RO
CK
WA
LL
RO
CK
WA
LL
RO
CK
WA
LL
RO
CK
Boundarylayer
Plug Boundarylayer
NON-NEWTONIANMAGMA
Shea
r st
ress
0
Vel
ocity
8.13 Velocity and shear stress gradients in confined magma flow.Profiles of a lava flow in a confined channel viewed from aboveor of a subterranean conduit viewed from the side. (a) Para-bolic velocity profile (arrows) in flowing Newtonian magma.(b) Plug flow in non-Newtonian (viscoplastic) magma or vol-canic debris flow. (c) Schematic profile of shear stress.
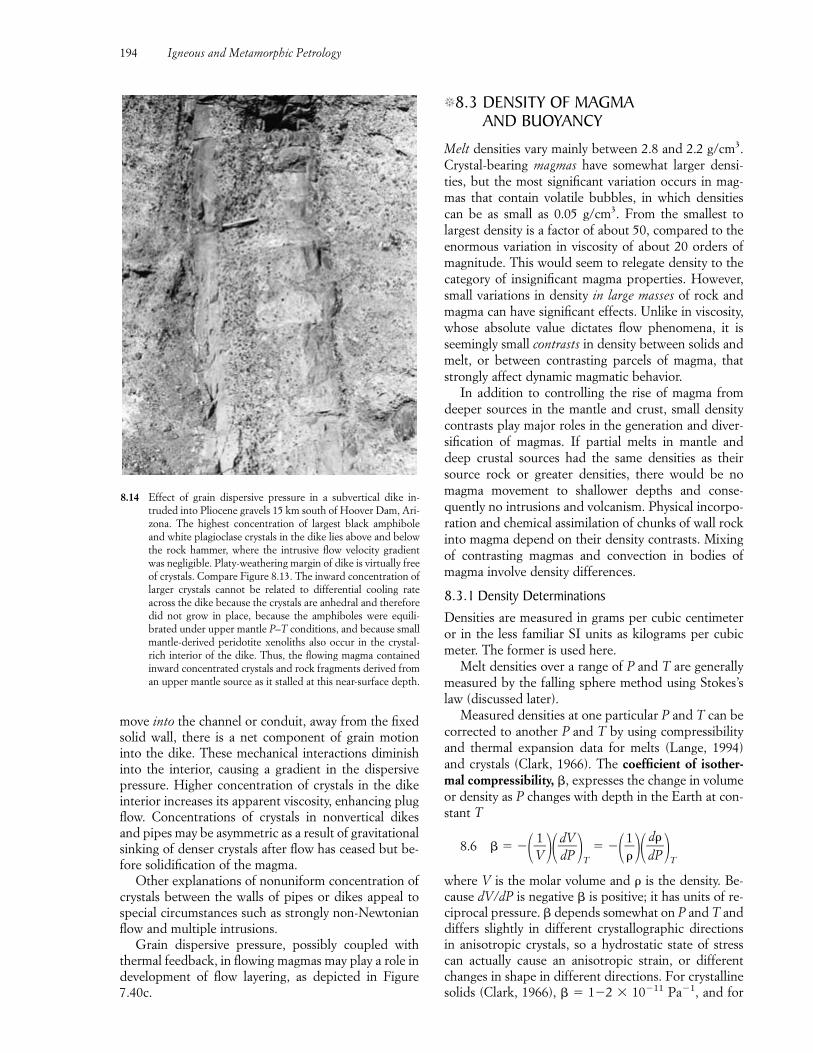
move into the channel or conduit, away from the fixedsolid wall, there is a net component of grain motioninto the dike. These mechanical interactions diminishinto the interior, causing a gradient in the dispersivepressure. Higher concentration of crystals in the dikeinterior increases its apparent viscosity, enhancing plugflow. Concentrations of crystals in nonvertical dikesand pipes may be asymmetric as a result of gravitationalsinking of denser crystals after flow has ceased but be-fore solidification of the magma.
Other explanations of nonuniform concentration ofcrystals between the walls of pipes or dikes appeal tospecial circumstances such as strongly non-Newtonianflow and multiple intrusions.
Grain dispersive pressure, possibly coupled withthermal feedback, in flowing magmas may play a role indevelopment of flow layering, as depicted in Figure7.40c.
�8.3 DENSITY OF MAGMA AND BUOYANCY
Melt densities vary mainly between 2.8 and 2.2 g/cm3.Crystal-bearing magmas have somewhat larger densi-ties, but the most significant variation occurs in mag-mas that contain volatile bubbles, in which densitiescan be as small as 0.05 g/cm3. From the smallest tolargest density is a factor of about 50, compared to theenormous variation in viscosity of about 20 orders ofmagnitude. This would seem to relegate density to thecategory of insignificant magma properties. However,small variations in density in large masses of rock andmagma can have significant effects. Unlike in viscosity,whose absolute value dictates flow phenomena, it isseemingly small contrasts in density between solids andmelt, or between contrasting parcels of magma, thatstrongly affect dynamic magmatic behavior.
In addition to controlling the rise of magma fromdeeper sources in the mantle and crust, small densitycontrasts play major roles in the generation and diver-sification of magmas. If partial melts in mantle anddeep crustal sources had the same densities as theirsource rock or greater densities, there would be nomagma movement to shallower depths and conse-quently no intrusions and volcanism. Physical incorpo-ration and chemical assimilation of chunks of wall rockinto magma depend on their density contrasts. Mixingof contrasting magmas and convection in bodies ofmagma involve density differences.
8.3.1 Density DeterminationsDensities are measured in grams per cubic centimeteror in the less familiar SI units as kilograms per cubicmeter. The former is used here.
Melt densities over a range of P and T are generallymeasured by the falling sphere method using Stokes’slaw (discussed later).
Measured densities at one particular P and T can becorrected to another P and T by using compressibilityand thermal expansion data for melts (Lange, 1994)and crystals (Clark, 1966). The coefficient of isother-mal compressibility, �, expresses the change in volumeor density as P changes with depth in the Earth at con-stant T
8.6 � � ���V1
����ddVP��
T
� ���1�
����ddP���
T
where V is the molar volume and � is the density. Be-cause dV/dP is negative � is positive; it has units of re-ciprocal pressure. � depends somewhat on P and T anddiffers slightly in different crystallographic directionsin anisotropic crystals, so a hydrostatic state of stresscan actually cause an anisotropic strain, or differentchanges in shape in different directions. For crystallinesolids (Clark, 1966), � � 1�2 � 10�11 Pa�1, and for
194 Igneous and Metamorphic Petrology
8.14 Effect of grain dispersive pressure in a subvertical dike in-truded into Pliocene gravels 15 km south of Hoover Dam, Ari-zona. The highest concentration of largest black amphiboleand white plagioclase crystals in the dike lies above and belowthe rock hammer, where the intrusive flow velocity gradientwas negligible. Platy-weathering margin of dike is virtually freeof crystals. Compare Figure 8.13. The inward concentration oflarger crystals cannot be related to differential cooling rateacross the dike because the crystals are anhedral and thereforedid not grow in place, because the amphiboles were equili-brated under upper mantle P–T conditions, and because smallmantle-derived peridotite xenoliths also occur in the crystal-rich interior of the dike. Thus, the flowing magma containedinward concentrated crystals and rock fragments derived froman upper mantle source as it stalled at this near-surface depth.
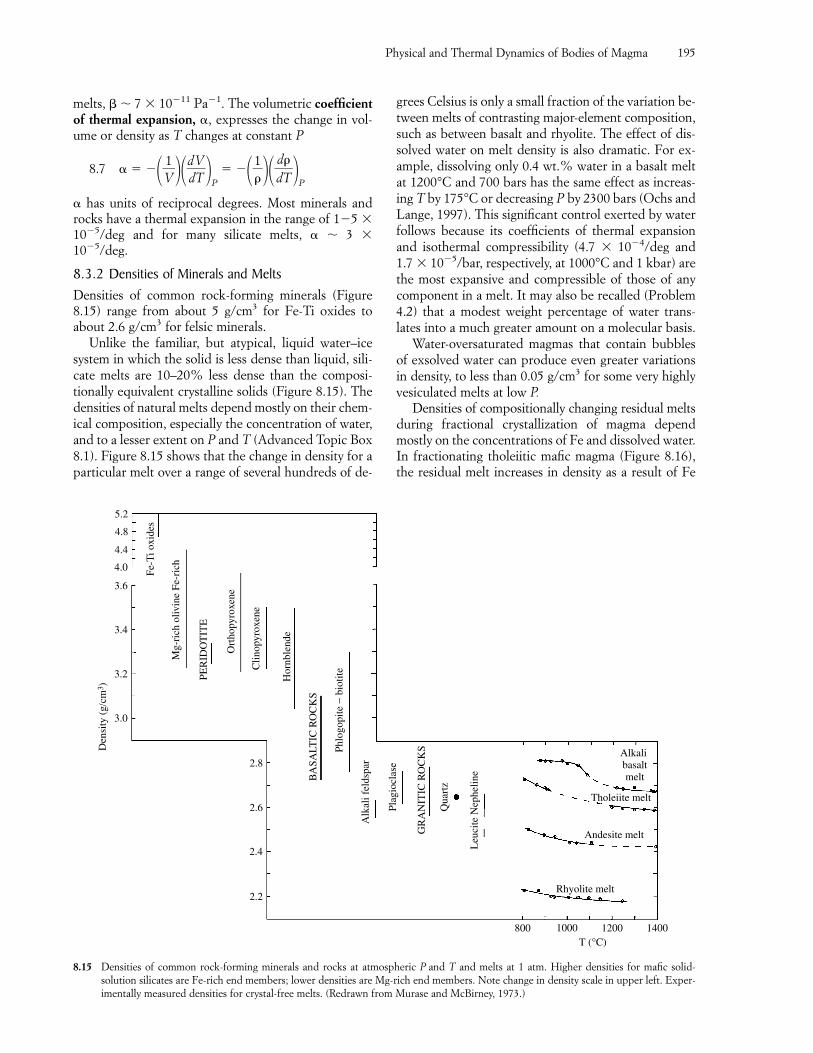
melts, � � 7 � 10�11 Pa�1. The volumetric coefficientof thermal expansion, �, expresses the change in vol-ume or density as T changes at constant P
8.7 � � ���V1
����ddVT��
P
� ���1�
����ddT���
P
� has units of reciprocal degrees. Most minerals androcks have a thermal expansion in the range of 1�5 �10�5/deg and for many silicate melts, � � 3 �10�5/deg.
8.3.2 Densities of Minerals and MeltsDensities of common rock-forming minerals (Figure8.15) range from about 5 g/cm3 for Fe-Ti oxides toabout 2.6 g/cm3 for felsic minerals.
Unlike the familiar, but atypical, liquid water–icesystem in which the solid is less dense than liquid, sili-cate melts are 10–20% less dense than the composi-tionally equivalent crystalline solids (Figure 8.15). Thedensities of natural melts depend mostly on their chem-ical composition, especially the concentration of water,and to a lesser extent on P and T (Advanced Topic Box8.1). Figure 8.15 shows that the change in density for aparticular melt over a range of several hundreds of de-
grees Celsius is only a small fraction of the variation be-tween melts of contrasting major-element composition,such as between basalt and rhyolite. The effect of dis-solved water on melt density is also dramatic. For ex-ample, dissolving only 0.4 wt.% water in a basalt meltat 1200°C and 700 bars has the same effect as increas-ing T by 175°C or decreasing P by 2300 bars (Ochs andLange, 1997). This significant control exerted by waterfollows because its coefficients of thermal expansionand isothermal compressibility (4.7 � 10�4/deg and1.7 � 10�5/bar, respectively, at 1000°C and 1 kbar) arethe most expansive and compressible of those of anycomponent in a melt. It may also be recalled (Problem4.2) that a modest weight percentage of water trans-lates into a much greater amount on a molecular basis.
Water-oversaturated magmas that contain bubblesof exsolved water can produce even greater variationsin density, to less than 0.05 g/cm3 for some very highlyvesiculated melts at low P.
Densities of compositionally changing residual meltsduring fractional crystallization of magma dependmostly on the concentrations of Fe and dissolved water.In fractionating tholeiitic mafic magma (Figure 8.16),the residual melt increases in density as a result of Fe
Physical and Thermal Dynamics of Bodies of Magma 195
800 1000 1200 1400
Andesite melt
Rhyolite melt
Tholeiite melt
Alkali basaltmelt
Leu
cite
Nep
helin
e
Qua
rtz
GR
AN
ITIC
RO
CK
S
Plag
iocl
ase
Alk
ali f
elds
par
Phlo
gopi
te −
bio
tite
BA
SALT
IC R
OC
KS
Hor
nble
nde
Clin
opyr
oxen
e
PER
IDO
TIT
E
Mg-
rich
oliv
ine
Fe-r
ich
Fe-T
i oxi
des
2.4
2.2
2.6
2.8
3.0
3.2
3.4
3.6
4.0
4.4
4.8
5.2
T (°C)
Ort
hopy
roxe
ne
Den
sity
(g/
cm3 )
8.15 Densities of common rock-forming minerals and rocks at atmospheric P and T and melts at 1 atm. Higher densities for mafic solid-solution silicates are Fe-rich end members; lower densities are Mg-rich end members. Note change in density scale in upper left. Exper-imentally measured densities for crystal-free melts. (Redrawn from Murase and McBirney, 1973.)
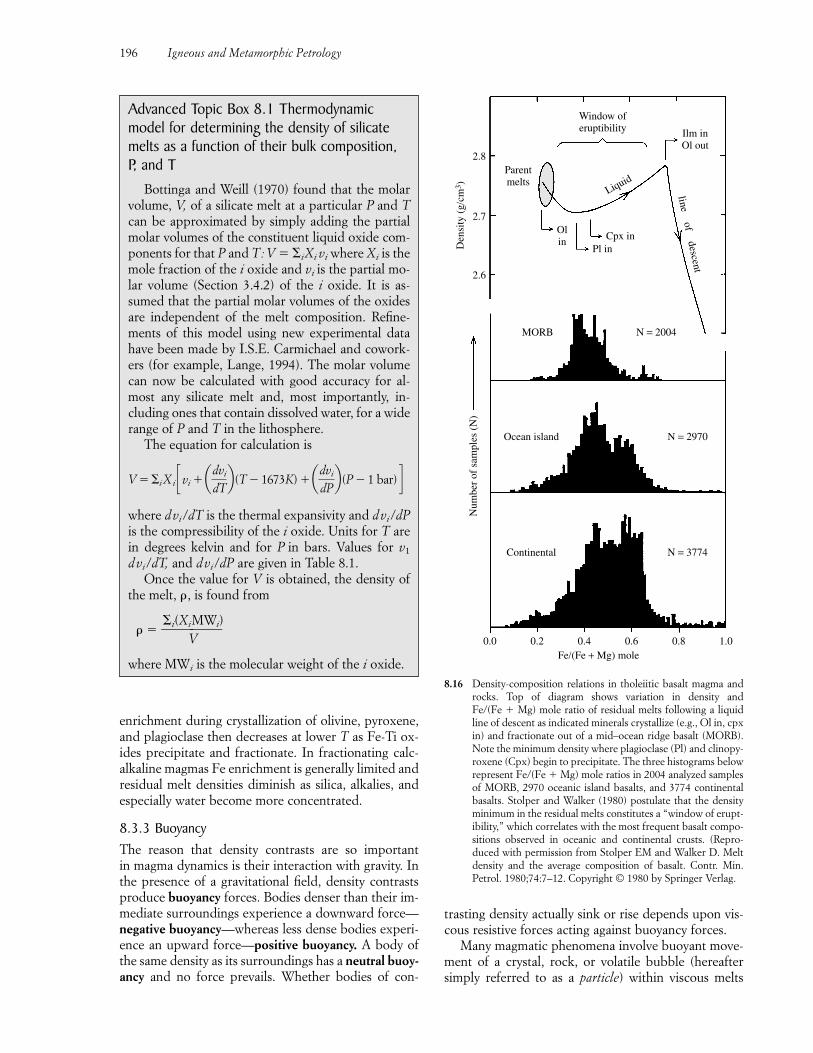
enrichment during crystallization of olivine, pyroxene,and plagioclase then decreases at lower T as Fe-Ti ox-ides precipitate and fractionate. In fractionating calc-alkaline magmas Fe enrichment is generally limited andresidual melt densities diminish as silica, alkalies, andespecially water become more concentrated.
8.3.3 BuoyancyThe reason that density contrasts are so important in magma dynamics is their interaction with gravity. Inthe presence of a gravitational field, density contrastsproduce buoyancy forces. Bodies denser than their im-mediate surroundings experience a downward force—negative buoyancy—whereas less dense bodies experi-ence an upward force—positive buoyancy. A body ofthe same density as its surroundings has a neutral buoy-ancy and no force prevails. Whether bodies of con-
trasting density actually sink or rise depends upon vis-cous resistive forces acting against buoyancy forces.
Many magmatic phenomena involve buoyant move-ment of a crystal, rock, or volatile bubble (hereaftersimply referred to as a particle) within viscous melts
196 Igneous and Metamorphic Petrology
0.0 0.2 0.4 0.6 0.8 1.0
Continental N = 3774
Ocean island N = 2970
N = 2004
Fe/(Fe + Mg) mole
Num
ber
of s
ampl
es (
N)
MORB
Parentmelts
Olin
Pl inCpx in
Liquid
Window oferuptibility Ilm in
Ol outline of descent
2.6
2.7
2.8
Den
sity
(g/
cm3 )
8.16 Density-composition relations in tholeiitic basalt magma androcks. Top of diagram shows variation in density and Fe/(Fe � Mg) mole ratio of residual melts following a liquidline of descent as indicated minerals crystallize (e.g., Ol in, cpx in) and fractionate out of a mid–ocean ridge basalt (MORB).Note the minimum density where plagioclase (Pl) and clinopy-roxene (Cpx) begin to precipitate. The three histograms belowrepresent Fe/(Fe � Mg) mole ratios in 2004 analyzed samplesof MORB, 2970 oceanic island basalts, and 3774 continentalbasalts. Stolper and Walker (1980) postulate that the densityminimum in the residual melts constitutes a “window of erupt-ibility,” which correlates with the most frequent basalt compo-sitions observed in oceanic and continental crusts. (Repro-duced with permission from Stolper EM and Walker D. Meltdensity and the average composition of basalt. Contr. Min.Petrol. 1980;74:7–12. Copyright © 1980 by Springer Verlag.
Advanced Topic Box 8.1 Thermodynamicmodel for determining the density of silicatemelts as a function of their bulk composition,P, and T
Bottinga and Weill (1970) found that the molarvolume, V, of a silicate melt at a particular P and Tcan be approximated by simply adding the partialmolar volumes of the constituent liquid oxide com-ponents for that P and T: V � �iXi vi where Xi is themole fraction of the i oxide and vi is the partial mo-lar volume (Section 3.4.2) of the i oxide. It is as-sumed that the partial molar volumes of the oxidesare independent of the melt composition. Refine-ments of this model using new experimental datahave been made by I.S.E. Carmichael and cowork-ers (for example, Lange, 1994). The molar volumecan now be calculated with good accuracy for al-most any silicate melt and, most importantly, in-cluding ones that contain dissolved water, for a widerange of P and T in the lithosphere.
The equation for calculation is
where dvi/dT is the thermal expansivity and dvi/dPis the compressibility of the i oxide. Units for T arein degrees kelvin and for P in bars. Values for v1
dvi/dT, and dvi/dP are given in Table 8.1.Once the value for V is obtained, the density of
the melt, �, is found from
� � ��i(Xi
VMWi)�
where MWi is the molecular weight of the i oxide.
V � �iXi cvi � advi
dTb(T � 1673K) � advi
dPb(P � 1 bar) d
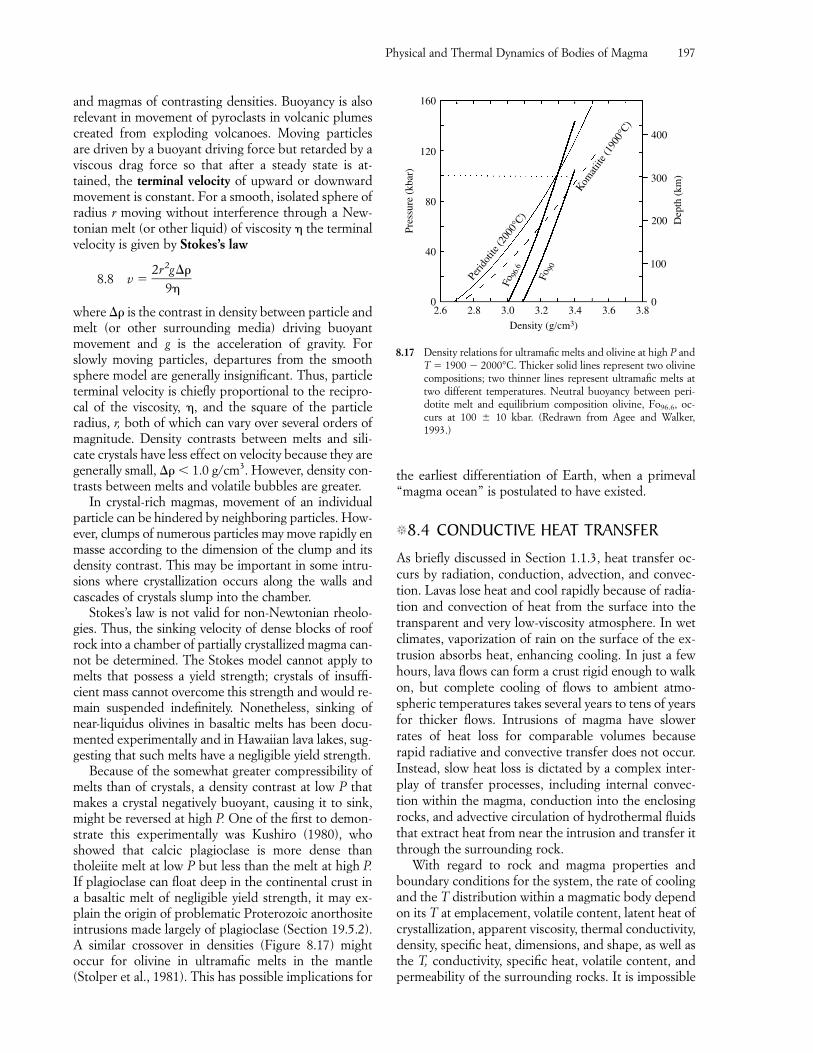
and magmas of contrasting densities. Buoyancy is alsorelevant in movement of pyroclasts in volcanic plumescreated from exploding volcanoes. Moving particlesare driven by a buoyant driving force but retarded by aviscous drag force so that after a steady state is at-tained, the terminal velocity of upward or downwardmovement is constant. For a smooth, isolated sphere ofradius r moving without interference through a New-tonian melt (or other liquid) of viscosity the terminalvelocity is given by Stokes’s law
8.8 v � �2r2
9g
��
where � is the contrast in density between particle andmelt (or other surrounding media) driving buoyantmovement and g is the acceleration of gravity. Forslowly moving particles, departures from the smoothsphere model are generally insignificant. Thus, particleterminal velocity is chiefly proportional to the recipro-cal of the viscosity, , and the square of the particle radius, r, both of which can vary over several orders ofmagnitude. Density contrasts between melts and sili-cate crystals have less effect on velocity because they aregenerally small, � � 1.0 g/cm3. However, density con-trasts between melts and volatile bubbles are greater.
In crystal-rich magmas, movement of an individualparticle can be hindered by neighboring particles. How-ever, clumps of numerous particles may move rapidly enmasse according to the dimension of the clump and itsdensity contrast. This may be important in some intru-sions where crystallization occurs along the walls andcascades of crystals slump into the chamber.
Stokes’s law is not valid for non-Newtonian rheolo-gies. Thus, the sinking velocity of dense blocks of roofrock into a chamber of partially crystallized magma can-not be determined. The Stokes model cannot apply tomelts that possess a yield strength; crystals of insuffi-cient mass cannot overcome this strength and would re-main suspended indefinitely. Nonetheless, sinking ofnear-liquidus olivines in basaltic melts has been docu-mented experimentally and in Hawaiian lava lakes, sug-gesting that such melts have a negligible yield strength.
Because of the somewhat greater compressibility ofmelts than of crystals, a density contrast at low P thatmakes a crystal negatively buoyant, causing it to sink,might be reversed at high P. One of the first to demon-strate this experimentally was Kushiro (1980), whoshowed that calcic plagioclase is more dense thantholeiite melt at low P but less than the melt at high P.If plagioclase can float deep in the continental crust ina basaltic melt of negligible yield strength, it may ex-plain the origin of problematic Proterozoic anorthositeintrusions made largely of plagioclase (Section 19.5.2).A similar crossover in densities (Figure 8.17) might occur for olivine in ultramafic melts in the mantle(Stolper et al., 1981). This has possible implications for
the earliest differentiation of Earth, when a primeval“magma ocean” is postulated to have existed.
�8.4 CONDUCTIVE HEAT TRANSFER
As briefly discussed in Section 1.1.3, heat transfer oc-curs by radiation, conduction, advection, and convec-tion. Lavas lose heat and cool rapidly because of radia-tion and convection of heat from the surface into thetransparent and very low-viscosity atmosphere. In wetclimates, vaporization of rain on the surface of the ex-trusion absorbs heat, enhancing cooling. In just a fewhours, lava flows can form a crust rigid enough to walkon, but complete cooling of flows to ambient atmo-spheric temperatures takes several years to tens of yearsfor thicker flows. Intrusions of magma have slowerrates of heat loss for comparable volumes becauserapid radiative and convective transfer does not occur.Instead, slow heat loss is dictated by a complex inter-play of transfer processes, including internal convec-tion within the magma, conduction into the enclosingrocks, and advective circulation of hydrothermal fluidsthat extract heat from near the intrusion and transfer itthrough the surrounding rock.
With regard to rock and magma properties andboundary conditions for the system, the rate of coolingand the T distribution within a magmatic body dependon its T at emplacement, volatile content, latent heat ofcrystallization, apparent viscosity, thermal conductivity,density, specific heat, dimensions, and shape, as well asthe T, conductivity, specific heat, volatile content, andpermeability of the surrounding rocks. It is impossible
Physical and Thermal Dynamics of Bodies of Magma 197
2.6 2.8 3.0 3.2 3.4 3.6 3.8
Density (g/cm3)
0
40
80
120
160
Pres
sure
(kb
ar)
0
100
200
300
400
Dep
th (
km)
Komat
iite (
1900
°C)
Perid
otite
(200
0°C)
Fo96
.6
Fo90
8.17 Density relations for ultramafic melts and olivine at high P andT � 1900 � 2000°C. Thicker solid lines represent two olivinecompositions; two thinner lines represent ultramafic melts attwo different temperatures. Neutral buoyancy between peri-dotite melt and equilibrium composition olivine, Fo96.6, oc-curs at 100 � 10 kbar. (Redrawn from Agee and Walker,1993.)
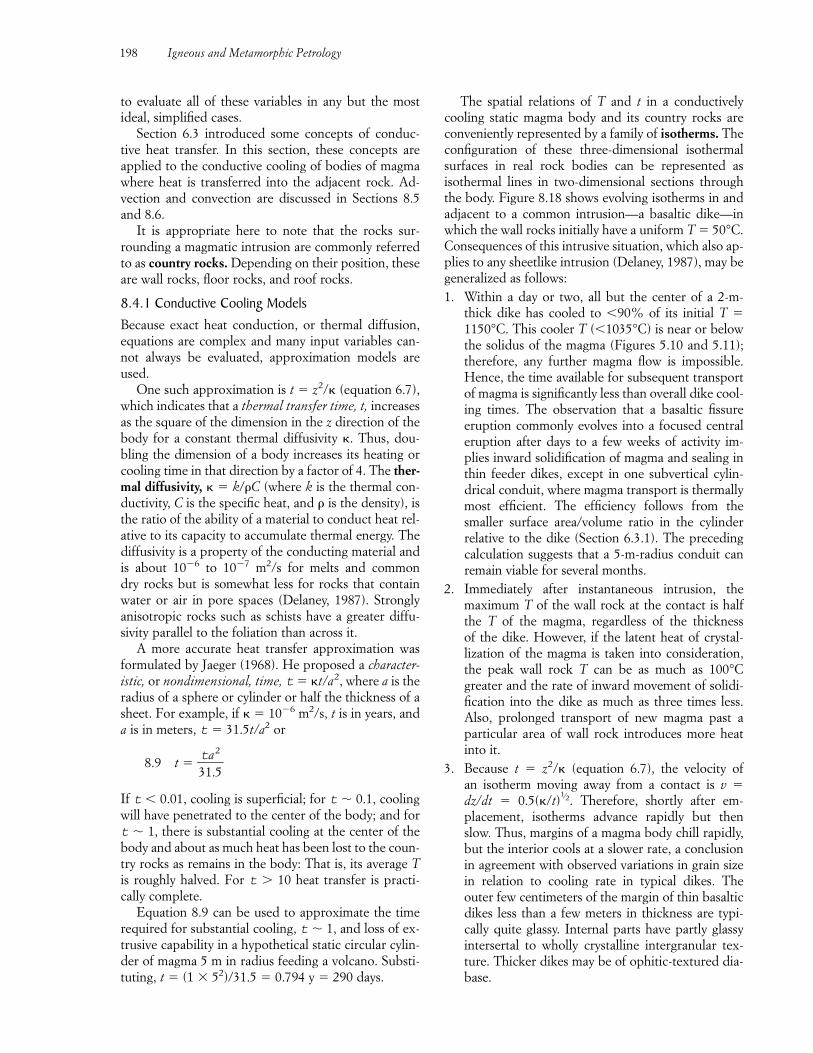
to evaluate all of these variables in any but the mostideal, simplified cases.
Section 6.3 introduced some concepts of conduc-tive heat transfer. In this section, these concepts are applied to the conductive cooling of bodies of magmawhere heat is transferred into the adjacent rock. Ad-vection and convection are discussed in Sections 8.5and 8.6.
It is appropriate here to note that the rocks sur-rounding a magmatic intrusion are commonly referredto as country rocks. Depending on their position, theseare wall rocks, floor rocks, and roof rocks.
8.4.1 Conductive Cooling ModelsBecause exact heat conduction, or thermal diffusion,equations are complex and many input variables can-not always be evaluated, approximation models areused.
One such approximation is t � z2/� (equation 6.7),which indicates that a thermal transfer time, t, increasesas the square of the dimension in the z direction of thebody for a constant thermal diffusivity �. Thus, dou-bling the dimension of a body increases its heating orcooling time in that direction by a factor of 4. The ther-mal diffusivity, � � k/�C (where k is the thermal con-ductivity, C is the specific heat, and � is the density), isthe ratio of the ability of a material to conduct heat rel-ative to its capacity to accumulate thermal energy. Thediffusivity is a property of the conducting material andis about 10�6 to 10�7 m2/s for melts and common dry rocks but is somewhat less for rocks that containwater or air in pore spaces (Delaney, 1987). Stronglyanisotropic rocks such as schists have a greater diffu-sivity parallel to the foliation than across it.
A more accurate heat transfer approximation wasformulated by Jaeger (1968). He proposed a character-istic, or nondimensional, time, t � �t/a2, where a is theradius of a sphere or cylinder or half the thickness of asheet. For example, if � � 10�6 m2/s, t is in years, anda is in meters, t � 31.5t/a2 or
8.9 t � �3t1a.
2
5�
If t � 0.01, cooling is superficial; for t � 0.1, coolingwill have penetrated to the center of the body; and fort � 1, there is substantial cooling at the center of thebody and about as much heat has been lost to the coun-try rocks as remains in the body: That is, its average Tis roughly halved. For t � 10 heat transfer is practi-cally complete.
Equation 8.9 can be used to approximate the timerequired for substantial cooling, t � 1, and loss of ex-trusive capability in a hypothetical static circular cylin-der of magma 5 m in radius feeding a volcano. Substi-tuting, t � (1 � 52)/31.5 � 0.794 y � 290 days.
The spatial relations of T and t in a conductivelycooling static magma body and its country rocks areconveniently represented by a family of isotherms. Theconfiguration of these three-dimensional isothermalsurfaces in real rock bodies can be represented asisothermal lines in two-dimensional sections throughthe body. Figure 8.18 shows evolving isotherms in andadjacent to a common intrusion—a basaltic dike—inwhich the wall rocks initially have a uniform T � 50°C.Consequences of this intrusive situation, which also ap-plies to any sheetlike intrusion (Delaney, 1987), may begeneralized as follows:1. Within a day or two, all but the center of a 2-m-
thick dike has cooled to �90% of its initial T �1150°C. This cooler T (�1035°C) is near or belowthe solidus of the magma (Figures 5.10 and 5.11);therefore, any further magma flow is impossible.Hence, the time available for subsequent transportof magma is significantly less than overall dike cool-ing times. The observation that a basaltic fissureeruption commonly evolves into a focused centraleruption after days to a few weeks of activity im-plies inward solidification of magma and sealing inthin feeder dikes, except in one subvertical cylin-drical conduit, where magma transport is thermallymost efficient. The efficiency follows from thesmaller surface area/volume ratio in the cylinderrelative to the dike (Section 6.3.1). The precedingcalculation suggests that a 5-m-radius conduit canremain viable for several months.
2. Immediately after instantaneous intrusion, themaximum T of the wall rock at the contact is halfthe T of the magma, regardless of the thickness of the dike. However, if the latent heat of crystal-lization of the magma is taken into consideration,the peak wall rock T can be as much as 100°Cgreater and the rate of inward movement of solidi-fication into the dike as much as three times less.Also, prolonged transport of new magma past aparticular area of wall rock introduces more heatinto it.
3. Because t � z2/� (equation 6.7), the velocity of an isotherm moving away from a contact is v �dz/dt � 0.5(�/t)
1⁄2. Therefore, shortly after em-placement, isotherms advance rapidly but thenslow. Thus, margins of a magma body chill rapidly,but the interior cools at a slower rate, a conclusionin agreement with observed variations in grain sizein relation to cooling rate in typical dikes. Theouter few centimeters of the margin of thin basalticdikes less than a few meters in thickness are typi-cally quite glassy. Internal parts have partly glassyintersertal to wholly crystalline intergranular tex-ture. Thicker dikes may be of ophitic-textured dia-base.
198 Igneous and Metamorphic Petrology
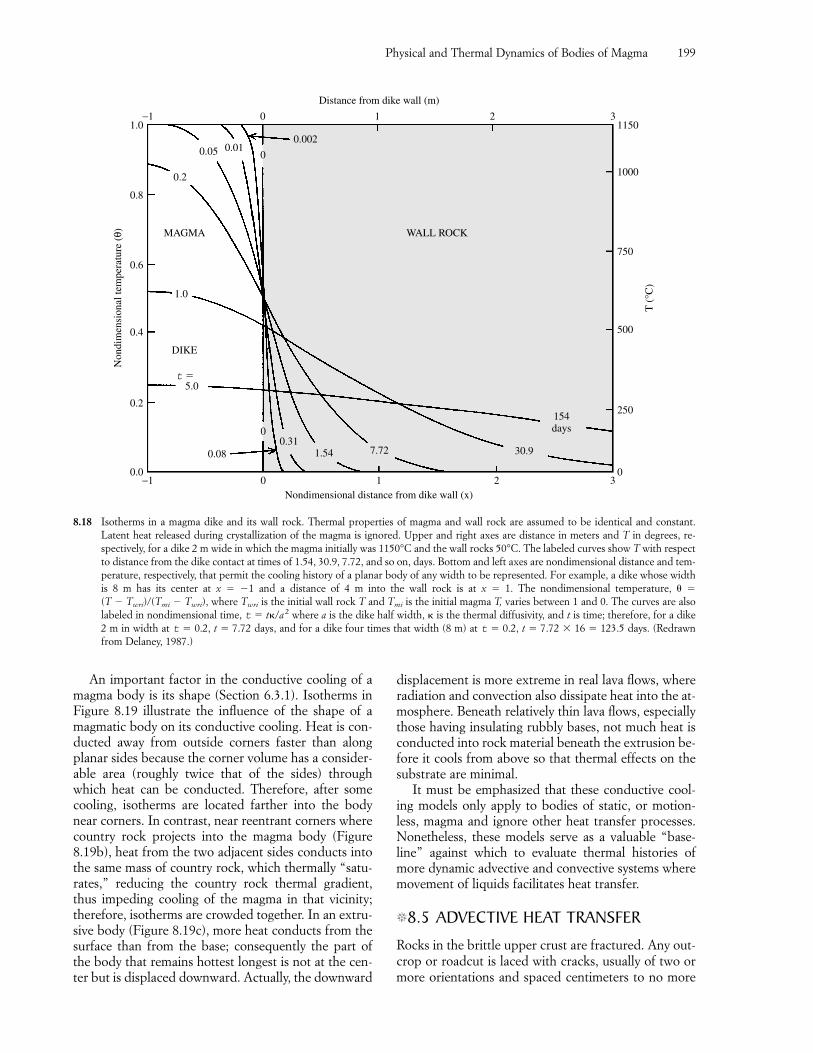
An important factor in the conductive cooling of amagma body is its shape (Section 6.3.1). Isotherms inFigure 8.19 illustrate the influence of the shape of amagmatic body on its conductive cooling. Heat is con-ducted away from outside corners faster than alongplanar sides because the corner volume has a consider-able area (roughly twice that of the sides) throughwhich heat can be conducted. Therefore, after somecooling, isotherms are located farther into the bodynear corners. In contrast, near reentrant corners wherecountry rock projects into the magma body (Figure8.19b), heat from the two adjacent sides conducts intothe same mass of country rock, which thermally “satu-rates,” reducing the country rock thermal gradient,thus impeding cooling of the magma in that vicinity;therefore, isotherms are crowded together. In an extru-sive body (Figure 8.19c), more heat conducts from thesurface than from the base; consequently the part ofthe body that remains hottest longest is not at the cen-ter but is displaced downward. Actually, the downward
Physical and Thermal Dynamics of Bodies of Magma 199
displacement is more extreme in real lava flows, whereradiation and convection also dissipate heat into the at-mosphere. Beneath relatively thin lava flows, especiallythose having insulating rubbly bases, not much heat isconducted into rock material beneath the extrusion be-fore it cools from above so that thermal effects on thesubstrate are minimal.
It must be emphasized that these conductive cool-ing models only apply to bodies of static, or motion-less, magma and ignore other heat transfer processes.Nonetheless, these models serve as a valuable “base-line” against which to evaluate thermal histories ofmore dynamic advective and convective systems wheremovement of liquids facilitates heat transfer.
�8.5 ADVECTIVE HEAT TRANSFER
Rocks in the brittle upper crust are fractured. Any out-crop or roadcut is laced with cracks, usually of two ormore orientations and spaced centimeters to no more
−1 0 1 2 3
−1 0 1 2 3
Nondimensional distance from dike wall (x)
0.0
0.2
0.4
0.6
0.8
1.0
0
250
500
750
1000
1150N
ondi
men
sion
al te
mpe
ratu
re (
θ)Distance from dike wall (m)
T (
°C)
0.05
0.2
0.010
0.002
MAGMA
DIKE
1.0
5.0
0.08
00.31
1.54 7.72 30.9
154days
WALL ROCK
8.18 Isotherms in a magma dike and its wall rock. Thermal properties of magma and wall rock are assumed to be identical and constant. Latent heat released during crystallization of the magma is ignored. Upper and right axes are distance in meters and T in degrees, re-spectively, for a dike 2 m wide in which the magma initially was 1150°C and the wall rocks 50°C. The labeled curves show T with respectto distance from the dike contact at times of 1.54, 30.9, 7.72, and so on, days. Bottom and left axes are nondimensional distance and tem-perature, respectively, that permit the cooling history of a planar body of any width to be represented. For example, a dike whose widthis 8 m has its center at x � �1 and a distance of 4 m into the wall rock is at x � 1. The nondimensional temperature, � �
(T � Twri)/(Tmi � Twri), where Twri is the initial wall rock T and Tmi is the initial magma T, varies between 1 and 0. The curves are alsolabeled in nondimensional time, t � t�/a2 where a is the dike half width, � is the thermal diffusivity, and t is time; therefore, for a dike 2 m in width at t � 0.2, t � 7.72 days, and for a dike four times that width (8 m) at t � 0.2, t � 7.72 � 16 � 123.5 days. (Redrawnfrom Delaney, 1987.)
t �
than a meter or so apart. These fractures are commonlyfilled with fluid, usually aqueous. Deep drilling andstudy of exhumed once-buried rocks reveal the pres-ence of fluids in cracks to depths of at least 10 km.Even in the deeper crust and upper mantle, where rockflows as a viscous or ductile material, extensional frac-tures must still form by hydraulic fracturing, as evi-denced by sheetlike magma intrusions and veins (PlateVI) found in such rocks now exposed at the surface.
The significance of these facts is this: Movement ofmagma and hydrothermal fluids in the Earth throughinterconnected openings in rock can transfer heatmuch more rapidly than by conduction alone. The drycountry rock model assumed for simplicity in conduc-tive calculations is inappropriate for many geologic en-vironments. Advection of liquids through passagewaysin rocks “short-circuits” heat transfer from a cooling
magma intrusion via a lower resistance path into thecooler country rocks. Far traveling advecting liquidscan move faster than heat can conduct through solidrock. Magma derived from a central intrusive mass canquickly invade fractures in the surrounding rock, form-ing dikes and sills. Swarms of such sheetlike intrusionsare common over large plutons (see Figure 9.5) andtestify that heat has been transferred far into the coun-try rocks. Exsolved aqueous fluids expelled from acrystallizing magma intrusion might mix with largervolumes of meteoric water lodged in country rockopenings to form huge advective systems (Section4.3.3).
In the absence of preexisting fractures, or wherepreexisting fractures are not suitably oriented in the local stress field to be open, high-pressure magmas and hydrothermal fluids can move into self-generated
200 Igneous and Metamorphic Petrology
0.010.02
0.04
2aMAGMA
(a)
(c)
(b)
COUNTRY ROCK COUNTRY ROCK
a
COUNTRY ROCK
0.010.020.04
MAGMA
ROCKCOUNTRY
Air
0.010.02
0.04
MAGMA
a
8.19 Isotherms in cooling magmatic bodies. Magma bodies extend indefinitely in the third dimension perpendicular to the page. Isothermsare 0.8T0 at nondimensional times (see caption Figure 8.18) t � 0.01, 0.02, and 0.04 after emplacement of magma initially at a uniformtemperature T0. The pattern of a family of isotherms at different temperatures at one instant of time would be similar. Country rocks(shaded) are initially at a uniform temperature. (a) and (b) are intrusions and (c) is an extrusion. In (a), a magma conduit that is square in cross section and 8 m on a side, the 0.8T0 isotherm has advanced more than two-thirds of the way into the conduit and is a cir-cle (cylinder in three dimensions) after a time t � ta2/� � [0.04 � (4m)2]/10�6 m2/s � 6.4 � 105 s � 1.16 � 10�5 days/s � 7.4 days.In (c), contraction-induced joint columns oriented perpendicular to isotherms are shown schematically by irregular lines. (Redrawn fromJaeger, 1968.)
hydraulic extensional fractures (Figure 8.2c). At shal-low depths of the crust, wholesale brecciation can oc-cur where roof rocks rupture over an intrusion if ex-cessive fluid pressures develop (last part of Section4.3.1). Magma and fluids advecting into widely distrib-uted cracks and breccia openings rapidly lose heat byconduction to the large contacting surface areas ofcooler rock.
Advective transfer of heat associated with magmasascending from the mantle elevates geothermal gradi-ents in the crust above subduction zones and in rifts.As a result, deeper crustal temperatures locally reachthe solidus and cause magma generation.
Advection requires permeable rock, as either preex-isting channels or self-induced hydraulic extensionalfractures created by the advecting magma or fluid. Per-meability is the ease with which fluid can movethrough interconnected openings. Porosity is the pro-portion of openings available in the rock to hold fluid:that is, pore volume/total rock volume. In a lava flow,vesicles and cracks formed during thermal contractionand perhaps by continued flow of the still-mobile inte-rior create porosity. In a plutonic rock, such as granite,porosity lies in cracks and perhaps vugs produced byexsolved fluids. Porosity and permeability generally de-crease with depth in the Earth, especially if related tocracks.
�8.6 MAGMA CONVECTION
Convection is a more efficient mode of heat transfer, byone to two orders of magnitude, than conduction incooling magma bodies. Convecting magma bodiestransfer more heat to the roof rocks, where solidustemperatures can be exceeded, causing partial melting,especially above large mafic intrusions. Convection alsoinfluences the way a magma body crystallizes and un-mixes into compositionally diverse parts, or remainshomogeneous.
The essence of convection is transfer of heat withina body by buoyant movement of thermally contrastingparts of it. (In contrast, advection is movement of a liq-uid through openings in a solid.) In magma systems,convection may be initiated by injection of hottermagma into the base of a chamber filled with cooler,denser magma, causing a convective overturn to restoregravitational equilibrium. Convection also occurs dur-ing foundering of slabs of cooler, dense roof rock intoa magma chamber, causing cool magma adjacent to theslab to be dragged into the hotter interior. The convec-tion discussed in the remainder of this section is drivenby internal density differences within the liquid bodycaused by contrasts in T and/or composition.
Purely thermal convection in a homogeneous melt is considered first to establish some concepts of con-
vection. Then follows a discussion of convection inmore typical crystallizing magmas, where contrasts inboth T and composition drive thermochemical convec-tion.
8.6.1 Thermal Convection in a Completely Molten Body of MeltConvective motion of water in a pot on a hot stove is a familiar example of thermal convection. Gravita-tional stabilization occurs when cooler, more densefluid at the top sinks and hotter, less dense fluid at thebottom rises. The released gravitational potential en-ergy is consumed in overcoming viscous resistance toflow.
As a consequence of conductive heat loss into thewall rock, the T of a melt decreases exponentially to-ward a vertical contact of an intrusion (Figure 8.20).This cooler and, therefore, denser melt in the thermalboundary layer is negatively buoyant and potentiallyable to sink. A gradient in the concentration of water inthe melt near the contact may develop as a result of in-ward diffusion from water-bearing wall rock. Thismore hydrous melt is less dense, positively buoyant,and potentially able to rise. Any density contrast in asteeply inclined thermal or compositional boundarylayer (Figure 8.20) is gravitationally unstable, butwhether the buoyancy is sufficent to cause movementdepends on melt rheology. If movement of the bound-ary layer does occur, return flow must necessarily occurfarther into the closed body of melt. These comple-mentary flows establish convection.
What happens at more or less horizontal contactsbetween melt and country rocks, such as at the marginsof a flat sill (Figure 8.21)? For simplicity, assume thatthe body of melt, initially, has a uniform T above theliquidus. Self-compression in the insulated intrusiondue to the downward increasing weight of the melt cre-ates an adiabatic T gradient that is only a few tenths ofa degree per kilometer. (Recall in Section 3.2.1 thatcompressive work done on a system transforms intothermal energy.) Whether gravitational instability de-velops in the melt near the roof as it cools and becomesdenser depends on the contrast in T between roof melt,Tr, and floor melt, Tf, or (Tf � Tr). More heat tends tobe lost by conduction through the roof than the floorof a thick horizontal sheet because shallower rocks arecooler on an ordinary geotherm and conductive heattransfer is greater where the thermal gradient (equation1.5) is greater. Additionally, for shallow intrusions,groundwater in fractured roof rocks absorbs heat andadvects it away. After conductive, and possible advec-tive, heat loss (Figure 8.21b), the cooler melt at the roofmight be dense enough to overcome viscous resistanceto flow, causing convective overturn (Figure 8.21c).Cooler, denser melt sinks and deeper, hotter, less dense
Physical and Thermal Dynamics of Bodies of Magma 201
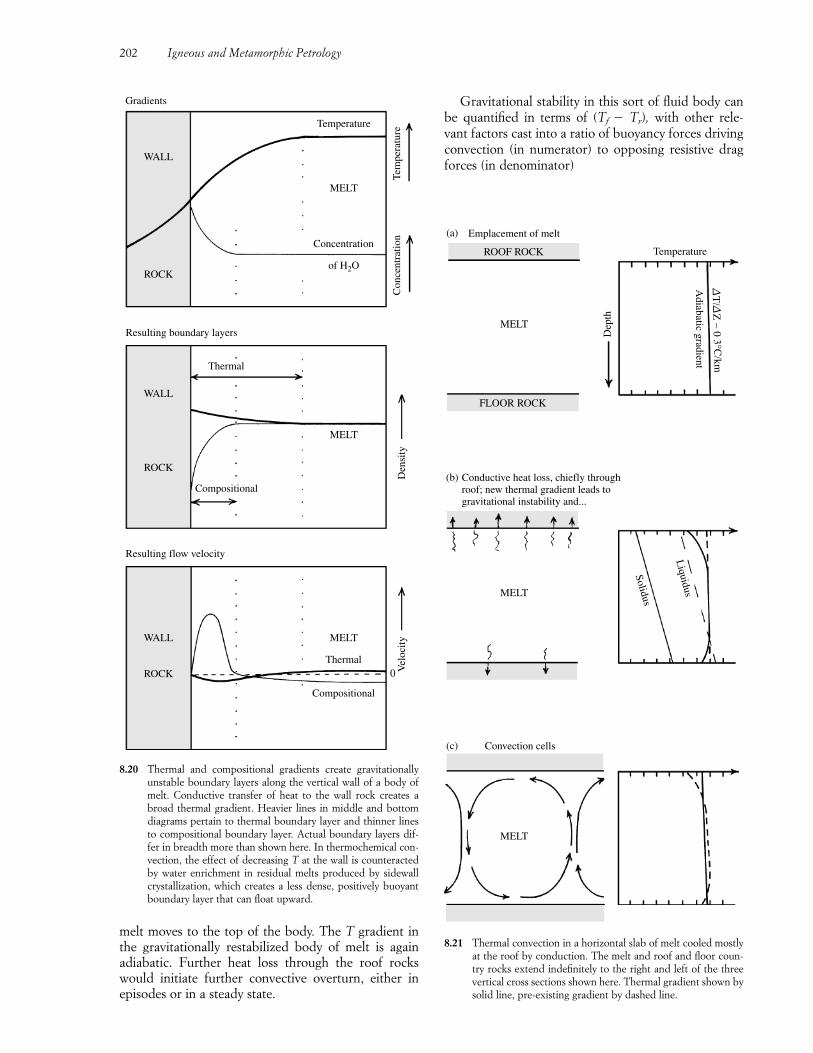
Gravitational stability in this sort of fluid body canbe quantified in terms of (Tf � Tr), with other rele-vant factors cast into a ratio of buoyancy forces drivingconvection (in numerator) to opposing resistive dragforces (in denominator)
202 Igneous and Metamorphic Petrology
Gradients
Resulting boundary layers
Resulting flow velocity
WALL
ROCK
WALL
Thermal
ROCK
WALL
ROCK
Temperature
MELT
Concentration
of H2O
Con
cent
ratio
nTe
mpe
ratu
re
Compositional
MELT
Vel
ocity
Den
sity
Compositional
Thermal
MELT
0
8.20 Thermal and compositional gradients create gravitationallyunstable boundary layers along the vertical wall of a body ofmelt. Conductive transfer of heat to the wall rock creates abroad thermal gradient. Heavier lines in middle and bottomdiagrams pertain to thermal boundary layer and thinner linesto compositional boundary layer. Actual boundary layers dif-fer in breadth more than shown here. In thermochemical con-vection, the effect of decreasing T at the wall is counteractedby water enrichment in residual melts produced by sidewallcrystallization, which creates a less dense, positively buoyantboundary layer that can float upward.
FLOOR ROCK
Emplacement of melt
ROOF ROCK Temperature
Dep
th
Adiabatic gradient
Conductive heat loss, chiefly throughroof; new thermal gradient leads togravitational instability and...
Liquidus
Solidus
Convection cells
∆T/∆
Z ∼ 0
3°C/km
(a)
(b)
(c)
MELT
MELT
MELT
8.21 Thermal convection in a horizontal slab of melt cooled mostlyat the roof by conduction. The melt and roof and floor coun-try rocks extend indefinitely to the right and left of the threevertical cross sections shown here. Thermal gradient shown bysolid line, pre-existing gradient by dashed line.
melt moves to the top of the body. The T gradient inthe gravitationally restabilized body of melt is againadiabatic. Further heat loss through the roof rockswould initiate further convective overturn, either inepisodes or in a steady state.
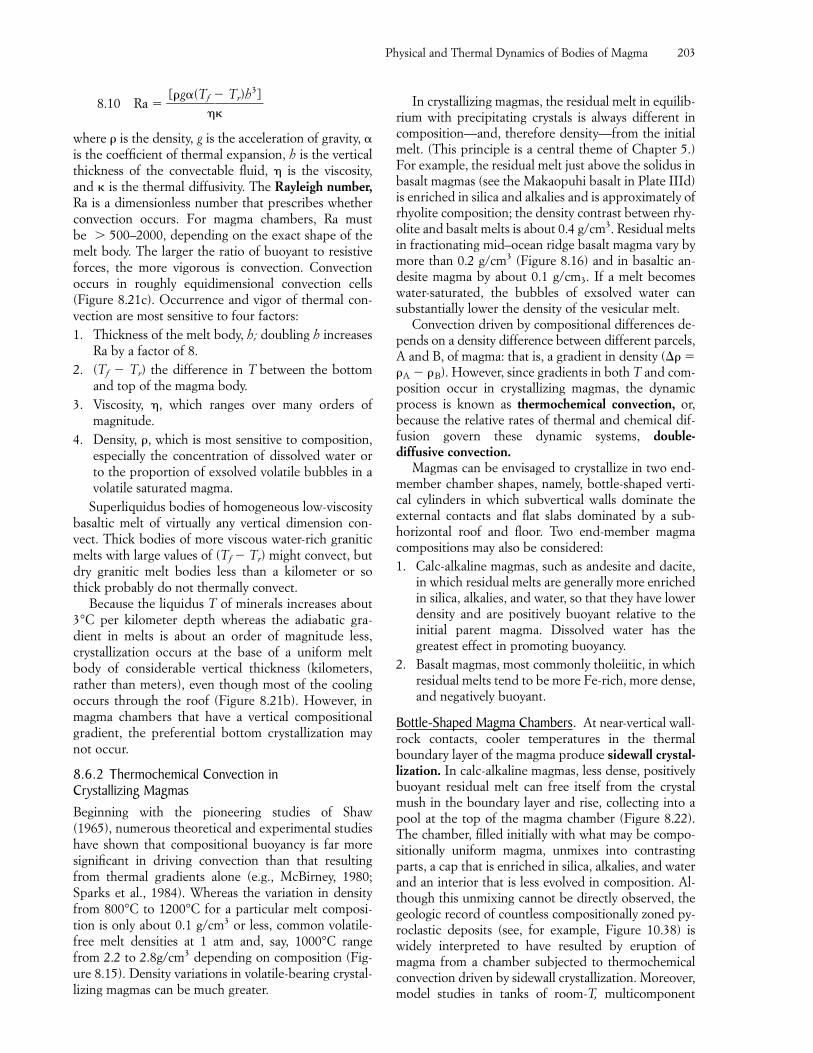
8.10 Ra ��[�g�(Tf
�
�
Tr)h3]
�
where � is the density, g is the acceleration of gravity, �is the coefficient of thermal expansion, h is the verticalthickness of the convectable fluid, is the viscosity,and � is the thermal diffusivity. The Rayleigh number,Ra is a dimensionless number that prescribes whetherconvection occurs. For magma chambers, Ra must be � 500–2000, depending on the exact shape of themelt body. The larger the ratio of buoyant to resistiveforces, the more vigorous is convection. Convectionoccurs in roughly equidimensional convection cells(Figure 8.21c). Occurrence and vigor of thermal con-vection are most sensitive to four factors:1. Thickness of the melt body, h; doubling h increases
Ra by a factor of 8.2. (Tf � Tr) the difference in T between the bottom
and top of the magma body.3. Viscosity, , which ranges over many orders of
magnitude.4. Density, �, which is most sensitive to composition,
especially the concentration of dissolved water orto the proportion of exsolved volatile bubbles in avolatile saturated magma.
Superliquidus bodies of homogeneous low-viscositybasaltic melt of virtually any vertical dimension con-vect. Thick bodies of more viscous water-rich graniticmelts with large values of (Tf � Tr) might convect, butdry granitic melt bodies less than a kilometer or sothick probably do not thermally convect.
Because the liquidus T of minerals increases about3°C per kilometer depth whereas the adiabatic gra-dient in melts is about an order of magnitude less,crystallization occurs at the base of a uniform meltbody of considerable vertical thickness (kilometers,rather than meters), even though most of the coolingoccurs through the roof (Figure 8.21b). However, inmagma chambers that have a vertical compositionalgradient, the preferential bottom crystallization maynot occur.
8.6.2 Thermochemical Convection in Crystallizing MagmasBeginning with the pioneering studies of Shaw (1965), numerous theoretical and experimental studieshave shown that compositional buoyancy is far moresignificant in driving convection than that resultingfrom thermal gradients alone (e.g., McBirney, 1980;Sparks et al., 1984). Whereas the variation in densityfrom 800°C to 1200°C for a particular melt composi-tion is only about 0.1 g/cm3 or less, common volatile-free melt densities at 1 atm and, say, 1000°C range from 2.2 to 2.8g/cm3 depending on composition (Fig-ure 8.15). Density variations in volatile-bearing crystal-lizing magmas can be much greater.
Physical and Thermal Dynamics of Bodies of Magma 203
In crystallizing magmas, the residual melt in equilib-rium with precipitating crystals is always different incomposition—and, therefore density—from the initialmelt. (This principle is a central theme of Chapter 5.)For example, the residual melt just above the solidus inbasalt magmas (see the Makaopuhi basalt in Plate IIId)is enriched in silica and alkalies and is approximately ofrhyolite composition; the density contrast between rhy-olite and basalt melts is about 0.4 g/cm3. Residual meltsin fractionating mid–ocean ridge basalt magma vary bymore than 0.2 g/cm3 (Figure 8.16) and in basaltic an-desite magma by about 0.1 g/cm3. If a melt becomeswater-saturated, the bubbles of exsolved water cansubstantially lower the density of the vesicular melt.
Convection driven by compositional differences de-pends on a density difference between different parcels,A and B, of magma: that is, a gradient in density (� ��A � �B). However, since gradients in both T and com-position occur in crystallizing magmas, the dynamicprocess is known as thermochemical convection, or,because the relative rates of thermal and chemical dif-fusion govern these dynamic systems, double-diffusive convection.
Magmas can be envisaged to crystallize in two end-member chamber shapes, namely, bottle-shaped verti-cal cylinders in which subvertical walls dominate theexternal contacts and flat slabs dominated by a sub-horizontal roof and floor. Two end-member magmacompositions may also be considered:1. Calc-alkaline magmas, such as andesite and dacite,
in which residual melts are generally more enrichedin silica, alkalies, and water, so that they have lowerdensity and are positively buoyant relative to theinitial parent magma. Dissolved water has thegreatest effect in promoting buoyancy.
2. Basalt magmas, most commonly tholeiitic, in whichresidual melts tend to be more Fe-rich, more dense,and negatively buoyant.
Bottle-Shaped Magma Chambers. At near-vertical wall-rock contacts, cooler temperatures in the thermalboundary layer of the magma produce sidewall crystal-lization. In calc-alkaline magmas, less dense, positivelybuoyant residual melt can free itself from the crystalmush in the boundary layer and rise, collecting into apool at the top of the magma chamber (Figure 8.22).The chamber, filled initially with what may be compo-sitionally uniform magma, unmixes into contrastingparts, a cap that is enriched in silica, alkalies, and waterand an interior that is less evolved in composition. Al-though this unmixing cannot be directly observed, thegeologic record of countless compositionally zoned py-roclastic deposits (see, for example, Figure 10.38) iswidely interpreted to have resulted by eruption ofmagma from a chamber subjected to thermochemicalconvection driven by sidewall crystallization. Moreover,model studies in tanks of room-T, multicomponent
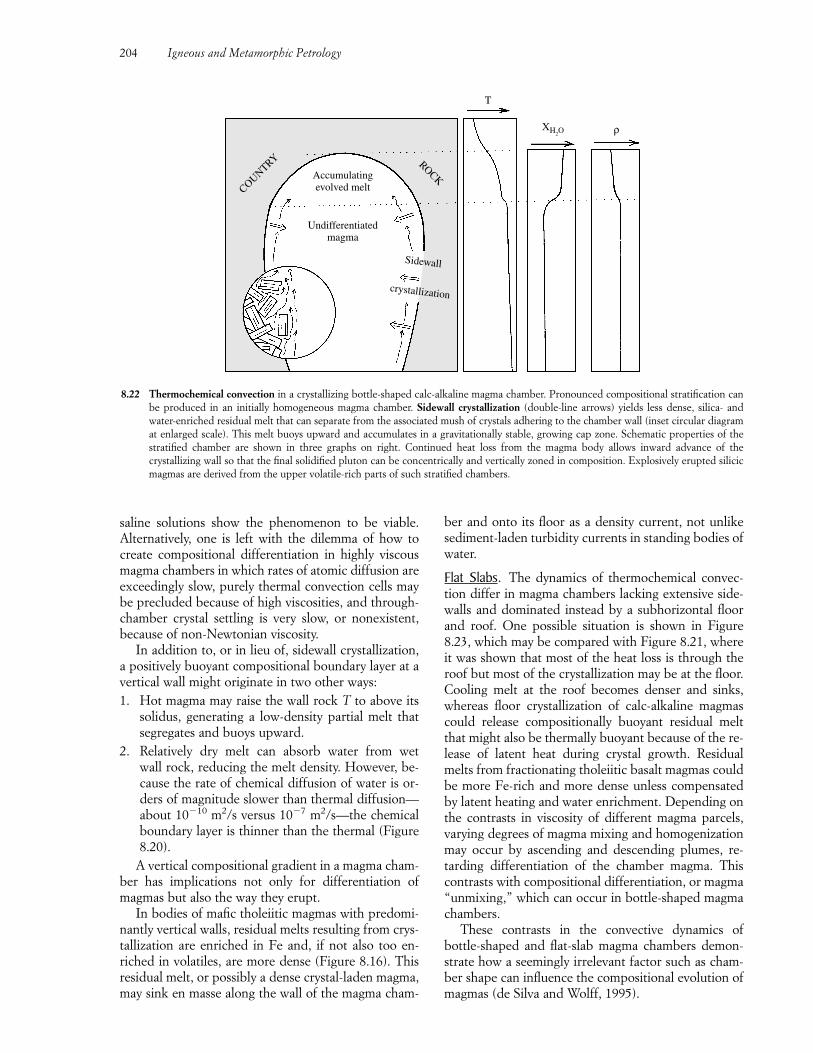
saline solutions show the phenomenon to be viable. Alternatively, one is left with the dilemma of how tocreate compositional differentiation in highly viscousmagma chambers in which rates of atomic diffusion areexceedingly slow, purely thermal convection cells maybe precluded because of high viscosities, and through-chamber crystal settling is very slow, or nonexistent,because of non-Newtonian viscosity.
In addition to, or in lieu of, sidewall crystallization,a positively buoyant compositional boundary layer at avertical wall might originate in two other ways:1. Hot magma may raise the wall rock T to above its
solidus, generating a low-density partial melt thatsegregates and buoys upward.
2. Relatively dry melt can absorb water from wet wall rock, reducing the melt density. However, be-cause the rate of chemical diffusion of water is or-ders of magnitude slower than thermal diffusion—about 10�10 m2/s versus 10�7 m2/s—the chemicalboundary layer is thinner than the thermal (Figure8.20).
A vertical compositional gradient in a magma cham-ber has implications not only for differentiation ofmagmas but also the way they erupt.
In bodies of mafic tholeiitic magmas with predomi-nantly vertical walls, residual melts resulting from crys-tallization are enriched in Fe and, if not also too en-riched in volatiles, are more dense (Figure 8.16). Thisresidual melt, or possibly a dense crystal-laden magma,may sink en masse along the wall of the magma cham-
ber and onto its floor as a density current, not unlikesediment-laden turbidity currents in standing bodies ofwater.
Flat Slabs. The dynamics of thermochemical convec-tion differ in magma chambers lacking extensive side-walls and dominated instead by a subhorizontal floorand roof. One possible situation is shown in Figure8.23, which may be compared with Figure 8.21, whereit was shown that most of the heat loss is through theroof but most of the crystallization may be at the floor.Cooling melt at the roof becomes denser and sinks,whereas floor crystallization of calc-alkaline magmascould release compositionally buoyant residual meltthat might also be thermally buoyant because of the re-lease of latent heat during crystal growth. Residualmelts from fractionating tholeiitic basalt magmas couldbe more Fe-rich and more dense unless compensatedby latent heating and water enrichment. Depending onthe contrasts in viscosity of different magma parcels,varying degrees of magma mixing and homogenizationmay occur by ascending and descending plumes, re-tarding differentiation of the chamber magma. Thiscontrasts with compositional differentiation, or magma“unmixing,” which can occur in bottle-shaped magmachambers.
These contrasts in the convective dynamics of bottle-shaped and flat-slab magma chambers demon-strate how a seemingly irrelevant factor such as cham-ber shape can influence the compositional evolution ofmagmas (de Silva and Wolff, 1995).
204 Igneous and Metamorphic Petrology
COUNTRY ROCKAccumulatingevolved melt
Undifferentiatedmagma
Sidewall
crystallization
T
XH2O ρ
8.22 Thermochemical convection in a crystallizing bottle-shaped calc-alkaline magma chamber. Pronounced compositional stratification canbe produced in an initially homogeneous magma chamber. Sidewall crystallization (double-line arrows) yields less dense, silica- and water-enriched residual melt that can separate from the associated mush of crystals adhering to the chamber wall (inset circular diagramat enlarged scale). This melt buoys upward and accumulates in a gravitationally stable, growing cap zone. Schematic properties of thestratified chamber are shown in three graphs on right. Continued heat loss from the magma body allows inward advance of the crystallizing wall so that the final solidified pluton can be concentrically and vertically zoned in composition. Explosively erupted silicicmagmas are derived from the upper volatile-rich parts of such stratified chambers.
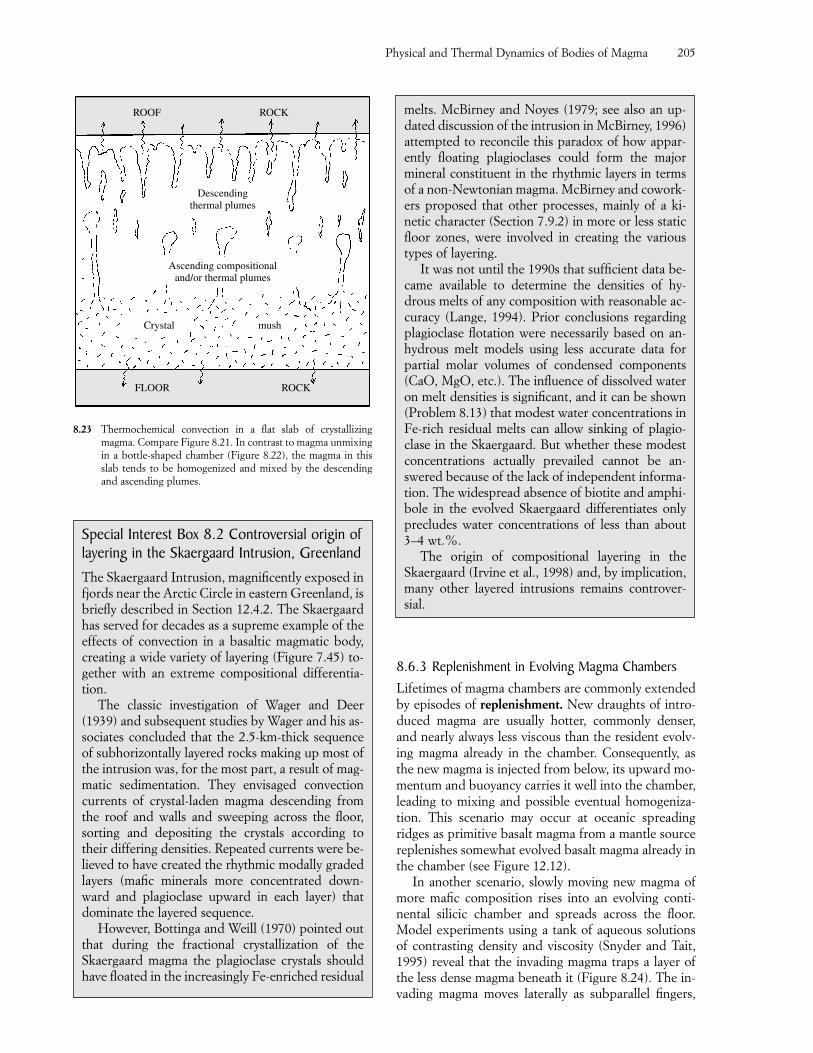
8.6.3 Replenishment in Evolving Magma ChambersLifetimes of magma chambers are commonly extendedby episodes of replenishment. New draughts of intro-duced magma are usually hotter, commonly denser,and nearly always less viscous than the resident evolv-ing magma already in the chamber. Consequently, asthe new magma is injected from below, its upward mo-mentum and buoyancy carries it well into the chamber,leading to mixing and possible eventual homogeniza-tion. This scenario may occur at oceanic spreadingridges as primitive basalt magma from a mantle sourcereplenishes somewhat evolved basalt magma already inthe chamber (see Figure 12.12).
In another scenario, slowly moving new magma ofmore mafic composition rises into an evolving conti-nental silicic chamber and spreads across the floor.Model experiments using a tank of aqueous solutionsof contrasting density and viscosity (Snyder and Tait,1995) reveal that the invading magma traps a layer ofthe less dense magma beneath it (Figure 8.24). The in-vading magma moves laterally as subparallel fingers,
Physical and Thermal Dynamics of Bodies of Magma 205
ROOF ROCK
FLOOR ROCK
mush
Descendingthermal plumes
Ascending compositionaland/or thermal plumes
Crystal
8.23 Thermochemical convection in a flat slab of crystallizingmagma. Compare Figure 8.21. In contrast to magma unmixingin a bottle-shaped chamber (Figure 8.22), the magma in thisslab tends to be homogenized and mixed by the descendingand ascending plumes.
Special Interest Box 8.2 Controversial origin oflayering in the Skaergaard Intrusion, GreenlandThe Skaergaard Intrusion, magnificently exposed infjords near the Arctic Circle in eastern Greenland, isbriefly described in Section 12.4.2. The Skaergaardhas served for decades as a supreme example of theeffects of convection in a basaltic magmatic body,creating a wide variety of layering (Figure 7.45) to-gether with an extreme compositional differentia-tion.
The classic investigation of Wager and Deer(1939) and subsequent studies by Wager and his as-sociates concluded that the 2.5-km-thick sequenceof subhorizontally layered rocks making up most ofthe intrusion was, for the most part, a result of mag-matic sedimentation. They envisaged convectioncurrents of crystal-laden magma descending fromthe roof and walls and sweeping across the floor,sorting and depositing the crystals according totheir differing densities. Repeated currents were be-lieved to have created the rhythmic modally gradedlayers (mafic minerals more concentrated down-ward and plagioclase upward in each layer) thatdominate the layered sequence.
However, Bottinga and Weill (1970) pointed outthat during the fractional crystallization of theSkaergaard magma the plagioclase crystals shouldhave floated in the increasingly Fe-enriched residual
melts. McBirney and Noyes (1979; see also an up-dated discussion of the intrusion in McBirney, 1996)attempted to reconcile this paradox of how appar-ently floating plagioclases could form the majormineral constituent in the rhythmic layers in termsof a non-Newtonian magma. McBirney and cowork-ers proposed that other processes, mainly of a ki-netic character (Section 7.9.2) in more or less staticfloor zones, were involved in creating the varioustypes of layering.
It was not until the 1990s that sufficient data be-came available to determine the densities of hy-drous melts of any composition with reasonable ac-curacy (Lange, 1994). Prior conclusions regardingplagioclase flotation were necessarily based on an-hydrous melt models using less accurate data forpartial molar volumes of condensed components(CaO, MgO, etc.). The influence of dissolved wateron melt densities is significant, and it can be shown(Problem 8.13) that modest water concentrations inFe-rich residual melts can allow sinking of plagio-clase in the Skaergaard. But whether these modestconcentrations actually prevailed cannot be an-swered because of the lack of independent informa-tion. The widespread absence of biotite and amphi-bole in the evolved Skaergaard differentiates onlyprecludes water concentrations of less than about3–4 wt.%.
The origin of compositional layering in theSkaergaard (Irvine et al., 1998) and, by implication,many other layered intrusions remains controver-sial.
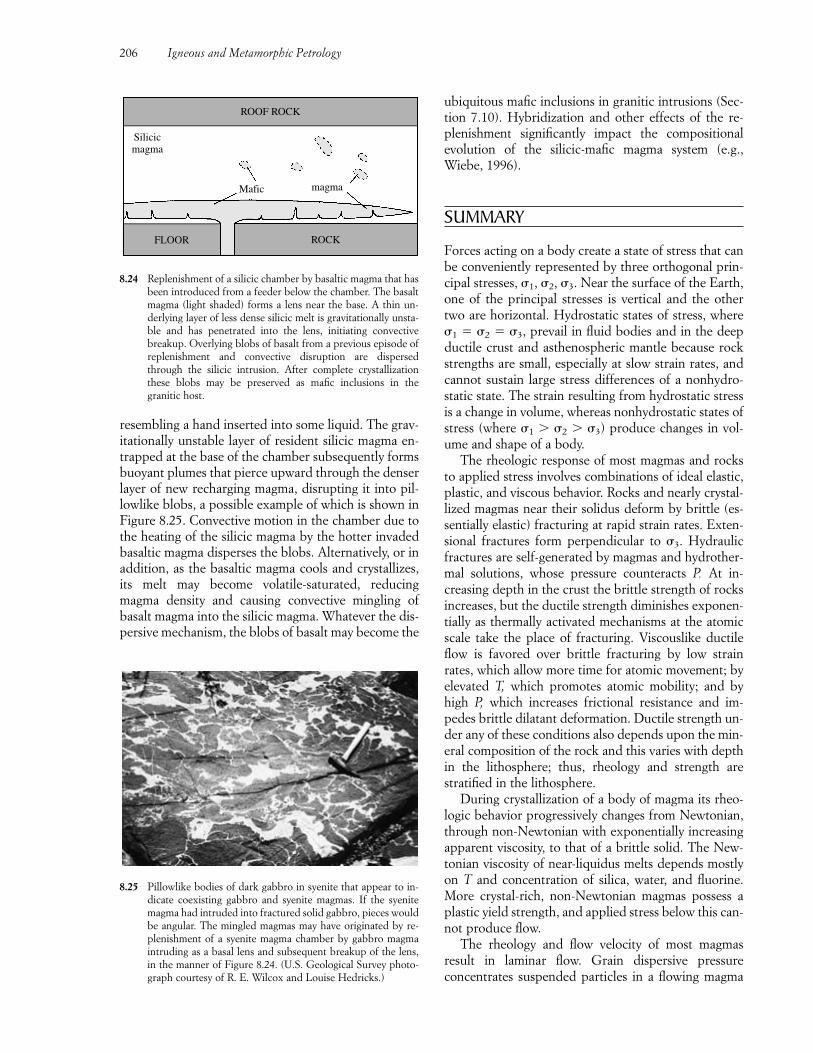
resembling a hand inserted into some liquid. The grav-itationally unstable layer of resident silicic magma en-trapped at the base of the chamber subsequently formsbuoyant plumes that pierce upward through the denserlayer of new recharging magma, disrupting it into pil-lowlike blobs, a possible example of which is shown inFigure 8.25. Convective motion in the chamber due tothe heating of the silicic magma by the hotter invadedbasaltic magma disperses the blobs. Alternatively, or inaddition, as the basaltic magma cools and crystallizes,its melt may become volatile-saturated, reducingmagma density and causing convective mingling ofbasalt magma into the silicic magma. Whatever the dis-persive mechanism, the blobs of basalt may become the
ubiquitous mafic inclusions in granitic intrusions (Sec-tion 7.10). Hybridization and other effects of the re-plenishment significantly impact the compositionalevolution of the silicic-mafic magma system (e.g.,Wiebe, 1996).
SUMMARY
Forces acting on a body create a state of stress that canbe conveniently represented by three orthogonal prin-cipal stresses, �1, �2, �3. Near the surface of the Earth,one of the principal stresses is vertical and the othertwo are horizontal. Hydrostatic states of stress, where�1 � �2 � �3, prevail in fluid bodies and in the deepductile crust and asthenospheric mantle because rockstrengths are small, especially at slow strain rates, andcannot sustain large stress differences of a nonhydro-static state. The strain resulting from hydrostatic stressis a change in volume, whereas nonhydrostatic states ofstress (where �1 � �2 � �3) produce changes in vol-ume and shape of a body.
The rheologic response of most magmas and rocksto applied stress involves combinations of ideal elastic,plastic, and viscous behavior. Rocks and nearly crystal-lized magmas near their solidus deform by brittle (es-sentially elastic) fracturing at rapid strain rates. Exten-sional fractures form perpendicular to �3. Hydraulicfractures are self-generated by magmas and hydrother-mal solutions, whose pressure counteracts P. At in-creasing depth in the crust the brittle strength of rocksincreases, but the ductile strength diminishes exponen-tially as thermally activated mechanisms at the atomicscale take the place of fracturing. Viscouslike ductileflow is favored over brittle fracturing by low strainrates, which allow more time for atomic movement; byelevated T, which promotes atomic mobility; and byhigh P, which increases frictional resistance and im-pedes brittle dilatant deformation. Ductile strength un-der any of these conditions also depends upon the min-eral composition of the rock and this varies with depthin the lithosphere; thus, rheology and strength arestratified in the lithosphere.
During crystallization of a body of magma its rheo-logic behavior progressively changes from Newtonian,through non-Newtonian with exponentially increasingapparent viscosity, to that of a brittle solid. The New-tonian viscosity of near-liquidus melts depends mostlyon T and concentration of silica, water, and fluorine.More crystal-rich, non-Newtonian magmas possess aplastic yield strength, and applied stress below this can-not produce flow.
The rheology and flow velocity of most magmas result in laminar flow. Grain dispersive pressure concentrates suspended particles in a flowing magma
206 Igneous and Metamorphic Petrology
FLOOR ROCK
magma
ROOF ROCK
Silicicmagma
Mafic
8.24 Replenishment of a silicic chamber by basaltic magma that hasbeen introduced from a feeder below the chamber. The basaltmagma (light shaded) forms a lens near the base. A thin un-derlying layer of less dense silicic melt is gravitationally unsta-ble and has penetrated into the lens, initiating convectivebreakup. Overlying blobs of basalt from a previous episode ofreplenishment and convective disruption are dispersedthrough the silicic intrusion. After complete crystallizationthese blobs may be preserved as mafic inclusions in thegranitic host.
8.25 Pillowlike bodies of dark gabbro in syenite that appear to in-dicate coexisting gabbro and syenite magmas. If the syenitemagma had intruded into fractured solid gabbro, pieces wouldbe angular. The mingled magmas may have originated by re-plenishment of a syenite magma chamber by gabbro magmaintruding as a basal lens and subsequent breakup of the lens,in the manner of Figure 8.24. (U.S. Geological Survey photo-graph courtesy of R. E. Wilcox and Louise Hedricks.)
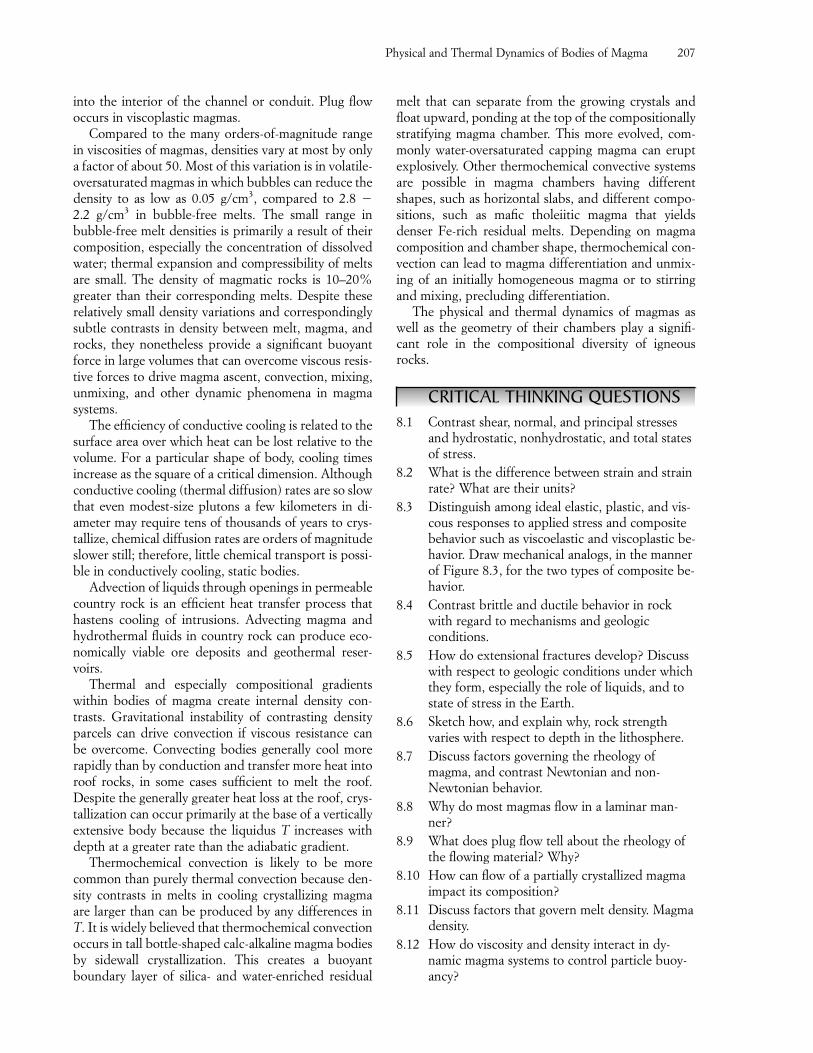
into the interior of the channel or conduit. Plug flowoccurs in viscoplastic magmas.
Compared to the many orders-of-magnitude rangein viscosities of magmas, densities vary at most by onlya factor of about 50. Most of this variation is in volatile-oversaturated magmas in which bubbles can reduce thedensity to as low as 0.05 g/cm3, compared to 2.8 �2.2 g/cm3 in bubble-free melts. The small range in bubble-free melt densities is primarily a result of theircomposition, especially the concentration of dissolvedwater; thermal expansion and compressibility of meltsare small. The density of magmatic rocks is 10–20%greater than their corresponding melts. Despite theserelatively small density variations and correspondinglysubtle contrasts in density between melt, magma, androcks, they nonetheless provide a significant buoyantforce in large volumes that can overcome viscous resis-tive forces to drive magma ascent, convection, mixing,unmixing, and other dynamic phenomena in magmasystems.
The efficiency of conductive cooling is related to thesurface area over which heat can be lost relative to thevolume. For a particular shape of body, cooling timesincrease as the square of a critical dimension. Althoughconductive cooling (thermal diffusion) rates are so slowthat even modest-size plutons a few kilometers in di-ameter may require tens of thousands of years to crys-tallize, chemical diffusion rates are orders of magnitudeslower still; therefore, little chemical transport is possi-ble in conductively cooling, static bodies.
Advection of liquids through openings in permeablecountry rock is an efficient heat transfer process thathastens cooling of intrusions. Advecting magma andhydrothermal fluids in country rock can produce eco-nomically viable ore deposits and geothermal reser-voirs.
Thermal and especially compositional gradientswithin bodies of magma create internal density con-trasts. Gravitational instability of contrasting densityparcels can drive convection if viscous resistance canbe overcome. Convecting bodies generally cool morerapidly than by conduction and transfer more heat intoroof rocks, in some cases sufficient to melt the roof.Despite the generally greater heat loss at the roof, crys-tallization can occur primarily at the base of a verticallyextensive body because the liquidus T increases withdepth at a greater rate than the adiabatic gradient.
Thermochemical convection is likely to be morecommon than purely thermal convection because den-sity contrasts in melts in cooling crystallizing magmaare larger than can be produced by any differences inT. It is widely believed that thermochemical convectionoccurs in tall bottle-shaped calc-alkaline magma bodiesby sidewall crystallization. This creates a buoyantboundary layer of silica- and water-enriched residual
melt that can separate from the growing crystals andfloat upward, ponding at the top of the compositionallystratifying magma chamber. This more evolved, com-monly water-oversaturated capping magma can eruptexplosively. Other thermochemical convective systemsare possible in magma chambers having differentshapes, such as horizontal slabs, and different compo-sitions, such as mafic tholeiitic magma that yieldsdenser Fe-rich residual melts. Depending on magmacomposition and chamber shape, thermochemical con-vection can lead to magma differentiation and unmix-ing of an initially homogeneous magma or to stirringand mixing, precluding differentiation.
The physical and thermal dynamics of magmas aswell as the geometry of their chambers play a signifi-cant role in the compositional diversity of igneousrocks.
CRITICAL THINKING QUESTIONS8.1 Contrast shear, normal, and principal stresses
and hydrostatic, nonhydrostatic, and total statesof stress.
8.2 What is the difference between strain and strainrate? What are their units?
8.3 Distinguish among ideal elastic, plastic, and vis-cous responses to applied stress and compositebehavior such as viscoelastic and viscoplastic be-havior. Draw mechanical analogs, in the mannerof Figure 8.3, for the two types of composite be-havior.
8.4 Contrast brittle and ductile behavior in rockwith regard to mechanisms and geologic conditions.
8.5 How do extensional fractures develop? Discusswith respect to geologic conditions under whichthey form, especially the role of liquids, and tostate of stress in the Earth.
8.6 Sketch how, and explain why, rock strengthvaries with respect to depth in the lithosphere.
8.7 Discuss factors governing the rheology ofmagma, and contrast Newtonian and non-Newtonian behavior.
8.8 Why do most magmas flow in a laminar man-ner?
8.9 What does plug flow tell about the rheology ofthe flowing material? Why?
8.10 How can flow of a partially crystallized magmaimpact its composition?
8.11 Discuss factors that govern melt density. Magmadensity.
8.12 How do viscosity and density interact in dy-namic magma systems to control particle buoy-ancy?
Physical and Thermal Dynamics of Bodies of Magma 207
8.13 Contrast the control on buoyant motion of largeblocks of foreign rock immersed in a body ofmagma versus with buoyant motion of an iso-lated crystal.
8.14 Characterize factors governing heat transfer byconduction.
8.15 Discuss relevant factors and processes in advec-tive heat transfer.
8.16 What drives convection and what retards it?8.17 How do advective and convective transfer of
heat differ?8.18 How do thermochemical and thermal convec-
tion differ?8.19 How can the geometry (size and shape) of a
body of magma influence its chemical evolu-tion?
PROBLEMS8.1 In Figure 8.2a and 8.2b calculate the linear
strain in the directions of �1 and �3 by carefullymeasuring lengths l0, l1, and l3 with a millimeterscale. (Partial answer: In the �1 direction �1 � �0.2 � �20%.)
8.2 What is the change in volume of an assumedisotropic crystal in moving it isothermally fromthe surface of the Earth to a depth of 35 km inthe continental crust? (Answer: 1%.)
8.3 Show that the state of stress in the deep crust isvirtually hydrostatic by comparing the ductilestrength of “wet” granite at a depth of 30 km(Figure 8.8) with the magnitude of the confiningpressure, P, at that depth. (Answer: Thestrength, which is the maximum stress differ-ence possible at that depth, is 0.001% of P.)
8.4 Draw a stress-strain rate diagram for a viscoplas-tic body that obeys equation 8.3.
8.5 Using MELTS software (Advanced Topic Box5.3) explore the counteracting effects on resid-ual melt viscosity of increasing concentrations ofsilica and water in a fractionating andesitemagma whose initial water content is 1.5 wt.%.Using equation 8.4 determine the apparent vis-cosity of the magma at T increments of 25°C be-low the liquidus. Discuss your results and anyassumptions made.
8.6 Determine and discuss the flow regime (laminarversus turbulent) of (a) the upper mantle whoseapparent viscosity is approximately 1021 Pa s; (b) a river of water whose velocity is as much as20 m/s; (c) a river of basalt lava near its liquidusT flowing at a velocity of 8 m/s in a channel 2 m deep and 5 m wide. For each situation ex-
plain or justify your choice of viscosities andboundary conditions.
8.7 Calculate the approximate density of an an-desite magma at 1000°C and 6 bars that con-tains 75 volume % water bubbles. Use valuesfor water and melt density read from Figures 4.4and 8.15.
8.8 Determine the laminar flow velocity of a pahoehoe “tongue” of basalt melt 1 m wide and0.3 m thick. Justify assumptions made in this determination.
8.9 Compare the relative effect on the density of asilicate melt by increasing P versus increasing Tin the crust of the Earth. Do melt densities in-crease or decrease with depth? Assume the geothermal gradient is T/z � 25°C/km andthe geobaric gradient is P/z � 27 MPa/km.(Answer: The compressive effect of P per 1-kmincrease in depth is 2.5 times that of the expan-sive effect of T per kilometer.)
8.10 Compare the distance traversed by isolated crystals 1 mm in diameter of plagioclase (� � 2.65 g/cm3) and pyroxene (� � 3.3 g/cm3)in a granite melt ( � 107 Pa s; � � 2.3 g/cm3)and a basalt melt ( � 102 Pa s; � � 2.7 g/cm3).Indicate any assumptions made in your calcula-tions. (Partial answer: The pyroxene would set-tle 100 m in 1 year in the basalt melt.)
8.11 Using the 1-atm density of tholeiite melt in Figure 8.15 and a 1-atm density for An60 of 2.7 g/cm3 determine the P at which the plagio-clase crystals are neutrally buoyant at 1200°C.Indicate assumptions made in this determina-tion.
8.12 A famous basalt flow on Hualalai volcano onthe Island of Hawaii contains mantle-derivedperidotite xenoliths that are as much as 70 cmin diameter. What minimum ascent velocitywould have been required to lift these xenolithsto the surface of the Earth so they would notsink en route? For the acceleration of gravityuse 980 cm/s2 and note that 1 Pa � 10 g/cm s2.Justify your choice of parameters and explainany assumptions made in the calculation.
8.13 Read Special Interest Box 8.2. Using the Langedensity equations in Advanced Topic Box 8.1and the partial molar volumes in Table 8.1 showthat crystals of plagioclase An58(� � 2.70 g/cm3)would float in a tholeiitic basalt melt equivalentto the LZb Skaergaard composition in Table12.6 because its density at 1160°C and 2160bars is calculated to be 2.76 g/cm3. For this cal-culated melt density, partition the 12.84 wt.%total Fe as FeO listed in Table 12.6 into 2.14wt.% Fe2O3 and 10.91 wt.% FeO and assume
208 Igneous and Metamorphic Petrology
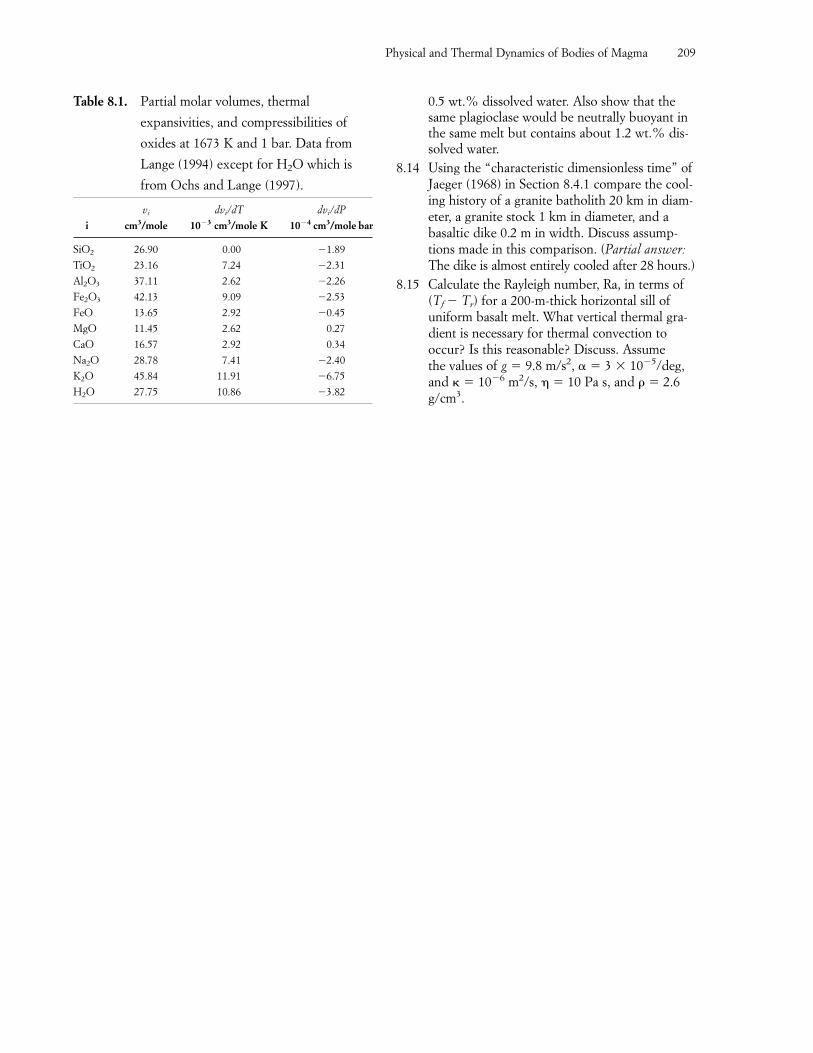
0.5 wt.% dissolved water. Also show that thesame plagioclase would be neutrally buoyant inthe same melt but contains about 1.2 wt.% dis-solved water.
8.14 Using the “characteristic dimensionless time” ofJaeger (1968) in Section 8.4.1 compare the cool-ing history of a granite batholith 20 km in diam-eter, a granite stock 1 km in diameter, and abasaltic dike 0.2 m in width. Discuss assump-tions made in this comparison. (Partial answer:The dike is almost entirely cooled after 28 hours.)
8.15 Calculate the Rayleigh number, Ra, in terms of(Tf � Tr) for a 200-m-thick horizontal sill ofuniform basalt melt. What vertical thermal gra-dient is necessary for thermal convection to occur? Is this reasonable? Discuss. Assume the values of g � 9.8 m/s2, � � 3 � 10�5/deg,and � � 10�6 m2/s, � 10 Pa s, and � � 2.6g/cm3.
Physical and Thermal Dynamics of Bodies of Magma 209
Table 8.1. Partial molar volumes, thermal
expansivities, and compressibilities of
oxides at 1673 K and 1 bar. Data from
Lange (1994) except for H2O which is
from Ochs and Lange (1997).
vi dvi/dT dvi/dP
i cm3/mole 10�3 cm3/mole K 10�4 cm3/mole bar
SiO2 26.90 0.00 �1.89
TiO2 23.16 7.24 �2.31
Al2O3 37.11 2.62 �2.26
Fe2O3 42.13 9.09 �2.53
FeO 13.65 2.92 �0.45
MgO 11.45 2.62 0.27
CaO 16.57 2.92 0.34
Na2O 28.78 7.41 �2.40
K2O 45.84 11.91 �6.75
H2O 27.75 10.86 �3.82
FUNDAMENTAL QUESTIONSCONSIDERED IN THIS CHAPTER
1. How does magma rise from its site of generationin the deep crust and upper mantle and move toshallower depths in the solid lithosphere: That is,how does magma ascend?
2. How is room created in solid rock for magma tointrude: That is, how is magma emplaced?
INTRODUCTION
It has been recognized for at least a century that the fun-damental driving force causing magma to rise is its buoy-ancy—the difference between the density of the magmaand its surrounding country rock. Magma generated bypartial melting of solid source rock in the deep crust oruppermost mantle is less dense than the surroundingrock and is, therefore, gravitationally unstable and capa-ble of rising. But whether a mass of magma can actuallyascend buoyantly depends on the relative magnitude ofthe resistive force that is dictated by the magma rheology,basically its viscosity. Large volumes of silicic magma arerequired to provide the necessary buoyant force to over-come the viscous resistive force at the margin of themagma body where it contacts solid country rock.Smaller volumes of less viscous basaltic magma can as-cend with greater facility and more speed, even in largesurface area dikes that have been created by tectonicforces or by the pressure of the magma itself.
Ascending magma constitutes a classic interactionof the two fundamental but opposing energy sources—thermal and gravitational—within the Earth. Meltingat the magma source might proceed without bound un-
til all of the source rock is melted and the causativemechanism (e.g., decompression, volatile influx) stops.But in a gravitational field, the partially melted rock ora segregated partial melt usually becomes sufficientlybuoyant to rise out of the source before complete melt-ing occurs. Gravity-driven ascent is commonly arrestedas the magma loses heat to the country rocks, becomesmore viscous, and stops flowing. Or magma may as-cend all of the way to the surface of the Earth and exitas a volcanic extrusion.
During ascent and intrusion of magma, nature exer-cises its principle of parsimony, taking the path of leastwork that consumes the least energy.
Magma ascent and final emplacement cannot alwaysbe separated and distinguished; rather, they are a dy-namic continuum. Thus, a vertical dike through whichmagma ascended from a deep source also constitutes anintrusion, unless somehow the magma drained out orthe crack closed together to eliminate the filling magma.
The challenge for the petrologist is to try to under-stand the physical and thermal dynamics of ascent andemplacement of a magma body from the field relations,fabric, and composition of a partially exposed andlong-dead cold intrusion.
Magma ascent constitutes a significant advectivetransfer of heat from deep levels of the lithosphere toshallower and, therefore, plays a major role in the ther-mal evolution of the cooling Earth.
�9.1 MOVEMENT OF MAGMA IN THE EARTH
9.1.1 Neutral Buoyancy and the Crustal Density FilterMafic to ultramafic magmas in the uppermost mantle areless dense than the mantle peridotite in which they
Magma Ascent andEmplacement: FieldRelations of Intrusions
CHAPTER9
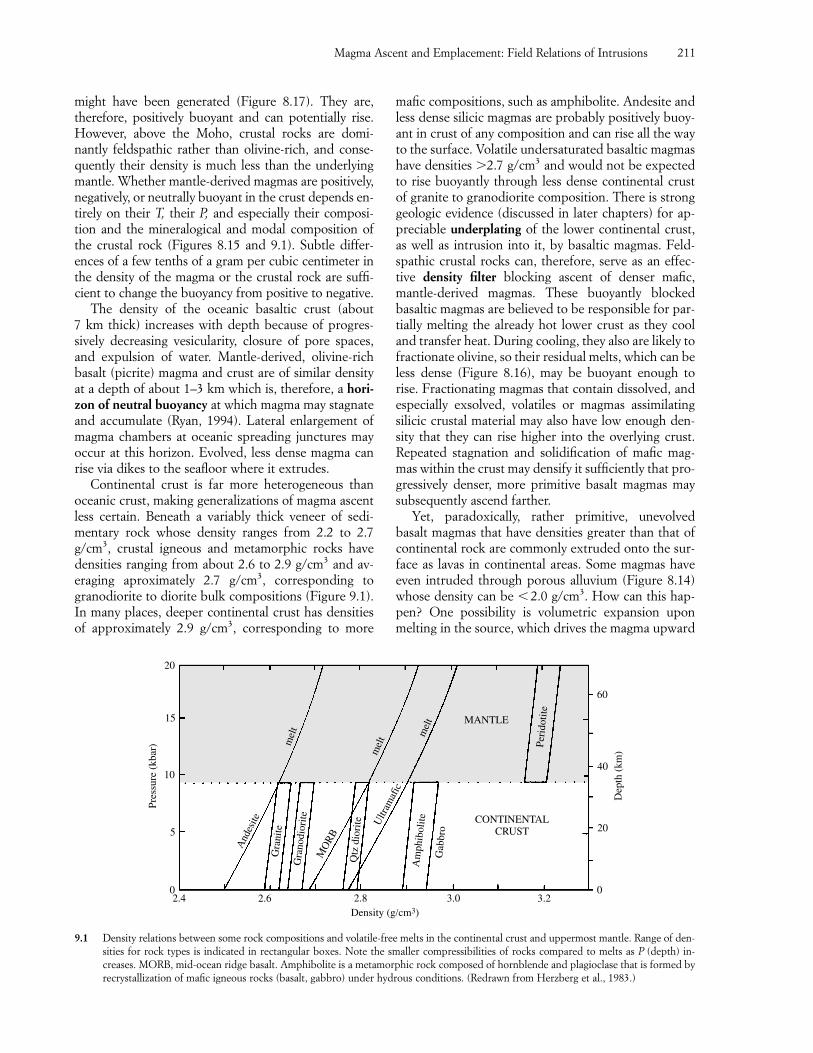
Magma Ascent and Emplacement: Field Relations of Intrusions 211
might have been generated (Figure 8.17). They are,therefore, positively buoyant and can potentially rise.However, above the Moho, crustal rocks are domi-nantly feldspathic rather than olivine-rich, and conse-quently their density is much less than the underlyingmantle. Whether mantle-derived magmas are positively,negatively, or neutrally buoyant in the crust depends en-tirely on their T, their P, and especially their composi-tion and the mineralogical and modal composition ofthe crustal rock (Figures 8.15 and 9.1). Subtle differ-ences of a few tenths of a gram per cubic centimeter inthe density of the magma or the crustal rock are suffi-cient to change the buoyancy from positive to negative.
The density of the oceanic basaltic crust (about 7 km thick) increases with depth because of progres-sively decreasing vesicularity, closure of pore spaces,and expulsion of water. Mantle-derived, olivine-richbasalt (picrite) magma and crust are of similar densityat a depth of about 1–3 km which is, therefore, a hori-zon of neutral buoyancy at which magma may stagnateand accumulate (Ryan, 1994). Lateral enlargement ofmagma chambers at oceanic spreading junctures mayoccur at this horizon. Evolved, less dense magma canrise via dikes to the seafloor where it extrudes.
Continental crust is far more heterogeneous thanoceanic crust, making generalizations of magma ascentless certain. Beneath a variably thick veneer of sedi-mentary rock whose density ranges from 2.2 to 2.7g/cm3, crustal igneous and metamorphic rocks havedensities ranging from about 2.6 to 2.9 g/cm3 and av-eraging aproximately 2.7 g/cm3, corresponding to granodiorite to diorite bulk compositions (Figure 9.1).In many places, deeper continental crust has densitiesof approximately 2.9 g/cm3, corresponding to more
mafic compositions, such as amphibolite. Andesite andless dense silicic magmas are probably positively buoy-ant in crust of any composition and can rise all the wayto the surface. Volatile undersaturated basaltic magmashave densities �2.7 g/cm3 and would not be expectedto rise buoyantly through less dense continental crustof granite to granodiorite composition. There is stronggeologic evidence (discussed in later chapters) for ap-preciable underplating of the lower continental crust,as well as intrusion into it, by basaltic magmas. Feld-spathic crustal rocks can, therefore, serve as an effec-tive density filter blocking ascent of denser mafic, mantle-derived magmas. These buoyantly blockedbasaltic magmas are believed to be responsible for par-tially melting the already hot lower crust as they cooland transfer heat. During cooling, they also are likely tofractionate olivine, so their residual melts, which can beless dense (Figure 8.16), may be buoyant enough torise. Fractionating magmas that contain dissolved, andespecially exsolved, volatiles or magmas assimilatingsilicic crustal material may also have low enough den-sity that they can rise higher into the overlying crust.Repeated stagnation and solidification of mafic mag-mas within the crust may densify it sufficiently that pro-gressively denser, more primitive basalt magmas maysubsequently ascend farther.
Yet, paradoxically, rather primitive, unevolvedbasalt magmas that have densities greater than that ofcontinental rock are commonly extruded onto the sur-face as lavas in continental areas. Some magmas haveeven intruded through porous alluvium (Figure 8.14)whose density can be � 2.0 g/cm3. How can this hap-pen? One possibility is volumetric expansion uponmelting in the source, which drives the magma upward
mel
t
mel
t mel
t MANTLE
Peri
dotit
e
CONTINENTALCRUST
Am
phib
olite
Gab
bro
Ultr
amaf
ic
Qtz
dio
rite
MO
RB
Gra
nodi
orite
And
esite
Pres
sure
(kb
ar)
2.4 2.6 2.8 3.0 3.20
20
40
60
Dep
th (
km)
20
15
10
5
0
Density (g/cm3)
Gra
nite
9.1 Density relations between some rock compositions and volatile-free melts in the continental crust and uppermost mantle. Range of den-sities for rock types is indicated in rectangular boxes. Note the smaller compressibilities of rocks compared to melts as P (depth) in-creases. MORB, mid-ocean ridge basalt. Amphibolite is a metamorphic rock composed of hornblende and plagioclase that is formed byrecrystallization of mafic igneous rocks (basalt, gabbro) under hydrous conditions. (Redrawn from Herzberg et al., 1983.)
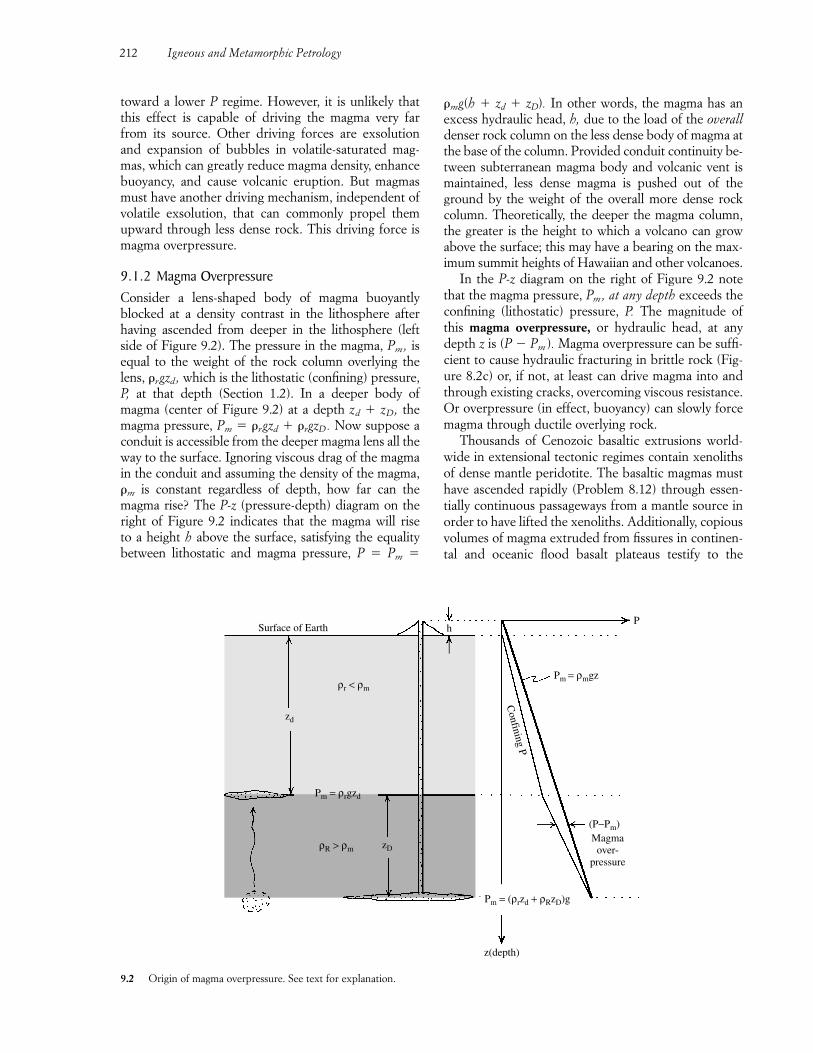
212 Igneous and Metamorphic Petrology
toward a lower P regime. However, it is unlikely thatthis effect is capable of driving the magma very farfrom its source. Other driving forces are exsolutionand expansion of bubbles in volatile-saturated mag-mas, which can greatly reduce magma density, enhancebuoyancy, and cause volcanic eruption. But magmasmust have another driving mechanism, independent ofvolatile exsolution, that can commonly propel themupward through less dense rock. This driving force ismagma overpressure.
9.1.2 Magma OverpressureConsider a lens-shaped body of magma buoyantlyblocked at a density contrast in the lithosphere afterhaving ascended from deeper in the lithosphere (leftside of Figure 9.2). The pressure in the magma, Pm, isequal to the weight of the rock column overlying thelens, �rgzd , which is the lithostatic (confining) pressure,P, at that depth (Section 1.2). In a deeper body ofmagma (center of Figure 9.2) at a depth zd � zD, themagma pressure, Pm � �rgzd � �rgzD. Now suppose aconduit is accessible from the deeper magma lens all theway to the surface. Ignoring viscous drag of the magmain the conduit and assuming the density of the magma,�m is constant regardless of depth, how far can themagma rise? The P-z (pressure-depth) diagram on theright of Figure 9.2 indicates that the magma will rise to a height h above the surface, satisfying the equalitybetween lithostatic and magma pressure, P � Pm �
�mg(h � zd � zD). In other words, the magma has an excess hydraulic head, h, due to the load of the overalldenser rock column on the less dense body of magma atthe base of the column. Provided conduit continuity be-tween subterranean magma body and volcanic vent ismaintained, less dense magma is pushed out of theground by the weight of the overall more dense rockcolumn. Theoretically, the deeper the magma column,the greater is the height to which a volcano can growabove the surface; this may have a bearing on the max-imum summit heights of Hawaiian and other volcanoes.
In the P-z diagram on the right of Figure 9.2 notethat the magma pressure, Pm, at any depth exceeds theconfining (lithostatic) pressure, P. The magnitude ofthis magma overpressure, or hydraulic head, at anydepth z is (P � Pm). Magma overpressure can be suffi-cient to cause hydraulic fracturing in brittle rock (Fig-ure 8.2c) or, if not, at least can drive magma into andthrough existing cracks, overcoming viscous resistance.Or overpressure (in effect, buoyancy) can slowly forcemagma through ductile overlying rock.
Thousands of Cenozoic basaltic extrusions world-wide in extensional tectonic regimes contain xenolithsof dense mantle peridotite. The basaltic magmas musthave ascended rapidly (Problem 8.12) through essen-tially continuous passageways from a mantle source inorder to have lifted the xenoliths. Additionally, copiousvolumes of magma extruded from fissures in continen-tal and oceanic flood basalt plateaus testify to the
Surface of Earth h
Confining P
Pm = ρmgz
(P−Pm)Magmaover-
pressure
Pm = (ρrzd + ρRzD)g
z(depth)
P
ρr < ρm
zd
zD
Pm = ρrgzd
ρR > ρm
9.2 Origin of magma overpressure. See text for explanation.
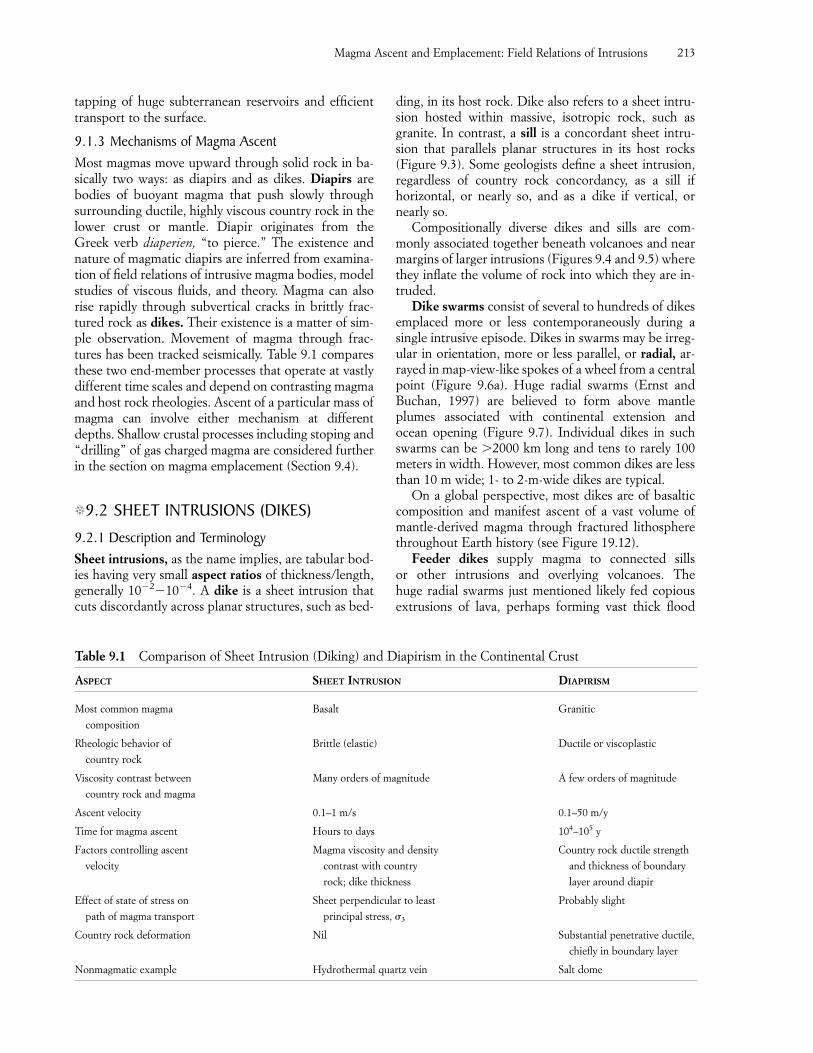
Magma Ascent and Emplacement: Field Relations of Intrusions 213
tapping of huge subterranean reservoirs and efficienttransport to the surface.
9.1.3 Mechanisms of Magma AscentMost magmas move upward through solid rock in ba-sically two ways: as diapirs and as dikes. Diapirs arebodies of buoyant magma that push slowly throughsurrounding ductile, highly viscous country rock in thelower crust or mantle. Diapir originates from theGreek verb diaperien, “to pierce.” The existence andnature of magmatic diapirs are inferred from examina-tion of field relations of intrusive magma bodies, modelstudies of viscous fluids, and theory. Magma can alsorise rapidly through subvertical cracks in brittly frac-tured rock as dikes. Their existence is a matter of sim-ple observation. Movement of magma through frac-tures has been tracked seismically. Table 9.1 comparesthese two end-member processes that operate at vastlydifferent time scales and depend on contrasting magmaand host rock rheologies. Ascent of a particular mass ofmagma can involve either mechanism at differentdepths. Shallow crustal processes including stoping and“drilling” of gas charged magma are considered furtherin the section on magma emplacement (Section 9.4).
�9.2 SHEET INTRUSIONS (DIKES)
9.2.1 Description and TerminologySheet intrusions, as the name implies, are tabular bod-ies having very small aspect ratios of thickness/length,generally 10�2�10�4. A dike is a sheet intrusion thatcuts discordantly across planar structures, such as bed-
ding, in its host rock. Dike also refers to a sheet intru-sion hosted within massive, isotropic rock, such asgranite. In contrast, a sill is a concordant sheet intru-sion that parallels planar structures in its host rocks(Figure 9.3). Some geologists define a sheet intrusion,regardless of country rock concordancy, as a sill if horizontal, or nearly so, and as a dike if vertical, ornearly so.
Compositionally diverse dikes and sills are com-monly associated together beneath volcanoes and nearmargins of larger intrusions (Figures 9.4 and 9.5) wherethey inflate the volume of rock into which they are in-truded.
Dike swarms consist of several to hundreds of dikesemplaced more or less contemporaneously during asingle intrusive episode. Dikes in swarms may be irreg-ular in orientation, more or less parallel, or radial, ar-rayed in map-view-like spokes of a wheel from a centralpoint (Figure 9.6a). Huge radial swarms (Ernst andBuchan, 1997) are believed to form above mantleplumes associated with continental extension andocean opening (Figure 9.7). Individual dikes in suchswarms can be �2000 km long and tens to rarely 100meters in width. However, most common dikes are lessthan 10 m wide; 1- to 2-m-wide dikes are typical.
On a global perspective, most dikes are of basalticcomposition and manifest ascent of a vast volume ofmantle-derived magma through fractured lithospherethroughout Earth history (see Figure 19.12).
Feeder dikes supply magma to connected sills or other intrusions and overlying volcanoes. The huge radial swarms just mentioned likely fed copious extrusions of lava, perhaps forming vast thick flood
Table 9.1 Comparison of Sheet Intrusion (Diking) and Diapirism in the Continental Crust
ASPECT SHEET INTRUSION DIAPIRISM
Most common magma Basalt Granitic
composition
Rheologic behavior of Brittle (elastic) Ductile or viscoplastic
country rock
Viscosity contrast between Many orders of magnitude A few orders of magnitude
country rock and magma
Ascent velocity 0.1–1 m/s 0.1–50 m/y
Time for magma ascent Hours to days 104–105 y
Factors controlling ascent Magma viscosity and density Country rock ductile strength
velocity contrast with country and thickness of boundary
rock; dike thickness layer around diapir
Effect of state of stress on Sheet perpendicular to least Probably slight
path of magma transport principal stress, �3
Country rock deformation Nil Substantial penetrative ductile,
chiefly in boundary layer
Nonmagmatic example Hydrothermal quartz vein Salt dome
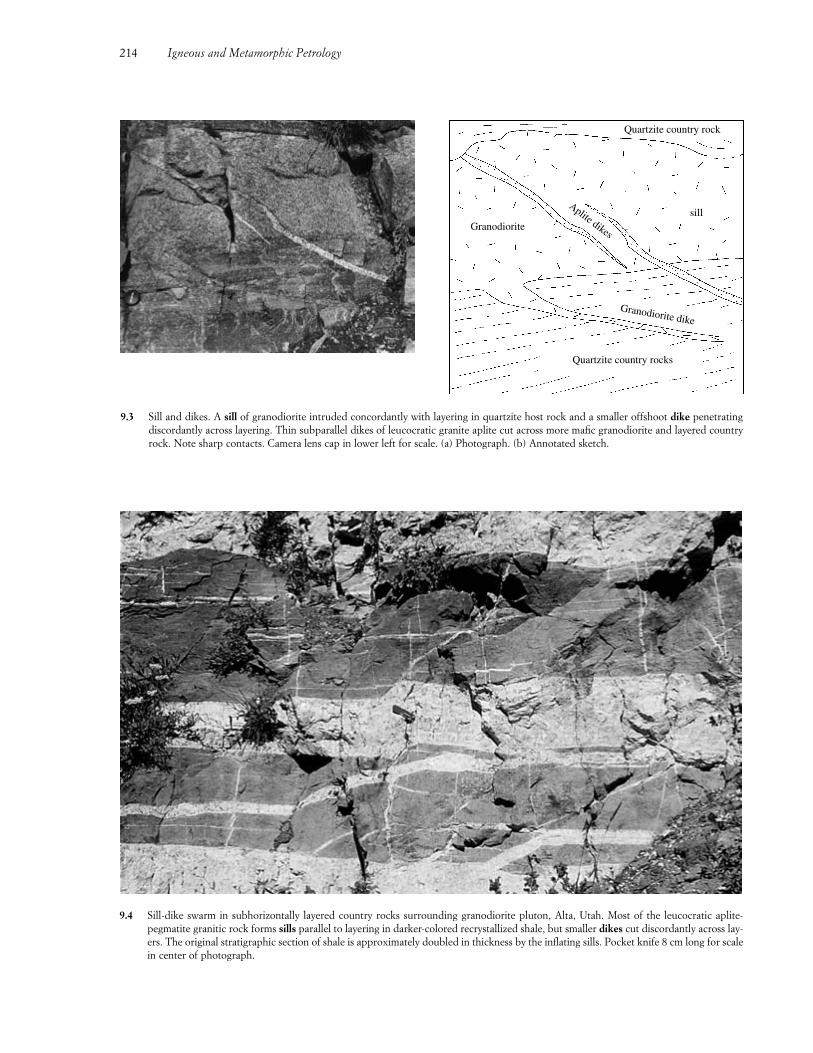
214 Igneous and Metamorphic Petrology
9.4 Sill-dike swarm in subhorizontally layered country rocks surrounding granodiorite pluton, Alta, Utah. Most of the leucocratic aplite-pegmatite granitic rock forms sills parallel to layering in darker-colored recrystallized shale, but smaller dikes cut discordantly across lay-ers. The original stratigraphic section of shale is approximately doubled in thickness by the inflating sills. Pocket knife 8 cm long for scalein center of photograph.
9.3 Sill and dikes. A sill of granodiorite intruded concordantly with layering in quartzite host rock and a smaller offshoot dike penetratingdiscordantly across layering. Thin subparallel dikes of leucocratic granite aplite cut across more mafic granodiorite and layered countryrock. Note sharp contacts. Camera lens cap in lower left for scale. (a) Photograph. (b) Annotated sketch.
Quartzite country rock
sill
Granodiorite dike
Quartzite country rocks
Granodiorite
Aplite dikes
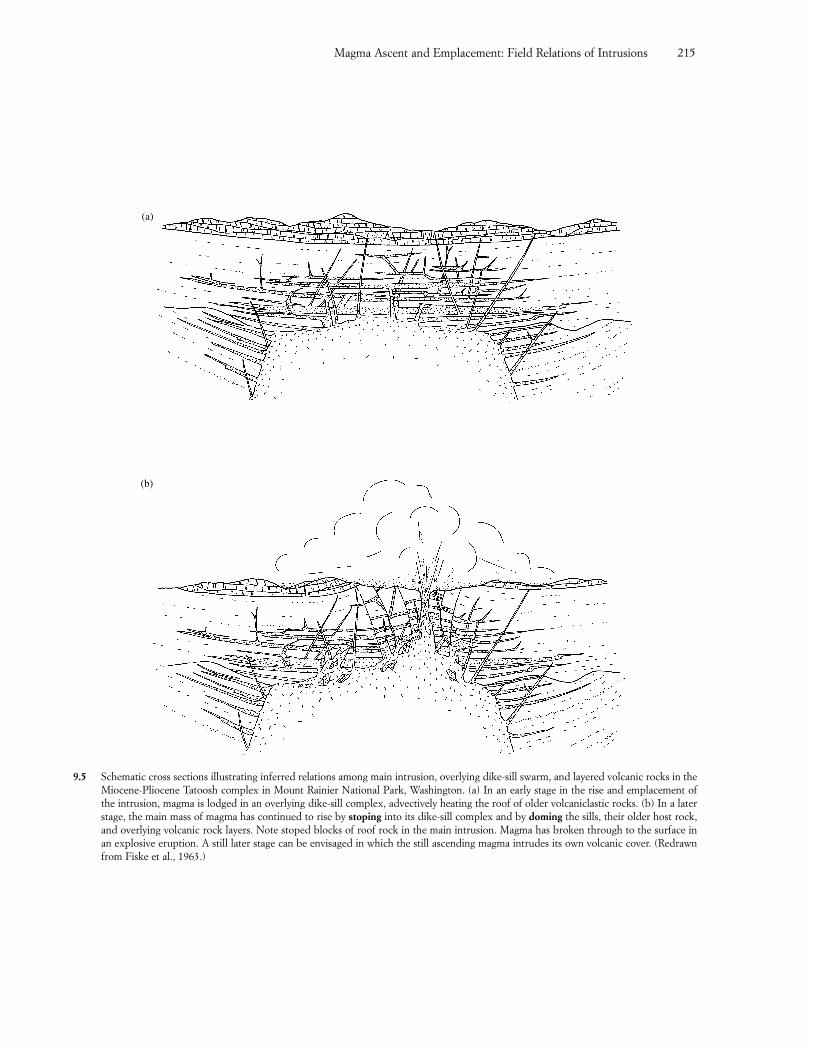
Magma Ascent and Emplacement: Field Relations of Intrusions 215
(b)
9.5 Schematic cross sections illustrating inferred relations among main intrusion, overlying dike-sill swarm, and layered volcanic rocks in theMiocene-Pliocene Tatoosh complex in Mount Rainier National Park, Washington. (a) In an early stage in the rise and emplacement ofthe intrusion, magma is lodged in an overlying dike-sill complex, advectively heating the roof of older volcaniclastic rocks. (b) In a laterstage, the main mass of magma has continued to rise by stoping into its dike-sill complex and by doming the sills, their older host rock,and overlying volcanic rock layers. Note stoped blocks of roof rock in the main intrusion. Magma has broken through to the surface inan explosive eruption. A still later stage can be envisaged in which the still ascending magma intrudes its own volcanic cover. (Redrawnfrom Fiske et al., 1963.)
(a)
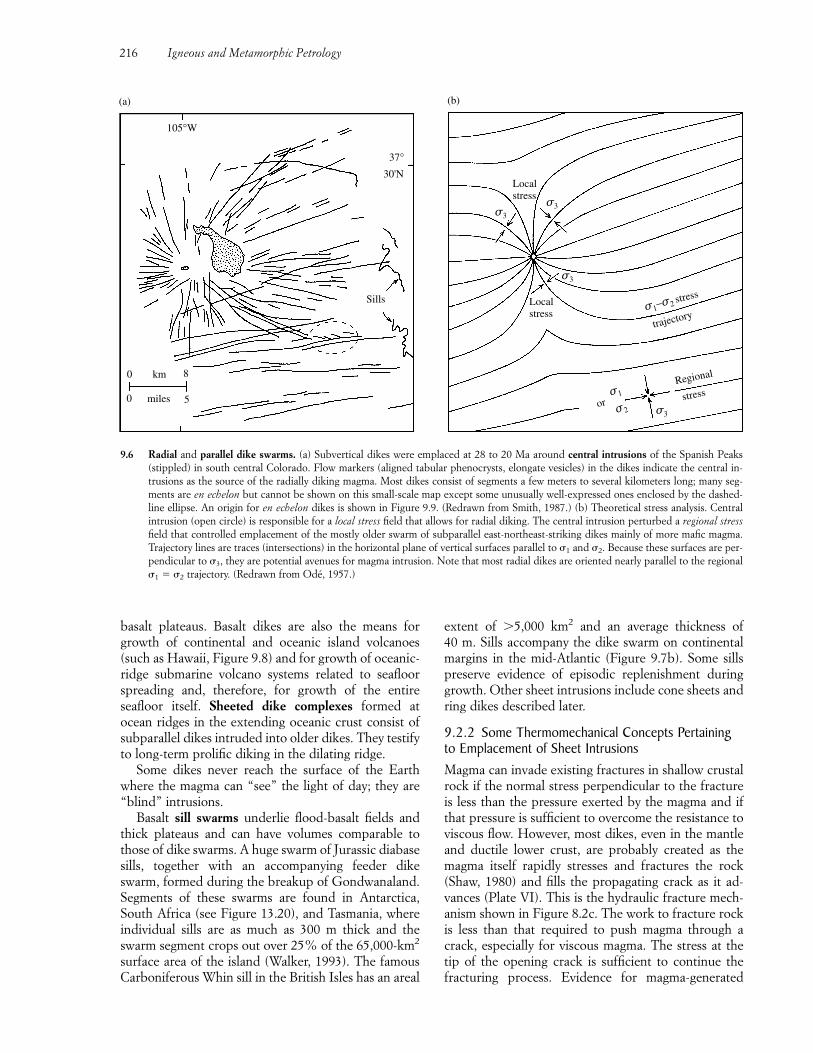
extent of �5,000 km2 and an average thickness of 40 m. Sills accompany the dike swarm on continentalmargins in the mid-Atlantic (Figure 9.7b). Some sillspreserve evidence of episodic replenishment duringgrowth. Other sheet intrusions include cone sheets andring dikes described later.
9.2.2 Some Thermomechanical Concepts Pertainingto Emplacement of Sheet IntrusionsMagma can invade existing fractures in shallow crustalrock if the normal stress perpendicular to the fractureis less than the pressure exerted by the magma and ifthat pressure is sufficient to overcome the resistance toviscous flow. However, most dikes, even in the mantleand ductile lower crust, are probably created as themagma itself rapidly stresses and fractures the rock(Shaw, 1980) and fills the propagating crack as it ad-vances (Plate VI). This is the hydraulic fracture mech-anism shown in Figure 8.2c. The work to fracture rockis less than that required to push magma through acrack, especially for viscous magma. The stress at thetip of the opening crack is sufficient to continue thefracturing process. Evidence for magma-generated
216 Igneous and Metamorphic Petrology
basalt plateaus. Basalt dikes are also the means forgrowth of continental and oceanic island volcanoes(such as Hawaii, Figure 9.8) and for growth of oceanic-ridge submarine volcano systems related to seafloorspreading and, therefore, for growth of the entireseafloor itself. Sheeted dike complexes formed atocean ridges in the extending oceanic crust consist ofsubparallel dikes intruded into older dikes. They testifyto long-term prolific diking in the dilating ridge.
Some dikes never reach the surface of the Earthwhere the magma can “see” the light of day; they are“blind” intrusions.
Basalt sill swarms underlie flood-basalt fields andthick plateaus and can have volumes comparable tothose of dike swarms. A huge swarm of Jurassic diabasesills, together with an accompanying feeder dikeswarm, formed during the breakup of Gondwanaland.Segments of these swarms are found in Antarctica,South Africa (see Figure 13.20), and Tasmania, whereindividual sills are as much as 300 m thick and theswarm segment crops out over 25% of the 65,000-km2
surface area of the island (Walker, 1993). The famousCarboniferous Whin sill in the British Isles has an areal
37°30'N
Sills
0 km 8
0 miles 5
105°W
(a)
(b)
Localstress
Localstress
σ3
σ3
σ3
σ1−σ2 stress
trajectory
Regional
stress
σ3σ2
σ1or
9.6 Radial and parallel dike swarms. (a) Subvertical dikes were emplaced at 28 to 20 Ma around central intrusions of the Spanish Peaks(stippled) in south central Colorado. Flow markers (aligned tabular phenocrysts, elongate vesicles) in the dikes indicate the central in-trusions as the source of the radially diking magma. Most dikes consist of segments a few meters to several kilometers long; many seg-ments are en echelon but cannot be shown on this small-scale map except some unusually well-expressed ones enclosed by the dashed-line ellipse. An origin for en echelon dikes is shown in Figure 9.9. (Redrawn from Smith, 1987.) (b) Theoretical stress analysis. Centralintrusion (open circle) is responsible for a local stress field that allows for radial diking. The central intrusion perturbed a regional stressfield that controlled emplacement of the mostly older swarm of subparallel east-northeast-striking dikes mainly of more mafic magma.Trajectory lines are traces (intersections) in the horizontal plane of vertical surfaces parallel to �1 and �2. Because these surfaces are per-pendicular to �3, they are potential avenues for magma intrusion. Note that most radial dikes are oriented nearly parallel to the regional�1 � �2 trajectory. (Redrawn from Odé, 1957.)
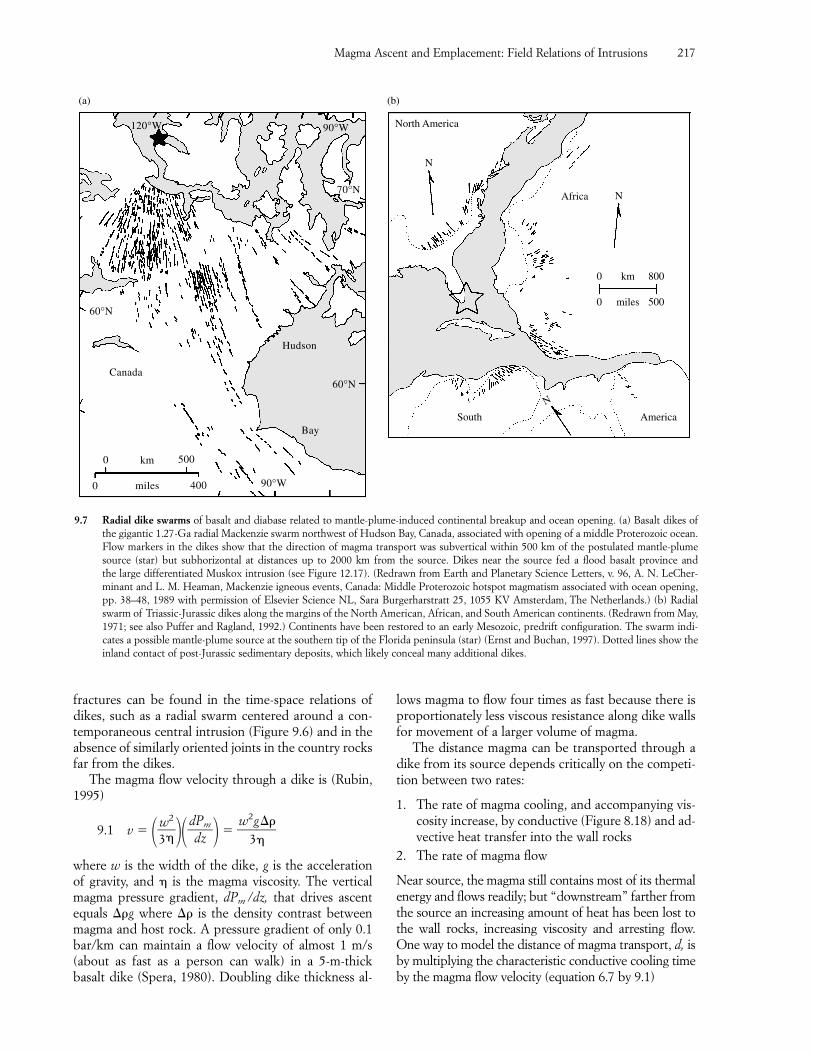
fractures can be found in the time-space relations ofdikes, such as a radial swarm centered around a con-temporaneous central intrusion (Figure 9.6) and in theabsence of similarly oriented joints in the country rocksfar from the dikes.
The magma flow velocity through a dike is (Rubin,1995)
9.1 v � �3w
2
��ddPzm
� � w2
3g
��
where w is the width of the dike, g is the accelerationof gravity, and is the magma viscosity. The verticalmagma pressure gradient, dPm /dz, that drives ascentequals ��g where �� is the density contrast betweenmagma and host rock. A pressure gradient of only 0.1bar/km can maintain a flow velocity of almost 1 m/s(about as fast as a person can walk) in a 5-m-thickbasalt dike (Spera, 1980). Doubling dike thickness al-
lows magma to flow four times as fast because there isproportionately less viscous resistance along dike wallsfor movement of a larger volume of magma.
The distance magma can be transported through adike from its source depends critically on the competi-tion between two rates:
1. The rate of magma cooling, and accompanying vis-cosity increase, by conductive (Figure 8.18) and ad-vective heat transfer into the wall rocks
2. The rate of magma flow
Near source, the magma still contains most of its thermalenergy and flows readily; but “downstream” farther fromthe source an increasing amount of heat has been lost tothe wall rocks, increasing viscosity and arresting flow.One way to model the distance of magma transport, d, isby multiplying the characteristic conductive cooling timeby the magma flow velocity (equation 6.7 by 9.1)
Magma Ascent and Emplacement: Field Relations of Intrusions 217
0 km 500
0 miles 400 90°W
Bay
60°N
Hudson
70°N
90°W120°W
60°N
Canada
South America
(a) (b)
N
North America
Africa N
0 km 800
0 miles 500
N
9.7 Radial dike swarms of basalt and diabase related to mantle-plume-induced continental breakup and ocean opening. (a) Basalt dikes ofthe gigantic 1.27-Ga radial Mackenzie swarm northwest of Hudson Bay, Canada, associated with opening of a middle Proterozoic ocean.Flow markers in the dikes show that the direction of magma transport was subvertical within 500 km of the postulated mantle-plumesource (star) but subhorizontal at distances up to 2000 km from the source. Dikes near the source fed a flood basalt province and the large differentiated Muskox intrusion (see Figure 12.17). (Redrawn from Earth and Planetary Science Letters, v. 96, A. N. LeCher-minant and L. M. Heaman, Mackenzie igneous events, Canada: Middle Proterozoic hotspot magmatism associated with ocean opening,pp. 38–48, 1989 with permission of Elsevier Science NL, Sara Burgerharstratt 25, 1055 KV Amsterdam, The Netherlands.) (b) Radialswarm of Triassic-Jurassic dikes along the margins of the North American, African, and South American continents. (Redrawn from May,1971; see also Puffer and Ragland, 1992.) Continents have been restored to an early Mesozoic, predrift configuration. The swarm indi-cates a possible mantle-plume source at the southern tip of the Florida peninsula (star) (Ernst and Buchan, 1997). Dotted lines show theinland contact of post-Jurassic sedimentary deposits, which likely conceal many additional dikes.
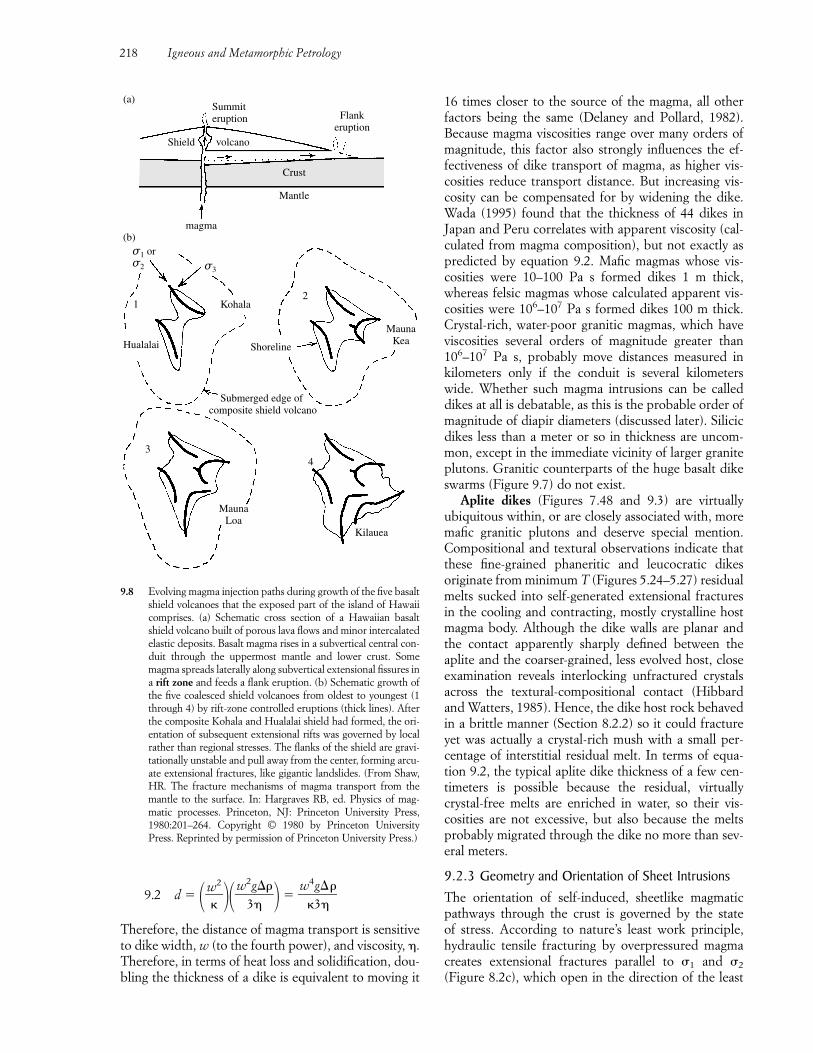
9.2 d � �w�
2
��w2
3g
��� �
w�
4g3�
�
Therefore, the distance of magma transport is sensitiveto dike width, w (to the fourth power), and viscosity, .Therefore, in terms of heat loss and solidification, dou-bling the thickness of a dike is equivalent to moving it
16 times closer to the source of the magma, all otherfactors being the same (Delaney and Pollard, 1982).Because magma viscosities range over many orders ofmagnitude, this factor also strongly influences the ef-fectiveness of dike transport of magma, as higher vis-cosities reduce transport distance. But increasing vis-cosity can be compensated for by widening the dike.Wada (1995) found that the thickness of 44 dikes inJapan and Peru correlates with apparent viscosity (cal-culated from magma composition), but not exactly aspredicted by equation 9.2. Mafic magmas whose vis-cosities were 10–100 Pa s formed dikes 1 m thick,whereas felsic magmas whose calculated apparent vis-cosities were 106–107 Pa s formed dikes 100 m thick.Crystal-rich, water-poor granitic magmas, which haveviscosities several orders of magnitude greater than106–107 Pa s, probably move distances measured inkilometers only if the conduit is several kilometerswide. Whether such magma intrusions can be calleddikes at all is debatable, as this is the probable order ofmagnitude of diapir diameters (discussed later). Silicicdikes less than a meter or so in thickness are uncom-mon, except in the immediate vicinity of larger graniteplutons. Granitic counterparts of the huge basalt dikeswarms (Figure 9.7) do not exist.
Aplite dikes (Figures 7.48 and 9.3) are virtuallyubiquitous within, or are closely associated with, moremafic granitic plutons and deserve special mention.Compositional and textural observations indicate thatthese fine-grained phaneritic and leucocratic dikesoriginate from minimum T (Figures 5.24–5.27) residualmelts sucked into self-generated extensional fracturesin the cooling and contracting, mostly crystalline hostmagma body. Although the dike walls are planar andthe contact apparently sharply defined between theaplite and the coarser-grained, less evolved host, closeexamination reveals interlocking unfractured crystalsacross the textural-compositional contact (Hibbardand Watters, 1985). Hence, the dike host rock behavedin a brittle manner (Section 8.2.2) so it could fractureyet was actually a crystal-rich mush with a small per-centage of interstitial residual melt. In terms of equa-tion 9.2, the typical aplite dike thickness of a few cen-timeters is possible because the residual, virtuallycrystal-free melts are enriched in water, so their vis-cosities are not excessive, but also because the meltsprobably migrated through the dike no more than sev-eral meters.
9.2.3 Geometry and Orientation of Sheet IntrusionsThe orientation of self-induced, sheetlike magmaticpathways through the crust is governed by the state of stress. According to nature’s least work principle,hydraulic tensile fracturing by overpressured magmacreates extensional fractures parallel to �1 and �2
(Figure 8.2c), which open in the direction of the least
218 Igneous and Metamorphic Petrology
Shield volcano
Summiteruption Flank
eruption
Crust
Mantle
magma
(a)
σ1 orσ2
(b)
1
σ3
Kohala
Hualalai
3
MaunaLoa
Submerged edge of composite shield volcano
Shoreline
4
2
MaunaKea
Kilauea
9.8 Evolving magma injection paths during growth of the five basaltshield volcanoes that the exposed part of the island of Hawaiicomprises. (a) Schematic cross section of a Hawaiian basaltshield volcano built of porous lava flows and minor intercalatedelastic deposits. Basalt magma rises in a subvertical central con-duit through the uppermost mantle and lower crust. Somemagma spreads laterally along subvertical extensional fissures ina rift zone and feeds a flank eruption. (b) Schematic growth ofthe five coalesced shield volcanoes from oldest to youngest (1through 4) by rift-zone controlled eruptions (thick lines). Afterthe composite Kohala and Hualalai shield had formed, the ori-entation of subsequent extensional rifts was governed by localrather than regional stresses. The flanks of the shield are gravi-tationally unstable and pull away from the center, forming arcu-ate extensional fractures, like gigantic landslides. (From Shaw,HR. The fracture mechanisms of magma transport from themantle to the surface. In: Hargraves RB, ed. Physics of mag-matic processes. Princeton, NJ: Princeton University Press,1980:201–264. Copyright © 1980 by Princeton UniversityPress. Reprinted by permission of Princeton University Press.)
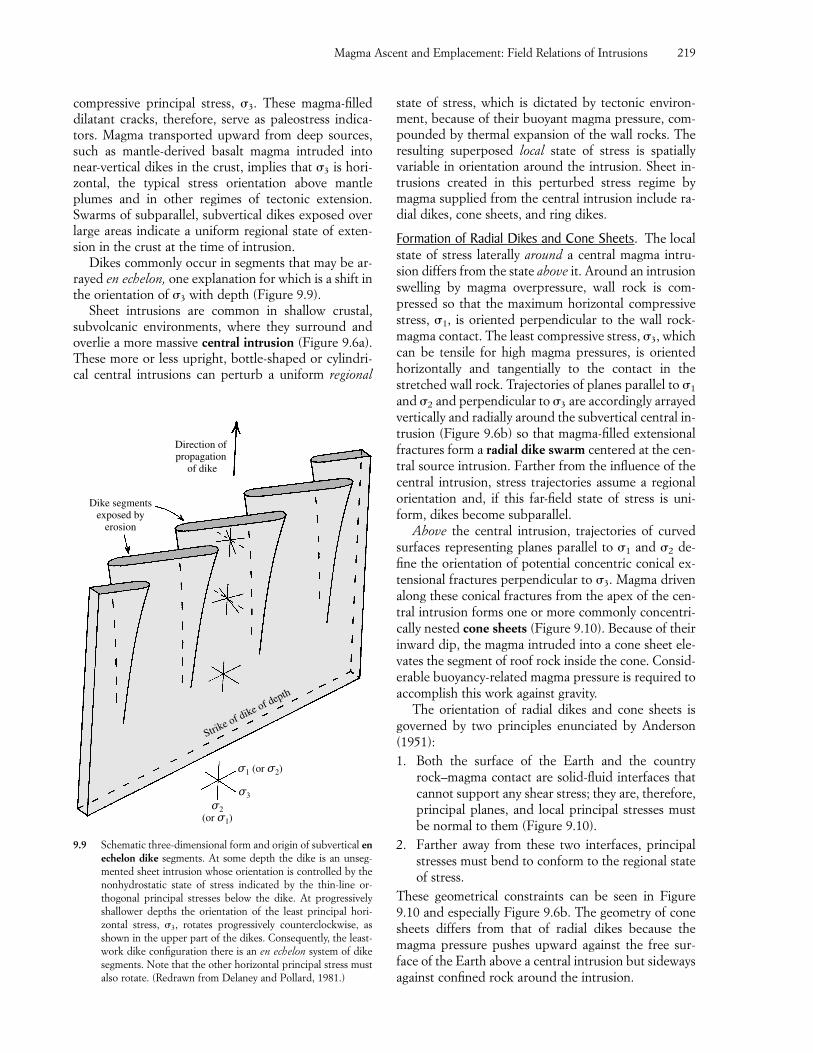
compressive principal stress, �3. These magma-filleddilatant cracks, therefore, serve as paleostress indica-tors. Magma transported upward from deep sources,such as mantle-derived basalt magma intruded intonear-vertical dikes in the crust, implies that �3 is hori-zontal, the typical stress orientation above mantleplumes and in other regimes of tectonic extension.Swarms of subparallel, subvertical dikes exposed overlarge areas indicate a uniform regional state of exten-sion in the crust at the time of intrusion.
Dikes commonly occur in segments that may be ar-rayed en echelon, one explanation for which is a shift inthe orientation of �3 with depth (Figure 9.9).
Sheet intrusions are common in shallow crustal,subvolcanic environments, where they surround andoverlie a more massive central intrusion (Figure 9.6a).These more or less upright, bottle-shaped or cylindri-cal central intrusions can perturb a uniform regional
state of stress, which is dictated by tectonic environ-ment, because of their buoyant magma pressure, com-pounded by thermal expansion of the wall rocks. Theresulting superposed local state of stress is spatiallyvariable in orientation around the intrusion. Sheet in-trusions created in this perturbed stress regime bymagma supplied from the central intrusion include ra-dial dikes, cone sheets, and ring dikes.
Formation of Radial Dikes and Cone Sheets. The localstate of stress laterally around a central magma intru-sion differs from the state above it. Around an intrusionswelling by magma overpressure, wall rock is com-pressed so that the maximum horizontal compressivestress, �1, is oriented perpendicular to the wall rock-magma contact. The least compressive stress, �3, whichcan be tensile for high magma pressures, is orientedhorizontally and tangentially to the contact in thestretched wall rock. Trajectories of planes parallel to �1
and �2 and perpendicular to �3 are accordingly arrayedvertically and radially around the subvertical central in-trusion (Figure 9.6b) so that magma-filled extensionalfractures form a radial dike swarm centered at the cen-tral source intrusion. Farther from the influence of thecentral intrusion, stress trajectories assume a regionalorientation and, if this far-field state of stress is uni-form, dikes become subparallel.
Above the central intrusion, trajectories of curvedsurfaces representing planes parallel to �1 and �2 de-fine the orientation of potential concentric conical ex-tensional fractures perpendicular to �3. Magma drivenalong these conical fractures from the apex of the cen-tral intrusion forms one or more commonly concentri-cally nested cone sheets (Figure 9.10). Because of theirinward dip, the magma intruded into a cone sheet ele-vates the segment of roof rock inside the cone. Consid-erable buoyancy-related magma pressure is required toaccomplish this work against gravity.
The orientation of radial dikes and cone sheets isgoverned by two principles enunciated by Anderson(1951):1. Both the surface of the Earth and the country
rock–magma contact are solid-fluid interfaces thatcannot support any shear stress; they are, therefore,principal planes, and local principal stresses mustbe normal to them (Figure 9.10).
2. Farther away from these two interfaces, principalstresses must bend to conform to the regional stateof stress.
These geometrical constraints can be seen in Figure9.10 and especially Figure 9.6b. The geometry of conesheets differs from that of radial dikes because themagma pressure pushes upward against the free sur-face of the Earth above a central intrusion but sidewaysagainst confined rock around the intrusion.
Magma Ascent and Emplacement: Field Relations of Intrusions 219
Strike of dike of depth
σ1 (or σ2)
σ2(or σ1)
σ3
Dike segmentsexposed by
erosion
Direction of propagation
of dike
9.9 Schematic three-dimensional form and origin of subvertical enechelon dike segments. At some depth the dike is an unseg-mented sheet intrusion whose orientation is controlled by thenonhydrostatic state of stress indicated by the thin-line or-thogonal principal stresses below the dike. At progressivelyshallower depths the orientation of the least principal hori-zontal stress, �3, rotates progressively counterclockwise, asshown in the upper part of the dikes. Consequently, the least-work dike configuration there is an en echelon system of dikesegments. Note that the other horizontal principal stress mustalso rotate. (Redrawn from Delaney and Pollard, 1981.)
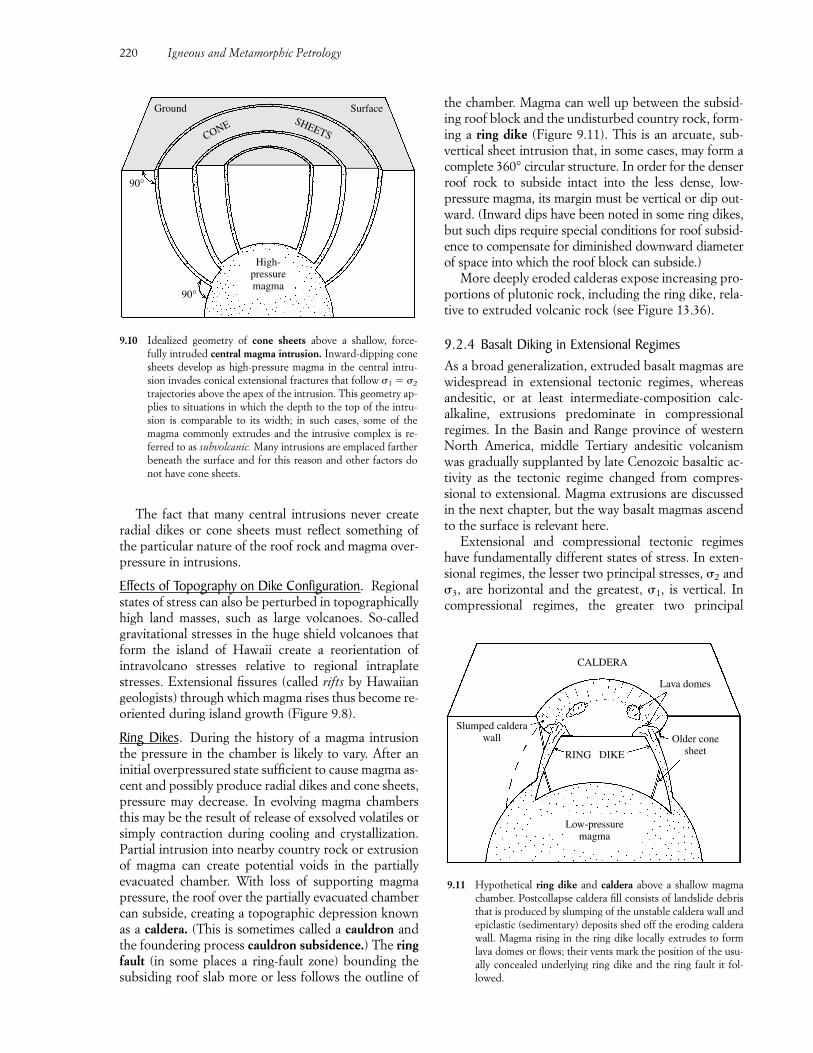
The fact that many central intrusions never createradial dikes or cone sheets must reflect something ofthe particular nature of the roof rock and magma over-pressure in intrusions.
Effects of Topography on Dike Configuration. Regionalstates of stress can also be perturbed in topographicallyhigh land masses, such as large volcanoes. So-calledgravitational stresses in the huge shield volcanoes thatform the island of Hawaii create a reorientation of intravolcano stresses relative to regional intraplatestresses. Extensional fissures (called rifts by Hawaiiangeologists) through which magma rises thus become re-oriented during island growth (Figure 9.8).
Ring Dikes. During the history of a magma intrusionthe pressure in the chamber is likely to vary. After aninitial overpressured state sufficient to cause magma as-cent and possibly produce radial dikes and cone sheets,pressure may decrease. In evolving magma chambersthis may be the result of release of exsolved volatiles orsimply contraction during cooling and crystallization.Partial intrusion into nearby country rock or extrusionof magma can create potential voids in the partiallyevacuated chamber. With loss of supporting magmapressure, the roof over the partially evacuated chambercan subside, creating a topographic depression knownas a caldera. (This is sometimes called a cauldron andthe foundering process cauldron subsidence.) The ringfault (in some places a ring-fault zone) bounding thesubsiding roof slab more or less follows the outline of
the chamber. Magma can well up between the subsid-ing roof block and the undisturbed country rock, form-ing a ring dike (Figure 9.11). This is an arcuate, sub-vertical sheet intrusion that, in some cases, may form acomplete 360° circular structure. In order for the denserroof rock to subside intact into the less dense, low-pressure magma, its margin must be vertical or dip out-ward. (Inward dips have been noted in some ring dikes,but such dips require special conditions for roof subsid-ence to compensate for diminished downward diameterof space into which the roof block can subside.)
More deeply eroded calderas expose increasing pro-portions of plutonic rock, including the ring dike, rela-tive to extruded volcanic rock (see Figure 13.36).
9.2.4 Basalt Diking in Extensional RegimesAs a broad generalization, extruded basalt magmas arewidespread in extensional tectonic regimes, whereasandesitic, or at least intermediate-composition calc-alkaline, extrusions predominate in compressionalregimes. In the Basin and Range province of westernNorth America, middle Tertiary andesitic volcanismwas gradually supplanted by late Cenozoic basaltic ac-tivity as the tectonic regime changed from compres-sional to extensional. Magma extrusions are discussedin the next chapter, but the way basalt magmas ascendto the surface is relevant here.
Extensional and compressional tectonic regimeshave fundamentally different states of stress. In exten-sional regimes, the lesser two principal stresses, �2 and�3, are horizontal and the greatest, �1, is vertical. Incompressional regimes, the greater two principal
220 Igneous and Metamorphic Petrology
RING DIKE
Low-pressuremagma
Slumped calderawall Older cone
sheet
CALDERA
Lava domes
9.11 Hypothetical ring dike and caldera above a shallow magmachamber. Postcollapse caldera fill consists of landslide debristhat is produced by slumping of the unstable caldera wall andepiclastic (sedimentary) deposits shed off the eroding calderawall. Magma rising in the ring dike locally extrudes to formlava domes or flows; their vents mark the position of the usu-ally concealed underlying ring dike and the ring fault it fol-lowed.
Ground Surface
CONE SHEETS
High-pressuremagma
90°
90°
9.10 Idealized geometry of cone sheets above a shallow, force-fully intruded central magma intrusion. Inward-dipping conesheets develop as high-pressure magma in the central intru-sion invades conical extensional fractures that follow �1 � �2
trajectories above the apex of the intrusion. This geometry ap-plies to situations in which the depth to the top of the intru-sion is comparable to its width; in such cases, some of themagma commonly extrudes and the intrusive complex is re-ferred to as subvolcanic. Many intrusions are emplaced fartherbeneath the surface and for this reason and other factors donot have cone sheets.
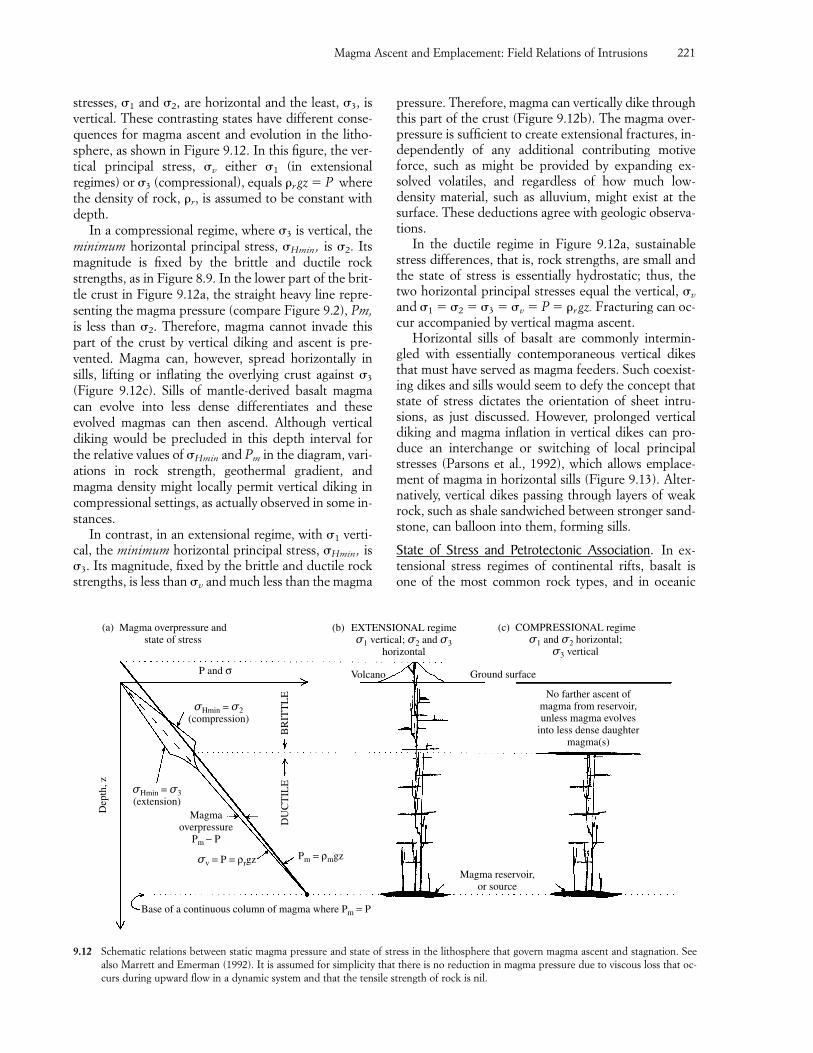
stresses, �1 and �2, are horizontal and the least, �3, isvertical. These contrasting states have different conse-quences for magma ascent and evolution in the litho-sphere, as shown in Figure 9.12. In this figure, the ver-tical principal stress, �v either �1 (in extensionalregimes) or �3 (compressional), equals �rgz � P wherethe density of rock, �r, is assumed to be constant withdepth.
In a compressional regime, where �3 is vertical, theminimum horizontal principal stress, �Hmin , is �2. Itsmagnitude is fixed by the brittle and ductile rockstrengths, as in Figure 8.9. In the lower part of the brit-tle crust in Figure 9.12a, the straight heavy line repre-senting the magma pressure (compare Figure 9.2), Pm,is less than �2. Therefore, magma cannot invade thispart of the crust by vertical diking and ascent is pre-vented. Magma can, however, spread horizontally insills, lifting or inflating the overlying crust against �3
(Figure 9.12c). Sills of mantle-derived basalt magmacan evolve into less dense differentiates and theseevolved magmas can then ascend. Although verticaldiking would be precluded in this depth interval forthe relative values of �Hmin and Pm in the diagram, vari-ations in rock strength, geothermal gradient, andmagma density might locally permit vertical diking incompressional settings, as actually observed in some in-stances.
In contrast, in an extensional regime, with �1 verti-cal, the minimum horizontal principal stress, �Hmin , is�3. Its magnitude, fixed by the brittle and ductile rockstrengths, is less than �v and much less than the magma
pressure. Therefore, magma can vertically dike throughthis part of the crust (Figure 9.12b). The magma over-pressure is sufficient to create extensional fractures, in-dependently of any additional contributing motiveforce, such as might be provided by expanding ex-solved volatiles, and regardless of how much low-density material, such as alluvium, might exist at thesurface. These deductions agree with geologic observa-tions.
In the ductile regime in Figure 9.12a, sustainablestress differences, that is, rock strengths, are small andthe state of stress is essentially hydrostatic; thus, thetwo horizontal principal stresses equal the vertical, �v
and �1 � �2 � �3 � �v � P � �rgz. Fracturing can oc-cur accompanied by vertical magma ascent.
Horizontal sills of basalt are commonly intermin-gled with essentially contemporaneous vertical dikesthat must have served as magma feeders. Such coexist-ing dikes and sills would seem to defy the concept thatstate of stress dictates the orientation of sheet intru-sions, as just discussed. However, prolonged verticaldiking and magma inflation in vertical dikes can pro-duce an interchange or switching of local principalstresses (Parsons et al., 1992), which allows emplace-ment of magma in horizontal sills (Figure 9.13). Alter-natively, vertical dikes passing through layers of weakrock, such as shale sandwiched between stronger sand-stone, can balloon into them, forming sills.
State of Stress and Petrotectonic Association. In ex-tensional stress regimes of continental rifts, basalt isone of the most common rock types, and in oceanic
Magma Ascent and Emplacement: Field Relations of Intrusions 221
P and σ Volcano Ground surface
No farther ascent ofmagma from reservoir,unless magma evolves
into less dense daughtermagma(s)
Magma reservoir,or source
Base of a continuous column of magma where Pm = P
σHmin = σ3
(extension)
Pm = ρmgzσv = P = ρrgz
Magmaoverpressure
Pm − P
σHmin = σ2(compression)
DU
CT
ILE
BR
ITT
LE
Dep
th, z
Magma overpressure andstate of stress
(a) EXTENSIONAL regimeσ1 vertical; σ2 and σ3
horizontal
(b) COMPRESSIONAL regimeσ1 and σ2 horizontal;
σ3 vertical
(c)
9.12 Schematic relations between static magma pressure and state of stress in the lithosphere that govern magma ascent and stagnation. Seealso Marrett and Emerman (1992). It is assumed for simplicity that there is no reduction in magma pressure due to viscous loss that oc-curs during upward flow in a dynamic system and that the tensile strength of rock is nil.
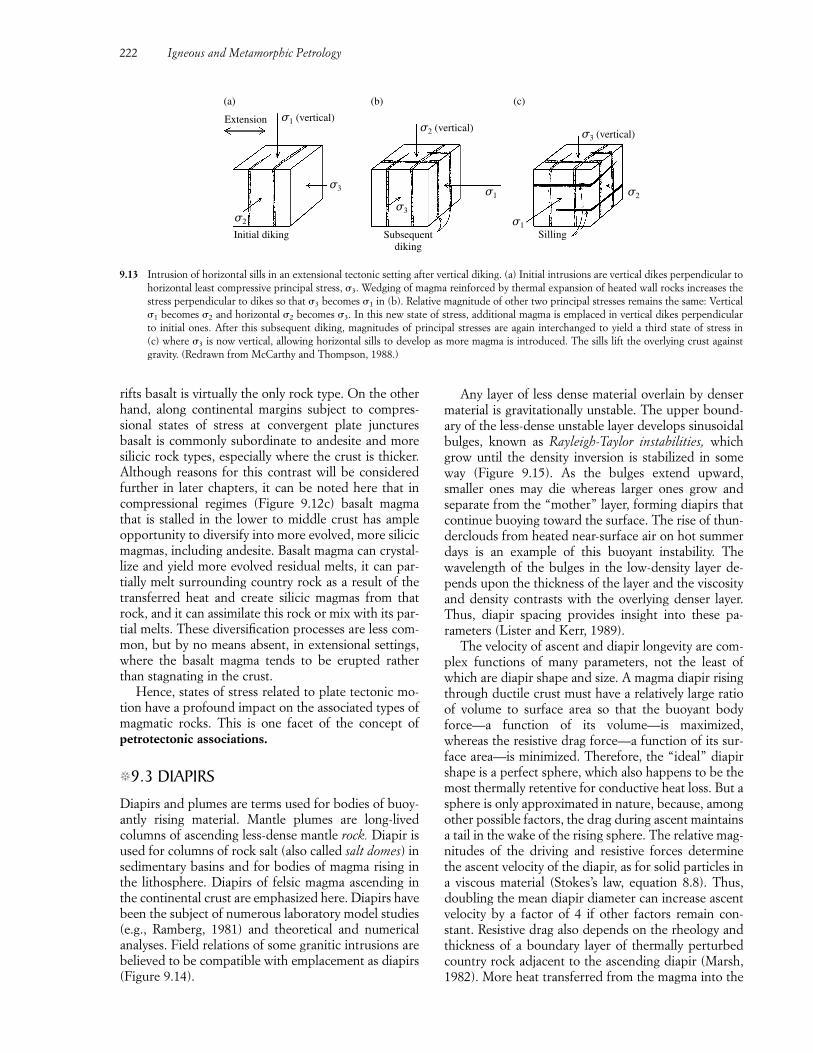
Any layer of less dense material overlain by densermaterial is gravitationally unstable. The upper bound-ary of the less-dense unstable layer develops sinusoidalbulges, known as Rayleigh-Taylor instabilities, whichgrow until the density inversion is stabilized in someway (Figure 9.15). As the bulges extend upward,smaller ones may die whereas larger ones grow andseparate from the “mother” layer, forming diapirs thatcontinue buoying toward the surface. The rise of thun-derclouds from heated near-surface air on hot summerdays is an example of this buoyant instability. Thewavelength of the bulges in the low-density layer de-pends upon the thickness of the layer and the viscosityand density contrasts with the overlying denser layer.Thus, diapir spacing provides insight into these pa-rameters (Lister and Kerr, 1989).
The velocity of ascent and diapir longevity are com-plex functions of many parameters, not the least ofwhich are diapir shape and size. A magma diapir risingthrough ductile crust must have a relatively large ratioof volume to surface area so that the buoyant bodyforce—a function of its volume—is maximized,whereas the resistive drag force—a function of its sur-face area—is minimized. Therefore, the “ideal” diapirshape is a perfect sphere, which also happens to be themost thermally retentive for conductive heat loss. But asphere is only approximated in nature, because, amongother possible factors, the drag during ascent maintainsa tail in the wake of the rising sphere. The relative mag-nitudes of the driving and resistive forces determinethe ascent velocity of the diapir, as for solid particles ina viscous material (Stokes’s law, equation 8.8). Thus,doubling the mean diapir diameter can increase ascentvelocity by a factor of 4 if other factors remain con-stant. Resistive drag also depends on the rheology andthickness of a boundary layer of thermally perturbedcountry rock adjacent to the ascending diapir (Marsh,1982). More heat transferred from the magma into the
222 Igneous and Metamorphic Petrology
rifts basalt is virtually the only rock type. On the otherhand, along continental margins subject to compres-sional states of stress at convergent plate juncturesbasalt is commonly subordinate to andesite and moresilicic rock types, especially where the crust is thicker.Although reasons for this contrast will be consideredfurther in later chapters, it can be noted here that incompressional regimes (Figure 9.12c) basalt magmathat is stalled in the lower to middle crust has ampleopportunity to diversify into more evolved, more silicicmagmas, including andesite. Basalt magma can crystal-lize and yield more evolved residual melts, it can par-tially melt surrounding country rock as a result of thetransferred heat and create silicic magmas from thatrock, and it can assimilate this rock or mix with its par-tial melts. These diversification processes are less com-mon, but by no means absent, in extensional settings,where the basalt magma tends to be erupted ratherthan stagnating in the crust.
Hence, states of stress related to plate tectonic mo-tion have a profound impact on the associated types ofmagmatic rocks. This is one facet of the concept ofpetrotectonic associations.
�9.3 DIAPIRS
Diapirs and plumes are terms used for bodies of buoy-antly rising material. Mantle plumes are long-livedcolumns of ascending less-dense mantle rock. Diapir isused for columns of rock salt (also called salt domes) insedimentary basins and for bodies of magma rising inthe lithosphere. Diapirs of felsic magma ascending inthe continental crust are emphasized here. Diapirs havebeen the subject of numerous laboratory model studies(e.g., Ramberg, 1981) and theoretical and numericalanalyses. Field relations of some granitic intrusions arebelieved to be compatible with emplacement as diapirs(Figure 9.14).
Initial diking
σ2
σ3
σ3
σ1
σ1
σ2
σ1 (vertical)σ2 (vertical)
σ3 (vertical)
Extension
Subsequentdiking
Silling
(a) (b) (c)
9.13 Intrusion of horizontal sills in an extensional tectonic setting after vertical diking. (a) Initial intrusions are vertical dikes perpendicular tohorizontal least compressive principal stress, �3. Wedging of magma reinforced by thermal expansion of heated wall rocks increases thestress perpendicular to dikes so that �3 becomes �1 in (b). Relative magnitude of other two principal stresses remains the same: Vertical�1 becomes �2 and horizontal �2 becomes �3. In this new state of stress, additional magma is emplaced in vertical dikes perpendicularto initial ones. After this subsequent diking, magnitudes of principal stresses are again interchanged to yield a third state of stress in (c) where �3 is now vertical, allowing horizontal sills to develop as more magma is introduced. The sills lift the overlying crust againstgravity. (Redrawn from McCarthy and Thompson, 1988.)
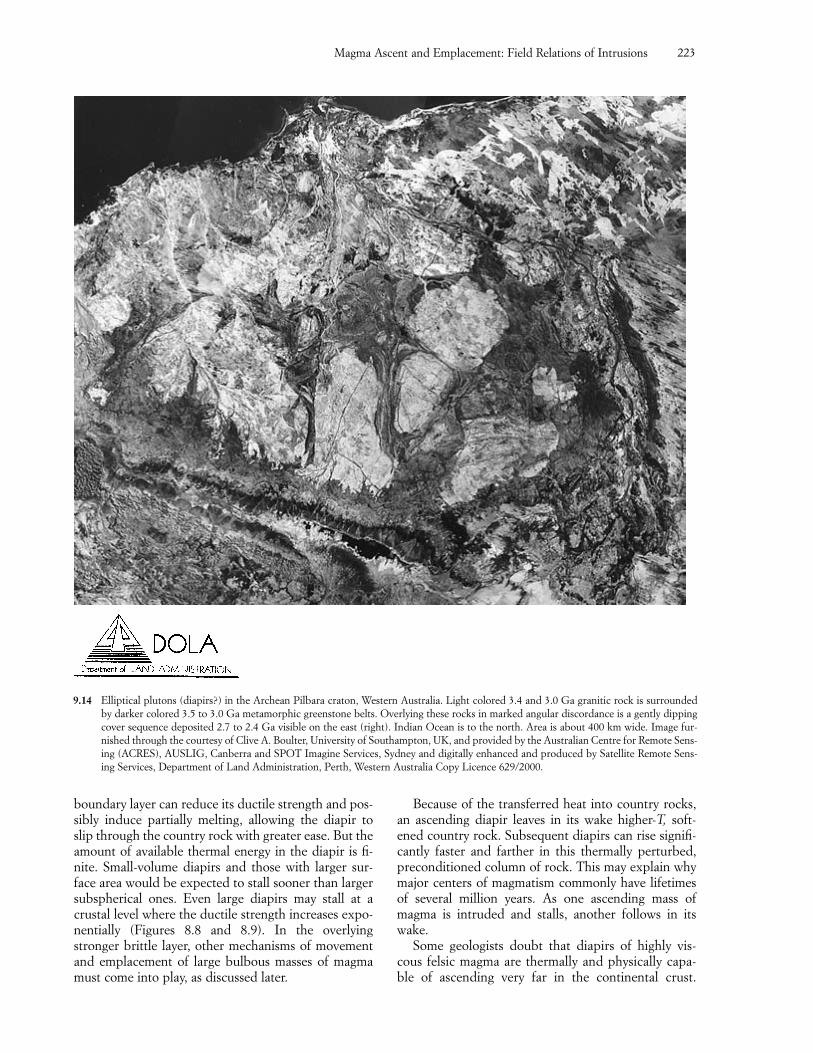
Magma Ascent and Emplacement: Field Relations of Intrusions 223
boundary layer can reduce its ductile strength and pos-sibly induce partially melting, allowing the diapir toslip through the country rock with greater ease. But theamount of available thermal energy in the diapir is fi-nite. Small-volume diapirs and those with larger sur-face area would be expected to stall sooner than largersubspherical ones. Even large diapirs may stall at acrustal level where the ductile strength increases expo-nentially (Figures 8.8 and 8.9). In the overlyingstronger brittle layer, other mechanisms of movementand emplacement of large bulbous masses of magmamust come into play, as discussed later.
9.14 Elliptical plutons (diapirs?) in the Archean Pilbara craton, Western Australia. Light colored 3.4 and 3.0 Ga granitic rock is surroundedby darker colored 3.5 to 3.0 Ga metamorphic greenstone belts. Overlying these rocks in marked angular discordance is a gently dippingcover sequence deposited 2.7 to 2.4 Ga visible on the east (right). Indian Ocean is to the north. Area is about 400 km wide. Image fur-nished through the courtesy of Clive A. Boulter, University of Southampton, UK, and provided by the Australian Centre for Remote Sens-ing (ACRES), AUSLIG, Canberra and SPOT Imagine Services, Sydney and digitally enhanced and produced by Satellite Remote Sens-ing Services, Department of Land Administration, Perth, Western Australia Copy Licence 629/2000.
Because of the transferred heat into country rocks,an ascending diapir leaves in its wake higher-T, soft-ened country rock. Subsequent diapirs can rise signifi-cantly faster and farther in this thermally perturbed,preconditioned column of rock. This may explain whymajor centers of magmatism commonly have lifetimesof several million years. As one ascending mass ofmagma is intruded and stalls, another follows in itswake.
Some geologists doubt that diapirs of highly vis-cous felsic magma are thermally and physically capa-ble of ascending very far in the continental crust.
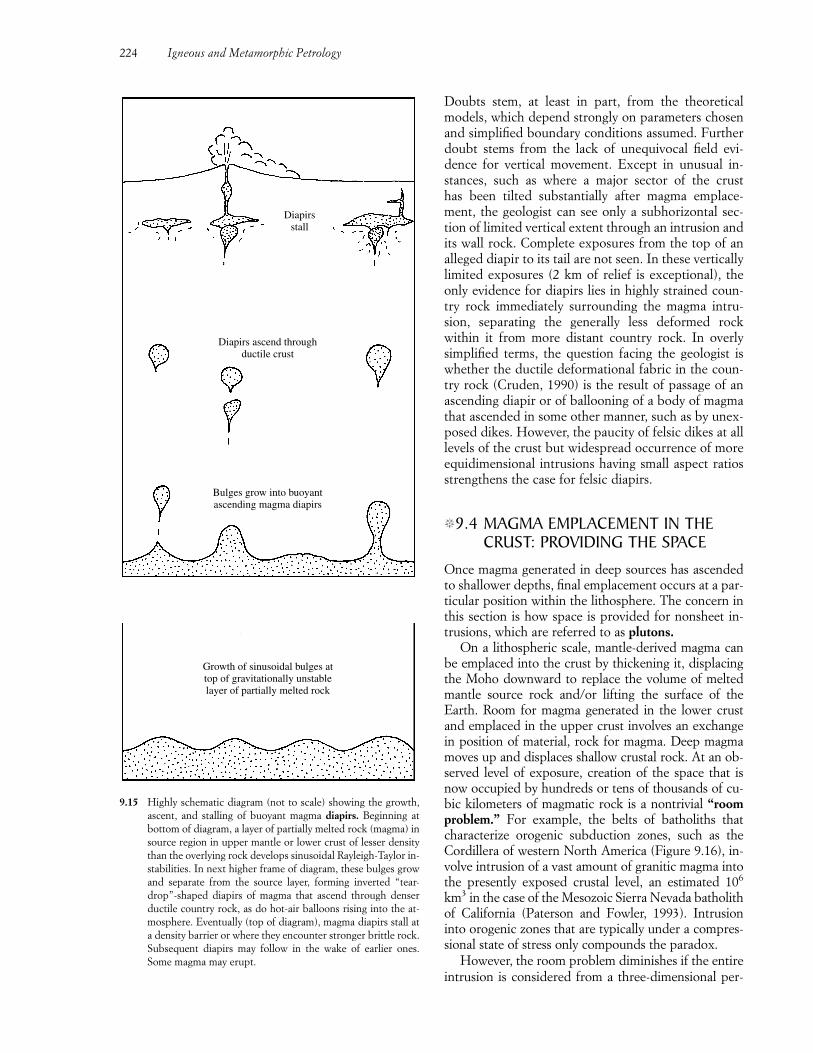
Doubts stem, at least in part, from the theoreticalmodels, which depend strongly on parameters chosenand simplified boundary conditions assumed. Furtherdoubt stems from the lack of unequivocal field evi-dence for vertical movement. Except in unusual in-stances, such as where a major sector of the crusthas been tilted substantially after magma emplace-ment, the geologist can see only a subhorizontal sec-tion of limited vertical extent through an intrusion andits wall rock. Complete exposures from the top of analleged diapir to its tail are not seen. In these verticallylimited exposures (2 km of relief is exceptional), theonly evidence for diapirs lies in highly strained coun-try rock immediately surrounding the magma intru-sion, separating the generally less deformed rockwithin it from more distant country rock. In overlysimplified terms, the question facing the geologist iswhether the ductile deformational fabric in the coun-try rock (Cruden, 1990) is the result of passage of anascending diapir or of ballooning of a body of magmathat ascended in some other manner, such as by unex-posed dikes. However, the paucity of felsic dikes at alllevels of the crust but widespread occurrence of moreequidimensional intrusions having small aspect ratiosstrengthens the case for felsic diapirs.
�9.4 MAGMA EMPLACEMENT IN THECRUST: PROVIDING THE SPACE
Once magma generated in deep sources has ascendedto shallower depths, final emplacement occurs at a par-ticular position within the lithosphere. The concern inthis section is how space is provided for nonsheet in-trusions, which are referred to as plutons.
On a lithospheric scale, mantle-derived magma canbe emplaced into the crust by thickening it, displacingthe Moho downward to replace the volume of meltedmantle source rock and/or lifting the surface of theEarth. Room for magma generated in the lower crustand emplaced in the upper crust involves an exchangein position of material, rock for magma. Deep magmamoves up and displaces shallow crustal rock. At an ob-served level of exposure, creation of the space that isnow occupied by hundreds or tens of thousands of cu-bic kilometers of magmatic rock is a nontrivial “roomproblem.” For example, the belts of batholiths thatcharacterize orogenic subduction zones, such as theCordillera of western North America (Figure 9.16), in-volve intrusion of a vast amount of granitic magma intothe presently exposed crustal level, an estimated 106
km3 in the case of the Mesozoic Sierra Nevada batholithof California (Paterson and Fowler, 1993). Intrusioninto orogenic zones that are typically under a compres-sional state of stress only compounds the paradox.
However, the room problem diminishes if the entireintrusion is considered from a three-dimensional per-
224 Igneous and Metamorphic Petrology
Growth of sinusoidal bulges attop of gravitationally unstablelayer of partially melted rock
9.15 Highly schematic diagram (not to scale) showing the growth,ascent, and stalling of buoyant magma diapirs. Beginning atbottom of diagram, a layer of partially melted rock (magma) insource region in upper mantle or lower crust of lesser densitythan the overlying rock develops sinusoidal Rayleigh-Taylor in-stabilities. In next higher frame of diagram, these bulges growand separate from the source layer, forming inverted “tear-drop”-shaped diapirs of magma that ascend through denserductile country rock, as do hot-air balloons rising into the at-mosphere. Eventually (top of diagram), magma diapirs stall ata density barrier or where they encounter stronger brittle rock.Subsequent diapirs may follow in the wake of earlier ones.Some magma may erupt.
Bulges grow into buoyantascending magma diapirs
Diapirs ascend throughductile crust
Diapirsstall
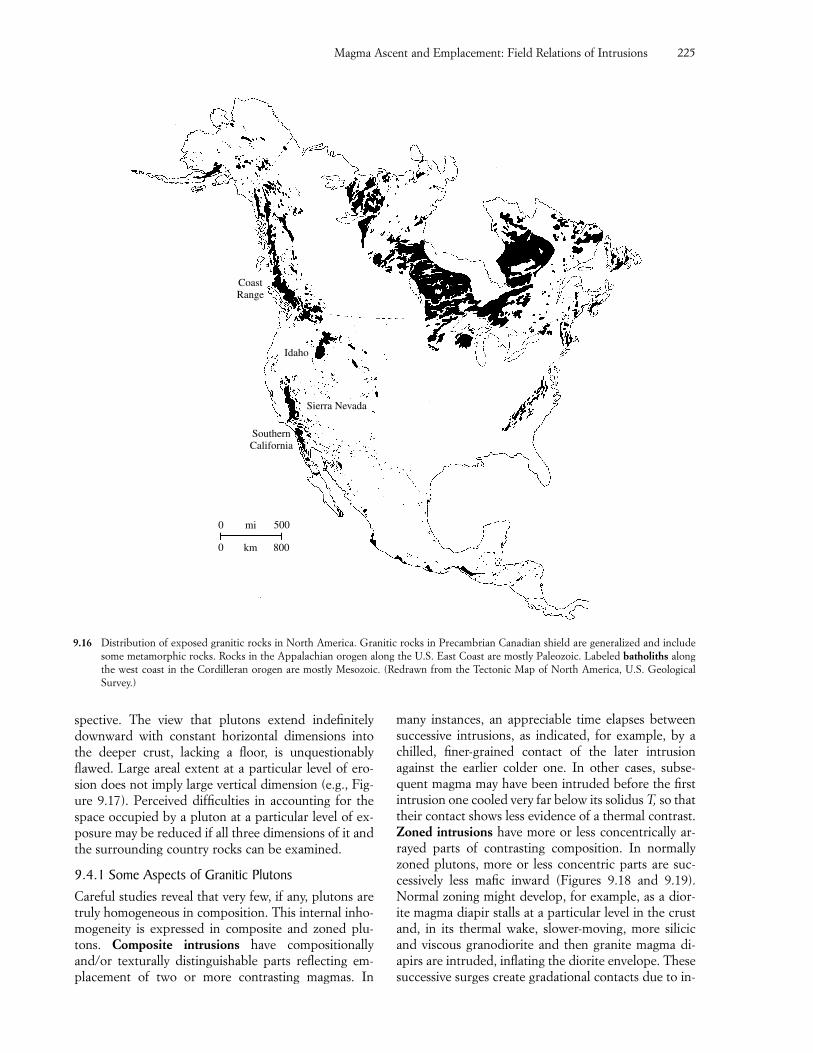
many instances, an appreciable time elapses betweensuccessive intrusions, as indicated, for example, by achilled, finer-grained contact of the later intrusionagainst the earlier colder one. In other cases, subse-quent magma may have been intruded before the firstintrusion one cooled very far below its solidus T, so thattheir contact shows less evidence of a thermal contrast.Zoned intrusions have more or less concentrically ar-rayed parts of contrasting composition. In normallyzoned plutons, more or less concentric parts are suc-cessively less mafic inward (Figures 9.18 and 9.19).Normal zoning might develop, for example, as a dior-ite magma diapir stalls at a particular level in the crustand, in its thermal wake, slower-moving, more silicicand viscous granodiorite and then granite magma di-apirs are intruded, inflating the diorite envelope. Thesesuccessive surges create gradational contacts due to in-
Magma Ascent and Emplacement: Field Relations of Intrusions 225
spective. The view that plutons extend indefinitelydownward with constant horizontal dimensions intothe deeper crust, lacking a floor, is unquestionablyflawed. Large areal extent at a particular level of ero-sion does not imply large vertical dimension (e.g., Fig-ure 9.17). Perceived difficulties in accounting for thespace occupied by a pluton at a particular level of ex-posure may be reduced if all three dimensions of it andthe surrounding country rocks can be examined.
9.4.1 Some Aspects of Granitic PlutonsCareful studies reveal that very few, if any, plutons aretruly homogeneous in composition. This internal inho-mogeneity is expressed in composite and zoned plu-tons. Composite intrusions have compositionallyand/or texturally distinguishable parts reflecting em-placement of two or more contrasting magmas. In
Sierra Nevada
SouthernCalifornia
CoastRange
Idaho
0 800km
mi 5000
9.16 Distribution of exposed granitic rocks in North America. Granitic rocks in Precambrian Canadian shield are generalized and includesome metamorphic rocks. Rocks in the Appalachian orogen along the U.S. East Coast are mostly Paleozoic. Labeled batholiths alongthe west coast in the Cordilleran orogen are mostly Mesozoic. (Redrawn from the Tectonic Map of North America, U.S. Geological Survey.)
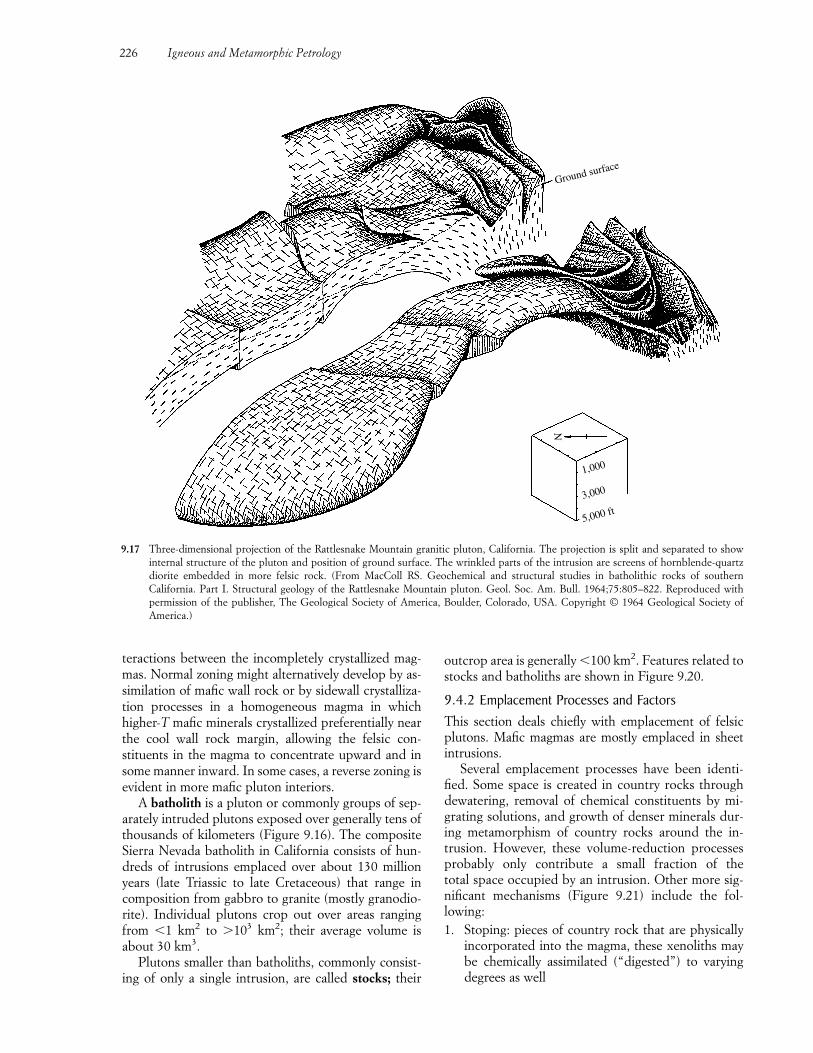
226 Igneous and Metamorphic Petrology
teractions between the incompletely crystallized mag-mas. Normal zoning might alternatively develop by as-similation of mafic wall rock or by sidewall crystalliza-tion processes in a homogeneous magma in whichhigher-T mafic minerals crystallized preferentially nearthe cool wall rock margin, allowing the felsic con-stituents in the magma to concentrate upward and insome manner inward. In some cases, a reverse zoning isevident in more mafic pluton interiors.
A batholith is a pluton or commonly groups of sep-arately intruded plutons exposed over generally tens ofthousands of kilometers (Figure 9.16). The compositeSierra Nevada batholith in California consists of hun-dreds of intrusions emplaced over about 130 millionyears (late Triassic to late Cretaceous) that range incomposition from gabbro to granite (mostly granodio-rite). Individual plutons crop out over areas rangingfrom �1 km2 to �103 km2; their average volume isabout 30 km3.
Plutons smaller than batholiths, commonly consist-ing of only a single intrusion, are called stocks; their
outcrop area is generally �100 km2. Features related tostocks and batholiths are shown in Figure 9.20.
9.4.2 Emplacement Processes and FactorsThis section deals chiefly with emplacement of felsicplutons. Mafic magmas are mostly emplaced in sheetintrusions.
Several emplacement processes have been identi-fied. Some space is created in country rocks throughdewatering, removal of chemical constituents by mi-grating solutions, and growth of denser minerals dur-ing metamorphism of country rocks around the in-trusion. However, these volume-reduction processesprobably only contribute a small fraction of the total space occupied by an intrusion. Other more sig-nificant mechanisms (Figure 9.21) include the fol-lowing:1. Stoping: pieces of country rock that are physically
incorporated into the magma, these xenoliths maybe chemically assimilated (“digested”) to varyingdegrees as well
1,000
3,000
5,000 ft
N
Ground surface
9.17 Three-dimensional projection of the Rattlesnake Mountain granitic pluton, California. The projection is split and separated to show internal structure of the pluton and position of ground surface. The wrinkled parts of the intrusion are screens of hornblende-quartzdiorite embedded in more felsic rock. (From MacColl RS. Geochemical and structural studies in batholithic rocks of southern California. Part I. Structural geology of the Rattlesnake Mountain pluton. Geol. Soc. Am. Bull. 1964;75:805–822. Reproduced with permission of the publisher, The Geological Society of America, Boulder, Colorado, USA. Copyright © 1964 Geological Society ofAmerica.)
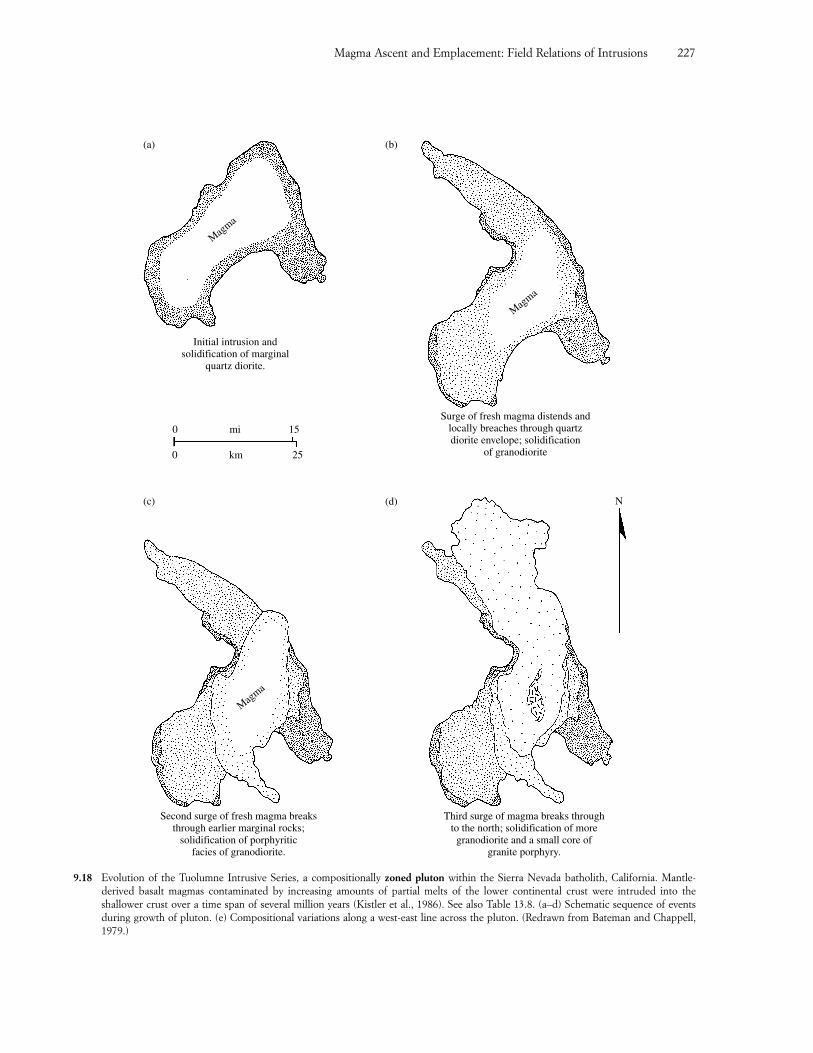
Magma Ascent and Emplacement: Field Relations of Intrusions 227
Mag
ma
Mag
ma
Initial intrusion andsolidification of marginal
quartz diorite.
Surge of fresh magma distends andlocally breaches through quartzdiorite envelope; solidification
of granodiorite
Mag
ma
Second surge of fresh magma breaksthrough earlier marginal rocks;
solidification of porphyriticfacies of granodiorite.
Third surge of magma breaks throughto the north; solidification of more
granodiorite and a small core ofgranite porphyry.
0 15
25km0
mi
(a) (b)
N(d)(c)
9.18 Evolution of the Tuolumne Intrusive Series, a compositionally zoned pluton within the Sierra Nevada batholith, California. Mantle-derived basalt magmas contaminated by increasing amounts of partial melts of the lower continental crust were intruded into the shallower crust over a time span of several million years (Kistler et al., 1986). See also Table 13.8. (a–d) Schematic sequence of eventsduring growth of pluton. (e) Compositional variations along a west-east line across the pluton. (Redrawn from Bateman and Chappell,1979.)
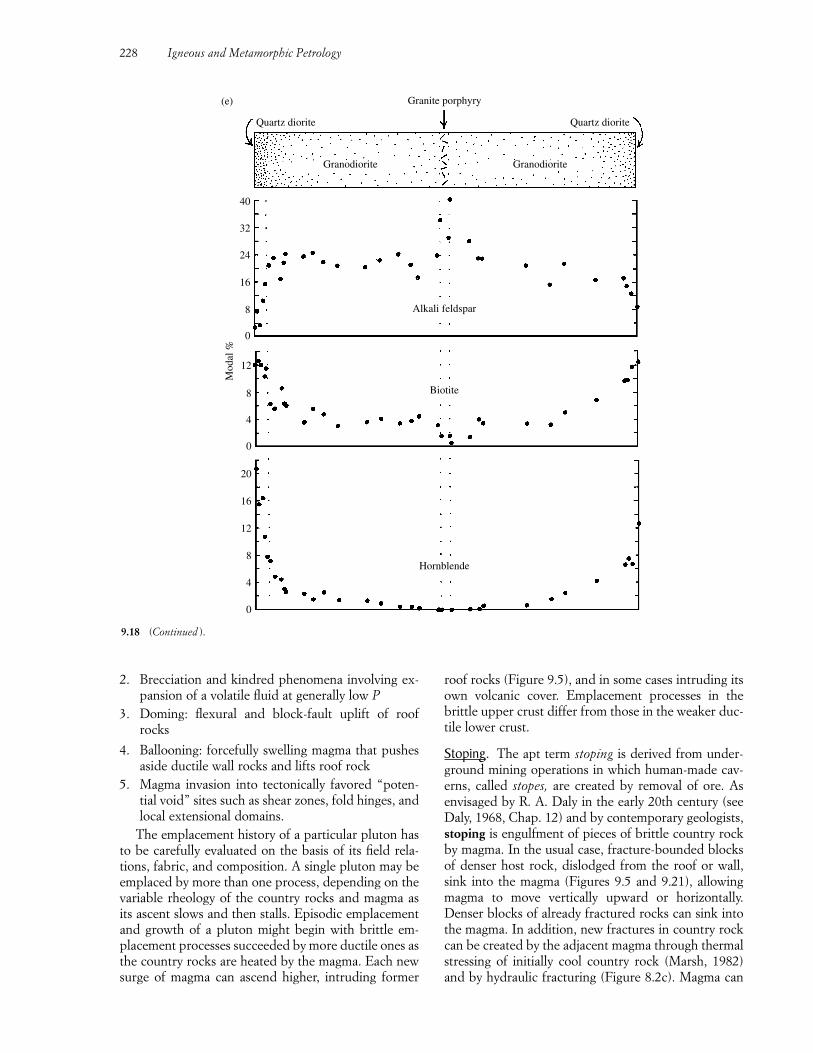
2. Brecciation and kindred phenomena involving ex-pansion of a volatile fluid at generally low P
3. Doming: flexural and block-fault uplift of roofrocks
4. Ballooning: forcefully swelling magma that pushesaside ductile wall rocks and lifts roof rock
5. Magma invasion into tectonically favored “poten-tial void” sites such as shear zones, fold hinges, andlocal extensional domains.
The emplacement history of a particular pluton hasto be carefully evaluated on the basis of its field rela-tions, fabric, and composition. A single pluton may beemplaced by more than one process, depending on thevariable rheology of the country rocks and magma asits ascent slows and then stalls. Episodic emplacementand growth of a pluton might begin with brittle em-placement processes succeeded by more ductile ones asthe country rocks are heated by the magma. Each newsurge of magma can ascend higher, intruding former
roof rocks (Figure 9.5), and in some cases intruding itsown volcanic cover. Emplacement processes in thebrittle upper crust differ from those in the weaker duc-tile lower crust.
Stoping. The apt term stoping is derived from under-ground mining operations in which human-made cav-erns, called stopes, are created by removal of ore. Asenvisaged by R. A. Daly in the early 20th century (seeDaly, 1968, Chap. 12) and by contemporary geologists,stoping is engulfment of pieces of brittle country rockby magma. In the usual case, fracture-bounded blocksof denser host rock, dislodged from the roof or wall,sink into the magma (Figures 9.5 and 9.21), allowingmagma to move vertically upward or horizontally.Denser blocks of already fractured rocks can sink intothe magma. In addition, new fractures in country rockcan be created by the adjacent magma through thermalstressing of initially cool country rock (Marsh, 1982)and by hydraulic fracturing (Figure 8.2c). Magma can
228 Igneous and Metamorphic Petrology
0
4
8
12
16
20
0
4
8
12
0
8
16
24
32
40
Granodiorite Granodiorite
Quartz diorite Quartz diorite
Granite porphyry
Alkali feldspar
Biotite
Hornblende
Mod
al %
(e)
9.18 (Continued ).
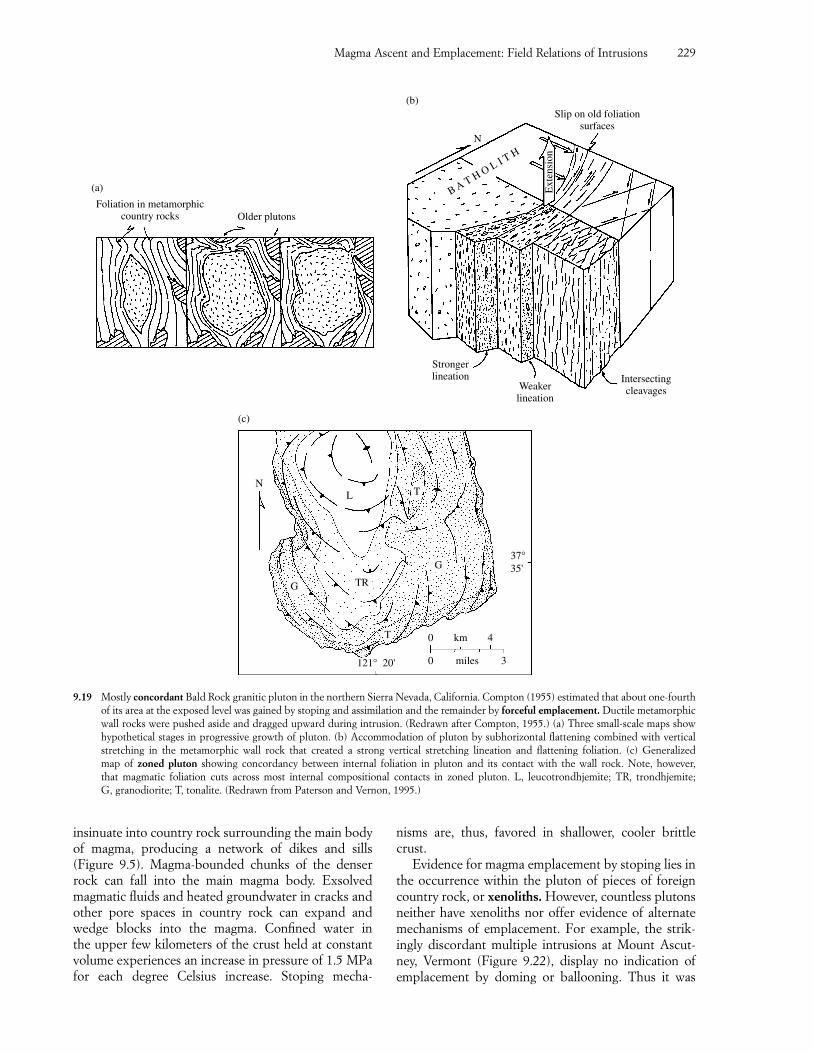
Magma Ascent and Emplacement: Field Relations of Intrusions 229
Foliation in metamorphiccountry rocks Older plutons
(a)
Strongerlineation
Weakerlineation
Intersectingcleavages
Slip on old foliationsurfaces
N
Ext
ensi
on
B A T H O L I T H
(b)
121° 20' 0
0 km 4
miles 3
T
G TR
G
TLN
35'
37°
(c)
9.19 Mostly concordant Bald Rock granitic pluton in the northern Sierra Nevada, California. Compton (1955) estimated that about one-fourthof its area at the exposed level was gained by stoping and assimilation and the remainder by forceful emplacement. Ductile metamorphicwall rocks were pushed aside and dragged upward during intrusion. (Redrawn after Compton, 1955.) (a) Three small-scale maps showhypothetical stages in progressive growth of pluton. (b) Accommodation of pluton by subhorizontal flattening combined with verticalstretching in the metamorphic wall rock that created a strong vertical stretching lineation and flattening foliation. (c) Generalized map of zoned pluton showing concordancy between internal foliation in pluton and its contact with the wall rock. Note, however, that magmatic foliation cuts across most internal compositional contacts in zoned pluton. L, leucotrondhjemite; TR, trondhjemite; G, granodiorite; T, tonalite. (Redrawn from Paterson and Vernon, 1995.)
insinuate into country rock surrounding the main bodyof magma, producing a network of dikes and sills (Figure 9.5). Magma-bounded chunks of the denserrock can fall into the main magma body. Exsolved magmatic fluids and heated groundwater in cracks andother pore spaces in country rock can expand andwedge blocks into the magma. Confined water in the upper few kilometers of the crust held at constantvolume experiences an increase in pressure of 1.5 MPafor each degree Celsius increase. Stoping mecha-
nisms are, thus, favored in shallower, cooler brittlecrust.
Evidence for magma emplacement by stoping lies inthe occurrence within the pluton of pieces of foreigncountry rock, or xenoliths. However, countless plutonsneither have xenoliths nor offer evidence of alternatemechanisms of emplacement. For example, the strik-ingly discordant multiple intrusions at Mount Ascut-ney, Vermont (Figure 9.22), display no indication ofemplacement by doming or ballooning. Thus it was
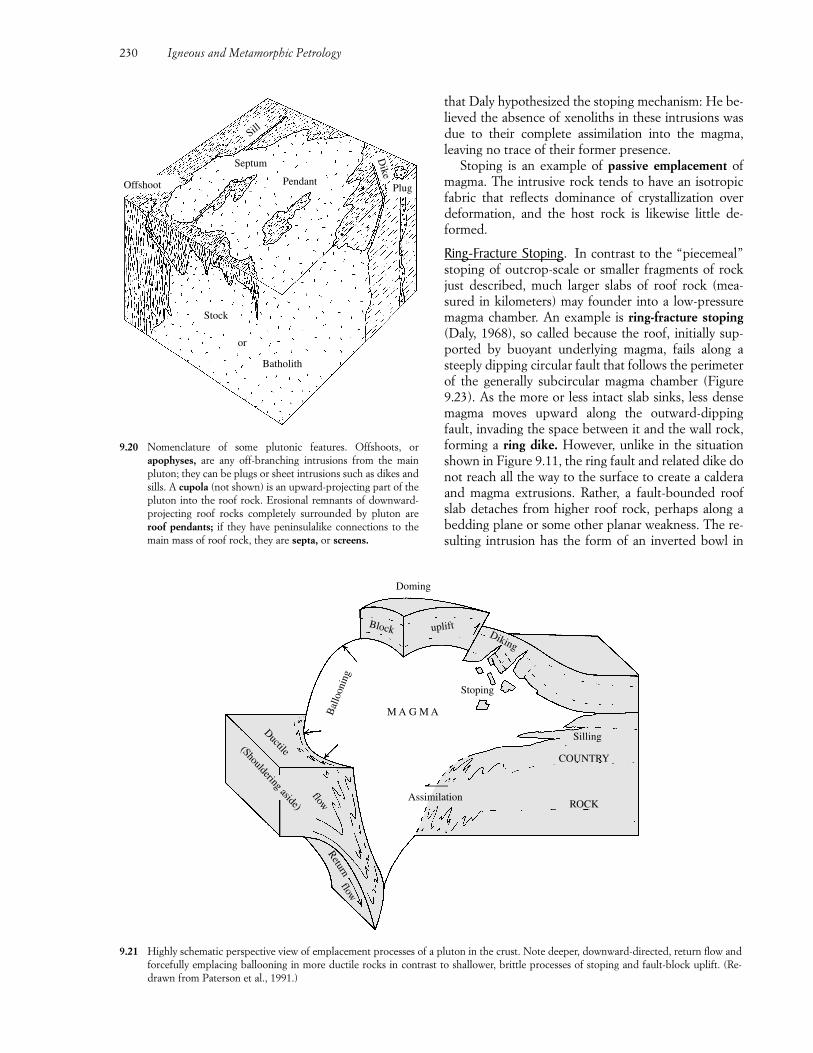
that Daly hypothesized the stoping mechanism: He be-lieved the absence of xenoliths in these intrusions wasdue to their complete assimilation into the magma,leaving no trace of their former presence.
Stoping is an example of passive emplacement ofmagma. The intrusive rock tends to have an isotropicfabric that reflects dominance of crystallization overdeformation, and the host rock is likewise little de-formed.
Ring-Fracture Stoping. In contrast to the “piecemeal”stoping of outcrop-scale or smaller fragments of rockjust described, much larger slabs of roof rock (mea-sured in kilometers) may founder into a low-pressuremagma chamber. An example is ring-fracture stoping(Daly, 1968), so called because the roof, initially sup-ported by buoyant underlying magma, fails along asteeply dipping circular fault that follows the perimeterof the generally subcircular magma chamber (Figure9.23). As the more or less intact slab sinks, less densemagma moves upward along the outward-dippingfault, invading the space between it and the wall rock,forming a ring dike. However, unlike in the situationshown in Figure 9.11, the ring fault and related dike donot reach all the way to the surface to create a calderaand magma extrusions. Rather, a fault-bounded roofslab detaches from higher roof rock, perhaps along abedding plane or some other planar weakness. The re-sulting intrusion has the form of an inverted bowl in
230 Igneous and Metamorphic Petrology
Offshoot
Sill
Septum
Pendant
Dike
Plug
Batholith
Stock
or
9.20 Nomenclature of some plutonic features. Offshoots, orapophyses, are any off-branching intrusions from the mainpluton; they can be plugs or sheet intrusions such as dikes andsills. A cupola (not shown) is an upward-projecting part of thepluton into the roof rock. Erosional remnants of downward-projecting roof rocks completely surrounded by pluton areroof pendants; if they have peninsulalike connections to themain mass of roof rock, they are septa, or screens.
Block uplift
Doming
Stoping
Diking
Silling
Assimilation
Returnflow
(Shouldering aside)
flow
Ductile
Bal
loon
ing
M A G M A
COUNTRY
ROCK
9.21 Highly schematic perspective view of emplacement processes of a pluton in the crust. Note deeper, downward-directed, return flow andforcefully emplacing ballooning in more ductile rocks in contrast to shallower, brittle processes of stoping and fault-block uplift. (Re-drawn from Paterson et al., 1991.)
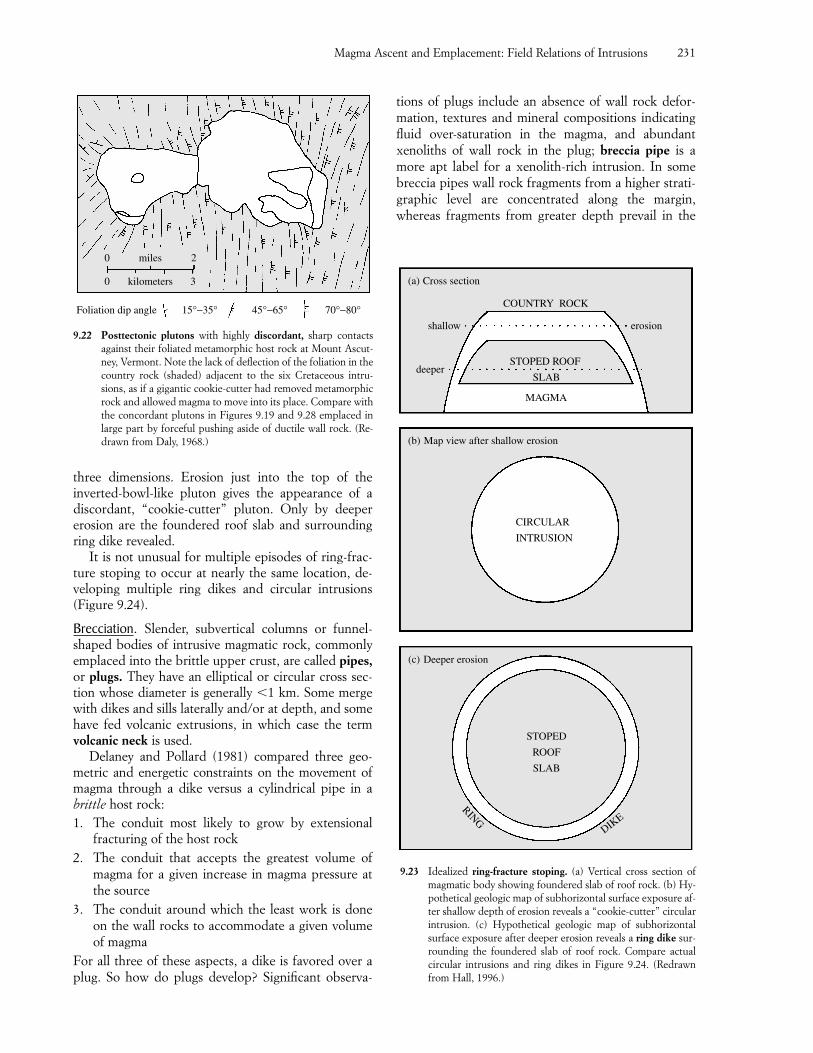
three dimensions. Erosion just into the top of the inverted-bowl-like pluton gives the appearance of adiscordant, “cookie-cutter” pluton. Only by deepererosion are the foundered roof slab and surroundingring dike revealed.
It is not unusual for multiple episodes of ring-frac-ture stoping to occur at nearly the same location, de-veloping multiple ring dikes and circular intrusions(Figure 9.24).
Brecciation. Slender, subvertical columns or funnel-shaped bodies of intrusive magmatic rock, commonlyemplaced into the brittle upper crust, are called pipes,or plugs. They have an elliptical or circular cross sec-tion whose diameter is generally �1 km. Some mergewith dikes and sills laterally and/or at depth, and somehave fed volcanic extrusions, in which case the termvolcanic neck is used.
Delaney and Pollard (1981) compared three geo-metric and energetic constraints on the movement ofmagma through a dike versus a cylindrical pipe in abrittle host rock:1. The conduit most likely to grow by extensional
fracturing of the host rock2. The conduit that accepts the greatest volume of
magma for a given increase in magma pressure atthe source
3. The conduit around which the least work is doneon the wall rocks to accommodate a given volumeof magma
For all three of these aspects, a dike is favored over aplug. So how do plugs develop? Significant observa-
tions of plugs include an absence of wall rock defor-mation, textures and mineral compositions indicatingfluid over-saturation in the magma, and abundantxenoliths of wall rock in the plug; breccia pipe is amore apt label for a xenolith-rich intrusion. In somebreccia pipes wall rock fragments from a higher strati-graphic level are concentrated along the margin,whereas fragments from greater depth prevail in the
Magma Ascent and Emplacement: Field Relations of Intrusions 231
0 kilometers 3
0 miles 2
Foliation dip angle 15°−35° 45°−65° 70°−80°
9.22 Posttectonic plutons with highly discordant, sharp contactsagainst their foliated metamorphic host rock at Mount Ascut-ney, Vermont. Note the lack of deflection of the foliation in thecountry rock (shaded) adjacent to the six Cretaceous intru-sions, as if a gigantic cookie-cutter had removed metamorphicrock and allowed magma to move into its place. Compare withthe concordant plutons in Figures 9.19 and 9.28 emplaced inlarge part by forceful pushing aside of ductile wall rock. (Re-drawn from Daly, 1968.)
CIRCULAR
INTRUSION
Map view after shallow erosion(b)
(c) Deeper erosion
RING
DIKE
MAGMA
(a) Cross section
COUNTRY ROCK
erosionshallow
deeperSTOPED ROOF
SLAB
STOPED
ROOF
SLAB
9.23 Idealized ring-fracture stoping. (a) Vertical cross section ofmagmatic body showing foundered slab of roof rock. (b) Hy-pothetical geologic map of subhorizontal surface exposure af-ter shallow depth of erosion reveals a “cookie-cutter” circularintrusion. (c) Hypothetical geologic map of subhorizontalsurface exposure after deeper erosion reveals a ring dike sur-rounding the foundered slab of roof rock. Compare actualcircular intrusions and ring dikes in Figure 9.24. (Redrawnfrom Hall, 1996.)
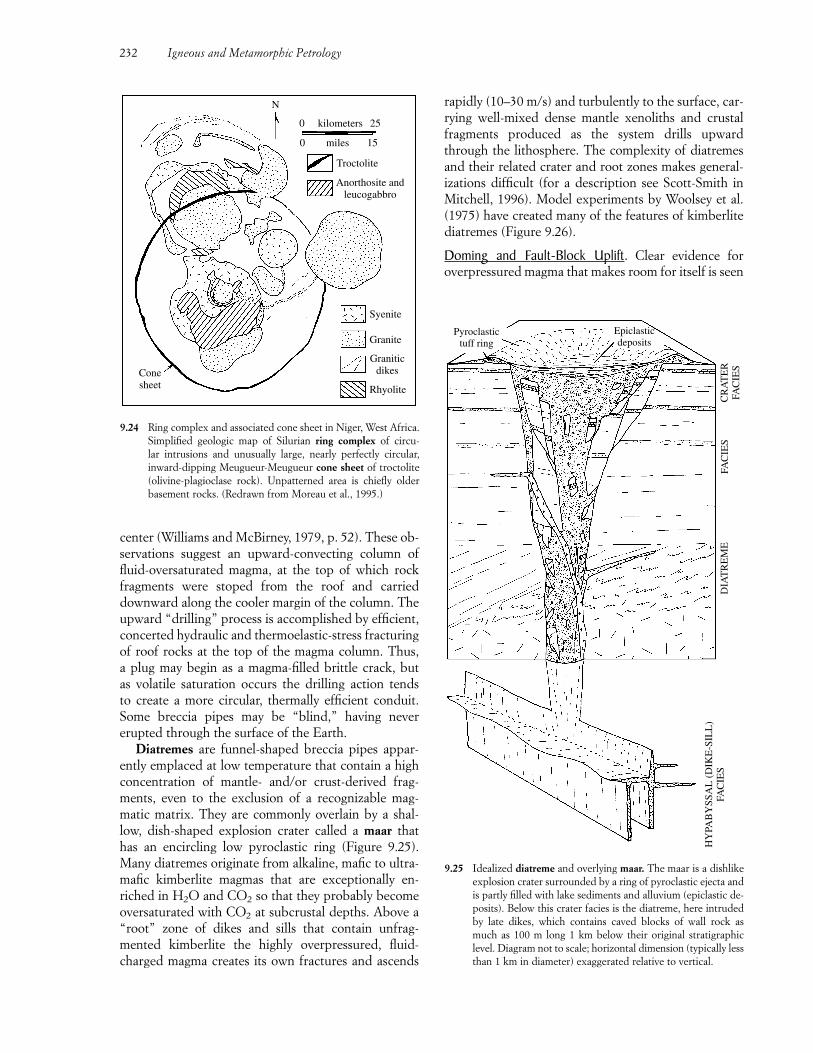
center (Williams and McBirney, 1979, p. 52). These ob-servations suggest an upward-convecting column offluid-oversaturated magma, at the top of which rockfragments were stoped from the roof and carrieddownward along the cooler margin of the column. Theupward “drilling” process is accomplished by efficient,concerted hydraulic and thermoelastic-stress fracturingof roof rocks at the top of the magma column. Thus, a plug may begin as a magma-filled brittle crack, but as volatile saturation occurs the drilling action tends to create a more circular, thermally efficient conduit.Some breccia pipes may be “blind,” having nevererupted through the surface of the Earth.
Diatremes are funnel-shaped breccia pipes appar-ently emplaced at low temperature that contain a highconcentration of mantle- and/or crust-derived frag-ments, even to the exclusion of a recognizable mag-matic matrix. They are commonly overlain by a shal-low, dish-shaped explosion crater called a maar thathas an encircling low pyroclastic ring (Figure 9.25).Many diatremes originate from alkaline, mafic to ultra-mafic kimberlite magmas that are exceptionally en-riched in H2O and CO2 so that they probably becomeoversaturated with CO2 at subcrustal depths. Above a“root” zone of dikes and sills that contain unfrag-mented kimberlite the highly overpressured, fluid-charged magma creates its own fractures and ascends
rapidly (10–30 m/s) and turbulently to the surface, car-rying well-mixed dense mantle xenoliths and crustalfragments produced as the system drills upwardthrough the lithosphere. The complexity of diatremesand their related crater and root zones makes general-izations difficult (for a description see Scott-Smith inMitchell, 1996). Model experiments by Woolsey et al.(1975) have created many of the features of kimberlitediatremes (Figure 9.26).
Doming and Fault-Block Uplift. Clear evidence foroverpressured magma that makes room for itself is seen
232 Igneous and Metamorphic Petrology
Pyroclastictuff ring
Epiclasticdeposits
CR
AT
ER
FAC
IES
DIA
TR
EM
EFA
CIE
S
HY
PAB
YSS
AL
(D
IKE
-SIL
L)
FAC
IES
9.25 Idealized diatreme and overlying maar. The maar is a dishlikeexplosion crater surrounded by a ring of pyroclastic ejecta andis partly filled with lake sediments and alluvium (epiclastic de-posits). Below this crater facies is the diatreme, here intrudedby late dikes, which contains caved blocks of wall rock asmuch as 100 m long 1 km below their original stratigraphiclevel. Diagram not to scale; horizontal dimension (typically lessthan 1 km in diameter) exaggerated relative to vertical.
N
Conesheet Rhyolite
Graniticdikes
Granite
Syenite
Troctolite
Anorthosite andleucogabbro
0 kilometers 25
150 miles
9.24 Ring complex and associated cone sheet in Niger, West Africa.Simplified geologic map of Silurian ring complex of circu-lar intrusions and unusually large, nearly perfectly circular, inward-dipping Meugueur-Meugueur cone sheet of troctolite(olivine-plagioclase rock). Unpatterned area is chiefly olderbasement rocks. (Redrawn from Moreau et al., 1995.)
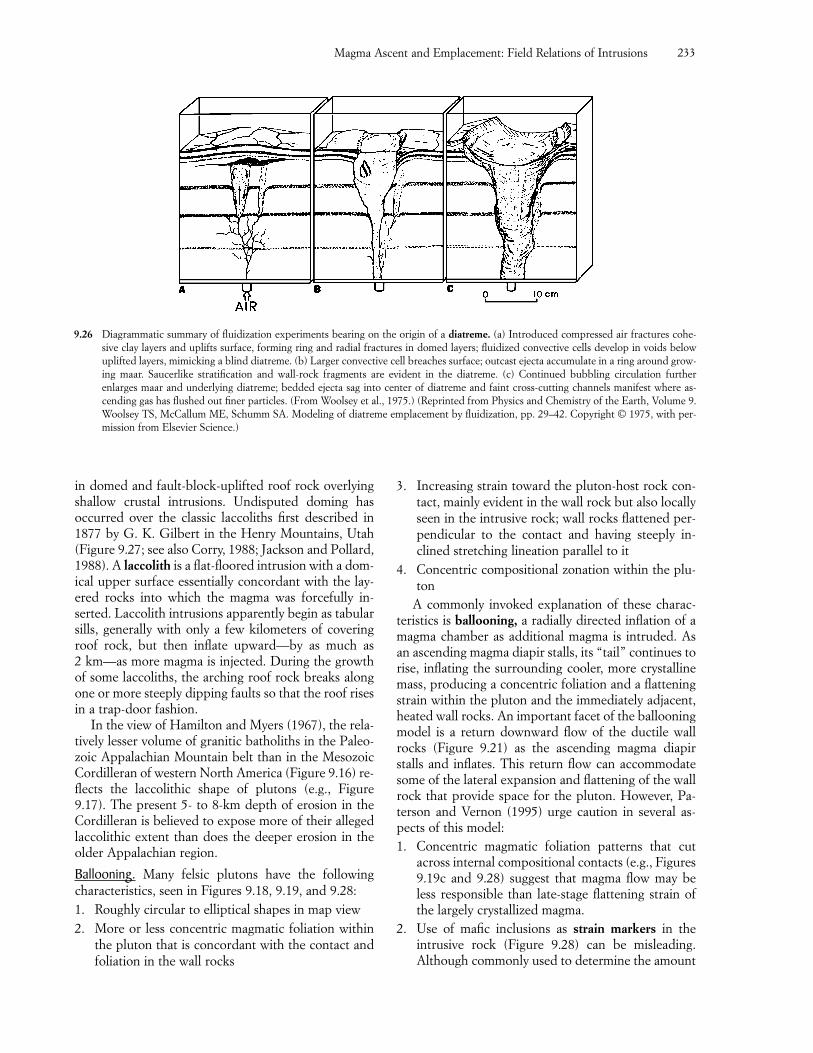
Magma Ascent and Emplacement: Field Relations of Intrusions 233
9.26 Diagrammatic summary of fluidization experiments bearing on the origin of a diatreme. (a) Introduced compressed air fractures cohe-sive clay layers and uplifts surface, forming ring and radial fractures in domed layers; fluidized convective cells develop in voids belowuplifted layers, mimicking a blind diatreme. (b) Larger convective cell breaches surface; outcast ejecta accumulate in a ring around grow-ing maar. Saucerlike stratification and wall-rock fragments are evident in the diatreme. (c) Continued bubbling circulation further enlarges maar and underlying diatreme; bedded ejecta sag into center of diatreme and faint cross-cutting channels manifest where as-cending gas has flushed out finer particles. (From Woolsey et al., 1975.) (Reprinted from Physics and Chemistry of the Earth, Volume 9.Woolsey TS, McCallum ME, Schumm SA. Modeling of diatreme emplacement by fluidization, pp. 29–42. Copyright © 1975, with per-mission from Elsevier Science.)
in domed and fault-block-uplifted roof rock overlyingshallow crustal intrusions. Undisputed doming has occurred over the classic laccoliths first described in1877 by G. K. Gilbert in the Henry Mountains, Utah(Figure 9.27; see also Corry, 1988; Jackson and Pollard,1988). A laccolith is a flat-floored intrusion with a dom-ical upper surface essentially concordant with the lay-ered rocks into which the magma was forcefully in-serted. Laccolith intrusions apparently begin as tabularsills, generally with only a few kilometers of coveringroof rock, but then inflate upward—by as much as 2 km—as more magma is injected. During the growthof some laccoliths, the arching roof rock breaks alongone or more steeply dipping faults so that the roof risesin a trap-door fashion.
In the view of Hamilton and Myers (1967), the rela-tively lesser volume of granitic batholiths in the Paleo-zoic Appalachian Mountain belt than in the MesozoicCordilleran of western North America (Figure 9.16) re-flects the laccolithic shape of plutons (e.g., Figure9.17). The present 5- to 8-km depth of erosion in theCordilleran is believed to expose more of their allegedlaccolithic extent than does the deeper erosion in theolder Appalachian region.
Ballooning. Many felsic plutons have the followingcharacteristics, seen in Figures 9.18, 9.19, and 9.28:1. Roughly circular to elliptical shapes in map view2. More or less concentric magmatic foliation within
the pluton that is concordant with the contact andfoliation in the wall rocks
3. Increasing strain toward the pluton-host rock con-tact, mainly evident in the wall rock but also locallyseen in the intrusive rock; wall rocks flattened per-pendicular to the contact and having steeply in-clined stretching lineation parallel to it
4. Concentric compositional zonation within the plu-ton
A commonly invoked explanation of these charac-teristics is ballooning, a radially directed inflation of amagma chamber as additional magma is intruded. Asan ascending magma diapir stalls, its “tail” continues torise, inflating the surrounding cooler, more crystallinemass, producing a concentric foliation and a flatteningstrain within the pluton and the immediately adjacent,heated wall rocks. An important facet of the ballooningmodel is a return downward flow of the ductile wallrocks (Figure 9.21) as the ascending magma diapirstalls and inflates. This return flow can accommodatesome of the lateral expansion and flattening of the wallrock that provide space for the pluton. However, Pa-terson and Vernon (1995) urge caution in several as-pects of this model:1. Concentric magmatic foliation patterns that cut
across internal compositional contacts (e.g., Figures9.19c and 9.28) suggest that magma flow may beless responsible than late-stage flattening strain ofthe largely crystallized magma.
2. Use of mafic inclusions as strain markers in the intrusive rock (Figure 9.28) can be misleading. Although commonly used to determine the amount
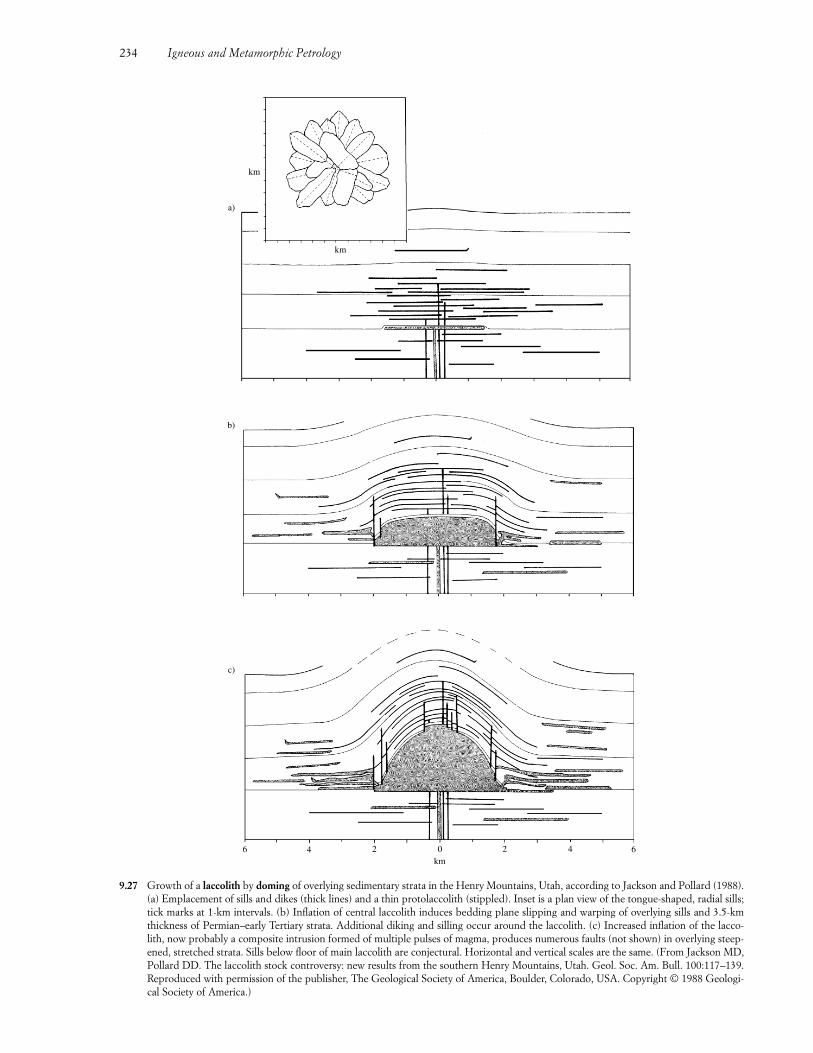
234 Igneous and Metamorphic Petrology
64204 26
c)
b)
a)
km
km
km
9.27 Growth of a laccolith by doming of overlying sedimentary strata in the Henry Mountains, Utah, according to Jackson and Pollard (1988).(a) Emplacement of sills and dikes (thick lines) and a thin protolaccolith (stippled). Inset is a plan view of the tongue-shaped, radial sills;tick marks at 1-km intervals. (b) Inflation of central laccolith induces bedding plane slipping and warping of overlying sills and 3.5-kmthickness of Permian–early Tertiary strata. Additional diking and silling occur around the laccolith. (c) Increased inflation of the lacco-lith, now probably a composite intrusion formed of multiple pulses of magma, produces numerous faults (not shown) in overlying steep-ened, stretched strata. Sills below floor of main laccolith are conjectural. Horizontal and vertical scales are the same. (From Jackson MD,Pollard DD. The laccolith stock controversy: new results from the southern Henry Mountains, Utah. Geol. Soc. Am. Bull. 100:117–139.Reproduced with permission of the publisher, The Geological Society of America, Boulder, Colorado, USA. Copyright © 1988 Geologi-cal Society of America.)
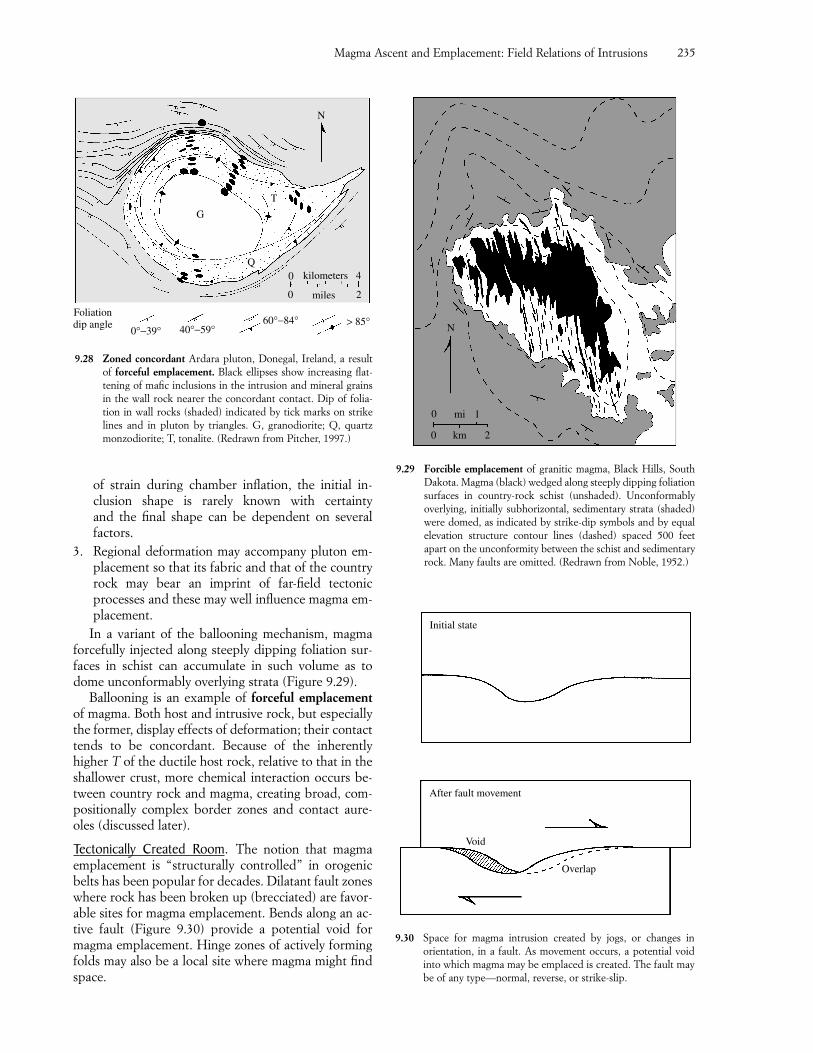
of strain during chamber inflation, the initial in-clusion shape is rarely known with certainty and the final shape can be dependent on severalfactors.
3. Regional deformation may accompany pluton em-placement so that its fabric and that of the countryrock may bear an imprint of far-field tectonicprocesses and these may well influence magma em-placement.
In a variant of the ballooning mechanism, magmaforcefully injected along steeply dipping foliation sur-faces in schist can accumulate in such volume as todome unconformably overlying strata (Figure 9.29).
Ballooning is an example of forceful emplacementof magma. Both host and intrusive rock, but especiallythe former, display effects of deformation; their contacttends to be concordant. Because of the inherentlyhigher T of the ductile host rock, relative to that in theshallower crust, more chemical interaction occurs be-tween country rock and magma, creating broad, com-positionally complex border zones and contact aure-oles (discussed later).
Tectonically Created Room. The notion that magmaemplacement is “structurally controlled” in orogenicbelts has been popular for decades. Dilatant fault zoneswhere rock has been broken up (brecciated) are favor-able sites for magma emplacement. Bends along an ac-tive fault (Figure 9.30) provide a potential void formagma emplacement. Hinge zones of actively formingfolds may also be a local site where magma might findspace.
Magma Ascent and Emplacement: Field Relations of Intrusions 235
Foliationdip angle
0°−39° 40°−59°60°−84° > 85°
N
0
0 miles 2
kilometers 4
G
T
Q
9.28 Zoned concordant Ardara pluton, Donegal, Ireland, a resultof forceful emplacement. Black ellipses show increasing flat-tening of mafic inclusions in the intrusion and mineral grainsin the wall rock nearer the concordant contact. Dip of folia-tion in wall rocks (shaded) indicated by tick marks on strikelines and in pluton by triangles. G, granodiorite; Q, quartzmonzodiorite; T, tonalite. (Redrawn from Pitcher, 1997.)
0 mi 1
N
20 km
9.29 Forcible emplacement of granitic magma, Black Hills, SouthDakota. Magma (black) wedged along steeply dipping foliationsurfaces in country-rock schist (unshaded). Unconformablyoverlying, initially subhorizontal, sedimentary strata (shaded)were domed, as indicated by strike-dip symbols and by equalelevation structure contour lines (dashed) spaced 500 feetapart on the unconformity between the schist and sedimentaryrock. Many faults are omitted. (Redrawn from Noble, 1952.)
Initial state
After fault movement
Void
Overlap
9.30 Space for magma intrusion created by jogs, or changes in orientation, in a fault. As movement occurs, a potential voidinto which magma may be emplaced is created. The fault maybe of any type—normal, reverse, or strike-slip.
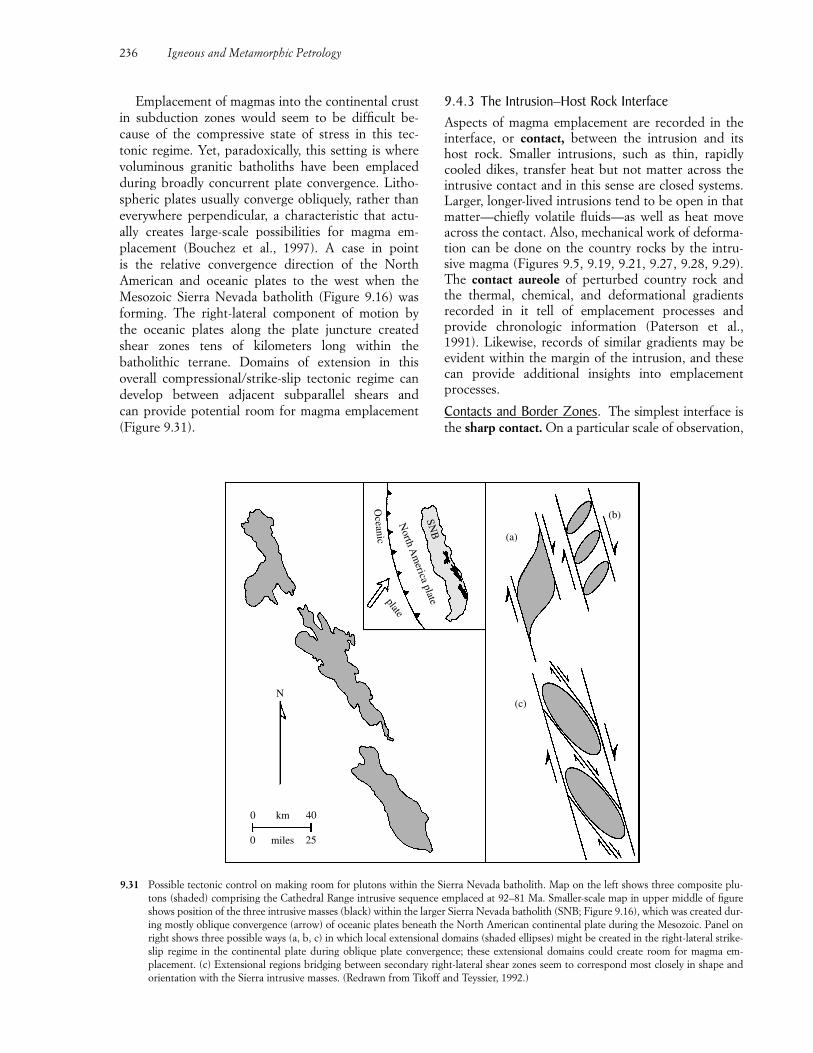
Emplacement of magmas into the continental crustin subduction zones would seem to be difficult be-cause of the compressive state of stress in this tec-tonic regime. Yet, paradoxically, this setting is wherevoluminous granitic batholiths have been emplacedduring broadly concurrent plate convergence. Litho-spheric plates usually converge obliquely, rather thaneverywhere perpendicular, a characteristic that actu-ally creates large-scale possibilities for magma em-placement (Bouchez et al., 1997). A case in point is the relative convergence direction of the North American and oceanic plates to the west when theMesozoic Sierra Nevada batholith (Figure 9.16) wasforming. The right-lateral component of motion by the oceanic plates along the plate juncture createdshear zones tens of kilometers long within thebatholithic terrane. Domains of extension in this overall compressional/strike-slip tectonic regime candevelop between adjacent subparallel shears and can provide potential room for magma emplacement(Figure 9.31).
9.4.3 The Intrusion–Host Rock InterfaceAspects of magma emplacement are recorded in theinterface, or contact, between the intrusion and itshost rock. Smaller intrusions, such as thin, rapidlycooled dikes, transfer heat but not matter across theintrusive contact and in this sense are closed systems.Larger, longer-lived intrusions tend to be open in thatmatter—chiefly volatile fluids—as well as heat moveacross the contact. Also, mechanical work of deforma-tion can be done on the country rocks by the intru-sive magma (Figures 9.5, 9.19, 9.21, 9.27, 9.28, 9.29).The contact aureole of perturbed country rock andthe thermal, chemical, and deformational gradientsrecorded in it tell of emplacement processes and provide chronologic information (Paterson et al.,1991). Likewise, records of similar gradients may beevident within the margin of the intrusion, and thesecan provide additional insights into emplacementprocesses.
Contacts and Border Zones. The simplest interface isthe sharp contact. On a particular scale of observation,
236 Igneous and Metamorphic Petrology
(c)
(a)
(b)SNB
North A
merica plateplate
Oceanic
0 km 40
0 miles 25
N
9.31 Possible tectonic control on making room for plutons within the Sierra Nevada batholith. Map on the left shows three composite plu-tons (shaded) comprising the Cathedral Range intrusive sequence emplaced at 92–81 Ma. Smaller-scale map in upper middle of figureshows position of the three intrusive masses (black) within the larger Sierra Nevada batholith (SNB; Figure 9.16), which was created dur-ing mostly oblique convergence (arrow) of oceanic plates beneath the North American continental plate during the Mesozoic. Panel onright shows three possible ways (a, b, c) in which local extensional domains (shaded ellipses) might be created in the right-lateral strike-slip regime in the continental plate during oblique plate convergence; these extensional domains could create room for magma em-placement. (c) Extensional regions bridging between secondary right-lateral shear zones seem to correspond most closely in shape andorientation with the Sierra intrusive masses. (Redrawn from Tikoff and Teyssier, 1992.)
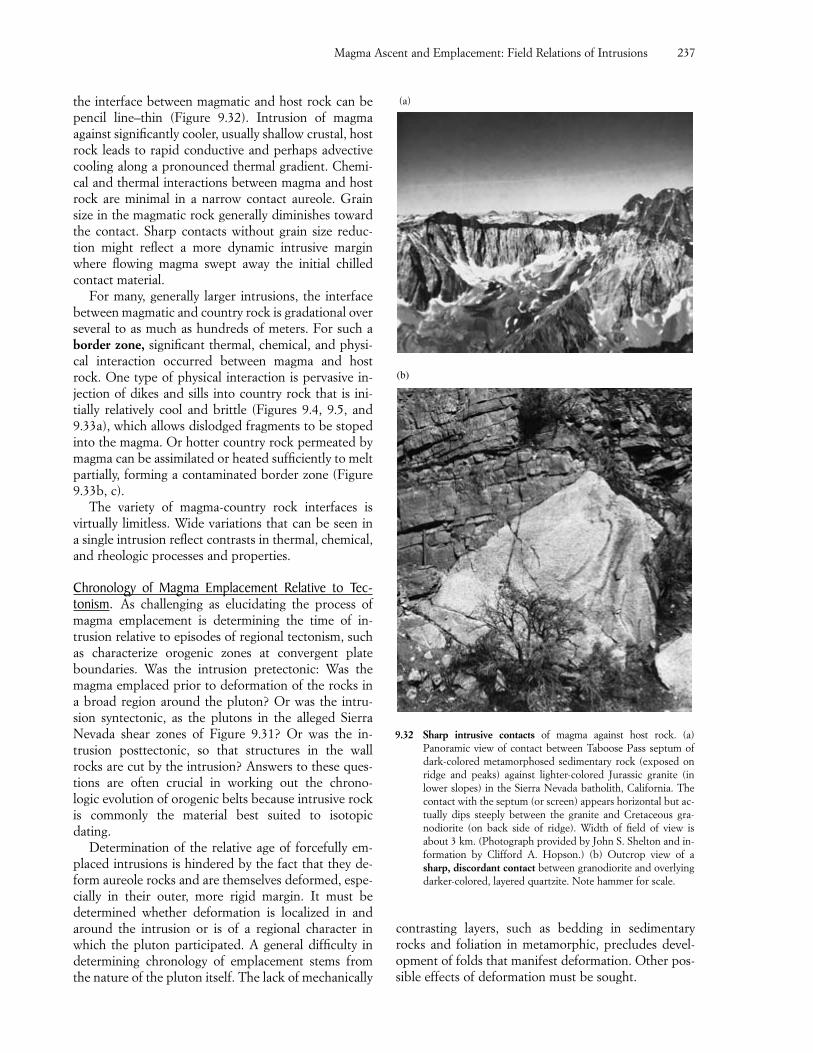
Magma Ascent and Emplacement: Field Relations of Intrusions 237
(b)
9.32 Sharp intrusive contacts of magma against host rock. (a)Panoramic view of contact between Taboose Pass septum ofdark-colored metamorphosed sedimentary rock (exposed onridge and peaks) against lighter-colored Jurassic granite (inlower slopes) in the Sierra Nevada batholith, California. Thecontact with the septum (or screen) appears horizontal but ac-tually dips steeply between the granite and Cretaceous gra-nodiorite (on back side of ridge). Width of field of view isabout 3 km. (Photograph provided by John S. Shelton and in-formation by Clifford A. Hopson.) (b) Outcrop view of asharp, discordant contact between granodiorite and overlyingdarker-colored, layered quartzite. Note hammer for scale.
the interface between magmatic and host rock can bepencil line–thin (Figure 9.32). Intrusion of magmaagainst significantly cooler, usually shallow crustal, hostrock leads to rapid conductive and perhaps advectivecooling along a pronounced thermal gradient. Chemi-cal and thermal interactions between magma and hostrock are minimal in a narrow contact aureole. Grainsize in the magmatic rock generally diminishes towardthe contact. Sharp contacts without grain size reduc-tion might reflect a more dynamic intrusive marginwhere flowing magma swept away the initial chilledcontact material.
For many, generally larger intrusions, the interfacebetween magmatic and country rock is gradational overseveral to as much as hundreds of meters. For such aborder zone, significant thermal, chemical, and physi-cal interaction occurred between magma and hostrock. One type of physical interaction is pervasive in-jection of dikes and sills into country rock that is ini-tially relatively cool and brittle (Figures 9.4, 9.5, and9.33a), which allows dislodged fragments to be stopedinto the magma. Or hotter country rock permeated bymagma can be assimilated or heated sufficiently to meltpartially, forming a contaminated border zone (Figure9.33b, c).
The variety of magma-country rock interfaces is virtually limitless. Wide variations that can be seen in a single intrusion reflect contrasts in thermal, chemical,and rheologic processes and properties.
Chronology of Magma Emplacement Relative to Tec-tonism. As challenging as elucidating the process ofmagma emplacement is determining the time of in-trusion relative to episodes of regional tectonism, suchas characterize orogenic zones at convergent plateboundaries. Was the intrusion pretectonic: Was themagma emplaced prior to deformation of the rocks ina broad region around the pluton? Or was the intru-sion syntectonic, as the plutons in the alleged SierraNevada shear zones of Figure 9.31? Or was the in-trusion posttectonic, so that structures in the wall rocks are cut by the intrusion? Answers to these ques-tions are often crucial in working out the chrono-logic evolution of orogenic belts because intrusive rock is commonly the material best suited to isotopic dating.
Determination of the relative age of forcefully em-placed intrusions is hindered by the fact that they de-form aureole rocks and are themselves deformed, espe-cially in their outer, more rigid margin. It must bedetermined whether deformation is localized in andaround the intrusion or is of a regional character inwhich the pluton participated. A general difficulty indetermining chronology of emplacement stems fromthe nature of the pluton itself. The lack of mechanically
contrasting layers, such as bedding in sedimentaryrocks and foliation in metamorphic, precludes devel-opment of folds that manifest deformation. Other pos-sible effects of deformation must be sought.
(a)
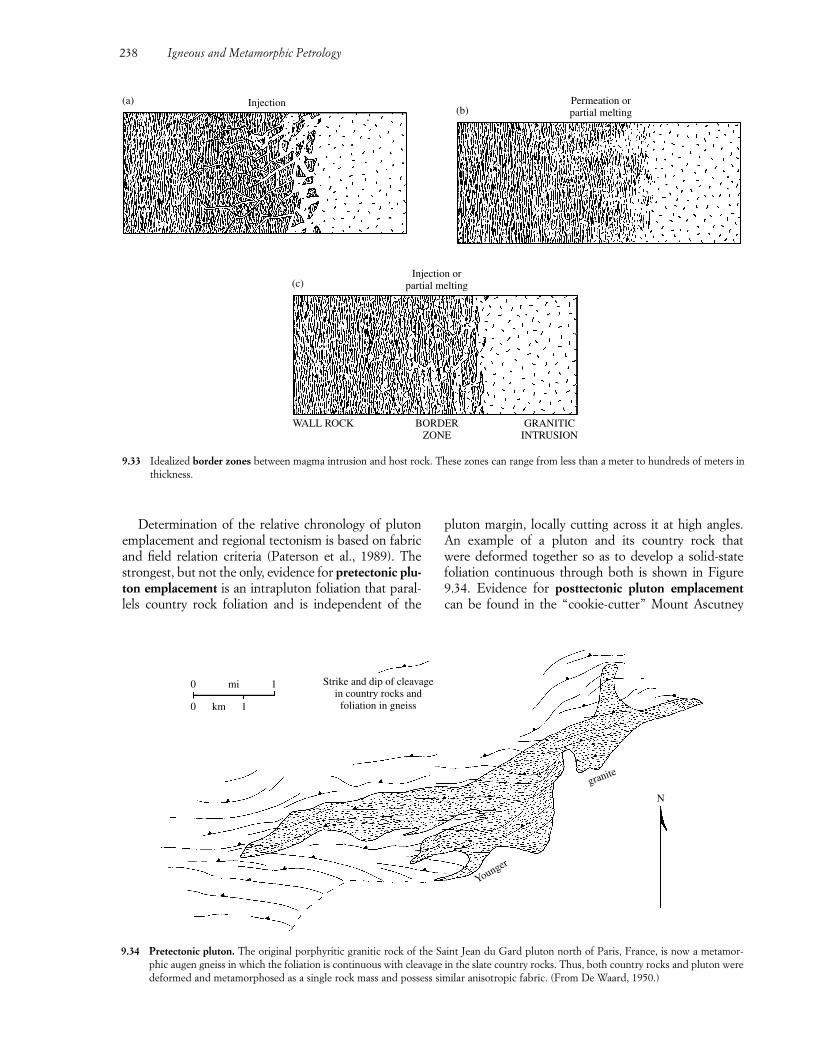
Determination of the relative chronology of plutonemplacement and regional tectonism is based on fabricand field relation criteria (Paterson et al., 1989). Thestrongest, but not the only, evidence for pretectonic plu-ton emplacement is an intrapluton foliation that paral-lels country rock foliation and is independent of the
pluton margin, locally cutting across it at high angles.An example of a pluton and its country rock that were deformed together so as to develop a solid-statefoliation continuous through both is shown in Figure9.34. Evidence for posttectonic pluton emplacementcan be found in the “cookie-cutter” Mount Ascutney
238 Igneous and Metamorphic Petrology
0
0 km 1
mi 1 Strike and dip of cleavagein country rocks and
foliation in gneiss
Younger
granite
N
9.34 Pretectonic pluton. The original porphyritic granitic rock of the Saint Jean du Gard pluton north of Paris, France, is now a metamor-phic augen gneiss in which the foliation is continuous with cleavage in the slate country rocks. Thus, both country rocks and pluton weredeformed and metamorphosed as a single rock mass and possess similar anisotropic fabric. (From De Waard, 1950.)
(a) Injection
9.33 Idealized border zones between magma intrusion and host rock. These zones can range from less than a meter to hundreds of meters inthickness.
(b)Permeation orpartial melting
WALL ROCK BORDERZONE
GRANITICINTRUSION
Injection orpartial melting(c)
intrusions (Figure 9.22), which are sharply discordantto country rock foliation and, therefore, were intrudedafter development of foliation in the metamorphic wallrocks. Syntectonic pluton emplacement can be the mostdifficult to ascertain. The most convincing occurs wherethe pluton contact is subparallel and continuous withthe foliation in the country rocks beyond that of the im-mediate thermal contact aureole. Magmatic minerals,perhaps defining an internal foliation in the pluton,such as an igneous lamination (Section 7.9), have thesame isotopic age as minerals defining the country rockfoliation.
SUMMARY
Magma ascent through the lithosphere is a thermal-mechanical phenomenon governed by buoyant drivingforces and viscous resistive forces related to the rheol-ogy of magma and lithospheric rock and to their con-trast in density. Other governing factors include tec-tonic regime, state of stress, and stratification of thelithosphere with respect to strength and brittle versusductile behavior. Energy for ascent is ultimately pro-vided by gravity and internal heat in the Earth.
“Density-filtered” mantle-derived basaltic magmascan underplate and stagnate near the base of the lower-density continental crust. These buoyantly blockedmagmas provide heat that can drive partial melting ofthe crust. Magma fractionation and assimilation of fel-sic country rock may reduce the density of evolvedmagmas, allowing farther ascent.
Subvertical basaltic dike swarms are crustal-scalefeatures that testify to copious magma transport from a mantle source through the crust. In extensional tectonic settings, magmas follow self-generated ex-tensional cracks oriented perpendicular to the leasthorizontal principal stress. If vertically continuous,overpressured basaltic magma can be driven upwardtens of kilometers, even through less dense rock mate-rial. In compressional regimes, basaltic magmas are lessable to rise all the way to the surface. Regional, far-fieldstates of stress can be modified in the local environ-ment of a central magma intrusion, allowing magma tointrude as cone sheets and radial dikes. Dike transportof magma is a trade-off between rate of flow and rate ofsolidification through conductive cooling; slowly flow-ing viscous magma dissipates heat to the wall rock andbecomes immobile. Because distance of magma trans-port through a dike is proportional to the fourth powerof its width and inversely proportional to magma vis-cosity, low viscosity basaltic magma can readily move a long distance through dikes a meter or so wide. Incontrast, much more viscous granitic magma requireswider dikes through which to move.
Volatile-rich mafic to ultramafic magmas probablybegin their ascent through the lithosphere via self-induced fractures. As overpressured magma followsthe upward-propagating crack, it may be arrested if thesupply is exhausted or continue as a fluid-oversatu-rated magma column that “drills” its way upward andfinally may breach the surface, where it creates an ex-plosive maar crater underlain by a diatreme.
Slow ascent of viscous granitic magma through duc-tile country rock as buoyant diapirs kilometers in di-ameter is an alternative mechanism to dike transport.The more or less spherical shape of the ascending di-apir minimizes viscous drag because of minimal surfacearea relative to volume. This, in turn, maximizes buoy-ant lift and retention of thermal energy. Diapirs aremost likely in the ductile, hotter lower crust, wherewall rocks can readily be thermally “softened” to facil-itate rise before stagnation at higher cooler crustal lev-els, where increased country rock strength arrests con-tinued ascent. Subsequent diapirs are likely to ascendmore easily in the thermally conditioned wake of pre-ceding ones.
Magma is finally emplaced as an intrusion or plutonas a result of increased viscosity and loss of mobilityupon cooling, insufficient buoyancy to carry it higher,or increased strength of the country rocks. Emplace-ment processes are most properly considered in threedimensions. However, the pluton–country rock systemis usually observable only in surface exposures of gen-erally less than a kilometer of surface relief. Careful andcritical observation of field relations, fabric, and rockand mineral compositions is required to interpret thespecific processes involved in magma emplacement fora particular pluton accurately. The relative contribu-tions of different emplacement processes are variable,even for a particular pluton. Laccoliths and some othercrustal plutons create room by upward forceful deflec-tion of the overlying roof rocks. Stoping is favored infractured shallow crustal rock but even with assimila-tion of country rock does not create new room formagma, therefore permitting only a transfer in positionbetween these masses. The absence of country rockxenoliths in an intrusion does not necessarily rule outstoping and assimilation; piecemeal stoped blocks mayhave been completely assimilated into the magma, orfoundered roof slabs may have sunk below the level ofexposure. Some plutons appear to have forcefullypushed aside their ductile wall rocks as the magma bal-looned laterally. Local extensional tectonic environ-ments may create room for magma emplacement.
Criteria for determination of the time of magma em-placement relative to regional tectonism are based onfabric and field relations near the pluton margin. Suchdeterminations can be crucial in unraveling complexorogenic chronology.
Magma Ascent and Emplacement: Field Relations of Intrusions 239

CRITICAL THINKING QUESTIONS9.1 Discuss the role of buoyancy in the movement
and stagnation of magma in the lithosphere.9.2 Discuss the origin and consequences of magma
overpressure. How is it a factor in ascent andemplacement of magma? How does high versuslow overpressure control different mechanismsof intrusion? How does overpressure movemagma to the surface, where it can erupt?
9.3 Contrast a local state of stress near a central in-trusion and a regional state and the processesthrough which these control the ascent and em-placement of magma.
9.4 Contrast how different sheet intrusions are em-placed.
9.5 Compare and contrast ascent of magma from itssource by diapirism and by diking with respectto thermomechanical factors and rheology ofmagma and country rock.
9.6 Characterize mechanisms of emplacement andmaking of room for intrusive magma, indicatingspecific evidence for each mechanism.
9.7 Discuss the so-called room problem for large in-trusions: whether it is real or fictive and why.
9.8 Indicate how the relative age of regional deforma-tion and processes of intrusion can be determinedin features of an intrusion and its country rock.
240 Igneous and Metamorphic Petrology
9.9 In Figure 9.7a, propose a reason why most ofthe dikes in the Mackenzie swarm are orientedapproximately north-south.
9.10 A long-standing observation is that the mostcommon intrusive rock is granitic and the mostcommon extrusive is basaltic. Propose reasonswhy this might be so.
PROBLEMS9.1 If the change in melt density with depth is taken
into account (Problem 8.9), how does this affectthe magnitude of the excess magma pressure inFigure 9.2? Explain fully and indicate any as-sumptions made.
9.2 Derive the expression for magma overpressure,or hydraulic head, ��gz. Indicate any assump-tions made.
9.3 What is the velocity of basalt magma risingthrough a 1-m-wide dike if magma � 100 Pa sand (�crust � �magma) � �� � 0.1 g/cm3? (An-swer: 3.3 m/s.)
9.4 Some 2-m-wide basalt dikes in Iceland are asmuch as 30 km long. All other factors being thesame, including magma supply rates, a 6-m-widedike in the Mackenzie swarm in Canada couldbe how long? (Answer: 2430 km.)
FUNDAMENTAL QUESTIONSCONSIDERED IN THIS CHAPTER
1. How is magma extruded onto the surface of theEarth?
2. What factors govern explosive eruptions versusquiet effusion of lava?
3. How can the fabric and field relations of volcanicrocks be used to decipher their manner of em-placement?
INTRODUCTION
Extrusive processes are more amenable to direct ob-servation and study than processes of magma ascentand intrusion, which were discussed in Chapter 9. Thisis not to say, however, that geologists fully understandeverything about extruding magmas and the rocksformed from them. Although some magma extrusions,such as low-viscosity, gas-poor basalt lavas, can be ob-served safely from within a few meters, one can onlyobserve explosive eruptions from distances of manykilometers. Interpretation of the products of these ex-ceedingly dangerous explosive eruptions can be chal-lenging.
This chapter delves into processes of magma extru-sion and the rock bodies and volcanic edifices so pro-duced. The emphasis here is on the field relations ofthe entire volcanic rock body—the whole genetic en-tity. The rock fabrics that were considered in Chapter7 and are observed in a single outcrop or on smallerscales than the whole body are not sharply distinct
from larger scale field relations. Despite their treatmentin separate chapters, both fabric and field relations ofvolcanic rocks record the character of formativeprocesses; they cannot and should not be divorcedfrom one another if the petrologist is to understandfully the origin of the rock body. For example, identi-cal porphyritic aphanitic fabrics could have originatedin a thin dike or in the margin of a small stock, in ashallow crustal environment, or in a lava flow, or as aclast in a volcanic debris flow. Only by means of thefield relations can the true origin be ascertained be-cause the cooling rate (thermal kinetic path) was simi-lar in each environment and as a result the same fabricdeveloped.
In this textbook, only a very brief summary of therapidly growing field of volcanology as it relates torock-forming processes and the fabric and field rela-tions of rock bodies can be provided. More extensivegeneral treatments are those by Williams and McBirney(1979), Cas and Wright (1987), Francis (1993), and themonumental Encyclopedia of Volcanoes edited bySigurdsson et al. (2000). Since Fisher and Schmincke(1984), an explosion in works on pyroclastic topics hasbeen edited by Sparks et al. (1997), Freundt and Rosi(1998), and Sparks and Gilbert (1999). A useful briefsummary is Walker (1993).
�10.1 OVERVIEW OF EXTRUSION: CONTROLS AND FACTORS
Two magma properties are of supreme importance inprocesses and products of extrusion: dissolved volatileconcentration in the melt fraction and rheology of the magma. Rheology is expressed in Newtonian and
CHAPTER
Magma Extrusion:Field Relations ofVolcanic Rock Bodies
10
non-Newtonian viscosity and depends not only on theconcentration of dissolved volatiles in the melt, but alsoon major element composition of the melt (especiallyconcentration of silica), magma T, crystallinity, andstrain rate. In this chapter, apparent viscosity (Section8.2.2) is used to denote magma rheology.
Volatile phenomena and rheology are involved inmoving magmas to the surface from buried chambersand feeding conduits; they are also involved in theprocesses of extrusion from the vent and emplacementof the magma onto the surface.
10.1.1 Moving Magma to the Surface: What Allows ExtrusionBasically two requirements must be satisfied if magmais to extrude, either directly from its source in the deepcrust or upper mantle where it was generated or froma staging chamber in the shallower crust. First, theremust be an opening to the surface from the buriedmagma body. Second, magma must be able to moveand be propelled through the opening. These are notnecessarily independent of one another and, in fact, areusually related. Several mechanisms, all of which de-pend on development of overpressure in the subter-ranean magma body, allow venting of magma:1. Independently of any exsolving and expanding
volatiles, a buried mass of magma may have the ca-pacity to rise and even fracture the overlying rocksby virtue of its buoyancy. Thus, in extensional tec-tonic regimes basaltic magma in upper mantle ordeep crustal reservoirs can invade subvertical frac-tures of its own making, ascend to the surface, andextrude. This mechanism probably accounts formost extrusions of basaltic magma.
2. After buoyant ascent from its source through dikesor as diapirs, magma stored for a time in a shallowcrustal chamber can subsequently erupt once itsvolatile fluid pressure or buoyant force exceeds thetensile strength of the roof rock overlying thechamber, causing the roof to rupture and then al-lowing the gas-charged magma to erupt. This canhappen in the following ways:(a) As a stationary magma cools and crystallizes
feldspars, pyroxenes, and so on, the residualmelt becomes saturated in volatiles. The result-ing volatile fluid pressure or the buoyancy ofthe bubbly magma can drive eruption.
(b) The magma may rise to still shallower crustallevels, causing more volatiles to exsolve and ex-pand in the decompressing system. Exsolutionand bubble growth may be retarded in rapidlyascending, viscous magmas so that eventualpressure release is greater and explosive erup-tion more violent. Instead of the magma’s risingto shallower levels to cause decompression, astationary magma system may be unroofed.
The catastrophic May 18, 1980, explosive erup-tion of Mount Saint Helens, Washington (Lipman and Mullineaux, 1981), furnishes anexample. After 2 months of seismic activity,steam-blast explosions at the summit, andbulging of the northern summit and flank areaat a rate of about 2 m/day, a magnitude 5�earthquake triggered a massive landslide in the unstable bulge, unroofing the buried grow-ing body of dacite magma (Figure 10.1). Thesudden decompression of the overpressuredmagma system produced a violent explosion.
(c) Mafic magma may be injected into the base of a chamber of cooler, less dense, more silicicmagma (Figure 8.24; Sparks and Sigurdsson,1977). Transfer of heat to the intruded residentsilicic magma may create enough additionalbuoyancy to cause eruption. But probablymore significantly, cooling and crystallization ofthe mafic magma cause volatile saturation andexsolution. Released volatiles float into theoverlying silicic magma, oversaturating it andincreasing the volatile pressure and magmabuoyancy.
(d) External water in the ground or in lakes orocean may come into contact with buriedmagma, absorb heat, and expand explosively,blowing off the shallow cover over the magmabody.
Changes in an extruding magma system can arrest fur-ther eruption. Deeper levels of evolved silicic crustalchambers tapped during continued extrusion are com-monly poorer in volatiles and are more crystalline: both characteristics create greater apparent viscosity ofthe magma and less eruptibility. A decrease in ascent velocity, caused by whatever process, can allow morecooling, crystallization, and potential loss of exsolvedvolatiles through permeable wall rock.
Magma is extruded either from a central vent orfrom a fissure. In a central eruption, magma vents froma more or less subvertical cylindrical feeding conduitand builds a conical volcano (Figure 10.2). Other mag-mas, commonly of basaltic composition, extrude froma long crack in the crust and constitute a fissure erup-tion (Figure 10.3); the subterranean feeder is a subver-tical dike. For thermal reasons (Section 8.4.1), erup-tions that begin from a fissure commonly becomelocalized into a central vent as extrusion continues.
10.1.2 Two Types of Extrusions: Explosive and EffusiveDepending on whether or not near-surface magmasblow apart into separate pieces, either of two types ofextrusion, explosive or effusive, can result. These con-trasts in the dynamics of extruding magma are linkedto vesiculation phenomena that depend on volatile con-
242 Igneous and Metamorphic Petrology
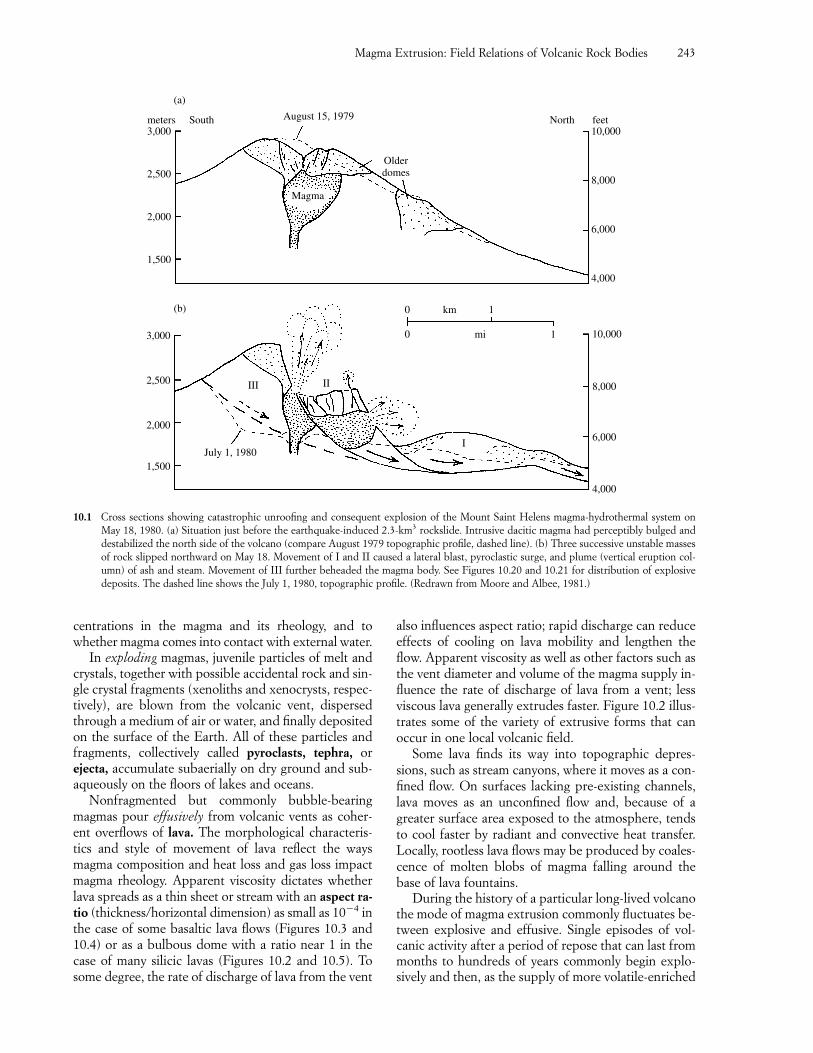
centrations in the magma and its rheology, and towhether magma comes into contact with external water.
In exploding magmas, juvenile particles of melt andcrystals, together with possible accidental rock and sin-gle crystal fragments (xenoliths and xenocrysts, respec-tively), are blown from the volcanic vent, dispersedthrough a medium of air or water, and finally depositedon the surface of the Earth. All of these particles andfragments, collectively called pyroclasts, tephra, orejecta, accumulate subaerially on dry ground and sub-aqueously on the floors of lakes and oceans.
Nonfragmented but commonly bubble-bearingmagmas pour effusively from volcanic vents as coher-ent overflows of lava. The morphological characteris-tics and style of movement of lava reflect the waysmagma composition and heat loss and gas loss impactmagma rheology. Apparent viscosity dictates whetherlava spreads as a thin sheet or stream with an aspect ra-tio (thickness/horizontal dimension) as small as 10�4 inthe case of some basaltic lava flows (Figures 10.3 and10.4) or as a bulbous dome with a ratio near 1 in thecase of many silicic lavas (Figures 10.2 and 10.5). Tosome degree, the rate of discharge of lava from the vent
also influences aspect ratio; rapid discharge can reduceeffects of cooling on lava mobility and lengthen theflow. Apparent viscosity as well as other factors such asthe vent diameter and volume of the magma supply in-fluence the rate of discharge of lava from a vent; lessviscous lava generally extrudes faster. Figure 10.2 illus-trates some of the variety of extrusive forms that canoccur in one local volcanic field.
Some lava finds its way into topographic depres-sions, such as stream canyons, where it moves as a con-fined flow. On surfaces lacking pre-existing channels,lava moves as an unconfined flow and, because of agreater surface area exposed to the atmosphere, tendsto cool faster by radiant and convective heat transfer.Locally, rootless lava flows may be produced by coales-cence of molten blobs of magma falling around thebase of lava fountains.
During the history of a particular long-lived volcanothe mode of magma extrusion commonly fluctuates be-tween explosive and effusive. Single episodes of vol-canic activity after a period of repose that can last frommonths to hundreds of years commonly begin explo-sively and then, as the supply of more volatile-enriched
Magma Extrusion: Field Relations of Volcanic Rock Bodies 243
August 15, 1979Southmeters feet10,000
8,000
6,000
4,000
North
1,500
2,000
2,500
3,000
Magma
Olderdomes
(a)
0 km 1
0 mi 1
(b)
3,000
2,500
2,000
1,500July 1, 1980
III II
I
10,000
8,000
6,000
4,000
10.1 Cross sections showing catastrophic unroofing and consequent explosion of the Mount Saint Helens magma-hydrothermal system onMay 18, 1980. (a) Situation just before the earthquake-induced 2.3-km3 rockslide. Intrusive dacitic magma had perceptibly bulged anddestabilized the north side of the volcano (compare August 1979 topographic profile, dashed line). (b) Three successive unstable massesof rock slipped northward on May 18. Movement of I and II caused a lateral blast, pyroclastic surge, and plume (vertical eruption col-umn) of ash and steam. Movement of III further beheaded the magma body. See Figures 10.20 and 10.21 for distribution of explosivedeposits. The dashed line shows the July 1, 1980, topographic profile. (Redrawn from Moore and Albee, 1981.)
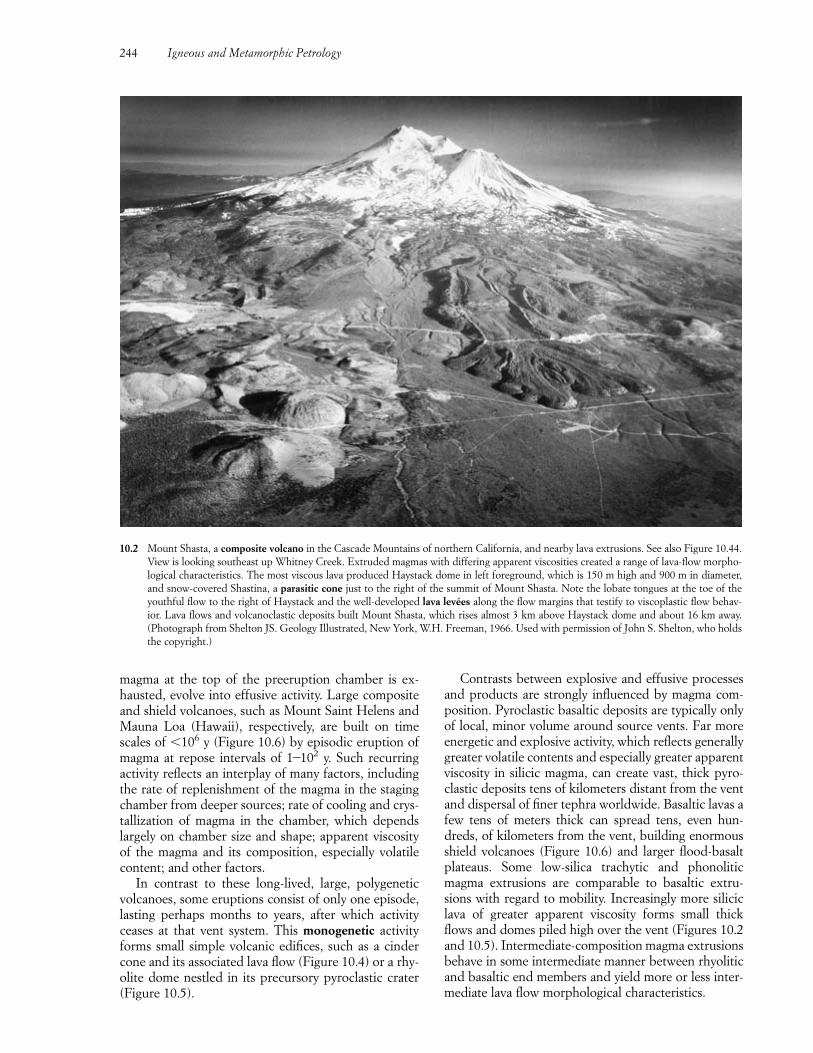
magma at the top of the preeruption chamber is ex-hausted, evolve into effusive activity. Large compositeand shield volcanoes, such as Mount Saint Helens andMauna Loa (Hawaii), respectively, are built on timescales of �106 y (Figure 10.6) by episodic eruption ofmagma at repose intervals of 1�102 y. Such recurringactivity reflects an interplay of many factors, includingthe rate of replenishment of the magma in the stagingchamber from deeper sources; rate of cooling and crys-tallization of magma in the chamber, which dependslargely on chamber size and shape; apparent viscosityof the magma and its composition, especially volatilecontent; and other factors.
In contrast to these long-lived, large, polygeneticvolcanoes, some eruptions consist of only one episode,lasting perhaps months to years, after which activityceases at that vent system. This monogenetic activityforms small simple volcanic edifices, such as a cindercone and its associated lava flow (Figure 10.4) or a rhy-olite dome nestled in its precursory pyroclastic crater(Figure 10.5).
Contrasts between explosive and effusive processesand products are strongly influenced by magma com-position. Pyroclastic basaltic deposits are typically onlyof local, minor volume around source vents. Far moreenergetic and explosive activity, which reflects generallygreater volatile contents and especially greater apparentviscosity in silicic magma, can create vast, thick pyro-clastic deposits tens of kilometers distant from the ventand dispersal of finer tephra worldwide. Basaltic lavas afew tens of meters thick can spread tens, even hun-dreds, of kilometers from the vent, building enormousshield volcanoes (Figure 10.6) and larger flood-basaltplateaus. Some low-silica trachytic and phonoliticmagma extrusions are comparable to basaltic extru-sions with regard to mobility. Increasingly more siliciclava of greater apparent viscosity forms small thickflows and domes piled high over the vent (Figures 10.2and 10.5). Intermediate-composition magma extrusionsbehave in some intermediate manner between rhyoliticand basaltic end members and yield more or less inter-mediate lava flow morphological characteristics.
244 Igneous and Metamorphic Petrology
10.2 Mount Shasta, a composite volcano in the Cascade Mountains of northern California, and nearby lava extrusions. See also Figure 10.44.View is looking southeast up Whitney Creek. Extruded magmas with differing apparent viscosities created a range of lava-flow morpho-logical characteristics. The most viscous lava produced Haystack dome in left foreground, which is 150 m high and 900 m in diameter,and snow-covered Shastina, a parasitic cone just to the right of the summit of Mount Shasta. Note the lobate tongues at the toe of theyouthful flow to the right of Haystack and the well-developed lava levées along the flow margins that testify to viscoplastic flow behav-ior. Lava flows and volcanoclastic deposits built Mount Shasta, which rises almost 3 km above Haystack dome and about 16 km away.(Photograph from Shelton JS. Geology Illustrated, New York, W.H. Freeman, 1966. Used with permission of John S. Shelton, who holdsthe copyright.)
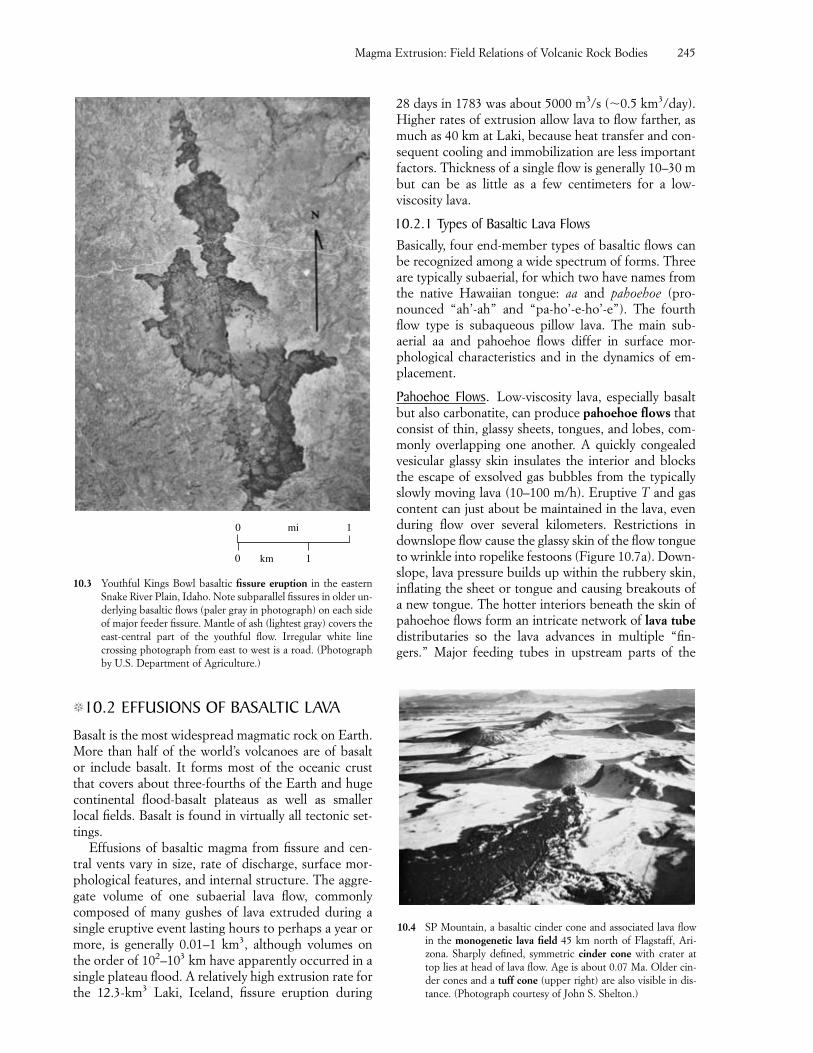
�10.2 EFFUSIONS OF BASALTIC LAVA
Basalt is the most widespread magmatic rock on Earth.More than half of the world’s volcanoes are of basalt or include basalt. It forms most of the oceanic crustthat covers about three-fourths of the Earth and hugecontinental flood-basalt plateaus as well as smaller local fields. Basalt is found in virtually all tectonic set-tings.
Effusions of basaltic magma from fissure and cen-tral vents vary in size, rate of discharge, surface mor-phological features, and internal structure. The aggre-gate volume of one subaerial lava flow, commonlycomposed of many gushes of lava extruded during asingle eruptive event lasting hours to perhaps a year ormore, is generally 0.01–1 km3, although volumes onthe order of 102–103 km have apparently occurred in asingle plateau flood. A relatively high extrusion rate forthe 12.3-km3 Laki, Iceland, fissure eruption during
28 days in 1783 was about 5000 m3/s (�0.5 km3/day).Higher rates of extrusion allow lava to flow farther, asmuch as 40 km at Laki, because heat transfer and con-sequent cooling and immobilization are less importantfactors. Thickness of a single flow is generally 10–30 mbut can be as little as a few centimeters for a low-viscosity lava.
10.2.1 Types of Basaltic Lava FlowsBasically, four end-member types of basaltic flows canbe recognized among a wide spectrum of forms. Threeare typically subaerial, for which two have names fromthe native Hawaiian tongue: aa and pahoehoe (pro-nounced “ah’-ah” and “pa-ho’-e-ho’-e”). The fourthflow type is subaqueous pillow lava. The main sub-aerial aa and pahoehoe flows differ in surface mor-phological characteristics and in the dynamics of em-placement.
Pahoehoe Flows. Low-viscosity lava, especially basaltbut also carbonatite, can produce pahoehoe flows thatconsist of thin, glassy sheets, tongues, and lobes, com-monly overlapping one another. A quickly congealedvesicular glassy skin insulates the interior and blocksthe escape of exsolved gas bubbles from the typicallyslowly moving lava (10–100 m/h). Eruptive T and gascontent can just about be maintained in the lava, evenduring flow over several kilometers. Restrictions indownslope flow cause the glassy skin of the flow tongueto wrinkle into ropelike festoons (Figure 10.7a). Down-slope, lava pressure builds up within the rubbery skin,inflating the sheet or tongue and causing breakouts ofa new tongue. The hotter interiors beneath the skin ofpahoehoe flows form an intricate network of lava tubedistributaries so the lava advances in multiple “fin-gers.” Major feeding tubes in upstream parts of the
Magma Extrusion: Field Relations of Volcanic Rock Bodies 245
0 1
1
mi
km0
10.3 Youthful Kings Bowl basaltic fissure eruption in the easternSnake River Plain, Idaho. Note subparallel fissures in older un-derlying basaltic flows (paler gray in photograph) on each sideof major feeder fissure. Mantle of ash (lightest gray) covers theeast-central part of the youthful flow. Irregular white linecrossing photograph from east to west is a road. (Photographby U.S. Department of Agriculture.)
10.4 SP Mountain, a basaltic cinder cone and associated lava flowin the monogenetic lava field 45 km north of Flagstaff, Ari-zona. Sharply defined, symmetric cinder cone with crater attop lies at head of lava flow. Age is about 0.07 Ma. Older cin-der cones and a tuff cone (upper right) are also visible in dis-tance. (Photograph courtesy of John S. Shelton.)
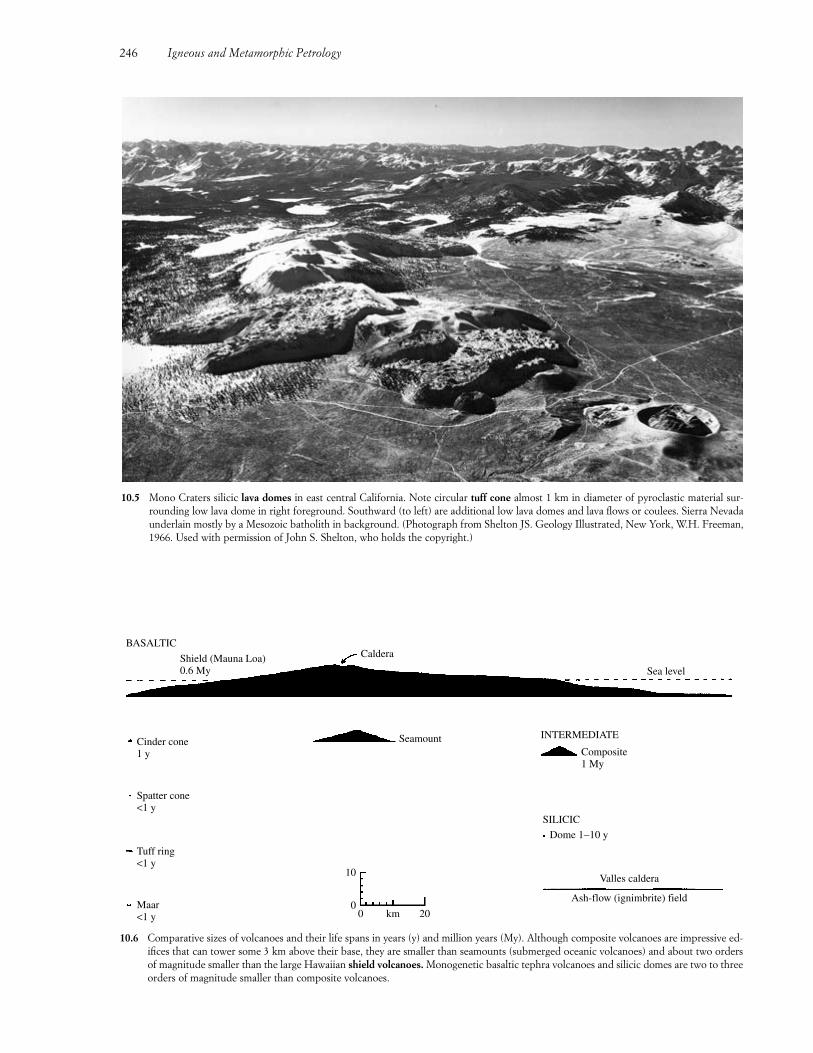
246 Igneous and Metamorphic Petrology
10.5 Mono Craters silicic lava domes in east central California. Note circular tuff cone almost 1 km in diameter of pyroclastic material sur-rounding low lava dome in right foreground. Southward (to left) are additional low lava domes and lava flows or coulees. Sierra Nevadaunderlain mostly by a Mesozoic batholith in background. (Photograph from Shelton JS. Geology Illustrated, New York, W.H. Freeman,1966. Used with permission of John S. Shelton, who holds the copyright.)
CalderaShield (Mauna Loa)0.6 My
BASALTIC
Cinder cone1 y
Spatter cone<1 y
Tuff ring<1 y
Maar<1 y 0
0
10
km 20
SeamountComposite1 My
Dome 1−10 y
Valles caldera
Ash-flow (ignimbrite) field
INTERMEDIATE
SILICIC
Sea level
10.6 Comparative sizes of volcanoes and their life spans in years (y) and million years (My). Although composite volcanoes are impressive ed-ifices that can tower some 3 km above their base, they are smaller than seamounts (submerged oceanic volcanoes) and about two ordersof magnitude smaller than the large Hawaiian shield volcanoes. Monogenetic basaltic tephra volcanoes and silicic domes are two to threeorders of magnitude smaller than composite volcanoes.
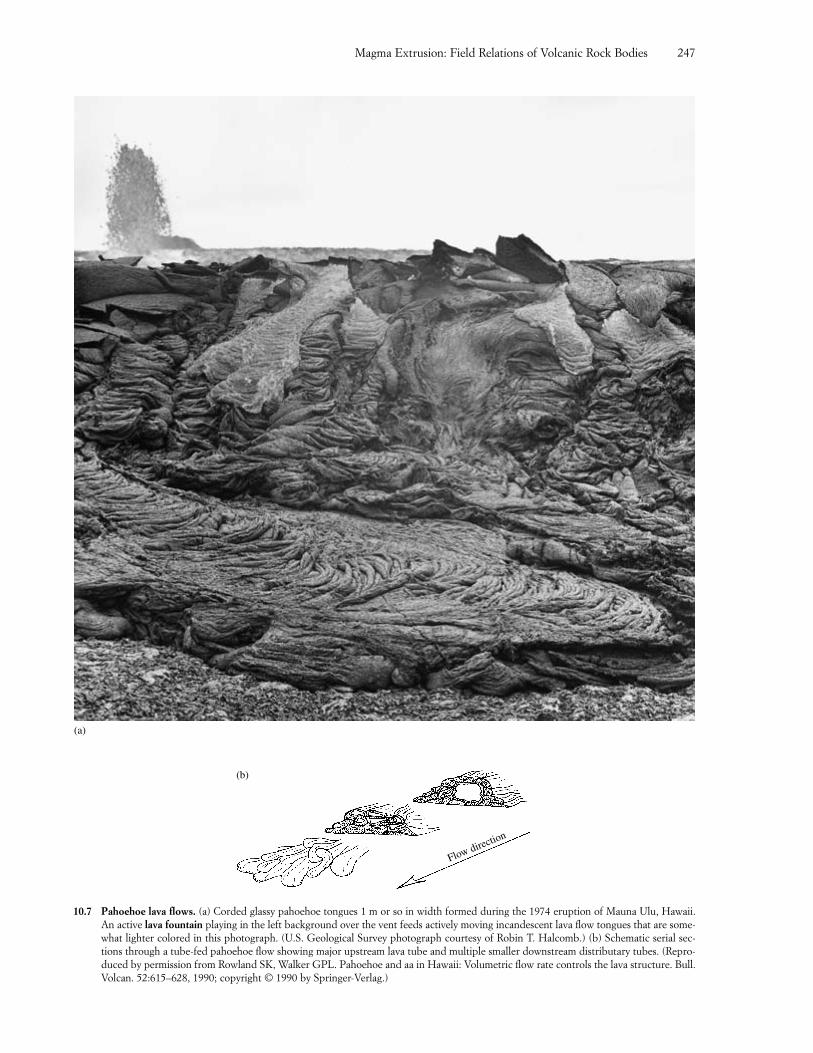
Magma Extrusion: Field Relations of Volcanic Rock Bodies 247
(a)
10.7 Pahoehoe lava flows. (a) Corded glassy pahoehoe tongues 1 m or so in width formed during the 1974 eruption of Mauna Ulu, Hawaii.An active lava fountain playing in the left background over the vent feeds actively moving incandescent lava flow tongues that are some-what lighter colored in this photograph. (U.S. Geological Survey photograph courtesy of Robin T. Halcomb.) (b) Schematic serial sec-tions through a tube-fed pahoehoe flow showing major upstream lava tube and multiple smaller downstream distributary tubes. (Repro-duced by permission from Rowland SK, Walker GPL. Pahoehoe and aa in Hawaii: Volumetric flow rate controls the lava structure. Bull.Volcan. 52:615–628, 1990; copyright © 1990 by Springer-Verlag.)
Flow direction
(b)
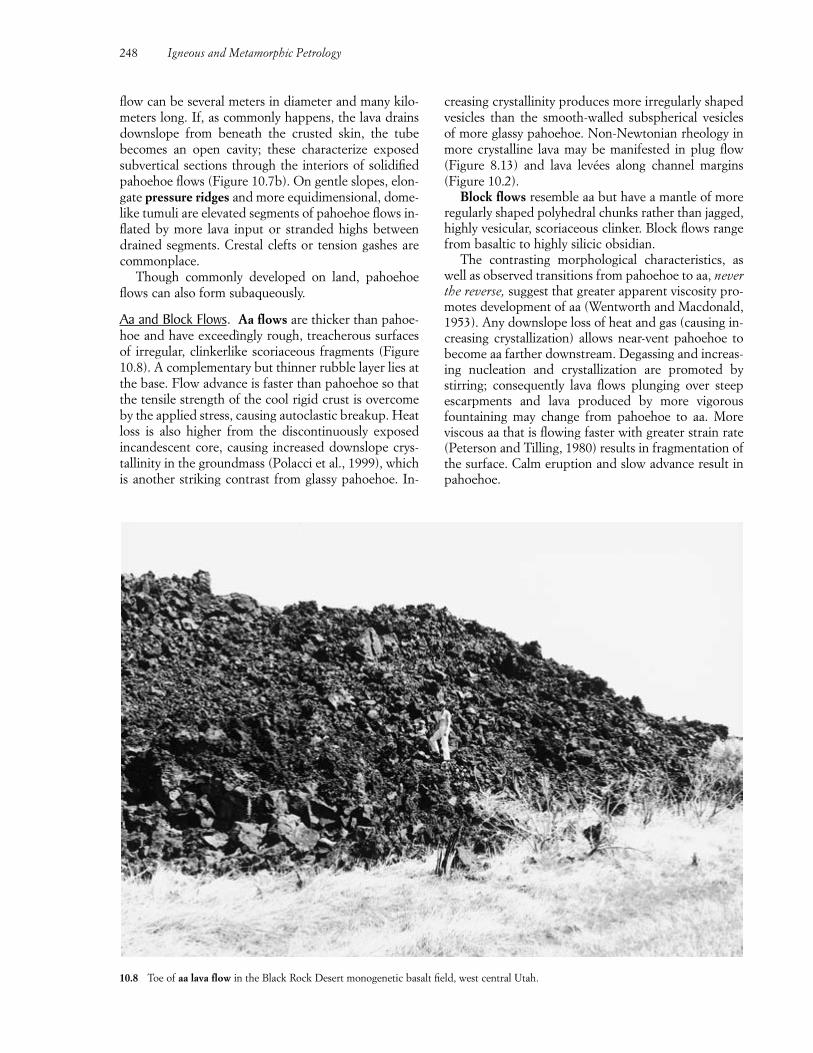
flow can be several meters in diameter and many kilo-meters long. If, as commonly happens, the lava drainsdownslope from beneath the crusted skin, the tube becomes an open cavity; these characterize exposedsubvertical sections through the interiors of solidifiedpahoehoe flows (Figure 10.7b). On gentle slopes, elon-gate pressure ridges and more equidimensional, dome-like tumuli are elevated segments of pahoehoe flows in-flated by more lava input or stranded highs betweendrained segments. Crestal clefts or tension gashes arecommonplace.
Though commonly developed on land, pahoehoeflows can also form subaqueously.
Aa and Block Flows. Aa flows are thicker than pahoe-hoe and have exceedìngly rough, treacherous surfacesof irregular, clinkerlike scoriaceous fragments (Figure10.8). A complementary but thinner rubble layer lies atthe base. Flow advance is faster than pahoehoe so thatthe tensile strength of the cool rigid crust is overcomeby the applied stress, causing autoclastic breakup. Heatloss is also higher from the discontinuously exposed incandescent core, causing increased downslope crys-tallinity in the groundmass (Polacci et al., 1999), whichis another striking contrast from glassy pahoehoe. In-
creasing crystallinity produces more irregularly shapedvesicles than the smooth-walled subspherical vesiclesof more glassy pahoehoe. Non-Newtonian rheology inmore crystalline lava may be manifested in plug flow(Figure 8.13) and lava levées along channel margins(Figure 10.2).
Block flows resemble aa but have a mantle of moreregularly shaped polyhedral chunks rather than jagged,highly vesicular, scoriaceous clinker. Block flows rangefrom basaltic to highly silicic obsidian.
The contrasting morphological characteristics, aswell as observed transitions from pahoehoe to aa, neverthe reverse, suggest that greater apparent viscosity pro-motes development of aa (Wentworth and Macdonald,1953). Any downslope loss of heat and gas (causing in-creasing crystallization) allows near-vent pahoehoe tobecome aa farther downstream. Degassing and increas-ing nucleation and crystallization are promoted by stirring; consequently lava flows plunging over steepescarpments and lava produced by more vigorousfountaining may change from pahoehoe to aa. Moreviscous aa that is flowing faster with greater strain rate(Peterson and Tilling, 1980) results in fragmentation ofthe surface. Calm eruption and slow advance result inpahoehoe.
248 Igneous and Metamorphic Petrology
10.8 Toe of aa lava flow in the Black Rock Desert monogenetic basalt field, west central Utah.
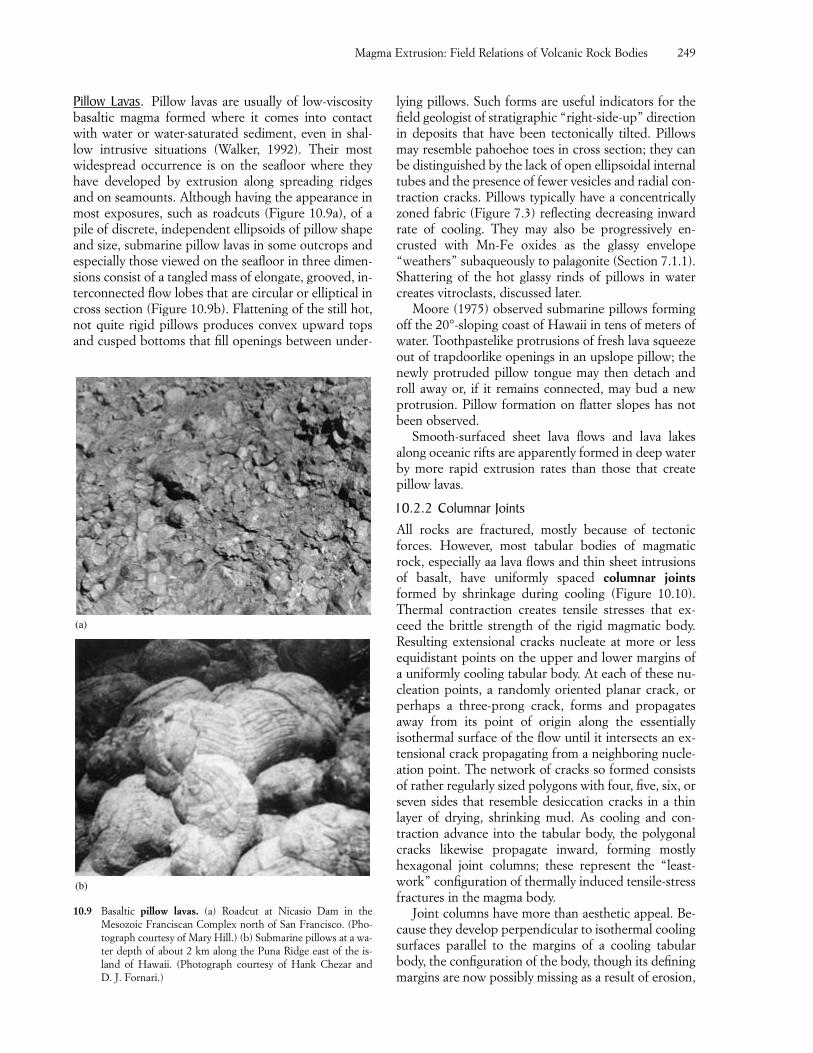
Pillow Lavas. Pillow lavas are usually of low-viscositybasaltic magma formed where it comes into contactwith water or water-saturated sediment, even in shal-low intrusive situations (Walker, 1992). Their mostwidespread occurrence is on the seafloor where theyhave developed by extrusion along spreading ridgesand on seamounts. Although having the appearance inmost exposures, such as roadcuts (Figure 10.9a), of apile of discrete, independent ellipsoids of pillow shapeand size, submarine pillow lavas in some outcrops andespecially those viewed on the seafloor in three dimen-sions consist of a tangled mass of elongate, grooved, in-terconnected flow lobes that are circular or elliptical incross section (Figure 10.9b). Flattening of the still hot,not quite rigid pillows produces convex upward topsand cusped bottoms that fill openings between under-
lying pillows. Such forms are useful indicators for thefield geologist of stratigraphic “right-side-up” directionin deposits that have been tectonically tilted. Pillowsmay resemble pahoehoe toes in cross section; they canbe distinguished by the lack of open ellipsoidal internaltubes and the presence of fewer vesicles and radial con-traction cracks. Pillows typically have a concentricallyzoned fabric (Figure 7.3) reflecting decreasing inwardrate of cooling. They may also be progressively en-crusted with Mn-Fe oxides as the glassy envelope“weathers” subaqueously to palagonite (Section 7.1.1).Shattering of the hot glassy rinds of pillows in watercreates vitroclasts, discussed later.
Moore (1975) observed submarine pillows formingoff the 20°-sloping coast of Hawaii in tens of meters ofwater. Toothpastelike protrusions of fresh lava squeezeout of trapdoorlike openings in an upslope pillow; thenewly protruded pillow tongue may then detach androll away or, if it remains connected, may bud a newprotrusion. Pillow formation on flatter slopes has notbeen observed.
Smooth-surfaced sheet lava flows and lava lakesalong oceanic rifts are apparently formed in deep waterby more rapid extrusion rates than those that createpillow lavas.
10.2.2 Columnar JointsAll rocks are fractured, mostly because of tectonicforces. However, most tabular bodies of magmaticrock, especially aa lava flows and thin sheet intrusionsof basalt, have uniformly spaced columnar jointsformed by shrinkage during cooling (Figure 10.10).Thermal contraction creates tensile stresses that ex-ceed the brittle strength of the rigid magmatic body.Resulting extensional cracks nucleate at more or lessequidistant points on the upper and lower margins ofa uniformly cooling tabular body. At each of these nu-cleation points, a randomly oriented planar crack, orperhaps a three-prong crack, forms and propagatesaway from its point of origin along the essentiallyisothermal surface of the flow until it intersects an ex-tensional crack propagating from a neighboring nucle-ation point. The network of cracks so formed consistsof rather regularly sized polygons with four, five, six, orseven sides that resemble desiccation cracks in a thinlayer of drying, shrinking mud. As cooling and con-traction advance into the tabular body, the polygonalcracks likewise propagate inward, forming mostlyhexagonal joint columns; these represent the “least-work” configuration of thermally induced tensile-stressfractures in the magma body.
Joint columns have more than aesthetic appeal. Be-cause they develop perpendicular to isothermal coolingsurfaces parallel to the margins of a cooling tabularbody, the configuration of the body, though its definingmargins are now possibly missing as a result of erosion,
Magma Extrusion: Field Relations of Volcanic Rock Bodies 249
10.9 Basaltic pillow lavas. (a) Roadcut at Nicasio Dam in the Mesozoic Franciscan Complex north of San Francisco. (Pho-tograph courtesy of Mary Hill.) (b) Submarine pillows at a wa-ter depth of about 2 km along the Puna Ridge east of the is-land of Hawaii. (Photograph courtesy of Hank Chezar and D. J. Fornari.)
(a)
(b)
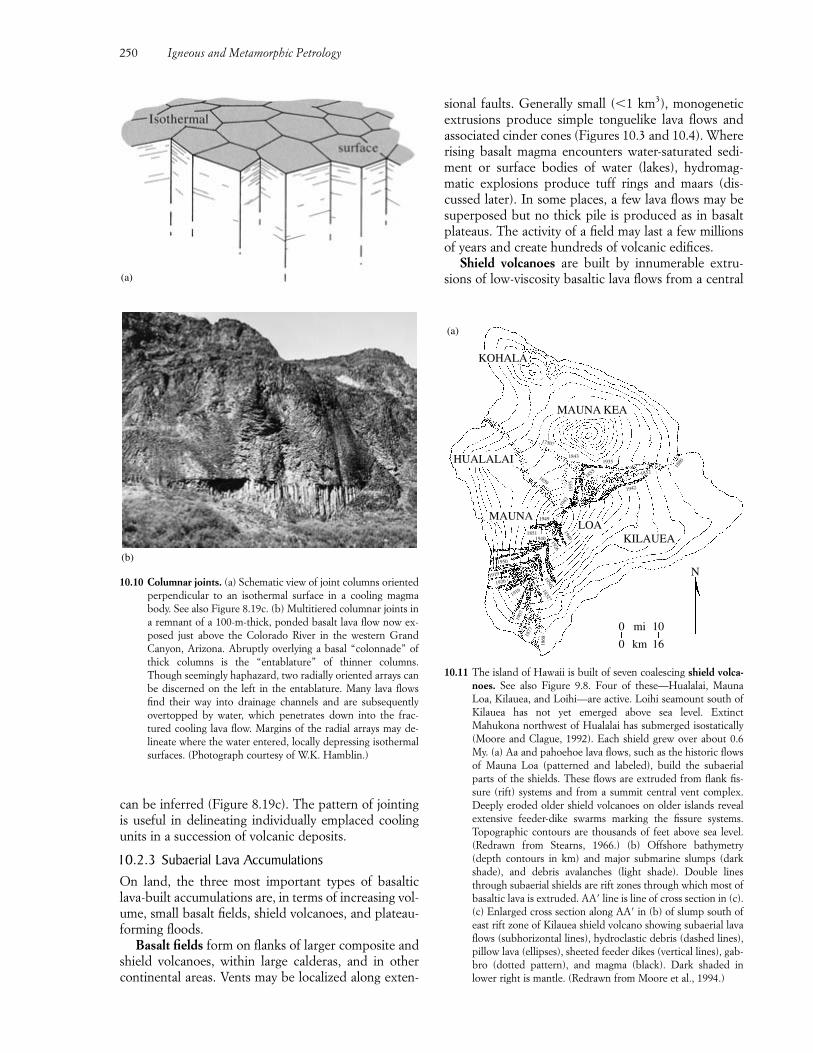
can be inferred (Figure 8.19c). The pattern of jointingis useful in delineating individually emplaced coolingunits in a succession of volcanic deposits.
10.2.3 Subaerial Lava AccumulationsOn land, the three most important types of basalticlava-built accumulations are, in terms of increasing vol-ume, small basalt fields, shield volcanoes, and plateau-forming floods.
Basalt fields form on flanks of larger composite andshield volcanoes, within large calderas, and in othercontinental areas. Vents may be localized along exten-
sional faults. Generally small (�1 km3), monogeneticextrusions produce simple tonguelike lava flows andassociated cinder cones (Figures 10.3 and 10.4). Whererising basalt magma encounters water-saturated sedi-ment or surface bodies of water (lakes), hydromag-matic explosions produce tuff rings and maars (dis-cussed later). In some places, a few lava flows may besuperposed but no thick pile is produced as in basaltplateaus. The activity of a field may last a few millionsof years and create hundreds of volcanic edifices.
Shield volcanoes are built by innumerable extru-sions of low-viscosity basaltic lava flows from a central
250 Igneous and Metamorphic Petrology
10.10 Columnar joints. (a) Schematic view of joint columns orientedperpendicular to an isothermal surface in a cooling magmabody. See also Figure 8.19c. (b) Multitiered columnar joints ina remnant of a 100-m-thick, ponded basalt lava flow now ex-posed just above the Colorado River in the western GrandCanyon, Arizona. Abruptly overlying a basal “colonnade” ofthick columns is the “entablature” of thinner columns.Though seemingly haphazard, two radially oriented arrays canbe discerned on the left in the entablature. Many lava flowsfind their way into drainage channels and are subsequentlyovertopped by water, which penetrates down into the frac-tured cooling lava flow. Margins of the radial arrays may de-lineate where the water entered, locally depressing isothermalsurfaces. (Photograph courtesy of W.K. Hamblin.)
(b)
10.11 The island of Hawaii is built of seven coalescing shield volca-noes. See also Figure 9.8. Four of these—Hualalai, MaunaLoa, Kilauea, and Loihi—are active. Loihi seamount south ofKilauea has not yet emerged above sea level. ExtinctMahukona northwest of Hualalai has submerged isostatically(Moore and Clague, 1992). Each shield grew over about 0.6My. (a) Aa and pahoehoe lava flows, such as the historic flowsof Mauna Loa (patterned and labeled), build the subaerialparts of the shields. These flows are extruded from flank fis-sure (rift) systems and from a summit central vent complex.Deeply eroded older shield volcanoes on older islands revealextensive feeder-dike swarms marking the fissure systems.Topographic contours are thousands of feet above sea level.(Redrawn from Stearns, 1966.) (b) Offshore bathymetry(depth contours in km) and major submarine slumps (darkshade), and debris avalanches (light shade). Double linesthrough subaerial shields are rift zones through which most ofbasaltic lava is extruded. AA� line is line of cross section in (c).(c) Enlarged cross section along AA� in (b) of slump south ofeast rift zone of Kilauea shield volcano showing subaerial lavaflows (subhorizontal lines), hydroclastic debris (dashed lines),pillow lava (ellipses), sheeted feeder dikes (vertical lines), gab-bro (dotted pattern), and magma (black). Dark shaded inlower right is mantle. (Redrawn from Moore et al., 1994.)
KOHALA
MAUNA KEA
HUALALAI
MAUNALOA
KILAUEA
N
0 mi 10
0 km 161868
1877
1907
1916
19261919
1950
1832?1950
1940 1926
1940
1851
1949
1942
1935
1855
1935
1942
1852
1880
1843
1750?
1859
(a)
(a)
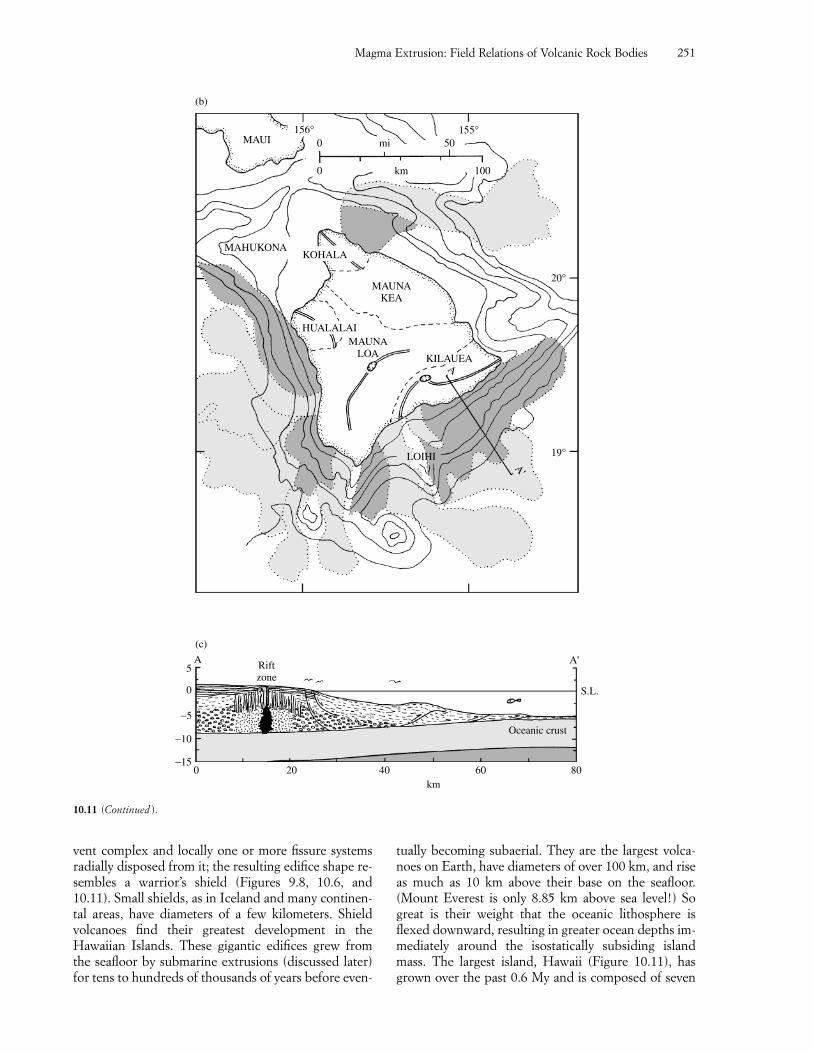
vent complex and locally one or more fissure systemsradially disposed from it; the resulting edifice shape re-sembles a warrior’s shield (Figures 9.8, 10.6, and10.11). Small shields, as in Iceland and many continen-tal areas, have diameters of a few kilometers. Shieldvolcanoes find their greatest development in theHawaiian Islands. These gigantic edifices grew fromthe seafloor by submarine extrusions (discussed later)for tens to hundreds of thousands of years before even-
tually becoming subaerial. They are the largest volca-noes on Earth, have diameters of over 100 km, and riseas much as 10 km above their base on the seafloor.(Mount Everest is only 8.85 km above sea level!) Sogreat is their weight that the oceanic lithosphere isflexed downward, resulting in greater ocean depths im-mediately around the isostatically subsiding islandmass. The largest island, Hawaii (Figure 10.11), hasgrown over the past 0.6 My and is composed of seven
Magma Extrusion: Field Relations of Volcanic Rock Bodies 251
(b)
MAUI156° 155°
0
0 km 100
mi 50
MAHUKONAKOHALA
HUALALAI
MAUNAKEA
MAUNALOA KILAUEA
A
A'
LOIHI
20°
19°
A
(c)
5
0
−5
−10
−15
Riftzone
A'
S.L.
806040km
200
Oceanic crust
10.11 (Continued ).
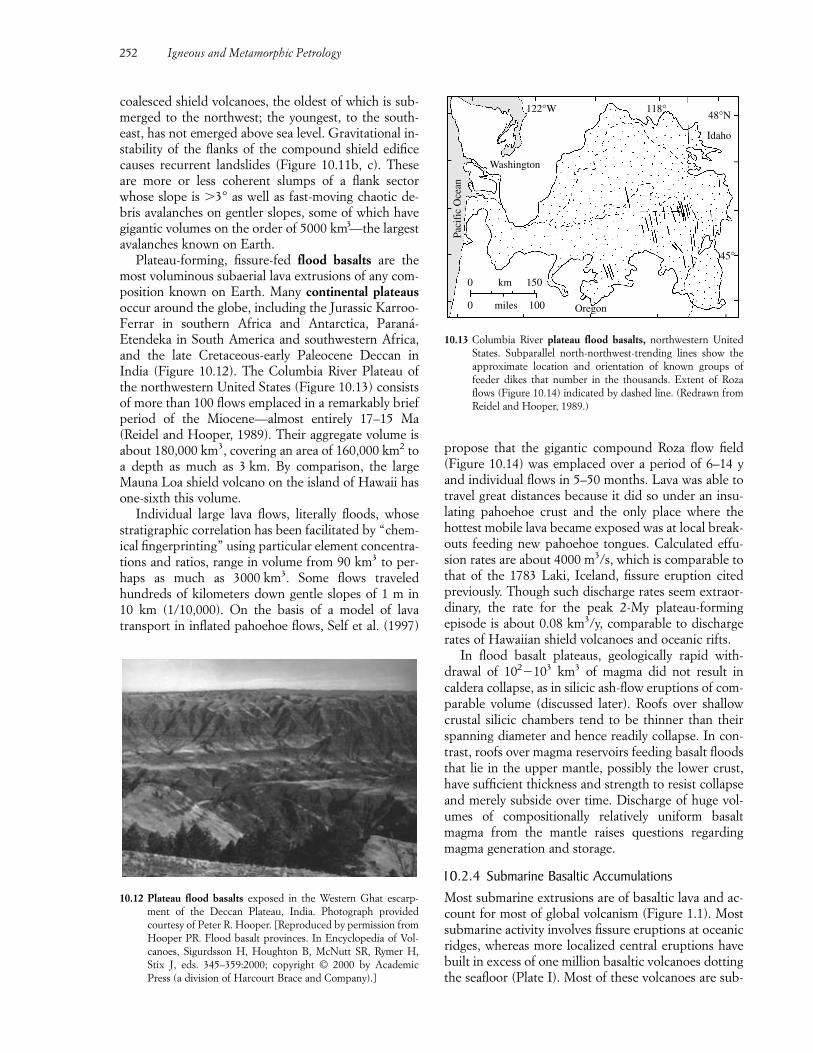
coalesced shield volcanoes, the oldest of which is sub-merged to the northwest; the youngest, to the south-east, has not emerged above sea level. Gravitational in-stability of the flanks of the compound shield edificecauses recurrent landslides (Figure 10.11b, c). Theseare more or less coherent slumps of a flank sectorwhose slope is �3° as well as fast-moving chaotic de-bris avalanches on gentler slopes, some of which havegigantic volumes on the order of 5000 km3—the largestavalanches known on Earth.
Plateau-forming, fissure-fed flood basalts are themost voluminous subaerial lava extrusions of any com-position known on Earth. Many continental plateausoccur around the globe, including the Jurassic Karroo-Ferrar in southern Africa and Antarctica, Paraná-Etendeka in South America and southwestern Africa,and the late Cretaceous-early Paleocene Deccan inIndia (Figure 10.12). The Columbia River Plateau ofthe northwestern United States (Figure 10.13) consistsof more than 100 flows emplaced in a remarkably briefperiod of the Miocene—almost entirely 17–15 Ma (Reidel and Hooper, 1989). Their aggregate volume isabout 180,000 km3, covering an area of 160,000 km2 toa depth as much as 3 km. By comparison, the largeMauna Loa shield volcano on the island of Hawaii hasone-sixth this volume.
Individual large lava flows, literally floods, whosestratigraphic correlation has been facilitated by “chem-ical fingerprinting” using particular element concentra-tions and ratios, range in volume from 90 km3 to per-haps as much as 3000 km3. Some flows traveledhundreds of kilometers down gentle slopes of 1 m in10 km (1/10,000). On the basis of a model of lavatransport in inflated pahoehoe flows, Self et al. (1997)
propose that the gigantic compound Roza flow field(Figure 10.14) was emplaced over a period of 6–14 yand individual flows in 5–50 months. Lava was able totravel great distances because it did so under an insu-lating pahoehoe crust and the only place where thehottest mobile lava became exposed was at local break-outs feeding new pahoehoe tongues. Calculated effu-sion rates are about 4000 m3/s, which is comparable tothat of the 1783 Laki, Iceland, fissure eruption citedpreviously. Though such discharge rates seem extraor-dinary, the rate for the peak 2-My plateau-formingepisode is about 0.08 km3/y, comparable to dischargerates of Hawaiian shield volcanoes and oceanic rifts.
In flood basalt plateaus, geologically rapid with-drawal of 102�103 km3 of magma did not result incaldera collapse, as in silicic ash-flow eruptions of com-parable volume (discussed later). Roofs over shallowcrustal silicic chambers tend to be thinner than theirspanning diameter and hence readily collapse. In con-trast, roofs over magma reservoirs feeding basalt floodsthat lie in the upper mantle, possibly the lower crust,have sufficient thickness and strength to resist collapseand merely subside over time. Discharge of huge vol-umes of compositionally relatively uniform basaltmagma from the mantle raises questions regardingmagma generation and storage.
10.2.4 Submarine Basaltic AccumulationsMost submarine extrusions are of basaltic lava and ac-count for most of global volcanism (Figure 1.1). Mostsubmarine activity involves fissure eruptions at oceanicridges, whereas more localized central eruptions havebuilt in excess of one million basaltic volcanoes dottingthe seafloor (Plate I). Most of these volcanoes are sub-
252 Igneous and Metamorphic Petrology
10.12 Plateau flood basalts exposed in the Western Ghat escarp-ment of the Deccan Plateau, India. Photograph providedcourtesy of Peter R. Hooper. [Reproduced by permission fromHooper PR. Flood basalt provinces. In Encyclopedia of Vol-canoes, Sigurdsson H, Houghton B, McNutt SR, Rymer H,Stix J, eds. 345–359:2000; copyright © 2000 by AcademicPress (a division of Harcourt Brace and Company).]
0 km 150
0 miles 100 Oregon
45°
Idaho
48°N118°122°W
Washington
Paci
fic
Oce
an
10.13 Columbia River plateau flood basalts, northwestern UnitedStates. Subparallel north-northwest-trending lines show theapproximate location and orientation of known groups offeeder dikes that number in the thousands. Extent of Rozaflows (Figure 10.14) indicated by dashed line. (Redrawn fromReidel and Hooper, 1989.)
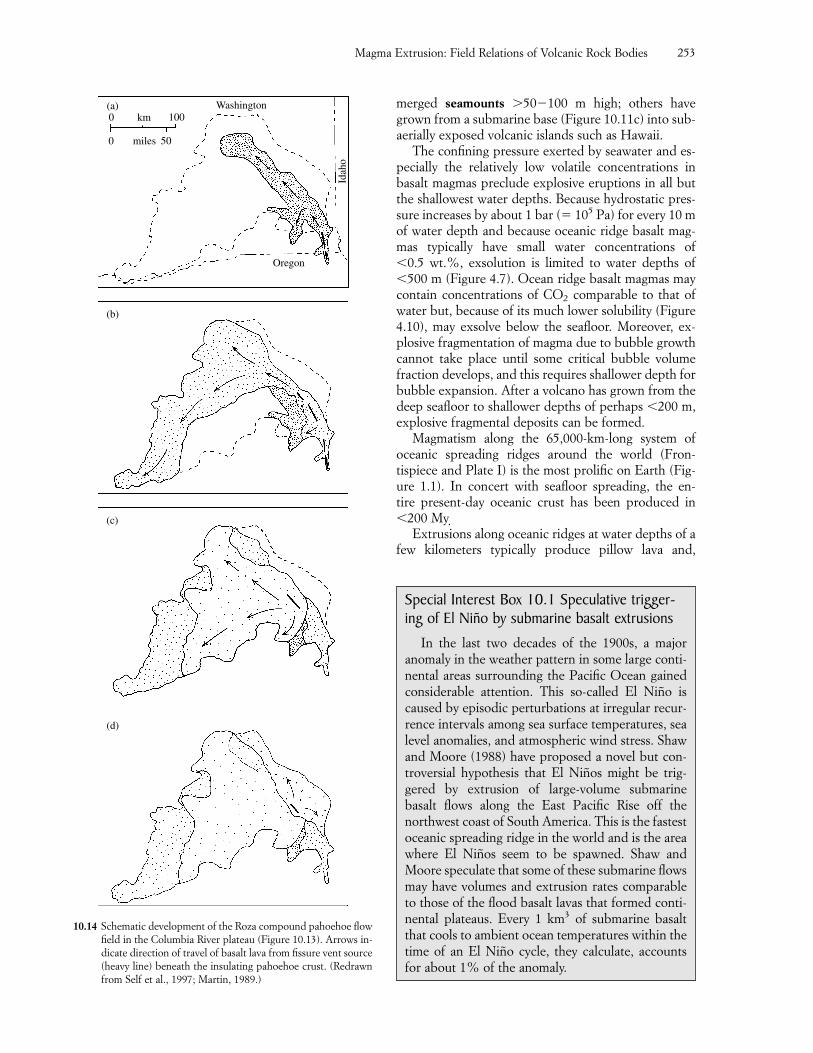
merged seamounts �50�100 m high; others havegrown from a submarine base (Figure 10.11c) into sub-aerially exposed volcanic islands such as Hawaii.
The confining pressure exerted by seawater and es-pecially the relatively low volatile concentrations inbasalt magmas preclude explosive eruptions in all butthe shallowest water depths. Because hydrostatic pres-sure increases by about 1 bar (� 105 Pa) for every 10 mof water depth and because oceanic ridge basalt mag-mas typically have small water concentrations of�0.5 wt.%, exsolution is limited to water depths of�500 m (Figure 4.7). Ocean ridge basalt magmas maycontain concentrations of CO2 comparable to that ofwater but, because of its much lower solubility (Figure4.10), may exsolve below the seafloor. Moreover, ex-plosive fragmentation of magma due to bubble growthcannot take place until some critical bubble volumefraction develops, and this requires shallower depth forbubble expansion. After a volcano has grown from thedeep seafloor to shallower depths of perhaps �200 m,explosive fragmental deposits can be formed.
Magmatism along the 65,000-km-long system ofoceanic spreading ridges around the world (Fron-tispiece and Plate I) is the most prolific on Earth (Fig-ure 1.1). In concert with seafloor spreading, the en-tire present-day oceanic crust has been produced in�200 My.
Extrusions along oceanic ridges at water depths of afew kilometers typically produce pillow lava and,
Magma Extrusion: Field Relations of Volcanic Rock Bodies 253
(a) Washington100km0
0 miles 50
Oregon
Idah
o
(b)
(c)
(d)
10.14 Schematic development of the Roza compound pahoehoe flowfield in the Columbia River plateau (Figure 10.13). Arrows in-dicate direction of travel of basalt lava from fissure vent source(heavy line) beneath the insulating pahoehoe crust. (Redrawnfrom Self et al., 1997; Martin, 1989.)
Special Interest Box 10.1 Speculative trigger-ing of El Niño by submarine basalt extrusions
In the last two decades of the 1900s, a majoranomaly in the weather pattern in some large conti-nental areas surrounding the Pacific Ocean gainedconsiderable attention. This so-called El Niño iscaused by episodic perturbations at irregular recur-rence intervals among sea surface temperatures, sealevel anomalies, and atmospheric wind stress. Shawand Moore (1988) have proposed a novel but con-troversial hypothesis that El Niños might be trig-gered by extrusion of large-volume submarinebasalt flows along the East Pacific Rise off thenorthwest coast of South America. This is the fastestoceanic spreading ridge in the world and is the areawhere El Niños seem to be spawned. Shaw andMoore speculate that some of these submarine flowsmay have volumes and extrusion rates comparableto those of the flood basalt lavas that formed conti-nental plateaus. Every 1 km3 of submarine basaltthat cools to ambient ocean temperatures within thetime of an El Niño cycle, they calculate, accountsfor about 1% of the anomaly.
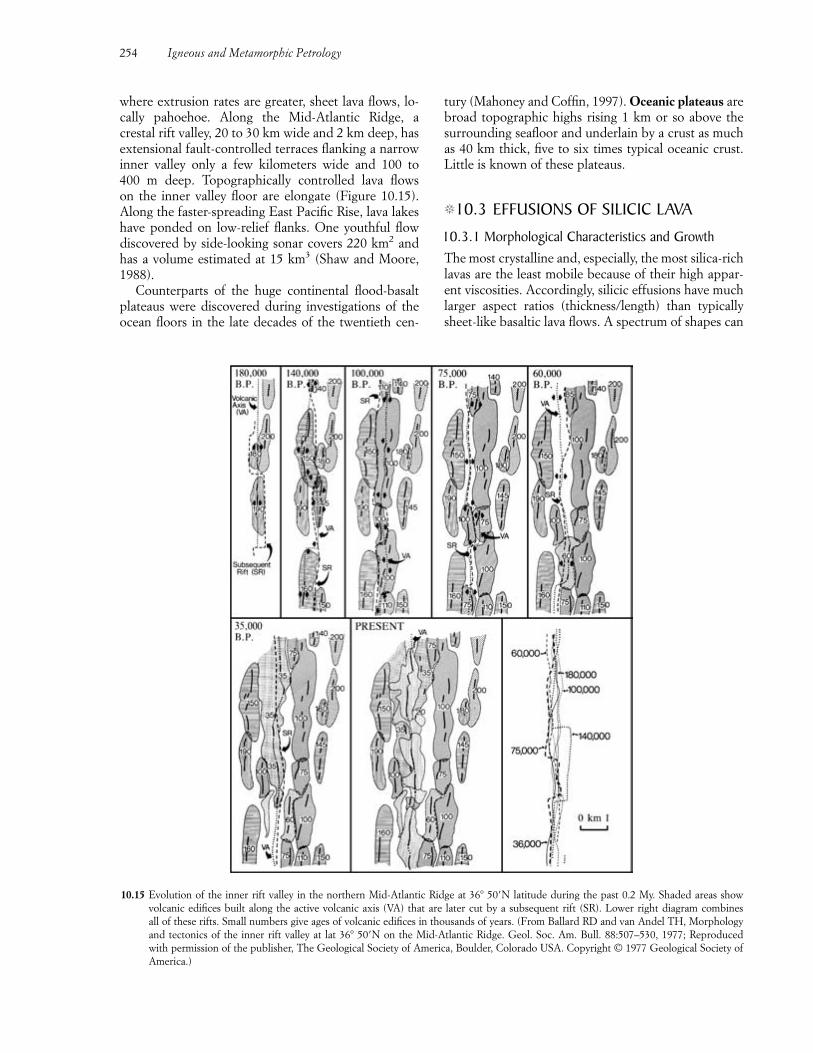
where extrusion rates are greater, sheet lava flows, lo-cally pahoehoe. Along the Mid-Atlantic Ridge, a crestal rift valley, 20 to 30 km wide and 2 km deep, hasextensional fault-controlled terraces flanking a narrowinner valley only a few kilometers wide and 100 to 400 m deep. Topographically controlled lava flows on the inner valley floor are elongate (Figure 10.15).Along the faster-spreading East Pacific Rise, lava lakeshave ponded on low-relief flanks. One youthful flowdiscovered by side-looking sonar covers 220 km2 andhas a volume estimated at 15 km3 (Shaw and Moore,1988).
Counterparts of the huge continental flood-basaltplateaus were discovered during investigations of theocean floors in the late decades of the twentieth cen-
tury (Mahoney and Coffin, 1997). Oceanic plateaus arebroad topographic highs rising 1 km or so above thesurrounding seafloor and underlain by a crust as muchas 40 km thick, five to six times typical oceanic crust.Little is known of these plateaus.
�10.3 EFFUSIONS OF SILICIC LAVA
10.3.1 Morphological Characteristics and GrowthThe most crystalline and, especially, the most silica-richlavas are the least mobile because of their high appar-ent viscosities. Accordingly, silicic effusions have muchlarger aspect ratios (thickness/length) than typicallysheet-like basaltic lava flows. A spectrum of shapes can
254 Igneous and Metamorphic Petrology
10.15 Evolution of the inner rift valley in the northern Mid-Atlantic Ridge at 36� 50�N latitude during the past 0.2 My. Shaded areas show volcanic edifices built along the active volcanic axis (VA) that are later cut by a subsequent rift (SR). Lower right diagram combines all of these rifts. Small numbers give ages of volcanic edifices in thousands of years. (From Ballard RD and van Andel TH, Morphologyand tectonics of the inner rift valley at lat 36� 50�N on the Mid-Atlantic Ridge. Geol. Soc. Am. Bull. 88:507–530, 1977; Reproduced with permission of the publisher, The Geological Society of America, Boulder, Colorado USA. Copyright © 1977 Geological Society ofAmerica.)
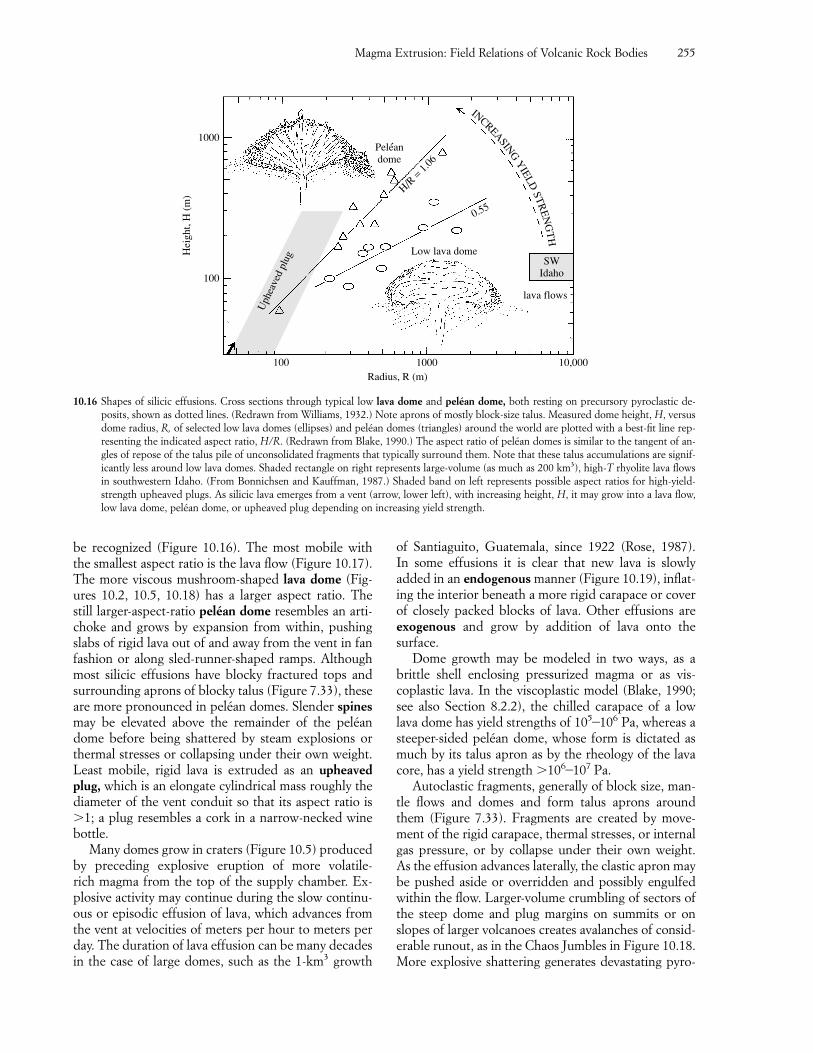
be recognized (Figure 10.16). The most mobile withthe smallest aspect ratio is the lava flow (Figure 10.17).The more viscous mushroom-shaped lava dome (Fig-ures 10.2, 10.5, 10.18) has a larger aspect ratio. The still larger-aspect-ratio peléan dome resembles an arti-choke and grows by expansion from within, pushingslabs of rigid lava out of and away from the vent in fanfashion or along sled-runner-shaped ramps. Althoughmost silicic effusions have blocky fractured tops andsurrounding aprons of blocky talus (Figure 7.33), theseare more pronounced in peléan domes. Slender spinesmay be elevated above the remainder of the peléandome before being shattered by steam explosions orthermal stresses or collapsing under their own weight.Least mobile, rigid lava is extruded as an upheavedplug, which is an elongate cylindrical mass roughly thediameter of the vent conduit so that its aspect ratio is�1; a plug resembles a cork in a narrow-necked winebottle.
Many domes grow in craters (Figure 10.5) producedby preceding explosive eruption of more volatile-rich magma from the top of the supply chamber. Ex-plosive activity may continue during the slow continu-ous or episodic effusion of lava, which advances fromthe vent at velocities of meters per hour to meters perday. The duration of lava effusion can be many decadesin the case of large domes, such as the 1-km3 growth
of Santiaguito, Guatemala, since 1922 (Rose, 1987). In some effusions it is clear that new lava is slowlyadded in an endogenous manner (Figure 10.19), inflat-ing the interior beneath a more rigid carapace or coverof closely packed blocks of lava. Other effusions areexogenous and grow by addition of lava onto the surface.
Dome growth may be modeled in two ways, as abrittle shell enclosing pressurized magma or as vis-coplastic lava. In the viscoplastic model (Blake, 1990;see also Section 8.2.2), the chilled carapace of a lowlava dome has yield strengths of 105�106 Pa, whereas asteeper-sided peléan dome, whose form is dictated asmuch by its talus apron as by the rheology of the lavacore, has a yield strength �106�107 Pa.
Autoclastic fragments, generally of block size, man-tle flows and domes and form talus aprons aroundthem (Figure 7.33). Fragments are created by move-ment of the rigid carapace, thermal stresses, or internalgas pressure, or by collapse under their own weight. As the effusion advances laterally, the clastic apron maybe pushed aside or overridden and possibly engulfedwithin the flow. Larger-volume crumbling of sectors ofthe steep dome and plug margins on summits or onslopes of larger volcanoes creates avalanches of consid-erable runout, as in the Chaos Jumbles in Figure 10.18.More explosive shattering generates devastating pyro-
Magma Extrusion: Field Relations of Volcanic Rock Bodies 255
Uph
eave
d pl
ug
100 1000 10,000Radius, R (m)
Low lava domeSW
Idaho
lava flows
INCREASING
YIELD
STR
EN
GT
H
100
1000
Hei
ght,
H (
m)
0.55
H/R = 1.
06Peleandome
'
10.16 Shapes of silicic effusions. Cross sections through typical low lava dome and peléan dome, both resting on precursory pyroclastic de-posits, shown as dotted lines. (Redrawn from Williams, 1932.) Note aprons of mostly block-size talus. Measured dome height, H, versusdome radius, R, of selected low lava domes (ellipses) and peléan domes (triangles) around the world are plotted with a best-fit line rep-resenting the indicated aspect ratio, H/R. (Redrawn from Blake, 1990.) The aspect ratio of peléan domes is similar to the tangent of an-gles of repose of the talus pile of unconsolidated fragments that typically surround them. Note that these talus accumulations are signif-icantly less around low lava domes. Shaded rectangle on right represents large-volume (as much as 200 km3), high-T rhyolite lava flowsin southwestern Idaho. (From Bonnichsen and Kauffman, 1987.) Shaded band on left represents possible aspect ratios for high-yield-strength upheaved plugs. As silicic lava emerges from a vent (arrow, lower left), with increasing height, H, it may grow into a lava flow,low lava dome, peléan dome, or upheaved plug depending on increasing yield strength.
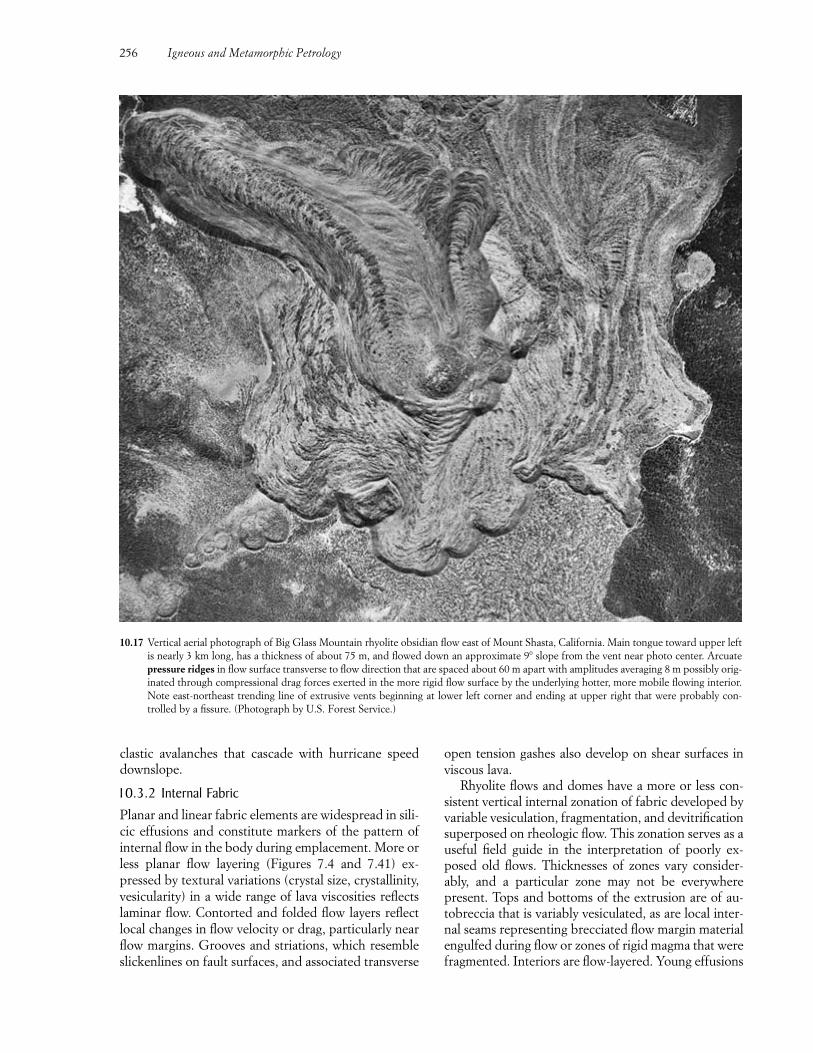
clastic avalanches that cascade with hurricane speeddownslope.
10.3.2 Internal Fabric Planar and linear fabric elements are widespread in sili-cic effusions and constitute markers of the pattern ofinternal flow in the body during emplacement. More orless planar flow layering (Figures 7.4 and 7.41) ex-pressed by textural variations (crystal size, crystallinity,vesicularity) in a wide range of lava viscosities reflectslaminar flow. Contorted and folded flow layers reflectlocal changes in flow velocity or drag, particularly nearflow margins. Grooves and striations, which resembleslickenlines on fault surfaces, and associated transverse
open tension gashes also develop on shear surfaces inviscous lava.
Rhyolite flows and domes have a more or less con-sistent vertical internal zonation of fabric developed byvariable vesiculation, fragmentation, and devitrificationsuperposed on rheologic flow. This zonation serves as auseful field guide in the interpretation of poorly ex-posed old flows. Thicknesses of zones vary consider-ably, and a particular zone may not be everywhere present. Tops and bottoms of the extrusion are of au-tobreccia that is variably vesiculated, as are local inter-nal seams representing brecciated flow margin materialengulfed during flow or zones of rigid magma that werefragmented. Interiors are flow-layered. Young effusions
256 Igneous and Metamorphic Petrology
10.17 Vertical aerial photograph of Big Glass Mountain rhyolite obsidian flow east of Mount Shasta, California. Main tongue toward upper leftis nearly 3 km long, has a thickness of about 75 m, and flowed down an approximate 9� slope from the vent near photo center. Arcuatepressure ridges in flow surface transverse to flow direction that are spaced about 60 m apart with amplitudes averaging 8 m possibly orig-inated through compressional drag forces exerted in the more rigid flow surface by the underlying hotter, more mobile flowing interior.Note east-northeast trending line of extrusive vents beginning at lower left corner and ending at upper right that were probably con-trolled by a fissure. (Photograph by U.S. Forest Service.)
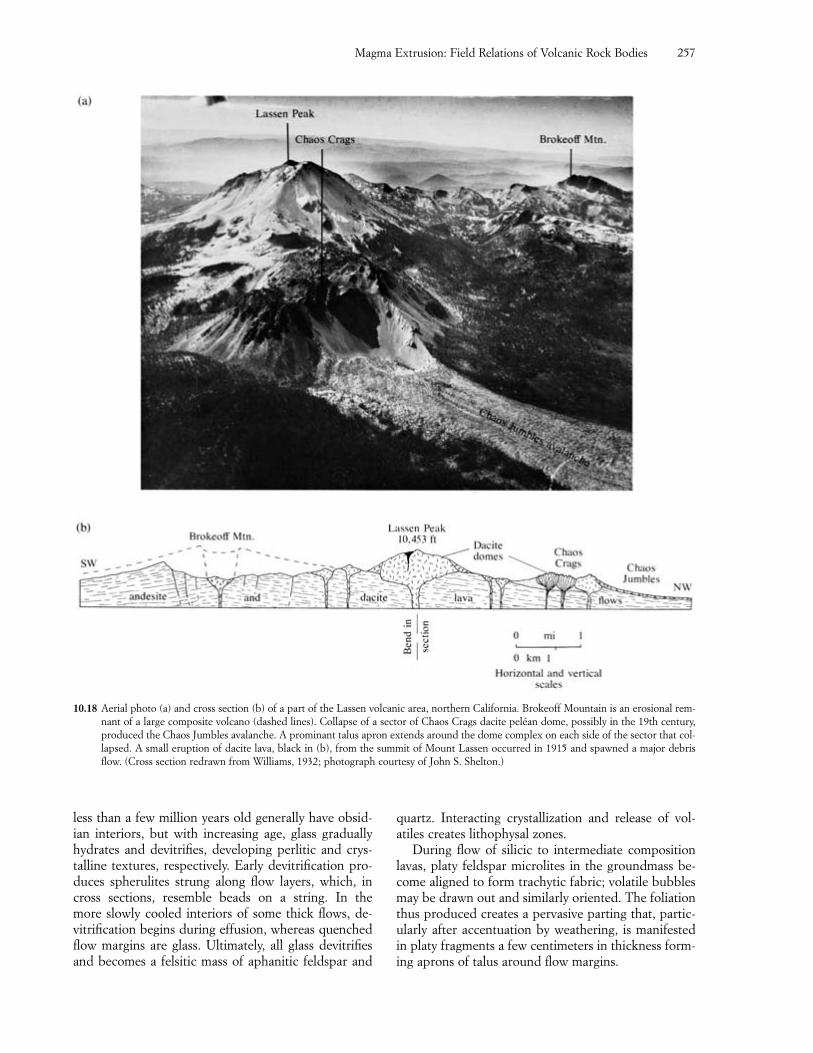
less than a few million years old generally have obsid-ian interiors, but with increasing age, glass graduallyhydrates and devitrifies, developing perlitic and crys-talline textures, respectively. Early devitrification pro-duces spherulites strung along flow layers, which, incross sections, resemble beads on a string. In the more slowly cooled interiors of some thick flows, de-vitrification begins during effusion, whereas quenchedflow margins are glass. Ultimately, all glass devitrifiesand becomes a felsitic mass of aphanitic feldspar and
quartz. Interacting crystallization and release of vol-atiles creates lithophysal zones.
During flow of silicic to intermediate compositionlavas, platy feldspar microlites in the groundmass be-come aligned to form trachytic fabric; volatile bubblesmay be drawn out and similarly oriented. The foliationthus produced creates a pervasive parting that, partic-ularly after accentuation by weathering, is manifestedin platy fragments a few centimeters in thickness form-ing aprons of talus around flow margins.
Magma Extrusion: Field Relations of Volcanic Rock Bodies 257
10.18 Aerial photo (a) and cross section (b) of a part of the Lassen volcanic area, northern California. Brokeoff Mountain is an erosional rem-nant of a large composite volcano (dashed lines). Collapse of a sector of Chaos Crags dacite peléan dome, possibly in the 19th century,produced the Chaos Jumbles avalanche. A prominant talus apron extends around the dome complex on each side of the sector that col-lapsed. A small eruption of dacite lava, black in (b), from the summit of Mount Lassen occurred in 1915 and spawned a major debrisflow. (Cross section redrawn from Williams, 1932; photograph courtesy of John S. Shelton.)
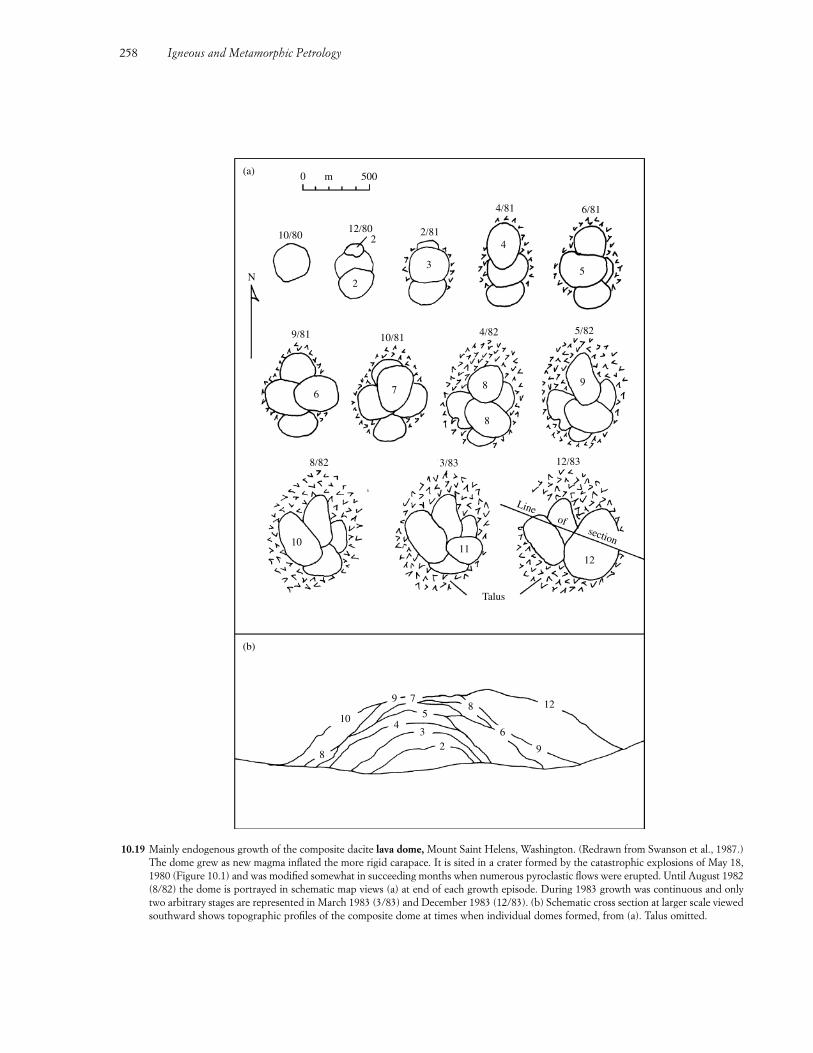
258 Igneous and Metamorphic Petrology
0 m 500
12/80 2/81
4/81
(a)
N
9/81
7
10/81
3/83
Talus
Line of section
12
12/83
98
8
4/82 5/82
2
3
4
5
6/81
10/80 2
6
8/82
1011
(b)
9 7
5
23
4
8
108 12
9
6
10.19 Mainly endogenous growth of the composite dacite lava dome, Mount Saint Helens, Washington. (Redrawn from Swanson et al., 1987.)The dome grew as new magma inflated the more rigid carapace. It is sited in a crater formed by the catastrophic explosions of May 18,1980 (Figure 10.1) and was modified somewhat in succeeding months when numerous pyroclastic flows were erupted. Until August 1982(8/82) the dome is portrayed in schematic map views (a) at end of each growth episode. During 1983 growth was continuous and onlytwo arbitrary stages are represented in March 1983 (3/83) and December 1983 (12/83). (b) Schematic cross section at larger scale viewedsouthward shows topographic profiles of the composite dome at times when individual domes formed, from (a). Talus omitted.
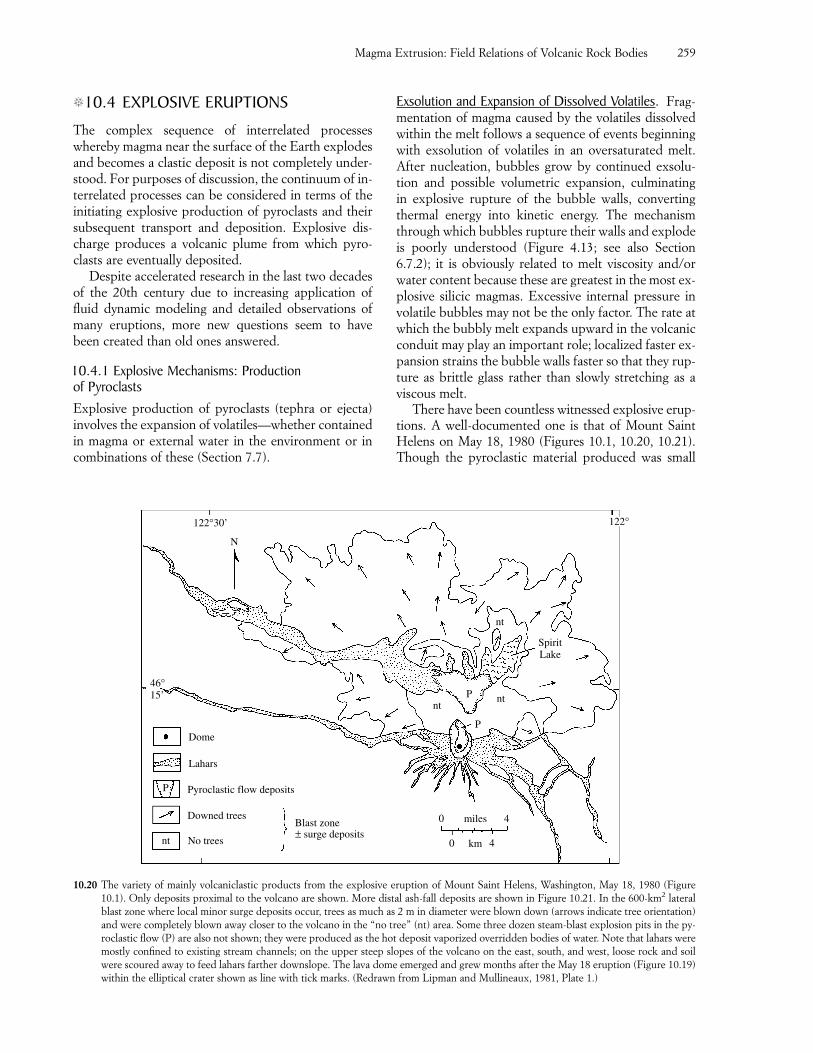
�10.4 EXPLOSIVE ERUPTIONS
The complex sequence of interrelated processeswhereby magma near the surface of the Earth explodesand becomes a clastic deposit is not completely under-stood. For purposes of discussion, the continuum of in-terrelated processes can be considered in terms of theinitiating explosive production of pyroclasts and theirsubsequent transport and deposition. Explosive dis-charge produces a volcanic plume from which pyro-clasts are eventually deposited.
Despite accelerated research in the last two decadesof the 20th century due to increasing application offluid dynamic modeling and detailed observations ofmany eruptions, more new questions seem to havebeen created than old ones answered.
10.4.1 Explosive Mechanisms: Production of PyroclastsExplosive production of pyroclasts (tephra or ejecta)involves the expansion of volatiles—whether containedin magma or external water in the environment or incombinations of these (Section 7.7).
Exsolution and Expansion of Dissolved Volatiles. Frag-mentation of magma caused by the volatiles dissolvedwithin the melt follows a sequence of events beginningwith exsolution of volatiles in an oversaturated melt.After nucleation, bubbles grow by continued exsolu-tion and possible volumetric expansion, culminating in explosive rupture of the bubble walls, convertingthermal energy into kinetic energy. The mechanismthrough which bubbles rupture their walls and explodeis poorly understood (Figure 4.13; see also Section6.7.2); it is obviously related to melt viscosity and/orwater content because these are greatest in the most ex-plosive silicic magmas. Excessive internal pressure involatile bubbles may not be the only factor. The rate atwhich the bubbly melt expands upward in the volcanicconduit may play an important role; localized faster ex-pansion strains the bubble walls faster so that they rup-ture as brittle glass rather than slowly stretching as aviscous melt.
There have been countless witnessed explosive erup-tions. A well-documented one is that of Mount SaintHelens on May 18, 1980 (Figures 10.1, 10.20, 10.21).Though the pyroclastic material produced was small
Magma Extrusion: Field Relations of Volcanic Rock Bodies 259
Dome
Lahars
Pyroclastic flow deposits
Downed trees
No trees
Blast zone± surge deposits
122°30’
N
46°15’
nt
ntnt
SpiritLake
P
P
0 miles 4
0 4km
P
nt
122°
10.20 The variety of mainly volcaniclastic products from the explosive eruption of Mount Saint Helens, Washington, May 18, 1980 (Figure10.1). Only deposits proximal to the volcano are shown. More distal ash-fall deposits are shown in Figure 10.21. In the 600-km2 lateralblast zone where local minor surge deposits occur, trees as much as 2 m in diameter were blown down (arrows indicate tree orientation)and were completely blown away closer to the volcano in the “no tree” (nt) area. Some three dozen steam-blast explosion pits in the py-roclastic flow (P) are also not shown; they were produced as the hot deposit vaporized overridden bodies of water. Note that lahars weremostly confined to existing stream channels; on the upper steep slopes of the volcano on the east, south, and west, loose rock and soilwere scoured away to feed lahars farther downslope. The lava dome emerged and grew months after the May 18 eruption (Figure 10.19)within the elliptical crater shown as line with tick marks. (Redrawn from Lipman and Mullineaux, 1981, Plate 1.)
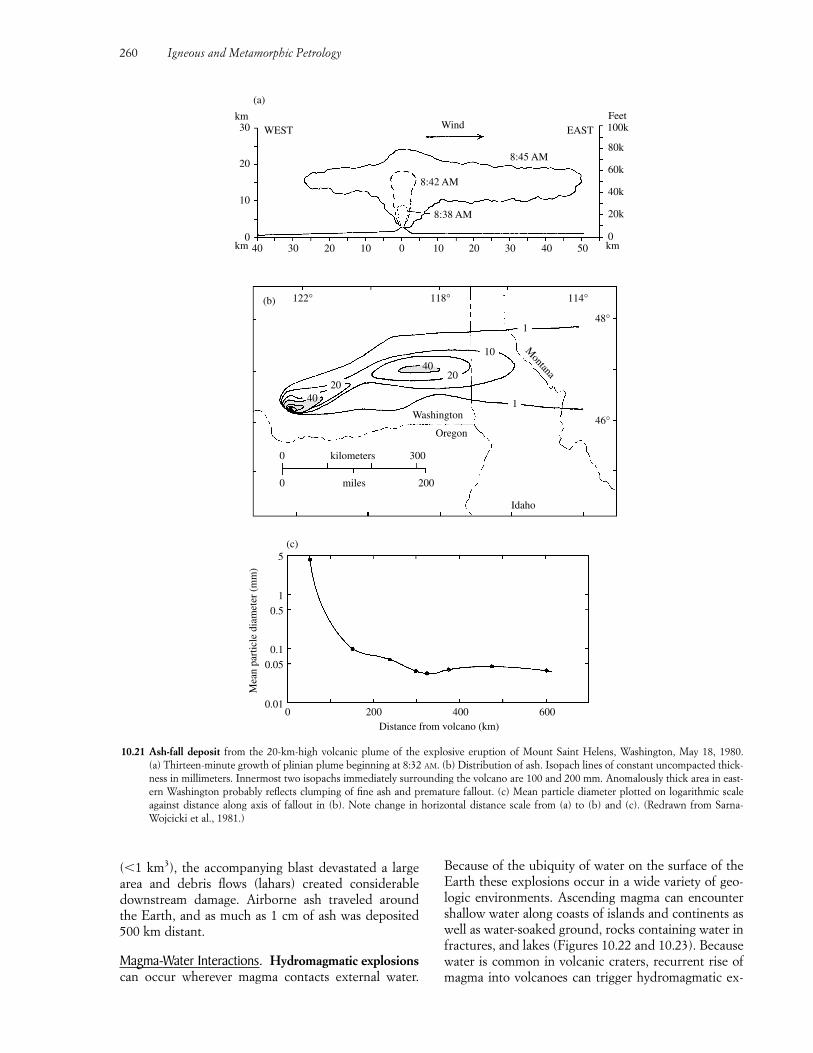
260 Igneous and Metamorphic Petrology
(�1 km3), the accompanying blast devastated a largearea and debris flows (lahars) created considerabledownstream damage. Airborne ash traveled around the Earth, and as much as 1 cm of ash was deposited500 km distant.
Magma-Water Interactions. Hydromagmatic explosionscan occur wherever magma contacts external water.
Because of the ubiquity of water on the surface of theEarth these explosions occur in a wide variety of geo-logic environments. Ascending magma can encountershallow water along coasts of islands and continents aswell as water-soaked ground, rocks containing water infractures, and lakes (Figures 10.22 and 10.23). Becausewater is common in volcanic craters, recurrent rise ofmagma into volcanoes can trigger hydromagmatic ex-
040 30 20 10 0 10 20 30 40 50
10
20
30
kmkm
kmWEST Wind 100k
80k
60k
40k
20k
0
FeetEAST
8:45 AM
8:42 AM
8:38 AM
(a)
(b) 122° 118° 114°
48°
46°
10
2040
2040
Washington
Idaho
Oregon
300kilometers0
0 200miles
(c)5
1
0.5
0.1
0.05
0.01
Mea
n pa
rtic
le d
iam
eter
(m
m)
0 200 400 600Distance from volcano (km)
Montana
1
1
10.21 Ash-fall deposit from the 20-km-high volcanic plume of the explosive eruption of Mount Saint Helens, Washington, May 18, 1980. (a) Thirteen-minute growth of plinian plume beginning at 8:32 AM. (b) Distribution of ash. Isopach lines of constant uncompacted thick-ness in millimeters. Innermost two isopachs immediately surrounding the volcano are 100 and 200 mm. Anomalously thick area in east-ern Washington probably reflects clumping of fine ash and premature fallout. (c) Mean particle diameter plotted on logarithmic scaleagainst distance along axis of fallout in (b). Note change in horizontal distance scale from (a) to (b) and (c). (Redrawn from Sarna-Wojcicki et al., 1981.)
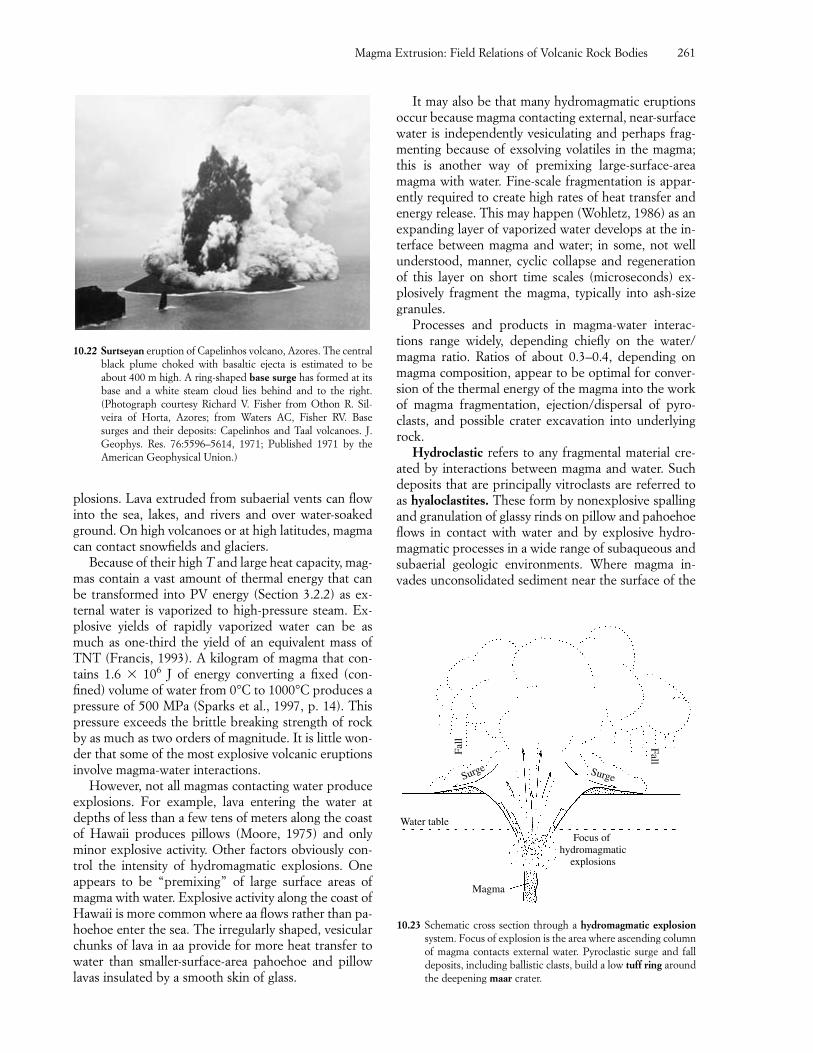
plosions. Lava extruded from subaerial vents can flowinto the sea, lakes, and rivers and over water-soakedground. On high volcanoes or at high latitudes, magmacan contact snowfields and glaciers.
Because of their high T and large heat capacity, mag-mas contain a vast amount of thermal energy that canbe transformed into PV energy (Section 3.2.2) as ex-ternal water is vaporized to high-pressure steam. Ex-plosive yields of rapidly vaporized water can be asmuch as one-third the yield of an equivalent mass ofTNT (Francis, 1993). A kilogram of magma that con-tains 1.6 106 J of energy converting a fixed (con-fined) volume of water from 0°C to 1000°C produces apressure of 500 MPa (Sparks et al., 1997, p. 14). Thispressure exceeds the brittle breaking strength of rockby as much as two orders of magnitude. It is little won-der that some of the most explosive volcanic eruptionsinvolve magma-water interactions.
However, not all magmas contacting water produceexplosions. For example, lava entering the water atdepths of less than a few tens of meters along the coastof Hawaii produces pillows (Moore, 1975) and onlyminor explosive activity. Other factors obviously con-trol the intensity of hydromagmatic explosions. Oneappears to be “premixing” of large surface areas ofmagma with water. Explosive activity along the coast ofHawaii is more common where aa flows rather than pa-hoehoe enter the sea. The irregularly shaped, vesicularchunks of lava in aa provide for more heat transfer towater than smaller-surface-area pahoehoe and pillowlavas insulated by a smooth skin of glass.
It may also be that many hydromagmatic eruptionsoccur because magma contacting external, near-surfacewater is independently vesiculating and perhaps frag-menting because of exsolving volatiles in the magma;this is another way of premixing large-surface-areamagma with water. Fine-scale fragmentation is appar-ently required to create high rates of heat transfer andenergy release. This may happen (Wohletz, 1986) as anexpanding layer of vaporized water develops at the in-terface between magma and water; in some, not wellunderstood, manner, cyclic collapse and regenerationof this layer on short time scales (microseconds) ex-plosively fragment the magma, typically into ash-sizegranules.
Processes and products in magma-water interac-tions range widely, depending chiefly on the water/magma ratio. Ratios of about 0.3–0.4, depending onmagma composition, appear to be optimal for conver-sion of the thermal energy of the magma into the workof magma fragmentation, ejection/dispersal of pyro-clasts, and possible crater excavation into underlyingrock.
Hydroclastic refers to any fragmental material cre-ated by interactions between magma and water. Suchdeposits that are principally vitroclasts are referred toas hyaloclastites. These form by nonexplosive spallingand granulation of glassy rinds on pillow and pahoehoeflows in contact with water and by explosive hydro-magmatic processes in a wide range of subaqueous andsubaerial geologic environments. Where magma in-vades unconsolidated sediment near the surface of the
Magma Extrusion: Field Relations of Volcanic Rock Bodies 261
10.22 Surtseyan eruption of Capelinhos volcano, Azores. The centralblack plume choked with basaltic ejecta is estimated to beabout 400 m high. A ring-shaped base surge has formed at itsbase and a white steam cloud lies behind and to the right.(Photograph courtesy Richard V. Fisher from Othon R. Sil-veira of Horta, Azores; from Waters AC, Fisher RV. Basesurges and their deposits: Capelinhos and Taal volcanoes. J.Geophys. Res. 76:5596–5614, 1971; Published 1971 by theAmerican Geophysical Union.)
Surge Surge
Magma
Fall
Focus of hydromagmatic
explosions
Fall
Water table
10.23 Schematic cross section through a hydromagmatic explosionsystem. Focus of explosion is the area where ascending columnof magma contacts external water. Pyroclastic surge and falldeposits, including ballistic clasts, build a low tuff ring aroundthe deepening maar crater.
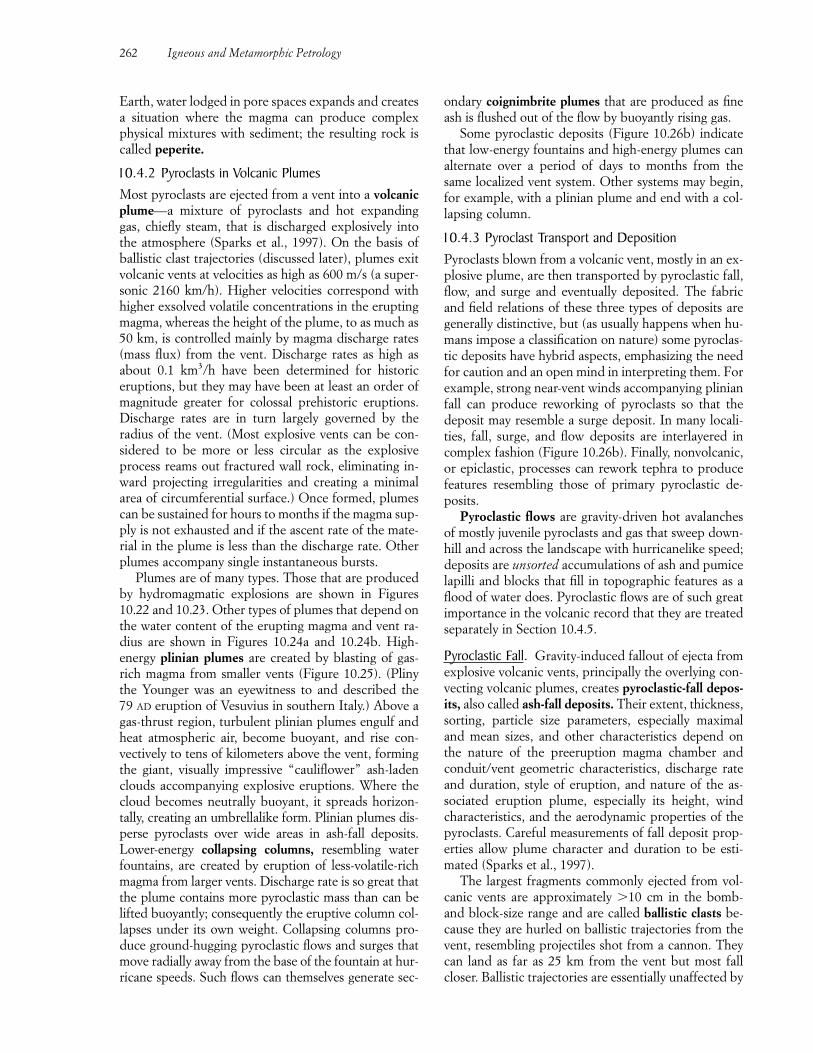
Earth, water lodged in pore spaces expands and createsa situation where the magma can produce complexphysical mixtures with sediment; the resulting rock iscalled peperite.
10.4.2 Pyroclasts in Volcanic PlumesMost pyroclasts are ejected from a vent into a volcanicplume—a mixture of pyroclasts and hot expanding gas, chiefly steam, that is discharged explosively intothe atmosphere (Sparks et al., 1997). On the basis ofballistic clast trajectories (discussed later), plumes exitvolcanic vents at velocities as high as 600 m/s (a super-sonic 2160 km/h). Higher velocities correspond withhigher exsolved volatile concentrations in the eruptingmagma, whereas the height of the plume, to as much as50 km, is controlled mainly by magma discharge rates(mass flux) from the vent. Discharge rates as high asabout 0.1 km3/h have been determined for historiceruptions, but they may have been at least an order ofmagnitude greater for colossal prehistoric eruptions.Discharge rates are in turn largely governed by the radius of the vent. (Most explosive vents can be con-sidered to be more or less circular as the explosiveprocess reams out fractured wall rock, eliminating in-ward projecting irregularities and creating a minimalarea of circumferential surface.) Once formed, plumescan be sustained for hours to months if the magma sup-ply is not exhausted and if the ascent rate of the mate-rial in the plume is less than the discharge rate. Otherplumes accompany single instantaneous bursts.
Plumes are of many types. Those that are producedby hydromagmatic explosions are shown in Figures10.22 and 10.23. Other types of plumes that depend onthe water content of the erupting magma and vent ra-dius are shown in Figures 10.24a and 10.24b. High-energy plinian plumes are created by blasting of gas-rich magma from smaller vents (Figure 10.25). (Plinythe Younger was an eyewitness to and described the 79 AD eruption of Vesuvius in southern Italy.) Above agas-thrust region, turbulent plinian plumes engulf andheat atmospheric air, become buoyant, and rise con-vectively to tens of kilometers above the vent, formingthe giant, visually impressive “cauliflower” ash-ladenclouds accompanying explosive eruptions. Where thecloud becomes neutrally buoyant, it spreads horizon-tally, creating an umbrellalike form. Plinian plumes dis-perse pyroclasts over wide areas in ash-fall deposits.Lower-energy collapsing columns, resembling waterfountains, are created by eruption of less-volatile-richmagma from larger vents. Discharge rate is so great thatthe plume contains more pyroclastic mass than can belifted buoyantly; consequently the eruptive column col-lapses under its own weight. Collapsing columns pro-duce ground-hugging pyroclastic flows and surges thatmove radially away from the base of the fountain at hur-ricane speeds. Such flows can themselves generate sec-
ondary coignimbrite plumes that are produced as fineash is flushed out of the flow by buoyantly rising gas.
Some pyroclastic deposits (Figure 10.26b) indicatethat low-energy fountains and high-energy plumes canalternate over a period of days to months from thesame localized vent system. Other systems may begin,for example, with a plinian plume and end with a col-lapsing column.
10.4.3 Pyroclast Transport and DepositionPyroclasts blown from a volcanic vent, mostly in an ex-plosive plume, are then transported by pyroclastic fall,flow, and surge and eventually deposited. The fabricand field relations of these three types of deposits aregenerally distinctive, but (as usually happens when hu-mans impose a classification on nature) some pyroclas-tic deposits have hybrid aspects, emphasizing the needfor caution and an open mind in interpreting them. Forexample, strong near-vent winds accompanying plinianfall can produce reworking of pyroclasts so that thedeposit may resemble a surge deposit. In many locali-ties, fall, surge, and flow deposits are interlayered incomplex fashion (Figure 10.26b). Finally, nonvolcanic,or epiclastic, processes can rework tephra to producefeatures resembling those of primary pyroclastic de-posits.
Pyroclastic flows are gravity-driven hot avalanchesof mostly juvenile pyroclasts and gas that sweep down-hill and across the landscape with hurricanelike speed;deposits are unsorted accumulations of ash and pumicelapilli and blocks that fill in topographic features as aflood of water does. Pyroclastic flows are of such greatimportance in the volcanic record that they are treatedseparately in Section 10.4.5.
Pyroclastic Fall. Gravity-induced fallout of ejecta fromexplosive volcanic vents, principally the overlying con-vecting volcanic plumes, creates pyroclastic-fall depos-its, also called ash-fall deposits. Their extent, thickness,sorting, particle size parameters, especially maximaland mean sizes, and other characteristics depend onthe nature of the preeruption magma chamber andconduit/vent geometric characteristics, discharge rateand duration, style of eruption, and nature of the as-sociated eruption plume, especially its height, windcharacteristics, and the aerodynamic properties of thepyroclasts. Careful measurements of fall deposit prop-erties allow plume character and duration to be esti-mated (Sparks et al., 1997).
The largest fragments commonly ejected from vol-canic vents are approximately �10 cm in the bomb-and block-size range and are called ballistic clasts be-cause they are hurled on ballistic trajectories from thevent, resembling projectiles shot from a cannon. Theycan land as far as 25 km from the vent but most fallcloser. Ballistic trajectories are essentially unaffected by
262 Igneous and Metamorphic Petrology
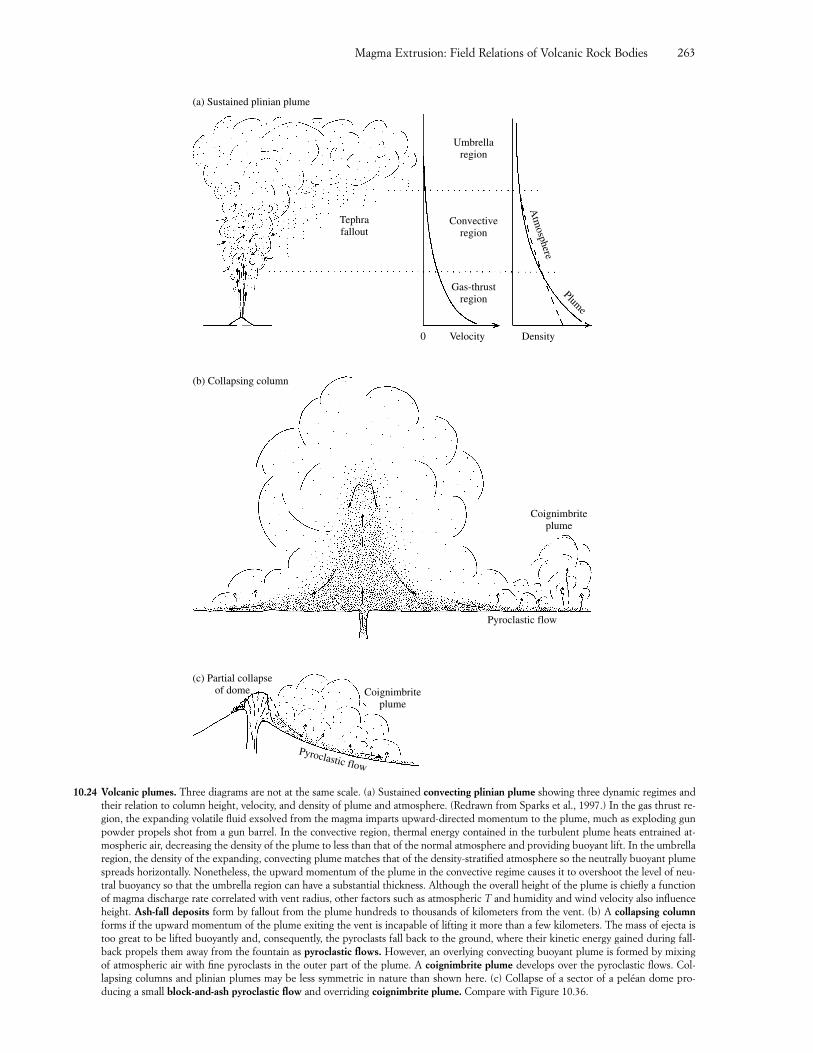
Magma Extrusion: Field Relations of Volcanic Rock Bodies 263
(a) Sustained plinian plume
Tephrafallout
Umbrellaregion
Convectiveregion
Gas-thrustregion
0 Velocity Density
Plume
(b) Collapsing column
Coignimbriteplume
Pyroclastic flow
(c) Partial collapseof dome Coignimbrite
plume
Pyroclastic flow
Atm
osphere
10.24 Volcanic plumes. Three diagrams are not at the same scale. (a) Sustained convecting plinian plume showing three dynamic regimes andtheir relation to column height, velocity, and density of plume and atmosphere. (Redrawn from Sparks et al., 1997.) In the gas thrust re-gion, the expanding volatile fluid exsolved from the magma imparts upward-directed momentum to the plume, much as exploding gunpowder propels shot from a gun barrel. In the convective region, thermal energy contained in the turbulent plume heats entrained at-mospheric air, decreasing the density of the plume to less than that of the normal atmosphere and providing buoyant lift. In the umbrellaregion, the density of the expanding, convecting plume matches that of the density-stratified atmosphere so the neutrally buoyant plumespreads horizontally. Nonetheless, the upward momentum of the plume in the convective regime causes it to overshoot the level of neu-tral buoyancy so that the umbrella region can have a substantial thickness. Although the overall height of the plume is chiefly a functionof magma discharge rate correlated with vent radius, other factors such as atmospheric T and humidity and wind velocity also influenceheight. Ash-fall deposits form by fallout from the plume hundreds to thousands of kilometers from the vent. (b) A collapsing columnforms if the upward momentum of the plume exiting the vent is incapable of lifting it more than a few kilometers. The mass of ejecta istoo great to be lifted buoyantly and, consequently, the pyroclasts fall back to the ground, where their kinetic energy gained during fall-back propels them away from the fountain as pyroclastic flows. However, an overlying convecting buoyant plume is formed by mixingof atmospheric air with fine pyroclasts in the outer part of the plume. A coignimbrite plume develops over the pyroclastic flows. Col-lapsing columns and plinian plumes may be less symmetric in nature than shown here. (c) Collapse of a sector of a peléan dome pro-ducing a small block-and-ash pyroclastic flow and overriding coignimbrite plume. Compare with Figure 10.36.
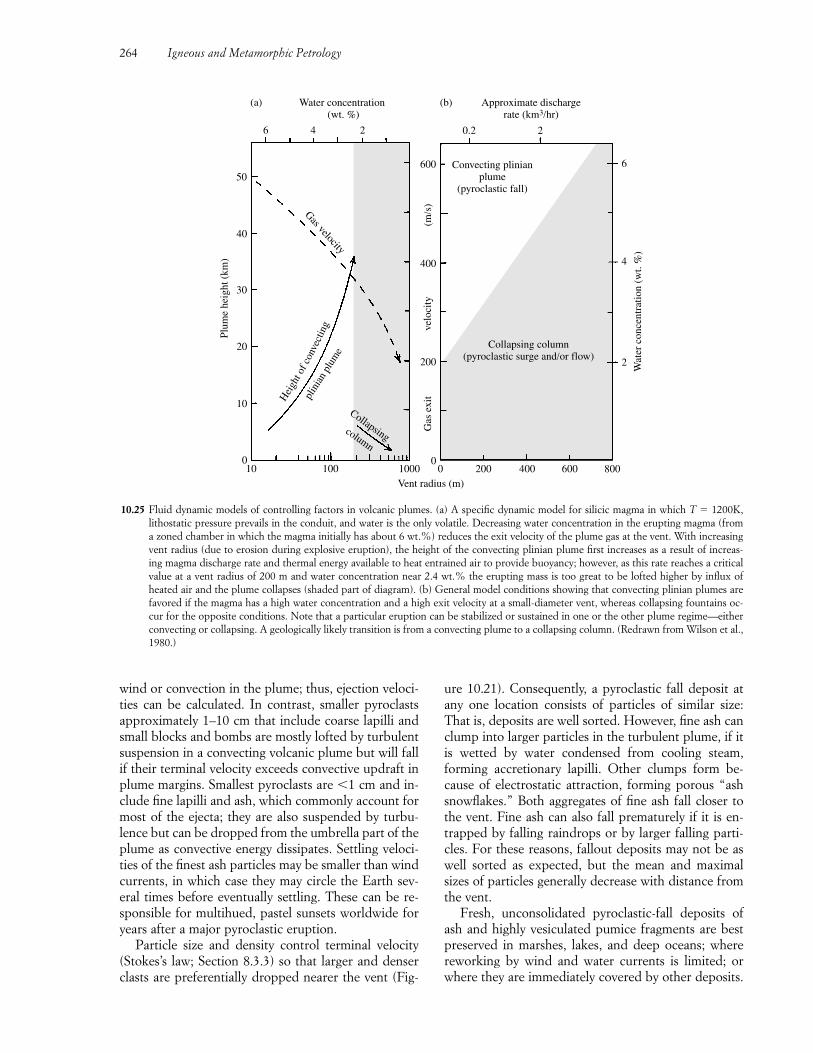
wind or convection in the plume; thus, ejection veloci-ties can be calculated. In contrast, smaller pyroclastsapproximately 1–10 cm that include coarse lapilli andsmall blocks and bombs are mostly lofted by turbulentsuspension in a convecting volcanic plume but will fallif their terminal velocity exceeds convective updraft inplume margins. Smallest pyroclasts are �1 cm and in-clude fine lapilli and ash, which commonly account formost of the ejecta; they are also suspended by turbu-lence but can be dropped from the umbrella part of theplume as convective energy dissipates. Settling veloci-ties of the finest ash particles may be smaller than windcurrents, in which case they may circle the Earth sev-eral times before eventually settling. These can be re-sponsible for multihued, pastel sunsets worldwide foryears after a major pyroclastic eruption.
Particle size and density control terminal velocity(Stokes’s law; Section 8.3.3) so that larger and denserclasts are preferentially dropped nearer the vent (Fig-
ure 10.21). Consequently, a pyroclastic fall deposit atany one location consists of particles of similar size:That is, deposits are well sorted. However, fine ash canclump into larger particles in the turbulent plume, if itis wetted by water condensed from cooling steam,forming accretionary lapilli. Other clumps form be-cause of electrostatic attraction, forming porous “ashsnowflakes.” Both aggregates of fine ash fall closer tothe vent. Fine ash can also fall prematurely if it is en-trapped by falling raindrops or by larger falling parti-cles. For these reasons, fallout deposits may not be aswell sorted as expected, but the mean and maximalsizes of particles generally decrease with distance fromthe vent.
Fresh, unconsolidated pyroclastic-fall deposits ofash and highly vesiculated pumice fragments are bestpreserved in marshes, lakes, and deep oceans; wherereworking by wind and water currents is limited; orwhere they are immediately covered by other deposits.
264 Igneous and Metamorphic Petrology
Collapsing column(pyroclastic surge and/or flow)
0 200 400 600 800
2
4
6
Wat
er c
once
ntra
tion
(wt.
%)
Convecting plinianplume
(pyroclastic fall)
Gas
exi
t ve
loci
ty
200
0
400
600
(m/s
)
Approximate dischargerate (km3/hr)
0.2 2
(b)
Vent radius (m)
6 4 2
Water concentration (wt. %)
(a)
50
40
30
20
10
010 100 1000
Plum
e he
ight
(km
)
Gas velocity
Hei
ght o
f con
vect
ing
plin
ian
plum
e
Collapsingcolumn
10.25 Fluid dynamic models of controlling factors in volcanic plumes. (a) A specific dynamic model for silicic magma in which T � 1200K,lithostatic pressure prevails in the conduit, and water is the only volatile. Decreasing water concentration in the erupting magma (froma zoned chamber in which the magma initially has about 6 wt.%) reduces the exit velocity of the plume gas at the vent. With increasingvent radius (due to erosion during explosive eruption), the height of the convecting plinian plume first increases as a result of increas-ing magma discharge rate and thermal energy available to heat entrained air to provide buoyancy; however, as this rate reaches a criticalvalue at a vent radius of 200 m and water concentration near 2.4 wt.% the erupting mass is too great to be lofted higher by influx ofheated air and the plume collapses (shaded part of diagram). (b) General model conditions showing that convecting plinian plumes arefavored if the magma has a high water concentration and a high exit velocity at a small-diameter vent, whereas collapsing fountains oc-cur for the opposite conditions. Note that a particular eruption can be stabilized or sustained in one or the other plume regime—eitherconvecting or collapsing. A geologically likely transition is from a convecting plume to a collapsing column. (Redrawn from Wilson et al.,1980.)
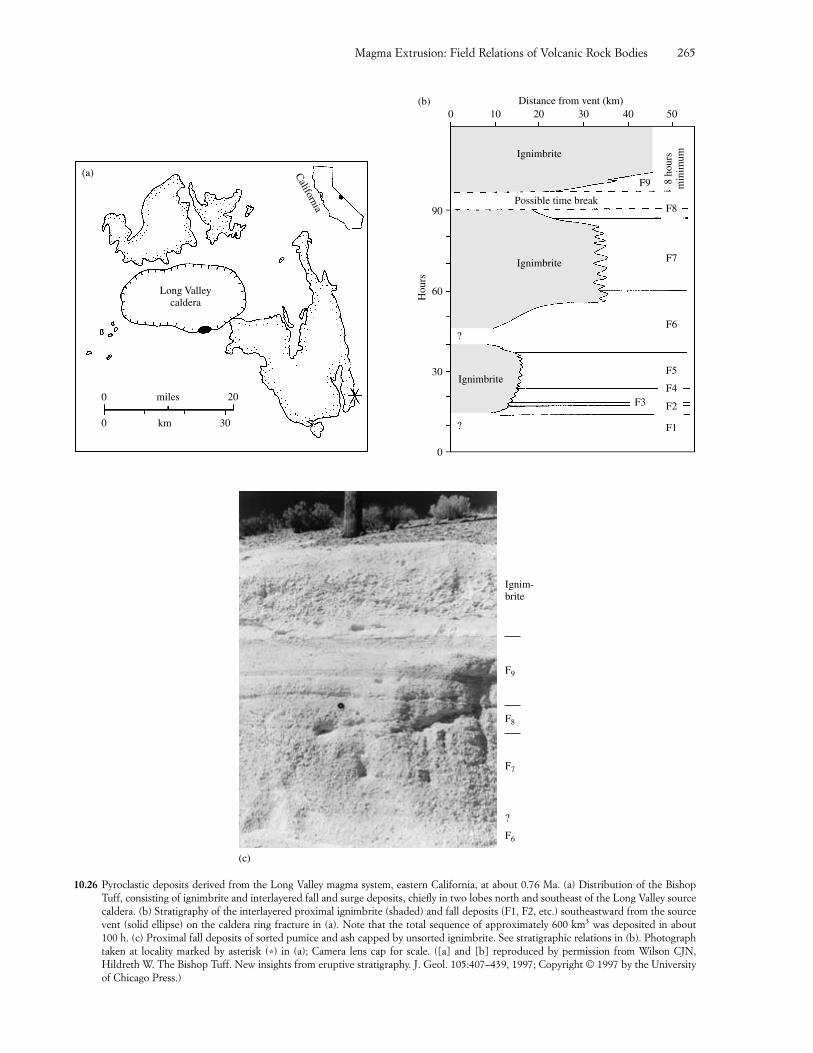
Magma Extrusion: Field Relations of Volcanic Rock Bodies 265
Ignim-brite
F9
F8
F7
?
F6
(c)
10.26 Pyroclastic deposits derived from the Long Valley magma system, eastern California, at about 0.76 Ma. (a) Distribution of the BishopTuff, consisting of ignimbrite and interlayered fall and surge deposits, chiefly in two lobes north and southeast of the Long Valley sourcecaldera. (b) Stratigraphy of the interlayered proximal ignimbrite (shaded) and fall deposits (F1, F2, etc.) southeastward from the sourcevent (solid ellipse) on the caldera ring fracture in (a). Note that the total sequence of approximately 600 km3 was deposited in about 100 h. (c) Proximal fall deposits of sorted pumice and ash capped by unsorted ignimbrite. See stratigraphic relations in (b). Photographtaken at locality marked by asterisk (*) in (a); Camera lens cap for scale. ([a] and [b] reproduced by permission from Wilson CJN, Hildreth W. The Bishop Tuff. New insights from eruptive stratigraphy. J. Geol. 105:407–439, 1997; Copyright © 1997 by the Universityof Chicago Press.)
(a)
Long Valleycaldera
California
0
0 30km
miles 20
0 10 20 30 40 50Distance from vent (km)
Ignimbrite
Ignimbrite
Ignimbrite
0
30
60
90
Hou
rs
(b)
Possible time break
F9
F8
F7
F6
F5
F4
F2
F1
F3
8 ho
urs
min
imum
?
?
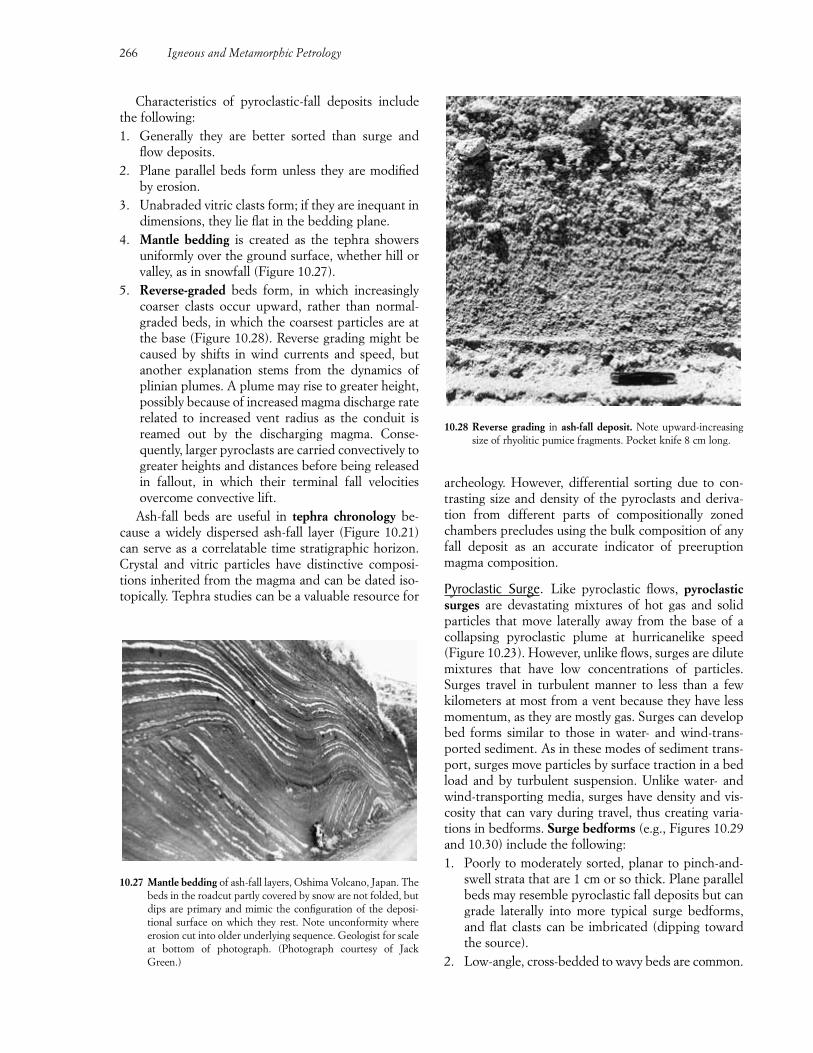
Characteristics of pyroclastic-fall deposits includethe following: 1. Generally they are better sorted than surge and
flow deposits.2. Plane parallel beds form unless they are modified
by erosion.3. Unabraded vitric clasts form; if they are inequant in
dimensions, they lie flat in the bedding plane. 4. Mantle bedding is created as the tephra showers
uniformly over the ground surface, whether hill orvalley, as in snowfall (Figure 10.27).
5. Reverse-graded beds form, in which increasinglycoarser clasts occur upward, rather than normal-graded beds, in which the coarsest particles are atthe base (Figure 10.28). Reverse grading might becaused by shifts in wind currents and speed, but another explanation stems from the dynamics ofplinian plumes. A plume may rise to greater height,possibly because of increased magma discharge raterelated to increased vent radius as the conduit isreamed out by the discharging magma. Conse-quently, larger pyroclasts are carried convectively togreater heights and distances before being releasedin fallout, in which their terminal fall velocitiesovercome convective lift.
Ash-fall beds are useful in tephra chronology be-cause a widely dispersed ash-fall layer (Figure 10.21)can serve as a correlatable time stratigraphic horizon.Crystal and vitric particles have distinctive composi-tions inherited from the magma and can be dated iso-topically. Tephra studies can be a valuable resource for
archeology. However, differential sorting due to con-trasting size and density of the pyroclasts and deriva-tion from different parts of compositionally zonedchambers precludes using the bulk composition of anyfall deposit as an accurate indicator of preeruptionmagma composition.
Pyroclastic Surge. Like pyroclastic flows, pyroclasticsurges are devastating mixtures of hot gas and solidparticles that move laterally away from the base of acollapsing pyroclastic plume at hurricanelike speed(Figure 10.23). However, unlike flows, surges are dilutemixtures that have low concentrations of particles.Surges travel in turbulent manner to less than a fewkilometers at most from a vent because they have lessmomentum, as they are mostly gas. Surges can developbed forms similar to those in water- and wind-trans-ported sediment. As in these modes of sediment trans-port, surges move particles by surface traction in a bedload and by turbulent suspension. Unlike water- andwind-transporting media, surges have density and vis-cosity that can vary during travel, thus creating varia-tions in bedforms. Surge bedforms (e.g., Figures 10.29and 10.30) include the following:1. Poorly to moderately sorted, planar to pinch-and-
swell strata that are 1 cm or so thick. Plane parallelbeds may resemble pyroclastic fall deposits but cangrade laterally into more typical surge bedforms,and flat clasts can be imbricated (dipping towardthe source).
2. Low-angle, cross-bedded to wavy beds are common.
266 Igneous and Metamorphic Petrology
10.27 Mantle bedding of ash-fall layers, Oshima Volcano, Japan. Thebeds in the roadcut partly covered by snow are not folded, butdips are primary and mimic the configuration of the deposi-tional surface on which they rest. Note unconformity whereerosion cut into older underlying sequence. Geologist for scaleat bottom of photograph. (Photograph courtesy of JackGreen.)
10.28 Reverse grading in ash-fall deposit. Note upward-increasingsize of rhyolitic pumice fragments. Pocket knife 8 cm long.
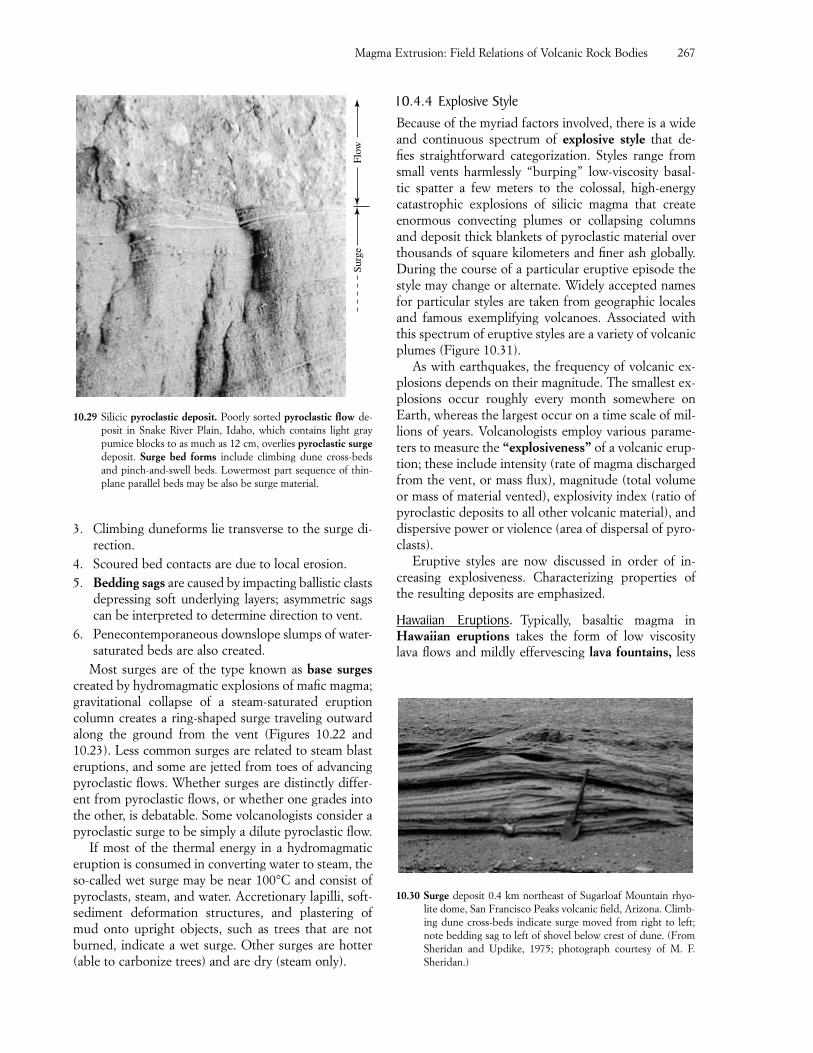
3. Climbing duneforms lie transverse to the surge di-rection.
4. Scoured bed contacts are due to local erosion.5. Bedding sags are caused by impacting ballistic clasts
depressing soft underlying layers; asymmetric sagscan be interpreted to determine direction to vent.
6. Penecontemporaneous downslope slumps of water-saturated beds are also created.
Most surges are of the type known as base surgescreated by hydromagmatic explosions of mafic magma;gravitational collapse of a steam-saturated eruptioncolumn creates a ring-shaped surge traveling outwardalong the ground from the vent (Figures 10.22 and10.23). Less common surges are related to steam blasteruptions, and some are jetted from toes of advancingpyroclastic flows. Whether surges are distinctly differ-ent from pyroclastic flows, or whether one grades intothe other, is debatable. Some volcanologists consider apyroclastic surge to be simply a dilute pyroclastic flow.
If most of the thermal energy in a hydromagmaticeruption is consumed in converting water to steam, theso-called wet surge may be near 100°C and consist ofpyroclasts, steam, and water. Accretionary lapilli, soft-sediment deformation structures, and plastering ofmud onto upright objects, such as trees that are notburned, indicate a wet surge. Other surges are hotter(able to carbonize trees) and are dry (steam only).
10.4.4 Explosive StyleBecause of the myriad factors involved, there is a wideand continuous spectrum of explosive style that de-fies straightforward categorization. Styles range fromsmall vents harmlessly “burping” low-viscosity basal-tic spatter a few meters to the colossal, high-energy catastrophic explosions of silicic magma that createenormous convecting plumes or collapsing columnsand deposit thick blankets of pyroclastic material overthousands of square kilometers and finer ash globally.During the course of a particular eruptive episode thestyle may change or alternate. Widely accepted namesfor particular styles are taken from geographic localesand famous exemplifying volcanoes. Associated withthis spectrum of eruptive styles are a variety of volcanicplumes (Figure 10.31).
As with earthquakes, the frequency of volcanic ex-plosions depends on their magnitude. The smallest ex-plosions occur roughly every month somewhere onEarth, whereas the largest occur on a time scale of mil-lions of years. Volcanologists employ various parame-ters to measure the “explosiveness” of a volcanic erup-tion; these include intensity (rate of magma dischargedfrom the vent, or mass flux), magnitude (total volumeor mass of material vented), explosivity index (ratio ofpyroclastic deposits to all other volcanic material), anddispersive power or violence (area of dispersal of pyro-clasts).
Eruptive styles are now discussed in order of in-creasing explosiveness. Characterizing properties ofthe resulting deposits are emphasized.
Hawaiian Eruptions. Typically, basaltic magma inHawaiian eruptions takes the form of low viscosity lava flows and mildly effervescing lava fountains, less
Magma Extrusion: Field Relations of Volcanic Rock Bodies 267
Flow
Surg
e
10.29 Silicic pyroclastic deposit. Poorly sorted pyroclastic flow de-posit in Snake River Plain, Idaho, which contains light graypumice blocks to as much as 12 cm, overlies pyroclastic surgedeposit. Surge bed forms include climbing dune cross-bedsand pinch-and-swell beds. Lowermost part sequence of thin-plane parallel beds may be also be surge material.
10.30 Surge deposit 0.4 km northeast of Sugarloaf Mountain rhyo-lite dome, San Francisco Peaks volcanic field, Arizona. Climb-ing dune cross-beds indicate surge moved from right to left;note bedding sag to left of shovel below crest of dune. (FromSheridan and Updike, 1975; photograph courtesy of M. F.Sheridan.)
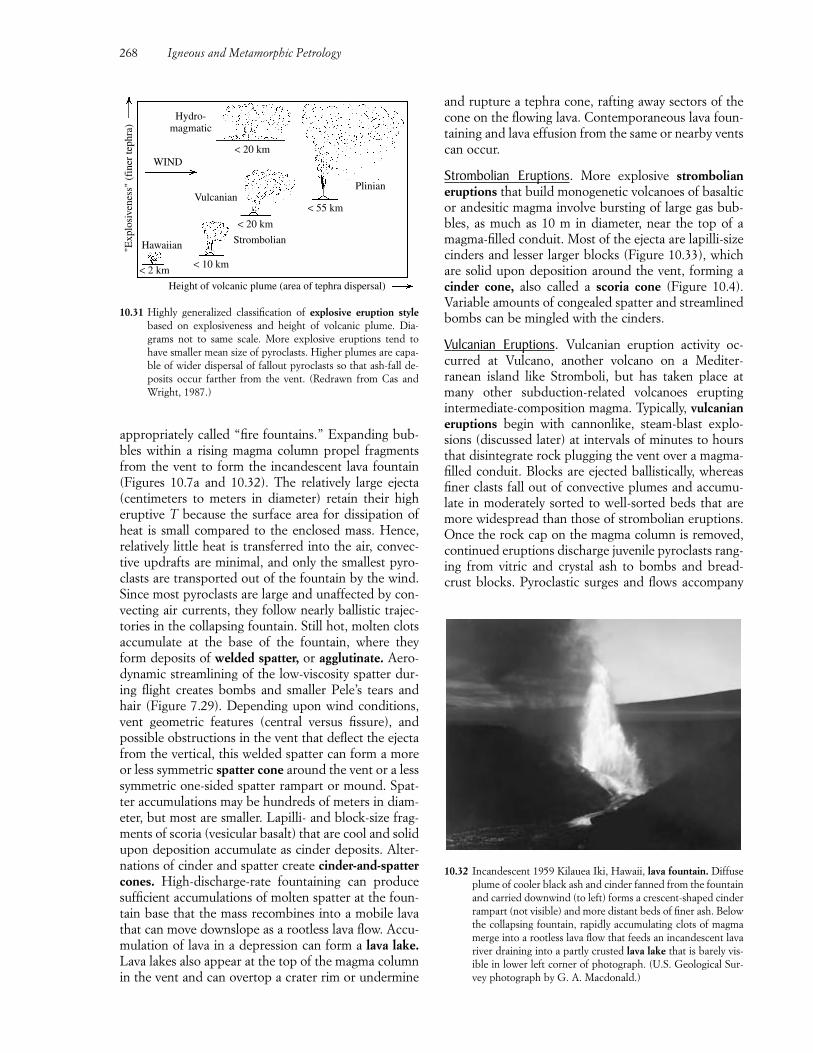
appropriately called “fire fountains.” Expanding bub-bles within a rising magma column propel fragmentsfrom the vent to form the incandescent lava fountain(Figures 10.7a and 10.32). The relatively large ejecta(centimeters to meters in diameter) retain their higheruptive T because the surface area for dissipation ofheat is small compared to the enclosed mass. Hence,relatively little heat is transferred into the air, convec-tive updrafts are minimal, and only the smallest pyro-clasts are transported out of the fountain by the wind.Since most pyroclasts are large and unaffected by con-vecting air currents, they follow nearly ballistic trajec-tories in the collapsing fountain. Still hot, molten clotsaccumulate at the base of the fountain, where theyform deposits of welded spatter, or agglutinate. Aero-dynamic streamlining of the low-viscosity spatter dur-ing flight creates bombs and smaller Pele’s tears andhair (Figure 7.29). Depending upon wind conditions,vent geometric features (central versus fissure), andpossible obstructions in the vent that deflect the ejectafrom the vertical, this welded spatter can form a moreor less symmetric spatter cone around the vent or a lesssymmetric one-sided spatter rampart or mound. Spat-ter accumulations may be hundreds of meters in diam-eter, but most are smaller. Lapilli- and block-size frag-ments of scoria (vesicular basalt) that are cool and solidupon deposition accumulate as cinder deposits. Alter-nations of cinder and spatter create cinder-and-spattercones. High-discharge-rate fountaining can producesufficient accumulations of molten spatter at the foun-tain base that the mass recombines into a mobile lavathat can move downslope as a rootless lava flow. Accu-mulation of lava in a depression can form a lava lake.Lava lakes also appear at the top of the magma columnin the vent and can overtop a crater rim or undermine
and rupture a tephra cone, rafting away sectors of thecone on the flowing lava. Contemporaneous lava foun-taining and lava effusion from the same or nearby ventscan occur.
Strombolian Eruptions. More explosive strombolianeruptions that build monogenetic volcanoes of basalticor andesitic magma involve bursting of large gas bub-bles, as much as 10 m in diameter, near the top of amagma-filled conduit. Most of the ejecta are lapilli-sizecinders and lesser larger blocks (Figure 10.33), whichare solid upon deposition around the vent, forming acinder cone, also called a scoria cone (Figure 10.4).Variable amounts of congealed spatter and streamlinedbombs can be mingled with the cinders.
Vulcanian Eruptions. Vulcanian eruption activity oc-curred at Vulcano, another volcano on a Mediter-ranean island like Stromboli, but has taken place atmany other subduction-related volcanoes erupting intermediate-composition magma. Typically, vulcanianeruptions begin with cannonlike, steam-blast explo-sions (discussed later) at intervals of minutes to hoursthat disintegrate rock plugging the vent over a magma-filled conduit. Blocks are ejected ballistically, whereasfiner clasts fall out of convective plumes and accumu-late in moderately sorted to well-sorted beds that aremore widespread than those of strombolian eruptions.Once the rock cap on the magma column is removed,continued eruptions discharge juvenile pyroclasts rang-ing from vitric and crystal ash to bombs and bread-crust blocks. Pyroclastic surges and flows accompany
268 Igneous and Metamorphic Petrology
Hydro-magmatic
< 20 kmWIND
< 2 km< 10 km
< 20 km
< 55 km
Hawaiian Strombolian
VulcanianPlinian
Height of volcanic plume (area of tephra dispersal)
"Exp
losi
vene
ss"
(fin
er te
phra
)
10.31 Highly generalized classification of explosive eruption stylebased on explosiveness and height of volcanic plume. Dia-grams not to same scale. More explosive eruptions tend tohave smaller mean size of pyroclasts. Higher plumes are capa-ble of wider dispersal of fallout pyroclasts so that ash-fall de-posits occur farther from the vent. (Redrawn from Cas andWright, 1987.)
10.32 Incandescent 1959 Kilauea Iki, Hawaii, lava fountain. Diffuseplume of cooler black ash and cinder fanned from the fountainand carried downwind (to left) forms a crescent-shaped cinderrampart (not visible) and more distant beds of finer ash. Belowthe collapsing fountain, rapidly accumulating clots of magmamerge into a rootless lava flow that feeds an incandescent lavariver draining into a partly crusted lava lake that is barely vis-ible in lower left corner of photograph. (U.S. Geological Sur-vey photograph by G. A. Macdonald.)
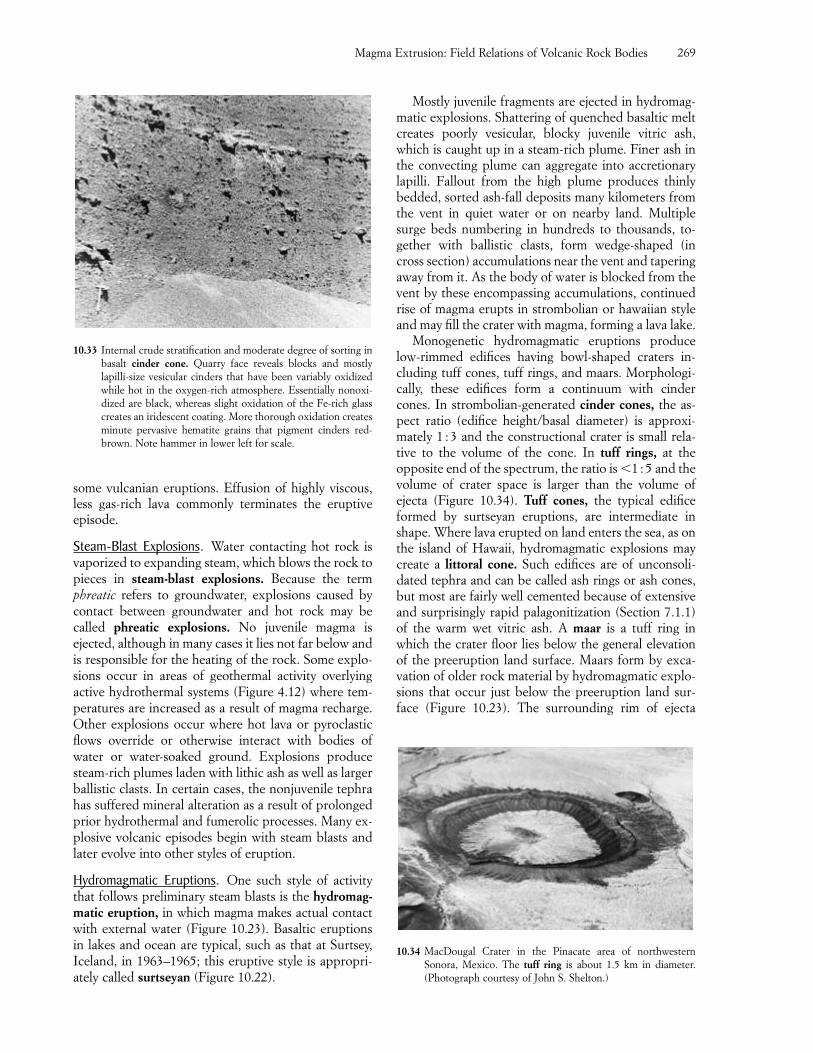
some vulcanian eruptions. Effusion of highly viscous,less gas-rich lava commonly terminates the eruptiveepisode.
Steam-Blast Explosions. Water contacting hot rock isvaporized to expanding steam, which blows the rock topieces in steam-blast explosions. Because the termphreatic refers to groundwater, explosions caused bycontact between groundwater and hot rock may becalled phreatic explosions. No juvenile magma isejected, although in many cases it lies not far below andis responsible for the heating of the rock. Some explo-sions occur in areas of geothermal activity overlying active hydrothermal systems (Figure 4.12) where tem-peratures are increased as a result of magma recharge.Other explosions occur where hot lava or pyroclasticflows override or otherwise interact with bodies of water or water-soaked ground. Explosions producesteam-rich plumes laden with lithic ash as well as largerballistic clasts. In certain cases, the nonjuvenile tephrahas suffered mineral alteration as a result of prolongedprior hydrothermal and fumerolic processes. Many ex-plosive volcanic episodes begin with steam blasts andlater evolve into other styles of eruption.
Hydromagmatic Eruptions. One such style of activitythat follows preliminary steam blasts is the hydromag-matic eruption, in which magma makes actual contactwith external water (Figure 10.23). Basaltic eruptionsin lakes and ocean are typical, such as that at Surtsey,Iceland, in 1963–1965; this eruptive style is appropri-ately called surtseyan (Figure 10.22).
Mostly juvenile fragments are ejected in hydromag-matic explosions. Shattering of quenched basaltic meltcreates poorly vesicular, blocky juvenile vitric ash,which is caught up in a steam-rich plume. Finer ash inthe convecting plume can aggregate into accretionarylapilli. Fallout from the high plume produces thinlybedded, sorted ash-fall deposits many kilometers fromthe vent in quiet water or on nearby land. Multiplesurge beds numbering in hundreds to thousands, to-gether with ballistic clasts, form wedge-shaped (incross section) accumulations near the vent and taperingaway from it. As the body of water is blocked from thevent by these encompassing accumulations, continuedrise of magma erupts in strombolian or hawaiian styleand may fill the crater with magma, forming a lava lake.
Monogenetic hydromagmatic eruptions producelow-rimmed edifices having bowl-shaped craters in-cluding tuff cones, tuff rings, and maars. Morphologi-cally, these edifices form a continuum with cindercones. In strombolian-generated cinder cones, the as-pect ratio (edifice height/basal diameter) is approxi-mately 1 : 3 and the constructional crater is small rela-tive to the volume of the cone. In tuff rings, at theopposite end of the spectrum, the ratio is �1 : 5 and thevolume of crater space is larger than the volume ofejecta (Figure 10.34). Tuff cones, the typical edificeformed by surtseyan eruptions, are intermediate inshape. Where lava erupted on land enters the sea, as onthe island of Hawaii, hydromagmatic explosions maycreate a littoral cone. Such edifices are of unconsoli-dated tephra and can be called ash rings or ash cones,but most are fairly well cemented because of extensiveand surprisingly rapid palagonitization (Section 7.1.1)of the warm wet vitric ash. A maar is a tuff ring inwhich the crater floor lies below the general elevationof the preeruption land surface. Maars form by exca-vation of older rock material by hydromagmatic explo-sions that occur just below the preeruption land sur-face (Figure 10.23). The surrounding rim of ejecta
Magma Extrusion: Field Relations of Volcanic Rock Bodies 269
10.33 Internal crude stratification and moderate degree of sorting inbasalt cinder cone. Quarry face reveals blocks and mostlylapilli-size vesicular cinders that have been variably oxidizedwhile hot in the oxygen-rich atmosphere. Essentially nonoxi-dized are black, whereas slight oxidation of the Fe-rich glasscreates an iridescent coating. More thorough oxidation createsminute pervasive hematite grains that pigment cinders red-brown. Note hammer in lower left for scale.
10.34 MacDougal Crater in the Pinacate area of northwesternSonora, Mexico. The tuff ring is about 1.5 km in diameter.(Photograph courtesy of John S. Shelton.)
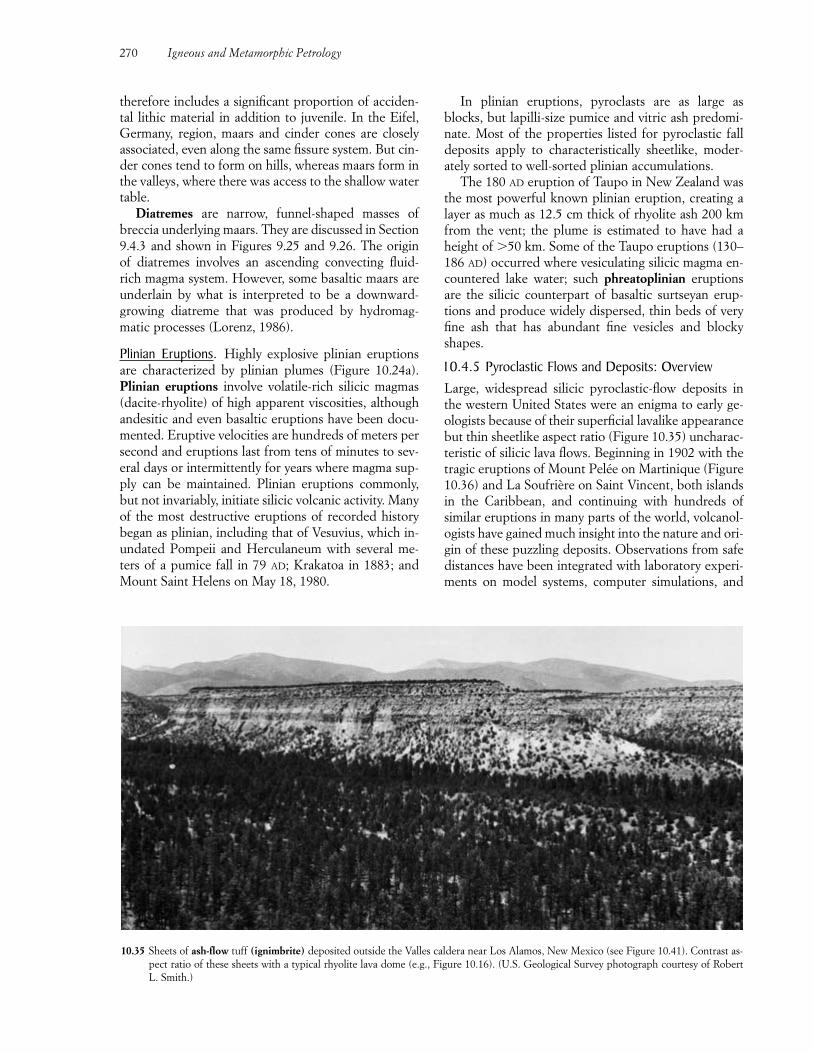
therefore includes a significant proportion of acciden-tal lithic material in addition to juvenile. In the Eifel,Germany, region, maars and cinder cones are closelyassociated, even along the same fissure system. But cin-der cones tend to form on hills, whereas maars form inthe valleys, where there was access to the shallow watertable.
Diatremes are narrow, funnel-shaped masses ofbreccia underlying maars. They are discussed in Section9.4.3 and shown in Figures 9.25 and 9.26. The origin of diatremes involves an ascending convecting fluid-rich magma system. However, some basaltic maars are underlain by what is interpreted to be a downward-growing diatreme that was produced by hydromag-matic processes (Lorenz, 1986).
Plinian Eruptions. Highly explosive plinian eruptionsare characterized by plinian plumes (Figure 10.24a).Plinian eruptions involve volatile-rich silicic magmas(dacite-rhyolite) of high apparent viscosities, althoughandesitic and even basaltic eruptions have been docu-mented. Eruptive velocities are hundreds of meters persecond and eruptions last from tens of minutes to sev-eral days or intermittently for years where magma sup-ply can be maintained. Plinian eruptions commonly,but not invariably, initiate silicic volcanic activity. Manyof the most destructive eruptions of recorded historybegan as plinian, including that of Vesuvius, which in-undated Pompeii and Herculaneum with several me-ters of a pumice fall in 79 AD; Krakatoa in 1883; andMount Saint Helens on May 18, 1980.
In plinian eruptions, pyroclasts are as large asblocks, but lapilli-size pumice and vitric ash predomi-nate. Most of the properties listed for pyroclastic falldeposits apply to characteristically sheetlike, moder-ately sorted to well-sorted plinian accumulations.
The 180 AD eruption of Taupo in New Zealand wasthe most powerful known plinian eruption, creating alayer as much as 12.5 cm thick of rhyolite ash 200 kmfrom the vent; the plume is estimated to have had aheight of �50 km. Some of the Taupo eruptions (130–186 AD) occurred where vesiculating silicic magma en-countered lake water; such phreatoplinian eruptionsare the silicic counterpart of basaltic surtseyan erup-tions and produce widely dispersed, thin beds of veryfine ash that has abundant fine vesicles and blockyshapes.
10.4.5 Pyroclastic Flows and Deposits: OverviewLarge, widespread silicic pyroclastic-flow deposits inthe western United States were an enigma to early ge-ologists because of their superficial lavalike appearancebut thin sheetlike aspect ratio (Figure 10.35) uncharac-teristic of silicic lava flows. Beginning in 1902 with thetragic eruptions of Mount Pelée on Martinique (Figure10.36) and La Soufrière on Saint Vincent, both islandsin the Caribbean, and continuing with hundreds ofsimilar eruptions in many parts of the world, volcanol-ogists have gained much insight into the nature and ori-gin of these puzzling deposits. Observations from safedistances have been integrated with laboratory experi-ments on model systems, computer simulations, and
270 Igneous and Metamorphic Petrology
10.35 Sheets of ash-flow tuff (ignimbrite) deposited outside the Valles caldera near Los Alamos, New Mexico (see Figure 10.41). Contrast as-pect ratio of these sheets with a typical rhyolite lava dome (e.g., Figure 10.16). (U.S. Geological Survey photograph courtesy of RobertL. Smith.)
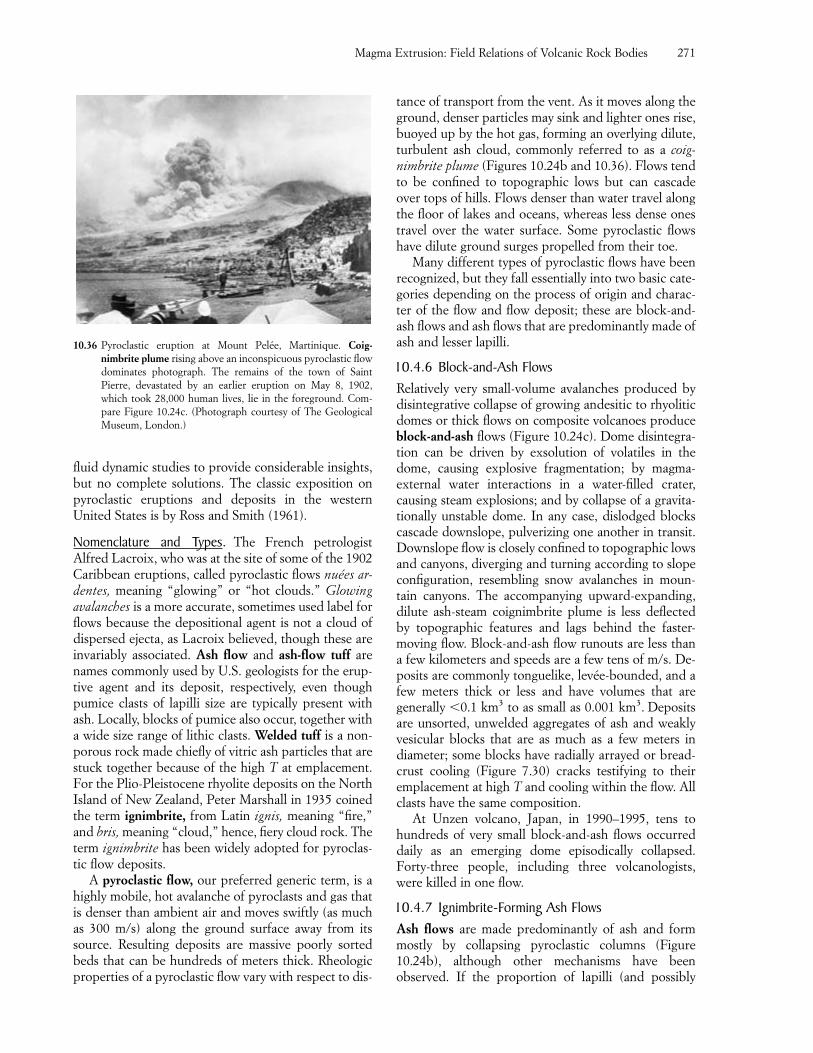
fluid dynamic studies to provide considerable insights,but no complete solutions. The classic exposition onpyroclastic eruptions and deposits in the westernUnited States is by Ross and Smith (1961).
Nomenclature and Types. The French petrologist Alfred Lacroix, who was at the site of some of the 1902Caribbean eruptions, called pyroclastic flows nuées ar-dentes, meaning “glowing” or “hot clouds.” Glowingavalanches is a more accurate, sometimes used label forflows because the depositional agent is not a cloud ofdispersed ejecta, as Lacroix believed, though these areinvariably associated. Ash flow and ash-flow tuff arenames commonly used by U.S. geologists for the erup-tive agent and its deposit, respectively, even thoughpumice clasts of lapilli size are typically present withash. Locally, blocks of pumice also occur, together witha wide size range of lithic clasts. Welded tuff is a non-porous rock made chiefly of vitric ash particles that arestuck together because of the high T at emplacement.For the Plio-Pleistocene rhyolite deposits on the NorthIsland of New Zealand, Peter Marshall in 1935 coinedthe term ignimbrite, from Latin ignis, meaning “fire,”and bris, meaning “cloud,” hence, fiery cloud rock. Theterm ignimbrite has been widely adopted for pyroclas-tic flow deposits.
A pyroclastic flow, our preferred generic term, is ahighly mobile, hot avalanche of pyroclasts and gas thatis denser than ambient air and moves swiftly (as muchas 300 m/s) along the ground surface away from itssource. Resulting deposits are massive poorly sortedbeds that can be hundreds of meters thick. Rheologicproperties of a pyroclastic flow vary with respect to dis-
tance of transport from the vent. As it moves along theground, denser particles may sink and lighter ones rise,buoyed up by the hot gas, forming an overlying dilute,turbulent ash cloud, commonly referred to as a coig-nimbrite plume (Figures 10.24b and 10.36). Flows tendto be confined to topographic lows but can cascadeover tops of hills. Flows denser than water travel alongthe floor of lakes and oceans, whereas less dense onestravel over the water surface. Some pyroclastic flowshave dilute ground surges propelled from their toe.
Many different types of pyroclastic flows have beenrecognized, but they fall essentially into two basic cate-gories depending on the process of origin and charac-ter of the flow and flow deposit; these are block-and-ash flows and ash flows that are predominantly made ofash and lesser lapilli.
10.4.6 Block-and-Ash FlowsRelatively very small-volume avalanches produced bydisintegrative collapse of growing andesitic to rhyoliticdomes or thick flows on composite volcanoes produceblock-and-ash flows (Figure 10.24c). Dome disintegra-tion can be driven by exsolution of volatiles in thedome, causing explosive fragmentation; by magma-external water interactions in a water-filled crater, causing steam explosions; and by collapse of a gravita-tionally unstable dome. In any case, dislodged blockscascade downslope, pulverizing one another in transit.Downslope flow is closely confined to topographic lowsand canyons, diverging and turning according to slopeconfiguration, resembling snow avalanches in moun-tain canyons. The accompanying upward-expanding,dilute ash-steam coignimbrite plume is less deflectedby topographic features and lags behind the faster-moving flow. Block-and-ash flow runouts are less thana few kilometers and speeds are a few tens of m/s. De-posits are commonly tonguelike, levée-bounded, and afew meters thick or less and have volumes that are generally �0.1 km3 to as small as 0.001 km3. Depositsare unsorted, unwelded aggregates of ash and weaklyvesicular blocks that are as much as a few meters in diameter; some blocks have radially arrayed or bread-crust cooling (Figure 7.30) cracks testifying to theiremplacement at high T and cooling within the flow. Allclasts have the same composition.
At Unzen volcano, Japan, in 1990–1995, tens tohundreds of very small block-and-ash flows occurreddaily as an emerging dome episodically collapsed.Forty-three people, including three volcanologists,were killed in one flow.
10.4.7 Ignimbrite-Forming Ash FlowsAsh flows are made predominantly of ash and formmostly by collapsing pyroclastic columns (Figure10.24b), although other mechanisms have beenobserved. If the proportion of lapilli (and possibly
Magma Extrusion: Field Relations of Volcanic Rock Bodies 271
10.36 Pyroclastic eruption at Mount Pelée, Martinique. Coig-nimbrite plume rising above an inconspicuous pyroclastic flowdominates photograph. The remains of the town of SaintPierre, devastated by an earlier eruption on May 8, 1902,which took 28,000 human lives, lie in the foreground. Com-pare Figure 10.24c. (Photograph courtesy of The GeologicalMuseum, London.)
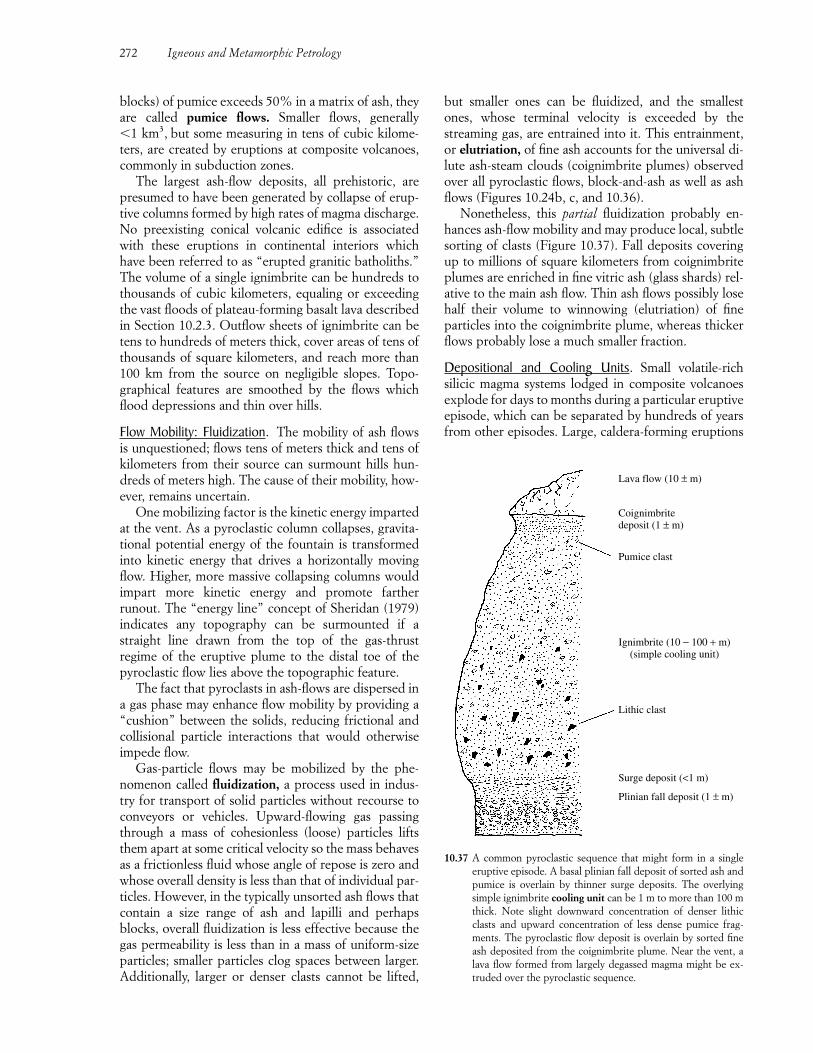
blocks) of pumice exceeds 50% in a matrix of ash, theyare called pumice flows. Smaller flows, generally�1 km3, but some measuring in tens of cubic kilome-ters, are created by eruptions at composite volcanoes,commonly in subduction zones.
The largest ash-flow deposits, all prehistoric, arepresumed to have been generated by collapse of erup-tive columns formed by high rates of magma discharge.No preexisting conical volcanic edifice is associatedwith these eruptions in continental interiors whichhave been referred to as “erupted granitic batholiths.”The volume of a single ignimbrite can be hundreds tothousands of cubic kilometers, equaling or exceedingthe vast floods of plateau-forming basalt lava describedin Section 10.2.3. Outflow sheets of ignimbrite can betens to hundreds of meters thick, cover areas of tens ofthousands of square kilometers, and reach more than100 km from the source on negligible slopes. Topo-graphical features are smoothed by the flows whichflood depressions and thin over hills.
Flow Mobility: Fluidization. The mobility of ash flowsis unquestioned; flows tens of meters thick and tens ofkilometers from their source can surmount hills hun-dreds of meters high. The cause of their mobility, how-ever, remains uncertain.
One mobilizing factor is the kinetic energy impartedat the vent. As a pyroclastic column collapses, gravita-tional potential energy of the fountain is transformedinto kinetic energy that drives a horizontally movingflow. Higher, more massive collapsing columns wouldimpart more kinetic energy and promote fartherrunout. The “energy line” concept of Sheridan (1979)indicates any topography can be surmounted if astraight line drawn from the top of the gas-thrustregime of the eruptive plume to the distal toe of the pyroclastic flow lies above the topographic feature.
The fact that pyroclasts in ash-flows are dispersed ina gas phase may enhance flow mobility by providing a“cushion” between the solids, reducing frictional andcollisional particle interactions that would otherwiseimpede flow.
Gas-particle flows may be mobilized by the phe-nomenon called fluidization, a process used in indus-try for transport of solid particles without recourse toconveyors or vehicles. Upward-flowing gas passingthrough a mass of cohesionless (loose) particles liftsthem apart at some critical velocity so the mass behavesas a frictionless fluid whose angle of repose is zero andwhose overall density is less than that of individual par-ticles. However, in the typically unsorted ash flows thatcontain a size range of ash and lapilli and perhapsblocks, overall fluidization is less effective because thegas permeability is less than in a mass of uniform-sizeparticles; smaller particles clog spaces between larger.Additionally, larger or denser clasts cannot be lifted,
but smaller ones can be fluidized, and the smallestones, whose terminal velocity is exceeded by thestreaming gas, are entrained into it. This entrainment,or elutriation, of fine ash accounts for the universal di-lute ash-steam clouds (coignimbrite plumes) observedover all pyroclastic flows, block-and-ash as well as ashflows (Figures 10.24b, c, and 10.36).
Nonetheless, this partial fluidization probably en-hances ash-flow mobility and may produce local, subtlesorting of clasts (Figure 10.37). Fall deposits coveringup to millions of square kilometers from coignimbriteplumes are enriched in fine vitric ash (glass shards) rel-ative to the main ash flow. Thin ash flows possibly losehalf their volume to winnowing (elutriation) of fineparticles into the coignimbrite plume, whereas thickerflows probably lose a much smaller fraction.
Depositional and Cooling Units. Small volatile-richsilicic magma systems lodged in composite volcanoesexplode for days to months during a particular eruptiveepisode, which can be separated by hundreds of yearsfrom other episodes. Large, caldera-forming eruptions
272 Igneous and Metamorphic Petrology
Lava flow (10 ± m)
Coignimbrite deposit (1 ± m)
Pumice clast
Ignimbrite (10 − 100 + m)(simple cooling unit)
Lithic clast
Surge deposit (<1 m)
Plinian fall deposit (1 ± m)
10.37 A common pyroclastic sequence that might form in a singleeruptive episode. A basal plinian fall deposit of sorted ash andpumice is overlain by thinner surge deposits. The overlyingsimple ignimbrite cooling unit can be 1 m to more than 100 mthick. Note slight downward concentration of denser lithicclasts and upward concentration of less dense pumice frag-ments. The pyroclastic flow deposit is overlain by sorted fineash deposited from the coignimbrite plume. Near the vent, alava flow formed from largely degassed magma might be ex-truded over the pyroclastic sequence.
have repose times between eruptive episodes of asmuch as 105�106 y. Thus, ignimbrite sequences arebuilt of multiple depositional flow units; each unit rep-resents one explosive event. These ignimbrites may beseparated by surge and fall deposits (Figures 10.29 and10.37).
A cooling unit is a pyroclastic flow deposit nearly in-stantaneously laid down that cools as a thermal entity.A simple cooling unit can comprise one depositionalunit, or it can be made of two or more that are em-placed nearly simultaneously so that there are no inter-nal cooling breaks, such as intervening less welded tuff(discussed later). Discerning boundaries between de-positional units within a simple cooling unit can bechallenging; compositional discontinuities and inter-vening surge and fall deposits can be helpful. A com-pound cooling unit consists of a succession of flowsemplaced closely in time so that only partial coolingbreaks occur between depositional units.
Composition of Deposits. Most ignimbrites are rhyo-lite; fewer are dacite, trachyte, and phonolite; andesiteis uncommon. Juvenile pyroclasts are predominantlyash-size vitroclasts and lesser crystals. Larger cognatepumice lapilli are typical, whereas lithic lapilli can beconspicuous in some deposits. Crystals include euhe-dral to subhedral intact phenocrysts formed in thepreeruption magma chamber and phenoclasts of thesame ancestory but broken during eruption. These primary crystals may be very sparse, �1% of the de-posit, but can range to as much as about 50%. Somelithic clasts are cognate crystalline fragments related to the erupted magma, such as from the crystallizedwall of the magma chamber. Accidental lithic frag-ments (xenoliths) can be chunks of rock torn from theenlarging conduit during explosive eruption, wallrockfrom the preeruption magma chamber, and loose rockfragments on the ground picked up and incorporatedinto a turbulent flow. The proportion of lithic frag-ments, pumice clasts, and phenocrysts in the depositcan vary widely, each from 0% to as much as 50% orso, whereas juvenile vitric ash particles are always inabundance.
Compositionally zoned ignimbrites were first welldocumented by Lipman et al. (1966; see also Hildreth,1981). In some of these ash-flow deposits zonation iscryptic and can only be discerned by laboratory analy-ses, whereas in others it is quite conspicuous in thefield (Figure 10.38a). Normally, the proportion of phe-nocrysts in the rock, as well as their sizes, increasestratigraphically upward in the sheet, as do FeO, MgO,and CaO, whereas the lower part of the ignimbritesheet has a more evolved composition. A commonzonation is a basal, high-silica rhyolite overlain by low-silica rhyolite, by dacite, or, in instances of strong zon-ing, by andesite. In some deposits, lateral zonation is
also evident from proximal parts near the source to dis-tal parts tens of kilometers distant. Strong vertical andhorizontal zonation in an ash-flow deposit may make itdifficult to correlate isolated exposures of one deposi-tional unit. Other useful correlation tools include pre-cise isotopic dating and paleomagnetic analyses (Best et al., 1995).
Zoned ignimbrite deposits are derived by more orless systematic withdrawal from preeruption magmachambers that have compositional gradients (Figure10.38b). The more evolved top of the chamber iserupted first; then successively deeper parts areerupted, producing, in the deposit, an inverted zona-tion of that in the chamber. It is obvious that a sampleof bulk tuff in most instances does not accurately rep-resent any of the preeruption magma; the tuff sample is an explosive mixture of pyroclasts derived from dif-ferent compositional zones in the chamber. Moreover,the tuff has likely suffered some differential loss of finevitric ash by elutriation from the ash flow. Unalteredpumice lumps hosted in the tuff, on the other hand,represent unmodified samples of the preeruptionmagma. Therefore, analyses of pumice best portraycompositional variations in the preeruption magmabody. Likewise, analyses of single glass shards, usuallyby electron microprobe, accurately reflect the meltcomposition.
Secondary Zonation after Deposition. Ash-flow de-posits commonly have other zonal features that are su-perimposed on any primary compositional zonationjust described. Secondary processes formed duringcooling of the hot mass of pyroclasts and entrapped gasinclude (Figure 10.39):1. Welding and compaction2. Vapor-phase crystallization of minerals from the en-
trapped gas3. Devitrification (delayed crystallization) of the glassy
material
Welding is the bonding of hot glass particles. Be-cause of the weight of overlying pyroclasts on these soft sticky particles, they are compacted together andtrapped gas is squeezed out, collapsing pore spaces andvesicles within pumice fragments and reducing thebulk porosity of the tuff. In some deposits, interstitialgas that is largely steam may be partially resorbed intovitroclasts, reducing their viscosity and, hence, pro-moting welding more or less independently of com-paction (Sparks et al., 1999). But generally the most in-tense welding and compaction occur in the lowerportion of the flow, though not at the base, where fastercooling prevents much welding (Figure 10.39). Weld-ing and compaction operate simultaneously to createthe typical eutaxitic fabric of welded ash-flow tuffs, inwhich pumice lapilli and glass shards are flattened into
Magma Extrusion: Field Relations of Volcanic Rock Bodies 273
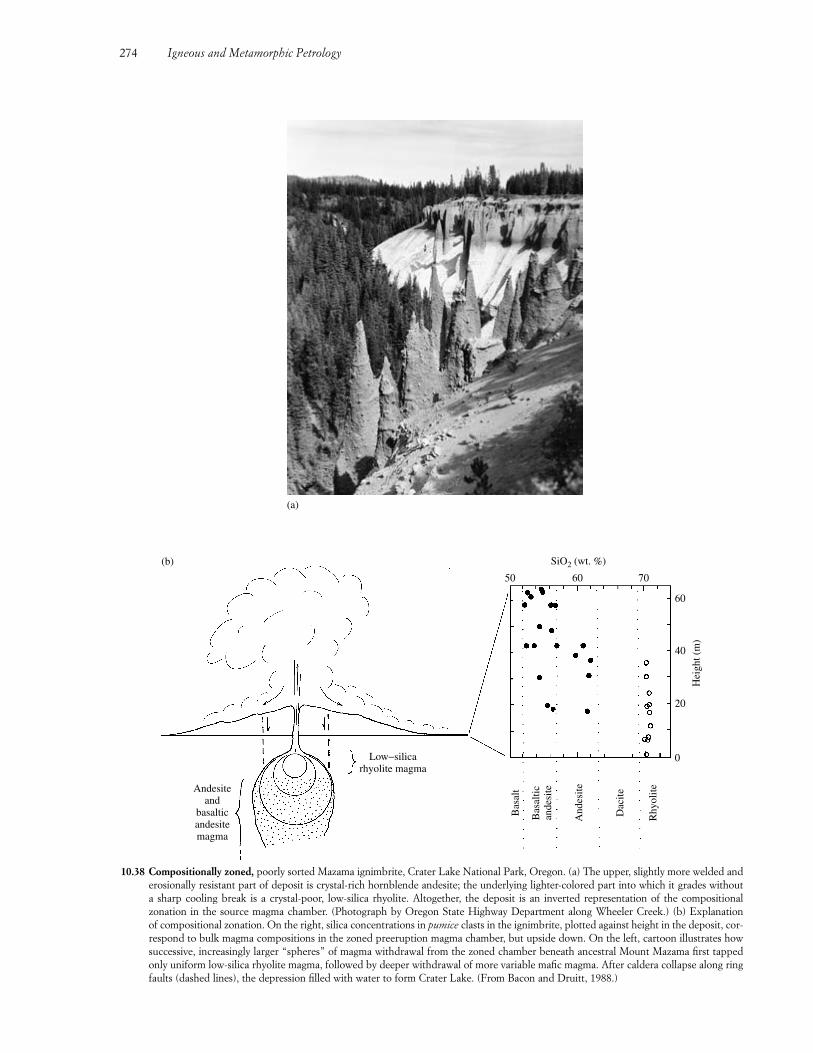
274 Igneous and Metamorphic Petrology
(a)
10.38 Compositionally zoned, poorly sorted Mazama ignimbrite, Crater Lake National Park, Oregon. (a) The upper, slightly more welded anderosionally resistant part of deposit is crystal-rich hornblende andesite; the underlying lighter-colored part into which it grades without a sharp cooling break is a crystal-poor, low-silica rhyolite. Altogether, the deposit is an inverted representation of the compositional zonation in the source magma chamber. (Photograph by Oregon State Highway Department along Wheeler Creek.) (b) Explanation of compositional zonation. On the right, silica concentrations in pumice clasts in the ignimbrite, plotted against height in the deposit, cor-respond to bulk magma compositions in the zoned preeruption magma chamber, but upside down. On the left, cartoon illustrates howsuccessive, increasingly larger “spheres” of magma withdrawal from the zoned chamber beneath ancestral Mount Mazama first tappedonly uniform low-silica rhyolite magma, followed by deeper withdrawal of more variable mafic magma. After caldera collapse along ringfaults (dashed lines), the depression filled with water to form Crater Lake. (From Bacon and Druitt, 1988.)
Andesiteand
basalticandesitemagma
Low−silicarhyolite magma
50 60 70SiO2 (wt. %)
60
40
20
0
Bas
altic
ande
site
Bas
alt
And
esite
Dac
ite
Rhy
olite
Hei
ght (
m)
(b)
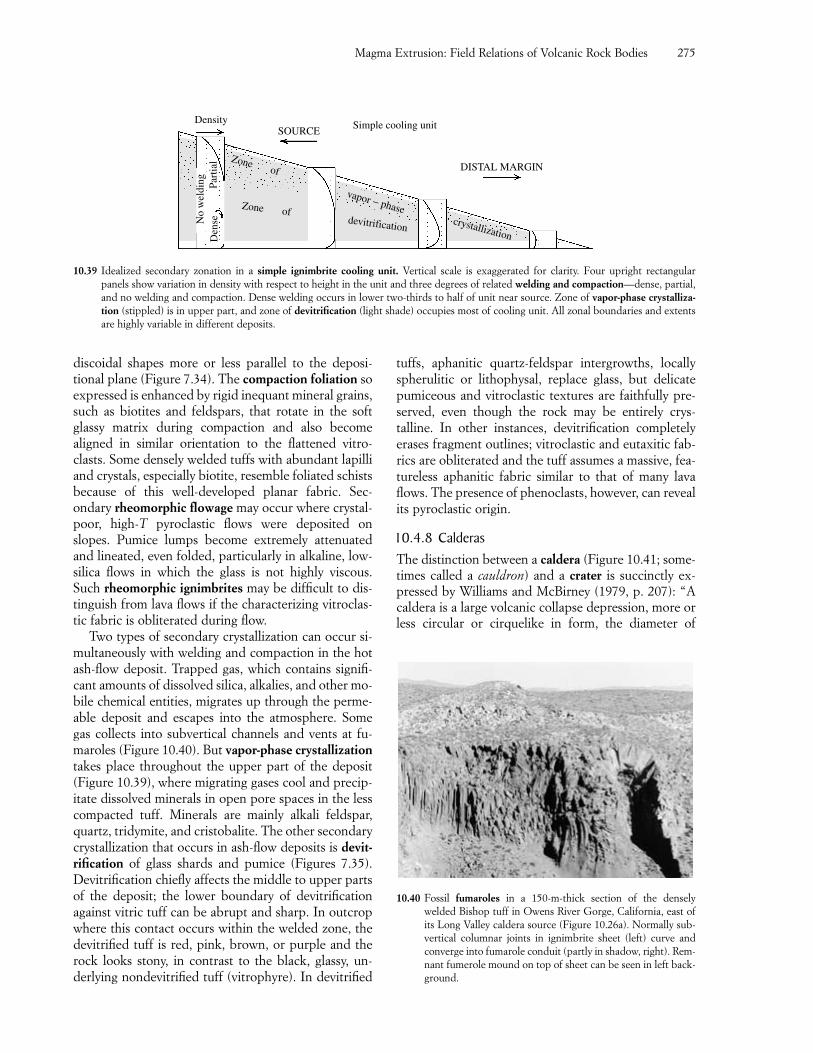
discoidal shapes more or less parallel to the deposi-tional plane (Figure 7.34). The compaction foliation soexpressed is enhanced by rigid inequant mineral grains,such as biotites and feldspars, that rotate in the softglassy matrix during compaction and also becomealigned in similar orientation to the flattened vitro-clasts. Some densely welded tuffs with abundant lapilliand crystals, especially biotite, resemble foliated schistsbecause of this well-developed planar fabric. Sec-ondary rheomorphic flowage may occur where crystal-poor, high-T pyroclastic flows were deposited onslopes. Pumice lumps become extremely attenuatedand lineated, even folded, particularly in alkaline, low-silica flows in which the glass is not highly viscous.Such rheomorphic ignimbrites may be difficult to dis-tinguish from lava flows if the characterizing vitroclas-tic fabric is obliterated during flow.
Two types of secondary crystallization can occur si-multaneously with welding and compaction in the hotash-flow deposit. Trapped gas, which contains signifi-cant amounts of dissolved silica, alkalies, and other mo-bile chemical entities, migrates up through the perme-able deposit and escapes into the atmosphere. Somegas collects into subvertical channels and vents at fu-maroles (Figure 10.40). But vapor-phase crystallizationtakes place throughout the upper part of the deposit(Figure 10.39), where migrating gases cool and precip-itate dissolved minerals in open pore spaces in the lesscompacted tuff. Minerals are mainly alkali feldspar,quartz, tridymite, and cristobalite. The other secondarycrystallization that occurs in ash-flow deposits is devit-rification of glass shards and pumice (Figures 7.35).Devitrification chiefly affects the middle to upper partsof the deposit; the lower boundary of devitrificationagainst vitric tuff can be abrupt and sharp. In outcropwhere this contact occurs within the welded zone, thedevitrified tuff is red, pink, brown, or purple and therock looks stony, in contrast to the black, glassy, un-derlying nondevitrified tuff (vitrophyre). In devitrified
tuffs, aphanitic quartz-feldspar intergrowths, locallyspherulitic or lithophysal, replace glass, but delicatepumiceous and vitroclastic textures are faithfully pre-served, even though the rock may be entirely crys-talline. In other instances, devitrification completelyerases fragment outlines; vitroclastic and eutaxitic fab-rics are obliterated and the tuff assumes a massive, fea-tureless aphanitic fabric similar to that of many lavaflows. The presence of phenoclasts, however, can revealits pyroclastic origin.
10.4.8 CalderasThe distinction between a caldera (Figure 10.41; some-times called a cauldron) and a crater is succinctly ex-pressed by Williams and McBirney (1979, p. 207): “Acaldera is a large volcanic collapse depression, more orless circular or cirquelike in form, the diameter of
Magma Extrusion: Field Relations of Volcanic Rock Bodies 275
Zone of
Zone of
Den
sePa
rtia
lN
o w
eldi
ng
DensitySOURCE
Simple cooling unit
DISTAL MARGIN
crystallization
vapor − phasedevitrification
10.39 Idealized secondary zonation in a simple ignimbrite cooling unit. Vertical scale is exaggerated for clarity. Four upright rectangular panels show variation in density with respect to height in the unit and three degrees of related welding and compaction—dense, partial,and no welding and compaction. Dense welding occurs in lower two-thirds to half of unit near source. Zone of vapor-phase crystalliza-tion (stippled) is in upper part, and zone of devitrification (light shade) occupies most of cooling unit. All zonal boundaries and extentsare highly variable in different deposits.
10.40 Fossil fumaroles in a 150-m-thick section of the denselywelded Bishop tuff in Owens River Gorge, California, east ofits Long Valley caldera source (Figure 10.26a). Normally sub-vertical columnar joints in ignimbrite sheet (left) curve andconverge into fumarole conduit (partly in shadow, right). Rem-nant fumerole mound on top of sheet can be seen in left back-ground.
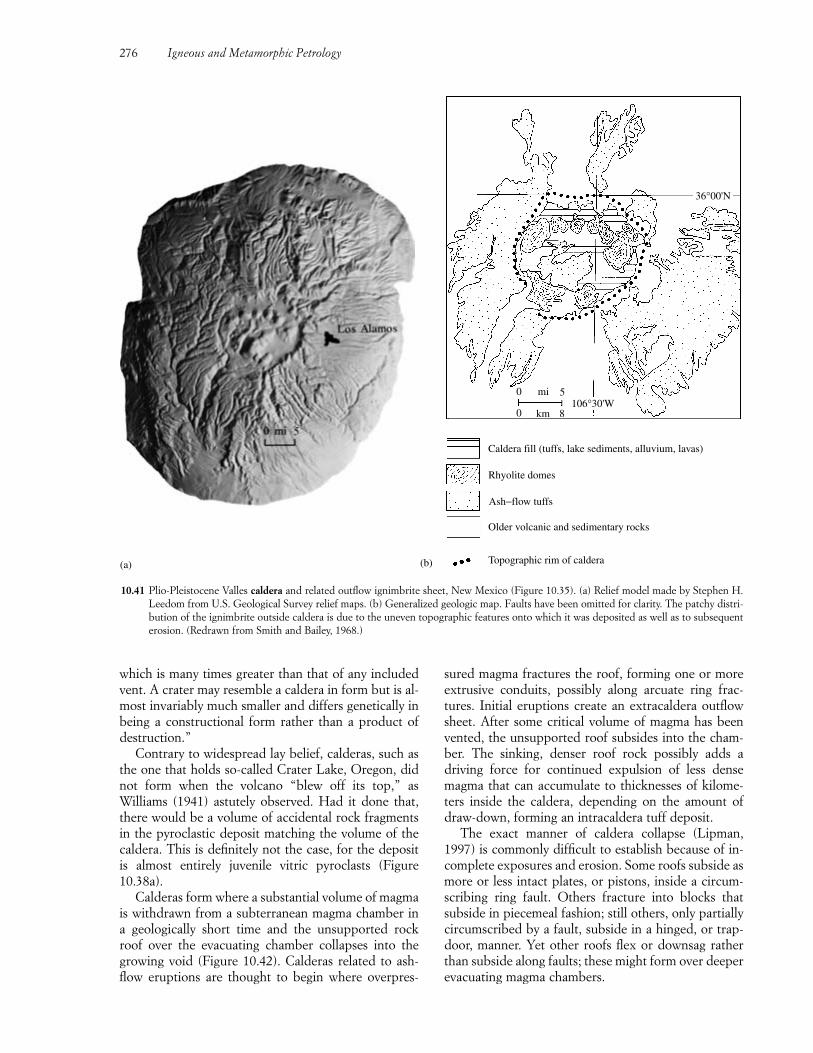
which is many times greater than that of any includedvent. A crater may resemble a caldera in form but is al-most invariably much smaller and differs genetically inbeing a constructional form rather than a product ofdestruction.”
Contrary to widespread lay belief, calderas, such asthe one that holds so-called Crater Lake, Oregon, didnot form when the volcano “blew off its top,” asWilliams (1941) astutely observed. Had it done that,there would be a volume of accidental rock fragmentsin the pyroclastic deposit matching the volume of thecaldera. This is definitely not the case, for the deposit is almost entirely juvenile vitric pyroclasts (Figure10.38a).
Calderas form where a substantial volume of magmais withdrawn from a subterranean magma chamber in a geologically short time and the unsupported rockroof over the evacuating chamber collapses into thegrowing void (Figure 10.42). Calderas related to ash-flow eruptions are thought to begin where overpres-
276 Igneous and Metamorphic Petrology
(a)
10.41 Plio-Pleistocene Valles caldera and related outflow ignimbrite sheet, New Mexico (Figure 10.35). (a) Relief model made by Stephen H.Leedom from U.S. Geological Survey relief maps. (b) Generalized geologic map. Faults have been omitted for clarity. The patchy distri-bution of the ignimbrite outside caldera is due to the uneven topographic features onto which it was deposited as well as to subsequenterosion. (Redrawn from Smith and Bailey, 1968.)
0 mi 5
0 km 8106°30'W
36°00'N
Caldera fill (tuffs, lake sediments, alluvium, lavas)
Rhyolite domes
Ash−flow tuffs
Older volcanic and sedimentary rocks
Topographic rim of caldera(b)
sured magma fractures the roof, forming one or moreextrusive conduits, possibly along arcuate ring frac-tures. Initial eruptions create an extracaldera outflowsheet. After some critical volume of magma has beenvented, the unsupported roof subsides into the cham-ber. The sinking, denser roof rock possibly adds a driving force for continued expulsion of less densemagma that can accumulate to thicknesses of kilome-ters inside the caldera, depending on the amount ofdraw-down, forming an intracaldera tuff deposit.
The exact manner of caldera collapse (Lipman,1997) is commonly difficult to establish because of in-complete exposures and erosion. Some roofs subside asmore or less intact plates, or pistons, inside a circum-scribing ring fault. Others fracture into blocks thatsubside in piecemeal fashion; still others, only partiallycircumscribed by a fault, subside in a hinged, or trap-door, manner. Yet other roofs flex or downsag ratherthan subside along faults; these might form over deeperevacuating magma chambers.
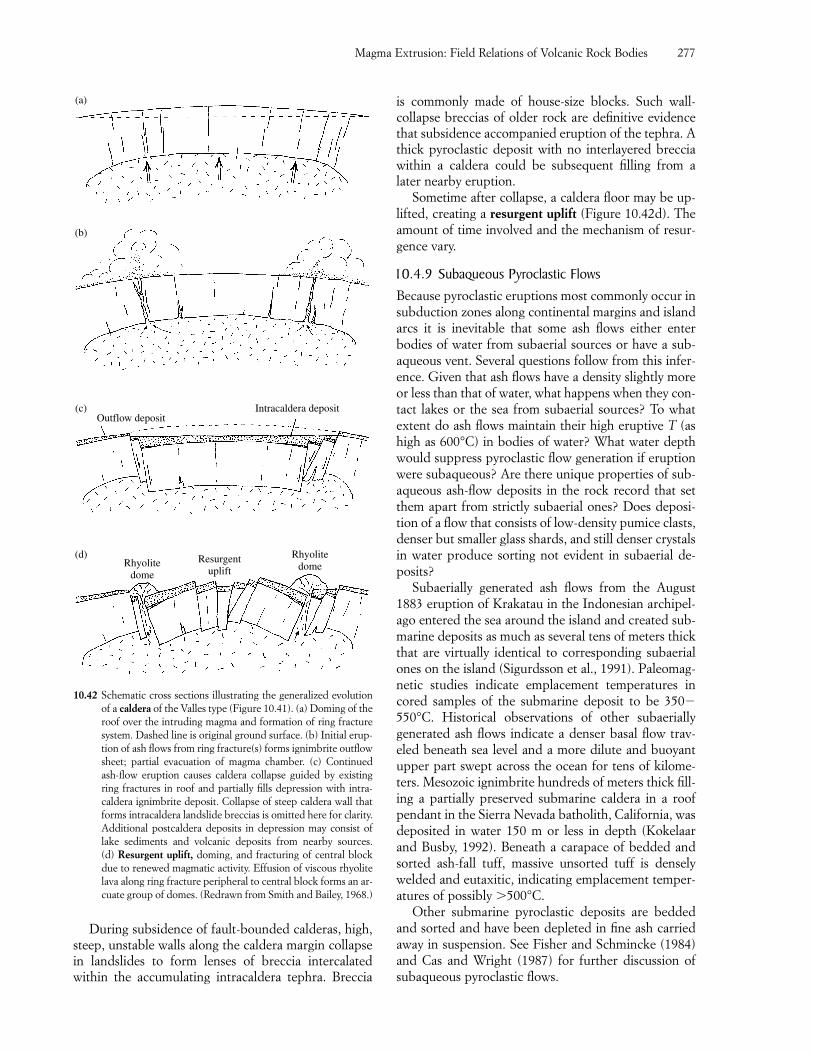
During subsidence of fault-bounded calderas, high,steep, unstable walls along the caldera margin collapsein landslides to form lenses of breccia intercalatedwithin the accumulating intracaldera tephra. Breccia
is commonly made of house-size blocks. Such wall-collapse breccias of older rock are definitive evidencethat subsidence accompanied eruption of the tephra. Athick pyroclastic deposit with no interlayered brecciawithin a caldera could be subsequent filling from alater nearby eruption.
Sometime after collapse, a caldera floor may be up-lifted, creating a resurgent uplift (Figure 10.42d). Theamount of time involved and the mechanism of resur-gence vary.
10.4.9 Subaqueous Pyroclastic FlowsBecause pyroclastic eruptions most commonly occur insubduction zones along continental margins and islandarcs it is inevitable that some ash flows either enterbodies of water from subaerial sources or have a sub-aqueous vent. Several questions follow from this infer-ence. Given that ash flows have a density slightly moreor less than that of water, what happens when they con-tact lakes or the sea from subaerial sources? To whatextent do ash flows maintain their high eruptive T (ashigh as 600°C) in bodies of water? What water depthwould suppress pyroclastic flow generation if eruptionwere subaqueous? Are there unique properties of sub-aqueous ash-flow deposits in the rock record that setthem apart from strictly subaerial ones? Does deposi-tion of a flow that consists of low-density pumice clasts,denser but smaller glass shards, and still denser crystalsin water produce sorting not evident in subaerial de-posits?
Subaerially generated ash flows from the August1883 eruption of Krakatau in the Indonesian archipel-ago entered the sea around the island and created sub-marine deposits as much as several tens of meters thickthat are virtually identical to corresponding subaerialones on the island (Sigurdsson et al., 1991). Paleomag-netic studies indicate emplacement temperatures incored samples of the submarine deposit to be 350�550°C. Historical observations of other subaeriallygenerated ash flows indicate a denser basal flow trav-eled beneath sea level and a more dilute and buoyantupper part swept across the ocean for tens of kilome-ters. Mesozoic ignimbrite hundreds of meters thick fill-ing a partially preserved submarine caldera in a roofpendant in the Sierra Nevada batholith, California, wasdeposited in water 150 m or less in depth (Kokelaarand Busby, 1992). Beneath a carapace of bedded andsorted ash-fall tuff, massive unsorted tuff is denselywelded and eutaxitic, indicating emplacement temper-atures of possibly �500°C.
Other submarine pyroclastic deposits are beddedand sorted and have been depleted in fine ash carriedaway in suspension. See Fisher and Schmincke (1984)and Cas and Wright (1987) for further discussion ofsubaqueous pyroclastic flows.
Magma Extrusion: Field Relations of Volcanic Rock Bodies 277
(a)
(b)
Outflow depositIntracaldera deposit(c)
Rhyolitedome
Rhyolitedome
Resurgentuplift
(d)
10.42 Schematic cross sections illustrating the generalized evolutionof a caldera of the Valles type (Figure 10.41). (a) Doming of theroof over the intruding magma and formation of ring fracturesystem. Dashed line is original ground surface. (b) Initial erup-tion of ash flows from ring fracture(s) forms ignimbrite outflowsheet; partial evacuation of magma chamber. (c) Continuedash-flow eruption causes caldera collapse guided by existingring fractures in roof and partially fills depression with intra-caldera ignimbrite deposit. Collapse of steep caldera wall thatforms intracaldera landslide breccias is omitted here for clarity.Additional postcaldera deposits in depression may consist oflake sediments and volcanic deposits from nearby sources. (d) Resurgent uplift, doming, and fracturing of central blockdue to renewed magmatic activity. Effusion of viscous rhyolitelava along ring fracture peripheral to central block forms an ar-cuate group of domes. (Redrawn from Smith and Bailey, 1968.)
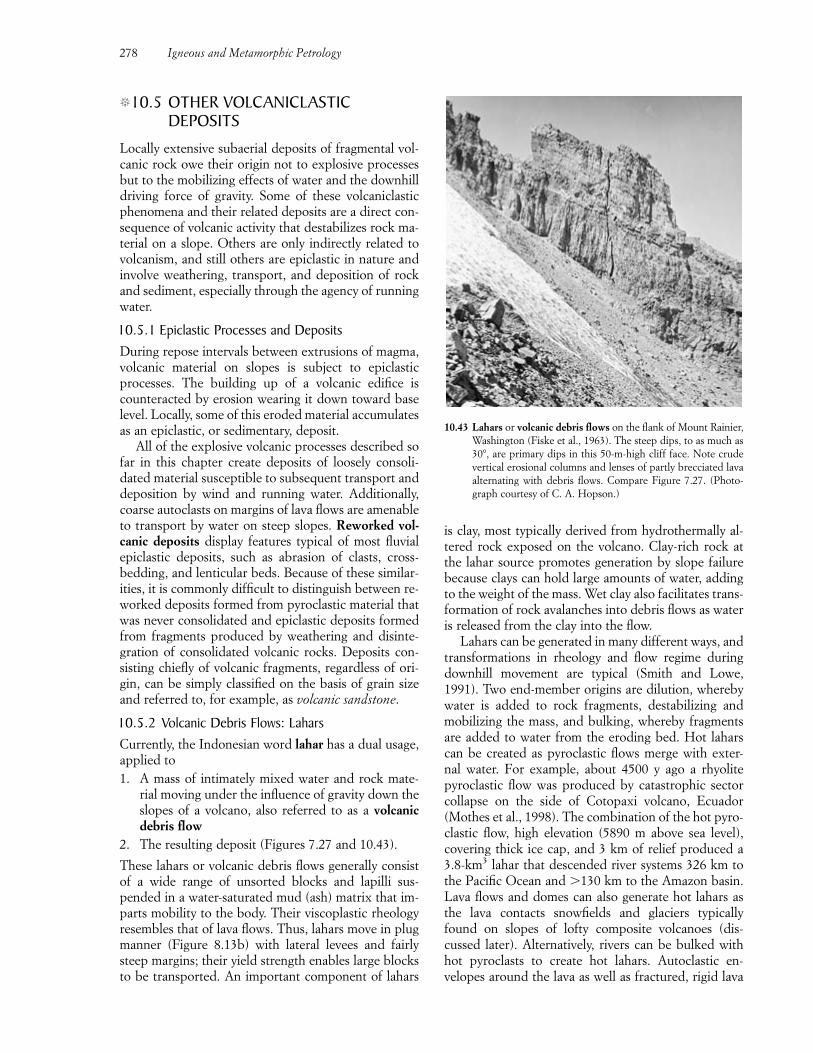
�10.5 OTHER VOLCANICLASTIC DEPOSITS
Locally extensive subaerial deposits of fragmental vol-canic rock owe their origin not to explosive processesbut to the mobilizing effects of water and the downhilldriving force of gravity. Some of these volcaniclasticphenomena and their related deposits are a direct con-sequence of volcanic activity that destabilizes rock ma-terial on a slope. Others are only indirectly related tovolcanism, and still others are epiclastic in nature andinvolve weathering, transport, and deposition of rockand sediment, especially through the agency of runningwater.
10.5.1 Epiclastic Processes and DepositsDuring repose intervals between extrusions of magma,volcanic material on slopes is subject to epiclasticprocesses. The building up of a volcanic edifice iscounteracted by erosion wearing it down toward baselevel. Locally, some of this eroded material accumulatesas an epiclastic, or sedimentary, deposit.
All of the explosive volcanic processes described sofar in this chapter create deposits of loosely consoli-dated material susceptible to subsequent transport anddeposition by wind and running water. Additionally,coarse autoclasts on margins of lava flows are amenableto transport by water on steep slopes. Reworked vol-canic deposits display features typical of most fluvialepiclastic deposits, such as abrasion of clasts, cross-bedding, and lenticular beds. Because of these similar-ities, it is commonly difficult to distinguish between re-worked deposits formed from pyroclastic material thatwas never consolidated and epiclastic deposits formedfrom fragments produced by weathering and disinte-gration of consolidated volcanic rocks. Deposits con-sisting chiefly of volcanic fragments, regardless of ori-gin, can be simply classified on the basis of grain sizeand referred to, for example, as volcanic sandstone.
10.5.2 Volcanic Debris Flows: LaharsCurrently, the Indonesian word lahar has a dual usage,applied to1. A mass of intimately mixed water and rock mate-
rial moving under the influence of gravity down theslopes of a volcano, also referred to as a volcanicdebris flow
2. The resulting deposit (Figures 7.27 and 10.43).
These lahars or volcanic debris flows generally consistof a wide range of unsorted blocks and lapilli sus-pended in a water-saturated mud (ash) matrix that im-parts mobility to the body. Their viscoplastic rheologyresembles that of lava flows. Thus, lahars move in plugmanner (Figure 8.13b) with lateral levees and fairlysteep margins; their yield strength enables large blocksto be transported. An important component of lahars
is clay, most typically derived from hydrothermally al-tered rock exposed on the volcano. Clay-rich rock atthe lahar source promotes generation by slope failurebecause clays can hold large amounts of water, addingto the weight of the mass. Wet clay also facilitates trans-formation of rock avalanches into debris flows as wateris released from the clay into the flow.
Lahars can be generated in many different ways, andtransformations in rheology and flow regime duringdownhill movement are typical (Smith and Lowe,1991). Two end-member origins are dilution, wherebywater is added to rock fragments, destabilizing andmobilizing the mass, and bulking, whereby fragmentsare added to water from the eroding bed. Hot laharscan be created as pyroclastic flows merge with exter-nal water. For example, about 4500 y ago a rhyolite pyroclastic flow was produced by catastrophic sectorcollapse on the side of Cotopaxi volcano, Ecuador(Mothes et al., 1998). The combination of the hot pyro-clastic flow, high elevation (5890 m above sea level),covering thick ice cap, and 3 km of relief produced a3.8-km3 lahar that descended river systems 326 km tothe Pacific Ocean and �130 km to the Amazon basin.Lava flows and domes can also generate hot lahars asthe lava contacts snowfields and glaciers typicallyfound on slopes of lofty composite volcanoes (dis-cussed later). Alternatively, rivers can be bulked withhot pyroclasts to create hot lahars. Autoclastic en-velopes around the lava as well as fractured, rigid lava
278 Igneous and Metamorphic Petrology
10.43 Lahars or volcanic debris flows on the flank of Mount Rainier,Washington (Fiske et al., 1963). The steep dips, to as much as30�, are primary dips in this 50-m-high cliff face. Note crudevertical erosional columns and lenses of partly brecciated lavaalternating with debris flows. Compare Figure 7.27. (Photo-graph courtesy of C. A. Hopson.)
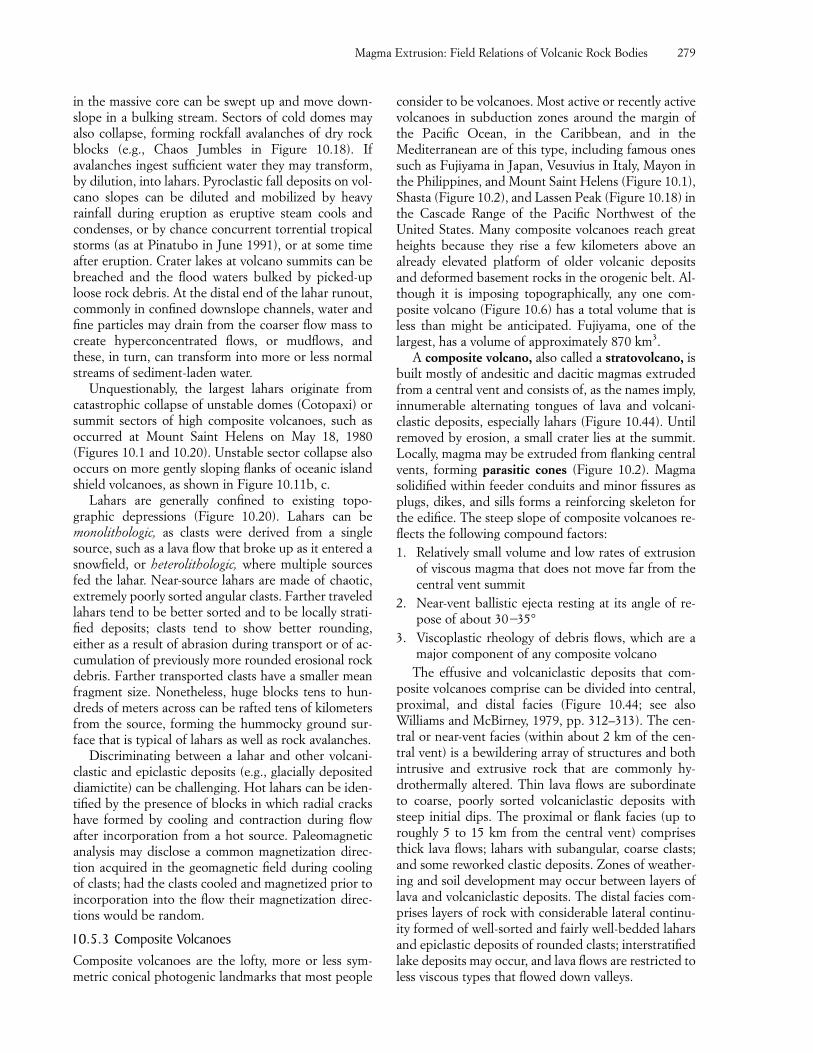
in the massive core can be swept up and move down-slope in a bulking stream. Sectors of cold domes mayalso collapse, forming rockfall avalanches of dry rockblocks (e.g., Chaos Jumbles in Figure 10.18). Ifavalanches ingest sufficient water they may transform,by dilution, into lahars. Pyroclastic fall deposits on vol-cano slopes can be diluted and mobilized by heavyrainfall during eruption as eruptive steam cools andcondenses, or by chance concurrent torrential tropicalstorms (as at Pinatubo in June 1991), or at some timeafter eruption. Crater lakes at volcano summits can bebreached and the flood waters bulked by picked-uploose rock debris. At the distal end of the lahar runout,commonly in confined downslope channels, water andfine particles may drain from the coarser flow mass tocreate hyperconcentrated flows, or mudflows, andthese, in turn, can transform into more or less normalstreams of sediment-laden water.
Unquestionably, the largest lahars originate fromcatastrophic collapse of unstable domes (Cotopaxi) orsummit sectors of high composite volcanoes, such asoccurred at Mount Saint Helens on May 18, 1980(Figures 10.1 and 10.20). Unstable sector collapse alsooccurs on more gently sloping flanks of oceanic islandshield volcanoes, as shown in Figure 10.11b, c.
Lahars are generally confined to existing topo-graphic depressions (Figure 10.20). Lahars can bemonolithologic, as clasts were derived from a singlesource, such as a lava flow that broke up as it entered asnowfield, or heterolithologic, where multiple sourcesfed the lahar. Near-source lahars are made of chaotic,extremely poorly sorted angular clasts. Farther traveledlahars tend to be better sorted and to be locally strati-fied deposits; clasts tend to show better rounding,either as a result of abrasion during transport or of ac-cumulation of previously more rounded erosional rockdebris. Farther transported clasts have a smaller meanfragment size. Nonetheless, huge blocks tens to hun-dreds of meters across can be rafted tens of kilometersfrom the source, forming the hummocky ground sur-face that is typical of lahars as well as rock avalanches.
Discriminating between a lahar and other volcani-clastic and epiclastic deposits (e.g., glacially depositeddiamictite) can be challenging. Hot lahars can be iden-tified by the presence of blocks in which radial crackshave formed by cooling and contraction during flow after incorporation from a hot source. Paleomagneticanalysis may disclose a common magnetization direc-tion acquired in the geomagnetic field during coolingof clasts; had the clasts cooled and magnetized prior toincorporation into the flow their magnetization direc-tions would be random.
10.5.3 Composite VolcanoesComposite volcanoes are the lofty, more or less sym-metric conical photogenic landmarks that most people
consider to be volcanoes. Most active or recently activevolcanoes in subduction zones around the margin ofthe Pacific Ocean, in the Caribbean, and in theMediterranean are of this type, including famous onessuch as Fujiyama in Japan, Vesuvius in Italy, Mayon inthe Philippines, and Mount Saint Helens (Figure 10.1),Shasta (Figure 10.2), and Lassen Peak (Figure 10.18) inthe Cascade Range of the Pacific Northwest of theUnited States. Many composite volcanoes reach greatheights because they rise a few kilometers above an already elevated platform of older volcanic depositsand deformed basement rocks in the orogenic belt. Al-though it is imposing topographically, any one com-posite volcano (Figure 10.6) has a total volume that isless than might be anticipated. Fujiyama, one of thelargest, has a volume of approximately 870 km3.
A composite volcano, also called a stratovolcano, isbuilt mostly of andesitic and dacitic magmas extrudedfrom a central vent and consists of, as the names imply,innumerable alternating tongues of lava and volcani-clastic deposits, especially lahars (Figure 10.44). Untilremoved by erosion, a small crater lies at the summit.Locally, magma may be extruded from flanking centralvents, forming parasitic cones (Figure 10.2). Magmasolidified within feeder conduits and minor fissures asplugs, dikes, and sills forms a reinforcing skeleton forthe edifice. The steep slope of composite volcanoes re-flects the following compound factors: 1. Relatively small volume and low rates of extrusion
of viscous magma that does not move far from thecentral vent summit
2. Near-vent ballistic ejecta resting at its angle of re-pose of about 30�35°
3. Viscoplastic rheology of debris flows, which are amajor component of any composite volcano
The effusive and volcaniclastic deposits that com-posite volcanoes comprise can be divided into central,proximal, and distal facies (Figure 10.44; see alsoWilliams and McBirney, 1979, pp. 312–313). The cen-tral or near-vent facies (within about 2 km of the cen-tral vent) is a bewildering array of structures and bothintrusive and extrusive rock that are commonly hy-drothermally altered. Thin lava flows are subordinateto coarse, poorly sorted volcaniclastic deposits withsteep initial dips. The proximal or flank facies (up toroughly 5 to 15 km from the central vent) comprisesthick lava flows; lahars with subangular, coarse clasts;and some reworked clastic deposits. Zones of weather-ing and soil development may occur between layers oflava and volcaniclastic deposits. The distal facies com-prises layers of rock with considerable lateral continu-ity formed of well-sorted and fairly well-bedded laharsand epiclastic deposits of rounded clasts; interstratifiedlake deposits may occur, and lava flows are restricted toless viscous types that flowed down valleys.
Magma Extrusion: Field Relations of Volcanic Rock Bodies 279
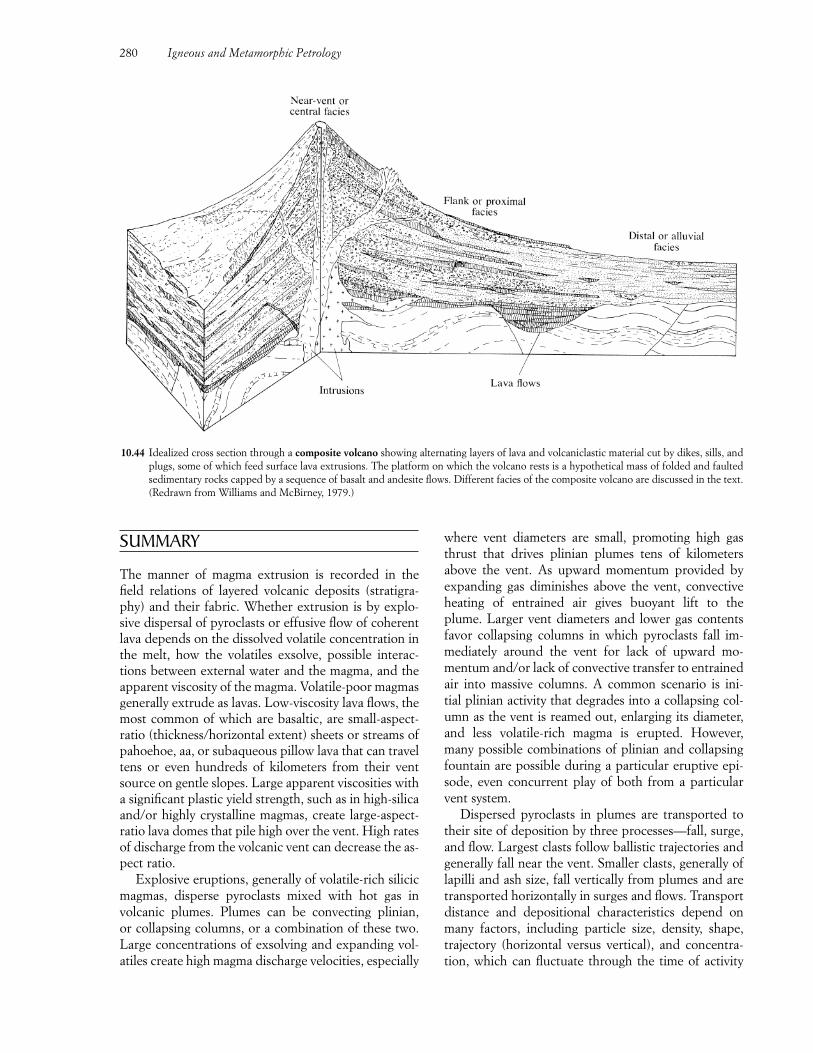
SUMMARY
The manner of magma extrusion is recorded in thefield relations of layered volcanic deposits (stratigra-phy) and their fabric. Whether extrusion is by explo-sive dispersal of pyroclasts or effusive flow of coherentlava depends on the dissolved volatile concentration inthe melt, how the volatiles exsolve, possible interac-tions between external water and the magma, and theapparent viscosity of the magma. Volatile-poor magmasgenerally extrude as lavas. Low-viscosity lava flows, themost common of which are basaltic, are small-aspect-ratio (thickness/horizontal extent) sheets or streams ofpahoehoe, aa, or subaqueous pillow lava that can traveltens or even hundreds of kilometers from their ventsource on gentle slopes. Large apparent viscosities witha significant plastic yield strength, such as in high-silicaand/or highly crystalline magmas, create large-aspect-ratio lava domes that pile high over the vent. High ratesof discharge from the volcanic vent can decrease the as-pect ratio.
Explosive eruptions, generally of volatile-rich silicicmagmas, disperse pyroclasts mixed with hot gas in volcanic plumes. Plumes can be convecting plinian, or collapsing columns, or a combination of these two.Large concentrations of exsolving and expanding vol-atiles create high magma discharge velocities, especially
where vent diameters are small, promoting high gasthrust that drives plinian plumes tens of kilometersabove the vent. As upward momentum provided by expanding gas diminishes above the vent, convectiveheating of entrained air gives buoyant lift to the plume. Larger vent diameters and lower gas contentsfavor collapsing columns in which pyroclasts fall im-mediately around the vent for lack of upward mo-mentum and/or lack of convective transfer to entrainedair into massive columns. A common scenario is ini-tial plinian activity that degrades into a collapsing col-umn as the vent is reamed out, enlarging its diameter,and less volatile-rich magma is erupted. However,many possible combinations of plinian and collapsingfountain are possible during a particular eruptive epi-sode, even concurrent play of both from a particularvent system.
Dispersed pyroclasts in plumes are transported totheir site of deposition by three processes—fall, surge,and flow. Largest clasts follow ballistic trajectories andgenerally fall near the vent. Smaller clasts, generally oflapilli and ash size, fall vertically from plumes and aretransported horizontally in surges and flows. Transportdistance and depositional characteristics depend onmany factors, including particle size, density, shape,trajectory (horizontal versus vertical), and concentra-tion, which can fluctuate through the time of activity
280 Igneous and Metamorphic Petrology
10.44 Idealized cross section through a composite volcano showing alternating layers of lava and volcaniclastic material cut by dikes, sills, andplugs, some of which feed surface lava extrusions. The platform on which the volcano rests is a hypothetical mass of folded and faultedsedimentary rocks capped by a sequence of basalt and andesite flows. Different facies of the composite volcano are discussed in the text.(Redrawn from Williams and McBirney, 1979.)
ate lofty plumes of ash and pumice lapilli, fallout from which creates bedded and sorted pyroclastic falldeposits.
Explosiveness and magma viscosity govern the char-acter of volcanic edifices, or landforms. Steep, conicalcomposite volcanoes are created by countless centraleruptions over a million years or so of relatively viscousandesitic-dacitic lava and exploded ballistic ejecta ac-cumulating near vent and pyroclastic flows and debrisflows (lahars) sweeping farther downslope. Enormousfloods of basaltic magma create oceanic plateaus on theseafloor. Fissure-fed floods create continental plateausin just a few million years. Gently sloping, fissure- andcentral-vent-fed basaltic shield volcanoes grow in ahalf-million years or less. In contrast to these long-lived, focused extrusions, monogenetic extrusions ofbasaltic lava build strombolian cinder (scoria) conesand isolated lava flows in less than a few years, formingsmall basaltic lava fields.
CRITICAL THINKING QUESTIONS10.1 Characterize conditions that allow explosive ver-
sus effusive extrusions of magma.10.2 Describe and account for the contrasts in effu-
sions of basaltic and silicic lavas.10.3 Discuss the nature of explosive volcanic plumes
and controlling factors in their development.10.4 Summarize styles of explosive eruption in terms
of explosiveness, associated volcanic plumes,and pyroclastic deposits that are produced.
10.5 Discuss the origin of volcanic edifices, explain-ing the contrasts in their shape and how theyare built up above ground level or extend be-low.
PROBLEMS10.1 Devils Tower in the northeastern corner of
Wyoming is a mass of rock that rises 260 mabove the surrounding plain and has spectacularsubvertical columnar joints. It is often said torepresent a volcanic neck, the feeder conduit ofnow-eroded overlying lava flows. Make a sketchof the tower and critique this explanation.
10.2 Make a sketch of Figure 10.10b showing howthe radial arrays of joint columns in the entabla-ture could have been produced by isothermsperturbed by water entering in widely spacedfractures.
10.3 Describe, or diagram, the transformations andtransfers of conserved energy in a volatile-richmagma that take place from its generation by
of the surge, flow, or fall process. Pyroclastic fall de-posits are mantle-bedded, and are generally finer andincreasingly better sorted with respect to particle sizeaway from the vent. Beds may be normally-graded orreverse-graded.
In pyroclastic surge and flow horizontal transportoccurs from the base of a collapsing column as a mix-ture of pyroclasts and hot gas. Surges have dilute par-ticle concentrations and their moderately sorted de-posits lie within 1 km or so of the vent. Plane-parallelsurge beds are widespread, but other bedforms thatcan indicate direction of transport include wavy beds,low-angle cross beds, climbing dunes, and ballistic-clast sags. Near-vent accumulations of basaltic tephrabuilt by pyroclastic surges and ballistic ejecta form tuff cones, tuff rings, and, if a below-ground-levelcrater is explosively excavated, maars and diatremes.Pyroclastic flows have high particle concentrations and produce massive unsorted deposits. Small block-and-ash flows, whose volume is generally �0.01 km3,are generated by collapse of a lava dome at the sum-mit of a volcano and happen dozens to hundreds oftimes in an episode of activity at a subduction-sitedcomposite volcano. Larger ash-flow, or ignimbrite,eruptions occur less frequently at a particular locale;deposits of ash and lapilli can be hundreds of metersthick (a few km in caldera depressions), extend over ahundred kilometers from source, and have volumes as much as thousands of cubic kilometers. The consid-erable mobility of hot pyroclastic flows results fromtheir potential energy inherited from the collapsingmassive column and their endowment of gas that pro-duces partial fluidization. As some of the fluidizing gas escapes from the avalanche it carries with it thefiner, mostly vitric ash and creates an overlying coig-nimbrite plume that produces downwind beds of fineash. Escaping gas in deposits promotes vapor-phasecrystallization in pore spaces, which accompanies de-vitrification and welding and compaction of the ig-nimbrite after deposition.
A wide spectrum of explosive style is dictated by the range in magma composition and volatile content.Least explosive are Hawaiian eruptions, in whichbasaltic lava fountains build near-vent spatter depositsand streams of lava, some formed as rootless flows ofmolten spatter, and flow away from the vent. Strom-bolian eruptions of a boiling top of the basaltic or andesitic magma column exposed in the vent throw out ballistic ejecta, forming a cinder (scoria) cone; lava flows away from the vent area. Vulcanian erup-tions commonly begin with steam blast ejection of accidental clasts and then proceed to ejection of juve-nile clasts as the ascending column of magma is ex-posed. At the most explosive end of the spectrum areplinian and ash-flow eruptions. Plinian eruptions cre-
Magma Extrusion: Field Relations of Volcanic Rock Bodies 281

thermally induced partial melting in the deepcrust, through explosive venting into a plinianplume, and final deposition in ash-fall beds.
10.4 In Figure 10.38b, why are there both rhyoliteand mafic pumices in the Mazama ignimbritedeposit from heights of about 15 to 35 m,
whereas there are only mafic above and rhyolitebelow?
10.5 Draw topographic profiles of hilly terrain onwhich you characterize and distinguish betweenthe field relations and fabric of pyroclastic fall,surge, and flow deposits.
282 Igneous and Metamorphic Petrology
FUNDAMENTAL QUESTIONSCONSIDERED IN THIS CHAPTER
1. What is the role of the mantle in global magmageneration?
2. How and where can solid rock be melted to gen-erate magma?
3. How does the mineralogical and chemical compo-sition of solid rocks in the upper mantle and lowercontinental crust dictate the composition of mag-mas generated by partial melting in these sourceregions?
4. How do partial melting conditions in source re-gions influence the composition of the generatedmagmas?
INTRODUCTION
The basic problems in understanding magmatic rocksare how, where, and why they are created and what ac-counts for their wide range of compositions, as exem-plified in any variation diagram (e.g., Figure 2.4).
Clearly, active volcanoes manifest the occurrence ofmagma in the Earth. Basaltic lavas extruded from vol-canoes have T � 1200°C, whereas rhyolitic magmascommonly erupt at 900–700°C. These temperaturesimply that magma has to be created at depths of at leastthe lower crust (45–35 km) or upper mantle (60 km),assuming a uniform geothermal gradient of 20°C andnegligible cooling during ascent. But we know that thecrust and mantle are generally solid rock all the way tothe outer liquid metallic core because they transmit
seismic shear waves. So what are the anomalous con-ditions that explain how and why silicate magma isgenerated from solid silicate rock in the mantle andpossibly the lower crust? Somehow, already hot butsubsolidus rock must be perturbed to cause meltingand magma generation.
Magma generation must be closely linked withglobal tectonics because active volcanoes occur wherelithospheric plates are diverging and converging andwhere mantle plumes are actively rising, as underHawaii (Figure 1.5 and Plate I). No active volcanoesoccur in the central part of North America or Australiaor in other huge areas around the globe.
�11.1 MELTING OF SOLID ROCK:CHANGES IN P, T, AND X
Melting of a solid is conventionally associated with anincrease in T(��T ). However, phase diagrams inChapter 5 show that melting can also occur at virtuallyconstant T (isothermally) by decompression (��P)and by influx of volatiles (��Xvolatiles) into already hot rock. In all three changes in state of the system, the rock already contains a significant store of ther-mal energy and becomes a melting source rock as��T, ��P, and ��Xvolatiles perturbations move the system above the solidus (Figure 11.1). Total melt-ing of a source rock to its liquidus requires large, andgeologically unrealistic, changes in these three inten-sive variables. Before total melting might occur, eitherthe buoyant melt separates and moves out of thesource or the partially melted rock becomes suffi-ciently buoyant to rise en masse, perhaps as a diapir,out of the source region and away from the perturbingchanges.
CHAPTER
Generation of Magma 11
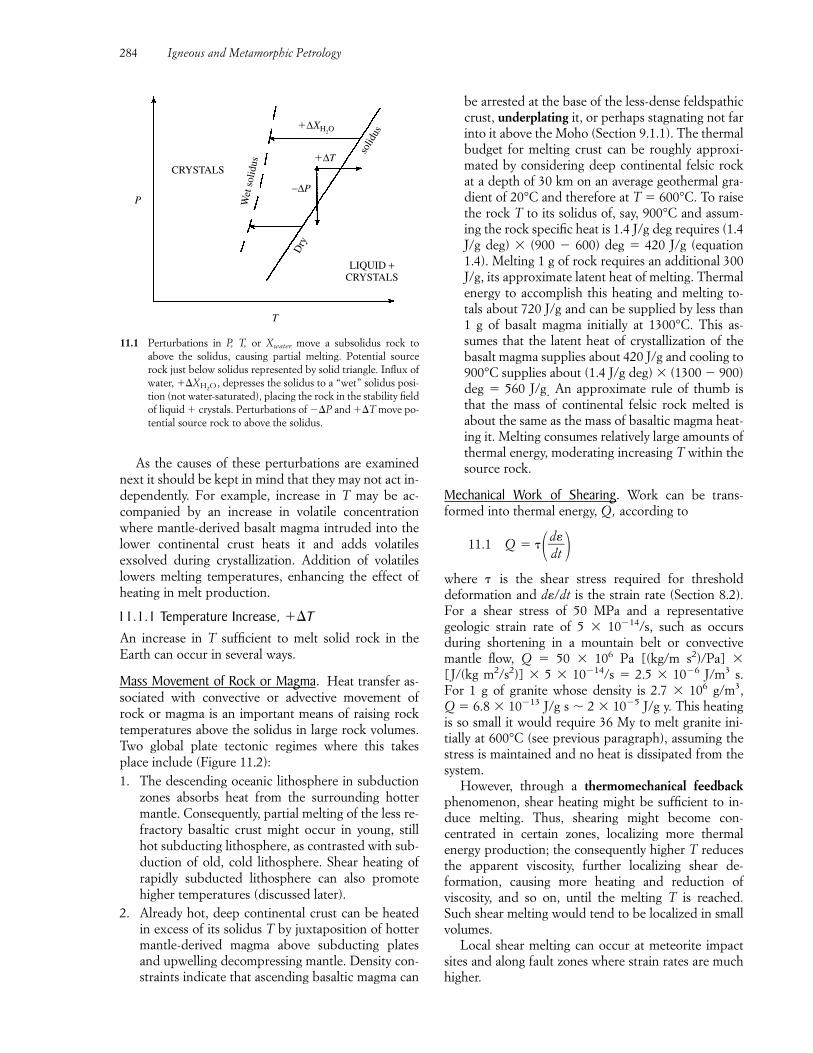
As the causes of these perturbations are examinednext it should be kept in mind that they may not act in-dependently. For example, increase in T may be ac-companied by an increase in volatile concentrationwhere mantle-derived basalt magma intruded into thelower continental crust heats it and adds volatiles exsolved during crystallization. Addition of volatileslowers melting temperatures, enhancing the effect ofheating in melt production.
11.1.1 Temperature Increase, ��TAn increase in T sufficient to melt solid rock in theEarth can occur in several ways.
Mass Movement of Rock or Magma. Heat transfer as-sociated with convective or advective movement ofrock or magma is an important means of raising rocktemperatures above the solidus in large rock volumes.Two global plate tectonic regimes where this takesplace include (Figure 11.2):1. The descending oceanic lithosphere in subduction
zones absorbs heat from the surrounding hottermantle. Consequently, partial melting of the less re-fractory basaltic crust might occur in young, stillhot subducting lithosphere, as contrasted with sub-duction of old, cold lithosphere. Shear heating ofrapidly subducted lithosphere can also promotehigher temperatures (discussed later).
2. Already hot, deep continental crust can be heatedin excess of its solidus T by juxtaposition of hottermantle-derived magma above subducting platesand upwelling decompressing mantle. Density con-straints indicate that ascending basaltic magma can
be arrested at the base of the less-dense feldspathiccrust, underplating it, or perhaps stagnating not farinto it above the Moho (Section 9.1.1). The thermalbudget for melting crust can be roughly approxi-mated by considering deep continental felsic rockat a depth of 30 km on an average geothermal gra-dient of 20°C and therefore at T � 600°C. To raisethe rock T to its solidus of, say, 900°C and assum-ing the rock specific heat is 1.4 J/g deg requires (1.4J/g deg) � (900 � 600) deg � 420 J/g (equation1.4). Melting 1 g of rock requires an additional 300J/g, its approximate latent heat of melting. Thermalenergy to accomplish this heating and melting to-tals about 720 J/g and can be supplied by less than1 g of basalt magma initially at 1300°C. This as-sumes that the latent heat of crystallization of thebasalt magma supplies about 420 J/g and cooling to900°C supplies about (1.4 J/g deg) � (1300 � 900)deg � 560 J/g. An approximate rule of thumb isthat the mass of continental felsic rock melted isabout the same as the mass of basaltic magma heat-ing it. Melting consumes relatively large amounts ofthermal energy, moderating increasing T within thesource rock.
Mechanical Work of Shearing. Work can be trans-formed into thermal energy, Q, according to
11.1 Q � ���dd
t��
where � is the shear stress required for threshold deformation and d/dt is the strain rate (Section 8.2).For a shear stress of 50 MPa and a representative geologic strain rate of 5 � 10�14/s, such as occurs during shortening in a mountain belt or convectivemantle flow, Q � 50 � 106 Pa [(kg/m s2)/Pa] �[J/(kg m2/s2)] � 5 � 10�14/s � 2.5 � 10�6 J/m3 s. For 1 g of granite whose density is 2.7 � 106 g/m3, Q � 6.8 � 10�13 J/g s � 2 � 10�5 J/g y. This heatingis so small it would require 36 My to melt granite ini-tially at 600°C (see previous paragraph), assuming thestress is maintained and no heat is dissipated from thesystem.
However, through a thermomechanical feedbackphenomenon, shear heating might be sufficient to in-duce melting. Thus, shearing might become con-centrated in certain zones, localizing more thermal energy production; the consequently higher T reducesthe apparent viscosity, further localizing shear de-formation, causing more heating and reduction of viscosity, and so on, until the melting T is reached.Such shear melting would tend to be localized in smallvolumes.
Local shear melting can occur at meteorite impactsites and along fault zones where strain rates are muchhigher.
284 Igneous and Metamorphic Petrology
11.1 Perturbations in P, T, or Xwater move a subsolidus rock toabove the solidus, causing partial melting. Potential sourcerock just below solidus represented by solid triangle. Influx ofwater, ��XH2O, depresses the solidus to a “wet” solidus posi-tion (not water-saturated), placing the rock in the stability fieldof liquid � crystals. Perturbations of ��P and ��T move po-tential source rock to above the solidus.
T
LIQUID +CRYSTALS
Dry
−∆P
�∆T
Wet
sol
idus
solid
us
�∆XH2O
CRYSTALS
P
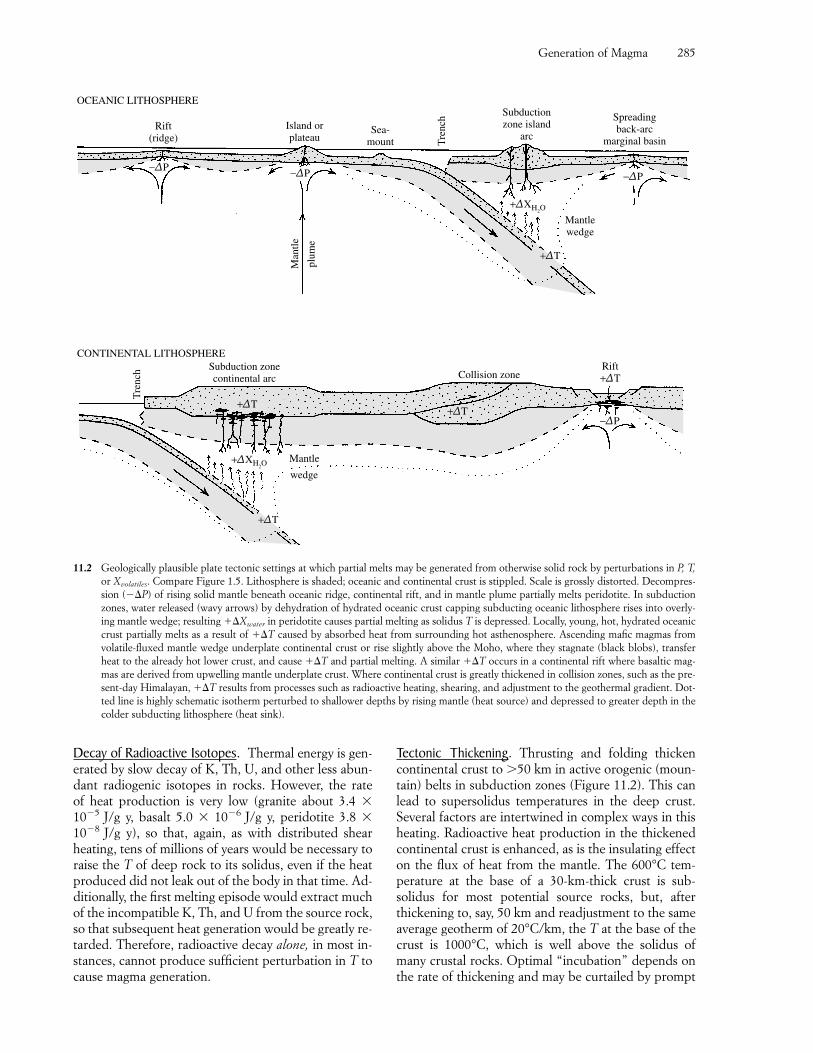
Decay of Radioactive Isotopes. Thermal energy is gen-erated by slow decay of K, Th, U, and other less abun-dant radiogenic isotopes in rocks. However, the rate of heat production is very low (granite about 3.4 �10�5 J/g y, basalt 5.0 � 10�6 J/g y, peridotite 3.8 �10�8 J/g y), so that, again, as with distributed shearheating, tens of millions of years would be necessary toraise the T of deep rock to its solidus, even if the heatproduced did not leak out of the body in that time. Ad-ditionally, the first melting episode would extract muchof the incompatible K, Th, and U from the source rock,so that subsequent heat generation would be greatly re-tarded. Therefore, radioactive decay alone, in most in-stances, cannot produce sufficient perturbation in T tocause magma generation.
Tectonic Thickening. Thrusting and folding thickencontinental crust to 50 km in active orogenic (moun-tain) belts in subduction zones (Figure 11.2). This canlead to supersolidus temperatures in the deep crust.Several factors are intertwined in complex ways in thisheating. Radioactive heat production in the thickenedcontinental crust is enhanced, as is the insulating effecton the flux of heat from the mantle. The 600°C tem-perature at the base of a 30-km-thick crust is sub-solidus for most potential source rocks, but, afterthickening to, say, 50 km and readjustment to the sameaverage geotherm of 20°C/km, the T at the base of thecrust is 1000°C, which is well above the solidus ofmany crustal rocks. Optimal “incubation” depends onthe rate of thickening and may be curtailed by prompt
Generation of Magma 285
Rift(ridge)
Island orplateau
Sea-mount T
renc
h Subductionzone island
arc
Spreadingback-arc
marginal basin
−∆P
+∆XH2O
Mantlewedge
+∆T
plum
e
Man
tle
−∆P−∆P
OCEANIC LITHOSPHERE
Tre
nch Subduction zone
continental arc Collision zoneRift+∆T
−∆P+∆T
Mantle
wedge
+∆T
+∆T
+∆XH2O
CONTINENTAL LITHOSPHERE
11.2 Geologically plausible plate tectonic settings at which partial melts may be generated from otherwise solid rock by perturbations in P, T,or Xvolatiles. Compare Figure 1.5. Lithosphere is shaded; oceanic and continental crust is stippled. Scale is grossly distorted. Decompres-sion (��P) of rising solid mantle beneath oceanic ridge, continental rift, and in mantle plume partially melts peridotite. In subductionzones, water released (wavy arrows) by dehydration of hydrated oceanic crust capping subducting oceanic lithosphere rises into overly-ing mantle wedge; resulting ��Xwater in peridotite causes partial melting as solidus T is depressed. Locally, young, hot, hydrated oceaniccrust partially melts as a result of ��T caused by absorbed heat from surrounding hot asthenosphere. Ascending mafic magmas fromvolatile-fluxed mantle wedge underplate continental crust or rise slightly above the Moho, where they stagnate (black blobs), transferheat to the already hot lower crust, and cause ��T and partial melting. A similar ��T occurs in a continental rift where basaltic mag-mas are derived from upwelling mantle underplate crust. Where continental crust is greatly thickened in collision zones, such as the pre-sent-day Himalayan, ��T results from processes such as radioactive heating, shearing, and adjustment to the geothermal gradient. Dot-ted line is highly schematic isotherm perturbed to shallower depths by rising mantle (heat source) and depressed to greater depth in thecolder subducting lithosphere (heat sink).
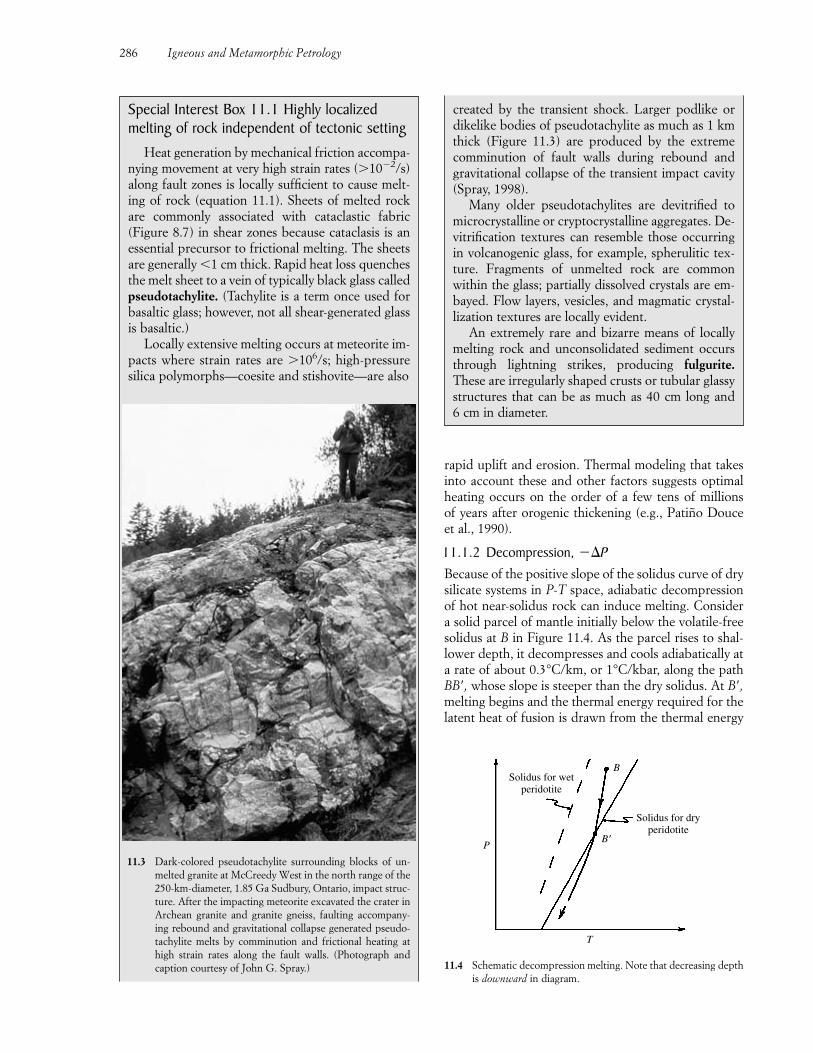
rapid uplift and erosion. Thermal modeling that takesinto account these and other factors suggests optimalheating occurs on the order of a few tens of millions of years after orogenic thickening (e.g., Patiño Douce et al., 1990).
11.1.2 Decompression, ��PBecause of the positive slope of the solidus curve of drysilicate systems in P-T space, adiabatic decompressionof hot near-solidus rock can induce melting. Considera solid parcel of mantle initially below the volatile-freesolidus at B in Figure 11.4. As the parcel rises to shal-lower depth, it decompresses and cools adiabatically ata rate of about 0.3°C/km, or 1°C/kbar, along the pathBB�, whose slope is steeper than the dry solidus. At B�,melting begins and the thermal energy required for thelatent heat of fusion is drawn from the thermal energy
286 Igneous and Metamorphic Petrology
Special Interest Box 11.1 Highly localizedmelting of rock independent of tectonic setting
Heat generation by mechanical friction accompa-nying movement at very high strain rates (10�2/s)along fault zones is locally sufficient to cause melt-ing of rock (equation 11.1). Sheets of melted rockare commonly associated with cataclastic fabric(Figure 8.7) in shear zones because cataclasis is anessential precursor to frictional melting. The sheetsare generally �1 cm thick. Rapid heat loss quenchesthe melt sheet to a vein of typically black glass calledpseudotachylite. (Tachylite is a term once used forbasaltic glass; however, not all shear-generated glassis basaltic.)
Locally extensive melting occurs at meteorite im-pacts where strain rates are 106/s; high-pressuresilica polymorphs—coesite and stishovite—are also
11.3 Dark-colored pseudotachylite surrounding blocks of un-melted granite at McCreedy West in the north range of the250-km-diameter, 1.85 Ga Sudbury, Ontario, impact struc-ture. After the impacting meteorite excavated the crater inArchean granite and granite gneiss, faulting accompany-ing rebound and gravitational collapse generated pseudo-tachylite melts by comminution and frictional heating athigh strain rates along the fault walls. (Photograph andcaption courtesy of John G. Spray.)
created by the transient shock. Larger podlike ordikelike bodies of pseudotachylite as much as 1 kmthick (Figure 11.3) are produced by the extremecomminution of fault walls during rebound andgravitational collapse of the transient impact cavity(Spray, 1998).
Many older pseudotachylites are devitrified tomicrocrystalline or cryptocrystalline aggregates. De-vitrification textures can resemble those occurringin volcanogenic glass, for example, spherulitic tex-ture. Fragments of unmelted rock are commonwithin the glass; partially dissolved crystals are em-bayed. Flow layers, vesicles, and magmatic crystal-lization textures are locally evident.
An extremely rare and bizarre means of locallymelting rock and unconsolidated sediment occursthrough lightning strikes, producing fulgurite.These are irregularly shaped crusts or tubular glassystructures that can be as much as 40 cm long and6 cm in diameter.
11.4 Schematic decompression melting. Note that decreasing depthis downward in diagram.
P
T
Solidus for wetperidotite
Solidus for dryperidotite
B'
B
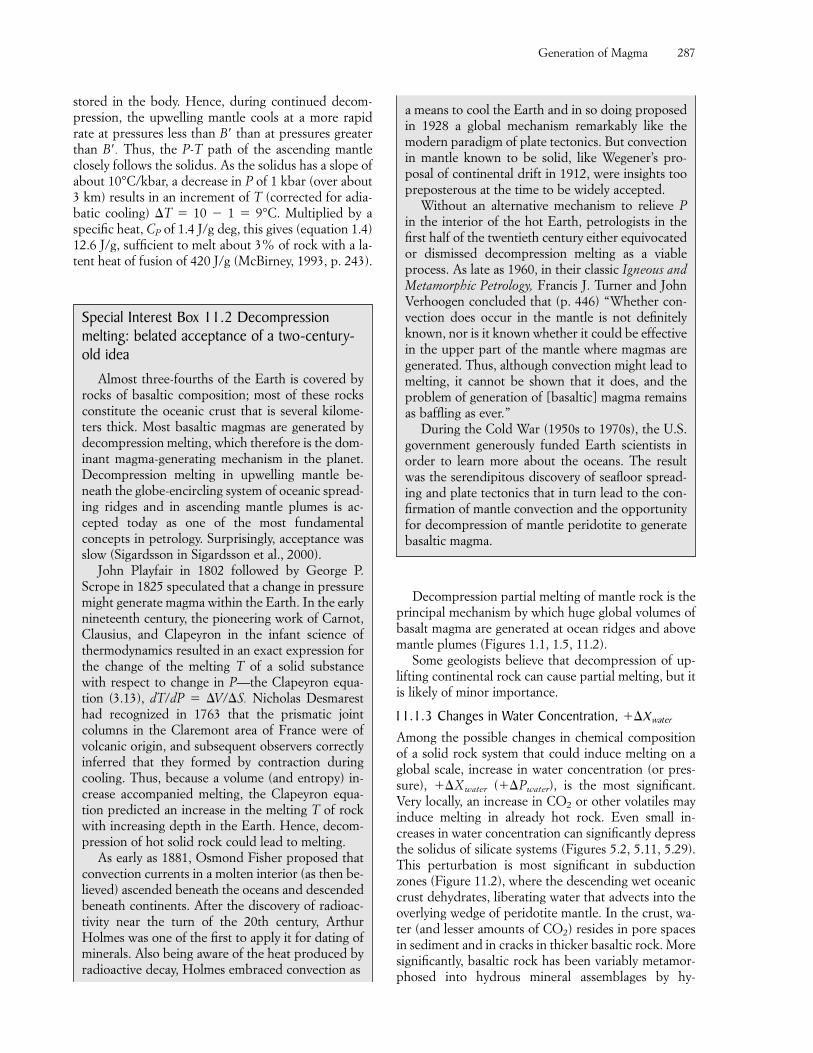
stored in the body. Hence, during continued decom-pression, the upwelling mantle cools at a more rapidrate at pressures less than B� than at pressures greaterthan B�. Thus, the P-T path of the ascending mantleclosely follows the solidus. As the solidus has a slope ofabout 10°C/kbar, a decrease in P of 1 kbar (over about3 km) results in an increment of T (corrected for adia-batic cooling) �T � 10 � 1 � 9°C. Multiplied by aspecific heat, CP of 1.4 J/g deg, this gives (equation 1.4)12.6 J/g, sufficient to melt about 3% of rock with a la-tent heat of fusion of 420 J/g (McBirney, 1993, p. 243).
Decompression partial melting of mantle rock is theprincipal mechanism by which huge global volumes ofbasalt magma are generated at ocean ridges and abovemantle plumes (Figures 1.1, 1.5, 11.2).
Some geologists believe that decompression of up-lifting continental rock can cause partial melting, but itis likely of minor importance.
11.1.3 Changes in Water Concentration, ��Xwater
Among the possible changes in chemical compositionof a solid rock system that could induce melting on aglobal scale, increase in water concentration (or pres-sure), ��Xwater (��Pwater), is the most significant.Very locally, an increase in CO2 or other volatiles mayinduce melting in already hot rock. Even small in-creases in water concentration can significantly depressthe solidus of silicate systems (Figures 5.2, 5.11, 5.29).This perturbation is most significant in subductionzones (Figure 11.2), where the descending wet oceaniccrust dehydrates, liberating water that advects into theoverlying wedge of peridotite mantle. In the crust, wa-ter (and lesser amounts of CO2) resides in pore spacesin sediment and in cracks in thicker basaltic rock. Moresignificantly, basaltic rock has been variably metamor-phosed into hydrous mineral assemblages by hy-
Generation of Magma 287
Special Interest Box 11.2 Decompressionmelting: belated acceptance of a two-century-old idea
Almost three-fourths of the Earth is covered byrocks of basaltic composition; most of these rocksconstitute the oceanic crust that is several kilome-ters thick. Most basaltic magmas are generated bydecompression melting, which therefore is the dom-inant magma-generating mechanism in the planet.Decompression melting in upwelling mantle be-neath the globe-encircling system of oceanic spread-ing ridges and in ascending mantle plumes is ac-cepted today as one of the most fundamentalconcepts in petrology. Surprisingly, acceptance wasslow (Sigardsson in Sigardsson et al., 2000).
John Playfair in 1802 followed by George P.Scrope in 1825 speculated that a change in pressuremight generate magma within the Earth. In the earlynineteenth century, the pioneering work of Carnot,Clausius, and Clapeyron in the infant science ofthermodynamics resulted in an exact expression forthe change of the melting T of a solid substancewith respect to change in P—the Clapeyron equa-tion (3.13), dT/dP � �V/�S. Nicholas Desmaresthad recognized in 1763 that the prismatic jointcolumns in the Claremont area of France were ofvolcanic origin, and subsequent observers correctlyinferred that they formed by contraction duringcooling. Thus, because a volume (and entropy) in-crease accompanied melting, the Clapeyron equa-tion predicted an increase in the melting T of rockwith increasing depth in the Earth. Hence, decom-pression of hot solid rock could lead to melting.
As early as 1881, Osmond Fisher proposed thatconvection currents in a molten interior (as then be-lieved) ascended beneath the oceans and descendedbeneath continents. After the discovery of radioac-tivity near the turn of the 20th century, ArthurHolmes was one of the first to apply it for dating ofminerals. Also being aware of the heat produced byradioactive decay, Holmes embraced convection as
a means to cool the Earth and in so doing proposedin 1928 a global mechanism remarkably like themodern paradigm of plate tectonics. But convectionin mantle known to be solid, like Wegener’s pro-posal of continental drift in 1912, were insights toopreposterous at the time to be widely accepted.
Without an alternative mechanism to relieve Pin the interior of the hot Earth, petrologists in thefirst half of the twentieth century either equivocatedor dismissed decompression melting as a viableprocess. As late as 1960, in their classic Igneous andMetamorphic Petrology, Francis J. Turner and JohnVerhoogen concluded that (p. 446) “Whether con-vection does occur in the mantle is not definitelyknown, nor is it known whether it could be effectivein the upper part of the mantle where magmas aregenerated. Thus, although convection might lead tomelting, it cannot be shown that it does, and theproblem of generation of [basaltic] magma remainsas baffling as ever.”
During the Cold War (1950s to 1970s), the U.S.government generously funded Earth scientists inorder to learn more about the oceans. The resultwas the serendipitous discovery of seafloor spread-ing and plate tectonics that in turn lead to the con-firmation of mantle convection and the opportunityfor decompression of mantle peridotite to generatebasaltic magma.
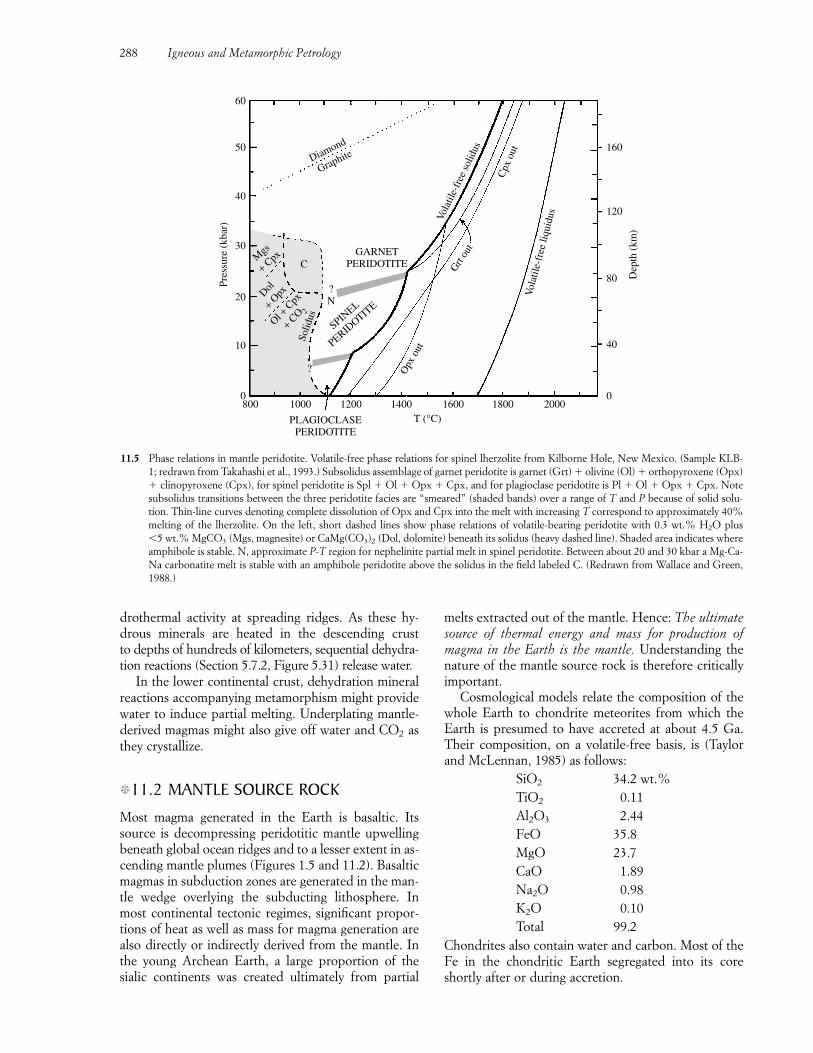
drothermal activity at spreading ridges. As these hy-drous minerals are heated in the descending crustto depths of hundreds of kilometers, sequential dehydra-tion reactions (Section 5.7.2, Figure 5.31) release water.
In the lower continental crust, dehydration mineralreactions accompanying metamorphism might providewater to induce partial melting. Underplating mantle-derived magmas might also give off water and CO2 asthey crystallize.
�11.2 MANTLE SOURCE ROCK
Most magma generated in the Earth is basaltic. Itssource is decompressing peridotitic mantle upwellingbeneath global ocean ridges and to a lesser extent in as-cending mantle plumes (Figures 1.5 and 11.2). Basalticmagmas in subduction zones are generated in the man-tle wedge overlying the subducting lithosphere. Inmost continental tectonic regimes, significant propor-tions of heat as well as mass for magma generation arealso directly or indirectly derived from the mantle. Inthe young Archean Earth, a large proportion of thesialic continents was created ultimately from partial
melts extracted out of the mantle. Hence: The ultimatesource of thermal energy and mass for production ofmagma in the Earth is the mantle. Understanding thenature of the mantle source rock is therefore criticallyimportant.
Cosmological models relate the composition of thewhole Earth to chondrite meteorites from which theEarth is presumed to have accreted at about 4.5 Ga.Their composition, on a volatile-free basis, is (Taylorand McLennan, 1985) as follows:
SiO2 34.2 wt.%TiO2 0.11Al2O3 2.44FeO 35.8MgO 23.7CaO 1.89Na2O 0.98K2O 0.10Total 99.2
Chondrites also contain water and carbon. Most of theFe in the chondritic Earth segregated into its coreshortly after or during accretion.
288 Igneous and Metamorphic Petrology
11.5 Phase relations in mantle peridotite. Volatile-free phase relations for spinel lherzolite from Kilborne Hole, New Mexico. (Sample KLB-1; redrawn from Takahashi et al., 1993.) Subsolidus assemblage of garnet peridotite is garnet (Grt) � olivine (Ol) � orthopyroxene (Opx)� clinopyroxene (Cpx), for spinel peridotite is Spl � Ol � Opx � Cpx, and for plagioclase peridotite is Pl � Ol � Opx � Cpx. Notesubsolidus transitions between the three peridotite facies are “smeared” (shaded bands) over a range of T and P because of solid solu-tion. Thin-line curves denoting complete dissolution of Opx and Cpx into the melt with increasing T correspond to approximately 40%melting of the lherzolite. On the left, short dashed lines show phase relations of volatile-bearing peridotite with 0.3 wt.% H2O plus �5 wt.% MgCO3 (Mgs, magnesite) or CaMg(CO3)2 (Dol, dolomite) beneath its solidus (heavy dashed line). Shaded area indicates whereamphibole is stable. N, approximate P-T region for nephelinite partial melt in spinel peridotite. Between about 20 and 30 kbar a Mg-Ca-Na carbonatite melt is stable with an amphibole peridotite above the solidus in the field labeled C. (Redrawn from Wallace and Green,1988.)
800 1000 1200 1400 1600 1800 2000T (°C)PLAGIOCLASE
PERIDOTITE
0
10
20
30
40
50
60
Pres
sure
(kb
ar)
0
40
80
120
160
Dep
th (
km)
Opx
out
Vol
atile
-fre
e liq
uidu
s
Grt
out
Cpx
out
Vola
tile-
free
sol
idus
GARNETPERIDOTITE
?N
SPINEL
PERIDOTIT
E
?
Ol + C
px+ C
O 2
Dol+ O
px
Mgs
+ Cpx
Solid
us
C
Diamond
Graphite
Measured seismic velocities in the upper mantle arecompatible with a rock made of olivine, pyroxene, andgarnet. These three phases are composed essentially of the five major chondritic chemical components:SiO2, Al2O3, FeO, MgO, and CaO. Upper mantle den-sities constrained by isostatic calculations are about3.35 g/cm3 (increasing slightly with depth, Figure 1.3), which is more consistent with peridotite (about3.3 g/cm3) than with olivine-free, pyroxene-garnet rock(eclogite, 3.5 g/cm3), although bodies of the lattermight occur in minor amounts within the former.
Peridotite is an ultramafic rock made of Mg-richolivine and lesser amounts of pyroxene, usually bothCa-Mg-rich clinopyroxene and Ca-poor, Mg-rich or-thopyroxene; these three crystalline phases are a stableassemblage to a depth of about 410 km. Most peri-dotites contain more Al in the bulk rock than can beheld in solid solution in pyroxenes and olivine, thusstabilizing a separate minor Al-rich phase, whose na-ture depends on P and less on T. At less than about 8 kbar (30-km depth), the stable Al-rich phase is pla-gioclase; from there to about 25 kbar (roughly 75 km,depending on crustal thickness), it is spinel; and at stillhigher P it is garnet (Figure 11.5). Transitions betweenthese three peridotite assemblages are smeared over a range of P (depth) and T because the minerals aresolid solutions. Garnetiferous peridotites equilibratedat depths greater than about 150 km and occurring asxenoliths in some kimberlitic rock also contain dia-mond. Diamonds commonly contain minute inclusionsof minerals stable in the upper mantle (pyroxene, gar-net). Extremely rare diamonds contain inclusions sta-ble only at 670 km-depth in the deep mantle (Mg-Fe-Ca-Al perovskite, Figure 1.3), testifying to the depthfrom which at least some kimberlitic magmas carryingsuspended diamonds are derived. At shallower depthswhere diamond is not stable, the stable C-bearingphase may be graphite if reducing conditions prevailor, if more oxidizing, a carbonate mineral or CO2
found in fluid inclusions in mantle minerals.Some petrologic information on the uppermost
mantle is from dredged samples from upfaulted seg-ments of the seafloor and from large tracts of alpineperidotite or peridotite massifs exposed in mountainbelts. The bodies of peridotite are components ofophiolite—segments of oceanic lithosphere tectonicallyemplaced and exposed in mountain belts adjacent tooceanic trenches (see Section 13.6). Oceanic rockscommonly suffer overprinting metamorphic effectsthat have erased their primary character to varying de-grees. However, ophiolites provide key stratigraphicand structural information that dredge samples and in-clusions, described next, cannot.
11.2.1 Mantle-Derived InclusionsImportant compositional information on the mantle isprovided by phaneritic mantle-derived inclusions of
peridotitic rock, usually hosted in alkaline basaltic andkimberlitic rock in thousands of localities worldwide(e.g., Nixon, 1987). These typically fresh and unaltereddense inclusions, also called nodules, or xenoliths, arefragments of rock entrained from near the source of thehost magma or plucked from shallower conduit wallsand lifted to the surface during rapid ascent. Mineralgeobarometers indicate equilibration in the uppermantle. Inclusions are of two types, classified accordingto their clinopyroxene: Cr-rich diopside or Al-Fe-Ti-rich clinopyroxene.
Cr-Diopside Peridotite. The most common mantle-derived inclusion consists mostly of olivine with subor-dinate pyroxenes and smaller amounts of either spinel(Mg, Fe2�)(Cr, Al, Fe3�)2O4 or pyropic garnet (Mg,Fe2�, Ca)3(Al, Cr)2Si3O12. The clinopyroxene is essen-tially diopside (CaMgSi2O6) that contains only a smallweight percentage of alumina and Fe-oxide, but be-cause of a few tenths of weight percentage of Cr2O3
is characteristically an emerald-green color (Plate V).Although constituting �20% and generally �5% ofthese inclusions, this distinctive green Cr-diopsideserves as a characterizing mineral. Olivines and or-thopyroxenes contain about 90 mol% of the Mg endmember. Some of these peridotites contain less than1% or so of hydrous minerals, including phlogopiteand pargasite or richterite amphibole (Appendix A).Modal proportions of olivine and pyroxenes classifymost inclusions as lherzolite and harzburgite; fewer aredunite. A metamorphic fabric resulting from texturalequilibration has created 120° triple-grain junctions(Section 6.4). Some inclusions show subtle, morepyroxene-rich layers. Some show a late imprint of sheardeformation manifested in strained olivines that havedeformation bands of contrasting optical extinction ori-entation in polarized light in thin sections.
Spinel-bearing peridotite inclusions are hosted al-most exclusively in alkaline basalt, basanite, andnephelinite and very rarely in andesitic rocks in sub-duction zones. Host magmas are characteristicallyvolatile-rich, are commonly explosive, and tend to as-cend rapidly from their upper mantle source. The ab-sence of inclusions in far more widespread tholeiiticbasalts possibly stems from slower ascent to the surfaceand the more evolved nature of these magmas, whichinvolves fractional crystallization of more primitiveparents in crustal storage chambers; both factors in-hibit lifting dense inclusions to the surface and pro-mote their assimilation. Spinel peridotite inclusions aremostly of latest Cenozoic age. Whether from oceanic orcontinental regimes, they are not significantly different(McDonough, 1990), indicating that the uppermostmantle in these two global areas is similar.
Garnet peridotite inclusions derived from greaterdepths in the mantle are somewhat different chemicallyfrom spinel peridotites (Table 11.1). They are hosted in
Generation of Magma 289
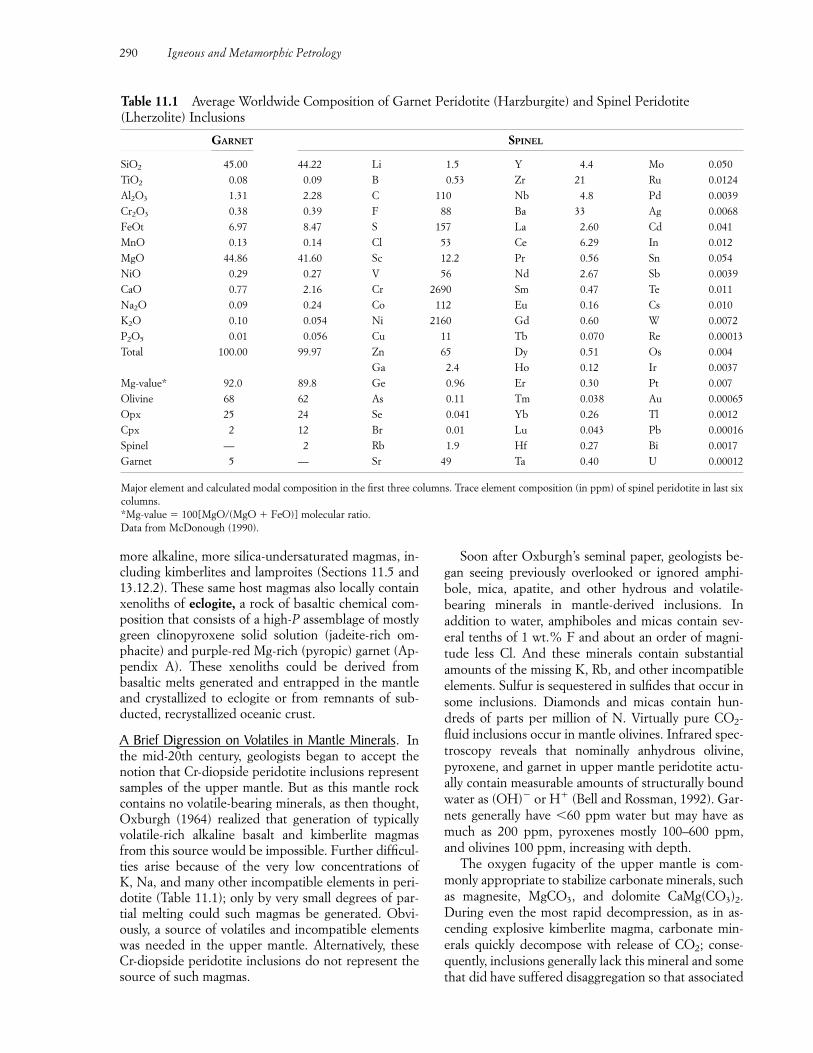
more alkaline, more silica-undersaturated magmas, in-cluding kimberlites and lamproites (Sections 11.5 and13.12.2). These same host magmas also locally containxenoliths of eclogite, a rock of basaltic chemical com-position that consists of a high-P assemblage of mostlygreen clinopyroxene solid solution (jadeite-rich om-phacite) and purple-red Mg-rich (pyropic) garnet (Ap-pendix A). These xenoliths could be derived frombasaltic melts generated and entrapped in the mantleand crystallized to eclogite or from remnants of sub-ducted, recrystallized oceanic crust.
A Brief Digression on Volatiles in Mantle Minerals. Inthe mid-20th century, geologists began to accept thenotion that Cr-diopside peridotite inclusions representsamples of the upper mantle. But as this mantle rockcontains no volatile-bearing minerals, as then thought,Oxburgh (1964) realized that generation of typicallyvolatile-rich alkaline basalt and kimberlite magmasfrom this source would be impossible. Further difficul-ties arise because of the very low concentrations of K, Na, and many other incompatible elements in peri-dotite (Table 11.1); only by very small degrees of par-tial melting could such magmas be generated. Obvi-ously, a source of volatiles and incompatible elementswas needed in the upper mantle. Alternatively, theseCr-diopside peridotite inclusions do not represent thesource of such magmas.
Soon after Oxburgh’s seminal paper, geologists be-gan seeing previously overlooked or ignored amphi-bole, mica, apatite, and other hydrous and volatile-bearing minerals in mantle-derived inclusions. Inaddition to water, amphiboles and micas contain sev-eral tenths of 1 wt.% F and about an order of magni-tude less Cl. And these minerals contain substantialamounts of the missing K, Rb, and other incompatibleelements. Sulfur is sequestered in sulfides that occur insome inclusions. Diamonds and micas contain hun-dreds of parts per million of N. Virtually pure CO2-fluid inclusions occur in mantle olivines. Infrared spec-troscopy reveals that nominally anhydrous olivine,pyroxene, and garnet in upper mantle peridotite actu-ally contain measurable amounts of structurally boundwater as (OH)� or H� (Bell and Rossman, 1992). Gar-nets generally have �60 ppm water but may have asmuch as 200 ppm, pyroxenes mostly 100–600 ppm,and olivines 100 ppm, increasing with depth.
The oxygen fugacity of the upper mantle is com-monly appropriate to stabilize carbonate minerals, suchas magnesite, MgCO3, and dolomite CaMg(CO3)2.During even the most rapid decompression, as in as-cending explosive kimberlite magma, carbonate min-erals quickly decompose with release of CO2; conse-quently, inclusions generally lack this mineral and somethat did have suffered disaggregation so that associated
290 Igneous and Metamorphic Petrology
Table 11.1 Average Worldwide Composition of Garnet Peridotite (Harzburgite) and Spinel Peridotite(Lherzolite) Inclusions
GARNET SPINEL
SiO2 45.00 44.22 Li 1.5 Y 4.4 Mo 0.050TiO2 0.08 0.09 B 0.53 Zr 21 Ru 0.0124Al2O3 1.31 2.28 C 110 Nb 4.8 Pd 0.0039Cr2O3 0.38 0.39 F 88 Ba 33 Ag 0.0068FeOt 6.97 8.47 S 157 La 2.60 Cd 0.041MnO 0.13 0.14 Cl 53 Ce 6.29 In 0.012MgO 44.86 41.60 Sc 12.2 Pr 0.56 Sn 0.054NiO 0.29 0.27 V 56 Nd 2.67 Sb 0.0039CaO 0.77 2.16 Cr 2690 Sm 0.47 Te 0.011Na2O 0.09 0.24 Co 112 Eu 0.16 Cs 0.010K2O 0.10 0.054 Ni 2160 Gd 0.60 W 0.0072P2O5 0.01 0.056 Cu 11 Tb 0.070 Re 0.00013Total 100.00 99.97 Zn 65 Dy 0.51 Os 0.004
Ga 2.4 Ho 0.12 Ir 0.0037Mg-value* 92.0 89.8 Ge 0.96 Er 0.30 Pt 0.007Olivine 68 62 As 0.11 Tm 0.038 Au 0.00065Opx 25 24 Se 0.041 Yb 0.26 Tl 0.0012Cpx 2 12 Br 0.01 Lu 0.043 Pb 0.00016Spinel — 2 Rb 1.9 Hf 0.27 Bi 0.0017Garnet 5 — Sr 49 Ta 0.40 U 0.00012
Major element and calculated modal composition in the first three columns. Trace element composition (in ppm) of spinel peridotite in last sixcolumns.*Mg-value � 100[MgO/(MgO � FeO)] molecular ratio.Data from McDonough (1990).
silicate grains have been dispersed as xenocrysts in thekimberlite.
Mantle volatiles could originate from two sources.Juvenile volatiles were derived from the primeval chon-dritic material from which the planet formed at 4.5 Ga.Volatiles liberated from subducting oceanic crust areintroduced into the overlying mantle and perhaps, bysome means, distributed more widely through themantle. It is estimated that six times more water is in-troduced into the mantle over subducting oceanic crustthan is delivered to the surface of the Earth in subduc-tion-zone volcanism (Thompson, 1992).
Al-Fe-Ti-Rich Clinopyroxene Inclusions. Though not asabundant as Cr-rich diopside inclusions, Al-Fe-Ti-richclinopyroxene inclusions are nonetheless widespread.They are especially significant in containing substantialamounts of volatile-bearing minerals enriched in in-compatible elements (K, Rb, Ti, C, H, etc.). Some con-sist exclusively of volatile phases. These inclusions arepetrographically more variable than Cr-diopside inclu-sions, into which they may locally grade, but are domi-nated by clinopyroxenes rich in Al, Fe, and Ti; becauseof their black, conchoidally fractured aspect in handsamples, these clinopyroxenes resemble obsidian. Modalproportions range widely among the following constit-uent minerals: clinopyroxene, olivine, orthopyroxene,high-Al/Cr spinel, magnetite, ilmenite, rutile, zircon,plagioclase (in low-P inclusions), carbonate minerals,Fe-sulfides, apatite, amphibole, and phlogopite. Notethat the latter five contain volatiles and the latter threeare hydrous. Wehrlites, olivine clinopyroxenites, andpyroxenites are common rock types (Figure 2.10b), to-gether with mica- and amphibole-bearing varieties.Olivines are enriched in Fe and orthopyroxenes in Al,Fe, and Ti relative to these phases in Cr-diopside in-clusions. Textures of inclusions are also variable, butmagmatic ones are common, such as amphibole poiki-litically enclosing other phases. Preservation of mag-matic textures in inclusions suggests crystallizationfrom melts not long before entrainment into the hostmagma; otherwise textural equilibration and develop-ment of metamorphic fabric would be expected to oc-cur at the high T prevailing in the mantle.
Discrete megacrysts, up to several centimeters in di-ameter, of clinopyroxene, olivine, orthopyroxene, high-Al/Cr spinel, magnetite, ilmenite, rutile, zircon, amphi-bole, phlogopite, and plagioclase can occur with orwithout accompanying xenoliths in alkaline mafic hostrocks.
Significantly, Al-Fe-Ti-rich clinopyroxene assem-blages are locally found as veins, to as much as severalcentimeters thick (Plate VI and Figure 11.6a), in Cr-rich diopside peridotite inclusions (e.g., Wilshire et al.,1988). Mineral barometers indicate that some veinedinclusions are derived from depths of at least 170 km in
the mantle. Thicker veins may be the source of discretemegacrysts and xenoliths of the Al-Fe-Ti-rich clinopy-roxene assemblage. Many veins are remarkably planar,indicating that the mantle host rock fractured in a brit-tle manner, probably hydraulically (Section 8.2.1), thenthe liquid hydraulic agent was emplaced into the frac-ture, forming the vein. Similar veins occur in large sub-aerial exposures of peridotite in ophiolite. Multiplegenerations of veins, one or more cutting earlier ones,are locally evident in both ophiolite and inclusions.Wall rock of Cr-diopside peridotite adjacent to a veincan be modified chemically and mineralogically for dis-tances up to as much as several centimeters.
11.2.2 Metasomatized and Enriched Mantle RockSubsolidus modification of the chemical compositionof a rock through the agency of invasive percolating liq-uids is called metasomatism. Rock volume can remainconstant during this open-system replacive metasoma-tism. Two types may be defined: In cryptic metasoma-tism original solid-solution minerals remain but arechanged in composition; for example, original clinopy-roxenes may be made more Fe-rich, but subtle chemi-cal changes may not be obvious, hence the designationcryptic (hidden) metasomatism. In modal metasoma-tism original minerals are replaced by entirely new min-erals; an olivine-orthopyroxene assemblage (harzbur-gite) may be modally metasomatized to a new mineralassemblage of amphibole and clinopyroxene. Obvi-ously, these two types of metasomatism can develop si-multaneously in the same volume of rock; some originalsolid solution mineral compositions can be modifiedand other unstable minerals are replaced by new ones.
Metasomatism has been studied for at least a cen-tury in crustal metamorphic terranes and around oredeposits. However, Bailey (1970) first realized thatxenoliths of Al-Fe-Ti-rich assemblages in alkaline vol-canic rocks are records of mantle metasomatism andthat they have a significant bearing on the generation ofalkaline magmas. The rationale is that some highly al-kaline mafic and ultramafic magmas cannot readily bederived from “normal” mantle of anhydrous, incom-patible element-poor Cr-diopside peridotite. This ster-ile, or infertile, rock has to be metasomatically enrichedin incompatible elements (Figure 11.6) before it can bea viable source of alkaline magmas that are enriched insuch elements (see Section 11.5).
Enrichment details depend on the nature of the liq-uid, composition of the wall rock, and partition coeffi-cients between the metasomatizing liquid and the min-erals in the wall rock. Volatile-bearing minerals createdby modal metasomatism—chiefly phlogopite, amphi-bole, apatite—harbor most of the incompatible ele-ments—K, Ti, Al, Rb, Ba, Sr, H, F, Cl, and light rareearth elements. In their absence, incompatible ele-ments are sequestered in clinopyroxene.
Generation of Magma 291
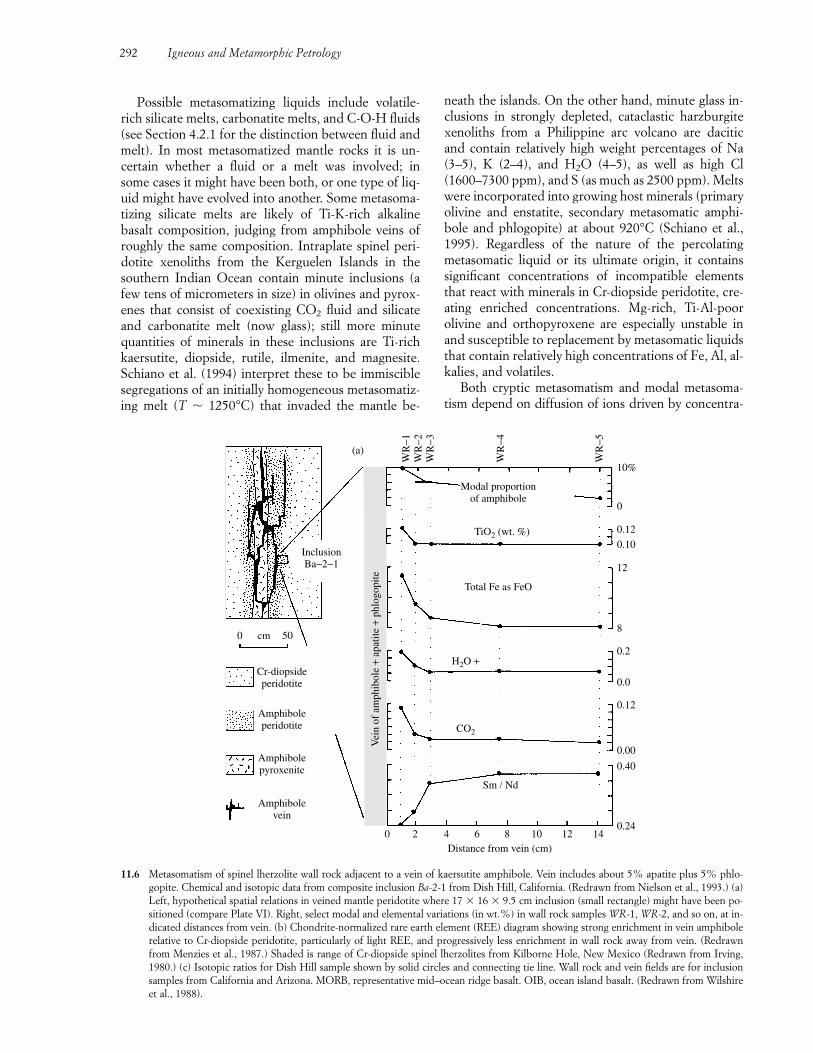
292 Igneous and Metamorphic Petrology
11.6 Metasomatism of spinel lherzolite wall rock adjacent to a vein of kaersutite amphibole. Vein includes about 5% apatite plus 5% phlo-gopite. Chemical and isotopic data from composite inclusion Ba-2-1 from Dish Hill, California. (Redrawn from Nielson et al., 1993.) (a)Left, hypothetical spatial relations in veined mantle peridotite where 17 � 16 � 9.5 cm inclusion (small rectangle) might have been po-sitioned (compare Plate VI). Right, select modal and elemental variations (in wt.%) in wall rock samples WR-1, WR-2, and so on, at in-dicated distances from vein. (b) Chondrite-normalized rare earth element (REE) diagram showing strong enrichment in vein amphibolerelative to Cr-diopside peridotite, particularly of light REE, and progressively less enrichment in wall rock away from vein. (Redrawnfrom Menzies et al., 1987.) Shaded is range of Cr-diopside spinel lherzolites from Kilborne Hole, New Mexico (Redrawn from Irving,1980.) (c) Isotopic ratios for Dish Hill sample shown by solid circles and connecting tie line. Wall rock and vein fields are for inclusionsamples from California and Arizona. MORB, representative mid–ocean ridge basalt. OIB, ocean island basalt. (Redrawn from Wilshireet al., 1988).
Amphibolevein
Amphibolepyroxenite
Amphiboleperidotite
Cr-diopsideperidotite
0 50cm
InclusionBa−2−1
(a)
WR
−1W
R−2
WR
−3
WR
−4
WR
−5
10%
0
0.12
0.10
12
8
0.2
0.0
0.12
0.00
0.40
0.2414121086420
Vei
n of
am
phib
ole
+ ap
atite
+ p
hlog
opite
Modal proportionof amphibole
Total Fe as FeO
H2O +
CO2
TiO2 (wt. %)
Sm / Nd
Distance from vein (cm)
Possible metasomatizing liquids include volatile-rich silicate melts, carbonatite melts, and C-O-H fluids(see Section 4.2.1 for the distinction between fluid andmelt). In most metasomatized mantle rocks it is un-certain whether a fluid or a melt was involved; in some cases it might have been both, or one type of liq-uid might have evolved into another. Some metasoma-tizing silicate melts are likely of Ti-K-rich alkalinebasalt composition, judging from amphibole veins ofroughly the same composition. Intraplate spinel peri-dotite xenoliths from the Kerguelen Islands in thesouthern Indian Ocean contain minute inclusions (afew tens of micrometers in size) in olivines and pyrox-enes that consist of coexisting CO2 fluid and silicateand carbonatite melt (now glass); still more minutequantities of minerals in these inclusions are Ti-richkaersutite, diopside, rutile, ilmenite, and magnesite.Schiano et al. (1994) interpret these to be immisciblesegregations of an initially homogeneous metasomatiz-ing melt (T � 1250°C) that invaded the mantle be-
neath the islands. On the other hand, minute glass in-clusions in strongly depleted, cataclastic harzburgitexenoliths from a Philippine arc volcano are dacitic and contain relatively high weight percentages of Na(3–5), K (2–4), and H2O (4–5), as well as high Cl(1600–7300 ppm), and S (as much as 2500 ppm). Meltswere incorporated into growing host minerals (primaryolivine and enstatite, secondary metasomatic amphi-bole and phlogopite) at about 920°C (Schiano et al.,1995). Regardless of the nature of the percolatingmetasomatic liquid or its ultimate origin, it containssignificant concentrations of incompatible elementsthat react with minerals in Cr-diopside peridotite, cre-ating enriched concentrations. Mg-rich, Ti-Al-poorolivine and orthopyroxene are especially unstable inand susceptible to replacement by metasomatic liquidsthat contain relatively high concentrations of Fe, Al, al-kalies, and volatiles.
Both cryptic metasomatism and modal metasoma-tism depend on diffusion of ions driven by concentra-
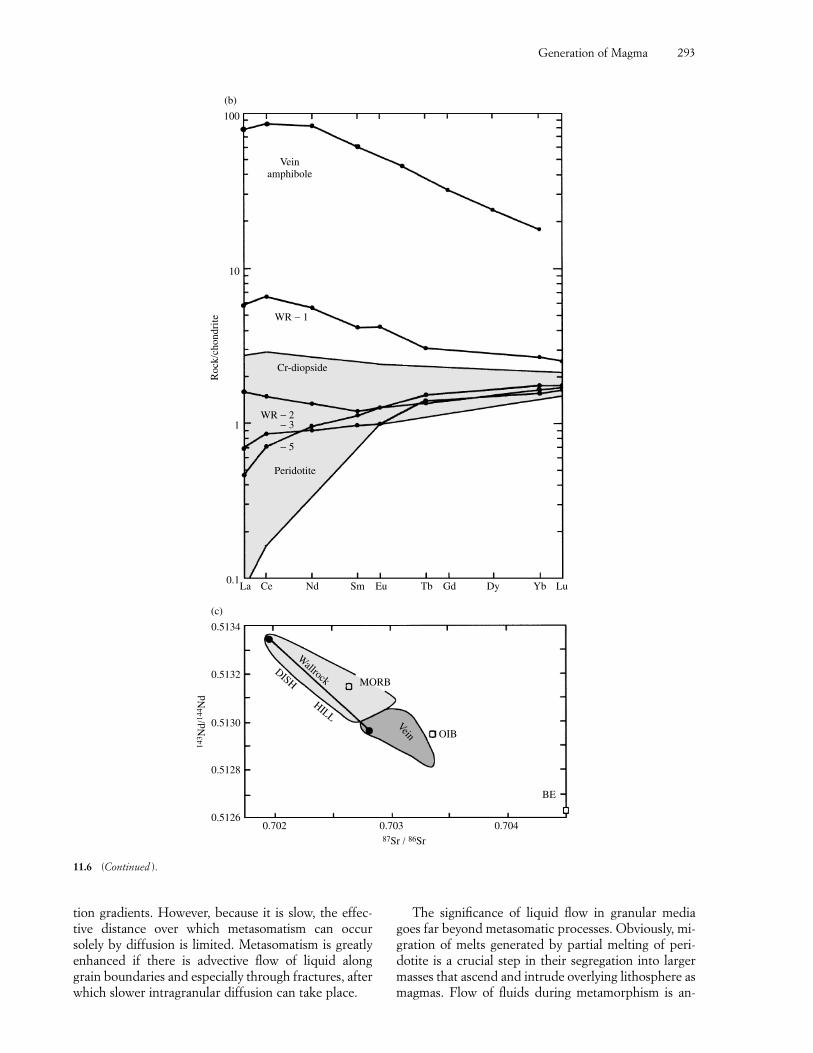
Generation of Magma 293
0.7020.5126
0.5128
0.5130
0.5132
0.5134
0.703 0.70487Sr / 86Sr
143 N
d/14
4 Nd
(c)
La Ce Nd Sm Eu Tb Gd Dy Yb Lu
− 5
− 3 WR − 2
Peridotite
Cr-diopside
WR − 1
Veinamphibole
100
10
1
0.1
Roc
k/ch
ondr
ite
(b)
MORBDISH
HILL
Wallrock
OIB
Vein
BE
11.6 (Continued ).
tion gradients. However, because it is slow, the effec-tive distance over which metasomatism can occursolely by diffusion is limited. Metasomatism is greatlyenhanced if there is advective flow of liquid along grain boundaries and especially through fractures, afterwhich slower intragranular diffusion can take place.
The significance of liquid flow in granular mediagoes far beyond metasomatic processes. Obviously, mi-gration of melts generated by partial melting of peri-dotite is a crucial step in their segregation into largermasses that ascend and intrude overlying lithosphere asmagmas. Flow of fluids during metamorphism is an-
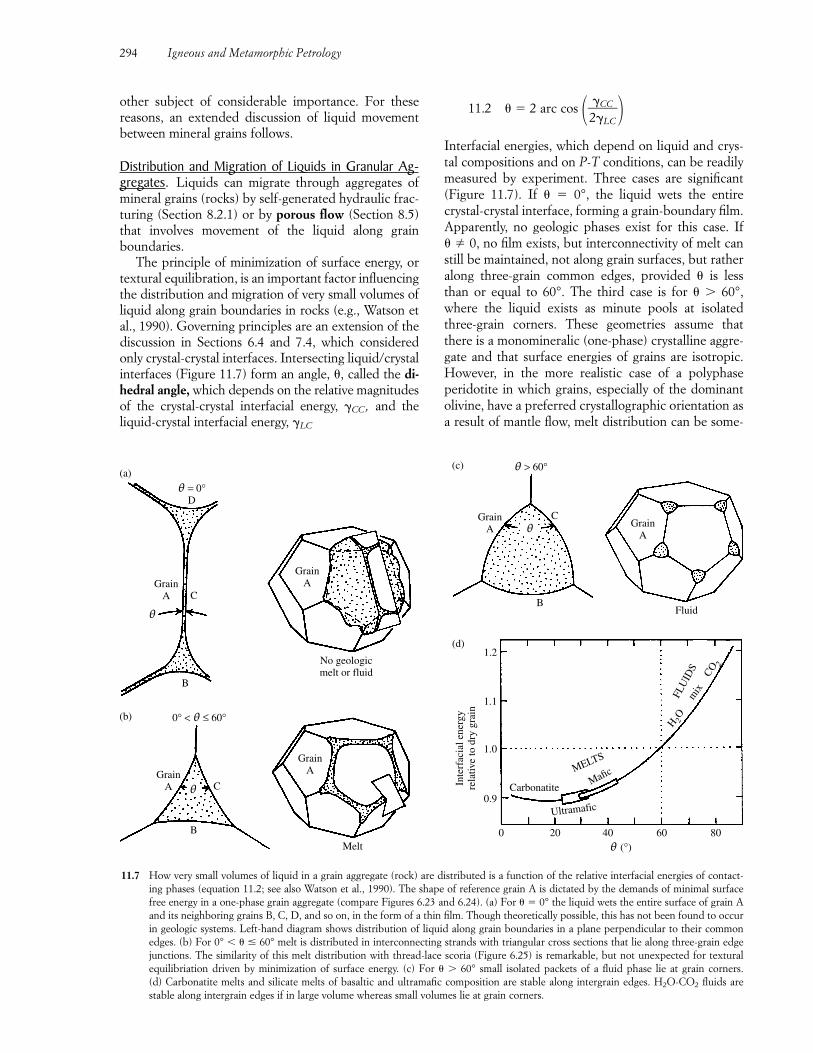
other subject of considerable importance. For thesereasons, an extended discussion of liquid movementbetween mineral grains follows.
Distribution and Migration of Liquids in Granular Ag-gregates. Liquids can migrate through aggregates ofmineral grains (rocks) by self-generated hydraulic frac-turing (Section 8.2.1) or by porous flow (Section 8.5)that involves movement of the liquid along grainboundaries.
The principle of minimization of surface energy, ortextural equilibration, is an important factor influencingthe distribution and migration of very small volumes ofliquid along grain boundaries in rocks (e.g., Watson etal., 1990). Governing principles are an extension of thediscussion in Sections 6.4 and 7.4, which consideredonly crystal-crystal interfaces. Intersecting liquid/crystalinterfaces (Figure 11.7) form an angle, , called the di-hedral angle, which depends on the relative magnitudesof the crystal-crystal interfacial energy, �CC, and the liquid-crystal interfacial energy, �LC
294 Igneous and Metamorphic Petrology
11.7 How very small volumes of liquid in a grain aggregate (rock) are distributed is a function of the relative interfacial energies of contact-ing phases (equation 11.2; see also Watson et al., 1990). The shape of reference grain A is dictated by the demands of minimal surfacefree energy in a one-phase grain aggregate (compare Figures 6.23 and 6.24). (a) For � 0° the liquid wets the entire surface of grain Aand its neighboring grains B, C, D, and so on, in the form of a thin film. Though theoretically possible, this has not been found to occurin geologic systems. Left-hand diagram shows distribution of liquid along grain boundaries in a plane perpendicular to their commonedges. (b) For 0° � � 60° melt is distributed in interconnecting strands with triangular cross sections that lie along three-grain edgejunctions. The similarity of this melt distribution with thread-lace scoria (Figure 6.25) is remarkable, but not unexpected for texturalequilibriation driven by minimization of surface energy. (c) For 60° small isolated packets of a fluid phase lie at grain corners. (d) Carbonatite melts and silicate melts of basaltic and ultramafic composition are stable along intergrain edges. H2O-CO2 fluids are stable along intergrain edges if in large volume whereas small volumes lie at grain corners.
Melt
B
θ CGrain
A
GrainA
0° < θ ≤ 60°
B
θ
GrainA C
θ = 0°D
GrainA
No geologicmelt or fluid
(b)
(a)
0 20 40 60 80θ (°)
0.9
1.0
1.1
1.2
Inte
rfac
ial e
nerg
yre
lativ
e to
dry
gra
in
B
GrainA
C
θ > 60°
θGrain
A
Fluid
FLU
IDS
MELTS
mix
CO 2
Ultramafic
(d)
(c)
Mafic
H 2O
Carbonatite
11.2 � 2 arc cos ��2�
�C
L
C
C��
Interfacial energies, which depend on liquid and crys-tal compositions and on P-T conditions, can be readilymeasured by experiment. Three cases are significant(Figure 11.7). If � 0°, the liquid wets the entire crystal-crystal interface, forming a grain-boundary film.Apparently, no geologic phases exist for this case. If � 0, no film exists, but interconnectivity of melt canstill be maintained, not along grain surfaces, but ratheralong three-grain common edges, provided is lessthan or equal to 60°. The third case is for 60°,where the liquid exists as minute pools at isolatedthree-grain corners. These geometries assume thatthere is a monomineralic (one-phase) crystalline aggre-gate and that surface energies of grains are isotropic.However, in the more realistic case of a polyphaseperidotite in which grains, especially of the dominantolivine, have a preferred crystallographic orientation asa result of mantle flow, melt distribution can be some-
what different from that depicted in Figure 11.7. Per-meabilities (rates of liquid flow; Section 8.5) can begreater in anisotropic fabrics.
Figure 11.7d shows that CO2 fluids are not inter-connected until they make up about 8% of the aggre-gate as isolated pools merge. Water-rich fluids mayhave interconnectivity along three-grain edges. Maficto ultramafic hydrous silicate melts have interconnec-tivity under virtually any upper mantle condition inperidotite even at melt fractions as low as about 1%.Carbonatite melts maintain interconnectivity at meltfractions as low as �0.1%.
Because of their low viscosity, melts are able to infil-trate along grain edges through mantle rock readily inthe process of porous flow (McKenzie, 1985). Theprincipal driving force, at least for larger volumes ofmelt, is the buoyancy of the less-dense melt. However,interconnecting strands of melt along three-grain edgescan actually lower the interfacial energy in a grain aggregate, relative to the melt-free aggregate. Conse-quently, any available melt can be drawn spontaneouslyinto an initially melt-free peridotite, reducing the en-ergy of the system (Watson et al., 1990). Melts proba-bly penetrate along grain boundaries by a coupled dis-solution-precipitation process. Rates of porous flow areon the order of 1 mm/day for basaltic melts and per-haps a couple of orders of magnitude faster for aque-ous fluids if their dihedral angles are �60°. Carbonatitemelts also move fast.
In sheared peridotite xenoliths, grain size has beenreduced and grains stretched into lenticular shapes,creating a penetrative foliation. Any melt in ductilelydeforming peridotite would tend to collect along shearsurfaces where the rate of melt migration might be en-hanced, that is, flow permeability increased, relative toa static, nondeforming rock system.
Metasomatized Subcrustal Lithosphere. It is quite pos-sible that porous flow of liquids, perhaps assisted bythe grain-scale deformation just described, occurs inthe convecting asthenospheric mantle. Very slight par-tial melting (�1%?) of the asthenosphere might createmetasomatizing melts. Where strands of ascendingbuoyant liquids collect to form overpressured volumes,hydraulic fracturing can occur, allowing faster ascent.But because moving liquid of either form carries littleheat relative to the larger mass of wall rock, the melt orfluid readily freezes as veins, unless there is enough vol-ume of melt to continue to ascend as magma. Mantlewedges overlying subducting oceanic plates (Figure11.2) are likely extensively veined (Davies, 1999). Up-permost mantle beneath continental rifts and wheremantle plumes are operative is also likely metasomati-cally veined. After liquid production has ceased be-neath a particular plate, it may begin again during thecourse of changing plate motions. Thick, relatively cool(low-geothermal-gradient) mantle underpinnings of
continents, especially shields that may be as old as theearly Proterozoic, might have been metasomatized tovarying degrees by repeated veining episodes. TheArchean mantle may have been too hot to allow freez-ing of veins. Younger lithosphere in oceanic areas hasalso been metasomatized. This metasomatized sub-crustal or mantle lithosphere, laced as it is with meta-somatic veins, is believed to play a very important rolein the generation of alkaline magmas, especially thehighly alkaline, highly potassic magmas (Section 11.5).
�11.3 GENERATION OF MAGMA IN MANTLE PERIDOTITE
Chapter 5 introduced concepts of the melting of multi-phase silicate rocks based on their crystal-melt equilib-ria. In this section, additional concepts, which relate to generation of a wide range of ultramafic and maficmelts from “normal” mantle sources, that is, Cr-diopside peridotite, are developed.
Although decompression melting is undoubtedlyparamount in generation of basaltic melts from peri-dotite, it is convenient to examine partial melting thataccompanies an increase in T using available T-X phasediagrams to elucidate pertinent concepts. The systemMg2SiO4-CaMgSi2O6-SiO2 under water-saturated con-ditions at P � 20 kbar (Figures 11.8 and 11.9) will beused to model melting. The small amounts of Al, Ti, Fe,Cr, Mn, K, Na, and other minor and trace elements,mainly sequestered in solid solution in clinopyroxene,the small modal amounts of spinel or garnet in naturalperidotites, and amphibole and mica in hydrous peri-dotite, are ignored at this point. The average worldwidespinel lherzolite (Table 11.1) with its somewhat depletedcomposition is used as a model of the source rock.
Generation of a melt that is less than the whole rockis referred to as partial melting. Different types of par-tial melting have been recognized, only two of whichare considered here:1. Equilibrium (batch) partial melting generates a
melt that is in equilibrium with the crystallineresidue as long as the two are in intimate commu-nication and until the melt leaves. Equilibriummelting in a closed system is the reverse of equilib-rium crystallization.
2. Fractional partial melting generates melt that is im-mediately isolated from the crystalline residue; noreaction relations occur between melt and crystals.As it is a disequilibrium process, it is not the reverseof fractional crystallization.
11.3.1 Equilibrium (Batch) Partial Melting of LherzoliteIn Figure 11.9a, the first melt to form with rising T in alherzolite L has a composition at point M. This invari-ant point represents the only possible melt in the
Generation of Magma 295
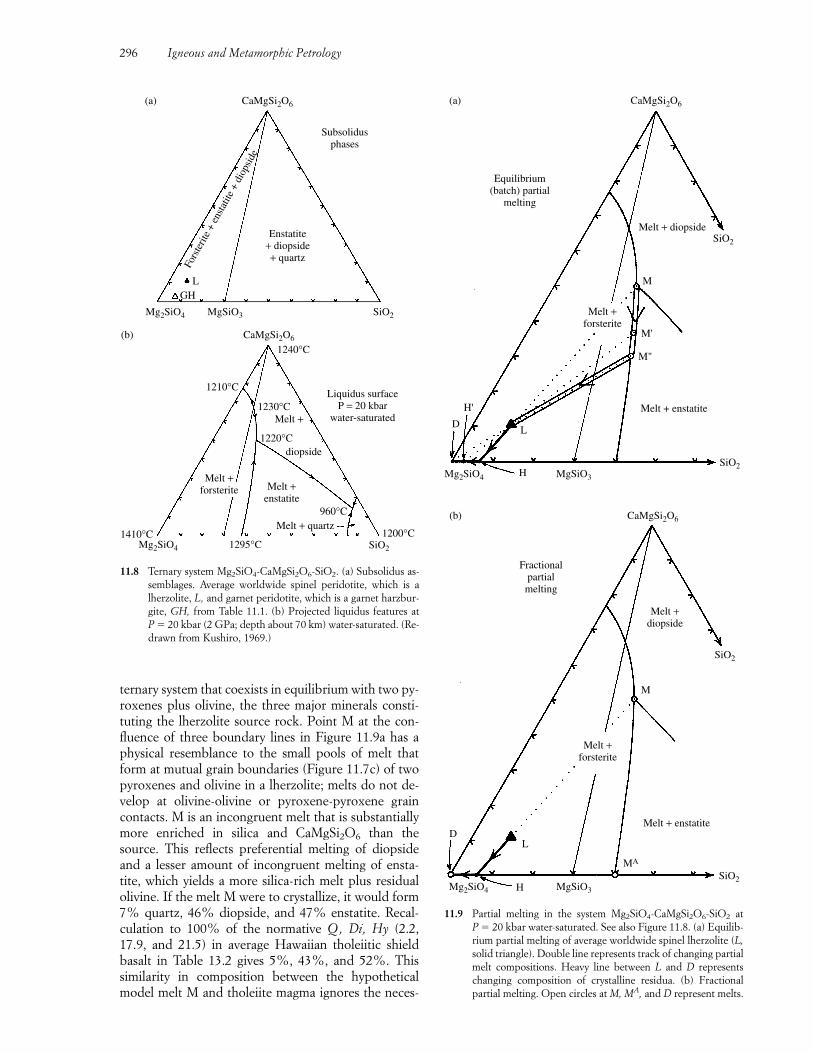
ternary system that coexists in equilibrium with two py-roxenes plus olivine, the three major minerals consti-tuting the lherzolite source rock. Point M at the con-fluence of three boundary lines in Figure 11.9a has aphysical resemblance to the small pools of melt thatform at mutual grain boundaries (Figure 11.7c) of twopyroxenes and olivine in a lherzolite; melts do not de-velop at olivine-olivine or pyroxene-pyroxene graincontacts. M is an incongruent melt that is substantiallymore enriched in silica and CaMgSi2O6 than thesource. This reflects preferential melting of diopsideand a lesser amount of incongruent melting of ensta-tite, which yields a more silica-rich melt plus residualolivine. If the melt M were to crystallize, it would form7% quartz, 46% diopside, and 47% enstatite. Recal-culation to 100% of the normative Q , Di, Hy (2.2,17.9, and 21.5) in average Hawaiian tholeiitic shieldbasalt in Table 13.2 gives 5%, 43%, and 52%. Thissimilarity in composition between the hypotheticalmodel melt M and tholeiite magma ignores the neces-
296 Igneous and Metamorphic Petrology
11.8 Ternary system Mg2SiO4-CaMgSi2O6-SiO2. (a) Subsolidus as-semblages. Average worldwide spinel peridotite, which is alherzolite, L, and garnet peridotite, which is a garnet harzbur-gite, GH, from Table 11.1. (b) Projected liquidus features at P � 20 kbar (2 GPa; depth about 70 km) water-saturated. (Re-drawn from Kushiro, 1969.)
Subsolidusphases
Fors
terit
e +
enst
atite
+ d
iops
ide
LGH
Mg2SiO4 MgSiO3
CaMgSi2O6
SiO2
SiO2Mg2SiO4
CaMgSi2O6
1240°C
1230°C
1220°C
1210°CLiquidus surface
P = 20 kbarwater-saturatedMelt +
Melt +forsterite Melt +
enstatite
Melt + quartz
diopside
960°C
1200°C
Enstatite+ diopside+ quartz
1410°C1295°C
(b)
(a)
11.9 Partial melting in the system Mg2SiO4-CaMgSi2O6-SiO2 at P � 20 kbar water-saturated. See also Figure 11.8. (a) Equilib-rium partial melting of average worldwide spinel lherzolite (L,solid triangle). Double line represents track of changing partialmelt compositions. Heavy line between L and D representschanging composition of crystalline residua. (b) Fractionalpartial melting. Open circles at M, MA, and D represent melts.
DL
Mg2SiO4 MgSiO3
SiO2
MA
Melt +diopside
Melt +forsterite
M
H
SiO2
CaMgSi2O6
Fractionalpartialmelting
(b)
Melt + enstatite
HMg2SiO4 MgSiO3
SiO2
Melt + enstatite
LD
H'
Melt +forsterite
M
M'
M"
Melt + diopsideSiO2
(a)
Equilibrium(batch) partial
melting
CaMgSi2O6
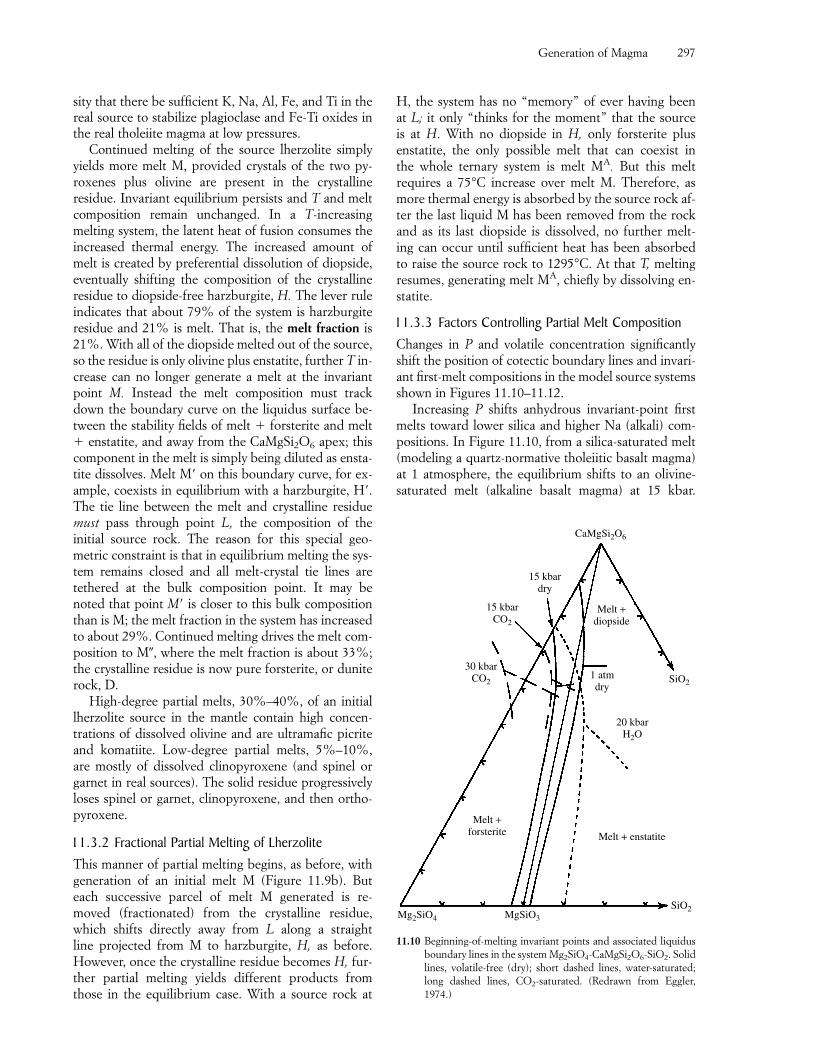
sity that there be sufficient K, Na, Al, Fe, and Ti in thereal source to stabilize plagioclase and Fe-Ti oxides inthe real tholeiite magma at low pressures.
Continued melting of the source lherzolite simplyyields more melt M, provided crystals of the two py-roxenes plus olivine are present in the crystallineresidue. Invariant equilibrium persists and T and meltcomposition remain unchanged. In a T-increasingmelting system, the latent heat of fusion consumes theincreased thermal energy. The increased amount ofmelt is created by preferential dissolution of diopside,eventually shifting the composition of the crystallineresidue to diopside-free harzburgite, H. The lever ruleindicates that about 79% of the system is harzburgiteresidue and 21% is melt. That is, the melt fraction is21%. With all of the diopside melted out of the source,so the residue is only olivine plus enstatite, further T in-crease can no longer generate a melt at the invariantpoint M. Instead the melt composition must trackdown the boundary curve on the liquidus surface be-tween the stability fields of melt � forsterite and melt� enstatite, and away from the CaMgSi2O6 apex; thiscomponent in the melt is simply being diluted as ensta-tite dissolves. Melt M� on this boundary curve, for ex-ample, coexists in equilibrium with a harzburgite, H�.The tie line between the melt and crystalline residuemust pass through point L, the composition of the initial source rock. The reason for this special geo-metric constraint is that in equilibrium melting the sys-tem remains closed and all melt-crystal tie lines aretethered at the bulk composition point. It may benoted that point M� is closer to this bulk compositionthan is M; the melt fraction in the system has increasedto about 29%. Continued melting drives the melt com-position to M�, where the melt fraction is about 33%;the crystalline residue is now pure forsterite, or duniterock, D.
High-degree partial melts, 30%–40%, of an initiallherzolite source in the mantle contain high concen-trations of dissolved olivine and are ultramafic picriteand komatiite. Low-degree partial melts, 5%–10%, are mostly of dissolved clinopyroxene (and spinel orgarnet in real sources). The solid residue progressivelyloses spinel or garnet, clinopyroxene, and then ortho-pyroxene.
11.3.2 Fractional Partial Melting of LherzoliteThis manner of partial melting begins, as before, withgeneration of an initial melt M (Figure 11.9b). Buteach successive parcel of melt M generated is re-moved (fractionated) from the crystalline residue,which shifts directly away from L along a straight line projected from M to harzburgite, H, as before.However, once the crystalline residue becomes H, fur-ther partial melting yields different products fromthose in the equilibrium case. With a source rock at
H, the system has no “memory” of ever having been at L; it only “thinks for the moment” that the source is at H. With no diopside in H, only forsterite plus enstatite, the only possible melt that can coexist in the whole ternary system is melt MA. But this melt requires a 75°C increase over melt M. Therefore, asmore thermal energy is absorbed by the source rock af-ter the last liquid M has been removed from the rockand as its last diopside is dissolved, no further melt-ing can occur until sufficient heat has been absorbed to raise the source rock to 1295°C. At that T, meltingresumes, generating melt MA, chiefly by dissolving en-statite.
11.3.3 Factors Controlling Partial Melt CompositionChanges in P and volatile concentration significantlyshift the position of cotectic boundary lines and invari-ant first-melt compositions in the model source systemsshown in Figures 11.10–11.12.
Increasing P shifts anhydrous invariant-point firstmelts toward lower silica and higher Na (alkali) com-positions. In Figure 11.10, from a silica-saturated melt(modeling a quartz-normative tholeiitic basalt magma)at 1 atmosphere, the equilibrium shifts to an olivine-saturated melt (alkaline basalt magma) at 15 kbar.
Generation of Magma 297
11.10 Beginning-of-melting invariant points and associated liquidusboundary lines in the system Mg2SiO4-CaMgSi2O6-SiO2. Solidlines, volatile-free (dry); short dashed lines, water-saturated;long dashed lines, CO2-saturated. (Redrawn from Eggler,1974.)
Melt +diopside
Melt +forsterite
1 atmdry
20 kbarH2O
15 kbarCO2
30 kbarCO2
15 kbardry
SiO2
Mg2SiO4 MgSiO3
SiO2
CaMgSi2O6
Melt + enstatite
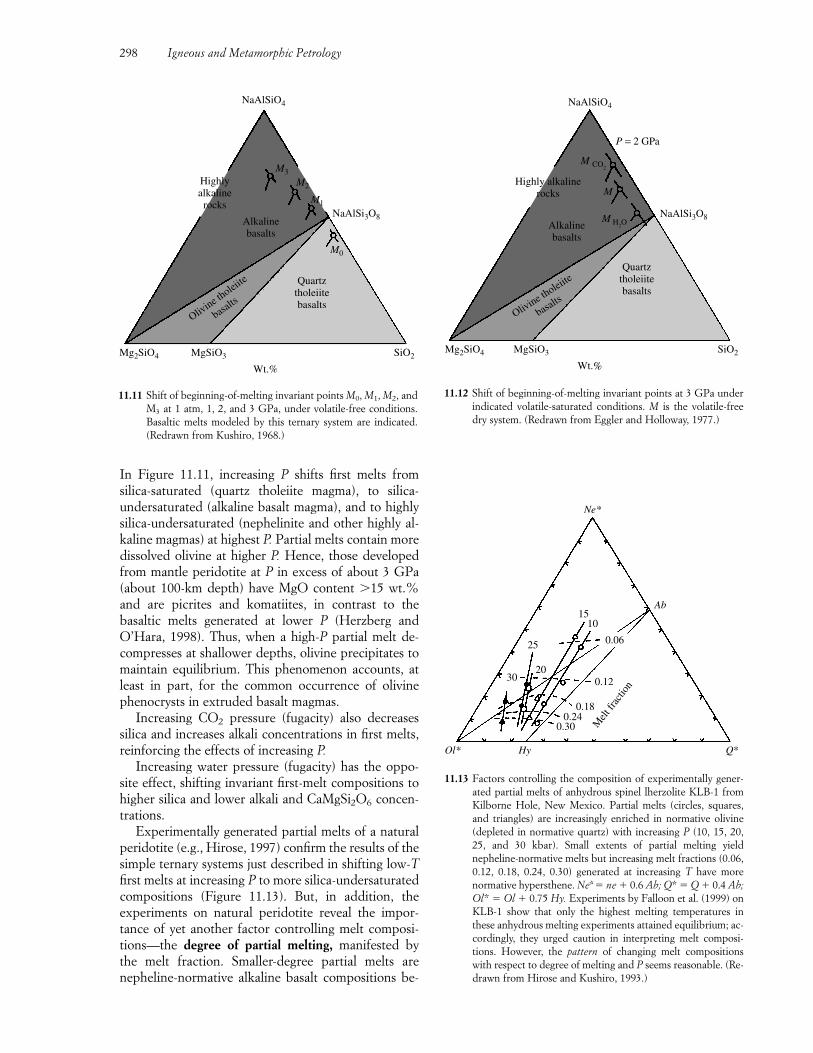
In Figure 11.11, increasing P shifts first melts from silica-saturated (quartz tholeiite magma), to silica-undersaturated (alkaline basalt magma), and to highlysilica-undersaturated (nephelinite and other highly al-kaline magmas) at highest P. Partial melts contain moredissolved olivine at higher P. Hence, those developedfrom mantle peridotite at P in excess of about 3 GPa(about 100-km depth) have MgO content 15 wt.%and are picrites and komatiites, in contrast to thebasaltic melts generated at lower P (Herzberg andO’Hara, 1998). Thus, when a high-P partial melt de-compresses at shallower depths, olivine precipitates tomaintain equilibrium. This phenomenon accounts, atleast in part, for the common occurrence of olivinephenocrysts in extruded basalt magmas.
Increasing CO2 pressure (fugacity) also decreasessilica and increases alkali concentrations in first melts,reinforcing the effects of increasing P.
Increasing water pressure (fugacity) has the oppo-site effect, shifting invariant first-melt compositions tohigher silica and lower alkali and CaMgSi2O6 concen-trations.
Experimentally generated partial melts of a naturalperidotite (e.g., Hirose, 1997) confirm the results of thesimple ternary systems just described in shifting low-Tfirst melts at increasing P to more silica-undersaturatedcompositions (Figure 11.13). But, in addition, the experiments on natural peridotite reveal the impor-tance of yet another factor controlling melt composi-tions—the degree of partial melting, manifested by the melt fraction. Smaller-degree partial melts arenepheline-normative alkaline basalt compositions be-
298 Igneous and Metamorphic Petrology
11.11 Shift of beginning-of-melting invariant points M0, M1, M2, andM3 at 1 atm, 1, 2, and 3 GPa, under volatile-free conditions.Basaltic melts modeled by this ternary system are indicated.(Redrawn from Kushiro, 1968.)
Highlyalkalinerocks
Alkalinebasalts
Quartztholeiitebasalts
Olivine t
holeiite
basalts
M0
M1
M2
M3
NaAlSi3O8
Mg2SiO4 MgSiO3 SiO2
NaAlSiO4
Wt.%
11.12 Shift of beginning-of-melting invariant points at 3 GPa underindicated volatile-saturated conditions. M is the volatile-freedry system. (Redrawn from Eggler and Holloway, 1977.)
Mg2SiO4 MgSiO3 SiO2
Quartztholeiitebasalts
Olivine th
oleiite
basalts
Alkalinebasalts
Highly alkalinerocks
M H2O
M
M CO2
NaAlSiO4
P = 2 GPa
NaAlSi3O8
Wt.%
11.13 Factors controlling the composition of experimentally gener-ated partial melts of anhydrous spinel lherzolite KLB-1 fromKilborne Hole, New Mexico. Partial melts (circles, squares,and triangles) are increasingly enriched in normative olivine(depleted in normative quartz) with increasing P (10, 15, 20,25, and 30 kbar). Small extents of partial melting yieldnepheline-normative melts but increasing melt fractions (0.06,0.12, 0.18, 0.24, 0.30) generated at increasing T have morenormative hypersthene. Ne* � ne � 0.6 Ab; Q* � Q � 0.4 Ab;Ol* � Ol � 0.75 Hy. Experiments by Falloon et al. (1999) onKLB-1 show that only the highest melting temperatures inthese anhydrous melting experiments attained equilibrium; ac-cordingly, they urged caution in interpreting melt composi-tions. However, the pattern of changing melt compositionswith respect to degree of melting and P seems reasonable. (Re-drawn from Hirose and Kushiro, 1993.)
1510
20
25
0.12
0.180.24
0.30 Mel
t fra
ctio
n
Q*Hy
Ab
Ne*
Ol*
30
0.06
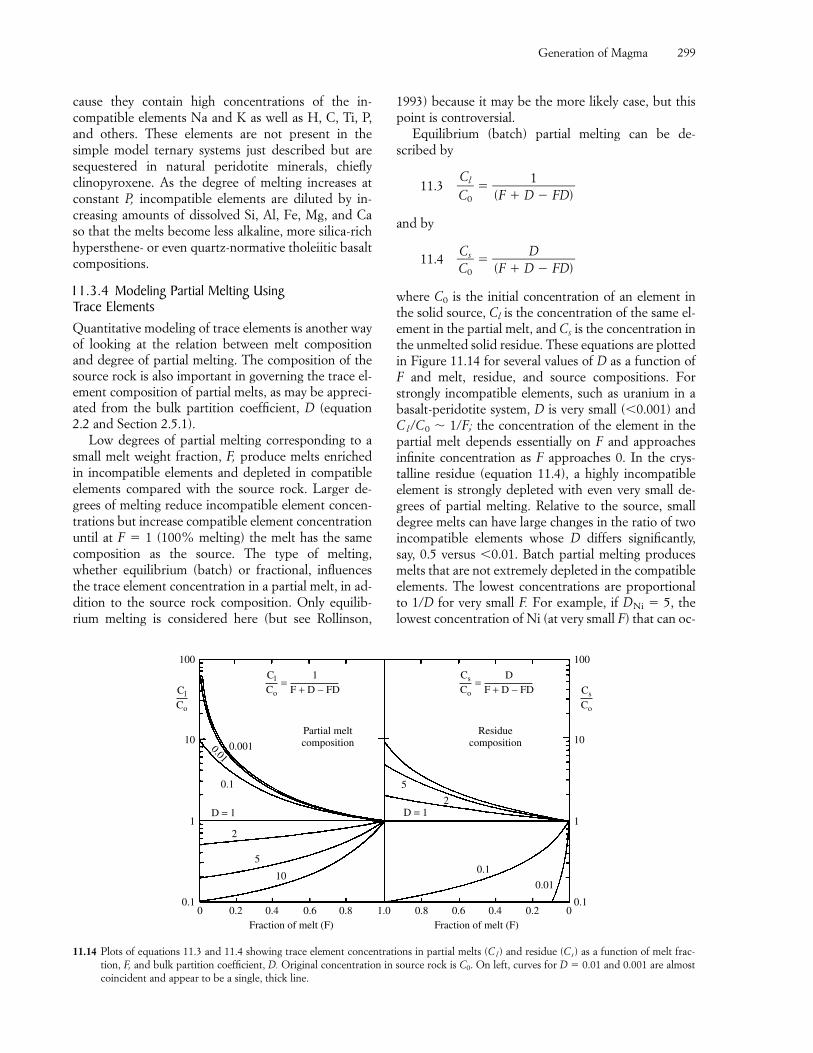
cause they contain high concentrations of the in-compatible elements Na and K as well as H, C, Ti, P,and others. These elements are not present in the simple model ternary systems just described but are sequestered in natural peridotite minerals, chieflyclinopyroxene. As the degree of melting increases atconstant P, incompatible elements are diluted by in-creasing amounts of dissolved Si, Al, Fe, Mg, and Ca so that the melts become less alkaline, more silica-rich hypersthene- or even quartz-normative tholeiitic basaltcompositions.
11.3.4 Modeling Partial Melting Using Trace ElementsQuantitative modeling of trace elements is another wayof looking at the relation between melt compositionand degree of partial melting. The composition of thesource rock is also important in governing the trace el-ement composition of partial melts, as may be appreci-ated from the bulk partition coefficient, D (equation2.2 and Section 2.5.1).
Low degrees of partial melting corresponding to asmall melt weight fraction, F, produce melts enrichedin incompatible elements and depleted in compatibleelements compared with the source rock. Larger de-grees of melting reduce incompatible element concen-trations but increase compatible element concentrationuntil at F � 1 (100% melting) the melt has the samecomposition as the source. The type of melting,whether equilibrium (batch) or fractional, influencesthe trace element concentration in a partial melt, in ad-dition to the source rock composition. Only equilib-rium melting is considered here (but see Rollinson,
1993) because it may be the more likely case, but thispoint is controversial.
Equilibrium (batch) partial melting can be de-scribed by
11.3 �CC
0
l� � �
(F � D1
� FD)�
and by
11.4 �CC
0
s� � �(F � D
D� FD)�
where C0 is the initial concentration of an element inthe solid source, Cl is the concentration of the same el-ement in the partial melt, and Cs is the concentration inthe unmelted solid residue. These equations are plottedin Figure 11.14 for several values of D as a function of F and melt, residue, and source compositions. Forstrongly incompatible elements, such as uranium in abasalt-peridotite system, D is very small (�0.001) andCl/C0 � 1/F; the concentration of the element in thepartial melt depends essentially on F and approachesinfinite concentration as F approaches 0. In the crys-talline residue (equation 11.4), a highly incompatibleelement is strongly depleted with even very small de-grees of partial melting. Relative to the source, smalldegree melts can have large changes in the ratio of twoincompatible elements whose D differs significantly,say, 0.5 versus �0.01. Batch partial melting producesmelts that are not extremely depleted in the compatibleelements. The lowest concentrations are proportionalto 1/D for very small F. For example, if DNi � 5, thelowest concentration of Ni (at very small F) that can oc-
Generation of Magma 299
11.14 Plots of equations 11.3 and 11.4 showing trace element concentrations in partial melts (Cl) and residue (Cs) as a function of melt frac-tion, F, and bulk partition coefficient, D. Original concentration in source rock is C0. On left, curves for D � 0.01 and 0.001 are almostcoincident and appear to be a single, thick line.
Cl
Co
1F + D − FD
=Cl
Co
Cs
Co
Cs
Co
DF + D − FD
=
Residuecomposition
2
5
D = 1
0.1
0.0110
5
2
D = 1
0.1
0.0010.01
Partial meltcomposition
100
10
1
0.1
100
10
1
0.10 0.2 0.4 0.6 0.8 1.0 0.8 0.6 0.4 0.2 0
Fraction of melt (F)Fraction of melt (F)
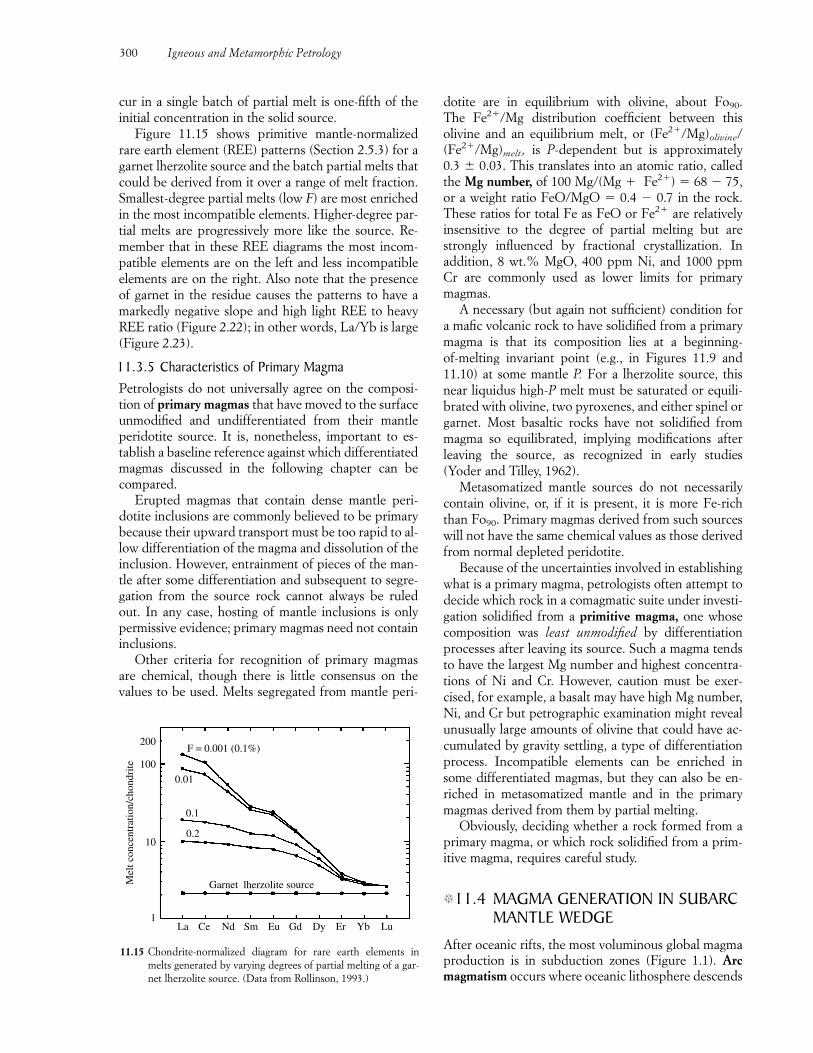
cur in a single batch of partial melt is one-fifth of theinitial concentration in the solid source.
Figure 11.15 shows primitive mantle-normalizedrare earth element (REE) patterns (Section 2.5.3) for agarnet lherzolite source and the batch partial melts thatcould be derived from it over a range of melt fraction.Smallest-degree partial melts (low F) are most enrichedin the most incompatible elements. Higher-degree par-tial melts are progressively more like the source. Re-member that in these REE diagrams the most incom-patible elements are on the left and less incompatibleelements are on the right. Also note that the presenceof garnet in the residue causes the patterns to have amarkedly negative slope and high light REE to heavyREE ratio (Figure 2.22); in other words, La/Yb is large(Figure 2.23).
11.3.5 Characteristics of Primary MagmaPetrologists do not universally agree on the composi-tion of primary magmas that have moved to the surfaceunmodified and undifferentiated from their mantleperidotite source. It is, nonetheless, important to es-tablish a baseline reference against which differentiatedmagmas discussed in the following chapter can be compared.
Erupted magmas that contain dense mantle peri-dotite inclusions are commonly believed to be primarybecause their upward transport must be too rapid to al-low differentiation of the magma and dissolution of theinclusion. However, entrainment of pieces of the man-tle after some differentiation and subsequent to segre-gation from the source rock cannot always be ruledout. In any case, hosting of mantle inclusions is onlypermissive evidence; primary magmas need not containinclusions.
Other criteria for recognition of primary magmasare chemical, though there is little consensus on thevalues to be used. Melts segregated from mantle peri-
dotite are in equilibrium with olivine, about Fo90. The Fe2�/Mg distribution coefficient between thisolivine and an equilibrium melt, or (Fe2�/Mg)olivine/(Fe2�/Mg)melt , is P-dependent but is approximately 0.3 � 0.03. This translates into an atomic ratio, calledthe Mg number, of 100 Mg/(Mg � Fe2�) � 68 � 75,or a weight ratio FeO/MgO � 0.4 � 0.7 in the rock.These ratios for total Fe as FeO or Fe2� are relativelyinsensitive to the degree of partial melting but arestrongly influenced by fractional crystallization. In addition, 8 wt.% MgO, 400 ppm Ni, and 1000 ppm Cr are commonly used as lower limits for primary magmas.
A necessary (but again not sufficient) condition fora mafic volcanic rock to have solidified from a primarymagma is that its composition lies at a beginning-of-melting invariant point (e.g., in Figures 11.9 and11.10) at some mantle P. For a lherzolite source, thisnear liquidus high-P melt must be saturated or equili-brated with olivine, two pyroxenes, and either spinel orgarnet. Most basaltic rocks have not solidified frommagma so equilibrated, implying modifications afterleaving the source, as recognized in early studies (Yoder and Tilley, 1962).
Metasomatized mantle sources do not necessarilycontain olivine, or, if it is present, it is more Fe-richthan Fo90. Primary magmas derived from such sourceswill not have the same chemical values as those derivedfrom normal depleted peridotite.
Because of the uncertainties involved in establishingwhat is a primary magma, petrologists often attempt todecide which rock in a comagmatic suite under investi-gation solidified from a primitive magma, one whosecomposition was least unmodified by differentiationprocesses after leaving its source. Such a magma tendsto have the largest Mg number and highest concentra-tions of Ni and Cr. However, caution must be exer-cised, for example, a basalt may have high Mg number,Ni, and Cr but petrographic examination might revealunusually large amounts of olivine that could have ac-cumulated by gravity settling, a type of differentiationprocess. Incompatible elements can be enriched insome differentiated magmas, but they can also be en-riched in metasomatized mantle and in the primarymagmas derived from them by partial melting.
Obviously, deciding whether a rock formed from aprimary magma, or which rock solidified from a prim-itive magma, requires careful study.
�11.4 MAGMA GENERATION IN SUBARC MANTLE WEDGE
After oceanic rifts, the most voluminous global magmaproduction is in subduction zones (Figure 1.1). Arcmagmatism occurs where oceanic lithosphere descends
300 Igneous and Metamorphic Petrology
11.15 Chondrite-normalized diagram for rare earth elements inmelts generated by varying degrees of partial melting of a gar-net lherzolite source. (Data from Rollinson, 1993.)
F = 0.001 (0.1%)
0.01
0.1
0.2
Garnet lherzolite source
200
100
10
1
Mel
t con
cent
ratio
n/ch
ondr
ite
La Ce Nd Sm Eu Gd Dy Er Yb Lu
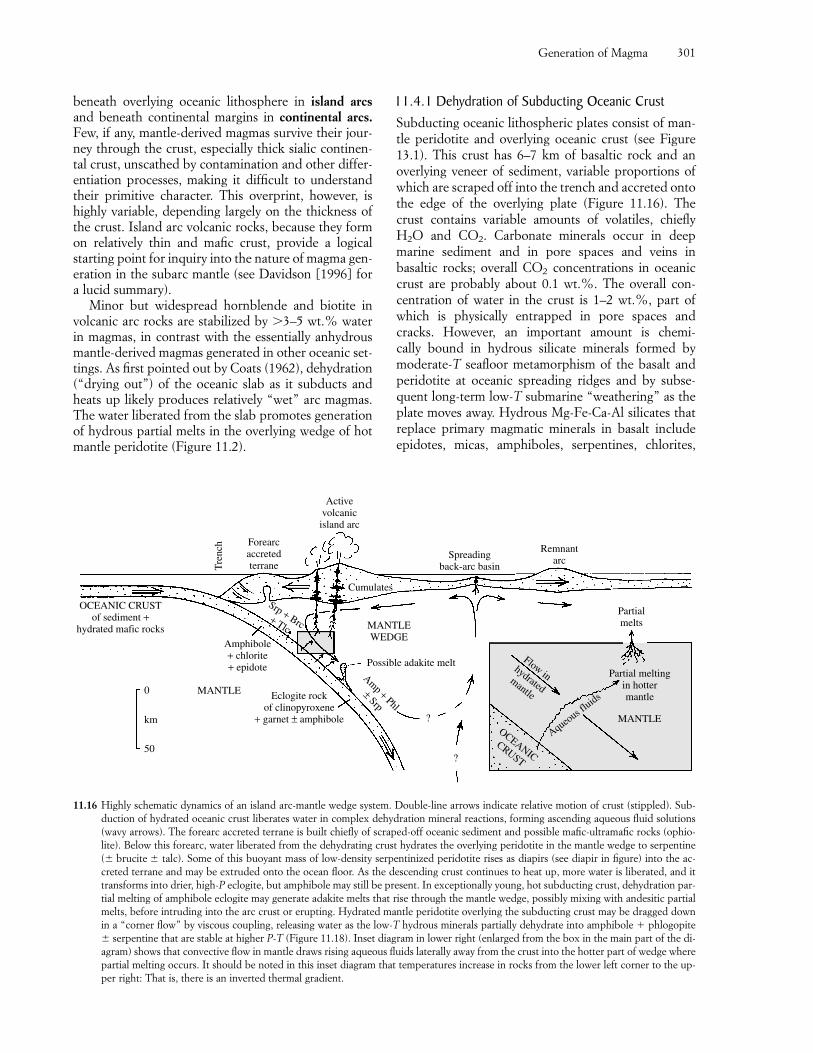
11.4.1 Dehydration of Subducting Oceanic CrustSubducting oceanic lithospheric plates consist of man-tle peridotite and overlying oceanic crust (see Figure13.1). This crust has 6–7 km of basaltic rock and anoverlying veneer of sediment, variable proportions ofwhich are scraped off into the trench and accreted ontothe edge of the overlying plate (Figure 11.16). Thecrust contains variable amounts of volatiles, chieflyH2O and CO2. Carbonate minerals occur in deep marine sediment and in pore spaces and veins inbasaltic rocks; overall CO2 concentrations in oceaniccrust are probably about 0.1 wt.%. The overall con-centration of water in the crust is 1–2 wt.%, part ofwhich is physically entrapped in pore spaces andcracks. However, an important amount is chemi-cally bound in hydrous silicate minerals formed bymoderate-T seafloor metamorphism of the basalt andperidotite at oceanic spreading ridges and by subse-quent long-term low-T submarine “weathering” as theplate moves away. Hydrous Mg-Fe-Ca-Al silicates thatreplace primary magmatic minerals in basalt includeepidotes, micas, amphiboles, serpentines, chlorites,
Generation of Magma 301
beneath overlying oceanic lithosphere in island arcsand beneath continental margins in continental arcs.Few, if any, mantle-derived magmas survive their jour-ney through the crust, especially thick sialic continen-tal crust, unscathed by contamination and other differ-entiation processes, making it difficult to understandtheir primitive character. This overprint, however, ishighly variable, depending largely on the thickness ofthe crust. Island arc volcanic rocks, because they formon relatively thin and mafic crust, provide a logicalstarting point for inquiry into the nature of magma gen-eration in the subarc mantle (see Davidson [1996] fora lucid summary).
Minor but widespread hornblende and biotite involcanic arc rocks are stabilized by 3–5 wt.% waterin magmas, in contrast with the essentially anhydrousmantle-derived magmas generated in other oceanic set-tings. As first pointed out by Coats (1962), dehydration(“drying out”) of the oceanic slab as it subducts andheats up likely produces relatively “wet” arc magmas.The water liberated from the slab promotes generationof hydrous partial melts in the overlying wedge of hotmantle peridotite (Figure 11.2).
11.16 Highly schematic dynamics of an island arc-mantle wedge system. Double-line arrows indicate relative motion of crust (stippled). Sub-duction of hydrated oceanic crust liberates water in complex dehydration mineral reactions, forming ascending aqueous fluid solutions(wavy arrows). The forearc accreted terrane is built chiefly of scraped-off oceanic sediment and possible mafic-ultramafic rocks (ophio-lite). Below this forearc, water liberated from the dehydrating crust hydrates the overlying peridotite in the mantle wedge to serpentine(� brucite � talc). Some of this buoyant mass of low-density serpentinized peridotite rises as diapirs (see diapir in figure) into the ac-creted terrane and may be extruded onto the ocean floor. As the descending crust continues to heat up, more water is liberated, and ittransforms into drier, high-P eclogite, but amphibole may still be present. In exceptionally young, hot subducting crust, dehydration par-tial melting of amphibole eclogite may generate adakite melts that rise through the mantle wedge, possibly mixing with andesitic partialmelts, before intruding into the arc crust or erupting. Hydrated mantle peridotite overlying the subducting crust may be dragged downin a “corner flow” by viscous coupling, releasing water as the low-T hydrous minerals partially dehydrate into amphibole � phlogopite� serpentine that are stable at higher P-T (Figure 11.18). Inset diagram in lower right (enlarged from the box in the main part of the di-agram) shows that convective flow in mantle draws rising aqueous fluids laterally away from the crust into the hotter part of wedge wherepartial melting occurs. It should be noted in this inset diagram that temperatures increase in rocks from the lower left corner to the up-per right: That is, there is an inverted thermal gradient.
0
km
50
MANTLE Eclogite rockof clinopyroxene
+ garnet ± amphibole
Amphibole+ chlorite+ epidote
OCEANIC CRUSTof sediment +
hydrated mafic rocks
Tre
nch Forearc
accretedterrane
Activevolcanicisland arc
Spreadingback-arc basin
Remnantarc
Partialmelts
Partial meltingin hottermantle
MANTLEAqueo
us fluids
Flow inhydrated
mantle
OCEANICCRUST?
?
Amp + Phl± Srp
Srp + Brc+ Tlc
Cumulates
Possible adakite melt
MANTLEWEDGE

302 Igneous and Metamorphic Petrology
chloritoid, prehnite, pumpellyite, talc, lawsonite, zeo-lites, and clay minerals. As the crust is compressed andslowly heated during subduction, physically entrappedwater is first released at a depth probably not exceed-ing several kilometers. During further descent andheating, a series of endothermic, subsolidus dehydra-tion reactions (Section 5.7.2 and Figure 5.31b) are“smeared” over a considerable range of T, P (depth),and volatile fugacities, progressively liberating waterfrom the hydrous minerals (e.g., Liu et al., 1996). Thesmearing results from extensive solid solution in thehydrous phases, like the melting of plagioclase solid so-lutions that takes place over a range of T (Figure 5.13).P-T paths that a subducting slab take through time arehighly variable, making generalizations difficult.
The major factor governing the depth of volatile min-eral decomposition in subducting slabs is their thermalstate (T distribution). For example, dehydration occursat shallower depths in hotter slabs. This thermal statedepends on many factors (Peacock et al., 1994):1. The age of the incoming slab. Young lithosphere
from a nearby spreading ridge is hotter.2. The mass of previously subducted lithosphere. Pre-
viously cooled asthenosphere cannot heat the slabas fast.
3. Intensity of shear heating along the margins of the
enough to recycle the entire mass of the oceansonce every 5 My!
2. Seafloor hot springs support a unique biologicalcommunity that is a factor in the global foodchain.
3. The circulation system impacts the chemicalcomposition of ocean water. Sinks and sourcesof mineral components are influenced by crust-seawater interactions. Components added byrivers and precipitated in marine sediments arenot the only governing factors, as once thought.
4. Minerals, such as chalcopyrite (CuFeS2) andsphalerite (ZnS), are deposited on the seafloor asthe hydrothermal solutions cool at black smokervents. Because of seafloor spreading, these po-tentially economic deposits are included in on-land ophiolite (Section 13.6) or are processed inthe subduction “factory” where plates converge.
5. Primary anhydrous minerals in the mafic and ul-tramafic rocks of the oceanic lithosphere aretransformed by seafloor metamorphism into hy-drous, more oxidized minerals. As these hy-drated rocks are heated in subducting slabs, theliberated water promotes magma generation inthe overlying mantle wedge and is, therefore,chiefly responsible for global arc magmatism—the second most prolific on Earth (Figure 1.1).
Special Interest Box 11.3 Significance of theradiator on the front of the global magma engine
Sampling of oceanic lithosphere reveals wide-spread and locally intense alteration of the rocks atspreading ridges by seawater advecting throughpervasive fractures. As it traverses through the hotcrust, the seawater is heated and dissolves high con-centrations of various mineral components from thehot rock. Where vented back into the ocean at T asmuch as 350�C these hydrothermal solutions form“black smokers” (Figure 11.17). Advective circula-tion of seawater at oceanic ridges has the followingmajor impacts on global geology:1. Circulation acts as a gigantic “radiator on the
front of the global magma engine” (Sigurdssonet al., 2000, p. 5), providing for significant dissi-pation of heat from the interior of the Earth. Itis estimated that seawater advects through thehot crust at a rate of about 1.5 � 1014 kg/y, or
11.17 Black smoker venting from a hot spring on the East PacificRise at a water depth of about 3 km. Dark-gray plume car-ries high concentrations of minute mineral precipitates, in-cluding Cu-Fe-Zn sulfides. Photograph taken by Robert D.Ballard from the deep submersible Alvin and furnishedcourtesy of Woods Hole Oceanographic Institution.
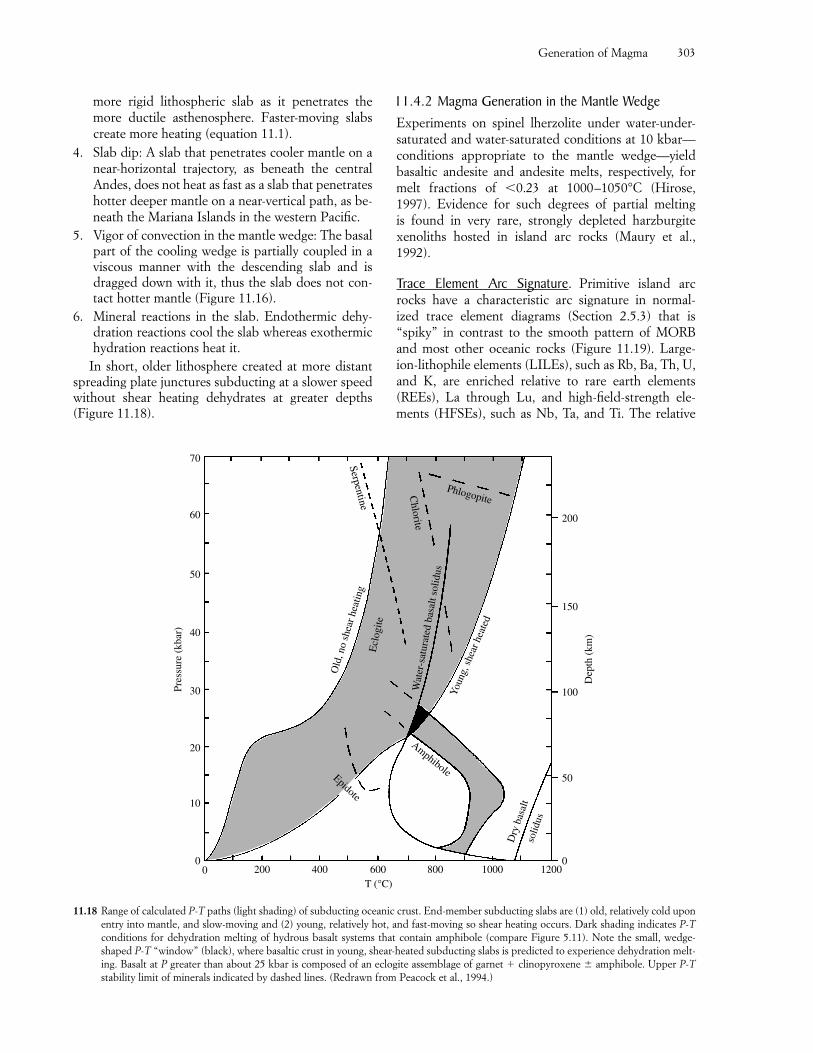
Generation of Magma 303
more rigid lithospheric slab as it penetrates themore ductile asthenosphere. Faster-moving slabscreate more heating (equation 11.1).
4. Slab dip: A slab that penetrates cooler mantle on anear-horizontal trajectory, as beneath the centralAndes, does not heat as fast as a slab that penetrateshotter deeper mantle on a near-vertical path, as be-neath the Mariana Islands in the western Pacific.
5. Vigor of convection in the mantle wedge: The basalpart of the cooling wedge is partially coupled in aviscous manner with the descending slab and isdragged down with it, thus the slab does not con-tact hotter mantle (Figure 11.16).
6. Mineral reactions in the slab. Endothermic dehy-dration reactions cool the slab whereas exothermichydration reactions heat it.
In short, older lithosphere created at more distantspreading plate junctures subducting at a slower speedwithout shear heating dehydrates at greater depths(Figure 11.18).
11.4.2 Magma Generation in the Mantle WedgeExperiments on spinel lherzolite under water-under-saturated and water-saturated conditions at 10 kbar—conditions appropriate to the mantle wedge—yieldbasaltic andesite and andesite melts, respectively, formelt fractions of �0.23 at 1000–1050°C (Hirose,1997). Evidence for such degrees of partial melting is found in very rare, strongly depleted harzburgitexenoliths hosted in island arc rocks (Maury et al.,1992).
Trace Element Arc Signature. Primitive island arcrocks have a characteristic arc signature in normal-ized trace element diagrams (Section 2.5.3) that is“spiky” in contrast to the smooth pattern of MORBand most other oceanic rocks (Figure 11.19). Large-ion-lithophile elements (LILEs), such as Rb, Ba, Th, U,and K, are enriched relative to rare earth elements(REEs), La through Lu, and high-field-strength ele-ments (HFSEs), such as Nb, Ta, and Ti. The relative
11.18 Range of calculated P-T paths (light shading) of subducting oceanic crust. End-member subducting slabs are (1) old, relatively cold uponentry into mantle, and slow-moving and (2) young, relatively hot, and fast-moving so shear heating occurs. Dark shading indicates P-Tconditions for dehydration melting of hydrous basalt systems that contain amphibole (compare Figure 5.11). Note the small, wedge-shaped P-T “window” (black), where basaltic crust in young, shear-heated subducting slabs is predicted to experience dehydration melt-ing. Basalt at P greater than about 25 kbar is composed of an eclogite assemblage of garnet � clinopyroxene � amphibole. Upper P-Tstability limit of minerals indicated by dashed lines. (Redrawn from Peacock et al., 1994.)
Serpentine
Chlorite
Phlogopite
Wat
er-s
atur
ated
bas
alt s
olid
us
Ecl
ogite
Old
, no
shea
r hea
ting
You
ng, s
hear
hea
ted
Dry
bas
alt
solid
us
AmphiboleEpidote
70
60
50
40
Pres
sure
(kb
ar)
30
20
10
00 200 400 600 800 1000 1200
0
50
100
150
200
Dep
th (
km)
T (°C)
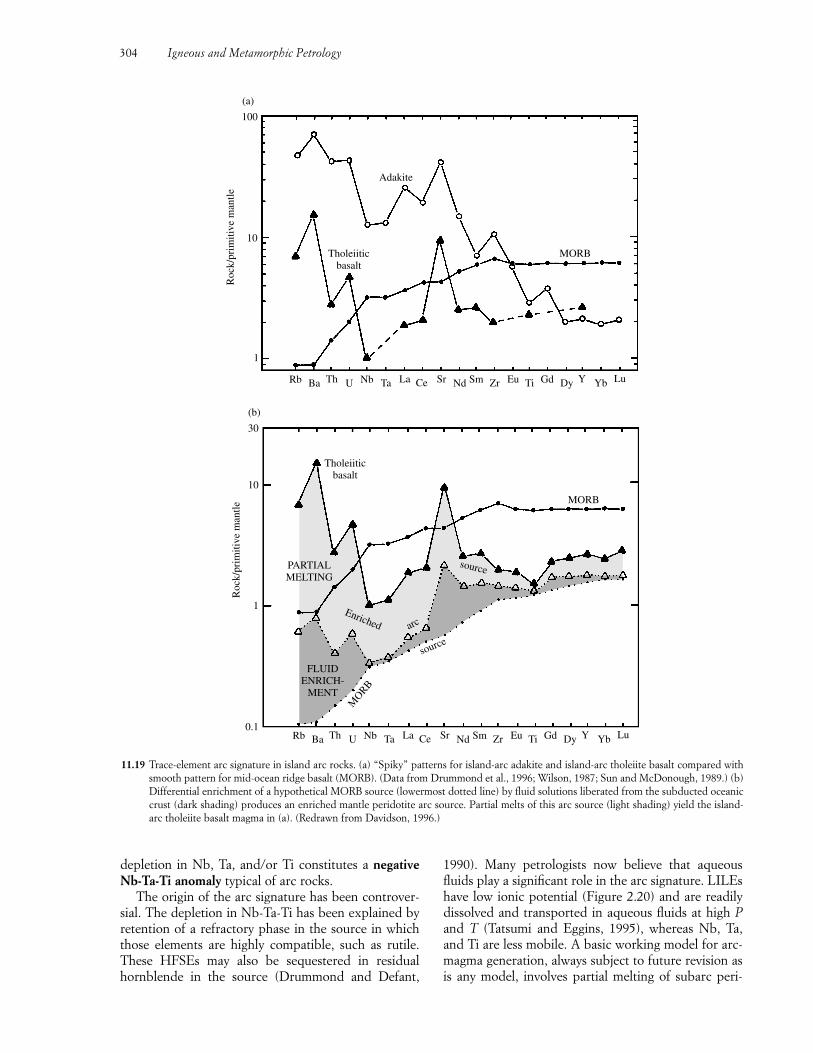
304 Igneous and Metamorphic Petrology
depletion in Nb, Ta, and/or Ti constitutes a negativeNb-Ta-Ti anomaly typical of arc rocks.
The origin of the arc signature has been controver-sial. The depletion in Nb-Ta-Ti has been explained byretention of a refractory phase in the source in whichthose elements are highly compatible, such as rutile.These HFSEs may also be sequestered in residualhornblende in the source (Drummond and Defant,
1990). Many petrologists now believe that aqueousfluids play a significant role in the arc signature. LILEshave low ionic potential (Figure 2.20) and are readilydissolved and transported in aqueous fluids at high Pand T (Tatsumi and Eggins, 1995), whereas Nb, Ta,and Ti are less mobile. A basic working model for arc-magma generation, always subject to future revision asis any model, involves partial melting of subarc peri-
11.19 Trace-element arc signature in island arc rocks. (a) “Spiky” patterns for island-arc adakite and island-arc tholeiite basalt compared withsmooth pattern for mid-ocean ridge basalt (MORB). (Data from Drummond et al., 1996; Wilson, 1987; Sun and McDonough, 1989.) (b)Differential enrichment of a hypothetical MORB source (lowermost dotted line) by fluid solutions liberated from the subducted oceaniccrust (dark shading) produces an enriched mantle peridotite arc source. Partial melts of this arc source (light shading) yield the island-arc tholeiite basalt magma in (a). (Redrawn from Davidson, 1996.)
Adakite
Tholeiiticbasalt
MORB
(a)
100
10R
ock/
prim
itive
man
tle
1
Rb Ba Th U Nb Ta La Ce Sr Nd Sm Zr Eu Ti Gd Dy Y Yb Lu
Rb Ba Th U Nb Ta La Ce Sr Nd Sm Zr Eu Ti Gd Dy Y Yb Lu0.1
1
10
30
Tholeiiticbasalt
PARTIALMELTING
Enriched
FLUIDENRICH-
MENT
MORB
arc
source
source
MORB
Roc
k/pr
imiti
ve m
antle
(b)
Generation of Magma 305
dotite that has been metasomatically enriched in themore soluble ions (Figure 11.19b). Dissolved compo-nents might be from the slab with possible additionsscavenged from the subarc wedge. Migrating silicatemelts do not have these selective element preferencesand therefore, if present, cannot dominate as metaso-matizing agents.
Whether oceanic sediment contributes to arc mag-mas has also been controversial. However, significantamounts (to as much as 100 ppm) of boron (B) in arcrocks and the discovery of cosmogenic 10Be (Section2.6.3) in some of them have proved that at least somesediment is subducted (e.g., Leeman, 1996) and may bemelted in some arcs. B is enriched in ocean-floor sedi-ment and altered oceanic crust, whereas in mantlerocks it is �1 ppm. B is sequestered in clay and otherphyllosilicate minerals and is quite mobile in aqueousfluids created as these minerals are heated in the sub-ducting slab and liberate water. Be is like B in manyways and the near-uniformity of 10Be/B ratios within aparticular arc suggests that the two elements are gov-erned by the same process that transfers matter fromthe slab to the mantle wedge. B abundances and10Be/B ratios decrease in arc rocks away from thetrench, consistent with progressive scavenging of B andBe from the slab during its descent.
11.4.3 Partial Melting of Subducted Basaltic Oceanic Crust: AdakiteIn the early days of the plate tectonic “revolution” itwas believed by many geologists that melting of thesubducted basaltic crust yielded the copious volumesof magmas manifested in this regime. However, it wassoon realized that the overlying water-fluxed perido-tite wedge provided a more viable magma source.Nonetheless, theoretical studies revealed a small “win-dow” in P-T-time-composition space where partialmelting of subducted basaltic crust might occur inyoung, hot slabs. Figure 11.18 indicates a range of P-Tpaths that subducting plates might take. Only theyoungest and, therefore, hottest lithosphere descend-ing rapidly, therefore inducing greatest shear heating, isexpected to experience partial melting. At the other extreme, old lithosphere created at distant spreadingridges subducting at a slow speed without shear heat-ing follows a path far below the T of even a water-saturated basalt solidus. The basaltic crust in whichpartial melting is likely to occur has been mostly dehy-drated and converted to a high-P hydrous eclogitic as-semblage of pyropic garnet, jadeitic clinopyroxene, andamphibole (Figure 5.11).
The search for candidate rocks in arcs where thesubducting slab is �25 Ma and might represent par-tial melts of this amphibole-bearing eclogite assem-blage has focused on adakite, named for Adak Islandin the Aleutian arc. Adakite is basically a dacite, lo-
cally an andesite, having unusually high concentra-tions of Al2O3 (17 wt.%), Na, Sr, and Eu, but lowMg, Ti, Nd, Y, Yb, and 87Sr/86Sr relative to the wide-spread andesite-dacite-rhyolite suite in subductionzones (Drummond et al., 1996). The high Sr and Eusuggest a lack of plagioclase in the source or no frac-tionation of this phase. The elevated light REE/heavy
Special Interest Box 11.4 Catalina schist: An exposed sample of the crust-mantle wedge interface
The discussion in Section 11.4 regarding hydra-tion of the subarc mantle wedge, associated metaso-matism, and partial melting in it and the basalticcrust is largely based on inference. However, expo-sures on Santa Catalina Island southwest of Los An-geles, California, are consistent with the nature ofthe inferred crust-mantle wedge interface and af-ford an opportunity for verification by real rocks(Sorensen, 1988).
The rocks show clear evidence for fluid migra-tion, metasomatism, and partial melting, althoughmineral barometers indicate these processes oc-curred at shallower depths (approximately 30 km)than those generally inferred (Figure 11.18). Therocks are part of an accreted terrane in the Creta-ceous forearc of coastal California formed whereoceanic lithosphere was subducted beneath thecontinent (Figure 11.16) and subsequently upliftedto the surface. Structurally lowest rocks metamor-phosed at lowest T are overlain by rocks metamor-phosed at increasing T; this thermally inverted (rel-ative to a normal geothermal gradient) sequence ispresumed to be a sample of the crust-mantle wedgeinterface (see inset diagram in Figure 11.16). Meta-morphosed gabbros and overlying seafloor clayrocks represent a segment of the oceanic crust.Overlying these is what appears to be a segment ofthe mantle wedge that consists of metasomatizedperidotite and enclosed amphibole-eclogite blocksof tholeiitic basalt composition. The metasomatizedperidotite consists of combinations of enstatite, an-thophyllite, tremolite, talc, and quartz that indi-cate addition of water and Si and loss of Mg fromthe initial rock. (Widespread lower-T serpentine re-places these minerals.) The high-T hydration meta-somatism culminated in partial melting of thebasaltic rocks, producing thin dikes, stringers, andlarger pods of plagioclase � quartz � muscovite.Had the partial melting occurred at T �20 kbar ormore (70 km; see Figure 11.18), partial meltswould have been adakitic (trondhjemitic) in com-position.
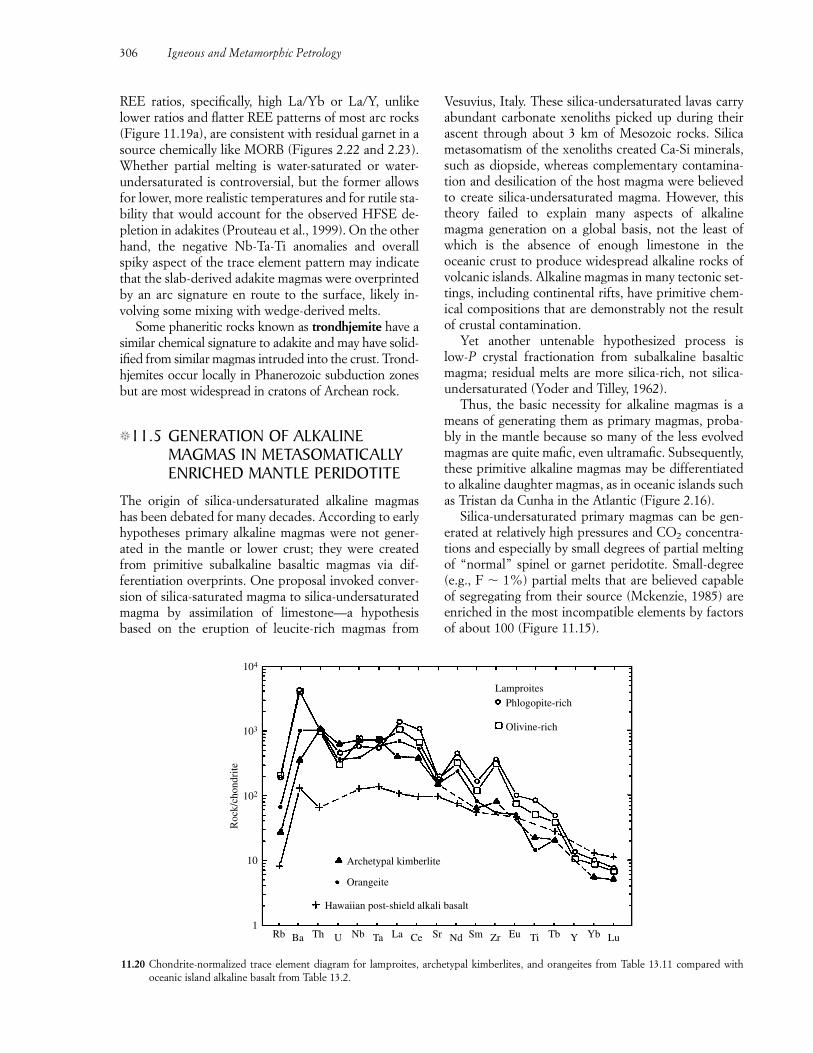
306 Igneous and Metamorphic Petrology
REE ratios, specifically, high La/Yb or La/Y, unlikelower ratios and flatter REE patterns of most arc rocks(Figure 11.19a), are consistent with residual garnet in asource chemically like MORB (Figures 2.22 and 2.23).Whether partial melting is water-saturated or water-undersaturated is controversial, but the former allowsfor lower, more realistic temperatures and for rutile sta-bility that would account for the observed HFSE de-pletion in adakites (Prouteau et al., 1999). On the otherhand, the negative Nb-Ta-Ti anomalies and overallspiky aspect of the trace element pattern may indicatethat the slab-derived adakite magmas were overprintedby an arc signature en route to the surface, likely in-volving some mixing with wedge-derived melts.
Some phaneritic rocks known as trondhjemite have asimilar chemical signature to adakite and may have solid-ified from similar magmas intruded into the crust. Trond-hjemites occur locally in Phanerozoic subduction zonesbut are most widespread in cratons of Archean rock.
�11.5 GENERATION OF ALKALINE MAGMAS IN METASOMATICALLY ENRICHED MANTLE PERIDOTITE
The origin of silica-undersaturated alkaline magmashas been debated for many decades. According to earlyhypotheses primary alkaline magmas were not gener-ated in the mantle or lower crust; they were createdfrom primitive subalkaline basaltic magmas via dif-ferentiation overprints. One proposal invoked conver-sion of silica-saturated magma to silica-undersaturatedmagma by assimilation of limestone—a hypothesisbased on the eruption of leucite-rich magmas from
Vesuvius, Italy. These silica-undersaturated lavas carryabundant carbonate xenoliths picked up during theirascent through about 3 km of Mesozoic rocks. Silicametasomatism of the xenoliths created Ca-Si minerals,such as diopside, whereas complementary contamina-tion and desilication of the host magma were believedto create silica-undersaturated magma. However, thistheory failed to explain many aspects of alkalinemagma generation on a global basis, not the least ofwhich is the absence of enough limestone in theoceanic crust to produce widespread alkaline rocks ofvolcanic islands. Alkaline magmas in many tectonic set-tings, including continental rifts, have primitive chem-ical compositions that are demonstrably not the resultof crustal contamination.
Yet another untenable hypothesized process islow-P crystal fractionation from subalkaline basalticmagma; residual melts are more silica-rich, not silica-undersaturated (Yoder and Tilley, 1962).
Thus, the basic necessity for alkaline magmas is ameans of generating them as primary magmas, proba-bly in the mantle because so many of the less evolvedmagmas are quite mafic, even ultramafic. Subsequently,these primitive alkaline magmas may be differentiatedto alkaline daughter magmas, as in oceanic islands suchas Tristan da Cunha in the Atlantic (Figure 2.16).
Silica-undersaturated primary magmas can be gen-erated at relatively high pressures and CO2 concentra-tions and especially by small degrees of partial meltingof “normal” spinel or garnet peridotite. Small-degree(e.g., F � 1%) partial melts that are believed capableof segregating from their source (Mckenzie, 1985) areenriched in the most incompatible elements by factorsof about 100 (Figure 11.15).
11.20 Chondrite-normalized trace element diagram for lamproites, archetypal kimberlites, and orangeites from Table 13.11 compared withoceanic island alkaline basalt from Table 13.2.
LamproitesPhlogopite-rich
Olivine-rich
Archetypal kimberlite
Orangeite
Hawaiian post-shield alkali basalt
Rb Ba Th U Nb Ta La Ce Sr Nd Sm Zr Eu Ti Tb Y Yb Lu1
10
102
103
104
Roc
k/ch
ondr
ite
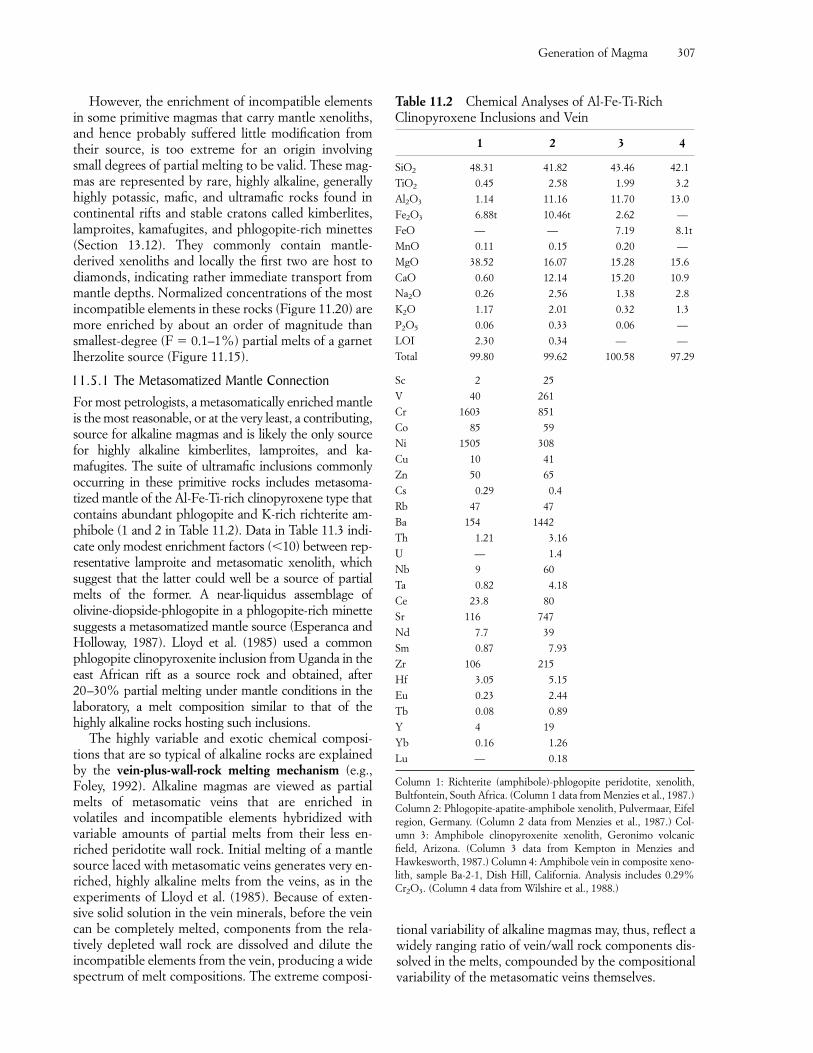
Generation of Magma 307
However, the enrichment of incompatible elementsin some primitive magmas that carry mantle xenoliths,and hence probably suffered little modification fromtheir source, is too extreme for an origin involvingsmall degrees of partial melting to be valid. These mag-mas are represented by rare, highly alkaline, generallyhighly potassic, mafic, and ultramafic rocks found incontinental rifts and stable cratons called kimberlites,lamproites, kamafugites, and phlogopite-rich minettes(Section 13.12). They commonly contain mantle-derived xenoliths and locally the first two are host todiamonds, indicating rather immediate transport frommantle depths. Normalized concentrations of the mostincompatible elements in these rocks (Figure 11.20) aremore enriched by about an order of magnitude thansmallest-degree (F � 0.1–1%) partial melts of a garnetlherzolite source (Figure 11.15).
11.5.1 The Metasomatized Mantle ConnectionFor most petrologists, a metasomatically enriched mantleis the most reasonable, or at the very least, a contributing,source for alkaline magmas and is likely the only sourcefor highly alkaline kimberlites, lamproites, and ka-mafugites. The suite of ultramafic inclusions commonlyoccurring in these primitive rocks includes metasoma-tized mantle of the Al-Fe-Ti-rich clinopyroxene type thatcontains abundant phlogopite and K-rich richterite am-phibole (1 and 2 in Table 11.2). Data in Table 11.3 indi-cate only modest enrichment factors (�10) between rep-resentative lamproite and metasomatic xenolith, whichsuggest that the latter could well be a source of partialmelts of the former. A near-liquidus assemblage ofolivine-diopside-phlogopite in a phlogopite-rich minettesuggests a metasomatized mantle source (Esperanca andHolloway, 1987). Lloyd et al. (1985) used a common phlogopite clinopyroxenite inclusion from Uganda in theeast African rift as a source rock and obtained, after20–30% partial melting under mantle conditions in thelaboratory, a melt composition similar to that of thehighly alkaline rocks hosting such inclusions.
The highly variable and exotic chemical composi-tions that are so typical of alkaline rocks are explainedby the vein-plus-wall-rock melting mechanism (e.g.,Foley, 1992). Alkaline magmas are viewed as partialmelts of metasomatic veins that are enriched involatiles and incompatible elements hybridized withvariable amounts of partial melts from their less en-riched peridotite wall rock. Initial melting of a mantlesource laced with metasomatic veins generates very en-riched, highly alkaline melts from the veins, as in theexperiments of Lloyd et al. (1985). Because of exten-sive solid solution in the vein minerals, before the veincan be completely melted, components from the rela-tively depleted wall rock are dissolved and dilute theincompatible elements from the vein, producing a widespectrum of melt compositions. The extreme composi-
tional variability of alkaline magmas may, thus, reflect awidely ranging ratio of vein/wall rock components dis-solved in the melts, compounded by the compositionalvariability of the metasomatic veins themselves.
Table 11.2 Chemical Analyses of Al-Fe-Ti-RichClinopyroxene Inclusions and Vein
1 2 3 4
SiO2 48.31 41.82 43.46 42.1TiO2 0.45 2.58 1.99 3.2Al2O3 1.14 11.16 11.70 13.0Fe2O3 6.88t 10.46t 2.62 —FeO — — 7.19 8.1tMnO 0.11 0.15 0.20 —MgO 38.52 16.07 15.28 15.6CaO 0.60 12.14 15.20 10.9Na2O 0.26 2.56 1.38 2.8K2O 1.17 2.01 0.32 1.3P2O5 0.06 0.33 0.06 —LOI 2.30 0.34 — —Total 99.80 99.62 100.58 97.29
Sc 2 25V 40 261Cr 1603 851Co 85 59Ni 1505 308Cu 10 41Zn 50 65Cs 0.29 0.4Rb 47 47Ba 154 1442Th 1.21 3.16U — 1.4Nb 9 60Ta 0.82 4.18Ce 23.8 80Sr 116 747Nd 7.7 39Sm 0.87 7.93Zr 106 215Hf 3.05 5.15Eu 0.23 2.44Tb 0.08 0.89Y 4 19Yb 0.16 1.26
Lu — 0.18
Column 1: Richterite (amphibole)-phlogopite peridotite, xenolith,Bultfontein, South Africa. (Column 1 data from Menzies et al., 1987.)Column 2: Phlogopite-apatite-amphibole xenolith, Pulvermaar, Eifelregion, Germany. (Column 2 data from Menzies et al., 1987.) Col-umn 3: Amphibole clinopyroxenite xenolith, Geronimo volcanicfield, Arizona. (Column 3 data from Kempton in Menzies andHawkesworth, 1987.) Column 4: Amphibole vein in composite xeno-lith, sample Ba-2-1, Dish Hill, California. Analysis includes 0.29%Cr2O3. (Column 4 data from Wilshire et al., 1988.)
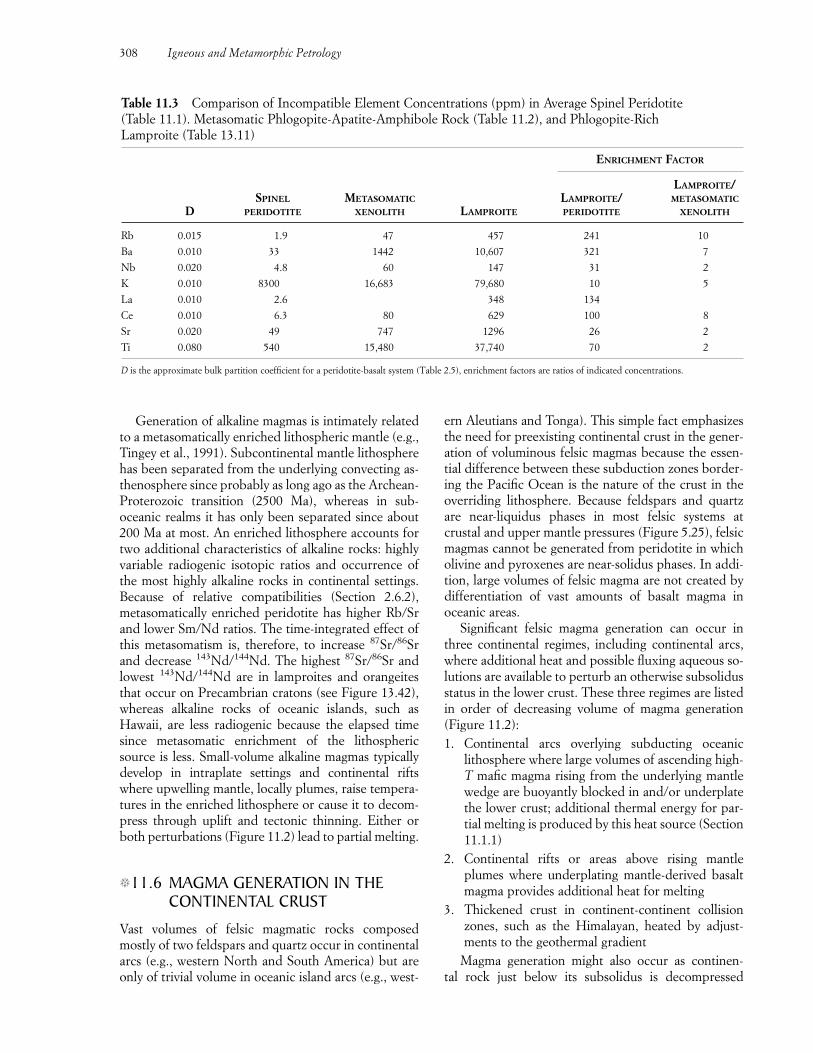
308 Igneous and Metamorphic Petrology
Table 11.3 Comparison of Incompatible Element Concentrations (ppm) in Average Spinel Peridotite(Table 11.1). Metasomatic Phlogopite-Apatite-Amphibole Rock (Table 11.2), and Phlogopite-Rich Lamproite (Table 13.11)
ENRICHMENT FACTOR
LAMPROITE/SPINEL METASOMATIC LAMPROITE/ METASOMATIC
D PERIDOTITE XENOLITH LAMPROITE PERIDOTITE XENOLITH
Rb 0.015 1.9 47 457 241 10
Ba 0.010 33 1442 10,607 321 7
Nb 0.020 4.8 60 147 31 2
K 0.010 8300 16,683 79,680 10 5
La 0.010 2.6 348 134
Ce 0.010 6.3 80 629 100 8
Sr 0.020 49 747 1296 26 2
Ti 0.080 540 15,480 37,740 70 2
D is the approximate bulk partition coefficient for a peridotite-basalt system (Table 2.5), enrichment factors are ratios of indicated concentrations.
ern Aleutians and Tonga). This simple fact emphasizesthe need for preexisting continental crust in the gener-ation of voluminous felsic magmas because the essen-tial difference between these subduction zones border-ing the Pacific Ocean is the nature of the crust in theoverriding lithosphere. Because feldspars and quartzare near-liquidus phases in most felsic systems atcrustal and upper mantle pressures (Figure 5.25), felsicmagmas cannot be generated from peridotite in whicholivine and pyroxenes are near-solidus phases. In addi-tion, large volumes of felsic magma are not created bydifferentiation of vast amounts of basalt magma inoceanic areas.
Significant felsic magma generation can occur inthree continental regimes, including continental arcs,where additional heat and possible fluxing aqueous so-lutions are available to perturb an otherwise subsolidusstatus in the lower crust. These three regimes are listedin order of decreasing volume of magma generation(Figure 11.2):1. Continental arcs overlying subducting oceanic
lithosphere where large volumes of ascending high-T mafic magma rising from the underlying mantlewedge are buoyantly blocked in and/or underplatethe lower crust; additional thermal energy for par-tial melting is produced by this heat source (Section11.1.1)
2. Continental rifts or areas above rising mantleplumes where underplating mantle-derived basaltmagma provides additional heat for melting
3. Thickened crust in continent-continent collisionzones, such as the Himalayan, heated by adjust-ments to the geothermal gradient
Magma generation might also occur as continen-tal rock just below its subsolidus is decompressed
Generation of alkaline magmas is intimately relatedto a metasomatically enriched lithospheric mantle (e.g.,Tingey et al., 1991). Subcontinental mantle lithospherehas been separated from the underlying convecting as-thenosphere since probably as long ago as the Archean-Proterozoic transition (2500 Ma), whereas in sub-oceanic realms it has only been separated since about200 Ma at most. An enriched lithosphere accounts fortwo additional characteristics of alkaline rocks: highlyvariable radiogenic isotopic ratios and occurrence ofthe most highly alkaline rocks in continental settings.Because of relative compatibilities (Section 2.6.2),metasomatically enriched peridotite has higher Rb/Srand lower Sm/Nd ratios. The time-integrated effect ofthis metasomatism is, therefore, to increase 87Sr/86Srand decrease 143Nd/144Nd. The highest 87Sr/86Sr andlowest 143Nd/144Nd are in lamproites and orangeitesthat occur on Precambrian cratons (see Figure 13.42),whereas alkaline rocks of oceanic islands, such asHawaii, are less radiogenic because the elapsed timesince metasomatic enrichment of the lithosphericsource is less. Small-volume alkaline magmas typicallydevelop in intraplate settings and continental riftswhere upwelling mantle, locally plumes, raise tempera-tures in the enriched lithosphere or cause it to decom-press through uplift and tectonic thinning. Either orboth perturbations (Figure 11.2) lead to partial melting.
�11.6 MAGMA GENERATION IN THECONTINENTAL CRUST
Vast volumes of felsic magmatic rocks composedmostly of two feldspars and quartz occur in continentalarcs (e.g., western North and South America) but areonly of trivial volume in oceanic island arcs (e.g., west-
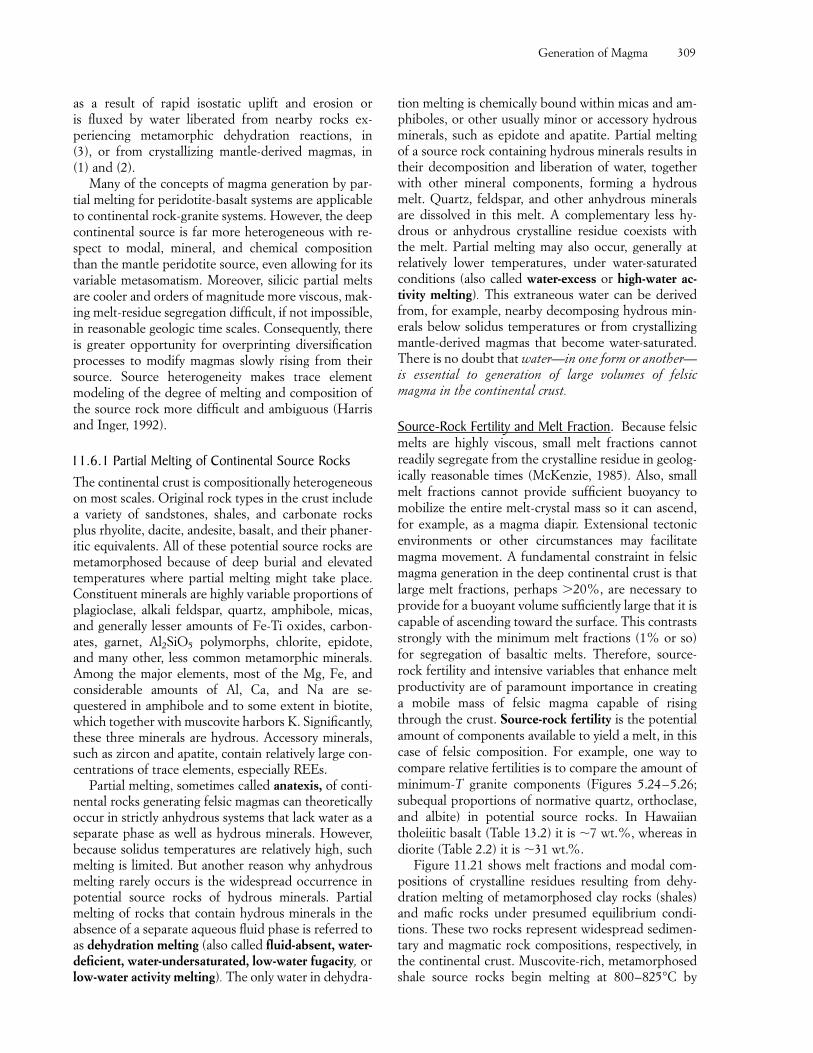
Generation of Magma 309
as a result of rapid isostatic uplift and erosion or is fluxed by water liberated from nearby rocks ex-periencing metamorphic dehydration reactions, in (3), or from crystallizing mantle-derived magmas, in (1) and (2).
Many of the concepts of magma generation by par-tial melting for peridotite-basalt systems are applicableto continental rock-granite systems. However, the deepcontinental source is far more heterogeneous with re-spect to modal, mineral, and chemical compositionthan the mantle peridotite source, even allowing for itsvariable metasomatism. Moreover, silicic partial meltsare cooler and orders of magnitude more viscous, mak-ing melt-residue segregation difficult, if not impossible,in reasonable geologic time scales. Consequently, thereis greater opportunity for overprinting diversificationprocesses to modify magmas slowly rising from theirsource. Source heterogeneity makes trace elementmodeling of the degree of melting and composition ofthe source rock more difficult and ambiguous (Harrisand Inger, 1992).
11.6.1 Partial Melting of Continental Source RocksThe continental crust is compositionally heterogeneouson most scales. Original rock types in the crust includea variety of sandstones, shales, and carbonate rocksplus rhyolite, dacite, andesite, basalt, and their phaner-itic equivalents. All of these potential source rocks aremetamorphosed because of deep burial and elevatedtemperatures where partial melting might take place.Constituent minerals are highly variable proportions ofplagioclase, alkali feldspar, quartz, amphibole, micas,and generally lesser amounts of Fe-Ti oxides, carbon-ates, garnet, Al2SiO5 polymorphs, chlorite, epidote,and many other, less common metamorphic minerals.Among the major elements, most of the Mg, Fe, andconsiderable amounts of Al, Ca, and Na are se-questered in amphibole and to some extent in biotite,which together with muscovite harbors K. Significantly,these three minerals are hydrous. Accessory minerals,such as zircon and apatite, contain relatively large con-centrations of trace elements, especially REEs.
Partial melting, sometimes called anatexis, of conti-nental rocks generating felsic magmas can theoreticallyoccur in strictly anhydrous systems that lack water as aseparate phase as well as hydrous minerals. However,because solidus temperatures are relatively high, suchmelting is limited. But another reason why anhydrousmelting rarely occurs is the widespread occurrence inpotential source rocks of hydrous minerals. Partialmelting of rocks that contain hydrous minerals in theabsence of a separate aqueous fluid phase is referred toas dehydration melting (also called fluid-absent, water-deficient, water-undersaturated, low-water fugacity, orlow-water activity melting). The only water in dehydra-
tion melting is chemically bound within micas and am-phiboles, or other usually minor or accessory hydrousminerals, such as epidote and apatite. Partial melting of a source rock containing hydrous minerals results intheir decomposition and liberation of water, togetherwith other mineral components, forming a hydrousmelt. Quartz, feldspar, and other anhydrous mineralsare dissolved in this melt. A complementary less hy-drous or anhydrous crystalline residue coexists withthe melt. Partial melting may also occur, generally atrelatively lower temperatures, under water-saturatedconditions (also called water-excess or high-water ac-tivity melting). This extraneous water can be derivedfrom, for example, nearby decomposing hydrous min-erals below solidus temperatures or from crystallizingmantle-derived magmas that become water-saturated.There is no doubt that water—in one form or another—is essential to generation of large volumes of felsicmagma in the continental crust.
Source-Rock Fertility and Melt Fraction. Because felsicmelts are highly viscous, small melt fractions cannotreadily segregate from the crystalline residue in geolog-ically reasonable times (McKenzie, 1985). Also, smallmelt fractions cannot provide sufficient buoyancy tomobilize the entire melt-crystal mass so it can ascend,for example, as a magma diapir. Extensional tectonicenvironments or other circumstances may facilitatemagma movement. A fundamental constraint in felsicmagma generation in the deep continental crust is thatlarge melt fractions, perhaps 20%, are necessary toprovide for a buoyant volume sufficiently large that it iscapable of ascending toward the surface. This contrastsstrongly with the minimum melt fractions (1% or so)for segregation of basaltic melts. Therefore, source-rock fertility and intensive variables that enhance meltproductivity are of paramount importance in creating a mobile mass of felsic magma capable of risingthrough the crust. Source-rock fertility is the potentialamount of components available to yield a melt, in thiscase of felsic composition. For example, one way tocompare relative fertilities is to compare the amount ofminimum-T granite components (Figures 5.24–5.26;subequal proportions of normative quartz, orthoclase,and albite) in potential source rocks. In Hawaiiantholeiitic basalt (Table 13.2) it is �7 wt.%, whereas indiorite (Table 2.2) it is �31 wt.%.
Figure 11.21 shows melt fractions and modal com-positions of crystalline residues resulting from dehy-dration melting of metamorphosed clay rocks (shales)and mafic rocks under presumed equilibrium condi-tions. These two rocks represent widespread sedimen-tary and magmatic rock compositions, respectively, inthe continental crust. Muscovite-rich, metamorphosedshale source rocks begin melting at 800–825°C by
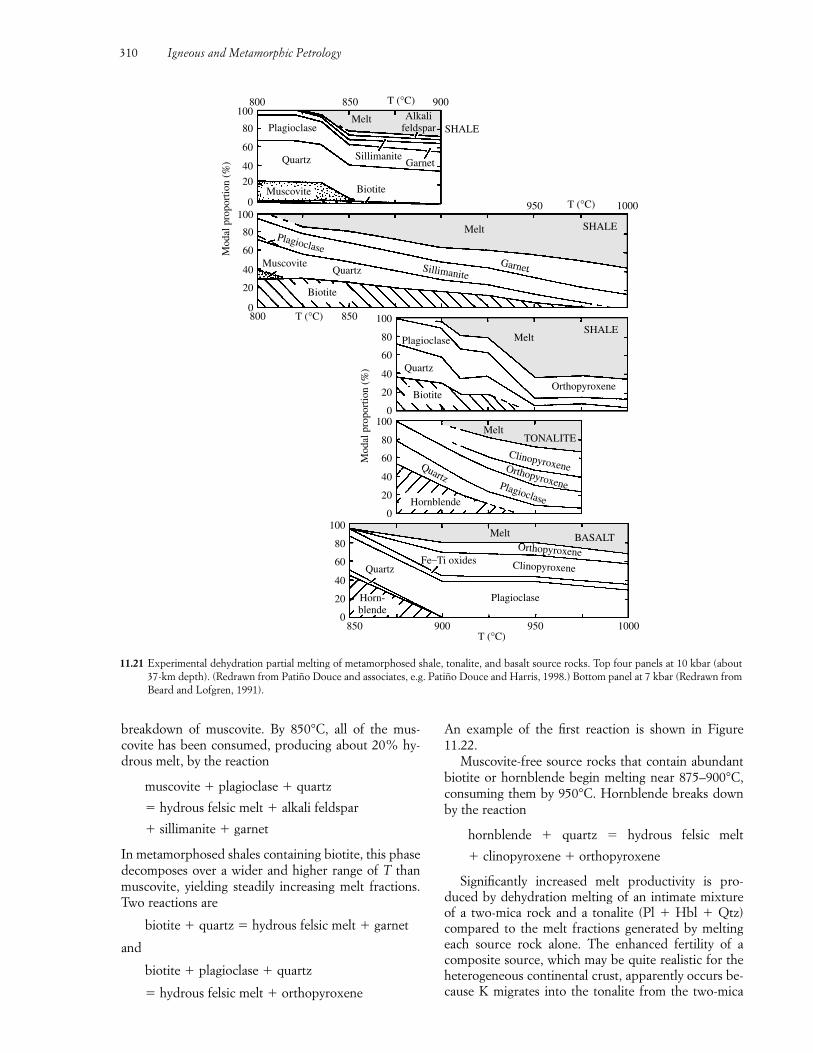
breakdown of muscovite. By 850°C, all of the mus-covite has been consumed, producing about 20% hy-drous melt, by the reaction
muscovite � plagioclase � quartz
� hydrous felsic melt � alkali feldspar
� sillimanite � garnet
In metamorphosed shales containing biotite, this phasedecomposes over a wider and higher range of T thanmuscovite, yielding steadily increasing melt fractions.Two reactions are
biotite � quartz � hydrous felsic melt � garnet
and
biotite � plagioclase � quartz
� hydrous felsic melt � orthopyroxene
An example of the first reaction is shown in Figure11.22.
Muscovite-free source rocks that contain abundantbiotite or hornblende begin melting near 875–900°C,consuming them by 950°C. Hornblende breaks downby the reaction
hornblende � quartz � hydrous felsic melt
� clinopyroxene � orthopyroxene
Significantly increased melt productivity is pro-duced by dehydration melting of an intimate mixtureof a two-mica rock and a tonalite (Pl � Hbl � Qtz)compared to the melt fractions generated by meltingeach source rock alone. The enhanced fertility of acomposite source, which may be quite realistic for theheterogeneous continental crust, apparently occurs be-cause K migrates into the tonalite from the two-mica
310 Igneous and Metamorphic Petrology
11.21 Experimental dehydration partial melting of metamorphosed shale, tonalite, and basalt source rocks. Top four panels at 10 kbar (about37-km depth). (Redrawn from Patiño Douce and associates, e.g. Patiño Douce and Harris, 1998.) Bottom panel at 7 kbar (Redrawn fromBeard and Lofgren, 1991).
Plagioclase
Quartz
Melt Alkalifeldspar
SillimaniteGarnet
BiotiteMuscovite
SHALE
900T (°C)850800100
80
60
40
20
0100
80
60
40
20
0T (°C) 850800 100
80
60
40
20
0100
80
60
40
20
0100
80
60
40
20
0850 900 950 1000
T (°C)
Plagioclase
Clinopyroxene
OrthopyroxeneBASALTMelt
Fe_Ti oxidesQuartz
Horn-blende
Hornblende
QuartzPlagioclase
Orthopyroxene
Clinopyroxene
TONALITEMelt
Melt
Biotite
Quartz
Plagioclase
Orthopyroxene
SHALE
Biotite
QuartzMuscovite Sillimanite
Melt
Garnet
SHALE
1000T (°C)950
Mod
al p
ropo
rtio
n (%
)
Mod
al p
ropo
rtio
n (%
)Plagioclase
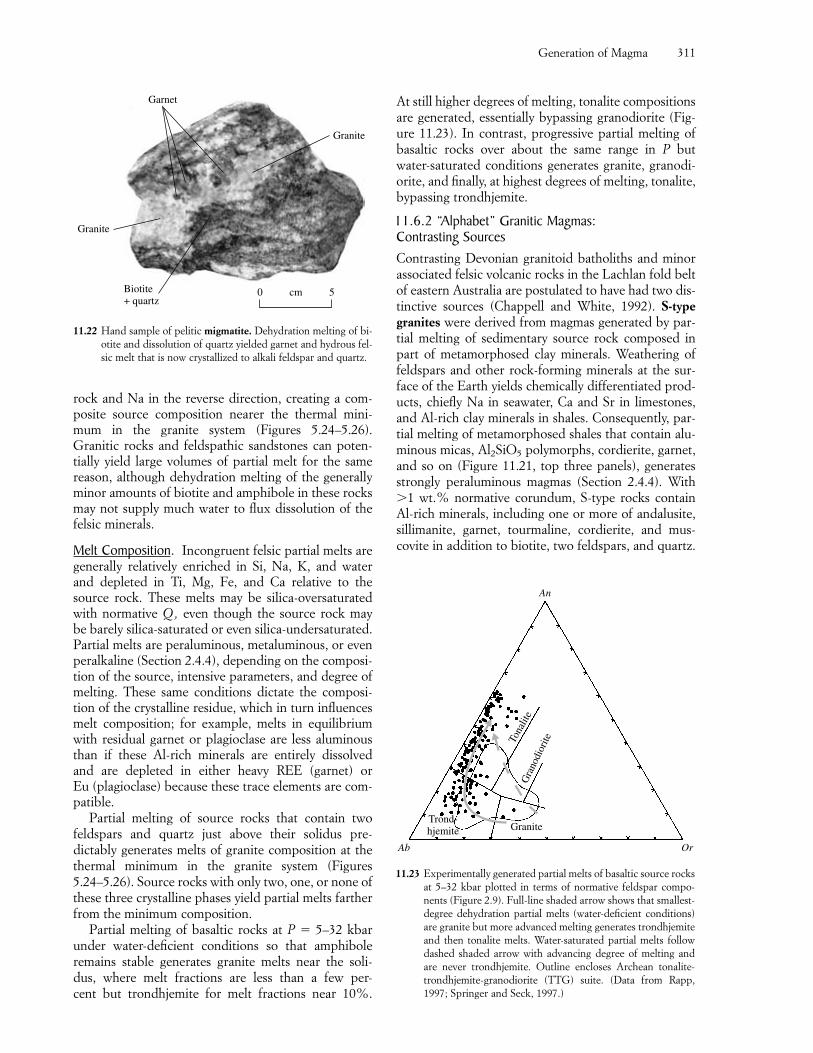
Generation of Magma 311
rock and Na in the reverse direction, creating a com-posite source composition nearer the thermal mini-mum in the granite system (Figures 5.24–5.26).Granitic rocks and feldspathic sandstones can poten-tially yield large volumes of partial melt for the samereason, although dehydration melting of the generallyminor amounts of biotite and amphibole in these rocksmay not supply much water to flux dissolution of thefelsic minerals.
Melt Composition. Incongruent felsic partial melts aregenerally relatively enriched in Si, Na, K, and waterand depleted in Ti, Mg, Fe, and Ca relative to thesource rock. These melts may be silica-oversaturatedwith normative Q , even though the source rock may be barely silica-saturated or even silica-undersaturated.Partial melts are peraluminous, metaluminous, or evenperalkaline (Section 2.4.4), depending on the composi-tion of the source, intensive parameters, and degree ofmelting. These same conditions dictate the composi-tion of the crystalline residue, which in turn influencesmelt composition; for example, melts in equilibriumwith residual garnet or plagioclase are less aluminousthan if these Al-rich minerals are entirely dissolved and are depleted in either heavy REE (garnet) or Eu (plagioclase) because these trace elements are com-patible.
Partial melting of source rocks that contain twofeldspars and quartz just above their solidus pre-dictably generates melts of granite composition at thethermal minimum in the granite system (Figures5.24–5.26). Source rocks with only two, one, or none ofthese three crystalline phases yield partial melts fartherfrom the minimum composition.
Partial melting of basaltic rocks at P � 5–32 kbarunder water-deficient conditions so that amphibole remains stable generates granite melts near the soli-dus, where melt fractions are less than a few per-cent but trondhjemite for melt fractions near 10%.
At still higher degrees of melting, tonalite compositionsare generated, essentially bypassing granodiorite (Fig-ure 11.23). In contrast, progressive partial melting ofbasaltic rocks over about the same range in P but water-saturated conditions generates granite, granodi-orite, and finally, at highest degrees of melting, tonalite,bypassing trondhjemite.
11.6.2 “Alphabet” Granitic Magmas: Contrasting SourcesContrasting Devonian granitoid batholiths and minorassociated felsic volcanic rocks in the Lachlan fold beltof eastern Australia are postulated to have had two dis-tinctive sources (Chappell and White, 1992). S-typegranites were derived from magmas generated by par-tial melting of sedimentary source rock composed inpart of metamorphosed clay minerals. Weathering offeldspars and other rock-forming minerals at the sur-face of the Earth yields chemically differentiated prod-ucts, chiefly Na in seawater, Ca and Sr in limestones,and Al-rich clay minerals in shales. Consequently, par-tial melting of metamorphosed shales that contain alu-minous micas, Al2SiO5 polymorphs, cordierite, garnet,and so on (Figure 11.21, top three panels), generatesstrongly peraluminous magmas (Section 2.4.4). With1 wt.% normative corundum, S-type rocks containAl-rich minerals, including one or more of andalusite,sillimanite, garnet, tourmaline, cordierite, and mus-covite in addition to biotite, two feldspars, and quartz.
11.22 Hand sample of pelitic migmatite. Dehydration melting of bi-otite and dissolution of quartz yielded garnet and hydrous fel-sic melt that is now crystallized to alkali feldspar and quartz.
Granite
Biotite+ quartz
Granite
Garnet
0 5cm
11.23 Experimentally generated partial melts of basaltic source rocksat 5–32 kbar plotted in terms of normative feldspar compo-nents (Figure 2.9). Full-line shaded arrow shows that smallest-degree dehydration partial melts (water-deficient conditions)are granite but more advanced melting generates trondhjemiteand then tonalite melts. Water-saturated partial melts followdashed shaded arrow with advancing degree of melting andare never trondhjemite. Outline encloses Archean tonalite-trondhjemite-granodiorite (TTG) suite. (Data from Rapp,1997; Springer and Seck, 1997.)
Tona
lite
Gra
nodi
orite
GraniteTrond-hjemite
Ab Or
An
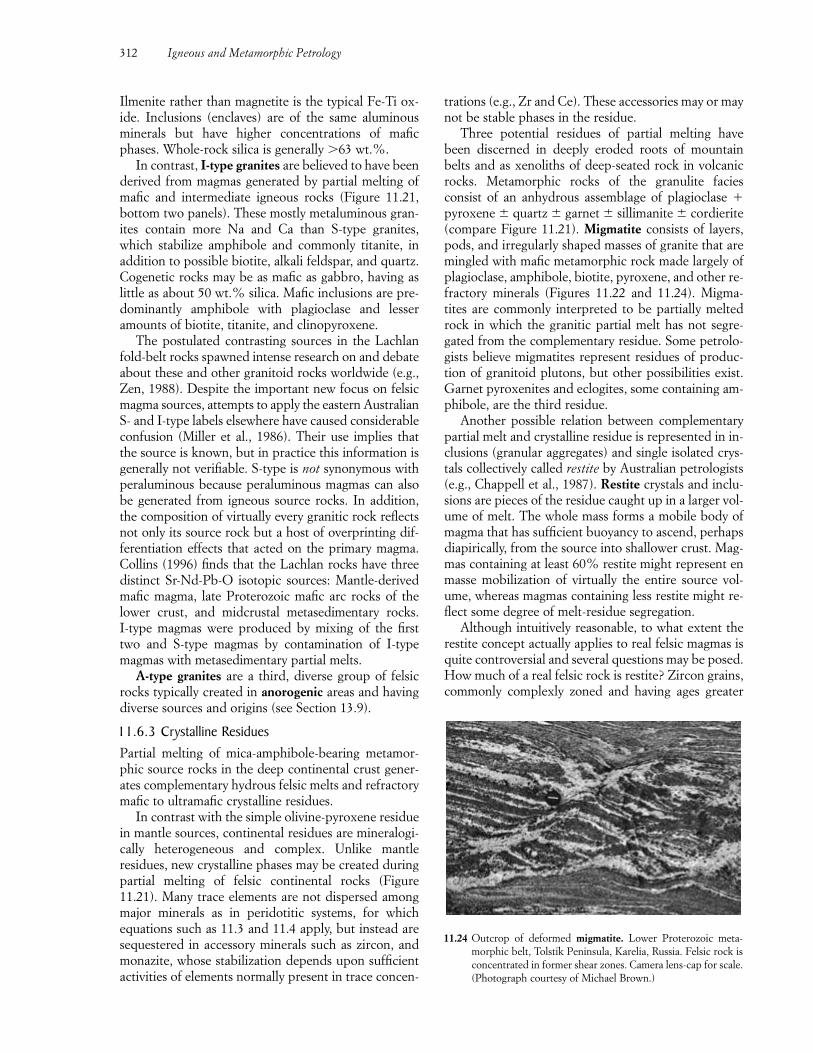
Ilmenite rather than magnetite is the typical Fe-Ti ox-ide. Inclusions (enclaves) are of the same aluminousminerals but have higher concentrations of maficphases. Whole-rock silica is generally 63 wt.%.
In contrast, I-type granites are believed to have beenderived from magmas generated by partial melting ofmafic and intermediate igneous rocks (Figure 11.21,bottom two panels). These mostly metaluminous gran-ites contain more Na and Ca than S-type granites,which stabilize amphibole and commonly titanite, inaddition to possible biotite, alkali feldspar, and quartz.Cogenetic rocks may be as mafic as gabbro, having aslittle as about 50 wt.% silica. Mafic inclusions are pre-dominantly amphibole with plagioclase and lesseramounts of biotite, titanite, and clinopyroxene.
The postulated contrasting sources in the Lachlanfold-belt rocks spawned intense research on and debateabout these and other granitoid rocks worldwide (e.g.,Zen, 1988). Despite the important new focus on felsicmagma sources, attempts to apply the eastern AustralianS- and I-type labels elsewhere have caused considerableconfusion (Miller et al., 1986). Their use implies thatthe source is known, but in practice this information isgenerally not verifiable. S-type is not synonymous withperaluminous because peraluminous magmas can alsobe generated from igneous source rocks. In addition,the composition of virtually every granitic rock reflectsnot only its source rock but a host of overprinting dif-ferentiation effects that acted on the primary magma.Collins (1996) finds that the Lachlan rocks have threedistinct Sr-Nd-Pb-O isotopic sources: Mantle-derivedmafic magma, late Proterozoic mafic arc rocks of thelower crust, and midcrustal metasedimentary rocks. I-type magmas were produced by mixing of the firsttwo and S-type magmas by contamination of I-typemagmas with metasedimentary partial melts.
A-type granites are a third, diverse group of felsicrocks typically created in anorogenic areas and havingdiverse sources and origins (see Section 13.9).
11.6.3 Crystalline ResiduesPartial melting of mica-amphibole-bearing metamor-phic source rocks in the deep continental crust gener-ates complementary hydrous felsic melts and refractorymafic to ultramafic crystalline residues.
In contrast with the simple olivine-pyroxene residuein mantle sources, continental residues are mineralogi-cally heterogeneous and complex. Unlike mantleresidues, new crystalline phases may be created duringpartial melting of felsic continental rocks (Figure11.21). Many trace elements are not dispersed amongmajor minerals as in peridotitic systems, for whichequations such as 11.3 and 11.4 apply, but instead aresequestered in accessory minerals such as zircon, andmonazite, whose stabilization depends upon sufficientactivities of elements normally present in trace concen-
trations (e.g., Zr and Ce). These accessories may or maynot be stable phases in the residue.
Three potential residues of partial melting havebeen discerned in deeply eroded roots of mountainbelts and as xenoliths of deep-seated rock in volcanicrocks. Metamorphic rocks of the granulite facies consist of an anhydrous assemblage of plagioclase �pyroxene � quartz � garnet � sillimanite � cordierite(compare Figure 11.21). Migmatite consists of layers,pods, and irregularly shaped masses of granite that aremingled with mafic metamorphic rock made largely ofplagioclase, amphibole, biotite, pyroxene, and other re-fractory minerals (Figures 11.22 and 11.24). Migma-tites are commonly interpreted to be partially meltedrock in which the granitic partial melt has not segre-gated from the complementary residue. Some petrolo-gists believe migmatites represent residues of produc-tion of granitoid plutons, but other possibilities exist.Garnet pyroxenites and eclogites, some containing am-phibole, are the third residue.
Another possible relation between complementarypartial melt and crystalline residue is represented in in-clusions (granular aggregates) and single isolated crys-tals collectively called restite by Australian petrologists(e.g., Chappell et al., 1987). Restite crystals and inclu-sions are pieces of the residue caught up in a larger vol-ume of melt. The whole mass forms a mobile body ofmagma that has sufficient buoyancy to ascend, perhapsdiapirically, from the source into shallower crust. Mag-mas containing at least 60% restite might represent enmasse mobilization of virtually the entire source vol-ume, whereas magmas containing less restite might re-flect some degree of melt-residue segregation.
Although intuitively reasonable, to what extent therestite concept actually applies to real felsic magmas isquite controversial and several questions may be posed.How much of a real felsic rock is restite? Zircon grains,commonly complexly zoned and having ages greater
312 Igneous and Metamorphic Petrology
11.24 Outcrop of deformed migmatite. Lower Proterozoic meta-morphic belt, Tolstik Peninsula, Karelia, Russia. Felsic rock isconcentrated in former shear zones. Camera lens-cap for scale.(Photograph courtesy of Michael Brown.)
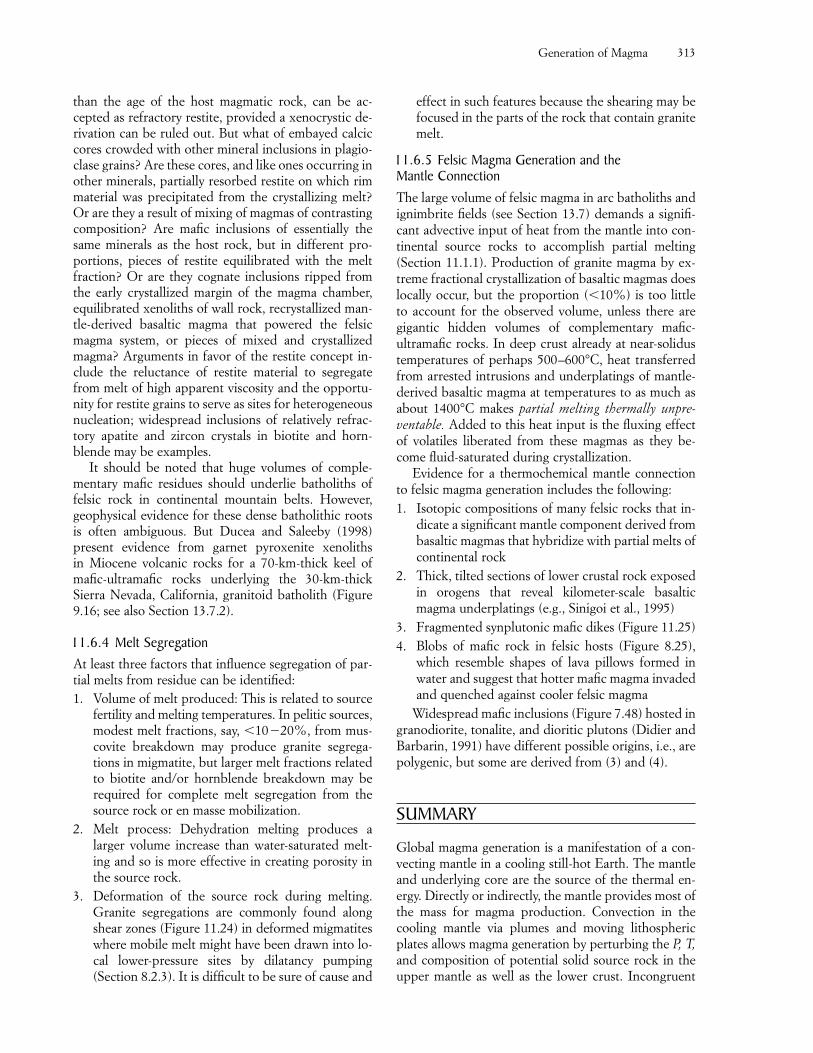
than the age of the host magmatic rock, can be ac-cepted as refractory restite, provided a xenocrystic de-rivation can be ruled out. But what of embayed calciccores crowded with other mineral inclusions in plagio-clase grains? Are these cores, and like ones occurring inother minerals, partially resorbed restite on which rimmaterial was precipitated from the crystallizing melt?Or are they a result of mixing of magmas of contrastingcomposition? Are mafic inclusions of essentially thesame minerals as the host rock, but in different pro-portions, pieces of restite equilibrated with the meltfraction? Or are they cognate inclusions ripped fromthe early crystallized margin of the magma chamber,equilibrated xenoliths of wall rock, recrystallized man-tle-derived basaltic magma that powered the felsicmagma system, or pieces of mixed and crystallizedmagma? Arguments in favor of the restite concept in-clude the reluctance of restite material to segregatefrom melt of high apparent viscosity and the opportu-nity for restite grains to serve as sites for heterogeneousnucleation; widespread inclusions of relatively refrac-tory apatite and zircon crystals in biotite and horn-blende may be examples.
It should be noted that huge volumes of comple-mentary mafic residues should underlie batholiths offelsic rock in continental mountain belts. However,geophysical evidence for these dense batholithic rootsis often ambiguous. But Ducea and Saleeby (1998) present evidence from garnet pyroxenite xenoliths in Miocene volcanic rocks for a 70-km-thick keel ofmafic-ultramafic rocks underlying the 30-km-thickSierra Nevada, California, granitoid batholith (Figure9.16; see also Section 13.7.2).
11.6.4 Melt SegregationAt least three factors that influence segregation of par-tial melts from residue can be identified:1. Volume of melt produced: This is related to source
fertility and melting temperatures. In pelitic sources,modest melt fractions, say, �10�20%, from mus-covite breakdown may produce granite segrega-tions in migmatite, but larger melt fractions relatedto biotite and/or hornblende breakdown may berequired for complete melt segregation from thesource rock or en masse mobilization.
2. Melt process: Dehydration melting produces alarger volume increase than water-saturated melt-ing and so is more effective in creating porosity inthe source rock.
3. Deformation of the source rock during melting.Granite segregations are commonly found alongshear zones (Figure 11.24) in deformed migmatiteswhere mobile melt might have been drawn into lo-cal lower-pressure sites by dilatancy pumping(Section 8.2.3). It is difficult to be sure of cause and
effect in such features because the shearing may befocused in the parts of the rock that contain granitemelt.
11.6.5 Felsic Magma Generation and the Mantle ConnectionThe large volume of felsic magma in arc batholiths andignimbrite fields (see Section 13.7) demands a signifi-cant advective input of heat from the mantle into con-tinental source rocks to accomplish partial melting(Section 11.1.1). Production of granite magma by ex-treme fractional crystallization of basaltic magmas doeslocally occur, but the proportion (�10%) is too little to account for the observed volume, unless there are gigantic hidden volumes of complementary mafic-ultramafic rocks. In deep crust already at near-solidustemperatures of perhaps 500–600°C, heat transferredfrom arrested intrusions and underplatings of mantle-derived basaltic magma at temperatures to as much asabout 1400°C makes partial melting thermally unpre-ventable. Added to this heat input is the fluxing effectof volatiles liberated from these magmas as they be-come fluid-saturated during crystallization.
Evidence for a thermochemical mantle connectionto felsic magma generation includes the following:1. Isotopic compositions of many felsic rocks that in-
dicate a significant mantle component derived frombasaltic magmas that hybridize with partial melts ofcontinental rock
2. Thick, tilted sections of lower crustal rock exposedin orogens that reveal kilometer-scale basalticmagma underplatings (e.g., Sinigoi et al., 1995)
3. Fragmented synplutonic mafic dikes (Figure 11.25)4. Blobs of mafic rock in felsic hosts (Figure 8.25),
which resemble shapes of lava pillows formed inwater and suggest that hotter mafic magma invadedand quenched against cooler felsic magma
Widespread mafic inclusions (Figure 7.48) hosted ingranodiorite, tonalite, and dioritic plutons (Didier andBarbarin, 1991) have different possible origins, i.e., arepolygenic, but some are derived from (3) and (4).
SUMMARY
Global magma generation is a manifestation of a con-vecting mantle in a cooling still-hot Earth. The mantleand underlying core are the source of the thermal en-ergy. Directly or indirectly, the mantle provides most ofthe mass for magma production. Convection in thecooling mantle via plumes and moving lithosphericplates allows magma generation by perturbing the P, T,and composition of potential solid source rock in theupper mantle as well as the lower crust. Incongruent
Generation of Magma 313
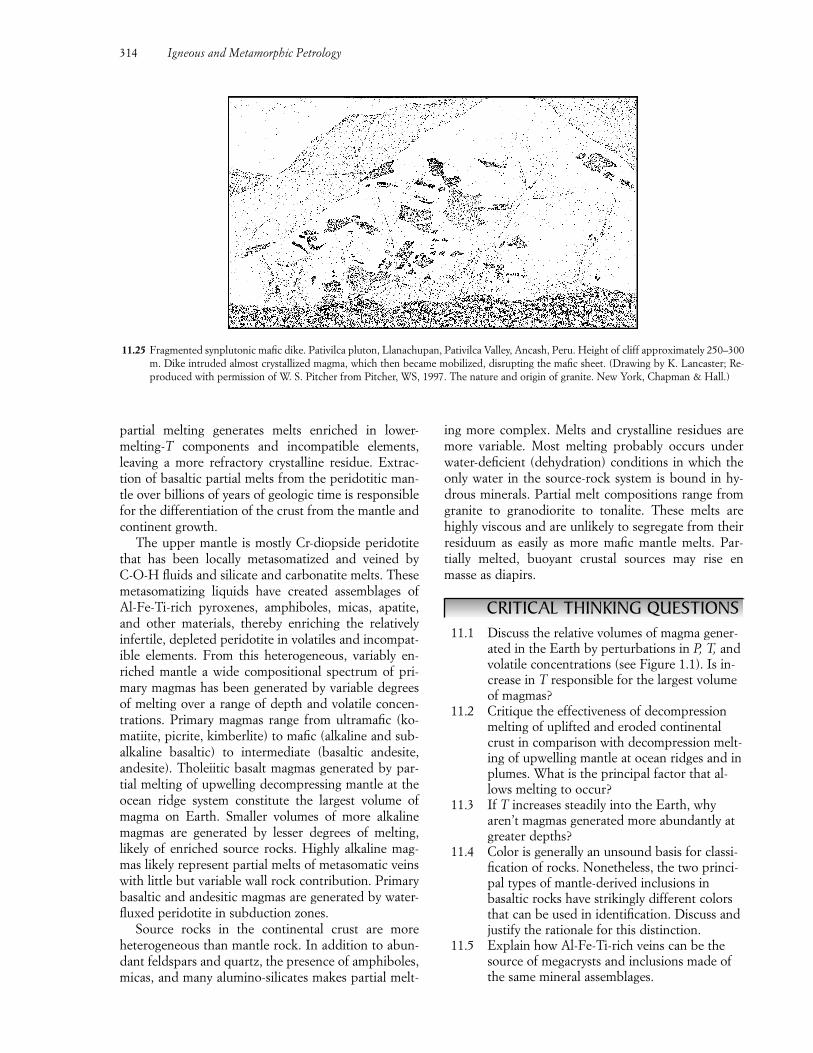
partial melting generates melts enriched in lower-melting-T components and incompatible elements,leaving a more refractory crystalline residue. Extrac-tion of basaltic partial melts from the peridotitic man-tle over billions of years of geologic time is responsiblefor the differentiation of the crust from the mantle andcontinent growth.
The upper mantle is mostly Cr-diopside peridotitethat has been locally metasomatized and veined by C-O-H fluids and silicate and carbonatite melts. Thesemetasomatizing liquids have created assemblages of Al-Fe-Ti-rich pyroxenes, amphiboles, micas, apatite,and other materials, thereby enriching the relatively infertile, depleted peridotite in volatiles and incompat-ible elements. From this heterogeneous, variably en-riched mantle a wide compositional spectrum of pri-mary magmas has been generated by variable degreesof melting over a range of depth and volatile concen-trations. Primary magmas range from ultramafic (ko-matiite, picrite, kimberlite) to mafic (alkaline and sub-alkaline basaltic) to intermediate (basaltic andesite,andesite). Tholeiitic basalt magmas generated by par-tial melting of upwelling decompressing mantle at theocean ridge system constitute the largest volume ofmagma on Earth. Smaller volumes of more alkalinemagmas are generated by lesser degrees of melting,likely of enriched source rocks. Highly alkaline mag-mas likely represent partial melts of metasomatic veinswith little but variable wall rock contribution. Primarybasaltic and andesitic magmas are generated by water-fluxed peridotite in subduction zones.
Source rocks in the continental crust are more heterogeneous than mantle rock. In addition to abun-dant feldspars and quartz, the presence of amphiboles,micas, and many alumino-silicates makes partial melt-
ing more complex. Melts and crystalline residues aremore variable. Most melting probably occurs underwater-deficient (dehydration) conditions in which theonly water in the source-rock system is bound in hy-drous minerals. Partial melt compositions range fromgranite to granodiorite to tonalite. These melts arehighly viscous and are unlikely to segregate from theirresiduum as easily as more mafic mantle melts. Par-tially melted, buoyant crustal sources may rise enmasse as diapirs.
CRITICAL THINKING QUESTIONS11.1 Discuss the relative volumes of magma gener-
ated in the Earth by perturbations in P, T, andvolatile concentrations (see Figure 1.1). Is in-crease in T responsible for the largest volumeof magmas?
11.2 Critique the effectiveness of decompressionmelting of uplifted and eroded continentalcrust in comparison with decompression melt-ing of upwelling mantle at ocean ridges and inplumes. What is the principal factor that al-lows melting to occur?
11.3 If T increases steadily into the Earth, whyaren’t magmas generated more abundantly atgreater depths?
11.4 Color is generally an unsound basis for classi-fication of rocks. Nonetheless, the two princi-pal types of mantle-derived inclusions inbasaltic rocks have strikingly different colorsthat can be used in identification. Discuss andjustify the rationale for this distinction.
11.5 Explain how Al-Fe-Ti-rich veins can be thesource of megacrysts and inclusions made ofthe same mineral assemblages.
314 Igneous and Metamorphic Petrology
11.25 Fragmented synplutonic mafic dike. Pativilca pluton, Llanachupan, Pativilca Valley, Ancash, Peru. Height of cliff approximately 250–300m. Dike intruded almost crystallized magma, which then became mobilized, disrupting the mafic sheet. (Drawing by K. Lancaster; Re-produced with permission of W. S. Pitcher from Pitcher, WS, 1997. The nature and origin of granite. New York, Chapman & Hall.)
estimated from just that contained as (OH�)in nominally “water-free” crystalline phases.Calculate this amount. Compare it with arough estimate of the amount of water in theoceans.
11.2 Estimate the amount of water cycled annuallyinto the mantle via subducting oceanic crustthat is entering the subduction zone at a rateof 5 cm/y. Compare this value with theamount of water exsolved from solidifyingmantle-derived magmas intruded into and ex-truded onto the crust. Show all calculationsand indicate and justify the numbers used.Discuss your results.
11.3 Draw the Mg2SiO4-SiO2 binary phase diagramfor 20-kbar anhydrous and for 20-kbar water-saturated from Figures 11.8b and 11.10. Com-pare with Figure 5.8. Discuss whether enstatitemelts congruently or incongruently at 20 kbar.
11.4 Compare equilibrium and fractional partialmelting of spinel lherzolite (Figure 11.9) bymaking diagrams in which T is plotted on thevertical axis and melt fraction on the horizon-tal axis. Indicate compositions of melts andcrystalline residues at critical points in the dia-grams. Discuss contrasts in these two styles ofpartial melting.
11.5 Partially melt, in both equilibrium and frac-tional manners, a rock composed of 30%diopside, and equal amounts of quartz and enstatite in the system in Figure 11.9. De-scribe in detail the compositions of crystallineresidues and melts and plot their paths in theternary.
11.6 Compare the time a basaltic melt would taketo ascend buoyantly 100 km via porous flowthrough mantle peridotite versus through adike 1 cm in width (see equation 9.1). Com-pare these times with the time for porous flowof an aqueous fluid rising 100 km above asubducting oceanic crust. Indicate all assump-tions made and values of parameters chosen.Discuss the implications of your calculatedtimes.
11.7 Write a mineralogical reaction whereby lher-zolite is metasomatized by silica-bearing aqueous fluid to an assemblage of enstatite �anthophyllite � tremolite � talc � quartz.See Special Interest Box 11.4.
11.6 Why are incompatible elements sequestered insome mantle minerals (amphiboles, clinopy-roxenes) and not others (olivine)?
11.7 Why is there an “inverted” thermal gradientfrom the subducting crust into the overlyingmantle in the area of the inset diagram in Figure 11.16?
11.8 Review the possible compositions of primarymagmas that can be generated from mantlesources and indicate the conditions underwhich they form.
11.9 The oldest known alkaline rocks on Earth areabout 2.7 Ga, whereas older rocks to as muchas 4.0 Ga include tholeiitic basalts and a vari-ety of silica-saturated felsic rocks. Suggest onereason for the apparent absence of alkalinemagmas in the young Earth.
11.10 Discuss the differences between primary andprimitive mantle-derived magmas. How canthey be accurately identified?
11.11 Contrast partial melting in lower continentalcrust and upper mantle.
11.12 What distinctive major- and trace-element signatures, if any, might be used to distin-guish dehydration partial melts of muscovite-bearing from hornblende source rock?
11.13 Explain why S-type granites typically have il-menite rather than magnetite and have lowFe2O3/FeO ratios relative to I-type. (Hint: Isthere something in shale source rocks thatwould cause their magmas to have low oxygenfugacity?)
11.14 How might juvenile primeval versus recycledsurface water be distinguished in mantle min-erals?
11.15 Section 11.2.1 indicated that eclogite xeno-liths from the mantle might have two origins.How might these be distinguished in a partic-ular xenolith?
11.16 Propose an alternate interpretation of themafic blocks in granitoid pluton shown in Fig-ure 11.25. What evidence might you seek todecide between your interpretation and thatcited in the figure caption?
PROBLEMS11.1 The minimal amount of water in the upper
mantle to a depth of 670 km may be roughly
Generation of Magma 315
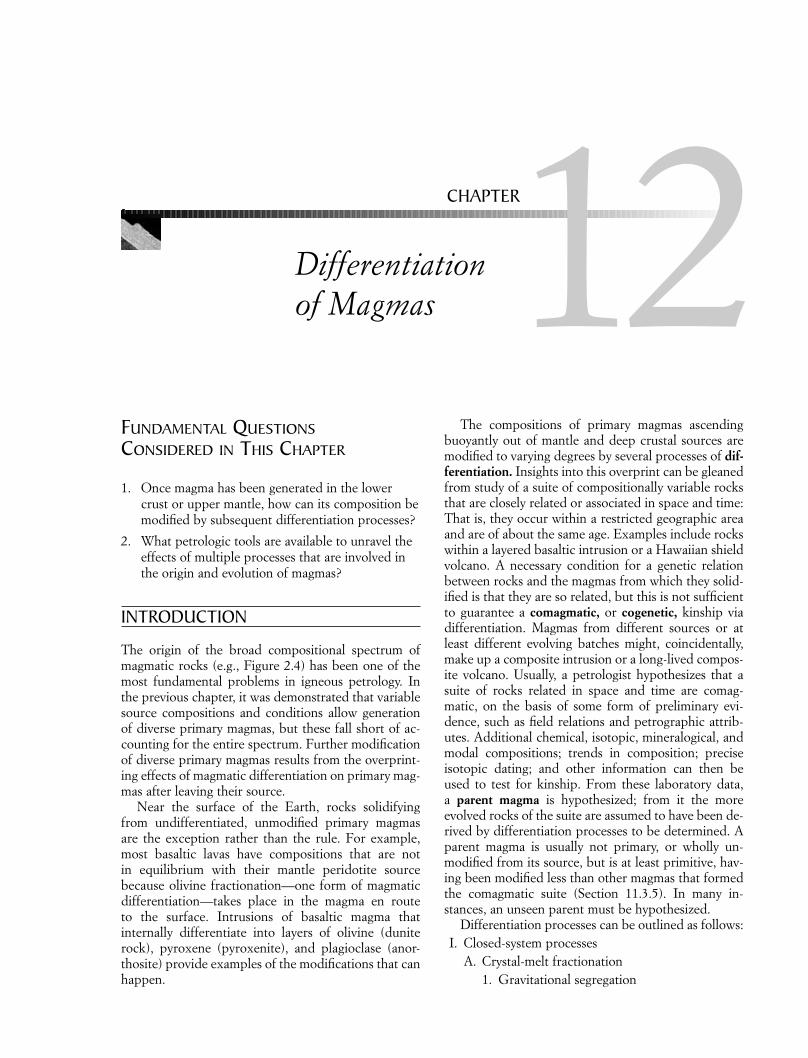
FUNDAMENTAL QUESTIONSCONSIDERED IN THIS CHAPTER
1. Once magma has been generated in the lowercrust or upper mantle, how can its composition bemodified by subsequent differentiation processes?
2. What petrologic tools are available to unravel theeffects of multiple processes that are involved inthe origin and evolution of magmas?
INTRODUCTION
The origin of the broad compositional spectrum ofmagmatic rocks (e.g., Figure 2.4) has been one of themost fundamental problems in igneous petrology. Inthe previous chapter, it was demonstrated that variablesource compositions and conditions allow generationof diverse primary magmas, but these fall short of ac-counting for the entire spectrum. Further modificationof diverse primary magmas results from the overprint-ing effects of magmatic differentiation on primary mag-mas after leaving their source.
Near the surface of the Earth, rocks solidifying from undifferentiated, unmodified primary magmasare the exception rather than the rule. For example,most basaltic lavas have compositions that are not in equilibrium with their mantle peridotite source because olivine fractionation—one form of magmaticdifferentiation—takes place in the magma en route to the surface. Intrusions of basaltic magma that internally differentiate into layers of olivine (duniterock), pyroxene (pyroxenite), and plagioclase (anor-thosite) provide examples of the modifications that can happen.
The compositions of primary magmas ascendingbuoyantly out of mantle and deep crustal sources aremodified to varying degrees by several processes of dif-ferentiation. Insights into this overprint can be gleanedfrom study of a suite of compositionally variable rocksthat are closely related or associated in space and time:That is, they occur within a restricted geographic areaand are of about the same age. Examples include rockswithin a layered basaltic intrusion or a Hawaiian shieldvolcano. A necessary condition for a genetic relationbetween rocks and the magmas from which they solid-ified is that they are so related, but this is not sufficientto guarantee a comagmatic, or cogenetic, kinship viadifferentiation. Magmas from different sources or atleast different evolving batches might, coincidentally,make up a composite intrusion or a long-lived compos-ite volcano. Usually, a petrologist hypothesizes that asuite of rocks related in space and time are comag-matic, on the basis of some form of preliminary evi-dence, such as field relations and petrographic attrib-utes. Additional chemical, isotopic, mineralogical, andmodal compositions; trends in composition; preciseisotopic dating; and other information can then beused to test for kinship. From these laboratory data, a parent magma is hypothesized; from it the moreevolved rocks of the suite are assumed to have been de-rived by differentiation processes to be determined. Aparent magma is usually not primary, or wholly un-modified from its source, but is at least primitive, hav-ing been modified less than other magmas that formedthe comagmatic suite (Section 11.3.5). In many in-stances, an unseen parent must be hypothesized.
Differentiation processes can be outlined as follows:I. Closed-system processes
A. Crystal-melt fractionation1. Gravitational segregation
12CHAPTER
Differentiation of Magmas
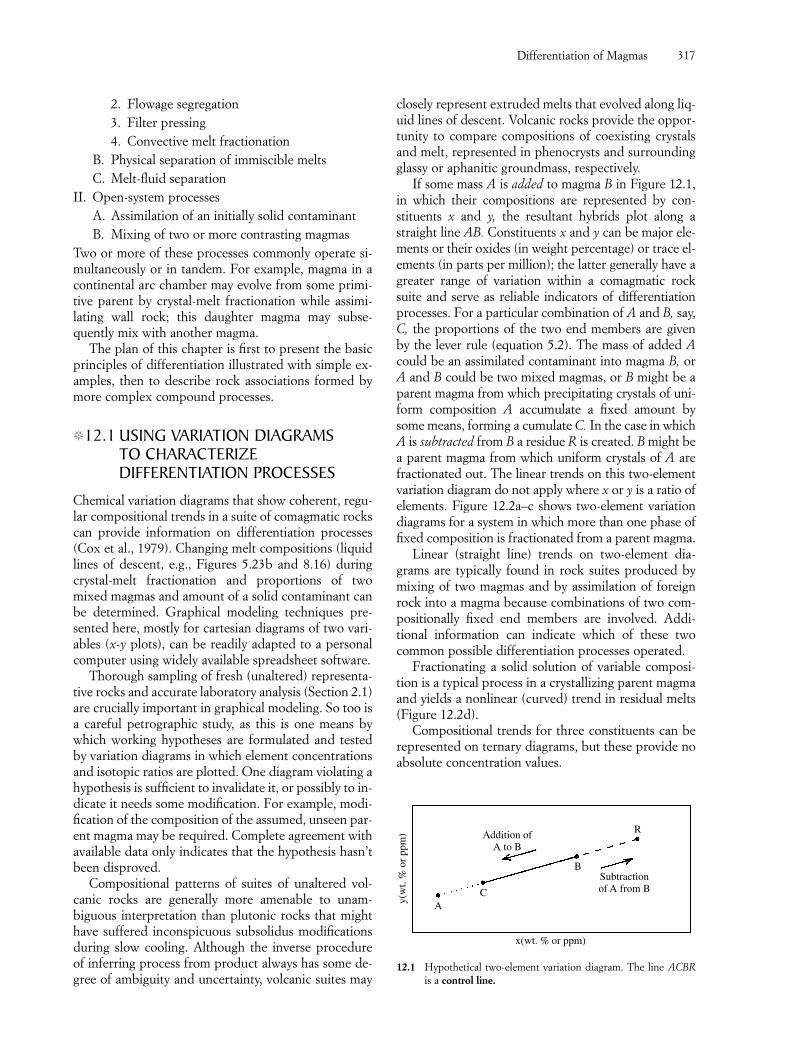
2. Flowage segregation3. Filter pressing4. Convective melt fractionation
B. Physical separation of immiscible meltsC. Melt-fluid separation
II. Open-system processesA. Assimilation of an initially solid contaminantB. Mixing of two or more contrasting magmas
Two or more of these processes commonly operate si-multaneously or in tandem. For example, magma in acontinental arc chamber may evolve from some primi-tive parent by crystal-melt fractionation while assimi-lating wall rock; this daughter magma may subse-quently mix with another magma.
The plan of this chapter is first to present the basicprinciples of differentiation illustrated with simple ex-amples, then to describe rock associations formed bymore complex compound processes.
�12.1 USING VARIATION DIAGRAMS TO CHARACTERIZEDIFFERENTIATION PROCESSES
Chemical variation diagrams that show coherent, regu-lar compositional trends in a suite of comagmatic rockscan provide information on differentiation processes(Cox et al., 1979). Changing melt compositions (liquidlines of descent, e.g., Figures 5.23b and 8.16) duringcrystal-melt fractionation and proportions of twomixed magmas and amount of a solid contaminant canbe determined. Graphical modeling techniques pre-sented here, mostly for cartesian diagrams of two vari-ables (x-y plots), can be readily adapted to a personalcomputer using widely available spreadsheet software.
Thorough sampling of fresh (unaltered) representa-tive rocks and accurate laboratory analysis (Section 2.1)are crucially important in graphical modeling. So too isa careful petrographic study, as this is one means bywhich working hypotheses are formulated and testedby variation diagrams in which element concentrationsand isotopic ratios are plotted. One diagram violating ahypothesis is sufficient to invalidate it, or possibly to in-dicate it needs some modification. For example, modi-fication of the composition of the assumed, unseen par-ent magma may be required. Complete agreement withavailable data only indicates that the hypothesis hasn’tbeen disproved.
Compositional patterns of suites of unaltered vol-canic rocks are generally more amenable to unam-biguous interpretation than plutonic rocks that mighthave suffered inconspicuous subsolidus modificationsduring slow cooling. Although the inverse procedureof inferring process from product always has some de-gree of ambiguity and uncertainty, volcanic suites may
closely represent extruded melts that evolved along liq-uid lines of descent. Volcanic rocks provide the oppor-tunity to compare compositions of coexisting crystalsand melt, represented in phenocrysts and surroundingglassy or aphanitic groundmass, respectively.
If some mass A is added to magma B in Figure 12.1,in which their compositions are represented by con-stituents x and y, the resultant hybrids plot along astraight line AB. Constituents x and y can be major ele-ments or their oxides (in weight percentage) or trace el-ements (in parts per million); the latter generally have agreater range of variation within a comagmatic rocksuite and serve as reliable indicators of differentiationprocesses. For a particular combination of A and B, say,C, the proportions of the two end members are given by the lever rule (equation 5.2). The mass of added Acould be an assimilated contaminant into magma B, orA and B could be two mixed magmas, or B might be aparent magma from which precipitating crystals of uni-form composition A accumulate a fixed amount bysome means, forming a cumulate C. In the case in whichA is subtracted from B a residue R is created. B might bea parent magma from which uniform crystals of A arefractionated out. The linear trends on this two-elementvariation diagram do not apply where x or y is a ratio ofelements. Figure 12.2a–c shows two-element variationdiagrams for a system in which more than one phase offixed composition is fractionated from a parent magma.
Linear (straight line) trends on two-element dia-grams are typically found in rock suites produced bymixing of two magmas and by assimilation of foreignrock into a magma because combinations of two com-positionally fixed end members are involved. Addi-tional information can indicate which of these twocommon possible differentiation processes operated.
Fractionating a solid solution of variable composi-tion is a typical process in a crystallizing parent magmaand yields a nonlinear (curved) trend in residual melts(Figure 12.2d).
Compositional trends for three constituents can berepresented on ternary diagrams, but these provide noabsolute concentration values.
Differentiation of Magmas 317
y(w
t. %
or
ppm
)
x(wt. % or ppm)
AC
B
R
Subtractionof A from B
Addition ofA to B
12.1 Hypothetical two-element variation diagram. The line is a control line.
ACBR
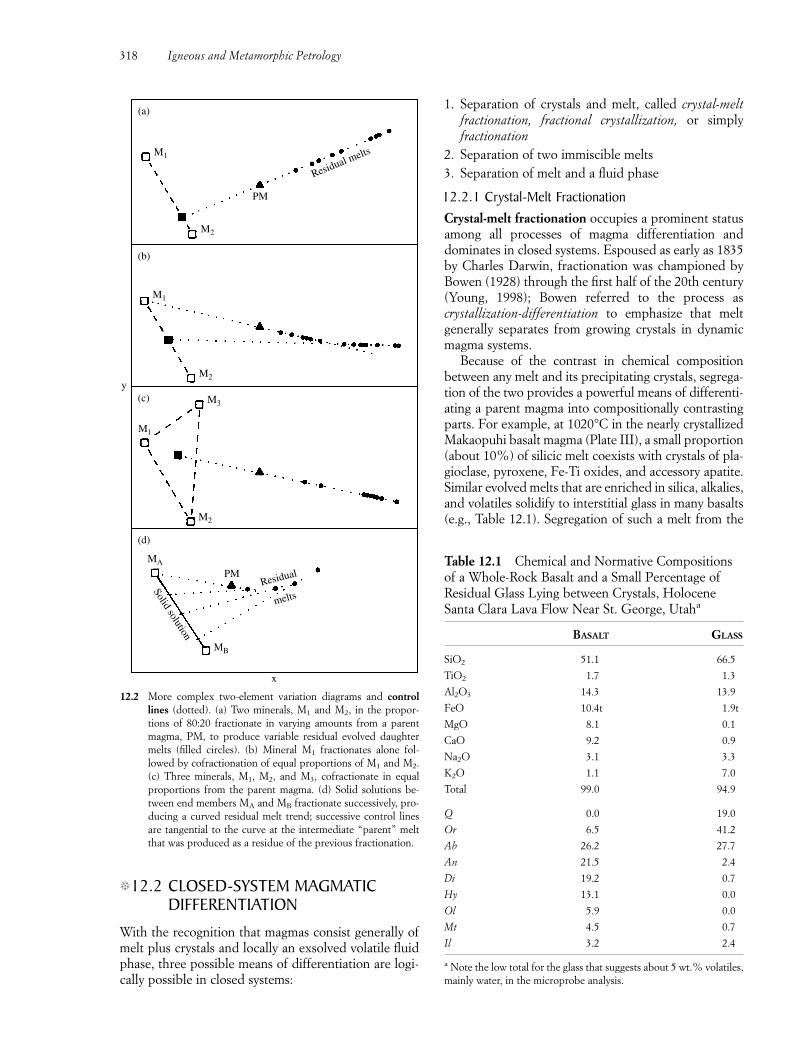
�12.2 CLOSED-SYSTEM MAGMATICDIFFERENTIATION
With the recognition that magmas consist generally ofmelt plus crystals and locally an exsolved volatile fluidphase, three possible means of differentiation are logi-cally possible in closed systems:
1. Separation of crystals and melt, called crystal-meltfractionation, fractional crystallization, or simplyfractionation
2. Separation of two immiscible melts3. Separation of melt and a fluid phase
12.2.1 Crystal-Melt FractionationCrystal-melt fractionation occupies a prominent statusamong all processes of magma differentiation anddominates in closed systems. Espoused as early as 1835by Charles Darwin, fractionation was championed byBowen (1928) through the first half of the 20th century(Young, 1998); Bowen referred to the process as crystallization-differentiation to emphasize that meltgenerally separates from growing crystals in dynamicmagma systems.
Because of the contrast in chemical composition between any melt and its precipitating crystals, segrega-tion of the two provides a powerful means of differenti-ating a parent magma into compositionally contrastingparts. For example, at 1020°C in the nearly crystallizedMakaopuhi basalt magma (Plate III), a small proportion(about 10%) of silicic melt coexists with crystals of pla-gioclase, pyroxene, Fe-Ti oxides, and accessory apatite.Similar evolved melts that are enriched in silica, alkalies,and volatiles solidify to interstitial glass in many basalts(e.g., Table 12.1). Segregation of such a melt from the
318 Igneous and Metamorphic Petrology
(a)
M1
M2
M1
M2
M3
M1
M2
MA
PM
MB
PM
Residual melts
(b)
y
x
(c)
(d)
Residual
melts
Solid solution
12.2 More complex two-element variation diagrams and controllines (dotted). (a) Two minerals, M1 and M2, in the propor-tions of 80:20 fractionate in varying amounts from a parentmagma, PM, to produce variable residual evolved daughtermelts (filled circles). (b) Mineral M1 fractionates alone fol-lowed by cofractionation of equal proportions of M1 and M2.(c) Three minerals, M1, M2, and M3, cofractionate in equalproportions from the parent magma. (d) Solid solutions be-tween end members MA and MB fractionate successively, pro-ducing a curved residual melt trend; successive control linesare tangential to the curve at the intermediate “parent” meltthat was produced as a residue of the previous fractionation.
Table 12.1 Chemical and Normative Compositionsof a Whole-Rock Basalt and a Small Percentage ofResidual Glass Lying between Crystals, HoloceneSanta Clara Lava Flow Near St. George, Utaha
BASALT GLASS
SiO2 51.1 66.5
TiO2 1.7 1.3
Al2O3 14.3 13.9
FeO 10.4t 1.9t
MgO 8.1 0.1
CaO 9.2 0.9
Na2O 3.1 3.3
K2O 1.1 7.0
Total 99.0 94.9
Q 0.0 19.0
Or 6.5 41.2
Ab 26.2 27.7
An 21.5 2.4
Di 19.2 0.7
Hy 13.1 0.0
Ol 5.9 0.0
Mt 4.5 0.7
Il 3.2 2.4
a Note the low total for the glass that suggests about 5 wt.% volatiles,mainly water, in the microprobe analysis.
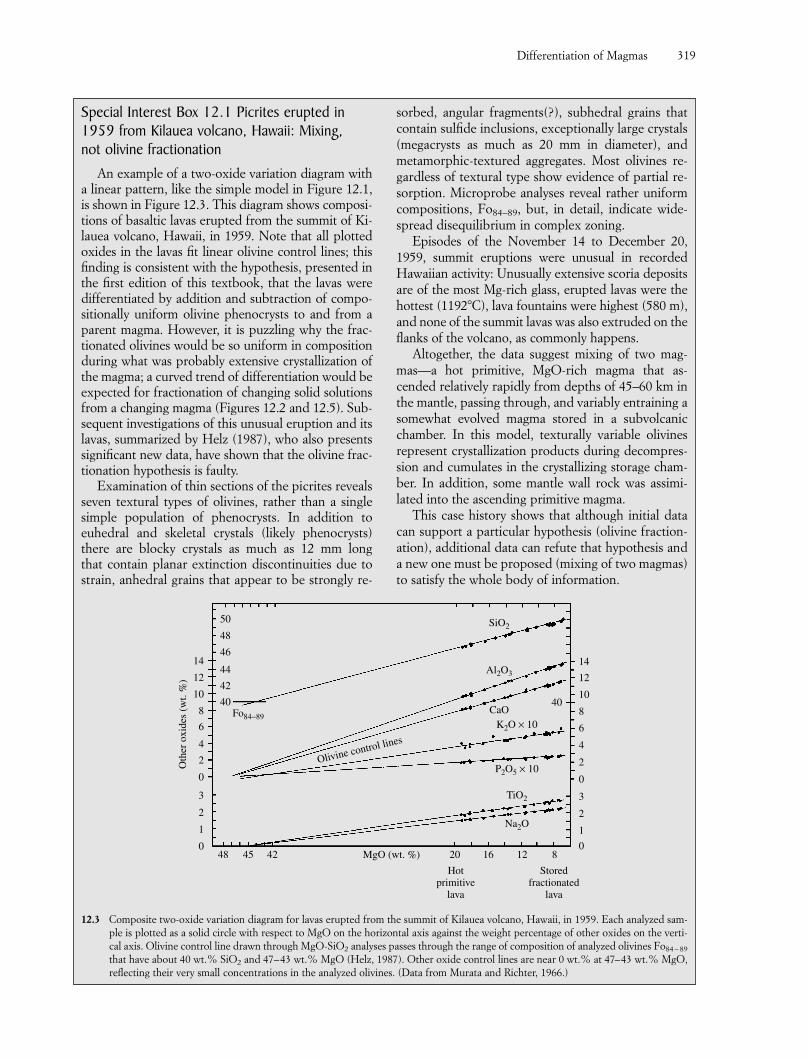
Special Interest Box 12.1 Picrites erupted in1959 from Kilauea volcano, Hawaii: Mixing,not olivine fractionation
An example of a two-oxide variation diagram witha linear pattern, like the simple model in Figure 12.1,is shown in Figure 12.3. This diagram shows composi-tions of basaltic lavas erupted from the summit of Ki-lauea volcano, Hawaii, in 1959. Note that all plottedoxides in the lavas fit linear olivine control lines; thisfinding is consistent with the hypothesis, presented inthe first edition of this textbook, that the lavas weredifferentiated by addition and subtraction of compo-sitionally uniform olivine phenocrysts to and from aparent magma. However, it is puzzling why the frac-tionated olivines would be so uniform in compositionduring what was probably extensive crystallization ofthe magma; a curved trend of differentiation would beexpected for fractionation of changing solid solutionsfrom a changing magma (Figures 12.2 and 12.5). Sub-sequent investigations of this unusual eruption and itslavas, summarized by Helz (1987), who also presentssignificant new data, have shown that the olivine frac-tionation hypothesis is faulty.
Examination of thin sections of the picrites revealsseven textural types of olivines, rather than a singlesimple population of phenocrysts. In addition to euhedral and skeletal crystals (likely phenocrysts)there are blocky crystals as much as 12 mm long that contain planar extinction discontinuities due tostrain, anhedral grains that appear to be strongly re-
sorbed, angular fragments(?), subhedral grains thatcontain sulfide inclusions, exceptionally large crystals(megacrysts as much as 20 mm in diameter), andmetamorphic-textured aggregates. Most olivines re-gardless of textural type show evidence of partial re-sorption. Microprobe analyses reveal rather uniformcompositions, Fo84–89, but, in detail, indicate wide-spread disequilibrium in complex zoning.
Episodes of the November 14 to December 20,1959, summit eruptions were unusual in recordedHawaiian activity: Unusually extensive scoria depositsare of the most Mg-rich glass, erupted lavas were thehottest (1192�C), lava fountains were highest (580 m),and none of the summit lavas was also extruded on theflanks of the volcano, as commonly happens.
Altogether, the data suggest mixing of two mag-mas—a hot primitive, MgO-rich magma that as-cended relatively rapidly from depths of 45–60 km inthe mantle, passing through, and variably entraining asomewhat evolved magma stored in a subvolcanicchamber. In this model, texturally variable olivinesrepresent crystallization products during decompres-sion and cumulates in the crystallizing storage cham-ber. In addition, some mantle wall rock was assimi-lated into the ascending primitive magma.
This case history shows that although initial datacan support a particular hypothesis (olivine fraction-ation), additional data can refute that hypothesis anda new one must be proposed (mixing of two magmas)to satisfy the whole body of information.
Differentiation of Magmas 319
48 45 42 20MgO (wt. %) 16 12 8
Hotprimitive
lava
Storedfractionated
lava
0
1
2
3
0
2
4
6
8
10
12
14
40
0
1
2
3
0
2
4
6
8
10
12
14
42
40
44
46
48
50
Oth
er o
xide
s (w
t. %
)
Fo84−89
Olivine control lines
SiO2
Al2O3
CaOK2O × 10
P2O5 × 10
TiO2
Na2O
12.3 Composite two-oxide variation diagram for lavas erupted from the summit of Kilauea volcano, Hawaii, in 1959. Each analyzed sam-ple is plotted as a solid circle with respect to MgO on the horizontal axis against the weight percentage of other oxides on the verti-cal axis. Olivine control line drawn through MgO-SiO2 analyses passes through the range of composition of analyzed olivines Fo84 – 89
that have about 40 wt.% SiO2 and 47–43 wt.% MgO (Helz, 1987). Other oxide control lines are near 0 wt.% at 47–43 wt.% MgO,reflecting their very small concentrations in the analyzed olivines. (Data from Murata and Richter, 1966.)
crystalline framework has been observed in some thickbasalt flows and sills where it has collected into thinpods of granitic rock.
Thus, the effects of fractionation of a parent magmaare manifested in complementary evolved residual meltsand accumulated crystals. Rocks derived from residualmelts have relatively evolved compositions and possi-bly phenocryst-free aphanitic or glassy texture.
Complementary accumulations of crystals that dif-fer in composition not only from the separated meltbut from the parent magma as well are called cumu-lates. Layers made virtually of only pyroxene, olivine,or plagioclase occur in some large, slowly cooled in-trusions of basaltic magma. Such monomineralic layersof pyroxenite, dunite, or anorthosite, respectively, canonly form by crystal accumulation because no magmasof equivalent composition are known to occur. Modestaccumulation of a magnesian olivine near Fo90 (Ap-pendix A), such as typically crystallizes from primitivebasalt magmas, enriches the magma in Mg but depletesthe residual magma in Mg and enriches it in Si, Ti, Al,Ca, Na, K, and P. Summit extrusions of basaltic lavasfrom Kilauea volcano, Hawaii, in 1959 ranged fromolivine-rich picrites to olivine-poor basalts. Picritelavas carrying as much as 30% olivine were erupted atunusually high rates of discharge from the vent, creat-ing exceptionally high (580 m) lava fountains. Analysesof these two extreme lavas show the anticipated varia-tions in major elements (Table 12.2; Figure 12.3).
Trace Element Modeling of Fractional Crystallization.In evolving magmas, the effect of fractional crystalli-zation is more obvious in trace element than major element variations. For example, fractional crystalliza-tion drives a subalkaline magma toward the composi-tion of a minimum melt in the granite system (Figure5.27a). In such high-SiO2 granite magma, the coexist-
ing melt and solids (subequal proportions of plagio-clase, alkali feldspar, and quartz) have nearly the samemajor element composition, and large amounts of frac-tionation yield only small changes in major elements of,perhaps, 2 wt.% in SiO2. However, trace element con-centrations can vary by several hundred percent. (In-terestingly, in some such rocks Mg qualifies as a traceelement.) Powerful constraints on the crystal-melt frac-tionation can be provided by trace elements.
During progressive crystallization of a magma, com-patible elements are concentrated in the solids and incompatible elements are continuously enriched inthe residual liquid. The extent of crystallization of amagma system is an important control on the trace ele-ment concentrations of the residual melt and the solids.
For a closed magma system undergoing perfect frac-tional crystallization, the relations among the bulk dis-tribution coefficient, D (Section 2.5.1); melt fraction, F;and concentration ratio of a particular element in theresidual melt to that in the parent magma, Cm/Cp, aregiven by the Rayleigh law
�CC
m
p� � F (D�1) 12.1
This equation is plotted in Figure 12.4 for several val-ues of D. The extent of fractional crystallization is es-pecially critical for those elements that have either veryhigh or very low bulk distribution coefficients. For acompatible element, such as Ni (DNi � 7), in a basalticmagma precipitating olivine � pyroxene, the concen-tration of Ni in the residual melt decreases to 0.5 thatin the parent magma after only 10% crystallization (F � 0.1) and to 0.01 after 54% crystallization. In con-trast, the concentration of an incompatible element,such as Rb (DRb � 0.001), in the residual melt of thesame parent magma has only doubled after 50% crys-tallization, and advanced crystallization, about 90%, isneeded to increase its concentration in the residualmelt 10-fold.
Incompatible element enrichment in residual meltscan set the stage for subsequent processes to enrichthem further, possibly into economic concentrations in ore deposits. Beryllium (Be) is an example. Be oredeposits are typically associated with highly evolvedgranites and rhyolites. In granite magma systems, melt-fluid separation can concentrate the Be into pegmatiticminerals (e.g., beryl) that can be mined (discussedlater).
If distribution coefficients and fractionating crys-talline phases are known or can be assumed with somedegree of certainty, crystal-melt fractionation modelscan be compared with trends from analytical data onrock suites. A model for a fractionally crystallizingmagma system in which melt and solid solutions arecontinuously varying is fitted to analytical data on arock suite in Figure 12.5. The variation trend for com-patible versus incompatible element is strongly curved.
320 Igneous and Metamorphic Petrology
Table 12.2 Compositions of Most Olivine-RichBasalt (Picrite) and Most Olivine-Poor Basalt Eruptedfrom the Summit of Kilauea Volcano, Hawaii, in 1959
PICRITE OLIVINE-POOR BASALT
SiO2 46.93 49.89
TiO2 1.93 2.72
Al2O3 9.77 13.46
FeOt 11.74 11.35
MnO 0.18 0.18
MgO 19.00 8.00
CaO 8.29 11.33
Na2O 1.58 2.25
K2O 0.39 0.55
P2O5 0.19 0.27
Total 100.00 100.00
See also Figure 12.3. (Data from Murata and Richter, 1966.)
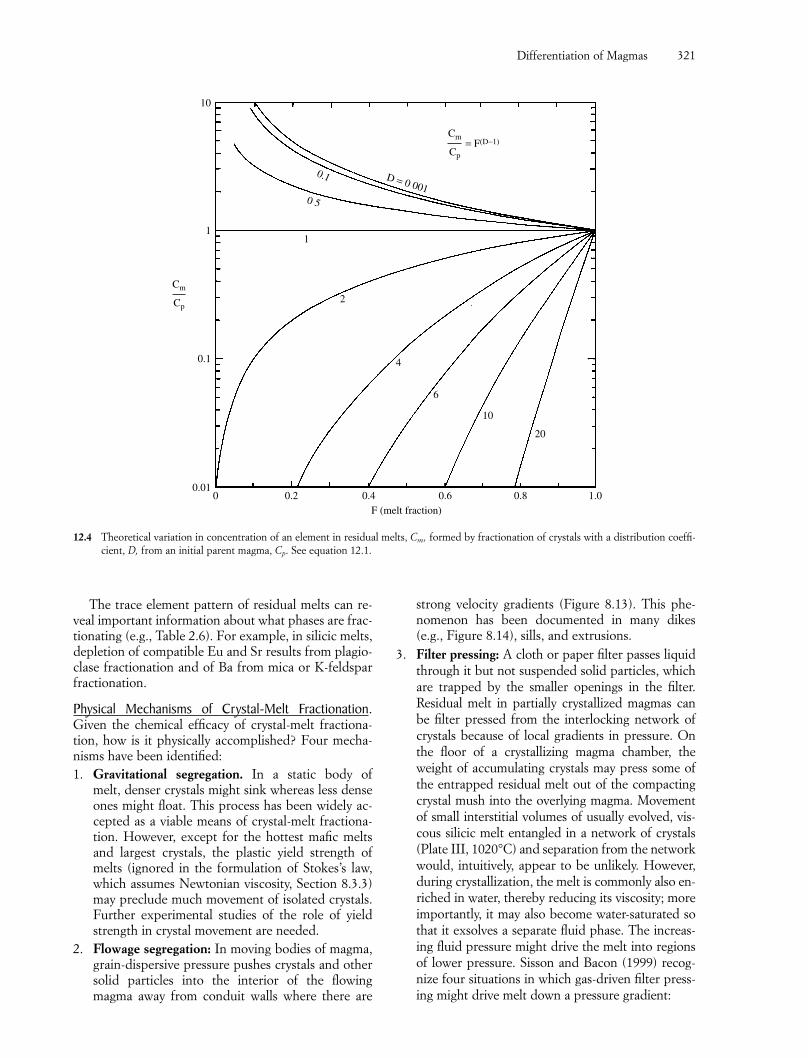
The trace element pattern of residual melts can re-veal important information about what phases are frac-tionating (e.g., Table 2.6). For example, in silicic melts,depletion of compatible Eu and Sr results from plagio-clase fractionation and of Ba from mica or K-feldsparfractionation.
Physical Mechanisms of Crystal-Melt Fractionation.Given the chemical efficacy of crystal-melt fractiona-tion, how is it physically accomplished? Four mecha-nisms have been identified:1. Gravitational segregation. In a static body of
melt, denser crystals might sink whereas less denseones might float. This process has been widely ac-cepted as a viable means of crystal-melt fractiona-tion. However, except for the hottest mafic meltsand largest crystals, the plastic yield strength ofmelts (ignored in the formulation of Stokes’s law,which assumes Newtonian viscosity, Section 8.3.3)may preclude much movement of isolated crystals.Further experimental studies of the role of yieldstrength in crystal movement are needed.
2. Flowage segregation: In moving bodies of magma,grain-dispersive pressure pushes crystals and othersolid particles into the interior of the flowingmagma away from conduit walls where there are
strong velocity gradients (Figure 8.13). This phe-nomenon has been documented in many dikes(e.g., Figure 8.14), sills, and extrusions.
3. Filter pressing: A cloth or paper filter passes liquidthrough it but not suspended solid particles, whichare trapped by the smaller openings in the filter.Residual melt in partially crystallized magmas canbe filter pressed from the interlocking network ofcrystals because of local gradients in pressure. Onthe floor of a crystallizing magma chamber, theweight of accumulating crystals may press some ofthe entrapped residual melt out of the compactingcrystal mush into the overlying magma. Movementof small interstitial volumes of usually evolved, vis-cous silicic melt entangled in a network of crystals(Plate III, 1020°C) and separation from the networkwould, intuitively, appear to be unlikely. However,during crystallization, the melt is commonly also en-riched in water, thereby reducing its viscosity; moreimportantly, it may also become water-saturated sothat it exsolves a separate fluid phase. The increas-ing fluid pressure might drive the melt into regionsof lower pressure. Sisson and Bacon (1999) recog-nize four situations in which gas-driven filter press-ing might drive melt down a pressure gradient:
Differentiation of Magmas 321
10
1
0.1
0.01
Cp
Cm
Cp
Cm= F(D−1)
D = 0 001
0.1
0 5
1
2
4
6
10
20
0 0.2 0.4 0.6 0.8 1.0F (melt fraction)
12.4 Theoretical variation in concentration of an element in residual melts, Cm, formed by fractionation of crystals with a distribution coeffi-cient, D, from an initial parent magma, Cp. See equation 12.1.
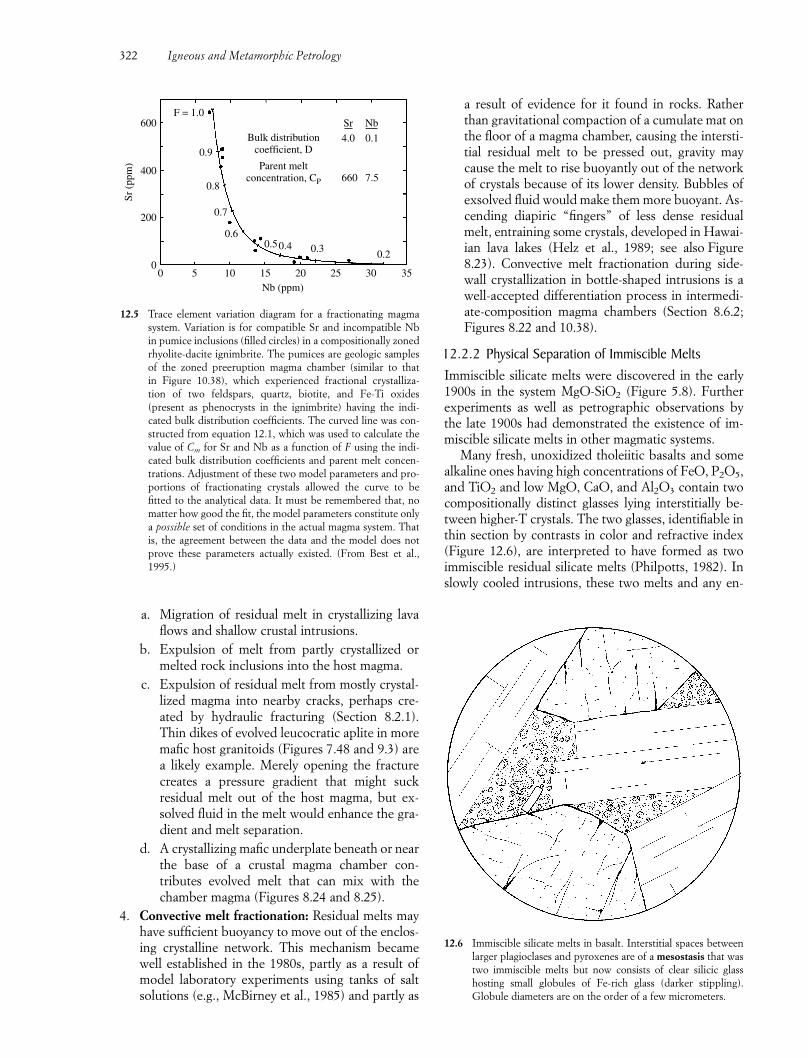
a. Migration of residual melt in crystallizing lavaflows and shallow crustal intrusions.
b. Expulsion of melt from partly crystallized ormelted rock inclusions into the host magma.
c. Expulsion of residual melt from mostly crystal-lized magma into nearby cracks, perhaps cre-ated by hydraulic fracturing (Section 8.2.1).Thin dikes of evolved leucocratic aplite in moremafic host granitoids (Figures 7.48 and 9.3) area likely example. Merely opening the fracturecreates a pressure gradient that might suckresidual melt out of the host magma, but ex-solved fluid in the melt would enhance the gra-dient and melt separation.
d. A crystallizing mafic underplate beneath or nearthe base of a crustal magma chamber con-tributes evolved melt that can mix with thechamber magma (Figures 8.24 and 8.25).
4. Convective melt fractionation: Residual melts mayhave sufficient buoyancy to move out of the enclos-ing crystalline network. This mechanism becamewell established in the 1980s, partly as a result ofmodel laboratory experiments using tanks of saltsolutions (e.g., McBirney et al., 1985) and partly as
a result of evidence for it found in rocks. Ratherthan gravitational compaction of a cumulate mat onthe floor of a magma chamber, causing the intersti-tial residual melt to be pressed out, gravity maycause the melt to rise buoyantly out of the networkof crystals because of its lower density. Bubbles ofexsolved fluid would make them more buoyant. As-cending diapiric “fingers” of less dense residualmelt, entraining some crystals, developed in Hawai-ian lava lakes (Helz et al., 1989; see also Figure8.23). Convective melt fractionation during side-wall crystallization in bottle-shaped intrusions is awell-accepted differentiation process in intermedi-ate-composition magma chambers (Section 8.6.2;Figures 8.22 and 10.38).
12.2.2 Physical Separation of Immiscible MeltsImmiscible silicate melts were discovered in the early1900s in the system MgO-SiO2 (Figure 5.8). Furtherexperiments as well as petrographic observations bythe late 1900s had demonstrated the existence of im-miscible silicate melts in other magmatic systems.
Many fresh, unoxidized tholeiitic basalts and somealkaline ones having high concentrations of FeO, P2O5,and TiO2 and low MgO, CaO, and Al2O3 contain twocompositionally distinct glasses lying interstitially be-tween higher-T crystals. The two glasses, identifiable inthin section by contrasts in color and refractive index(Figure 12.6), are interpreted to have formed as twoimmiscible residual silicate melts (Philpotts, 1982). Inslowly cooled intrusions, these two melts and any en-
322 Igneous and Metamorphic Petrology
00
200
400
600
5 10 15 20 25 30 35
Sr (
ppm
)
Nb (ppm)
F = 1.0
0.9
0.8
0.7
0.60.50.4 0.3 0.2
0.14.0
7.5660
Bulk distributioncoefficient, D
Parent meltconcentration, CP
Sr Nb
12.5 Trace element variation diagram for a fractionating magmasystem. Variation is for compatible Sr and incompatible Nb in pumice inclusions (filled circles) in a compositionally zonedrhyolite-dacite ignimbrite. The pumices are geologic samplesof the zoned preeruption magma chamber (similar to that in Figure 10.38), which experienced fractional crystalliza-tion of two feldspars, quartz, biotite, and Fe-Ti oxides (present as phenocrysts in the ignimbrite) having the indi-cated bulk distribution coefficients. The curved line was con-structed from equation 12.1, which was used to calculate thevalue of Cm for Sr and Nb as a function of F using the indi-cated bulk distribution coefficients and parent melt concen-trations. Adjustment of these two model parameters and pro-portions of fractionating crystals allowed the curve to be fitted to the analytical data. It must be remembered that, nomatter how good the fit, the model parameters constitute onlya possible set of conditions in the actual magma system. Thatis, the agreement between the data and the model does notprove these parameters actually existed. (From Best et al.,1995.)
12.6 Immiscible silicate melts in basalt. Interstitial spaces betweenlarger plagioclases and pyroxenes are of a mesostasis that wastwo immiscible melts but now consists of clear silicic glasshosting small globules of Fe-rich glass (darker stippling).Globule diameters are on the order of a few micrometers.
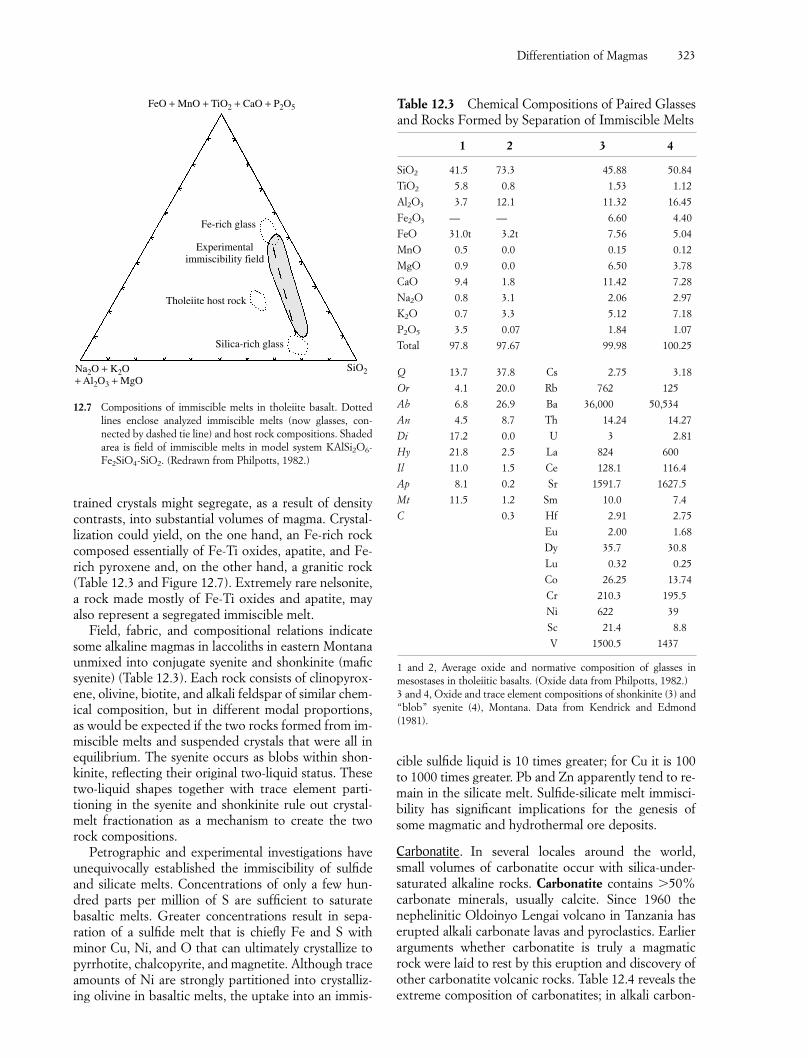
trained crystals might segregate, as a result of densitycontrasts, into substantial volumes of magma. Crystal-lization could yield, on the one hand, an Fe-rich rockcomposed essentially of Fe-Ti oxides, apatite, and Fe-rich pyroxene and, on the other hand, a granitic rock(Table 12.3 and Figure 12.7). Extremely rare nelsonite,a rock made mostly of Fe-Ti oxides and apatite, mayalso represent a segregated immiscible melt.
Field, fabric, and compositional relations indicatesome alkaline magmas in laccoliths in eastern Montanaunmixed into conjugate syenite and shonkinite (maficsyenite) (Table 12.3). Each rock consists of clinopyrox-ene, olivine, biotite, and alkali feldspar of similar chem-ical composition, but in different modal proportions,as would be expected if the two rocks formed from im-miscible melts and suspended crystals that were all inequilibrium. The syenite occurs as blobs within shon-kinite, reflecting their original two-liquid status. Thesetwo-liquid shapes together with trace element parti-tioning in the syenite and shonkinite rule out crystal-melt fractionation as a mechanism to create the tworock compositions.
Petrographic and experimental investigations haveunequivocally established the immiscibility of sulfideand silicate melts. Concentrations of only a few hun-dred parts per million of S are sufficient to saturatebasaltic melts. Greater concentrations result in sepa-ration of a sulfide melt that is chiefly Fe and S with minor Cu, Ni, and O that can ultimately crystallize topyrrhotite, chalcopyrite, and magnetite. Although traceamounts of Ni are strongly partitioned into crystalliz-ing olivine in basaltic melts, the uptake into an immis-
cible sulfide liquid is 10 times greater; for Cu it is 100to 1000 times greater. Pb and Zn apparently tend to re-main in the silicate melt. Sulfide-silicate melt immisci-bility has significant implications for the genesis ofsome magmatic and hydrothermal ore deposits.
Carbonatite. In several locales around the world, small volumes of carbonatite occur with silica-under-saturated alkaline rocks. Carbonatite contains �50%carbonate minerals, usually calcite. Since 1960 thenephelinitic Oldoinyo Lengai volcano in Tanzania haserupted alkali carbonate lavas and pyroclastics. Earlierarguments whether carbonatite is truly a magmaticrock were laid to rest by this eruption and discovery ofother carbonatite volcanic rocks. Table 12.4 reveals theextreme composition of carbonatites; in alkali carbon-
Differentiation of Magmas 323
Na2O + K2O+ Al2O3 + MgO
SiO2
FeO + MnO + TiO2 + CaO + P2O5
Fe-rich glass
Experimentalimmiscibility field
Silica-rich glass
Tholeiite host rock
12.7 Compositions of immiscible melts in tholeiite basalt. Dottedlines enclose analyzed immiscible melts (now glasses, con-nected by dashed tie line) and host rock compositions. Shadedarea is field of immiscible melts in model system KAlSi2O6-Fe2SiO4-SiO2. (Redrawn from Philpotts, 1982.)
Table 12.3 Chemical Compositions of Paired Glassesand Rocks Formed by Separation of Immiscible Melts
1 2 3 4
SiO2 41.5 73.3 45.88 50.84
TiO2 5.8 0.8 1.53 1.12
Al2O3 3.7 12.1 11.32 16.45
Fe2O3 — — 6.60 4.40
FeO 31.0t 3.2t 7.56 5.04
MnO 0.5 0.0 0.15 0.12
MgO 0.9 0.0 6.50 3.78
CaO 9.4 1.8 11.42 7.28
Na2O 0.8 3.1 2.06 2.97
K2O 0.7 3.3 5.12 7.18
P2O5 3.5 0.07 1.84 1.07
Total 97.8 97.67 99.98 100.25
Q 13.7 37.8 Cs 2.75 3.18
Or 4.1 20.0 Rb 762 125
Ab 6.8 26.9 Ba 36,000 50,534
An 4.5 8.7 Th 14.24 14.27
Di 17.2 0.0 U 3 2.81
Hy 21.8 2.5 La 824 600
Il 11.0 1.5 Ce 128.1 116.4
Ap 8.1 0.2 Sr 1591.7 1627.5
Mt 11.5 1.2 Sm 10.0 7.4
C 0.3 Hf 2.91 2.75
Eu 2.00 1.68
Dy 35.7 30.8
Lu 0.32 0.25
Co 26.25 13.74
Cr 210.3 195.5
Ni 622 39
Sc 21.4 8.8
V 1500.5 1437
1 and 2, Average oxide and normative composition of glasses inmesostases in tholeiitic basalts. (Oxide data from Philpotts, 1982.)3 and 4, Oxide and trace element compositions of shonkinite (3) and“blob” syenite (4), Montana. Data from Kendrick and Edmond(1981).
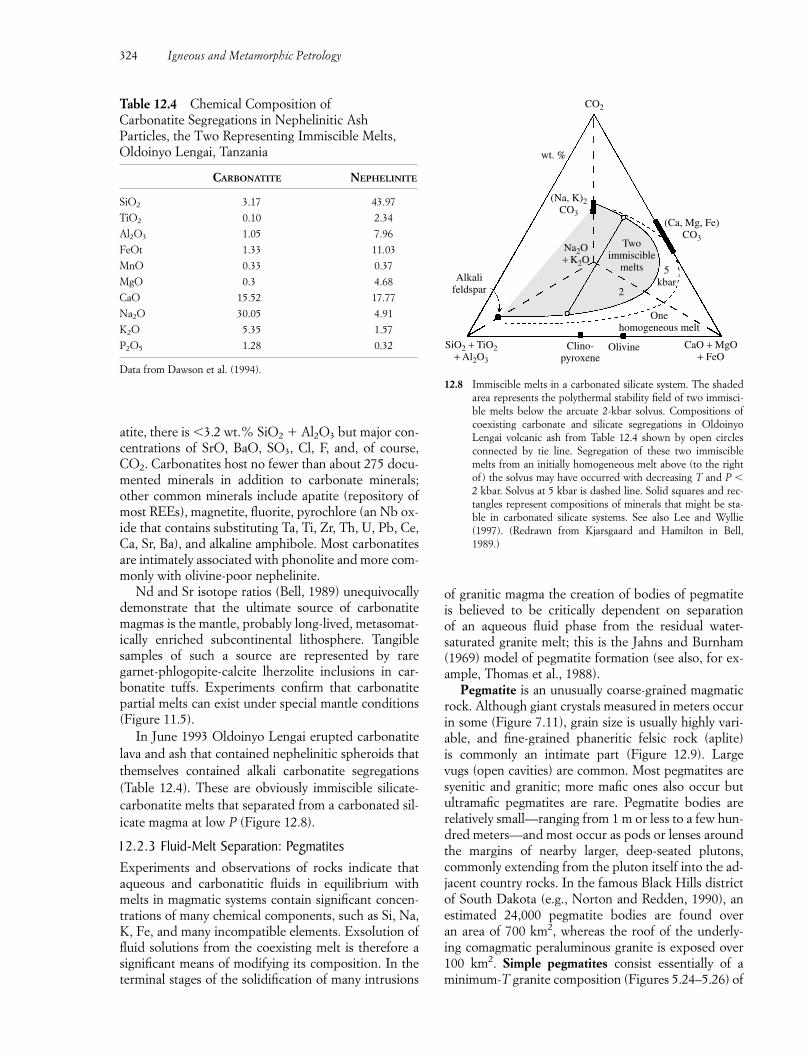
atite, there is �3.2 wt.% SiO2 Al2O3 but major con-centrations of SrO, BaO, SO3, Cl, F, and, of course,CO2. Carbonatites host no fewer than about 275 docu-mented minerals in addition to carbonate minerals;other common minerals include apatite (repository ofmost REEs), magnetite, fluorite, pyrochlore (an Nb ox-ide that contains substituting Ta, Ti, Zr, Th, U, Pb, Ce,Ca, Sr, Ba), and alkaline amphibole. Most carbonatitesare intimately associated with phonolite and more com-monly with olivine-poor nephelinite.
Nd and Sr isotope ratios (Bell, 1989) unequivocallydemonstrate that the ultimate source of carbonatitemagmas is the mantle, probably long-lived, metasomat-ically enriched subcontinental lithosphere. Tangiblesamples of such a source are represented by rare garnet-phlogopite-calcite lherzolite inclusions in car-bonatite tuffs. Experiments confirm that carbonatitepartial melts can exist under special mantle conditions(Figure 11.5).
In June 1993 Oldoinyo Lengai erupted carbonatitelava and ash that contained nephelinitic spheroids thatthemselves contained alkali carbonatite segregations(Table 12.4). These are obviously immiscible silicate-carbonatite melts that separated from a carbonated sil-icate magma at low P (Figure 12.8).
12.2.3 Fluid-Melt Separation: PegmatitesExperiments and observations of rocks indicate thataqueous and carbonatitic fluids in equilibrium withmelts in magmatic systems contain significant concen-trations of many chemical components, such as Si, Na,K, Fe, and many incompatible elements. Exsolution offluid solutions from the coexisting melt is therefore asignificant means of modifying its composition. In theterminal stages of the solidification of many intrusions
of granitic magma the creation of bodies of pegmatiteis believed to be critically dependent on separation of an aqueous fluid phase from the residual water-saturated granite melt; this is the Jahns and Burnham(1969) model of pegmatite formation (see also, for ex-ample, Thomas et al., 1988).
Pegmatite is an unusually coarse-grained magmaticrock. Although giant crystals measured in meters occurin some (Figure 7.11), grain size is usually highly vari-able, and fine-grained phaneritic felsic rock (aplite) is commonly an intimate part (Figure 12.9). Large vugs (open cavities) are common. Most pegmatites aresyenitic and granitic; more mafic ones also occur butultramafic pegmatites are rare. Pegmatite bodies arerelatively small—ranging from 1 m or less to a few hun-dred meters—and most occur as pods or lenses aroundthe margins of nearby larger, deep-seated plutons,commonly extending from the pluton itself into the ad-jacent country rocks. In the famous Black Hills districtof South Dakota (e.g., Norton and Redden, 1990), anestimated 24,000 pegmatite bodies are found over an area of 700 km2, whereas the roof of the underly-ing comagmatic peraluminous granite is exposed over100 km2. Simple pegmatites consist essentially of aminimum-T granite composition (Figures 5.24–5.26) of
324 Igneous and Metamorphic Petrology
Table 12.4 Chemical Composition of Carbonatite Segregations in Nephelinitic Ash Particles, the Two Representing Immiscible Melts,Oldoinyo Lengai, Tanzania
CARBONATITE NEPHELINITE
SiO2 3.17 43.97
TiO2 0.10 2.34
Al2O3 1.05 7.96
FeOt 1.33 11.03
MnO 0.33 0.37
MgO 0.3 4.68
CaO 15.52 17.77
Na2O 30.05 4.91
K2O 5.35 1.57
P2O5 1.28 0.32
Data from Dawson et al. (1994).
SiO2 + TiO2+ Al2O3
CaO + MgO+ FeO
Clino-pyroxene
Olivine
Onehomogeneous melt
5kbar
(Ca, Mg, Fe)CO3
CO2
wt. %
Alkalifeldspar
(Na, K)2CO3
Na2O+ K2O
2
Twoimmiscible
melts
12.8 Immiscible melts in a carbonated silicate system. The shadedarea represents the polythermal stability field of two immisci-ble melts below the arcuate 2-kbar solvus. Compositions of coexisting carbonate and silicate segregations in OldoinyoLengai volcanic ash from Table 12.4 shown by open circlesconnected by tie line. Segregation of these two immisciblemelts from an initially homogeneous melt above (to the rightof) the solvus may have occurred with decreasing T and P �2 kbar. Solvus at 5 kbar is dashed line. Solid squares and rec-tangles represent compositions of minerals that might be sta-ble in carbonated silicate systems. See also Lee and Wyllie(1997). (Redrawn from Kjarsgaard and Hamilton in Bell,1989.)
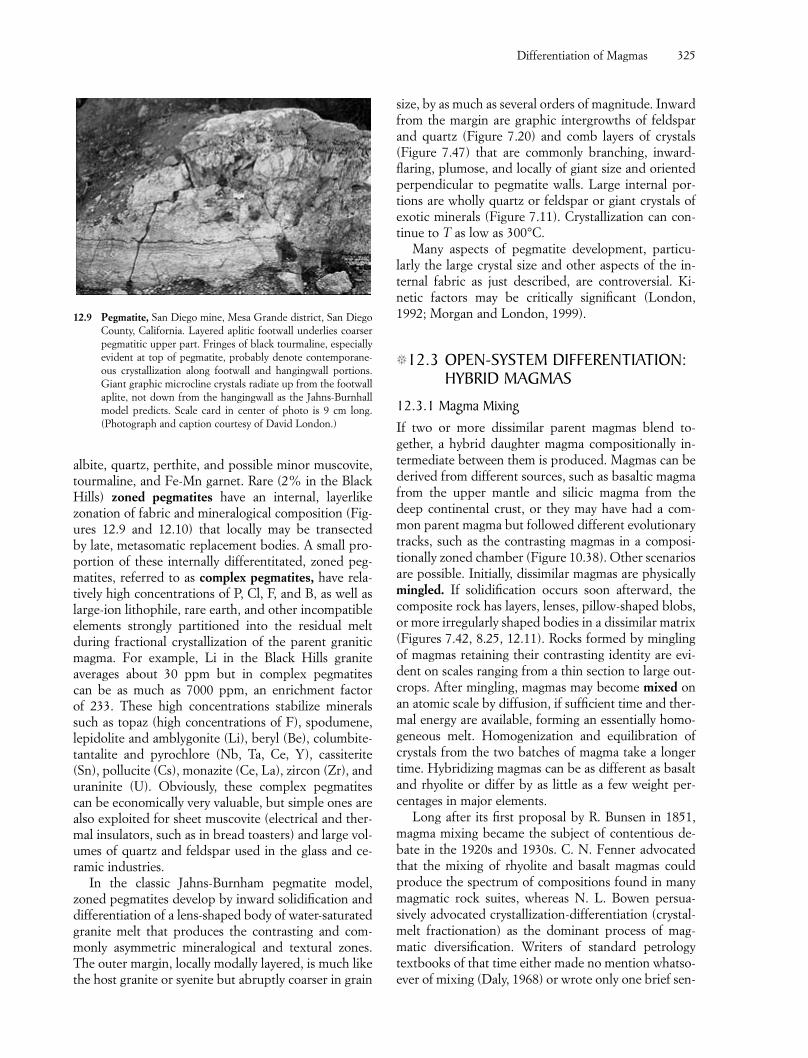
albite, quartz, perthite, and possible minor muscovite,tourmaline, and Fe-Mn garnet. Rare (2% in the BlackHills) zoned pegmatites have an internal, layerlikezonation of fabric and mineralogical composition (Fig-ures 12.9 and 12.10) that locally may be transected by late, metasomatic replacement bodies. A small pro-portion of these internally differentitated, zoned peg-matites, referred to as complex pegmatites, have rela-tively high concentrations of P, Cl, F, and B, as well aslarge-ion lithophile, rare earth, and other incompatibleelements strongly partitioned into the residual meltduring fractional crystallization of the parent graniticmagma. For example, Li in the Black Hills granite averages about 30 ppm but in complex pegmatites can be as much as 7000 ppm, an enrichment factor of 233. These high concentrations stabilize minerals such as topaz (high concentrations of F), spodumene,lepidolite and amblygonite (Li), beryl (Be), columbite-tantalite and pyrochlore (Nb, Ta, Ce, Y), cassiterite(Sn), pollucite (Cs), monazite (Ce, La), zircon (Zr), anduraninite (U). Obviously, these complex pegmatitescan be economically very valuable, but simple ones arealso exploited for sheet muscovite (electrical and ther-mal insulators, such as in bread toasters) and large vol-umes of quartz and feldspar used in the glass and ce-ramic industries.
In the classic Jahns-Burnham pegmatite model,zoned pegmatites develop by inward solidification anddifferentiation of a lens-shaped body of water-saturatedgranite melt that produces the contrasting and com-monly asymmetric mineralogical and textural zones.The outer margin, locally modally layered, is much likethe host granite or syenite but abruptly coarser in grain
size, by as much as several orders of magnitude. Inwardfrom the margin are graphic intergrowths of feldsparand quartz (Figure 7.20) and comb layers of crystals(Figure 7.47) that are commonly branching, inward-flaring, plumose, and locally of giant size and orientedperpendicular to pegmatite walls. Large internal por-tions are wholly quartz or feldspar or giant crystals ofexotic minerals (Figure 7.11). Crystallization can con-tinue to T as low as 300°C.
Many aspects of pegmatite development, particu-larly the large crystal size and other aspects of the in-ternal fabric as just described, are controversial. Ki-netic factors may be critically significant (London,1992; Morgan and London, 1999).
�12.3 OPEN-SYSTEM DIFFERENTIATION:HYBRID MAGMAS
12.3.1 Magma MixingIf two or more dissimilar parent magmas blend to-gether, a hybrid daughter magma compositionally in-termediate between them is produced. Magmas can bederived from different sources, such as basaltic magmafrom the upper mantle and silicic magma from thedeep continental crust, or they may have had a com-mon parent magma but followed different evolutionarytracks, such as the contrasting magmas in a composi-tionally zoned chamber (Figure 10.38). Other scenariosare possible. Initially, dissimilar magmas are physicallymingled. If solidification occurs soon afterward, thecomposite rock has layers, lenses, pillow-shaped blobs,or more irregularly shaped bodies in a dissimilar matrix(Figures 7.42, 8.25, 12.11). Rocks formed by minglingof magmas retaining their contrasting identity are evi-dent on scales ranging from a thin section to large out-crops. After mingling, magmas may become mixed onan atomic scale by diffusion, if sufficient time and ther-mal energy are available, forming an essentially homo-geneous melt. Homogenization and equilibration ofcrystals from the two batches of magma take a longertime. Hybridizing magmas can be as different as basaltand rhyolite or differ by as little as a few weight per-centages in major elements.
Long after its first proposal by R. Bunsen in 1851,magma mixing became the subject of contentious de-bate in the 1920s and 1930s. C. N. Fenner advocatedthat the mixing of rhyolite and basalt magmas couldproduce the spectrum of compositions found in manymagmatic rock suites, whereas N. L. Bowen persua-sively advocated crystallization-differentiation (crystal-melt fractionation) as the dominant process of mag-matic diversification. Writers of standard petrologytextbooks of that time either made no mention whatso-ever of mixing (Daly, 1968) or wrote only one brief sen-
Differentiation of Magmas 325
12.9 Pegmatite, San Diego mine, Mesa Grande district, San DiegoCounty, California. Layered aplitic footwall underlies coarserpegmatitic upper part. Fringes of black tourmaline, especiallyevident at top of pegmatite, probably denote contemporane-ous crystallization along footwall and hangingwall portions.Giant graphic microcline crystals radiate up from the footwallaplite, not down from the hangingwall as the Jahns-Burnhallmodel predicts. Scale card in center of photo is 9 cm long.(Photograph and caption courtesy of David London.)
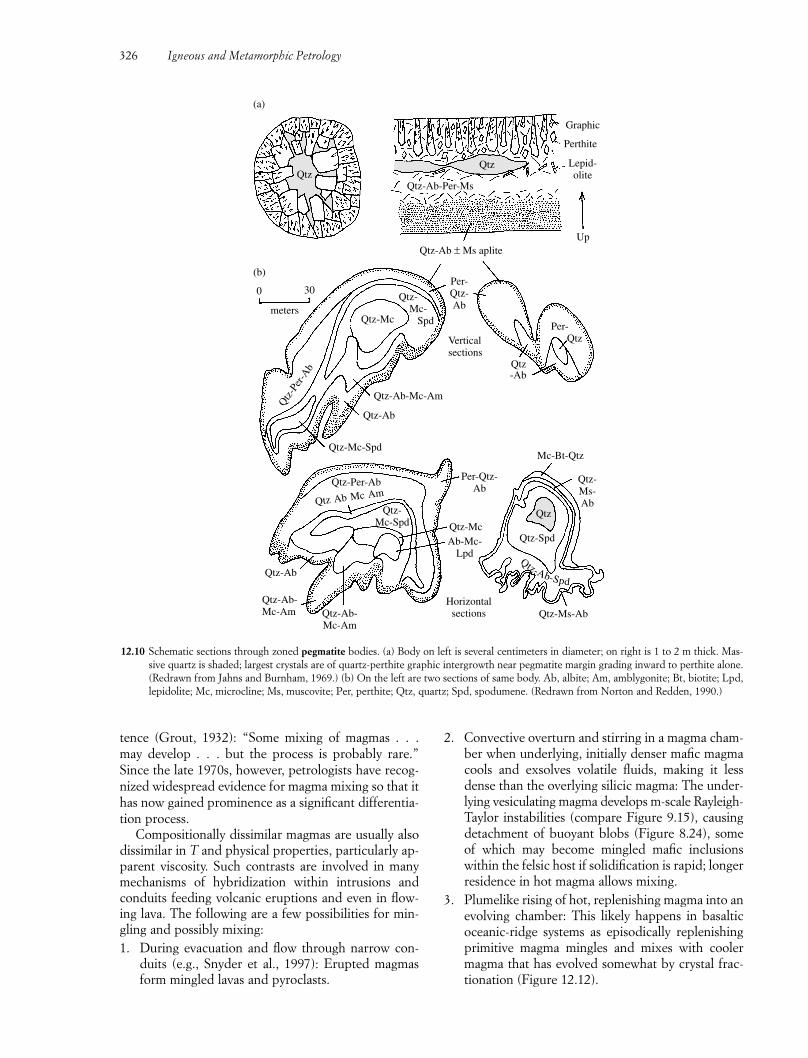
tence (Grout, 1932): “Some mixing of magmas . . .may develop . . . but the process is probably rare.”Since the late 1970s, however, petrologists have recog-nized widespread evidence for magma mixing so that ithas now gained prominence as a significant differentia-tion process.
Compositionally dissimilar magmas are usually alsodissimilar in T and physical properties, particularly ap-parent viscosity. Such contrasts are involved in manymechanisms of hybridization within intrusions andconduits feeding volcanic eruptions and even in flow-ing lava. The following are a few possibilities for min-gling and possibly mixing:1. During evacuation and flow through narrow con-
duits (e.g., Snyder et al., 1997): Erupted magmasform mingled lavas and pyroclasts.
2. Convective overturn and stirring in a magma cham-ber when underlying, initially denser mafic magmacools and exsolves volatile fluids, making it lessdense than the overlying silicic magma: The under-lying vesiculating magma develops m-scale Rayleigh-Taylor instabilities (compare Figure 9.15), causingdetachment of buoyant blobs (Figure 8.24), someof which may become mingled mafic inclusionswithin the felsic host if solidification is rapid; longerresidence in hot magma allows mixing.
3. Plumelike rising of hot, replenishing magma into anevolving chamber: This likely happens in basalticoceanic-ridge systems as episodically replenishingprimitive magma mingles and mixes with coolermagma that has evolved somewhat by crystal frac-tionation (Figure 12.12).
326 Igneous and Metamorphic Petrology
Qtz
Qtz-Spd
Qtz-Ms-AbHorizontal
sections
Qtz-McAb-Mc-
Lpd
QtzQtz-Ab-Per-Ms
Qtz-Ab ± Ms aplite
Graphic
Lepid-olite
Perthite
Up
Per-Qtz-Ab
Qtz- Mc- SpdQtz-Mc
Qtz
-Per
-Ab
0 30
meters
Qtz-Mc-Spd
Qtz-Ab-Mc-Am
Qtz-Ab
Verticalsections
Qtz-Ab
Per- Qtz
Mc-Bt-Qtz
Qtz-Ms-Ab
Qtz-Ab-Spd
Qtz-Ab-Mc-Am
Qtz-Ab-Mc-Am
Qtz-Per-Ab
Qtz Ab Mc Am
Qtz-Mc-Spd
Qtz-Ab
Per-Qtz-Ab
Qtz
(b)
(a)
12.10 Schematic sections through zoned pegmatite bodies. (a) Body on left is several centimeters in diameter; on right is 1 to 2 m thick. Mas-sive quartz is shaded; largest crystals are of quartz-perthite graphic intergrowth near pegmatite margin grading inward to perthite alone.(Redrawn from Jahns and Burnham, 1969.) (b) On the left are two sections of same body. Ab, albite; Am, amblygonite; Bt, biotite; Lpd,lepidolite; Mc, microcline; Ms, muscovite; Per, perthite; Qtz, quartz; Spd, spodumene. (Redrawn from Norton and Redden, 1990.)
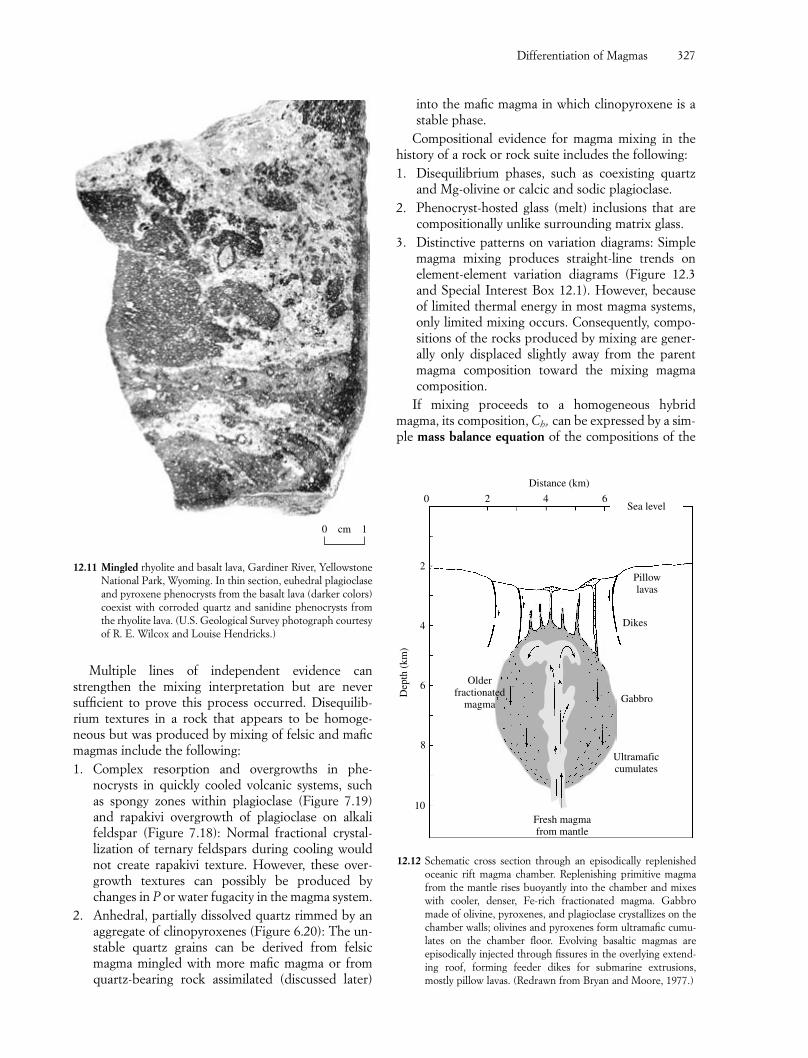
Multiple lines of independent evidence canstrengthen the mixing interpretation but are never sufficient to prove this process occurred. Disequilib-rium textures in a rock that appears to be homoge-neous but was produced by mixing of felsic and maficmagmas include the following:1. Complex resorption and overgrowths in phe-
nocrysts in quickly cooled volcanic systems, such as spongy zones within plagioclase (Figure 7.19)and rapakivi overgrowth of plagioclase on alkalifeldspar (Figure 7.18): Normal fractional crystal-lization of ternary feldspars during cooling wouldnot create rapakivi texture. However, these over-growth textures can possibly be produced bychanges in P or water fugacity in the magma system.
2. Anhedral, partially dissolved quartz rimmed by anaggregate of clinopyroxenes (Figure 6.20): The un-stable quartz grains can be derived from felsicmagma mingled with more mafic magma or fromquartz-bearing rock assimilated (discussed later)
into the mafic magma in which clinopyroxene is astable phase.
Compositional evidence for magma mixing in thehistory of a rock or rock suite includes the following:1. Disequilibrium phases, such as coexisting quartz
and Mg-olivine or calcic and sodic plagioclase.2. Phenocryst-hosted glass (melt) inclusions that are
compositionally unlike surrounding matrix glass.3. Distinctive patterns on variation diagrams: Simple
magma mixing produces straight-line trends on element-element variation diagrams (Figure 12.3and Special Interest Box 12.1). However, becauseof limited thermal energy in most magma systems,only limited mixing occurs. Consequently, compo-sitions of the rocks produced by mixing are gener-ally only displaced slightly away from the parentmagma composition toward the mixing magmacomposition.
If mixing proceeds to a homogeneous hybridmagma, its composition, Ch, can be expressed by a sim-ple mass balance equation of the compositions of the
Differentiation of Magmas 327
0 1cm
12.11 Mingled rhyolite and basalt lava, Gardiner River, YellowstoneNational Park, Wyoming. In thin section, euhedral plagioclaseand pyroxene phenocrysts from the basalt lava (darker colors)coexist with corroded quartz and sanidine phenocrysts fromthe rhyolite lava. (U.S. Geological Survey photograph courtesyof R. E. Wilcox and Louise Hendricks.)
Gabbro
Dikes
Pillowlavas
Fresh magmafrom mantle
10
8
6
4
2
0 2 4 6Sea level
Dep
th (
km)
Distance (km)
Olderfractionated
magma
Ultramaficcumulates
12.12 Schematic cross section through an episodically replenishedoceanic rift magma chamber. Replenishing primitive magmafrom the mantle rises buoyantly into the chamber and mixeswith cooler, denser, Fe-rich fractionated magma. Gabbromade of olivine, pyroxenes, and plagioclase crystallizes on thechamber walls; olivines and pyroxenes form ultramafic cumu-lates on the chamber floor. Evolving basaltic magmas areepisodically injected through fissures in the overlying extend-ing roof, forming feeder dikes for submarine extrusions,mostly pillow lavas. (Redrawn from Bryan and Moore, 1977.)
two end-member parent magmas, Cx and Cy; the mix-ing proportion, Fx, represents the weight fraction ofone of the magmas
12.2 Ch � CxFx Cy(1 � Fx)
Magma mixing, depending on how disparate themagmas are, may be accompanied by crystallization ofnew phases stabilized by the compositional and ther-mal properties of the hybrid system.
12.3.2 AssimilationAfter leaving its source, a batch of ascending buoyantprimary magma can encounter wall rock of differentcomposition, especially basaltic magmas from mantlesources rising into sialic rocks of the continental crustand any silicate magma encountering Ca-rich limestoneor Al-rich shale or their metamorphic equivalents.Magmas interact with their surroundings in an attemptto attain chemical and thermal equilibrium, especiallywhere they slow or even stop in subterranean storagechambers. Hot country rocks are by no means inert tohotter, contrasting magma.
Incorporation of solid rock into a magma of differ-ent composition is the process of assimilation; it pro-duces a contaminated magma, which is also hybrid,like mixed magmas. The contaminant can be countryrock around the magma chamber or xenoliths withinthe magma. Assimilation may initially involve simplephysical dispersal of xenoliths and xenocrysts into themagma, such as Precambrian zircons in Miocene rhyo-lite. Depending on magma and foreign material com-positions and temperatures and available time, the for-eign material chemically equilibrates with the melt tovarying degrees. Minerals may selectively dissolve intothe melt and contaminant ions incorporate into it bytime- and T-dependent diffusion. Commonly, assimila-tion involves mixing with melts created by melting ofthe contaminant rock.
The thermal and chemical principles of assimilationwere enunciated by Bowen (1928) many decades ago.Assimilation requires thermal energy, the source ofwhich can only be the magma itself. Heat from themagma has two sources:1. That released during cooling to lower T2. The latent heat of crystallizationAs few magmas appear to be superheated above theirliquidus T, the available heat for assimilation is derivedby concurrent crystallization and cooling of the magmabelow its liquidus. Section 11.1.1 indicated that themass of lower continental crustal rock melted by a massof intruded hotter basaltic magma is of the same orderof magnitude, more of this magma would be requiredin the cooler shallower crust. Obviously, hotter, moremafic magmas have greater assimilative potential. Buttransfer of heat from a magma body into adjacent
cooler rock leads to solidification at its contact, build-ing an armor of solid magmatic rock that inhibits further assimilation. Pieces of stoped country rock(Section 9.4.3) within a body of magma afford a signif-icantly greater surface area over which heat can betransferred and assimilative processes operate than thecountry rock. Volatile fluids liberated from heatedcountry rock may contaminate volatile-poor magmawith Si, K, Na, and other elements, as the fluid solutionis absorbed into it.
The fate of assimilated crystals depends on theircomposition and that of the parent melt. Provided suf-ficient heat is available, a crystalline phase dissolves ifthe silicate melt is not already saturated with respect tothat phase. Thus, quartz xenocrysts can dissolve on atime scale of days in basaltic melts in which the activityof silica is �1 (the usual case); melts so contaminatedare enriched in silica. Alkali feldspar, biotite, and horn-blende in granite assimilated by basalt follow a similarfate, but the details differ. Assimilation of granite inbasalt magma promotes crystallization of some of thephases it would have normally precipitated and alongsimilar lines of liquid descent; however, felsic deriva-tives are more abundant. Crystals react with a melt if they would have precipitated from the magma athigher T. Thus, physically ingested crystals of Mg-richolivine into Makaopuhi basalt magma at T � 1075°Cand 1 atm (Plate III), where olivine is no longer stable,would induce precipitation of additional stable pyrox-ene by a reaction relation with the melt. Xenocrysts of clinopyroxene—perhaps derived from incorporatedbasalt xenoliths—in a granodiorite melt precipitatingstable hornblende but not pyroxene would be ex-pected to react with the melt, forming, by ionic diffu-sion, a reaction rim of hornblende surrounding andpossibly eventually replacing the unstable clinopyrox-ene. Assimilation of quartz xenocrysts, perhaps fromingested blocks of sandstone, into a quartz-saturatedgranitic melt simply adds more modal quartz to the fi-nal granite. Assimilation of Al-rich minerals into basaltmagma stabilizes calcic plagioclase at the expense ofcalcic clinopyroxene, so that leucocratic orthopyrox-ene gabbro (norite) magmas might form.
Evidence for magma contamination in the history ofa rock is generally only permissive. The presence ofxenocrysts (e.g., quartz in basalt, Figure 6.20) andxenoliths in a magmatic rock may suggest they are con-taminants, but xenocrysts can also originate by mixingof dissimilar magmas, and foreign material can be in-corporated late into the magma with minimal contami-nation of the melt. Strained xenocrysts that show un-dulatory optical extinction under cross-polarized lightin thin section or other solid-state strain effects are es-pecially useful in distinguishing assimilated solid mate-rial from phenocrysts in mixed magmas.
328 Igneous and Metamorphic Petrology
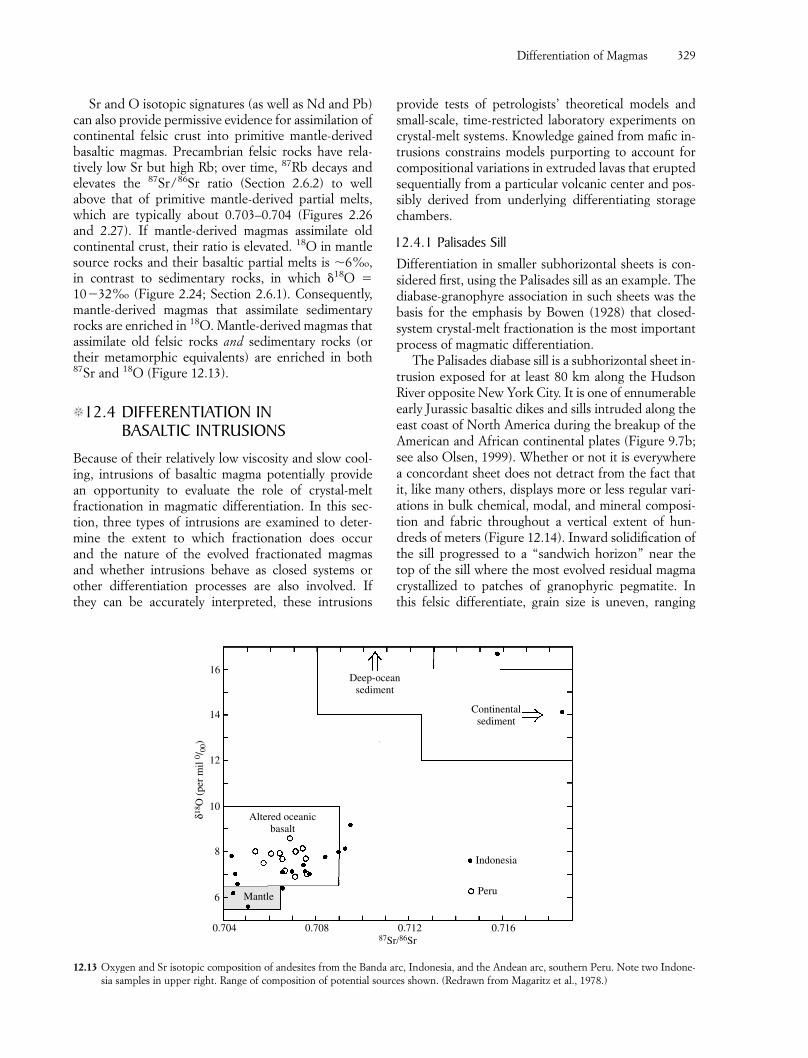
Sr and O isotopic signatures (as well as Nd and Pb)can also provide permissive evidence for assimilation ofcontinental felsic crust into primitive mantle-derivedbasaltic magmas. Precambrian felsic rocks have rela-tively low Sr but high Rb; over time, 87Rb decays andelevates the 87Sr/86Sr ratio (Section 2.6.2) to wellabove that of primitive mantle-derived partial melts,which are typically about 0.703–0.704 (Figures 2.26and 2.27). If mantle-derived magmas assimilate oldcontinental crust, their ratio is elevated. 18O in mantlesource rocks and their basaltic partial melts is �6%o,in contrast to sedimentary rocks, in which 18O �10�32%o (Figure 2.24; Section 2.6.1). Consequently,mantle-derived magmas that assimilate sedimentaryrocks are enriched in 18O. Mantle-derived magmas thatassimilate old felsic rocks and sedimentary rocks (ortheir metamorphic equivalents) are enriched in both87Sr and 18O (Figure 12.13).
�12.4 DIFFERENTIATION IN BASALTIC INTRUSIONS
Because of their relatively low viscosity and slow cool-ing, intrusions of basaltic magma potentially provide an opportunity to evaluate the role of crystal-melt fractionation in magmatic differentiation. In this sec-tion, three types of intrusions are examined to deter-mine the extent to which fractionation does occur and the nature of the evolved fractionated magmas and whether intrusions behave as closed systems orother differentiation processes are also involved. If they can be accurately interpreted, these intrusions
provide tests of petrologists’ theoretical models andsmall-scale, time-restricted laboratory experiments oncrystal-melt systems. Knowledge gained from mafic in-trusions constrains models purporting to account forcompositional variations in extruded lavas that eruptedsequentially from a particular volcanic center and pos-sibly derived from underlying differentiating storagechambers.
12.4.1 Palisades SillDifferentiation in smaller subhorizontal sheets is con-sidered first, using the Palisades sill as an example. Thediabase-granophyre association in such sheets was thebasis for the emphasis by Bowen (1928) that closed-system crystal-melt fractionation is the most importantprocess of magmatic differentiation.
The Palisades diabase sill is a subhorizontal sheet in-trusion exposed for at least 80 km along the HudsonRiver opposite New York City. It is one of ennumerableearly Jurassic basaltic dikes and sills intruded along theeast coast of North America during the breakup of theAmerican and African continental plates (Figure 9.7b;see also Olsen, 1999). Whether or not it is everywherea concordant sheet does not detract from the fact thatit, like many others, displays more or less regular vari-ations in bulk chemical, modal, and mineral composi-tion and fabric throughout a vertical extent of hun-dreds of meters (Figure 12.14). Inward solidification ofthe sill progressed to a “sandwich horizon” near thetop of the sill where the most evolved residual magmacrystallized to patches of granophyric pegmatite. Inthis felsic differentiate, grain size is uneven, ranging
Differentiation of Magmas 329
0.704 0.708 0.712 0.716
Mantle
Altered oceanicbasalt
Deep-oceansediment
Continentalsediment
Indonesia
Peru6
8
10
12
14
16
δ18 O
(pe
r m
il 0 /
00)
87Sr/86Sr
12.13 Oxygen and Sr isotopic composition of andesites from the Banda arc, Indonesia, and the Andean arc, southern Peru. Note two Indone-sia samples in upper right. Range of composition of potential sources shown. (Redrawn from Magaritz et al., 1978.)
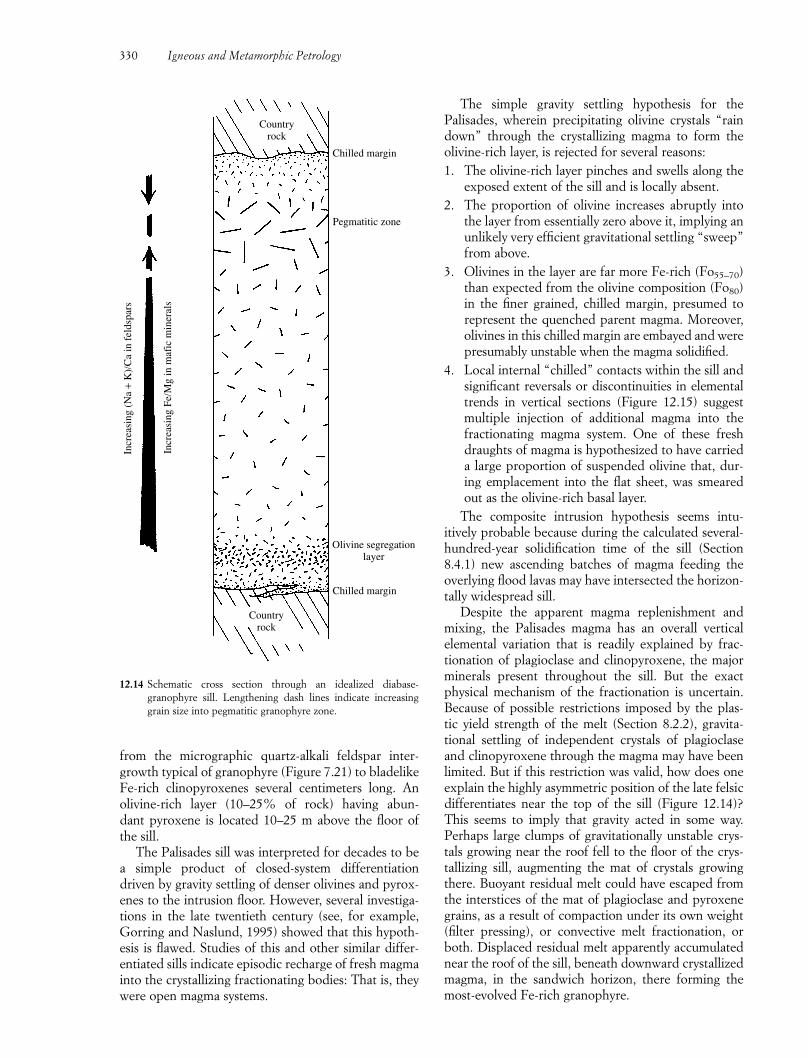
from the micrographic quartz-alkali feldspar inter-growth typical of granophyre (Figure 7.21) to bladelikeFe-rich clinopyroxenes several centimeters long. Anolivine-rich layer (10–25% of rock) having abun-dant pyroxene is located 10–25 m above the floor ofthe sill.
The Palisades sill was interpreted for decades to bea simple product of closed-system differentiation driven by gravity settling of denser olivines and pyrox-enes to the intrusion floor. However, several investiga-tions in the late twentieth century (see, for example,Gorring and Naslund, 1995) showed that this hypoth-esis is flawed. Studies of this and other similar differ-entiated sills indicate episodic recharge of fresh magmainto the crystallizing fractionating bodies: That is, theywere open magma systems.
The simple gravity settling hypothesis for the Palisades, wherein precipitating olivine crystals “raindown” through the crystallizing magma to form theolivine-rich layer, is rejected for several reasons:1. The olivine-rich layer pinches and swells along the
exposed extent of the sill and is locally absent.2. The proportion of olivine increases abruptly into
the layer from essentially zero above it, implying anunlikely very efficient gravitational settling “sweep”from above.
3. Olivines in the layer are far more Fe-rich (Fo55–70)than expected from the olivine composition (Fo80)in the finer grained, chilled margin, presumed torepresent the quenched parent magma. Moreover,olivines in this chilled margin are embayed and werepresumably unstable when the magma solidified.
4. Local internal “chilled” contacts within the sill andsignificant reversals or discontinuities in elementaltrends in vertical sections (Figure 12.15) suggestmultiple injection of additional magma into thefractionating magma system. One of these freshdraughts of magma is hypothesized to have carrieda large proportion of suspended olivine that, dur-ing emplacement into the flat sheet, was smearedout as the olivine-rich basal layer.
The composite intrusion hypothesis seems intu-itively probable because during the calculated several-hundred-year solidification time of the sill (Section8.4.1) new ascending batches of magma feeding theoverlying flood lavas may have intersected the horizon-tally widespread sill.
Despite the apparent magma replenishment andmixing, the Palisades magma has an overall vertical elemental variation that is readily explained by frac-tionation of plagioclase and clinopyroxene, the majorminerals present throughout the sill. But the exactphysical mechanism of the fractionation is uncertain.Because of possible restrictions imposed by the plas-tic yield strength of the melt (Section 8.2.2), gravita-tional settling of independent crystals of plagioclaseand clinopyroxene through the magma may have beenlimited. But if this restriction was valid, how does oneexplain the highly asymmetric position of the late felsicdifferentiates near the top of the sill (Figure 12.14)?This seems to imply that gravity acted in some way.Perhaps large clumps of gravitationally unstable crys-tals growing near the roof fell to the floor of the crys-tallizing sill, augmenting the mat of crystals growingthere. Buoyant residual melt could have escaped fromthe interstices of the mat of plagioclase and pyroxenegrains, as a result of compaction under its own weight(filter pressing), or convective melt fractionation, orboth. Displaced residual melt apparently accumulatednear the roof of the sill, beneath downward crystallizedmagma, in the sandwich horizon, there forming themost-evolved Fe-rich granophyre.
330 Igneous and Metamorphic Petrology
Countryrock
Countryrock
Chilled margin
Pegmatitic zone
Olivine segregationlayer
Chilled margin
Incr
easi
ng (
Na
+ K
)/Ca
in f
elds
pars
Incr
easi
ng F
e/M
g in
maf
ic m
iner
als
12.14 Schematic cross section through an idealized diabase-granophyre sill. Lengthening dash lines indicate increasinggrain size into pegmatitic granophyre zone.
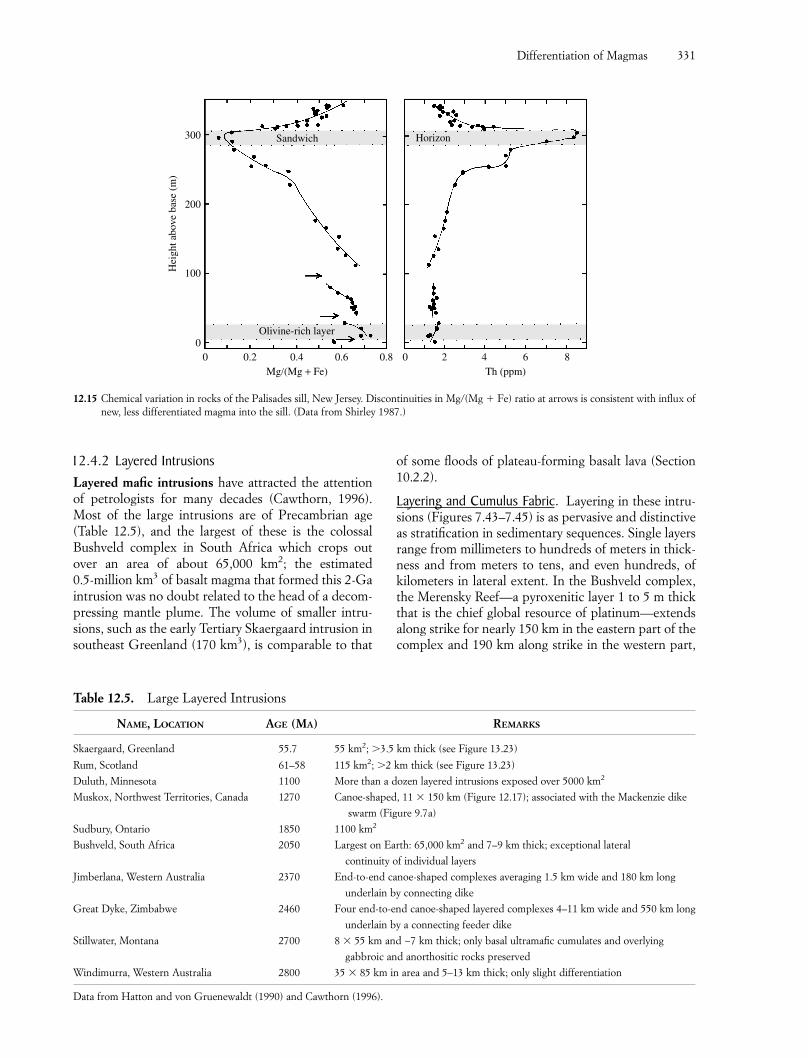
Differentiation of Magmas 331
12.4.2 Layered IntrusionsLayered mafic intrusions have attracted the attentionof petrologists for many decades (Cawthorn, 1996).Most of the large intrusions are of Precambrian age(Table 12.5), and the largest of these is the colossalBushveld complex in South Africa which crops outover an area of about 65,000 km2; the estimated 0.5-million km3 of basalt magma that formed this 2-Gaintrusion was no doubt related to the head of a decom-pressing mantle plume. The volume of smaller intru-sions, such as the early Tertiary Skaergaard intrusion insoutheast Greenland (170 km3), is comparable to that
of some floods of plateau-forming basalt lava (Section10.2.2).
Layering and Cumulus Fabric. Layering in these intru-sions (Figures 7.43–7.45) is as pervasive and distinctiveas stratification in sedimentary sequences. Single layersrange from millimeters to hundreds of meters in thick-ness and from meters to tens, and even hundreds, ofkilometers in lateral extent. In the Bushveld complex,the Merensky Reef—a pyroxenitic layer 1 to 5 m thickthat is the chief global resource of platinum—extendsalong strike for nearly 150 km in the eastern part of thecomplex and 190 km along strike in the western part,
00
100
200
300
0.2 0.4 0.6 0.8 0 2 4 6 8Mg/(Mg + Fe)
Hei
ght a
bove
bas
e (m
)
Th (ppm)
Sandwich Horizon
Olivine-rich layer
12.15 Chemical variation in rocks of the Palisades sill, New Jersey. Discontinuities in Mg/(Mg Fe) ratio at arrows is consistent with influx ofnew, less differentiated magma into the sill. (Data from Shirley 1987.)
Table 12.5. Large Layered Intrusions
NAME, LOCATION AGE (MA) REMARKS
Skaergaard, Greenland 55.7 55 km2; �3.5 km thick (see Figure 13.23)
Rum, Scotland 61–58 115 km2; �2 km thick (see Figure 13.23)
Duluth, Minnesota 1100 More than a dozen layered intrusions exposed over 5000 km2
Muskox, Northwest Territories, Canada 1270 Canoe-shaped, 11 � 150 km (Figure 12.17); associated with the Mackenzie dike
swarm (Figure 9.7a)
Sudbury, Ontario 1850 1100 km2
Bushveld, South Africa 2050 Largest on Earth: 65,000 km2 and 7–9 km thick; exceptional lateral
continuity of individual layers
Jimberlana, Western Australia 2370 End-to-end canoe-shaped complexes averaging 1.5 km wide and 180 km long
underlain by connecting dike
Great Dyke, Zimbabwe 2460 Four end-to-end canoe-shaped layered complexes 4–11 km wide and 550 km long
underlain by a connecting feeder dike
Stillwater, Montana 2700 8 � 55 km and ~7 km thick; only basal ultramafic cumulates and overlying
gabbroic and anorthositic rocks preserved
Windimurra, Western Australia 2800 35 � 85 km in area and 5–13 km thick; only slight differentiation
Data from Hatton and von Gruenewaldt (1990) and Cawthorn (1996).
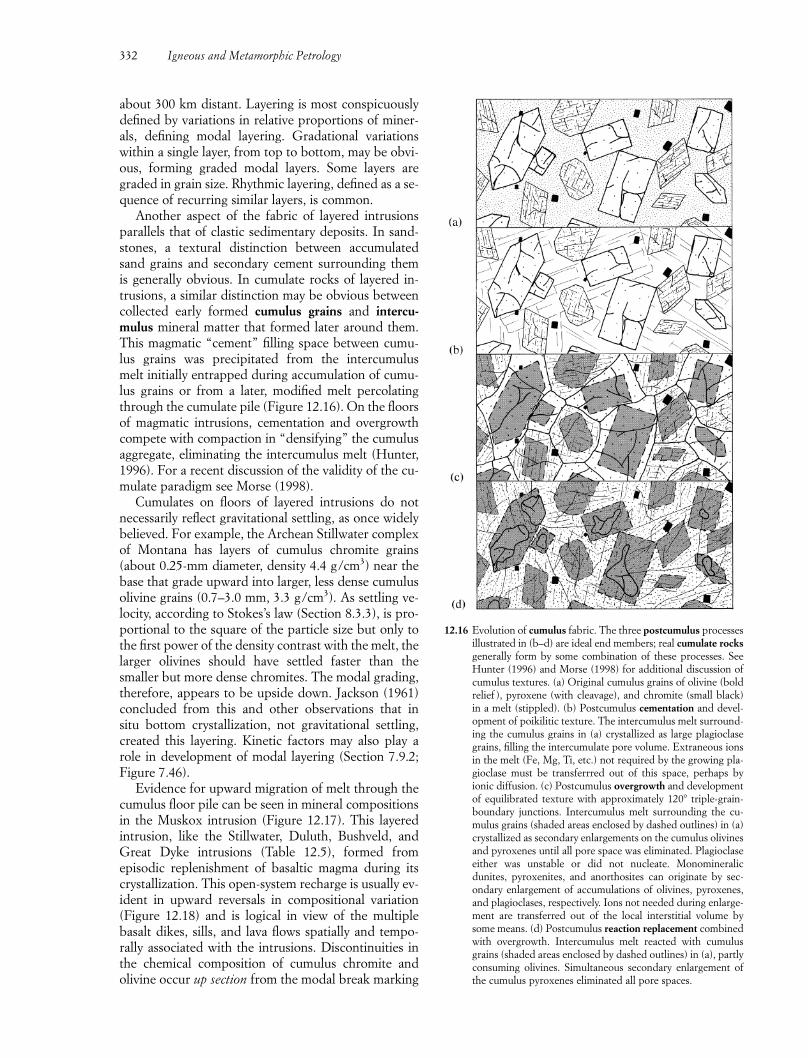
about 300 km distant. Layering is most conspicuouslydefined by variations in relative proportions of miner-als, defining modal layering. Gradational variationswithin a single layer, from top to bottom, may be obvi-ous, forming graded modal layers. Some layers aregraded in grain size. Rhythmic layering, defined as a se-quence of recurring similar layers, is common.
Another aspect of the fabric of layered intrusionsparallels that of clastic sedimentary deposits. In sand-stones, a textural distinction between accumulatedsand grains and secondary cement surrounding them is generally obvious. In cumulate rocks of layered in-trusions, a similar distinction may be obvious betweencollected early formed cumulus grains and intercu-mulus mineral matter that formed later around them.This magmatic “cement” filling space between cumu-lus grains was precipitated from the intercumulus melt initially entrapped during accumulation of cumu-lus grains or from a later, modified melt percolatingthrough the cumulate pile (Figure 12.16). On the floorsof magmatic intrusions, cementation and overgrowthcompete with compaction in “densifying” the cumulusaggregate, eliminating the intercumulus melt (Hunter,1996). For a recent discussion of the validity of the cu-mulate paradigm see Morse (1998).
Cumulates on floors of layered intrusions do notnecessarily reflect gravitational settling, as once widelybelieved. For example, the Archean Stillwater complexof Montana has layers of cumulus chromite grains(about 0.25-mm diameter, density 4.4 g/cm3) near thebase that grade upward into larger, less dense cumulusolivine grains (0.7–3.0 mm, 3.3 g/cm3). As settling ve-locity, according to Stokes’s law (Section 8.3.3), is pro-portional to the square of the particle size but only tothe first power of the density contrast with the melt, thelarger olivines should have settled faster than thesmaller but more dense chromites. The modal grading,therefore, appears to be upside down. Jackson (1961)concluded from this and other observations that in situ bottom crystallization, not gravitational settling,created this layering. Kinetic factors may also play arole in development of modal layering (Section 7.9.2;Figure 7.46).
Evidence for upward migration of melt through thecumulus floor pile can be seen in mineral compositionsin the Muskox intrusion (Figure 12.17). This layeredintrusion, like the Stillwater, Duluth, Bushveld, andGreat Dyke intrusions (Table 12.5), formed fromepisodic replenishment of basaltic magma during itscrystallization. This open-system recharge is usually ev-ident in upward reversals in compositional variation(Figure 12.18) and is logical in view of the multiplebasalt dikes, sills, and lava flows spatially and tempo-rally associated with the intrusions. Discontinuities inthe chemical composition of cumulus chromite andolivine occur up section from the modal break marking
332 Igneous and Metamorphic Petrology
12.16 Evolution of cumulus fabric. The three postcumulus processesillustrated in (b–d) are ideal end members; real cumulate rocksgenerally form by some combination of these processes. SeeHunter (1996) and Morse (1998) for additional discussion ofcumulus textures. (a) Original cumulus grains of olivine (boldrelief ), pyroxene (with cleavage), and chromite (small black)in a melt (stippled). (b) Postcumulus cementation and devel-opment of poikilitic texture. The intercumulus melt surround-ing the cumulus grains in (a) crystallized as large plagioclasegrains, filling the intercumulate pore volume. Extraneous ionsin the melt (Fe, Mg, Ti, etc.) not required by the growing pla-gioclase must be transferrred out of this space, perhaps byionic diffusion. (c) Postcumulus overgrowth and developmentof equilibrated texture with approximately 120� triple-grain-boundary junctions. Intercumulus melt surrounding the cu-mulus grains (shaded areas enclosed by dashed outlines) in (a)crystallized as secondary enlargements on the cumulus olivinesand pyroxenes until all pore space was eliminated. Plagioclaseeither was unstable or did not nucleate. Monomineralicdunites, pyroxenites, and anorthosites can originate by sec-ondary enlargement of accumulations of olivines, pyroxenes,and plagioclases, respectively. Ions not needed during enlarge-ment are transferred out of the local interstitial volume bysome means. (d) Postcumulus reaction replacement combinedwith overgrowth. Intercumulus melt reacted with cumulusgrains (shaded areas enclosed by dashed outlines) in (a), partlyconsuming olivines. Simultaneous secondary enlargement ofthe cumulus pyroxenes eliminated all pore spaces.
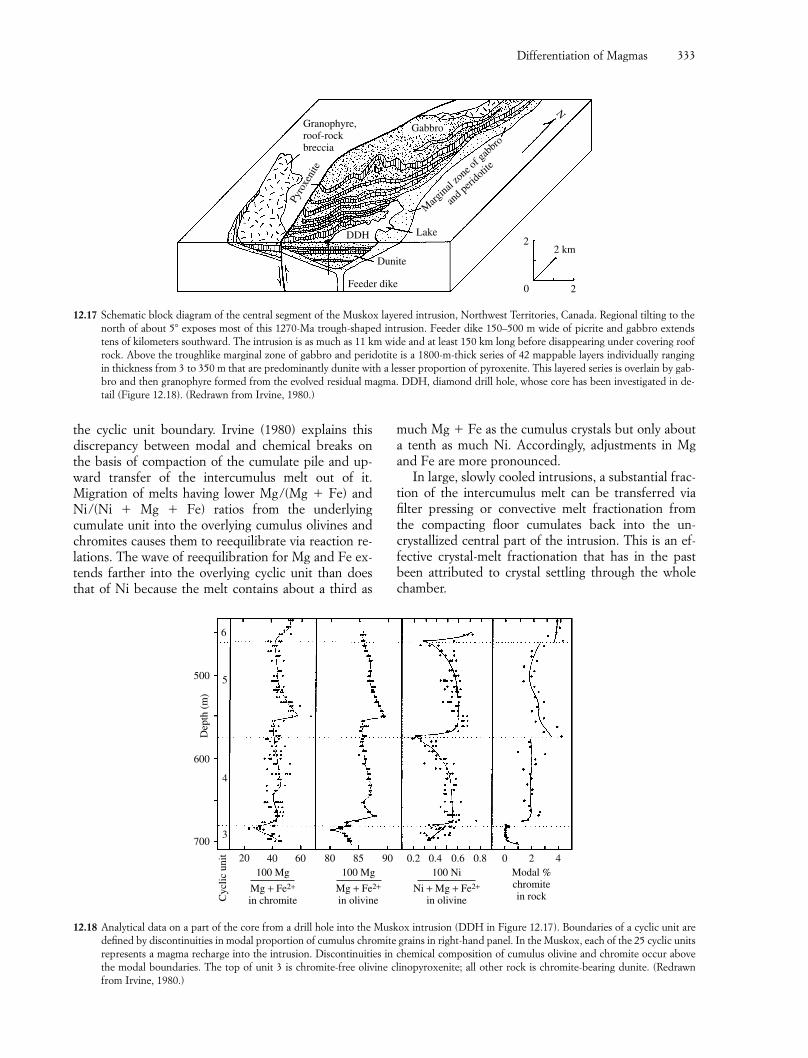
Differentiation of Magmas 333
the cyclic unit boundary. Irvine (1980) explains thisdiscrepancy between modal and chemical breaks onthe basis of compaction of the cumulate pile and up-ward transfer of the intercumulus melt out of it. Migration of melts having lower Mg/(Mg Fe) andNi/(Ni Mg Fe) ratios from the underlying cumulate unit into the overlying cumulus olivines andchromites causes them to reequilibrate via reaction re-lations. The wave of reequilibration for Mg and Fe ex-tends farther into the overlying cyclic unit than doesthat of Ni because the melt contains about a third as
much Mg Fe as the cumulus crystals but only abouta tenth as much Ni. Accordingly, adjustments in Mgand Fe are more pronounced.
In large, slowly cooled intrusions, a substantial frac-tion of the intercumulus melt can be transferred via filter pressing or convective melt fractionation from the compacting floor cumulates back into the un-crystallized central part of the intrusion. This is an ef-fective crystal-melt fractionation that has in the pastbeen attributed to crystal settling through the wholechamber.
Dunite
Feeder dike
DDH
Pyro
xeni
te
Granophyre,roof-rockbreccia
Gabbro
N
Lake
Marg
inal z
one o
f gab
bro
and p
erido
tite
2
2
0
2 km
12.17 Schematic block diagram of the central segment of the Muskox layered intrusion, Northwest Territories, Canada. Regional tilting to thenorth of about 5� exposes most of this 1270-Ma trough-shaped intrusion. Feeder dike 150–500 m wide of picrite and gabbro extendstens of kilometers southward. The intrusion is as much as 11 km wide and at least 150 km long before disappearing under covering roofrock. Above the troughlike marginal zone of gabbro and peridotite is a 1800-m-thick series of 42 mappable layers individually rangingin thickness from 3 to 350 m that are predominantly dunite with a lesser proportion of pyroxenite. This layered series is overlain by gab-bro and then granophyre formed from the evolved residual magma. DDH, diamond drill hole, whose core has been investigated in de-tail (Figure 12.18). (Redrawn from Irvine, 1980.)
20 40 60 80 85 90 0.2 0.4 0.6 0.8 0 2 4
700
500
600
6
5
4
3
Dep
th (
m)
100 Mg 100 Mg 100 Ni Modal %chromitein rockC
yclic
uni
t
Mg + Fe2+
in chromiteMg + Fe2+
in olivineNi + Mg + Fe2+
in olivine
12.18 Analytical data on a part of the core from a drill hole into the Muskox intrusion (DDH in Figure 12.17). Boundaries of a cyclic unit aredefined by discontinuities in modal proportion of cumulus chromite grains in right-hand panel. In the Muskox, each of the 25 cyclic unitsrepresents a magma recharge into the intrusion. Discontinuities in chemical composition of cumulus olivine and chromite occur abovethe modal boundaries. The top of unit 3 is chromite-free olivine clinopyroxenite; all other rock is chromite-bearing dunite. (Redrawnfrom Irvine, 1980.)
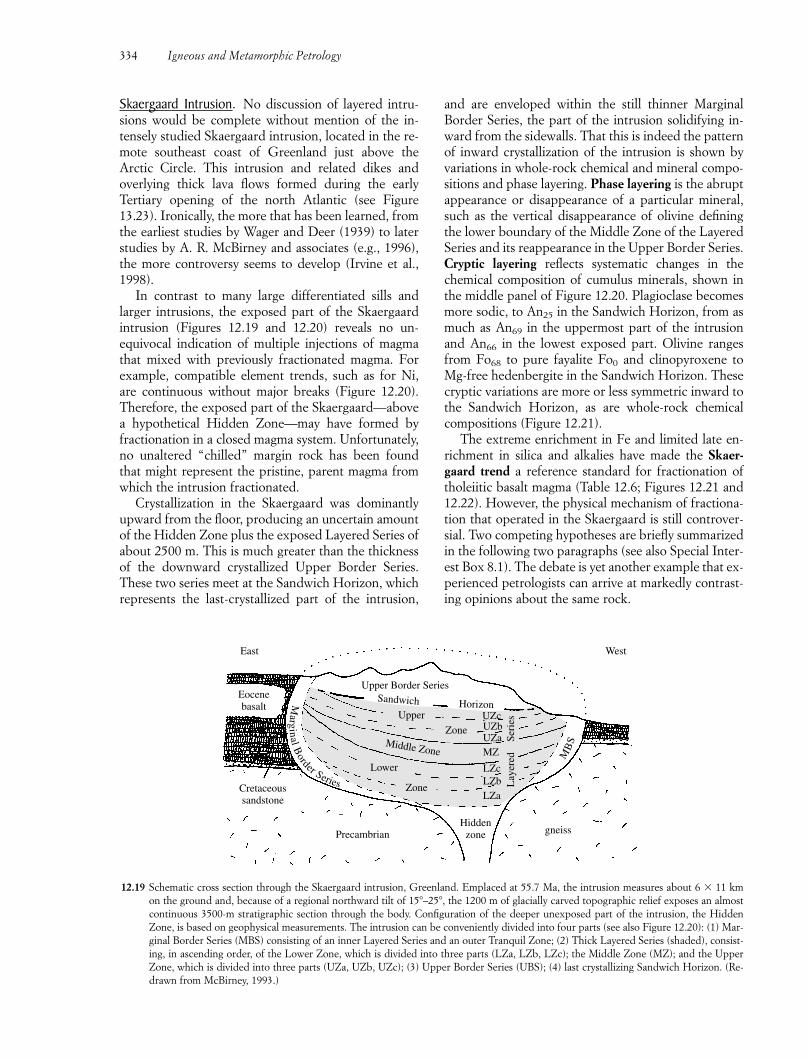
334 Igneous and Metamorphic Petrology
Skaergaard Intrusion. No discussion of layered intru-sions would be complete without mention of the in-tensely studied Skaergaard intrusion, located in the re-mote southeast coast of Greenland just above theArctic Circle. This intrusion and related dikes andoverlying thick lava flows formed during the early Tertiary opening of the north Atlantic (see Figure13.23). Ironically, the more that has been learned, fromthe earliest studies by Wager and Deer (1939) to laterstudies by A. R. McBirney and associates (e.g., 1996),the more controversy seems to develop (Irvine et al.,1998).
In contrast to many large differentiated sills andlarger intrusions, the exposed part of the Skaergaardintrusion (Figures 12.19 and 12.20) reveals no un-equivocal indication of multiple injections of magmathat mixed with previously fractionated magma. Forexample, compatible element trends, such as for Ni,are continuous without major breaks (Figure 12.20).Therefore, the exposed part of the Skaergaard—abovea hypothetical Hidden Zone—may have formed byfractionation in a closed magma system. Unfortunately,no unaltered “chilled” margin rock has been foundthat might represent the pristine, parent magma fromwhich the intrusion fractionated.
Crystallization in the Skaergaard was dominantlyupward from the floor, producing an uncertain amountof the Hidden Zone plus the exposed Layered Series ofabout 2500 m. This is much greater than the thicknessof the downward crystallized Upper Border Series.These two series meet at the Sandwich Horizon, whichrepresents the last-crystallized part of the intrusion,
and are enveloped within the still thinner MarginalBorder Series, the part of the intrusion solidifying in-ward from the sidewalls. That this is indeed the patternof inward crystallization of the intrusion is shown byvariations in whole-rock chemical and mineral compo-sitions and phase layering. Phase layering is the abruptappearance or disappearance of a particular mineral,such as the vertical disappearance of olivine definingthe lower boundary of the Middle Zone of the LayeredSeries and its reappearance in the Upper Border Series.Cryptic layering reflects systematic changes in thechemical composition of cumulus minerals, shown inthe middle panel of Figure 12.20. Plagioclase becomesmore sodic, to An25 in the Sandwich Horizon, from asmuch as An69 in the uppermost part of the intrusionand An66 in the lowest exposed part. Olivine rangesfrom Fo68 to pure fayalite Fo0 and clinopyroxene toMg-free hedenbergite in the Sandwich Horizon. Thesecryptic variations are more or less symmetric inward tothe Sandwich Horizon, as are whole-rock chemicalcompositions (Figure 12.21).
The extreme enrichment in Fe and limited late en-richment in silica and alkalies have made the Skaer-gaard trend a reference standard for fractionation oftholeiitic basalt magma (Table 12.6; Figures 12.21 and12.22). However, the physical mechanism of fractiona-tion that operated in the Skaergaard is still controver-sial. Two competing hypotheses are briefly summarizedin the following two paragraphs (see also Special Inter-est Box 8.1). The debate is yet another example that ex-perienced petrologists can arrive at markedly contrast-ing opinions about the same rock.
Upper Border SeriesSandwich Horizon
Upper
ZoneUZcUZbUZaMZ
LZcLZbLZa
Hiddenzone gneissPrecambrian
Cretaceoussandstone
Eocenebasalt
East West
Marginal
Border Series L
ayer
ed
Ser
ies
MB
SMiddle Zone
Lower
Zone
12.19 Schematic cross section through the Skaergaard intrusion, Greenland. Emplaced at 55.7 Ma, the intrusion measures about kmon the ground and, because of a regional northward tilt of 15�–25�, the 1200 m of glacially carved topographic relief exposes an almostcontinuous 3500-m stratigraphic section through the body. Configuration of the deeper unexposed part of the intrusion, the HiddenZone, is based on geophysical measurements. The intrusion can be conveniently divided into four parts (see also Figure 12.20): (1) Mar-ginal Border Series (MBS) consisting of an inner Layered Series and an outer Tranquil Zone; (2) Thick Layered Series (shaded), consist-ing, in ascending order, of the Lower Zone, which is divided into three parts (LZa, LZb, LZc); the Middle Zone (MZ); and the UpperZone, which is divided into three parts (UZa, UZb, UZc); (3) Upper Border Series (UBS); (4) last crystallizing Sandwich Horizon. (Re-drawn from McBirney, 1993.)
6 � 11
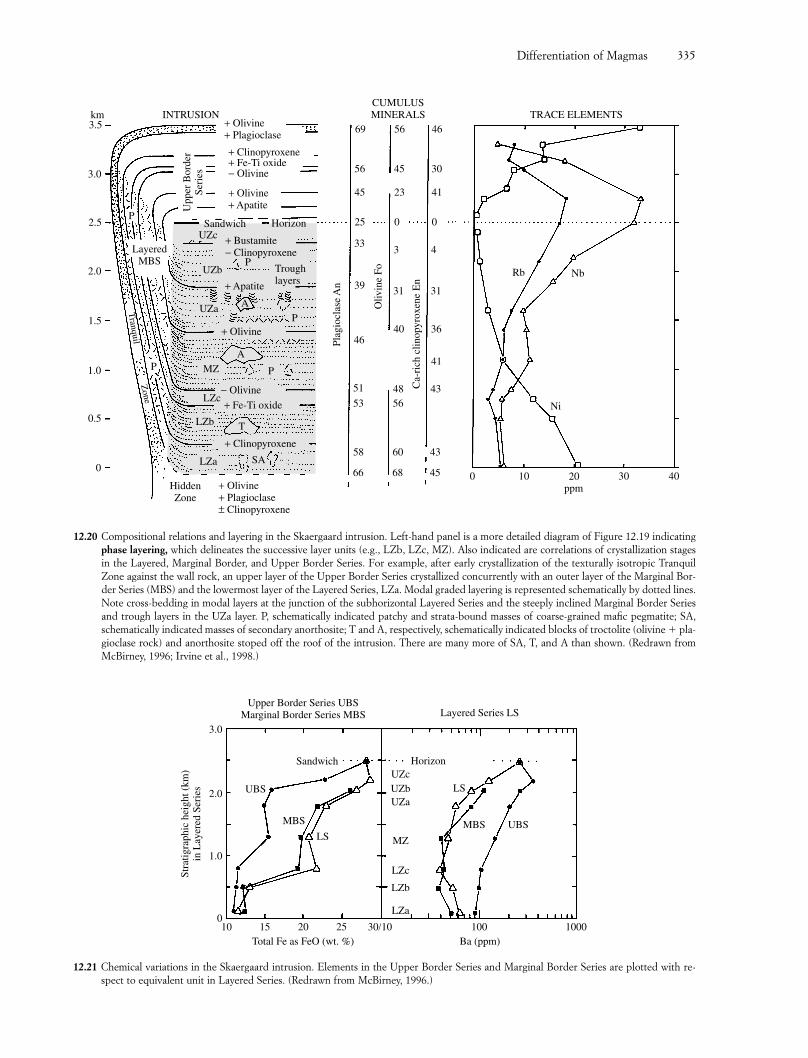
Differentiation of Magmas 335
TRACE ELEMENTSCUMULUSMINERALSINTRUSION
+ Olivine+ Plagioclase
+ Clinopyroxene+ Fe-Ti oxide− Olivine
+ Olivine+ Apatite
Sandwich HorizonUZc
UZb
UZa
+ Bustamite− Clinopyroxene
P
+ Apatite
Troughlayers
P
P
P
A
+ Olivine
AMZ
LZc
LZb
− Olivine
+ Fe-Ti oxide
T
+ Clinopyroxene
LZa SA
HiddenZone
+ Olivine+ Plagioclase± Clinopyroxene
0
0.5
1.0
1.5
2.0
2.5
3.0
3.5km
Tranquil
Zone
P
LayeredMBS
Upp
er B
orde
rSe
ries
69
56
45
25
33
39
46
51
53
58
66
56
45
23
0
3
31
40
4856
60
68
46
30
41
0
4
31
36
43
43
45
Plag
iocl
ase
An
Oliv
ine
Fo Rb Nb
Ni
0 10 20 30 40ppm
41
Ca-
rich
clin
opyr
oxen
e E
n
12.20 Compositional relations and layering in the Skaergaard intrusion. Left-hand panel is a more detailed diagram of Figure 12.19 indicatingphase layering, which delineates the successive layer units (e.g., LZb, LZc, MZ). Also indicated are correlations of crystallization stagesin the Layered, Marginal Border, and Upper Border Series. For example, after early crystallization of the texturally isotropic TranquilZone against the wall rock, an upper layer of the Upper Border Series crystallized concurrently with an outer layer of the Marginal Bor-der Series (MBS) and the lowermost layer of the Layered Series, LZa. Modal graded layering is represented schematically by dotted lines.Note cross-bedding in modal layers at the junction of the subhorizontal Layered Series and the steeply inclined Marginal Border Seriesand trough layers in the UZa layer. P, schematically indicated patchy and strata-bound masses of coarse-grained mafic pegmatite; SA,schematically indicated masses of secondary anorthosite; T and A, respectively, schematically indicated blocks of troctolite (olivine pla-gioclase rock) and anorthosite stoped off the roof of the intrusion. There are many more of SA, T, and A than shown. (Redrawn fromMcBirney, 1996; Irvine et al., 1998.)
100
1.0
2.0
3.0
15 20 25 100 100030/10Total Fe as FeO (wt. %) Ba (ppm)
Stra
tigra
phic
hei
ght (
km)
in L
ayer
ed S
erie
s
Upper Border Series UBSMarginal Border Series MBS Layered Series LS
Sandwich
UBS
MBS
LS
LZa
LZb
LZc
MZ
UZaUZbUZc
Horizon
LS
MBS UBS
12.21 Chemical variations in the Skaergaard intrusion. Elements in the Upper Border Series and Marginal Border Series are plotted with re-spect to equivalent unit in Layered Series. (Redrawn from McBirney, 1996.)
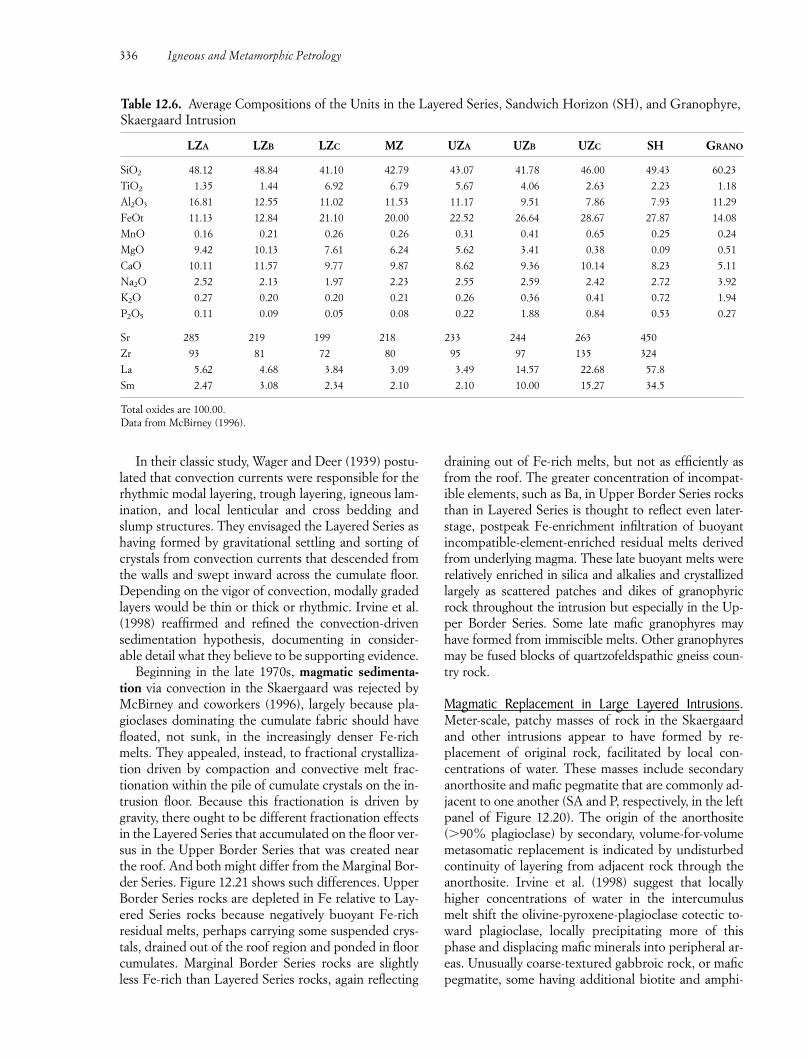
336 Igneous and Metamorphic Petrology
In their classic study, Wager and Deer (1939) postu-lated that convection currents were responsible for therhythmic modal layering, trough layering, igneous lam-ination, and local lenticular and cross bedding andslump structures. They envisaged the Layered Series ashaving formed by gravitational settling and sorting ofcrystals from convection currents that descended fromthe walls and swept inward across the cumulate floor.Depending on the vigor of convection, modally gradedlayers would be thin or thick or rhythmic. Irvine et al.(1998) reaffirmed and refined the convection-drivensedimentation hypothesis, documenting in consider-able detail what they believe to be supporting evidence.
Beginning in the late 1970s, magmatic sedimenta-tion via convection in the Skaergaard was rejected byMcBirney and coworkers (1996), largely because pla-gioclases dominating the cumulate fabric should havefloated, not sunk, in the increasingly denser Fe-richmelts. They appealed, instead, to fractional crystalliza-tion driven by compaction and convective melt frac-tionation within the pile of cumulate crystals on the in-trusion floor. Because this fractionation is driven bygravity, there ought to be different fractionation effectsin the Layered Series that accumulated on the floor ver-sus in the Upper Border Series that was created nearthe roof. And both might differ from the Marginal Bor-der Series. Figure 12.21 shows such differences. UpperBorder Series rocks are depleted in Fe relative to Lay-ered Series rocks because negatively buoyant Fe-richresidual melts, perhaps carrying some suspended crys-tals, drained out of the roof region and ponded in floorcumulates. Marginal Border Series rocks are slightlyless Fe-rich than Layered Series rocks, again reflecting
draining out of Fe-rich melts, but not as efficiently asfrom the roof. The greater concentration of incompat-ible elements, such as Ba, in Upper Border Series rocksthan in Layered Series is thought to reflect even later-stage, postpeak Fe-enrichment infiltration of buoyantincompatible-element-enriched residual melts derivedfrom underlying magma. These late buoyant melts wererelatively enriched in silica and alkalies and crystallizedlargely as scattered patches and dikes of granophyricrock throughout the intrusion but especially in the Up-per Border Series. Some late mafic granophyres mayhave formed from immiscible melts. Other granophyresmay be fused blocks of quartzofeldspathic gneiss coun-try rock.
Magmatic Replacement in Large Layered Intrusions.Meter-scale, patchy masses of rock in the Skaergaardand other intrusions appear to have formed by re-placement of original rock, facilitated by local con-centrations of water. These masses include secondaryanorthosite and mafic pegmatite that are commonly ad-jacent to one another (SA and P, respectively, in the leftpanel of Figure 12.20). The origin of the anorthosite(�90% plagioclase) by secondary, volume-for-volumemetasomatic replacement is indicated by undisturbedcontinuity of layering from adjacent rock through theanorthosite. Irvine et al. (1998) suggest that locallyhigher concentrations of water in the intercumulusmelt shift the olivine-pyroxene-plagioclase cotectic to-ward plagioclase, locally precipitating more of thisphase and displacing mafic minerals into peripheral ar-eas. Unusually coarse-textured gabbroic rock, or maficpegmatite, some having additional biotite and amphi-
Table 12.6. Average Compositions of the Units in the Layered Series, Sandwich Horizon (SH), and Granophyre,Skaergaard Intrusion
LZA LZB LZC MZ UZA UZB UZC SH GRANO
SiO2 48.12 48.84 41.10 42.79 43.07 41.78 46.00 49.43 60.23
TiO2 1.35 1.44 6.92 6.79 5.67 4.06 2.63 2.23 1.18
Al2O3 16.81 12.55 11.02 11.53 11.17 9.51 7.86 7.93 11.29
FeOt 11.13 12.84 21.10 20.00 22.52 26.64 28.67 27.87 14.08
MnO 0.16 0.21 0.26 0.26 0.31 0.41 0.65 0.25 0.24
MgO 9.42 10.13 7.61 6.24 5.62 3.41 0.38 0.09 0.51
CaO 10.11 11.57 9.77 9.87 8.62 9.36 10.14 8.23 5.11
Na2O 2.52 2.13 1.97 2.23 2.55 2.59 2.42 2.72 3.92
K2O 0.27 0.20 0.20 0.21 0.26 0.36 0.41 0.72 1.94
P2O5 0.11 0.09 0.05 0.08 0.22 1.88 0.84 0.53 0.27
Sr 285 219 199 218 233 244 263 450
Zr 93 81 72 80 95 97 135 324
La 5.62 4.68 3.84 3.09 3.49 14.57 22.68 57.8
Sm 2.47 3.08 2.34 2.10 2.10 10.00 15.27 34.5
Total oxides are 100.00.Data from McBirney (1996).
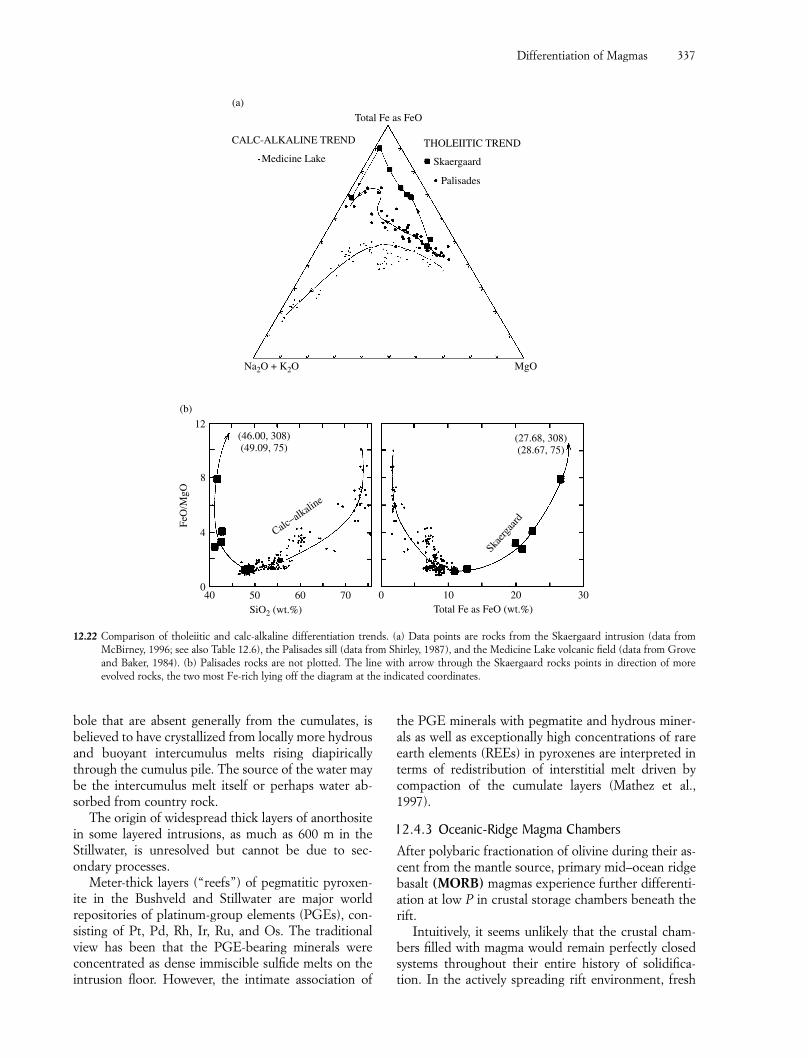
Differentiation of Magmas 337
Na2O + K2O MgO
THOLEIITIC TREND
Skaergaard
Palisades
Total Fe as FeO
CALC-ALKALINE TREND
Medicine Lake
(a)
12.22 Comparison of tholeiitic and calc-alkaline differentiation trends. (a) Data points are rocks from the Skaergaard intrusion (data fromMcBirney, 1996; see also Table 12.6), the Palisades sill (data from Shirley, 1987), and the Medicine Lake volcanic field (data from Groveand Baker, 1984). (b) Palisades rocks are not plotted. The line with arrow through the Skaergaard rocks points in direction of moreevolved rocks, the two most Fe-rich lying off the diagram at the indicated coordinates.
bole that are absent generally from the cumulates, isbelieved to have crystallized from locally more hydrousand buoyant intercumulus melts rising diapiricallythrough the cumulus pile. The source of the water maybe the intercumulus melt itself or perhaps water ab-sorbed from country rock.
The origin of widespread thick layers of anorthositein some layered intrusions, as much as 600 m in theStillwater, is unresolved but cannot be due to sec-ondary processes.
Meter-thick layers (“reefs”) of pegmatitic pyroxen-ite in the Bushveld and Stillwater are major worldrepositories of platinum-group elements (PGEs), con-sisting of Pt, Pd, Rh, Ir, Ru, and Os. The traditionalview has been that the PGE-bearing minerals wereconcentrated as dense immiscible sulfide melts on theintrusion floor. However, the intimate association of
the PGE minerals with pegmatite and hydrous miner-als as well as exceptionally high concentrations of rareearth elements (REEs) in pyroxenes are interpreted interms of redistribution of interstitial melt driven bycompaction of the cumulate layers (Mathez et al.,1997).
12.4.3 Oceanic-Ridge Magma ChambersAfter polybaric fractionation of olivine during their as-cent from the mantle source, primary mid–ocean ridgebasalt (MORB) magmas experience further differenti-ation at low P in crustal storage chambers beneath therift.
Intuitively, it seems unlikely that the crustal cham-bers filled with magma would remain perfectly closedsystems throughout their entire history of solidifica-tion. In the actively spreading rift environment, fresh
(46.00, 308)(49.09, 75)
Calc−alk
aline
12
8
4
040 50 60 70
SiO2 (wt.%)
FeO
/MgO
(27.68, 308)(28.67, 75)
0 10 20 30Total Fe as FeO (wt.%)
Skae
rgaa
rd
(b)
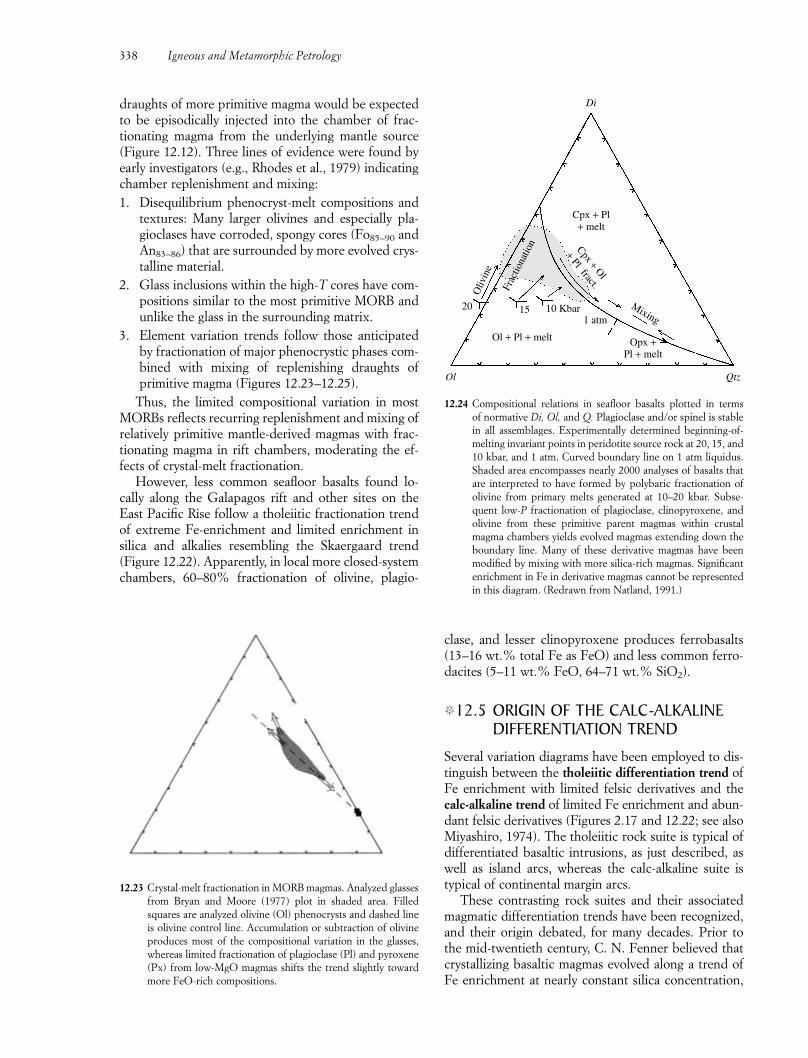
338 Igneous and Metamorphic Petrology
draughts of more primitive magma would be expectedto be episodically injected into the chamber of frac-tionating magma from the underlying mantle source(Figure 12.12). Three lines of evidence were found byearly investigators (e.g., Rhodes et al., 1979) indicatingchamber replenishment and mixing:1. Disequilibrium phenocryst-melt compositions and
textures: Many larger olivines and especially pla-gioclases have corroded, spongy cores (Fo85–90 andAn83–86) that are surrounded by more evolved crys-talline material.
2. Glass inclusions within the high-T cores have com-positions similar to the most primitive MORB andunlike the glass in the surrounding matrix.
3. Element variation trends follow those anticipatedby fractionation of major phenocrystic phases com-bined with mixing of replenishing draughts ofprimitive magma (Figures 12.23–12.25).
Thus, the limited compositional variation in mostMORBs reflects recurring replenishment and mixing ofrelatively primitive mantle-derived magmas with frac-tionating magma in rift chambers, moderating the ef-fects of crystal-melt fractionation.
However, less common seafloor basalts found lo-cally along the Galapagos rift and other sites on theEast Pacific Rise follow a tholeiitic fractionation trendof extreme Fe-enrichment and limited enrichment insilica and alkalies resembling the Skaergaard trend(Figure 12.22). Apparently, in local more closed-systemchambers, 60–80% fractionation of olivine, plagio-
clase, and lesser clinopyroxene produces ferrobasalts(13–16 wt.% total Fe as FeO) and less common ferro-dacites (5–11 wt.% FeO, 64–71 wt.% SiO2).
�12.5 ORIGIN OF THE CALC-ALKALINEDIFFERENTIATION TREND
Several variation diagrams have been employed to dis-tinguish between the tholeiitic differentiation trend ofFe enrichment with limited felsic derivatives and thecalc-alkaline trend of limited Fe enrichment and abun-dant felsic derivatives (Figures 2.17 and 12.22; see alsoMiyashiro, 1974). The tholeiitic rock suite is typical ofdifferentiated basaltic intrusions, as just described, aswell as island arcs, whereas the calc-alkaline suite istypical of continental margin arcs.
These contrasting rock suites and their associatedmagmatic differentiation trends have been recognized,and their origin debated, for many decades. Prior tothe mid-twentieth century, C. N. Fenner believed thatcrystallizing basaltic magmas evolved along a trend ofFe enrichment at nearly constant silica concentration,
12.23 Crystal-melt fractionation in MORB magmas. Analyzed glassesfrom Bryan and Moore (1977) plot in shaded area. Filledsquares are analyzed olivine (Ol) phenocrysts and dashed lineis olivine control line. Accumulation or subtraction of olivineproduces most of the compositional variation in the glasses,whereas limited fractionation of plagioclase (Pl) and pyroxene(Px) from low-MgO magmas shifts the trend slightly towardmore FeO-rich compositions.
15 10 Kbar1 atm
Mixing
Cpx + Ol
+ Pl fract.Cpx + Pl+ melt
Di
Ol Qtz
Opx +Pl + melt
Ol + Pl + melt
20
Oliv
ine
Frac
tiona
tion
12.24 Compositional relations in seafloor basalts plotted in termsof normative Di, Ol, and Q. Plagioclase and/or spinel is stablein all assemblages. Experimentally determined beginning-of-melting invariant points in peridotite source rock at 20, 15, and10 kbar, and 1 atm. Curved boundary line on 1 atm liquidus.Shaded area encompasses nearly 2000 analyses of basalts thatare interpreted to have formed by polybaric fractionation ofolivine from primary melts generated at 10–20 kbar. Subse-quent low-P fractionation of plagioclase, clinopyroxene, andolivine from these primitive parent magmas within crustalmagma chambers yields evolved magmas extending down theboundary line. Many of these derivative magmas have beenmodified by mixing with more silica-rich magmas. Significantenrichment in Fe in derivative magmas cannot be representedin this diagram. (Redrawn from Natland, 1991.)
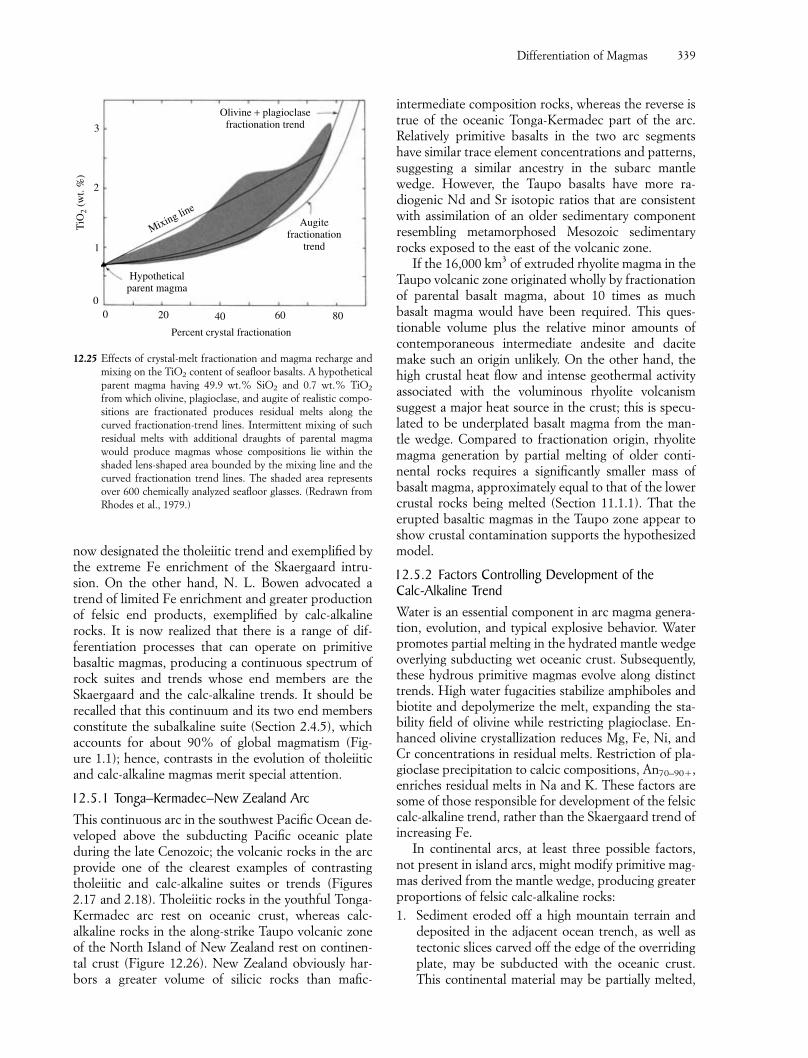
Differentiation of Magmas 339
now designated the tholeiitic trend and exemplified bythe extreme Fe enrichment of the Skaergaard intru-sion. On the other hand, N. L. Bowen advocated atrend of limited Fe enrichment and greater productionof felsic end products, exemplified by calc-alkalinerocks. It is now realized that there is a range of dif-ferentiation processes that can operate on primitivebasaltic magmas, producing a continuous spectrum ofrock suites and trends whose end members are theSkaergaard and the calc-alkaline trends. It should berecalled that this continuum and its two end membersconstitute the subalkaline suite (Section 2.4.5), whichaccounts for about 90% of global magmatism (Fig-ure 1.1); hence, contrasts in the evolution of tholeiiticand calc-alkaline magmas merit special attention.
12.5.1 Tonga–Kermadec–New Zealand ArcThis continuous arc in the southwest Pacific Ocean de-veloped above the subducting Pacific oceanic plateduring the late Cenozoic; the volcanic rocks in the arcprovide one of the clearest examples of contrastingtholeiitic and calc-alkaline suites or trends (Figures2.17 and 2.18). Tholeiitic rocks in the youthful Tonga-Kermadec arc rest on oceanic crust, whereas calc-alkaline rocks in the along-strike Taupo volcanic zoneof the North Island of New Zealand rest on continen-tal crust (Figure 12.26). New Zealand obviously har-bors a greater volume of silicic rocks than mafic-
intermediate composition rocks, whereas the reverse istrue of the oceanic Tonga-Kermadec part of the arc.Relatively primitive basalts in the two arc segmentshave similar trace element concentrations and patterns,suggesting a similar ancestry in the subarc mantlewedge. However, the Taupo basalts have more ra-diogenic Nd and Sr isotopic ratios that are consistentwith assimilation of an older sedimentary componentresembling metamorphosed Mesozoic sedimentaryrocks exposed to the east of the volcanic zone.
If the 16,000 km3 of extruded rhyolite magma in theTaupo volcanic zone originated wholly by fractionationof parental basalt magma, about 10 times as muchbasalt magma would have been required. This ques-tionable volume plus the relative minor amounts ofcontemporaneous intermediate andesite and dacitemake such an origin unlikely. On the other hand, thehigh crustal heat flow and intense geothermal activityassociated with the voluminous rhyolite volcanism suggest a major heat source in the crust; this is specu-lated to be underplated basalt magma from the man-tle wedge. Compared to fractionation origin, rhyolitemagma generation by partial melting of older conti-nental rocks requires a significantly smaller mass ofbasalt magma, approximately equal to that of the lowercrustal rocks being melted (Section 11.1.1). That theerupted basaltic magmas in the Taupo zone appear toshow crustal contamination supports the hypothesizedmodel.
12.5.2 Factors Controlling Development of theCalc-Alkaline TrendWater is an essential component in arc magma genera-tion, evolution, and typical explosive behavior. Waterpromotes partial melting in the hydrated mantle wedgeoverlying subducting wet oceanic crust. Subsequently,these hydrous primitive magmas evolve along distincttrends. High water fugacities stabilize amphiboles andbiotite and depolymerize the melt, expanding the sta-bility field of olivine while restricting plagioclase. En-hanced olivine crystallization reduces Mg, Fe, Ni, andCr concentrations in residual melts. Restriction of pla-gioclase precipitation to calcic compositions, An70–90,enriches residual melts in Na and K. These factors aresome of those responsible for development of the felsiccalc-alkaline trend, rather than the Skaergaard trend ofincreasing Fe.
In continental arcs, at least three possible factors,not present in island arcs, might modify primitive mag-mas derived from the mantle wedge, producing greaterproportions of felsic calc-alkaline rocks:1. Sediment eroded off a high mountain terrain and
deposited in the adjacent ocean trench, as well astectonic slices carved off the edge of the overridingplate, may be subducted with the oceanic crust.This continental material may be partially melted,
00
1
2
3
20 40 60 80
Percent crystal fractionation
TiO
2 (w
t. %
)
Hypotheticalparent magma
Mixing line
Olivine + plagioclasefractionation trend
Augitefractionation
trend
12.25 Effects of crystal-melt fractionation and magma recharge andmixing on the TiO2 content of seafloor basalts. A hypotheticalparent magma having 49.9 wt.% SiO2 and 0.7 wt.% TiO2
from which olivine, plagioclase, and augite of realistic compo-sitions are fractionated produces residual melts along thecurved fractionation-trend lines. Intermittent mixing of suchresidual melts with additional draughts of parental magmawould produce magmas whose compositions lie within theshaded lens-shaped area bounded by the mixing line and thecurved fractionation trend lines. The shaded area representsover 600 chemically analyzed seafloor glasses. (Redrawn fromRhodes et al., 1979.)
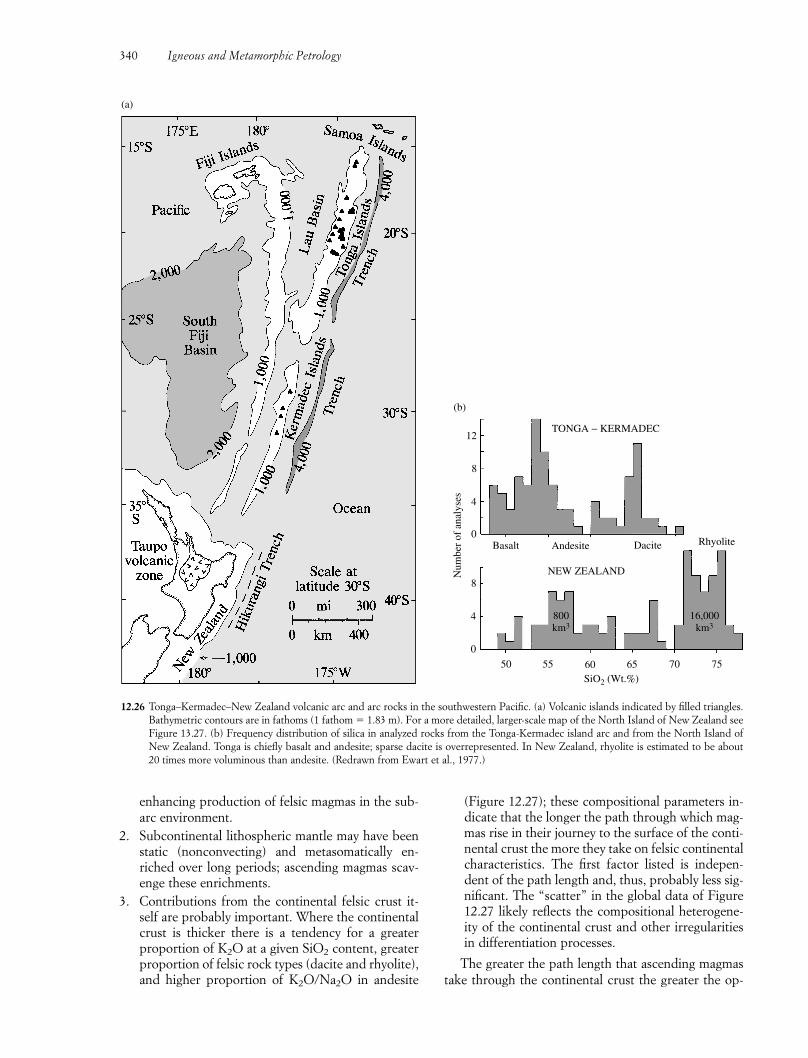
340 Igneous and Metamorphic Petrology
enhancing production of felsic magmas in the sub-arc environment.
2. Subcontinental lithospheric mantle may have beenstatic (nonconvecting) and metasomatically en-riched over long periods; ascending magmas scav-enge these enrichments.
3. Contributions from the continental felsic crust it-self are probably important. Where the continentalcrust is thicker there is a tendency for a greater proportion of K2O at a given SiO2 content, greaterproportion of felsic rock types (dacite and rhyolite),and higher proportion of K2O/Na2O in andesite
(Figure 12.27); these compositional parameters in-dicate that the longer the path through which mag-mas rise in their journey to the surface of the conti-nental crust the more they take on felsic continentalcharacteristics. The first factor listed is indepen-dent of the path length and, thus, probably less sig-nificant. The “scatter” in the global data of Figure12.27 likely reflects the compositional heterogene-ity of the continental crust and other irregularitiesin differentiation processes.
The greater the path length that ascending magmastake through the continental crust the greater the op-
(a)
12.26 Tonga–Kermadec–New Zealand volcanic arc and arc rocks in the southwestern Pacific. (a) Volcanic islands indicated by filled triangles.Bathymetric contours are in fathoms (1 fathom � 1.83 m). For a more detailed, larger-scale map of the North Island of New Zealand seeFigure 13.27. (b) Frequency distribution of silica in analyzed rocks from the Tonga-Kermadec island arc and from the North Island ofNew Zealand. Tonga is chiefly basalt and andesite; sparse dacite is overrepresented. In New Zealand, rhyolite is estimated to be about20 times more voluminous than andesite. (Redrawn from Ewart et al., 1977.)
50 55 60 65 70 75SiO2 (Wt.%)
0
4
8
0
4
8
12
NEW ZEALAND
RhyoliteBasalt Andesite Dacite
TONGA − KERMADEC
Num
ber
of a
naly
ses
16,000km3
800km3
(b)
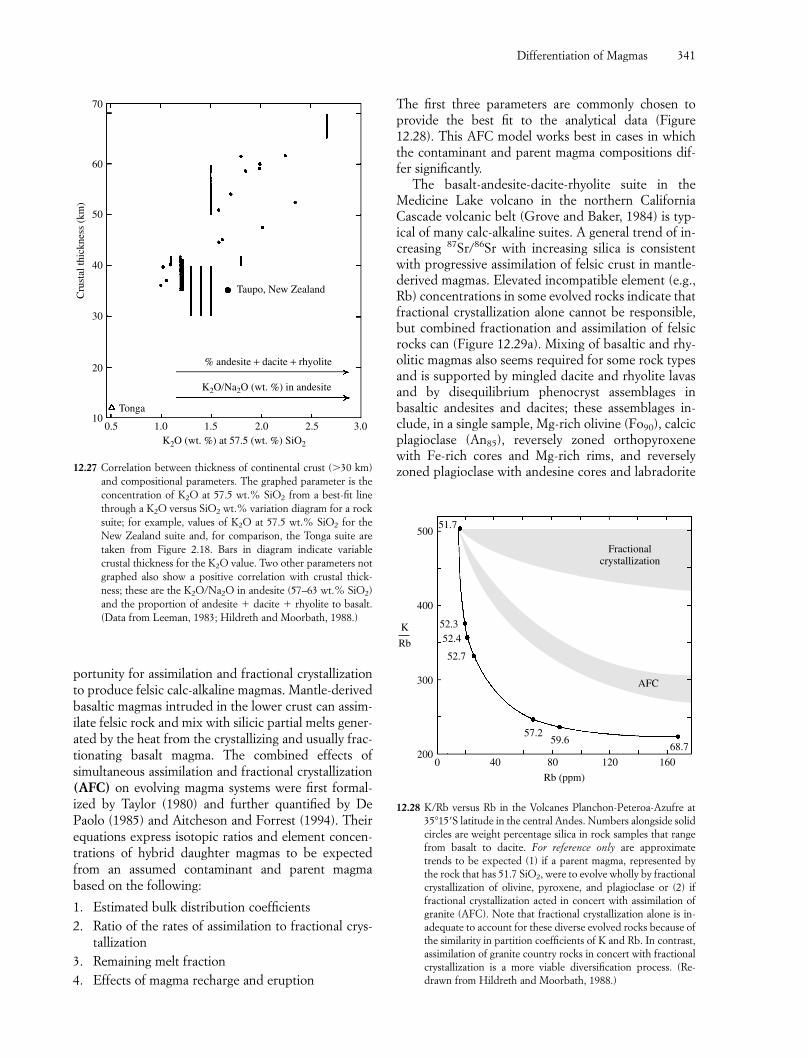
Differentiation of Magmas 341
portunity for assimilation and fractional crystallizationto produce felsic calc-alkaline magmas. Mantle-derivedbasaltic magmas intruded in the lower crust can assim-ilate felsic rock and mix with silicic partial melts gener-ated by the heat from the crystallizing and usually frac-tionating basalt magma. The combined effects ofsimultaneous assimilation and fractional crystallization(AFC) on evolving magma systems were first formal-ized by Taylor (1980) and further quantified by DePaolo (1985) and Aitcheson and Forrest (1994). Theirequations express isotopic ratios and element concen-trations of hybrid daughter magmas to be expectedfrom an assumed contaminant and parent magmabased on the following:
1. Estimated bulk distribution coefficients2. Ratio of the rates of assimilation to fractional crys-
tallization3. Remaining melt fraction4. Effects of magma recharge and eruption
The first three parameters are commonly chosen toprovide the best fit to the analytical data (Figure12.28). This AFC model works best in cases in whichthe contaminant and parent magma compositions dif-fer significantly.
The basalt-andesite-dacite-rhyolite suite in theMedicine Lake volcano in the northern California Cascade volcanic belt (Grove and Baker, 1984) is typ-ical of many calc-alkaline suites. A general trend of in-creasing 87Sr/86Sr with increasing silica is consistentwith progressive assimilation of felsic crust in mantle-derived magmas. Elevated incompatible element (e.g.,Rb) concentrations in some evolved rocks indicate thatfractional crystallization alone cannot be responsible,but combined fractionation and assimilation of felsicrocks can (Figure 12.29a). Mixing of basaltic and rhy-olitic magmas also seems required for some rock typesand is supported by mingled dacite and rhyolite lavasand by disequilibrium phenocryst assemblages inbasaltic andesites and dacites; these assemblages in-clude, in a single sample, Mg-rich olivine (Fo90), calcicplagioclase (An85), reversely zoned orthopyroxenewith Fe-rich cores and Mg-rich rims, and reverselyzoned plagioclase with andesine cores and labradorite
0.5 1.0 1.5 2.0 2.5 3.0
% andesite + dacite + rhyolite
K2O/Na2O (wt. %) in andesite
Taupo, New Zealand
Tonga
K2O (wt. %) at 57.5 (wt. %) SiO2
10
20
30
40
50
60
70
Cru
stal
thic
knes
s (k
m)
12.27 Correlation between thickness of continental crust (�30 km)and compositional parameters. The graphed parameter is theconcentration of K2O at 57.5 wt.% SiO2 from a best-fit linethrough a K2O versus SiO2 wt.% variation diagram for a rocksuite; for example, values of K2O at 57.5 wt.% SiO2 for theNew Zealand suite and, for comparison, the Tonga suite aretaken from Figure 2.18. Bars in diagram indicate variablecrustal thickness for the K2O value. Two other parameters notgraphed also show a positive correlation with crustal thick-ness; these are the K2O/Na2O in andesite (57–63 wt.% SiO2)and the proportion of andesite dacite rhyolite to basalt.(Data from Leeman, 1983; Hildreth and Moorbath, 1988.)
0 40 80 120 160200
300
400
500
52.352.4
52.7
51.7
57.259.6
68.7
AFC
Fractionalcrystallization
K
Rb
Rb (ppm)
12.28 K/Rb versus Rb in the Volcanes Planchon-Peteroa-Azufre at35�15�S latitude in the central Andes. Numbers alongside solidcircles are weight percentage silica in rock samples that rangefrom basalt to dacite. For reference only are approximatetrends to be expected (1) if a parent magma, represented bythe rock that has 51.7 SiO2, were to evolve wholly by fractionalcrystallization of olivine, pyroxene, and plagioclase or (2) iffractional crystallization acted in concert with assimilation ofgranite (AFC). Note that fractional crystallization alone is in-adequate to account for these diverse evolved rocks because ofthe similarity in partition coefficients of K and Rb. In contrast,assimilation of granite country rocks in concert with fractionalcrystallization is a more viable diversification process. (Re-drawn from Hildreth and Moorbath, 1988.)
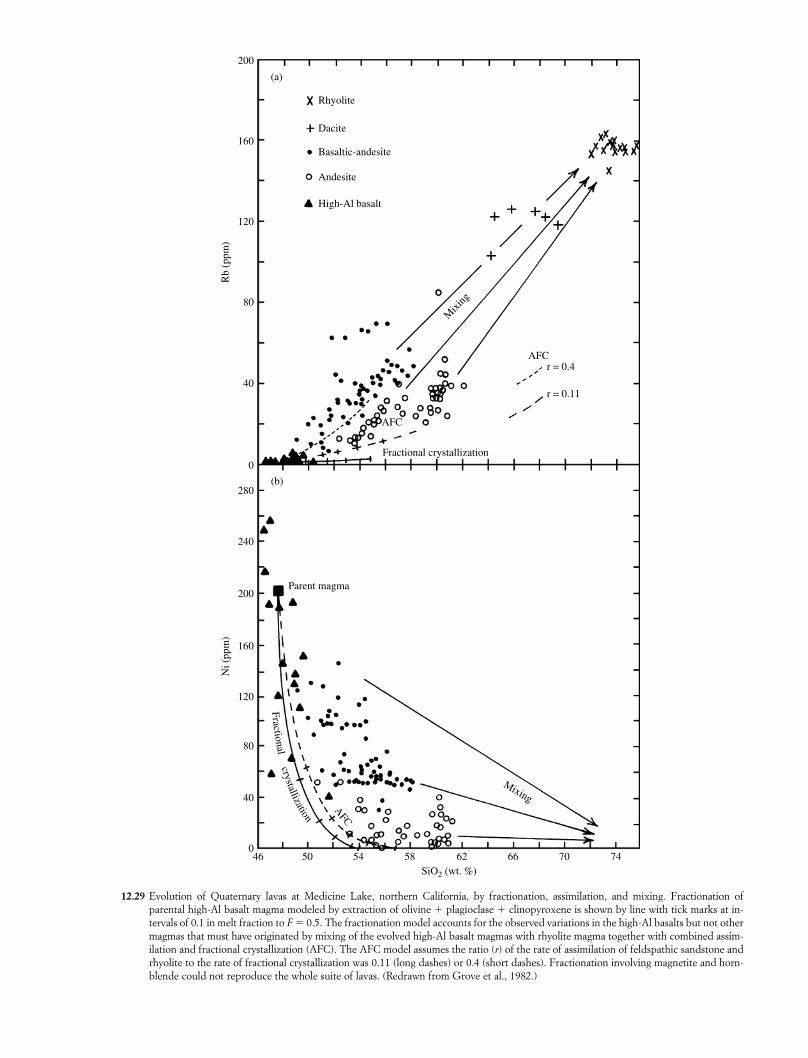
46 50 54 58 62 66 70 74SiO2 (wt. %)
0
40
80
120
160
200
240
280
0
40
80
120
160
200
Ni (
ppm
)R
b (p
pm)
(a)
Rhyolite
Dacite
Basaltic-andesite
Andesite
High-Al basalt
Mix
ing
AFC
Fractional crystallization
AFC
r = 0.11
r = 0.4
(b)
Parent magma
AFC
Mixing
Fractional
crystallization
12.29 Evolution of Quaternary lavas at Medicine Lake, northern California, by fractionation, assimilation, and mixing. Fractionation ofparental high-Al basalt magma modeled by extraction of olivine plagioclase clinopyroxene is shown by line with tick marks at in-tervals of 0.1 in melt fraction to F � 0.5. The fractionation model accounts for the observed variations in the high-Al basalts but not othermagmas that must have originated by mixing of the evolved high-Al basalt magmas with rhyolite magma together with combined assim-ilation and fractional crystallization (AFC). The AFC model assumes the ratio (r) of the rate of assimilation of feldspathic sandstone andrhyolite to the rate of fractional crystallization was 0.11 (long dashes) or 0.4 (short dashes). Fractionation involving magnetite and horn-blende could not reproduce the whole suite of lavas. (Redrawn from Grove et al., 1982.)
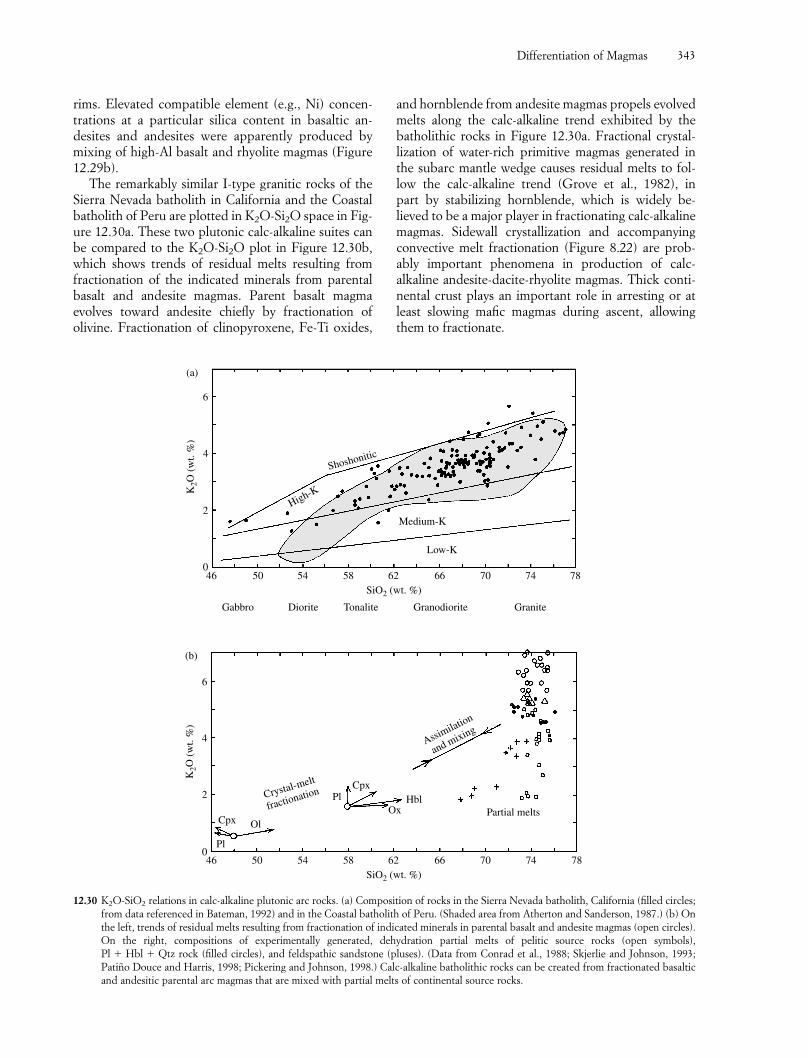
Differentiation of Magmas 343
46 50 54 58 62 66 70 74 780
2
4
6
SiO2 (wt. %)
46 50 54 58 62 66 70 74 78SiO2 (wt. %)
K2O
(w
t. %
)
0
2
4
6
K2O
(w
t. %
)
Pl
Cpx Ol
PlCpx
HblOx
Crystal-melt
fractionation
Assimilation
and mixing
Partial melts
Granite
High-K
Shoshonitic
Low-K
Medium-K
(a)
(b)
Gabbro Diorite Tonalite Granodiorite
12.30 K2O-SiO2 relations in calc-alkaline plutonic arc rocks. (a) Composition of rocks in the Sierra Nevada batholith, California (filled circles;from data referenced in Bateman, 1992) and in the Coastal batholith of Peru. (Shaded area from Atherton and Sanderson, 1987.) (b) Onthe left, trends of residual melts resulting from fractionation of indicated minerals in parental basalt and andesite magmas (open circles).On the right, compositions of experimentally generated, dehydration partial melts of pelitic source rocks (open symbols),
rock (filled circles), and feldspathic sandstone (pluses). (Data from Conrad et al., 1988; Skjerlie and Johnson, 1993;Patiño Douce and Harris, 1998; Pickering and Johnson, 1998.) Calc-alkaline batholithic rocks can be created from fractionated basalticand andesitic parental arc magmas that are mixed with partial melts of continental source rocks.
Pl Hbl Qtz
rims. Elevated compatible element (e.g., Ni) concen-trations at a particular silica content in basaltic an-desites and andesites were apparently produced bymixing of high-Al basalt and rhyolite magmas (Figure12.29b).
The remarkably similar I-type granitic rocks of theSierra Nevada batholith in California and the Coastalbatholith of Peru are plotted in K2O-Si2O space in Fig-ure 12.30a. These two plutonic calc-alkaline suites canbe compared to the K2O-Si2O plot in Figure 12.30b,which shows trends of residual melts resulting fromfractionation of the indicated minerals from parentalbasalt and andesite magmas. Parent basalt magmaevolves toward andesite chiefly by fractionation ofolivine. Fractionation of clinopyroxene, Fe-Ti oxides,
and hornblende from andesite magmas propels evolvedmelts along the calc-alkaline trend exhibited by thebatholithic rocks in Figure 12.30a. Fractional crystal-lization of water-rich primitive magmas generated inthe subarc mantle wedge causes residual melts to fol-low the calc-alkaline trend (Grove et al., 1982), in part by stabilizing hornblende, which is widely be-lieved to be a major player in fractionating calc-alkalinemagmas. Sidewall crystallization and accompanyingconvective melt fractionation (Figure 8.22) are prob-ably important phenomena in production of calc-alkaline andesite-dacite-rhyolite magmas. Thick conti-nental crust plays an important role in arresting or atleast slowing mafic magmas during ascent, allowingthem to fractionate.
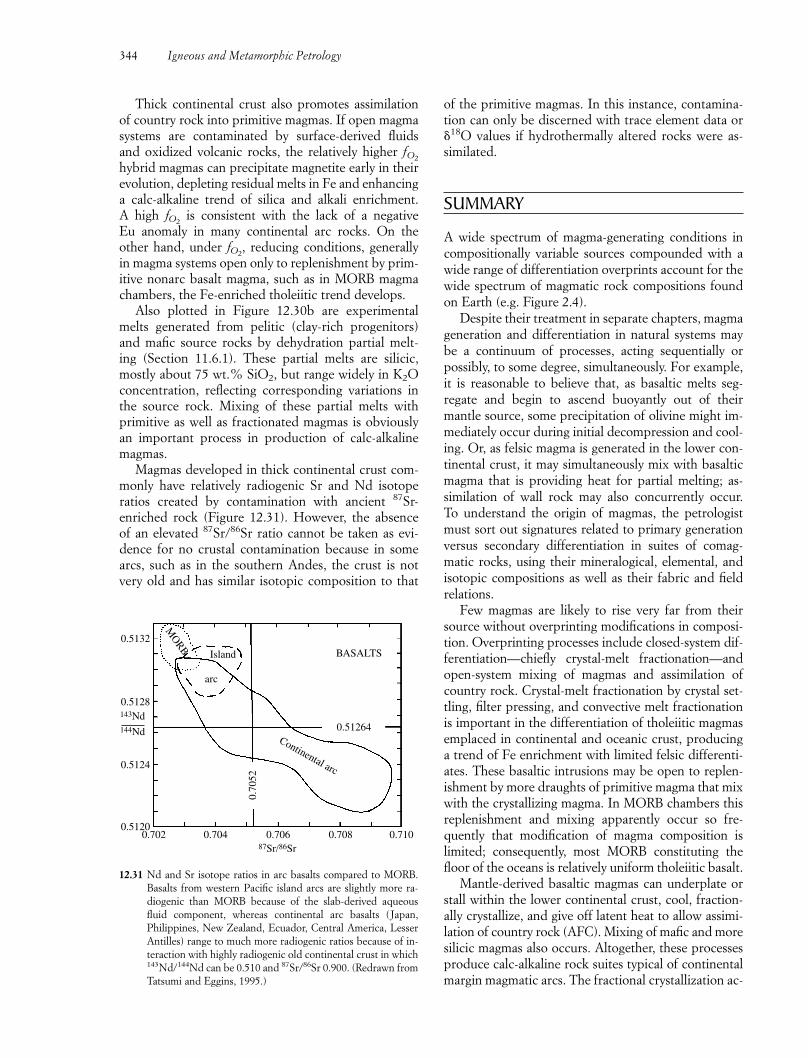
344 Igneous and Metamorphic Petrology
0.702 0.704 0.706 0.708 0.7100.5120
0.5124
0.5128
0.5132M
ORB
Island BASALTS
Continental arc
0.51264
0.70
52
arc
143Nd144Nd
87Sr/86Sr
12.31 Nd and Sr isotope ratios in arc basalts compared to MORB.Basalts from western Pacific island arcs are slightly more ra-diogenic than MORB because of the slab-derived aqueousfluid component, whereas continental arc basalts (Japan,Philippines, New Zealand, Ecuador, Central America, LesserAntilles) range to much more radiogenic ratios because of in-teraction with highly radiogenic old continental crust in which143Nd/144Nd can be 0.510 and 87Sr/86Sr 0.900. (Redrawn fromTatsumi and Eggins, 1995.)
Thick continental crust also promotes assimilationof country rock into primitive magmas. If open magmasystems are contaminated by surface-derived fluids and oxidized volcanic rocks, the relatively higher fO2
hybrid magmas can precipitate magnetite early in theirevolution, depleting residual melts in Fe and enhancinga calc-alkaline trend of silica and alkali enrichment. A high fO2
is consistent with the lack of a negative Eu anomaly in many continental arc rocks. On theother hand, under fO2
, reducing conditions, generallyin magma systems open only to replenishment by prim-itive nonarc basalt magma, such as in MORB magmachambers, the Fe-enriched tholeiitic trend develops.
Also plotted in Figure 12.30b are experimentalmelts generated from pelitic (clay-rich progenitors)and mafic source rocks by dehydration partial melt-ing (Section 11.6.1). These partial melts are silicic,mostly about 75 wt.% SiO2, but range widely in K2Oconcentration, reflecting corresponding variations inthe source rock. Mixing of these partial melts withprimitive as well as fractionated magmas is obviouslyan important process in production of calc-alkaline magmas.
Magmas developed in thick continental crust com-monly have relatively radiogenic Sr and Nd isotope ratios created by contamination with ancient 87Sr-enriched rock (Figure 12.31). However, the absence of an elevated 87Sr/86Sr ratio cannot be taken as evi-dence for no crustal contamination because in somearcs, such as in the southern Andes, the crust is notvery old and has similar isotopic composition to that
of the primitive magmas. In this instance, contamina-tion can only be discerned with trace element data or18O values if hydrothermally altered rocks were as-similated.
SUMMARY
A wide spectrum of magma-generating conditions incompositionally variable sources compounded with awide range of differentiation overprints account for thewide spectrum of magmatic rock compositions foundon Earth (e.g. Figure 2.4).
Despite their treatment in separate chapters, magmageneration and differentiation in natural systems maybe a continuum of processes, acting sequentially orpossibly, to some degree, simultaneously. For example,it is reasonable to believe that, as basaltic melts seg-regate and begin to ascend buoyantly out of their mantle source, some precipitation of olivine might im-mediately occur during initial decompression and cool-ing. Or, as felsic magma is generated in the lower con-tinental crust, it may simultaneously mix with basalticmagma that is providing heat for partial melting; as-similation of wall rock may also concurrently occur. To understand the origin of magmas, the petrologistmust sort out signatures related to primary generationversus secondary differentiation in suites of comag-matic rocks, using their mineralogical, elemental, andisotopic compositions as well as their fabric and fieldrelations.
Few magmas are likely to rise very far from theirsource without overprinting modifications in composi-tion. Overprinting processes include closed-system dif-ferentiation—chiefly crystal-melt fractionation—andopen-system mixing of magmas and assimilation ofcountry rock. Crystal-melt fractionation by crystal set-tling, filter pressing, and convective melt fractionationis important in the differentiation of tholeiitic magmasemplaced in continental and oceanic crust, producinga trend of Fe enrichment with limited felsic differenti-ates. These basaltic intrusions may be open to replen-ishment by more draughts of primitive magma that mixwith the crystallizing magma. In MORB chambers thisreplenishment and mixing apparently occur so fre-quently that modification of magma composition islimited; consequently, most MORB constituting thefloor of the oceans is relatively uniform tholeiitic basalt.
Mantle-derived basaltic magmas can underplate orstall within the lower continental crust, cool, fraction-ally crystallize, and give off latent heat to allow assimi-lation of country rock (AFC). Mixing of mafic and moresilicic magmas also occurs. Altogether, these processesproduce calc-alkaline rock suites typical of continentalmargin magmatic arcs. The fractional crystallization ac-
Differentiation of Magmas 345
mas with continental crust a viable means ofcreating highly potassic magmas that form theshoshonite series? Discuss.
12.11 What are the different ways that andesiticmagmas can be produced in arcs? What traceelement and isotopic attributes would distin-guish among these?
12.12 Rocks originating by mingling of two magmasand by physical separation of immiscible meltsmay be superficially similar. What rock attrib-utes would distinguish between these origins?
PROBLEMS12.1 Evaluate the validity of hornblende fractiona-
tion from a parental andesite magma in produc-ing rhyolite and dacite daughter magmas. Usecompositions from Table 2.2 and Appendix Aon two-element variation diagrams. Criticallydiscuss your results.
12.2 In Figure 12.29a, what was the approximateproportion of rhyolite magma that mixed withandesite magma that contains 60 wt.% SiO2 tocreate dacite that contains 69.5 wt.% SiO2?
12.3 Write a stoichiometrically balanced reaction forassimilation of Al-rich minerals and rocks bybasalt magma to yield anorthite and enstatitecomponents in the hybrid contaminated magmaat the expense of diopside in the basalt. UseAl2SiO5 to represent the aluminous material.What bearing might this assimilation have onthe origin of some leuconorite?
12.4 Write balanced mineralogical reactions showinghow: (a) An initially subalkaline, silica-saturatedmagma that contains normative enstatite and or-thoclase could become silica-undersaturated withnormative diopside and leucite by assimilatinglimestone. (b) Silica from the magma can metaso-matize wall rock and xenolithic limestone anddolomite, producing calcium silicate mineralssuch as wollastonite and diopside. Discuss howeffective these reactions are in modifying the de-gree of silica saturation in the original magma.
12.5 Examine the consequences of assimilation ofcrystalline material into magma using the binarysystem NaAlSi3O8-CaAl2Si2O8 as a model. Con-sider a model magma that contains crystals ofplagioclase An40 in equilibrium with melt intowhich crystals of cool An60 and of An20 are in-troduced. Compare and contrast the subsequentevolution of the two magmas as they crystallize.
12.6 Le Roex et al. (1990) show that the basanite-phonotephrite-tephriphonolite-phonolite se-quence on Tristan da Cunha (Figure 2.16) wascreated by crystal-melt fractionation. This
companying assimilation is particularly effective in pro-ducing the calc-alkaline trend if it occurs under ele-vated water and oxygen fugacities. Thicker continentalcrusts allow more opportunity for AFC and mixing, sothat in thickest crusts, as in the central Andes of SouthAmerica, little, if any, primitive mantle-derived basalticmagma is extruded and most shallow intrusions andextrusions are of rhyolite, dacite, and andesite.
CRITICAL THINKING QUESTIONS12.1 Essentially monomineralic layers of pyroxen-
ite, dunite, or anorthosite in large differenti-ated basaltic intrusions can only form by crys-tal accumulation because no magmas ofequivalent composition are known to occur.What do you think is the evidence for no suchmagmas? (Hint: Consider the volcanic record.)
12.2 How do monomineralic layers (see precedingquestion) originate? Even the least “porous”cumulate still has a significant proportion ofinterstitial basaltic melt entrapped between thecumulus crystals.
12.3 Why are Sr and Nd isotopic ratios not used toevaluate details of crystal-melt fractionation inmagma systems?
12.4 Explain the origin of the seven textural typesof olivine grains in the 1959 summit eruptionof Kilauea, Hawaii (Special Interest Box 12.1).Which are mantle-derived, cumulates, or pre-cipitates of ascending magma?
12.5 Mixed magmas erupted from volcanoes canhave an essentially homogeneous melt, butcrystals are commonly markedly inhomoge-neous and display disequilibrium textures andlocally complex zoning. Why?
12.6 Why is assimilation probably insignificant inthe evolution of MORB magmas crystallizingin oceanic crustal magma chambers?
12.7 Critically evaluate the origin of pegmatites, es-pecially their distinctive fabric, in terms of theJahns-Burnham model involving volatile-over-saturated magma systems versus the Londonmodel involving kinetic factors in an under-cooled magma system.
12.8 Contrast primary, primitive, and parentmagma—their differences and ways each canbe discerned.
12.9 (a) Does the immiscible Fe-rich glass inmesostases of some tholeiitic basalts (column1, Table 12.3) resemble any common silicaterock? (b) In what ways does it differ fromother rocks of comparable silica content?
12.10 Examine Figures 12.30, 2.18, and 13.24. Iscontamination of mantle-derived basaltic mag-
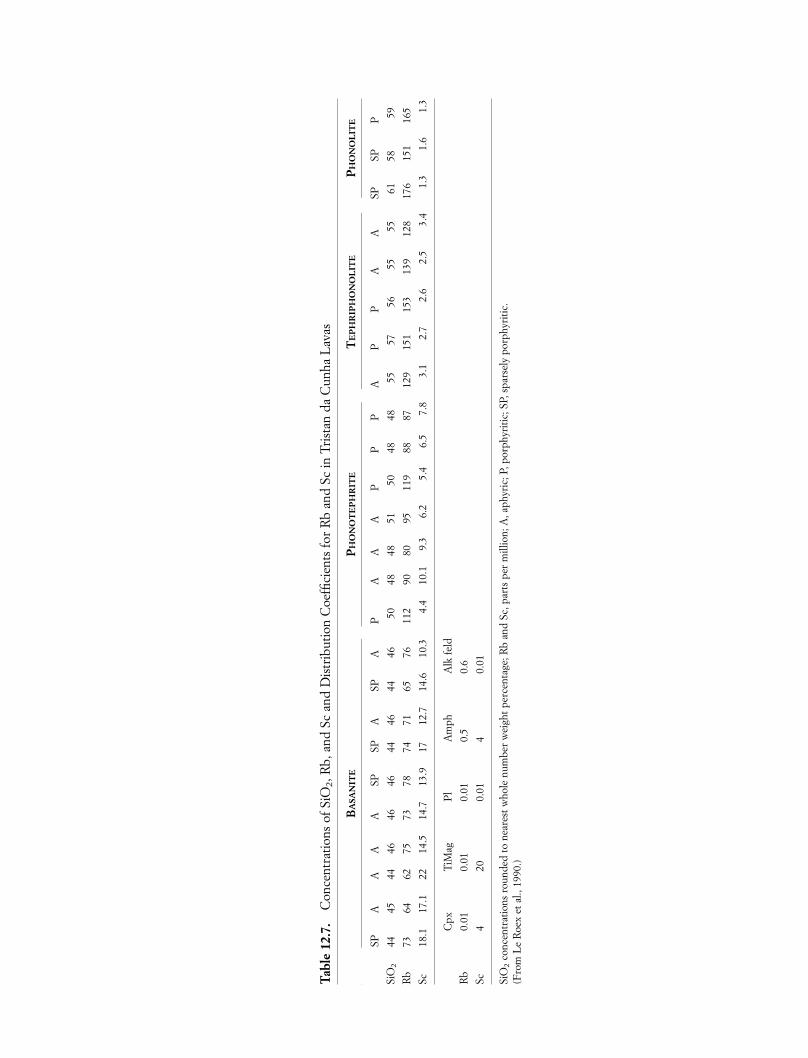
Tabl
e 12
.7.
Con
cent
ratio
ns o
f SiO
2, R
b, a
nd S
c an
d D
istr
ibut
ion
Coe
ffici
ents
for
Rb
and
Sc in
Tri
stan
da
Cun
ha L
avas
BA
SAN
ITE
PHO
NO
TE
PH
RIT
ET
EP
HR
IPH
ON
OL
ITE
PHO
NO
LIT
E
Cpx
TiM
agP
lA
mph
Alk
feld
Rb
0.01
0.01
0.01
0.5
0.6
Sc4
200.
014
0.01
SiO
2co
ncen
trat
ions
rou
nded
to n
eare
st w
hole
num
ber
wei
ght p
erce
ntag
e; R
b an
d Sc
, par
ts p
er m
illio
n; A
, aph
yric
; P, p
orph
yriti
c; S
P, s
pars
ely
porp
hyri
tic.
(Fro
m L
e R
oex
et a
l., 1
990.
)
SPA
AA
ASP
SPA
SPA
PA
SiO
244
4544
4646
4644
4644
4650
48
Rb
7364
6275
7378
7471
6576
112
90
Sc18
.117
.122
14.5
14.7
13.9
1712
.714
.610
.34.
410
.1
AA
PP
PA
PP
AA
SPSP
P
4851
5048
4855
5756
5555
6158
59
8095
119
8887
129
151
153
139
128
176
151
165
9.3
6.2
5.4
6.5
7.8
3.1
2.7
2.6
2.5
3.4
1.3
1.6
1.3
fractionation can be approximated by consider-ing just two trace elements—Rb and Sc. (a) Arethese elements compatible? Incompatible? (b) Using the data in Table 12.7, make a plot of Rb versus Sc for the sequence of rocks. (c) Which sample would be a reasonable parentmagma for the sequence? (d) Determine bulkdistribution coefficients for Rb and Sc that,when used in equation 12.1, yield a model Rb-Sc curve fitting the data points as closely aspossible. Can the entire sequence be modeledby one set of coefficients? Discuss. (e) Whatweight proportions of clinopyroxene (Cpx), titaniferous magnetite (Ti-Mag), and plagioclase(Pl) account for differentiation of the basanite-phonotephrite part of the sequence? Discussyour results. (f ) Can the tephriphonolite-phonolite suite be produced by fractionating the same minerals? Others? Discuss.
12.7 If the immiscible Fe-rich glass in column 1,Table 12.3, were to crystallize, of what mineralswould it be composed and what would be theirmodal proportions? Assume an oxygen fugacitybuffered by QFM (Figure 3.14).
12.8 For the shonkinite-syenite association in Table12.3 plot the first 13 trace elements listed on aprimitive-mantle normalized diagram (Table2.7). How do the two patterns compare withthose for other rocks in this textbook? Is it pos-sible that these two rocks could be related byfractional cystallization, rather than by separa-tion of immiscible melts? Critically evaluatewhether fractionation of common rock-formingminerals might account for the trace elementcontents of the two rocks. For example, are theCo and Ni contents consistent with olivine frac-tionation? Ti and V with Fe-Ti oxide fractiona-tion? And so on.
Differentiation of Magmas 347
FUNDAMENTAL QUESTIONSCONSIDERED IN THIS CHAPTER
1. What rock types and rock suites form petrotec-tonic associations with particular tectonic settings?
2. How do trace element and isotopic compositionsof petrotectonic associations, combined with othercompositional, fabric, and field data, provideinsights into magma evolution?
3. What role does global tectonic setting play in theway magmas are generated and differentiated?
INTRODUCTION
Global magma production is inextricably linked withmovement of lithospheric plates and mantle plumes—the two manifestations of convection in the coolingmantle. Despite the stirring action of these two modesof convection, the mantle has a long-standing chemi-cal and isotopic heterogeneity. Hence, mantle-derivedmagmas have varying elemental and isotopic signaturesthat depend on the part of the mantle where plate- andplume-related conditions allow partial melting. Con-trasting mantle as well as continental sources, togetherwith variable processes of magma generation and dif-ferentiation, depend upon the global tectonic setting inwhich they function. Consequently, different globalsettings yield suites of comagmatic rocks having dis-tinctive compositional attributes, called petrotectonicassociations. A striking contrast between two such as-sociations is the copious production of tholeiitic basalt
magma along oceanic rifts versus the creation of calc-alkaline granitoid batholiths along continental marginsubduction zones.
As in any categorization of geologic systems, sometransitional associations are to be expected, such as theback-arc setting where rocks have attributes of both is-land arcs and oceanic spreading ridges. Additionally,some tectonic settings can evolve over geologic timefrom one to another. For example, a continental in-traplate regime overlying a rising mantle plume mightevolve into a continental rift and then into an oceanicrift; such is the well-documented continental breakupexperienced by landmasses surrounding the AtlanticOcean.
This chapter begins with associations of chieflybasaltic magmas generated by decompressing mantlewhere it wells up beneath oceanic spreading ridges andascends in deep mantle plumes. Following sectionsdeal with more varied arc associations where platesconverge and finally with associations in continentalrifts and stable cratons.
The intent of this chapter is to summarize the rocktypes and rock suites that occur in major global tec-tonic settings and the creation of the magmas in thesepetrotectonic associations. Trace element and isotopicdata furnish insights into the origin of the magmas—their sources, partial melting conditions, and subse-quent differentiation.
Plate tectonic settings where petrotectonic associa-tions develop are displayed schematically in Figures 1.5and 11.2. Additional details can be found in manybooks dedicated to specific associations, as referencedherein, and in overall summaries by Hess (1989), Wilson (1989), and McBirney (1993).
13CHAPTER
MagmaticPetrotectonicAssociations
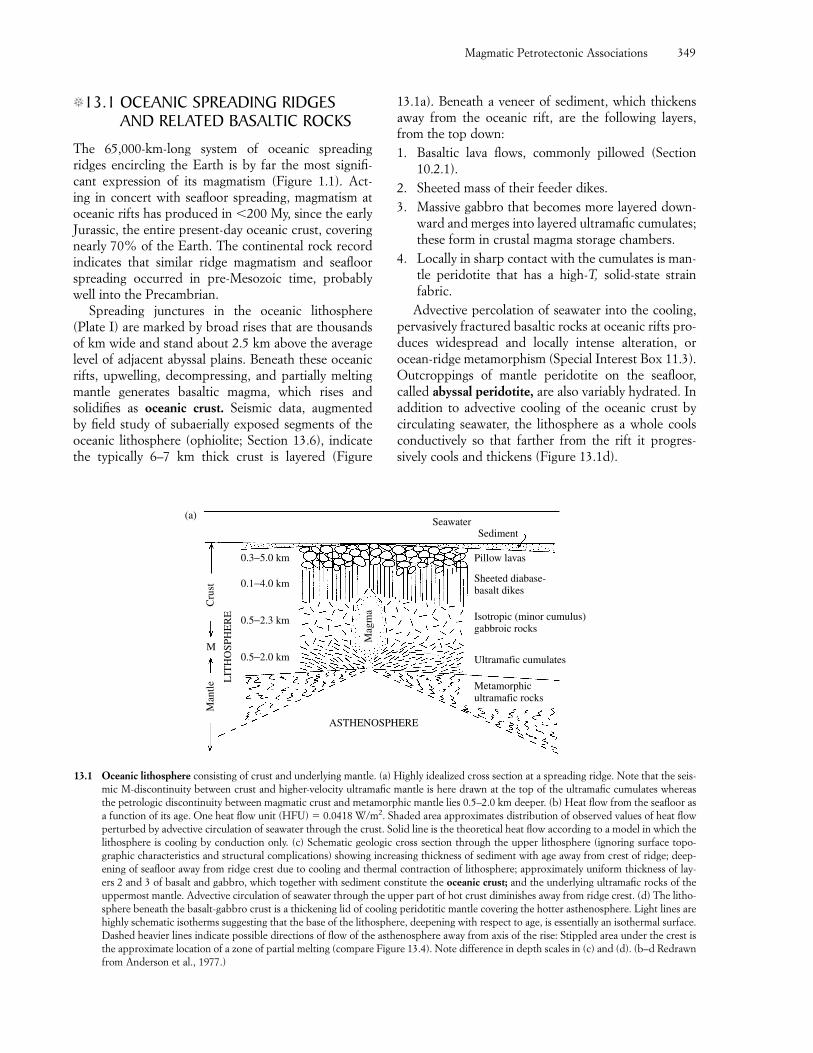
Magmatic Petrotectonic Associations 349
SedimentSeawater
Cru
stM
antle
M
LIT
HO
SPH
ER
E
0.3−5.0 km
0.1−4.0 km
0.5−2.3 km
0.5−2.0 km
Mag
ma
ASTHENOSPHERE
Metamorphicultramafic rocks
Ultramafic cumulates
Isotropic (minor cumulus)gabbroic rocks
Sheeted diabase-basalt dikes
Pillow lavas
(a)
13.1 Oceanic lithosphere consisting of crust and underlying mantle. (a) Highly idealized cross section at a spreading ridge. Note that the seis-mic M-discontinuity between crust and higher-velocity ultramafic mantle is here drawn at the top of the ultramafic cumulates whereasthe petrologic discontinuity between magmatic crust and metamorphic mantle lies 0.5–2.0 km deeper. (b) Heat flow from the seafloor asa function of its age. One heat flow unit (HFU) � 0.0418 W/m2. Shaded area approximates distribution of observed values of heat flowperturbed by advective circulation of seawater through the crust. Solid line is the theoretical heat flow according to a model in which thelithosphere is cooling by conduction only. (c) Schematic geologic cross section through the upper lithosphere (ignoring surface topo-graphic characteristics and structural complications) showing increasing thickness of sediment with age away from crest of ridge; deep-ening of seafloor away from ridge crest due to cooling and thermal contraction of lithosphere; approximately uniform thickness of lay-ers 2 and 3 of basalt and gabbro, which together with sediment constitute the oceanic crust; and the underlying ultramafic rocks of theuppermost mantle. Advective circulation of seawater through the upper part of hot crust diminishes away from ridge crest. (d) The litho-sphere beneath the basalt-gabbro crust is a thickening lid of cooling peridotitic mantle covering the hotter asthenosphere. Light lines arehighly schematic isotherms suggesting that the base of the lithosphere, deepening with respect to age, is essentially an isothermal surface.Dashed heavier lines indicate possible directions of flow of the asthenosphere away from axis of the rise: Stippled area under the crest isthe approximate location of a zone of partial melting (compare Figure 13.4). Note difference in depth scales in (c) and (d). (b–d Redrawnfrom Anderson et al., 1977.)
�13.1 OCEANIC SPREADING RIDGESAND RELATED BASALTIC ROCKS
The 65,000-km-long system of oceanic spreadingridges encircling the Earth is by far the most signifi-cant expression of its magmatism (Figure 1.1). Act-ing in concert with seafloor spreading, magmatism atoceanic rifts has produced in �200 My, since the earlyJurassic, the entire present-day oceanic crust, coveringnearly 70% of the Earth. The continental rock recordindicates that similar ridge magmatism and seafloorspreading occurred in pre-Mesozoic time, probablywell into the Precambrian.
Spreading junctures in the oceanic lithosphere(Plate I) are marked by broad rises that are thousandsof km wide and stand about 2.5 km above the averagelevel of adjacent abyssal plains. Beneath these oceanicrifts, upwelling, decompressing, and partially meltingmantle generates basaltic magma, which rises and solidifies as oceanic crust. Seismic data, augmented by field study of subaerially exposed segments of theoceanic lithosphere (ophiolite; Section 13.6), indicatethe typically 6–7 km thick crust is layered (Figure
13.1a). Beneath a veneer of sediment, which thickensaway from the oceanic rift, are the following layers,from the top down:1. Basaltic lava flows, commonly pillowed (Section
10.2.1).2. Sheeted mass of their feeder dikes.3. Massive gabbro that becomes more layered down-
ward and merges into layered ultramafic cumulates;these form in crustal magma storage chambers.
4. Locally in sharp contact with the cumulates is man-tle peridotite that has a high-T, solid-state strainfabric.
Advective percolation of seawater into the cooling,pervasively fractured basaltic rocks at oceanic rifts pro-duces widespread and locally intense alteration, orocean-ridge metamorphism (Special Interest Box 11.3).Outcroppings of mantle peridotite on the seafloor,called abyssal peridotite, are also variably hydrated. Inaddition to advective cooling of the oceanic crust bycirculating seawater, the lithosphere as a whole coolsconductively so that farther from the rift it progres-sively cools and thickens (Figure 13.1d).
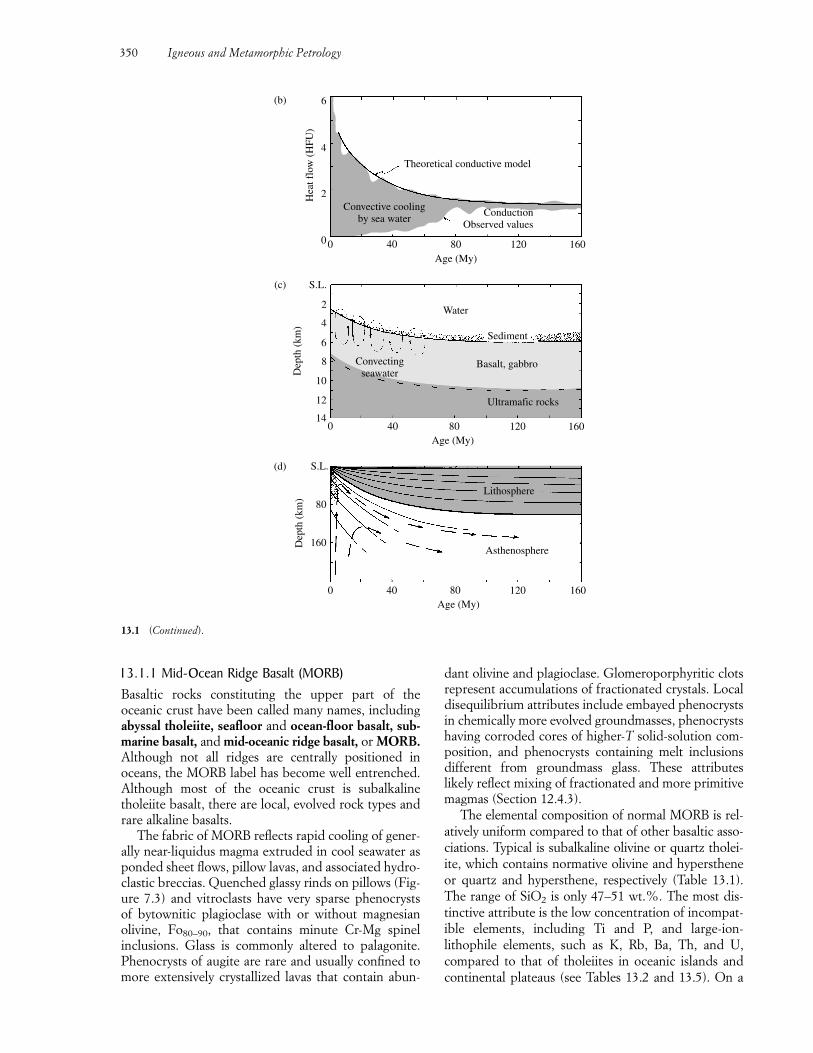
13.1.1 Mid-Ocean Ridge Basalt (MORB)Basaltic rocks constituting the upper part of theoceanic crust have been called many names, includingabyssal tholeiite, seafloor and ocean-floor basalt, sub-marine basalt, and mid-oceanic ridge basalt, or MORB.Although not all ridges are centrally positioned inoceans, the MORB label has become well entrenched.Although most of the oceanic crust is subalkalinetholeiite basalt, there are local, evolved rock types andrare alkaline basalts.
The fabric of MORB reflects rapid cooling of gener-ally near-liquidus magma extruded in cool seawater asponded sheet flows, pillow lavas, and associated hydro-clastic breccias. Quenched glassy rinds on pillows (Fig-ure 7.3) and vitroclasts have very sparse phenocrysts of bytownitic plagioclase with or without magnesianolivine, Fo80–90, that contains minute Cr-Mg spinel inclusions. Glass is commonly altered to palagonite.Phenocrysts of augite are rare and usually confined tomore extensively crystallized lavas that contain abun-
dant olivine and plagioclase. Glomeroporphyritic clotsrepresent accumulations of fractionated crystals. Localdisequilibrium attributes include embayed phenocrystsin chemically more evolved groundmasses, phenocrystshaving corroded cores of higher-T solid-solution com-position, and phenocrysts containing melt inclusionsdifferent from groundmass glass. These attributeslikely reflect mixing of fractionated and more primitivemagmas (Section 12.4.3).
The elemental composition of normal MORB is rel-atively uniform compared to that of other basaltic asso-ciations. Typical is subalkaline olivine or quartz tholei-ite, which contains normative olivine and hyperstheneor quartz and hypersthene, respectively (Table 13.1).The range of SiO2 is only 47–51 wt.%. The most dis-tinctive attribute is the low concentration of incompat-ible elements, including Ti and P, and large-ion-lithophile elements, such as K, Rb, Ba, Th, and U,compared to that of tholeiites in oceanic islands andcontinental plateaus (see Tables 13.2 and 13.5). On a
Theoretical conductive model
Convective coolingby sea water
ConductionObserved values
0Age (My)
40 80 120 1600
2
4
6
Hea
t flo
w (
HFU
)
Sediment
Basalt, gabbro
Ultramafic rocks
Convectingseawater
Age (My)
Water
800 40 120 160
S.L.
2
4
6
8
10
12
14
Dep
th (
km)
Age (My)0 40 80 120 160
Dep
th (
km)
Lithosphere
Asthenosphere
S.L.
80
160
(b)
(c)
(d)
13.1 (Continued).
350 Igneous and Metamorphic Petrology
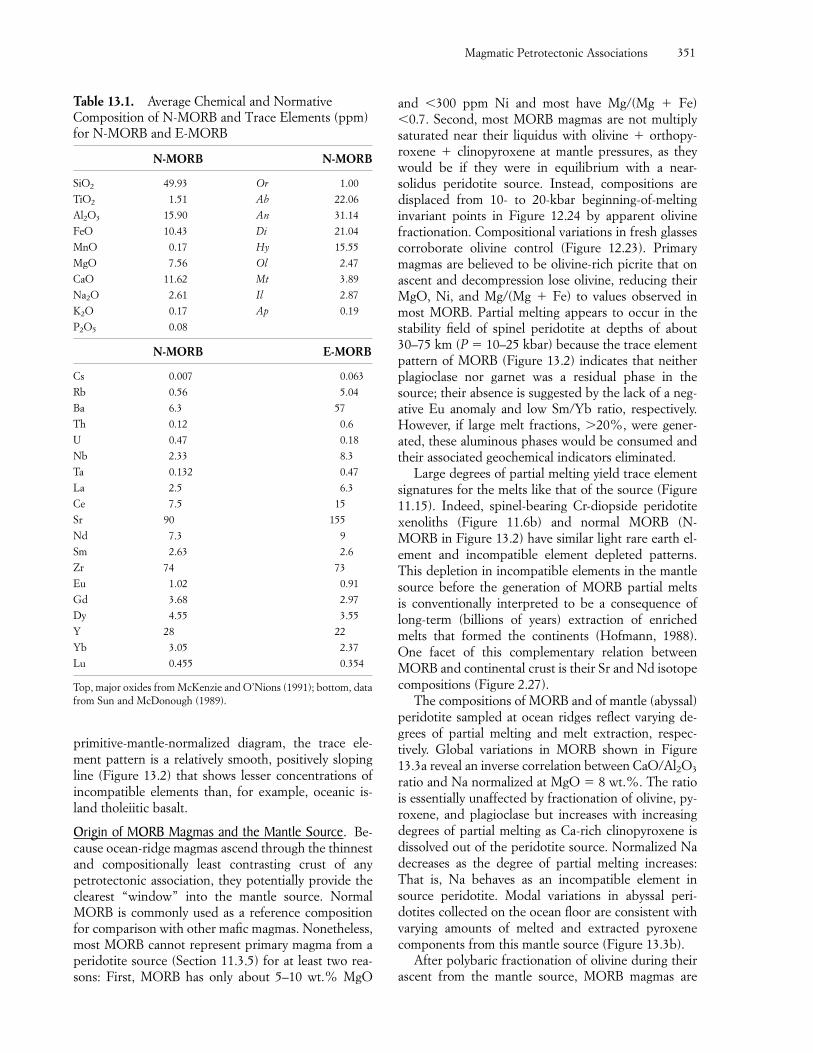
Magmatic Petrotectonic Associations 351
primitive-mantle-normalized diagram, the trace ele-ment pattern is a relatively smooth, positively slopingline (Figure 13.2) that shows lesser concentrations ofincompatible elements than, for example, oceanic is-land tholeiitic basalt.
Origin of MORB Magmas and the Mantle Source. Be-cause ocean-ridge magmas ascend through the thinnestand compositionally least contrasting crust of anypetrotectonic association, they potentially provide theclearest “window” into the mantle source. NormalMORB is commonly used as a reference compositionfor comparison with other mafic magmas. Nonetheless,most MORB cannot represent primary magma from aperidotite source (Section 11.3.5) for at least two rea-sons: First, MORB has only about 5–10 wt.% MgO
and �300 ppm Ni and most have Mg/(Mg � Fe) �0.7. Second, most MORB magmas are not multiply saturated near their liquidus with olivine � orthopy-roxene � clinopyroxene at mantle pressures, as theywould be if they were in equilibrium with a near-solidus peridotite source. Instead, compositions aredisplaced from 10- to 20-kbar beginning-of-melting invariant points in Figure 12.24 by apparent olivinefractionation. Compositional variations in fresh glassescorroborate olivine control (Figure 12.23). Primarymagmas are believed to be olivine-rich picrite that onascent and decompression lose olivine, reducing theirMgO, Ni, and Mg/(Mg � Fe) to values observed inmost MORB. Partial melting appears to occur in thestability field of spinel peridotite at depths of about30–75 km (P � 10–25 kbar) because the trace elementpattern of MORB (Figure 13.2) indicates that neitherplagioclase nor garnet was a residual phase in thesource; their absence is suggested by the lack of a neg-ative Eu anomaly and low Sm/Yb ratio, respectively.However, if large melt fractions, �20%, were gener-ated, these aluminous phases would be consumed andtheir associated geochemical indicators eliminated.
Large degrees of partial melting yield trace elementsignatures for the melts like that of the source (Figure11.15). Indeed, spinel-bearing Cr-diopside peridotitexenoliths (Figure 11.6b) and normal MORB (N-MORB in Figure 13.2) have similar light rare earth el-ement and incompatible element depleted patterns.This depletion in incompatible elements in the mantlesource before the generation of MORB partial melts is conventionally interpreted to be a consequence oflong-term (billions of years) extraction of enrichedmelts that formed the continents (Hofmann, 1988).One facet of this complementary relation betweenMORB and continental crust is their Sr and Nd isotopecompositions (Figure 2.27).
The compositions of MORB and of mantle (abyssal)peridotite sampled at ocean ridges reflect varying de-grees of partial melting and melt extraction, respec-tively. Global variations in MORB shown in Figure13.3a reveal an inverse correlation between CaO/Al2O3
ratio and Na normalized at MgO � 8 wt.%. The ratiois essentially unaffected by fractionation of olivine, py-roxene, and plagioclase but increases with increasingdegrees of partial melting as Ca-rich clinopyroxene isdissolved out of the peridotite source. Normalized Nadecreases as the degree of partial melting increases:That is, Na behaves as an incompatible element insource peridotite. Modal variations in abyssal peri-dotites collected on the ocean floor are consistent withvarying amounts of melted and extracted pyroxenecomponents from this mantle source (Figure 13.3b).
After polybaric fractionation of olivine during theirascent from the mantle source, MORB magmas are
Table 13.1. Average Chemical and NormativeComposition of N-MORB and Trace Elements (ppm)for N-MORB and E-MORB
N-MORB N-MORB
SiO2 49.93 Or 1.00
TiO2 1.51 Ab 22.06
Al2O3 15.90 An 31.14
FeO 10.43 Di 21.04
MnO 0.17 Hy 15.55
MgO 7.56 Ol 2.47
CaO 11.62 Mt 3.89
Na2O 2.61 Il 2.87
K2O 0.17 Ap 0.19
P2O5 0.08
N-MORB E-MORB
Cs 0.007 0.063
Rb 0.56 5.04
Ba 6.3 57
Th 0.12 0.6
U 0.47 0.18
Nb 2.33 8.3
Ta 0.132 0.47
La 2.5 6.3
Ce 7.5 15
Sr 90 155
Nd 7.3 9
Sm 2.63 2.6
Zr 74 73
Eu 1.02 0.91
Gd 3.68 2.97
Dy 4.55 3.55
Y 28 22
Yb 3.05 2.37
Lu 0.455 0.354
Top, major oxides from McKenzie and O’Nions (1991); bottom, datafrom Sun and McDonough (1989).
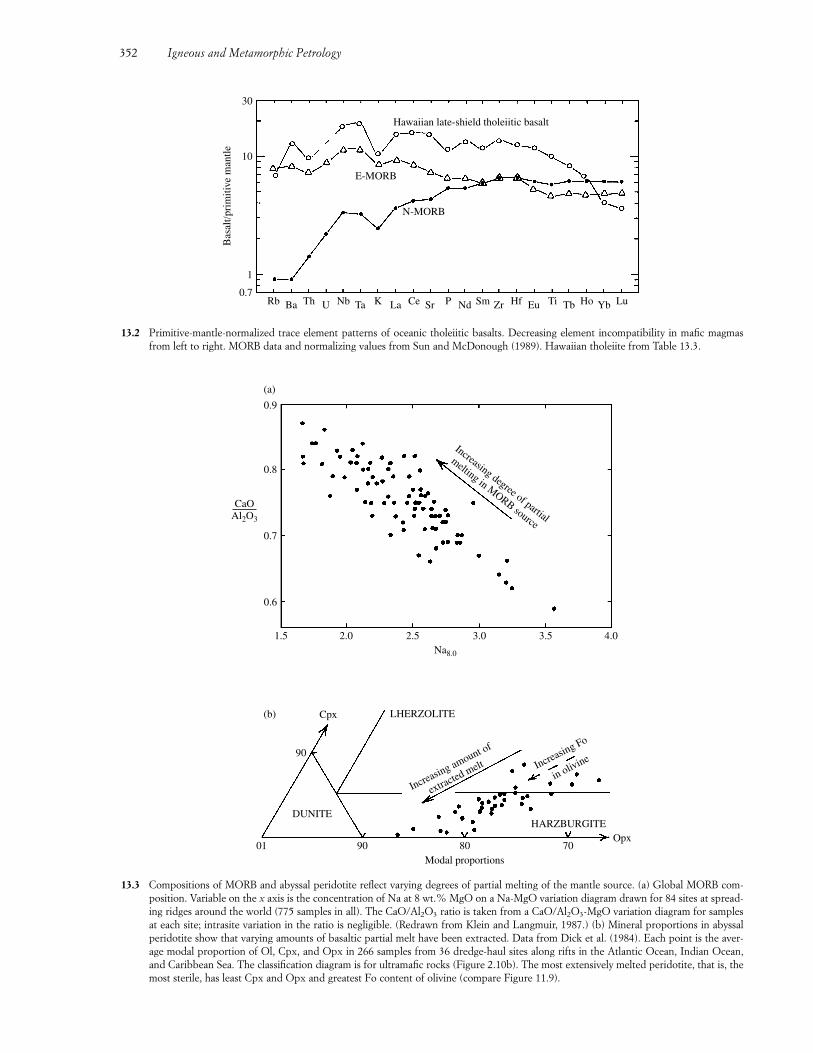
352 Igneous and Metamorphic Petrology
Rb Ba Th U Nb Ta K La Ce Sr P Nd Sm Zr Hf Eu Ti Tb Ho Yb Lu0.7
1
10
30
Bas
alt/p
rim
itive
man
tle
E-MORB
N-MORB
Hawaiian late-shield tholeiitic basalt
13.2 Primitive-mantle-normalized trace element patterns of oceanic tholeiitic basalts. Decreasing element incompatibility in mafic magmasfrom left to right. MORB data and normalizing values from Sun and McDonough (1989). Hawaiian tholeiite from Table 13.3.
DUNITE
01 90 80 70
HARZBURGITE
Modal proportions
in olivineIncreasing Fo
Increasing amount of
extracted melt
LHERZOLITE
90
Cpx
1.5 2.0 2.5 3.0 3.5 4.0Na8.0
0.6
0.7
0.8
0.9
CaOAl2O3
(a)
Increasing degree of partial
melting in MORB source
Opx
(b)
13.3 Compositions of MORB and abyssal peridotite reflect varying degrees of partial melting of the mantle source. (a) Global MORB com-position. Variable on the x axis is the concentration of Na at 8 wt.% MgO on a Na-MgO variation diagram drawn for 84 sites at spread-ing ridges around the world (775 samples in all). The CaO/Al2O3 ratio is taken from a CaO/Al2O3-MgO variation diagram for samplesat each site; intrasite variation in the ratio is negligible. (Redrawn from Klein and Langmuir, 1987.) (b) Mineral proportions in abyssalperidotite show that varying amounts of basaltic partial melt have been extracted. Data from Dick et al. (1984). Each point is the aver-age modal proportion of Ol, Cpx, and Opx in 266 samples from 36 dredge-haul sites along rifts in the Atlantic Ocean, Indian Ocean,and Caribbean Sea. The classification diagram is for ultramafic rocks (Figure 2.10b). The most extensively melted peridotite, that is, themost sterile, has least Cpx and Opx and greatest Fo content of olivine (compare Figure 11.9).
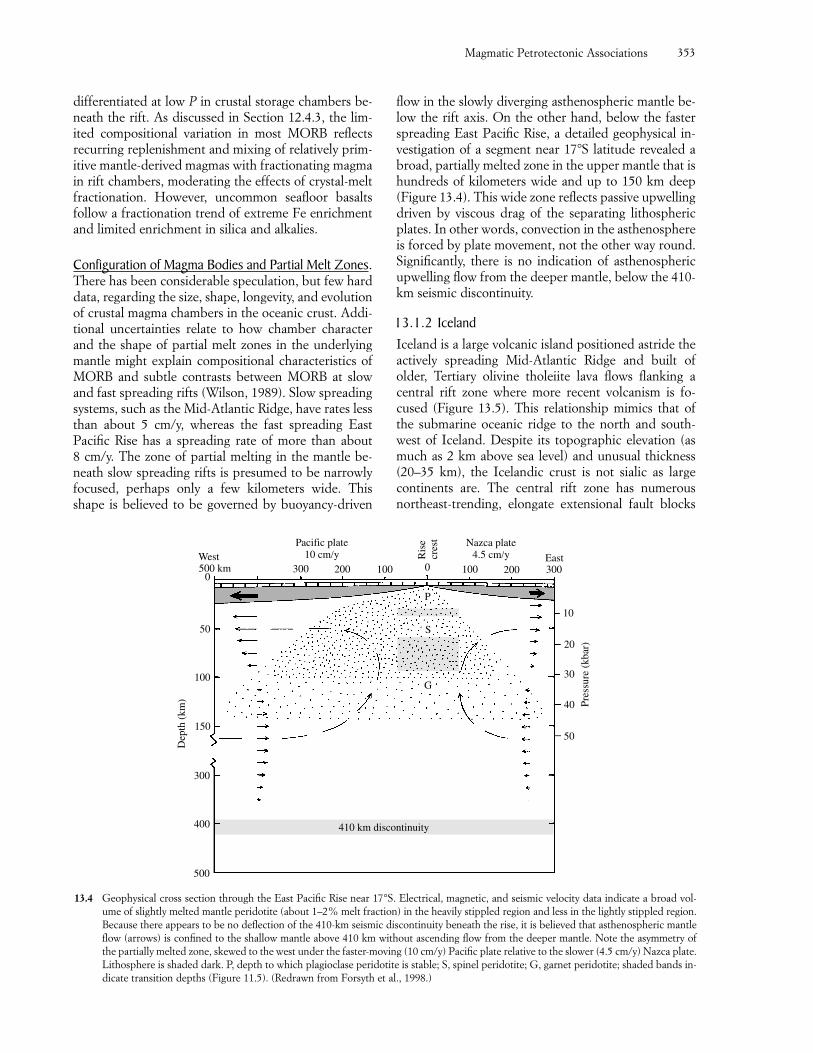
differentiated at low P in crustal storage chambers be-neath the rift. As discussed in Section 12.4.3, the lim-ited compositional variation in most MORB reflects recurring replenishment and mixing of relatively prim-itive mantle-derived magmas with fractionating magmain rift chambers, moderating the effects of crystal-meltfractionation. However, uncommon seafloor basaltsfollow a fractionation trend of extreme Fe enrichmentand limited enrichment in silica and alkalies.
Configuration of Magma Bodies and Partial Melt Zones.There has been considerable speculation, but few harddata, regarding the size, shape, longevity, and evolutionof crustal magma chambers in the oceanic crust. Addi-tional uncertainties relate to how chamber characterand the shape of partial melt zones in the underlyingmantle might explain compositional characteristics ofMORB and subtle contrasts between MORB at slowand fast spreading rifts (Wilson, 1989). Slow spreadingsystems, such as the Mid-Atlantic Ridge, have rates lessthan about 5 cm/y, whereas the fast spreading East Pacific Rise has a spreading rate of more than about 8 cm/y. The zone of partial melting in the mantle be-neath slow spreading rifts is presumed to be narrowlyfocused, perhaps only a few kilometers wide. Thisshape is believed to be governed by buoyancy-driven
flow in the slowly diverging asthenospheric mantle be-low the rift axis. On the other hand, below the fasterspreading East Pacific Rise, a detailed geophysical in-vestigation of a segment near 17�S latitude revealed abroad, partially melted zone in the upper mantle that ishundreds of kilometers wide and up to 150 km deep(Figure 13.4). This wide zone reflects passive upwellingdriven by viscous drag of the separating lithosphericplates. In other words, convection in the asthenosphereis forced by plate movement, not the other way round.Significantly, there is no indication of asthenosphericupwelling flow from the deeper mantle, below the 410-km seismic discontinuity.
13.1.2 IcelandIceland is a large volcanic island positioned astride theactively spreading Mid-Atlantic Ridge and built ofolder, Tertiary olivine tholeiite lava flows flanking acentral rift zone where more recent volcanism is fo-cused (Figure 13.5). This relationship mimics that ofthe submarine oceanic ridge to the north and south-west of Iceland. Despite its topographic elevation (asmuch as 2 km above sea level) and unusual thickness(20–35 km), the Icelandic crust is not sialic as largecontinents are. The central rift zone has numerousnortheast-trending, elongate extensional fault blocks
Magmatic Petrotectonic Associations 353
410 km discontinuity
500 km 300 200 100 0 100 200 300West
Pacific plate10 cm/y R
ise
cres
t Nazca plate4.5 cm/y East
P
S
G
10
20
30
40
50
500
400
300
150
100
50
0
Dep
th (
km) Pres
sure
(kb
ar)
13.4 Geophysical cross section through the East Pacific Rise near 17°S. Electrical, magnetic, and seismic velocity data indicate a broad vol-ume of slightly melted mantle peridotite (about 1–2% melt fraction) in the heavily stippled region and less in the lightly stippled region.Because there appears to be no deflection of the 410-km seismic discontinuity beneath the rise, it is believed that asthenospheric mantleflow (arrows) is confined to the shallow mantle above 410 km without ascending flow from the deeper mantle. Note the asymmetry ofthe partially melted zone, skewed to the west under the faster-moving (10 cm/y) Pacific plate relative to the slower (4.5 cm/y) Nazca plate.Lithosphere is shaded dark. P, depth to which plagioclase peridotite is stable; S, spinel peridotite; G, garnet peridotite; shaded bands in-dicate transition depths (Figure 11.5). (Redrawn from Forsyth et al., 1998.)
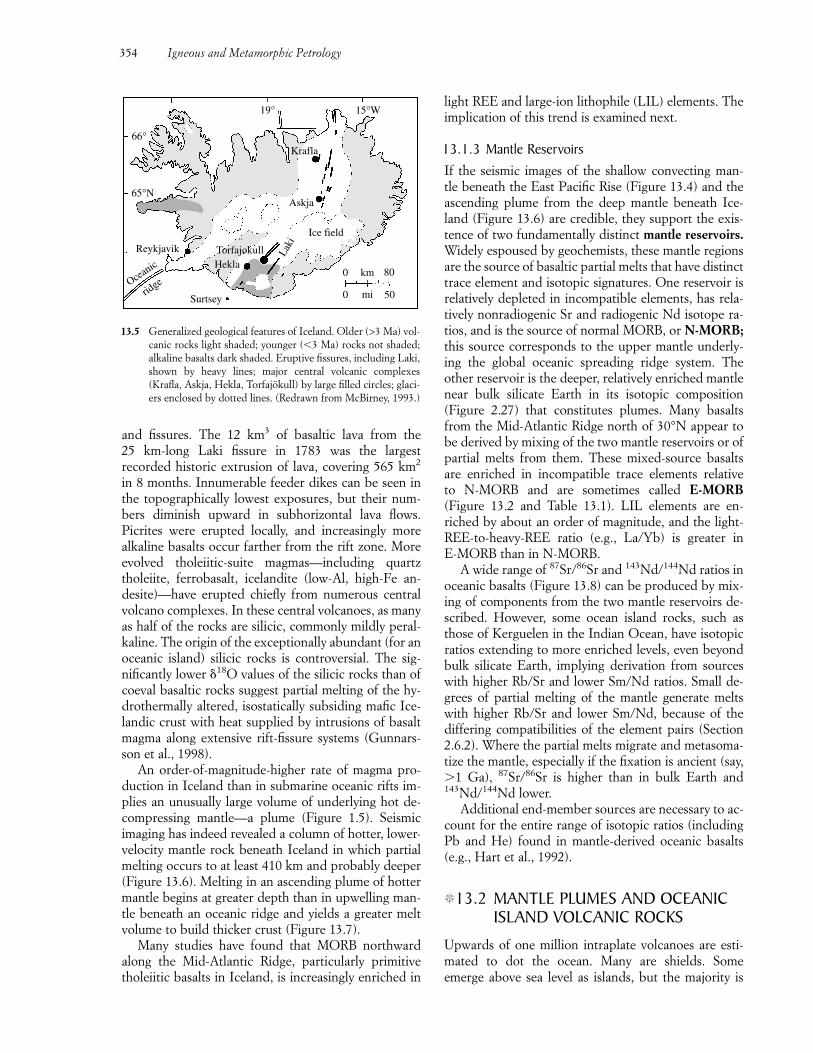
354 Igneous and Metamorphic Petrology
13.5 Generalized geological features of Iceland. Older (>3 Ma) vol-canic rocks light shaded; younger (�3 Ma) rocks not shaded;alkaline basalts dark shaded. Eruptive fissures, including Laki,shown by heavy lines; major central volcanic complexes(Krafla, Askja, Hekla, Torfajökull) by large filled circles; glaci-ers enclosed by dotted lines. (Redrawn from McBirney, 1993.)
Torfajokull Laki
Ice field
0 km 80
0 mi 50
Askja
15°W
Krafla66°
65°N
Oceanic
ridge
Surtsey
19°
Reykjavik¨
Hekla
and fissures. The 12 km3 of basaltic lava from the 25 km-long Laki fissure in 1783 was the largestrecorded historic extrusion of lava, covering 565 km2
in 8 months. Innumerable feeder dikes can be seen inthe topographically lowest exposures, but their num-bers diminish upward in subhorizontal lava flows. Picrites were erupted locally, and increasingly more alkaline basalts occur farther from the rift zone. Moreevolved tholeiitic-suite magmas—including quartztholeiite, ferrobasalt, icelandite (low-Al, high-Fe an-desite)—have erupted chiefly from numerous centralvolcano complexes. In these central volcanoes, as manyas half of the rocks are silicic, commonly mildly peral-kaline. The origin of the exceptionally abundant (for anoceanic island) silicic rocks is controversial. The sig-nificantly lower �18O values of the silicic rocks than ofcoeval basaltic rocks suggest partial melting of the hy-drothermally altered, isostatically subsiding mafic Ice-landic crust with heat supplied by intrusions of basaltmagma along extensive rift-fissure systems (Gunnars-son et al., 1998).
An order-of-magnitude-higher rate of magma pro-duction in Iceland than in submarine oceanic rifts im-plies an unusually large volume of underlying hot de-compressing mantle—a plume (Figure 1.5). Seismicimaging has indeed revealed a column of hotter, lower-velocity mantle rock beneath Iceland in which partialmelting occurs to at least 410 km and probably deeper(Figure 13.6). Melting in an ascending plume of hottermantle begins at greater depth than in upwelling man-tle beneath an oceanic ridge and yields a greater meltvolume to build thicker crust (Figure 13.7).
Many studies have found that MORB northwardalong the Mid-Atlantic Ridge, particularly primitivetholeiitic basalts in Iceland, is increasingly enriched in
light REE and large-ion lithophile (LIL) elements. Theimplication of this trend is examined next.
13.1.3 Mantle ReservoirsIf the seismic images of the shallow convecting man-tle beneath the East Pacific Rise (Figure 13.4) and theascending plume from the deep mantle beneath Ice-land (Figure 13.6) are credible, they support the exis-tence of two fundamentally distinct mantle reservoirs.Widely espoused by geochemists, these mantle regionsare the source of basaltic partial melts that have distincttrace element and isotopic signatures. One reservoir isrelatively depleted in incompatible elements, has rela-tively nonradiogenic Sr and radiogenic Nd isotope ra-tios, and is the source of normal MORB, or N-MORB;this source corresponds to the upper mantle underly-ing the global oceanic spreading ridge system. Theother reservoir is the deeper, relatively enriched mantlenear bulk silicate Earth in its isotopic composition(Figure 2.27) that constitutes plumes. Many basaltsfrom the Mid-Atlantic Ridge north of 30°N appear tobe derived by mixing of the two mantle reservoirs or ofpartial melts from them. These mixed-source basaltsare enriched in incompatible trace elements relative to N-MORB and are sometimes called E-MORB(Figure 13.2 and Table 13.1). LIL elements are en-riched by about an order of magnitude, and the light-REE-to-heavy-REE ratio (e.g., La/Yb) is greater in E-MORB than in N-MORB.
A wide range of 87Sr/86Sr and 143Nd/144Nd ratios inoceanic basalts (Figure 13.8) can be produced by mix-ing of components from the two mantle reservoirs de-scribed. However, some ocean island rocks, such asthose of Kerguelen in the Indian Ocean, have isotopicratios extending to more enriched levels, even beyondbulk silicate Earth, implying derivation from sourceswith higher Rb/Sr and lower Sm/Nd ratios. Small de-grees of partial melting of the mantle generate meltswith higher Rb/Sr and lower Sm/Nd, because of thediffering compatibilities of the element pairs (Section2.6.2). Where the partial melts migrate and metasoma-tize the mantle, especially if the fixation is ancient (say,�1 Ga), 87Sr/86Sr is higher than in bulk Earth and143Nd/144Nd lower.
Additional end-member sources are necessary to ac-count for the entire range of isotopic ratios (includingPb and He) found in mantle-derived oceanic basalts(e.g., Hart et al., 1992).
�13.2 MANTLE PLUMES AND OCEANICISLAND VOLCANIC ROCKS
Upwards of one million intraplate volcanoes are esti-mated to dot the ocean. Many are shields. Someemerge above sea level as islands, but the majority is
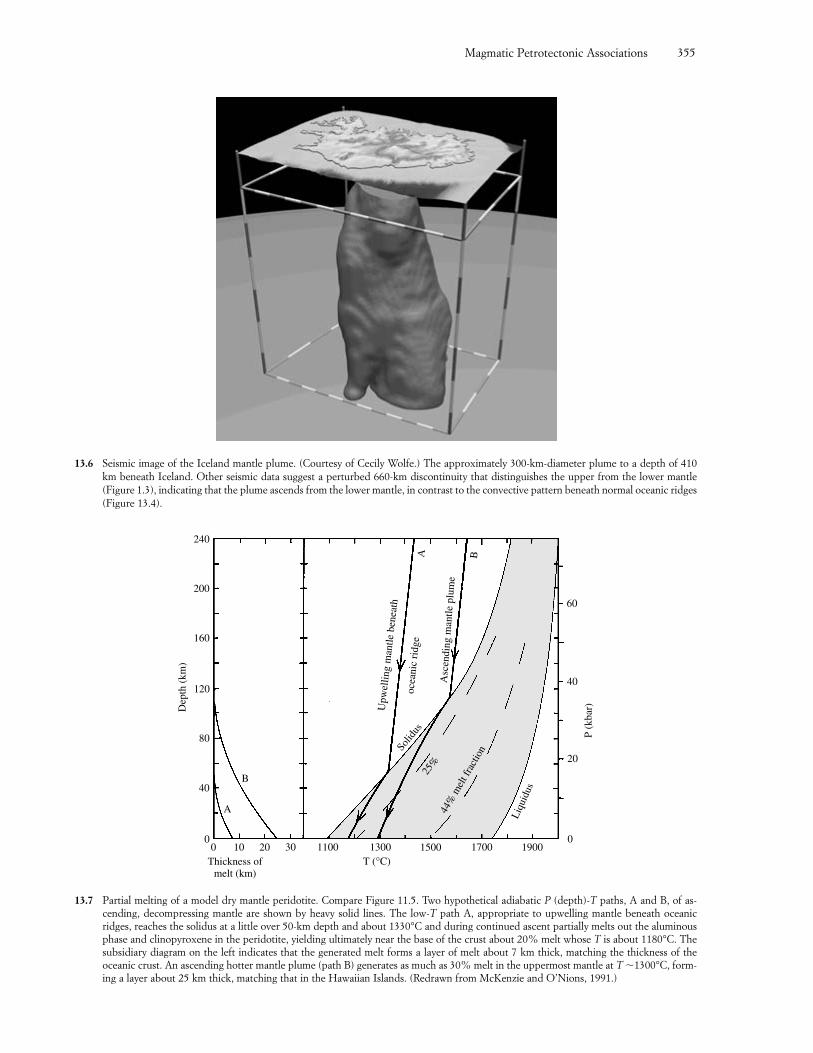
Magmatic Petrotectonic Associations 355
13.6 Seismic image of the Iceland mantle plume. (Courtesy of Cecily Wolfe.) The approximately 300-km-diameter plume to a depth of 410km beneath Iceland. Other seismic data suggest a perturbed 660-km discontinuity that distinguishes the upper from the lower mantle(Figure 1.3), indicating that the plume ascends from the lower mantle, in contrast to the convective pattern beneath normal oceanic ridges(Figure 13.4).
0 10 20 30 1100 1300 1500 1700 1900
Liqu
idus
0
20
40
60
T (°C)
P (k
bar)
Thickness ofmelt (km)
0
40
80
120
160
200
240
Dep
th (
km)
Upw
ellin
g m
antle
ben
eath
ocea
nic
ridg
e
Solid
us
Asc
endi
ng m
antle
plu
me
A B
25%
44%
mel
t fra
ctio
n
A
B
13.7 Partial melting of a model dry mantle peridotite. Compare Figure 11.5. Two hypothetical adiabatic P (depth)-T paths, A and B, of as-cending, decompressing mantle are shown by heavy solid lines. The low-T path A, appropriate to upwelling mantle beneath oceanicridges, reaches the solidus at a little over 50-km depth and about 1330°C and during continued ascent partially melts out the aluminousphase and clinopyroxene in the peridotite, yielding ultimately near the base of the crust about 20% melt whose T is about 1180°C. Thesubsidiary diagram on the left indicates that the generated melt forms a layer of melt about 7 km thick, matching the thickness of theoceanic crust. An ascending hotter mantle plume (path B) generates as much as 30% melt in the uppermost mantle at T �1300°C, form-ing a layer about 25 km thick, matching that in the Hawaiian Islands. (Redrawn from McKenzie and O’Nions, 1991.)
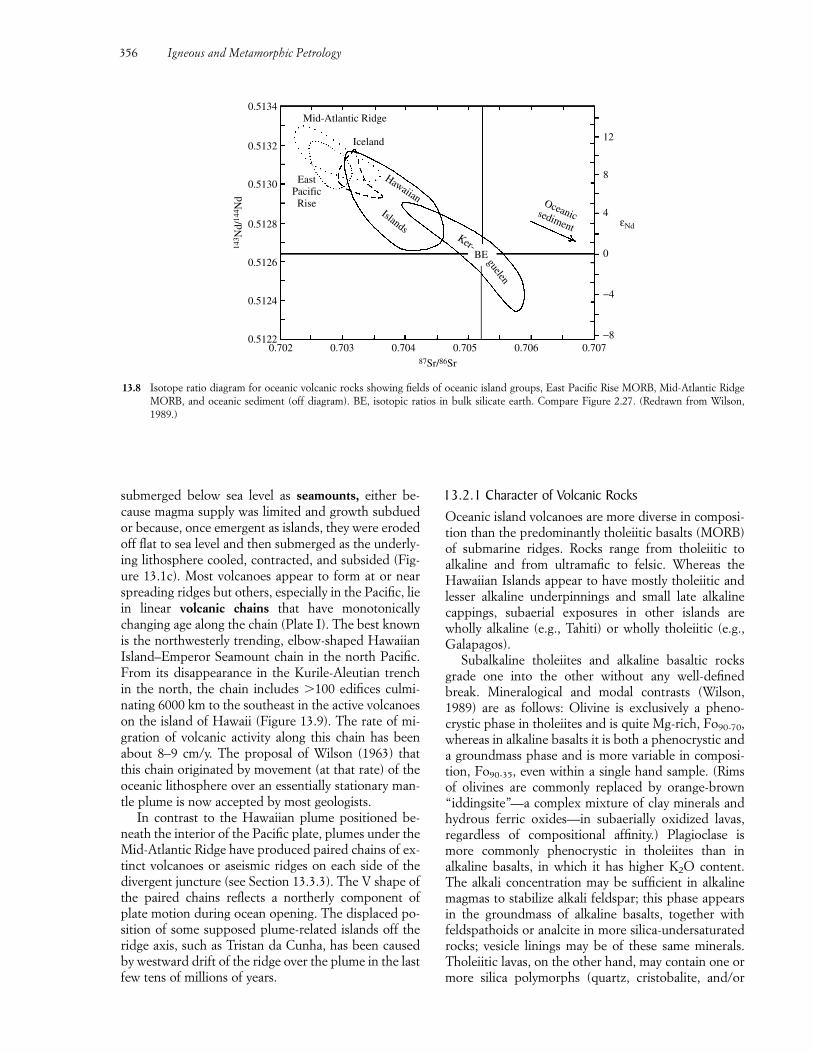
356 Igneous and Metamorphic Petrology
0.702 0.703 0.704 0.705 0.706 0.70787Sr/86Sr
0.5122
0.5124
0.5126
0.5128
0.5130
0.5132
0.5134
143 N
d/14
4 Nd
−8
−4
0
4
8
12
εNd
Ker-
guelen
BE
Oceanicsediment
Hawaiian
Islands
EastPacificRise
Mid-Atlantic Ridge
Iceland
13.8 Isotope ratio diagram for oceanic volcanic rocks showing fields of oceanic island groups, East Pacific Rise MORB, Mid-Atlantic RidgeMORB, and oceanic sediment (off diagram). BE, isotopic ratios in bulk silicate earth. Compare Figure 2.27. (Redrawn from Wilson,1989.)
submerged below sea level as seamounts, either be-cause magma supply was limited and growth subduedor because, once emergent as islands, they were erodedoff flat to sea level and then submerged as the underly-ing lithosphere cooled, contracted, and subsided (Fig-ure 13.1c). Most volcanoes appear to form at or nearspreading ridges but others, especially in the Pacific, liein linear volcanic chains that have monotonicallychanging age along the chain (Plate I). The best knownis the northwesterly trending, elbow-shaped HawaiianIsland–Emperor Seamount chain in the north Pacific.From its disappearance in the Kurile-Aleutian trenchin the north, the chain includes �100 edifices culmi-nating 6000 km to the southeast in the active volcanoeson the island of Hawaii (Figure 13.9). The rate of mi-gration of volcanic activity along this chain has beenabout 8–9 cm/y. The proposal of Wilson (1963) thatthis chain originated by movement (at that rate) of theoceanic lithosphere over an essentially stationary man-tle plume is now accepted by most geologists.
In contrast to the Hawaiian plume positioned be-neath the interior of the Pacific plate, plumes under theMid-Atlantic Ridge have produced paired chains of ex-tinct volcanoes or aseismic ridges on each side of thedivergent juncture (see Section 13.3.3). The V shape ofthe paired chains reflects a northerly component ofplate motion during ocean opening. The displaced po-sition of some supposed plume-related islands off theridge axis, such as Tristan da Cunha, has been causedby westward drift of the ridge over the plume in the lastfew tens of millions of years.
13.2.1 Character of Volcanic RocksOceanic island volcanoes are more diverse in composi-tion than the predominantly tholeiitic basalts (MORB)of submarine ridges. Rocks range from tholeiitic to alkaline and from ultramafic to felsic. Whereas theHawaiian Islands appear to have mostly tholeiitic andlesser alkaline underpinnings and small late alkalinecappings, subaerial exposures in other islands arewholly alkaline (e.g., Tahiti) or wholly tholeiitic (e.g.,Galapagos).
Subalkaline tholeiites and alkaline basaltic rocksgrade one into the other without any well-definedbreak. Mineralogical and modal contrasts (Wilson,1989) are as follows: Olivine is exclusively a pheno-crystic phase in tholeiites and is quite Mg-rich, Fo90-70,whereas in alkaline basalts it is both a phenocrystic anda groundmass phase and is more variable in composi-tion, Fo90-35, even within a single hand sample. (Rimsof olivines are commonly replaced by orange-brown“iddingsite”—a complex mixture of clay minerals andhydrous ferric oxides—in subaerially oxidized lavas,regardless of compositional affinity.) Plagioclase ismore commonly phenocrystic in tholeiites than in alkaline basalts, in which it has higher K2O content.The alkali concentration may be sufficient in alkalinemagmas to stabilize alkali feldspar; this phase appearsin the groundmass of alkaline basalts, together withfeldspathoids or analcite in more silica-undersaturatedrocks; vesicle linings may be of these same minerals.Tholeiitic lavas, on the other hand, may contain one ormore silica polymorphs (quartz, cristobalite, and/or
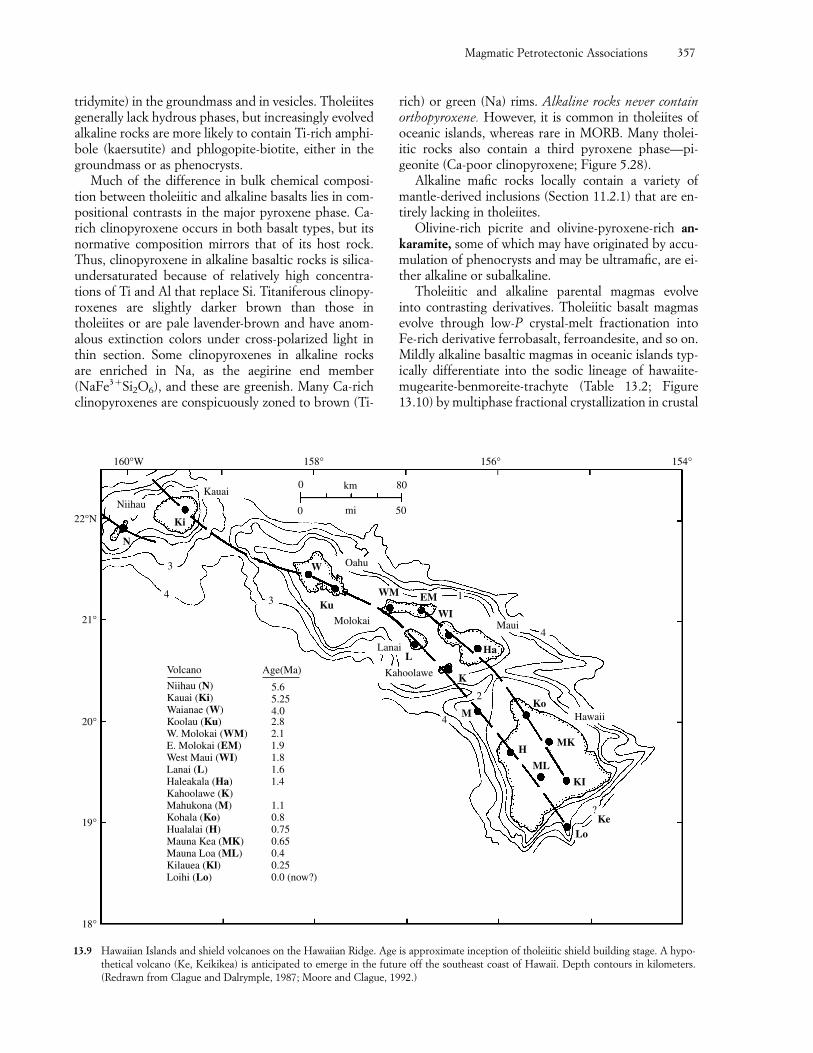
Magmatic Petrotectonic Associations 357
W. Molokai (WM) 2.1E. Molokai (EM) 1.9West Maui (WI) 1.8Lanai (L) 1.6Haleakala (Ha) 1.4Kahoolawe (K)Mahukona (M) 1.1Kohala (Ko) 0.8Hualalai (H) 0.75Mauna Kea (MK) 0.65Mauna Loa (ML) 0.4Kilauea (Kl) 0.25Loihi (Lo) 0.0 (now?)
160°W 158° 156° 154°
0 km 80
0 mi 50
3
4
N
Ki
Kauai
22°N
21°
20°
19°
18°
LoKe
KI
Ko
ML
MK
?
H
M
K
Hawaii
2
4
4Maui
WI
WM EM
W Oahu
Volcano
Niihau (N)Kauai (Ki)Waianae (W)Koolau (Ku) 2.8
Ku
Molokai
LanaiL
Kahoolawe
3
5.65.254.0
Ha
1
Niihau
Age(Ma)
13.9 Hawaiian Islands and shield volcanoes on the Hawaiian Ridge. Age is approximate inception of tholeiitic shield building stage. A hypo-thetical volcano (Ke, Keikikea) is anticipated to emerge in the future off the southeast coast of Hawaii. Depth contours in kilometers.(Redrawn from Clague and Dalrymple, 1987; Moore and Clague, 1992.)
tridymite) in the groundmass and in vesicles. Tholeiitesgenerally lack hydrous phases, but increasingly evolvedalkaline rocks are more likely to contain Ti-rich amphi-bole (kaersutite) and phlogopite-biotite, either in thegroundmass or as phenocrysts.
Much of the difference in bulk chemical composi-tion between tholeiitic and alkaline basalts lies in com-positional contrasts in the major pyroxene phase. Ca-rich clinopyroxene occurs in both basalt types, but itsnormative composition mirrors that of its host rock.Thus, clinopyroxene in alkaline basaltic rocks is silica-undersaturated because of relatively high concentra-tions of Ti and Al that replace Si. Titaniferous clinopy-roxenes are slightly darker brown than those intholeiites or are pale lavender-brown and have anom-alous extinction colors under cross-polarized light inthin section. Some clinopyroxenes in alkaline rocks are enriched in Na, as the aegirine end member(NaFe3�Si2O6), and these are greenish. Many Ca-richclinopyroxenes are conspicuously zoned to brown (Ti-
rich) or green (Na) rims. Alkaline rocks never containorthopyroxene. However, it is common in tholeiites ofoceanic islands, whereas rare in MORB. Many tholei-itic rocks also contain a third pyroxene phase—pi-geonite (Ca-poor clinopyroxene; Figure 5.28).
Alkaline mafic rocks locally contain a variety ofmantle-derived inclusions (Section 11.2.1) that are en-tirely lacking in tholeiites.
Olivine-rich picrite and olivine-pyroxene-rich an-karamite, some of which may have originated by accu-mulation of phenocrysts and may be ultramafic, are ei-ther alkaline or subalkaline.
Tholeiitic and alkaline parental magmas evolve into contrasting derivatives. Tholeiitic basalt magmasevolve through low-P crystal-melt fractionation intoFe-rich derivative ferrobasalt, ferroandesite, and so on.Mildly alkaline basaltic magmas in oceanic islands typ-ically differentiate into the sodic lineage of hawaiite-mugearite-benmoreite-trachyte (Table 13.2; Figure13.10) by multiphase fractional crystallization in crustal
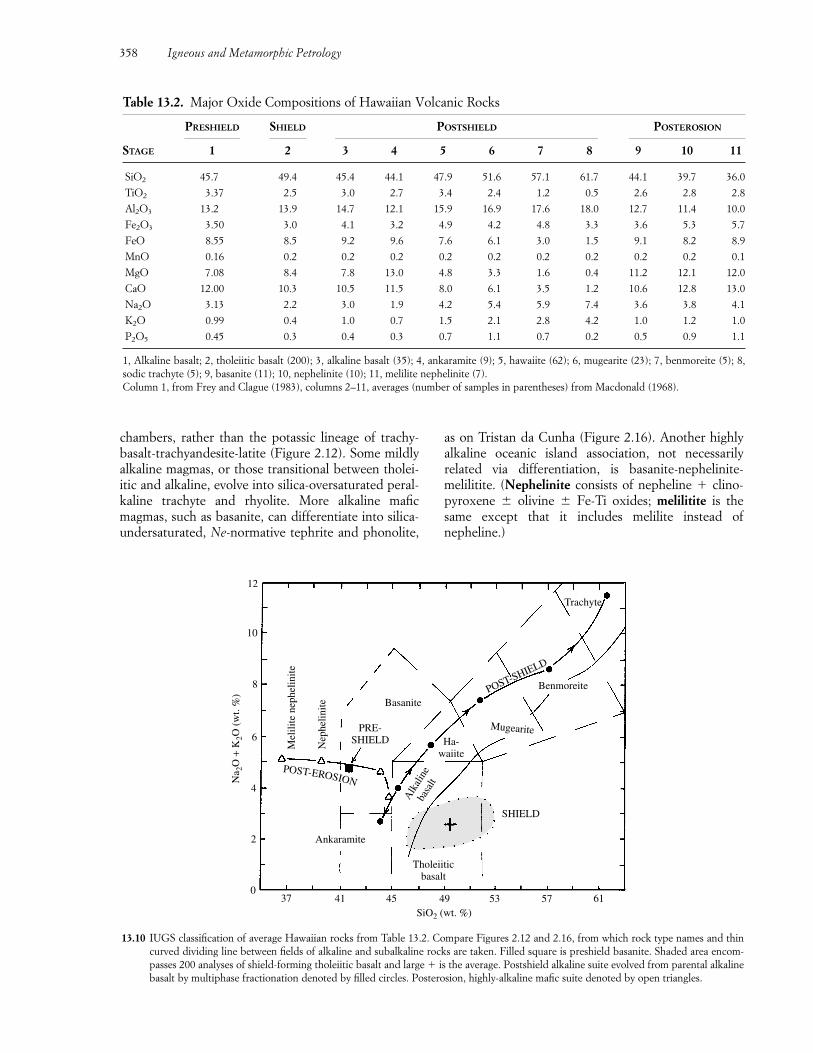
358 Igneous and Metamorphic Petrology
13.10 IUGS classification of average Hawaiian rocks from Table 13.2. Compare Figures 2.12 and 2.16, from which rock type names and thincurved dividing line between fields of alkaline and subalkaline rocks are taken. Filled square is preshield basanite. Shaded area encom-passes 200 analyses of shield-forming tholeiitic basalt and large � is the average. Postshield alkaline suite evolved from parental alkalinebasalt by multiphase fractionation denoted by filled circles. Posterosion, highly-alkaline mafic suite denoted by open triangles.
37 41 45 49 53 57 610
2
4
6
8
10
12
Tholeiiticbasalt
SiO2 (wt. %)
SHIELD
Mugearite
Benmoreite
Trachyte
Ha-waiite
Alk
alin
eba
salt
Ankaramite
POST-EROSION
PRE-SHIELD
Basanite
Nep
helin
ite
Mel
ilite
nep
helin
ite
Na 2
O +
K2O
(w
t. %
) POST-SHIELD
Table 13.2. Major Oxide Compositions of Hawaiian Volcanic Rocks
PRESHIELD SHIELD POSTSHIELD POSTEROSION
STAGE 1 2 3 4 5 6 7 8 9 10 11
SiO2 45.7 49.4 45.4 44.1 47.9 51.6 57.1 61.7 44.1 39.7 36.0
TiO2 3.37 2.5 3.0 2.7 3.4 2.4 1.2 0.5 2.6 2.8 2.8
Al2O3 13.2 13.9 14.7 12.1 15.9 16.9 17.6 18.0 12.7 11.4 10.0
Fe2O3 3.50 3.0 4.1 3.2 4.9 4.2 4.8 3.3 3.6 5.3 5.7
FeO 8.55 8.5 9.2 9.6 7.6 6.1 3.0 1.5 9.1 8.2 8.9
MnO 0.16 0.2 0.2 0.2 0.2 0.2 0.2 0.2 0.2 0.2 0.1
MgO 7.08 8.4 7.8 13.0 4.8 3.3 1.6 0.4 11.2 12.1 12.0
CaO 12.00 10.3 10.5 11.5 8.0 6.1 3.5 1.2 10.6 12.8 13.0
Na2O 3.13 2.2 3.0 1.9 4.2 5.4 5.9 7.4 3.6 3.8 4.1
K2O 0.99 0.4 1.0 0.7 1.5 2.1 2.8 4.2 1.0 1.2 1.0
P2O5 0.45 0.3 0.4 0.3 0.7 1.1 0.7 0.2 0.5 0.9 1.1
1, Alkaline basalt; 2, tholeiitic basalt (200); 3, alkaline basalt (35); 4, ankaramite (9); 5, hawaiite (62); 6, mugearite (23); 7, benmoreite (5); 8,sodic trachyte (5); 9, basanite (11); 10, nephelinite (10); 11, melilite nephelinite (7).Column 1, from Frey and Clague (1983), columns 2–11, averages (number of samples in parentheses) from Macdonald (1968).
chambers, rather than the potassic lineage of trachy-basalt-trachyandesite-latite (Figure 2.12). Some mildlyalkaline magmas, or those transitional between tholei-itic and alkaline, evolve into silica-oversaturated peral-kaline trachyte and rhyolite. More alkaline mafic magmas, such as basanite, can differentiate into silica-undersaturated, Ne-normative tephrite and phonolite,
as on Tristan da Cunha (Figure 2.16). Another highlyalkaline oceanic island association, not necessarily related via differentiation, is basanite-nephelinite-melilitite. (Nephelinite consists of nepheline � clino-pyroxene � olivine � Fe-Ti oxides; melilitite is thesame except that it includes melilite instead ofnepheline.)
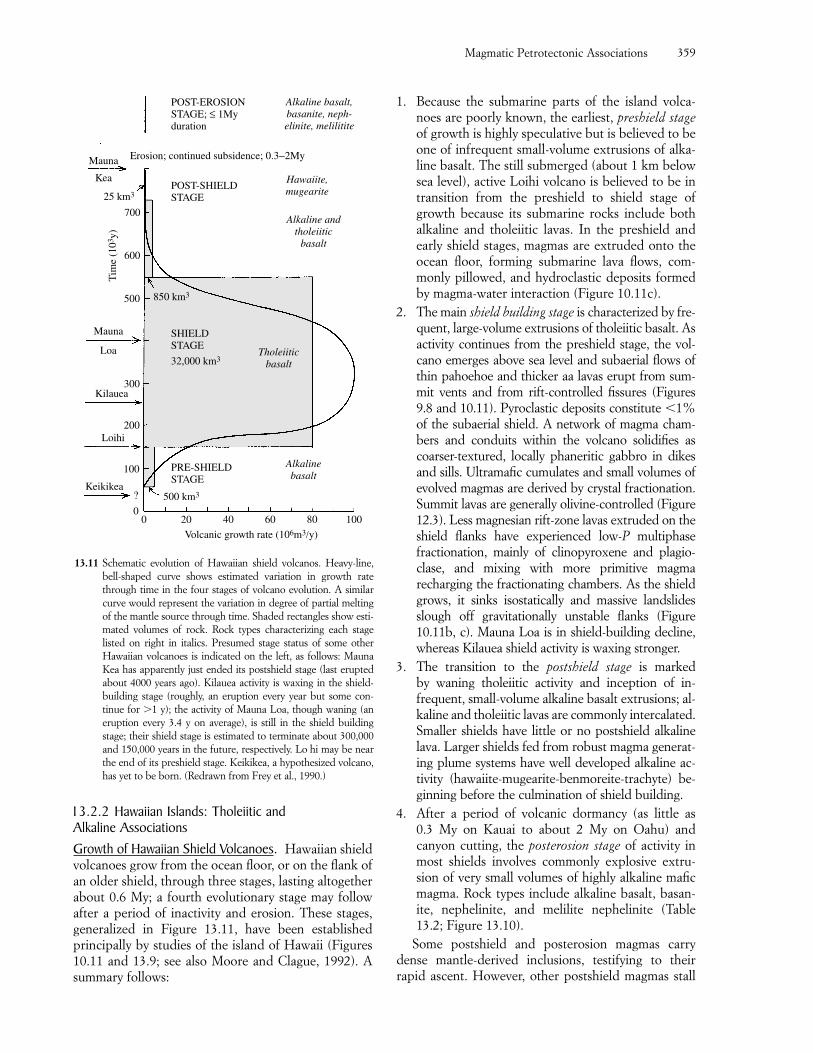
13.2.2 Hawaiian Islands: Tholeiitic and Alkaline AssociationsGrowth of Hawaiian Shield Volcanoes. Hawaiian shieldvolcanoes grow from the ocean floor, or on the flank ofan older shield, through three stages, lasting altogetherabout 0.6 My; a fourth evolutionary stage may followafter a period of inactivity and erosion. These stages,generalized in Figure 13.11, have been establishedprincipally by studies of the island of Hawaii (Figures10.11 and 13.9; see also Moore and Clague, 1992). Asummary follows:
1. Because the submarine parts of the island volca-noes are poorly known, the earliest, preshield stageof growth is highly speculative but is believed to beone of infrequent small-volume extrusions of alka-line basalt. The still submerged (about 1 km belowsea level), active Loihi volcano is believed to be intransition from the preshield to shield stage ofgrowth because its submarine rocks include bothalkaline and tholeiitic lavas. In the preshield andearly shield stages, magmas are extruded onto theocean floor, forming submarine lava flows, com-monly pillowed, and hydroclastic deposits formedby magma-water interaction (Figure 10.11c).
2. The main shield building stage is characterized by fre-quent, large-volume extrusions of tholeiitic basalt. Asactivity continues from the preshield stage, the vol-cano emerges above sea level and subaerial flows ofthin pahoehoe and thicker aa lavas erupt from sum-mit vents and from rift-controlled fissures (Figures9.8 and 10.11). Pyroclastic deposits constitute �1%of the subaerial shield. A network of magma cham-bers and conduits within the volcano solidifies ascoarser-textured, locally phaneritic gabbro in dikesand sills. Ultramafic cumulates and small volumes ofevolved magmas are derived by crystal fractionation.Summit lavas are generally olivine-controlled (Figure12.3). Less magnesian rift-zone lavas extruded on theshield flanks have experienced low-P multiphasefractionation, mainly of clinopyroxene and plagio-clase, and mixing with more primitive magmarecharging the fractionating chambers. As the shieldgrows, it sinks isostatically and massive landslidesslough off gravitationally unstable flanks (Figure10.11b, c). Mauna Loa is in shield-building decline,whereas Kilauea shield activity is waxing stronger.
3. The transition to the postshield stage is marked by waning tholeiitic activity and inception of in-frequent, small-volume alkaline basalt extrusions; al-kaline and tholeiitic lavas are commonly intercalated.Smaller shields have little or no postshield alkalinelava. Larger shields fed from robust magma generat-ing plume systems have well developed alkaline ac-tivity (hawaiite-mugearite-benmoreite-trachyte) be-ginning before the culmination of shield building.
4. After a period of volcanic dormancy (as little as 0.3 My on Kauai to about 2 My on Oahu) andcanyon cutting, the posterosion stage of activity inmost shields involves commonly explosive extru-sion of very small volumes of highly alkaline maficmagma. Rock types include alkaline basalt, basan-ite, nephelinite, and melilite nephelinite (Table13.2; Figure 13.10).
Some postshield and posterosion magmas carrydense mantle-derived inclusions, testifying to theirrapid ascent. However, other postshield magmas stall
Magmatic Petrotectonic Associations 359
500 km3
PRE-SHIELDSTAGE
Alkalinebasalt
0 20 40 60 80 1000
100
200
300
500
600
700
SHIELDSTAGE
Mauna
Loa
Kilauea
Loihi
Keikikea?
850 km3
25 km3
Mauna
Kea
POST-EROSIONSTAGE; ≤ 1Myduration
Erosion; continued subsidence; 0.3−2My
POST-SHIELDSTAGE
Alkaline basalt,basanite, neph-elinite, melilitite
Hawaiite,mugearite
Alkaline andtholeiitic
basalt
32,000 km3Tholeiitic
basalt
Volcanic growth rate (106m3/y)
Tim
e (1
03y)
13.11 Schematic evolution of Hawaiian shield volcanos. Heavy-line,bell-shaped curve shows estimated variation in growth ratethrough time in the four stages of volcano evolution. A similarcurve would represent the variation in degree of partial meltingof the mantle source through time. Shaded rectangles show esti-mated volumes of rock. Rock types characterizing each stagelisted on right in italics. Presumed stage status of some otherHawaiian volcanoes is indicated on the left, as follows: MaunaKea has apparently just ended its postshield stage (last eruptedabout 4000 years ago). Kilauea activity is waxing in the shield-building stage (roughly, an eruption every year but some con-tinue for �1 y); the activity of Mauna Loa, though waning (aneruption every 3.4 y on average), is still in the shield buildingstage; their shield stage is estimated to terminate about 300,000and 150,000 years in the future, respectively. Lo hi may be nearthe end of its preshield stage. Keikikea, a hypothesized volcano,has yet to be born. (Redrawn from Frey et al., 1990.)
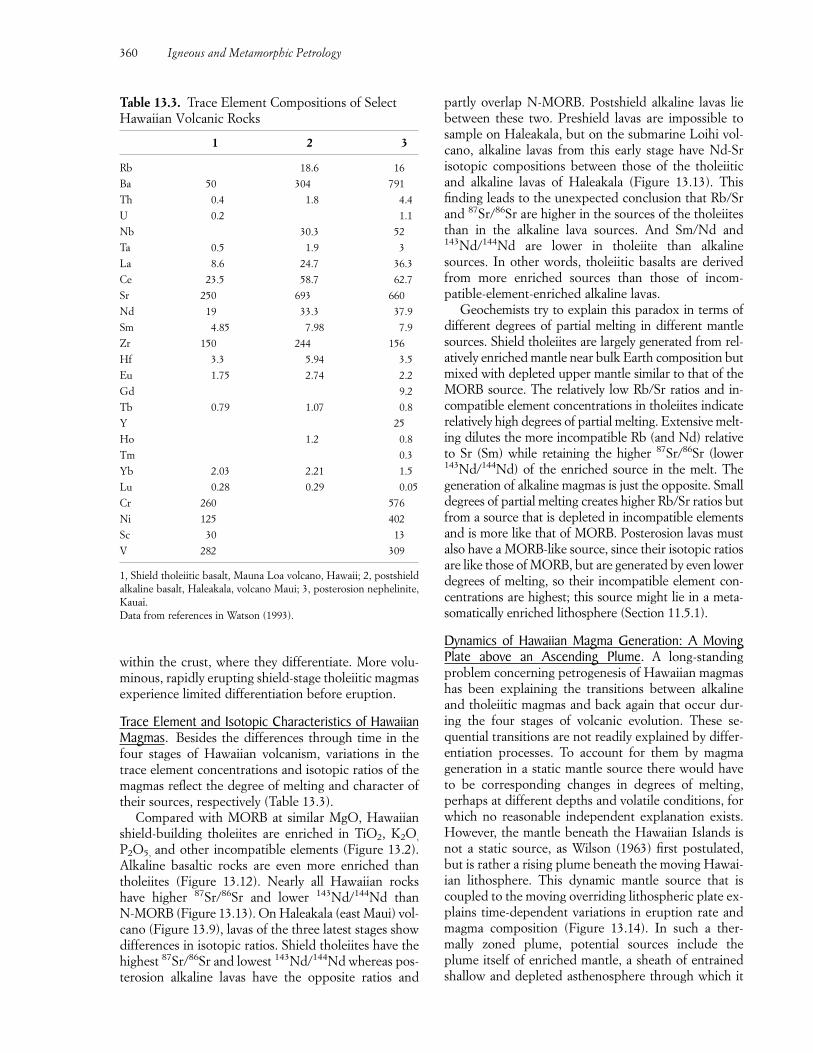
within the crust, where they differentiate. More volu-minous, rapidly erupting shield-stage tholeiitic magmasexperience limited differentiation before eruption.
Trace Element and Isotopic Characteristics of HawaiianMagmas. Besides the differences through time in thefour stages of Hawaiian volcanism, variations in thetrace element concentrations and isotopic ratios of themagmas reflect the degree of melting and character oftheir sources, respectively (Table 13.3).
Compared with MORB at similar MgO, Hawaiianshield-building tholeiites are enriched in TiO2, K2O,
P2O5, and other incompatible elements (Figure 13.2).Alkaline basaltic rocks are even more enriched thantholeiites (Figure 13.12). Nearly all Hawaiian rockshave higher 87Sr/86Sr and lower 143Nd/144Nd than N-MORB (Figure 13.13). On Haleakala (east Maui) vol-cano (Figure 13.9), lavas of the three latest stages showdifferences in isotopic ratios. Shield tholeiites have thehighest 87Sr/86Sr and lowest 143Nd/144Nd whereas pos-terosion alkaline lavas have the opposite ratios and
partly overlap N-MORB. Postshield alkaline lavas liebetween these two. Preshield lavas are impossible tosample on Haleakala, but on the submarine Loihi vol-cano, alkaline lavas from this early stage have Nd-Srisotopic compositions between those of the tholeiiticand alkaline lavas of Haleakala (Figure 13.13). Thisfinding leads to the unexpected conclusion that Rb/Srand 87Sr/86Sr are higher in the sources of the tholeiitesthan in the alkaline lava sources. And Sm/Nd and143Nd/144Nd are lower in tholeiite than alkalinesources. In other words, tholeiitic basalts are derivedfrom more enriched sources than those of incom-patible-element-enriched alkaline lavas.
Geochemists try to explain this paradox in terms ofdifferent degrees of partial melting in different mantlesources. Shield tholeiites are largely generated from rel-atively enriched mantle near bulk Earth composition butmixed with depleted upper mantle similar to that of theMORB source. The relatively low Rb/Sr ratios and in-compatible element concentrations in tholeiites indicaterelatively high degrees of partial melting. Extensive melt-ing dilutes the more incompatible Rb (and Nd) relativeto Sr (Sm) while retaining the higher 87Sr/86Sr (lower143Nd/144Nd) of the enriched source in the melt. Thegeneration of alkaline magmas is just the opposite. Smalldegrees of partial melting creates higher Rb/Sr ratios butfrom a source that is depleted in incompatible elementsand is more like that of MORB. Posterosion lavas mustalso have a MORB-like source, since their isotopic ratiosare like those of MORB, but are generated by even lowerdegrees of melting, so their incompatible element con-centrations are highest; this source might lie in a meta-somatically enriched lithosphere (Section 11.5.1).
Dynamics of Hawaiian Magma Generation: A MovingPlate above an Ascending Plume. A long-standingproblem concerning petrogenesis of Hawaiian magmashas been explaining the transitions between alkalineand tholeiitic magmas and back again that occur dur-ing the four stages of volcanic evolution. These se-quential transitions are not readily explained by differ-entiation processes. To account for them by magmageneration in a static mantle source there would haveto be corresponding changes in degrees of melting,perhaps at different depths and volatile conditions, forwhich no reasonable independent explanation exists.However, the mantle beneath the Hawaiian Islands isnot a static source, as Wilson (1963) first postulated,but is rather a rising plume beneath the moving Hawai-ian lithosphere. This dynamic mantle source that iscoupled to the moving overriding lithospheric plate ex-plains time-dependent variations in eruption rate andmagma composition (Figure 13.14). In such a ther-mally zoned plume, potential sources include theplume itself of enriched mantle, a sheath of entrainedshallow and depleted asthenosphere through which it
360 Igneous and Metamorphic Petrology
Table 13.3. Trace Element Compositions of SelectHawaiian Volcanic Rocks
1 2 3
Rb 18.6 16
Ba 50 304 791
Th 0.4 1.8 4.4
U 0.2 1.1
Nb 30.3 52
Ta 0.5 1.9 3
La 8.6 24.7 36.3
Ce 23.5 58.7 62.7
Sr 250 693 660
Nd 19 33.3 37.9
Sm 4.85 7.98 7.9
Zr 150 244 156
Hf 3.3 5.94 3.5
Eu 1.75 2.74 2.2
Gd 9.2
Tb 0.79 1.07 0.8
Y 25
Ho 1.2 0.8
Tm 0.3
Yb 2.03 2.21 1.5
Lu 0.28 0.29 0.05
Cr 260 576
Ni 125 402
Sc 30 13
V 282 309
1, Shield tholeiitic basalt, Mauna Loa volcano, Hawaii; 2, postshieldalkaline basalt, Haleakala, volcano Maui; 3, posterosion nephelinite,Kauai.Data from references in Watson (1993).
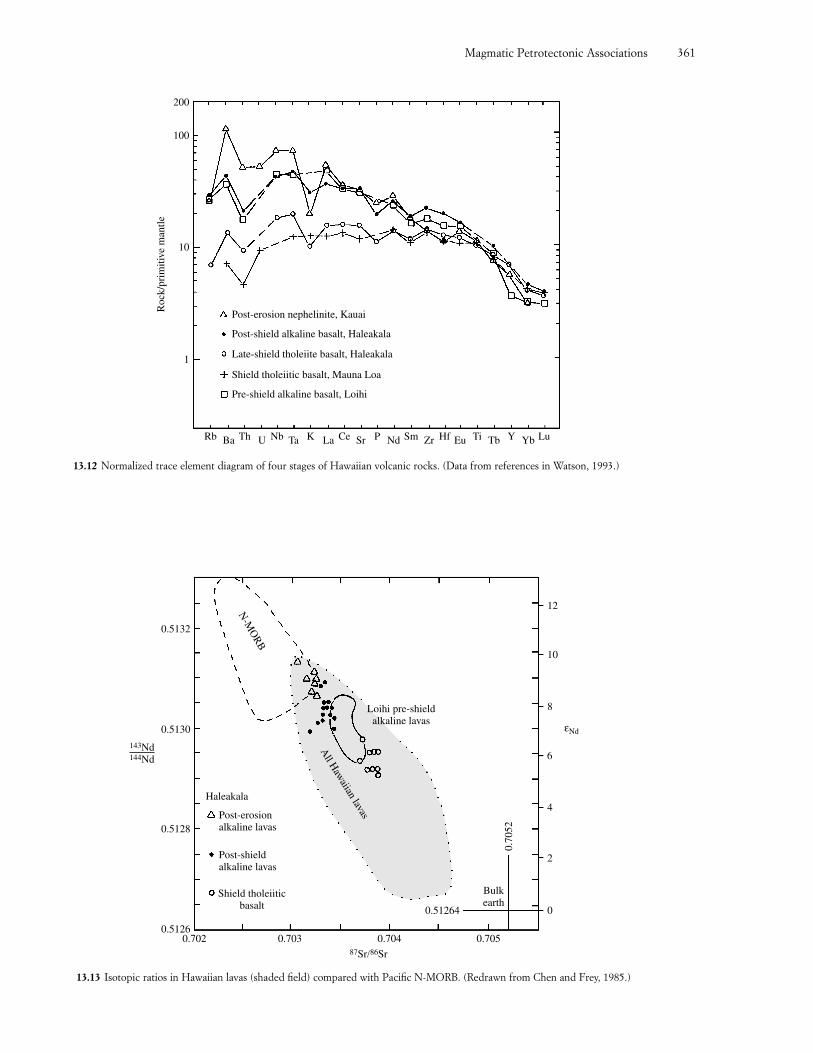
Magmatic Petrotectonic Associations 361
Post-erosion nephelinite, Kauai
Post-shield alkaline basalt, Haleakala
Late-shield tholeiite basalt, Haleakala
Shield tholeiitic basalt, Mauna Loa
Pre-shield alkaline basalt, Loihi
1
10
100
200
Roc
k/pr
imiti
ve m
antle
Rb Ba U Nb Ta K La Ce Sr P Nd Sm Zr Hf Eu Ti Tb Y Yb LuTh
13.12 Normalized trace element diagram of four stages of Hawaiian volcanic rocks. (Data from references in Watson, 1993.)
0.7020.5126
0.5128
0.5130
0.5132
0.703 0.704 0.70587Sr/86Sr
143Nd144Nd
0
2
4
6
8
10
12
εNd
N-M
OR
B
Haleakala
Post-erosionalkaline lavas
Post-shieldalkaline lavas
Shield tholeiiticbasalt 0.51264
0.70
52
Bulkearth
All H
awaiian lavas
Loihi pre-shieldalkaline lavas
13.13 Isotopic ratios in Hawaiian lavas (shaded field) compared with Pacific N-MORB. (Redrawn from Chen and Frey, 1985.)
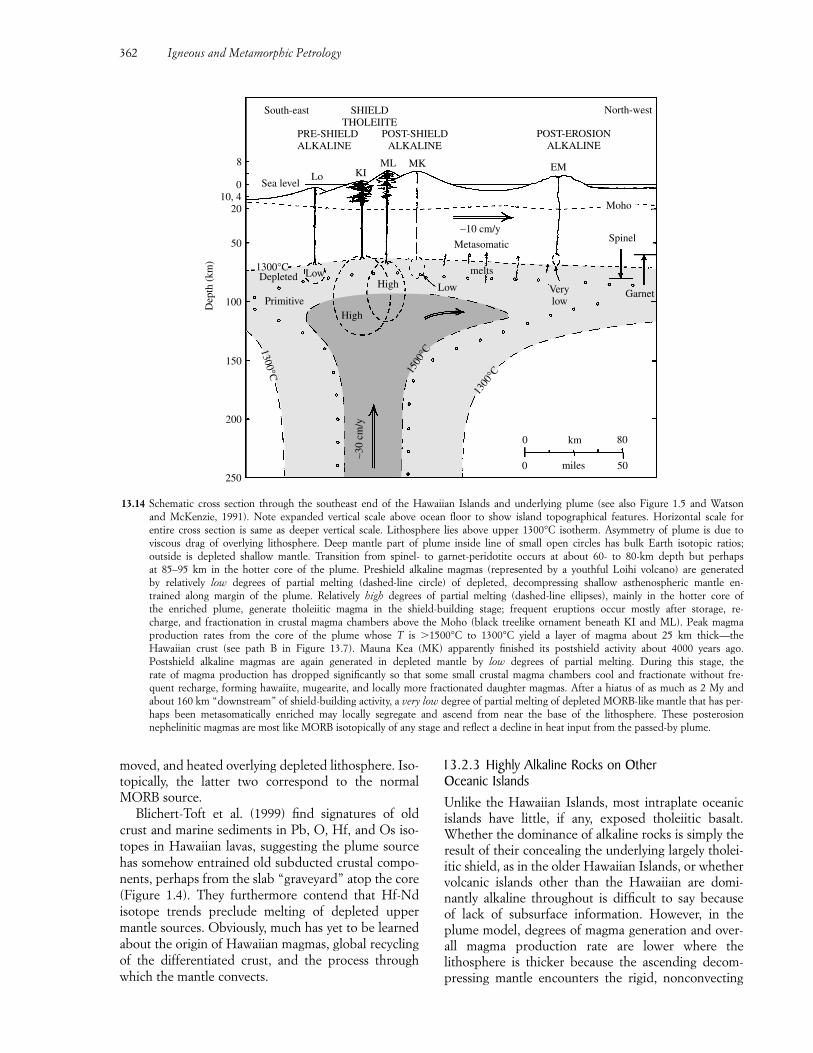
moved, and heated overlying depleted lithosphere. Iso-topically, the latter two correspond to the normalMORB source.
Blichert-Toft et al. (1999) find signatures of oldcrust and marine sediments in Pb, O, Hf, and Os iso-topes in Hawaiian lavas, suggesting the plume sourcehas somehow entrained old subducted crustal compo-nents, perhaps from the slab “graveyard” atop the core(Figure 1.4). They furthermore contend that Hf-Ndisotope trends preclude melting of depleted uppermantle sources. Obviously, much has yet to be learnedabout the origin of Hawaiian magmas, global recyclingof the differentiated crust, and the process throughwhich the mantle convects.
13.2.3 Highly Alkaline Rocks on Other Oceanic IslandsUnlike the Hawaiian Islands, most intraplate oceanicislands have little, if any, exposed tholeiitic basalt.Whether the dominance of alkaline rocks is simply theresult of their concealing the underlying largely tholei-itic shield, as in the older Hawaiian Islands, or whethervolcanic islands other than the Hawaiian are domi-nantly alkaline throughout is difficult to say because of lack of subsurface information. However, in theplume model, degrees of magma generation and over-all magma production rate are lower where the lithosphere is thicker because the ascending decom-pressing mantle encounters the rigid, nonconvecting
362 Igneous and Metamorphic Petrology
North-west
PRE-SHIELDALKALINE
0
8
10, 420
50
100
150
200
250
0 km 80
0 miles 50
Sea levelLo KI
ML MK
SHIELDTHOLEIITE
POST-SHIELDALKALINE
EM
POST-EROSIONALKALINE
South-east
Moho
Spinel
Very low
Garnet
melts
LowHigh
High
Dep
th (
km)
∼10 cm/y
∼30
cm/y
Metasomatic
1500
°C
1300
°C
1300°C
LowDepleted
Primitive
1300°C
13.14 Schematic cross section through the southeast end of the Hawaiian Islands and underlying plume (see also Figure 1.5 and Watson and McKenzie, 1991). Note expanded vertical scale above ocean floor to show island topographical features. Horizontal scale for entire cross section is same as deeper vertical scale. Lithosphere lies above upper 1300°C isotherm. Asymmetry of plume is due to viscous drag of overlying lithosphere. Deep mantle part of plume inside line of small open circles has bulk Earth isotopic ratios; outside is depleted shallow mantle. Transition from spinel- to garnet-peridotite occurs at about 60- to 80-km depth but perhaps at 85–95 km in the hotter core of the plume. Preshield alkaline magmas (represented by a youthful Loihi volcano) are generated by relatively low degrees of partial melting (dashed-line circle) of depleted, decompressing shallow asthenospheric mantle en-trained along margin of the plume. Relatively high degrees of partial melting (dashed-line ellipses), mainly in the hotter core of the enriched plume, generate tholeiitic magma in the shield-building stage; frequent eruptions occur mostly after storage, re-charge, and fractionation in crustal magma chambers above the Moho (black treelike ornament beneath KI and ML). Peak magma production rates from the core of the plume whose T is �1500°C to 1300°C yield a layer of magma about 25 km thick—the Hawaiian crust (see path B in Figure 13.7). Mauna Kea (MK) apparently finished its postshield activity about 4000 years ago. Postshield alkaline magmas are again generated in depleted mantle by low degrees of partial melting. During this stage, the rate of magma production has dropped significantly so that some small crustal magma chambers cool and fractionate without fre-quent recharge, forming hawaiite, mugearite, and locally more fractionated daughter magmas. After a hiatus of as much as 2 My andabout 160 km “downstream” of shield-building activity, a very low degree of partial melting of depleted MORB-like mantle that has per-haps been metasomatically enriched may locally segregate and ascend from near the base of the lithosphere. These posterosionnephelinitic magmas are most like MORB isotopically of any stage and reflect a decline in heat input from the passed-by plume.
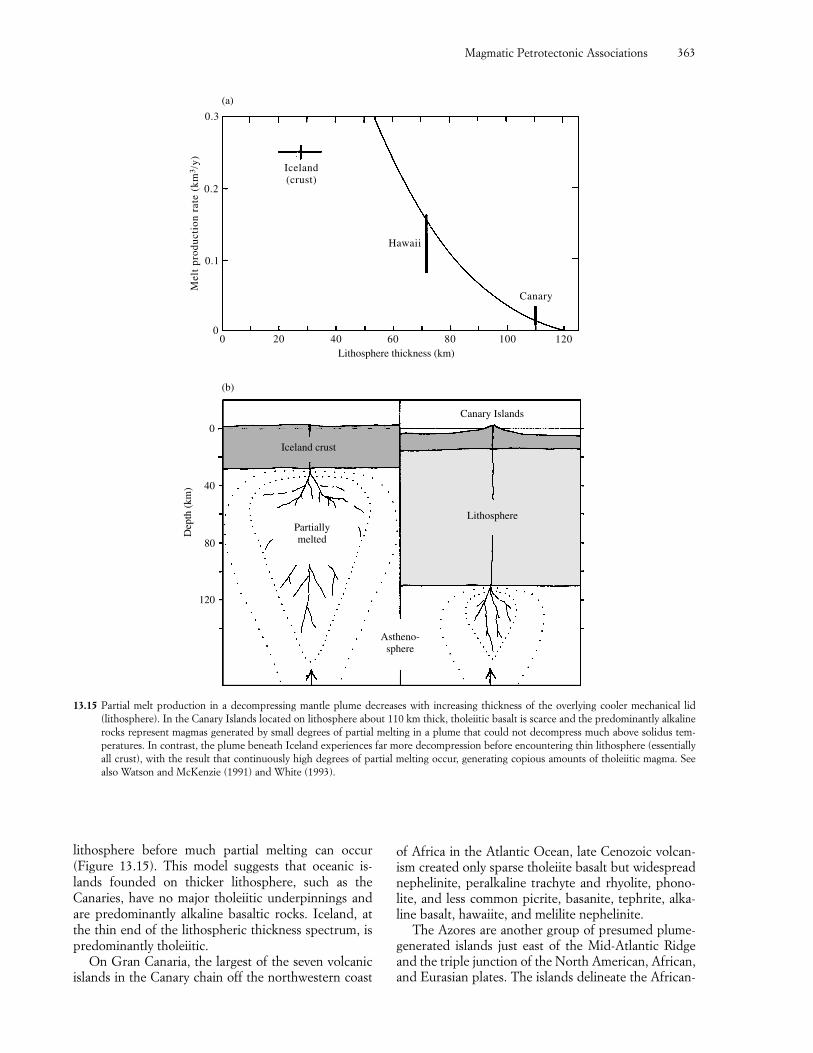
lithosphere before much partial melting can occur(Figure 13.15). This model suggests that oceanic is-lands founded on thicker lithosphere, such as the Canaries, have no major tholeiitic underpinnings andare predominantly alkaline basaltic rocks. Iceland, atthe thin end of the lithospheric thickness spectrum, ispredominantly tholeiitic.
On Gran Canaria, the largest of the seven volcanicislands in the Canary chain off the northwestern coast
of Africa in the Atlantic Ocean, late Cenozoic volcan-ism created only sparse tholeiite basalt but widespreadnephelinite, peralkaline trachyte and rhyolite, phono-lite, and less common picrite, basanite, tephrite, alka-line basalt, hawaiite, and melilite nephelinite.
The Azores are another group of presumed plume-generated islands just east of the Mid-Atlantic Ridgeand the triple junction of the North American, African,and Eurasian plates. The islands delineate the African-
Magmatic Petrotectonic Associations 363
Iceland(crust)
Hawaii
Canary
0 20 40 60 80 100 1200
0.1
0.2
0.3
Mel
t pr
oduc
tion
rat
e (k
m3 /
y)
Canary Islands
Lithosphere
Astheno-sphere
Partiallymelted
120
80
40
0
Lithosphere thickness (km)
Dep
th (
km)
(b)
(a)
Iceland crust
13.15 Partial melt production in a decompressing mantle plume decreases with increasing thickness of the overlying cooler mechanical lid(lithosphere). In the Canary Islands located on lithosphere about 110 km thick, tholeiitic basalt is scarce and the predominantly alkalinerocks represent magmas generated by small degrees of partial melting in a plume that could not decompress much above solidus tem-peratures. In contrast, the plume beneath Iceland experiences far more decompression before encountering thin lithosphere (essentiallyall crust), with the result that continuously high degrees of partial melting occur, generating copious amounts of tholeiitic magma. Seealso Watson and McKenzie (1991) and White (1993).
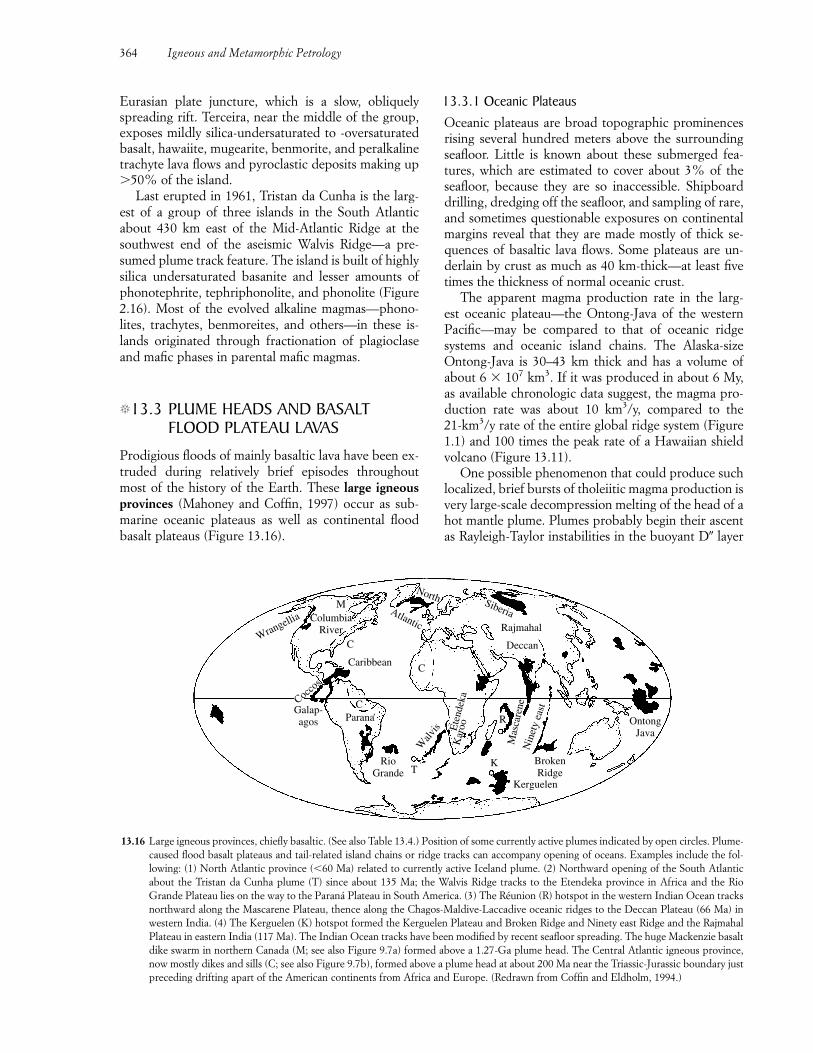
Eurasian plate juncture, which is a slow, obliquelyspreading rift. Terceira, near the middle of the group,exposes mildly silica-undersaturated to -oversaturatedbasalt, hawaiite, mugearite, benmorite, and peralkalinetrachyte lava flows and pyroclastic deposits making up�50% of the island.
Last erupted in 1961, Tristan da Cunha is the larg-est of a group of three islands in the South Atlanticabout 430 km east of the Mid-Atlantic Ridge at thesouthwest end of the aseismic Walvis Ridge—a pre-sumed plume track feature. The island is built of highlysilica undersaturated basanite and lesser amounts ofphonotephrite, tephriphonolite, and phonolite (Figure2.16). Most of the evolved alkaline magmas—phono-lites, trachytes, benmoreites, and others—in these is-lands originated through fractionation of plagioclaseand mafic phases in parental mafic magmas.
�13.3 PLUME HEADS AND BASALTFLOOD PLATEAU LAVAS
Prodigious floods of mainly basaltic lava have been ex-truded during relatively brief episodes throughoutmost of the history of the Earth. These large igneousprovinces (Mahoney and Coffin, 1997) occur as sub-marine oceanic plateaus as well as continental floodbasalt plateaus (Figure 13.16).
13.3.1 Oceanic PlateausOceanic plateaus are broad topographic prominencesrising several hundred meters above the surroundingseafloor. Little is known about these submerged fea-tures, which are estimated to cover about 3% of theseafloor, because they are so inaccessible. Shipboarddrilling, dredging off the seafloor, and sampling of rare,and sometimes questionable exposures on continentalmargins reveal that they are made mostly of thick se-quences of basaltic lava flows. Some plateaus are un-derlain by crust as much as 40 km-thick—at least fivetimes the thickness of normal oceanic crust.
The apparent magma production rate in the larg-est oceanic plateau—the Ontong-Java of the western Pacific—may be compared to that of oceanic ridge systems and oceanic island chains. The Alaska-size Ontong-Java is 30–43 km thick and has a volume ofabout 6 107 km3. If it was produced in about 6 My,as available chronologic data suggest, the magma pro-duction rate was about 10 km3/y, compared to the 21-km3/y rate of the entire global ridge system (Figure1.1) and 100 times the peak rate of a Hawaiian shieldvolcano (Figure 13.11).
One possible phenomenon that could produce suchlocalized, brief bursts of tholeiitic magma production isvery large-scale decompression melting of the head of ahot mantle plume. Plumes probably begin their ascentas Rayleigh-Taylor instabilities in the buoyant D layer
364 Igneous and Metamorphic Petrology
ColumbiaRiver
WrangelliaM
Atlantic
North
C
CaribbeanC
CParana'
Coccos
Galap-agos
RioGrande T
Walv
is Ete
ndek
aK
aroo
K
R
Mas
care
ne
BrokenRidge
Kerguelen
Nin
ety
east
Deccan
Rajmahal
Siberia
OntongJava
13.16 Large igneous provinces, chiefly basaltic. (See also Table 13.4.) Position of some currently active plumes indicated by open circles. Plume-caused flood basalt plateaus and tail-related island chains or ridge tracks can accompany opening of oceans. Examples include the fol-lowing: (1) North Atlantic province (�60 Ma) related to currently active Iceland plume. (2) Northward opening of the South Atlanticabout the Tristan da Cunha plume (T) since about 135 Ma; the Walvis Ridge tracks to the Etendeka province in Africa and the RioGrande Plateau lies on the way to the Paraná Plateau in South America. (3) The Réunion (R) hotspot in the western Indian Ocean tracksnorthward along the Mascarene Plateau, thence along the Chagos-Maldive-Laccadive oceanic ridges to the Deccan Plateau (66 Ma) inwestern India. (4) The Kerguelen (K) hotspot formed the Kerguelen Plateau and Broken Ridge and Ninety east Ridge and the RajmahalPlateau in eastern India (117 Ma). The Indian Ocean tracks have been modified by recent seafloor spreading. The huge Mackenzie basaltdike swarm in northern Canada (M; see also Figure 9.7a) formed above a 1.27-Ga plume head. The Central Atlantic igneous province,now mostly dikes and sills (C; see also Figure 9.7b), formed above a plume head at about 200 Ma near the Triassic-Jurassic boundary justpreceding drifting apart of the American continents from Africa and Europe. (Redrawn from Coffin and Eldholm, 1994.)
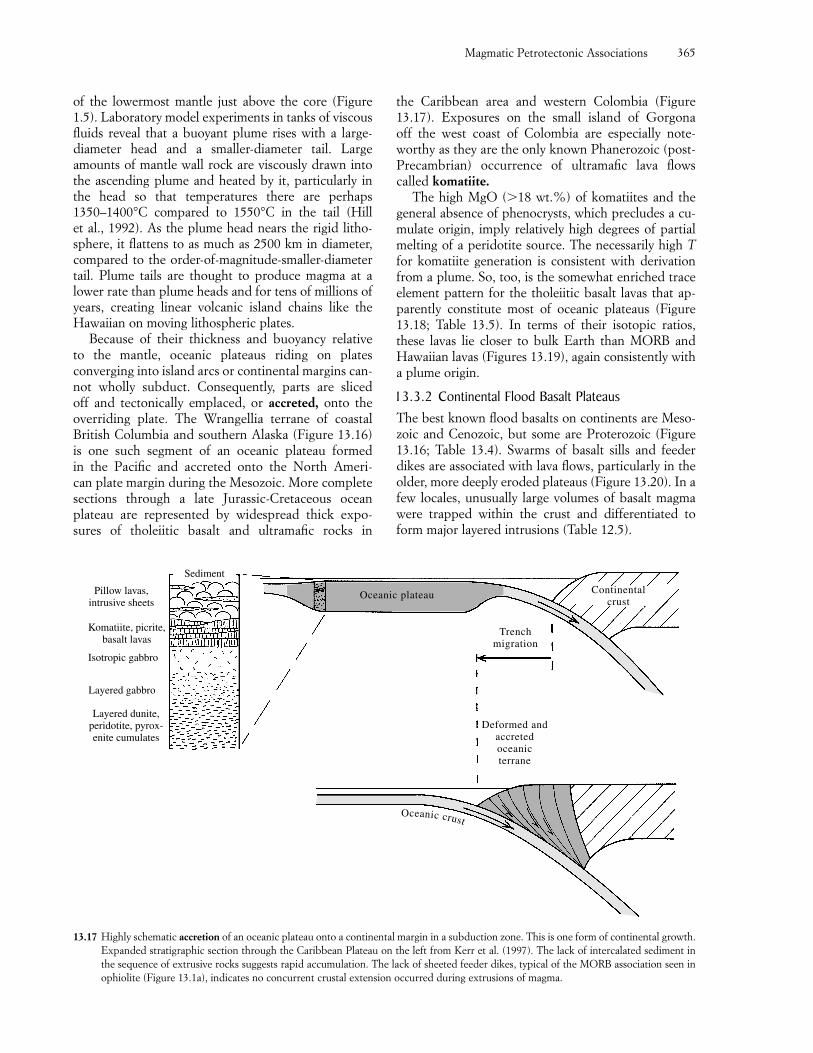
of the lowermost mantle just above the core (Figure1.5). Laboratory model experiments in tanks of viscousfluids reveal that a buoyant plume rises with a large-diameter head and a smaller-diameter tail. Largeamounts of mantle wall rock are viscously drawn intothe ascending plume and heated by it, particularly inthe head so that temperatures there are perhaps1350–1400°C compared to 1550°C in the tail (Hill et al., 1992). As the plume head nears the rigid litho-sphere, it flattens to as much as 2500 km in diameter,compared to the order-of-magnitude-smaller-diametertail. Plume tails are thought to produce magma at alower rate than plume heads and for tens of millions ofyears, creating linear volcanic island chains like theHawaiian on moving lithospheric plates.
Because of their thickness and buoyancy relative to the mantle, oceanic plateaus riding on plates converging into island arcs or continental margins can-not wholly subduct. Consequently, parts are sliced off and tectonically emplaced, or accreted, onto theoverriding plate. The Wrangellia terrane of coastalBritish Columbia and southern Alaska (Figure 13.16)is one such segment of an oceanic plateau formed in the Pacific and accreted onto the North Ameri-can plate margin during the Mesozoic. More completesections through a late Jurassic-Cretaceous oceanplateau are represented by widespread thick expo-sures of tholeiitic basalt and ultramafic rocks in
the Caribbean area and western Colombia (Figure 13.17). Exposures on the small island of Gorgona off the west coast of Colombia are especially note-worthy as they are the only known Phanerozoic (post-Precambrian) occurrence of ultramafic lava flowscalled komatiite.
The high MgO (�18 wt.%) of komatiites and thegeneral absence of phenocrysts, which precludes a cu-mulate origin, imply relatively high degrees of partialmelting of a peridotite source. The necessarily high Tfor komatiite generation is consistent with derivationfrom a plume. So, too, is the somewhat enriched traceelement pattern for the tholeiitic basalt lavas that ap-parently constitute most of oceanic plateaus (Figure13.18; Table 13.5). In terms of their isotopic ratios,these lavas lie closer to bulk Earth than MORB andHawaiian lavas (Figures 13.19), again consistently witha plume origin.
13.3.2 Continental Flood Basalt PlateausThe best known flood basalts on continents are Meso-zoic and Cenozoic, but some are Proterozoic (Figure13.16; Table 13.4). Swarms of basalt sills and feederdikes are associated with lava flows, particularly in theolder, more deeply eroded plateaus (Figure 13.20). In afew locales, unusually large volumes of basalt magmawere trapped within the crust and differentiated toform major layered intrusions (Table 12.5).
Magmatic Petrotectonic Associations 365
Sediment
Pillow lavas,intrusive sheets
Komatiite, picrite,basalt lavas
Isotropic gabbro
Layered gabbro
Layered dunite,peridotite, pyrox-enite cumulates
Oceanic plateau Continentalcrust
Trenchmigration
Deformed andaccretedoceanicterrane
Oceanic crust
13.17 Highly schematic accretion of an oceanic plateau onto a continental margin in a subduction zone. This is one form of continental growth.Expanded stratigraphic section through the Caribbean Plateau on the left from Kerr et al. (1997). The lack of intercalated sediment inthe sequence of extrusive rocks suggests rapid accumulation. The lack of sheeted feeder dikes, typical of the MORB association seen inophiolite (Figure 13.1a), indicates no concurrent crustal extension occurred during extrusions of magma.
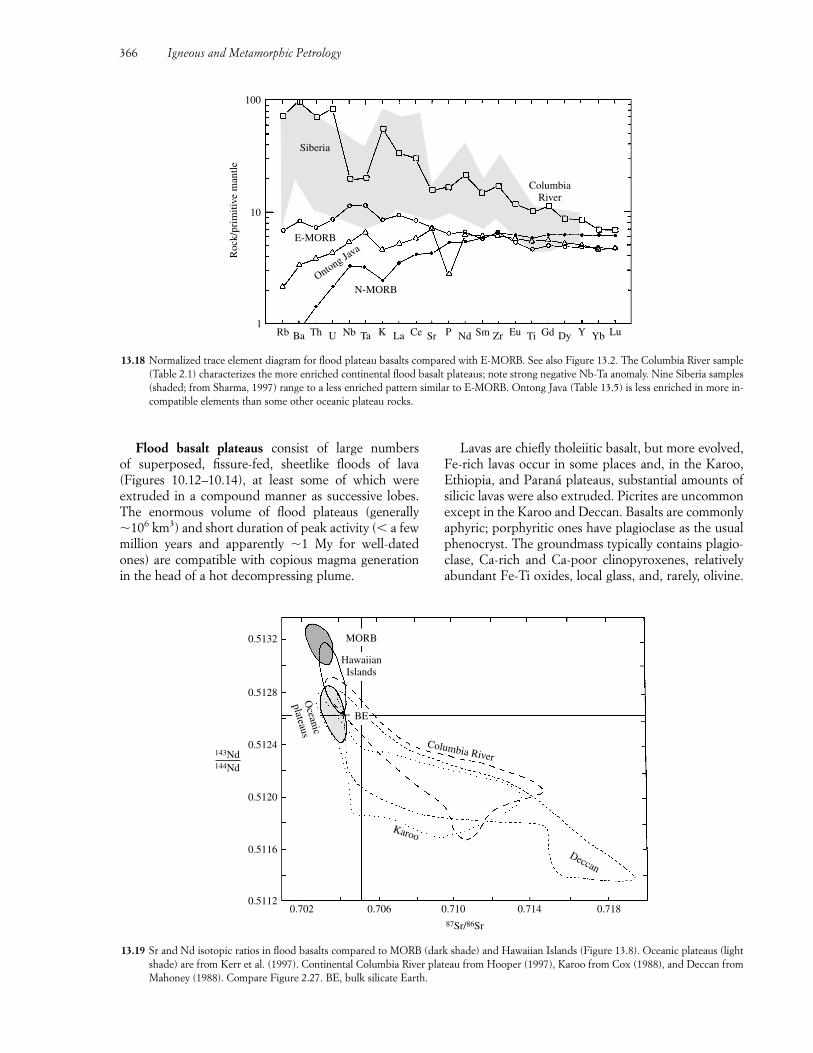
Flood basalt plateaus consist of large numbers of superposed, fissure-fed, sheetlike floods of lava (Figures 10.12–10.14), at least some of which were extruded in a compound manner as successive lobes.The enormous volume of flood plateaus (generally�106 km3) and short duration of peak activity (� a fewmillion years and apparently �1 My for well-datedones) are compatible with copious magma generationin the head of a hot decompressing plume.
Lavas are chiefly tholeiitic basalt, but more evolved,Fe-rich lavas occur in some places and, in the Karoo,Ethiopia, and Paraná plateaus, substantial amounts ofsilicic lavas were also extruded. Picrites are uncommonexcept in the Karoo and Deccan. Basalts are commonlyaphyric; porphyritic ones have plagioclase as the usualphenocryst. The groundmass typically contains plagio-clase, Ca-rich and Ca-poor clinopyroxenes, relativelyabundant Fe-Ti oxides, local glass, and, rarely, olivine.
366 Igneous and Metamorphic Petrology
Siberia
ColumbiaRiver
E-MORB
Ontong Java
N-MORB
Ba U Ta La Sr Nd Zr Ti Dy YbRb Th Nb K Ce P Sm Eu Gd Y Lu1
10
100
Roc
k/pr
imiti
ve m
antle
13.18 Normalized trace element diagram for flood plateau basalts compared with E-MORB. See also Figure 13.2. The Columbia River sample(Table 2.1) characterizes the more enriched continental flood basalt plateaus; note strong negative Nb-Ta anomaly. Nine Siberia samples(shaded; from Sharma, 1997) range to a less enriched pattern similar to E-MORB. Ontong Java (Table 13.5) is less enriched in more in-compatible elements than some other oceanic plateau rocks.
MORB
HawaiianIslands
BE
Oceanic
plateaus
Columbia River
Karoo
Deccan
0.714 0.7180.7100.7060.70287Sr/86Sr
0.5112
0.5116
0.5120
0.5124
0.5128
0.5132
143Nd144Nd
13.19 Sr and Nd isotopic ratios in flood basalts compared to MORB (dark shade) and Hawaiian Islands (Figure 13.8). Oceanic plateaus (lightshade) are from Kerr et al. (1997). Continental Columbia River plateau from Hooper (1997), Karoo from Cox (1988), and Deccan fromMahoney (1988). Compare Figure 2.27. BE, bulk silicate Earth.
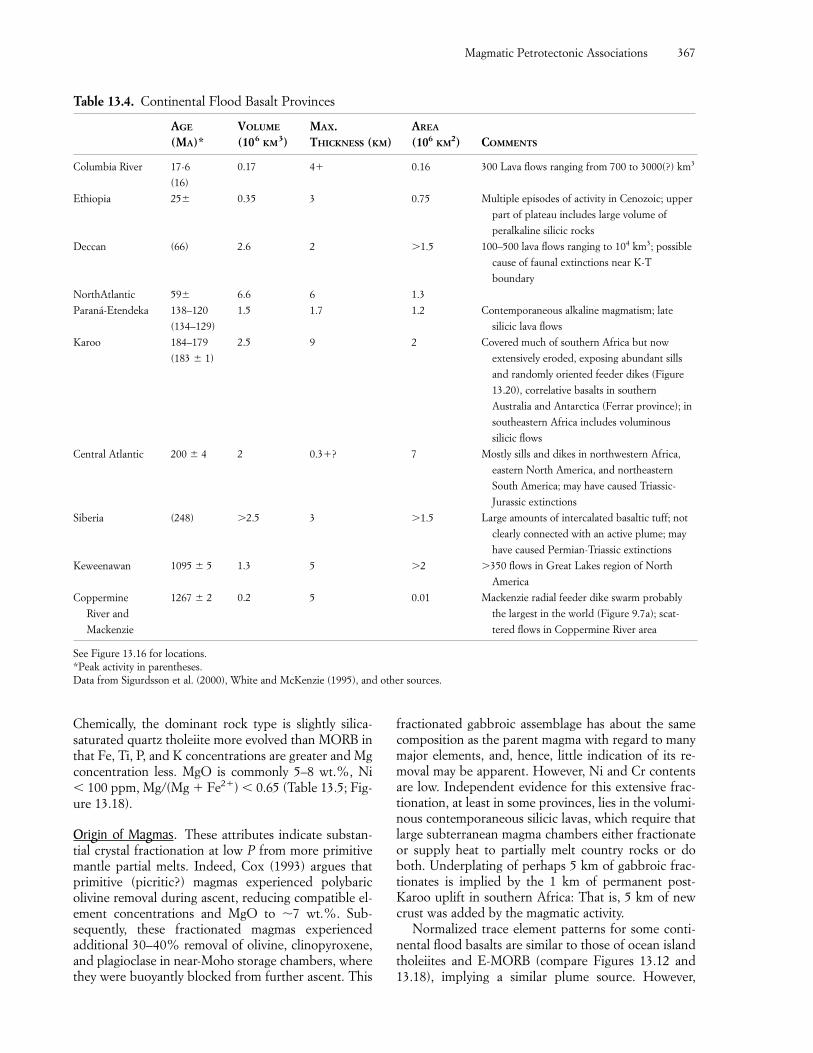
Chemically, the dominant rock type is slightly silica-saturated quartz tholeiite more evolved than MORB inthat Fe, Ti, P, and K concentrations are greater and Mgconcentration less. MgO is commonly 5–8 wt.%, Ni � 100 ppm, Mg/(Mg � Fe2�) � 0.65 (Table 13.5; Fig-ure 13.18).
Origin of Magmas. These attributes indicate substan-tial crystal fractionation at low P from more primitivemantle partial melts. Indeed, Cox (1993) argues thatprimitive (picritic?) magmas experienced polybaricolivine removal during ascent, reducing compatible el-ement concentrations and MgO to �7 wt.%. Sub-sequently, these fractionated magmas experienced additional 30–40% removal of olivine, clinopyroxene, and plagioclase in near-Moho storage chambers, wherethey were buoyantly blocked from further ascent. This
fractionated gabbroic assemblage has about the samecomposition as the parent magma with regard to manymajor elements, and, hence, little indication of its re-moval may be apparent. However, Ni and Cr contentsare low. Independent evidence for this extensive frac-tionation, at least in some provinces, lies in the volumi-nous contemporaneous silicic lavas, which require thatlarge subterranean magma chambers either fractionateor supply heat to partially melt country rocks or doboth. Underplating of perhaps 5 km of gabbroic frac-tionates is implied by the 1 km of permanent post-Karoo uplift in southern Africa: That is, 5 km of newcrust was added by the magmatic activity.
Normalized trace element patterns for some conti-nental flood basalts are similar to those of ocean islandtholeiites and E-MORB (compare Figures 13.12 and13.18), implying a similar plume source. However,
Magmatic Petrotectonic Associations 367
Columbia River
Ethiopia
Deccan
NorthAtlantic
Paraná-Etendeka
Karoo
Central Atlantic
Siberia
Keweenawan
Coppermine
River and
Mackenzie
AGE
(MA)*
17-6
(16)
25�
(66)
59�
138–120
(134–129)
184–179
(183 � 1)
200 � 4
(248)
1095 � 5
1267 � 2
VOLUME
(106 KM3)
0.17
0.35
2.6
6.6
1.5
2.5
2
�2.5
1.3
0.2
MAX. THICKNESS (KM)
4�
3
2
6
1.7
9
0.3�?
3
5
5
AREA
(106 KM2)
0.16
0.75
�1.5
1.3
1.2
2
7
�1.5
�2
0.01
COMMENTS
300 Lava flows ranging from 700 to 3000(?) km3
Multiple episodes of activity in Cenozoic; upper
part of plateau includes large volume of
peralkaline silicic rocks
100–500 lava flows ranging to 104 km3; possible
cause of faunal extinctions near K-T
boundary
Contemporaneous alkaline magmatism; late
silicic lava flows
Covered much of southern Africa but now
extensively eroded, exposing abundant sills
and randomly oriented feeder dikes (Figure
13.20), correlative basalts in southern
Australia and Antarctica (Ferrar province); in
southeastern Africa includes voluminous
silicic flows
Mostly sills and dikes in northwestern Africa,
eastern North America, and northeastern
South America; may have caused Triassic-
Jurassic extinctions
Large amounts of intercalated basaltic tuff; not
clearly connected with an active plume; may
have caused Permian-Triassic extinctions
�350 flows in Great Lakes region of North
America
Mackenzie radial feeder dike swarm probably
the largest in the world (Figure 9.7a); scat-
tered flows in Coppermine River area
Table 13.4. Continental Flood Basalt Provinces
See Figure 13.16 for locations. *Peak activity in parentheses.Data from Sigurdsson et al. (2000), White and McKenzie (1995), and other sources.
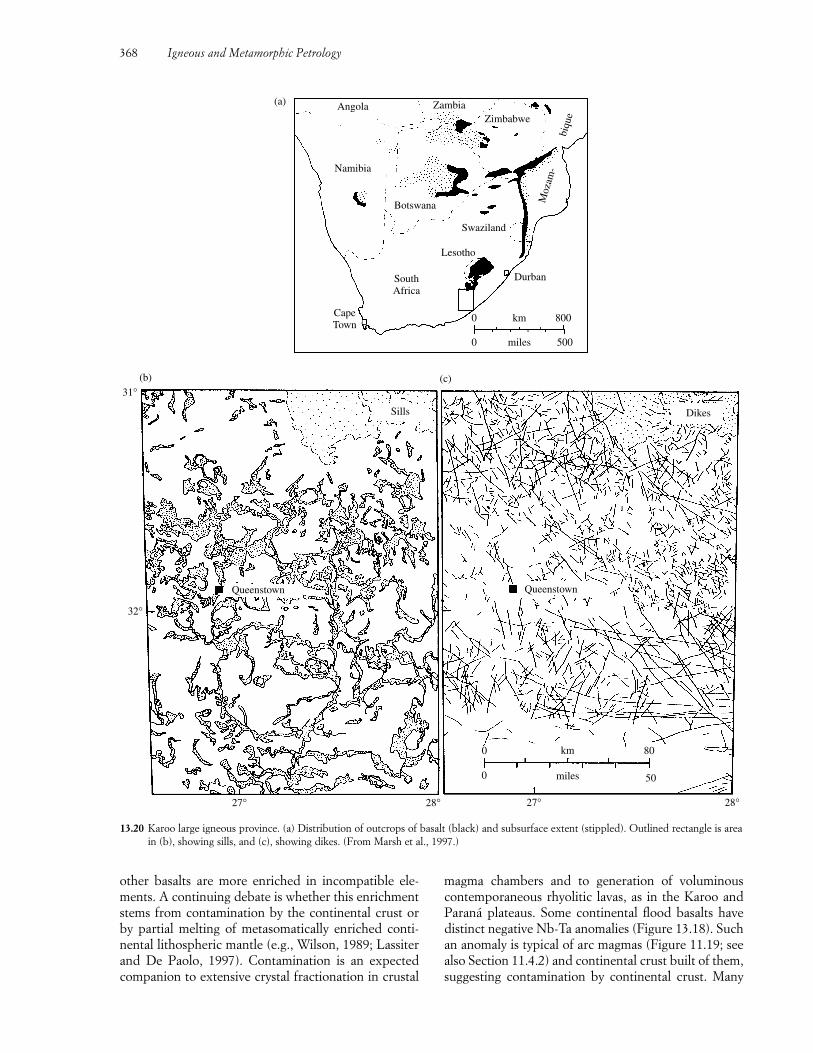
other basalts are more enriched in incompatible ele-ments. A continuing debate is whether this enrichmentstems from contamination by the continental crust orby partial melting of metasomatically enriched conti-nental lithospheric mantle (e.g., Wilson, 1989; Lassiterand De Paolo, 1997). Contamination is an expectedcompanion to extensive crystal fractionation in crustal
magma chambers and to generation of voluminouscontemporaneous rhyolitic lavas, as in the Karoo andParaná plateaus. Some continental flood basalts havedistinct negative Nb-Ta anomalies (Figure 13.18). Suchan anomaly is typical of arc magmas (Figure 11.19; seealso Section 11.4.2) and continental crust built of them,suggesting contamination by continental crust. Many
368 Igneous and Metamorphic Petrology
13.20 Karoo large igneous province. (a) Distribution of outcrops of basalt (black) and subsurface extent (stippled). Outlined rectangle is areain (b), showing sills, and (c), showing dikes. (From Marsh et al., 1997.)
0 miles 500
0 km 800
Durban
Lesotho
Swaziland
Botswana
SouthAfrica
CapeTown
Namibia
Angola ZambiaZimbabwe
biqu
e
Moz
am-
(a)
31°
32°
27° 28° 27° 28°
0 km 80
0 miles 50
Queenstown Queenstown
Sills Dikes
(c)(b)
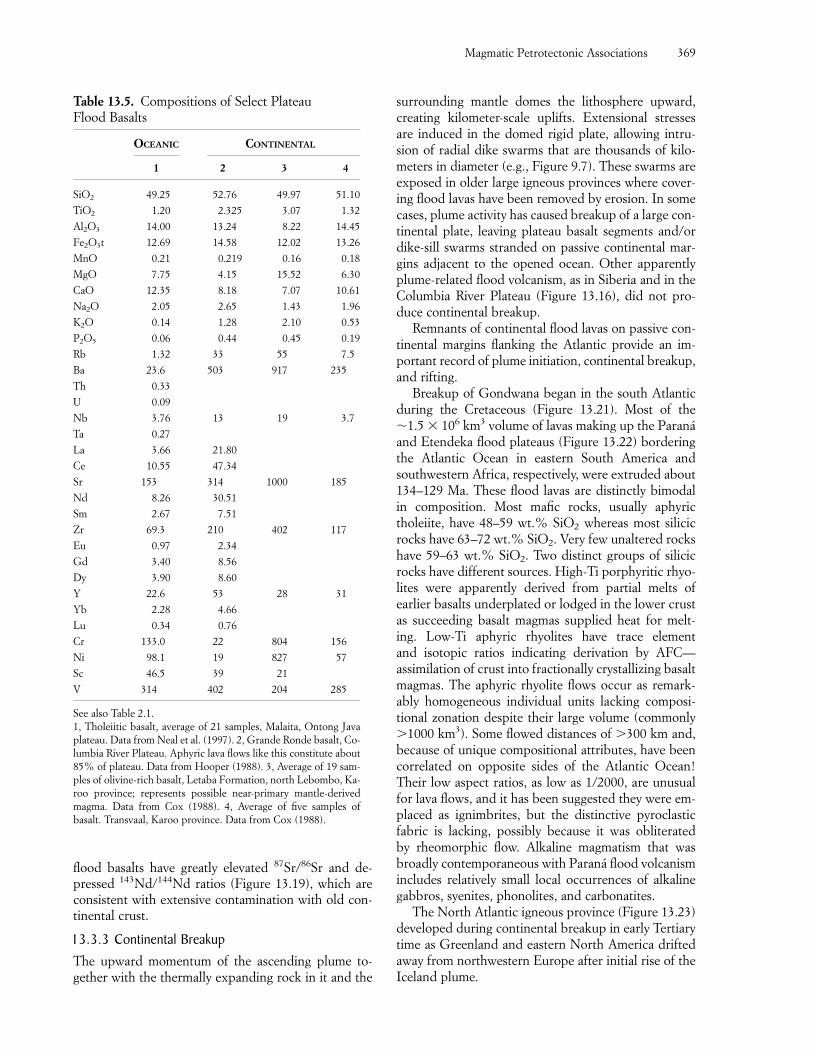
flood basalts have greatly elevated 87Sr/86Sr and de-pressed 143Nd/144Nd ratios (Figure 13.19), which areconsistent with extensive contamination with old con-tinental crust.
13.3.3 Continental BreakupThe upward momentum of the ascending plume to-gether with the thermally expanding rock in it and the
surrounding mantle domes the lithosphere upward,creating kilometer-scale uplifts. Extensional stressesare induced in the domed rigid plate, allowing intru-sion of radial dike swarms that are thousands of kilo-meters in diameter (e.g., Figure 9.7). These swarms areexposed in older large igneous provinces where cover-ing flood lavas have been removed by erosion. In somecases, plume activity has caused breakup of a large con-tinental plate, leaving plateau basalt segments and/ordike-sill swarms stranded on passive continental mar-gins adjacent to the opened ocean. Other apparentlyplume-related flood volcanism, as in Siberia and in theColumbia River Plateau (Figure 13.16), did not pro-duce continental breakup.
Remnants of continental flood lavas on passive con-tinental margins flanking the Atlantic provide an im-portant record of plume initiation, continental breakup,and rifting.
Breakup of Gondwana began in the south Atlanticduring the Cretaceous (Figure 13.21). Most of the �1.5 106 km3 volume of lavas making up the Paranáand Etendeka flood plateaus (Figure 13.22) borderingthe Atlantic Ocean in eastern South America andsouthwestern Africa, respectively, were extruded about134–129 Ma. These flood lavas are distinctly bimodalin composition. Most mafic rocks, usually aphyrictholeiite, have 48–59 wt.% SiO2 whereas most silicicrocks have 63–72 wt.% SiO2. Very few unaltered rockshave 59–63 wt.% SiO2. Two distinct groups of silicicrocks have different sources. High-Ti porphyritic rhyo-lites were apparently derived from partial melts of earlier basalts underplated or lodged in the lower crustas succeeding basalt magmas supplied heat for melt-ing. Low-Ti aphyric rhyolites have trace element and isotopic ratios indicating derivation by AFC—assimilation of crust into fractionally crystallizing basaltmagmas. The aphyric rhyolite flows occur as remark-ably homogeneous individual units lacking composi-tional zonation despite their large volume (commonly�1000 km3). Some flowed distances of �300 km and,because of unique compositional attributes, have beencorrelated on opposite sides of the Atlantic Ocean!Their low aspect ratios, as low as 1/2000, are unusualfor lava flows, and it has been suggested they were em-placed as ignimbrites, but the distinctive pyroclasticfabric is lacking, possibly because it was obliterated by rheomorphic flow. Alkaline magmatism that wasbroadly contemporaneous with Paraná flood volcanismincludes relatively small local occurrences of alkalinegabbros, syenites, phonolites, and carbonatites.
The North Atlantic igneous province (Figure 13.23)developed during continental breakup in early Tertiarytime as Greenland and eastern North America driftedaway from northwestern Europe after initial rise of theIceland plume.
Magmatic Petrotectonic Associations 369
Table 13.5. Compositions of Select Plateau Flood Basalts
OCEANIC CONTINENTAL
1 2 3 4
SiO2 49.25 52.76 49.97 51.10
TiO2 1.20 2.325 3.07 1.32
Al2O3 14.00 13.24 8.22 14.45
Fe2O3t 12.69 14.58 12.02 13.26
MnO 0.21 0.219 0.16 0.18
MgO 7.75 4.15 15.52 6.30
CaO 12.35 8.18 7.07 10.61
Na2O 2.05 2.65 1.43 1.96
K2O 0.14 1.28 2.10 0.53
P2O5 0.06 0.44 0.45 0.19
Rb 1.32 33 55 7.5
Ba 23.6 503 917 235
Th 0.33
U 0.09
Nb 3.76 13 19 3.7
Ta 0.27
La 3.66 21.80
Ce 10.55 47.34
Sr 153 314 1000 185
Nd 8.26 30.51
Sm 2.67 7.51
Zr 69.3 210 402 117
Eu 0.97 2.34
Gd 3.40 8.56
Dy 3.90 8.60
Y 22.6 53 28 31
Yb 2.28 4.66
Lu 0.34 0.76
Cr 133.0 22 804 156
Ni 98.1 19 827 57
Sc 46.5 39 21
V 314 402 204 285
See also Table 2.1.1, Tholeiitic basalt, average of 21 samples, Malaita, Ontong Javaplateau. Data from Neal et al. (1997). 2, Grande Ronde basalt, Co-lumbia River Plateau. Aphyric lava flows like this constitute about85% of plateau. Data from Hooper (1988). 3, Average of 19 sam-ples of olivine-rich basalt, Letaba Formation, north Lebombo, Ka-roo province; represents possible near-primary mantle-derivedmagma. Data from Cox (1988). 4, Average of five samples ofbasalt. Transvaal, Karoo province. Data from Cox (1988).
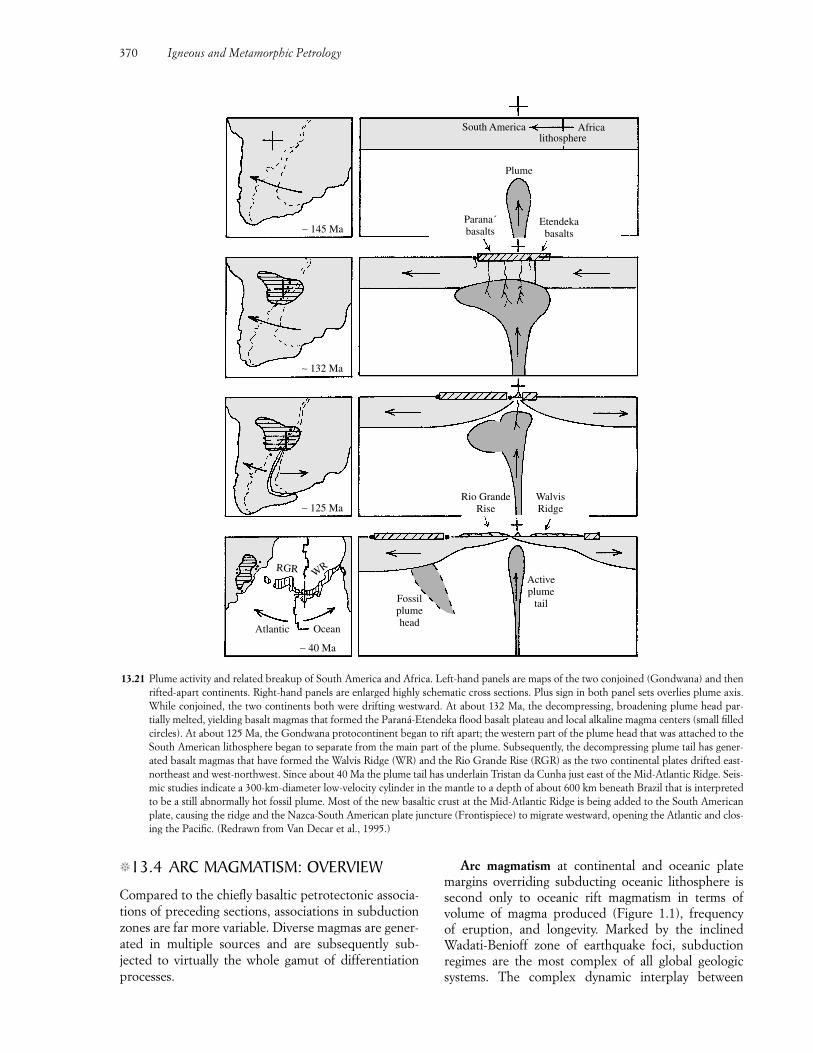
�13.4 ARC MAGMATISM: OVERVIEW
Compared to the chiefly basaltic petrotectonic associa-tions of preceding sections, associations in subductionzones are far more variable. Diverse magmas are gener-ated in multiple sources and are subsequently sub-jected to virtually the whole gamut of differentiationprocesses.
Arc magmatism at continental and oceanic platemargins overriding subducting oceanic lithosphere issecond only to oceanic rift magmatism in terms of volume of magma produced (Figure 1.1), frequency of eruption, and longevity. Marked by the inclined Wadati-Benioff zone of earthquake foci, subductionregimes are the most complex of all global geologic systems. The complex dynamic interplay between
370 Igneous and Metamorphic Petrology
RGR WR
Ocean
∼ 40 Ma
∼ 125 Ma
∼ 132 Ma
∼ 145 MaParana´basalts
Etendekabasalts
Plume
South America Africalithosphere
Rio GrandeRise
WalvisRidge
Activeplume
tailFossilplumehead
Atlantic
13.21 Plume activity and related breakup of South America and Africa. Left-hand panels are maps of the two conjoined (Gondwana) and thenrifted-apart continents. Right-hand panels are enlarged highly schematic cross sections. Plus sign in both panel sets overlies plume axis.While conjoined, the two continents both were drifting westward. At about 132 Ma, the decompressing, broadening plume head par-tially melted, yielding basalt magmas that formed the Paraná-Etendeka flood basalt plateau and local alkaline magma centers (small filledcircles). At about 125 Ma, the Gondwana protocontinent began to rift apart; the western part of the plume head that was attached to theSouth American lithosphere began to separate from the main part of the plume. Subsequently, the decompressing plume tail has gener-ated basalt magmas that have formed the Walvis Ridge (WR) and the Rio Grande Rise (RGR) as the two continental plates drifted east-northeast and west-northwest. Since about 40 Ma the plume tail has underlain Tristan da Cunha just east of the Mid-Atlantic Ridge. Seis-mic studies indicate a 300-km-diameter low-velocity cylinder in the mantle to a depth of about 600 km beneath Brazil that is interpretedto be a still abnormally hot fossil plume. Most of the new basaltic crust at the Mid-Atlantic Ridge is being added to the South Americanplate, causing the ridge and the Nazca-South American plate juncture (Frontispiece) to migrate westward, opening the Atlantic and clos-ing the Pacific. (Redrawn from Van Decar et al., 1995.)
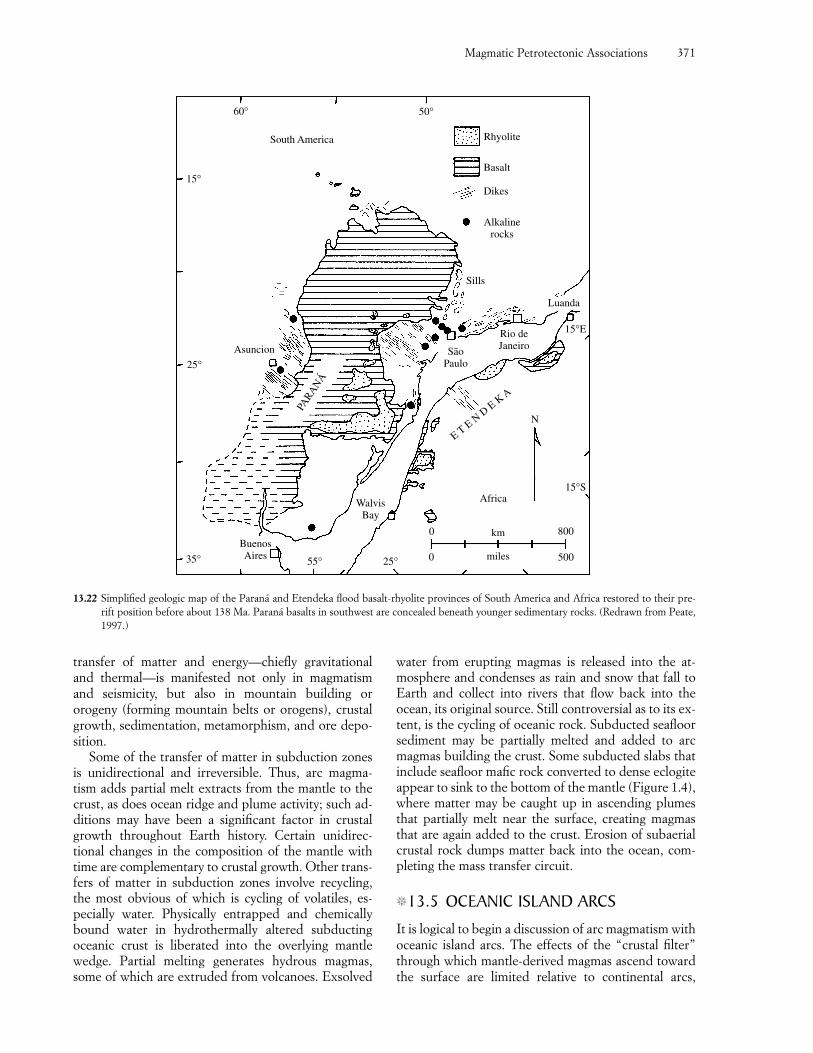
transfer of matter and energy—chiefly gravitationaland thermal—is manifested not only in magmatism and seismicity, but also in mountain building ororogeny (forming mountain belts or orogens), crustalgrowth, sedimentation, metamorphism, and ore depo-sition.
Some of the transfer of matter in subduction zonesis unidirectional and irreversible. Thus, arc magma-tism adds partial melt extracts from the mantle to thecrust, as does ocean ridge and plume activity; such ad-ditions may have been a significant factor in crustalgrowth throughout Earth history. Certain unidirec-tional changes in the composition of the mantle withtime are complementary to crustal growth. Other trans-fers of matter in subduction zones involve recycling,the most obvious of which is cycling of volatiles, es-pecially water. Physically entrapped and chemicallybound water in hydrothermally altered subductingoceanic crust is liberated into the overlying mantlewedge. Partial melting generates hydrous magmas,some of which are extruded from volcanoes. Exsolved
water from erupting magmas is released into the at-mosphere and condenses as rain and snow that fall toEarth and collect into rivers that flow back into theocean, its original source. Still controversial as to its ex-tent, is the cycling of oceanic rock. Subducted seafloorsediment may be partially melted and added to arcmagmas building the crust. Some subducted slabs thatinclude seafloor mafic rock converted to dense eclogiteappear to sink to the bottom of the mantle (Figure 1.4),where matter may be caught up in ascending plumesthat partially melt near the surface, creating magmasthat are again added to the crust. Erosion of subaerialcrustal rock dumps matter back into the ocean, com-pleting the mass transfer circuit.
�13.5 OCEANIC ISLAND ARCS
It is logical to begin a discussion of arc magmatism withoceanic island arcs. The effects of the “crustal filter”through which mantle-derived magmas ascend towardthe surface are limited relative to continental arcs,
Magmatic Petrotectonic Associations 371
60° 50°
South America
15°
25°
35°
Rhyolite
Basalt
Dikes
Alkalinerocks
Sills
Luanda
15°ERio deJaneiroSão
Paulo
E T E N D
E K A
Africa
N
0 km 800
miles 5000
WalvisBay
25°55°
BuenosAires
15°S
Asuncion
PARA
NÁ
13.22 Simplified geologic map of the Paraná and Etendeka flood basalt-rhyolite provinces of South America and Africa restored to their pre-rift position before about 138 Ma. Paraná basalts in southwest are concealed beneath younger sedimentary rocks. (Redrawn from Peate,1997.)
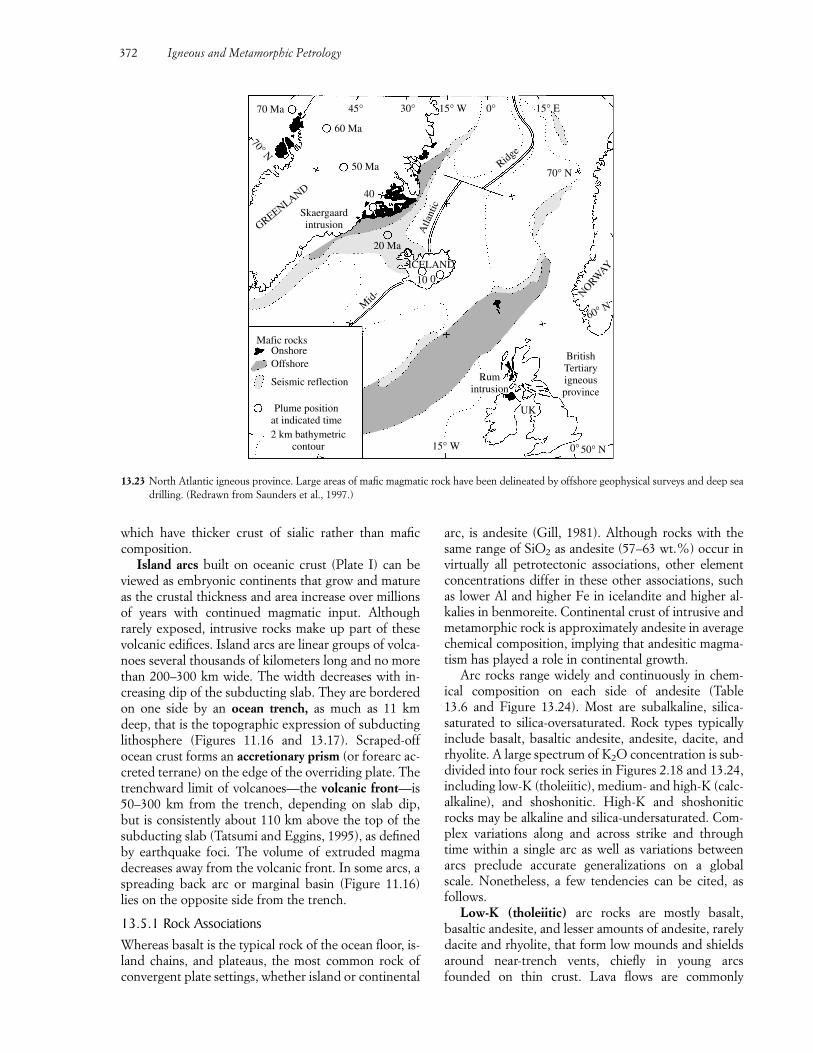
372 Igneous and Metamorphic Petrology
Mafic rocksOnshoreOffshore
Seismic reflection
Plume positionat indicated time2 km bathymetric
contour 15° W
Rumintrusion
BritishTertiaryigneousprovince
UK
0°50° N
60° N
NORWAY
Mid-
10 0ICELAND
20 Ma
Atla
ntic
Ridge
70° N
15° E0°15° W30°45°
60 Ma
50 Ma
40
Skaergaardintrusion
70 Ma
70° N
GREENLAND
13.23 North Atlantic igneous province. Large areas of mafic magmatic rock have been delineated by offshore geophysical surveys and deep seadrilling. (Redrawn from Saunders et al., 1997.)
arc, is andesite (Gill, 1981). Although rocks with thesame range of SiO2 as andesite (57–63 wt.%) occur invirtually all petrotectonic associations, other elementconcentrations differ in these other associations, suchas lower Al and higher Fe in icelandite and higher al-kalies in benmoreite. Continental crust of intrusive andmetamorphic rock is approximately andesite in averagechemical composition, implying that andesitic magma-tism has played a role in continental growth.
Arc rocks range widely and continuously in chem-ical composition on each side of andesite (Table 13.6 and Figure 13.24). Most are subalkaline, silica-saturated to silica-oversaturated. Rock types typicallyinclude basalt, basaltic andesite, andesite, dacite, andrhyolite. A large spectrum of K2O concentration is sub-divided into four rock series in Figures 2.18 and 13.24,including low-K (tholeiitic), medium- and high-K (calc-alkaline), and shoshonitic. High-K and shoshoniticrocks may be alkaline and silica-undersaturated. Com-plex variations along and across strike and throughtime within a single arc as well as variations betweenarcs preclude accurate generalizations on a globalscale. Nonetheless, a few tendencies can be cited, asfollows.
Low-K (tholeiitic) arc rocks are mostly basalt,basaltic andesite, and lesser amounts of andesite, rarelydacite and rhyolite, that form low mounds and shieldsaround near-trench vents, chiefly in young arcsfounded on thin crust. Lava flows are commonly
which have thicker crust of sialic rather than maficcomposition.
Island arcs built on oceanic crust (Plate I) can beviewed as embryonic continents that grow and matureas the crustal thickness and area increase over millionsof years with continued magmatic input. Althoughrarely exposed, intrusive rocks make up part of thesevolcanic edifices. Island arcs are linear groups of volca-noes several thousands of kilometers long and no morethan 200–300 km wide. The width decreases with in-creasing dip of the subducting slab. They are borderedon one side by an ocean trench, as much as 11 kmdeep, that is the topographic expression of subductinglithosphere (Figures 11.16 and 13.17). Scraped-offocean crust forms an accretionary prism (or forearc ac-creted terrane) on the edge of the overriding plate. Thetrenchward limit of volcanoes—the volcanic front—is50–300 km from the trench, depending on slab dip,but is consistently about 110 km above the top of thesubducting slab (Tatsumi and Eggins, 1995), as definedby earthquake foci. The volume of extruded magmadecreases away from the volcanic front. In some arcs, aspreading back arc or marginal basin (Figure 11.16)lies on the opposite side from the trench.
13.5.1 Rock AssociationsWhereas basalt is the typical rock of the ocean floor, is-land chains, and plateaus, the most common rock ofconvergent plate settings, whether island or continental
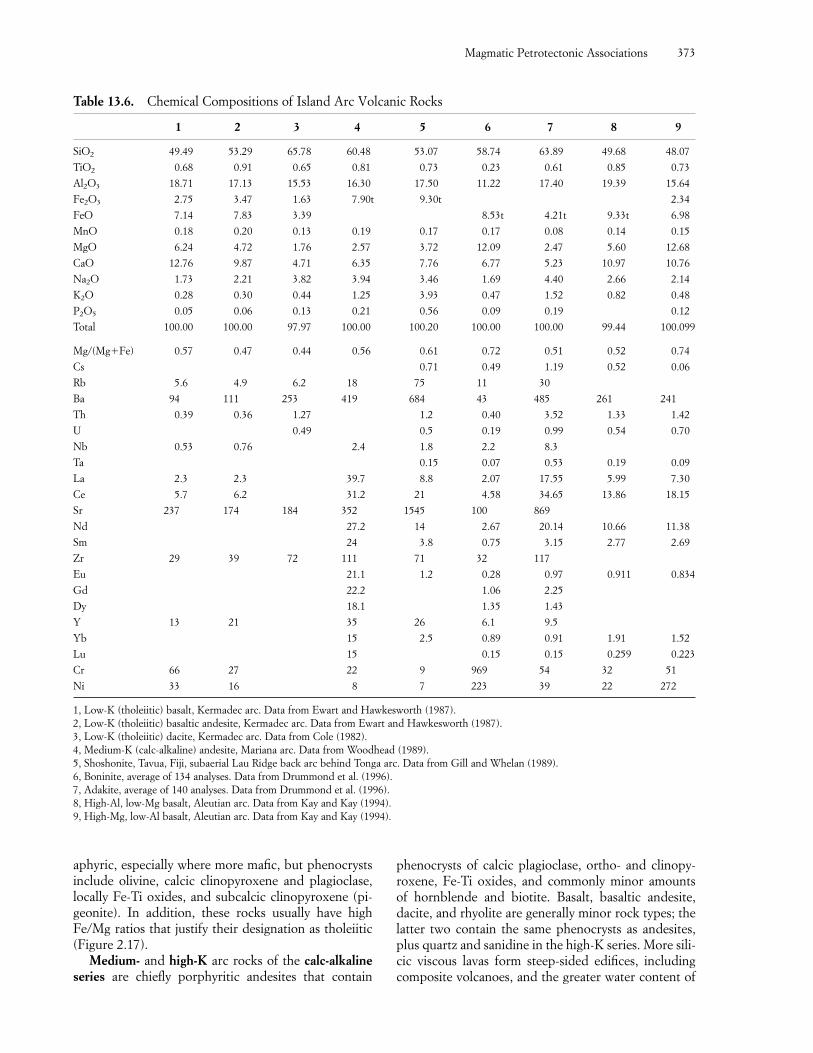
aphyric, especially where more mafic, but phenocrystsinclude olivine, calcic clinopyroxene and plagioclase,locally Fe-Ti oxides, and subcalcic clinopyroxene (pi-geonite). In addition, these rocks usually have highFe/Mg ratios that justify their designation as tholeiitic(Figure 2.17).
Medium- and high-K arc rocks of the calc-alkalineseries are chiefly porphyritic andesites that contain
phenocrysts of calcic plagioclase, ortho- and clinopy-roxene, Fe-Ti oxides, and commonly minor amounts of hornblende and biotite. Basalt, basaltic andesite,dacite, and rhyolite are generally minor rock types; thelatter two contain the same phenocrysts as andesites,plus quartz and sanidine in the high-K series. More sili-cic viscous lavas form steep-sided edifices, includingcomposite volcanoes, and the greater water content of
Magmatic Petrotectonic Associations 373
Table 13.6. Chemical Compositions of Island Arc Volcanic Rocks
1 2 3 4 5 6 7 8 9
SiO2 49.49 53.29 65.78 60.48 53.07 58.74 63.89 49.68 48.07
TiO2 0.68 0.91 0.65 0.81 0.73 0.23 0.61 0.85 0.73
Al2O3 18.71 17.13 15.53 16.30 17.50 11.22 17.40 19.39 15.64
Fe2O3 2.75 3.47 1.63 7.90t 9.30t 2.34
FeO 7.14 7.83 3.39 8.53t 4.21t 9.33t 6.98
MnO 0.18 0.20 0.13 0.19 0.17 0.17 0.08 0.14 0.15
MgO 6.24 4.72 1.76 2.57 3.72 12.09 2.47 5.60 12.68
CaO 12.76 9.87 4.71 6.35 7.76 6.77 5.23 10.97 10.76
Na2O 1.73 2.21 3.82 3.94 3.46 1.69 4.40 2.66 2.14
K2O 0.28 0.30 0.44 1.25 3.93 0.47 1.52 0.82 0.48
P2O5 0.05 0.06 0.13 0.21 0.56 0.09 0.19 0.12
Total 100.00 100.00 97.97 100.00 100.20 100.00 100.00 99.44 100.099
Mg/(Mg�Fe) 0.57 0.47 0.44 0.56 0.61 0.72 0.51 0.52 0.74
Cs 0.71 0.49 1.19 0.52 0.06
Rb 5.6 4.9 6.2 18 75 11 30
Ba 94 111 253 419 684 43 485 261 241
Th 0.39 0.36 1.27 1.2 0.40 3.52 1.33 1.42
U 0.49 0.5 0.19 0.99 0.54 0.70
Nb 0.53 0.76 2.4 1.8 2.2 8.3
Ta 0.15 0.07 0.53 0.19 0.09
La 2.3 2.3 39.7 8.8 2.07 17.55 5.99 7.30
Ce 5.7 6.2 31.2 21 4.58 34.65 13.86 18.15
Sr 237 174 184 352 1545 100 869
Nd 27.2 14 2.67 20.14 10.66 11.38
Sm 24 3.8 0.75 3.15 2.77 2.69
Zr 29 39 72 111 71 32 117
Eu 21.1 1.2 0.28 0.97 0.911 0.834
Gd 22.2 1.06 2.25
Dy 18.1 1.35 1.43
Y 13 21 35 26 6.1 9.5
Yb 15 2.5 0.89 0.91 1.91 1.52
Lu 15 0.15 0.15 0.259 0.223
Cr 66 27 22 9 969 54 32 51
Ni 33 16 8 7 223 39 22 272
1, Low-K (tholeiitic) basalt, Kermadec arc. Data from Ewart and Hawkesworth (1987).2, Low-K (tholeiitic) basaltic andesite, Kermadec arc. Data from Ewart and Hawkesworth (1987).3, Low-K (tholeiitic) dacite, Kermadec arc. Data from Cole (1982).4, Medium-K (calc-alkaline) andesite, Mariana arc. Data from Woodhead (1989).5, Shoshonite, Tavua, Fiji, subaerial Lau Ridge back arc behind Tonga arc. Data from Gill and Whelan (1989).6, Boninite, average of 134 analyses. Data from Drummond et al. (1996).7, Adakite, average of 140 analyses. Data from Drummond et al. (1996).8, High-Al, low-Mg basalt, Aleutian arc. Data from Kay and Kay (1994).9, High-Mg, low-Al basalt, Aleutian arc. Data from Kay and Kay (1994).
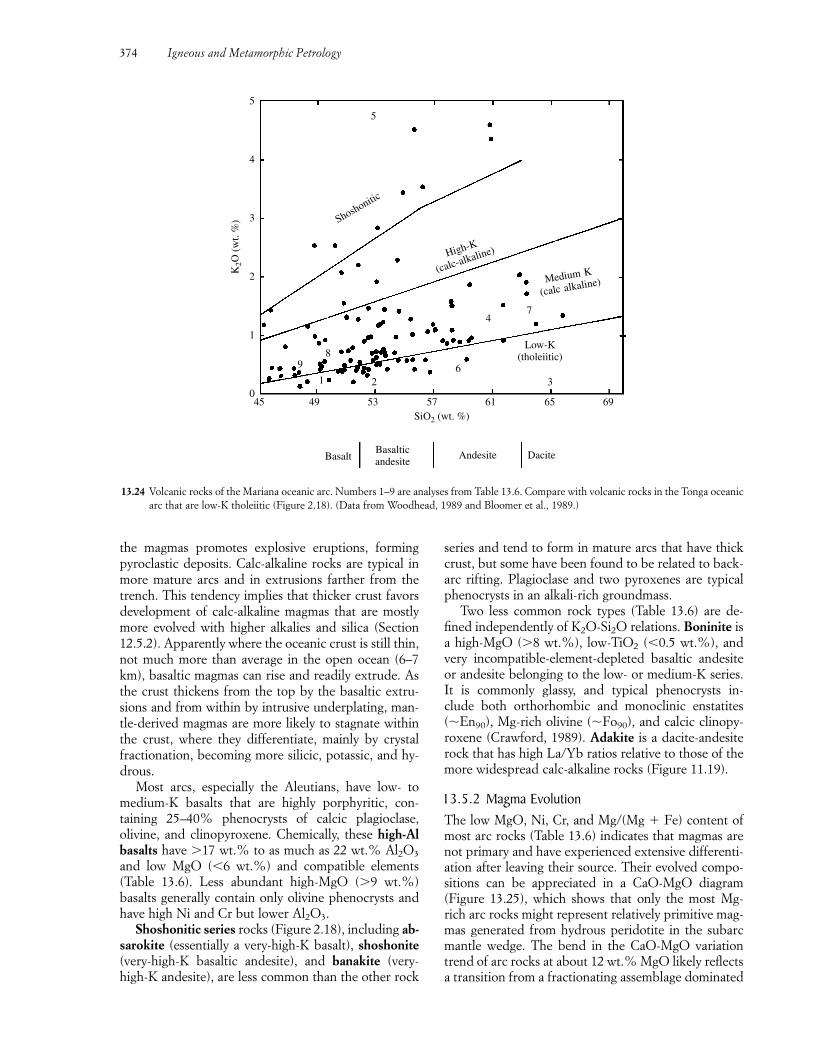
the magmas promotes explosive eruptions, forming pyroclastic deposits. Calc-alkaline rocks are typical inmore mature arcs and in extrusions farther from thetrench. This tendency implies that thicker crust favorsdevelopment of calc-alkaline magmas that are mostlymore evolved with higher alkalies and silica (Section12.5.2). Apparently where the oceanic crust is still thin,not much more than average in the open ocean (6–7km), basaltic magmas can rise and readily extrude. Asthe crust thickens from the top by the basaltic extru-sions and from within by intrusive underplating, man-tle-derived magmas are more likely to stagnate withinthe crust, where they differentiate, mainly by crystalfractionation, becoming more silicic, potassic, and hy-drous.
Most arcs, especially the Aleutians, have low- tomedium-K basalts that are highly porphyritic, con-taining 25–40% phenocrysts of calcic plagioclase,olivine, and clinopyroxene. Chemically, these high-Albasalts have �17 wt.% to as much as 22 wt.% Al2O3
and low MgO (�6 wt.%) and compatible elements(Table 13.6). Less abundant high-MgO (�9 wt.%)basalts generally contain only olivine phenocrysts andhave high Ni and Cr but lower Al2O3.
Shoshonitic series rocks (Figure 2.18), including ab-sarokite (essentially a very-high-K basalt), shoshonite(very-high-K basaltic andesite), and banakite (very-high-K andesite), are less common than the other rock
series and tend to form in mature arcs that have thickcrust, but some have been found to be related to back-arc rifting. Plagioclase and two pyroxenes are typicalphenocrysts in an alkali-rich groundmass.
Two less common rock types (Table 13.6) are de-fined independently of K2O-Si2O relations. Boninite isa high-MgO (�8 wt.%), low-TiO2 (�0.5 wt.%), andvery incompatible-element-depleted basaltic andesiteor andesite belonging to the low- or medium-K series.It is commonly glassy, and typical phenocrysts in-clude both orthorhombic and monoclinic enstatites(�En90), Mg-rich olivine (�Fo90), and calcic clinopy-roxene (Crawford, 1989). Adakite is a dacite-andesiterock that has high La/Yb ratios relative to those of themore widespread calc-alkaline rocks (Figure 11.19).
13.5.2 Magma EvolutionThe low MgO, Ni, Cr, and Mg/(Mg � Fe) content ofmost arc rocks (Table 13.6) indicates that magmas arenot primary and have experienced extensive differenti-ation after leaving their source. Their evolved compo-sitions can be appreciated in a CaO-MgO diagram(Figure 13.25), which shows that only the most Mg-rich arc rocks might represent relatively primitive mag-mas generated from hydrous peridotite in the subarcmantle wedge. The bend in the CaO-MgO variationtrend of arc rocks at about 12 wt.% MgO likely reflectsa transition from a fractionating assemblage dominated
374 Igneous and Metamorphic Petrology
BasaltBasalticandesite
Andesite Dacite
45 49 53 57 61 65 69SiO2 (wt. %)
5
4
3
2
1
0
K2O
(w
t. %
) Shoshonitic
High-K
(calc-alkaline)
Medium K
(calc alkaline)
98
1 2 36
47
5
Low-K(tholeiitic)
13.24 Volcanic rocks of the Mariana oceanic arc. Numbers 1–9 are analyses from Table 13.6. Compare with volcanic rocks in the Tonga oceanicarc that are low-K tholeiitic (Figure 2.18). (Data from Woodhead, 1989 and Bloomer et al., 1989.)
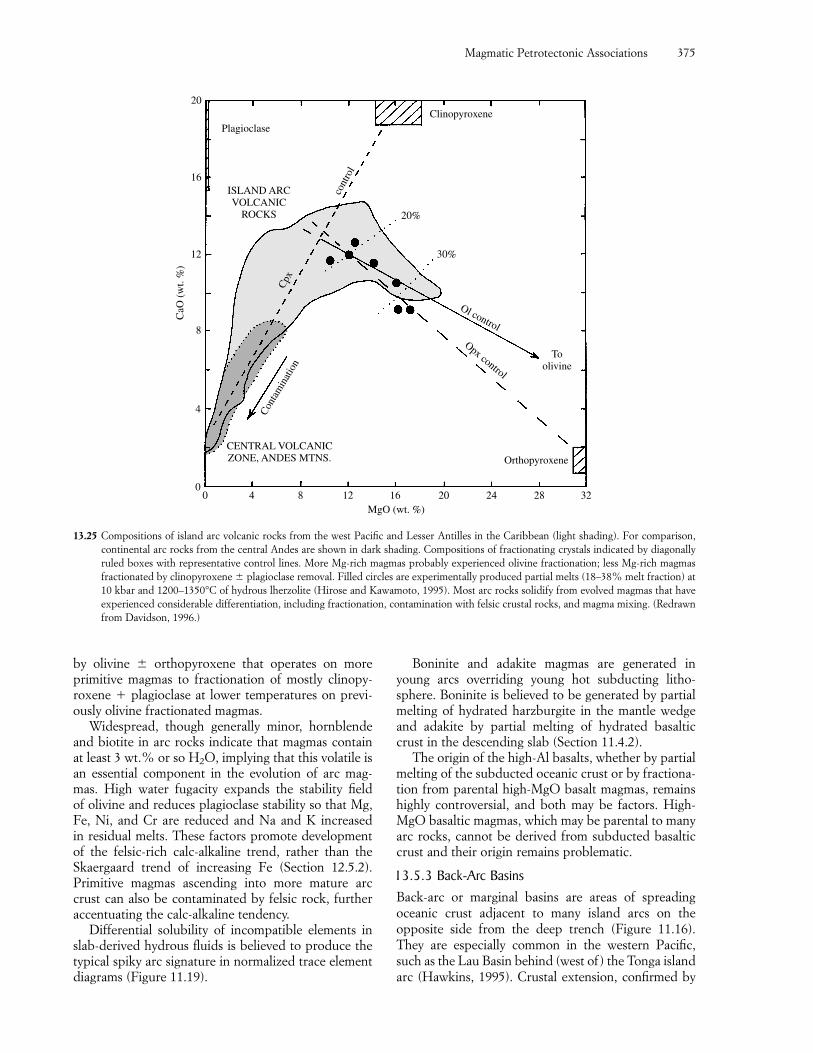
by olivine � orthopyroxene that operates on moreprimitive magmas to fractionation of mostly clinopy-roxene � plagioclase at lower temperatures on previ-ously olivine fractionated magmas.
Widespread, though generally minor, hornblendeand biotite in arc rocks indicate that magmas contain at least 3 wt.% or so H2O, implying that this volatile isan essential component in the evolution of arc mag-mas. High water fugacity expands the stability field of olivine and reduces plagioclase stability so that Mg, Fe, Ni, and Cr are reduced and Na and K increased in residual melts. These factors promote developmentof the felsic-rich calc-alkaline trend, rather than theSkaergaard trend of increasing Fe (Section 12.5.2).Primitive magmas ascending into more mature arccrust can also be contaminated by felsic rock, furtheraccentuating the calc-alkaline tendency.
Differential solubility of incompatible elements inslab-derived hydrous fluids is believed to produce thetypical spiky arc signature in normalized trace elementdiagrams (Figure 11.19).
Boninite and adakite magmas are generated inyoung arcs overriding young hot subducting litho-sphere. Boninite is believed to be generated by partialmelting of hydrated harzburgite in the mantle wedgeand adakite by partial melting of hydrated basalticcrust in the descending slab (Section 11.4.2).
The origin of the high-Al basalts, whether by partialmelting of the subducted oceanic crust or by fractiona-tion from parental high-MgO basalt magmas, remainshighly controversial, and both may be factors. High-MgO basaltic magmas, which may be parental to manyarc rocks, cannot be derived from subducted basalticcrust and their origin remains problematic.
13.5.3 Back-Arc BasinsBack-arc or marginal basins are areas of spreadingoceanic crust adjacent to many island arcs on the opposite side from the deep trench (Figure 11.16).They are especially common in the western Pacific,such as the Lau Basin behind (west of) the Tonga islandarc (Hawkins, 1995). Crustal extension, confirmed by
Magmatic Petrotectonic Associations 375
Plagioclase
cont
rol
Clinopyroxene
20%
30%
Ol control
Toolivine
Opx control
ISLAND ARCVOLCANIC
ROCKS
Cpx
Con
tam
inat
ion
20
16
12
8
4
0
CENTRAL VOLCANICZONE, ANDES MTNS. Orthopyroxene
0 4 8 12 16 20 24 28 32MgO (wt. %)
CaO
(w
t. %
)
13.25 Compositions of island arc volcanic rocks from the west Pacific and Lesser Antilles in the Caribbean (light shading). For comparison,continental arc rocks from the central Andes are shown in dark shading. Compositions of fractionating crystals indicated by diagonallyruled boxes with representative control lines. More Mg-rich magmas probably experienced olivine fractionation; less Mg-rich magmasfractionated by clinopyroxene � plagioclase removal. Filled circles are experimentally produced partial melts (18–38% melt fraction) at10 kbar and 1200–1350°C of hydrous lherzolite (Hirose and Kawamoto, 1995). Most arc rocks solidify from evolved magmas that haveexperienced considerable differentiation, including fractionation, contamination with felsic crustal rocks, and magma mixing. (Redrawnfrom Davidson, 1996.)
symmetric linear magnetic anomalies, is paradoxicaland controversial; it may be caused by some sort ofcounterflow in the subarc mantle wedge or “roll back”of a gravitationally sinking slab within the overall con-vergent plate regime. Basalts forming new ocean flooralong back-arc spreading ridges resemble MORB buthave distinct arc affinities, such as negative Nb-Taanomalies and elevated water content. Somehow, aque-ous fluids liberated from the subducting slab are trans-ferred into the MORB-like magma source beneath theback-arc spreading axis.
�13.6 OPHIOLITE
Accreted terranes of oceanic rocks emplaced alongmargins of continental and oceanic plates overridingsubducting slabs (Figures 13.17 and 11.16) commonlyinclude a distinctive sequence of rocks called ophiolite.Most of the hundreds of ophiolite sequences recog-nized worldwide are dismembered to varying degreesso that only parts are exposed. Unusually well-exposed,complete ophiolites include the Semail along thenortheast coast of the Arabian Peninsula in the Sul-tanate of Oman (see Figure 18.25; Searle and Cox,1999), the Bay of Islands in western Newfoundland,and the nearly complete Troodos ophiolite on the is-land of Cyprus in the Mediterranean (Moores, 1982).
Contact thermal metamorphic effects on countryrocks are limited or absent, even though a high-Tmagma is implied by the high content of Mg-richolivine in the ultramafic members of the ophiolite se-quence. Instead, contacts between the ophiolite pack-age and surrounding rocks, as well as internal lithologiccontacts, are tectonic, marked by breccia and slicken-sides; hence, ophiolites appear to have been emplacedas subsolidus masses, commonly along fault zones.
13.6.1 CharacteristicsOphiolite is a distinctive sequence of magmatic, sedimentary, and metamorphic rocks formed in anoceanic environment and made up of the oceanic crustand uppermost mantle rocks (Figure 13.1a; see alsoMoores, 1982). (Ophiolite is from the Greek, ophite,referring to a serpent, in allusion to the widespreadscaly green serpentine in the sequence.) Always vari-ably deformed, recrystallized, and hydrated, a com-plete ophiolite sequence consists of the following, fromthe top down:1. Marine sedimentary rock: Thinly layered (centime-
ters-scale) Fe-Mn-rich chert and shale are com-mon, but deep ocean (pelagic) red limestone occursin some. In many ophiolites, volcaniclastic depos-its intercalated with turbidite sequences indicatenearby explosive volcanism and development ofdeep-sea fans essentially contemporaneous withunderlying magmatic rocks; such deposits are typi-cal of island arcs rather than the open-ocean, in-
traplate environment where chert, shale, and lime-stone form. Moores (1982) argues that the uncon-ventional inclusion of the sedimentary componentin the definition of ophiolite provides a geologiccriterion for deciding the oceanic environment inwhich ophiolites are created.
2. Extrusive magmatic rock, chiefly basaltic: Pillowlavas predominate, but sheet flows and breccias arecommon. Apparently arc-related volcanic debrisflows and silicic lavas are found in some ophiolites.Sills are locally common, as are dikes, which in-crease downward.
3. Sheeted dike complex: Dikes mostly of basalt and slightly coarser diabase (dolerite) are generally1–3 m thick. In the Oman ophiolite, dikes have auniform strike over an exposed distance of 400 km!Dikes intruded into dikes, without any other wallrock, are convincing proof of formation in activelyextending crust. Anastamosing zones of brecciationon scales from microscopic to hand sample arewidespread. Their irregular disposition is incom-patible with a tectonic origin and suggests insteadexplosive shattering due to advective entry of coldseawater into the hot dikes.
4. Massive (isotropic) gabbro: Below the depth of ad-vective water penetration, magma intrusions coolmore slowly by conduction and convection and so-lidify in the extending crust by plating crystals ontothe walls, forming bodies of gabbro with isotropicfabric. Amphibole in local dioritic rocks testifies to high concentrations of water in the fraction-ated tops of crustal magma chambers. More felsicdifferentiates, which occur as irregularly shapedmasses in diorite and gabbro and as thin dikes in-truded into basalt, constitute 5%–10% of the plu-tonic part of ophiolite. These plagiogranite (alsocalled albite granite, trondhjemite, or granophyre)differentiates consist of granophyric aggregates ofquartz and strongly zoned oligoclase-andesine(Table 13.7); K-rich feldspar is notably absent andminor primary mafic minerals are altered to chloriteand actinolite.
5. Layered ultramafic-mafic cumulates: These are ac-cumulations of fractionated crystals on the floors ofgabbroic magma chambers. Olivine and pyroxenecumulates (dunite, peridotite) occur at the base,succeeded upward by Ol � Cpx � Pl cumulates(gabbro). Cyclic mineral and phase layering is com-mon. A general lack of intrusive contacts within thegabbroic and ultramafic cumulate parts of ophio-lites may be created by intermittent recharge ofprimitive magma into crystallizing magma beforecomplete solidification occurred in the actively ex-tending oceanic crust.
6. Deformed (“tectonized”) peridotite: This meta-morphic-textured mantle rock below the magmatic
376 Igneous and Metamorphic Petrology
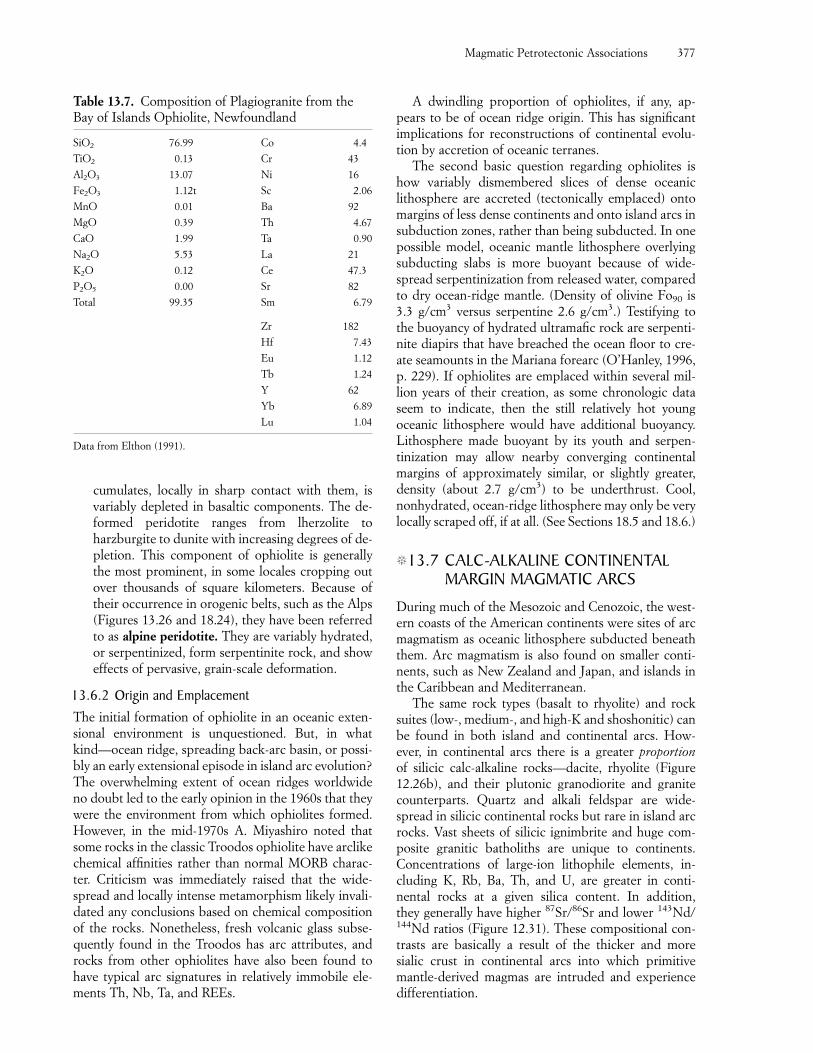
cumulates, locally in sharp contact with them, isvariably depleted in basaltic components. The de-formed peridotite ranges from lherzolite toharzburgite to dunite with increasing degrees of de-pletion. This component of ophiolite is generallythe most prominent, in some locales cropping outover thousands of square kilometers. Because oftheir occurrence in orogenic belts, such as the Alps(Figures 13.26 and 18.24), they have been referredto as alpine peridotite. They are variably hydrated,or serpentinized, form serpentinite rock, and showeffects of pervasive, grain-scale deformation.
13.6.2 Origin and EmplacementThe initial formation of ophiolite in an oceanic exten-sional environment is unquestioned. But, in whatkind—ocean ridge, spreading back-arc basin, or possi-bly an early extensional episode in island arc evolution?The overwhelming extent of ocean ridges worldwideno doubt led to the early opinion in the 1960s that theywere the environment from which ophiolites formed.However, in the mid-1970s A. Miyashiro noted thatsome rocks in the classic Troodos ophiolite have arclikechemical affinities rather than normal MORB charac-ter. Criticism was immediately raised that the wide-spread and locally intense metamorphism likely invali-dated any conclusions based on chemical compositionof the rocks. Nonetheless, fresh volcanic glass subse-quently found in the Troodos has arc attributes, androcks from other ophiolites have also been found tohave typical arc signatures in relatively immobile ele-ments Th, Nb, Ta, and REEs.
A dwindling proportion of ophiolites, if any, ap-pears to be of ocean ridge origin. This has significantimplications for reconstructions of continental evolu-tion by accretion of oceanic terranes.
The second basic question regarding ophiolites ishow variably dismembered slices of dense oceaniclithosphere are accreted (tectonically emplaced) ontomargins of less dense continents and onto island arcs insubduction zones, rather than being subducted. In onepossible model, oceanic mantle lithosphere overlyingsubducting slabs is more buoyant because of wide-spread serpentinization from released water, comparedto dry ocean-ridge mantle. (Density of olivine Fo90 is3.3 g/cm3 versus serpentine 2.6 g/cm3.) Testifying tothe buoyancy of hydrated ultramafic rock are serpenti-nite diapirs that have breached the ocean floor to cre-ate seamounts in the Mariana forearc (O’Hanley, 1996,p. 229). If ophiolites are emplaced within several mil-lion years of their creation, as some chronologic dataseem to indicate, then the still relatively hot youngoceanic lithosphere would have additional buoyancy.Lithosphere made buoyant by its youth and serpen-tinization may allow nearby converging continentalmargins of approximately similar, or slightly greater,density (about 2.7 g/cm3) to be underthrust. Cool,nonhydrated, ocean-ridge lithosphere may only be verylocally scraped off, if at all. (See Sections 18.5 and 18.6.)
�13.7 CALC-ALKALINE CONTINENTALMARGIN MAGMATIC ARCS
During much of the Mesozoic and Cenozoic, the west-ern coasts of the American continents were sites of arcmagmatism as oceanic lithosphere subducted beneaththem. Arc magmatism is also found on smaller conti-nents, such as New Zealand and Japan, and islands inthe Caribbean and Mediterranean.
The same rock types (basalt to rhyolite) and rocksuites (low-, medium-, and high-K and shoshonitic) canbe found in both island and continental arcs. How-ever, in continental arcs there is a greater proportionof silicic calc-alkaline rocks—dacite, rhyolite (Figure12.26b), and their plutonic granodiorite and granitecounterparts. Quartz and alkali feldspar are wide-spread in silicic continental rocks but rare in island arcrocks. Vast sheets of silicic ignimbrite and huge com-posite granitic batholiths are unique to continents.Concentrations of large-ion lithophile elements, in-cluding K, Rb, Ba, Th, and U, are greater in conti-nental rocks at a given silica content. In addition, they generally have higher 87Sr/86Sr and lower 143Nd/144Nd ratios (Figure 12.31). These compositional con-trasts are basically a result of the thicker and moresialic crust in continental arcs into which primitivemantle-derived magmas are intruded and experiencedifferentiation.
Magmatic Petrotectonic Associations 377
Table 13.7. Composition of Plagiogranite from theBay of Islands Ophiolite, Newfoundland
SiO2 76.99 Co 4.4
TiO2 0.13 Cr 43
Al2O3 13.07 Ni 16
Fe2O3 1.12t Sc 2.06
MnO 0.01 Ba 92
MgO 0.39 Th 4.67
CaO 1.99 Ta 0.90
Na2O 5.53 La 21
K2O 0.12 Ce 47.3
P2O5 0.00 Sr 82
Total 99.35 Sm 6.79
Zr 182
Hf 7.43
Eu 1.12
Tb 1.24
Y 62
Yb 6.89
Lu 1.04
Data from Elthon (1991).
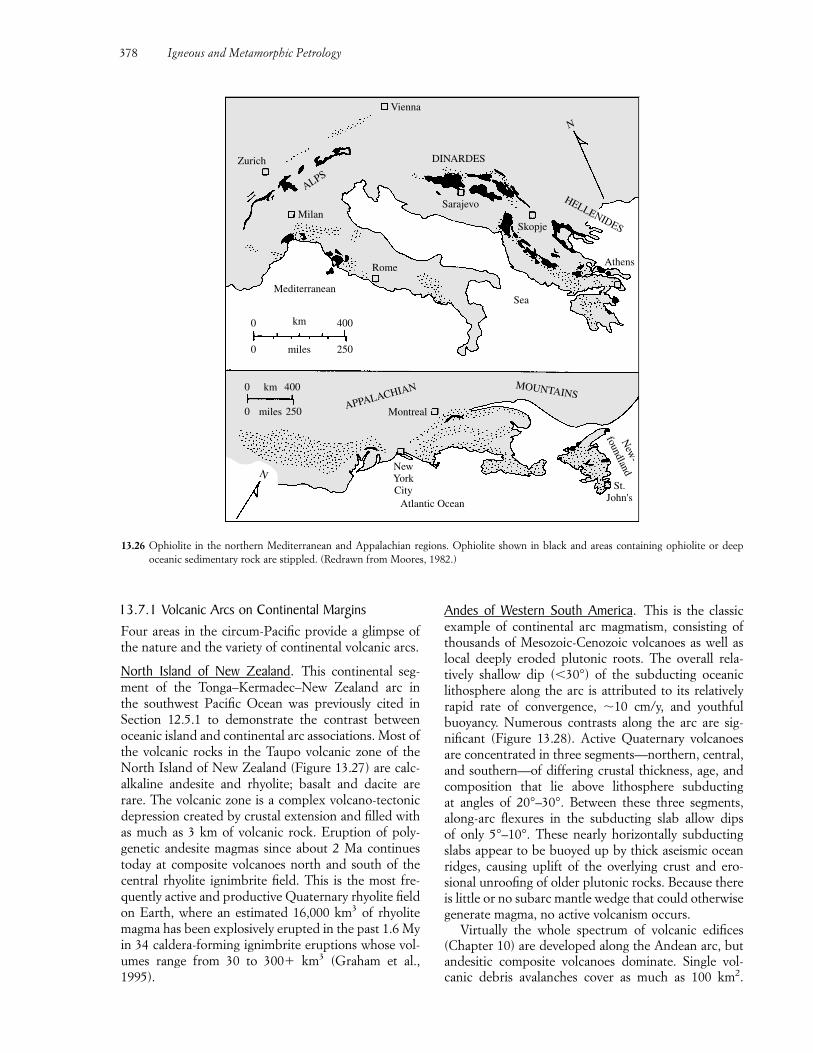
378 Igneous and Metamorphic Petrology
km
miles
0 400
0 250
km
miles
0 400
0 250
NNewYorkCity
Atlantic Ocean
St.John's
New
-
foundland
MOUNTAINSAPPALACHIAN
Montreal
Mediterranean
Rome
Sea
Sarajevo
Skopje
HELLENIDES
Athens
N
DINARDES
Vienna
Zurich
Milan
ALPS
13.26 Ophiolite in the northern Mediterranean and Appalachian regions. Ophiolite shown in black and areas containing ophiolite or deepoceanic sedimentary rock are stippled. (Redrawn from Moores, 1982.)
13.7.1 Volcanic Arcs on Continental MarginsFour areas in the circum-Pacific provide a glimpse ofthe nature and the variety of continental volcanic arcs.
North Island of New Zealand. This continental seg-ment of the Tonga–Kermadec–New Zealand arc in the southwest Pacific Ocean was previously cited inSection 12.5.1 to demonstrate the contrast betweenoceanic island and continental arc associations. Most ofthe volcanic rocks in the Taupo volcanic zone of theNorth Island of New Zealand (Figure 13.27) are calc-alkaline andesite and rhyolite; basalt and dacite arerare. The volcanic zone is a complex volcano-tectonicdepression created by crustal extension and filled withas much as 3 km of volcanic rock. Eruption of poly-genetic andesite magmas since about 2 Ma continuestoday at composite volcanoes north and south of thecentral rhyolite ignimbrite field. This is the most fre-quently active and productive Quaternary rhyolite fieldon Earth, where an estimated 16,000 km3 of rhyolitemagma has been explosively erupted in the past 1.6 Myin 34 caldera-forming ignimbrite eruptions whose vol-umes range from 30 to 300� km3 (Graham et al.,1995).
Andes of Western South America. This is the classicexample of continental arc magmatism, consisting ofthousands of Mesozoic-Cenozoic volcanoes as well aslocal deeply eroded plutonic roots. The overall rela-tively shallow dip (�30°) of the subducting oceaniclithosphere along the arc is attributed to its relativelyrapid rate of convergence, �10 cm/y, and youthfulbuoyancy. Numerous contrasts along the arc are sig-nificant (Figure 13.28). Active Quaternary volcanoesare concentrated in three segments—northern, central,and southern—of differing crustal thickness, age, andcomposition that lie above lithosphere subducting at angles of 20°–30°. Between these three segments,along-arc flexures in the subducting slab allow dips of only 5°–10°. These nearly horizontally subductingslabs appear to be buoyed up by thick aseismic oceanridges, causing uplift of the overlying crust and ero-sional unroofing of older plutonic rocks. Because thereis little or no subarc mantle wedge that could otherwisegenerate magma, no active volcanism occurs.
Virtually the whole spectrum of volcanic edifices(Chapter 10) are developed along the Andean arc, butandesitic composite volcanoes dominate. Single vol-canic debris avalanches cover as much as 100 km2.
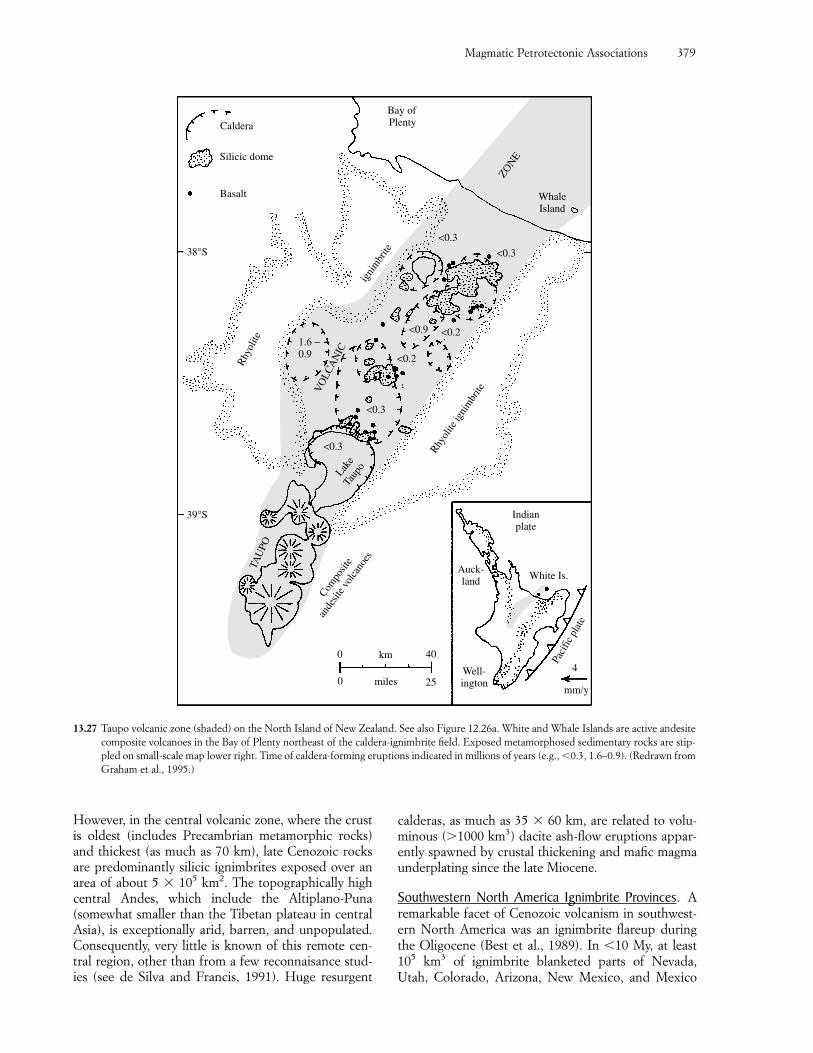
Magmatic Petrotectonic Associations 379
However, in the central volcanic zone, where the crustis oldest (includes Precambrian metamorphic rocks)and thickest (as much as 70 km), late Cenozoic rocksare predominantly silicic ignimbrites exposed over anarea of about 5 105 km2. The topographically highcentral Andes, which include the Altiplano-Puna(somewhat smaller than the Tibetan plateau in centralAsia), is exceptionally arid, barren, and unpopulated.Consequently, very little is known of this remote cen-tral region, other than from a few reconnaisance stud-ies (see de Silva and Francis, 1991). Huge resurgent
calderas, as much as 35 60 km, are related to volu-minous (�1000 km3) dacite ash-flow eruptions appar-ently spawned by crustal thickening and mafic magmaunderplating since the late Miocene.
Southwestern North America Ignimbrite Provinces. Aremarkable facet of Cenozoic volcanism in southwest-ern North America was an ignimbrite flareup duringthe Oligocene (Best et al., 1989). In �10 My, at least105 km3 of ignimbrite blanketed parts of Nevada,Utah, Colorado, Arizona, New Mexico, and Mexico
White Is.
Indianplate
Auck-land
Well-ington
0 km 40
250 miles
TAU
PO
VO
LCA
NIC
1.6 −0.9
igni
mbr
ite
<0.3
<0.3
WhaleIsland
ZON
E
Bay ofPlenty
Silicic dome
38°S
39°S
Rhy
olite
<0.9 <0.2
<0.2
<0.3
<0.3
Lake
Taup
o
Rhyol
ite ig
nim
brite
Paci
fic p
late
4
mm/y
Basalt
Caldera
Compo
site
ande
site v
olca
noes
13.27 Taupo volcanic zone (shaded) on the North Island of New Zealand. See also Figure 12.26a. White and Whale Islands are active andesitecomposite volcanoes in the Bay of Plenty northeast of the caldera-ignimbrite field. Exposed metamorphosed sedimentary rocks are stip-pled on small-scale map lower right. Time of caldera-forming eruptions indicated in millions of years (e.g., �0.3, 1.6–0.9). (Redrawn fromGraham et al., 1995.)
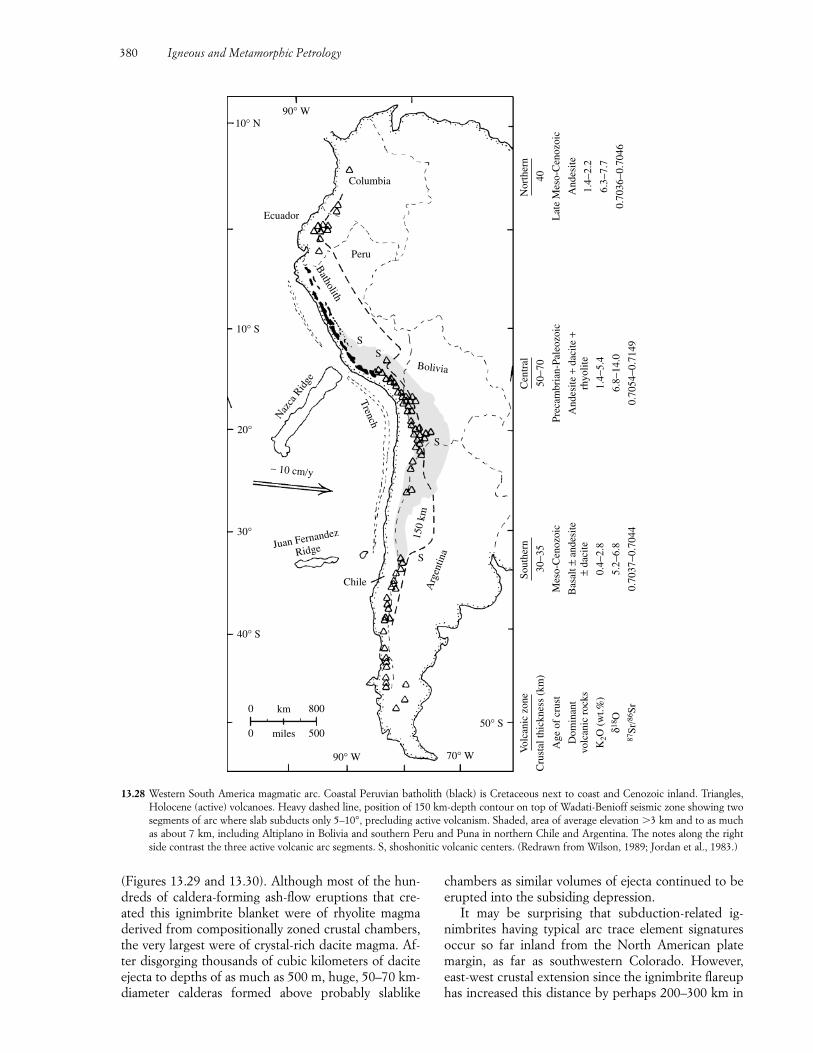
380 Igneous and Metamorphic Petrology
(Figures 13.29 and 13.30). Although most of the hun-dreds of caldera-forming ash-flow eruptions that cre-ated this ignimbrite blanket were of rhyolite magmaderived from compositionally zoned crustal chambers,the very largest were of crystal-rich dacite magma. Af-ter disgorging thousands of cubic kilometers of daciteejecta to depths of as much as 500 m, huge, 50–70 km-diameter calderas formed above probably slablike
chambers as similar volumes of ejecta continued to beerupted into the subsiding depression.
It may be surprising that subduction-related ig-nimbrites having typical arc trace element signatures occur so far inland from the North American platemargin, as far as southwestern Colorado. However,east-west crustal extension since the ignimbrite flareuphas increased this distance by perhaps 200–300 km in
13.28 Western South America magmatic arc. Coastal Peruvian batholith (black) is Cretaceous next to coast and Cenozoic inland. Triangles,Holocene (active) volcanoes. Heavy dashed line, position of 150 km-depth contour on top of Wadati-Benioff seismic zone showing twosegments of arc where slab subducts only 5–10°, precluding active volcanism. Shaded, area of average elevation �3 km and to as muchas about 7 km, including Altiplano in Bolivia and southern Peru and Puna in northern Chile and Argentina. The notes along the rightside contrast the three active volcanic arc segments. S, shoshonitic volcanic centers. (Redrawn from Wilson, 1989; Jordan et al., 1983.)
0 800km
0 500miles
40° S
30°
20°
10° S
10° N
Ecuador
90° W 70° W
Juan Fernandez
Ridge
∼ 10 cm/y
Naz
ca R
idge
Trench
Bolivia
150
km
S
Arg
entin
a
Peru
Columbia
90° W
Batholith
SS
Chile
50° S
Vol
cani
c zo
ne
Cru
stal
thic
knes
s (k
m)
Age
of
crus
t
Dom
inan
tvo
lcan
ic r
ocks
Sout
hern
30−3
5
Mes
o-C
enoz
oic
Bas
alt ±
and
esite
Cen
tral
50−7
0
Prec
ambr
ian-
Pale
ozoi
c
And
esite
+ d
acite
+
Nor
ther
n
40
Lat
e M
eso-
Cen
ozoi
c
And
esite
S
1.4−
2.2
6.3−
7.7
0.70
36−0
.704
6
K2O
(w
t.%)
δ18 O
87Sr
/86 S
r
0.4−
2.8
5.2−
6.8
0.70
37−0
.704
4
± da
cite
rhyo
lite
1.4−
5.4
6.8−
14.0
0.70
54−0
.714
9
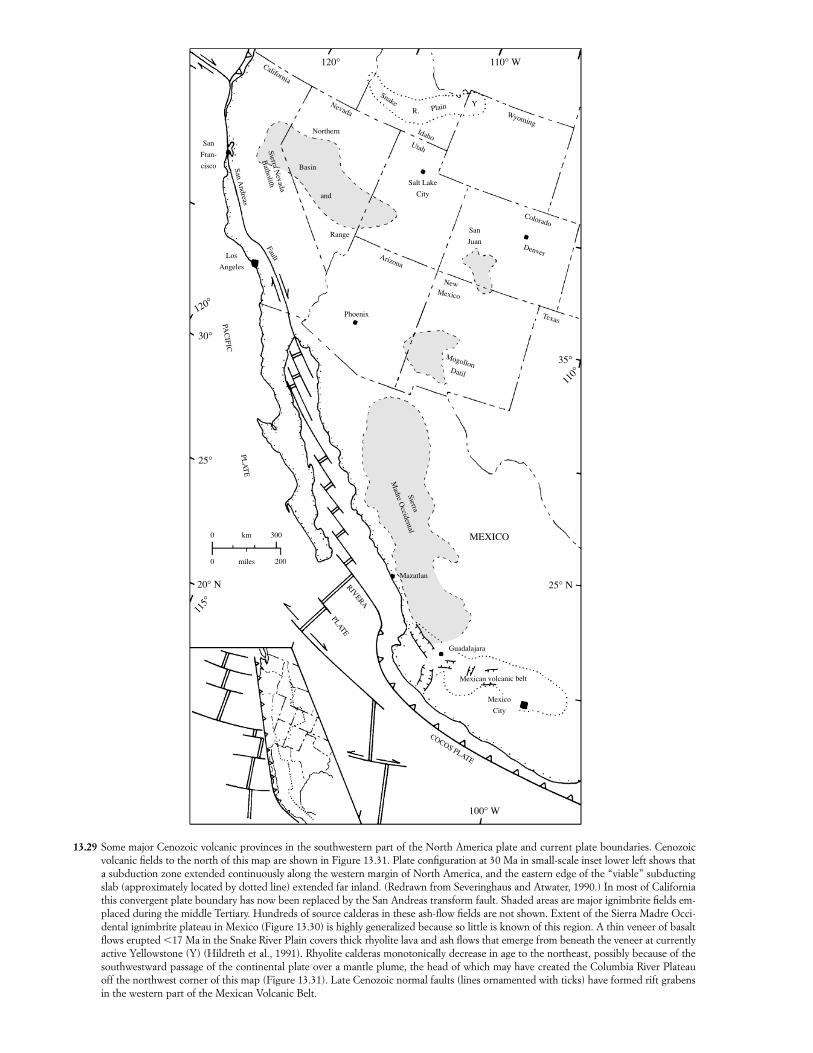
13.29 Some major Cenozoic volcanic provinces in the southwestern part of the North America plate and current plate boundaries. Cenozoicvolcanic fields to the north of this map are shown in Figure 13.31. Plate configuration at 30 Ma in small-scale inset lower left shows thata subduction zone extended continuously along the western margin of North America, and the eastern edge of the “viable” subductingslab (approximately located by dotted line) extended far inland. (Redrawn from Severinghaus and Atwater, 1990.) In most of Californiathis convergent plate boundary has now been replaced by the San Andreas transform fault. Shaded areas are major ignimbrite fields em-placed during the middle Tertiary. Hundreds of source calderas in these ash-flow fields are not shown. Extent of the Sierra Madre Occi-dental ignimbrite plateau in Mexico (Figure 13.30) is highly generalized because so little is known of this region. A thin veneer of basaltflows erupted �17 Ma in the Snake River Plain covers thick rhyolite lava and ash flows that emerge from beneath the veneer at currentlyactive Yellowstone (Y) (Hildreth et al., 1991). Rhyolite calderas monotonically decrease in age to the northeast, possibly because of thesouthwestward passage of the continental plate over a mantle plume, the head of which may have created the Columbia River Plateauoff the northwest corner of this map (Figure 13.31). Late Cenozoic normal faults (lines ornamented with ticks) have formed rift grabensin the western part of the Mexican Volcanic Belt.
0 miles 200
0 km 300
115°
20° Ν
25°
30°
120°
Los
Angeles
San
Fran-
cisco
PAC
IFIC
PLA
TE
San Andreas
FaultSierra N
evada
Batholith
Basin
Range
Phoenix
Arizona
Nevada
California
120° 110° W
Snake R. Plain
IdahoUtah
YWyoming
Salt Lake
City
Colorado
Denver
San
Juan
NewMexico
MogollonDatil
Texas
35°
110°
Mazatlan
Guadalajara
Mexican volcanic belt
Mexico
City
COCOS PLATE
100° W
Sierra
Madre O
ccidental
RIVERA
PLATE
25° Ν
MEXICO
and
Northern
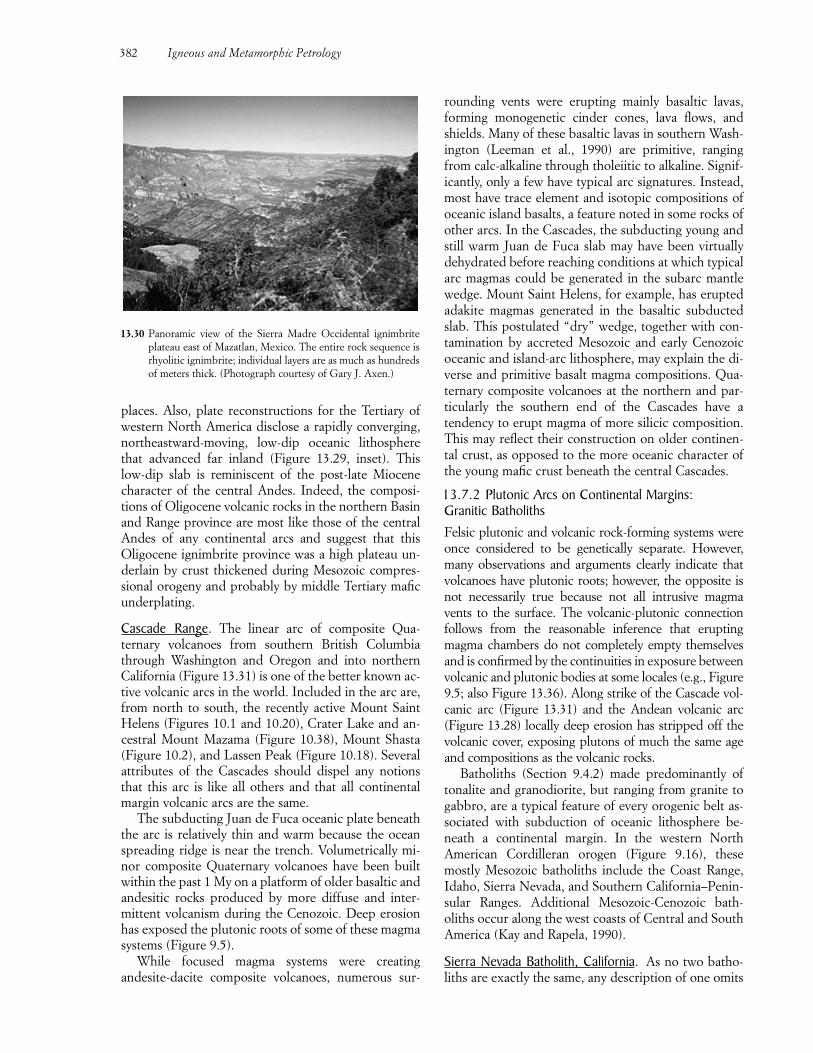
382 Igneous and Metamorphic Petrology
places. Also, plate reconstructions for the Tertiary ofwestern North America disclose a rapidly converging,northeastward-moving, low-dip oceanic lithospherethat advanced far inland (Figure 13.29, inset). Thislow-dip slab is reminiscent of the post-late Miocenecharacter of the central Andes. Indeed, the composi-tions of Oligocene volcanic rocks in the northern Basinand Range province are most like those of the centralAndes of any continental arcs and suggest that thisOligocene ignimbrite province was a high plateau un-derlain by crust thickened during Mesozoic compres-sional orogeny and probably by middle Tertiary maficunderplating.
Cascade Range. The linear arc of composite Qua-ternary volcanoes from southern British Columbiathrough Washington and Oregon and into northernCalifornia (Figure 13.31) is one of the better known ac-tive volcanic arcs in the world. Included in the arc are,from north to south, the recently active Mount SaintHelens (Figures 10.1 and 10.20), Crater Lake and an-cestral Mount Mazama (Figure 10.38), Mount Shasta(Figure 10.2), and Lassen Peak (Figure 10.18). Severalattributes of the Cascades should dispel any notionsthat this arc is like all others and that all continentalmargin volcanic arcs are the same.
The subducting Juan de Fuca oceanic plate beneaththe arc is relatively thin and warm because the oceanspreading ridge is near the trench. Volumetrically mi-nor composite Quaternary volcanoes have been builtwithin the past 1 My on a platform of older basaltic andandesitic rocks produced by more diffuse and inter-mittent volcanism during the Cenozoic. Deep erosionhas exposed the plutonic roots of some of these magmasystems (Figure 9.5).
While focused magma systems were creating andesite-dacite composite volcanoes, numerous sur-
rounding vents were erupting mainly basaltic lavas,forming monogenetic cinder cones, lava flows, andshields. Many of these basaltic lavas in southern Wash-ington (Leeman et al., 1990) are primitive, rangingfrom calc-alkaline through tholeiitic to alkaline. Signif-icantly, only a few have typical arc signatures. Instead,most have trace element and isotopic compositions ofoceanic island basalts, a feature noted in some rocks ofother arcs. In the Cascades, the subducting young andstill warm Juan de Fuca slab may have been virtuallydehydrated before reaching conditions at which typicalarc magmas could be generated in the subarc mantlewedge. Mount Saint Helens, for example, has eruptedadakite magmas generated in the basaltic subductedslab. This postulated “dry” wedge, together with con-tamination by accreted Mesozoic and early Cenozoicoceanic and island-arc lithosphere, may explain the di-verse and primitive basalt magma compositions. Qua-ternary composite volcanoes at the northern and par-ticularly the southern end of the Cascades have atendency to erupt magma of more silicic composition.This may reflect their construction on older continen-tal crust, as opposed to the more oceanic character ofthe young mafic crust beneath the central Cascades.
13.7.2 Plutonic Arcs on Continental Margins: Granitic BatholithsFelsic plutonic and volcanic rock-forming systems wereonce considered to be genetically separate. However,many observations and arguments clearly indicate thatvolcanoes have plutonic roots; however, the opposite isnot necessarily true because not all intrusive magmavents to the surface. The volcanic-plutonic connectionfollows from the reasonable inference that eruptingmagma chambers do not completely empty themselvesand is confirmed by the continuities in exposure betweenvolcanic and plutonic bodies at some locales (e.g., Figure9.5; also Figure 13.36). Along strike of the Cascade vol-canic arc (Figure 13.31) and the Andean volcanic arc(Figure 13.28) locally deep erosion has stripped off thevolcanic cover, exposing plutons of much the same ageand compositions as the volcanic rocks.
Batholiths (Section 9.4.2) made predominantly oftonalite and granodiorite, but ranging from granite togabbro, are a typical feature of every orogenic belt as-sociated with subduction of oceanic lithosphere be-neath a continental margin. In the western NorthAmerican Cordilleran orogen (Figure 9.16), thesemostly Mesozoic batholiths include the Coast Range,Idaho, Sierra Nevada, and Southern California–Penin-sular Ranges. Additional Mesozoic-Cenozoic bath-oliths occur along the west coasts of Central and SouthAmerica (Kay and Rapela, 1990).
Sierra Nevada Batholith, California. As no two batho-liths are exactly the same, any description of one omits
13.30 Panoramic view of the Sierra Madre Occidental ignimbriteplateau east of Mazatlan, Mexico. The entire rock sequence isrhyolitic ignimbrite; individual layers are as much as hundredsof meters thick. (Photograph courtesy of Gary J. Axen.)
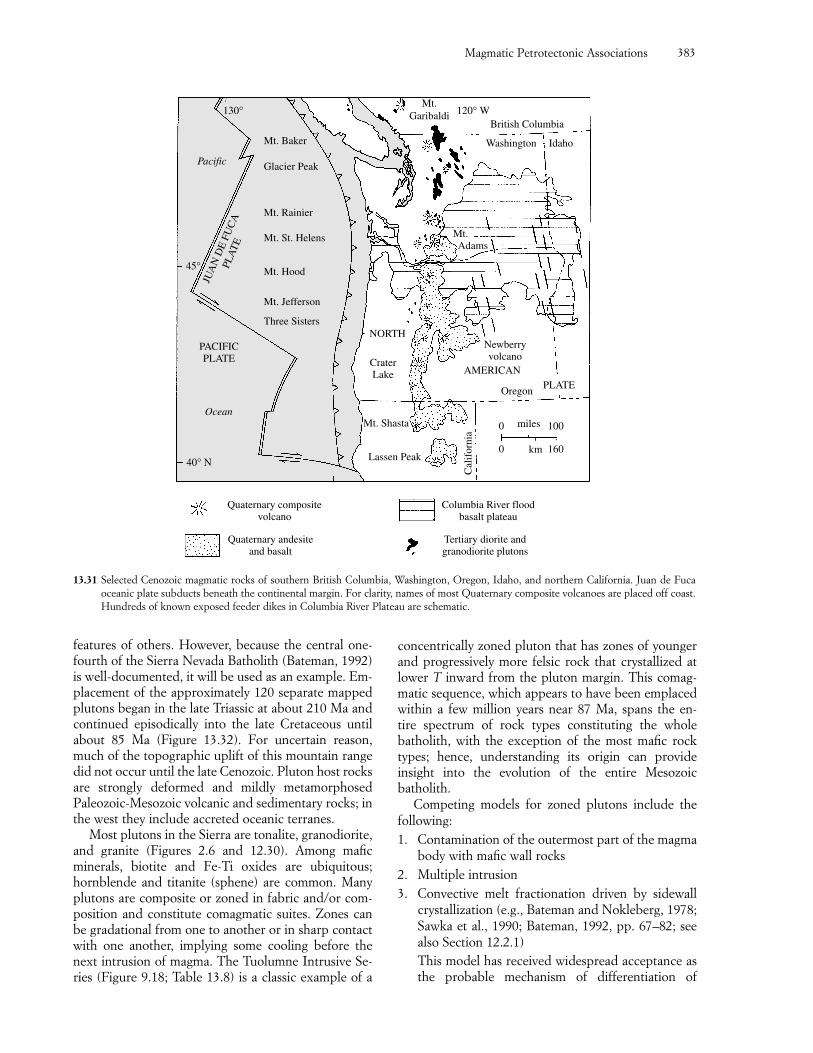
Magmatic Petrotectonic Associations 383
features of others. However, because the central one-fourth of the Sierra Nevada Batholith (Bateman, 1992)is well-documented, it will be used as an example. Em-placement of the approximately 120 separate mappedplutons began in the late Triassic at about 210 Ma andcontinued episodically into the late Cretaceous untilabout 85 Ma (Figure 13.32). For uncertain reason,much of the topographic uplift of this mountain rangedid not occur until the late Cenozoic. Pluton host rocksare strongly deformed and mildly metamorphosed Paleozoic-Mesozoic volcanic and sedimentary rocks; inthe west they include accreted oceanic terranes.
Most plutons in the Sierra are tonalite, granodiorite,and granite (Figures 2.6 and 12.30). Among mafic minerals, biotite and Fe-Ti oxides are ubiquitous;hornblende and titanite (sphene) are common. Manyplutons are composite or zoned in fabric and/or com-position and constitute comagmatic suites. Zones canbe gradational from one to another or in sharp contactwith one another, implying some cooling before thenext intrusion of magma. The Tuolumne Intrusive Se-ries (Figure 9.18; Table 13.8) is a classic example of a
concentrically zoned pluton that has zones of youngerand progressively more felsic rock that crystallized atlower T inward from the pluton margin. This comag-matic sequence, which appears to have been emplacedwithin a few million years near 87 Ma, spans the en-tire spectrum of rock types constituting the wholebatholith, with the exception of the most mafic rocktypes; hence, understanding its origin can provide insight into the evolution of the entire Mesozoicbatholith.
Competing models for zoned plutons include thefollowing:1. Contamination of the outermost part of the magma
body with mafic wall rocks2. Multiple intrusion3. Convective melt fractionation driven by sidewall
crystallization (e.g., Bateman and Nokleberg, 1978;Sawka et al., 1990; Bateman, 1992, pp. 67–82; seealso Section 12.2.1)This model has received widespread acceptance asthe probable mechanism of differentiation of
13.31 Selected Cenozoic magmatic rocks of southern British Columbia, Washington, Oregon, Idaho, and northern California. Juan de Fucaoceanic plate subducts beneath the continental margin. For clarity, names of most Quaternary composite volcanoes are placed off coast.Hundreds of known exposed feeder dikes in Columbia River Plateau are schematic.
Mt.Garibaldi
British Columbia
Washington Idaho
Mt. Adams
Newberryvolcano
AMERICAN
OregonPLATE
miles 1000
1600 km
Cal
ifor
nia
Mt. Shasta
Lassen Peak40° N
Ocean
PACIFICPLATE
Mt. Jefferson
Mt. Hood
Mt. St. Helens
Mt. Rainier
Glacier Peak
Mt. Baker
Three Sisters
130° 120° W
45°
Columbia River floodbasalt plateau
Tertiary diorite andgranodiorite plutons
Quaternary compositevolcano
Quaternary andesiteand basalt
NORTH
CraterLake
JUA
N D
E F
UC
APL
AT
E
Pacific
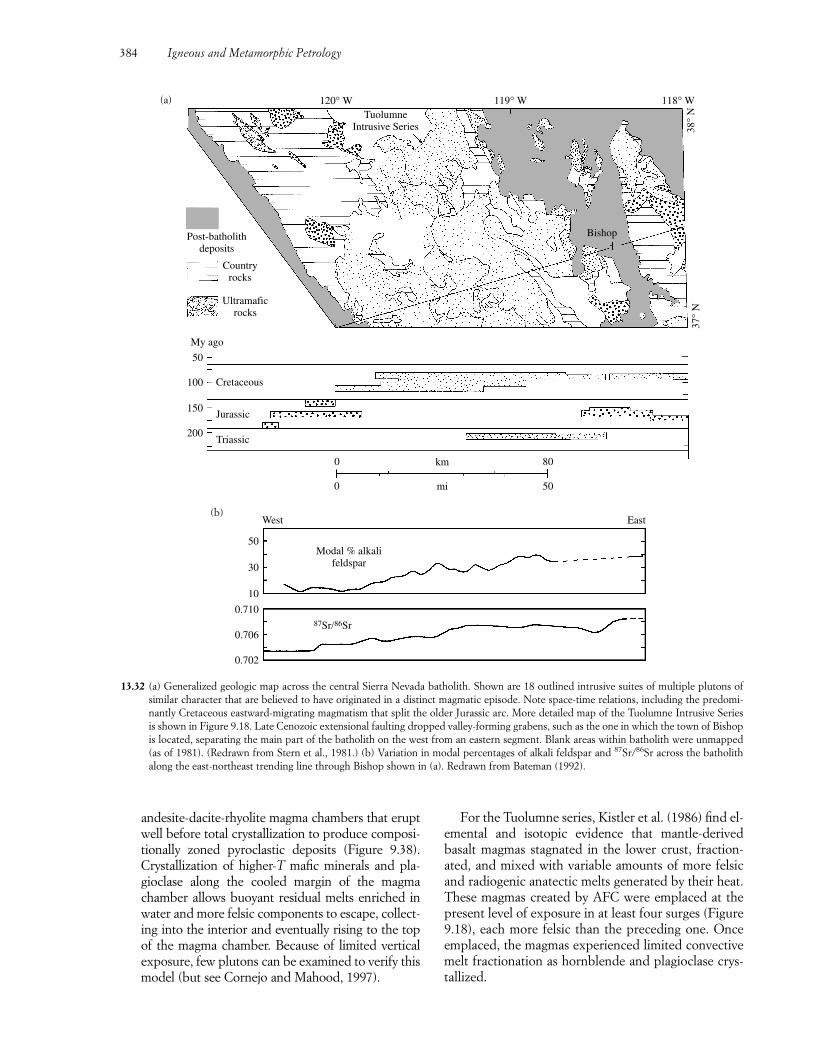
384 Igneous and Metamorphic Petrology
andesite-dacite-rhyolite magma chambers that eruptwell before total crystallization to produce composi-tionally zoned pyroclastic deposits (Figure 9.38).Crystallization of higher-T mafic minerals and pla-gioclase along the cooled margin of the magmachamber allows buoyant residual melts enriched inwater and more felsic components to escape, collect-ing into the interior and eventually rising to the topof the magma chamber. Because of limited verticalexposure, few plutons can be examined to verify thismodel (but see Cornejo and Mahood, 1997).
For the Tuolumne series, Kistler et al. (1986) find el-emental and isotopic evidence that mantle-derivedbasalt magmas stagnated in the lower crust, fraction-ated, and mixed with variable amounts of more felsicand radiogenic anatectic melts generated by their heat.These magmas created by AFC were emplaced at thepresent level of exposure in at least four surges (Figure9.18), each more felsic than the preceding one. Onceemplaced, the magmas experienced limited convectivemelt fractionation as hornblende and plagioclase crys-tallized.
13.32 (a) Generalized geologic map across the central Sierra Nevada batholith. Shown are 18 outlined intrusive suites of multiple plutons ofsimilar character that are believed to have originated in a distinct magmatic episode. Note space-time relations, including the predomi-nantly Cretaceous eastward-migrating magmatism that split the older Jurassic arc. More detailed map of the Tuolumne Intrusive Seriesis shown in Figure 9.18. Late Cenozoic extensional faulting dropped valley-forming grabens, such as the one in which the town of Bishopis located, separating the main part of the batholith on the west from an eastern segment. Blank areas within batholith were unmapped(as of 1981). (Redrawn from Stern et al., 1981.) (b) Variation in modal percentages of alkali feldspar and 87Sr/86Sr across the batholithalong the east-northeast trending line through Bishop shown in (a). Redrawn from Bateman (1992).
TuolumneIntrusive Series
120° W 119° W 118° W
Post-batholithdeposits
Countryrocks
Ultramaficrocks
My ago
50
100
150
200
Cretaceous
Jurassic
Triassic
0 km 80
0 mi 50
37° N
38° N
Bishop
0.710
10
30
50
0.706
0.702
87Sr/86Sr
West East
Modal % alkalifeldspar
(a)
(b)
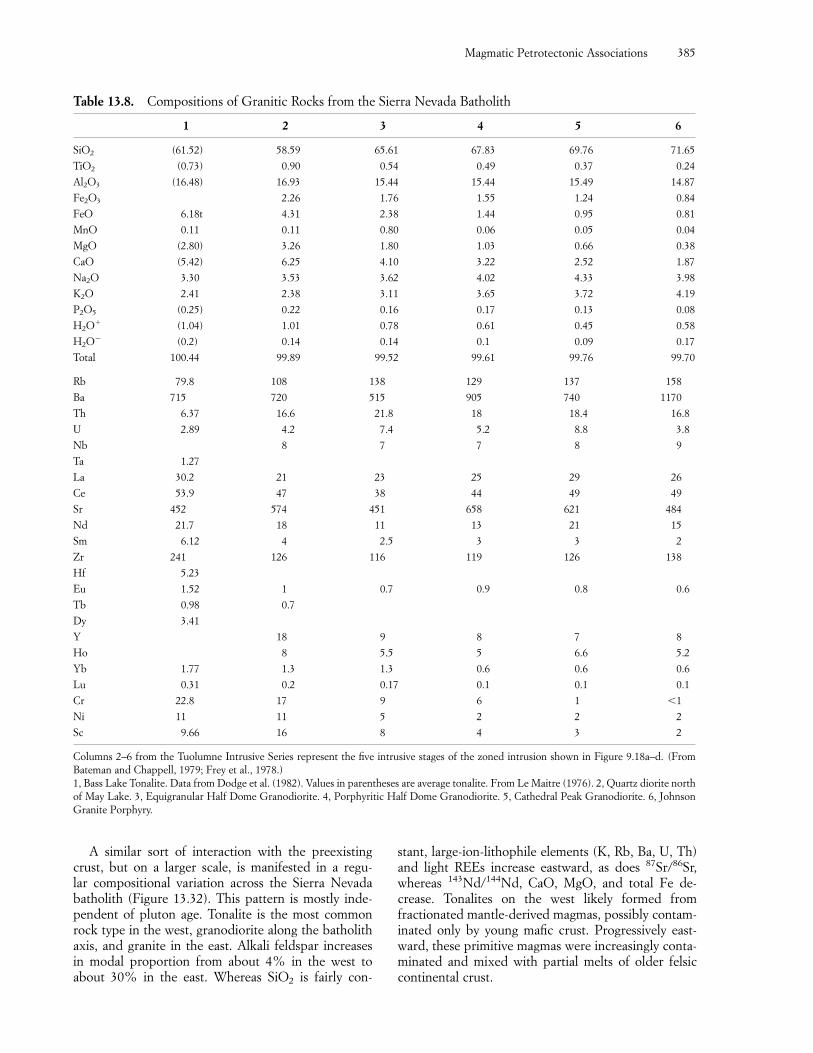
Magmatic Petrotectonic Associations 385
A similar sort of interaction with the preexistingcrust, but on a larger scale, is manifested in a regu-lar compositional variation across the Sierra Nevadabatholith (Figure 13.32). This pattern is mostly inde-pendent of pluton age. Tonalite is the most commonrock type in the west, granodiorite along the batholithaxis, and granite in the east. Alkali feldspar increases in modal proportion from about 4% in the west toabout 30% in the east. Whereas SiO2 is fairly con-
stant, large-ion-lithophile elements (K, Rb, Ba, U, Th)and light REEs increase eastward, as does 87Sr/86Sr,whereas 143Nd/144Nd, CaO, MgO, and total Fe de-crease. Tonalites on the west likely formed from fractionated mantle-derived magmas, possibly contam-inated only by young mafic crust. Progressively east-ward, these primitive magmas were increasingly conta-minated and mixed with partial melts of older felsiccontinental crust.
Table 13.8. Compositions of Granitic Rocks from the Sierra Nevada Batholith
1 2 3 4 5 6
SiO2 (61.52) 58.59 65.61 67.83 69.76 71.65
TiO2 (0.73) 0.90 0.54 0.49 0.37 0.24
Al2O3 (16.48) 16.93 15.44 15.44 15.49 14.87
Fe2O3 2.26 1.76 1.55 1.24 0.84
FeO 6.18t 4.31 2.38 1.44 0.95 0.81
MnO 0.11 0.11 0.80 0.06 0.05 0.04
MgO (2.80) 3.26 1.80 1.03 0.66 0.38
CaO (5.42) 6.25 4.10 3.22 2.52 1.87
Na2O 3.30 3.53 3.62 4.02 4.33 3.98
K2O 2.41 2.38 3.11 3.65 3.72 4.19
P2O5 (0.25) 0.22 0.16 0.17 0.13 0.08
H2O� (1.04) 1.01 0.78 0.61 0.45 0.58
H2O� (0.2) 0.14 0.14 0.1 0.09 0.17
Total 100.44 99.89 99.52 99.61 99.76 99.70
Rb 79.8 108 138 129 137 158
Ba 715 720 515 905 740 1170
Th 6.37 16.6 21.8 18 18.4 16.8
U 2.89 4.2 7.4 5.2 8.8 3.8
Nb 8 7 7 8 9
Ta 1.27
La 30.2 21 23 25 29 26
Ce 53.9 47 38 44 49 49
Sr 452 574 451 658 621 484
Nd 21.7 18 11 13 21 15
Sm 6.12 4 2.5 3 3 2
Zr 241 126 116 119 126 138
Hf 5.23
Eu 1.52 1 0.7 0.9 0.8 0.6
Tb 0.98 0.7
Dy 3.41
Y 18 9 8 7 8
Ho 8 5.5 5 6.6 5.2
Yb 1.77 1.3 1.3 0.6 0.6 0.6
Lu 0.31 0.2 0.17 0.1 0.1 0.1
Cr 22.8 17 9 6 1 �1
Ni 11 11 5 2 2 2
Sc 9.66 16 8 4 3 2
Columns 2–6 from the Tuolumne Intrusive Series represent the five intrusive stages of the zoned intrusion shown in Figure 9.18a–d. (FromBateman and Chappell, 1979; Frey et al., 1978.)1, Bass Lake Tonalite. Data from Dodge et al. (1982). Values in parentheses are average tonalite. From Le Maitre (1976). 2, Quartz diorite northof May Lake. 3, Equigranular Half Dome Granodiorite. 4, Porphyritic Half Dome Granodiorite. 5, Cathedral Peak Granodiorite. 6, JohnsonGranite Porphyry.
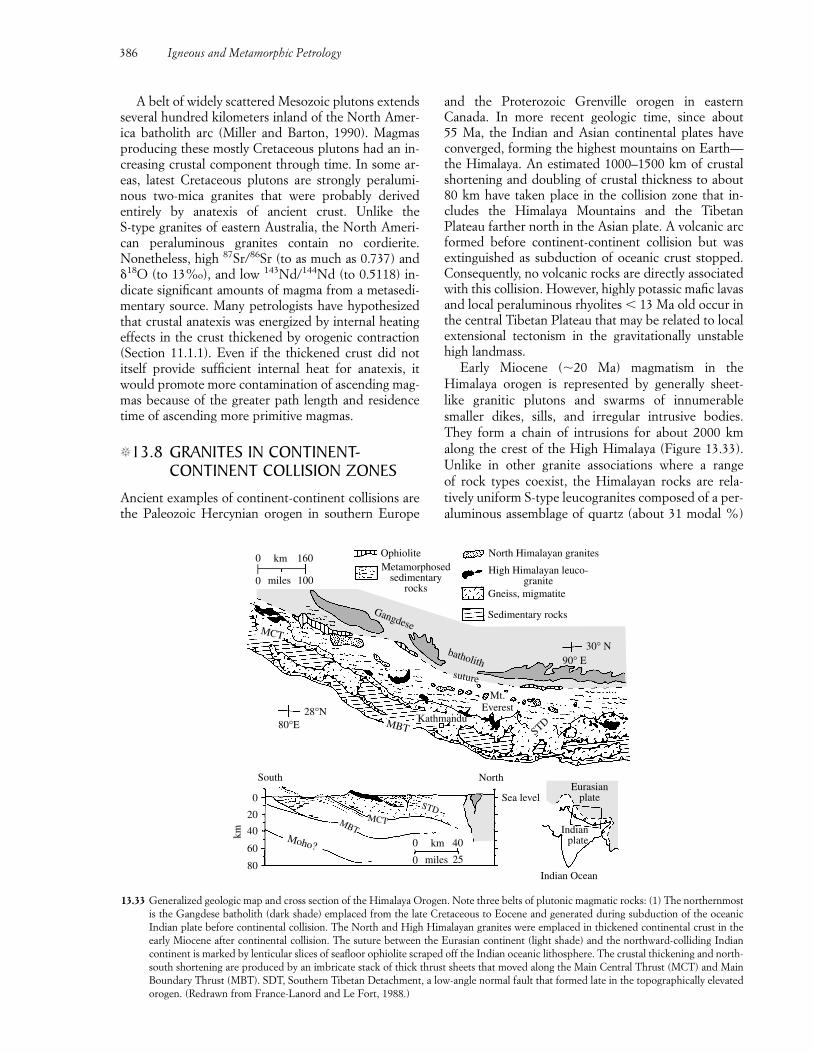
386 Igneous and Metamorphic Petrology
A belt of widely scattered Mesozoic plutons extendsseveral hundred kilometers inland of the North Amer-ica batholith arc (Miller and Barton, 1990). Magmasproducing these mostly Cretaceous plutons had an in-creasing crustal component through time. In some ar-eas, latest Cretaceous plutons are strongly peralumi-nous two-mica granites that were probably derivedentirely by anatexis of ancient crust. Unlike the S-type granites of eastern Australia, the North Ameri-can peraluminous granites contain no cordierite.Nonetheless, high 87Sr/86Sr (to as much as 0.737) and�18O (to 13%o), and low 143Nd/144Nd (to 0.5118) in-dicate significant amounts of magma from a metasedi-mentary source. Many petrologists have hypothesizedthat crustal anatexis was energized by internal heatingeffects in the crust thickened by orogenic contraction(Section 11.1.1). Even if the thickened crust did not itself provide sufficient internal heat for anatexis, itwould promote more contamination of ascending mag-mas because of the greater path length and residencetime of ascending more primitive magmas.
�13.8 GRANITES IN CONTINENT-CONTINENT COLLISION ZONES
Ancient examples of continent-continent collisions arethe Paleozoic Hercynian orogen in southern Europe
and the Proterozoic Grenville orogen in easternCanada. In more recent geologic time, since about 55 Ma, the Indian and Asian continental plates haveconverged, forming the highest mountains on Earth—the Himalaya. An estimated 1000–1500 km of crustalshortening and doubling of crustal thickness to about80 km have taken place in the collision zone that in-cludes the Himalaya Mountains and the TibetanPlateau farther north in the Asian plate. A volcanic arcformed before continent-continent collision but wasextinguished as subduction of oceanic crust stopped.Consequently, no volcanic rocks are directly associatedwith this collision. However, highly potassic mafic lavasand local peraluminous rhyolites � 13 Ma old occur inthe central Tibetan Plateau that may be related to localextensional tectonism in the gravitationally unstablehigh landmass.
Early Miocene (�20 Ma) magmatism in the Himalaya orogen is represented by generally sheet-like granitic plutons and swarms of innumerablesmaller dikes, sills, and irregular intrusive bodies.They form a chain of intrusions for about 2000 kmalong the crest of the High Himalaya (Figure 13.33).Unlike in other granite associations where a range of rock types coexist, the Himalayan rocks are rela-tively uniform S-type leucogranites composed of a per-aluminous assemblage of quartz (about 31 modal %)
13.33 Generalized geologic map and cross section of the Himalaya Orogen. Note three belts of plutonic magmatic rocks: (1) The northernmostis the Gangdese batholith (dark shade) emplaced from the late Cretaceous to Eocene and generated during subduction of the oceanicIndian plate before continental collision. The North and High Himalayan granites were emplaced in thickened continental crust in theearly Miocene after continental collision. The suture between the Eurasian continent (light shade) and the northward-colliding Indiancontinent is marked by lenticular slices of seafloor ophiolite scraped off the Indian oceanic lithosphere. The crustal thickening and north-south shortening are produced by an imbricate stack of thick thrust sheets that moved along the Main Central Thrust (MCT) and MainBoundary Thrust (MBT). SDT, Southern Tibetan Detachment, a low-angle normal fault that formed late in the topographically elevatedorogen. (Redrawn from France-Lanord and Le Fort, 1988.)
MCT
MBT
Gangdese
batholithsuture
90° E30° N
Mt.Everest
Eurasianplate
Kathmandu
MCTMBTMoho?
80
60
40
20
0
South North
28°N80°E
400
0 25
km
miles
Sea level
Indianplatekm
1600 km
0 100miles
OphioliteMetamorphosed
sedimentaryrocks
North Himalayan granites
High Himalayan leuco-granite
Gneiss, migmatite
Sedimentary rocks
STD
STD
Indian Ocean
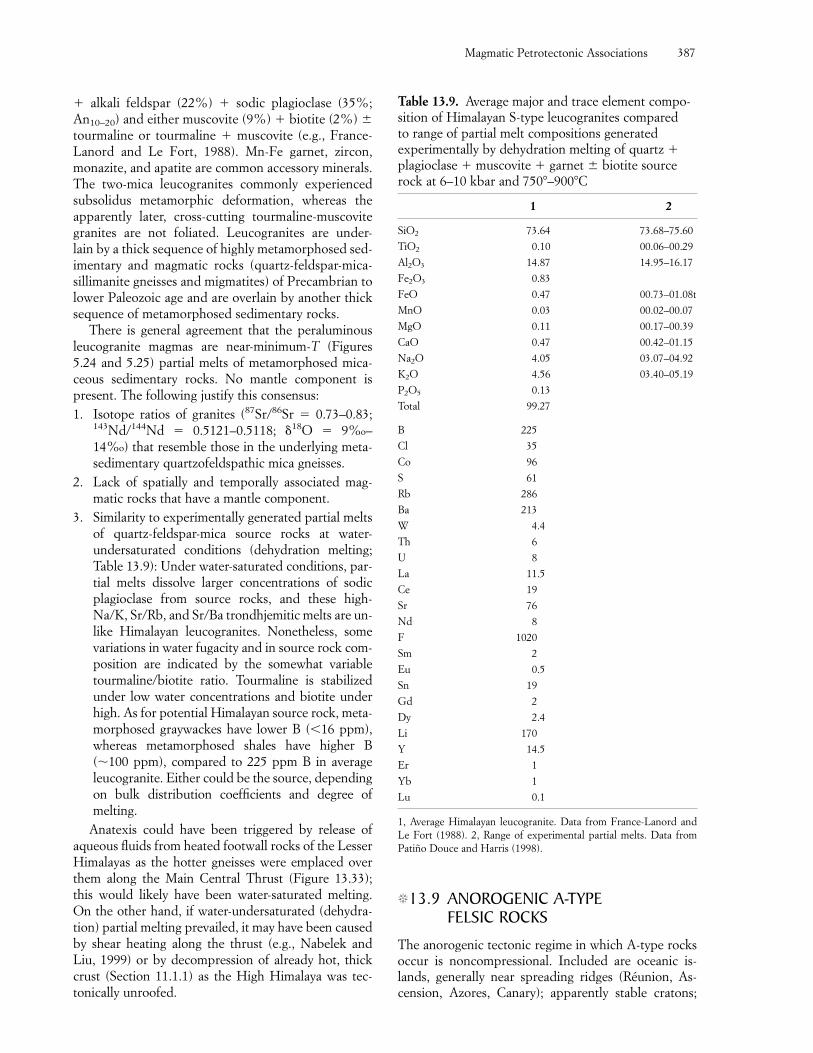
Magmatic Petrotectonic Associations 387
� alkali feldspar (22%) � sodic plagioclase (35%;An10–20) and either muscovite (9%) � biotite (2%) �tourmaline or tourmaline � muscovite (e.g., France-Lanord and Le Fort, 1988). Mn-Fe garnet, zircon,monazite, and apatite are common accessory minerals.The two-mica leucogranites commonly experiencedsubsolidus metamorphic deformation, whereas the apparently later, cross-cutting tourmaline-muscovitegranites are not foliated. Leucogranites are under-lain by a thick sequence of highly metamorphosed sed-imentary and magmatic rocks (quartz-feldspar-mica-sillimanite gneisses and migmatites) of Precambrian tolower Paleozoic age and are overlain by another thicksequence of metamorphosed sedimentary rocks.
There is general agreement that the peraluminousleucogranite magmas are near-minimum-T (Figures5.24 and 5.25) partial melts of metamorphosed mica-ceous sedimentary rocks. No mantle component is present. The following justify this consensus:1. Isotope ratios of granites (87Sr/86Sr � 0.73–0.83;
143Nd/144Nd � 0.5121–0.5118; �18O � 9%o–14%o) that resemble those in the underlying meta-sedimentary quartzofeldspathic mica gneisses.
2. Lack of spatially and temporally associated mag-matic rocks that have a mantle component.
3. Similarity to experimentally generated partial meltsof quartz-feldspar-mica source rocks at water-undersaturated conditions (dehydration melting;Table 13.9): Under water-saturated conditions, par-tial melts dissolve larger concentrations of sodicplagioclase from source rocks, and these high-Na/K, Sr/Rb, and Sr/Ba trondhjemitic melts are un-like Himalayan leucogranites. Nonetheless, somevariations in water fugacity and in source rock com-position are indicated by the somewhat variabletourmaline/biotite ratio. Tourmaline is stabilizedunder low water concentrations and biotite underhigh. As for potential Himalayan source rock, meta-morphosed graywackes have lower B (�16 ppm),whereas metamorphosed shales have higher B(�100 ppm), compared to 225 ppm B in averageleucogranite. Either could be the source, dependingon bulk distribution coefficients and degree ofmelting.
Anatexis could have been triggered by release ofaqueous fluids from heated footwall rocks of the LesserHimalayas as the hotter gneisses were emplaced overthem along the Main Central Thrust (Figure 13.33);this would likely have been water-saturated melting.On the other hand, if water-undersaturated (dehydra-tion) partial melting prevailed, it may have been causedby shear heating along the thrust (e.g., Nabelek andLiu, 1999) or by decompression of already hot, thickcrust (Section 11.1.1) as the High Himalaya was tec-tonically unroofed.
�13.9 ANOROGENIC A-TYPE FELSIC ROCKS
The anorogenic tectonic regime in which A-type rocksoccur is noncompressional. Included are oceanic is-lands, generally near spreading ridges (Réunion, As-cension, Azores, Canary); apparently stable cratons;
Table 13.9. Average major and trace element compo-sition of Himalayan S-type leucogranites compared to range of partial melt compositions generated experimentally by dehydration melting of quartz �plagioclase � muscovite � garnet � biotite sourcerock at 6–10 kbar and 750�–900�C
1 2
SiO2 73.64 73.68–75.60
TiO2 0.10 00.06–00.29
Al2O3 14.87 14.95–16.17
Fe2O3 0.83
FeO 0.47 00.73–01.08t
MnO 0.03 00.02–00.07
MgO 0.11 00.17–00.39
CaO 0.47 00.42–01.15
Na2O 4.05 03.07–04.92
K2O 4.56 03.40–05.19
P2O5 0.13
Total 99.27
B 225
Cl 35
Co 96
S 61
Rb 286
Ba 213
W 4.4
Th 6
U 8
La 11.5
Ce 19
Sr 76
Nd 8
F 1020
Sm 2
Eu 0.5
Sn 19
Gd 2
Dy 2.4
Li 170
Y 14.5
Er 1
Yb 1
Lu 0.1
1, Average Himalayan leucogranite. Data from France-Lanord andLe Fort (1988). 2, Range of experimental partial melts. Data fromPatiño Douce and Harris (1998).
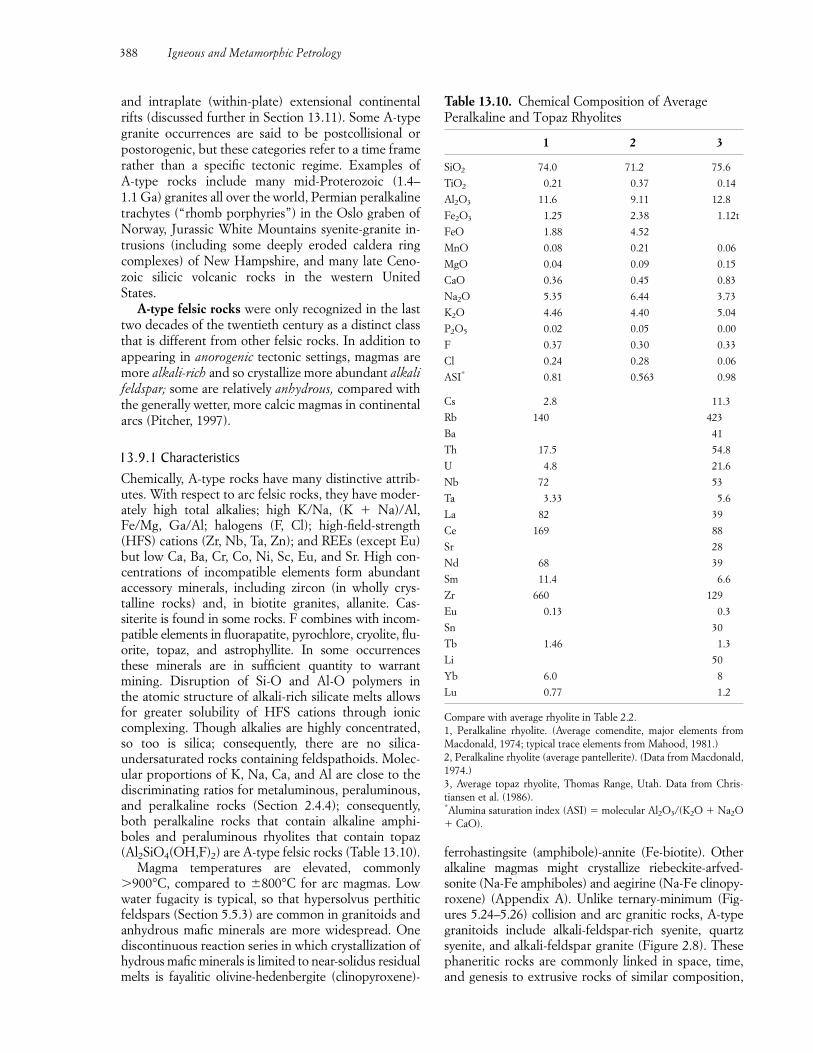
and intraplate (within-plate) extensional continentalrifts (discussed further in Section 13.11). Some A-typegranite occurrences are said to be postcollisional orpostorogenic, but these categories refer to a time framerather than a specific tectonic regime. Examples of A-type rocks include many mid-Proterozoic (1.4–1.1 Ga) granites all over the world, Permian peralkalinetrachytes (“rhomb porphyries”) in the Oslo graben ofNorway, Jurassic White Mountains syenite-granite in-trusions (including some deeply eroded caldera ringcomplexes) of New Hampshire, and many late Ceno-zoic silicic volcanic rocks in the western United States.
A-type felsic rocks were only recognized in the lasttwo decades of the twentieth century as a distinct classthat is different from other felsic rocks. In addition toappearing in anorogenic tectonic settings, magmas aremore alkali-rich and so crystallize more abundant alkalifeldspar; some are relatively anhydrous, compared withthe generally wetter, more calcic magmas in continentalarcs (Pitcher, 1997).
13.9.1 CharacteristicsChemically, A-type rocks have many distinctive attrib-utes. With respect to arc felsic rocks, they have moder-ately high total alkalies; high K/Na, (K � Na)/Al,Fe/Mg, Ga/Al; halogens (F, Cl); high-field-strength(HFS) cations (Zr, Nb, Ta, Zn); and REEs (except Eu)but low Ca, Ba, Cr, Co, Ni, Sc, Eu, and Sr. High con-centrations of incompatible elements form abundantaccessory minerals, including zircon (in wholly crys-talline rocks) and, in biotite granites, allanite. Cas-siterite is found in some rocks. F combines with incom-patible elements in fluorapatite, pyrochlore, cryolite, flu-orite, topaz, and astrophyllite. In some occurrencesthese minerals are in sufficient quantity to warrant mining. Disruption of Si-O and Al-O polymers in the atomic structure of alkali-rich silicate melts allowsfor greater solubility of HFS cations through ioniccomplexing. Though alkalies are highly concentrated,so too is silica; consequently, there are no silica-undersaturated rocks containing feldspathoids. Molec-ular proportions of K, Na, Ca, and Al are close to thediscriminating ratios for metaluminous, peraluminous,and peralkaline rocks (Section 2.4.4); consequently,both peralkaline rocks that contain alkaline amphi-boles and peraluminous rhyolites that contain topaz(Al2SiO4(OH,F)2) are A-type felsic rocks (Table 13.10).
Magma temperatures are elevated, commonly�900°C, compared to �800°C for arc magmas. Lowwater fugacity is typical, so that hypersolvus perthiticfeldspars (Section 5.5.3) are common in granitoids andanhydrous mafic minerals are more widespread. Onediscontinuous reaction series in which crystallization ofhydrous mafic minerals is limited to near-solidus residualmelts is fayalitic olivine-hedenbergite (clinopyroxene)-
ferrohastingsite (amphibole)-annite (Fe-biotite). Otheralkaline magmas might crystallize riebeckite-arfved-sonite (Na-Fe amphiboles) and aegirine (Na-Fe clinopy-roxene) (Appendix A). Unlike ternary-minimum (Fig-ures 5.24–5.26) collision and arc granitic rocks, A-typegranitoids include alkali-feldspar-rich syenite, quartzsyenite, and alkali-feldspar granite (Figure 2.8). Thesephaneritic rocks are commonly linked in space, time,and genesis to extrusive rocks of similar composition,
388 Igneous and Metamorphic Petrology
Table 13.10. Chemical Composition of Average Peralkaline and Topaz Rhyolites
1 2 3
SiO2 74.0 71.2 75.6
TiO2 0.21 0.37 0.14
Al2O3 11.6 9.11 12.8
Fe2O3 1.25 2.38 1.12t
FeO 1.88 4.52
MnO 0.08 0.21 0.06
MgO 0.04 0.09 0.15
CaO 0.36 0.45 0.83
Na2O 5.35 6.44 3.73
K2O 4.46 4.40 5.04
P2O5 0.02 0.05 0.00
F 0.37 0.30 0.33
Cl 0.24 0.28 0.06
ASI* 0.81 0.563 0.98
Cs 2.8 11.3
Rb 140 423
Ba 41
Th 17.5 54.8
U 4.8 21.6
Nb 72 53
Ta 3.33 5.6
La 82 39
Ce 169 88
Sr 28
Nd 68 39
Sm 11.4 6.6
Zr 660 129
Eu 0.13 0.3
Sn 30
Tb 1.46 1.3
Li 50
Yb 6.0 8
Lu 0.77 1.2
Compare with average rhyolite in Table 2.2. 1, Peralkaline rhyolite. (Average comendite, major elements fromMacdonald, 1974; typical trace elements from Mahood, 1981.)2, Peralkaline rhyolite (average pantellerite). (Data from Macdonald,1974.)3, Average topaz rhyolite, Thomas Range, Utah. Data from Chris-tiansen et al. (1986).*Alumina saturation index (ASI) � molecular Al2O3/(K2O � Na2O� CaO).
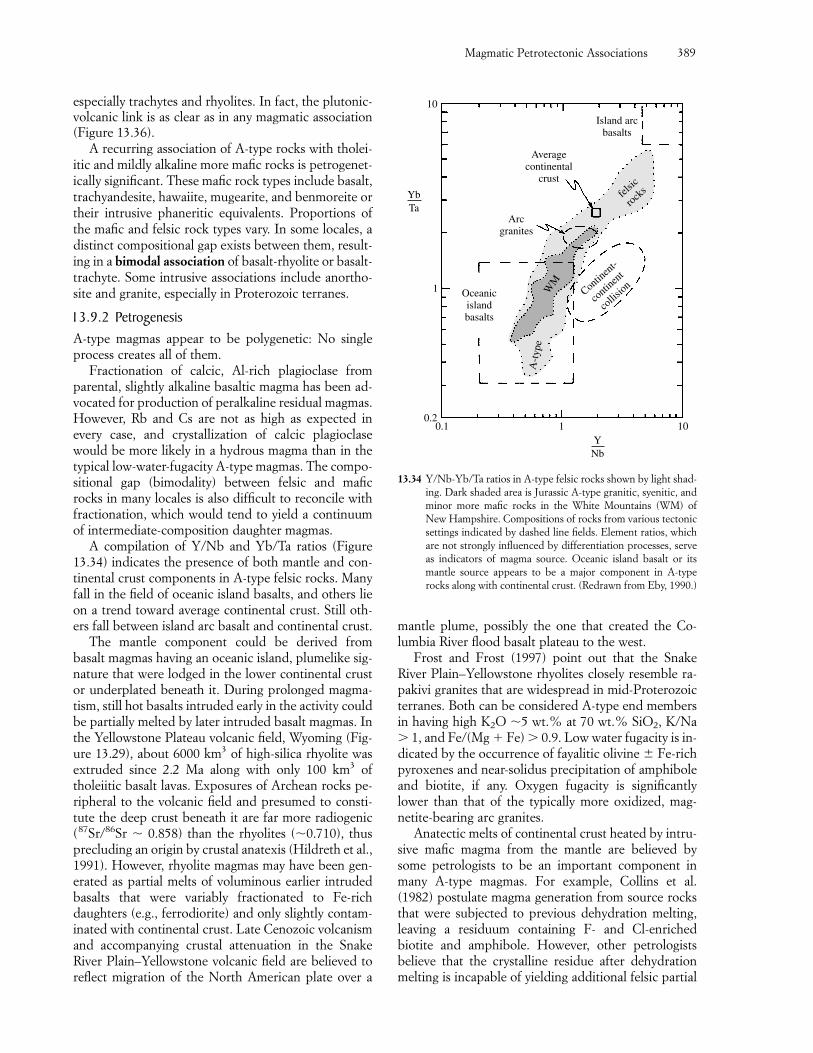
Magmatic Petrotectonic Associations 389
especially trachytes and rhyolites. In fact, the plutonic-volcanic link is as clear as in any magmatic association(Figure 13.36).
A recurring association of A-type rocks with tholei-itic and mildly alkaline more mafic rocks is petrogenet-ically significant. These mafic rock types include basalt,trachyandesite, hawaiite, mugearite, and benmoreite ortheir intrusive phaneritic equivalents. Proportions ofthe mafic and felsic rock types vary. In some locales, adistinct compositional gap exists between them, result-ing in a bimodal association of basalt-rhyolite or basalt-trachyte. Some intrusive associations include anortho-site and granite, especially in Proterozoic terranes.
13.9.2 PetrogenesisA-type magmas appear to be polygenetic: No singleprocess creates all of them.
Fractionation of calcic, Al-rich plagioclase fromparental, slightly alkaline basaltic magma has been ad-vocated for production of peralkaline residual magmas.However, Rb and Cs are not as high as expected inevery case, and crystallization of calcic plagioclasewould be more likely in a hydrous magma than in thetypical low-water-fugacity A-type magmas. The compo-sitional gap (bimodality) between felsic and maficrocks in many locales is also difficult to reconcile withfractionation, which would tend to yield a continuumof intermediate-composition daughter magmas.
A compilation of Y/Nb and Yb/Ta ratios (Figure13.34) indicates the presence of both mantle and con-tinental crust components in A-type felsic rocks. Manyfall in the field of oceanic island basalts, and others lieon a trend toward average continental crust. Still oth-ers fall between island arc basalt and continental crust.
The mantle component could be derived frombasalt magmas having an oceanic island, plumelike sig-nature that were lodged in the lower continental crustor underplated beneath it. During prolonged magma-tism, still hot basalts intruded early in the activity couldbe partially melted by later intruded basalt magmas. Inthe Yellowstone Plateau volcanic field, Wyoming (Fig-ure 13.29), about 6000 km3 of high-silica rhyolite wasextruded since 2.2 Ma along with only 100 km3 oftholeiitic basalt lavas. Exposures of Archean rocks pe-ripheral to the volcanic field and presumed to consti-tute the deep crust beneath it are far more radiogenic(87Sr/86Sr � 0.858) than the rhyolites (�0.710), thusprecluding an origin by crustal anatexis (Hildreth et al.,1991). However, rhyolite magmas may have been gen-erated as partial melts of voluminous earlier intrudedbasalts that were variably fractionated to Fe-richdaughters (e.g., ferrodiorite) and only slightly contam-inated with continental crust. Late Cenozoic volcanismand accompanying crustal attenuation in the SnakeRiver Plain–Yellowstone volcanic field are believed toreflect migration of the North American plate over a
mantle plume, possibly the one that created the Co-lumbia River flood basalt plateau to the west.
Frost and Frost (1997) point out that the SnakeRiver Plain–Yellowstone rhyolites closely resemble ra-pakivi granites that are widespread in mid-Proterozoicterranes. Both can be considered A-type end membersin having high K2O �5 wt.% at 70 wt.% SiO2, K/Na� 1, and Fe/(Mg � Fe) � 0.9. Low water fugacity is in-dicated by the occurrence of fayalitic olivine � Fe-richpyroxenes and near-solidus precipitation of amphiboleand biotite, if any. Oxygen fugacity is significantlylower than that of the typically more oxidized, mag-netite-bearing arc granites.
Anatectic melts of continental crust heated by intru-sive mafic magma from the mantle are believed bysome petrologists to be an important component inmany A-type magmas. For example, Collins et al.(1982) postulate magma generation from source rocksthat were subjected to previous dehydration melting,leaving a residuum containing F- and Cl-enriched biotite and amphibole. However, other petrologists believe that the crystalline residue after dehydrationmelting is incapable of yielding additional felsic partial
13.34 Y/Nb-Yb/Ta ratios in A-type felsic rocks shown by light shad-ing. Dark shaded area is Jurassic A-type granitic, syenitic, andminor more mafic rocks in the White Mountains (WM) ofNew Hampshire. Compositions of rocks from various tectonicsettings indicated by dashed line fields. Element ratios, whichare not strongly influenced by differentiation processes, serveas indicators of magma source. Oceanic island basalt or itsmantle source appears to be a major component in A-typerocks along with continental crust. (Redrawn from Eby, 1990.)
felsic
rocks
WM
A-t
ype
Oceanicislandbasalts
Arcgranites
Averagecontinental
crust
Island arcbasalts
Contin
ent-
conti
nent
collis
ion
YNb
0.21 100.1
10
1
YbTa
390 Igneous and Metamorphic Petrology
melts. They instead propose, as did T.F.W. Barth in themid-1900s for the Oslo, Norway, rocks, dehydrationmelting of tonalite or granodiorite, which could havebeen produced in an immediately preceding, or in anancient, episode of arc magmatism. Patiño Douce(1997) finds that high-T anatexis in the shallow crust (Pless than or equal to 4 kbar) of arc source rocks con-taining only limited amounts of biotite and amphiboleyields melts that have major-element compositions sim-ilar to that of A-type granitoids. Because the residue ismostly calcic plagioclase and orthopyroxene, partialmelts contain virtually all of the F and Cl from thesource and have high Ga/Al (Ga is incompatible in theresidual minerals), Fe/Mg, K/Na, and (Na � K)/Cabut low compatible Ca, Sr, and Eu. Low Ni, Cr, and Coin the melts reflect low concentrations in the source.However, the partial melts of arc rocks would have anegative Nb-Ta anomaly and Rb/Nb would be high—neither of which is characteristic of A-type felsic rocks.
13.9.3 Anorogenic Ring Complexes in Nigeria and NigerThe classic A-type rocks lie within a diffuse north-south belt of ring complexes in Nigeria and Niger incentral Africa (Figure 13.35). An imperfect southwardmigration from Silurian to Jurassic together with localdoming might suggest movement of the African plateover a mantle plume. However, some geologists work-ing in Africa (e.g., Bowden et al., 1987) believe that thebelt originated as a result of reactivation of Precam-brian zones of weakness—faults—in the craton. Thereason for the overall southward migration of activityin the belt for 250 My and the migration of activity in aparticular string of complexes, as well as the magmaheat source, remains uncertain.
Although basaltic rocks occupy only a small propor-tion of exposures in the ring complexes, the role ofbasalt magmas in the evolution of the bimodal mafic-felsic association cannot be overlooked. There are earlybasalt lavas and basalt inclusions in granites—some ofwhich are pillowlike, indicating mingling of basalticand granitic magmas—and minor late basalt dikes. Theamazing 65-km-diameter Meugueur-Meugueur conesheet consists of troctolite (olivine � plagioclase gab-bro) and encompasses a 900-km2 anorthosite-leuco-gabbro body intruded by A-type granites and syenites(Figure 9.24). The petrogenetic linking of basalt,anorthosite, and granite/syenite seems strong. In otherring complexes, most precursory basalt magmas mayhave lodged deep in the crust, where they promotedgeneration of felsic magmas, some of which ascendedhigh enough to erupt along ring fractures and vent asash flows (Figure 13.36). The collapsed calderas out-lined by the ring dikes partially filled with ignimbrite.Late biotite granite magmas rose into the volcanicroots.
�13.10 GRANITES AND GRANITES
It should be obvious by now that a variety of graniticrocks develop in several different tectonic settings, in-cluding the following:1. Granophyric plagiogranite in ophiolite sequences
(Section 13.6.1); most (all?) sequences appear tohave formed in arc settings.
2. Granophyre in differentiated basalt sills (Section12.4.1) and layered intrusions (Section 12.4.2),both likely associated with mantle plumes.
3. Dioritic differentiates in island arcs.4. Granodiorite and lesser associated gabbro, tonalite,
granite, and dioritic rock in huge batholiths of con-tinental arcs (Section 13.6.2). Both I- and S-typesare represented.
5. S-type leucogranite in continent-continent collisionzones (Section 13.8).
6. A-type granite and syenite in anorogenic regimes(13.9); these are especially significant in the mid-Proterozoic.
7. A chiefly Archean association of tonalite-trond-hjemite-granodiorite and generally younger Archeanand Proterozoic granitic rocks (Chapter 19).
The first three occurrences have only minor volumes ofgranitic rock, but locally large volumes of leucograniteoccur in continent-continent collision zones. Thelargest volumes of granitic rock are found in continen-tal arcs and in the Precambrian occurrences.
Since Read (1957) and other early workers wrote of“granites and granites,” petrologists have consideredand debated granites from several different perspec-tives—all intending to cast some light on understand-ing the origin of these multifaceted, polygenetic rockmasses (e.g., Clarke, 1992; Pitcher, 1997). In additionto tectonic setting, granites have been categorized withrespect to1. Time of emplacement relative to regional deforma-
tion or tectonism (pre-, syn-, and posttectonic)2. Several chemical and isotopic attributes (e.g., per-
alkaline, peraluminous, and metaluminous; radio-genic and nonradiogenic; high and low �18O)
3. Modal composition (leucogranite, granite, granodi-orite, and so on)
4. Fabric related to degree of water saturation (hyper-solvus and subsolvus) or other special conditions ofmagma evolution (porphyry, rapakivi)
5. Mechanism of ascent through the crust (diapir ver-sus dike)
6. Depth of final crystallization (for example, stabi-lized epidote at high P)
7. Source (S- and I-type) and degree of crustal con-tamination
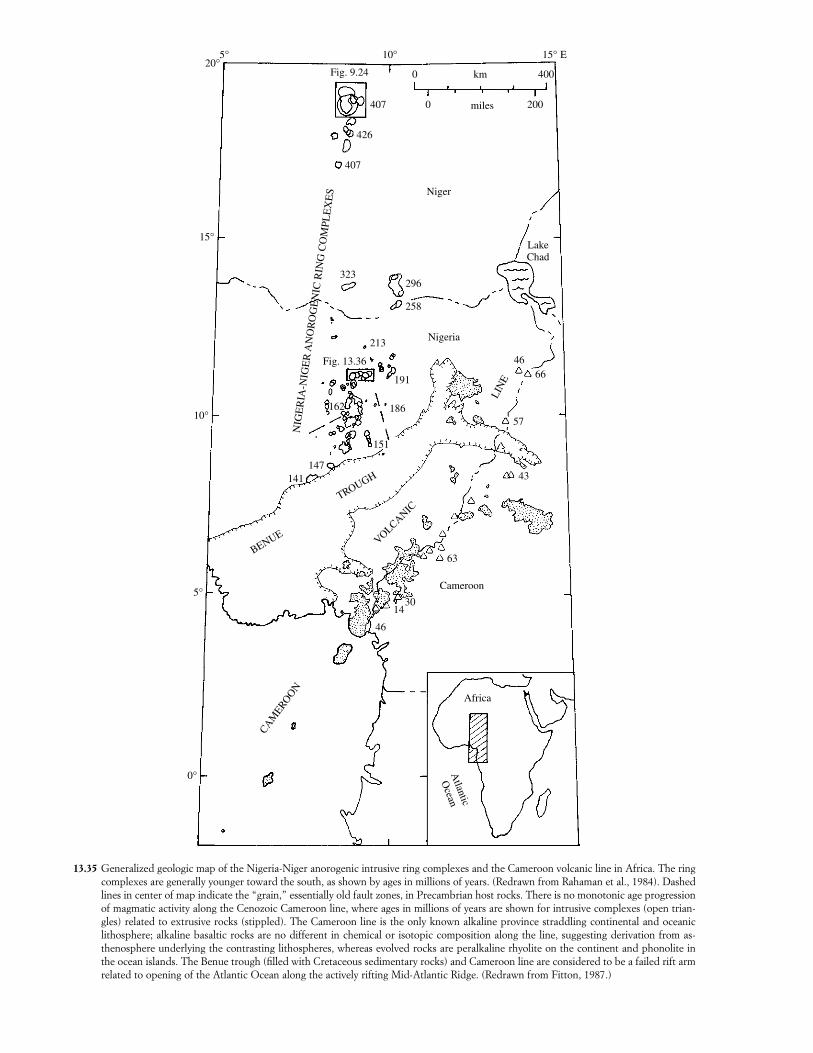
13.35 Generalized geologic map of the Nigeria-Niger anorogenic intrusive ring complexes and the Cameroon volcanic line in Africa. The ringcomplexes are generally younger toward the south, as shown by ages in millions of years. (Redrawn from Rahaman et al., 1984). Dashedlines in center of map indicate the “grain,” essentially old fault zones, in Precambrian host rocks. There is no monotonic age progressionof magmatic activity along the Cenozoic Cameroon line, where ages in millions of years are shown for intrusive complexes (open trian-gles) related to extrusive rocks (stippled). The Cameroon line is the only known alkaline province straddling continental and oceaniclithosphere; alkaline basaltic rocks are no different in chemical or isotopic composition along the line, suggesting derivation from as-thenosphere underlying the contrasting lithospheres, whereas evolved rocks are peralkaline rhyolite on the continent and phonolite inthe ocean islands. The Benue trough (filled with Cretaceous sedimentary rocks) and Cameroon line are considered to be a failed rift armrelated to opening of the Atlantic Ocean along the actively rifting Mid-Atlantic Ridge. (Redrawn from Fitton, 1987.)
5°20°
10° 15° Ε
15°
10°
5°
0°
CAM
ERO
ON
BENUE VOLCANIC
TROUGH
Atlantic
Ocean
Africa
30
63
14
46
43
57
6646
258
213
191
186
151
147141
162
296
Nigeria
Fig. 13.36
NIG
ER
IA-N
IGE
R A
NO
RO
GE
NIC
RIN
G C
OM
PLE
XE
S
323
407
426
407
0 400
2000
km
miles
LakeChad
LIN
E
Cameroon
Fig. 9.24
Niger
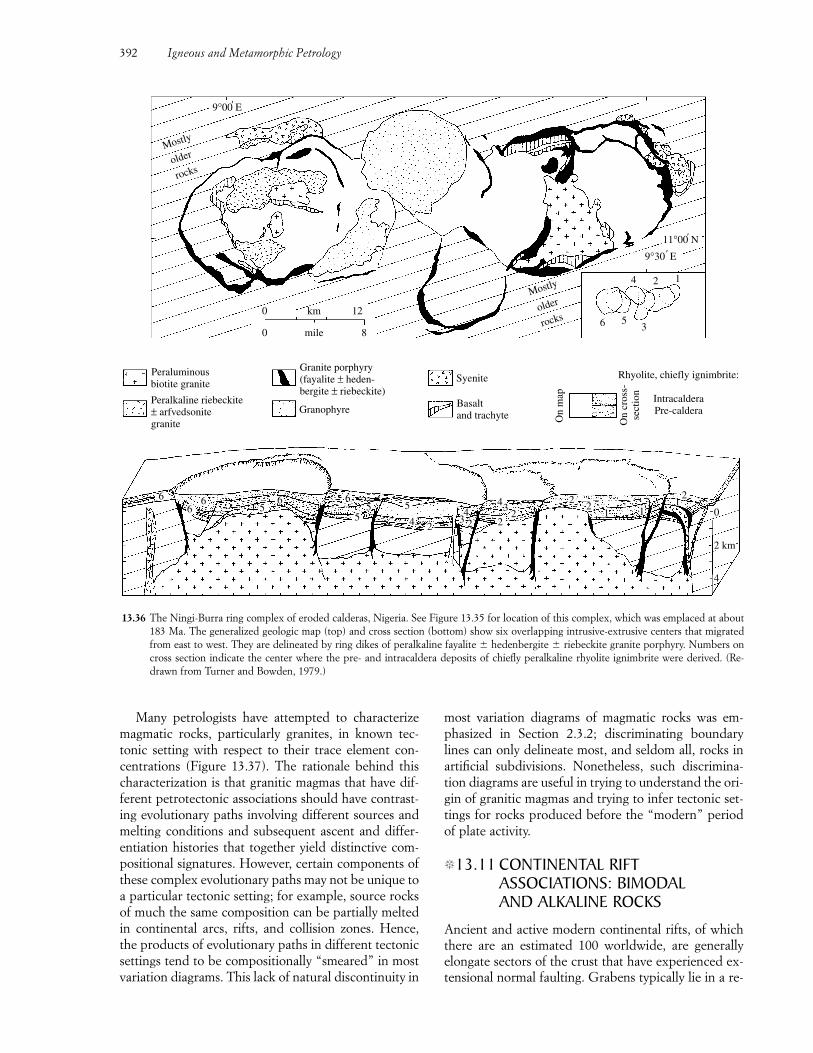
Many petrologists have attempted to characterizemagmatic rocks, particularly granites, in known tec-tonic setting with respect to their trace element con-centrations (Figure 13.37). The rationale behind thischaracterization is that granitic magmas that have dif-ferent petrotectonic associations should have contrast-ing evolutionary paths involving different sources andmelting conditions and subsequent ascent and differ-entiation histories that together yield distinctive com-positional signatures. However, certain components ofthese complex evolutionary paths may not be unique toa particular tectonic setting; for example, source rocksof much the same composition can be partially meltedin continental arcs, rifts, and collision zones. Hence,the products of evolutionary paths in different tectonicsettings tend to be compositionally “smeared” in mostvariation diagrams. This lack of natural discontinuity in
most variation diagrams of magmatic rocks was em-phasized in Section 2.3.2; discriminating boundarylines can only delineate most, and seldom all, rocks inartificial subdivisions. Nonetheless, such discrimina-tion diagrams are useful in trying to understand the ori-gin of granitic magmas and trying to infer tectonic set-tings for rocks produced before the “modern” periodof plate activity.
�13.11 CONTINENTAL RIFTASSOCIATIONS: BIMODAL AND ALKALINE ROCKS
Ancient and active modern continental rifts, of whichthere are an estimated 100 worldwide, are generallyelongate sectors of the crust that have experienced ex-tensional normal faulting. Grabens typically lie in a re-
392 Igneous and Metamorphic Petrology
13.36 The Ningi-Burra ring complex of eroded calderas, Nigeria. See Figure 13.35 for location of this complex, which was emplaced at about183 Ma. The generalized geologic map (top) and cross section (bottom) show six overlapping intrusive-extrusive centers that migratedfrom east to west. They are delineated by ring dikes of peralkaline fayalite � hedenbergite � riebeckite granite porphyry. Numbers oncross section indicate the center where the pre- and intracaldera deposits of chiefly peralkaline rhyolite ignimbrite were derived. (Re-drawn from Turner and Bowden, 1979.)
Granite porphyry(fayalite ± heden-bergite ± riebeckite)
GranophyrePeralkaline riebeckite± arfvedsonitegranite
Peraluminousbiotite granite
On
map
Syenite
Basaltand trachyte
On
cros
s-se
ctio
n
Rhyolite, chiefly ignimbrite:
IntracalderaPre-caldera
6 53
4 2 1
11°00' N
9°30' E
rocksolder
Mostly
0 mile 8
0 km 12
Mostly
older
rocks
9°00' E
66
65
6 65
55
4 2342 2
22
21 1
10
2 km
4
234
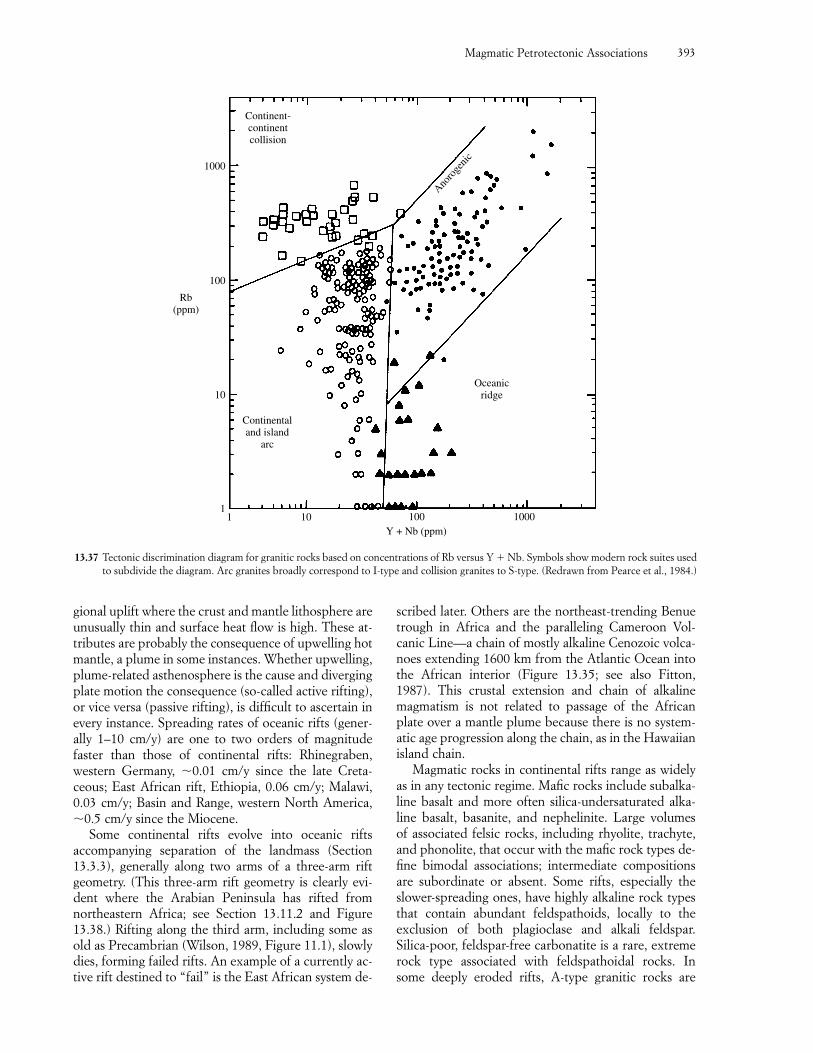
gional uplift where the crust and mantle lithosphere areunusually thin and surface heat flow is high. These at-tributes are probably the consequence of upwelling hotmantle, a plume in some instances. Whether upwelling,plume-related asthenosphere is the cause and divergingplate motion the consequence (so-called active rifting),or vice versa (passive rifting), is difficult to ascertain inevery instance. Spreading rates of oceanic rifts (gener-ally 1–10 cm/y) are one to two orders of magnitudefaster than those of continental rifts: Rhinegraben,western Germany, �0.01 cm/y since the late Creta-ceous; East African rift, Ethiopia, 0.06 cm/y; Malawi, 0.03 cm/y; Basin and Range, western North America,�0.5 cm/y since the Miocene.
Some continental rifts evolve into oceanic rifts accompanying separation of the landmass (Section13.3.3), generally along two arms of a three-arm riftgeometry. (This three-arm rift geometry is clearly evi-dent where the Arabian Peninsula has rifted fromnortheastern Africa; see Section 13.11.2 and Figure13.38.) Rifting along the third arm, including some asold as Precambrian (Wilson, 1989, Figure 11.1), slowlydies, forming failed rifts. An example of a currently ac-tive rift destined to “fail” is the East African system de-
scribed later. Others are the northeast-trending Benuetrough in Africa and the paralleling Cameroon Vol-canic Line—a chain of mostly alkaline Cenozoic volca-noes extending 1600 km from the Atlantic Ocean intothe African interior (Figure 13.35; see also Fitton,1987). This crustal extension and chain of alkalinemagmatism is not related to passage of the Africanplate over a mantle plume because there is no system-atic age progression along the chain, as in the Hawaiianisland chain.
Magmatic rocks in continental rifts range as widelyas in any tectonic regime. Mafic rocks include subalka-line basalt and more often silica-undersaturated alka-line basalt, basanite, and nephelinite. Large volumes of associated felsic rocks, including rhyolite, trachyte,and phonolite, that occur with the mafic rock types de-fine bimodal associations; intermediate compositionsare subordinate or absent. Some rifts, especially theslower-spreading ones, have highly alkaline rock typesthat contain abundant feldspathoids, locally to the exclusion of both plagioclase and alkali feldspar. Silica-poor, feldspar-free carbonatite is a rare, extremerock type associated with feldspathoidal rocks. In some deeply eroded rifts, A-type granitic rocks are
Magmatic Petrotectonic Associations 393
13.37 Tectonic discrimination diagram for granitic rocks based on concentrations of Rb versus Y � Nb. Symbols show modern rock suites usedto subdivide the diagram. Arc granites broadly correspond to I-type and collision granites to S-type. (Redrawn from Pearce et al., 1984.)
1 10 100 1000 Y + Nb (ppm)
1
10
100
1000
Rb(ppm)
Continent-continentcollision
Anoro
geni
c
Oceanicridge
Continentaland island
arc
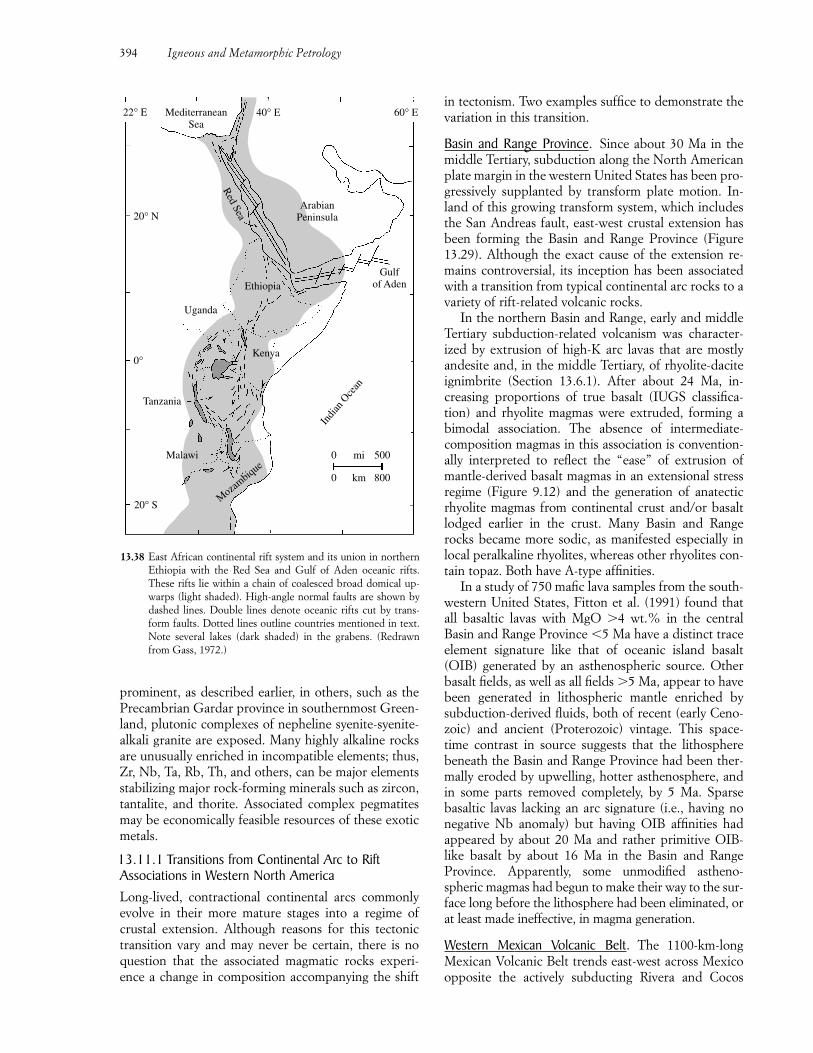
prominent, as described earlier, in others, such as the Precambrian Gardar province in southernmost Green-land, plutonic complexes of nepheline syenite-syenite-alkali granite are exposed. Many highly alkaline rocksare unusually enriched in incompatible elements; thus,Zr, Nb, Ta, Rb, Th, and others, can be major elementsstabilizing major rock-forming minerals such as zircon,tantalite, and thorite. Associated complex pegmatitesmay be economically feasible resources of these exoticmetals.
13.11.1 Transitions from Continental Arc to RiftAssociations in Western North AmericaLong-lived, contractional continental arcs commonlyevolve in their more mature stages into a regime ofcrustal extension. Although reasons for this tectonictransition vary and may never be certain, there is noquestion that the associated magmatic rocks experi-ence a change in composition accompanying the shift
in tectonism. Two examples suffice to demonstrate thevariation in this transition.
Basin and Range Province. Since about 30 Ma in themiddle Tertiary, subduction along the North Americanplate margin in the western United States has been pro-gressively supplanted by transform plate motion. In-land of this growing transform system, which includesthe San Andreas fault, east-west crustal extension hasbeen forming the Basin and Range Province (Figure13.29). Although the exact cause of the extension re-mains controversial, its inception has been associatedwith a transition from typical continental arc rocks to avariety of rift-related volcanic rocks.
In the northern Basin and Range, early and middleTertiary subduction-related volcanism was character-ized by extrusion of high-K arc lavas that are mostly andesite and, in the middle Tertiary, of rhyolite-dacite ignimbrite (Section 13.6.1). After about 24 Ma, in-creasing proportions of true basalt (IUGS classifica-tion) and rhyolite magmas were extruded, forming a bimodal association. The absence of intermediate-composition magmas in this association is convention-ally interpreted to reflect the “ease” of extrusion ofmantle-derived basalt magmas in an extensional stressregime (Figure 9.12) and the generation of anatecticrhyolite magmas from continental crust and/or basaltlodged earlier in the crust. Many Basin and Rangerocks became more sodic, as manifested especially inlocal peralkaline rhyolites, whereas other rhyolites con-tain topaz. Both have A-type affinities.
In a study of 750 mafic lava samples from the south-western United States, Fitton et al. (1991) found thatall basaltic lavas with MgO �4 wt.% in the centralBasin and Range Province �5 Ma have a distinct traceelement signature like that of oceanic island basalt(OIB) generated by an asthenospheric source. Otherbasalt fields, as well as all fields �5 Ma, appear to havebeen generated in lithospheric mantle enriched by subduction-derived fluids, both of recent (early Ceno-zoic) and ancient (Proterozoic) vintage. This space-time contrast in source suggests that the lithospherebeneath the Basin and Range Province had been ther-mally eroded by upwelling, hotter asthenosphere, andin some parts removed completely, by 5 Ma. Sparsebasaltic lavas lacking an arc signature (i.e., having nonegative Nb anomaly) but having OIB affinities had appeared by about 20 Ma and rather primitive OIB-like basalt by about 16 Ma in the Basin and RangeProvince. Apparently, some unmodified astheno-spheric magmas had begun to make their way to the sur-face long before the lithosphere had been eliminated, orat least made ineffective, in magma generation.
Western Mexican Volcanic Belt. The 1100-km-longMexican Volcanic Belt trends east-west across Mexicoopposite the actively subducting Rivera and Cocos
394 Igneous and Metamorphic Petrology
13.38 East African continental rift system and its union in northernEthiopia with the Red Sea and Gulf of Aden oceanic rifts.These rifts lie within a chain of coalesced broad domical up-warps (light shaded). High-angle normal faults are shown bydashed lines. Double lines denote oceanic rifts cut by trans-form faults. Dotted lines outline countries mentioned in text.Note several lakes (dark shaded) in the grabens. (Redrawnfrom Gass, 1972.)
MediterraneanSea
22° E 60° E40° E
20° N
20° S
0°
Tanzania
Malawi
Moza
mbique
Indi
an O
cean
0 mi 500
0 km 800
Kenya
Gulfof Aden
ArabianPeninsula
Red Sea
Ethiopia
Uganda
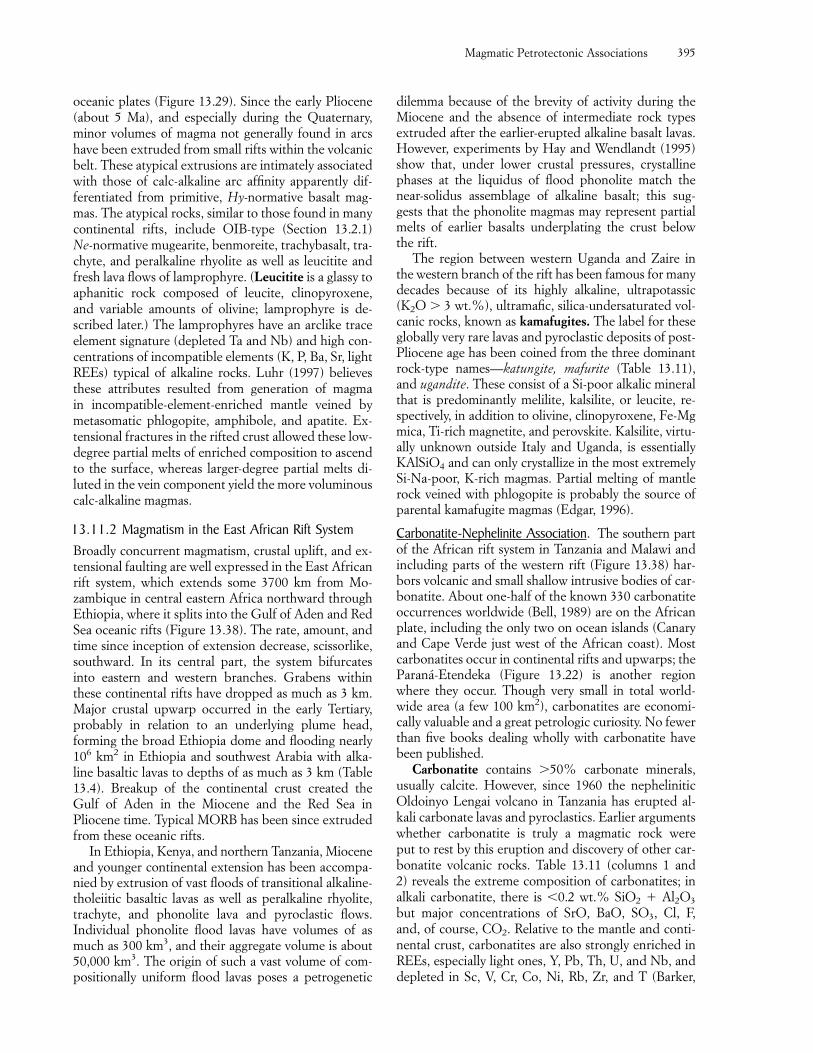
oceanic plates (Figure 13.29). Since the early Pliocene(about 5 Ma), and especially during the Quaternary,minor volumes of magma not generally found in arcshave been extruded from small rifts within the volcanicbelt. These atypical extrusions are intimately associatedwith those of calc-alkaline arc affinity apparently dif-ferentiated from primitive, Hy-normative basalt mag-mas. The atypical rocks, similar to those found in manycontinental rifts, include OIB-type (Section 13.2.1) Ne-normative mugearite, benmoreite, trachybasalt, tra-chyte, and peralkaline rhyolite as well as leucitite andfresh lava flows of lamprophyre. (Leucitite is a glassy toaphanitic rock composed of leucite, clinopyroxene,and variable amounts of olivine; lamprophyre is de-scribed later.) The lamprophyres have an arclike traceelement signature (depleted Ta and Nb) and high con-centrations of incompatible elements (K, P, Ba, Sr, lightREEs) typical of alkaline rocks. Luhr (1997) believesthese attributes resulted from generation of magma in incompatible-element-enriched mantle veined bymetasomatic phlogopite, amphibole, and apatite. Ex-tensional fractures in the rifted crust allowed these low-degree partial melts of enriched composition to ascendto the surface, whereas larger-degree partial melts di-luted in the vein component yield the more voluminouscalc-alkaline magmas.
13.11.2 Magmatism in the East African Rift SystemBroadly concurrent magmatism, crustal uplift, and ex-tensional faulting are well expressed in the East Africanrift system, which extends some 3700 km from Mo-zambique in central eastern Africa northward throughEthiopia, where it splits into the Gulf of Aden and RedSea oceanic rifts (Figure 13.38). The rate, amount, andtime since inception of extension decrease, scissorlike,southward. In its central part, the system bifurcatesinto eastern and western branches. Grabens withinthese continental rifts have dropped as much as 3 km.Major crustal upwarp occurred in the early Tertiary,probably in relation to an underlying plume head,forming the broad Ethiopia dome and flooding nearly106 km2 in Ethiopia and southwest Arabia with alka-line basaltic lavas to depths of as much as 3 km (Table13.4). Breakup of the continental crust created theGulf of Aden in the Miocene and the Red Sea inPliocene time. Typical MORB has been since extrudedfrom these oceanic rifts.
In Ethiopia, Kenya, and northern Tanzania, Mioceneand younger continental extension has been accompa-nied by extrusion of vast floods of transitional alkaline-tholeiitic basaltic lavas as well as peralkaline rhyolite,trachyte, and phonolite lava and pyroclastic flows. Individual phonolite flood lavas have volumes of asmuch as 300 km3, and their aggregate volume is about50,000 km3. The origin of such a vast volume of com-positionally uniform flood lavas poses a petrogenetic
dilemma because of the brevity of activity during theMiocene and the absence of intermediate rock typesextruded after the earlier-erupted alkaline basalt lavas.However, experiments by Hay and Wendlandt (1995)show that, under lower crustal pressures, crystallinephases at the liquidus of flood phonolite match thenear-solidus assemblage of alkaline basalt; this sug-gests that the phonolite magmas may represent partialmelts of earlier basalts underplating the crust below the rift.
The region between western Uganda and Zaire inthe western branch of the rift has been famous for manydecades because of its highly alkaline, ultrapotassic(K2O � 3 wt.%), ultramafic, silica-undersaturated vol-canic rocks, known as kamafugites. The label for theseglobally very rare lavas and pyroclastic deposits of post-Pliocene age has been coined from the three dominantrock-type names—katungite, mafurite (Table 13.11),and ugandite. These consist of a Si-poor alkalic mineralthat is predominantly melilite, kalsilite, or leucite, re-spectively, in addition to olivine, clinopyroxene, Fe-Mgmica, Ti-rich magnetite, and perovskite. Kalsilite, virtu-ally unknown outside Italy and Uganda, is essentiallyKAlSiO4 and can only crystallize in the most extremelySi-Na-poor, K-rich magmas. Partial melting of mantlerock veined with phlogopite is probably the source ofparental kamafugite magmas (Edgar, 1996).
Carbonatite-Nephelinite Association. The southern partof the African rift system in Tanzania and Malawi andincluding parts of the western rift (Figure 13.38) har-bors volcanic and small shallow intrusive bodies of car-bonatite. About one-half of the known 330 carbonatiteoccurrences worldwide (Bell, 1989) are on the Africanplate, including the only two on ocean islands (Canaryand Cape Verde just west of the African coast). Mostcarbonatites occur in continental rifts and upwarps; theParaná-Etendeka (Figure 13.22) is another regionwhere they occur. Though very small in total world-wide area (a few 100 km2), carbonatites are economi-cally valuable and a great petrologic curiosity. No fewerthan five books dealing wholly with carbonatite havebeen published.
Carbonatite contains �50% carbonate minerals,usually calcite. However, since 1960 the nepheliniticOldoinyo Lengai volcano in Tanzania has erupted al-kali carbonate lavas and pyroclastics. Earlier argumentswhether carbonatite is truly a magmatic rock were put to rest by this eruption and discovery of other car-bonatite volcanic rocks. Table 13.11 (columns 1 and 2) reveals the extreme composition of carbonatites; inalkali carbonatite, there is �0.2 wt.% SiO2 � Al2O3
but major concentrations of SrO, BaO, SO3, Cl, F, and, of course, CO2. Relative to the mantle and conti-nental crust, carbonatites are also strongly enriched inREEs, especially light ones, Y, Pb, Th, U, and Nb, anddepleted in Sc, V, Cr, Co, Ni, Rb, Zr, and T (Barker,
Magmatic Petrotectonic Associations 395
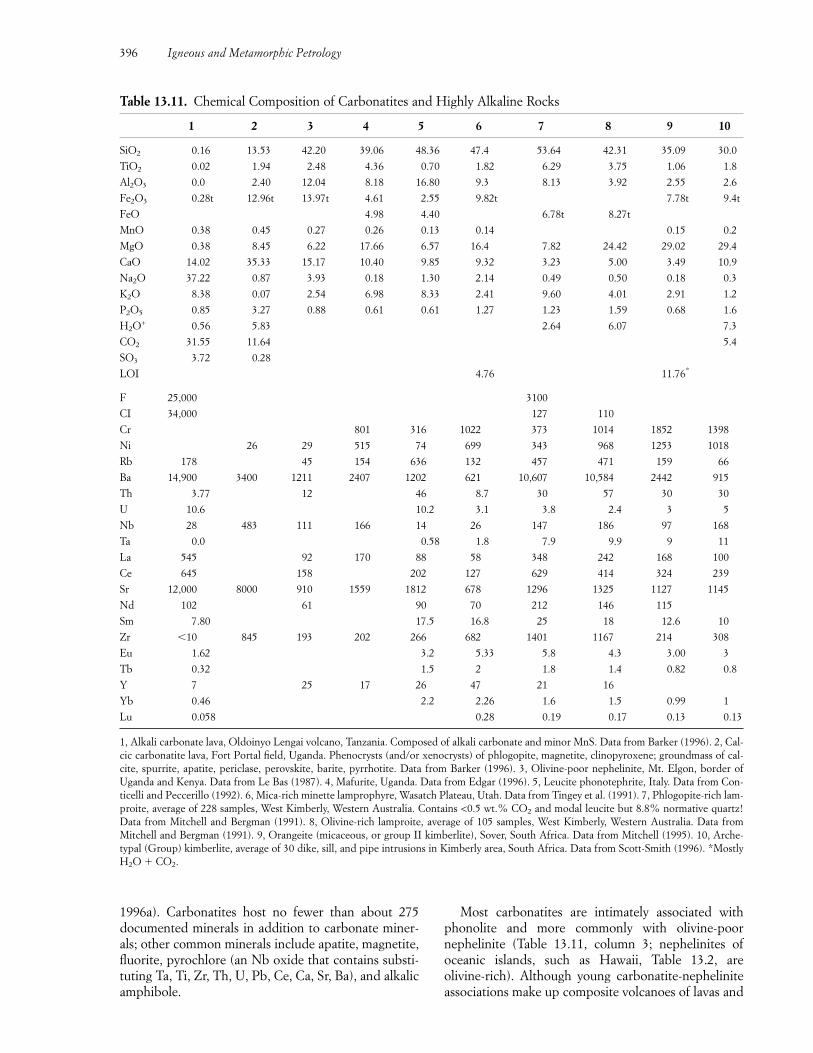
1996a). Carbonatites host no fewer than about 275documented minerals in addition to carbonate miner-als; other common minerals include apatite, magnetite,fluorite, pyrochlore (an Nb oxide that contains substi-tuting Ta, Ti, Zr, Th, U, Pb, Ce, Ca, Sr, Ba), and alkalicamphibole.
Most carbonatites are intimately associated withphonolite and more commonly with olivine-poornephelinite (Table 13.11, column 3; nephelinites ofoceanic islands, such as Hawaii, Table 13.2, are olivine-rich). Although young carbonatite-nepheliniteassociations make up composite volcanoes of lavas and
396 Igneous and Metamorphic Petrology
Table 13.11. Chemical Composition of Carbonatites and Highly Alkaline Rocks
1 2 3 4 5 6 7 8 9 10
SiO2 0.16 13.53 42.20 39.06 48.36 47.4 53.64 42.31 35.09 30.0
TiO2 0.02 1.94 2.48 4.36 0.70 1.82 6.29 3.75 1.06 1.8
Al2O3 0.0 2.40 12.04 8.18 16.80 9.3 8.13 3.92 2.55 2.6
Fe2O3 0.28t 12.96t 13.97t 4.61 2.55 9.82t 7.78t 9.4t
FeO 4.98 4.40 6.78t 8.27t
MnO 0.38 0.45 0.27 0.26 0.13 0.14 0.15 0.2
MgO 0.38 8.45 6.22 17.66 6.57 16.4 7.82 24.42 29.02 29.4
CaO 14.02 35.33 15.17 10.40 9.85 9.32 3.23 5.00 3.49 10.9
Na2O 37.22 0.87 3.93 0.18 1.30 2.14 0.49 0.50 0.18 0.3
K2O 8.38 0.07 2.54 6.98 8.33 2.41 9.60 4.01 2.91 1.2
P2O5 0.85 3.27 0.88 0.61 0.61 1.27 1.23 1.59 0.68 1.6
H2O+ 0.56 5.83 2.64 6.07 7.3
CO2 31.55 11.64 5.4
SO3 3.72 0.28
LOI 4.76 11.76*
F 25,000 3100
CI 34,000 127 110
Cr 801 316 1022 373 1014 1852 1398
Ni 26 29 515 74 699 343 968 1253 1018
Rb 178 45 154 636 132 457 471 159 66
Ba 14,900 3400 1211 2407 1202 621 10,607 10,584 2442 915
Th 3.77 12 46 8.7 30 57 30 30
U 10.6 10.2 3.1 3.8 2.4 3 5
Nb 28 483 111 166 14 26 147 186 97 168
Ta 0.0 0.58 1.8 7.9 9.9 9 11
La 545 92 170 88 58 348 242 168 100
Ce 645 158 202 127 629 414 324 239
Sr 12,000 8000 910 1559 1812 678 1296 1325 1127 1145
Nd 102 61 90 70 212 146 115
Sm 7.80 17.5 16.8 25 18 12.6 10
Zr �10 845 193 202 266 682 1401 1167 214 308
Eu 1.62 3.2 5.33 5.8 4.3 3.00 3
Tb 0.32 1.5 2 1.8 1.4 0.82 0.8
Y 7 25 17 26 47 21 16
Yb 0.46 2.2 2.26 1.6 1.5 0.99 1
Lu 0.058 0.28 0.19 0.17 0.13 0.13
1, Alkali carbonate lava, Oldoinyo Lengai volcano, Tanzania. Composed of alkali carbonate and minor MnS. Data from Barker (1996). 2, Cal-cic carbonatite lava, Fort Portal field, Uganda. Phenocrysts (and/or xenocrysts) of phlogopite, magnetite, clinopyroxene; groundmass of cal-cite, spurrite, apatite, periclase, perovskite, barite, pyrrhotite. Data from Barker (1996). 3, Olivine-poor nephelinite, Mt. Elgon, border ofUganda and Kenya. Data from Le Bas (1987). 4, Mafurite, Uganda. Data from Edgar (1996). 5, Leucite phonotephrite, Italy. Data from Con-ticelli and Peccerillo (1992). 6, Mica-rich minette lamprophyre, Wasatch Plateau, Utah. Data from Tingey et al. (1991). 7, Phlogopite-rich lam-proite, average of 228 samples, West Kimberly, Western Australia. Contains <0.5 wt.% CO2 and modal leucite but 8.8% normative quartz!Data from Mitchell and Bergman (1991). 8, Olivine-rich lamproite, average of 105 samples, West Kimberly, Western Australia. Data fromMitchell and Bergman (1991). 9, Orangeite (micaceous, or group II kimberlite), Sover, South Africa. Data from Mitchell (1995). 10, Arche-typal (Group) kimberlite, average of 30 dike, sill, and pipe intrusions in Kimberly area, South Africa. Data from Scott-Smith (1996). *MostlyH2O � CO2.
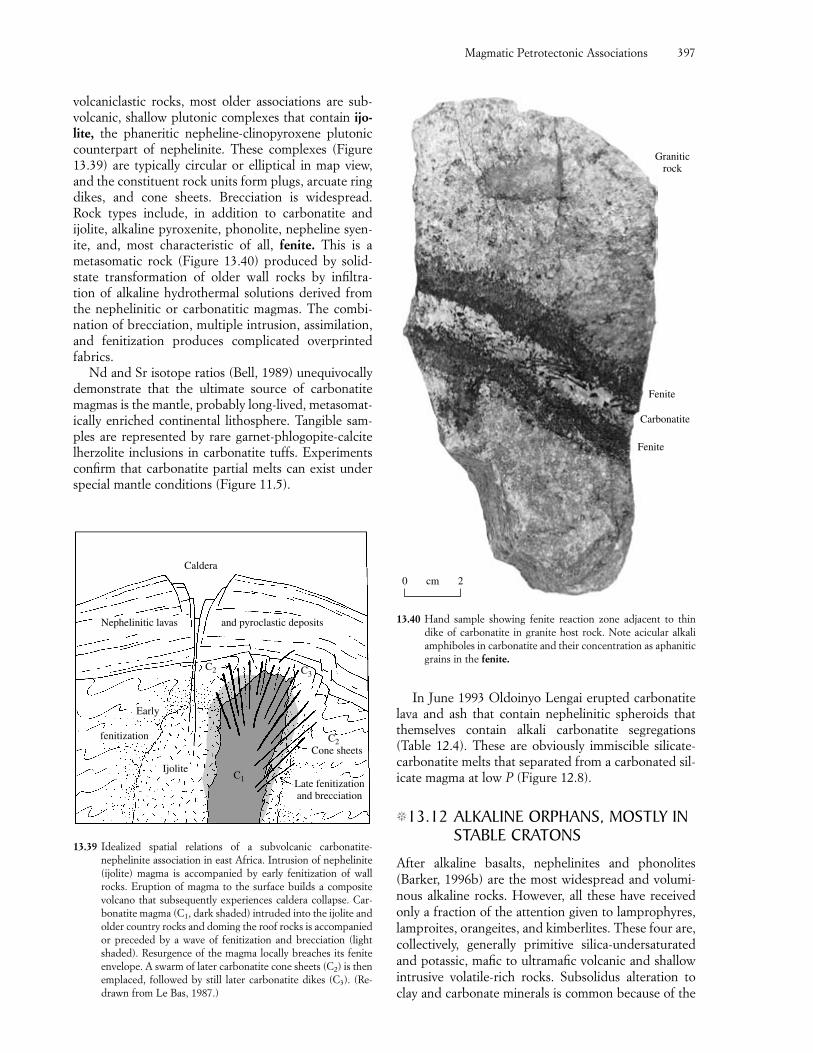
volcaniclastic rocks, most older associations are sub-volcanic, shallow plutonic complexes that contain ijo-lite, the phaneritic nepheline-clinopyroxene plutoniccounterpart of nephelinite. These complexes (Figure13.39) are typically circular or elliptical in map view,and the constituent rock units form plugs, arcuate ringdikes, and cone sheets. Brecciation is widespread.Rock types include, in addition to carbonatite and ijolite, alkaline pyroxenite, phonolite, nepheline syen-ite, and, most characteristic of all, fenite. This is ametasomatic rock (Figure 13.40) produced by solid-state transformation of older wall rocks by infiltra-tion of alkaline hydrothermal solutions derived fromthe nephelinitic or carbonatitic magmas. The combi-nation of brecciation, multiple intrusion, assimilation,and fenitization produces complicated overprintedfabrics.
Nd and Sr isotope ratios (Bell, 1989) unequivocallydemonstrate that the ultimate source of carbonatitemagmas is the mantle, probably long-lived, metasomat-ically enriched continental lithosphere. Tangible sam-ples are represented by rare garnet-phlogopite-calcitelherzolite inclusions in carbonatite tuffs. Experimentsconfirm that carbonatite partial melts can exist underspecial mantle conditions (Figure 11.5).
In June 1993 Oldoinyo Lengai erupted carbonatitelava and ash that contain nephelinitic spheroids thatthemselves contain alkali carbonatite segregations(Table 12.4). These are obviously immiscible silicate-carbonatite melts that separated from a carbonated sil-icate magma at low P (Figure 12.8).
�13.12 ALKALINE ORPHANS, MOSTLY INSTABLE CRATONS
After alkaline basalts, nephelinites and phonolites(Barker, 1996b) are the most widespread and volumi-nous alkaline rocks. However, all these have receivedonly a fraction of the attention given to lamprophyres,lamproites, orangeites, and kimberlites. These four are,collectively, generally primitive silica-undersaturatedand potassic, mafic to ultramafic volcanic and shallowintrusive volatile-rich rocks. Subsolidus alteration toclay and carbonate minerals is common because of the
Magmatic Petrotectonic Associations 397
13.39 Idealized spatial relations of a subvolcanic carbonatite-nephelinite association in east Africa. Intrusion of nephelinite(ijolite) magma is accompanied by early fenitization of wallrocks. Eruption of magma to the surface builds a compositevolcano that subsequently experiences caldera collapse. Car-bonatite magma (C1, dark shaded) intruded into the ijolite andolder country rocks and doming the roof rocks is accompaniedor preceded by a wave of fenitization and brecciation (lightshaded). Resurgence of the magma locally breaches its feniteenvelope. A swarm of later carbonatite cone sheets (C2) is thenemplaced, followed by still later carbonatite dikes (C3). (Re-drawn from Le Bas, 1987.)
Caldera
Nephelinitic lavas and pyroclastic deposits
C2 C3
C2Cone sheets
Late fenitizationand brecciation
Ijolite
fenitization
Early
C1
13.40 Hand sample showing fenite reaction zone adjacent to thindike of carbonatite in granite host rock. Note acicular alkaliamphiboles in carbonatite and their concentration as aphaniticgrains in the fenite.
Graniticrock
Fenite
Fenite
Carbonatite
0 2cm
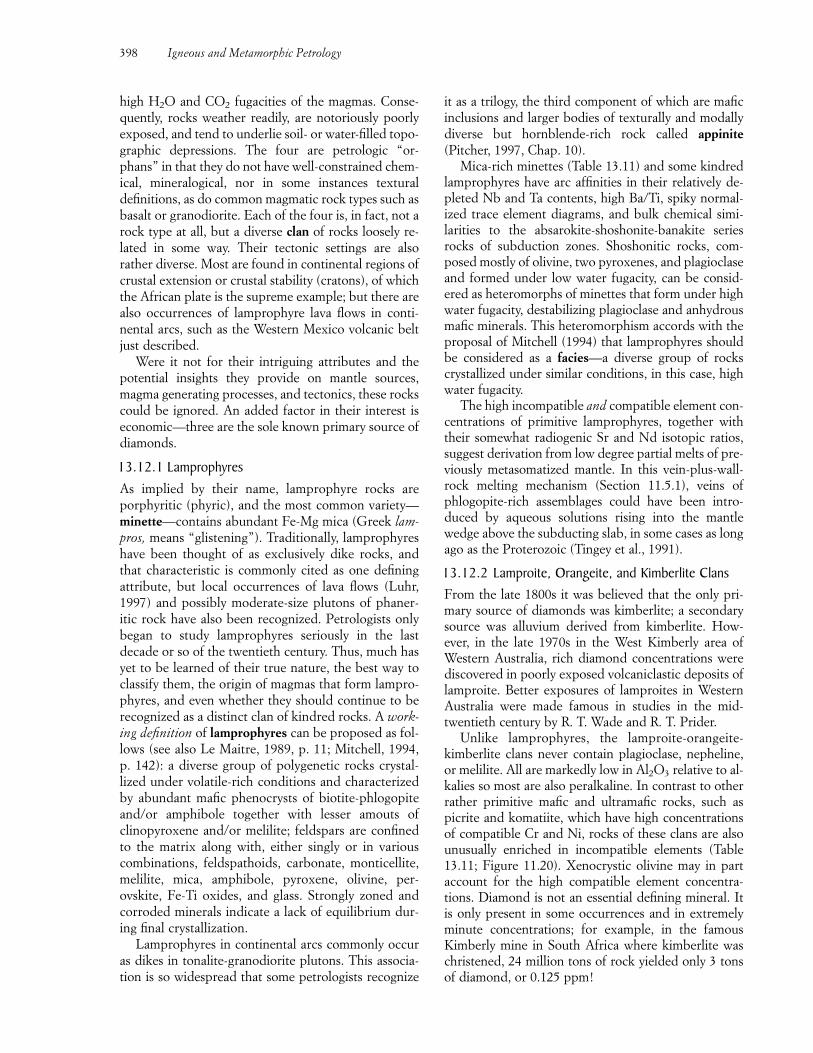
high H2O and CO2 fugacities of the magmas. Conse-quently, rocks weather readily, are notoriously poorlyexposed, and tend to underlie soil- or water-filled topo-graphic depressions. The four are petrologic “or-phans” in that they do not have well-constrained chem-ical, mineralogical, nor in some instances texturaldefinitions, as do common magmatic rock types such asbasalt or granodiorite. Each of the four is, in fact, not arock type at all, but a diverse clan of rocks loosely re-lated in some way. Their tectonic settings are alsorather diverse. Most are found in continental regions ofcrustal extension or crustal stability (cratons), of whichthe African plate is the supreme example; but there arealso occurrences of lamprophyre lava flows in conti-nental arcs, such as the Western Mexico volcanic beltjust described.
Were it not for their intriguing attributes and thepotential insights they provide on mantle sources,magma generating processes, and tectonics, these rockscould be ignored. An added factor in their interest iseconomic—three are the sole known primary source ofdiamonds.
13.12.1 LamprophyresAs implied by their name, lamprophyre rocks are porphyritic (phyric), and the most common variety—minette—contains abundant Fe-Mg mica (Greek lam-pros, means “glistening”). Traditionally, lamprophyreshave been thought of as exclusively dike rocks, andthat characteristic is commonly cited as one definingattribute, but local occurrences of lava flows (Luhr,1997) and possibly moderate-size plutons of phaner-itic rock have also been recognized. Petrologists onlybegan to study lamprophyres seriously in the lastdecade or so of the twentieth century. Thus, much hasyet to be learned of their true nature, the best way toclassify them, the origin of magmas that form lampro-phyres, and even whether they should continue to berecognized as a distinct clan of kindred rocks. A work-ing definition of lamprophyres can be proposed as fol-lows (see also Le Maitre, 1989, p. 11; Mitchell, 1994,p. 142): a diverse group of polygenetic rocks crystal-lized under volatile-rich conditions and characterizedby abundant mafic phenocrysts of biotite-phlogopiteand/or amphibole together with lesser amouts ofclinopyroxene and/or melilite; feldspars are confinedto the matrix along with, either singly or in variouscombinations, feldspathoids, carbonate, monticellite,melilite, mica, amphibole, pyroxene, olivine, per-ovskite, Fe-Ti oxides, and glass. Strongly zoned andcorroded minerals indicate a lack of equilibrium dur-ing final crystallization.
Lamprophyres in continental arcs commonly occuras dikes in tonalite-granodiorite plutons. This associa-tion is so widespread that some petrologists recognize
it as a trilogy, the third component of which are maficinclusions and larger bodies of texturally and modallydiverse but hornblende-rich rock called appinite(Pitcher, 1997, Chap. 10).
Mica-rich minettes (Table 13.11) and some kindredlamprophyres have arc affinities in their relatively de-pleted Nb and Ta contents, high Ba/Ti, spiky normal-ized trace element diagrams, and bulk chemical simi-larities to the absarokite-shoshonite-banakite seriesrocks of subduction zones. Shoshonitic rocks, com-posed mostly of olivine, two pyroxenes, and plagioclaseand formed under low water fugacity, can be consid-ered as heteromorphs of minettes that form under highwater fugacity, destabilizing plagioclase and anhydrousmafic minerals. This heteromorphism accords with theproposal of Mitchell (1994) that lamprophyres shouldbe considered as a facies—a diverse group of rockscrystallized under similar conditions, in this case, highwater fugacity.
The high incompatible and compatible element con-centrations of primitive lamprophyres, together withtheir somewhat radiogenic Sr and Nd isotopic ratios,suggest derivation from low degree partial melts of pre-viously metasomatized mantle. In this vein-plus-wall-rock melting mechanism (Section 11.5.1), veins of phlogopite-rich assemblages could have been intro-duced by aqueous solutions rising into the mantlewedge above the subducting slab, in some cases as longago as the Proterozoic (Tingey et al., 1991).
13.12.2 Lamproite, Orangeite, and Kimberlite ClansFrom the late 1800s it was believed that the only pri-mary source of diamonds was kimberlite; a secondarysource was alluvium derived from kimberlite. How-ever, in the late 1970s in the West Kimberly area ofWestern Australia, rich diamond concentrations werediscovered in poorly exposed volcaniclastic deposits oflamproite. Better exposures of lamproites in WesternAustralia were made famous in studies in the mid-twentieth century by R. T. Wade and R. T. Prider.
Unlike lamprophyres, the lamproite-orangeite-kimberlite clans never contain plagioclase, nepheline,or melilite. All are markedly low in Al2O3 relative to al-kalies so most are also peralkaline. In contrast to otherrather primitive mafic and ultramafic rocks, such as picrite and komatiite, which have high concentrationsof compatible Cr and Ni, rocks of these clans are alsounusually enriched in incompatible elements (Table13.11; Figure 11.20). Xenocrystic olivine may in partaccount for the high compatible element concentra-tions. Diamond is not an essential defining mineral. Itis only present in some occurrences and in extremelyminute concentrations; for example, in the famousKimberly mine in South Africa where kimberlite waschristened, 24 million tons of rock yielded only 3 tonsof diamond, or 0.125 ppm!
398 Igneous and Metamorphic Petrology
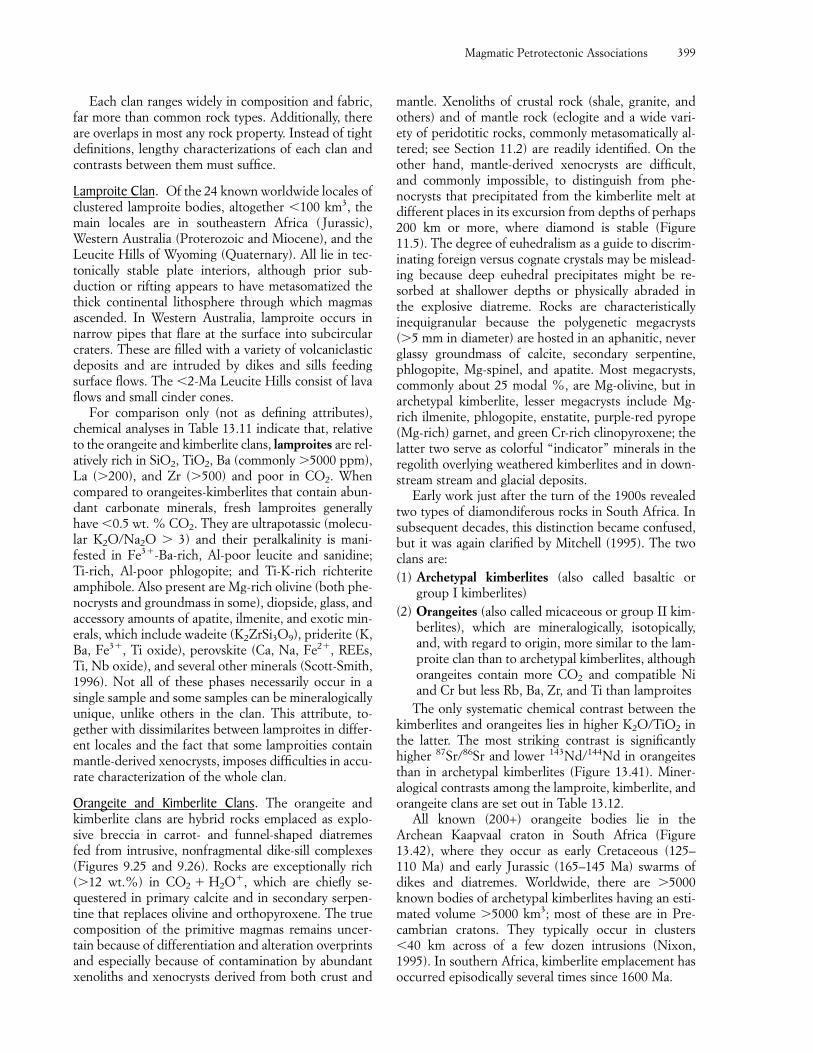
Each clan ranges widely in composition and fabric,far more than common rock types. Additionally, thereare overlaps in most any rock property. Instead of tightdefinitions, lengthy characterizations of each clan andcontrasts between them must suffice.
Lamproite Clan. Of the 24 known worldwide locales ofclustered lamproite bodies, altogether �100 km3, themain locales are in southeastern Africa ( Jurassic),Western Australia (Proterozoic and Miocene), and theLeucite Hills of Wyoming (Quaternary). All lie in tec-tonically stable plate interiors, although prior sub-duction or rifting appears to have metasomatized thethick continental lithosphere through which magmasascended. In Western Australia, lamproite occurs innarrow pipes that flare at the surface into subcircularcraters. These are filled with a variety of volcaniclasticdeposits and are intruded by dikes and sills feedingsurface flows. The �2-Ma Leucite Hills consist of lavaflows and small cinder cones.
For comparison only (not as defining attributes),chemical analyses in Table 13.11 indicate that, relativeto the orangeite and kimberlite clans, lamproites are rel-atively rich in SiO2, TiO2, Ba (commonly �5000 ppm),La (�200), and Zr (�500) and poor in CO2. Whencompared to orangeites-kimberlites that contain abun-dant carbonate minerals, fresh lamproites generallyhave �0.5 wt. % CO2. They are ultrapotassic (molecu-lar K2O/Na2O � 3) and their peralkalinity is mani-fested in Fe3�-Ba-rich, Al-poor leucite and sanidine;Ti-rich, Al-poor phlogopite; and Ti-K-rich richteriteamphibole. Also present are Mg-rich olivine (both phe-nocrysts and groundmass in some), diopside, glass, andaccessory amounts of apatite, ilmenite, and exotic min-erals, which include wadeite (K2ZrSi3O9), priderite (K,Ba, Fe3�, Ti oxide), perovskite (Ca, Na, Fe2�, REEs,Ti, Nb oxide), and several other minerals (Scott-Smith,1996). Not all of these phases necessarily occur in a single sample and some samples can be mineralogicallyunique, unlike others in the clan. This attribute, to-gether with dissimilarites between lamproites in differ-ent locales and the fact that some lamproities containmantle-derived xenocrysts, imposes difficulties in accu-rate characterization of the whole clan.
Orangeite and Kimberlite Clans. The orangeite andkimberlite clans are hybrid rocks emplaced as explo-sive breccia in carrot- and funnel-shaped diatremes fed from intrusive, nonfragmental dike-sill complexes (Figures 9.25 and 9.26). Rocks are exceptionally rich(�12 wt.%) in CO2 � H2O�, which are chiefly se-questered in primary calcite and in secondary serpen-tine that replaces olivine and orthopyroxene. The truecomposition of the primitive magmas remains uncer-tain because of differentiation and alteration overprintsand especially because of contamination by abundantxenoliths and xenocrysts derived from both crust and
mantle. Xenoliths of crustal rock (shale, granite, andothers) and of mantle rock (eclogite and a wide vari-ety of peridotitic rocks, commonly metasomatically al-tered; see Section 11.2) are readily identified. On theother hand, mantle-derived xenocrysts are difficult,and commonly impossible, to distinguish from phe-nocrysts that precipitated from the kimberlite melt atdifferent places in its excursion from depths of perhaps200 km or more, where diamond is stable (Figure11.5). The degree of euhedralism as a guide to discrim-inating foreign versus cognate crystals may be mislead-ing because deep euhedral precipitates might be re-sorbed at shallower depths or physically abraded in the explosive diatreme. Rocks are characteristically inequigranular because the polygenetic megacrysts (�5 mm in diameter) are hosted in an aphanitic, neverglassy groundmass of calcite, secondary serpentine,phlogopite, Mg-spinel, and apatite. Most megacrysts,commonly about 25 modal %, are Mg-olivine, but inarchetypal kimberlite, lesser megacrysts include Mg-rich ilmenite, phlogopite, enstatite, purple-red pyrope(Mg-rich) garnet, and green Cr-rich clinopyroxene; thelatter two serve as colorful “indicator” minerals in theregolith overlying weathered kimberlites and in down-stream stream and glacial deposits.
Early work just after the turn of the 1900s revealedtwo types of diamondiferous rocks in South Africa. Insubsequent decades, this distinction became confused,but it was again clarified by Mitchell (1995). The twoclans are:(1) Archetypal kimberlites (also called basaltic or
group I kimberlites)(2) Orangeites (also called micaceous or group II kim-
berlites), which are mineralogically, isotopically,and, with regard to origin, more similar to the lam-proite clan than to archetypal kimberlites, althoughorangeites contain more CO2 and compatible Niand Cr but less Rb, Ba, Zr, and Ti than lamproites
The only systematic chemical contrast between thekimberlites and orangeites lies in higher K2O/TiO2 inthe latter. The most striking contrast is significantlyhigher 87Sr/86Sr and lower 143Nd/144Nd in orangeitesthan in archetypal kimberlites (Figure 13.41). Miner-alogical contrasts among the lamproite, kimberlite, andorangeite clans are set out in Table 13.12.
All known (200+) orangeite bodies lie in theArchean Kaapvaal craton in South Africa (Figure13.42), where they occur as early Cretaceous (125–110 Ma) and early Jurassic (165–145 Ma) swarms ofdikes and diatremes. Worldwide, there are �5000known bodies of archetypal kimberlites having an esti-mated volume �5000 km3; most of these are in Pre-cambrian cratons. They typically occur in clusters �40 km across of a few dozen intrusions (Nixon,1995). In southern Africa, kimberlite emplacement hasoccurred episodically several times since 1600 Ma.
Magmatic Petrotectonic Associations 399
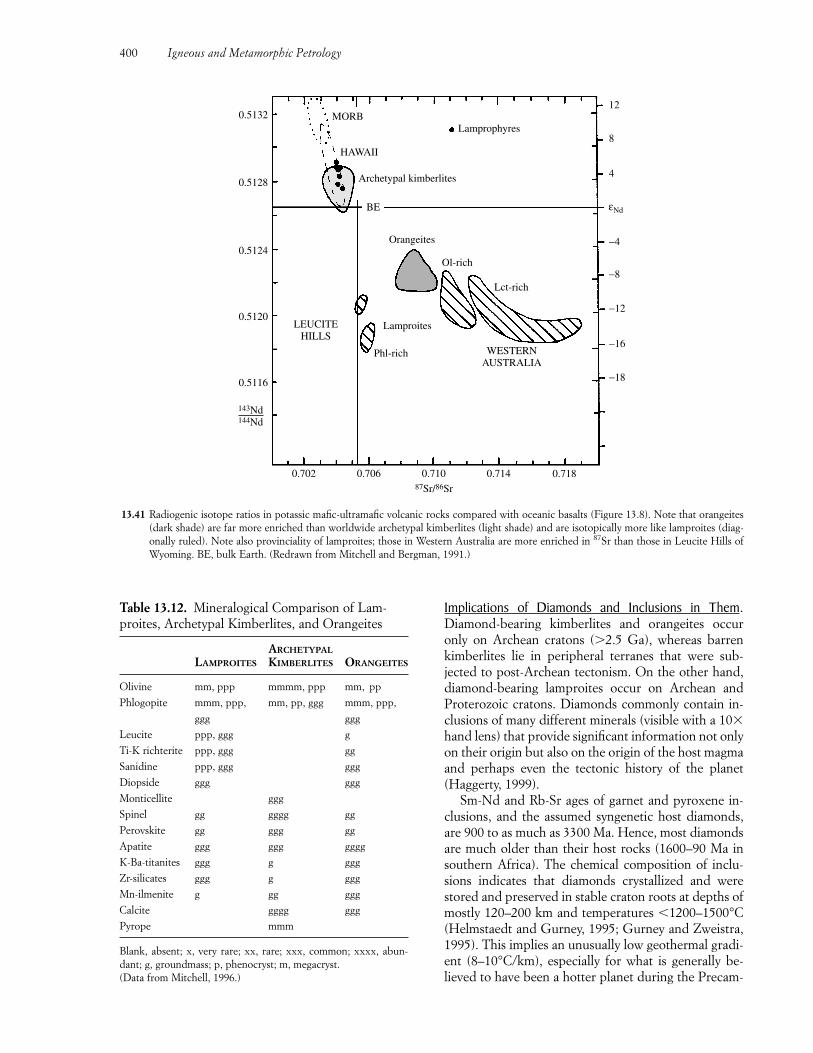
Implications of Diamonds and Inclusions in Them.Diamond-bearing kimberlites and orangeites occuronly on Archean cratons (�2.5 Ga), whereas barrenkimberlites lie in peripheral terranes that were sub-jected to post-Archean tectonism. On the other hand,diamond-bearing lamproites occur on Archean andProterozoic cratons. Diamonds commonly contain in-clusions of many different minerals (visible with a 10hand lens) that provide significant information not onlyon their origin but also on the origin of the host magmaand perhaps even the tectonic history of the planet(Haggerty, 1999).
Sm-Nd and Rb-Sr ages of garnet and pyroxene in-clusions, and the assumed syngenetic host diamonds,are 900 to as much as 3300 Ma. Hence, most diamondsare much older than their host rocks (1600–90 Ma insouthern Africa). The chemical composition of inclu-sions indicates that diamonds crystallized and werestored and preserved in stable craton roots at depths ofmostly 120–200 km and temperatures �1200–1500°C(Helmstaedt and Gurney, 1995; Gurney and Zweistra,1995). This implies an unusually low geothermal gradi-ent (8–10°C/km), especially for what is generally be-lieved to have been a hotter planet during the Precam-
400 Igneous and Metamorphic Petrology
13.41 Radiogenic isotope ratios in potassic mafic-ultramafic volcanic rocks compared with oceanic basalts (Figure 13.8). Note that orangeites(dark shade) are far more enriched than worldwide archetypal kimberlites (light shade) and are isotopically more like lamproites (diag-onally ruled). Note also provinciality of lamproites; those in Western Australia are more enriched in 87Sr than those in Leucite Hills ofWyoming. BE, bulk Earth. (Redrawn from Mitchell and Bergman, 1991.)
0.702 0.706 0.710 0.714 0.71887Sr/86Sr
0.5116
0.5120
0.5124
0.5128
0.5132
143Nd144Nd
LEUCITEHILLS
Phl-rich
Lamproites
WESTERNAUSTRALIA
Lct-rich
Ol-rich
Orangeites
BE
Archetypal kimberlites
HAWAII
MORBLamprophyres
12
8
4
−4
−8
−12
−16
−18
εNd
Table 13.12. Mineralogical Comparison of Lam-proites, Archetypal Kimberlites, and Orangeites
ARCHETYPALLAMPROITES KIMBERLITES ORANGEITES
Olivine mm, ppp mmmm, ppp mm, pp
Phlogopite mmm, ppp, mm, pp, ggg mmm, ppp,
ggg ggg
Leucite ppp, ggg g
Ti-K richterite ppp, ggg gg
Sanidine ppp, ggg ggg
Diopside ggg ggg
Monticellite ggg
Spinel gg gggg gg
Perovskite gg ggg gg
Apatite ggg ggg gggg
K-Ba-titanites ggg g ggg
Zr-silicates ggg g ggg
Mn-ilmenite g gg ggg
Calcite gggg ggg
Pyrope mmm
Blank, absent; x, very rare; xx, rare; xxx, common; xxxx, abun-dant; g, groundmass; p, phenocryst; m, megacryst.(Data from Mitchell, 1996.)
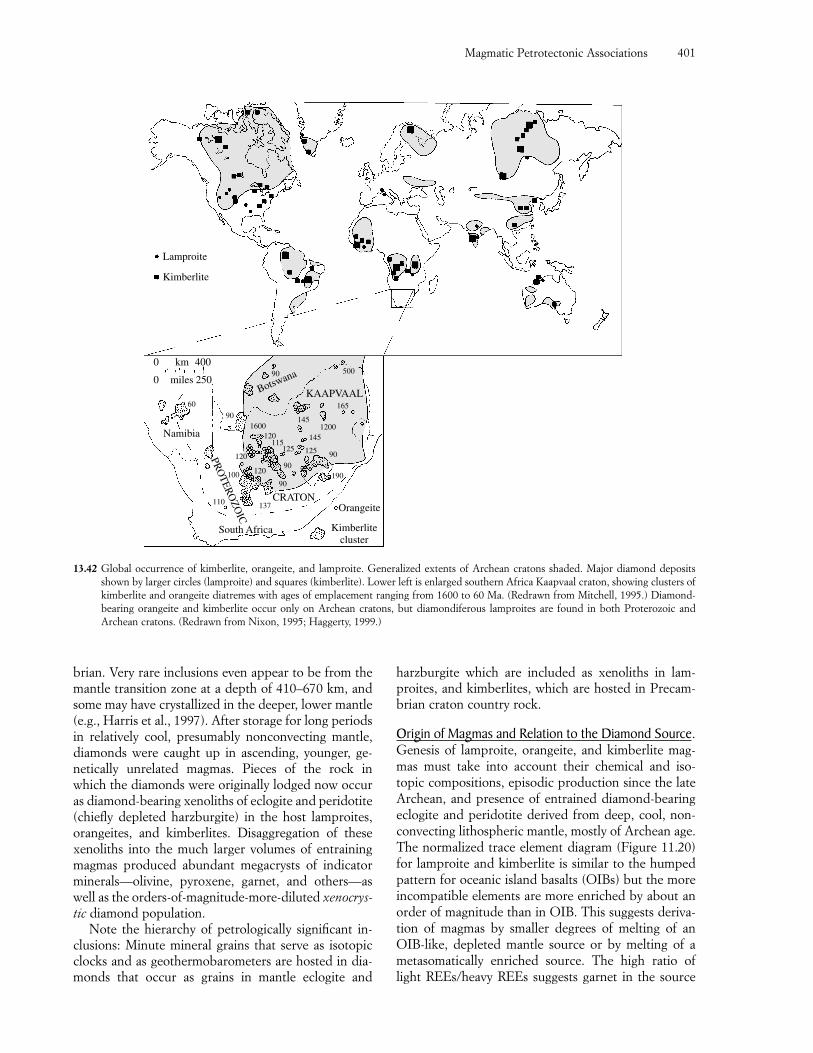
brian. Very rare inclusions even appear to be from themantle transition zone at a depth of 410–670 km, andsome may have crystallized in the deeper, lower mantle(e.g., Harris et al., 1997). After storage for long periodsin relatively cool, presumably nonconvecting mantle,diamonds were caught up in ascending, younger, ge-netically unrelated magmas. Pieces of the rock in which the diamonds were originally lodged now occuras diamond-bearing xenoliths of eclogite and peridotite(chiefly depleted harzburgite) in the host lamproites,orangeites, and kimberlites. Disaggregation of thesexenoliths into the much larger volumes of entrainingmagmas produced abundant megacrysts of indicatorminerals—olivine, pyroxene, garnet, and others—aswell as the orders-of-magnitude-more-diluted xenocrys-tic diamond population.
Note the hierarchy of petrologically significant in-clusions: Minute mineral grains that serve as isotopicclocks and as geothermobarometers are hosted in dia-monds that occur as grains in mantle eclogite and
harzburgite which are included as xenoliths in lam-proites, and kimberlites, which are hosted in Precam-brian craton country rock.
Origin of Magmas and Relation to the Diamond Source.Genesis of lamproite, orangeite, and kimberlite mag-mas must take into account their chemical and iso-topic compositions, episodic production since the lateArchean, and presence of entrained diamond-bearingeclogite and peridotite derived from deep, cool, non-convecting lithospheric mantle, mostly of Archean age.The normalized trace element diagram (Figure 11.20)for lamproite and kimberlite is similar to the humpedpattern for oceanic island basalts (OIBs) but the moreincompatible elements are more enriched by about anorder of magnitude than in OIB. This suggests deriva-tion of magmas by smaller degrees of melting of anOIB-like, depleted mantle source or by melting of ametasomatically enriched source. The high ratio oflight REEs/heavy REEs suggests garnet in the source
Magmatic Petrotectonic Associations 401
13.42 Global occurrence of kimberlite, orangeite, and lamproite. Generalized extents of Archean cratons shaded. Major diamond depositsshown by larger circles (lamproite) and squares (kimberlite). Lower left is enlarged southern Africa Kaapvaal craton, showing clusters ofkimberlite and orangeite diatremes with ages of emplacement ranging from 1600 to 60 Ma. (Redrawn from Mitchell, 1995.) Diamond-bearing orangeite and kimberlite occur only on Archean cratons, but diamondiferous lamproites are found in both Proterozoic andArchean cratons. (Redrawn from Nixon, 1995; Haggerty, 1999.)
0 miles 250
4000 km
60
Namibia
PRO
TERO
ZOIC
100
110
120
South Africa
137CRATON
90
Botswana 500
165
145
145
125125115
1201600
90
1200
Lamproite
Kimberlite
90
90120
90
Orangeite
Kimberlitecluster
190
KAAPVAAL
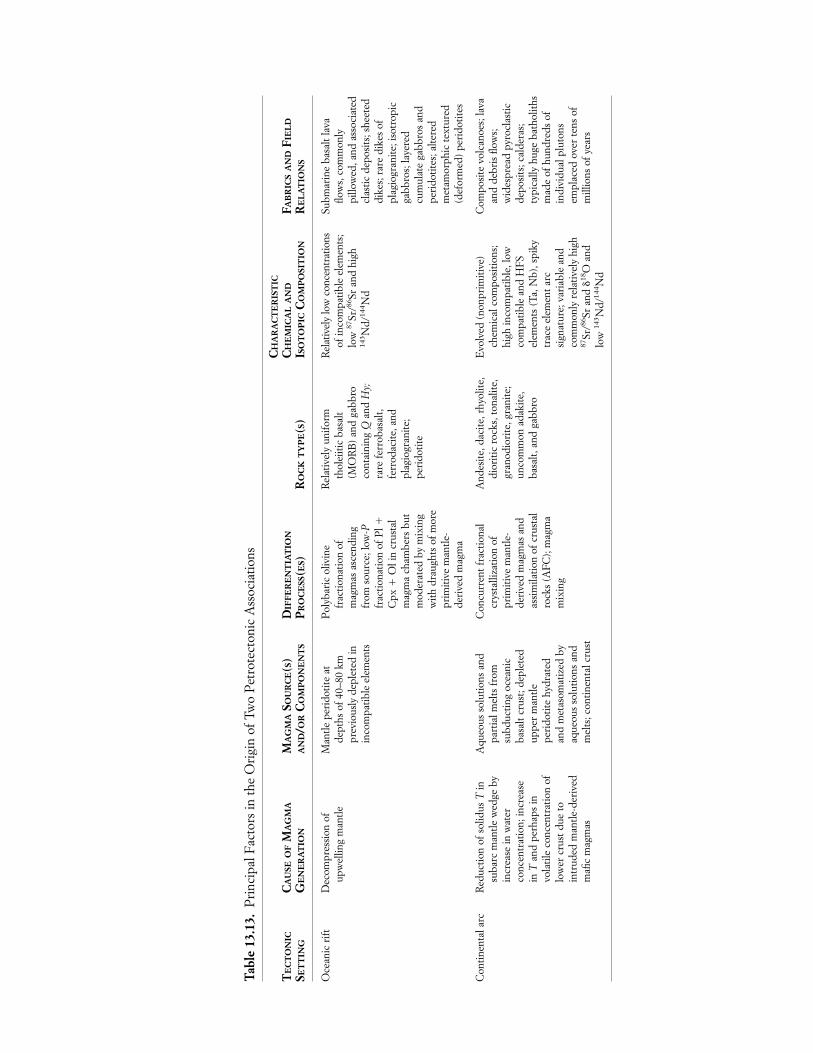
Tabl
e 13
.13.
Pri
ncip
al F
acto
rs in
the
Ori
gin
of T
wo
Pet
rote
cton
ic A
ssoc
iatio
ns
TE
CT
ON
ICS E
TT
ING
Oce
anic
rift
Con
tinen
tal a
rc
CA
USE
OF
MA
GM
AG
EN
ER
AT
ION
Dec
ompr
essi
on o
fup
wel
ling
man
tle
Red
uctio
n of
sol
idus
Tin
suba
rc m
antle
wed
ge b
yin
crea
se in
wat
erco
ncen
trat
ion;
incr
ease
in T
and
perh
aps
invo
latil
e co
ncen
trat
ion
oflo
wer
cru
st d
ue to
intr
uded
man
tle-d
eriv
edm
afic
mag
mas
MA
GM
ASO
UR
CE
(S)
AN
D/ O
RC
OM
PO
NE
NT
S
Man
tle p
erid
otite
at
dept
hs o
f 40–
80 k
mpr
evio
usly
dep
lete
d in
inco
mpa
tible
ele
men
ts
Aqu
eous
sol
utio
ns a
ndpa
rtia
l mel
ts fr
omsu
bduc
ting
ocea
nic
basa
lt cr
ust;
depl
eted
uppe
r m
antle
peri
dotit
e hy
drat
edan
d m
etas
omat
ized
by
aque
ous
solu
tions
and
mel
ts; c
ontin
enta
l cru
st
DIF
FER
EN
TIA
TIO
NPR
OC
ESS
(ES)
Pol
ybar
ic o
livin
efr
actio
natio
n of
mag
mas
asc
endi
ngfr
om s
ourc
e; lo
w-P
frac
tiona
tion
of P
l �C
px �
Ol i
n cr
usta
lm
agm
a ch
ambe
rs b
utm
oder
ated
by
mix
ing
with
dra
ught
s of
mor
epr
imiti
ve m
antle
-de
rive
d m
agm
a
Con
curr
ent f
ract
iona
lcr
ysta
lliza
tion
ofpr
imiti
ve m
antle
-de
rive
d m
agm
as a
ndas
sim
ilatio
n of
cru
stal
rock
s (A
FC
); m
agm
am
ixin
g
RO
CK
TY
PE
(S)
Rel
ativ
ely
unifo
rmth
olei
itic
basa
lt(M
OR
B)
and
gabb
roco
ntai
ning
Qan
d H
y;ra
re fe
rrob
asal
t,fe
rrod
acite
, and
plag
iogr
anite
;pe
rido
tite
And
esite
, dac
ite, r
hyol
ite,
dior
itic
rock
s, to
nalit
e,gr
anod
iori
te, g
rani
te;
unco
mm
on a
daki
te,
basa
lt, a
nd g
abbr
o
CH
AR
AC
TE
RIS
TIC
CH
EM
ICA
LA
ND
ISO
TO
PIC
CO
MP
OSI
TIO
N
Rel
ativ
ely
low
con
cent
ratio
nsof
inco
mpa
tible
ele
men
ts;
low
87Sr
/86Sr
and
hig
h14
3 Nd/
144 N
d
Evo
lved
(no
npri
miti
ve)
chem
ical
com
posi
tions
;hi
gh in
com
patib
le, l
owco
mpa
tible
and
HF
Sel
emen
ts (
Ta, N
b), s
piky
trac
e el
emen
t arc
sign
atur
e; v
aria
ble
and
com
mon
ly r
elat
ivel
y hi
gh87
Sr/86
Sr a
nd �
18O
and
low
143 N
d/14
4 Nd
FAB
RIC
SA
ND
FIE
LD
RE
LA
TIO
NS
Subm
arin
e ba
salt
lava
flow
s, c
omm
only
pillo
wed
, and
ass
ocia
ted
clas
tic d
epos
its; s
heet
eddi
kes;
rar
e di
kes
ofpl
agio
gran
ite; i
sotr
opic
gabb
ros;
laye
red
cum
ulat
e ga
bbro
s an
dpe
rido
tites
; alte
red
met
amor
phic
text
ured
(def
orm
ed)
peri
dotit
es
Com
posi
te v
olca
noes
; lav
aan
d de
bris
flow
s;w
ides
prea
d py
rocl
astic
depo
sits
; cal
dera
s;ty
pica
lly h
uge
bath
olith
sm
ade
of h
undr
eds
ofin
divi
dual
plu
tons
empl
aced
ove
r te
ns o
fm
illio
ns o
f yea
rs
Magmatic Petrotectonic Associations 403
residue, agreeing with the deep source implied by thexenocrystic diamonds. Figure 13.41 shows that magmascreating the archetypal kimberlite clan have a sourcethat is near bulk Earth and like that of asthenospheric,plume-related OIB, exemplified by Hawaiian magmas.In striking contrast, orangeite and lamproite clans havehigher 87Sr/86Sr and lower 143Nd/144Nd, so their mag-mas must have a major component from mantle litho-sphere metasomatically enriched during the Precam-brian.
It is possible that nonconvecting mantle underly-ing old cratons is a remnant of ancient mantle plumes(Herzberg and O’Hara, 1998; Haggerty, 1999) and hasexperienced an unusual long-term history of metaso-matism and a younger episode of magma generation, assuggested by markedly different Sr isotope ratios oflamproites in Figure 13.41. Whether the diamondifer-ous eclogites in the subcratonic mantle representfrozen high-P basaltic melts or remnants of ancientsubducted oceanic crust (Helmstaedt and Gurney,1995) is controversial. Likewise, the source of the car-bon for diamonds and the CO2 dissolved in the kim-berlitic magmas—whether from ancient subductedcrust or primeval mantle—is also controversial. Thesequestions bear on the problematic origin of Archeancontinents and lithosphere (see Section 19.8).
SUMMARY
Relating the wide diversity of magmatic rocks to theirtectonic setting provides rich insights into the way theEarth works—a central theme of this textbook. Inter-pretive models of magma origin can constrain globalmodels proposed by geophysicists and tectonic geolo-gists, and vice versa. Of fundamental concern is thethermal budget of the Earth, the way its vast store ofthermal energy is dissipated through motion of litho-spheric plates and rise of mantle plumes and the mag-matism associated with these convective processes.
From a narrower perspective, study of petrotec-tonic associations focuses attention on specific magmasources, conditions of generation, and subsequentprocesses of differentiation of primitive magmas thathave produced distinct rock types and rock suites inspecific tectonic settings. Rather than a lengthy sum-mary of all of the associations described in this chapter,only two strongly contrasting associations are set out inTable 13.13.
CRITICAL THINKING QUESTIONS13.1 Prepare a detailed summary of each of the
petrotectonic associations described in this
chapter using the format in Table 13.13. Twoare provided as examples.
13.2 How does the composition of oceanic rocksconstrain models proposed by geophysicistsconcerning the nature of the mantle and con-vection in it?
13.3 In the complementary Sr and Nd isotope com-positions of MORB and continental crust (Fig-ure 2.27) why is MORB closer to the mantle ar-ray than the continental crust?
13.4 How does the composition of rocks in ophio-lites constrain their tectonic interpretation?
13.5 What was the state of stress during emplace-ment of the Karoo dikes and sills shown in Fig-ure 13.20b?
13.6 What special geologic conditions in Icelandcompared to other oceanic islands might be re-sponsible for the exceptionally large proportionof silicic rocks?
13.7 Explain the paradox of the mica-rich lamproitein Table 13.11, column 7, that contains norma-tive quartz but modal leucite (see also problem13.2). How would you classify this rock? Is itsilica-oversaturated or silica-undersaturated?
13.8 What do kimberlitic and lamproitic rocks tellus about the history of cratons (long-term sta-ble sectors of continents unaffected by tecton-ism) and their thermal state?
13.9 Diamonds contain mineral inclusions that crys-tallized deep in the mantle at high T as longago as 3 Ga. How is it possible for these to bepreserved for our study?
13.10 Why does orthopyroxene never crystallize un-der equilibrium conditions in silica-undersatu-rated alkaline magmas?
13.11 From phase diagrams in Chapters 5 and 11how might you account for the contrastingcompositions of olivines in Hawaiian tholeiiticand alkaline basalts (Section 13.2.1)?
PROBLEMS13.1 Make primitive-mantle-normalized trace ele-
ment diagrams of granitic and rhyolitic rocksfrom Tables 13.7, 13.8, 13.9, and 13.10. Com-pare these patterns and comment on what theytell about the source of magmas and overprint-ing differentiation processes.
13.2 Calculate the normative composition of the pla-giogranite in Table 13.7 and the phlogopite-richlamproite in Table 13.11. How do these normscompare with the corresponding modes? Seealso critical thinking question 13.7.
FUNDAMENTAL QUESTIONSCONSIDERED IN THIS CHAPTER
1. What is the nature of subsolidus changes in thefabric and composition of rocks that occur duringmetamorphism?
2. What transfers of energy and matter in geologicsystems bring about metamorphism?
3. In what geologic settings does metamorphismoccur, and why?
4. What role do metamorphic rocks play in ourunderstanding of crustal evolution, global platetectonics, and how the Earth works?
INTRODUCTION
In the dynamic Earth, changes in geologic systems res-ulting from transfers and transformations of energyand from movement of rock, magma, and fluids arecontinually occurring, chiefly near margins of lithos-pheric plates. States of thermodynamic equilibrium areperturbed, causing rock systems to seek new, lower energy, more stable states by adjustment of their fabricand composition. These equilibrating adjustments thattake place in the solid state at elevated temperaturesare called metamorphism. Equilibration processes andthe kinetic factors that control their rates vary widely,depending on the fabric and composition of the parentrock, the T and P of the evolving rock system, the com-position of fluids in it, and the prevailing state of stress.
Changing geologic conditions in metamorphic systemsrange between those where buried sediment is ce-mented and lithified in the sedimentary process knownas diagenesis at relatively low T and P, up to whererock partially melts (Figure 14.1). Simply put, duringmetamorphism, rocks are hot enough to recrystallizebut not hot enough to melt.
Many sedimentary and some magmatic rock-formingsystems can be directly observed. However, our studyof metamorphic rock-forming systems can never enjoythis benefit because of their concealment well beneaththe surface of the Earth, where P and T are elevated.Consequently, equilibrating metamorphic processescan generally only be understood from observationsmade of their rock products long after the meta-morphism has terminated, combined with logic and inferences from necessarily simplified thermodynamic models and laboratory experiments.
Like magmatism, metamorphism involves transfer ofheat and mass. Consequently, many concepts developedin preceding chapters apply equally well to metamor-phic systems as to magmatic ones. Examples includeconcepts of thermodynamics and kinetics (Chapter 3),phase equilibria (Chapter 5), diffusive transport of atomsand heat (Chapter 6), and stress-deformation relation-ships and rheologic behavior (Chapter 8).
Nonetheless, there are significant contrasts betweenmagmatic and metamorphic systems. Magmatic beha-vior is dominated by a melt, or silicate liquid, that con-tains dissolved volatiles and interacts with crystallinephases. In contrast, subsolidus metamorphic systemslack a melt but usually have a volatile fluid that interacts chemically, physically, and thermally with the
MetamorphicRocks andMetamorphism:An Overview
14CHAPTER
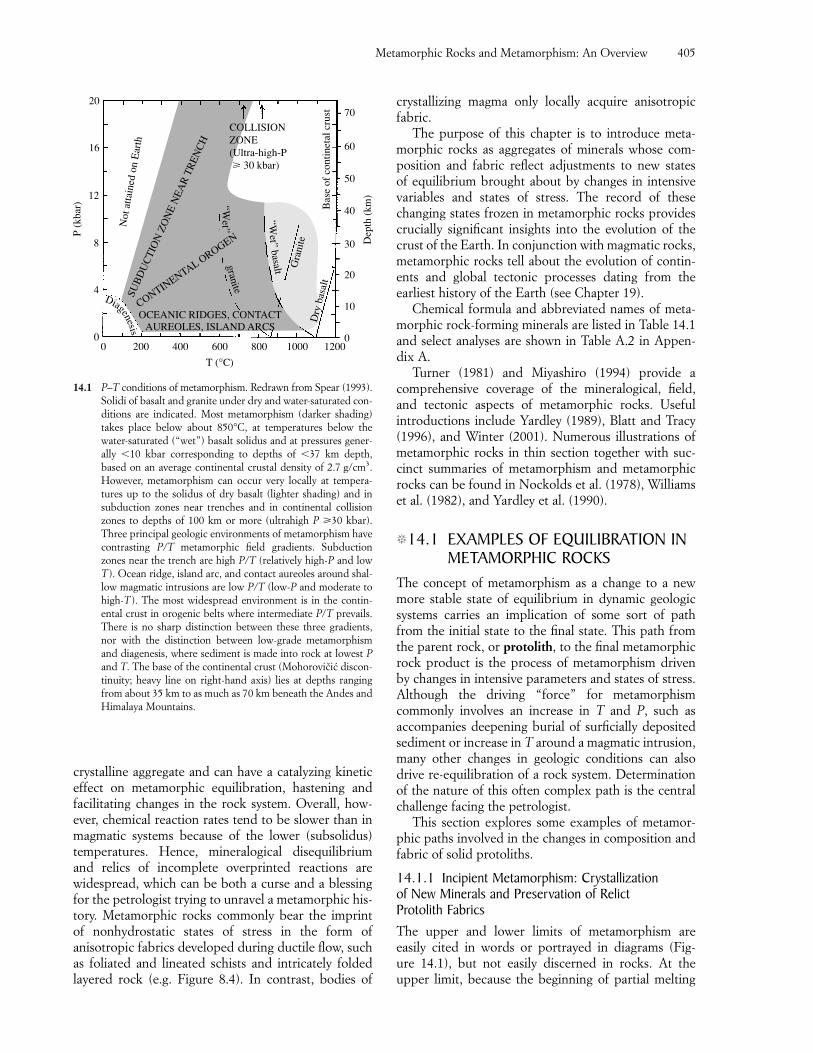
crystalline aggregate and can have a catalyzing kineticeffect on metamorphic equilibration, hastening and facilitating changes in the rock system. Overall, how-ever, chemical reaction rates tend to be slower than in magmatic systems because of the lower (subsolidus)temperatures. Hence, mineralogical disequilibriumand relics of incomplete overprinted reactions arewidespread, which can be both a curse and a blessingfor the petrologist trying to unravel a metamorphic his-tory. Metamorphic rocks commonly bear the imprint of nonhydrostatic states of stress in the form ofanisotropic fabrics developed during ductile flow, suchas foliated and lineated schists and intricately foldedlayered rock (e.g. Figure 8.4). In contrast, bodies of
crystallizing magma only locally acquire anisotropicfabric.
The purpose of this chapter is to introduce meta-morphic rocks as aggregates of minerals whose com-position and fabric reflect adjustments to new states of equilibrium brought about by changes in intensivevariables and states of stress. The record of thesechanging states frozen in metamorphic rocks providescrucially significant insights into the evolution of thecrust of the Earth. In conjunction with magmatic rocks,metamorphic rocks tell about the evolution of contin-ents and global tectonic processes dating from the earliest history of the Earth (see Chapter 19).
Chemical formula and abbreviated names of meta-morphic rock-forming minerals are listed in Table 14.1and select analyses are shown in Table A.2 in Appen-dix A.
Turner (1981) and Miyashiro (1994) provide a comprehensive coverage of the mineralogical, field,and tectonic aspects of metamorphic rocks. Useful introductions include Yardley (1989), Blatt and Tracy(1996), and Winter (2001). Numerous illustrations ofmetamorphic rocks in thin section together with suc-cinct summaries of metamorphism and metamorphicrocks can be found in Nockolds et al. (1978), Williamset al. (1982), and Yardley et al. (1990).
�14.1 EXAMPLES OF EQUILIBRATION INMETAMORPHIC ROCKS
The concept of metamorphism as a change to a newmore stable state of equilibrium in dynamic geologicsystems carries an implication of some sort of pathfrom the initial state to the final state. This path fromthe parent rock, or protolith, to the final metamorphicrock product is the process of metamorphism drivenby changes in intensive parameters and states of stress.Although the driving “force” for metamorphism commonly involves an increase in T and P, such as accompanies deepening burial of surficially depositedsediment or increase in T around a magmatic intrusion,many other changes in geologic conditions can alsodrive re-equilibration of a rock system. Determinationof the nature of this often complex path is the centralchallenge facing the petrologist.
This section explores some examples of metamor-phic paths involved in the changes in composition andfabric of solid protoliths.
14.1.1 Incipient Metamorphism: Crystallization of New Minerals and Preservation of Relict Protolith FabricsThe upper and lower limits of metamorphism are easily cited in words or portrayed in diagrams (Fig-ure 14.1), but not easily discerned in rocks. At the upper limit, because the beginning of partial melting
Metamorphic Rocks and Metamorphism: An Overview 405
P (k
bar)
2070
Not
atta
ined
on
Ear
thSU
BD
UC
TIO
N Z
ON
E N
EAR
TR
ENC
H
CONTINENTAL OROGEN
OCEANIC RIDGES, CONTACTAUREOLES, ISLAND ARCS
Dry
bas
alt
Gra
nite
COLLISIONZONE(Ultra-high-P � 30 kbar)
Bas
e of
con
tinet
al c
rust
granite“W
et”
16
12
8
4
0
Dep
th (
km)
0 200 400 600 800 1000 1200
60
50
40
30
20
10
0
Diagenesis
T (°C)
“Wet”
basalt
14.1 P–T conditions of metamorphism. Redrawn from Spear (1993).Solidi of basalt and granite under dry and water-saturated con-ditions are indicated. Most metamorphism (darker shading)takes place below about 850°C, at temperatures below the water-saturated (“wet”) basalt solidus and at pressures gener-ally �10 kbar corresponding to depths of �37 km depth,based on an average continental crustal density of 2.7 g/cm3.However, metamorphism can occur very locally at tempera-tures up to the solidus of dry basalt (lighter shading) and insubduction zones near trenches and in continental collisionzones to depths of 100 km or more (ultrahigh P �30 kbar).Three principal geologic environments of metamorphism havecontrasting P/T metamorphic field gradients. Subductionzones near the trench are high P/T (relatively high-P and lowT ). Ocean ridge, island arc, and contact aureoles around shal-low magmatic intrusions are low P/T (low-P and moderate tohigh-T ). The most widespread environment is in the contin-ental crust in orogenic belts where intermediate P/T prevails.There is no sharp distinction between these three gradients,nor with the distinction between low-grade metamorphismand diagenesis, where sediment is made into rock at lowest Pand T. The base of the continental crust (Mohorovidic discon-tinuity; heavy line on right-hand axis) lies at depths rangingfrom about 35 km to as much as 70 km beneath the Andes andHimalaya Mountains.
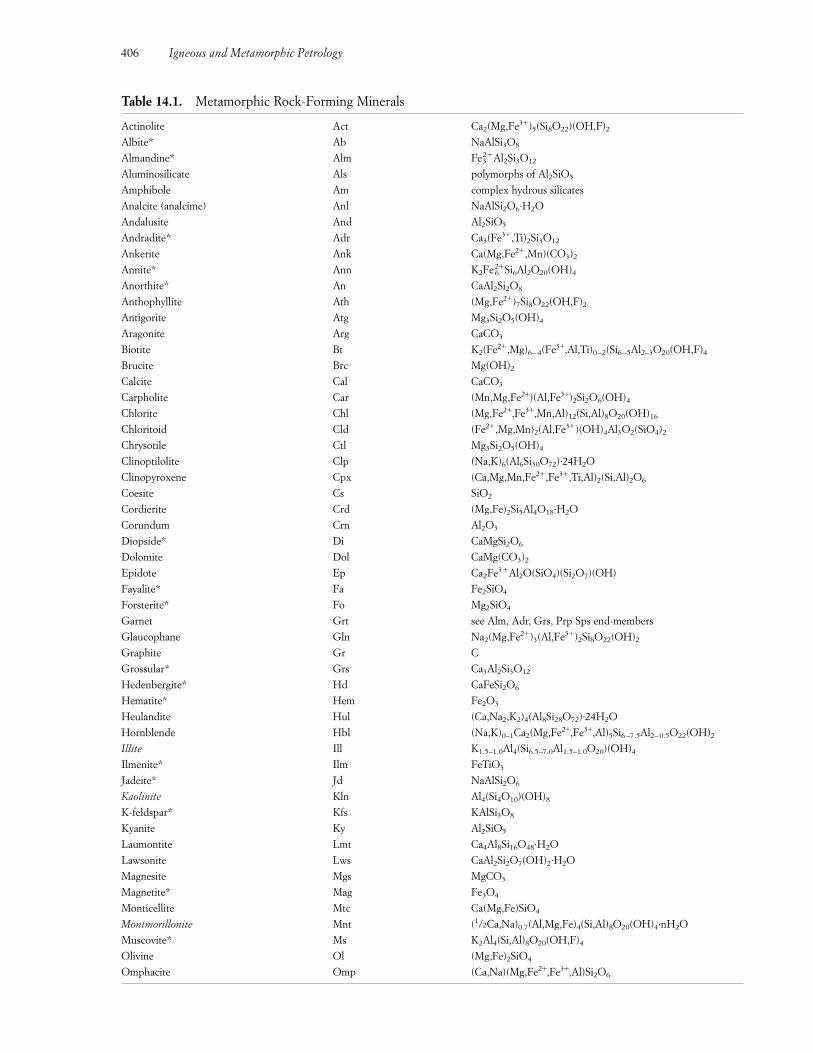
406 Igneous and Metamorphic Petrology
Table 14.1. Metamorphic Rock-Forming Minerals
Actinolite Act Ca2(Mg,Fe3�)5(Si8O22)(OH,F)2
Albite* Ab NaAlSi3O8
Almandine* Alm Fe32�Al2Si3O12
Aluminosilicate Als polymorphs of Al2SiO5
Amphibole Am complex hydrous silicates
Analcite (analcime) Anl NaAlSi2O6·H2O
Andalusite And Al2SiO5
Andradite* Adr Ca3(Fe3�,Ti)2Si3O12
Ankerite Ank Ca(Mg,Fe2�,Mn)(CO3)2
Annite* Ann K2Fe62�Si6Al2O20(OH)4
Anorthite* An CaAl2Si2O8
Anthophyllite Ath (Mg,Fe2�)7Si8O22(OH,F)2
Antigorite Atg Mg3Si2O5(OH)4
Aragonite Arg CaCO3
Biotite Bt K2(Fe2�,Mg)6– 4(Fe3�,Al,Ti)0 –2(Si6 –5Al2–3O20(OH,F)4
Brucite Brc Mg(OH)2
Calcite Cal CaCO3
Carpholite Car (Mn,Mg,Fe2�)(Al,Fe3�)2Si2O6(OH)4
Chlorite Chl (Mg,Fe2�,Fe3�,Mn,Al)12(Si,Al)8O20(OH)16
Chloritoid Cld (Fe2�,Mg,Mn)2(Al,Fe3�)(OH)4Al3O2(SiO4)2
Chrysotile Ctl Mg3Si2O5(OH)4
Clinoptilolite Clp (Na,K)6(Al6Si30O72)·24H2O
Clinopyroxene Cpx (Ca,Mg,Mn,Fe2�,Fe3�,Ti,Al)2(Si,Al)2O6
Coesite Cs SiO2
Cordierite Crd (Mg,Fe)2Si5Al4O18·H2O
Corundum Crn Al2O3
Diopside* Di CaMgSi2O6
Dolomite Dol CaMg(CO3)2
Epidote Ep Ca2Fe3�Al2O(SiO4)(Si2O7)(OH)
Fayalite* Fa Fe2SiO4
Forsterite* Fo Mg2SiO4
Garnet Grt see Alm, Adr, Grs, Prp Sps end-members
Glaucophane Gln Na2(Mg,Fe2�)3(Al,Fe3�)2Si8O22(OH)2
Graphite Gr C
Grossular* Grs Ca3Al2Si3O12
Hedenbergite* Hd CaFeSi2O6
Hematite* Hem Fe2O3
Heulandite Hul (Ca,Na2,K2)4(Al8Si28O72)·24H2O
Hornblende Hbl (Na,K)0–1Ca2(Mg,Fe2�,Fe3�,Al)5Si6 –7.5Al2– 0.5O22(OH)2
Illite Ill K1.5–1.0Al4(Si6.5–7.0Al1.5–1.0O20)(OH)4
Ilmenite* Ilm FeTiO3
Jadeite* Jd NaAlSi2O6
Kaolinite Kln Al4(Si4O10)(OH)8
K-feldspar* Kfs KAlSi3O8
Kyanite Ky Al2SiO5
Laumontite Lmt Ca4Al8Si16O48·H2O
Lawsonite Lws CaAl2Si2O7(OH)2·H2O
Magnesite Mgs MgCO3
Magnetite* Mag Fe3O4
Monticellite Mtc Ca(Mg,Fe)SiO4
Montmorillonite Mnt (1/2Ca,Na)0.7(Al,Mg,Fe)4(Si,Al)8O20(OH)4·nH2O
Muscovite* Ms K2Al4(Si,Al)8O20(OH,F)4
Olivine Ol (Mg,Fe)2SiO4
Omphacite Omp (Ca,Na)(Mg,Fe2�,Fe3�,Al)Si2O6
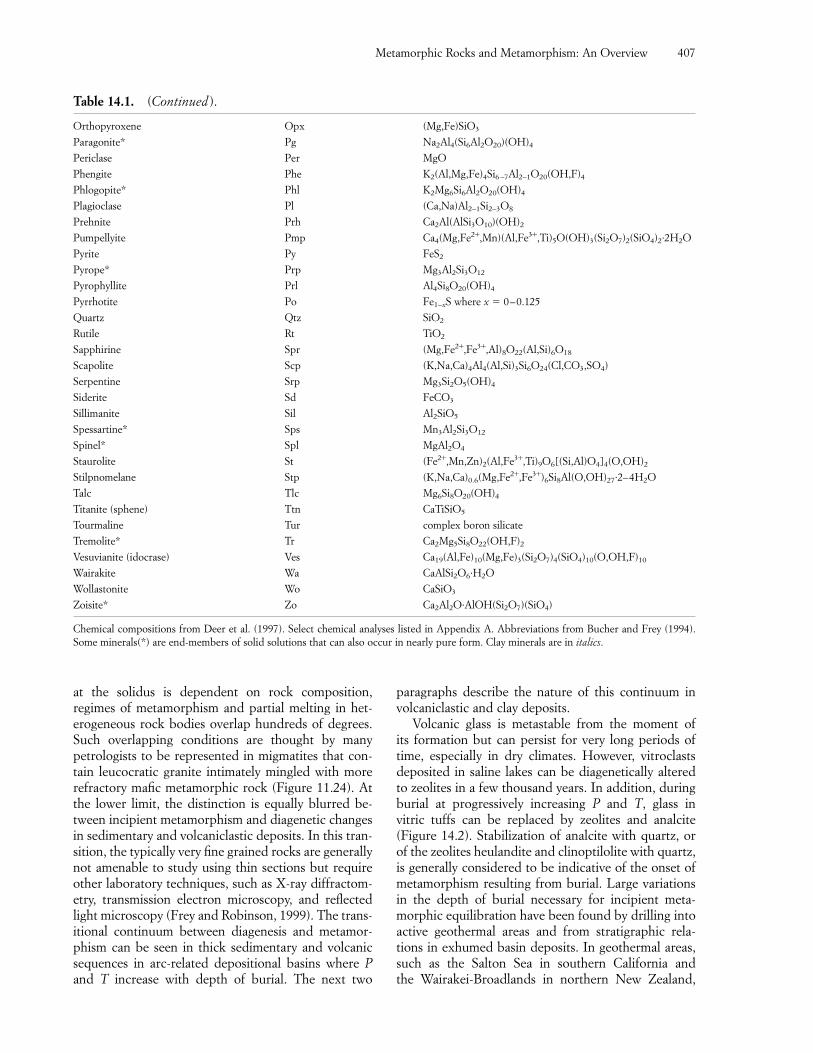
Metamorphic Rocks and Metamorphism: An Overview 407
at the solidus is dependent on rock composition,regimes of metamorphism and partial melting in het-erogeneous rock bodies overlap hundreds of degrees.Such overlapping conditions are thought by manypetrologists to be represented in migmatites that con-tain leucocratic granite intimately mingled with morerefractory mafic metamorphic rock (Figure 11.24). Atthe lower limit, the distinction is equally blurred be-tween incipient metamorphism and diagenetic changesin sedimentary and volcaniclastic deposits. In this tran-sition, the typically very fine grained rocks are generallynot amenable to study using thin sections but requireother laboratory techniques, such as X-ray diffractom-etry, transmission electron microscopy, and reflectedlight microscopy (Frey and Robinson, 1999). The trans-itional continuum between diagenesis and metamor-phism can be seen in thick sedimentary and volcanicsequences in arc-related depositional basins where Pand T increase with depth of burial. The next two
paragraphs describe the nature of this continuum involcaniclastic and clay deposits.
Volcanic glass is metastable from the moment of its formation but can persist for very long periods oftime, especially in dry climates. However, vitroclastsdeposited in saline lakes can be diagenetically alteredto zeolites in a few thousand years. In addition, duringburial at progressively increasing P and T, glass in vitric tuffs can be replaced by zeolites and analcite(Figure 14.2). Stabilization of analcite with quartz, orof the zeolites heulandite and clinoptilolite with quartz,is generally considered to be indicative of the onset ofmetamorphism resulting from burial. Large variationsin the depth of burial necessary for incipient meta-morphic equilibration have been found by drilling intoactive geothermal areas and from stratigraphic rela-tions in exhumed basin deposits. In geothermal areas,such as the Salton Sea in southern California and the Wairakei-Broadlands in northern New Zealand,
Table 14.1. (Continued).
Orthopyroxene Opx (Mg,Fe)SiO3
Paragonite* Pg Na2Al4(Si6Al2O20)(OH)4
Periclase Per MgO
Phengite Phe K2(Al,Mg,Fe)4Si6 –7Al2–1O20(OH,F)4
Phlogopite* Phl K2Mg6Si6Al2O20(OH)4
Plagioclase Pl (Ca,Na)Al2–1Si2–3O8
Prehnite Prh Ca2Al(AlSi3O10)(OH)2
Pumpellyite Pmp Ca4(Mg,Fe2�,Mn)(Al,Fe3�,Ti)5O(OH)3(Si2O7)2(SiO4)2·2H2O
Pyrite Py FeS2
Pyrope* Prp Mg3Al2Si3O12
Pyrophyllite Prl Al4Si8O20(OH)4
Pyrrhotite Po Fe1–xS where x � 0–0.125
Quartz Qtz SiO2
Rutile Rt TiO2
Sapphirine Spr (Mg,Fe2�,Fe3�,Al)8O22(Al,Si)6O18
Scapolite Scp (K,Na,Ca)4Al4(Al,Si)3Si6O24(Cl,CO3,SO4)
Serpentine Srp Mg3Si2O5(OH)4
Siderite Sd FeCO3
Sillimanite Sil Al2SiO5
Spessartine* Sps Mn3Al2Si3O12
Spinel* Spl MgAl2O4
Staurolite St (Fe2�,Mn,Zn)2(Al,Fe3�,Ti)9O6[(Si,Al)O4]4(O,OH)2
Stilpnomelane Stp (K,Na,Ca)0.6(Mg,Fe2�,Fe3�)6Si8Al(O,OH)27·2–4H2O
Talc Tlc Mg6Si8O20(OH)4
Titanite (sphene) Ttn CaTiSiO5
Tourmaline Tur complex boron silicate
Tremolite* Tr Ca2Mg5Si8O22(OH,F)2
Vesuvianite (idocrase) Ves Ca19(Al,Fe)10(Mg,Fe)3(Si2O7)4(SiO4)10(O,OH,F)10
Wairakite Wa CaAlSi2O6·H2O
Wollastonite Wo CaSiO3
Zoisite* Zo Ca2Al2O·AlOH(Si2O7)(SiO4)
Chemical compositions from Deer et al. (1997). Select chemical analyses listed in Appendix A. Abbreviations from Bucher and Frey (1994).Some minerals(*) are end-members of solid solutions that can also occur in nearly pure form. Clay minerals are in italics.
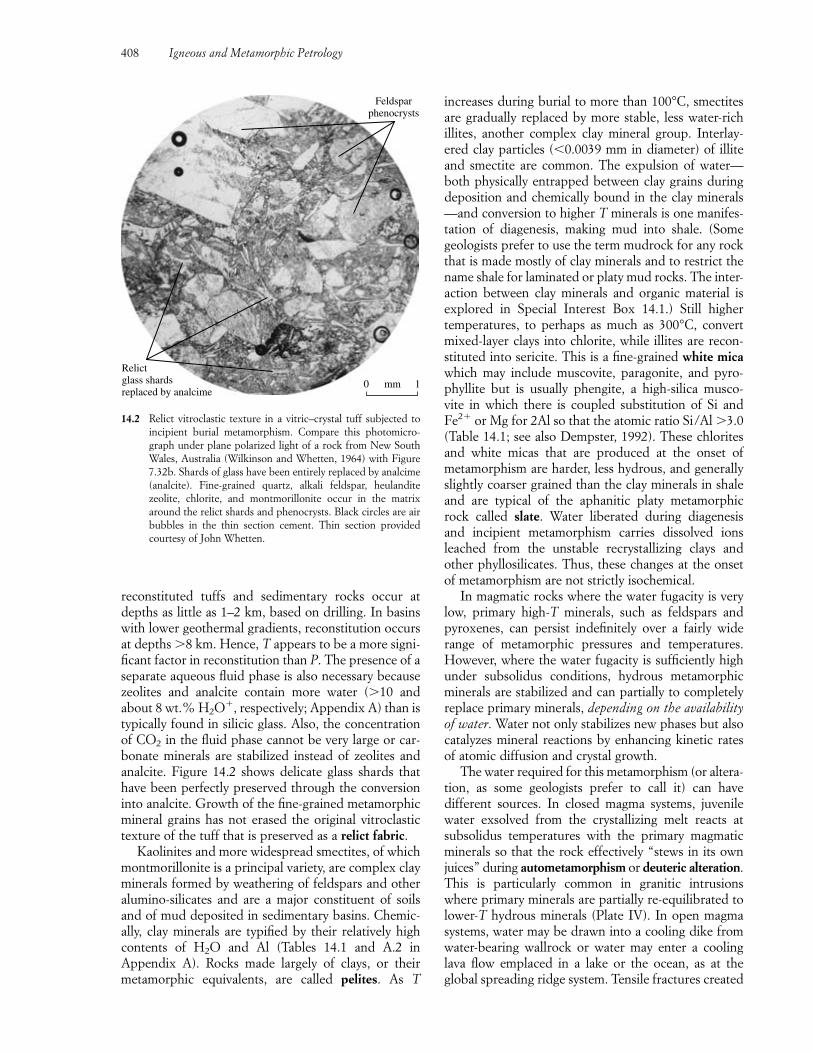
increases during burial to more than 100°C, smectitesare gradually replaced by more stable, less water-rich illites, another complex clay mineral group. Interlay-ered clay particles (�0.0039 mm in diameter) of illiteand smectite are common. The expulsion of water—both physically entrapped between clay grains duringdeposition and chemically bound in the clay minerals—and conversion to higher T minerals is one manifes-tation of diagenesis, making mud into shale. (Some geologists prefer to use the term mudrock for any rockthat is made mostly of clay minerals and to restrict thename shale for laminated or platy mud rocks. The inter-action between clay minerals and organic material isexplored in Special Interest Box 14.1.) Still higher temperatures, to perhaps as much as 300°C, convertmixed-layer clays into chlorite, while illites are recon-stituted into sericite. This is a fine-grained white micawhich may include muscovite, paragonite, and pyro-phyllite but is usually phengite, a high-silica musco-vite in which there is coupled substitution of Si andFe2� or Mg for 2Al so that the atomic ratio Si/Al �3.0(Table 14.1; see also Dempster, 1992). These chloritesand white micas that are produced at the onset of metamorphism are harder, less hydrous, and generallyslightly coarser grained than the clay minerals in shaleand are typical of the aphanitic platy metamorphic rock called slate. Water liberated during diagenesis and incipient metamorphism carries dissolved ionsleached from the unstable recrystallizing clays andother phyllosilicates. Thus, these changes at the onsetof metamorphism are not strictly isochemical.
In magmatic rocks where the water fugacity is verylow, primary high-T minerals, such as feldspars and pyroxenes, can persist indefinitely over a fairly widerange of metamorphic pressures and temperatures.However, where the water fugacity is sufficiently highunder subsolidus conditions, hydrous metamorphicminerals are stabilized and can partially to completelyreplace primary minerals, depending on the availabilityof water. Water not only stabilizes new phases but alsocatalyzes mineral reactions by enhancing kinetic ratesof atomic diffusion and crystal growth.
The water required for this metamorphism (or altera-tion, as some geologists prefer to call it) can have different sources. In closed magma systems, juvenilewater exsolved from the crystallizing melt reacts at subsolidus temperatures with the primary magmaticminerals so that the rock effectively “stews in its ownjuices” during autometamorphism or deuteric alteration.This is particularly common in granitic intrusionswhere primary minerals are partially re-equilibrated tolower-T hydrous minerals (Plate IV). In open magmasystems, water may be drawn into a cooling dike fromwater-bearing wallrock or water may enter a coolinglava flow emplaced in a lake or the ocean, as at theglobal spreading ridge system. Tensile fractures created
408 Igneous and Metamorphic Petrology
reconstituted tuffs and sedimentary rocks occur atdepths as little as 1–2 km, based on drilling. In basinswith lower geothermal gradients, reconstitution occursat depths �8 km. Hence, T appears to be a more signi-ficant factor in reconstitution than P. The presence of aseparate aqueous fluid phase is also necessary becausezeolites and analcite contain more water (�10 andabout 8 wt.% H2O�, respectively; Appendix A) than istypically found in silicic glass. Also, the concentrationof CO2 in the fluid phase cannot be very large or car-bonate minerals are stabilized instead of zeolites andanalcite. Figure 14.2 shows delicate glass shards thathave been perfectly preserved through the conversioninto analcite. Growth of the fine-grained metamorphicmineral grains has not erased the original vitroclastictexture of the tuff that is preserved as a relict fabric.
Kaolinites and more widespread smectites, of whichmontmorillonite is a principal variety, are complex clayminerals formed by weathering of feldspars and otheralumino-silicates and are a major constituent of soilsand of mud deposited in sedimentary basins. Chemic-ally, clay minerals are typified by their relatively highcontents of H2O and Al (Tables 14.1 and A.2 in Appendix A). Rocks made largely of clays, or theirmetamorphic equivalents, are called pelites. As T
Feldsparphenocrysts
10 mm
Relictglass shardsreplaced by analcime
14.2 Relict vitroclastic texture in a vitric–crystal tuff subjected toincipient burial metamorphism. Compare this photomicro-graph under plane polarized light of a rock from New SouthWales, Australia (Wilkinson and Whetten, 1964) with Figure7.32b. Shards of glass have been entirely replaced by analcime(analcite). Fine-grained quartz, alkali feldspar, heulandite zeolite, chlorite, and montmorillonite occur in the matrixaround the relict shards and phenocrysts. Black circles are airbubbles in the thin section cement. Thin section providedcourtesy of John Whetten.
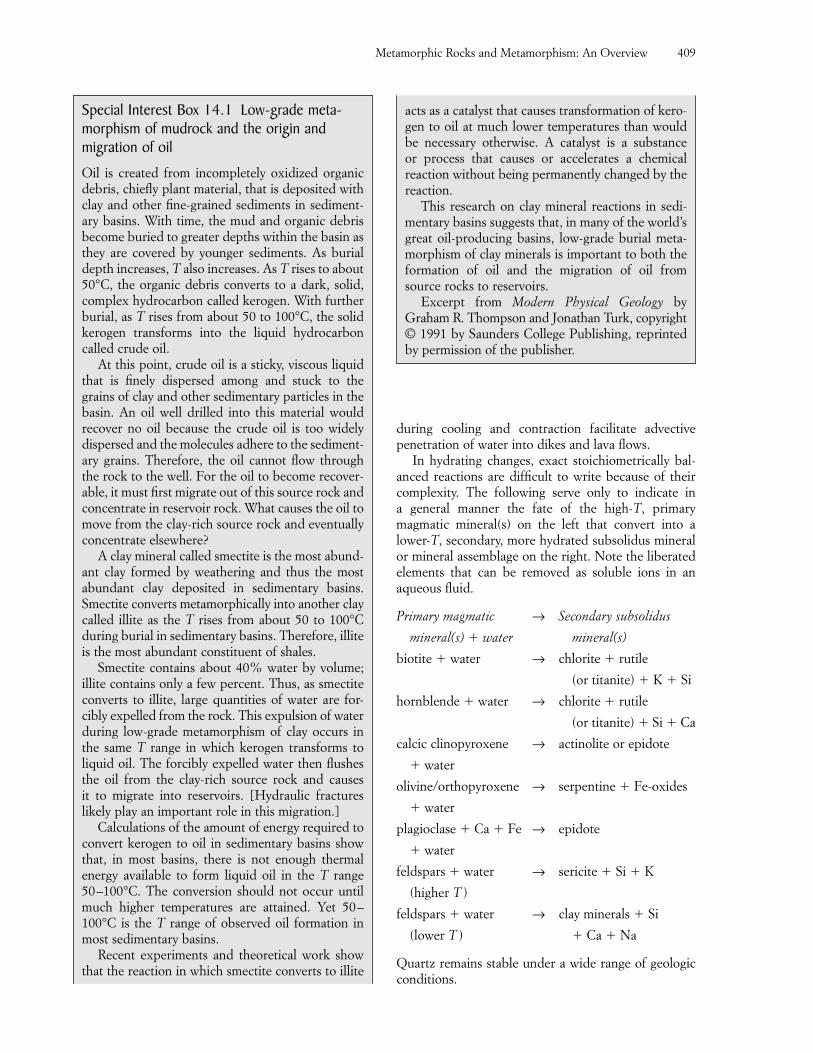
Metamorphic Rocks and Metamorphism: An Overview 409
Special Interest Box 14.1 Low-grade meta-morphism of mudrock and the origin and migration of oil
Oil is created from incompletely oxidized organicdebris, chiefly plant material, that is deposited withclay and other fine-grained sediments in sediment-ary basins. With time, the mud and organic debrisbecome buried to greater depths within the basin asthey are covered by younger sediments. As burialdepth increases, T also increases. As T rises to about50°C, the organic debris converts to a dark, solid,complex hydrocarbon called kerogen. With furtherburial, as T rises from about 50 to 100°C, the solidkerogen transforms into the liquid hydrocarboncalled crude oil.
At this point, crude oil is a sticky, viscous liquidthat is finely dispersed among and stuck to thegrains of clay and other sedimentary particles in thebasin. An oil well drilled into this material would recover no oil because the crude oil is too widelydispersed and the molecules adhere to the sediment-ary grains. Therefore, the oil cannot flow throughthe rock to the well. For the oil to become recover-able, it must first migrate out of this source rock andconcentrate in reservoir rock. What causes the oil tomove from the clay-rich source rock and eventuallyconcentrate elsewhere?
A clay mineral called smectite is the most abund-ant clay formed by weathering and thus the mostabundant clay deposited in sedimentary basins.Smectite converts metamorphically into another claycalled illite as the T rises from about 50 to 100°Cduring burial in sedimentary basins. Therefore, illiteis the most abundant constituent of shales.
Smectite contains about 40% water by volume;illite contains only a few percent. Thus, as smectiteconverts to illite, large quantities of water are for-cibly expelled from the rock. This expulsion of waterduring low-grade metamorphism of clay occurs inthe same T range in which kerogen transforms toliquid oil. The forcibly expelled water then flushesthe oil from the clay-rich source rock and causes it to migrate into reservoirs. [Hydraulic fractureslikely play an important role in this migration.]
Calculations of the amount of energy required toconvert kerogen to oil in sedimentary basins showthat, in most basins, there is not enough thermal energy available to form liquid oil in the T range50–100°C. The conversion should not occur untilmuch higher temperatures are attained. Yet 50–100°C is the T range of observed oil formation inmost sedimentary basins.
Recent experiments and theoretical work showthat the reaction in which smectite converts to illite
during cooling and contraction facilitate advective penetration of water into dikes and lava flows.
In hydrating changes, exact stoichiometrically bal-anced reactions are difficult to write because of theircomplexity. The following serve only to indicate in a general manner the fate of the high-T, primary magmatic mineral(s) on the left that convert into alower-T, secondary, more hydrated subsolidus mineralor mineral assemblage on the right. Note the liberated elements that can be removed as soluble ions in anaqueous fluid.
Primary magmatic → Secondary subsolidus
mineral(s) � water mineral(s)
biotite � water → chlorite � rutile
(or titanite) � K � Si
hornblende � water → chlorite � rutile
(or titanite) � Si � Ca
calcic clinopyroxene → actinolite or epidote
� water
olivine/orthopyroxene → serpentine � Fe-oxides
� water
plagioclase � Ca � Fe → epidote
� water
feldspars � water → sericite � Si � K
(higher T )
feldspars � water → clay minerals � Si
(lower T ) � Ca � Na
Quartz remains stable under a wide range of geologicconditions.
acts as a catalyst that causes transformation of kero-gen to oil at much lower temperatures than wouldbe necessary otherwise. A catalyst is a substance or process that causes or accelerates a chemical reaction without being permanently changed by thereaction.
This research on clay mineral reactions in sedi-mentary basins suggests that, in many of the world’sgreat oil-producing basins, low-grade burial meta-morphism of clay minerals is important to both theformation of oil and the migration of oil fromsource rocks to reservoirs.
Excerpt from Modern Physical Geology by Graham R. Thompson and Jonathan Turk, copyright© 1991 by Saunders College Publishing, reprintedby permission of the publisher.
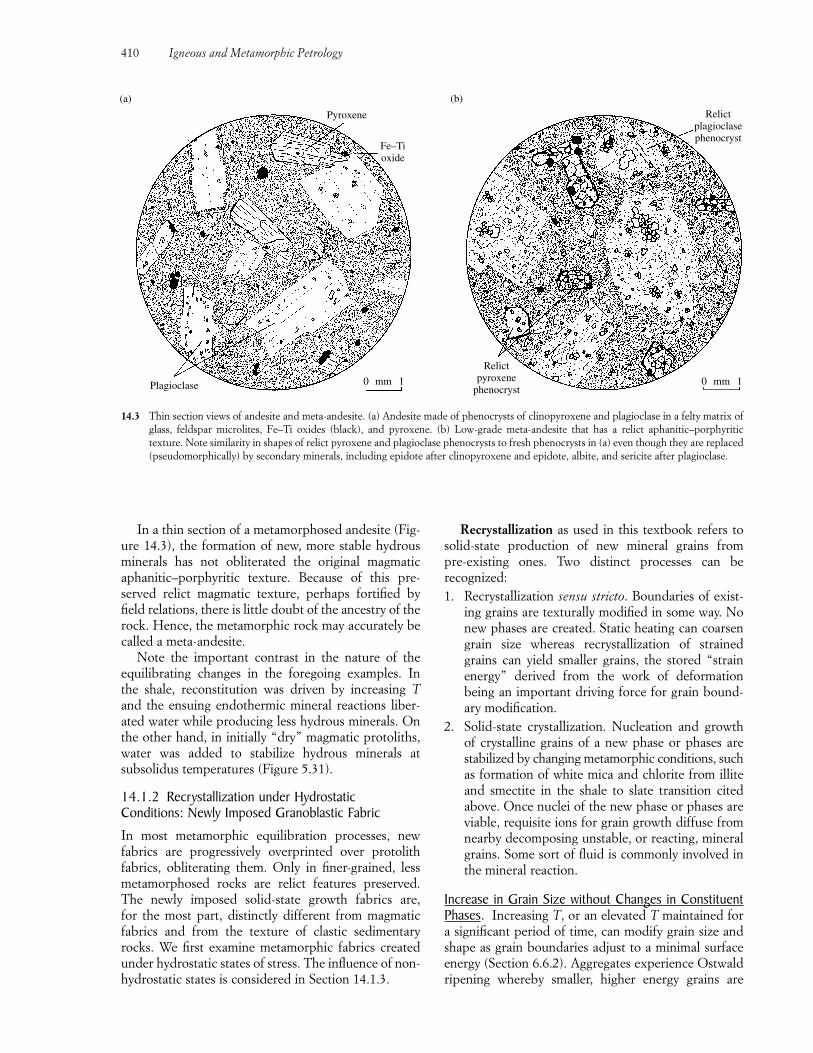
410 Igneous and Metamorphic Petrology
In a thin section of a metamorphosed andesite (Fig-ure 14.3), the formation of new, more stable hydrousminerals has not obliterated the original magmaticaphanitic–porphyritic texture. Because of this pre-served relict magmatic texture, perhaps fortified byfield relations, there is little doubt of the ancestry of therock. Hence, the metamorphic rock may accurately becalled a meta-andesite.
Note the important contrast in the nature of theequilibrating changes in the foregoing examples. In the shale, reconstitution was driven by increasing Tand the ensuing endothermic mineral reactions liber-ated water while producing less hydrous minerals. Onthe other hand, in initially “dry” magmatic protoliths, water was added to stabilize hydrous minerals at subsolidus temperatures (Figure 5.31).
14.1.2 Recrystallization under HydrostaticConditions: Newly Imposed Granoblastic Fabric
In most metamorphic equilibration processes, new fabrics are progressively overprinted over protolithfabrics, obliterating them. Only in finer-grained, lessmetamorphosed rocks are relict features preserved.The newly imposed solid-state growth fabrics are, for the most part, distinctly different from magmatic fabrics and from the texture of clastic sedimentaryrocks. We first examine metamorphic fabrics createdunder hydrostatic states of stress. The influence of non-hydrostatic states is considered in Section 14.1.3.
Recrystallization as used in this textbook refers tosolid-state production of new mineral grains from pre-existing ones. Two distinct processes can be recognized:1. Recrystallization sensu stricto. Boundaries of exist-
ing grains are texturally modified in some way. Nonew phases are created. Static heating can coarsengrain size whereas recrystallization of strainedgrains can yield smaller grains, the stored “strainenergy” derived from the work of deformation being an important driving force for grain bound-ary modification.
2. Solid-state crystallization. Nucleation and growthof crystalline grains of a new phase or phases arestabilized by changing metamorphic conditions, suchas formation of white mica and chlorite from illiteand smectite in the shale to slate transition citedabove. Once nuclei of the new phase or phases areviable, requisite ions for grain growth diffuse fromnearby decomposing unstable, or reacting, mineralgrains. Some sort of fluid is commonly involved inthe mineral reaction.
Increase in Grain Size without Changes in ConstituentPhases. Increasing T, or an elevated T maintained fora significant period of time, can modify grain size andshape as grain boundaries adjust to a minimal surfaceenergy (Section 6.6.2). Aggregates experience Ostwaldripening whereby smaller, higher energy grains are
(a)
Plagioclase
Pyroxene
(b)
Relictplagioclasephenocryst
Fe–Tioxide
mm0 1 mm0 1
Relictpyroxene
phenocryst
14.3 Thin section views of andesite and meta-andesite. (a) Andesite made of phenocrysts of clinopyroxene and plagioclase in a felty matrix ofglass, feldspar microlites, Fe–Ti oxides (black), and pyroxene. (b) Low-grade meta-andesite that has a relict aphanitic–porphyritic texture. Note similarity in shapes of relict pyroxene and plagioclase phenocrysts to fresh phenocrysts in (a) even though they are replaced(pseudomorphically) by secondary minerals, including epidote after clinopyroxene and epidote, albite, and sericite after plagioclase.
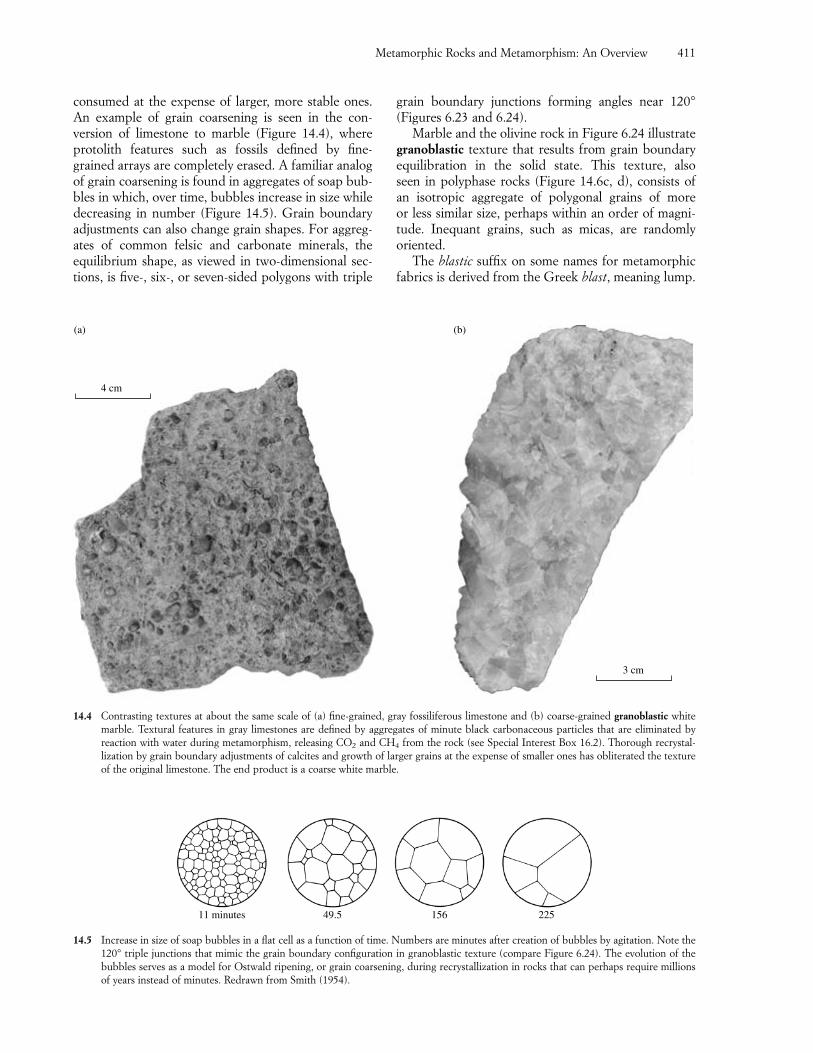
Metamorphic Rocks and Metamorphism: An Overview 411
consumed at the expense of larger, more stable ones.An example of grain coarsening is seen in the con-version of limestone to marble (Figure 14.4), whereprotolith features such as fossils defined by fine-grained arrays are completely erased. A familiar analogof grain coarsening is found in aggregates of soap bub-bles in which, over time, bubbles increase in size whiledecreasing in number (Figure 14.5). Grain boundaryadjustments can also change grain shapes. For aggreg-ates of common felsic and carbonate minerals, theequilibrium shape, as viewed in two-dimensional sec-tions, is five-, six-, or seven-sided polygons with triple
grain boundary junctions forming angles near 120°(Figures 6.23 and 6.24).
Marble and the olivine rock in Figure 6.24 illustrategranoblastic texture that results from grain boundaryequilibration in the solid state. This texture, also seen in polyphase rocks (Figure 14.6c, d), consists of an isotropic aggregate of polygonal grains of more or less similar size, perhaps within an order of magni-tude. Inequant grains, such as micas, are randomly oriented.
The blastic suffix on some names for metamorphicfabrics is derived from the Greek blast, meaning lump.
11 minutes 49.5 156 225
(a) (b)
4 cm
3 cm
14.4 Contrasting textures at about the same scale of (a) fine-grained, gray fossiliferous limestone and (b) coarse-grained granoblastic whitemarble. Textural features in gray limestones are defined by aggregates of minute black carbonaceous particles that are eliminated by reaction with water during metamorphism, releasing CO2 and CH4 from the rock (see Special Interest Box 16.2). Thorough recrystal-lization by grain boundary adjustments of calcites and growth of larger grains at the expense of smaller ones has obliterated the textureof the original limestone. The end product is a coarse white marble.
14.5 Increase in size of soap bubbles in a flat cell as a function of time. Numbers are minutes after creation of bubbles by agitation. Note the120° triple junctions that mimic the grain boundary configuration in granoblastic texture (compare Figure 6.24). The evolution of thebubbles serves as a model for Ostwald ripening, or grain coarsening, during recrystallization in rocks that can perhaps require millionsof years instead of minutes. Redrawn from Smith (1954).
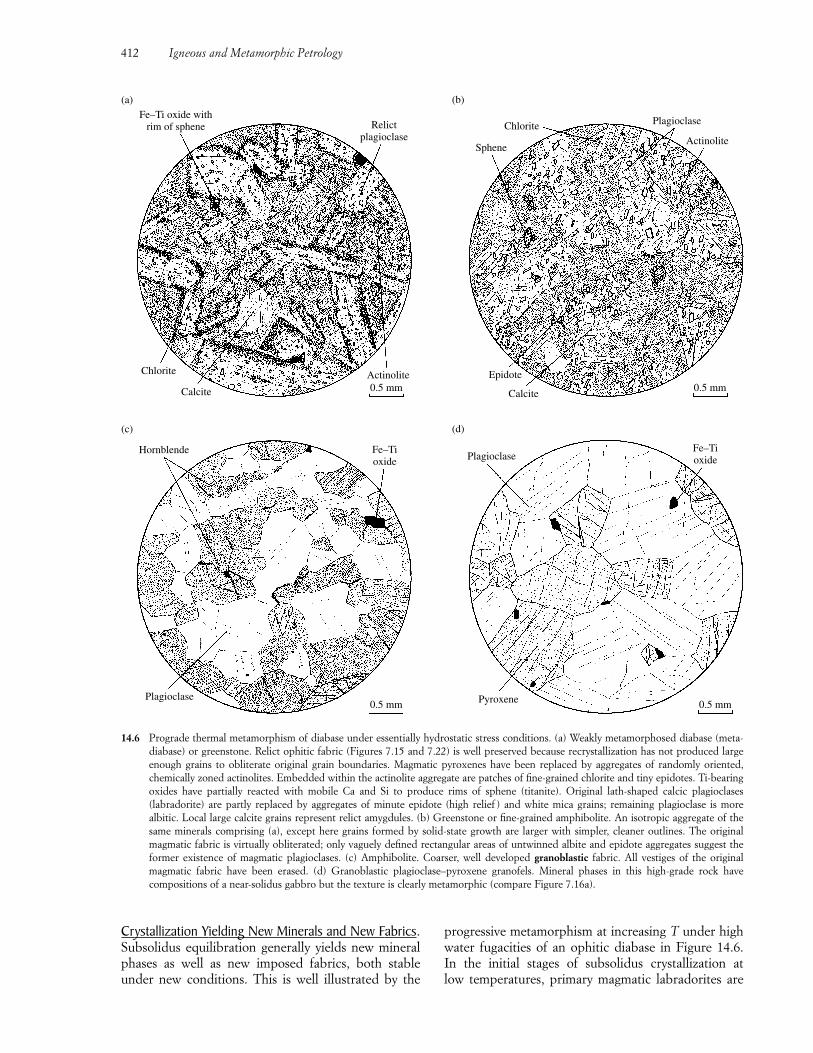
(a)
Chlorite
Calcite
Fe–Ti oxide withrim of sphene
(b)
Chlorite Plagioclase
ActinoliteSphene
Relictplagioclase
0.5 mm 0.5 mmActinolite Epidote
Calcite
(c)
Plagioclase
Hornblende
(d)
PlagioclaseFe–Tioxide
Fe–Tioxide
0.5 mm 0.5 mmPyroxene
14.6 Prograde thermal metamorphism of diabase under essentially hydrostatic stress conditions. (a) Weakly metamorphosed diabase (meta-diabase) or greenstone. Relict ophitic fabric (Figures 7.15 and 7.22) is well preserved because recrystallization has not produced largeenough grains to obliterate original grain boundaries. Magmatic pyroxenes have been replaced by aggregates of randomly oriented,chemically zoned actinolites. Embedded within the actinolite aggregate are patches of fine-grained chlorite and tiny epidotes. Ti-bearingoxides have partially reacted with mobile Ca and Si to produce rims of sphene (titanite). Original lath-shaped calcic plagioclases(labradorite) are partly replaced by aggregates of minute epidote (high relief ) and white mica grains; remaining plagioclase is more albitic. Local large calcite grains represent relict amygdules. (b) Greenstone or fine-grained amphibolite. An isotropic aggregate of thesame minerals comprising (a), except here grains formed by solid-state growth are larger with simpler, cleaner outlines. The original magmatic fabric is virtually obliterated; only vaguely defined rectangular areas of untwinned albite and epidote aggregates suggest theformer existence of magmatic plagioclases. (c) Amphibolite. Coarser, well developed granoblastic fabric. All vestiges of the original magmatic fabric have been erased. (d) Granoblastic plagioclase–pyroxene granofels. Mineral phases in this high-grade rock have compositions of a near-solidus gabbro but the texture is clearly metamorphic (compare Figure 7.16a).
412 Igneous and Metamorphic Petrology
Crystallization Yielding New Minerals and New Fabrics.Subsolidus equilibration generally yields new mineralphases as well as new imposed fabrics, both stable under new conditions. This is well illustrated by the
progressive metamorphism at increasing T under highwater fugacities of an ophitic diabase in Figure 14.6. In the initial stages of subsolidus crystallization at low temperatures, primary magmatic labradorites are
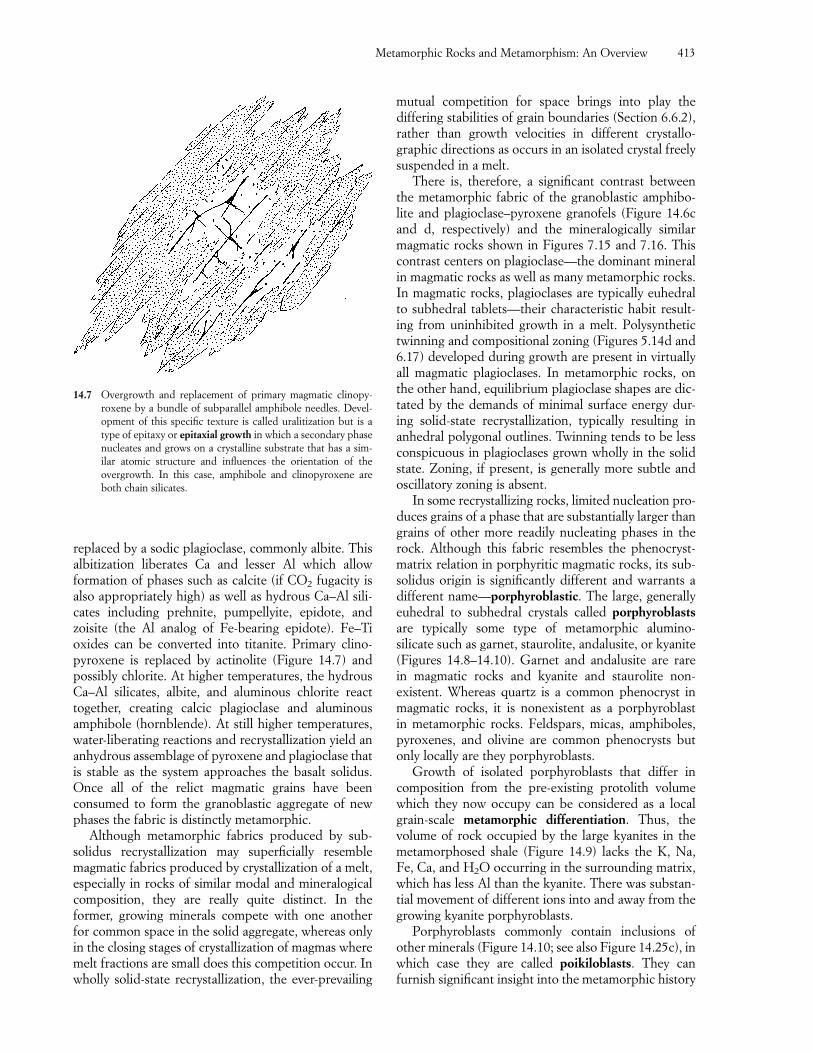
mutual competition for space brings into play the differing stabilities of grain boundaries (Section 6.6.2),rather than growth velocities in different crystallo-graphic directions as occurs in an isolated crystal freelysuspended in a melt.
There is, therefore, a significant contrast betweenthe metamorphic fabric of the granoblastic amphibo-lite and plagioclase–pyroxene granofels (Figure 14.6cand d, respectively) and the mineralogically similarmagmatic rocks shown in Figures 7.15 and 7.16. Thiscontrast centers on plagioclase—the dominant mineralin magmatic rocks as well as many metamorphic rocks.In magmatic rocks, plagioclases are typically euhedralto subhedral tablets—their characteristic habit result-ing from uninhibited growth in a melt. Polysynthetictwinning and compositional zoning (Figures 5.14d and6.17) developed during growth are present in virtuallyall magmatic plagioclases. In metamorphic rocks, onthe other hand, equilibrium plagioclase shapes are dic-tated by the demands of minimal surface energy dur-ing solid-state recrystallization, typically resulting inanhedral polygonal outlines. Twinning tends to be lessconspicuous in plagioclases grown wholly in the solidstate. Zoning, if present, is generally more subtle andoscillatory zoning is absent.
In some recrystallizing rocks, limited nucleation pro-duces grains of a phase that are substantially larger thangrains of other more readily nucleating phases in therock. Although this fabric resembles the phenocryst-matrix relation in porphyritic magmatic rocks, its sub-solidus origin is significantly different and warrants adifferent name—porphyroblastic. The large, generallyeuhedral to subhedral crystals called porphyroblastsare typically some type of metamorphic alumino-silicate such as garnet, staurolite, andalusite, or kyanite(Figures 14.8–14.10). Garnet and andalusite are rare in magmatic rocks and kyanite and staurolite non-existent. Whereas quartz is a common phenocryst inmagmatic rocks, it is nonexistent as a porphyroblast in metamorphic rocks. Feldspars, micas, amphiboles,pyroxenes, and olivine are common phenocrysts butonly locally are they porphyroblasts.
Growth of isolated porphyroblasts that differ incomposition from the pre-existing protolith volumewhich they now occupy can be considered as a localgrain-scale metamorphic differentiation. Thus, the volume of rock occupied by the large kyanites in themetamorphosed shale (Figure 14.9) lacks the K, Na,Fe, Ca, and H2O occurring in the surrounding matrix,which has less Al than the kyanite. There was substan-tial movement of different ions into and away from thegrowing kyanite porphyroblasts.
Porphyroblasts commonly contain inclusions ofother minerals (Figure 14.10; see also Figure 14.25c), inwhich case they are called poikiloblasts. They can furnish significant insight into the metamorphic history
Metamorphic Rocks and Metamorphism: An Overview 413
replaced by a sodic plagioclase, commonly albite. This albitization liberates Ca and lesser Al which allow formation of phases such as calcite (if CO2 fugacity isalso appropriately high) as well as hydrous Ca–Al sili-cates including prehnite, pumpellyite, epidote, andzoisite (the Al analog of Fe-bearing epidote). Fe–Ti oxides can be converted into titanite. Primary clino-pyroxene is replaced by actinolite (Figure 14.7) and possibly chlorite. At higher temperatures, the hydrousCa–Al silicates, albite, and aluminous chlorite react together, creating calcic plagioclase and aluminous amphibole (hornblende). At still higher temperatures,water-liberating reactions and recrystallization yield ananhydrous assemblage of pyroxene and plagioclase thatis stable as the system approaches the basalt solidus.Once all of the relict magmatic grains have been consumed to form the granoblastic aggregate of newphases the fabric is distinctly metamorphic.
Although metamorphic fabrics produced by sub-solidus recrystallization may superficially resemblemagmatic fabrics produced by crystallization of a melt,especially in rocks of similar modal and mineralogicalcomposition, they are really quite distinct. In the former, growing minerals compete with one anotherfor common space in the solid aggregate, whereas onlyin the closing stages of crystallization of magmas wheremelt fractions are small does this competition occur. Inwholly solid-state recrystallization, the ever-prevailing
14.7 Overgrowth and replacement of primary magmatic clinopy-roxene by a bundle of subparallel amphibole needles. Devel-opment of this specific texture is called uralitization but is atype of epitaxy or epitaxial growth in which a secondary phasenucleates and grows on a crystalline substrate that has a sim-ilar atomic structure and influences the orientation of the overgrowth. In this case, amphibole and clinopyroxene areboth chain silicates.
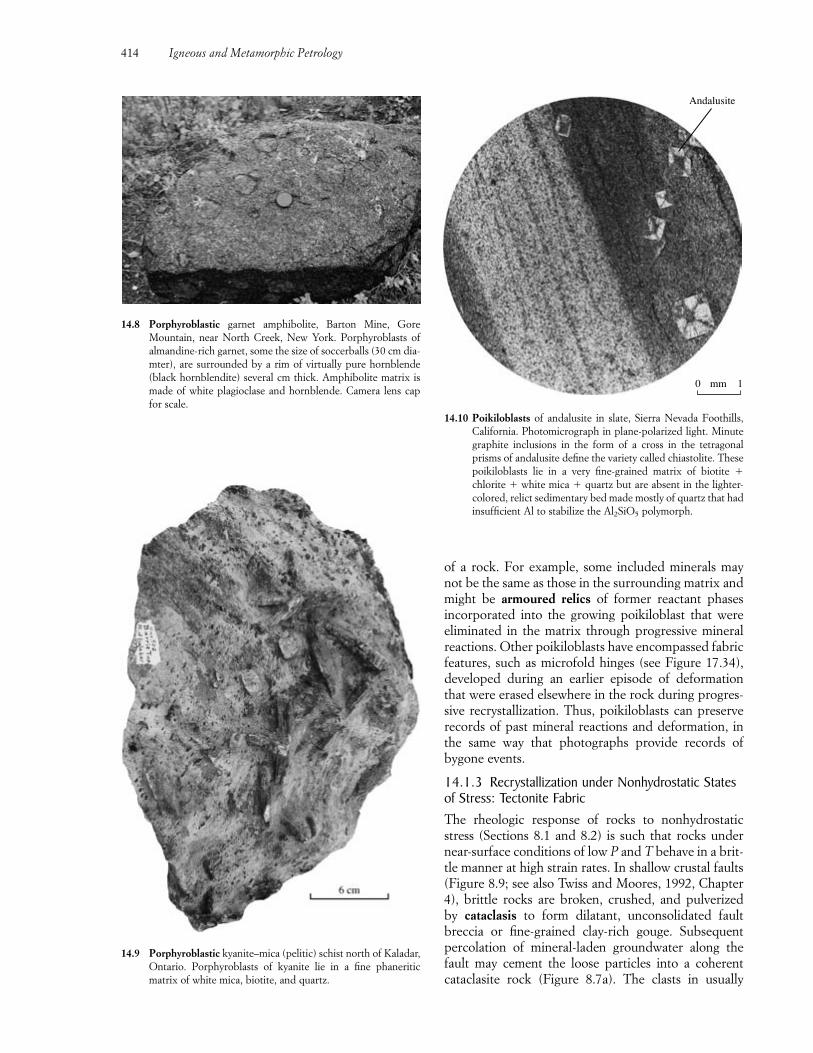
414 Igneous and Metamorphic Petrology
of a rock. For example, some included minerals maynot be the same as those in the surrounding matrix andmight be armoured relics of former reactant phases incorporated into the growing poikiloblast that wereeliminated in the matrix through progressive mineralreactions. Other poikiloblasts have encompassed fabricfeatures, such as microfold hinges (see Figure 17.34),developed during an earlier episode of deformationthat were erased elsewhere in the rock during progres-sive recrystallization. Thus, poikiloblasts can preserverecords of past mineral reactions and deformation, inthe same way that photographs provide records of bygone events.
14.1.3 Recrystallization under Nonhydrostatic Statesof Stress: Tectonite FabricThe rheologic response of rocks to nonhydrostaticstress (Sections 8.1 and 8.2) is such that rocks undernear-surface conditions of low P and T behave in a brit-tle manner at high strain rates. In shallow crustal faults(Figure 8.9; see also Twiss and Moores, 1992, Chapter4), brittle rocks are broken, crushed, and pulverized by cataclasis to form dilatant, unconsolidated faultbreccia or fine-grained clay-rich gouge. Subsequentpercolation of mineral-laden groundwater along thefault may cement the loose particles into a coherentcataclasite rock (Figure 8.7a). The clasts in usually
Andalusite
10 mm
14.10 Poikiloblasts of andalusite in slate, Sierra Nevada Foothills,California. Photomicrograph in plane-polarized light. Minutegraphite inclusions in the form of a cross in the tetragonalprisms of andalusite define the variety called chiastolite. Thesepoikiloblasts lie in a very fine-grained matrix of biotite �
chlorite � white mica � quartz but are absent in the lighter-colored, relict sedimentary bed made mostly of quartz that hadinsufficient Al to stabilize the Al2SiO5 polymorph.
14.9 Porphyroblastic kyanite–mica (pelitic) schist north of Kaladar,Ontario. Porphyroblasts of kyanite lie in a fine phaneritic matrix of white mica, biotite, and quartz.
14.8 Porphyroblastic garnet amphibolite, Barton Mine, GoreMountain, near North Creek, New York. Porphyroblasts of almandine-rich garnet, some the size of soccerballs (30 cm dia-mter), are surrounded by a rim of virtually pure hornblende(black hornblendite) several cm thick. Amphibolite matrix ismade of white plagioclase and hornblende. Camera lens capfor scale.
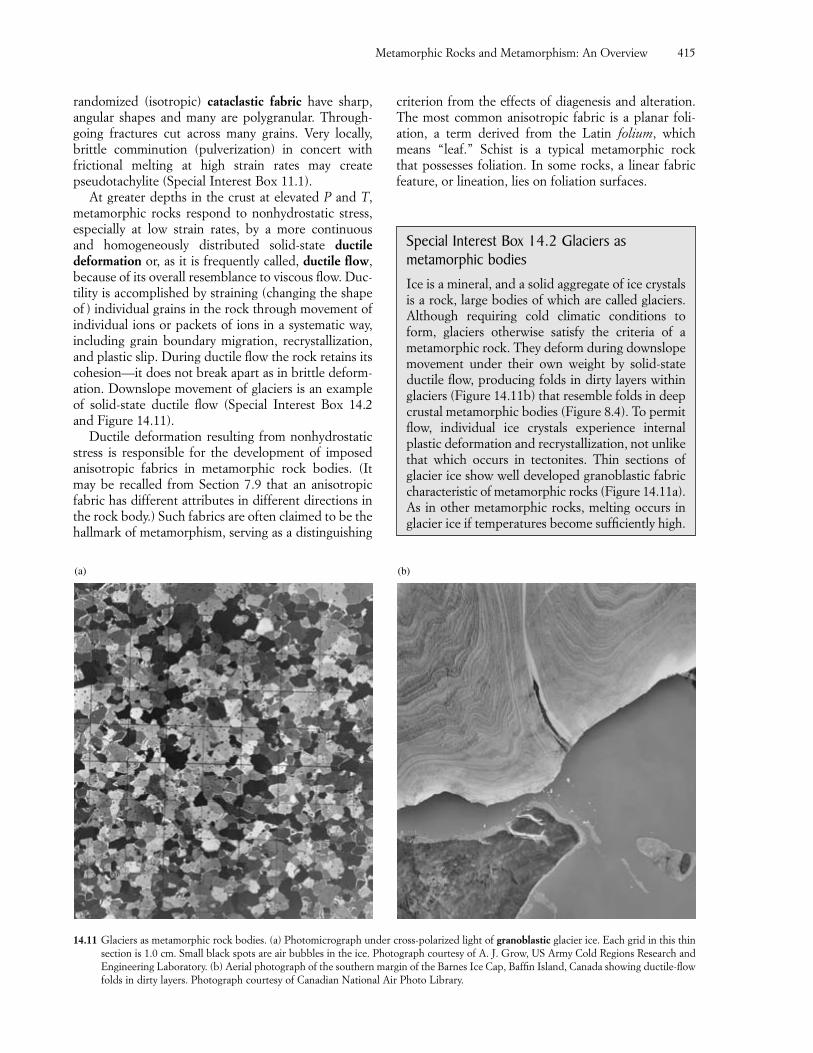
Metamorphic Rocks and Metamorphism: An Overview 415
randomized (isotropic) cataclastic fabric have sharp,angular shapes and many are polygranular. Through-going fractures cut across many grains. Very locally,brittle comminution (pulverization) in concert withfrictional melting at high strain rates may createpseudotachylite (Special Interest Box 11.1).
At greater depths in the crust at elevated P and T,metamorphic rocks respond to nonhydrostatic stress,especially at low strain rates, by a more continuous and homogeneously distributed solid-state ductile deformation or, as it is frequently called, ductile flow,because of its overall resemblance to viscous flow. Duc-tility is accomplished by straining (changing the shapeof ) individual grains in the rock through movement ofindividual ions or packets of ions in a systematic way,including grain boundary migration, recrystallization,and plastic slip. During ductile flow the rock retains itscohesion—it does not break apart as in brittle deform-ation. Downslope movement of glaciers is an exampleof solid-state ductile flow (Special Interest Box 14.2and Figure 14.11).
Ductile deformation resulting from nonhydrostaticstress is responsible for the development of imposedanisotropic fabrics in metamorphic rock bodies. (Itmay be recalled from Section 7.9 that an anisotropicfabric has different attributes in different directions inthe rock body.) Such fabrics are often claimed to be thehallmark of metamorphism, serving as a distinguishing
criterion from the effects of diagenesis and alteration.The most common anisotropic fabric is a planar foli-ation, a term derived from the Latin folium, whichmeans “leaf.” Schist is a typical metamorphic rock that possesses foliation. In some rocks, a linear fabricfeature, or lineation, lies on foliation surfaces.
Special Interest Box 14.2 Glaciers as metamorphic bodiesIce is a mineral, and a solid aggregate of ice crystalsis a rock, large bodies of which are called glaciers.Although requiring cold climatic conditions toform, glaciers otherwise satisfy the criteria of ametamorphic rock. They deform during downslopemovement under their own weight by solid-stateductile flow, producing folds in dirty layers withinglaciers (Figure 14.11b) that resemble folds in deepcrustal metamorphic bodies (Figure 8.4). To permitflow, individual ice crystals experience internalplastic deformation and recrystallization, not unlikethat which occurs in tectonites. Thin sections of glacier ice show well developed granoblastic fabriccharacteristic of metamorphic rocks (Figure 14.11a).As in other metamorphic rocks, melting occurs inglacier ice if temperatures become sufficiently high.
14.11 Glaciers as metamorphic rock bodies. (a) Photomicrograph under cross-polarized light of granoblastic glacier ice. Each grid in this thinsection is 1.0 cm. Small black spots are air bubbles in the ice. Photograph courtesy of A. J. Grow, US Army Cold Regions Research andEngineering Laboratory. (b) Aerial photograph of the southern margin of the Barnes Ice Cap, Baffin Island, Canada showing ductile-flowfolds in dirty layers. Photograph courtesy of Canadian National Air Photo Library.
(a) (b)
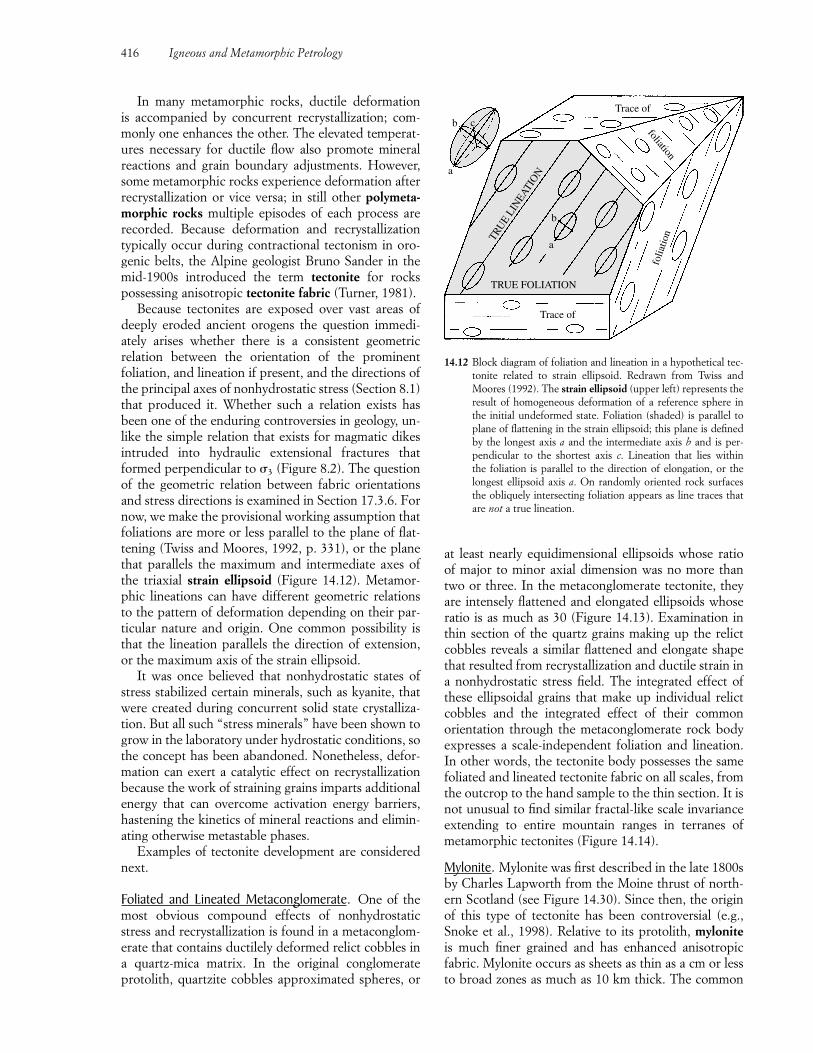
416 Igneous and Metamorphic Petrology
In many metamorphic rocks, ductile deformation is accompanied by concurrent recrystallization; com-monly one enhances the other. The elevated temperat-ures necessary for ductile flow also promote mineralreactions and grain boundary adjustments. However,some metamorphic rocks experience deformation afterrecrystallization or vice versa; in still other polymeta-morphic rocks multiple episodes of each process arerecorded. Because deformation and recrystallizationtypically occur during contractional tectonism in oro-genic belts, the Alpine geologist Bruno Sander in themid-1900s introduced the term tectonite for rocks possessing anisotropic tectonite fabric (Turner, 1981).
Because tectonites are exposed over vast areas ofdeeply eroded ancient orogens the question immedi-ately arises whether there is a consistent geometric relation between the orientation of the prominent foliation, and lineation if present, and the directions ofthe principal axes of nonhydrostatic stress (Section 8.1)that produced it. Whether such a relation exists hasbeen one of the enduring controversies in geology, un-like the simple relation that exists for magmatic dikesintruded into hydraulic extensional fractures thatformed perpendicular to �3 (Figure 8.2). The questionof the geometric relation between fabric orientationsand stress directions is examined in Section 17.3.6. Fornow, we make the provisional working assumption thatfoliations are more or less parallel to the plane of flat-tening (Twiss and Moores, 1992, p. 331), or the planethat parallels the maximum and intermediate axes ofthe triaxial strain ellipsoid (Figure 14.12). Metamor-phic lineations can have different geometric relationsto the pattern of deformation depending on their par-ticular nature and origin. One common possibility isthat the lineation parallels the direction of extension,or the maximum axis of the strain ellipsoid.
It was once believed that nonhydrostatic states ofstress stabilized certain minerals, such as kyanite, thatwere created during concurrent solid state crystalliza-tion. But all such “stress minerals” have been shown togrow in the laboratory under hydrostatic conditions, sothe concept has been abandoned. Nonetheless, defor-mation can exert a catalytic effect on recrystallizationbecause the work of straining grains imparts additionalenergy that can overcome activation energy barriers,hastening the kinetics of mineral reactions and elimin-ating otherwise metastable phases.
Examples of tectonite development are considerednext.
Foliated and Lineated Metaconglomerate. One of themost obvious compound effects of nonhydrostaticstress and recrystallization is found in a metaconglom-erate that contains ductilely deformed relict cobbles ina quartz-mica matrix. In the original conglomerate protolith, quartzite cobbles approximated spheres, or
at least nearly equidimensional ellipsoids whose ratioof major to minor axial dimension was no more thantwo or three. In the metaconglomerate tectonite, theyare intensely flattened and elongated ellipsoids whoseratio is as much as 30 (Figure 14.13). Examination inthin section of the quartz grains making up the relictcobbles reveals a similar flattened and elongate shapethat resulted from recrystallization and ductile strain ina nonhydrostatic stress field. The integrated effect ofthese ellipsoidal grains that make up individual relictcobbles and the integrated effect of their common orientation through the metaconglomerate rock bodyexpresses a scale-independent foliation and lineation.In other words, the tectonite body possesses the samefoliated and lineated tectonite fabric on all scales, fromthe outcrop to the hand sample to the thin section. It isnot unusual to find similar fractal-like scale invarianceextending to entire mountain ranges in terranes ofmetamorphic tectonites (Figure 14.14).
Mylonite. Mylonite was first described in the late 1800sby Charles Lapworth from the Moine thrust of north-ern Scotland (see Figure 14.30). Since then, the originof this type of tectonite has been controversial (e.g.,Snoke et al., 1998). Relative to its protolith, myloniteis much finer grained and has enhanced anisotropicfabric. Mylonite occurs as sheets as thin as a cm or lessto broad zones as much as 10 km thick. The common
b
a
cTrace of
b
a
TRUE FOLIATION
Trace of
TRU
E LI
NEA
TIO
N
folia
tion
foliation
14.12 Block diagram of foliation and lineation in a hypothetical tec-tonite related to strain ellipsoid. Redrawn from Twiss andMoores (1992). The strain ellipsoid (upper left) represents theresult of homogeneous deformation of a reference sphere inthe initial undeformed state. Foliation (shaded) is parallel toplane of flattening in the strain ellipsoid; this plane is definedby the longest axis a and the intermediate axis b and is per-pendicular to the shortest axis c. Lineation that lies within the foliation is parallel to the direction of elongation, or thelongest ellipsoid axis a. On randomly oriented rock surfacesthe obliquely intersecting foliation appears as line traces thatare not a true lineation.
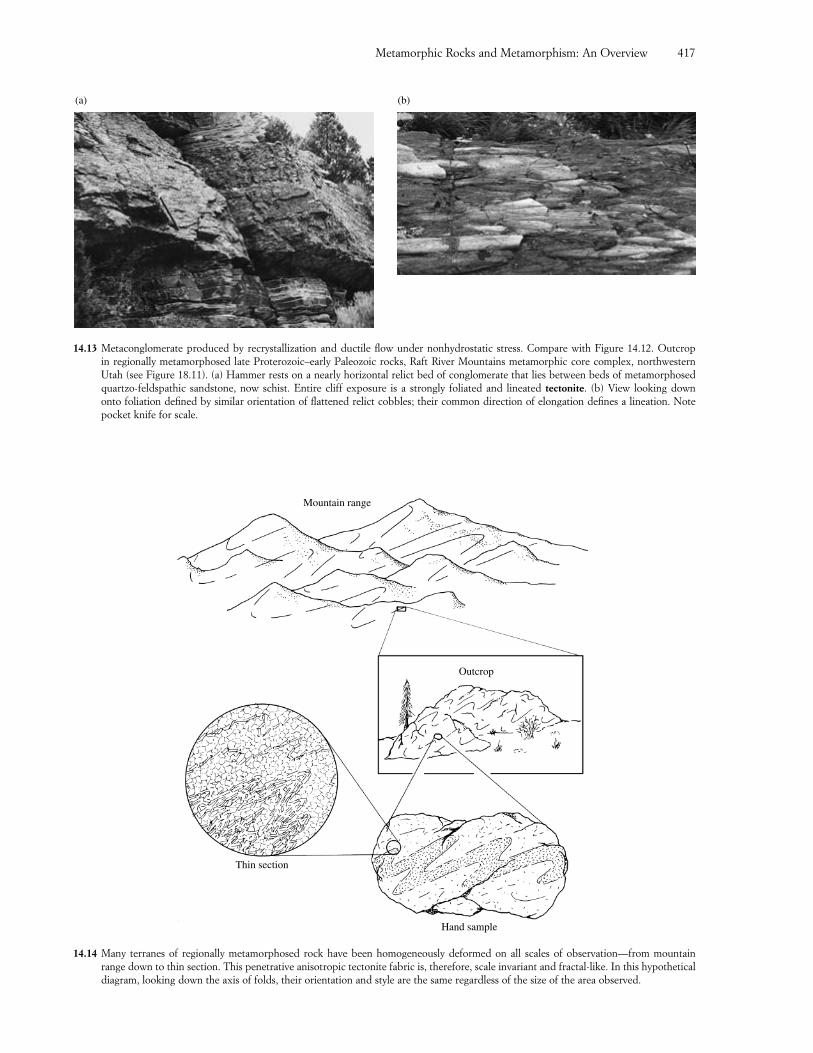
Metamorphic Rocks and Metamorphism: An Overview 417
(a) (b)
14.13 Metaconglomerate produced by recrystallization and ductile flow under nonhydrostatic stress. Compare with Figure 14.12. Outcrop in regionally metamorphosed late Proterozoic–early Paleozoic rocks, Raft River Mountains metamorphic core complex, northwesternUtah (see Figure 18.11). (a) Hammer rests on a nearly horizontal relict bed of conglomerate that lies between beds of metamorphosedquartzo-feldspathic sandstone, now schist. Entire cliff exposure is a strongly foliated and lineated tectonite. (b) View looking down onto foliation defined by similar orientation of flattened relict cobbles; their common direction of elongation defines a lineation. Notepocket knife for scale.
Mountain range
Outcrop
Thin section
Hand sample
14.14 Many terranes of regionally metamorphosed rock have been homogeneously deformed on all scales of observation—from mountainrange down to thin section. This penetrative anisotropic tectonite fabric is, therefore, scale invariant and fractal-like. In this hypotheticaldiagram, looking down the axis of folds, their orientation and style are the same regardless of the size of the area observed.
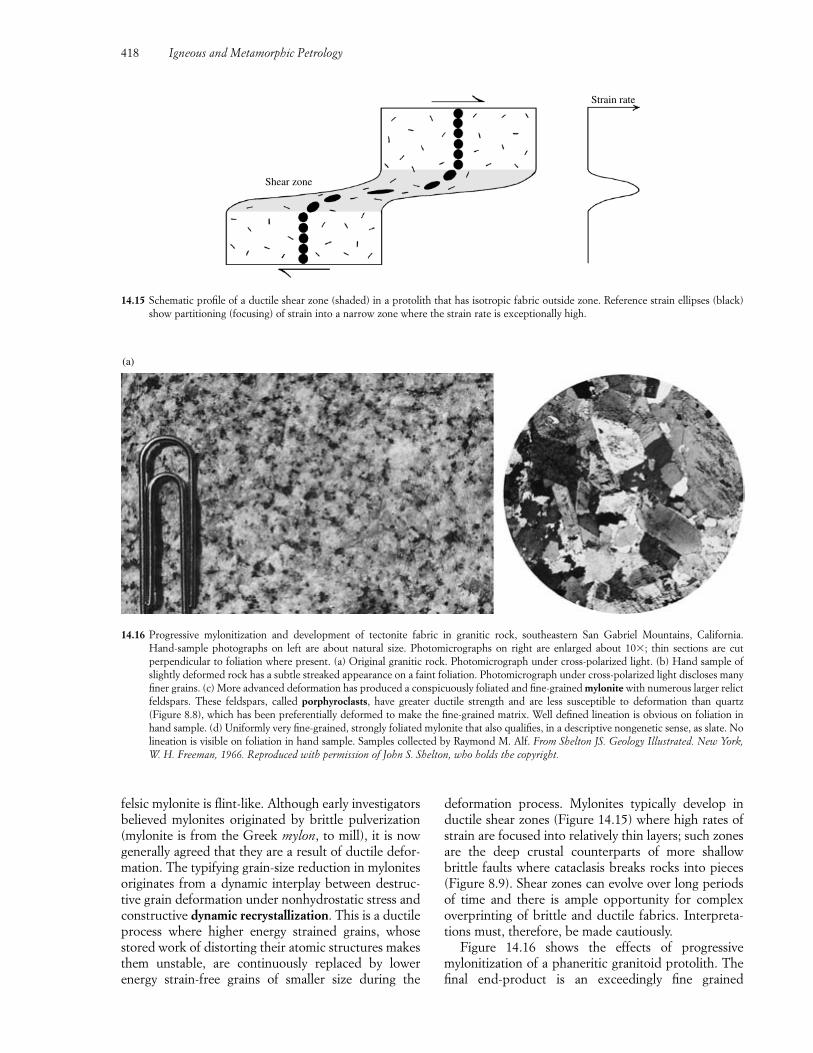
418 Igneous and Metamorphic Petrology
14.16 Progressive mylonitization and development of tectonite fabric in granitic rock, southeastern San Gabriel Mountains, California. Hand-sample photographs on left are about natural size. Photomicrographs on right are enlarged about 10�; thin sections are cut perpendicular to foliation where present. (a) Original granitic rock. Photomicrograph under cross-polarized light. (b) Hand sample ofslightly deformed rock has a subtle streaked appearance on a faint foliation. Photomicrograph under cross-polarized light discloses manyfiner grains. (c) More advanced deformation has produced a conspicuously foliated and fine-grained mylonite with numerous larger relictfeldspars. These feldspars, called porphyroclasts, have greater ductile strength and are less susceptible to deformation than quartz (Figure 8.8), which has been preferentially deformed to make the fine-grained matrix. Well defined lineation is obvious on foliation inhand sample. (d) Uniformly very fine-grained, strongly foliated mylonite that also qualifies, in a descriptive nongenetic sense, as slate. Nolineation is visible on foliation in hand sample. Samples collected by Raymond M. Alf. From Shelton JS. Geology Illustrated. New York,W. H. Freeman, 1966. Reproduced with permission of John S. Shelton, who holds the copyright.
deformation process. Mylonites typically develop inductile shear zones (Figure 14.15) where high rates ofstrain are focused into relatively thin layers; such zonesare the deep crustal counterparts of more shallow brittle faults where cataclasis breaks rocks into pieces(Figure 8.9). Shear zones can evolve over long periodsof time and there is ample opportunity for complexoverprinting of brittle and ductile fabrics. Interpreta-tions must, therefore, be made cautiously.
Figure 14.16 shows the effects of progressive mylonitization of a phaneritic granitoid protolith. Thefinal end-product is an exceedingly fine grained
felsic mylonite is flint-like. Although early investigatorsbelieved mylonites originated by brittle pulverization(mylonite is from the Greek mylon, to mill), it is nowgenerally agreed that they are a result of ductile defor-mation. The typifying grain-size reduction in mylonitesoriginates from a dynamic interplay between destruc-tive grain deformation under nonhydrostatic stress andconstructive dynamic recrystallization. This is a ductileprocess where higher energy strained grains, whosestored work of distorting their atomic structures makesthem unstable, are continuously replaced by lower energy strain-free grains of smaller size during the
Strain rate
Shear zone
14.15 Schematic profile of a ductile shear zone (shaded) in a protolith that has isotropic fabric outside zone. Reference strain ellipses (black)show partitioning (focusing) of strain into a narrow zone where the strain rate is exceptionally high.
(a)
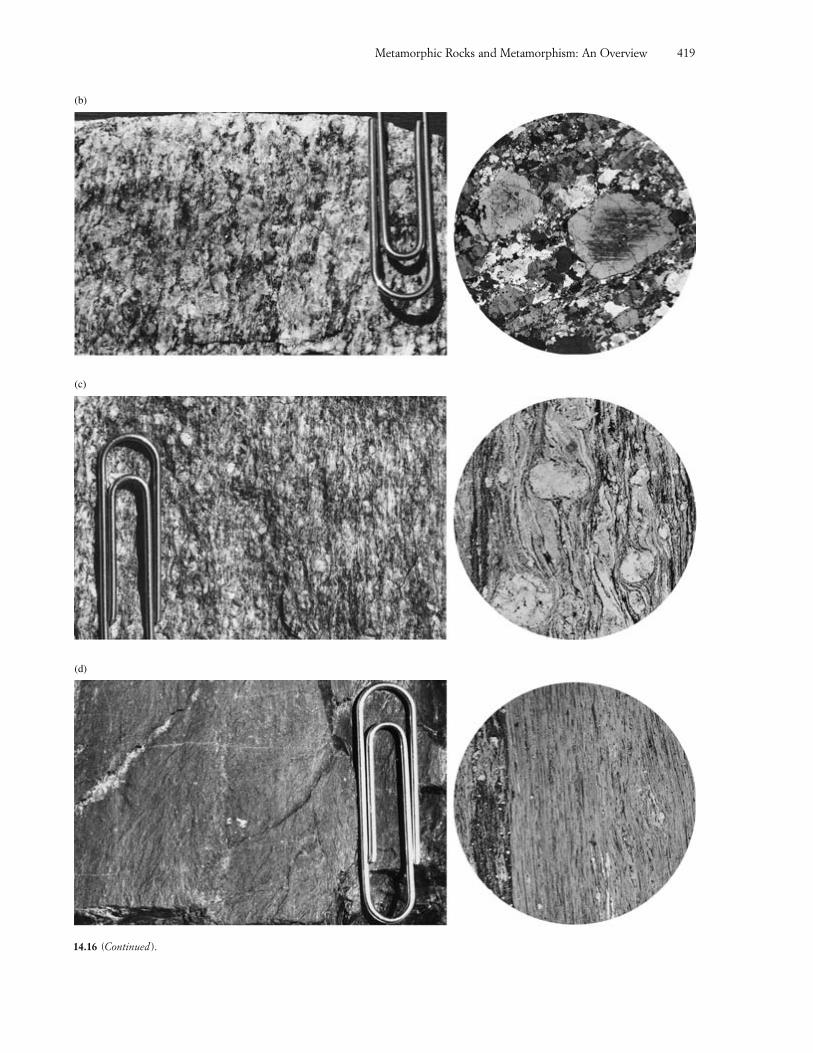
14.16 (Continued).
(b)
(c)
(d)
Metamorphic Rocks and Metamorphism: An Overview 419
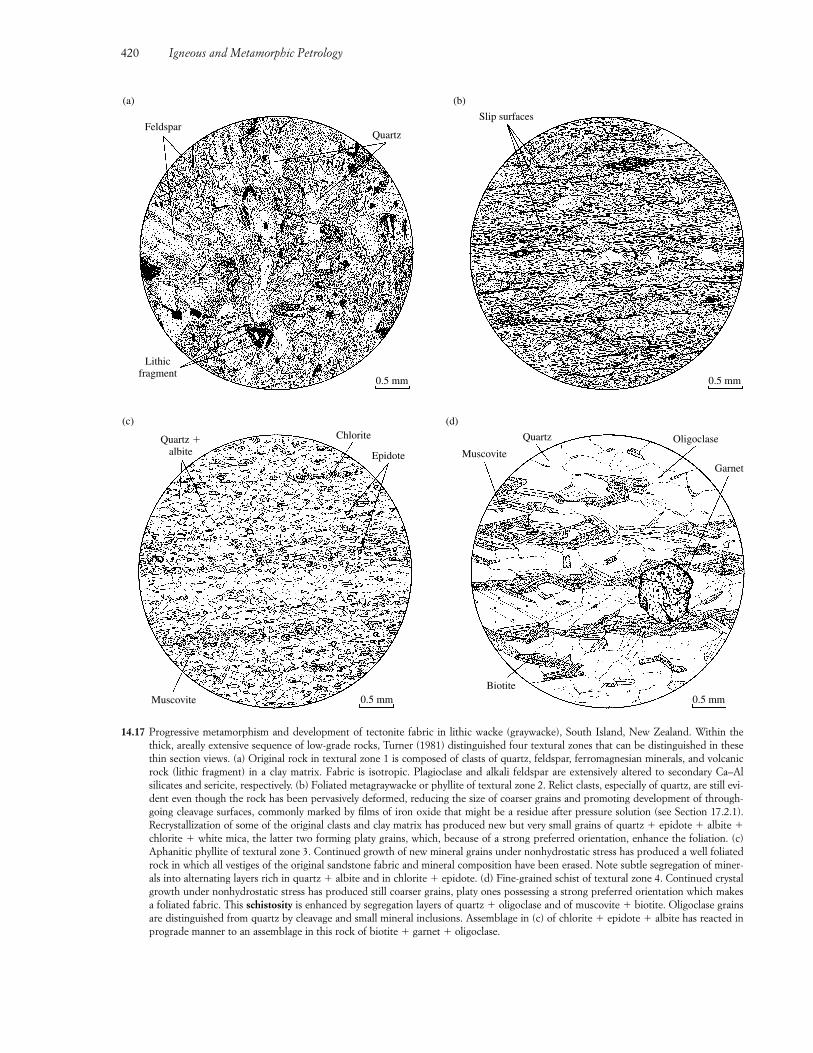
420 Igneous and Metamorphic Petrology
(a)
Lithicfragment
Feldspar
(b)
Slip surfaces
Quartz
0.5 mm 0.5 mm
(c)
Muscovite
Quartz �albite
(d)
Muscovite
QuartzChlorite
Epidote
0.5 mm 0.5 mm
Oligoclase
Garnet
Biotite
14.17 Progressive metamorphism and development of tectonite fabric in lithic wacke (graywacke), South Island, New Zealand. Within thethick, areally extensive sequence of low-grade rocks, Turner (1981) distinguished four textural zones that can be distinguished in thesethin section views. (a) Original rock in textural zone 1 is composed of clasts of quartz, feldspar, ferromagnesian minerals, and volcanicrock (lithic fragment) in a clay matrix. Fabric is isotropic. Plagioclase and alkali feldspar are extensively altered to secondary Ca–Al silicates and sericite, respectively. (b) Foliated metagraywacke or phyllite of textural zone 2. Relict clasts, especially of quartz, are still evi-dent even though the rock has been pervasively deformed, reducing the size of coarser grains and promoting development of through-going cleavage surfaces, commonly marked by films of iron oxide that might be a residue after pressure solution (see Section 17.2.1). Recrystallization of some of the original clasts and clay matrix has produced new but very small grains of quartz � epidote � albite �chlorite � white mica, the latter two forming platy grains, which, because of a strong preferred orientation, enhance the foliation. (c)Aphanitic phyllite of textural zone 3. Continued growth of new mineral grains under nonhydrostatic stress has produced a well foliatedrock in which all vestiges of the original sandstone fabric and mineral composition have been erased. Note subtle segregation of miner-als into alternating layers rich in quartz � albite and in chlorite � epidote. (d) Fine-grained schist of textural zone 4. Continued crystalgrowth under nonhydrostatic stress has produced still coarser grains, platy ones possessing a strong preferred orientation which makesa foliated fabric. This schistosity is enhanced by segregation layers of quartz � oligoclase and of muscovite � biotite. Oligoclase grainsare distinguished from quartz by cleavage and small mineral inclusions. Assemblage in (c) of chlorite � epidote � albite has reacted inprograde manner to an assemblage in this rock of biotite � garnet � oligoclase.
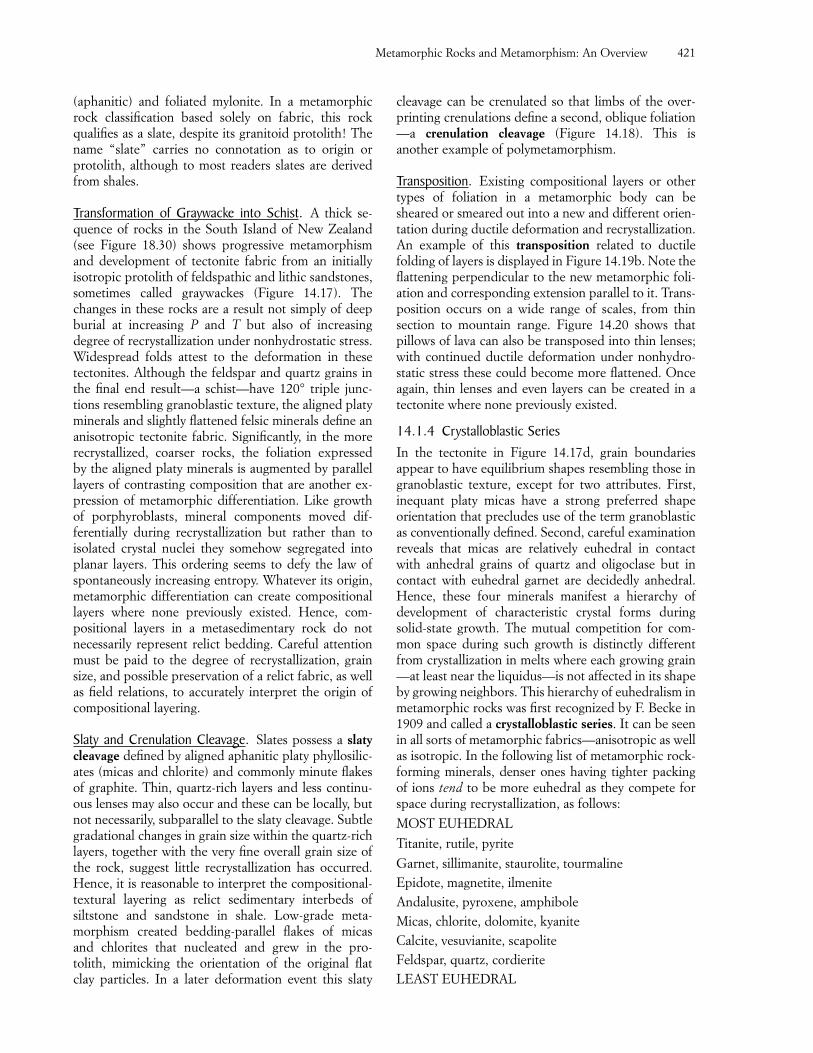
(aphanitic) and foliated mylonite. In a metamorphicrock classification based solely on fabric, this rockqualifies as a slate, despite its granitoid protolith! Thename “slate” carries no connotation as to origin or protolith, although to most readers slates are derivedfrom shales.
Transformation of Graywacke into Schist. A thick se-quence of rocks in the South Island of New Zealand(see Figure 18.30) shows progressive metamorphismand development of tectonite fabric from an initiallyisotropic protolith of feldspathic and lithic sandstones,sometimes called graywackes (Figure 14.17). Thechanges in these rocks are a result not simply of deepburial at increasing P and T but also of increasing degree of recrystallization under nonhydrostatic stress.Widespread folds attest to the deformation in thesetectonites. Although the feldspar and quartz grains inthe final end result—a schist—have 120° triple junc-tions resembling granoblastic texture, the aligned platyminerals and slightly flattened felsic minerals define ananisotropic tectonite fabric. Significantly, in the morerecrystallized, coarser rocks, the foliation expressed by the aligned platy minerals is augmented by parallellayers of contrasting composition that are another ex-pression of metamorphic differentiation. Like growthof porphyroblasts, mineral components moved dif-ferentially during recrystallization but rather than toisolated crystal nuclei they somehow segregated intoplanar layers. This ordering seems to defy the law ofspontaneously increasing entropy. Whatever its origin,metamorphic differentiation can create compositionallayers where none previously existed. Hence, com-positional layers in a metasedimentary rock do not necessarily represent relict bedding. Careful attentionmust be paid to the degree of recrystallization, grainsize, and possible preservation of a relict fabric, as wellas field relations, to accurately interpret the origin ofcompositional layering.
Slaty and Crenulation Cleavage. Slates possess a slatycleavage defined by aligned aphanitic platy phyllosilic-ates (micas and chlorite) and commonly minute flakesof graphite. Thin, quartz-rich layers and less continu-ous lenses may also occur and these can be locally, butnot necessarily, subparallel to the slaty cleavage. Subtlegradational changes in grain size within the quartz-richlayers, together with the very fine overall grain size ofthe rock, suggest little recrystallization has occurred.Hence, it is reasonable to interpret the compositional-textural layering as relict sedimentary interbeds of siltstone and sandstone in shale. Low-grade meta-morphism created bedding-parallel flakes of micas and chlorites that nucleated and grew in the pro-tolith, mimicking the orientation of the original flat clay particles. In a later deformation event this slaty
cleavage can be crenulated so that limbs of the over-printing crenulations define a second, oblique foliation—a crenulation cleavage (Figure 14.18). This is another example of polymetamorphism.
Transposition. Existing compositional layers or othertypes of foliation in a metamorphic body can besheared or smeared out into a new and different orien-tation during ductile deformation and recrystallization.An example of this transposition related to ductilefolding of layers is displayed in Figure 14.19b. Note theflattening perpendicular to the new metamorphic foli-ation and corresponding extension parallel to it. Trans-position occurs on a wide range of scales, from thinsection to mountain range. Figure 14.20 shows that pillows of lava can also be transposed into thin lenses;with continued ductile deformation under nonhydro-static stress these could become more flattened. Onceagain, thin lenses and even layers can be created in atectonite where none previously existed.
14.1.4 Crystalloblastic SeriesIn the tectonite in Figure 14.17d, grain boundaries appear to have equilibrium shapes resembling those ingranoblastic texture, except for two attributes. First,inequant platy micas have a strong preferred shape orientation that precludes use of the term granoblasticas conventionally defined. Second, careful examinationreveals that micas are relatively euhedral in contactwith anhedral grains of quartz and oligoclase but incontact with euhedral garnet are decidedly anhedral.Hence, these four minerals manifest a hierarchy of development of characteristic crystal forms duringsolid-state growth. The mutual competition for com-mon space during such growth is distinctly differentfrom crystallization in melts where each growing grain—at least near the liquidus—is not affected in its shapeby growing neighbors. This hierarchy of euhedralism inmetamorphic rocks was first recognized by F. Becke in1909 and called a crystalloblastic series. It can be seenin all sorts of metamorphic fabrics—anisotropic as wellas isotropic. In the following list of metamorphic rock-forming minerals, denser ones having tighter packingof ions tend to be more euhedral as they compete forspace during recrystallization, as follows:
MOST EUHEDRAL
Titanite, rutile, pyrite
Garnet, sillimanite, staurolite, tourmalineEpidote, magnetite, ilmeniteAndalusite, pyroxene, amphiboleMicas, chlorite, dolomite, kyaniteCalcite, vesuvianite, scapoliteFeldspar, quartz, cordieriteLEAST EUHEDRAL
Metamorphic Rocks and Metamorphism: An Overview 421
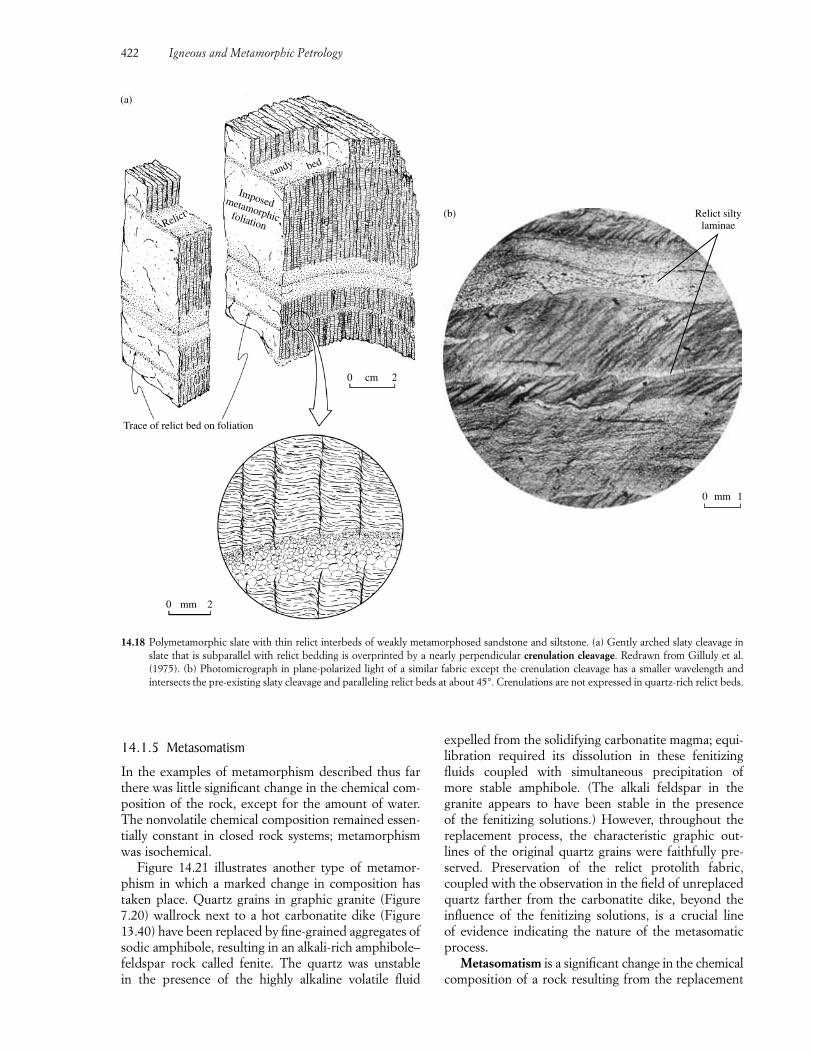
422 Igneous and Metamorphic Petrology
expelled from the solidifying carbonatite magma; equi-libration required its dissolution in these fenitizingfluids coupled with simultaneous precipitation of more stable amphibole. (The alkali feldspar in thegranite appears to have been stable in the presence of the fenitizing solutions.) However, throughout the replacement process, the characteristic graphic out-lines of the original quartz grains were faithfully pre-served. Preservation of the relict protolith fabric, coupled with the observation in the field of unreplacedquartz farther from the carbonatite dike, beyond theinfluence of the fenitizing solutions, is a crucial line of evidence indicating the nature of the metasomaticprocess.
Metasomatism is a significant change in the chemicalcomposition of a rock resulting from the replacement
14.18 Polymetamorphic slate with thin relict interbeds of weakly metamorphosed sandstone and siltstone. (a) Gently arched slaty cleavage inslate that is subparallel with relict bedding is overprinted by a nearly perpendicular crenulation cleavage. Redrawn from Gilluly et al.(1975). (b) Photomicrograph in plane-polarized light of a similar fabric except the crenulation cleavage has a smaller wavelength and intersects the pre-existing slaty cleavage and paralleling relict beds at about 45°. Crenulations are not expressed in quartz-rich relict beds.
Relict siltylaminae
(b)
10 mm
sandy bed
ImposedmetamorphicfoliationRelict
Trace of relict bed on foliation
0 2mm
20 cm
(a)
14.1.5 Metasomatism
In the examples of metamorphism described thus farthere was little significant change in the chemical com-position of the rock, except for the amount of water.The nonvolatile chemical composition remained essen-tially constant in closed rock systems; metamorphismwas isochemical.
Figure 14.21 illustrates another type of metamor-phism in which a marked change in composition hastaken place. Quartz grains in graphic granite (Figure7.20) wallrock next to a hot carbonatite dike (Figure13.40) have been replaced by fine-grained aggregates ofsodic amphibole, resulting in an alkali-rich amphibole–feldspar rock called fenite. The quartz was unstable in the presence of the highly alkaline volatile fluid
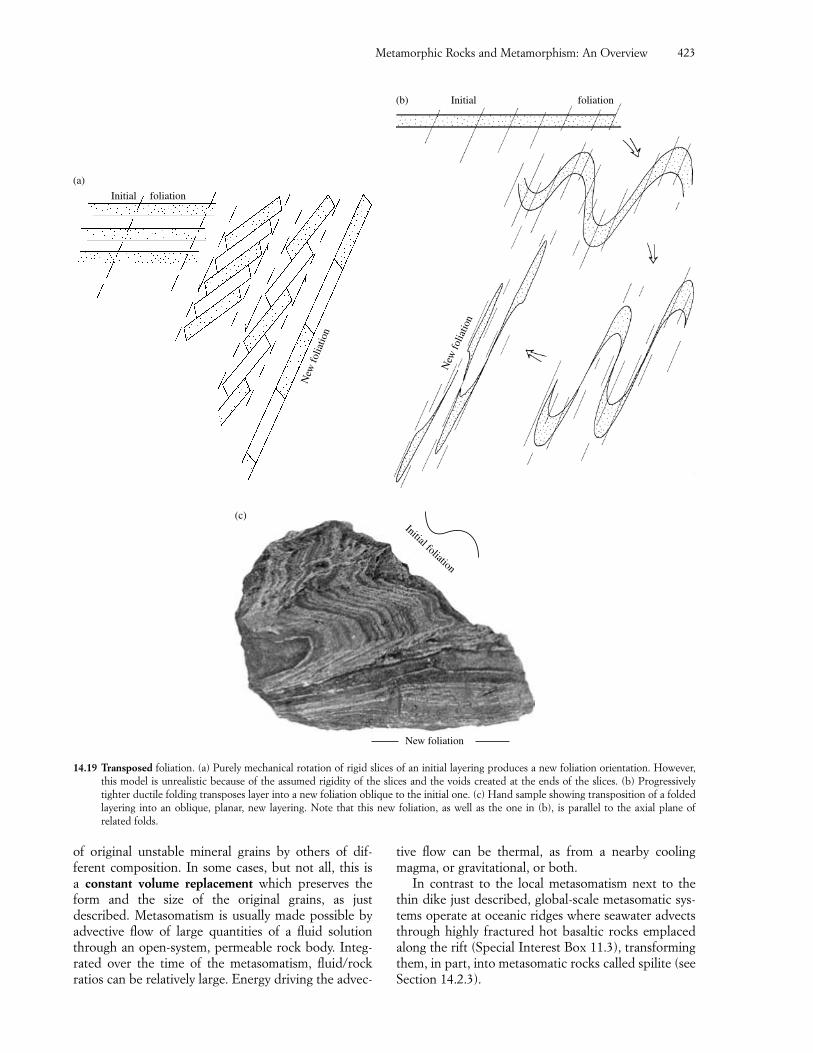
of original unstable mineral grains by others of dif-ferent composition. In some cases, but not all, this is a constant volume replacement which preserves theform and the size of the original grains, as just described. Metasomatism is usually made possible byadvective flow of large quantities of a fluid solutionthrough an open-system, permeable rock body. Integ-rated over the time of the metasomatism, fluid/rock ratios can be relatively large. Energy driving the advec-
tive flow can be thermal, as from a nearby coolingmagma, or gravitational, or both.
In contrast to the local metasomatism next to thethin dike just described, global-scale metasomatic sys-tems operate at oceanic ridges where seawater advectsthrough highly fractured hot basaltic rocks emplacedalong the rift (Special Interest Box 11.3), transformingthem, in part, into metasomatic rocks called spilite (seeSection 14.2.3).
Metamorphic Rocks and Metamorphism: An Overview 423
Initial foliation
(a)
New
folia
tion
14.19 Transposed foliation. (a) Purely mechanical rotation of rigid slices of an initial layering produces a new foliation orientation. However,this model is unrealistic because of the assumed rigidity of the slices and the voids created at the ends of the slices. (b) Progressivelytighter ductile folding transposes layer into a new foliation oblique to the initial one. (c) Hand sample showing transposition of a foldedlayering into an oblique, planar, new layering. Note that this new foliation, as well as the one in (b), is parallel to the axial plane of related folds.
Initial foliation(b)
New
folia
tion
Initial foliation
New foliation
(c)
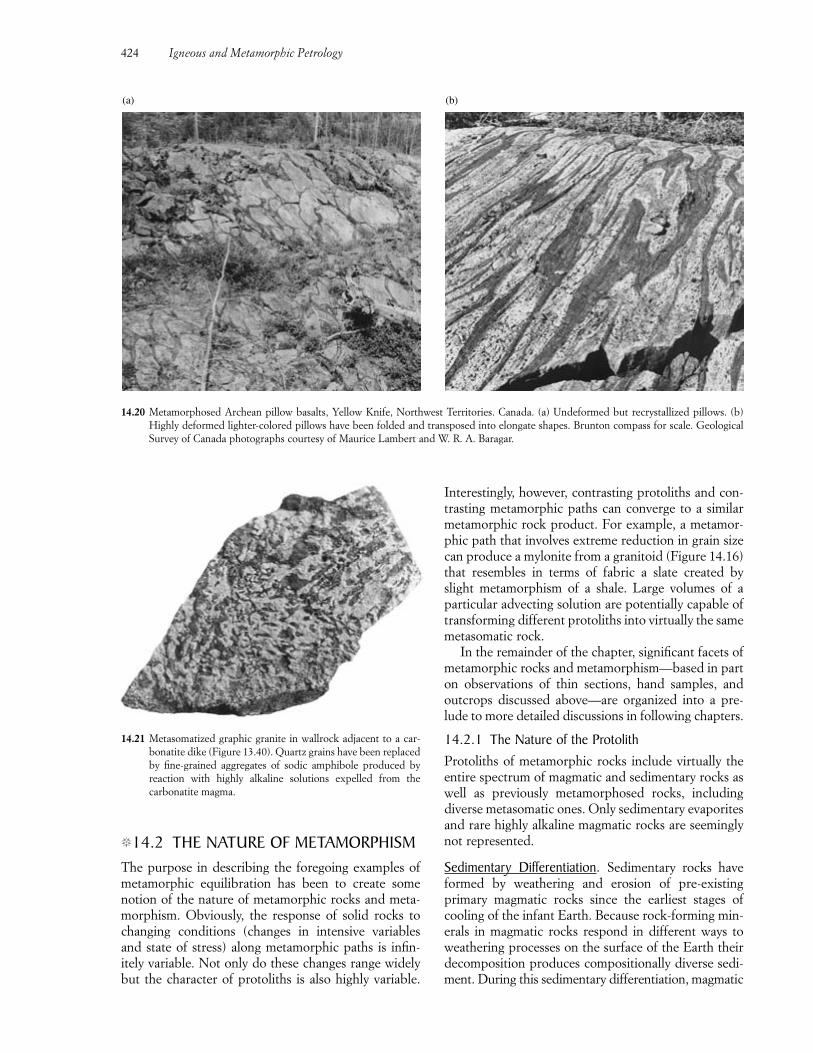
�14.2 THE NATURE OF METAMORPHISMThe purpose in describing the foregoing examples ofmetamorphic equilibration has been to create some notion of the nature of metamorphic rocks and meta-morphism. Obviously, the response of solid rocks tochanging conditions (changes in intensive variables and state of stress) along metamorphic paths is infin-itely variable. Not only do these changes range widelybut the character of protoliths is also highly variable.
Interestingly, however, contrasting protoliths and con-trasting metamorphic paths can converge to a similarmetamorphic rock product. For example, a metamor-phic path that involves extreme reduction in grain sizecan produce a mylonite from a granitoid (Figure 14.16)that resembles in terms of fabric a slate created byslight metamorphism of a shale. Large volumes of aparticular advecting solution are potentially capable oftransforming different protoliths into virtually the samemetasomatic rock.
In the remainder of the chapter, significant facets ofmetamorphic rocks and metamorphism—based in parton observations of thin sections, hand samples, andoutcrops discussed above—are organized into a pre-lude to more detailed discussions in following chapters.
14.2.1 The Nature of the ProtolithProtoliths of metamorphic rocks include virtually theentire spectrum of magmatic and sedimentary rocks aswell as previously metamorphosed rocks, including diverse metasomatic ones. Only sedimentary evaporitesand rare highly alkaline magmatic rocks are seeminglynot represented.
Sedimentary Differentiation. Sedimentary rocks haveformed by weathering and erosion of pre-existing primary magmatic rocks since the earliest stages ofcooling of the infant Earth. Because rock-forming min-erals in magmatic rocks respond in different ways toweathering processes on the surface of the Earth theirdecomposition produces compositionally diverse sedi-ment. During this sedimentary differentiation, magmatic
424 Igneous and Metamorphic Petrology
(a) (b)
14.20 Metamorphosed Archean pillow basalts, Yellow Knife, Northwest Territories. Canada. (a) Undeformed but recrystallized pillows. (b)Highly deformed lighter-colored pillows have been folded and transposed into elongate shapes. Brunton compass for scale. GeologicalSurvey of Canada photographs courtesy of Maurice Lambert and W. R. A. Baragar.
14.21 Metasomatized graphic granite in wallrock adjacent to a car-bonatite dike (Figure 13.40). Quartz grains have been replacedby fine-grained aggregates of sodic amphibole produced by reaction with highly alkaline solutions expelled from the carbonatite magma.
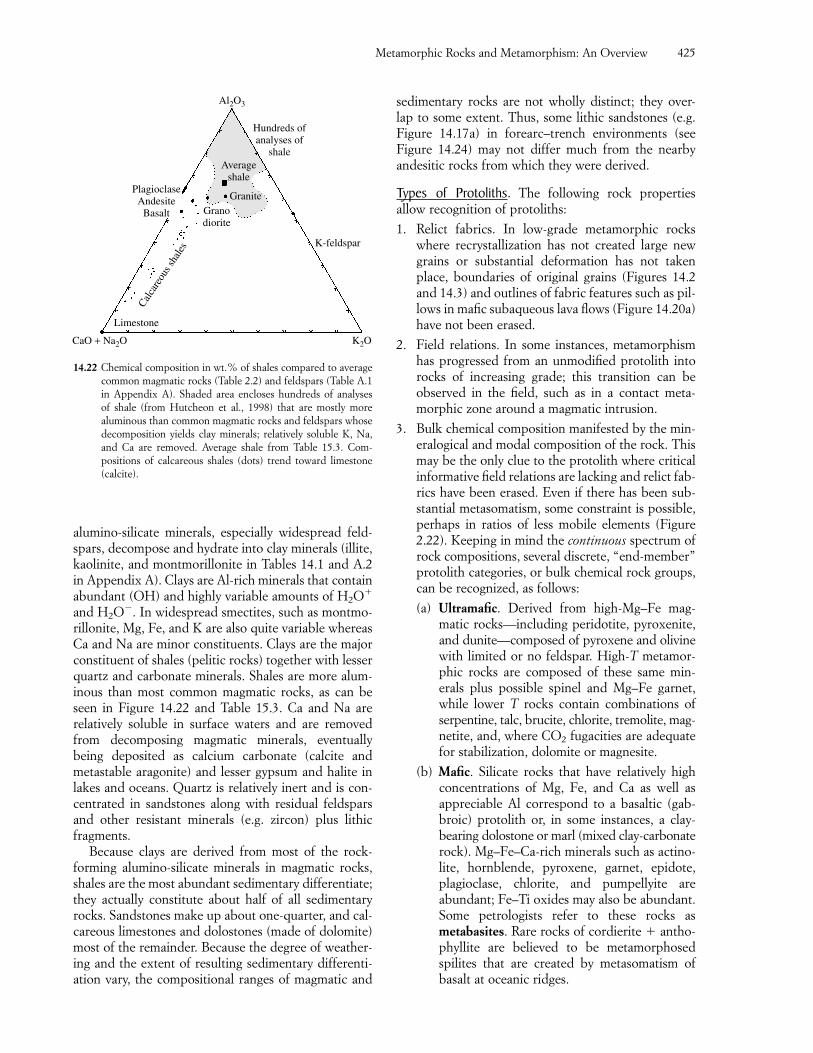
alumino-silicate minerals, especially widespread feld-spars, decompose and hydrate into clay minerals (illite,kaolinite, and montmorillonite in Tables 14.1 and A.2in Appendix A). Clays are Al-rich minerals that containabundant (OH) and highly variable amounts of H2O�
and H2O. In widespread smectites, such as montmo-rillonite, Mg, Fe, and K are also quite variable whereasCa and Na are minor constituents. Clays are the majorconstituent of shales (pelitic rocks) together with lesserquartz and carbonate minerals. Shales are more alum-inous than most common magmatic rocks, as can beseen in Figure 14.22 and Table 15.3. Ca and Na are relatively soluble in surface waters and are removedfrom decomposing magmatic minerals, eventually being deposited as calcium carbonate (calcite andmetastable aragonite) and lesser gypsum and halite inlakes and oceans. Quartz is relatively inert and is con-centrated in sandstones along with residual feldsparsand other resistant minerals (e.g. zircon) plus lithicfragments.
Because clays are derived from most of the rock-forming alumino-silicate minerals in magmatic rocks,shales are the most abundant sedimentary differentiate;they actually constitute about half of all sedimentaryrocks. Sandstones make up about one-quarter, and cal-careous limestones and dolostones (made of dolomite)most of the remainder. Because the degree of weather-ing and the extent of resulting sedimentary differenti-ation vary, the compositional ranges of magmatic and
sedimentary rocks are not wholly distinct; they over-lap to some extent. Thus, some lithic sandstones (e.g.Figure 14.17a) in forearc–trench environments (seeFigure 14.24) may not differ much from the nearby andesitic rocks from which they were derived.
Types of Protoliths. The following rock properties allow recognition of protoliths:
1. Relict fabrics. In low-grade metamorphic rockswhere recrystallization has not created large newgrains or substantial deformation has not takenplace, boundaries of original grains (Figures 14.2and 14.3) and outlines of fabric features such as pil-lows in mafic subaqueous lava flows (Figure 14.20a)have not been erased.
2. Field relations. In some instances, metamorphismhas progressed from an unmodified protolith intorocks of increasing grade; this transition can be observed in the field, such as in a contact meta-morphic zone around a magmatic intrusion.
3. Bulk chemical composition manifested by the min-eralogical and modal composition of the rock. Thismay be the only clue to the protolith where criticalinformative field relations are lacking and relict fab-rics have been erased. Even if there has been sub-stantial metasomatism, some constraint is possible,perhaps in ratios of less mobile elements (Figure2.22). Keeping in mind the continuous spectrum ofrock compositions, several discrete, “end-member”protolith categories, or bulk chemical rock groups,can be recognized, as follows:
(a) Ultramafic. Derived from high-Mg–Fe mag-matic rocks—including peridotite, pyroxenite,and dunite—composed of pyroxene and olivinewith limited or no feldspar. High-T metamor-phic rocks are composed of these same min-erals plus possible spinel and Mg–Fe garnet,while lower T rocks contain combinations ofserpentine, talc, brucite, chlorite, tremolite, mag-netite, and, where CO2 fugacities are adequatefor stabilization, dolomite or magnesite.
(b) Mafic. Silicate rocks that have relatively highconcentrations of Mg, Fe, and Ca as well as appreciable Al correspond to a basaltic (gab-broic) protolith or, in some instances, a clay-bearing dolostone or marl (mixed clay-carbonaterock). Mg–Fe–Ca-rich minerals such as actino-lite, hornblende, pyroxene, garnet, epidote,plagioclase, chlorite, and pumpellyite are abundant; Fe–Ti oxides may also be abundant.Some petrologists refer to these rocks asmetabasites. Rare rocks of cordierite � antho-phyllite are believed to be metamorphosedspilites that are created by metasomatism ofbasalt at oceanic ridges.
Metamorphic Rocks and Metamorphism: An Overview 425
CaO + Na2O K2O
GraniteGranodiorite
K-feldspar
Averageshale
Hundreds ofanalyses of
shale
PlagioclaseAndesite
Basalt
Al2O3
Calca
reou
s sha
les
Limestone
14.22 Chemical composition in wt.% of shales compared to averagecommon magmatic rocks (Table 2.2) and feldspars (Table A.1in Appendix A). Shaded area encloses hundreds of analyses of shale (from Hutcheon et al., 1998) that are mostly more aluminous than common magmatic rocks and feldspars whosedecomposition yields clay minerals; relatively soluble K, Na,and Ca are removed. Average shale from Table 15.3. Com-positions of calcareous shales (dots) trend toward limestone(calcite).
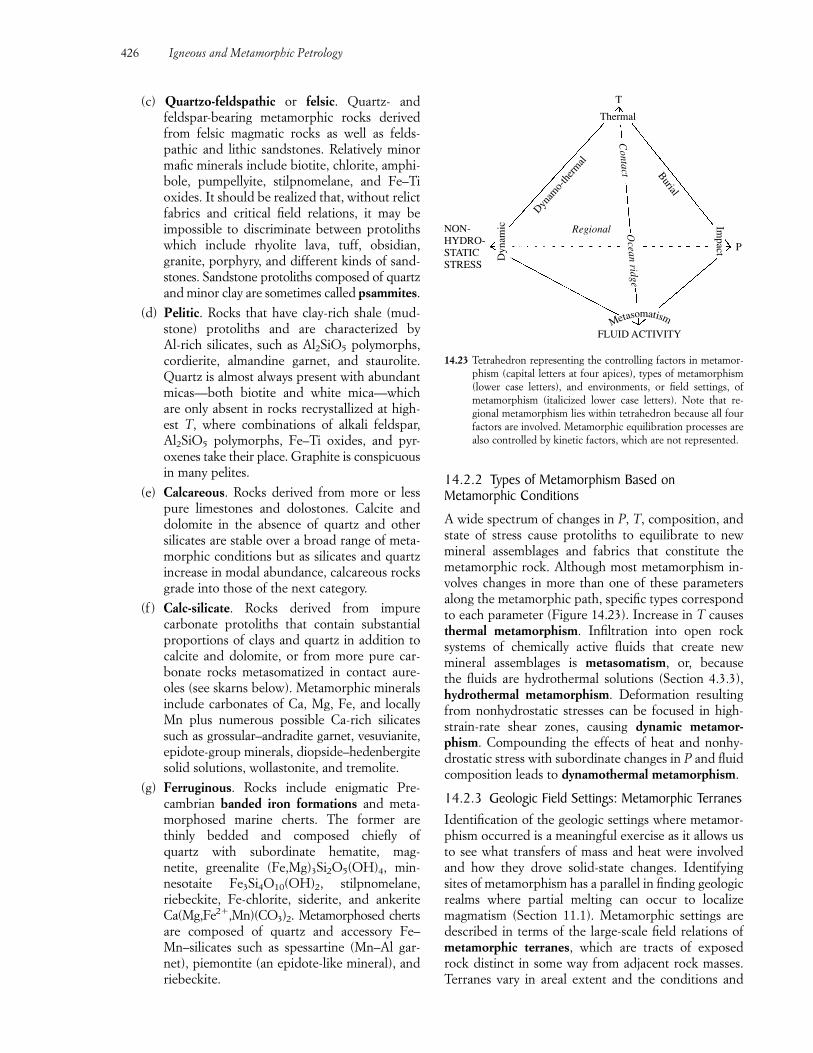
(c) Quartzo-feldspathic or felsic. Quartz- andfeldspar-bearing metamorphic rocks derivedfrom felsic magmatic rocks as well as felds-pathic and lithic sandstones. Relatively minormafic minerals include biotite, chlorite, amphi-bole, pumpellyite, stilpnomelane, and Fe–Tioxides. It should be realized that, without relictfabrics and critical field relations, it may be impossible to discriminate between protolithswhich include rhyolite lava, tuff, obsidian,granite, porphyry, and different kinds of sand-stones. Sandstone protoliths composed of quartzand minor clay are sometimes called psammites.
(d) Pelitic. Rocks that have clay-rich shale (mud-stone) protoliths and are characterized by Al-rich silicates, such as Al2SiO5 polymorphs,cordierite, almandine garnet, and staurolite.Quartz is almost always present with abundantmicas—both biotite and white mica—whichare only absent in rocks recrystallized at high-est T, where combinations of alkali feldspar,Al2SiO5 polymorphs, Fe–Ti oxides, and pyr-oxenes take their place. Graphite is conspicuousin many pelites.
(e) Calcareous. Rocks derived from more or lesspure limestones and dolostones. Calcite anddolomite in the absence of quartz and other silicates are stable over a broad range of meta-morphic conditions but as silicates and quartzincrease in modal abundance, calcareous rocksgrade into those of the next category.
(f ) Calc-silicate. Rocks derived from impure carbonate protoliths that contain substantialproportions of clays and quartz in addition tocalcite and dolomite, or from more pure car-bonate rocks metasomatized in contact aure-oles (see skarns below). Metamorphic mineralsinclude carbonates of Ca, Mg, Fe, and locallyMn plus numerous possible Ca-rich silicatessuch as grossular–andradite garnet, vesuvianite,epidote-group minerals, diopside–hedenbergitesolid solutions, wollastonite, and tremolite.
(g) Ferruginous. Rocks include enigmatic Pre-cambrian banded iron formations and meta-morphosed marine cherts. The former arethinly bedded and composed chiefly of quartz with subordinate hematite, mag-netite, greenalite (Fe,Mg)3Si2O5(OH)4, min-nesotaite Fe3Si4O10(OH)2, stilpnomelane,riebeckite, Fe-chlorite, siderite, and ankeriteCa(Mg,Fe2�,Mn)(CO3)2. Metamorphosed chertsare composed of quartz and accessory Fe–Mn–silicates such as spessartine (Mn–Al gar-net), piemontite (an epidote-like mineral), andriebeckite.
14.2.2 Types of Metamorphism Based onMetamorphic Conditions
A wide spectrum of changes in P, T, composition, andstate of stress cause protoliths to equilibrate to newmineral assemblages and fabrics that constitute themetamorphic rock. Although most metamorphism in-volves changes in more than one of these parametersalong the metamorphic path, specific types correspondto each parameter (Figure 14.23). Increase in T causesthermal metamorphism. Infiltration into open rocksystems of chemically active fluids that create new mineral assemblages is metasomatism, or, because the fluids are hydrothermal solutions (Section 4.3.3),hydrothermal metamorphism. Deformation resultingfrom nonhydrostatic stresses can be focused in high-strain-rate shear zones, causing dynamic metamor-phism. Compounding the effects of heat and nonhy-drostatic stress with subordinate changes in P and fluidcomposition leads to dynamothermal metamorphism.
14.2.3 Geologic Field Settings: Metamorphic TerranesIdentification of the geologic settings where metamor-phism occurred is a meaningful exercise as it allows usto see what transfers of mass and heat were involvedand how they drove solid-state changes. Identifyingsites of metamorphism has a parallel in finding geologicrealms where partial melting can occur to localize magmatism (Section 11.1). Metamorphic settings aredescribed in terms of the large-scale field relations ofmetamorphic terranes, which are tracts of exposedrock distinct in some way from adjacent rock masses.Terranes vary in areal extent and the conditions and
426 Igneous and Metamorphic Petrology
NON-HYDRO-STATICSTRESS
P
Dyn
amic
Thermal
Impact
T
Metasomatism
FLUID ACTIVITY
Dynam
o-th
erm
al
Burial
Contact
Ocean ridge
Regional
14.23 Tetrahedron representing the controlling factors in metamor-phism (capital letters at four apices), types of metamorphism(lower case letters), and environments, or field settings, ofmetamorphism (italicized lower case letters). Note that re-gional metamorphism lies within tetrahedron because all fourfactors are involved. Metamorphic equilibration processes arealso controlled by kinetic factors, which are not represented.
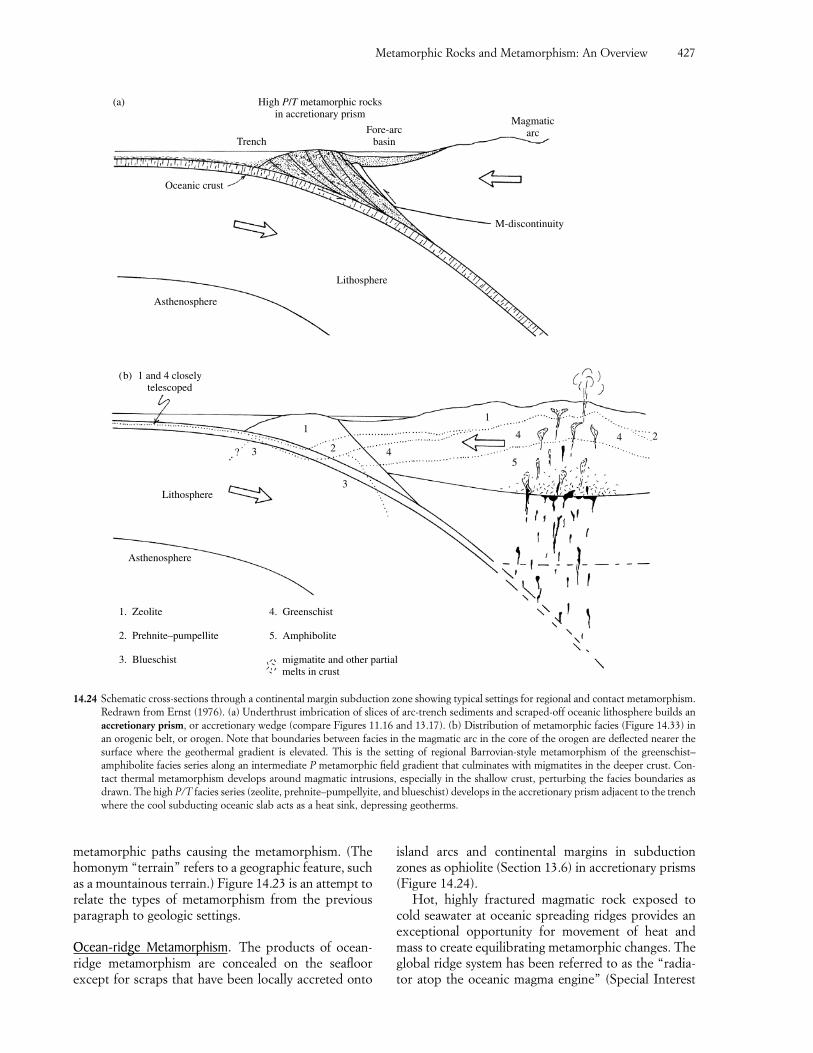
metamorphic paths causing the metamorphism. (Thehomonym “terrain” refers to a geographic feature, suchas a mountainous terrain.) Figure 14.23 is an attempt torelate the types of metamorphism from the previousparagraph to geologic settings.
Ocean-ridge Metamorphism. The products of ocean-ridge metamorphism are concealed on the seafloor except for scraps that have been locally accreted onto
island arcs and continental margins in subductionzones as ophiolite (Section 13.6) in accretionary prisms(Figure 14.24).
Hot, highly fractured magmatic rock exposed tocold seawater at oceanic spreading ridges provides anexceptional opportunity for movement of heat andmass to create equilibrating metamorphic changes. Theglobal ridge system has been referred to as the “radia-tor atop the oceanic magma engine” (Special Interest
Metamorphic Rocks and Metamorphism: An Overview 427
TrenchFore-arc
basin
High P/T metamorphic rocksin accretionary prism
(a)
Magmaticarc
Oceanic crust
Lithosphere
Asthenosphere
1 and 4 closelytelescoped
(b)
1
23
3
4?
1
4
5
4 2
Lithosphere
Asthenosphere
1. Zeolite
2. Prehnite–pumpellite
3. Blueschist
4. Greenschist
5. Amphibolite
migmatite and other partialmelts in crust
M-discontinuity
14.24 Schematic cross-sections through a continental margin subduction zone showing typical settings for regional and contact metamorphism.Redrawn from Ernst (1976). (a) Underthrust imbrication of slices of arc-trench sediments and scraped-off oceanic lithosphere builds anaccretionary prism, or accretionary wedge (compare Figures 11.16 and 13.17). (b) Distribution of metamorphic facies (Figure 14.33) inan orogenic belt, or orogen. Note that boundaries between facies in the magmatic arc in the core of the orogen are deflected nearer thesurface where the geothermal gradient is elevated. This is the setting of regional Barrovian-style metamorphism of the greenschist–amphibolite facies series along an intermediate P metamorphic field gradient that culminates with migmatites in the deeper crust. Con-tact thermal metamorphism develops around magmatic intrusions, especially in the shallow crust, perturbing the facies boundaries asdrawn. The high P/T facies series (zeolite, prehnite–pumpellyite, and blueschist) develops in the accretionary prism adjacent to the trenchwhere the cool subducting oceanic slab acts as a heat sink, depressing geotherms.
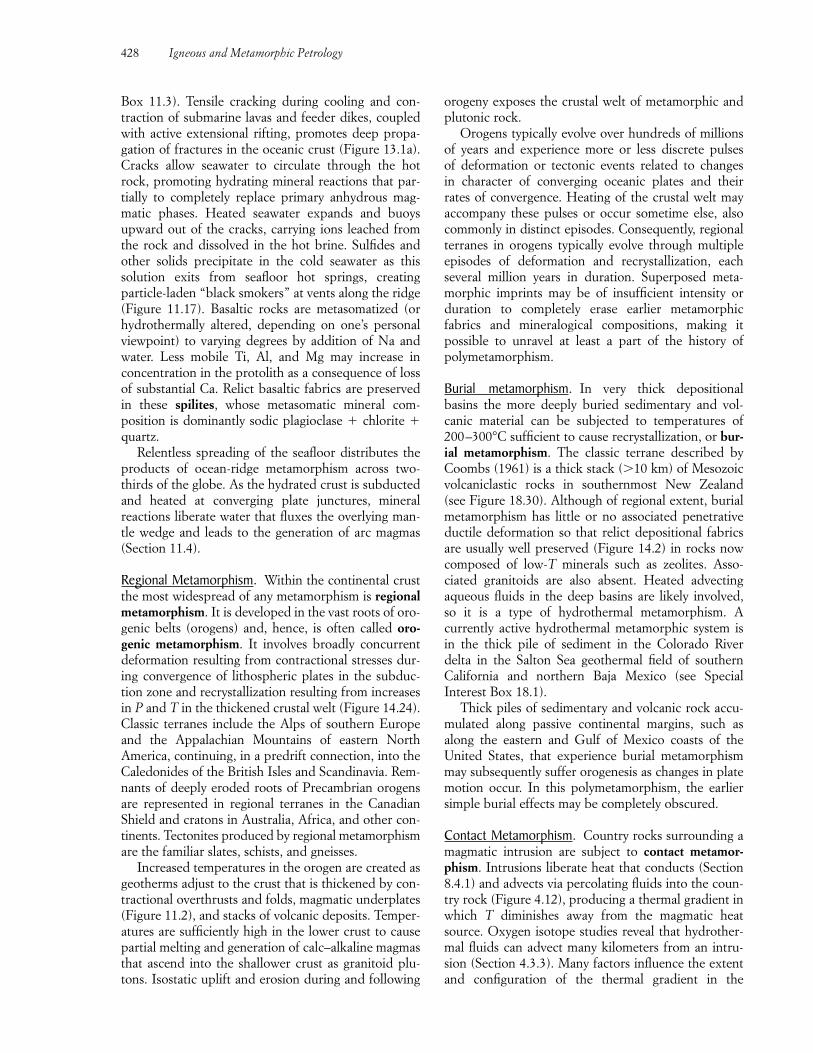
Box 11.3). Tensile cracking during cooling and con-traction of submarine lavas and feeder dikes, coupledwith active extensional rifting, promotes deep propa-gation of fractures in the oceanic crust (Figure 13.1a).Cracks allow seawater to circulate through the hotrock, promoting hydrating mineral reactions that par-tially to completely replace primary anhydrous mag-matic phases. Heated seawater expands and buoys upward out of the cracks, carrying ions leached fromthe rock and dissolved in the hot brine. Sulfides andother solids precipitate in the cold seawater as this solution exits from seafloor hot springs, creating particle-laden “black smokers” at vents along the ridge(Figure 11.17). Basaltic rocks are metasomatized (orhydrothermally altered, depending on one’s personalviewpoint) to varying degrees by addition of Na andwater. Less mobile Ti, Al, and Mg may increase in concentration in the protolith as a consequence of lossof substantial Ca. Relict basaltic fabrics are preservedin these spilites, whose metasomatic mineral com-position is dominantly sodic plagioclase � chlorite �quartz.
Relentless spreading of the seafloor distributes theproducts of ocean-ridge metamorphism across two-thirds of the globe. As the hydrated crust is subductedand heated at converging plate junctures, mineral reactions liberate water that fluxes the overlying man-tle wedge and leads to the generation of arc magmas(Section 11.4).
Regional Metamorphism. Within the continental crustthe most widespread of any metamorphism is regionalmetamorphism. It is developed in the vast roots of oro-genic belts (orogens) and, hence, is often called oro-genic metamorphism. It involves broadly concurrentdeformation resulting from contractional stresses dur-ing convergence of lithospheric plates in the subduc-tion zone and recrystallization resulting from increasesin P and T in the thickened crustal welt (Figure 14.24).Classic terranes include the Alps of southern Europeand the Appalachian Mountains of eastern NorthAmerica, continuing, in a predrift connection, into theCaledonides of the British Isles and Scandinavia. Rem-nants of deeply eroded roots of Precambrian orogensare represented in regional terranes in the CanadianShield and cratons in Australia, Africa, and other con-tinents. Tectonites produced by regional metamorphismare the familiar slates, schists, and gneisses.
Increased temperatures in the orogen are created asgeotherms adjust to the crust that is thickened by con-tractional overthrusts and folds, magmatic underplates(Figure 11.2), and stacks of volcanic deposits. Temper-atures are sufficiently high in the lower crust to causepartial melting and generation of calc–alkaline magmasthat ascend into the shallower crust as granitoid plu-tons. Isostatic uplift and erosion during and following
orogeny exposes the crustal welt of metamorphic andplutonic rock.
Orogens typically evolve over hundreds of millionsof years and experience more or less discrete pulses of deformation or tectonic events related to changes in character of converging oceanic plates and theirrates of convergence. Heating of the crustal welt mayaccompany these pulses or occur sometime else, alsocommonly in distinct episodes. Consequently, regionalterranes in orogens typically evolve through multipleepisodes of deformation and recrystallization, each several million years in duration. Superposed meta-morphic imprints may be of insufficient intensity orduration to completely erase earlier metamorphic fabrics and mineralogical compositions, making it possible to unravel at least a part of the history of polymetamorphism.
Burial metamorphism. In very thick depositionalbasins the more deeply buried sedimentary and vol-canic material can be subjected to temperatures of200–300°C sufficient to cause recrystallization, or bur-ial metamorphism. The classic terrane described byCoombs (1961) is a thick stack (�10 km) of Mesozoicvolcaniclastic rocks in southernmost New Zealand (see Figure 18.30). Although of regional extent, burialmetamorphism has little or no associated penetrativeductile deformation so that relict depositional fabricsare usually well preserved (Figure 14.2) in rocks nowcomposed of low-T minerals such as zeolites. Asso-ciated granitoids are also absent. Heated advectingaqueous fluids in the deep basins are likely involved, so it is a type of hydrothermal metamorphism. A currently active hydrothermal metamorphic system isin the thick pile of sediment in the Colorado Riverdelta in the Salton Sea geothermal field of southernCalifornia and northern Baja Mexico (see Special Interest Box 18.1).
Thick piles of sedimentary and volcanic rock accu-mulated along passive continental margins, such asalong the eastern and Gulf of Mexico coasts of theUnited States, that experience burial metamorphismmay subsequently suffer orogenesis as changes in platemotion occur. In this polymetamorphism, the earliersimple burial effects may be completely obscured.
Contact Metamorphism. Country rocks surrounding amagmatic intrusion are subject to contact metamor-phism. Intrusions liberate heat that conducts (Section8.4.1) and advects via percolating fluids into the coun-try rock (Figure 4.12), producing a thermal gradient inwhich T diminishes away from the magmatic heatsource. Oxygen isotope studies reveal that hydrother-mal fluids can advect many kilometers from an intru-sion (Section 4.3.3). Many factors influence the extentand configuration of the thermal gradient in the
428 Igneous and Metamorphic Petrology
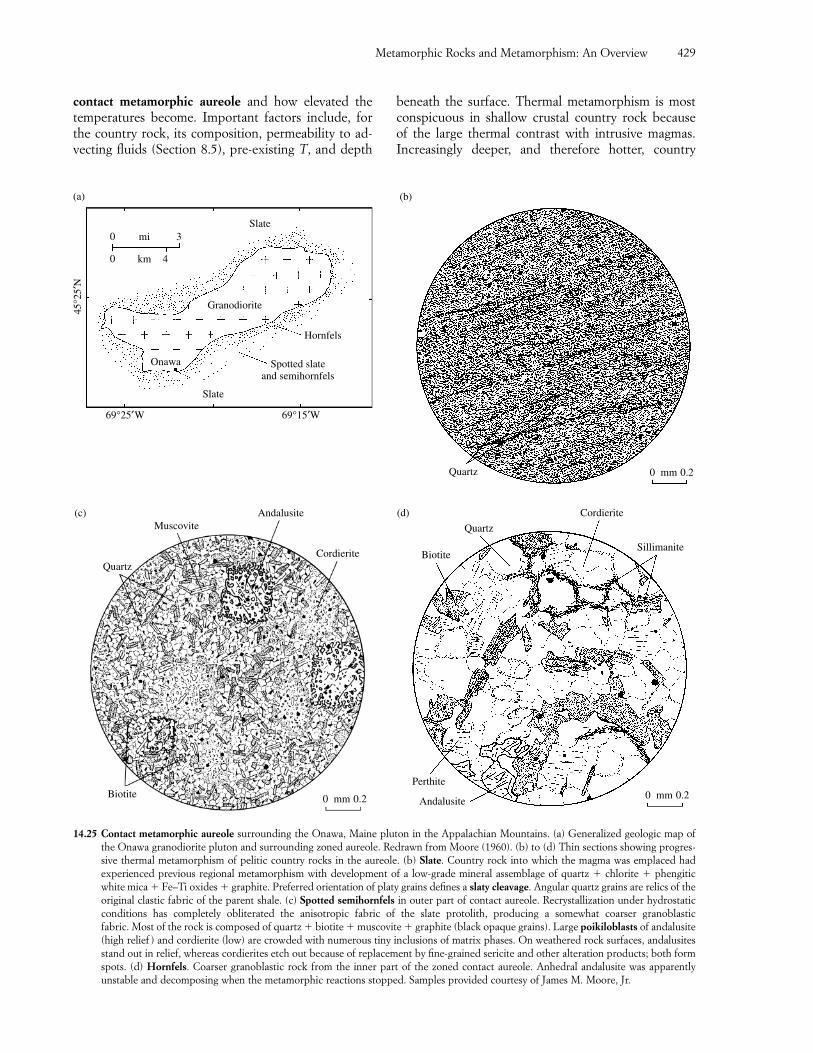
contact metamorphic aureole and how elevated thetemperatures become. Important factors include, forthe country rock, its composition, permeability to ad-vecting fluids (Section 8.5), pre-existing T, and depth
beneath the surface. Thermal metamorphism is most conspicuous in shallow crustal country rock because of the large thermal contrast with intrusive magmas. Increasingly deeper, and therefore hotter, country
Metamorphic Rocks and Metamorphism: An Overview 429
45°2
5′N
0 mi 3
0 km 4
Slate
Granodiorite
Hornfels
Spotted slateand semihornfels
Slate
Onawa
69°15′W69°25′W
(a) (b)
Quartz 0 mm 0.2
(c)
Biotite 0 mm 0.2
Quartz
MuscoviteAndalusite
Cordierite
(d)
Perthite
Andalusite0 mm 0.2
Biotite
Quartz
Cordierite
Sillimanite
14.25 Contact metamorphic aureole surrounding the Onawa, Maine pluton in the Appalachian Mountains. (a) Generalized geologic map ofthe Onawa granodiorite pluton and surrounding zoned aureole. Redrawn from Moore (1960). (b) to (d) Thin sections showing progres-sive thermal metamorphism of pelitic country rocks in the aureole. (b) Slate. Country rock into which the magma was emplaced had experienced previous regional metamorphism with development of a low-grade mineral assemblage of quartz � chlorite � phengiticwhite mica � Fe–Ti oxides � graphite. Preferred orientation of platy grains defines a slaty cleavage. Angular quartz grains are relics of theoriginal clastic fabric of the parent shale. (c) Spotted semihornfels in outer part of contact aureole. Recrystallization under hydrostaticconditions has completely obliterated the anisotropic fabric of the slate protolith, producing a somewhat coarser granoblastic fabric. Most of the rock is composed of quartz � biotite � muscovite � graphite (black opaque grains). Large poikiloblasts of andalusite(high relief ) and cordierite (low) are crowded with numerous tiny inclusions of matrix phases. On weathered rock surfaces, andalusitesstand out in relief, whereas cordierites etch out because of replacement by fine-grained sericite and other alteration products; both formspots. (d) Hornfels. Coarser granoblastic rock from the inner part of the zoned contact aureole. Anhedral andalusite was apparently unstable and decomposing when the metamorphic reactions stopped. Samples provided courtesy of James M. Moore, Jr.
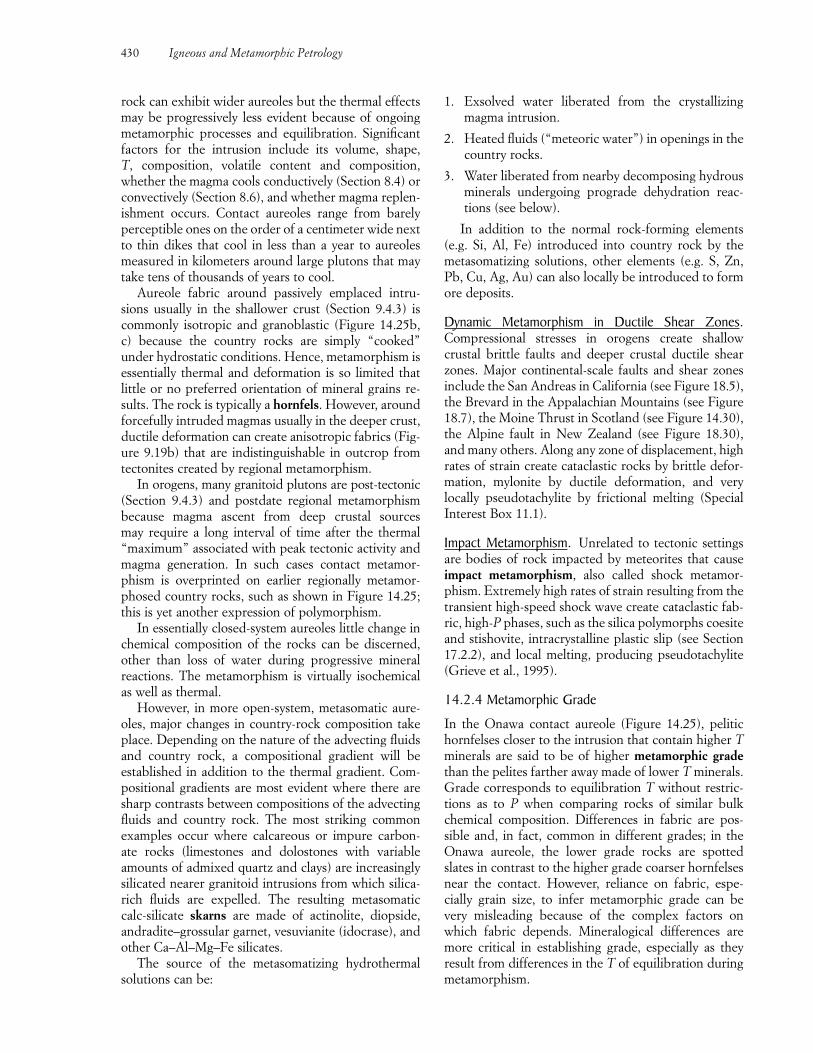
rock can exhibit wider aureoles but the thermal effectsmay be progressively less evident because of ongoingmetamorphic processes and equilibration. Significantfactors for the intrusion include its volume, shape, T, composition, volatile content and composition,whether the magma cools conductively (Section 8.4) orconvectively (Section 8.6), and whether magma replen-ishment occurs. Contact aureoles range from barelyperceptible ones on the order of a centimeter wide next to thin dikes that cool in less than a year to aureolesmeasured in kilometers around large plutons that maytake tens of thousands of years to cool.
Aureole fabric around passively emplaced intru-sions usually in the shallower crust (Section 9.4.3) iscommonly isotropic and granoblastic (Figure 14.25b,c) because the country rocks are simply “cooked” under hydrostatic conditions. Hence, metamorphism isessentially thermal and deformation is so limited thatlittle or no preferred orientation of mineral grains re-sults. The rock is typically a hornfels. However, aroundforcefully intruded magmas usually in the deeper crust,ductile deformation can create anisotropic fabrics (Fig-ure 9.19b) that are indistinguishable in outcrop fromtectonites created by regional metamorphism.
In orogens, many granitoid plutons are post-tectonic(Section 9.4.3) and postdate regional metamorphismbecause magma ascent from deep crustal sources may require a long interval of time after the thermal“maximum” associated with peak tectonic activity andmagma generation. In such cases contact metamor-phism is overprinted on earlier regionally metamor-phosed country rocks, such as shown in Figure 14.25;this is yet another expression of polymorphism.
In essentially closed-system aureoles little change inchemical composition of the rocks can be discerned,other than loss of water during progressive mineral reactions. The metamorphism is virtually isochemicalas well as thermal.
However, in more open-system, metasomatic aure-oles, major changes in country-rock composition takeplace. Depending on the nature of the advecting fluidsand country rock, a compositional gradient will be established in addition to the thermal gradient. Com-positional gradients are most evident where there aresharp contrasts between compositions of the advectingfluids and country rock. The most striking common examples occur where calcareous or impure carbon-ate rocks (limestones and dolostones with variableamounts of admixed quartz and clays) are increasinglysilicated nearer granitoid intrusions from which silica-rich fluids are expelled. The resulting metasomaticcalc-silicate skarns are made of actinolite, diopside, andradite–grossular garnet, vesuvianite (idocrase), andother Ca–Al–Mg–Fe silicates.
The source of the metasomatizing hydrothermal solutions can be:
1. Exsolved water liberated from the crystallizingmagma intrusion.
2. Heated fluids (“meteoric water”) in openings in thecountry rocks.
3. Water liberated from nearby decomposing hydrousminerals undergoing prograde dehydration reac-tions (see below).
In addition to the normal rock-forming elements(e.g. Si, Al, Fe) introduced into country rock by themetasomatizing solutions, other elements (e.g. S, Zn,Pb, Cu, Ag, Au) can also locally be introduced to formore deposits.
Dynamic Metamorphism in Ductile Shear Zones.Compressional stresses in orogens create shallowcrustal brittle faults and deeper crustal ductile shearzones. Major continental-scale faults and shear zonesinclude the San Andreas in California (see Figure 18.5),the Brevard in the Appalachian Mountains (see Figure18.7), the Moine Thrust in Scotland (see Figure 14.30),the Alpine fault in New Zealand (see Figure 18.30),and many others. Along any zone of displacement, highrates of strain create cataclastic rocks by brittle defor-mation, mylonite by ductile deformation, and very locally pseudotachylite by frictional melting (SpecialInterest Box 11.1).
Impact Metamorphism. Unrelated to tectonic settingsare bodies of rock impacted by meteorites that causeimpact metamorphism, also called shock metamor-phism. Extremely high rates of strain resulting from thetransient high-speed shock wave create cataclastic fab-ric, high-P phases, such as the silica polymorphs coesiteand stishovite, intracrystalline plastic slip (see Section17.2.2), and local melting, producing pseudotachylite(Grieve et al., 1995).
14.2.4 Metamorphic Grade
In the Onawa contact aureole (Figure 14.25), pelitichornfelses closer to the intrusion that contain higher Tminerals are said to be of higher metamorphic gradethan the pelites farther away made of lower T minerals.Grade corresponds to equilibration T without restric-tions as to P when comparing rocks of similar bulkchemical composition. Differences in fabric are pos-sible and, in fact, common in different grades; in the Onawa aureole, the lower grade rocks are spottedslates in contrast to the higher grade coarser hornfelsesnear the contact. However, reliance on fabric, espe-cially grain size, to infer metamorphic grade can bevery misleading because of the complex factors onwhich fabric depends. Mineralogical differences aremore critical in establishing grade, especially as they result from differences in the T of equilibration duringmetamorphism.
430 Igneous and Metamorphic Petrology
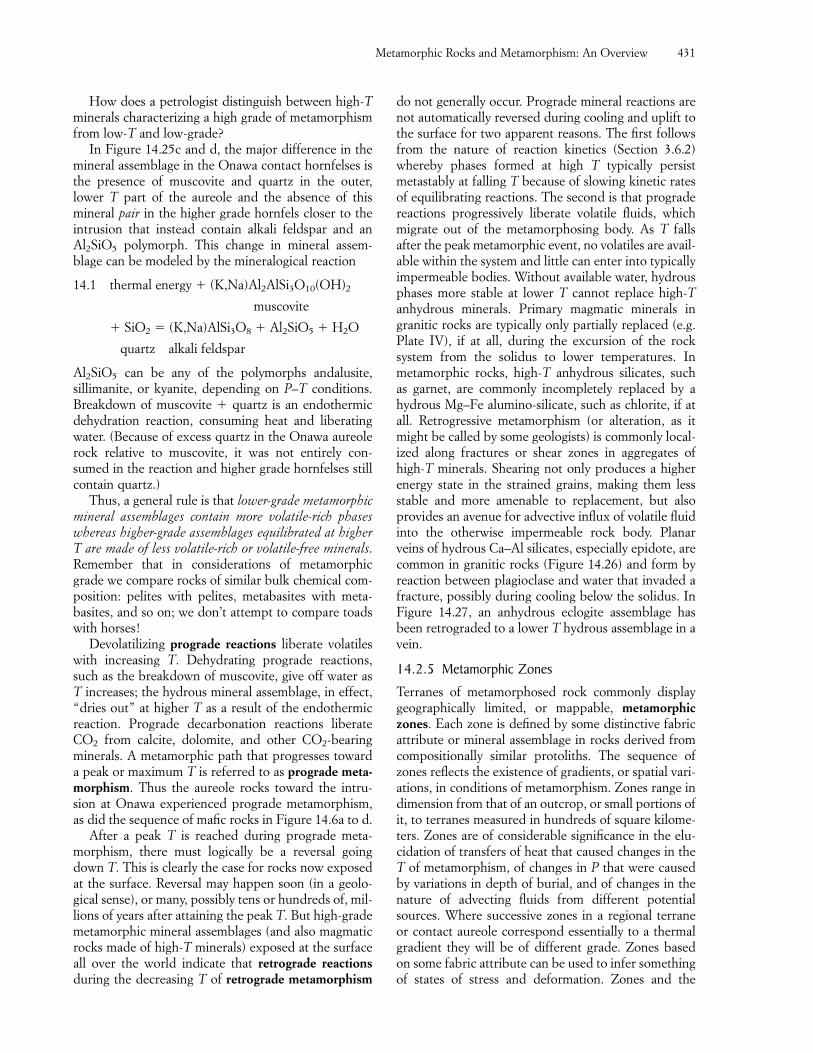
How does a petrologist distinguish between high-Tminerals characterizing a high grade of metamorphismfrom low-T and low-grade?
In Figure 14.25c and d, the major difference in themineral assemblage in the Onawa contact hornfelses isthe presence of muscovite and quartz in the outer,lower T part of the aureole and the absence of this mineral pair in the higher grade hornfels closer to theintrusion that instead contain alkali feldspar and anAl2SiO5 polymorph. This change in mineral assem-blage can be modeled by the mineralogical reaction
14.1 thermal energy � (K,Na)Al2AlSi3O10(OH)2
muscovite
� SiO2 � (K,Na)AlSi3O8 � Al2SiO5 � H2O
quartz alkali feldspar
Al2SiO5 can be any of the polymorphs andalusite, sillimanite, or kyanite, depending on P–T conditions.Breakdown of muscovite � quartz is an endothermicdehydration reaction, consuming heat and liberatingwater. (Because of excess quartz in the Onawa aureolerock relative to muscovite, it was not entirely con-sumed in the reaction and higher grade hornfelses stillcontain quartz.)
Thus, a general rule is that lower-grade metamorphicmineral assemblages contain more volatile-rich phaseswhereas higher-grade assemblages equilibrated at higherT are made of less volatile-rich or volatile-free minerals.Remember that in considerations of metamorphicgrade we compare rocks of similar bulk chemical com-position: pelites with pelites, metabasites with meta-basites, and so on; we don’t attempt to compare toadswith horses!
Devolatilizing prograde reactions liberate volatileswith increasing T. Dehydrating prograde reactions,such as the breakdown of muscovite, give off water asT increases; the hydrous mineral assemblage, in effect,“dries out” at higher T as a result of the endothermicreaction. Prograde decarbonation reactions liberateCO2 from calcite, dolomite, and other CO2-bearingminerals. A metamorphic path that progresses towarda peak or maximum T is referred to as prograde meta-morphism. Thus the aureole rocks toward the intru-sion at Onawa experienced prograde metamorphism,as did the sequence of mafic rocks in Figure 14.6a to d.
After a peak T is reached during prograde meta-morphism, there must logically be a reversal goingdown T. This is clearly the case for rocks now exposedat the surface. Reversal may happen soon (in a geolo-gical sense), or many, possibly tens or hundreds of, mil-lions of years after attaining the peak T. But high-grademetamorphic mineral assemblages (and also magmaticrocks made of high-T minerals) exposed at the surfaceall over the world indicate that retrograde reactionsduring the decreasing T of retrograde metamorphism
do not generally occur. Prograde mineral reactions arenot automatically reversed during cooling and uplift tothe surface for two apparent reasons. The first followsfrom the nature of reaction kinetics (Section 3.6.2)whereby phases formed at high T typically persistmetastably at falling T because of slowing kinetic ratesof equilibrating reactions. The second is that progradereactions progressively liberate volatile fluids, whichmigrate out of the metamorphosing body. As T falls after the peak metamorphic event, no volatiles are avail-able within the system and little can enter into typicallyimpermeable bodies. Without available water, hydrousphases more stable at lower T cannot replace high-Tanhydrous minerals. Primary magmatic minerals ingranitic rocks are typically only partially replaced (e.g.Plate IV), if at all, during the excursion of the rock system from the solidus to lower temperatures. Inmetamorphic rocks, high-T anhydrous silicates, such as garnet, are commonly incompletely replaced by ahydrous Mg–Fe alumino-silicate, such as chlorite, if atall. Retrogressive metamorphism (or alteration, as itmight be called by some geologists) is commonly local-ized along fractures or shear zones in aggregates ofhigh-T minerals. Shearing not only produces a higherenergy state in the strained grains, making them lessstable and more amenable to replacement, but alsoprovides an avenue for advective influx of volatile fluidinto the otherwise impermeable rock body. Planarveins of hydrous Ca–Al silicates, especially epidote, arecommon in granitic rocks (Figure 14.26) and form byreaction between plagioclase and water that invaded afracture, possibly during cooling below the solidus. InFigure 14.27, an anhydrous eclogite assemblage hasbeen retrograded to a lower T hydrous assemblage in avein.
14.2.5 Metamorphic Zones
Terranes of metamorphosed rock commonly displaygeographically limited, or mappable, metamorphiczones. Each zone is defined by some distinctive fabricattribute or mineral assemblage in rocks derived fromcompositionally similar protoliths. The sequence ofzones reflects the existence of gradients, or spatial vari-ations, in conditions of metamorphism. Zones range indimension from that of an outcrop, or small portions ofit, to terranes measured in hundreds of square kilome-ters. Zones are of considerable significance in the elu-cidation of transfers of heat that caused changes in theT of metamorphism, of changes in P that were causedby variations in depth of burial, and of changes in thenature of advecting fluids from different potentialsources. Where successive zones in a regional terraneor contact aureole correspond essentially to a thermalgradient they will be of different grade. Zones based on some fabric attribute can be used to infer somethingof states of stress and deformation. Zones and the
Metamorphic Rocks and Metamorphism: An Overview 431
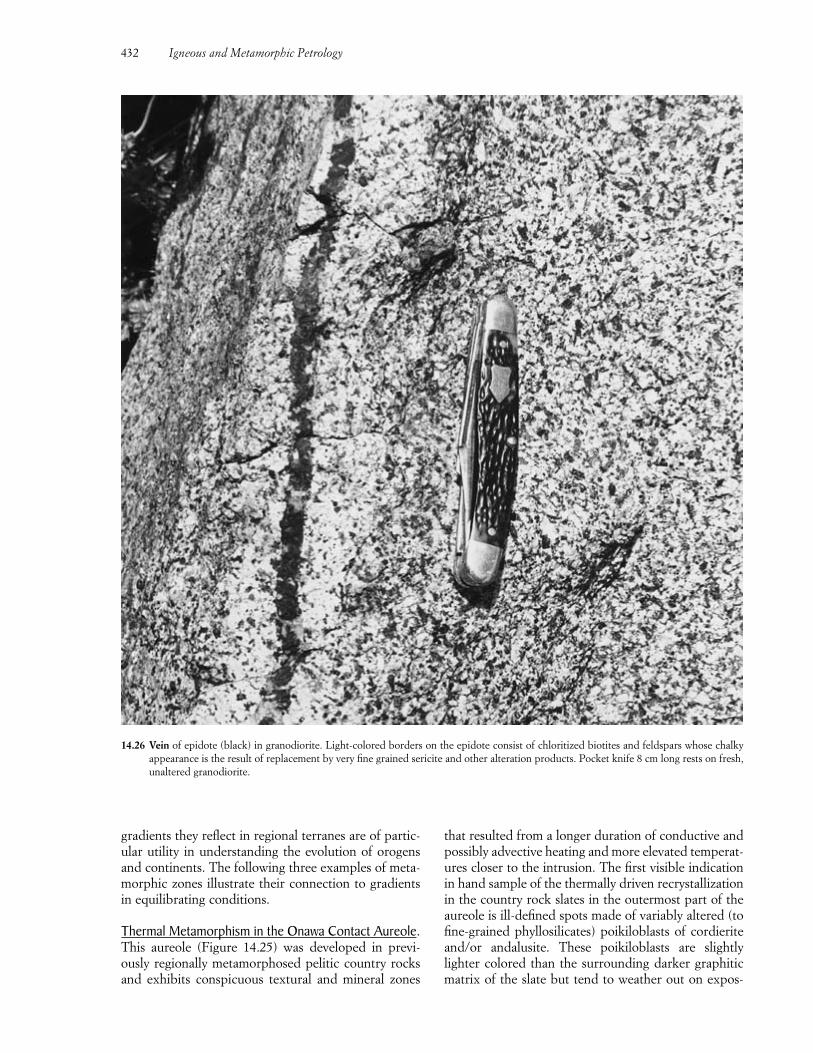
gradients they reflect in regional terranes are of partic-ular utility in understanding the evolution of orogensand continents. The following three examples of meta-morphic zones illustrate their connection to gradientsin equilibrating conditions.
Thermal Metamorphism in the Onawa Contact Aureole.This aureole (Figure 14.25) was developed in previ-ously regionally metamorphosed pelitic country rocksand exhibits conspicuous textural and mineral zones
432 Igneous and Metamorphic Petrology
14.26 Vein of epidote (black) in granodiorite. Light-colored borders on the epidote consist of chloritized biotites and feldspars whose chalkyappearance is the result of replacement by very fine grained sericite and other alteration products. Pocket knife 8 cm long rests on fresh,unaltered granodiorite.
that resulted from a longer duration of conductive andpossibly advective heating and more elevated temperat-ures closer to the intrusion. The first visible indicationin hand sample of the thermally driven recrystallizationin the country rock slates in the outermost part of theaureole is ill-defined spots made of variably altered (tofine-grained phyllosilicates) poikiloblasts of cordieriteand/or andalusite. These poikiloblasts are slightlylighter colored than the surrounding darker graphiticmatrix of the slate but tend to weather out on expos-
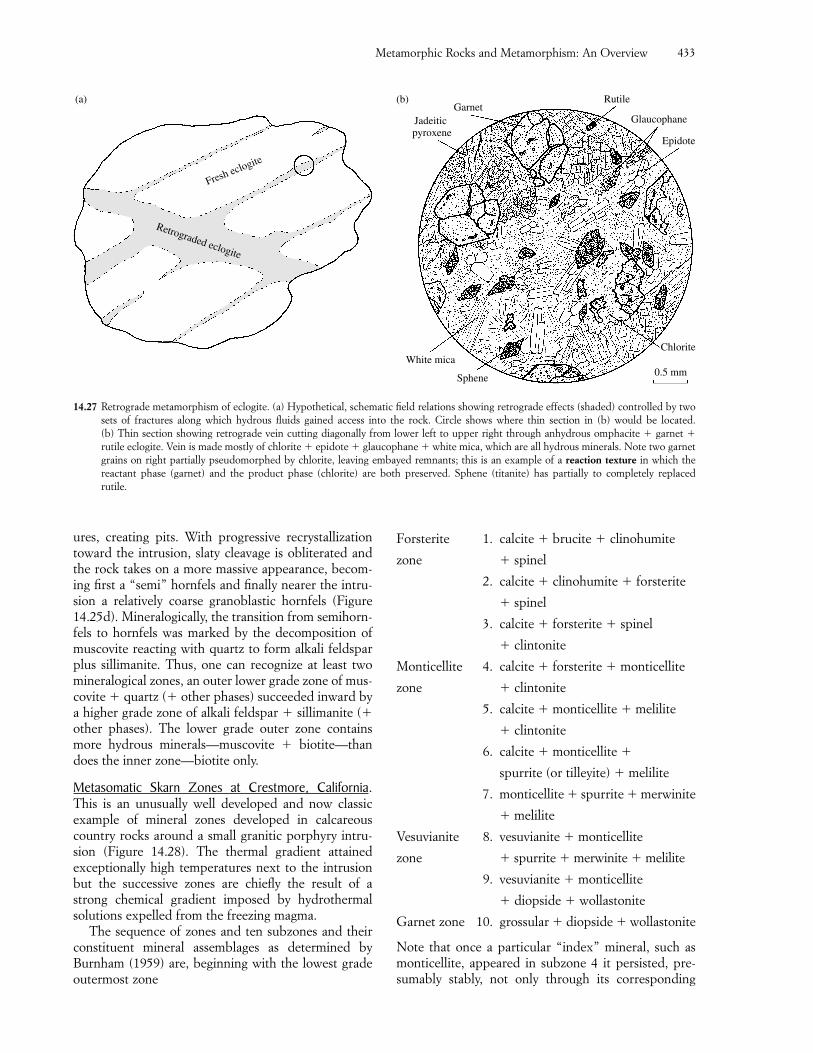
Metamorphic Rocks and Metamorphism: An Overview 433
ures, creating pits. With progressive recrystallizationtoward the intrusion, slaty cleavage is obliterated andthe rock takes on a more massive appearance, becom-ing first a “semi” hornfels and finally nearer the intru-sion a relatively coarse granoblastic hornfels (Figure14.25d). Mineralogically, the transition from semihorn-fels to hornfels was marked by the decomposition ofmuscovite reacting with quartz to form alkali feldsparplus sillimanite. Thus, one can recognize at least twomineralogical zones, an outer lower grade zone of mus-covite � quartz (� other phases) succeeded inward bya higher grade zone of alkali feldspar � sillimanite (�other phases). The lower grade outer zone containsmore hydrous minerals—muscovite � biotite—thandoes the inner zone—biotite only.
Metasomatic Skarn Zones at Crestmore, California.This is an unusually well developed and now classic example of mineral zones developed in calcareouscountry rocks around a small granitic porphyry intru-sion (Figure 14.28). The thermal gradient attained exceptionally high temperatures next to the intrusionbut the successive zones are chiefly the result of astrong chemical gradient imposed by hydrothermal solutions expelled from the freezing magma.
The sequence of zones and ten subzones and theirconstituent mineral assemblages as determined byBurnham (1959) are, beginning with the lowest gradeoutermost zone
Forsterite 1. calcite � brucite � clinohumite
zone � spinel
2. calcite � clinohumite � forsterite
� spinel
3. calcite � forsterite � spinel
� clintonite
Monticellite 4. calcite � forsterite � monticellite
zone � clintonite
5. calcite � monticellite � melilite
� clintonite
6. calcite � monticellite �
spurrite (or tilleyite) � melilite
7. monticellite � spurrite � merwinite
� melilite
Vesuvianite 8. vesuvianite � monticellite
zone � spurrite � merwinite � melilite
9. vesuvianite � monticellite
� diopside � wollastonite
Garnet zone 10. grossular � diopside � wollastonite
Note that once a particular “index” mineral, such asmonticellite, appeared in subzone 4 it persisted, pre-sumably stably, not only through its corresponding
Retrograded eclogite
Fresh eclogite
(b)(a)
White mica
Sphene 0.5 mm
Jadeitic pyroxene
GarnetRutile
Glaucophane
Epidote
Chlorite
14.27 Retrograde metamorphism of eclogite. (a) Hypothetical, schematic field relations showing retrograde effects (shaded) controlled by twosets of fractures along which hydrous fluids gained access into the rock. Circle shows where thin section in (b) would be located. (b) Thin section showing retrograde vein cutting diagonally from lower left to upper right through anhydrous omphacite � garnet �rutile eclogite. Vein is made mostly of chlorite � epidote � glaucophane � white mica, which are all hydrous minerals. Note two garnetgrains on right partially pseudomorphed by chlorite, leaving embayed remnants; this is an example of a reaction texture in which the reactant phase (garnet) and the product phase (chlorite) are both preserved. Sphene (titanite) has partially to completely replaced rutile.
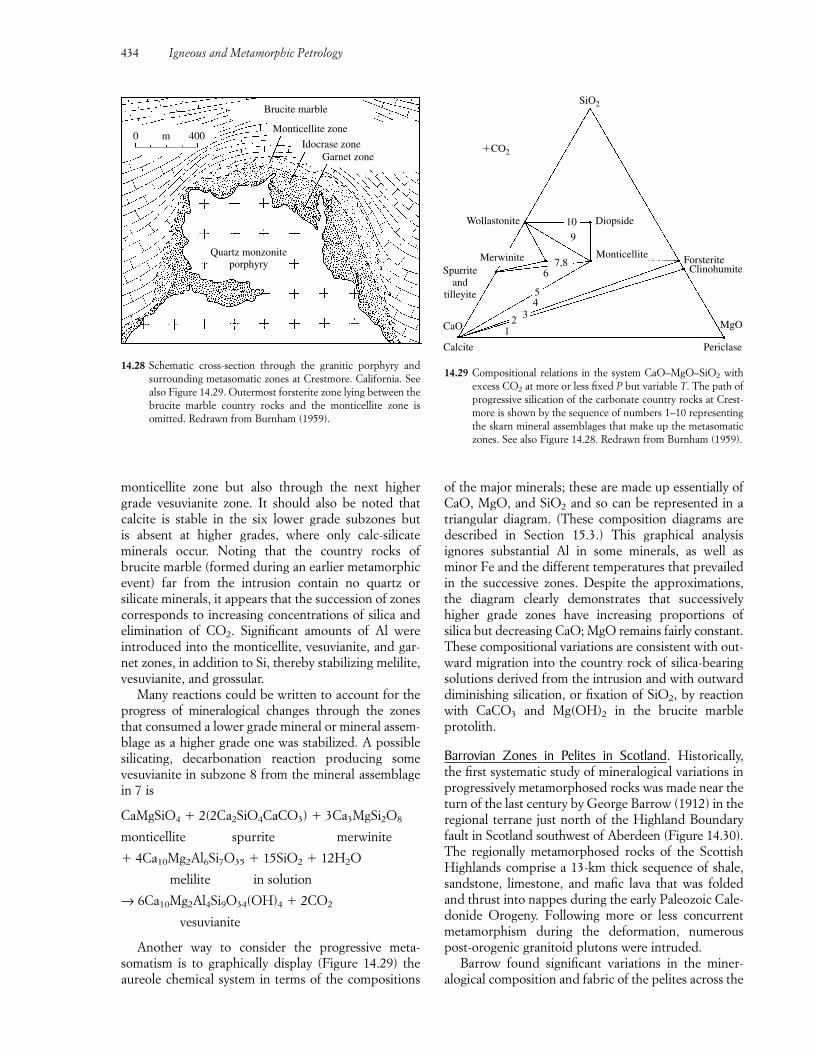
434 Igneous and Metamorphic Petrology
monticellite zone but also through the next highergrade vesuvianite zone. It should also be noted that calcite is stable in the six lower grade subzones but is absent at higher grades, where only calc-silicate minerals occur. Noting that the country rocks ofbrucite marble (formed during an earlier metamorphicevent) far from the intrusion contain no quartz or silicate minerals, it appears that the succession of zones corresponds to increasing concentrations of silica andelimination of CO2. Significant amounts of Al were introduced into the monticellite, vesuvianite, and gar-net zones, in addition to Si, thereby stabilizing melilite,vesuvianite, and grossular.
Many reactions could be written to account for theprogress of mineralogical changes through the zonesthat consumed a lower grade mineral or mineral assem-blage as a higher grade one was stabilized. A possiblesilicating, decarbonation reaction producing somevesuvianite in subzone 8 from the mineral assemblagein 7 is
CaMgSiO4 � 2(2Ca2SiO4CaCO3) � 3Ca3MgSi2O8
monticellite spurrite merwinite
� 4Ca10Mg2Al6Si7O35 � 15SiO2 � 12H2O
melilite in solution
→ 6Ca10Mg2Al4Si9O34(OH)4 � 2CO2
vesuvianite
Another way to consider the progressive meta-somatism is to graphically display (Figure 14.29) theaureole chemical system in terms of the compositions
of the major minerals; these are made up essentially ofCaO, MgO, and SiO2 and so can be represented in atriangular diagram. (These composition diagrams aredescribed in Section 15.3.) This graphical analysis ignores substantial Al in some minerals, as well as minor Fe and the different temperatures that prevailedin the successive zones. Despite the approximations,the diagram clearly demonstrates that successivelyhigher grade zones have increasing proportions of silica but decreasing CaO; MgO remains fairly constant.These compositional variations are consistent with out-ward migration into the country rock of silica-bearingsolutions derived from the intrusion and with outward diminishing silication, or fixation of SiO2, by reactionwith CaCO3 and Mg(OH)2 in the brucite marble protolith.
Barrovian Zones in Pelites in Scotland. Historically,the first systematic study of mineralogical variations inprogressively metamorphosed rocks was made near theturn of the last century by George Barrow (1912) in theregional terrane just north of the Highland Boundaryfault in Scotland southwest of Aberdeen (Figure 14.30).The regionally metamorphosed rocks of the ScottishHighlands comprise a 13-km thick sequence of shale,sandstone, limestone, and mafic lava that was foldedand thrust into nappes during the early Paleozoic Cale-donide Orogeny. Following more or less concurrentmetamorphism during the deformation, numerouspost-orogenic granitoid plutons were intruded.
Barrow found significant variations in the miner-alogical composition and fabric of the pelites across the
Brucite marble
Monticellite zone
Idocrase zoneGarnet zone
Quartz monzoniteporphyry
0 m 400
14.28 Schematic cross-section through the granitic porphyry andsurrounding metasomatic zones at Crestmore. California. Seealso Figure 14.29. Outermost forsterite zone lying between thebrucite marble country rocks and the monticellite zone isomitted. Redrawn from Burnham (1959).
Calcite Periclase
CaO MgO
Spurriteand
tilleyite
Merwinite
Wollastonite Diopside
Monticellite ForsteriteClinohumite
10
9
7,86
54
321
SiO2
�CO2
14.29 Compositional relations in the system CaO–MgO–SiO2 withexcess CO2 at more or less fixed P but variable T. The path ofprogressive silication of the carbonate country rocks at Crest-more is shown by the sequence of numbers 1–10 representingthe skarn mineral assemblages that make up the metasomaticzones. See also Figure 14.28. Redrawn from Burnham (1959).
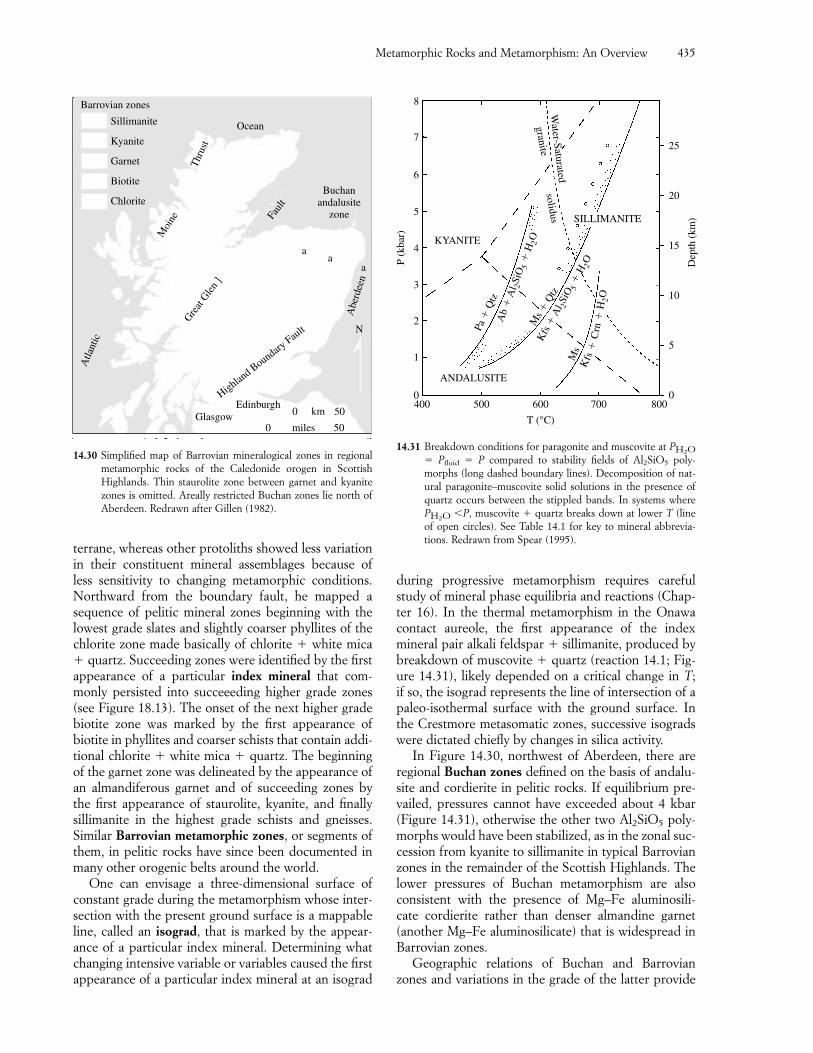
during progressive metamorphism requires carefulstudy of mineral phase equilibria and reactions (Chap-ter 16). In the thermal metamorphism in the Onawacontact aureole, the first appearance of the index mineral pair alkali feldspar � sillimanite, produced bybreakdown of muscovite � quartz (reaction 14.1; Fig-ure 14.31), likely depended on a critical change in T; if so, the isograd represents the line of intersection of apaleo-isothermal surface with the ground surface. Inthe Crestmore metasomatic zones, successive isogradswere dictated chiefly by changes in silica activity.
In Figure 14.30, northwest of Aberdeen, there areregional Buchan zones defined on the basis of andalu-site and cordierite in pelitic rocks. If equilibrium pre-vailed, pressures cannot have exceeded about 4 kbar(Figure 14.31), otherwise the other two Al2SiO5 poly-morphs would have been stabilized, as in the zonal suc-cession from kyanite to sillimanite in typical Barrovianzones in the remainder of the Scottish Highlands. The lower pressures of Buchan metamorphism are also consistent with the presence of Mg–Fe aluminosili-cate cordierite rather than denser almandine garnet(another Mg–Fe aluminosilicate) that is widespread inBarrovian zones.
Geographic relations of Buchan and Barrovianzones and variations in the grade of the latter provide
Metamorphic Rocks and Metamorphism: An Overview 435
terrane, whereas other protoliths showed less variationin their constituent mineral assemblages because of less sensitivity to changing metamorphic conditions.Northward from the boundary fault, he mapped a sequence of pelitic mineral zones beginning with thelowest grade slates and slightly coarser phyllites of thechlorite zone made basically of chlorite � white mica� quartz. Succeeding zones were identified by the firstappearance of a particular index mineral that com-monly persisted into succeeeding higher grade zones(see Figure 18.13). The onset of the next higher gradebiotite zone was marked by the first appearance of biotite in phyllites and coarser schists that contain addi-tional chlorite � white mica � quartz. The beginningof the garnet zone was delineated by the appearance ofan almandiferous garnet and of succeeding zones bythe first appearance of staurolite, kyanite, and finallysillimanite in the highest grade schists and gneisses.Similar Barrovian metamorphic zones, or segments ofthem, in pelitic rocks have since been documented inmany other orogenic belts around the world.
One can envisage a three-dimensional surface ofconstant grade during the metamorphism whose inter-section with the present ground surface is a mappableline, called an isograd, that is marked by the appear-ance of a particular index mineral. Determining whatchanging intensive variable or variables caused the firstappearance of a particular index mineral at an isograd
Barrovian zones
Sillimanite
Kyanite
Garnet
Biotite
Chlorite
Ocean
0
0 miles
50
N
Buchanandalusite
zoneFaul
t
aa
a
Abe
rdee
n
EdinburghGlasgow
Highland B
oundary Fau
lt
Atla
ntic
Gre
at G
len
]
Moi
ne
Thru
st
50
km
14.30 Simplified map of Barrovian mineralogical zones in regionalmetamorphic rocks of the Caledonide orogen in ScottishHighlands. Thin staurolite zone between garnet and kyanitezones is omitted. Areally restricted Buchan zones lie north ofAberdeen. Redrawn after Gillen (1982).
P (k
bar)
Dep
th (
km)
8
7
6
5
4
3
2
1
0
25
20
15
10
5
0
KYANITE
SILLIMANITE
ANDALUSITE
granitesolidus
Pa �
Qtz
Ab
� A
l 2Si
O5 �
H2O
Ms �
Qtz
Ms
Kfs
� A
l 2Si
O 5 �
H2O
Kfs
�C
rn�
H2O
400 500 600
T (°C)
700 800
Water-Saturated
14.31 Breakdown conditions for paragonite and muscovite at P� Pfluid � P compared to stability fields of Al2SiO5 poly-morphs (long dashed boundary lines). Decomposition of nat-ural paragonite–muscovite solid solutions in the presence ofquartz occurs between the stippled bands. In systems whereP �P, muscovite � quartz breaks down at lower T (lineof open circles). See Table 14.1 for key to mineral abbrevia-tions. Redrawn from Spear (1995).
H2O
H2O
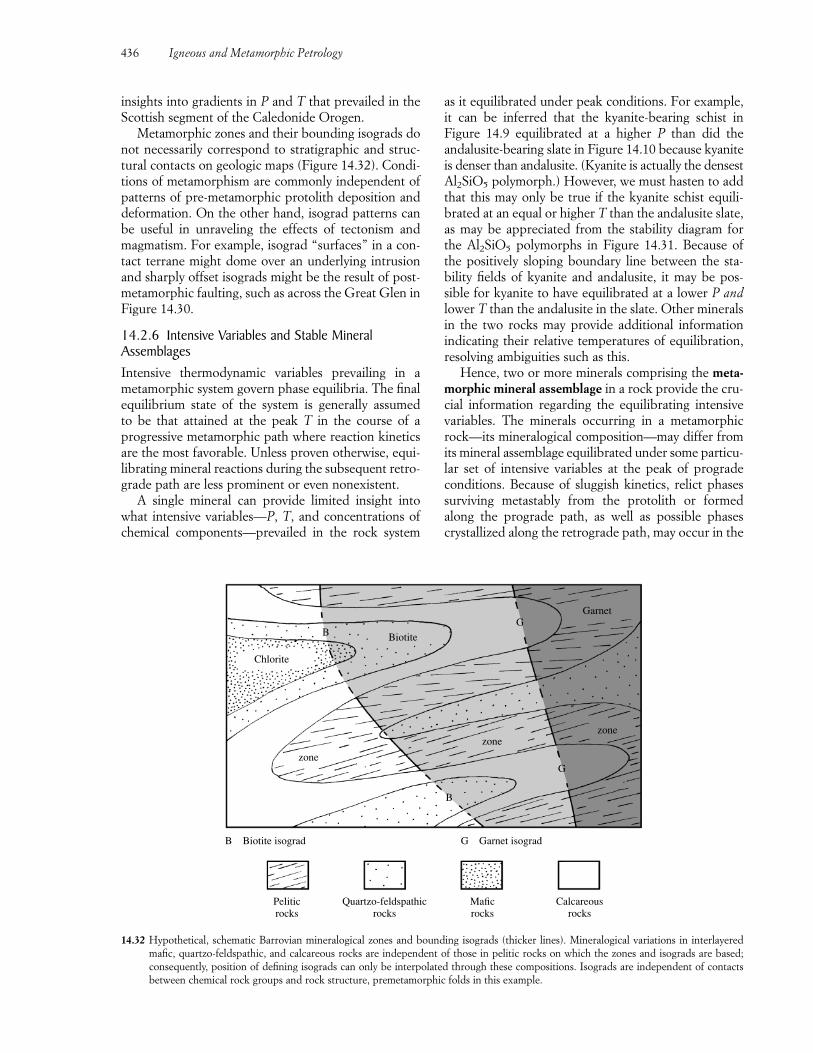
436 Igneous and Metamorphic Petrology
as it equilibrated under peak conditions. For example,it can be inferred that the kyanite-bearing schist in Figure 14.9 equilibrated at a higher P than did the andalusite-bearing slate in Figure 14.10 because kyaniteis denser than andalusite. (Kyanite is actually the densestAl2SiO5 polymorph.) However, we must hasten to addthat this may only be true if the kyanite schist equili-brated at an equal or higher T than the andalusite slate,as may be appreciated from the stability diagram forthe Al2SiO5 polymorphs in Figure 14.31. Because ofthe positively sloping boundary line between the sta-bility fields of kyanite and andalusite, it may be pos-sible for kyanite to have equilibrated at a lower P andlower T than the andalusite in the slate. Other mineralsin the two rocks may provide additional informationindicating their relative temperatures of equilibration,resolving ambiguities such as this.
Hence, two or more minerals comprising the meta-morphic mineral assemblage in a rock provide the cru-cial information regarding the equilibrating intensivevariables. The minerals occurring in a metamorphicrock—its mineralogical composition—may differ fromits mineral assemblage equilibrated under some particu-lar set of intensive variables at the peak of progradeconditions. Because of sluggish kinetics, relict phasessurviving metastably from the protolith or formedalong the prograde path, as well as possible phasescrystallized along the retrograde path, may occur in the
Chlorite
B
B
G
zone
zone
zone
G
Biotite
Garnet
B Biotite isograd G Garnet isograd
Peliticrocks
Quartzo-feldspathicrocks
Maficrocks
Calcareousrocks
14.32 Hypothetical, schematic Barrovian mineralogical zones and bounding isograds (thicker lines). Mineralogical variations in interlayeredmafic, quartzo-feldspathic, and calcareous rocks are independent of those in pelitic rocks on which the zones and isograds are based;consequently, position of defining isograds can only be interpolated through these compositions. Isograds are independent of contactsbetween chemical rock groups and rock structure, premetamorphic folds in this example.
insights into gradients in P and T that prevailed in theScottish segment of the Caledonide Orogen.
Metamorphic zones and their bounding isograds donot necessarily correspond to stratigraphic and struc-tural contacts on geologic maps (Figure 14.32). Condi-tions of metamorphism are commonly independent ofpatterns of pre-metamorphic protolith deposition anddeformation. On the other hand, isograd patterns canbe useful in unraveling the effects of tectonism andmagmatism. For example, isograd “surfaces” in a con-tact terrane might dome over an underlying intrusionand sharply offset isograds might be the result of post-metamorphic faulting, such as across the Great Glen inFigure 14.30.
14.2.6 Intensive Variables and Stable MineralAssemblagesIntensive thermodynamic variables prevailing in ametamorphic system govern phase equilibria. The finalequilibrium state of the system is generally assumed to be that attained at the peak T in the course of a progressive metamorphic path where reaction kineticsare the most favorable. Unless proven otherwise, equi-librating mineral reactions during the subsequent retro-grade path are less prominent or even nonexistent.
A single mineral can provide limited insight intowhat intensive variables—P, T, and concentrations ofchemical components—prevailed in the rock system
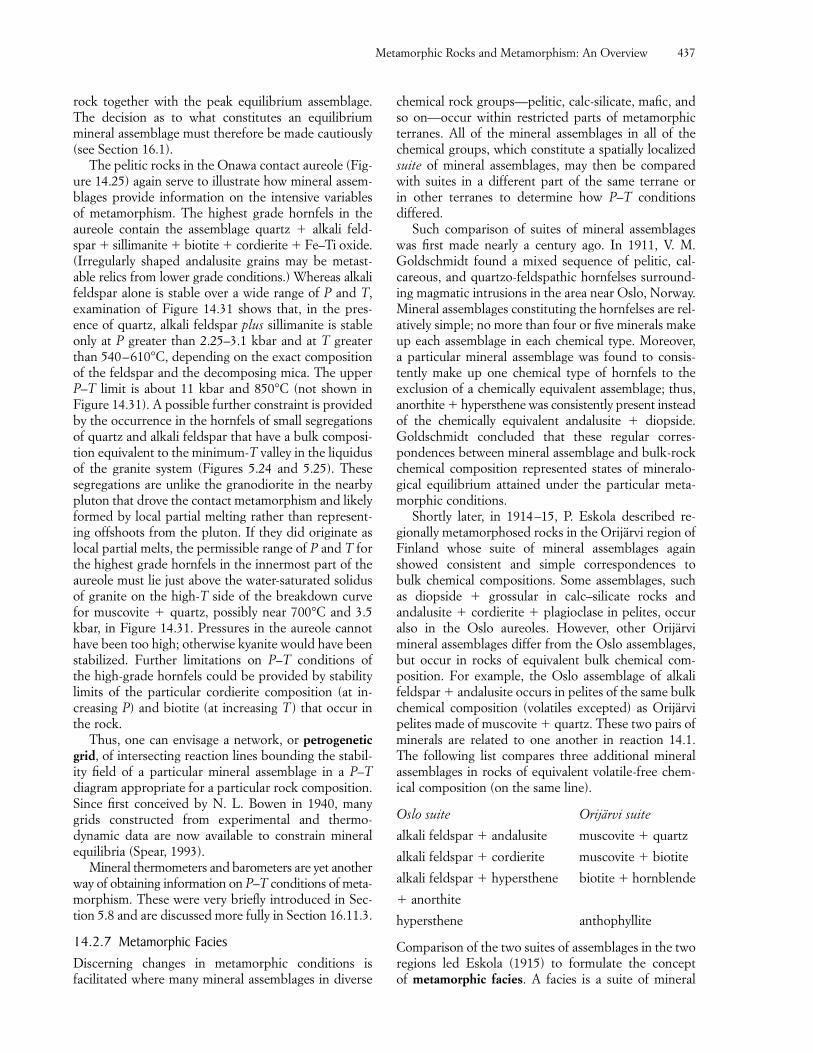
rock together with the peak equilibrium assemblage.The decision as to what constitutes an equilibriummineral assemblage must therefore be made cautiously(see Section 16.1).
The pelitic rocks in the Onawa contact aureole (Fig-ure 14.25) again serve to illustrate how mineral assem-blages provide information on the intensive variablesof metamorphism. The highest grade hornfels in theaureole contain the assemblage quartz � alkali feld-spar � sillimanite � biotite � cordierite � Fe–Ti oxide.(Irregularly shaped andalusite grains may be metast-able relics from lower grade conditions.) Whereas alkalifeldspar alone is stable over a wide range of P and T,examination of Figure 14.31 shows that, in the pres-ence of quartz, alkali feldspar plus sillimanite is stableonly at P greater than 2.25–3.1 kbar and at T greaterthan 540–610°C, depending on the exact compositionof the feldspar and the decomposing mica. The upperP–T limit is about 11 kbar and 850°C (not shown inFigure 14.31). A possible further constraint is providedby the occurrence in the hornfels of small segregationsof quartz and alkali feldspar that have a bulk composi-tion equivalent to the minimum-T valley in the liquidusof the granite system (Figures 5.24 and 5.25). Thesesegregations are unlike the granodiorite in the nearbypluton that drove the contact metamorphism and likelyformed by local partial melting rather than represent-ing offshoots from the pluton. If they did originate aslocal partial melts, the permissible range of P and T forthe highest grade hornfels in the innermost part of theaureole must lie just above the water-saturated solidusof granite on the high-T side of the breakdown curvefor muscovite � quartz, possibly near 700°C and 3.5kbar, in Figure 14.31. Pressures in the aureole cannothave been too high; otherwise kyanite would have beenstabilized. Further limitations on P–T conditions of the high-grade hornfels could be provided by stabilitylimits of the particular cordierite composition (at in-creasing P) and biotite (at increasing T) that occur inthe rock.
Thus, one can envisage a network, or petrogeneticgrid, of intersecting reaction lines bounding the stabil-ity field of a particular mineral assemblage in a P–Tdiagram appropriate for a particular rock composition.Since first conceived by N. L. Bowen in 1940, manygrids constructed from experimental and thermo-dynamic data are now available to constrain mineralequilibria (Spear, 1993).
Mineral thermometers and barometers are yet anotherway of obtaining information on P–T conditions of meta-morphism. These were very briefly introduced in Sec-tion 5.8 and are discussed more fully in Section 16.11.3.
14.2.7 Metamorphic FaciesDiscerning changes in metamorphic conditions is facilitated where many mineral assemblages in diverse
chemical rock groups—pelitic, calc-silicate, mafic, andso on—occur within restricted parts of metamorphicterranes. All of the mineral assemblages in all of thechemical groups, which constitute a spatially localizedsuite of mineral assemblages, may then be comparedwith suites in a different part of the same terrane or in other terranes to determine how P–T conditions differed.
Such comparison of suites of mineral assemblageswas first made nearly a century ago. In 1911, V. M.Goldschmidt found a mixed sequence of pelitic, cal-careous, and quartzo-feldspathic hornfelses surround-ing magmatic intrusions in the area near Oslo, Norway.Mineral assemblages constituting the hornfelses are rel-atively simple; no more than four or five minerals makeup each assemblage in each chemical type. Moreover, a particular mineral assemblage was found to consis-tently make up one chemical type of hornfels to the exclusion of a chemically equivalent assemblage; thus,anorthite � hypersthene was consistently present insteadof the chemically equivalent andalusite � diopside.Goldschmidt concluded that these regular corres-pondences between mineral assemblage and bulk-rockchemical composition represented states of mineralo-gical equilibrium attained under the particular meta-morphic conditions.
Shortly later, in 1914–15, P. Eskola described re-gionally metamorphosed rocks in the Orijärvi region ofFinland whose suite of mineral assemblages againshowed consistent and simple correspondences to bulk chemical compositions. Some assemblages, suchas diopside � grossular in calc–silicate rocks and andalusite � cordierite � plagioclase in pelites, occuralso in the Oslo aureoles. However, other Orijärvi mineral assemblages differ from the Oslo assemblages,but occur in rocks of equivalent bulk chemical com-position. For example, the Oslo assemblage of alkalifeldspar � andalusite occurs in pelites of the same bulkchemical composition (volatiles excepted) as Orijärvipelites made of muscovite � quartz. These two pairs ofminerals are related to one another in reaction 14.1.The following list compares three additional mineralassemblages in rocks of equivalent volatile-free chem-ical composition (on the same line).
Oslo suite Orijärvi suite
alkali feldspar � andalusite muscovite � quartz
alkali feldspar � cordierite muscovite � biotite
alkali feldspar � hypersthene biotite � hornblende
� anorthite
hypersthene anthophyllite
Comparison of the two suites of assemblages in the tworegions led Eskola (1915) to formulate the concept of metamorphic facies. A facies is a suite of mineral
Metamorphic Rocks and Metamorphism: An Overview 437
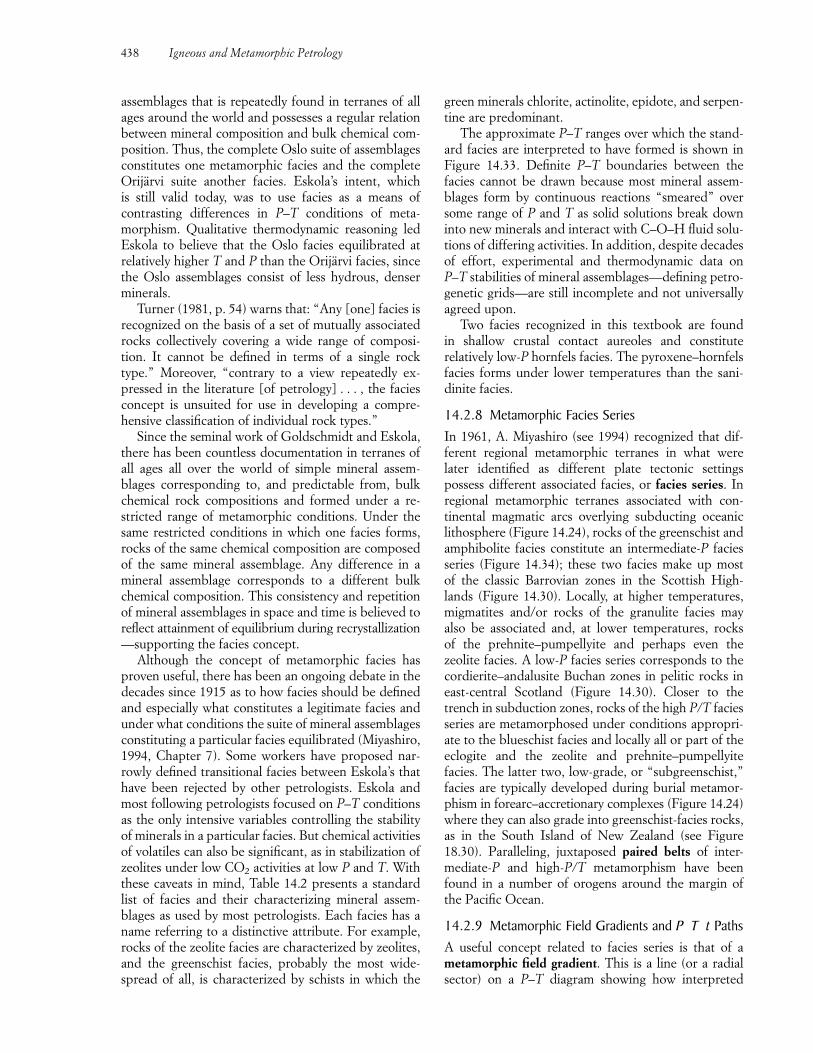
assemblages that is repeatedly found in terranes of allages around the world and possesses a regular relationbetween mineral composition and bulk chemical com-position. Thus, the complete Oslo suite of assemblagesconstitutes one metamorphic facies and the completeOrijärvi suite another facies. Eskola’s intent, which is still valid today, was to use facies as a means of contrasting differences in P–T conditions of meta-morphism. Qualitative thermodynamic reasoning ledEskola to believe that the Oslo facies equilibrated atrelatively higher T and P than the Orijärvi facies, sincethe Oslo assemblages consist of less hydrous, denserminerals.
Turner (1981, p. 54) warns that: “Any [one] facies isrecognized on the basis of a set of mutually associatedrocks collectively covering a wide range of composi-tion. It cannot be defined in terms of a single rocktype.” Moreover, “contrary to a view repeatedly ex-pressed in the literature [of petrology] . . . , the faciesconcept is unsuited for use in developing a compre-hensive classification of individual rock types.”
Since the seminal work of Goldschmidt and Eskola,there has been countless documentation in terranes ofall ages all over the world of simple mineral assem-blages corresponding to, and predictable from, bulkchemical rock compositions and formed under a re-stricted range of metamorphic conditions. Under thesame restricted conditions in which one facies forms,rocks of the same chemical composition are composedof the same mineral assemblage. Any difference in amineral assemblage corresponds to a different bulkchemical composition. This consistency and repetitionof mineral assemblages in space and time is believed toreflect attainment of equilibrium during recrystallization—supporting the facies concept.
Although the concept of metamorphic facies hasproven useful, there has been an ongoing debate in thedecades since 1915 as to how facies should be definedand especially what constitutes a legitimate facies andunder what conditions the suite of mineral assemblagesconstituting a particular facies equilibrated (Miyashiro,1994, Chapter 7). Some workers have proposed nar-rowly defined transitional facies between Eskola’s thathave been rejected by other petrologists. Eskola andmost following petrologists focused on P–T conditionsas the only intensive variables controlling the stabilityof minerals in a particular facies. But chemical activitiesof volatiles can also be significant, as in stabilization ofzeolites under low CO2 activities at low P and T. Withthese caveats in mind, Table 14.2 presents a standardlist of facies and their characterizing mineral assem-blages as used by most petrologists. Each facies has aname referring to a distinctive attribute. For example,rocks of the zeolite facies are characterized by zeolites,and the greenschist facies, probably the most wide-spread of all, is characterized by schists in which the
green minerals chlorite, actinolite, epidote, and serpen-tine are predominant.
The approximate P–T ranges over which the stand-ard facies are interpreted to have formed is shown inFigure 14.33. Definite P–T boundaries between the facies cannot be drawn because most mineral assem-blages form by continuous reactions “smeared” oversome range of P and T as solid solutions break downinto new minerals and interact with C–O–H fluid solu-tions of differing activities. In addition, despite decadesof effort, experimental and thermodynamic data onP–T stabilities of mineral assemblages—defining petro-genetic grids—are still incomplete and not universallyagreed upon.
Two facies recognized in this textbook are found in shallow crustal contact aureoles and constitute relatively low-P hornfels facies. The pyroxene–hornfelsfacies forms under lower temperatures than the sani-dinite facies.
14.2.8 Metamorphic Facies SeriesIn 1961, A. Miyashiro (see 1994) recognized that dif-ferent regional metamorphic terranes in what werelater identified as different plate tectonic settings possess different associated facies, or facies series. Inregional metamorphic terranes associated with con-tinental magmatic arcs overlying subducting oceaniclithosphere (Figure 14.24), rocks of the greenschist andamphibolite facies constitute an intermediate-P faciesseries (Figure 14.34); these two facies make up most of the classic Barrovian zones in the Scottish High-lands (Figure 14.30). Locally, at higher temperatures,migmatites and/or rocks of the granulite facies mayalso be associated and, at lower temperatures, rocks of the prehnite–pumpellyite and perhaps even the zeolite facies. A low-P facies series corresponds to thecordierite–andalusite Buchan zones in pelitic rocks ineast-central Scotland (Figure 14.30). Closer to thetrench in subduction zones, rocks of the high P/T faciesseries are metamorphosed under conditions appropri-ate to the blueschist facies and locally all or part of theeclogite and the zeolite and prehnite–pumpellyite facies. The latter two, low-grade, or “subgreenschist,”facies are typically developed during burial metamor-phism in forearc–accretionary complexes (Figure 14.24)where they can also grade into greenschist-facies rocks,as in the South Island of New Zealand (see Figure18.30). Paralleling, juxtaposed paired belts of inter-mediate-P and high-P/T metamorphism have beenfound in a number of orogens around the margin of the Pacific Ocean.
14.2.9 Metamorphic Field Gradients and P T t PathsA useful concept related to facies series is that of ametamorphic field gradient. This is a line (or a radialsector) on a P–T diagram showing how interpreted
438 Igneous and Metamorphic Petrology
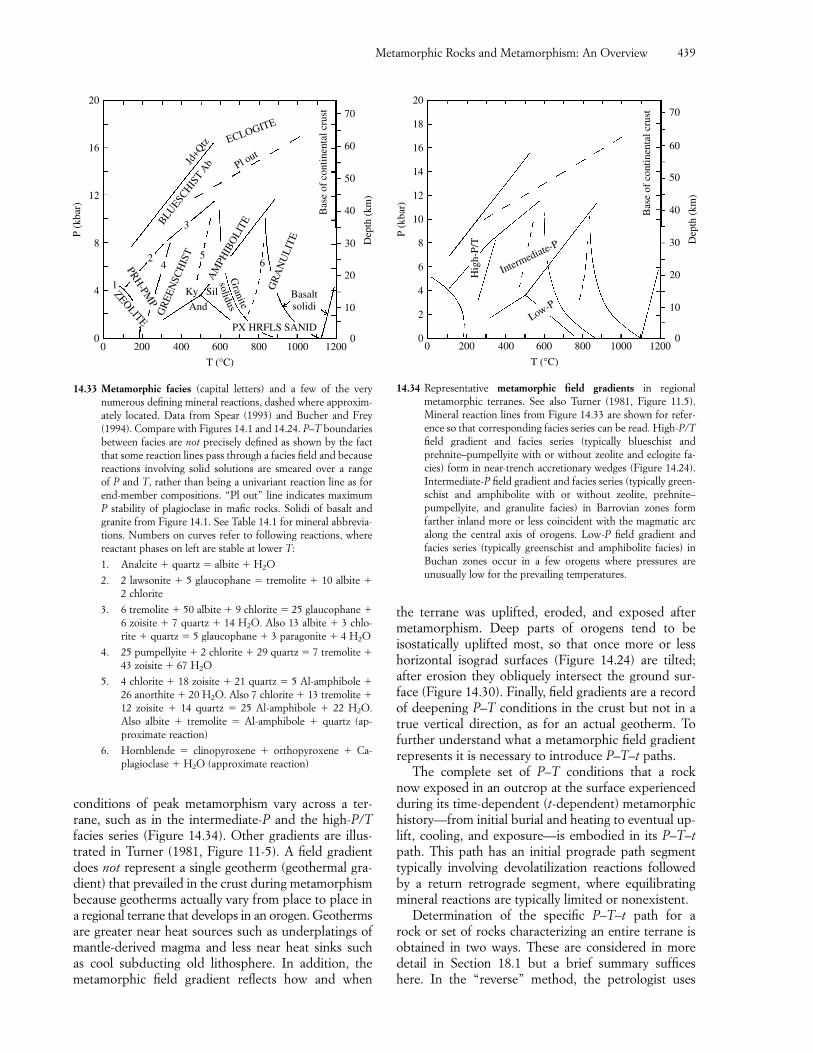
Metamorphic Rocks and Metamorphism: An Overview 439
conditions of peak metamorphism vary across a ter-rane, such as in the intermediate-P and the high-P/Tfacies series (Figure 14.34). Other gradients are illus-trated in Turner (1981, Figure 11-5). A field gradientdoes not represent a single geotherm (geothermal gra-dient) that prevailed in the crust during metamorphismbecause geotherms actually vary from place to place ina regional terrane that develops in an orogen. Geothermsare greater near heat sources such as underplatings ofmantle-derived magma and less near heat sinks such as cool subducting old lithosphere. In addition, themetamorphic field gradient reflects how and when
the terrane was uplifted, eroded, and exposed aftermetamorphism. Deep parts of orogens tend to be isostatically uplifted most, so that once more or lesshorizontal isograd surfaces (Figure 14.24) are tilted; after erosion they obliquely intersect the ground sur-face (Figure 14.30). Finally, field gradients are a recordof deepening P–T conditions in the crust but not in atrue vertical direction, as for an actual geotherm. Tofurther understand what a metamorphic field gradientrepresents it is necessary to introduce P–T–t paths.
The complete set of P–T conditions that a rock now exposed in an outcrop at the surface experiencedduring its time-dependent (t-dependent) metamorphichistory—from initial burial and heating to eventual up-lift, cooling, and exposure—is embodied in its P–T–tpath. This path has an initial prograde path segmenttypically involving devolatilization reactions followedby a return retrograde segment, where equilibratingmineral reactions are typically limited or nonexistent.
Determination of the specific P–T–t path for a rock or set of rocks characterizing an entire terrane isobtained in two ways. These are considered in more detail in Section 18.1 but a brief summary suffices here. In the “reverse” method, the petrologist uses
P (k
bar)
20
16
12
8
4
0
Dep
th (
km)
70
60
50
40
20
10
0 200 400 600
T (°C)
800 1000 1200
30
0
Bas
e of
con
tinen
tal c
rust
ECLOGITE
Pl out
Jd+Q
tz
BLUESC
HIS
T Ab
GR
EE
NSC
HIS
T
3
2
1
45
6PRH-PM
P
ZEOLITE
Ky Sil
And
AM
PHIB
OLI
TE
solidusG
ranite
Basaltsolidi
GR
AN
UL
ITE
PX HRFLS SANID
14.33 Metamorphic facies (capital letters) and a few of the very numerous defining mineral reactions, dashed where approxim-ately located. Data from Spear (1993) and Bucher and Frey(1994). Compare with Figures 14.1 and 14.24. P–T boundariesbetween facies are not precisely defined as shown by the factthat some reaction lines pass through a facies field and becausereactions involving solid solutions are smeared over a range of P and T, rather than being a univariant reaction line as forend-member compositions. “Pl out” line indicates maximumP stability of plagioclase in mafic rocks. Solidi of basalt andgranite from Figure 14.1. See Table 14.1 for mineral abbrevia-tions. Numbers on curves refer to following reactions, wherereactant phases on left are stable at lower T:
1. Analcite � quartz � albite � H2O
2. 2 lawsonite � 5 glaucophane � tremolite � 10 albite �2 chlorite
3. 6 tremolite � 50 albite � 9 chlorite � 25 glaucophane �6 zoisite � 7 quartz � 14 H2O. Also 13 albite � 3 chlo-rite � quartz � 5 glaucophane � 3 paragonite � 4 H2O
4. 25 pumpellyite � 2 chlorite � 29 quartz � 7 tremolite �43 zoisite � 67 H2O
5. 4 chlorite � 18 zoisite � 21 quartz � 5 Al-amphibole �26 anorthite � 20 H2O. Also 7 chlorite � 13 tremolite �12 zoisite � 14 quartz � 25 Al-amphibole � 22 H2O.Also albite � tremolite � Al-amphibole � quartz (ap-proximate reaction)
6. Hornblende � clinopyroxene � orthopyroxene � Ca-plagioclase � H2O (approximate reaction)
P (k
bar)
Dep
th (
km)
20
18
16
14
12
10
8
6
4
2
0
70
50
40
30
Hig
h-P/
T
Intermediate-P
Low-P
Bas
e of
con
tinen
tal c
rust
60
20
10
00 200 400 600 800 1000 1200
T (°C)
14.34 Representative metamorphic field gradients in regional metamorphic terranes. See also Turner (1981, Figure 11.5).Mineral reaction lines from Figure 14.33 are shown for refer-ence so that corresponding facies series can be read. High-P/Tfield gradient and facies series (typically blueschist andprehnite–pumpellyite with or without zeolite and eclogite fa-cies) form in near-trench accretionary wedges (Figure 14.24).Intermediate-P field gradient and facies series (typically green-schist and amphibolite with or without zeolite, prehnite–pumpellyite, and granulite facies) in Barrovian zones form farther inland more or less coincident with the magmatic arcalong the central axis of orogens. Low-P field gradient and facies series (typically greenschist and amphibolite facies) inBuchan zones occur in a few orogens where pressures are unusually low for the prevailing temperatures.
Tabl
e 14
.2.
Min
eral
ass
embl
ages
in th
e co
nven
tiona
lly r
ecog
nize
d m
etam
orph
ic fa
cies
list
ed a
ccor
ding
to m
ajor
che
mic
al g
roup
s of
met
amor
phic
roc
ks
FAC
IES
Zeo
lite
Pre
hnite
–pu
mpe
llyite
Gre
ensc
hist
Am
phib
olite
Gra
nulit
e
Blu
esch
ist
Ecl
ogite
Pyr
oxen
eho
rnfe
ls
Sani
dini
te
Fro
m T
urne
r (1
981)
, Yar
dley
(19
89),
and
Bla
tt a
nd T
racy
(19
96).
Stab
le d
iagn
ostic
min
eral
ass
embl
ages
are
den
oted
by
“�”
in li
stin
g, p
ossi
ble
addi
tiona
l sta
ble
phas
es in
ass
embl
age
by
; oth
erw
ise
the
list o
nly
indi
cate
s lik
ely
min
eral
s. Q
uart
zo-f
elds
path
ic r
ocks
incl
ude
silic
ic m
agm
atic
roc
k pr
otol
iths
as w
ell a
s fe
ldsp
athi
c/lit
hic
sand
ston
es a
nd a
rc-r
elat
ed v
olca
nicl
astic
dep
osits
.*P
lagi
ocla
se is
usu
ally
mor
e ca
lcic
than
abo
ut A
n 24
but a
sta
bly
coex
istin
g al
bite
(A
n �5)
has
als
o be
en r
epor
ted
beca
use
of th
e ex
iste
nce
of a
nar
row
sol
vus
in s
odic
pla
gioc
lase
s.
MA
FIC
RO
CK
S( A
LL
ASS
EM
BL
AG
ES
F E
–TI
OX
IDE
S)
Lau
mon
tite;
heu
land
ite
Pre
hnite
�pu
mpe
llyite
ch
lori
te
albi
te
epid
ote;
act
inol
ite ta
kes
plac
eof
pre
hnite
at h
ighe
r T
; law
soni
te �
albi
te �
chlo
rite
occ
urs
at h
ighe
r P
Alb
ite �
chlo
rite
�ac
tinol
ite �
epid
ote
�tit
anite
qu
artz
w
hite
mic
a
calc
ite; s
tilpn
omel
ane
isw
ides
prea
d at
low
er T
and
biot
ite a
thi
gher
Tw
here
hor
nble
nde
also
occ
urs
Hor
nble
nde
�ol
igoc
lase
*
epid
ote
al
man
dine
-ric
h ga
rnet
tit
anite
bi
otite
ch
lori
te
quar
tz
Pla
gioc
lase
�cl
inop
yrox
ene
�or
thop
yrox
ene
ho
rnbl
ende
ol
ivin
e(l
ow P
); P
lagi
ocla
se �
clin
opyr
oxen
e�
orth
opyr
oxen
e �
garn
et
horn
blen
de (
med
ium
P);
Pla
gioc
lase
�cl
inop
yrox
ene
�ga
rnet
�qu
artz
ho
rnbl
ende
(hi
gh P
)G
lauc
opha
ne �
law
soni
te
arag
onite
ja
deiti
c cl
inop
yrox
ene
ch
lori
te
albi
te
titan
ite
pum
pelly
ite
actin
olite
or
horn
blen
de
stilp
nom
elan
e
epid
ote
ga
rnet
Om
phac
ite �
pyro
pe-r
ich
garn
et
kyan
ite
rutil
e
quar
tz o
r co
esite
Ess
entia
lly a
s gr
anul
ite fa
cies
Nea
r su
bsol
idus
bas
alt a
ssem
blag
e
PEL
ITIC
RO
CK
S(A
LL
ASS
EM
BL
AG
ES
Q
UA
RT
Z
FE–T
IO
XID
ES)
Mix
ed-la
yer
clay
s
Whi
te m
ica/
illite
�ch
lori
te �
albi
te
stilp
nom
elan
e
Mus
covi
te �
chlo
rite
al
bite
pa
rago
nite
gr
aphi
te
rutil
e
mag
netit
e
hem
atite
ca
rbon
ate
ep
idot
e
K-f
elds
par
F
e-T
iox
ides
st
ilpno
mel
ane
(low
Al)
py
roph
yllit
e
chlo
rito
id (
the
latt
er tw
o in
hig
h-A
l roc
ks);
�bi
otite
in th
e bi
otite
zon
e; �
alm
andi
ne-r
ich
garn
et in
the
garn
et z
one
Bio
tite
m
usco
vite
pl
agio
clas
e
alm
andi
ne-
rich
gar
net
cord
ieri
te
alum
inos
ilica
te
chlo
rite
al
kali
feld
spar
m
agne
tite
gr
aphi
te;
�st
auro
lite
in th
e st
auro
lite
zone
; �ky
anite
in th
eky
anite
zon
e; �
silli
man
ite in
the
silli
man
ite z
one
Alk
ali f
elds
par
pl
agio
clas
e
scap
olite
co
rdie
rite
ga
rnet
ru
tile
ilm
enite
m
agne
tite
gr
aphi
te
oliv
ine
co
rund
um
spin
el
kyan
ite (
high
P)
si
llim
anite
(m
oder
ate
P); O
rtho
pyro
xene
�sa
pphi
rine
(hi
gh T
)
Gla
ucop
hane
�la
wso
nite
al
bite
ph
engi
te
pa
rago
nite
ga
rnet
ch
lori
te
epid
ote
ky
anite
ch
lori
toid
tit
anite
Pyr
ope-
rich
gar
net �
carp
holit
e �
phen
gite
�ch
lori
toid
�ch
lori
te �
kyan
ite
coes
iteE
ssen
tially
as
gran
ulite
faci
es b
ut a
ndal
usite
isty
pica
l alu
min
osili
cate
; cor
dier
ite �
biot
ite te
nds
to b
e m
ore
stab
le th
an a
lman
dine
gar
net,
exce
ptw
here
Fe2�
/Mg
is h
igh;
sili
ca d
efici
ent r
ocks
cont
ain
spin
el, c
orun
dum
, and
alk
ali f
elds
par
inlie
u of
an
alum
inos
ilica
teSa
nidi
ne, t
ridy
mite
, cor
dier
ite, m
ullit
e(3
Al 2
O3·
2H2O
), gl
ass,
clin
opyr
oxen
e, s
pine
l,co
rund
um (
in s
ilica
-poo
r ro
cks)
QU
AR
TZ
O-F
EL
DSP
AT
HIC
RO
CK
S(A
LL
ASS
EM
BL
AG
ES
�Q
UA
RT
Z
FE–T
IO
XID
ES)
Heu
land
ite �
anal
cite
and
laum
ontit
e �
albi
te(w
aira
kite
may
occ
ur in
lieu
of h
eula
ndite
; som
ero
cks
cont
ain
chlo
rite
)A
lbite
�ch
lori
te
pum
pelly
ite
preh
nite
st
ilpno
mel
ane
w
hite
mic
a
titan
ite
epid
ote
ca
rbon
ate;
act
inol
ite ta
kes
plac
e of
pre
hnite
at h
ighe
r T
; law
soni
te is
sta
ble
at h
ighe
r P
Alb
ite �
epid
ote
�m
usco
vite
�ch
lori
te
titan
ite
stilp
nom
elan
e
actin
olite
; bio
tite
isst
able
at h
ighe
r T
Pla
gioc
lase
�al
kali
feld
spar
�bi
otite
m
usco
vite
ho
rnbl
ende
Alk
ali f
elds
par
�pl
agio
clas
e �
garn
et
kyan
ite
orth
opyr
oxen
e
clin
opyr
oxen
e
horn
blen
de
mag
netit
e
ilmen
ite
Jade
itic
clin
opyr
oxen
e �
law
soni
te �
mus
covi
te �
chlo
rite
�tit
anite
gl
auco
phan
e
Ess
entia
lly a
s gr
anul
ite fa
cies
Sani
dine
, tri
dym
ite, c
ordi
erite
, gla
ss,
clin
opyr
oxen
e
CA
LC
AR
EO
US
AN
DC
AL
C–S
ILIC
AT
ER
OC
KS
Cal
cite
, dol
omite
, qua
rtz,
talc
, cla
ys
Cal
cite
, pre
hnite
, alb
ite, q
uart
z,ch
lori
te
Cal
cite
, dol
omite
, qua
rtz,
mus
covi
te,
albi
te, K
-fel
dspa
r, ch
lori
te, z
oisi
te
Cal
cite
, dol
omite
, qua
rtz,
dio
psid
e,tr
emol
ite, f
orst
erite
, gro
ssul
ar,
anor
thite
, hor
nble
nde,
clin
ozoi
site
Cal
cite
, dol
omite
, qua
rtz,
dio
psid
e,sc
apol
ite, a
nort
hite
, for
ster
ite,
wol
last
onite
, gra
phite
Ara
goni
te, c
alci
te
Ess
entia
lly a
s gr
anul
ite fa
cies
ve
suvi
anite
w
olla
ston
ite
Ano
rthi
te �
wol
last
onite
di
opsi
dein
sili
ca-r
ich
rock
s; c
alci
te, w
olla
s-to
nite
, mel
ilite
(C
a 2M
gSi 2
O7)
, lar
nite
(Ca 2
SiO
4), m
erw
inite
(C
a 3M
gSi 2
O8)
,m
ontic
ellit
e in
sili
ca-p
oor
rock
s
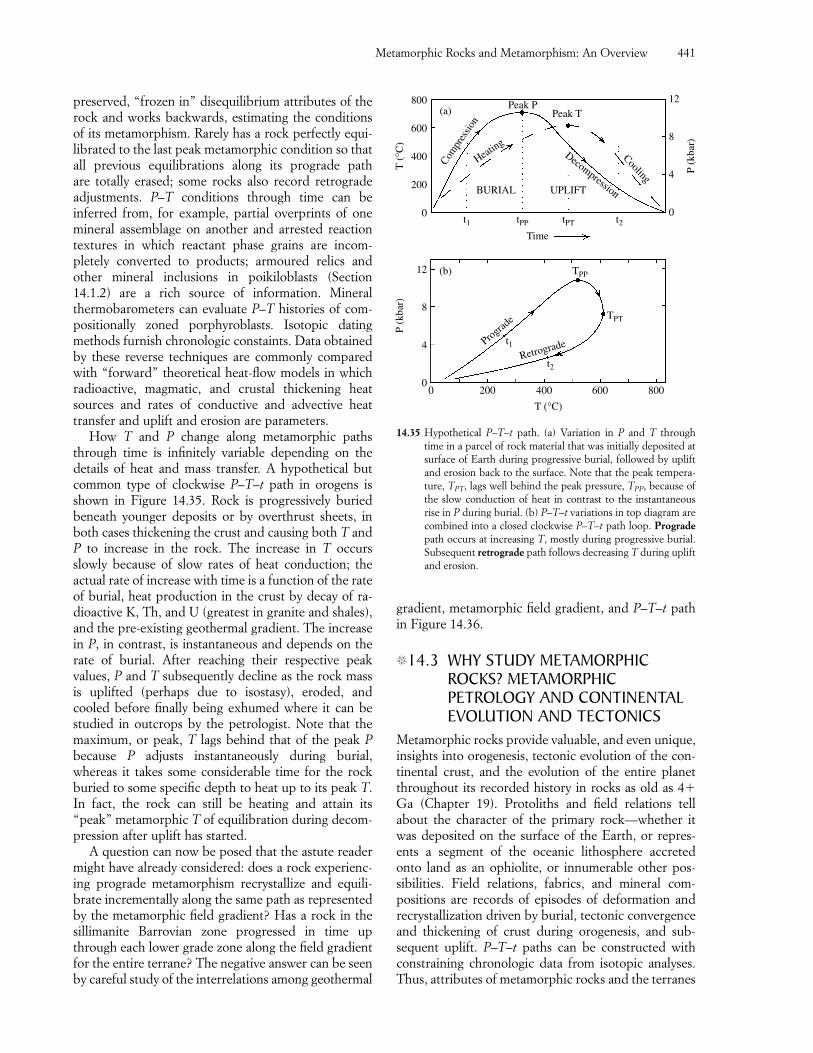
preserved, “frozen in” disequilibrium attributes of therock and works backwards, estimating the conditionsof its metamorphism. Rarely has a rock perfectly equi-librated to the last peak metamorphic condition so thatall previous equilibrations along its prograde path are totally erased; some rocks also record retrogradeadjustments. P–T conditions through time can be inferred from, for example, partial overprints of onemineral assemblage on another and arrested reactiontextures in which reactant phase grains are incom-pletely converted to products; armoured relics andother mineral inclusions in poikiloblasts (Section14.1.2) are a rich source of information. Mineral thermobarometers can evaluate P–T histories of com-positionally zoned porphyroblasts. Isotopic datingmethods furnish chronologic constaints. Data obtainedby these reverse techniques are commonly comparedwith “forward” theoretical heat-flow models in whichradioactive, magmatic, and crustal thickening heatsources and rates of conductive and advective heattransfer and uplift and erosion are parameters.
How T and P change along metamorphic pathsthrough time is infinitely variable depending on the details of heat and mass transfer. A hypothetical butcommon type of clockwise P–T–t path in orogens isshown in Figure 14.35. Rock is progressively buried beneath younger deposits or by overthrust sheets, inboth cases thickening the crust and causing both T andP to increase in the rock. The increase in T occursslowly because of slow rates of heat conduction; the actual rate of increase with time is a function of the rateof burial, heat production in the crust by decay of ra-dioactive K, Th, and U (greatest in granite and shales),and the pre-existing geothermal gradient. The increasein P, in contrast, is instantaneous and depends on therate of burial. After reaching their respective peak values, P and T subsequently decline as the rock massis uplifted (perhaps due to isostasy), eroded, andcooled before finally being exhumed where it can bestudied in outcrops by the petrologist. Note that themaximum, or peak, T lags behind that of the peak Pbecause P adjusts instantaneously during burial,whereas it takes some considerable time for the rockburied to some specific depth to heat up to its peak T.In fact, the rock can still be heating and attain its“peak” metamorphic T of equilibration during decom-pression after uplift has started.
A question can now be posed that the astute readermight have already considered: does a rock experienc-ing prograde metamorphism recrystallize and equili-brate incrementally along the same path as representedby the metamorphic field gradient? Has a rock in thesillimanite Barrovian zone progressed in time upthrough each lower grade zone along the field gradientfor the entire terrane? The negative answer can be seenby careful study of the interrelations among geothermal
Metamorphic Rocks and Metamorphism: An Overview 441
gradient, metamorphic field gradient, and P–T–t pathin Figure 14.36.
�14.3 WHY STUDY METAMORPHICROCKS? METAMORPHICPETROLOGY AND CONTINENTALEVOLUTION AND TECTONICS
Metamorphic rocks provide valuable, and even unique,insights into orogenesis, tectonic evolution of the con-tinental crust, and the evolution of the entire planetthroughout its recorded history in rocks as old as 4�Ga (Chapter 19). Protoliths and field relations tellabout the character of the primary rock—whether itwas deposited on the surface of the Earth, or repres-ents a segment of the oceanic lithosphere accreted onto land as an ophiolite, or innumerable other pos-sibilities. Field relations, fabrics, and mineral com-positions are records of episodes of deformation andrecrystallization driven by burial, tectonic convergenceand thickening of crust during orogenesis, and sub-sequent uplift. P–T–t paths can be constructed withconstraining chronologic data from isotopic analyses.Thus, attributes of metamorphic rocks and the terranes
T (
°C)
P (k
bar)
800
600
400
200
0
P (k
bar)
12
8
4
0
12
8
4
0
400
T (°C)
600 8002000
t1 tPP
TPP
TPT
tPT t2Time
(a)
(b)
Compr
essio
n
Heating
Peak PPeak T
DecompressionUPLIFTBURIALCooling
Prograde
Retrogradet1
t2
14.35 Hypothetical P–T–t path. (a) Variation in P and T throughtime in a parcel of rock material that was initially deposited atsurface of Earth during progressive burial, followed by upliftand erosion back to the surface. Note that the peak tempera-ture, TPT, lags well behind the peak pressure, TPP, because ofthe slow conduction of heat in contrast to the instantaneousrise in P during burial. (b) P–T–t variations in top diagram arecombined into a closed clockwise P–T–t path loop. Progradepath occurs at increasing T, mostly during progressive burial.Subsequent retrograde path follows decreasing T during upliftand erosion.
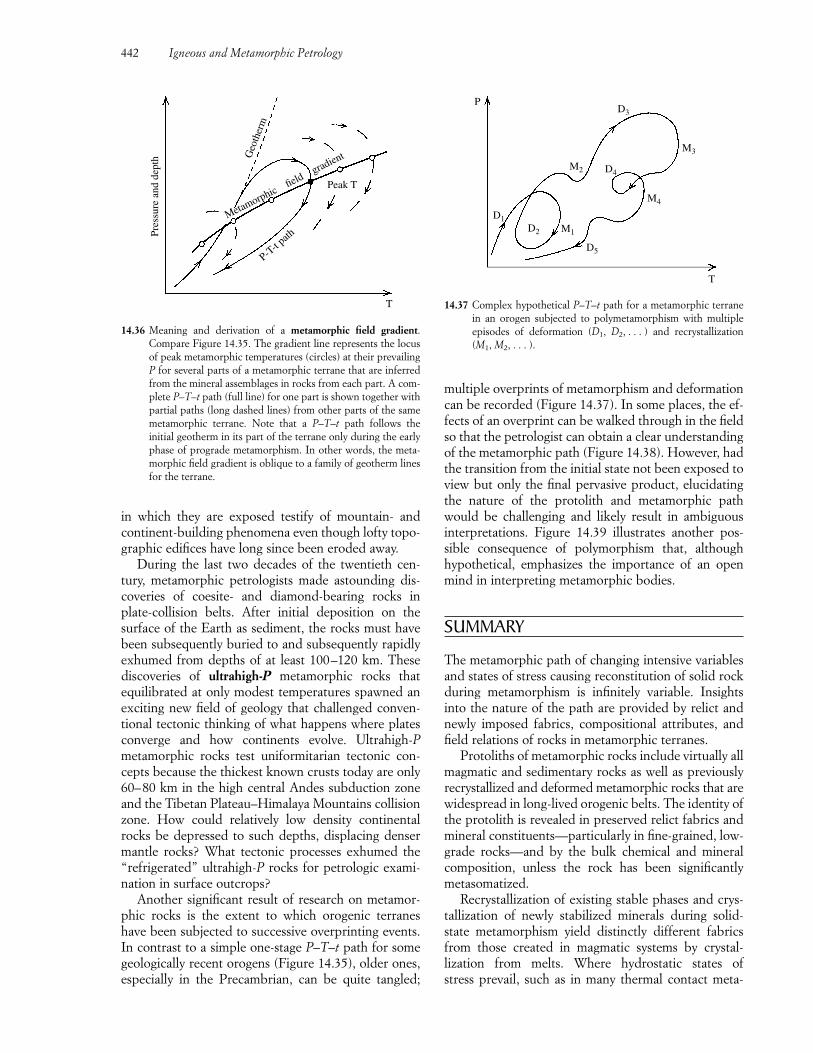
442 Igneous and Metamorphic Petrology
in which they are exposed testify of mountain- andcontinent-building phenomena even though lofty topo-graphic edifices have long since been eroded away.
During the last two decades of the twentieth cen-tury, metamorphic petrologists made astounding dis-coveries of coesite- and diamond-bearing rocks inplate-collision belts. After initial deposition on the surface of the Earth as sediment, the rocks must havebeen subsequently buried to and subsequently rapidlyexhumed from depths of at least 100–120 km. Thesediscoveries of ultrahigh-P metamorphic rocks thatequilibrated at only modest temperatures spawned anexciting new field of geology that challenged conven-tional tectonic thinking of what happens where platesconverge and how continents evolve. Ultrahigh-Pmetamorphic rocks test uniformitarian tectonic con-cepts because the thickest known crusts today are only60–80 km in the high central Andes subduction zoneand the Tibetan Plateau–Himalaya Mountains collisionzone. How could relatively low density continentalrocks be depressed to such depths, displacing densermantle rocks? What tectonic processes exhumed the“refrigerated” ultrahigh-P rocks for petrologic exami-nation in surface outcrops?
Another significant result of research on metamor-phic rocks is the extent to which orogenic terraneshave been subjected to successive overprinting events.In contrast to a simple one-stage P–T–t path for somegeologically recent orogens (Figure 14.35), older ones,especially in the Precambrian, can be quite tangled;
multiple overprints of metamorphism and deformationcan be recorded (Figure 14.37). In some places, the ef-fects of an overprint can be walked through in the fieldso that the petrologist can obtain a clear understandingof the metamorphic path (Figure 14.38). However, hadthe transition from the initial state not been exposed toview but only the final pervasive product, elucidatingthe nature of the protolith and metamorphic pathwould be challenging and likely result in ambiguous interpretations. Figure 14.39 illustrates another pos-sible consequence of polymorphism that, although hypothetical, emphasizes the importance of an openmind in interpreting metamorphic bodies.
SUMMARY
The metamorphic path of changing intensive variablesand states of stress causing reconstitution of solid rockduring metamorphism is infinitely variable. Insightsinto the nature of the path are provided by relict andnewly imposed fabrics, compositional attributes, andfield relations of rocks in metamorphic terranes.
Protoliths of metamorphic rocks include virtually allmagmatic and sedimentary rocks as well as previouslyrecrystallized and deformed metamorphic rocks that arewidespread in long-lived orogenic belts. The identity ofthe protolith is revealed in preserved relict fabrics andmineral constituents—particularly in fine-grained, low-grade rocks—and by the bulk chemical and mineralcomposition, unless the rock has been significantlymetasomatized.
Recrystallization of existing stable phases and crys-tallization of newly stabilized minerals during solid-state metamorphism yield distinctly different fabricsfrom those created in magmatic systems by crystal-lization from melts. Where hydrostatic states of stress prevail, such as in many thermal contact meta-
Pres
sure
and
dep
th
T
Metamorphic field g
radientGeo
ther
m
Peak T
P-T-t
path
14.36 Meaning and derivation of a metamorphic field gradient.Compare Figure 14.35. The gradient line represents the locusof peak metamorphic temperatures (circles) at their prevailingP for several parts of a metamorphic terrane that are inferredfrom the mineral assemblages in rocks from each part. A com-plete P–T–t path (full line) for one part is shown together withpartial paths (long dashed lines) from other parts of the samemetamorphic terrane. Note that a P–T–t path follows the initial geotherm in its part of the terrane only during the earlyphase of prograde metamorphism. In other words, the meta-morphic field gradient is oblique to a family of geotherm linesfor the terrane.
P
T
D1D2 M1
D5
M4
D4
M3
D3
M2
14.37 Complex hypothetical P–T–t path for a metamorphic terranein an orogen subjected to polymetamorphism with multipleepisodes of deformation (D1, D2, . . . ) and recrystallization(M1, M2, . . . ).
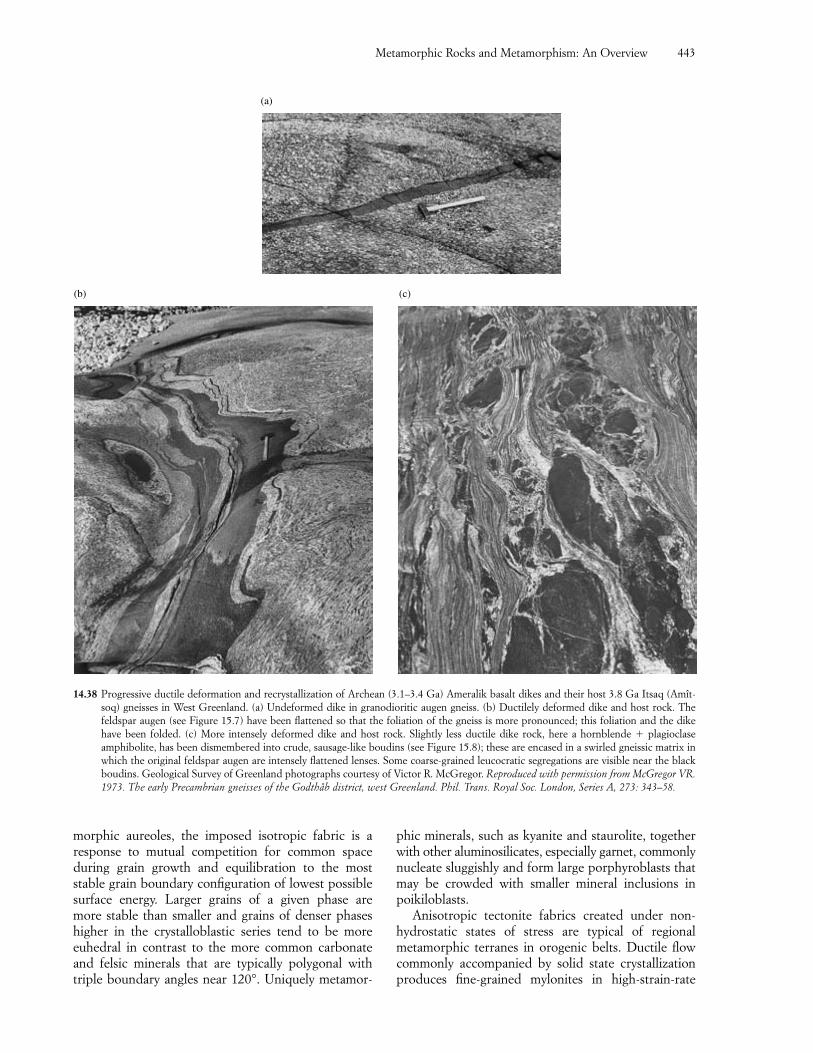
Metamorphic Rocks and Metamorphism: An Overview 443
phic minerals, such as kyanite and staurolite, togetherwith other aluminosilicates, especially garnet, commonlynucleate sluggishly and form large porphyroblasts thatmay be crowded with smaller mineral inclusions inpoikiloblasts.
Anisotropic tectonite fabrics created under non-hydrostatic states of stress are typical of regional metamorphic terranes in orogenic belts. Ductile flow commonly accompanied by solid state crystallizationproduces fine-grained mylonites in high-strain-rate
(a)
(b) (c)
14.38 Progressive ductile deformation and recrystallization of Archean (3.1–3.4 Ga) Ameralik basalt dikes and their host 3.8 Ga Itsaq (Amît-soq) gneisses in West Greenland. (a) Undeformed dike in granodioritic augen gneiss. (b) Ductilely deformed dike and host rock. Thefeldspar augen (see Figure 15.7) have been flattened so that the foliation of the gneiss is more pronounced; this foliation and the dikehave been folded. (c) More intensely deformed dike and host rock. Slightly less ductile dike rock, here a hornblende � plagioclase amphibolite, has been dismembered into crude, sausage-like boudins (see Figure 15.8); these are encased in a swirled gneissic matrix inwhich the original feldspar augen are intensely flattened lenses. Some coarse-grained leucocratic segregations are visible near the blackboudins. Geological Survey of Greenland photographs courtesy of Victor R. McGregor. Reproduced with permission from McGregor VR.1973. The early Precambrian gneisses of the Godthåb district, west Greenland. Phil. Trans. Royal Soc. London, Series A, 273: 343–58.
morphic aureoles, the imposed isotropic fabric is a response to mutual competition for common spaceduring grain growth and equilibration to the most stable grain boundary configuration of lowest possiblesurface energy. Larger grains of a given phase are more stable than smaller and grains of denser phaseshigher in the crystalloblastic series tend to be more euhedral in contrast to the more common carbonateand felsic minerals that are typically polygonal withtriple boundary angles near 120°. Uniquely metamor-
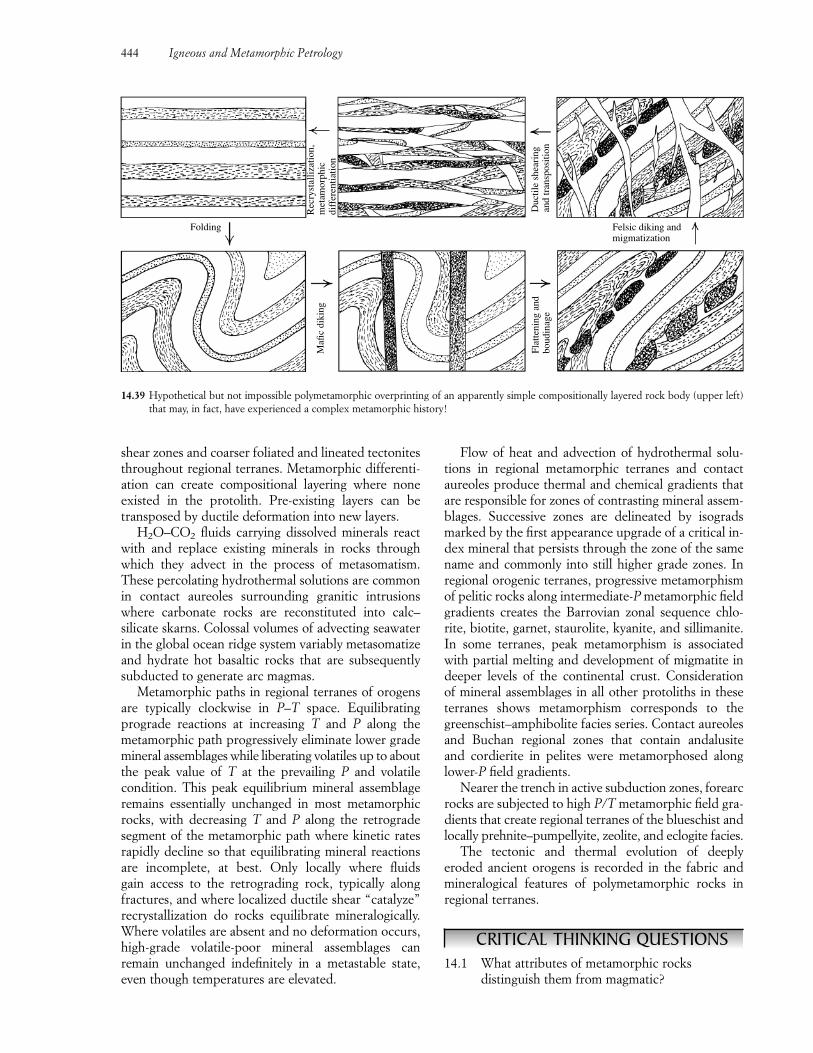
444 Igneous and Metamorphic Petrology
Flow of heat and advection of hydrothermal solu-tions in regional metamorphic terranes and contact aureoles produce thermal and chemical gradients thatare responsible for zones of contrasting mineral assem-blages. Successive zones are delineated by isogradsmarked by the first appearance upgrade of a critical in-dex mineral that persists through the zone of the samename and commonly into still higher grade zones. Inregional orogenic terranes, progressive metamorphismof pelitic rocks along intermediate-P metamorphic fieldgradients creates the Barrovian zonal sequence chlo-rite, biotite, garnet, staurolite, kyanite, and sillimanite.In some terranes, peak metamorphism is associatedwith partial melting and development of migmatite indeeper levels of the continental crust. Consideration of mineral assemblages in all other protoliths in theseterranes shows metamorphism corresponds to thegreenschist–amphibolite facies series. Contact aureolesand Buchan regional zones that contain andalusite and cordierite in pelites were metamorphosed alonglower-P field gradients.
Nearer the trench in active subduction zones, forearcrocks are subjected to high P/T metamorphic field gra-dients that create regional terranes of the blueschist andlocally prehnite–pumpellyite, zeolite, and eclogite facies.
The tectonic and thermal evolution of deeplyeroded ancient orogens is recorded in the fabric andmineralogical features of polymetamorphic rocks in regional terranes.
CRITICAL THINKING QUESTIONS14.1 What attributes of metamorphic rocks
distinguish them from magmatic?
shear zones and coarser foliated and lineated tectonitesthroughout regional terranes. Metamorphic differenti-ation can create compositional layering where none existed in the protolith. Pre-existing layers can betransposed by ductile deformation into new layers.
H2O–CO2 fluids carrying dissolved minerals reactwith and replace existing minerals in rocks throughwhich they advect in the process of metasomatism.These percolating hydrothermal solutions are commonin contact aureoles surrounding granitic intrusionswhere carbonate rocks are reconstituted into calc–silicate skarns. Colossal volumes of advecting seawaterin the global ocean ridge system variably metasomatizeand hydrate hot basaltic rocks that are subsequentlysubducted to generate arc magmas.
Metamorphic paths in regional terranes of orogensare typically clockwise in P–T space. Equilibrating prograde reactions at increasing T and P along themetamorphic path progressively eliminate lower grademineral assemblages while liberating volatiles up to aboutthe peak value of T at the prevailing P and volatile condition. This peak equilibrium mineral assemblageremains essentially unchanged in most metamorphicrocks, with decreasing T and P along the retrogradesegment of the metamorphic path where kinetic ratesrapidly decline so that equilibrating mineral reactionsare incomplete, at best. Only locally where fluids gain access to the retrograding rock, typically alongfractures, and where localized ductile shear “catalyze” recrystallization do rocks equilibrate mineralogically.Where volatiles are absent and no deformation occurs,high-grade volatile-poor mineral assemblages can remain unchanged indefinitely in a metastable state,even though temperatures are elevated.
14.39 Hypothetical but not impossible polymetamorphic overprinting of an apparently simple compositionally layered rock body (upper left)that may, in fact, have experienced a complex metamorphic history!
Folding Felsic diking andmigmatization
Mafi
c di
king
Rec
ryst
alliz
atio
n,m
etam
orph
icdi
ffer
entia
tion
Flat
teni
ng a
ndbo
udin
age
Duc
tile
shea
ring
and
tran
spos
ition
14.2 Contrast the factors controlling grain size inmetamorphic and magmatic rocks. Grainshape.
14.3 Metamorphism of a shale, a graywacke, or abasalt yields rocks of varied mineral composi-tion depending on the metamorphic grade. Incontrast, different grades of metamorphism of a pure limestone or of a pure quartz sandstone yield only marble and quartzite, respectively. Why?
14.4 Is the meta-andesite in Figure 14.3b a result of prograde or retrograde metamorphism? Discuss.
14.5 Discuss the different ways that compositionallayering can originate in metamorphic bodies.
14.6 How would you distinguish between a relictplagioclase phenocryst in a metamorphosedgranodiorite, a plagioclase porphyroclast in amylonite, and a plagioclase porphyroblast in agranoblastic rock?
14.7 Why are migmatites not found in metamorphicterranes formed near the trench in subduction zones (high-P/T facies series)?
14.8 What evidence might be found in a single handsample for prograde metamorphism? For retro-grade metamorphism? Cite examples.
14.9 Cite mineralogical evidence that the rock inFigure 14.6d is higher grade than in Figure14.6c and that it is higher grade than in Figure 14.6b?
14.10 Why is there no single metamorphic field gradient for all metamorphic terranes?
14.11 Cite three examples of polymetamorphismfrom the illustrations of metamorphic rocks inthis chapter.
14.12 What factors govern the width of a contactmetamorphic aureole at a particular level oferosion?
14.13 If a metasomatic rock has no relict fabric, how can the nature of the original rock be determined?
14.14 The glacier in Figure 14.11b has the appear-ance of a metamorphic tectonite yet the ice ona microscopic scale in Figure 14.11a does not.Why?
14.15 Contrast the concepts of metamorphic faciesand metamorphic zones.
14.16 Where would rocks of the sanidinite facies beexpected to form?
14.17 Propose reasons why protoliths of sedimentaryevaporites, mostly gypsum and halite, and ofhighly alkaline rocks, such as kimberlites, areessentially nonexistent in metamorphic terranes.
14.18 Why are anisotropic fabrics more common inmetamorphic rocks than magmatic?
14.19 Discuss the nature of the metamorphic differ-entiation (differential movement of ions) in thegrowth of the garnet porphyroblasts in the rockshown in Figure 14.8. Are any assumptionsnecessary?
14.20 The lowest grade rocks in terranes of inter-mediate facies series are typically of the greenschist facies, rather than the zeolite andprehnite–pumpellyite facies as in near trenchterranes. Propose two reasons why this mightbe the case.
14.21 From Table 14.2, track critical changes in diagnostic mineral assemblages in intermediatefacies series in the most common magmatic and sedimentary protoliths. Track changes inmetabasites in the high-P/T facies series.
14.22 Contrast the fabrics of cataclastic, mylonitic,and granoblastic rocks. Describe grain size andshape, preferred dimensional orientation ofgrains, and presence and character of frag-ments. What are the contrasting processes andconditions of production of these fabrics?
PROBLEMS14.1 How much linear strain (Equation 8.2) is
represented in a deformed cobble from the Raft River Mountains metaconglomerate (Figure 14.13) that is 4 cm thick (c, the mini-mum axis), 12 cm wide (b, the intermediateaxis), and 120 cm long (a, the maximum axis)?What two assumptions must be made to answerthis question? Hint: the volume of an ellipsoid is�abc/6.
14.2 A skarn is composed of the equilibrium mineralassemblage pyrite � garnet � diopside � calcite.Sketch mutual grain shapes in the aggregate,making sure that each phase contacts everyother phase somewhere.
14.3 Make the simplistic assumption that Barrovianisograds in northern Scotland correspond to paleo-isothermal surfaces that intersect the present erosion surface. Sketch a cross-sectionfrom Glasgow on the south to the northeast end of the exposed Great Glen Fault showinghow postmetamorphic uplift and erosion of the Caledonide Orogen could have created thepresent configuration of the isograds in Fig-ure 14.30.
14.4 Write balanced stoichimetric equations showingthe chemical equivalence of Orijärvi and Oslomineral assemblages listed in Section 14.2.7.
Metamorphic Rocks and Metamorphism: An Overview 445

14.6 It is usually believed that the sillimanite zone isof higher grade than the kyanite zone in Bar-rovian terranes. In a P–T diagram based on the stability fields of these two Al2SiO5 polymorphs(Figure 14.31), show how a orogenic clockwiseP–T–t path could make kyanite a retrogradeproduct.
446 Igneous and Metamorphic Petrology
14.5 On photocopies of Figures 14.1, 14.33, and14.34 draw lines representing 10, 50, and100°C/km geotherms. Relate these reference geotherms to facies series and explain them in terms of the geologic environments of metamorphism.
FUNDAMENTAL QUESTIONSCONSIDERED IN THIS CHAPTER
1. What specific fabrics are found in metamorphicrocks?
2. How are metamorphic rocks classified?
3. What are the attributes of the major types ofmetamorphic rocks?
4. What graphical devices are available to representthe stable mineral assemblage of a rock relative toits bulk chemical composition?
INTRODUCTION
It will come as welcome news that the descriptive petro-graphic terminology of metamorphic rocks is simplerthan that of magmatic rocks. Fewer basic fabrics arerecognized and named and classification is much sim-pler. Although the chemical compositions of metamor-phic rocks range over a broad spectrum of magmatic,sedimentary, and metasomatic protoliths, some chem-ical groups are lacking or, at least, very rare; these include sedimentary evaporites, such as gypsum andhalite, and highly alkaline magmatic rocks, such as kamafugites and kimberlites. The intricate chemicalclassification of magmatic rocks has no counterpart inmetamorphic classifications. Thus, widespread tholeiiticand alkaline basalts as well as less common basanite,
nephelinite, hawaiite, and so on that are narrowlydefined on the basis of silica and alkali contents can all,upon metamorphism, be composed essentially of thesame simple assemblage of plagioclase � hornblende inthe rock type called amphibolite. The chemical variationsin these several mafic protoliths are accommodated andconcealed by the extensive solid solution in the twoconstituent minerals. Metamorphic rock classificationis both simple and flexible. To a relatively few basicnames can be appended descriptive modifiers that fea-ture particular rock properties or mode of origin.
This chapter is a petrographic catalog. It dealsmostly with the descriptive aspects of metamorphicrocks based on observations of outcrops, hand sam-ples, and thin sections viewed under the microscope. Itis designed to be used as an adjunct to study of rocksin the field and laboratory.
Careful observation and documentation of petro-graphic attributes is always a fundamental step inpetrologic investigations as they provide a lasting foun-dation for subsequent interpretations, some of whichare presented in following chapters. Interpretationsmay be modified or abandoned as new observations,paradigms, and methods of study emerge in the courseof time, but accurately documented petrographic attrib-utes do not change.
�15.1 METAMORPHIC FABRICSRelict fabrics preserved in low-grade rocks that haveexperienced limited recrystallization can be described
Petrography ofMetamorphicRocks: Fabric,Composition, andClassification
15CHAPTER
in terms of the protolith fabric, such as the relict por-phyritic texture in a meta-andesite (Figure 14.3).
Although the imposed fabric of metamorphic rockscreated under subsolidus conditions shares some sim-ilarities with the fabric of magmatic rocks, there are distinct differences. Metamorphic rocks are aphaniticand phaneritic like magmatic rocks; they are neverglassy because metamorphic systems, by definition,never contain a melt that can quench to glass. Nor doconfined metamorphic rock systems in the deep crusthave a separate expanding volatile fluid phase that isinvolved in volcanic systems. Where present, a fluid is limited to intergranular spaces and local fractures.There are only a limited number of ways by which basic grain shapes can be stably arrayed in a recrystal-lizing solid. Subsolidus equilibration of grain shapes inmetamorphic aggregates tends to converge toward afew basic patterns and mutual relations, thus yieldingfewer fabrics than are created in crystallizing magmas.
Despite these simplifying factors, whose expressionis obvious in many isotropic fabrics (Section 14.1.2),complex interactions between solid state recrystalliza-tion and ductile deformation that results from imposednonhydrostatic stresses are widespread in metamor-phic systems. These interactions are expressed in thepenetrative anisotropic fabrics of tectonites that typifyregional terranes in orogens. Tectonites commonlyevolve through multiple overprints of deformation andrecrystallization during polymetamorphism. Complextectonite fabrics are, at once, both beautiful to beholdand challenging to unravel and interpret. This com-pound attribute has resulted in a number of richly illustrated compendia with interpretive discussions;these include Weiss (1972), Borradaile et al. (1982), Fry(1984), Barker (1990), Yardley et al. (1990), Twiss andMoores (1992, Chapter 13), Passchier and Trouw(1996), and Snoke et al. (1998).
15.1.1 Anisotropic Fabrics of TectonitesThe penetrative aspect of tectonite fabrics implies particular properties are present throughout every part of the rock body. In the ideal case of a uniform, or homogeneous, deformation, properties observableon the microscopic scale integrate and build into theincreasing larger scale attributes possessing similarform and geometry that can be seen in hand samples,outcrops, and even entire terranes (Figure 14.14). Thisfractal-like character of tectonites means that there can be little real distinction between the endeavors ofthe structural geologist and the metamorphic petrolo-gist investigating tectonite fabrics; they can, in fact, bequite complementary.
It must be pointed out, however, that many meta-morphic bodies have been inhomogeneously deformedbecause of heterogeneities in rheologic response in different parts (Figure 14.38). In addition, overprinted
processes, such as localized high-strain-rate shear inmylonite zones and partial melting, can also create heterogeneous fabric on the outcrop scale (see Figure15.5).
Imposed penetrative tectonite fabrics can be ex-pressed in many different ways. Some depend on di-mensional aspects of individual mineral grains in therock aggregate. Thus, platy phyllosilicate and graphitegrains may have a preferred orientation so that theirlongest dimensions are more or less parallel in a rock;the fabric is a planar foliation. In other rocks, columnaror needle-like amphibole grains may have a preferredorientation so that their one longest dimension is moreor less parallel in a rock; the fabric is a lineation. Felsicand carbonate mineral grains that are ordinarily equantmay be flattened or elongate in some rocks so as to ex-press a foliation or lineation or both. Other anisotropicfabrics depend on compositional layering and inequantaggregates of minerals; still others on structures, suchas folds. In some tectonites, the anisotropy is a crypticpreferred orientation of crystal lattices in the mineralgrains that is not visible to the unaided eye. For ex-ample, the c-axes of quartz grains in a mylonite can beuniformly oriented at a large angle to the foliation.
The most common anisotropic fabric is foliation,sometimes designated as an S-surface from the Germanword Schiefer, meaning schist. Multiple foliations in arock may be desigated, from oldest to youngest, as S1,S2, S3, and so on. A tectonite that possesses one or morefoliations is said to be an S-tectonite. Rarely are tec-tonites only lineated; one such L-tectonite would be anonfoliated rock that contains subparallel columnaramphiboles. Many S-tectonites also have a penetrativelineation that is visible on or within foliation surfaces;such rocks are L–S-tectonites. It should be remem-bered that line traces of a foliation exposed on randomoblique surfaces do not constitute a true lineation (Figure 14.12).
In tectonites, there is never a perfect preferred orientation of inequant grains, aggregates of grains, orlattices of grains that define the anisotropic fabric. Not every one of the columnar amphiboles in the L-tectonite just cited is exactly parallel. The degree to which the preferred orientation is developed variesbetween the ideal end-member extremes of perfectlyoriented (never attained in nature) and random(isotropic).
Under the same metamorphic conditions (non-hydrostatic state of stress, P, and T), the character of anisotropy in a rock depends on its mineralogicaland modal composition. Understandably, abundantoriented platy micas and chlorites in low-grade pelitescreate a strong foliation so that the rock readily splitsinto parallel plates or slabs when struck by a hammer.This physically or mechanically significant foliation inaphanitic rocks has been utilized for centuries in the
448 Igneous and Metamorphic Petrology
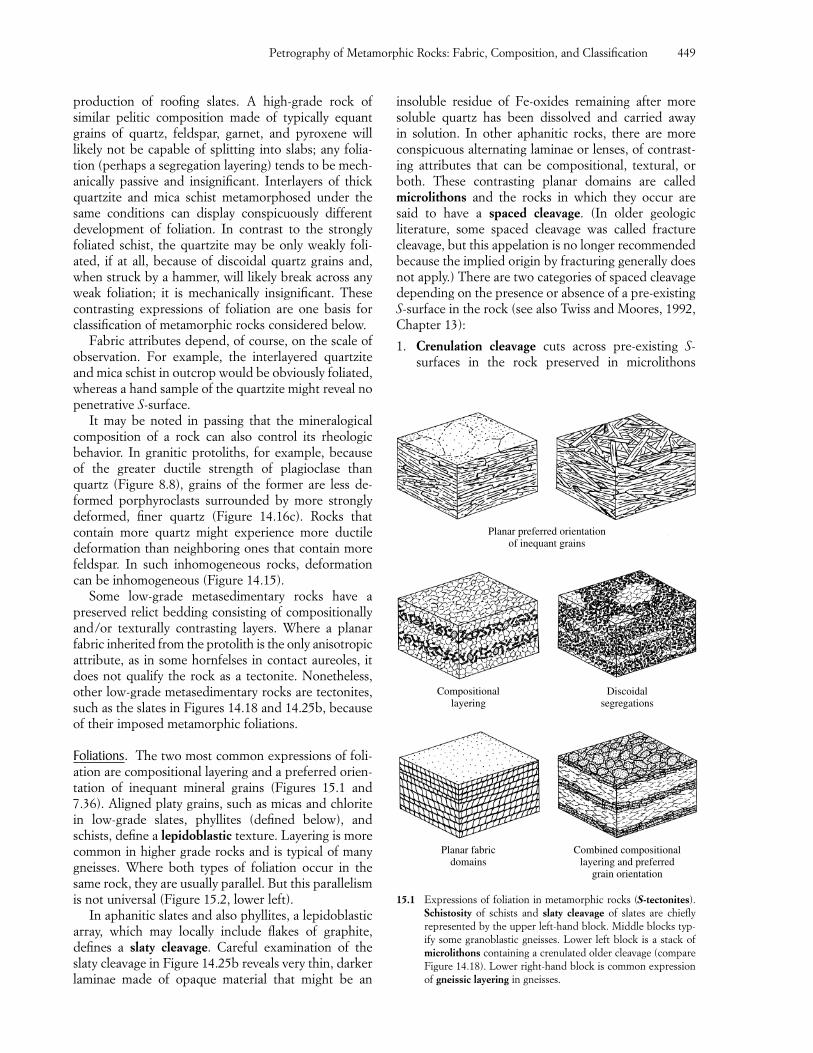
production of roofing slates. A high-grade rock of similar pelitic composition made of typically equantgrains of quartz, feldspar, garnet, and pyroxene willlikely not be capable of splitting into slabs; any folia-tion (perhaps a segregation layering) tends to be mech-anically passive and insignificant. Interlayers of thickquartzite and mica schist metamorphosed under thesame conditions can display conspicuously differentdevelopment of foliation. In contrast to the strongly foliated schist, the quartzite may be only weakly foli-ated, if at all, because of discoidal quartz grains and,when struck by a hammer, will likely break across anyweak foliation; it is mechanically insignificant. Thesecontrasting expressions of foliation are one basis forclassification of metamorphic rocks considered below.
Fabric attributes depend, of course, on the scale ofobservation. For example, the interlayered quartziteand mica schist in outcrop would be obviously foliated,whereas a hand sample of the quartzite might reveal nopenetrative S-surface.
It may be noted in passing that the mineralogicalcomposition of a rock can also control its rheologic behavior. In granitic protoliths, for example, becauseof the greater ductile strength of plagioclase thanquartz (Figure 8.8), grains of the former are less de-formed porphyroclasts surrounded by more stronglydeformed, finer quartz (Figure 14.16c). Rocks that contain more quartz might experience more ductile deformation than neighboring ones that contain morefeldspar. In such inhomogeneous rocks, deformationcan be inhomogeneous (Figure 14.15).
Some low-grade metasedimentary rocks have a preserved relict bedding consisting of compositionallyand/or texturally contrasting layers. Where a planarfabric inherited from the protolith is the only anisotropicattribute, as in some hornfelses in contact aureoles, itdoes not qualify the rock as a tectonite. Nonetheless,other low-grade metasedimentary rocks are tectonites,such as the slates in Figures 14.18 and 14.25b, becauseof their imposed metamorphic foliations.
Foliations. The two most common expressions of foli-ation are compositional layering and a preferred orien-tation of inequant mineral grains (Figures 15.1 and7.36). Aligned platy grains, such as micas and chloritein low-grade slates, phyllites (defined below), andschists, define a lepidoblastic texture. Layering is morecommon in higher grade rocks and is typical of manygneisses. Where both types of foliation occur in thesame rock, they are usually parallel. But this parallelismis not universal (Figure 15.2, lower left).
In aphanitic slates and also phyllites, a lepidoblasticarray, which may locally include flakes of graphite,defines a slaty cleavage. Careful examination of theslaty cleavage in Figure 14.25b reveals very thin, darkerlaminae made of opaque material that might be an
insoluble residue of Fe-oxides remaining after moresoluble quartz has been dissolved and carried away in solution. In other aphanitic rocks, there are moreconspicuous alternating laminae or lenses, of contrast-ing attributes that can be compositional, textural, orboth. These contrasting planar domains are called microlithons and the rocks in which they occur are said to have a spaced cleavage. (In older geologic literature, some spaced cleavage was called fracturecleavage, but this appelation is no longer recommendedbecause the implied origin by fracturing generally doesnot apply.) There are two categories of spaced cleavagedepending on the presence or absence of a pre-existingS-surface in the rock (see also Twiss and Moores, 1992,Chapter 13):
1. Crenulation cleavage cuts across pre-existing S-surfaces in the rock preserved in microlithons
Petrography of Metamorphic Rocks: Fabric, Composition, and Classification 449
Planar preferred orientationof inequant grains
Compositionallayering
Discoidalsegregations
Planar fabricdomains
Combined compositionallayering and preferred
grain orientation
15.1 Expressions of foliation in metamorphic rocks (S-tectonites).Schistosity of schists and slaty cleavage of slates are chieflyrepresented by the upper left-hand block. Middle blocks typ-ify some granoblastic gneisses. Lower left block is a stack ofmicrolithons containing a crenulated older cleavage (compareFigure 14.18). Lower right-hand block is common expressionof gneissic layering in gneisses.
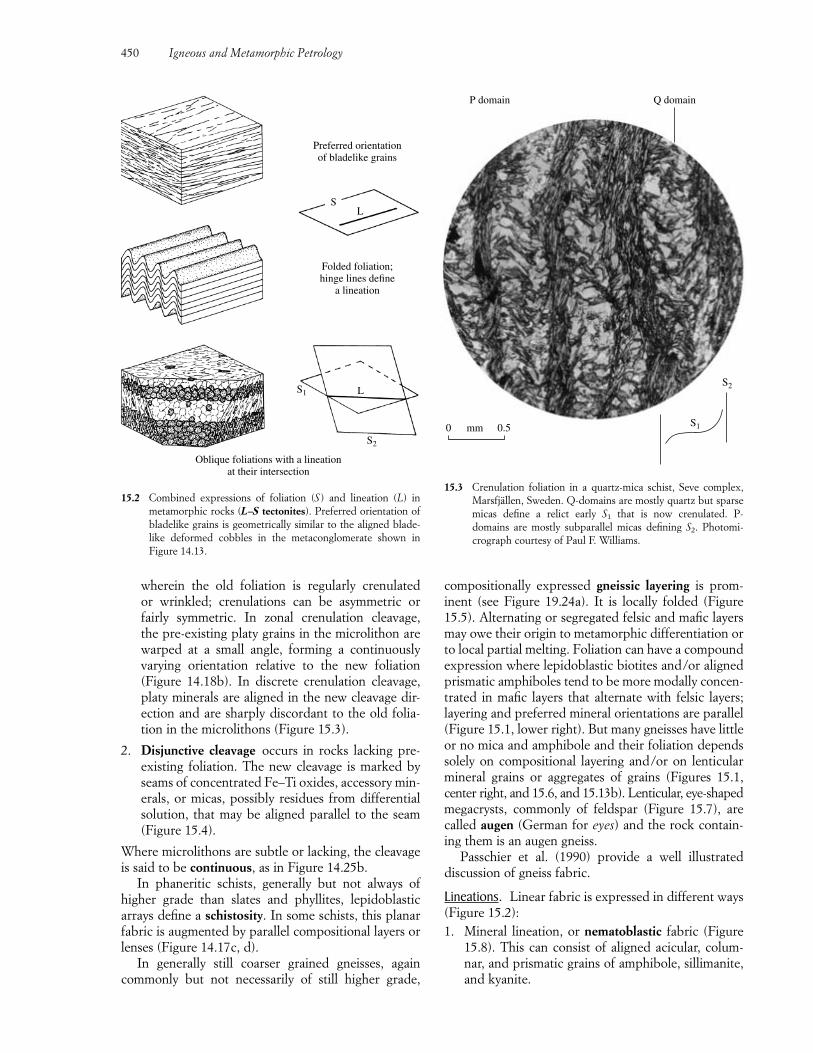
wherein the old foliation is regularly crenulated or wrinkled; crenulations can be asymmetric orfairly symmetric. In zonal crenulation cleavage, the pre-existing platy grains in the microlithon arewarped at a small angle, forming a continuouslyvarying orientation relative to the new foliation(Figure 14.18b). In discrete crenulation cleavage,platy minerals are aligned in the new cleavage dir-ection and are sharply discordant to the old folia-tion in the microlithons (Figure 15.3).
2. Disjunctive cleavage occurs in rocks lacking pre-existing foliation. The new cleavage is marked byseams of concentrated Fe–Ti oxides, accessory min-erals, or micas, possibly residues from differentialsolution, that may be aligned parallel to the seam(Figure 15.4).
Where microlithons are subtle or lacking, the cleavageis said to be continuous, as in Figure 14.25b.
In phaneritic schists, generally but not always ofhigher grade than slates and phyllites, lepidoblastic arrays define a schistosity. In some schists, this planarfabric is augmented by parallel compositional layers orlenses (Figure 14.17c, d).
In generally still coarser grained gneisses, againcommonly but not necessarily of still higher grade,
compositionally expressed gneissic layering is prom-inent (see Figure 19.24a). It is locally folded (Figure15.5). Alternating or segregated felsic and mafic layersmay owe their origin to metamorphic differentiation orto local partial melting. Foliation can have a compoundexpression where lepidoblastic biotites and/or alignedprismatic amphiboles tend to be more modally concen-trated in mafic layers that alternate with felsic layers;layering and preferred mineral orientations are parallel(Figure 15.1, lower right). But many gneisses have littleor no mica and amphibole and their foliation dependssolely on compositional layering and/or on lenticularmineral grains or aggregates of grains (Figures 15.1,center right, and 15.6, and 15.13b). Lenticular, eye-shapedmegacrysts, commonly of feldspar (Figure 15.7), arecalled augen (German for eyes) and the rock contain-ing them is an augen gneiss.
Passchier et al. (1990) provide a well illustrated discussion of gneiss fabric.
Lineations. Linear fabric is expressed in different ways(Figure 15.2):1. Mineral lineation, or nematoblastic fabric (Figure
15.8). This can consist of aligned acicular, colum-nar, and prismatic grains of amphibole, sillimanite,and kyanite.
450 Igneous and Metamorphic Petrology
Preferred orientationof bladelike grains
Folded foliation;hinge lines define
a lineation
SL
L
S2
S1
Oblique foliations with a lineationat their intersection
15.2 Combined expressions of foliation (S ) and lineation (L) inmetamorphic rocks (L–S tectonites). Preferred orientation ofbladelike grains is geometrically similar to the aligned blade-like deformed cobbles in the metaconglomerate shown in Figure 14.13.
P domain Q domain
S2
S10 0.5mm
15.3 Crenulation foliation in a quartz-mica schist, Seve complex,Marsfjällen, Sweden. Q-domains are mostly quartz but sparsemicas define a relict early S1 that is now crenulated. P-domains are mostly subparallel micas defining S2. Photomi-crograph courtesy of Paul F. Williams.
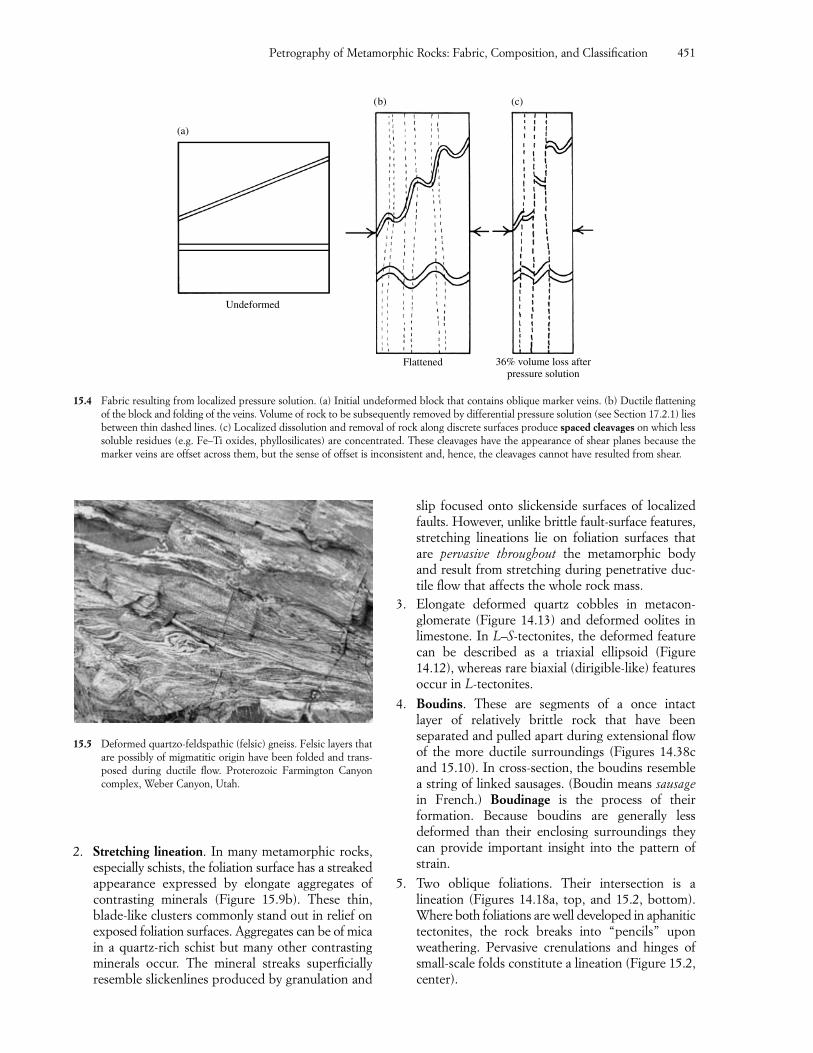
2. Stretching lineation. In many metamorphic rocks,especially schists, the foliation surface has a streakedappearance expressed by elongate aggregates ofcontrasting minerals (Figure 15.9b). These thin,blade-like clusters commonly stand out in relief onexposed foliation surfaces. Aggregates can be of micain a quartz-rich schist but many other contrastingminerals occur. The mineral streaks superficially resemble slickenlines produced by granulation and
slip focused onto slickenside surfaces of localizedfaults. However, unlike brittle fault-surface features,stretching lineations lie on foliation surfaces thatare pervasive throughout the metamorphic bodyand result from stretching during penetrative duc-tile flow that affects the whole rock mass.
3. Elongate deformed quartz cobbles in metacon-glomerate (Figure 14.13) and deformed oolites inlimestone. In L–S-tectonites, the deformed featurecan be described as a triaxial ellipsoid (Figure14.12), whereas rare biaxial (dirigible-like) featuresoccur in L-tectonites.
4. Boudins. These are segments of a once intact layer of relatively brittle rock that have been separated and pulled apart during extensional flowof the more ductile surroundings (Figures 14.38cand 15.10). In cross-section, the boudins resemblea string of linked sausages. (Boudin means sausagein French.) Boudinage is the process of their formation. Because boudins are generally less deformed than their enclosing surroundings they can provide important insight into the pattern ofstrain.
5. Two oblique foliations. Their intersection is a lineation (Figures 14.18a, top, and 15.2, bottom).Where both foliations are well developed in aphanitictectonites, the rock breaks into “pencils” uponweathering. Pervasive crenulations and hinges ofsmall-scale folds constitute a lineation (Figure 15.2,center).
Petrography of Metamorphic Rocks: Fabric, Composition, and Classification 451
36% volume loss afterpressure solution
Flattened
Undeformed
(a)
(b) (c)
15.4 Fabric resulting from localized pressure solution. (a) Initial undeformed block that contains oblique marker veins. (b) Ductile flatteningof the block and folding of the veins. Volume of rock to be subsequently removed by differential pressure solution (see Section 17.2.1) liesbetween thin dashed lines. (c) Localized dissolution and removal of rock along discrete surfaces produce spaced cleavages on which lesssoluble residues (e.g. Fe–Ti oxides, phyllosilicates) are concentrated. These cleavages have the appearance of shear planes because themarker veins are offset across them, but the sense of offset is inconsistent and, hence, the cleavages cannot have resulted from shear.
15.5 Deformed quartzo-feldspathic (felsic) gneiss. Felsic layers thatare possibly of migmatitic origin have been folded and trans-posed during ductile flow. Proterozoic Farmington Canyoncomplex, Weber Canyon, Utah.
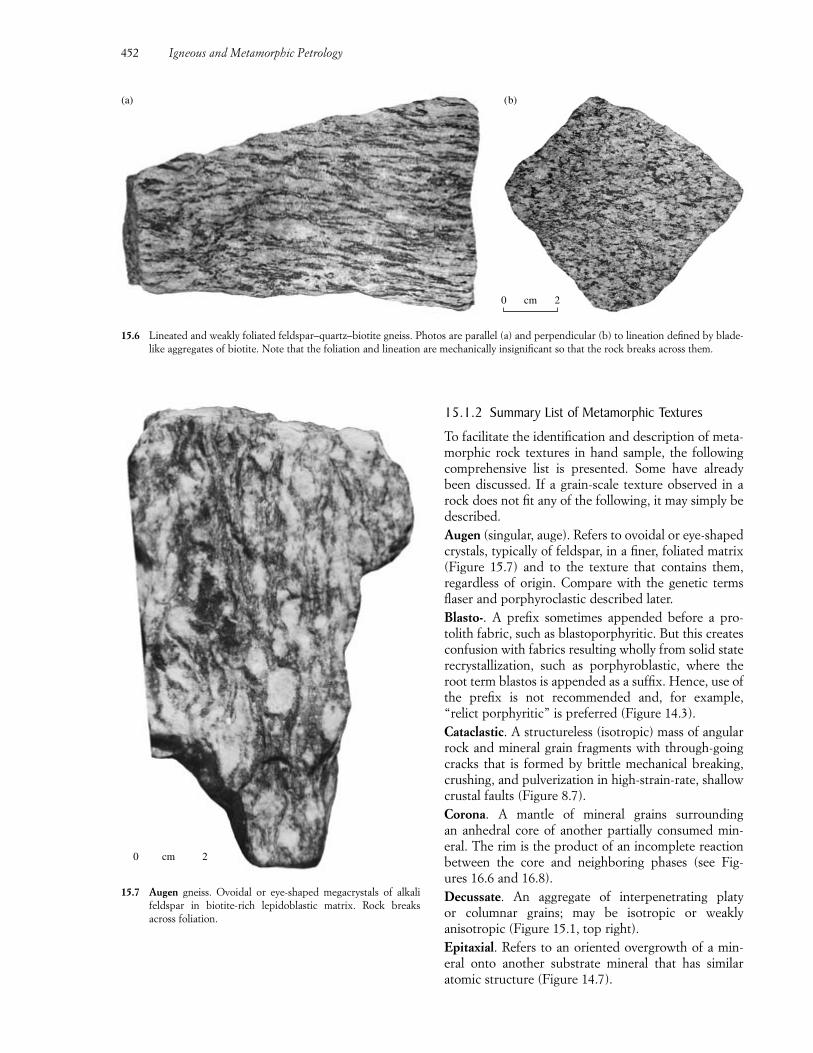
15.1.2 Summary List of Metamorphic Textures
To facilitate the identification and description of meta-morphic rock textures in hand sample, the followingcomprehensive list is presented. Some have alreadybeen discussed. If a grain-scale texture observed in arock does not fit any of the following, it may simply bedescribed.Augen (singular, auge). Refers to ovoidal or eye-shapedcrystals, typically of feldspar, in a finer, foliated matrix(Figure 15.7) and to the texture that contains them, regardless of origin. Compare with the genetic termsflaser and porphyroclastic described later.Blasto-. A prefix sometimes appended before a pro-tolith fabric, such as blastoporphyritic. But this createsconfusion with fabrics resulting wholly from solid staterecrystallization, such as porphyroblastic, where theroot term blastos is appended as a suffix. Hence, use ofthe prefix is not recommended and, for example,“relict porphyritic” is preferred (Figure 14.3).Cataclastic. A structureless (isotropic) mass of angularrock and mineral grain fragments with through-goingcracks that is formed by brittle mechanical breaking,crushing, and pulverization in high-strain-rate, shallowcrustal faults (Figure 8.7).Corona. A mantle of mineral grains surrounding an anhedral core of another partially consumed min-eral. The rim is the product of an incomplete reactionbetween the core and neighboring phases (see Fig-ures 16.6 and 16.8).Decussate. An aggregate of interpenetrating platy or columnar grains; may be isotropic or weaklyanisotropic (Figure 15.1, top right).Epitaxial. Refers to an oriented overgrowth of a min-eral onto another substrate mineral that has similaratomic structure (Figure 14.7).
452 Igneous and Metamorphic Petrology
0 2cm
15.7 Augen gneiss. Ovoidal or eye-shaped megacrystals of alkalifeldspar in biotite-rich lepidoblastic matrix. Rock breaksacross foliation.
(a) (b)
0 2cm
15.6 Lineated and weakly foliated feldspar–quartz–biotite gneiss. Photos are parallel (a) and perpendicular (b) to lineation defined by blade-like aggregates of biotite. Note that the foliation and lineation are mechanically insignificant so that the rock breaks across them.
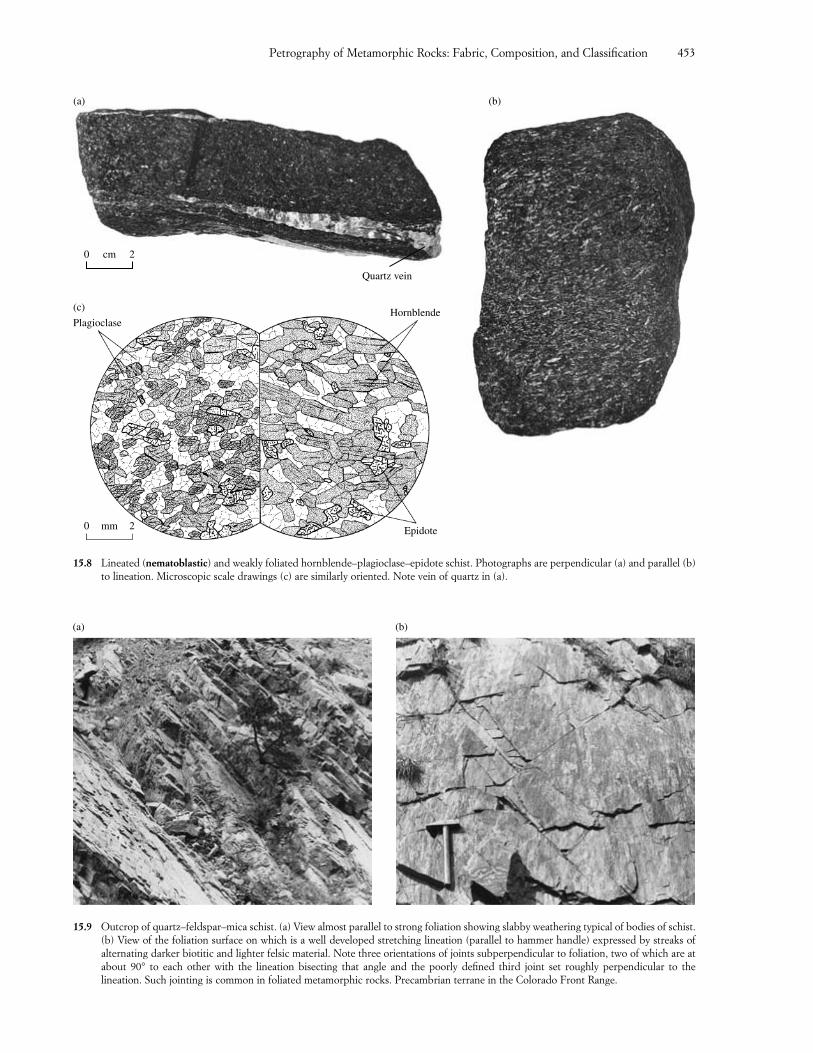
Petrography of Metamorphic Rocks: Fabric, Composition, and Classification 453
Plagioclase
(c) Hornblende
Epidote0 2mm
0 2cm
Quartz vein
(a) (b)
15.8 Lineated (nematoblastic) and weakly foliated hornblende–plagioclase–epidote schist. Photographs are perpendicular (a) and parallel (b)to lineation. Microscopic scale drawings (c) are similarly oriented. Note vein of quartz in (a).
(a) (b)
15.9 Outcrop of quartz–feldspar–mica schist. (a) View almost parallel to strong foliation showing slabby weathering typical of bodies of schist.(b) View of the foliation surface on which is a well developed stretching lineation (parallel to hammer handle) expressed by streaks of alternating darker biotitic and lighter felsic material. Note three orientations of joints subperpendicular to foliation, two of which are atabout 90° to each other with the lineation bisecting that angle and the poorly defined third joint set roughly perpendicular to the lineation. Such jointing is common in foliated metamorphic rocks. Precambrian terrane in the Colorado Front Range.
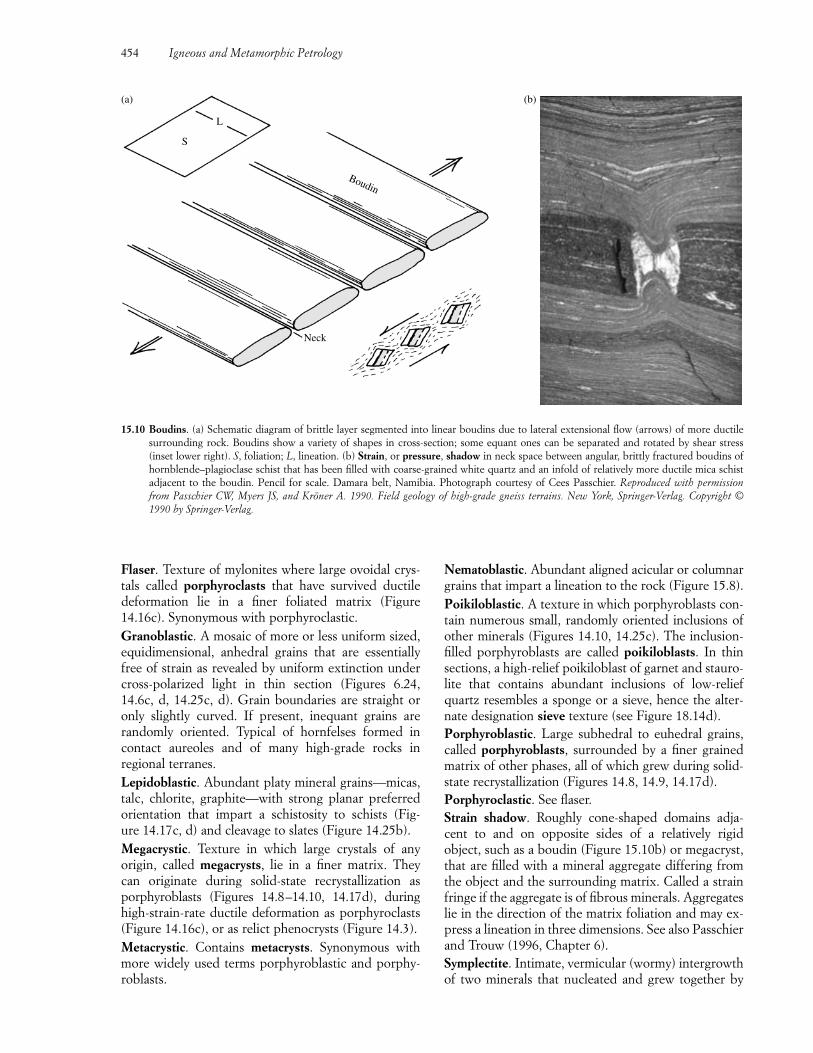
Flaser. Texture of mylonites where large ovoidal crys-tals called porphyroclasts that have survived ductiledeformation lie in a finer foliated matrix (Figure14.16c). Synonymous with porphyroclastic.Granoblastic. A mosaic of more or less uniform sized,equidimensional, anhedral grains that are essentiallyfree of strain as revealed by uniform extinction undercross-polarized light in thin section (Figures 6.24,14.6c, d, 14.25c, d). Grain boundaries are straight oronly slightly curved. If present, inequant grains are randomly oriented. Typical of hornfelses formed incontact aureoles and of many high-grade rocks in regional terranes.Lepidoblastic. Abundant platy mineral grains—micas,talc, chlorite, graphite—with strong planar preferredorientation that impart a schistosity to schists (Fig-ure 14.17c, d) and cleavage to slates (Figure 14.25b).Megacrystic. Texture in which large crystals of any origin, called megacrysts, lie in a finer matrix. They can originate during solid-state recrystallization as porphyroblasts (Figures 14.8–14.10, 14.17d), duringhigh-strain-rate ductile deformation as porphyroclasts(Figure 14.16c), or as relict phenocrysts (Figure 14.3).Metacrystic. Contains metacrysts. Synonymous withmore widely used terms porphyroblastic and porphy-roblasts.
Nematoblastic. Abundant aligned acicular or columnargrains that impart a lineation to the rock (Figure 15.8).Poikiloblastic. A texture in which porphyroblasts con-tain numerous small, randomly oriented inclusions ofother minerals (Figures 14.10, 14.25c). The inclusion-filled porphyroblasts are called poikiloblasts. In thinsections, a high-relief poikiloblast of garnet and stauro-lite that contains abundant inclusions of low-reliefquartz resembles a sponge or a sieve, hence the alter-nate designation sieve texture (see Figure 18.14d).Porphyroblastic. Large subhedral to euhedral grains,called porphyroblasts, surrounded by a finer grainedmatrix of other phases, all of which grew during solid-state recrystallization (Figures 14.8, 14.9, 14.17d).Porphyroclastic. See flaser.Strain shadow. Roughly cone-shaped domains adja-cent to and on opposite sides of a relatively rigid object, such as a boudin (Figure 15.10b) or megacryst,that are filled with a mineral aggregate differing fromthe object and the surrounding matrix. Called a strainfringe if the aggregate is of fibrous minerals. Aggregateslie in the direction of the matrix foliation and may ex-press a lineation in three dimensions. See also Passchierand Trouw (1996, Chapter 6).Symplectite. Intimate, vermicular (wormy) intergrowthof two minerals that nucleated and grew together by
454 Igneous and Metamorphic Petrology
L
(a) (b)
S
Boudin
Neck
15.10 Boudins. (a) Schematic diagram of brittle layer segmented into linear boudins due to lateral extensional flow (arrows) of more ductilesurrounding rock. Boudins show a variety of shapes in cross-section; some equant ones can be separated and rotated by shear stress (inset lower right). S, foliation; L, lineation. (b) Strain, or pressure, shadow in neck space between angular, brittly fractured boudins ofhornblende–plagioclase schist that has been filled with coarse-grained white quartz and an infold of relatively more ductile mica schistadjacent to the boudin. Pencil for scale. Damara belt, Namibia. Photograph courtesy of Cees Passchier. Reproduced with permission from Passchier CW, Myers JS, and Kröner A. 1990. Field geology of high-grade gneiss terrains. New York, Springer-Verlag. Copyright © 1990 by Springer-Verlag.
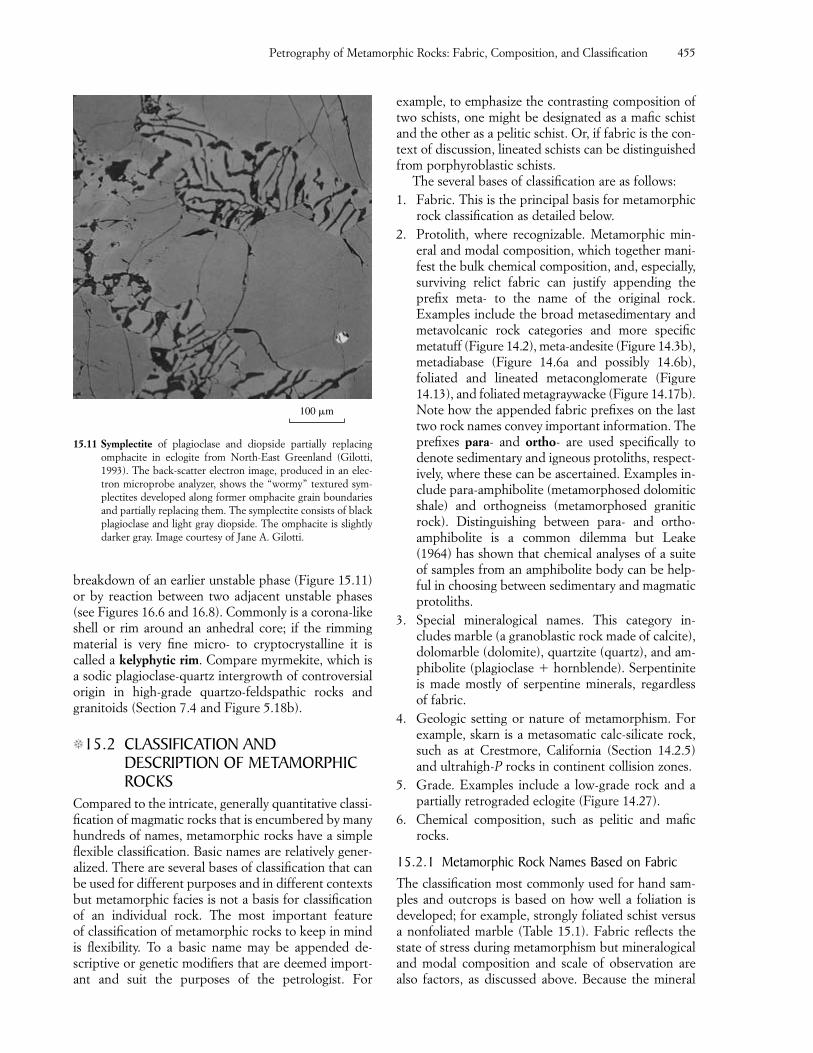
breakdown of an earlier unstable phase (Figure 15.11)or by reaction between two adjacent unstable phases(see Figures 16.6 and 16.8). Commonly is a corona-likeshell or rim around an anhedral core; if the rimmingmaterial is very fine micro- to cryptocrystalline it iscalled a kelyphytic rim. Compare myrmekite, which isa sodic plagioclase-quartz intergrowth of controversialorigin in high-grade quartzo-feldspathic rocks andgranitoids (Section 7.4 and Figure 5.18b).
�15.2 CLASSIFICATION ANDDESCRIPTION OF METAMORPHICROCKS
Compared to the intricate, generally quantitative classi-fication of magmatic rocks that is encumbered by manyhundreds of names, metamorphic rocks have a simpleflexible classification. Basic names are relatively gener-alized. There are several bases of classification that canbe used for different purposes and in different contextsbut metamorphic facies is not a basis for classificationof an individual rock. The most important feature of classification of metamorphic rocks to keep in mindis flexibility. To a basic name may be appended de-scriptive or genetic modifiers that are deemed import-ant and suit the purposes of the petrologist. For
example, to emphasize the contrasting composition oftwo schists, one might be designated as a mafic schistand the other as a pelitic schist. Or, if fabric is the con-text of discussion, lineated schists can be distinguishedfrom porphyroblastic schists.
The several bases of classification are as follows:1. Fabric. This is the principal basis for metamorphic
rock classification as detailed below.2. Protolith, where recognizable. Metamorphic min-
eral and modal composition, which together mani-fest the bulk chemical composition, and, especially,surviving relict fabric can justify appending theprefix meta- to the name of the original rock. Examples include the broad metasedimentary andmetavolcanic rock categories and more specificmetatuff (Figure 14.2), meta-andesite (Figure 14.3b),metadiabase (Figure 14.6a and possibly 14.6b), foliated and lineated metaconglomerate (Figure14.13), and foliated metagraywacke (Figure 14.17b).Note how the appended fabric prefixes on the lasttwo rock names convey important information. Theprefixes para- and ortho- are used specifically todenote sedimentary and igneous protoliths, respect-ively, where these can be ascertained. Examples in-clude para-amphibolite (metamorphosed dolomiticshale) and orthogneiss (metamorphosed graniticrock). Distinguishing between para- and ortho-amphibolite is a common dilemma but Leake(1964) has shown that chemical analyses of a suiteof samples from an amphibolite body can be help-ful in choosing between sedimentary and magmaticprotoliths.
3. Special mineralogical names. This category in-cludes marble (a granoblastic rock made of calcite),dolomarble (dolomite), quartzite (quartz), and am-phibolite (plagioclase � hornblende). Serpentiniteis made mostly of serpentine minerals, regardless of fabric.
4. Geologic setting or nature of metamorphism. Forexample, skarn is a metasomatic calc-silicate rock,such as at Crestmore, California (Section 14.2.5)and ultrahigh-P rocks in continent collision zones.
5. Grade. Examples include a low-grade rock and apartially retrograded eclogite (Figure 14.27).
6. Chemical composition, such as pelitic and maficrocks.
15.2.1 Metamorphic Rock Names Based on FabricThe classification most commonly used for hand sam-ples and outcrops is based on how well a foliation is developed; for example, strongly foliated schist versusa nonfoliated marble (Table 15.1). Fabric reflects thestate of stress during metamorphism but mineralogicaland modal composition and scale of observation arealso factors, as discussed above. Because the mineral
Petrography of Metamorphic Rocks: Fabric, Composition, and Classification 455
100 �m
15.11 Symplectite of plagioclase and diopside partially replacing omphacite in eclogite from North-East Greenland (Gilotti,1993). The back-scatter electron image, produced in an elec-tron microprobe analyzer, shows the “wormy” textured sym-plectites developed along former omphacite grain boundariesand partially replacing them. The symplectite consists of blackplagioclase and light gray diopside. The omphacite is slightlydarker gray. Image courtesy of Jane A. Gilotti.
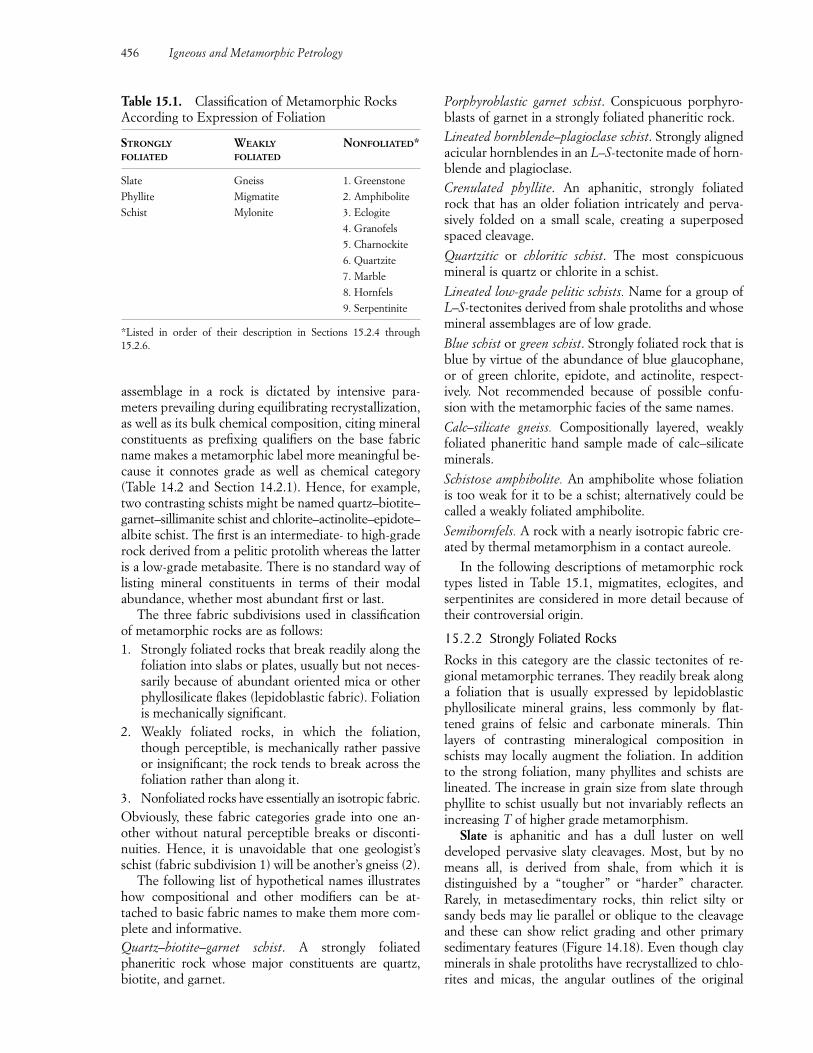
assemblage in a rock is dictated by intensive para-meters prevailing during equilibrating recrystallization,as well as its bulk chemical composition, citing mineralconstituents as prefixing qualifiers on the base fabricname makes a metamorphic label more meaningful be-cause it connotes grade as well as chemical category(Table 14.2 and Section 14.2.1). Hence, for example,two contrasting schists might be named quartz–biotite–garnet–sillimanite schist and chlorite–actinolite–epidote–albite schist. The first is an intermediate- to high-graderock derived from a pelitic protolith whereas the latteris a low-grade metabasite. There is no standard way oflisting mineral constituents in terms of their modalabundance, whether most abundant first or last.
The three fabric subdivisions used in classificationof metamorphic rocks are as follows:1. Strongly foliated rocks that break readily along the
foliation into slabs or plates, usually but not neces-sarily because of abundant oriented mica or otherphyllosilicate flakes (lepidoblastic fabric). Foliationis mechanically significant.
2. Weakly foliated rocks, in which the foliation,though perceptible, is mechanically rather passiveor insignificant; the rock tends to break across thefoliation rather than along it.
3. Nonfoliated rocks have essentially an isotropic fabric.Obviously, these fabric categories grade into one an-other without natural perceptible breaks or disconti-nuities. Hence, it is unavoidable that one geologist’sschist (fabric subdivision 1) will be another’s gneiss (2).
The following list of hypothetical names illustrateshow compositional and other modifiers can be at-tached to basic fabric names to make them more com-plete and informative.Quartz–biotite–garnet schist. A strongly foliatedphaneritic rock whose major constituents are quartz,biotite, and garnet.
Porphyroblastic garnet schist. Conspicuous porphyro-blasts of garnet in a strongly foliated phaneritic rock.Lineated hornblende–plagioclase schist. Strongly alignedacicular hornblendes in an L–S-tectonite made of horn-blende and plagioclase.Crenulated phyllite. An aphanitic, strongly foliatedrock that has an older foliation intricately and perva-sively folded on a small scale, creating a superposedspaced cleavage.
Quartzitic or chloritic schist. The most conspicuousmineral is quartz or chlorite in a schist.
Lineated low-grade pelitic schists. Name for a group ofL–S-tectonites derived from shale protoliths and whosemineral assemblages are of low grade.
Blue schist or green schist. Strongly foliated rock that isblue by virtue of the abundance of blue glaucophane,or of green chlorite, epidote, and actinolite, respect-ively. Not recommended because of possible confu-sion with the metamorphic facies of the same names.
Calc–silicate gneiss. Compositionally layered, weaklyfoliated phaneritic hand sample made of calc–silicateminerals.
Schistose amphibolite. An amphibolite whose foliationis too weak for it to be a schist; alternatively could becalled a weakly foliated amphibolite.
Semihornfels. A rock with a nearly isotropic fabric cre-ated by thermal metamorphism in a contact aureole.
In the following descriptions of metamorphic rocktypes listed in Table 15.1, migmatites, eclogites, andserpentinites are considered in more detail because oftheir controversial origin.
15.2.2 Strongly Foliated RocksRocks in this category are the classic tectonites of re-gional metamorphic terranes. They readily break alonga foliation that is usually expressed by lepidoblasticphyllosilicate mineral grains, less commonly by flat-tened grains of felsic and carbonate minerals. Thin layers of contrasting mineralogical composition inschists may locally augment the foliation. In addition to the strong foliation, many phyllites and schists are lineated. The increase in grain size from slate throughphyllite to schist usually but not invariably reflects anincreasing T of higher grade metamorphism.
Slate is aphanitic and has a dull luster on well developed pervasive slaty cleavages. Most, but by nomeans all, is derived from shale, from which it is distinguished by a “tougher” or “harder” character.Rarely, in metasedimentary rocks, thin relict silty orsandy beds may lie parallel or oblique to the cleavageand these can show relict grading and other primarysedimentary features (Figure 14.18). Even though clayminerals in shale protoliths have recrystallized to chlo-rites and micas, the angular outlines of the original
456 Igneous and Metamorphic Petrology
Table 15.1. Classification of Metamorphic RocksAccording to Expression of Foliation
STRONGLY WEAKLY NONFOLIATED*FOLIATED FOLIATED
Slate Gneiss 1. Greenstone
Phyllite Migmatite 2. Amphibolite
Schist Mylonite 3. Eclogite
4. Granofels
5. Charnockite
6. Quartzite
7. Marble
8. Hornfels
9. Serpentinite
*Listed in order of their description in Sections 15.2.4 through15.2.6.
Migmatite is a composite, heterogeneous rock (theGreek migma means mixture) on the outcrop scale thatconsists of mafic metamorphic rock mingled with felsicrock in the form of planar to folded and contorted layers, criss-crossing veins, and irregular pods (Fig-ures 11.24, 15.12, 15.13a, and 15.14). There may be no sharp distinction between quartzo-feldspathic gneissand migmatite; hence labels such as migmatitic gneissand gneissic migmatite are frequently used. The richlyillustrated Mehnert (1968) shows the wide variety ofmigmatites. The leucocratic component is sharplybounded to gradational with the more mafic host schist,gneiss, or amphibolite. In many migmatites, the leuco-cratic leucosome is separated from the mesosome(a descriptive term for intermediate rock) or paleo-some (a genetic term for the “average” protolith), by amore mafic selvage, or melanosome (Figures 15.13aand 15.15).
The origin of migmatites has been the subject ofheated controversy since their first description by theFinnish geologist J. J. Sederholm in 1907 (Ashworth,1985). A bewildering terminology, partly descriptiveand partly genetic (such as mesosome versus paleo-some), has grown during this debate. The origin ofmigmatites seems to be linked in some way with theirtypical occurrence in high-T sectors of regional meta-morphic terranes where mineral assemblages define theupper amphibolite facies (Figure 14.33). Under theseconditions, decomposition of muscovite (Figure 14.31)and perhaps biotite liberates water that may be essen-tial in creating local water-saturated conditions for minimum-T partial melting just above the granite solidus(Figures 5.24–5.26; see also Section 11.6.1 and Figure11.21, top). Thus, the felsic leucosome in migmatitescan be generated by in situ partial melting and segre-gation from the paleosome, the melanosome being amafic residue. Mass-balance investigations disclosingcomplementary compositions support this closed sys-tem origin, as does the presence of euhedral, slightlyzoned plagioclases of magmatic character in some leu-cosomes. Nonetheless, a complementary compositionalrelation does not always exist and in such cases it is argued that leucosomes could have been intruded asmagmas from a more distant source, despite the neces-sarily pervasiveness of the injections. Another proposedorigin consistent with the pervasive heterogeneity ofmigmatites and the more or less complementary com-position of leucosome and melanosome with the paleo-some is metamorphic differentiation; mafic and felsiccomponents segregate via diffusion. Exactly how thisordering and decrease in entropy of the system can occur spontaneously is a puzzle. Yet another origin involves metasomatic transformation of the parent rock by introduction of felsic components via pene-trating fluids. The origin of migmatites has yet to be resolved. They may, in fact, be polygenetic, originating
Petrography of Metamorphic Rocks: Fabric, Composition, and Classification 457
quartz grains may be still evident in typically low-gradeslates (Figure 14.25b). Weakly foliated metagraywackes(Figure 14.17b) are commonly interlayered with slates,as are various metavolcanic rocks such as greenstonesand metatuffs that have relict magmatic fabrics. Slatesare purple or red (oxidized, with abundant hematite),green (chlorite) and, most commonly, gray to black (reduced, with graphite). Some of the latter have porphyroblasts of euhedral pyrite. Low-temperaturerecrystallization of slate in contact aureoles createspoikiloblasts of cordierite, andalusite, or mica, formingspotted slates (Figures 14.10 and 14.25c); locally, altered cordierites preferentially weather out, leavingpits.
Phyllite is also aphanitic, but because of a slightlycoarser grain size than slate, has a lustrous or silkysheen on foliation surfaces. Phyllites are transitionalbetween slates and schists and share associations andproperties of both.
Widespread schists are phaneritic, commonly porphyroblastic, and have a weak to well developedsegregation layering of felsic and mafic material thatusually parallels and augments the already strong lepido-blastic fabric (Figure 14.17d). Lineation is commonlyexpressed by elongate segregations of contrasting min-erals (Figure 15.9) or by folds and wrinkles in the foli-ation. Relative to slates and phyllites, coarser-grainedschists have better developed imposed metamorphicfabrics that have modified and usually erased relictmagmatic and sedimentary features. Compositionallayering in schists may have originated by metamorphicdifferentiation in addition to or in lieu of inherited bedding.
All chemical classes are represented in schists, but pelitic and quartzo-feldspathic compositions withabundant micas and chlorites are most common. Diagnostic minerals indicate low- to intermediate-grade conditions of the subgreenschist, greenschist,blueschist, and amphibolite facies.
15.2.3 Weakly Foliated RocksThe typically higher grade of metamorphism of aphaneritic gneiss is evident in the low modal propor-tion, or absence, of micas and chlorite. Grains of majorrock-forming minerals, mostly quartz and feldspar, aremore equant. Foliation ranges from barely perceptible toconspicuous and is expressed by sparse or imperfectlyaligned platy minerals, parallelism of augen in augengneiss (Figures 14.38a and 15.7), flattened mineral aggregates (Figures 15.6 and 15.13b), or mechanicallypassive compositional layering (Figure 15.5; see alsoFigure 19.24a). Mafic layers may be more strongly foli-ated where there are lepidoblastic biotites or decussateamphiboles, whereas alternating felsic layers tend to begranoblastic. Abundant field photographs in Passchieret al. (1990) illustrate the character of gneisses.
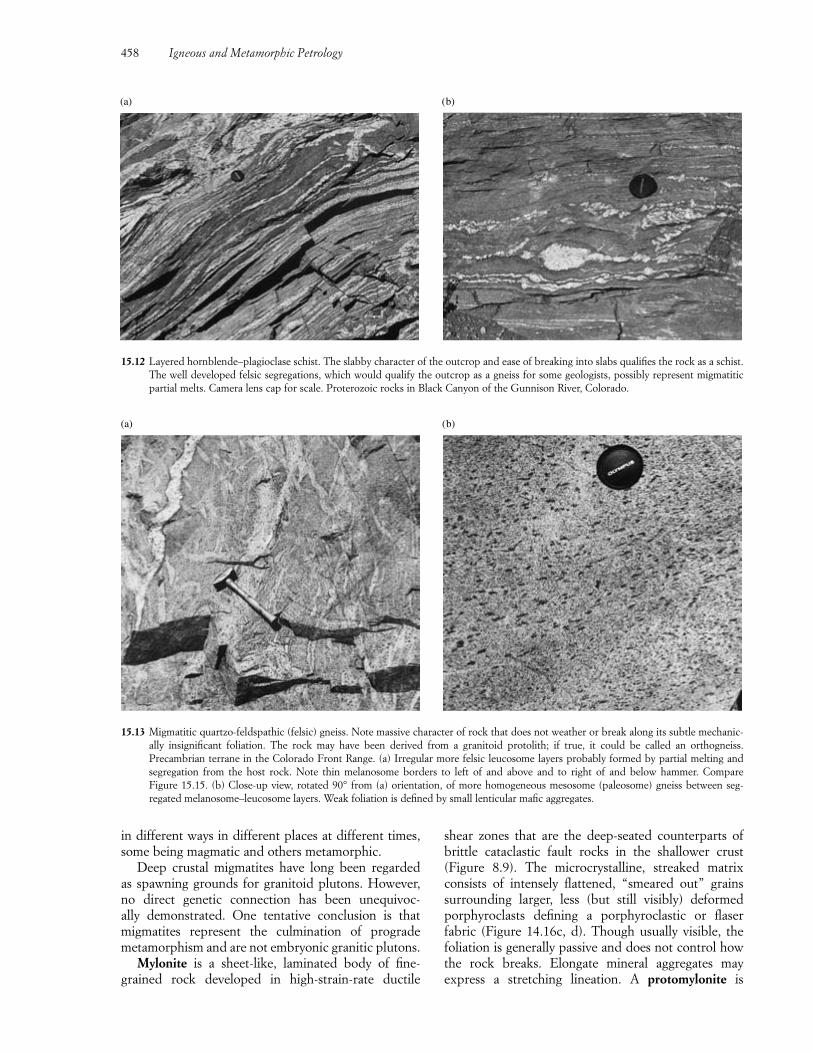
458 Igneous and Metamorphic Petrology
(a) (b)
in different ways in different places at different times,some being magmatic and others metamorphic.
Deep crustal migmatites have long been regarded as spawning grounds for granitoid plutons. However,no direct genetic connection has been unequivoc-ally demonstrated. One tentative conclusion is thatmigmatites represent the culmination of progrademetamorphism and are not embryonic granitic plutons.
Mylonite is a sheet-like, laminated body of fine-grained rock developed in high-strain-rate ductile
shear zones that are the deep-seated counterparts ofbrittle cataclastic fault rocks in the shallower crust(Figure 8.9). The microcrystalline, streaked matrixconsists of intensely flattened, “smeared out” grainssurrounding larger, less (but still visibly) deformedporphyroclasts defining a porphyroclastic or flaser fabric (Figure 14.16c, d). Though usually visible, thefoliation is generally passive and does not control howthe rock breaks. Elongate mineral aggregates may express a stretching lineation. A protomylonite is
15.12 Layered hornblende–plagioclase schist. The slabby character of the outcrop and ease of breaking into slabs qualifies the rock as a schist.The well developed felsic segregations, which would qualify the outcrop as a gneiss for some geologists, possibly represent migmatiticpartial melts. Camera lens cap for scale. Proterozoic rocks in Black Canyon of the Gunnison River, Colorado.
(a) (b)
15.13 Migmatitic quartzo-feldspathic (felsic) gneiss. Note massive character of rock that does not weather or break along its subtle mechanic-ally insignificant foliation. The rock may have been derived from a granitoid protolith; if true, it could be called an orthogneiss. Precambrian terrane in the Colorado Front Range. (a) Irregular more felsic leucosome layers probably formed by partial melting and segregation from the host rock. Note thin melanosome borders to left of and above and to right of and below hammer. Compare Figure 15.15. (b) Close-up view, rotated 90° from (a) orientation, of more homogeneous mesosome (paleosome) gneiss between seg-regated melanosome–leucosome layers. Weak foliation is defined by small lenticular mafic aggregates.
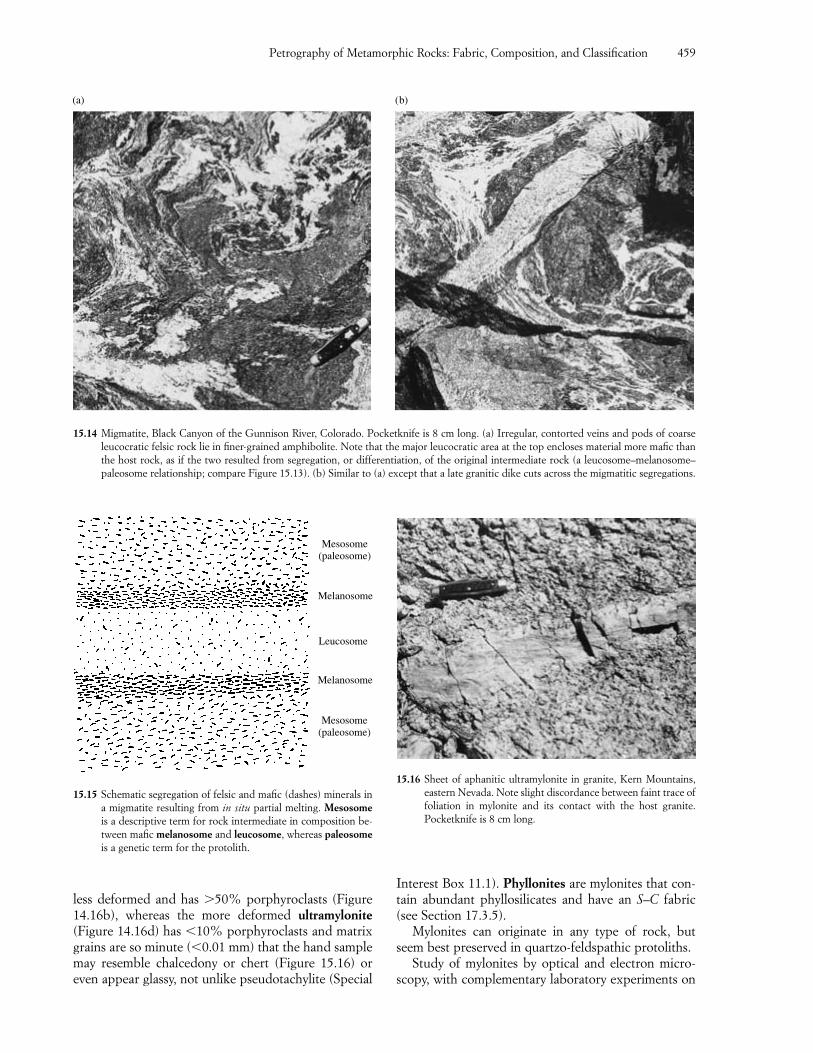
less deformed and has �50% porphyroclasts (Figure14.16b), whereas the more deformed ultramylonite(Figure 14.16d) has �10% porphyroclasts and matrixgrains are so minute (�0.01 mm) that the hand samplemay resemble chalcedony or chert (Figure 15.16) oreven appear glassy, not unlike pseudotachylite (Special
Interest Box 11.1). Phyllonites are mylonites that con-tain abundant phyllosilicates and have an S–C fabric(see Section 17.3.5).
Mylonites can originate in any type of rock, butseem best preserved in quartzo-feldspathic protoliths.
Study of mylonites by optical and electron micro-scopy, with complementary laboratory experiments on
Petrography of Metamorphic Rocks: Fabric, Composition, and Classification 459
(a) (b)
15.14 Migmatite, Black Canyon of the Gunnison River, Colorado. Pocketknife is 8 cm long. (a) Irregular, contorted veins and pods of coarseleucocratic felsic rock lie in finer-grained amphibolite. Note that the major leucocratic area at the top encloses material more mafic thanthe host rock, as if the two resulted from segregation, or differentiation, of the original intermediate rock (a leucosome–melanosome–paleosome relationship; compare Figure 15.13). (b) Similar to (a) except that a late granitic dike cuts across the migmatitic segregations.
Mesosome(paleosome)
Melanosome
Leucosome
Melanosome
Mesosome(paleosome)
15.15 Schematic segregation of felsic and mafic (dashes) minerals ina migmatite resulting from in situ partial melting. Mesosomeis a descriptive term for rock intermediate in composition be-tween mafic melanosome and leucosome, whereas paleosomeis a genetic term for the protolith.
15.16 Sheet of aphanitic ultramylonite in granite, Kern Mountains,eastern Nevada. Note slight discordance between faint trace offoliation in mylonite and its contact with the host granite.Pocketknife is 8 cm long.
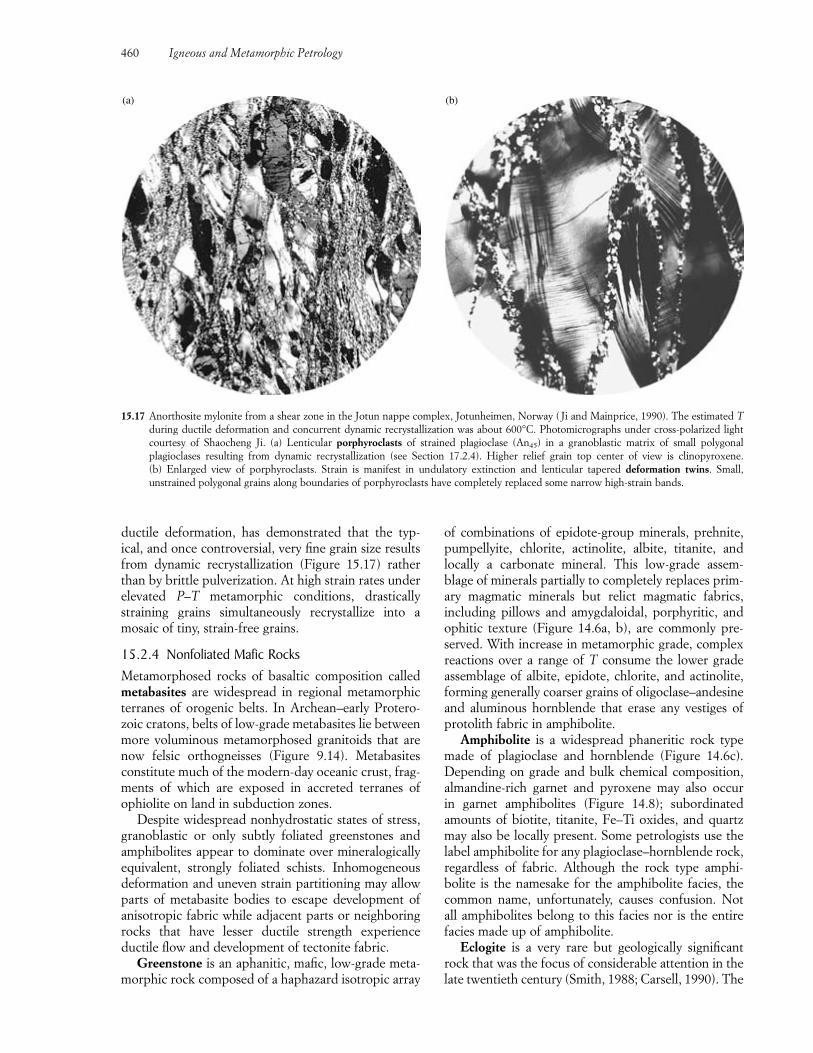
ductile deformation, has demonstrated that the typ-ical, and once controversial, very fine grain size resultsfrom dynamic recrystallization (Figure 15.17) ratherthan by brittle pulverization. At high strain rates underelevated P–T metamorphic conditions, drasticallystraining grains simultaneously recrystallize into a mosaic of tiny, strain-free grains.
15.2.4 Nonfoliated Mafic RocksMetamorphosed rocks of basaltic composition calledmetabasites are widespread in regional metamorphicterranes of orogenic belts. In Archean–early Protero-zoic cratons, belts of low-grade metabasites lie betweenmore voluminous metamorphosed granitoids that arenow felsic orthogneisses (Figure 9.14). Metabasitesconstitute much of the modern-day oceanic crust, frag-ments of which are exposed in accreted terranes ofophiolite on land in subduction zones.
Despite widespread nonhydrostatic states of stress,granoblastic or only subtly foliated greenstones andamphibolites appear to dominate over mineralogicallyequivalent, strongly foliated schists. Inhomogeneousdeformation and uneven strain partitioning may allowparts of metabasite bodies to escape development ofanisotropic fabric while adjacent parts or neighboringrocks that have lesser ductile strength experience ductile flow and development of tectonite fabric.
Greenstone is an aphanitic, mafic, low-grade meta-morphic rock composed of a haphazard isotropic array
of combinations of epidote-group minerals, prehnite,pumpellyite, chlorite, actinolite, albite, titanite, and locally a carbonate mineral. This low-grade assem-blage of minerals partially to completely replaces prim-ary magmatic minerals but relict magmatic fabrics, including pillows and amygdaloidal, porphyritic, andophitic texture (Figure 14.6a, b), are commonly pre-served. With increase in metamorphic grade, complexreactions over a range of T consume the lower grade assemblage of albite, epidote, chlorite, and actinolite,forming generally coarser grains of oligoclase–andesineand aluminous hornblende that erase any vestiges ofprotolith fabric in amphibolite.
Amphibolite is a widespread phaneritic rock typemade of plagioclase and hornblende (Figure 14.6c).Depending on grade and bulk chemical composition,almandine-rich garnet and pyroxene may also occur in garnet amphibolites (Figure 14.8); subordinatedamounts of biotite, titanite, Fe–Ti oxides, and quartzmay also be locally present. Some petrologists use thelabel amphibolite for any plagioclase–hornblende rock,regardless of fabric. Although the rock type amphi-bolite is the namesake for the amphibolite facies, the common name, unfortunately, causes confusion. Notall amphibolites belong to this facies nor is the entirefacies made up of amphibolite.
Eclogite is a very rare but geologically significantrock that was the focus of considerable attention in thelate twentieth century (Smith, 1988; Carsell, 1990). The
460 Igneous and Metamorphic Petrology
15.17 Anorthosite mylonite from a shear zone in the Jotun nappe complex, Jotunheimen, Norway ( Ji and Mainprice, 1990). The estimated Tduring ductile deformation and concurrent dynamic recrystallization was about 600°C. Photomicrographs under cross-polarized lightcourtesy of Shaocheng Ji. (a) Lenticular porphyroclasts of strained plagioclase (An45) in a granoblastic matrix of small polygonal plagioclases resulting from dynamic recrystallization (see Section 17.2.4). Higher relief grain top center of view is clinopyroxene. (b) Enlarged view of porphyroclasts. Strain is manifest in undulatory extinction and lenticular tapered deformation twins. Small, unstrained polygonal grains along boundaries of porphyroclasts have completely replaced some narrow high-strain bands.
(a) (b)
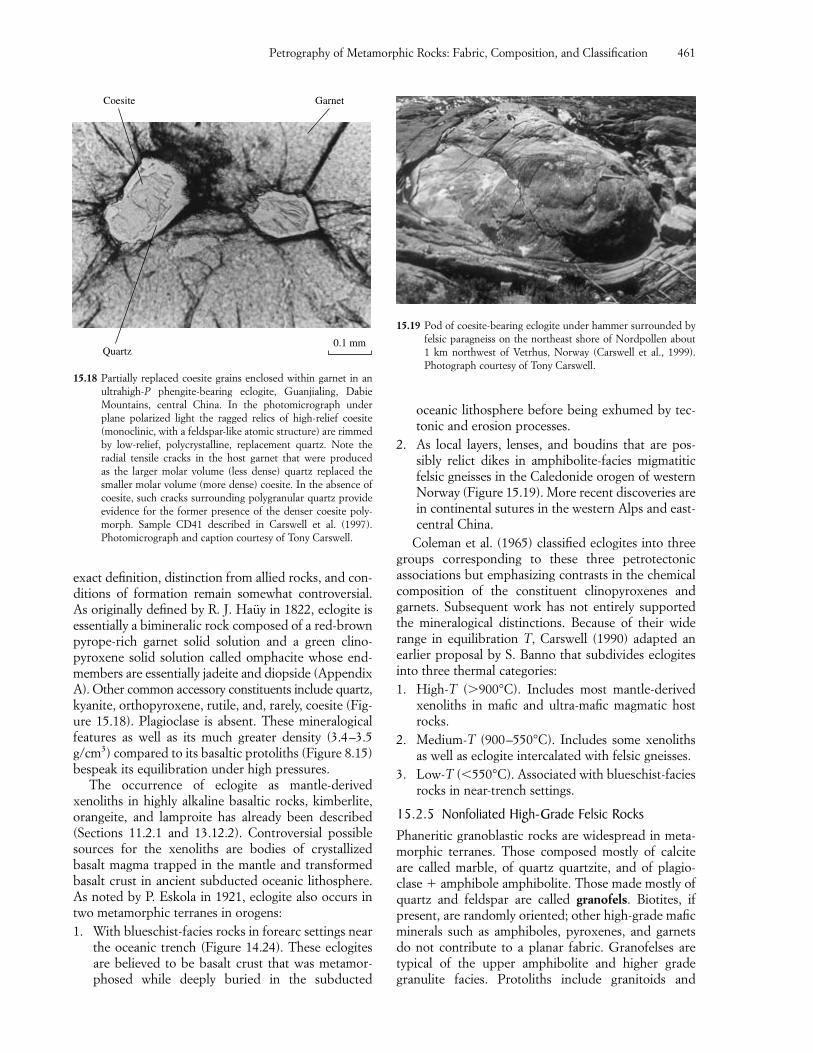
oceanic lithosphere before being exhumed by tec-tonic and erosion processes.
2. As local layers, lenses, and boudins that are pos-sibly relict dikes in amphibolite-facies migmatitic felsic gneisses in the Caledonide orogen of westernNorway (Figure 15.19). More recent discoveries arein continental sutures in the western Alps and east-central China.
Coleman et al. (1965) classified eclogites into threegroups corresponding to these three petrotectonic associations but emphasizing contrasts in the chemicalcomposition of the constituent clinopyroxenes and garnets. Subsequent work has not entirely supportedthe mineralogical distinctions. Because of their widerange in equilibration T, Carswell (1990) adapted anearlier proposal by S. Banno that subdivides eclogitesinto three thermal categories:1. High-T (�900°C). Includes most mantle-derived
xenoliths in mafic and ultra-mafic magmatic hostrocks.
2. Medium-T (900–550°C). Includes some xenolithsas well as eclogite intercalated with felsic gneisses.
3. Low-T (�550°C). Associated with blueschist-faciesrocks in near-trench settings.
15.2.5 Nonfoliated High-Grade Felsic RocksPhaneritic granoblastic rocks are widespread in meta-morphic terranes. Those composed mostly of calciteare called marble, of quartz quartzite, and of plagio-clase � amphibole amphibolite. Those made mostly ofquartz and feldspar are called granofels. Biotites, ifpresent, are randomly oriented; other high-grade maficminerals such as amphiboles, pyroxenes, and garnetsdo not contribute to a planar fabric. Granofelses aretypical of the upper amphibolite and higher gradegranulite facies. Protoliths include granitoids and
Petrography of Metamorphic Rocks: Fabric, Composition, and Classification 461
0.1 mmQuartz
Coesite Garnet
15.18 Partially replaced coesite grains enclosed within garnet in anultrahigh-P phengite-bearing eclogite, Guanjialing, DabieMountains, central China. In the photomicrograph underplane polarized light the ragged relics of high-relief coesite(monoclinic, with a feldspar-like atomic structure) are rimmedby low-relief, polycrystalline, replacement quartz. Note the radial tensile cracks in the host garnet that were produced as the larger molar volume (less dense) quartz replaced thesmaller molar volume (more dense) coesite. In the absence ofcoesite, such cracks surrounding polygranular quartz provideevidence for the former presence of the denser coesite poly-morph. Sample CD41 described in Carswell et al. (1997). Photomicrograph and caption courtesy of Tony Carswell.
exact definition, distinction from allied rocks, and con-ditions of formation remain somewhat controversial.As originally defined by R. J. Haüy in 1822, eclogite isessentially a bimineralic rock composed of a red-brownpyrope-rich garnet solid solution and a green clino-pyroxene solid solution called omphacite whose end-members are essentially jadeite and diopside (AppendixA). Other common accessory constituents include quartz,kyanite, orthopyroxene, rutile, and, rarely, coesite (Fig-ure 15.18). Plagioclase is absent. These mineralogicalfeatures as well as its much greater density (3.4–3.5g/cm3) compared to its basaltic protoliths (Figure 8.15)bespeak its equilibration under high pressures.
The occurrence of eclogite as mantle-derived xenoliths in highly alkaline basaltic rocks, kimberlite,orangeite, and lamproite has already been described(Sections 11.2.1 and 13.12.2). Controversial possiblesources for the xenoliths are bodies of crystallizedbasalt magma trapped in the mantle and transformedbasalt crust in ancient subducted oceanic lithosphere.As noted by P. Eskola in 1921, eclogite also occurs intwo metamorphic terranes in orogens:1. With blueschist-facies rocks in forearc settings near
the oceanic trench (Figure 14.24). These eclogitesare believed to be basalt crust that was metamor-phosed while deeply buried in the subducted
15.19 Pod of coesite-bearing eclogite under hammer surrounded byfelsic paragneiss on the northeast shore of Nordpollen about 1 km northwest of Vetrhus, Norway (Carswell et al., 1999).Photograph courtesy of Tony Carswell.
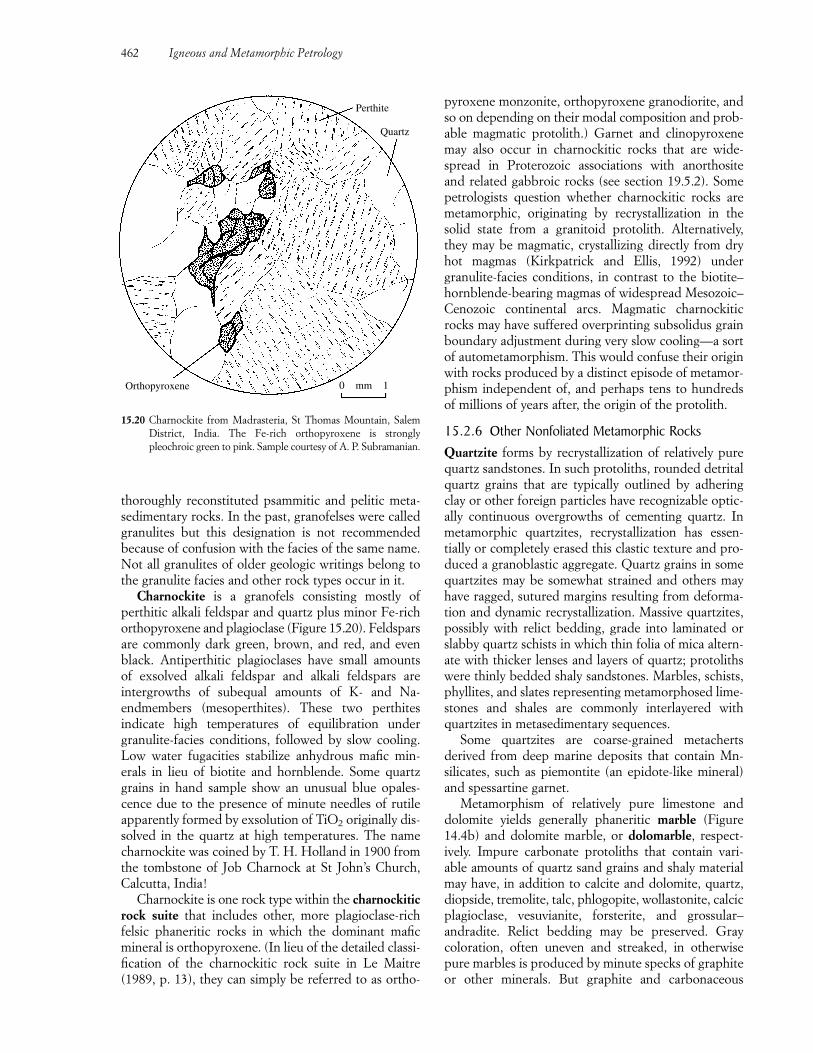
thoroughly reconstituted psammitic and pelitic meta-sedimentary rocks. In the past, granofelses were calledgranulites but this designation is not recommended because of confusion with the facies of the same name.Not all granulites of older geologic writings belong tothe granulite facies and other rock types occur in it.
Charnockite is a granofels consisting mostly ofperthitic alkali feldspar and quartz plus minor Fe-richorthopyroxene and plagioclase (Figure 15.20). Feldsparsare commonly dark green, brown, and red, and evenblack. Antiperthitic plagioclases have small amounts of exsolved alkali feldspar and alkali feldspars are intergrowths of subequal amounts of K- and Na-endmembers (mesoperthites). These two perthites indicate high temperatures of equilibration under granulite-facies conditions, followed by slow cooling.Low water fugacities stabilize anhydrous mafic min-erals in lieu of biotite and hornblende. Some quartzgrains in hand sample show an unusual blue opales-cence due to the presence of minute needles of rutileapparently formed by exsolution of TiO2 originally dis-solved in the quartz at high temperatures. The namecharnockite was coined by T. H. Holland in 1900 fromthe tombstone of Job Charnock at St John’s Church,Calcutta, India!
Charnockite is one rock type within the charnockiticrock suite that includes other, more plagioclase-richfelsic phaneritic rocks in which the dominant maficmineral is orthopyroxene. (In lieu of the detailed classi-fication of the charnockitic rock suite in Le Maitre(1989, p. 13), they can simply be referred to as ortho-
pyroxene monzonite, orthopyroxene granodiorite, andso on depending on their modal composition and prob-able magmatic protolith.) Garnet and clinopyroxenemay also occur in charnockitic rocks that are wide-spread in Proterozoic associations with anorthositeand related gabbroic rocks (see section 19.5.2). Somepetrologists question whether charnockitic rocks aremetamorphic, originating by recrystallization in thesolid state from a granitoid protolith. Alternatively,they may be magmatic, crystallizing directly from dryhot magmas (Kirkpatrick and Ellis, 1992) under granulite-facies conditions, in contrast to the biotite–hornblende-bearing magmas of widespread Mesozoic–Cenozoic continental arcs. Magmatic charnockiticrocks may have suffered overprinting subsolidus grainboundary adjustment during very slow cooling—a sortof autometamorphism. This would confuse their originwith rocks produced by a distinct episode of metamor-phism independent of, and perhaps tens to hundredsof millions of years after, the origin of the protolith.
15.2.6 Other Nonfoliated Metamorphic RocksQuartzite forms by recrystallization of relatively purequartz sandstones. In such protoliths, rounded detritalquartz grains that are typically outlined by adheringclay or other foreign particles have recognizable optic-ally continuous overgrowths of cementing quartz. Inmetamorphic quartzites, recrystallization has essen-tially or completely erased this clastic texture and pro-duced a granoblastic aggregate. Quartz grains in somequartzites may be somewhat strained and others mayhave ragged, sutured margins resulting from deforma-tion and dynamic recrystallization. Massive quartzites,possibly with relict bedding, grade into laminated orslabby quartz schists in which thin folia of mica altern-ate with thicker lenses and layers of quartz; protolithswere thinly bedded shaly sandstones. Marbles, schists,phyllites, and slates representing metamorphosed lime-stones and shales are commonly interlayered withquartzites in metasedimentary sequences.
Some quartzites are coarse-grained metacherts derived from deep marine deposits that contain Mn-silicates, such as piemontite (an epidote-like mineral)and spessartine garnet.
Metamorphism of relatively pure limestone anddolomite yields generally phaneritic marble (Figure14.4b) and dolomite marble, or dolomarble, respect-ively. Impure carbonate protoliths that contain vari-able amounts of quartz sand grains and shaly materialmay have, in addition to calcite and dolomite, quartz,diopside, tremolite, talc, phlogopite, wollastonite, calcicplagioclase, vesuvianite, forsterite, and grossular–andradite. Relict bedding may be preserved. Gray coloration, often uneven and streaked, in otherwisepure marbles is produced by minute specks of graphiteor other minerals. But graphite and carbonaceous
462 Igneous and Metamorphic Petrology
Perthite
Quartz
Orthopyroxene 0 mm 1
15.20 Charnockite from Madrasteria, St Thomas Mountain, SalemDistrict, India. The Fe-rich orthopyroxene is stronglypleochroic green to pink. Sample courtesy of A. P. Subramanian.
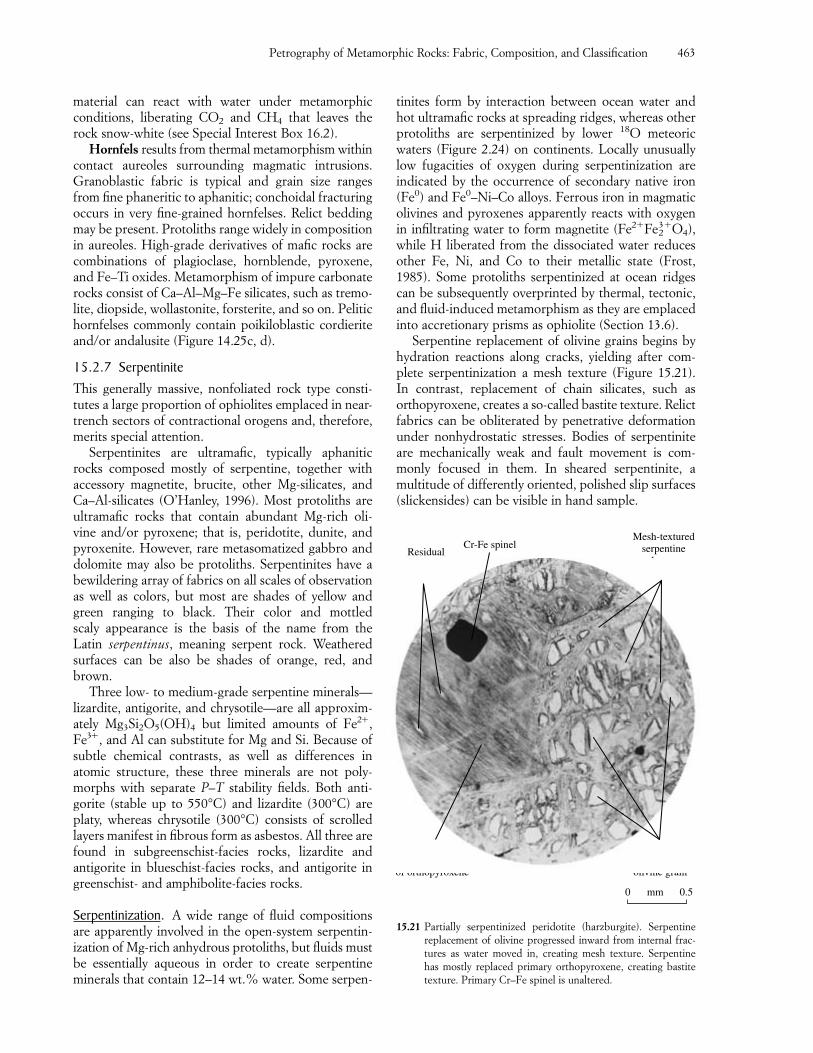
material can react with water under metamorphic conditions, liberating CO2 and CH4 that leaves therock snow-white (see Special Interest Box 16.2).
Hornfels results from thermal metamorphism withincontact aureoles surrounding magmatic intrusions.Granoblastic fabric is typical and grain size rangesfrom fine phaneritic to aphanitic; conchoidal fracturingoccurs in very fine-grained hornfelses. Relict beddingmay be present. Protoliths range widely in compositionin aureoles. High-grade derivatives of mafic rocks arecombinations of plagioclase, hornblende, pyroxene,and Fe–Ti oxides. Metamorphism of impure carbonaterocks consist of Ca–Al–Mg–Fe silicates, such as tremo-lite, diopside, wollastonite, forsterite, and so on. Pelitichornfelses commonly contain poikiloblastic cordieriteand/or andalusite (Figure 14.25c, d).
15.2.7 SerpentiniteThis generally massive, nonfoliated rock type consti-tutes a large proportion of ophiolites emplaced in near-trench sectors of contractional orogens and, therefore,merits special attention.
Serpentinites are ultramafic, typically aphaniticrocks composed mostly of serpentine, together with accessory magnetite, brucite, other Mg-silicates, andCa–Al-silicates (O’Hanley, 1996). Most protoliths areultramafic rocks that contain abundant Mg-rich oli-vine and/or pyroxene; that is, peridotite, dunite, andpyroxenite. However, rare metasomatized gabbro anddolomite may also be protoliths. Serpentinites have abewildering array of fabrics on all scales of observationas well as colors, but most are shades of yellow andgreen ranging to black. Their color and mottled scaly appearance is the basis of the name from theLatin serpentinus, meaning serpent rock. Weatheredsurfaces can be also be shades of orange, red, andbrown.
Three low- to medium-grade serpentine minerals—lizardite, antigorite, and chrysotile—are all approxim-ately Mg3Si2O5(OH)4 but limited amounts of Fe2�,Fe3�, and Al can substitute for Mg and Si. Because ofsubtle chemical contrasts, as well as differences inatomic structure, these three minerals are not poly-morphs with separate P–T stability fields. Both anti-gorite (stable up to 550°C) and lizardite (300°C) areplaty, whereas chrysotile (300°C) consists of scrolledlayers manifest in fibrous form as asbestos. All three arefound in subgreenschist-facies rocks, lizardite andantigorite in blueschist-facies rocks, and antigorite ingreenschist- and amphibolite-facies rocks.
Serpentinization. A wide range of fluid compositionsare apparently involved in the open-system serpentin-ization of Mg-rich anhydrous protoliths, but fluids mustbe essentially aqueous in order to create serpentineminerals that contain 12–14 wt.% water. Some serpen-
Petrography of Metamorphic Rocks: Fabric, Composition, and Classification 463
ResidualCr-Fe spinel
Mesh-texturedserpentine
l
olivine grainof orthopyroxene
0.50 mm
15.21 Partially serpentinized peridotite (harzburgite). Serpentine replacement of olivine progressed inward from internal frac-tures as water moved in, creating mesh texture. Serpentine has mostly replaced primary orthopyroxene, creating bastitetexture. Primary Cr–Fe spinel is unaltered.
tinites form by interaction between ocean water andhot ultramafic rocks at spreading ridges, whereas otherprotoliths are serpentinized by lower 18O meteoric waters (Figure 2.24) on continents. Locally unusuallylow fugacities of oxygen during serpentinization are indicated by the occurrence of secondary native iron(Fe0) and Fe0–Ni–Co alloys. Ferrous iron in magmaticolivines and pyroxenes apparently reacts with oxygenin infiltrating water to form magnetite (Fe2�Fe �O4),while H liberated from the dissociated water reducesother Fe, Ni, and Co to their metallic state (Frost,1985). Some protoliths serpentinized at ocean ridgescan be subsequently overprinted by thermal, tectonic,and fluid-induced metamorphism as they are emplacedinto accretionary prisms as ophiolite (Section 13.6).
Serpentine replacement of olivine grains begins byhydration reactions along cracks, yielding after com-plete serpentinization a mesh texture (Figure 15.21). In contrast, replacement of chain silicates, such as orthopyroxene, creates a so-called bastite texture. Relictfabrics can be obliterated by penetrative deformationunder nonhydrostatic stresses. Bodies of serpentiniteare mechanically weak and fault movement is com-monly focused in them. In sheared serpentinite, a multitude of differently oriented, polished slip surfaces(slickensides) can be visible in hand sample.
23
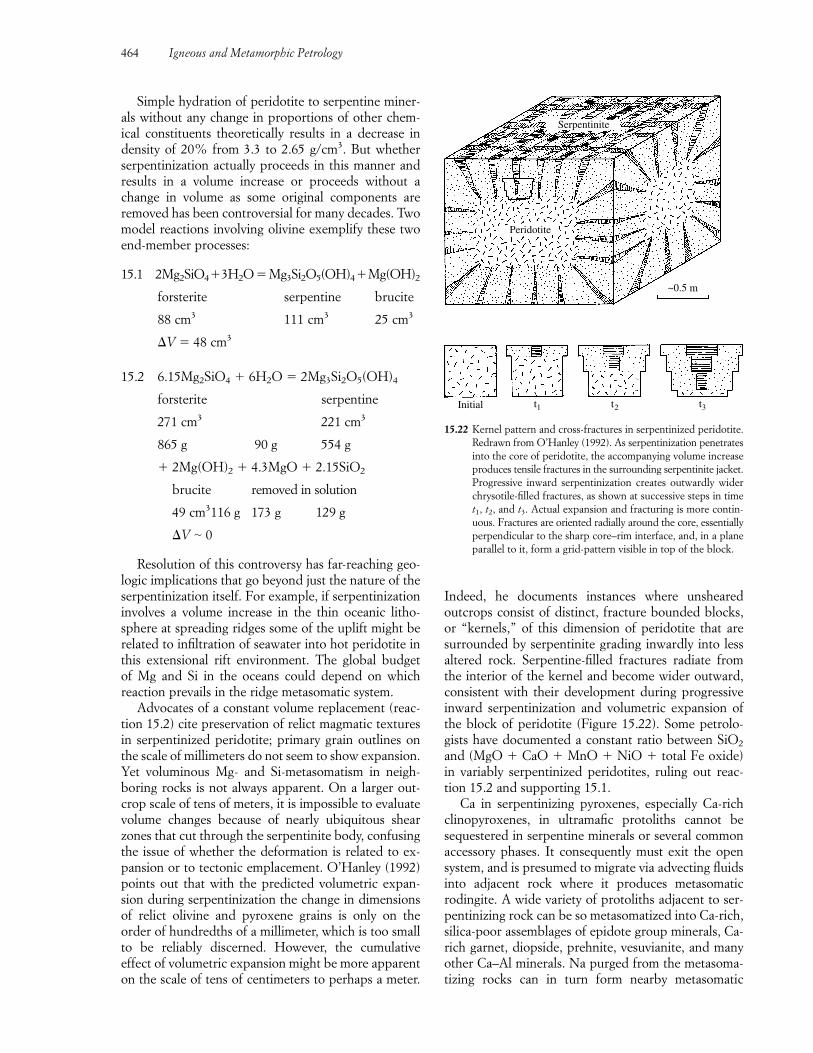
Simple hydration of peridotite to serpentine miner-als without any change in proportions of other chem-ical constituents theoretically results in a decrease indensity of 20% from 3.3 to 2.65 g/cm3. But whetherserpentinization actually proceeds in this manner andresults in a volume increase or proceeds without achange in volume as some original components are removed has been controversial for many decades. Twomodel reactions involving olivine exemplify these twoend-member processes:
15.1 2Mg2SiO4�3H2O � Mg3Si2O5(OH)4�Mg(OH)2
forsterite serpentine brucite
88 cm3 111 cm3 25 cm3
�V � 48 cm3
15.2 6.15Mg2SiO4 � 6H2O � 2Mg3Si2O5(OH)4
forsterite serpentine
271 cm3 221 cm3
865 g 90 g 554 g
� 2Mg(OH)2 � 4.3MgO � 2.15SiO2
brucite removed in solution
49 cm3116 g 173 g 129 g
�V � 0
Resolution of this controversy has far-reaching geo-logic implications that go beyond just the nature of theserpentinization itself. For example, if serpentinizationinvolves a volume increase in the thin oceanic litho-sphere at spreading ridges some of the uplift might berelated to infiltration of seawater into hot peridotite inthis extensional rift environment. The global budget of Mg and Si in the oceans could depend on which reaction prevails in the ridge metasomatic system.
Advocates of a constant volume replacement (reac-tion 15.2) cite preservation of relict magmatic texturesin serpentinized peridotite; primary grain outlines onthe scale of millimeters do not seem to show expansion.Yet voluminous Mg- and Si-metasomatism in neigh-boring rocks is not always apparent. On a larger out-crop scale of tens of meters, it is impossible to evaluatevolume changes because of nearly ubiquitous shearzones that cut through the serpentinite body, confusingthe issue of whether the deformation is related to ex-pansion or to tectonic emplacement. O’Hanley (1992)points out that with the predicted volumetric expan-sion during serpentinization the change in dimensionsof relict olivine and pyroxene grains is only on the order of hundredths of a millimeter, which is too smallto be reliably discerned. However, the cumulative effect of volumetric expansion might be more apparenton the scale of tens of centimeters to perhaps a meter.
Indeed, he documents instances where unsheared outcrops consist of distinct, fracture bounded blocks,or “kernels,” of this dimension of peridotite that are surrounded by serpentinite grading inwardly into lessaltered rock. Serpentine-filled fractures radiate fromthe interior of the kernel and become wider outward,consistent with their development during progressiveinward serpentinization and volumetric expansion ofthe block of peridotite (Figure 15.22). Some petrolo-gists have documented a constant ratio between SiO2
and (MgO � CaO � MnO � NiO � total Fe oxide)in variably serpentinized peridotites, ruling out reac-tion 15.2 and supporting 15.1.
Ca in serpentinizing pyroxenes, especially Ca-richclinopyroxenes, in ultramafic protoliths cannot be sequestered in serpentine minerals or several commonaccessory phases. It consequently must exit the opensystem, and is presumed to migrate via advecting fluidsinto adjacent rock where it produces metasomaticrodingite. A wide variety of protoliths adjacent to ser-pentinizing rock can be so metasomatized into Ca-rich,silica-poor assemblages of epidote group minerals, Ca-rich garnet, diopside, prehnite, vesuvianite, and manyother Ca–Al minerals. Na purged from the metasoma-tizing rocks can in turn form nearby metasomatic
464 Igneous and Metamorphic Petrology
Peridotite
Serpentinite
~0.5 m
Initial t1 t2 t3
15.22 Kernel pattern and cross-fractures in serpentinized peridotite.Redrawn from O’Hanley (1992). As serpentinization penetratesinto the core of peridotite, the accompanying volume increaseproduces tensile fractures in the surrounding serpentinite jacket.Progressive inward serpentinization creates outwardly widerchrysotile-filled fractures, as shown at successive steps in timet1, t2, and t3. Actual expansion and fracturing is more contin-uous. Fractures are oriented radially around the core, essentiallyperpendicular to the sharp core–rim interface, and, in a planeparallel to it, form a grid-pattern visible in top of the block.
albitites or, at higher pressures in a subduction setting,jadeitic rocks.
Intimate mixtures of green serpentinite and whitecarbonate rock, seen in polished floor tiles and build-ing façades, is called ophicalcite, from the Greekophites, meaning like a serpent. The carbonate is commonly introduced into openings in cataclastic serpentinite formed in fault zones.
15.2.8 Metasomatic Rock TypesGenerally nonfoliated rocks originating by replacementof pre-existing minerals are described in the followingparagraphs. Serpentinite could have been included here.
Skarn is a calc-silicate rock produced by metaso-matic replacement of predominantly carbonate rock(limestone and dolostone) by Ca–Mg–Fe–Al silicates(Einaudi et al., 1981). Replacement is accomplished byadvecting hydrothermal solutions usually derived froma nearby magmatic intrusion and on a smaller scale byinterdiffusion of components at boundaries betweenlayers of silicate and carbonate rock in contact and regional settings. A wide variety of silicate minerals are formed in contact aureoles, including diopside–hedenbergite, vesuvianite, grossular–andradite, scapolite,and epidote minerals. Economically valuable depositsof magnetite as well as sulfides and oxides of Cu, Mn,Zn, and Pb also occur locally. Most of the world’s tungsten (W) is obtained from scheelite, CaWO4, andwolframite, (Fe,Mn)WO4, in skarns.
Jasperoid is produced in much the same manner asskarn by advecting silica-laden hydrothermal solutions,usually derived from nearby magmatic intrusions.Limestone and dolostone are replaced to varying de-grees by microcrystalline quartz so that the protolithappears unchanged, even preserving a dark gray color.Jasperoid is locally host to economic deposits of Au,Ag, and other metals.
Greisen is a metasomatized granitic rock, commonlyof the S-type, produced by interaction with hydrother-mal solutions having high concentrations of F, B, Li,W, and Sn. Very large time-integrated fluid/rock ratioscreate a greisen composed chiefly of quartz and Li-bearing mica (muscovite, zinnwaldite, or lepidolite)plus accessory topaz, tourmaline, fluorite, rutile, cassi-terite, and wolframite. Some greisens are economic resources of the listed elements.
Fenite is a syenitic product of alkali metasomatismof felsic country rock surrounding intrusions of car-bonatite and some highly alkaline magmas (Figures13.39 and 13.40). The fenitizing Na–K-rich solutionsdesilicate the protolith by replacing any unstablequartz by Na–Fe-rich amphibole and/or pyroxene(Figure 14.21), whereas alkali feldspar remains stable.Apatite and titanite are accessories.
Rodingite is a massive light-colored rock composedof Ca-rich minerals produced by infiltration of Ca-
bearing solutions into rocks surrounding serpentiniz-ing ultramafic protoliths.
Spilite is a metasomatized basalt produced by hydro-thermal activity at ocean ridges and more locally byburial metamorphism. Ca has been removed (chieflyfrom primary calcic plagioclase), along with transitionmetals such as Cu, Ni, Co, and Mn, while Na, H2O,and perhaps Mg have been added. Ti and Al remainconstant. The metasomatic assemblage is of low-gradealbite–oligoclase � chlorite � tremolite–actinolite andlocally includes epidote, pumpellyite, prehnite, andquartz. A light gray (in thin section) aggregate of cryp-tocrystalline titanite (“leucoxene”) commonly replacesprimary Fe–Ti oxides. Magmatic clinopyroxenes andprotolith textures may only partially be replaced. Wide-spread amygdules are of chalcedony, opal, chlorite, calcite, and hydrous Ca–Al silicates. First recognizedover 150 years ago as pillow lavas within ophiolitic sequences, spilites were believed to have have crystal-lized directly from a unique spilitic magma.
The protolith of rare anthophyllite–cordierite rockshas been a long-standing controversy, but they are nowbelieved to originate by recrystallization at moderate-Tand moderate- to low-P of highly metasomatized,Ti–Ca–Na-poor, ocean ridge basalts.
15.2.9 MisfitsInevitably, there will be rocks that cannot be appro-priately matched to any of the foregoing defined rock types. Common misfits are weakly or nonfoliatedrocks of variable grain size and commonly composed of a partially retrograded mineral assemblage. Thesemay simply be called “rock” with an appropriate com-positional qualifier, such as feldspar–quartz–chloriterock.
15.2.10 High-Strain-Rate Rocks in Fault and Shear ZonesBrittle to ductile rock-forming processes (Sections 8.2and 14.1.3) operate where bodies of rock slip rapidlypast one another. During shallow crustal low-T faulting,brittle rock is mechanically broken, crushed, and pul-verized to form a structureless (isotropic) mass of angu-lar fragments possessing cataclastic fabric (Figure 8.7).Coarser fragments make up tectonic or fault breccia,whereas more thoroughly and intensely pulverizedsandy to clay-like material is fault gouge. Subsequentcementation of these cohesionless porous materialsmay occur where dissolved minerals precipitate frominfiltrating ground water, forming a solid cataclasticrock. This term is also used for a nonfoliated cohesiverock formed by processes transitional between brittleand ductile. Very local melting can create pseudo-tachylite (Special Interest Box 11.1).
Ductile deformation in generally deep crustal shearzones creates fine grained, cohesive mylonite.
Petrography of Metamorphic Rocks: Fabric, Composition, and Classification 465
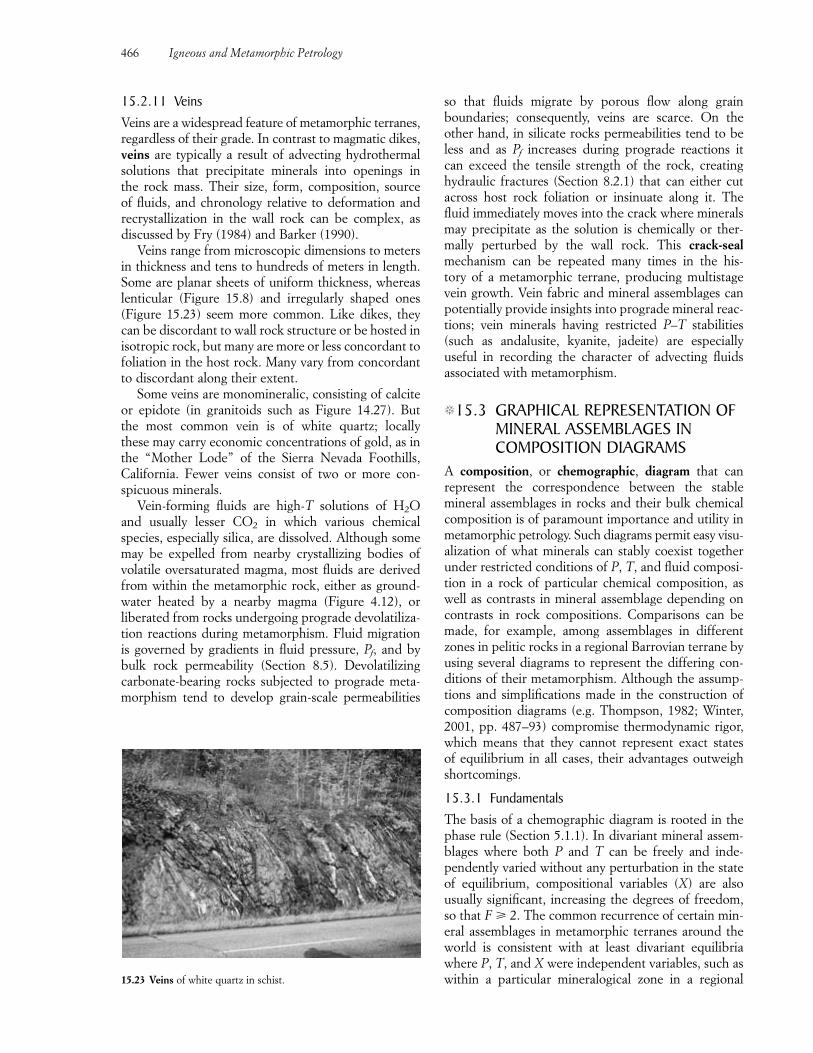
15.2.11 VeinsVeins are a widespread feature of metamorphic terranes,regardless of their grade. In contrast to magmatic dikes,veins are typically a result of advecting hydrothermalsolutions that precipitate minerals into openings in the rock mass. Their size, form, composition, source of fluids, and chronology relative to deformation and recrystallization in the wall rock can be complex, asdiscussed by Fry (1984) and Barker (1990).
Veins range from microscopic dimensions to metersin thickness and tens to hundreds of meters in length.Some are planar sheets of uniform thickness, whereaslenticular (Figure 15.8) and irregularly shaped ones(Figure 15.23) seem more common. Like dikes, theycan be discordant to wall rock structure or be hosted inisotropic rock, but many are more or less concordant tofoliation in the host rock. Many vary from concordantto discordant along their extent.
Some veins are monomineralic, consisting of calciteor epidote (in granitoids such as Figure 14.27). But the most common vein is of white quartz; locally these may carry economic concentrations of gold, as inthe “Mother Lode” of the Sierra Nevada Foothills, California. Fewer veins consist of two or more con-spicuous minerals.
Vein-forming fluids are high-T solutions of H2Oand usually lesser CO2 in which various chemicalspecies, especially silica, are dissolved. Although somemay be expelled from nearby crystallizing bodies ofvolatile oversaturated magma, most fluids are derivedfrom within the metamorphic rock, either as ground-water heated by a nearby magma (Figure 4.12), or liberated from rocks undergoing prograde devolatiliza-tion reactions during metamorphism. Fluid migrationis governed by gradients in fluid pressure, Pf, and bybulk rock permeability (Section 8.5). Devolatilizingcarbonate-bearing rocks subjected to prograde meta-morphism tend to develop grain-scale permeabilities
so that fluids migrate by porous flow along grainboundaries; consequently, veins are scarce. On theother hand, in silicate rocks permeabilities tend to beless and as Pf increases during prograde reactions it can exceed the tensile strength of the rock, creatinghydraulic fractures (Section 8.2.1) that can either cutacross host rock foliation or insinuate along it. Thefluid immediately moves into the crack where mineralsmay precipitate as the solution is chemically or ther-mally perturbed by the wall rock. This crack-sealmechanism can be repeated many times in the his-tory of a metamorphic terrane, producing multistagevein growth. Vein fabric and mineral assemblages canpotentially provide insights into prograde mineral reac-tions; vein minerals having restricted P–T stabilities(such as andalusite, kyanite, jadeite) are especially useful in recording the character of advecting fluids associated with metamorphism.
�15.3 GRAPHICAL REPRESENTATION OFMINERAL ASSEMBLAGES INCOMPOSITION DIAGRAMS
A composition, or chemographic, diagram that canrepresent the correspondence between the stable mineral assemblages in rocks and their bulk chemicalcomposition is of paramount importance and utility inmetamorphic petrology. Such diagrams permit easy visu-alization of what minerals can stably coexist togetherunder restricted conditions of P, T, and fluid composi-tion in a rock of particular chemical composition, aswell as contrasts in mineral assemblage depending oncontrasts in rock compositions. Comparisons can bemade, for example, among assemblages in differentzones in pelitic rocks in a regional Barrovian terrane byusing several diagrams to represent the differing con-ditions of their metamorphism. Although the assump-tions and simplifications made in the construction ofcomposition diagrams (e.g. Thompson, 1982; Winter,2001, pp. 487–93) compromise thermodynamic rigor,which means that they cannot represent exact states of equilibrium in all cases, their advantages outweighshortcomings.
15.3.1 FundamentalsThe basis of a chemographic diagram is rooted in thephase rule (Section 5.1.1). In divariant mineral assem-blages where both P and T can be freely and inde-pendently varied without any perturbation in the stateof equilibrium, compositional variables (X) are alsousually significant, increasing the degrees of freedom,so that F � 2. The common recurrence of certain min-eral assemblages in metamorphic terranes around theworld is consistent with at least divariant equilibriawhere P, T, and X were independent variables, such aswithin a particular mineralogical zone in a regional
466 Igneous and Metamorphic Petrology
15.23 Veins of white quartz in schist.
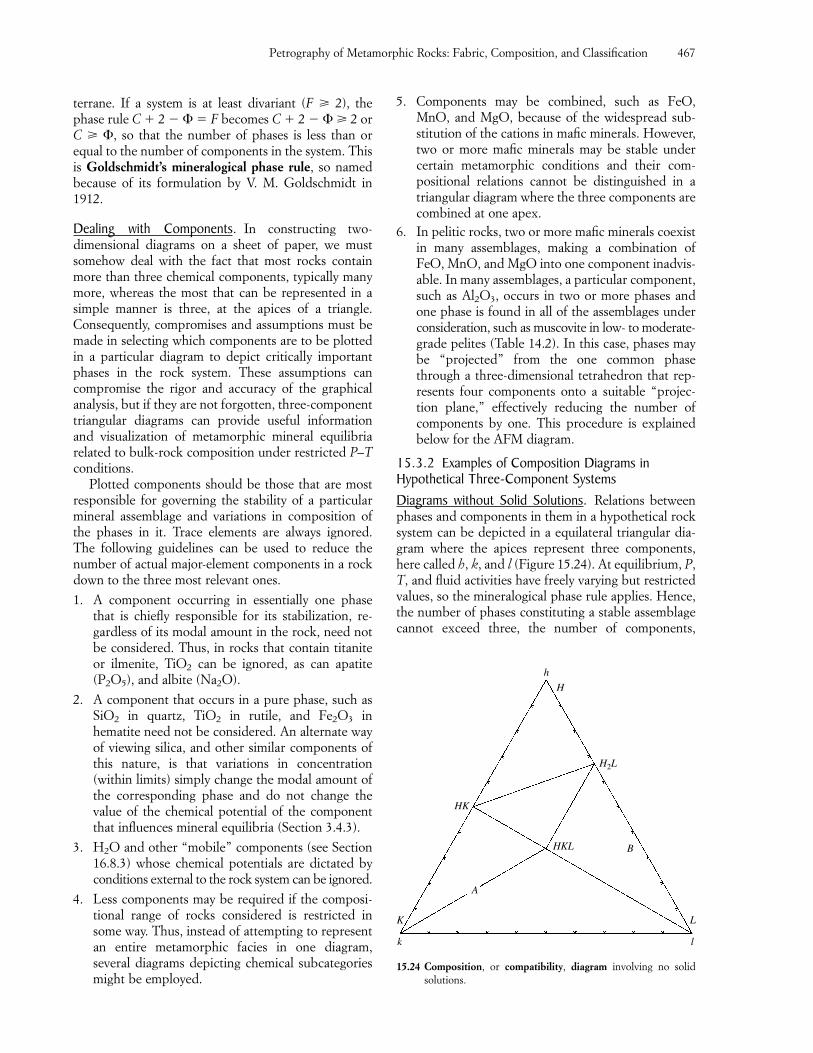
terrane. If a system is at least divariant (F � 2), thephase rule C � 2 � F becomes C � 2 � 2 orC � , so that the number of phases is less than orequal to the number of components in the system. Thisis Goldschmidt’s mineralogical phase rule, so namedbecause of its formulation by V. M. Goldschmidt in1912.
Dealing with Components. In constructing two-dimensional diagrams on a sheet of paper, we mustsomehow deal with the fact that most rocks containmore than three chemical components, typically manymore, whereas the most that can be represented in asimple manner is three, at the apices of a triangle. Consequently, compromises and assumptions must bemade in selecting which components are to be plottedin a particular diagram to depict critically importantphases in the rock system. These assumptions can compromise the rigor and accuracy of the graphicalanalysis, but if they are not forgotten, three-componenttriangular diagrams can provide useful information and visualization of metamorphic mineral equilibria related to bulk-rock composition under restricted P–Tconditions.
Plotted components should be those that are mostresponsible for governing the stability of a particularmineral assemblage and variations in composition ofthe phases in it. Trace elements are always ignored. The following guidelines can be used to reduce thenumber of actual major-element components in a rockdown to the three most relevant ones.
1. A component occurring in essentially one phasethat is chiefly responsible for its stabilization, re-gardless of its modal amount in the rock, need notbe considered. Thus, in rocks that contain titaniteor ilmenite, TiO2 can be ignored, as can apatite(P2O5), and albite (Na2O).
2. A component that occurs in a pure phase, such asSiO2 in quartz, TiO2 in rutile, and Fe2O3 inhematite need not be considered. An alternate wayof viewing silica, and other similar components ofthis nature, is that variations in concentration(within limits) simply change the modal amount ofthe corresponding phase and do not change thevalue of the chemical potential of the componentthat influences mineral equilibria (Section 3.4.3).
3. H2O and other “mobile” components (see Section16.8.3) whose chemical potentials are dictated byconditions external to the rock system can be ignored.
4. Less components may be required if the composi-tional range of rocks considered is restricted insome way. Thus, instead of attempting to representan entire metamorphic facies in one diagram, several diagrams depicting chemical subcategoriesmight be employed.
5. Components may be combined, such as FeO,MnO, and MgO, because of the widespread sub-stitution of the cations in mafic minerals. However,two or more mafic minerals may be stable undercertain metamorphic conditions and their com-positional relations cannot be distinguished in a triangular diagram where the three components arecombined at one apex.
6. In pelitic rocks, two or more mafic minerals coexistin many assemblages, making a combination ofFeO, MnO, and MgO into one component inadvis-able. In many assemblages, a particular component,such as Al2O3, occurs in two or more phases andone phase is found in all of the assemblages underconsideration, such as muscovite in low- to moderate-grade pelites (Table 14.2). In this case, phases maybe “projected” from the one common phasethrough a three-dimensional tetrahedron that rep-resents four components onto a suitable “projec-tion plane,” effectively reducing the number ofcomponents by one. This procedure is explainedbelow for the AFM diagram.
15.3.2 Examples of Composition Diagrams inHypothetical Three-Component SystemsDiagrams without Solid Solutions. Relations betweenphases and components in them in a hypothetical rocksystem can be depicted in a equilateral triangular dia-gram where the apices represent three components,here called h, k, and l (Figure 15.24). At equilibrium, P,T, and fluid activities have freely varying but restrictedvalues, so the mineralogical phase rule applies. Hence,the number of phases constituting a stable assemblagecannot exceed three, the number of components,
Petrography of Metamorphic Rocks: Fabric, Composition, and Classification 467
K
HKL
H2L
HK
B
H
h
A
k
L
l
15.24 Composition, or compatibility, diagram involving no solid solutions.
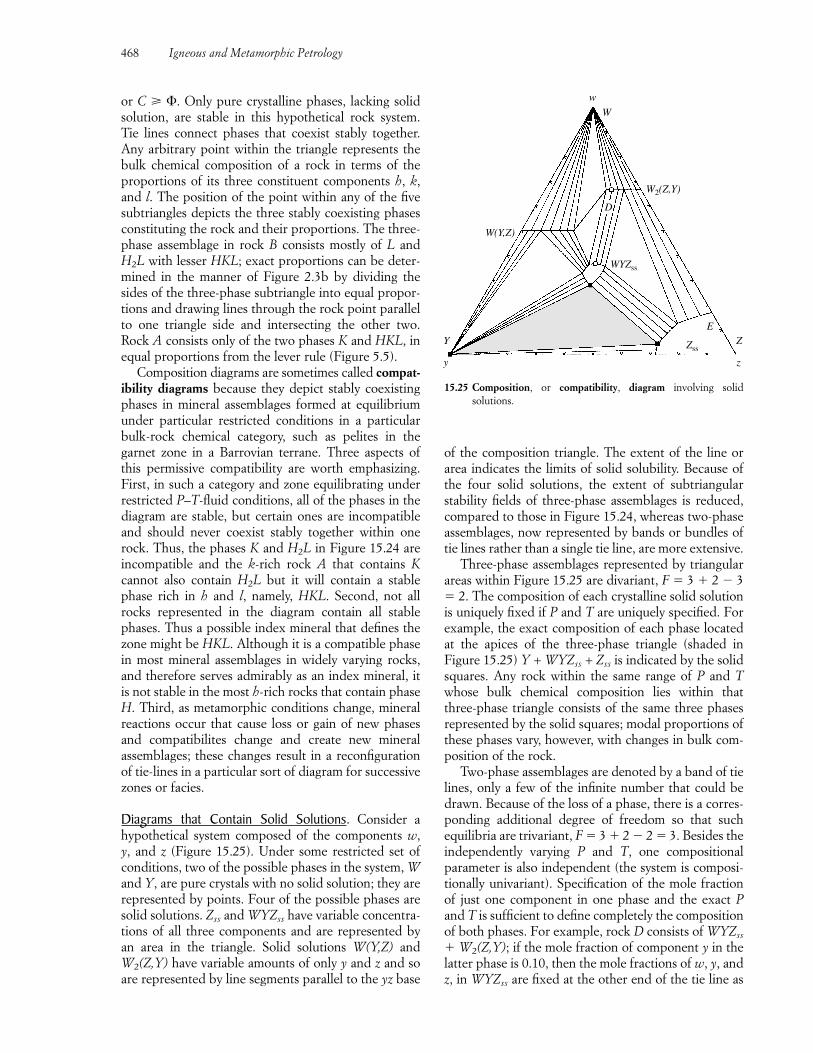
or C � . Only pure crystalline phases, lacking solidsolution, are stable in this hypothetical rock system. Tie lines connect phases that coexist stably together. Any arbitrary point within the triangle represents thebulk chemical composition of a rock in terms of theproportions of its three constituent components h, k,and l. The position of the point within any of the fivesubtriangles depicts the three stably coexisting phasesconstituting the rock and their proportions. The three-phase assemblage in rock B consists mostly of L andH2L with lesser HKL; exact proportions can be deter-mined in the manner of Figure 2.3b by dividing thesides of the three-phase subtriangle into equal propor-tions and drawing lines through the rock point parallelto one triangle side and intersecting the other two.Rock A consists only of the two phases K and HKL, inequal proportions from the lever rule (Figure 5.5).
Composition diagrams are sometimes called compat-ibility diagrams because they depict stably coexistingphases in mineral assemblages formed at equilibriumunder particular restricted conditions in a particularbulk-rock chemical category, such as pelites in the garnet zone in a Barrovian terrane. Three aspects ofthis permissive compatibility are worth emphasizing.First, in such a category and zone equilibrating underrestricted P–T-fluid conditions, all of the phases in thediagram are stable, but certain ones are incompatibleand should never coexist stably together within onerock. Thus, the phases K and H2L in Figure 15.24 areincompatible and the k-rich rock A that contains Kcannot also contain H2L but it will contain a stablephase rich in h and l, namely, HKL. Second, not allrocks represented in the diagram contain all stablephases. Thus a possible index mineral that defines thezone might be HKL. Although it is a compatible phasein most mineral assemblages in widely varying rocks,and therefore serves admirably as an index mineral, itis not stable in the most h-rich rocks that contain phaseH. Third, as metamorphic conditions change, mineralreactions occur that cause loss or gain of new phasesand compatibilites change and create new mineral assemblages; these changes result in a reconfigurationof tie-lines in a particular sort of diagram for successivezones or facies.
Diagrams that Contain Solid Solutions. Consider a hypothetical system composed of the components w, y, and z (Figure 15.25). Under some restricted set of conditions, two of the possible phases in the system, Wand Y, are pure crystals with no solid solution; they arerepresented by points. Four of the possible phases aresolid solutions. Zss and WYZss have variable concentra-tions of all three components and are represented by an area in the triangle. Solid solutions W(Y,Z) andW2(Z,Y) have variable amounts of only y and z and soare represented by line segments parallel to the yz base
of the composition triangle. The extent of the line orarea indicates the limits of solid solubility. Because ofthe four solid solutions, the extent of subtriangular stability fields of three-phase assemblages is reduced,compared to those in Figure 15.24, whereas two-phaseassemblages, now represented by bands or bundles oftie lines rather than a single tie line, are more extensive.
Three-phase assemblages represented by triangularareas within Figure 15.25 are divariant, F � 3 � 2 3 � 2. The composition of each crystalline solid solutionis uniquely fixed if P and T are uniquely specified. Forexample, the exact composition of each phase locatedat the apices of the three-phase triangle (shaded in Figure 15.25) Y + WYZss + Zss is indicated by the solidsquares. Any rock within the same range of P and Twhose bulk chemical composition lies within thatthree-phase triangle consists of the same three phasesrepresented by the solid squares; modal proportions ofthese phases vary, however, with changes in bulk com-position of the rock.
Two-phase assemblages are denoted by a band of tielines, only a few of the infinite number that could bedrawn. Because of the loss of a phase, there is a corres-ponding additional degree of freedom so that suchequilibria are trivariant, F � 3 � 2 2 � 3. Besides theindependently varying P and T, one compositional parameter is also independent (the system is composi-tionally univariant). Specification of the mole fractionof just one component in one phase and the exact Pand T is sufficient to define completely the compositionof both phases. For example, rock D consists of WYZss
� W2(Z,Y); if the mole fraction of component y in thelatter phase is 0.10, then the mole fractions of w, y, andz, in WYZss are fixed at the other end of the tie line as
468 Igneous and Metamorphic Petrology
Y
WYZss
W2(Z,Y)
W(Y,Z)
E
W
w
y
Z
z
Zss
D
15.25 Composition, or compatibility, diagram involving solid solutions.
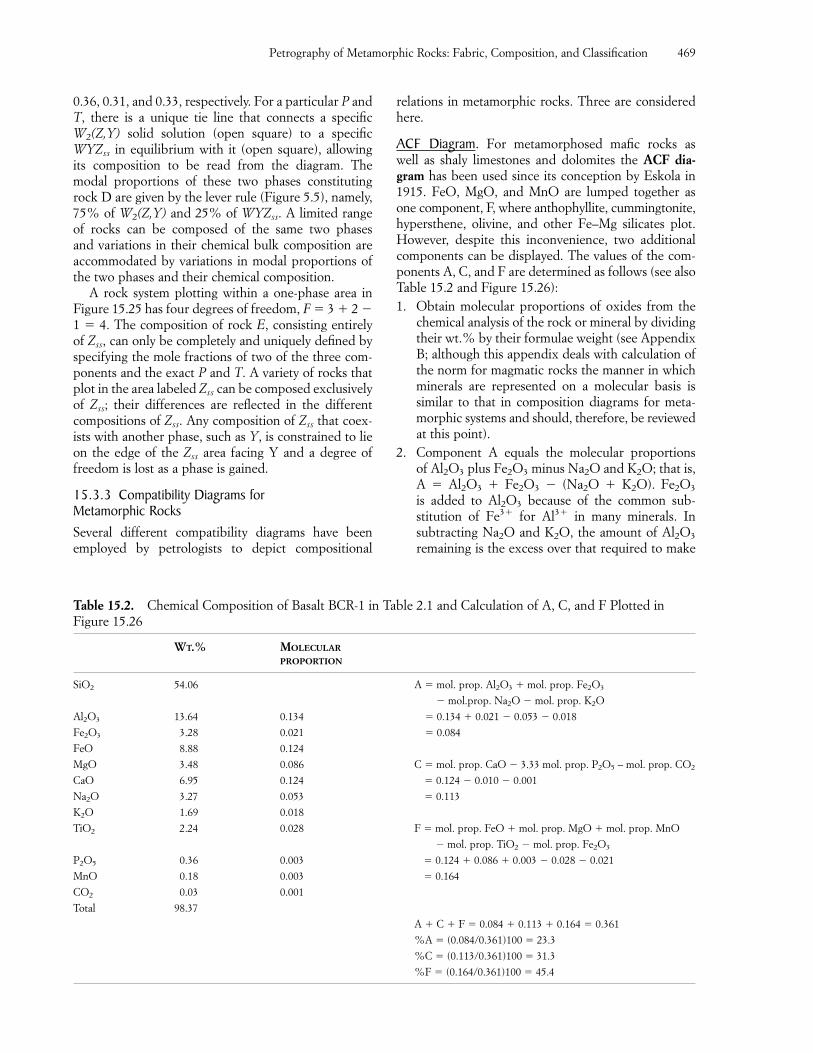
0.36, 0.31, and 0.33, respectively. For a particular P andT, there is a unique tie line that connects a specificW2(Z,Y) solid solution (open square) to a specificWYZss in equilibrium with it (open square), allowingits composition to be read from the diagram. Themodal proportions of these two phases constitutingrock D are given by the lever rule (Figure 5.5), namely,75% of W2(Z,Y) and 25% of WYZss. A limited rangeof rocks can be composed of the same two phases and variations in their chemical bulk composition areaccommodated by variations in modal proportions ofthe two phases and their chemical composition.
A rock system plotting within a one-phase area inFigure 15.25 has four degrees of freedom, F � 3 � 2 1 � 4. The composition of rock E, consisting entirelyof Zss, can only be completely and uniquely defined byspecifying the mole fractions of two of the three com-ponents and the exact P and T. A variety of rocks thatplot in the area labeled Zss can be composed exclusivelyof Zss; their differences are reflected in the differentcompositions of Zss. Any composition of Zss that coex-ists with another phase, such as Y, is constrained to lieon the edge of the Zss area facing Y and a degree offreedom is lost as a phase is gained.
15.3.3 Compatibility Diagrams for Metamorphic RocksSeveral different compatibility diagrams have been employed by petrologists to depict compositional
relations in metamorphic rocks. Three are consideredhere.
ACF Diagram. For metamorphosed mafic rocks as well as shaly limestones and dolomites the ACF dia-gram has been used since its conception by Eskola in1915. FeO, MgO, and MnO are lumped together asone component, F, where anthophyllite, cummingtonite,hypersthene, olivine, and other Fe–Mg silicates plot.However, despite this inconvenience, two additionalcomponents can be displayed. The values of the com-ponents A, C, and F are determined as follows (see alsoTable 15.2 and Figure 15.26):1. Obtain molecular proportions of oxides from the
chemical analysis of the rock or mineral by dividingtheir wt.% by their formulae weight (see AppendixB; although this appendix deals with calculation ofthe norm for magmatic rocks the manner in whichminerals are represented on a molecular basis issimilar to that in composition diagrams for meta-morphic systems and should, therefore, be reviewedat this point).
2. Component A equals the molecular proportions of Al2O3 plus Fe2O3 minus Na2O and K2O; that is,A � Al2O3 � Fe2O3 (Na2O � K2O). Fe2O3
is added to Al2O3 because of the common sub-stitution of Fe3� for Al3� in many minerals. In subtracting Na2O and K2O, the amount of Al2O3
remaining is the excess over that required to make
Petrography of Metamorphic Rocks: Fabric, Composition, and Classification 469
Table 15.2. Chemical Composition of Basalt BCR-1 in Table 2.1 and Calculation of A, C, and F Plotted inFigure 15.26
WT.% MOLECULARPROPORTION
SiO2 54.06 A � mol. prop. Al2O3 � mol. prop. Fe2O3
mol.prop. Na2O mol. prop. K2O
Al2O3 13.64 0.134 � 0.134 � 0.021 0.053 0.018
Fe2O3 3.28 0.021 � 0.084
FeO 8.88 0.124
MgO 3.48 0.086 C � mol. prop. CaO 3.33 mol. prop. P2O5 – mol. prop. CO2
CaO 6.95 0.124 � 0.124 0.010 0.001
Na2O 3.27 0.053 � 0.113
K2O 1.69 0.018
TiO2 2.24 0.028 F � mol. prop. FeO � mol. prop. MgO � mol. prop. MnO
mol. prop. TiO2 mol. prop. Fe2O3
P2O5 0.36 0.003 � 0.124 � 0.086 � 0.003 0.028 0.021
MnO 0.18 0.003 � 0.164
CO2 0.03 0.001
Total 98.37
A � C � F � 0.084 � 0.113 � 0.164 � 0.361
%A � (0.084/0.361)100 � 23.3
%C � (0.113/0.361)100 � 31.3
%F � (0.164/0.361)100 � 45.4
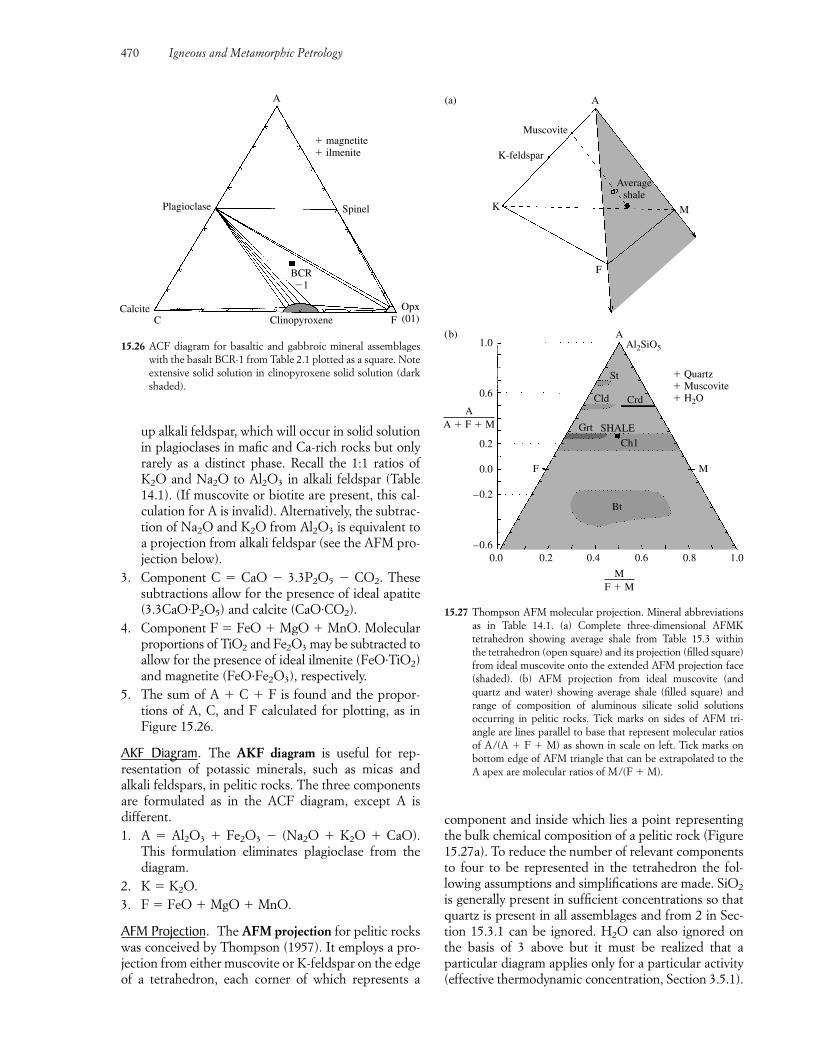
up alkali feldspar, which will occur in solid solutionin plagioclases in mafic and Ca-rich rocks but onlyrarely as a distinct phase. Recall the 1:1 ratios ofK2O and Na2O to Al2O3 in alkali feldspar (Table14.1). (If muscovite or biotite are present, this cal-culation for A is invalid). Alternatively, the subtrac-tion of Na2O and K2O from Al2O3 is equivalent toa projection from alkali feldspar (see the AFM pro-jection below).
3. Component C � CaO 3.3P2O5 CO2. Thesesubtractions allow for the presence of ideal apatite(3.3CaO·P2O5) and calcite (CaO·CO2).
4. Component F � FeO � MgO � MnO. Molecularproportions of TiO2 and Fe2O3 may be subtracted toallow for the presence of ideal ilmenite (FeO·TiO2)and magnetite (FeO·Fe2O3), respectively.
5. The sum of A � C � F is found and the propor-tions of A, C, and F calculated for plotting, as inFigure 15.26.
AKF Diagram. The AKF diagram is useful for rep-resentation of potassic minerals, such as micas and alkali feldspars, in pelitic rocks. The three componentsare formulated as in the ACF diagram, except A is different.1. A � Al2O3 � Fe2O3 (Na2O � K2O � CaO).
This formulation eliminates plagioclase from thediagram.
2. K � K2O.3. F � FeO � MgO � MnO.
AFM Projection. The AFM projection for pelitic rockswas conceived by Thompson (1957). It employs a pro-jection from either muscovite or K-feldspar on the edgeof a tetrahedron, each corner of which represents a
component and inside which lies a point representingthe bulk chemical composition of a pelitic rock (Figure15.27a). To reduce the number of relevant componentsto four to be represented in the tetrahedron the fol-lowing assumptions and simplifications are made. SiO2
is generally present in sufficient concentrations so thatquartz is present in all assemblages and from 2 in Sec-tion 15.3.1 can be ignored. H2O can also ignored onthe basis of 3 above but it must be realized that a particular diagram applies only for a particular activity(effective thermodynamic concentration, Section 3.5.1).
470 Igneous and Metamorphic Petrology
Opx(01)Clinopyroxene
BCR1
CalciteC
Plagioclase Spinel
A
� magnetite� ilmenite
F
15.26 ACF diagram for basaltic and gabbroic mineral assemblageswith the basalt BCR-1 from Table 2.1 plotted as a square. Noteextensive solid solution in clinopyroxene solid solution (darkshaded).
15.27 Thompson AFM molecular projection. Mineral abbreviationsas in Table 14.1. (a) Complete three-dimensional AFMK tetrahedron showing average shale from Table 15.3 within the tetrahedron (open square) and its projection (filled square)from ideal muscovite onto the extended AFM projection face(shaded). (b) AFM projection from ideal muscovite (andquartz and water) showing average shale (filled square) andrange of composition of aluminous silicate solid solutions occurring in pelitic rocks. Tick marks on sides of AFM tri-angle are lines parallel to base that represent molecular ratiosof A/(A � F � M) as shown in scale on left. Tick marks onbottom edge of AFM triangle that can be extrapolated to theA apex are molecular ratios of M/(F � M).
Bt
Al2SiO5
� Quartz� Muscovite� H2O
A
K M
F
Muscovite
K-feldspar
Averageshale
(b)
(a)
AA � F � M
1.0
0.6
0.2
0.0
–0.2
–0.61.00.80.60.40.20.0
A
St
Cld Crd
Grt
F M
SHALE
Ch1
MF � M
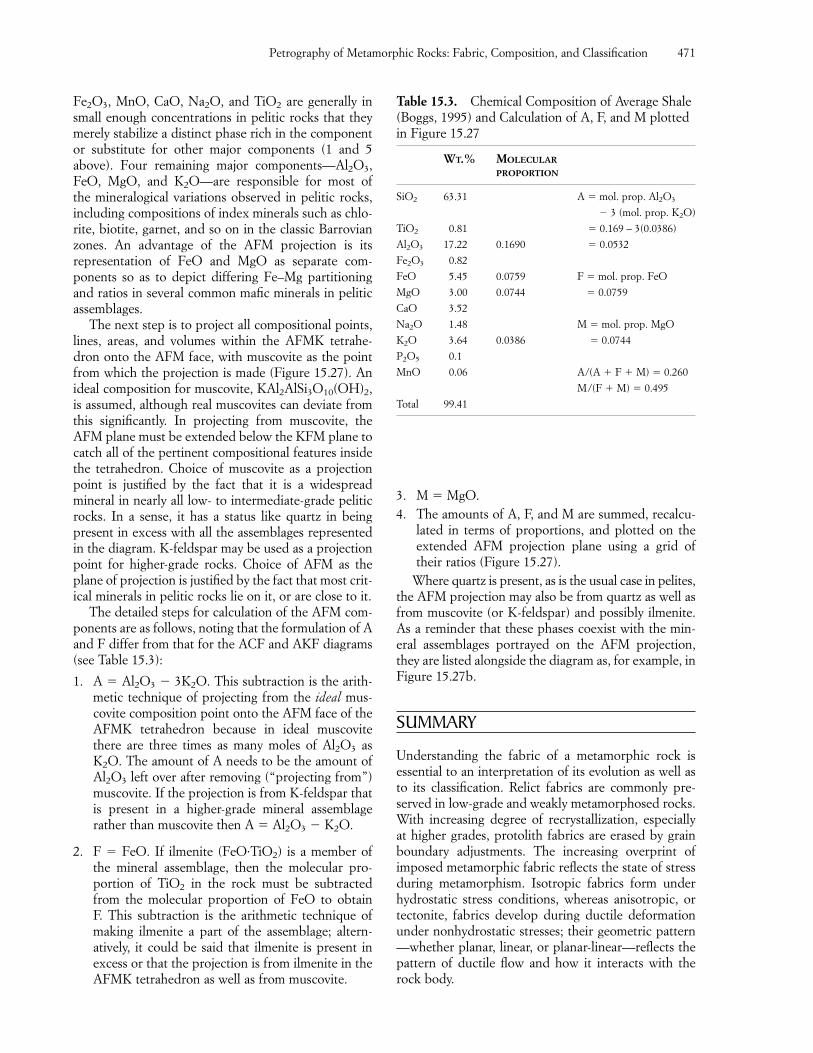
Fe2O3, MnO, CaO, Na2O, and TiO2 are generally insmall enough concentrations in pelitic rocks that theymerely stabilize a distinct phase rich in the componentor substitute for other major components (1 and 5above). Four remaining major components—Al2O3,FeO, MgO, and K2O—are responsible for most of the mineralogical variations observed in pelitic rocks,including compositions of index minerals such as chlo-rite, biotite, garnet, and so on in the classic Barrovianzones. An advantage of the AFM projection is its representation of FeO and MgO as separate com-ponents so as to depict differing Fe–Mg partitioning and ratios in several common mafic minerals in peliticassemblages.
The next step is to project all compositional points,lines, areas, and volumes within the AFMK tetrahe-dron onto the AFM face, with muscovite as the pointfrom which the projection is made (Figure 15.27). Anideal composition for muscovite, KAl2AlSi3O10(OH)2,is assumed, although real muscovites can deviate fromthis significantly. In projecting from muscovite, theAFM plane must be extended below the KFM plane tocatch all of the pertinent compositional features insidethe tetrahedron. Choice of muscovite as a projectionpoint is justified by the fact that it is a widespread mineral in nearly all low- to intermediate-grade peliticrocks. In a sense, it has a status like quartz in beingpresent in excess with all the assemblages representedin the diagram. K-feldspar may be used as a projectionpoint for higher-grade rocks. Choice of AFM as theplane of projection is justified by the fact that most crit-ical minerals in pelitic rocks lie on it, or are close to it.
The detailed steps for calculation of the AFM com-ponents are as follows, noting that the formulation of Aand F differ from that for the ACF and AKF diagrams(see Table 15.3):
1. A � Al2O3 3K2O. This subtraction is the arith-metic technique of projecting from the ideal mus-covite composition point onto the AFM face of theAFMK tetrahedron because in ideal muscovitethere are three times as many moles of Al2O3 asK2O. The amount of A needs to be the amount ofAl2O3 left over after removing (“projecting from”)muscovite. If the projection is from K-feldspar thatis present in a higher-grade mineral assemblagerather than muscovite then A � Al2O3 K2O.
2. F � FeO. If ilmenite (FeO·TiO2) is a member ofthe mineral assemblage, then the molecular pro-portion of TiO2 in the rock must be subtractedfrom the molecular proportion of FeO to obtain F. This subtraction is the arithmetic technique ofmaking ilmenite a part of the assemblage; altern-atively, it could be said that ilmenite is present in excess or that the projection is from ilmenite in theAFMK tetrahedron as well as from muscovite.
3. M � MgO.4. The amounts of A, F, and M are summed, recalcu-
lated in terms of proportions, and plotted on theextended AFM projection plane using a grid oftheir ratios (Figure 15.27).
Where quartz is present, as is the usual case in pelites,the AFM projection may also be from quartz as well asfrom muscovite (or K-feldspar) and possibly ilmenite.As a reminder that these phases coexist with the min-eral assemblages portrayed on the AFM projection, they are listed alongside the diagram as, for example, inFigure 15.27b.
SUMMARY
Understanding the fabric of a metamorphic rock is essential to an interpretation of its evolution as well asto its classification. Relict fabrics are commonly pre-served in low-grade and weakly metamorphosed rocks.With increasing degree of recrystallization, especially at higher grades, protolith fabrics are erased by grainboundary adjustments. The increasing overprint of imposed metamorphic fabric reflects the state of stressduring metamorphism. Isotropic fabrics form underhydrostatic stress conditions, whereas anisotropic, ortectonite, fabrics develop during ductile deformationunder nonhydrostatic stresses; their geometric pattern—whether planar, linear, or planar-linear—reflects thepattern of ductile flow and how it interacts with therock body.
Petrography of Metamorphic Rocks: Fabric, Composition, and Classification 471
Table 15.3. Chemical Composition of Average Shale(Boggs, 1995) and Calculation of A, F, and M plottedin Figure 15.27
WT.% MOLECULARPROPORTION
SiO2 63.31 A � mol. prop. Al2O3
3 (mol. prop. K2O)
TiO2 0.81 � 0.169 – 3(0.0386)
Al2O3 17.22 0.1690 � 0.0532
Fe2O3 0.82
FeO 5.45 0.0759 F � mol. prop. FeO
MgO 3.00 0.0744 � 0.0759
CaO 3.52
Na2O 1.48 M � mol. prop. MgO
K2O 3.64 0.0386 � 0.0744
P2O5 0.1
MnO 0.06 A/(A � F � M) � 0.260
M/(F � M) � 0.495
Total 99.41
In contrast to the intricate and generally quantitativeclassification of magmatic rocks, that for metamorphicrocks is simpler and more flexible; it is based on theprotolith, rock composition, and metamorphic fabric,conditions, and setting. The relict fabric and composi-tion allow a rock to be classified in terms of its pro-tolith as, for example, a metaconglomerate, metatuff, ororthogneiss. Most metamorphic rocks can be classifiedinto one of three broad categories of metamorphic fabric, namely:
1. Strongly foliated slate, phyllite, and schist of in-creasing grain size that are found over widespreadregional metamorphic terranes.
2. Weakly foliated rocks that include gneiss, dynamic-ally recrystallized mylonite in ductile shear zones,and migmatite developed in deep crustal, high-grade terranes.
3. Essentially nonfoliated amphibolite, granofels,greenstone, marble, quartzite, and serpentinite are widespread in regional terranes, whereascharnockitic rocks are less common and eclogiterare. Isotropic-textured hornfels is developed bythermal metamorphism, most commonly of peliticprotoliths, in contact aureoles around magmatic intrusions. Metasomatic skarn, greisen, and feniteare also developed around magmatic intrusions,whereas rodingite and spilite are created by re-placement processes near bodies of serpentinitizingultramafic rocks and from seafloor basalt nearoceanic ridges, respectively.
Widespread veins, most commonly of quartz, testifyof advecting hydrothermal solutions moving throughmetamorphosing rock masses.
By judicious choice of relevant components, the bulkchemical compositions of rocks and their constituentmineral assemblages may be plotted on an appropriatetriangular composition diagram to assess compatibilit-ies for a restricted range of P–T-fluid composition.
CRITICAL THINKING QUESTIONS15.1 Justify the use of so few metamorphic rock
names relative to magmatic.15.2 A sequence of shales and shaly dolomites next
to a magmatic intrusion has been recrystallizedto granoblastic rocks that have conspicuousrelict bedding. Constituent minerals are severalCa–Al–Mg–Fe silicates. Comparison of theirbulk chemical composition with beds of un-metamorphosed rocks along strike some dis-tance away indicates the major chemical changeis restricted to a loss of H2O and CO2. Whatwould you name these metamorphic rocks? Jus-tify your answer.
15.3 Why cannot metamorphic facies be used forclassification of an individual rock sample?
15.4 What are possible protoliths of a quartz–feldspar granofels? How could it be distin-guished from a unmetamorphosed granitoid?
15.5 What is the origin of secondary magnetite inserpentinite? Would you expect the magnetitegrains to be robust euhedra as they commonlyare in magmatic rocks (e.g. Figures 7.9 and7.16)? Discuss.
15.6 Imagine a planetary body entirely lacking involatiles. How would this lack impact theclassification of metamorphic rocks examinedby a geologist roaming over the surface of theplanet?
15.7 Is serpentinite a metasomatic rock? Discuss.15.8 What arguments could you present to justify the
metasomatic origin of spilite, rather than directcrystallization from a unique spilite magma?
15.9 Using any chemical analysis of a basaltic rock inthis textbook, indicate where the major and mi-nor elements are sequestered in the minerals ofan eclogite (clinopyroxene � garnet � rutile).
472 Igneous and Metamorphic Petrology
FUNDAMENTAL QUESTIONSCONSIDERED IN THIS CHAPTER
1. What types of mineral reactions allowmetamorphic systems to attain new states of morestable thermodynamic equilibrium?
2. What parameters govern mineral reactions andhow can they be evaluated and graphed to depictthe course of changing metamorphic systems?
3. How does the composition of fluids influencemetamorphic mineral reactions?
4. What do metamorphic reactions tell about theflow of fluids in the crust? About the significanceof isograds?
5. How can mineral equilibria and assemblages serve as geothermobarometers to elucidate P–Tconditions of metamorphism?
INTRODUCTION
Changes in P, T, and/or X (chemical composition) ofsufficient magnitude in a metamorphic system can create a new state of more stable thermodynamic equi-librium. Any new mineralogical state is reached via oneor more mineralogical reactions that consume initialless stable reactant phases in favor of new, more stableproduct phases. Concepts of equilibrium thermody-namics (Chapter 3) provide a fruitful context for studyof these changes.
Great strides have been made over the past decadesin our understanding of the metamorphic changes driving mineral reactions and forming specific mineral
assemblages. This understanding of mineral paragene-sis has come from extensive laboratory studies fosteredby development of experimental apparatus and tech-niques that simulate P–T–X conditions in metamor-phic systems and by determinations of thermodynamicparameters that can be applied to mineral equilibria.However, experimental data regarding paragenesis insubsolidus metamorphic systems must be interpretedcautiously because of widespread kinetic problemswith metastable phases, especially those preservedfrom some prior state. For the same reasons, miner-alogical compositions of real metamorphic rocks mustbe interpreted cautiously; disequilibrium states arecommon.
The history of mineral reactions can be preserved inreaction textures in which products of mineralogicalreactions as well as remaining relics of the initial reactant minerals are found in close spatial association.Examples of reaction textures include pseudomorphicreplacement of garnet by aggregates of chlorite in the retrograded eclogite in Figure 14.27b, replace-ment of olivine and orthopyroxene by serpentine (Figure 15.21), and coronas (see Figure 16.6). But evendeceptively simple pseudomorphic replacements can bedifficult to interpret; it is generally impossible to writea balanced stoichiometric reaction for something assimple as anhydrous phase � H2O → hydrous phase.Local, grain-scale changes in chemical compositionduring open system behavior are probably the rulerather than the exception. An equally serious problemis that reaction textures are distressingly uncommonin metamorphic rocks. Grains of product phases com-monly do not grow directly in contact with grains of reactant phases, as in pseudomorphic replacements.Rather, reactants and products may be separated by
MetamorphicMineral Reactionsand Equilibria
16CHAPTER
grains that seemingly did not participate in the reac-tion. Textural evidence for a mineral reaction across anisograd in a metamorpic terrane may not be obvious.Careful integration of all textural and mineralogicalproperties of rocks may be required to comprehendpast reactions.
Plentiful evidence indicates that fluids are intimatelyinvolved in many, if not most, metamorphic mineral reactions, either liberated from reacting phases, incorp-orated into product phases, or indirectly involved as a catalyst and medium of ionic transport. In manymetamorphic rocks, the availability of a catalytic inter-granular fluid is deemed to be kinetically necessary toaccount for various mineralogical and textural aspects.In a larger geologic sense, flow of fluids during meta-morphism has a profound impact not only on thecourse of mineral reactions but also on movement ofmass and heat in the crust.
This chapter begins with a summary of criteria for evaluation of mineral equilibrium in metamorphicrocks. Following discussions of mineral reactions beginwith solids of fixed composition, progress to those in-volving solid solution and then to reactions in which afluid plays a critical role and, lastly, treat reactions influid-rich open metasomatic systems. The chapter con-cludes with comments on the role of kinetics in mineralreactions and how they might actually take place, and,finally, how mineral equilibria can be used in geother-mobarometry to determine the T and P of metamor-phism and to assess isograds in zoned metamorphicterranes.
Four major books—all published at about the sametime by established petrologists—deal with metamor-phic mineral equilibria and reactions. Bucher and Frey(1994) and Miyashiro (1994) are essentially descriptive,whereas Kretz (1994) and Spear (1993) provide a morerigorous thermodynamic approach. A recent well bal-anced summary is Winter (2001).
Mineral abbreviations used in this chapter are fromTable 14.1.
�16.1 EQUILIBRIUM MINERALASSEMBLAGES
In metamorphic terranes, equilibration of minerals toprevailing P–T conditions is suggested by consistentcorrelations between mineralogical composition andbulk chemical composition—as embodied in the faciesconcept—and by systematic geographic variations inmineralogical composition in a particular chemicalrock group—reflected in metamorphic zones. It maybe necessary to identify and distinguish between con-trasting bulk chemical domains, if such are present.For example, layers of calc–silicate and pelitic rockmetamorphosed under the same P–T conditions will have different stable mineral assemblages, each
developed in a state of local equilibrium. On the scaleof a thin section, verification of what coexisting min-erals constitute a stable equilibrium mineral assemblageis not easy, especially in polymetamorphic rocks. The following criteria for equilibrium (e.g. Vernon, 1977;Yardley, 1989) should be evaluated, keeping in mindthat they are only necessary conditions, never sufficientto prove stable equilibrium. Some criteria are textural(see Chapter 17).1. Absence of known incompatible mineral pairs,
such as quartz � magnesian olivine (Figure 5.8) orhematite � graphite. Stabilization of hematite re-quires relatively oxidizing conditions of high oxy-gen fugacity, whereas graphite requires relativelylow oxygen fugacity.
2. All phases are in mutual contact with one another,with due recognition of the third dimension aboveand below the plane of the two-dimensional thinsection. Grains of new phases tend to nucleate andgrow along intergrain boundaries; consequently, ifa particular mineral grain becomes isolated fromthe intergrain network it may be unable to reactfurther and equilibrate with diffusing components.A particular phase occurring only as grains inside a corona or only as inclusions in a poikiloblastshould thus be suspect, as it may belong to an earl-ier assemblage of minerals. On the other hand, aparticular mineral might selectively nucleate on another, such as sillimanite on biotite (see Figure16.2), precluding mutual contact with all otherequilibrium phases in the rock.
3. No evidence of replacement of one mineral by another. Aggregates of chlorite fringing garnet or having the typical dodecahedral outline of garnet(Figure 14.27b) are likely to be a product of retro-grade hydration, as are fine grained white mica re-placements of Al2SiO5 polymorphs and feldspars.Caution is required where relict primary grains in a magmatic rock are selectively replaced by fine aggregates of specific minerals under essentiallyequilibrium conditions and where partial replace-ment results from an arrested reaction caused byexhaustion of a reacting phase, including a fluid.
4. Absence of grain domains showing deformation adjacent to domains showing strain-free grains thatmight have grown under different conditions (seeSection 17.3).
5. Grains have shapes indicative of minimum surfaceenergy such as develop in granoblastic aggregates(Figure 14.6c, d) and where a crystalloblastic seriesis expressed (Section 14.1.4 and Figure 14.17d).Texturally equilibrated grain shapes may not beequant if the mineral in question possesses strongenergy anisotropy (see Section 17.1.2). In fine-grained low-grade rocks or other instances where
474 Igneous and Metamorphic Petrology
time was insufficient to equilibrate the texture, grainswill not have equilibrated shapes (Figure 14.6a)even though a state of chemical equilibrium mayhave been achieved. Chemical equilibrium tends tobe attained faster than textural equilibrium.
6. Microprobe analyses reveal mineral grains are uni-form in composition so that the distribution ofchemical elements is similar between pairs of min-erals in different parts of the rock. If a particularphase occurs as zoned grains, the edges of severalgrains which are all adjacent to grains of anotherphase should be of similar composition. This criter-ion manifests a state of local equilibrium. Interiorsof zoned grains may not be in equilibrium withother phases (2 above).
�16.2 OVERVIEW OF METAMORPHICMINERAL REACTIONS
Mineral reactions can be classified with regard to the phases that are involved (A and B below) or with regard to the reaction mechanisms and equilibrium conditions (C and D).
A. Solid–solid reactions involve only solid phases asreactants and products without direct participationof a volatile phase. A fluid may, nonetheless, be apassive or indirect catalytic participant, enhancingnucleation and providing a medium for diffusivetransport of ions redistributed during growth of thenew products.
B. Solid–fluid reactions (Section 16.6) release or con-sume a volatile fluid and depend not only on P andT but the composition of the volatile as well. Redoxreactions (Section 16.9) are driven by changes in Tand fugacities of volatiles, principally oxygen, andresult in changes of oxidation states and types ofvariable-valence phases in assemblages. Metasomaticreactions (Section 16.8) occur in open metamorphicsystems where exchange of components betweeninvasive fluids and the solid phases in a rock resultsin an entirely new product mineral assemblage.
C. Discontinuous reactions occur, ideally, at a single Tat a particular P. Reactant and product phases arein equilibrium along a univariant boundary line(Section 5.1.1) in P–T space. Discontinuous reac-tions are of two types:
1. Polymorphic phase transitions (Section 16.3)involve transformation of one solid phase to another of identical chemical composition butdifferent atomic structure in a one-componentsystem, such as calcite → aragonite.
2. Net-transfer (heterogeneous) reactions (Sec-tion 16.4) involve marked movement of matteramong multiple phases, consuming reactants
and producing new phases. Modal proportionsof the compositionally contrasting phases changeduring the course of the reaction.
D. Continuous reactions (Section 16.5) are continu-ously at equilibrium over a range of values of thecontrolling intensive variables as a result of sub-stantial compositional variation (solid solution) inthe reactant and product phases. Chemical com-positions of participating phases and their modalproportions change during the course of the reac-tion. A continuous reaction becomes a discon-tinuous one if only pure end-member phases are considered. An exchange reaction (Section 16.5.2)is a special subclass in which there is no change inmodal proportions of reactant and product phases,only in the concentrations of substitutive ions, such as Fe and Mg, changing the Fe/(Fe � Mg) ratio in participating mafic garnet, cordierite, andso on.
Except for polymorphic transitions, most reactionsin metamorphic rocks are combinations of these idealend-member types.
�16.3 POLYMORPHIC TRANSITIONS
The presence of a polymorph can potentially provideimportant constraints on P–T conditions in the appro-priate chemical categories of a rock where it occurs because only these two intensive parameters controlthe stability of the phases of like chemical composition.In theory, polymorph stability and positions of bound-ary lines in P–T space are unaffected by other chemicalcomponents than those making up the pure poly-morphs themselves and that do not dissolve in thepolymorphs. Thus, phase equilibria between quartzand coesite in a SiO2 system flooded with CO2 or in the presence of CaO and FeO are no different from the pure system without these additional components.
It should also be noted that kinetic factors can com-promise the stability relations of polymorphs in rocks.
In any stability field of a particular polymorph, bothP and T can be freely and independently varied with-out any perturbation in the state of equilibrium. This is a state of divariant equilibrium where there are two degrees of freedom, F � 2. Divariant stability fields are separated by univariant boundary lines where twophases coexist stably together. This decrease in thevariance in systems of fixed composition follows fromthe Gibbs phase rule (Section 5.1.1): for every increasein the number of phases the degree of freedom de-creases by one. From the Clapeyron Equation (3.13),boundary lines are straight provided the changes in entropy and molar volume, �S and �V, of the poly-morphic transition are constant and do not vary withrespect to P and T, or variations in these parameters
Metamorphic Mineral Reactions and Equilibria 475
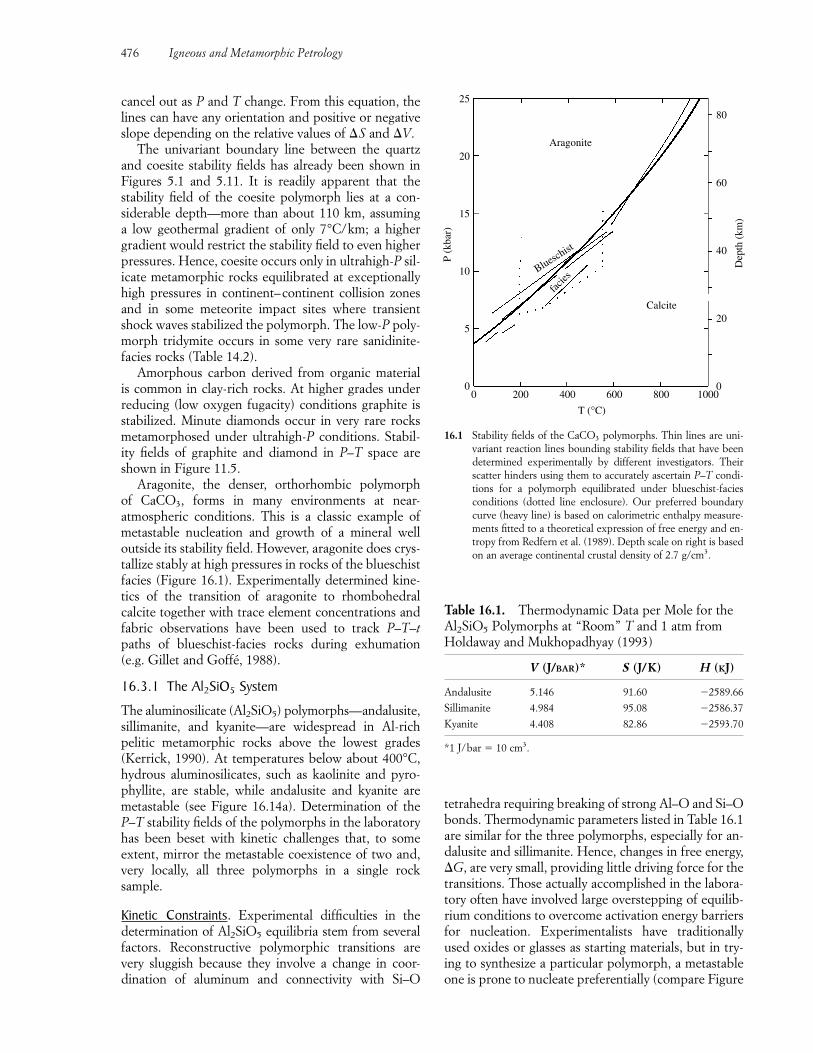
cancel out as P and T change. From this equation, thelines can have any orientation and positive or negativeslope depending on the relative values of �S and �V.
The univariant boundary line between the quartzand coesite stability fields has already been shown inFigures 5.1 and 5.11. It is readily apparent that the stability field of the coesite polymorph lies at a con-siderable depth—more than about 110 km, assuming a low geothermal gradient of only 7°C/km; a highergradient would restrict the stability field to even higherpressures. Hence, coesite occurs only in ultrahigh-P sil-icate metamorphic rocks equilibrated at exceptionallyhigh pressures in continent–continent collision zonesand in some meteorite impact sites where transientshock waves stabilized the polymorph. The low-P poly-morph tridymite occurs in some very rare sanidinite-facies rocks (Table 14.2).
Amorphous carbon derived from organic material is common in clay-rich rocks. At higher grades underreducing (low oxygen fugacity) conditions graphite isstabilized. Minute diamonds occur in very rare rocksmetamorphosed under ultrahigh-P conditions. Stabil-ity fields of graphite and diamond in P–T space areshown in Figure 11.5.
Aragonite, the denser, orthorhombic polymorph of CaCO3, forms in many environments at near-atmospheric conditions. This is a classic example ofmetastable nucleation and growth of a mineral welloutside its stability field. However, aragonite does crys-tallize stably at high pressures in rocks of the blueschistfacies (Figure 16.1). Experimentally determined kine-tics of the transition of aragonite to rhombohedral calcite together with trace element concentrations andfabric observations have been used to track P–T–tpaths of blueschist-facies rocks during exhumation(e.g. Gillet and Goffé, 1988).
16.3.1 The Al2SiO5 System
The aluminosilicate (Al2SiO5) polymorphs—andalusite,sillimanite, and kyanite—are widespread in Al-richpelitic metamorphic rocks above the lowest grades(Kerrick, 1990). At temperatures below about 400°C,hydrous aluminosilicates, such as kaolinite and pyro-phyllite, are stable, while andalusite and kyanite aremetastable (see Figure 16.14a). Determination of theP–T stability fields of the polymorphs in the laboratoryhas been beset with kinetic challenges that, to some extent, mirror the metastable coexistence of two and,very locally, all three polymorphs in a single rock sample.
Kinetic Constraints. Experimental difficulties in thedetermination of Al2SiO5 equilibria stem from severalfactors. Reconstructive polymorphic transitions arevery sluggish because they involve a change in coor-dination of aluminum and connectivity with Si–O
tetrahedra requiring breaking of strong Al–O and Si–Obonds. Thermodynamic parameters listed in Table 16.1are similar for the three polymorphs, especially for an-dalusite and sillimanite. Hence, changes in free energy,�G, are very small, providing little driving force for thetransitions. Those actually accomplished in the labora-tory often have involved large overstepping of equilib-rium conditions to overcome activation energy barriersfor nucleation. Experimentalists have traditionallyused oxides or glasses as starting materials, but in try-ing to synthesize a particular polymorph, a metastableone is prone to nucleate preferentially (compare Figure
476 Igneous and Metamorphic Petrology
P (k
bar)
Dep
th (
km)
25
20
15
10
5
0
80
60
40
20
00 200 400 600 800 1000
T (°C)
Calcite
facies
Blueschist
Aragonite
16.1 Stability fields of the CaCO3 polymorphs. Thin lines are uni-variant reaction lines bounding stability fields that have beendetermined experimentally by different investigators. Theirscatter hinders using them to accurately ascertain P–T condi-tions for a polymorph equilibrated under blueschist-faciesconditions (dotted line enclosure). Our preferred boundarycurve (heavy line) is based on calorimetric enthalpy measure-ments fitted to a theoretical expression of free energy and en-tropy from Redfern et al. (1989). Depth scale on right is basedon an average continental crustal density of 2.7 g/cm3.
Table 16.1. Thermodynamic Data per Mole for theAl2SiO5 Polymorphs at “Room” T and 1 atm fromHoldaway and Mukhopadhyay (1993)
V (J/BAR)* S (J/K) H (KJ)
Andalusite 5.146 91.60 �2589.66
Sillimanite 4.984 95.08 �2586.37
Kyanite 4.408 82.86 �2593.70
*1 J/bar � 10 cm3.
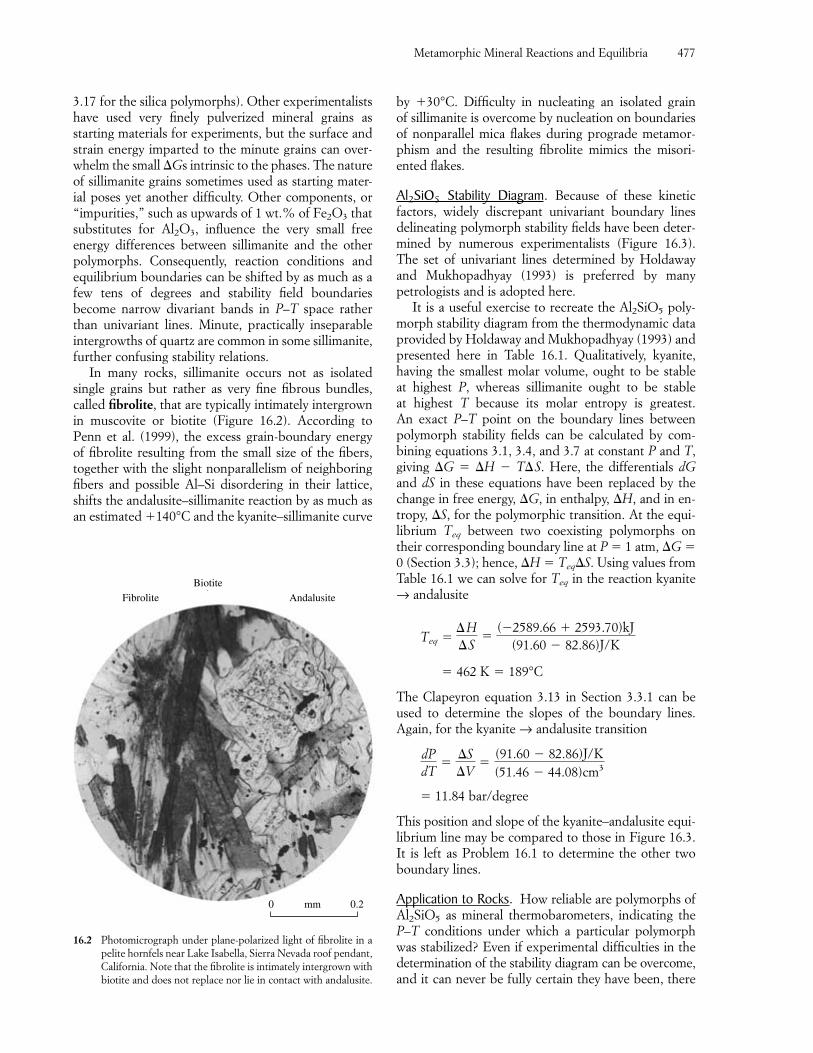
3.17 for the silica polymorphs). Other experimentalistshave used very finely pulverized mineral grains as starting materials for experiments, but the surface andstrain energy imparted to the minute grains can over-whelm the small �Gs intrinsic to the phases. The natureof sillimanite grains sometimes used as starting mater-ial poses yet another difficulty. Other components, or“impurities,” such as upwards of 1 wt.% of Fe2O3 thatsubstitutes for Al2O3, influence the very small free energy differences between sillimanite and the otherpolymorphs. Consequently, reaction conditions andequilibrium boundaries can be shifted by as much as afew tens of degrees and stability field boundaries become narrow divariant bands in P–T space ratherthan univariant lines. Minute, practically inseparableintergrowths of quartz are common in some sillimanite,further confusing stability relations.
In many rocks, sillimanite occurs not as isolated single grains but rather as very fine fibrous bundles,called fibrolite, that are typically intimately intergrownin muscovite or biotite (Figure 16.2). According toPenn et al. (1999), the excess grain-boundary energy of fibrolite resulting from the small size of the fibers, together with the slight nonparallelism of neighboringfibers and possible Al–Si disordering in their lattice,shifts the andalusite–sillimanite reaction by as much asan estimated �140°C and the kyanite–sillimanite curve
by �30°C. Difficulty in nucleating an isolated grain of sillimanite is overcome by nucleation on boundariesof nonparallel mica flakes during prograde metamor-phism and the resulting fibrolite mimics the misori-ented flakes.
Al2SiO5 Stability Diagram. Because of these kineticfactors, widely discrepant univariant boundary linesdelineating polymorph stability fields have been deter-mined by numerous experimentalists (Figure 16.3).The set of univariant lines determined by Holdawayand Mukhopadhyay (1993) is preferred by manypetrologists and is adopted here.
It is a useful exercise to recreate the Al2SiO5 poly-morph stability diagram from the thermodynamic dataprovided by Holdaway and Mukhopadhyay (1993) andpresented here in Table 16.1. Qualitatively, kyanite,having the smallest molar volume, ought to be stable at highest P, whereas sillimanite ought to be stable at highest T because its molar entropy is greatest. An exact P–T point on the boundary lines between polymorph stability fields can be calculated by com-bining equations 3.1, 3.4, and 3.7 at constant P and T,giving �G � �H � T�S. Here, the differentials dGand dS in these equations have been replaced by thechange in free energy, �G, in enthalpy, �H, and in en-tropy, �S, for the polymorphic transition. At the equi-librium Teq between two coexisting polymorphs ontheir corresponding boundary line at P � 1 atm, �G �0 (Section 3.3); hence, �H � Teq�S. Using values fromTable 16.1 we can solve for Teq in the reaction kyanite→ andalusite
The Clapeyron equation 3.13 in Section 3.3.1 can beused to determine the slopes of the boundary lines.Again, for the kyanite → andalusite transition
� 11.84 bar/degree
This position and slope of the kyanite–andalusite equi-librium line may be compared to those in Figure 16.3.It is left as Problem 16.1 to determine the other twoboundary lines.
Application to Rocks. How reliable are polymorphs ofAl2SiO5 as mineral thermobarometers, indicating theP–T conditions under which a particular polymorphwas stabilized? Even if experimental difficulties in thedetermination of the stability diagram can be overcome,and it can never be fully certain they have been, there
dPdT
��S�V
�(91.60 � 82.86)J/K(51.46 � 44.08)cm3
� 462 K � 189°C
Teq ��H�S
�(�2589.66 � 2593.70)kJ
(91.60 � 82.86)J/K
Metamorphic Mineral Reactions and Equilibria 477
0 0.2mm
Fibrolite
Biotite
Andalusite
16.2 Photomicrograph under plane-polarized light of fibrolite in apelite hornfels near Lake Isabella, Sierra Nevada roof pendant,California. Note that the fibrolite is intimately intergrown withbiotite and does not replace nor lie in contact with andalusite.
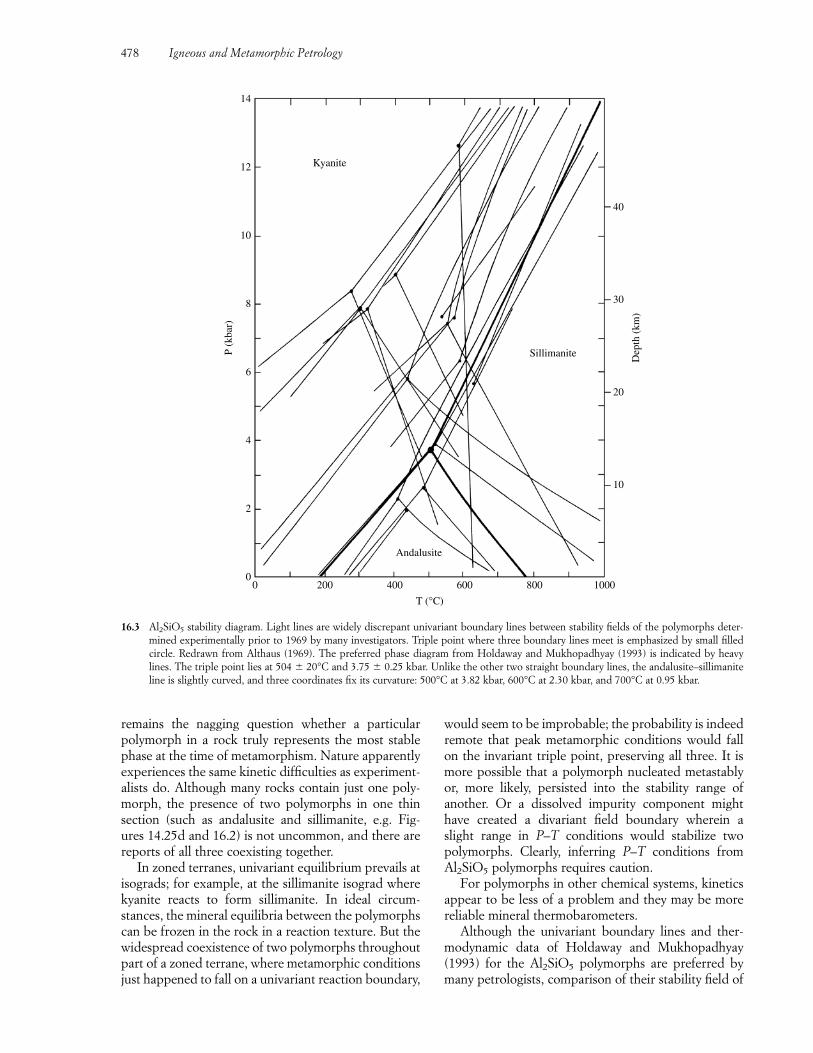
remains the nagging question whether a particularpolymorph in a rock truly represents the most stablephase at the time of metamorphism. Nature apparentlyexperiences the same kinetic difficulties as experiment-alists do. Although many rocks contain just one poly-morph, the presence of two polymorphs in one thinsection (such as andalusite and sillimanite, e.g. Fig-ures 14.25d and 16.2) is not uncommon, and there arereports of all three coexisting together.
In zoned terranes, univariant equilibrium prevails atisograds; for example, at the sillimanite isograd wherekyanite reacts to form sillimanite. In ideal circum-stances, the mineral equilibria between the polymorphscan be frozen in the rock in a reaction texture. But thewidespread coexistence of two polymorphs throughoutpart of a zoned terrane, where metamorphic conditionsjust happened to fall on a univariant reaction boundary,
would seem to be improbable; the probability is indeedremote that peak metamorphic conditions would fallon the invariant triple point, preserving all three. It ismore possible that a polymorph nucleated metastablyor, more likely, persisted into the stability range of another. Or a dissolved impurity component mighthave created a divariant field boundary wherein a slight range in P–T conditions would stabilize twopolymorphs. Clearly, inferring P–T conditions fromAl2SiO5 polymorphs requires caution.
For polymorphs in other chemical systems, kineticsappear to be less of a problem and they may be morereliable mineral thermobarometers.
Although the univariant boundary lines and ther-modynamic data of Holdaway and Mukhopadhyay(1993) for the Al2SiO5 polymorphs are preferred bymany petrologists, comparison of their stability field of
478 Igneous and Metamorphic Petrology
P (k
bar)
Dep
th (
km)
14
12
10
8
6
4
2
0
40
30
20
10
0 200 400 600 800
Kyanite
Sillimanite
Andalusite
1000
T (°C)
16.3 Al2SiO5 stability diagram. Light lines are widely discrepant univariant boundary lines between stability fields of the polymorphs deter-mined experimentally prior to 1969 by many investigators. Triple point where three boundary lines meet is emphasized by small filledcircle. Redrawn from Althaus (1969). The preferred phase diagram from Holdaway and Mukhopadhyay (1993) is indicated by heavylines. The triple point lies at 504 � 20°C and 3.75 � 0.25 kbar. Unlike the other two straight boundary lines, the andalusite–sillimaniteline is slightly curved, and three coordinates fix its curvature: 500°C at 3.82 kbar, 600°C at 2.30 kbar, and 700°C at 0.95 kbar.
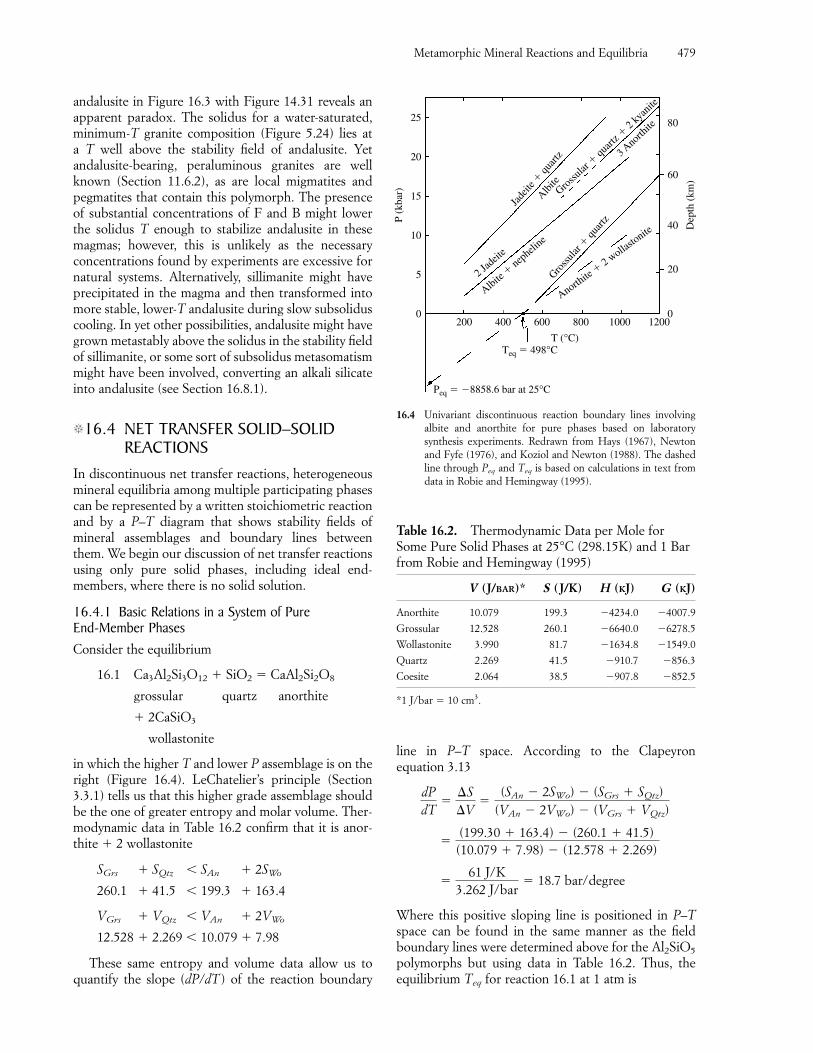
andalusite in Figure 16.3 with Figure 14.31 reveals anapparent paradox. The solidus for a water-saturated,minimum-T granite composition (Figure 5.24) lies at a T well above the stability field of andalusite. Yet andalusite-bearing, peraluminous granites are wellknown (Section 11.6.2), as are local migmatites andpegmatites that contain this polymorph. The presenceof substantial concentrations of F and B might lowerthe solidus T enough to stabilize andalusite in thesemagmas; however, this is unlikely as the necessary concentrations found by experiments are excessive fornatural systems. Alternatively, sillimanite might haveprecipitated in the magma and then transformed intomore stable, lower-T andalusite during slow subsoliduscooling. In yet other possibilities, andalusite might havegrown metastably above the solidus in the stability fieldof sillimanite, or some sort of subsolidus metasomatismmight have been involved, converting an alkali silicateinto andalusite (see Section 16.8.1).
�16.4 NET TRANSFER SOLID–SOLIDREACTIONS
In discontinuous net transfer reactions, heterogeneousmineral equilibria among multiple participating phasescan be represented by a written stoichiometric reactionand by a P–T diagram that shows stability fields ofmineral assemblages and boundary lines betweenthem. We begin our discussion of net transfer reactionsusing only pure solid phases, including ideal end-members, where there is no solid solution.
16.4.1 Basic Relations in a System of Pure End-Member PhasesConsider the equilibrium
16.1 Ca3Al2Si3O12 � SiO2 � CaAl2Si2O8
grossular quartz anorthite
� 2CaSiO3
wollastonite
in which the higher T and lower P assemblage is on theright (Figure 16.4). LeChatelier’s principle (Section3.3.1) tells us that this higher grade assemblage shouldbe the one of greater entropy and molar volume. Ther-modynamic data in Table 16.2 confirm that it is anor-thite � 2 wollastonite
SGrs � SQtz � SAn � 2SWo
260.1 � 41.5 � 199.3 � 163.4
VGrs � VQtz � VAn � 2VWo
12.528 � 2.269 � 10.079 � 7.98
These same entropy and volume data allow us toquantify the slope (dP/dT) of the reaction boundary
line in P–T space. According to the Clapeyron equation 3.13
Where this positive sloping line is positioned in P–Tspace can be found in the same manner as the fieldboundary lines were determined above for the Al2SiO5
polymorphs but using data in Table 16.2. Thus, theequilibrium Teq for reaction 16.1 at 1 atm is
�61 J/K
3.262 J/bar� 18.7 bar/degree
�(199.30 � 163.4) � (260.1 � 41.5)(10.079 � 7.98) � (12.578 � 2.269)
dPdT
��S�V
�(SAn � 2SWo) � (SGrs � SQtz)
(VAn � 2VWo) � (VGrs � VQtz)
Metamorphic Mineral Reactions and Equilibria 479
P (k
bar)
3 Ano
rthite
Dep
th (
km)
25
20
15
10
5
0
80
60
40
20
0200 400 600 800 1000
Anorthite
� 2 w
ollasto
nite
Gross
ular
� qu
artz
Albite �
nepheli
ne
2 Jadeit
e
Jade
ite �
quar
tz
Albite
Grossu
lar �
quart
z � 2
kyan
ite
1200
T (°C)Teq � 498°C
Peq � �8858.6 bar at 25°C
16.4 Univariant discontinuous reaction boundary lines involving albite and anorthite for pure phases based on laboratory synthesis experiments. Redrawn from Hays (1967), Newtonand Fyfe (1976), and Koziol and Newton (1988). The dashedline through Peq and Teq is based on calculations in text fromdata in Robie and Hemingway (1995).
Table 16.2. Thermodynamic Data per Mole forSome Pure Solid Phases at 25°C (298.15K) and 1 Barfrom Robie and Hemingway (1995)
V (J/BAR)* S (J/K) H (KJ) G (KJ)
Anorthite 10.079 199.3 �4234.0 �4007.9
Grossular 12.528 260.1 �6640.0 �6278.5
Wollastonite 3.990 81.7 �1634.8 �1549.0
Quartz 2.269 41.5 �910.7 �856.3
Coesite 2.064 38.5 �907.8 �852.5
*1 J/bar � 10 cm3.
A second method of determining a point on the equi-librium boundary line begins with an expression forthe free energy, � , of Reaction 16.1 at the equi-librium Teq and Peq relative to some reference state,�G° , such as 25°C (298.15K) and 1 bar. We firstintegrate Equation 3.11, dGP � �SdT, at constant P,and Equation 3.12, dGT � VdP, at constant T, betweenthe reference state and the equilibrium Teq and Peq andthen combine to give
16.2
� �S(Teq � Tref)
This expression assumes that V is independent of Pand S of T. Here we note that, at the equilibrium Teq
and Peq, � � 0; furthermore, the calculationsare simplified if we evaluate Peq where Teq � 25°C �Tref. Equation 16.2 becomes
16.3 �
Using data in Table 16.2, �V � 3.262 J/bar and�G � 28 900 J. Remembering that Pref � 1 bar,we can solve for Peq, obtaining �8858.6 bar at 25°C.Although this is a geologically unrealistic P, extrapola-tion to higher P–T values along a properly sloping line(18.7 bar/degree) is quite reasonable.
From the alternate reaction points at Teq � 498°Cand 1 atm and Peq � �8858.6 bar at 25°C on the fieldboundary line determined by the two methods, a slop-ing line can be plotted in Figure 16.4 by taking somearbitrary “rise and run” of, say, (400 � 18.7) bar/400°C� 7480 bar/400°C. This line based on thermodynamicdata deviates increasingly at higher P from the bound-ary line based independently on laboratory synthesisexperiments. One reason for the discrepancy is a P de-pendence on the �V of the reaction, which we ignored.In many cases, different approaches yield significantlydifferent results, forcing the petrologist to critically examine the data, rejecting one or more or all sets, andpossibly performing additional experimental work totry to resolve the discrepancies.
It may be noted that the boundary lines in Figure16.4 are straight lines; that is, they are linear functionsof P and T. However, some solid–solid equilibria defineslightly curved lines where molar volumes and en-tropies vary with respect to P and T; the andalusite–sillimanite reaction line in Figure 16.3 is an example.Using computer spreadsheets, it is easy to take into account heat capacities, compressibilities, and so on to
Tref,Pref
�G0Tref,Pref
� �V(Peq � Pref)
GTeq,Peq
�GTeq, Peq� �G°Tref, Pref
� �V(Peq � Pref)
Tref,Pref
GTeq,Peq
�47 100 J61.1 J/K
� 771K � 498°C
�(�4234 000 �2{�1634 800}) � (�6 640 000 � 910 700)
(199.30 � 163.4) � (260.1 � 41.5)
Teq ��H�S
create more accurate reaction lines from thermody-namic data (Nordstrom and Munoz, 1994, p.101).
It is important to note in Figure 16.4 that the stabil-ity field of a phase, or phase assemblage, shrinks in thepresence of an additional reacting phase. Thus, the P–Tstability field of anorthite � wollastonite lies within,and at lower P and T than, the field of anorthite alone.Where kyanite is present, grossular � quartz is stableonly at pressures higher than in systems lacking kyan-ite. Albite encompasses the more restricted stabilityfield of the assemblage albite � nepheline, and the stability field of jadeite � quartz is a part of the largerfield of stable jadeite. This same concept explains whyolivine in basaltic systems is stable to only deep levelsof the continental crust (Figure 5.11), whereas in peri-dotite it is stable to depths of a magnitude greater inthe mantle (Figure 1.3). In basaltic systems, olivine isconsumed in reactions with plagioclase at modest P,whereas in peridotite olivine does not react with any ofthe other coexisting phases. (Nonetheless, beginningnear 410 km depth in the mantle, olivine undergoes aphase transformation into a denser spinel-like mineral.)
In the three component system SiO2–CaO–Al2O3,the phase rule indicates that the boundary line repre-sents a state of univariant equilibrium where all foursolid phases (grossular � quartz � anorthite � wollas-tonite) coexist in equilibrium (F � 2 � C � � 2 �3 � 4 � 1). For P–T values off the univariant line, nomore than three phases can coexist stably in states ofdivariant equilibrium where T and P can freely and independently vary without affecting the phases inequilibrium. Examination of reaction 16.1 indicateswhich three phases can coexist. In the low-T divariantfield, grossular and quartz occur stably together butwollastonite or anorthite may also be present, but notboth. In the high-T divariant field, wollastonite andanorthite are stably coexistent but grossular or quartzmay also be present, but not both.
In most stability diagrams only the critical deter-mining phases are indicated, such as the lower Tassemblage grossular � quartz and the higher Tassemblage wollastonite � anorthite in Figure 16.4. Inmost instances, the molar proportions of grossular andquartz would not be exactly the same in a rock under-going prograde metamorphism at, say, 10 kbars and900°C. So what happens is that the lesser of one ofthese reactant phases, let’s say it is quartz, is entirelyconsumed while the more abundant and excess grossu-lar persists stably above 900°C, together with the prod-uct phases wollastonite and anorthite. The reaction at 10 kbar progresses at 900°C until quartz is entirelyconsumed and only then can T increase in the heatingsystem, bringing it into the higher T divariant field.
In the very unusual instance where the number ofmoles of grossular is exactly equivalent to that ofquartz in a rock, an increase in T above 900°C at
480 Igneous and Metamorphic Petrology
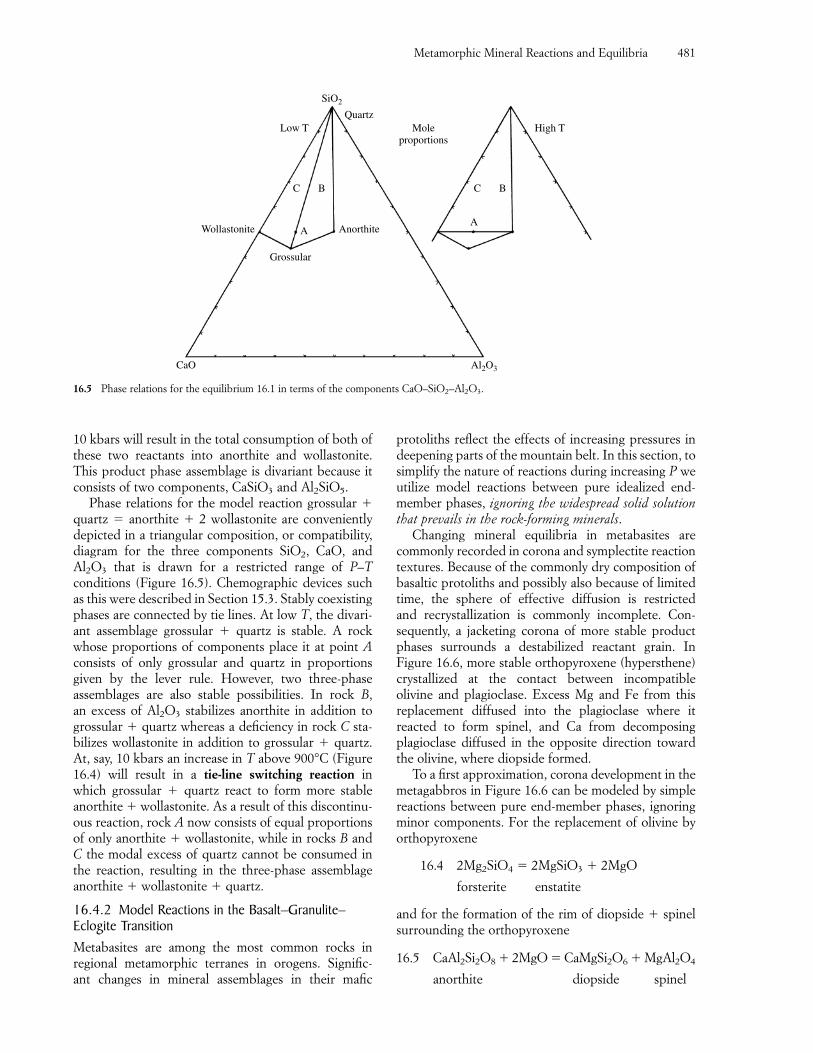
10 kbars will result in the total consumption of both ofthese two reactants into anorthite and wollastonite.This product phase assemblage is divariant because itconsists of two components, CaSiO3 and Al2SiO5.
Phase relations for the model reaction grossular �quartz � anorthite � 2 wollastonite are convenientlydepicted in a triangular composition, or compatibility,diagram for the three components SiO2, CaO, andAl2O3 that is drawn for a restricted range of P–Tconditions (Figure 16.5). Chemographic devices suchas this were described in Section 15.3. Stably coexistingphases are connected by tie lines. At low T, the divari-ant assemblage grossular � quartz is stable. A rockwhose proportions of components place it at point Aconsists of only grossular and quartz in proportionsgiven by the lever rule. However, two three-phase assemblages are also stable possibilities. In rock B, an excess of Al2O3 stabilizes anorthite in addition togrossular � quartz whereas a deficiency in rock C sta-bilizes wollastonite in addition to grossular � quartz.At, say, 10 kbars an increase in T above 900°C (Figure16.4) will result in a tie-line switching reaction inwhich grossular � quartz react to form more stableanorthite � wollastonite. As a result of this discontinu-ous reaction, rock A now consists of equal proportionsof only anorthite � wollastonite, while in rocks B andC the modal excess of quartz cannot be consumed inthe reaction, resulting in the three-phase assemblageanorthite � wollastonite � quartz.
16.4.2 Model Reactions in the Basalt–Granulite–Eclogite TransitionMetabasites are among the most common rocks in regional metamorphic terranes in orogens. Signific-ant changes in mineral assemblages in their mafic
protoliths reflect the effects of increasing pressures indeepening parts of the mountain belt. In this section, tosimplify the nature of reactions during increasing P weutilize model reactions between pure idealized end-member phases, ignoring the widespread solid solutionthat prevails in the rock-forming minerals.
Changing mineral equilibria in metabasites are commonly recorded in corona and symplectite reactiontextures. Because of the commonly dry composition ofbasaltic protoliths and possibly also because of limitedtime, the sphere of effective diffusion is restricted and recrystallization is commonly incomplete. Con-sequently, a jacketing corona of more stable productphases surrounds a destabilized reactant grain. In Figure 16.6, more stable orthopyroxene (hypersthene)crystallized at the contact between incompatibleolivine and plagioclase. Excess Mg and Fe from this replacement diffused into the plagioclase where it reacted to form spinel, and Ca from decomposing plagioclase diffused in the opposite direction towardthe olivine, where diopside formed.
To a first approximation, corona development in themetagabbros in Figure 16.6 can be modeled by simplereactions between pure end-member phases, ignoringminor components. For the replacement of olivine byorthopyroxene
16.4 2Mg2SiO4 � 2MgSiO3 � 2MgO
forsterite enstatite
and for the formation of the rim of diopside � spinelsurrounding the orthopyroxene
16.5 CaAl2Si2O8 � 2MgO � CaMgSi2O6 � MgAl2O4
anorthite diopside spinel
Metamorphic Mineral Reactions and Equilibria 481
Wollastonite
Low T High TMoleproportions
Quartz
Anorthite
Grossular
CaO Al2O3
SiO2
A
BC
A
BC
16.5 Phase relations for the equilibrium 16.1 in terms of the components CaO–SiO2–Al2O3.
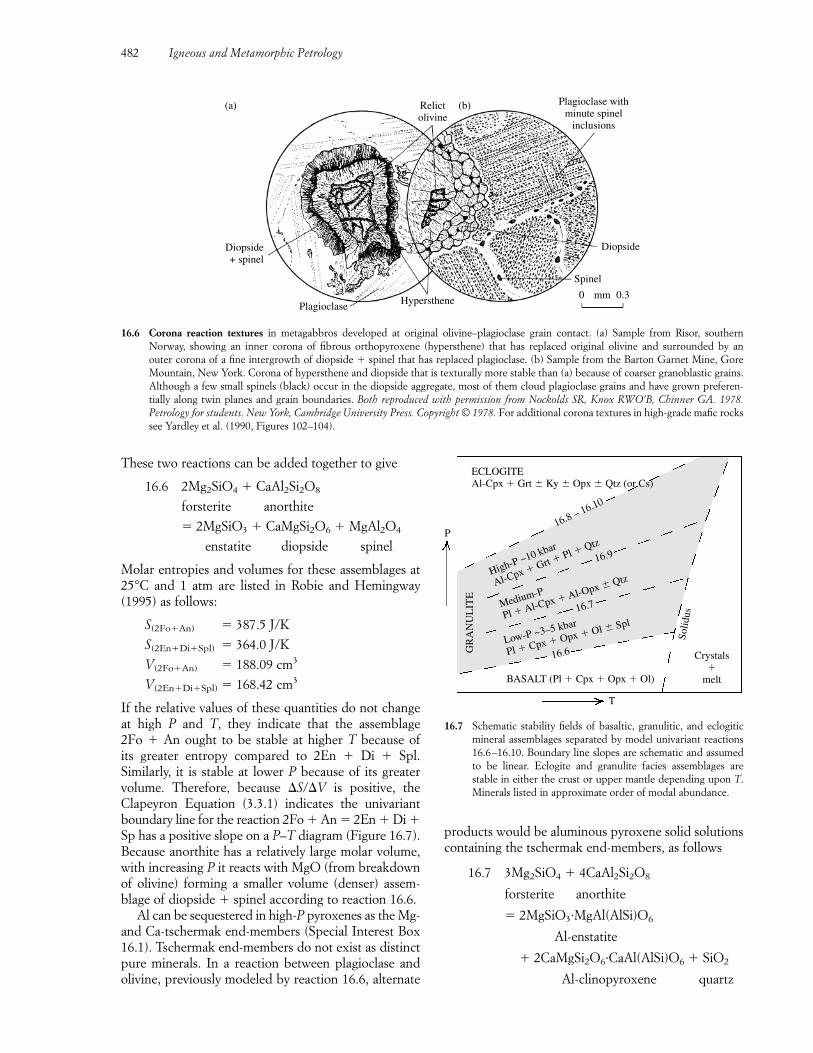
These two reactions can be added together to give
16.6 2Mg2SiO4 � CaAl2Si2O8
forsterite anorthite
� 2MgSiO3 � CaMgSi2O6 � MgAl2O4
enstatite diopside spinel
Molar entropies and volumes for these assemblages at25°C and 1 atm are listed in Robie and Hemingway(1995) as follows:
S(2Fo�An) � 387.5 J/K
S(2En�Di�Spl) � 364.0 J/K
V(2Fo�An) � 188.09 cm3
V(2En�Di�Spl) � 168.42 cm3
If the relative values of these quantities do not changeat high P and T, they indicate that the assemblage 2Fo � An ought to be stable at higher T because of its greater entropy compared to 2En � Di � Spl. Similarly, it is stable at lower P because of its greater volume. Therefore, because �S/�V is positive, theClapeyron Equation (3.3.1) indicates the univariantboundary line for the reaction 2Fo � An � 2En � Di �Sp has a positive slope on a P–T diagram (Figure 16.7).Because anorthite has a relatively large molar volume,with increasing P it reacts with MgO (from breakdownof olivine) forming a smaller volume (denser) assem-blage of diopside � spinel according to reaction 16.6.
Al can be sequestered in high-P pyroxenes as the Mg-and Ca-tschermak end-members (Special Interest Box16.1). Tschermak end-members do not exist as distinctpure minerals. In a reaction between plagioclase andolivine, previously modeled by reaction 16.6, alternate
products would be aluminous pyroxene solid solutionscontaining the tschermak end-members, as follows
16.7 3Mg2SiO4 � 4CaAl2Si2O8
forsterite anorthite
� 2MgSiO3·MgAl(AlSi)O6
Al-enstatite
� 2CaMgSi2O6·CaAl(AlSi)O6 � SiO2
Al-clinopyroxene quartz
482 Igneous and Metamorphic Petrology
P
T
BASALT (Pl � Cpx � Opx � Ol)
Crystals�
melt
GR
AN
UL
ITE
Solid
us
ECLOGITEAl-Cpx � Grt � Ky � Opx � Qtz (or Cs)
Low-P ~3–5 kbar
Pl � Cpx � Opx � Ol � Spl
Medium-P
Pl � Al-Cpx � Al-Opx � QtzHigh-P ~10 kbar
Al-Cpx � Grt � Pl � Qtz
16.8 – 16.10
16.9
16.7
16.6
16.7 Schematic stability fields of basaltic, granulitic, and eclogiticmineral assemblages separated by model univariant reactions16.6–16.10. Boundary line slopes are schematic and assumedto be linear. Eclogite and granulite facies assemblages are stable in either the crust or upper mantle depending upon T.Minerals listed in approximate order of modal abundance.
Plagioclase
Diopside+ spinel
Hypersthene
Spinel
Diopside
Plagioclase withminute spinel
inclusions
Relictolivine
(a) (b)
0 0.3mm
16.6 Corona reaction textures in metagabbros developed at original olivine–plagioclase grain contact. (a) Sample from Risor, southern Norway, showing an inner corona of fibrous orthopyroxene (hypersthene) that has replaced original olivine and surrounded by an outer corona of a fine intergrowth of diopside � spinel that has replaced plagioclase. (b) Sample from the Barton Garnet Mine, GoreMountain, New York. Corona of hypersthene and diopside that is texturally more stable than (a) because of coarser granoblastic grains.Although a few small spinels (black) occur in the diopside aggregate, most of them cloud plagioclase grains and have grown preferen-tially along twin planes and grain boundaries. Both reproduced with permission from Nockolds SR, Knox RWO’B, Chinner GA. 1978.Petrology for students. New York, Cambridge University Press. Copyright © 1978. For additional corona textures in high-grade mafic rockssee Yardley et al. (1990, Figures 102–104).
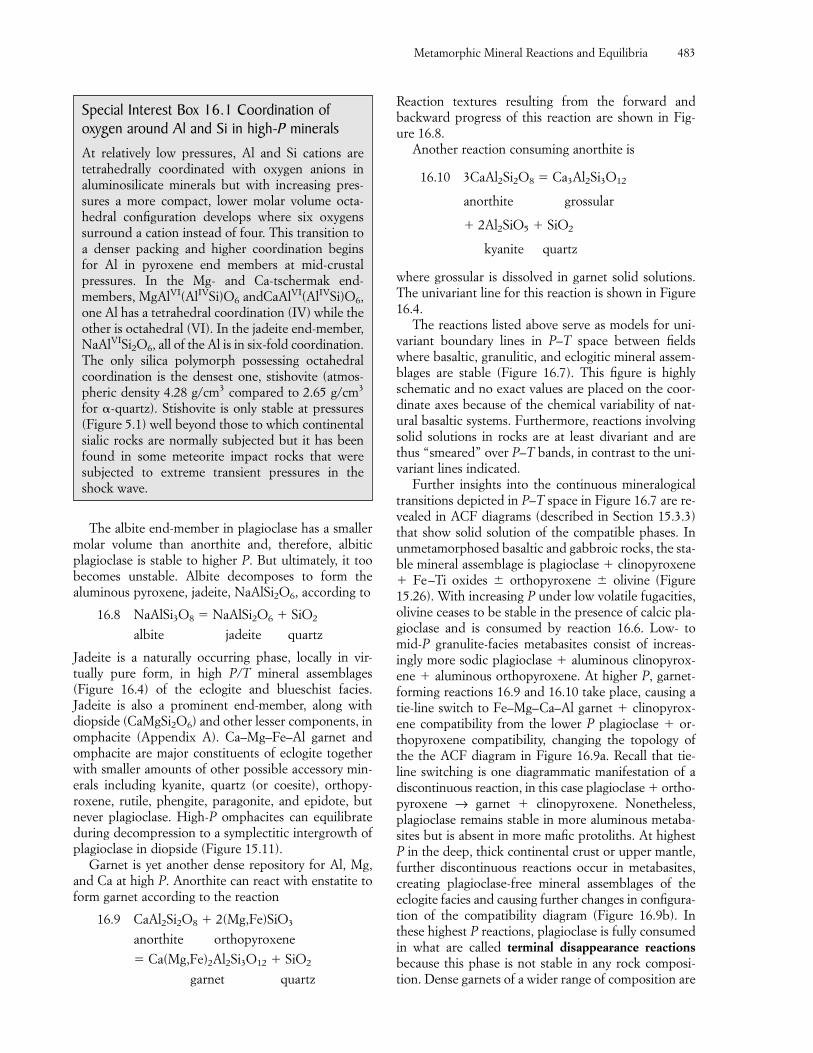
The albite end-member in plagioclase has a smallermolar volume than anorthite and, therefore, albitic plagioclase is stable to higher P. But ultimately, it toobecomes unstable. Albite decomposes to form the aluminous pyroxene, jadeite, NaAlSi2O6, according to
16.8 NaAlSi3O8 � NaAlSi2O6 � SiO2
albite jadeite quartz
Jadeite is a naturally occurring phase, locally in vir-tually pure form, in high P/T mineral assemblages (Figure 16.4) of the eclogite and blueschist facies.Jadeite is also a prominent end-member, along withdiopside (CaMgSi2O6) and other lesser components, inomphacite (Appendix A). Ca–Mg–Fe–Al garnet andomphacite are major constituents of eclogite togetherwith smaller amounts of other possible accessory min-erals including kyanite, quartz (or coesite), orthopy-roxene, rutile, phengite, paragonite, and epidote, butnever plagioclase. High-P omphacites can equilibrateduring decompression to a symplectitic intergrowth ofplagioclase in diopside (Figure 15.11).
Garnet is yet another dense repository for Al, Mg,and Ca at high P. Anorthite can react with enstatite toform garnet according to the reaction
16.9 CaAl2Si2O8 � 2(Mg,Fe)SiO3
anorthite orthopyroxene
� Ca(Mg,Fe)2Al2Si3O12 � SiO2
garnet quartz
Reaction textures resulting from the forward and backward progress of this reaction are shown in Fig-ure 16.8.
Another reaction consuming anorthite is
16.10 3CaAl2Si2O8 � Ca3Al2Si3O12
anorthite grossular
� 2Al2SiO5 � SiO2
kyanite quartz
where grossular is dissolved in garnet solid solutions.The univariant line for this reaction is shown in Figure16.4.
The reactions listed above serve as models for uni-variant boundary lines in P–T space between fieldswhere basaltic, granulitic, and eclogitic mineral assem-blages are stable (Figure 16.7). This figure is highlyschematic and no exact values are placed on the coor-dinate axes because of the chemical variability of nat-ural basaltic systems. Furthermore, reactions involvingsolid solutions in rocks are at least divariant and arethus “smeared” over P–T bands, in contrast to the uni-variant lines indicated.
Further insights into the continuous mineralogicaltransitions depicted in P–T space in Figure 16.7 are re-vealed in ACF diagrams (described in Section 15.3.3)that show solid solution of the compatible phases. Inunmetamorphosed basaltic and gabbroic rocks, the sta-ble mineral assemblage is plagioclase � clinopyroxene� Fe–Ti oxides � orthopyroxene � olivine (Figure15.26). With increasing P under low volatile fugacities,olivine ceases to be stable in the presence of calcic pla-gioclase and is consumed by reaction 16.6. Low- tomid-P granulite-facies metabasites consist of increas-ingly more sodic plagioclase � aluminous clinopyrox-ene � aluminous orthopyroxene. At higher P, garnet-forming reactions 16.9 and 16.10 take place, causing atie-line switch to Fe–Mg–Ca–Al garnet � clinopyrox-ene compatibility from the lower P plagioclase � or-thopyroxene compatibility, changing the topology ofthe the ACF diagram in Figure 16.9a. Recall that tie-line switching is one diagrammatic manifestation of adiscontinuous reaction, in this case plagioclase � ortho-pyroxene → garnet � clinopyroxene. Nonetheless, plagioclase remains stable in more aluminous metaba-sites but is absent in more mafic protoliths. At highestP in the deep, thick continental crust or upper mantle,further discontinuous reactions occur in metabasites,creating plagioclase-free mineral assemblages of theeclogite facies and causing further changes in configura-tion of the compatibility diagram (Figure 16.9b). Inthese highest P reactions, plagioclase is fully consumedin what are called terminal disappearance reactionsbecause this phase is not stable in any rock composi-tion. Dense garnets of a wider range of composition are
Metamorphic Mineral Reactions and Equilibria 483
Special Interest Box 16.1 Coordination of oxygen around Al and Si in high-P mineralsAt relatively low pressures, Al and Si cations aretetrahedrally coordinated with oxygen anions inaluminosilicate minerals but with increasing pres-sures a more compact, lower molar volume octa-hedral configuration develops where six oxygens surround a cation instead of four. This transition toa denser packing and higher coordination begins for Al in pyroxene end members at mid-crustalpressures. In the Mg- and Ca-tschermak end-members, MgAlVI(AlIVSi)O6 andCaAlVI(AlIVSi)O6,one Al has a tetrahedral coordination (IV) while theother is octahedral (VI). In the jadeite end-member,NaAlVISi2O6, all of the Al is in six-fold coordination.The only silica polymorph possessing octahedral coordination is the densest one, stishovite (atmos-pheric density 4.28 g/cm3 compared to 2.65 g/cm3
for -quartz). Stishovite is only stable at pressures(Figure 5.1) well beyond those to which continentalsialic rocks are normally subjected but it has beenfound in some meteorite impact rocks that weresubjected to extreme transient pressures in theshock wave.
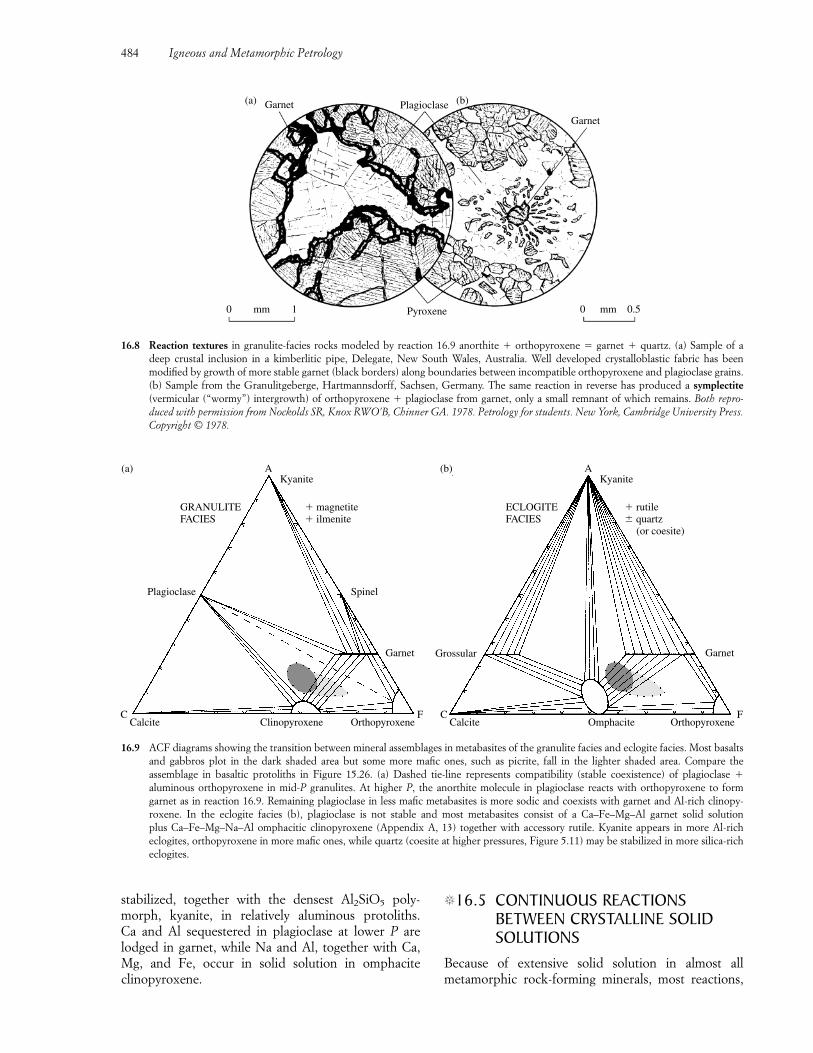
stabilized, together with the densest Al2SiO5 poly-morph, kyanite, in relatively aluminous protoliths. Ca and Al sequestered in plagioclase at lower P arelodged in garnet, while Na and Al, together with Ca,Mg, and Fe, occur in solid solution in omphaciteclinopyroxene.
�16.5 CONTINUOUS REACTIONSBETWEEN CRYSTALLINE SOLIDSOLUTIONS
Because of extensive solid solution in almost all metamorphic rock-forming minerals, most reactions,
484 Igneous and Metamorphic Petrology
0 1mm 0.50 mmPyroxene
Plagioclase
Garnet
Garnet(a) (b)
16.8 Reaction textures in granulite-facies rocks modeled by reaction 16.9 anorthite � orthopyroxene � garnet � quartz. (a) Sample of a deep crustal inclusion in a kimberlitic pipe, Delegate, New South Wales, Australia. Well developed crystalloblastic fabric has beenmodified by growth of more stable garnet (black borders) along boundaries between incompatible orthopyroxene and plagioclase grains.(b) Sample from the Granulitgeberge, Hartmannsdorff, Sachsen, Germany. The same reaction in reverse has produced a symplectite(vermicular (“wormy”) intergrowth) of orthopyroxene � plagioclase from garnet, only a small remnant of which remains. Both repro-duced with permission from Nockolds SR, Knox RWO’B, Chinner GA. 1978. Petrology for students. New York, Cambridge University Press.Copyright © 1978.
(a) AKyanite
GRANULITEFACIES
� magnetite� ilmenite
Spinel
Garnet
Plagioclase
CCalcite
FOrthopyroxeneClinopyroxene
(b) AKyanite
ECLOGITEFACIES
� rutile� quartz (or coesite)
GarnetGrossular
CCalcite
FOrthopyroxeneOmphacite
16.9 ACF diagrams showing the transition between mineral assemblages in metabasites of the granulite facies and eclogite facies. Most basaltsand gabbros plot in the dark shaded area but some more mafic ones, such as picrite, fall in the lighter shaded area. Compare the assemblage in basaltic protoliths in Figure 15.26. (a) Dashed tie-line represents compatibility (stable coexistence) of plagioclase �
aluminous orthopyroxene in mid-P granulites. At higher P, the anorthite molecule in plagioclase reacts with orthopyroxene to form garnet as in reaction 16.9. Remaining plagioclase in less mafic metabasites is more sodic and coexists with garnet and Al-rich clinopy-roxene. In the eclogite facies (b), plagioclase is not stable and most metabasites consist of a Ca–Fe–Mg–Al garnet solid solution plus Ca–Fe–Mg–Na–Al omphacitic clinopyroxene (Appendix A, 13) together with accessory rutile. Kyanite appears in more Al-richeclogites, orthopyroxene in more mafic ones, while quartz (coesite at higher pressures, Figure 5.11) may be stabilized in more silica-richeclogites.
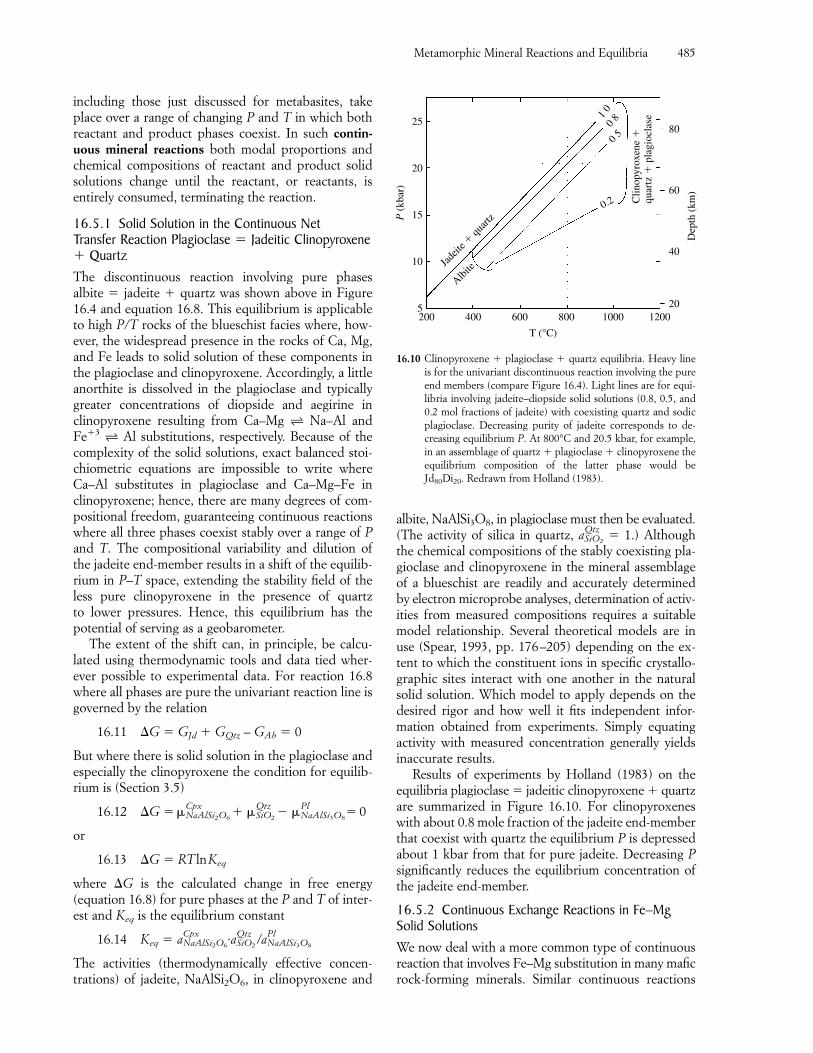
including those just discussed for metabasites, takeplace over a range of changing P and T in which bothreactant and product phases coexist. In such contin-uous mineral reactions both modal proportions andchemical compositions of reactant and product solidsolutions change until the reactant, or reactants, is entirely consumed, terminating the reaction.
16.5.1 Solid Solution in the Continuous Net Transfer Reaction Plagioclase � Jadeitic Clinopyroxene� QuartzThe discontinuous reaction involving pure phases albite � jadeite � quartz was shown above in Figure16.4 and equation 16.8. This equilibrium is applicableto high P/T rocks of the blueschist facies where, how-ever, the widespread presence in the rocks of Ca, Mg,and Fe leads to solid solution of these components inthe plagioclase and clinopyroxene. Accordingly, a littleanorthite is dissolved in the plagioclase and typicallygreater concentrations of diopside and aegirine inclinopyroxene resulting from Ca–Mg b Na–Al andFe�3 b Al substitutions, respectively. Because of thecomplexity of the solid solutions, exact balanced stoi-chiometric equations are impossible to write whereCa–Al substitutes in plagioclase and Ca–Mg–Fe inclinopyroxene; hence, there are many degrees of com-positional freedom, guaranteeing continuous reactionswhere all three phases coexist stably over a range of Pand T. The compositional variability and dilution ofthe jadeite end-member results in a shift of the equilib-rium in P–T space, extending the stability field of theless pure clinopyroxene in the presence of quartz to lower pressures. Hence, this equilibrium has the potential of serving as a geobarometer.
The extent of the shift can, in principle, be calcu-lated using thermodynamic tools and data tied wher-ever possible to experimental data. For reaction 16.8where all phases are pure the univariant reaction line isgoverned by the relation
16.11 �G � GJd � GQtz – GAb � 0
But where there is solid solution in the plagioclase andespecially the clinopyroxene the condition for equilib-rium is (Section 3.5)
16.12 �G �
or
16.13 �G � RT lnKeq
where �G is the calculated change in free energy(equation 16.8) for pure phases at the P and T of inter-est and Keq is the equilibrium constant
16.14 Keq �
The activities (thermodynamically effective concen-trations) of jadeite, NaAlSi2O6, in clinopyroxene and
aNaAlSi2O6
Cpx ·aSiO2
Qtz /aNaAlSi3O8
Pl
�NaAlSi2O6
Cpx� �
QtzSiO2
� �NaAlSi3O8
Pl� 0
albite, NaAlSi3O8, in plagioclase must then be evaluated.(The activity of silica in quartz, a � 1.) Althoughthe chemical compositions of the stably coexisting pla-gioclase and clinopyroxene in the mineral assemblageof a blueschist are readily and accurately determinedby electron microprobe analyses, determination of activ-ities from measured compositions requires a suitablemodel relationship. Several theoretical models are inuse (Spear, 1993, pp. 176–205) depending on the ex-tent to which the constituent ions in specific crystallo-graphic sites interact with one another in the naturalsolid solution. Which model to apply depends on thedesired rigor and how well it fits independent infor-mation obtained from experiments. Simply equatingactivity with measured concentration generally yieldsinaccurate results.
Results of experiments by Holland (1983) on theequilibria plagioclase � jadeitic clinopyroxene � quartzare summarized in Figure 16.10. For clinopyroxeneswith about 0.8 mole fraction of the jadeite end-memberthat coexist with quartz the equilibrium P is depressedabout 1 kbar from that for pure jadeite. Decreasing Psignificantly reduces the equilibrium concentration ofthe jadeite end-member.
16.5.2 Continuous Exchange Reactions in Fe–MgSolid SolutionsWe now deal with a more common type of continuousreaction that involves Fe–Mg substitution in many maficrock-forming minerals. Similar continuous reactions
SiO2
Qtz
Metamorphic Mineral Reactions and Equilibria 485
P (
kbar
)
Dep
th (
km)
25
20
15
10
5
80
60
40
20200 12001000800600400
T (°C)
Jade
ite �
quart
z
Albite
0.2
0 50 81
0
Clin
opyr
oxen
e �
quar
tz �
pla
gioc
lase
16.10 Clinopyroxene � plagioclase � quartz equilibria. Heavy lineis for the univariant discontinuous reaction involving the pureend members (compare Figure 16.4). Light lines are for equi-libria involving jadeite–diopside solid solutions (0.8, 0.5, and0.2 mol fractions of jadeite) with coexisting quartz and sodicplagioclase. Decreasing purity of jadeite corresponds to de-creasing equilibrium P. At 800°C and 20.5 kbar, for example,in an assemblage of quartz � plagioclase � clinopyroxene theequilibrium composition of the latter phase would beJd80Di20. Redrawn from Holland (1983).
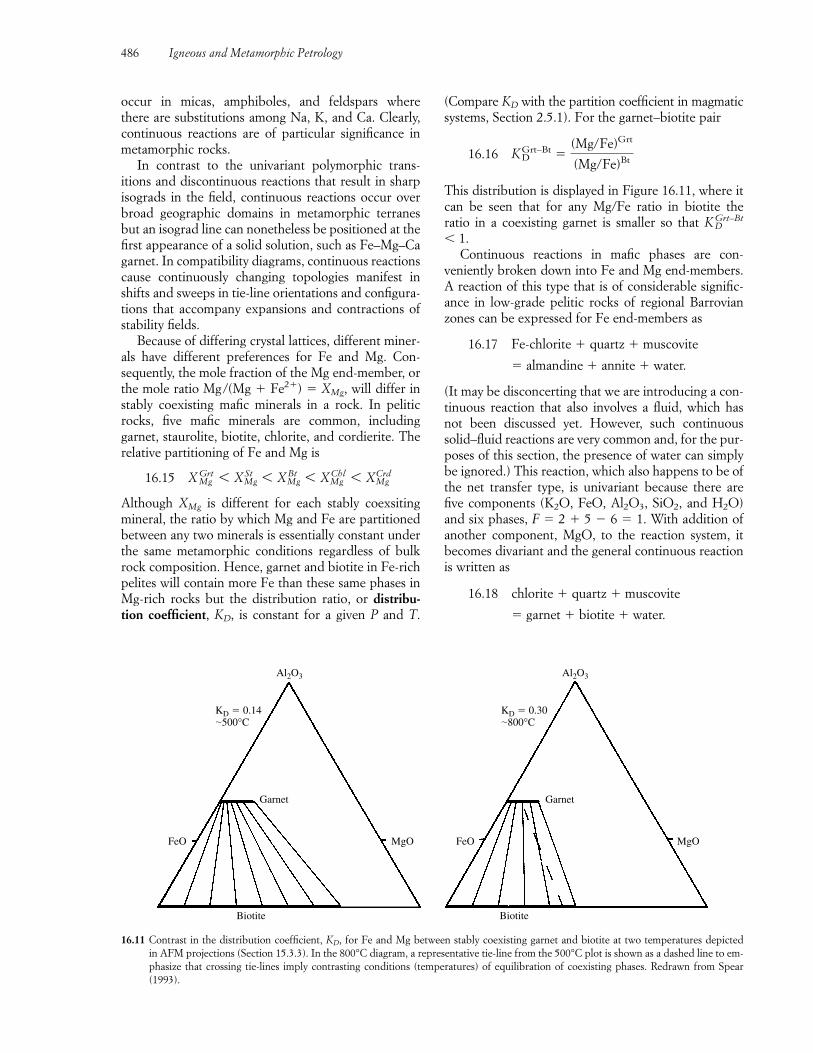
occur in micas, amphiboles, and feldspars where there are substitutions among Na, K, and Ca. Clearly,continuous reactions are of particular significance inmetamorphic rocks.
In contrast to the univariant polymorphic trans-itions and discontinuous reactions that result in sharpisograds in the field, continuous reactions occur overbroad geographic domains in metamorphic terranesbut an isograd line can nonetheless be positioned at thefirst appearance of a solid solution, such as Fe–Mg–Cagarnet. In compatibility diagrams, continuous reactionscause continuously changing topologies manifest inshifts and sweeps in tie-line orientations and configura-tions that accompany expansions and contractions ofstability fields.
Because of differing crystal lattices, different miner-als have different preferences for Fe and Mg. Con-sequently, the mole fraction of the Mg end-member, orthe mole ratio Mg/(Mg � Fe2�) � XMg, will differ instably coexisting mafic minerals in a rock. In peliticrocks, five mafic minerals are common, including garnet, staurolite, biotite, chlorite, and cordierite. Therelative partitioning of Fe and Mg is
16.15 X
Although XMg is different for each stably coexsitingmineral, the ratio by which Mg and Fe are partitionedbetween any two minerals is essentially constant underthe same metamorphic conditions regardless of bulkrock composition. Hence, garnet and biotite in Fe-richpelites will contain more Fe than these same phases inMg-rich rocks but the distribution ratio, or distribu-tion coefficient, KD, is constant for a given P and T.
MgGrt 6 XSt
Mg 6 XBtMg 6 XChl
Mg 6 XMgCrd
486 Igneous and Metamorphic Petrology
Biotite
FeO MgO
Garnet
KD � 0.14�500°C
Al2O3
Biotite
FeO MgO
Garnet
KD � 0.30�800°C
Al2O3
16.11 Contrast in the distribution coefficient, KD, for Fe and Mg between stably coexisting garnet and biotite at two temperatures depicted in AFM projections (Section 15.3.3). In the 800°C diagram, a representative tie-line from the 500°C plot is shown as a dashed line to em-phasize that crossing tie-lines imply contrasting conditions (temperatures) of equilibration of coexisting phases. Redrawn from Spear(1993).
(Compare KD with the partition coefficient in magmaticsystems, Section 2.5.1). For the garnet–biotite pair
16.16 K
This distribution is displayed in Figure 16.11, where itcan be seen that for any Mg/Fe ratio in biotite the ratio in a coexisting garnet is smaller so that K� 1.
Continuous reactions in mafic phases are con-veniently broken down into Fe and Mg end-members.A reaction of this type that is of considerable signific-ance in low-grade pelitic rocks of regional Barrovianzones can be expressed for Fe end-members as
16.17 Fe-chlorite � quartz � muscovite
� almandine � annite � water.
(It may be disconcerting that we are introducing a con-tinuous reaction that also involves a fluid, which hasnot been discussed yet. However, such continuoussolid–fluid reactions are very common and, for the pur-poses of this section, the presence of water can simplybe ignored.) This reaction, which also happens to be ofthe net transfer type, is univariant because there arefive components (K2O, FeO, Al2O3, SiO2, and H2O)and six phases, F � 2 � 5 � 6 � 1. With addition ofanother component, MgO, to the reaction system, itbecomes divariant and the general continuous reactionis written as
16.18 chlorite � quartz � muscovite
� garnet � biotite � water.
DGrt–Bt
DGrt–Bt �
(Mg/Fe)Grt
(Mg/Fe)Bt
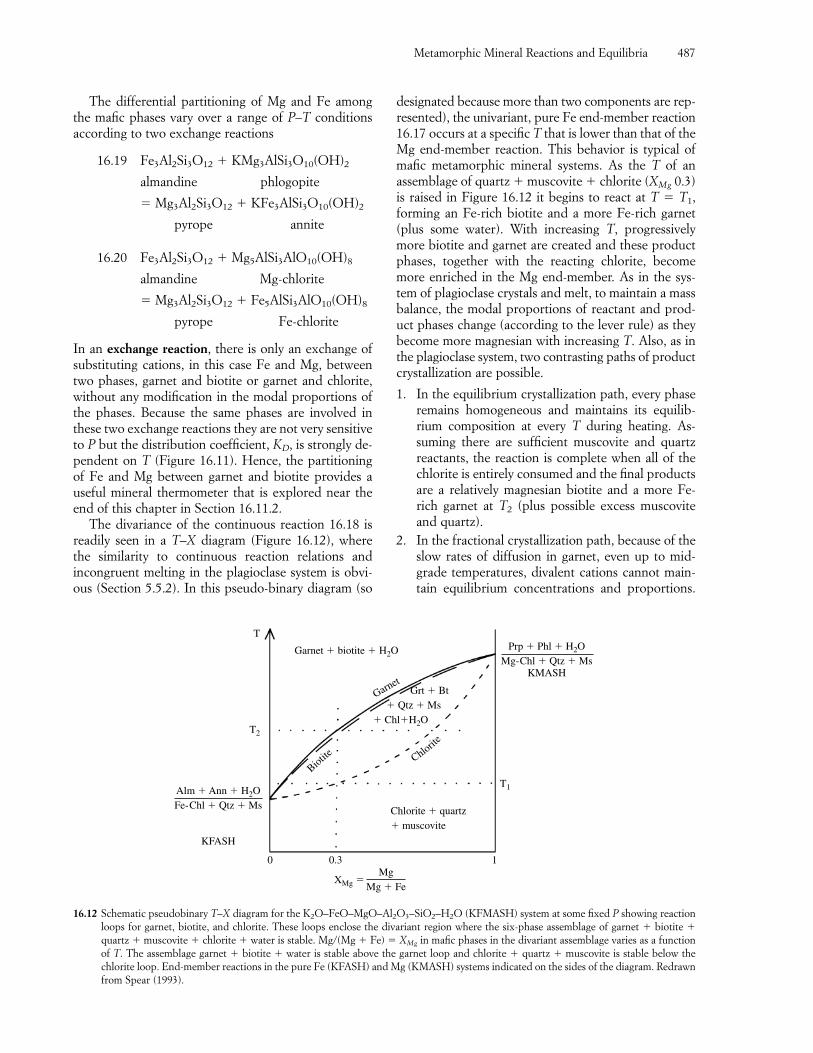
The differential partitioning of Mg and Fe amongthe mafic phases vary over a range of P–T conditionsaccording to two exchange reactions
16.19 Fe3Al2Si3O12 � KMg3AlSi3O10(OH)2
almandine phlogopite
� Mg3Al2Si3O12 � KFe3AlSi3O10(OH)2
pyrope annite
16.20 Fe3Al2Si3O12 � Mg5AlSi3AlO10(OH)8
almandine Mg-chlorite
� Mg3Al2Si3O12 � Fe5AlSi3AlO10(OH)8
pyrope Fe-chlorite
In an exchange reaction, there is only an exchange ofsubstituting cations, in this case Fe and Mg, betweentwo phases, garnet and biotite or garnet and chlorite,without any modification in the modal proportions ofthe phases. Because the same phases are involved inthese two exchange reactions they are not very sensitiveto P but the distribution coefficient, KD, is strongly de-pendent on T (Figure 16.11). Hence, the partitioningof Fe and Mg between garnet and biotite provides auseful mineral thermometer that is explored near theend of this chapter in Section 16.11.2.
The divariance of the continuous reaction 16.18 isreadily seen in a T–X diagram (Figure 16.12), wherethe similarity to continuous reaction relations and incongruent melting in the plagioclase system is obvi-ous (Section 5.5.2). In this pseudo-binary diagram (so
designated because more than two components are rep-resented), the univariant, pure Fe end-member reaction16.17 occurs at a specific T that is lower than that of theMg end-member reaction. This behavior is typical ofmafic metamorphic mineral systems. As the T of an assemblage of quartz � muscovite � chlorite (XMg 0.3)is raised in Figure 16.12 it begins to react at T � T1,forming an Fe-rich biotite and a more Fe-rich garnet(plus some water). With increasing T, progressivelymore biotite and garnet are created and these productphases, together with the reacting chlorite, becomemore enriched in the Mg end-member. As in the sys-tem of plagioclase crystals and melt, to maintain a massbalance, the modal proportions of reactant and prod-uct phases change (according to the lever rule) as theybecome more magnesian with increasing T. Also, as inthe plagioclase system, two contrasting paths of productcrystallization are possible.
1. In the equilibrium crystallization path, every phaseremains homogeneous and maintains its equilib-rium composition at every T during heating. As-suming there are sufficient muscovite and quartz reactants, the reaction is complete when all of thechlorite is entirely consumed and the final productsare a relatively magnesian biotite and a more Fe-rich garnet at T2 (plus possible excess muscoviteand quartz).
2. In the fractional crystallization path, because of theslow rates of diffusion in garnet, even up to mid-grade temperatures, divalent cations cannot main-tain equilibrium concentrations and proportions.
Metamorphic Mineral Reactions and Equilibria 487
0
Alm � Ann � H2OFe-Chl � Qtz � Ms
KFASH
MgMg � Fe
Garnet � biotite � H2O Prp � Phl � H2OMg-Chl � Qtz � Ms
KMASH
Grt � Bt � Qtz � Ms� Chl�H2O
Chlorite � quartz� muscovite
T2
T
T1
0.3 1
XMg �
Chlorite
Biotite
Garnet
16.12 Schematic pseudobinary T–X diagram for the K2O–FeO–MgO–Al2O3–SiO2–H2O (KFMASH) system at some fixed P showing reactionloops for garnet, biotite, and chlorite. These loops enclose the divariant region where the six-phase assemblage of garnet � biotite �quartz � muscovite � chlorite � water is stable. Mg/(Mg � Fe) � XMg in mafic phases in the divariant assemblage varies as a functionof T. The assemblage garnet � biotite � water is stable above the garnet loop and chlorite � quartz � muscovite is stable below thechlorite loop. End-member reactions in the pure Fe (KFASH) and Mg (KMASH) systems indicated on the sides of the diagram. Redrawnfrom Spear (1993).
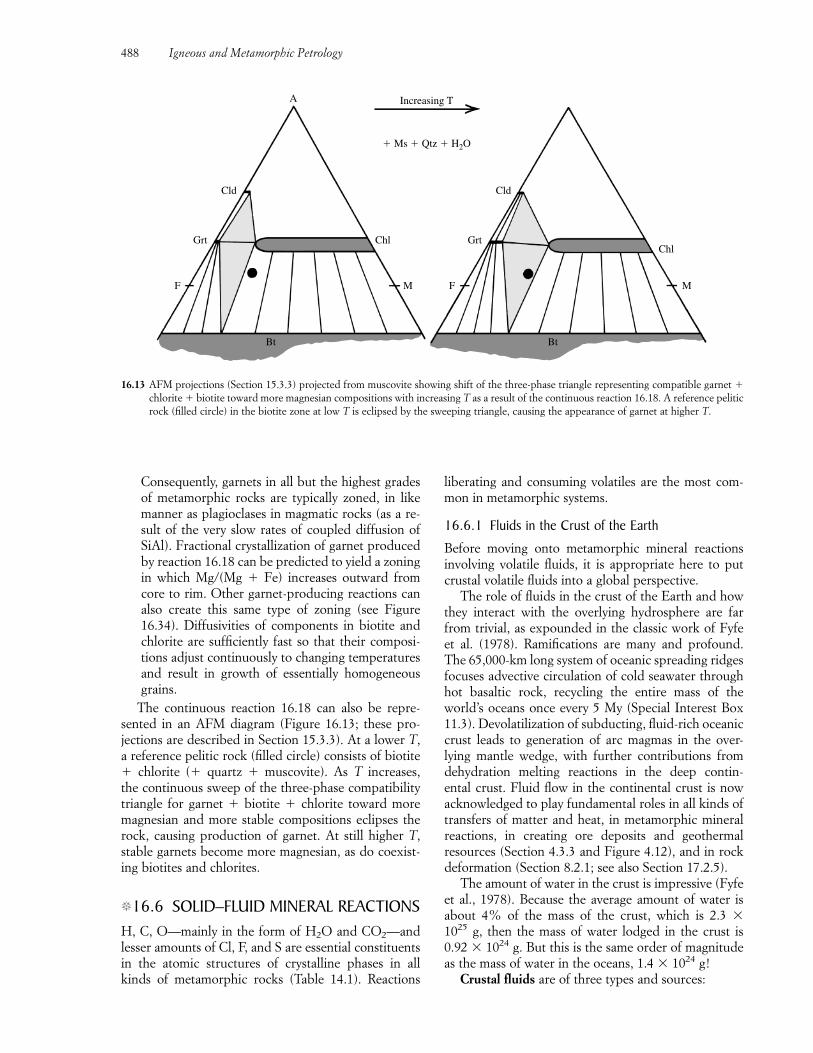
Consequently, garnets in all but the highest gradesof metamorphic rocks are typically zoned, in likemanner as plagioclases in magmatic rocks (as a re-sult of the very slow rates of coupled diffusion ofSiAl). Fractional crystallization of garnet producedby reaction 16.18 can be predicted to yield a zoningin which Mg/(Mg � Fe) increases outward fromcore to rim. Other garnet-producing reactions canalso create this same type of zoning (see Figure16.34). Diffusivities of components in biotite andchlorite are sufficiently fast so that their composi-tions adjust continuously to changing temperaturesand result in growth of essentially homogeneousgrains.
The continuous reaction 16.18 can also be repre-sented in an AFM diagram (Figure 16.13; these pro-jections are described in Section 15.3.3). At a lower T,a reference pelitic rock (filled circle) consists of biotite� chlorite (� quartz � muscovite). As T increases, the continuous sweep of the three-phase compatibilitytriangle for garnet � biotite � chlorite toward moremagnesian and more stable compositions eclipses therock, causing production of garnet. At still higher T, stable garnets become more magnesian, as do coexist-ing biotites and chlorites.
�16.6 SOLID–FLUID MINERAL REACTIONSH, C, O—mainly in the form of H2O and CO2—andlesser amounts of Cl, F, and S are essential constituentsin the atomic structures of crystalline phases in allkinds of metamorphic rocks (Table 14.1). Reactions
liberating and consuming volatiles are the most com-mon in metamorphic systems.
16.6.1 Fluids in the Crust of the Earth
Before moving onto metamorphic mineral reactions involving volatile fluids, it is appropriate here to putcrustal volatile fluids into a global perspective.
The role of fluids in the crust of the Earth and howthey interact with the overlying hydrosphere are farfrom trivial, as expounded in the classic work of Fyfe et al. (1978). Ramifications are many and profound.The 65,000-km long system of oceanic spreading ridgesfocuses advective circulation of cold seawater throughhot basaltic rock, recycling the entire mass of theworld’s oceans once every 5 My (Special Interest Box11.3). Devolatilization of subducting, fluid-rich oceaniccrust leads to generation of arc magmas in the over-lying mantle wedge, with further contributions fromdehydration melting reactions in the deep contin-ental crust. Fluid flow in the continental crust is nowacknowledged to play fundamental roles in all kinds oftransfers of matter and heat, in metamorphic mineralreactions, in creating ore deposits and geothermal resources (Section 4.3.3 and Figure 4.12), and in rockdeformation (Section 8.2.1; see also Section 17.2.5).
The amount of water in the crust is impressive (Fyfeet al., 1978). Because the average amount of water isabout 4% of the mass of the crust, which is 2.3 �1025 g, then the mass of water lodged in the crust is0.92 � 1024 g. But this is the same order of magnitudeas the mass of water in the oceans, 1.4 � 1024 g!
Crustal fluids are of three types and sources:
488 Igneous and Metamorphic Petrology
Grt
Cld
F
Chl
M
Bt
A
Grt
Cld
Increasing T
� Ms � Qtz � H2O
F
Chl
M
Bt
16.13 AFM projections (Section 15.3.3) projected from muscovite showing shift of the three-phase triangle representing compatible garnet �chlorite � biotite toward more magnesian compositions with increasing T as a result of the continuous reaction 16.18. A reference peliticrock (filled circle) in the biotite zone at low T is eclipsed by the sweeping triangle, causing the appearance of garnet at higher T.
1. Water from the hydrosphere of the Earth that isheld in openings in rocks. In the continental crust,cracks in rocks such as granite and pore spaces between sediment grains hold meteoric (ground)water, while in oceanic regions saline seawater re-sides in fractured mafic rocks at spreading ridgesand in seafloor sediment.
2. Metamorphic fluids produced by devolatilizingmetamorphic reactions.
3. Magmatic fluids exsolved from evolving magmas(Section 4.2.3). Common arc magmas of intermedi-ate to silicic composition crystallizing biotite andhornblende must have water concentrations of atleast 3–4 wt.% in order to stabilize these hydrousphases. However, modal amounts of these hydrousminerals are typically �30%; with 1–2 wt.% waterin hornblendes and 2–3 wt.% in biotites the excesswater in the magma system can be released into thesurroundings during crystallization.
Mixing from the three sources is likely in many crustalfluids. Oxygen isotope ratios (Section 2.6 and Figure2.24) can indicate dominant contributions.
During burial and compaction of marine sediment-ary deposits along continental margins and in subduc-tion zones, enormous volumes of entrapped aqueousfluid are liberated. Sediments and loosely cementedsedimentary rocks can have pore spaces occupying asmuch as one-third the total rock volume to depths ofhundreds of feet but after burial to 5 km or so, �2wt.% water remains in increasingly more isolated andsmaller pore spaces or perhaps as an intergranular fluidalong grain edges. In addition to compaction, pore vol-ume diminishes as a consequence of recrystallization,including grain boundary adjustments during pressuresolution (see Section 17.2.1), and precipitation of ce-menting minerals from pore solutions. In rock bodieswith interconnecting openings (permeability) extend-ing all the way to the surface, buoyant water will flowupwards out of the body, commonly venting in springs.
After physical release of entrapped pore fluid, mostlywater, 5–10 wt.% H2O bound structurally in protolithminerals can be driven out of rocks with rising T duringprograde dehydration reactions. These aqueous meta-morphic fluids are released over virtually the wholerange of metamorphic conditions from widespread hydrous solid solutions undergoing continuous break-down (Figure 16.14; compare Table 14.2). In peliticrocks, for example, the generalized prograde reactionsequence of clay minerals → chlorites → micas → an-hydrous silicates consists entirely of solid solutions.Walther and Orville (1982) calculated that the expelledwater (and smaller amounts of CO2) during devolatiliza-tion of an average shale could instantaneously occupyabout 12% of the rock volume at 500°C and 5 kbar. Toput this in perspective, if all of the expelled water from
a 1000 km3 block of dehydrated shale were to be col-lected into a 100 km2 lake it would be 1.25 km deep!
A similar situation prevails for metamorphism of hydrous mafic rocks, where again, upwards of 5 wt.%water can be liberated (Figure 16.14d). In the lesswidespread calc–silicate rocks, decarbonation reactionscan potentially liberate vast amounts of CO2. On aweight basis, there is 44 and 47% CO2 in pure calciteand dolomite, respectively. Most decarbonation reac-tions are continuous over a range of P–T conditionsand the amount of liberated CO2 depends on the fluidcomposition and proportions of silicate- and carbonate-bearing phases, as will be appreciated later. At lowestmetamorphic grades, methane (CH4) may also be ex-pelled by reactions involving carbonaceous material inshale and carbonate rock protoliths (Special InterestBox 16.2).
Clearly, the amount of fluid in a metamorphic systemvaries through time (Rubie, 1986). This is especiallytrue of polymetamorphic rocks. At a given depth andP, the amount of fluid and its associated fluid pressure,Pfluid, is likely to change during the course of metamor-phism. This means that Pfluid does not always equal P,as commonly assumed.
Virtually the only tangible, separate fluid phase re-maining from metamorphic reactions in rocks collectedat the surface occurs as minute volumes entrapped influid inclusions (Special Interest Box 16.3).
Metamorphic Mineral Reactions and Equilibria 489
Special Interest Box 16.2 Bleaching of carbonate rocks around magmatic intrusionsIn many contact metamorphic aureoles aroundgranitic intrusions, the most conspicuous change isa bleaching of limestone or dolomite country rockswhose original gray color is a result of very smallamounts of fine carbonaceous matter. The progres-sive whitening of the protolith toward the magmaticcontact is generally not regular and concentric, butis strongly influenced by bedding. Some relict bedsare more bleached than adjacent ones at the samedistance from the contact, suggesting a control re-lated to bedding characterisitics such as permeabil-ity rather than simple conductive heating. For theNotch Peak aureole in western Utah, Todd (1990)concluded that the bleaching agent was infiltratedwater that reacted with carbonaceous matter (mod-eled as graphite, C) producing methane and carbondioxide according to 2C � 2H2O � CH4 � CO2.
The water-rich fluids cannot have come from devolatilization reactions in the protolith becausethey would have been CO2-rich. Isotopic data indic-ate the infiltrating water that reacted with the rockwas of magmatic origin, not heated meteoric water.
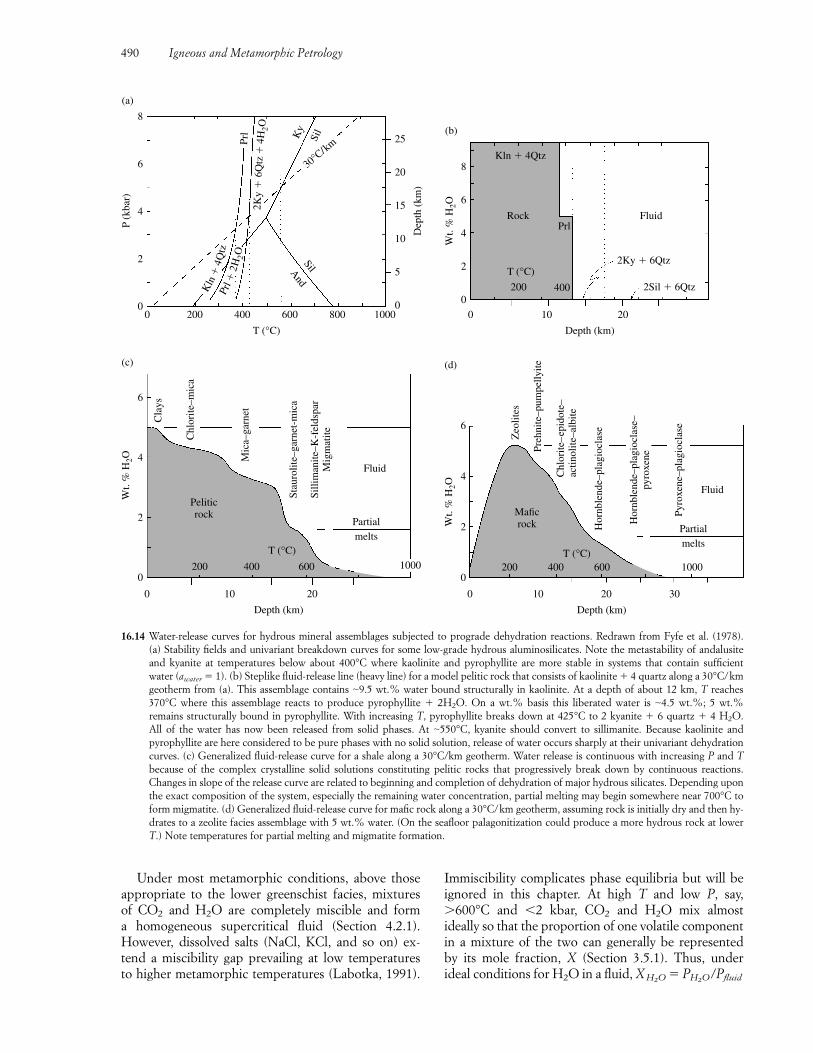
Under most metamorphic conditions, above thoseappropriate to the lower greenschist facies, mixtures of CO2 and H2O are completely miscible and form a homogeneous supercritical fluid (Section 4.2.1).However, dissolved salts (NaCl, KCl, and so on) ex-tend a miscibility gap prevailing at low temperatures to higher metamorphic temperatures (Labotka, 1991).
Immiscibility complicates phase equilibria but will beignored in this chapter. At high T and low P, say,�600°C and �2 kbar, CO2 and H2O mix almost ideally so that the proportion of one volatile component in a mixture of the two can generally be represented by its mole fraction, X (Section 3.5.1). Thus, underideal conditions for H2O in a fluid, X � P /PfluidH2OH2O
490 Igneous and Metamorphic Petrology
P (k
bar)
Dep
th (
km)
8
6
4
2
0
(a)
25
20
15
10
5
00 400200 600 800 1000
T (°C)
Ky
Sil
30°C/k
mPrl
SilAnd
Kln
�4Q
tzPr
l�2H
2O
Wt.
% H
2O
8
6
4
2
0
0 10 20
Depth (km)
Rock Fluid
2Ky � 6Qtz
2Sil � 6Qtz
Kln � 4Qtz
Prl
T (°C)
200 400
(b)
2Ky
�6Q
tz�
4H2O
Wt.
% H
2O
6
4
2
0
(c)
0 10 20
1000
Depth (km)
200 400 600
T (°C)
Peliticrock
Cla
ys
Chl
orite
–mic
a
Mic
a–ga
rnet
Stau
rolit
e–ga
rnet
-mic
a
Silli
man
ite–K
-fel
dspa
rM
igm
atite
Partialmelts
Fluid
Wt.
% H
2O
6
4
2
0
(d)
0 10 20 30
1000
Depth (km)
200 400 600T (°C)
Maficrock Partial
melts
Fluid
Zeo
lites
Preh
nite
–pum
pelly
ite
Chl
orite
–ep
idot
e–ac
tinol
ite–a
lbite
Hor
nble
nde–
plag
iocl
ase
Hor
nble
nde–
plag
iocl
ase–
pyro
xene
Pyro
xene
–pla
gioc
lase
16.14 Water-release curves for hydrous mineral assemblages subjected to prograde dehydration reactions. Redrawn from Fyfe et al. (1978). (a) Stability fields and univariant breakdown curves for some low-grade hydrous aluminosilicates. Note the metastability of andalusiteand kyanite at temperatures below about 400°C where kaolinite and pyrophyllite are more stable in systems that contain sufficient water (awater � 1). (b) Steplike fluid-release line (heavy line) for a model pelitic rock that consists of kaolinite � 4 quartz along a 30°C/kmgeotherm from (a). This assemblage contains �9.5 wt.% water bound structurally in kaolinite. At a depth of about 12 km, T reaches370°C where this assemblage reacts to produce pyrophyllite � 2H2O. On a wt.% basis this liberated water is �4.5 wt.%; 5 wt.% remains structurally bound in pyrophyllite. With increasing T, pyrophyllite breaks down at 425°C to 2 kyanite � 6 quartz � 4 H2O. All of the water has now been released from solid phases. At �550°C, kyanite should convert to sillimanite. Because kaolinite and pyrophyllite are here considered to be pure phases with no solid solution, release of water occurs sharply at their univariant dehydrationcurves. (c) Generalized fluid-release curve for a shale along a 30°C/km geotherm. Water release is continuous with increasing P and Tbecause of the complex crystalline solid solutions constituting pelitic rocks that progressively break down by continuous reactions.Changes in slope of the release curve are related to beginning and completion of dehydration of major hydrous silicates. Depending uponthe exact composition of the system, especially the remaining water concentration, partial melting may begin somewhere near 700°C toform migmatite. (d) Generalized fluid-release curve for mafic rock along a 30°C/km geotherm, assuming rock is initially dry and then hy-drates to a zeolite facies assemblage with 5 wt.% water. (On the seafloor palagonitization could produce a more hydrous rock at lowerT.) Note temperatures for partial melting and migmatite formation.
� P /(P � P ), where P and P are partial pressures. At lower T and higher P, volatile mixtures are nonideal. For thermodynamic calculations,this nonideality requires use of fluid activities or fugac-ities (Spear, 1993, p. 228).
Among natural fluids, water has unusually high solvent capacity, especially for ionic compounds suchas NaCl, because of the strongly polar nature of itsmolecule and lone-pair electrons (e.g. Brimhall and Crerar, 1987).
The separate volatile phase in metamorphic systemshas been referred to as a vapor, gas, liquid, fluid, andsupercritical fluid. However, because of the low P andT of the critical points of H2O and CO2, above whichthere is no sharp distinction between gas (vapor) andliquid, a separate phase of these volatiles can simply be called a fluid (Section 4.2.1). In most metamorphicsystems the density, or specific volume, of the fluidvaries continuously as a function of T and P. But asboth increase with increasing depth, the fluid expan-sion resulting from increasing T is nearly compensatedby compression from increasing P. For example, alonga geothermal gradient of 15°C/km to a depth of 35 kmthe specific volume of water deviates only slightly from its familiar value at atmospheric conditions of 1.0 cm3/g (Figure 4.3). For carbon dioxide along thesame geotherm the specific volume ranges betweenabout 0.8 and 1.2 cm3/g (Spear, 1993, p. 229).
16.6.2 Fundamental Concepts of Solid–Fluid ReactionsThe general form of a prograde, volatile-liberating re-action is
16.21 Heat � volatile-bearing crystalline phase
→ volatile-poor (or -free) crystalline phase
� volatile fluid
Hence, most devolatilization reactions are endothermic;they consume heat, “dry out” mineral assemblages, andmoderate otherwise rising temperatures during meta-morphic heating. In the reverse sense, hydration andcarbonation reactions are exothermic. Conversion ofvolatile-free rocks, such as dry basalt, into volatile-bearing greenschist or zeolite facies assemblages pro-duces heat; temperatures can increase several tens ofdegrees if all the heat in the rock is conserved. Provid-ing CO2 and H2O are continuously available, exother-mic reactions might be thermally self-accelerating andcause an initially volatile-free magmatic protolith tomove rapidly through the lowest metamorphic grades.
Entropy–Molar Volume Relations. Under most meta-morphic conditions, a volatile phase has a large molarentropy compared to the partial molar entropy of thesame volatile structurally bound in a hydrous silicate orcarbonate mineral. Consequently, the separate volatile
CO2H2OCO2H2OH2O
Metamorphic Mineral Reactions and Equilibria 491
Special Interest Box 16.3 Fluid inclusionsMetamorphic minerals, typically quartz, commonlycontain minute fluid inclusions (Crawford and Hollister, 1986). They originate as more or less randomly distributed pockets of fluid entrappedduring growth of the host grain (primary inclu-sions) or as healed fluid-filled microcracks formedafter the host grain crystallized (secondary inclu-sions; Figure 16.25). Inclusions are generally�0.03–0.05 mm in diameter but larger ones can be found in veins formed from fluid precipitates in rock fractures. Vein quartz in metamorphic terranes is typically snow-white because of an estimated 109 fluid inclusions per cm3 (Roedder,1984, p. 2). Inclusions can provide important insights into the composition of the fluid presentwhen the host mineral grain formed and P–T con-ditions of crystallization.
In addition to a homogeneous fluid, or locallytwo immiscible fluids, inclusions also may contain a bubble of low-density vapor and one or morecrystalline daughter phases (usually halite, but alsosylvite, calcite, and various fluorides) that appar-ently precipitated as the fluid cooled from hightemperatures.
Laser-excited Raman microspectroscopy dis-criminates among fluids of SO4, CH4, CO2, andH2O within inclusions. More indirect informationis provided by observations on a heating–freezingstage. Pure H2O fluid freezes at 0°C but dissolvedsalts depress the freezing T, to as much as �23°C at the NaCl–H2O eutectic. Identifiable daughtercrystal may help constrain the fluid composition.Pure CO2 freezes at �56.6°C, but mixed with H2Oraises the freezing T towards 0°C while mixtureswith CH4 (methane) lower it towards about�184°C.
Distinguishing inclusions formed during pro-grade and particularly peak metamorphic condi-tions from secondary inclusions formed duringcracking accompanying uplift and cooling of ametamorphic terrane is not easy. Moreover, inclu-sions can be perturbed in many ways after initialentrapment, such as by leakage and reaction withthe host crystal. Caution must, therefore, be takenin the interpretation of P–T–X data based on fluidinclusions.
Inclusion studies reveal that fluids in low-grademetamorphic rocks are dominantly methane, pre-sumably derived from carbonaceous material, those in lower greenschist- to middle amphibolite-facies rocks fluids are essentially aqueous, while ingranulite-facies rocks CO2 dominates (Spear, 1993,p. 669).
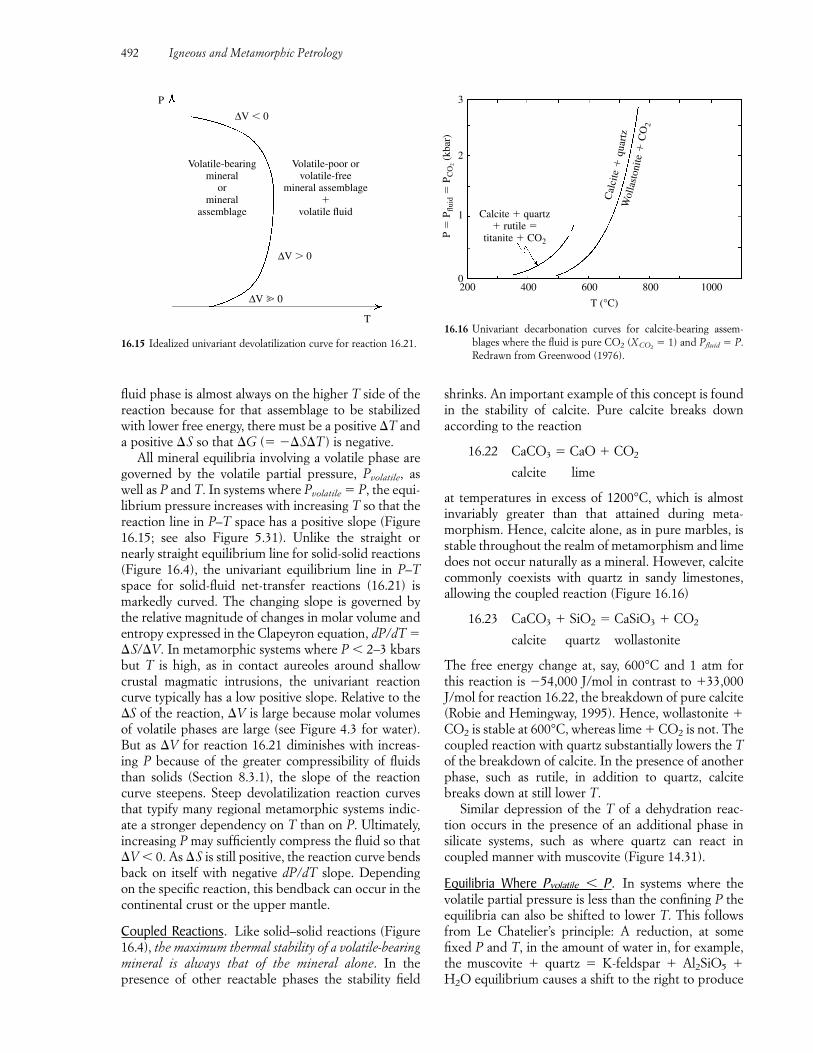
fluid phase is almost always on the higher T side of thereaction because for that assemblage to be stabilizedwith lower free energy, there must be a positive �T anda positive �S so that �G (� ��S�T ) is negative.
All mineral equilibria involving a volatile phase aregoverned by the volatile partial pressure, Pvolatile, aswell as P and T. In systems where Pvolatile � P, the equi-librium pressure increases with increasing T so that thereaction line in P–T space has a positive slope (Figure16.15; see also Figure 5.31). Unlike the straight ornearly straight equilibrium line for solid-solid reactions(Figure 16.4), the univariant equilibrium line in P–Tspace for solid-fluid net-transfer reactions (16.21) ismarkedly curved. The changing slope is governed bythe relative magnitude of changes in molar volume andentropy expressed in the Clapeyron equation, dP/dT ��S/�V. In metamorphic systems where P � 2–3 kbarsbut T is high, as in contact aureoles around shallowcrustal magmatic intrusions, the univariant reactioncurve typically has a low positive slope. Relative to the�S of the reaction, �V is large because molar volumesof volatile phases are large (see Figure 4.3 for water).But as �V for reaction 16.21 diminishes with increas-ing P because of the greater compressibility of fluidsthan solids (Section 8.3.1), the slope of the reactioncurve steepens. Steep devolatilization reaction curvesthat typify many regional metamorphic systems indic-ate a stronger dependency on T than on P. Ultimately,increasing P may sufficiently compress the fluid so that�V � 0. As �S is still positive, the reaction curve bendsback on itself with negative dP/dT slope. Dependingon the specific reaction, this bendback can occur in thecontinental crust or the upper mantle.
Coupled Reactions. Like solid–solid reactions (Figure16.4), the maximum thermal stability of a volatile-bearingmineral is always that of the mineral alone. In the presence of other reactable phases the stability field
shrinks. An important example of this concept is foundin the stability of calcite. Pure calcite breaks down according to the reaction
16.22 CaCO3 � CaO � CO2
calcite lime
at temperatures in excess of 1200°C, which is almostinvariably greater than that attained during meta-morphism. Hence, calcite alone, as in pure marbles, isstable throughout the realm of metamorphism and limedoes not occur naturally as a mineral. However, calcitecommonly coexists with quartz in sandy limestones, allowing the coupled reaction (Figure 16.16)
16.23 CaCO3 � SiO2 � CaSiO3 � CO2
calcite quartz wollastonite
The free energy change at, say, 600°C and 1 atm for this reaction is �54,000 J/mol in contrast to �33,000J/mol for reaction 16.22, the breakdown of pure calcite (Robie and Hemingway, 1995). Hence, wollastonite �CO2 is stable at 600°C, whereas lime � CO2 is not. Thecoupled reaction with quartz substantially lowers the Tof the breakdown of calcite. In the presence of anotherphase, such as rutile, in addition to quartz, calcitebreaks down at still lower T.
Similar depression of the T of a dehydration reac-tion occurs in the presence of an additional phase in silicate systems, such as where quartz can react in coupled manner with muscovite (Figure 14.31).
Equilibria Where Pvolatile � P. In systems where the volatile partial pressure is less than the confining P theequilibria can also be shifted to lower T. This followsfrom Le Chatelier’s principle: A reduction, at somefixed P and T, in the amount of water in, for example,the muscovite � quartz � K-feldspar � Al2SiO5 �H2O equilibrium causes a shift to the right to produce
492 Igneous and Metamorphic Petrology
P
T
Volatile-poor orvolatile-free
mineral assemblage�
volatile fluid
∆V � 0
∆V 0
∆V � 0
Volatile-bearingmineral
ormineral
assemblage
16.15 Idealized univariant devolatilization curve for reaction 16.21.
P �
Pflu
id �
PC
O2 (
kbar
)
Calcite � quartz� rutile �
titanite � CO2
3
2
1
0200 400 600 800 1000
T (°C)
Wol
last
onite
�C
O2
Cal
cite
�qu
artz
16.16 Univariant decarbonation curves for calcite-bearing assem-blages where the fluid is pure CO2 (X � 1) and Pfluid � P.Redrawn from Greenwood (1976).
CO2
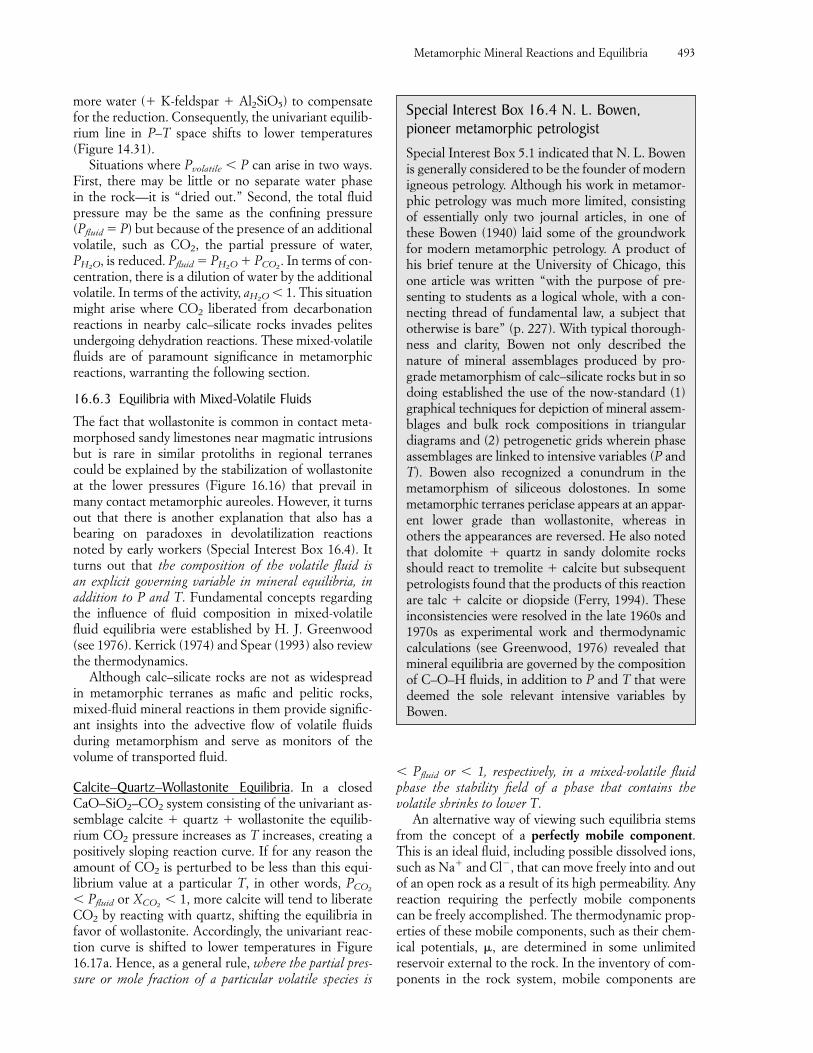
more water (� K-feldspar � Al2SiO5) to compensatefor the reduction. Consequently, the univariant equilib-rium line in P–T space shifts to lower temperatures(Figure 14.31).
Situations where Pvolatile � P can arise in two ways.First, there may be little or no separate water phase in the rock—it is “dried out.” Second, the total fluidpressure may be the same as the confining pressure(Pfluid � P) but because of the presence of an additionalvolatile, such as CO2, the partial pressure of water,P , is reduced. Pfluid � P � P . In terms of con-centration, there is a dilution of water by the additionalvolatile. In terms of the activity, a � 1. This situationmight arise where CO2 liberated from decarbonationreactions in nearby calc–silicate rocks invades pelitesundergoing dehydration reactions. These mixed-volatilefluids are of paramount significance in metamorphicreactions, warranting the following section.
16.6.3 Equilibria with Mixed-Volatile Fluids
The fact that wollastonite is common in contact meta-morphosed sandy limestones near magmatic intrusionsbut is rare in similar protoliths in regional terranescould be explained by the stabilization of wollastoniteat the lower pressures (Figure 16.16) that prevail inmany contact metamorphic aureoles. However, it turnsout that there is another explanation that also has abearing on paradoxes in devolatilization reactionsnoted by early workers (Special Interest Box 16.4). Itturns out that the composition of the volatile fluid is an explicit governing variable in mineral equilibria, inaddition to P and T. Fundamental concepts regardingthe influence of fluid composition in mixed-volatilefluid equilibria were established by H. J. Greenwood(see 1976). Kerrick (1974) and Spear (1993) also reviewthe thermodynamics.
Although calc–silicate rocks are not as widespreadin metamorphic terranes as mafic and pelitic rocks,mixed-fluid mineral reactions in them provide signific-ant insights into the advective flow of volatile fluidsduring metamorphism and serve as monitors of the volume of transported fluid.
Calcite–Quartz–Wollastonite Equilibria. In a closedCaO–SiO2–CO2 system consisting of the univariant as-semblage calcite � quartz � wollastonite the equilib-rium CO2 pressure increases as T increases, creating apositively sloping reaction curve. If for any reason theamount of CO2 is perturbed to be less than this equi-librium value at a particular T, in other words, P� Pfluid or X � 1, more calcite will tend to liberateCO2 by reacting with quartz, shifting the equilibria infavor of wollastonite. Accordingly, the univariant reac-tion curve is shifted to lower temperatures in Figure16.17a. Hence, as a general rule, where the partial pres-sure or mole fraction of a particular volatile species is
CO2
CO2
H2O
CO2H2OH2O
� Pfluid or � 1, respectively, in a mixed-volatile fluidphase the stability field of a phase that contains thevolatile shrinks to lower T.
An alternative way of viewing such equilibria stemsfrom the concept of a perfectly mobile component.This is an ideal fluid, including possible dissolved ions,such as Na� and Cl�, that can move freely into and outof an open rock as a result of its high permeability. Anyreaction requiring the perfectly mobile componentscan be freely accomplished. The thermodynamic prop-erties of these mobile components, such as their chem-ical potentials, �, are determined in some unlimitedreservoir external to the rock. In the inventory of com-ponents in the rock system, mobile components are
Metamorphic Mineral Reactions and Equilibria 493
Special Interest Box 16.4 N. L. Bowen, pioneer metamorphic petrologistSpecial Interest Box 5.1 indicated that N. L. Bowenis generally considered to be the founder of modernigneous petrology. Although his work in metamor-phic petrology was much more limited, consistingof essentially only two journal articles, in one ofthese Bowen (1940) laid some of the groundworkfor modern metamorphic petrology. A product ofhis brief tenure at the University of Chicago, thisone article was written “with the purpose of pre-senting to students as a logical whole, with a con-necting thread of fundamental law, a subject thatotherwise is bare” (p. 227). With typical thorough-ness and clarity, Bowen not only described the nature of mineral assemblages produced by pro-grade metamorphism of calc–silicate rocks but in sodoing established the use of the now-standard (1)graphical techniques for depiction of mineral assem-blages and bulk rock compositions in triangular diagrams and (2) petrogenetic grids wherein phaseassemblages are linked to intensive variables (P andT). Bowen also recognized a conundrum in themetamorphism of siliceous dolostones. In somemetamorphic terranes periclase appears at an appar-ent lower grade than wollastonite, whereas in others the appearances are reversed. He also notedthat dolomite � quartz in sandy dolomite rocksshould react to tremolite � calcite but subsequentpetrologists found that the products of this reactionare talc � calcite or diopside (Ferry, 1994). Theseinconsistencies were resolved in the late 1960s and1970s as experimental work and thermodynamiccalculations (see Greenwood, 1976) revealed thatmineral equilibria are governed by the compositionof C–O–H fluids, in addition to P and T that weredeemed the sole relevant intensive variables byBowen.
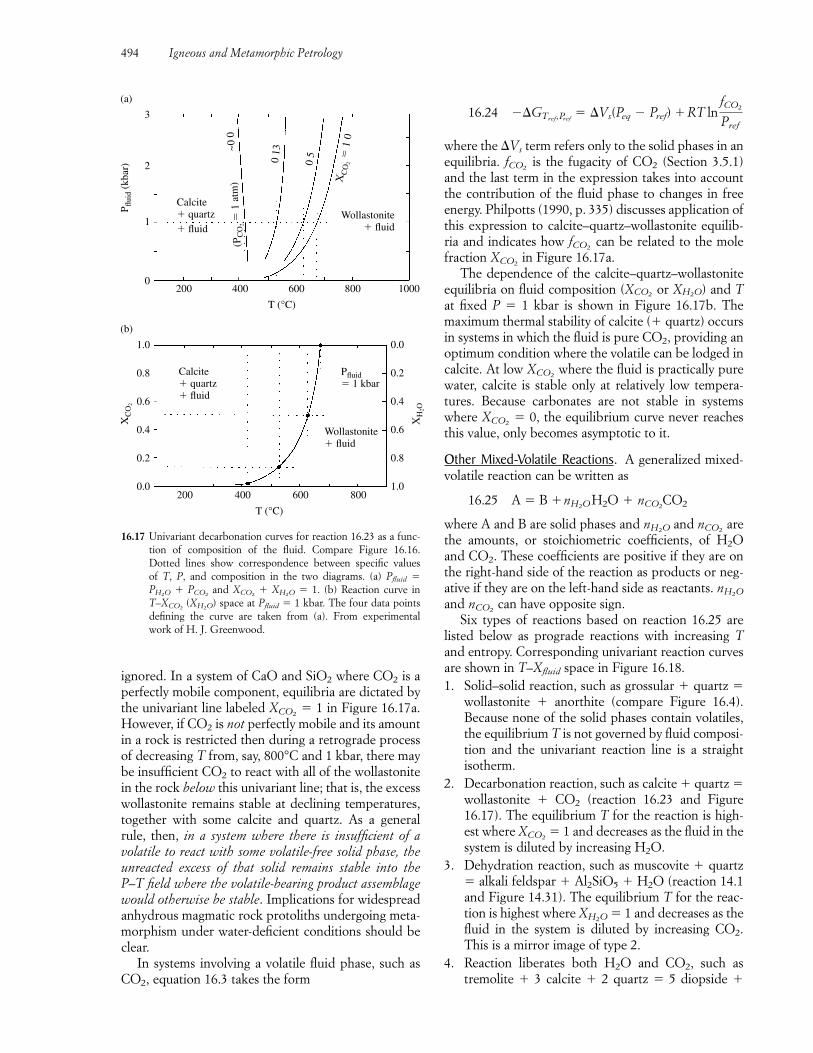
ignored. In a system of CaO and SiO2 where CO2 is aperfectly mobile component, equilibria are dictated bythe univariant line labeled X � 1 in Figure 16.17a.However, if CO2 is not perfectly mobile and its amountin a rock is restricted then during a retrograde processof decreasing T from, say, 800°C and 1 kbar, there maybe insufficient CO2 to react with all of the wollastonitein the rock below this univariant line; that is, the excesswollastonite remains stable at declining temperatures,together with some calcite and quartz. As a generalrule, then, in a system where there is insufficient of avolatile to react with some volatile-free solid phase, theunreacted excess of that solid remains stable into theP–T field where the volatile-bearing product assemblagewould otherwise be stable. Implications for widespreadanhydrous magmatic rock protoliths undergoing meta-morphism under water-deficient conditions should beclear.
In systems involving a volatile fluid phase, such asCO2, equation 16.3 takes the form
CO2
16.24 ��
where the �Vs term refers only to the solid phases in anequilibria. f is the fugacity of CO2 (Section 3.5.1)and the last term in the expression takes into accountthe contribution of the fluid phase to changes in freeenergy. Philpotts (1990, p. 335) discusses application ofthis expression to calcite–quartz–wollastonite equilib-ria and indicates how f can be related to the molefraction X in Figure 16.17a.
The dependence of the calcite–quartz–wollastoniteequilibria on fluid composition (X or X ) and Tat fixed P � 1 kbar is shown in Figure 16.17b. Themaximum thermal stability of calcite (� quartz) occursin systems in which the fluid is pure CO2, providing anoptimum condition where the volatile can be lodged incalcite. At low X where the fluid is practically purewater, calcite is stable only at relatively low tempera-tures. Because carbonates are not stable in systemswhere X � 0, the equilibrium curve never reachesthis value, only becomes asymptotic to it.
Other Mixed-Volatile Reactions. A generalized mixed-volatile reaction can be written as
16.25 A � B �
where A and B are solid phases and n and n arethe amounts, or stoichiometric coefficients, of H2Oand CO2. These coefficients are positive if they are onthe right-hand side of the reaction as products or neg-ative if they are on the left-hand side as reactants. nand n can have opposite sign.
Six types of reactions based on reaction 16.25 arelisted below as prograde reactions with increasing Tand entropy. Corresponding univariant reaction curvesare shown in T–Xfluid space in Figure 16.18.1. Solid–solid reaction, such as grossular � quartz �
wollastonite � anorthite (compare Figure 16.4).Because none of the solid phases contain volatiles,the equilibrium T is not governed by fluid composi-tion and the univariant reaction line is a straightisotherm.
2. Decarbonation reaction, such as calcite � quartz �wollastonite � CO2 (reaction 16.23 and Figure16.17). The equilibrium T for the reaction is high-est where X � 1 and decreases as the fluid in thesystem is diluted by increasing H2O.
3. Dehydration reaction, such as muscovite � quartz� alkali feldspar � Al2SiO5 � H2O (reaction 14.1and Figure 14.31). The equilibrium T for the reac-tion is highest where X � 1 and decreases as thefluid in the system is diluted by increasing CO2.This is a mirror image of type 2.
4. Reaction liberates both H2O and CO2, such astremolite � 3 calcite � 2 quartz � 5 diopside �
H2O
CO2
CO2
H2O
CO2H2O
nH2OH2O � nCO2CO2
CO2
CO2
H2OCO2
CO2
CO2
CO2
GTref,Pref� �Vs(Peq � Pref) � RT ln
fCO2
Pref
494 Igneous and Metamorphic Petrology
XC
O2
XH
2O
1.0
0.8
0.6
0.4
0.2
0.0
(b)
(a)
0.0
0.2
0.4
0.6
0.8
1.0400200 600 800
T (°C)
P flui
d (k
bar)
Calcite� quartz� fluid
Calcite� quartz� fluid
Pfluid� 1 kbar
(PC
O2 �
1 a
tm) X
CO
2 �
10
~00
013
05
Wollastonite� fluid
Wollastonite� fluid
3
2
1
0200 400 600 800 1000
T (°C)
16.17 Univariant decarbonation curves for reaction 16.23 as a func-tion of composition of the fluid. Compare Figure 16.16. Dotted lines show correspondence between specific values of T, P, and composition in the two diagrams. (a) Pfluid �
P � P and X � X � 1. (b) Reaction curve inT–X (X ) space at Pfluid � 1 kbar. The four data pointsdefining the curve are taken from (a). From experimental work of H. J. Greenwood.
H2OCO2
H2OCO2CO2H2O
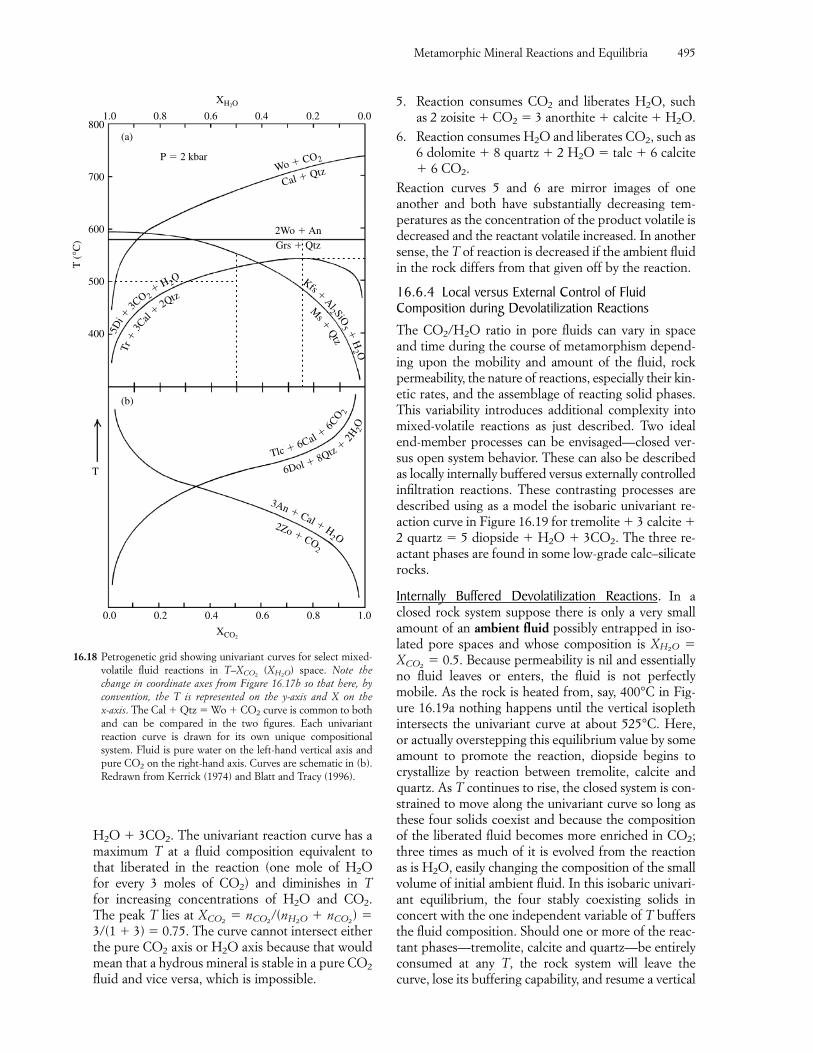
H2O � 3CO2. The univariant reaction curve has amaximum T at a fluid composition equivalent tothat liberated in the reaction (one mole of H2O for every 3 moles of CO2) and diminishes in Tfor increasing concentrations of H2O and CO2.The peak T lies at X � n /(n � n ) �3/(1 � 3) � 0.75. The curve cannot intersect eitherthe pure CO2 axis or H2O axis because that wouldmean that a hydrous mineral is stable in a pure CO2
fluid and vice versa, which is impossible.
CO2H2OCO2CO2
5. Reaction consumes CO2 and liberates H2O, such as 2 zoisite � CO2 � 3 anorthite � calcite � H2O.
6. Reaction consumes H2O and liberates CO2, such as6 dolomite � 8 quartz � 2 H2O � talc � 6 calcite� 6 CO2.
Reaction curves 5 and 6 are mirror images of one another and both have substantially decreasing tem-peratures as the concentration of the product volatile isdecreased and the reactant volatile increased. In anothersense, the T of reaction is decreased if the ambient fluidin the rock differs from that given off by the reaction.
16.6.4 Local versus External Control of FluidComposition during Devolatilization ReactionsThe CO2/H2O ratio in pore fluids can vary in spaceand time during the course of metamorphism depend-ing upon the mobility and amount of the fluid, rockpermeability, the nature of reactions, especially their kin-etic rates, and the assemblage of reacting solid phases.This variability introduces additional complexity intomixed-volatile reactions as just described. Two idealend-member processes can be envisaged—closed ver-sus open system behavior. These can also be describedas locally internally buffered versus externally controlledinfiltration reactions. These contrasting processes aredescribed using as a model the isobaric univariant re-action curve in Figure 16.19 for tremolite � 3 calcite �2 quartz � 5 diopside � H2O � 3CO2. The three re-actant phases are found in some low-grade calc–silicaterocks.
Internally Buffered Devolatilization Reactions. In aclosed rock system suppose there is only a very smallamount of an ambient fluid possibly entrapped in iso-lated pore spaces and whose composition is X �X � 0.5. Because permeability is nil and essentiallyno fluid leaves or enters, the fluid is not perfectly mobile. As the rock is heated from, say, 400°C in Fig-ure 16.19a nothing happens until the vertical isoplethintersects the univariant curve at about 525°C. Here, or actually overstepping this equilibrium value by someamount to promote the reaction, diopside begins tocrystallize by reaction between tremolite, calcite andquartz. As T continues to rise, the closed system is con-strained to move along the univariant curve so long asthese four solids coexist and because the compositionof the liberated fluid becomes more enriched in CO2;three times as much of it is evolved from the reactionas is H2O, easily changing the composition of the smallvolume of initial ambient fluid. In this isobaric univari-ant equilibrium, the four stably coexisting solids inconcert with the one independent variable of T buffersthe fluid composition. Should one or more of the reac-tant phases—tremolite, calcite and quartz—be entirelyconsumed at any T, the rock system will leave thecurve, lose its buffering capability, and resume a vertical
CO2
H2O
Metamorphic Mineral Reactions and Equilibria 495
T (
°C)
T
800
700
600
500
400
0.0 0.2 0.4 0.6 0.8 1.0
1.0
(a)
P � 2 kbar
(b)
0.8 0.6 0.4 0.2 0.0
XCO2
XH2O
Wo � CO2
5Di �
3CO 2
�H 2O
Tr�
3Cal
�2Qtz
Kfs �
Al2 SiO5 �
H2 O
Tlc � 6Cal �6CO 2
3An � Cal � H2 O
2Zo � CO2
6Dol � 8Qtz�
2H2O
Ms �
Qtz
Cal � Qtz
2Wo � AnGrs � Qtz
16.18 Petrogenetic grid showing univariant curves for select mixed-volatile fluid reactions in T–X (X ) space. Note thechange in coordinate axes from Figure 16.17b so that here, byconvention, the T is represented on the y-axis and X on the x-axis. The Cal � Qtz � Wo � CO2 curve is common to bothand can be compared in the two figures. Each univariant reaction curve is drawn for its own unique compositional system. Fluid is pure water on the left-hand vertical axis andpure CO2 on the right-hand axis. Curves are schematic in (b).Redrawn from Kerrick (1974) and Blatt and Tracy (1996).
H2OCO2
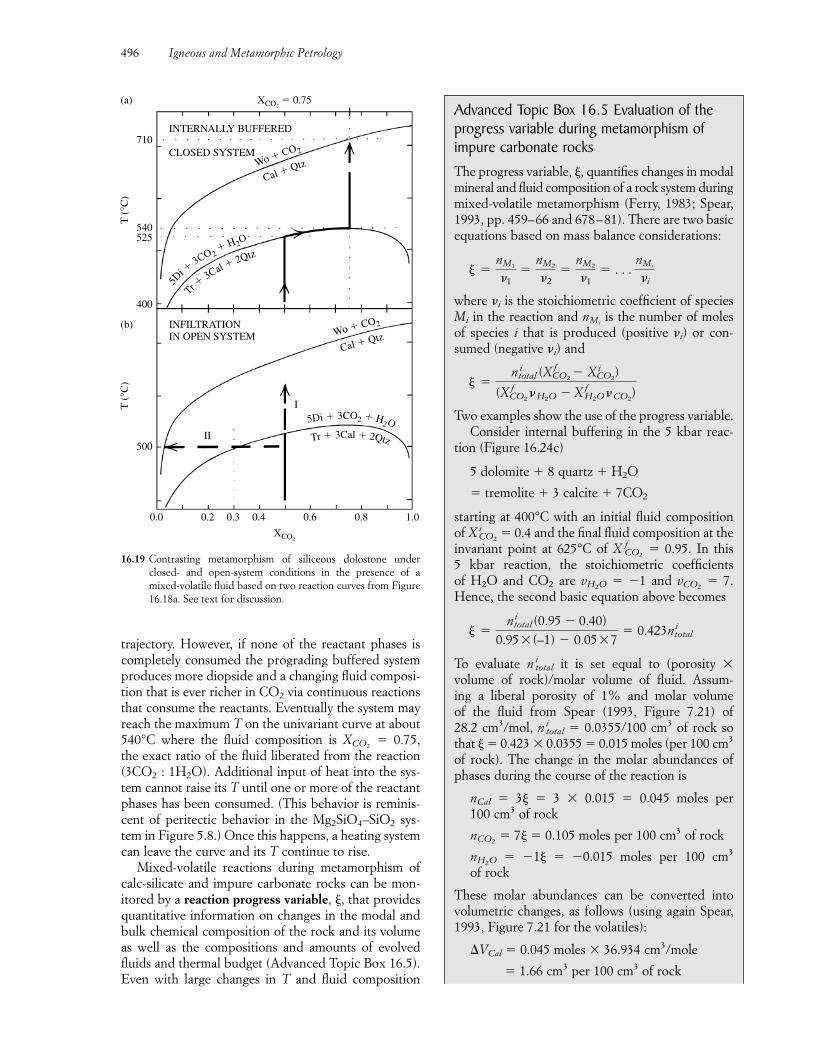
trajectory. However, if none of the reactant phases iscompletely consumed the prograding buffered systemproduces more diopside and a changing fluid composi-tion that is ever richer in CO2 via continuous reactionsthat consume the reactants. Eventually the system mayreach the maximum T on the univariant curve at about540°C where the fluid composition is X � 0.75, the exact ratio of the fluid liberated from the reaction(3CO2 : 1H2O). Additional input of heat into the sys-tem cannot raise its T until one or more of the reactantphases has been consumed. (This behavior is reminis-cent of peritectic behavior in the Mg2SiO4–SiO2 sys-tem in Figure 5.8.) Once this happens, a heating systemcan leave the curve and its T continue to rise.
Mixed-volatile reactions during metamorphism ofcalc-silicate and impure carbonate rocks can be mon-itored by a reaction progress variable, �, that providesquantitative information on changes in the modal andbulk chemical composition of the rock and its volumeas well as the compositions and amounts of evolvedfluids and thermal budget (Advanced Topic Box 16.5).Even with large changes in T and fluid composition
CO2
496 Igneous and Metamorphic Petrology
T (
°C)
T (
°C)
525
400
500
(b) INFILTRATIONIN OPEN SYSTEM
INTERNALLY BUFFERED
CLOSED SYSTEM
540
710
0.0 0.2 0.3 0.4 0.6
I
II
0.8 1.0
XCO2
XCO2 � 0.75(a)
Wo � CO2
Cal � Qtz
Wo � CO2
Cal � Qtz
5Di � 3CO2 � H2O
Tr � 3Cal � 2Qtz
5D
i �3CO 2
� H2O
Tr �3Cal � 2Qtz
16.19 Contrasting metamorphism of siliceous dolostone underclosed- and open-system conditions in the presence of amixed-volatile fluid based on two reaction curves from Figure16.18a. See text for discussion.
Advanced Topic Box 16.5 Evaluation of theprogress variable during metamorphism of impure carbonate rocksThe progress variable, �, quantifies changes in modalmineral and fluid composition of a rock system duringmixed-volatile metamorphism (Ferry, 1983; Spear,1993, pp. 459–66 and 678–81). There are two basicequations based on mass balance considerations:
where �i is the stoichiometric coefficient of speciesMi in the reaction and n is the number of molesof species i that is produced (positive �i) or con-sumed (negative �i) and
Two examples show the use of the progress variable.Consider internal buffering in the 5 kbar reac-
tion (Figure 16.24c)
5 dolomite � 8 quartz � H2O
� tremolite � 3 calcite � 7CO2
starting at 400°C with an initial fluid compositionof X � 0.4 and the final fluid composition at the invariant point at 625°C of X � 0.95. In this 5 kbar reaction, the stoichiometric coefficients of H2O and CO2 are v � �1 and v � 7.Hence, the second basic equation above becomes
To evaluate n it is set equal to (porosity �volume of rock)/molar volume of fluid. Assum-ing a liberal porosity of 1% and molar volume of the fluid from Spear (1993, Figure 7.21) of 28.2 cm3/mol, n � 0.0355/100 cm3 of rock sothat � � 0.423 � 0.0355 � 0.015 moles (per 100 cm3
of rock). The change in the molar abundances ofphases during the course of the reaction is
nCal � 3� � 3 � 0.015 � 0.045 moles per 100 cm3 of rock
n � 7� � 0.105 moles per 100 cm3 of rock
n � �1� � �0.015 moles per 100 cm3
of rock
These molar abundances can be converted into volumetric changes, as follows (using again Spear,1993, Figure 7.21 for the volatiles):
�VCal � 0.045 moles � 36.934 cm3/mole
� 1.66 cm3 per 100 cm3 of rock
H2O
CO2
totali
totali
� �ntotal
i (0.95 � 0.40)0.95� (–1) � 0.05�7
� 0.423ntotali
CO2H2O
fCO2
CO2
i
� �ntotal
i (XCO2
f � XCO2
i )
(XCO2
f �H2O � XH2Of �CO2
)
Mi
� �nM1
�1�
nM2
�2�
nM2
�1� . . .
nMi
�i
between initial and final conditions, internally bufferedreactions may not yield much change in modal com-position of a rock.
Infiltration Metamorphism in Open Systems. Supposethe rock is a highly permeable, open system and invas-ive, perfectly mobile fluids from an external source can penetrate along fractures and/or grain boundaries.The infiltrating fluid significantly dilutes or even flushesaway that created by any local reaction; the mass of themobile fluid can be greater than that of the reacting
solid phases, the fluid/rock ratio is relatively high. Cal-culations based on the reaction progress variable indic-ate time-integrated fluid/rock ratios over the entirecourse of the reaction are commonly 1 to 4 and locallygreater (Spear, 1993, p. 680). It has been argued bysome petrologists that the typical Barrovian metamor-phism of carbonate-bearing metasedimentary rocks requires significant infiltration of aqueous fluids, asotherwise very high temperatures are needed. Systemsinvolving infiltration metamorphism in permeablerocks include “flooding” of a local decarbonating sys-tem by water liberated from nearby pelitic rocks experi-encing dehydration reactions or by aqueous solutionsexpelled from adjacent magmatic intrusions. The con-tact metamorphic aureole is a particularly favorable environment for infiltration metamorphism because ofthe heat source that can drive advective flow. Two sce-narios can be considered, again using the same isobaricdiopside-producing reaction as in Figure 16.19a.
In one case (I in Figure 16.19b), as before, a rockcomposed of tremolite � calcite � quartz is heatedabove 400°C but is simultaneously flooded by a mobilefluid from a uniform external source whose composi-tion is X � 0.5. At T � 525°C (or above as requiredby necessary overstepping), diopside begins to be pro-duced from the reactant phases, while the fluid com-position remains the same. Under these conditions theperfectly mobile fluids CO2 and H2O are not countedas components and consequently not counted as phaseseither. Hence, the isobaric system is invariant becauseit consists of three components (CaO, MgO, andSiO2), four (solid) phases, and with T still an indepen-dent variable, F � 1 � C � � 1 � 3 � 4 � 0. Anyadditional heat input into the invariant system is con-sumed by the endothermic devolatilization reactionwhile T remains fixed at 525°C; more diopside is pro-duced until one of the reactant phases is consumed.Once this happens, the heating system can continue toget hotter, leaving its invariant state on the reaction lineand rising along a vertical trajectory. This open-systemprocess involving a fixed fluid composition is basicallya discontinuous reaction that occurs at some specific T.
In the second scenario (II in Figure 16.19b), sup-pose a rock at 500°C composed of tremolite � calcite� quartz is suddenly invaded by essentially pure waterof the same T, perhaps by hydraulic fracturing in a contact aureole or by pervasive advective flow alongpermeable relict bedding planes. As the ambient fluid,with a composition X � 0.5, mixes with the greateramount of infiltrating aqueous fluid, the rock systemfollows a horizontal trajectory in Figure 16.19b thateventually intersects the univariant curve where thefluid is about X � 0.3, producing diopside. In thisisobaric–isothermal situation, the changing compositionof the fluid drives the devolatilization reaction. As moreaqueous fluid invades the rock the composition of the
CO2
CO2
CO2
Metamorphic Mineral Reactions and Equilibria 497
�V � 0.105 moles � 44 cm3/mole
� 4.62 cm3 per 100 cm3 of rock
�V � �0.015 moles � 23 cm3/mole
� �0.345 cm3 per 100 cm3 of rock
The remainder of the volumetric modal changes arefound in Problem 16.8. The changes in modal pro-portions of solid phases are so small as to be barelynoticeable in thin section, despite the reaction pro-gressing over 225°C with substantial changes influid composition.
Consider next an open system subjected toinfiltration metamorphism at 525°C and 5 kbarwhere the composition of the equilibrium fluid isX � 0.52. In this system, the amount of infiltrat-ing fluid, n , is obtained from the equation
The infiltrating fluid is assumed to be X � 0.2and the amount of tremolite produced in the reac-tion is assumed to be 20 modal percent. From thefirst basic equation above, � � nTr/vTr � nTr �(mole/272.92 cm3) 20 cm3 � 0.07328 mole oftremolite in 100 cm3 of rock. Substituting this valuein the equation above
� �0.07328
� �0.07328 = 0.888 mole
Since the molar volume of the infiltrating fluid isapproximately 25 cm3/mole (Spear, 1993, Figure7.21) the total volume of the infiltrating fluid is0.888 mole � 25 cm3/mole � 22.2 cm3 per 100 cm3
of rock. In other words, the fluid/rock ratio isabout 0.22.
For a more CO2-rich infiltrating fluid the ratiowould be greater, whereas for a more water-richfluid the ratio would be smaller.
–3.880.32
(0.52{–1} � 0.48{7})(0.52 � 0.2)
ntotala
CO2
a
ntotala � ��
(XCO2�H2O � XH2O�CO2
)(XCO2
� XaCO2
)
totala
CO2
H2O
CO2
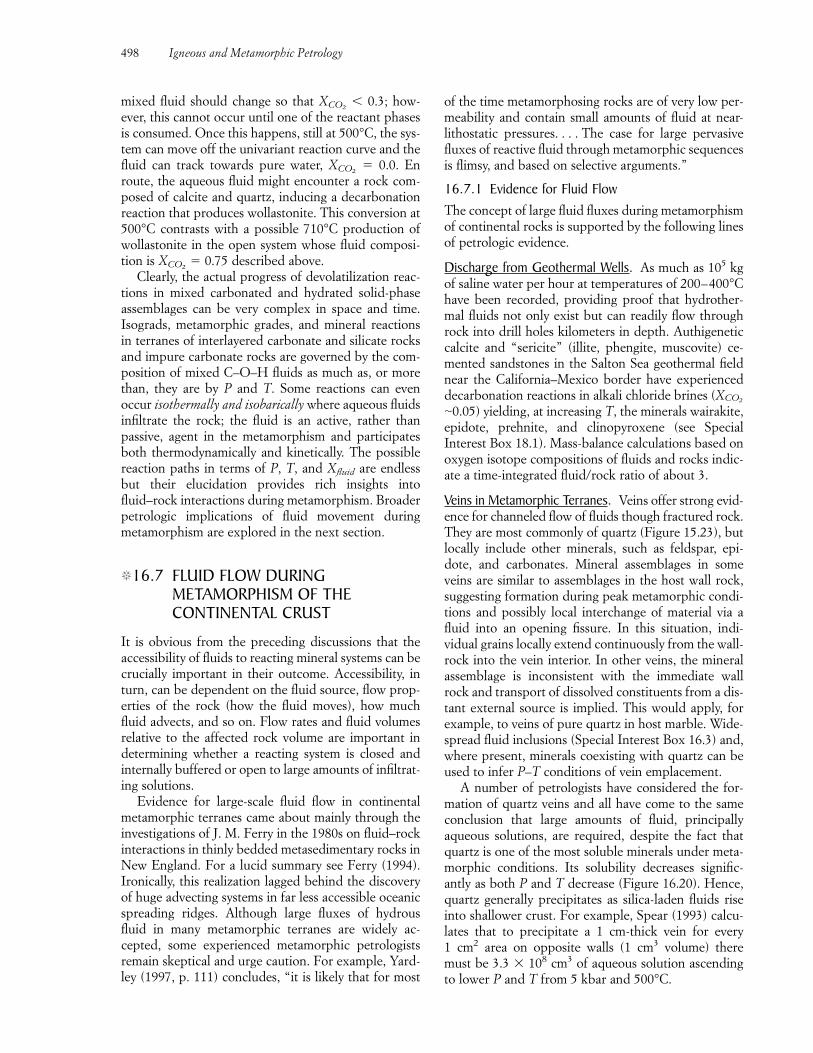
mixed fluid should change so that X � 0.3; how-ever, this cannot occur until one of the reactant phasesis consumed. Once this happens, still at 500°C, the sys-tem can move off the univariant reaction curve and thefluid can track towards pure water, X � 0.0. Enroute, the aqueous fluid might encounter a rock com-posed of calcite and quartz, inducing a decarbonationreaction that produces wollastonite. This conversion at500°C contrasts with a possible 710°C production ofwollastonite in the open system whose fluid composi-tion is X � 0.75 described above.
Clearly, the actual progress of devolatilization reac-tions in mixed carbonated and hydrated solid-phase assemblages can be very complex in space and time.Isograds, metamorphic grades, and mineral reactionsin terranes of interlayered carbonate and silicate rocksand impure carbonate rocks are governed by the com-position of mixed C–O–H fluids as much as, or morethan, they are by P and T. Some reactions can even occur isothermally and isobarically where aqueous fluidsinfiltrate the rock; the fluid is an active, rather than passive, agent in the metamorphism and participatesboth thermodynamically and kinetically. The possiblereaction paths in terms of P, T, and Xfluid are endlessbut their elucidation provides rich insights intofluid–rock interactions during metamorphism. Broaderpetrologic implications of fluid movement duringmetamorphism are explored in the next section.
�16.7 FLUID FLOW DURINGMETAMORPHISM OF THECONTINENTAL CRUST
It is obvious from the preceding discussions that theaccessibility of fluids to reacting mineral systems can becrucially important in their outcome. Accessibility, inturn, can be dependent on the fluid source, flow prop-erties of the rock (how the fluid moves), how muchfluid advects, and so on. Flow rates and fluid volumesrelative to the affected rock volume are important indetermining whether a reacting system is closed and internally buffered or open to large amounts of infiltrat-ing solutions.
Evidence for large-scale fluid flow in continentalmetamorphic terranes came about mainly through theinvestigations of J. M. Ferry in the 1980s on fluid–rockinteractions in thinly bedded metasedimentary rocks inNew England. For a lucid summary see Ferry (1994).Ironically, this realization lagged behind the discoveryof huge advecting systems in far less accessible oceanicspreading ridges. Although large fluxes of hydrousfluid in many metamorphic terranes are widely ac-cepted, some experienced metamorphic petrologistsremain skeptical and urge caution. For example, Yard-ley (1997, p. 111) concludes, “it is likely that for most
CO2
CO2
CO2of the time metamorphosing rocks are of very low per-meability and contain small amounts of fluid at near-lithostatic pressures. . . . The case for large pervasivefluxes of reactive fluid through metamorphic sequencesis flimsy, and based on selective arguments.”
16.7.1 Evidence for Fluid FlowThe concept of large fluid fluxes during metamorphismof continental rocks is supported by the following linesof petrologic evidence.
Discharge from Geothermal Wells. As much as 105 kgof saline water per hour at temperatures of 200–400°Chave been recorded, providing proof that hydrother-mal fluids not only exist but can readily flow throughrock into drill holes kilometers in depth. Authigeneticcalcite and “sericite” (illite, phengite, muscovite) ce-mented sandstones in the Salton Sea geothermal fieldnear the California–Mexico border have experienceddecarbonation reactions in alkali chloride brines (X�0.05) yielding, at increasing T, the minerals wairakite,epidote, prehnite, and clinopyroxene (see Special Interest Box 18.1). Mass-balance calculations based onoxygen isotope compositions of fluids and rocks indic-ate a time-integrated fluid/rock ratio of about 3.
Veins in Metamorphic Terranes. Veins offer strong evid-ence for channeled flow of fluids though fractured rock.They are most commonly of quartz (Figure 15.23), butlocally include other minerals, such as feldspar, epi-dote, and carbonates. Mineral assemblages in someveins are similar to assemblages in the host wall rock,suggesting formation during peak metamorphic condi-tions and possibly local interchange of material via afluid into an opening fissure. In this situation, indi-vidual grains locally extend continuously from the wall-rock into the vein interior. In other veins, the mineralassemblage is inconsistent with the immediate wallrock and transport of dissolved constituents from a dis-tant external source is implied. This would apply, forexample, to veins of pure quartz in host marble. Wide-spread fluid inclusions (Special Interest Box 16.3) and,where present, minerals coexisting with quartz can beused to infer P–T conditions of vein emplacement.
A number of petrologists have considered the for-mation of quartz veins and all have come to the sameconclusion that large amounts of fluid, principallyaqueous solutions, are required, despite the fact thatquartz is one of the most soluble minerals under meta-morphic conditions. Its solubility decreases signific-antly as both P and T decrease (Figure 16.20). Hence,quartz generally precipitates as silica-laden fluids riseinto shallower crust. For example, Spear (1993) calcu-lates that to precipitate a 1 cm-thick vein for every 1 cm2 area on opposite walls (1 cm3 volume) theremust be 3.3 � 108 cm3 of aqueous solution ascendingto lower P and T from 5 kbar and 500°C.
CO2
498 Igneous and Metamorphic Petrology
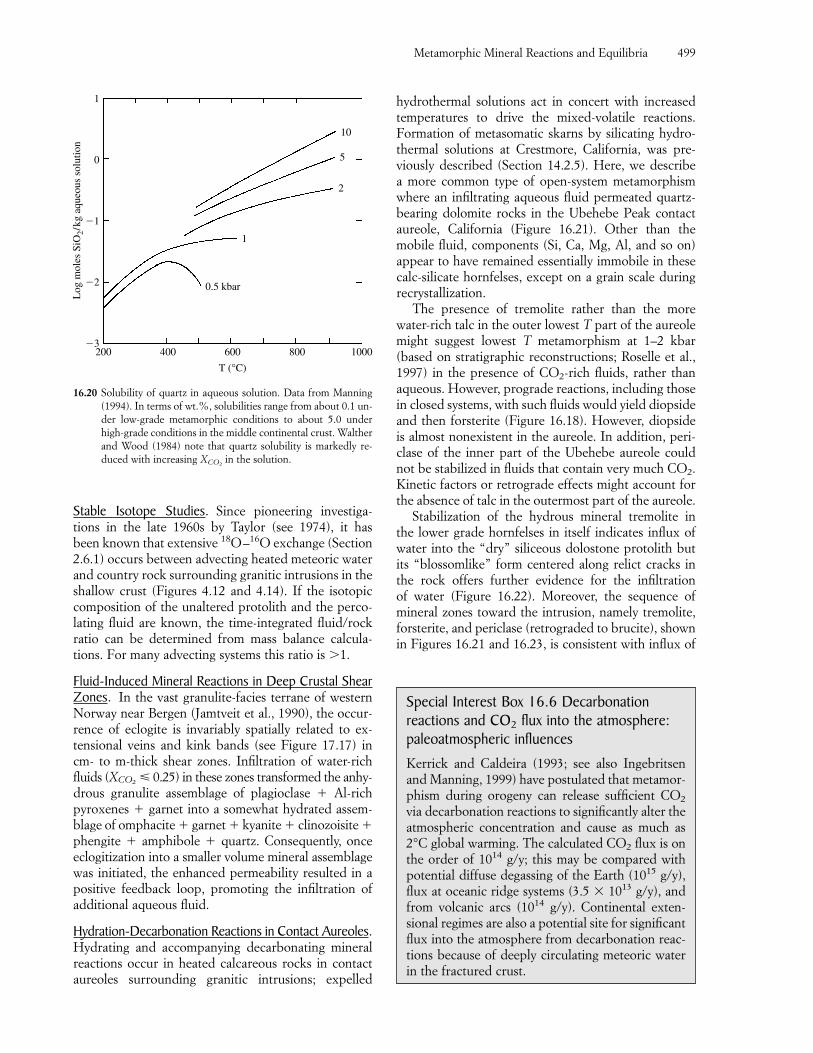
Stable Isotope Studies. Since pioneering investiga-tions in the late 1960s by Taylor (see 1974), it has been known that extensive 18O–16O exchange (Section2.6.1) occurs between advecting heated meteoric waterand country rock surrounding granitic intrusions in theshallow crust (Figures 4.12 and 4.14). If the isotopiccomposition of the unaltered protolith and the perco-lating fluid are known, the time-integrated fluid/rockratio can be determined from mass balance calcula-tions. For many advecting systems this ratio is �1.
Fluid-Induced Mineral Reactions in Deep Crustal ShearZones. In the vast granulite-facies terrane of westernNorway near Bergen (Jamtveit et al., 1990), the occur-rence of eclogite is invariably spatially related to ex-tensional veins and kink bands (see Figure 17.17) incm- to m-thick shear zones. Infiltration of water-richfluids (X � 0.25) in these zones transformed the anhy-drous granulite assemblage of plagioclase � Al-rich pyroxenes � garnet into a somewhat hydrated assem-blage of omphacite � garnet � kyanite � clinozoisite �phengite � amphibole � quartz. Consequently, onceeclogitization into a smaller volume mineral assemblagewas initiated, the enhanced permeability resulted in apositive feedback loop, promoting the infiltration ofadditional aqueous fluid.
Hydration-Decarbonation Reactions in Contact Aureoles.Hydrating and accompanying decarbonating mineralreactions occur in heated calcareous rocks in contactaureoles surrounding granitic intrusions; expelled
CO2
hydrothermal solutions act in concert with increasedtemperatures to drive the mixed-volatile reactions.Formation of metasomatic skarns by silicating hydro-thermal solutions at Crestmore, California, was pre-viously described (Section 14.2.5). Here, we describe a more common type of open-system metamorphismwhere an infiltrating aqueous fluid permeated quartz-bearing dolomite rocks in the Ubehebe Peak contactaureole, California (Figure 16.21). Other than the mobile fluid, components (Si, Ca, Mg, Al, and so on)appear to have remained essentially immobile in thesecalc-silicate hornfelses, except on a grain scale duringrecrystallization.
The presence of tremolite rather than the more water-rich talc in the outer lowest T part of the aureolemight suggest lowest T metamorphism at 1–2 kbar(based on stratigraphic reconstructions; Roselle et al.,1997) in the presence of CO2-rich fluids, rather thanaqueous. However, prograde reactions, including thosein closed systems, with such fluids would yield diopsideand then forsterite (Figure 16.18). However, diopsideis almost nonexistent in the aureole. In addition, peri-clase of the inner part of the Ubehebe aureole couldnot be stabilized in fluids that contain very much CO2.Kinetic factors or retrograde effects might account forthe absence of talc in the outermost part of the aureole.
Stabilization of the hydrous mineral tremolite in the lower grade hornfelses in itself indicates influx ofwater into the “dry” siliceous dolostone protolith butits “blossomlike” form centered along relict cracks inthe rock offers further evidence for the infiltration of water (Figure 16.22). Moreover, the sequence ofmineral zones toward the intrusion, namely tremolite,forsterite, and periclase (retrograded to brucite), shownin Figures 16.21 and 16.23, is consistent with influx of
Metamorphic Mineral Reactions and Equilibria 499
Log
mol
es S
iO2/
kg a
queo
us s
olut
ion
1
0
�1
�2
�3200 400 600 800
10
5
2
1
0.5 kbar
1000
T (°C)
16.20 Solubility of quartz in aqueous solution. Data from Manning(1994). In terms of wt.%, solubilities range from about 0.1 un-der low-grade metamorphic conditions to about 5.0 underhigh-grade conditions in the middle continental crust. Waltherand Wood (1984) note that quartz solubility is markedly re-duced with increasing X in the solution.CO2
Special Interest Box 16.6 Decarbonation reactions and CO2 flux into the atmosphere:paleoatmospheric influencesKerrick and Caldeira (1993; see also Ingebritsenand Manning, 1999) have postulated that metamor-phism during orogeny can release sufficient CO2
via decarbonation reactions to significantly alter theatmospheric concentration and cause as much as2°C global warming. The calculated CO2 flux is onthe order of 1014 g/y; this may be compared withpotential diffuse degassing of the Earth (1015 g/y),flux at oceanic ridge systems (3.5 � 1013 g/y), andfrom volcanic arcs (1014 g/y). Continental exten-sional regimes are also a potential site for significantflux into the atmosphere from decarbonation reac-tions because of deeply circulating meteoric waterin the fractured crust.
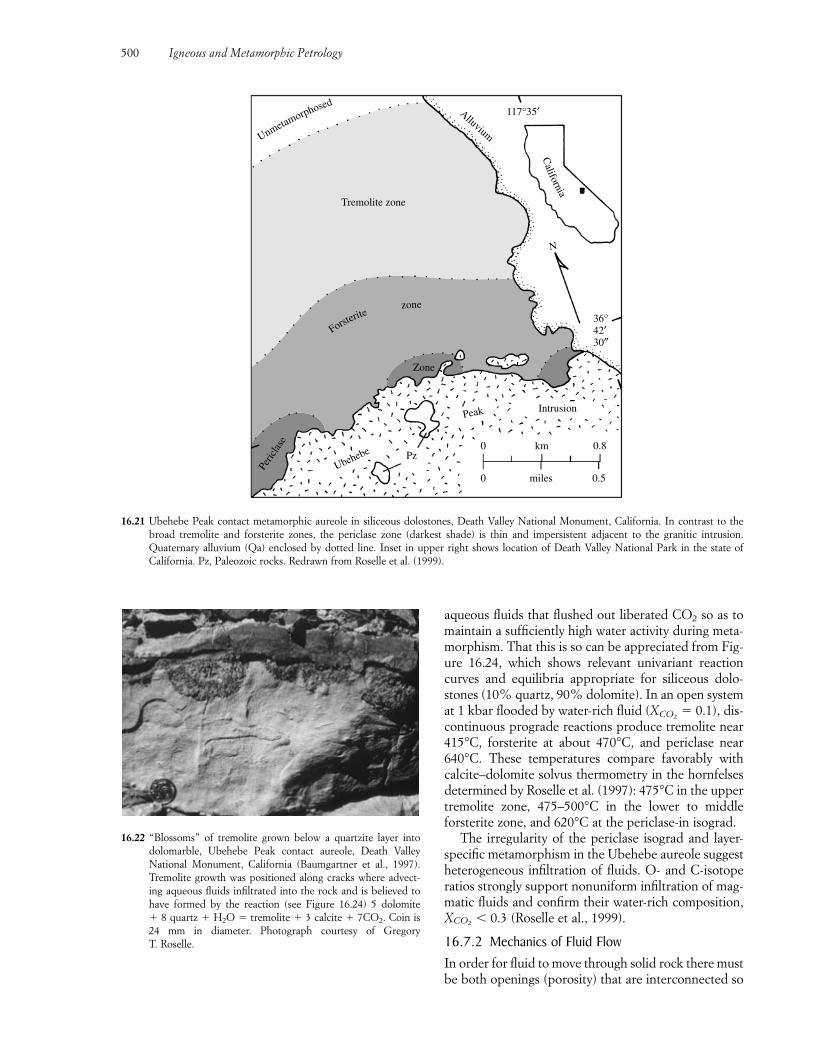
aqueous fluids that flushed out liberated CO2 so as tomaintain a sufficiently high water activity during meta-morphism. That this is so can be appreciated from Fig-ure 16.24, which shows relevant univariant reactioncurves and equilibria appropriate for siliceous dolo-stones (10% quartz, 90% dolomite). In an open systemat 1 kbar flooded by water-rich fluid (X � 0.1), dis-continuous prograde reactions produce tremolite near415°C, forsterite at about 470°C, and periclase near640°C. These temperatures compare favorably withcalcite–dolomite solvus thermometry in the hornfelsesdetermined by Roselle et al. (1997): 475°C in the uppertremolite zone, 475–500°C in the lower to middleforsterite zone, and 620°C at the periclase-in isograd.
The irregularity of the periclase isograd and layer-specific metamorphism in the Ubehebe aureole suggestheterogeneous infiltration of fluids. O- and C-isotoperatios strongly support nonuniform infiltration of mag-matic fluids and confirm their water-rich composition,X � 0.3 (Roselle et al., 1999).
16.7.2 Mechanics of Fluid FlowIn order for fluid to move through solid rock there mustbe both openings (porosity) that are interconnected so
CO2
CO2
500 Igneous and Metamorphic Petrology
Ubehebe Pz
Peak
0 km 0.8
0 miles 0.5
Intrusion
36°42′30″
117°35′
Tremolite zone
Alluvium
N
Unmetamorphosed
California
Peric
lase
Zone
Forsterite
zone
16.21 Ubehebe Peak contact metamorphic aureole in siliceous dolostones, Death Valley National Monument, California. In contrast to thebroad tremolite and forsterite zones, the periclase zone (darkest shade) is thin and impersistent adjacent to the granitic intrusion. Quaternary alluvium (Qa) enclosed by dotted line. Inset in upper right shows location of Death Valley National Park in the state of California. Pz, Paleozoic rocks. Redrawn from Roselle et al. (1999).
16.22 “Blossoms” of tremolite grown below a quartzite layer intodolomarble, Ubehebe Peak contact aureole, Death Valley National Monument, California (Baumgartner et al., 1997).Tremolite growth was positioned along cracks where advect-ing aqueous fluids infiltrated into the rock and is believed to have formed by the reaction (see Figure 16.24) 5 dolomite � 8 quartz � H2O � tremolite � 3 calcite � 7CO2. Coin is24 mm in diameter. Photograph courtesy of Gregory T. Roselle.
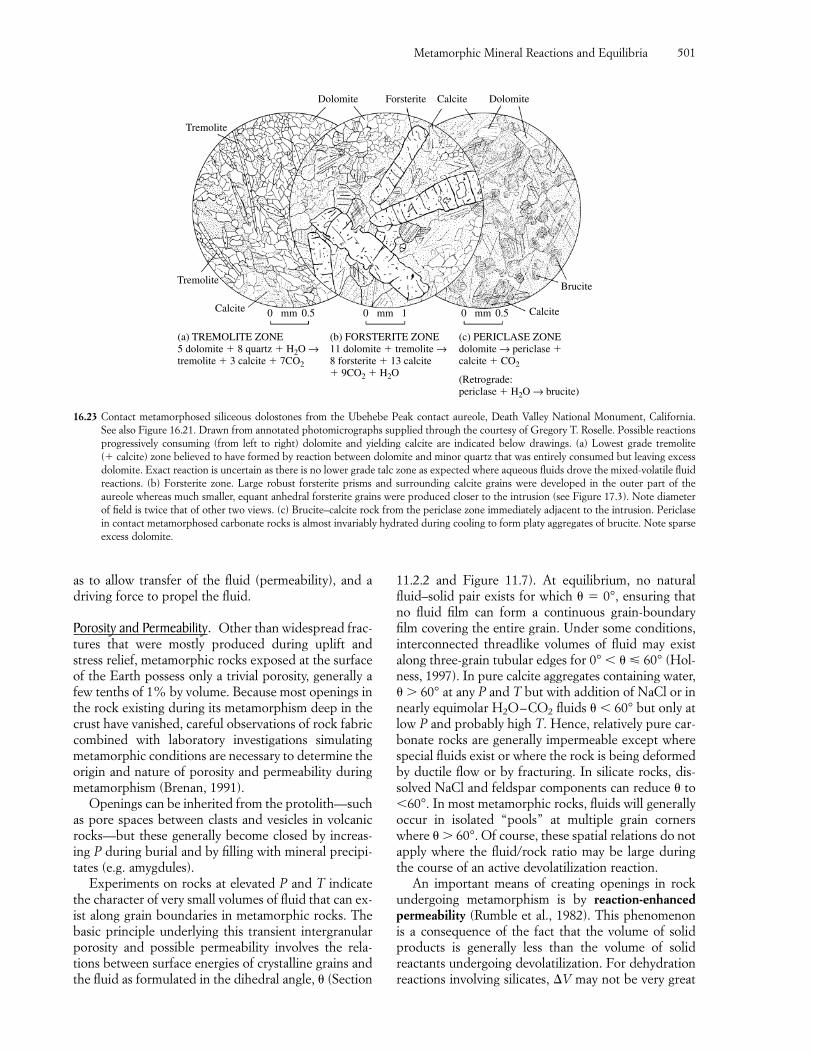
as to allow transfer of the fluid (permeability), and adriving force to propel the fluid.
Porosity and Permeability. Other than widespread frac-tures that were mostly produced during uplift andstress relief, metamorphic rocks exposed at the surfaceof the Earth possess only a trivial porosity, generally afew tenths of 1% by volume. Because most openings inthe rock existing during its metamorphism deep in thecrust have vanished, careful observations of rock fabriccombined with laboratory investigations simulatingmetamorphic conditions are necessary to determine theorigin and nature of porosity and permeability duringmetamorphism (Brenan, 1991).
Openings can be inherited from the protolith—suchas pore spaces between clasts and vesicles in volcanicrocks—but these generally become closed by increas-ing P during burial and by filling with mineral precipi-tates (e.g. amygdules).
Experiments on rocks at elevated P and T indicatethe character of very small volumes of fluid that can ex-ist along grain boundaries in metamorphic rocks. Thebasic principle underlying this transient intergranularporosity and possible permeability involves the rela-tions between surface energies of crystalline grains andthe fluid as formulated in the dihedral angle, � (Section
11.2.2 and Figure 11.7). At equilibrium, no naturalfluid–solid pair exists for which � � 0°, ensuring thatno fluid film can form a continuous grain-boundaryfilm covering the entire grain. Under some conditions,interconnected threadlike volumes of fluid may existalong three-grain tubular edges for 0° � � � 60° (Hol-ness, 1997). In pure calcite aggregates containing water,� � 60° at any P and T but with addition of NaCl or innearly equimolar H2O–CO2 fluids � � 60° but only atlow P and probably high T. Hence, relatively pure car-bonate rocks are generally impermeable except wherespecial fluids exist or where the rock is being deformedby ductile flow or by fracturing. In silicate rocks, dis-solved NaCl and feldspar components can reduce � to�60°. In most metamorphic rocks, fluids will generallyoccur in isolated “pools” at multiple grain cornerswhere � � 60°. Of course, these spatial relations do notapply where the fluid/rock ratio may be large duringthe course of an active devolatilization reaction.
An important means of creating openings in rockundergoing metamorphism is by reaction-enhancedpermeability (Rumble et al., 1982). This phenomenonis a consequence of the fact that the volume of solidproducts is generally less than the volume of solid reactants undergoing devolatilization. For dehydrationreactions involving silicates, �V may not be very great
Metamorphic Mineral Reactions and Equilibria 501
Tremolite
Tremolite
Brucite
Calcite Calcite
Dolomite Forsterite Calcite Dolomite
0 0.5mm 0 1mm 0
(a) TREMOLITE ZONE5 dolomite � 8 quartz � H2O →tremolite � 3 calcite � 7CO2
(b) FORSTERITE ZONE11 dolomite � tremolite →8 forsterite � 13 calcite� 9CO2 � H2O
(c) PERICLASE ZONEdolomite → periclase �calcite � CO2
(Retrograde:periclase � H2O → brucite)
0.5mm
16.23 Contact metamorphosed siliceous dolostones from the Ubehebe Peak contact aureole, Death Valley National Monument, California. See also Figure 16.21. Drawn from annotated photomicrographs supplied through the courtesy of Gregory T. Roselle. Possible reactionsprogressively consuming (from left to right) dolomite and yielding calcite are indicated below drawings. (a) Lowest grade tremolite (� calcite) zone believed to have formed by reaction between dolomite and minor quartz that was entirely consumed but leaving excessdolomite. Exact reaction is uncertain as there is no lower grade talc zone as expected where aqueous fluids drove the mixed-volatile fluidreactions. (b) Forsterite zone. Large robust forsterite prisms and surrounding calcite grains were developed in the outer part of the aureole whereas much smaller, equant anhedral forsterite grains were produced closer to the intrusion (see Figure 17.3). Note diameterof field is twice that of other two views. (c) Brucite–calcite rock from the periclase zone immediately adjacent to the intrusion. Periclasein contact metamorphosed carbonate rocks is almost invariably hydrated during cooling to form platy aggregates of brucite. Note sparseexcess dolomite.
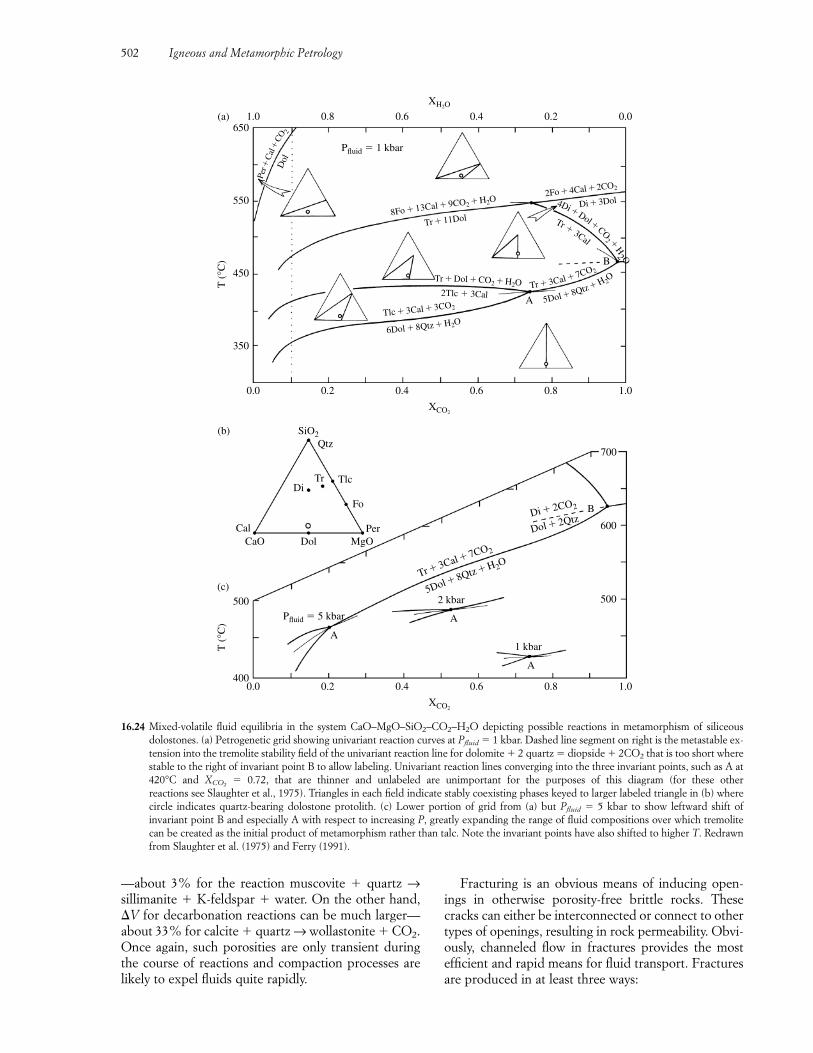
—about 3% for the reaction muscovite � quartz →sillimanite � K-feldspar � water. On the other hand,�V for decarbonation reactions can be much larger—about 33% for calcite � quartz → wollastonite � CO2.Once again, such porosities are only transient duringthe course of reactions and compaction processes arelikely to expel fluids quite rapidly.
Fracturing is an obvious means of inducing open-ings in otherwise porosity-free brittle rocks. Thesecracks can either be interconnected or connect to othertypes of openings, resulting in rock permeability. Obvi-ously, channeled flow in fractures provides the mostefficient and rapid means for fluid transport. Fracturesare produced in at least three ways:
502 Igneous and Metamorphic Petrology
T (
°C)
500
600
B
500(c)
4000.0 0.2 0.4 0.6 0.8 1.0
XCO2
SiO2Qtz
(b)
Tlc
Fo
PerMgODol
DiTr
CaOCal
T (
°C)
450
350
650
550
0.0 0.2 0.4 0.6 0.8 1.0
1.0 0.20.40.60.8 0.0
XCO2
XH2O
(a)
2 kbar
Pfluid � 5 kbar
Pfluid � 1 kbar
A
1 kbar
A
A
Tr � 3Cal � 7CO2
Tlc � 3Cal � 3CO2
Di � 2CO2
Dol � 2Qtz
5Dol � 8Qtz � H2O
6Dol � 8Qtz � H2O
Tr � Dol � CO2 � H2O
4Di�Dol�CO
2 �H
2 O
8Fo � 13Cal � 9CO2 � H2O
Tr � 11Dol Tr �3Cal
Tr � 3Cal � 7CO2
2Fo � 4Cal �2CO2
Per�
Cal
�CO
2D
ol
Di � 3Dol
5Dol � 8Qtz � H 2O
2Tlc � 3CalA
B
700
16.24 Mixed-volatile fluid equilibria in the system CaO–MgO–SiO2–CO2–H2O depicting possible reactions in metamorphism of siliceousdolostones. (a) Petrogenetic grid showing univariant reaction curves at Pfluid � 1 kbar. Dashed line segment on right is the metastable ex-tension into the tremolite stability field of the univariant reaction line for dolomite � 2 quartz � diopside � 2CO2 that is too short wherestable to the right of invariant point B to allow labeling. Univariant reaction lines converging into the three invariant points, such as A at420°C and X � 0.72, that are thinner and unlabeled are unimportant for the purposes of this diagram (for these other reactions see Slaughter et al., 1975). Triangles in each field indicate stably coexisting phases keyed to larger labeled triangle in (b) wherecircle indicates quartz-bearing dolostone protolith. (c) Lower portion of grid from (a) but Pfluid � 5 kbar to show leftward shift of invariant point B and especially A with respect to increasing P, greatly expanding the range of fluid compositions over which tremolitecan be created as the initial product of metamorphism rather than talc. Note the invariant points have also shifted to higher T. Redrawnfrom Slaughter et al. (1975) and Ferry (1991).
CO2
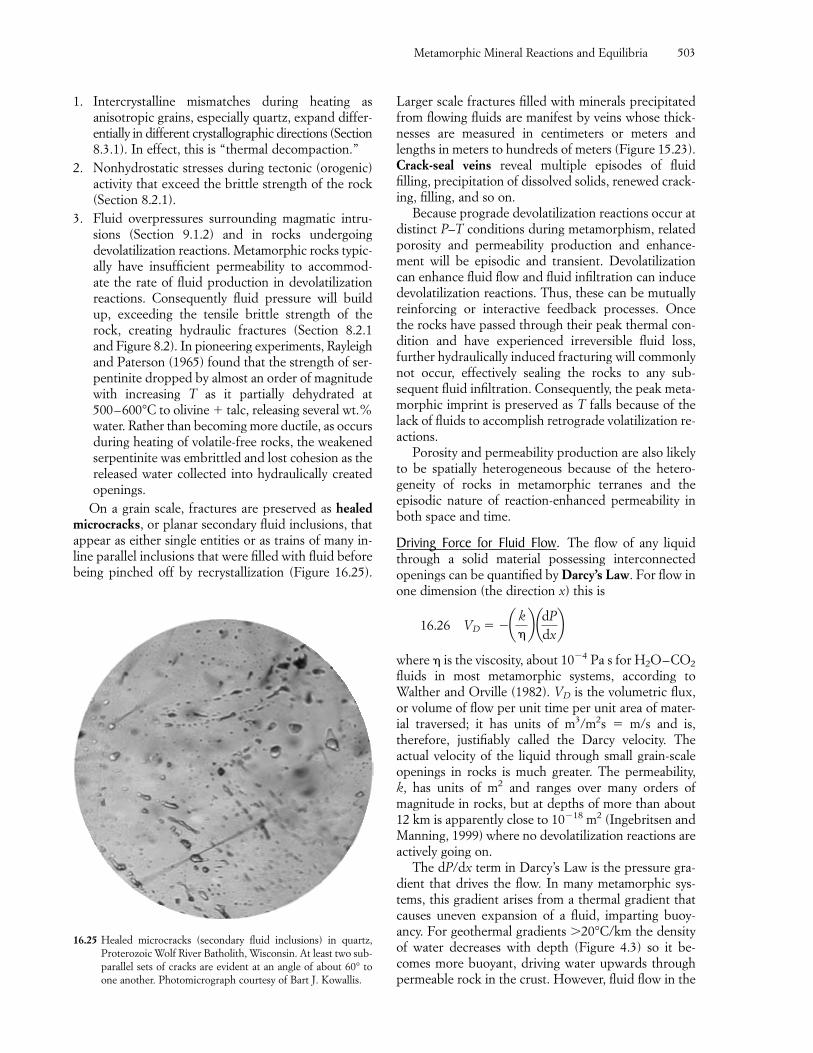
1. Intercrystalline mismatches during heating asanisotropic grains, especially quartz, expand differ-entially in different crystallographic directions (Section8.3.1). In effect, this is “thermal decompaction.”
2. Nonhydrostatic stresses during tectonic (orogenic)activity that exceed the brittle strength of the rock(Section 8.2.1).
3. Fluid overpressures surrounding magmatic intru-sions (Section 9.1.2) and in rocks undergoing devolatilization reactions. Metamorphic rocks typic-ally have insufficient permeability to accommod-ate the rate of fluid production in devolatilizationreactions. Consequently fluid pressure will buildup, exceeding the tensile brittle strength of therock, creating hydraulic fractures (Section 8.2.1and Figure 8.2). In pioneering experiments, Rayleighand Paterson (1965) found that the strength of ser-pentinite dropped by almost an order of magnitudewith increasing T as it partially dehydrated at500–600°C to olivine � talc, releasing several wt.%water. Rather than becoming more ductile, as occursduring heating of volatile-free rocks, the weakenedserpentinite was embrittled and lost cohesion as thereleased water collected into hydraulically createdopenings.
On a grain scale, fractures are preserved as healedmicrocracks, or planar secondary fluid inclusions, thatappear as either single entities or as trains of many in-line parallel inclusions that were filled with fluid beforebeing pinched off by recrystallization (Figure 16.25).
Larger scale fractures filled with minerals precipitatedfrom flowing fluids are manifest by veins whose thick-nesses are measured in centimeters or meters andlengths in meters to hundreds of meters (Figure 15.23).Crack-seal veins reveal multiple episodes of fluidfilling, precipitation of dissolved solids, renewed crack-ing, filling, and so on.
Because prograde devolatilization reactions occur atdistinct P–T conditions during metamorphism, relatedporosity and permeability production and enhance-ment will be episodic and transient. Devolatilizationcan enhance fluid flow and fluid infiltration can inducedevolatilization reactions. Thus, these can be mutuallyreinforcing or interactive feedback processes. Once the rocks have passed through their peak thermal con-dition and have experienced irreversible fluid loss, further hydraulically induced fracturing will commonlynot occur, effectively sealing the rocks to any sub-sequent fluid infiltration. Consequently, the peak meta-morphic imprint is preserved as T falls because of thelack of fluids to accomplish retrograde volatilization re-actions.
Porosity and permeability production are also likelyto be spatially heterogeneous because of the hetero-geneity of rocks in metamorphic terranes and theepisodic nature of reaction-enhanced permeability inboth space and time.
Driving Force for Fluid Flow. The flow of any liquidthrough a solid material possessing interconnectedopenings can be quantified by Darcy’s Law. For flow inone dimension (the direction x) this is
16.26 VD � �
where � is the viscosity, about 10�4 Pa s for H2O–CO2
fluids in most metamorphic systems, according toWalther and Orville (1982). VD is the volumetric flux,or volume of flow per unit time per unit area of mater-ial traversed; it has units of m3/m2s � m/s and is, therefore, justifiably called the Darcy velocity. The actual velocity of the liquid through small grain-scaleopenings in rocks is much greater. The permeability, k, has units of m2 and ranges over many orders of magnitude in rocks, but at depths of more than about12 km is apparently close to 10�18 m2 (Ingebritsen andManning, 1999) where no devolatilization reactions are actively going on.
The dP/dx term in Darcy’s Law is the pressure gra-dient that drives the flow. In many metamorphic sys-tems, this gradient arises from a thermal gradient thatcauses uneven expansion of a fluid, imparting buoy-ancy. For geothermal gradients �20°C/km the densityof water decreases with depth (Figure 4.3) so it be-comes more buoyant, driving water upwards throughpermeable rock in the crust. However, fluid flow in the
¢ k�≤ ¢dP
dx≤
Metamorphic Mineral Reactions and Equilibria 503
16.25 Healed microcracks (secondary fluid inclusions) in quartz,Proterozoic Wolf River Batholith, Wisconsin. At least two sub-parallel sets of cracks are evident at an angle of about 60° toone another. Photomicrograph courtesy of Bart J. Kowallis.
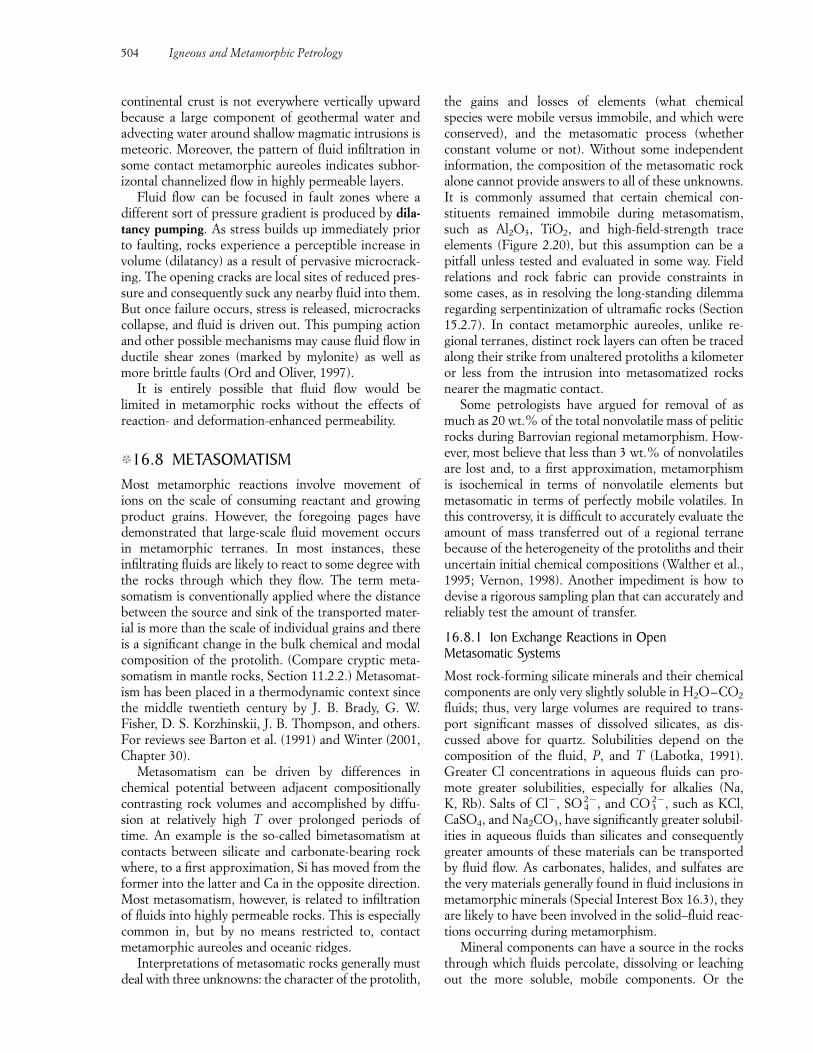
continental crust is not everywhere vertically upwardbecause a large component of geothermal water andadvecting water around shallow magmatic intrusions ismeteoric. Moreover, the pattern of fluid infiltration insome contact metamorphic aureoles indicates subhor-izontal channelized flow in highly permeable layers.
Fluid flow can be focused in fault zones where a different sort of pressure gradient is produced by dila-tancy pumping. As stress builds up immediately priorto faulting, rocks experience a perceptible increase involume (dilatancy) as a result of pervasive microcrack-ing. The opening cracks are local sites of reduced pres-sure and consequently suck any nearby fluid into them.But once failure occurs, stress is released, microcrackscollapse, and fluid is driven out. This pumping actionand other possible mechanisms may cause fluid flow inductile shear zones (marked by mylonite) as well asmore brittle faults (Ord and Oliver, 1997).
It is entirely possible that fluid flow would be limited in metamorphic rocks without the effects of reaction- and deformation-enhanced permeability.
�16.8 METASOMATISMMost metamorphic reactions involve movement of ions on the scale of consuming reactant and growingproduct grains. However, the foregoing pages havedemonstrated that large-scale fluid movement occursin metamorphic terranes. In most instances, theseinfiltrating fluids are likely to react to some degree withthe rocks through which they flow. The term meta-somatism is conventionally applied where the distancebetween the source and sink of the transported mater-ial is more than the scale of individual grains and thereis a significant change in the bulk chemical and modalcomposition of the protolith. (Compare cryptic meta-somatism in mantle rocks, Section 11.2.2.) Metasomat-ism has been placed in a thermodynamic context sincethe middle twentieth century by J. B. Brady, G. W.Fisher, D. S. Korzhinskii, J. B. Thompson, and others.For reviews see Barton et al. (1991) and Winter (2001,Chapter 30).
Metasomatism can be driven by differences inchemical potential between adjacent compositionallycontrasting rock volumes and accomplished by diffu-sion at relatively high T over prolonged periods oftime. An example is the so-called bimetasomatism atcontacts between silicate and carbonate-bearing rockwhere, to a first approximation, Si has moved from theformer into the latter and Ca in the opposite direction.Most metasomatism, however, is related to infiltrationof fluids into highly permeable rocks. This is especiallycommon in, but by no means restricted to, contactmetamorphic aureoles and oceanic ridges.
Interpretations of metasomatic rocks generally mustdeal with three unknowns: the character of the protolith,
the gains and losses of elements (what chemical species were mobile versus immobile, and which wereconserved), and the metasomatic process (whetherconstant volume or not). Without some independentinformation, the composition of the metasomatic rockalone cannot provide answers to all of these unknowns.It is commonly assumed that certain chemical con-stituents remained immobile during metasomatism,such as Al2O3, TiO2, and high-field-strength trace elements (Figure 2.20), but this assumption can be apitfall unless tested and evaluated in some way. Fieldrelations and rock fabric can provide constraints insome cases, as in resolving the long-standing dilemmaregarding serpentinization of ultramafic rocks (Section15.2.7). In contact metamorphic aureoles, unlike re-gional terranes, distinct rock layers can often be tracedalong their strike from unaltered protoliths a kilometeror less from the intrusion into metasomatized rocksnearer the magmatic contact.
Some petrologists have argued for removal of asmuch as 20 wt.% of the total nonvolatile mass of peliticrocks during Barrovian regional metamorphism. How-ever, most believe that less than 3 wt.% of nonvolatilesare lost and, to a first approximation, metamorphism is isochemical in terms of nonvolatile elements butmetasomatic in terms of perfectly mobile volatiles. Inthis controversy, it is difficult to accurately evaluate theamount of mass transferred out of a regional terranebecause of the heterogeneity of the protoliths and theiruncertain initial chemical compositions (Walther et al.,1995; Vernon, 1998). Another impediment is how todevise a rigorous sampling plan that can accurately andreliably test the amount of transfer.
16.8.1 Ion Exchange Reactions in Open Metasomatic Systems
Most rock-forming silicate minerals and their chemicalcomponents are only very slightly soluble in H2O–CO2
fluids; thus, very large volumes are required to trans-port significant masses of dissolved silicates, as dis-cussed above for quartz. Solubilities depend on thecomposition of the fluid, P, and T (Labotka, 1991).Greater Cl concentrations in aqueous fluids can pro-mote greater solubilities, especially for alkalies (Na, K, Rb). Salts of Cl�, SO 4
2�, and CO 23�, such as KCl,
CaSO4, and Na2CO3, have significantly greater solubil-ities in aqueous fluids than silicates and consequentlygreater amounts of these materials can be transportedby fluid flow. As carbonates, halides, and sulfates arethe very materials generally found in fluid inclusions inmetamorphic minerals (Special Interest Box 16.3), theyare likely to have been involved in the solid–fluid reac-tions occurring during metamorphism.
Mineral components can have a source in the rocksthrough which fluids percolate, dissolving or leachingout the more soluble, mobile components. Or the
504 Igneous and Metamorphic Petrology
components may have been derived from nearby mag-matic sources, such as silica in the metasomatizing solutions at Crestmore, California (Section 14.2.5).
In an ion-exchange reaction, ions in a fluid ex-change with other ions in neighboring solids withoutdestroying them. This reaction is modeled as follows:
16.27 AX � B� � BX � A�
solid in fluid solid in fluid
A familiar example of an ion-exchange reaction is thewater-softening action of some Na-bearing zeolites inwhich dissolved Ca2�, which causes “hardness” in water, is taken into the zeolite in exchange for twoNa�, which pass from the zeolite into the water.
Common alkali-ion-exchange reactions in metamor-phic rocks involve micas and feldspars as these are thechief repositories of Na and K. Many different reac-tions can be written but for muscovite breakdown twopossibilities include:
16.28 KAl2AlSi3O10(OH)2 � 6SiO2 � 2K�
muscovite quartz in fluid
� 3KAlSi3O8 � 2H�
K-feldspar in fluid
16.29 2KAl2AlSi3O10(OH)2 � 2H�
muscovite in fluid
� 3Al2SiO5 � 3SiO2 � 3H2O � 2K�
quartz in fluid solution
For reaction 16.29 where the solid phases and water arepure with activities � 1 the equilibrium constant, Keq, is
16.30 Keq �
showing that the stabilities of micas and alkali feldsparsin aqueous solutions depend on ratios of activities at aspecified P and T (Figure 16.26). High H� concentra-tions relative to K� and Na� stabilize an aluminosilic-ate, whereas the opposite stabilize feldspars. Micas arestable at intermediate alkali ion/hydrogen ion ratios.
Hydrogen metasomatism is particularly commonand widespread around granitic intrusions in the shal-low continental crust. The high H� activity relative toother major elements causes removal of Na, K, Ca, Mg,and Fe in feldspars and mafic silicates in felsic countryrocks as well as the intrusion. In the initial sericitic alteration stage, white micas � clay minerals are stabil-ized at the expense of feldspars. Clay minerals, such askaolinite, are stabilized at the expense of K-feldspar according to the reaction
16.31 2KAlSi3O8 � 2H� � H2O
� Al2Si2O5(OH)4 � 4SiO2 � 2K�
aK�2
aH�2
More aluminous chlorites and epidotes replace biotite,amphibole, and pyroxene. In more advanced argillic alteration, feldspars and micas are converted into pyrophyllite, andalusite, and other aluminosilicates.Where the activity of S is sufficient, Fe from break-down of mafic silicates and Fe–Ti oxides produceswidespread pyrite. At higher T, greisens may develop(Section 15.2.8) that contain aluminosilicates such astopaz (high F activity) and tourmaline (B). Extensivehalos of sericitic and argillic alteration around more localized hydrothermal ore deposits provide valuableexploration targets.
16.8.2 The Thompson Model of Metasomatic Zoningand Local EquilibriumFor a system to be in complete thermodynamic equi-librium, all intensive variables—T, P, and chemical potentials of every component—must be uniformthroughout. No incompatible phases, such as quartzand forsterite, can exist together. However, as Thomp-son (1959, p. 430) points out, “though a large volumeof rock commonly contains mutually incompatiblephases and is thus not in internal equilibrium, it is generally possible to regard any part of such a thermo-dynamic system as substantially in internal equilibriumif that part is made sufficiently small.” This expressionof the concept of local equilibrium has a significant
Metamorphic Mineral Reactions and Equilibria 505
102
101
103
104103
Paragonite
600°C
500°C
650°C
Muscovite
K-feldspar
Albite
Ms
Ab
Kfs
Ab
Ms
Pg
MsAl2SiO5 � Qtz
102101
Na�
H�
Al2SiO5
K�
H�
16.26 Phase relations in the system Na–K–Al–Si–O–H as a functionof T and the ratios of alkali and hydrogen ions at 5 kbar anda � 0.5. Ion-exchange reactions 16.28 and 16.29 are topand bottom subhorizontal lines, respectively. Note shrinkingof muscovite stability field with increasing T (light shaded at500°C, medium shaded at 600°C, and dark shaded at 650°C)and absence of paragonite field at 600 and 650°C. CompareFigure 14.31. Redrawn from Wintsch (1975).
H2O
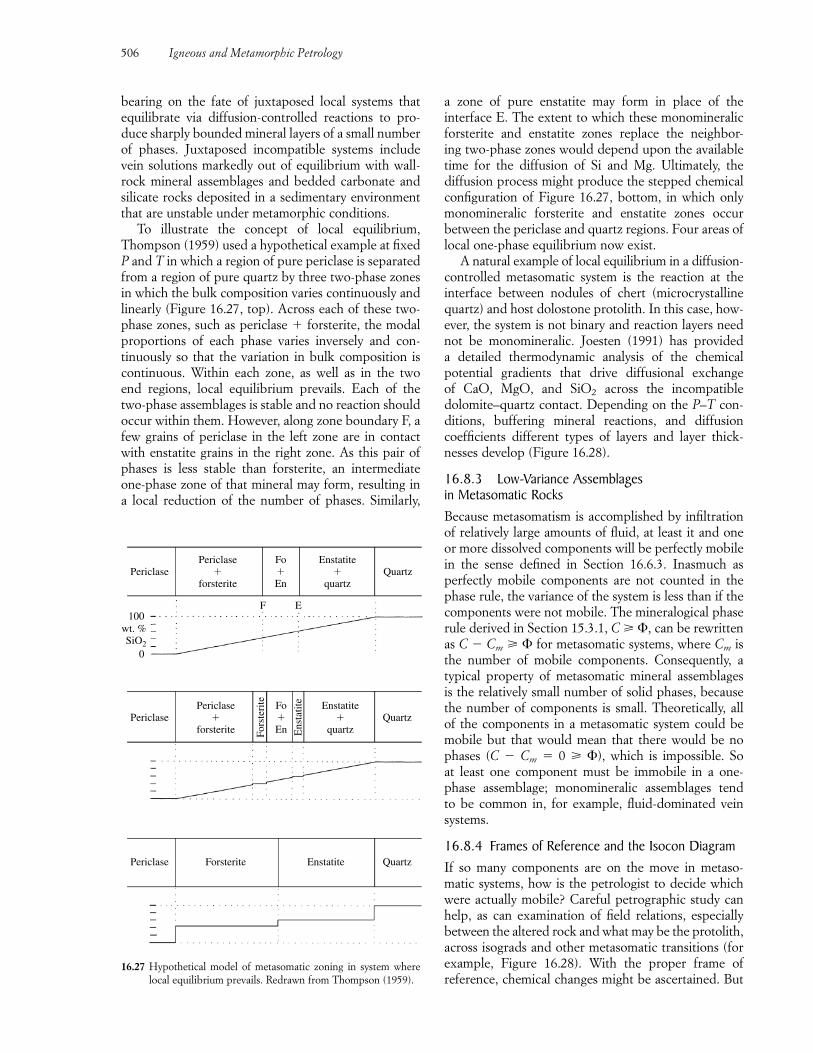
bearing on the fate of juxtaposed local systems thatequilibrate via diffusion-controlled reactions to pro-duce sharply bounded mineral layers of a small numberof phases. Juxtaposed incompatible systems includevein solutions markedly out of equilibrium with wall-rock mineral assemblages and bedded carbonate andsilicate rocks deposited in a sedimentary environmentthat are unstable under metamorphic conditions.
To illustrate the concept of local equilibrium,Thompson (1959) used a hypothetical example at fixedP and T in which a region of pure periclase is separatedfrom a region of pure quartz by three two-phase zonesin which the bulk composition varies continuously andlinearly (Figure 16.27, top). Across each of these two-phase zones, such as periclase � forsterite, the modalproportions of each phase varies inversely and con-tinuously so that the variation in bulk composition iscontinuous. Within each zone, as well as in the two end regions, local equilibrium prevails. Each of thetwo-phase assemblages is stable and no reaction shouldoccur within them. However, along zone boundary F, afew grains of periclase in the left zone are in contactwith enstatite grains in the right zone. As this pair ofphases is less stable than forsterite, an intermediateone-phase zone of that mineral may form, resulting in a local reduction of the number of phases. Similarly,
a zone of pure enstatite may form in place of the interface E. The extent to which these monomineralicforsterite and enstatite zones replace the neighbor-ing two-phase zones would depend upon the availabletime for the diffusion of Si and Mg. Ultimately, the diffusion process might produce the stepped chemicalconfiguration of Figure 16.27, bottom, in which onlymonomineralic forsterite and enstatite zones occur between the periclase and quartz regions. Four areas oflocal one-phase equilibrium now exist.
A natural example of local equilibrium in a diffusion-controlled metasomatic system is the reaction at the interface between nodules of chert (microcrystallinequartz) and host dolostone protolith. In this case, how-ever, the system is not binary and reaction layers neednot be monomineralic. Joesten (1991) has provided a detailed thermodynamic analysis of the chemical potential gradients that drive diffusional exchange of CaO, MgO, and SiO2 across the incompatibledolomite–quartz contact. Depending on the P–T con-ditions, buffering mineral reactions, and diffusioncoefficients different types of layers and layer thick-nesses develop (Figure 16.28).
16.8.3 Low-Variance Assemblages in Metasomatic RocksBecause metasomatism is accomplished by infiltrationof relatively large amounts of fluid, at least it and oneor more dissolved components will be perfectly mobilein the sense defined in Section 16.6.3. Inasmuch as perfectly mobile components are not counted in thephase rule, the variance of the system is less than if thecomponents were not mobile. The mineralogical phaserule derived in Section 15.3.1, C � , can be rewrittenas C � Cm � for metasomatic systems, where Cm isthe number of mobile components. Consequently, atypical property of metasomatic mineral assemblages is the relatively small number of solid phases, becausethe number of components is small. Theoretically, all of the components in a metasomatic system could bemobile but that would mean that there would be nophases (C � Cm � 0 � ), which is impossible. So at least one component must be immobile in a one-phase assemblage; monomineralic assemblages tend to be common in, for example, fluid-dominated veinsystems.
16.8.4 Frames of Reference and the Isocon DiagramIf so many components are on the move in metaso-matic systems, how is the petrologist to decide whichwere actually mobile? Careful petrographic study canhelp, as can examination of field relations, especiallybetween the altered rock and what may be the protolith,across isograds and other metasomatic transitions (forexample, Figure 16.28). With the proper frame of reference, chemical changes might be ascertained. But
506 Igneous and Metamorphic Petrology
Periclase Forsterite Enstatite Quartz
Periclase
Fors
teri
te
Ens
tatit
ePericlase�
forsterite
Fo�En
Enstatite�
quartzQuartz
Periclase
100
0
wt. %SiO2
Periclase�
forsterite
F
Fo�En
Enstatite�
quartzQuartz
E
16.27 Hypothetical model of metasomatic zoning in system wherelocal equilibrium prevails. Redrawn from Thompson (1959).
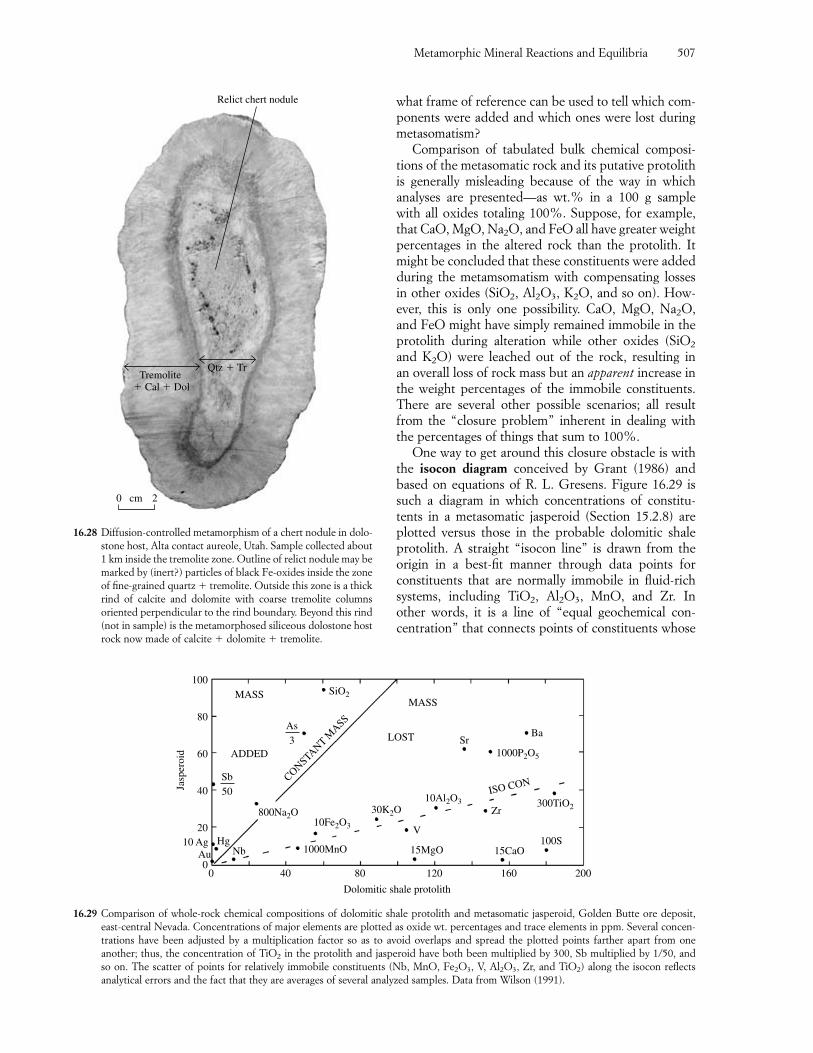
Metamorphic Mineral Reactions and Equilibria 507
Relict chert nodule
Qtz � TrTremolite
� Cal � Dol
0 2cm
16.28 Diffusion-controlled metamorphism of a chert nodule in dolo-stone host, Alta contact aureole, Utah. Sample collected about1 km inside the tremolite zone. Outline of relict nodule may bemarked by (inert?) particles of black Fe-oxides inside the zoneof fine-grained quartz � tremolite. Outside this zone is a thickrind of calcite and dolomite with coarse tremolite columns oriented perpendicular to the rind boundary. Beyond this rind(not in sample) is the metamorphosed siliceous dolostone hostrock now made of calcite � dolomite � tremolite.
Jasp
eroi
d
100
80
60
40
20
00 40 80 120 160 200
Dolomitic shale protolith
MASSMASS
LOST
CONSTANT M
ASS
ISO CON
ADDED
800Na2O
NbHg10 Ag
Au
10Fe2O3
1000MnO 15MgO
V
Zr300TiO2
15CaO100S
10Al2O3
1000P2O5
BaSr
30K2O
SiO2
Sb50
As3
16.29 Comparison of whole-rock chemical compositions of dolomitic shale protolith and metasomatic jasperoid, Golden Butte ore deposit,east-central Nevada. Concentrations of major elements are plotted as oxide wt. percentages and trace elements in ppm. Several concen-trations have been adjusted by a multiplication factor so as to avoid overlaps and spread the plotted points farther apart from one another; thus, the concentration of TiO2 in the protolith and jasperoid have both been multiplied by 300, Sb multiplied by 1/50, and so on. The scatter of points for relatively immobile constituents (Nb, MnO, Fe2O3, V, Al2O3, Zr, and TiO2) along the isocon reflects analytical errors and the fact that they are averages of several analyzed samples. Data from Wilson (1991).
what frame of reference can be used to tell which com-ponents were added and which ones were lost duringmetasomatism?
Comparison of tabulated bulk chemical composi-tions of the metasomatic rock and its putative protolithis generally misleading because of the way in whichanalyses are presented—as wt.% in a 100 g samplewith all oxides totaling 100%. Suppose, for example,that CaO, MgO, Na2O, and FeO all have greater weightpercentages in the altered rock than the protolith. Itmight be concluded that these constituents were addedduring the metamsomatism with compensating lossesin other oxides (SiO2, Al2O3, K2O, and so on). How-ever, this is only one possibility. CaO, MgO, Na2O, and FeO might have simply remained immobile in theprotolith during alteration while other oxides (SiO2
and K2O) were leached out of the rock, resulting in an overall loss of rock mass but an apparent increase inthe weight percentages of the immobile constituents.There are several other possible scenarios; all resultfrom the “closure problem” inherent in dealing withthe percentages of things that sum to 100%.
One way to get around this closure obstacle is withthe isocon diagram conceived by Grant (1986) andbased on equations of R. L. Gresens. Figure 16.29 issuch a diagram in which concentrations of constitu-tents in a metasomatic jasperoid (Section 15.2.8) areplotted versus those in the probable dolomitic shaleprotolith. A straight “isocon line” is drawn from theorigin in a best-fit manner through data points for constituents that are normally immobile in fluid-richsystems, including TiO2, Al2O3, MnO, and Zr. In other words, it is a line of “equal geochemical con-centration” that connects points of constituents whose
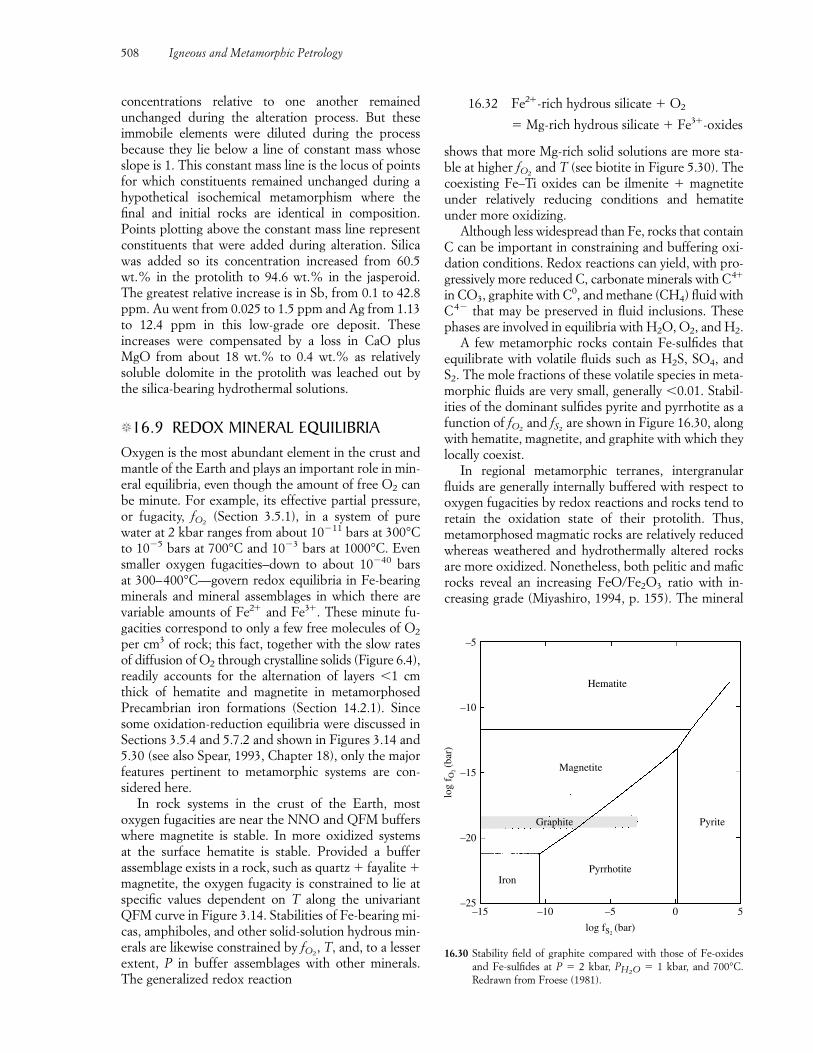
concentrations relative to one another remained unchanged during the alteration process. But these immobile elements were diluted during the process because they lie below a line of constant mass whoseslope is 1. This constant mass line is the locus of pointsfor which constituents remained unchanged during ahypothetical isochemical metamorphism where thefinal and initial rocks are identical in composition.Points plotting above the constant mass line representconstituents that were added during alteration. Silicawas added so its concentration increased from 60.5wt.% in the protolith to 94.6 wt.% in the jasperoid.The greatest relative increase is in Sb, from 0.1 to 42.8ppm. Au went from 0.025 to 1.5 ppm and Ag from 1.13to 12.4 ppm in this low-grade ore deposit. These increases were compensated by a loss in CaO plusMgO from about 18 wt.% to 0.4 wt.% as relatively soluble dolomite in the protolith was leached out bythe silica-bearing hydrothermal solutions.
�16.9 REDOX MINERAL EQUILIBRIAOxygen is the most abundant element in the crust andmantle of the Earth and plays an important role in min-eral equilibria, even though the amount of free O2 canbe minute. For example, its effective partial pressure,or fugacity, f (Section 3.5.1), in a system of pure water at 2 kbar ranges from about 10�11 bars at 300°Cto 10�5 bars at 700°C and 10�3 bars at 1000°C. Evensmaller oxygen fugacities–down to about 10�40 bars at 300–400°C—govern redox equilibria in Fe-bearingminerals and mineral assemblages in which there arevariable amounts of Fe2� and Fe3�. These minute fu-gacities correspond to only a few free molecules of O2
per cm3 of rock; this fact, together with the slow ratesof diffusion of O2 through crystalline solids (Figure 6.4),readily accounts for the alternation of layers �1 cmthick of hematite and magnetite in metamorphosedPrecambrian iron formations (Section 14.2.1). Sincesome oxidation-reduction equilibria were discussed inSections 3.5.4 and 5.7.2 and shown in Figures 3.14 and5.30 (see also Spear, 1993, Chapter 18), only the majorfeatures pertinent to metamorphic systems are con-sidered here.
In rock systems in the crust of the Earth, most oxygen fugacities are near the NNO and QFM bufferswhere magnetite is stable. In more oxidized systems at the surface hematite is stable. Provided a buffer assemblage exists in a rock, such as quartz � fayalite �magnetite, the oxygen fugacity is constrained to lie atspecific values dependent on T along the univariantQFM curve in Figure 3.14. Stabilities of Fe-bearing mi-cas, amphiboles, and other solid-solution hydrous min-erals are likewise constrained by f , T, and, to a lesserextent, P in buffer assemblages with other minerals.The generalized redox reaction
O2
O2
16.32 Fe2�-rich hydrous silicate � O2
� Mg-rich hydrous silicate � Fe3�-oxides
shows that more Mg-rich solid solutions are more sta-ble at higher f and T (see biotite in Figure 5.30). Thecoexisting Fe–Ti oxides can be ilmenite � magnetiteunder relatively reducing conditions and hematite under more oxidizing.
Although less widespread than Fe, rocks that containC can be important in constraining and buffering oxi-dation conditions. Redox reactions can yield, with pro-gressively more reduced C, carbonate minerals with C4�
in CO3, graphite with C0, and methane (CH4) fluid withC4� that may be preserved in fluid inclusions. Thesephases are involved in equilibria with H2O, O2, and H2.
A few metamorphic rocks contain Fe-sulfides thatequilibrate with volatile fluids such as H2S, SO4, andS2. The mole fractions of these volatile species in meta-morphic fluids are very small, generally �0.01. Stabil-ities of the dominant sulfides pyrite and pyrrhotite as afunction of f and f are shown in Figure 16.30, alongwith hematite, magnetite, and graphite with which theylocally coexist.
In regional metamorphic terranes, intergranularfluids are generally internally buffered with respect tooxygen fugacities by redox reactions and rocks tend toretain the oxidation state of their protolith. Thus,metamorphosed magmatic rocks are relatively reducedwhereas weathered and hydrothermally altered rocksare more oxidized. Nonetheless, both pelitic and maficrocks reveal an increasing FeO/Fe2O3 ratio with in-creasing grade (Miyashiro, 1994, p. 155). The mineral
S2O2
O2
508 Igneous and Metamorphic Petrology
log
f O2 (b
ar)
–5
–10
–15
–20
–25–15 –10
Graphite
Magnetite
Hematite
Pyrite
Pyrrhotite
–5 0 5
log fS2 (bar)
Iron
16.30 Stability field of graphite compared with those of Fe-oxidesand Fe-sulfides at P � 2 kbar, P � 1 kbar, and 700°C. Redrawn from Froese (1981).
H2O
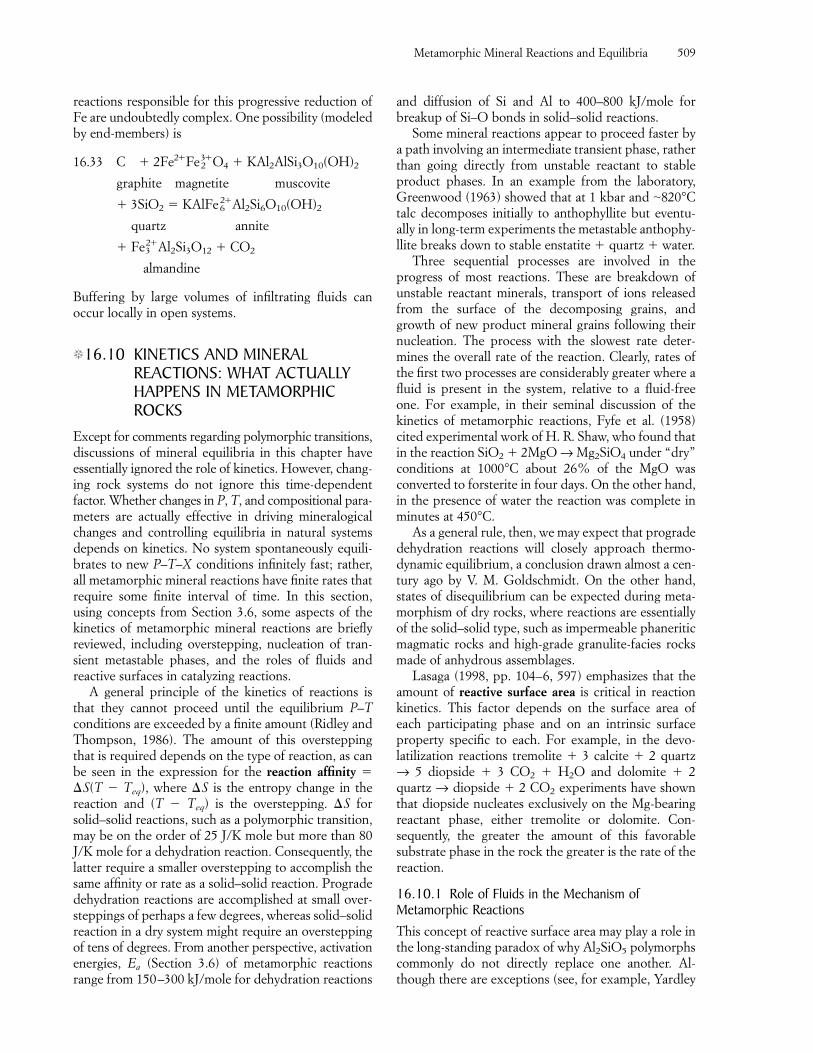
reactions responsible for this progressive reduction ofFe are undoubtedly complex. One possibility (modeledby end-members) is
16.33 C � 2Fe2�Fe23�O4 � KAl2AlSi3O10(OH)2
graphite magnetite muscovite
� 3SiO2 � KAlFe62�Al2Si6O10(OH)2
quartz annite
� Fe32�Al2Si3O12 � CO2
almandine
Buffering by large volumes of infiltrating fluids can occur locally in open systems.
�16.10 KINETICS AND MINERALREACTIONS: WHAT ACTUALLYHAPPENS IN METAMORPHICROCKS
Except for comments regarding polymorphic transitions,discussions of mineral equilibria in this chapter haveessentially ignored the role of kinetics. However, chang-ing rock systems do not ignore this time-dependent factor. Whether changes in P, T, and compositional para-meters are actually effective in driving mineralogicalchanges and controlling equilibria in natural systemsdepends on kinetics. No system spontaneously equili-brates to new P–T–X conditions infinitely fast; rather,all metamorphic mineral reactions have finite rates thatrequire some finite interval of time. In this section, using concepts from Section 3.6, some aspects of thekinetics of metamorphic mineral reactions are brieflyreviewed, including overstepping, nucleation of tran-sient metastable phases, and the roles of fluids and reactive surfaces in catalyzing reactions.
A general principle of the kinetics of reactions isthat they cannot proceed until the equilibrium P–Tconditions are exceeded by a finite amount (Ridley andThompson, 1986). The amount of this oversteppingthat is required depends on the type of reaction, as canbe seen in the expression for the reaction affinity ��S(T � Teq), where �S is the entropy change in the reaction and (T � Teq) is the overstepping. �S forsolid–solid reactions, such as a polymorphic transition,may be on the order of 25 J/K mole but more than 80J/K mole for a dehydration reaction. Consequently, thelatter require a smaller overstepping to accomplish thesame affinity or rate as a solid–solid reaction. Progradedehydration reactions are accomplished at small over-steppings of perhaps a few degrees, whereas solid–solidreaction in a dry system might require an oversteppingof tens of degrees. From another perspective, activationenergies, Ea (Section 3.6) of metamorphic reactionsrange from 150–300 kJ/mole for dehydration reactions
and diffusion of Si and Al to 400–800 kJ/mole forbreakup of Si–O bonds in solid–solid reactions.
Some mineral reactions appear to proceed faster bya path involving an intermediate transient phase, ratherthan going directly from unstable reactant to stableproduct phases. In an example from the laboratory,Greenwood (1963) showed that at 1 kbar and �820°Ctalc decomposes initially to anthophyllite but eventu-ally in long-term experiments the metastable anthophy-llite breaks down to stable enstatite � quartz � water.
Three sequential processes are involved in theprogress of most reactions. These are breakdown ofunstable reactant minerals, transport of ions releasedfrom the surface of the decomposing grains, andgrowth of new product mineral grains following theirnucleation. The process with the slowest rate deter-mines the overall rate of the reaction. Clearly, rates ofthe first two processes are considerably greater where afluid is present in the system, relative to a fluid-freeone. For example, in their seminal discussion of the kinetics of metamorphic reactions, Fyfe et al. (1958)cited experimental work of H. R. Shaw, who found thatin the reaction SiO2 � 2MgO → Mg2SiO4 under “dry”conditions at 1000°C about 26% of the MgO was converted to forsterite in four days. On the other hand,in the presence of water the reaction was complete inminutes at 450°C.
As a general rule, then, we may expect that progradedehydration reactions will closely approach thermo-dynamic equilibrium, a conclusion drawn almost a cen-tury ago by V. M. Goldschmidt. On the other hand,states of disequilibrium can be expected during meta-morphism of dry rocks, where reactions are essentiallyof the solid–solid type, such as impermeable phaneriticmagmatic rocks and high-grade granulite-facies rocksmade of anhydrous assemblages.
Lasaga (1998, pp. 104–6, 597) emphasizes that theamount of reactive surface area is critical in reactionkinetics. This factor depends on the surface area ofeach participating phase and on an intrinsic surfaceproperty specific to each. For example, in the devo-latilization reactions tremolite � 3 calcite � 2 quartz→ 5 diopside � 3 CO2 � H2O and dolomite � 2quartz → diopside � 2 CO2 experiments have shownthat diopside nucleates exclusively on the Mg-bearingreactant phase, either tremolite or dolomite. Con-sequently, the greater the amount of this favorable substrate phase in the rock the greater is the rate of thereaction.
16.10.1 Role of Fluids in the Mechanism ofMetamorphic ReactionsThis concept of reactive surface area may play a role inthe long-standing paradox of why Al2SiO5 polymorphscommonly do not directly replace one another. Al-though there are exceptions (see, for example, Yardley
Metamorphic Mineral Reactions and Equilibria 509
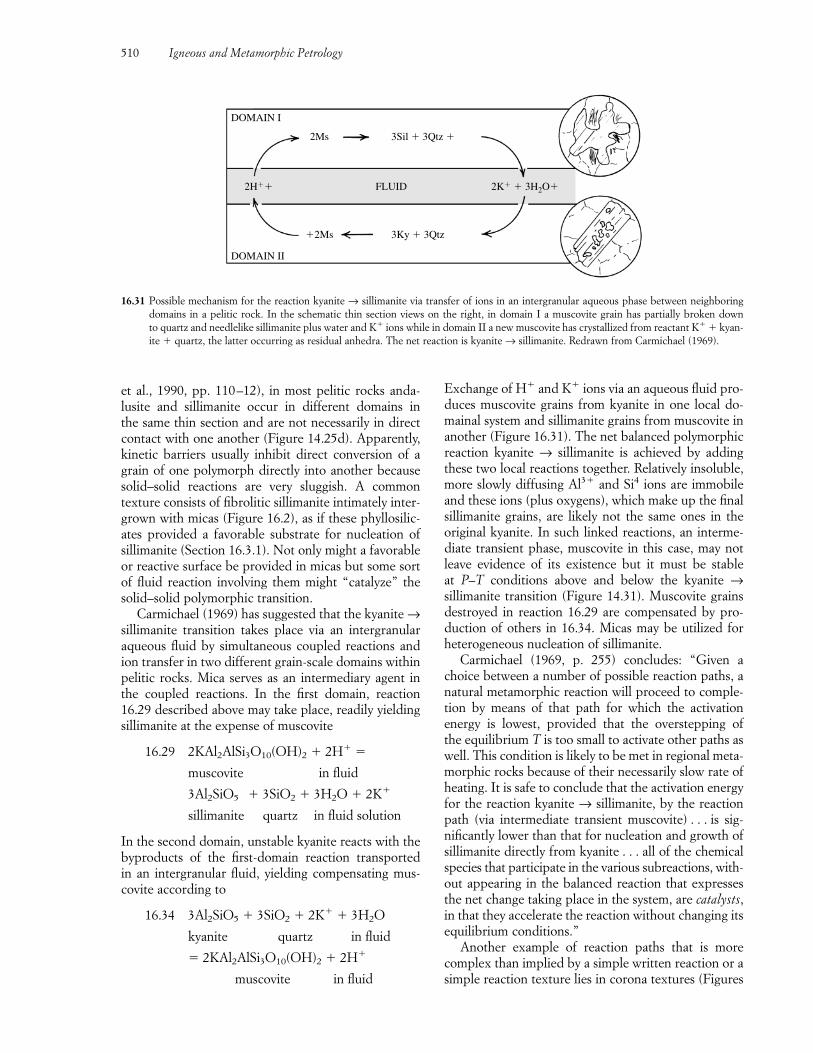
et al., 1990, pp. 110–12), in most pelitic rocks anda-lusite and sillimanite occur in different domains in the same thin section and are not necessarily in directcontact with one another (Figure 14.25d). Apparently,kinetic barriers usually inhibit direct conversion of agrain of one polymorph directly into another becausesolid–solid reactions are very sluggish. A common texture consists of fibrolitic sillimanite intimately inter-grown with micas (Figure 16.2), as if these phyllosilic-ates provided a favorable substrate for nucleation ofsillimanite (Section 16.3.1). Not only might a favorableor reactive surface be provided in micas but some sortof fluid reaction involving them might “catalyze” thesolid–solid polymorphic transition.
Carmichael (1969) has suggested that the kyanite →sillimanite transition takes place via an intergranularaqueous fluid by simultaneous coupled reactions andion transfer in two different grain-scale domains withinpelitic rocks. Mica serves as an intermediary agent inthe coupled reactions. In the first domain, reaction16.29 described above may take place, readily yieldingsillimanite at the expense of muscovite
16.29 2KAl2AlSi3O10(OH)2 � 2H� �
muscovite in fluid
3Al2SiO5 � 3SiO2 � 3H2O � 2K�
sillimanite quartz in fluid solution
In the second domain, unstable kyanite reacts with thebyproducts of the first-domain reaction transported in an intergranular fluid, yielding compensating mus-covite according to
16.34 3Al2SiO5 � 3SiO2 � 2K� � 3H2O
kyanite quartz in fluid
� 2KAl2AlSi3O10(OH)2 � 2H�
muscovite in fluid
Exchange of H� and K� ions via an aqueous fluid pro-duces muscovite grains from kyanite in one local do-mainal system and sillimanite grains from muscovite inanother (Figure 16.31). The net balanced polymorphicreaction kyanite → sillimanite is achieved by addingthese two local reactions together. Relatively insoluble,more slowly diffusing Al3� and Si4 ions are immobileand these ions (plus oxygens), which make up the finalsillimanite grains, are likely not the same ones in theoriginal kyanite. In such linked reactions, an interme-diate transient phase, muscovite in this case, may notleave evidence of its existence but it must be stable at P–T conditions above and below the kyanite →sillimanite transition (Figure 14.31). Muscovite grainsdestroyed in reaction 16.29 are compensated by pro-duction of others in 16.34. Micas may be utilized forheterogeneous nucleation of sillimanite.
Carmichael (1969, p. 255) concludes: “Given achoice between a number of possible reaction paths, anatural metamorphic reaction will proceed to comple-tion by means of that path for which the activation energy is lowest, provided that the overstepping of the equilibrium T is too small to activate other paths aswell. This condition is likely to be met in regional meta-morphic rocks because of their necessarily slow rate ofheating. It is safe to conclude that the activation energyfor the reaction kyanite → sillimanite, by the reactionpath (via intermediate transient muscovite) . . . is sig-nificantly lower than that for nucleation and growth ofsillimanite directly from kyanite . . . all of the chemicalspecies that participate in the various subreactions, with-out appearing in the balanced reaction that expressesthe net change taking place in the system, are catalysts,in that they accelerate the reaction without changing itsequilibrium conditions.”
Another example of reaction paths that is morecomplex than implied by a simple written reaction or asimple reaction texture lies in corona textures (Figures
510 Igneous and Metamorphic Petrology
DOMAIN I
DOMAIN II
2H�� FLUID 2K� � 3H2O�
2Ms 3Sil � 3Qtz �
�2Ms 3Ky � 3Qtz
16.31 Possible mechanism for the reaction kyanite → sillimanite via transfer of ions in an intergranular aqueous phase between neighboringdomains in a pelitic rock. In the schematic thin section views on the right, in domain I a muscovite grain has partially broken down to quartz and needlelike sillimanite plus water and K� ions while in domain II a new muscovite has crystallized from reactant K� � kyan-ite � quartz, the latter occurring as residual anhedra. The net reaction is kyanite → sillimanite. Redrawn from Carmichael (1969).
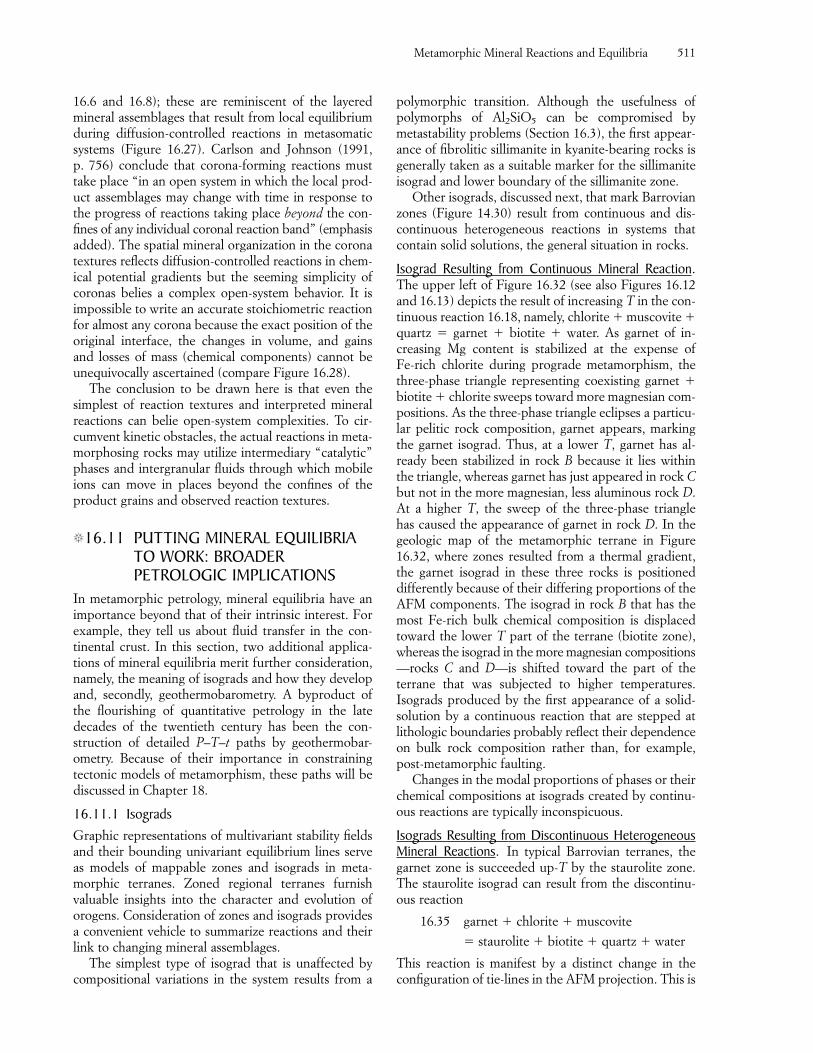
16.6 and 16.8); these are reminiscent of the layeredmineral assemblages that result from local equilibriumduring diffusion-controlled reactions in metasomaticsystems (Figure 16.27). Carlson and Johnson (1991, p. 756) conclude that corona-forming reactions musttake place “in an open system in which the local prod-uct assemblages may change with time in response tothe progress of reactions taking place beyond the con-fines of any individual coronal reaction band” (emphasisadded). The spatial mineral organization in the coronatextures reflects diffusion-controlled reactions in chem-ical potential gradients but the seeming simplicity ofcoronas belies a complex open-system behavior. It isimpossible to write an accurate stoichiometric reactionfor almost any corona because the exact position of theoriginal interface, the changes in volume, and gains and losses of mass (chemical components) cannot beunequivocally ascertained (compare Figure 16.28).
The conclusion to be drawn here is that even thesimplest of reaction textures and interpreted mineralreactions can belie open-system complexities. To cir-cumvent kinetic obstacles, the actual reactions in meta-morphosing rocks may utilize intermediary “catalytic”phases and intergranular fluids through which mobileions can move in places beyond the confines of theproduct grains and observed reaction textures.
�16.11 PUTTING MINERAL EQUILIBRIATO WORK: BROADERPETROLOGIC IMPLICATIONS
In metamorphic petrology, mineral equilibria have animportance beyond that of their intrinsic interest. Forexample, they tell us about fluid transfer in the con-tinental crust. In this section, two additional applica-tions of mineral equilibria merit further consideration,namely, the meaning of isograds and how they developand, secondly, geothermobarometry. A byproduct ofthe flourishing of quantitative petrology in the latedecades of the twentieth century has been the con-struction of detailed P–T–t paths by geothermobar-ometry. Because of their importance in constrainingtectonic models of metamorphism, these paths will bediscussed in Chapter 18.
16.11.1 IsogradsGraphic representations of multivariant stability fieldsand their bounding univariant equilibrium lines serveas models of mappable zones and isograds in meta-morphic terranes. Zoned regional terranes furnishvaluable insights into the character and evolution oforogens. Consideration of zones and isograds providesa convenient vehicle to summarize reactions and theirlink to changing mineral assemblages.
The simplest type of isograd that is unaffected bycompositional variations in the system results from a
polymorphic transition. Although the usefulness ofpolymorphs of Al2SiO5 can be compromised bymetastability problems (Section 16.3), the first appear-ance of fibrolitic sillimanite in kyanite-bearing rocks isgenerally taken as a suitable marker for the sillimaniteisograd and lower boundary of the sillimanite zone.
Other isograds, discussed next, that mark Barrovianzones (Figure 14.30) result from continuous and dis-continuous heterogeneous reactions in systems thatcontain solid solutions, the general situation in rocks.
Isograd Resulting from Continuous Mineral Reaction.The upper left of Figure 16.32 (see also Figures 16.12and 16.13) depicts the result of increasing T in the con-tinuous reaction 16.18, namely, chlorite � muscovite �quartz � garnet � biotite � water. As garnet of in-creasing Mg content is stabilized at the expense of Fe-rich chlorite during prograde metamorphism, thethree-phase triangle representing coexisting garnet �biotite � chlorite sweeps toward more magnesian com-positions. As the three-phase triangle eclipses a particu-lar pelitic rock composition, garnet appears, markingthe garnet isograd. Thus, at a lower T, garnet has al-ready been stabilized in rock B because it lies withinthe triangle, whereas garnet has just appeared in rock Cbut not in the more magnesian, less aluminous rock D.At a higher T, the sweep of the three-phase triangle has caused the appearance of garnet in rock D. In thegeologic map of the metamorphic terrane in Figure16.32, where zones resulted from a thermal gradient,the garnet isograd in these three rocks is positioned differently because of their differing proportions of theAFM components. The isograd in rock B that has themost Fe-rich bulk chemical composition is displacedtoward the lower T part of the terrane (biotite zone),whereas the isograd in the more magnesian compositions—rocks C and D—is shifted toward the part of the terrane that was subjected to higher temperatures. Isograds produced by the first appearance of a solid-solution by a continuous reaction that are stepped atlithologic boundaries probably reflect their dependenceon bulk rock composition rather than, for example,post-metamorphic faulting.
Changes in the modal proportions of phases or theirchemical compositions at isograds created by continu-ous reactions are typically inconspicuous.
Isograds Resulting from Discontinuous HeterogeneousMineral Reactions. In typical Barrovian terranes, thegarnet zone is succeeded up-T by the staurolite zone.The staurolite isograd can result from the discontinu-ous reaction
16.35 garnet � chlorite � muscovite
� staurolite � biotite � quartz � water
This reaction is manifest by a distinct change in theconfiguration of tie-lines in the AFM projection. This is
Metamorphic Mineral Reactions and Equilibria 511
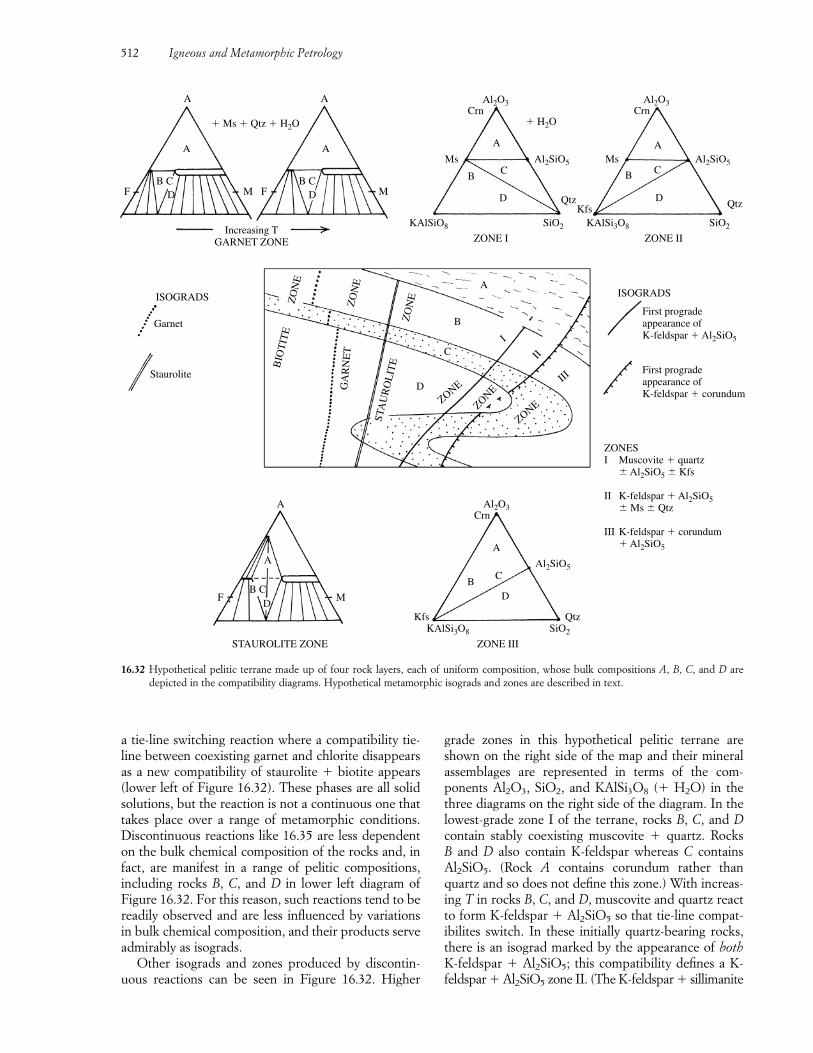
a tie-line switching reaction where a compatibility tie-line between coexisting garnet and chlorite disappearsas a new compatibility of staurolite � biotite appears(lower left of Figure 16.32). These phases are all solidsolutions, but the reaction is not a continuous one thattakes place over a range of metamorphic conditions.Discontinuous reactions like 16.35 are less dependenton the bulk chemical composition of the rocks and, infact, are manifest in a range of pelitic compositions, including rocks B, C, and D in lower left diagram ofFigure 16.32. For this reason, such reactions tend to bereadily observed and are less influenced by variationsin bulk chemical composition, and their products serveadmirably as isograds.
Other isograds and zones produced by discontin-uous reactions can be seen in Figure 16.32. Higher
grade zones in this hypothetical pelitic terrane areshown on the right side of the map and their mineralassemblages are represented in terms of the com-ponents Al2O3, SiO2, and KAlSi3O8 (� H2O) in thethree diagrams on the right side of the diagram. In the lowest-grade zone I of the terrane, rocks B, C, and Dcontain stably coexisting muscovite � quartz. Rocks B and D also contain K-feldspar whereas C containsAl2SiO5. (Rock A contains corundum rather thanquartz and so does not define this zone.) With increas-ing T in rocks B, C, and D, muscovite and quartz reactto form K-feldspar � Al2SiO5 so that tie-line compat-ibilites switch. In these initially quartz-bearing rocks,there is an isograd marked by the appearance of bothK-feldspar � Al2SiO5; this compatibility defines a K-feldspar � Al2SiO5 zone II. (The K-feldspar � sillimanite
512 Igneous and Metamorphic Petrology
Qtz
SiO2KAlSi3O8
ZONE IIZONE I
Kfs
Ms
Crn
Al2SiO5
Al2O3
Qtz
SiO2KAlSiO8
� Ms � Qtz � H2O
Increasing TGARNET ZONE
ISOGRADS ISOGRADS
Garnet
Staurolite
Ms
Crn
Al2SiO5
Al2O3
A
B C
D
QtzSiO2KAlSi3O8
STAUROLITE ZONE ZONE III
Kfs
Crn
Al2SiO5
Al2O3A
A
BC
D
A
B C
D
A A
A A
B C B CDF M F M
ZO
NE
BIO
TIT
E
ZO
NE
GA
RN
ET
ZO
NE
STA
UR
OL
ITE
II
ZONE
ZONE
III
ZONE
I
A
B
C
D
F M
A
B CD
First progradeappearance ofK-feldspar � Al2SiO5
First progradeappearance ofK-feldspar � corundum
ZONESI Muscovite � quartz
� Al2SiO5 � Kfs
II K-feldspar � Al2SiO5� Ms � Qtz
III K-feldspar � corundum� Al2SiO5
� H2O
D
16.32 Hypothetical pelitic terrane made up of four rock layers, each of uniform composition, whose bulk compositions A, B, C, and D are depicted in the compatibility diagrams. Hypothetical metamorphic isograds and zones are described in text.
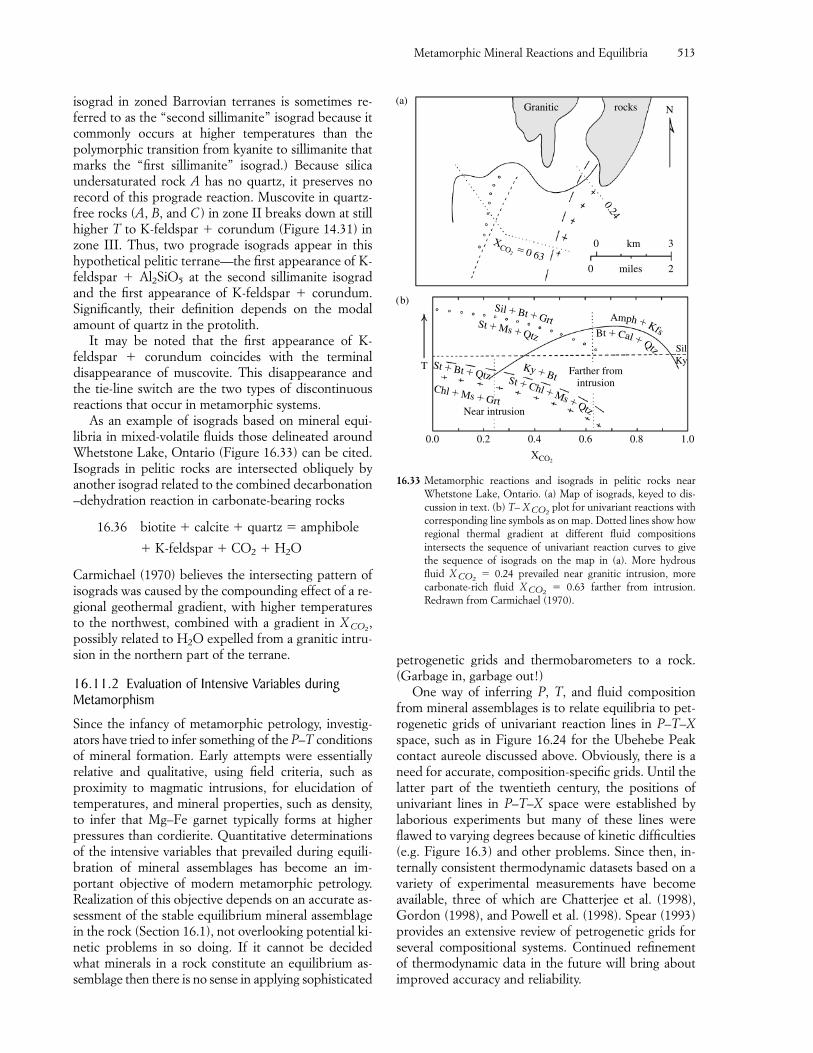
isograd in zoned Barrovian terranes is sometimes re-ferred to as the “second sillimanite” isograd because itcommonly occurs at higher temperatures than thepolymorphic transition from kyanite to sillimanite thatmarks the “first sillimanite” isograd.) Because silica undersaturated rock A has no quartz, it preserves norecord of this prograde reaction. Muscovite in quartz-free rocks (A, B, and C ) in zone II breaks down at stillhigher T to K-feldspar � corundum (Figure 14.31) inzone III. Thus, two prograde isograds appear in thishypothetical pelitic terrane—the first appearance of K-feldspar � Al2SiO5 at the second sillimanite isogradand the first appearance of K-feldspar � corundum.Significantly, their definition depends on the modalamount of quartz in the protolith.
It may be noted that the first appearance of K-feldspar � corundum coincides with the terminal disappearance of muscovite. This disappearance andthe tie-line switch are the two types of discontinuousreactions that occur in metamorphic systems.
As an example of isograds based on mineral equi-libria in mixed-volatile fluids those delineated aroundWhetstone Lake, Ontario (Figure 16.33) can be cited.Isograds in pelitic rocks are intersected obliquely byanother isograd related to the combined decarbonation–dehydration reaction in carbonate-bearing rocks
16.36 biotite � calcite � quartz � amphibole
� K-feldspar � CO2 � H2O
Carmichael (1970) believes the intersecting pattern ofisograds was caused by the compounding effect of a re-gional geothermal gradient, with higher temperaturesto the northwest, combined with a gradient in X ,possibly related to H2O expelled from a granitic intru-sion in the northern part of the terrane.
16.11.2 Evaluation of Intensive Variables duringMetamorphism
Since the infancy of metamorphic petrology, investig-ators have tried to infer something of the P–T conditionsof mineral formation. Early attempts were essentiallyrelative and qualitative, using field criteria, such asproximity to magmatic intrusions, for elucidation oftemperatures, and mineral properties, such as density,to infer that Mg–Fe garnet typically forms at higherpressures than cordierite. Quantitative determinationsof the intensive variables that prevailed during equili-bration of mineral assemblages has become an im-portant objective of modern metamorphic petrology. Realization of this objective depends on an accurate as-sessment of the stable equilibrium mineral assemblagein the rock (Section 16.1), not overlooking potential ki-netic problems in so doing. If it cannot be decidedwhat minerals in a rock constitute an equilibrium as-semblage then there is no sense in applying sophisticated
CO2
petrogenetic grids and thermobarometers to a rock.(Garbage in, garbage out!)
One way of inferring P, T, and fluid compositionfrom mineral assemblages is to relate equilibria to pet-rogenetic grids of univariant reaction lines in P–T–Xspace, such as in Figure 16.24 for the Ubehebe Peakcontact aureole discussed above. Obviously, there is aneed for accurate, composition-specific grids. Until thelatter part of the twentieth century, the positions of univariant lines in P–T–X space were established by laborious experiments but many of these lines wereflawed to varying degrees because of kinetic difficulties(e.g. Figure 16.3) and other problems. Since then, in-ternally consistent thermodynamic datasets based on avariety of experimental measurements have becomeavailable, three of which are Chatterjee et al. (1998),Gordon (1998), and Powell et al. (1998). Spear (1993)provides an extensive review of petrogenetic grids forseveral compositional systems. Continued refinementof thermodynamic data in the future will bring aboutimproved accuracy and reliability.
Metamorphic Mineral Reactions and Equilibria 513
(a)
(b)
T
0.0 0.2
Near intrusion
Farther fromintrusion
SilKy
Chl � Ms � Grt
St � Bt � Qtz
0.4 0.6 0.8
0 3km
0 2miles
1.0
XCO2
XCO
2 � 0 63
Granitic rocks N
0.24
St � Chl � Ms �Qtz
Sil � Bt �GrtSt � Ms �Qtz Bt � Cal � Qtz
Amph � Kfs
Ky � Bt
16.33 Metamorphic reactions and isograds in pelitic rocks nearWhetstone Lake, Ontario. (a) Map of isograds, keyed to dis-cussion in text. (b) T– X plot for univariant reactions withcorresponding line symbols as on map. Dotted lines show howregional thermal gradient at different fluid compositions intersects the sequence of univariant reaction curves to give the sequence of isograds on the map in (a). More hydrous fluid X � 0.24 prevailed near granitic intrusion, more carbonate-rich fluid X � 0.63 farther from intrusion. Redrawn from Carmichael (1970).
CO2
CO2
CO2
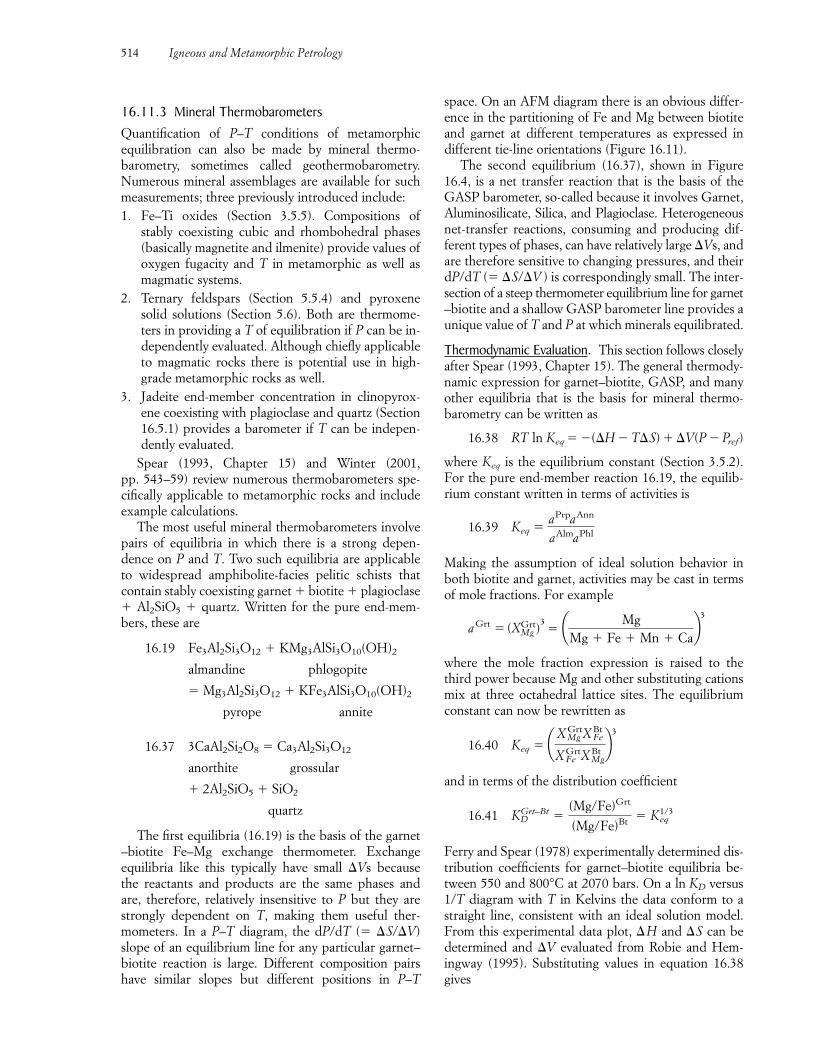
16.11.3 Mineral ThermobarometersQuantification of P–T conditions of metamorphicequilibration can also be made by mineral thermo-barometry, sometimes called geothermobarometry. Numerous mineral assemblages are available for suchmeasurements; three previously introduced include:1. Fe–Ti oxides (Section 3.5.5). Compositions of
stably coexisting cubic and rhombohedral phases(basically magnetite and ilmenite) provide values ofoxygen fugacity and T in metamorphic as well asmagmatic systems.
2. Ternary feldspars (Section 5.5.4) and pyroxenesolid solutions (Section 5.6). Both are thermome-ters in providing a T of equilibration if P can be in-dependently evaluated. Although chiefly applicableto magmatic rocks there is potential use in high-grade metamorphic rocks as well.
3. Jadeite end-member concentration in clinopyrox-ene coexisting with plagioclase and quartz (Section16.5.1) provides a barometer if T can be indepen-dently evaluated.
Spear (1993, Chapter 15) and Winter (2001, pp. 543–59) review numerous thermobarometers spe-cifically applicable to metamorphic rocks and include example calculations.
The most useful mineral thermobarometers involvepairs of equilibria in which there is a strong depen-dence on P and T. Two such equilibria are applicableto widespread amphibolite-facies pelitic schists thatcontain stably coexisting garnet � biotite � plagioclase� Al2SiO5 � quartz. Written for the pure end-mem-bers, these are
16.19 Fe3Al2Si3O12 � KMg3AlSi3O10(OH)2
almandine phlogopite
� Mg3Al2Si3O12 � KFe3AlSi3O10(OH)2
pyrope annite
16.37 3CaAl2Si2O8 � Ca3Al2Si3O12
anorthite grossular
� 2Al2SiO5 � SiO2
quartz
The first equilibria (16.19) is the basis of the garnet–biotite Fe–Mg exchange thermometer. Exchangeequilibria like this typically have small �Vs because the reactants and products are the same phases and are, therefore, relatively insensitive to P but they arestrongly dependent on T, making them useful ther-mometers. In a P–T diagram, the dP/dT (� �S/�V)slope of an equilibrium line for any particular garnet–biotite reaction is large. Different composition pairshave similar slopes but different positions in P–T
space. On an AFM diagram there is an obvious differ-ence in the partitioning of Fe and Mg between biotiteand garnet at different temperatures as expressed indifferent tie-line orientations (Figure 16.11).
The second equilibrium (16.37), shown in Figure16.4, is a net transfer reaction that is the basis of theGASP barometer, so-called because it involves Garnet,Aluminosilicate, Silica, and Plagioclase. Heterogeneousnet-transfer reactions, consuming and producing dif-ferent types of phases, can have relatively large �Vs, andare therefore sensitive to changing pressures, and theirdP/dT (� �S/�V ) is correspondingly small. The inter-section of a steep thermometer equilibrium line for garnet–biotite and a shallow GASP barometer line provides aunique value of T and P at which minerals equilibrated.
Thermodynamic Evaluation. This section follows closelyafter Spear (1993, Chapter 15). The general thermody-namic expression for garnet–biotite, GASP, and manyother equilibria that is the basis for mineral thermo-barometry can be written as
16.38 RT ln Keq � �(�H � T�S) � �V(P � Pref)
where Keq is the equilibrium constant (Section 3.5.2).For the pure end-member reaction 16.19, the equilib-rium constant written in terms of activities is
16.39 Keq �
Making the assumption of ideal solution behavior inboth biotite and garnet, activities may be cast in termsof mole fractions. For example
aGrt �
where the mole fraction expression is raised to thethird power because Mg and other substituting cationsmix at three octahedral lattice sites. The equilibriumconstant can now be rewritten as
16.40 Keq �
and in terms of the distribution coefficient
16.41
Ferry and Spear (1978) experimentally determined dis-tribution coefficients for garnet–biotite equilibria be-tween 550 and 800°C at 2070 bars. On a ln KD versus1/T diagram with T in Kelvins the data conform to astraight line, consistent with an ideal solution model.From this experimental data plot, �H and �S can bedetermined and �V evaluated from Robie and Hem-ingway (1995). Substituting values in equation 16.38gives
KGrt–BtD �
(Mg/Fe)Grt
(Mg/Fe)Bt � Keq1/3
¢XGrtMg XBt
Fe
XGrtFe XBt
Mg
≤3
(XMgGrt)
3� ¢ Mg
Mg � Fe � Mn � Ca≤3
aPrpaAnn
aAlmaPhl
514 Igneous and Metamorphic Petrology
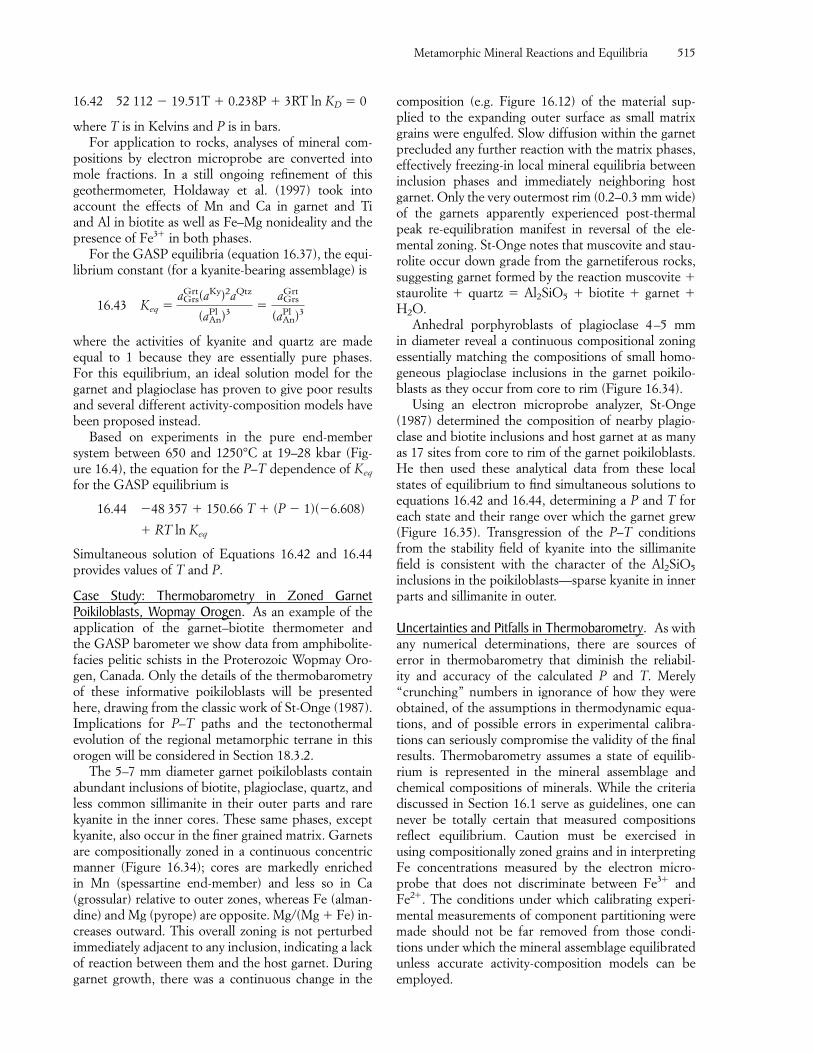
16.42 52 112 � 19.51T � 0.238P � 3RT ln KD � 0
where T is in Kelvins and P is in bars.For application to rocks, analyses of mineral com-
positions by electron microprobe are converted intomole fractions. In a still ongoing refinement of this geothermometer, Holdaway et al. (1997) took into account the effects of Mn and Ca in garnet and Ti and Al in biotite as well as Fe–Mg nonideality and thepresence of Fe3� in both phases.
For the GASP equilibria (equation 16.37), the equi-librium constant (for a kyanite-bearing assemblage) is
16.43 Keq �
where the activities of kyanite and quartz are madeequal to 1 because they are essentially pure phases. For this equilibrium, an ideal solution model for thegarnet and plagioclase has proven to give poor resultsand several different activity-composition models havebeen proposed instead.
Based on experiments in the pure end-member system between 650 and 1250°C at 19–28 kbar (Fig-ure 16.4), the equation for the P–T dependence of Keq
for the GASP equilibrium is
16.44 �48 357 � 150.66 T � (P � 1)(�6.608)
� RT ln Keq
Simultaneous solution of Equations 16.42 and 16.44provides values of T and P.
Case Study: Thermobarometry in Zoned Garnet Poikiloblasts, Wopmay Orogen. As an example of the application of the garnet–biotite thermometer and the GASP barometer we show data from amphibolite-facies pelitic schists in the Proterozoic Wopmay Oro-gen, Canada. Only the details of the thermobarometryof these informative poikiloblasts will be presentedhere, drawing from the classic work of St-Onge (1987).Implications for P–T paths and the tectonothermalevolution of the regional metamorphic terrane in thisorogen will be considered in Section 18.3.2.
The 5–7 mm diameter garnet poikiloblasts containabundant inclusions of biotite, plagioclase, quartz, andless common sillimanite in their outer parts and rarekyanite in the inner cores. These same phases, exceptkyanite, also occur in the finer grained matrix. Garnetsare compositionally zoned in a continuous concentricmanner (Figure 16.34); cores are markedly enriched in Mn (spessartine end-member) and less so in Ca(grossular) relative to outer zones, whereas Fe (alman-dine) and Mg (pyrope) are opposite. Mg/(Mg � Fe) in-creases outward. This overall zoning is not perturbedimmediately adjacent to any inclusion, indicating a lackof reaction between them and the host garnet. Duringgarnet growth, there was a continuous change in the
aGrsGrt(aKy)2aQtz
(aAnPl )3 �
aGrsGrt
(aAnPl )3
composition (e.g. Figure 16.12) of the material sup-plied to the expanding outer surface as small matrixgrains were engulfed. Slow diffusion within the garnetprecluded any further reaction with the matrix phases,effectively freezing-in local mineral equilibria betweeninclusion phases and immediately neighboring hostgarnet. Only the very outermost rim (0.2–0.3 mm wide)of the garnets apparently experienced post-thermalpeak re-equilibration manifest in reversal of the ele-mental zoning. St-Onge notes that muscovite and stau-rolite occur down grade from the garnetiferous rocks,suggesting garnet formed by the reaction muscovite �staurolite � quartz � Al2SiO5 � biotite � garnet �H2O.
Anhedral porphyroblasts of plagioclase 4–5 mm in diameter reveal a continuous compositional zoningessentially matching the compositions of small homo-geneous plagioclase inclusions in the garnet poikilo-blasts as they occur from core to rim (Figure 16.34).
Using an electron microprobe analyzer, St-Onge(1987) determined the composition of nearby plagio-clase and biotite inclusions and host garnet at as manyas 17 sites from core to rim of the garnet poikiloblasts.He then used these analytical data from these localstates of equilibrium to find simultaneous solutions toequations 16.42 and 16.44, determining a P and T foreach state and their range over which the garnet grew(Figure 16.35). Transgression of the P–T conditionsfrom the stability field of kyanite into the sillimanitefield is consistent with the character of the Al2SiO5
inclusions in the poikiloblasts—sparse kyanite in innerparts and sillimanite in outer.
Uncertainties and Pitfalls in Thermobarometry. As withany numerical determinations, there are sources of error in thermobarometry that diminish the reliabil-ity and accuracy of the calculated P and T. Merely“crunching” numbers in ignorance of how they wereobtained, of the assumptions in thermodynamic equa-tions, and of possible errors in experimental calibra-tions can seriously compromise the validity of the finalresults. Thermobarometry assumes a state of equilib-rium is represented in the mineral assemblage andchemical compositions of minerals. While the criteriadiscussed in Section 16.1 serve as guidelines, one cannever be totally certain that measured compositionsreflect equilibrium. Caution must be exercised in using compositionally zoned grains and in interpretingFe concentrations measured by the electron micro-probe that does not discriminate between Fe3� andFe2�. The conditions under which calibrating experi-mental measurements of component partitioning weremade should not be far removed from those condi-tions under which the mineral assemblage equilibratedunless accurate activity-composition models can beemployed.
Metamorphic Mineral Reactions and Equilibria 515
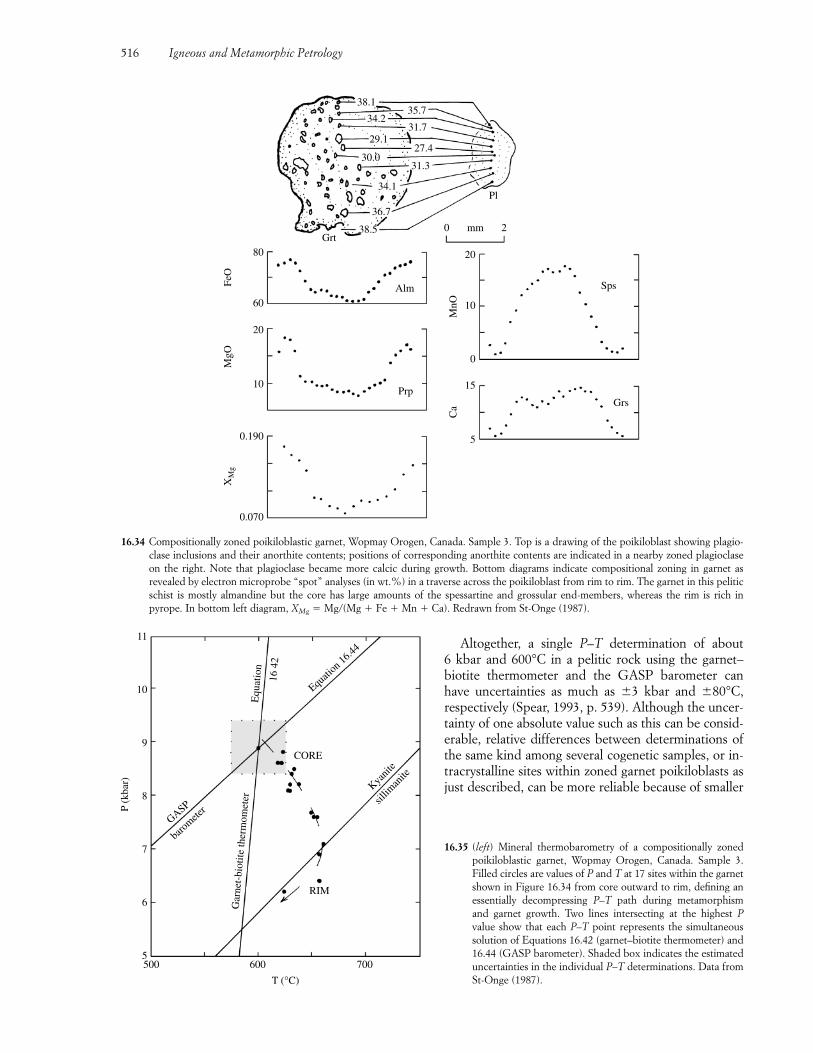
Altogether, a single P–T determination of about 6 kbar and 600°C in a pelitic rock using the garnet–biotite thermometer and the GASP barometer canhave uncertainties as much as �3 kbar and �80°C, respectively (Spear, 1993, p. 539). Although the uncer-tainty of one absolute value such as this can be consid-erable, relative differences between determinations ofthe same kind among several cogenetic samples, or in-tracrystalline sites within zoned garnet poikiloblasts asjust described, can be more reliable because of smaller
516 Igneous and Metamorphic Petrology
XM
g
0.190
0.070
MgO
20
10
FeO
80
60
MnO
20
10
0
Ca
15
5
Alm
0 mm 2
Prp
Sps
Grs
38.135.7
34.231.7
29.127.4
30.031.3
34.1
36.7
38.5
Pl
Grt
16.35 (left) Mineral thermobarometry of a compositionally zonedpoikiloblastic garnet, Wopmay Orogen, Canada. Sample 3.Filled circles are values of P and T at 17 sites within the garnetshown in Figure 16.34 from core outward to rim, defining anessentially decompressing P–T path during metamorphismand garnet growth. Two lines intersecting at the highest Pvalue show that each P–T point represents the simultaneoussolution of Equations 16.42 (garnet–biotite thermometer) and16.44 (GASP barometer). Shaded box indicates the estimateduncertainties in the individual P–T determinations. Data fromSt-Onge (1987).
16.34 Compositionally zoned poikiloblastic garnet, Wopmay Orogen, Canada. Sample 3. Top is a drawing of the poikiloblast showing plagio-clase inclusions and their anorthite contents; positions of corresponding anorthite contents are indicated in a nearby zoned plagioclaseon the right. Note that plagioclase became more calcic during growth. Bottom diagrams indicate compositional zoning in garnet as revealed by electron microprobe “spot” analyses (in wt.%) in a traverse across the poikiloblast from rim to rim. The garnet in this peliticschist is mostly almandine but the core has large amounts of the spessartine and grossular end-members, whereas the rim is rich in pyrope. In bottom left diagram, XMg � Mg/(Mg � Fe � Mn � Ca). Redrawn from St-Onge (1987).
P (k
bar)
11
10
9
8
7
6
5500 600 700
T (°C)
RIM
CORE
Kyanit
esil
liman
ite
GASP
baro
meter
Equati
on 16
.44
Gar
net-
biot
ite th
erm
omet
erE
quat
ion
1642
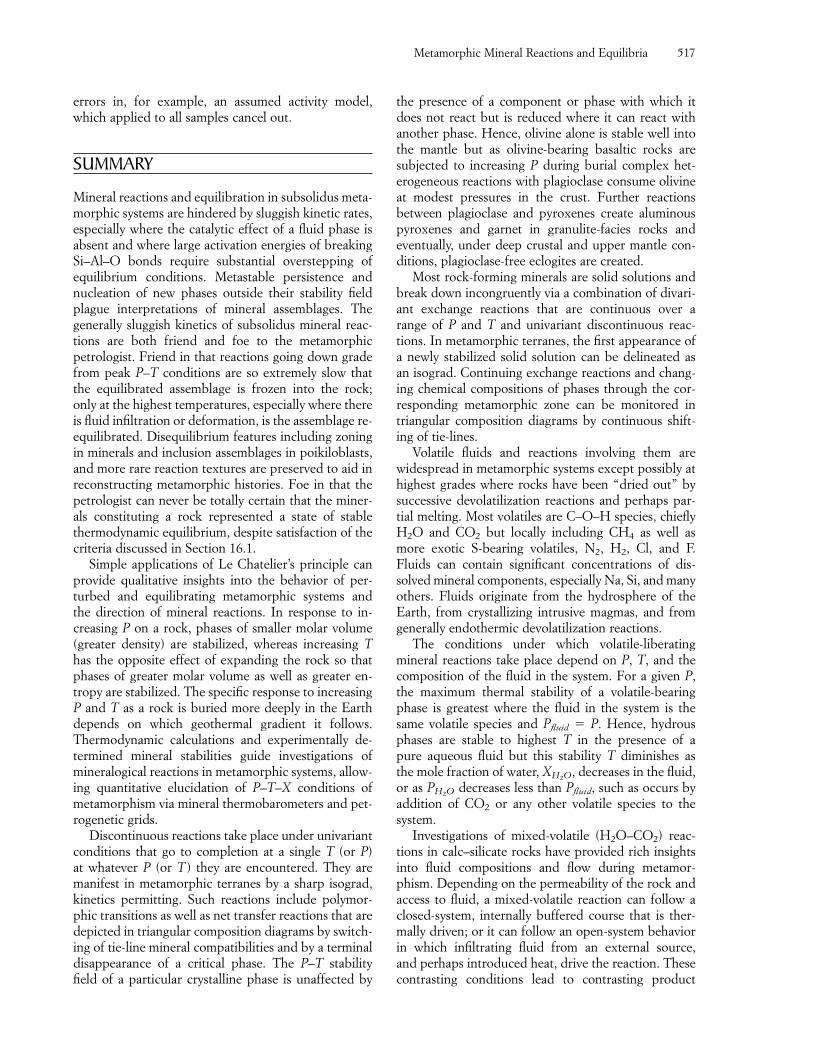
errors in, for example, an assumed activity model,which applied to all samples cancel out.
SUMMARY
Mineral reactions and equilibration in subsolidus meta-morphic systems are hindered by sluggish kinetic rates,especially where the catalytic effect of a fluid phase isabsent and where large activation energies of breakingSi–Al–O bonds require substantial overstepping ofequilibrium conditions. Metastable persistence and nucleation of new phases outside their stability fieldplague interpretations of mineral assemblages. Thegenerally sluggish kinetics of subsolidus mineral reac-tions are both friend and foe to the metamorphicpetrologist. Friend in that reactions going down gradefrom peak P–T conditions are so extremely slow thatthe equilibrated assemblage is frozen into the rock;only at the highest temperatures, especially where thereis fluid infiltration or deformation, is the assemblage re-equilibrated. Disequilibrium features including zoningin minerals and inclusion assemblages in poikiloblasts,and more rare reaction textures are preserved to aid inreconstructing metamorphic histories. Foe in that thepetrologist can never be totally certain that the miner-als constituting a rock represented a state of stablethermodynamic equilibrium, despite satisfaction of thecriteria discussed in Section 16.1.
Simple applications of Le Chatelier’s principle canprovide qualitative insights into the behavior of per-turbed and equilibrating metamorphic systems and the direction of mineral reactions. In response to in-creasing P on a rock, phases of smaller molar volume(greater density) are stabilized, whereas increasing Thas the opposite effect of expanding the rock so thatphases of greater molar volume as well as greater en-tropy are stabilized. The specific response to increasingP and T as a rock is buried more deeply in the Earthdepends on which geothermal gradient it follows.Thermodynamic calculations and experimentally de-termined mineral stabilities guide investigations ofmineralogical reactions in metamorphic systems, allow-ing quantitative elucidation of P–T–X conditions ofmetamorphism via mineral thermobarometers and pet-rogenetic grids.
Discontinuous reactions take place under univariantconditions that go to completion at a single T (or P) at whatever P (or T ) they are encountered. They aremanifest in metamorphic terranes by a sharp isograd,kinetics permitting. Such reactions include polymor-phic transitions as well as net transfer reactions that aredepicted in triangular composition diagrams by switch-ing of tie-line mineral compatibilities and by a terminaldisappearance of a critical phase. The P–T stabilityfield of a particular crystalline phase is unaffected by
the presence of a component or phase with which itdoes not react but is reduced where it can react withanother phase. Hence, olivine alone is stable well intothe mantle but as olivine-bearing basaltic rocks aresubjected to increasing P during burial complex het-erogeneous reactions with plagioclase consume olivineat modest pressures in the crust. Further reactions between plagioclase and pyroxenes create aluminouspyroxenes and garnet in granulite-facies rocks andeventually, under deep crustal and upper mantle con-ditions, plagioclase-free eclogites are created.
Most rock-forming minerals are solid solutions andbreak down incongruently via a combination of divari-ant exchange reactions that are continuous over arange of P and T and univariant discontinuous reac-tions. In metamorphic terranes, the first appearance ofa newly stabilized solid solution can be delineated as an isograd. Continuing exchange reactions and chang-ing chemical compositions of phases through the cor-responding metamorphic zone can be monitored in triangular composition diagrams by continuous shift-ing of tie-lines.
Volatile fluids and reactions involving them arewidespread in metamorphic systems except possibly athighest grades where rocks have been “dried out” bysuccessive devolatilization reactions and perhaps par-tial melting. Most volatiles are C–O–H species, chieflyH2O and CO2 but locally including CH4 as well asmore exotic S-bearing volatiles, N2, H2, Cl, and F. Fluids can contain significant concentrations of dis-solved mineral components, especially Na, Si, and manyothers. Fluids originate from the hydrosphere of theEarth, from crystallizing intrusive magmas, and fromgenerally endothermic devolatilization reactions.
The conditions under which volatile-liberating mineral reactions take place depend on P, T, and thecomposition of the fluid in the system. For a given P,the maximum thermal stability of a volatile-bearingphase is greatest where the fluid in the system is thesame volatile species and Pfluid � P. Hence, hydrousphases are stable to highest T in the presence of a pure aqueous fluid but this stability T diminishes as the mole fraction of water, X , decreases in the fluid,or as P decreases less than Pfluid, such as occurs byaddition of CO2 or any other volatile species to the system.
Investigations of mixed-volatile (H2O–CO2) reac-tions in calc–silicate rocks have provided rich insightsinto fluid compositions and flow during metamor-phism. Depending on the permeability of the rock andaccess to fluid, a mixed-volatile reaction can follow aclosed-system, internally buffered course that is ther-mally driven; or it can follow an open-system behaviorin which infiltrating fluid from an external source, and perhaps introduced heat, drive the reaction. Thesecontrasting conditions lead to contrasting product
H2O
H2O
Metamorphic Mineral Reactions and Equilibria 517
mineral assemblages. Infiltration of aqueous fluids isresponsible for the production of water-bearing talcand tremolite during low-grade metamorphism of initially anhydrous siliceous dolostones, as well assignificantly lower temperatures of metamorphism ofcalc–silicate rocks in general, compared to temperat-ures in closed systems. Infiltration of large amounts of fluid through metamorphic terranes is indicated byveins and grossly perturbed O-isotopic ratios aroundgranitic intrusions. In these cases the time-integratedfluid/rock ratio can be relatively large.
Permeability is enhanced in metamorphosing rocksby mineral reactions and deformation. Solid phasesproduced by devolatilization reactions occupy a smallervolume than solid reactant phases; consequently, inter-connected grain-scale openings may be created duringthe progress of the reaction. If the devolatilization re-action produces more fluid than can be accommodatedin existing pores spaces—the usual case—and at agreater rate than can be dissipated for a given state ofpermeability, Pfluid can exceed the tensile strength ofthe rock, causing hydraulic fracturing. These fracturescan range from pervasive microcracks to more widelyspaced fractures of larger aperture through which largevolumes of flowing fluid can be channeled. Because devolatilization reactions are episodic during the courseof metamorphism, permeability production is alsolikely episodic, perhaps accounting for crack-seal veinsin metamorphic terranes.
Flowing fluids create low-variance metasomaticrocks such as skarns in contact aureoles, hydrothermalore deposits, and hydrothermally altered seafloor rocksthat are essential in the generation of arc magmas insubduction zones. On a smaller grain scale, movementof ions through fluid pathways in different domains ofan open system appears to explain how mineral reac-tions actually progress.
CRITICAL THINKING QUESTIONS16.1 Justify the characterization of the Al2SiO5
and CaCO3 systems as consisting of only onecomponent, even though there are three chemical elements in each.
16.2 Justify the univariant nature of the discontinu-ous reactions in Figure 16.4.
16.3 Discuss how differing Fe/Mg ratios and Si, Al,and Na contents would influence the P of reactions involved in the transition from basalt to eclogite.
16.4 Categorize the different types of metamorphicmineral reactions and indicate fundamentalprinciples that govern them.
16.5 Discuss how different proportions of CO2
and H2O in the fluid phase influence mineral
equilibria in the zeolite facies. Specifically, under what conditions is the assemblage analcite � quartz more stable than albite �H2O? Zeolite minerals � CO2 more stablethan calcite � clay minerals � quartz � H2O?
16.6 Using Le Chatelier’s principle and other relevant concepts, justify the curvature of the two univariant reaction curves in Figure16.18b that have H2O and CO2 on oppositesides of the reaction.
16.7 How would the univariant breakdown curvesfor micas in Figure 14.31 be shifted under conditions of P � Pfluid? Of X � 1?What geologic situation(s) might cause theseconditions?
16.8 Discuss the different types of reactions responsible for isograds.
16.9 A sequence of alternating thin beds of shaleand limestone that contains quartz sand grainsappears to have been metamorphosed to ahigher T than adjacent much thicker beds presumed to have experienced the same metamorphic T. How might this happen? Is T the only controlling factor in metamorphicgrade?
16.10 Imagine a “world” in which carbonate mineralsare never in contact or have any chemical com-munication with silicate minerals. How mightmetamorphic systems be different in this worldfrom those on Earth?
16.11 The transition from amphibolite-facies to anhydrous granulite-facies assemblages cantake place by a prograde increase in T. Howelse might this transition occur isothermally bychanging the CO2 content of the fluid in therock system? Draw a diagram depicting how T and X stabilize the two assemblages.
16.12 The infiltration of large volumes of aqueousfluids has been well documented during metamorphism of carbonate-bearing rocks.Does infiltration of fluid not play a role inmetamorphism of more widespread mafic andpelitic rocks? Discuss fully.
16.13 Propose two geologically realistic histories forthe rocks shown in Figure 16.6. In other words,what changes in geologic setting might havecreated the coronas?
16.14 Discuss possible geologic histories of the rocksillustrated in Figure 16.8.
16.15 Discuss the utility of CaCO3 and Al2SiO5
polymorphs as indicators of P–T conditions.Consider both equilibrium and kinetic implications.
CO2
H2OH2O
518 Igneous and Metamorphic Petrology
16.16 Compare and contrast Darcy’s Law for advect-ive flow of a liquid through a permeable rockand Newtonian flow of a viscous material (Sections 6.1 and 8.1.3).
16.17 Using Figure 16.4 as a guide, what can you sayabout the stability of grossular alone withoutany other phase that can react with it?
16.18 Account for the contrast between the straightunivariant lines for solid–solid reactions andthe curved lines for devolatilization reactions inP–T space.
16.19 Using Figure 16.10: (a) Describe what happensto the composition of clinopyroxene that con-tains 50 mol % of the jadeite end-member andcoexists with quartz and sodic plagioclase as Pincreases above 15 kbar at 670°C. (b) Supposea rock contains an apparent equilibrium assem-blage of quartz � sodic plagioclase � clinopy-roxene that contains 80 mol % of the jadeiteend-member. An independent mineral ther-mometer indicates an equilibration T of 400°C.What was the equilibration P?
16.20 Was it just the whim of the experimentaliststhat equilibria for the garnet–biotite thermome-ter were investigated in the laboratory at550–800°C but for the GASP barometer at650–1250°C, mostly beyond common meta-morphic temperatures? Provide a reasonableexplanation.
PROBLEMS16.1 Determine the positions and slopes of the
kyanite–sillimanite and andalusite–sillimaniteboundary lines in the Al2SiO5 stability diagramusing the calculations in Section 16.3.1 as aguide. Note that the low-P metastable extensionof the kyanite–sillimanite boundary line can beextrapolated through the stability field of andalusite, intersecting the T-axis where
P � 1 atm. Discuss your results. How well doyour calculated boundary lines agree with Figure 16.3? Account for any differences.
16.2 Write a balanced equation for the reaction anorthite � enstatite → pyrope � quartz. Howdoes this compare with reaction 16.9. Usingdata in Robie and Hemingway (1995) show that this reaction has a positive slope in P–Tspace.
16.3 Plot the composition of a basalt listed in anytable in Chapter 13 on an ACF diagram. Com-pare your plotted composition with Figure 16.9and discuss the nature of changes in mineral assemblages through the granulite and eclogitefacies.
16.4 Some Ca–Mg–Fe–Al garnets in granulite-faciesrocks show replacement by a fine-grained inter-growth of aluminous orthopyroxene � Mg–Fespinel � cordierite. Using S and V values in Robie and Hemingway (1995), postulate howthis symplectite might have originated.
16.5 In the internally buffered example in AdvancedTopic Box 16.5, calculate the volumetricchanges in tremolite, dolomite, and quartz.Their molar volumes are 272.90, 64.34, and22.69 cm3/mole, respectively (at 1 bar and298K). Comment on these changes. Would they be visible petrographically? Partial answer:�VDol � �4.83 cm3 per 100 cm3 of rock. Thisloss in reactant dolomite is only about 5% ofthe rock, which would be barely visible.
16.6 Using thermodynamic data in Table 16.2 forquartz and coesite determine the position andslope of the inivariant boundary curve betweenthe stability fields of these two polymorphs inP–T space. Compare your results with Figures5.11 and 18.35.
16.7 Draw a P–T diagram for the continuous reac-tion 16.18, fully labeling all fields and univariantlines.
Metamorphic Mineral Reactions and Equilibria 519
FUNDAMENTAL QUESTIONSCONSIDERED IN THIS CHAPTER
1. What factors and solid-state processes areinvolved in the development and evolution ofmetamorphic fabric?
2. How does solid-state crystallization interact withgrain-scale ductile deformation undernonhydrostatic states of stress to produce thecharacteristic anisotropic fabric of tectonites?
3. How can the tectonic history of complexpolymetamorphic rocks be unraveled frommetamorphic fabrics?
INTRODUCTION
The kinetically controlled equilibrating path from aninitial to a more stable final state in changing metamor-phic systems is a complex interplay between subsoliduscrystallization, grain boundary stabilization, and, intectonites of orogens, more or less concurrent grain-scale ductile deformation. It is incumbent on thepetrologist to understand these processes, which arecommonly episodic and repeated during polymetamor-phism, by careful study of the metamorphic fabric.Understanding what constitutes a stable equilibriummineral assemblage depends on an accurate interpreta-tion of textures. Determination of P–T–t paths must
recognize mineral zonation, inclusions in poikiloblasts,and relict minerals and textures. Rocks metamor-phosed to high grade and then totally retrograded canbe distinguished by critical fabric features from rocksof the same mineral assemblage that never reached thehigh grade (McGregor and Friend, 1997). Accurate interpretation of ductile shear fabric can reveal thesense (direction) of shear and tell whether the fault wascontractional or extensional; this can be of paramountimportance in reconstructing the tectonic history ofcomplex metamorphic terranes.
There are, of course, parallels between the kineticpaths followed by crystallizing magmas and recrystal-lizing metamorphic rocks as intensive variables changeand a state of more stable equilibrium is approached inthe system. In both, new more stable crystalline phasesof lesser free energy first nucleate and then grow by diffusion of ions, replacing initial metastable phases.However, the kinetically controlled process paths inevolving metamorphic fabrics differ in significant ways,principally because of the subsolidus nature of meta-morphism (excluding partially melting rock systems)and the intimate role played by ductile deformation inthe evolution of tectonites. In more detail:1. Mineral growth takes place in the solid state so that
growing crystals must compete with others forspace while reacting grains being consumed createspace. This environmental milieu is quite differentfrom crystallizing magmas where crystals expandmore or less freely in a melt during growth. In
Evolution ofImposedMetamorphicFabrics: Processesand Kinetics
17CHAPTER
metamorphic rocks, the most efficient avenue fordiffusion of ions to growing grains lies along inter-grain boundaries. Although some metamorphic systems may be completely devoid of any fluid,most contain a solution of H–O–C-bearing volatilecomponents and locally S-, Cl-, F-, and N-bearingcomponents also. Because of the low porosity ofmetamorphic rocks under elevated P, this fluid islikely to be only thin threads along three-grainboundaries or isolated pools at multiple grain cor-ners (Section 16.7.2). In rocks where decompos-ing reacting minerals are liberating volatiles thefluid pressure may be sufficiently high to induce hydraulic fractures (Section 8.2.1 and Figure 8.2).
2. Grain boundary adjustments minimizing the sur-face energy of the grain aggregate (Section 6.4) are of greater consequence during the long time periods of metamorphic episodes, particularly indeep crustal regional terranes of orogens.
3. Metamorphic rocks in orogens are commonly de-formed by pervasive grain-scale ductile processesunder nonhydrostatic stress, resulting in a pre-served anisotropic tectonite fabric. Existing grainsare destroyed to varying degrees and new grainsgrow concurrently with deformation; in manycases, deformation is progressing while mineral reactions are creating new mineral assemblages. In metamorphic tectonite systems, deformation andrecrystallization are intimately intertwined. The twoprocesses can have a synergetic or feedback rela-tion; as one acts it influences the other, which inturn has an effect on the first. The presence of avolatile fluid can have a profound effect on thissynergism because it is an important factor both indeformation and in mineral equilibration and re-crystallization, as found in the Chapter 16. In con-trast, anisotropic fabric resulting from deformationof a body of magma is uncommon because the bodyresponds by flow of the melt phase, perhaps pro-ducing flow layering or igneous lamination. Even inmagmas of high crystallinity, individual mineralgrains may reveal only limited deformation becauseits effects are erased at high magmatic temperatures.
4. In subsolidus metamorphic systems, kinetic ratesare slower, in some instances by many orders ofmagnitude, and there is more metastable persist-ence of mineral phases, compared to higher T mag-matic systems. Although metamorphic systemstend toward states of equilibrium, nonequilibriumeffects can occur and the petrologist needs to beaware of their possible presence.
This chapter deals with fabrics imposed duringmetamorphism—in contrast to relict fabrics preservedfrom the protolith that were described in Chapter 14.Nucleation and crystallization in static, nondeforming
metamorphic rocks are considered first, while sub-sequent sections deal with the compounding effects ofdeformation and fluid involvement during recrystal-lization in tectonites.
Summaries of fabric development include Spry(1969), Barker (1990), and Shelly (1993); Kretz (1994)is an advanced treatment. Passchier and Trouw (1996),Snoke et al. (1998), and Vernon (2002) provide well illustrated interpretations of tectonite fabrics.
�17.1 SOLID-STATE CRYSTALLIZATIONUNDER STATIC CONDITIONS
In the simplest of metamorphic systems, recrystalliza-tion takes place without concurrent deformation. Typical of such systems is thermal metamorphism ormetasomatism in contact aureoles around passively intruded magmas where recrystallization is activated bychanges in T or by introduced advecting fluids.
As defined in Section 14.1.2, recrystallization in-cludes both adjustment of grain boundaries of existingstable phases, such as of quartz grains during heating ofa quartzite, and formation of new stable product grainsfrom unstable reactants, as in the growth of garnet porphyroblasts from decomposing grains of chlorite,muscovite, and quartz.
Formation of an entirely new phase grain in a crys-talline solid aggregate depends on four processes:1. Destruction of pre-existing reactant phases by re-
moval of ions from grain surfaces; in the presenceof a fluid phase this is a dissolution process.
2. Diffusive transport of ions through the intergran-ular medium from reactant to product phases.
3. Nucleation of newly stable crystalline product grains.4. Grain growth—the incorporation of transported
nutrient ions onto the grain surface.These steps may even be involved in polymorphic transitions, as suggested in Section 16.10.1.
Each of these four kinetic processes proceeds at adifferent rate. Some petrologists believe that the firsttwo steps are the slowest and, therefore, control theoverall rate of formation of the new product grains.The consistent recurrence of essentially the same sequence of mineral zones in regional terranes impliesthat nucleation and growth keep pace with changingmetamorphic conditions (Ridley and Thompson, 1986).On the other hand, the persistence of lower grade relictphases into higher grade rocks suggests the sluggish-ness of their destruction. Because of the exceedinglyslow interdiffusion of NaSi and CaAl in plagioclase(Figure 6.4), breakdown reactions could be similarlyslow and require large overstepping to accomplish. Rubie (1998) claims that plagioclase might survive formillions of years at 20 kbar and 600°C in the stabilityfield of jadeite � grossular � kyanite � quartz without
Evolution of Imposed Metamorphic Fabrics: Processes and Kinetics 521
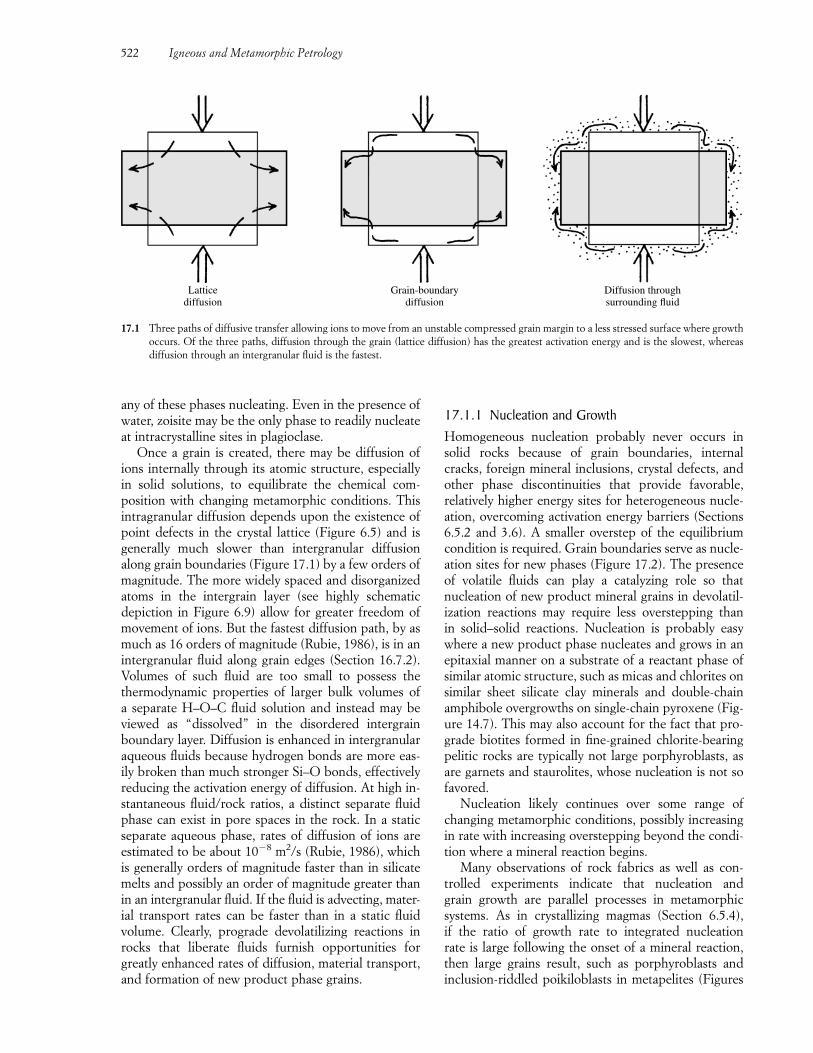
any of these phases nucleating. Even in the presence ofwater, zoisite may be the only phase to readily nucleateat intracrystalline sites in plagioclase.
Once a grain is created, there may be diffusion ofions internally through its atomic structure, especiallyin solid solutions, to equilibrate the chemical com-position with changing metamorphic conditions. Thisintragranular diffusion depends upon the existence ofpoint defects in the crystal lattice (Figure 6.5) and isgenerally much slower than intergranular diffusionalong grain boundaries (Figure 17.1) by a few orders ofmagnitude. The more widely spaced and disorganizedatoms in the intergrain layer (see highly schematic depiction in Figure 6.9) allow for greater freedom ofmovement of ions. But the fastest diffusion path, by asmuch as 16 orders of magnitude (Rubie, 1986), is in anintergranular fluid along grain edges (Section 16.7.2).Volumes of such fluid are too small to possess the thermodynamic properties of larger bulk volumes of a separate H–O–C fluid solution and instead may beviewed as “dissolved” in the disordered intergrainboundary layer. Diffusion is enhanced in intergranularaqueous fluids because hydrogen bonds are more eas-ily broken than much stronger Si–O bonds, effectivelyreducing the activation energy of diffusion. At high in-stantaneous fluid/rock ratios, a distinct separate fluidphase can exist in pore spaces in the rock. In a staticseparate aqueous phase, rates of diffusion of ions areestimated to be about 10�8 m2/s (Rubie, 1986), whichis generally orders of magnitude faster than in silicatemelts and possibly an order of magnitude greater thanin an intergranular fluid. If the fluid is advecting, mater-ial transport rates can be faster than in a static fluidvolume. Clearly, prograde devolatilizing reactions inrocks that liberate fluids furnish opportunities forgreatly enhanced rates of diffusion, material transport,and formation of new product phase grains.
17.1.1 Nucleation and GrowthHomogeneous nucleation probably never occurs insolid rocks because of grain boundaries, internalcracks, foreign mineral inclusions, crystal defects, andother phase discontinuities that provide favorable, relatively higher energy sites for heterogeneous nucle-ation, overcoming activation energy barriers (Sections6.5.2 and 3.6). A smaller overstep of the equilibriumcondition is required. Grain boundaries serve as nucle-ation sites for new phases (Figure 17.2). The presenceof volatile fluids can play a catalyzing role so that nucleation of new product mineral grains in devolatil-ization reactions may require less overstepping than in solid–solid reactions. Nucleation is probably easywhere a new product phase nucleates and grows in anepitaxial manner on a substrate of a reactant phase ofsimilar atomic structure, such as micas and chlorites onsimilar sheet silicate clay minerals and double-chainamphibole overgrowths on single-chain pyroxene (Fig-ure 14.7). This may also account for the fact that pro-grade biotites formed in fine-grained chlorite-bearingpelitic rocks are typically not large porphyroblasts, asare garnets and staurolites, whose nucleation is not sofavored.
Nucleation likely continues over some range ofchanging metamorphic conditions, possibly increasingin rate with increasing overstepping beyond the condi-tion where a mineral reaction begins.
Many observations of rock fabrics as well as con-trolled experiments indicate that nucleation and grain growth are parallel processes in metamorphic systems. As in crystallizing magmas (Section 6.5.4), if the ratio of growth rate to integrated nucleation rate is large following the onset of a mineral reaction,then large grains result, such as porphyroblasts and inclusion-riddled poikiloblasts in metapelites (Figures
522 Igneous and Metamorphic Petrology
Latticediffusion
Grain-boundarydiffusion
Diffusion throughsurrounding fluid
17.1 Three paths of diffusive transfer allowing ions to move from an unstable compressed grain margin to a less stressed surface where growthoccurs. Of the three paths, diffusion through the grain (lattice diffusion) has the greatest activation energy and is the slowest, whereasdiffusion through an intergranular fluid is the fastest.
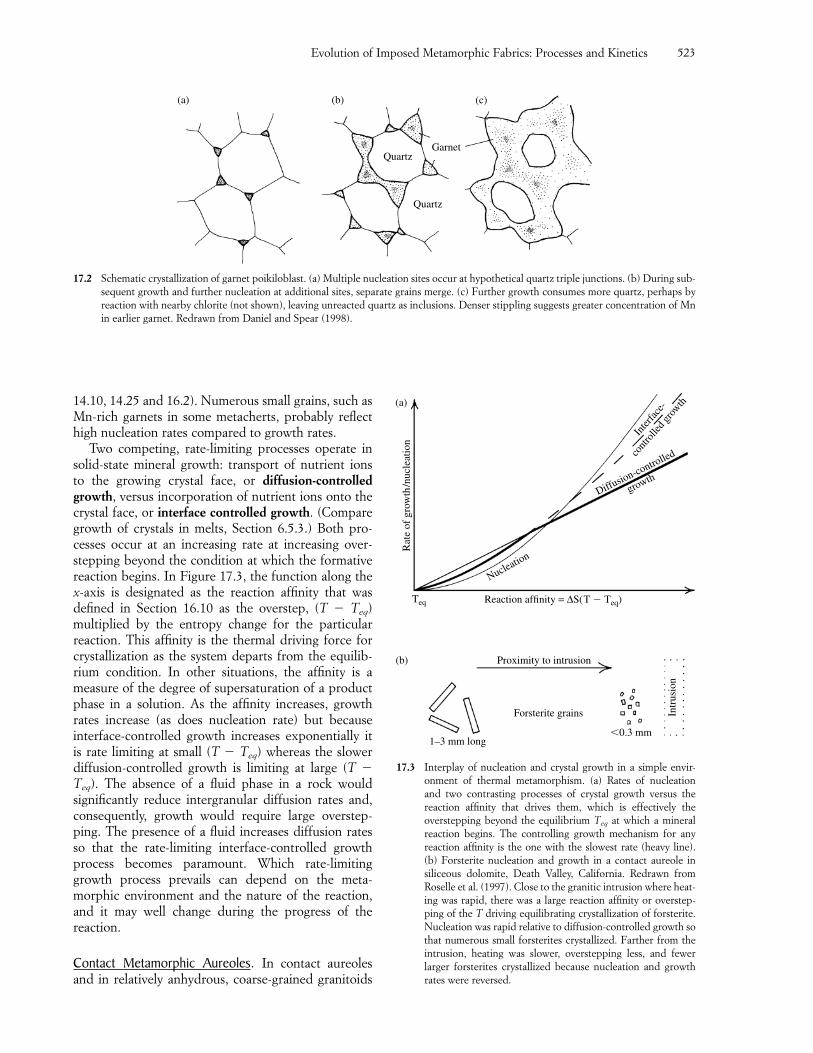
Evolution of Imposed Metamorphic Fabrics: Processes and Kinetics 523
14.10, 14.25 and 16.2). Numerous small grains, such asMn-rich garnets in some metacherts, probably reflecthigh nucleation rates compared to growth rates.
Two competing, rate-limiting processes operate insolid-state mineral growth: transport of nutrient ions to the growing crystal face, or diffusion-controlledgrowth, versus incorporation of nutrient ions onto thecrystal face, or interface controlled growth. (Comparegrowth of crystals in melts, Section 6.5.3.) Both pro-cesses occur at an increasing rate at increasing over-stepping beyond the condition at which the formativereaction begins. In Figure 17.3, the function along thex-axis is designated as the reaction affinity that wasdefined in Section 16.10 as the overstep, (T � Teq) multiplied by the entropy change for the particular reaction. This affinity is the thermal driving force forcrystallization as the system departs from the equilib-rium condition. In other situations, the affinity is ameasure of the degree of supersaturation of a productphase in a solution. As the affinity increases, growthrates increase (as does nucleation rate) but because interface-controlled growth increases exponentially itis rate limiting at small (T � Teq) whereas the slowerdiffusion-controlled growth is limiting at large (T �Teq). The absence of a fluid phase in a rock wouldsignificantly reduce intergranular diffusion rates and,consequently, growth would require large overstep-ping. The presence of a fluid increases diffusion ratesso that the rate-limiting interface-controlled growthprocess becomes paramount. Which rate-limitinggrowth process prevails can depend on the meta-morphic environment and the nature of the reaction,and it may well change during the progress of the reaction.
Contact Metamorphic Aureoles. In contact aureolesand in relatively anhydrous, coarse-grained granitoids
(a) (b)
Quartz
Quartz
Garnet
(c)
17.2 Schematic crystallization of garnet poikiloblast. (a) Multiple nucleation sites occur at hypothetical quartz triple junctions. (b) During sub-sequent growth and further nucleation at additional sites, separate grains merge. (c) Further growth consumes more quartz, perhaps byreaction with nearby chlorite (not shown), leaving unreacted quartz as inclusions. Denser stippling suggests greater concentration of Mnin earlier garnet. Redrawn from Daniel and Spear (1998).
Rat
e of
gro
wth
/nuc
leat
ion
(a)
Teq
Nucleation
Diffusion-controlled
growth
Inter
face
-
cont
rolle
d gro
wth
Reaction affinity = ∆S(T � Teq)
Proximity to intrusion
Forsterite grains Intr
usio
n
1–3 mm long�0.3 mm
(b)
17.3 Interplay of nucleation and crystal growth in a simple envir-onment of thermal metamorphism. (a) Rates of nucleation and two contrasting processes of crystal growth versus the reaction affinity that drives them, which is effectively the overstepping beyond the equilibrium Teq at which a mineralreaction begins. The controlling growth mechanism for anyreaction affinity is the one with the slowest rate (heavy line).(b) Forsterite nucleation and growth in a contact aureole insiliceous dolomite, Death Valley, California. Redrawn fromRoselle et al. (1997). Close to the granitic intrusion where heat-ing was rapid, there was a large reaction affinity or overstep-ping of the T driving equilibrating crystallization of forsterite.Nucleation was rapid relative to diffusion-controlled growth sothat numerous small forsterites crystallized. Farther from theintrusion, heating was slower, overstepping less, and fewerlarger forsterites crystallized because nucleation and growthrates were reversed.
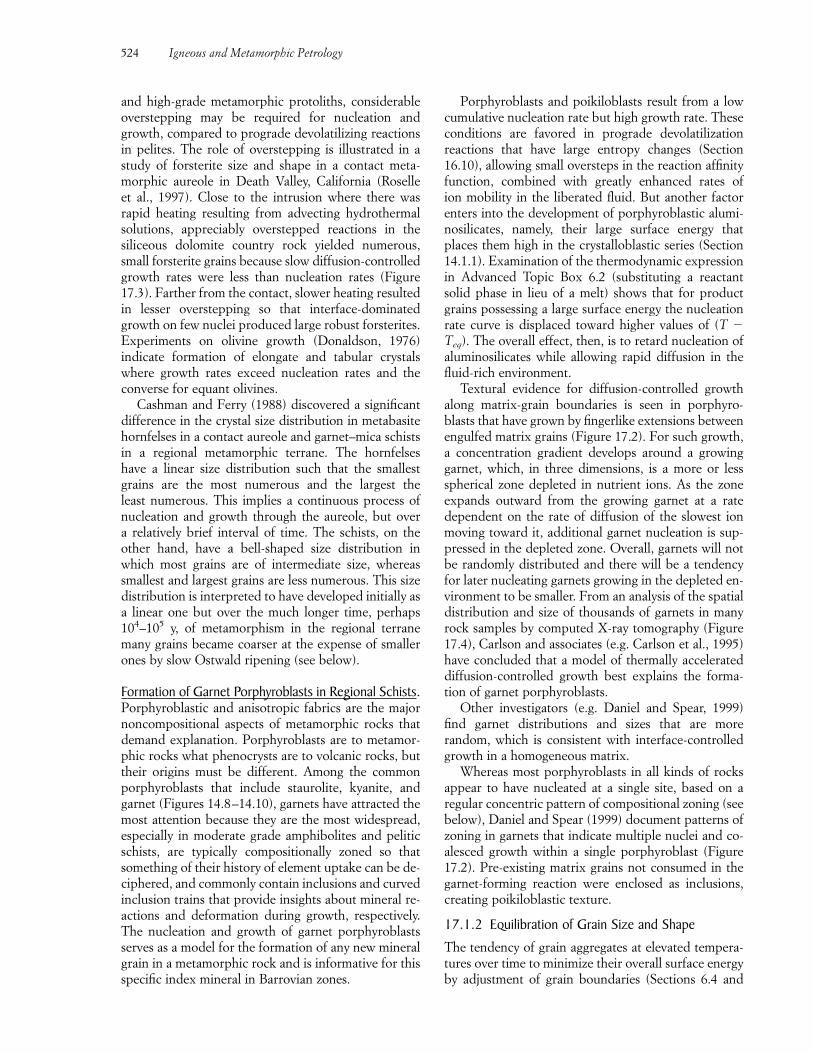
and high-grade metamorphic protoliths, considerable overstepping may be required for nucleation andgrowth, compared to prograde devolatilizing reactionsin pelites. The role of overstepping is illustrated in astudy of forsterite size and shape in a contact meta-morphic aureole in Death Valley, California (Roselle et al., 1997). Close to the intrusion where there wasrapid heating resulting from advecting hydrothermalsolutions, appreciably overstepped reactions in thesiliceous dolomite country rock yielded numerous, small forsterite grains because slow diffusion-controlledgrowth rates were less than nucleation rates (Figure17.3). Farther from the contact, slower heating resultedin lesser overstepping so that interface-dominatedgrowth on few nuclei produced large robust forsterites.Experiments on olivine growth (Donaldson, 1976) indicate formation of elongate and tabular crystalswhere growth rates exceed nucleation rates and theconverse for equant olivines.
Cashman and Ferry (1988) discovered a significantdifference in the crystal size distribution in metabasitehornfelses in a contact aureole and garnet–mica schistsin a regional metamorphic terrane. The hornfelses have a linear size distribution such that the smallestgrains are the most numerous and the largest the least numerous. This implies a continuous process ofnucleation and growth through the aureole, but over a relatively brief interval of time. The schists, on theother hand, have a bell-shaped size distribution inwhich most grains are of intermediate size, whereassmallest and largest grains are less numerous. This sizedistribution is interpreted to have developed initially asa linear one but over the much longer time, perhaps104–105 y, of metamorphism in the regional terranemany grains became coarser at the expense of smallerones by slow Ostwald ripening (see below).
Formation of Garnet Porphyroblasts in Regional Schists.Porphyroblastic and anisotropic fabrics are the majornoncompositional aspects of metamorphic rocks thatdemand explanation. Porphyroblasts are to metamor-phic rocks what phenocrysts are to volcanic rocks, buttheir origins must be different. Among the commonporphyroblasts that include staurolite, kyanite, andgarnet (Figures 14.8–14.10), garnets have attracted themost attention because they are the most widespread,especially in moderate grade amphibolites and peliticschists, are typically compositionally zoned so thatsomething of their history of element uptake can be de-ciphered, and commonly contain inclusions and curvedinclusion trains that provide insights about mineral re-actions and deformation during growth, respectively.The nucleation and growth of garnet porphyroblastsserves as a model for the formation of any new mineralgrain in a metamorphic rock and is informative for thisspecific index mineral in Barrovian zones.
Porphyroblasts and poikiloblasts result from a lowcumulative nucleation rate but high growth rate. Theseconditions are favored in prograde devolatilization reactions that have large entropy changes (Section16.10), allowing small oversteps in the reaction affinityfunction, combined with greatly enhanced rates of ion mobility in the liberated fluid. But another factorenters into the development of porphyroblastic alumi-nosilicates, namely, their large surface energy thatplaces them high in the crystalloblastic series (Section14.1.1). Examination of the thermodynamic expressionin Advanced Topic Box 6.2 (substituting a reactantsolid phase in lieu of a melt) shows that for productgrains possessing a large surface energy the nucleationrate curve is displaced toward higher values of (T �Teq). The overall effect, then, is to retard nucleation of aluminosilicates while allowing rapid diffusion in thefluid-rich environment.
Textural evidence for diffusion-controlled growthalong matrix-grain boundaries is seen in porphyro-blasts that have grown by fingerlike extensions betweenengulfed matrix grains (Figure 17.2). For such growth,a concentration gradient develops around a growinggarnet, which, in three dimensions, is a more or lessspherical zone depleted in nutrient ions. As the zoneexpands outward from the growing garnet at a rate dependent on the rate of diffusion of the slowest ionmoving toward it, additional garnet nucleation is sup-pressed in the depleted zone. Overall, garnets will notbe randomly distributed and there will be a tendencyfor later nucleating garnets growing in the depleted en-vironment to be smaller. From an analysis of the spatialdistribution and size of thousands of garnets in manyrock samples by computed X-ray tomography (Figure17.4), Carlson and associates (e.g. Carlson et al., 1995)have concluded that a model of thermally accelerateddiffusion-controlled growth best explains the forma-tion of garnet porphyroblasts.
Other investigators (e.g. Daniel and Spear, 1999)find garnet distributions and sizes that are more random, which is consistent with interface-controlledgrowth in a homogeneous matrix.
Whereas most porphyroblasts in all kinds of rocksappear to have nucleated at a single site, based on aregular concentric pattern of compositional zoning (seebelow), Daniel and Spear (1999) document patterns ofzoning in garnets that indicate multiple nuclei and co-alesced growth within a single porphyroblast (Figure17.2). Pre-existing matrix grains not consumed in thegarnet-forming reaction were enclosed as inclusions,creating poikiloblastic texture.
17.1.2 Equilibration of Grain Size and Shape
The tendency of grain aggregates at elevated tempera-tures over time to minimize their overall surface energyby adjustment of grain boundaries (Sections 6.4 and
524 Igneous and Metamorphic Petrology
6.6.2) governs many aspects of metamorphic fabric.This is a secondary phenomenon after initial nucleationand growth. Few values of surface energies of silicatemineral exist, but for a given mineral grain depend onatomic structure, the type of neighboring grains andtheir orientation, and grain size.
Grain Size. Because aggregates of increasingly smallergrains have increasingly greater surface areas relative totheir volume, their surface energy increases. For anyone grain, surface energy increases with decrease in radius of curvature of the surface. Hence, energy is reduced if curvature is straightened or small grains areconsumed by expanding large ones (Figure 14.5). Themost stable grain size would theoretically be one inwhich there is a single crystal of each phase in the aggregate. However, this ideal stable state is never real-ized in nature because the driving force for grain coars-ening, sometimes called Ostwald ripening, becomesvanishingly small long before a minimum energy stateis reached. This can be seen for quartz, whose averageinterfacial energy is 5 � 10�5 J/cm2. An increase ingrain size from 8 to 40 micrometers (microns) is drivenby an energy reduction of 6.7 J/mole, whereas furtherincrease from 40 to 1200 micrometers reduces the energy by only 0.0033 J/mole (Tullis and Yund, 1982).Hence, for all but the smallest grain sizes in rocks, surface-energy driving forces are orders of magnitude
smaller than the internal Gibbs free energies of solidphases that drive mineral reactions. Accordingly, coars-ening requires the most favorable kinetic conditions ofelevated T and long time periods.
Monomineralic aggregates are most likely to showcoarsening, whereas in polyphase rocks, such as horn-felses in contact aureoles (Figures 14.25 and 16.23),prograde reactions may override coarsening effects. Onthe basis of experimental measurements at 1000°C and15 kbar over many days, Tullis and Yund (1982) ex-trapolated conditions for coarsening of wet microcrys-talline quartz to more normal metamorphic conditionsof 600°C and 3 kbar; from an initial grain size of �100micrometers, it would require 105 y to achieve coars-ening to 0.6 mm and 106 y to 2.3 mm. Coarsening ratesfor limestone are much faster, accounting for the occurrence of much coarser marbles (Figure 14.4b)than quartzites.
The presence of small grains of a “second phase”can retard coarsening of major larger grains by “pin-ning” their boundaries, effectively suppressing grainboundary migration. Mas and Crowley (1996) found anorder of magnitude variation in the size of calcite grainsin a Massachusetts marble that had apparently experi-enced uniform P, T, and strain histories. Only a fewmodal percent of a second phase (quartz, mica, alkalifeldspar, apatite, Fe–Ti oxide) was effective in suppress-ing grain growth during greenschist facies condition.
Evolution of Imposed Metamorphic Fabrics: Processes and Kinetics 525
(a)
0 cm 4
(b)
17.4 Fabric of a garnet–kyanite–biotite–quartz–feldspar tectonite, Mica Dam, British Columbia. (a) Conventional photograph of hand sample. Note white quartz vein on left. (b) Image generated from high-resolution computed X-ray tomography (Denison et al., 1997). A wedge of rock has been artificially extracted from the upper right of the image to reveal the underlying three-dimensional aspect of the fabric. Brighter grayscales correspond to more dense materials so that garnet porphyroblasts are prominent light gray spots, kyaniteporphyroblasts are darker gray but slightly lighter than the adjacent polygranular lenses of biotite, and darkest gray to black is quartz. A color image of this same sample from a different perspective is on the cover of the August 28, 1992 issue of Science (Carlson and Denison, 1992). Computed X-ray tomography (CT) data from the University of Texas High-Resolution CT Facility. Photograph, CT image, and caption courtesy of William D. Carlson and Richard Ketchum.
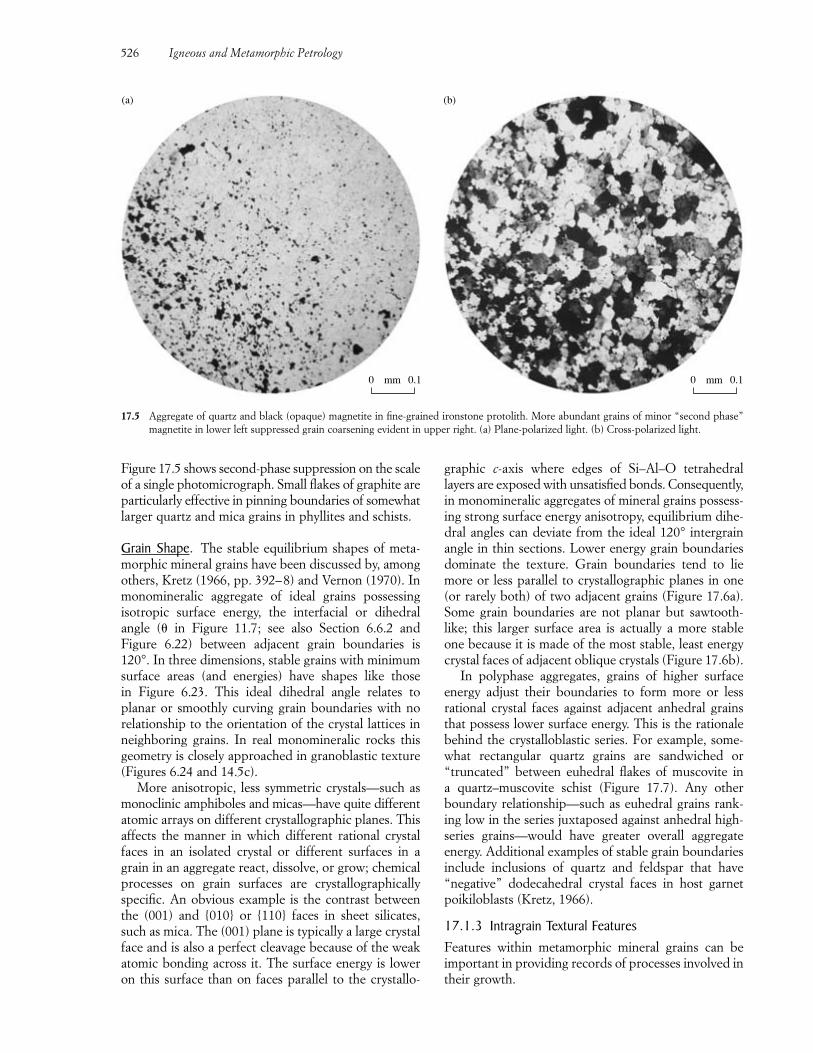
Figure 17.5 shows second-phase suppression on the scaleof a single photomicrograph. Small flakes of graphite areparticularly effective in pinning boundaries of somewhatlarger quartz and mica grains in phyllites and schists.
Grain Shape. The stable equilibrium shapes of meta-morphic mineral grains have been discussed by, amongothers, Kretz (1966, pp. 392–8) and Vernon (1970). Inmonomineralic aggregate of ideal grains possessingisotropic surface energy, the interfacial or dihedral angle (� in Figure 11.7; see also Section 6.6.2 and Figure 6.22) between adjacent grain boundaries is120°. In three dimensions, stable grains with minimumsurface areas (and energies) have shapes like those in Figure 6.23. This ideal dihedral angle relates to planar or smoothly curving grain boundaries with norelationship to the orientation of the crystal lattices inneighboring grains. In real monomineralic rocks thisgeometry is closely approached in granoblastic texture(Figures 6.24 and 14.5c).
More anisotropic, less symmetric crystals—such asmonoclinic amphiboles and micas—have quite differentatomic arrays on different crystallographic planes. Thisaffects the manner in which different rational crystalfaces in an isolated crystal or different surfaces in agrain in an aggregate react, dissolve, or grow; chemicalprocesses on grain surfaces are crystallographicallyspecific. An obvious example is the contrast betweenthe (001) and {010} or {110} faces in sheet silicates,such as mica. The (001) plane is typically a large crystalface and is also a perfect cleavage because of the weakatomic bonding across it. The surface energy is loweron this surface than on faces parallel to the crystallo-
graphic c-axis where edges of Si–Al–O tetrahedral layers are exposed with unsatisfied bonds. Consequently,in monomineralic aggregates of mineral grains possess-ing strong surface energy anisotropy, equilibrium dihe-dral angles can deviate from the ideal 120° intergrainangle in thin sections. Lower energy grain boundariesdominate the texture. Grain boundaries tend to liemore or less parallel to crystallographic planes in one(or rarely both) of two adjacent grains (Figure 17.6a).Some grain boundaries are not planar but sawtooth-like; this larger surface area is actually a more stableone because it is made of the most stable, least energycrystal faces of adjacent oblique crystals (Figure 17.6b).
In polyphase aggregates, grains of higher surface energy adjust their boundaries to form more or less rational crystal faces against adjacent anhedral grainsthat possess lower surface energy. This is the rationalebehind the crystalloblastic series. For example, some-what rectangular quartz grains are sandwiched or“truncated” between euhedral flakes of muscovite in a quartz–muscovite schist (Figure 17.7). Any otherboundary relationship—such as euhedral grains rank-ing low in the series juxtaposed against anhedral high-series grains—would have greater overall aggregate energy. Additional examples of stable grain boundariesinclude inclusions of quartz and feldspar that have“negative” dodecahedral crystal faces in host garnetpoikiloblasts (Kretz, 1966).
17.1.3 Intragrain Textural FeaturesFeatures within metamorphic mineral grains can beimportant in providing records of processes involved intheir growth.
526 Igneous and Metamorphic Petrology
(a)
0 0.1mm
(b)
0 0.1mm
17.5 Aggregate of quartz and black (opaque) magnetite in fine-grained ironstone protolith. More abundant grains of minor “second phase”magnetite in lower left suppressed grain coarsening evident in upper right. (a) Plane-polarized light. (b) Cross-polarized light.
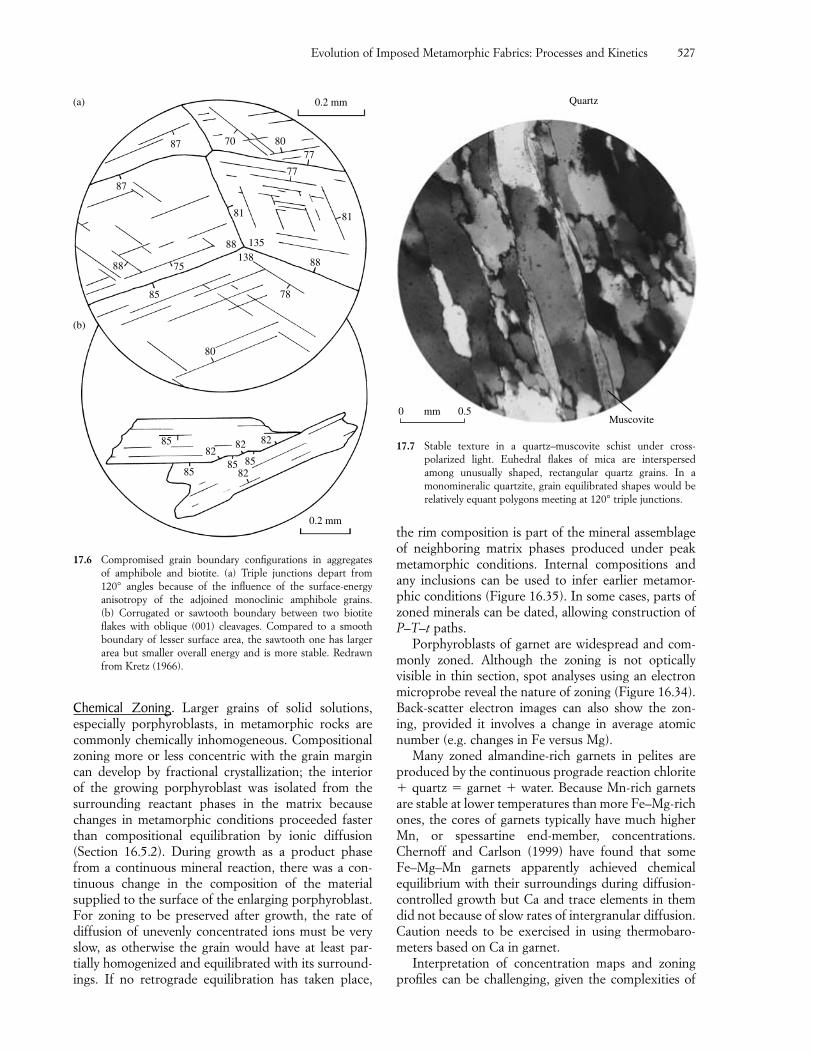
Chemical Zoning. Larger grains of solid solutions, especially porphyroblasts, in metamorphic rocks arecommonly chemically inhomogeneous. Compositionalzoning more or less concentric with the grain margincan develop by fractional crystallization; the interior of the growing porphyroblast was isolated from the surrounding reactant phases in the matrix becausechanges in metamorphic conditions proceeded fasterthan compositional equilibration by ionic diffusion(Section 16.5.2). During growth as a product phasefrom a continuous mineral reaction, there was a con-tinuous change in the composition of the material supplied to the surface of the enlarging porphyroblast.For zoning to be preserved after growth, the rate of diffusion of unevenly concentrated ions must be veryslow, as otherwise the grain would have at least par-tially homogenized and equilibrated with its surround-ings. If no retrograde equilibration has taken place,
the rim composition is part of the mineral assemblageof neighboring matrix phases produced under peakmetamorphic conditions. Internal compositions andany inclusions can be used to infer earlier metamor-phic conditions (Figure 16.35). In some cases, parts ofzoned minerals can be dated, allowing construction ofP–T–t paths.
Porphyroblasts of garnet are widespread and com-monly zoned. Although the zoning is not optically visible in thin section, spot analyses using an electronmicroprobe reveal the nature of zoning (Figure 16.34).Back-scatter electron images can also show the zon-ing, provided it involves a change in average atomicnumber (e.g. changes in Fe versus Mg).
Many zoned almandine-rich garnets in pelites areproduced by the continuous prograde reaction chlorite� quartz � garnet � water. Because Mn-rich garnetsare stable at lower temperatures than more Fe–Mg-richones, the cores of garnets typically have much higherMn, or spessartine end-member, concentrations. Chernoff and Carlson (1999) have found that someFe–Mg–Mn garnets apparently achieved chemicalequilibrium with their surroundings during diffusion-controlled growth but Ca and trace elements in themdid not because of slow rates of intergranular diffusion.Caution needs to be exercised in using thermobaro-meters based on Ca in garnet.
Interpretation of concentration maps and zoningprofiles can be challenging, given the complexities of
Evolution of Imposed Metamorphic Fabrics: Processes and Kinetics 527
(b)
(a)
87 70 8077
0.2 mm
77
81
135
81
88
78
85
85
828282
85 8582
0.2 mm
80
85
88
87
75138
88
Quartz
Muscovite0 0.5mm
17.6 Compromised grain boundary configurations in aggregates of amphibole and biotite. (a) Triple junctions depart from 120° angles because of the influence of the surface-energyanisotropy of the adjoined monoclinic amphibole grains. (b) Corrugated or sawtooth boundary between two biotiteflakes with oblique (001) cleavages. Compared to a smoothboundary of lesser surface area, the sawtooth one has largerarea but smaller overall energy and is more stable. Redrawnfrom Kretz (1966).
17.7 Stable texture in a quartz–muscovite schist under cross-polarized light. Euhedral flakes of mica are interspersedamong unusually shaped, rectangular quartz grains. In amonomineralic quartzite, grain equilibrated shapes would berelatively equant polygons meeting at 120° triple junctions.
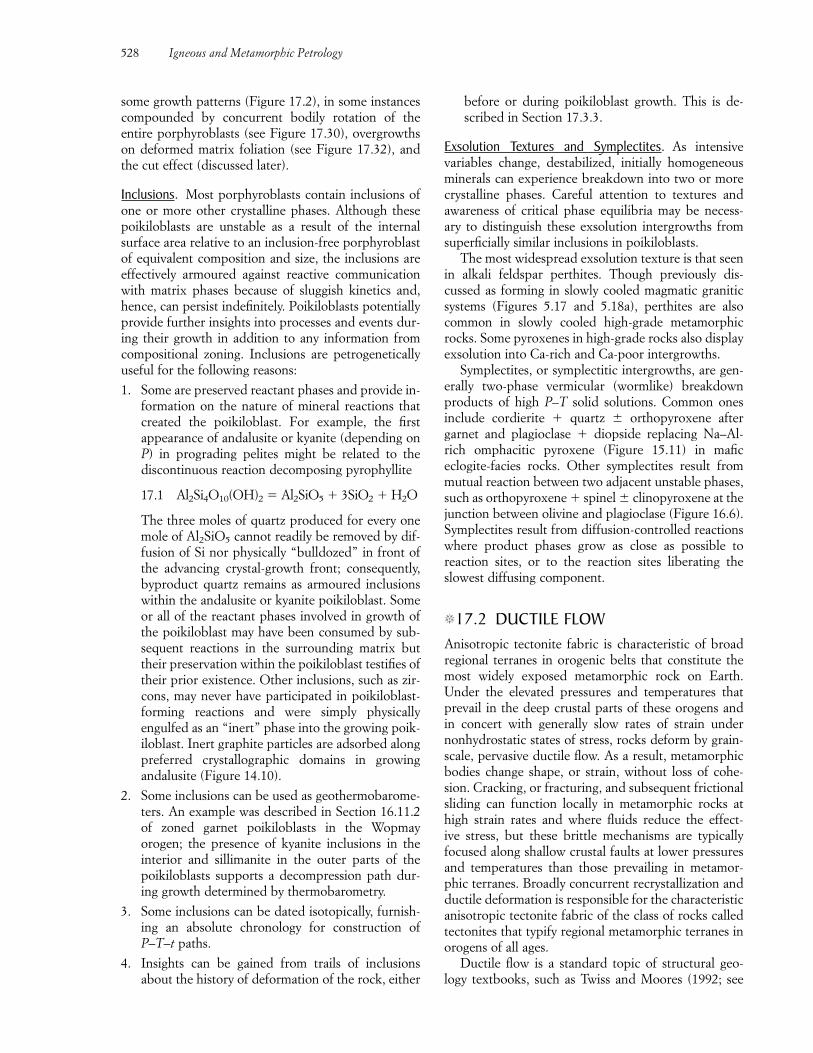
some growth patterns (Figure 17.2), in some instancescompounded by concurrent bodily rotation of the entire porphyroblasts (see Figure 17.30), overgrowthson deformed matrix foliation (see Figure 17.32), andthe cut effect (discussed later).
Inclusions. Most porphyroblasts contain inclusions ofone or more other crystalline phases. Although thesepoikiloblasts are unstable as a result of the internal surface area relative to an inclusion-free porphyroblastof equivalent composition and size, the inclusions areeffectively armoured against reactive communicationwith matrix phases because of sluggish kinetics and,hence, can persist indefinitely. Poikiloblasts potentiallyprovide further insights into processes and events dur-ing their growth in addition to any information fromcompositional zoning. Inclusions are petrogeneticallyuseful for the following reasons:
1. Some are preserved reactant phases and provide in-formation on the nature of mineral reactions thatcreated the poikiloblast. For example, the first appearance of andalusite or kyanite (depending onP) in prograding pelites might be related to the discontinuous reaction decomposing pyrophyllite
17.1 Al2Si4O10(OH)2 � Al2SiO5 � 3SiO2 � H2O
The three moles of quartz produced for every onemole of Al2SiO5 cannot readily be removed by dif-fusion of Si nor physically “bulldozed” in front ofthe advancing crystal-growth front; consequently,byproduct quartz remains as armoured inclusionswithin the andalusite or kyanite poikiloblast. Someor all of the reactant phases involved in growth ofthe poikiloblast may have been consumed by sub-sequent reactions in the surrounding matrix buttheir preservation within the poikiloblast testifies oftheir prior existence. Other inclusions, such as zir-cons, may never have participated in poikiloblast-forming reactions and were simply physically engulfed as an “inert” phase into the growing poik-iloblast. Inert graphite particles are adsorbed alongpreferred crystallographic domains in growing andalusite (Figure 14.10).
2. Some inclusions can be used as geothermobarome-ters. An example was described in Section 16.11.2of zoned garnet poikiloblasts in the Wopmay orogen; the presence of kyanite inclusions in the interior and sillimanite in the outer parts of thepoikiloblasts supports a decompression path dur-ing growth determined by thermobarometry.
3. Some inclusions can be dated isotopically, furnish-ing an absolute chronology for construction ofP–T–t paths.
4. Insights can be gained from trails of inclusionsabout the history of deformation of the rock, either
before or during poikiloblast growth. This is de-scribed in Section 17.3.3.
Exsolution Textures and Symplectites. As intensivevariables change, destabilized, initially homogeneousminerals can experience breakdown into two or morecrystalline phases. Careful attention to textures andawareness of critical phase equilibria may be necess-ary to distinguish these exsolution intergrowths fromsuperficially similar inclusions in poikiloblasts.
The most widespread exsolution texture is that seenin alkali feldspar perthites. Though previously dis-cussed as forming in slowly cooled magmatic graniticsystems (Figures 5.17 and 5.18a), perthites are alsocommon in slowly cooled high-grade metamorphicrocks. Some pyroxenes in high-grade rocks also displayexsolution into Ca-rich and Ca-poor intergrowths.
Symplectites, or symplectitic intergrowths, are gen-erally two-phase vermicular (wormlike) breakdownproducts of high P–T solid solutions. Common ones include cordierite � quartz � orthopyroxene after garnet and plagioclase � diopside replacing Na–Al-rich omphacitic pyroxene (Figure 15.11) in maficeclogite-facies rocks. Other symplectites result frommutual reaction between two adjacent unstable phases,such as orthopyroxene � spinel � clinopyroxene at thejunction between olivine and plagioclase (Figure 16.6).Symplectites result from diffusion-controlled reactionswhere product phases grow as close as possible to reaction sites, or to the reaction sites liberating theslowest diffusing component.
�17.2 DUCTILE FLOWAnisotropic tectonite fabric is characteristic of broadregional terranes in orogenic belts that constitute themost widely exposed metamorphic rock on Earth. Under the elevated pressures and temperatures thatprevail in the deep crustal parts of these orogens and in concert with generally slow rates of strain undernonhydrostatic states of stress, rocks deform by grain-scale, pervasive ductile flow. As a result, metamorphicbodies change shape, or strain, without loss of cohe-sion. Cracking, or fracturing, and subsequent frictionalsliding can function locally in metamorphic rocks athigh strain rates and where fluids reduce the effect-ive stress, but these brittle mechanisms are typically focused along shallow crustal faults at lower pressuresand temperatures than those prevailing in metamor-phic terranes. Broadly concurrent recrystallization andductile deformation is responsible for the characteristicanisotropic tectonite fabric of the class of rocks calledtectonites that typify regional metamorphic terranes inorogens of all ages.
Ductile flow is a standard topic of structural geo-logy textbooks, such as Twiss and Moores (1992; see
528 Igneous and Metamorphic Petrology
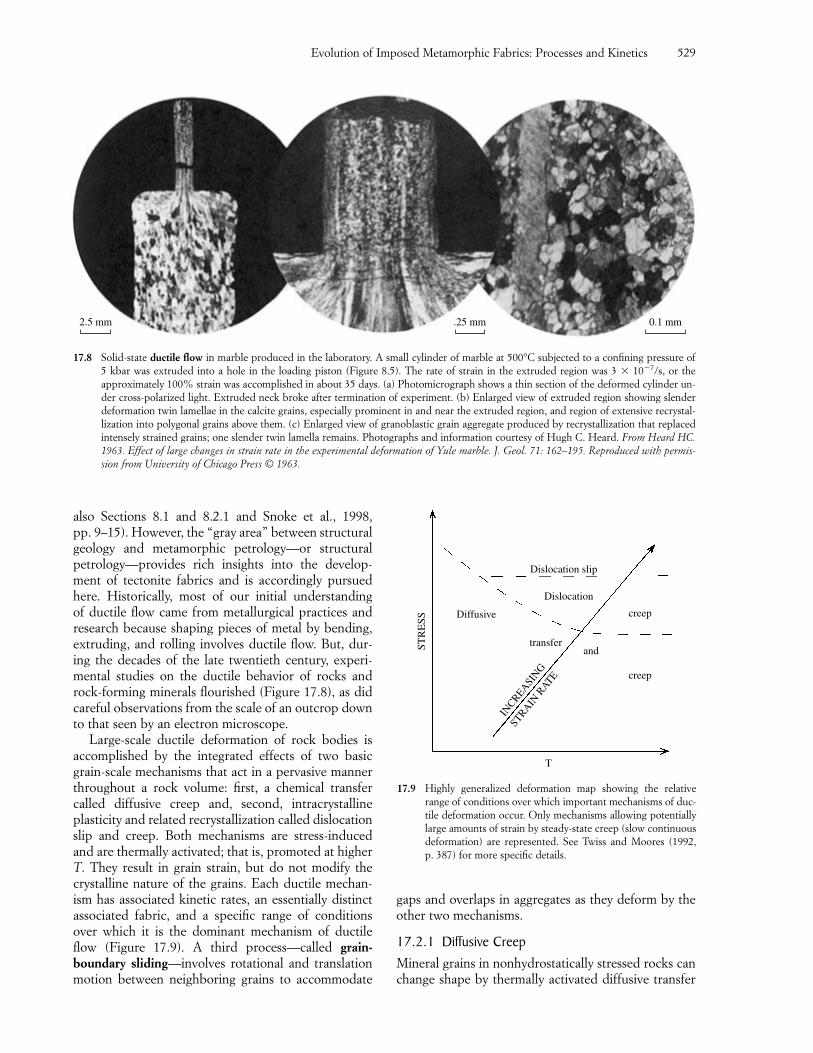
also Sections 8.1 and 8.2.1 and Snoke et al., 1998, pp. 9–15). However, the “gray area” between structural geology and metamorphic petrology—or structuralpetrology—provides rich insights into the develop-ment of tectonite fabrics and is accordingly pursuedhere. Historically, most of our initial understanding of ductile flow came from metallurgical practices andresearch because shaping pieces of metal by bending,extruding, and rolling involves ductile flow. But, dur-ing the decades of the late twentieth century, experi-mental studies on the ductile behavior of rocks androck-forming minerals flourished (Figure 17.8), as didcareful observations from the scale of an outcrop downto that seen by an electron microscope.
Large-scale ductile deformation of rock bodies is accomplished by the integrated effects of two basicgrain-scale mechanisms that act in a pervasive mannerthroughout a rock volume: first, a chemical transfercalled diffusive creep and, second, intracrystalline plasticity and related recrystallization called dislocationslip and creep. Both mechanisms are stress-inducedand are thermally activated; that is, promoted at higherT. They result in grain strain, but do not modify thecrystalline nature of the grains. Each ductile mechan-ism has associated kinetic rates, an essentially distinctassociated fabric, and a specific range of conditionsover which it is the dominant mechanism of ductileflow (Figure 17.9). A third process—called grain-boundary sliding—involves rotational and translationmotion between neighboring grains to accommodate
gaps and overlaps in aggregates as they deform by theother two mechanisms.
17.2.1 Diffusive CreepMineral grains in nonhydrostatically stressed rocks canchange shape by thermally activated diffusive transfer
Evolution of Imposed Metamorphic Fabrics: Processes and Kinetics 529
2.5 mm .25 mm 0.1 mm
17.8 Solid-state ductile flow in marble produced in the laboratory. A small cylinder of marble at 500°C subjected to a confining pressure of 5 kbar was extruded into a hole in the loading piston (Figure 8.5). The rate of strain in the extruded region was 3 � 10�7/s, or the approximately 100% strain was accomplished in about 35 days. (a) Photomicrograph shows a thin section of the deformed cylinder un-der cross-polarized light. Extruded neck broke after termination of experiment. (b) Enlarged view of extruded region showing slenderdeformation twin lamellae in the calcite grains, especially prominent in and near the extruded region, and region of extensive recrystal-lization into polygonal grains above them. (c) Enlarged view of granoblastic grain aggregate produced by recrystallization that replacedintensely strained grains; one slender twin lamella remains. Photographs and information courtesy of Hugh C. Heard. From Heard HC.1963. Effect of large changes in strain rate in the experimental deformation of Yule marble. J. Geol. 71: 162–195. Reproduced with permis-sion from University of Chicago Press © 1963.
STR
ESS
Dislocation slip
Dislocation
creep
creep
and
Diffusive
T
transfer
INCREASI
NG
STRAIN
RATE
17.9 Highly generalized deformation map showing the relativerange of conditions over which important mechanisms of duc-tile deformation occur. Only mechanisms allowing potentiallylarge amounts of strain by steady-state creep (slow continuousdeformation) are represented. See Twiss and Moores (1992, p. 387) for more specific details.
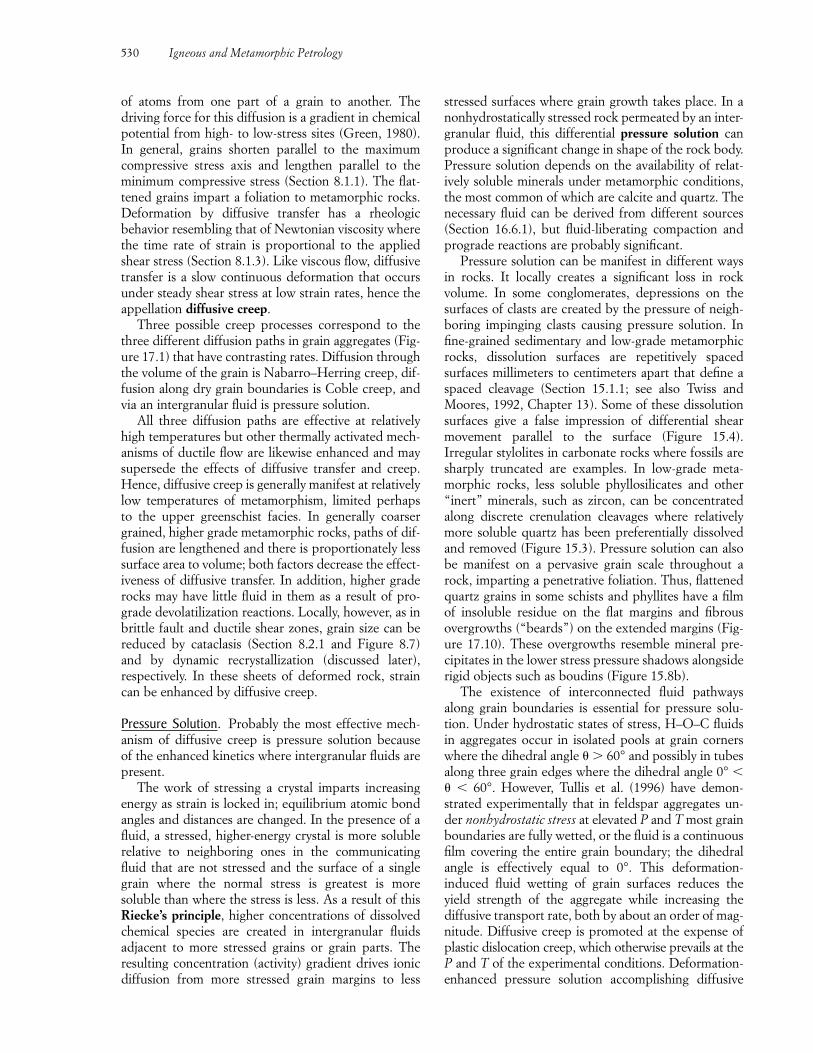
of atoms from one part of a grain to another. The driving force for this diffusion is a gradient in chemicalpotential from high- to low-stress sites (Green, 1980).In general, grains shorten parallel to the maximumcompressive stress axis and lengthen parallel to theminimum compressive stress (Section 8.1.1). The flat-tened grains impart a foliation to metamorphic rocks.Deformation by diffusive transfer has a rheologic behavior resembling that of Newtonian viscosity wherethe time rate of strain is proportional to the appliedshear stress (Section 8.1.3). Like viscous flow, diffusivetransfer is a slow continuous deformation that occursunder steady shear stress at low strain rates, hence theappellation diffusive creep.
Three possible creep processes correspond to thethree different diffusion paths in grain aggregates (Fig-ure 17.1) that have contrasting rates. Diffusion throughthe volume of the grain is Nabarro–Herring creep, dif-fusion along dry grain boundaries is Coble creep, andvia an intergranular fluid is pressure solution.
All three diffusion paths are effective at relativelyhigh temperatures but other thermally activated mech-anisms of ductile flow are likewise enhanced and maysupersede the effects of diffusive transfer and creep.Hence, diffusive creep is generally manifest at relativelylow temperatures of metamorphism, limited perhaps to the upper greenschist facies. In generally coarsergrained, higher grade metamorphic rocks, paths of dif-fusion are lengthened and there is proportionately lesssurface area to volume; both factors decrease the effect-iveness of diffusive transfer. In addition, higher graderocks may have little fluid in them as a result of pro-grade devolatilization reactions. Locally, however, as inbrittle fault and ductile shear zones, grain size can bereduced by cataclasis (Section 8.2.1 and Figure 8.7)and by dynamic recrystallization (discussed later), respectively. In these sheets of deformed rock, straincan be enhanced by diffusive creep.
Pressure Solution. Probably the most effective mech-anism of diffusive creep is pressure solution because of the enhanced kinetics where intergranular fluids arepresent.
The work of stressing a crystal imparts increasingenergy as strain is locked in; equilibrium atomic bondangles and distances are changed. In the presence of afluid, a stressed, higher-energy crystal is more solublerelative to neighboring ones in the communicatingfluid that are not stressed and the surface of a singlegrain where the normal stress is greatest is more soluble than where the stress is less. As a result of thisRiecke’s principle, higher concentrations of dissolvedchemical species are created in intergranular fluids adjacent to more stressed grains or grain parts. The resulting concentration (activity) gradient drives ionicdiffusion from more stressed grain margins to less
stressed surfaces where grain growth takes place. In anonhydrostatically stressed rock permeated by an inter-granular fluid, this differential pressure solution canproduce a significant change in shape of the rock body.Pressure solution depends on the availability of relat-ively soluble minerals under metamorphic conditions,the most common of which are calcite and quartz. Thenecessary fluid can be derived from different sources(Section 16.6.1), but fluid-liberating compaction andprograde reactions are probably significant.
Pressure solution can be manifest in different waysin rocks. It locally creates a significant loss in rock volume. In some conglomerates, depressions on thesurfaces of clasts are created by the pressure of neigh-boring impinging clasts causing pressure solution. Infine-grained sedimentary and low-grade metamorphicrocks, dissolution surfaces are repetitively spaced surfaces millimeters to centimeters apart that define aspaced cleavage (Section 15.1.1; see also Twiss andMoores, 1992, Chapter 13). Some of these dissolutionsurfaces give a false impression of differential shearmovement parallel to the surface (Figure 15.4). Irregular stylolites in carbonate rocks where fossils aresharply truncated are examples. In low-grade meta-morphic rocks, less soluble phyllosilicates and other“inert” minerals, such as zircon, can be concentratedalong discrete crenulation cleavages where relativelymore soluble quartz has been preferentially dissolvedand removed (Figure 15.3). Pressure solution can alsobe manifest on a pervasive grain scale throughout arock, imparting a penetrative foliation. Thus, flattenedquartz grains in some schists and phyllites have a filmof insoluble residue on the flat margins and fibrousovergrowths (“beards”) on the extended margins (Fig-ure 17.10). These overgrowths resemble mineral pre-cipitates in the lower stress pressure shadows alongsiderigid objects such as boudins (Figure 15.8b).
The existence of interconnected fluid pathwaysalong grain boundaries is essential for pressure solu-tion. Under hydrostatic states of stress, H–O–C fluidsin aggregates occur in isolated pools at grain cornerswhere the dihedral angle � 60° and possibly in tubesalong three grain edges where the dihedral angle 0° �� � 60°. However, Tullis et al. (1996) have demon-strated experimentally that in feldspar aggregates un-der nonhydrostatic stress at elevated P and T most grainboundaries are fully wetted, or the fluid is a continuousfilm covering the entire grain boundary; the dihedralangle is effectively equal to 0°. This deformation-induced fluid wetting of grain surfaces reduces theyield strength of the aggregate while increasing the diffusive transport rate, both by about an order of mag-nitude. Diffusive creep is promoted at the expense ofplastic dislocation creep, which otherwise prevails at theP and T of the experimental conditions. Deformation-enhanced pressure solution accomplishing diffusive
530 Igneous and Metamorphic Petrology
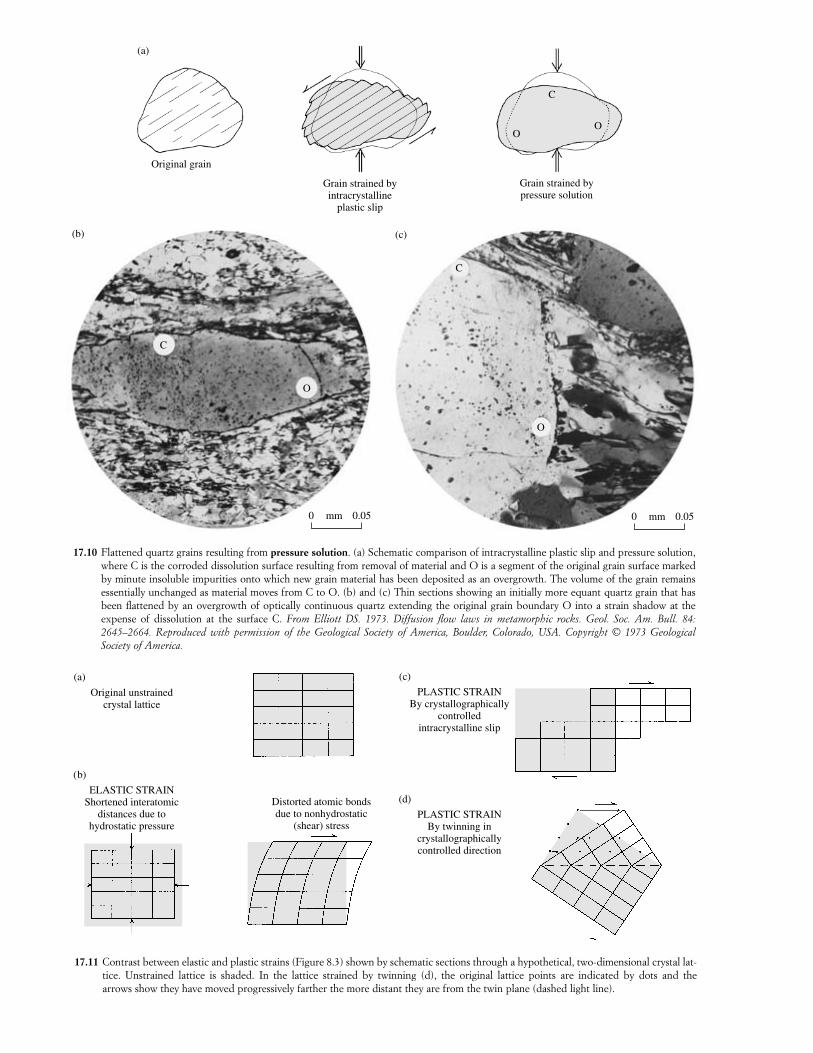
Original grain
(a)
Grain strained byintracrystalline
plastic slip
OO
C
Grain strained bypressure solution
(b)
C
O
0 0.05mm
C
O
(c)
0 0.05mm
17.10 Flattened quartz grains resulting from pressure solution. (a) Schematic comparison of intracrystalline plastic slip and pressure solution,where C is the corroded dissolution surface resulting from removal of material and O is a segment of the original grain surface markedby minute insoluble impurities onto which new grain material has been deposited as an overgrowth. The volume of the grain remains essentially unchanged as material moves from C to O. (b) and (c) Thin sections showing an initially more equant quartz grain that hasbeen flattened by an overgrowth of optically continuous quartz extending the original grain boundary O into a strain shadow at the expense of dissolution at the surface C. From Elliott DS. 1973. Diffusion flow laws in metamorphic rocks. Geol. Soc. Am. Bull. 84:2645–2664. Reproduced with permission of the Geological Society of America, Boulder, Colorado, USA. Copyright © 1973 Geological Society of America.
Distorted atomic bondsdue to nonhydrostatic
(shear) stress
ELASTIC STRAINShortened interatomic
distances due tohydrostatic pressure
Original unstrainedcrystal lattice
(a)
(b)
(c)
PLASTIC STRAINBy crystallographically
controlledintracrystalline slip
(d)
PLASTIC STRAINBy twinning in
crystallographicallycontrolled direction
17.11 Contrast between elastic and plastic strains (Figure 8.3) shown by schematic sections through a hypothetical, two-dimensional crystal lat-tice. Unstrained lattice is shaded. In the lattice strained by twinning (d), the original lattice points are indicated by dots and the arrows show they have moved progressively farther the more distant they are from the twin plane (dashed light line).
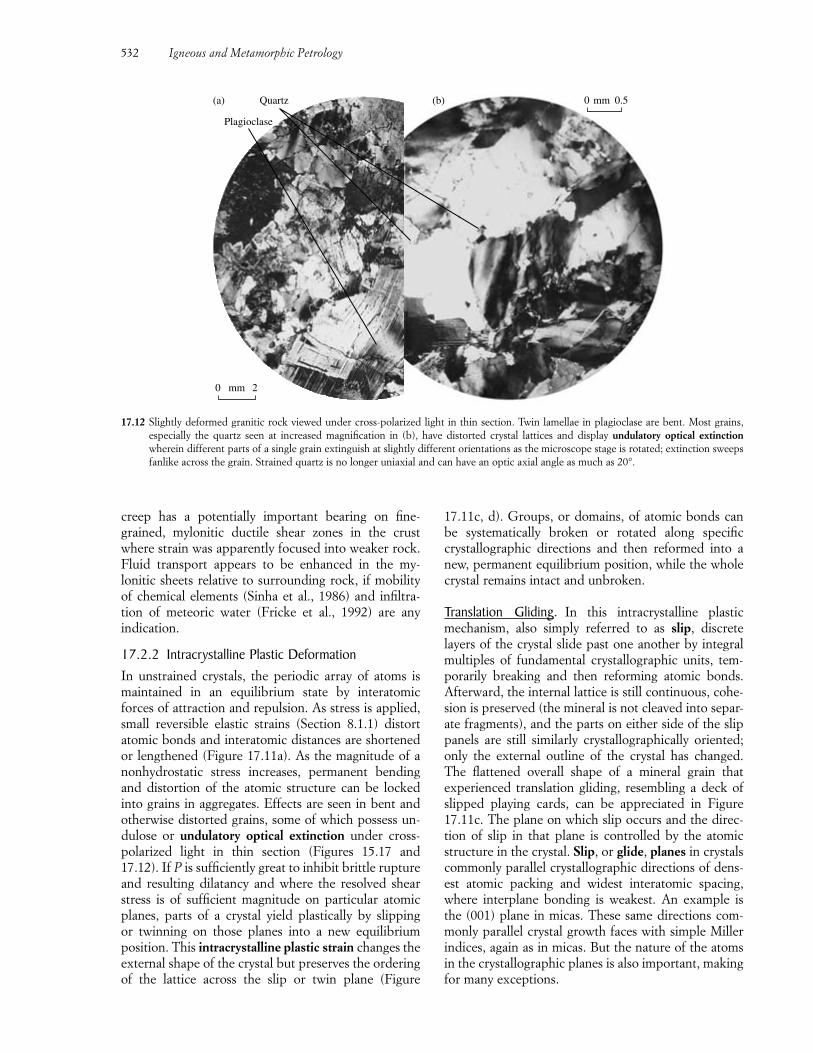
creep has a potentially important bearing on fine-grained, mylonitic ductile shear zones in the crustwhere strain was apparently focused into weaker rock.Fluid transport appears to be enhanced in the my-lonitic sheets relative to surrounding rock, if mobilityof chemical elements (Sinha et al., 1986) and infiltra-tion of meteoric water (Fricke et al., 1992) are any indication.
17.2.2 Intracrystalline Plastic DeformationIn unstrained crystals, the periodic array of atoms ismaintained in an equilibrium state by interatomicforces of attraction and repulsion. As stress is applied,small reversible elastic strains (Section 8.1.1) distortatomic bonds and interatomic distances are shortenedor lengthened (Figure 17.11a). As the magnitude of anonhydrostatic stress increases, permanent bendingand distortion of the atomic structure can be lockedinto grains in aggregates. Effects are seen in bent andotherwise distorted grains, some of which possess un-dulose or undulatory optical extinction under cross-polarized light in thin section (Figures 15.17 and17.12). If P is sufficiently great to inhibit brittle ruptureand resulting dilatancy and where the resolved shearstress is of sufficient magnitude on particular atomicplanes, parts of a crystal yield plastically by slipping or twinning on those planes into a new equilibrium position. This intracrystalline plastic strain changes the external shape of the crystal but preserves the ordering of the lattice across the slip or twin plane (Figure
17.11c, d). Groups, or domains, of atomic bonds canbe systematically broken or rotated along specific crystallographic directions and then reformed into anew, permanent equilibrium position, while the wholecrystal remains intact and unbroken.
Translation Gliding. In this intracrystalline plasticmechanism, also simply referred to as slip, discrete layers of the crystal slide past one another by integralmultiples of fundamental crystallographic units, tem-porarily breaking and then reforming atomic bonds.Afterward, the internal lattice is still continuous, cohe-sion is preserved (the mineral is not cleaved into separ-ate fragments), and the parts on either side of the slippanels are still similarly crystallographically oriented;only the external outline of the crystal has changed.The flattened overall shape of a mineral grain that experienced translation gliding, resembling a deck ofslipped playing cards, can be appreciated in Figure17.11c. The plane on which slip occurs and the direc-tion of slip in that plane is controlled by the atomicstructure in the crystal. Slip, or glide, planes in crystalscommonly parallel crystallographic directions of dens-est atomic packing and widest interatomic spacing,where interplane bonding is weakest. An example isthe (001) plane in micas. These same directions com-monly parallel crystal growth faces with simple Millerindices, again as in micas. But the nature of the atomsin the crystallographic planes is also important, makingfor many exceptions.
532 Igneous and Metamorphic Petrology
Plagioclase
Quartz(a) (b) 0 mm 0.5
0 mm 2
17.12 Slightly deformed granitic rock viewed under cross-polarized light in thin section. Twin lamellae in plagioclase are bent. Most grains, especially the quartz seen at increased magnification in (b), have distorted crystal lattices and display undulatory optical extinctionwherein different parts of a single grain extinguish at slightly different orientations as the microscope stage is rotated; extinction sweepsfanlike across the grain. Strained quartz is no longer uniaxial and can have an optic axial angle as much as 20°.
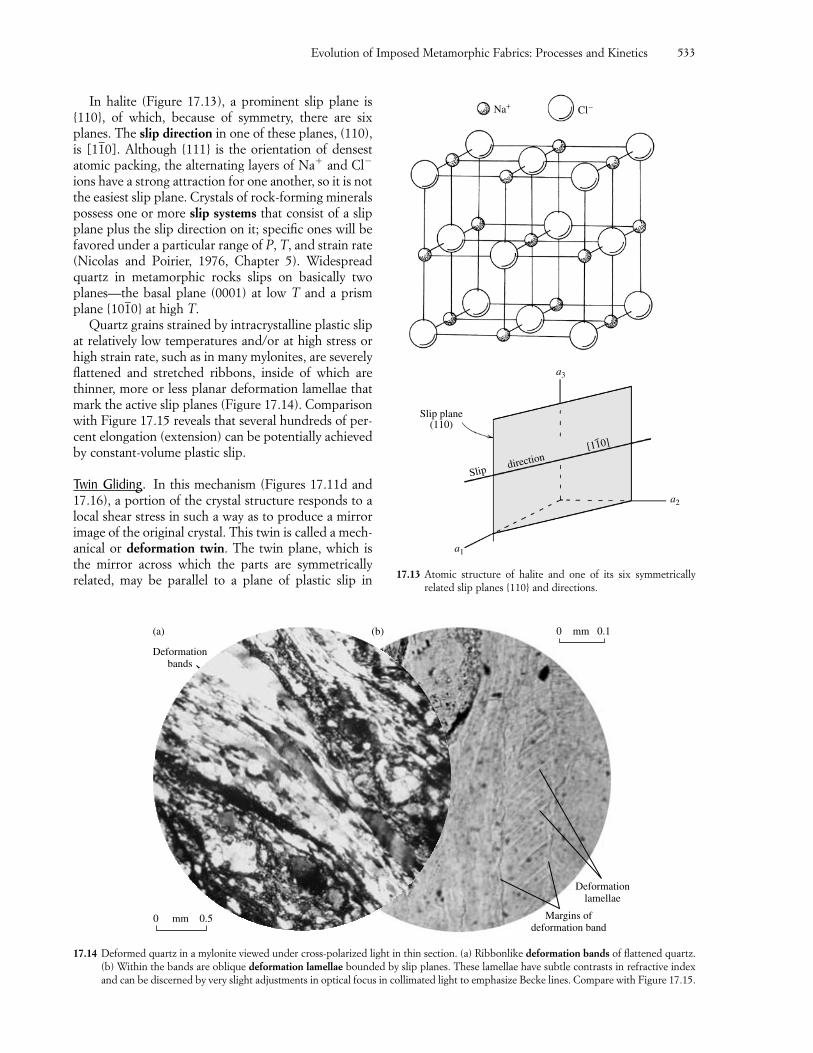
In halite (Figure 17.13), a prominent slip plane is{110}, of which, because of symmetry, there are sixplanes. The slip direction in one of these planes, (110),is [110]. Although {111} is the orientation of densestatomic packing, the alternating layers of Na� and Cl�
ions have a strong attraction for one another, so it is notthe easiest slip plane. Crystals of rock-forming mineralspossess one or more slip systems that consist of a slipplane plus the slip direction on it; specific ones will befavored under a particular range of P, T, and strain rate(Nicolas and Poirier, 1976, Chapter 5). Widespreadquartz in metamorphic rocks slips on basically twoplanes—the basal plane (0001) at low T and a prismplane {1010} at high T.
Quartz grains strained by intracrystalline plastic slipat relatively low temperatures and/or at high stress orhigh strain rate, such as in many mylonites, are severelyflattened and stretched ribbons, inside of which arethinner, more or less planar deformation lamellae thatmark the active slip planes (Figure 17.14). Comparisonwith Figure 17.15 reveals that several hundreds of per-cent elongation (extension) can be potentially achievedby constant-volume plastic slip.
Twin Gliding. In this mechanism (Figures 17.11d and17.16), a portion of the crystal structure responds to alocal shear stress in such a way as to produce a mirrorimage of the original crystal. This twin is called a mech-anical or deformation twin. The twin plane, which isthe mirror across which the parts are symmetrically related, may be parallel to a plane of plastic slip in
Evolution of Imposed Metamorphic Fabrics: Processes and Kinetics 533
a2
a1
Slip plane(110)
a3
Na+ Cl−
Slipdirection
[110]
17.13 Atomic structure of halite and one of its six symmetrically related slip planes {110} and directions.
(a) (b)
Deformationbands
Deformationlamellae
Margins ofdeformation band
0 mm 0.5
0 mm 0.1
17.14 Deformed quartz in a mylonite viewed under cross-polarized light in thin section. (a) Ribbonlike deformation bands of flattened quartz.(b) Within the bands are oblique deformation lamellae bounded by slip planes. These lamellae have subtle contrasts in refractive indexand can be discerned by very slight adjustments in optical focus in collimated light to emphasize Becke lines. Compare with Figure 17.15.
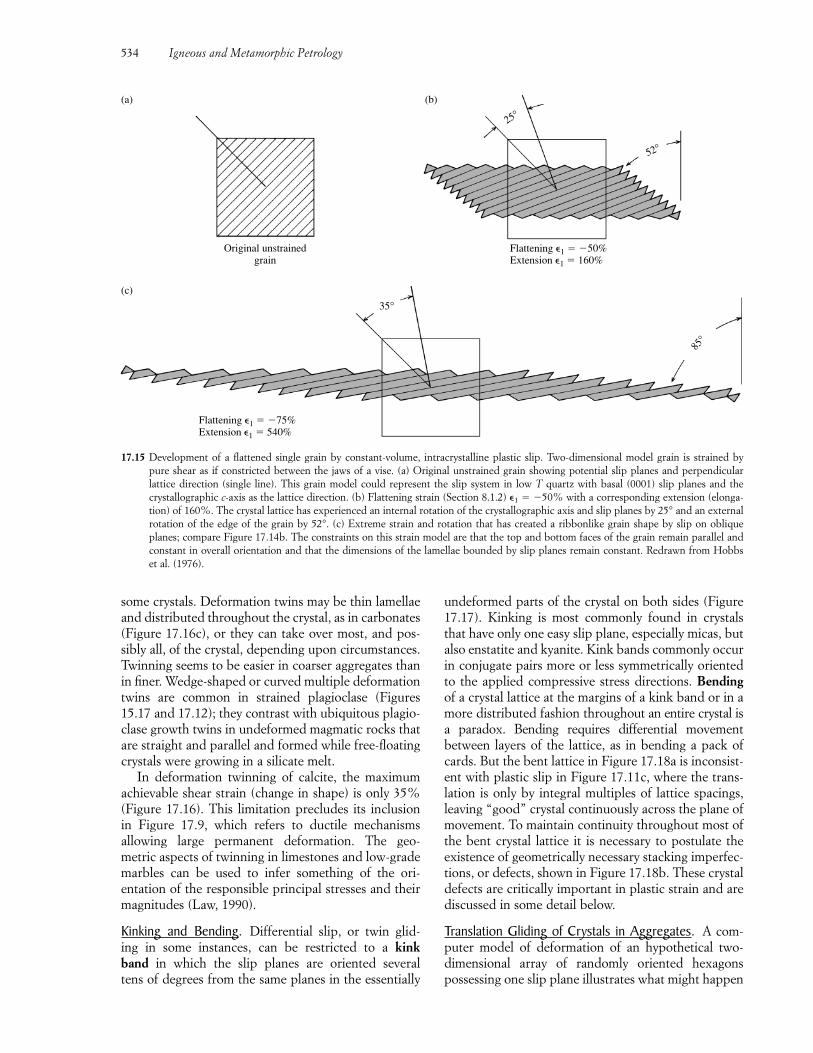
534 Igneous and Metamorphic Petrology
Original unstrainedgrain
Flattening �1 � �50%Extension �1 � 160%
25°
35°
52°
Flattening �1 � �75%Extension �1 � 540%
85°
17.15 Development of a flattened single grain by constant-volume, intracrystalline plastic slip. Two-dimensional model grain is strained by pure shear as if constricted between the jaws of a vise. (a) Original unstrained grain showing potential slip planes and perpendicular lattice direction (single line). This grain model could represent the slip system in low T quartz with basal (0001) slip planes and the crystallographic c-axis as the lattice direction. (b) Flattening strain (Section 8.1.2) 1 � �50% with a corresponding extension (elonga-tion) of 160%. The crystal lattice has experienced an internal rotation of the crystallographic axis and slip planes by 25° and an externalrotation of the edge of the grain by 52°. (c) Extreme strain and rotation that has created a ribbonlike grain shape by slip on obliqueplanes; compare Figure 17.14b. The constraints on this strain model are that the top and bottom faces of the grain remain parallel andconstant in overall orientation and that the dimensions of the lamellae bounded by slip planes remain constant. Redrawn from Hobbs et al. (1976).
some crystals. Deformation twins may be thin lamellaeand distributed throughout the crystal, as in carbonates(Figure 17.16c), or they can take over most, and pos-sibly all, of the crystal, depending upon circumstances.Twinning seems to be easier in coarser aggregates thanin finer. Wedge-shaped or curved multiple deformationtwins are common in strained plagioclase (Figures15.17 and 17.12); they contrast with ubiquitous plagio-clase growth twins in undeformed magmatic rocks thatare straight and parallel and formed while free-floatingcrystals were growing in a silicate melt.
In deformation twinning of calcite, the maximumachievable shear strain (change in shape) is only 35%(Figure 17.16). This limitation precludes its inclusionin Figure 17.9, which refers to ductile mechanisms allowing large permanent deformation. The geo-metric aspects of twinning in limestones and low-grade marbles can be used to infer something of the ori-entation of the responsible principal stresses and their magnitudes (Law, 1990).
Kinking and Bending. Differential slip, or twin glid-ing in some instances, can be restricted to a kink band in which the slip planes are oriented several tens of degrees from the same planes in the essentially
undeformed parts of the crystal on both sides (Figure17.17). Kinking is most commonly found in crystalsthat have only one easy slip plane, especially micas, butalso enstatite and kyanite. Kink bands commonly occurin conjugate pairs more or less symmetrically orientedto the applied compressive stress directions. Bendingof a crystal lattice at the margins of a kink band or in amore distributed fashion throughout an entire crystal isa paradox. Bending requires differential movement between layers of the lattice, as in bending a pack ofcards. But the bent lattice in Figure 17.18a is inconsist-ent with plastic slip in Figure 17.11c, where the trans-lation is only by integral multiples of lattice spacings,leaving “good” crystal continuously across the plane ofmovement. To maintain continuity throughout most ofthe bent crystal lattice it is necessary to postulate theexistence of geometrically necessary stacking imperfec-tions, or defects, shown in Figure 17.18b. These crystaldefects are critically important in plastic strain and arediscussed in some detail below.
Translation Gliding of Crystals in Aggregates. A com-puter model of deformation of an hypothetical two-dimensional array of randomly oriented hexagons possessing one slip plane illustrates what might happen
(a)
(c)
(b)
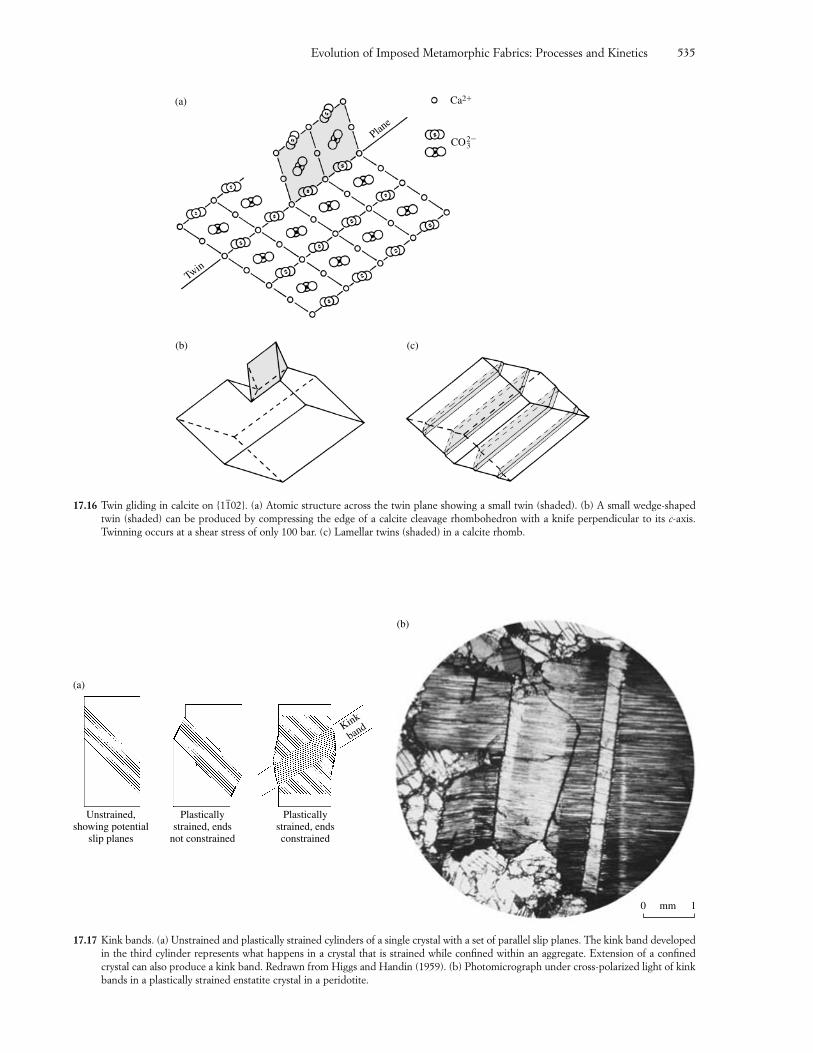
Evolution of Imposed Metamorphic Fabrics: Processes and Kinetics 535
(a)
Plane
Twin
Ca2�
CO32�
(b) (c)
17.16 Twin gliding in calcite on {1102}. (a) Atomic structure across the twin plane showing a small twin (shaded). (b) A small wedge-shapedtwin (shaded) can be produced by compressing the edge of a calcite cleavage rhombohedron with a knife perpendicular to its c-axis.Twinning occurs at a shear stress of only 100 bar. (c) Lamellar twins (shaded) in a calcite rhomb.
Unstrained,showing potential
slip planes
Plasticallystrained, ends
not constrained
Plasticallystrained, endsconstrained
Kink
band
(a)
(b)
0 mm 1
17.17 Kink bands. (a) Unstrained and plastically strained cylinders of a single crystal with a set of parallel slip planes. The kink band developedin the third cylinder represents what happens in a crystal that is strained while confined within an aggregate. Extension of a confinedcrystal can also produce a kink band. Redrawn from Higgs and Handin (1959). (b) Photomicrograph under cross-polarized light of kinkbands in a plastically strained enstatite crystal in a peridotite.
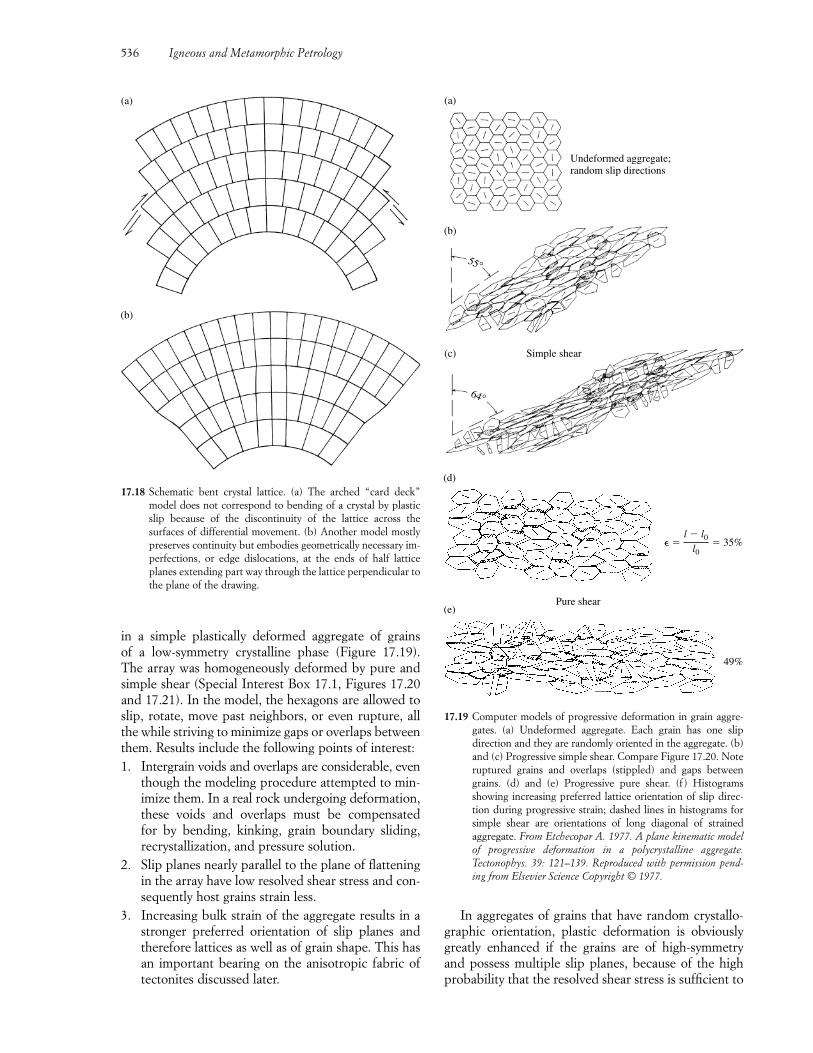
In aggregates of grains that have random crystallo-graphic orientation, plastic deformation is obviouslygreatly enhanced if the grains are of high-symmetry and possess multiple slip planes, because of the highprobability that the resolved shear stress is sufficient to
536 Igneous and Metamorphic Petrology
(a)
(b)
17.18 Schematic bent crystal lattice. (a) The arched “card deck”model does not correspond to bending of a crystal by plasticslip because of the discontinuity of the lattice across the surfaces of differential movement. (b) Another model mostlypreserves continuity but embodies geometrically necessary im-perfections, or edge dislocations, at the ends of half latticeplanes extending part way through the lattice perpendicular tothe plane of the drawing.
(a)
(b)
(c) Simple shear
64°
Undeformed aggregate;random slip directions
55°
(d)
(e)Pure shear
� � 35%
49%
l � l0l0
17.19 Computer models of progressive deformation in grain aggre-gates. (a) Undeformed aggregate. Each grain has one slip direction and they are randomly oriented in the aggregate. (b)and (c) Progressive simple shear. Compare Figure 17.20. Noteruptured grains and overlaps (stippled) and gaps betweengrains. (d) and (e) Progressive pure shear. (f ) Histogramsshowing increasing preferred lattice orientation of slip direc-tion during progressive strain; dashed lines in histograms forsimple shear are orientations of long diagonal of strained aggregate. From Etchecopar A. 1977. A plane kinematic modelof progressive deformation in a polycrystalline aggregate.Tectonophys. 39: 121–139. Reproduced with permission pend-ing from Elsevier Science Copyright © 1977.
in a simple plastically deformed aggregate of grains of a low-symmetry crystalline phase (Figure 17.19).The array was homogeneously deformed by pure and simple shear (Special Interest Box 17.1, Figures 17.20and 17.21). In the model, the hexagons are allowed toslip, rotate, move past neighbors, or even rupture, allthe while striving to minimize gaps or overlaps betweenthem. Results include the following points of interest:1. Intergrain voids and overlaps are considerable, even
though the modeling procedure attempted to min-imize them. In a real rock undergoing deformation,these voids and overlaps must be compensated for by bending, kinking, grain boundary sliding, recrystallization, and pressure solution.
2. Slip planes nearly parallel to the plane of flatteningin the array have low resolved shear stress and con-sequently host grains strain less.
3. Increasing bulk strain of the aggregate results in astronger preferred orientation of slip planes andtherefore lattices as well as of grain shape. This hasan important bearing on the anisotropic fabric oftectonites discussed later.
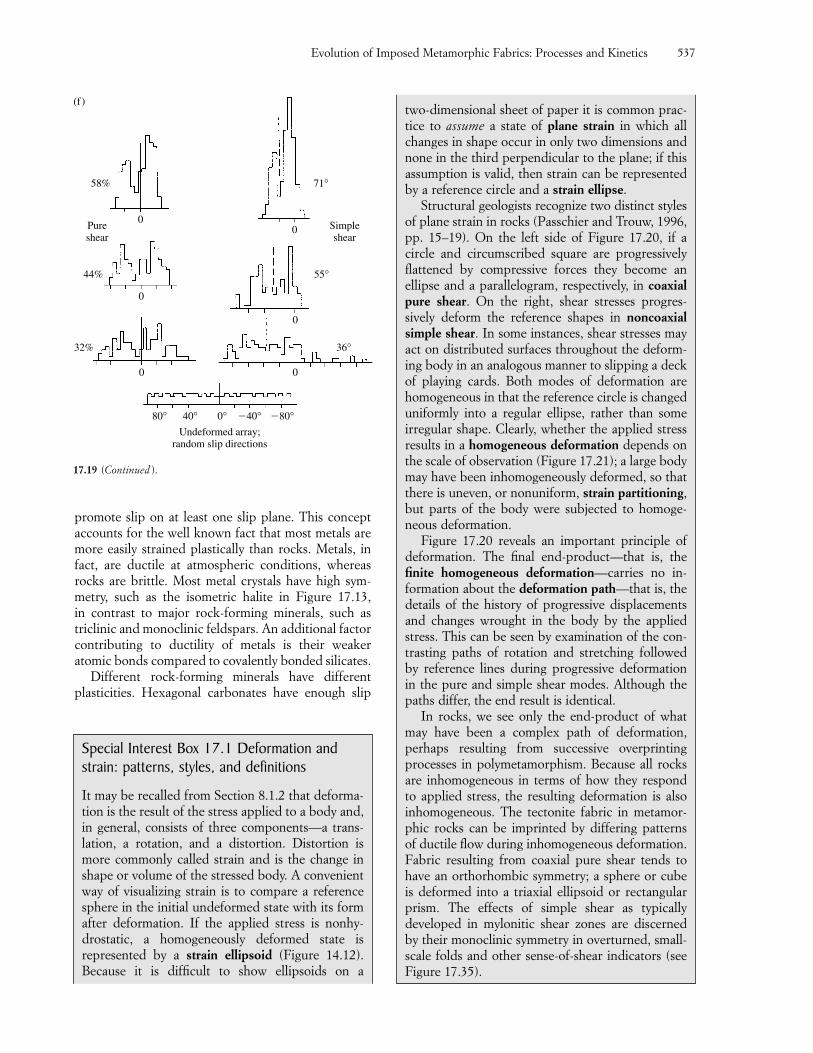
Evolution of Imposed Metamorphic Fabrics: Processes and Kinetics 537
17.19 (Continued ).
(f )
32% 36°
44% 55°
58% 71°
Pureshear
Simpleshear
00
0
0
0 0
0°Undeformed array;
random slip directions
80° 40° �40° �80°
two-dimensional sheet of paper it is common prac-tice to assume a state of plane strain in which allchanges in shape occur in only two dimensions andnone in the third perpendicular to the plane; if thisassumption is valid, then strain can be representedby a reference circle and a strain ellipse.
Structural geologists recognize two distinct stylesof plane strain in rocks (Passchier and Trouw, 1996,pp. 15–19). On the left side of Figure 17.20, if a circle and circumscribed square are progressivelyflattened by compressive forces they become an ellipse and a parallelogram, respectively, in coaxialpure shear. On the right, shear stresses progres-sively deform the reference shapes in noncoaxialsimple shear. In some instances, shear stresses mayact on distributed surfaces throughout the deform-ing body in an analogous manner to slipping a deckof playing cards. Both modes of deformation are homogeneous in that the reference circle is changeduniformly into a regular ellipse, rather than some irregular shape. Clearly, whether the applied stressresults in a homogeneous deformation depends onthe scale of observation (Figure 17.21); a large bodymay have been inhomogeneously deformed, so thatthere is uneven, or nonuniform, strain partitioning,but parts of the body were subjected to homoge-neous deformation.
Figure 17.20 reveals an important principle ofdeformation. The final end-product—that is, thefinite homogeneous deformation—carries no in-formation about the deformation path—that is, the details of the history of progressive displacementsand changes wrought in the body by the appliedstress. This can be seen by examination of the con-trasting paths of rotation and stretching followed by reference lines during progressive deformationin the pure and simple shear modes. Although thepaths differ, the end result is identical.
In rocks, we see only the end-product of whatmay have been a complex path of deformation, perhaps resulting from successive overprintingprocesses in polymetamorphism. Because all rocksare inhomogeneous in terms of how they respond to applied stress, the resulting deformation is alsoinhomogeneous. The tectonite fabric in metamor-phic rocks can be imprinted by differing patterns of ductile flow during inhomogeneous deformation.Fabric resulting from coaxial pure shear tends tohave an orthorhombic symmetry; a sphere or cubeis deformed into a triaxial ellipsoid or rectangularprism. The effects of simple shear as typically developed in mylonitic shear zones are discerned by their monoclinic symmetry in overturned, small-scale folds and other sense-of-shear indicators (seeFigure 17.35).
Special Interest Box 17.1 Deformation andstrain: patterns, styles, and definitions
It may be recalled from Section 8.1.2 that deforma-tion is the result of the stress applied to a body and,in general, consists of three components—a trans-lation, a rotation, and a distortion. Distortion ismore commonly called strain and is the change inshape or volume of the stressed body. A convenientway of visualizing strain is to compare a referencesphere in the initial undeformed state with its formafter deformation. If the applied stress is nonhy-drostatic, a homogeneously deformed state is represented by a strain ellipsoid (Figure 14.12). Because it is difficult to show ellipsoids on a
promote slip on at least one slip plane. This concept accounts for the well known fact that most metals aremore easily strained plastically than rocks. Metals, infact, are ductile at atmospheric conditions, whereasrocks are brittle. Most metal crystals have high sym-metry, such as the isometric halite in Figure 17.13, in contrast to major rock-forming minerals, such as triclinic and monoclinic feldspars. An additional factorcontributing to ductility of metals is their weakeratomic bonds compared to covalently bonded silicates.
Different rock-forming minerals have differentplasticities. Hexagonal carbonates have enough slip
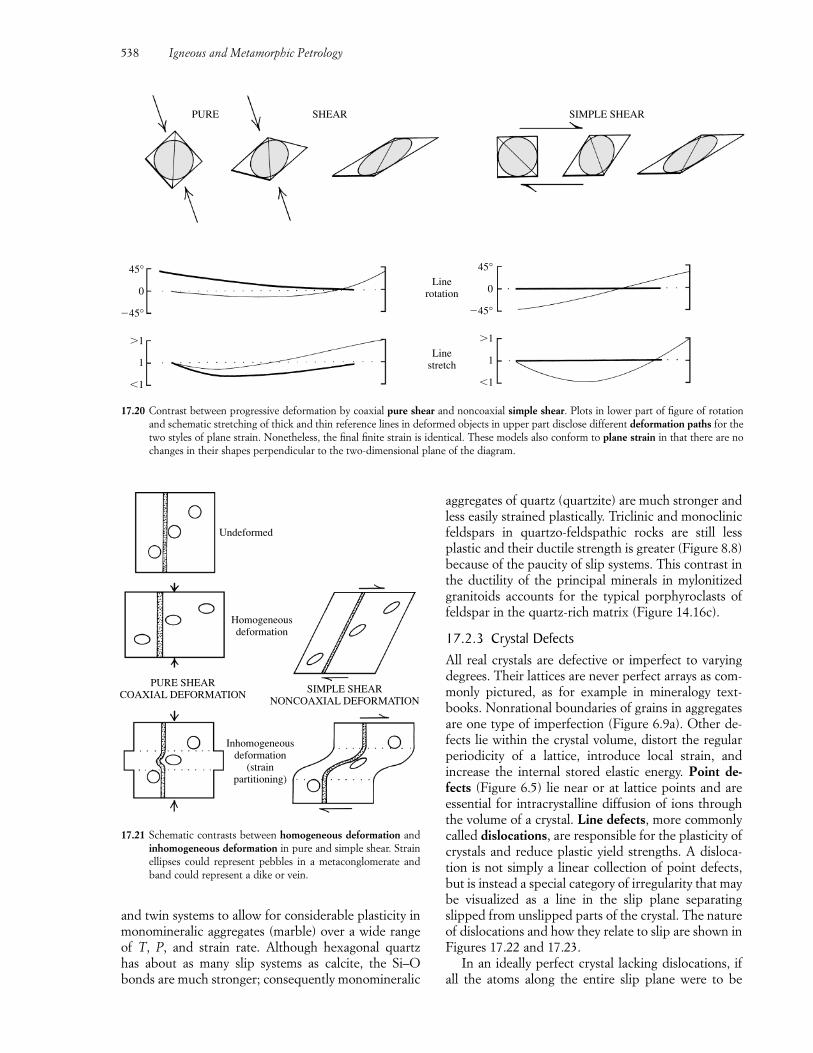
and twin systems to allow for considerable plasticity inmonomineralic aggregates (marble) over a wide rangeof T, P, and strain rate. Although hexagonal quartz has about as many slip systems as calcite, the Si–Obonds are much stronger; consequently monomineralic
538 Igneous and Metamorphic Petrology
45°
0
�45°
45°
0
�45°
1
1
�1
1
1
�1
Linerotation
Linestretch
PURE SHEAR SIMPLE SHEAR
17.20 Contrast between progressive deformation by coaxial pure shear and noncoaxial simple shear. Plots in lower part of figure of rotationand schematic stretching of thick and thin reference lines in deformed objects in upper part disclose different deformation paths for thetwo styles of plane strain. Nonetheless, the final finite strain is identical. These models also conform to plane strain in that there are nochanges in their shapes perpendicular to the two-dimensional plane of the diagram.
Undeformed
Homogeneousdeformation
SIMPLE SHEARNONCOAXIAL DEFORMATION
Inhomogeneousdeformation
(strainpartitioning)
PURE SHEARCOAXIAL DEFORMATION
17.21 Schematic contrasts between homogeneous deformation andinhomogeneous deformation in pure and simple shear. Strainellipses could represent pebbles in a metaconglomerate andband could represent a dike or vein.
aggregates of quartz (quartzite) are much stronger andless easily strained plastically. Triclinic and monoclinicfeldspars in quartzo-feldspathic rocks are still less plastic and their ductile strength is greater (Figure 8.8)because of the paucity of slip systems. This contrast inthe ductility of the principal minerals in mylonitizedgranitoids accounts for the typical porphyroclasts offeldspar in the quartz-rich matrix (Figure 14.16c).
17.2.3 Crystal DefectsAll real crystals are defective or imperfect to varyingdegrees. Their lattices are never perfect arrays as com-monly pictured, as for example in mineralogy text-books. Nonrational boundaries of grains in aggregatesare one type of imperfection (Figure 6.9a). Other de-fects lie within the crystal volume, distort the regularperiodicity of a lattice, introduce local strain, and increase the internal stored elastic energy. Point de-fects (Figure 6.5) lie near or at lattice points and are essential for intracrystalline diffusion of ions throughthe volume of a crystal. Line defects, more commonlycalled dislocations, are responsible for the plasticity ofcrystals and reduce plastic yield strengths. A disloca-tion is not simply a linear collection of point defects,but is instead a special category of irregularity that maybe visualized as a line in the slip plane separatingslipped from unslipped parts of the crystal. The natureof dislocations and how they relate to slip are shown inFigures 17.22 and 17.23.
In an ideally perfect crystal lacking dislocations, ifall the atoms along the entire slip plane were to be
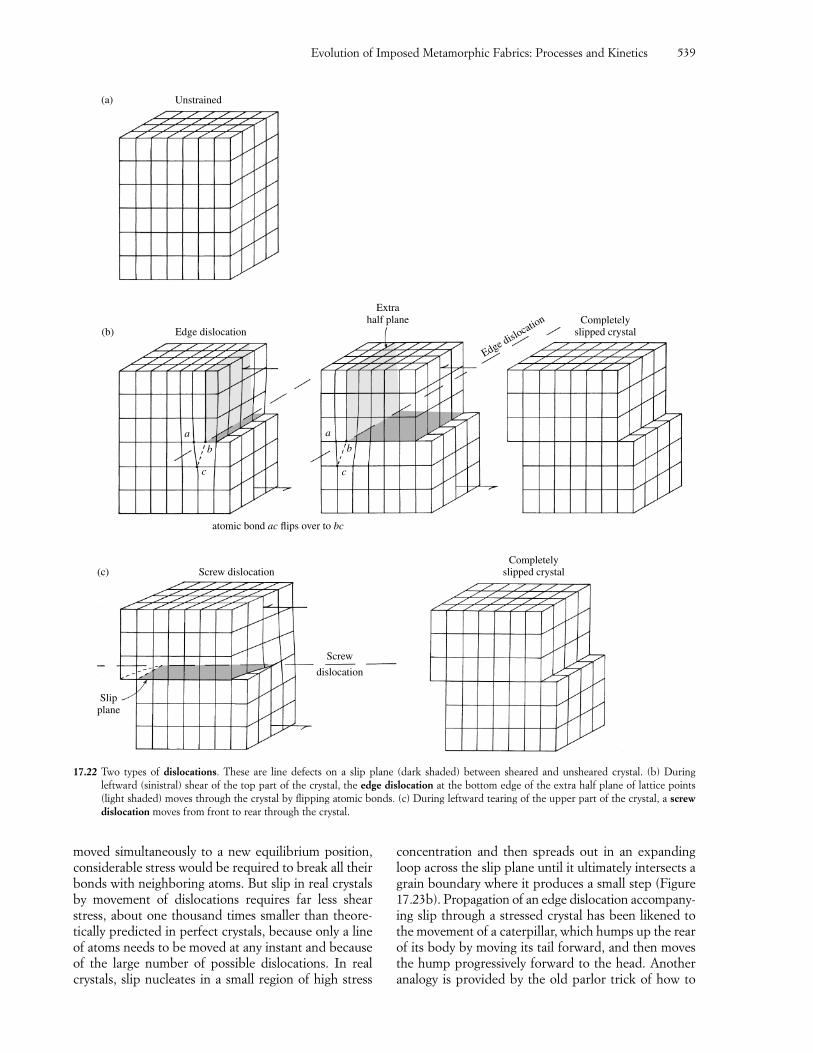
moved simultaneously to a new equilibrium position,considerable stress would be required to break all theirbonds with neighboring atoms. But slip in real crystalsby movement of dislocations requires far less shearstress, about one thousand times smaller than theore-tically predicted in perfect crystals, because only a line of atoms needs to be moved at any instant and becauseof the large number of possible dislocations. In realcrystals, slip nucleates in a small region of high stress
concentration and then spreads out in an expandingloop across the slip plane until it ultimately intersects agrain boundary where it produces a small step (Figure17.23b). Propagation of an edge dislocation accompany-ing slip through a stressed crystal has been likened tothe movement of a caterpillar, which humps up the rearof its body by moving its tail forward, and then movesthe hump progressively forward to the head. Anotheranalogy is provided by the old parlor trick of how to
Evolution of Imposed Metamorphic Fabrics: Processes and Kinetics 539
Unstrained(a)
Edge dislocation(b)
a
b
c
Extrahalf plane Completely
slipped crystal
Edge dislocation
atomic bond ac flips over to bc
Screw dislocation(c)Completely
slipped crystal
Slipplane
Screw
dislocation
a
b
c
17.22 Two types of dislocations. These are line defects on a slip plane (dark shaded) between sheared and unsheared crystal. (b) During leftward (sinistral) shear of the top part of the crystal, the edge dislocation at the bottom edge of the extra half plane of lattice points(light shaded) moves through the crystal by flipping atomic bonds. (c) During leftward tearing of the upper part of the crystal, a screwdislocation moves from front to rear through the crystal.
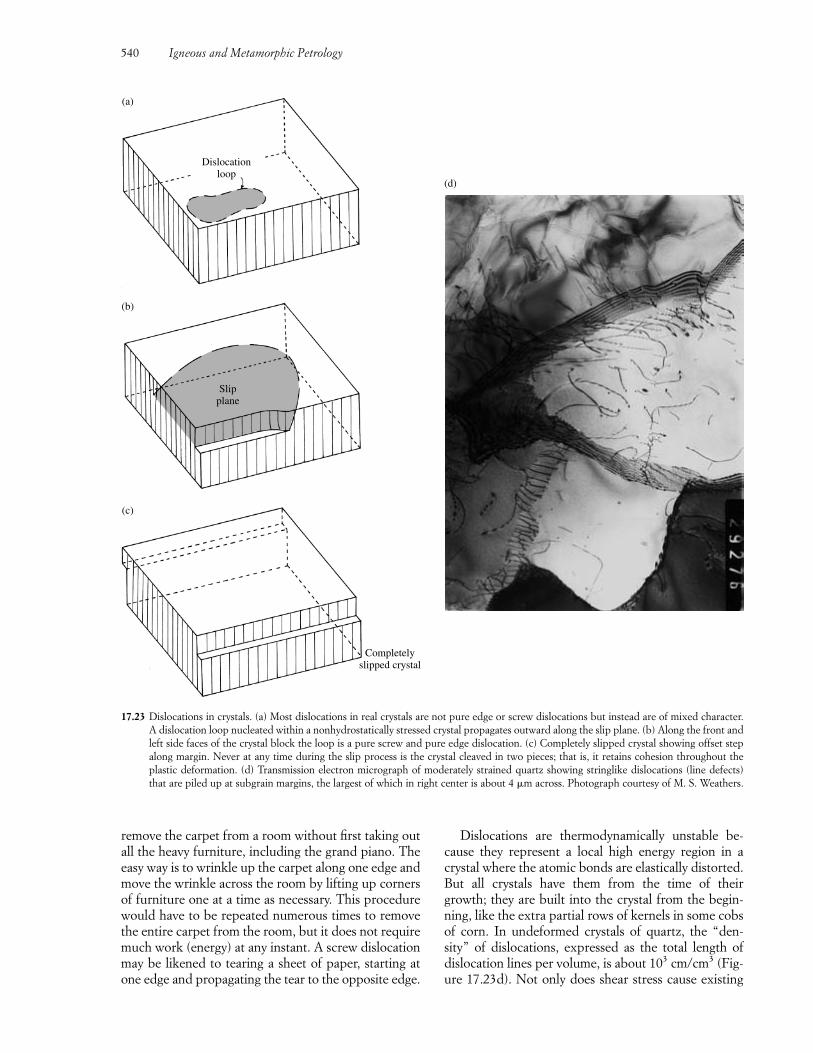
remove the carpet from a room without first taking outall the heavy furniture, including the grand piano. Theeasy way is to wrinkle up the carpet along one edge andmove the wrinkle across the room by lifting up cornersof furniture one at a time as necessary. This procedurewould have to be repeated numerous times to removethe entire carpet from the room, but it does not requiremuch work (energy) at any instant. A screw dislocationmay be likened to tearing a sheet of paper, starting atone edge and propagating the tear to the opposite edge.
Dislocations are thermodynamically unstable be-cause they represent a local high energy region in acrystal where the atomic bonds are elastically distorted.But all crystals have them from the time of theirgrowth; they are built into the crystal from the begin-ning, like the extra partial rows of kernels in some cobsof corn. In undeformed crystals of quartz, the “den-sity” of dislocations, expressed as the total length ofdislocation lines per volume, is about 103 cm/cm3 (Fig-ure 17.23d). Not only does shear stress cause existing
540 Igneous and Metamorphic Petrology
17.23 Dislocations in crystals. (a) Most dislocations in real crystals are not pure edge or screw dislocations but instead are of mixed character.A dislocation loop nucleated within a nonhydrostatically stressed crystal propagates outward along the slip plane. (b) Along the front andleft side faces of the crystal block the loop is a pure screw and pure edge dislocation. (c) Completely slipped crystal showing offset stepalong margin. Never at any time during the slip process is the crystal cleaved in two pieces; that is, it retains cohesion throughout theplastic deformation. (d) Transmission electron micrograph of moderately strained quartz showing stringlike dislocations (line defects)that are piled up at subgrain margins, the largest of which in right center is about 4 �m across. Photograph courtesy of M. S. Weathers.
Dislocationloop
Slipplane
Completelyslipped crystal
(a)
(b)
(c)
(d)
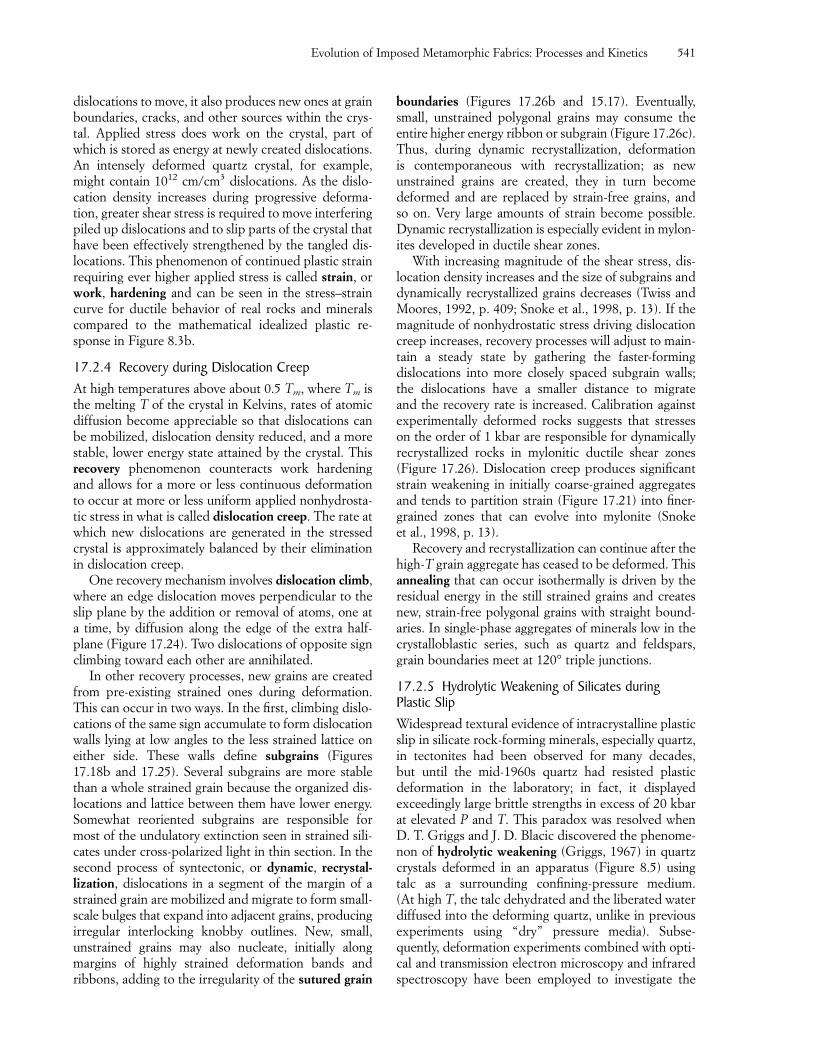
dislocations to move, it also produces new ones at grainboundaries, cracks, and other sources within the crys-tal. Applied stress does work on the crystal, part ofwhich is stored as energy at newly created dislocations.An intensely deformed quartz crystal, for example,might contain 1012 cm/cm3 dislocations. As the dislo-cation density increases during progressive deforma-tion, greater shear stress is required to move interferingpiled up dislocations and to slip parts of the crystal thathave been effectively strengthened by the tangled dis-locations. This phenomenon of continued plastic strainrequiring ever higher applied stress is called strain, orwork, hardening and can be seen in the stress–straincurve for ductile behavior of real rocks and mineralscompared to the mathematical idealized plastic re-sponse in Figure 8.3b.
17.2.4 Recovery during Dislocation CreepAt high temperatures above about 0.5 Tm, where Tm isthe melting T of the crystal in Kelvins, rates of atomicdiffusion become appreciable so that dislocations canbe mobilized, dislocation density reduced, and a morestable, lower energy state attained by the crystal. Thisrecovery phenomenon counteracts work hardeningand allows for a more or less continuous deformationto occur at more or less uniform applied nonhydrosta-tic stress in what is called dislocation creep. The rate atwhich new dislocations are generated in the stressedcrystal is approximately balanced by their eliminationin dislocation creep.
One recovery mechanism involves dislocation climb,where an edge dislocation moves perpendicular to theslip plane by the addition or removal of atoms, one at a time, by diffusion along the edge of the extra half-plane (Figure 17.24). Two dislocations of opposite signclimbing toward each other are annihilated.
In other recovery processes, new grains are createdfrom pre-existing strained ones during deformation.This can occur in two ways. In the first, climbing dislo-cations of the same sign accumulate to form dislocationwalls lying at low angles to the less strained lattice oneither side. These walls define subgrains (Figures17.18b and 17.25). Several subgrains are more stablethan a whole strained grain because the organized dis-locations and lattice between them have lower energy.Somewhat reoriented subgrains are responsible formost of the undulatory extinction seen in strained sili-cates under cross-polarized light in thin section. In thesecond process of syntectonic, or dynamic, recrystal-lization, dislocations in a segment of the margin of astrained grain are mobilized and migrate to form small-scale bulges that expand into adjacent grains, producingirregular interlocking knobby outlines. New, small, unstrained grains may also nucleate, initially along margins of highly strained deformation bands and ribbons, adding to the irregularity of the sutured grain
boundaries (Figures 17.26b and 15.17). Eventually,small, unstrained polygonal grains may consume theentire higher energy ribbon or subgrain (Figure 17.26c).Thus, during dynamic recrystallization, deformation is contemporaneous with recrystallization; as new unstrained grains are created, they in turn become deformed and are replaced by strain-free grains, and so on. Very large amounts of strain become possible.Dynamic recrystallization is especially evident in mylon-ites developed in ductile shear zones.
With increasing magnitude of the shear stress, dis-location density increases and the size of subgrains anddynamically recrystallized grains decreases (Twiss andMoores, 1992, p. 409; Snoke et al., 1998, p. 13). If themagnitude of nonhydrostatic stress driving dislocationcreep increases, recovery processes will adjust to main-tain a steady state by gathering the faster-forming dislocations into more closely spaced subgrain walls;the dislocations have a smaller distance to migrate and the recovery rate is increased. Calibration againstexperimentally deformed rocks suggests that stresses on the order of 1 kbar are responsible for dynamicallyrecrystallized rocks in mylonitic ductile shear zones(Figure 17.26). Dislocation creep produces significantstrain weakening in initially coarse-grained aggregatesand tends to partition strain (Figure 17.21) into finer-grained zones that can evolve into mylonite (Snoke et al., 1998, p. 13).
Recovery and recrystallization can continue after thehigh-T grain aggregate has ceased to be deformed. Thisannealing that can occur isothermally is driven by theresidual energy in the still strained grains and createsnew, strain-free polygonal grains with straight bound-aries. In single-phase aggregates of minerals low in thecrystalloblastic series, such as quartz and feldspars,grain boundaries meet at 120° triple junctions.
17.2.5 Hydrolytic Weakening of Silicates duringPlastic SlipWidespread textural evidence of intracrystalline plasticslip in silicate rock-forming minerals, especially quartz,in tectonites had been observed for many decades, but until the mid-1960s quartz had resisted plastic deformation in the laboratory; in fact, it displayed exceedingly large brittle strengths in excess of 20 kbarat elevated P and T. This paradox was resolved whenD. T. Griggs and J. D. Blacic discovered the phenome-non of hydrolytic weakening (Griggs, 1967) in quartzcrystals deformed in an apparatus (Figure 8.5) usingtalc as a surrounding confining-pressure medium. (At high T, the talc dehydrated and the liberated water diffused into the deforming quartz, unlike in previousexperiments using “dry” pressure media). Subse-quently, deformation experiments combined with opti-cal and transmission electron microscopy and infraredspectroscopy have been employed to investigate the
Evolution of Imposed Metamorphic Fabrics: Processes and Kinetics 541
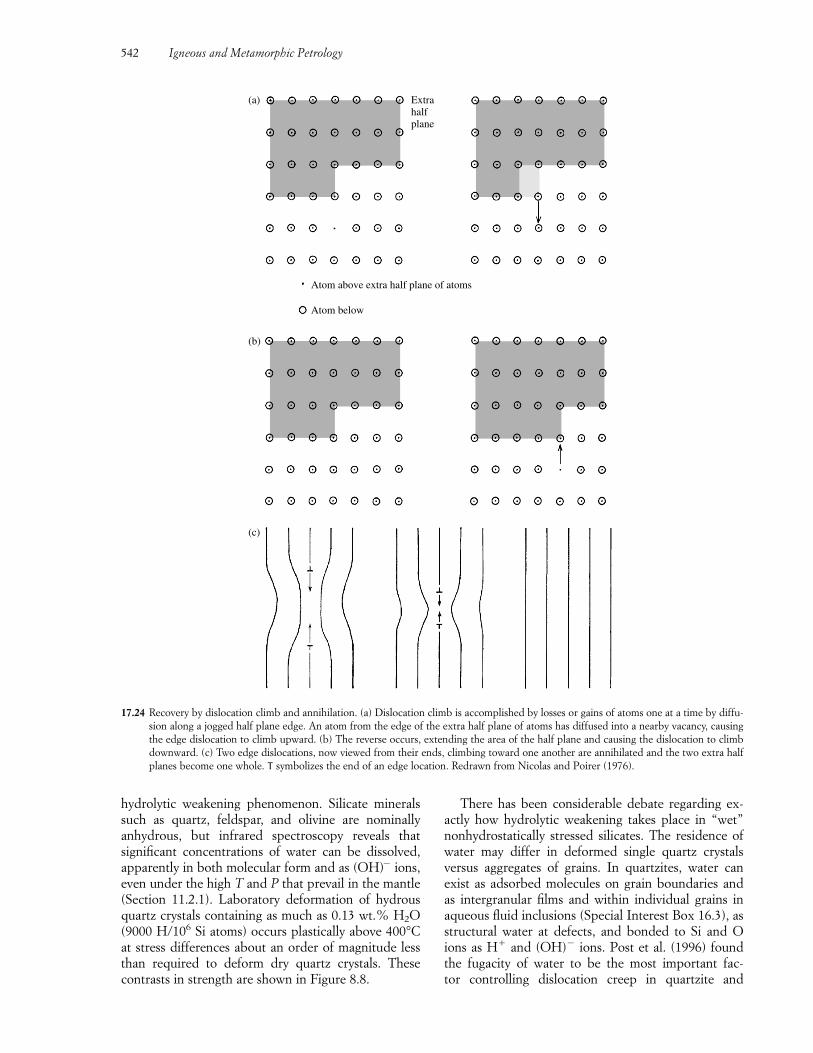
hydrolytic weakening phenomenon. Silicate mineralssuch as quartz, feldspar, and olivine are nominally anhydrous, but infrared spectroscopy reveals thatsignificant concentrations of water can be dissolved,apparently in both molecular form and as (OH)� ions,even under the high T and P that prevail in the mantle(Section 11.2.1). Laboratory deformation of hydrousquartz crystals containing as much as 0.13 wt.% H2O(9000 H/106 Si atoms) occurs plastically above 400°Cat stress differences about an order of magnitude lessthan required to deform dry quartz crystals. These contrasts in strength are shown in Figure 8.8.
There has been considerable debate regarding ex-actly how hydrolytic weakening takes place in “wet”nonhydrostatically stressed silicates. The residence ofwater may differ in deformed single quartz crystals versus aggregates of grains. In quartzites, water can exist as adsorbed molecules on grain boundaries and as intergranular films and within individual grains inaqueous fluid inclusions (Special Interest Box 16.3), asstructural water at defects, and bonded to Si and Oions as H� and (OH)� ions. Post et al. (1996) foundthe fugacity of water to be the most important fac-tor controlling dislocation creep in quartzite and
542 Igneous and Metamorphic Petrology
Atom above extra half plane of atoms
Atom below
Extrahalfplane
(a)
(b)
(c)
17.24 Recovery by dislocation climb and annihilation. (a) Dislocation climb is accomplished by losses or gains of atoms one at a time by diffu-sion along a jogged half plane edge. An atom from the edge of the extra half plane of atoms has diffused into a nearby vacancy, causingthe edge dislocation to climb upward. (b) The reverse occurs, extending the area of the half plane and causing the dislocation to climbdownward. (c) Two edge dislocations, now viewed from their ends, climbing toward one another are annihilated and the two extra halfplanes become one whole. T symbolizes the end of an edge location. Redrawn from Nicolas and Poirer (1976).
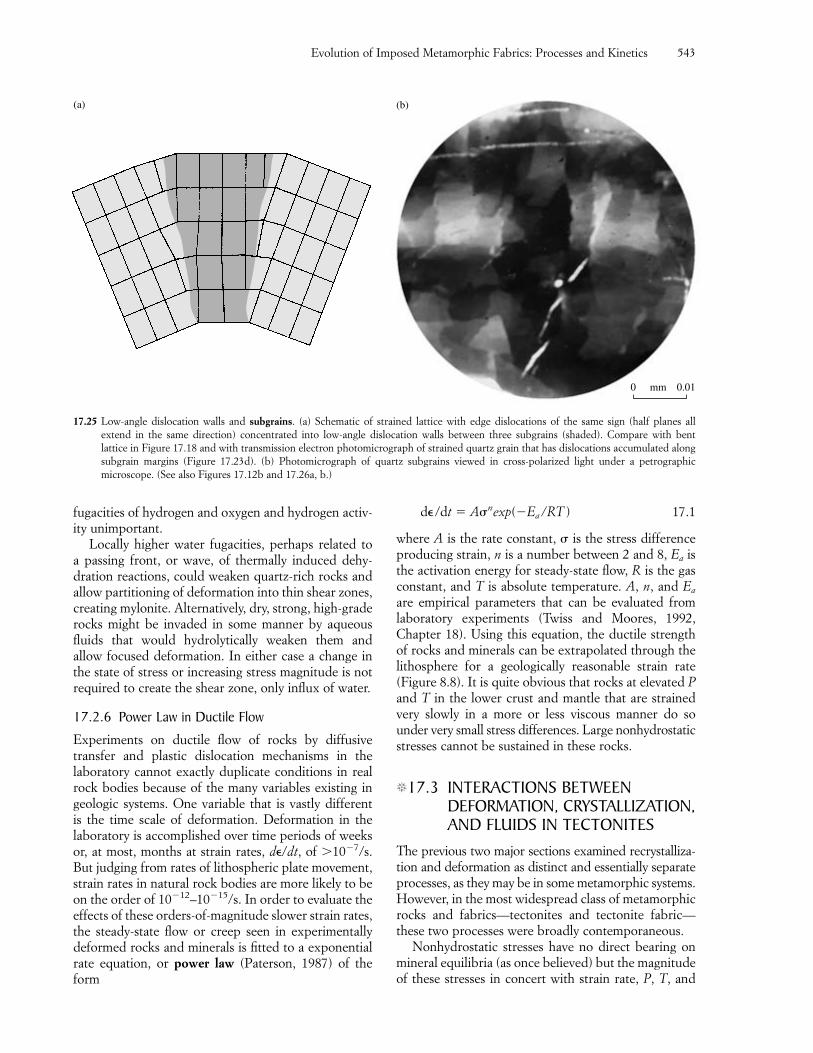
Evolution of Imposed Metamorphic Fabrics: Processes and Kinetics 543
(a) (b)
0.010 mm
17.25 Low-angle dislocation walls and subgrains. (a) Schematic of strained lattice with edge dislocations of the same sign (half planes all extend in the same direction) concentrated into low-angle dislocation walls between three subgrains (shaded). Compare with bent lattice in Figure 17.18 and with transmission electron photomicrograph of strained quartz grain that has dislocations accumulated alongsubgrain margins (Figure 17.23d). (b) Photomicrograph of quartz subgrains viewed in cross-polarized light under a petrographic microscope. (See also Figures 17.12b and 17.26a, b.)
fugacities of hydrogen and oxygen and hydrogen activ-ity unimportant.
Locally higher water fugacities, perhaps related to a passing front, or wave, of thermally induced dehy-dration reactions, could weaken quartz-rich rocks andallow partitioning of deformation into thin shear zones,creating mylonite. Alternatively, dry, strong, high-graderocks might be invaded in some manner by aqueousfluids that would hydrolytically weaken them and allow focused deformation. In either case a change inthe state of stress or increasing stress magnitude is notrequired to create the shear zone, only influx of water.
17.2.6 Power Law in Ductile Flow
Experiments on ductile flow of rocks by diffusivetransfer and plastic dislocation mechanisms in the laboratory cannot exactly duplicate conditions in realrock bodies because of the many variables existing ingeologic systems. One variable that is vastly different is the time scale of deformation. Deformation in thelaboratory is accomplished over time periods of weeksor, at most, months at strain rates, d/dt, of 10�7/s.But judging from rates of lithospheric plate movement,strain rates in natural rock bodies are more likely to beon the order of 10�12–10�15/s. In order to evaluate theeffects of these orders-of-magnitude slower strain rates,the steady-state flow or creep seen in experimentallydeformed rocks and minerals is fitted to a exponentialrate equation, or power law (Paterson, 1987) of theform
d/dt � A�nexp(�Ea/RT ) 17.1
where A is the rate constant, � is the stress differenceproducing strain, n is a number between 2 and 8, Ea isthe activation energy for steady-state flow, R is the gasconstant, and T is absolute temperature. A, n, and Ea
are empirical parameters that can be evaluated fromlaboratory experiments (Twiss and Moores, 1992,Chapter 18). Using this equation, the ductile strengthof rocks and minerals can be extrapolated through thelithosphere for a geologically reasonable strain rate(Figure 8.8). It is quite obvious that rocks at elevated Pand T in the lower crust and mantle that are strainedvery slowly in a more or less viscous manner do so under very small stress differences. Large nonhydrostaticstresses cannot be sustained in these rocks.
�17.3 INTERACTIONS BETWEENDEFORMATION, CRYSTALLIZATION,AND FLUIDS IN TECTONITES
The previous two major sections examined recrystalliza-tion and deformation as distinct and essentially separateprocesses, as they may be in some metamorphic systems.However, in the most widespread class of metamorphicrocks and fabrics—tectonites and tectonite fabric—these two processes were broadly contemporaneous.
Nonhydrostatic stresses have no direct bearing onmineral equilibria (as once believed) but the magnitudeof these stresses in concert with strain rate, P, T, and
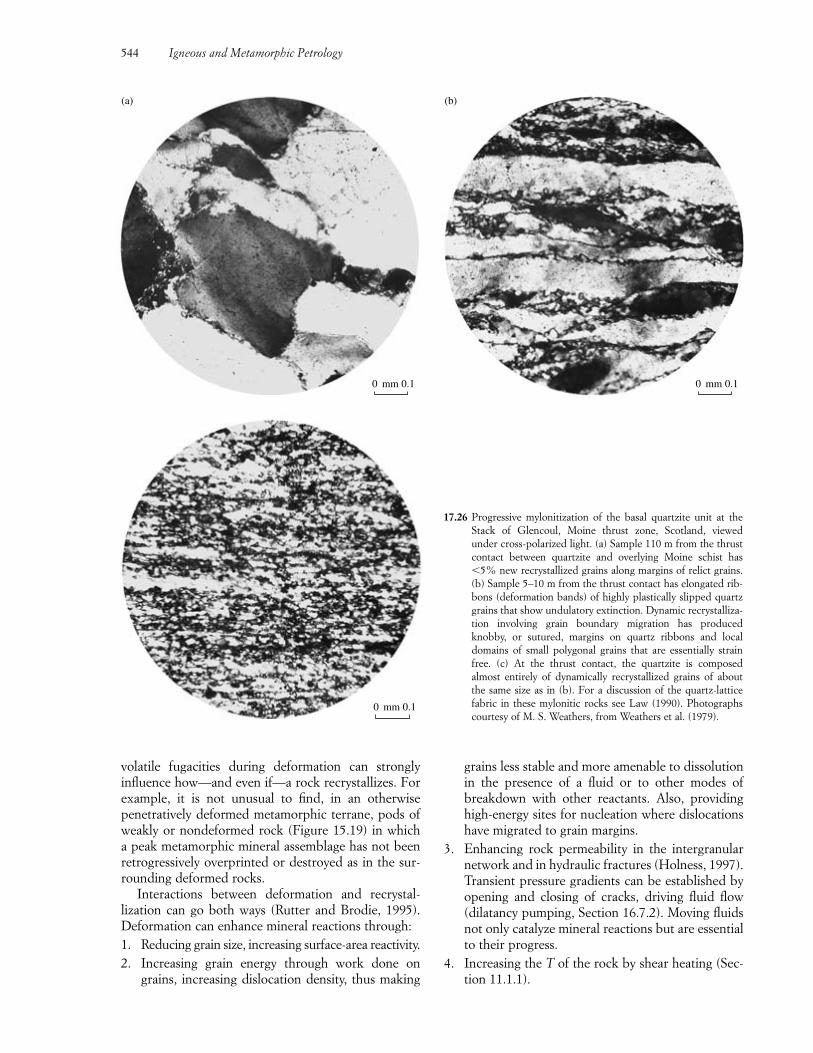
volatile fugacities during deformation can stronglyinfluence how—and even if—a rock recrystallizes. Forexample, it is not unusual to find, in an otherwise penetratively deformed metamorphic terrane, pods ofweakly or nondeformed rock (Figure 15.19) in which a peak metamorphic mineral assemblage has not beenretrogressively overprinted or destroyed as in the sur-rounding deformed rocks.
Interactions between deformation and recrystal-lization can go both ways (Rutter and Brodie, 1995). Deformation can enhance mineral reactions through:1. Reducing grain size, increasing surface-area reactivity.2. Increasing grain energy through work done on
grains, increasing dislocation density, thus making
grains less stable and more amenable to dissolutionin the presence of a fluid or to other modes ofbreakdown with other reactants. Also, providinghigh-energy sites for nucleation where dislocationshave migrated to grain margins.
3. Enhancing rock permeability in the intergranularnetwork and in hydraulic fractures (Holness, 1997).Transient pressure gradients can be established byopening and closing of cracks, driving fluid flow(dilatancy pumping, Section 16.7.2). Moving fluidsnot only catalyze mineral reactions but are essentialto their progress.
4. Increasing the T of the rock by shear heating (Sec-tion 11.1.1).
544 Igneous and Metamorphic Petrology
(a)
0 0.1mm
(b)
0 0.1mm
0 0.1mm
17.26 Progressive mylonitization of the basal quartzite unit at theStack of Glencoul, Moine thrust zone, Scotland, viewed under cross-polarized light. (a) Sample 110 m from the thrustcontact between quartzite and overlying Moine schist has�5% new recrystallized grains along margins of relict grains.(b) Sample 5–10 m from the thrust contact has elongated rib-bons (deformation bands) of highly plastically slipped quartzgrains that show undulatory extinction. Dynamic recrystalliza-tion involving grain boundary migration has producedknobby, or sutured, margins on quartz ribbons and local domains of small polygonal grains that are essentially strainfree. (c) At the thrust contact, the quartzite is composed almost entirely of dynamically recrystallized grains of aboutthe same size as in (b). For a discussion of the quartz-latticefabric in these mylonitic rocks see Law (1990). Photographscourtesy of M. S. Weathers, from Weathers et al. (1979).
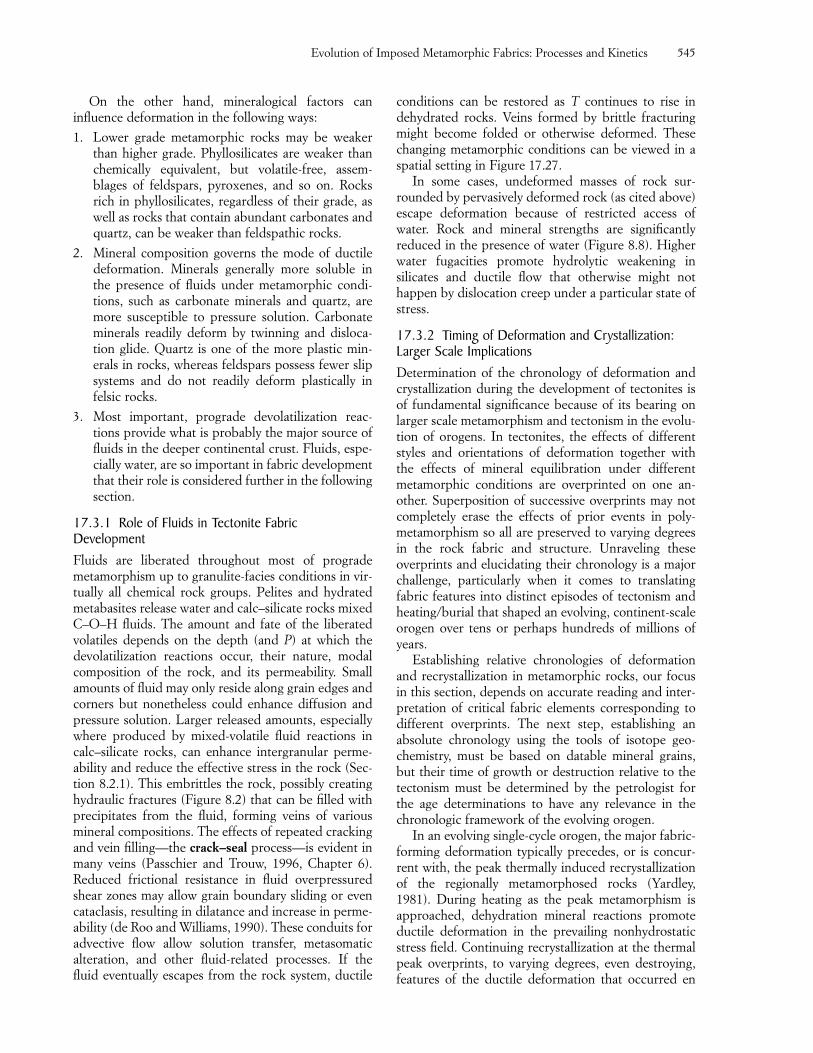
On the other hand, mineralogical factors caninfluence deformation in the following ways:
1. Lower grade metamorphic rocks may be weakerthan higher grade. Phyllosilicates are weaker thanchemically equivalent, but volatile-free, assem-blages of feldspars, pyroxenes, and so on. Rocksrich in phyllosilicates, regardless of their grade, aswell as rocks that contain abundant carbonates andquartz, can be weaker than feldspathic rocks.
2. Mineral composition governs the mode of ductiledeformation. Minerals generally more soluble inthe presence of fluids under metamorphic condi-tions, such as carbonate minerals and quartz, aremore susceptible to pressure solution. Carbonateminerals readily deform by twinning and disloca-tion glide. Quartz is one of the more plastic min-erals in rocks, whereas feldspars possess fewer slipsystems and do not readily deform plastically in felsic rocks.
3. Most important, prograde devolatilization reac-tions provide what is probably the major source offluids in the deeper continental crust. Fluids, espe-cially water, are so important in fabric developmentthat their role is considered further in the followingsection.
17.3.1 Role of Fluids in Tectonite FabricDevelopmentFluids are liberated throughout most of progrademetamorphism up to granulite-facies conditions in vir-tually all chemical rock groups. Pelites and hydratedmetabasites release water and calc–silicate rocks mixedC–O–H fluids. The amount and fate of the liberatedvolatiles depends on the depth (and P) at which the devolatilization reactions occur, their nature, modalcomposition of the rock, and its permeability. Smallamounts of fluid may only reside along grain edges andcorners but nonetheless could enhance diffusion andpressure solution. Larger released amounts, especiallywhere produced by mixed-volatile fluid reactions incalc–silicate rocks, can enhance intergranular perme-ability and reduce the effective stress in the rock (Sec-tion 8.2.1). This embrittles the rock, possibly creatinghydraulic fractures (Figure 8.2) that can be filled withprecipitates from the fluid, forming veins of variousmineral compositions. The effects of repeated crackingand vein filling—the crack–seal process—is evident inmany veins (Passchier and Trouw, 1996, Chapter 6).Reduced frictional resistance in fluid overpressuredshear zones may allow grain boundary sliding or evencataclasis, resulting in dilatance and increase in perme-ability (de Roo and Williams, 1990). These conduits foradvective flow allow solution transfer, metasomatic alteration, and other fluid-related processes. If the fluid eventually escapes from the rock system, ductile
conditions can be restored as T continues to rise in dehydrated rocks. Veins formed by brittle fracturingmight become folded or otherwise deformed. Thesechanging metamorphic conditions can be viewed in aspatial setting in Figure 17.27.
In some cases, undeformed masses of rock sur-rounded by pervasively deformed rock (as cited above)escape deformation because of restricted access of water. Rock and mineral strengths are significantly reduced in the presence of water (Figure 8.8). Higherwater fugacities promote hydrolytic weakening in silicates and ductile flow that otherwise might not happen by dislocation creep under a particular state ofstress.
17.3.2 Timing of Deformation and Crystallization:Larger Scale ImplicationsDetermination of the chronology of deformation andcrystallization during the development of tectonites isof fundamental significance because of its bearing onlarger scale metamorphism and tectonism in the evolu-tion of orogens. In tectonites, the effects of differentstyles and orientations of deformation together withthe effects of mineral equilibration under differentmetamorphic conditions are overprinted on one an-other. Superposition of successive overprints may notcompletely erase the effects of prior events in poly-metamorphism so all are preserved to varying degreesin the rock fabric and structure. Unraveling these overprints and elucidating their chronology is a majorchallenge, particularly when it comes to translating fabric features into distinct episodes of tectonism andheating/burial that shaped an evolving, continent-scaleorogen over tens or perhaps hundreds of millions ofyears.
Establishing relative chronologies of deformationand recrystallization in metamorphic rocks, our focusin this section, depends on accurate reading and inter-pretation of critical fabric elements corresponding todifferent overprints. The next step, establishing an absolute chronology using the tools of isotope geo-chemistry, must be based on datable mineral grains,but their time of growth or destruction relative to thetectonism must be determined by the petrologist forthe age determinations to have any relevance in thechronologic framework of the evolving orogen.
In an evolving single-cycle orogen, the major fabric-forming deformation typically precedes, or is concur-rent with, the peak thermally induced recrystallizationof the regionally metamorphosed rocks (Yardley,1981). During heating as the peak metamorphism isapproached, dehydration mineral reactions promoteductile deformation in the prevailing nonhydrostaticstress field. Continuing recrystallization at the thermalpeak overprints, to varying degrees, even destroying,features of the ductile deformation that occurred en
Evolution of Imposed Metamorphic Fabrics: Processes and Kinetics 545
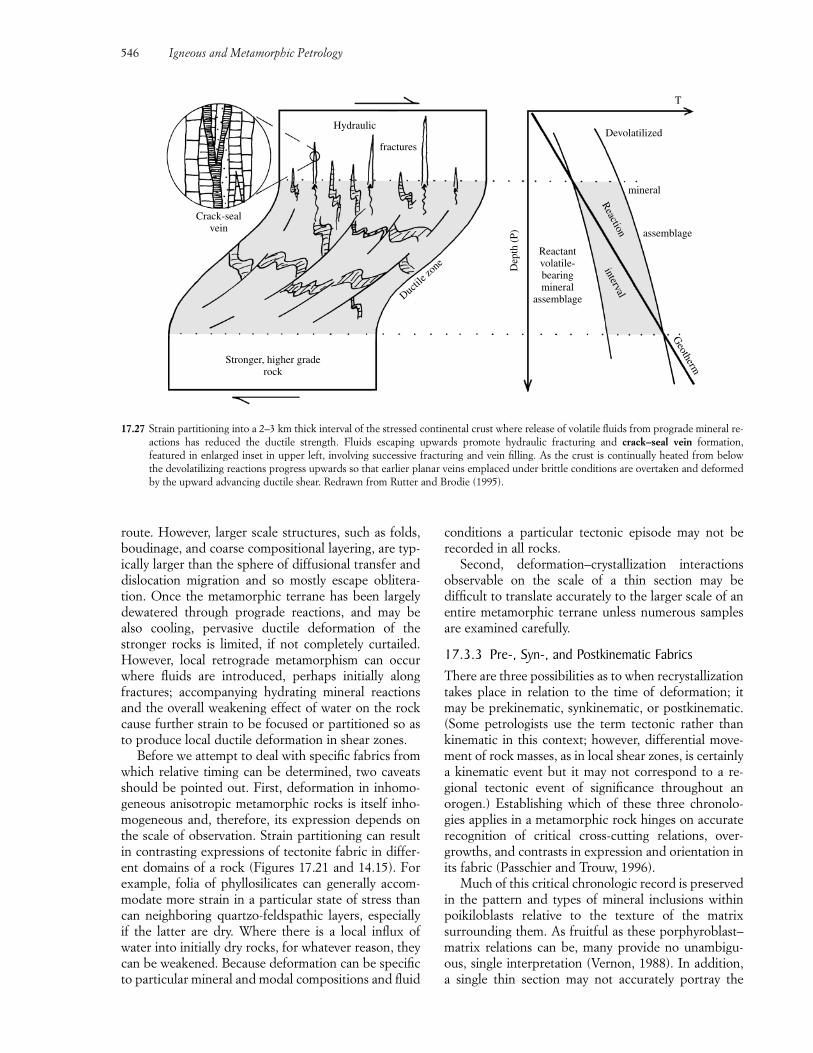
route. However, larger scale structures, such as folds,boudinage, and coarse compositional layering, are typ-ically larger than the sphere of diffusional transfer anddislocation migration and so mostly escape oblitera-tion. Once the metamorphic terrane has been largelydewatered through prograde reactions, and may bealso cooling, pervasive ductile deformation of thestronger rocks is limited, if not completely curtailed.However, local retrograde metamorphism can occurwhere fluids are introduced, perhaps initially alongfractures; accompanying hydrating mineral reactionsand the overall weakening effect of water on the rockcause further strain to be focused or partitioned so asto produce local ductile deformation in shear zones.
Before we attempt to deal with specific fabrics fromwhich relative timing can be determined, two caveatsshould be pointed out. First, deformation in inhomo-geneous anisotropic metamorphic rocks is itself inho-mogeneous and, therefore, its expression depends onthe scale of observation. Strain partitioning can resultin contrasting expressions of tectonite fabric in differ-ent domains of a rock (Figures 17.21 and 14.15). Forexample, folia of phyllosilicates can generally accom-modate more strain in a particular state of stress thancan neighboring quartzo-feldspathic layers, especiallyif the latter are dry. Where there is a local influx of water into initially dry rocks, for whatever reason, theycan be weakened. Because deformation can be specificto particular mineral and modal compositions and fluid
conditions a particular tectonic episode may not berecorded in all rocks.
Second, deformation–crystallization interactionsobservable on the scale of a thin section may bedifficult to translate accurately to the larger scale of anentire metamorphic terrane unless numerous samplesare examined carefully.
17.3.3 Pre-, Syn-, and Postkinematic FabricsThere are three possibilities as to when recrystallizationtakes place in relation to the time of deformation; itmay be prekinematic, synkinematic, or postkinematic.(Some petrologists use the term tectonic rather thankinematic in this context; however, differential move-ment of rock masses, as in local shear zones, is certainlya kinematic event but it may not correspond to a re-gional tectonic event of significance throughout an orogen.) Establishing which of these three chronolo-gies applies in a metamorphic rock hinges on accuraterecognition of critical cross-cutting relations, over-growths, and contrasts in expression and orientation inits fabric (Passchier and Trouw, 1996).
Much of this critical chronologic record is preservedin the pattern and types of mineral inclusions withinpoikiloblasts relative to the texture of the matrix surrounding them. As fruitful as these porphyroblast–matrix relations can be, many provide no unambigu-ous, single interpretation (Vernon, 1988). In addition,a single thin section may not accurately portray the
546 Igneous and Metamorphic Petrology
Crack-sealvein
Stronger, higher graderock
Hydraulic
fractures Devolatilized
T
mineral
assemblage
Reactantvolatile-bearingmineral
assemblageDuctil
e zon
e Dep
th (
P)
interval
Reaction
Geotherm
17.27 Strain partitioning into a 2–3 km thick interval of the stressed continental crust where release of volatile fluids from prograde mineral re-actions has reduced the ductile strength. Fluids escaping upwards promote hydraulic fracturing and crack–seal vein formation, featured in enlarged inset in upper left, involving successive fracturing and vein filling. As the crust is continually heated from below the devolatilizing reactions progress upwards so that earlier planar veins emplaced under brittle conditions are overtaken and deformedby the upward advancing ductile shear. Redrawn from Rutter and Brodie (1995).
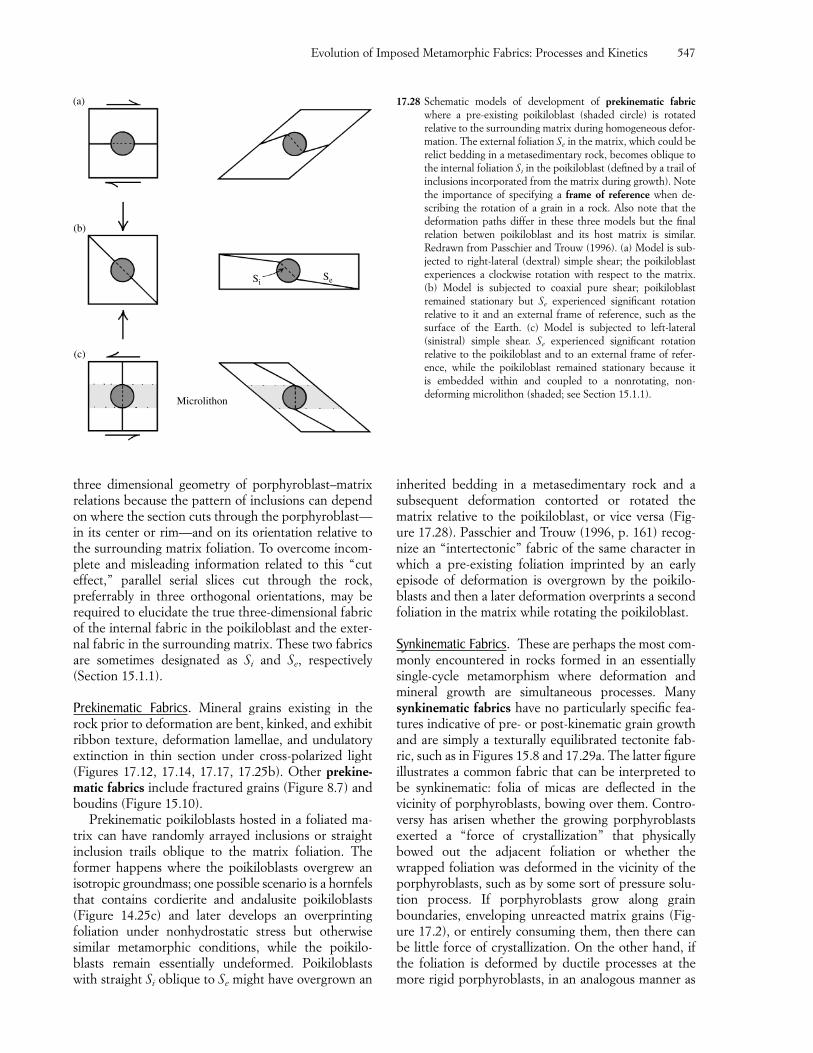
three dimensional geometry of porphyroblast–matrixrelations because the pattern of inclusions can dependon where the section cuts through the porphyroblast—in its center or rim—and on its orientation relative tothe surrounding matrix foliation. To overcome incom-plete and misleading information related to this “cuteffect,” parallel serial slices cut through the rock, preferrably in three orthogonal orientations, may be required to elucidate the true three-dimensional fabricof the internal fabric in the poikiloblast and the exter-nal fabric in the surrounding matrix. These two fabricsare sometimes designated as Si and Se, respectively(Section 15.1.1).
Prekinematic Fabrics. Mineral grains existing in therock prior to deformation are bent, kinked, and exhibitribbon texture, deformation lamellae, and undulatoryextinction in thin section under cross-polarized light(Figures 17.12, 17.14, 17.17, 17.25b). Other prekine-matic fabrics include fractured grains (Figure 8.7) andboudins (Figure 15.10).
Prekinematic poikiloblasts hosted in a foliated ma-trix can have randomly arrayed inclusions or straightinclusion trails oblique to the matrix foliation. The former happens where the poikiloblasts overgrew anisotropic groundmass; one possible scenario is a hornfelsthat contains cordierite and andalusite poikiloblasts(Figure 14.25c) and later develops an overprinting foliation under nonhydrostatic stress but otherwisesimilar metamorphic conditions, while the poikilo-blasts remain essentially undeformed. Poikiloblastswith straight Si oblique to Se might have overgrown an
inherited bedding in a metasedimentary rock and asubsequent deformation contorted or rotated the matrix relative to the poikiloblast, or vice versa (Fig-ure 17.28). Passchier and Trouw (1996, p. 161) recog-nize an “intertectonic” fabric of the same character inwhich a pre-existing foliation imprinted by an earlyepisode of deformation is overgrown by the poikilo-blasts and then a later deformation overprints a secondfoliation in the matrix while rotating the poikiloblast.
Synkinematic Fabrics. These are perhaps the most com-monly encountered in rocks formed in an essentiallysingle-cycle metamorphism where deformation andmineral growth are simultaneous processes. Manysynkinematic fabrics have no particularly specific fea-tures indicative of pre- or post-kinematic grain growthand are simply a texturally equilibrated tectonite fab-ric, such as in Figures 15.8 and 17.29a. The latter figureillustrates a common fabric that can be interpreted tobe synkinematic: folia of micas are deflected in thevicinity of porphyroblasts, bowing over them. Contro-versy has arisen whether the growing porphyroblasts exerted a “force of crystallization” that physicallybowed out the adjacent foliation or whether thewrapped foliation was deformed in the vicinity of theporphyroblasts, such as by some sort of pressure solu-tion process. If porphyroblasts grow along grainboundaries, enveloping unreacted matrix grains (Fig-ure 17.2), or entirely consuming them, then there canbe little force of crystallization. On the other hand, ifthe foliation is deformed by ductile processes at themore rigid porphyroblasts, in an analogous manner as
Evolution of Imposed Metamorphic Fabrics: Processes and Kinetics 547
(a)
Microlithon
SiSe
(b)
(c)
17.28 Schematic models of development of prekinematic fabricwhere a pre-existing poikiloblast (shaded circle) is rotated relative to the surrounding matrix during homogeneous defor-mation. The external foliation Se in the matrix, which could berelict bedding in a metasedimentary rock, becomes oblique tothe internal foliation Si in the poikiloblast (defined by a trail ofinclusions incorporated from the matrix during growth). Notethe importance of specifying a frame of reference when de-scribing the rotation of a grain in a rock. Also note that the deformation paths differ in these three models but the final relation betwen poikiloblast and its host matrix is similar. Redrawn from Passchier and Trouw (1996). (a) Model is sub-jected to right-lateral (dextral) simple shear; the poikiloblastexperiences a clockwise rotation with respect to the matrix. (b) Model is subjected to coaxial pure shear; poikiloblast remained stationary but Se experienced significant rotation relative to it and an external frame of reference, such as thesurface of the Earth. (c) Model is subjected to left-lateral(sinistral) simple shear. Se experienced significant rotation relative to the poikiloblast and to an external frame of refer-ence, while the poikiloblast remained stationary because it is embedded within and coupled to a nonrotating, non-deforming microlithon (shaded; see Section 15.1.1).
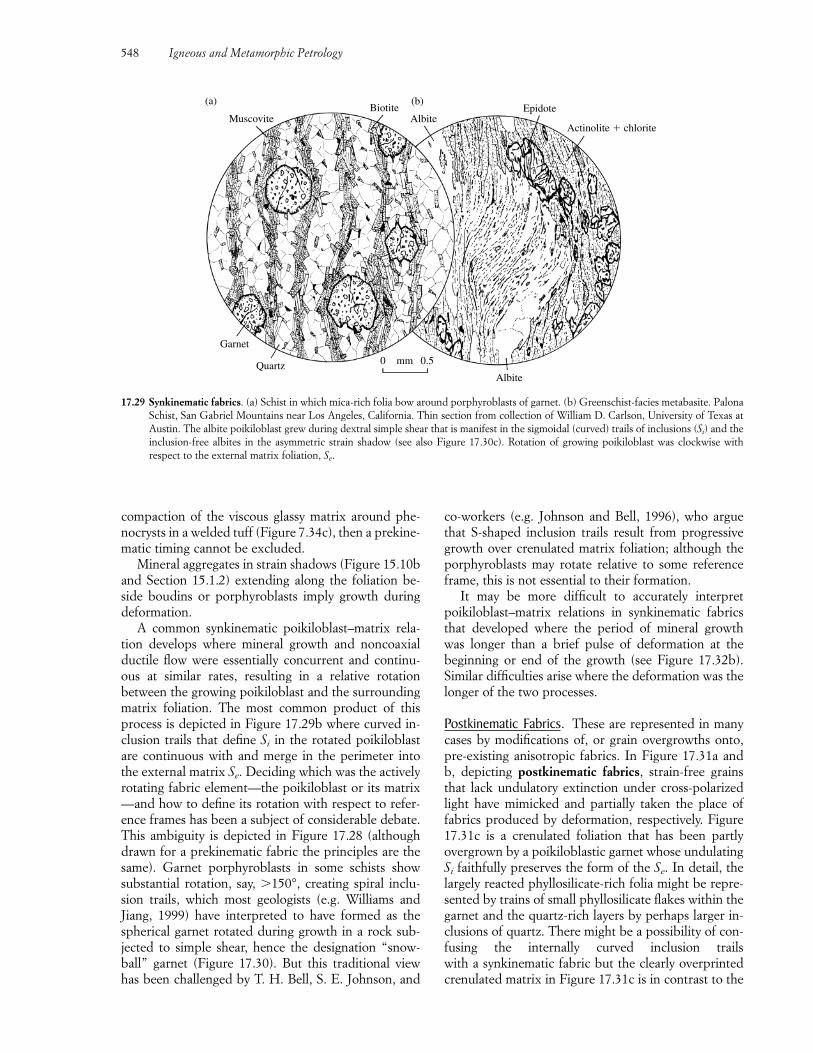
compaction of the viscous glassy matrix around phe-nocrysts in a welded tuff (Figure 7.34c), then a prekine-matic timing cannot be excluded.
Mineral aggregates in strain shadows (Figure 15.10band Section 15.1.2) extending along the foliation be-side boudins or porphyroblasts imply growth duringdeformation.
A common synkinematic poikiloblast–matrix rela-tion develops where mineral growth and noncoaxialductile flow were essentially concurrent and continu-ous at similar rates, resulting in a relative rotation between the growing poikiloblast and the surroundingmatrix foliation. The most common product of thisprocess is depicted in Figure 17.29b where curved in-clusion trails that define Si in the rotated poikiloblastare continuous with and merge in the perimeter intothe external matrix Se. Deciding which was the activelyrotating fabric element—the poikiloblast or its matrix—and how to define its rotation with respect to refer-ence frames has been a subject of considerable debate.This ambiguity is depicted in Figure 17.28 (althoughdrawn for a prekinematic fabric the principles are thesame). Garnet porphyroblasts in some schists showsubstantial rotation, say, 150°, creating spiral inclu-sion trails, which most geologists (e.g. Williams andJiang, 1999) have interpreted to have formed as thespherical garnet rotated during growth in a rock sub-jected to simple shear, hence the designation “snow-ball” garnet (Figure 17.30). But this traditional viewhas been challenged by T. H. Bell, S. E. Johnson, and
548 Igneous and Metamorphic Petrology
MuscoviteBiotite
Albite
(a) (b)Epidote
Actinolite � chlorite
Garnet
Quartz 0 0.5mm
Albite
17.29 Synkinematic fabrics. (a) Schist in which mica-rich folia bow around porphyroblasts of garnet. (b) Greenschist-facies metabasite. PalonaSchist, San Gabriel Mountains near Los Angeles, California. Thin section from collection of William D. Carlson, University of Texas atAustin. The albite poikiloblast grew during dextral simple shear that is manifest in the sigmoidal (curved) trails of inclusions (Si) and theinclusion-free albites in the asymmetric strain shadow (see also Figure 17.30c). Rotation of growing poikiloblast was clockwise with respect to the external matrix foliation, Se.
co-workers (e.g. Johnson and Bell, 1996), who arguethat S-shaped inclusion trails result from progressivegrowth over crenulated matrix foliation; although theporphyroblasts may rotate relative to some referenceframe, this is not essential to their formation.
It may be more difficult to accurately interpret poikiloblast–matrix relations in synkinematic fabricsthat developed where the period of mineral growth was longer than a brief pulse of deformation at the beginning or end of the growth (see Figure 17.32b).Similar difficulties arise where the deformation was thelonger of the two processes.
Postkinematic Fabrics. These are represented in manycases by modifications of, or grain overgrowths onto,pre-existing anisotropic fabrics. In Figure 17.31a andb, depicting postkinematic fabrics, strain-free grainsthat lack undulatory extinction under cross-polarizedlight have mimicked and partially taken the place offabrics produced by deformation, respectively. Figure17.31c is a crenulated foliation that has been partlyovergrown by a poikiloblastic garnet whose undulatingSi faithfully preserves the form of the Se. In detail, thelargely reacted phyllosilicate-rich folia might be repre-sented by trains of small phyllosilicate flakes within thegarnet and the quartz-rich layers by perhaps larger in-clusions of quartz. There might be a possibility of con-fusing the internally curved inclusion trails with a synkinematic fabric but the clearly overprintedcrenulated matrix in Figure 17.31c is in contrast to the
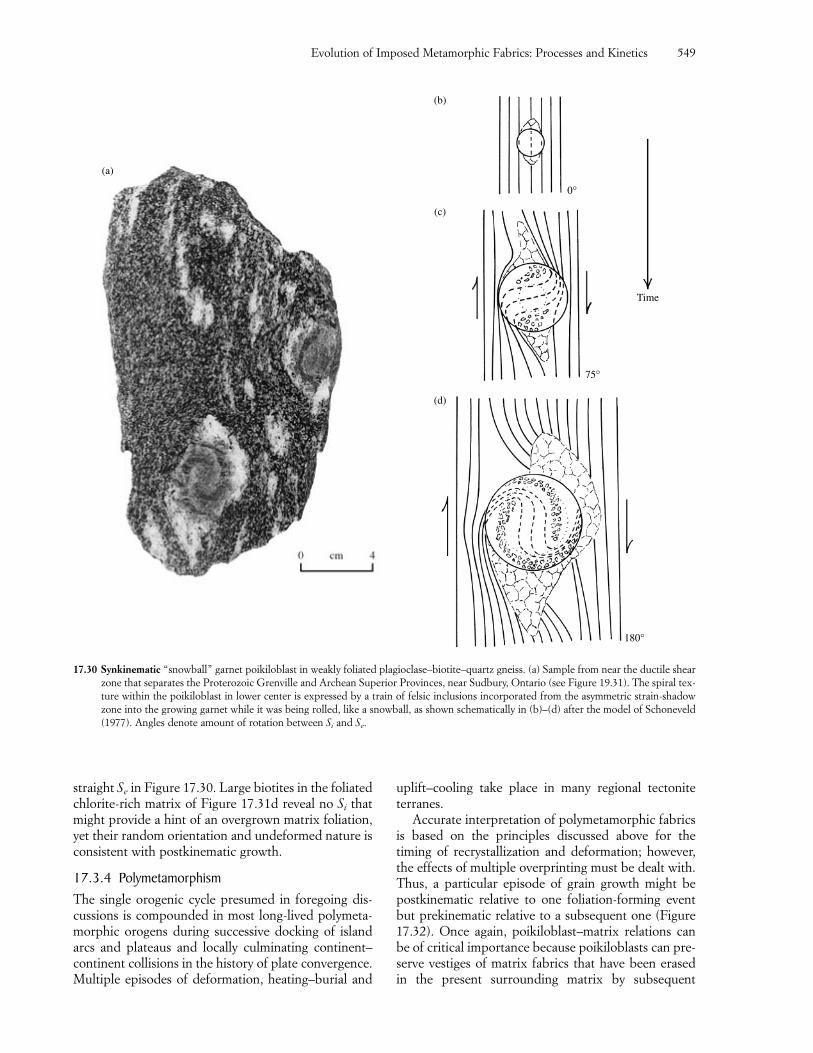
straight Se in Figure 17.30. Large biotites in the foliatedchlorite-rich matrix of Figure 17.31d reveal no Si thatmight provide a hint of an overgrown matrix foliation,yet their random orientation and undeformed nature isconsistent with postkinematic growth.
17.3.4 PolymetamorphismThe single orogenic cycle presumed in foregoing dis-cussions is compounded in most long-lived polymeta-morphic orogens during successive docking of islandarcs and plateaus and locally culminating continent–continent collisions in the history of plate convergence.Multiple episodes of deformation, heating–burial and
uplift–cooling take place in many regional tectonite terranes.
Accurate interpretation of polymetamorphic fabricsis based on the principles discussed above for the timing of recrystallization and deformation; however,the effects of multiple overprinting must be dealt with.Thus, a particular episode of grain growth might bepostkinematic relative to one foliation-forming eventbut prekinematic relative to a subsequent one (Figure17.32). Once again, poikiloblast–matrix relations canbe of critical importance because poikiloblasts can pre-serve vestiges of matrix fabrics that have been erased in the present surrounding matrix by subsequent
Evolution of Imposed Metamorphic Fabrics: Processes and Kinetics 549
Time
(d)
(c)
(b)
75°
180°
0°
17.30 Synkinematic “snowball” garnet poikiloblast in weakly foliated plagioclase–biotite–quartz gneiss. (a) Sample from near the ductile shearzone that separates the Proterozoic Grenville and Archean Superior Provinces, near Sudbury, Ontario (see Figure 19.31). The spiral tex-ture within the poikiloblast in lower center is expressed by a train of felsic inclusions incorporated from the asymmetric strain-shadowzone into the growing garnet while it was being rolled, like a snowball, as shown schematically in (b)–(d) after the model of Schoneveld(1977). Angles denote amount of rotation between Si and Se.
(a)
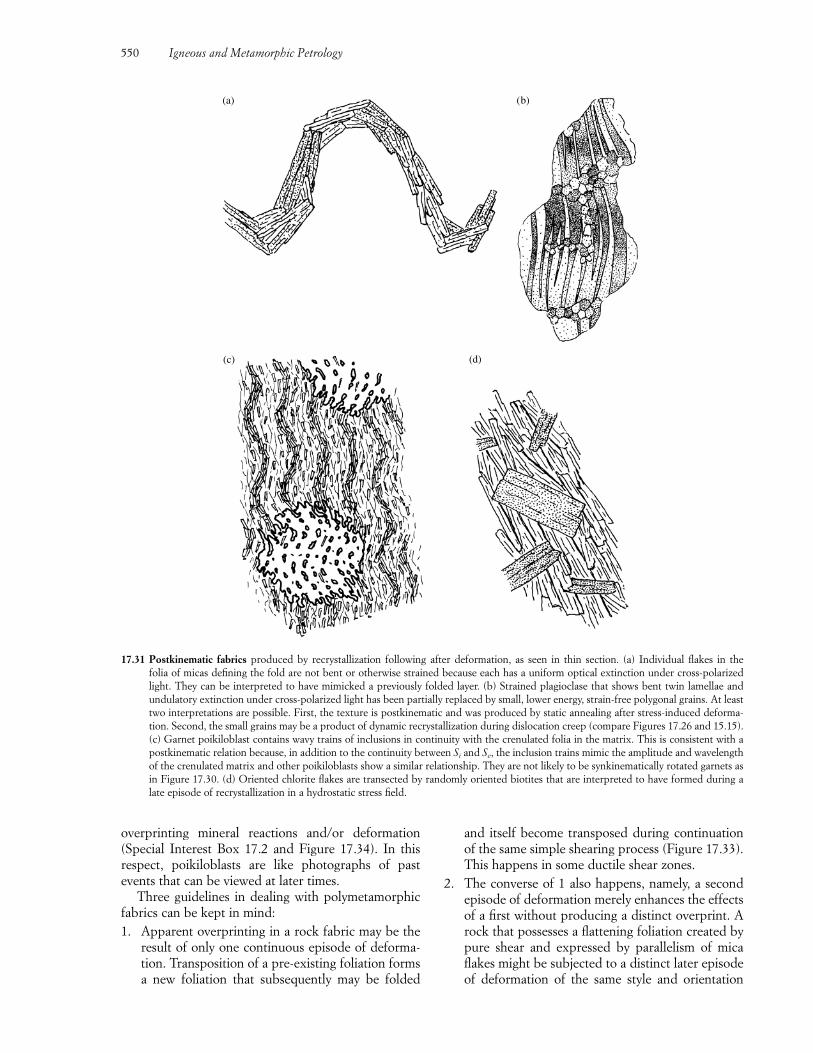
overprinting mineral reactions and/or deformation(Special Interest Box 17.2 and Figure 17.34). In this respect, poikiloblasts are like photographs of pastevents that can be viewed at later times.
Three guidelines in dealing with polymetamorphicfabrics can be kept in mind:1. Apparent overprinting in a rock fabric may be the
result of only one continuous episode of deforma-tion. Transposition of a pre-existing foliation formsa new foliation that subsequently may be folded
and itself become transposed during continuationof the same simple shearing process (Figure 17.33).This happens in some ductile shear zones.
2. The converse of 1 also happens, namely, a secondepisode of deformation merely enhances the effectsof a first without producing a distinct overprint. Arock that possesses a flattening foliation created bypure shear and expressed by parallelism of micaflakes might be subjected to a distinct later episodeof deformation of the same style and orientation
550 Igneous and Metamorphic Petrology
(a) (b)
(d)(c)
17.31 Postkinematic fabrics produced by recrystallization following after deformation, as seen in thin section. (a) Individual flakes in the folia of micas defining the fold are not bent or otherwise strained because each has a uniform optical extinction under cross-polarizedlight. They can be interpreted to have mimicked a previously folded layer. (b) Strained plagioclase that shows bent twin lamellae and undulatory extinction under cross-polarized light has been partially replaced by small, lower energy, strain-free polygonal grains. At leasttwo interpretations are possible. First, the texture is postkinematic and was produced by static annealing after stress-induced deforma-tion. Second, the small grains may be a product of dynamic recrystallization during dislocation creep (compare Figures 17.26 and 15.15).(c) Garnet poikiloblast contains wavy trains of inclusions in continuity with the crenulated folia in the matrix. This is consistent with apostkinematic relation because, in addition to the continuity between Si and Se, the inclusion trains mimic the amplitude and wavelengthof the crenulated matrix and other poikiloblasts show a similar relationship. They are not likely to be synkinematically rotated garnets asin Figure 17.30. (d) Oriented chlorite flakes are transected by randomly oriented biotites that are interpreted to have formed during alate episode of recrystallization in a hydrostatic stress field.
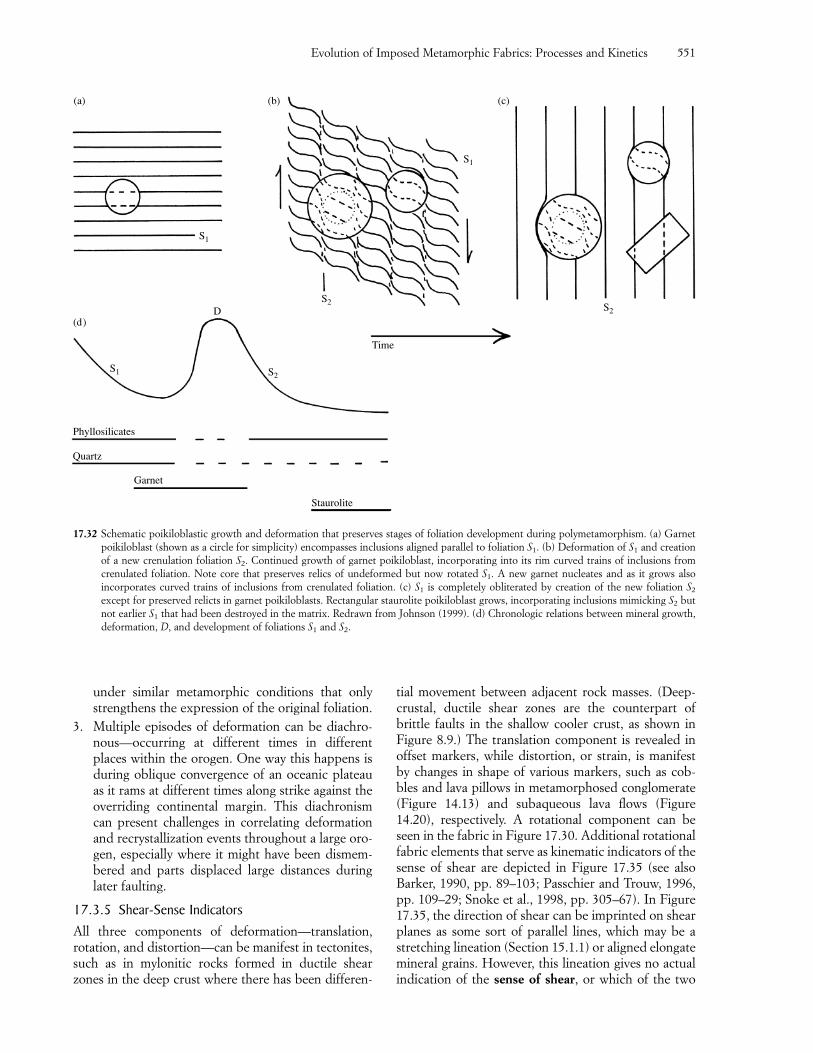
under similar metamorphic conditions that onlystrengthens the expression of the original foliation.
3. Multiple episodes of deformation can be diachro-nous—occurring at different times in differentplaces within the orogen. One way this happens isduring oblique convergence of an oceanic plateauas it rams at different times along strike against theoverriding continental margin. This diachronismcan present challenges in correlating deformationand recrystallization events throughout a large oro-gen, especially where it might have been dismem-bered and parts displaced large distances duringlater faulting.
17.3.5 Shear-Sense IndicatorsAll three components of deformation—translation, rotation, and distortion—can be manifest in tectonites,such as in mylonitic rocks formed in ductile shearzones in the deep crust where there has been differen-
tial movement between adjacent rock masses. (Deep-crustal, ductile shear zones are the counterpart of brittle faults in the shallow cooler crust, as shown inFigure 8.9.) The translation component is revealed inoffset markers, while distortion, or strain, is manifestby changes in shape of various markers, such as cob-bles and lava pillows in metamorphosed conglomerate(Figure 14.13) and subaqueous lava flows (Figure14.20), respectively. A rotational component can beseen in the fabric in Figure 17.30. Additional rotationalfabric elements that serve as kinematic indicators of thesense of shear are depicted in Figure 17.35 (see alsoBarker, 1990, pp. 89–103; Passchier and Trouw, 1996,pp. 109–29; Snoke et al., 1998, pp. 305–67). In Figure17.35, the direction of shear can be imprinted on shearplanes as some sort of parallel lines, which may be astretching lineation (Section 15.1.1) or aligned elongatemineral grains. However, this lineation gives no actualindication of the sense of shear, or which of the two
Evolution of Imposed Metamorphic Fabrics: Processes and Kinetics 551
(c)(b)(a)
(d)D
S1
S2
S1
S2
Time
S2S1
Phyllosilicates
Garnet
Quartz
Staurolite
17.32 Schematic poikiloblastic growth and deformation that preserves stages of foliation development during polymetamorphism. (a) Garnetpoikiloblast (shown as a circle for simplicity) encompasses inclusions aligned parallel to foliation S1. (b) Deformation of S1 and creationof a new crenulation foliation S2. Continued growth of garnet poikiloblast, incorporating into its rim curved trains of inclusions fromcrenulated foliation. Note core that preserves relics of undeformed but now rotated S1. A new garnet nucleates and as it grows also incorporates curved trains of inclusions from crenulated foliation. (c) S1 is completely obliterated by creation of the new foliation S2
except for preserved relicts in garnet poikiloblasts. Rectangular staurolite poikiloblast grows, incorporating inclusions mimicking S2 butnot earlier S1 that had been destroyed in the matrix. Redrawn from Johnson (1999). (d) Chronologic relations between mineral growth,deformation, D, and development of foliations S1 and S2.
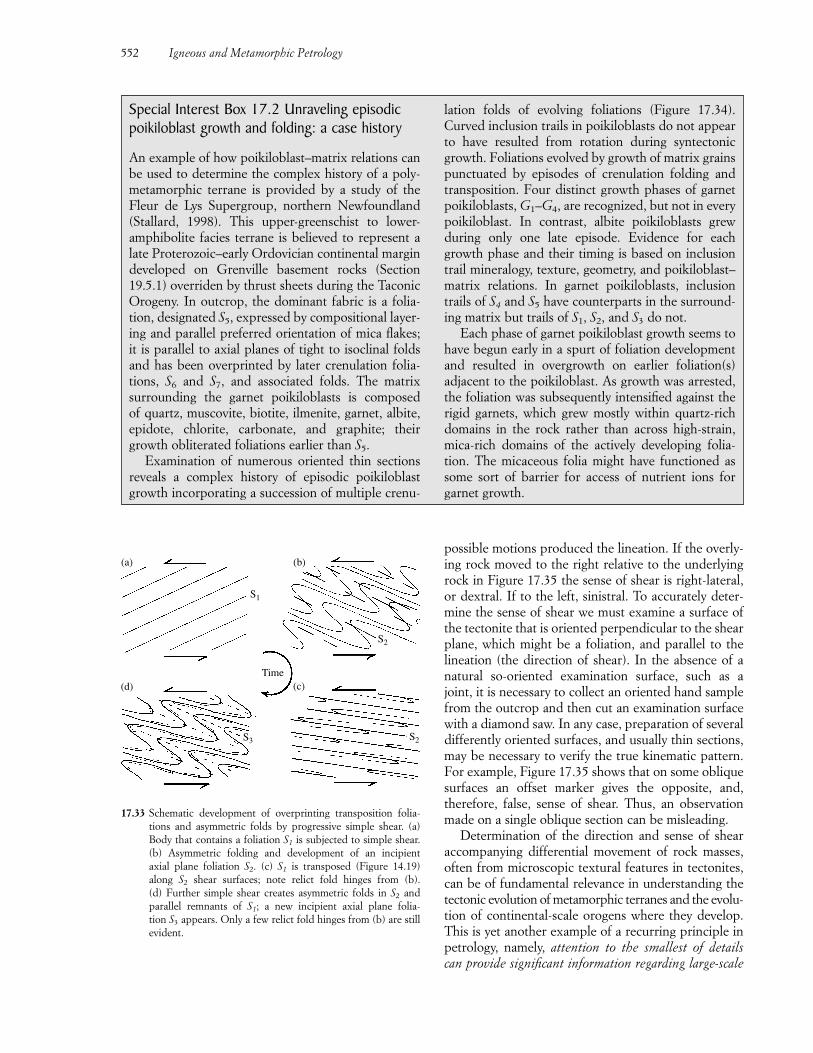
552 Igneous and Metamorphic Petrology
Special Interest Box 17.2 Unraveling episodicpoikiloblast growth and folding: a case history
An example of how poikiloblast–matrix relations canbe used to determine the complex history of a poly-metamorphic terrane is provided by a study of theFleur de Lys Supergroup, northern Newfoundland(Stallard, 1998). This upper-greenschist to lower-amphibolite facies terrane is believed to represent alate Proterozoic–early Ordovician continental margindeveloped on Grenville basement rocks (Section19.5.1) overriden by thrust sheets during the TaconicOrogeny. In outcrop, the dominant fabric is a folia-tion, designated S5, expressed by compositional layer-ing and parallel preferred orientation of mica flakes;it is parallel to axial planes of tight to isoclinal foldsand has been overprinted by later crenulation folia-tions, S6 and S7, and associated folds. The matrix surrounding the garnet poikiloblasts is composed of quartz, muscovite, biotite, ilmenite, garnet, albite,epidote, chlorite, carbonate, and graphite; theirgrowth obliterated foliations earlier than S5.
Examination of numerous oriented thin sectionsreveals a complex history of episodic poikiloblastgrowth incorporating a succession of multiple crenu-
(a) (b)
(d) (c)Time
S1
S2
S2
S3
17.33 Schematic development of overprinting transposition folia-tions and asymmetric folds by progressive simple shear. (a)Body that contains a foliation S1 is subjected to simple shear.(b) Asymmetric folding and development of an incipient axial plane foliation S2. (c) S1 is transposed (Figure 14.19)along S2 shear surfaces; note relict fold hinges from (b). (d) Further simple shear creates asymmetric folds in S2 andparallel remnants of S1; a new incipient axial plane folia-tion S3 appears. Only a few relict fold hinges from (b) are stillevident.
lation folds of evolving foliations (Figure 17.34).Curved inclusion trails in poikiloblasts do not appearto have resulted from rotation during syntectonicgrowth. Foliations evolved by growth of matrix grainspunctuated by episodes of crenulation folding andtransposition. Four distinct growth phases of garnetpoikiloblasts, G1–G4, are recognized, but not in everypoikiloblast. In contrast, albite poikiloblasts grewduring only one late episode. Evidence for eachgrowth phase and their timing is based on inclusiontrail mineralogy, texture, geometry, and poikiloblast–matrix relations. In garnet poikiloblasts, inclusiontrails of S4 and S5 have counterparts in the surround-ing matrix but trails of S1, S2, and S3 do not.
Each phase of garnet poikiloblast growth seems tohave begun early in a spurt of foliation developmentand resulted in overgrowth on earlier foliation(s) adjacent to the poikiloblast. As growth was arrested,the foliation was subsequently intensified against therigid garnets, which grew mostly within quartz-richdomains in the rock rather than across high-strain,mica-rich domains of the actively developing folia-tion. The micaceous folia might have functioned assome sort of barrier for access of nutrient ions for garnet growth.
possible motions produced the lineation. If the overly-ing rock moved to the right relative to the underlyingrock in Figure 17.35 the sense of shear is right-lateral,or dextral. If to the left, sinistral. To accurately deter-mine the sense of shear we must examine a surface ofthe tectonite that is oriented perpendicular to the shearplane, which might be a foliation, and parallel to thelineation (the direction of shear). In the absence of anatural so-oriented examination surface, such as ajoint, it is necessary to collect an oriented hand samplefrom the outcrop and then cut an examination surfacewith a diamond saw. In any case, preparation of severaldifferently oriented surfaces, and usually thin sections,may be necessary to verify the true kinematic pattern.For example, Figure 17.35 shows that on some obliquesurfaces an offset marker gives the opposite, and,therefore, false, sense of shear. Thus, an observationmade on a single oblique section can be misleading.
Determination of the direction and sense of shearaccompanying differential movement of rock masses,often from microscopic textural features in tectonites,can be of fundamental relevance in understanding thetectonic evolution of metamorphic terranes and the evolu-tion of continental-scale orogens where they develop.This is yet another example of a recurring principle inpetrology, namely, attention to the smallest of details can provide significant information regarding large-scale
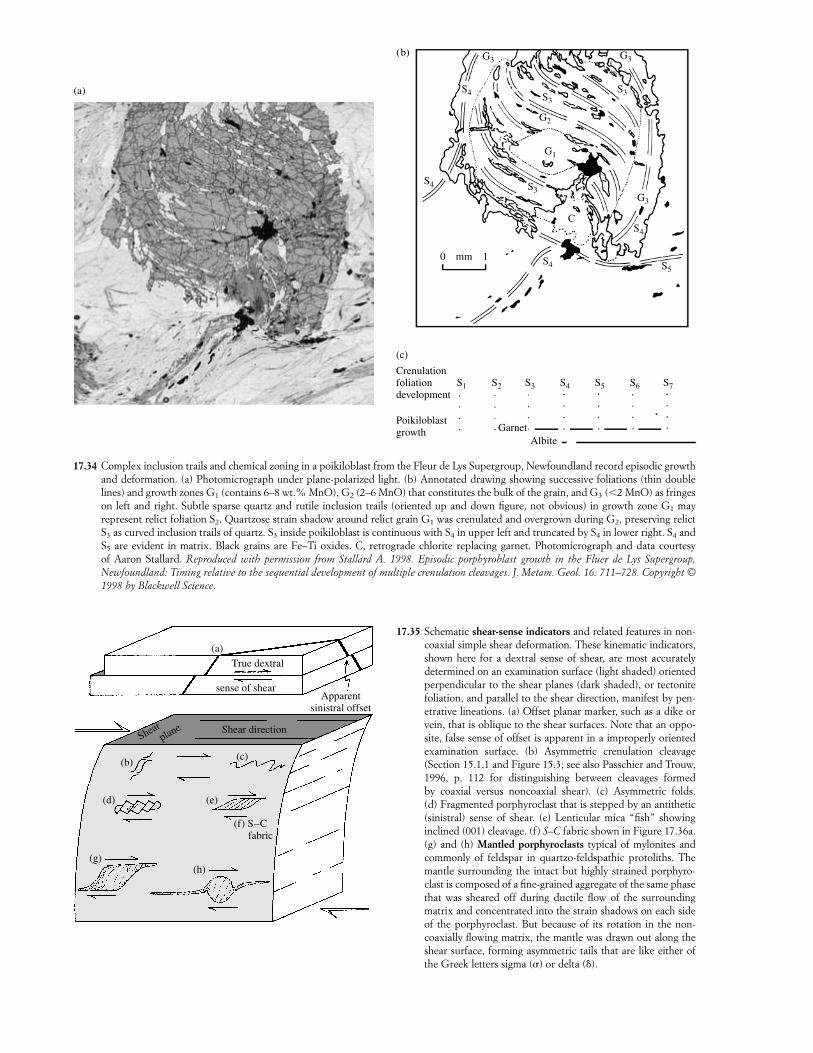
(a)
(c)
Crenulationfoliationdevelopment
Poikiloblastgrowth Garnet
Albite
S1 S2 S3 S4 S5 S6 S7
S4
S4 S5
S4
G3
S3
G1
G2
S3
G3 G3
S3S4
C
0 mm 1
(b)
17.34 Complex inclusion trails and chemical zoning in a poikiloblast from the Fleur de Lys Supergroup, Newfoundland record episodic growthand deformation. (a) Photomicrograph under plane-polarized light. (b) Annotated drawing showing successive foliations (thin doublelines) and growth zones G1 (contains 6–8 wt.% MnO), G2 (2–6 MnO) that constitutes the bulk of the grain, and G3 (�2 MnO) as fringeson left and right. Subtle sparse quartz and rutile inclusion trails (oriented up and down figure, not obvious) in growth zone G1 may represent relict foliation S2. Quartzose strain shadow around relict grain G1 was crenulated and overgrown during G2, preserving relictS3 as curved inclusion trails of quartz. S3 inside poikiloblast is continuous with S4 in upper left and truncated by S4 in lower right. S4 andS5 are evident in matrix. Black grains are Fe–Ti oxides. C, retrograde chlorite replacing garnet. Photomicrograph and data courtesy of Aaron Stallard. Reproduced with permission from Stallard A. 1998. Episodic porphyroblast growth in the Fluer de Lys Supergroup, Newfoundland: Timing relative to the sequential development of multiple crenulation cleavages. J. Metam. Geol. 16: 711–728. Copyright ©1998 by Blackwell Science.
(a)
True dextral
sense of shearApparent
sinistral offset
Shear directionShear
plane
(b)(c)
(e)(d)
(g)(h)
(f) S–Cfabric
17.35 Schematic shear-sense indicators and related features in non-coaxial simple shear deformation. These kinematic indicators,shown here for a dextral sense of shear, are most accurately determined on an examination surface (light shaded) orientedperpendicular to the shear planes (dark shaded), or tectonitefoliation, and parallel to the shear direction, manifest by pen-etrative lineations. (a) Offset planar marker, such as a dike orvein, that is oblique to the shear surfaces. Note that an oppo-site, false sense of offset is apparent in a improperly orientedexamination surface. (b) Asymmetric crenulation cleavage(Section 15.1.1 and Figure 15.3; see also Passchier and Trouw,1996, p. 112 for distinguishing between cleavages formed by coaxial versus noncoaxial shear). (c) Asymmetric folds. (d) Fragmented porphyroclast that is stepped by an antithetic(sinistral) sense of shear. (e) Lenticular mica “fish” showing inclined (001) cleavage. (f) S–C fabric shown in Figure 17.36a.(g) and (h) Mantled porphyroclasts typical of mylonites andcommonly of feldspar in quartzo-feldspathic protoliths. Themantle surrounding the intact but highly strained porphyro-clast is composed of a fine-grained aggregate of the same phasethat was sheared off during ductile flow of the surroundingmatrix and concentrated into the strain shadows on each sideof the porphyroclast. But because of its rotation in the non-coaxially flowing matrix, the mantle was drawn out along theshear surface, forming asymmetric tails that are like either ofthe Greek letters sigma (�) or delta ( ).
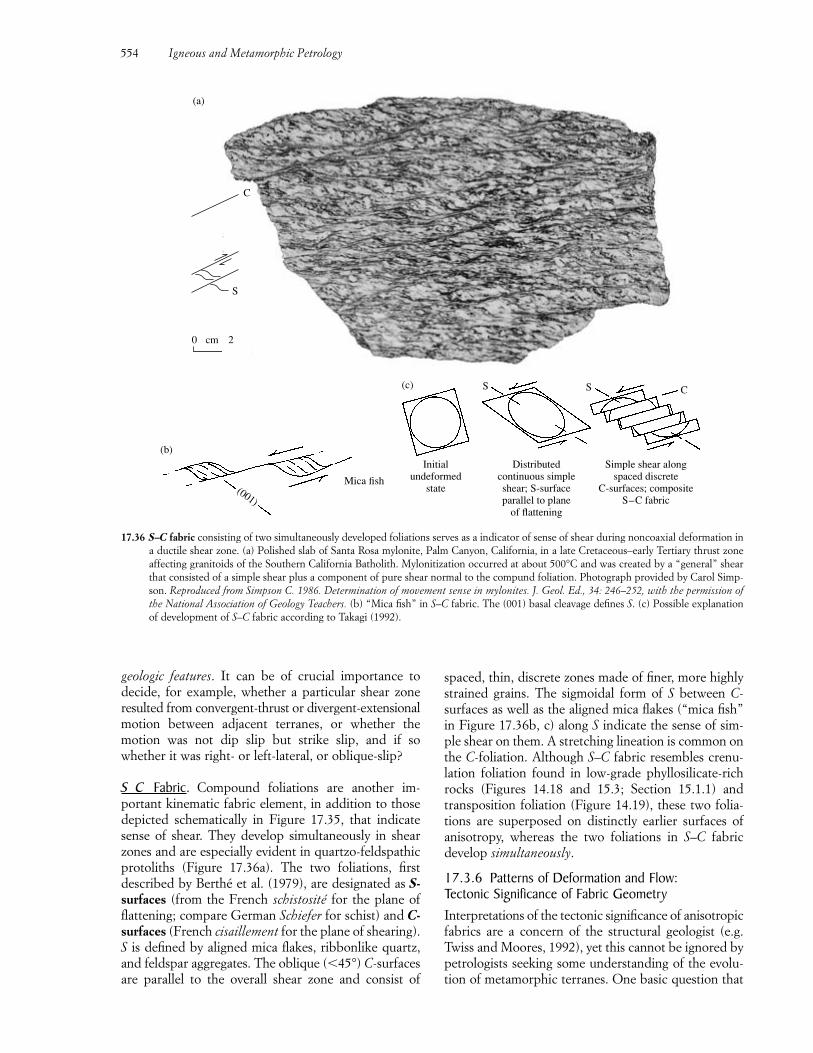
(a)
0 2cm
C
S
17.36 S–C fabric consisting of two simultaneously developed foliations serves as a indicator of sense of shear during noncoaxial deformation ina ductile shear zone. (a) Polished slab of Santa Rosa mylonite, Palm Canyon, California, in a late Cretaceous–early Tertiary thrust zoneaffecting granitoids of the Southern California Batholith. Mylonitization occurred at about 500°C and was created by a “general” shearthat consisted of a simple shear plus a component of pure shear normal to the compund foliation. Photograph provided by Carol Simp-son. Reproduced from Simpson C. 1986. Determination of movement sense in mylonites. J. Geol. Ed., 34: 246–252, with the permission ofthe National Association of Geology Teachers. (b) “Mica fish” in S–C fabric. The (001) basal cleavage defines S. (c) Possible explanationof development of S–C fabric according to Takagi (1992).
geologic features. It can be of crucial importance to decide, for example, whether a particular shear zoneresulted from convergent-thrust or divergent-extensionalmotion between adjacent terranes, or whether the motion was not dip slip but strike slip, and if sowhether it was right- or left-lateral, or oblique-slip?
S C Fabric. Compound foliations are another im-portant kinematic fabric element, in addition to thosedepicted schematically in Figure 17.35, that indicatesense of shear. They develop simultaneously in shearzones and are especially evident in quartzo-feldspathicprotoliths (Figure 17.36a). The two foliations, first described by Berthé et al. (1979), are designated as S-surfaces (from the French schistosité for the plane offlattening; compare German Schiefer for schist) and C-surfaces (French cisaillement for the plane of shearing).S is defined by aligned mica flakes, ribbonlike quartz,and feldspar aggregates. The oblique (�45°) C-surfacesare parallel to the overall shear zone and consist of
spaced, thin, discrete zones made of finer, more highlystrained grains. The sigmoidal form of S between C-surfaces as well as the aligned mica flakes (“mica fish”in Figure 17.36b, c) along S indicate the sense of sim-ple shear on them. A stretching lineation is common onthe C-foliation. Although S–C fabric resembles crenu-lation foliation found in low-grade phyllosilicate-richrocks (Figures 14.18 and 15.3; Section 15.1.1) andtransposition foliation (Figure 14.19), these two folia-tions are superposed on distinctly earlier surfaces ofanisotropy, whereas the two foliations in S–C fabric develop simultaneously.
17.3.6 Patterns of Deformation and Flow: Tectonic Significance of Fabric GeometryInterpretations of the tectonic significance of anisotropicfabrics are a concern of the structural geologist (e.g.Twiss and Moores, 1992), yet this cannot be ignored bypetrologists seeking some understanding of the evolu-tion of metamorphic terranes. One basic question that
554 Igneous and Metamorphic Petrology
(b)
Mica fish(001)
(c) S S C
Initialundeformed
state
Distributedcontinuous simpleshear; S-surfaceparallel to plane
of flattening
Simple shear alongspaced discrete
C-surfaces; compositeS–C fabric
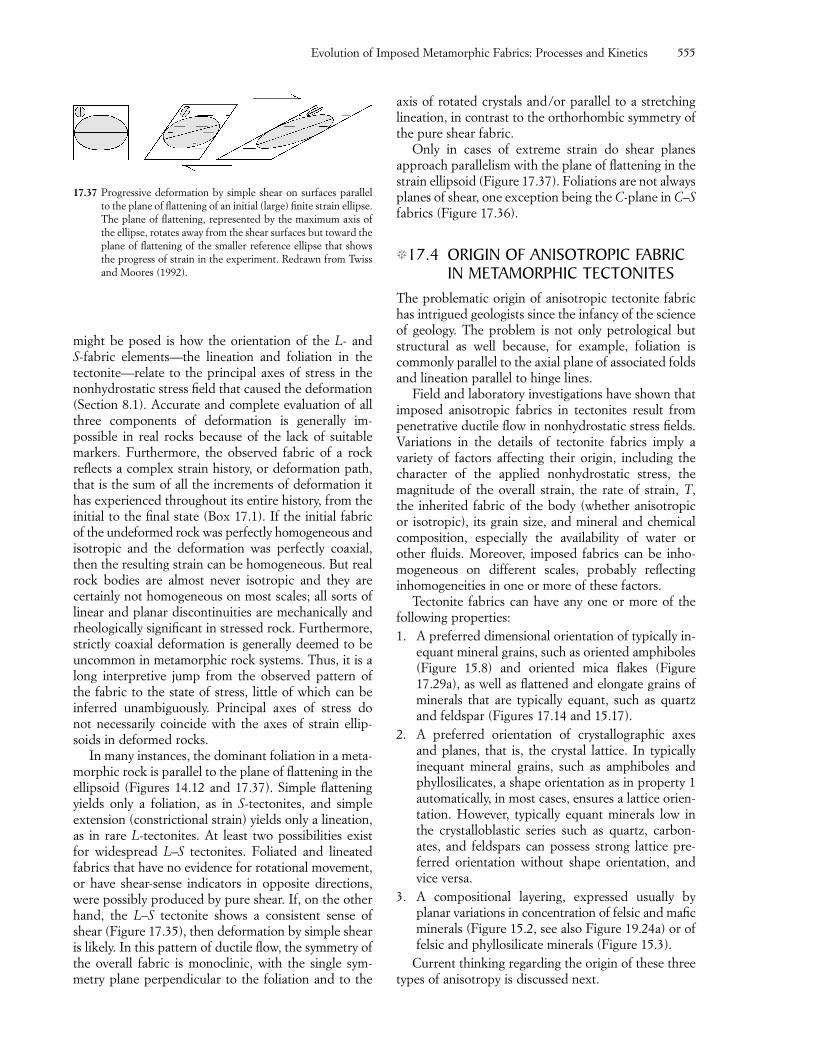
might be posed is how the orientation of the L- and S-fabric elements—the lineation and foliation in thetectonite—relate to the principal axes of stress in thenonhydrostatic stress field that caused the deformation(Section 8.1). Accurate and complete evaluation of allthree components of deformation is generally im-possible in real rocks because of the lack of suitablemarkers. Furthermore, the observed fabric of a rockreflects a complex strain history, or deformation path,that is the sum of all the increments of deformation ithas experienced throughout its entire history, from theinitial to the final state (Box 17.1). If the initial fabric of the undeformed rock was perfectly homogeneous andisotropic and the deformation was perfectly coaxial,then the resulting strain can be homogeneous. But realrock bodies are almost never isotropic and they are certainly not homogeneous on most scales; all sorts oflinear and planar discontinuities are mechanically andrheologically significant in stressed rock. Furthermore,strictly coaxial deformation is generally deemed to beuncommon in metamorphic rock systems. Thus, it is along interpretive jump from the observed pattern ofthe fabric to the state of stress, little of which can be inferred unambiguously. Principal axes of stress do not necessarily coincide with the axes of strain ellip-soids in deformed rocks.
In many instances, the dominant foliation in a meta-morphic rock is parallel to the plane of flattening in theellipsoid (Figures 14.12 and 17.37). Simple flatteningyields only a foliation, as in S-tectonites, and simple extension (constrictional strain) yields only a lineation,as in rare L-tectonites. At least two possibilities existfor widespread L–S tectonites. Foliated and lineatedfabrics that have no evidence for rotational movement,or have shear-sense indicators in opposite directions,were possibly produced by pure shear. If, on the otherhand, the L–S tectonite shows a consistent sense ofshear (Figure 17.35), then deformation by simple shearis likely. In this pattern of ductile flow, the symmetry ofthe overall fabric is monoclinic, with the single sym-metry plane perpendicular to the foliation and to the
axis of rotated crystals and/or parallel to a stretching lineation, in contrast to the orthorhombic symmetry ofthe pure shear fabric.
Only in cases of extreme strain do shear planes approach parallelism with the plane of flattening in thestrain ellipsoid (Figure 17.37). Foliations are not alwaysplanes of shear, one exception being the C-plane in C–Sfabrics (Figure 17.36).
�17.4 ORIGIN OF ANISOTROPIC FABRICIN METAMORPHIC TECTONITES
The problematic origin of anisotropic tectonite fabrichas intrigued geologists since the infancy of the scienceof geology. The problem is not only petrological butstructural as well because, for example, foliation iscommonly parallel to the axial plane of associated foldsand lineation parallel to hinge lines.
Field and laboratory investigations have shown thatimposed anisotropic fabrics in tectonites result frompenetrative ductile flow in nonhydrostatic stress fields.Variations in the details of tectonite fabrics imply a variety of factors affecting their origin, including thecharacter of the applied nonhydrostatic stress, the magnitude of the overall strain, the rate of strain, T, the inherited fabric of the body (whether anisotropic or isotropic), its grain size, and mineral and chemicalcomposition, especially the availability of water orother fluids. Moreover, imposed fabrics can be inho-mogeneous on different scales, probably reflecting inhomogeneities in one or more of these factors.
Tectonite fabrics can have any one or more of thefollowing properties:1. A preferred dimensional orientation of typically in-
equant mineral grains, such as oriented amphiboles(Figure 15.8) and oriented mica flakes (Figure17.29a), as well as flattened and elongate grains ofminerals that are typically equant, such as quartzand feldspar (Figures 17.14 and 15.17).
2. A preferred orientation of crystallographic axesand planes, that is, the crystal lattice. In typicallyinequant mineral grains, such as amphiboles andphyllosilicates, a shape orientation as in property 1automatically, in most cases, ensures a lattice orien-tation. However, typically equant minerals low inthe crystalloblastic series such as quartz, carbon-ates, and feldspars can possess strong lattice pre-ferred orientation without shape orientation, andvice versa.
3. A compositional layering, expressed usually by planar variations in concentration of felsic and maficminerals (Figure 15.2, see also Figure 19.24a) or offelsic and phyllosilicate minerals (Figure 15.3).
Current thinking regarding the origin of these threetypes of anisotropy is discussed next.
Evolution of Imposed Metamorphic Fabrics: Processes and Kinetics 555
17.37 Progressive deformation by simple shear on surfaces parallelto the plane of flattening of an initial (large) finite strain ellipse.The plane of flattening, represented by the maximum axis ofthe ellipse, rotates away from the shear surfaces but toward theplane of flattening of the smaller reference ellipse that showsthe progress of strain in the experiment. Redrawn from Twissand Moores (1992).
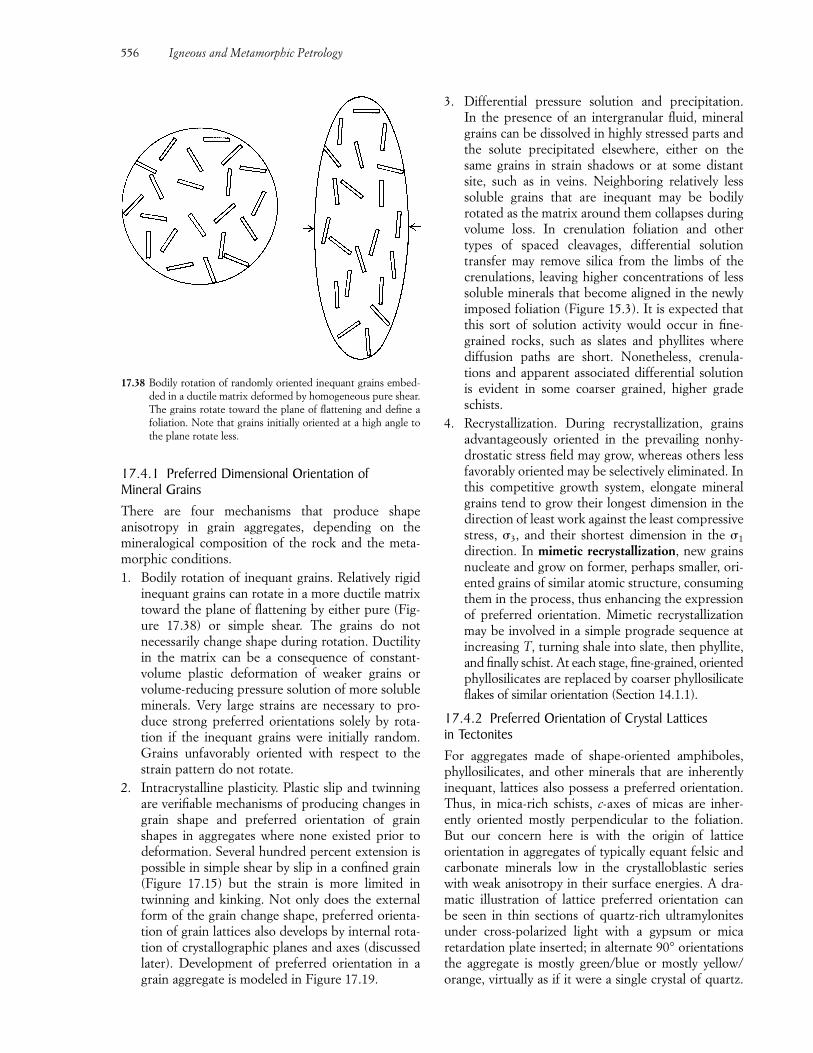
17.4.1 Preferred Dimensional Orientation of Mineral GrainsThere are four mechanisms that produce shapeanisotropy in grain aggregates, depending on the mineralogical composition of the rock and the meta-morphic conditions.1. Bodily rotation of inequant grains. Relatively rigid
inequant grains can rotate in a more ductile matrixtoward the plane of flattening by either pure (Fig-ure 17.38) or simple shear. The grains do not necessarily change shape during rotation. Ductilityin the matrix can be a consequence of constant-volume plastic deformation of weaker grains or volume-reducing pressure solution of more solubleminerals. Very large strains are necessary to pro-duce strong preferred orientations solely by rota-tion if the inequant grains were initially random.Grains unfavorably oriented with respect to thestrain pattern do not rotate.
2. Intracrystalline plasticity. Plastic slip and twinningare verifiable mechanisms of producing changes ingrain shape and preferred orientation of grainshapes in aggregates where none existed prior todeformation. Several hundred percent extension ispossible in simple shear by slip in a confined grain(Figure 17.15) but the strain is more limited intwinning and kinking. Not only does the externalform of the grain change shape, preferred orienta-tion of grain lattices also develops by internal rota-tion of crystallographic planes and axes (discussedlater). Development of preferred orientation in agrain aggregate is modeled in Figure 17.19.
3. Differential pressure solution and precipitation. In the presence of an intergranular fluid, mineralgrains can be dissolved in highly stressed parts andthe solute precipitated elsewhere, either on thesame grains in strain shadows or at some distantsite, such as in veins. Neighboring relatively lesssoluble grains that are inequant may be bodily rotated as the matrix around them collapses duringvolume loss. In crenulation foliation and othertypes of spaced cleavages, differential solutiontransfer may remove silica from the limbs of thecrenulations, leaving higher concentrations of lesssoluble minerals that become aligned in the newlyimposed foliation (Figure 15.3). It is expected thatthis sort of solution activity would occur in fine-grained rocks, such as slates and phyllites wherediffusion paths are short. Nonetheless, crenula-tions and apparent associated differential solutionis evident in some coarser grained, higher gradeschists.
4. Recrystallization. During recrystallization, grainsadvantageously oriented in the prevailing nonhy-drostatic stress field may grow, whereas others lessfavorably oriented may be selectively eliminated. Inthis competitive growth system, elongate mineralgrains tend to grow their longest dimension in thedirection of least work against the least compressivestress, �3, and their shortest dimension in the �1
direction. In mimetic recrystallization, new grainsnucleate and grow on former, perhaps smaller, ori-ented grains of similar atomic structure, consumingthem in the process, thus enhancing the expressionof preferred orientation. Mimetic recrystallizationmay be involved in a simple prograde sequence atincreasing T, turning shale into slate, then phyllite,and finally schist. At each stage, fine-grained, orientedphyllosilicates are replaced by coarser phyllosilicateflakes of similar orientation (Section 14.1.1).
17.4.2 Preferred Orientation of Crystal Lattices in TectonitesFor aggregates made of shape-oriented amphiboles,phyllosilicates, and other minerals that are inherentlyinequant, lattices also possess a preferred orientation.Thus, in mica-rich schists, c-axes of micas are inher-ently oriented mostly perpendicular to the foliation.But our concern here is with the origin of lattice orientation in aggregates of typically equant felsic andcarbonate minerals low in the crystalloblastic serieswith weak anisotropy in their surface energies. A dra-matic illustration of lattice preferred orientation can be seen in thin sections of quartz-rich ultramylonitesunder cross-polarized light with a gypsum or mica retardation plate inserted; in alternate 90° orientationsthe aggregate is mostly green/blue or mostly yellow/orange, virtually as if it were a single crystal of quartz.
556 Igneous and Metamorphic Petrology
17.38 Bodily rotation of randomly oriented inequant grains embed-ded in a ductile matrix deformed by homogeneous pure shear.The grains rotate toward the plane of flattening and define afoliation. Note that grains initially oriented at a high angle tothe plane rotate less.
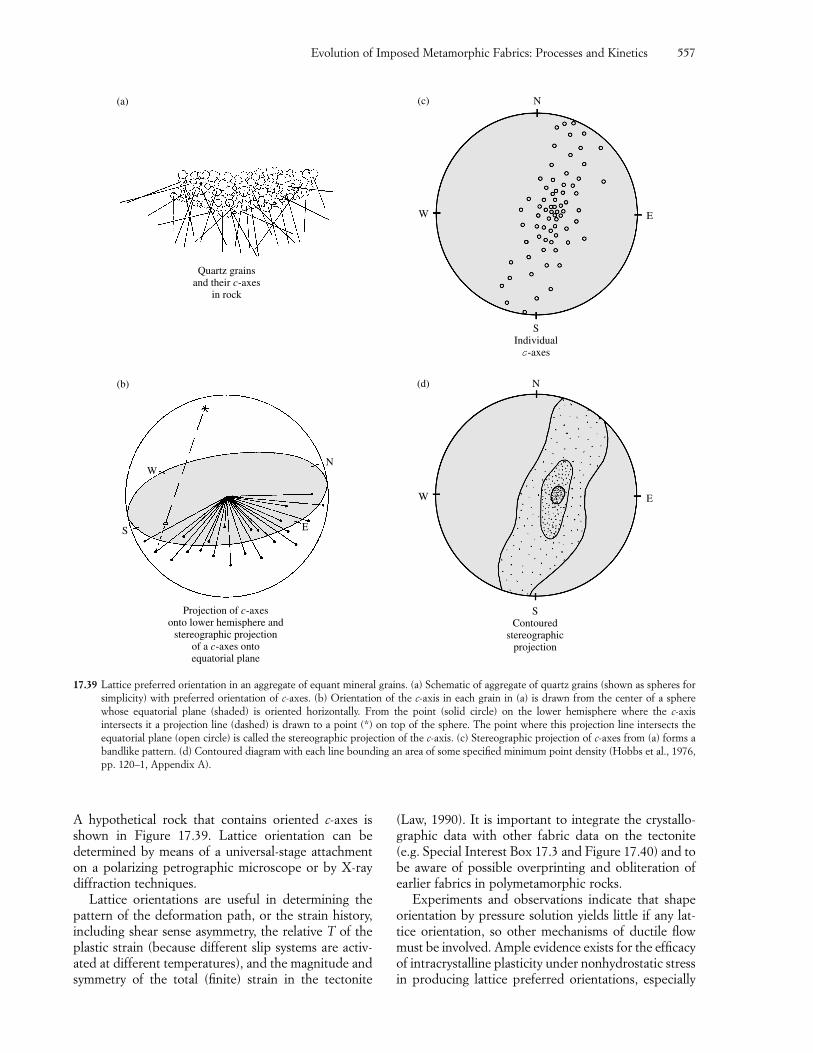
Evolution of Imposed Metamorphic Fabrics: Processes and Kinetics 557
S
WN
E
Quartz grainsand their c-axes
in rock
Projection of c-axesonto lower hemisphere and
stereographic projectionof a c-axes ontoequatorial plane
(a)
(b)
N
W E
SIndividual
c-axes
(c)
N
W E
SContoured
stereographicprojection
(d)
17.39 Lattice preferred orientation in an aggregate of equant mineral grains. (a) Schematic of aggregate of quartz grains (shown as spheres forsimplicity) with preferred orientation of c-axes. (b) Orientation of the c-axis in each grain in (a) is drawn from the center of a spherewhose equatorial plane (shaded) is oriented horizontally. From the point (solid circle) on the lower hemisphere where the c-axis intersects it a projection line (dashed) is drawn to a point (*) on top of the sphere. The point where this projection line intersects theequatorial plane (open circle) is called the stereographic projection of the c-axis. (c) Stereographic projection of c-axes from (a) forms abandlike pattern. (d) Contoured diagram with each line bounding an area of some specified minimum point density (Hobbs et al., 1976,pp. 120–1, Appendix A).
A hypothetical rock that contains oriented c-axes isshown in Figure 17.39. Lattice orientation can be determined by means of a universal-stage attachmenton a polarizing petrographic microscope or by X-raydiffraction techniques.
Lattice orientations are useful in determining thepattern of the deformation path, or the strain history,including shear sense asymmetry, the relative T of theplastic strain (because different slip systems are activ-ated at different temperatures), and the magnitude andsymmetry of the total (finite) strain in the tectonite
(Law, 1990). It is important to integrate the crystallo-graphic data with other fabric data on the tectonite(e.g. Special Interest Box 17.3 and Figure 17.40) and tobe aware of possible overprinting and obliteration ofearlier fabrics in polymetamorphic rocks.
Experiments and observations indicate that shapeorientation by pressure solution yields little if any lat-tice orientation, so other mechanisms of ductile flowmust be involved. Ample evidence exists for the efficacyof intracrystalline plasticity under nonhydrostatic stressin producing lattice preferred orientations, especially
558 Igneous and Metamorphic Petrology
in quartz and calcite. Figures 17.15–17.17 and 17.19 reveal that slip, twinning, and kinking are capable ofrotating grain lattices in aggregates. Slip is especially effective because large amounts of strain are possible,allowing correspondingly strong preferred orientations.Dynamic recrystallization during dislocation creep yields
new, more stable, smaller, unstrained grains or subgrainsby migration of dislocations and grain boundaries; thenew grains have more or less the same lattice orienta-tion as the original plastically deformed ones. Static annealing yields new grains with a complex relation tothe pre-existing strained and lattice oriented grains.
17.4.3 Cleavage, Schistosity, and Compositional LayeringA long-standing controversy in structural petrology hasbeen the origin of cleavage in slates and phyllites. A related dilemma is the origin of compositional layeringthat, although characterizing coarse-grained, high-grade gneisses, also occurs in finer grained, lower graderocks as well. Neither of these foliations imposed onto the rock during metamorphism has been fully accounted for. From symmetry, the imposed planarfabric must develop from a planar pattern of strainduring deformation. Obviously, recrystallization playsa role, as does the availability and movement of fluids.
Cleavage and Schistosity. While simple progressivemimetic recrystallization of shale yielding the meta-morphic sequence of slate, phyllite, and schist—as suggested at the end of Section 17.4.1—may take placein some terranes, many foliated tectonites reveal a morecomplex evolution. Overprinting effects of deformationand recrystallization are common. Foliations range overa wide spectrum of types and scales (Section 15.1.1),from continuous to spaced, and including slaty, crenu-lation, and disjunctive cleavages and counterpart schis-tosity and crenulation schistosity in coarser tectonites.A recent critical review of a vast number of studies byVernon (1998) forms the basis of the following.
However the fabric may be designated, slates, phyl-lites, and schists derived from sedimentary protolithstypically possess two alternating and locally anastomos-ing domains (Figure 15.3; see also Borradaile et al.,1982):1. P-domains are folia of mostly oriented flakes of
phyllosilicates (micas and chlorite) and more finegrained carbonaceous matter, locally graphite, andFe–Ti oxides. They contain only minor quartzgrains, none obviously detrital and all conspicu-ously flattened; some quartz grains appear trun-cated by adjacent phyllosilicate flakes and have local pressure-shadow overgrowths (Figure 17.10).Obliquely oriented relict bedding contacts are dis-placed along mica films.
2. Q-domains consist of quartz and lesser feldsparplus possible carbonate minerals and minor, lesswell aligned phyllosilicate grains. Grains are lessdeformed and relict detrital grains are preserved inlow-grade rocks.
These two domains are commonly interpreted (e.g.,Williams, 1990) to represent the effects of strain parti-tioning and differential pressure solution. P-domains
Special Interest Box 17.3 Integratinganisotropic lattice fabric into the evolution of atectonite terrane: a case historyAn example of how lattice preferred orientation ofquartz can be related to other aspects of tectonitefabric is provided by lineated metasedimentaryquartz–feldspar schists in the Raft River Mountainsmetamorphic core complex, northwestern Utah(Section 18.2.1 and Figure 18.11; see also Compton,1980). The uniform east–west lineations consist ofstreaked mineral aggregates and hinges of local re-cumbent isoclinal folds. The subhorizontal folia-tion defines a small amplitude, elongate east–weststructural dome—the core complex. Quartz andminor feldspar grains in the schists are relict sandgrains of fairly uniform size that have been de-formed into triaxial ellipsoids with shortest axesperpendicular to foliation and longest axes parallelto lineation. Local relict conglomeratic beds in themetasedimentary sequence have remarkable triaxialcobbles of similar shape and orientation (Figure14.13). Ribbonlike lenticular quartz grains with un-dulose optical extinction, elongate subgrains, andbasal-plane deformation lamellae are consistentwith translation slip. A few relict quartz sand grainsthat are undeformed have c-axes oriented perpen-dicular to the foliation, an orientation unfavorableto either basal or prism slip under a compressionacting normal to the foliation. Deformed quartzgrains have volumes similar to those of less-deformed feldspar grains, supporting a constantvolume process of plastic deformation acting oninitially uniform size sand grains. Although somesamples have lattice fabrics that are monoclinic ortriclinic c-axis orientation patterns, orthorhombicsymmetry patterns are more common (Figure 17.40).Experimental and computer-simulated deformationof quartzite by coaxial strain via dislocation glideand climb has yielded similar orthorhombic patterns (Tullis, 1977; Lister and Hobbs, 1980).Compton (1980) concluded that the L–S tectonitesof the core complex were produced by east–westextension and subvertical flattening during essen-tially coaxial strain, modified locally by simpleshear, resulting from upward doming of the heatedbuoyant core of the metamorphic complex.
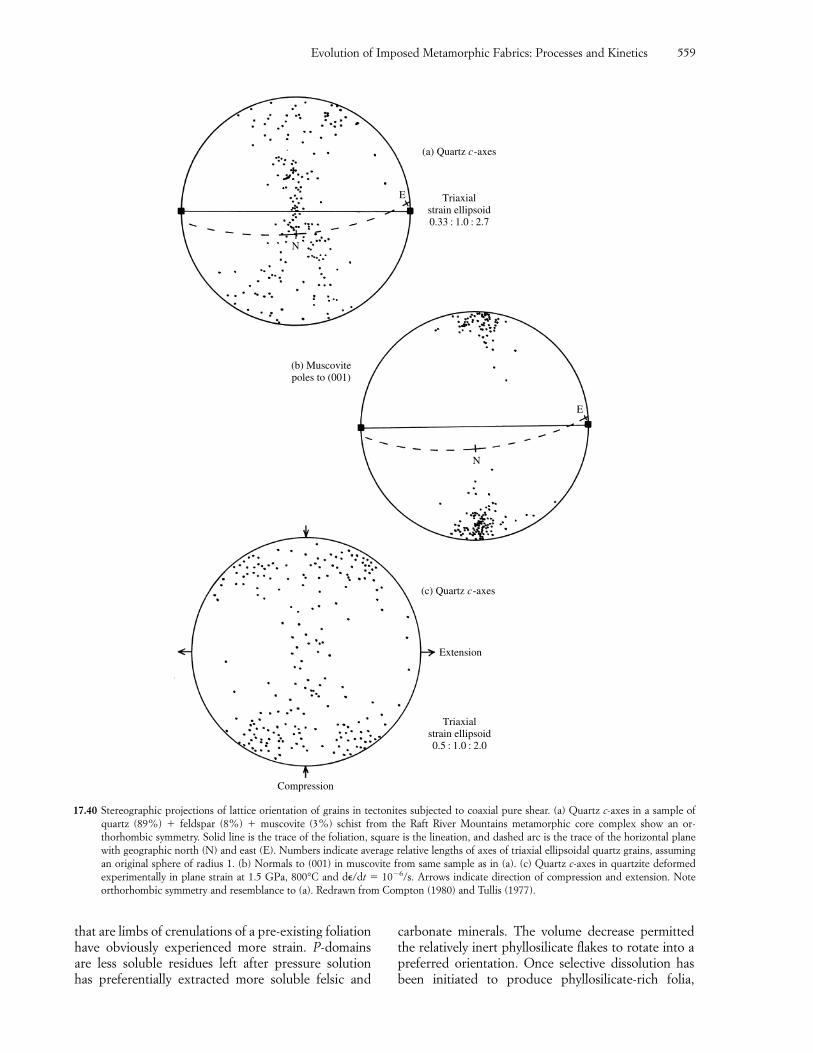
Evolution of Imposed Metamorphic Fabrics: Processes and Kinetics 559
17.40 Stereographic projections of lattice orientation of grains in tectonites subjected to coaxial pure shear. (a) Quartz c-axes in a sample ofquartz (89%) � feldspar (8%) � muscovite (3%) schist from the Raft River Mountains metamorphic core complex show an or-thorhombic symmetry. Solid line is the trace of the foliation, square is the lineation, and dashed arc is the trace of the horizontal planewith geographic north (N) and east (E). Numbers indicate average relative lengths of axes of triaxial ellipsoidal quartz grains, assumingan original sphere of radius 1. (b) Normals to (001) in muscovite from same sample as in (a). (c) Quartz c-axes in quartzite deformed experimentally in plane strain at 1.5 GPa, 800°C and d/dt � 10�6/s. Arrows indicate direction of compression and extension. Note orthorhombic symmetry and resemblance to (a). Redrawn from Compton (1980) and Tullis (1977).
N
E
E
N
(a) Quartz c-axes
Triaxialstrain ellipsoid0.33 : 1.0 : 2.7
(b) Muscovitepoles to (001)
(c) Quartz c-axes
Triaxialstrain ellipsoid0.5 : 1.0 : 2.0
Extension
Compression
that are limbs of crenulations of a pre-existing foliationhave obviously experienced more strain. P-domainsare less soluble residues left after pressure solution has preferentially extracted more soluble felsic and
carbonate minerals. The volume decrease permittedthe relatively inert phyllosilicate flakes to rotate into a preferred orientation. Once selective dissolution hasbeen initiated to produce phyllosilicate-rich folia,
subsequent prograde reactions will liberate more water from them, facilitating additional corrosion of remaining soluble grains and bodily rotation of inertflakes. This metamorphic differentiation can thus con-tinue during prograde metamorphism.
In a classic study of slates in the Delaware WaterGap area of New Jersey and Pennsylvania, Maxwell(1962) envisaged that, prior to consolidation, a thicksequence of muds, silts, and sands was dewatered as it was subjected to tectonic forces, bodily rotating phyllosilicate flakes into a preferred planar orientationparallel to the plane of flattening and to axial planes offolded beds. Grains of sand were entrained into theexpelled water that migrated along incipient cleavagesurfaces, forming cleavage-parallel sheets of sandstonethat penetrate into the slate from adjacent sandy beds.Subsequent workers on these and other slates aroundthe world have concluded that mechanical rotation ofdetrital grains can occur in the early stages of cleavagedevelopment but that pressure solution and mimeticrecrystallization are dominant processes during laterprogressive metamorphism.
After one and a half centuries, controversy continuesas to the amount of volume lost during evolution of slatycleavage and foliation in tectonites in general. Estim-ates range upwards to 60% of the protolith volume, as Sorby (1853) first claimed. Estimates are based on,for example, a comparison between the amount of per-ceived flattening perpendicular to the foliation and theextension parallel to it. Debate persists regarding howmuch of the lost volume was fluids, principally water,and how much was nonvolatile components, and thedegree to which the rock system remain closed, exceptfor the expelled water, and on what scale—domainal oroutcrop or larger. Local overgrowths in strain shadowsindicate grain-scale precipitation of transferred solute.On the other hand, low-grade metasedimentary terranesare characterized by widespread veins of predomin-antly quartz that probably represent the sinks for thesubstantial silica dissolved during foliation evolution,as well as dehydration mineral reactions. Many geo-chemical studies (see references in Vernon, 1998) haveattempted to cast light on the degree to which meta-morphosing systems are closed by comparing ratios of mobile to immobile elements, such as Al, Ti, and Zr (Section 16.8.4). However, this approach suffersfrom the apparent absence of truly immobile elements.Rather than making complementary studies, geochemistsand structural petrologists have tended to work on dif-ferent terranes. An exception is the work of Erslev (1998),who concluded that nonvolatile losses in three of fourNorth American Paleozoic slate terranes are minimal.
Differentiated Compositional Layering. Layers of con-trasting composition are evident at a range of scales inmetamorphic rocks of a wide range of grade.
Large-scale layers in recognizable, generally low-grade metasedimentary and metavolcanic rocks arecommonly relict depositional beds and flows, especiallywhere there are contrasts in composition and thicknessin a sequence. Smaller scale compositional layers, onthe order of centimeters, can be more difficult to inter-pret accurately. Bedding features, such as graded grainsize and cross-bedding, can be helpful, but otherpurely metamorphic fabrics can locally resemble thesefeatures, which are usually evident only in weakly metamorphosed, low-grade rocks. Even if it can be unequivocally demonstrated that a rock protolith wassedimentary, there is no assurance that the layering isrelict bedding because other origins are possible. Forexample, some layers and especially lenses of very smallaspect ratio (thickness divided by length) result fromtransposition processes (Figures 14.19 and 17.33).Other layers originate in other ways, as the followingparagraphs suggest.
Differentiated layering is a product of organizationor reorganization of matter during metamorphism of a protolith lacking such layering (Williams, 1990). Itstrue origin can be verified where the layering over-prints an earlier foliation, which might or might not be a relict bedding in the protolith, or where it can beseen to have evolved from essentially isotropic rock bymetamorphic processes (e.g. Figure 14.17). As in thegrowth of large porphyroblasts during metamorphism(e.g. soccer-ball-size garnet, Figure 14.8), segregationof chemical elements by diffusive transport is likely tobe involved, except creating a planar fabric elementrather than a subspherical one.
This layer-generating metamorphic differentiationraises several questions. Can the coarser-grained andthicker compositional layering typifying gneisses (see,for example, Figure 19.24a) somehow evolve by furtherprogressive metamorphism of the differentiated P- andQ-domain layering in finer grained tectonites describedabove? How does compositional layering develop inorthogneisses derived from isotropic magmatic pro-toliths? How much compositional layering in high-grade migmatitic gneisses (Figures 15.12–15.14) is ofanatectic origin? Field observations and experimentaldata on phase equilibria indicate that at least somemigmatites are a product of partial melting and thatconcurrent deformation can play a significant role in segregating the partial melt from the crystalline residue and concentrating it into planar domains (Section 11.6.4 and, for example, Brown and Rushmer,1997). But other examples of migmatization might beformed by a strictly subsolidus process and, if so, howdoes the differentiation into contrasting leucosome and melanosome take place (Figure 15.15)? These and other questions that could be posed highlight thedilemma of how segregation occurs to create the com-positional layering in gneisses.
560 Igneous and Metamorphic Petrology
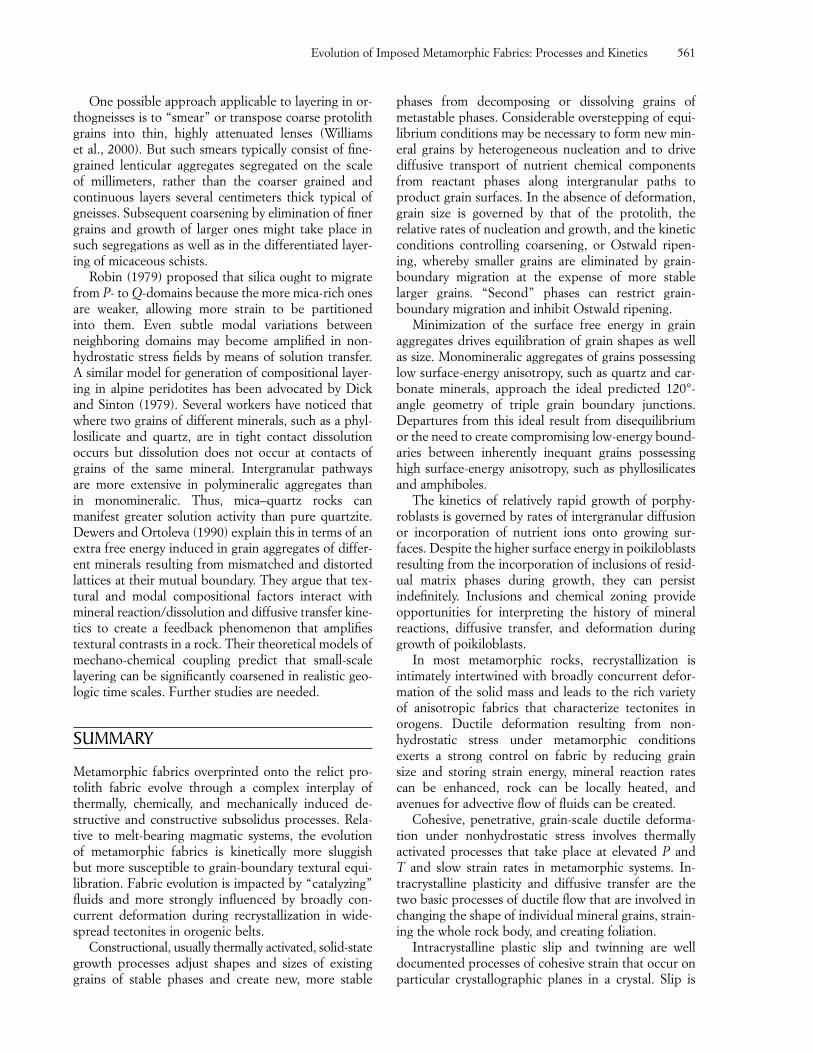
One possible approach applicable to layering in or-thogneisses is to “smear” or transpose coarse protolithgrains into thin, highly attenuated lenses (Williams et al., 2000). But such smears typically consist of fine-grained lenticular aggregates segregated on the scale of millimeters, rather than the coarser grained and continuous layers several centimeters thick typical ofgneisses. Subsequent coarsening by elimination of finergrains and growth of larger ones might take place insuch segregations as well as in the differentiated layer-ing of micaceous schists.
Robin (1979) proposed that silica ought to migratefrom P- to Q-domains because the more mica-rich onesare weaker, allowing more strain to be partitioned into them. Even subtle modal variations betweenneighboring domains may become amplified in non-hydrostatic stress fields by means of solution transfer. A similar model for generation of compositional layer-ing in alpine peridotites has been advocated by Dickand Sinton (1979). Several workers have noticed thatwhere two grains of different minerals, such as a phyl-losilicate and quartz, are in tight contact dissolution occurs but dissolution does not occur at contacts ofgrains of the same mineral. Intergranular pathways are more extensive in polymineralic aggregates than in monomineralic. Thus, mica–quartz rocks can manifest greater solution activity than pure quartzite. Dewers and Ortoleva (1990) explain this in terms of an extra free energy induced in grain aggregates of differ-ent minerals resulting from mismatched and distortedlattices at their mutual boundary. They argue that tex-tural and modal compositional factors interact withmineral reaction/dissolution and diffusive transfer kine-tics to create a feedback phenomenon that amplifiestextural contrasts in a rock. Their theoretical models ofmechano-chemical coupling predict that small-scalelayering can be significantly coarsened in realistic geo-logic time scales. Further studies are needed.
SUMMARY
Metamorphic fabrics overprinted onto the relict pro-tolith fabric evolve through a complex interplay ofthermally, chemically, and mechanically induced de-structive and constructive subsolidus processes. Rela-tive to melt-bearing magmatic systems, the evolution of metamorphic fabrics is kinetically more sluggish but more susceptible to grain-boundary textural equi-libration. Fabric evolution is impacted by “catalyzing”fluids and more strongly influenced by broadly con-current deformation during recrystallization in wide-spread tectonites in orogenic belts.
Constructional, usually thermally activated, solid-stategrowth processes adjust shapes and sizes of existinggrains of stable phases and create new, more stable
phases from decomposing or dissolving grains ofmetastable phases. Considerable overstepping of equi-librium conditions may be necessary to form new min-eral grains by heterogeneous nucleation and to drivediffusive transport of nutrient chemical componentsfrom reactant phases along intergranular paths toproduct grain surfaces. In the absence of deformation,grain size is governed by that of the protolith, the relative rates of nucleation and growth, and the kineticconditions controlling coarsening, or Ostwald ripen-ing, whereby smaller grains are eliminated by grain-boundary migration at the expense of more stablelarger grains. “Second” phases can restrict grain-boundary migration and inhibit Ostwald ripening.
Minimization of the surface free energy in grain aggregates drives equilibration of grain shapes as wellas size. Monomineralic aggregates of grains possessinglow surface-energy anisotropy, such as quartz and car-bonate minerals, approach the ideal predicted 120°-angle geometry of triple grain boundary junctions. Departures from this ideal result from disequilibriumor the need to create compromising low-energy bound-aries between inherently inequant grains possessinghigh surface-energy anisotropy, such as phyllosilicatesand amphiboles.
The kinetics of relatively rapid growth of porphy-roblasts is governed by rates of intergranular diffusionor incorporation of nutrient ions onto growing sur-faces. Despite the higher surface energy in poikiloblastsresulting from the incorporation of inclusions of resid-ual matrix phases during growth, they can persistindefinitely. Inclusions and chemical zoning provideopportunities for interpreting the history of mineral reactions, diffusive transfer, and deformation duringgrowth of poikiloblasts.
In most metamorphic rocks, recrystallization is intimately intertwined with broadly concurrent defor-mation of the solid mass and leads to the rich variety of anisotropic fabrics that characterize tectonites inorogens. Ductile deformation resulting from non-hydrostatic stress under metamorphic conditions exerts a strong control on fabric by reducing grain size and storing strain energy, mineral reaction ratescan be enhanced, rock can be locally heated, and avenues for advective flow of fluids can be created.
Cohesive, penetrative, grain-scale ductile deforma-tion under nonhydrostatic stress involves thermally activated processes that take place at elevated P and T and slow strain rates in metamorphic systems. In-tracrystalline plasticity and diffusive transfer are thetwo basic processes of ductile flow that are involved inchanging the shape of individual mineral grains, strain-ing the whole rock body, and creating foliation.
Intracrystalline plastic slip and twinning are welldocumented processes of cohesive strain that occur onparticular crystallographic planes in a crystal. Slip is
Evolution of Imposed Metamorphic Fabrics: Processes and Kinetics 561
made possible by the presence of dislocations which allow parts of the crystal to translate past one anotherat much lower applied stress than for a theoreticallyperfect crystal. In the presence of water, silicates can behydrolytically weakened and made more susceptible toplastic slip. If thermally activated at high T, disloca-tions can climb away from obstacles in their slip planes,preventing work hardening of the strained grain and allowing recovery to a state where more slip can occur.Recovery can create more stable, less strained sub-grains of slightly different lattice orientations boundedby low-angle dislocation walls. Recovery can also involve grain-boundary migration in the process of dynamic (syntectonic) recrystallization, resulting inknobby, or sutured, grain margins on strained grainsand ultimately creating aggregates of small, polygonal,essentially strain-free grains that replace the less stablestrained grains. Simultaneous, continuous intracrys-talline slip, recovery, and dynamic recrystallization canaccomplish large strains during steady-state flow in tectonites. Because this dislocation creep is a constant-volume process, it is insensitive to P but depends on Tand strain rate. A power law equation incorporatesthese environmental factors with applied stress and theactivation energy of flow, permitting extrapolation ofexperimental data to real geologic systems, and show-ing that large ductile strains can occur at only smallstress differences over long periods of time. Deepcrustal and mantle rock deform by ductile flow at slowstrain rates as if they were low viscosity liquids with almost no shear strength. Slip and dislocation creepcan create a strong preferred crystallographic orienta-tion of grains in deformed rocks.
Diffusive transfer and creep occurs by intergranulardiffusion of atoms; is especially effective in the pres-ence of a grain-boundary fluid, in which case it is calledpressure solution because more highly stressed parts ofgrains are preferrentially dissolved. Grain boundarysliding can accompany diffusive transfer but develop-mant of a preferred crystallographic orientation doesnot. Transfer is strongly T dependent because of thediffusion rate dependence and generally occurs atslower strain rates than intracrystalline plastic flow.
In simple orogenic cycles, prograde metamorphicreactions that accompany increasing depth of burial release volatiles that facilitate deformation. After peak metamorphism, rocks may be relatively strong and resist further deformation unless there is sub-sequent influx of fluid that will render them more susceptible to ductile or brittle deformation. Althoughdeformation and recrystallization may be broadly con-current, in most orogens each is typically episodic andrepetitive. Unraveling the timing of multiple overprintsof recrystallization and deformation in polymetamor-phic tectonites requires careful attention to fabric fea-tures such as overgrowths and cross-cutting relations.
Inclusion trails in poikiloblasts and their geometric relation to the surrounding matrix foliation can pro-vide important clues to the nature of deformationwhose effects have been erased in the matrix by laterdeformation events or mineral modifications. Kinem-atic indicators in tectonite fabrics record details of the deformation path, which is a complex function of the state(s) of stress, rates of strain, and rheologicalproperties of the rock, including the character of its inhomogeneities.
Imposed metamorphic foliations reflect ductile flowand grain-boundary adjustments under nonhydrostaticstress. Typically, a single foliation is parallel to the plane of flattening in the finite (bulk) strain ellipsoid.Intracrystalline plastic twinning and especially slip are effective processes of creating preferred shape orienta-tions of mineral grains in tectonites. Plastic strain alsoorients crystal lattices that can be preserved by recov-ery processes. Diffusive transfer accompanied by grainboundary sliding yields shape orientations but not lattice, while bodily rotations of inherently inequantgrains in a more ductile matrix create both. Foliation in fine-grained metasedimentary tectonites probablyevolves by bodily rotation of grains, perhaps accom-panying volume loss by dewatering, followed by laterpressure solution and mimetic recrystallization. Thesetectonites possess phyllosilicate-rich and quartz-richdomains that can evolve during further metamorphisminto more strongly differentiated layering by continueddeformation, strain partitioning, and differential pres-sure solution. Coarser compositional layering typifyinggneisses can originate by anatectic migmatization andpossibly other little understood processes involvingmechano-chemical self-organization and amplificationof subtle layering.
CRITICAL THINKING QUESTIONS17.1 Larger quartz grains in the lower left of Fig-
ure 17.5 could have been created by poikilo-blastically encompassing magnetite grains as inclusions. Why do you suppose this did nothappen?
17.2 Describe the textural evidence seen in thin section for ductile deformation of quartz.
17.3 With all sorts of modern laboratory equip-ment at your disposal, indicate two ways thatyou could distinguish between diffusive anddislocation creep as mechanisms creating a mylonite.
17.4 Figure 17.31b shows strained plagioclase with bent twin lamellae and undulatory extinction under cross-polarized light has beenpartially replaced by small polygonal grainslacking undulatory extinction. What are two
562 Igneous and Metamorphic Petrology
interpretations of this texture regarding timingof deformation and recrystallization? Howwould you distinguish between these?
17.5 Diffusion is enhanced in crystals experiencingstrain. Explain why this is so.
17.6 If it is assumed that the mineral inclusions embedded in a poikiloblast originated duringgrowth and incorporation of matrix grains,how would you account for their smaller size?Indicate two possibilities and how you mighttest which one is the more likely.
17.7 Discuss reasons why strain can be partitionedinto different domains in an inhomogeneouslydeforming rock body.
17.8 Describe the mechanisms that can causechange in grain shape. To what extent do these
mechanisms also change the orientation of thecrystal lattice?
17.9 Justify the commonly invoked assumption thatstates of stress at depth in the Earth are, to afirst approximation, hydrostatic.
17.10 Would one anticipate any correlation betweenmetamorphic grade and the mode of deforma-tion producing preferred grain orientation intectonites? Justify your answer.
17.11 Discuss the role of water in the formation ofanisotropic fabric in metamorphic tectonites.
17.12 Contrast the conditions that favor one mech-anism of ductile flow over another.
17.13 Discuss fabric features that distinguish betweenpre-, syn-, and postkinematic crystallization, indicating any possible ambiguities.
Evolution of Imposed Metamorphic Fabrics: Processes and Kinetics 563
FUNDAMENTAL QUESTIONSCONSIDERED IN THIS CHAPTER
1. How does the tectonic and thermal evolution ofrock masses at convergent plate boundariesthrough time govern the nature of regionalmetamorphism?
2. Conversely, how can zones, facies, and the P–T–tpaths in ancient metamorphic terranes provideinsights into the tectonothermal evolution of theorogens (mountain belts) in which they werecreated?
3. What mineral reactions and assemblages definemetamorphic zones and facies in regionalenvironments?
INTRODUCTION
Metamorphism is driven by transfer of heat and mass,including fluids, in ways that are related to the tectonicsetting in which the transfer occurs. This concept wasintroduced in Section 14.2.3 but is further developedas the central theme of this chapter. Tectonothermalfactors governing the development of metamorphiczones and facies in active orogenic belts are recorded in the time-dependent P–T path of the rock or terrane.Data to construct this path can be determined by thermobarometry of mineral assemblages and zoned
porphyroblasts, mineral inclusions, petrogenetic grids, and chronologic analyses of appropriate timemarkers.
Metamorphism on Earth is almost entirely focusednear convergent and divergent plate boundaries be-cause these are the only tectonic regimes where flows of heat and mass are of sufficient magnitude to causechanges in the states of geologic systems. Within plateinteriors, such as stable cratons, steady-state geothermsand virtual lack of movement of mass preclude muchmetamorphism; only locally do small intrusions ofhighly alkaline mafic magmas (Section 13.12) createnegligible contact metamorphism. Strike-slip and trans-form fault regimes likewise generally lack significantvertical movement of mass in the gravitational field but focused deformation and shear heating can createlocal metamorphism, such as mylonitization. Ocean-ridge metamorphism takes place in a relatively narrowzone at spreading ridges but its variable effects coverthe entire floor of the oceans because of seafloorspreading.
Regional metamorphism of a variable complex char-acter develops in broad orogens in thick continentalcrust at active convergent plate junctures over time pe-riods of tens to perhaps hundreds of millions of years.The geometry and rates of plate convergence, platecharacter, and details of tectonic and thermal processesin the asthenosphere and lithosphere all play a part in metamorphic development and character. The typ-ical tectonites of convergent orogens are commonly
Metamorphism atConvergent PlateMargins: P–T–tPaths, Facies, and Zones
18CHAPTER
polymetamorphic, having experienced multiple episodes of recrystallization and pervasive solid-state ductile deformation associated with contractional folding andthrusting on a regional scale. Heat sources drivingmetamorphism in orogens can be magmatic intrusionsand underplates, as well as adjustment of geotherms related to crustal thickening, strain heating, advectingfluids, and decay of radioactive U, Th, and K.
In this chapter, we first consider P–T–t paths andhow they provide insights into the tectonothermal evo-lution of convergent-plate orogens and regional meta-morphic terranes (Figure 14.24). Mineral assemblagesin the classic intermediate- and low-P Barrovian andBuchan zones of these terranes are then reviewed as astandard of comparison with other types of P–T zonesand facies. Ocean-ridge metamorphism is briefly sum-marized as a prelude to discussion of typical high P/Tmetamorphic facies series in near-trench accretionary-wedge regimes where oceanic and terrigenous rocks are complexly juxtaposed. Lastly, recent discoveries ofvery rare but intriguing ultrahigh-P rocks formed incontinent–continent collision zones are considered.
�18.1 P–T–t PATHSBefore we deal with metamorphic associations of con-vergent plate junctions, which are the major topic ofthis chapter, the concept of P–T–t paths is developedfurther here, building on the introduction in Section14.2.9. Such paths depict the tectonothermal history ofan individual rock sample or a metamorphic terrane.Because of intimate relations between thermal and tec-tonic phenomena during orogenesis, determination ofthe P–T history of a metamorphic terrane in a orogencan provide insight into its tectonic evolution. Integra-tion of data on changing P–T conditions in a metamor-phic terrane in a chronologic framework of time, t, yields a P–T–t path that can constrain the nature of dynamic tectonic phenomena. So called “reverse”petrologic interpretations of metamorphic rocks cantest and refine “forward” tectonothermal modeling oforogeny and lithospheric plate interaction, and viceversa. New developments in the late 1970s and 1980sin geophysics, computer modeling, geochronology, andmetamorphic petrology converged into this new fieldof research on the tectonothermal evolution of orogensand the thermobarometry of metamorphic associa-tions. Useful discourses on P–T–t paths and their im-plications include Haugerud and Zen (1991), Hodges(1991), and Spear (1993).
18.1.1 Thermal ConsiderationsThe crust of the Earth is enriched in incompatible elements relative to the mantle. Further enrichment inradioactive K, U, and Th develops in the upper 15–20 kmof the continental crust because these incompatible
elements are taken up in partial melts that rise from the lower to upper crust. For reasonable rates of radioactive heat production in the crust of averagethickness, augmented by typical heat input from theunderlying mantle, the T just above the Moho is500–600°C. However, such a “normal” geotherm is inconsistent with peak temperatures of 600–750°C atdepths of 20–30 km recorded in typical Barrovian ter-ranes of orogens. To overcome this thermal deficiency,the geotherm must be perturbed in some way. One wayto increase the T in the lower crust is by underplatingor intruding it by hot mantle-derived basaltic magma(Section 11.1.1).
However, it was pioneering studies by Oxburgh andTurcotte (1974) and England and Richardson (1977)that first drew attention to other significant factors that perturb geotherms in active orogens and createunusually high temperatures in the deep crust. Theydemonstrated through forward tectonothermal model-ing that, because rocks are such slow conductors ofheat (Section 1.1.3), tectonic movement of rock masson “rapid” plate tectonic time scales of cm/y in an orogen can significantly perturb geothermal gradients.Indeed, young mountain belts are far removed fromthermal equilibrium. First-order factors that pro-foundly control P–T conditions and paths during thehistory of a metamorphic terrane include the dynamicinteraction between tectonic movement of rock mass of particular dimensions and rates, time available forconductive re-equilibration, rate of erosion or tectonicunroofing, and distribution of heat sources. Second-order, less significant, factors that can locally perturb ageotherm include strain heating, advecting fluids andmagma, and mineral reactions.
Tectonothermal models of orogeny published in the last two decades of the twentieth century dependon the specific boundary conditions just listed, butthese are never fully known for even young mountain-metamorphic belts. Hence, only a few generalities ofthe models can be accepted with any degree of con-fidence. Elevated geotherms capable of creating real-istic temperatures for metamorphism typically invokecombinations of a thicker crust and enhanced radioac-tive heat production below or within the crust. Thick-ening of continental crust by thrusting, folding, andmagmatic intrusion and extrusion during orogenesis is,of course, a fundamental and long-standing concept.The model in Figure 18.1 illustrates the thermal re-sponse of instantaneously doubling the crustal thick-ness by thrusting. Several tens of millions of years arerequired to subsequently conductively re-equilibratethe sawtooth-like geotherm that is created at the in-stant of thrusting. During this re-equilibration, or ther-mal relaxation, temperatures at any particular depthprogressively increase and P–T conditions and pathsappropriate to Barrovian metamorphism can develop.
Metamorphism at Convergent Plate Margins: P–T–t Paths, Facies, and Zones 565
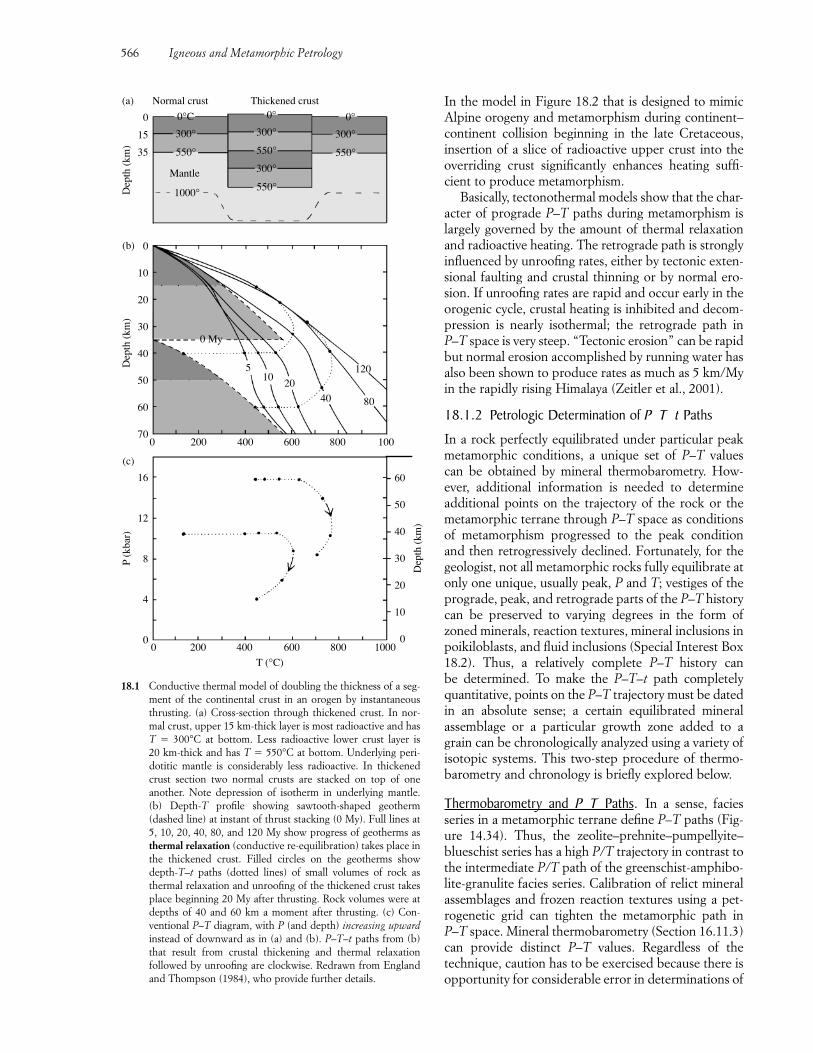
In the model in Figure 18.2 that is designed to mimicAlpine orogeny and metamorphism during continent–continent collision beginning in the late Cretaceous, insertion of a slice of radioactive upper crust into theoverriding crust significantly enhances heating suffi-cient to produce metamorphism.
Basically, tectonothermal models show that the char-acter of prograde P–T paths during metamorphism islargely governed by the amount of thermal relaxationand radioactive heating. The retrograde path is stronglyinfluenced by unroofing rates, either by tectonic exten-sional faulting and crustal thinning or by normal ero-sion. If unroofing rates are rapid and occur early in theorogenic cycle, crustal heating is inhibited and decom-pression is nearly isothermal; the retrograde path inP–T space is very steep. “Tectonic erosion” can be rapidbut normal erosion accomplished by running water hasalso been shown to produce rates as much as 5 km/Myin the rapidly rising Himalaya (Zeitler et al., 2001).
18.1.2 Petrologic Determination of P T t Paths
In a rock perfectly equilibrated under particular peakmetamorphic conditions, a unique set of P–T valuescan be obtained by mineral thermobarometry. How-ever, additional information is needed to determine additional points on the trajectory of the rock or themetamorphic terrane through P–T space as conditionsof metamorphism progressed to the peak conditionand then retrogressively declined. Fortunately, for thegeologist, not all metamorphic rocks fully equilibrate atonly one unique, usually peak, P and T; vestiges of theprograde, peak, and retrograde parts of the P–T historycan be preserved to varying degrees in the form ofzoned minerals, reaction textures, mineral inclusions inpoikiloblasts, and fluid inclusions (Special Interest Box18.2). Thus, a relatively complete P–T history can be determined. To make the P–T–t path completelyquantitative, points on the P–T trajectory must be datedin an absolute sense; a certain equilibrated mineral assemblage or a particular growth zone added to agrain can be chronologically analyzed using a variety ofisotopic systems. This two-step procedure of thermo-barometry and chronology is briefly explored below.
Thermobarometry and P T Paths. In a sense, facies series in a metamorphic terrane define P–T paths (Fig-ure 14.34). Thus, the zeolite–prehnite–pumpellyite–blueschist series has a high P/T trajectory in contrast tothe intermediate P/T path of the greenschist-amphibo-lite-granulite facies series. Calibration of relict mineralassemblages and frozen reaction textures using a pet-rogenetic grid can tighten the metamorphic path inP–T space. Mineral thermobarometry (Section 16.11.3)can provide distinct P–T values. Regardless of the technique, caution has to be exercised because there isopportunity for considerable error in determinations of
566 Igneous and Metamorphic Petrology
Dep
th (
km)
Dep
th (
km)
P (k
bar)
0
15
35
Dep
th (
km)
0
10
20
30
40
50
60
70
16
12
8
4
0
1008006004002000
60
50
40
30
20
10
0
0°C
300°
550°
0°300°
550°
300°
550°1000°
Mantle
(a) Normal crust Thickened crust
0 My
510
20
40 80
120
(b)
(c)
10008006004002000
T (°C)
300°
550°
0°
18.1 Conductive thermal model of doubling the thickness of a seg-ment of the continental crust in an orogen by instantaneousthrusting. (a) Cross-section through thickened crust. In nor-mal crust, upper 15 km-thick layer is most radioactive and hasT � 300°C at bottom. Less radioactive lower crust layer is 20 km-thick and has T � 550°C at bottom. Underlying peri-dotitic mantle is considerably less radioactive. In thickenedcrust section two normal crusts are stacked on top of one another. Note depression of isotherm in underlying mantle. (b) Depth-T profile showing sawtooth-shaped geotherm(dashed line) at instant of thrust stacking (0 My). Full lines at5, 10, 20, 40, 80, and 120 My show progress of geotherms asthermal relaxation (conductive re-equilibration) takes place inthe thickened crust. Filled circles on the geotherms showdepth-T–t paths (dotted lines) of small volumes of rock asthermal relaxation and unroofing of the thickened crust takesplace beginning 20 My after thrusting. Rock volumes were atdepths of 40 and 60 km a moment after thrusting. (c) Con-ventional P–T diagram, with P (and depth) increasing upwardinstead of downward as in (a) and (b). P–T–t paths from (b)that result from crustal thickening and thermal relaxation followed by unroofing are clockwise. Redrawn from Englandand Thompson (1984), who provide further details.
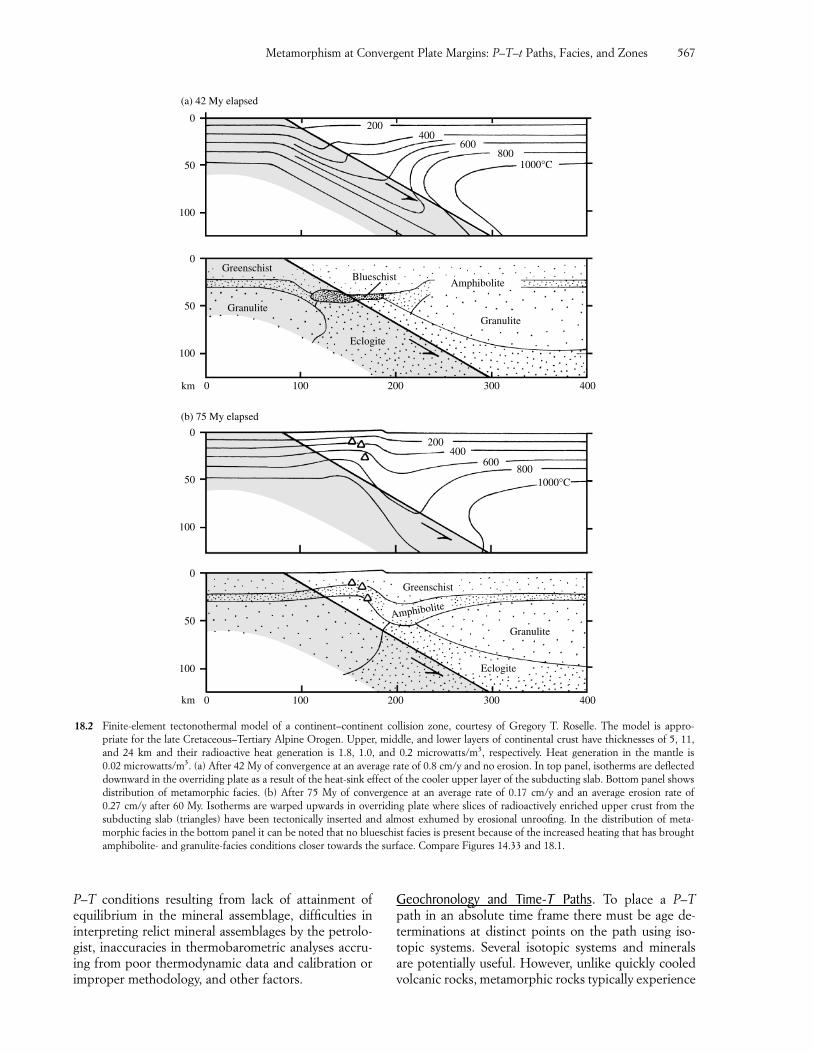
Metamorphism at Convergent Plate Margins: P–T–t Paths, Facies, and Zones 567
P–T conditions resulting from lack of attainment ofequilibrium in the mineral assemblage, difficulties ininterpreting relict mineral assemblages by the petrolo-gist, inaccuracies in thermobarometric analyses accru-ing from poor thermodynamic data and calibration orimproper methodology, and other factors.
Geochronology and Time-T Paths. To place a P–Tpath in an absolute time frame there must be age de-terminations at distinct points on the path using iso-topic systems. Several isotopic systems and mineralsare potentially useful. However, unlike quickly cooledvolcanic rocks, metamorphic rocks typically experience
(a) 42 My elapsed
0
50
100
0
50
100
(b) 75 My elapsed
km
km
0
50
100
0
50
100
4003002001000
4003002001000
200400
600800
1000°C
Greenschist
Granulite
BlueschistAmphibolite
Granulite
Eclogite
200400
600800
1000°C
Greenschist
Amphibolite
Granulite
Eclogite
18.2 Finite-element tectonothermal model of a continent–continent collision zone, courtesy of Gregory T. Roselle. The model is appro-priate for the late Cretaceous–Tertiary Alpine Orogen. Upper, middle, and lower layers of continental crust have thicknesses of 5, 11,and 24 km and their radioactive heat generation is 1.8, 1.0, and 0.2 microwatts/m3, respectively. Heat generation in the mantle is 0.02 microwatts/m3. (a) After 42 My of convergence at an average rate of 0.8 cm/y and no erosion. In top panel, isotherms are deflected downward in the overriding plate as a result of the heat-sink effect of the cooler upper layer of the subducting slab. Bottom panel showsdistribution of metamorphic facies. (b) After 75 My of convergence at an average rate of 0.17 cm/y and an average erosion rate of 0.27 cm/y after 60 My. Isotherms are warped upwards in overriding plate where slices of radioactively enriched upper crust from thesubducting slab (triangles) have been tectonically inserted and almost exhumed by erosional unroofing. In the distribution of meta-morphic facies in the bottom panel it can be noted that no blueschist facies is present because of the increased heating that has broughtamphibolite- and granulite-facies conditions closer towards the surface. Compare Figures 14.33 and 18.1.
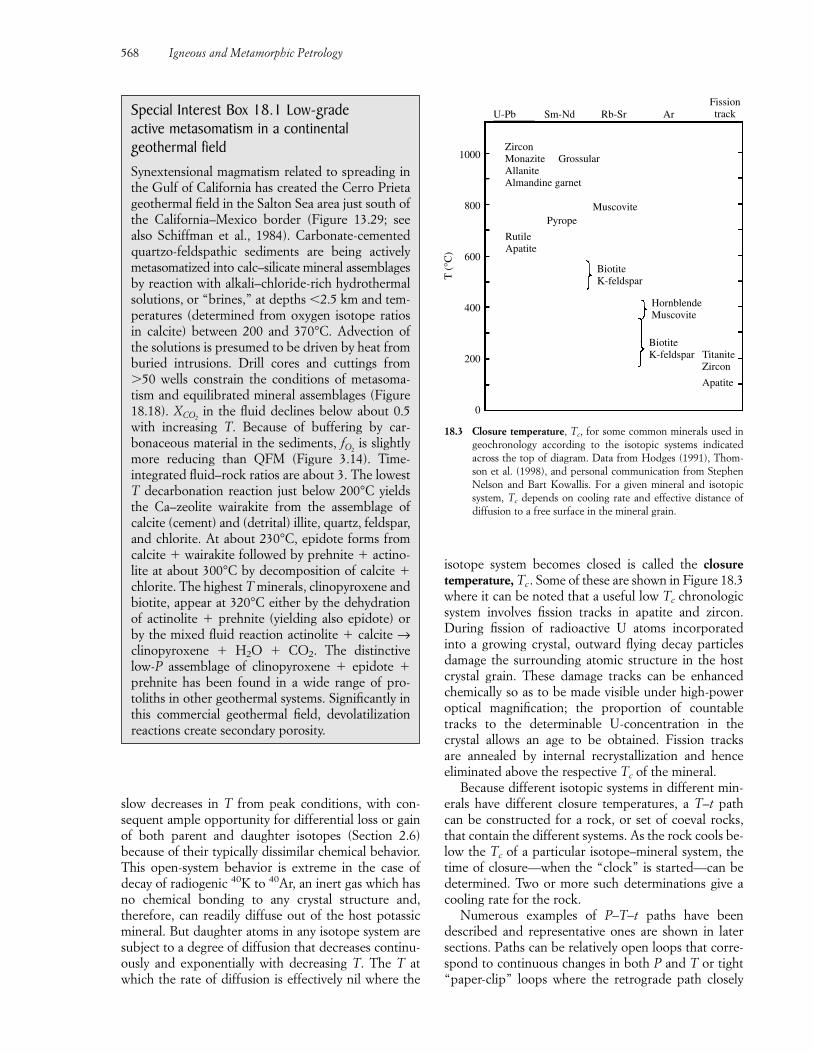
slow decreases in T from peak conditions, with con-sequent ample opportunity for differential loss or gainof both parent and daughter isotopes (Section 2.6) because of their typically dissimilar chemical behavior.This open-system behavior is extreme in the case of decay of radiogenic 40K to 40Ar, an inert gas which hasno chemical bonding to any crystal structure and,therefore, can readily diffuse out of the host potassicmineral. But daughter atoms in any isotope system aresubject to a degree of diffusion that decreases continu-ously and exponentially with decreasing T. The T atwhich the rate of diffusion is effectively nil where the
isotope system becomes closed is called the closuretemperature, Tc . Some of these are shown in Figure 18.3where it can be noted that a useful low Tc chronologicsystem involves fission tracks in apatite and zircon.During fission of radioactive U atoms incorporatedinto a growing crystal, outward flying decay particlesdamage the surrounding atomic structure in the hostcrystal grain. These damage tracks can be enhancedchemically so as to be made visible under high-poweroptical magnification; the proportion of countabletracks to the determinable U-concentration in the crystal allows an age to be obtained. Fission tracks are annealed by internal recrystallization and henceeliminated above the respective Tc of the mineral.
Because different isotopic systems in different min-erals have different closure temperatures, a T–t pathcan be constructed for a rock, or set of coeval rocks,that contain the different systems. As the rock cools be-low the Tc of a particular isotope–mineral system, thetime of closure—when the “clock” is started—can bedetermined. Two or more such determinations give acooling rate for the rock.
Numerous examples of P–T–t paths have been described and representative ones are shown in latersections. Paths can be relatively open loops that corre-spond to continuous changes in both P and T or tight“paper-clip” loops where the retrograde path closely
568 Igneous and Metamorphic Petrology
Special Interest Box 18.1 Low-grade active metasomatism in a continental geothermal fieldSynextensional magmatism related to spreading inthe Gulf of California has created the Cerro Prietageothermal field in the Salton Sea area just south ofthe California–Mexico border (Figure 13.29; seealso Schiffman et al., 1984). Carbonate-cementedquartzo-feldspathic sediments are being activelymetasomatized into calc–silicate mineral assemblagesby reaction with alkali–chloride-rich hydrothermalsolutions, or “brines,” at depths �2.5 km and tem-peratures (determined from oxygen isotope ratiosin calcite) between 200 and 370°C. Advection ofthe solutions is presumed to be driven by heat fromburied intrusions. Drill cores and cuttings from�50 wells constrain the conditions of metasoma-tism and equilibrated mineral assemblages (Figure18.18). X in the fluid declines below about 0.5with increasing T. Because of buffering by car-bonaceous material in the sediments, f is slightlymore reducing than QFM (Figure 3.14). Time-integrated fluid–rock ratios are about 3. The lowestT decarbonation reaction just below 200°C yieldsthe Ca–zeolite wairakite from the assemblage ofcalcite (cement) and (detrital) illite, quartz, feldspar,and chlorite. At about 230°C, epidote forms fromcalcite � wairakite followed by prehnite � actino-lite at about 300°C by decomposition of calcite �chlorite. The highest T minerals, clinopyroxene andbiotite, appear at 320°C either by the dehydrationof actinolite � prehnite (yielding also epidote) orby the mixed fluid reaction actinolite � calcite →clinopyroxene � H2O � CO2. The distinctive low-P assemblage of clinopyroxene � epidote �prehnite has been found in a wide range of pro-toliths in other geothermal systems. Significantly inthis commercial geothermal field, devolatilizationreactions create secondary porosity.
O2
CO2
T (
°C)
1000
800
600
400
200
0
ZirconMonazite GrossularAllanite Almandine garnet
MuscovitePyrope
RutileApatite
BiotiteK-feldspar
HornblendeMuscovite
BiotiteK-feldspar Titanite Zircon
Apatite
U-Pb Sm-Nd Rb-Sr ArFissiontrack
18.3 Closure temperature, Tc, for some common minerals used ingeochronology according to the isotopic systems indicatedacross the top of diagram. Data from Hodges (1991), Thom-son et al. (1998), and personal communication from StephenNelson and Bart Kowallis. For a given mineral and isotopicsystem, Tc depends on cooling rate and effective distance ofdiffusion to a free surface in the mineral grain.
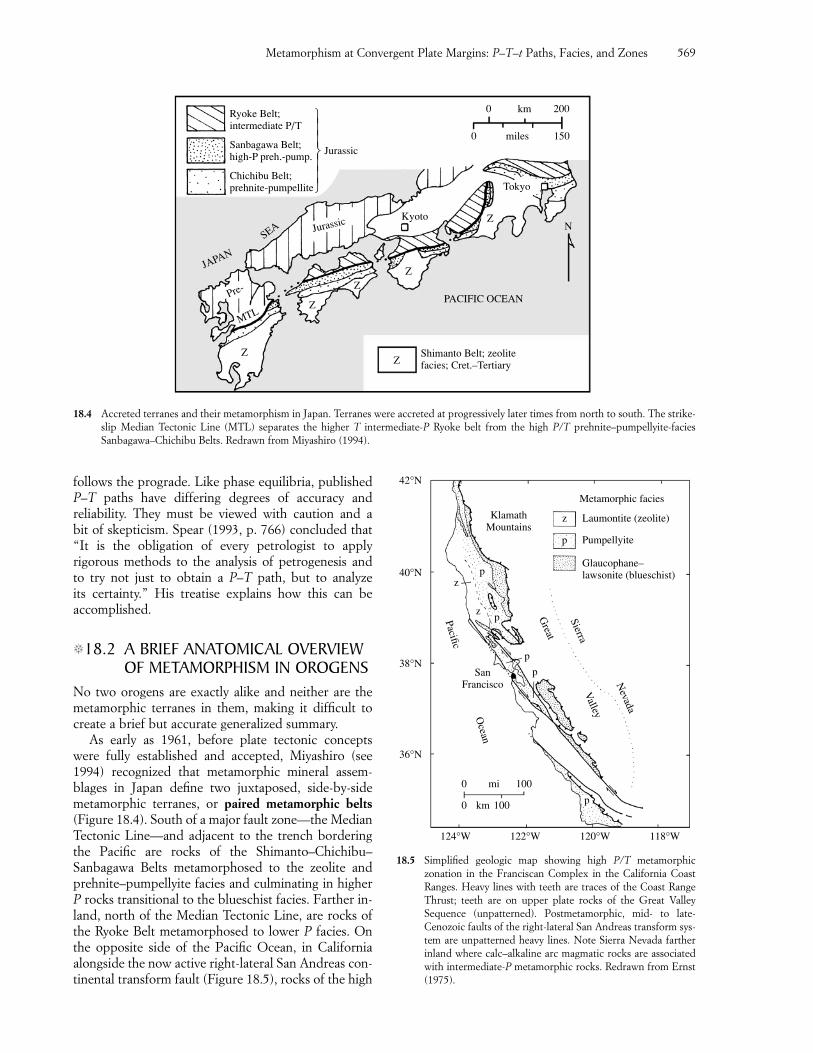
follows the prograde. Like phase equilibria, publishedP–T paths have differing degrees of accuracy and reliability. They must be viewed with caution and a bit of skepticism. Spear (1993, p. 766) concluded that“It is the obligation of every petrologist to apply rigorous methods to the analysis of petrogenesis and to try not just to obtain a P–T path, but to analyze its certainty.” His treatise explains how this can be accomplished.
�18.2 A BRIEF ANATOMICAL OVERVIEWOF METAMORPHISM IN OROGENS
No two orogens are exactly alike and neither are themetamorphic terranes in them, making it difficult tocreate a brief but accurate generalized summary.
As early as 1961, before plate tectonic conceptswere fully established and accepted, Miyashiro (see1994) recognized that metamorphic mineral assem-blages in Japan define two juxtaposed, side-by-sidemetamorphic terranes, or paired metamorphic belts(Figure 18.4). South of a major fault zone—the MedianTectonic Line—and adjacent to the trench borderingthe Pacific are rocks of the Shimanto–Chichibu–Sanbagawa Belts metamorphosed to the zeolite andprehnite–pumpellyite facies and culminating in higherP rocks transitional to the blueschist facies. Farther in-land, north of the Median Tectonic Line, are rocks ofthe Ryoke Belt metamorphosed to lower P facies. Onthe opposite side of the Pacific Ocean, in Californiaalongside the now active right-lateral San Andreas con-tinental transform fault (Figure 18.5), rocks of the high
Metamorphism at Convergent Plate Margins: P–T–t Paths, Facies, and Zones 569
Ryoke Belt; intermediate P/T
Sanbagawa Belt;high-P preh.-pump.
Chichibu Belt;prehnite-pumpellite
Jurassic
0
0 miles 150
km 200
KyotoJurassic
JAPAN
SEA
Pre-
MTLPACIFIC OCEAN
N
Tokyo
Z
ZZ
Z
Z
Z
Shimanto Belt; zeolitefacies; Cret.–Tertiary
18.4 Accreted terranes and their metamorphism in Japan. Terranes were accreted at progressively later times from north to south. The strike-slip Median Tectonic Line (MTL) separates the higher T intermediate-P Ryoke belt from the high P/T prehnite–pumpellyite-facies Sanbagawa–Chichibu Belts. Redrawn from Miyashiro (1994).
42°N
40°N
38°N
36°N
124°W 122°W 120°W 118°W
0 100mi
0 100km p
Ocean
Pacific
Great
Sierra
Nevada
Valley
SanFrancisco
p
p
pz
zp
z
p
Laumontite (zeolite)
Metamorphic facies
Pumpellyite
Glaucophane–lawsonite (blueschist)
KlamathMountains
18.5 Simplified geologic map showing high P/T metamorphic zonation in the Franciscan Complex in the California CoastRanges. Heavy lines with teeth are traces of the Coast RangeThrust; teeth are on upper plate rocks of the Great Valley Sequence (unpatterned). Postmetamorphic, mid- to late-Cenozoic faults of the right-lateral San Andreas transform sys-tem are unpatterned heavy lines. Note Sierra Nevada fartherinland where calc–alkaline arc magmatic rocks are associatedwith intermediate-P metamorphic rocks. Redrawn from Ernst(1975).
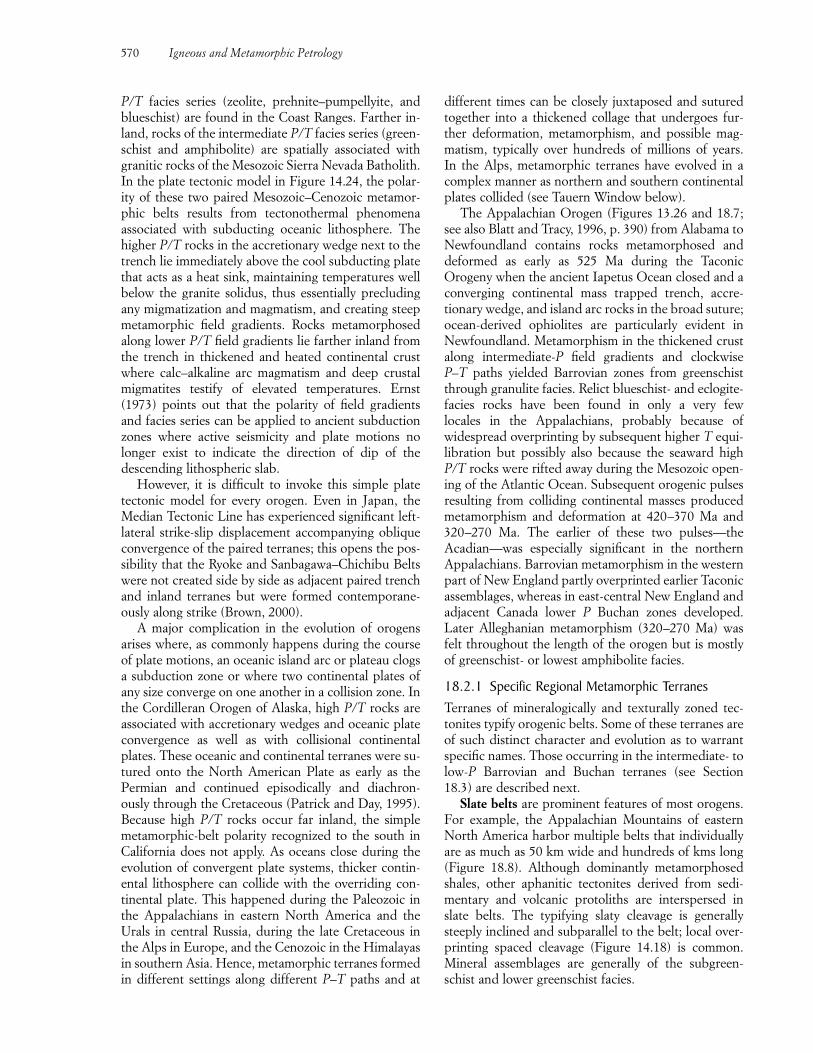
P/T facies series (zeolite, prehnite–pumpellyite, andblueschist) are found in the Coast Ranges. Farther in-land, rocks of the intermediate P/T facies series (green-schist and amphibolite) are spatially associated withgranitic rocks of the Mesozoic Sierra Nevada Batholith.In the plate tectonic model in Figure 14.24, the polar-ity of these two paired Mesozoic–Cenozoic metamor-phic belts results from tectonothermal phenomena associated with subducting oceanic lithosphere. Thehigher P/T rocks in the accretionary wedge next to thetrench lie immediately above the cool subducting platethat acts as a heat sink, maintaining temperatures wellbelow the granite solidus, thus essentially precludingany migmatization and magmatism, and creating steepmetamorphic field gradients. Rocks metamorphosedalong lower P/T field gradients lie farther inland fromthe trench in thickened and heated continental crustwhere calc–alkaline arc magmatism and deep crustalmigmatites testify of elevated temperatures. Ernst(1973) points out that the polarity of field gradientsand facies series can be applied to ancient subductionzones where active seismicity and plate motions nolonger exist to indicate the direction of dip of the descending lithospheric slab.
However, it is difficult to invoke this simple platetectonic model for every orogen. Even in Japan, theMedian Tectonic Line has experienced significant left-lateral strike-slip displacement accompanying obliqueconvergence of the paired terranes; this opens the pos-sibility that the Ryoke and Sanbagawa–Chichibu Beltswere not created side by side as adjacent paired trenchand inland terranes but were formed contemporane-ously along strike (Brown, 2000).
A major complication in the evolution of orogensarises where, as commonly happens during the courseof plate motions, an oceanic island arc or plateau clogsa subduction zone or where two continental plates ofany size converge on one another in a collision zone. Inthe Cordilleran Orogen of Alaska, high P/T rocks areassociated with accretionary wedges and oceanic plateconvergence as well as with collisional continentalplates. These oceanic and continental terranes were su-tured onto the North American Plate as early as thePermian and continued episodically and diachron-ously through the Cretaceous (Patrick and Day, 1995).Because high P/T rocks occur far inland, the simplemetamorphic-belt polarity recognized to the south inCalifornia does not apply. As oceans close during theevolution of convergent plate systems, thicker contin-ental lithosphere can collide with the overriding con-tinental plate. This happened during the Paleozoic inthe Appalachians in eastern North America and theUrals in central Russia, during the late Cretaceous inthe Alps in Europe, and the Cenozoic in the Himalayasin southern Asia. Hence, metamorphic terranes formedin different settings along different P–T paths and at
different times can be closely juxtaposed and suturedtogether into a thickened collage that undergoes fur-ther deformation, metamorphism, and possible mag-matism, typically over hundreds of millions of years. In the Alps, metamorphic terranes have evolved in acomplex manner as northern and southern continentalplates collided (see Tauern Window below).
The Appalachian Orogen (Figures 13.26 and 18.7;see also Blatt and Tracy, 1996, p. 390) from Alabama toNewfoundland contains rocks metamorphosed and deformed as early as 525 Ma during the TaconicOrogeny when the ancient Iapetus Ocean closed and aconverging continental mass trapped trench, accre-tionary wedge, and island arc rocks in the broad suture;ocean-derived ophiolites are particularly evident inNewfoundland. Metamorphism in the thickened crustalong intermediate-P field gradients and clockwise P–T paths yielded Barrovian zones from greenschistthrough granulite facies. Relict blueschist- and eclogite-facies rocks have been found in only a very few locales in the Appalachians, probably because of widespread overprinting by subsequent higher T equi-libration but possibly also because the seaward highP/T rocks were rifted away during the Mesozoic open-ing of the Atlantic Ocean. Subsequent orogenic pulsesresulting from colliding continental masses producedmetamorphism and deformation at 420–370 Ma and320–270 Ma. The earlier of these two pulses—the Acadian—was especially significant in the northernAppalachians. Barrovian metamorphism in the westernpart of New England partly overprinted earlier Taconicassemblages, whereas in east-central New England andadjacent Canada lower P Buchan zones developed.Later Alleghanian metamorphism (320–270 Ma) wasfelt throughout the length of the orogen but is mostlyof greenschist- or lowest amphibolite facies.
18.2.1 Specific Regional Metamorphic TerranesTerranes of mineralogically and texturally zoned tec-tonites typify orogenic belts. Some of these terranes areof such distinct character and evolution as to warrantspecific names. Those occurring in the intermediate- tolow-P Barrovian and Buchan terranes (see Section18.3) are described next.
Slate belts are prominent features of most orogens.For example, the Appalachian Mountains of easternNorth America harbor multiple belts that individuallyare as much as 50 km wide and hundreds of kms long(Figure 18.8). Although dominantly metamorphosedshales, other aphanitic tectonites derived from sedi-mentary and volcanic protoliths are interspersed inslate belts. The typifying slaty cleavage is generallysteeply inclined and subparallel to the belt; local over-printing spaced cleavage (Figure 14.18) is common.Mineral assemblages are generally of the subgreen-schist and lower greenschist facies.
570 Igneous and Metamorphic Petrology
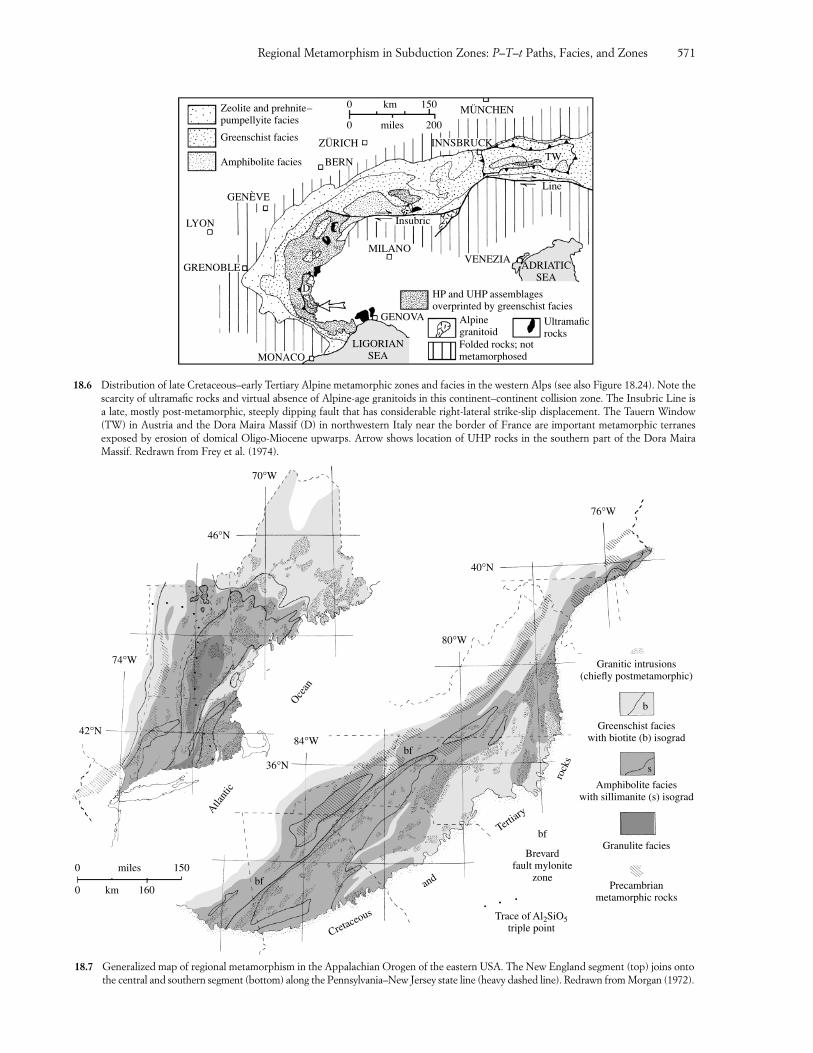
Amphibolite facies
GENEVE
LYON
D
Zeolite and prehnite–pumpellyite facies
Greenschist facies
0 km 150
0 miles 200
MÜNCHEN
ZÜRICH
BERN
´
MONACOLIGORIAN
SEA
GENOVA
HP and UHP assemblagesoverprinted by greenschist facies
AlpinegranitoidFolded rocks; notmetamorphosed
Ultramaficrocks
MILANOVENEZIA
ADRIATICSEA
Line
TWINNSBRUCK
Insubric
GRENOBLE
18.6 Distribution of late Cretaceous–early Tertiary Alpine metamorphic zones and facies in the western Alps (see also Figure 18.24). Note thescarcity of ultramafic rocks and virtual absence of Alpine-age granitoids in this continent–continent collision zone. The Insubric Line isa late, mostly post-metamorphic, steeply dipping fault that has considerable right-lateral strike-slip displacement. The Tauern Window(TW) in Austria and the Dora Maira Massif (D) in northwestern Italy near the border of France are important metamorphic terranes exposed by erosion of domical Oligo-Miocene upwarps. Arrow shows location of UHP rocks in the southern part of the Dora MairaMassif. Redrawn from Frey et al. (1974).
Granitic intrusions(chiefly postmetamorphic)
Greenschist facieswith biotite (b) isograd
Amphibolite facieswith sillimanite (s) isograd
Granulite facies
Precambrianmetamorphic rocks
0 150miles
0 160km
Atla
ntic
Oce
an
42°N
74°W
46°N
70°W
bf
Cretaceous
and
Tertiar
y
rock
s36°N
40°N
84°W
80°W
76°W
bf
bf
Brevardfault mylonite
zone
Trace of Al2SiO5triple point
b
s
18.7 Generalized map of regional metamorphism in the Appalachian Orogen of the eastern USA. The New England segment (top) joins ontothe central and southern segment (bottom) along the Pennsylvania–New Jersey state line (heavy dashed line). Redrawn from Morgan (1972).
Regional Metamorphism in Subduction Zones: P–T–t Paths, Facies, and Zones 571
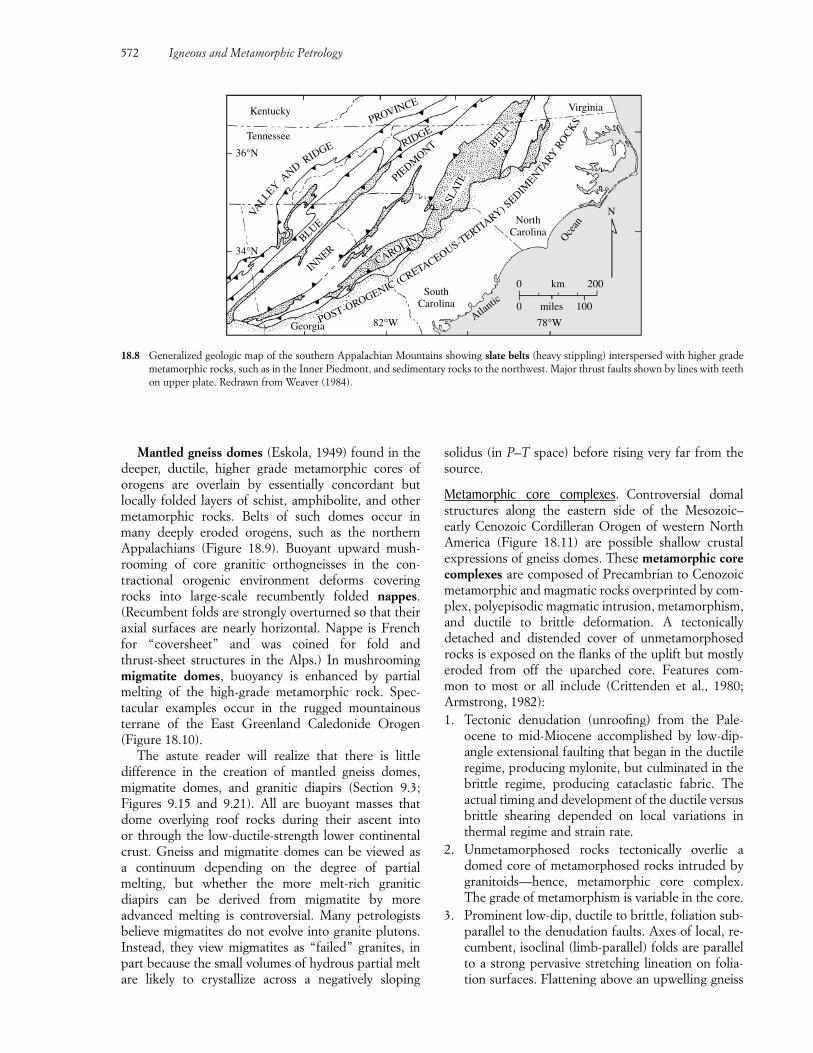
Mantled gneiss domes (Eskola, 1949) found in thedeeper, ductile, higher grade metamorphic cores oforogens are overlain by essentially concordant but locally folded layers of schist, amphibolite, and othermetamorphic rocks. Belts of such domes occur in many deeply eroded orogens, such as the northern Appalachians (Figure 18.9). Buoyant upward mush-rooming of core granitic orthogneisses in the con-tractional orogenic environment deforms coveringrocks into large-scale recumbently folded nappes. (Recumbent folds are strongly overturned so that theiraxial surfaces are nearly horizontal. Nappe is Frenchfor “coversheet” and was coined for fold and thrust-sheet structures in the Alps.) In mushroomingmigmatite domes, buoyancy is enhanced by partialmelting of the high-grade metamorphic rock. Spec-tacular examples occur in the rugged mountainous terrane of the East Greenland Caledonide Orogen (Figure 18.10).
The astute reader will realize that there is little difference in the creation of mantled gneiss domes,migmatite domes, and granitic diapirs (Section 9.3;Figures 9.15 and 9.21). All are buoyant masses thatdome overlying roof rocks during their ascent into or through the low-ductile-strength lower continentalcrust. Gneiss and migmatite domes can be viewed as a continuum depending on the degree of partial melting, but whether the more melt-rich granitic diapirs can be derived from migmatite by more advanced melting is controversial. Many petrologistsbelieve migmatites do not evolve into granite plutons.Instead, they view migmatites as “failed” granites, inpart because the small volumes of hydrous partial meltare likely to crystallize across a negatively sloping
solidus (in P–T space) before rising very far from thesource.
Metamorphic core complexes. Controversial domalstructures along the eastern side of the Mesozoic–early Cenozoic Cordilleran Orogen of western NorthAmerica (Figure 18.11) are possible shallow crustal expressions of gneiss domes. These metamorphic corecomplexes are composed of Precambrian to Cenozoicmetamorphic and magmatic rocks overprinted by com-plex, polyepisodic magmatic intrusion, metamorphism,and ductile to brittle deformation. A tectonically detached and distended cover of unmetamorphosedrocks is exposed on the flanks of the uplift but mostlyeroded from off the uparched core. Features com-mon to most or all include (Crittenden et al., 1980;Armstrong, 1982):1. Tectonic denudation (unroofing) from the Pale-
ocene to mid-Miocene accomplished by low-dip-angle extensional faulting that began in the ductileregime, producing mylonite, but culminated in thebrittle regime, producing cataclastic fabric. The actual timing and development of the ductile versusbrittle shearing depended on local variations inthermal regime and strain rate.
2. Unmetamorphosed rocks tectonically overlie adomed core of metamorphosed rocks intruded bygranitoids—hence, metamorphic core complex.The grade of metamorphism is variable in the core.
3. Prominent low-dip, ductile to brittle, foliation sub-parallel to the denudation faults. Axes of local, re-cumbent, isoclinal (limb-parallel) folds are parallelto a strong pervasive stretching lineation on folia-tion surfaces. Flattening above an upwelling gneiss
572 Igneous and Metamorphic Petrology
36°N
34°N
82°W 78°W
0 miles 100
0 km 200
N
VirginiaKentucky
Tennessee
Georgia
INNER
BLUE
PIEDM
ONT
SLAT
E
BELT
RIDGE
CAROLINA
POST-OROGENIC(CRETACEOUS-TERTIA
RY) SEDIMEN
TARY
ROCK
SPROVINCE
VALLEY
ANDRIDGE
SouthCarolina
NorthCarolina
Oce
an
Atlantic
18.8 Generalized geologic map of the southern Appalachian Mountains showing slate belts (heavy stippling) interspersed with higher grademetamorphic rocks, such as in the Inner Piedmont, and sedimentary rocks to the northwest. Major thrust faults shown by lines with teethon upper plate. Redrawn from Weaver (1984).
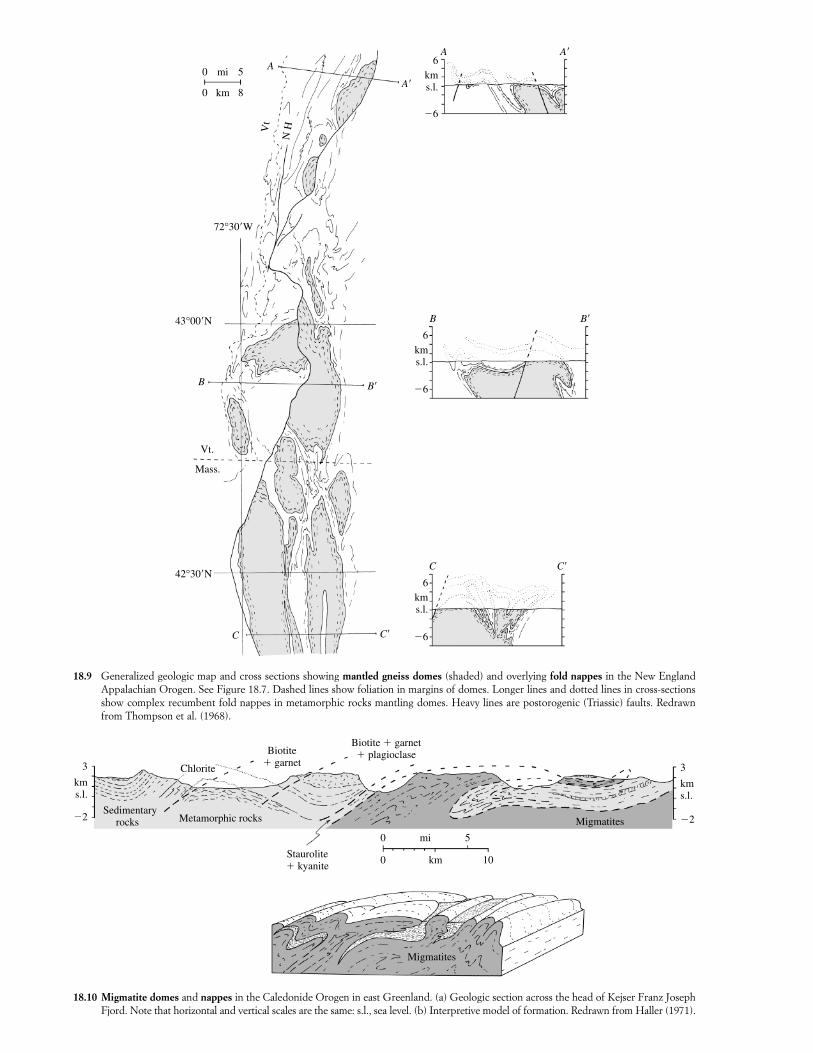
6
�6
kms.l.
6
�6
kms.l.
6
�6
kms.l.
Mass.
Vt.
42°30�N
B�B
B�B
C�C
C�C
A�
A�
AA
43°00�N
72°30�W
0 5mi
0 8km
Vt
NH
18.9 Generalized geologic map and cross sections showing mantled gneiss domes (shaded) and overlying fold nappes in the New EnglandAppalachian Orogen. See Figure 18.7. Dashed lines show foliation in margins of domes. Longer lines and dotted lines in cross-sectionsshow complex recumbent fold nappes in metamorphic rocks mantling domes. Heavy lines are postorogenic (Triassic) faults. Redrawnfrom Thompson et al. (1968).
3
kms.l.
�2
3
kms.l.
�2
0 5mi
0 10km
Sedimentaryrocks Metamorphic rocks
Chlorite
Biotite� garnet
Biotite � garnet� plagioclase
Staurolite� kyanite
Migmatites
Migmatites
18.10 Migmatite domes and nappes in the Caledonide Orogen in east Greenland. (a) Geologic section across the head of Kejser Franz JosephFjord. Note that horizontal and vertical scales are the same: s.l., sea level. (b) Interpretive model of formation. Redrawn from Haller (1971).
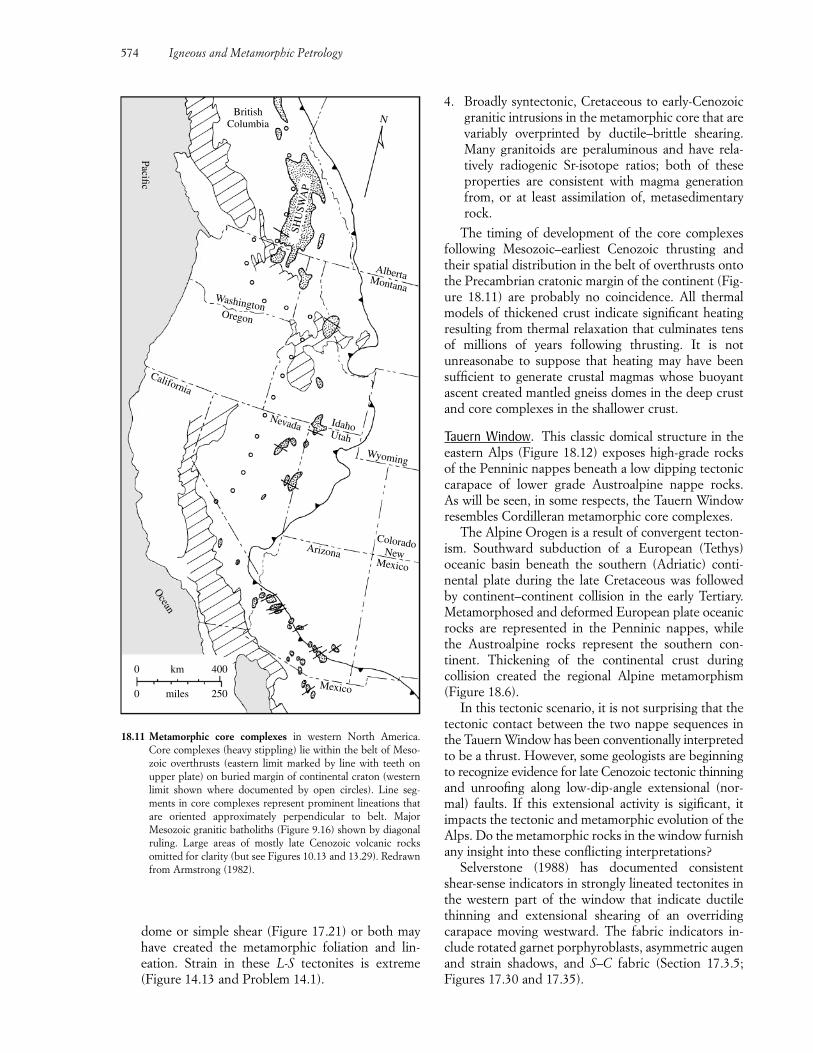
dome or simple shear (Figure 17.21) or both mayhave created the metamorphic foliation and lin-eation. Strain in these L-S tectonites is extreme(Figure 14.13 and Problem 14.1).
4. Broadly syntectonic, Cretaceous to early-Cenozoicgranitic intrusions in the metamorphic core that arevariably overprinted by ductile–brittle shearing.Many granitoids are peraluminous and have rela-tively radiogenic Sr-isotope ratios; both of theseproperties are consistent with magma generationfrom, or at least assimilation of, metasedimentaryrock.
The timing of development of the core complexesfollowing Mesozoic–earliest Cenozoic thrusting andtheir spatial distribution in the belt of overthrusts ontothe Precambrian cratonic margin of the continent (Fig-ure 18.11) are probably no coincidence. All thermalmodels of thickened crust indicate significant heatingresulting from thermal relaxation that culminates tensof millions of years following thrusting. It is not unreasonabe to suppose that heating may have beensufficient to generate crustal magmas whose buoyantascent created mantled gneiss domes in the deep crustand core complexes in the shallower crust.
Tauern Window. This classic domical structure in theeastern Alps (Figure 18.12) exposes high-grade rocksof the Penninic nappes beneath a low dipping tectoniccarapace of lower grade Austroalpine nappe rocks. As will be seen, in some respects, the Tauern Windowresembles Cordilleran metamorphic core complexes.
The Alpine Orogen is a result of convergent tecton-ism. Southward subduction of a European (Tethys)oceanic basin beneath the southern (Adriatic) conti-nental plate during the late Cretaceous was followed by continent–continent collision in the early Tertiary.Metamorphosed and deformed European plate oceanicrocks are represented in the Penninic nappes, while the Austroalpine rocks represent the southern con-tinent. Thickening of the continental crust during collision created the regional Alpine metamorphism(Figure 18.6).
In this tectonic scenario, it is not surprising that thetectonic contact between the two nappe sequences inthe Tauern Window has been conventionally interpretedto be a thrust. However, some geologists are beginningto recognize evidence for late Cenozoic tectonic thinningand unroofing along low-dip-angle extensional (nor-mal) faults. If this extensional activity is sigificant, it impacts the tectonic and metamorphic evolution of theAlps. Do the metamorphic rocks in the window furnishany insight into these conflicting interpretations?
Selverstone (1988) has documented consistentshear-sense indicators in strongly lineated tectonites inthe western part of the window that indicate ductilethinning and extensional shearing of an overridingcarapace moving westward. The fabric indicators in-clude rotated garnet porphyroblasts, asymmetric augenand strain shadows, and S–C fabric (Section 17.3.5;Figures 17.30 and 17.35).
574 Igneous and Metamorphic Petrology
PacificO
cean
Arizona
ColoradoNew
Mexico
Wyoming
IdahoUtah
Nevada
California
WashingtonOregon
AlbertaMontanaSH
USW
AP
Mexico
0 km 400
0 miles 250
BritishColumbia N
18.11 Metamorphic core complexes in western North America.Core complexes (heavy stippling) lie within the belt of Meso-zoic overthrusts (eastern limit marked by line with teeth on upper plate) on buried margin of continental craton (westernlimit shown where documented by open circles). Line seg-ments in core complexes represent prominent lineations thatare oriented approximately perpendicular to belt. MajorMesozoic granitic batholiths (Figure 9.16) shown by diagonalruling. Large areas of mostly late Cenozoic volcanic rocksomitted for clarity (but see Figures 10.13 and 13.29). Redrawnfrom Armstrong (1982).
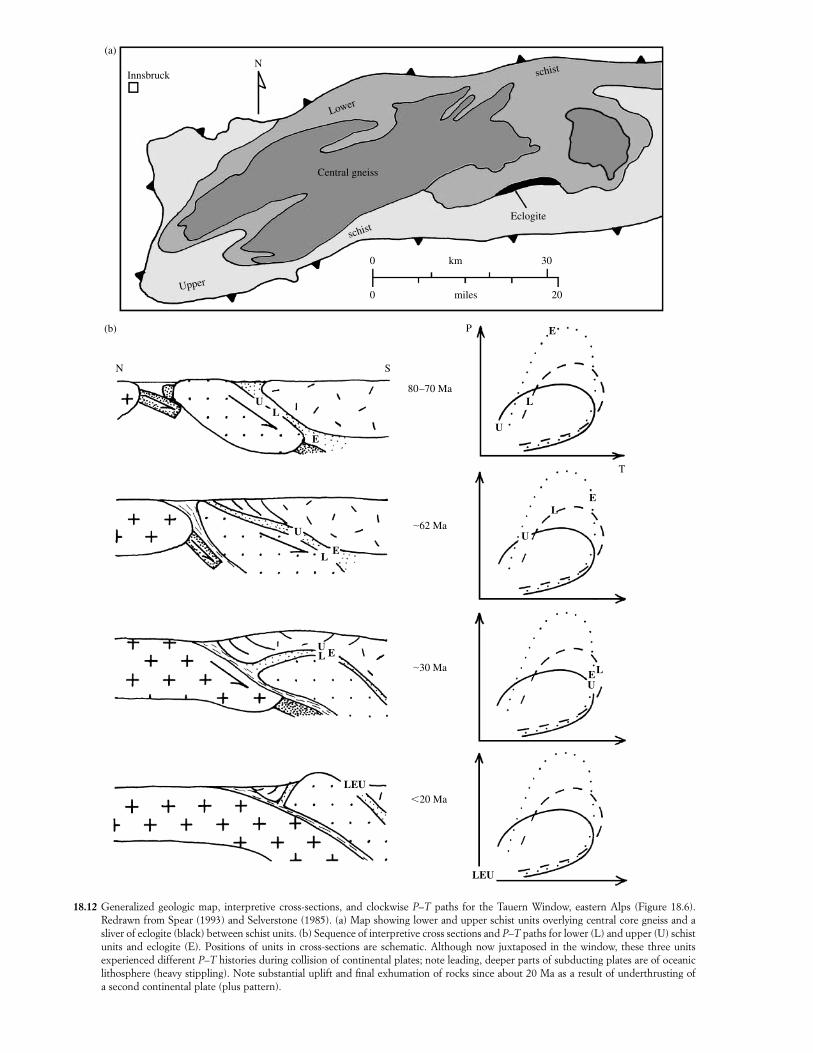
InnsbruckN
schist
Lower
Central gneiss
Upper
schistEclogite
0 km 30
0 miles 20
(a)
(b)
N S
P
80–70 Ma
�62 Ma
�30 Ma
�20 Ma
U
L
E
EL
U
EU
L
LEU
LEU
UL E
EL
U
E
UL
T
18.12 Generalized geologic map, interpretive cross-sections, and clockwise P–T paths for the Tauern Window, eastern Alps (Figure 18.6). Redrawn from Spear (1993) and Selverstone (1985). (a) Map showing lower and upper schist units overlying central core gneiss and asliver of eclogite (black) between schist units. (b) Sequence of interpretive cross sections and P–T paths for lower (L) and upper (U) schistunits and eclogite (E). Positions of units in cross-sections are schematic. Although now juxtaposed in the window, these three units experienced different P–T histories during collision of continental plates; note leading, deeper parts of subducting plates are of oceaniclithosphere (heavy stippling). Note substantial uplift and final exhumation of rocks since about 20 Ma as a result of underthrusting of a second continental plate (plus pattern).
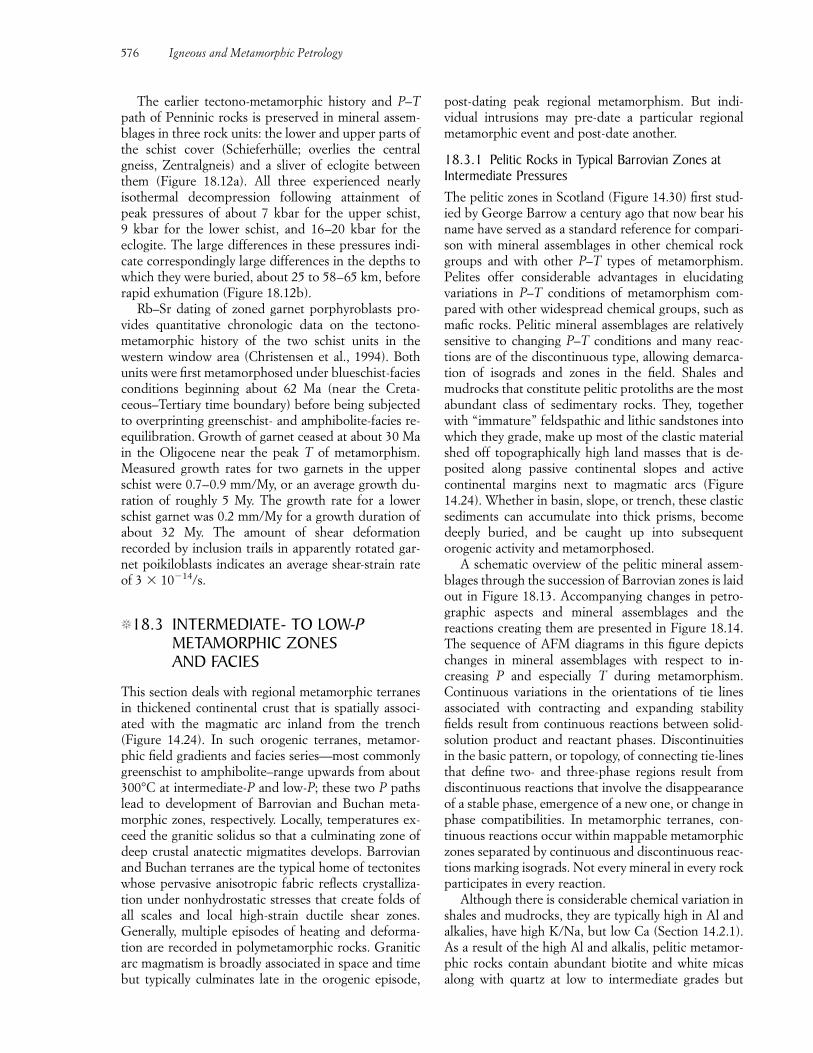
The earlier tectono-metamorphic history and P–Tpath of Penninic rocks is preserved in mineral assem-blages in three rock units: the lower and upper parts ofthe schist cover (Schieferhülle; overlies the centralgneiss, Zentralgneis) and a sliver of eclogite betweenthem (Figure 18.12a). All three experienced nearlyisothermal decompression following attainment ofpeak pressures of about 7 kbar for the upper schist, 9 kbar for the lower schist, and 16–20 kbar for theeclogite. The large differences in these pressures indi-cate correspondingly large differences in the depths towhich they were buried, about 25 to 58–65 km, beforerapid exhumation (Figure 18.12b).
Rb–Sr dating of zoned garnet porphyroblasts pro-vides quantitative chronologic data on the tectono-metamorphic history of the two schist units in the western window area (Christensen et al., 1994). Bothunits were first metamorphosed under blueschist-faciesconditions beginning about 62 Ma (near the Creta-ceous–Tertiary time boundary) before being subjectedto overprinting greenschist- and amphibolite-facies re-equilibration. Growth of garnet ceased at about 30 Main the Oligocene near the peak T of metamorphism.Measured growth rates for two garnets in the upperschist were 0.7–0.9 mm/My, or an average growth du-ration of roughly 5 My. The growth rate for a lowerschist garnet was 0.2 mm/My for a growth duration ofabout 32 My. The amount of shear deformationrecorded by inclusion trails in apparently rotated gar-net poikiloblasts indicates an average shear-strain rateof 3 � 10�14/s.
�18.3 INTERMEDIATE- TO LOW-PMETAMORPHIC ZONES AND FACIES
This section deals with regional metamorphic terranesin thickened continental crust that is spatially associ-ated with the magmatic arc inland from the trench(Figure 14.24). In such orogenic terranes, metamor-phic field gradients and facies series—most commonlygreenschist to amphibolite–range upwards from about300°C at intermediate-P and low-P; these two P pathslead to development of Barrovian and Buchan meta-morphic zones, respectively. Locally, temperatures ex-ceed the granitic solidus so that a culminating zone ofdeep crustal anatectic migmatites develops. Barrovianand Buchan terranes are the typical home of tectoniteswhose pervasive anisotropic fabric reflects crystalliza-tion under nonhydrostatic stresses that create folds ofall scales and local high-strain ductile shear zones.Generally, multiple episodes of heating and deforma-tion are recorded in polymetamorphic rocks. Graniticarc magmatism is broadly associated in space and timebut typically culminates late in the orogenic episode,
post-dating peak regional metamorphism. But indi-vidual intrusions may pre-date a particular regionalmetamorphic event and post-date another.
18.3.1 Pelitic Rocks in Typical Barrovian Zones atIntermediate PressuresThe pelitic zones in Scotland (Figure 14.30) first stud-ied by George Barrow a century ago that now bear hisname have served as a standard reference for compari-son with mineral assemblages in other chemical rockgroups and with other P–T types of metamorphism.Pelites offer considerable advantages in elucidatingvariations in P–T conditions of metamorphism com-pared with other widespread chemical groups, such asmafic rocks. Pelitic mineral assemblages are relativelysensitive to changing P–T conditions and many reac-tions are of the discontinuous type, allowing demarca-tion of isograds and zones in the field. Shales andmudrocks that constitute pelitic protoliths are the mostabundant class of sedimentary rocks. They, togetherwith “immature” feldspathic and lithic sandstones intowhich they grade, make up most of the clastic materialshed off topographically high land masses that is de-posited along passive continental slopes and activecontinental margins next to magmatic arcs (Figure14.24). Whether in basin, slope, or trench, these clasticsediments can accumulate into thick prisms, becomedeeply buried, and be caught up into subsequent orogenic activity and metamorphosed.
A schematic overview of the pelitic mineral assem-blages through the succession of Barrovian zones is laidout in Figure 18.13. Accompanying changes in petro-graphic aspects and mineral assemblages and the reactions creating them are presented in Figure 18.14.The sequence of AFM diagrams in this figure depictschanges in mineral assemblages with respect to in-creasing P and especially T during metamorphism.Continuous variations in the orientations of tie lines associated with contracting and expanding stabilityfields result from continuous reactions between solid-solution product and reactant phases. Discontinuitiesin the basic pattern, or topology, of connecting tie-linesthat define two- and three-phase regions result fromdiscontinuous reactions that involve the disappearanceof a stable phase, emergence of a new one, or change inphase compatibilities. In metamorphic terranes, con-tinuous reactions occur within mappable metamorphiczones separated by continuous and discontinuous reac-tions marking isograds. Not every mineral in every rockparticipates in every reaction.
Although there is considerable chemical variation inshales and mudrocks, they are typically high in Al andalkalies, have high K/Na, but low Ca (Section 14.2.1).As a result of the high Al and alkalis, pelitic metamor-phic rocks contain abundant biotite and white micasalong with quartz at low to intermediate grades but
576 Igneous and Metamorphic Petrology
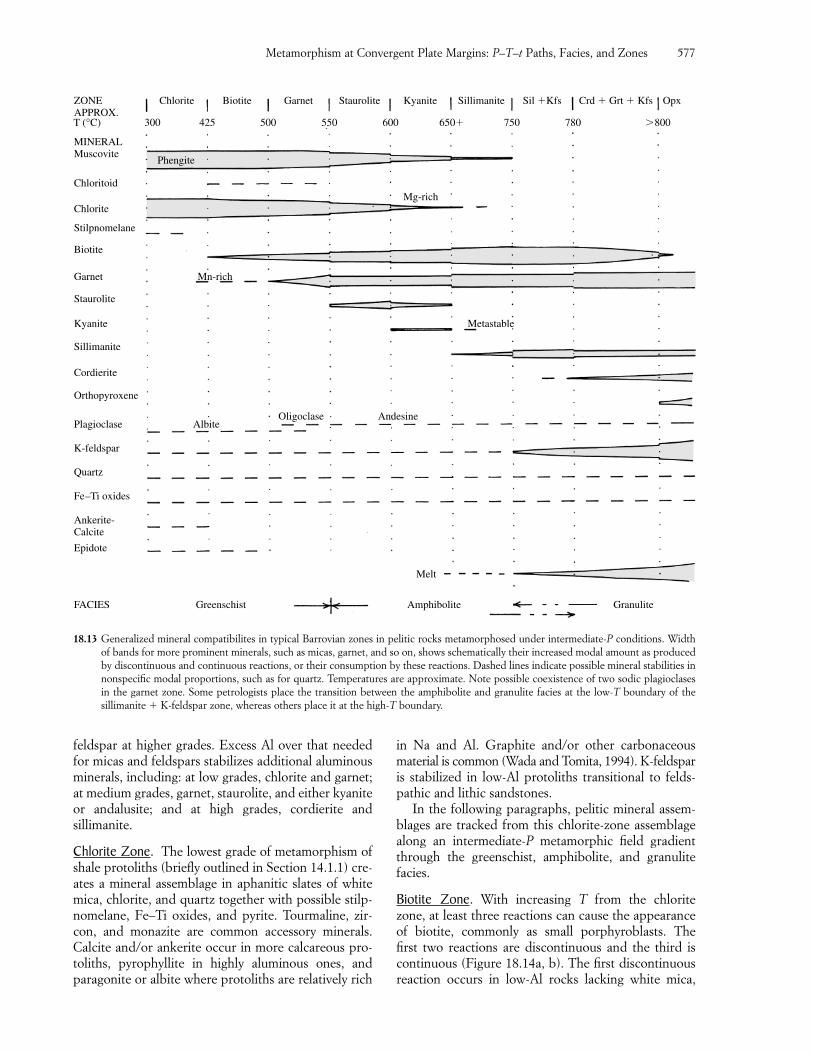
feldspar at higher grades. Excess Al over that neededfor micas and feldspars stabilizes additional aluminousminerals, including: at low grades, chlorite and garnet;at medium grades, garnet, staurolite, and either kyaniteor andalusite; and at high grades, cordierite and sillimanite.
Chlorite Zone. The lowest grade of metamorphism ofshale protoliths (briefly outlined in Section 14.1.1) cre-ates a mineral assemblage in aphanitic slates of whitemica, chlorite, and quartz together with possible stilp-nomelane, Fe–Ti oxides, and pyrite. Tourmaline, zir-con, and monazite are common accessory minerals.Calcite and/or ankerite occur in more calcareous pro-toliths, pyrophyllite in highly aluminous ones, andparagonite or albite where protoliths are relatively rich
in Na and Al. Graphite and/or other carbonaceous material is common (Wada and Tomita, 1994). K-feldsparis stabilized in low-Al protoliths transitional to felds-pathic and lithic sandstones.
In the following paragraphs, pelitic mineral assem-blages are tracked from this chlorite-zone assemblagealong an intermediate-P metamorphic field gradientthrough the greenschist, amphibolite, and granulite facies.
Biotite Zone. With increasing T from the chloritezone, at least three reactions can cause the appearanceof biotite, commonly as small porphyroblasts. The first two reactions are discontinuous and the third iscontinuous (Figure 18.14a, b). The first discontinuousreaction occurs in low-Al rocks lacking white mica,
Metamorphism at Convergent Plate Margins: P–T–t Paths, Facies, and Zones 577
Orthopyroxene
Plagioclase
K-feldspar
Quartz
Fe–Ti oxides
Ankerite-Calcite
Epidote
FACIES Greenschist Amphibolite Granulite
Melt
AlbiteOligoclase Andesine
ZONEAPPROX.
Chlorite
T (°C) 300
Phengite
425 500 550 600 650� 750 780 �800
Biotite Garnet Staurolite Kyanite Sillimanite Sil �Kfs Crd � Grt � Kfs Opx
MINERALMuscovite
Chloritoid
ChloriteMg-rich
Stilpnomelane
Biotite
Garnet Mn-rich
Staurolite
Kyanite Metastable
Sillimanite
Cordierite
18.13 Generalized mineral compatibilites in typical Barrovian zones in pelitic rocks metamorphosed under intermediate-P conditions. Widthof bands for more prominent minerals, such as micas, garnet, and so on, shows schematically their increased modal amount as producedby discontinuous and continuous reactions, or their consumption by these reactions. Dashed lines indicate possible mineral stabilities innonspecific modal proportions, such as for quartz. Temperatures are approximate. Note possible coexistence of two sodic plagioclasesin the garnet zone. Some petrologists place the transition between the amphibolite and granulite facies at the low-T boundary of the sillimanite � K-feldspar zone, whereas others place it at the high-T boundary.
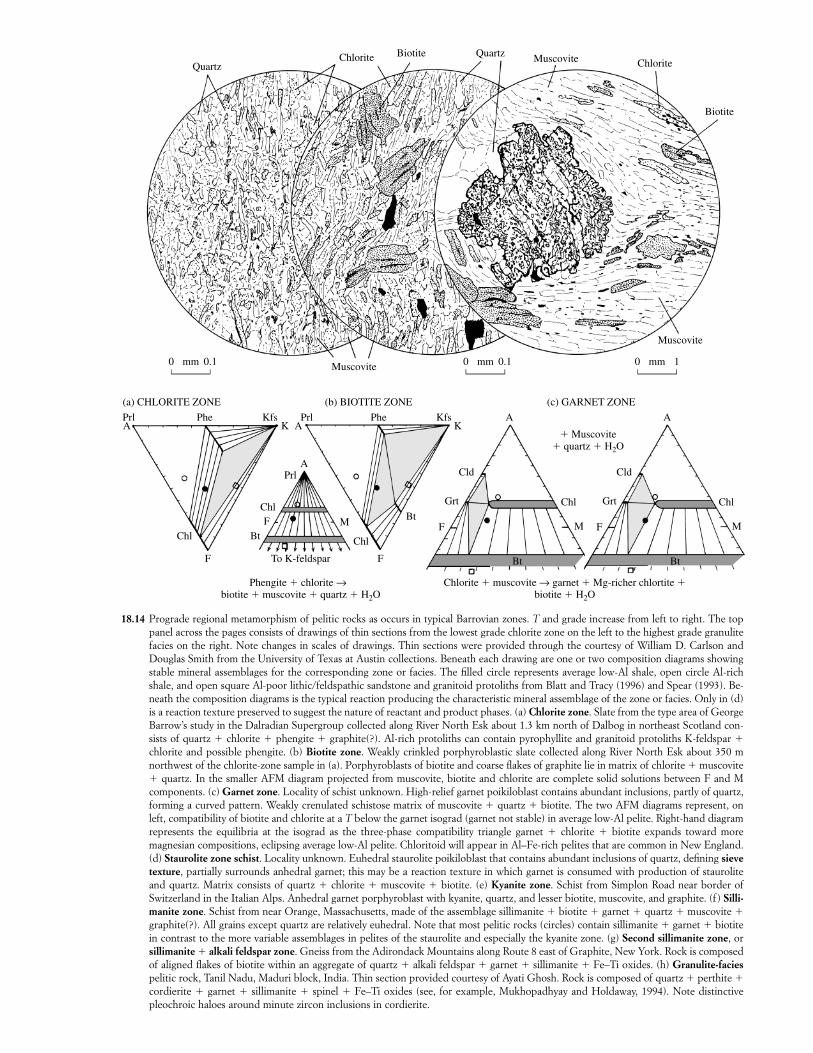
To K-feldspar
Phengite � chlorite → biotite � muscovite � quartz � H2O
Chlorite � muscovite → garnet � Mg-richer chlortite �biotite � H2O
Prl
(a) CHLORITE ZONE (b) BIOTITE ZONE (c) GARNET ZONE
Phe Kfs
A
K
M BtChl
M
AAPrl Phe Kfs A
K
Chl
Chl
Chl
Cld
Grt
F
Prl
F
Bt
F
F
Bt
Chl
M
A
Cld
Grt
F
Bt
0 0.1mm 0 0.1mm 0 1mm
� Muscovite� quartz � H2O
Muscovite
Muscovite
Biotite
ChloriteMuscoviteQuartzBiotiteChloriteQuartz
18.14 Prograde regional metamorphism of pelitic rocks as occurs in typical Barrovian zones. T and grade increase from left to right. The toppanel across the pages consists of drawings of thin sections from the lowest grade chlorite zone on the left to the highest grade granulitefacies on the right. Note changes in scales of drawings. Thin sections were provided through the courtesy of William D. Carlson and Douglas Smith from the University of Texas at Austin collections. Beneath each drawing are one or two composition diagrams showingstable mineral assemblages for the corresponding zone or facies. The filled circle represents average low-Al shale, open circle Al-richshale, and open square Al-poor lithic/feldspathic sandstone and granitoid protoliths from Blatt and Tracy (1996) and Spear (1993). Be-neath the composition diagrams is the typical reaction producing the characteristic mineral assemblage of the zone or facies. Only in (d)is a reaction texture preserved to suggest the nature of reactant and product phases. (a) Chlorite zone. Slate from the type area of GeorgeBarrow’s study in the Dalradian Supergroup collected along River North Esk about 1.3 km north of Dalbog in northeast Scotland con-sists of quartz � chlorite � phengite � graphite(?). Al-rich protoliths can contain pyrophyllite and granitoid protoliths K-feldspar �chlorite and possible phengite. (b) Biotite zone. Weakly crinkled porphyroblastic slate collected along River North Esk about 350 mnorthwest of the chlorite-zone sample in (a). Porphyroblasts of biotite and coarse flakes of graphite lie in matrix of chlorite � muscovite� quartz. In the smaller AFM diagram projected from muscovite, biotite and chlorite are complete solid solutions between F and M components. (c) Garnet zone. Locality of schist unknown. High-relief garnet poikiloblast contains abundant inclusions, partly of quartz,forming a curved pattern. Weakly crenulated schistose matrix of muscovite � quartz � biotite. The two AFM diagrams represent, onleft, compatibility of biotite and chlorite at a T below the garnet isograd (garnet not stable) in average low-Al pelite. Right-hand diagramrepresents the equilibria at the isograd as the three-phase compatibility triangle garnet � chlorite � biotite expands toward more magnesian compositions, eclipsing average low-Al pelite. Chloritoid will appear in Al–Fe-rich pelites that are common in New England.(d) Staurolite zone schist. Locality unknown. Euhedral staurolite poikiloblast that contains abundant inclusions of quartz, defining sievetexture, partially surrounds anhedral garnet; this may be a reaction texture in which garnet is consumed with production of stauroliteand quartz. Matrix consists of quartz � chlorite � muscovite � biotite. (e) Kyanite zone. Schist from Simplon Road near border ofSwitzerland in the Italian Alps. Anhedral garnet porphyroblast with kyanite, quartz, and lesser biotite, muscovite, and graphite. (f ) Silli-manite zone. Schist from near Orange, Massachusetts, made of the assemblage sillimanite � biotite � garnet � quartz � muscovite �graphite(?). All grains except quartz are relatively euhedral. Note that most pelitic rocks (circles) contain sillimanite � garnet � biotitein contrast to the more variable assemblages in pelites of the staurolite and especially the kyanite zone. (g) Second sillimanite zone, orsillimanite � alkali feldspar zone. Gneiss from the Adirondack Mountains along Route 8 east of Graphite, New York. Rock is composedof aligned flakes of biotite within an aggregate of quartz � alkali feldspar � garnet � sillimanite � Fe–Ti oxides. (h) Granulite-faciespelitic rock, Tanil Nadu, Maduri block, India. Thin section provided courtesy of Ayati Ghosh. Rock is composed of quartz � perthite �cordierite � garnet � sillimanite � spinel � Fe–Ti oxides (see, for example, Mukhopadhyay and Holdaway, 1994). Note distinctivepleochroic haloes around minute zircon inclusions in cordierite.
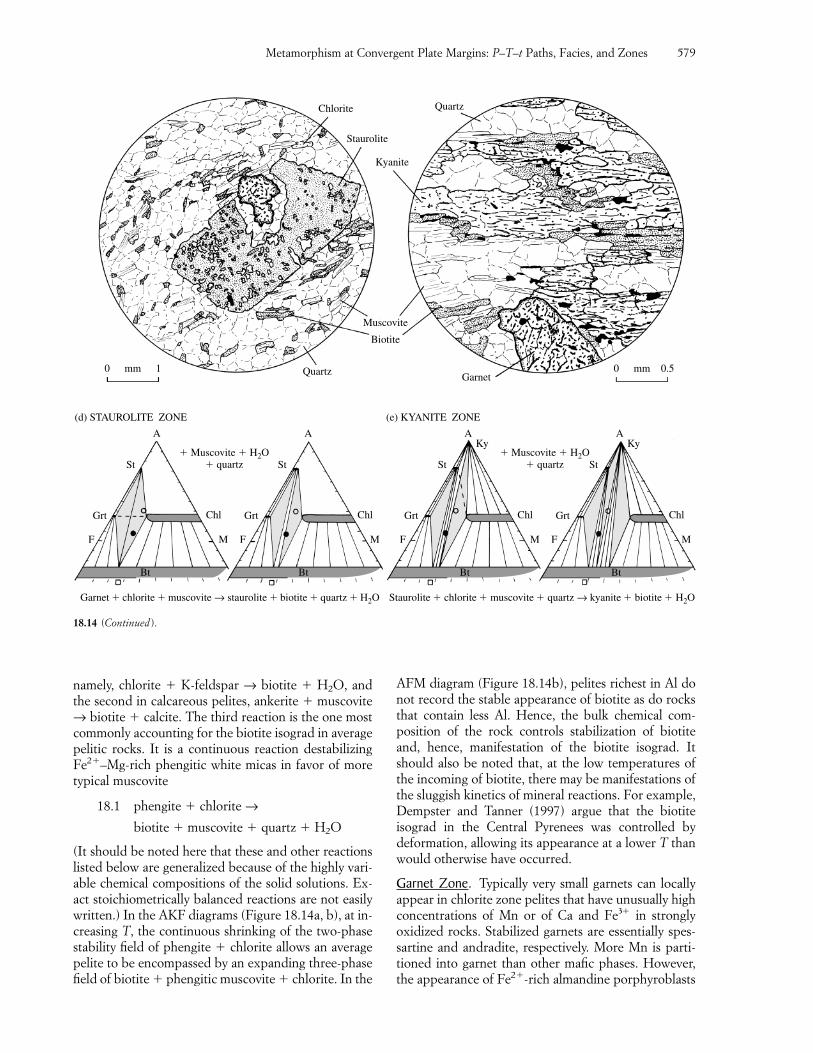
namely, chlorite � K-feldspar → biotite � H2O, andthe second in calcareous pelites, ankerite � muscovite→ biotite � calcite. The third reaction is the one mostcommonly accounting for the biotite isograd in averagepelitic rocks. It is a continuous reaction destabilizingFe2�–Mg-rich phengitic white micas in favor of moretypical muscovite
18.1 phengite � chlorite →biotite � muscovite � quartz � H2O
(It should be noted here that these and other reactionslisted below are generalized because of the highly vari-able chemical compositions of the solid solutions. Ex-act stoichiometrically balanced reactions are not easilywritten.) In the AKF diagrams (Figure 18.14a, b), at in-creasing T, the continuous shrinking of the two-phasestability field of phengite � chlorite allows an averagepelite to be encompassed by an expanding three-phasefield of biotite � phengitic muscovite � chlorite. In the
AFM diagram (Figure 18.14b), pelites richest in Al donot record the stable appearance of biotite as do rocksthat contain less Al. Hence, the bulk chemical com-position of the rock controls stabilization of biotiteand, hence, manifestation of the biotite isograd. Itshould also be noted that, at the low temperatures ofthe incoming of biotite, there may be manifestations ofthe sluggish kinetics of mineral reactions. For example,Dempster and Tanner (1997) argue that the biotite isograd in the Central Pyrenees was controlled by deformation, allowing its appearance at a lower T thanwould otherwise have occurred.
Garnet Zone. Typically very small garnets can locallyappear in chlorite zone pelites that have unusually highconcentrations of Mn or of Ca and Fe3� in strongly oxidized rocks. Stabilized garnets are essentially spes-sartine and andradite, respectively. More Mn is parti-tioned into garnet than other mafic phases. However,the appearance of Fe2�-rich almandine porphyroblasts
Metamorphism at Convergent Plate Margins: P–T–t Paths, Facies, and Zones 579
Grt
St
F M
Chl
Bt
Garnet � chlorite � muscovite → staurolite � biotite � quartz � H2O Staurolite � chlorite � muscovite � quartz → kyanite � biotite � H2O
A
(d) STAUROLITE ZONE
Grt
St
F M
Chl
Ky
Bt
A
Grt
St
F M
Chl
Bt
A
Grt
St
F M
Chl
Ky
Bt
A
(e) KYANITE ZONE
0 1mm 0 0.5mmQuartz Garnet
Muscovite
Biotite
Kyanite
Staurolite
Chlorite Quartz
� Muscovite � H2O� quartz
� Muscovite � H2O� quartz
18.14 (Continued).
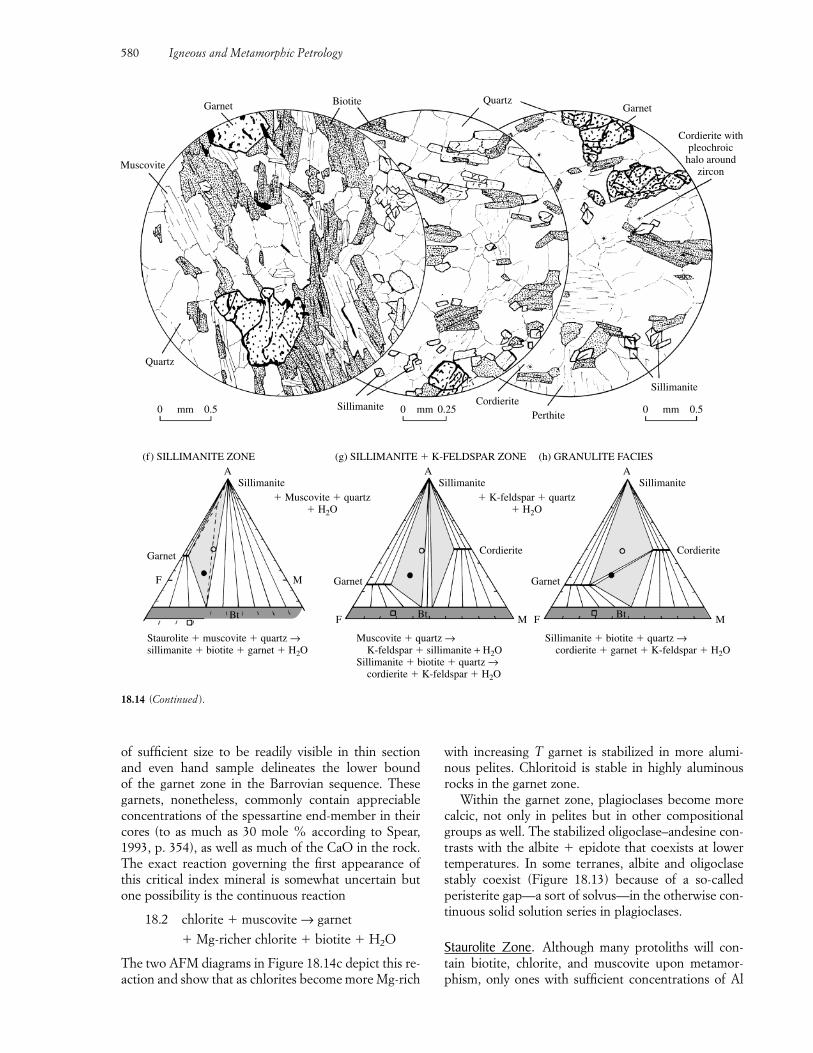
of sufficient size to be readily visible in thin section and even hand sample delineates the lower bound of the garnet zone in the Barrovian sequence. These garnets, nonetheless, commonly contain appreciableconcentrations of the spessartine end-member in theircores (to as much as 30 mole % according to Spear,1993, p. 354), as well as much of the CaO in the rock.The exact reaction governing the first appearance ofthis critical index mineral is somewhat uncertain butone possibility is the continuous reaction
18.2 chlorite � muscovite → garnet
� Mg-richer chlorite � biotite � H2O
The two AFM diagrams in Figure 18.14c depict this re-action and show that as chlorites become more Mg-rich
with increasing T garnet is stabilized in more alumi-nous pelites. Chloritoid is stable in highly aluminousrocks in the garnet zone.
Within the garnet zone, plagioclases become morecalcic, not only in pelites but in other compositionalgroups as well. The stabilized oligoclase–andesine con-trasts with the albite � epidote that coexists at lowertemperatures. In some terranes, albite and oligoclasestably coexist (Figure 18.13) because of a so-calledperisterite gap—a sort of solvus—in the otherwise con-tinuous solid solution series in plagioclases.
Staurolite Zone. Although many protoliths will con-tain biotite, chlorite, and muscovite upon metamor-phism, only ones with sufficient concentrations of Al
580 Igneous and Metamorphic Petrology
Bt
Staurolite � muscovite � quartz →sillimanite � biotite � garnet � H2O
Muscovite � quartz →K-feldspar � sillimanite + H2O
Sillimanite � biotite � quartz →cordierite � K-feldspar � H2O
Sillimanite � biotite � quartz →cordierite � garnet � K-feldspar � H2O
Bt Bt M
Cordierite withpleochroic
halo aroundzircon
Muscovite
Quartz
Sillimanite
SillimaniteCordierite
Perthite
Garnet
Garnet
Garnet
Cordierite
Garnet
Cordierite
F
F F
M
M
Sillimanite Sillimanite Sillimanite
GarnetBiotite Quartz
0 0.5mm 0 0.25mm 0 0.5mm
A A A
� Muscovite � quartz� H2O
� K-feldspar � quartz� H2O
(f) SILLIMANITE ZONE (g) SILLIMANITE � K-FELDSPAR ZONE (h) GRANULITE FACIES
18.14 (Continued).
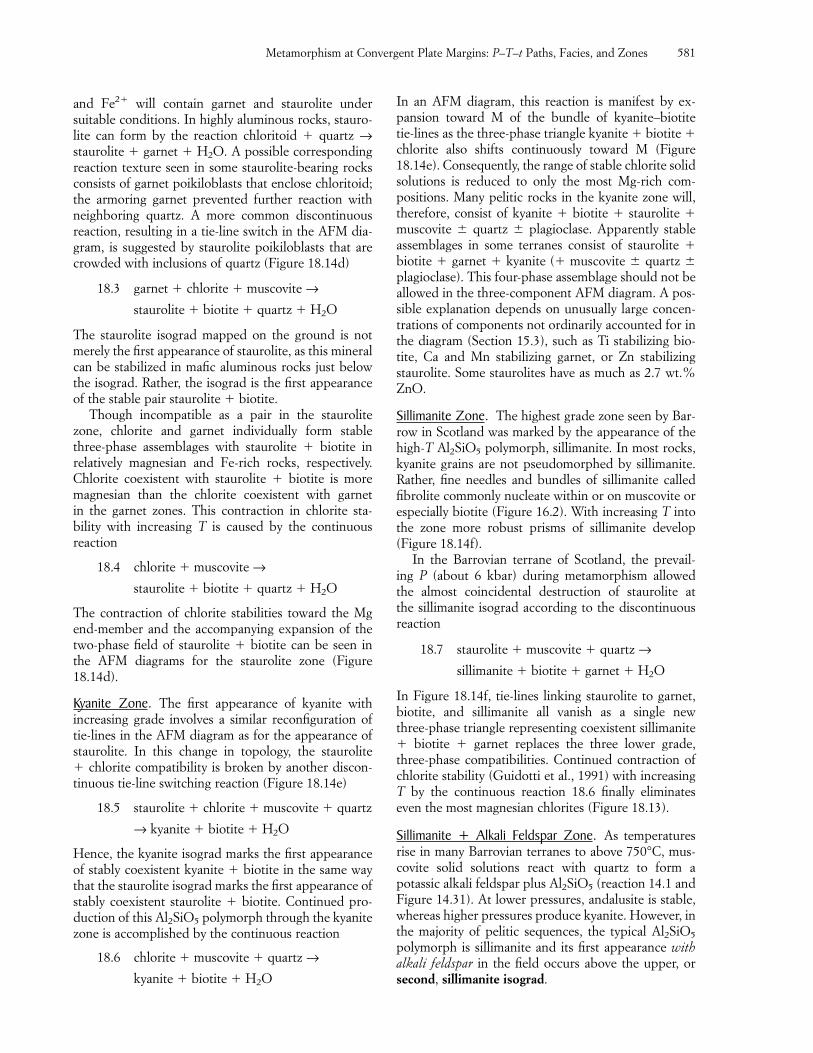
and Fe2� will contain garnet and staurolite under suitable conditions. In highly aluminous rocks, stauro-lite can form by the reaction chloritoid � quartz →staurolite � garnet � H2O. A possible correspondingreaction texture seen in some staurolite-bearing rocksconsists of garnet poikiloblasts that enclose chloritoid;the armoring garnet prevented further reaction withneighboring quartz. A more common discontinuousreaction, resulting in a tie-line switch in the AFM dia-gram, is suggested by staurolite poikiloblasts that arecrowded with inclusions of quartz (Figure 18.14d)
18.3 garnet � chlorite � muscovite →staurolite � biotite � quartz � H2O
The staurolite isograd mapped on the ground is notmerely the first appearance of staurolite, as this mineralcan be stabilized in mafic aluminous rocks just belowthe isograd. Rather, the isograd is the first appearanceof the stable pair staurolite � biotite.
Though incompatible as a pair in the staurolitezone, chlorite and garnet individually form stablethree-phase assemblages with staurolite � biotite inrelatively magnesian and Fe-rich rocks, respectively.Chlorite coexistent with staurolite � biotite is moremagnesian than the chlorite coexistent with garnet in the garnet zones. This contraction in chlorite sta-bility with increasing T is caused by the continuous reaction
18.4 chlorite � muscovite →staurolite � biotite � quartz � H2O
The contraction of chlorite stabilities toward the Mgend-member and the accompanying expansion of thetwo-phase field of staurolite � biotite can be seen inthe AFM diagrams for the staurolite zone (Figure18.14d).
Kyanite Zone. The first appearance of kyanite with increasing grade involves a similar reconfiguration oftie-lines in the AFM diagram as for the appearance ofstaurolite. In this change in topology, the staurolite � chlorite compatibility is broken by another discon-tinuous tie-line switching reaction (Figure 18.14e)
18.5 staurolite � chlorite � muscovite � quartz
→ kyanite � biotite � H2O
Hence, the kyanite isograd marks the first appearanceof stably coexistent kyanite � biotite in the same waythat the staurolite isograd marks the first appearance ofstably coexistent staurolite � biotite. Continued pro-duction of this Al2SiO5 polymorph through the kyanitezone is accomplished by the continuous reaction
18.6 chlorite � muscovite � quartz →kyanite � biotite � H2O
In an AFM diagram, this reaction is manifest by ex-pansion toward M of the bundle of kyanite–biotite tie-lines as the three-phase triangle kyanite � biotite �chlorite also shifts continuously toward M (Figure18.14e). Consequently, the range of stable chlorite solidsolutions is reduced to only the most Mg-rich com-positions. Many pelitic rocks in the kyanite zone will,therefore, consist of kyanite � biotite � staurolite �muscovite quartz plagioclase. Apparently stableassemblages in some terranes consist of staurolite �biotite � garnet � kyanite (� muscovite quartz plagioclase). This four-phase assemblage should not beallowed in the three-component AFM diagram. A pos-sible explanation depends on unusually large concen-trations of components not ordinarily accounted for inthe diagram (Section 15.3), such as Ti stabilizing bio-tite, Ca and Mn stabilizing garnet, or Zn stabilizingstaurolite. Some staurolites have as much as 2.7 wt.%ZnO.
Sillimanite Zone. The highest grade zone seen by Bar-row in Scotland was marked by the appearance of thehigh-T Al2SiO5 polymorph, sillimanite. In most rocks,kyanite grains are not pseudomorphed by sillimanite.Rather, fine needles and bundles of sillimanite calledfibrolite commonly nucleate within or on muscovite orespecially biotite (Figure 16.2). With increasing T intothe zone more robust prisms of sillimanite develop(Figure 18.14f).
In the Barrovian terrane of Scotland, the prevail-ing P (about 6 kbar) during metamorphism allowed the almost coincidental destruction of staurolite at the sillimanite isograd according to the discontinuous reaction
18.7 staurolite � muscovite � quartz →sillimanite � biotite � garnet � H2O
In Figure 18.14f, tie-lines linking staurolite to garnet,biotite, and sillimanite all vanish as a single new three-phase triangle representing coexistent sillimanite� biotite � garnet replaces the three lower grade,three-phase compatibilities. Continued contraction ofchlorite stability (Guidotti et al., 1991) with increasingT by the continuous reaction 18.6 finally eliminateseven the most magnesian chlorites (Figure 18.13).
Sillimanite + Alkali Feldspar Zone. As temperaturesrise in many Barrovian terranes to above 750°C, mus-covite solid solutions react with quartz to form a potassic alkali feldspar plus Al2SiO5 (reaction 14.1 andFigure 14.31). At lower pressures, andalusite is stable,whereas higher pressures produce kyanite. However, inthe majority of pelitic sequences, the typical Al2SiO5
polymorph is sillimanite and its first appearance withalkali feldspar in the field occurs above the upper, orsecond, sillimanite isograd.
Metamorphism at Convergent Plate Margins: P–T–t Paths, Facies, and Zones 581
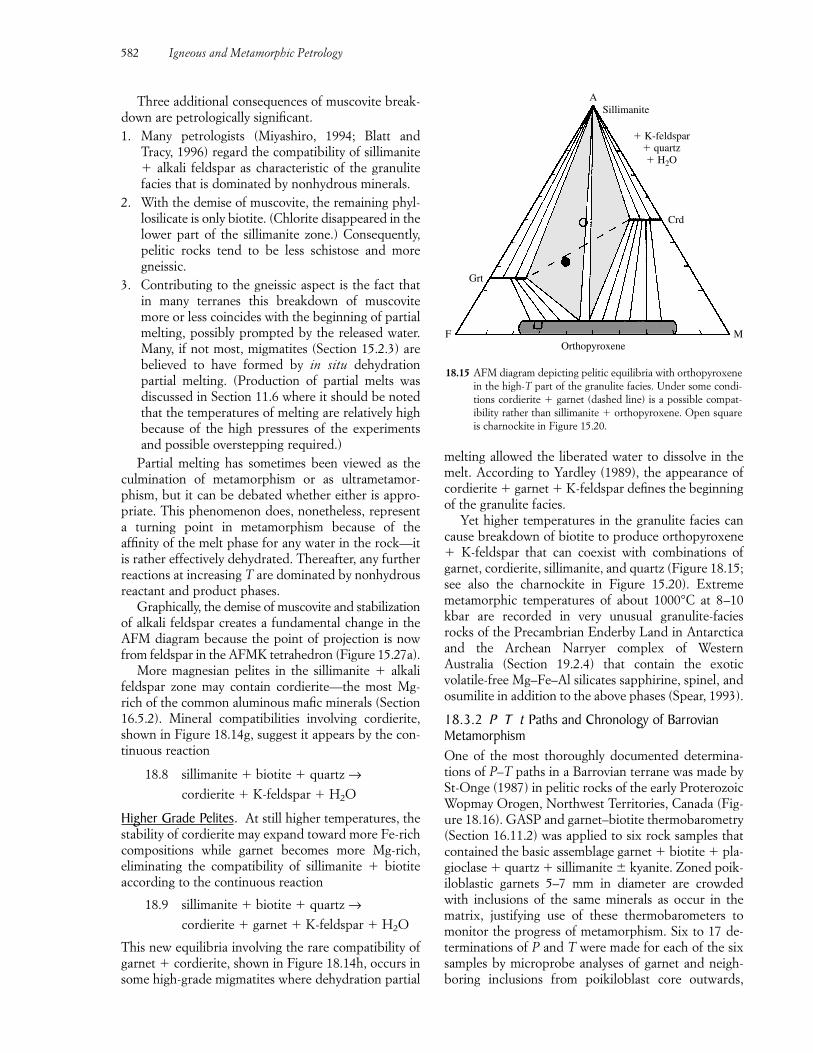
Three additional consequences of muscovite break-down are petrologically significant.1. Many petrologists (Miyashiro, 1994; Blatt and
Tracy, 1996) regard the compatibility of sillimanite� alkali feldspar as characteristic of the granulitefacies that is dominated by nonhydrous minerals.
2. With the demise of muscovite, the remaining phyl-losilicate is only biotite. (Chlorite disappeared in thelower part of the sillimanite zone.) Consequently,pelitic rocks tend to be less schistose and moregneissic.
3. Contributing to the gneissic aspect is the fact thatin many terranes this breakdown of muscovitemore or less coincides with the beginning of partialmelting, possibly prompted by the released water.Many, if not most, migmatites (Section 15.2.3) arebelieved to have formed by in situ dehydration partial melting. (Production of partial melts wasdiscussed in Section 11.6 where it should be notedthat the temperatures of melting are relatively highbecause of the high pressures of the experimentsand possible overstepping required.)
Partial melting has sometimes been viewed as theculmination of metamorphism or as ultrametamor-phism, but it can be debated whether either is appro-priate. This phenomenon does, nonetheless, representa turning point in metamorphism because of theaffinity of the melt phase for any water in the rock—itis rather effectively dehydrated. Thereafter, any furtherreactions at increasing T are dominated by nonhydrousreactant and product phases.
Graphically, the demise of muscovite and stabilizationof alkali feldspar creates a fundamental change in theAFM diagram because the point of projection is nowfrom feldspar in the AFMK tetrahedron (Figure 15.27a).
More magnesian pelites in the sillimanite � alkalifeldspar zone may contain cordierite—the most Mg-rich of the common aluminous mafic minerals (Section16.5.2). Mineral compatibilities involving cordierite,shown in Figure 18.14g, suggest it appears by the con-tinuous reaction
18.8 sillimanite � biotite � quartz →cordierite � K-feldspar � H2O
Higher Grade Pelites. At still higher temperatures, thestability of cordierite may expand toward more Fe-richcompositions while garnet becomes more Mg-rich,eliminating the compatibility of sillimanite � biotiteaccording to the continuous reaction
18.9 sillimanite � biotite � quartz →cordierite � garnet � K-feldspar � H2O
This new equilibria involving the rare compatibility ofgarnet � cordierite, shown in Figure 18.14h, occurs insome high-grade migmatites where dehydration partial
melting allowed the liberated water to dissolve in themelt. According to Yardley (1989), the appearance ofcordierite � garnet � K-feldspar defines the beginningof the granulite facies.
Yet higher temperatures in the granulite facies cancause breakdown of biotite to produce orthopyroxene� K-feldspar that can coexist with combinations ofgarnet, cordierite, sillimanite, and quartz (Figure 18.15;see also the charnockite in Figure 15.20). Extrememetamorphic temperatures of about 1000°C at 8–10kbar are recorded in very unusual granulite-faciesrocks of the Precambrian Enderby Land in Antarcticaand the Archean Narryer complex of Western Australia (Section 19.2.4) that contain the exoticvolatile-free Mg–Fe–Al silicates sapphirine, spinel, andosumilite in addition to the above phases (Spear, 1993).
18.3.2 P T t Paths and Chronology of BarrovianMetamorphismOne of the most thoroughly documented determina-tions of P–T paths in a Barrovian terrane was made bySt-Onge (1987) in pelitic rocks of the early ProterozoicWopmay Orogen, Northwest Territories, Canada (Fig-ure 18.16). GASP and garnet–biotite thermobarometry(Section 16.11.2) was applied to six rock samples thatcontained the basic assemblage garnet � biotite � pla-gioclase � quartz � sillimanite kyanite. Zoned poik-iloblastic garnets 5–7 mm in diameter are crowdedwith inclusions of the same minerals as occur in the matrix, justifying use of these thermobarometers tomonitor the progress of metamorphism. Six to 17 de-terminations of P and T were made for each of the sixsamples by microprobe analyses of garnet and neigh-boring inclusions from poikiloblast core outwards,
582 Igneous and Metamorphic Petrology
F MOrthopyroxene
ASillimanite
Crd
Grt
� K-feldspar� quartz� H2O
18.15 AFM diagram depicting pelitic equilibria with orthopyroxenein the high-T part of the granulite facies. Under some condi-tions cordierite � garnet (dashed line) is a possible compat-ibility rather than sillimanite � orthopyroxene. Open squareis charnockite in Figure 15.20.
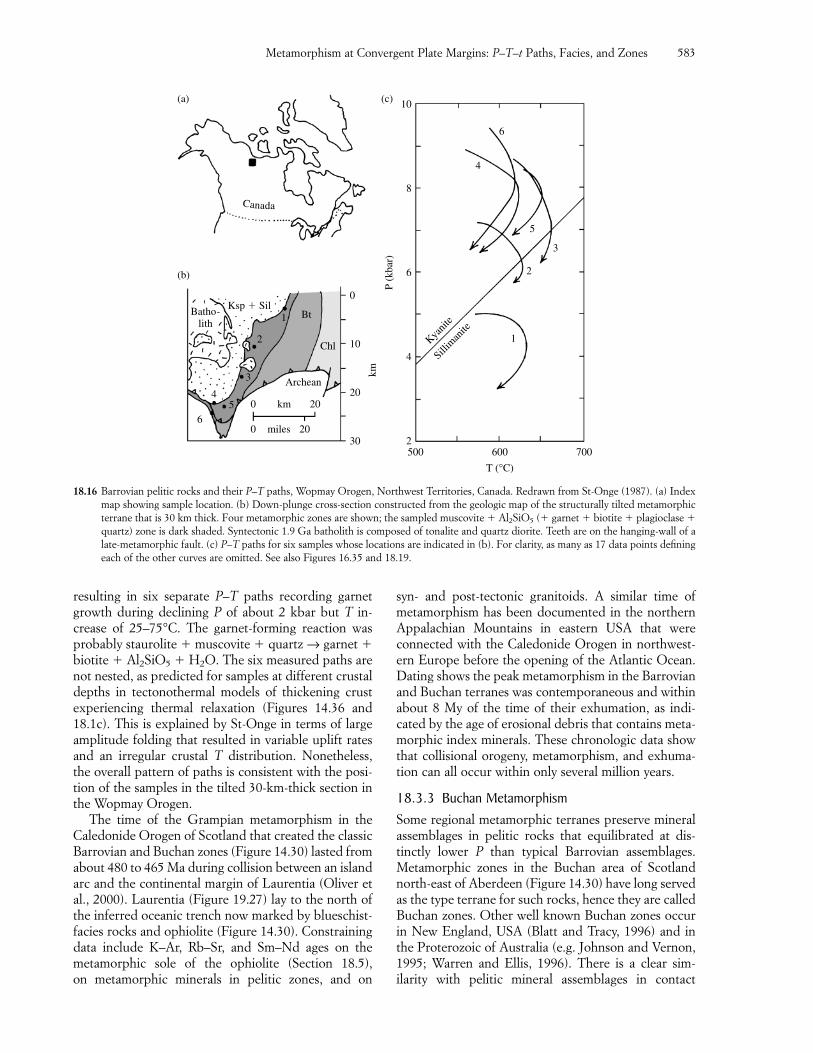
resulting in six separate P–T paths recording garnetgrowth during declining P of about 2 kbar but T in-crease of 25–75°C. The garnet-forming reaction wasprobably staurolite � muscovite � quartz → garnet �biotite � Al2SiO5 � H2O. The six measured paths arenot nested, as predicted for samples at different crustaldepths in tectonothermal models of thickening crustexperiencing thermal relaxation (Figures 14.36 and18.1c). This is explained by St-Onge in terms of largeamplitude folding that resulted in variable uplift ratesand an irregular crustal T distribution. Nonetheless,the overall pattern of paths is consistent with the posi-tion of the samples in the tilted 30-km-thick section inthe Wopmay Orogen.
The time of the Grampian metamorphism in theCaledonide Orogen of Scotland that created the classicBarrovian and Buchan zones (Figure 14.30) lasted fromabout 480 to 465 Ma during collision between an islandarc and the continental margin of Laurentia (Oliver etal., 2000). Laurentia (Figure 19.27) lay to the north ofthe inferred oceanic trench now marked by blueschist-facies rocks and ophiolite (Figure 14.30). Constrainingdata include K–Ar, Rb–Sr, and Sm–Nd ages on themetamorphic sole of the ophiolite (Section 18.5), on metamorphic minerals in pelitic zones, and on
syn- and post-tectonic granitoids. A similar time ofmetamorphism has been documented in the northernAppalachian Mountains in eastern USA that were connected with the Caledonide Orogen in northwest-ern Europe before the opening of the Atlantic Ocean.Dating shows the peak metamorphism in the Barrovianand Buchan terranes was contemporaneous and withinabout 8 My of the time of their exhumation, as indi-cated by the age of erosional debris that contains meta-morphic index minerals. These chronologic data showthat collisional orogeny, metamorphism, and exhuma-tion can all occur within only several million years.
18.3.3 Buchan MetamorphismSome regional metamorphic terranes preserve mineralassemblages in pelitic rocks that equilibrated at dis-tinctly lower P than typical Barrovian assemblages.Metamorphic zones in the Buchan area of Scotlandnorth-east of Aberdeen (Figure 14.30) have long servedas the type terrane for such rocks, hence they are calledBuchan zones. Other well known Buchan zones occurin New England, USA (Blatt and Tracy, 1996) and inthe Proterozoic of Australia (e.g. Johnson and Vernon,1995; Warren and Ellis, 1996). There is a clear sim-ilarity with pelitic mineral assemblages in contact
Metamorphism at Convergent Plate Margins: P–T–t Paths, Facies, and Zones 583
P (k
bar)
km
10
8
6
4
2
0
10
20
30
0 20km
0 20miles
700500 600
T (°C)
6
4
5
3
2
1Kyanit
eSill
iman
ite
Archean
Chl
Bt
(b)
(a) (c)
1
2
3
45
6
Batho-lith
Ksp � Sil
Canada
18.16 Barrovian pelitic rocks and their P–T paths, Wopmay Orogen, Northwest Territories, Canada. Redrawn from St-Onge (1987). (a) Indexmap showing sample location. (b) Down-plunge cross-section constructed from the geologic map of the structurally tilted metamorphicterrane that is 30 km thick. Four metamorphic zones are shown; the sampled muscovite � Al2SiO5 (� garnet � biotite � plagioclase �quartz) zone is dark shaded. Syntectonic 1.9 Ga batholith is composed of tonalite and quartz diorite. Teeth are on the hanging-wall of alate-metamorphic fault. (c) P–T paths for six samples whose locations are indicated in (b). For clarity, as many as 17 data points definingeach of the other curves are omitted. See also Figures 16.35 and 18.19.
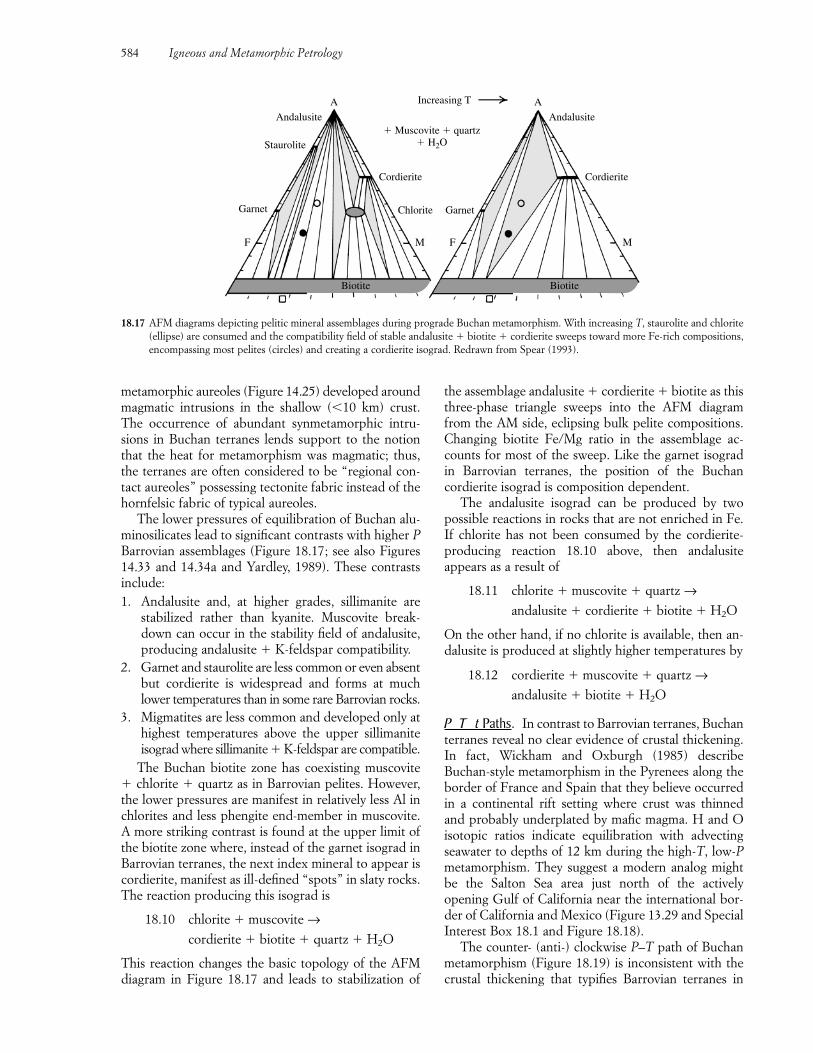
metamorphic aureoles (Figure 14.25) developed aroundmagmatic intrusions in the shallow (�10 km) crust.The occurrence of abundant synmetamorphic intru-sions in Buchan terranes lends support to the notionthat the heat for metamorphism was magmatic; thus,the terranes are often considered to be “regional con-tact aureoles” possessing tectonite fabric instead of thehornfelsic fabric of typical aureoles.
The lower pressures of equilibration of Buchan alu-minosilicates lead to significant contrasts with higher PBarrovian assemblages (Figure 18.17; see also Figures14.33 and 14.34a and Yardley, 1989). These contrastsinclude:1. Andalusite and, at higher grades, sillimanite are
stabilized rather than kyanite. Muscovite break-down can occur in the stability field of andalusite,producing andalusite � K-feldspar compatibility.
2. Garnet and staurolite are less common or even absentbut cordierite is widespread and forms at muchlower temperatures than in some rare Barrovian rocks.
3. Migmatites are less common and developed only athighest temperatures above the upper sillimaniteisograd where sillimanite � K-feldspar are compatible.
The Buchan biotite zone has coexisting muscovite� chlorite � quartz as in Barrovian pelites. However,the lower pressures are manifest in relatively less Al inchlorites and less phengite end-member in muscovite.A more striking contrast is found at the upper limit ofthe biotite zone where, instead of the garnet isograd inBarrovian terranes, the next index mineral to appear iscordierite, manifest as ill-defined “spots” in slaty rocks.The reaction producing this isograd is
18.10 chlorite � muscovite →cordierite � biotite � quartz � H2O
This reaction changes the basic topology of the AFMdiagram in Figure 18.17 and leads to stabilization of
the assemblage andalusite � cordierite � biotite as thisthree-phase triangle sweeps into the AFM diagramfrom the AM side, eclipsing bulk pelite compositions.Changing biotite Fe/Mg ratio in the assemblage ac-counts for most of the sweep. Like the garnet isogradin Barrovian terranes, the position of the Buchancordierite isograd is composition dependent.
The andalusite isograd can be produced by two possible reactions in rocks that are not enriched in Fe.If chlorite has not been consumed by the cordierite-producing reaction 18.10 above, then andalusite appears as a result of
18.11 chlorite � muscovite � quartz →andalusite � cordierite � biotite � H2O
On the other hand, if no chlorite is available, then an-dalusite is produced at slightly higher temperatures by
18.12 cordierite � muscovite � quartz →andalusite � biotite � H2O
P T t Paths. In contrast to Barrovian terranes, Buchanterranes reveal no clear evidence of crustal thickening.In fact, Wickham and Oxburgh (1985) describeBuchan-style metamorphism in the Pyrenees along theborder of France and Spain that they believe occurredin a continental rift setting where crust was thinnedand probably underplated by mafic magma. H and Oisotopic ratios indicate equilibration with advectingseawater to depths of 12 km during the high-T, low-Pmetamorphism. They suggest a modern analog mightbe the Salton Sea area just north of the actively opening Gulf of California near the international bor-der of California and Mexico (Figure 13.29 and SpecialInterest Box 18.1 and Figure 18.18).
The counter- (anti-) clockwise P–T path of Buchanmetamorphism (Figure 18.19) is inconsistent with thecrustal thickening that typifies Barrovian terranes in
584 Igneous and Metamorphic Petrology
Biotite Biotite
M
CordieriteCordierite
AndalusiteAndalusite
Staurolite
FM
Chlorite Garnet
F
Garnet
AA Increasing T
� Muscovite � quartz� H2O
18.17 AFM diagrams depicting pelitic mineral assemblages during prograde Buchan metamorphism. With increasing T, staurolite and chlorite(ellipse) are consumed and the compatibility field of stable andalusite � biotite � cordierite sweeps toward more Fe-rich compositions,encompassing most pelites (circles) and creating a cordierite isograd. Redrawn from Spear (1993).
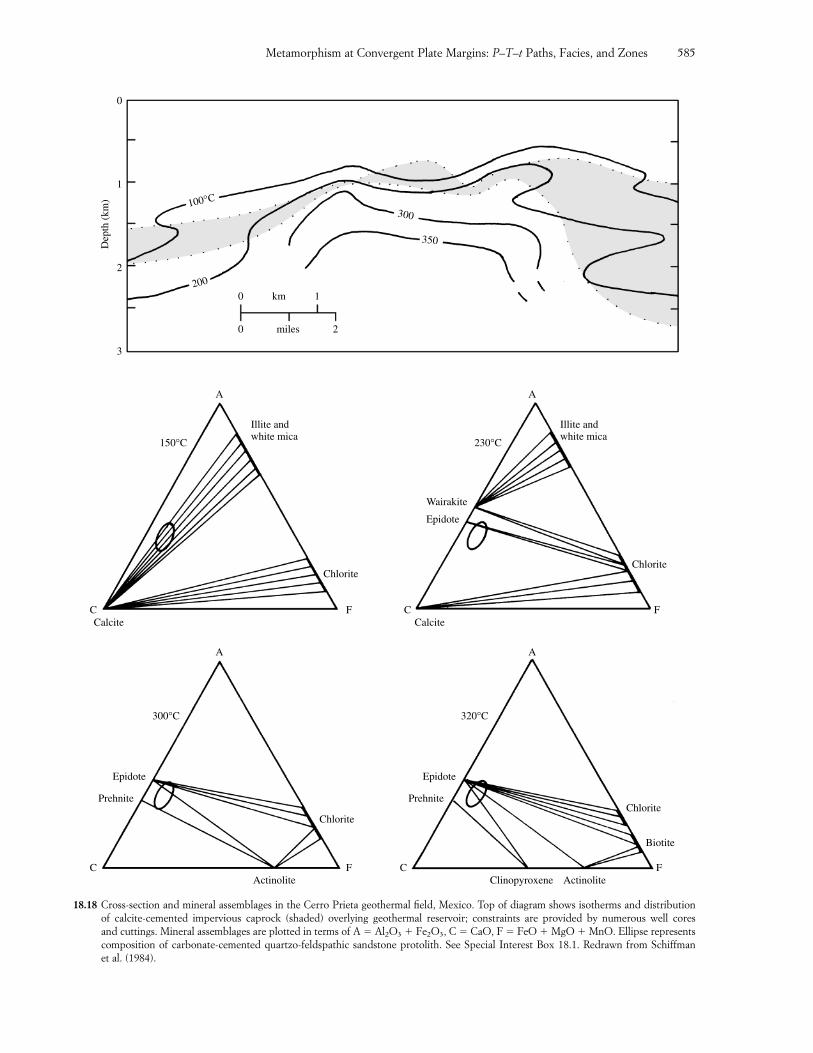
Metamorphism at Convergent Plate Margins: P–T–t Paths, Facies, and Zones 585
Dep
th (
km)
0
1
2
3
C F
Prehnite
Epidote
300°C 320°C
Biotite
Chlorite
Actinolite
A
C F
Prehnite
Epidote
Chlorite
ActinoliteClinopyroxene
A
C F
150°C 230°C
Chlorite
Illite andwhite mica
Illite andwhite mica
Calcite
A
C F
Epidote
Wairakite
Chlorite
Calcite
A
0 1km
0 2miles
100°C
200
300
350
18.18 Cross-section and mineral assemblages in the Cerro Prieta geothermal field, Mexico. Top of diagram shows isotherms and distributionof calcite-cemented impervious caprock (shaded) overlying geothermal reservoir; constraints are provided by numerous well cores and cuttings. Mineral assemblages are plotted in terms of A � Al2O3 � Fe2O3, C � CaO, F � FeO � MgO � MnO. Ellipse representscomposition of carbonate-cemented quartzo-feldspathic sandstone protolith. See Special Interest Box 18.1. Redrawn from Schiffman et al. (1984).
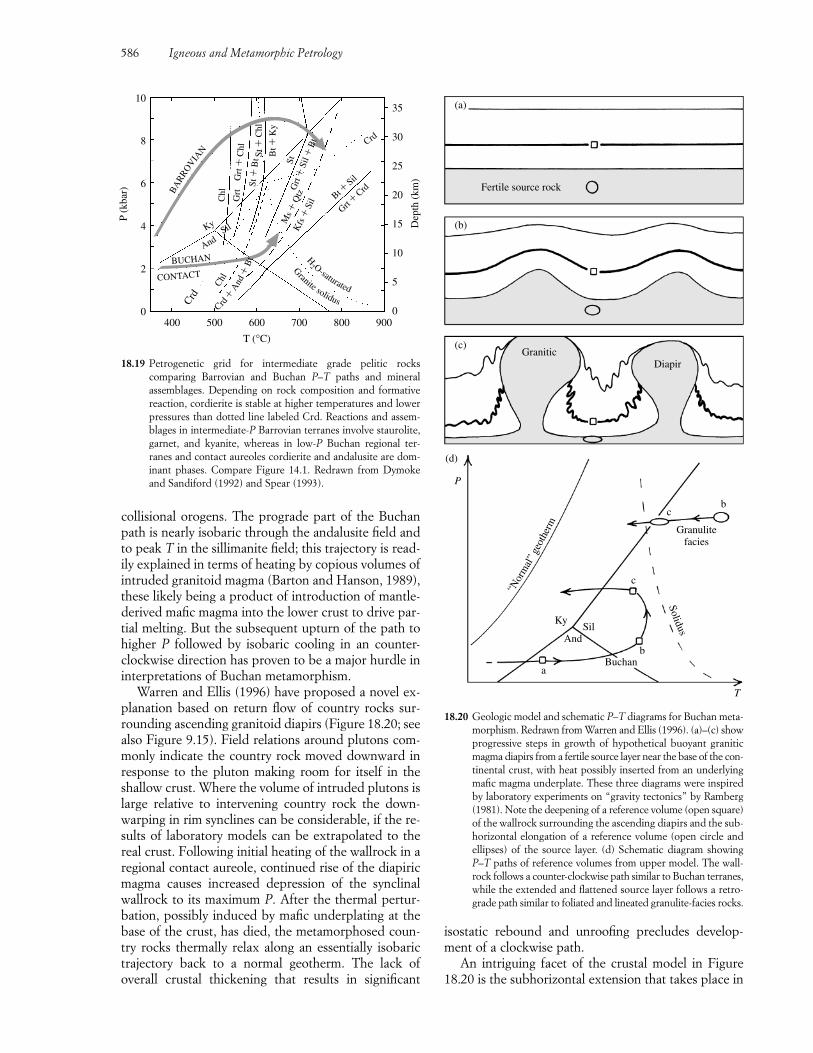
586 Igneous and Metamorphic Petrology
P (k
bar)
Dep
th (
km)
10
8
6
4
2
0
35
30
25
20
15
10
5
0400 500 600 700 800 900
T (°C)
BUCHAN
CONTACT
AndSilKy
Chl
Grt
Grt
�C
hlSt
�B
t St �
Chl
Bt �
Ky
Grt
�Si
l�B
t
Chl
Crd�
And
�B
t
Granite solidus
BA
RRO
VIA
N
H2 O-saturated
Ms�
Qtz
Kfs
�Si
l Bt�Sil
Grt�Crd
St
Crd
Crd
18.19 Petrogenetic grid for intermediate grade pelitic rocks comparing Barrovian and Buchan P–T paths and mineral assemblages. Depending on rock composition and formativereaction, cordierite is stable at higher temperatures and lowerpressures than dotted line labeled Crd. Reactions and assem-blages in intermediate-P Barrovian terranes involve staurolite,garnet, and kyanite, whereas in low-P Buchan regional ter-ranes and contact aureoles cordierite and andalusite are dom-inant phases. Compare Figure 14.1. Redrawn from Dymokeand Sandiford (1992) and Spear (1993). P
T
“Nor
mal
”ge
othe
rm
Solidus
Buchan
And
KySil
b
a
c
cb
Granulitefacies
GraniticDiapir
(a)
(b)
(c)
(d)
Fertile source rock
18.20 Geologic model and schematic P–T diagrams for Buchan meta-morphism. Redrawn from Warren and Ellis (1996). (a)–(c) showprogressive steps in growth of hypothetical buoyant graniticmagma diapirs from a fertile source layer near the base of the con-tinental crust, with heat possibly inserted from an underlyingmafic magma underplate. These three diagrams were inspiredby laboratory experiments on “gravity tectonics” by Ramberg(1981). Note the deepening of a reference volume (open square)of the wallrock surrounding the ascending diapirs and the sub-horizontal elongation of a reference volume (open circle andellipses) of the source layer. (d) Schematic diagram showingP–T paths of reference volumes from upper model. The wall-rock follows a counter-clockwise path similar to Buchan terranes,while the extended and flattened source layer follows a retro-grade path similar to foliated and lineated granulite-facies rocks.
collisional orogens. The prograde part of the Buchanpath is nearly isobaric through the andalusite field andto peak T in the sillimanite field; this trajectory is read-ily explained in terms of heating by copious volumes ofintruded granitoid magma (Barton and Hanson, 1989),these likely being a product of introduction of mantle-derived mafic magma into the lower crust to drive par-tial melting. But the subsequent upturn of the path tohigher P followed by isobaric cooling in an counter-clockwise direction has proven to be a major hurdle ininterpretations of Buchan metamorphism.
Warren and Ellis (1996) have proposed a novel ex-planation based on return flow of country rocks sur-rounding ascending granitoid diapirs (Figure 18.20; seealso Figure 9.15). Field relations around plutons com-monly indicate the country rock moved downward inresponse to the pluton making room for itself in theshallow crust. Where the volume of intruded plutons islarge relative to intervening country rock the down-warping in rim synclines can be considerable, if the re-sults of laboratory models can be extrapolated to thereal crust. Following initial heating of the wallrock in aregional contact aureole, continued rise of the diapiricmagma causes increased depression of the synclinalwallrock to its maximum P. After the thermal pertur-bation, possibly induced by mafic underplating at thebase of the crust, has died, the metamorphosed coun-try rocks thermally relax along an essentially isobarictrajectory back to a normal geotherm. The lack ofoverall crustal thickening that results in significant
isostatic rebound and unroofing precludes develop-ment of a clockwise path.
An intriguing facet of the crustal model in Figure18.20 is the subhorizontal extension that takes place in
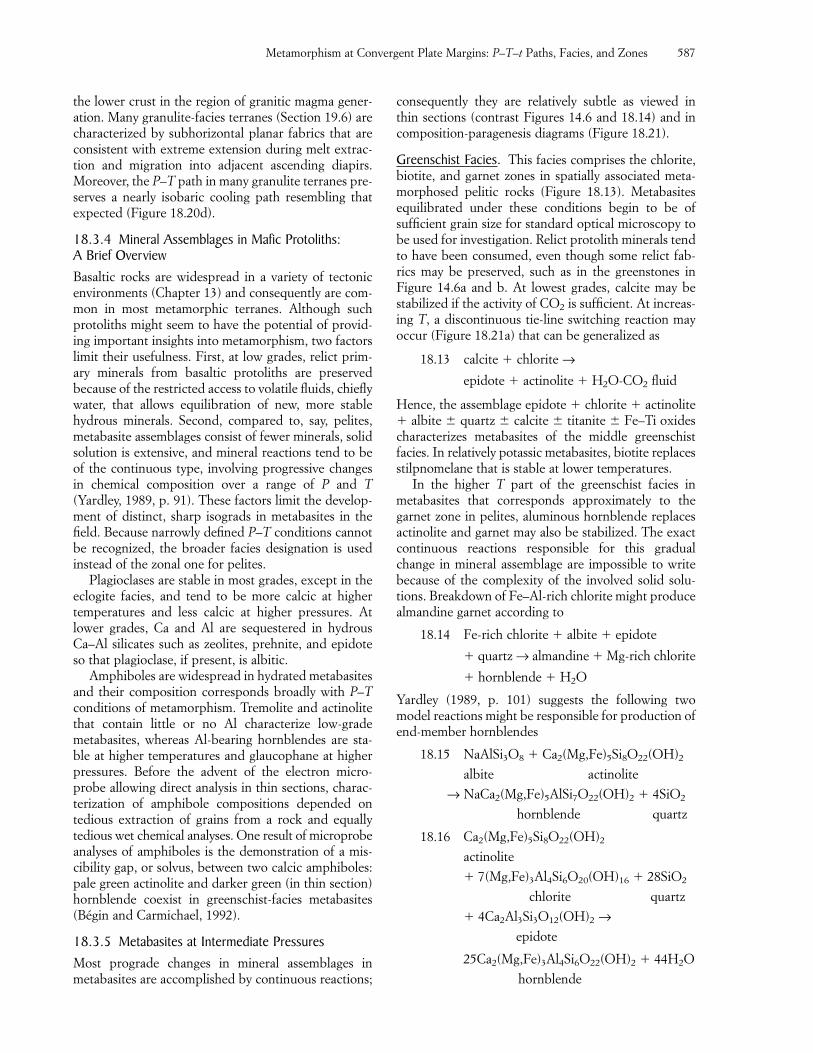
the lower crust in the region of granitic magma gener-ation. Many granulite-facies terranes (Section 19.6) arecharacterized by subhorizontal planar fabrics that areconsistent with extreme extension during melt extrac-tion and migration into adjacent ascending diapirs.Moreover, the P–T path in many granulite terranes pre-serves a nearly isobaric cooling path resembling thatexpected (Figure 18.20d).
18.3.4 Mineral Assemblages in Mafic Protoliths: A Brief OverviewBasaltic rocks are widespread in a variety of tectonicenvironments (Chapter 13) and consequently are com-mon in most metamorphic terranes. Although suchprotoliths might seem to have the potential of provid-ing important insights into metamorphism, two factorslimit their usefulness. First, at low grades, relict prim-ary minerals from basaltic protoliths are preserved because of the restricted access to volatile fluids, chieflywater, that allows equilibration of new, more stable hydrous minerals. Second, compared to, say, pelites,metabasite assemblages consist of fewer minerals, solidsolution is extensive, and mineral reactions tend to beof the continuous type, involving progressive changesin chemical composition over a range of P and T(Yardley, 1989, p. 91). These factors limit the develop-ment of distinct, sharp isograds in metabasites in thefield. Because narrowly defined P–T conditions cannotbe recognized, the broader facies designation is usedinstead of the zonal one for pelites.
Plagioclases are stable in most grades, except in theeclogite facies, and tend to be more calcic at highertemperatures and less calcic at higher pressures. Atlower grades, Ca and Al are sequestered in hydrousCa–Al silicates such as zeolites, prehnite, and epidoteso that plagioclase, if present, is albitic.
Amphiboles are widespread in hydrated metabasitesand their composition corresponds broadly with P–Tconditions of metamorphism. Tremolite and actinolitethat contain little or no Al characterize low-grademetabasites, whereas Al-bearing hornblendes are sta-ble at higher temperatures and glaucophane at higherpressures. Before the advent of the electron micro-probe allowing direct analysis in thin sections, charac-terization of amphibole compositions depended on tedious extraction of grains from a rock and equally tedious wet chemical analyses. One result of microprobeanalyses of amphiboles is the demonstration of a mis-cibility gap, or solvus, between two calcic amphiboles:pale green actinolite and darker green (in thin section)hornblende coexist in greenschist-facies metabasites(Bégin and Carmichael, 1992).
18.3.5 Metabasites at Intermediate PressuresMost prograde changes in mineral assemblages inmetabasites are accomplished by continuous reactions;
consequently they are relatively subtle as viewed in thin sections (contrast Figures 14.6 and 18.14) and incomposition-paragenesis diagrams (Figure 18.21).
Greenschist Facies. This facies comprises the chlorite,biotite, and garnet zones in spatially associated meta-morphosed pelitic rocks (Figure 18.13). Metabasitesequilibrated under these conditions begin to be ofsufficient grain size for standard optical microscopy tobe used for investigation. Relict protolith minerals tendto have been consumed, even though some relict fab-rics may be preserved, such as in the greenstones inFigure 14.6a and b. At lowest grades, calcite may bestabilized if the activity of CO2 is sufficient. At increas-ing T, a discontinuous tie-line switching reaction mayoccur (Figure 18.21a) that can be generalized as
18.13 calcite � chlorite →epidote � actinolite � H2O-CO2 fluid
Hence, the assemblage epidote � chlorite � actinolite� albite quartz calcite titanite Fe–Ti oxidescharacterizes metabasites of the middle greenschist facies. In relatively potassic metabasites, biotite replacesstilpnomelane that is stable at lower temperatures.
In the higher T part of the greenschist facies inmetabasites that corresponds approximately to the garnet zone in pelites, aluminous hornblende replacesactinolite and garnet may also be stabilized. The exactcontinuous reactions responsible for this gradualchange in mineral assemblage are impossible to writebecause of the complexity of the involved solid solu-tions. Breakdown of Fe–Al-rich chlorite might producealmandine garnet according to
18.14 Fe-rich chlorite � albite � epidote
� quartz → almandine � Mg-rich chlorite
� hornblende � H2O
Yardley (1989, p. 101) suggests the following twomodel reactions might be responsible for production ofend-member hornblendes
18.15 NaAlSi3O8 � Ca2(Mg,Fe)5Si8O22(OH)2
albite actinolite
→ NaCa2(Mg,Fe)5AlSi7O22(OH)2 � 4SiO2
hornblende quartz
18.16 Ca2(Mg,Fe)5Si8O22(OH)2
actinolite
� 7(Mg,Fe)3Al4Si6O20(OH)16 � 28SiO2
chlorite quartz
� 4Ca2Al3Si3O12(OH)2 →epidote
25Ca2(Mg,Fe)3Al4Si6O22(OH)2 � 44H2O
hornblende
Metamorphism at Convergent Plate Margins: P–T–t Paths, Facies, and Zones 587
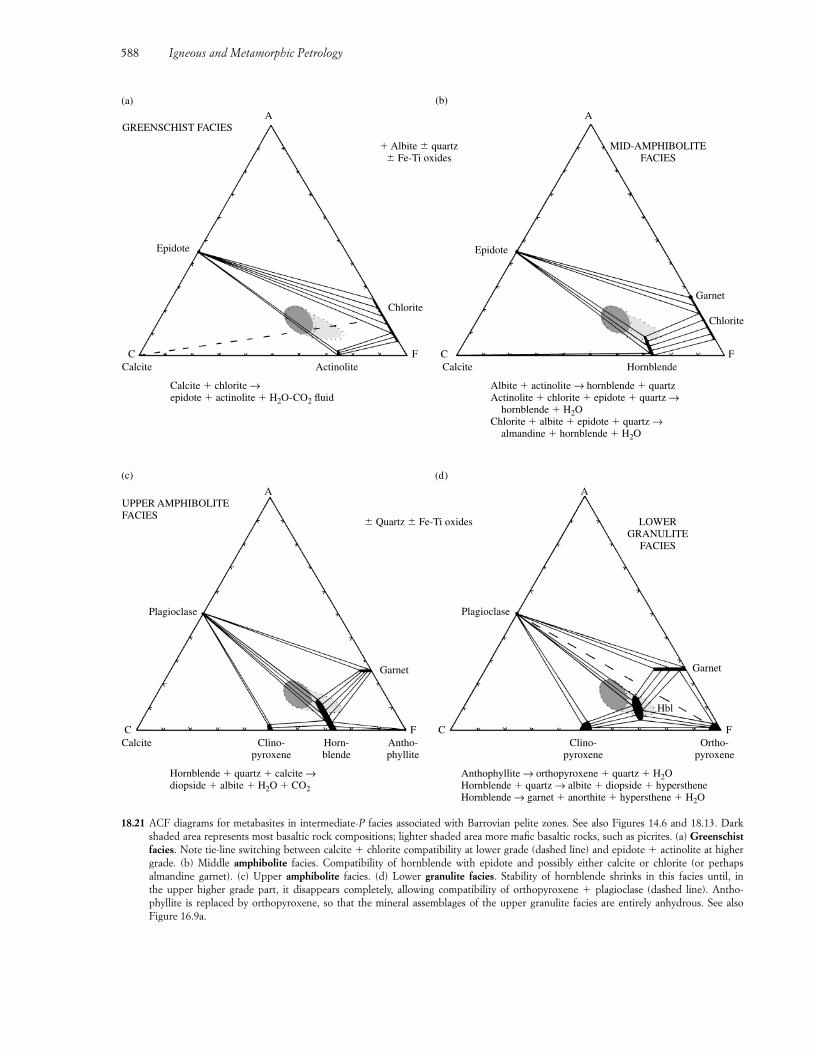
588 Igneous and Metamorphic Petrology
Calcite Actinolite
Calcite � chlorite →epidote � actinolite � H2O-CO2 fluid
Albite � actinolite → hornblende � quartzActinolite � chlorite � epidote � quartz →
hornblende � H2OChlorite � albite � epidote � quartz →
almandine � hornblende � H2O
Calcite Hornblende
ChloriteChlorite
Garnet
FC FC
EpidoteEpidote
� Albite quartz Fe-Ti oxides
MID-AMPHIBOLITEFACIES
AAGREENSCHIST FACIES
(b)(a)
Calcite Clino-pyroxene
Clino-pyroxene
Horn-blende
Antho-phyllite
Hornblende � quartz � calcite →diopside � albite � H2O � CO2
Anthophyllite → orthopyroxene � quartz � H2OHornblende � quartz → albite � diopside � hyperstheneHornblende → garnet � anorthite � hypersthene � H2O
Ortho-pyroxene
Garnet Garnet
Hbl
F FCC
PlagioclasePlagioclase
Quartz Fe-Ti oxides LOWERGRANULITE
FACIES
AAUPPER AMPHIBOLITEFACIES
(d)(c)
18.21 ACF diagrams for metabasites in intermediate-P facies associated with Barrovian pelite zones. See also Figures 14.6 and 18.13. Darkshaded area represents most basaltic rock compositions; lighter shaded area more mafic basaltic rocks, such as picrites. (a) Greenschistfacies. Note tie-line switching between calcite � chlorite compatibility at lower grade (dashed line) and epidote � actinolite at highergrade. (b) Middle amphibolite facies. Compatibility of hornblende with epidote and possibly either calcite or chlorite (or perhaps almandine garnet). (c) Upper amphibolite facies. (d) Lower granulite facies. Stability of hornblende shrinks in this facies until, in the upper higher grade part, it disappears completely, allowing compatibility of orthopyroxene � plagioclase (dashed line). Antho-phyllite is replaced by orthopyroxene, so that the mineral assemblages of the upper granulite facies are entirely anhydrous. See also Figure 16.9a.
Amphibolite Facies. With increasing T into amphi-bolite facies conditions in metabasites, epidote andchlorite decrease in abundance and eventually dis-appear, while hornblende, almandine-rich garnet, and plagioclase increase (Figures 18.21b, c). All thesechanges result from continuous reactions involving solidsolutions, possibly of the form (Yardley, 1989, p. 101)
18.17 3(Mg,Fe)10Al4Si6O20(OH)16
chlorite
� 12Ca2Al3Si3O12(OH)2 � 4SiO2 →epidote quartz
10Ca2(Mg,Fe)3Al4Si6O22(OH)2
hornblende
� 4CaAl2Si2O8 � 2H2O
anorthite
The anorthite produced in this reaction combines withexisting albite to yield oligoclase. Hence, most meta-basites will consist of hornblende � plagioclase; withisotropic fabric, this is an amphibolite rock type (Fig-ure 14.6c). Minor amounts of almandine-rich garnetmay appear in some amphibolites (Figure 14.9) and,transitional into the granulate facies, relatively calcicbasaltic protoliths will contain a minor amount ofclinopyroxene formed by initial breakdown of horn-blende. A possible model reaction for production ofdiopside � albite (the latter entering plagioclase solidsolutions) involves quartz � calcite (or wollastonite) asreactants with Al-poor hornblende
18.18 NaCa2(Mg,Fe)5AlSi7O22(OH)2 � 6SiO2
hornblende quartz
� 3CaCO3 → 5Ca(Mg,Fe)Si2O6
calcite diopside
� NaAlSi3O8 � H2O � 5CO2
albite
Granulite Facies. The transition from the amphiboliteto granulite facies in metabasites (Figure 18.21c, d) isgradational and results from continuous reactions, as inlower-grade transitions. Hornblende and locally biotitepersist into the lower part of the granulite facies,whereas only anhydrous mafic phases are stable in the upper, highest T part of the facies (Figure 14.6d) in plagioclase–pyroxene granofels. Low- to middle-granulite-facies hornblendes in thin section tend to bepleochroic brown in plane-polarized light, presumablybecause of higher concentrations of Ti, rather than theusual bluish-green of amphibolite-facies hornblendes.Two reactions that could possibly consume horn-blende, both Al-poor and Al-rich, producing plagio-clase � pyroxene � Ca–Mg–Fe garnet, are
18.19 NaCa2(Mg,Fe)5AlSi7O22(OH)2 � 3SiO2
hornblende quartz
→ NaAlSi3O8 � 2Ca(Mg,Fe)Si2O6
albite diopside
� 3(Mg,Fe)SiO3 � H2O
hypersthene
18.20 Ca2(Mg,Fe)3Al4Si6O22(OH)2 →hornblende
Ca(Mg,Fe)2Al2Si3O12 � CaAl2Si2O8
garnet anorthite
� (Mg,Fe)SiO3 � H2O
hypersthene
In more mafic rocks, anthophyllite breaks down toyield orthopyroxene � quartz � water according to
18.21 (Mg,Fe)7Si8O22(OH)2 → 7(Mg,Fe)SiO3
� SiO2 � H2O
Orthopyroxene is stable with clinopyroxene and, withthe disappearance of hornblende near the middle ofthe facies, orthopyroxene is compatible with andesineor perhaps labradorite plagioclase (Figure 18.21d). Athigher pressures in the granulite facies, this compat-ibility is broken and is replaced by garnet � clinopyro-xene (Figure 16.9).
Granulite-facies rocks are more widespread in Precambrian cratons (Section 19.6) than in the highestT part of Phanerozoic Barrovian terranes. Locally, especially in shear zones where fluids have infiltrated,granulite-facies rocks are variably retrograded to amphibolite- and greenschist-facies assemblages. Manygranulite-facies metabasites and those in the higher Tamphibolite facies will have migmatitic leucosomes ofsodic plagioclase and quartz produced by dehydrationpartial melting (Figure 11.21).
�18.4 OCEAN-RIDGE METAMORPHISMBefore proceeding onto high-P metamorphism in near-trench terranes we make a brief digression to describethe nature and products of the metamorphism that oc-curs at ocean ridges. Interaction between cold seawaterand hot mafic–ultramafic rocks in the 65 000-km-longoceanic spreading-ridge system is likely the largest active metamorphic system on the planet (Humphris et al., 1995). It is metasomatism on a grand scale! The entire mass of the world’s oceans is circulated throughthe seafloor about once every 5 My (Special InterestBox 11.3). Because of seafloor spreading, the metaso-matic products cover a major part of the planet and,therefore, in terms of area, are the most extensive
Metamorphism at Convergent Plate Margins: P–T–t Paths, Facies, and Zones 589
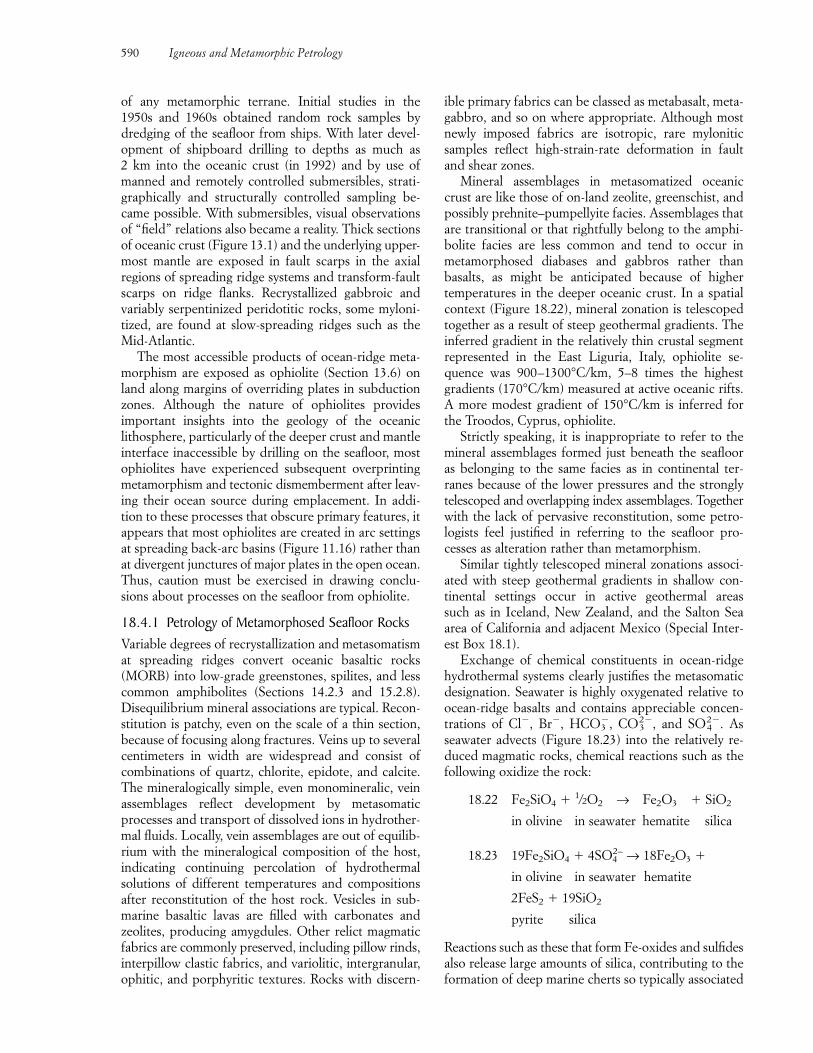
of any metamorphic terrane. Initial studies in the 1950s and 1960s obtained random rock samples bydredging of the seafloor from ships. With later devel-opment of shipboard drilling to depths as much as 2 km into the oceanic crust (in 1992) and by use ofmanned and remotely controlled submersibles, strati-graphically and structurally controlled sampling be-came possible. With submersibles, visual observationsof “field” relations also became a reality. Thick sectionsof oceanic crust (Figure 13.1) and the underlying upper-most mantle are exposed in fault scarps in the axial regions of spreading ridge systems and transform-faultscarps on ridge flanks. Recrystallized gabbroic andvariably serpentinized peridotitic rocks, some myloni-tized, are found at slow-spreading ridges such as theMid-Atlantic.
The most accessible products of ocean-ridge meta-morphism are exposed as ophiolite (Section 13.6) onland along margins of overriding plates in subductionzones. Although the nature of ophiolites provides important insights into the geology of the oceanic lithosphere, particularly of the deeper crust and mantleinterface inaccessible by drilling on the seafloor, mostophiolites have experienced subsequent overprintingmetamorphism and tectonic dismemberment after leav-ing their ocean source during emplacement. In addi-tion to these processes that obscure primary features, itappears that most ophiolites are created in arc settingsat spreading back-arc basins (Figure 11.16) rather thanat divergent junctures of major plates in the open ocean.Thus, caution must be exercised in drawing conclu-sions about processes on the seafloor from ophiolite.
18.4.1 Petrology of Metamorphosed Seafloor RocksVariable degrees of recrystallization and metasomatismat spreading ridges convert oceanic basaltic rocks(MORB) into low-grade greenstones, spilites, and lesscommon amphibolites (Sections 14.2.3 and 15.2.8).Disequilibrium mineral associations are typical. Recon-stitution is patchy, even on the scale of a thin section,because of focusing along fractures. Veins up to severalcentimeters in width are widespread and consist ofcombinations of quartz, chlorite, epidote, and calcite.The mineralogically simple, even monomineralic, veinassemblages reflect development by metasomaticprocesses and transport of dissolved ions in hydrother-mal fluids. Locally, vein assemblages are out of equilib-rium with the mineralogical composition of the host,indicating continuing percolation of hydrothermal solutions of different temperatures and compositionsafter reconstitution of the host rock. Vesicles in sub-marine basaltic lavas are filled with carbonates and zeolites, producing amygdules. Other relict magmaticfabrics are commonly preserved, including pillow rinds,interpillow clastic fabrics, and variolitic, intergranular,ophitic, and porphyritic textures. Rocks with discern-
ible primary fabrics can be classed as metabasalt, meta-gabbro, and so on where appropriate. Although mostnewly imposed fabrics are isotropic, rare myloniticsamples reflect high-strain-rate deformation in faultand shear zones.
Mineral assemblages in metasomatized oceaniccrust are like those of on-land zeolite, greenschist, andpossibly prehnite–pumpellyite facies. Assemblages thatare transitional or that rightfully belong to the amphi-bolite facies are less common and tend to occur inmetamorphosed diabases and gabbros rather thanbasalts, as might be anticipated because of higher temperatures in the deeper oceanic crust. In a spatialcontext (Figure 18.22), mineral zonation is telescopedtogether as a result of steep geothermal gradients. Theinferred gradient in the relatively thin crustal segmentrepresented in the East Liguria, Italy, ophiolite se-quence was 900–1300°C/km, 5–8 times the highestgradients (170°C/km) measured at active oceanic rifts.A more modest gradient of 150°C/km is inferred forthe Troodos, Cyprus, ophiolite.
Strictly speaking, it is inappropriate to refer to themineral assemblages formed just beneath the seaflooras belonging to the same facies as in continental ter-ranes because of the lower pressures and the stronglytelescoped and overlapping index assemblages. Togetherwith the lack of pervasive reconstitution, some petro-logists feel justified in referring to the seafloor pro-cesses as alteration rather than metamorphism.
Similar tightly telescoped mineral zonations associ-ated with steep geothermal gradients in shallow con-tinental settings occur in active geothermal areas such as in Iceland, New Zealand, and the Salton Seaarea of California and adjacent Mexico (Special Inter-est Box 18.1).
Exchange of chemical constituents in ocean-ridgehydrothermal systems clearly justifies the metasomaticdesignation. Seawater is highly oxygenated relative toocean-ridge basalts and contains appreciable concen-trations of Cl�, Br�, HCO3
�, CO32�, and SO4
2�. As seawater advects (Figure 18.23) into the relatively re-duced magmatic rocks, chemical reactions such as thefollowing oxidize the rock:
18.22 Fe2SiO4 � 1/2O2 → Fe2O3 � SiO2
in olivine in seawater hematite silica
18.23 19Fe2SiO4 � 4SO42– → 18Fe2O3 �
in olivine in seawater hematite
2FeS2 � 19SiO2
pyrite silica
Reactions such as these that form Fe-oxides and sulfidesalso release large amounts of silica, contributing to theformation of deep marine cherts so typically associated
590 Igneous and Metamorphic Petrology
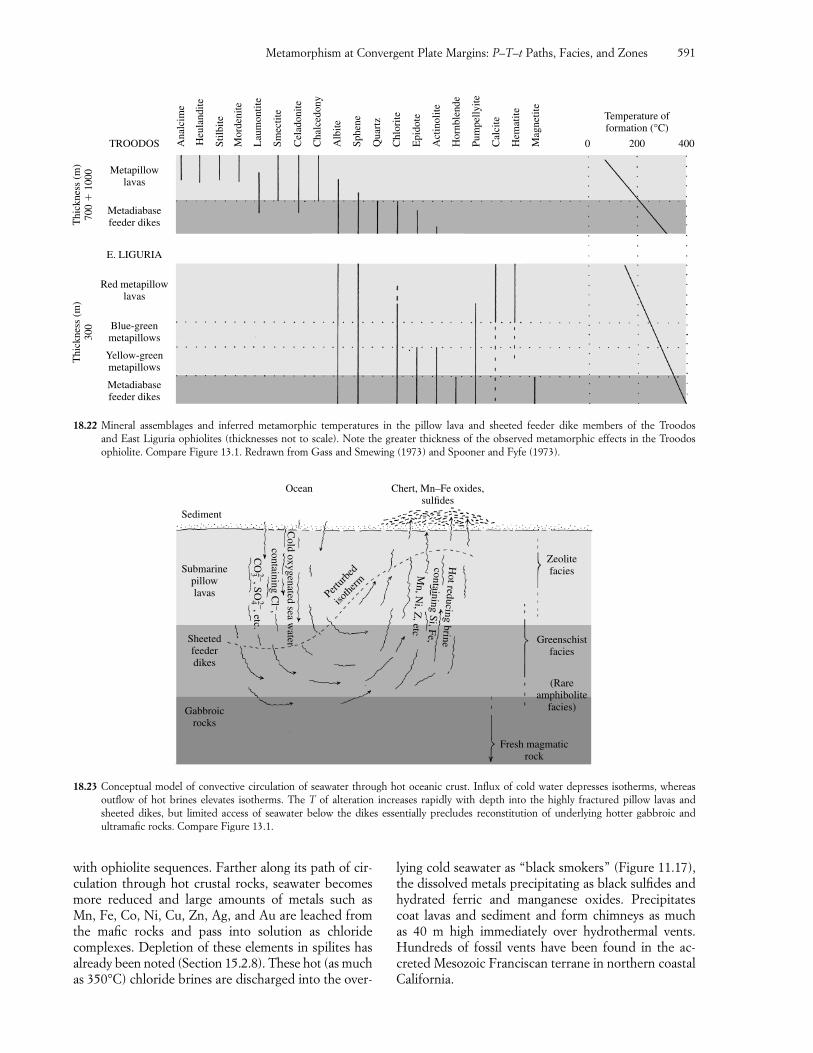
with ophiolite sequences. Farther along its path of cir-culation through hot crustal rocks, seawater becomesmore reduced and large amounts of metals such as Mn, Fe, Co, Ni, Cu, Zn, Ag, and Au are leached fromthe mafic rocks and pass into solution as chloride complexes. Depletion of these elements in spilites hasalready been noted (Section 15.2.8). These hot (as muchas 350°C) chloride brines are discharged into the over-
lying cold seawater as “black smokers” (Figure 11.17),the dissolved metals precipitating as black sulfides andhydrated ferric and manganese oxides. Precipitatescoat lavas and sediment and form chimneys as much as 40 m high immediately over hydrothermal vents.Hundreds of fossil vents have been found in the ac-creted Mesozoic Franciscan terrane in northern coastalCalifornia.
Metamorphism at Convergent Plate Margins: P–T–t Paths, Facies, and Zones 591
Red metapillowlavas
Blue-greenmetapillows
Yellow-greenmetapillows
Metadiabasefeeder dikes
Metapillowlavas
Metadiabasefeeder dikes
E. LIGURIA
TROODOS Ana
lcim
e
Heu
land
ite
Stilb
ite
Mor
deni
te
Lau
mon
tite
Smec
tite
Cel
adon
ite
Alb
ite
Cha
lced
ony
Sphe
ne
Qua
rtz
Chl
orite
Act
inol
ite
Epi
dote
Hor
nble
nde
Pum
pelly
ite
Cal
cite
Hem
atite
Mag
netit
e
Thi
ckne
ss (
m)
300
Thi
ckne
ss (
m)
700
� 1
000
0 200
Temperature offormation (°C)
400
18.22 Mineral assemblages and inferred metamorphic temperatures in the pillow lava and sheeted feeder dike members of the Troodos and East Liguria ophiolites (thicknesses not to scale). Note the greater thickness of the observed metamorphic effects in the Troodosophiolite. Compare Figure 13.1. Redrawn from Gass and Smewing (1973) and Spooner and Fyfe (1973).
Sediment
Submarinepillowlavas
Sheetedfeederdikes
Gabbroicrocks
Zeolitefacies
Greenschistfacies
(Rareamphibolite
facies)
Fresh magmaticrock
Chert, Mn–Fe oxides,sulfides
Ocean
Cold oxygenated sea w
ater
Hot reducing brine
containing Si, Fe,M
n, Ni, Z
, etc
containing Cl −,
CO
3 2−, SO4 2−, etc.
Pertur
bed
isothe
rm
18.23 Conceptual model of convective circulation of seawater through hot oceanic crust. Influx of cold water depresses isotherms, whereasoutflow of hot brines elevates isotherms. The T of alteration increases rapidly with depth into the highly fractured pillow lavas andsheeted dikes, but limited access of seawater below the dikes essentially precludes reconstitution of underlying hotter gabbroic and ultramafic rocks. Compare Figure 13.1.
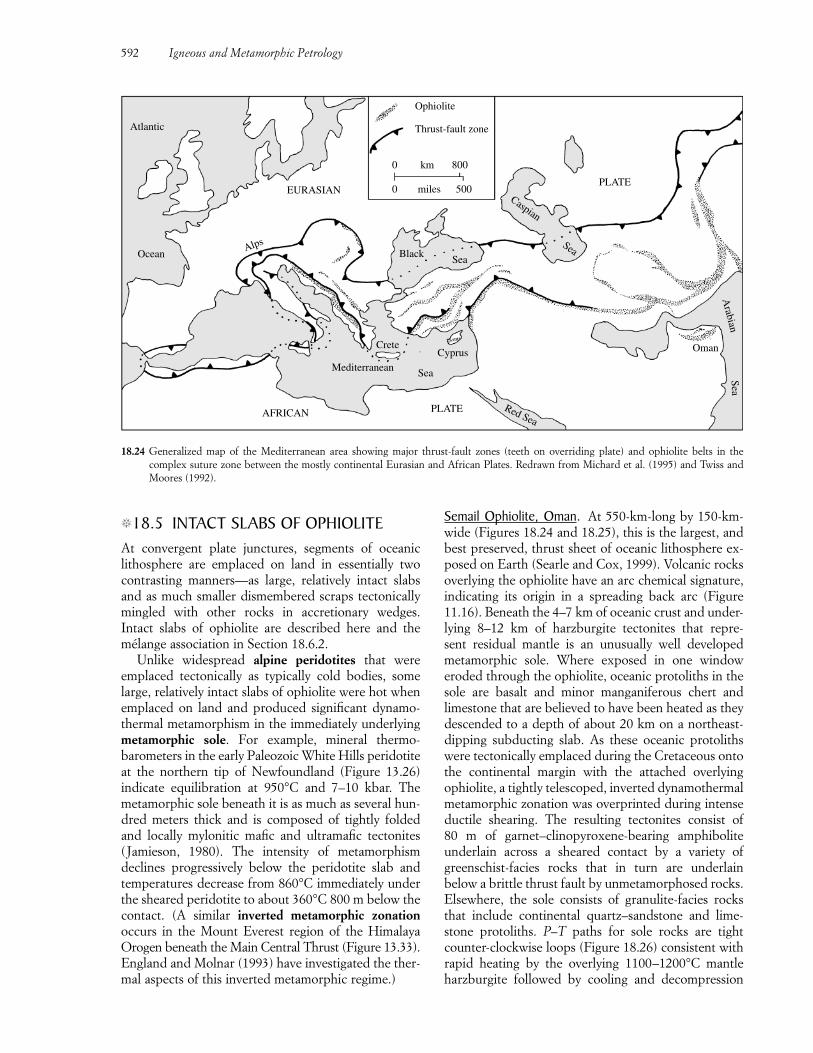
�18.5 INTACT SLABS OF OPHIOLITEAt convergent plate junctures, segments of oceanic lithosphere are emplaced on land in essentially twocontrasting manners—as large, relatively intact slabsand as much smaller dismembered scraps tectonicallymingled with other rocks in accretionary wedges. Intact slabs of ophiolite are described here and themélange association in Section 18.6.2.
Unlike widespread alpine peridotites that were emplaced tectonically as typically cold bodies, somelarge, relatively intact slabs of ophiolite were hot whenemplaced on land and produced significant dynamo-thermal metamorphism in the immediately underlyingmetamorphic sole. For example, mineral thermo-barometers in the early Paleozoic White Hills peridotiteat the northern tip of Newfoundland (Figure 13.26) indicate equilibration at 950°C and 7–10 kbar. Themetamorphic sole beneath it is as much as several hun-dred meters thick and is composed of tightly foldedand locally mylonitic mafic and ultramafic tectonites(Jamieson, 1980). The intensity of metamorphism declines progressively below the peridotite slab andtemperatures decrease from 860°C immediately underthe sheared peridotite to about 360°C 800 m below thecontact. (A similar inverted metamorphic zonationoccurs in the Mount Everest region of the HimalayaOrogen beneath the Main Central Thrust (Figure 13.33).England and Molnar (1993) have investigated the ther-mal aspects of this inverted metamorphic regime.)
Semail Ophiolite, Oman. At 550-km-long by 150-km-wide (Figures 18.24 and 18.25), this is the largest, andbest preserved, thrust sheet of oceanic lithosphere ex-posed on Earth (Searle and Cox, 1999). Volcanic rocksoverlying the ophiolite have an arc chemical signature,indicating its origin in a spreading back arc (Figure11.16). Beneath the 4–7 km of oceanic crust and under-lying 8–12 km of harzburgite tectonites that repre-sent residual mantle is an unusually well developedmetamorphic sole. Where exposed in one windoweroded through the ophiolite, oceanic protoliths in thesole are basalt and minor manganiferous chert andlimestone that are believed to have been heated as theydescended to a depth of about 20 km on a northeast-dipping subducting slab. As these oceanic protolithswere tectonically emplaced during the Cretaceous ontothe continental margin with the attached overlyingophiolite, a tightly telescoped, inverted dynamothermalmetamorphic zonation was overprinted during intenseductile shearing. The resulting tectonites consist of 80 m of garnet–clinopyroxene-bearing amphibolite underlain across a sheared contact by a variety ofgreenschist-facies rocks that in turn are underlain below a brittle thrust fault by unmetamorphosed rocks.Elsewhere, the sole consists of granulite-facies rocksthat include continental quartz–sandstone and lime-stone protoliths. P–T paths for sole rocks are tightcounter-clockwise loops (Figure 18.26) consistent withrapid heating by the overlying 1100–1200°C mantleharzburgite followed by cooling and decompression
592 Igneous and Metamorphic Petrology
AFRICAN PLATE Red Sea
Sea
CreteCyprus
Mediterranean
AlpsBlack
Sea
Caspian
Sea
PLATE
Oman
Arabian
Sea
EURASIAN
Atlantic
Ocean
Ophiolite
Thrust-fault zone
0 800km
0 500miles
18.24 Generalized map of the Mediterranean area showing major thrust-fault zones (teeth on overriding plate) and ophiolite belts in the complex suture zone between the mostly continental Eurasian and African Plates. Redrawn from Michard et al. (1995) and Twiss andMoores (1992).
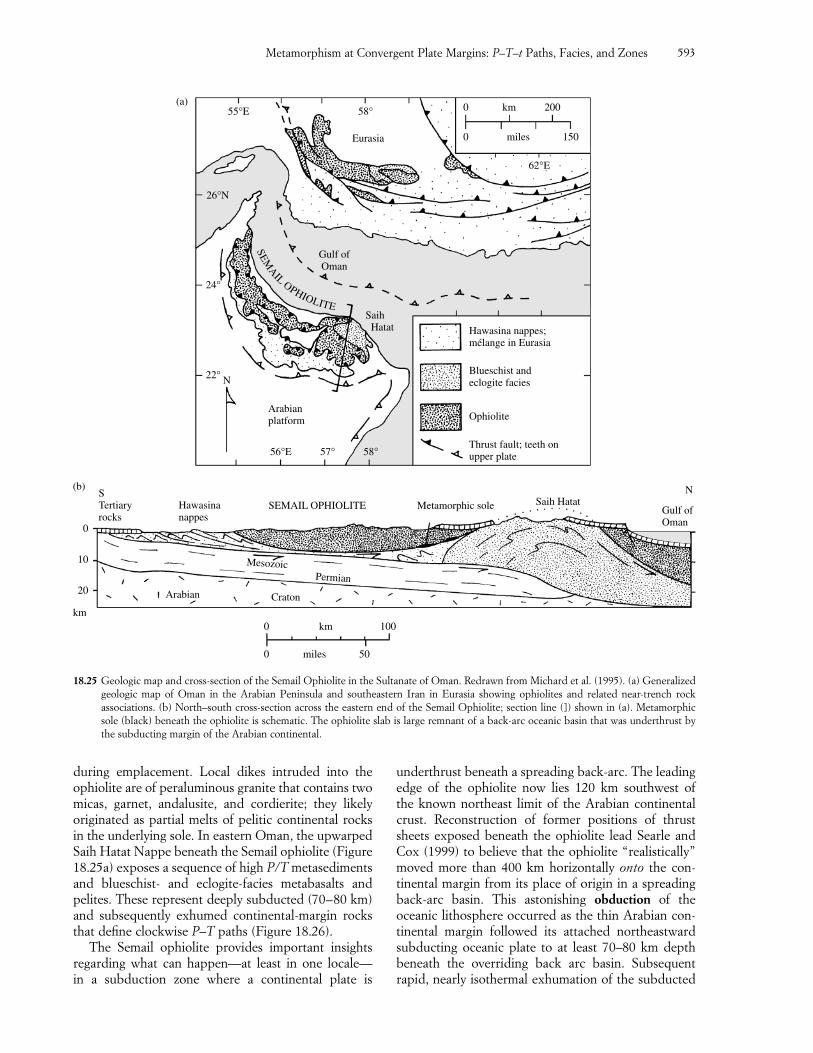
during emplacement. Local dikes intruded into theophiolite are of peraluminous granite that contains twomicas, garnet, andalusite, and cordierite; they likelyoriginated as partial melts of pelitic continental rocksin the underlying sole. In eastern Oman, the upwarpedSaih Hatat Nappe beneath the Semail ophiolite (Figure18.25a) exposes a sequence of high P/T metasedimentsand blueschist- and eclogite-facies metabasalts andpelites. These represent deeply subducted (70–80 km)and subsequently exhumed continental-margin rocksthat define clockwise P–T paths (Figure 18.26).
The Semail ophiolite provides important insights regarding what can happen—at least in one locale—in a subduction zone where a continental plate is
underthrust beneath a spreading back-arc. The leadingedge of the ophiolite now lies 120 km southwest of the known northeast limit of the Arabian continentalcrust. Reconstruction of former positions of thrustsheets exposed beneath the ophiolite lead Searle andCox (1999) to believe that the ophiolite “realistically”moved more than 400 km horizontally onto the con-tinental margin from its place of origin in a spreadingback-arc basin. This astonishing obduction of theoceanic lithosphere occurred as the thin Arabian con-tinental margin followed its attached northeastwardsubducting oceanic plate to at least 70–80 km depthbeneath the overriding back arc basin. Subsequentrapid, nearly isothermal exhumation of the subducted
Metamorphism at Convergent Plate Margins: P–T–t Paths, Facies, and Zones 593
(a)
(b)
km
0
10
20
Hawasina nappes;mélange in Eurasia
Blueschist andeclogite facies
Ophiolite
Thrust fault; teeth onupper plate
Arabianplatform
56°E 57° 58°
Saih Hatat
Gulf ofOman
Eurasia
55°E
26°N
24°
22°
62°E
58°
0 150miles
0 200km
SEM
AILOPHIOLITE
N
STertiaryrocks
Hawasinanappes
SEMAIL OPHIOLITE Metamorphic sole Saih HatatGulf ofOman
N
Arabian Craton
MesozoicPermian
0 100km
0 50miles
18.25 Geologic map and cross-section of the Semail Ophiolite in the Sultanate of Oman. Redrawn from Michard et al. (1995). (a) Generalizedgeologic map of Oman in the Arabian Peninsula and southeastern Iran in Eurasia showing ophiolites and related near-trench rock associations. (b) North–south cross-section across the eastern end of the Semail Ophiolite; section line (]) shown in (a). Metamorphicsole (black) beneath the ophiolite is schematic. The ophiolite slab is large remnant of a back-arc oceanic basin that was underthrust bythe subducting margin of the Arabian continental.
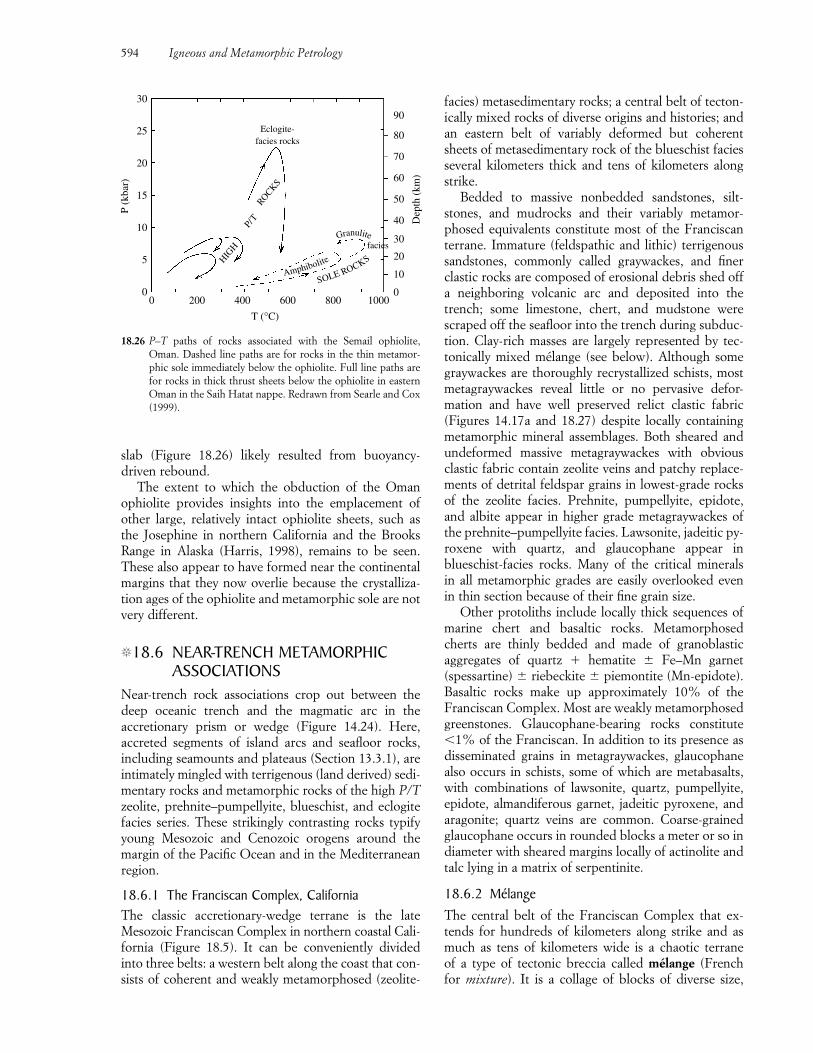
facies) metasedimentary rocks; a central belt of tecton-ically mixed rocks of diverse origins and histories; andan eastern belt of variably deformed but coherentsheets of metasedimentary rock of the blueschist faciesseveral kilometers thick and tens of kilometers alongstrike.
Bedded to massive nonbedded sandstones, silt-stones, and mudrocks and their variably metamor-phosed equivalents constitute most of the Franciscanterrane. Immature (feldspathic and lithic) terrigenoussandstones, commonly called graywackes, and finerclastic rocks are composed of erosional debris shed offa neighboring volcanic arc and deposited into thetrench; some limestone, chert, and mudstone werescraped off the seafloor into the trench during subduc-tion. Clay-rich masses are largely represented by tec-tonically mixed mélange (see below). Although somegraywackes are thoroughly recrystallized schists, mostmetagraywackes reveal little or no pervasive defor-mation and have well preserved relict clastic fabric(Figures 14.17a and 18.27) despite locally containing metamorphic mineral assemblages. Both sheared andundeformed massive metagraywackes with obviousclastic fabric contain zeolite veins and patchy replace-ments of detrital feldspar grains in lowest-grade rocksof the zeolite facies. Prehnite, pumpellyite, epidote,and albite appear in higher grade metagraywackes ofthe prehnite–pumpellyite facies. Lawsonite, jadeitic py-roxene with quartz, and glaucophane appear inblueschist-facies rocks. Many of the critical minerals in all metamorphic grades are easily overlooked even in thin section because of their fine grain size.
Other protoliths include locally thick sequences ofmarine chert and basaltic rocks. Metamorphosedcherts are thinly bedded and made of granoblastic aggregates of quartz � hematite Fe–Mn garnet(spessartine) riebeckite piemontite (Mn-epidote).Basaltic rocks make up approximately 10% of theFranciscan Complex. Most are weakly metamorphosedgreenstones. Glaucophane-bearing rocks constitute�1% of the Franciscan. In addition to its presence asdisseminated grains in metagraywackes, glaucophanealso occurs in schists, some of which are metabasalts,with combinations of lawsonite, quartz, pumpellyite,epidote, almandiferous garnet, jadeitic pyroxene, andaragonite; quartz veins are common. Coarse-grainedglaucophane occurs in rounded blocks a meter or so indiameter with sheared margins locally of actinolite andtalc lying in a matrix of serpentinite.
18.6.2 MélangeThe central belt of the Franciscan Complex that ex-tends for hundreds of kilometers along strike and asmuch as tens of kilometers wide is a chaotic terrane of a type of tectonic breccia called mélange (French for mixture). It is a collage of blocks of diverse size,
594 Igneous and Metamorphic Petrology
P (k
bar)
Dep
th (
km)
30
25
20
15
10
5
0
90
80
70
60
50
40
30
20
10
00 200 400 600 800 1000
T (°C)
HIGH
P/T
ROCKS
Eclogite-facies rocks
SOLE ROCKS
Amphibolite
faciesGranulite
18.26 P–T paths of rocks associated with the Semail ophiolite,Oman. Dashed line paths are for rocks in the thin metamor-phic sole immediately below the ophiolite. Full line paths arefor rocks in thick thrust sheets below the ophiolite in easternOman in the Saih Hatat nappe. Redrawn from Searle and Cox(1999).
slab (Figure 18.26) likely resulted from buoyancy-driven rebound.
The extent to which the obduction of the Omanophiolite provides insights into the emplacement ofother large, relatively intact ophiolite sheets, such asthe Josephine in northern California and the BrooksRange in Alaska (Harris, 1998), remains to be seen.These also appear to have formed near the continentalmargins that they now overlie because the crystalliza-tion ages of the ophiolite and metamorphic sole are notvery different.
�18.6 NEAR-TRENCH METAMORPHICASSOCIATIONS
Near-trench rock associations crop out between thedeep oceanic trench and the magmatic arc in the accretionary prism or wedge (Figure 14.24). Here, accreted segments of island arcs and seafloor rocks, including seamounts and plateaus (Section 13.3.1), areintimately mingled with terrigenous (land derived) sedi-mentary rocks and metamorphic rocks of the high P/Tzeolite, prehnite–pumpellyite, blueschist, and eclogitefacies series. These strikingly contrasting rocks typifyyoung Mesozoic and Cenozoic orogens around themargin of the Pacific Ocean and in the Mediterraneanregion.
18.6.1 The Franciscan Complex, CaliforniaThe classic accretionary-wedge terrane is the lateMesozoic Franciscan Complex in northern coastal Cali-fornia (Figure 18.5). It can be conveniently dividedinto three belts: a western belt along the coast that con-sists of coherent and weakly metamorphosed (zeolite-
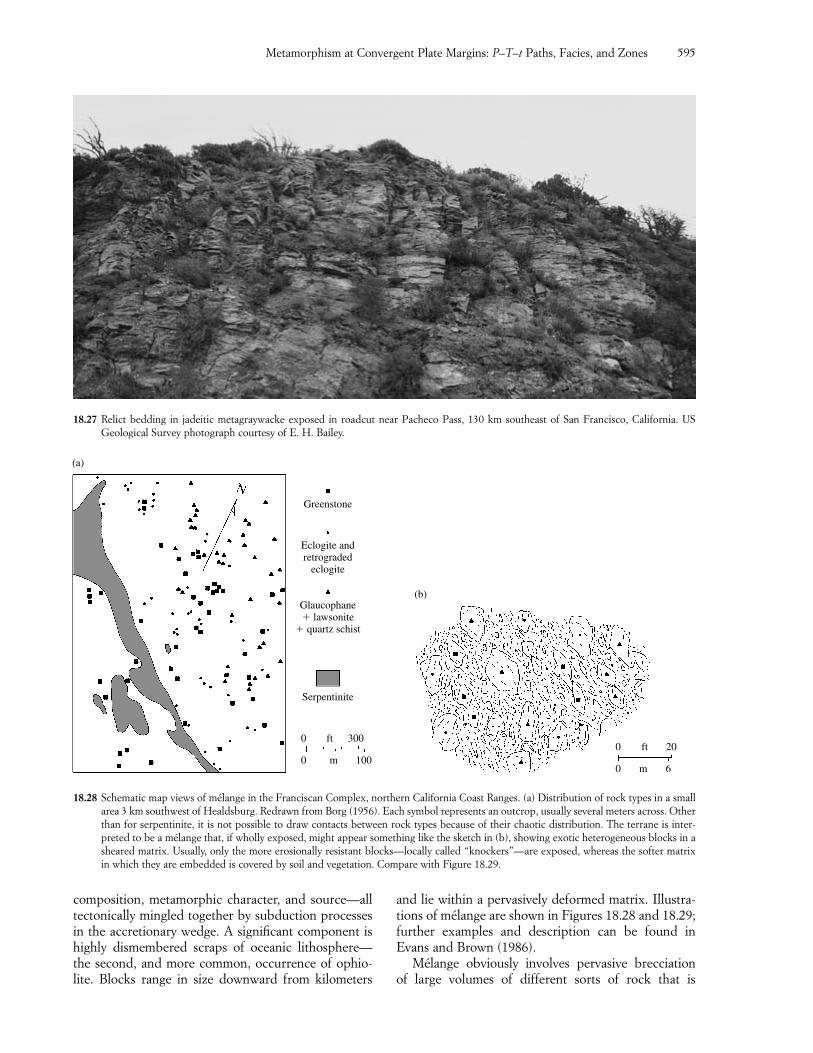
composition, metamorphic character, and source—alltectonically mingled together by subduction processesin the accretionary wedge. A significant component ishighly dismembered scraps of oceanic lithosphere—the second, and more common, occurrence of ophio-lite. Blocks range in size downward from kilometers
and lie within a pervasively deformed matrix. Illustra-tions of mélange are shown in Figures 18.28 and 18.29;further examples and description can be found inEvans and Brown (1986).
Mélange obviously involves pervasive brecciation of large volumes of different sorts of rock that is
Metamorphism at Convergent Plate Margins: P–T–t Paths, Facies, and Zones 595
18.27 Relict bedding in jadeitic metagraywacke exposed in roadcut near Pacheco Pass, 130 km southeast of San Francisco, California. US Geological Survey photograph courtesy of E. H. Bailey.
Glaucophane� lawsonite
� quartz schist
Serpentinite
Eclogite andretrograded
eclogite
Greenstone
(a)
1000 m
3000 ft
60 m
200 ft
(b)
18.28 Schematic map views of mélange in the Franciscan Complex, northern California Coast Ranges. (a) Distribution of rock types in a smallarea 3 km southwest of Healdsburg. Redrawn from Borg (1956). Each symbol represents an outcrop, usually several meters across. Otherthan for serpentinite, it is not possible to draw contacts between rock types because of their chaotic distribution. The terrane is inter-preted to be a mélange that, if wholly exposed, might appear something like the sketch in (b), showing exotic heterogeneous blocks in asheared matrix. Usually, only the more erosionally resistant blocks—locally called “knockers”—are exposed, whereas the softer matrixin which they are embedded is covered by soil and vegetation. Compare with Figure 18.29.
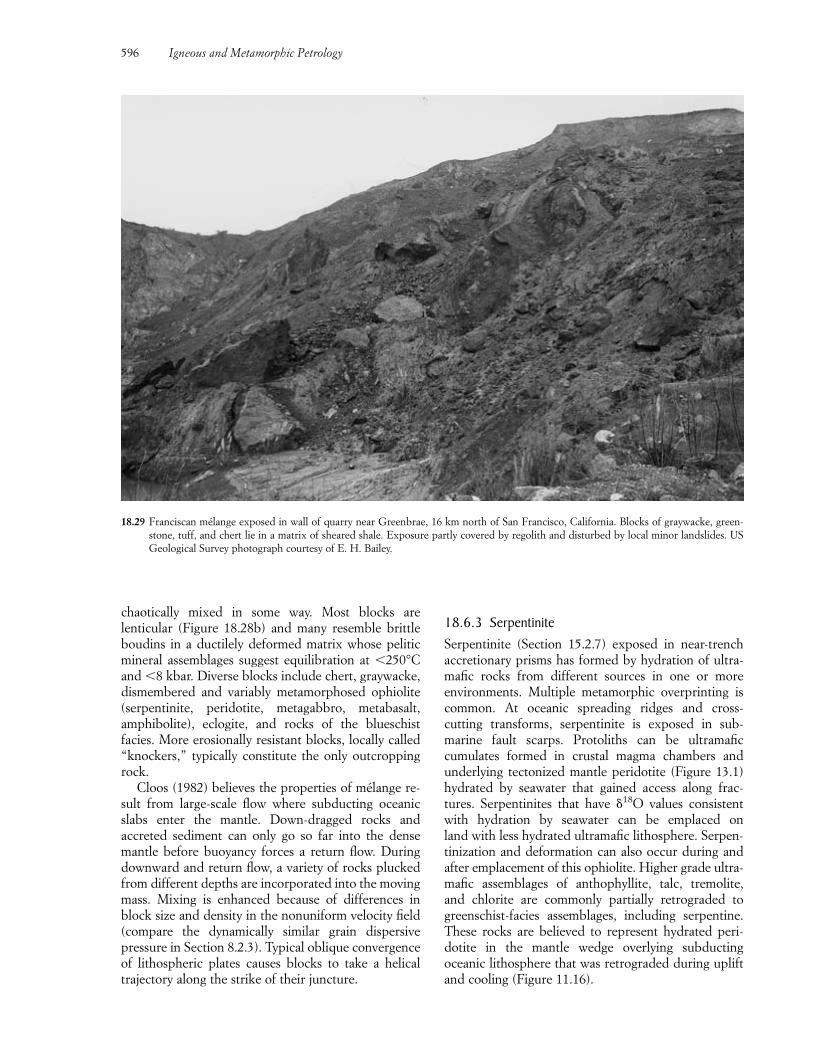
chaotically mixed in some way. Most blocks are lenticular (Figure 18.28b) and many resemble brittleboudins in a ductilely deformed matrix whose peliticmineral assemblages suggest equilibration at �250°Cand �8 kbar. Diverse blocks include chert, graywacke,dismembered and variably metamorphosed ophiolite(serpentinite, peridotite, metagabbro, metabasalt, amphibolite), eclogite, and rocks of the blueschist facies. More erosionally resistant blocks, locally called“knockers,” typically constitute the only outcroppingrock.
Cloos (1982) believes the properties of mélange re-sult from large-scale flow where subducting oceanicslabs enter the mantle. Down-dragged rocks and accreted sediment can only go so far into the dense mantle before buoyancy forces a return flow. Duringdownward and return flow, a variety of rocks pluckedfrom different depths are incorporated into the movingmass. Mixing is enhanced because of differences inblock size and density in the nonuniform velocity field(compare the dynamically similar grain dispersive pressure in Section 8.2.3). Typical oblique convergenceof lithospheric plates causes blocks to take a helical trajectory along the strike of their juncture.
18.6.3 SerpentiniteSerpentinite (Section 15.2.7) exposed in near-trenchaccretionary prisms has formed by hydration of ultra-mafic rocks from different sources in one or more environments. Multiple metamorphic overprinting iscommon. At oceanic spreading ridges and cross-cutting transforms, serpentinite is exposed in sub-marine fault scarps. Protoliths can be ultramafic cumulates formed in crustal magma chambers and underlying tectonized mantle peridotite (Figure 13.1)hydrated by seawater that gained access along frac-tures. Serpentinites that have 18O values consistentwith hydration by seawater can be emplaced on land with less hydrated ultramafic lithosphere. Serpen-tinization and deformation can also occur during andafter emplacement of this ophiolite. Higher grade ultra-mafic assemblages of anthophyllite, talc, tremolite, and chlorite are commonly partially retrograded togreenschist-facies assemblages, including serpentine.These rocks are believed to represent hydrated peri-dotite in the mantle wedge overlying subductingoceanic lithosphere that was retrograded during upliftand cooling (Figure 11.16).
596 Igneous and Metamorphic Petrology
18.29 Franciscan mélange exposed in wall of quarry near Greenbrae, 16 km north of San Francisco, California. Blocks of graywacke, green-stone, tuff, and chert lie in a matrix of sheared shale. Exposure partly covered by regolith and disturbed by local minor landslides. USGeological Survey photograph courtesy of E. H. Bailey.
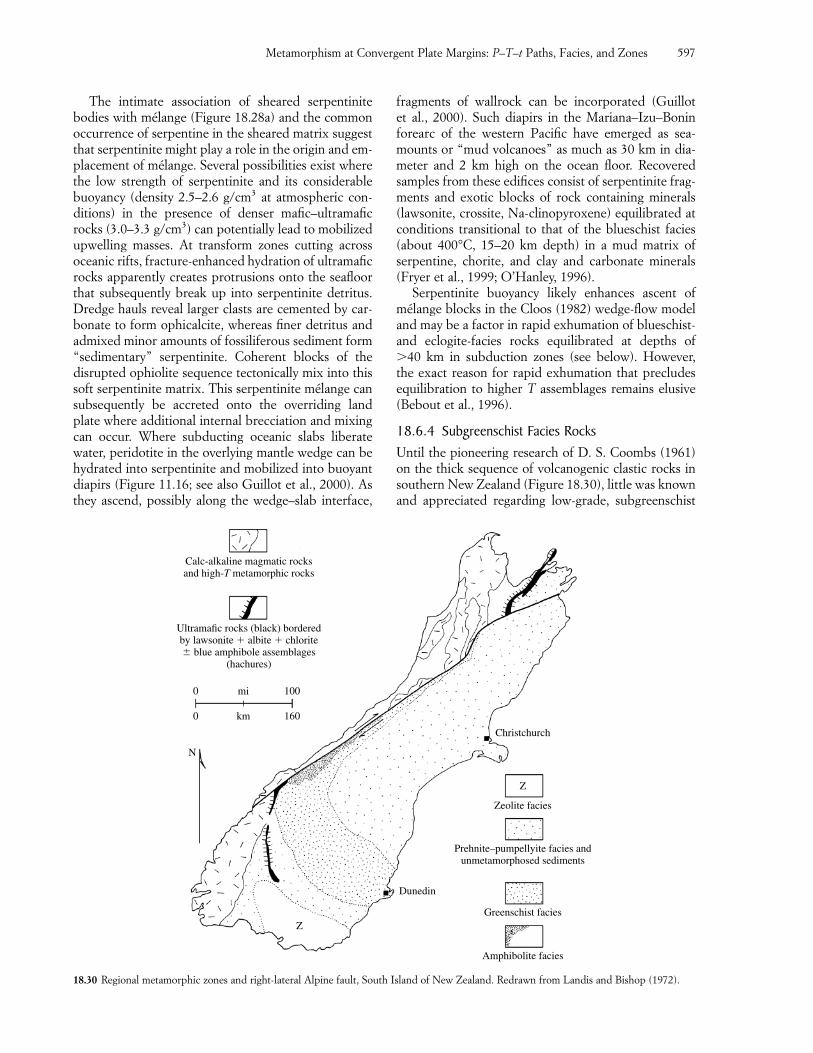
The intimate association of sheared serpentinitebodies with mélange (Figure 18.28a) and the commonoccurrence of serpentine in the sheared matrix suggestthat serpentinite might play a role in the origin and em-placement of mélange. Several possibilities exist wherethe low strength of serpentinite and its considerablebuoyancy (density 2.5–2.6 g/cm3 at atmospheric con-ditions) in the presence of denser mafic–ultramaficrocks (3.0–3.3 g/cm3) can potentially lead to mobilizedupwelling masses. At transform zones cutting acrossoceanic rifts, fracture-enhanced hydration of ultramaficrocks apparently creates protrusions onto the seafloorthat subsequently break up into serpentinite detritus.Dredge hauls reveal larger clasts are cemented by car-bonate to form ophicalcite, whereas finer detritus andadmixed minor amounts of fossiliferous sediment form“sedimentary” serpentinite. Coherent blocks of thedisrupted ophiolite sequence tectonically mix into thissoft serpentinite matrix. This serpentinite mélange cansubsequently be accreted onto the overriding landplate where additional internal brecciation and mixingcan occur. Where subducting oceanic slabs liberate water, peridotite in the overlying mantle wedge can behydrated into serpentinite and mobilized into buoyantdiapirs (Figure 11.16; see also Guillot et al., 2000). Asthey ascend, possibly along the wedge–slab interface,
fragments of wallrock can be incorporated (Guillot et al., 2000). Such diapirs in the Mariana–Izu–Bonin forearc of the western Pacific have emerged as sea-mounts or “mud volcanoes” as much as 30 km in dia-meter and 2 km high on the ocean floor. Recoveredsamples from these edifices consist of serpentinite frag-ments and exotic blocks of rock containing minerals(lawsonite, crossite, Na-clinopyroxene) equilibrated atconditions transitional to that of the blueschist facies(about 400°C, 15–20 km depth) in a mud matrix of serpentine, chorite, and clay and carbonate minerals(Fryer et al., 1999; O’Hanley, 1996).
Serpentinite buoyancy likely enhances ascent ofmélange blocks in the Cloos (1982) wedge-flow modeland may be a factor in rapid exhumation of blueschist-and eclogite-facies rocks equilibrated at depths of �40 km in subduction zones (see below). However, the exact reason for rapid exhumation that precludesequilibration to higher T assemblages remains elusive(Bebout et al., 1996).
18.6.4 Subgreenschist Facies RocksUntil the pioneering research of D. S. Coombs (1961)on the thick sequence of volcanogenic clastic rocks insouthern New Zealand (Figure 18.30), little was knownand appreciated regarding low-grade, subgreenschist
Metamorphism at Convergent Plate Margins: P–T–t Paths, Facies, and Zones 597
Calc-alkaline magmatic rocksand high-T metamorphic rocks
Ultramafic rocks (black) borderedby lawsonite � albite � chlorite blue amphibole assemblages
(hachures)
Prehnite–pumpellyite facies andunmetamorphosed sediments
Zeolite facies
Z
Z
Christchurch
Greenschist facies
Amphibolite facies
0 100mi
0
N
160km
Dunedin
18.30 Regional metamorphic zones and right-lateral Alpine fault, South Island of New Zealand. Redrawn from Landis and Bishop (1972).
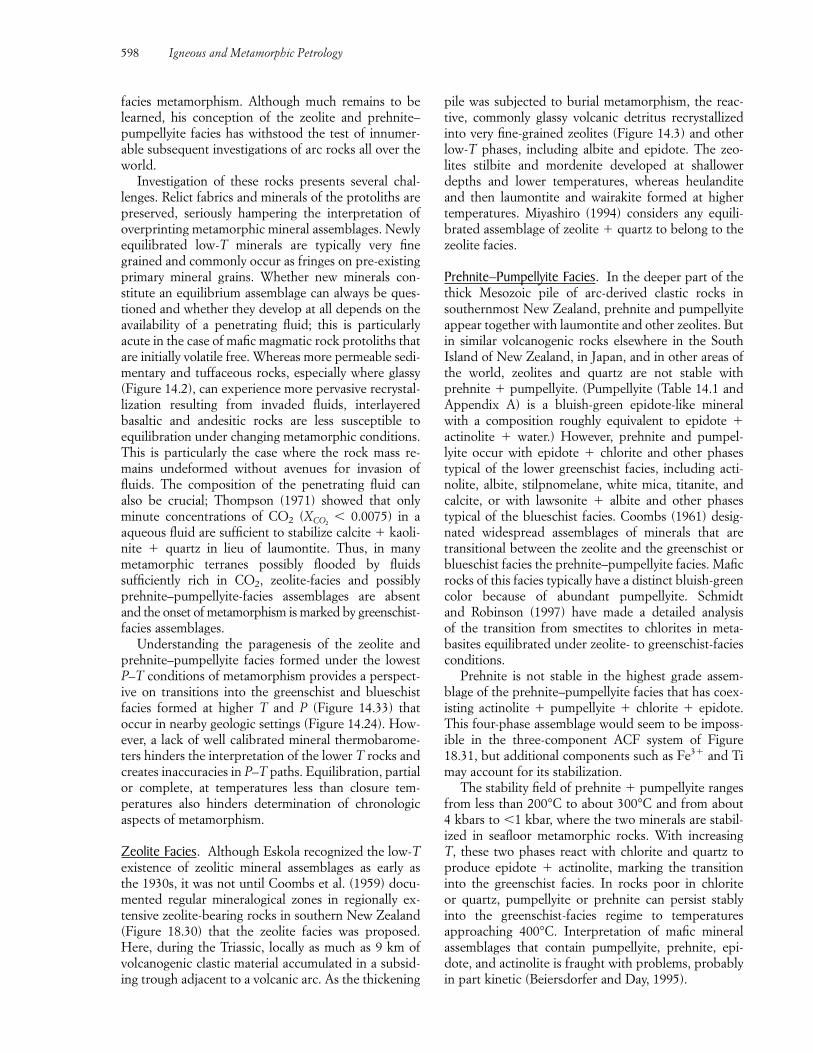
facies metamorphism. Although much remains to belearned, his conception of the zeolite and prehnite–pumpellyite facies has withstood the test of innumer-able subsequent investigations of arc rocks all over theworld.
Investigation of these rocks presents several chal-lenges. Relict fabrics and minerals of the protoliths arepreserved, seriously hampering the interpretation ofoverprinting metamorphic mineral assemblages. Newlyequilibrated low-T minerals are typically very finegrained and commonly occur as fringes on pre-existingprimary mineral grains. Whether new minerals con-stitute an equilibrium assemblage can always be ques-tioned and whether they develop at all depends on theavailability of a penetrating fluid; this is particularlyacute in the case of mafic magmatic rock protoliths thatare initially volatile free. Whereas more permeable sedi-mentary and tuffaceous rocks, especially where glassy(Figure 14.2), can experience more pervasive recrystal-lization resulting from invaded fluids, interlayeredbasaltic and andesitic rocks are less susceptible to equilibration under changing metamorphic conditions.This is particularly the case where the rock mass re-mains undeformed without avenues for invasion offluids. The composition of the penetrating fluid canalso be crucial; Thompson (1971) showed that onlyminute concentrations of CO2 (X � 0.0075) in aaqueous fluid are sufficient to stabilize calcite � kaoli-nite � quartz in lieu of laumontite. Thus, in manymetamorphic terranes possibly flooded by fluids sufficiently rich in CO2, zeolite-facies and possiblyprehnite–pumpellyite-facies assemblages are absentand the onset of metamorphism is marked by greenschist-facies assemblages.
Understanding the paragenesis of the zeolite andprehnite–pumpellyite facies formed under the lowestP–T conditions of metamorphism provides a perspect-ive on transitions into the greenschist and blueschist facies formed at higher T and P (Figure 14.33) that occur in nearby geologic settings (Figure 14.24). How-ever, a lack of well calibrated mineral thermobarome-ters hinders the interpretation of the lower T rocks andcreates inaccuracies in P–T paths. Equilibration, partialor complete, at temperatures less than closure tem-peratures also hinders determination of chronologic aspects of metamorphism.
Zeolite Facies. Although Eskola recognized the low-Texistence of zeolitic mineral assemblages as early as the 1930s, it was not until Coombs et al. (1959) docu-mented regular mineralogical zones in regionally ex-tensive zeolite-bearing rocks in southern New Zealand(Figure 18.30) that the zeolite facies was proposed.Here, during the Triassic, locally as much as 9 km ofvolcanogenic clastic material accumulated in a subsid-ing trough adjacent to a volcanic arc. As the thickening
CO2
pile was subjected to burial metamorphism, the reac-tive, commonly glassy volcanic detritus recrystallizedinto very fine-grained zeolites (Figure 14.3) and otherlow-T phases, including albite and epidote. The zeo-lites stilbite and mordenite developed at shallowerdepths and lower temperatures, whereas heulanditeand then laumontite and wairakite formed at highertemperatures. Miyashiro (1994) considers any equili-brated assemblage of zeolite � quartz to belong to thezeolite facies.
Prehnite–Pumpellyite Facies. In the deeper part of thethick Mesozoic pile of arc-derived clastic rocks insouthernmost New Zealand, prehnite and pumpellyiteappear together with laumontite and other zeolites. Butin similar volcanogenic rocks elsewhere in the South Island of New Zealand, in Japan, and in other areas ofthe world, zeolites and quartz are not stable withprehnite � pumpellyite. (Pumpellyite (Table 14.1 andAppendix A) is a bluish-green epidote-like mineralwith a composition roughly equivalent to epidote �actinolite � water.) However, prehnite and pumpel-lyite occur with epidote � chlorite and other phasestypical of the lower greenschist facies, including acti-nolite, albite, stilpnomelane, white mica, titanite, andcalcite, or with lawsonite � albite and other phasestypical of the blueschist facies. Coombs (1961) desig-nated widespread assemblages of minerals that aretransitional between the zeolite and the greenschist orblueschist facies the prehnite–pumpellyite facies. Maficrocks of this facies typically have a distinct bluish-greencolor because of abundant pumpellyite. Schmidt and Robinson (1997) have made a detailed analysis of the transition from smectites to chlorites in meta-basites equilibrated under zeolite- to greenschist-faciesconditions.
Prehnite is not stable in the highest grade assem-blage of the prehnite–pumpellyite facies that has coex-isting actinolite � pumpellyite � chlorite � epidote.This four-phase assemblage would seem to be imposs-ible in the three-component ACF system of Figure18.31, but additional components such as Fe3� and Timay account for its stabilization.
The stability field of prehnite � pumpellyite rangesfrom less than 200°C to about 300°C and from about 4 kbars to �1 kbar, where the two minerals are stabil-ized in seafloor metamorphic rocks. With increasing T, these two phases react with chlorite and quartz toproduce epidote � actinolite, marking the transitioninto the greenschist facies. In rocks poor in chlorite or quartz, pumpellyite or prehnite can persist stably into the greenschist-facies regime to temperatures approaching 400°C. Interpretation of mafic mineral assemblages that contain pumpellyite, prehnite, epi-dote, and actinolite is fraught with problems, probablyin part kinetic (Beiersdorfer and Day, 1995).
598 Igneous and Metamorphic Petrology
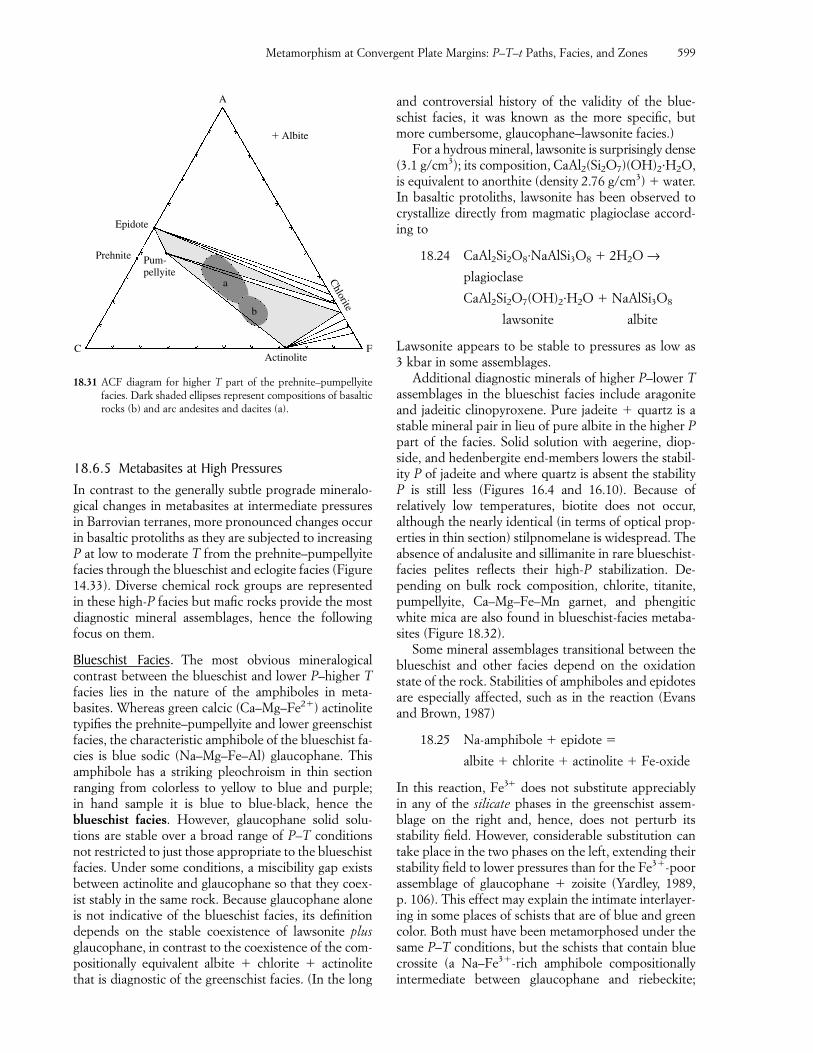
18.6.5 Metabasites at High PressuresIn contrast to the generally subtle prograde mineralo-gical changes in metabasites at intermediate pressuresin Barrovian terranes, more pronounced changes occurin basaltic protoliths as they are subjected to increasingP at low to moderate T from the prehnite–pumpellyitefacies through the blueschist and eclogite facies (Figure14.33). Diverse chemical rock groups are representedin these high-P facies but mafic rocks provide the mostdiagnostic mineral assemblages, hence the followingfocus on them.
Blueschist Facies. The most obvious mineralogicalcontrast between the blueschist and lower P–higher Tfacies lies in the nature of the amphiboles in meta-basites. Whereas green calcic (Ca–Mg–Fe2�) actinolitetypifies the prehnite–pumpellyite and lower greenschistfacies, the characteristic amphibole of the blueschist fa-cies is blue sodic (Na–Mg–Fe–Al) glaucophane. Thisamphibole has a striking pleochroism in thin sectionranging from colorless to yellow to blue and purple; in hand sample it is blue to blue-black, hence theblueschist facies. However, glaucophane solid solu-tions are stable over a broad range of P–T conditionsnot restricted to just those appropriate to the blueschistfacies. Under some conditions, a miscibility gap existsbetween actinolite and glaucophane so that they coex-ist stably in the same rock. Because glaucophane aloneis not indicative of the blueschist facies, its definitiondepends on the stable coexistence of lawsonite plusglaucophane, in contrast to the coexistence of the com-positionally equivalent albite � chlorite � actinolitethat is diagnostic of the greenschist facies. (In the long
and controversial history of the validity of the blue-schist facies, it was known as the more specific, butmore cumbersome, glaucophane–lawsonite facies.)
For a hydrous mineral, lawsonite is surprisingly dense(3.1 g/cm3); its composition, CaAl2(Si2O7)(OH)2·H2O,is equivalent to anorthite (density 2.76 g/cm3) � water.In basaltic protoliths, lawsonite has been observed tocrystallize directly from magmatic plagioclase accord-ing to
18.24 CaAl2Si2O8·NaAlSi3O8 � 2H2O →plagioclase
CaAl2Si2O7(OH)2·H2O � NaAlSi3O8
lawsonite albite
Lawsonite appears to be stable to pressures as low as 3 kbar in some assemblages.
Additional diagnostic minerals of higher P–lower Tassemblages in the blueschist facies include aragoniteand jadeitic clinopyroxene. Pure jadeite � quartz is astable mineral pair in lieu of pure albite in the higher Ppart of the facies. Solid solution with aegerine, diop-side, and hedenbergite end-members lowers the stabil-ity P of jadeite and where quartz is absent the stabilityP is still less (Figures 16.4 and 16.10). Because of relatively low temperatures, biotite does not occur, although the nearly identical (in terms of optical prop-erties in thin section) stilpnomelane is widespread. Theabsence of andalusite and sillimanite in rare blueschist-facies pelites reflects their high-P stabilization. De-pending on bulk rock composition, chlorite, titanite,pumpellyite, Ca–Mg–Fe–Mn garnet, and phengiticwhite mica are also found in blueschist-facies metaba-sites (Figure 18.32).
Some mineral assemblages transitional between theblueschist and other facies depend on the oxidationstate of the rock. Stabilities of amphiboles and epidotesare especially affected, such as in the reaction (Evansand Brown, 1987)
18.25 Na-amphibole � epidote �
albite � chlorite � actinolite � Fe-oxide
In this reaction, Fe3� does not substitute appreciably in any of the silicate phases in the greenschist assem-blage on the right and, hence, does not perturb its stability field. However, considerable substitution cantake place in the two phases on the left, extending theirstability field to lower pressures than for the Fe3�-poorassemblage of glaucophane � zoisite (Yardley, 1989, p. 106). This effect may explain the intimate interlayer-ing in some places of schists that are of blue and greencolor. Both must have been metamorphosed under thesame P–T conditions, but the schists that contain bluecrossite (a Na–Fe3�-rich amphibole compositionallyintermediate between glaucophane and riebeckite;
Metamorphism at Convergent Plate Margins: P–T–t Paths, Facies, and Zones 599
C FActinolite
Prehnite
Epidote
Pum-pellyite
a
A
� Albite
b
Chlorite
18.31 ACF diagram for higher T part of the prehnite–pumpellyite facies. Dark shaded ellipses represent compositions of basalticrocks (b) and arc andesites and dacites (a).
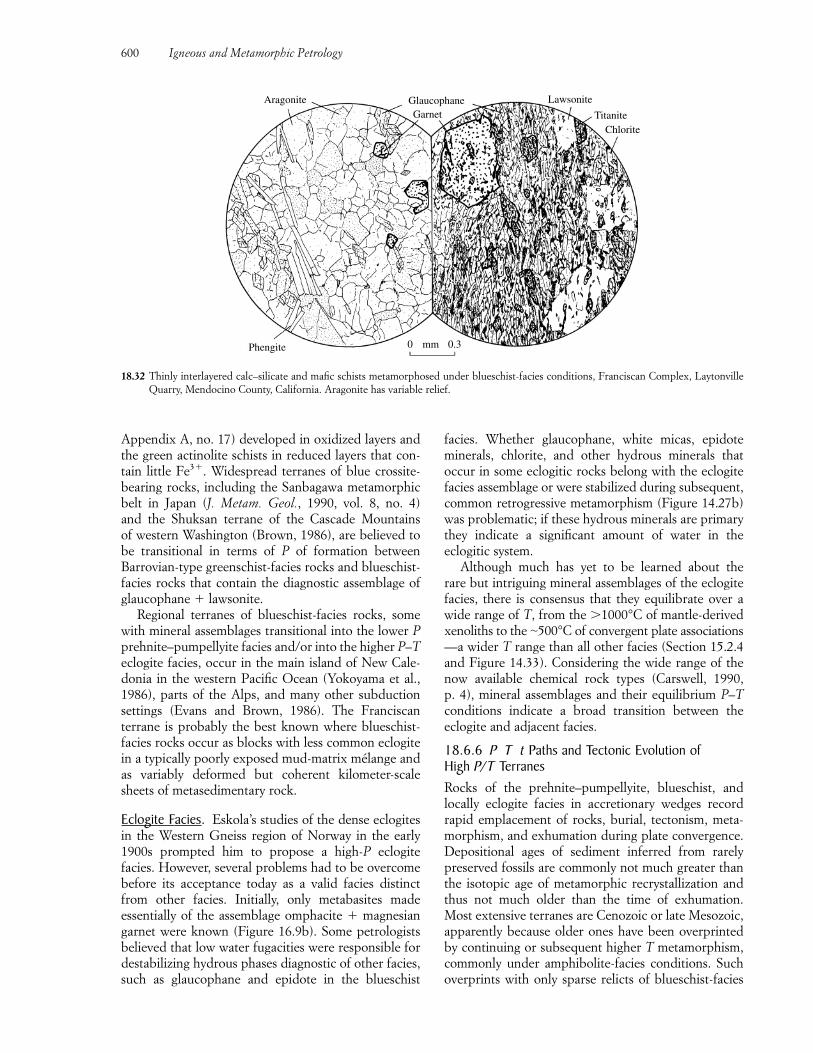
Appendix A, no. 17) developed in oxidized layers andthe green actinolite schists in reduced layers that con-tain little Fe3�. Widespread terranes of blue crossite-bearing rocks, including the Sanbagawa metamorphicbelt in Japan (J. Metam. Geol., 1990, vol. 8, no. 4) and the Shuksan terrane of the Cascade Mountains of western Washington (Brown, 1986), are believed tobe transitional in terms of P of formation between Barrovian-type greenschist-facies rocks and blueschist-facies rocks that contain the diagnostic assemblage ofglaucophane � lawsonite.
Regional terranes of blueschist-facies rocks, somewith mineral assemblages transitional into the lower Pprehnite–pumpellyite facies and/or into the higher P–Teclogite facies, occur in the main island of New Cale-donia in the western Pacific Ocean (Yokoyama et al.,1986), parts of the Alps, and many other subductionsettings (Evans and Brown, 1986). The Franciscan terrane is probably the best known where blueschist-facies rocks occur as blocks with less common eclogitein a typically poorly exposed mud-matrix mélange andas variably deformed but coherent kilometer-scalesheets of metasedimentary rock.
Eclogite Facies. Eskola’s studies of the dense eclogitesin the Western Gneiss region of Norway in the early1900s prompted him to propose a high-P eclogite facies. However, several problems had to be overcomebefore its acceptance today as a valid facies distinctfrom other facies. Initially, only metabasites made essentially of the assemblage omphacite � magnesiangarnet were known (Figure 16.9b). Some petrologistsbelieved that low water fugacities were responsible fordestabilizing hydrous phases diagnostic of other facies,such as glaucophane and epidote in the blueschist
facies. Whether glaucophane, white micas, epidoteminerals, chlorite, and other hydrous minerals that occur in some eclogitic rocks belong with the eclogitefacies assemblage or were stabilized during subsequent,common retrogressive metamorphism (Figure 14.27b)was problematic; if these hydrous minerals are primarythey indicate a significant amount of water in theeclogitic system.
Although much has yet to be learned about the rare but intriguing mineral assemblages of the eclogitefacies, there is consensus that they equilibrate over awide range of T, from the �1000°C of mantle-derivedxenoliths to the �500°C of convergent plate associations—a wider T range than all other facies (Section 15.2.4and Figure 14.33). Considering the wide range of thenow available chemical rock types (Carswell, 1990, p. 4), mineral assemblages and their equilibrium P–Tconditions indicate a broad transition between theeclogite and adjacent facies.
18.6.6 P T t Paths and Tectonic Evolution of High P/T TerranesRocks of the prehnite–pumpellyite, blueschist, and locally eclogite facies in accretionary wedges recordrapid emplacement of rocks, burial, tectonism, meta-morphism, and exhumation during plate convergence.Depositional ages of sediment inferred from rarely preserved fossils are commonly not much greater thanthe isotopic age of metamorphic recrystallization andthus not much older than the time of exhumation.Most extensive terranes are Cenozoic or late Mesozoic,apparently because older ones have been overprintedby continuing or subsequent higher T metamorphism,commonly under amphibolite-facies conditions. Suchoverprints with only sparse relicts of blueschist-facies
600 Igneous and Metamorphic Petrology
Phengite 0 0.3mm
ChloriteTitanite
LawsoniteGlaucophaneAragoniteGarnet
18.32 Thinly interlayered calc–silicate and mafic schists metamorphosed under blueschist-facies conditions, Franciscan Complex, LaytonvilleQuarry, Mendocino County, California. Aragonite has variable relief.
assemblages have been noted in several terranes, suchas in the Appalachian Mountains of Vermont (Lairdand Albee, 1981).
The contrasting tectonothermal processes in con-vergent plate terranes that, on the one hand, preservehigh-P/T rocks and, on the other hand, produce higherT metamorphism were first recognized in pioneeringwork by Ernst (see 1988). Most such metamorphic terranes follow P–T paths that move into greenschist-and locally amphibolite-facies conditions on the retro-grade segment of their path (Figure 18.33) because ofsignificant heating before decompression; subductionof heat-producing continental rocks, as in the Alpinemodel in Figure 18.2a, might have been responsible. In contrast, fewer terranes, such as the Franciscan, remained refrigerated during exhumation, perhaps because they were incorporated into rapidly rising, verybuoyant serpentinite diapirs and mélanges spawned inthe hydrating mantle wedge overlying the descendingslab. The corresponding steeper P–T path penetrateswell into the stability field of aragonite, while the ret-rograde path essentially retraces the prograde at onlyslightly higher T, avoids greenschist-facies conditions,and returns into the field of calcite at low T, perhaps onthe order of 100°C. This sort of refrigerated path mayaccount for widespread preservation of metastablearagonite in Franciscan rocks of appropriate com-
position (Figure 18.32a) and its absence in rocks meta-morphosed to higher T blueschist-facies conditions.Although some of the latter never enter the stabilityfield of aragonite, others at lower T do, and becausetheir path brings them back into the stability field ofcalcite at significantly higher T, on the order of 400°C,transformation to the lower P polymorph is kineticallyeffective (Carlson and Rosenfield, 1981).
�18.7 ULTRAHIGH-P METAMORPHICROCKS
The occurrence of coesite, albeit exceedingly rare, inmetamorphosed continental rocks (Figure 15.18) hasprompted the recognition of a distinct type of ultra-high-P (UHP) metamorphism. These terranes equili-brated in the stability field of this silica polymorph inexcess of about 29 kbars at 800°C (see Figure 18.35).Even more rare diamond in such terranes constrainsequilibration pressures to at least 38 kbar (about 140 kmdepth) at 800°C—the graphite–diamond transition. Although the rarity of coesite and diamond, whichstems in part from their sporadic preservation, maylimit the recognition of UHP rocks, other mineralbarometers confirm these extreme pressures.
Study of UHP rocks is not an esoteric petrologic exercise. The ramifications of burial of substantial terranes of continental rock to depths �100 km intothe denser upper mantle and their subsequent exhu-mation challenge conventional tectonic concepts. Forexample, the deepest Moho today is only about 80 kmbeneath the Himalaya orogen. Does this mean that theHimalayan continent–continent collision zone is unlikepast collision orogens where UHP rocks have beenfound? Or, are geophysical determinations of the depthof the thickened Himalayan continental crust flawed insome way? How is it possible for any tectonic processto push relatively buoyant continental rock into thedenser upper mantle? How are such once deeply buriedrocks exhumed? What do UHP rocks tell us about our conventional notions of how continents grow?
When the first edition of this textbook was pub-lished in 1982, UHP rocks were unknown. FollowingChristian Chopin’s discovery just two years later(Chopin, 1984) of coesite in silicic continental rocks ofthe western Alps and then a few months later by Smith(1984) in eclogites in the Western Gneiss region ofNorway, such rocks were subsequently found in Chinaand in a dozen other orogens worldwide (Hacker andLiou, 1998). The intriguing petrologic implications and challenges together with the tantalizing tectonicparadoxes have spawned over one hundred researcharticles, several symposium volumes, and at least fourbooks, clearly making this one of the hottest (or deep-est, depending on one’s inclinations) topics in geologyof the late twentieth century!
Metamorphism at Convergent Plate Margins: P–T–t Paths, Facies, and Zones 601
P (k
bar)
Dep
th (
km)
12
10
8
6
4
2
0
40
30
20
10
00 100 200 300 400 500
T (°C)
Arg
Cal
Fran
cisca
n BLU
ESC
HIS
T
GREENSCHIST
18.33 Schematic P–T paths for high-P/T rocks. Generalized fields ofblueschist- and greenschist-facies conditions are indicated.Aragonite–calcite univariant equilibrium curve from Figure16.1. Long dashed line depicts a possible path taken by manyFranciscan blueschist-facies rocks. Short dashed line repre-sents path of blueschist-facies rocks in other terranes that apparently experience greater heating and consequent equili-bration of greenschist-facies mineral assemblages. Because of these higher temperatures, aragonite can transform into calcite that generally doesn’t happen in the refrigerated Franciscan rocks because of unfavorable kinetics at low temperatures. Redrawn from Ernst (1988).
18.7.1 Coesite and Diamond: Diagnostic UHP Minerals
UHP minerals and mineral assemblages are typicallypreserved in tectonically emplaced lenses and thin layers intercalated within lower-P rocks of the amphi-bolite and greenschist facies. P–T paths can be recon-structed, sometimes only crudely because of the lack ofpertinent experimental and thermodynamic data, usingdisequilibrium mineral assemblages, zoned minerals,and, especially, mineral inclusions within unreactivehost grains, such as pyropic garnet, jadeitic clinopyro-xene or omphacite, kyanite, and zircon. These strongmineral grains served as effective “pressure cells” (Spe-cial Interest Box 18.2) that preserved the UHP envir-onment of the inclusion during exhumation of therocks. Preserved UHP polymorphs of silica and carbonprovide the most direct barometric insights. Most coesites have been partially to completely pseudomor-phed by lower P quartz in distinctive “palisade-textured”aggregates encased within their host. The larger molarvolume of the replacing quartz commonly ruptured the host mineral grain during exhumation, creatingsurrounding radial expansion cracks (Figure 15.16).
Microdiamonds, generally �0.1 mm in diameter,also occur as inclusions in garnets in rocks of theDabie–Sulu terrane in China and the Kokchetav Com-plex of northern Kazakhstan. In the Western Gneissesof Norway (see below), because of their extremelysmall abundance, diamonds have only been recoveredby acid digestion of large volumes of rock. Skeptics ofUHP metamorphism have argued that these minute dia-monds are a contaminant from laboratory processing.(Rocks are usually cut by diamond impregnated sawblades and diamond grit is used as an abrasive in pre-paration of thin sections.) Or, diamonds were formedat high-stress grain boundaries or by nonequilibriumfactors. But the preservation of diamonds and coesitesas inclusions within some sort of mineral host disprovesboth laboratory contamination and high-stress grainboundary nucleation. Others have argued that diamondand coesite were somehow stabilized by large nonhy-drostatic stresses, but this “tectonic overpressure” notionwas discounted decades ago when it was realized howweak rocks are under metamorphic conditions (Sections8.2.1 and 17.2.6; see also Stöckhert and Renner, 1998).
Relict mineral assemblages that mostly escaped re-equilibration at lower P as a result of limited access ofvolatile fluids and/or absence of deformation corrobor-ate ultrahigh pressures inferred from coesite and dia-mond. For example, the Kokchetav rocks are unique in containing clinopyroxene grains with exsolutionlamella of K-feldspar; potassic clinopyroxene is stableonly under UHP conditions. Defining assemblages inclassic UHP terranes are considered next for the DoraMaira Massif of the western Alps and the Dabie–Suluterrane of east-central China.
602 Igneous and Metamorphic Petrology
Special Interest Box 18.2 Mineral grains as“flight recorders” of their geologic historyEveryone has become familiar in recent years withthe “black-box” flight recorder sought in crashedairplanes that can tell of circumstances leading upto the crash to aid investigators reconstructing theevent. In a similar way, inclusions embedded in amineral grain tell about various aspects of its history.
Garnet porphyroblasts are a useful “flightrecorder” that allow the petrologic investigator to un-ravel the time-dependent thermobarometric path fromrocks caught up in the orogenic wreckage of platecollisions (Haugerud and Zen, 1991). The typical longhistory of growth of porphyroblasts over millions ofyears (see Section 18.2 on the Tauern Window) underchanging metamorphic conditions is recorded insuccessive compositional zones (Figure 16.34) that canpotentially yield P–T values using thermobarometrictechniques. “Potentially” is used in the foregoingsentence because of numerous pitfalls in thermo-barometry of garnets that arise from complexities inzoning related to, for example, skeletal growth, dif-fusional adjustments in compositional zones aftergrowth, especially at high temperatures, and lack of original equilibration of Ca concentrations. Theassemblage of mineral inclusions incorporated intopoikiloblastic garnets during growth can be assessedin petrogenetic grids. In addition to this potentialpetrologic information is the opportunity for iso-topic dating of successive zones of the garnet eitherusing the Rb–Sr isotope system on the garnet itselfor the U–Pb isotopic system on inclusions of zircon,rutile, and titanite (see Special Interest Box 19.1).
Amazing discoveries of polymorphs of silica andcarbon stable only under mantle pressures occurringas inclusions in garnet and other mineral “pressurevessels” spawned a whole new field of ultrahigh-Pmetamorphic petrology in the last 15 years of thetwentieth century. Tectonic models had to be revisedto reconcile the deep burial and rapid exhumationof the sedimentary protoliths that host coesite and diamond. Incredibly, details of the history ofcontinental-scale orogens are obtained from micron-size mineral inclusions!
In a further step, minute mineral inclusions in dia-monds hosted in peridotite and eclogite xenolithsin kimberlite (Section 13.12.2) reveal informationabout the mineralogical nature of the mantle.
Fluid inclusions in a wide variety of hosts (Spe-cial Interest Box 16.3) provide useful informationregarding P–T–Xfluid conditions of mineral growthand deformation. Melt inclusions provide data onvolatile solubilities in melts at elevated P and T andtheir impact on explosive volcanism and other geo-logic phenomena (Section 4.3).
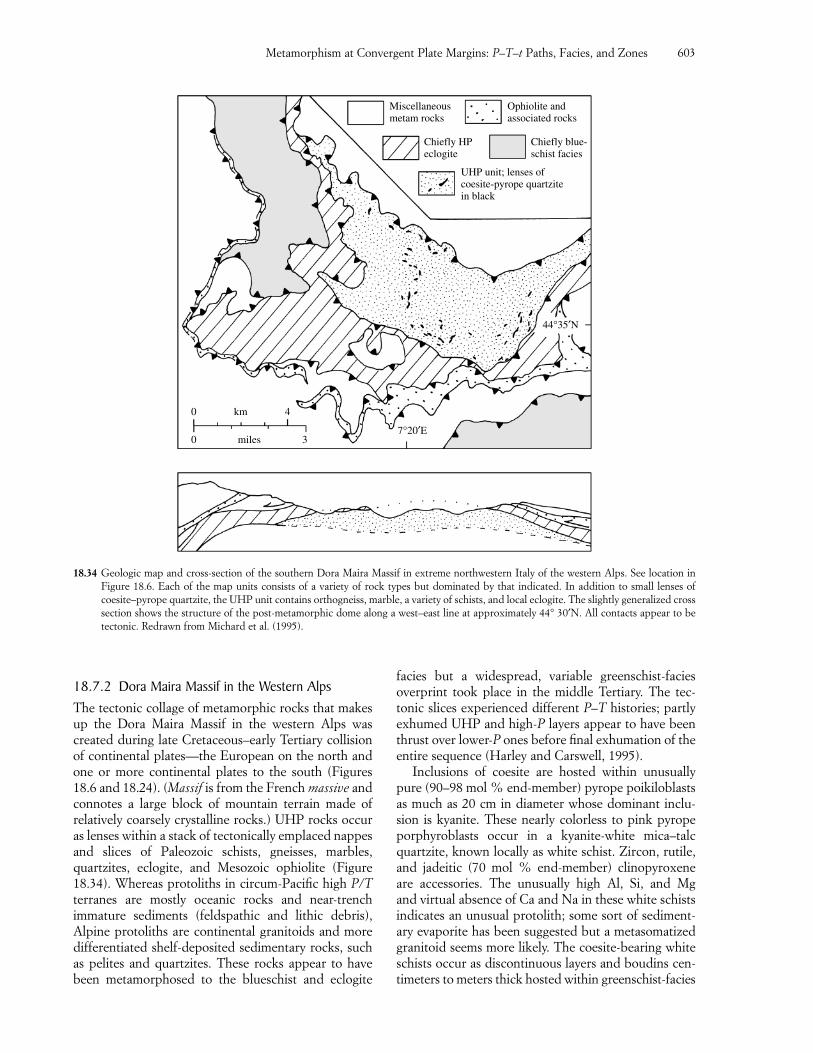
18.7.2 Dora Maira Massif in the Western AlpsThe tectonic collage of metamorphic rocks that makesup the Dora Maira Massif in the western Alps was created during late Cretaceous–early Tertiary collisionof continental plates—the European on the north andone or more continental plates to the south (Figures18.6 and 18.24). (Massif is from the French massive andconnotes a large block of mountain terrain made of relatively coarsely crystalline rocks.) UHP rocks occuras lenses within a stack of tectonically emplaced nappesand slices of Paleozoic schists, gneisses, marbles,quartzites, eclogite, and Mesozoic ophiolite (Figure18.34). Whereas protoliths in circum-Pacific high P/Tterranes are mostly oceanic rocks and near-trench immature sediments (feldspathic and lithic debris),Alpine protoliths are continental granitoids and moredifferentiated shelf-deposited sedimentary rocks, suchas pelites and quartzites. These rocks appear to havebeen metamorphosed to the blueschist and eclogite
facies but a widespread, variable greenschist-faciesoverprint took place in the middle Tertiary. The tec-tonic slices experienced different P–T histories; partlyexhumed UHP and high-P layers appear to have beenthrust over lower-P ones before final exhumation of theentire sequence (Harley and Carswell, 1995).
Inclusions of coesite are hosted within unusuallypure (90–98 mol % end-member) pyrope poikiloblastsas much as 20 cm in diameter whose dominant inclu-sion is kyanite. These nearly colorless to pink pyropeporphyroblasts occur in a kyanite-white mica–talcquartzite, known locally as white schist. Zircon, rutile,and jadeitic (70 mol % end-member) clinopyroxeneare accessories. The unusually high Al, Si, and Mg and virtual absence of Ca and Na in these white schistsindicates an unusual protolith; some sort of sediment-ary evaporite has been suggested but a metasomatizedgranitoid seems more likely. The coesite-bearing whiteschists occur as discontinuous layers and boudins cen-timeters to meters thick hosted within greenschist-facies
Metamorphism at Convergent Plate Margins: P–T–t Paths, Facies, and Zones 603
0 km 4
0 miles 37°20′E
44°35′N
Miscellaneousmetam rocks
Chiefly HPeclogite
UHP unit; lenses ofcoesite-pyrope quartzitein black
Chiefly blue-schist facies
Ophiolite andassociated rocks
18.34 Geologic map and cross-section of the southern Dora Maira Massif in extreme northwestern Italy of the western Alps. See location inFigure 18.6. Each of the map units consists of a variety of rock types but dominated by that indicated. In addition to small lenses of coesite–pyrope quartzite, the UHP unit contains orthogneiss, marble, a variety of schists, and local eclogite. The slightly generalized crosssection shows the structure of the post-metamorphic dome along a west–east line at approximately 44° 30′N. All contacts appear to betectonic. Redrawn from Michard et al. (1995).
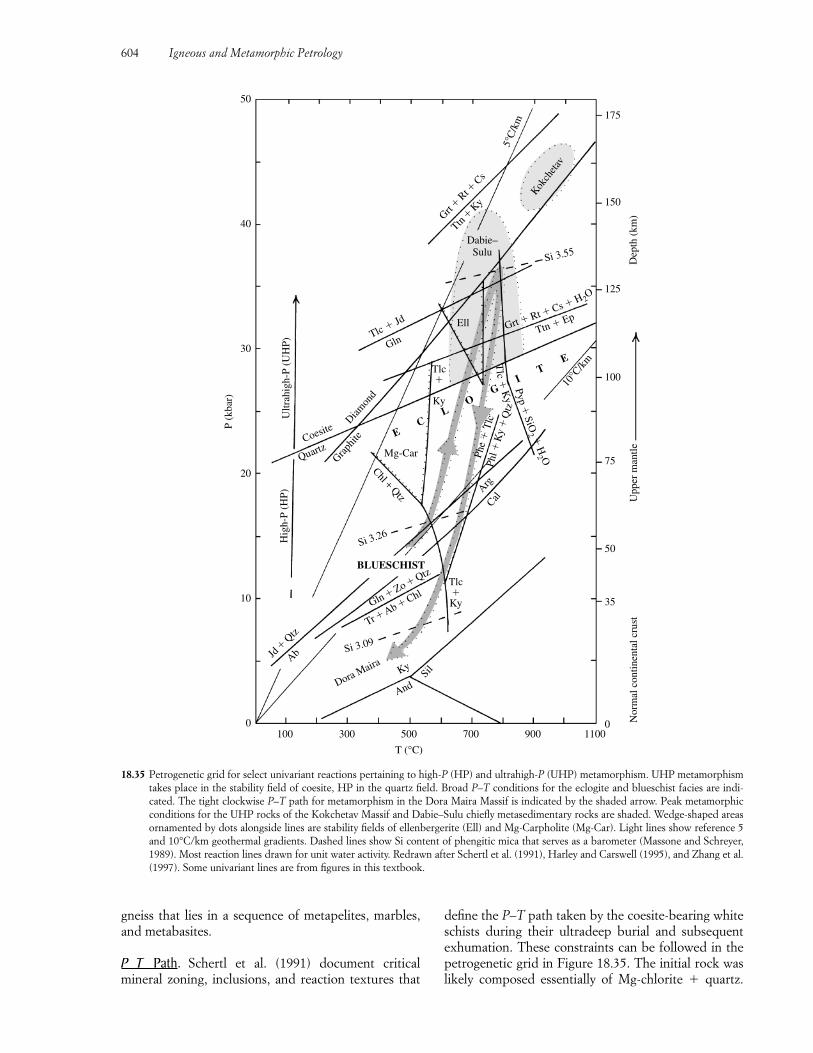
gneiss that lies in a sequence of metapelites, marbles,and metabasites.
P T Path. Schertl et al. (1991) document critical mineral zoning, inclusions, and reaction textures that
define the P–T path taken by the coesite-bearing whiteschists during their ultradeep burial and subsequentexhumation. These constraints can be followed in thepetrogenetic grid in Figure 18.35. The initial rock waslikely composed essentially of Mg-chlorite � quartz.
604 Igneous and Metamorphic Petrology
P (k
bar)
Hig
h-P
(HP)
Ultr
ahig
h-P
(UH
P)
Dep
th (
km)
Nor
mal
con
tinen
tal c
rust
Upp
er m
antle
50
40
30
20
10
0
175
150
125
100
75
50
35
0100 300 500 700 900 1100
T (°C)
And
SilKy
Dora MairaSi 3.09
Si 3.26
Si 3.55
Tlc�Ky
Tlc�
Ky
Jd �
Qtz
Gln � Zo � Qtz
Chl + Qtz
Tr � Ab � Chl
Ab
BLUESCHIST
ArgCal
Mg-Car
Graph
iteDiam
ond
Tlc � Jd
Gln
QuartzCoesite
Ell
Dabie–Sulu
EC
LO
GI
TE
Phe
�T
lcPh
l�K
y�
Qtz
Pyp�
SiO2 �
H2 O
Grt � Rt � Cs � H 2O
Grt�
Rt�Cs
Ttn�
Ky
Ttn � EpT
lc�
Ky
10°C
/km
5°C
/km
Kokch
etav
18.35 Petrogenetic grid for select univariant reactions pertaining to high-P (HP) and ultrahigh-P (UHP) metamorphism. UHP metamorphismtakes place in the stability field of coesite, HP in the quartz field. Broad P–T conditions for the eclogite and blueschist facies are indi-cated. The tight clockwise P–T path for metamorphism in the Dora Maira Massif is indicated by the shaded arrow. Peak metamorphicconditions for the UHP rocks of the Kokchetav Massif and Dabie–Sulu chiefly metasedimentary rocks are shaded. Wedge-shaped areasornamented by dots alongside lines are stability fields of ellenbergerite (Ell) and Mg-Carpholite (Mg-Car). Light lines show reference 5and 10°C/km geothermal gradients. Dashed lines show Si content of phengitic mica that serves as a barometer (Massone and Schreyer,1989). Most reaction lines drawn for unit water activity. Redrawn after Schertl et al. (1991), Harley and Carswell (1995), and Zhang et al.(1997). Some univariant lines are from figures in this textbook.
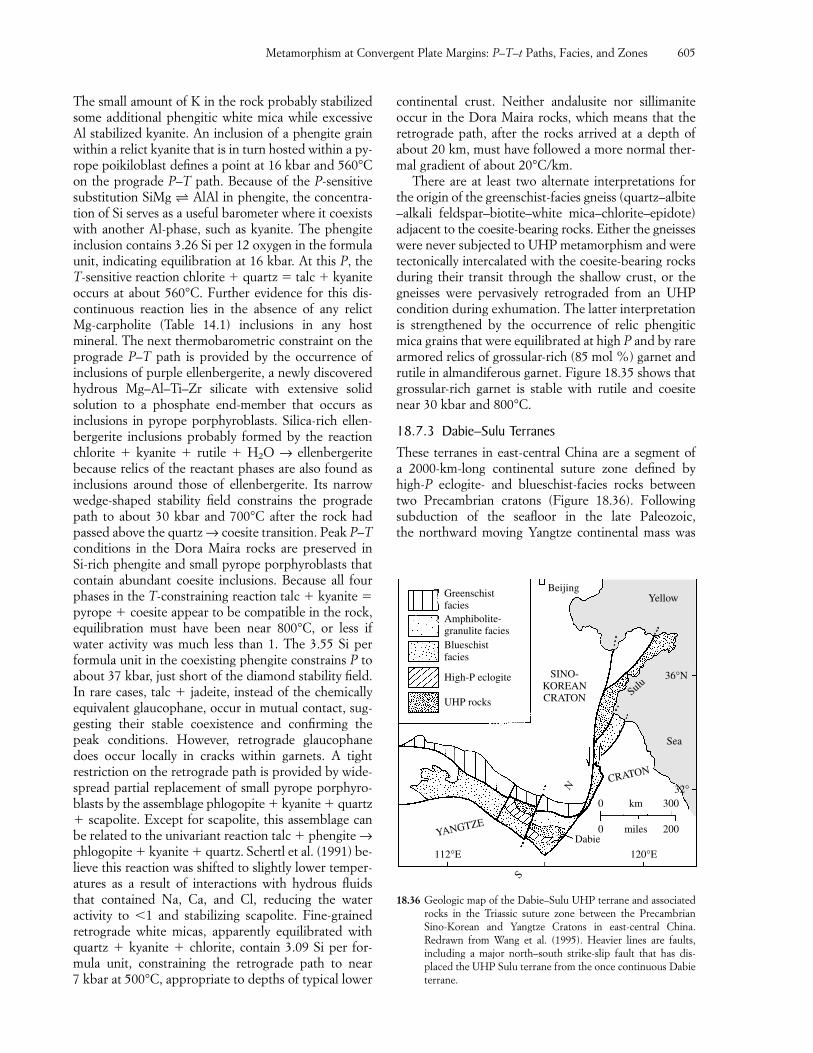
The small amount of K in the rock probably stabilizedsome additional phengitic white mica while excessiveAl stabilized kyanite. An inclusion of a phengite grainwithin a relict kyanite that is in turn hosted within a py-rope poikiloblast defines a point at 16 kbar and 560°Con the prograde P–T path. Because of the P-sensitivesubstitution SiMg b AlAl in phengite, the concentra-tion of Si serves as a useful barometer where it coexistswith another Al-phase, such as kyanite. The phengiteinclusion contains 3.26 Si per 12 oxygen in the formulaunit, indicating equilibration at 16 kbar. At this P, theT-sensitive reaction chlorite � quartz � talc � kyaniteoccurs at about 560°C. Further evidence for this dis-continuous reaction lies in the absence of any relictMg-carpholite (Table 14.1) inclusions in any host mineral. The next thermobarometric constraint on theprograde P–T path is provided by the occurrence of inclusions of purple ellenbergerite, a newly discoveredhydrous Mg–Al–Ti–Zr silicate with extensive solid solution to a phosphate end-member that occurs as inclusions in pyrope porphyroblasts. Silica-rich ellen-bergerite inclusions probably formed by the reactionchlorite � kyanite � rutile � H2O → ellenbergeritebecause relics of the reactant phases are also found asinclusions around those of ellenbergerite. Its narrowwedge-shaped stability field constrains the progradepath to about 30 kbar and 700°C after the rock hadpassed above the quartz → coesite transition. Peak P–Tconditions in the Dora Maira rocks are preserved in Si-rich phengite and small pyrope porphyroblasts thatcontain abundant coesite inclusions. Because all fourphases in the T-constraining reaction talc � kyanite �pyrope � coesite appear to be compatible in the rock,equilibration must have been near 800°C, or less if water activity was much less than 1. The 3.55 Si per formula unit in the coexisting phengite constrains P toabout 37 kbar, just short of the diamond stability field.In rare cases, talc � jadeite, instead of the chemicallyequivalent glaucophane, occur in mutual contact, sug-gesting their stable coexistence and confirming thepeak conditions. However, retrograde glaucophanedoes occur locally in cracks within garnets. A tight restriction on the retrograde path is provided by wide-spread partial replacement of small pyrope porphyro-blasts by the assemblage phlogopite � kyanite � quartz� scapolite. Except for scapolite, this assemblage canbe related to the univariant reaction talc � phengite →phlogopite � kyanite � quartz. Schertl et al. (1991) be-lieve this reaction was shifted to slightly lower temper-atures as a result of interactions with hydrous fluidsthat contained Na, Ca, and Cl, reducing the water activity to �1 and stabilizing scapolite. Fine-grainedretrograde white micas, apparently equilibrated withquartz � kyanite � chlorite, contain 3.09 Si per for-mula unit, constraining the retrograde path to near 7 kbar at 500°C, appropriate to depths of typical lower
continental crust. Neither andalusite nor sillimanite occur in the Dora Maira rocks, which means that theretrograde path, after the rocks arrived at a depth ofabout 20 km, must have followed a more normal ther-mal gradient of about 20°C/km.
There are at least two alternate interpretations forthe origin of the greenschist-facies gneiss (quartz–albite–alkali feldspar–biotite–white mica–chlorite–epidote)adjacent to the coesite-bearing rocks. Either the gneisseswere never subjected to UHP metamorphism and weretectonically intercalated with the coesite-bearing rocksduring their transit through the shallow crust, or thegneisses were pervasively retrograded from an UHPcondition during exhumation. The latter interpretationis strengthened by the occurrence of relic phengiticmica grains that were equilibrated at high P and by rarearmored relics of grossular-rich (85 mol %) garnet andrutile in almandiferous garnet. Figure 18.35 shows thatgrossular-rich garnet is stable with rutile and coesitenear 30 kbar and 800°C.
18.7.3 Dabie–Sulu TerranesThese terranes in east-central China are a segment of a 2000-km-long continental suture zone defined byhigh-P eclogite- and blueschist-facies rocks betweentwo Precambrian cratons (Figure 18.36). Followingsubduction of the seafloor in the late Paleozoic, the northward moving Yangtze continental mass was
Metamorphism at Convergent Plate Margins: P–T–t Paths, Facies, and Zones 605
18.36 Geologic map of the Dabie–Sulu UHP terrane and associatedrocks in the Triassic suture zone between the PrecambrianSino-Korean and Yangtze Cratons in east-central China. Redrawn from Wang et al. (1995). Heavier lines are faults, including a major north–south strike-slip fault that has dis-placed the UHP Sulu terrane from the once continuous Dabieterrane.
S
N
112°E 120°E
0 300km
0 200milesDabie
CRATON
YANGTZE
Sea
Sulu36°N
32°
YellowBeijing
SINO-KOREANCRATON
GreenschistfaciesAmphibolite-granulite faciesBlueschistfacies
High-P eclogite
UHP rocks
jammed below the edge of the Sino-Korean continentin the late Triassic, 240–230 Ma, creating the UHProcks now exposed over an area of about 1000 km3.Associated tectonites to the north in the Dabie terraneare amphibolite- and granulite-facies felsic gneisses andmigmatites, whereas to the south, across a possible detachment surface marked by mélange, more variedrocks include felsic gneiss, paraschist, marble, ultra-mafic rocks, and lenses and layers of eclogite hostedwithin them.
Coesite and coesite relics occur as inclusions in gar-net, clinopyroxene, kyanite, dolomite, and zircon. Raremicrodiamond inclusions and armored relics of grossular-rich garnet and rutile in eclogite garnets indicate pres-sures �30 kbar at 700°C (Figure 18.35). UHP rocksare pervasively overprinted by amphibolite-facies assem-blages. Bolin et al. (1999) believe the UHP rocks wereexhumed in three stages between 230 and 120 Ma.
18.7.4 Evolution of UHP TerranesUntil the 1980s, subducting plates were believed to beessentially restricted to those of oceanic lithosphere;continental lithosphere with its thick, significantly less dense crust was deemed to be just too buoyant to subduct into the mantle. In the classic continent–continent collision zone of the Himalaya, the Eurasianplate in Tibet is underthrust at a shallow angle by theIndian continent so that the deepest part of the Moholies at depths of “only” 70–80 km (Figure 13.33); theunderthrust continental plate does not penetrate intothe mantle. However, the dogma that continental platescannot subduct was overturned in the 1980s with discoveries of coesite and diamond in continental protoliths that must have been buried twice as deep, todepths of 120–160 km (Figure 18.35).
In trying to understand the tectonothermal evolu-tion of UHP terranes it is significant that not only werethey buried to great depth but they are also restrictedto continental, not oceanic, protoliths in elongate continent–continent suture zones. Protoliths followedrelatively refrigerated P–T paths during burial and exhumation. After initial burial along an approximatetrajectory of 10°C/km to about 560°C at 55–60 km, theDora Maira rocks were subsequently transferred to800°C at about 130 km (Figure 18.35) along a trajec-tory of a little more than 3°C/km. Decompression followed along a similar trajectory to about 30 km. This path precludes sufficient heating to create partialmelting—hence the virtual absence of coeval silicicmagmatism (Figure 18.6) like the Himalaya granites(Figure 13.33). More mafic calc–alkaline magmatism ofthe Andean type (Section 13.7) is also absent becausethere is no subducting and water-liberating oceaniccrust to foster generation of magmas in the arc mantle.What seems to be required is rapid subduction and return exhumation of cold continental lithosphere.
Just how rapid is revealed by chronologic analysesof minerals in assemblages that also yield thermobaro-metric data on P–T paths. SHRIMP analyses (see Special Interest Box 19.1) for U–Th–Pb isotopes in titanite grains in the Dora Maira rocks yield an age of35.1 0.9 Ma for the metamorphism at maximum P(35 kbar near 125 km depth; Rubatto and Hermann,2001). Retrograde titanites equilibrated at about 35 kmdepth yield an age of 32.9 0.9 Ma, indicating as-tounding exhumation rates of a few centimeters peryear (the exact rate must take into account the uncer-tainty errors in the chronologic and barometric ana-lyses). Subsequent slower exhumation at about 0.5 cm/ybrought the UHP rocks to a depth of about 10 km and250°C at 29.9 1.4 Ma, based on annealing of fissiontracks in zircon. Chronologic data on the coesite-bearingrocks at the western end of the middle Tertiary Himalaya and diamond-bearing rocks of the 500 MaKokchetav and 210 Ma Dabie–Sulu have larger analyt-ical uncertainties but are of similar magnitude (centi-meters per year).
Such astounding rates of exhumation of low-density,refrigerated continental rocks from mantle depths appear to be required for preservation of UHP metamorphism. (One is reminded of the response of a basketball pushed into the water in a swimmingpool; once released the buoyant ball rapidly pops back to the surface.) One possible scenario (O’Brien et al., 2001) involves break-off of the leading, denseroceanic part of the descending slab that was acted on by a slab-pull force earlier in the subductionprocess. Once freed of its denser leading part, thebuoyant continental material can pop up to the top ofthe mantle at rates of centimeters per year. Subsequentslower rates of exhumation occur as more normal iso-static rebound takes place in the imbricate stack ofthrust slices.
SUMMARY
Metamorphic zones, facies, and P–T paths provide im-portant constraints on dynamic tectonic and thermalphenomena at convergent plate junctures duringorogeny. The nature of the plates, whether continentalor oceanic, their thermal state and thickness, rate ofconvergence, distribution of radioactive heat sources,and rate of unroofing govern the conductive thermalevolution of orogens and the metamorphic terranes in them. Faster convergence rates tend to counteract the heating effect via thermal relaxation of thickenedcrust that largely controls the prograde path of meta-morphism. Rapid unroofing—by tectonic extensionalfaulting or erosion or both—leads to steep thermal gradients near the surface of the Earth and nearly iso-thermal, retrograde decompression metamorphic paths.
606 Igneous and Metamorphic Petrology
Additional factors that can be of local significance inthe thermal history of orogens include magmatic andstrain heating, advective transfer of heat via fluids, andthe heat budget of mineral reactions.
Several means are available to construct P–T pathsin a rock or suite of cogenetic rocks for the terrane in which they were metamorphosed. Broad paths aredefined by facies series and metamorphic zones. Thermobarometry on mineral assemblages and zonedminerals can yield quantitative data but caution mustbe exercised because of disequilibrium effects resultingfrom sluggish kinetics and overprinting. Further con-straints are provided by mineral inclusions in poikilo-blasts and other relic mineral assemblages preserved in reaction textures; these assemblages can be placed in petrogenetic grids derived from experimental andthermodynamic data. High temperatures and completemineral equilibration at peak metamorphic conditionscan all but eliminate the prograde path record; for thisreason, retrograde paths are generally more readily determined.
Chronologic data at specific P–T points in the meta-morphic path permit construction of a complete P–T–tpath; such information provides quantitative estimatesof rates of mineral growth and of burial and exhuma-tion during metamorphism.
Orogens and the metamorphic terranes in them areinfinitely variable in detail. Some Mesozoic–Cenozoicorogens of the circum-Pacific have paired belts withhigh P/T metamorphism developed in the accretionarywedge and intermediate- to low-P metamorphism farther inland coincident with the magmatic arc. Mostorogens, however, are not so simple because of multi-ple episodes of docking and suturing of island arcs,oceanic plateaus, ophiolite, and continental fragmentsonto overriding continental plates. Some orogens ex-perienced culminating continent–continent collisionsand suturing, only to be later affected by crustal exten-sion and rifting.
The classic Barrovian metamorphic zones devel-oped in pelitic rocks at intermediate pressures havebeen a standard reference for regional metamorphismin orogens since the work of George Barrow in theScottish Highlands a century ago. Successive progradeappearance via continuous and discontinuous reactionsof chlorite, biotite, garnet, staurolite, kyanite, sillima-nite, and sillimanite � K-feldspar ( migmatite) definethese Barrovian zones. Higher grade minerals and assemblages of the granulite facies found in other terranes around the world include cordierite, spinel,sapphirine, and orthopyroxene � K-feldspar in lieu ofbiotite.
Widespread metabasites in Barrovian terranes havefewer phases formed by mostly continuous reactions,hindering definition of P–T conditions from mineralassemblages. Greenschist-facies metabasites in chlorite
and biotite pelite zones contain epidote � chlorite �actinolite � albite quartz calcite titanite Fe–Ti oxides. In the garnet zone, aluminous horn-blende replaces actinolite, oligoclase replaces albite,and almandine-rich garnet may also appear. Chloriteand epidote disappear in the amphibolite facies (stau-rolite, kyanite, and sillimanite zones) and pyroxenes replace hornblende as the dominant mafic phase in thegranulite facies.
Intermediate-P metamorphism defines open-loop,clockwise P–T paths in orogens where the continentalcrust is thickened and thermal relaxation occurs over atleast tens of millions of years. In pelitic rocks, this pathis recorded in prograde kyanite, perhaps preserved asinclusions in cores of porphyroblasts, followed by laterhigher T sillimanite.
Lower P regional metamorphism in some orogensresembles that developed in contact aureoles sur-rounding magmatic intrusions except for the concur-rent deformation that creates tectonite fabric instead of hornfelsic. Indeed, this Buchan style is sometimesreferred to as regional contact metamorphism becauseof widespread more or less synchronous granitoid intrusions that serve as an important heat source, per-haps with an additional heat flux from underplatingmantle-derived basaltic magma. The typical flat-loop,counter-clockwise P–T paths recorded for Buchanmetamorphism reflect this external input of heat. Thelack of much change in P during the prograde and retrograde paths reflects the lack of concurrent crustalthickening and consequent isostatic unroofing adjust-ments. In pelitic rocks, the prograde Buchan path isrecorded by early andalusite succeeded by sillimanite;cordierite is widespread, whereas staurolite and espe-cially garnet are less common, or absent.
Ocean-ridge metamorphism (or alteration, as somewould prefer) is a globally significant interaction be-tween seawater and hot basaltic rock at spreadingoceanic rifts. Metasomatism results in mineral assem-blages resembling those of the zeolite, prehnite–pumpellyite, greenschist, and locally amphibolite facies. But the reconstitution is patchy, more or lessmonomineralic veins are widespread, and the mineralzonation is telescoped within the upper few kilometersof the seafloor in pillow lavas and underlying sheeteddike complex. Metasomatism creates metal sulfidesand releases silica for seafloor chert deposits.
The most intact oceanic lithosphere exposed onland is found in a few large slabs of ophiolite, such asthe Semail in Oman. These ophiolites appear to havebeen created in back-arc basins underthrust by nearbysubducting continental margins that subsequentlybuoyed upward, lifting the overriding oceanic rocksabove sealevel.
Terranes of arc-trench sedimentary deposits(graywacke), mélange, high P/T facies series rocks,
Metamorphism at Convergent Plate Margins: P–T–t Paths, Facies, and Zones 607
serpentinite, and variably dismembered ophiolite typify accretionary wedges over subducting oceaniclithosphere alongside oceanic trenches. Zeolite-faciesrocks characterized by any one of several zeolites coex-isting stably with quartz are typically developed inthick prisms of volcanogenic detritus shed off adjacentvolcanic highlands. Locally merging into zeolitic rocksare those of the higher P and T prehnite–pumpellyitefacies that are characterized by these two phases coex-isting stably with certain minerals of the greenschistand blueschist facies. Blueschist-facies rocks are char-acterized by stable glaucophane � lawsonite and additionally at higher P by aragonite and a jadeiticclinopyroxene; stilpnomelane occurs instead of bio-tite, kyanite instead of andalusite or sillimanite, andphengite-rich white mica, titanite, and garnet are com-mon. The diagnostic assemblage in metabasites of mag-nesian garnet � omphacite defines the eclogite facies.
High P/T metamorphism of the blueschist and adjacent facies follows relatively tightly looped clock-wise P–T paths; these refrigerated rock paths implynearly isothermal burial and subsequent immediate exhumation. Little heating takes place because of therelatively rapid burial and exhumation in the near-trench, accretionary-wedge setting over cool subduct-ing oceanic lithosphere. Consequently, no magmatismand migmatism take place. If exhumation is not sorapid, as commonly happens in more mature and collisional orogens, thermal relaxation via conduc-tion of heat can transform blueschist-facies mineral assemblages into greenschist- or amphibolite-facies assemblages.
Very rare, low- to moderate-T, ultrahigh-P (UHP)rocks occur in several continent–continent collisionalzones. Although the defining coesite and diamond inclusions in garnets and other “pressure cell” mineralsare very rarely preserved, other relict UHP mineral as-semblages that escaped lower-P or higher-T overprint-ing metamorphism are consistent with their ultradeepancestry. These UHP phases and assemblages includepyrope garnet, Si-rich phengite, ellenbergite, K–Al-richclinopyroxene, talc � kyanite, and grossular-rich gar-net � rutile. Preservation of UHP rocks appears tostem from their development in continental protolithsthat were rapidly exhumed once buoyant forces tookover in the refrigerated subducting plate.
CRITICAL THINKING QUESTIONS
18.1 Why are pelitic rocks better indicators of metamorphic grade in Barrovian terranes thanfeldspathic sandstones and granitoids?
18.2 Discuss mineralogical changes during progres-sive Barrovian-style regional metamorphism ofpelitic rocks. Cite first appearances of index
minerals or mineral compatibilities and changesin composition of solid solutions.
18.3 The first and second sillimanite isograds maynot be sharply defined in pelites in Barrovianterranes, but for two different reasons. Discussthese.
18.4 What would be the advantages and disadvant-ages of erecting a new UHP facies distinct from the eclogite facies? Would this be a validmetamorphic facies?
18.5 What is a possible pitfall in using the SHRIMPU–Pb age of a zircon inclusion in a zoned garnet from a garnet-zone pelitic rock to constrain a point on its P–T–t path? How validis the fission-track age of an apatite inclusion in the garnet in constraining the peak metamorphic T? Discuss fully.
18.6 How would you account for the high closure T for the U–Pb isotope system in zircon?
18.7 How might the rate of plate convergence gov-ern the development of paired metamorphicbelts?
18.8 Explore the geologic consequences of rapid uplift and erosion on configuration of the geotherm, age of exposed metamorphic rocks,and occurrence of hot springs. Suggest and discuss other implications.
18.9 Heat conduction from a static magmatic bodyraises the T of adjacent rocks to only aboutone-half that of the body (Section 8.4.1). How do you reconcile the 860°C recorded in the metamorphic sole immediately below the White Hills peridotite whose mineral assemblage had equilibrated at 950°C?
18.10 Because of lithospheric plate reorganization,ancient subduction zones are not marked by active seismicity and arc volcanism. Withoutthese indicators of active subduction, what rock types and associations verify the formerexistence of a subduction zone and its polarity(direction of slab dip)?
18.11 Contrast the two ways that ophiolite is emplaced and occurs in subduction zones.
18.12 Suppose that an amphibole grain grew progressively during metamorphism on a clockwise P–T path under blueschist- and amphibolite- and finally greenschist-facies conditions. Describe its compositional zoning,assuming it never fully equilibrated under anyfacies conditions.
18.13 Compare P–T paths of Barrovian, Buchan,blueschist-facies, and UHP metamorphism. Explain and account for their differences.
608 Igneous and Metamorphic Petrology
PROBLEMS
18.1 Compare typical rates of heat conduction and tectonic transport of rock mass. Using the Jaeger approximation in Section 8.4.1 for a thermally perturbed overthrust rock slab 20 km thick in a convergent plate regime, calculate the time required to allow“substantial” and “practically complete” ther-mal effects at the center of the slab. Answer:About 3 and �30 million years. In 3 millionyears, what is the distance of transport using a reasonable plate tectonic rate of movement?Discuss your results.
18.2 Evaluate the contribution of strain heating bythe mechanical work of shearing during orogen-
esis using equation 11.1. Assume a 100-km-wide orogen shortened at a rate of 1 cm/y at ashear stress of 100 bars. Compare this rate ofheating with that due to radioactivity in graniteand, if the model crust is 30 km thick, with thatof the average surface heat flow. Discuss yourresults.
18.3 Construct an AKF diagram for pelitic mineralassemblages of the Barrovian staurolite zone.How does it compare with the AFM diagram in terms of representing mineral reactions in the zone?
Metamorphism at Convergent Plate Margins: P–T–t Paths, Facies, and Zones 609
FUNDAMENTAL QUESTIONSCONSIDERED IN THIS CHAPTER
1. What was the nature of magmatic andmetamorphic rock-forming processes during theinfancy of planet Earth and how do they comparewith those of more recent geologic time? In otherwords, how valid is the concept ofUniformitarianism?
2. How far back in the geologic past were platetectonics and mantle plumes expressions of theconvecting-mantle heat engine driving rock-forming processes?
3. What is the nature of the oldest preservedremnants of sialic and mafic crust? How closelydo these correspond to younger (Mesozoic–Cenozoic) continental and oceanic crust?
4. How have continents evolved throughout Earthhistory?
INTRODUCTION
In this concluding chapter, we continue to pursue a fundamental concept introduced in Chapter 1 andexamined throughout this textbook: rocks provide arecord of how the Earth works, how gravitational andthermal energy drive movement of matter in rock-forming processes. However, in this chapter, we focusnot on the distinct and separate records preserved inmagmatic and metamorphic rocks but rather on an in-tegrated view of the rock-forming systems in a specificinterval of time—the Precambrian. During this first 3.9 Gy, or 87%, of Earth history defined by the lack of
conspicuous fossils, unique and unusually widespreadassociations of rocks were created; these include ultra-mafic komatiite lava flows, megacrystic and massif-type anorthosite, rapakivi granites, and vast terranes oftonalite, trondhjemite, and granodiorite orthogneiss.Do these unusual associations merely reflect a muchgreater amount of time for their creation? Or, do theyimply something fundamentally different about rock-forming processes in the youthful Earth? In the morelikely latter case, significant contrasts between theseearliest rocks and “modern” rocks, formed since thecreation of the oldest preserved oceanic crust byseafloor spreading in the Jurassic, raise important questions regarding global geologic systems in the premodern planet. How did a presumably hotter convecting-mantle heat engine drive tectonic pro-cesses during the Precambrian? Were there movinglithospheric plates as today? Were there continents and ocean basins as during modern times?
Despite the difficulties in interpreting Precambrianrocks and their formative geologic systems, trying tounderstand them is a tantalizing challenge that cannotbe ignored. New discoveries, new techniques of study,and new ways of thinking about Precambrian rocks inthe coming decades will be needed to resolve specu-lative and conflicting interpretations.
The exposed volume of the Precambrian recordpreserved in continents on Earth decreases expon-entially in older rocks and its clarity is increasinglyclouded by overprinting, commonly multiple, episodesof recrystallization, deformation, metasomatism, andmigmatization, or partial melting (see, for example,Figure 14.39). Original field relations are difficult, ifnot impossible, to interpret unambiguously in suchmetamorphic rocks. It is not always possible to viewthe progressive effects of a single overprint from initial
PrecambrianRockAssociations
19CHAPTER
through intermediate to the final state of the changingrock system, as in the examples shown in Figures14.16, 14.17, and 14.38.
Important keys to unlocking the complexities ofPrecambrian geology are precise isotope geochrono-logy (Special Interest Box 19.1) and trace element and isotope geochemistry. Precise dating can establishtime(s) of recrystallization, reveal the cooling history of a rock by determining closure temperatures in dif-ferent datable minerals (Figure 18.3), and tell when anepisode of deformation occurred by dating the retro-grade minerals in a shear zone. Stratigraphic and struc-tural dilemmas can be resolved, such as whether a thicksequence of metamorphic rock layers originated by im-bricate stacking of thrust sheets of rocks of similar ageor by sequential deposition and emplacement. Isotopicsystematics permit a distinction between older contin-ental rock that was recycled or reworked via melting or metamorphism versus juvenile additions to contin-ental crust that were created by magmas extractedfrom the mantle, and possibly when that extraction occurred (“model age”). Using these laboratory tech-niques, virtually the entire history of some rocks canpotentially be unraveled, from their time of crystalliza-tion from magma through burial and multiple episodesof recrystallization and deformation to final uplift andexhumation. But this laboratory work can be meaning-less without careful field observations and mapping toestablish an accurate spatial and temporal context forrock masses. Many hours of patient field work to find acritical relationship between rock units can be just asimportant as the time spent in the determination of anisotope ratio.
Because of the almost universal metamorphism thathas affected Precambrian rocks, standard geochemicaland isotopic techniques employed for fresh youngerrocks may not be applicable or valid because con-centrations and ratios of many elements and isotopescan be perturbed. Before using any geochemical data, whole suites of samples should be carefully and
Precambrian Rock Associations 611
Special Interest Box 19.1 Age determinationsin old rocksStandard methods for dating of Phanerozoic rocksthat utilize Rb–Sr (Section 2.6.2) and K–Ar isotopicsystems are generally not suitable for older Pre-cambrian rocks because of metamorphic overprintsthat alter parent-daughter ratios. The Sm–Nd sys-tem is less susceptible to open-system alterationand has yielded some useful ages. The U–Pb systemhas proven to be the most useful on ancient rocks,primarily using zircon (ZrSiO4) grains because theynot only contain measurable concentrations of the
parent U that substitutes for Zr but also are relatively immune to effects of metamorphism andmelting and, in fact, can develop datable over-growths during these processes. Other U-bearingminerals such as titanite, baddeleyite, garnet, rutile,and monazite have also yielded useful data. The refractory nature of zircon is manifest in its occur-rence as Precambrian restite xenocrysts in Ceno-zoic silicic rocks whose magmas were generated by partial melting of continental crust. Another desirable attribute of zircon is that it provides twoindependent chronometers (238U and 235U) whichserve as an internal check on closed system beha-vior. A drawback of zircon for dating is its absencein mafic and ultramafic rocks.
Many zircon grains have experienced multipleepisodes of growth during the history of their hostrock; these overgrowth zones are visible underhigh-power magnification. Dating of individualzones is made possible with a sensitive high resolu-tion ion micro probe (SHRIMP) such as the oneemployed at the Australian National University in Canberra by Compston and colleagues (e.g.Compston and Pidgeon, 1986) and at the Geolo-gical Survey of Canada in Ottawa by Stern and colleagues (e.g. Stern and Bleeker, 1998). Theseworkers have determined ages of the oldest knownrocks and minerals on Earth. A high energy beamof oxygen ions is used to ionize a small hemispher-ical volume of zircon within a growth zone on apolished section through the interior of the grain(Figure 19.1). The released U, Th, and Pb isotopesare separated and ratios measured in the high resolu-tion mass spectrometer for the age determination(Faure, 1986).
Much less expensive but equally precise datingas SHRIMP, as well as trace element analyses, canbe performed by laser ablation inductively coupledplasma mass spectrometry (The Lattice, Mineralo-gical Society of America, February 2001).
A less precise method of dating monazite grainshas been described by Williams et al. (1999). Mon-azite (Table 2.3) is a widespread accessory min-eral in magmatic and metamorphic rocks, containssignificant amounts of Th and U and little non-radiogenic Pb, and has very slow diffusion rates of relevant atoms. Its value as a chronometer is greatlyenhanced because the analyses can be made in polished sections with an electron microprobe—astandard analytical tool in most geological labora-tories. Ages can be directly correlated with fabricand mineralogical features in the same polishedthin section to elucidate important episodes in thetectonic, magmatic, and metamorphic history of therock (e.g. Section 17.3.3).
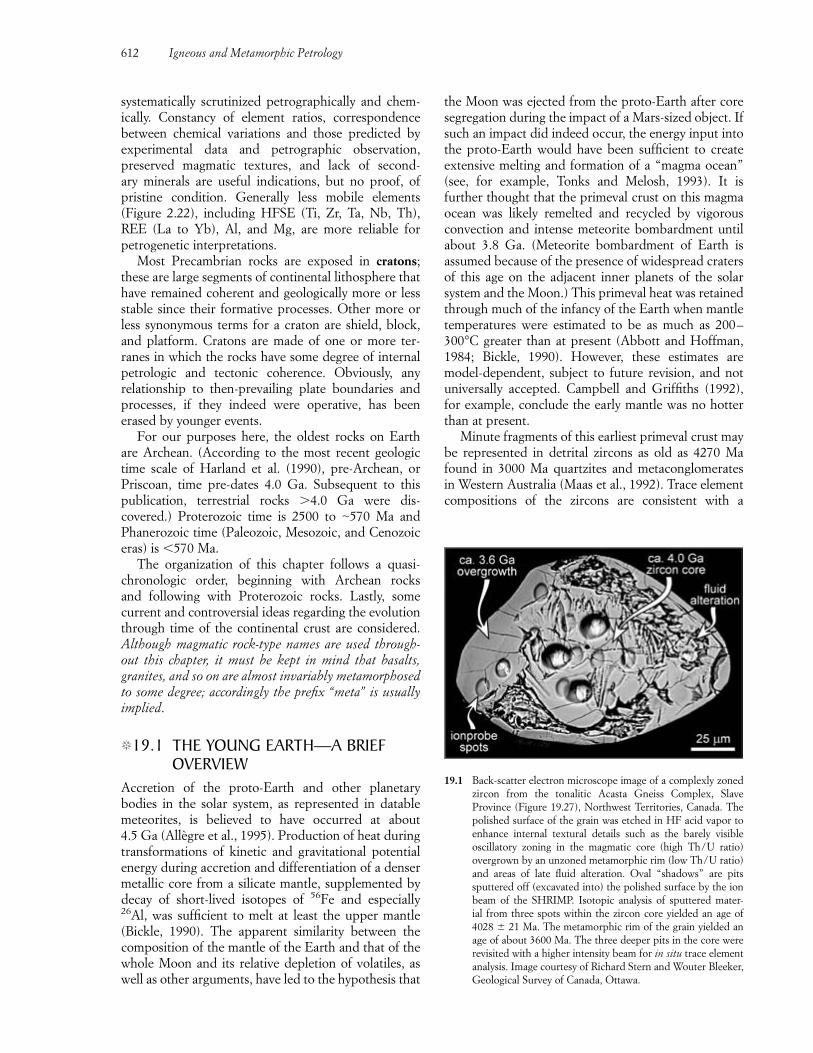
systematically scrutinized petrographically and chem-ically. Constancy of element ratios, correspondence between chemical variations and those predicted by experimental data and petrographic observation, preserved magmatic textures, and lack of second-ary minerals are useful indications, but no proof, of pristine condition. Generally less mobile elements (Figure 2.22), including HFSE (Ti, Zr, Ta, Nb, Th),REE (La to Yb), Al, and Mg, are more reliable for petrogenetic interpretations.
Most Precambrian rocks are exposed in cratons;these are large segments of continental lithosphere thathave remained coherent and geologically more or lessstable since their formative processes. Other more orless synonymous terms for a craton are shield, block,and platform. Cratons are made of one or more ter-ranes in which the rocks have some degree of internalpetrologic and tectonic coherence. Obviously, any relationship to then-prevailing plate boundaries andprocesses, if they indeed were operative, has beenerased by younger events.
For our purposes here, the oldest rocks on Earth are Archean. (According to the most recent geologictime scale of Harland et al. (1990), pre-Archean, orPriscoan, time pre-dates 4.0 Ga. Subsequent to thispublication, terrestrial rocks �4.0 Ga were dis-covered.) Proterozoic time is 2500 to �570 Ma andPhanerozoic time (Paleozoic, Mesozoic, and Cenozoiceras) is �570 Ma.
The organization of this chapter follows a quasi-chronologic order, beginning with Archean rocks and following with Proterozoic rocks. Lastly, some current and controversial ideas regarding the evolutionthrough time of the continental crust are considered.Although magmatic rock-type names are used through-out this chapter, it must be kept in mind that basalts,granites, and so on are almost invariably metamorphosedto some degree; accordingly the prefix “meta” is usuallyimplied.
�19.1 THE YOUNG EARTH—A BRIEFOVERVIEW
Accretion of the proto-Earth and other planetary bodies in the solar system, as represented in datablemeteorites, is believed to have occurred at about 4.5 Ga (Allègre et al., 1995). Production of heat duringtransformations of kinetic and gravitational potentialenergy during accretion and differentiation of a densermetallic core from a silicate mantle, supplemented bydecay of short-lived isotopes of 56Fe and especially26Al, was sufficient to melt at least the upper mantle(Bickle, 1990). The apparent similarity between thecomposition of the mantle of the Earth and that of thewhole Moon and its relative depletion of volatiles, aswell as other arguments, have led to the hypothesis that
the Moon was ejected from the proto-Earth after coresegregation during the impact of a Mars-sized object. Ifsuch an impact did indeed occur, the energy input intothe proto-Earth would have been sufficient to createextensive melting and formation of a “magma ocean”(see, for example, Tonks and Melosh, 1993). It is further thought that the primeval crust on this magmaocean was likely remelted and recycled by vigorousconvection and intense meteorite bombardment untilabout 3.8 Ga. (Meteorite bombardment of Earth is assumed because of the presence of widespread cratersof this age on the adjacent inner planets of the solar system and the Moon.) This primeval heat was retainedthrough much of the infancy of the Earth when mantletemperatures were estimated to be as much as 200–300°C greater than at present (Abbott and Hoffman,1984; Bickle, 1990). However, these estimates aremodel-dependent, subject to future revision, and notuniversally accepted. Campbell and Griffiths (1992),for example, conclude the early mantle was no hotterthan at present.
Minute fragments of this earliest primeval crust maybe represented in detrital zircons as old as 4270 Mafound in 3000 Ma quartzites and metaconglomerates in Western Australia (Maas et al., 1992). Trace elementcompositions of the zircons are consistent with a
612 Igneous and Metamorphic Petrology
19.1 Back-scatter electron microscope image of a complexly zonedzircon from the tonalitic Acasta Gneiss Complex, SlaveProvince (Figure 19.27), Northwest Territories, Canada. Thepolished surface of the grain was etched in HF acid vapor toenhance internal textural details such as the barely visible oscillatory zoning in the magmatic core (high Th/U ratio)overgrown by an unzoned metamorphic rim (low Th/U ratio)and areas of late fluid alteration. Oval “shadows” are pits sputtered off (excavated into) the polished surface by the ionbeam of the SHRIMP. Isotopic analysis of sputtered mater-ial from three spots within the zircon core yielded an age of4028 � 21 Ma. The metamorphic rim of the grain yielded anage of about 3600 Ma. The three deeper pits in the core were revisited with a higher intensity beam for in situ trace elementanalysis. Image courtesy of Richard Stern and Wouter Bleeker,Geological Survey of Canada, Ottawa.
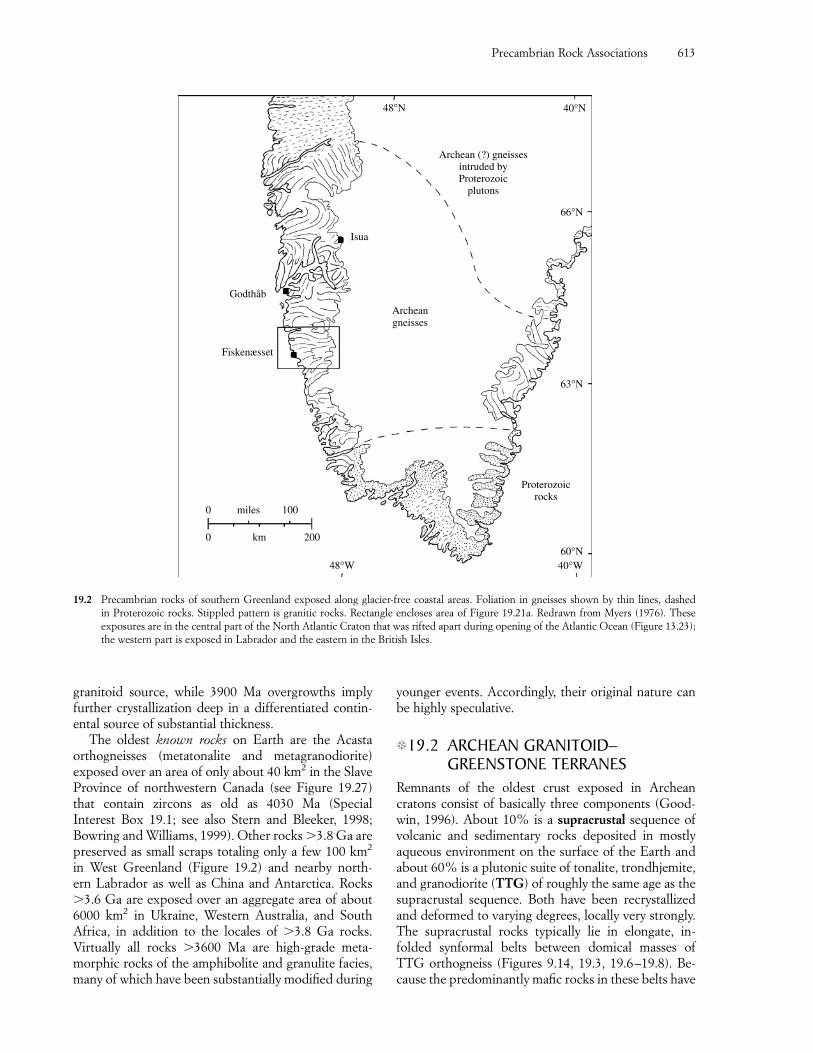
granitoid source, while 3900 Ma overgrowths implyfurther crystallization deep in a differentiated contin-ental source of substantial thickness.
The oldest known rocks on Earth are the Acasta orthogneisses (metatonalite and metagranodiorite) exposed over an area of only about 40 km2 in the SlaveProvince of northwestern Canada (see Figure 19.27)that contain zircons as old as 4030 Ma (Special Interest Box 19.1; see also Stern and Bleeker, 1998;Bowring and Williams, 1999). Other rocks �3.8 Ga arepreserved as small scraps totaling only a few 100 km2
in West Greenland (Figure 19.2) and nearby north-ern Labrador as well as China and Antarctica. Rocks�3.6 Ga are exposed over an aggregate area of about6000 km2 in Ukraine, Western Australia, and SouthAfrica, in addition to the locales of �3.8 Ga rocks. Virtually all rocks �3600 Ma are high-grade meta-morphic rocks of the amphibolite and granulite facies,many of which have been substantially modified during
younger events. Accordingly, their original nature canbe highly speculative.
�19.2 ARCHEAN GRANITOID–GREENSTONE TERRANES
Remnants of the oldest crust exposed in Archean cratons consist of basically three components (Good-win, 1996). About 10% is a supracrustal sequence ofvolcanic and sedimentary rocks deposited in mostlyaqueous environment on the surface of the Earth andabout 60% is a plutonic suite of tonalite, trondhjemite,and granodiorite (TTG) of roughly the same age as thesupracrustal sequence. Both have been recrystallizedand deformed to varying degrees, locally very strongly.The supracrustal rocks typically lie in elongate, in-folded synformal belts between domical masses ofTTG orthogneiss (Figures 9.14, 19.3, 19.6–19.8). Be-cause the predominantly mafic rocks in these belts have
Precambrian Rock Associations 613
48°N
Isua
Godthåb
Fiskenæsset
Archeangneisses
40°W
66°N
63°N
60°N
40°N
Archean (?) gneissesintruded byProterozoic
plutons
Proterozoicrocks
48°W
200km0
100miles0
19.2 Precambrian rocks of southern Greenland exposed along glacier-free coastal areas. Foliation in gneisses shown by thin lines, dashed in Proterozoic rocks. Stippled pattern is granitic rocks. Rectangle encloses area of Figure 19.21a. Redrawn from Myers (1976). These exposures are in the central part of the North Atlantic Craton that was rifted apart during opening of the Atlantic Ocean (Figure 13.23);the western part is exposed in Labrador and the eastern in the British Isles.
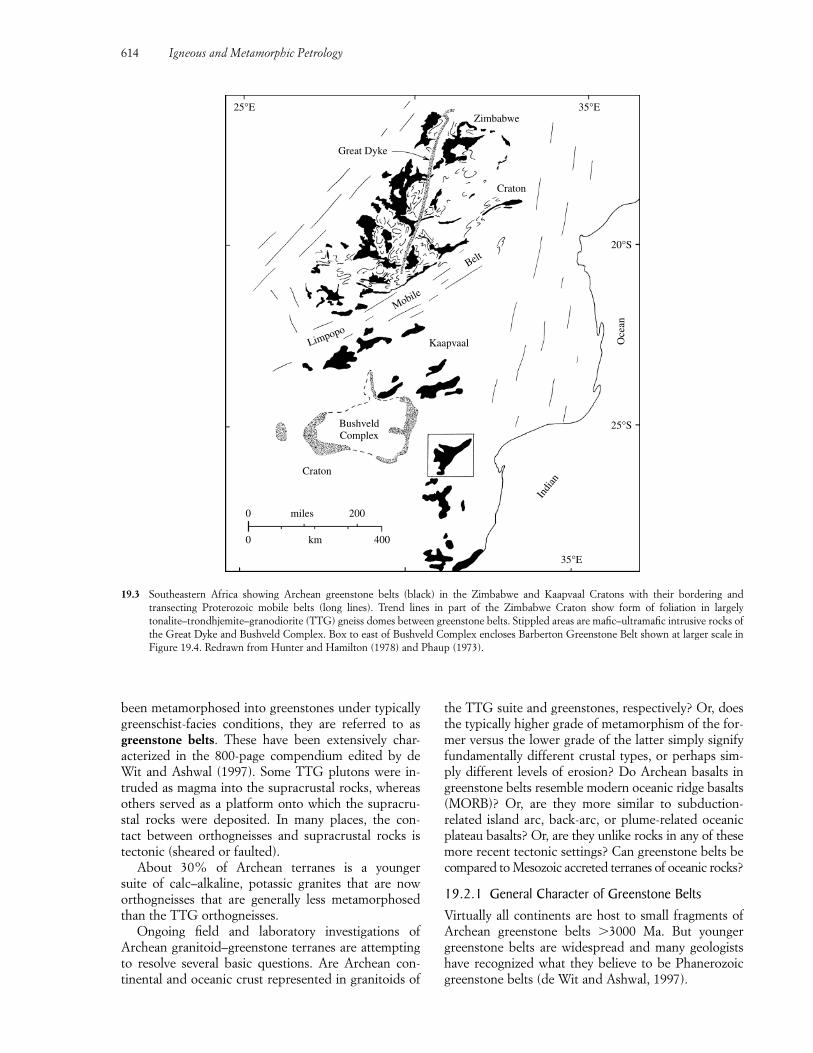
been metamorphosed into greenstones under typicallygreenschist-facies conditions, they are referred to asgreenstone belts. These have been extensively char-acterized in the 800-page compendium edited by de Wit and Ashwal (1997). Some TTG plutons were in-truded as magma into the supracrustal rocks, whereasothers served as a platform onto which the supracru-stal rocks were deposited. In many places, the con-tact between orthogneisses and supracrustal rocks is tectonic (sheared or faulted).
About 30% of Archean terranes is a younger suite of calc–alkaline, potassic granites that are now orthogneisses that are generally less metamorphosedthan the TTG orthogneisses.
Ongoing field and laboratory investigations ofArchean granitoid–greenstone terranes are attemptingto resolve several basic questions. Are Archean con-tinental and oceanic crust represented in granitoids of
the TTG suite and greenstones, respectively? Or, doesthe typically higher grade of metamorphism of the for-mer versus the lower grade of the latter simply signifyfundamentally different crustal types, or perhaps sim-ply different levels of erosion? Do Archean basalts ingreenstone belts resemble modern oceanic ridge basalts(MORB)? Or, are they more similar to subduction-related island arc, back-arc, or plume-related oceanicplateau basalts? Or, are they unlike rocks in any of thesemore recent tectonic settings? Can greenstone belts becompared to Mesozoic accreted terranes of oceanic rocks?
19.2.1 General Character of Greenstone BeltsVirtually all continents are host to small fragments ofArchean greenstone belts �3000 Ma. But youngergreenstone belts are widespread and many geologistshave recognized what they believe to be Phanerozoicgreenstone belts (de Wit and Ashwal, 1997).
614 Igneous and Metamorphic Petrology
25°S
20°S
Oce
an
Craton
35°EZimbabwe
25°E
Great Dyke
Belt
Mobile
Limpopo
BushveldComplex
Craton
Kaapvaal
Indi
an35°E
0
0 km 400
miles 200
19.3 Southeastern Africa showing Archean greenstone belts (black) in the Zimbabwe and Kaapvaal Cratons with their bordering and transecting Proterozoic mobile belts (long lines). Trend lines in part of the Zimbabwe Craton show form of foliation in largelytonalite–trondhjemite–granodiorite (TTG) gneiss domes between greenstone belts. Stippled areas are mafic–ultramafic intrusive rocks ofthe Great Dyke and Bushveld Complex. Box to east of Bushveld Complex encloses Barberton Greenstone Belt shown at larger scale inFigure 19.4. Redrawn from Hunter and Hamilton (1978) and Phaup (1973).
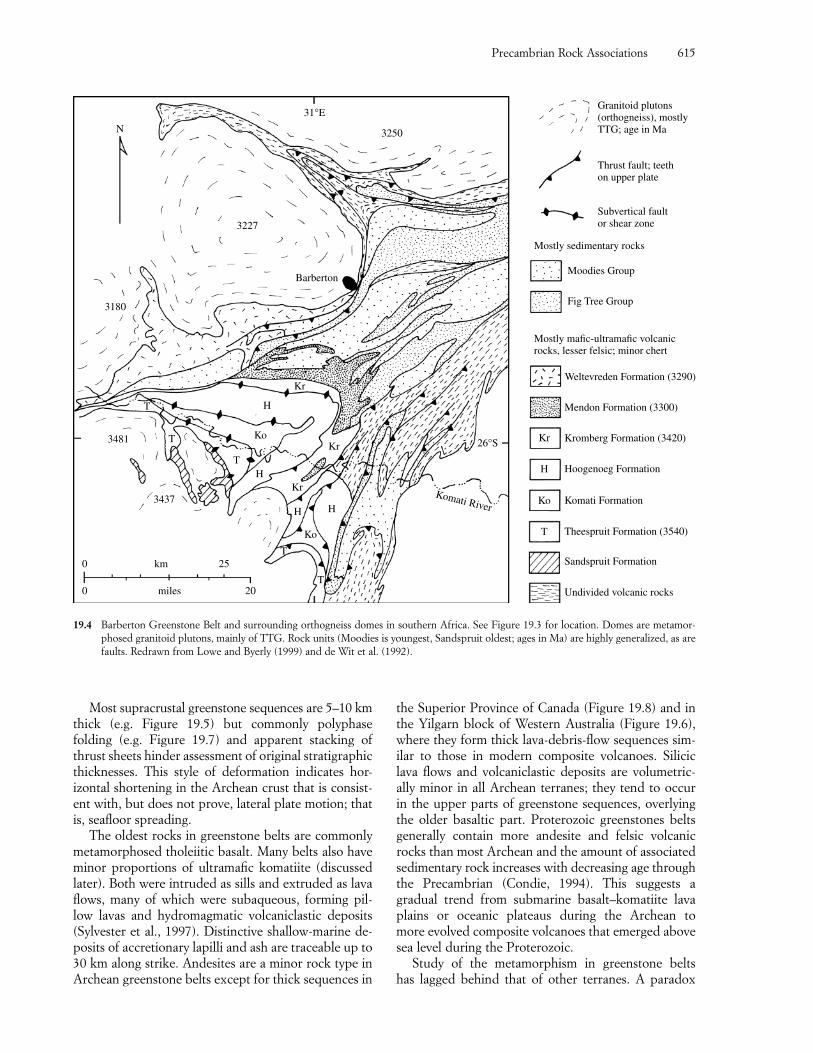
Most supracrustal greenstone sequences are 5–10 kmthick (e.g. Figure 19.5) but commonly polyphase folding (e.g. Figure 19.7) and apparent stacking ofthrust sheets hinder assessment of original stratigraphicthicknesses. This style of deformation indicates hor-izontal shortening in the Archean crust that is consist-ent with, but does not prove, lateral plate motion; thatis, seafloor spreading.
The oldest rocks in greenstone belts are commonlymetamorphosed tholeiitic basalt. Many belts also haveminor proportions of ultramafic komatiite (discussedlater). Both were intruded as sills and extruded as lavaflows, many of which were subaqueous, forming pil-low lavas and hydromagmatic volcaniclastic deposits(Sylvester et al., 1997). Distinctive shallow-marine de-posits of accretionary lapilli and ash are traceable up to30 km along strike. Andesites are a minor rock type inArchean greenstone belts except for thick sequences in
the Superior Province of Canada (Figure 19.8) and inthe Yilgarn block of Western Australia (Figure 19.6),where they form thick lava-debris-flow sequences sim-ilar to those in modern composite volcanoes. Siliciclava flows and volcaniclastic deposits are volumetric-ally minor in all Archean terranes; they tend to occur in the upper parts of greenstone sequences, overlyingthe older basaltic part. Proterozoic greenstones beltsgenerally contain more andesite and felsic volcanicrocks than most Archean and the amount of associatedsedimentary rock increases with decreasing age throughthe Precambrian (Condie, 1994). This suggests a gradual trend from submarine basalt–komatiite lavaplains or oceanic plateaus during the Archean to more evolved composite volcanoes that emerged abovesea level during the Proterozoic.
Study of the metamorphism in greenstone belts has lagged behind that of other terranes. A paradox
Precambrian Rock Associations 615
Granitoid plutons(orthogneiss), mostlyTTG; age in Ma
Thrust fault; teethon upper plate
Subvertical faultor shear zone
Moodies Group
Mostly sedimentary rocks
Mostly mafic-ultramafic volcanicrocks, lesser felsic; minor chert
Fig Tree Group
Weltevreden Formation (3290)
Mendon Formation (3300)
Kromberg Formation (3420)
Hoogenoeg Formation
Kr
H
Komati FormationKo
Theespruit Formation (3540)
Sandspruit Formation
Undivided volcanic rocks
T
20miles
25
3437
3481
3180
3227
Barberton
3250
31°E
N
T
TH
Kr
Ko
HH
26°SKr
Kr
Komati River
T
T
Ko
HT
km
0
0
19.4 Barberton Greenstone Belt and surrounding orthogneiss domes in southern Africa. See Figure 19.3 for location. Domes are metamor-phosed granitoid plutons, mainly of TTG. Rock units (Moodies is youngest, Sandspruit oldest; ages in Ma) are highly generalized, as arefaults. Redrawn from Lowe and Byerly (1999) and de Wit et al. (1992).
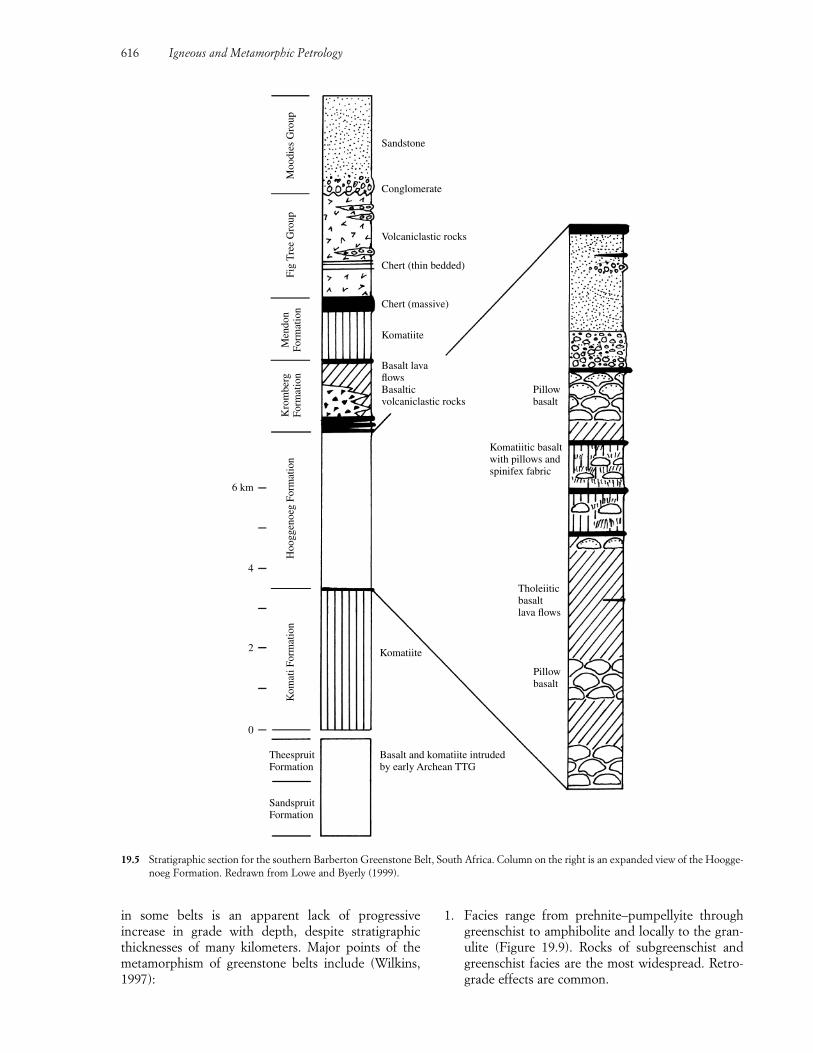
616 Igneous and Metamorphic Petrology
6 km
4
2
0
TheespruitFormation
Basalt and komatiite intrudedby early Archean TTG
Komatiite
Pillowbasalt
Tholeiiticbasaltlava flows
Komatiitic basaltwith pillows andspinifex fabric
Pillowbasalt
Basalt lavaflowsBasalticvolcaniclastic rocks
Chert (massive)
Chert (thin bedded)
Volcaniclastic rocks
Conglomerate
Sandstone
Moo
dies
Gro
upFi
g T
ree
Gro
upH
oogg
enoe
g Fo
rmat
ion
Kom
ati F
orm
atio
nM
endo
nFo
rmat
ion
Kro
mbe
rgFo
rmat
ion
Komatiite
SandspruitFormation
19.5 Stratigraphic section for the southern Barberton Greenstone Belt, South Africa. Column on the right is an expanded view of the Hoogge-noeg Formation. Redrawn from Lowe and Byerly (1999).
in some belts is an apparent lack of progressive increase in grade with depth, despite stratigraphicthicknesses of many kilometers. Major points of themetamorphism of greenstone belts include (Wilkins,1997):
1. Facies range from prehnite–pumpellyite throughgreenschist to amphibolite and locally to the gran-ulite (Figure 19.9). Rocks of subgreenschist andgreenschist facies are the most widespread. Retro-grade effects are common.
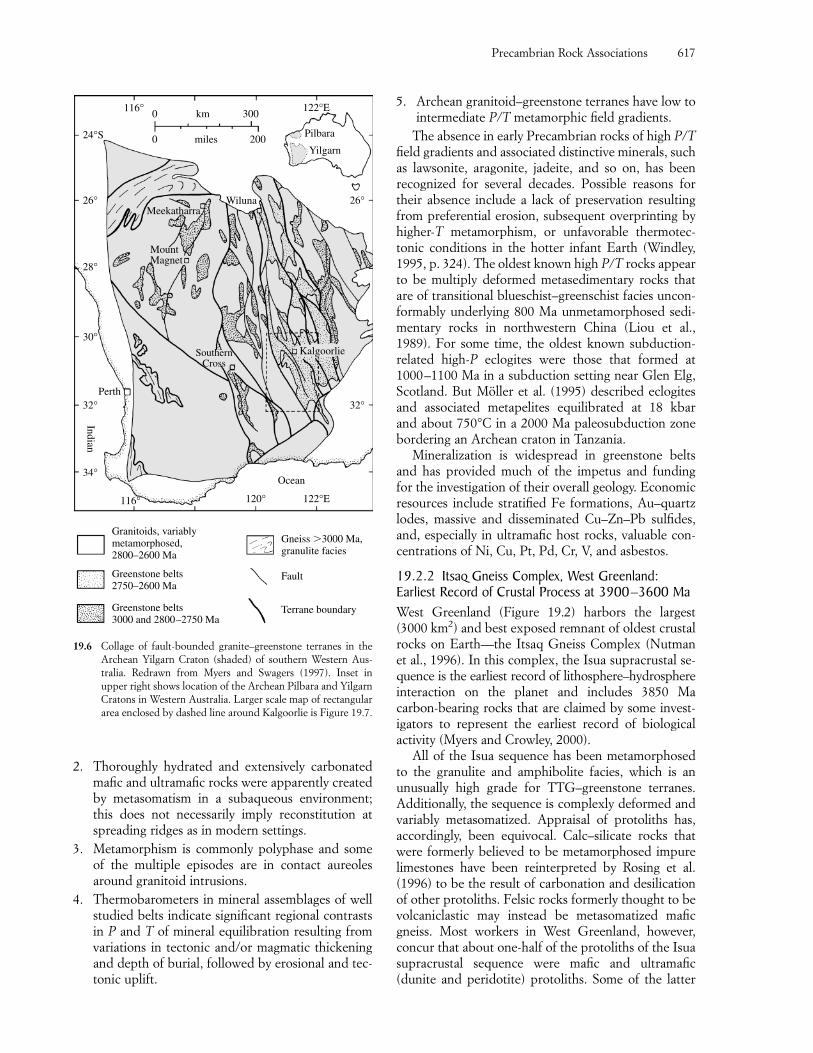
2. Thoroughly hydrated and extensively carbonatedmafic and ultramafic rocks were apparently createdby metasomatism in a subaqueous environment;this does not necessarily imply reconstitution atspreading ridges as in modern settings.
3. Metamorphism is commonly polyphase and someof the multiple episodes are in contact aureolesaround granitoid intrusions.
4. Thermobarometers in mineral assemblages of wellstudied belts indicate significant regional contrastsin P and T of mineral equilibration resulting fromvariations in tectonic and/or magmatic thickeningand depth of burial, followed by erosional and tec-tonic uplift.
5. Archean granitoid–greenstone terranes have low tointermediate P/T metamorphic field gradients.
The absence in early Precambrian rocks of high P/Tfield gradients and associated distinctive minerals, suchas lawsonite, aragonite, jadeite, and so on, has been recognized for several decades. Possible reasons fortheir absence include a lack of preservation resultingfrom preferential erosion, subsequent overprinting byhigher-T metamorphism, or unfavorable thermotec-tonic conditions in the hotter infant Earth (Windley,1995, p. 324). The oldest known high P/T rocks appearto be multiply deformed metasedimentary rocks thatare of transitional blueschist–greenschist facies uncon-formably underlying 800 Ma unmetamorphosed sedi-mentary rocks in northwestern China (Liou et al.,1989). For some time, the oldest known subduction-related high-P eclogites were those that formed at1000–1100 Ma in a subduction setting near Glen Elg,Scotland. But Möller et al. (1995) described eclogitesand associated metapelites equilibrated at 18 kbar and about 750°C in a 2000 Ma paleosubduction zonebordering an Archean craton in Tanzania.
Mineralization is widespread in greenstone beltsand has provided much of the impetus and funding for the investigation of their overall geology. Economic resources include stratified Fe formations, Au–quartzlodes, massive and disseminated Cu–Zn–Pb sulfides,and, especially in ultramafic host rocks, valuable con-centrations of Ni, Cu, Pt, Pd, Cr, V, and asbestos.
19.2.2 Itsaq Gneiss Complex, West Greenland:Earliest Record of Crustal Process at 3900–3600 MaWest Greenland (Figure 19.2) harbors the largest(3000 km2) and best exposed remnant of oldest crustalrocks on Earth—the Itsaq Gneiss Complex (Nutmanet al., 1996). In this complex, the Isua supracrustal se-quence is the earliest record of lithosphere–hydrosphereinteraction on the planet and includes 3850 Ma carbon-bearing rocks that are claimed by some invest-igators to represent the earliest record of biological activity (Myers and Crowley, 2000).
All of the Isua sequence has been metamorphosedto the granulite and amphibolite facies, which is an unusually high grade for TTG–greenstone terranes.Additionally, the sequence is complexly deformed andvariably metasomatized. Appraisal of protoliths has,accordingly, been equivocal. Calc–silicate rocks thatwere formerly believed to be metamorphosed impurelimestones have been reinterpreted by Rosing et al.(1996) to be the result of carbonation and desilicationof other protoliths. Felsic rocks formerly thought to bevolcaniclastic may instead be metasomatized maficgneiss. Most workers in West Greenland, however,concur that about one-half of the protoliths of the Isuasupracrustal sequence were mafic and ultramafic(dunite and peridotite) protoliths. Some of the latter
Precambrian Rock Associations 617
116°
24°S
122°E300km0
200Pilbara
Yilgarn
26°
32°
122°E
Ocean
120°116°
34°
32°
30°
28°
26°Meekatharra
Wiluna
MountMagnet
SouthernCross
Kalgoorlie
Perth
Indian
miles0
Granitoids, variablymetamorphosed,2800–2600 Ma
Gneiss �3000 Ma,granulite facies
Fault
Terrane boundary
Greenstone belts2750–2600 Ma
Greenstone belts3000 and 2800–2750 Ma
19.6 Collage of fault-bounded granite–greenstone terranes in theArchean Yilgarn Craton (shaded) of southern Western Aus-tralia. Redrawn from Myers and Swagers (1997). Inset in upper right shows location of the Archean Pilbara and YilgarnCratons in Western Australia. Larger scale map of rectangulararea enclosed by dashed line around Kalgoorlie is Figure 19.7.
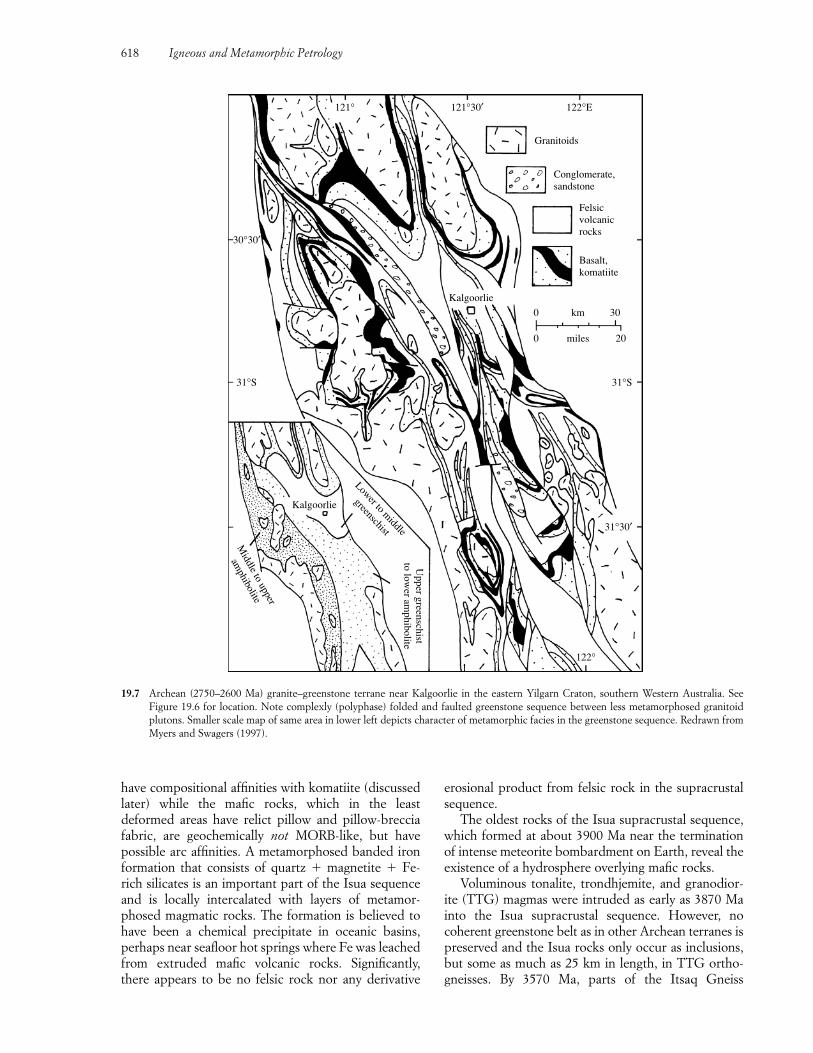
have compositional affinities with komatiite (discussedlater) while the mafic rocks, which in the least deformed areas have relict pillow and pillow-brecciafabric, are geochemically not MORB-like, but havepossible arc affinities. A metamorphosed banded ironformation that consists of quartz � magnetite � Fe-rich silicates is an important part of the Isua sequenceand is locally intercalated with layers of metamor-phosed magmatic rocks. The formation is believed tohave been a chemical precipitate in oceanic basins, perhaps near seafloor hot springs where Fe was leachedfrom extruded mafic volcanic rocks. Significantly, there appears to be no felsic rock nor any derivative
erosional product from felsic rock in the supracrustalsequence.
The oldest rocks of the Isua supracrustal sequence,which formed at about 3900 Ma near the terminationof intense meteorite bombardment on Earth, reveal theexistence of a hydrosphere overlying mafic rocks.
Voluminous tonalite, trondhjemite, and granodior-ite (TTG) magmas were intruded as early as 3870 Mainto the Isua supracrustal sequence. However, no coherent greenstone belt as in other Archean terranes ispreserved and the Isua rocks only occur as inclusions,but some as much as 25 km in length, in TTG ortho-gneisses. By 3570 Ma, parts of the Itsaq Gneiss
618 Igneous and Metamorphic Petrology
122°E121°30′121°
30°30′
31°S
Kalgoorlie
Lower to middle
greenschist
Middle to upper
amphibolite
Upper greenschist
to lower am
phibolite
122°
31°30′
31°S
Kalgoorlie
Granitoids
Conglomerate,sandstone
Felsicvolcanicrocks
Basalt,komatiite
0
0
km
miles
30
20
19.7 Archean (2750–2600 Ma) granite–greenstone terrane near Kalgoorlie in the eastern Yilgarn Craton, southern Western Australia. See Figure 19.6 for location. Note complexly (polyphase) folded and faulted greenstone sequence between less metamorphosed granitoidplutons. Smaller scale map of same area in lower left depicts character of metamorphic facies in the greenstone sequence. Redrawn fromMyers and Swagers (1997).
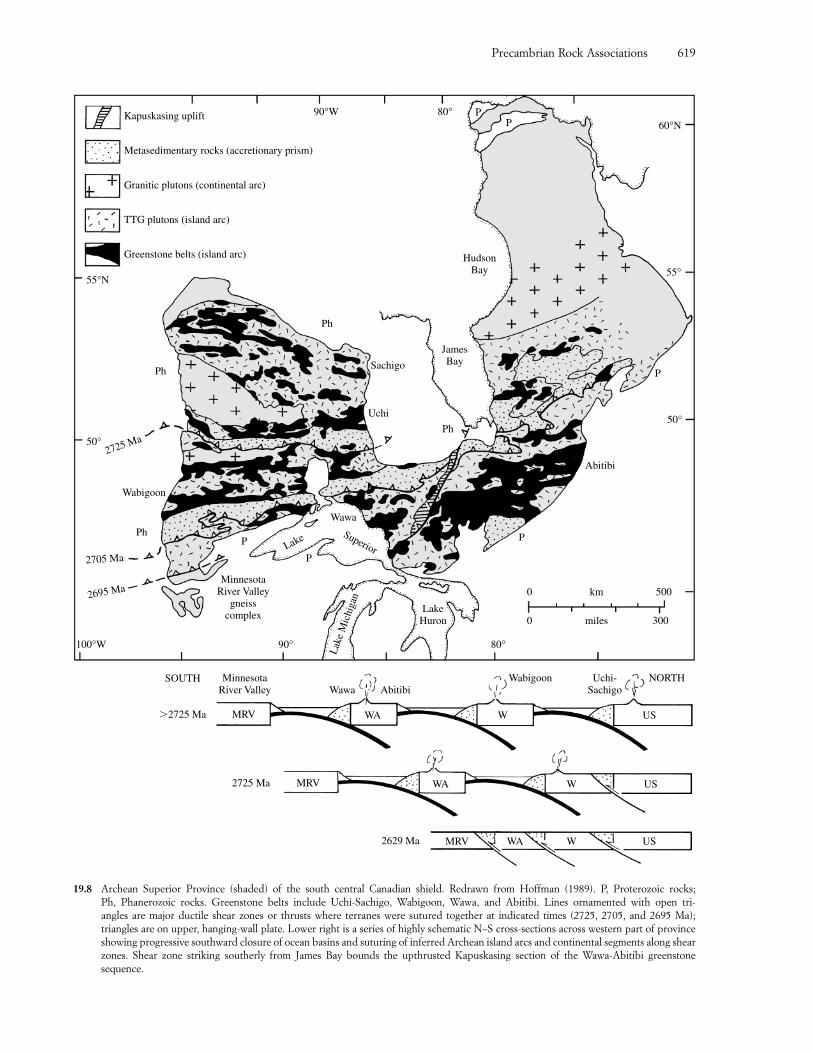
Precambrian Rock Associations 619
Kapuskasing uplift
Metasedimentary rocks (accretionary prism)
Granitic plutons (continental arc)
TTG plutons (island arc)
Greenstone belts (island arc)
55°N
50°
100°W 90° 80°
0 500km
0 300miles
50°
55°
60°N80°90°W P
P
HudsonBay
2725 Ma
Wabigoon
Ph
2695 Ma
2705 Ma
P
MinnesotaRiver Valley
gneisscomplex
Lake Superior
Wawa
LakeHuron
P
Lak
e M
ichi
gan
Abitibi
Uchi
Sachigo
Ph
Ph
Ph
JamesBay
P
P
SOUTH
�2725 Ma MRV
2629 Ma MRV WA W US
2725 Ma MRV WA W US
WA W US
MinnesotaRiver Valley
Wabigoon Uchi-Sachigo
NORTHWawa Abitibi
19.8 Archean Superior Province (shaded) of the south central Canadian shield. Redrawn from Hoffman (1989). P, Proterozoic rocks; Ph, Phanerozoic rocks. Greenstone belts include Uchi-Sachigo, Wabigoon, Wawa, and Abitibi. Lines ornamented with open tri-angles are major ductile shear zones or thrusts where terranes were sutured together at indicated times (2725, 2705, and 2695 Ma); triangles are on upper, hanging-wall plate. Lower right is a series of highly schematic N–S cross-sections across western part of provinceshowing progressive southward closure of ocean basins and suturing of inferred Archean island arcs and continental segments along shearzones. Shear zone striking southerly from James Bay bounds the upthrusted Kapuskasing section of the Wawa-Abitibi greenstone sequence.
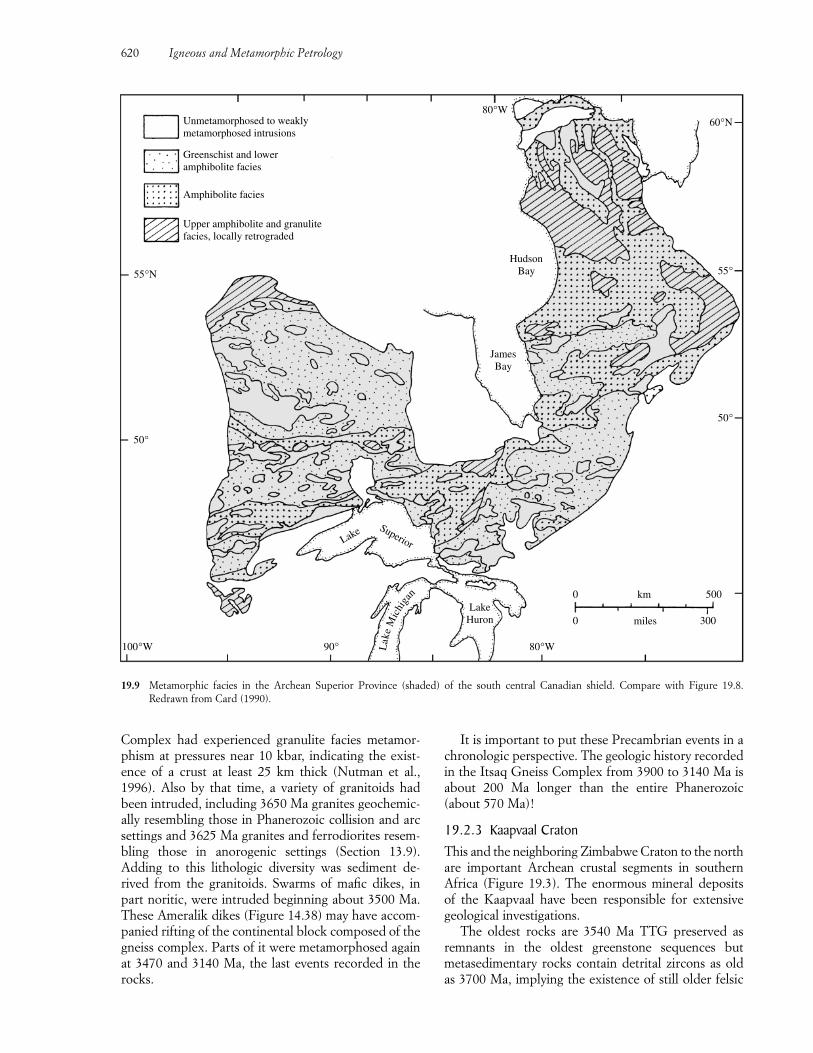
Complex had experienced granulite facies metamor-phism at pressures near 10 kbar, indicating the exist-ence of a crust at least 25 km thick (Nutman et al.,1996). Also by that time, a variety of granitoids hadbeen intruded, including 3650 Ma granites geochemic-ally resembling those in Phanerozoic collision and arcsettings and 3625 Ma granites and ferrodiorites resem-bling those in anorogenic settings (Section 13.9).Adding to this lithologic diversity was sediment de-rived from the granitoids. Swarms of mafic dikes, inpart noritic, were intruded beginning about 3500 Ma.These Ameralik dikes (Figure 14.38) may have accom-panied rifting of the continental block composed of thegneiss complex. Parts of it were metamorphosed againat 3470 and 3140 Ma, the last events recorded in therocks.
It is important to put these Precambrian events in achronologic perspective. The geologic history recordedin the Itsaq Gneiss Complex from 3900 to 3140 Ma isabout 200 Ma longer than the entire Phanerozoic(about 570 Ma)!
19.2.3 Kaapvaal CratonThis and the neighboring Zimbabwe Craton to the northare important Archean crustal segments in southernAfrica (Figure 19.3). The enormous mineral deposits of the Kaapvaal have been responsible for extensive geological investigations.
The oldest rocks are 3540 Ma TTG preserved asremnants in the oldest greenstone sequences butmetasedimentary rocks contain detrital zircons as oldas 3700 Ma, implying the existence of still older felsic
620 Igneous and Metamorphic Petrology
Unmetamorphosed to weaklymetamorphosed intrusions
Greenschist and loweramphibolite facies
Amphibolite facies
Upper amphibolite and granulitefacies, locally retrograded
HudsonBay
JamesBay
Lake Superior
Lak
eM
ichi
ga
nLake
Huron
55°N
50°
100°W 80°W90°
0
0
500
300
km
miles
50°
55°
60°N80°W
19.9 Metamorphic facies in the Archean Superior Province (shaded) of the south central Canadian shield. Compare with Figure 19.8. Redrawn from Card (1990).
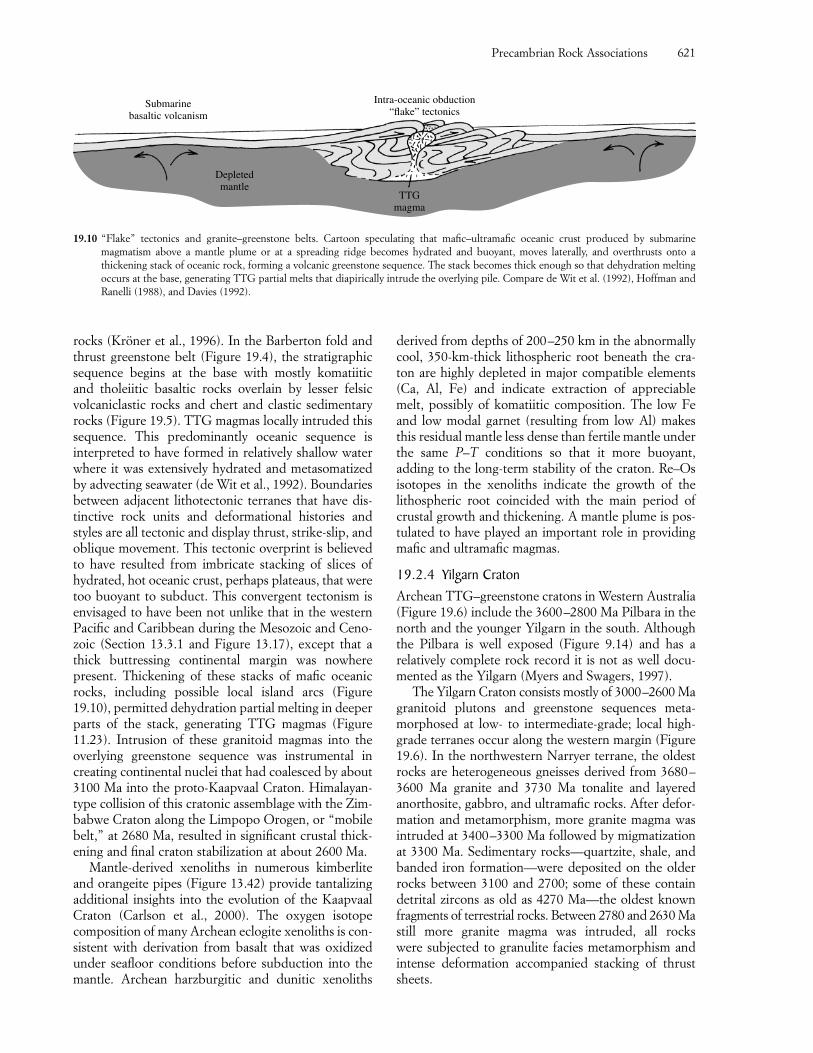
rocks (Kröner et al., 1996). In the Barberton fold andthrust greenstone belt (Figure 19.4), the stratigraphicsequence begins at the base with mostly komatiitic and tholeiitic basaltic rocks overlain by lesser felsic volcaniclastic rocks and chert and clastic sedimentaryrocks (Figure 19.5). TTG magmas locally intruded thissequence. This predominantly oceanic sequence is interpreted to have formed in relatively shallow waterwhere it was extensively hydrated and metasomatizedby advecting seawater (de Wit et al., 1992). Boundariesbetween adjacent lithotectonic terranes that have dis-tinctive rock units and deformational histories andstyles are all tectonic and display thrust, strike-slip, andoblique movement. This tectonic overprint is believedto have resulted from imbricate stacking of slices of hydrated, hot oceanic crust, perhaps plateaus, that weretoo buoyant to subduct. This convergent tectonism isenvisaged to have been not unlike that in the westernPacific and Caribbean during the Mesozoic and Ceno-zoic (Section 13.3.1 and Figure 13.17), except that athick buttressing continental margin was nowherepresent. Thickening of these stacks of mafic oceanicrocks, including possible local island arcs (Figure19.10), permitted dehydration partial melting in deeperparts of the stack, generating TTG magmas (Figure11.23). Intrusion of these granitoid magmas into theoverlying greenstone sequence was instrumental in creating continental nuclei that had coalesced by about3100 Ma into the proto-Kaapvaal Craton. Himalayan-type collision of this cratonic assemblage with the Zim-babwe Craton along the Limpopo Orogen, or “mobilebelt,” at 2680 Ma, resulted in significant crustal thick-ening and final craton stabilization at about 2600 Ma.
Mantle-derived xenoliths in numerous kimberliteand orangeite pipes (Figure 13.42) provide tantalizingadditional insights into the evolution of the KaapvaalCraton (Carlson et al., 2000). The oxygen isotope composition of many Archean eclogite xenoliths is con-sistent with derivation from basalt that was oxidizedunder seafloor conditions before subduction into themantle. Archean harzburgitic and dunitic xenoliths
derived from depths of 200–250 km in the abnormallycool, 350-km-thick lithospheric root beneath the cra-ton are highly depleted in major compatible elements(Ca, Al, Fe) and indicate extraction of appreciablemelt, possibly of komatiitic composition. The low Feand low modal garnet (resulting from low Al) makesthis residual mantle less dense than fertile mantle underthe same P–T conditions so that it more buoyant,adding to the long-term stability of the craton. Re–Osisotopes in the xenoliths indicate the growth of thelithospheric root coincided with the main period ofcrustal growth and thickening. A mantle plume is pos-tulated to have played an important role in providingmafic and ultramafic magmas.
19.2.4 Yilgarn CratonArchean TTG–greenstone cratons in Western Australia(Figure 19.6) include the 3600–2800 Ma Pilbara in thenorth and the younger Yilgarn in the south. Althoughthe Pilbara is well exposed (Figure 9.14) and has a relatively complete rock record it is not as well docu-mented as the Yilgarn (Myers and Swagers, 1997).
The Yilgarn Craton consists mostly of 3000–2600 Magranitoid plutons and greenstone sequences meta-morphosed at low- to intermediate-grade; local high-grade terranes occur along the western margin (Figure19.6). In the northwestern Narryer terrane, the oldestrocks are heterogeneous gneisses derived from 3680–3600 Ma granite and 3730 Ma tonalite and layeredanorthosite, gabbro, and ultramafic rocks. After defor-mation and metamorphism, more granite magma wasintruded at 3400–3300 Ma followed by migmatizationat 3300 Ma. Sedimentary rocks—quartzite, shale, andbanded iron formation—were deposited on the olderrocks between 3100 and 2700; some of these containdetrital zircons as old as 4270 Ma—the oldest knownfragments of terrestrial rocks. Between 2780 and 2630 Mastill more granite magma was intruded, all rocks were subjected to granulite facies metamorphism andintense deformation accompanied stacking of thrustsheets.
Precambrian Rock Associations 621
Submarinebasaltic volcanism
Depletedmantle
TTGmagma
Intra-oceanic obduction“flake” tectonics
19.10 “Flake” tectonics and granite–greenstone belts. Cartoon speculating that mafic–ultramafic oceanic crust produced by submarine magmatism above a mantle plume or at a spreading ridge becomes hydrated and buoyant, moves laterally, and overthrusts onto a thickening stack of oceanic rock, forming a volcanic greenstone sequence. The stack becomes thick enough so that dehydration meltingoccurs at the base, generating TTG partial melts that diapirically intrude the overlying pile. Compare de Wit et al. (1992), Hoffman andRanelli (1988), and Davies (1992).
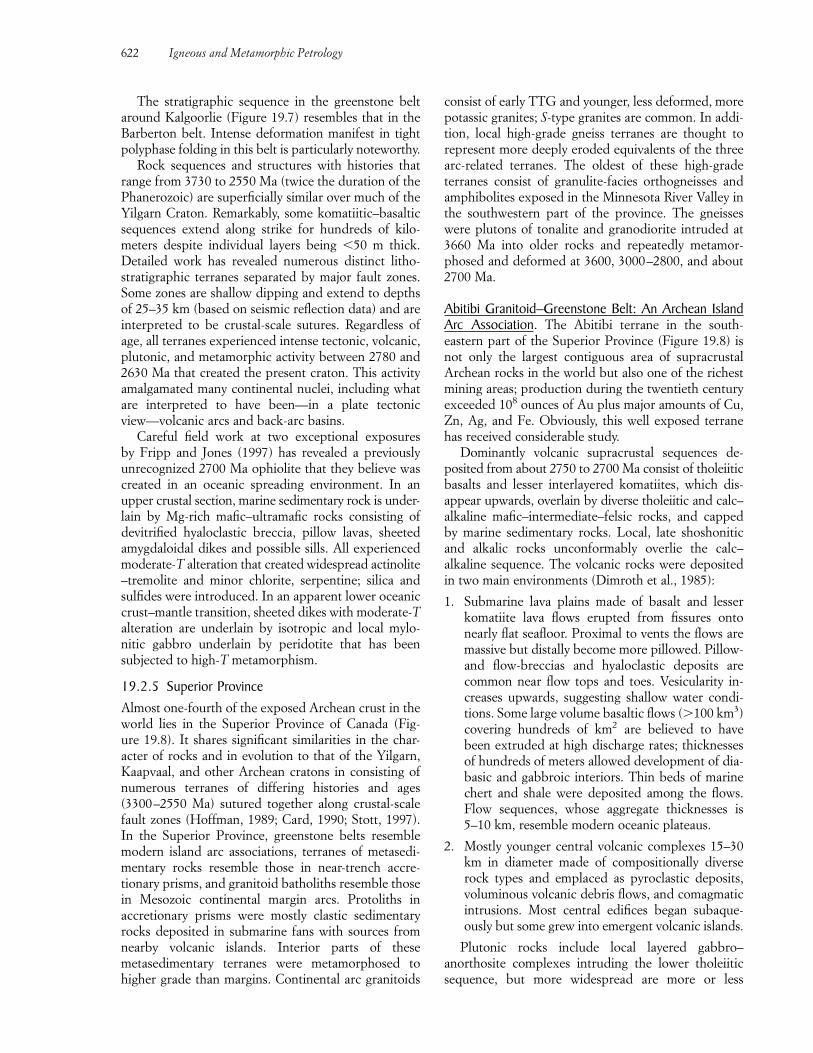
The stratigraphic sequence in the greenstone beltaround Kalgoorlie (Figure 19.7) resembles that in theBarberton belt. Intense deformation manifest in tightpolyphase folding in this belt is particularly noteworthy.
Rock sequences and structures with histories thatrange from 3730 to 2550 Ma (twice the duration of thePhanerozoic) are superficially similar over much of theYilgarn Craton. Remarkably, some komatiitic–basalticsequences extend along strike for hundreds of kilo-meters despite individual layers being �50 m thick.Detailed work has revealed numerous distinct litho-stratigraphic terranes separated by major fault zones.Some zones are shallow dipping and extend to depthsof 25–35 km (based on seismic reflection data) and areinterpreted to be crustal-scale sutures. Regardless ofage, all terranes experienced intense tectonic, volcanic,plutonic, and metamorphic activity between 2780 and2630 Ma that created the present craton. This activityamalgamated many continental nuclei, including whatare interpreted to have been—in a plate tectonicview—volcanic arcs and back-arc basins.
Careful field work at two exceptional exposures by Fripp and Jones (1997) has revealed a previouslyunrecognized 2700 Ma ophiolite that they believe wascreated in an oceanic spreading environment. In an upper crustal section, marine sedimentary rock is under-lain by Mg-rich mafic–ultramafic rocks consisting ofdevitrified hyaloclastic breccia, pillow lavas, sheetedamygdaloidal dikes and possible sills. All experiencedmoderate-T alteration that created widespread actinolite–tremolite and minor chlorite, serpentine; silica andsulfides were introduced. In an apparent lower oceaniccrust–mantle transition, sheeted dikes with moderate-Talteration are underlain by isotropic and local mylo-nitic gabbro underlain by peridotite that has been subjected to high-T metamorphism.
19.2.5 Superior ProvinceAlmost one-fourth of the exposed Archean crust in theworld lies in the Superior Province of Canada (Fig-ure 19.8). It shares significant similarities in the char-acter of rocks and in evolution to that of the Yilgarn, Kaapvaal, and other Archean cratons in consisting ofnumerous terranes of differing histories and ages(3300–2550 Ma) sutured together along crustal-scalefault zones (Hoffman, 1989; Card, 1990; Stott, 1997).In the Superior Province, greenstone belts resemblemodern island arc associations, terranes of metasedi-mentary rocks resemble those in near-trench accre-tionary prisms, and granitoid batholiths resemble thosein Mesozoic continental margin arcs. Protoliths in accretionary prisms were mostly clastic sedimentaryrocks deposited in submarine fans with sources fromnearby volcanic islands. Interior parts of thesemetasedimentary terranes were metamorphosed tohigher grade than margins. Continental arc granitoids
consist of early TTG and younger, less deformed, morepotassic granites; S-type granites are common. In addi-tion, local high-grade gneiss terranes are thought torepresent more deeply eroded equivalents of the threearc-related terranes. The oldest of these high-grade terranes consist of granulite-facies orthogneisses andamphibolites exposed in the Minnesota River Valley inthe southwestern part of the province. The gneisseswere plutons of tonalite and granodiorite intruded at3660 Ma into older rocks and repeatedly metamor-phosed and deformed at 3600, 3000–2800, and about2700 Ma.
Abitibi Granitoid–Greenstone Belt: An Archean IslandArc Association. The Abitibi terrane in the south-eastern part of the Superior Province (Figure 19.8) isnot only the largest contiguous area of supracrustalArchean rocks in the world but also one of the richestmining areas; production during the twentieth centuryexceeded 108 ounces of Au plus major amounts of Cu,Zn, Ag, and Fe. Obviously, this well exposed terranehas received considerable study.
Dominantly volcanic supracrustal sequences de-posited from about 2750 to 2700 Ma consist of tholeiiticbasalts and lesser interlayered komatiites, which dis-appear upwards, overlain by diverse tholeiitic and calc–alkaline mafic–intermediate–felsic rocks, and cappedby marine sedimentary rocks. Local, late shoshoniticand alkalic rocks unconformably overlie the calc–alkaline sequence. The volcanic rocks were depositedin two main environments (Dimroth et al., 1985):
1. Submarine lava plains made of basalt and lesser komatiite lava flows erupted from fissures ontonearly flat seafloor. Proximal to vents the flows aremassive but distally become more pillowed. Pillow-and flow-breccias and hyaloclastic deposits arecommon near flow tops and toes. Vesicularity in-creases upwards, suggesting shallow water condi-tions. Some large volume basaltic flows (�100 km3)covering hundreds of km2 are believed to havebeen extruded at high discharge rates; thicknessesof hundreds of meters allowed development of dia-basic and gabbroic interiors. Thin beds of marinechert and shale were deposited among the flows.Flow sequences, whose aggregate thicknesses is5–10 km, resemble modern oceanic plateaus.
2. Mostly younger central volcanic complexes 15–30km in diameter made of compositionally diverserock types and emplaced as pyroclastic deposits,voluminous volcanic debris flows, and comagmaticintrusions. Most central edifices began subaque-ously but some grew into emergent volcanic islands.
Plutonic rocks include local layered gabbro–anorthosite complexes intruding the lower tholeiitic sequence, but more widespread are more or less
622 Igneous and Metamorphic Petrology
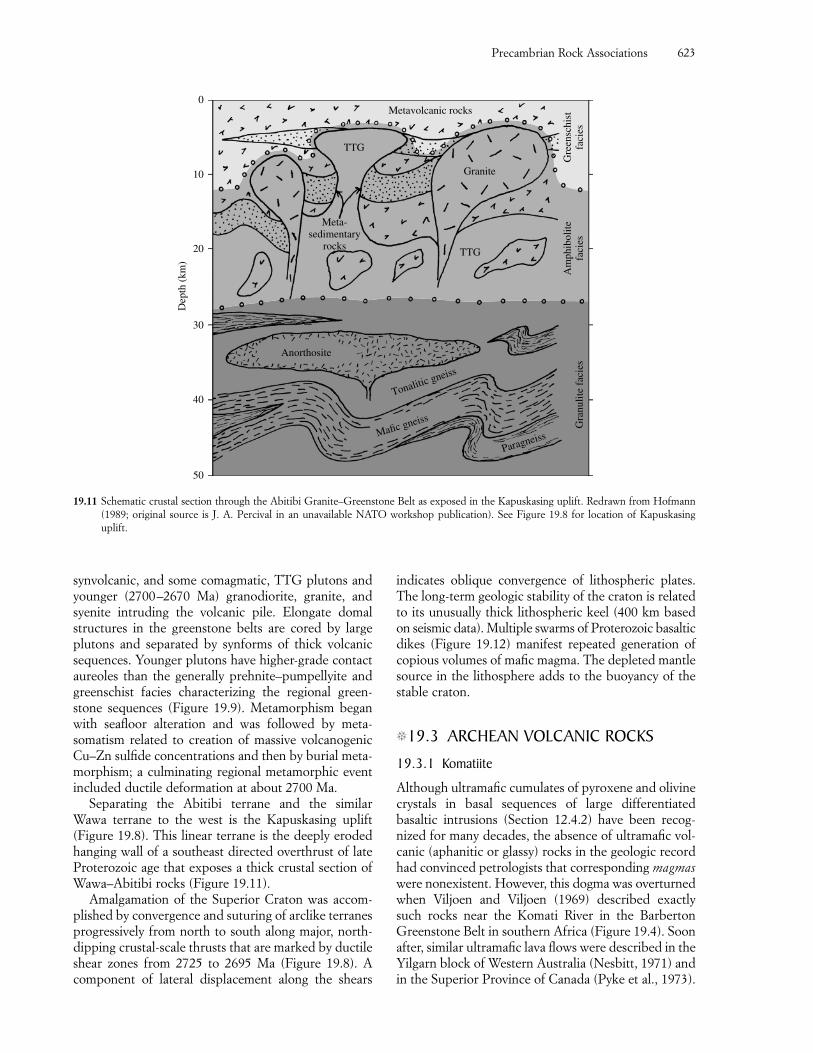
synvolcanic, and some comagmatic, TTG plutons andyounger (2700–2670 Ma) granodiorite, granite, andsyenite intruding the volcanic pile. Elongate domalstructures in the greenstone belts are cored by largeplutons and separated by synforms of thick volcanic sequences. Younger plutons have higher-grade contactaureoles than the generally prehnite–pumpellyite andgreenschist facies characterizing the regional green-stone sequences (Figure 19.9). Metamorphism beganwith seafloor alteration and was followed by meta-somatism related to creation of massive volcanogenicCu–Zn sulfide concentrations and then by burial meta-morphism; a culminating regional metamorphic eventincluded ductile deformation at about 2700 Ma.
Separating the Abitibi terrane and the similar Wawa terrane to the west is the Kapuskasing uplift(Figure 19.8). This linear terrane is the deeply erodedhanging wall of a southeast directed overthrust of lateProterozoic age that exposes a thick crustal section ofWawa–Abitibi rocks (Figure 19.11).
Amalgamation of the Superior Craton was accom-plished by convergence and suturing of arclike terranesprogressively from north to south along major, north-dipping crustal-scale thrusts that are marked by ductileshear zones from 2725 to 2695 Ma (Figure 19.8). Acomponent of lateral displacement along the shears
indicates oblique convergence of lithospheric plates.The long-term geologic stability of the craton is relatedto its unusually thick lithospheric keel (400 km basedon seismic data). Multiple swarms of Proterozoic basalticdikes (Figure 19.12) manifest repeated generation ofcopious volumes of mafic magma. The depleted mantlesource in the lithosphere adds to the buoyancy of thestable craton.
�19.3 ARCHEAN VOLCANIC ROCKS
19.3.1 Komatiite
Although ultramafic cumulates of pyroxene and olivinecrystals in basal sequences of large differentiatedbasaltic intrusions (Section 12.4.2) have been recog-nized for many decades, the absence of ultramafic vol-canic (aphanitic or glassy) rocks in the geologic recordhad convinced petrologists that corresponding magmaswere nonexistent. However, this dogma was overturnedwhen Viljoen and Viljoen (1969) described exactlysuch rocks near the Komati River in the BarbertonGreenstone Belt in southern Africa (Figure 19.4). Soonafter, similar ultramafic lava flows were described in theYilgarn block of Western Australia (Nesbitt, 1971) andin the Superior Province of Canada (Pyke et al., 1973).
Precambrian Rock Associations 623
Dep
th (
km)
0
10
20
30
40
50
TTG
TTG
Am
phib
olite
faci
esG
ranu
lite
faci
esG
reen
schi
stfa
cies
Meta-sedimentary
rocks
Metavolcanic rocks
Granite
ParagneissMafic gneiss
Tonalitic gneiss
Anorthosite
19.11 Schematic crustal section through the Abitibi Granite–Greenstone Belt as exposed in the Kapuskasing uplift. Redrawn from Hofmann(1989; original source is J. A. Percival in an unavailable NATO workshop publication). See Figure 19.8 for location of Kapuskasing uplift.
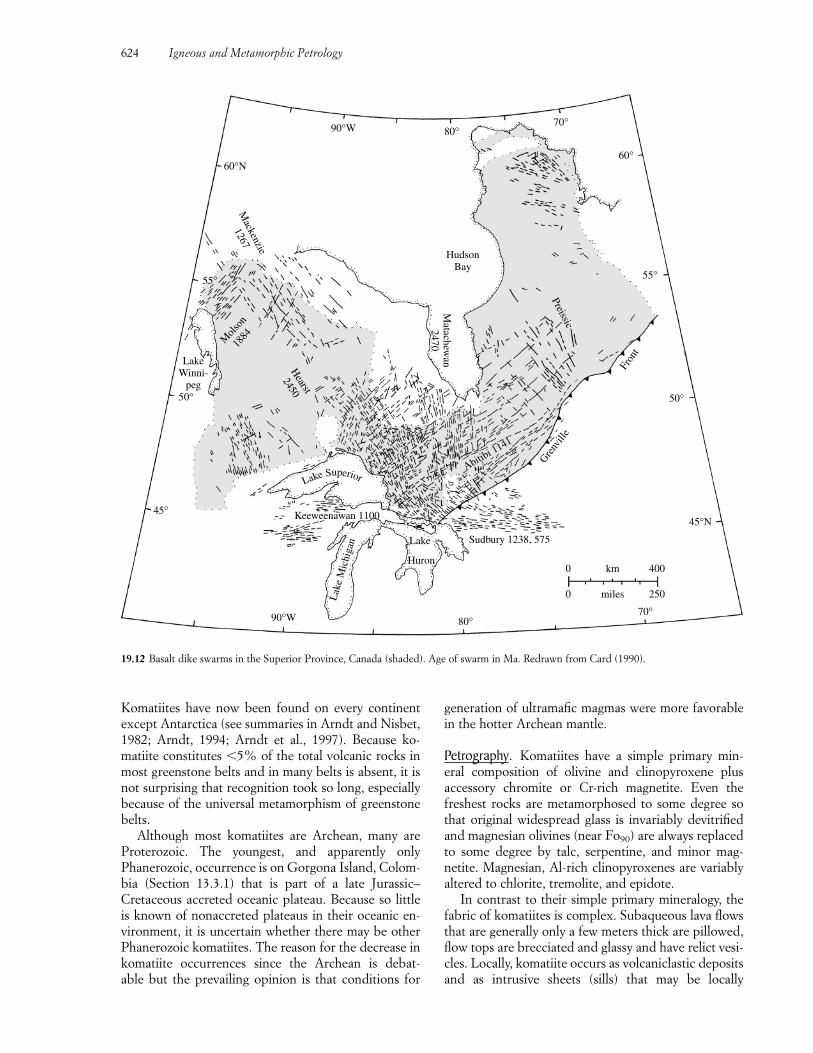
Komatiites have now been found on every continentexcept Antarctica (see summaries in Arndt and Nisbet,1982; Arndt, 1994; Arndt et al., 1997). Because ko-matiite constitutes �5% of the total volcanic rocks inmost greenstone belts and in many belts is absent, it isnot surprising that recognition took so long, especiallybecause of the universal metamorphism of greenstonebelts.
Although most komatiites are Archean, many areProterozoic. The youngest, and apparently onlyPhanerozoic, occurrence is on Gorgona Island, Colom-bia (Section 13.3.1) that is part of a late Jurassic–Cretaceous accreted oceanic plateau. Because so littleis known of nonaccreted plateaus in their oceanic en-vironment, it is uncertain whether there may be otherPhanerozoic komatiites. The reason for the decrease inkomatiite occurrences since the Archean is debat-able but the prevailing opinion is that conditions for
generation of ultramafic magmas were more favorablein the hotter Archean mantle.
Petrography. Komatiites have a simple primary min-eral composition of olivine and clinopyroxene plus accessory chromite or Cr-rich magnetite. Even thefreshest rocks are metamorphosed to some degree sothat original widespread glass is invariably devitrifiedand magnesian olivines (near Fo90) are always replacedto some degree by talc, serpentine, and minor mag-netite. Magnesian, Al-rich clinopyroxenes are variablyaltered to chlorite, tremolite, and epidote.
In contrast to their simple primary mineralogy, thefabric of komatiites is complex. Subaqueous lava flowsthat are generally only a few meters thick are pillowed,flow tops are brecciated and glassy and have relict vesi-cles. Locally, komatiite occurs as volcaniclastic depositsand as intrusive sheets (sills) that may be locally
624 Igneous and Metamorphic Petrology
90°W
60°N
80°
HudsonBay
70°
55°
50°
45°
90°W 80°70°
45°N
50°
60°
55°
Matachew
an2470
Mackenzie
1267
Mol
son
1884
LakeWinni-
peg
Hearst
2450
Lake Superior
Keeweenawan 1100
Lake
Huron
Sudbury 1238, 575
Lak
e M
ichi
gan
Abitibi 1141
Gre
nvill
e
Fron
t
Preissic
0 400km
0 250miles
19.12 Basalt dike swarms in the Superior Province, Canada (shaded). Age of swarm in Ma. Redrawn from Card (1990).
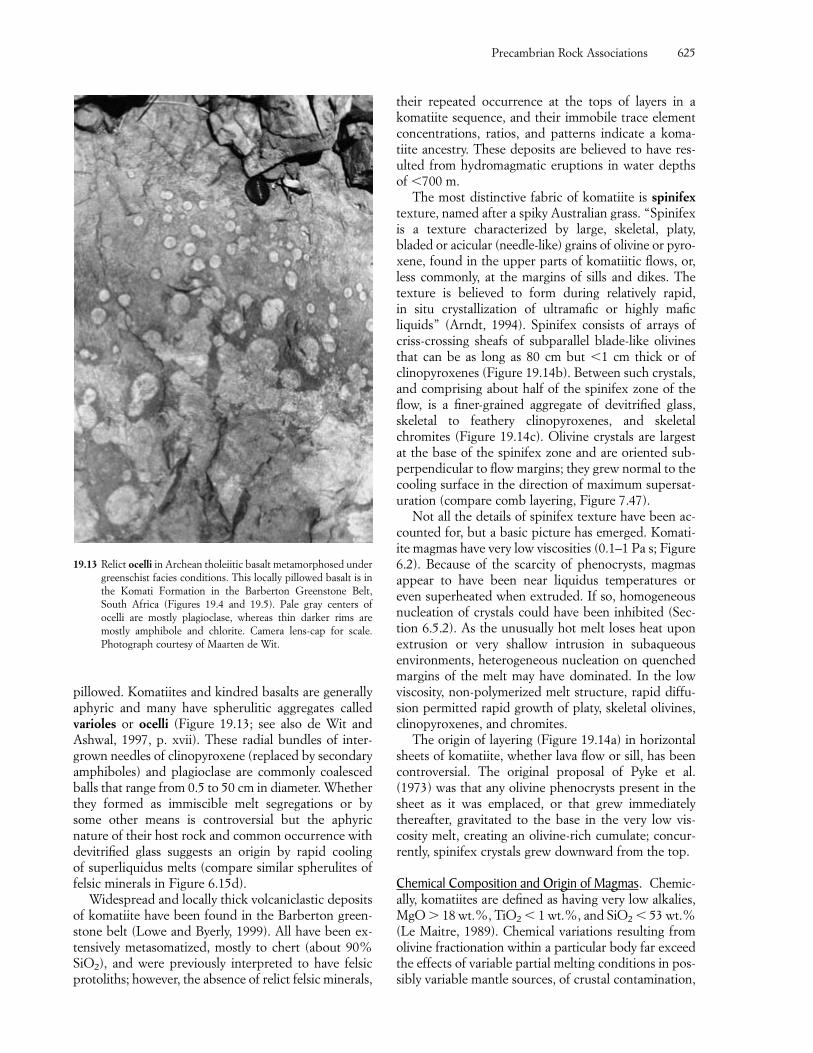
19.13 Relict ocelli in Archean tholeiitic basalt metamorphosed undergreenschist facies conditions. This locally pillowed basalt is inthe Komati Formation in the Barberton Greenstone Belt,South Africa (Figures 19.4 and 19.5). Pale gray centers ofocelli are mostly plagioclase, whereas thin darker rims aremostly amphibole and chlorite. Camera lens-cap for scale.Photograph courtesy of Maarten de Wit.
pillowed. Komatiites and kindred basalts are generallyaphyric and many have spherulitic aggregates calledvarioles or ocelli (Figure 19.13; see also de Wit andAshwal, 1997, p. xvii). These radial bundles of inter-grown needles of clinopyroxene (replaced by secondaryamphiboles) and plagioclase are commonly coalescedballs that range from 0.5 to 50 cm in diameter. Whetherthey formed as immiscible melt segregations or bysome other means is controversial but the aphyric nature of their host rock and common occurrence with devitrified glass suggests an origin by rapid cooling of superliquidus melts (compare similar spherulites of felsic minerals in Figure 6.15d).
Widespread and locally thick volcaniclastic depositsof komatiite have been found in the Barberton green-stone belt (Lowe and Byerly, 1999). All have been ex-tensively metasomatized, mostly to chert (about 90%SiO2), and were previously interpreted to have felsicprotoliths; however, the absence of relict felsic minerals,
Precambrian Rock Associations 625
their repeated occurrence at the tops of layers in a komatiite sequence, and their immobile trace elementconcentrations, ratios, and patterns indicate a koma-tiite ancestry. These deposits are believed to have res-ulted from hydromagmatic eruptions in water depthsof �700 m.
The most distinctive fabric of komatiite is spinifextexture, named after a spiky Australian grass. “Spinifexis a texture characterized by large, skeletal, platy,bladed or acicular (needle-like) grains of olivine or pyro-xene, found in the upper parts of komatiitic flows, or,less commonly, at the margins of sills and dikes. Thetexture is believed to form during relatively rapid, in situ crystallization of ultramafic or highly mafic liquids” (Arndt, 1994). Spinifex consists of arrays ofcriss-crossing sheafs of subparallel blade-like olivinesthat can be as long as 80 cm but �1 cm thick or ofclinopyroxenes (Figure 19.14b). Between such crystals,and comprising about half of the spinifex zone of theflow, is a finer-grained aggregate of devitrified glass,skeletal to feathery clinopyroxenes, and skeletalchromites (Figure 19.14c). Olivine crystals are largestat the base of the spinifex zone and are oriented sub-perpendicular to flow margins; they grew normal to thecooling surface in the direction of maximum supersat-uration (compare comb layering, Figure 7.47).
Not all the details of spinifex texture have been ac-counted for, but a basic picture has emerged. Komati-ite magmas have very low viscosities (0.1–1 Pa s; Figure6.2). Because of the scarcity of phenocrysts, magmasappear to have been near liquidus temperatures oreven superheated when extruded. If so, homogeneousnucleation of crystals could have been inhibited (Sec-tion 6.5.2). As the unusually hot melt loses heat uponextrusion or very shallow intrusion in subaqueous environments, heterogeneous nucleation on quenchedmargins of the melt may have dominated. In the lowviscosity, non-polymerized melt structure, rapid diffu-sion permitted rapid growth of platy, skeletal olivines,clinopyroxenes, and chromites.
The origin of layering (Figure 19.14a) in horizontalsheets of komatiite, whether lava flow or sill, has beencontroversial. The original proposal of Pyke et al.(1973) was that any olivine phenocrysts present in thesheet as it was emplaced, or that grew immediatelythereafter, gravitated to the base in the very low vis-cosity melt, creating an olivine-rich cumulate; concur-rently, spinifex crystals grew downward from the top.
Chemical Composition and Origin of Magmas. Chemic-ally, komatiites are defined as having very low alkalies,MgO � 18 wt.%, TiO2 � 1 wt.%, and SiO2 � 53 wt.%(Le Maitre, 1989). Chemical variations resulting fromolivine fractionation within a particular body far exceedthe effects of variable partial melting conditions in pos-sibly variable mantle sources, of crustal contamination,
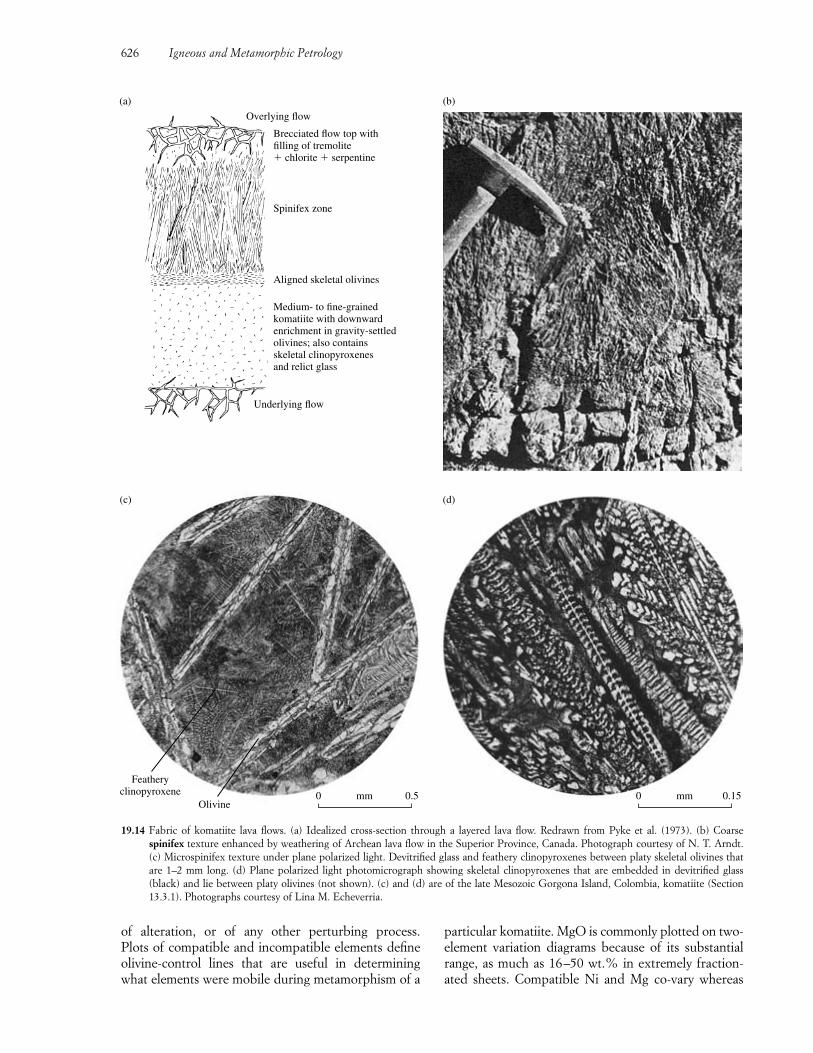
(b)(a)
Overlying flow
Brecciated flow top withfilling of tremolite� chlorite � serpentine
Spinifex zone
Aligned skeletal olivines
Medium- to fine-grainedkomatiite with downwardenrichment in gravity-settledolivines; also containsskeletal clinopyroxenesand relict glass
Underlying flow
(c) (d)
Featheryclinopyroxene
Olivine0 0.5mm 0 0.15mm
19.14 Fabric of komatiite lava flows. (a) Idealized cross-section through a layered lava flow. Redrawn from Pyke et al. (1973). (b) Coarsespinifex texture enhanced by weathering of Archean lava flow in the Superior Province, Canada. Photograph courtesy of N. T. Arndt.(c) Microspinifex texture under plane polarized light. Devitrified glass and feathery clinopyroxenes between platy skeletal olivines thatare 1–2 mm long. (d) Plane polarized light photomicrograph showing skeletal clinopyroxenes that are embedded in devitrified glass(black) and lie between platy olivines (not shown). (c) and (d) are of the late Mesozoic Gorgona Island, Colombia, komatiite (Section13.3.1). Photographs courtesy of Lina M. Echeverria.
of alteration, or of any other perturbing process. Plots of compatible and incompatible elements defineolivine-control lines that are useful in determiningwhat elements were mobile during metamorphism of a
626 Igneous and Metamorphic Petrology
particular komatiite. MgO is commonly plotted on two-element variation diagrams because of its substantialrange, as much as 16–50 wt.% in extremely fraction-ated sheets. Compatible Ni and Mg co-vary whereas
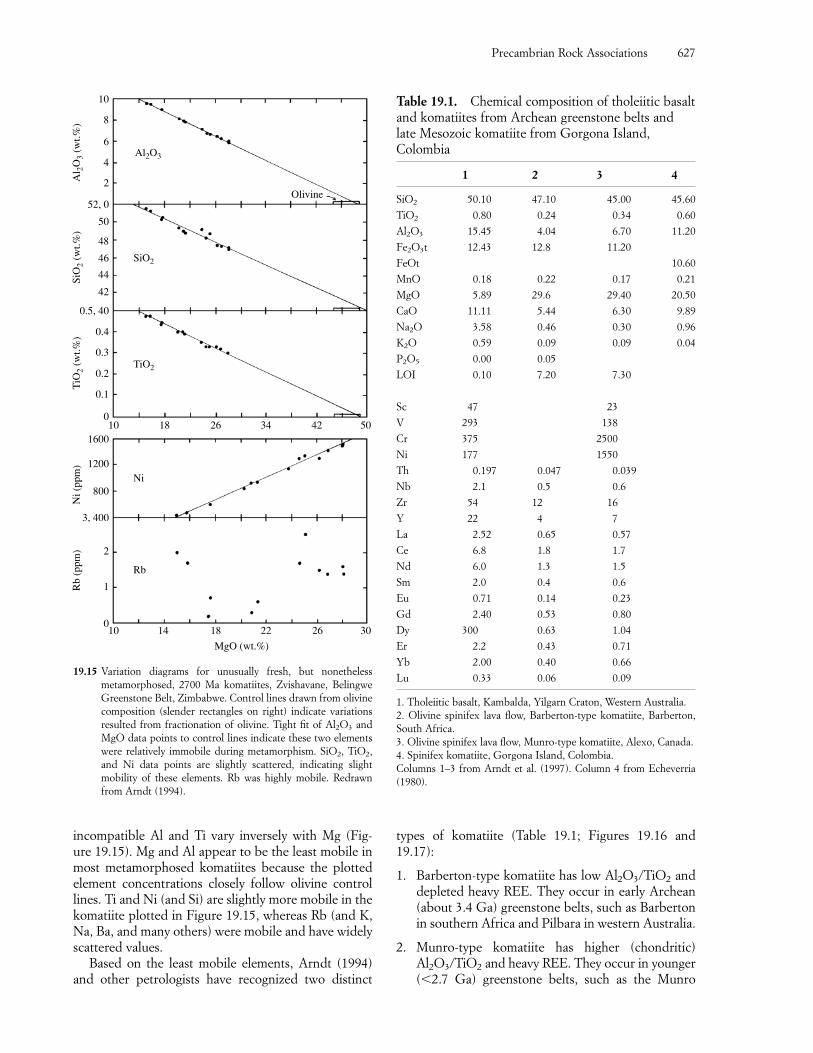
incompatible Al and Ti vary inversely with Mg (Fig-ure 19.15). Mg and Al appear to be the least mobile inmost metamorphosed komatiites because the plottedelement concentrations closely follow olivine controllines. Ti and Ni (and Si) are slightly more mobile in thekomatiite plotted in Figure 19.15, whereas Rb (and K,Na, Ba, and many others) were mobile and have widelyscattered values.
Based on the least mobile elements, Arndt (1994)and other petrologists have recognized two distinct
types of komatiite (Table 19.1; Figures 19.16 and19.17):
1. Barberton-type komatiite has low Al2O3/TiO2 anddepleted heavy REE. They occur in early Archean(about 3.4 Ga) greenstone belts, such as Barbertonin southern Africa and Pilbara in western Australia.
2. Munro-type komatiite has higher (chondritic)Al2O3/TiO2 and heavy REE. They occur in younger(�2.7 Ga) greenstone belts, such as the Munro
Precambrian Rock Associations 627
Al 2
O3
(wt.%
)Si
O2
(wt.%
)T
iO2
(wt.%
)
10
8
6
4
2
52, 0
50
48
46
44
42
0.5, 40
0.4
Ni (
ppm
)R
b (p
pm)
1600
1200
800
3, 400
2
1
0
0.3
0.2
0.1
050421810 26 34
10 14 18 22 26 30
MgO (wt.%)
Rb
Ni
TiO2
SiO2
Al2O3
Olivine
Table 19.1. Chemical composition of tholeiitic basaltand komatiites from Archean greenstone belts andlate Mesozoic komatiite from Gorgona Island,Colombia
1 2 3 4
SiO2 50.10 47.10 45.00 45.60
TiO2 0.80 0.24 0.34 0.60
Al2O3 15.45 4.04 6.70 11.20
Fe2O3t 12.43 12.8 11.20
FeOt 10.60
MnO 0.18 0.22 0.17 0.21
MgO 5.89 29.6 29.40 20.50
CaO 11.11 5.44 6.30 9.89
Na2O 3.58 0.46 0.30 0.96
K2O 0.59 0.09 0.09 0.04
P2O5 0.00 0.05
LOI 0.10 7.20 7.30
Sc 47 23
V 293 138
Cr 375 2500
Ni 177 1550
Th 0.197 0.047 0.039
Nb 2.1 0.5 0.6
Zr 54 12 16
Y 22 4 7
La 2.52 0.65 0.57
Ce 6.8 1.8 1.7
Nd 6.0 1.3 1.5
Sm 2.0 0.4 0.6
Eu 0.71 0.14 0.23
Gd 2.40 0.53 0.80
Dy 300 0.63 1.04
Er 2.2 0.43 0.71
Yb 2.00 0.40 0.66
Lu 0.33 0.06 0.09
1. Tholeiitic basalt, Kambalda, Yilgarn Craton, Western Australia.2. Olivine spinifex lava flow, Barberton-type komatiite, Barberton,South Africa.3. Olivine spinifex lava flow, Munro-type komatiite, Alexo, Canada.4. Spinifex komatiite, Gorgona Island, Colombia.Columns 1–3 from Arndt et al. (1997). Column 4 from Echeverria(1980).
19.15 Variation diagrams for unusually fresh, but nonetheless metamorphosed, 2700 Ma komatiites, Zvishavane, BelingweGreenstone Belt, Zimbabwe. Control lines drawn from olivinecomposition (slender rectangles on right) indicate variationsresulted from fractionation of olivine. Tight fit of Al2O3 andMgO data points to control lines indicate these two elementswere relatively immobile during metamorphism. SiO2, TiO2,and Ni data points are slightly scattered, indicating slight mobility of these elements. Rb was highly mobile. Redrawnfrom Arndt (1994).
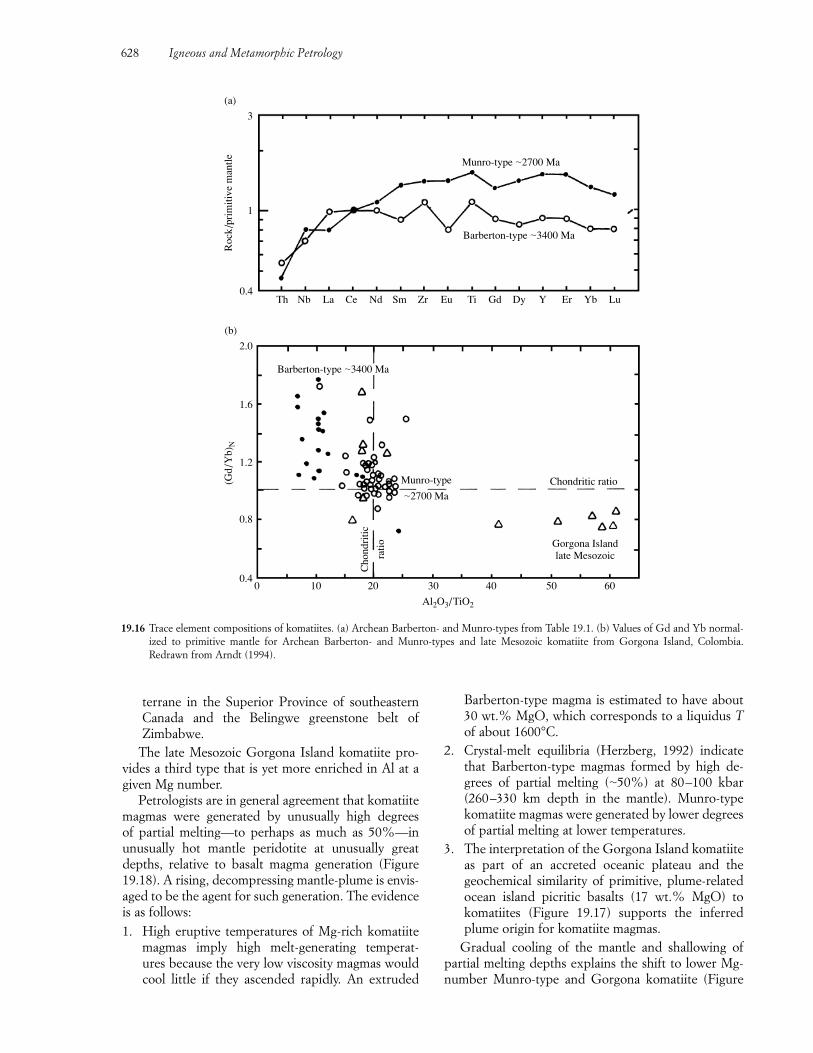
Barberton-type magma is estimated to have about30 wt.% MgO, which corresponds to a liquidus Tof about 1600°C.
2. Crystal-melt equilibria (Herzberg, 1992) indicatethat Barberton-type magmas formed by high de-grees of partial melting (�50%) at 80–100 kbar(260–330 km depth in the mantle). Munro-type komatiite magmas were generated by lower degreesof partial melting at lower temperatures.
3. The interpretation of the Gorgona Island komatiiteas part of an accreted oceanic plateau and the geochemical similarity of primitive, plume-relatedocean island picritic basalts (17 wt.% MgO) to komatiites (Figure 19.17) supports the inferredplume origin for komatiite magmas.
Gradual cooling of the mantle and shallowing ofpartial melting depths explains the shift to lower Mg-number Munro-type and Gorgona komatiite (Figure
628 Igneous and Metamorphic Petrology
Roc
k/p
rim
itive
man
tle(G
d/Y
b)N
3
(a)
1
0.4Th Nb La Ce Nd Sm Zr Eu Ti Gd Dy Y Er Yb Lu
(b)
2.0
1.6
1.2
0.8
0.40 10 20 30 40 50 60
Al2O3/TiO2
Munro-type �2700 Ma
Barberton-type �3400 Ma
Barberton-type �3400 Ma
Munro-type
�2700 MaChondritic ratio
Gorgona Islandlate Mesozoic
Cho
ndri
tic
ratio
19.16 Trace element compositions of komatiites. (a) Archean Barberton- and Munro-types from Table 19.1. (b) Values of Gd and Yb normal-ized to primitive mantle for Archean Barberton- and Munro-types and late Mesozoic komatiite from Gorgona Island, Colombia. Redrawn from Arndt (1994).
terrane in the Superior Province of southeasternCanada and the Belingwe greenstone belt of Zimbabwe.
The late Mesozoic Gorgona Island komatiite pro-vides a third type that is yet more enriched in Al at agiven Mg number.
Petrologists are in general agreement that komatiitemagmas were generated by unusually high degrees of partial melting—to perhaps as much as 50%—inunusually hot mantle peridotite at unusually greatdepths, relative to basalt magma generation (Figure19.18). A rising, decompressing mantle-plume is envis-aged to be the agent for such generation. The evidenceis as follows:1. High eruptive temperatures of Mg-rich komatiite
magmas imply high melt-generating temperat-ures because the very low viscosity magmas wouldcool little if they ascended rapidly. An extruded
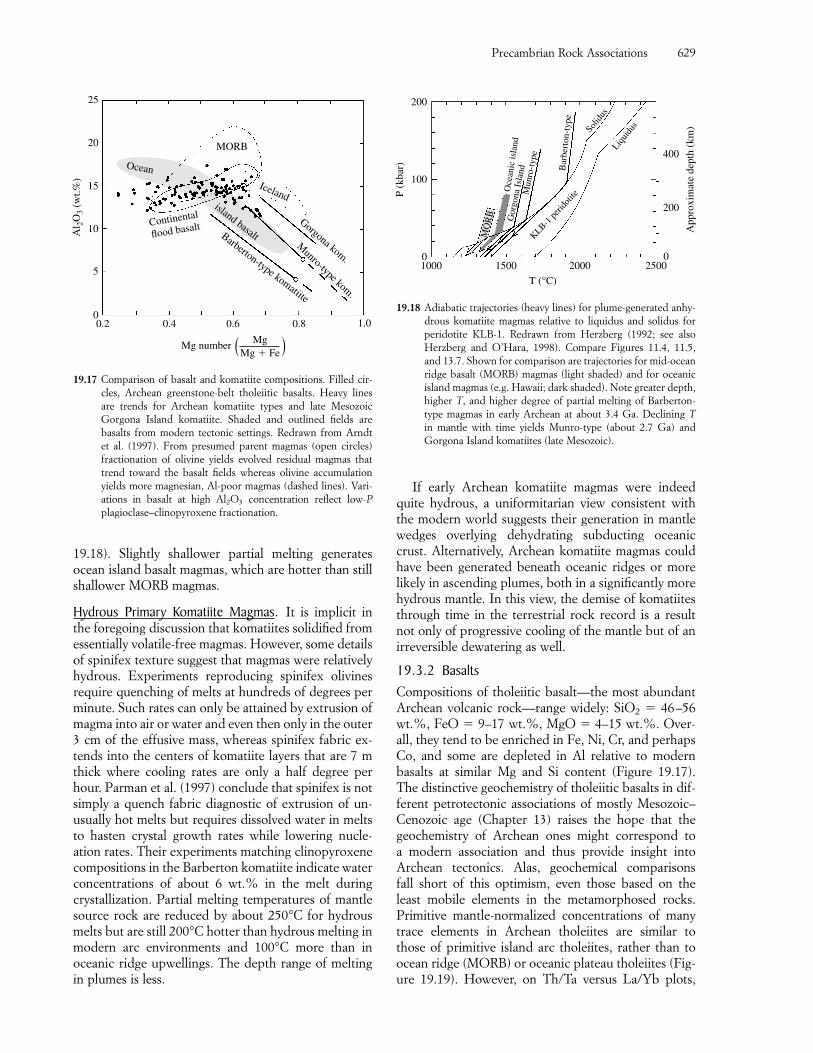
19.18). Slightly shallower partial melting generatesocean island basalt magmas, which are hotter than stillshallower MORB magmas.
Hydrous Primary Komatiite Magmas. It is implicit inthe foregoing discussion that komatiites solidified fromessentially volatile-free magmas. However, some detailsof spinifex texture suggest that magmas were relativelyhydrous. Experiments reproducing spinifex olivines require quenching of melts at hundreds of degrees perminute. Such rates can only be attained by extrusion ofmagma into air or water and even then only in the outer3 cm of the effusive mass, whereas spinifex fabric ex-tends into the centers of komatiite layers that are 7 mthick where cooling rates are only a half degree perhour. Parman et al. (1997) conclude that spinifex is notsimply a quench fabric diagnostic of extrusion of un-usually hot melts but requires dissolved water in meltsto hasten crystal growth rates while lowering nucle-ation rates. Their experiments matching clinopyroxenecompositions in the Barberton komatiite indicate waterconcentrations of about 6 wt.% in the melt duringcrystallization. Partial melting temperatures of mantlesource rock are reduced by about 250°C for hydrousmelts but are still 200°C hotter than hydrous melting inmodern arc environments and 100°C more than inoceanic ridge upwellings. The depth range of meltingin plumes is less.
If early Archean komatiite magmas were indeedquite hydrous, a uniformitarian view consistent withthe modern world suggests their generation in mantlewedges overlying dehydrating subducting oceaniccrust. Alternatively, Archean komatiite magmas couldhave been generated beneath oceanic ridges or morelikely in ascending plumes, both in a significantly morehydrous mantle. In this view, the demise of komatiitesthrough time in the terrestrial rock record is a resultnot only of progressive cooling of the mantle but of anirreversible dewatering as well.
19.3.2 BasaltsCompositions of tholeiitic basalt—the most abundantArchean volcanic rock—range widely: SiO2 � 46–56wt.%, FeO � 9–17 wt.%, MgO � 4–15 wt.%. Over-all, they tend to be enriched in Fe, Ni, Cr, and perhapsCo, and some are depleted in Al relative to modernbasalts at similar Mg and Si content (Figure 19.17). The distinctive geochemistry of tholeiitic basalts in dif-ferent petrotectonic associations of mostly Mesozoic–Cenozoic age (Chapter 13) raises the hope that the geochemistry of Archean ones might correspond to a modern association and thus provide insight intoArchean tectonics. Alas, geochemical comparisons fall short of this optimism, even those based on theleast mobile elements in the metamorphosed rocks.Primitive mantle-normalized concentrations of manytrace elements in Archean tholeiites are similar to those of primitive island arc tholeiites, rather than toocean ridge (MORB) or oceanic plateau tholeiites (Fig-ure 19.19). However, on Th/Ta versus La/Yb plots,
Precambrian Rock Associations 629
Al 2
O3
(wt.%
)
25
20
15
10
5
01.00.2 0.4 0.6
Mg number MgMg � Fe
0.8
MORB
Ocean
Iceland
Continental
flood basaltBarberton-type komatiite
island basaltM
unro-type kom.
Gorgona kom.
19.17 Comparison of basalt and komatiite compositions. Filled cir-cles, Archean greenstone-belt tholeiitic basalts. Heavy lines are trends for Archean komatiite types and late MesozoicGorgona Island komatiite. Shaded and outlined fields arebasalts from modern tectonic settings. Redrawn from Arndt et al. (1997). From presumed parent magmas (open circles)fractionation of olivine yields evolved residual magmas thattrend toward the basalt fields whereas olivine accumulationyields more magnesian, Al-poor magmas (dashed lines). Vari-ations in basalt at high Al2O3 concentration reflect low-Pplagioclase–clinopyroxene fractionation.
P (k
bar)
App
roxi
mat
e de
pth
(km
)
400
200
200
100
01000 1500
T (°C)
2000 2500
MO
RB
Oce
anic
isla
ndG
orgo
na I
slan
dM
unro
-typ
e
Bar
bert
on-t
ype
Solid
usLiq
uidu
s
KLB-1 pe
ridoti
te
0
19.18 Adiabatic trajectories (heavy lines) for plume-generated anhy-drous komatiite magmas relative to liquidus and solidus forperidotite KLB-1. Redrawn from Herzberg (1992; see alsoHerzberg and O’Hara, 1998). Compare Figures 11.4, 11.5,and 13.7. Shown for comparison are trajectories for mid-oceanridge basalt (MORB) magmas (light shaded) and for oceanicisland magmas (e.g. Hawaii; dark shaded). Note greater depth,higher T, and higher degree of partial melting of Barberton-type magmas in early Archean at about 3.4 Ga. Declining Tin mantle with time yields Munro-type (about 2.7 Ga) andGorgona Island komatiites (late Mesozoic).
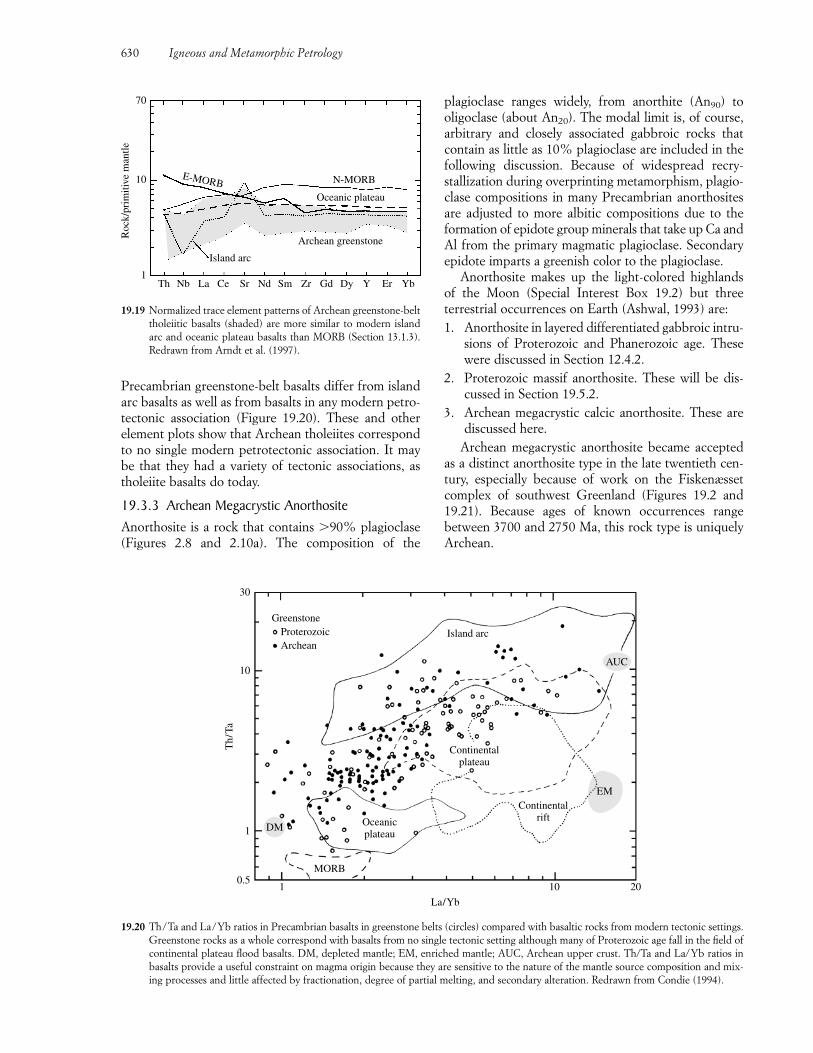
Precambrian greenstone-belt basalts differ from islandarc basalts as well as from basalts in any modern petro-tectonic association (Figure 19.20). These and other element plots show that Archean tholeiites correspondto no single modern petrotectonic association. It maybe that they had a variety of tectonic associations, astholeiite basalts do today.
19.3.3 Archean Megacrystic AnorthositeAnorthosite is a rock that contains �90% plagioclase(Figures 2.8 and 2.10a). The composition of the
plagioclase ranges widely, from anorthite (An90) tooligoclase (about An20). The modal limit is, of course,arbitrary and closely associated gabbroic rocks thatcontain as little as 10% plagioclase are included in thefollowing discussion. Because of widespread recry-stallization during overprinting metamorphism, plagio-clase compositions in many Precambrian anorthositesare adjusted to more albitic compositions due to theformation of epidote group minerals that take up Ca andAl from the primary magmatic plagioclase. Secondaryepidote imparts a greenish color to the plagioclase.
Anorthosite makes up the light-colored highlands of the Moon (Special Interest Box 19.2) but three terrestrial occurrences on Earth (Ashwal, 1993) are:1. Anorthosite in layered differentiated gabbroic intru-
sions of Proterozoic and Phanerozoic age. Thesewere discussed in Section 12.4.2.
2. Proterozoic massif anorthosite. These will be dis-cussed in Section 19.5.2.
3. Archean megacrystic calcic anorthosite. These arediscussed here.
Archean megacrystic anorthosite became acceptedas a distinct anorthosite type in the late twentieth cen-tury, especially because of work on the Fiskenæssetcomplex of southwest Greenland (Figures 19.2 and19.21). Because ages of known occurrences range between 3700 and 2750 Ma, this rock type is uniquelyArchean.
630 Igneous and Metamorphic Petrology
Roc
k/pr
imiti
ve m
antle
70
10
1Th Nb La Ce Sr Nd Sm Zr Gd Dy Y Er Yb
Island arc
Archean greenstone
Oceanic plateau
N-MORBE-MORB
Th/
Ta
30
GreenstoneProterozoicArchean
10
1
0.520101
La/Yb
Island arc
Continentalplateau
ContinentalriftOceanic
plateau
MORB
AUC
DM
EM
19.19 Normalized trace element patterns of Archean greenstone-belttholeiitic basalts (shaded) are more similar to modern islandarc and oceanic plateau basalts than MORB (Section 13.1.3). Redrawn from Arndt et al. (1997).
19.20 Th/Ta and La/Yb ratios in Precambrian basalts in greenstone belts (circles) compared with basaltic rocks from modern tectonic settings.Greenstone rocks as a whole correspond with basalts from no single tectonic setting although many of Proterozoic age fall in the field ofcontinental plateau flood basalts. DM, depleted mantle; EM, enriched mantle; AUC, Archean upper crust. Th/Ta and La/Yb ratios inbasalts provide a useful constraint on magma origin because they are sensitive to the nature of the mantle source composition and mix-ing processes and little affected by fractionation, degree of partial melting, and secondary alteration. Redrawn from Condie (1994).
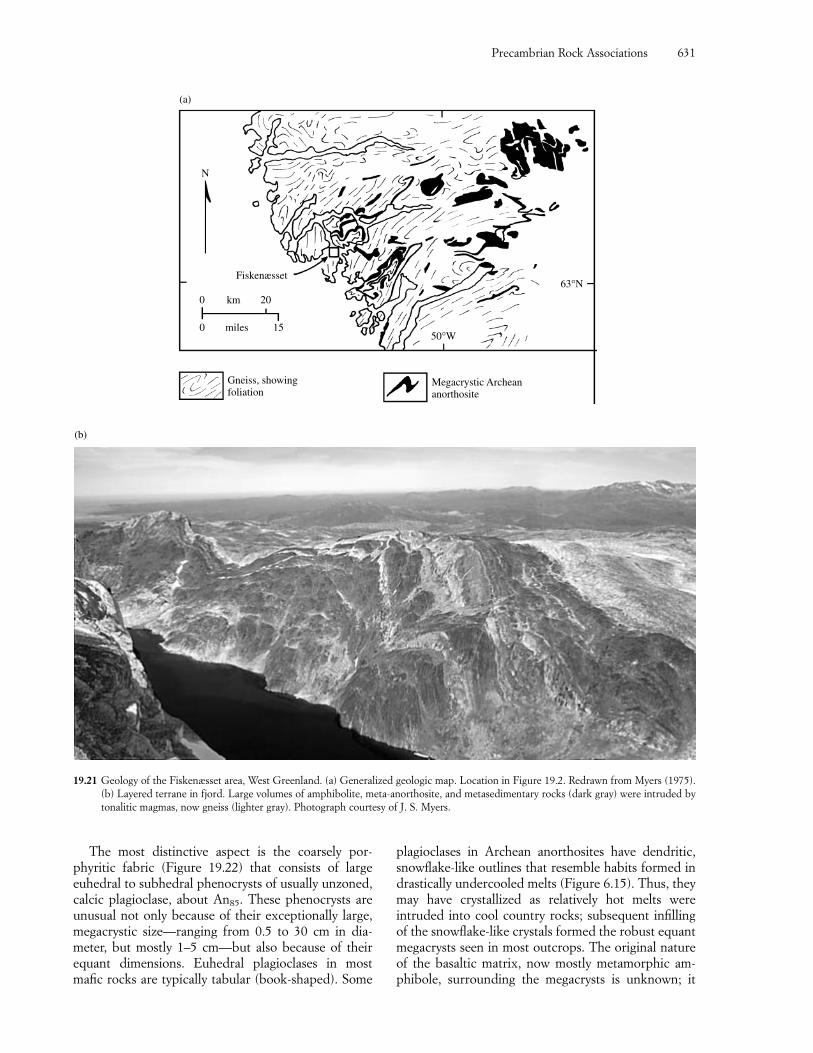
N
Fiskenæsset
0 20km
0 15miles50°W
63°N
Megacrystic Archeananorthosite
Gneiss, showingfoliation
(a)
(b)
19.21 Geology of the Fiskenæsset area, West Greenland. (a) Generalized geologic map. Location in Figure 19.2. Redrawn from Myers (1975).(b) Layered terrane in fjord. Large volumes of amphibolite, meta-anorthosite, and metasedimentary rocks (dark gray) were intruded bytonalitic magmas, now gneiss (lighter gray). Photograph courtesy of J. S. Myers.
The most distinctive aspect is the coarsely por-phyritic fabric (Figure 19.22) that consists of large euhedral to subhedral phenocrysts of usually unzoned,calcic plagioclase, about An85. These phenocrysts areunusual not only because of their exceptionally large,megacrystic size—ranging from 0.5 to 30 cm in dia-meter, but mostly 1–5 cm—but also because of theirequant dimensions. Euhedral plagioclases in mostmafic rocks are typically tabular (book-shaped). Some
Precambrian Rock Associations 631
plagioclases in Archean anorthosites have dendritic,snowflake-like outlines that resemble habits formed indrastically undercooled melts (Figure 6.15). Thus, theymay have crystallized as relatively hot melts were intruded into cool country rocks; subsequent infillingof the snowflake-like crystals formed the robust equantmegacrysts seen in most outcrops. The original natureof the basaltic matrix, now mostly metamorphic am-phibole, surrounding the megacrysts is unknown; it
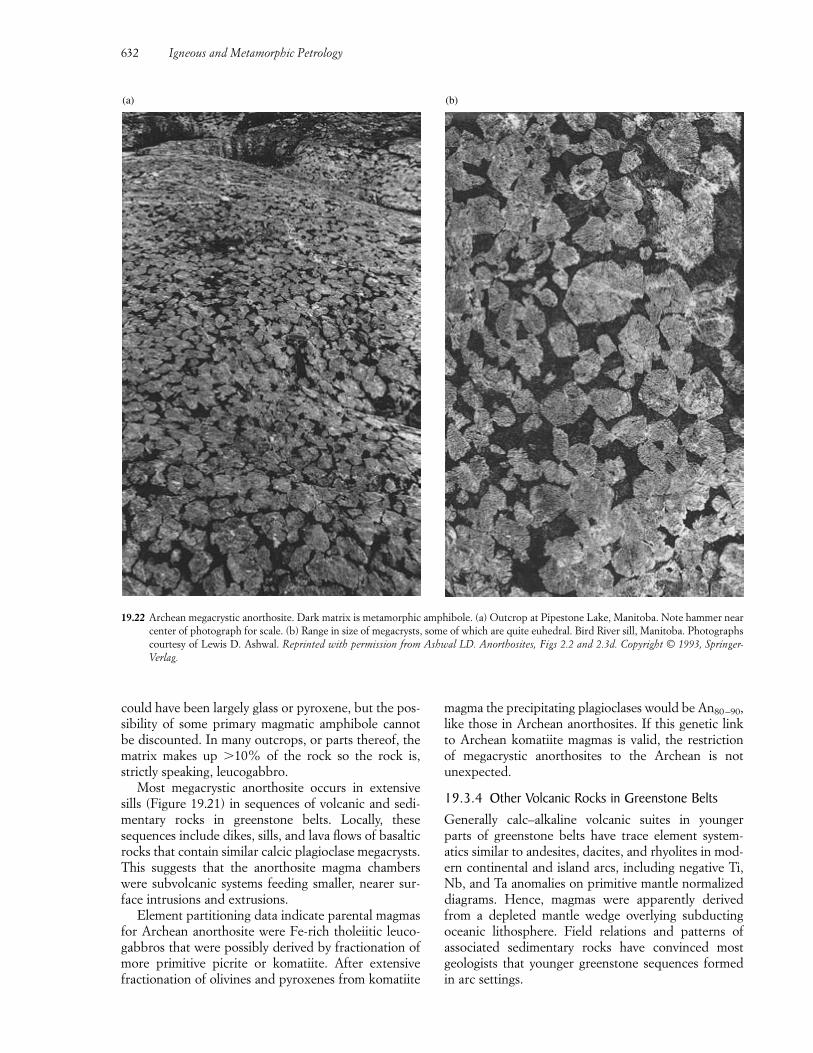
(a) (b)
19.22 Archean megacrystic anorthosite. Dark matrix is metamorphic amphibole. (a) Outcrop at Pipestone Lake, Manitoba. Note hammer nearcenter of photograph for scale. (b) Range in size of megacrysts, some of which are quite euhedral. Bird River sill, Manitoba. Photographscourtesy of Lewis D. Ashwal. Reprinted with permission from Ashwal LD. Anorthosites, Figs 2.2 and 2.3d. Copyright © 1993, Springer-Verlag.
could have been largely glass or pyroxene, but the pos-sibility of some primary magmatic amphibole cannotbe discounted. In many outcrops, or parts thereof, thematrix makes up �10% of the rock so the rock is,strictly speaking, leucogabbro.
Most megacrystic anorthosite occurs in extensivesills (Figure 19.21) in sequences of volcanic and sedi-mentary rocks in greenstone belts. Locally, these sequences include dikes, sills, and lava flows of basalticrocks that contain similar calcic plagioclase megacrysts.This suggests that the anorthosite magma chamberswere subvolcanic systems feeding smaller, nearer sur-face intrusions and extrusions.
Element partitioning data indicate parental magmasfor Archean anorthosite were Fe-rich tholeiitic leuco-gabbros that were possibly derived by fractionation ofmore primitive picrite or komatiite. After extensivefractionation of olivines and pyroxenes from komatiite
magma the precipitating plagioclases would be An80 –90,like those in Archean anorthosites. If this genetic linkto Archean komatiite magmas is valid, the restriction of megacrystic anorthosites to the Archean is not unexpected.
19.3.4 Other Volcanic Rocks in Greenstone BeltsGenerally calc–alkaline volcanic suites in younger parts of greenstone belts have trace element system-atics similar to andesites, dacites, and rhyolites in mod-ern continental and island arcs, including negative Ti,Nb, and Ta anomalies on primitive mantle normalizeddiagrams. Hence, magmas were apparently derivedfrom a depleted mantle wedge overlying subductingoceanic lithosphere. Field relations and patterns of associated sedimentary rocks have convinced most geologists that younger greenstone sequences formedin arc settings.
632 Igneous and Metamorphic Petrology
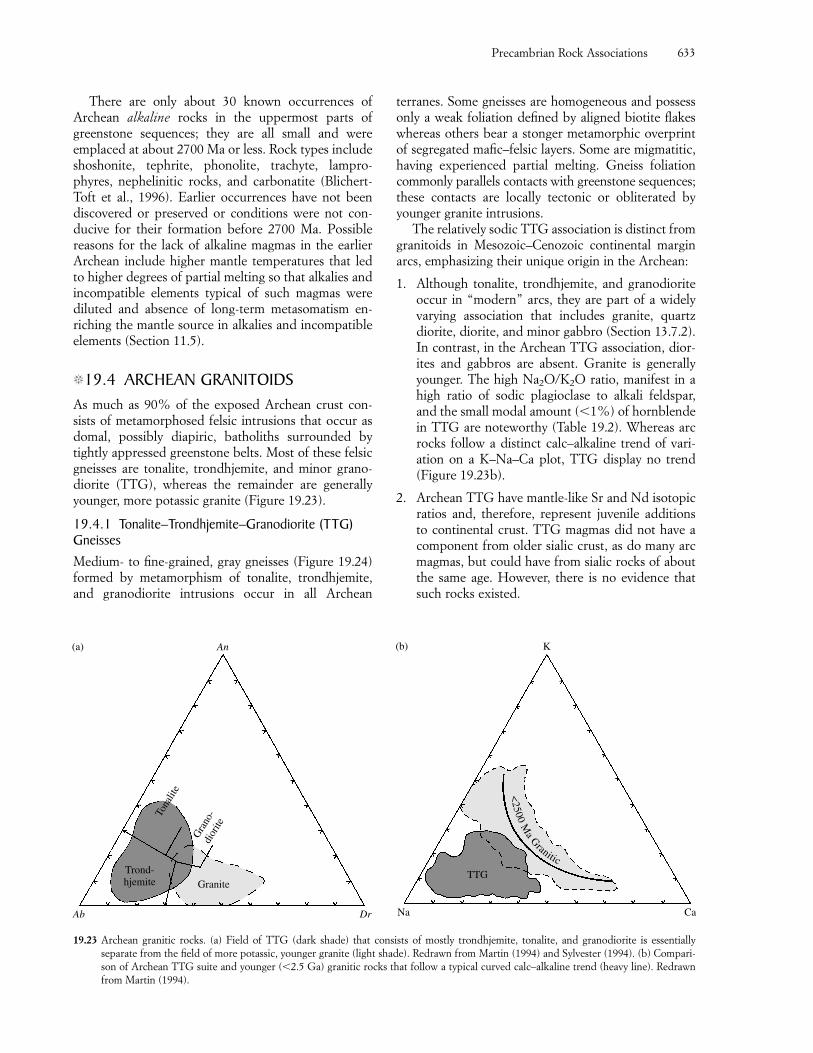
There are only about 30 known occurrences ofArchean alkaline rocks in the uppermost parts ofgreenstone sequences; they are all small and were emplaced at about 2700 Ma or less. Rock types includeshoshonite, tephrite, phonolite, trachyte, lampro-phyres, nephelinitic rocks, and carbonatite (Blichert-Toft et al., 1996). Earlier occurrences have not beendiscovered or preserved or conditions were not con-ducive for their formation before 2700 Ma. Possiblereasons for the lack of alkaline magmas in the earlierArchean include higher mantle temperatures that ledto higher degrees of partial melting so that alkalies andincompatible elements typical of such magmas were diluted and absence of long-term metasomatism en-riching the mantle source in alkalies and incompatibleelements (Section 11.5).
�19.4 ARCHEAN GRANITOIDSAs much as 90% of the exposed Archean crust con-sists of metamorphosed felsic intrusions that occur as domal, possibly diapiric, batholiths surrounded bytightly appressed greenstone belts. Most of these felsicgneisses are tonalite, trondhjemite, and minor grano-diorite (TTG), whereas the remainder are generallyyounger, more potassic granite (Figure 19.23).
19.4.1 Tonalite–Trondhjemite–Granodiorite (TTG)GneissesMedium- to fine-grained, gray gneisses (Figure 19.24)formed by metamorphism of tonalite, trondhjemite,and granodiorite intrusions occur in all Archean
terranes. Some gneisses are homogeneous and possessonly a weak foliation defined by aligned biotite flakeswhereas others bear a stonger metamorphic overprintof segregated mafic–felsic layers. Some are migmatitic,having experienced partial melting. Gneiss foliationcommonly parallels contacts with greenstone sequences;these contacts are locally tectonic or obliterated byyounger granite intrusions.
The relatively sodic TTG association is distinct fromgranitoids in Mesozoic–Cenozoic continental marginarcs, emphasizing their unique origin in the Archean:
1. Although tonalite, trondhjemite, and granodioriteoccur in “modern” arcs, they are part of a widelyvarying association that includes granite, quartzdiorite, diorite, and minor gabbro (Section 13.7.2).In contrast, in the Archean TTG association, dior-ites and gabbros are absent. Granite is generallyyounger. The high Na2O/K2O ratio, manifest in ahigh ratio of sodic plagioclase to alkali feldspar, and the small modal amount (�1%) of hornblendein TTG are noteworthy (Table 19.2). Whereas arcrocks follow a distinct calc–alkaline trend of vari-ation on a K–Na–Ca plot, TTG display no trend(Figure 19.23b).
2. Archean TTG have mantle-like Sr and Nd isotopicratios and, therefore, represent juvenile additionsto continental crust. TTG magmas did not have acomponent from older sialic crust, as do many arcmagmas, but could have from sialic rocks of aboutthe same age. However, there is no evidence thatsuch rocks existed.
Precambrian Rock Associations 633
Ab Dr
An
Tona
lite
Gra
no-
dior
ite
Trond-hjemite Granite
(a)
Na Ca
K
TTG
(b)
<2500
Ma
G
ranitic
19.23 Archean granitic rocks. (a) Field of TTG (dark shade) that consists of mostly trondhjemite, tonalite, and granodiorite is essentially separate from the field of more potassic, younger granite (light shade). Redrawn from Martin (1994) and Sylvester (1994). (b) Compari-son of Archean TTG suite and younger (�2.5 Ga) granitic rocks that follow a typical curved calc–alkaline trend (heavy line). Redrawnfrom Martin (1994).
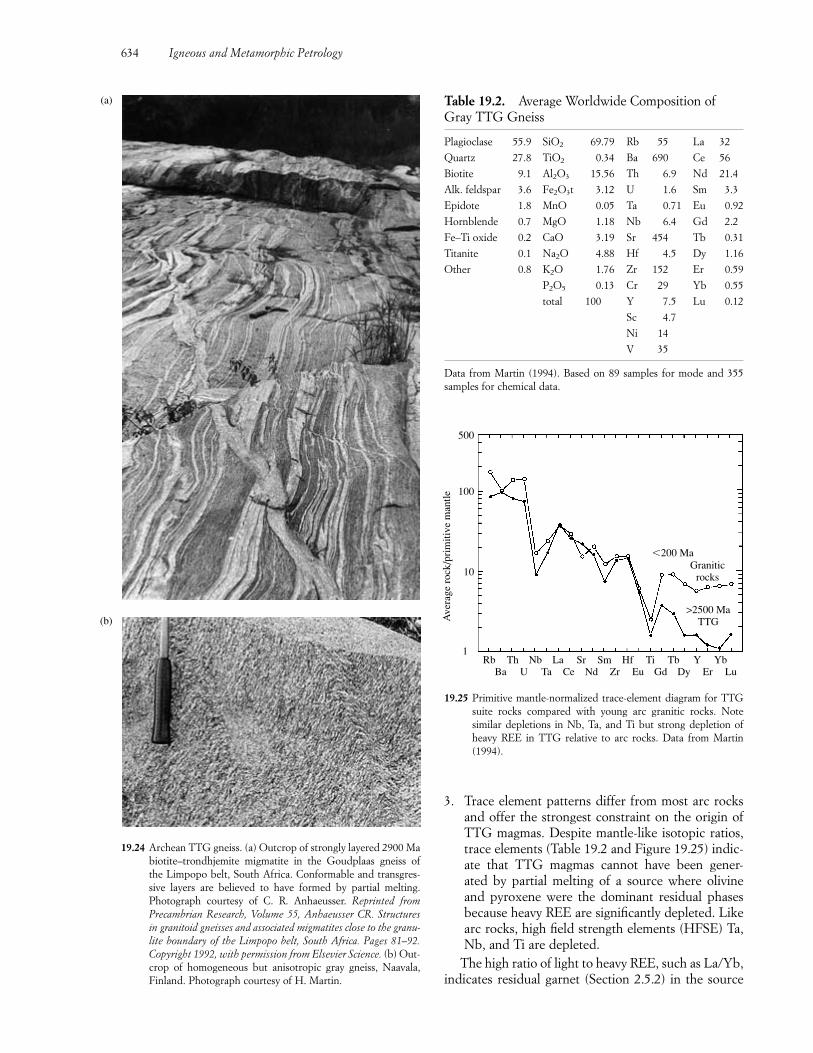
19.24 Archean TTG gneiss. (a) Outcrop of strongly layered 2900 Mabiotite–trondhjemite migmatite in the Goudplaas gneiss of the Limpopo belt, South Africa. Conformable and transgres-sive layers are believed to have formed by partial melting. Photograph courtesy of C. R. Anhaeusser. Reprinted from Precambrian Research, Volume 55, Anhaeusser CR. Structuresin granitoid gneisses and associated migmatites close to the granu-lite boundary of the Limpopo belt, South Africa. Pages 81–92.Copyright 1992, with permission from Elsevier Science. (b) Out-crop of homogeneous but anisotropic gray gneiss, Naavala,Finland. Photograph courtesy of H. Martin.
(a)
(b)
3. Trace element patterns differ from most arc rocksand offer the strongest constraint on the origin ofTTG magmas. Despite mantle-like isotopic ratios,trace elements (Table 19.2 and Figure 19.25) indic-ate that TTG magmas cannot have been gener-ated by partial melting of a source where olivineand pyroxene were the dominant residual phases because heavy REE are significantly depleted. Likearc rocks, high field strength elements (HFSE) Ta,Nb, and Ti are depleted.
The high ratio of light to heavy REE, such as La/Yb,indicates residual garnet (Section 2.5.2) in the source
634 Igneous and Metamorphic Petrology
Table 19.2. Average Worldwide Composition ofGray TTG Gneiss
Plagioclase 55.9 SiO2 69.79 Rb 55 La 32
Quartz 27.8 TiO2 0.34 Ba 690 Ce 56
Biotite 9.1 Al2O3 15.56 Th 6.9 Nd 21.4
Alk. feldspar 3.6 Fe2O3t 3.12 U 1.6 Sm 3.3
Epidote 1.8 MnO 0.05 Ta 0.71 Eu 0.92
Hornblende 0.7 MgO 1.18 Nb 6.4 Gd 2.2
Fe–Ti oxide 0.2 CaO 3.19 Sr 454 Tb 0.31
Titanite 0.1 Na2O 4.88 Hf 4.5 Dy 1.16
Other 0.8 K2O 1.76 Zr 152 Er 0.59
P2O5 0.13 Cr 29 Yb 0.55
total 100 Y 7.5 Lu 0.12
Sc 4.7
Ni 14
V 35
Data from Martin (1994). Based on 89 samples for mode and 355samples for chemical data.
Ave
rage
roc
k/pr
imiti
ve m
antle
500
100
10
1Yb
LuY
ErTb
DyTi
GdHf
EuSm
ZrSr
NdLa
CeNb
TaTh
URb
Ba
�200 MaGranitic
rocks
>2500 MaTTG
19.25 Primitive mantle-normalized trace-element diagram for TTGsuite rocks compared with young arc granitic rocks. Note similar depletions in Nb, Ta, and Ti but strong depletion ofheavy REE in TTG relative to arc rocks. Data from Martin(1994).
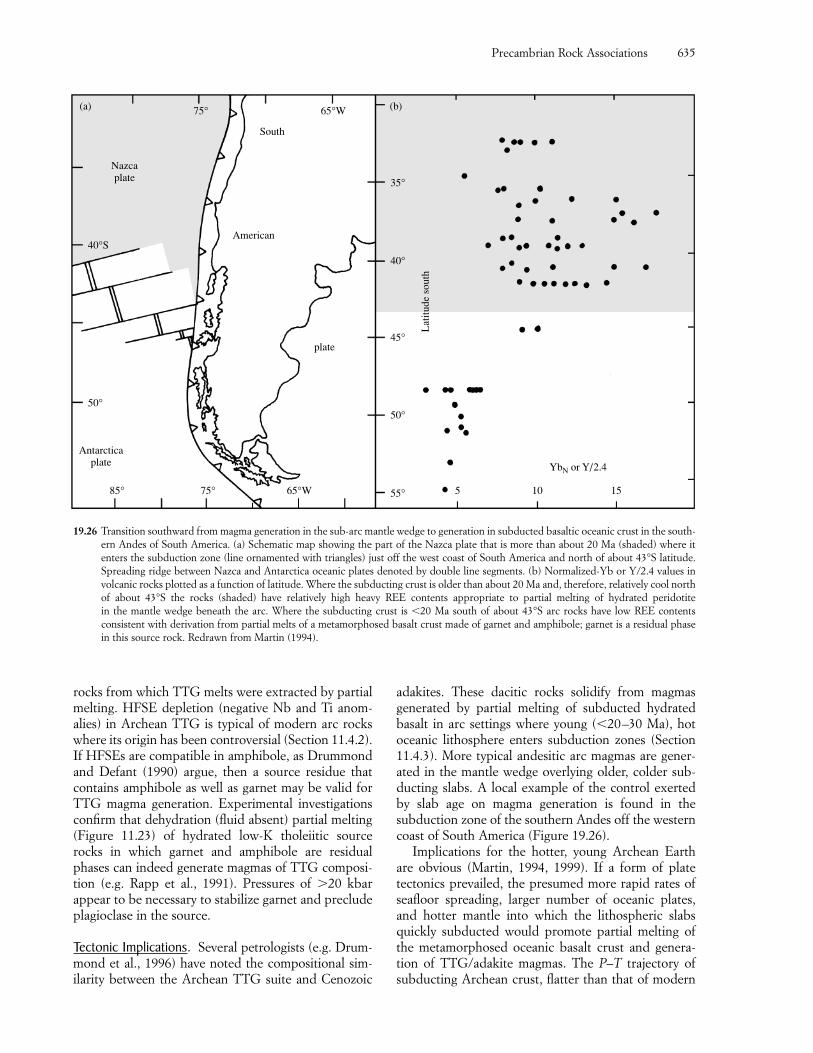
(a) (b)
Nazcaplate
South
American
plate
YbN or Y/2.4
40°S
75° 65°W
50°
Antarcticaplate
85° 75° 5 10 1565°W 55°
50°
45°
40°
35°
Lat
itude
sou
th
19.26 Transition southward from magma generation in the sub-arc mantle wedge to generation in subducted basaltic oceanic crust in the south-ern Andes of South America. (a) Schematic map showing the part of the Nazca plate that is more than about 20 Ma (shaded) where itenters the subduction zone (line ornamented with triangles) just off the west coast of South America and north of about 43°S latitude.Spreading ridge between Nazca and Antarctica oceanic plates denoted by double line segments. (b) Normalized-Yb or Y/2.4 values involcanic rocks plotted as a function of latitude. Where the subducting crust is older than about 20 Ma and, therefore, relatively cool northof about 43°S the rocks (shaded) have relatively high heavy REE contents appropriate to partial melting of hydrated peridotite in the mantle wedge beneath the arc. Where the subducting crust is �20 Ma south of about 43°S arc rocks have low REE contents consistent with derivation from partial melts of a metamorphosed basalt crust made of garnet and amphibole; garnet is a residual phasein this source rock. Redrawn from Martin (1994).
rocks from which TTG melts were extracted by partialmelting. HFSE depletion (negative Nb and Ti anom-alies) in Archean TTG is typical of modern arc rockswhere its origin has been controversial (Section 11.4.2).If HFSEs are compatible in amphibole, as Drummondand Defant (1990) argue, then a source residue thatcontains amphibole as well as garnet may be valid forTTG magma generation. Experimental investigationsconfirm that dehydration (fluid absent) partial melting(Figure 11.23) of hydrated low-K tholeiitic sourcerocks in which garnet and amphibole are residualphases can indeed generate magmas of TTG composi-tion (e.g. Rapp et al., 1991). Pressures of �20 kbar appear to be necessary to stabilize garnet and precludeplagioclase in the source.
Tectonic Implications. Several petrologists (e.g. Drum-mond et al., 1996) have noted the compositional sim-ilarity between the Archean TTG suite and Cenozoic
adakites. These dacitic rocks solidify from magmasgenerated by partial melting of subducted hydratedbasalt in arc settings where young (�20–30 Ma), hotoceanic lithosphere enters subduction zones (Section11.4.3). More typical andesitic arc magmas are gener-ated in the mantle wedge overlying older, colder sub-ducting slabs. A local example of the control exertedby slab age on magma generation is found in the subduction zone of the southern Andes off the westerncoast of South America (Figure 19.26).
Implications for the hotter, young Archean Earthare obvious (Martin, 1994, 1999). If a form of plate tectonics prevailed, the presumed more rapid rates ofseafloor spreading, larger number of oceanic plates,and hotter mantle into which the lithospheric slabsquickly subducted would promote partial melting ofthe metamorphosed oceanic basalt crust and genera-tion of TTG/adakite magmas. The P–T trajectory ofsubducting Archean crust, flatter than that of modern
Precambrian Rock Associations 635
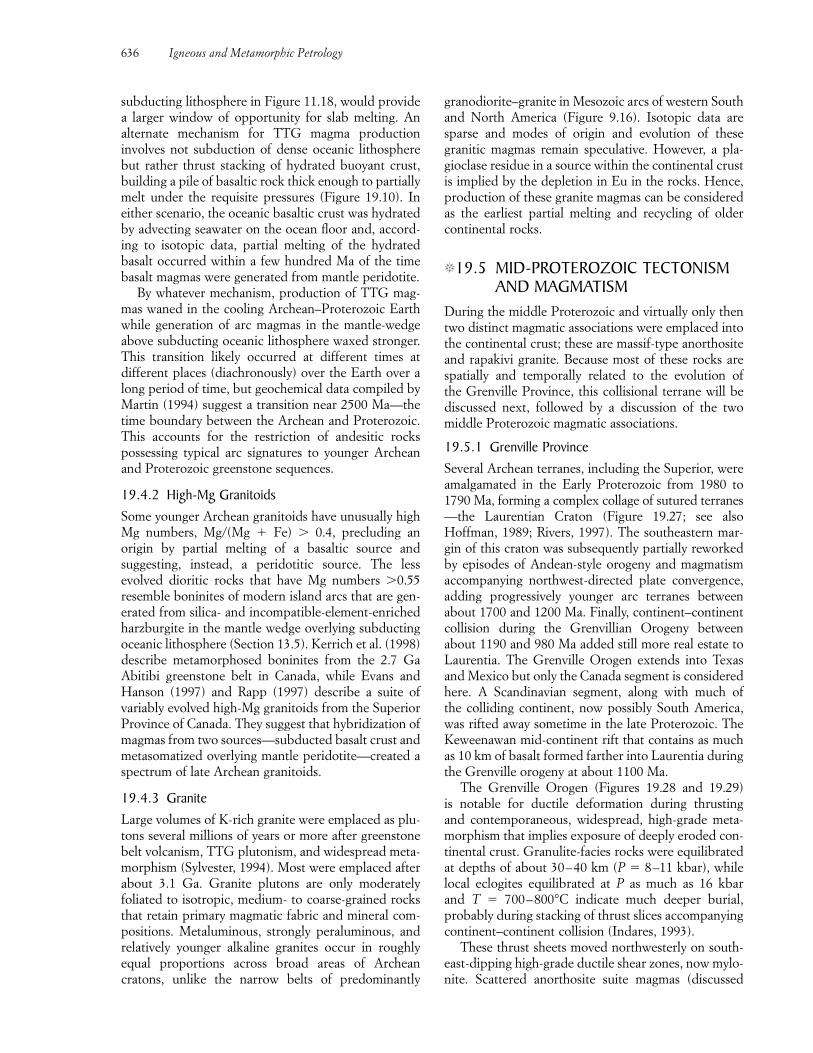
subducting lithosphere in Figure 11.18, would providea larger window of opportunity for slab melting. An alternate mechanism for TTG magma production involves not subduction of dense oceanic lithospherebut rather thrust stacking of hydrated buoyant crust,building a pile of basaltic rock thick enough to partiallymelt under the requisite pressures (Figure 19.10). In either scenario, the oceanic basaltic crust was hydratedby advecting seawater on the ocean floor and, accord-ing to isotopic data, partial melting of the hydratedbasalt occurred within a few hundred Ma of the timebasalt magmas were generated from mantle peridotite.
By whatever mechanism, production of TTG mag-mas waned in the cooling Archean–Proterozoic Earthwhile generation of arc magmas in the mantle-wedgeabove subducting oceanic lithosphere waxed stronger.This transition likely occurred at different times at different places (diachronously) over the Earth over along period of time, but geochemical data compiled byMartin (1994) suggest a transition near 2500 Ma—thetime boundary between the Archean and Proterozoic.This accounts for the restriction of andesitic rocks possessing typical arc signatures to younger Archeanand Proterozoic greenstone sequences.
19.4.2 High-Mg GranitoidsSome younger Archean granitoids have unusually highMg numbers, Mg/(Mg � Fe) � 0.4, precluding an origin by partial melting of a basaltic source and suggesting, instead, a peridotitic source. The lessevolved dioritic rocks that have Mg numbers �0.55 resemble boninites of modern island arcs that are gen-erated from silica- and incompatible-element-enrichedharzburgite in the mantle wedge overlying subductingoceanic lithosphere (Section 13.5). Kerrich et al. (1998)describe metamorphosed boninites from the 2.7 GaAbitibi greenstone belt in Canada, while Evans andHanson (1997) and Rapp (1997) describe a suite ofvariably evolved high-Mg granitoids from the SuperiorProvince of Canada. They suggest that hybridization ofmagmas from two sources—subducted basalt crust andmetasomatized overlying mantle peridotite—created aspectrum of late Archean granitoids.
19.4.3 GraniteLarge volumes of K-rich granite were emplaced as plu-tons several millions of years or more after greenstonebelt volcanism, TTG plutonism, and widespread meta-morphism (Sylvester, 1994). Most were emplaced afterabout 3.1 Ga. Granite plutons are only moderately foliated to isotropic, medium- to coarse-grained rocksthat retain primary magmatic fabric and mineral com-positions. Metaluminous, strongly peraluminous, andrelatively younger alkaline granites occur in roughlyequal proportions across broad areas of Archean cratons, unlike the narrow belts of predominantly
granodiorite–granite in Mesozoic arcs of western Southand North America (Figure 9.16). Isotopic data aresparse and modes of origin and evolution of thesegranitic magmas remain speculative. However, a pla-gioclase residue in a source within the continental crustis implied by the depletion in Eu in the rocks. Hence,production of these granite magmas can be consideredas the earliest partial melting and recycling of oldercontinental rocks.
�19.5 MID-PROTEROZOIC TECTONISMAND MAGMATISM
During the middle Proterozoic and virtually only thentwo distinct magmatic associations were emplaced intothe continental crust; these are massif-type anorthositeand rapakivi granite. Because most of these rocks arespatially and temporally related to the evolution of the Grenville Province, this collisional terrane will bediscussed next, followed by a discussion of the twomiddle Proterozoic magmatic associations.
19.5.1 Grenville ProvinceSeveral Archean terranes, including the Superior, wereamalgamated in the Early Proterozoic from 1980 to1790 Ma, forming a complex collage of sutured terranes—the Laurentian Craton (Figure 19.27; see also Hoffman, 1989; Rivers, 1997). The southeastern mar-gin of this craton was subsequently partially reworkedby episodes of Andean-style orogeny and magmatismaccompanying northwest-directed plate convergence,adding progressively younger arc terranes betweenabout 1700 and 1200 Ma. Finally, continent–continentcollision during the Grenvillian Orogeny betweenabout 1190 and 980 Ma added still more real estate toLaurentia. The Grenville Orogen extends into Texasand Mexico but only the Canada segment is consideredhere. A Scandinavian segment, along with much of the colliding continent, now possibly South America,was rifted away sometime in the late Proterozoic. The Keweenawan mid-continent rift that contains as muchas 10 km of basalt formed farther into Laurentia duringthe Grenville orogeny at about 1100 Ma.
The Grenville Orogen (Figures 19.28 and 19.29) is notable for ductile deformation during thrusting and contemporaneous, widespread, high-grade meta-morphism that implies exposure of deeply eroded con-tinental crust. Granulite-facies rocks were equilibratedat depths of about 30–40 km (P � 8–11 kbar), while local eclogites equilibrated at P as much as 16 kbar and T � 700–800°C indicate much deeper burial,probably during stacking of thrust slices accompanyingcontinent–continent collision (Indares, 1993).
These thrust sheets moved northwesterly on south-east-dipping high-grade ductile shear zones, now mylo-nite. Scattered anorthosite suite magmas (discussed
636 Igneous and Metamorphic Petrology
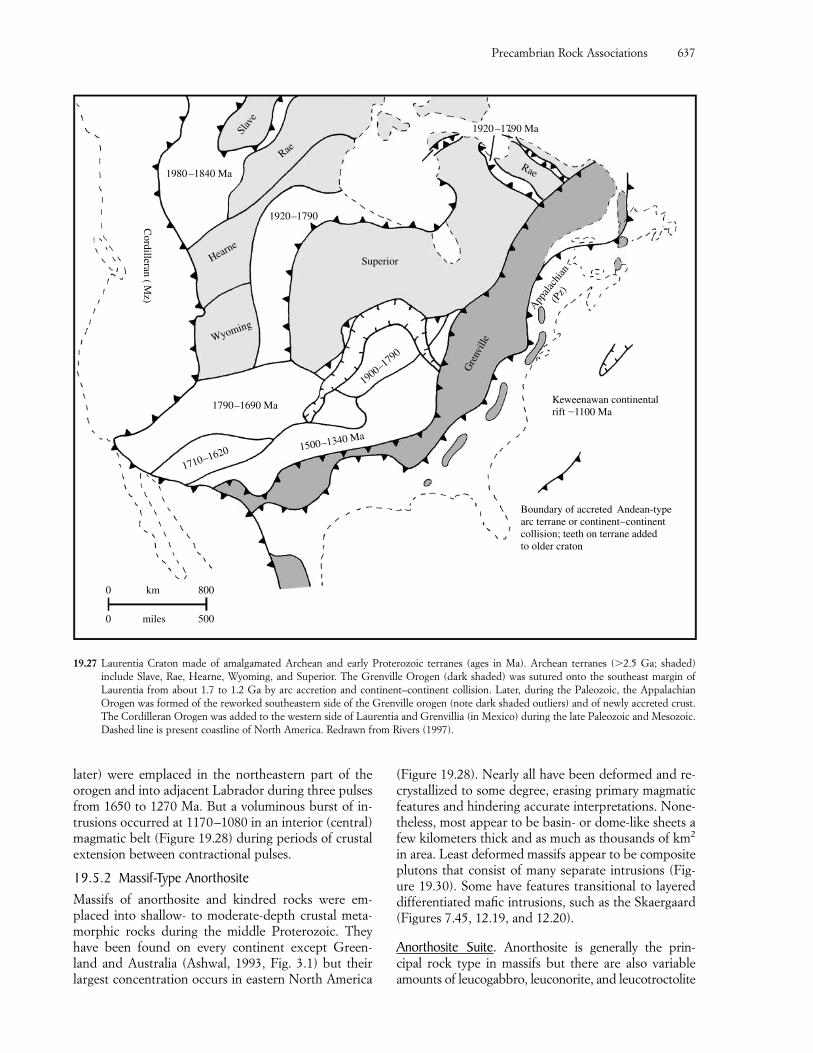
Boundary of accreted Andean-typearc terrane or continent–continentcollision; teeth on terrane addedto older craton
0 800
0 500
km
miles
1920 –1790 Ma
Rae
Superior
Slav
e
Rae
1980 –1840 Ma
Hearne
Wyoming
1790–1690 Ma
1710–1620 1500–1340 Ma
1900–1790
Gre
nvill
e
Appala
chian
(Pz)
Cordilleran (M
z)
Keweenawan continentalrift �1100 Ma
1920–1790
later) were emplaced in the northeastern part of theorogen and into adjacent Labrador during three pulsesfrom 1650 to 1270 Ma. But a voluminous burst of in-trusions occurred at 1170–1080 in an interior (central)magmatic belt (Figure 19.28) during periods of crustalextension between contractional pulses.
19.5.2 Massif-Type AnorthositeMassifs of anorthosite and kindred rocks were em-placed into shallow- to moderate-depth crustal meta-morphic rocks during the middle Proterozoic. Theyhave been found on every continent except Green-land and Australia (Ashwal, 1993, Fig. 3.1) but theirlargest concentration occurs in eastern North America
(Figure 19.28). Nearly all have been deformed and re-crystallized to some degree, erasing primary magmatic features and hindering accurate interpretations. None-theless, most appear to be basin- or dome-like sheets afew kilometers thick and as much as thousands of km2
in area. Least deformed massifs appear to be compositeplutons that consist of many separate intrusions (Fig-ure 19.30). Some have features transitional to layereddifferentiated mafic intrusions, such as the Skaergaard(Figures 7.45, 12.19, and 12.20).
Anorthosite Suite. Anorthosite is generally the prin-cipal rock type in massifs but there are also variableamounts of leucogabbro, leuconorite, and leucotroctolite
Precambrian Rock Associations 637
19.27 Laurentia Craton made of amalgamated Archean and early Proterozoic terranes (ages in Ma). Archean terranes (�2.5 Ga; shaded) include Slave, Rae, Hearne, Wyoming, and Superior. The Grenville Orogen (dark shaded) was sutured onto the southeast margin of Laurentia from about 1.7 to 1.2 Ga by arc accretion and continent–continent collision. Later, during the Paleozoic, the Appalachian Orogen was formed of the reworked southeastern side of the Grenville orogen (note dark shaded outliers) and of newly accreted crust.The Cordilleran Orogen was added to the western side of Laurentia and Grenvillia (in Mexico) during the late Paleozoic and Mesozoic.Dashed line is present coastline of North America. Redrawn from Rivers (1997).
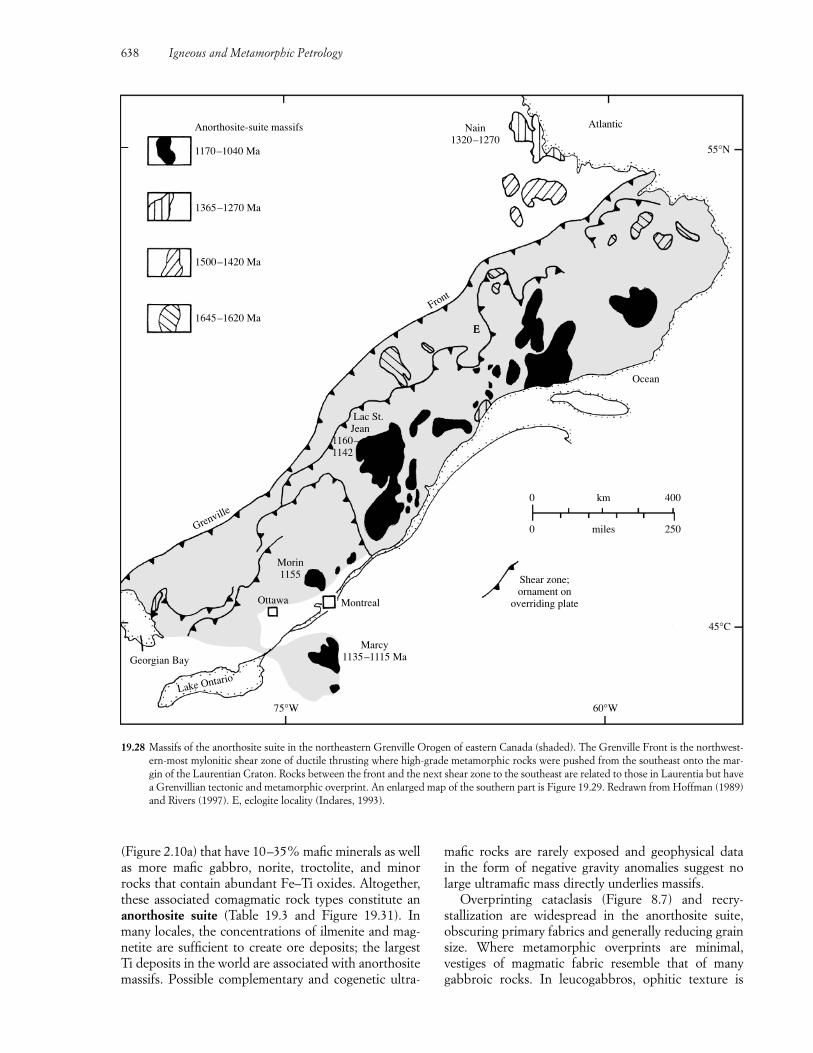
Anorthosite-suite massifs
1170–1040 Ma
1365–1270 Ma
Nain1320–1270
Atlantic
55°N
45°C
60°W
Shear zone;ornament on
overriding plate
E
1500–1420 Ma
1645–1620 Ma
Georgian Bay
Lake Ontario
75°W
Marcy1135–1115 Ma
MontrealOttawa
Morin1155
Grenville
Lac St. Jean1160–1142
E
Front
Ocean
0 km 400
0 miles 250
19.28 Massifs of the anorthosite suite in the northeastern Grenville Orogen of eastern Canada (shaded). The Grenville Front is the northwest-ern-most mylonitic shear zone of ductile thrusting where high-grade metamorphic rocks were pushed from the southeast onto the mar-gin of the Laurentian Craton. Rocks between the front and the next shear zone to the southeast are related to those in Laurentia but havea Grenvillian tectonic and metamorphic overprint. An enlarged map of the southern part is Figure 19.29. Redrawn from Hoffman (1989)and Rivers (1997). E, eclogite locality (Indares, 1993).
(Figure 2.10a) that have 10–35% mafic minerals as wellas more mafic gabbro, norite, troctolite, and minorrocks that contain abundant Fe–Ti oxides. Altogether,these associated comagmatic rock types constitute ananorthosite suite (Table 19.3 and Figure 19.31). Inmany locales, the concentrations of ilmenite and mag-netite are sufficient to create ore deposits; the largest Ti deposits in the world are associated with anorthositemassifs. Possible complementary and cogenetic ultra-
mafic rocks are rarely exposed and geophysical data in the form of negative gravity anomalies suggest nolarge ultramafic mass directly underlies massifs.
Overprinting cataclasis (Figure 8.7) and recry-stallization are widespread in the anorthosite suite, obscuring primary fabrics and generally reducing grainsize. Where metamorphic overprints are minimal, vestiges of magmatic fabric resemble that of many gabbroic rocks. In leucogabbros, ophitic texture is
638 Igneous and Metamorphic Petrology
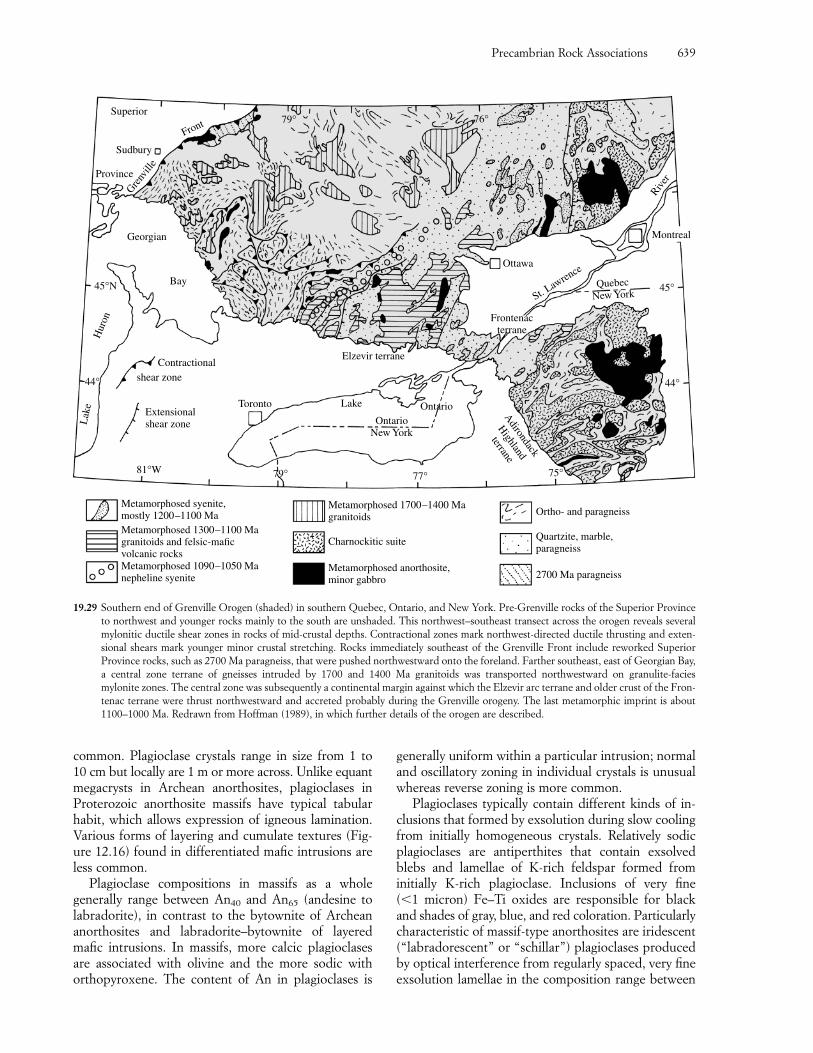
common. Plagioclase crystals range in size from 1 to 10 cm but locally are 1 m or more across. Unlike equantmegacrysts in Archean anorthosites, plagioclases inProterozoic anorthosite massifs have typical tabularhabit, which allows expression of igneous lamination.Various forms of layering and cumulate textures (Fig-ure 12.16) found in differentiated mafic intrusions areless common.
Plagioclase compositions in massifs as a whole generally range between An40 and An65 (andesine tolabradorite), in contrast to the bytownite of Archeananorthosites and labradorite–bytownite of layeredmafic intrusions. In massifs, more calcic plagioclasesare associated with olivine and the more sodic with orthopyroxene. The content of An in plagioclases is
generally uniform within a particular intrusion; normaland oscillatory zoning in individual crystals is unusualwhereas reverse zoning is more common.
Plagioclases typically contain different kinds of in-clusions that formed by exsolution during slow coolingfrom initially homogeneous crystals. Relatively sodicplagioclases are antiperthites that contain exsolvedblebs and lamellae of K-rich feldspar formed from initially K-rich plagioclase. Inclusions of very fine (�1 micron) Fe–Ti oxides are responsible for blackand shades of gray, blue, and red coloration. Particularlycharacteristic of massif-type anorthosites are iridescent(“labradorescent” or “schillar”) plagioclases producedby optical interference from regularly spaced, very fineexsolution lamellae in the composition range between
Precambrian Rock Associations 639
Metamorphosed syenite,mostly 1200–1100 Ma
Metamorphosed 1700–1400 Magranitoids Ortho- and paragneiss
Quartzite, marble,paragneiss
2700 Ma paragneiss
Charnockitic suite
Metamorphosed anorthosite,minor gabbro
Metamorphosed 1300–1100 Magranitoids and felsic-mafic volcanic rocksMetamorphosed 1090–1050 Manepheline syenite
81°W 79° 77° 75°
Extensionalshear zone
Toronto Lake OntarioOntario
New York
44°
45°
Montreal
Ottawa
QuebecNew YorkSt. L
awrence
River
Frontenacterrane
Elzevir terraneContractional
shear zone
Bay
Georgian
45°N
44°
Hur
on
Lak
e
Province
Grenv
ille
Sudbury
Superior
Front 79° 76°
Adirondack
Highland
terrane
19.29 Southern end of Grenville Orogen (shaded) in southern Quebec, Ontario, and New York. Pre-Grenville rocks of the Superior Provinceto northwest and younger rocks mainly to the south are unshaded. This northwest–southeast transect across the orogen reveals severalmylonitic ductile shear zones in rocks of mid-crustal depths. Contractional zones mark northwest-directed ductile thrusting and exten-sional shears mark younger minor crustal stretching. Rocks immediately southeast of the Grenville Front include reworked SuperiorProvince rocks, such as 2700 Ma paragneiss, that were pushed northwestward onto the foreland. Farther southeast, east of Georgian Bay,a central zone terrane of gneisses intruded by 1700 and 1400 Ma granitoids was transported northwestward on granulite-facies mylonite zones. The central zone was subsequently a continental margin against which the Elzevir arc terrane and older crust of the Fron-tenac terrane were thrust northwestward and accreted probably during the Grenville orogeny. The last metamorphic imprint is about1100–1000 Ma. Redrawn from Hoffman (1989), in which further details of the orogen are described.
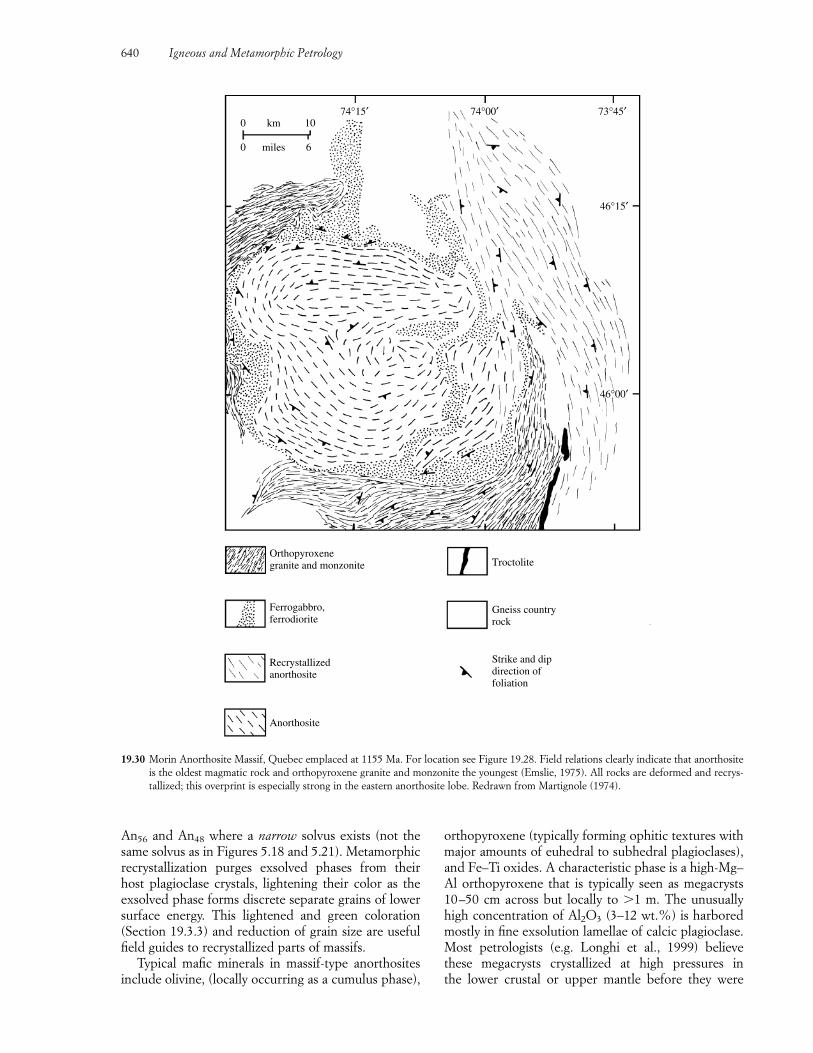
An56 and An48 where a narrow solvus exists (not thesame solvus as in Figures 5.18 and 5.21). Metamorphicrecrystallization purges exsolved phases from their host plagioclase crystals, lightening their color as theexsolved phase forms discrete separate grains of lowersurface energy. This lightened and green coloration(Section 19.3.3) and reduction of grain size are usefulfield guides to recrystallized parts of massifs.
Typical mafic minerals in massif-type anorthositesinclude olivine, (locally occurring as a cumulus phase),
orthopyroxene (typically forming ophitic textures withmajor amounts of euhedral to subhedral plagioclases),and Fe–Ti oxides. A characteristic phase is a high-Mg–Al orthopyroxene that is typically seen as megacrysts10–50 cm across but locally to �1 m. The unusuallyhigh concentration of Al2O3 (3–12 wt.%) is harboredmostly in fine exsolution lamellae of calcic plagioclase.Most petrologists (e.g. Longhi et al., 1999) believethese megacrysts crystallized at high pressures in the lower crustal or upper mantle before they were
640 Igneous and Metamorphic Petrology
Orthopyroxenegranite and monzonite
Ferrogabbro,ferrodiorite
Recrystallizedanorthosite
Anorthosite
Troctolite
Gneiss countryrock
Strike and dipdirection offoliation
0 km 10
0 miles 6
74°15′ 74°00′ 73°45′
46°15′
46°00′
19.30 Morin Anorthosite Massif, Quebec emplaced at 1155 Ma. For location see Figure 19.28. Field relations clearly indicate that anorthositeis the oldest magmatic rock and orthopyroxene granite and monzonite the youngest (Emslie, 1975). All rocks are deformed and recrys-tallized; this overprint is especially strong in the eastern anorthosite lobe. Redrawn from Martignole (1974).
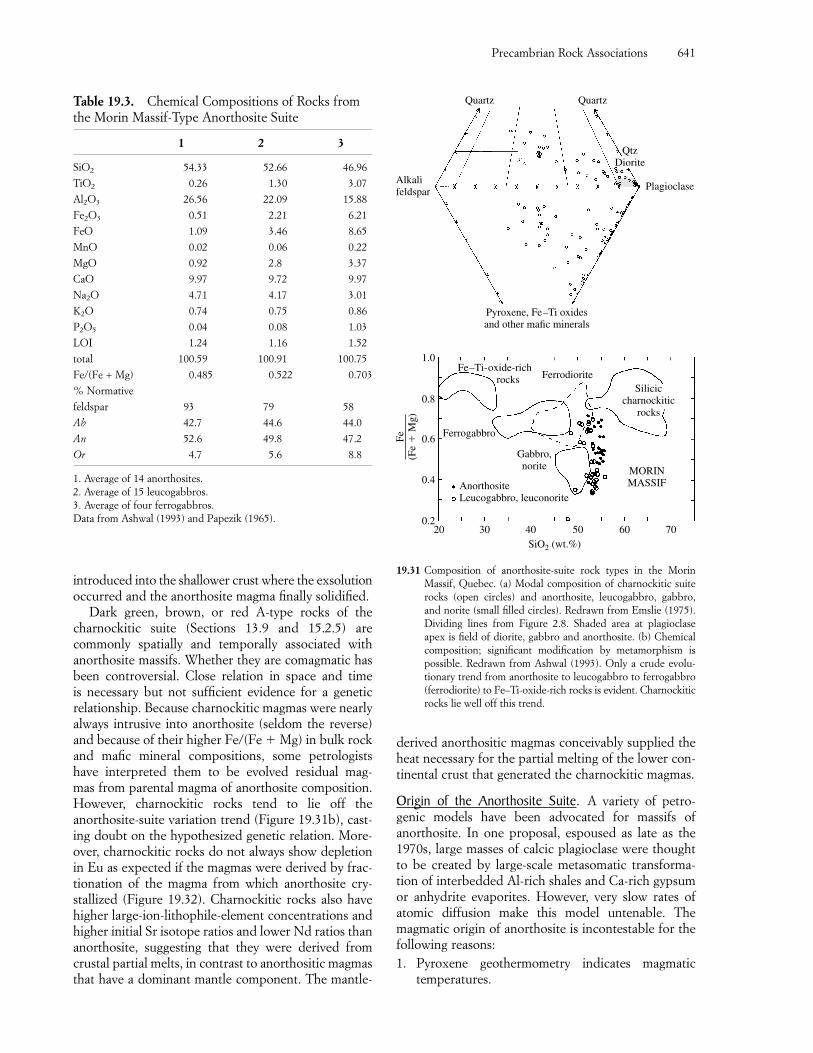
introduced into the shallower crust where the exsolutionoccurred and the anorthosite magma finally solidified.
Dark green, brown, or red A-type rocks of thecharnockitic suite (Sections 13.9 and 15.2.5) are commonly spatially and temporally associated withanorthosite massifs. Whether they are comagmatic hasbeen controversial. Close relation in space and time is necessary but not sufficient evidence for a genetic relationship. Because charnockitic magmas were nearlyalways intrusive into anorthosite (seldom the reverse)and because of their higher Fe/(Fe � Mg) in bulk rockand mafic mineral compositions, some petrologistshave interpreted them to be evolved residual mag-mas from parental magma of anorthosite composition.However, charnockitic rocks tend to lie off theanorthosite-suite variation trend (Figure 19.31b), cast-ing doubt on the hypothesized genetic relation. More-over, charnockitic rocks do not always show depletionin Eu as expected if the magmas were derived by frac-tionation of the magma from which anorthosite cry-stallized (Figure 19.32). Charnockitic rocks also havehigher large-ion-lithophile-element concentrations andhigher initial Sr isotope ratios and lower Nd ratios thananorthosite, suggesting that they were derived fromcrustal partial melts, in contrast to anorthositic magmasthat have a dominant mantle component. The mantle-
derived anorthositic magmas conceivably supplied theheat necessary for the partial melting of the lower con-tinental crust that generated the charnockitic magmas.
Origin of the Anorthosite Suite. A variety of petro-genic models have been advocated for massifs ofanorthosite. In one proposal, espoused as late as the1970s, large masses of calcic plagioclase were thoughtto be created by large-scale metasomatic transforma-tion of interbedded Al-rich shales and Ca-rich gypsumor anhydrite evaporites. However, very slow rates ofatomic diffusion make this model untenable. The magmatic origin of anorthosite is incontestable for thefollowing reasons:1. Pyroxene geothermometry indicates magmatic
temperatures.
Precambrian Rock Associations 641
Table 19.3. Chemical Compositions of Rocks fromthe Morin Massif-Type Anorthosite Suite
1 2 3
SiO2 54.33 52.66 46.96
TiO2 0.26 1.30 3.07
Al2O3 26.56 22.09 15.88
Fe2O3 0.51 2.21 6.21
FeO 1.09 3.46 8.65
MnO 0.02 0.06 0.22
MgO 0.92 2.8 3.37
CaO 9.97 9.72 9.97
Na2O 4.71 4.17 3.01
K2O 0.74 0.75 0.86
P2O5 0.04 0.08 1.03
LOI 1.24 1.16 1.52
total 100.59 100.91 100.75
Fe/(Fe + Mg) 0.485 0.522 0.703
% Normative
feldspar 93 79 58
Ab 42.7 44.6 44.0
An 52.6 49.8 47.2
Or 4.7 5.6 8.8
1. Average of 14 anorthosites.2. Average of 15 leucogabbros.3. Average of four ferrogabbros.Data from Ashwal (1993) and Papezik (1965).
Alkalifeldspar Plagioclase
Quartz Quartz
QtzDiorite
Pyroxene, Fe–Ti oxidesand other mafic minerals
19.31 Composition of anorthosite-suite rock types in the Morin Massif, Quebec. (a) Modal composition of charnockitic suiterocks (open circles) and anorthosite, leucogabbro, gabbro,and norite (small filled circles). Redrawn from Emslie (1975).Dividing lines from Figure 2.8. Shaded area at plagioclaseapex is field of diorite, gabbro and anorthosite. (b) Chemicalcomposition; significant modification by metamorphism ispossible. Redrawn from Ashwal (1993). Only a crude evolu-tionary trend from anorthosite to leucogabbro to ferrogabbro(ferrodiorite) to Fe–Ti-oxide-rich rocks is evident. Charnockiticrocks lie well off this trend.
Fe(F
e �
Mg)
1.0
0.8
0.6
0.4
0.2
SiO2 (wt.%)
Siliciccharnockitic
rocks
FerrodioriteFe–Ti-oxide-rich
rocks
Ferrogabbro
Gabbro,norite MORIN
MASSIF
20 30 40 50 60 70
AnorthositeLeucogabbro, leuconorite
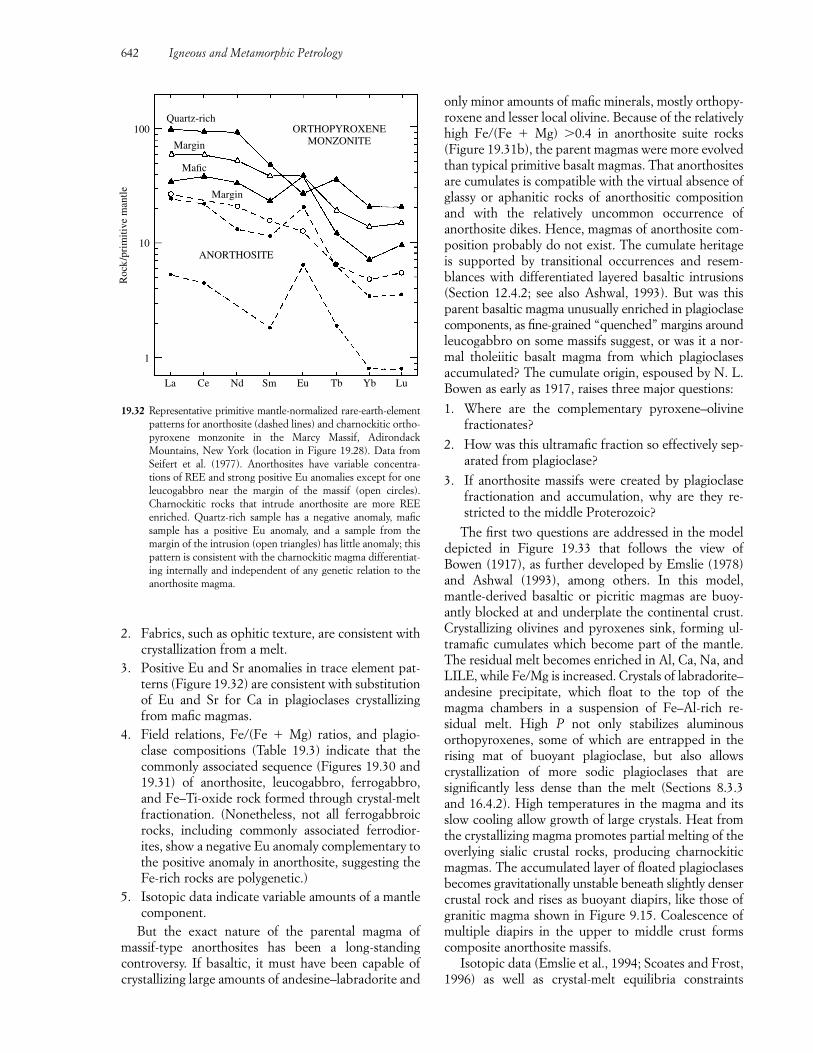
2. Fabrics, such as ophitic texture, are consistent withcrystallization from a melt.
3. Positive Eu and Sr anomalies in trace element pat-terns (Figure 19.32) are consistent with substitutionof Eu and Sr for Ca in plagioclases crystallizingfrom mafic magmas.
4. Field relations, Fe/(Fe � Mg) ratios, and plagio-clase compositions (Table 19.3) indicate that thecommonly associated sequence (Figures 19.30 and19.31) of anorthosite, leucogabbro, ferrogabbro,and Fe–Ti-oxide rock formed through crystal-meltfractionation. (Nonetheless, not all ferrogabbroicrocks, including commonly associated ferrodior-ites, show a negative Eu anomaly complementary tothe positive anomaly in anorthosite, suggesting theFe-rich rocks are polygenetic.)
5. Isotopic data indicate variable amounts of a mantlecomponent.
But the exact nature of the parental magma of massif-type anorthosites has been a long-standing controversy. If basaltic, it must have been capable ofcrystallizing large amounts of andesine–labradorite and
only minor amounts of mafic minerals, mostly orthopy-roxene and lesser local olivine. Because of the relativelyhigh Fe/(Fe � Mg) �0.4 in anorthosite suite rocks(Figure 19.31b), the parent magmas were more evolvedthan typical primitive basalt magmas. That anorthositesare cumulates is compatible with the virtual absence ofglassy or aphanitic rocks of anorthositic compositionand with the relatively uncommon occurrence ofanorthosite dikes. Hence, magmas of anorthosite com-position probably do not exist. The cumulate heritageis supported by transitional occurrences and resem-blances with differentiated layered basaltic intrusions(Section 12.4.2; see also Ashwal, 1993). But was thisparent basaltic magma unusually enriched in plagioclasecomponents, as fine-grained “quenched” margins aroundleucogabbro on some massifs suggest, or was it a nor-mal tholeiitic basalt magma from which plagioclases accumulated? The cumulate origin, espoused by N. L.Bowen as early as 1917, raises three major questions:
1. Where are the complementary pyroxene–olivinefractionates?
2. How was this ultramafic fraction so effectively sep-arated from plagioclase?
3. If anorthosite massifs were created by plagioclasefractionation and accumulation, why are they re-stricted to the middle Proterozoic?
The first two questions are addressed in the modeldepicted in Figure 19.33 that follows the view ofBowen (1917), as further developed by Emslie (1978)and Ashwal (1993), among others. In this model, mantle-derived basaltic or picritic magmas are buoy-antly blocked at and underplate the continental crust. Crystallizing olivines and pyroxenes sink, forming ul-tramafic cumulates which become part of the mantle.The residual melt becomes enriched in Al, Ca, Na, andLILE, while Fe/Mg is increased. Crystals of labradorite–andesine precipitate, which float to the top of themagma chambers in a suspension of Fe–Al-rich re-sidual melt. High P not only stabilizes aluminous orthopyroxenes, some of which are entrapped in the rising mat of buoyant plagioclase, but also allows crystallization of more sodic plagioclases that aresignificantly less dense than the melt (Sections 8.3.3and 16.4.2). High temperatures in the magma and itsslow cooling allow growth of large crystals. Heat fromthe crystallizing magma promotes partial melting of theoverlying sialic crustal rocks, producing charnockiticmagmas. The accumulated layer of floated plagioclasesbecomes gravitationally unstable beneath slightly densercrustal rock and rises as buoyant diapirs, like those ofgranitic magma shown in Figure 9.15. Coalescence ofmultiple diapirs in the upper to middle crust formscomposite anorthosite massifs.
Isotopic data (Emslie et al., 1994; Scoates and Frost,1996) as well as crystal-melt equilibria constraints
642 Igneous and Metamorphic Petrology
Roc
k/p
rim
itive
man
tle100
10
1
La
ANORTHOSITE
Margin
Mafic
Margin
Quartz-richORTHOPYROXENE
MONZONITE
Ce Nd Sm Eu Tb Yb Lu
19.32 Representative primitive mantle-normalized rare-earth-elementpatterns for anorthosite (dashed lines) and charnockitic ortho-pyroxene monzonite in the Marcy Massif, Adirondack Mountains, New York (location in Figure 19.28). Data fromSeifert et al. (1977). Anorthosites have variable concentra-tions of REE and strong positive Eu anomalies except for oneleucogabbro near the margin of the massif (open circles).Charnockitic rocks that intrude anorthosite are more REE enriched. Quartz-rich sample has a negative anomaly, maficsample has a positive Eu anomaly, and a sample from the margin of the intrusion (open triangles) has little anomaly; thispattern is consistent with the charnockitic magma differentiat-ing internally and independent of any genetic relation to theanorthosite magma.
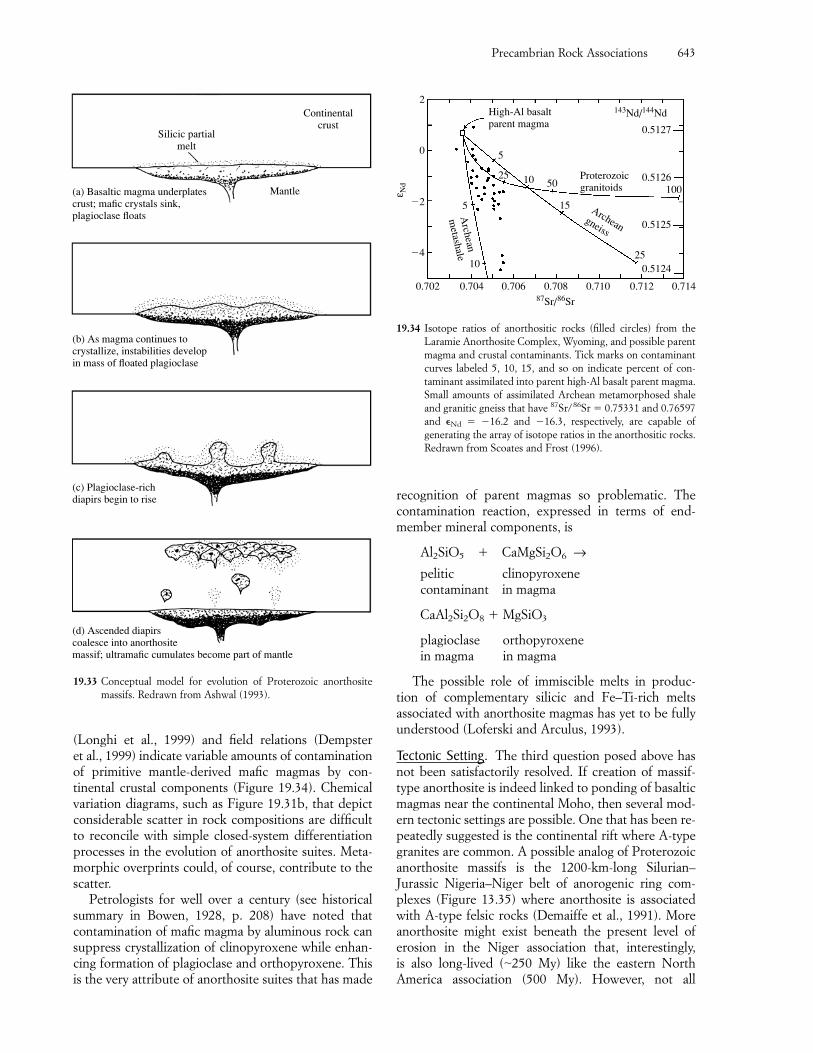
(Longhi et al., 1999) and field relations (Dempster et al., 1999) indicate variable amounts of contaminationof primitive mantle-derived mafic magmas by con-tinental crustal components (Figure 19.34). Chemicalvariation diagrams, such as Figure 19.31b, that depictconsiderable scatter in rock compositions are difficultto reconcile with simple closed-system differentiationprocesses in the evolution of anorthosite suites. Meta-morphic overprints could, of course, contribute to thescatter.
Petrologists for well over a century (see historicalsummary in Bowen, 1928, p. 208) have noted that contamination of mafic magma by aluminous rock cansuppress crystallization of clinopyroxene while enhan-cing formation of plagioclase and orthopyroxene. Thisis the very attribute of anorthosite suites that has made
recognition of parent magmas so problematic. Thecontamination reaction, expressed in terms of end-member mineral components, is
Al2SiO5 � CaMgSi2O6 →pelitic clinopyroxenecontaminant in magma
CaAl2Si2O8 � MgSiO3
plagioclase orthopyroxenein magma in magma
The possible role of immiscible melts in produc-tion of complementary silicic and Fe–Ti-rich melts associated with anorthosite magmas has yet to be fully understood (Loferski and Arculus, 1993).
Tectonic Setting. The third question posed above hasnot been satisfactorily resolved. If creation of massif-type anorthosite is indeed linked to ponding of basalticmagmas near the continental Moho, then several mod-ern tectonic settings are possible. One that has been re-peatedly suggested is the continental rift where A-typegranites are common. A possible analog of Proterozoicanorthosite massifs is the 1200-km-long Silurian–Jurassic Nigeria–Niger belt of anorogenic ring com-plexes (Figure 13.35) where anorthosite is associatedwith A-type felsic rocks (Demaiffe et al., 1991). Moreanorthosite might exist beneath the present level oferosion in the Niger association that, interestingly, is also long-lived (�250 My) like the eastern NorthAmerica association (500 My). However, not all
Precambrian Rock Associations 643
Silicic partialmelt
Continentalcrust
Mantle(a) Basaltic magma underplatescrust; mafic crystals sink,plagioclase floats
(b) As magma continues tocrystallize, instabilities developin mass of floated plagioclase
(c) Plagioclase-richdiapirs begin to rise
(d) Ascended diapirscoalesce into anorthositemassif; ultramafic cumulates become part of mantle
19.33 Conceptual model for evolution of Proterozoic anorthositemassifs. Redrawn from Ashwal (1993).
ε Nd
�2 5
10�4
0
2
5
25 10
15
250.5124
0.5125
0.5126
0.5127
143Nd/144Nd
50100
0.7140.7120.7100.7080.7060.7040.702
High-Al basaltparent magma
Proterozoicgranitoids
Archeangneiss
Archean
metashale
87Sr/86Sr
19.34 Isotope ratios of anorthositic rocks (filled circles) from theLaramie Anorthosite Complex, Wyoming, and possible parentmagma and crustal contaminants. Tick marks on contaminantcurves labeled 5, 10, 15, and so on indicate percent of con-taminant assimilated into parent high-Al basalt parent magma.Small amounts of assimilated Archean metamorphosed shaleand granitic gneiss that have 87Sr/86Sr � 0.75331 and 0.76597and �Nd � �16.2 and �16.3, respectively, are capable of generating the array of isotope ratios in the anorthositic rocks.Redrawn from Scoates and Frost (1996).
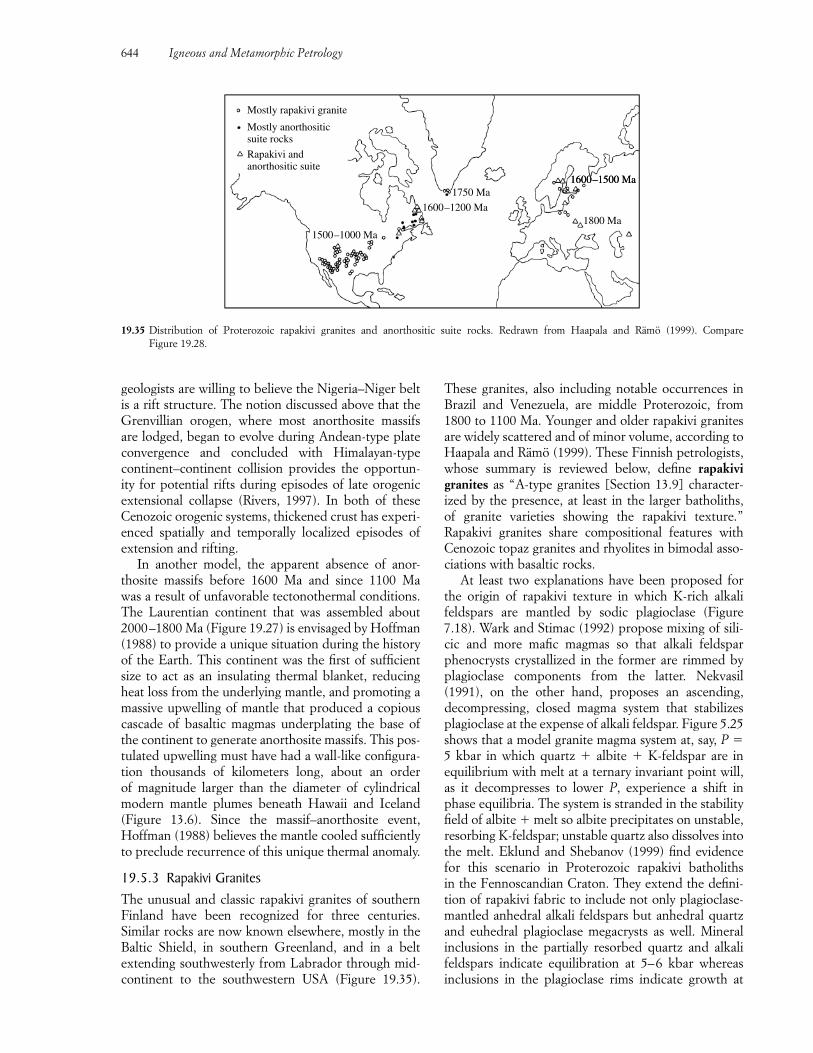
geologists are willing to believe the Nigeria–Niger beltis a rift structure. The notion discussed above that theGrenvillian orogen, where most anorthosite massifs are lodged, began to evolve during Andean-type plateconvergence and concluded with Himalayan-type continent–continent collision provides the opportun-ity for potential rifts during episodes of late orogenicextensional collapse (Rivers, 1997). In both of theseCenozoic orogenic systems, thickened crust has experi-enced spatially and temporally localized episodes of extension and rifting.
In another model, the apparent absence of anor-thosite massifs before 1600 Ma and since 1100 Ma was a result of unfavorable tectonothermal conditions.The Laurentian continent that was assembled about2000–1800 Ma (Figure 19.27) is envisaged by Hoffman(1988) to provide a unique situation during the historyof the Earth. This continent was the first of sufficientsize to act as an insulating thermal blanket, reducingheat loss from the underlying mantle, and promoting amassive upwelling of mantle that produced a copiouscascade of basaltic magmas underplating the base ofthe continent to generate anorthosite massifs. This pos-tulated upwelling must have had a wall-like configura-tion thousands of kilometers long, about an order of magnitude larger than the diameter of cylindrical modern mantle plumes beneath Hawaii and Iceland(Figure 13.6). Since the massif–anorthosite event,Hoffman (1988) believes the mantle cooled sufficientlyto preclude recurrence of this unique thermal anomaly.
19.5.3 Rapakivi GranitesThe unusual and classic rapakivi granites of southernFinland have been recognized for three centuries. Similar rocks are now known elsewhere, mostly in theBaltic Shield, in southern Greenland, and in a belt extending southwesterly from Labrador through mid-continent to the southwestern USA (Figure 19.35).
These granites, also including notable occurrences inBrazil and Venezuela, are middle Proterozoic, from1800 to 1100 Ma. Younger and older rapakivi granitesare widely scattered and of minor volume, according toHaapala and Rämö (1999). These Finnish petrologists,whose summary is reviewed below, define rapakivigranites as “A-type granites [Section 13.9] character-ized by the presence, at least in the larger batholiths, of granite varieties showing the rapakivi texture.” Rapakivi granites share compositional features withCenozoic topaz granites and rhyolites in bimodal asso-ciations with basaltic rocks.
At least two explanations have been proposed forthe origin of rapakivi texture in which K-rich alkalifeldspars are mantled by sodic plagioclase (Figure7.18). Wark and Stimac (1992) propose mixing of sili-cic and more mafic magmas so that alkali feldspar phenocrysts crystallized in the former are rimmed byplagioclase components from the latter. Nekvasil(1991), on the other hand, proposes an ascending, decompressing, closed magma system that stabilizesplagioclase at the expense of alkali feldspar. Figure 5.25shows that a model granite magma system at, say, P �5 kbar in which quartz � albite � K-feldspar are inequilibrium with melt at a ternary invariant point will,as it decompresses to lower P, experience a shift inphase equilibria. The system is stranded in the stabilityfield of albite � melt so albite precipitates on unstable,resorbing K-feldspar; unstable quartz also dissolves intothe melt. Eklund and Shebanov (1999) find evidencefor this scenario in Proterozoic rapakivi batholiths in the Fennoscandian Craton. They extend the defini-tion of rapakivi fabric to include not only plagioclase-mantled anhedral alkali feldspars but anhedral quartzand euhedral plagioclase megacrysts as well. Mineralinclusions in the partially resorbed quartz and alkalifeldspars indicate equilibration at 5–6 kbar whereas inclusions in the plagioclase rims indicate growth at
644 Igneous and Metamorphic Petrology
Mostly rapakivi granite
Mostly anorthositicsuite rocks
Rapakivi andanorthositic suite
1500–1000 Ma
1600–1200 Ma
1600–1500 Ma1600–1500 Ma
1800 Ma
1750 Ma
19.35 Distribution of Proterozoic rapakivi granites and anorthositic suite rocks. Redrawn from Haapala and Rämö (1999). Compare Figure 19.28.
1–3.5 kbar. Evidence for a decompression origin of rapakivi texture is better preserved in shallower plu-tons than in larger, deep crustal, more slowly cooled intrusions.
The prominent belt of rapakivi granites in northernEurope and across North America coincides broadly inage and eclipses the geographic belt of massif-typeanorthosite suite (Figures 19.28 and 19.35). Hence, any model explaining the origin of the former mustsomehow account for the latter, even though the twomay not be strictly co-magmatic. The two might at leastshare a similar tectonic setting.
Though by no means certain, an incipient oraborted continental rift has been suggested becausethis is the tectonic setting of Phanerozoic A-type gran-ites. Indeed, extensional tectonic features have beenrecognized in some of the Finish Proterozoic rapakivioccurrences. A preferred model (Frost and Frost,1997; Haapala and Rämö, 1999) for the origin of the essentially bimodal mafic–silicic magmas of theanorthosite–granite association involves underplatingof continental crust by mantle-derived tholeiitic basaltmagmas. Expelled heat generates granitic partial meltsfrom sialic country rocks. However, the lack of negat-ive Nb anomalies in most rapakivi and A-type granitesprecludes much crustal contribution. This suggeststhat, especially for the more reduced rapakivi magmas,derivation was by extreme differentiation of the tholei-itic intrusions or partial melting of them generated byheat from subsequent and continuing underplating(Section 13.9.2).
U–Pb chronologic data show that the three-stepwestward growth of the Proterozoic Baltic Shield insouthwestern Sweden by arc magmatism was “echoed”by three slightly younger episodes of also westward mi-grating intracratonic rapakivi magmatism in southeast-ern Sweden (Åhäll et al., 2000). How these contrastingstyles of magmatism might be linked in the convectingmantle is speculative. Indeed, how magmatism in the8000-km-long belt of 1800–1100 Ma rapakivi granitesand largely coeval anorthositic rocks is linked to man-tle dynamics is a major unresolved question.
�19.6 GRANULITE-FACIES TERRANES IN ARCHEAN AND PROTEROZOICCRATONS
Although Phanerozoic granulite-facies rocks do exist,such as the famous Hercynian granulites of Europeformed at about 300 Ma, the majority of these high-grade metamorphic rocks occur in Precambrian cra-tons (Harley, 1989). In some places, there is a regularand continuous prograde zonation from amphibolite-facies rocks into granulite but more typically a terraneof wholly granulite-facies rocks is separated from un-
like rocks by an unconformity, post-metamorphic fault,or shear zone. Some wholly granulite terranes weremetamorphosed at constant P but variable T, whereasothers are the reverse. Many granulite terranes showpartial to complete retrogression to amphibolite- orgreenschist-facies assemblages, particularly along faultsand shear zones where water infiltrated. Granulite protoliths are compositionally diverse sedimentary and magmatic rocks. Polymetamorphism is typical.Charnockitic rocks (Section 15.2.5) are widespread.Many granulite terranes have a subhorizontal planarfabric expressed by compositional layering that hasbeen locally isoclinally folded and transposed into root-less folds (Figure 14.19b). This fabric is consistent withlarge amounts of vertical flattening and subhorizontalextension.
For brevity in this section, granulite-facies rocks andterranes will simply be referred to as granulites. This usage does not connote a particular fabric, as in theolder geologic literature.
19.6.1 Mineral Assemblages and ReactionsThe transition from hydrous amphibolite-facies to mostlyanhydrous granulite assemblages (Sections 18.3.1 and18.3.5) is marked by formation of orthopyroxene �alkali feldspar at the expense of biotite in pelitic andfelsic rocks and of orthopyroxene � clinopyroxene (�almandine–pyrope garnet � quartz) from hornblendein more mafic rocks. Mineral assemblages and thermo-barometry indicate granulite assemblages equilibrateover a broad range of temperatures generally fromabout 650 to 900°C but to as much as 1050°C and pressures of generally �5 kbar to as much as 12 kbaror depths of 20–45 km (Harley, 1989, 1998). Lowerpressures are the same as those at which amphibolite-facies assemblages equilibrate but temperatures arehigher and water activity is lower. At one time it wasthought that the only difference in equilibrating con-dition was the lower water activity. Possible factorslowering water activity include extraction of waterfrom the prograding system via dehydration reactions,extraction of hydrous partial melts, or transfer of waterdown a concentration gradient into adjacent dry maficmagmas. Another factor in the conversion could beinfiltration of CO2 into the amphibolite system, dilut-ing the water concentration and destabilizing hydrousphases. That this can actually happen is vividly shownin outcrops in southern India where light-colored amphibole–feldspar orthogneiss has been convertedinto dark pyroxene charnockite in folds and tensionfractures related to overprinting shear deformation( Janardhan et al., 1982). Fluid inclusions in thecharnockite are dominantly CO2 whereas those in theamphibole gneiss are dominantly H2O. Beginning with Touret in 1971 (see Touret and Hartel, 1988), thiscontrast in fluid inclusion composition between
Precambrian Rock Associations 645
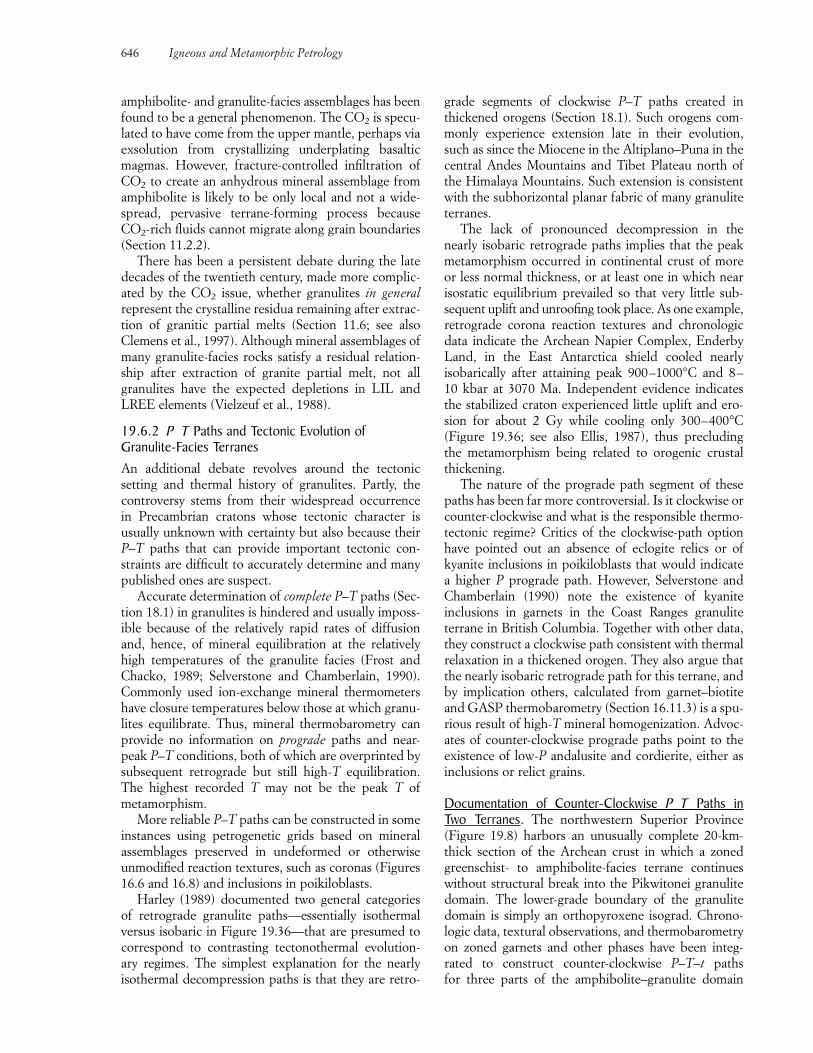
amphibolite- and granulite-facies assemblages has beenfound to be a general phenomenon. The CO2 is specu-lated to have come from the upper mantle, perhaps viaexsolution from crystallizing underplating basalticmagmas. However, fracture-controlled infiltration ofCO2 to create an anhydrous mineral assemblage fromamphibolite is likely to be only local and not a wide-spread, pervasive terrane-forming process becauseCO2-rich fluids cannot migrate along grain boundaries(Section 11.2.2).
There has been a persistent debate during the latedecades of the twentieth century, made more complic-ated by the CO2 issue, whether granulites in generalrepresent the crystalline residua remaining after extrac-tion of granitic partial melts (Section 11.6; see alsoClemens et al., 1997). Although mineral assemblages ofmany granulite-facies rocks satisfy a residual relation-ship after extraction of granite partial melt, not allgranulites have the expected depletions in LIL andLREE elements (Vielzeuf et al., 1988).
19.6.2 P T Paths and Tectonic Evolution ofGranulite-Facies TerranesAn additional debate revolves around the tectonic setting and thermal history of granulites. Partly, thecontroversy stems from their widespread occurrence in Precambrian cratons whose tectonic character isusually unknown with certainty but also because theirP–T paths that can provide important tectonic con-straints are difficult to accurately determine and manypublished ones are suspect.
Accurate determination of complete P–T paths (Sec-tion 18.1) in granulites is hindered and usually imposs-ible because of the relatively rapid rates of diffusionand, hence, of mineral equilibration at the relativelyhigh temperatures of the granulite facies (Frost andChacko, 1989; Selverstone and Chamberlain, 1990).Commonly used ion-exchange mineral thermometershave closure temperatures below those at which granu-lites equilibrate. Thus, mineral thermobarometry canprovide no information on prograde paths and near-peak P–T conditions, both of which are overprinted bysubsequent retrograde but still high-T equilibration.The highest recorded T may not be the peak T of metamorphism.
More reliable P–T paths can be constructed in someinstances using petrogenetic grids based on mineral assemblages preserved in undeformed or otherwise unmodified reaction textures, such as coronas (Figures16.6 and 16.8) and inclusions in poikiloblasts.
Harley (1989) documented two general categoriesof retrograde granulite paths—essentially isothermalversus isobaric in Figure 19.36—that are presumed tocorrespond to contrasting tectonothermal evolution-ary regimes. The simplest explanation for the nearlyisothermal decompression paths is that they are retro-
grade segments of clockwise P–T paths created inthickened orogens (Section 18.1). Such orogens com-monly experience extension late in their evolution,such as since the Miocene in the Altiplano–Puna in thecentral Andes Mountains and Tibet Plateau north ofthe Himalaya Mountains. Such extension is consistentwith the subhorizontal planar fabric of many granuliteterranes.
The lack of pronounced decompression in thenearly isobaric retrograde paths implies that the peakmetamorphism occurred in continental crust of moreor less normal thickness, or at least one in which nearisostatic equilibrium prevailed so that very little sub-sequent uplift and unroofing took place. As one example,retrograde corona reaction textures and chronologicdata indicate the Archean Napier Complex, EnderbyLand, in the East Antarctica shield cooled nearly isobarically after attaining peak 900–1000°C and 8–10 kbar at 3070 Ma. Independent evidence indicatesthe stabilized craton experienced little uplift and ero-sion for about 2 Gy while cooling only 300–400°C(Figure 19.36; see also Ellis, 1987), thus precluding the metamorphism being related to orogenic crustalthickening.
The nature of the prograde path segment of thesepaths has been far more controversial. Is it clockwise orcounter-clockwise and what is the responsible thermo-tectonic regime? Critics of the clockwise-path optionhave pointed out an absence of eclogite relics or ofkyanite inclusions in poikiloblasts that would indicate a higher P prograde path. However, Selverstone andChamberlain (1990) note the existence of kyanite inclusions in garnets in the Coast Ranges granulite terrane in British Columbia. Together with other data,they construct a clockwise path consistent with thermalrelaxation in a thickened orogen. They also argue thatthe nearly isobaric retrograde path for this terrane, andby implication others, calculated from garnet–biotiteand GASP thermobarometry (Section 16.11.3) is a spu-rious result of high-T mineral homogenization. Advoc-ates of counter-clockwise prograde paths point to the existence of low-P andalusite and cordierite, either asinclusions or relict grains.
Documentation of Counter-Clockwise P T Paths inTwo Terranes. The northwestern Superior Province(Figure 19.8) harbors an unusually complete 20-km-thick section of the Archean crust in which a zonedgreenschist- to amphibolite-facies terrane continueswithout structural break into the Pikwitonei granulitedomain. The lower-grade boundary of the granulitedomain is simply an orthopyroxene isograd. Chrono-logic data, textural observations, and thermobarometryon zoned garnets and other phases have been integ-rated to construct counter-clockwise P–T–t paths for three parts of the amphibolite–granulite domain
646 Igneous and Metamorphic Petrology
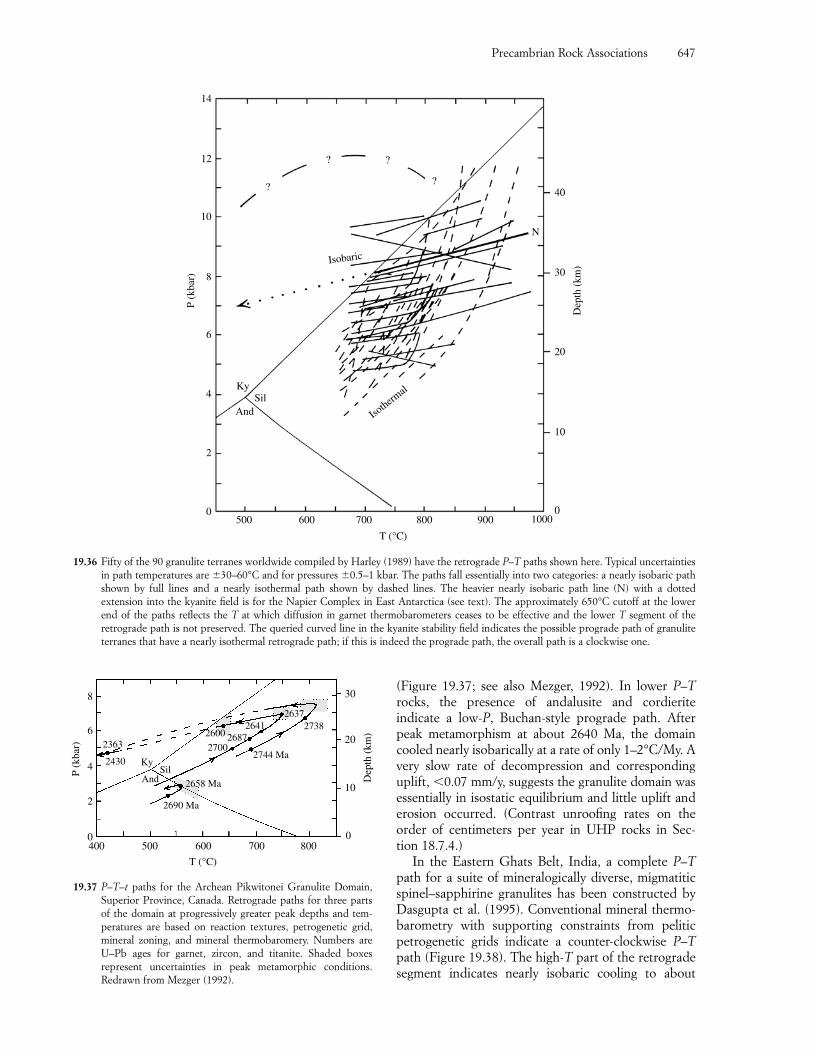
(Figure 19.37; see also Mezger, 1992). In lower P–Trocks, the presence of andalusite and cordierite indicate a low-P, Buchan-style prograde path. Afterpeak metamorphism at about 2640 Ma, the domaincooled nearly isobarically at a rate of only 1–2°C/My. Avery slow rate of decompression and correspondinguplift, �0.07 mm/y, suggests the granulite domain wasessentially in isostatic equilibrium and little uplift and erosion occurred. (Contrast unroofing rates on the order of centimeters per year in UHP rocks in Sec-tion 18.7.4.)
In the Eastern Ghats Belt, India, a complete P–Tpath for a suite of mineralogically diverse, migmatiticspinel–sapphirine granulites has been constructed byDasgupta et al. (1995). Conventional mineral thermo-barometry with supporting constraints from peliticpetrogenetic grids indicate a counter-clockwise P–Tpath (Figure 19.38). The high-T part of the retrogradesegment indicates nearly isobaric cooling to about
Precambrian Rock Associations 647
P (k
bar)
Dep
th (
km)
14
12
10
8
6
4
2
0
40
30
10
20
01000900800700
T (°C)
600500
?
? ?
?
Isobaric
Isotherm
alKySil
And
N
19.36 Fifty of the 90 granulite terranes worldwide compiled by Harley (1989) have the retrograde P–T paths shown here. Typical uncertaintiesin path temperatures are �30–60°C and for pressures �0.5–1 kbar. The paths fall essentially into two categories: a nearly isobaric pathshown by full lines and a nearly isothermal path shown by dashed lines. The heavier nearly isobaric path line (N) with a dotted extension into the kyanite field is for the Napier Complex in East Antarctica (see text). The approximately 650°C cutoff at the lower end of the paths reflects the T at which diffusion in garnet thermobarometers ceases to be effective and the lower T segment of the retrograde path is not preserved. The queried curved line in the kyanite stability field indicates the possible prograde path of granuliteterranes that have a nearly isothermal retrograde path; if this is indeed the prograde path, the overall path is a clockwise one.
P (k
bar)
Dep
th (
km)
8
6
4
2
0400 500
26372738
2744 Ma
2690 Ma
2658 Ma
SilKy
And
2363
24302700
26872641
2600
600
T (°C)
700 800
30
20
10
0
19.37 P–T–t paths for the Archean Pikwitonei Granulite Domain,Superior Province, Canada. Retrograde paths for three partsof the domain at progressively greater peak depths and tem-peratures are based on reaction textures, petrogenetic grid,mineral zoning, and mineral thermobaromery. Numbers areU–Pb ages for garnet, zircon, and titanite. Shaded boxes represent uncertainties in peak metamorphic conditions. Redrawn from Mezger (1992).
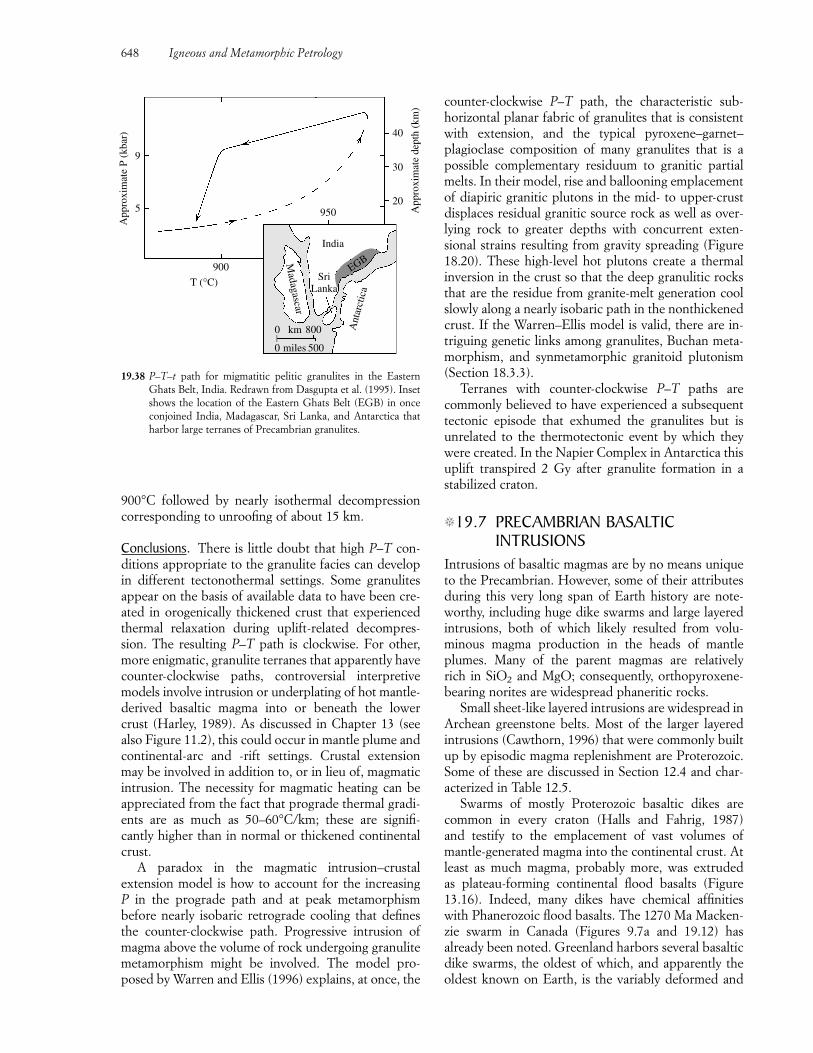
900°C followed by nearly isothermal decompressioncorresponding to unroofing of about 15 km.
Conclusions. There is little doubt that high P–T con-ditions appropriate to the granulite facies can developin different tectonothermal settings. Some granulitesappear on the basis of available data to have been cre-ated in orogenically thickened crust that experiencedthermal relaxation during uplift-related decompres-sion. The resulting P–T path is clockwise. For other,more enigmatic, granulite terranes that apparently havecounter-clockwise paths, controversial interpretivemodels involve intrusion or underplating of hot mantle-derived basaltic magma into or beneath the lower crust (Harley, 1989). As discussed in Chapter 13 (seealso Figure 11.2), this could occur in mantle plume andcontinental-arc and -rift settings. Crustal extensionmay be involved in addition to, or in lieu of, magmaticintrusion. The necessity for magmatic heating can beappreciated from the fact that prograde thermal gradi-ents are as much as 50–60°C/km; these are signifi-cantly higher than in normal or thickened continentalcrust.
A paradox in the magmatic intrusion–crustal extension model is how to account for the increasing P in the prograde path and at peak metamorphism before nearly isobaric retrograde cooling that defines the counter-clockwise path. Progressive intrusion ofmagma above the volume of rock undergoing granulitemetamorphism might be involved. The model pro-posed by Warren and Ellis (1996) explains, at once, the
counter-clockwise P–T path, the characteristic sub-horizontal planar fabric of granulites that is consistentwith extension, and the typical pyroxene–garnet–plagioclase composition of many granulites that is apossible complementary residuum to granitic partialmelts. In their model, rise and ballooning emplacementof diapiric granitic plutons in the mid- to upper-crustdisplaces residual granitic source rock as well as over-lying rock to greater depths with concurrent exten-sional strains resulting from gravity spreading (Figure18.20). These high-level hot plutons create a thermalinversion in the crust so that the deep granulitic rocksthat are the residue from granite-melt generation coolslowly along a nearly isobaric path in the nonthickenedcrust. If the Warren–Ellis model is valid, there are in-triguing genetic links among granulites, Buchan meta-morphism, and synmetamorphic granitoid plutonism(Section 18.3.3).
Terranes with counter-clockwise P–T paths are commonly believed to have experienced a subsequenttectonic episode that exhumed the granulites but is unrelated to the thermotectonic event by which theywere created. In the Napier Complex in Antarctica thisuplift transpired 2 Gy after granulite formation in a stabilized craton.
�19.7 PRECAMBRIAN BASALTICINTRUSIONS
Intrusions of basaltic magmas are by no means uniqueto the Precambrian. However, some of their attributesduring this very long span of Earth history are note-worthy, including huge dike swarms and large layeredintrusions, both of which likely resulted from volu-minous magma production in the heads of mantleplumes. Many of the parent magmas are relatively rich in SiO2 and MgO; consequently, orthopyroxene-bearing norites are widespread phaneritic rocks.
Small sheet-like layered intrusions are widespread inArchean greenstone belts. Most of the larger layeredintrusions (Cawthorn, 1996) that were commonly builtup by episodic magma replenishment are Proterozoic.Some of these are discussed in Section 12.4 and char-acterized in Table 12.5.
Swarms of mostly Proterozoic basaltic dikes arecommon in every craton (Halls and Fahrig, 1987) and testify to the emplacement of vast volumes of mantle-generated magma into the continental crust. Atleast as much magma, probably more, was extruded as plateau-forming continental flood basalts (Figure13.16). Indeed, many dikes have chemical affinitieswith Phanerozoic flood basalts. The 1270 Ma Macken-zie swarm in Canada (Figures 9.7a and 19.12) has already been noted. Greenland harbors several basalticdike swarms, the oldest of which, and apparently theoldest known on Earth, is the variably deformed and
648 Igneous and Metamorphic Petrology
App
roxi
mat
e P
(kba
r)
App
roxi
mat
e de
pth
(km
)
9
5
40
30
20950
900
T (°C)
0 800
SriLanka
India
km
0 500miles
Madagascar
Ant
arct
ica
EGB
19.38 P–T–t path for migmatitic pelitic granulites in the EasternGhats Belt, India. Redrawn from Dasgupta et al. (1995). Insetshows the location of the Eastern Ghats Belt (EGB) in onceconjoined India, Madagascar, Sri Lanka, and Antarctica thatharbor large terranes of Precambrian granulites.
metamorphosed 3400–3100 Ma Ameralik–Tarssartôqswarm in the area around Godthåb (Figure 19.2) thatintrudes the 3800 Ma Amîtsoq granitic gneisses (Figure14.38).
Thick sequences of flood basalts and local komatiitewere emplaced at about 2715 Ma on the Pilbara, Superior, and Kaapvaal cratons and 2760–2680 Ma onSouth American and Indian cratons. Because these cra-tons don’t share earlier geologic histories and thereforeevolved as separate entities, Nelson et al. (1999) specu-late that this episode of volcanism reflects a global-scaleconvective overturn of the mantle and massive decom-pression melting. Overlying thick accumulations of lateArchean–early Proterozoic banded iron formations inthese cratons may have resulted from related fluctua-tions in global sea level and by enrichment of seawaterin Fe from the partly submarine lavas.
As many as nine distinct swarms of Proterozoicbasaltic dikes are evident in the southern SuperiorProvince (Figure 19.12). The largest of these is thenorth- to northwest-striking, 2470–2450 Ma Hearst–Matachewan swarm which intrudes an area �250 000 km2
and represents a minimum volume of 50 000 km3 ofbasaltic magma. This swarm may well be the oldestpreserved large igneous province that was formedabove a major mantle plume (Heaman, 1997). Severallarge-volume basaltic intrusions of about the same ageare known around the world (Table 12.5), includingthe 2460 Ma Great Dyke of Zimbabwe, 2440–2450 Malayered mafic intrusions, flood basalts and dike swarmsin the Karelian craton of Finland and Russia, and 2420 Ma dike swarms in the Lewisian craton, Scotland,in the Dharwar craton, India, in the Vestfold craton,Antarctica, and in the Yilgarn block, Western Aus-tralia, which also includes the Jimberlana layered intrusion. One or more mantle plume systems, depend-ing on how the cratons were then amalgamated, may be represented in these widespread basaltic intrusions.They possibly reflect a major shift in global mantle dy-namics at 2460–2420 Ma near the transition betweenthe greenstone-belt dominated Archean and moremodern mafic petrotectonic associations of the Pro-terozoic and Phanerozoic.
Another facet of the shift in global dynamics nearthe Archean–Proterozoic time boundary resulted incontrasts in the mantle lithosphere underpinning con-tinental crusts. Using geophysical and xenolith data,O’Reilly et al. (2001) show that Archean lithosphereconsists mostly of depleted peridotite, including lher-zolite and large proportions of low Ca–Al, clinopyroxene-free harzburgite, whereas Proterozoic lithosphere issignificantly less depleted and Phanerozoic still less.The refractory, relatively buoyant, thick keel beneathArchean cratons must have contributed to their stabil-ity and longevity for the past 2.5 Gy, limiting their elim-ination by gravitational forces and by partial melting.
�19.8 MODELS FOR THE EVOLUTION OFTHE PRECAMBRIAN CRUST
In this last section, we return to the basic questionsposed at the beginning of the chapter regarding the nature of the Precambrian mafic and sialic crusts of theEarth and how they have evolved throughout geologictime. We attempt to draw together ideas concerningthe magmatic and tectonic processes involved in thisevolution (Hoffman, 1989; Windley, 1995). Some ten-tative conclusions can be drawn but they should onlybe considered as steps toward final answers. Compar-isons are made with modern processes of continentalgrowth, including arc magmatism drawing juvenilepartial melts from the mantle and accretion of oceanicterranes.
For some geologists, the bimodal association ofgranitoid and greenstone represents vestiges of ancientfelsic crust and mafic ocean basins. But other geologistsare unwilling to accept such a simple explanation or areunwilling to believe in their formation by plate tectonicprocesses as we know them today. This unwillingnessarises in part from occurrence of unique rocks and associations during the Archean and the absence ofothers found in the Phanerozoic (Figure 19.39b). Komatiite, megacrystic anorthosite, and widespreadTTG and greenstone sequences occur in the Archeanand anorthosite suite massifs and rapakivi granite inthe Proterozoic. Alkalic rocks, ophiolite, eclogite, andblueschist-facies rocks are absent through most of theArchean and into the Proterozoic.
Despite the naysayers, an experienced Precambriangeologist, Hoffman (1989), concludes that Archeanrocks are compositionally similar to those formed atmodern subduction zones, with differences attribut-able to higher mean mantle T and possibly greater melting of subducting oceanic crust at mantle depths.At the risk of being dogmatic, Windley (1995, p. 409)that “the conclusions of hundreds of internationalearth scientists of every possible discipline working onArchean rocks and theoretical models . . . all point intheir independent ways to broadly the same conclu-sion, namely, that some form of modern-style plate tectonic activity was responsible for the growth of thecontinents in the Archean.” We have to find explana-tions for the differences!
If plate tectonics had prevailed in the young Earth,its character would likely have been different from todaybecause it was significantly hotter (Figure 19.39a). Because rocks preserved in remnants of Archean continents do not show elevated geothermal gradientsrelative to young rocks, the excess heat must have beendissipated through the oceanic crust where, today,most internal heat is efficiently dissipated by advectingseawater and mantle convection; the latter would havebeen more vigorous than today because of the reduced
Precambrian Rock Associations 649
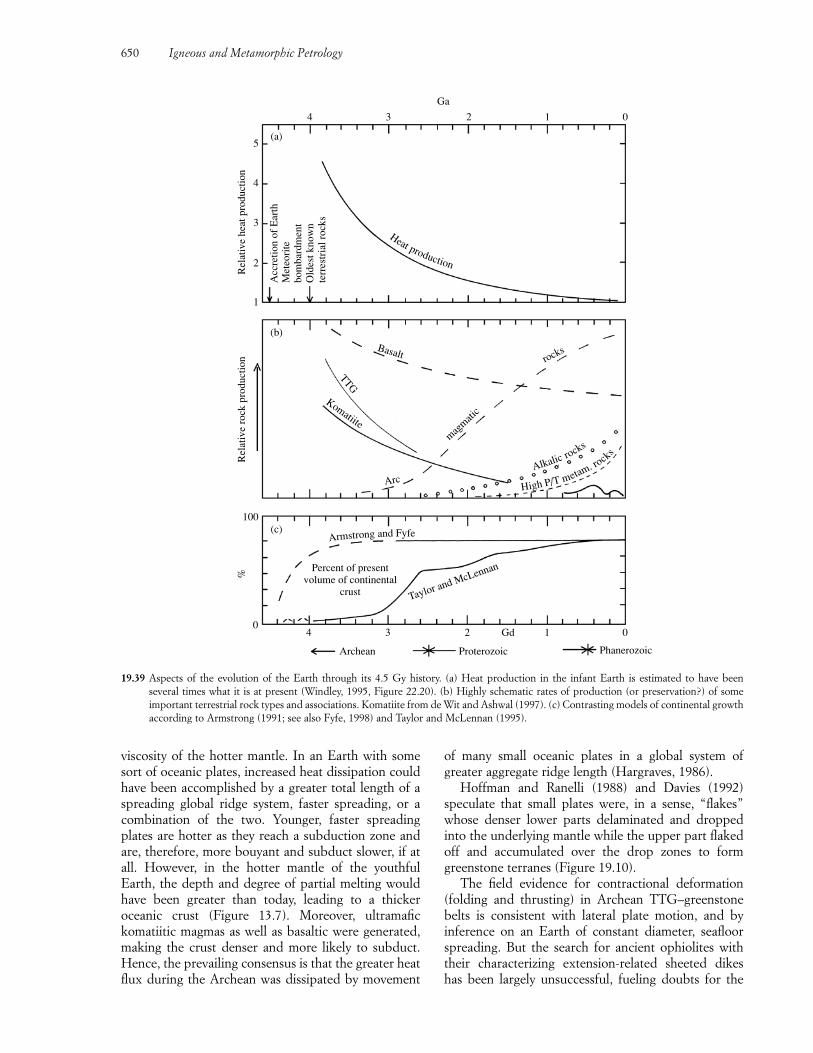
viscosity of the hotter mantle. In an Earth with somesort of oceanic plates, increased heat dissipation couldhave been accomplished by a greater total length of aspreading global ridge system, faster spreading, or acombination of the two. Younger, faster spreadingplates are hotter as they reach a subduction zone andare, therefore, more bouyant and subduct slower, if atall. However, in the hotter mantle of the youthfulEarth, the depth and degree of partial melting wouldhave been greater than today, leading to a thickeroceanic crust (Figure 13.7). Moreover, ultramafic komatiitic magmas as well as basaltic were generated,making the crust denser and more likely to subduct.Hence, the prevailing consensus is that the greater heatflux during the Archean was dissipated by movement
of many small oceanic plates in a global system ofgreater aggregate ridge length (Hargraves, 1986).
Hoffman and Ranelli (1988) and Davies (1992)speculate that small plates were, in a sense, “flakes”whose denser lower parts delaminated and droppedinto the underlying mantle while the upper part flakedoff and accumulated over the drop zones to formgreenstone terranes (Figure 19.10).
The field evidence for contractional deformation(folding and thrusting) in Archean TTG–greenstonebelts is consistent with lateral plate motion, and by inference on an Earth of constant diameter, seafloorspreading. But the search for ancient ophiolites withtheir characterizing extension-related sheeted dikes has been largely unsuccessful, fueling doubts for the
650 Igneous and Metamorphic Petrology
Rel
ativ
e ro
ck p
rodu
ctio
nR
elat
ive
heat
pro
duct
ion
5
4
(a)
(b)
(c)
3
Ga
2 1 0
4
3
2
1
01Gd2
Percent of presentvolume of continental
crust Taylor and McLennan
34
Phanerozoic
Acc
retio
n of
Ear
thM
eteo
rite
bom
bard
men
tO
ldes
t kno
wn
terr
estr
ial r
ocks
Heat production
Basalt
TTG
Komatiite
Arc
magmati
c
rocks
Alkalic rocks
High P/T metam. rocks
100
0
%
Archean Proterozoic
Armstrong and Fyfe
19.39 Aspects of the evolution of the Earth through its 4.5 Gy history. (a) Heat production in the infant Earth is estimated to have been several times what it is at present (Windley, 1995, Figure 22.20). (b) Highly schematic rates of production (or preservation?) of some important terrestrial rock types and associations. Komatiite from de Wit and Ashwal (1997). (c) Contrasting models of continental growthaccording to Armstrong (1991; see also Fyfe, 1998) and Taylor and McLennan (1995).
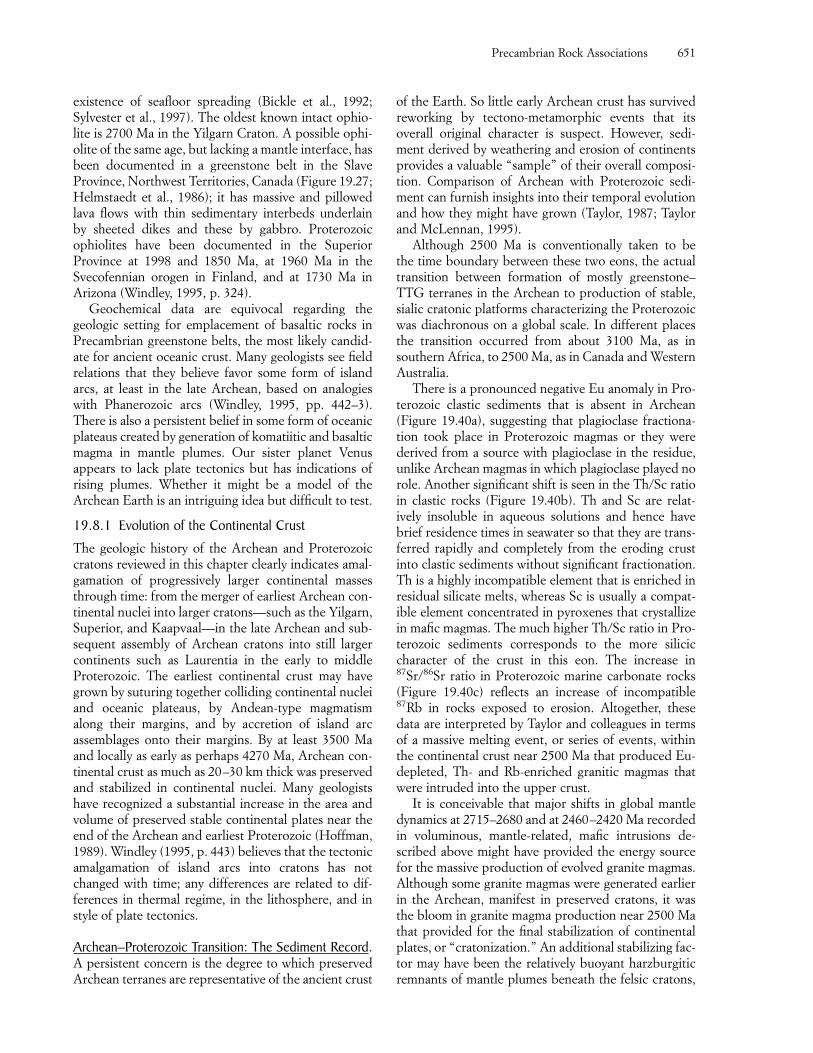
existence of seafloor spreading (Bickle et al., 1992;Sylvester et al., 1997). The oldest known intact ophio-lite is 2700 Ma in the Yilgarn Craton. A possible ophi-olite of the same age, but lacking a mantle interface, hasbeen documented in a greenstone belt in the SlaveProvince, Northwest Territories, Canada (Figure 19.27;Helmstaedt et al., 1986); it has massive and pillowedlava flows with thin sedimentary interbeds underlain by sheeted dikes and these by gabbro. Proterozoicophiolites have been documented in the SuperiorProvince at 1998 and 1850 Ma, at 1960 Ma in the Svecofennian orogen in Finland, and at 1730 Ma in Arizona (Windley, 1995, p. 324).
Geochemical data are equivocal regarding the geologic setting for emplacement of basaltic rocks inPrecambrian greenstone belts, the most likely candid-ate for ancient oceanic crust. Many geologists see fieldrelations that they believe favor some form of islandarcs, at least in the late Archean, based on analogieswith Phanerozoic arcs (Windley, 1995, pp. 442–3).There is also a persistent belief in some form of oceanicplateaus created by generation of komatiitic and basalticmagma in mantle plumes. Our sister planet Venus appears to lack plate tectonics but has indications ofrising plumes. Whether it might be a model of theArchean Earth is an intriguing idea but difficult to test.
19.8.1 Evolution of the Continental Crust
The geologic history of the Archean and Proterozoiccratons reviewed in this chapter clearly indicates amal-gamation of progressively larger continental massesthrough time: from the merger of earliest Archean con-tinental nuclei into larger cratons—such as the Yilgarn,Superior, and Kaapvaal—in the late Archean and sub-sequent assembly of Archean cratons into still largercontinents such as Laurentia in the early to middle Proterozoic. The earliest continental crust may havegrown by suturing together colliding continental nucleiand oceanic plateaus, by Andean-type magmatismalong their margins, and by accretion of island arc assemblages onto their margins. By at least 3500 Maand locally as early as perhaps 4270 Ma, Archean con-tinental crust as much as 20–30 km thick was preservedand stabilized in continental nuclei. Many geologistshave recognized a substantial increase in the area andvolume of preserved stable continental plates near theend of the Archean and earliest Proterozoic (Hoffman,1989). Windley (1995, p. 443) believes that the tectonicamalgamation of island arcs into cratons has notchanged with time; any differences are related to dif-ferences in thermal regime, in the lithosphere, and instyle of plate tectonics.
Archean–Proterozoic Transition: The Sediment Record.A persistent concern is the degree to which preservedArchean terranes are representative of the ancient crust
of the Earth. So little early Archean crust has survivedreworking by tectono-metamorphic events that itsoverall original character is suspect. However, sedi-ment derived by weathering and erosion of continentsprovides a valuable “sample” of their overall composi-tion. Comparison of Archean with Proterozoic sedi-ment can furnish insights into their temporal evolutionand how they might have grown (Taylor, 1987; Taylorand McLennan, 1995).
Although 2500 Ma is conventionally taken to be the time boundary between these two eons, the actualtransition between formation of mostly greenstone–TTG terranes in the Archean to production of stable,sialic cratonic platforms characterizing the Proterozoicwas diachronous on a global scale. In different placesthe transition occurred from about 3100 Ma, as insouthern Africa, to 2500 Ma, as in Canada and WesternAustralia.
There is a pronounced negative Eu anomaly in Pro-terozoic clastic sediments that is absent in Archean(Figure 19.40a), suggesting that plagioclase fractiona-tion took place in Proterozoic magmas or they were derived from a source with plagioclase in the residue,unlike Archean magmas in which plagioclase played norole. Another significant shift is seen in the Th/Sc ratioin clastic rocks (Figure 19.40b). Th and Sc are relat-ively insoluble in aqueous solutions and hence havebrief residence times in seawater so that they are trans-ferred rapidly and completely from the eroding crustinto clastic sediments without significant fractionation.Th is a highly incompatible element that is enriched inresidual silicate melts, whereas Sc is usually a compat-ible element concentrated in pyroxenes that crystallizein mafic magmas. The much higher Th/Sc ratio in Pro-terozoic sediments corresponds to the more siliciccharacter of the crust in this eon. The increase in87Sr/86Sr ratio in Proterozoic marine carbonate rocks(Figure 19.40c) reflects an increase of incompatible87Rb in rocks exposed to erosion. Altogether, thesedata are interpreted by Taylor and colleagues in termsof a massive melting event, or series of events, withinthe continental crust near 2500 Ma that produced Eu-depleted, Th- and Rb-enriched granitic magmas thatwere intruded into the upper crust.
It is conceivable that major shifts in global mantledynamics at 2715–2680 and at 2460–2420 Ma recordedin voluminous, mantle-related, mafic intrusions de-scribed above might have provided the energy sourcefor the massive production of evolved granite magmas.Although some granite magmas were generated earlierin the Archean, manifest in preserved cratons, it wasthe bloom in granite magma production near 2500 Mathat provided for the final stabilization of continentalplates, or “cratonization.” An additional stabilizing fac-tor may have been the relatively buoyant harzburgiticremnants of mantle plumes beneath the felsic cratons,
Precambrian Rock Associations 651
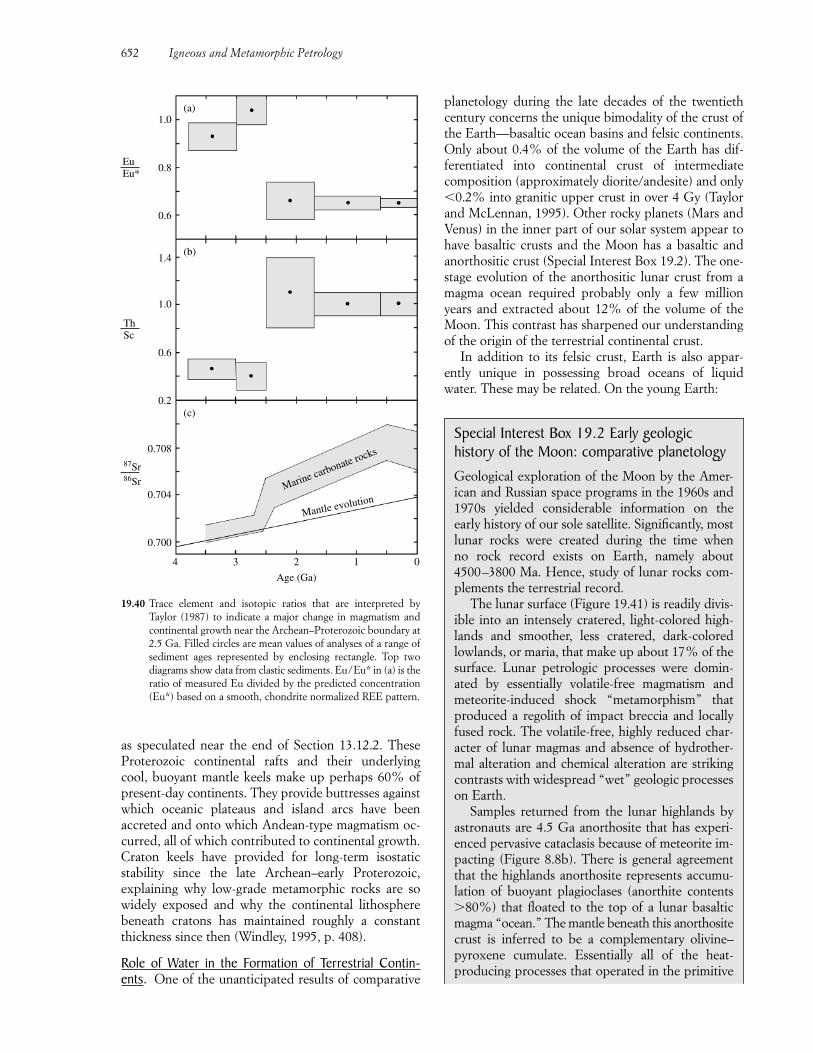
Special Interest Box 19.2 Early geologic history of the Moon: comparative planetologyGeological exploration of the Moon by the Amer-ican and Russian space programs in the 1960s and1970s yielded considerable information on the early history of our sole satellite. Significantly, mostlunar rocks were created during the time when no rock record exists on Earth, namely about4500–3800 Ma. Hence, study of lunar rocks com-plements the terrestrial record.
The lunar surface (Figure 19.41) is readily divis-ible into an intensely cratered, light-colored high-lands and smoother, less cratered, dark-coloredlowlands, or maria, that make up about 17% of thesurface. Lunar petrologic processes were domin-ated by essentially volatile-free magmatism and meteorite-induced shock “metamorphism” thatproduced a regolith of impact breccia and locallyfused rock. The volatile-free, highly reduced char-acter of lunar magmas and absence of hydrother-mal alteration and chemical alteration are strikingcontrasts with widespread “wet” geologic processeson Earth.
Samples returned from the lunar highlands byastronauts are 4.5 Ga anorthosite that has experi-enced pervasive cataclasis because of meteorite im-pacting (Figure 8.8b). There is general agreementthat the highlands anorthosite represents accumu-lation of buoyant plagioclases (anorthite contents�80%) that floated to the top of a lunar basalticmagma “ocean.” The mantle beneath this anorthositecrust is inferred to be a complementary olivine–pyroxene cumulate. Essentially all of the heat-producing processes that operated in the primitive
as speculated near the end of Section 13.12.2. TheseProterozoic continental rafts and their underlying cool, buoyant mantle keels make up perhaps 60% ofpresent-day continents. They provide buttresses againstwhich oceanic plateaus and island arcs have been accreted and onto which Andean-type magmatism oc-curred, all of which contributed to continental growth.Craton keels have provided for long-term isostatic stability since the late Archean–early Proterozoic, explaining why low-grade metamorphic rocks are sowidely exposed and why the continental lithospherebeneath cratons has maintained roughly a constantthickness since then (Windley, 1995, p. 408).
Role of Water in the Formation of Terrestrial Contin-ents. One of the unanticipated results of comparative
planetology during the late decades of the twentiethcentury concerns the unique bimodality of the crust ofthe Earth—basaltic ocean basins and felsic continents.Only about 0.4% of the volume of the Earth has dif-ferentiated into continental crust of intermediate composition (approximately diorite/andesite) and only�0.2% into granitic upper crust in over 4 Gy (Taylorand McLennan, 1995). Other rocky planets (Mars andVenus) in the inner part of our solar system appear tohave basaltic crusts and the Moon has a basaltic andanorthositic crust (Special Interest Box 19.2). The one-stage evolution of the anorthositic lunar crust from amagma ocean required probably only a few millionyears and extracted about 12% of the volume of theMoon. This contrast has sharpened our understandingof the origin of the terrestrial continental crust.
In addition to its felsic crust, Earth is also appar-ently unique in possessing broad oceans of liquid water. These may be related. On the young Earth:
652 Igneous and Metamorphic Petrology
EuEu*
ThSc
87Sr86Sr
0.700
0.704
0.708
0.2
0.6
1.0
1.4
0.6
0.8
1.0
(c)
(b)
(a)
012
Age (Ga)
34
Mantle evolutionMarine carbonate rocks
19.40 Trace element and isotopic ratios that are interpreted by Taylor (1987) to indicate a major change in magmatism andcontinental growth near the Archean–Proterozoic boundary at2.5 Ga. Filled circles are mean values of analyses of a range ofsediment ages represented by enclosing rectangle. Top two diagrams show data from clastic sediments. Eu/Eu* in (a) is theratio of measured Eu divided by the predicted concentration(Eu*) based on a smooth, chondrite normalized REE pattern.
1. Basaltic crust that formed from first-stage partialmelts of the mantle was hydrated on the oceanfloor, and then
2. subjected to dehydration partial melting, either insubducting slabs or at the base of stacked slices, orflakes (Figure 19.10), generating TTG magmas.
3. Rocks of the TTG suite were subsequently partiallymelted, perhaps with heat provided by basaltmagma underplatings, to generate K-rich graniticrock.
Campbell and Taylor (1983, p. 1063; see also Fyfe,1988) conclude that: “Water is essential for the forma-tion of granites and granite, in turn, is essential for theformation of stable continents. The Earth is the onlyplanet with granite and continents because it is the onlyplanet with abundant water.”
Why Is There So Little Old Continental Crust? A controversial question is whether the continents havegrown progressively throughout the recorded historyof the Earth by accumulation of increasing volumes of felsic rock, or whether they attained virtually theirentire present-day volume in the earliest infancy of theplanet. In other words, does the minute amount ofcrust �3.8 Ga (a few hundred square kilometers,worldwide) and the still small but greater area of theArchean crust (15% of all the continents) reflect theamount formed during those times, or does it insteadreflect all that has survived recycling and reworkingsince then? Most geochemists have advocated pro-gressive continental growth throughout the history of the Earth (Figure 19.39c), as indicated in the pre-ceding paragraphs summarizing the work of Taylor and colleagues.
Nonetheless, R. L. Armstrong argued as early as1981 (see Armstrong, 1991) for a model in which theEarth experienced a major silicate differentiation into afelsic crust enriched in incompatible elements and adepleted mantle during its earliest infancy, perhaps notlong after the universally accepted differentiation ofthe metallic core from silicate material. In Armstrong’sview, the relatively large size of the Earth among rockyplanets, its retention of water, and dynamic surface renewal processes (plate tectonics and erosion) have effectively erased all vestiges of the first several hun-dred million years of the crustal rock record. Meteoriteimpact and vigorous convection in the hotter, possiblyhydrous infant mantle was also significant in virtuallyeliminating vestiges of the earliest sialic crust. Althoughmuch of the geochemical and isotopic data is consistentwith either the slow progressive growth or the early differentiation models, Nd isotopic ratios provide animportant constraint. Because many of the oldest (3.8–4.0 Ga) Archean rocks have positive �Nd values, to asmuch as �4, there must have been complementary rocksback then having negative �Nd values; that is, enriched
Precambrian Rock Associations 653
19.41 Moon. Note intensely cratered, light-colored, 4500 Maanorthosite highlands and topographically lower, less cratered,dark, 4000–3200 Ma basalt maria. Photograph courtesy ofLick Observatory, California.
Earth (Sections 1.1.5 and 19.1) also prevailed in the Moon to create enough heat to form a magmaocean.
Massive meteorite bombardment culminatingabout 3.9 Ga excavated major basins on the lunarsurface and may have generated avenues throughthe cooling and thickening crust through whichmare basalt magmas were later extruded. Theselavas flooded excavated basins and lowlands fromabout 4.0 to 3.2, and perhaps to 2.5 Ga. Lunarbasalts have a pronounced negative Eu anomaly(Figure 2.23) that resulted from derivation of themagmas by partial melting of the Eu-depleted lunarmantle, which in turn was the result of enrichmentof Eu in the crystallizing plagioclases in the lunarmagma ocean.
On the early Earth, no anorthosite crust formed;Sr isotopes and Eu abundances indicate no suchprimeval reservoir. Earth appears to have less Aland Ca, overall, than the Moon so that plagioclasewould not have been a crystallizing phase in anyterrestrial magma ocean (Taylor and McLennan,1995). In addition, plagioclase would probablyhave sunk in the hydrous terrestrial magma, ratherthan floated as it did in the dry, more dense, basalticlunar ocean. Finally, because of greater gravity onthe larger Earth, plagioclase on Earth is stable toshallower depths, to only about 40 km depth, below which the stable aluminous phase in basalticsystems is garnet.
felsic rocks (Bowring and Housh, 1995; see also Figure2.27). The trace element content of 4.27 Ga detrital zircons is consistent with a thick felsic crust when they formed (Section 19.1). A slight gradual increase inthe most positive values of �Nd through the youngerrock record implies continuing magma extractions thatformed new, or “juvenile,” crust from mantle sourcerocks largely depleted in the infancy of the planet. The major shift in composition between Archean andProterozoic sediment indicated above reflects, in Armstrong’s view, amalgamation of smaller blocks ofcrust into larger stable cratons capable of granite production, as contrasted with earlier survival of onlycontinental nuclei and island arcs.
A central point of disagreement between the twocompeting models is how much sediment is subductedand recycled back into the mantle. Armstrong (1981)and Fyfe (1998) reviewed lines of evidence indicatingthat more continent-derived sediment is being recycledback into the mantle at subduction zones than is generally estimated and that current rates of crustal accretion are approximately balanced by loss of crustthrough sediment subduction and tectonic erosion ofoverriding plates. Because of the very large ratio ofmantle rock to subducted sediment in magma sourcevolumes, the presence of sediment is scarcely evident in the composition of arc rocks and they have also usually been contaminated with crustal material duringascent.
SUMMARY
The primary properties and origin of most Precambrianprotoliths are obscured to varying degrees because ofmultiple overprints of deformation, recrystallization,and partial melting. Petrogenetic interpretations, espe-cially for Archean rocks, are consequently fraught withuncertainties; many interpretations are highly specula-tive and should be considered as preliminary workinghypotheses guiding future research. Opinions regard-ing global tectonomagmatic processes in the youngEarth tend to fall between two extremes: those thatadopt a uniformitarian approach based upon modernplate tectonic processes, casting even Archean geologyin a framework of seafloor spreading and lithosphericsubduction, and those that adopt a unique tectonicframework for the young Earth.
The oldest known vestiges of crustal rocks include4270 Ma detrital zircons in younger metasedimentaryrocks and a small area (40 km2) of 4030 Ma ortho-gneisses. These minerals and rocks derived from felsicprotoliths were not recycled into the hot, probably vigorously convecting mantle or destroyed during anepisode of intense meteorite bombardment that lasteduntil about 3800 Ma.
The oldest Archean terranes, to as much as 3600 Ma,of areal consequence consist mostly of tonalite, trond-hjemite, and granodiorite (TTG) intrusions and lesser,slightly younger K-rich granites, both variably meta-morphosed into orthogneisses. TTG have a distinctivetrace element signature of high ratio of light REE to heavy REE that is consistent with partial melting ofa hydrous basaltic source in which garnet and likelyamphibole were residual phases. Hydration of thesource rocks probably occurred in a seafloor environ-ment while the �70 km depth for partial melting couldhave occurred in a subducted slab or at the base of a thick stack of oceanic crustal slices. Younger, more K-rich granitic magmas might have been generated bypartial melting of TTG source rocks. Squeezed be-tween the domical composite felsic plutons are more or less contemporaneous supracrustal sequences oftypically low-grade metavolcanic and metasedimentaryrocks. The dominant protolith in these greenstonebelts is tholeiitic basalt. Lesser komatiite in greenstonesequences also occurs as shallow intrusions and sub-aqueous lava flows and volcaniclastic deposits. The ultramafic, possibly relatively hydrous, magmas fromwhich komatiite formed appear to have been generatedby unusually high degrees of partial melting in a hotmantle, apparently deep in ascending plumes. Sheets of megacrystic anorthosite and leucogabbro are char-acterized by abundant crystals of bytownite as much as 30 cm in diameter. These uniquely Archean rocksappear to have formed from Fe-rich tholeiitic leuco-gabbro magmas that were possibly derived by fraction-ation of more primitive komatiite. Younger greenstonesequences consist of increasing amounts of more felsicvolcanic rocks that have affinities with modern arcrocks and of sedimentary rocks derived by subaerialerosion of the magmatic protoliths.
Toward the end of the Archean, changes in globalgeologic processes may have been more significant than any differences between Proterozoic and Phane-rozoic dynamics. The apparently diachronous demiseof Archean tectonism and rock-forming processes wasrecorded over a period of a few hundred million yearsin different cratons. The decline in the T of the mantleis probably manifest in decreasing occurrences of komatiite through the Precambrian and a transitionfrom dehydration partial melting of basaltic oceaniccrust, primarily in the Archean, yielding TTG magmas,to subsequent partial melting in hydrated mantle-wedges overlying subducting oceanic slabs, yieldingcalc–alkaline arc magmas (Figure 19.39b). A decliningthermal budget is consistent with the delayed appear-ance of alkaline magmatic rocks and high P/T meta-morphic rocks.
The exact character of the early Archean crust remains uncertain. However, many geologists hold to aview of numerous “mini” plates bounded by a global
654 Igneous and Metamorphic Petrology
system of spreading “ridges” that was significantlylonger overall than in modern times in order to dissip-ate the greater thermal energy of the infant Earth. Butthere is no clear geochemical evidence for an oceaniccrust like that of the modern MORB. Some Archeantholeiites have chemical affinities with modern islandarc and oceanic plateau rocks. Although contractionaldeformation (thrusting and folding) is typical of eventhe oldest greenstone belts, vestiges of complementaryextensional oceanic terranes, as manifest in sheeteddike complexes of ophiolite, are absent until about 2.7 Ga in the late Archean. Whether ophiolite was not preserved before then or not formed in a plate tectonicregime different from today because of a different thermal budget and more vigorous mantle convectionis debatable.
Scattered continental nuclei made of distinct granitoid–greenstone terranes were sutured togetherinto cratons along contractional ductile shear zonesduring the late Archean. Some of these cratons werefurther amalgamated into yet larger continental plates(e.g. Laurentia) during the Proterozoic. Continent–continent collision zones as well as accreted island arcsand Andean-type continental arcs are widespread. Several large differentiated basaltic intrusions andspectacular swarms of basaltic dikes that likely fed volu-minous plateau-forming provinces testify of massive in-puts of mantle-derived magma into and onto cratonicblocks, the thick, cool, stabilizing roots of which areresidues of relatively buoyant depleted harzburgite.
The mid-Proterozoic, from about 1.8 to 1.1 Ga, was puncuated by a major magmatic episode now preserved in a belt extending from Fennoscandia, tosouthern Greenland, across southern Quebec and On-tario, and into the mid-continent and southwest USA.This event yielded an essentially bimodal association ofmassif-type anorthositic rocks and lesser kindred gab-bros along with granitic, syenitic, and charnockiticrocks, many of which have rapakivi texture and are ofA-type. Opinions regarding the tectonic setting of thismagmatic association continue to focus on an extend-ing crust, in part during the later stages of orogenywhen thickened continental crust collapses. Upwellingasthenospheric mantle erodes the lithosphere and un-derplates and invades the extending crust with copiousvolumes of basalt magma. Flotation of plagioclases in the differentiating magma is postulated to have produced the anorthosite massifs while anatexis of thesialic crust and older basaltic inputs yielded associatedcharnockitic rocks.
Growing understanding of the evolution of Precam-brian terranes is providing important insights into howthe irreversibly cooling Earth has worked throughoutits 4.5 Ga existence. As stated in the opening pages ofthis textbook, the convecting mantle has always playeda key role in rock-forming processes in which thermal
and gravitational energy interacts with matter, strivingtowards states of stable equilibrium.
CRITICAL THINKING QUESTIONS19.1 Can the mobility of chemical elements be
assessed in altered basalts in greenstone belts inthe same way that it is in komatiites? Discuss.
19.2 Apart from their same rock-type designation,are there other similarities between Archeanmegacrystic anorthosites and Proterozoic massif-type anorthosites? Differences? Discussthe rationale undergirding rock classificationand the broader petrologic implications ofanorthosite in Precambrian rock associations.
19.3 How do you account for the contrasting strikesof the subvertical dike swarms depicted in Figure 19.12? Are the swarms related to mantleplumes or some other factor?
19.4 How do Proterozoic rapakivi granites differfrom Mesozoic continental arc granitoids?
19.5 Contrast lunar and Precambrian terrestrialcrusts with respect to their constituent feldspars.How do you account for these contrasts?
19.6 A basic difference between the Archean TTGsuite and Mesozoic calc–alkaline arc granitoidslies in the depletion of K and Ca in the former.Considering the widespread, and commonly intense metamorphism of the TTGsuite, is it possible that these two fairly mobileelements have been removed from what wereoriginally granite–granodiorite rocks? What evidence and arguments can you present?
19.7 Discuss the thermal evolution of the Earth during its infancy. Consider heat sources andsinks.
19.8 What is a possible reason for the apparent lack of progressive increase in grade of meta-morphism in greenstone belts with respect tostratigraphic depth, despite thicknesses ofmany kilometers? How might you test your explanation?
19.9 Many geologists believe that the Archeanoceanic crust subducted into the mantle as ithas during the Cenozoic. Is this belief provenby the widespread occurrence of ArcheanTTG? Critically discuss. If it did subduct, how would you account for the contrast inabundance of Archean TTG and Cenozoicadakite? Sketch a P–T diagram to illustratecontrasting thermal paths of subducting slabs.
19.10 What factors would favor thick stacking ofslices of oceanic crust (Figure 19.10) ratherthan subduction into the mantle?
Precambrian Rock Associations 655
19.11 Compare and contrast the oldest rocks in the Slave Province of northwestern Canada (Acasta gneiss), in West Greenland (Itsaq Gneiss Complex), in South Africa (Barberton terrane), and in Western Australia (Narryer terrane). Can it be concluded that the oldest rocks are everywherevestiges of a mafic oceanic(?) crust? Sialic con-tinental crust? How representative of the earli-est crust of the Earth are these terranes?
19.12 What possible role do oceans on Earth play in the development of a felsic continentalcrust?
19.13 Review the factual evidence and arguments forand against growth of the continents throughtime.
19.14 How has the lithospheric mantle evolvedthrough time? What might account for changesin its character?
656 Igneous and Metamorphic Petrology
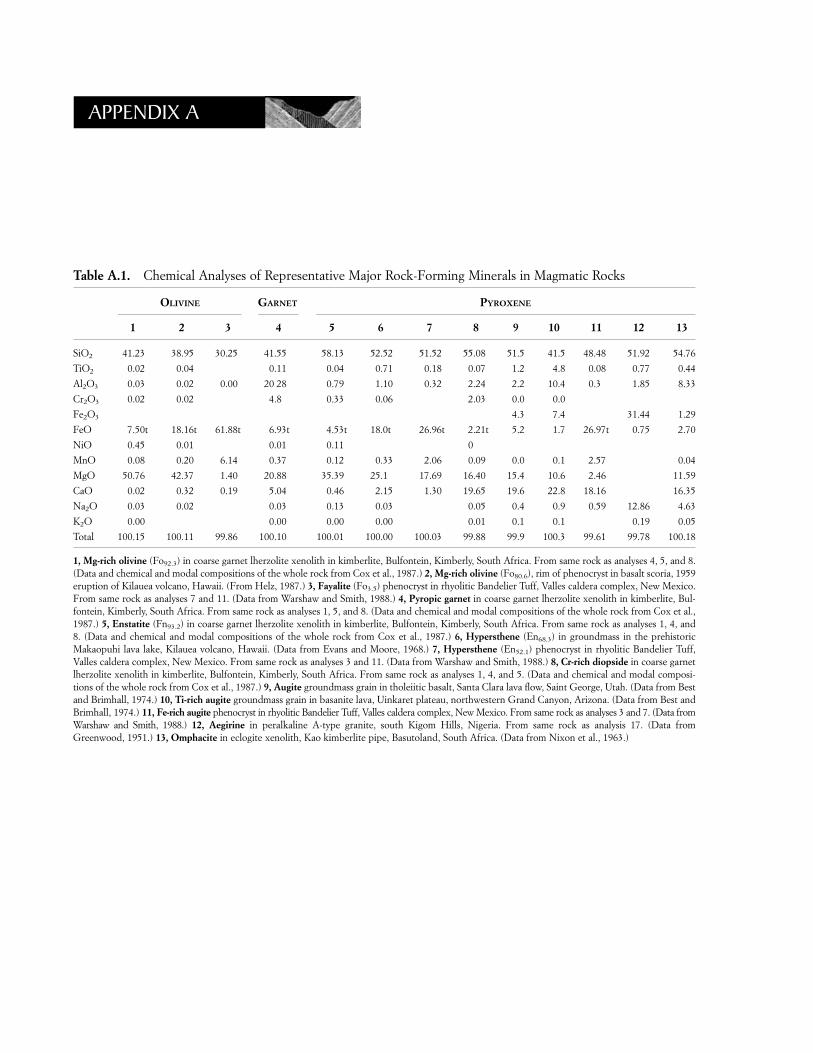
APPENDIX A
Table A.1. Chemical Analyses of Representative Major Rock-Forming Minerals in Magmatic Rocks
OLIVINE GARNET PYROXENE
1 2 3 4 5 6 7 8 9 10 11 12 13
SiO2 41.23 38.95 30.25 41.55 58.13 52.52 51.52 55.08 51.5 41.5 48.48 51.92 54.76
TiO2 0.02 0.04 0.11 0.04 0.71 0.18 0.07 1.2 4.8 0.08 0.77 0.44
Al2O3 0.03 0.02 0.00 20 28 0.79 1.10 0.32 2.24 2.2 10.4 0.3 1.85 8.33
Cr2O3 0.02 0.02 4.8 0.33 0.06 2.03 0.0 0.0
Fe2O3 4.3 7.4 31.44 1.29
FeO 7.50t 18.16t 61.88t 6.93t 4.53t 18.0t 26.96t 2.21t 5.2 1.7 26.97t 0.75 2.70
NiO 0.45 0.01 0.01 0.11 0
MnO 0.08 0.20 6.14 0.37 0.12 0.33 2.06 0.09 0.0 0.1 2.57 0.04
MgO 50.76 42.37 1.40 20.88 35.39 25.1 17.69 16.40 15.4 10.6 2.46 11.59
CaO 0.02 0.32 0.19 5.04 0.46 2.15 1.30 19.65 19.6 22.8 18.16 16.35
Na2O 0.03 0.02 0.03 0.13 0.03 0.05 0.4 0.9 0.59 12.86 4.63
K2O 0.00 0.00 0.00 0.00 0.01 0.1 0.1 0.19 0.05
Total 100.15 100.11 99.86 100.10 100.01 100.00 100.03 99.88 99.9 100.3 99.61 99.78 100.18
1, Mg-rich olivine (Fo92.3) in coarse garnet lherzolite xenolith in kimberlite, Bulfontein, Kimberly, South Africa. From same rock as analyses 4, 5, and 8.(Data and chemical and modal compositions of the whole rock from Cox et al., 1987.) 2, Mg-rich olivine (Fo80.6), rim of phenocryst in basalt scoria, 1959eruption of Kilauea volcano, Hawaii. (From Helz, 1987.) 3, Fayalite (Fo3.5) phenocryst in rhyolitic Bandelier Tuff, Valles caldera complex, New Mexico.From same rock as analyses 7 and 11. (Data from Warshaw and Smith, 1988.) 4, Pyropic garnet in coarse garnet lherzolite xenolith in kimberlite, Bul-fontein, Kimberly, South Africa. From same rock as analyses 1, 5, and 8. (Data and chemical and modal compositions of the whole rock from Cox et al.,1987.) 5, Enstatite (Fn93.2) in coarse garnet lherzolite xenolith in kimberlite, Bulfontein, Kimberly, South Africa. From same rock as analyses 1, 4, and 8. (Data and chemical and modal compositions of the whole rock from Cox et al., 1987.) 6, Hypersthene (En68.3) in groundmass in the prehistoricMakaopuhi lava lake, Kilauea volcano, Hawaii. (Data from Evans and Moore, 1968.) 7, Hypersthene (En52.1) phenocryst in rhyolitic Bandelier Tuff,Valles caldera complex, New Mexico. From same rock as analyses 3 and 11. (Data from Warshaw and Smith, 1988.) 8, Cr-rich diopside in coarse garnetlherzolite xenolith in kimberlite, Bulfontein, Kimberly, South Africa. From same rock as analyses 1, 4, and 5. (Data and chemical and modal composi-tions of the whole rock from Cox et al., 1987.) 9, Augite groundmass grain in tholeiitic basalt, Santa Clara lava flow, Saint George, Utah. (Data from Bestand Brimhall, 1974.) 10, Ti-rich augite groundmass grain in basanite lava, Uinkaret plateau, northwestern Grand Canyon, Arizona. (Data from Best andBrimhall, 1974.) 11, Fe-rich augite phenocryst in rhyolitic Bandelier Tuff, Valles caldera complex, New Mexico. From same rock as analyses 3 and 7. (Data fromWarshaw and Smith, 1988.) 12, Aegirine in peralkaline A-type granite, south Kigom Hills, Nigeria. From same rock as analysis 17. (Data from Greenwood, 1951.) 13, Omphacite in eclogite xenolith, Kao kimberlite pipe, Basutoland, South Africa. (Data from Nixon et al., 1963.)
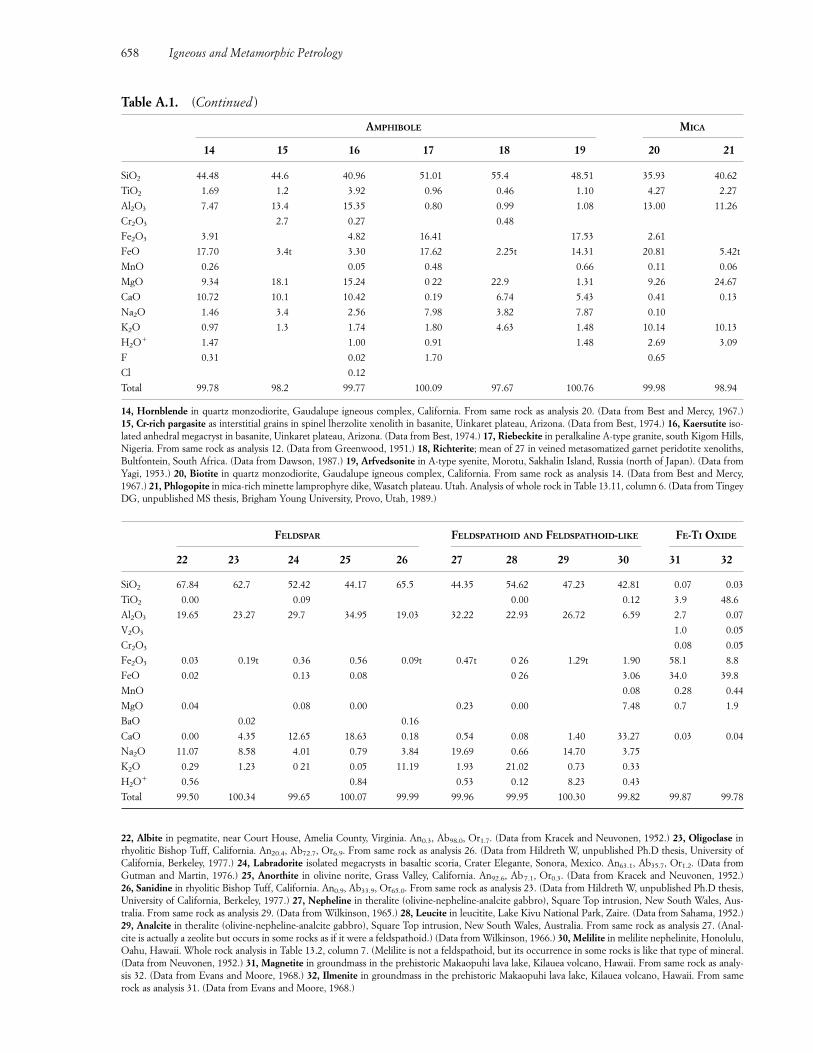
658 Igneous and Metamorphic Petrology
Table A.1. (Continued)
AMPHIBOLE MICA
14 15 16 17 18 19 20 21
SiO2 44.48 44.6 40.96 51.01 55.4 48.51 35.93 40.62
TiO2 1.69 1.2 3.92 0.96 0.46 1.10 4.27 2.27
Al2O3 7.47 13.4 15.35 0.80 0.99 1.08 13.00 11.26
Cr2O3 2.7 0.27 0.48
Fe2O3 3.91 4.82 16.41 17.53 2.61
FeO 17.70 3.4t 3.30 17.62 2.25t 14.31 20.81 5.42t
MnO 0.26 0.05 0.48 0.66 0.11 0.06
MgO 9.34 18.1 15.24 0 22 22.9 1.31 9.26 24.67
CaO 10.72 10.1 10.42 0.19 6.74 5.43 0.41 0.13
Na2O 1.46 3.4 2.56 7.98 3.82 7.87 0.10
K2O 0.97 1.3 1.74 1.80 4.63 1.48 10.14 10.13
H2O� 1.47 1.00 0.91 1.48 2.69 3.09
F 0.31 0.02 1.70 0.65
Cl 0.12
Total 99.78 98.2 99.77 100.09 97.67 100.76 99.98 98.94
14, Hornblende in quartz monzodiorite, Gaudalupe igneous complex, California. From same rock as analysis 20. (Data from Best and Mercy, 1967.) 15, Cr-rich pargasite as interstitial grains in spinel lherzolite xenolith in basanite, Uinkaret plateau, Arizona. (Data from Best, 1974.) 16, Kaersutite iso-lated anhedral megacryst in basanite, Uinkaret plateau, Arizona. (Data from Best, 1974.) 17, Riebeckite in peralkaline A-type granite, south Kigom Hills,Nigeria. From same rock as analysis 12. (Data from Greenwood, 1951.) 18, Richterite; mean of 27 in veined metasomatized garnet peridotite xenoliths,Bultfontein, South Africa. (Data from Dawson, 1987.) 19, Arfvedsonite in A-type syenite, Morotu, Sakhalin Island, Russia (north of Japan). (Data fromYagi, 1953.) 20, Biotite in quartz monzodiorite, Gaudalupe igneous complex, California. From same rock as analysis 14. (Data from Best and Mercy,1967.) 21, Phlogopite in mica-rich minette lamprophyre dike, Wasatch plateau. Utah. Analysis of whole rock in Table 13.11, column 6. (Data from TingeyDG, unpublished MS thesis, Brigham Young University, Provo, Utah, 1989.)
FELDSPAR FELDSPATHOID AND FELDSPATHOID-LIKE FE-TI OXIDE
22 23 24 25 26 27 28 29 30 31 32
SiO2 67.84 62.7 52.42 44.17 65.5 44.35 54.62 47.23 42.81 0.07 0.03
TiO2 0.00 0.09 0.00 0.12 3.9 48.6
Al2O3 19.65 23.27 29.7 34.95 19.03 32.22 22.93 26.72 6.59 2.7 0.07
V2O3 1.0 0.05
Cr2O3 0.08 0.05
Fe2O3 0.03 0.19t 0.36 0.56 0.09t 0.47t 0 26 1.29t 1.90 58.1 8.8
FeO 0.02 0.13 0.08 0 26 3.06 34.0 39.8
MnO 0.08 0.28 0.44
MgO 0.04 0.08 0.00 0.23 0.00 7.48 0.7 1.9
BaO 0.02 0.16
CaO 0.00 4.35 12.65 18.63 0.18 0.54 0.08 1.40 33.27 0.03 0.04
Na2O 11.07 8.58 4.01 0.79 3.84 19.69 0.66 14.70 3.75
K2O 0.29 1.23 0 21 0.05 11.19 1.93 21.02 0.73 0.33
H2O� 0.56 0.84 0.53 0.12 8.23 0.43
Total 99.50 100.34 99.65 100.07 99.99 99.96 99.95 100.30 99.82 99.87 99.78
22, Albite in pegmatite, near Court House, Amelia County, Virginia. An0.3, Ab98.0, Or1.7. (Data from Kracek and Neuvonen, 1952.) 23, Oligoclase inrhyolitic Bishop Tuff, California. An20.4, Ab72.7, Or6.9. From same rock as analysis 26. (Data from Hildreth W, unpublished Ph.D thesis, University ofCalifornia, Berkeley, 1977.) 24, Labradorite isolated megacrysts in basaltic scoria, Crater Elegante, Sonora, Mexico. An63.1, Ab35.7, Or1.2. (Data from Gutman and Martin, 1976.) 25, Anorthite in olivine norite, Grass Valley, California. An92.6, Ab7.1, Or0.3. (Data from Kracek and Neuvonen, 1952.) 26, Sanidine in rhyolitic Bishop Tuff, California. An0.9, Ab33.9, Or65.0. From same rock as analysis 23. (Data from Hildreth W, unpublished Ph.D thesis,University of California, Berkeley, 1977.) 27, Nepheline in theralite (olivine-nepheline-analcite gabbro), Square Top intrusion, New South Wales, Aus-tralia. From same rock as analysis 29. (Data from Wilkinson, 1965.) 28, Leucite in leucitite, Lake Kivu National Park, Zaire. (Data from Sahama, 1952.)29, Analcite in theralite (olivine-nepheline-analcite gabbro), Square Top intrusion, New South Wales, Australia. From same rock as analysis 27. (Anal-cite is actually a zeolite but occurs in some rocks as if it were a feldspathoid.) (Data from Wilkinson, 1966.) 30, Melilite in melilite nephelinite, Honolulu,Oahu, Hawaii. Whole rock analysis in Table 13.2, column 7. (Melilite is not a feldspathoid, but its occurrence in some rocks is like that type of mineral.(Data from Neuvonen, 1952.) 31, Magnetite in groundmass in the prehistoric Makaopuhi lava lake, Kilauea volcano, Hawaii. From same rock as analy-sis 32. (Data from Evans and Moore, 1968.) 32, Ilmenite in groundmass in the prehistoric Makaopuhi lava lake, Kilauea volcano, Hawaii. From samerock as analysis 31. (Data from Evans and Moore, 1968.)
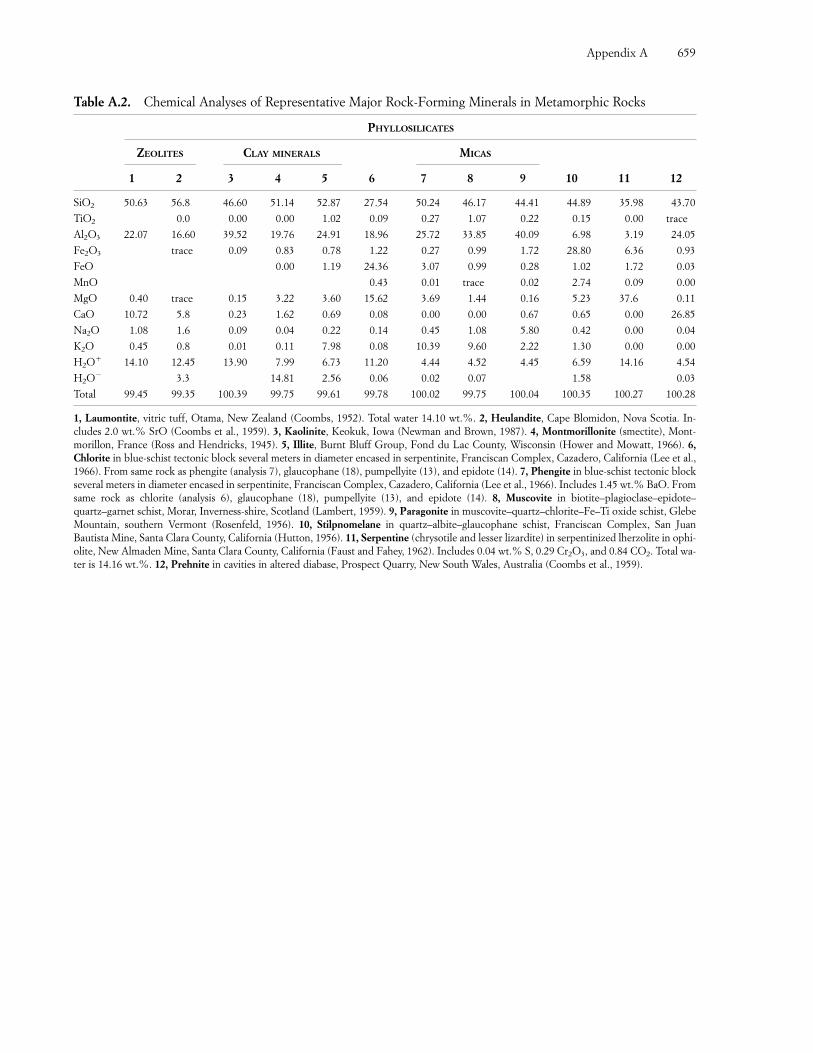
Appendix A 659
Table A.2. Chemical Analyses of Representative Major Rock-Forming Minerals in Metamorphic Rocks
PHYLLOSILICATES
ZEOLITES CLAY MINERALS MICAS
1 2 3 4 5 6 7 8 9 10 11 12
SiO2 50.63 56.8 46.60 51.14 52.87 27.54 50.24 46.17 44.41 44.89 35.98 43.70
TiO2 0.0 0.00 0.00 1.02 0.09 0.27 1.07 0.22 0.15 0.00 trace
Al2O3 22.07 16.60 39.52 19.76 24.91 18.96 25.72 33.85 40.09 6.98 3.19 24.05
Fe2O3 trace 0.09 0.83 0.78 1.22 0.27 0.99 1.72 28.80 6.36 0.93
FeO 0.00 1.19 24.36 3.07 0.99 0.28 1.02 1.72 0.03
MnO 0.43 0.01 trace 0.02 2.74 0.09 0.00
MgO 0.40 trace 0.15 3.22 3.60 15.62 3.69 1.44 0.16 5.23 37.6 0.11
CaO 10.72 5.8 0.23 1.62 0.69 0.08 0.00 0.00 0.67 0.65 0.00 26.85
Na2O 1.08 1.6 0.09 0.04 0.22 0.14 0.45 1.08 5.80 0.42 0.00 0.04
K2O 0.45 0.8 0.01 0.11 7.98 0.08 10.39 9.60 2.22 1.30 0.00 0.00
H2O� 14.10 12.45 13.90 7.99 6.73 11.20 4.44 4.52 4.45 6.59 14.16 4.54
H2O� 3.3 14.81 2.56 0.06 0.02 0.07 1.58 0.03
Total 99.45 99.35 100.39 99.75 99.61 99.78 100.02 99.75 100.04 100.35 100.27 100.28
1, Laumontite, vitric tuff, Otama, New Zealand (Coombs, 1952). Total water 14.10 wt.%. 2, Heulandite, Cape Blomidon, Nova Scotia. In-cludes 2.0 wt.% SrO (Coombs et al., 1959). 3, Kaolinite, Keokuk, Iowa (Newman and Brown, 1987). 4, Montmorillonite (smectite), Mont-morillon, France (Ross and Hendricks, 1945). 5, Illite, Burnt Bluff Group, Fond du Lac County, Wisconsin (Hower and Mowatt, 1966). 6,Chlorite in blue-schist tectonic block several meters in diameter encased in serpentinite, Franciscan Complex, Cazadero, California (Lee et al.,1966). From same rock as phengite (analysis 7), glaucophane (18), pumpellyite (13), and epidote (14). 7, Phengite in blue-schist tectonic blockseveral meters in diameter encased in serpentinite, Franciscan Complex, Cazadero, California (Lee et al., 1966). Includes 1.45 wt.% BaO. Fromsame rock as chlorite (analysis 6), glaucophane (18), pumpellyite (13), and epidote (14). 8, Muscovite in biotite–plagioclase–epidote–quartz–garnet schist, Morar, Inverness-shire, Scotland (Lambert, 1959). 9, Paragonite in muscovite–quartz–chlorite–Fe–Ti oxide schist, GlebeMountain, southern Vermont (Rosenfeld, 1956). 10, Stilpnomelane in quartz–albite–glaucophane schist, Franciscan Complex, San JuanBautista Mine, Santa Clara County, California (Hutton, 1956). 11, Serpentine (chrysotile and lesser lizardite) in serpentinized lherzolite in ophi-olite, New Almaden Mine, Santa Clara County, California (Faust and Fahey, 1962). Includes 0.04 wt.% S, 0.29 Cr2O3, and 0.84 CO2. Total wa-ter is 14.16 wt.%. 12, Prehnite in cavities in altered diabase, Prospect Quarry, New South Wales, Australia (Coombs et al., 1959).
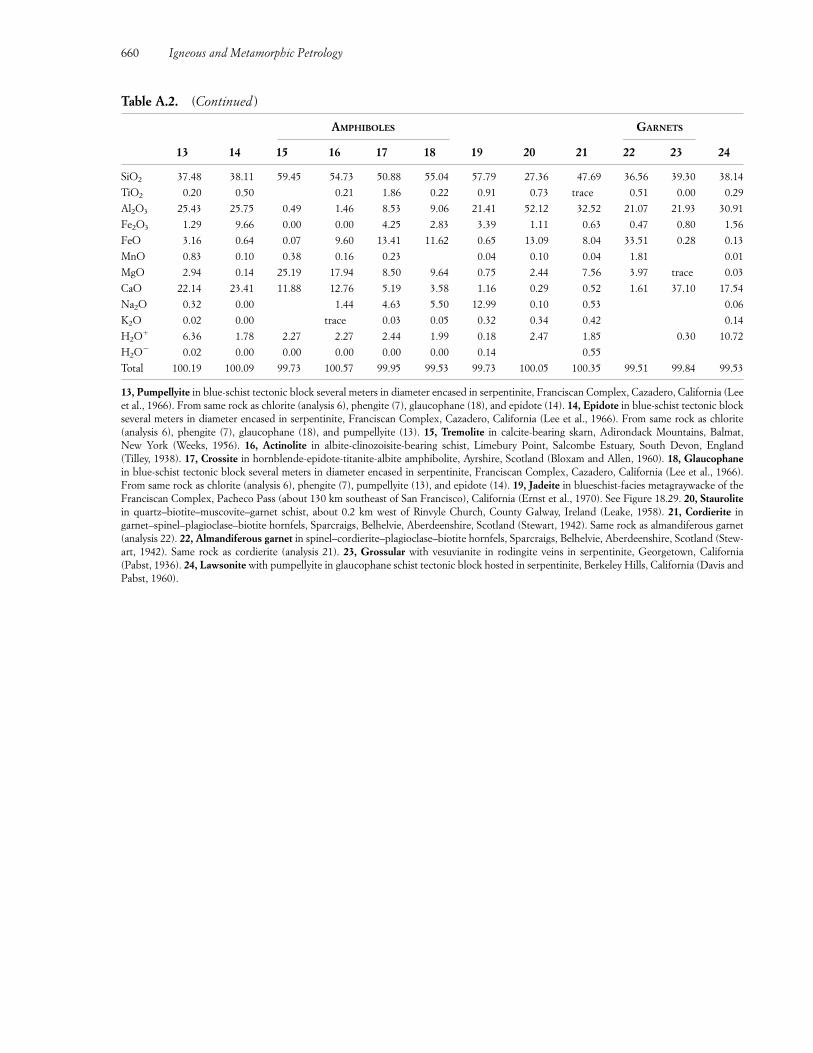
Table A.2. (Continued)
AMPHIBOLES GARNETS
13 14 15 16 17 18 19 20 21 22 23 24
SiO2 37.48 38.11 59.45 54.73 50.88 55.04 57.79 27.36 47.69 36.56 39.30 38.14
TiO2 0.20 0.50 0.21 1.86 0.22 0.91 0.73 trace 0.51 0.00 0.29
Al2O3 25.43 25.75 0.49 1.46 8.53 9.06 21.41 52.12 32.52 21.07 21.93 30.91
Fe2O3 1.29 9.66 0.00 0.00 4.25 2.83 3.39 1.11 0.63 0.47 0.80 1.56
FeO 3.16 0.64 0.07 9.60 13.41 11.62 0.65 13.09 8.04 33.51 0.28 0.13
MnO 0.83 0.10 0.38 0.16 0.23 0.04 0.10 0.04 1.81 0.01
MgO 2.94 0.14 25.19 17.94 8.50 9.64 0.75 2.44 7.56 3.97 trace 0.03
CaO 22.14 23.41 11.88 12.76 5.19 3.58 1.16 0.29 0.52 1.61 37.10 17.54
Na2O 0.32 0.00 1.44 4.63 5.50 12.99 0.10 0.53 0.06
K2O 0.02 0.00 trace 0.03 0.05 0.32 0.34 0.42 0.14
H2O� 6.36 1.78 2.27 2.27 2.44 1.99 0.18 2.47 1.85 0.30 10.72
H2O� 0.02 0.00 0.00 0.00 0.00 0.00 0.14 0.55
Total 100.19 100.09 99.73 100.57 99.95 99.53 99.73 100.05 100.35 99.51 99.84 99.53
13, Pumpellyite in blue-schist tectonic block several meters in diameter encased in serpentinite, Franciscan Complex, Cazadero, California (Leeet al., 1966). From same rock as chlorite (analysis 6), phengite (7), glaucophane (18), and epidote (14). 14, Epidote in blue-schist tectonic blockseveral meters in diameter encased in serpentinite, Franciscan Complex, Cazadero, California (Lee et al., 1966). From same rock as chlorite(analysis 6), phengite (7), glaucophane (18), and pumpellyite (13). 15, Tremolite in calcite-bearing skarn, Adirondack Mountains, Balmat, New York (Weeks, 1956). 16, Actinolite in albite-clinozoisite-bearing schist, Limebury Point, Salcombe Estuary, South Devon, England (Tilley, 1938). 17, Crossite in hornblende-epidote-titanite-albite amphibolite, Ayrshire, Scotland (Bloxam and Allen, 1960). 18, Glaucophanein blue-schist tectonic block several meters in diameter encased in serpentinite, Franciscan Complex, Cazadero, California (Lee et al., 1966).From same rock as chlorite (analysis 6), phengite (7), pumpellyite (13), and epidote (14). 19, Jadeite in blueschist-facies metagraywacke of theFranciscan Complex, Pacheco Pass (about 130 km southeast of San Francisco), California (Ernst et al., 1970). See Figure 18.29. 20, Staurolitein quartz–biotite–muscovite–garnet schist, about 0.2 km west of Rinvyle Church, County Galway, Ireland (Leake, 1958). 21, Cordierite in garnet–spinel–plagioclase–biotite hornfels, Sparcraigs, Belhelvie, Aberdeenshire, Scotland (Stewart, 1942). Same rock as almandiferous garnet(analysis 22). 22, Almandiferous garnet in spinel–cordierite–plagioclase–biotite hornfels, Sparcraigs, Belhelvie, Aberdeenshire, Scotland (Stew-art, 1942). Same rock as cordierite (analysis 21). 23, Grossular with vesuvianite in rodingite veins in serpentinite, Georgetown, California(Pabst, 1936). 24, Lawsonite with pumpellyite in glaucophane schist tectonic block hosted in serpentinite, Berkeley Hills, California (Davis andPabst, 1960).
660 Igneous and Metamorphic Petrology
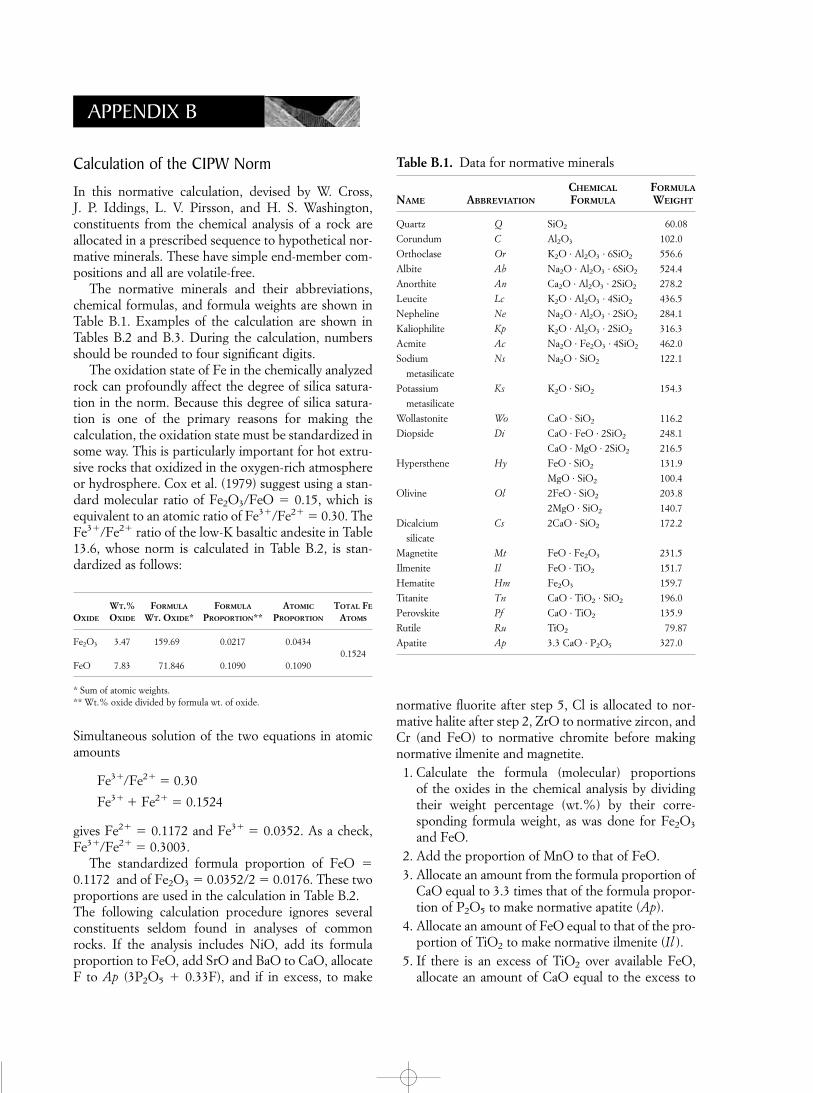
Calculation of the CIPW Norm
In this normative calculation, devised by W. Cross, J. P. Iddings, L. V. Pirsson, and H. S. Washington, constituents from the chemical analysis of a rock are allocated in a prescribed sequence to hypothetical nor-mative minerals. These have simple end-member com-positions and all are volatile-free.
The normative minerals and their abbreviations,chemical formulas, and formula weights are shown inTable B.1. Examples of the calculation are shown in Tables B.2 and B.3. During the calculation, numbersshould be rounded to four significant digits.
The oxidation state of Fe in the chemically analyzedrock can profoundly affect the degree of silica satura-tion in the norm. Because this degree of silica satura-tion is one of the primary reasons for making the calculation, the oxidation state must be standardized insome way. This is particularly important for hot extru-sive rocks that oxidized in the oxygen-rich atmosphereor hydrosphere. Cox et al. (1979) suggest using a stan-dard molecular ratio of Fe2O3/FeO � 0.15, which isequivalent to an atomic ratio of Fe3�/Fe2� � 0.30. TheFe3�/Fe2� ratio of the low-K basaltic andesite in Table13.6, whose norm is calculated in Table B.2, is stan-dardized as follows:
WT.% FORMULA FORMULA ATOMIC TOTAL FE
OXIDE OXIDE WT. OXIDE* PROPORTION** PROPORTION ATOMS
Fe2O3 3.47 159.69 0.0217 0.04340.1524
FeO 7.83 71.846 0.1090 0.1090
* Sum of atomic weights.** Wt.% oxide divided by formula wt. of oxide.
Simultaneous solution of the two equations in atomicamounts
Fe3�/Fe2� � 0.30
Fe3� � Fe2� � 0.1524
gives Fe2� � 0.1172 and Fe3� � 0.0352. As a check,Fe3�/Fe2� � 0.3003.
The standardized formula proportion of FeO �0.1172 and of Fe2O3 � 0.0352/2 � 0.0176. These twoproportions are used in the calculation in Table B.2.The following calculation procedure ignores severalconstituents seldom found in analyses of commonrocks. If the analysis includes NiO, add its formulaproportion to FeO, add SrO and BaO to CaO, allocateF to Ap (3P2O5 � 0.33F), and if in excess, to make
normative fluorite after step 5, Cl is allocated to nor-mative halite after step 2, ZrO to normative zircon, andCr (and FeO) to normative chromite before makingnormative ilmenite and magnetite.1. Calculate the formula (molecular) proportions
of the oxides in the chemical analysis by dividingtheir weight percentage (wt.%) by their corre-sponding formula weight, as was done for Fe2O3
and FeO.2. Add the proportion of MnO to that of FeO.3. Allocate an amount from the formula proportion of
CaO equal to 3.3 times that of the formula propor-tion of P2O5 to make normative apatite (Ap).
4. Allocate an amount of FeO equal to that of the pro-portion of TiO2 to make normative ilmenite (Il ).
5. If there is an excess of TiO2 over available FeO, allocate an amount of CaO equal to the excess to
APPENDIX B
Table B.1. Data for normative minerals
CHEMICAL FORMULANAME ABBREVIATION FORMULA WEIGHT
Quartz Q SiO2 60.08
Corundum C Al2O3 102.0
Orthoclase Or K2O · Al2O3 · 6SiO2 556.6
Albite Ab Na2O · Al2O3 · 6SiO2 524.4
Anorthite An Ca2O · Al2O3 · 2SiO2 278.2
Leucite Lc K2O · Al2O3 · 4SiO2 436.5
Nepheline Ne Na2O · Al2O3 · 2SiO2 284.1
Kaliophilite Kp K2O · Al2O3 · 2SiO2 316.3
Acmite Ac Na2O · Fe2O3 · 4SiO2 462.0
Sodium Ns Na2O · SiO2 122.1
metasilicate
Potassium Ks K2O · SiO2 154.3
metasilicate
Wollastonite Wo CaO · SiO2 116.2
Diopside Di CaO · FeO · 2SiO2 248.1
CaO · MgO · 2SiO2 216.5
Hypersthene Hy FeO · SiO2 131.9
MgO · SiO2 100.4
Olivine Ol 2FeO · SiO2 203.8
2MgO · SiO2 140.7
Dicalcium Cs 2CaO · SiO2 172.2
silicate
Magnetite Mt FeO · Fe2O3 231.5
Ilmenite Il FeO · TiO2 151.7
Hematite Hm Fe2O3 159.7
Titanite Tn CaO · TiO2 · SiO2 196.0
Perovskite Pf CaO · TiO2 135.9
Rutile Ru TiO2 79.87
Apatite Ap 3.3 CaO · P2O5 327.0
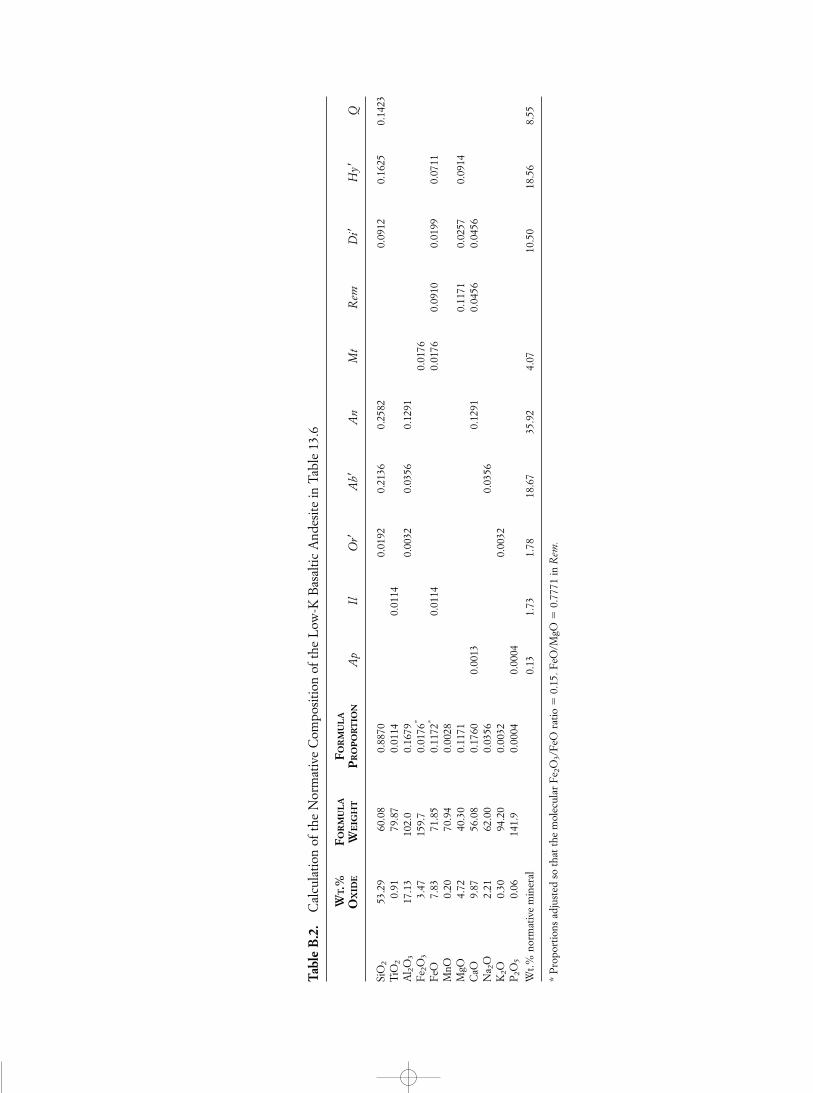
Tabl
e B
.2.
Cal
cula
tion
of th
e N
orm
ativ
e C
ompo
sitio
n of
the
Low
-K B
asal
tic A
ndes
ite in
Tab
le 1
3.6
WT.
%FO
RM
UL
AFO
RM
UL
AO
XID
EW
EIG
HT
PRO
PO
RT
ION
Ap
IlO
r�A
b�A
nM
tR
emD
i�H
y�Q
SiO
253
.29
60.0
80.
8870
0.01
920.
2136
0.25
820.
0912
0.16
250.
1423
TiO
20.
9179
.87
0.01
140.
0114
Al 2
O3
17.1
310
2.0
0.16
790.
0032
0.03
560.
1291
Fe 2
O3
3.47
159.
70.
0176
*0.
0176
FeO
7.83
71.8
50.
1172
*0.
0114
0.01
760.
0910
0.01
990.
0711
MnO
0.20
70.9
40.
0028
MgO
4.72
40.3
00.
1171
0.11
710.
0257
0.09
14C
aO9.
8756
.08
0.17
600.
0013
0.12
910.
0456
0.04
56N
a 2O
2.21
62.0
00.
0356
0.03
56K
2O0.
3094
.20
0.00
320.
0032
P2O
50.
0614
1.9
0.00
040.
0004
Wt.%
nor
mat
ive
min
eral
0.13
1.73
1.78
18.6
735
.92
4.07
10.5
018
.56
8.55
*P
ropo
rtio
ns a
djus
ted
so th
at th
e m
olec
ular
Fe 2
O3/
FeO
rat
io �
0.15
. FeO
/MgO
�0.
7771
in R
em.
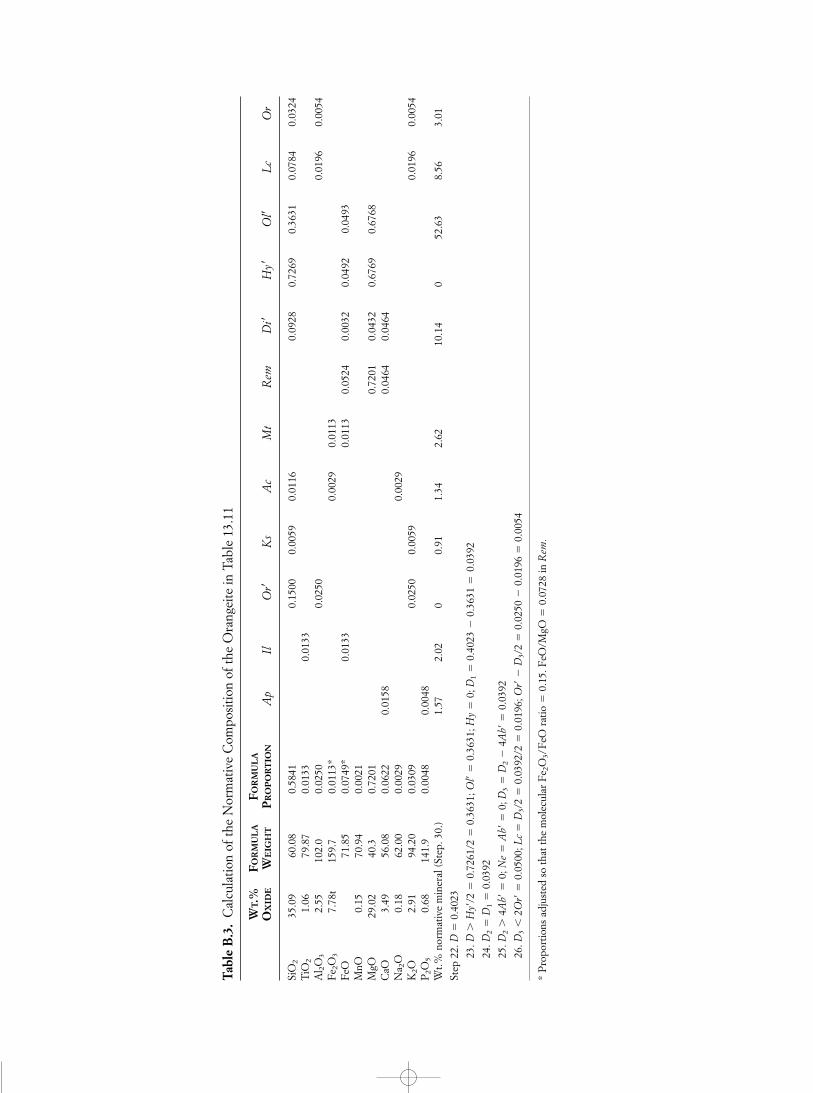
Tabl
e B
.3.
Cal
cula
tion
of th
e N
orm
ativ
e C
ompo
sitio
n of
the
Ora
ngei
te in
Tab
le 1
3.11
WT.
%FO
RM
UL
AFO
RM
UL
AO
XID
EW
EIG
HT
PRO
PO
RT
ION
Ap
IlO
r�K
sA
cM
tR
emD
i�H
y�O
l�L
cO
r
SiO
235
.09
60.0
80.
5841
0.15
000.
0059
0.01
160.
0928
0.72
690.
3631
0.07
840.
0324
TiO
21.
0679
.87
0.01
330.
0133
Al 2
O3
2.55
102.
00.
0250
0.02
500.
0196
0.00
54F
e 2O
37.
78t
159.
70.
0113
*0.
0029
0.01
13F
eO71
.85
0.07
49*
0.01
330.
0113
0.05
240.
0032
0.04
920.
0493
MnO
0.15
70.9
40.
0021
MgO
29.0
240
.30.
7201
0.72
010.
0432
0.67
690.
6768
CaO
3.49
56.0
80.
0622
0.01
580.
0464
0.04
64N
a 2O
0.18
62.0
00.
0029
0.00
29K
2O2.
9194
.20
0.03
090.
0250
0.00
590.
0196
0.00
54P
2O5
0.68
141.
90.
0048
0.00
48W
t.% n
orm
ativ
e m
iner
al (
Step
. 30.
)1.
572.
020
0.91
1.34
2.62
10.1
40
52.6
38.
563.
01
Step
22.
D�
0.40
23
23. D
�H
y�/2
�0.
7261
/2 �
0.36
31; O
l��
0.36
31; H
y�
0; D
1�
0.40
23 �
0.36
31 �
0.03
92
24. D
2�
D1
�0.
0392
25. D
2�
4Ab�
�0;
Ne
�A
b��
0; D
3�
D2
�4A
b��
0.03
92
26. D
3�
2Or�
�0.
0500
; Lc
�D
3/2
�0.
0392
/2 �
0.01
96; O
r��
D3/
2 �
0.02
50 �
0.01
96 �
0.00
54
* P
ropo
rtio
ns a
djus
ted
so th
at th
e m
olec
ular
Fe 2
O3/
FeO
rat
io �
0.15
. FeO
/MgO
�0.
0728
in R
em.
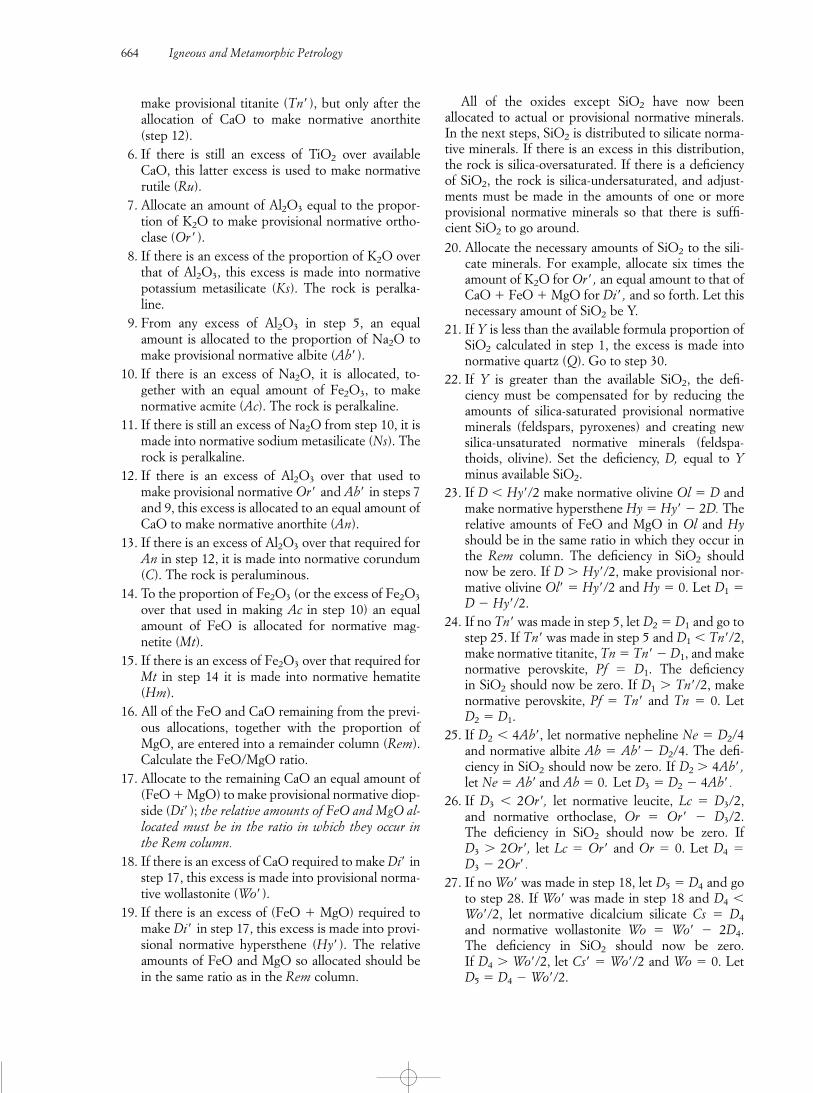
664 Igneous and Metamorphic Petrology
make provisional titanite (Tn�), but only after theallocation of CaO to make normative anorthite(step 12).
6. If there is still an excess of TiO2 over availableCaO, this latter excess is used to make normativerutile (Ru).
7. Allocate an amount of Al2O3 equal to the propor-tion of K2O to make provisional normative ortho-clase (Or� ).
8. If there is an excess of the proportion of K2O overthat of Al2O3, this excess is made into normativepotassium metasilicate (Ks). The rock is peralka-line.
9. From any excess of Al2O3 in step 5, an equalamount is allocated to the proportion of Na2O tomake provisional normative albite (Ab� ).
10. If there is an excess of Na2O, it is allocated, to-gether with an equal amount of Fe2O3, to makenormative acmite (Ac). The rock is peralkaline.
11. If there is still an excess of Na2O from step 10, it ismade into normative sodium metasilicate (Ns). Therock is peralkaline.
12. If there is an excess of Al2O3 over that used tomake provisional normative Or� and Ab� in steps 7and 9, this excess is allocated to an equal amount ofCaO to make normative anorthite (An).
13. If there is an excess of Al2O3 over that required forAn in step 12, it is made into normative corundum(C). The rock is peraluminous.
14. To the proportion of Fe2O3 (or the excess of Fe2O3
over that used in making Ac in step 10) an equalamount of FeO is allocated for normative mag-netite (Mt).
15. If there is an excess of Fe2O3 over that required forMt in step 14 it is made into normative hematite(Hm).
16. All of the FeO and CaO remaining from the previ-ous allocations, together with the proportion ofMgO, are entered into a remainder column (Rem).Calculate the FeO/MgO ratio.
17. Allocate to the remaining CaO an equal amount of(FeO � MgO) to make provisional normative diop-side (Di�); the relative amounts of FeO and MgO al-located must be in the ratio in which they occur inthe Rem column.
18. If there is an excess of CaO required to make Di� instep 17, this excess is made into provisional norma-tive wollastonite (Wo� ).
19. If there is an excess of (FeO � MgO) required tomake Di� in step 17, this excess is made into provi-sional normative hypersthene (Hy� ). The relativeamounts of FeO and MgO so allocated should bein the same ratio as in the Rem column.
All of the oxides except SiO2 have now been allocated to actual or provisional normative minerals.In the next steps, SiO2 is distributed to silicate norma-tive minerals. If there is an excess in this distribution,the rock is silica-oversaturated. If there is a deficiencyof SiO2, the rock is silica-undersaturated, and adjust-ments must be made in the amounts of one or moreprovisional normative minerals so that there is suffi-cient SiO2 to go around.
20. Allocate the necessary amounts of SiO2 to the sili-cate minerals. For example, allocate six times theamount of K2O for Or� , an equal amount to that ofCaO � FeO � MgO for Di� , and so forth. Let thisnecessary amount of SiO2 be Y.
21. If Y is less than the available formula proportion ofSiO2 calculated in step 1, the excess is made intonormative quartz (Q). Go to step 30.
22. If Y is greater than the available SiO2, the defi-ciency must be compensated for by reducing theamounts of silica-saturated provisional normativeminerals (feldspars, pyroxenes) and creating newsilica-unsaturated normative minerals (feldspa-thoids, olivine). Set the deficiency, D, equal to Yminus available SiO2.
23. If D � Hy�/2 make normative olivine Ol � D andmake normative hypersthene Hy � Hy� � 2D. Therelative amounts of FeO and MgO in Ol and Hyshould be in the same ratio in which they occur inthe Rem column. The deficiency in SiO2 shouldnow be zero. If D � Hy�/2, make provisional nor-mative olivine Ol� � Hy�/2 and Hy � 0. Let D1 �D � Hy�/2.
24. If no Tn� was made in step 5, let D2 � D1 and go tostep 25. If Tn� was made in step 5 and D1 � Tn�/2,make normative titanite, Tn � Tn� � D1, and makenormative perovskite, Pf � D1. The deficiency in SiO2 should now be zero. If D1 � Tn�/2, makenormative perovskite, Pf � Tn� and Tn � 0. Let D2 � D1.
25. If D2 � 4Ab�, let normative nepheline Ne � D2/4and normative albite Ab � Ab�� D2/4. The defi-ciency in SiO2 should now be zero. If D2 � 4Ab� ,let Ne � Ab� and Ab � 0. Let D3 � D2 � 4Ab� .
26. If D3 � 2Or�, let normative leucite, Lc � D3/2, and normative orthoclase, Or � Or� � D3/2. The deficiency in SiO2 should now be zero. If D3 � 2Or�, let Lc � Or� and Or � 0. Let D4 � D3 � 2Or� .
27. If no Wo� was made in step 18, let D5 � D4 and goto step 28. If Wo� was made in step 18 and D4 �Wo�/2, let normative dicalcium silicate Cs � D4
and normative wollastonite Wo � Wo� � 2D4. The deficiency in SiO2 should now be zero. If D4 � Wo�/2, let Cs� � Wo�/2 and Wo � 0. LetD5 � D4 � Wo�/2.
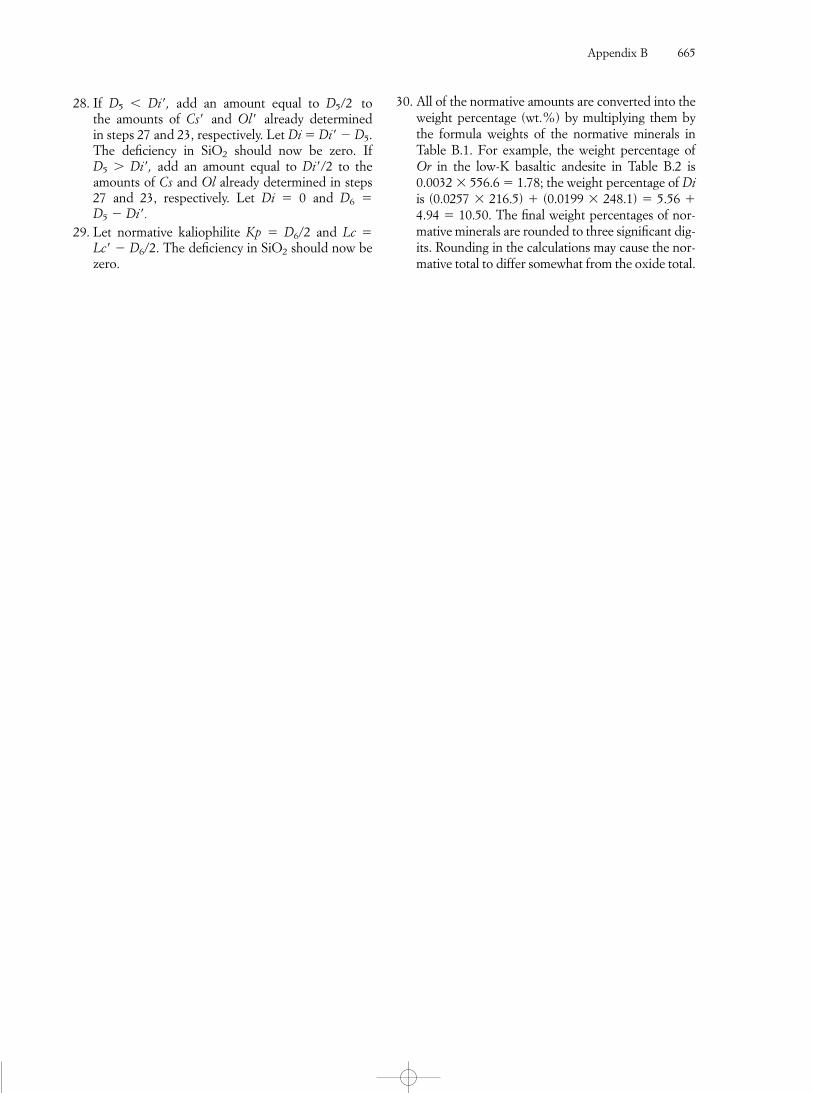
28. If D5 � Di�, add an amount equal to D5/2 to the amounts of Cs� and Ol� already determined in steps 27 and 23, respectively. Let Di � Di� � D5.The deficiency in SiO2 should now be zero. If D5 � Di�, add an amount equal to Di�/2 to theamounts of Cs and Ol already determined in steps27 and 23, respectively. Let Di � 0 and D6 �D5 � Di�.
29. Let normative kaliophilite Kp � D6/2 and Lc � Lc� � D6/2. The deficiency in SiO2 should now bezero.
30. All of the normative amounts are converted into theweight percentage (wt.%) by multiplying them bythe formula weights of the normative minerals inTable B.1. For example, the weight percentage ofOr in the low-K basaltic andesite in Table B.2 is0.0032 � 556.6 � 1.78; the weight percentage of Diis (0.0257 � 216.5) � (0.0199 � 248.1) � 5.56 �4.94 � 10.50. The final weight percentages of nor-mative minerals are rounded to three significant dig-its. Rounding in the calculations may cause the nor-mative total to differ somewhat from the oxide total.
Appendix B 665
Abbott DH, Hoffman SE. 1984. Archean plate tectonics revised. I. Heat flow, spreading rate, and the age of subduct-ing oceanic lithosphere and their effects on the origin andevolution of continents. Tectonics 3:429–448.
Agee CB, Walker D. 1993. Olivine flotation in mantle melt.Earth Planet. Sci. Lett. 114:315–324.
Åhäll K-I, Connelly JN, Brewer TS. 2000. Episodic rapakivimagmatism due to distal orogenesis? Correlation of 1.69-1.50 Ga orogenic and inboard, “anorogenic” events in theBaltic Shield. Geology 28:823–826.
Aitcheson SJ, Forrest AH. 1994. Quantification of crustalcontamination in open magmatic systems. J. Petrol.35:461–488.
Allègre CJ, Manhès G, Göpel C. 1995. The age of theEarth. Geochim. Cosmochim. Acta 59:1445–1456.
Althaus E. 1969. Das system Al2O3-SiO2-H2O. NeuesJahrb. Mineral. Abh. 111:111–161.
Anderson EM. 1951. The dynamics of faulting and dykeformation. Edinburgh, Oliver and Boyd.
Anderson GM. 1996. Thermodynamics of natural systems.New York, John Wiley and Sons.
Anderson JL, Smith DR. 1995. The effects of temperatureand f on the Al-in-hornblende barometer. Am. Mineral.80:549–559.
Anderson RN, Langseth MF, Sclater JG. 1977. The mechanisms of heat transfer through the floor of the Indian Ocean. J. Geophys. Res. 82:3391–3409.
Angrist SW, Hepler LG. 1967. Order and chaos: Laws ofenergy and entropy. New York, Basic Books.
Anhaeusser CR. 1992. Structures in granitoid gneisses andassociated migmatites close to the granulite boundary of theLimpopo Belt, South Africa. Precamb. Res. 55:81–92.
Anhaeusser CR, Wilson JF. 1981. The granitic–greenstoneshield. In: Hunter DR, ed. Precambrian of the southernhemisphere. New York, Elsevier:423–500.
Armstrong RL. 1981. Radiogenic isotopes: The case forcrustal recycling on a near-steady-state no-continental-growth Earth. Phil. Trans. Roy. Soc. Lond. A 301:443–472.
Armstrong RL. 1982. Cordilleran metamorphic core complexes—From Arizona to southern Canada. Ann. Rev.Earth Planet. Sci. 10:129–154.
Armstrong RL. 1991. The persistent myth of crustal growth.Australian J. Earth Sci. 38:613–630.
Arndt NT. 1994. Archean komatiites. In: Condie KC, ed.Archean crustal evolution. New York, Elsevier: 11–44.
Arndt NT, Albaréde F, Nisbet EG. 1997. Mafic and ultramfic magmatism. In: De Wit MJ, Ashwal LD, ed.Greenstone belts. Oxford, Clarendon: 233–254.
Arndt NT, Nisbet EG. 1982. Komatiites. Boston, GeorgeAllen and Unwin.
Ashwal LD. 1993. Anorthosites. New York, Springer-Verlag.
O2
Ashworth JR, ed. 1985. Migmatites. New York, Chapmanand Hall.
Atherton MP, Sanderson LM. 1987. The Cordillera Blancabatholith: A study of granite intrusion and the relation ofcrustal thickening to peraluminosity. Geol. Rund.76:213–232.
Atkins PW. 1978. Physical chemistry. San Francisco, W.H.Freeman.
Bacon CR. 1989. Crystallization of accessory phases in magmas by local saturation adjacent to phenocrysts.Geochim. Cosmochim. Acta. 53:1055–1066.
Bacon CR, Druitt, TH. 1988. Compositional evolution ofthe zoned calcalkaline magma chamber of Mount Mazama,Crater Lake, Oregon. Contrib. Mineral. Petrol. 98:224–256.
Bailey DK. 1970. Volatile flux, heat focussing and the gener-ation of magma. Geol. J. Spec. Issue 2:177–186.
Bailey EH, Stevens RE. 1960. Selective staining of K-feldspar and plagioclase on rock slabs and thin sections.Am. Mineral. 45:1020–1025.
Baker DR, Vaillancourt J. 1995. The low viscosities of F �H2O-bearing granitic melts and implications for melt ex-traction and transport. Earth Planet. Sci. Lett. 132:199–211.
Barker AJ. 1990. Introduction to metamorphic textures andmicrostructures. New York, Blackie.
Barker DS. 1996. Carbonatite volcanism. In: Mitchell RH,ed. Undersaturated alkaline rocks: Mineralogy, petrogenesis,and economic potential. Min. Assoc. Can. Short Course Ser.24:45–62.
Barker DS. 1996. Nephelinite-phonolite volcanism. In:Mitchell RH, ed. Undersaturated alkaline rocks: Mineralogy,petrogenesis, and economic potential. Min. Assoc. Can.Short Course Ser. 24:23–44.
Barker F, ed. 1979. Trondhjemites, dacites, and relatedrocks. New York, Elsevier.
Barnes HL. 1979. Geochemistry of hydrothermal ore deposits, 2nd ed. New York, John Wiley and Sons.
Barrow G. 1912. On the geology of lower Deeside and thesouthern highland border. Proc. Geol. Assoc. 23:268–284.
Barton MD, Hanson RB. 1989. Magmatism and the devel-opment of low-pressure metamorphic belts: Implicationsfrom the western United States and thermal modeling.Geol. Soc. Am. Bull. 101:1051–1065.
Barton MD, Ilchik RP, Marikos MA. 1991. Metasomatism.In: Kerrick DM, ed. Contact metamorphism, Rev. Mineral.26:321–350.
Bateman PC. 1992. Plutonism in the central part of theSierra Nevada batholith, California. US Geol. Surv. Prof.Pap. 1483.
Bateman PC, Chappell BW. 1979. Crystallization, fractiona-tion, and solidification of the Tuolumne intrusive series,Yosemite National Park, California. Geol. Soc. Am. Bull.90:465–482.
REFERENCES CITED
Bateman PC, Nokleberg WJ. 1978. Solidification of theMount Givens granodiorite, Sierra Nevada, California. J. Geol. 86:563–579.
Baumgartner LP, Gerdes ML, Person MA, Roselle GT.1997. Porosity and permeability of carbonate rocks duringcontact metamorphism. In: Jamtveit B, Yardley BWD, eds.Fluid flow and transport in rocks: Mechanisms and effects.New York, Chapman and Hall, 83–98.
Beard JS, Lofgren GE. 1991. Dehydration melting and water-saturated melting of basaltic and andesitic greenstonesand amphibolites at 1, 3, and 6.9 kb. J. Petrol. 32:365–401.
Bebout GE, Scholl DW, Kirby SH, Platt JP. 1996. Subduc-tion top to bottom. Am. Geophys. Union Monog. 96.
Bégin NJ, Carmichael DM. 1992. Textural and composi-tional relationships of Ca-amphiboles in metabasites of theCape Smith Belt, Northern Quebec: Implications for a mis-cibility gap at medium pressure. J. Petrol. 33:1317–1343.
Beiersdorfer RE, Day HW. 1995. Mineral paragenesis of pumpellyite in low-grade mafic rocks. Geol. Soc. Am. Special Paper 296:5–27.
Bell DR, Rossman GR. 1992. Water in Earth’s mantle: The role of nominally anhydrous minerals. Science255:1391–1397.
Bell K, ed. 1989. Carbonatites. Boston, Unwin Hyman.
Berthé D, Choukroune P, Jegouzo P. 1979. Orthogneiss,mylonite, and non-coaxial deformation of granites: The example of the south Armorican shear-zone. J. Struct. Geol. 1:31–42.
Best MG. 1974. Mantle-derived amphibole within inclusionsin alkalic-basaltic lavas. J. Geophys. Res. 79:2107–2113.
Best MG, Brimhall WH. 1974. Late Cenozoic alkalicbasaltic magmas in the western Colorado plateaus and theBasin and Range transition zone, USA, and their bearing onmantle dynamics. Geol. Soc. Am. Bull. 85:1677–1690.
Best MG, Christiansen EH. 1997. Origin of broken phe-nocrysts in ash-flow tuffs. Geol. Soc. Am. Bull. 109:63–73.
Best MG, Christiansen EH, Deino AL, Grommé CS, Mc-Kee EH, Noble DC. 1989. Eocene through Miocene volcan-ism in the Great Basin of the western United States. NewMex. Bur. Mines Mineral Resources Mem. 47:91–133.
Best MG, Christiansen EH, Deino AL, Grommé CS, TingeyDG. 1995. Correlation and emplacement of a large, zoned,discontinuously exposed ash-flow sheet: The 40Ar/39Archronology, paleomagnetism, and petrology of the Pahrana-gat Formation, Nevada. J. Geophys. Res. 100:24,593–24,609.
Best MG, Mercy ELP. 1967. Composition and crystalliza-tion of mafic minerals in the Guadalupe igneous complex,California. Am. Mineral. 52:436–474.
Bickle MJ. 1990. Mantle evolution. In: Hall RP, Hughes DJ,ed. Early Precambrian basic magmatism. London, Blackie:111–135.
Bickle MJ, Nisbet EG, Martin A. 1992. Archean greenstonebelts are not oceanic crust. J. Geol. 102:121–138.
Blake S. 1990. Viscoplastic models of lava domes. In: FinkJH, ed. Lava flows and domes. New York, Springer-Verlag:88–126.
Blatt H, Tracy RJ. 1996. Petrology: Igneous, sedimentary,and metamorphic, 2nd ed. New York, W.H. Freeman.
Blichert-Toft J, Arndt NT, Ludden JN. 1996. Precambrianalkaline magmatism. Lithos 37:97–111.
Blichert-Toft J, Frey FA, Albarede F. 1999. Hf isotope evidence for pelagic sediments in the source of Hawaiianbasalts. Science 285:879–882.
Bloomer SH, Stern RJ, Fisk E, Geschwind CH. 1989.Shoshonitic volcanism in the northern Mariana arc: 1. Mineralogic and major and trace element characterisitics. J. Geophys. Res. 94:4469–4496.
Bloxam TW, Allen JB. 1960. Glaucophane–schist, eclogite,and associated rocks from Knockormal in the Girvan–Ballantrae Complex, Ayrshire. Trans. Roy. Soc. Edin.64:1–32.
Boettcher AL, Burnham CW, Windom KE, Bohlen SR.1982. Liquids, glasses, and the melting of silicates to highpressures. J. Geol. 90:127–138.
Boggs S, Jr. 1995. Principles of sedimentology and strati-graphy. Englewood Cliffs, NJ, Prentice Hall.
Bohlen SR, Peacor DR, Essene EJ. 1980. Crystal chemistryof a metamorphic biotite and its significance in waterbarometry. Am. Mineral. 65:55–62.
Bolin C, Qingchen W, Mingguo Z. 1999. New data regard-ing hotly debated topics concerning UHP metamorphism ofthe Dabie-Sulu belt, east-central China. Internat. Geol. Rev.41:827–835.
Bonnichsen B, Kauffman DF. 1987. Physical features of rhyolite lava flows in the Snake River Plain volcanicprovince, southwestern Idaho. Geol. Soc. Am. Spec. Paper 212:119–145.
Borg IY. 1956. Glaucophane schists and eclogites nearHealdsburg, Califoinia. Geol. Soc. Am. Bull. 67:1563–1584.
Borradaile GJ, Bayly MB, Powell CMcA. 1982. Atlas of deformational and metamorphic rock fabrics. New York,Springer-Verlag.
Bottinga Y, Kudo A, Weill DF. 1966. Some observations on oscillatory zoning and crystallization of magmatic plagioclase. Am. Mineral. 51:792–806.
Bottinga Y, Weill DF. 1970. Densities of liquid silicate systems calculated from partial molar volumes of oxidecomponents. Am. J. Sci. 269:169–182.
Bottinga Y, Weill DF. 1972. The viscosity of magmatic silicate liquids: A model for calculation. Am. J. Sci.272:438–475.
Bouska V. 1993. Natural glasses. New York, Ellis Horwood.
Bowden P, Black R, Martin RF, Ike EC, Kinnaird JA, Batchelor RA. 1987. Niger-Nigerian alkaline ring com-plexes: A classic example of African Phanerozoic anoro-genic mid-plate magmatism. In: Fitton JG, Upton BGJ, eds. Alkaline igneous rocks. Geol. Soc. Spec. Pub.30:357–380.
Bowen NL. 1914. The ternary system: Diopside-forsterite-silica. Am. J. Sci. 188:207–264.
Bowen NL. 1917. The problem of the anorthosites. J. Geol.25:209–243.
References Cited 667
Bowen NL. 1921. Diffusion in silicate melts. J. Geol.29:295–317.
Bowen NL. 1928. The evolution of the igneous rocks.Princeton, NJ, Princeton University.
Bowen NL. 1940. Progressive metamorphism of siliceouslimestone and dolomite. J. Geol. 48:225–274.
Bowen NL, Anderson O. 1914. The binary systemMgO–SiO2. Am. J. Sci. 37:487–500.
Bowring SA, Housh T. 1995. The Earth’s early evolution.Sci. 269:1535–1540.
Bowring SA, Williams IS. 1999. Priscoan (4.00– 4.03 Ga) orthogneisses from northwestern Canada. Contr. Mineral.Petrol. 134:3–16.
Boyd FR, England JL. 1961. Melting of silicates at highpressures. Ann. Rept. Dir. Geophys. Lab. Yrbk. Carn. Inst.Wash. 60:113–125.
Brandeis G, Jaupart C. 1987. The kinetics of nucleation andcrystal growth and scaling laws for magmatic crystallization.Contr. Mineral. Petrol. 96:24–34.
Brenan J. 1991. Development and maintenance of meta-morphic permeability: Implications for fluid transport. In:Kerrick DM, ed. Contact metamorphism, Rev. Mineral.26:291–350.
Brimhall GH, Crerar DA. 1987. Ore fluids: Magmatic to supergene. In: Carmichael ISE, Eugster HP, ed. Thermody-namic modeling of geologic materials: Minerals, fluids, andmelts. Rev. Mineral. 17:235–321.
Brown EH. 1986. Geology of the Shuksan suite, North Cascades, Washington, USA. In Evans BW, Brown EH, eds. Blueschists and eclogites. Geol. Soc. Am. Mem.164:143–154.
Brown M. 2000. Unpairing metamorphic belts: P–T pathsand a tectonic model for the Ryoke Belt, southwest Japan. J. Metam. Geol. 16:3–22.
Brown M, Rushmer T. 1997. The role of deformation in themovement of granitic melt: Views from the laboratory andfield. In: Holness MB, ed. Deformation-enhanced fluidtransport in the Earth’s crust and mantle. New York, Chapman and Hall.
Brown WL. 1993. Fractional crystallization and zoning inigneous feldspars: Ideal water-buffered liquid fractionationlines and feldspar zoning paths. Contrib. Mineral. Petrol.113:115–125.
Bryan WB, Moore JG. 1977. Compositional variations ofyoung basalts in the Mid-Atlantic Ridge rift valley near 36°49′N. Geol. Soc. Am. Bull. 88:556–570.
Bucher K, Frey M. 1994. Petrogenesis of metamorphicrocks. New York, Springer-Verlag.
Buddington AF, Lindsley DH. 1964. Iron-titanium oxideminerals and synthetic equivalents. J. Petrol. 5:310–357.
Buening DK, Buseck PR. 1973. Fe-Mg lattice diffusion inolivine. J. Geophys. Res. 78:6852–6862.
Burnham CW. 1959. Contact metamorphism of magnesianlimestone at Crestmore, Ca. Geol. Soc. Am. Bull.70:879–920.
Burnham CW. 1979. The importance of volatile con-stituents. In: Yoder HS, ed. The evolution of the igneousrocks. Princeton, NJ, Princeton University: 1077–1084.
Burnham CW. 1979. Magmas and hydrothermal fluids. In:Barnes HL, ed. Geochemistry of hydrothermal ore deposits,2nd ed. New York, John Wiley and Sons: 71–136.
Burnham CW. 1985. Energy release in subvolcanic environ-ments: Implications for breccia formation. Econ. Geol.80:1515–1522.
Burnham CW, Davis NF. 1971. The role of H2O in silicatemelts. I. P–V–T relations in the system NaAlSi3O8-H2O.Am. J. Sci. 270:54–79.
Burnham CW, Davis NF. 1974. The role of H2O in silicatemelts: II. Thermodynamic and phase relations in the systemNaAlSi3O8-H2O to 10 kilobars, 700°C–1100°C. Am. J. Sci.274:902–940.
Burnham CW, Holloway JR, Davis NF. 1969. Thermody-namic properties of water to 1000°C and 10,000 bars. Geol.Soc. Am. Spec. Paper 132.
Burton KW, Onions RK. 1991, High-resolution garnetchronometry and the rates of metamorphic processes. EarthPlanet. Sci. Lett. 107:649–671.
Campbell IH, Griffiths RW. 1992. The changing nature ofmantle hotspots through time: Implications for the chemicalevolution of the mantle. J. Geol. 92:497–523.
Campbell IH, Hill RET, Griffiths RW. 1990. Melting inArchean mantle plumes: Heads its basalts, tails its komati-ites. Nature 339:697–699.
Campbell IH, Taylor SR. 1983. No water, no granites—nooceans, no continents. Geophys. Res. Lett. 10:1061–1064.
Card KD. 1990. A review of the Superior province of theCanadian shield, a product of Archean accretion. Precamb.Res. 48:99–156.
Carlson RW and 16 others. 2000. Continental growth,preservation, and modification in southern Africa. GSA Today 10;2:1–6.
Carlson WD, Denison C. 1992. Mechanisms of porphyro-blast crystallization: Results from high-resolution computedX-ray tomography. Science 257:1236–1239.
Carlson WD, Denison C, Ketcham RA. 1995. Controls onthe nucleation and growth of porphyroblasts: Kinetics fromnatural textures and numerical models. Geol. J. 30:207–225.
Carlson WD, Johnson CD. 1991. Coronal reaction texturesin garnet amphibolites of the Llano Uplift. Am. Mineral.76:756–772.
Carlson WD, Rosenfield JL. 1981. Optical determination oftopotactic aragonite-calcite growth kinetics: Metamorphicimplications. J. Geol. 89:615–638.
Carmichael DM. 1969. On the mechanism of progrademetamorphic reactions in quartz-bearing pelitic rocks.Contr. Mineral. Petrol. 20:244–267.
Carmichael DM. 1970. Intersecting isograds in the Whetstone Lake area, Ontario. J. Petrol. 11:147–181.
Carmichael ISE, Turner FJ, Verhoogen J. 1974. Igneouspetrology. New York, McGraw-Hill.
668 Igneous and Metamorphic Petrology
Carroll MR, Webster JD. 1994. Solubilities of sulfur, noblegases, nitrogen, chlorine, and fluorine in magmas. In: Carroll MR, Holloway JR, ed. Volatiles in magmas. Rev.Mineral. 30:231–279.
Carswell DA, ed. 1990. Eclogite facies rocks. New York,Chapman and Hall.
Carswell DA, Cuthbert SJ, Krogh Ravna EJ. 1999. Ultrahigh-pressure metamorphism in the western gneiss region ofthe Norwegian Caledonides. Internat. Geol. Rev. 41:955–966.
Carswell DA, O’Brien PJ, Wilson RN, Zhai M. 1997. Thermobarometry of phengite-bearing eclogites in the DabieMountains of central China. J. Metam. Geol. 15:239–252.
Carter JL. 1970. Mineralogy and chemistry of the Earth’supper mantle based on the partial fusion-partial crystalliza-tion model. Geol. Soc. Am. Bull. 81:2021–2034.
Cas RAF, Wright JV. 1987. Volcanic successions: Modernand ancient. London, Allen and Unwin.
Cashman KV. 1988. Crystallization of Mount St. Helens1980–1986 dacite: A quantitative textural approach. Bull.Volc. 50:194–209.
Cashman KV. 1990. Textural constraints on the kinetics ofcrystallization of igneous rocks. In: Nicholls J, Russell JK,eds. Modern methods of igneous petrology: Understandingmagmatic processes: Rev. Mineral. 24:259–314.
Cashman KV, Ferry JM. 1988. Crystal size distribution(CSD) in rocks and the kinetics and dynamics of crystalliza-tion: III Metamorphic crystallization. Contr. Mineral. Petrol.99:401–415.
Cashman KV, Mangan MT. 1994. Physical aspects of magmadegassing II. Constraints on vesiculation from textural studies oferuptive products. In: Carroll MR, Holloway JR,ed. Volatiles in magmas: Rev. Mineral. 30:447– 478.
Castle RO, Lindsley DH. 1993. An exsolution silica-pumpmodel for the origin of myrmekite. Contr. Mineral. Petrol.115:58–65.
Cawthorn RG. 1996. Layered intrusions. New York, Elsevier.
Chappell BW, White AJR. 1992. I- and S-type granites inthe Lachlan fold belt. Trans. R. Soc. Edin. Earth Sci.83:1–26.
Chappell BW, White AJR, Wyborn D. 1987. The impor-tance of residual source material (restite) in granite petroge-nesis. J. Petrol. 28:1111–1138.
Chatterjee ND, Krüger R, Haller G, Olbricht W. 1998. TheBayesian approach to an internally consistent thermody-namic database: Theory, database, and generation of phasediagrams. Contr. Mineral. Petrol. 133:149–168.
Chen C-Y, Frey FA. 1985. Trace element and isotopic geo-chemistry of lavas from Haleakala volcano, East Maui,Hawaii: Implications for the origin of Hawaiian basalts. J. Geophys. Res. 90:8743–8768.
Chernoff CB, Carlson WD. 1999. Trace element zoning as a record of chemical disequilibrium during garnet growth.Geol. 27:555–558.
Chopin C. 1984. Coesite and pure pyrope in high-gradeblueschists of the western Alps: A first record and someconsequences. Contr. Mineral. Petrol. 86:107–118.
Christiansen EH, Sheridan MF, Burt DM. 1986. The geology and geochemistry of Cenozoic topaz rhyolites fromthe western United States. Geol. Soc. Am. Spec. Pap. 205.
Christensen JN, Selverstone J, Rosenfeld, DePaolo DJ.1994. Correlation by Rb–Sr geochronology of garnet growthhistories from different structural levels within the TauernWindow, eastern Alps. Contr. Mineral. Petrol. 118:1–12.
Clague DA, Dalrymple GB. 1987. The Hawaiian–Emperorvolcanic chain. US Geol. Surv. Prof. Pap. 1350:5–84.
Clague DA, Straley PF. 1977. Petrologic nature of theoceanic Moho. Geology 5:133–136.
Clark SP, Jr. 1966. Handbook of physical constants. Geol.Soc. Am. Mem. 97.
Clarke DB. 1992. Granitoid rocks. New York, Chapmanand Hall.
Clemens JD, Droop GTR, Stevens G. 1997. High-grademetamophism, dehydration, and crustal melting: A reinves-tigation based on new experiments in the silica-saturatedportion of the system KAlO2-MgO-SiO2-H2O-CO2 at P � 1.5 GPa. Contr. Mineral. Petrol. 129:308–325.
Cliff RA. 1985. Isotopic dating in metamorphic belts. J. Geol. Soc. London 142:97–110.
Cloos M. 1982. Flow mélanges: Numerical modeling andgeologic constraints on their origin in the Franciscan sub-duction complex, Calif. Geol. Soc. Am. Bull. 93:330–345.
Cloos M. 1993. Lithospheric buoyancy and collisional orogenesis: Subduction of oceanic plateaus, continentalmargins, island arcs, spreading ridges, and seamounts. Geol. Soc. Am. Bull. 105:715–737.
Coats RR. 1962. Magma type and crustal structure in theAleutian arc. Am. Geophys. Union Monog. 6:92–109.
Coffin MF, Eldholm O. 1994. Large igneous provinces:Crustal structure, dimensions, and external consequences.Rev. Geophys. 32:1–36.
Cole JW. 1982. Tonga–Kermadec–New Zealand. In: ThorpeRS, ed. Andesites. New York, John Wiley and Sons:245–258.
Coleman RG, Lee DE, Beatty LB, Brannick WW. 1965.Eclogites and eclogites. Their differences and similarities.Geol. Soc. Am. Bull. 76:483–508.
Collins WJ. 1996. Lachlan fold belt granitoids: Products ofthree-component mixing. Trans. R. Soc. Edin. Earth Sci.87:171–181.
Collins WJ, Beams SD, White AJR, Chappell BW. 1982.Nature and origin of A-type granites with particular refer-ence to southeastern Australia. Contr. Mineral. Petrol.80:189–200.
Compagnoni R, Hirajima T, Chopin C. 1995. Ultra-high-pressure metamorphic rocks in the western Alps. In: Cole-man RG, Wang X, eds. Ultrahigh pressure metamorphism,New York, Cambridge University, 206–243.
Compston W. Pidgeon RT. 1986. Jack Hills, evidence ofmore very old detrital zircons in Western Australia. Nature.321:766–769.
Compton RR. 1955. Trondhjemite batholith near BidwellBar, California. Geol. Soc. Am. Bull. 66:9–44.
References Cited 669
Compton RR. 1980. Fabrics and strains in quartzites of ametamorphic core complex Raft River Mountains, Utah.Geol. Soc. Am. Mem. 153:385–398.
Condie KC. 1994. Greenstones through time. In: CondieKC, ed. Archean crustal evolution. New York, Elsevier:85–120.
Conrad WK, Nicholls IA, Wall VJ. 1988. Water-saturatedand -undersaturated melting of metaluminous and peralu-minous crustal compositions at 10 kb: Evidence for the origin of silicic magmas in the Taupo volcanic zone, NewZealand, and other occurrences. J. Petrol. 29:765–803.
Conticelli S, Peccerillo A. 1992. Petrology and geochemistryof potassic and ultrapotassic volcanism in central Italy: Petrogenesis and inferences on the evolution of the mantlesources. Lithos 28:221–240.
Coombs DS. 1952. Cell size, optical properties, and chemical composition of laumontite and leonhardite. Am.Mineral. 37:812–830.
Coombs DS. 1961. Some recent work on the lower gradesof metamorphism. Australian J. Sci. 24:203–215.
Coombs DS, Ellis AJ, Fyfe WS, Taylor AM. 1959. The zeolite facies, with comments on the interpretation of hydrothermal syntheses. Geochim. Cosmochim. Acta17:53–107.
Cornejo PC, Mahood GA. 1997. Seeing past the effects of re-equilibration to reconstruct magmatic gradients in plutons: La Gloria Pluton, central Chilean Andes. Contr.Mineral. Petrol. 127:159–175.
Corry CE. 1988. Laccoliths; Mechanics of emplacement andgrowth. Geol. Soc. Am. Spec. Paper 220.
Cox KG. 1988. The Karoo province. In: Macdougall JD, ed.Continental flood basalts. Boston, Kluwer:239–272.
Cox KG. 1993. Continental magmatic underplating. Phil.Trans. R. Soc. London A 342:155–166.
Cox KG, Bell JD, Pankhurst RJ. 1979. The interpretation ofigneous rocks. Boston, George Allen and Unwin.
Cox KG, Smith MR, Beswetherick S. 1987. Textural studiesof garnet lherzolites: Evidence of exsolution origin fromhigh-temperature harzburgites. In: Nixon PH, ed. Mantlexenoliths. New York, John Wiley and Sons:537–550.
Crank J. 1975. The mathematics of diffusion: Second Edition. London, Oxford University.
Crawford AJ, ed. 1989. Boninites. Boston, Unwin Hyman.
Crawford ML, Hollister LS. 1986. Metamorphic fluids: Theevidence from fluid inclusions. In: Walther JV, Wood BJ,eds. Fluid-rock interactions during metamorphism. NewYork, Springer-Verlag, 1–35.
Crisp SA. 1984. Rates of magma emplacement and volcanicoutput. J. Volc. Geotherm. Res. 20:177–211.
Crittenden MD, Coney PJ, Davis GH, eds. 1980. Cordilleranmetamorphic core complexes. Geol. Soc. Am. Mem. 153.
Cruden AR. 1990. Flow and fabric development during thediapiric rise of magma. J. Geol. 98:681–698.
Daly RA. Originally published in 1933, reprinted in 1968.Igneous rocks and the depths of the Earth. New York,Hafner.
Daniel CG, Spear FS. 1998. Three-dimensional patterns ofgarnet nucleation and growth. Geology 26:503–506.
Daniel CG, Spear FS. 1999. The clustered nucleation andgrowth processes of garnet in regional metamorphic rocksfrom north-west Connecticut, USA. J. Metam. Geol.17:503–520.
Dasgupta S, Sengupta P, Ehl J, Raith M, Bardhan S. 1995.Reaction textures in a suite of spinel granulites from theeastern Ghats belt, India: Evidence for polymetamorphism,a partial petrogenetic grid in the system KFMASH and theroles of ZnO and Fe2O3. J. Petrol. 36:435–461.
Davidson JP. 1996. Deciphering mantle and crustal signa-tures in subduction zone magmatism. In: Bebout GE, SchollDW, Kirby SH, Platt JP, eds. Subduction top to bottom.Am. Geophys. Union Monog. 96:251–262.
Davies GF. 1992. On the emergence of plate tectonics. Geology 20:963–966.
Davies JH. 1999. The role of hydraulic fractures and intermediate-depth earthquakes in generating subduction-zone magmatism. Nature 398:142–145.
Davis BTC, England JL. 1963. Melting of forsterite,Mg2SiO4, at pressures up to 47 kbar. Ann. Rept. Dir. Geophys. Lab. Yrbk. Carn. Inst. Wash. 62:119–121.
Davis GA, Pabst A. 1960. Lawsonite and pumpellyite inglaucophane schist, north Berkeley Hills, California withnotes on the X-ray crystallography of lawsonite. Am. J. Sci.258:689–704.
Dawson JB. 1987. The MARID suite of xenoliths in kimber-lite: Relationships to veined and metasomatized peridotitexenoliths. In: Nixon PH, ed. Mantle xenoliths. New York,John Wiley and Sons:465–473.
Dawson JB, Pinkerton H, Norton GE, Pyle DM. 1990.Physicochemical properties of alkali carbonatite lavas: Data from the 1988 eruption of Oldoinyo Lengai, Tanzania.Geology 18:260–263.
Dawson JB, Pinkerton H, Pyle DM, Nyamweru C. 1994.June 1993 eruption of Oldoinyo Lengai, Tanzania: Exceptionally viscous and large carbonatite lava flows andevidence for coexisting silicate and carbonatite magmas.Geology 22:799–802.
De Graff JM, Aydin A. 1993. Effect of thermal regime ongrowth increment and spacing of contraction joints inbasaltic lava. J. Geophys. Res. 98:6411–6430.
De Paolo DJ. 1985. Isotopic studies of processes in maficmagma chambers: I. The Kiglapait intrusion, Labrador. J. Petrol. 26:925–951.
De Roo J, Williams PF. 1990. Dynamic recrystallization andsolution transfer in mylonitic rocks of the TetagoucheGroup, northern New Brunswick, Canada. Geol. Soc. Am.Bull. 102:1544–1554.
de Silva SL, Francis PW. 1991. Volcanoes of the central Andes. New York, Springer-Verlag.
de Silva SL, Wolff JA. 1995. Zoned magma chambers: Theinfluence of magma chamber geometry on sidewall convec-tive fractionation. J. Volc. Geotherm Res. 65:111–118.
De Waard D. 1950. Koninklijke Nederlandse Akademic vanWetenschappen Proc. 53.
670 Igneous and Metamorphic Petrology
De Wit MJ, Ashwal LD. 1997. Greenstone belts. Oxford,Clarendon.
De Wit MJ, Roering C, Hart RJ, Armstrong RA, de RondeCEJ, Green RWE, Tredoux M, Peberdy E, Hart RA. 1992.Formation of an Archean continent. Nature 357:553–562.
Decker R, Decker B. 1998. Volcanoes. New York, W.H.Freeman.
Deer WA, Howie RA, Zussman J. 1962. Rock-forming minerals: five volumes. London, Longman.
Deer WA, Howie RA, Zussman J. 1997. An introduction to the rock-forming minerals: Second edition. London,Longman.
Delaney PT. 1987. Heat transfer during emplacement andcooling of mafic dykes. In: Halls HC, Fahrig WF, eds. Maficdyke swarms. St John’s, Newfoundland: Geol. Assoc. Can.Spec. Pap. 34:31–46.
Delaney PT, Pollard DD. 1981. Deformation of host rocksand flow of magma during growth of minette dikes andbreccia-bearing intrusions near Ship Rock, New Mexico.US. Geol. Surv. Prof. Paper 1202.
Delaney PT, Pollard DD. 1982. Solidification of basalticmagma during flow in a dike. Am. J. Sci. 282:856–885.
Demaiffe D, Moreau C, Brown WL, Weis D. 1991. Geo-chemical and isotopic (Sr, Nd, and Pb) evidence on the origin of the anorthosite-bearing anorogenic complexes ofthe Aïr province, Niger. Earth Planet. Sci. Lett. 105:28–46.
Dempster TJ. 1992. Zoning and recrystallization of phengitic micas: Implications for metamorphic equilibration.Contr. Mineral. Petrol. 109:526–537.
Dempster TJ, Preston RJ, Bell BR. 1999. The origin of massif-type anorthosites: Evidence from interactions between crustal xenoliths and basaltic magma. J. Geol. Soc. London 156:41–46.
Dempster TJ, Tanner PWG. 1997. The biotite isograd, Central Pyrenees: A deformation-controlled reaction. J. Metam. Geol. 15:531–548.
Denison C, Carlson WD, Ketcham RA. 1997. Three-dimensional quantitative textural analysis of metamorphicrocks using high-resolution computed X-ray tomography:Part I. Methods and techniques. J. Metam. Geol. 15:29–44.
Dewers T, Ortoleva P. 1990. Differentiated structures arising from mechano-chemical feedback in stressed rocks.Earth-Sci. Rev. 29:283–298.
Dick HJB, Fisher RL, Bryan B. 1984. Mineralogic variabilityof the uppermost mantle along mid-ocean ridges. EarthPlanet. Sci. Lett. 69:88–106.
Dick HJB, Sinton JM. 1979. Compositional layering inalpine peridotites: Evidence for pressure solution creep inthe mantle. J. Geol. 87:403–416.
Didier J, Barbarin B. 1991. Enclaves and granite petrology.New York, Elsevier.
Dimroth E, Imreh L, Cousineau P, Leduc M, Sanschagrin Y.1985. Paleogeographic analysis of mafic submarine flowsand its use in the exploration for massive sulphide deposits.In: Ayres LD, Thurston PC, Card KD, Weber W, eds. Evolution of Archean supracrustal sequences. Geol. Assoc.Can. 28:203–222.
Dodge FCW, Millard HT Jr, Elsheimer HN. 1982. Compo-sitional variations and abundances of selected elements ingranitoid rocks and constituent minerals, central SierraNevada batholith, California. US Geol. Surv. Prof. Pap.1248.
Donaldson CH. 1976. An experimental investigation ofolivine morphology. Contr. Mineral. Petrol. 57:187–213.
Donaldson CH. 1977. Laboratory duplication of comb layering in the Rhum pluton. Mineral. Mag. 41:323–336.
Dowty E. 1980. Crystal growth and nucleation theory andthe numerical simulation of igneous crystallization. In: Hargraves RB, ed. Physics of magmatic processes. Princeton,NJ, Princeton University Press: 419–551.
Drummond MS, Defant MJ. 1990. A model for trond-hjemite–tonalite–dacite genesis and crustal growth via slabmelting: Archean to modern comparisons. J. Geophys. Res.95:21,503–21,521.
Drummond MS, Defant MJ, Kepezhinskas PK. 1996. Petrogenesis of slab-derived trondhjemite-tonalite-dacite/adakite magmas. Geol. Soc. Am. Spec. Pap. 315:205–215.
Dymoke P, Sandiford M. 1992. Phase relationships inBuchan facies series pelitic assemblages: Calculations withapplication to andalusite–staurolite parageneses in theMount Lofty Ranges, South Australia. Contr. Mineral.Petrol. 110:121–132.
Eby GN. 1990. The A-type granitoids: A review of their occurrence and chemical characteristics and speculations ontheir petrogenesis. Lithos 26:115–134.
Echeverria LM. 1980. Tertiary or Mesozoic komatiites from Gorgona Island, Colombia: Field relations and geochemistry. Contr. Mineral. Petrol. 73:253–266.
Edgar AD. 1996. Kalsilite-bearing volcanics (kamafugites).In: Mitchell RH, ed. Undersaturated alkaline rocks: Mineralogy, petrogenesis, and economic potential. Min. Assoc. Can. Short Course Ser. 24:153–174.
Eggler DH. 1974. Volatiles in ultrabasic and derivative rocksystems. Ann. Rept. Dir. Geophys. Lab. Yrbk Carn. Inst.Wash. 73:215–224.
Eggler DH, Holloway JR. 1977. Partial melting of peridotitein the presence of H2O and CO2: Principles and review,Oregon Dept. Geol. Mineral Indust. 96.
Einaudi MT, Meinert LD, Newberry RJ. 1981. Skarn deposits. Econ. Geol. 75th Ann. Vol. 327–391.
Eklund O, Shebanov AD. 1999. The origin of rapakivi texture by sub-isothermal decompression. Precamb. Res.95:129–146.
Ellis DJ. 1987. Origin and evolution of granulites in normaland thickened crusts. Geology 15:167–170.
Elthon D. 1991. Geochemical evidence for formation of theBay of Islands ophiolite above a subduction zone. Nature:354:140–143.
Emslie RF. 1975. Major rock units of the Morin complex,southwestern Quebec. Geol. Surv. Can. Paper 74–48.
Emslie RF. 1978. Anorthosite massifs, rapakivi granites, andlate Proterozoic rifting of North America. Precamb. Res,7:61–98.
References Cited 671
Emslie RF, Hamilton MA, Thériault RJ. 1994. Petrogenesisof a mid-Proterozoic anorthosite–mangerite–charnockite–granite (AMCG) complex: Isotopic and chemical evidencefrom the Nain plutonic suite. J. Geol. 102:539–558.
England PC, Molnar P. 1993. The interpretation of invertedmetamorphic isograds using simple physical calculations.Tectonics 12:145–157.
England PC, Richardson SW. 1977. The influence of erosionupon the mineral facies of rocks from different metamor-phic environments. J. Geol. Soc. London 134:201–213.
England PC, Thompson AB. 1984. Pressure–temperature–time paths of regional metamorphism I. Heat transfer during the evolution of regions of thickened continental crust.J. Petrol. 25:894–928.
Ernst RE, Buchan KL. 1997 Giant radiating dyke swarms:Their use in identifying pre-Mesozoic large igneousprovinces and mantle plumes. In: Mahoney JJ, Coffin MF,eds. Large igneous provinces: Continental, oceanic, andplanetary flood volcanism. Am. Geophys. Union Geophys.Monog. 100:297–334.
Ernst WG. 1973. Blueschist metamorphism and P–T regimesin active subduction zones. Tectonophysics 17:255–272.
Ernst WG, ed. 1975. Subduction zone metamorphism.Stroudsburg, PA, Dowden, Hutchinson, and Ross.
Ernst WG. 1976. Petrologic phase equilibria. San Francisco,W.H. Freeman.
Ernst WG. 1988. Tectonic history of subduction zones in-ferred from retrograde blueschist P–T paths. Geology16:1081–1084.
Ernst WG, Liou JG. 1995. Contrasting plate tectonic stylesof the Qinling–Dabie–Sulu and Franciscan metamorphicbelts. Geology 23:353–356.
Ernst WG, Seki Y, Onuki H, Gilbert MC. 1970. Compara-tive study of low-grade metamorphism in the CaliforniaCoast Ranges and the outer metamorphic belt of Japan.Geol. Soc. Am. Mem. 124.
Erslev EA. 1998. Limited, localized nonvolatile element fluxand volume change in Appalachian slates. Geol. Soc. Am.Bull. 110:900–915.
Eskola P. 1915. On the relations between the chemical andmineralogical composition in the metamorphic rocks of theOrijärvi region. Bull. Comm. Geol. Finlande no. 44.
Eskola PE. 1949. The problem of mantled gneiss domes.Geol. Soc. London Quart. J. 104:461–476.
Esperanca S, Holloway JR. 1987. On the origin of somemica-lamprophyres: Experimental evidence from a maficminette. Contr. Mineral. Petrol. 95:207–216.
Etchecopar A. 1977. A plane kinematic model of progres-sive deformation in a polycrystalline aggregate. Tectono-physics 39:121–139.
Eugster HP, Wones DR. 1962. Stability relations of ferrugi-nous biotite, annite. J. Petrol. 3:82–125.
Evans BW, Brown EH, eds. 1986. Blueschists and eclogites.Geol. Soc. Am. Mem. 164.
Evans BW, Brown EH. 1987. Reply on blueschists andeclogites. Geology 15:773–774.
Evans BW, Moore JG. 1968. Mineralogy as a function ofdepth in the prehistoric Makaopuhi tholeiitic lava lake,Hawaii. Contr. Mineral. Petrol. 17:85–115.
Evans OC, Hanson GN. 1997. Late- to post-kinematicArchean granitoids of the S.W. Superior province: Deriva-tion through direct mantle melting. In: De Wit MJ, AshwalLD, eds. Greenstone belts. Oxford, Clarendon: 280–295.
Ewart A, Brothers RN, Mateen A. 1977. An outline of thegeology and geochemistry, and the possible petrogeneticevolution of the volcanic rocks of the Tonga–Kermadec–New Zealand island arc. J. Volc. Geotherm. Res. 2:205–250.
Ewart A, Hawkesworth CJ. 1987. The Pleistocene–RecentTonga–Kermadec arc lavas: Interpretation of new isotopicand rare earth data in terms of a depleted mantle sourcemodel. J. Petrol. 28:495–530.
Ewart E. 1982. The mineralogy and petrology of Tertiary–recent orogenic volcanic rocks with special reference to theandesite–basaltic composition range. In: Thorpe RS, ed. Andesites. New York, John Wiley and Sons: 25–87.
Falloon TJ, Green DH, Danyushevsky LV, Faul UH. 1999.Peridotite melting at 1.0 and 1.5 GPa: an experimental evaluation of techniques using diamond aggregates and mineral mixes for determination of near-solidus melts. J. Petrol. 40:1343–1375.
Faure G. 1986. Principles of isotope geology, 2nd ed. New York, John Wiley and Sons.
Faust GT, Fahey JJ. 1962. The serpentine-group minerals.US Geol. Surv. Prof. Paper 384-A.
Fenn PM. 1977. The nucleation and growth of alkalifeldspars from hydrous melts. Can. Mineral. 15:135–161.
Fenn PM. 1986. On the origin of graphic granite. Am. Mineral. 71:325–330.
Ferry JM. 1983. Applications of the reaction progress variable in metamorphic petrology. J. Petrol. 24:343–376.
Ferry JM. 1991. Dehydration and decarbonation reactionsas a record of fluid infiltration. In: Kerrick DM, ed. Contactmetamorphism, Rev. Mineral. 26:351–393.
Ferry JM. 1994. A historical review of metamorphic fluidflow. J. Geophys. Res. 99:15,487–15,498.Ferry JM, Spear FS. 1978. Experimental calibration of thepartitioning of Fe and Mg between biotite and garnet. Contrib. Mineral. Petrol. 66:113–117.Fisher GW. 1978. Rate laws in metamorphism. Geochim.Cosmochim. Acta 42:1035–1080.
Fisher RV, Schmincke HU. 1984. Pyroclastic rocks. NewYork, Springer-Verlag.
Fisher RV, Smith GA. 1991. Volcanism, tectonics, and sedi-mentation. In: Fisher RV, Smith GA, eds. Sedimentation involcanic settings. Tulsa, OK, SEPM (Soc. for Sed. Geol.)Spec. Publ. 45:1–5.
Fiske RS, Hopson CA, Waters AC. 1963. Geology of MountRainier National Park, Washington. US Geol. Surv. Prof.Pap. 444.
Fitton JG. 1987. The Cameroon line, West Africa: A com-parison between oceanic and continental alkaline volcanism.In: Fitton JG, Upton BGJ, eds. Alkaline igneous rocks.Geol. Soc. Spec. Pub. 30:273–291.
672 Igneous and Metamorphic Petrology
Fitton JG, James D, Leeman WP. 1991. Basic magmatismassociated with late Cenozoic extension in the westernUnited States: Compositional variations in space and time.J. Geophys. Res. 96:13,693–13,711.
Fitton JG, Upton BGJ, eds. 1987. Alkaline igneous rocks:Geol. Soc. Lond. Spec. Pub. 30. Boston, Blackwell Scientific.
Flood RH, Vernon RH. 1988. Microstructural evidence oforders of crystallization in granitoid rocks. Lithos 21:237–245.
Foley S. 1992. Vein-plus-wall-rock melting mechanisms inthe lithosphere and the origin of potassic alkaline magmas.Lithos 28:435–453.
Forsyth DW and 15 others. 1998. Imaging the deep seismicstructure beneath a mid-ocean ridge: The MELT experi-ment. Science 280:1215–1218.
France-Lanord C, Le Fort P. 1988. Crustal melting andgranite genesis during the Himalayan collision orogenesis.Trans. R. Soc. Edin. Earth Sci. 79:183–195.
Francis P. 1993. Volcanoes: A planetary perspective. NewYork, Oxford.
Freer R. 1981. Diffusion in silicate minerals and glasses: A data digest and guide to the literature. Contr. Mineral.Petrol. 76:440–454.
Frey FA, Chappell BW, Roy SD. 1978. Fractionation ofrare-earth elements in the Tuolumne intrusive series, SierraNevada batholith, California. Geology 6:239–242.
Frey FA, Clague DA. 1983. Geochemistry of diverse basalttypes from Loihi Seamount, Hawaii: Petrogenetic implica-tions. Earth Planet. Sci. Lett. 66:337–355.
Frey FA, Wise WS, Garcia MO, West H, Kwon S-T,Kennedy A. 1990. Evolution of Mauna Kea volcano,Hawaii: Petrologic and geochemical constraints on post-shield volcanism. J. Geophys. Res. 95:1271–1300.
Frey M, Hunziker JC, Frank W, Boquet J, Dal Piaz GV,Jager E, Niggli E. 1974. Alpine metamorphism of the Alps.Schweiz. Mineral. Petrog. Mitt. 54:248–290.
Frey M, Robinson D. 1999. Low-grade metamorphism.Boston, Blackwell Science.
Fricke HC, Wickham SM, O’Neil JR. 1992. Oxygen and hydrogen isotope evidence for meteoric water infiltrationduring mylonitization and uplift in the Ruby Mountains–East Humboldt Range core complex, Nevada. Contr. Mineral. Petrol. 111:203–221.
Friedman I, Smith RL, Long WD. 1966. Hydration of natural glass and formation of perlite. Geol. Soc. Am. Bull.77:323–328.
Fripp REP, Jones MG. 1997. Sheeted intrusions and peridotite–gabbro assemblages in the Yilgarn craton, Western Australia:Elements of Archean ophiolites. In: de Wit M, Ashwal LD,eds. Greenstone belts. Oxford, Clarendon:422–437.
Froese E. 1981. Application of thermodynamics to the studyof mineral deposits. Geol. Surv. Canada Paper 80–28.
Frost BR. 1985. On the stability of sulfides, oxides, and native metals in serpentinite. J. Petrol. 26:31–63.
Frost BR, Chacko T. 1989. The granulite uncertainty principle: Limitation on thermobarometry in granulites. J. Geol. 97:435–450.
Frost BR, Lindsley DH. 1992. Equilibria among Fe–Ti oxides, pyroxenes, olivine, and quartz: Part II. Application.Am. Mineral. 77:1004–1020.
Frost BR, Tracy RJ. 1991. P–T paths from zoned garnets:Some minimum criterion. Am. J. Sci. 291:917–939.
Frost CD, Frost BR. 1997. Reduced rapakivi-type granites:The tholeiitic connection. Geology 25:647–650.
Fry N. 1984. The field description of metamorphic rocks.New York, Halsted.
Fryer P, Wheat CG, Mottl MJ. 1999. Mariana blueschistmud volcanism: Implications for conditions within the subduction zone. Geology 27:103–106.
Fuhrman ML, Lindsley DH. 1988. Ternary-feldspar modeling and thermometry. Am. Mineral. 73:201–215.
Fyfe WS. 1988. Granites and a wet convecting ultramaficplanet. Trans. R. Soc. Edinb. Earth Sci. 79:339–346.
Fyfe WS. 1998. Energy flow and geosphere interactionsArchean to present: The foundation of the global resourcebase. Precamb. Res. 91:5–13.
Fyfe WS, Price NJ, Thompson AB. 1978. Fluids in theEarth’s crust. New York, Elsevier.
Fyfe WS, Turner FJ, Verhoogen J. 1958. Metamorphic reac-tions and metamorphic facies. Geol. Soc. Am Mem. 73.
Gardner JE, Thomas RME, Jaupart C, Tait S. 1996. Frag-mentation of magma during plinian volcanic eruptions. Bull.Volc. 58:144–162.
Gasparik T. 1984. Two-pyroxene thermobarometry with newexperimental data in the system CaO-MgO-Al2O3-SiO2.Contr. Mineral. Petrol. 87:87–97.
Gass IG. 1972. Proposals concerning the variation of volcanic products and processes within the oceanic environ-ment. Phil. Trans. R. Soc. Lond. A 271:131–140.
Gass IG, Smewing JD. 1973. Intrusion, extrusion and metamorphism at constructive margins: Evidence from theTroodos Massif, Cyprus. Nature 242:26–29.
Ghiorso MS. 1997. Thermodynamic models of igneousprocesses. Ann. Rev. Earth Planet. Sci. 25:221–241.
Ghiorso MS, Carmichael ISE. 1987. Modeling magmaticsystems: Petrologic applications. In: Carmichael ISE, Eug-ster HP, eds. Thermodynamic modeling in geologic systems:Minerals, fluids, and melts. Rev. Mineral. 17:467–499.
Ghiorso MS, Sack RO. 1991. Fe-Ti oxide geothermometry:Thermodynamic formulation and the estimation of intensivevariables in silicic magmas. Contr. Mineral. Petrol.108:485–510.
Gill JB. 1981. Orogenic andesites and plate tectonics. New York, Springer-Verlag.
Gill JB, Whelan P. 1989. Early rifting of an oceanic islandarc (Fiji) produced shoshonitic to tholeiitic basalts. J. Geophys. Res. 94:4561–4578.
Gillen C. 1982. Metamorphic geology. An introduction totectonic and metamorphic processes. London, George Allenand Unwin.
Gillet P, Goffé B. 1988. On the significance of aragonite occurrences in the western Alps. Contr. Mineral. Petrol.99:70–81.
References Cited 673
Gilluly J, Waters AC, Woodford AO. 1975. Principles of geology, 4th ed. San Francisco, W.H. Freeman.
Gilotti JA. 1993. Discovery of a medium-temperature eclo-gite province in the Caledonides of North-East Greenland.Geology 21:523–526.
Goodwin AM. 1996. Principles of Precambrian geology.New York, Academic Press.
Gordon TM. 1998. WEBINVEQ thermobarometry: An experiment providing interactive scientific software on theWorld Wide Web. Computers Geosci. 24:43–49.
Gorring ML, Naslund HR. 1995. Geochemical reversalswithin the lower 100 m of the Palisades sill, New Jersey.Contr. Mineral. Petrol. 119:263–276.
Govindaraju K. 1989. Geostandards newsletter. July specialissue. XIII.
Graham IJ, Cole JW, Briggs RM, Gamble JA, Smith IEM.1995. Petrology and petrogenesis of volcanic rocks from theTaupo volcanic zone: A review. J. Volc. Geotherm. Res.68:59–87.
Grant JA. 1986. The isocon diagram—A simple solution toGresen’s equation for metasomatic alteration. Econ. Geol.81:1976–1982.
Green DH, Ringwood AE. 1967. An experimental investiga-tion of the gabbro to eclogite transformation and its petro-logic application. Geochim. Cosmochim. Acta 31:767–833.
Green HW, II. 1980. On the thermodynamics of nonhydro-statically stressed solids. Phil. Mag. 47A:637–647.
Green TH. 1980. Island arc and continent-building magma-tism: A review of petrogenetivc models based on experi-mental petrology and geochemistry. Tectonophys. 63:367–385.
Green TH. 1982. Anatexis of mafic crust and high pressurecrystallization of andesite. In: Thorpe RS, ed. Andesites.New York, John Wiley:465–487.
Greenwood HJ. 1963. The synthesis and stability of anthophyllite. J. Petrol. 4:317–351.
Greenwood HJ. 1976. Metamorphism at moderate tempera-tures and pressures. In: Bailey DK, Macdonald R, eds. New York, Academic Press:187–259.
Greenwood R. 1951. Younger intrusive rocks of Plateauprovince, Nigeria, compared with the alkalic rocks of New England. Geol. Soc. Am. Bull. 62:1151–1178.
Grieve R, Rupert J, Smith J, Therriault A. 1995. The recordof terrestrial impact cratering. GSA Today 5:10:189–196.
Griggs DT. 1967. Hydrolytic weakening of quartz and othersilicates. Geophys. J. Roy. Astron. Soc. 14:19–31.
Griggs DT, Blacic JD. 1965. Quartz: anomalous weakness ofsynthetic crystals. Science 147:292–295.
Grout FF. 1932. Petrography and petrology. New York, McGraw-Hill.
Grove TL, Baker MB. 1984. Phase equilibrium controls onthe tholeiitic versus calc-alkaline differentiation trends. J. Geophys. Res. 89:3253–3274.
Grove TL, Baker MB, Kinzler RJ. 1984. Coupled CaAl–NaSi diffusion in plagioclase feldspar: Experiments and applications to cooling rate speedometry. Geochim. Cosmochim. Acta 48:2113–2121.
Grove TL, Gerlach DC, Sando TW. 1982. Origin of calc–alkaline series lavas at Medicine Lake volcano by fractiona-tion, assimilation and mixing. Contr. Min. Petrol. 80:160–182.
Guidotti CV, Teichmann F, Henry DJ. 1991. Chlorite-bearingpolymetamorphic metapelites in the Rangely area, Maine:Evidence for equilibrium assemblages. Am. Mineral76:867–879.
Guilbert JM, Park CF, Jr. 1986. The geology of ore deposits.New York, Freeman.
Guillot S, Hattori KH, de Sigoyer J. 2000. Mantle wedgeserpentinization and exhumation of eclogites: Insights fromestern Ladakh, northwest Himalaya. Geology 28:199–202.
Gunnarsson B, Marsh BD, Taylor HP Jr. 1998. Generationof Icelandic rhyolites: Silicic lavas from the Torfajökull central volcano. J. Volc. Geothermal Res. 83:1–45.
Gurney JJ, Zweistra P. 1995. The interpretation of the majorelement compositions of mantle minerals in diamond exploration. J. Geochem. Explor. 53:293–310.
Gutman JT, Martin RF. 1976. Schweiz. Min. Petrol. Mitt.56:55– 64.
Haapala I, Rämö OT. 1999. Rapakivi granites and relatedrocks: An introduction. Precamb. Res. 95:1–7.
Hacker BR, Liou JG, eds. 1998. When continents collide:Geodynamics and geochemistry of ultrahigh-pressure rocks.Boston, Kluwer Academic.
Haggerty SE. 1999. A diamond trilogy: Superplumes, super-continents, and supernovae. Science 285:851–860.
Hall A. 1996. Igneous petrology, 2nd ed. Harlow, UK,Longman.
Hall RP, Hughes DJ, eds. 1990. Early Precambrian basicmagmatism. London, Blackie.
Haller J. 1971. Geology of the East Greenland Caledonides.New York: Wiley Interscience.
Halls HC, Fahrig WF, eds. 1987. Mafic dyke swarms. StJohn’s, Newfoundland: Geol. Assoc. Can. Spec. Pap. 34.
Hamilton W, Myers B. 1967. The nature of batholiths. USGeol. Surv. Prof. Pap. 554-C.
Hanson GN. 1978. The application of trace elements to thepetrogenesis of igneous rocks of granitic composition. EarthPlanet. Sci. Lett. 38:26– 43.
Hargraves RB. 1986. Faster spreading or greater ridgelength in the Archean? Geology 14:750–752.
Harland WB, Armstrong RL, Cox AV, Craig LE, Smith AG,Smith DG. 1990. A geologic time scale 1989. Cambridge,Cambridge University Press.
Harley SL. 1989. The origins of granulites: A metamorphicperspective. Geol. Mag. 126:215–247.
Harley SL. 1998. Ultrahigh temperature granulite metamor-phism (1050°C, 12 kbar) and decompression in garnet(Mg70)–orthopyroxene–sillimanite gneisses from the RauerGroup, East Antarctica. J. Metam. Geol. 16:541–562.
Harley SL, Carswell DA. 1995. Ultradeep crustal metamor-phism: A prospective view. J. Geophys. Res. 100:8367–8380.
Harris J, Hutchison MR, Hursthouse M, Light M, Harte B.1997. A new tetragonal silicate mineral occurring as inclu-sions in lower mantle diamonds. Nature 387:486–488.
674 Igneous and Metamorphic Petrology
Harris NBW, Inger S. 1992. Trace element modeling ofpelite-derived granites. Contr. Mineral. Petrol. 110:45–56.
Harris RA. 1998. Origin and tectonic evolution of the metamorphic sole beneath the Brooks Range ophiolite,Alaska. Geol. Soc. Am. Spec. Paper 324:293–312.
Hart SR, Hauri EH, Oschmann LA, Whitehead JA. 1992.Mantle plumes and entrainment: Isotopic evidence. Science256:517–520.
Haskins LA. 1983. Petrogenetic modeling—Use of rareearth elements. In: Henderson P, ed. Rare Earth ElementGeochemistry. Developments in Geochemistry. Amsterdam,Elsevier 2:115–152.
Hatton CJ, von Gruenewaldt G. 1990. Early Precambrianlayered intrusions. In: Hall RP, Hughes DJ, eds. Early Precambrian basic magmatism. London, Blackie:57–82.
Haugerud RA, Zen E. 1991. An essay on metamorphic pathstudies or Cassandra in P–T–t space. In: Perchuk LL, ed.Progress in metamorphic and magmatic petrology. NewYork, Cambridge University Press:323–348.
Hawkes DD. 1967. Order of abundant crystal nucleation ina natural magma. Geol. Mag. 104:473–486.
Hawkins JW. 1995. Evolution of the Lau Basin—insightsfrom ODP Leg 135. In: Taylor B, Natland J, eds. Activemargins and marginal basins of the western Pacific. Am.Geophys. Union Monog. 88:125–173.
Hay DE, Wendlandt RF. 1995. The origin of Kenya riftplateau-type flood phonolites: Results of high-pressure/high-temperature experiments in the systems phonolite-H2O andphonolite-H2O-CO2. J. Geophys. Res. 100:401–410.
Hays JF. 1967. Lime–alumina–silica. Ann. Rept. Dir.Carnegie Inst. Wash. Geophys. Lab. Yrbk 65:234–239.
Heaman LM. 1997. Global mafic magmatism at 2.45 Ga:remnants of an ancient large igneous province? Geology25:299–302.
Heard HC. 1963. Effect of large changes in strain rate inthe experimental deformation of Yule marble. J. Geol.71:162–195.
Heiken G. Wohletz K. 1985. Volcanic ash. Berkeley, Univer-sity of California Press.
Helmstaedt HH, Gurney JJ. 1995. Geotectonic controls ofprimary diamond deposits: Implications for area selection. J. Geochem. Explor. 53:125–144.
Helmstaedt HH, Padgham WA, Brophy JA. 1986. Multipledikes in lower Kam Group, Yellowknife greenstone belt:Evidence for Archean sea-floor spreading. Geology14:562–566.
Helz RT. 1987. Diverse olivine types in lava of the 1959eruption of Kilauea volcano and their bearing on eruptiondynamics. US Geol. Surv. Prof. Pap. 1350:691–722.
Helz RT, Kirschenbaum H, Marinenko JW. 1989. Diapirtransfer of melt in Kilauea Iki lava lake, Hawaii: A quick,efficient process of igneous differentitation. Geol. Soc. Am.Bull. 101:578–594.
Hemingway BS, Bohlen SR, Hankins WB, Westrum EF Jr.,Kuskov OL. 1998. Heat capacity and thermodynamic prop-erties for coesite and jadeite, reexamination of the quartz-coesite equilibrium boundary. Am. Mineral. 83:409–418.
Henley RW, Truesdell AH, Barton PB, Jr, Whitney JA. 1984.Fluid-mineral equilibria in hydrothermal systems. Rev.Econ. Geol. 1.
Herzberg CT. 1992. Depth and degree of melting of komati-ites. J. Geophys. Res. 97:4521–4540.
Herzberg CT, Fyfe WS, Carr MJ. 1983. Density constraintson the formation of the continental Moho and crust. Contr.Mineral. Petrol. 84:1–5.
Herzberg CT, O’Hara MJ. 1998. Phase equilibrium con-straints on the origin of basalts, picrites, and komatiites.Earth Sci. Rev. 44:39–79.
Hess K-U, Dingwell DB. 1996. Viscosities of hydrousleucogranitic melts: A non-Arrhenian model. Am. Mineral.81:1297–1300.
Hess PC. 1989. Origins of igneous rocks. Cambridge, MA,Harvard University Press.
Hess PC. 1995. Thermodynamic mixing properties and thestructure of silicate melts. In: Stebbins JF, McMillan PF,Dingwell DB, eds. Structure, dynamics, and properties ofsilicate melts. Rev. Mineral. 10:145–189.
Hibbard MJ, Watters RJ. 1985. Fracturing and diking in incompletely crystallized granitic plutons. Lithos 18:1–12.
Higgs DV, Handin J. 1959. Experimental deformation ofdolomite single crystals. Geol. Soc. Am. Bull. 70:245–278.
Hildreth W. 1981. Gradients in silicic magma chambers:Implications for lithospheric magmatism. J. Geophys. Res.86:10,153–10,192.
Hildreth W. 1983. The compositionally zoned eruption of 1912 in the Valley of Ten Thousand Smokes, Katmai National Park, Alaska. J. Volc. Geotherm. Res. 18:1–56.
Hildreth W, Halliday AN, Christiansen RL. 1991. Isotopicand chemical evidence concerning the genesis and contami-nation of basaltic and rhyolitic magma beneath the Yellow-stone Plateau volcanic field. J. Petrol. 32:63–138.
Hildreth W, Moorbath S. 1988. Crustal contributions to arcmagmatism in the Andes of central Chile. Contr. Mineral.Petrol. 98:455–489.
Hill RI, Campbell IH, Davies GF, Griffiths RW. 1992. Man-tle plumes and continental tectonics. Science 256:186–193.
Hirose K. 1997. Melting experiments on lherzolite KLB-1under hydrous conditions and generation of high-magnesianandesitic melts. Geology 25:42–44.
Hirose K, Kawamoto T. 1995. Hydrous partial melting oflherzolite at 1 GPa: The effect of H2O on the genesis ofbasaltic magmas. Earth Planet. Sci. Lett. 133:463–4–73.
Hirose K, Kushiro I. 1993. Partial melting of dry peridotitesat high pressures: Determination of compositions of meltssegregated from peridotite using aggregates of diamond.Earth Planet. Sci. Lett. 114:477–489.
Hobbs BE, Means WD, Williams PF. 1976. An outline ofstructural geology. New York, John Wiley and Sons.
Hodges KV. 1991. Pressure–temperature–time paths. Ann.Rev. Earth Planet. Sci. 19:207–236.
Hoffman PF. 1988. United plates of America, the birth of acraton. Ann. Rev. Earth Planet. Sci. 16:543–603.
References Cited 675
Hoffman PF. 1989. Precambrian geology and tectonic history of North America. In: Bally AW, Palmer AR, eds.The geology of North America—an overview. Geol. Soc. Am.A:447–512.
Hoffman PF, Ranelli G. 1988. Archean oceanic flake tecton-ics. Geophys. Res. Lett. 15:1077–1080.
Hofmann AW. 1980. Diffusion in natural silicate melts: Acritical review. In: Hargraves RB, ed. Physics of magmaticprocesses. Princeton, Princeton University Press:385–417.
Hofmann AW. 1988. Chemical differentiation of the Earth:The relationaship between mantle, continental crust, andoceanic crust. Earth Planet. Sci. Lett. 90:297–314.
Holdaway MJ, Mukhopadhyay B. 1993. A reevaluation ofthe stability relations of andalusite: Thermochemical dataand phase digram for the aluminum silicates. Am. Mineral.78:298–315.
Holdaway MJ, Mukhopadhyay B, Dyar MD, Guidotti CV,Dutrow BL. 1997. Garnet–biotite geothermometry revised:New Margules parameters and a natural specimen data setfrom Maine. Am. Mineral. 82:582–595.
Holland HD, Malinin SD. 1979. The solubility and occur-rence of non-ore minerals. In: Barnes HL, ed. Geochemistryof hydrothermal ore deposits: Second Edition. New York,John Wiley:461–508.
Holland TJB. 1983. The experimental determination of activities in disordered and short-range ordered jadeitic pyroxenes. Contrib. Mineral. Petrol. 82:214–220.
Holloway JR, Blank JG. 1994. Application of experimentalresults to C–O–H species in natural melts. In: Carroll MR,Holloway JR, eds. Volatiles in magmas. Rev. Mineral.30:187–230.
Holness MB. 1993. Temperature and pressure dependenceof quartz-aqueous fluid dihedral angles: The control of adsorbed H2O on the permeability of quartzites. EarthPlanet. Sci. Lettr. 117:363–377.
Holness MB. 1997. Surface chemical controls on pore-fluidconnectivity in texturally equilibrated materials. In: JamtveitB, Yardley BWD, eds. Fluid flow and transport in rocks:Mechanisms and effects. New York, Chapman andHall:149–169.
Holness MB, ed. 1997. Deformation-enhanced fluid trans-port in the Earth’s crust and mantle. New York, Chapmanand Hall.
Hooper PR. 1997. The Columbia River flood basaltprovince: Current status. In: Mahoney JJ, Coffin MF, ed.Large igneous provinces: Continental, oceanic, and plane-tary flood volcanism. Am. Geophys. Union Monog.100:1–28.
Hower J, Mowatt TC. 1966. The mineralogy of illites andmixed-layer illite montmorillonites. Am. Mineral.51:825–854.
Huebner JS, Turnock AC. 1980. The melting relations at 1 bar of pyroxenes composed largely of Ca-, Mg-, and Fe-bearing components. Am. Mineral. 65:225–271.
Humphris SE, Zierenberg RA, Mullineaux LS, ThomsonRE. 1995. Seafloor hydrothermal systems. Am. Geophys.Union Monog. 91.
Hunter DR, Hamilton PJ. 1978. The Bushveld Complex. In:Tarling DH, ed. Evolution of the Earth’s Crust. New York,Academic Press.
Hunter RH. 1987. Textural equilibrium in layered igneousrocks. In: Parsons I, ed. Origins of igneous layering. Boston,Reidel:473–503.
Hunter RH. 1996. Textural development in cumulate rocks.In: Cawthorn RG, ed. Layered intrusions. New York, Elsevier:77–102.
Huppert HE, Sparks RSJ. 1985. Komatiites I: Eruption andflow. J. Petrol. 26:694–725.
Hurwitz S, Navon O. 1994. Bubble nucleation in rhyoliticmelts: Experiments at high pressure, temperature, and water content. Earth Planet. Sci. Lett. 122:267–280.
Hutcheon I, Bloch J, de Caritat P, Shevalier M, Abercrom-bie H, Longstaffe F. 1998. What is the cause of potassiumenrichment in shales? In: Schieber J, Zimmerle W, Sethi PS,eds. Shales and mudstones II. Stuttgart, E. Schweizer-bartsche Verlagsbuchhandlung.
Hutton CO. 1956. Further data on the stilpnomelane mineral group. Am. Mineral. 41:608–615.
Indares A. 1993. Eclogitized gabbros from the easternGrenville Province: Textures, metamorphic context, and implications. Can. J. Earth Sci. 30:159–173.
Ingebritsen SE, Manning CE. 1999. Geologic implicationsof a permeability–depth curve for the continental crust. Geology 27:1107–1110.
Ingrin J, Hercule S, Charton T. 1995. Diffusion of hydrogenin diopside: Results of dehydration experiments. J. Geo-phys. Res. 100:15,489–15,499.
Irvine TN. 1980. Magmatic infiltration metasomatism, double-diffusive fractional crystallization, and adcumulusgrowth in the Muskox intrusion and other layered intru-sions. In: Hargraves RB, ed. Physics of magmatic processes.Princeton, NJ, Princeton University Press:325–383.
Irvine TN. 1987. Layering and related structures in theDuke Island and Skaergaard intrusions: Similarities, differ-ences, and origins. In Parsons I, ed. Origins of igneous layering. Boston, Reidel:185–245.
Irvine TN, Andersen JCØ, Brooks CK. 1998. Includedblocks (and blocks within blocks) in the Skaergaard intru-sion: Geologic relations and the origins of rhythmic modallygraded layers. Geol. Soc. Am. Bull. 110:1398–1447.
Irving AJ. 1980. Petrology and geochemistry of compositeultramafic xenoliths in alkalic basalts and implications formagmatic processes within the mantle. Am. J. Sci. 280-A:389–426.
Jackson ED. 1961. Primary textures and mineral associa-tions in the ultramafic zone of the Stillwater complex, Montana. US Geol. Surv. Prof. Pap. 358.
Jackson MD, Pollard DD. 1988. The laccolith-stock contro-versy: New results from the southern Henry Mountains,Utah. Geol. Soc. Am. Bull. 100:117–139.
Jaeger JC. 1968. Cooling and solidification of igneous rocks.In: Hess HH and Poldervaart A, eds. Basalts: The Polder-vaart treatise on rocks of basaltic composition. New York,Wiley Interscience:503–536.
676 Igneous and Metamorphic Petrology
Jahns RH, Burnham CW. 1969. Experimental studies ofpegmatite genesis: I. A model for the derivation and crystal-lization of granitic pegmatites. Econ. Geol. 64:843–864.
Jamieson RA. 1980. Formation of metamorphic aureoles be-neath ophiolites—Evidence from the St Anthony Complex,Newfoundland. Geology 8:150–154.
Jamieson RA, Beaumont C, Fullsack P, Lee B. 1998. Barrov-ian regional metamorphism: Where’s the heat? In TreloarPJ, O’Brien PJ, eds. What drives metamorphism and meta-morphic reactions. Geol. Soc. Lond. Spec. Publ. 138:23–51.
Jamtveit B, Bucher-Nurminen K, Austrheim H. 1990. Fluidcontrolled eclogitization of granulites in deep crustal shearzones, Bergen Arcs, western Norway. Contr. Mineral. Petrol.104:184–193.
Janardhan AS, Newton RC, Hansen EC. 1982. The trans-formation of amphibolite-facies gneiss to charnockite insouthern Karnataka and northern Tamil Nadu, India. Contr.Mineral. Petrol. 79:130–149.
Jeanloz R, Romanowicz B. 1997. Geophysical dynamics atthe center of the Earth. Physics Today, August:22–27.
Jenner GA, Dunning GR, Malpas J, Brown M, Brace T.1991. Bay of Islands and Little Port complexes, revisited:Age, geochemical and isotopic evidence confirm suprasub-duction-zone origin. Can. J. Earth Sci. 28:1635–1652.
Ji S, Mainprice JM. 1990. Recrystallization and fabric development in plagioclase. J. Geol. 98:65–79.
Joesten R. 1991. Local equilibrium in metasomatic processesrevisited: Diffusion-controlled growth of chert nodule reaction rims in dolomite. Am. Mineral. 76:743–755.
Johannes W. 1978. Melting of plagioclase in the systemAb–An–H2O and Qz–Ab–An–H2O at P � 5 kbars, anequilibrium problem. Contr. Mineral. Petrol. 66:295–303.
Johannes W, Holtz F. 1996. Petrogenesis and experimentalpetrology of granitic rocks. New York, Springer-Verlag.
Johannsen A. 1931, 1932, 1937, 1938. A descriptive petrography of the igneous rocks. Four volumes. Chicago,University of Chicago Press.
Johnson MC, Anderson AT, Jr, Rutherford MJ. 1994. Pre-eruptive volatile contents of magmas. In: Carroll MR,Holloway JR, eds. Volatiles in Magmas. Rev. Mineral.30:281–323.
Johnson SE. 1999. Porphyroblast microstructures: A reviewof current and future trends. Am. Mineral. 84:1711–1726.
Johnson SE, Bell TH. 1996. How useful are “millipede” andother similar porphyroblast microstructures for determiningsynmetamorphic deformation histories? J. Metam. Geol.14:15–28.
Johnson SE, Vernon RH. 1995. Stepping stones and pitfallsin the determination of an anticlockwise P–T–t-deformationpath: The low-P, high-T Cooma Complex, Australia. J.Metam. Geol. 13:165–183.
Jordan TE, Isacks BL, Allmendinger RW, Brewer JA, RamosVA, Ando CJ. 1983. Andean tectonics related to geometryof subducted Nazca plate. Geol. Soc. Am. Bull. 94:341–361.
Jost W. 1952. Diffusion in solids, liquids, and gases. NewYork, Academic.
H2O
Jurewicz SR, Watson EB. 1985. The distribution of a partialmelt in a granitic system: The application of liquid phasesintering theory. Geochim. Cosmochim. Acta 49:1109–1121.
Kay SM, Kay RW. 1994. Aleutian magmas in space andtime. In: Plafker G, Berg HC, eds. The geology of Alaska.Boulder, CO, Geol. Soc. Am. G-1:687–722.
Kay SM, Rapela CW, eds. 1990. Plutonism from Antarcticato Alaska. Geol. Soc. Am. Spec. Pap. 241.
Kendrick GC, Edmond CL. 1981. Magma immiscibility in the Shonkin Sag and Square Butte laccoliths. Geology9:615–619.
Keppler H. 1999. Experimental evidence for the source of excess sulfur in explosive volcanic eruptions. Science284:1652–1654.
Kerr AC, Tarney J, Marriner GF, Nivia A, Saunders AD.1997. The Caribbean-Colombian Cretaceous igneousprovince: The internal anatomy of an oceanic plateau. In:Mahoney JJ, Coffin MF, ed. Large igneous provinces: Continental, oceanic, and planetary flood volcanism. Am.Geophys. Union Monog. 100:123–144.
Kerrich R, Wyman D, Fan J, Bleeker W. 1998. Boninite series: low Ti-tholeiite associations from the 2.7 Ga Abitibigreenstone belt. Earth Planet. Sci. Lett. 164:3030–3106.
Kerrick DM. 1974. Review of metamorphic mixed-volatile(H2O–CO2) equilibria. Am. Mineral. 59:729–762.
Kerrick DM. 1990. The Al2SiO5 polymorphs. WashingtonDC, Mineral. Soc. Am. Rev. Mineral. 22.
Kerrick DM, Caldeira K. 1993. Paleoatmospheric conse-quences of CO2 released during early Cenozoic regionalmetamorphism in the Tethyan orogen. Chem. Geol.108:201–230.
Kinny PD. 1986. 3820 Ma zircons from a tonalitic gneiss inGodthåb district of southern West Greenland. Earth Planet.Sci. Lett. 79:337–347.
Kirby SH, Stein S, Okal EA, Rubie DC. 1996. Metastablemantle phase transformations and deep earthquakes in subducting oceanic lithosphere. Rev. Geophys. 34:261–306.
Kirkpatrick JA, Ellis DJ. 1992. C-type magmas: Igneouscharnockites and their extrusive equivalents. Trans. Roy.Soc. Edinb. Earth Sci. 83:155–164.
Kirkpatrick RJ. 1981. Kinetics of crystallization of igneousrocks. In: Lasaga AC, Kirkpatrick RJ, eds. Kinetics of geochemical processes. Rev. Mineral. 8:321–398.
Kirkpatrick RJ. 1983. Theory of nucleation in silicate melts.Am. Mineral. 68:66–77.
Kistler RW, Chappell BW, Peck DL, Bateman PC. 1986.Isotopic variation in the Tuolumne Intrusive Suite, centralSierra Nevada, California. Contr. Mineral. Petrol. 94:205–220.
Kjarsgaard BA, Hamilton DL. 1989. The genesis of carbon-atites by immiscibility. In: Bell K, ed. Carbonatites. Boston,Unwin Hyman:388–404.
Klein EM, Langmuir CH. 1987. Global correlation of ocean ridge basalt chemistry with axial depth and crustalthickness. J. Geophys. Res. 92:8089–8115.
Klug C, Cashman KV. 1994. Vesiculation of May 18, 1980,Mount St Helens magma. Geology:22:468–472.
References Cited 677
Klug C, Cashman KV. 1996. Permeability development invesiculating magmas: Implications for fragmentation. Bull.Volc. 58:87–100.
Kokelaar P, Busby C. 1992. Subaqueous explosive eruptionand welding of pyroclastic deposits. Science 257:196–201.
Komar PD. 1976. Phenocryst interactions and the velocityprofile of magma flowing through dikes or sills. Geol. Soc.Am. Bull. 87:1336–1342.
Koziol AM, Newton RC. 1988. Redetermination of theanorthite breakdown reaction and improvement of the plagioclase–garnet–Al2SiO5–quartz geobarometer. Am. Mineral. 73:216–223.
Kracek FC, Neuvonen KJ. 1952. Thermochemistry of the plagioclase and alkali feldspars. Am. J. Sci. Bowen Volume:293–309.
Krauskopf KB, Bird DK. 1995. Introduction to geochem-istry. New York, McGraw-Hill.
Kress VC, Carmichael ISE. 1991. The compressibility of sili-cate liquids containing Fe2O3 and the effect of composition,temperature, oxygen fugacity, and pressure on their redoxstates. Contr. Mineral. Petrol. 108:82–92.
Kretz R. 1966. Interpretation of the shape of mineral grainsin metamorphic rocks. J. Petrol. 7:68–94.
Kretz R. 1994. Metamorphic crystallization. New York,John Wiley and Sons.
Kröner A, Hegner E, Wendt JI, Byerly GR. 1996. The oldest part of the Barberton granitoid-greenstone terrain,South Africa: Evidence for crust formation between 3.5 and 3.7 Ga. Precamb. Res. 78:105–124.
Kushiro I. 1968. Compositions of magmas formed by partialzone melting of the Earth’s upper mantle. J. Geophys. Res.73:619–634.
Kushiro I. 1969. The system forsterite-diopside-silica withand without water at high pressures. Am. J. Sci. 267-A:269–294.
Kushiro I. 1980. Viscosity, density, and structure of silicatemelts at high pressure, and their petrologic applications. In: Hargraves RB, ed. Physics of magmatic processes.Princeton, NJ, Princeton University Press:93–120.
Labotka TC. 1991. Chemical and physical properties offluids. In: Kerrick DM, ed. Contact metamorphism. Rev.Mineral. 26:43–104.
Laird J, Albee AL. 1981. High pressure metamorphism in mafic schist from northern Vermont. Am. J. Sci.281:97–126.
Lambert RStJ. 1959. The mineralogy and metamorphism ofthe Moine Schists of the Morar and Knoydart districts ofInverness-Shire. Trans. Roy. Soc. Edinb. 63:553–589.
Landis CA, Bishop DG. 1972. Plate tectonics and regionalstratigraphic-metamorphic relations in the southern part of the New Zealand geosyncline. Geol. Soc. Am. Bull.83:2267–2284.
Lange RA. 1994. The effect of H2O, CO2, and F on thedensity and viscosity of silicate melts. In: Carroll MR, Holloway JR, eds. Volatiles in magmas: Rev. Mineral.30:331–369.
Lange RA, Carmichael ISE. 1990. Thermodynamic proper-ties of silicate liquids with emphasis on density, thermal expansion, and compressibility. In: Nicholls J, Russell JK,eds. Modern methods of igneous petrology: Understandingmagmatic processes: Rev. Mineral. 24:25–64.Lasaga AC. 1998. Kinetic theory in the earth sciences.Princeton, NJ, Princeton University Press.Lassiter JC, De Paolo DJ. 1997. Plume lithosphere interac-tion in the gen of continental and oceanic flood basalts:Chemical and isotopic constraints. In: Mahony JJ, CoffinMF, eds. Large igneous provinces: Continental, oceanic, and planetary flood volcanism. Am. Geophys. Un. Monog.100:335–356.Law RD. 1990. Crystallographic fabrics: A selective reviewof their application to research in structural geology. In:Knipe RJ, Rutter EH, eds. Deformation mechanisms, rheol-ogy, and tectonics. Geol. Soc. Lond. Spec. Pub. 54:335–352.Le Bas MJ. 1987. Nephelinites and carbonatites. In: FittonJG, Upton BGJ, eds. Alkaline igneous rocks. Geol. Soc.Spec. Pub. 30:53–83.Le Bas MJ, Le Maitre RW, Woolley AR. 1992. The con-struction of the total alkali–silica chemical classification ofvolcanic rocks. Mineral. Petrol. 46:1–22.Le Maitre RW. 1976. The chemical variability of some common igneous rocks. J. Petrol. 17:589–637.Le Maitre RW. 1982. Numerical petrology. New York, Elsevier.Le Maitre RW, ed. 1989. A classification of igneous rocksand glossary of terms. Oxford, Blackwell Scientific.Le Roex AP, Cliff RA, Adair BJI. 1990. Tristan da Cunha,South Atlantic: Geochemistry and petrogenesis of a basanite–phonolite lava series. J. Petrol. 31:779–812.Leake BE. 1958. Compositions of pelites from Connemara,County Galway, Ireland. Geol. Mag. 95:2387–2396.Leake BE. 1964. The chemical distinction between ortho-and para-amphibolite. J. Petrol. 5:238–254.Lee DE, Coleman RG, Bastron H, Smith VC. 1966. A two-amphibole glaucophane schist in the Franciscan Formation,Cazadero area, Sonoma County, California. US Geol. Surv.Prof. Paper 550-C:148–157.Lee W-J, Wyllie PJ. 1997. Liquid immiscibility in the joinNaAlSiO4-NaAlSi3O8-CaCO3 at 1 GPa: Implications forcrustal carbonates. J. Petrol. 38:1113–1135.Leeman WP. 1983. The influence of crustal signature oncompositions of subduction-related magmas. J. Volcan. Geotherm. Res. 18:561–588.Leeman WP. 1996. Boron and other fluid-mobile elementsin volcanic arc lavas: Implications for subduction processes.In: Bebout GE, Scholl DW, Kirby SH, Platt JP, eds. Sub-duction top to bottom. Am. Geophys. Union. Monog.96:269–276.Leeman WP, Smith DR, Hildreth W, Palacz Z, Rogers N.1990. Compositional diversity of late Cenozoic basalts in atransect across the southern Washington Cascades: Implica-tions for subduction zone magmatism. J. Geophys. Res.95:19,561–19,582.Lejeune AM, Bottinga Y, Trull TW, Richet P. 1999. Rheology of bubble-bearing magmas. Earth Planet. Sci.Lett. 166:71–84.
678 Igneous and Metamorphic Petrology
Lesher CE, Walker D. 1991. Thermal diffusion in petrology.In: Ganguly J, ed. Diffusion, atomic ordering, and masstransport: Selected topics in geochemistry. New York,Springer-Verlag:396–451.
Lindsley DH. 1983. Pyroxene thermometry. Am. Mineral.68:477–493.
Liou JG, and 14 others. 1989, Proterozoic blueschist belt inwestern China: Best documented Precambrian blueschists inthe world. Geology 17:1127–1131.
Liou JG, Hacker BR, Zhang RY. 2000. Into the forbiddenzone. Science 287:1215–1216.
Lipman PW. 1997. Subsidence of ash-flow calderas: Relationto caldera size and magma chamber geometry. Bull. Volc.59:198–218.
Lipman PW, Christiansen RL, O’Connor JT. 1966. A compositionally zoned ash-flow sheet in southern Nevada.US Geol. Surv. Prof. Pap. 524-F.
Lipman PW, Mullineaux DR, eds. 1981. The 1980 eruptionsof Mount St. Helens, Washington. US Geol. Surv. Prof.Pap. 1250.
Lister GS, Hobbs BE. 1980. The simulation of fabric development during plastic deformation and its appliationto quartzite: The influence of deformation history. J. Struct.Geol. 2:355–370.
Lister JR, Kerr RC. 1989. The effect of geometry on thegravitational instability of a buoyant region of viscous fluid.J. Fluid Mech. 202:577–594.
Lloyd FE, Arima M, Edgar AD. 1985. Partial melting of a phlogopite–clinopyroxenite nodule from south-westUganda: An experimental study bearing on the origin ofhighly potassic continental rift volcanics. Contr. Mineral.Petrol. 91:321–329.
Loferski PJ, Arculus RJ. 1993. Multiphase inclusions in plagioclase from anorthosites in the Stillwater complex,Montana: Implications for the origin of the anorthosites.Contr. Min. Petrol. 114:63–78.
Lofgren G. 1980. Experimental studies on the dynamiccrystallization of silicate melts. In: Hargraves RB, ed.Physics of magmatic processes. Princeton, Princeton University:487–551.
Lofgren G. 1983. Effect of heterogeneous nucleation onbasaltic textures: A dynamic crystallization study. J. Petrol.24:229–255.
London D. 1992. The application of experimental petrologyto the genesis and crystallization of granitic pegmatites. Can.Mineral. 30:499–540.
London D, Morgan GB VI, Hervig RL. 1989. Vapor-undersaturated experiments with Macusani glass � H2O at 200 MPa and the internal differentiation of granite pegmatites. Contr. Mineral. Petrol. 102:1–17.
Longhi J, Vander Auwera J, Fram MS, Duchesne J-C. 1999.Some phase equilibrium constraints on the origin of Proterozoic (massif ) anorthosites and related rocks. J. Petrol. 40:339–362.
Lorenz V. 1986. On the growth of maars and diatremes andits relevance to the formation of tuff rings. Bull. Volc.48:265–274.
Lowe DR, Byerly GR. 1999. Geologic evolution of the Barberton greenstone belt, South Africa. Geol. Soc. Am.Spec. Paper 329.
Luhr JF. 1997. Extensional tectonics and the diverse primitive volcanic rocks in the western Mexican VolcanicBelt. Can. Mineral. 35:473–500.
Luth RW. 1988. Effects of F on phase equilibria and liquidstructure in the system NaAlSiO4-CaMgSi2O6-SiO2. Am.Mineral. 73:306–312.
Maaløe S. 1978. The origin of rhythmic layering. Mineral.Mag. 42:337–345.
Maaløe S. 1985. Principles of igneous petrology. New York,Springer-Verlag.
Maas R, Kinny PD, Williams IS, Froude DO, Compston W.1992. The Earth’s oldest crust: A geochronologic and geo-chemical study of 3900–4200 Ma old detrital zircons fromMt Narryer and Jack hills, Western Australia. Geochim.Cosmochim. Acta 56:1281–1300.
McBirney AR. 1980. Mixing and unmixing of magmas. J. Volc. Geotherm. Res. 7:357–371.
McBirney AR. 1993. Igneous petrology: Second edition.Boston, Jones and Bartlett.
McBirney AR. 1996. The Skaergaard intrusion. In:Cawthorn RG, ed. Layered intrusions. New York, Elsevier:147–180.
McBirney AR, Baker BH, Nilson RH. 1985. Liquid fractiona-tion. Part I: Basic principles and experimental simulations.J. Volc. Geotherm. Res. 24:1–24.
McBirney AR, Murase T. 1984. Rheological properties ofmagmas. Ann. Rev. Earth Planet. Sci. 12:337–357.
McBirney AR, Noyes RM. 1979. Crystallization and layeringof Skaergaard intrusion. J. Petrol. 20:487–554.
McCarthy J, Thompson GA. 1988. Seismic imaging of extended crust with emphasis on the western United States.Geol. Soc. Am. Bull. 100:1361–1374.
MacColl RS. 1964. Geochemical and structural studies inbatholithic rocks of southern California: Part 1, structuralgeology of Rattlesnake Mountain pluton. Geol. Soc. Am.Bull. 75:805–822.
Macdonald GA. 1968. Composition and origin of Hawaiianlavas. Geol. Soc. Am. Mem. 116:477–522.
Macdonald R. 1974. Nomenclature and petrochemistry ofthe peralkaline oversaturated extrusive rocks. Bull. Volc.38:498–516.
McDonough WF. 1990. Constraints on the composition ofthe continental lithospheric mantle. Earth Planet. Sci. Lett.101:1–18.
McGregor VR, Friend CRL. 1997. Field recognition ofrocks totally retrogressed from granulite facies: An examplefrom Archean rocks in the Paamiut region, South-WestGreenland. Precamb. Res. 86:59–70.
McKenzie D. 1985. The extraction of magma from the crustand mantle. Earth Planet. Sci. Lett. 74:81–91.
McKenzie D, O’Nions RK. 1991. Partial melt distributionsfrom inversion of rare earth element concentrations. J. Petrol. 32:1021–1091.
References Cited 679
MacLellan HE, Trembath LT. 1991. The role of quartz crys-tallization in the development and preservation of igneoustexture in granitic rocks: Experimental evidence at 1 kbar.Am. Mineral. 76:1291–1305.
McMillan PF. 1994. Water solubility and speciation models.In: Carroll MR, Holloway JR, eds. Volatiles in Magmas. Rev.Mineral. 30:131–156.
Mader HM, Zhang Y, Phillips JC, Sparks RSJ, Sturtevant R,Stolper E. 1994. Experimental simulations of explosive degassing of magma. Nature 372:85–88.
Magaritz M, Whitford DJ, James DE. 1978. Oxygen isotopes and the origin of high-87Sr/86Sr andesites. EarthPlanet. Sci. Lett. 40:220–230.
Mahoney JJ. 1988. Deccan traps. In: Macdougall JD, ed.Continental flood basalts. Boston, Kluwer:151–194.
Mahoney JJ, Coffin MF, eds. 1997. Large igneous provinces:Continental, oceanic, and planetary flood volcanism. Am.Geophys. Union Monog. 100.
Mahood G. 1981. Chemical evolution of a Pleistocene rhyolitic center: Sierra La Primavera, Jalisco, Mexico. Contr. Mineral. Petrol. 77:129–149.
Mangan MT, Cashman KV. 1996. The structure of basalticscoria and reticulite and inferences for vesiculation, foamformation, and fragmentation in lava fountains. J. Volc. Geotherm. Res. 73:1–18.
Manning CE. 1994. The solubility of quartz in H2O in thelower crust and upper mantle. Geochim. et Cosmochim.Acta 58:4831–4839.
Marrett R, Emerman SH. 1992. The relations between fault-ing and mafic magmatism in the Altiplano–Puna plateau(central Andes). Earth Planet. Sci. Lett. 112:53–59.
Marsh BD. 1982. On the mechanics of igneous diapirism,stoping, and zone melting. Am. J. Sci. 282:808–855.
Marsh BD. 1988. Crystal size distribution (CSD) in rocksand the kinetics and dynamics of crystallization: I. TheoryContr. Mineral. Petrol. 99:277–291.
Marsh BD. 1989. Magma chambers. Ann. Rev. Earth Planet.Sci. 17:439–474.
Marsh JS, Hooper PR, Rehacek J, Duncan RA, Duncan AR.1997. Stratigraphy and age of Karoo basalts of Lesotho and implications for correlations within the Karoo igneousprovince. In: Mahoney JJ, Coffin MF, eds. Large igneousprovinces: Continental, oceanic, and planetary flood volcanism. Am. Geophys. Un. Monog. 100:247–272.
Martignole J. 1994. L’évolution magmatique du Complexede Morin et son apport au problème des anorthosites.Contr. Min. Petrol. 44:117–137.
Martin BS. 1989. The Roza Member, Columbia River BasaltGroup: Chemical stratigraphy and flow distribution. In: Reidel SP, Hooper PR, eds. Volcanism and tectonism in theColumbia River flood-basalt province. Geol. Soc. Am. Spec.Paper 239:85–104.
Martin H. 1994. The Archean grey gneisses and the genesisof continental crust. In: Condie KC, ed. Archean crustalevolution. New York, Elsevier:205–260.
Martin H. 1999. Adakitic magmas: Modern analogs ofArchean granitoids. Lithos 46:411–429.
Mas DL, Crowley PD. 1996. The effect of second-phaseparticles on stable grain size in regionally metamorphosedpolyphase calcite marbles. J. Metam. Geol. 14:155–162.
Massone H-J, Schreyer W. 1989. Stability field of the high-pressure assemblage talc � phengite and two new phengitebarometers. Eur. J. Mineral. 1:391–410.
Mathez, EA, Hunter, RH, Kinzler, R. 1997. Petrologic evolution of partially molten cumulate: The Atok section ofthe Bushveld Complex. Contr. Mineral. Petrol. 129:20–34.
Maughan LL, Christiansen EH, Best MG, Grommé CS,Deino A, Tingey DG. 2002. The Oligocene Lund Tuff,Great Basin, USA: A voluminous monotonous intermediate.J. Volc. Geotherm. Res.
Maury RC, Defant MJ, Joron J-L. 1992. Metasomatism of the sub-arc mantle inferred from trace elements in Philippine xenoliths. Nature 360:661–663.
Maxwell JC. 1962. Origin of slaty and fracture cleavage inthe Delaware Water gap area, New Jersey and Pennsylvania.In: Engel AEJ, James HL, Leonard BF, eds. Petrologic studies—a volume in honor of A.F. Buddington. Geol. Soc.Am. 281–311.
Maxwell JC. 1974. Anatomy of an orogen. Geol. Soc. Am.Bull. 85:1195–1204.
May PR. 1971. Patterns of Triassic–Jurassic diabase dikesaround the North Atlantic in the context of predrift posi-tion of the continents. Geol. Soc. Amer. Bull. 82:1285–1292.
Means WD, Park Y. 1994. New experimental approach tounderstanding igneous texture. Geology 22:323–326.
Mehnert KR. 1968. Migmatites. New York, Elsevier.
Menzies M, Rogers N, Tindle A, Hawkesworth C. 1987.Metasomatic and enrichment processes in lithospheric peri-dotites, an effect of asthenosphere-lithosphere interaction.In: Menzies MA, Hawkesworth CJ, eds. Mantle metasoma-tism. New York, Academic Press:313–361.
Merzbacher C, Eggler DH. 1984. A magmatic geohygrome-ter: Application to Mount St Helens and other dacitic magmas. Geology 12:587–590.
Mezger K. 1992. Temporal evolution of regional granuliteterranes: Implications for the formation of lowermost continental crust. In: Fountain DM, Arculus R, Kay RW,eds. Continental lower crust. New York, Elsevier:447–478.
Michard A, Henry C, Chopin C. 1995. Structures in UHPMrocks: A case study from the Alps. In: Coleman RG, WangX, eds. Ultrahigh pressure metamorphism, New York, Cambridge University Press:132–158.
Miller CF and six others. 1986. Comment and reply on “S-type granites and their probable absence in southwesternNorth America.” Geology 14:804–806.
Miller CF, Barton MD. 1990. Phanerozoic plutonism in the Cordilleran Interior, USA. Geol. Soc. Am. Spec. Pap.241:213–231.
Mitchell RH. 1994. The lamprophyre facies. Mineral.Petrol. 51:137–146.
Mitchell RH. 1995. Kimberlites, orangeites, and relatedrocks. New York, Plenum.
680 Igneous and Metamorphic Petrology
Mitchell RH, ed. 1996. Undersaturated alkaline rocks: Mineralogy, petrogenesis, and economic potential. Mineral.Assoc. Can. Short Course 24.
Mitchell RH, Bergman SC. 1991. Petrology of lamproites.New York, Plenum.
Mitchell RS. 1985. Dictionary of rocks. New York, VanNostrand Reinhold.
Miyashiro A. 1974. Volcanic rock series in island arcs andactive continental margins. Am. J. Sci. 274:321–355.
Miyashiro A. 1994. Metamorphic petrology. New York, Oxford University.
Möller A, Appel P, Mezger K, Schenk V. 1995. Evidence fora 2 Ga subduction zone: Eclogites in the Usagaran belt ofTanzania. Geology 23:1067–1070.
Moore G, Righter K, Carmichael ISE. 1995. The effect ofdissolved water on the oxidation state of iron in natural silicate liquids. Contr. Mineral. Petrol. 120:170–179.
Moore G, Vennemann T, Carmichael ISE. 1998. An empiri-cal model for the solubility of H2O in magmas to 3 kilobars.Am. Mineral. 83:36–42.
Moore JG. 1975. Mechanism of formation of pillow lava.Am. Sci. 63:269–277.
Moore JG, Albee WC. 1981. Topographic and structuralchanges, March–July, 1980—photogrammetric data. In: Lipman PW, Mullineaux DR, eds. The 1980 eruptions ofMount St. Helens, Washington. U.S. Geol. Surv. Prof. Paper1250:123–134.
Moore JG, Clague DA. 1992. Volcano growth and evolutionof the island of Hawaii. Geol. Soc. Am. Bull. 104:1471–1484.
Moore JG, Normark WR, Holcomb RT. 1994. Giant Hawaiianlandslides. Ann. Rev. Earth Planet. Sci. 22:119–144.
Moore JM, Jr. 1960. Phase relations in the contact aureoleof the Onawa pluton, Maine. Unpublished PhD thesis,Cambridge, MA, Massachusetts Institute of Technology.
Moores EM. 1982. Origin and emplacement of ophiolites.Rev. Geophys. Space Phys. 20:735–760.
Moreau C, Ohnenstetter D, Diot H, Demaiffe D, BrownWL. 1995. Emplacement of the Meugueur–Meugueur conesheet (Niger, West Africa), one of the world’s largest ig-neous ring-structures. In: Baer G, Heimann A, eds. Physicsand chemistry of dikes. Rotterdam, Balkema:41–49.
Morgan BA. 1972. Metamorphic map of the Appalachians.US Geol. Surv. Misc. Geol. Invest. Map I-724.
Morgan WJ. 1971. Convection plumes in the lower mantle.Nature 230:42–43.
Morse SA. 1970. Alkali feldspars with water at 5 kb. pressure. J. Petrol. 11:221–253.
Morse SA. 1980. Basalts and phase diagrams. New York,Springer Verlag.
Morse SA. 1998. Is the cumulate paradigm at risk? An extended discussion of the cumulate paradigm reconsidered.J. Geol. 106:367–370.
Mothes PA, Hall ML, Janda RJ. 1998. The enormous Chillos Valley lahar: An ash-flow generated debris flow from Cotopaxi volcano, Ecuador. Bull. Volc. 59:233–244.
Murase T, McBirney AR. 1973. Properties of some commonigneous rocks and their melts at high temperatures. Geol.Soc. Am. Bull. 84:3563–3592.
Murase T, McBirney AR, Melson WG. 1985. Viscosity ofthe dome of Mount St. Helens. J. Volc. Geotherm. Res.24:193–204.
Murata KJ, Richter DH. 1966. The settling of olivine in Kilauean magma as shown by lavas of the 1959 eruption.Am. J. Sci. 264:194–203.
Myers JS. 1975. Igneous stratigraphy of Archean anorthositeat Majorqap qâva, near Fiskenæsset, South-West Greenland.Rapp Gro̊nl Unders. 74.
Myers JS. 1976. The early Precambrian gneiss complex ofGreenland. In: Windley BF, ed. The early history of theEarth. New York, John Wiley and Sons.
Myers JS, Crowley JL. 2000. Vestiges of life in the oldestGreenland rocks? A review of early Archean geology in theGodthåbsfjord region, and reappraisal of field for �3850life on Akilia. Precamb. Res. 103:101–124.
Myers JS, Swagers C. 1997. The Yilgarn block. In: de WitM, Ashwal LD, eds. Greenstone belts. Oxford, Claren-don:640–656.
Mysen BO. 1988. Structure and properties of silicate melts.Amsterdam, Elsevier.
Nabelek PI, Liu M. 1999. Leucogranites in the Black Hillsof South Dakota: The consequence of shear heating duringcontinental collision. Geology 27:523–526.
Nasland HR, McBirney AR. 1996. Mechanisms of formationof igneous layering. In: Cawthorne RG, ed. Layered intru-sions. New York, Elsevier:1–44.
Natland J. 1991. Mineralogy and crystallization of oceanicbasalts. In: Floyd PA, ed. Oceanic basalts. New York, VanNostrand Reinhold:63–93.
Nekvasil H. 1991. Ascent of felsic magmas and formation ofrapakivi. Am. Mineral. 76:1279–1290.
Nekvasil H, Lindsley DH. 1990. Termination of the 2feldspar � liquid curve in the system Ab–Or–An–H2O atlow H2O contents. Am. Mineral. 75:1071–1079.
Nelson DR, Trendall AF, Altermann W. 1999. Chronologiccorrelations between the Pilbara and Kaapvaal cratons. Precamb. Res. 97:165–189.
Nelson DR, Trendall AF, de Laeter JR, Grobler NJ, Fletcher IR. 1992. A comparative study of the geochemicaland isotopic systematics of late Archean flood basalts from the Pilbara and Kaapvaal cratons. Precamb. Res.54:231–257.
Nelson SA. 1981. The possible role of thermal feedback inthe eruption of siliceous magmas. J. Volc. Geotherm. Res.11:127–137.
Nesbitt RW. 1971. Skeletal crystal forms in the ultramaficrocks of the Yilgarn block, western Australia: Evidence foran Archean ultramafic liquid. Geol. Soc. Aust. Spec. Publ.3:331–347.
Neuvonen KJ. 1952. Thermochemical investigation of theåermanite–gehlenite series. Bull. Comm. Géol. Finlande26:1–13.
References Cited 681
Newman ACD, Brown G. 1987. The chemical constitution of clays. In Newman ACD, ed. Chemistry of clays and clayminerals, Mineral. Soc. Monog. 6. New York, John Wileyand Sons, 2–128.
Newton RC, Fyfe WS. 1976. High pressure metamorphism.In: Bailey DK, Macdonald R, eds. The evolution of the crystalline rocks. New York, Academic Press:101–186.
Nicholas A. 1992. Kinematics in magmatic rocks with special reference to gabbros. J. Petrol. 33:891–915.
Nicolas A, Poirier JP. 1976. Crystalline plasticity and solidstate flow in metamorphic rocks. New York: John Wiley andSons.
Nielson JE, Budahn JR, Unruh DM, Wilshire HG. 1993.Actualistic models of mantle metasomatism documented ina composite xenolith from Dish Hill, California. Geochim.Cosmochim. Acta 57:105–121.
Nisbet EG. 1987. The young earth: An introduction toArchean geology. Boston, Allen and Unwin.
Nishiyama T. 1989. Kinetics of hydrofracturing and metamorphic veining. Geology 17:1068–1071.
Nixon PH, ed. 1987. Mantle xenoliths. New York, John Wiley and Sons.
Nixon PH. 1995. The morphology and nature of primarydiamondiferous occurrences. J. Geochem. Explor. 53:41–72.
Nixon PH, von Knorring O, Rooke JM. 1963. Kimberlitesand associated inclusions of Basutoland: A mineralogicaland geochemical study. Am. Mineral. 48:1090–1120.
Noble JA. 1952. Evaluation of criteria for the forcible intrusion of magma. J. Geol. 60:34–57.
Nockolds SR, Knox RWO’B, Chinner GA. 1978. Petrologyfor students. New York, Cambridge University Press.
Nordstrom DK, Munoz JL. 1994. Geochemical thermody-namics. Boston, Blackwell Scientific.
Norton JJ, Redden JA. 1990. Relations of zoned pegmatitesto other pegmatites, granite, and metamorphic rocks in the southern Black Hills, South Dakota. Am. Mineral.75:631–655.
Nutman AP, McGregor VR, Friend CRL, Bennett VC,Kinny PD. 1996. The Itsaq Gneiss Complex of southernWest Greenland; the world’s most extensive record of earlycrustal evolution (3900–3600 Ma). Precamb. Res. 78:1–39.
O’Brien PJ, Zotov N, Law R, Khan MA, Jan MG. 2001. Coesite in Himalayan eclogite and implications for modelsof India–Asia collision. Geol. 29:435–438.
O’Hanley DS. 1992. Solution to the volume problem in serpentinization. Geol. 20:705–708.
O’Hanley DS. 1996. Serpentinites: Records of tectonic andpetrologic history. New York, Oxford University Press.
O’Reilly SY, Griffin WL, Poudjom Djomani YH, Morgan P. 2001. Are lithospheres forever? Tracking changes in subcontinental lithospheric mantle through time. GSA Today 11(4):4–10.
Oches FA, III, Lange RA. 1997. The partial molar volume,thermal expansivity, and compressibility of H2O inNaAlSi3O8 liquid: New measurements and an internallyconsistent model. Contr. Mineral. Petrol. 129:155–165.
Odé H. 1957. Mechanical analysis of the dike pattern of the Spanish Peaks area, Colorado. Geol. Soc. Amer. Bull.68:567–578.
Oliver GJH, Chen F, Buchwaldt R, Hegner E. 2000. Fasttectonometamorphism and exhumation in the type area ofthe Barrovian and Buchan zones. Geology 28:459–462.
Olsen PE. 1999. Giant lava flows, mass extinctions, andmantle plumes. Science 284:604–605.
Ord A, Oliver NHS. 1997. Mechanical controls on fluidflow during regional metamorphism: Some numerical models. J. Metam. Geol. 15:345–359.
Oxburgh ER. 1964. Petrologic evidence for the presence of amphibole in the upper mantle and its petrogenetic andgeophysical implications. Mineral Mag. 101:1–19.
Oxburgh ER, Turcotte DL. 1974. Thermal gradients and regional metamorphism in overthrust terrains with specialreference to the eastern Alps. Schweiz. Mineral. Petrog.Mitt. 54:641–662.
Pabst A. 1936. Vesuvianite from Georgetown, California.Am. Mineral. 21:1–9.
Papezik VS. 1965. Geochemistry of some Canadiananorthosites. Geochim. Cosmochim. Acta 29:673–709.
Park Y, Hanson B. 1999. Experimental investigation of Ostwald-ripening rates of forsterite in the haplobasaltic system. J. Volc. Geotherm. Res. 90:103–113.
Parman SW, Dann JC, Grove TL, de Wit MJ. 1997. Em-placement conditions of komatiite magmas from the 3.49Ga Komati Formation, Barberton greenstone belt, SouthAfrica. Earth Planet. Sci. Lett. 150:303–323.
Parsons I, ed. 1987. Origins of igneous layering. Boston,Reidel.
Parsons T, Sleep NH, Thompson GA. 1992. Host rock rheology controls on the emplacement of tabular intrusions:Implications for underplating of extending crust. Tectonics11:1348–1356.
Passchier CW, Myers JS, Kröner A. 1990. Field geology ofhigh-grade gneiss terrains. Springer-Verlag, New York.
Passchier CW, Trouw RAJ. 1996. Microtectonics. New York,Springer-Verlag.
Paterson MS. 1987. Problems in the extrapolation of labora-tory rheological data. Tectonophysics 133:33–43.
Paterson SR, Fowler TK, Jr. 1993. Re-examining pluton emplacement processes. J. Struct. Geol. 15:191–206.
Paterson SR, Fowler TK, Jr, Schmidt KL, Yoshinobu AS,Yuan ES, Miller RB. 1998. Interpreting magmatic fabricpatterns in plutons. Lithos 44:53–82.
Paterson SR, Vernon RH. 1995. Bursting the bubble of ballooning plutons: A return to nested diapirs emplaced bymultiple processes. Geol. Soc. Am. Bull. 107:1356–1380.
Paterson SR, Vernon RH, Fowler TK, Jr. 1991. Aureole tectonics. In: Kerrick DM, ed. Contact metamorphism. Rev. Mineral. 26:673–722.
Paterson SR, Vernon RH, Tobisch OT. 1989. A review ofcriteria for the identification of magmatic and tectonic foliations in granitoids. J. Struct. Geol. 11:349–363.
682 Igneous and Metamorphic Petrology
Patiño Douce AE. 1997. Generation of metaluminous A-type granites by low-pressure melting of calc-alkalinegranitoids. Geology 25:743–746.
Patiño Douce AE, Harris N. 1998. Experimental constraintson Himalayan anatexis. J. Petrol. 39:689–710.
Patrick BE, Day HW. 1995. Cordilleran high-pressure metamorphic terranes: progress and problems. J. Metam.Geol. 13:1–8.
Peacock SM, Rushmer T, Thompson AB. 1994. Partial melting of subducting oceanic crust. Earth Planet. Sci. Lett.121:227–244.
Pearce JA, Harris NBW, Tindale AG. 1984. Trace elementdiscrimination diagrams for the tectonic interpretation ofgranitic rocks. J. Petrol. 25:956–983.
Pearce TH, Kolisnik AM. 1990. Observations of plagioclasezoning using interference imaging. Earth Sci. Rev. 29:9–26.
Peate DW. 1997. The Parana-Etendeka province. In: Mahoney JJ, Coffin MF, eds. Large igneous provinces: Continental, oceanic, and planetary flood volcanism. Am.Geophys. Union Monog. 100:217–245.
Penn RL, Banfield JF, Kerrick DM. 1999. TEM investiga-tion of Lewiston, Idaho, fibrolite: Microstructure and grainboundary energetics. Am. Mineral. 84:152–159.
Peterson DW, Tilling RI. 1980. Transition of basaltic lavafrom pahoehoe to aa, Kilauea volcano, Hawaii: Field observations and key factors. J. Volc. Geotherm. Res.7:271–293.
Petford N. 1996. Dykes or diapirs? Trans. R. Soc. Edinb.87:105–114.
Phaup WE. 1973. Geological Society of South Africa Special Publication 3.1.
Philpotts AR. 1982. Compositions of immiscible liquids involcanic rocks. Contrib. Mineral. Petrol. 80:201–218.
Philpotts AR. 1990. Principles of igneous and metamorphicpetrology. Englewood Cliffs, New Jersey, Prentice Hall.
Philpotts AR, Lewis CL. 1987. Pipe vesicles—An alternatemodel of their origin. Geology 15:971–974.
Pickering JM, Johnson AD. 1998. Fluid-absent melting behavior of a two-mica metapelite: Experimental constraintson the origin of Black Hills granite. J. Petrol. 39:1787–1804.
Pitcher WS. 1997. The nature and origin of granite. NewYork, Chapman and Hall.
Piwinskii AJ. 1968. Experimental studies of igneous rock series: Central Sierra Nevada batholith, California. J. Geol.76:548–570.
Polacci M, Cashman KV, Kauahikaua JP. 1999. Texturalcharacterization of the pahoehoe–aa transition in Hawaiianbasalt. Bull. Volc. 60:595–609.
Post AD, Tullis J, Yund RA. 1996. Effects of chemical environment on dislocation creep of quartzite. J. Geophys.Res. 101:22,143–22,155.
Powell R, Holland T, Worley B. 1998. Calculating phase diagrams involving solid solutions via non-linear equations,with examples using THERMOCALC. J. Metam. Geol.16:577–588.
Prouteau G, Scaillet B, Pichavant M, Maury RC. 1999.Fluid-present melting of ocean crust in subduction zones.Geology 27:1111–1114.
Puffer JH, Ragland PC, eds. 1992. Eastern North AmericaMesozoic magmatism. Geol. Soc. Am. Spec. Pap. 268.
Putnis A, McConnell JDC. 1980. Principles of mineral behavior. Boston, Blackwell Scientific.
Pyke DR, Naldrett AJ, Eckstrand OR. 1973. Archean ultramafic flows in Munro township, Ontario. Geol. Soc.Am. Bull., 84:955–978.
Rahaman MA, van Breemen O, Bowden P, Bennett JN.1984. Age migrations of anorogenic ring complexes innorthern Nigeria. J. Geol. 92:173–184.
Ramberg H. 1981. Gravity, deformation, and the earth’scrust. New York, Academic Press.
Rampino MR, Self S, Strothers RB. 1988. Volcanic winters.Ann. Rev. Earth Planet. Sci. 16:73–99.
Rapp RP. 1997. Heterogeneous source regions for Archeangranitoids: Experimental and geochemical evidence. In: De Wit MJ, Ashwal LD, eds. Greenstone belts. Oxford,Clarendon: 267–279.
Rapp RP, Watson EB, Miller CF. 1991. Partial melting ofamphibolite/eclogite and the origin of Archean trond-hjemites and tonalites. Precamb. Res. 51:1–25.
Rautenschlein M, Jenner GA, Hertogen J, Hofmann AW,Kerrich R, Schmincke H-U, White WM. 1985. Isotopic andtrace element composition of volcanic glasses from theAkaki Canyon, Cyprus: Implications for the origin of theTroodos ophiolite. Earth Planet. Sci. Lett. 75:369–383.
Rayleigh CB, Paterson MS. 1965. Experimental deformationof serpentinite and its tectonic implications. J. Geophys.Res. 70:3965–3985.
Read HH. 1957. The granite controversy. London, Murby.
Redfern SAT, Salje E, Navrotsky A. 1989. High-temperatureenthalpy at the orientational order-disorder transition in calcite: Implications for the calcite/aragonite phase equilib-rium. Contr. Mineral. Petrol. 101:479–484.
Reidel SP, Hooper PR, eds. 1989. Volcanism and tectonismin the Columbia River flood-basalt province. Geol. Soc. Am.Spec. Paper 239.
Rhodes JM, Dungan MA, Blanchard DP, Long PE. 1979.Magma mixing at mid-ocean ridges: Evidence from basaltsdrilled near 22°N on the Mid-Atlantic Ridge. Tectonophys.55:35– 61.
Richet P, Bottinga Y. 1995. Rheology and configurationalentropy of silicate melts. Rev. Mineral. 32:67–93.
Ridley J, Thompson AB. 1986. The role of mineral kineticsin the development of metamorphic microtextures. In:Walther JV, Wood BJ, eds. Fluid-rock interactions duringmetamorphism. New York, Springer-Verlag, 154–193.
Ridley JR, Vearncombe JR, Jelsma HA. 1997. Relations between greenstone belts and granitoids. In: De Wit MJ,Ashwal LD, eds. Greenstone belts. Oxford, Clarendon:376–397.Rivers T. 1997. Lithotectonic elements of the Grenvilleprovince: A review and tectonic implications. Precamb. Res. 86:117–154.
References Cited 683
Robie RA, Hemingway BS. 1995. Thermodynamic proper-ties of minerals and related substances at 298.15K and 1 bar(105 Pascals) pressure and at higher temperatures. US Geol.Surv. Bull. 2131.
Robin P-YF. 1979. Theory of metamorphic segregation andrelated processes. Geochim. Cosmochim Acta43:1587–1600.
Robinson P. 1991. The eye of the petrographer, the mind ofthe petrologist. Am. Mineral. 76:1781–1810.
Roedder E. 1984. Fluid inclusions. Washington DC, Mineral. Soc. Am. Rev. Mineral. 12.
Rollinson HR. 1993. Using geochemical data: Evaluation,presentation, interpretation. New York, John Wiley and Sons.
Rose AW, Burt DM. 1979. Hydrothermal alteration. In:Barnes HL, ed. Geochemistry of hydrothermal ore deposits,2nd ed. New York, John Wiley and Sons:173–235.
Rose EI. 1987. Volcanic activity at Santiaguito volcano,1976–1984. In: Fink JH, ed. The emplacement of silicicdomes and lava flows. Geol. Soc. Am. Spec. Paper212:17–27.
Roselle GT, Baumgartner LP, Chapman JA. 1997. Nucle-ation-dominated crystallization of forsterite in the UbehebePeak contact aureole, California. Geology 25:823–826.
Roselle GT, Baumgartner LP, Vellet JW. 1999. Stable isotope evidence of heterogeneous fluid infiltration at theUbehebe Peak contact aureole, Death Valley National Monument, California. Am. J. Sci. 299:93–138.
Rosenfeld JL. 1956. Paragonite in the schist of GlebeMountain, southern Vermont. Am. Mineral. 41:144–147.
Rosing MT, Rose NM, Bridgwater D, Thomsen HS. 1996.Earliest part of Earth’s stratigraphic record: A reappraisal of the �3.7 Ga Isua (Greenland) supracrustal sequence. Geology 24:43–46.
Ross CS, Hendricks SB. 1945. Minerals of the montmoril-lonite group. US Geol. Surv. Prof. Paper 205-B.
Ross CS, Smith RL. 1961. Ash-flow tuffs: Their origin, geologic relations, and identification. US Geol. Surv. Prof.Pap. 366.
Rubatto D, Hermann J. 2001. Exhumation as fast as sub-duction? Geol. 29:3–6.
Rubie DC. 1986. The catalysis of mineral reactions by waterand restrictions on the presence of aqueous fluid duringmetamorphism. Mineral. Mag. 50:399–415.
Rubie DC. 1998. Disequilibrium during metamorphism:The role of nucleation kinetics. In: Treloar PJ, O’Brien PJ,eds. What drives metamorphism and metamorphic reac-tions. Geol. Soc. Lond. Spec. Publ. 138:199–214.
Rubin AM. 1995. Propagation of magma-filled cracks. Ann.Rev. Earth Planet. Sci. 23:287–336.
Russell JK, Stanley CR. 1990. A theoretical basis for the development and use of chemical variation diagrams.Geochim. Cosmochim. Acta. 54:2419–2431.
Rutherford MJ, Hill PM. 1993. Magma ascent rates fromamphibole breakdown: An experimental study applied tothe 1980–86 Mount St. Helens eruptions. J. Geophys. Res.98:19,667–19,685.
Rutter EH, Brodie KH. 1995. Mechanistic interactions be-tween deformation and metamorphism. Geol. J. 30:227–240.
Ryan MP. 1994. Neutral-buoyancy controlled magma trans-port and storage in mid-ocean ridge magma reservoirs andtheir sheeted-dike complex: A summary of basic relation-ships. In: Ryan MP, ed. Magmatic systems. New York, Academic Press:97–138.
Ryan MP, Blevins JYK. 1987. The viscosity of synthetic andnatural silicate melts and glasses at high temperatures and 1 bar (105 Pascals) pressure and at higher pressures. USGeol. Surv. Bull. 1987.
Sahama TG. 1952. Leucite, potash nepheline, and clinopy-roxene from volcanic lavas from southwestern Uganda andadjoining Belgian Congo. Am. J. Sci. Bowen Volume:457–464.
Sandiford M. 1989. Horizontal structures in granulite ter-ranes: A record of mountain building or mountain collapse.Geology 17:449–452.
Sarna-Wojcicki AM, Shipley S, Waitt RB, Jr, Dzurisin D,Wood SH. 1981. Areal distribution, thickness, mass, volume, and grain size of air-fall ash from the six majoreruptions of 1980. In: Lipman PW, Mullineaux DR, eds.The 1980 eruptions of Mount St. Helens, Washington. USGeol. Surv. Prof. Paper 1250:577–600.
Saunders AD, Fitton JG, Kerr AC, Norry MJ, Kent RW.1997. The North Atlantic igneous province. In: Mahoney JJ,Coffin MF, eds. Large igneous provinces: Continental,oceanic, and planetary flood volcanism. Am. Geophys.Union Monog. 100:45–94.
Sawka WN, Chappell BW, Kistler RW. 1990. Granitoidcompositional zoning by side-wall boundary layer differenti-ation: Evidence from the Palisade Crest intrusive suite, central Sierra Nevada, California. J. Petrol. 31:519–553.
Schertl H-P, Schreyer W, Chopin C. 1991. The pyrope-coesite rocks and their country rocks at Parigi, Dora MairaMassif, Western Alps: A detailed petrography, mineralchemistry, and PT-path. Contr. Mineral. Petrol. 108:10–21.
Schiano P, Clocchiatti R, Shimizu N, Maury RC, JochumKP, Hofmann AW. 1995. Hydrous, silica-rich melts in thesub-arc mantle and their relationship with erupted lavas.Nature 377:595–600.
Schiano P, Clocchiatti R, Shimizu N, Weis D, Mattielli N.1994. Cogenetic silica-rich and carbonate-rich melts trappedin mantle minerals in Kerguelen ultramafic xenoliths: Impli-cations for metasomatism in the oceanic upper mantle.Earth Planet. Sci. Lett. 123:167–178.
Schiffman P, Elders WA, Williams AE, McDowell SD, Bird DK. 1984. Active metasomatism in the Cerro Prietogeothermal system, Baja California, Mexico: A telescopedlow-pressure, low-temperature metamorphic facies series.Geology 12:12–15, 255.
Schmidt ST, Robinson D. 1997. Metamorphic grade andporosity and permeability controls on mafic phyllosilicatedistributions in a regional zeolite to greenschist facies transition of the North Shore Volcanic Group, Minnesota.Geol. Soc. Am. Bull. 109:683–697.
Schoneveld C. 1977. A study of some typical inclusion patterns in strongly paracrystalline-rotated garnets. Tectonophysics 39:453–471.
684 Igneous and Metamorphic Petrology
Scoates JS, Frost CD. 1996. A strontium and neodymiumisotopic investigation of the Laramie anorthosites, Wyoming,USA: Implications for magma chamber processes and theevolution of magma conduits in Proterozoic anorthosites.Geochim. Cosmochim. Acta 60:95–107.
Scott-Smith B. 1966. Kimberlites. In: Mitchell RH, ed. Undersaturated alkaline rocks: Mineralogy, petrogenesis,and economic potential. Min. Assoc. Can. Short Course Ser. 24:217–244.
Searle M, Cox J. 1999. Tectonic setting, origin, and obductionof the Oman ophiolite. Geol. Soc. Am. Bull. 111:104–122.
Seifert KE, Voigt AF, Smith MF, Stensland WA. 1977. Rareearths in the Marcy and Morin anorthosite complexes. Can.J. Earth Sci. 14:1033–1045.
Self S, Thordarson T, Keszthelyi L. 1997. Emplacement ofcontinental flood basalt lava flows. In: Mahoney JJ, CoffinMF, eds. Large igneous provinces: Continental, oceanic, andplanetary flood volcanism. Am. Geophys. Union Monog.100:381–410.
Selverstone J. 1985. Petrologic constraints on imbrication,metamorphism, and uplift in the SW Tauern Window, eastern Alps. Tectonics 4:687–704.
Selverstone J. 1988. Evidence for east-west crustal extensionin the eastern Alps: Implications for the unroofing ofTauern Window. Tectonics 7:87–105.
Selverstone J, Chamberlain CP. 1990. Apparent isobariccooling paths from granulites: Two counterexamples fromBritish Columbia and New Hampshire. Geology 18:307–310.
Severinghaus J, Atwater T. 1990. Cenozoic geometry andthermal state of the subducting slabs beneath western NorthAmerica. Geol. Soc. Am. Mem. 176:1–22.
Shannon RD. 1976. Revised effective ionic radii and system-atic studies of interatomic distances in halides and chalco-genides. Acta Cryst. A. 32:751–767.
Sharma M. 1997. Siberian traps. In: Mahoney JJ, Coffin MF,eds. Large igneous provinces: Continental, oceanic, andplanetary flood volcanism. Am. Geophys. Union Monog.100:273–296.
Shaw HR. 1965. Comments on viscosity, crystal settling, andconvection in granitic magmas. Am. J. Sci. 263:120–152.
Shaw HR. 1969. Rheology of basalt in the melting range. J. Petrol. 10:51–535.
Shaw HR. 1972. Viscosities of magmatic silicate liquids: Anempirical method of prediction. Am. J. Sci. 272:870–893.
Shaw HR. 1974. Diffusion of H2O in granitic liquids. Part I,Experimental data: Part II, Mass transfer in magma cham-bers. In: Hofmann AW, Giletti BJ, Yoder HS, Jr, Yund RA,eds. Geochemical transport and kinetics. Carn. Inst. Wash.Publ. 634:139–170.
Shaw HR. 1980. The fracture mechanisms of magma trans-port from the mantle to the surface. In: Hargraves RB, ed.Physics of magmatic processes. Princeton, Princeton University:201–264.
Shaw HR, Moore JG. 1988. Magmatic heat and the El Niñocycle. EOS, Am. Geophys. Union Trans., 1553.
Shelly D. 1993. Igneous and metamorphic rocks under themicroscope. New York, Chapman and Hall.
Sheridan MF. 1979. Emplacement of pyroclastic flows: A review. Geol. Soc. Am. Spec. Pap. 180:125–136.
Sheridan MF, Updike RG. 1975. Sugarloaf mountain tephra—a Pleistocene rhyolitic deposit of base-surge origin innorthern Arizona. Geol. Soc. Am. Bull. 86:571–581.
Shirley DN. 1987. Differentiation and compaction in thePalisades sill, New Jersey. J. Petrol. 28:835–865.
Sigurdsson H, Carey S, Mandeville C, Bronto S. 1991. Pyroclastic flows of the 1883 Krakatau eruption. EOS,Trans. Am. Geophys. Union 72:377–381.
Silver LA, Ihinger PD, Stolper E. 1990. The influence ofbulk composition on the speciation of water in silicateglasses. Contr. Mineral. Petrol. 104:142–162.
Sinha AK, Hewitt DA, Rimstidt JD. 1986. Fluid interactionand element mobility in the development of ultramylonites.Geology 14:883–886.
Sinigoi S, Quick JE, Mayer A, Demarchi G. 1995. Density-controlled assimilation of underplated crust, Ivrea-Verbanozone, Italy. Earth Planet. Sci. Lett. 129:183–191.
Sisson TW, Bacon CR. 1999. Gas-driven filter pressing inmagmas. Geology 27:613–616.
Skjerlie KP, Johnson AD. 1993. Fluid-absent melting beha-vior of an F-rich tonalitic gneiss at mid-crustal pressures: Implications for the generation of anorogenic granites. J. Petrol. 34:785–815.
Slaughter J, Kerrick DM, Wall VJ. 1975. Experimental andthermodynamic study of equilibria in the system CaO–MgO–SiO2–H2O–CO2. Am. J. Sci. 275:143–162.
Smith AL, Carmichael ISE. 1969. Quaternary trachybasaltsfrom southeastern California. Am. Mineral. 54:909–923.
Smith CS. 1954. The shape of things. Sci. Am. 190:58–64.
Smith DC. 1984. Coesite in clinopyroxene in the Cale-donides and its implications for geodynamics. Nature310:641–644.
Smith DC, ed. 1988. Eclogites and eclogite facies rocks.New York, Elsevier.
Smith GA, Lowe DR. 1991. Lahars: Volcano-hydrologicevents and deposition in the debris flow-hyperconcentratedflow continuum. In: Fisher RV, Smith GA, ed. Sedimenta-tion in volcanic settings. SEPM (Society for SedimentaryGeology) Spec. Pub. 45:59–70.
Smith JV. 1997. Shear thickening dilatancy in crystal-richflows. J. Volc. Geotherm. Res. 79:1–8.
Smith RL. 1960. Zones and zonal variations in welded ashflows. US Geol. Surv. Prof. Pap. 354-F.
Smith RL. 1979. Ash-flow magmatism. Geol. Soc. Am.Spec. Pap. 180:5–27.
Smith RL, Bailey RA. 1968. Resurgent cauldrons. Geol. Soc.Am. Mem. 116:623–662.
Smith RP. 1987. Dyke emplacement at Spanish Peaks, Colorado. In: Halls HC, Fahrig WF, eds. Mafic dykeswarms. St John’s, Newfoundland: Geol. Assoc. CanadaSpecial Paper. 34:47–54.
Snoke AW, Tullis J, Todd VR. 1998. Fault-related rocks: Aphotographic atlas. Princeton, NJ, Princeton University Press.
References Cited 685
Snyder D, Crambes C, Tait S, Wiebe RA. 1997. Magmamingling in dikes and sills. J. Geol. 105:75–86.
Snyder D, Tait S. 1995. Replenishment of magma chambers:Comparison of fluid-mechanic experiments with field relations. Contr. Mineral. Petrol. 122:230–240.
Sobolev AV, Chaussidon M. 1996. H2O concentrations inprimary melts from supra-subduction zones and mid-oceanridges: Implications for H2O storage and recycling in themantle. Earth Planet. Sci. Lett. 137:45–55.
Sorby HC. 1853. On slaty cleavage, as exhibited in the Devonian limestones of Devonshire. Phil. Mag. 11:20–37.
Sorensen SS. 1988. Petrology of amphibolite-facies maficand ultramafic rocks from the Catalina Schist, southern Cal-ifornia: metasomatism and migmatization in a subductionzone metamorphic setting. J. Metam. Geol. 6:405–435.
Sparks RSJ, Barclay J, Jaupart C, Mader HM, Phillips JC.1994. Physical aspects of magma degassing I. Experimentaland theoretical constraints on vesiculation. In: Carroll MR,Holloway JR, eds. Volatiles in magmas: Rev. Mineral.30:413–445.
Sparks RSJ, Bursik MI, Carey SN, Gilbert JS, Glaze LS, Sigurdsson H, Woods AW. 1997. Volcanic plumes. NewYork, John Wiley & Sons.
Sparks RSJ, Huppert HE, Turner JS. 1984. The fluid dynamics of evolving magma chambers. Phil. Trans. R. Soc.London, A. 310:511–534.
Sparks RSJ, Sigurdsson H. 1977. Magma mixing: A mechanism for triggering acid explosive eruptions. Nature267:315–318.
Sparks RSJ, Tait SR, Yanev Y. 1999. Dense welding causedby volatile resorption. J. Geol. Soc. Lond. 156:217–225.
Spear FS. 1993. Metamorphic phase equilibria and pressure–temperature–time paths. Washington, DC, Mineral. Soc. Am.
Spera FJ. 1980. Aspects of magma transport. In: HargravesRB, ed. Physics of magmatic processes. Princeton, NJ,Princeton University:264–323.
Spooner ETC, Fyfe WS. 1973. Sub-sea-floor metamorphism,heat and mass transfer. Contr. Mineral. Petrol. 42:287–304.
Spray JG. 1998. Localized shock- and friction-induced melting in response to hypervelocity impact. In: Grady MM,Hutchison R, McCall GJH, Rothery DA, eds. Meteorites:Flux with time and impact effects. Geol Soc. Spec. Pub.140:195–204.
Springer W, Seck HA. 1997. Partial fusion of basic granulites at 5 to 15 kbar: implications for the origin ofTTG magmas. Contrib. Mineral. Petrol. 127:30–45.
Spry A. 1969. Metamorphic textures. New York, Pergamon.
St-Onge MR. 1987. Zoned poikiloblastic garnets: P–T pathsand syn-metamorphic uplift through 30 km of structuraldepth, Wopmay Orogen, Canada. J. Petrol. 28:1–21.
Stacey FD. 1992. Physics of the earth, 3rd ed. Brisbane,Brookfield.
Stallard A. 1998. Episodic porphyroblast growth in theFleur de Lys Supergroup, Newfoundland: Timing relative to the sequential development of multiple crenulation cleavages. J. Metam. Geol. 16:711–728.
Stearns HT. 1966. Geology of the state of Hawaii. PaloAlto, CA, Pacific Books.
Stern RA, Bleeker W. 1998, Age of the world’s oldest rocksrefined using Canada’s SHRIMP: The Acasta Gneiss Com-plex, Northwest Territories, Canada. Geosci. Can. 25:27–31.
Stern TW, Bateman PC, Morgan BA, Newell MF, Peck DL.1981. Isotopic U–Pb ages of zircon from the granitoids ofthe central Sierra Nevada: US Geol. Surv. Prof. Pap. 1185.
Stewart FH. 1942. Chemical data on a silica-poor argilla-ceous hornfels and its constituent minerals. Mineral. Mag.26:260–265.
Stimac JA, Wark DA. 1992. Plagioclase mantles on sanidinein silicic lavas, Clear Lake, California: Implications for theorigin of rapakivi texture. Geol. Soc. Am. Bull. 104:728–744.
Stöckhert B, Renner J. 1998. Rheology of crustal rocks at ultrahigh pressure. In Hacker BR, Liou JG, eds. When continents collide: Geodynamics and geochemistry of ultrahigh-pressure rocks. Boston, Kluwer Academic:57–95.
Stolper EM, Walker D. 1980. Melt density and the averagecomposition of basalt. Contr. Mineral. Petrol. 74:7–12.
Stolper EM, Walker D, Hager BH, Hays JF. 1981. Melt segregation from partially molten source region: The impor-tance of melt density and source region size. J. Geophys.Res. 86:6261–6271.
Stott GM. 1997. The Superior province, Canada. In: de WitM, Ashwal LD, eds. Greenstone belts. Oxford, ClarendonPress:480–501.
Sugioka I, Bursik M. 1995. Explosive fragmentation oferupting magma. Nature 373:689–692.
Sun S, McDonough WF. 1989. Chemical and isotopic systematics of oceanic basalts: Implications for mantle composition and processes. In: Saunders AD, Norry MJ,eds. Magmatism in the ocean basins. Boston, Blackwell Scientific:313–345.
Swamy V, Saxena SK, Sundman B, Zhang J. 1994. A ther-modynamic assessment of silica phase diagram. J. Geophys.Res. 99:11,787–11,794.
Swanson DA, Dzurisin D, Holcomb RT, Iwatsubo EY,Chadwick WW, Jr., Casadevall TJ, Ewert JW, Heliker CC.1987. Growth of the lava dome at Mount St Helens, Wash-ington, (USA), 1981–1983. In: Fink JH, ed. The emplace-ment of silicic domes and lava flows. Geol. Soc. Am. Spec.Paper 212:1–16.
Swanson SE. 1977. Relation of nucleation and crystal-growth rate to the development of granitic textures. Am.Mineral. 62:966–978.
Swanson SE, Fenn PM. 1986. Quartz crystallization in igneous rocks. Am. Mineral. 71:331–342.
Sylvester PJ. 1994. Archean granite plutons. In: Condie KC,ed. Archean crustal evolution. New York, Elsevier: 261–314.
Sylvester PJ, Harper GD, Byerly GR, Thurston PC. 1997.Volcanic aspects. In: De Wit MJ, Ashwal LD, eds. Greenstone belts. Oxford, Clarendon:55–90.
Symonds RB, Rose WI, Bluth GJS, Gerlach TM. 1994. Volcanic-gas studies: Methods, results, and applications. In: Carroll MR, Holloway JR, eds. Volatiles in Magmas, Rev. Mineral. 30:1–66.
686 Igneous and Metamorphic Petrology
Takagi H. 1992. Development of composite planar fabric inmylonites along the Median Tectonic Line, southwest Japan.The Island Arc, 1:92–102.
Takahashi E, Shimazaki T, Tsuzaki Y, Yoshida H. 1993.Melting study of a peridotite KLB-1 to 6.5 GPa, and theorigin of basaltic magmas. Phil. Trans. R. Soc. Lond. A,342:105–120.
Tatsumi Y, Eggins S. 1995. Subduction zone magmatism.Boston, Blackwell Science.
Taylor HP, Jr. 1974. The application of oxygen and hydro-gen isotope studies to problems of hydrothermal alterationand ore deposition. Econ. Geol. 69:843–883.
Taylor HP, Jr. 1980. The effects of assimilation of countryrocks by magmas on 18O/16O and 87Sr/86Sr systematics inigneous rocks. Earth Planet. Sci. Lett. 47:243–254.
Taylor HP, Jr., Sheppard SMF. 1986. Igneous rocks: I.Processes of isotopic fractionation and isotope systematics.In: Valley JW, Taylor HP, Jr, O’Neil JR, ed. Stable isotopesin high temperature geological processes. Rev. Mineral.16:227–271.
Taylor SR. 1982. Planetary science: A lunar perspective.Houston, TX: Lunar and Planet. Inst.
Taylor SR. 1987. Geochemical and petrological significanceof the Archean–Proterozoic boundary. In Pharaoh TC,Beckinsale RD, Rickard D, eds. Geochemistry and mineral-ization of Proterozoic volcanic suites. Geol. Soc. LondonSpec. Publi. 33:3–8.
Taylor SR, McLennan SM. 1985. The continental crust: Itscomposition and evolution. Boston, Blackwell Scientific.
Taylor SR, McLennan SM. 1995. The geochemical evolutionof the continental crust. Rev. Geophys. 33:241–265.
Thomas AV, Bray CJ, Spooner ETC. 1988. A discussion ofthe Jahns-Burnham proposal for the formation of zonedgranitic pegmatites using solid-liquid-vapour inclusionsfrom the Tanco pegmatite, S.E. Manitoba, Canada. Trans. R. Soc. Edin. Earth Sci. 79:299–315.
Thompson AB. 1971. P in low-grade metamorphism: Ze-olite, carbonate, clay mineral, prehnite relations in the systemCaO–Al2O3–CO2–H2O. Contr. Mineral. Petrol. 33:145–161.
Thompson AB. 1992. Water in the Earth’s upper mantle.Nature 358:295–301.
Thompson JB, Jr. 1957. The graphical analyses of mineralassemblages in pelitic schists. Am. J. Sci. 42:842–858.
Thompson JB, Jr. 1959. Local equilibrium in metasomaticprocesses. In: Abelson Ph, ed. Researches in geochemistry.Vol. 1. New York: John Wiley and Sons:427–457.
Thompson JB, Jr. 1970. Geochemical reaction and open systems. Geochim. Cosmochim. Acta 34:529–551.
Thompson JB, Jr. 1982. Composition space: An algebraicand geometric approach. In Ferry JM, ed. Characterizationof metamorphism through mineral equilibria. Rev. Mineral.10:1–31.
Thompson JB Jr., Robinson P, Clifford TN, Trask NJ, Jr.1968. Nappes and gneiss domes in west-central New Eng-land. In Zen E, White WS, Hadley JB, Thompson JB Jr,eds. Studies in Appalachian geology, Northern and Maritime. New York, Wiley Interscience:203–218.
CO2
Thomson SN, Stöckhert, Brix MR. 1998. Thermochrono-logy of high-pressure metamorphic rocks of Crete, Greece:Implications for the speed of tectonic processes. Geology26:259–262.
Thurston PC. 1994. Archean volcanic patterns. In: CondieKC, ed. Archean crustal evolution. New York, Elsevier:45–84.
Tikoff B, Teyssier C. 1989. Crustal-scale, en echelon, “P-shear” tensional bridges: a possible solution to thebatholith room problem. Geology 20:927–930.
Tilley CE. 1938. The status of hornblende in low grademetamorphic zones of green schists. Geol. Mag. 75:497–510.
Tilling RI. 1989. Volcanic hazards and their mitigation:Progress and problems. Rev. Geophys. 27:237–269.
Tingey DG, Christiansen EH, Best MG, Ruiz J, Lux DR.1991. Tertiary minette and melanephelinite dikes, WasatchPlateau, Utah: Records of mantle heterogeneities and chang-ing tectonics. J. Geophys. Res. 96:13,529–13,544.
Todd CS. 1990. Bleaching of limestones in the Notch Peakcontact-metamorphic aureole, Utah. Geology 18:83–86.
Tonks WB, Melosh HJ. 1993. Magma ocean formation dueto giant impacts. J. Geophys. Res. 98:5319–5333.
Touret JLR, Hartel THD. 1988. Synmetamorphic fluid inclusions in granulites. In: Vielzeuf D, Vidal P, eds. Granulites and crustal evolution. Boston, Kluwer Academic:397–418.
Tullis J. 1977. Preferred orientation of quartz produced byslip during plane strain. Tectonophysics 39:87–102.
Tullis J, Yund RA. 1982. Grain growth of quartz and calciteaggregates. J. Geol. 90:301–318.
Tullis J, Yund R, Farver J. 1996. Deformation enhancedfluid distribution in feldspar aggregates and implications forductile shear zones. Geology 24:63–66.
Turner DC, Bowden P. 1979. The Ningi-Burra complex,Nigeria: Dissected calderas and migrating magmatic centres.J. Geol. Soc. London 136:105–119.
Turner FJ. 1981. Metamorphic petrology. New York, McGraw-Hill.
Tuttle OF, Bowen NL. 1958. Origin of granite in the light of experimental studies in the system NaAlSi3O8-KAlSi3O8-SiO2-H2O. Geol. Soc. Am. Mem. 74.
Twiss RJ, Moores EM. 1992. Structural geology. New York,W.H. Freeman.
Van Decar JC, James DE, Assumpção M. 1995. Seismic evidence for a fossil mantle plume beneath South Americaand implications for plate driving forces. Nature 378:25–31.
van der Molen I, Paterson MS. 1979. Experimental defor-mation of partially melted granite. Contr. Mineral. Petrol.70:299–318.
Van der Plas L, Tobi AC. 1965. A chart for judging the reliability of point counting results. Am. J. Sci. 263:87–90.
Verhoogen J. 1980. Energetics of the earth. Washington,DC, National Acad.
Vernon RH. 1970. Comparative grain-boundary studies ofsome basic and ultrabasic granulites, nodules, and cumu-lates. Scot. J. Geol. 6:337–351.
References Cited 687
Vernon RH. 1976. Metamorphic processes. London, GeorgeAllen and Unwin.
Vernon RH. 1977. Relationships between microstructuresand metamorphic assemblages. Tectonophys. 39:439–452.
Vernon RH. 1986. K-feldspar megacrysts in granites—phenocrysts, not porphyroblasts. Earth Sci. Rev. 23:1–63.
Vernon RH. 1988. Porphyroblast-matrix microstructural relationships: Recent approaches and problems. In: Daly JS,Cliff RA, Yardley BWD, eds. Evolution of metamorphicbelts Geol. Soc. Lond. Spec. Pub. 43:83–102.
Vernon RH. 1998. Chemical and volume changes during deformation and prograde metamorphism of sediments. In:Treloar PJ, O’Brien PJ, eds. What drives metamorphismand metamorphic reactions. Geol. Soc. Lond. Spec. Publ.138:215–246.
Vernon RH. 2002. Introduction to rock microstructures.New York, Cambridge University Press.
Vielzeuf D, Clemens JD, Pin C, Moinet E. 1988. Granites,granulites, and crustal differentitation. In: Vielzeuf D, VidalP, eds. Granulites and crustal evolution. Boston, KluwerAcademic:59–86.
Viljoen MJ, Viljoen RP. 1969. The geology and geochemistryof the lower ultramafic unit of the Onverwacht group and aproposed new class of igneous rock. Geol. Soc. S. AfricaSpec. Publ. 255–85.
Wada H, Tomita T. 1994. Graphitization of carbonaceousmatter during metamorphism with references to carbonateand pelitic rocks of contact and regional metamorphisms,Japan. Contr. Mineral. Petrol. 118:217–228.
Wada Y. 1995. Reply [on the relationship between dike widthand magma viscosity]. J. Geophys. Res. 100:15,543–15,544.
Wager LR. 1959. Differing powers of crystal nucleation as afactor producing diversity in layered igneous intrusions.Mineral. Mag. 96:75–80.
Wager LR, Deer WA. 1939. Geological investigations inEast Greenland, Part III, The petrology of the Skaergaardintrusion, Kangerlugssuaq, East Greenland. Meddelelser omGrønland. 105:1–346.
Walker GPL. 1992. Morphometric study of pillow-sizespectrum among pillow lavas. Bull. Volc. 54:459–474.
Walker GPL. 1993. Basaltic-volcano systems. In: PrichardHM, Alabaster T, Harris NBW, Neary CR, eds. Magmaticprocesses and plate tectonics. Geol. Soc. Lond. Spec. Pub.76:3–39.
Wallace ME, Green DH. 1988. An experimental determina-tion of primary carbonatite magma composition. Nature335:343–346.
Wallace PJ, Anderson AT, Jr., Davis AM. 1995. Quantificationof pre-eruptive exsolved gas contents in silicic magmas. Nature 377:612–614.
Walther JV, Holdaway MJ, Ague JJ. 1995. Mass transferduring Barrovian metamorphism: Comment and reply. Am.J. Sci. 295:1020–1033.
Walther JV, Orville PM. 1982. Volatile production andtransport in regional metamorphism. Contr. Mineral. Petrol.79:252–257.
Walther JV, Wood BJ. 1984. Rate and mechanism in pro-grade metamorphism. Contr. Mineral. Petrol. 88:246–259.
Wang X, Zhang R, Liou JG. 1995. UHPM terrane in eastcentral China. In: Coleman RG, Wang X, eds. Ultrahighpressure metamorphism, New York, Cambridge University:356–390.
Wark DA, Stimac JA. 1992. Origin of mantled (rapakivi)feldspars: Experimental evidence on dissolution- and diffusion-controlled mechanism. Contr. Mineral. Petrol.111:345–361.
Warren RG, Ellis DJ. 1996. Mantle underplating, granitetectonics, and metamorphic P–T–t paths. Geology24:663–666.
Warshaw CM, Smith RL. 1988. Pyroxenes and fayalites inthe Bandelier Tuff, New Mexico: Temperatures and com-parisons with other rhyolites. Am. Mineral. 73:1025–1037.
Watson EB. 1994. Diffusion in volatile-bearing magmas. In:Carroll MR, Holloway JR, eds. Volatiles in magmas. Rev.Mineral. 30:371–411.
Watson EB, Brenan JM, Baker DR. 1990. Distribution offluids in the continental mantle. In: Menzies MA, ed. Continental mantle. Oxford, Clarendon Press:111–125.
Watson S. 1993. Rare earth element inversions and percola-tion models for Hawaii. J. Petrol. 34:763–783.
Watson S, McKenzie D. 1991. Melt generation by plumes:A study of Hawaiian volcanism. J. Petrol. 32:501–537.
Weathers MS, Bird JM, Cooper RF, Kohlstedt DL. 1979.Differential stress determined from deformation-inducedmicrostructures of the Moine thrust zone. J. Geophys. Res.84:7495–7509.
Weaver CE and associates. 1984. Shale-slate metamorphismin southern Appalachians. New York, Elsevier.
Webb SL, Dingwell DB. 1990. Non-Newtonian rheology ofigneous melts at high stresses and strain rates: Experimentalresults for rhyolite, andesite, basalt, and nephelinite. J. Geophys. Res. 95:15,695–15,701.
Weeks WF. 1956. Heats of formation of metamorphic minerals in the system CaO–MgO–SiO2–H2O and theirpetrological significances. J. Geol. 64:456–468.
Weill DF, Hon R, Navrotsky A. 1980. The igneous systemCaMgSi2O6-CaAl2Si2O8-NaAlSi3O8: variations on a classictheme by Bowen. In: Hargraves RB, ed. Physics of mag-matic processes. Princeton, NJ, Princeton UniversityPress:49–92.
Weiss LE. 1972. Minor structures of deformed rocks. New York, Springer-Verlag.
Wendlandt RF. 1991. Oxygen diffusion in basalt and andesite melts: Experimental results and discussion ofchemical versus tracer diffusion. Contr. Mineral. Petrol.108:463–471.
Wentworth CK, Macdonald GA. 1953. Structures and formsof basaltic rocks in Hawaii. U.S. Geol. Surv. Bull. 994.
White RS. 1993. Melt production rates in mantle plumes.Phil. Trans. R. Soc. London A 342:137–153.
White RS, McKenzie D. 1995. Mantle plumes and floodbasalts. J. Geophys. Res. 100:17,543–17,585.
688 Igneous and Metamorphic Petrology
Whitham AG, Sparks RSJ. 1986. Pumice. Bull. Volc.48:209–223.
Whitney JA. 1988. The origin of granite: The role andsource of water in the evolution of granitic magmas. Geol.Soc. Am. Bull. 100:1886–1897.
Wickham SM, Oxburgh ER. 1985. Continental rifts as a setting for regional metamorphism. Nature 318:330–333.
Wiebe RA. 1996. Mafic–silicic layered intrusions: The roleof basaltic injections on magmatic processes and the evolu-tion of silicic magma chambers. Trans. Roy. Soc. Edinb.Earth Sci. 87:233–242.
Wilkins C. 1997. Regional and contact metamorphism. In:de Wit M, Ashwal LD, eds. Greenstone belts. Oxford,Clarendon Press:126–163.
Wilkinson JFG. 1965. Some feldspars, nephelines, and analcimes from the Square Top intrusion, Nundle, NSW. J.Petrol. 6:420–444.
Wilkinson JFG, Whetten JT. 1964. Some analcime-bearingpyroclastic and sedimentary rocks from New South Wales. J. Sed. Petrol. 34:543–553.
Williams H. 1932. The history and character of volcanicdomes. Univ. California Publ. Geol. Sci. Bull. 21:51–146.
Williams H. 1932. Geology of Lassen Volcanic NationalPark, California. Univ. California Publ. Geol. Sci. Bull.21:195–385.
Williams H. 1941. Calderas and their origin. Univ. Calif.Pub. Geol. Sci. Bull. 25:239–346.
Williams H, McBirney AR. 1979. Volcanology. San Fran-sisco, Freeman Cooper.
Williams H, Turner FJ, Gilbert CM. 1982. Petrography: Anintroduction to the study of rocks in thin section. NewYork, W.H. Freeman.
Williams ML, Jercinovic MJ, Terry MP. 1999. Age mappingand dating of monazite on the electron microprobe: Decon-voluting multistage tectonic histories. Geol. 27:1023–1026.
Williams ML, Melis EA, Kopf CF, Hanmer S. 2000. Mi-crostructural tectonometamorphic processes and the devel-opment of gneissic layering: A mechanism for metamorphicsegregation. J. Metam. Geol. 18:41–57.
Williams PF. 1990. Differentiated layering in metamorphicrocks. Earth Sci. Rev. 29:267–281.
Williams PF, Jiang D. 1999. Rotating garnets. J. Metam.Geol. 17:367–378.
Wilshire HG, Meyer CE, Nakata JK, Calk LC, Shervais JW,Nielson JE, Schwarzman EC. 1988. Mafic and ultramaficxenoliths from volcanic rocks of the western United States.US Geol. Surv. Prof. Pap. 1443.
Wilson CJN, Hildreth W. 1997. The Bishop tuff: New insights from eruptive stratigraphy. J. Geol. 105:407–439.
Wilson DJ. 1991. Geology and geochemistry of the GoldenButte sediment-hosted Au deposit, east-central Nevada. Unpublished MS thesis, Brigham Young University, Provo,UT.
Wilson JT. 1963. Hypothesis of earth’s behavior. Nature198:925–929.
Wilson L, Sparks RSJ, Walker GPL. 1980. Explosive vol-canic eruptions—IV. The control of magma properties andconduit geometry on eruption column behavior. Geophys. J. R. Astron. Soc. 63:117–148.
Wilson M. Igneous petrogenesis: 1989. A global tectonic approach. Boston, Unwin Hyman.
Windley BF. 1995. The evolving continents. New York,John Wiley and Sons.
Winter JD. 2001. An introduction to igneous and metamor-phic petrology. Upper Saddle River, NJ, Prentice Hall.
Wintsch RP. 1975. Solid-fluid equilibria in the systemKAlSi3O8-NaAlSi3O8-Al2SiO5-SiO2-H2O-HCl. J. Petrol.16:57–79.
Wohletz KH. 1986. Explosive magma–water interactions:Thermodynamics, explosive mechanisms, and field studies.Bull. Volc. 48:245–264.
Wones DR, Eugster HP. 1965. Stability of biotite: Experi-ment, theory, and application. Am. Mineral. 50:1228–1272.
Woodhead J. 1989. Geochemistry of the Mariana arc (west-ern Pacific): Source composition and processes. Chem.Geol. 76:1–24.
Woolsey TS, McCallum ME, Schumm SA. 1975. Modelingof diatreme emplacement by fluidization. Phys. Chem.Earth 9:29–42.
Worster MG, Huppert HE, Sparks RSJ. 1990. Convectionand crystallization in magma cooled from above. EarthPlanet. Sci. Lett. 101:78–89.
Wright TL, Okamura RT. 1977. Cooling and crystallizationof tholeiitic basalt: Makaopuhi lava lake, Hawaii. US Geol.Surv. Prof. Pap. 1004.
Xue S, Morse SA. 1993. Geochemistry of the Nain massifanorthosite, Labrador: Magma diversity in five intrusions.Geochim. Cosmochim. Acta. 57:3925–3948.
Yagi K. 1953. Petrochemical studies of the alkalic rocks ofthe Morotu district, Sakhalin. Geol. Soc. Am. Bull.64:769–810.
Yardley BWD. 1981. Effect of cooling on the water contentand mechanical behavior of metamorphosed rocks. Geology9:405–408.
Yardley BWD. 1989. An introduction to metamorphicpetrology. New York, John Wiley and Sons.
Yardley BWD. 1997. The evolution of fluids through themetamorphic cycle. In: Jamtveit B, Yardley BWD, eds.Fluid flow and transport in rocks: Mechanisms and effects.New York, Chapman and Hall:99–121.
Yardley BWD, Mackenzie WS, Guilford C. 1990. Atlas ofmetamorphic rocks and their textures. New York, John Wiley and Sons.
Yoder HS, Jr. 1976. Generation of basaltic magma. Washington, DC, National Academy of Sciences.
Yoder HS, Jr, Stewart DB, Smith JV. 1957. Ternaryfeldspars. Ann. Rep. Dir. Geophys. Lab. Carn. Inst. Wash.Yrbk 56:206–214.
Yoder HS Jr, Tilley CE. 1962. Origin of basalt magmas: Anexperimental study of natural and synthetic rock systems. J. Petrol. 3:342–532.
References Cited 689
Yokoyama K, Brothers RN, Black PM. 1986. Regionaleclogite facies in the high-pressure metamorphic belt ofNew Caledonia. In: Evans BW, Brown EH, eds. Blueschistsand eclogites. Geol. Soc. Am. Mem. 164:407–423.
Young DA. 1998. N. L. Bowen and crystallization-differentiation: the evolution of a theory. Min. Soc. Amer.Pub. 4.
Zeitler PK, Meltzer AS, Koons PO, Craw D, Hallet B,Chamberlain CP, Kidd WSF, Park SK, Seeber L, Bishop M,Shroder J. 2001. Erosion, Himalayan geodynamics, and thegeomorphology of metamorphism. GSA Today, January, 4–9.
Zen E. 1988. Phase relations of peraluminous granitic rocksand their petrogenetic implications. Ann. Rev. Earth Planet.Sci. 16:21–51.
Zhang RY, Liou JG, Ernst WG, Coleman RG, Sobolev NV,Shatsky VS. 1997. Metamorphic evolution of diamond-bearing and associated rocks from the Kokchetav Massif,northern Kazakhstan. J. Metam. Geol. 15:479–496.
Zhang Y. 1998. The young age of Earth. Geochim. Cosmochim. Acta. 62:3185–3189.
Zhang Y, Walker D, Lesher CE. 1989. Diffusive crystal dissolution. Contr. Mineral. Petrol. 102:492–513.
690 Igneous and Metamorphic Petrology
Aa A thick basaltic to andesitic lava flow covered by an autoclastic mantle of sharp broken vesicular pieces (generally�1 m across) of the crusted surface; treacherous to walk over.
A-type Volcanic and plutonic felsic rocks that containabundant alkali feldspar and have other distinct geochemicalattributes (Section 13.9.1) that set them apart from arc mag-matic rocks; occur in anorogenic regions.
Absarokite Very high-K basalt. See Figure 2.18.
Abyssal peridotite Variably hydrated mantle peridotite exposed on seafloor; has a high-T tectonite fabric and is variably depleted in basaltic components.
Accessory minerals Minerals, such as zircon, apatite, andmagnetite, that occur in small modal proportions of no morethan a few percent and do not influence the naming of a rock.
Accidental clast A fragment of older rock unrelated tomagmatic rock that contains it; also called xenolith if rock orxenocryst if a crystal fragment.
Accreted Attached or fixed to; may refer to terranes ofoceanic rock tectonically attached to the overriding plate insubduction zones as an accretionary prism or wedge.
Accretionary lapilli Concentrically layered, usually pea-sized and -shaped object in pyroclastic deposits; formed inturbulent ash-and-steam clouds produced by explosive vol-canic eruptions where fine moist ash adheres to some sort ofnuclei.
Accretionary prism (wedge) In subduction zones, a linear,trench-facing mass of rocks scraped off the descendingoceanic plate (ophiolite) and tectonically mingled as mélangewith immature sedimentary deposits (mostly graywacke) de-rived from the adjacent volcanic arc. Metamorphism is of thehigh P/T facies series (two or more of the zeolite, prehnite-pumpellyite, blueschist, and eclogite facies).
Accuracy An indication of how close a measurement is tothe “true” value.
ACF, AFM, AKF diagrams See Composition diagram.
Acid rock Contains �66 wt.% silica.
Activation energy The impeding energy barrier between ametastable and a stable state.
Activity Effective thermodynamic concentration or availab-ility of a component in a real liquid or solid solution.
Adakite Subduction-related andesite-dacite rock type thatcontains relatively high La/Yb ratios; magma is believed tobe generated by partial melting of the hydrated basalticoceanic crust under high P where garnet is a residual phase.
Adiabatic system An isolated system in which no heat is exchanged with its surroundings.
Advection One of four types of heat transfer; involves flowof a liquid, either melt or volatile fluid, through openings ina rock whose T is different from the liquid.
Aerosol Micron-sized droplets of a compound, such as sul-furic acid, dispersed in the atmosphere by a volcanic eruption.
AFC Assimilation and Fractional Crystallization actingconcurrently in a magma system.
Agglutinate Rock produced by welding of molten basalticpyroclasts (“spatter”) deposited at the base of a lava fountain.
Alkaline basalt Basalt rock type containing normativenepheline.
Alkaline rocks Rock suite that has a relative excess of alka-lies over silica; rock types are usually silica undersaturated.
Alpine peridotite Variably serpentinized and usually de-formed peridotite in mountain belts that is a dismemberedsegment of ophiolite.
Alteration Change in composition of a rock or individualmineral, usually involving replacement by a secondary mineralor minerals; generally of a more local nature than metamor-phism or pertaining to changes related to fracture-localizedhydrothermal solutions.
Alumina saturation index Molecular ratio Al2O3/(K2O �Na2O � CaO).
Ambient fluid The small amount of volatile fluid present ina rock under equilibrium conditions where no mineral reac-tions are occurring. Can be stored in minute pools at graincorners, possibly in grain-edge tubes, and in fluid inclusions.
Amphibolite Phaneritic, more or less isotropic metabasitethat consists of essential plagioclase and hornblende and possible accessory almandine-rich garnet, pyroxene, biotite,titanite, Fe–Ti oxides, and quartz.
Amygdule Vesicle filled with low-T secondary minerals—especially calcite, quartz, and chalcedony—that precipitatefrom fluid solutions percolating through the rock. Corres-ponding texture is amygdaloidal.Anatexis Partial melting of rock.
Andesite Glassy or aphanitic rock made essentially of pla-gioclase, Fe–Ti oxides and some combination of pyroxene,hornblende, and perhaps biotite or olivine; contains 57–63wt.% silica and less than about 7 wt.% total alkalies. See Figures 2.12 and 2.13.
Anhedral (xenomorphic) Irregularly shaped compactgrains not bounded by any characteristic crystal faces.
Anisotropic fabric Directional fabric that looks differentand has different properties in different directions. Mostcommonly a planar foliation.
Ankaramite Basaltic rock that contains abundant pheno-crysts of pyroxene and olivine, usually by accumulation; maybe ultramafic.
Annealing In tectonites, recrystallization and recoverycontinuing at high T after deformation has ceased; producesgranoblastic texture.
Anorthosite Rock containing �90% plagioclase; typicalmafic minerals are Fe–Ti oxides, pyroxene and/or olivine.Occurs as layers in differentiated basaltic intrusions, as largeplutons (massifs) of the anorthosite suite that include comag-matic gabbro, norite, and troctolite and their leucocratic
GLOSSARY
varieties as well as minor rocks that contain abundant Fe–Tioxides, and as megacrystic sheetlike bodies of Archean age.
Aphanitic Texture that consists of a mosaic of crystals toosmall to be seen without magnification; may be cryptocrys-talline or microcrystalline.
Aphyric Nonporphyritic aphanitic texture.
Aplite Variety of leucocratic granite in which texture isaplitic; typically occurs in thin dikes within a coarser grained,somewhat more mafic granitic pluton; also in layers withpegmatite.
Aplitic Fine-grained phaneritic, equigranular texture inwhich virtually all, usually felsic, grains are equant and anhedral to subhedral. Typically “sugary” in appearance.
Apophysis An offshoot, or branching, intrusion from anunderlying larger pluton.
Apparent viscosity See Viscosity.
Appinite Phaneritic hornblende-rich rock that containssubordinate feldspar; usually associated with granitoids.
Arc magmatism Typically calc–alkaline produced whereoceanic lithosphere subducts beneath overlying oceanic litho-sphere in island arcs and beneath continental margins in con-tinental arcs.
Arc signature Characteristic primitive mantle- or chondrite-normalized trace element pattern of arc magmatic rocks thatis “spikey,” unlike the smoothly varying pattern of mid-oceanridge basalt; LIL elements are enriched relative to REE andHFS elements.
Armoured relics Unreacted mineral grain inclusions inpoikiloblasts.
Ash Volcaniclasts �2 mm; equivalent to sand, silt, and claysize for sedimentary fragments.
Ash flow A type of pyroclastic flow dominated by ash-sizeparticles but commonly containing lesser lapilli and localblocks; formed by a collapsing volcanic column.
Ash-flow tuff (ignimbrite) Rock formed from an ash flow.
Aspect ratio Ratio of thickness to length (diameter) of arock body, such as an extrusion or intrusion of magma. Alsorefers to a mineral grain and to a xenolith in a magmatic rock.
Assimilation Physical incorporation and chemical dissolutionof foreign material into a melt, modifying its composition; themagma or resulting rock is contaminated or hybrid.
Augen (singular is auge) Refers to ovoidal or eye-shapedcrystals, typically of feldspar, in a finer, foliated matrix of a metamorphic rock and to the texture made of them, re-gardless of origin. Compare with genetic terms flaser andporphyroclastic.
Aureole, contact metamorphic Thermally metamorphosedrocks (hornfelses) surrounding a magmatic intrusion. Carbonate country rocks are commonly metasomatized intoskarn.
Autoclast Usually block-size rock fragments formed on themargins of lava flows by breakup of the rigid crust.
Autolith A cognate inclusion that is genetically related tothe host magmatic rock.
Autometamorphism (deuteric alteration) Variable sub-solidus recrystallization at declining T in a cooling magmatic
body as primary minerals partially re-equilibrate with any remaining magmatic water into lower-T hydrous minerals.
Ballistic clast Block or bomb ejected explosively from avolcanic vent; follows a trajectory like a cannon shell.
Ballooning Radially directed inflation of a magma chamberagainst its country rocks as additional magma is forcefully intruded.
Banakite Very high-K andesite. See Figure 2.18.
Banded iron formation Thinly bedded, metamorphic, usually Precambrian rocks composed chiefly of quartz with subordinate hematite, magnetite, greenalite(Fe,Mg)3Si2O5(OH)4, minnesotaite Fe3Si4O10(OH)2, stilp-nomelane, riebeckite, Fe-chlorite, siderite, and ankerite.
Barometer, mineral A mineral or assemblage of stably co-existing minerals whose chemical composition is a sensitivefunction of the P of crystallization.
Barrovian metamorphic zones Result of intermediate-P re-gional metamorphism defined by chlorite, biotite, garnet,staurolite, kyanite, and sillimanite isograds. See Metamorphiczones.
Basalt Glassy or aphanitic rock made mostly of plagioclase,pyroxene, and Fe–Ti oxides with or without olivine; contains45–52 wt.% silica and less than 5 wt.% total alkalies. SeeFigure 2.12.
Basaltic andesite Glassy or aphanitic mafic rock that con-tains 52–57 wt. % silica and less than about 5 wt. % total alkalies. See Figure 2.12.
Basanite Silica-poor, alkali-rich basaltic rock. See Figure 2.12.
Base surge See pyroclastic surge.
Basic rock Contains 45–52 wt.% silica.
Batholith A terrane of several separately intruded magmas;exposed over hundreds to tens of thousands of km2.
Bedding sag Caused by impacting ballistic clasts depress-ing underlying soft, fine-grained, volcaniclastic layers.
Bending Occurs in a strained crystal lattice at the marginsof a kink band or in a more distributed fashion throughoutan entire crystal; probably depends on the existence of stack-ing imperfections or crystal defects.
Benmoreite Sodic trachyandesite. See Figure 2.12.
Bimodal Refers to two distinct grain-size populations inrocks and to closely associated basaltic and rhyolitic rocks insome petrotectonic associations; population essentially lacksintermediate members.
Binary Two components.
Block Angular volcaniclast �64 mm equivalent to cobbleand boulder size for sedimentary fragments.
Block-and-ash flow Small volume pyroclastic flow avalanchesthat are produced by disintegrative collapse of growing an-desitic to rhyolitic domes or thick flows that are positioned atsummits or on steep flanks of composite volcanoes.
Block lava flow Resembles aa but is covered by more regularlyshaped polyhedral autoclasts; can be as silicic as rhyolite.
Boiling See Exsolution.
Bomb Streamlined pyroclast �64 mm; equivalent to cobbleand boulder size for sedimentary fragments.
692 Igneous and Metamorphic Petrology
Boninite Basaltic andesitic or andesite in island arcs thathas MgO �8 wt.% and TiO2 <0.5 wt.%; contains abundantmagnesian pyroxenes usually in a glassy matrix.
Boudin In metamorphic terranes, one of a series of sausage-shaped rock bodies enclosed in more ductile, deformed matrix. Formed by boudinage as a brittle layer was stretchedand broken between ductilely extending surroundings.
Boundary layer, compositional A layer that has a strongcompositional variation (gradient) between two regions ofmore uniform composition; occurs, for example, between agrowing crystal and an enclosing melt that has slow rates ofchemical diffusion.
Boundary layer, thermal A layer, such as the lithosphere, in which there is a strong variation in T (steep geotherm) between two regions, the cool hydrosphere and hot sub-lithospheric mantle, of more uniform but contrasting T.
Boundary line, equilibrium Locus of values of intensivevariables in a phase diagram where phases in adjacent stabilityfields coexist stably together.
Breakdown See Decomposition.
Breccia pipe An intrusive magmatic pipe that containsabundant rock fragments, usually wallrock xenoliths.
Brecciated Refers to a fabric made of broken rock or mineralfragments.
Bridging oxygen In a melt, an O ion that is bonded with anetwork-forming Si or Al cation in a polymer.
Brittle behavior Response of rock subjected to high strainrates where P and T are low; characterized by elastic-likefracturing, breaking apart, and loss of cohesion when the applied stress reaches the elastic strength. Highly crystallinemagmas can also fracture in a brittle manner under highstrain rates.
Brittle strength Essentially the elastic strength, or stressdifference required to produce a fracture in a body.
Buchan metamorphic zones Result of low-P regional meta-morphism defined by cordierite- and andalusite-bearing min-eral assemblages. See Metamorphic zones.
Buffer reaction The activity or fugacity of a component is maintained or fixed during the course of a chemical ormineral reaction provided all of the participating phases inthe reaction coexist at equilibrium in a system.
Bulk silicate Earth Nd and Sr isotopic ratios in a chondriticEarth minus an adjustment for the segregated metallic core.
Bulk chemical composition Whole-rock chemical composition.
Bulk partition coefficient For a particular element in a rockis the sum of the partition coefficient for each mineral multi-plied by its weight fraction.
Buoyancy Gravity-related force acting on a body whosedensity differs from its immediate surroundings. Negativebuoyancy is a downward force on a body more dense than itssurrounding. Positive buoyancy is the opposite. Neutralbuoyancy prevails where there is no net force on a bodywhose density is the same as its surroundings.
Burial metamorphism Low-grade, regionally extensivemetamorphism resulting from deep burial and increasing P
and T but without accompanying deformation. Relict fabricsof sedimentary and volcanic protoliths are commonly pre-served. Grades into diagenesis at lower P and T at shallowerdepths.
Calc–alkaline rocks (trend) Subalkaline rocks that have relative enrichment in silica and alkalies and little enrichmentin Fe. See Figures 2.17 and 2.18.
Calcareous A compositional class of metamorphic rocksthat is composed mostly of calcite and dolomite and possibleaccessory quartz and Ca–Mg silicates such as tremolite, diop-side, and fosterite; derived from more or less pure limestoneand dolostone protoliths.
Calc–silicate A compositional class of metamorphic rocksthat is composed of combinations of two or more of quartz,carbonate minerals, and Ca-rich silicates such as wollastoniteand grossular; derived from impure limestone and dolostoneprotoliths that contained substantial amounts of clay and/orquartz or from more pure carbonate rocks metasomatized incontact metamorphic aureoles (skarn).
Caldera (cauldron) A more or less circular or ellipticaltopographic depression created by collapse of roof rock intoan underlying partially voided magma chamber.
Carbonatite A magmatic rock composed mostly of carbon-ate minerals.
Cataclasis Closely spaced brittle fracturing, crushing, fric-tional sliding and rotation of broken fragments past one another; produces a dilated cataclastic fabric in which in-duced voids have increased the rock volume.
Cauldron Alternate term for caldera.
Central eruption Magma vented from a subvertical pipe-like feeding conduit; builds a conical volcano. Contrast Fissure eruption.
Central magma intrusion Usually upright, bottle-shaped orcylindrical intrusion from which smaller sheet intrusions orapophyses may emanate.
Charnockitic rocks A group of usually dark-colored pyroxene-bearing granitoids of magmatic or metamorphicorigin that contain perthitic alkali feldspar, plagioclase, quartz,orthopyroxene, and possible clinopyroxene and garnet; haveaffinities with A-type granitic rocks. Greasy luster is com-mon. Includes charnockite (pyroxene granite), mangerite(pyroxene monzonite), jotunite (pyroxene monzodiorite),opdalite (pyroxene granodiorite), and enderbite (pyroxenetonalite).
Chemographic diagram See Composition diagram.
Chondrite A type of meteorite believed to have accreted to form the inner planets in the solar system, including Earth;used as a reference standard to compare trace element concentrations.
Chondrite-normalized trace element diagram The concen-tration ratio of a trace element in a rock to that in chondriteplotted on the logarithmic y-axis and ordered along the x-axisaccording to decreasing incompatibility.
Cinder (scoria) cone Deposit made of basaltic lapilli andlesser blocks deposited around a Strombolian eruption vent.
Cinders Lapilli-size scoria that are solid upon reaching theground after discharge from a volcanic vent.
Glossary 693
Clan A suite of rocks that are related in some way.
Clapeyron equation dP/dT � �S/�V. On a P–T diagram,gives the slope of a boundary line separating stability fields ofany two phases, or two assemblages of phases, of identicalcomposition in a closed system.
Cleavage For various types in aphanitic metamorphic rockssee Slaty cleavage.
Closed system Energy and heat can flow across the systemboundary but not matter.
Closure temperature T at which diffusion effectivelyceases, closing (or annealing in the case of fission tracks) themineral grain; in a datable isotopic system the determined ageis the time since closure when the “clock began ticking.”
Coaxial Refers to a progressive deformation in which suc-cessive increments of strain and the total final strain are geometrically similar.
Cognate inclusion (autolith) Piece of rock that is gen-etically related to the contrasting host rock in which it is embedded.
Cogenetic Of the same origin.
Coignimbrite plume A secondary volcanic plume that isproduced as fine ash is flushed out of an active pyroclasticflow by buoyantly rising gas.
Collapsing column A type of volcanic plume that resemblesa water fountain. Created by eruption from large vents ofvolatile-poor magma whose discharge rate is so great that thepyroclastic mass cannot be lifted buoyantly (as in plinianplumes) and consequently the eruptive column collapses underits own weight. The resulting runout produces pyroclasticflows.
Collision Refers to the convergence of two continentalplates that creates an orogen, or orogenic (mountain) belt.
Columnar joints Joints that form five-, six-, or seven-sidedcolumns of rock. Usually oriented approximately perpend-icular to the isothermal margins of tabular magma intrusions(dikes and sills) or extrusive deposits and formed by shrinkageduring cooling.
Comagmatic Kindred magmas having a common origin andusually related through differentiation processes.
Comb layering Layered fabric in magmatic rocks expressedby long, branching, skeletal to feathery, subparallel crystalsthat are oriented perpendicular to a planar boundary.Comendite A peralkaline rock in which Al2O3 �1.33 FeO� 4.4 (wt.%).Compaction foliation Flattened pumice lumps and vitro-clasts produced by the weight of the overlying ignimbrite deposit. See Eutaxitic fabric.Compatible element Preferentially included within a crystalline phase relative to the coexisting melt; partitioncoefficient �1.Compatibility diagram See Composition diagram.Components The smallest number of chemical entities required to describe the composition of every phase that exists in a system at equilibrium.Composite intrusion Has distinguishable parts of differentcomposition and/or fabric reflecting emplacement of two ormore contrasting magmas.
Composite (strato) volcano Built mostly of andesitic anddacitic magmas extruded from a central vent; consists of innumerable alternating tongues of lava and volcaniclasticdeposits, especially lahars.
Composition (compatibility) diagram Represents relationsbetween stable, compatible mineral assemblages under re-stricted P–T conditions and the bulk chemical compositionof the metamorphic rocks in which they occur. Three types ofthese usually triangular diagrams are in common use: ACF diagram for metabasites and metamorphosed shaly lime-stones and dolostones; end-member components are essentiallyAl2O3, CaO, and (FeO � MgO). AFM diagram for peliticrocks is a projection onto a triangular face of a tetrahedronwhose four end-member components are essentially Al2O3,FeO, MgO, and K2O; depending on metamorphic grade,projection is from muscovite or K-feldspar. AKF diagramuseful for representation of potassic minerals, such as micasand alkali feldspars, in metamorphosed pelitic rocks; com-ponents are Al2O3, K2O, and (FeO � MgO).
Compositional layering Planar contrasts in mineral ormodal composition in a rock body.
Compositional zoning Refers to systematic variation inchemical composition of a solid-solution mineral grain, amagmatic intrusion, or a pyroclastic deposit.
Compression A state of stress that results in material beingsqueezed together.
Conduction (heat diffusion) One of four types of heattransfer; accomplished by atomic motion in a static body.
Cone sheet A sheet intrusion formed where magma invadesa conical fracture system whose apex lies near the top of anunderlying central intrusion.
Confining pressure Caused by weight of overlying material(rock or water); denoted by P.
Constant volume replacement Occurs in an isolated min-eral grain or in a rock during metasomatism where the formand the size of the original grain(s) is (are) preserved.
Contact metamorphism Develops in a aureole of countryrock surrounding a magmatic intrusion. Essentially thermalmetamorphism produces hornfelses whereas mineral reac-tions with advecting expelled magmatic fluids and/or heatedground water in open rock systems causes hydrothermalmetamorphism and produces metasomatic skarn.
Contamination See Assimilation.
Continental arc Arc magmatism along a continental marginabove subducting oceanic lithosphere.
Continuous (divariant) reaction The most common type ofsolid-state metamorphic reaction involving crystalline solidsolutions. Reactions are of two types—exchange and nettransfer—and create continuous changes in chemical com-position of solid solutions over a range of changing meta-morphic conditions, usually in a divariant P–T stability field. InAFM and other diagrams, the continuous changes in mineralcomposition are manifest by continuous variation in tie-lineorientations. In metamorphic terranes, a continuous reactioncreates mineralogical changes over a broad geographic bandrather than at an abrupt isograd as created by a discontinuousreaction.
694 Igneous and Metamorphic Petrology
Continuous reaction relation As intensive variables changein a magma, reaction via ionic diffusion between a crystallinesolid solution and surrounding melt yields a solid solutionand melt of a slightly different composition. Such continuousincremental changes occur between plagioclase solid solu-tions and melt.
Continuous reaction series The crystalline products of aseries of incomplete continuous reaction relations duringfractional crystallization, such as a compositionally zonedplagioclase grain or compositionally variable plagioclases in amagma body.
Control line In a variation diagram for a suite of magmaticrocks, a line that shows the expected compositional changesresulting from fractionation of a phase or phases, mixing oftwo magmas, assimilation of some contaminant into a magma,or a combination of these differentiation processes.
Convection One of four types of heat transfer that is accomplished by movement of different parts of a body atdifferent T due to differences in their density.
Convective melt fractionation Segregation of buoyantresidual melt from partially crystallized magma, such as during sidewall crystallization.
Cooling unit A pyroclastic flow deposit that cooled as a single thermal entity with a unified history of compaction andwelding. This simple cooling unit may be made up of two ormore flows deposited rapidly enough so that there are no dis-continuities in a normal compaction/welding profile betweenthem. A compound cooling unit consists of a succession offlows emplaced closely in time so that only partial coolingbreaks occur between them.
Corona An anhedral mineral grain surrounded by a rim of other mineral grains produced by incomplete solid-statereaction between the unstable core and neighboring phases.
Cotectic P–T–X conditions under which two or more crys-tals are in equilibrium with a melt. In a phase diagram is theline on the liquidus surface corresponding to this equilibrium.
Country rock Rock surrounding a magmatic intrusion; alsocalled roof, floor, and wallrock as appropriate.
Crack–seal A common means of creating veins where rockcracks open by hydraulic fracturing, the responsible fluid fillsthe crack, and minerals precipitate from the fluid to seal itshut. Repetitions of the process can create thick veins.
Craton The long-term tectonically stable interior core of acontinent made predominantly of Precambrian rocks. Shieldand block are loosely synonymous.
Critical point At P and T above this point, a gas and liquidin a particular volatile system, such as H2O and CO2, are nolonger distinguishable and exist as a uniform fluid.
Cryptic layering Systematic changes in the chemical com-position of cumulus solid-solution minerals in a layered intrusion.
Cryptic metasomatism A type of metasomatism in whichthe only modification is a change in the composition of theoriginal solid-solution minerals.
Cryptocrystalline Texture that consists of a mosaic of minutecrystals which cannot be resolved with an optical microscopebut which diffract X-rays.
Crystal defects Possessed by all real crystals that are defect-ive or imperfect to varying degrees on the atomic scale. Include nonrational external boundaries of grains in aggreg-ates (Figure 6.9a) and defects within the crystalline volumethat distort the otherwise regular periodicity of the lattice, introduce local strain, and increase the internal stored elasticenergy. Point defects (Figure 6.5) are essential in the diffu-sion of ions through the volume of a crystal. Dislocations areline defects responsible for the plasticity of crystals and lie ina slip plane at the junction between slipped and unslippedparts of a deformed crystal; they can be edge or screw (Figures 17.22 and 17.23).Crystal-melt fractionation Separation of crystals and melt;also called fractional crystallization, fractionation, or crystal-lization differentiation.Crystalline residue Crystals remaining after incongruentpartial melting of a rock.Crystallinity Proportion of crystals in a glassy rock or in amagma.Crystallites Minute crystals that do not react visibly to polarized light under the microscope.Crystallization differentiation See Crystal-melt fractionation.Crystalloblastic series A hierarchy of grain shapes in meta-morphic rocks that reflect differing relative tendencies for development of characteristic crystal forms during solid-stategrowth. Denser minerals having tighter packing of ions andpossessing greater surface energies, such as garnet, tend to be more euhedral than contacting less dense minerals, such as quartz and feldspar, as they compete for space during re-crystallization and become texturally equilibrated.Cumulophyric A type of porphyritic texture in which severalphenocrysts are aggregated together; the matrix is usuallyglassy or aphanitic.Cumulus grains Unmodified accumulated products, or cumulates, of crystal-melt fractionation.Cupola More or less bell-shaped upper part of a pluton thatextends higher into the roof rock than the main underlyingmass.Dacite Glassy or aphanitic rock made essentially of plagio-clase and lesser quartz and a combination of Fe–Ti oxides,pyroxene, hornblende, biotite, and minor sanidine; contains63 to 69–77 wt.% silica and less than about 7 wt.% total alkalies. See Figures 2.12 and 2.13.Darcy’s Law An expression (16.26) for the velocity of flowof a fluid through a permeable solid.Decarbonation reaction Releases CO2.Decomposition (breakdown) reaction A primary crystallinephase that is replaced by one or more secondary crystallinephases due to changing intensive variables in the system.
Decomposition rim Partial subsolidus replacement of theouter part of an unstable mineral, usually biotite and amphi-bole, by an aggregate of secondary minerals, in response todeclining water pressure (fugacity) or increasing oxygen in anextrusive magmatic rock.
Decompression A reduction in P.
Decussate In metamorphic rocks, a texture in which interpenetrating platy or columnar grains are more or lessrandomly oriented.
Glossary 695
Defect See Crystal defect.Deformation Response of a body to applied stress. Hasthree components: rotation, translation, and distortion,which is usually called strain—the change in shape and/orvolume of a stressed body.
Deformation band A planar domain within a mineral grainthat has experienced a different kind of deformation than adjacent domains; commonly manifest in thin sections of deformed quartz in mylonite as ribbons of contrasting opticalextinction under cross-polarized light.
Deformation lamellae A series of thin planar domainsbounded by slip planes that have slightly different refractiveindices than other parts of the deformed mineral grain.
Deformation path The history of strain in a rock, or thesum of all the increments of deformation it has experiencedthroughout its entire history, from the initial to the final state.
Deformation twin A product of plastic ductile deformationof a mineral grain.
Degrees of freedom See Variance.
Dehydration melting Partial melting of rocks in which theonly water present is that bound structurally in hydrous minerals; no separate aqueous fluid phase exists. Also calledwater-deficient, water-undersaturated, or fluid-absent melting.
Dehydration reaction Releases H2O.
Dendritic Crystal shape resembling tree branches.
Density Mass divided by volume; has units of g/cm3.
Density filter Less dense continental crust that blocks the ascent of denser mafic mantle-derived magmas. See Underplating.
Depleted source Magma-generating region, usually withreference to the mantle, that is depleted in the most incom-patible elements, usually because of extraction of partialmelts.
Deuteric alteration See Autometamorphism.
Devitrification Delayed crystallization of glass.
Diabase (dolerite) Basaltic rock in which grain size is marginally phaneritic; typically occurs in dikes and sills.
Diagenesis Textural and compositional changes in buriedsediment at T and P less than those at which metamorphismtakes place. An example is conversion of water-saturatedmud into shale.
Diapir Body of buoyant magma or rock that ascends slowlythrough surrounding more dense, ductile, viscous countryrock in the lower continental crust or mantle.
Diatreme A type of breccia pipe that contains a high concen-tration of mantle- and/or crust-derived fragments, commonlyto the exclusion of recognizable magmatic rock; apparentlyemplaced at low T. Responsible magma that drove emplace-ment was volatile-rich, usually highly alkaline and mafic to ultramafic, such as kimberlite.
Differentiated layering A metamorphic fabric producedfrom an initially more isotropic protolith by segregation ofmafic or phyllosilicate material from felsic.
Differentiation See Magmatic differentiation.
Diffusion Movement of individual atoms through a groupof atoms, usually driven by a concentration (activity) gradient.
Diffusion coefficient (diffusivity) Proportionality constantbetween rate of diffusion and concentration gradient; relatedto the frequency at which atoms jump and their jumping distance.
Diffusive creep Slow continuous deformation accom-plished by diffusive movement of ions within a grain aggreg-ate under uniformly small shear stress at low strain rates.
Dihedral angle Angle between intersecting grain boundar-ies or intersecting liquid/crystal interfaces.
Dike A type of sheet intrusion in which magma intrudesdiscordantly across planar wallrock structure, such as bedding,or intrudes massive isotropic rock. Contrast Vein.
Dike swarm Several to as many as hundreds of dikes em-placed more or less contemporaneously during an intrusiveepisode; in a radial dike swarm the dikes are arrayed likespokes of a wheel from a central point.
Diktytaxitic Texture in some coarse-grained basalt lavaflows or sheet intrusions in which small angular voids (vugs)are interspersed in a network of plagioclase and pyroxenegrains.
Dilatancy pumping A deforming body may dilate (increasein volume) by developing internal openings into which anynearby liquid may be drawn.
Diorite Felsic phaneritic rock that contains, in terms of felsic minerals, �20 modal % quartz, has a plagioclase/alkali feldspar �9, and plagioclase less calcic than An50. SeeFigure 2.8.
Discontinuous (univariant) reaction A metamorphic min-eral reaction that takes place at a univariant line in P–T space;includes polymorphic transitions, reactions involving pure,nonsolid-solution phases such as albite � jadeite � quartz,and, most common of all, reactions among solid solutionsthat occur at a particular T for a given P. On AFM and othercompositional diagrams, the latter two net-transfer reactionsare manifest by a change in the configuration (topology) ofmineral compatibilities in a tie-line switching reaction or by complete disappearance of a phase in a terminal reaction.In metamorphic terranes, a discontinuous reaction caused by increasing T is manifest by the abrupt appearance or disappearance of the higher-grade phase(s), thus marking anisograd.
Discontinuous reaction relation As intensive variableschange in a magma, reaction between a crystalline phase thatmay be a solid solution and the surrounding melt creates adifferent crystalline phase that again may be a solid solutionplus melt of a slightly different composition. An example isthe discontinuous reaction with declining T between olivineand basaltic melt that creates orthopyroxene and a slightlymore siliceous melt.
Discontinuous reaction series The crystalline products of a series of incomplete discontinuous reaction relations thatcreates successive reaction pairs such as olivine and pyroxene,pyroxene and hornblende, and so on.
Dislocation See Crystal defects.
Dislocation creep Slow continuous plastic ductile deforma-tion at uniform stress that occurs in crystals at elevated T wherethe rate of generation of new dislocations is approximatelybalanced by their elimination through recovery processes.
696 Igneous and Metamorphic Petrology
Dissolution (resorption) A crystal taken into solution in amelt or volatile fluid.
Distribution coefficient The ratio of two exchangeable ions,such as Mg and Fe2� or Na and K, in two stably coexistingminerals in a metamorphic rock. Is essentially constant underthe same metamorphic conditions regardless of bulk rockcomposition. Compare Partition coefficient in magmatic systems.
Divariant A state of equilibrium that has two degrees offreedom.
Dolomarble Metamorphic rock composed of dolomite.
Ductile deformation (flow) Grain-scale permanent changein shape of a body without loss of cohesion caused by non-hydrostatic stress at slow rates of strain under metamorphicconditions. Compare Brittle deformation.
Dunite Ultramafic phaneritic rock that contains, in terms ofolivine and pyroxenes, �90% olivine. See Figure 2.10b.
Dynamic metamorphism An end-member type of meta-morphism produced wholly or nearly so by nonhydrostaticstresses that cause ductile deformation in tectonites. Com-monly focused in high-strain-rate mylonitic shear zones.
Dynamic (syntectonic) recrystallization A type of recrystal-lization involving recovery processes that is driven by plasticductile deformation; can accomplish very large amounts ofstrain in rocks such as mylonite in ductile shear zones. Asnew grains form, they in turn become deformed and new onesare created from them so that a dynamic balance develops between simultaneous and competing recovery and deforma-tion; the result can be a uniform grain size that is inverselyproportional to the applied nonhydrostatic stress.
Dynamothermal metamorphism Typifies regional terranesand involves effects of broadly concurrent heating and deformation.
Eclogite Uncommonly dense, essentially bimineralic rockof basaltic chemical composition made of red-brown Mg–Fe–Ca–Al garnet and green Na–Al–Ca–Mg clinopyroxene(omphacite); accessory constituents may include quartz,kyanite, orthopyroxene, rutile, and, rarely, coesite. Plagioclaseis absent.
Effective normal stress In a porous rock body, the pressureof a liquid (volatile fluid or magma) in the openings counter-acts the normal stress compressing the body.
Effusive eruption Magma extruded from a volcanic vent asa coherent lava flow, as contrasted with an explosive eruptionof pyroclasts.
Ejecta See Pyroclasts.
Elastic A behavior or response to applied stress in whichthe strained body returns instantaneously and reversibly to itsinitial undeformed state so long as the stress is less than theelastic strength.
Elastic strength The stress difference in an elastic body atwhich it breaks or fractures, losing cohesion and causing per-manent deformation.
Elutriation Entrainment of very fine ash particles in an upward streaming gas in a pyroclastic flow; creates a coign-imbrite plume.
E-MORB Derived from mixed-source basalts enriched inincompatible trace elements relative to normal (N-) MORB.
En echelon dikes A series of stepped separate dikes that areparallel to each other but oblique to the series as a whole.
Enclave See Mafic inclusion.
Endogenous Grown from within, as in a ballooning siliciclava dome.
Endothermic A chemical reaction that absorbs heat.
Energy Capacity for doing work. Gravitational potentialenergy of a mass is related to its position in the gravitationalfield of the Earth. Kinetic energy is possessed by a movingmass. Thermal energy resides in the motions and interactionsof atoms internally within a body and is commonly referredto as heat.
Enriched mantle Has greater concentrations of incompatibleelements than a depleted mantle from which partial meltinghas extracted these elements.
Enthalpy The amount of heat gained or lost in a system;roughly, the heat content of a sytem.
Enthalpy of melting See Latent heat of melting.
Entropy Uniformity in concentration of energy in a systemor the degree of disorder in a system.
Epitaxial Oriented overgrowth of a mineral onto anothersubstrate mineral that has similar atomic structure.
Equigranular Phaneritic texture in which grains are of similar size; also called granular.Equilibria States of equilibrium.
Equilibration Process of attaining a state of equilibrium.
Equilibrium State of a system in which the net result offorces acting on it is zero. Metastable equilibrium is a statethat can persist indefinitely but can change to a more stable,lower energy state by surmounting an activation energybarrier. Stable equilibrium is a readily reversible state that, if perturbed, returns to its original state of lowest energy. Unstable equilibrium is a state in which a slight disturbancewill cause a permanent change, usually to a more stable stateof lower energy.
Equilibrium constant Expresses the ratio of activities ofcomponents in a chemical reaction.
Eu anomaly On a chondrite- or primitive-mantle-normalizeddiagram, Eu is either enriched (positive anomaly) or depleted(negative anomaly) relative to a smooth curve drawn throughvalues of neighboring lighter and heavier rare earth elements.
Euhedral (idiomorphic) Mineral grain completely boundedby its own rational crystal faces, forming a tabular, platy,columnar, etc. habit.
Eutaxitic fabric (compaction foliation) In compacted andusually welded ash-flow tuffs, pumice lumps and glass shardsare flattened as a result of the weight of the overlying depositinto discoidal shapes more or less parallel to the depositionalplane. Flattened pumice lapilli called fiamme (Italian: flame)have ragged flame-like terminations. Not a type of flow layering.
Eutectic A system that consists of two or more crystallinephases plus a melt whose composition can be expressed interms of positive proportions of the crystalline phases. Allphases coexist in equilibrium at an isobaric invariant point
Glossary 697
Fenite Syenitic product of alkali metasomatism of felsiccountry rock surrounding intrusions of carbonatite, ijolite,and some other highly alkaline magmas. The fenitizingNa–K-rich solutions desilicate the protolith by replacing anyunstable quartz by Na–Fe-rich amphibole and/or pyroxenewhereas alkali feldspar remains and is perhaps augmented.Apatite and titanite are accessories.
Ferruginous A compositional class of metamorphic rocksthat are derived from Fe-rich protoliths, including meta-morphosed marine cherts and Precambrian banded iron formations.
Fertile (fertility) See Source-rock fertility.
Fiamme Flattened pumice lapilli or block in a compactedignimbrite; a feature in eutaxitic fabric.
Field relations Chronologic and spatial properties of amass of rock discerned in exposures (outcrops) in hills,mountains, and manmade road cuts.
Filter pressing Segregation of residual melt in partiallycrystallized magmas from the interlocking network of crystalsbecause of local gradients in pressure.
First Law of Thermodynamics The total amount of energyremains constant in a system; also called the Law of Con-servation of Energy.
Fissure eruption Magma vented from a subvertical crack orfracture. Compare Central eruption.
Flaser See Porphyroclastic.
Flow layering Fabric in a magmatic rock expressed by altern-ating planar contrasts in composition, in sizes of crystals, or inconcentration of vesicles; forms as a result of magma flow.
Flow markers Suspended rigid crystals, volatile-fluid bubbles, or distinctive mineral aggregates embedded inmagma that record attributes of the pattern of internal flowduring emplacement.
Flowage segregation In flowing bodies of magma, grain-dispersive pressure pushes crystals and other solid particlesaway from the margins into the interior.
Fluid, volatile Liquid phase that consists chiefly of volatilesand has a density generally �2 g/cm3.
Fluid-absent melting See Dehydration melting.
Fluid inclusion A minute volume of volatile fluid entrappedwithin a crystal; produced either by growth (primary inclu-sion) or by cracking, filling with fluid, and subsequent pinch-ing off by recrystallization (secondary inclusion or healed microcrack).
Fluid pressure The pressure exerted by volatile fluid in asystem.
Fluidization Mobilization of a pyroclastic flow due to up-ward movement of gas through the mass of cohesionless particles lifting them apart so that the flow behaves as if itwere a low-viscosity fluid.
Foliation (foliated fabric) Planar anisotropic fabric, suchas various types of layering and preferred planar orientationof inequant mineral grains.
Forceful emplacement Intrusion of magma that deformscountry rock, resulting in anisotropic fabric that is more orless concordant to intrusive contact.
698 Igneous and Metamorphic Petrology
(eutectic point) that is the minimum melting T (eutectic T )for the assemblage of crystalline phases. Removal of heat at a eutectic causes a decrease in the proportion of melt to crystals, but does not change the T of the system or the composition of any phase.
Evolved magma Derived from a parent magma by magmaticdifferentiation.
Exchange reaction A type of continuous reaction in whichthe concentrations of exchangeable ions, such as Mg andFe2� or Na and K, in reactant and product phases vary con-tinuously as P–T conditions change.
Exogenous Grown by addition onto the surface.
Exothermic A chemical reaction that releases heat.
Exsolution Process of releasing excess volatiles from aoversaturated melt as their concentration exceeds their solubility.
Extensional fractures Cracks formed under brittle condi-tions that are more or less planar and oriented perpendicularto the least principal stress, �3; can be filled with volatilefluids or magma, forming veins or dikes, respectively.
Extensive variables Parameters defining the nature of a system, such as volume, that depend on the amount of mate-rial in the system. Compare Intensive variables.
Extrusion Magma emplaced onto the surface of the Earth,either as coherent lava effusions or as explosive pyroclasticmaterial.
Fabric Non-compositional properties of a rock; includestextures and generally larger scale structures.
Fabric heteromorphs Different fabrics formed by differentkinetic paths in rocks or magmas of the same composition;for example, aphanitic and vitrophyric rhyolite and phaneriticgranite.
Facies Contrasting rocks formed under similar conditions.See also Metamorphic facies.
Fault (shear fracture) A fracture formed under brittle conditions of low P, T, and high strain rate along whichmovement occurs when the shear stress on the fracture exceeds the frictional resistance.Fault (tectonic) breccia Broken angular rock fragmentsproduced by movement of rock masses along a fault; fragmentscommonly show glossy striated surfaces called slickensides.Fault gouge Soft, unconsolidated clayey material along faultsthat is produced by intense pulverization and decompositionof minerals by advecting hydrothermal solutions.
Feeder dike Subvertical dike that supplies magma to anoverlying intrusion or volcano.Feldspar ternary A system composed of the three feldsparcomponents, NaAlSi3O8-KAlSi3O8-CaAl2Si2O8.Felsic Mnemonic adjective derived from feldspar and silica;used for feldspars and silica minerals and for rocks that con-tains abundant feldspar and possibly either quartz, such asgranite, or feldspathoids, such as phonolite.Felsitic Magmatic texture made of an aphanitic mosaic ofmostly felsic minerals; common in rhyolite, dacite, and trachyte.Felty (pilotaxitic) Holocrystalline, microcrystalline mag-matic texture that consists of small interwoven plagioclasetablets.
Fractional crystallization, Fractionation See Crystal-meltfractionation.
Fugacity Equivalent or effective partial pressure that isused to calculate free energy differences for real gases. Thefugacity coefficient is the ratio of fugacity to partial pressureand is a measure of the departure of a real gas from a perfectone.
Fulgurite Glassy rock formed by lightning strikes that locally partially melts rock or sediment; usually irregularlyshaped crust or tubular structure.
Fumarole A vent that releases volcanic gases.
Fused tuff Mostly ash-sized, unconsolidated vitroclasts thatare heated in some manner subsequent to deposition, such asby an overlying lava flow, so they become hot and stick together, forming a consolidated rock.
Ga Giga annum � 109 years.
Gabbro Mafic phaneritic rock type that contains 10–90modal % plagioclase more calcic than An50 plus pyroxene,Fe–Ti oxides, with or without olivine; chemically equivalentto basalt. See Figures 2.8 and 2.10a.
Geobaric gradient Increase in P per kilometer into theEarth.
Geobarometer, geothermometer See Barometer, Thermometer.Geothermal gradient (geotherm) Increase in T per kilometerinto the Earth.
Gibbs free energy A thermodynamic energy function for-mulated in such a way that it is a minimum in a stable system.
Glass An amorphous, usually silicate, solid whose dis-ordered atomic structure is that of a liquid; produced from a silicate melt that cooled too rapidly to crystallize. May subsequently devitrify.
Glassy (vitric) Made of glass.
Gneiss Phaneritic metamorphic rock of typically highergrade. Foliation is barely perceptible where expressed bysparse phyllosilicates or feldspar augen and is stronger butmechanically passive where expressed by compositional layering of felsic and mafic minerals.
Goldschmidt’s mineralogical phase rule The number ofstable phases in a metamorphic system at equilibrium is lessthan or equal to the number of components.
Grain-boundary diffusion Occurs along boundaries ofmineral grains in an aggregate.
Grain-boundary modification Change in the shape and/orsize of grains of crystalline phases in a rock under subsolidusconditions that minimizes the surface energy of the aggreg-ate, striving towards textural equilibration.
Grain-boundary sliding A process in grain-scale rock deformation usually operating in conjunction with other ductile mechanisms in which individual grains rotate and aredisplaced relative to neighboring ones so as to accommodatemisfits and prevent the formation of voids.
Grain dispersive pressure In a flowing liquid, suspendedsolid particles in the velocity gradient near the fixed bound-ary tend to migrate into the flowing liquid.
Granite Felsic phaneritic rock that contains, relative to felsic minerals, �20 modal % quartz and subequal amountsof alkali feldspar and plagioclase. See Figures 2.8 and 2.9.
Granite system The NaAlSi3O8-KAlSi3O8-SiO2-H2O system.
Granitic rock (granitoid) Quartz-bearing phaneritic felsicrock.
Granoblastic In metamorphic rocks, a mosaic of more orless uniformly sized, equidimensional, anhedral grains pro-duced by subsolidus recrystallization that are essentially free of strain as revealed by uniform extinction under cross-polarized light in thin section. Grain boundaries are straightor only slightly curved and triple junctions define angles ofabout 120°. If present, inequant grains are randomly ori-ented. Typical of hornfelses formed in contact metamorphicaureoles, of many high grade rocks in regional terranes, ofplastically deformed and dynamically recrystallized rocks,and of annealed rocks.
Granodiorite Felsic phaneritic rock that contains, relative tofelsic minerals, �20 modal % quartz and plagioclase � alkalifeldspar. See Figures 2.8 and 2.9.
Granofels Phaneritic granoblastic metamorphic rock madeup mostly of quartz and feldspar.
Granophyre Felsic magmatic rock that has granophyrictexture.
Granophyric See Graphic.
Granular See Equigranular.Granulite Metamorphic rock of the granulite facies thatconsists of mostly anhydrous minerals, such as plagioclase �pyroxene � garnet.
Graphic Magmatic texture that consists of an intergrowthof alkali feldspar and quartz, the latter in triangular andhook-like forms resembling ancient writing; can be coarsewhere the quartz grains are several mm, or microcrystallinevisible only with a microscope where it is called micrographicor granophyric. Contrast Myrmekite.
Gravitational segregation In a body of magma, sinking ofdenser crystals or floating of less dense ones.
Greenstone Low-grade, typically aphanitic metabasitecomposed of a haphazard isotropic array of combinations ofepidote-group minerals, prehnite, pumpellyite, chlorite, acti-nolite, albite, titanite, and locally a carbonate mineral. Relictmagmatic fabrics are commonly preserved.
Greenstone belt Elongate outcroppings of Precambrian,variably deformed, usually low-grade metavolcanic rocks,mostly greenstones, and lesser low-grade sedimentary rocks.
Greisen Metasomatized granitic rock, commonly of the S-type, that results from interaction with hydrothermal solu-tions having high activity of H, F, B, Li, W, and Sn. Wherethoroughly transformed, the greisen is composed chiefly of quartz and Li-bearing mica (muscovite, zinnwaldite, orlepidolite) and accessory topaz, tourmaline, fluorite, rutile,cassiterite, and wolframite.
Groundmass See Matrix.
Harzburgite Ultramafic phaneritic rock composed of or-thopyroxene, 40–90% olivine and �10% clinopyroxene; a type of peridotite. See Figure 2.10b.
Glossary 699
Hawaiian eruption Extrusion of low-viscosity basalticmagma from fissures or central vents, creating lava fountainsand lava flows that form a shield volcano.
Hawaiite Approximately a sodic andesite. See Figure 2.12.
Healed microcrack Secondary fluid inclusion, either singleentities or trains of many in-line parallel inclusions, producedwhere a pre-existing crack or crack system was filled withfluid before being pinched off by partial recrystallization.
Heat Transferred thermal energy.
Heat diffusion Alternate designation for heat conduction.
Heat flux (flow) Rate at which heat is transferred over timefrom the surface of a body.
Heterogeneous reaction Involves production and consump-tion of multiple phases; not a simple polymorphic transition.
High-field-strength (HFS) Refers to ions that have a chargegreater than or equal to 3 and radii � 0.7–1.1 Å; includes Zr,Ti, Nb, Ta, etc.
High-K rocks Calc-alkaline rocks that contain large con-centrations of K. See Figure 2.18.
Holocrystalline Texture made wholly of crystals withoutglass.
Homogeneous deformation In the final component ofstrain, initially straight lines have remained straight.
Horizon of neutral buoyancy In a density-stratified crust,the level where the density is equal to that of ascendingmagma.
Hornfels Aphanitic to fine phaneritic, granoblastic productof thermal metamorphism in contact metamorphic aureolessurrounding magmatic intrusions. Relict bedding may bepresent. Common pelitic hornfelses may contain poikilo-blastic cordierite and/or andalusite and are dark brown toblack, tough, and may have conchoidal fracture if aphanitic.Contrast Skarn.
Hybrid magma (rock) See Assimilation.
Hydraulic fracturing Occurs where volatile-fluid or magmapressure is sufficient to overcome compressive normal stressesand produce extensional fractures into which the fluid ormagma penetrates, forming veins or dikes, respectively.
Hydroclast Usually ash-size, blocky, poorly vesiculated, vitroclast formed by explosive fragmentation of magma con-tacting bodies of water; resulting hydroclastic deposits arecommon with pillow lava flows.
Hydrogen metasomatism Occurs where high H� activityrelative to other major elements in systems of fluid �feldspars � mafic silicates destabilizes these crystalline phasesat the expense of white micas, clay minerals, pyrophyllite,andalusite, and other aluminosilicates while Na, K, Ca, Mg,and Fe ions go into solution.
Hydrolytic weakening Response to applied nonhydrostaticstress in which small amounts of dissolved water significantlyreduces the strength and enhances the plasticity of nominallyanhydrous silicate minerals, especially quartz.
Hydromagmatic (phreatomagmatic) explosion Caused by interaction between magma and external water in theporous ground, lake, or ocean that is explosively vaporized tosteam.
Hydrostatic state of stress Three principal stresses are ofequal magnitude in all directions; also called pressure.
Hydrothermal alteration (metamorphism) Results fromadvective percolation of hydrothermal solutions through abody, especially along fractures.
Hydrothermal solution Hot aqueous fluid beneath the surface of the Earth; contains dissolved silica and many otherchemical constituents.
Hypabyssal Processes and products related to magma inthe shallow continental crust.
Hypersolvus Refers to granites and syenites that have crystal-lized from relatively dry magmas so that the feldspar is perthiteand accompanying mafic minerals are generally anhydrous.
Hypidiomorphic-granular Magmatic phaneritic texture thatconsists of a mixture of euhedral, subhedral, and anhedralgrains.
Idiomorphic See Euhedral.Igneous lamination Texture in a magmatic phaneritic rockexpressed by a planar preferred orientation of tabularfeldspars. Contrast Trachytic.
Ignimbrite See Ash-flow tuff.Ijolite Phaneritic nepheline–clinopyroxene rock.
Immiscible liquids Two melts of different composition thatcoexist stably at some particular P and T.
Immobile See Mobile element.Impact metamorphism See Shock metamorphism.
Incompatible element Element that is preferentially con-tained in loosely structured melt and excluded from more restrictive crystalline structures; partition coefficient �1.
Incongruent melting A common melting process in rocksand many single rock-forming minerals where the initial meltformed at increasing T is not of the same composition; thiscontrasting melt coexists with a crystalline phase, or phases,also different in composition from the starting crystalline material.
Index mineral A distinct mineral whose stabilization in ametamorphic terrane corresponds to a critical prograde min-eral reaction driven by a change of intensive variable; its firstappearance marks an isograd bounding a metamorphic zone.
Inequant Refers to a mineral grain whose dimensions are un-equal in different directions, for example, a platy or columnargrain.
Inequigranular Texture in a rock aggregate in which grainsare conspicuously variable in size. Can be either porphyriticor seriate.
Infiltration metamorphism Occurs in an open-rock systemwhere an invasive fluid from an external source penetratesalong fractures and/or grain boundaries, producing mineralreactions. The infiltrating fluid dilutes or flushes away thatcreated by the mineral reaction so that the fluid compositionat any time is externally controlled. The time-integratedfluid/rock ratio is relatively high. Contrast a locally control-led, internally buffered fluid system.
Inhomogeneous deformation In the final component ofstrain, initially straight lines have become curved, because ofuneven strain partitioning.
700 Igneous and Metamorphic Petrology
Intensive variable Parameter defining the nature of a systemthat is independent of the amount of material present and hasa definite value at each point within the system; includes T, Pand concentration, activity, or fugacity of chemical species.Contrast Extensive variable.
Intercumulus Melt or minerals in the space between cumu-lus mineral grains that form by accumulation of crystals in afractionating magma.
Interface The boundary between any two neighboringphases.
Intergranular Holocrystalline, microcrystalline texture ofmagmatic rocks in which randomly oriented crystals of plagioclase, pyroxene, and Fe–Ti oxides form a tight, inter-locking mosaic.
Intergranular fluid A separate, minute volume of a volatilephase that exists along grain boundaries in a meta-morphic rock; plays an active role in mineral reactions anddeformation.
Intermediate composition rock Contains 52–66 wt.% silica.
Internally buffered fluid system The fluid composition inthe closed-rock system is governed by the progress of localmixed-volatile reactions.
Intersertal Magmatic texture resembling intergranulartexture except brown glass is interspersed among the micro-crystalline grains.
Intracrystalline plastic strain Ductile deformation undermetamorphic conditions in which mineral grains changeshape by plastic slip or twin gliding on crystallographicallyfavored planes. Cohesion and ordering of the lattice acrossthe slip or twin plane is preserved.
Intrusion Refers to both the process and the product ofmagma inserted into pre-existing rock beneath the surface ofthe Earth. Compare Pluton.
Invariant A state of equilibrium that has no degrees of freedom.
Inverted metamorphic zonation Progressively lower-graderocks occur downward in the present-day crust; can developbeneath a hot overthrust sheet that was emplaced over coolerrock or by post-metamorphic folding and faulting.
Ion-exchange reaction A reaction in which one type of ionin a fluid exchanges with another type in a solid; the alkaliesK and Na are a common exchangeable ion pair that particip-ate in alkali-ion-exchange reactions.
Ionic potential Ratio of ionic charge to ionic radius.
Irreversible thermodynamic process A unidirectionalchange in a system from an initial metastable state to a morestable, lower energy final state brought about by a change inan intensive variable.
Island arc Arcuate string of volcanic islands built onoceanic crust overlying subducting oceanic lithosphere.
Isobaric Constant pressure.
Isocon diagram A cartesian diagram depicting concentra-tions of chemical elements in a metasomatic rock and its alleged protolith; used to evaluate the nature of the meta-somatism and mobility of elements.
Isograd See metamorphic zones and grades.
Isolated system No matter or energy can be transferredacross the system boundary with surroundings and no workcan be done on or by the system.
Isopleth A line of constant composition in a T–X or P–Xphase diagram.
Isothermal compressibility, coefficient of Isothermalchange in volume of a body with respect to increase in P withdepth in the Earth.
Isothermal line or surface (isotherm) A line or surface ofconstant T.
Isotope Atom of an element whose nucleus contains thesame number of protons but a different number of neutronsfrom another isotope of that element. An unstable isotopedecays by nuclear processes into one or more daughter radiogenic isotopes that may be of the same or a different element. A stable isotope does not decay. A cosmogenic isotope is produced when high-energy cosmic rays interactwith nuclei of atoms in the atmosphere.
Isotope exchange reaction T-dependent reaction involvingisotopes of a particular element changing their ratios in oneor more phases; commonly occurs in the presence of somekind of liquid in which the isotopes can readily diffuse.
Isotope fractionation Change in ratio of two isotopes of anelement during a physical or chemical process.
Isotropic fabric Random fabric; appears the same in all directions.
I-type Refers to granitic rocks derived from magmas gener-ated by partial melting of Igneous source rocks.
Jasperoid Metasomatized limestone or dolostone in whichthe original calcite and dolomite are replaced to varying degrees by aphanitic quartz precipitated from advecting silica-laden hydrothermal solutions, usually near magmaticintrusions; rock appears unchanged, even preserving the darkgray color of the carbonate protolith. May host economic Auand Ag deposits.
Juvenile Refers to particles or fluid derived directly frommagma.
Kamafugite A clan of strongly silica-undersaturated volcanicrocks that contain combinations of olivine, clinopyroxene,Fe–Mg mica, perovskite, and melilite (in katungite), orleucite (mafurite), or kalsilite (KAlSiO4) (ugandite).
Kelyphytic rim Micro- to crypto-crystalline corona formedby subsolidus mineral reaction at the contact between in-compatible mineral grains.
Kimberlite Ultramafic, megacrystic aphanitic magmaticrocks that contain abundant carbonate and secondary ser-pentine replacing olivine and pyroxene; typically occur infunnel-shaped diatremes overlying dike-sill complexes inPrecambrian cratons. Abundant xenoliths include crustalrocks as well as upper mantle peridotites and eclogites. Some kimberlites contain diamond. Compare orangeite andlamproite in Section 13.12.2.
Kinetic path The history of kinetic processes that are in-volved in the change in state of a rock-forming system; dictates the fabric of the resulting rock.
Kinetics Time-dependent dynamics of a system.
Glossary 701
Kinking Differential slip (twin gliding in some instances)restricted to a kink band, in which the slip planes are ori-ented several tens of degrees from the same crystallographicplanes in the essentially undeformed adjacent parts of thecrystal.
Komatiite Glassy to aphanitic ultramafic rocks composedessentially of olivine and pyroxene that form in lava flows andshallow intrusions; contains �18 wt.% MgO and �1 wt.%(Na2O � K2O); virtually all Precambrian.
L, L–S tectonite See Tectonite.
Laccolith Flat-floored intrusion with a domical roof; essen-tially concordant with layered country rocks.
Lahar (volcanic debris flow) Refers to a flowing mass ofrock material mobilized by entrained water that moves bygravity down the slopes of a volcano and to the resulting deposit.
Laminar flow Movement of a liquid in parallel sheets or“pencils,” depending on the configuration of the liquidboundaries; Reynolds number �500. Contrast Turbulentflow.
Lamproite Ultramafic to mafic porphyritic rocks that contain unusually high concentrations of K (manifest byabundant leucite and sanidine) as well as Ti, Zr, and Ba thatstabilize exotic minerals; occur in shallow pipes and overlyingvolcaniclastic deposits and lava flows. Some contain mantlexenoliths and xenocrysts, including diamond. Compare orangeite and kimberlite in Section 13.12.2.
Lamprophyre A generally mafic, alkaline, porphyritic rockthat typically occurs in dikes and that contains abundantmica, amphibole, clinopyroxene, and possibly olivine andmelilite; feldspar may be present but never as phenocrysts.
Lapilli Volcaniclasts 2–64 mm in size; equivalent to granuleand pebble size for sedimentary fragments.
Lapilli tuff Rock made of a mixture of ash- and lapilli-sizevolcaniclasts.
Large igneous province Large floods of basaltic lava ex-truded during relatively brief episodes that produce con-tinental and submarine oceanic plateaus. Some continentalprovinces also have large volumes of felsic lava.
Large-ion lithophile (LIL) Element whose ions are mono-or di-valent and have radii greater than 1.15 Å; includes Cs,Rb, K, Ba etc.
Latent heat (enthalpy) of melting The amount of heat absorbed at constant T of melting.
Latite Potassic trachyandesite. See Figure 2.12.
Lattice orientation In tectonites, a particular crystallographicaxis in grains within an aggregate possess a marked preferredorientation.
Lava Cohesive magma extruded from a volcanic vent.
Lava dome Lava extrusion having a relatively large heightto horizontal diameter (aspect ratio) because of high appar-ent viscosity in usually silicic lava; has a blocky autoclasticcarapace and a surrounding talus apron. Very steep-sided Pelean domes grow by expansion from within (endogen-ously), pushing slabs of rigid lava out of and away from thevent in fan fashion or along sled-runner-shaped ramps.
Lava fountain Blobs of relatively low viscosity magma, usually of basaltic composition, ejected in a fountainlike trajectory from an explosive volcanic vent.
LeChatelier’s principle If a change occurs in the state of a system, it will respond in such a way as to minimize or moderate the effects of the change.
Lepidoblastic A metamorphic texture in which abundantphyllosilicate or other platy mineral grains possessing strongplanar preferred orientation impart a schistosity to schistsand cleavage to slates.
Leucitite Glassy to aphanitic rock made of leucite, clinopy-roxene, Fe–Ti oxides, and possible olivine.
Leucocratic Refers to rocks that have �30 modal % maficminerals.
Leucosome Leucocratic felsic part of migmatite.
Lever rule An equation (5.2) that expresses the weight or mole fractions of two stably coexisting phases in a phasediagram.
Lherzolite A type of peridotite composed of orthopyroxeneand clinopyroxene and 40–90% olivine. See Figure 2.10b.
LIL See Large-ion lithophile.
Lineation (lineated fabric) Anisotropic fabric that is dominated by linear features. Includes nematoblastic texture,which is a preferred orientation of columnar mineral grains,stretching lineation, which is a fine-grained streaking of min-eral aggregates on a foliation, and other linear features, suchas elongate pebbles in a metaconglomerate.
Liquid Volatile fluid or silicate melt.
Liquid line of descent In a magma, the changing chemicalcomposition of the residual melt during crystallization.
Liquidus line (surface) T above which any mixture of com-ponents in an equilibrium system is wholly melted; locus of points representing the composition of melt coexisting stably with solid phases at some particular P and T in a phasediagram.
Liquidus phase The first crystalline phase to precipitate ina melt as it cools below the liquidus T.
Lithic clast Rock fragment in volcaniclastic deposit or rock;typically lapilli or block size.
Lithophysae In silicic lava flows and compacted tuffs, hollow gas cavities on rock surfaces that have concentric,bubble-like microcrystalline shells. Lithophysal is the corres-ponding fabric.
Littoral cone A type of hydroclastic deposit created wheresubaerially erupted lava contacts the ocean.
Local equilibrium Refers to small volumes of metamorphicrock that are in thermodynamic equilibrium even though thelarger surrounding volume is not because of mutually incom-patible phases.
Loss on ignition (LOI) Wt.% volatiles lost when rockpowder is heated to 1000°C.
Low-K rocks Essentially synonymous with tholeiitic rocks.See Figure 2.18.
Ma Mega annum � 106 years before present.
Maar A broad, low-relief, explosive volcanic crater whosefloor lies below the general elevation of the pre-eruption
702 Igneous and Metamorphic Petrology
land surface; ejecta forms a surrounding tuff ring. Some areunderlain by a diatreme.
Mafic Mnemonic adjective derived from magnesium andferrous/ferric; used to describe a mineral or a rock that con-tains large concentrations of Mg and Fe.
Mafic inclusion (enclave) Mafic aggregate embedded in amore felsic host rock; especially common in granodiorite,quartz diorite, and tonalite.
Magma Molten rock material; always contains a melt inwhich there are dissolved volatiles and commonly suspendedcrystals.
Magma generation Creation of primary magma by partialmelting of already hot source rock by local perturbations inP, T, and/or composition.
Magma overpressure Magma pressure that exceeds theconfining (lithostatic) pressure, P, at a particular depth.
Magmatic diffentiation Processes that modify the com-position of a primary magma after leaving its source.
Major element A chemical constituent in a rock which, ifexpressed as an oxide, is �0.1 wt.%; usually includes Si, Al,Fe, Mg, Ca, Na, and K.
Mantle bedding Thin layers of ash and lapilli in pyroclasticfall deposits created as tephra settles uniformly onto ground,like fallen snow.
Mantle plume Column of relatively hotter and less densemantle rock that rises buoyantly toward the base of the litho-sphere from the deeper mantle.
Mantle reservoir Source of basaltic partial melts having distinct trace element and isotopic signatures.
Mantled gneiss dome Domical structure in deeply erodedorogens in which the core is of remobilized gneiss overlain by a concordant carapace of usually younger layered meta-morphic rocks. Cores are migmatitic in migmatite domes.
Marble Usually phaneritic recrystallized limestone in whichcalcite grains define a commonly granoblastic texture.
Mass-balance equation Expresses the weight or mole fraction of phases and concentrations of constituents that areinvolved in a chemical reaction in a closed system.
Massif A massive, structurally distinct, commonly topo-graphically elevated block of rock in a mountainous terrain.
Massif-type anorthosite See Anorthosite.
Matrix (groundmass) The aggregate of smaller grains thatsurround larger ones in magmatic and metamorphic rocks;can be either aphanitic or phaneritic.
Medium-K rocks Calc–alkaline rocks that contain inter-mediate concentrations of K. See Figure 2.18.
Megacrystic Texture in which large crystals, calledmegacrysts, of any origin lie in a finer matrix.
Mélange Widespread terranes in accretionary prisms(wedges) in which rocks of diverse composition, source, andmetamorphic character are mingled together by tectonic orother subduction-related processes. Internal contacts, even in the best of exposures, generally lack continuity. Hetero-geneous blocks that range upwards to kilometers across commonly lie in a schistose matrix.
Melanosome See Migmatite.
Metastable or metastability Refers to a state of a systemthat has a lesser energy than another possible state but is pre-vented from changing to it because of an activation energybarrier.
Melilitite Highly alkaline, strongly silica undersaturatedglassy or aphanitic rock composed essentially of melilite andclinopyroxene. See Figure 2.12.
Melt High-T liquid solution of ions; essential part ofmagma.
Melt fraction Proportion of partial melt in a source rock orof melt in a magma; can be expressed as a percentage.
Melt inclusion Minute volume of melt enclosed within acrystal that commonly forms by entrapment during skeletalgrowth of the crystal; rapid extrusion of the magma quenchesthe inclusion to glass.
Mesosome See Migmatite.
Meta Prefix meaning metamorphosed that is applied to aprotolith rock type, such as metaconglomerate.
Metabasite Metamorphosed mafic silicate rock that has relatively high concentrations of Mg, Fe, Ca and Al; protoliths are basaltic or, less commonly, a clay-bearing dolostone or marl (mixed clay-carbonate rock).
Metacrystic Contains metacrysts. Synonymous with morewidely used terms porphyroblastic and porphyroblasts.
Metaluminous rock Alumina deficient so that alumina saturation index (mole basis) Al2O3/(K2O � Na2O) > 1;contains Al-poor biotite and hornblende and normative anorthite and diopside; usually refers to felsic rocks.
Metamorphic convergence Contrasting protoliths meta-morphosed along different paths can produce the samemetamorphic rock product.
Metamorphic core complex Distended cover of unmeta-morphosed rocks tectonically overlies a domed core of metamorphosed rocks intruded by granitoids. The tectonicdetachment between metamorphosed and unmetamorphosedrocks is marked by a zone of mylonitization and brittle cataclasis.
Metamorphic differentiation Subsolidus, grain-scale processin which chemical components in an initially homogene-ous rock diffuse and segregate to growing nuclei, formingporphyroblasts, or into compositionally contrasting differen-tiated layers.
Metamorphic facies The collective set of mineral assem-blages in rocks of diverse chemical composition that areclosely associated in space and equilibrated under a restrictedrange of P–T conditions. Different mineral assemblages indifferent rocks of one facies reflect contrasts in their bulkchemical composition. Critical defining mineral assemblagesand other common mineral constituents are listed in Table 14.2and P–T conditions are depicted in Figure 14.33.
Metamorphic facies series Two or more metamorphic faciesthat are repeatedly associated in regional terranes around theworld in particular plate tectonic settings. Three basic series(Figure 14.34) and corresponding metamorphic field gradi-ents include the (1) near-trench, high P/T facies series
Glossary 703
(blueschist, prehnite–pumpellyite, and locally eclogite andzeolite facies), (2) intermediate-P facies series (greenschist,amphibolite, and, locally, granulite facies) of Barrovian zonesgenerally coincident with the magmatic arc, and (3) low-Procks of the same facies associated with biotite-cordierite-andalusite Buchan zones and syntectonic granitoids.
Metamorphic field gradients The locus of collective peakP–T conditions (Figure 14.36) recorded in equilibrated min-eral assemblages in different parts of a regional metamorphicterrane or contact metamorphic aureole.
Metamorphic fluid Volatile phase liberated by metamorphicmineral reactions.
Metamorphic grade Generally refers to the mineralogicalcharacter of rocks linked to their T of metamorphism,whether low, intermediate, or high. Although rock fabric maychange with respect to grade, the most diagnostic indicator ofgrade is the mineral assemblage; in rocks of similar chemicalcomposition, ones metamorphosed at higher grade (higherT ) contain fewer volatile-bearing minerals or minerals thatcontain less volatiles. In a terrane of increasing grade, suc-cessive metamorphic zones can be delineated by isograds ofconstant grade.
Metamorphic mineral assemblage Two or more mineralsequilibrated under a restricted range of intensive variables ina particular rock system. Because of sluggish kinetics of solid-state mineral reactions during changing metamorphic condi-tions, the mineralogical composition of a metamorphic rockdoes not necessarily constitute its stable mineral assemblage.
Metamorphic sole The dynamothermally metamorphosedrocks developed beneath a large thrust slab of hot ophioliteobducted onland. The sole has an inverted metamorphiczonation.
Metamorphic zones Systematic spatial variation in somedistinctive fabric attribute or mineral assemblage within widecontact aureoles and regionally metamorphosed terranes; re-sult from variation in metamorphic conditions. Mineralogicalzones result from a gradient in intensive variables and are delineated by isograd lines marked by the first appearance(or disappearance) of a particular index mineral, or mineralassemblage, in rocks of the same bulk chemical composition.Barrovian metamorphic zones develop during regional meta-morphism at intermediate pressures; delineating isograds aremarked by the index minerals biotite, garnet, staurolite,kyanite, and sillimanite in pelitic rocks. Buchan metamorphiczones develop in regional terranes at relatively low P and aredelineated by phase assemblages that contain the critical min-erals andalusite and cordierite.
Metamorphism Subsolidus equilibrating adjustments incomposition and fabric of a rock that result from significantchanges in the state of the rock system, its defining P, T,chemical composition, and state of stress; adjustments usuallytake place in the presence of a volatile fluid and there may beinteracting deformation. During metamorphism, rocks arehot enough to recrystallize but not hot enough to experiencewidespread melting.
Metasomatism A type of open-system metamorphism inwhich the nonvolatile chemical composition of a rock ismodified as a result of percolation of liquid through the
permeable rock body. Modification can be in the types andamounts of minerals in modal metasomatism, or inconspicu-ous changes in composition of original solid-solution mineralsin cryptic metasomatism, or a combination of these.
Metastable See Equilibrium.
Mg number Atomic 100 Mg/(Mg � Fe) where Fe is totaliron.
Miarolitic In granitic rocks, texture defined by irregularlyshaped cavities (vugs) into which euhedral vapor-phase crys-tals have grown; cavities are generally many grain diametersapart.
Microcrystalline Texture that consists of a mosaic of crys-tals that are visible only under a microscope.
Micrographic See Graphic.
Microlites Microscopic crystals that display optical bire-fringence in polarized light; larger than crystallites.
Microlithon See Slaty cleavage.
Microstructure Alternate term for texture.
Migmatite Composite heterogeneous rock on the outcropscale that consists of relatively mafic metamorphic rock mingled with felsic rock in the form of planar to folded andcontorted layers, criss-crossing veins, and irregular pods. Felsic leucosome can be separated from the mesosome (a descriptive term for intermediate rock) or paleosome (a gen-etic term for the “average” protolith), by a more mafic selvage,or melanosome. Migmatites originate by (1) local partialmelting and segregation of minimum-T-composition meltsthat solidify in place within the more refractory host rock, (2) injection of small volumes of felsic magma from externalsources, or (3) subsolidus metamorphic differentiation.
Migmatite dome See Mantled gneiss dome.
Mimetic recrystallization During metamorphism, newgrains have essentially replicated or reproduced pre-existingfabric, as in growth of lepidoblastic micas from aligned claymineral grains during prograde metamorphism of shale.
Mineral assemblage See Metamorphic mineral assemblage.
Mineral association Two or more minerals that coexist stably in a rock, such as quartz, feldspar, and biotite in a granite. Compare Metamorphic mineral assemblage.
Mineral paragenesis Mineral assemblage in a rock and theconditions responsible for its formation.
Mineralogical composition Types and chemical composi-tions of minerals constituting a rock.
Mineralogical phase rule See Goldschmidt’s mineralogicalphase rule.
Mineralogical zone See Metamorphic zone.
Minette A type of lamprophyre composed of abundantphenocrystic and matrix biotite–phlogopite together with alkali feldspar �plagioclase, clinopyroxene, and possiblyolivine in the matrix.
Mingled Refers to a hybrid rock or the magma from whichit formed that has compositionally contrasting parts pro-duced by physically merged dissimilar magmas.
Miscibility gap Compositional range between stably coexist-ing phases across a solvus at a particular P and T.
704 Igneous and Metamorphic Petrology
Mixed Refers to a hybrid rock or the magma from which it formed by homogenization of blended dissimilarmagmas; phenocrysts may show disequilibrium textures andcompositions.
Mixed-volatile mineral reaction A reaction in a metamorphic-rock system that involves at least two volatile species, usuallyH2O and CO2.
Mobile component A component, most commonly avolatile such as water, whose concentration (activity) is deter-mined by factors external to the system; it is not counted inan inventory of components for the mineralogical phase rule.
Mobile element One that moves about in open rock systems, generally because of its mobility; Na and K are commonly mobile whereas Al, Ti, Zr, and many others areimmobile because they are more tightly bonded in silicatecrystals.
Mobility Solubility of an ion in fluid solutions; approxim-ately proportional to ionic potential.
Modal composition (mode) Volumetric proportions, usu-ally expressed on a percentage basis, of the minerals consti-tuting rock.
Modal metasomatism A type of metasomatism in whichoriginal minerals are replaced by entirely new more stableminerals.
Model A representation of a real system.
Molar heat capacity The ratio of heat transferred into orout of a body to the incremental rise in its temperature; hasunits of J/mole deg. Compare Specific heat.Molar volume Inverse of density, or the volume of one moleof a material.
Mole fraction The proportion of one component relative toall other components in a phase or system.
Monogenetic Resulting from one process or having onesource or originating at one time in one place, such as a vol-cano built in one extrusive episode.
Monomineralic Consisting of one mineral.
Monzonite Phaneritic magmatic rock that contains ap-proximately the same proportions of plagioclase and alkalifeldspar. See Figure 2.8.
MORB Mid-oceanic ridge basalt; constitutes the upperpart of the oceanic crust.
Mugearite Sodic basaltic trachyandesite. See Figure 2.12.
My 106 years.
Mylonite Sheets of rock whose porphyroclastic (flaser)fabric is the result of focused deformation at high strain ratesin ductile shear zones. The microcrystalline, streaked matrixconsists of intensely flattened grains surrounding larger, lessdeformed porphyroclasts. Foliation is generally passive andmay not control how the rock breaks. Elongate mineral aggregates can express a “stretching” lineation. Protomy-lonite has �50% porphyroclasts. Ultramylonite has �10%porphyroclasts and matrix grains are so minute (�0.01 mm)that the hand sample may resemble chalcedony or chert oreven appear glassy, not unlike pseudotachylite. Grain-size reduction in mylonites originates from a dynamic interplaybetween “destructive” plastic grain deformation under non-hydrostatic stress and constructive dynamic recrystallization.
Myrmekite In felsic rocks, texture that consists of an inter-growth of vermicular (“wormy”) quartz in a sodic plagioclasehost; commonly in contact with K-rich alkali feldspar.
Nappe A sheetlike mass of overthrust rock that may befolded in a recumbent (overturned) fashion.
Negative Nb–Ta–Ti anomaly Depletion of these HFS ele-ments relative to adjacent more and less compatible elementsin a normalized trace element pattern.
Nelsonite Extremely rare rock made mostly of Fe–Ti oxides and apatite.
Nematoblastic See Lineation.
Nephelinite Highly alkaline, strongly silica-undersaturatedglassy or aphanitic rock composed essentially of nephelineand clinopyroxene and possible olivine. See Figures 2.12 and2.13.
Net-transfer reaction In metamorphic rocks, a reaction inwhich there is production and consumption of phases thatchange their modal proportions and chemical compositionsthrough a divariant stability field.
Network-forming cation In a melt, Si and other smallhighly charged ions, such as Al and Ti, linked to O, forminga polymer.
Network-modifying cation In a melt, a generally larger ion of lesser charge, such as Ca, Mg, K, that is not part of apolymer.
Newtonian viscosity A type of viscosity in which thecoefficient of viscosity, or the viscosity, is the ratio of appliedshear stress to time rate of strain.
N-MORB Normal MORB; derived from a mantle reser-voir relatively depleted in incompatible elements.
Nonbridging oxygen In a melt, an O ion that is not part ofa polymer and that bonds with network-modifying cations.
Nonhydrostatic state of stress Three principal stresses areunequal; can deform a body.
Non-Newtonian viscosity See Viscosity.
Norite A type of gabbro that has more orthopyroxene thanclinopyroxene.
Normal stress A type of stress that acts perpendicular to asurface.
Normal zoning Compositional changes in a solid-solutionmineral grain that result from normal changes in intensivevariables, such as declining T producing declining anorthiteconcentration in a plagioclase grain from core to rim. Also,compositional variations in a magmatic body, such as inwardincrease in felsic mineral proportions in a granitic intrusion.
Normalized trace element diagram A plot of concentrationratios of trace elements relative to chondrite or primitivemantle, usually arranged according to incompatibility.
Normative composition (norm) Assemblage of hypo-thetical water-free, standard normative minerals calculatedfrom the chemical composition of a rock according to therules in Appendix B.
Nucleation Process of formation of an embryonic cluster of ions called a nucleus onto which additional ions attachduring subsequent crystal growth. The number of nuclei in avolume of melt is the nucleation density. In homogeneous
Glossary 705
nucleation, nuclei form within an existing homogeneousphase, such as a melt, by transient fluctuations in its atomicstructure that become stabilized if of sufficient size. In hetero-geneous nucleation, nuclei form on existing boundaries ofphases; this phenomenon likely occurs in some magmatic systems and is probably universal in metamorphic rocks.
Nuée ardente Alternate term for pyroclastic flow.
Obduction Overthrusting of oceanic lithosphere onto acontinental margin.
Ocean-ridge metamorphism Hydrothermal metamorphismat oceanic spreading ridges where advecting seawater inter-acts with hot fractured basaltic and peridotitic rocks of theoceanic lithosphere. Produces variably hydrated and locallycarbonated low-grade rocks that are distributed over two-thirds of the surface of the Earth as a result of seafloorspreading.
Oceanic plateau Broad topographic high rising a km or soabove the surrounding sea floor and underlain by a basalticcrust as much as 40 km thick.
Ocelli Alternate term for variole.
OIB Oceanic island basalt.
Oikocryst Large mineral grain that encloses smaller, ran-domly oriented mineral inclusions in the magmatic poikilitictexture.
Olivine tholeiite Basalt rock type that contains normativeolivine and hypersthene.
Open system Matter and energy can flow across the systemboundary and work can be done on and by the system.
Ophiolite A sequence of variably altered oceanic rocks exposed onland in subduction zones; includes from the topdown: (1) marine sedimentary rock, (2) volcanic rock (mostlybasaltic pillow lava), (3) sheeted-dike complex of basalticrock, (4) gabbro, (5) cumulate ultramafic rocks, and (6) meta-morphic-textured mantle peridotite. The sequence is a segment of oceanic crust and underlying mantle tectonicallyemplaced more or less intact onto the overriding plate by obduction or highly dismembered in accretionary prisms.
Ophitic Magmatic texture in which large clinopyroxenespartially to completely enclose smaller euhedral plagioclases;occurs in diabase and gabbro.
Orangeite Similar to kimberlite but containing more radiogenic Sr and Nd isotope ratios. See Section 13.12.2.
Order of magnitude Factor of ten.
Orogen An orogenic belt, or mountain belt, that is pro-duced where an oceanic plate converges against an overridingcontinental plate, which deforms by folding and thrustingand experiences arc magmatism and regional metamorphism.Some orogens that essentially lack arc magmatism are pro-duced by collision of two converging continental plates.
Ortho- Prefix denoting a magmatic protolith, as in ortho-gneiss derived by metamorphism of a quartz diorite.
Oscillatory zoning In a solid solution crystal, thin con-centric zones that are alternately enriched and depleted in an end member component; commonly occurs in magmaticplagioclase where the zones are alternately enriched and depleted in the anorthite end member.
Ostwald ripening (coarsening) Process of grain-boundarymigration in which less stable smaller grains of a particularphase in an aggregate are consumed so that neighboring onesof that phase grow larger; the total volume of the phase remains unchanged.
Ostwald’s step rule In a change of state, the kineticallymost favored phase (or phases) forms before the more stableone of least possible free energy.
Overpressured magma system The pressure of a magmasystem, or its volatile pressure, exceeds the confining pressure.
Oversaturated Refers to a system in which the concentra-tion of a component in a phase exceeds its solubility at someP and T so that a separate phase made of the componentforms. Also refers to the concentration of silica and aluminarelative to alkalies in magmas and rocks. See Silica saturation.
Overstepping A phenomenon caused by sluggish kineticrates of mineral reactions and phase transformation, such ascrystallization, where the change in the intensive variablemust go beyond the equilibrium value to induce the reactionor growth of the new, more stable, phase. For example, tofreeze water the T must generally overstep or cool below 0°C.
P Designates confining pressure.
P-domains Planar domains (microlithons) in foliated, low-grade metasedimentary protoliths that consist essentially oflepidoblastic folia of phyllosilicates and finer grained car-bonaceous matter, locally graphite, and Fe-Ti oxides. Minorquartz grains, if present, are flattened, truncated by adjacentphyllosilicates, and have local strain-shadow overgrowths.Contrast with Q-domains.
P–T path The trajectory in P–T space of metamorphic conditions experienced by a rock or terrane.
P–T–t path A metamorphic P–T path for which chrono-logic data have been linked to specific P–T points.
Pahoehoe lava flow Usually formed of low-viscosity basaltlava that consists of thin, glassy sheets, tongues and lobes,commonly overlapping one another and fed from distributarytubes; rock contains abundant subspherical vesicles and asmooth or ropelike surface. Contrast aa and block lava flows.
Paired metamorphic belts Paralleling juxtaposed belts of high P/T and intermediate-P metamorphism in someMesozoic–Cenozoic orogens in the circum-Pacific.
Palagonite Chemically altered basaltic glass that consists ofa complex mixture of clay and zeolite minerals and hydratedferric oxides; is variably orange to brown, isotropic to weaklybirefringent in thin section, and commonly concentricallylayered in colloform fashion.
Paleosome See Migmatite.
Pantellerite Peralkaline rock in which Al2O3 � 1.33 FeO� 4.4 (wt.%).
Para- Prefix denoting a sedimentary protolith, as inparaschist derived by metamorphism of a shale.
Parasitic cone Formed where magma is extruded from acentral vent on the flank of a composite or shield volcano.
Parent magma The initial magma from which daughter, orevolved, magmas are subsequently derived by differentiation.Not necessarily a primary magma.
706 Igneous and Metamorphic Petrology
Partial melting (anatexis) Generation of a melt that is lessthan the whole source rock. In equilibrium, or batch, partialmelting equilibrium is maintained between crystals and meltin the closed system. In fractional partial melting the melt isseparated from the residual crystals.
Partial molar volume The change in molar volume of aphase that results when a small amount of one component isadded to or taken away from the phase.
Partial pressure The pressure of one gas component in amixture of many.
Partially resorbed Refers to an unstable, anhedral remnantof a crystal that was not entirely dissolved into the melt before solidification of the system.
Partition coefficient The ratio of the concentration of an element in a mineral to that in the stably coexisting liquid.
Passive emplacement Intrusion of magma that results in little or no deformation of country rock.
Pegmatite Rocks of highly variable grain size in which indi-vidual crystals can be as much as several m. Usually refers toa textural variety of leucocratic granite. Simple pegmatiteconsists of albite, quartz, perthite, and possible minor mus-covite, tourmaline and Fe-Mn garnet. Complex pegmatitecontains essentially the same minerals but has in additionhigh concentrations of incompatible elements that stabilizeexotic minerals such as spodumene, pyrochlore, and cassi-terite. Zoned pegmatite has a generally imperfect layeredzonation of fabric and mineralogical composition.
Pegmatitic Fabric that consists of exceptionally large, butheterogeneously-sized, crystals, at least several cm to as muchas several m.
Peléan dome A highly viscous, steep sided lava dome.
Pelite (pelitic) Rocks made largely of clays (shale or mudstone) or their metamorphic equivalents. Metamorphicpelites are composed of some combination of Al-rich silicates, such as micas, chlorite, Al2SiO5 polymorphs,cordierite, garnet, staurolite, and at highest metamorphictemperatures, alkali feldspar; quartz is almost always presentand carbonaceous matter at low grade or graphite is common.
Peralkaline rocks Alumina-undersaturated felsic rock suitewhose alumina saturation index (mole basis) Al2O3/(K2O �Na2O) � 1; contain alkali-rich mafic minerals and have normative acmite or sodium metasilicate but no normativeanorthite.
Peraluminous rocks Alumina-oversaturated felsic rock suitewhose alumina saturation index (mole basis) Al2O3/(K2O �Na2O � CaO) > 1; contain aluminous minerals such as muscovite, garnet, cordierite.
Perfect equilibrium crystallization Growing crystals reactand re-equilibrate completely with a melt as P–T–X condi-tions change; solid-solution crystals are homogeneous.
Perfect fractional crystallization Crystals are immediatelyisolated, removed, or fractionated from the melt as soon asthey form so that no crystal-melt reaction relations occur.Some degree of fractional crystallization produces com-positional zoning in solid-solution mineral grains. See alsoContinuous reaction series.
Peridotite Ultramafic phaneritic rock composed of pyrox-ene and 40–90% olivine. See Figure 2.10b.
Peritectic An invariant reaction point in a cooling magmasystem where a reaction relation ensues between crystals andmelt to yield crystals of a different composition; same as anincongruent melting point in a heating system.
Perlite Hydrated silicic glass that has perlitic texture; typically pearl-gray color, but may be green, red, or brown.
Perlitic Texture in silicic glass that consists of concentriccracks formed by progressive hydration under subaerial conditions.
Permeability Rate at which fluid moves through a perme-able body according to Darcy’s Law. A permeable body hasinterconnected openings (pore spaces).
Perthite Intergrowth of irregular lamellae of Na-richfeldspar in a K-rich host. A product of exsolution below itssolvus of an initially homogeneous high-T alkali feldspar.
Petrogenesis Rock origin.
Petrogenetic grid A network of univariant reaction linesbounding stability fields of minerals and mineral assemblagesin a P–T diagram appropriate for a particular bulk-rockchemical composition.
Petrogeny’s residua system In the NaAlSi3O8-KAlSi3O8-SiO2-H2O “granite” system, the minimum T melt that coexists with subequal proportions of alkali feldspar andquartz; corresponds to the composition of most naturally occurring granites.
Petrography Observable and measurable properties of arock, including its modal composition and fabric, from whicha rock name can be applied.
Petrology The science of rocks, their nature and origin.
Petrotectonic association Specific types of rocks that occurtogether in a specific tectonic regime.
PGE See Platinum group elements.
Phaneritic Texture in which grains of major rock-formingminerals are all large enough to be identifiable withoutmagnification.
Phase A part of a system which is chemically and physic-ally homogeneous and bounded by a distinct interface withadjacent phases; may be solid, liquid, or gas.
Phase (stability) diagram Shows which phase or phases ina system are more stable with respect to T, P and concentra-tion of chemical components.
Phase layering Abrupt appearance or disappearance of aparticular mineral in a layered intrusion.
Phase rule Indicates the number of intensive variables thatmay independently vary without changing the number ofphases in a system at equilibrium.
Phengite High-silica muscovite in which there is coupledsubstitution of Si and Fe2� or Mg for 2Al; atomic Si/Al � 3.
Phenoclast Irregularly shaped fragment of quartz orfeldspar in pyroclastic flow deposits formed as crystals containing overpressured melt inclusions blow apart duringeruption.
Phenocryst Larger, more or less euhedral crystal precipi-tated from a melt embedded in finer grained or glassy matrix.
Glossary 707
Phonolite Highly alkaline, leucocratic, intermediate-silicaaphanitic or glassy rock composed of feldspathoids, alkalifeldspar, and minor mafic minerals. See Figures 2.12 and 2.13.
Phreatic explosion Produced where ground-water makescontact with hot rock, converting the water into a large volume of steam.
Phreatomagmatic explosion See Hydromagmatic explosion.
Phreatoplinian eruption Highly explosive venting of volatile-rich, usually silicic, magma enhanced by contact with externalwater that vaporizes to steam.
Phyllite Aphanitic metamorphic rock that has a lustrous orsilky sheen on well developed foliated surfaces. Mostlypelitic. Phyllites are transitional between slates and schistsand share associations and properties of both.
Phyllonite A type of mylonite that contains abundant phyllosilicates; may have S–C fabric.
Picrite An olivine-rich basalt in which MgO � 18 wt.%and (Na2O � K2O) � 1–3 wt.%.
Pipe vesicle See Vesicle.
Pilotaxitic See Felty.
Pipe (plug) Slender, subvertical columnar or funnel-shaped body of intrusive magmatic rock.
Pitchstone Massive, dark-colored glass that has a waxy luster in hand sample; contains 6–10 wt.% water absorbed at near atmospheric conditions.
Plagiogranite Phaneritic or granophyric rock composedmostly of sodic plagioclase, lesser quartz, and minor maficminerals; occurs in ophiolite.
Plane strain Change in shape or size is restricted to two dimensions while the third dimension remains unchanged.This is the type of strain in rocks that is represented, as a mat-ter of convenience, on a two-dimensional sheet of paper.
Plastic A behavior or response to applied stress in whichstrain is nonrecoverable (irreversible) at a stress above theyield strength of the material; below that stress no strain occurs.
Platinum group elements (PGE) Ru, Rh, Pd, Os, Ir, Pt.
Plinian eruption Highly explosive venting of volatile-rich,usually silicic, magma that forms a steady turbulent plinianplume.
Plinian plume A highly buoyant volcanic plume.
Plug See Pipe.
Pluton An intrusion of magma that is not sheet-like.
Plutonic Processes and products related to magma beneaththe surface of the Earth. Contrast Volcanic.
Poikilitic Magmatic texture in which large oikocrystsenclose smaller, randomly oriented mineral inclusions.
Poikiloblastic Metamorphic texture in which porphyro-blasts contain numerous inclusions of other minerals that areusually, but not always, the same minerals as in the surround-ing finer grained matrix. The inclusion-filled porphyroblastsare called poikiloblasts. In thin sections, high-relief poik-iloblasts of garnet and staurolite that contain abundant inclusions of low-relief quartz resemble a sponge or a sieve,hence the alternate designation sieve texture.
Point defects See Crystal defects.
Polygenetic Resulting from two or more processes or hav-ing multiple sources or originating at more than one time inmore than one place.
Polymer In a melt, chain of linked ions, usually Si and O.
Polymerization, degree of In a melt, the proportion of ionsthat form polymers; the ratio of non-bridging O to network-forming tetrahedrally coordinated cations, such as Si and Al.Silica-rich melts are more polymerized than silica-poor melts.
Polymetamorphism Repetition of essentially unrelatedepisodes of penetrative ductile deformation, or recrystalliza-tion, or both. Typical of regional metamorphism in long-livedorogens.
Porosity Proportion of openings in a rock that can hold liquid relative to the whole rock volume.
Porous flow Involves movement of liquid along grainboundaries or between connected pore spaces.
Porphyritic Inequigranular magmatic texture made of twograin sizes; more or less euhedral larger crystals, called phe-nocrysts, are embedded in a finer grained or glassy matrix.
Porphyroblastic Common texture in metamorphic rocks inwhich larger grains, called porphyroblasts, are surroundedby a finer grained matrix of other phases. Porphyroblasts are typically some type of alumino-silicate, such as garnet,staurolite, and andalusite.
Porphyroclastic Texture of mylonites where ovoidal,strained mineral grains, called porphyroclasts, that havemostly survived ductile deformation lie in a finer foliated matrix.
Porphyry Granitic rock that crystallized from a crystal-bearing magma in a shallow intrusion due to rapid reductionin water pressure, quenching the melt; creates aphanitic porphyritic texture.
Power law An exponential equation that relates the activa-tion energy of ductile strain, applied nonhydrostatic stress,strain rate, and T, permitting extrapolation to metamorphicconditions not attainable in the laboratory.
ppb Parts per billion.
ppm Parts per million.
Precision Reproducibility; a number that indicates howmuch statistical variation from the average or mean value occurs in replicate determinations.
Pressure Force acting over an area; has units of bars or Pascals (Pa). Confining pressure (also referred to as load or lithostatic pressure) at some depth within the Earth is produced by the weight of overlying rock or water. See alsohydrostatic state of stress.
Pressure ridge Elongate, commonly arcuate prominenceon the surface of a moving lava flow; wavelength and ampli-tude of uplifts are on the order of meters.
Pressure solution As a consequence of Riecke’s principle,ions diffuse from more soluble, more stressed grain marginsto less stressed surfaces where grain growth takes place; thepresence of an intergranular fluid phase enhances the diffu-sive transfer especially in aggregates of calcite and quartz thatare relatively soluble under metamorphic conditions.
708 Igneous and Metamorphic Petrology
Primary magma Unmodified magma at its source of gen-eration; has not experienced any subsequent overprinting differentiation.
Primitive magma A magma that has been relatively un-modified by differentiation processes after leaving its source.
Primitive mantle A hypothetical mantle composition beforeextraction of crustal components but after segregation of themetallic core; used as a comparative reference in normalizingtrace element concentrations.
Principal planes Three specially oriented orthogonalplanes in a stressed body on which only normal stresses (noshear stresses) prevail.
Principal stresses Three mutually perpendicular (orthogo-nal) normal stresses that act on principal planes; representthe total state of stress at a point in a body; in a general stateof stress they are unequal and denoted by �1 � �2 � �3. Allare compressive within the Earth.
Product phases More stable phases that are created anewfrom reactant phases during the progress of a mineral reaction.
Prograde metamorphism A metamorphic path of increas-ing T (and generally increasing P) that culminates at a peakor maximum T; manifest by prograde mineral reactions.
Prograde mineral reaction In metamorphic rocks, increas-ing T drives breakdown of lower-grade reactant phases andcreation of higher-grade product phases; commonly liberatesvolatiles.
Protolith Parent rock before metamorphism. May be ametamorphic rock in the case of polymetamorphism.
Protomylonite See Mylonite.
Psammitic Refers to sandy protoliths.
Pseudotachylite Typically black glassy to aphanitic rockthat is formed by melting along a fault.
Pumice Highly vesicular glass, usually silicic.
Pumice flow A type of pyroclastic flow that consists oflapilli and/or blocks of pumice in a lesser matrix of ash.
Pumiceous Highly vesicular texture in glass.
Pure shear Nonrotational coaxial strain.
Pyroclastic Refers to processes and products related to explosive volcanic eruption.
Pyroclastic fabric Fragmental volcanic fabric produced by explosive processes; includes vitroclasts quenched fromjuvenile melt.
Pyroclastic fall (ash fall) A deposit of moderately to wellsorted bedded ash or lapilli settled out of a volcanic plume.
Pyroclastic flow (ash flow, nuée ardente) Ground-hugging,fast-moving avalanche of hot ash, lapilli, and locally blockspartly mobilized by gas.
Pyroclastic surge Dilute concentration of solid particles inhot gas that moves across the ground at hurricane-like speed.A base surge is a ring-shaped surge moving radially outwardalong the ground from the base of a collapsing volcanic column.
Pyroclasts (ejecta, tephra) Fragments of volcanic materialejected explosively from a volcanic vent.
Pyroxenite Ultramafic phaneritic rock composed of pyroxenes and �40% olivine. See Figure 2.10b.
Q-domains Consist essentially of quartz and lesser possiblefeldspar, carbonate minerals, and poorly oriented phyllosili-cate grains. Grains are less deformed and relict detrital grainsare more common than in P-domains from which more soluble quartz was removed by pressure solution. Togetherwith P-domains, constitute two alternating and anastomosingfabric domains in foliated, low-grade meta-sedimentary protoliths whose origin is consistent with the effects of strainpartitioning and differential pressure solution.
Quartz diorite A diorite that contains, in terms of felsicminerals, �20 modal % quartz. See Figure 2.8.
Quartz monzonite A monzonite that contains, in terms offelsic minerals, �20 modal % quartz. See Figure 2.8.
Quartz tholeiite Basalt rock type that contains normativequartz and hypersthene.
Quartzite Recrystallized quartz-rich protolith in whichquartz grains define a commonly phaneritic granoblastic texture; ragged, serrated grain margins can result from deformation and dynamic recrystallization.
Radiation A type of heat transfer by electromagnetic energy through a transparent medium, such as solar heating.
Rapakivi Magmatic texture in which an alkali feldspargrain is rimmed by plagioclase.
Rapakivi granite A-type granite with rapakivi texture.
Rare earth elements (REE) Coherent group of usually divalent ions comprising atomic numbers 57 to 71; can include Y.
Rayleigh number A dimensionless ratio of buoyant drivingforce to viscous retarding force in thermal convection; largerratios correspond to greater gravitational instability that leadsto convection.
Reactant phases The phases that combine and are partiallyor wholly consumed during the progress of a mineral reaction.
Reaction affinity A measure of the driving force for a min-eral reaction as a changing system oversteps an equilibriumcondition. Can depend on the excess T in a prograde meta-morphic reaction or the degree of supersaturation of a crys-talline phase dissolved in a liquid. Formally, is the product ofthe thermal overstepping, (T Teq), and the entropy changefor the reaction.
Reaction-enhanced permeability Creation of intercon-nected openings in a metamorphosing rock by the mineral reaction occurring in it. Voids result where the volume ofsolid products is less than the volume of solid reactants, usually in a devolatilization reaction.
Reaction pair Two minerals, one of which partially formedat the expense of the other, in an incomplete discontinuousreaction relation involving a melt; for example, olivine andorthopyroxene.
Reaction progress variable A thermodynamic function thatpermits quantitative monitoring of the progress of mixed-volatile reactions during metamorphism of calc-silicate andimpure carbonate rocks.
Reaction relation Chemical reaction in which crystals andmelt combine to yield crystals and melt of a different com-position. Can be continuous or discontinuous.
Glossary 709
Reaction rim Magmatic texture in which a more stablemineral or mineral assemblage surrounds an earlier formed,less stable, mineral that was not completely resorbed in a reaction relation; the rim and rimmed mineral constitute a reaction pair.
Reaction series Crystalline products of a fractionatingmagma that are produced by incomplete continuous or discontinuous reaction relations. See Continuous and Discontinuous reaction series.
Reaction texture A metamorphic rock texture in which reactant phases, or their relics, and product phases are preserved in close spatial association; provide insights intothe nature of the solid-state mineral reaction.
Recovery Energy-reducing processes in a plasticallystrained aggregate that are accomplished by rearrangementof dislocations into subgrain walls, bulging of grain bound-aries into adjacent grains, and nucleation and growth ofstrain-free grains. Counteracts strain hardening in plasticallydeforming mineral grains and allows for slow continuous deformation, called dislocation creep, to occur under uni-form applied nonhydrostatic stress.
Recrystallization In a strict sense, involves grain-boundarymodification of existing stable phases in a solid-state meta-morphic system but in this textbook includes nucleation and growth of new crystalline phases stabilized by changingmetamorphic conditions; commonly facilitated by an inter-granular volatile fluid and enhanced by deformation.
Redox reaction Reduction–oxidation reaction that is con-trolled by oxygen fugacity as well as other intensive variables.
REE See Rare earth elements.
Regional metamorphism The most widespread of anymetamorphism within the continental crust; developed in thevast roots of orogens and involves broadly concurrent recrys-tallization resulting from changing P and T and deformationresulting from contractional nonhydrostatic stresses duringconvergence of lithospheric plates in the subduction zone.Typical products are tectonites in mineralogically diversemetamorphic zones.
Relaxation “time” In a viscous melt, shear strain may accu-mulate faster than the time required for the atoms to relaxinto their equilibrium configuration, so that the melt breaksapart as if it were a solid.
Relict fabric Vestiges of the original fabric of a protoliththat survived solid-state recrystallization during metamor-phism; commonly preserved in fine-grained, low-grade rocksin which new or boundary-modified metamorphic mineralgrains have not totally obliterated original mineral grains.
Replacement A secondary mineral grain, or fine-grainedaggregate of one or more minerals, taking the place of a prim-ary mineral grain formed under different conditions.
Replenishment Refers to new draughts of commonlydenser and usually hotter and more primitive magma intro-duced into a chamber of crystallizing magma.
Residual liquid (melt) Liquid (melt) that remains aftersome crystals have formed in a crystallizing magma.
Resorbed Crystal dissolved into a melt.
Restite Residual crystals or granular aggregates of thesource rock remaining after partial melt generation that havebeen entrained into the ascending magma and preserved after its solidification.
Resurgent (retrograde) boiling Release (exsolution) ofvolatiles from an initially volatile-undersaturated melt thatbecomes oversaturated because of crystallization of volatile-free minerals in a magma.
Resurgent caldera Created where a caldera floor is upliftedand domed sometime after subsidence.
Retrograde metamorphism Reconstitution of a rock duringdeclining T. Because of sluggish kinetics and difficulty ofmoving volatiles into impermeable high-grade rocks, retro-grade reactions that volatilize rocks during declining T aregenerally incomplete or do not take place at all; retrograde effects are commonly localized along fractures or shear zoneswhere volatile fluids can enter the otherwise impermeablerock.
Reverse graded bedding Particle size increases upwards ina bed.
Reversible thermodynamic process A change in a systemthat can be reversed by an infinitesimal change of an intensivevariable.
Reynolds number A dimensionless ratio of inertial to vis-cous forces used to characterize liquid flow as either laminaror turbulent; large ratios correspond to turbulent flow.
Rheology The science of the response of rocks and magmasto applied nonhydrostatic stress by combinations of ideallyelastic, plastic, and viscous behavior.
Rheomorphic Refers to secondary flow of a mass of hotwelded vitroclasts, such as happens where deposited on sloping ground.
Rhyolite Leucocratic glassy or aphanitic rock made essen-tially of alkali feldspar, lesser quartz, and minor mafic minerals; contains generally �69 wt.% silica and �6 wt.%total alkalies. See Figures 2.12 and 2.13.
Riecke’s principle Relatively more stressed crystals or morestressed parts possess a larger store of work-related energyand consequently are less stable and more soluble in the presence of a fluid.
Rift A linear region of crustal extension; magma may ascendthrough subvertical extensional fractures striking parallel tothe zone.
Ring dike Subvertical cylindrical sheet intrusion.
Ring fault (fracture) Cylindrical subvertical fault boundinga subsided roof slab that forms a caldera; approximately follows the outline of the underlying evacuated magma chamber.
Ring-fracture stoping Subsidence and engulfment of ring-fracture-bounded roof block into underlying magma chamber.
Rock suite A kindred group of rock types that have somecommon property, such as a compositional attribute; alkalinerocks are an example.
Rock type A rock designated by a narrowly defined com-position and fabric, such as andesite.
710 Igneous and Metamorphic Petrology
Rodingite Massive light-colored metasomatic rock composedof Ca-rich minerals; spatially associated with serpentinite.
Roof pendant Erosional remnant of downward projectingroof rock that is completely surrounded by plutonic rock.
Room problem How was space in the crust provided for amagmatic intrusion?
Saturated The state of a system in which the concentrationof some component equals its solubility.
S–C fabric Consists of compound foliations developed simultaneously in shear zones, especially evident in graniticprotoliths. Sigmoidal S-surfaces that are defined by alignedmica flakes and quartz ribbons lie between oblique C-surfacesthat are parallel to the overall shear zone and consist ofspaced, thin discrete zones made of finer, more highlystrained grains.
Schist Phaneritic, strongly foliated metamorphic rock; com-monly porphyroblastic and lineated. Weak to well developedsegregation layering of felsic and mafic material may enhancethe foliation expressed by preferred orientation of platy min-eral grains. Protoliths are commonly pelitic but any chemicalclass can be represented.
Schistosity A type of foliation in schists expressed by pre-ferred orientation of platy phyllosilicates and/or other flatmineral grains. Rocks possessing schistosity readily split intoslabs or plates.
Schlieren (singular is schliere) Magmatic fabric defined bydiffuse lenticular concentrations of mafic minerals in a moreleucocratic matrix; common in granitic rocks.
Scoria Highly vesicular mafic glass; there may be such ahigh concentration of minute hematite grains in red-brownscoria that it does not appear glassy in hand sample. Scoriace-ous is the corresponding fabric designation. Scoria conesdevelop around Strombolian vents.
Seamount Submarine topographic prominence; commonlyformed by extrusions of lava.
Second boiling See Resurgent boiling.
Second Law of Thermodynamics Spontaneous naturalprocesses even out the concentration of some form of energy;in an isolated system, spontaneous processes proceed in thedirection of increasing entropy.
Sense of shear See Shear-sense indicators.
Seriate Phaneritic, inequigranular magmatic texture inwhich grains range more or less continuously in size; contrastbimodal size distribution in porphyritic texture.
Sericite Fine-grained white mica.
Serpentinite Typically massive (nonfoliated), generallyaphanitic rock composed mostly of any of the three serpen-tine minerals lizardite, antigorite, and chrysotile togetherwith accessory magnetite, brucite, talc, and other Mg-bearingsilicates. Produced by low- to moderate-T hydration andmetasomatism of mostly ultramafic protoliths, as in ophiolite;widespread in accretionary prisms with mélange.
Shard Usually ash-size fragment of glass that was producedby explosive volcanism or hydromagmatic processes.
Shear fracture See Fault.
Shear-sense indicators Fabric features that indicate whetherthe sense of shear deformation was dextral (right-lateral) orsinistral (left-lateral). Include offset planar markers, step-faulted grains, and rotated porphyroclasts and poikiloblasts.
Shear stress A type of stress that acts parallel (tangential)to a surface.
Sheet intrusion Tabular magmatic body having very smallaspect ratio of thickness/length.
Sheeted dike complex Subparallel dikes intruded into wall-rocks of older dikes in an extending crust, such as at oceanspreading ridges.
Shield See Craton.
Shield volcano A low-aspect-ratio edifice having the shapeof an overturned dinner plate or warrior’s shield; built by innumerable extrusions of basaltic lava from a central ventcomplex and locally one or more associated fissure systems.
Shock (impact) metamorphism Localized reconstitution ofrocks impacted by meteorites. Characteristic features includecataclastic fabric, products of intracrystalline plastic strain,and high-P phases, such as the silica polymorphs coesite andstishovite.
Shoshonite Andesitic rock that contains very high concen-trations of K. See Figure 2.18.
Sialic Rock rich in Si and Al that contains abundantfeldspar; used especially with reference to the continentalcrust.
Sidewall crystallization Occurs in magma intrusions at subvertical contacts as heat is transferred into the wallrock.
Sieve texture See Poikiloblastic.
Silica saturation Refers to the activity of SiO2 or its con-centration relative to other oxides in a rock. Silica over-saturated rocks contain modal quartz or its polymorphs and normative quartz; corresponding melts have a silica activity � 1. Silica saturated rocks contain no modal quartz,feldspathoids, or olivine and no normative quartz, olivine, or nepheline. Silica undersaturated rocks contain modal Mg-olivine and possibly feldspathoids, analcime, perovskite,melilite, normative olivine and possibly nepheline; silica activity of melt �1.
Silicate liquid (melt) A high-T solution of ions, mainly silicon and oxygen.
Silicic Refers to rocks, magmas, and melts that containlarge concentrations of silica, manifest in rocks such as granite or rhyolite by an abundance of alkali feldspar, quartz,or its polymorphs, or glass rich in SiO2.
Sill A sheet intrusion that concordantly parallels planarstructures in its host rocks; sometimes defined as a horizontalsheet intrusion. Many sills emplaced during an intrusiveepisode are a sill swarm.
Simple shear Rotational, noncoaxial strain analogous to deforming a deck of cards.
Skarn Calc–silicate rock composed of Ca–Mg–Fe–Al silicate minerals produced from a limestone or dolostoneprotolith by metasomatic replacement. Most are in contactaureoles where replacement is accomplished by advectinghydrothermal solutions derived from the nearby magmatic
Glossary 711
intrusion or locally from heated meteoric ground water.Smaller scale skarns are created by interdiffusion of compon-ents at boundaries between layers of silicate and carbonaterock.
Skeletal Usually refers to a crystal habit in which the out-line or framework is incompletely filled in, such as H-shapedplagioclases; formed by rapid growth under substantial over-stepping of equilibrium conditions for initiating growth.
Slate Aphanitic metamorphic rock that has a dull luster onwell-developed pervasive slaty cleavages. Tougher than shale.Most commonly pelitic. Low-temperature recrystallization ofpelitic slate in contact aureoles creates poikiloblasts ofcordierite, andalusite, or mica, forming spotted slates.
Slate belt Linear terrane of slate and associated low-grademetasedimentary rocks in some mountain belts. Slaty cleav-age is generally steeply inclined and subparallel to the belt.
Slaty cleavage Foliation in aphanitic metamorphic rocksexpressed by preferred orientation of platy phyllosilicatesand other flat mineral grains: allows rocks to readily split into thin plates. If the fabric is homogeneous the cleavage issaid to be continuous but if there are alternating laminar orlenticular domains of contrasting compositional and/or textural character, called microlithons, the cleavage is spaced.Minerals may have been removed by dissolution along spacedcleavages, which are either a crenulation cleavage cuttingacross and wrinkling pre-existing S-surfaces in the rock ordisjunctive cleavage that occurs in rocks lacking pre-existingfoliation.
Slip (translation gliding) A mechanism of intracrystallineplastic strain that depends on the existence of dislocations inwhich parts of the crystal slide past one another in parallelfashion by integral multiples of fundamental crystallographicunits but retaining internal lattice continuity and cohesion.Slip (glide) planes in crystals commonly parallel crystallo-graphic directions of densest atomic packing and widest interatomic spacing, where interplane bonding is weakest, forexample, (001) in micas. The slip direction and other aspectsof the slip system are intrinsic to a particular crystal and theprevailing P, T, and strain rate.
Solid–fluid reaction Release or consume a volatile fluid;equilibria are governed by the composition (activity) of thefluid as well as P and T.
Solidus T below which any mixture of components in anequilibrium system consists only of crystalline solids.
Solubility Maximum concentration of a particular compon-ent that can be uniformly dissolved in a melt or crystal undera particular P and T without the appearance of a separate stable phase made of that component.
Solution A homogeneous mixture of two or more chemicalcomponents in which their concentrations may be freely varied within certain limits; can be solid, liquid, or gaseous.
Solvus Locus of points in T- or P-space below which an ini-tially homogeneous crystalline phase exsolves or unmixesinto two or more different homogeneous crystalline phases.
Soret diffusion A thermal gradient drives movement ofions in a chemically homogeneous melt.
Source rock Rock in the lower continental crust or uppermantle that is nearly at solidus T and partially melts because
of local changes in P, T or X; rock volume where magma is generated. Fertility refers to the potential amount of components that are available to yield a melt of a specificcomposition.
Spatter cone (mound) Solidified accumulation of blobs ofmolten, usually basaltic, lava around a lava fountain.
Specific heat Ratio between the increment of heat leavingor entering a unit of mass to its incremental change in T; hasunits of J/g deg. Compare molar heat capacity.
Specific volume The reciprocal of density.
Spherulite In magmatic rocks, a spherical mass of fibrousor needle-like crystals that radiates from a central point;range in diameter from less than a mm to a m or more. Prod-uct of devitrification of glass or crystallization of a drasticallyundercooled melt. Spherulitic is the corresponding fabric.
Spilite Metasomatized basalt composed of low-grade min-erals; relict magmatic clinopyroxenes and protolith texturesare common. Produced by ocean-ridge metamorphism andvery locally on continents by burial metamorphism.
Spinifex Texture characterized by subparallel skeletal,platy, or bladed olivine and/or pyroxene grains; typical of komatiite.
S-surface Alternate term for a foliation.
Stability, stable See Equilibrium.
Stability diagram See Phase diagram.
Stability field Divariant area in a phase diagram of two intensive variables over which a phase or assemblage ofphases is stable.
Standard state A carefully defined reference state for acompound.
State properties (variables) Thermodynamic parametersthat define the nature of a system.
State of stress The result of all of the forces that act on a body. Represented by three principal stresses. Can be compressive where material is pressed together beneath thesurface of the Earth or tensile where material is pulled apart.
S-tectonite A foliated tectonite.
Stock A pluton that is smaller than a batholith, commonlyonly a single intrusion; outcrop area generally �100 km2.
Stokes’s Law Expresses the limiting or terminal velocity ofa solid particle moving in the gravitational field within a gasor liquid medium.
Stoping Process by which usually felsic magma invades thebrittle upper crust by engulfing pieces of more dense countryrock.
Strain Distortion of a body, its change in shape and/or volume, under stress; one of three components of deforma-tion in a stressed body.
Strain ellipsoid A reference sphere in the undeformed state of a rock becomes a triaxial ellipsoid after deformationunder nonhydrostatic stress. A two-dimensional strain ellipsedepicts plane strain.
Strain (work) hardening Phenomenon in deforming mater-ials where ever-higher applied stress is necessary to achievecontinued plastic strain; caused by piling up and immobiliza-tion of dislocations in deforming grains.
712 Igneous and Metamorphic Petrology
Strain marker Texturally or compositionally distinct bodywithin a magma or rock that records the local strain.
Strain partitioning Refers to the inhomogeneity of deforma-tion in inhomogeneous anisotropic metamorphic rocks;strain is preferentially focused into weaker domains.
Strain rate The ratio of an increment of strain to the timeduring which it accumulates; has units of reciprocal seconds(s1).
Strain shadow In metamorphic rocks, fringing, mineral-filled zones on opposite sides of a relatively rigid object, suchas a boudin or porphyroblast, that extend into the surround-ing matrix in the direction of the foliation.
Stratovolcano See Composite volcano.
Strength The stress difference required to produce perman-ent deformation under specified conditions in a body.
Stress Magnitude of a force divided by the area over whichit is applied. Normal stress is perpendicular to the plane onwhich it acts. Shear stress is tangential (parallel) to the planeon which it acts.
Stress difference Difference in magnitude between max-imum and minimum applied stress.
Stretching lineation See Lineation.
Strombolian eruption Bursting of large gas bubbles inbasaltic or andesitic magma near the top of a conduit; result-ing ejecta form a cinder or scoria cone.
Structural order In a melt, regularity in the array of atoms.
Structure Features defined by aggregates of mineral grainsseen at a scale of hand sample or larger, such as bedding or afolded layer; together with texture constitutes fabric.
S-type granite Derived from metaluminous magmas gener-ated by partial melting Sedimentary source rocks that had ahigh clay content.
Subalkaline rocks A suite of rocks that have relatively lowalkali to silica ratios, is usually silica-saturated or silica-over-saturated, and contains no normative nepheline.
Subgrains Parts of a crystal in which the lattice is slightlymisoriented; display undulatory extinction. More or less planar subgrain boundaries form where migrating dislocationsaccumulated and piled up during plastic strain.
Subhedral Imperfectly formed compact grains only partlybounded by crystal faces.
Subsolvus Refers to granites and syenites that have crystal-lized from relatively hydrous magmas so that a plagioclaseand alkali feldspar crystallize directly from a melt. CompareHypersolvus.
Suite See Rock suite.Surface diffusion Occurs essentially over the surface of amineral grain through a static liquid in contact with it.
Surface energy Energy associated with a solid-solid orsolid-liquid interface resulting from unbalanced ionic forces;is minimized at equilibrium.
Surface tension Attractive force in a liquid body boundedby a gas where unbalanced atomic bonds on the surface ofthe liquid tend to pull it inward.
Surroundings The part of the Universe outside a definedsystem.
Surtseyan eruption See Hydromagmatic eruption.
Suture The contact zone between two converging conti-nental plates that have become attached to one another as theresult of collision.
Sutured Metamorphic texture in which boundaries ofgrains, which are commonly strained, are irregular and inter-locking like pieces of a jigsaw puzzle.
Syenite Felsic phaneritic rock that contains, relative to fel-sic minerals, �20 modal % quartz and a high alkali feldsparto plagioclase ratio. See Figure 2.8.
Symplectite Vermicular (wormy) intergrowth of two min-erals that nucleated and grew together by breakdown of anearlier unstable phase or by reaction between two adjacentunstable phases. Commonly is a corona around an anhedralcore. Compare Myrmekite.
Syntectonic recrystallization See Dynamic recrystallization.
System A part of the Universe under study or discussion.
T Temperature; measured in degrees Celsius (°C) or Kelvin(K); 0°C � 293 K.
Tectonite A rock that possesses an anisotropic, or tectonite,fabric produced by penetrative ductile deformation duringmetamorphism. Typical of regional metamorphic terranes inorogens. Most tectonites are foliated (S -tectonites) and manyof these are also lineated (L–S-tectonites), but rarely are theyonly lineated (L-tectonites).
Tensile strength The maximum stress difference an extend-ing or stretching body can withstand before breaking; is lessthan the compressive strength for the same body.
Tephra See Pyroclasts.
Terminal reaction A type of discontinuous reaction duringmetamorphism in which a particular crystalline phase is en-tirely consumed; for example, the prograde disappearance ofmuscovite at the second sillimanite isograd in pelitic rocks inBarrovian terranes.
Terminal velocity The limiting velocity, given by Stokes’sLaw, of a body sinking or rising in a liquid or gaseousmedium after the buoyant driving force and retarding viscousdrag force have been balanced.
Ternary Three components.
Terrane A tract of exposed rock that possesses common geologic properties or a history distinct from neighboring ones.A terrain is a geographic entity, such as a forested terrain.
Texture (microstructure) Size, shape, and mutual relationsof mineral grains and proportions of glass in a rock; togetherwith structure constitutes fabric.
Thermal conductivity Proportionality constant betweentime rate of heat flow and the thermal gradient.
Thermal diffusivity Ability of a material to conduct heatrelative to its accumulative capacity; ratio of thermal con-ductivity to the product of density and specific heat.
Thermal diffusion Heat conduction.
Thermal expansion, coefficient of Isobaric change in volume as T changes.
Thermal gradient Difference in T between adjacent hotterand colder parts of a body divided by the distance betweenthe parts.
Glossary 713
Thermal metamorphism An end-member type of meta-morphism resulting from an increase in T. Typical of contactmetamorphism around magmatic intrusions.
Thermal relaxation Restoration of a normal geothermalgradient in an active orogen that has been perturbed bycrustal thickening or other processes by conductive transferof heat.
Thermally activated Refers to processes that are enhancedbecause of increased atomic mobility at high T.
Thermochemical convection Motion in a viscous bodydriven by contrasts in composition and T that create densitycontrasts sufficient to cause gravitational instability.
Thermodynamic potential energy A thermodynamic energyfunction formulated in such a way that it is a minimum in astable system of variable chemical composition.
Thermodynamic process Change in a thermodynamic system from one equilibrium state to another.
Thermodynamics A set of mathematical models and con-cepts that show how changes in T, P, and chemical composi-tion affect the state of a system.
Thermomechanical feedback As a viscous body is sheared,the work is transformed into heat, raising its T, which reduces the viscosity, localizing subsequent shear flow and heating, causing further reduction in viscosity, and so on.
Thermometer, mineral A mineral or assemblage of stablycoexisting minerals whose chemical composition is sensitiveto the T of crystallization.
Third Law of Thermodynamics At absolute zero, wherethe Kelvin T is zero, crystals are perfectly ordered and allatoms are fixed in space so that there is only one possible dis-tribution; hence, entropy is zero.
Tholeiitic rocks (trend) Subalkaline rocks that have relatively strong enrichment in Fe relative to Mg and littlevariation in silica. Compare Calc–alkaline rocks. See Fig-ures 2.17 and 2.18.
Tie-line In a phase diagram, connects points representingcompositions of stably coexisting phases.
Tie-line switching reaction A type of discontinuous reac-tion during metamorphism in which there is a change in the configuration (topology) of mineral compatibilities in acomposition diagram.
Time-integrated fluid/rock ratio The total mass of the mobile fluid participating in an open-system metamorphicepisode relative to that of the reacting solid phases.
Tonalite Felsic phaneritic rock that contains, relative to felsic minerals, �20 modal % quartz and a plagioclase to alkali feldspar ratio �9. See Figures 2.8 and 2.9.
Trace element An element whose concentration is �1000ppm (�0.1 wt.%).
Trachyandesite Alkali-rich andesite. See Figure 2.12.
Trachybasalt Alkali-rich basalt. See Figure 2.12.
Trachyte Leucocratic glassy or aphanitic rock made essen-tially of alkali feldspar; contains 60–69 wt.% silica and �6wt.% total alkalies. See Figures 2.12 and 2.13.
Trachytic Magmatic texture in an aphanitic rock expressedby a planar preferred orientation of tabular feldspars.
Translation gliding See Slip.
Transport phenomena Transport of viscous material, atoms,or heat in a system.
Transposition Process during ductile deformation undernonhydrostatic stress in which compositional layers or othertypes of foliation are reoriented and drawn out along pene-trative shear surfaces; hinges of folds can be displaced alongthe surfaces.
Triple point Point of intersection of equilibrium boundarylines between three stability fields in a P–T phase diagram; allstable phases along these lines and in these fields coexist stably at the invariant triple point.
Troctolite A type of gabbro that has an olivine to pyroxeneratio �9. See Figure 2.10a.
Trondhjemite Phaneritic magmatic rock that consists ofsodic plagioclase, quartz, and minor mafic minerals; essen-tially synonymous with plagiogranite and leucotonolite. SeeFigures 2.8 and 2.9.
TTG Tonalite, trondhjemite and granodiorite.
Tuff Rock made of ash-size (�2 mm) volcaniclasts.
Tuff cone Formed by Surtseyan eruptions; intermediate inshape between a tuff ring and a cinder cone.
Tuff ring Pyroclastic deposit in which the ratio of height tobasal diameter is �1:5; volume of crater space is larger thanvolume of ejecta.
Turbulent flow Rapid and chaotic motion of particles insmall eddies superimposed on the overall flow of movingfluid; Reynolds number �4000.
Twin gliding A mechanism of intracrystalline plastic strainin which a portion of the crystal flips over across a favoredcrystallographic twin plane in response to applied shearstress. Such mechanical or deformation twins may be thinlamellae in the deformed crystal or they can take over mostand possibly all of the crystal.
Ultrabasic rock Contains �45 wt.% silica.
Ultrahigh-P (UHP) Refers to metamorphic pressures atleast sufficient to stabilize coesite in rocks of appropriate silica content.
Ultramafic rock Especially rich in Mg and Fe; generallyhave little or no feldspar.
Ultramylonite See Mylonite.
Undercooling The decrease in T below some equilibriumpoint where a phase becomes stable.
Underplating Process of lodging mantle-derived magma atthe base of the less dense continental crust.
Undersaturated The concentration of a component in aphase is less than its solubility at some P and T so that all ofthe component is dissolved homogeneously in the phase; alsorefers to the concentration of silica and alumina in magmasand rocks. See Silica saturation and Alumina saturation index.
Undulatory (undulose) optical extinction Effect seen undercross-polarized light in thin section where a bent or other-wise distorted grain has nonuniform extinction that sweepsirregularly across the grain as the microscope stage is rotated;is especially conspicuous in strained quartz.
714 Igneous and Metamorphic Petrology
Univariant A state of equilibrium that has one degree offreedom.
Univariant boundary line In phase and stability diagramsdepicting two intensive variables, the line separates stabilityfields. There is one degree of freedom for any state of equi-librium on the line; fixing one variable determines the other.
Univariant reaction See Discontinuous reaction.
Upper thermal stability limit The maximum T at which amineral or mineral assemblage is stable.
Vapor phase Volatile fluid; also refers to crystals precipi-tated from it by vapor-phase crystallization.
Variance (degrees of freedom) The number of independentintensive variables that must be specified to fully characterizethe state of equilibrium in a system.
Variation diagram Graph that shows trends or patterns incompositional data.
Variole (ocelli) Aggregate of radially arrayed, needle-likecrystals of plagioclase with or without clinopyroxene; formsin mafic magmas in contrast to a spherulite that forms in silicic magma.
Veins Planar to irregular and branching sheets generally ofvariable thickness that are concordant or discordant to wall-rock structures and typically composed of quartz or calcitebut locally may be polymineralic. Produced by advectingfluid solutions that precipitate minerals in fractures. Multi-stage vein growth is common and results from repetitions ofa crack–seal mechanism. Contrast dikes formed by magmaticintrusion.
Vesicle A smooth-walled, more or less spherical cavity in a magmatic rock formed by entrapment of a volatile fluidbubble during solidification of the melt; a pipe vesicle resultsfrom movement of the volatile bubble or the magma beforesolidification. Corresponding fabric is vesicular.Vesiculation Creation of volatile fluid bubbles in an over-saturated melt by exsolution.
Viscosity Resistance to flow; in a liquid, resistance resultsfrom immobility of atoms. The coefficient of Newtonian vis-cosity is the ratio of shear stress to the rate of shear strain andhas units of Pa·s. In a Newtonian viscous response to appliedshear stress, there is a resulting permanent strain no matterhow small the stress. A non-Newtonian viscous response toapplied stress is a compound rheologic behavior that hascomponents of plasticity as well as viscosity; because straindoes not occur until some critical plastic yield strength hasbeen exceeded a coefficient of viscosity cannot be exactlydefined and the non-Newtonian material has an apparent viscosity.
Vitroclast Fragment of glass.
Vitrophyre Texture in which large crystals (phenocrysts) liein a glassy matrix.
Volatiles Water, carbon dioxide, sulfur, fluorine, chlorine,etc. that are expanded gases at near atmospheric P but at increasing pressures become denser fluids; mixtures of two or more species are common.
Volcanic breccia Rock made dominantly of block-size (�64 mm) clasts.
Volcanic chain Line of volcanoes that have monotonicallychanging age, such as the Hawaiian chain formed as theoceanic lithosphere drifted over a mantle plume.
Volcanic debris flow See Lahar.Volcanic neck A pipelike magmatic intrusion that fed a volcanic extrusion.
Volcanic plume Mixture of pyroclasts and hot expandinggas, chiefly steam, that is discharged explosively from a ventinto the atmosphere. Plinian plume is created by gas-richmagma discharged rapidly from a relatively small diametervent that broadcasts ejecta over large areas as ash-fall.
Volcaniclast Fragment of volcanic rock material producedby any process.
Volcaniclastic Fabric made of volcaniclasts; also refers toany process by which they are produced.
Volume diffusion Occurs within any single homogeneousphase.
Vug Angular cavity in a rock; formed by collection of avolatile fluid between existing crystals. Corresponding fabricis vuggy.
Vulcanian eruption Complex explosive eruption of intermediate-composition magma that progresses fromsteam-blast explosions ejecting ballistic blocks to eruption of volcanic plumes that broadcast tephra over moderate distances to, finally, extrusion of highly viscous lava from thevent.
Water-deficient (-undersaturated) melting See Dehydra-tion melting.
Welded tuff Rock made mostly of vitric ash particles thatare stuck together because of high T at emplacement; usuallydevelops from an ash flow.
Welding Lithification process that consolidates loose vitro-clasts hot enough to stick together when deposited.
White mica Includes muscovite or phengite, paragonite,and pyrophyllite. Fine-grained white micas are called sericite.
Whole-rock (bulk) chemical composition Weight concen-trations of chemical species constituting a rock.
Work Product of force times a displacement in the direc-tion of the force. PV work is done in subvolcanic systems ashigh P gas expands against its surroundings.
Work hardening See Strain hardening.
Xenocryst Foreign crystal.
Xenolith Foreign rock fragment.
Xenomorphic See Anhedral.Yield strength The critical value of the stress difference atwhich a stressed plastic body permanently deforms.
Zoned or zoning Refers to a regular pattern of variation incomposition or some other property. Individual crystals ormineral grains can possess normal or oscillatory zoning incomposition. A zoned intrusion has more or less concen-trically arrayed parts of contrasting composition and/or fabric.
Zones See Metamorphic zones.
Glossary 715

Aa lava flow, 248f, 250fAbsarokite, 36–7, 374Abyssal peridotite, 351, 352fAccidental clasts (xenoliths), 167Accreted terrane, 301f, 365, 372
metamorphism in, 427f, 584–601Accretionary lapilli, 168, 264, 615Accretionary prism (wedge), see Accreted
terraneAccuracy versus precision, 17ACF diagram, 469, 470f, 483, 484fActivation energy, 67–8Activity, 62–4
models, 485, 515Adakite, 305–6, 373–5
relation to Precambrian TTG association,635–6
trace elements, 42, 304fAdiabatic system, 52f, 53Advection, 4, 199–201
oxygen isotope evidence for fluid, 45, 85f,499
See also Hydrothermal metamorphismAerosol, 84AFC, see AssimilationAFM projection, 470, 486f, 488fAfrican rift system, 393–7Agglutinate, see Welded spatterAKF diagram, 470Albite, 26f, 405t
crystal-melt equilibria, 101–11melting of, 58f, 89fsilica saturation and, 33, 34f, 64f
Aleutian-arc rocks, 373tAlkali feldspar system, 102, 104, 105fAlkaline rocks, 25f, 35, 36f, 396t
carbonatites and, 395–7in continental rifts, 392–7in cratons, 397–403generation of magmas, 306–8in oceanic settings, 36t, 346t, 356–64in Precambrian terranes, 633, 639f, 650f
AlpineOrogen, 566, 567f, 574–6, 592f, 603peridotite, 289, 377
Al2SiO5, see PolymorphsAlteration and altered rocks, 17, 81f, 84–5,
118, Plate IVargillic, 85, 505deuteric, 408propylitic, 85sericitic, 505
Alumina saturation, 34–5Amphibole
composition, 658t, 660tcrystal-melt equilibria, 100f, 115–19
Amphibolite, 412f, 460density, 211ffacies, 439f, 440, 571, 577f, 588f, 589
Amygdules, amygdaloidal fabric, 165Anatexis (partial melting), 309Andesite
arc petrotectonic associations, 372–5
classification, 32f, 33f, 374fcomposition
chemical, 20t, 373tmineralogical, 22f, 33f
parent magma, 338–44in Precambrian terranes, 615primary magma generation, 301–6
Andes Orogen, 378–9, 380fmodel for evolution of Precambrian
Grenville Orogen, 636Anhedral grains, 132, 155f, 159, 160fAnisotropic fabric, 159f, 171–81, 448–51
See also Fabric, metamorphic tectoniteAnkaramite, 357–8Annealing, 541Anorogenic
A-type rocks, 387–90ring complexes, 390–2
Anorthitecomposition, 26f, 405tcrystal-melt equilibria, 91f, 101–8
AnorthositeArchean megacrystic, 630–2chemical composition, 21tclassification, 29f, 30f, 630lunar, 652Proterozoic massifs, 637–44in ring complexes, 232f, 390suite, 637–43
Aphanitic texture, 27, 153–5basis of magmatic rock classification, 30–3
Aphyric texture, 153Aplite and aplitic texture, 29, 159, 160f
dikes, 181f, 214f, 218Appalachian Orogen, 378f, 570–3, 583, 601,
637fAppinite, 398Arc magmatism and petrotectonic associations,
36f, 37f, 300–6, 338–44, 370–1continental margins, 377–86island arcs, 371–7through Earth history, 650f
Arc-mantle-wedge system, 301f, 427fArmoured relics, 414Arrhenius equation, 67Ash, 27, 82–4, 142–5, 166–73, 259–77
flow, 271–5Ash-fall deposits, 262–6Ash-flow tuff, 270f, 271–5Aspect ratio, 243Assimilation, 140, 328–9
and fractional crystallization (AFC), 339–44Association
mineral, 22petrotectonic, 9, 348–400
Asthenosphere, 349, 350f, 363fAtmosphere, volcanism and, 82–4Atomic absorption spectrophotometry, 18A-type felsic rocks, 387–90, 641, 643–5Augen, 443f, 452Aureole, contact metamorphic, 236, 429f,
432–4, 523f, 499–501Autoclasts, 169, 171f
Autoliths, 181Autometamorphism, 408Avalanches, glowing, 271Azores, 261f, 363–4
Back-arc basins, 301f, 375–6Ballistic clasts, 262Ballooning of intrusive magma, 228, 230f,
233–5Banakite, 36, 37f, 374Banded iron formation, 426, 618, 649Barometer (geo-, mineral), see
ThermobarometerBarrow, George, 434, 576Basalt
alkaline, 35–7, 38fversus tholeiitic, 356–7
amygdaloidal, 165fcalc-alkaline, 43classification, 32f, 36–8composition
chemical, 21t, 99t, 320t, 351t, 358t, 360t,369t, 373t
Columbia River Plateau, 19tmineralogical, 22f, 356–7trace element, 43f, 304f, 361f, 366f
crystal-melt equilibria, 93–100dehydration melting of, 310f, 311density, 195fdikes, 216–22, 620, 624f, 625, 648–9flood plateau, 252, 364–9, 370–2immiscible silicate melts in, 322–3lava fields and flows, 245–50, 253fmagma generation, 295–308Makaopuhi (Hawaii), 98–9in oceanic spreading ridges, 349–54ophitic, 159f, 164fpillow, 151f, 249photomicrograph, 154f, Plate IIIin Precambrian greenstone belts, 615, 616f,
622, 627t, 629–30, 651scoria, 143shield volcanoes, 250–1silica saturation in, 37, 38fsubmarine accumulations of, 251–4, 615,
621–3tholeiitic, 35–7, 38f
versus alkaline, 356–7vitroclasts, 169fSee also Mid-ocean ridge basalt
Basanite, 21t, 32f, 36f, 358f, tBase surges, 261f, 266–7Batholith, 224–30, 382–6
Peruvian, 380fin Precambrian terranes, 633See also Sierra Nevada batholith
Bedding sags, 267Bedforms, surge, 266–7Beginning-of-melting points, 109–12, 296–8Bending, 534, 536f, 543fBenmoreite, 32f, 358tBeryllium, 39
isotopes, 47–9
INDEX
Note: Page numbers with an f indicate a figure; those with a t indicate a table
718 Index
Bimodal magmatic association, 388–90, 392–4Binary phase diagrams, 90–8Biotite
chemical composition, 658tdensity, 195fformula, 406tphotomicrograph, Plate IVstability
as a function of oxygen fugacity, 114–15,508
in pelitic metamorphic rocks, 486–8,577–84
trace elements, 23t, 41tin volcanic arc rocks, 301
Bleaching of gray carbonate rocks, 489Black smoker, 302f, 591Block, 27, 167f, 169f, 171f, 248f, 255f
lava flow, 248Block-and-ash flows, 271Blueschist metamorphic facies, 439f, 440, 567f,
570, 593f, 594–601absence during Archean, 617, 650f
Boiling magma, 79–80Boltzman constant, 128Bomb, 27, 169fBoninite, 373–5
chemically similar Precambrian granitoids,636
Border zones of magmatic intrusions, 236–7,238f
Bottle-shaped magma chambers, 203–4Boudins and boudinage, 451, 454f, 596Boundary line (equilibrium) in phase diagrams,
88, 480Bowen, N. L., 90, 111, 126, 158, 318, 325, 437,
493Breadcrust bomb, 168–9Breakdown reaction, 115Breccia pipes, 231–2, 232fBrecciation, 82, 228–32, 233fBrittle behavior, 187–9Buffer reaction, 63, 495–6Bulk partition coefficient, 39–40Bulk silicate Earth, 48Buoyancy, 196–7
crustal density and magma ascent, 210–13,217–18, 222–4
magma, 194–7, 210neutral, horizon of, 211
Bushveld (South Africa) intrusion, 331t, 331–2,614f
Calc–alkaline differentiation trend, 337f,338–44, 375, 633f
Calc–alkaline rock suite, 35–7, 337f, 373–86,632
Calcareous, 426Calcite
stability, 492–8twin gliding, 535f
Calc–silicate, 426Caldera(s), 220, 275–7
Long Valley (California), 265fNingi-Burra (Nigeria) ring complex, 392fring dike and, 220fValles (New Mexico), 246f, 276f, 277f
Caledonide Orogen, 573f, 583Cameroon volcanic line, 391fCanary Islands, 363Carbonatite, 323–4
nephelinite and, 395–7Carbon compounds in metamorphic rocks,
508, 577Cascade volcanic arc, 279, 382–3Cataclasis and cataclastic fabric, 188, 452, 465,
638Cations, in polymer network, 73–4Cauldron subsidence, 220Charnockitic suite, 462, 639f, 641, 642fChemical
analysis of minerals and rocks, 18–19composition, 12–13
of common magmatic rocks, 20t–21tof rock-forming minerals, 657t–660tSee also specific rock types and minerals
diffusion, see Diffusionelements, 19, 37–43
major, 19, 20t, 21t, 23tmobility, 39f, 504, 560, 612rare earth, 40trace, 19, 37–44
potential, 61Chemographic diagram, see Composition
diagramChlorite
chemical composition, 659tformula, 406tstability in pelitic metamorphic rocks, 486,
577–9Chondrite meteorite, 40, 288
trace elements, 43tChondrite-normalized trace element diagram,
42–3, 293f, 300f, 306fChopin, Christian, 601Cinder, 168
cone, 245f, 269fCIPW normative composition, 32–4, 661–5Clapeyron equation, 58, 287, 479, 492Classification of rocks
magmatic, 25–37, 358metamorphic, 447, 455–66
Cleavage in metamorphic rockscontinuous, 450crenulation, 421, 422f, 449, 530disjunctive, 450slaty, 421, 429f, 449, 558–60spaced, 449, 451f, 530
Climate, volcanism and, 81f, 82–4Clinopyroxene
in basaltic rocks, 357chemical composition, 657tdensity, 195fin mantle inclusions, 291–2, 307tphase relations, 112–13in Skaergaard intrusion, 112f, 335fin thin section, 151f, 154f, 159f, 161ftrace elements, 23t, 41t
Closed system, 52–3Closure temperature, 46, 126, 568, 611Coesite, 442, 461f, 601–6Cognate clasts and inclusions, 167, 181Coignimbrite plumes, 262, 263f, 271f, 272Collapsing volcanic columns, 262–3Columbia River Plateau, 252, 253f, 367t, 383f
composition of basalt, 19t, 366f, 369tColumnar joints, 249–50Comagmatic, 316Comb layering, 180f, 181Comendite, 35Compaction foliation, see Eutaxitic fabric
Compatibility diagram, see Compositiondiagram
Composite volcano, 244f, 279, 280f, 383fComposition diagram, 466–71Compositional boundary layer, 137, 139fCompositional layering, 178–80, 449f, 555,
558–61differentiated, 560–1
Compressibility, isothermal, 194Compressional tectonic regime and magma
ascent, 221Conductive heat transfer and cooling models,
3–6, 130–1, 197–9, 200fCone
cinder, 245f, 269fcinder-and-spatter, 268littoral, 269parasitic, 244f, 279sheet, 219–20spatter, 246f, 268tuff, 245f, 246f, 269
Confining pressure, 10, 184Constant volume replacement, 423Contact, magma-country rock, 236–7, 238fContact metamorphic aureole, 432–4, 499, 500,
523, 524Continent–continent collision zones, 386–7
Alpine Orogen, 567fGrenville Orogen, 636, 637f, 639fHimalaya Orogen, 386–7, 601, 606
Continentalcrust, see Crustmargin magmatic arcs, 301, 377–86
plateaus, 252, 365–9rifts, 392–7
Continuous reaction relations and series, 101–2Control lines, 317–19, 338f, 339f, 342f, 343f,
375f, 627fConvection, 4f, 6–9
double-diffusive, 203magma, 201–6mantle, 8–9thermal, 201–2thermochemical, 203–6
Convective melt fractionation, 203–4, 322, 343Cooling
conductive, 130–1unit, ignimbrite, 272–5
Coombs, Douglas S., 597, 598Cordilleran Orogen, 570, 574fCorona texture, 452, 482, 511Country rock surrounding magmatic intrusion,
198cooling in, 199f, 200ffoliation in, 229f, 230f, 231f, 235fmagma interface with, 236–9
Cr-diopside peridotite, 289, Plates V and VICrack–seal, see Vein(s)Crater Lake (Oregon), 274f, 276, 383Craton(s), 223f, 397–403, 612
amalgamation of, 636, 637f, 651Kaapvaal (Africa), 614f, 620–1keel beneath, 649, 652Laurentian (Canada), 636, 637fNorth Atlantic, 613
Itsaq (Greenland), Gneiss Complex, 617Pilbara (West Australia), 223f, 617fstabilization of, 651Yilgarn (West Australia), 613, 615, 617f,
621–2
Index 719
Zimbabwe (Africa), 614fCritical point, 75Crust
continental, 211, 309accretion of oceanic plateaus onto, 365breakup of, 216, 369, 370f, 371f, 372fdiapirism in, 213t, 222–4magma buoyancy in, 210–12magma emplacement in, 222–39magma generation in, 308–13
oceanic, 252–4, 301–6, 349–65back-arc basins in, 375–6cross section of, 349f, 350fdevolatilization of subducted, 301–3hydration and dehydration of, 301–6pressure-temperature paths of subducting,
303fspeculations concerning during
Precambrian time, 610, 614, 618, 619f,621–2, 629, 649–51, 655
Cryptic layering, 334Cryptocrystalline texture, 153Crystal(s)
assimilation of, 140, 328defects, 538–41diffusion in, 126–30dissolution of, 139–40, 141fgrowth of, 135–9, 410–13, 521–8interface between, 131–2markers during flow, 177fmodifications of, 139–42nucleus of, 133restite, 135shape in crystallizing magma, 136–8size distribution, 139, 524vapor-phase, 166, 173f, 275volume fraction in magma, 190–2zoned, 160, 527See also Grain
Crystalline residue, see MeltingCrystallinity, 27, 151
apparent viscosity dependent on, 190–1Crystallites, 150f, 151Crystallization of magma
equilibrium, 95–7, 102, 104ffabrics related to path of, 133–9, 151–62fractional, 95–7, 102, 103f, 108–12, 318–22,
341–3reaction relation in, 95sidewall, 203–4undercooling, 134–6vapor-phase, 166, 173f, 275volatile exsolution during, 79, 142
Crystal-melt equilibria, 87–119amphibole, 116–17basalt, 90–100dependence on water fugacity, 375feldspar, 100–12granite, 106–12granodiorite, 113–14hydrous magma, 113–17MELTS software for, 118mica, 114–15Mount Saint Helens, 116–17olivine, 112–13pyroxene, 112–13
Crystal-melt fractionation, 321–2in MORB magma, 338See also Fractional crystallization and
Fractionation
Crystalloblastic series, 421Cumulates, 320
in Proterozoic anorthosite massifs, 642, 643fCumulophyric texture, 139f, 158, 172fCumulus fabric, 331–2
Dacitechemical analysis, 20tclassification, 21f, 32f, 33fMount Saint Helens, 116–17mineral composition, 22f
Dalton’s law, 66Darcy’s law, 503Deccan (India) Plateau, 252f, 364f, 367tDecomposition
reaction, 114, 117rims, 118f, 162
Decompression, 90, 116crystallization during, in water saturated
magma, 90exsolution of volatiles from melt during,
79–82, 143–5melting and magma generation, 58, 286–7
Decussate texture, 452Deformation, 184–92, 537, 551
band, 533fbrittle, 187–8coaxial versus noncoaxial, 538fductile, 189geometric pattern of fabric resulting from,
537, 554–5homogeneous, 537, 538finfluence on recrystallization, 543–5lamella, 533fof magma, 191–4path recorded in metamorphic fabric, 537,
538fprogressive, 550frole of fluids during, 545twin, 533, 535f
Degrees of freedom (variance), 87, 88Dehydration melting, 309–11Dendritic crystals, 136–8Density, 10
of crust, 210–11determination, 194–5“filter” on ascending magma, 211melt, 194–7mineral, 195–7pressure dependence, 10, 194temperature dependence, 195
Depleted mantle, 43, 649Devitrification, 153, 173f, 275Diabase, 31, 159f
granophyre sill, 329–30Diagenesis, 404, 405fDiamond
mineral inclusions in, 400–1occurrence in rocks
magmatic, 398–9ultrahigh-P metamorphic, 601–2, 604f,
606relation to origin of magma, 401–3stability of, 11, 288f
Diapir, 213, 222–4, 586Diatreme, 232, 270Differentiation
magmatic, 300, 316–44metamorphic, 413, 421
Diffusion
chemical, 123f, 126–30Soret, 129–30thermal, 123f, 130–1, 197–9types in grain aggregates, 522See also Heat conduction
Diffusive creep (transfer), 529–32Diffusivity
chemical, 127–9thermal, 130, 198
Dihedral angle, 294, 530Dike(s), 213–22
aplite, 181f, 214f, 218basaltic in Precambrian terranes, 620, 623,
624f, 648–9cooling of (isotherms in), 198–9feeder dikes, 213–16, 218f, 333fmagma ascent by means of, 213with mantle-derived xenocrysts, 194fring, 220f, 230–1sheeted, 216, 349f, 376swarm, 213, 216f, 217f, 219See also Sheet intrusions
Dike-sill swarm, 214f, 215f, 368fDilatancy pumping, 191, 504Diopside
composition of Cr-rich, 657thydrogen diffusion in, 128fmelting of, 58f, 91f
Diorite, 20t, 22f, 29f, 211fDiscontinuous reaction series, 97Dislocation
climb, 541creep, 529slip (gliding), 529
Dislocations (line defects), 539f, 540frole in intracrystalline plastic slip, 538–41
Dissolution of crystals, 139–40Distribution coefficient, 486Dolerite, see DiabaseDolomarble, 462Domes
lava, 246f, 255–8, 276f, 277fpelean, 255related to caldera evolution, 220f, 276f, 277f
Donegal (Ireland) pluton, 235fDouble-diffusive convection, 203Ductile
deformation (flow), 415, 528–43power law governing, 543
shear zone, 418fstrength, 189, 543
Dunite, 21t, 30f, 143fDynamic recrystallization, 418, 460f
Earthage, 612, 650fcross section of, 8fenergy budget of, 9–10heat flow in, 3–8
East African rift system, 393–7East Pacific Rise, 353fEclogite, 100, 460, 461, 575f
facies, 439f, 440, 484, 567f, 593f, 594–601Precambrian, 617, 636, 650fthin section of, 433ftransition from granulite, 483, 493xenoliths, 290
Effusion of lava, 245–58Einstein–Roscoe equation, 190Ejecta, see Pyroclasts
720 Index
Elastic behavior, 185, 186fEl Chichón (Mexico) volcano, 84Elutriation, 272Emplacement
ash flows, 272ophiolite, 377, 592–7plutons, 210, 231–9See also Inclusions, mafic rock in
granitoidsEndogenous lava dome, 255, 258fEndothermic reactions, 54Energy
activation, 11, 56f, 67–9budget of Earth, 9–10chemical potential, 60–1definition of, 2–3forms of, 2–3, 52Gibbs free energy, 55–8, 56fgravitational potential, 3, 11, 52interfacial, intergrain, 131–3, 141–2kinetic, 3, 272law of conservation of, 3, 53partial molar free energy (chemical
potential), 60–1sinks in Earth, 9sources in Earth, 9–10surface free, 131–2, 134thermal, 3
See also Heattransformation of, 3work and, 3
Enriched mantle, 43, 291, 306–7, 353–4Enstatite
chemical composition, 657tincongruent melting of, 97relation to silica activity and silica saturation,
63–4Enthalpy, 53–4Entropy, 54–5Epiclasts, epiclastic fabric and processes, 167,
232f, 278–9Epitaxial growth, 413f, 452Equigranular texture, 156, 160fEquilibration
grain boundary, 162f, 162–3, 524–6in metamorphic rocks, 404–5
Equilibrium 11assessing state of in a rock, 117, 474–5boundary line in phase diagram, 88constant, 62–3, 485, 505, 514–15crystallization of magma, 95–7, 104flocal, in metamorphic system, 474, 505variance in states of, 88See also Crystal-melt equilibria and
Reaction(s)Eruption, see Volcanic eruptionEskola, P., 437, 461, 572Etendeka (Africa) flood plateau, 371fEthiopia, 367t, 393, 394fEu anomaly, 40, 43f, 651, 653Euhedral crystals, 132, 151f, 158, 159fEutaxitic fabric, 171, 172f, 275Eutectic, 91–2Exothermic reaction, 54Explosion, volcanic and explosive volcanism,
see Volcanic eruptionExsolution
in mineral grains, 103f, 105f, 162, 528of volatiles from melts, 79–83, 165–8,
259–60
Extensionalfractures and fracturing, 185f
basalt diking related to, 220–2as expression of brittle behavior, 187
tectonic regime and magma ascent, 221Extrusion of magma, 27, 241–6
effusive lava, 242–58explosive, 80–3, 242–3, 259–77
Fabric, generalanisotropic, 159f, 171–81contrast between magmatic and
metamorphic, 413, 448definition, 14heteromorphs, 148isotropic, 174See also Texture, and specific types, e.g.
eutaxitic; porphyroblasticFabric, magmatic, 148–81
caution in interpreting, 163–4grain boundary modification in, 140–2,
162–3grain shape in, 158–60of layered intrusions, 331–7of pegmatites, 324–5of silicic effusions, 256–7
Fabric, metamorphic, 411–23, 429, 442f, 443f,447–55
as basis for classification of rocks, 455–63grain boundary modification in, 411imposed, 410–22, 447–55, 520–61relict 408, 410f, 412f, 420f, 424f, 429fscale invariance in, 417fshear sense indicators, 551, 553f, 553tectonite, 414–24, 448–52, 528–61
expression of, 448geometric pattern, 537, 554–5penetrative aspect of, 448postkinematic, 548, 550fpreferred grain and lattice orientation,
555–60prekinematic, 547role of fluids in development of, 545synkinematic, 547–8, 549ftiming of deformation and
recrystallization, 545–53Fabric, volcaniclastic, 166–73, 260–79Faulting, brittle behavior and, 187–8Feathery crystals, 136–8, 151f, 158, 626fFeedback (thermomechanical), 191, 284Feldspar
chemical composition, 658tcrystal-melt equilibria, 100–12density, 195fductile strength, 190fin common magmatic rocks, 22frapakivi, 160fternary, 100, 104–9trace elements in, 23t, 41tzoning in, 103f, 139f, 161f
Felsic rocks, 28Felsitic texture, 153–5, 166fFelty texture, 153–5, 154fFenite, 397, 465Fenner, C. N., 325Ferromagnesian, 28
See also Mafic rocks and mineralsFerruginous, 426Ferry, J. M., 498Fiamme, 172f
Fibrolite, 477Fick’s laws of diffusion, 127–8Field relations, 13, 210, 241, 441
classification of magmatic rocks based on,27–8
of plutonic (intrusive) rocks, 210–39of volcanic rocks, 241–80
Fiji Islands, 340f, 373tFilter pressing in magma, 321–2Fissure eruption, 242, 245fFlaser texture, 454Flood basalt plateaus, 366–7, 371fFlow
aa lava, 248, 250fash, 271–2block, 249channeled lava, 192–3cooling unit of pyroclastic, 272–3, 275fcrystal markers and magma, 177fductile, see Ductile, deformationfabric of silicic lava, 256–7laminar, 192–3lava, 245–58layering, 150f, 176–7, 178fof liquid in granular aggregates, 294of magma, 191–4markers in magmatic rock, 176, 177fmobility of pyroclastic, 272pahoehoe lava, 245–8porous, of liquids, 294pumice, 271–2pyroclastic, 262, 263f, 270–1
sequence in, 272fsubaqueous, 277
rheomorphic, 275turbulent, 192–3viscous, 123f, 186, 190–4volcanic debris, see Lahar
Flowage segregation, 321Fluid(s), volatile
ambient (in metamorphic rocks), 495changing composition driving mineral
reactions, 497composition in mixed-volatile reactions,
495–8in crust, 488–91definition, 75, 491flow in metamorphic systems
driving force, 503evidence for, 498–500mechanisms, 500–4
grain-boundary (porous), 294, 295, 489, 491,495, 501, 509–11, 521–2, 530, 545
inclusions, 489, 491, 503, 602, 645in magma systems, 75–85mixed H2O–CO2, 493–500, 502f, 513pressure, 75–6, 489–91reactions involving, 475, 488–501, 504–5,
509–11release in prograde reactions, 489, 490f, 545to rock ratio, 497separation (exsolution) from melt, 324–5solubility in melts, 77–9specific volume (reciprocal density), 75
Fluidization, 272Foliation, 174f
basis of classification of metamorphic rocks,455–63
compaction, 275expressions of, 174–6, 449f
Index 721
in magmatic rocks, 174–81in metamorphic rocks, 448–50relation to strain ellipsoid, 416f
Fountain, basaltic lava, 267–8Fourier’s law, 130Fractional crystallization, 95–7, 103f, 318–22Fractionation
convective melt, 322crystal-melt, 95–7, 318–22, 627f, 629fisotopic, 44in MORB magma chambers, 338
Fractures and fracturing, 503extensional, 185f
basalt diking and, 220–2brittle behavior and, 187
hydraulic, 185f, 189, 503ring, 230–1, 232fshear (fault), 187, 188f
Fransican Complex (California), 594–601Fugacity, 61–2
oxygen, 65–6and biotite stability, 114fand Fe–Ti oxide stability, 65–6in metamorphic systems, 508
Fulgurite, 286Fumarole, 81f, 84, 275fFused tuff, 171
Gabbroclassification, 29f, 30fdensity in continental crust, 211flayering, 179f, 180mineral composition, 22fin ocean-ridge magma chamber, 327f, 349f,
365Garnet
biotite thermometer, 514, 515chemical composition, 657t, 660tformula, 406tgrowth, 524stability in pelitic metamorphic rocks,
479–84, 486–8, 577–82, 584ftrace elements in, 41tzoned, 516f, 525
GASP barometer, 514, 515Geobaric gradient, 10Geologic systems, 52–3Geothermal
gradient (geotherm), 5, 6f, 10, 565, 566freservoir, 81f, 85, 498
Geothermometer, see ThermobarometerGibbs
free energy, 52, 55–6nucleation and, 134partial molar, 60–1phase diagrams and, 94fsurface, 132
phase rule, 88–9Glass, 11, 22–3, 151
shards, 167–8, 170f, 172frelict, 173f, 408f
vesicular, 165fGlassy rocks, 151–2
classification of, 30–1, 32f, 152Glowing avalanche, 271Gneiss, 457, 582
mantled domes of, 572Goldschmidt, V. M., 437
mineralogical phase rule, 467Gondwana, breakup of, 216, 369, 370f
Gorgona Island (Colombia) komatiite, 365,628, 629
Grainboundary, diffusion, 126
equilibration (modification), 140–2,162–3, 411
fluid, see Fluid(s), grain-boundarysliding, 529sutured, 541
dispersive pressure, 193–4shape
anhedral, 132, 159in crystallizing magma, 136–42, 158–60equilibrium, in metamorphic rocks, 411,
526euhedral, 132, 158preferred orientation of, 449f, 555, 556subsolidus modification of, 140–2
sizecoarsening, see Ostwald ripeningin crystallizing magma, 138–41, 156fvariations in magmatic layers, 177–8, 179f
See also Crystal(s)Granite, granitic rocks, and granitoids, 29, 30f
assimilation of into magma, 328A-type, 312, 387–9
Proterozoic charnockitic suite, 641Proterozoic rapakivi, 644, 645
batholiths, 382–6classification, 29f, 30fcomposition
chemical, 20tmineralogical, 22fnormative, 110f
crystallization of magma, 105f, 106–12density, 195f, 211fdistribution in North America, 225fductile strength, 189femplacement (intrusion) into crust, 226–39generation of magma, 309–12graphic texture in, 162Himalayan, 386–7hypersolvus, 104, 105fI-type, 312, 390, 393fminimum-T melt composition, 108–12origin of magma, 108–12partial melts, 311fplutons, 223f–238fPrecambrian, 633–6rapakivi, 644, 645S-type, 311–12, 390, 393fsubsolvus, 104, 105f, Plate IVsystem, 106–11tectonic
discrimination using trace elements,390–2, 393f
settings, 390–2, 393ftypes of, 311–12, 390
Granitization, 111Granoblastic texture, 143f, 411, 412f, 429f, 454Granodiorite
classification, 29fcomposition
chemical, 20tmineralogical, 22f
crystal-melt equilibria, 113–14density in continental crust, 211fmafic inclusions in, 181fpartial melts, 311f
Granofels, 412f, 461
Granophyre, 162, 329, 336tGranulite facies, 312, 439f, 440, 484f, 571,
577f, 582, 588f, 589, 645–8Graphic texture, 162
relict in metasomatized rock, 424fGravitational potential energy, 3Gravitational segregation of crystals in magma,
321Gravity, geobaric gradient and, 10Graywacke, metamorphosed, 420f, 594, 595Great Dyke (Zimbabwe), 331t, 332, 614fGreenschist facies, 439f, 440, 571, 577f, 587,
588fGreenstone, 460, 594–6
terranes (belts), 613–23Barberton (South Africa), 614f, 615f, 616f,
621metamorphism in, 615–17
Greisen, 465Grenville (Canada) Province and Orogen,
636–9, 644Groundmass, 157
Harzburgitechemical composition, 21t, 290tclassification, 30fhydrated in mantle wedge, 303, 375in mantle, 289, 351, 352fresidual after partial melting, 297, 351, 352f
Hawaiimagma
generation beneath, 360–2, 362finjection paths, 218f
mantle plume under, 362fpartial melt production in, 363
pillow lavas of, 249f, 251fshield volcanoes, 246f, 250–2, 356, 357f
evolution, 359–62tholeiitic-alkaline associations, 359–62volcanic
eruptions, 267–8rocks, 98–9, 247f, 319, 358
Hawaiite, 32f, 358tHealed microcracks, 491, 503Heat
conduction of, 4–5, 198–9, 565atomic model for, 131f
flow (flux), 3–8production in Earth
during Precambrian, 612, 649, 650fby radioactive decay, 9, 285by tectonic thickening, 285–6by work, 284
specific, 4transfer, 4f
advective, 199–201conductive, 197–9, 200fconvective, 201–3
Hematite stability, 64–6, 508Heteromorphs, fabric, 31, 148High-field-strength (HFS) elements, 39f, 303–4Himalaya Orogen, 386–7, 592, 601, 606Holocrystalline rocks, 27Hornblende
chemical composition, 658tdensity, 195fformula, 406fin magmatic rocks, 22fphenocrysts, 116f, 118f, 154ftrace elements in, 23t, 41t
722 Index
Hornblende (continued)in volcanic arc rocks, 301
Hornfels, 429f, 430, 433, 463Hot springs, 81f
oceanic, 302Hyaloclastites, 261–2Hybridized magmas, 325–8Hydraulic fractures and fracturing, 185f, 189,
546fHydroclasts, 168Hydrogen isotopes, 44Hydrolytic weakening of silicates, 541–3Hydromagmatic explosions, 167, 260–2,
269–70Hydrostatic state of stress, 184
recrystallization under, 414–21See also Fabric, tectonite
Hydrothermalmetamorphism, 428, 430solutions, 84–5
source of, 430vein, 432f
Hypabyssal rocks, 28Hypidiomorphic-granular texture, 159, 163
Iceland, 353–4mantle plume beneath, 355f, 363f
Ideal solution, 62, 514Idiomorphic, 158Igneous lamination, 159f, 175, 176fIgnimbrite, 271
cooling unit of, 272–3, 275fin pyroclastic sequences, 265f, 272frheomorphic, 275fields, 378–82zoned, 273, 274f
Ijolite, 29f, 397fIlmenite
chemical composition, 658tin magmatic rocks, 26fmineral thermobarometer, 66trace elements in, 23t
Immiscibility, melt, 97–8, 322–4Inclusions
mafic rock in granitoids, 181mantle-derived rock, 289–91of melt trapped in mineral grains, 158–9of minerals in poikiloblasts, 413, 414
record of deformation, 528, 552, 553fuse in determining P–T–t path, 582–3,
603–5Incongruent melting, 97
in continental rock, 308–11in mantle source rock, 296–9
Index mineral, 435Inductively coupled plasma (ICP)
spectrometry, 18Intensive (state) variables, 53, 61, 72
evaluation during metamorphism, seeThermobarometer
Interface, crystal, 131, 132fInterfacial energy, 131–3Intergranular
diffusion, 509–11, 521–4, 529, 530fluids, see Fluid(s), grain-boundarytexture in basaltic rocks, 154f, 155
Intermediate composition, 32fInternational Union of Geological Sciences
(IUGS) classification of igneous rocks,28–32
Intracrystalline plasticity (strain), 529, 531f,532–43
role in preferred grain and latticeorientation, 556–8
Intrusionsbasaltic, 329–38central, 216f, 219
dike swarms around, 216fcomposite, 225contact aureole around, 429fhost rock interface with, 236–9laccolith, 233, 234flayered basaltic, 331–7, 648sheet, 213–22, 648, 649space for (“room problem”), 224, 226–36zoned, 225, 227f–229f
Intrusive rocks, 27–8, 155–7Ion-exchange reaction, 505Island arcs, 301, 371–6, 374f, 375f
composition of rocks in, 373tpossible terranes in Precambrian, 622primitive mantle and, 303–5, 304f
Isobaric, 54Isochron, 47fIsocon diagram, 507Isograd, metamorphic, 435, 511–13, 571Isolated system, 52fIsopleth, 91Isothermal compressibility, coefficient of, 194Isotherms, 91
in dike, 198, 199fin subduction zone, 567f
Isotopes, 44–9in andesite, 329fin arc rocks, 344beryllium, 47–9in contrasting mantle reservoirs, 354cosmogenic, 47–9exchange reaction for, 45in flood basalt plateaus, 366ffractionation of, 44in Hawaiian magmatic rocks, 360t, 361fin highly alkaline rocks, 308, 400in metasomatized mantle rock, 293fin oceanic magmatic rocks, 354, 356f, 366foxygen, 44–5, 45fin Precambrian continents, 651in Proterozoic anorthosite massifs, 643fradioactive decay of to create heat, 9, 285radiogenic, 45–7, 48fstable, 44–5, 45f
Isotropic fabric, 174
Jadeite, 406t, 479f, 485Japan, 7f, 271, 279Jasperoid, 465Joint(s)
columns in magmatic rocks, 249–50in metamorphic rocks, 453f
Juvenileclasts, 167gas, 82
Kamafugite, 395, 396tKaroo (Africa) basalt plateau, 364f, 367t, 368f
composition, 369tKelyphytic rim, 455Kerguelen Islands, 292Kermadec volcanic arc, 339, 340f
composition, 373t
Kilauea volcano (Hawaii), 319f, 320tKilborne Hole (New Mexico) peridotite, 288f,
293f, 298fKimberlite, 399
archetypal, 399, 400fdiatremes, 232, 233f
cold intrusion of, 79global occurrence, 401fmineralogical comparison, 400ttrace elements in, 306f
Kinetic(s), 66–9energy, 3paths, 67, 148–51, 149f, 520of reactions in metamorphic systems, see
Reactions, metamorphic mineralsteps in recrystallization, 521
Kink bands (kinking), 534, 535fKomatiite, 297, 365, 623–9, 650fKrakatoa (Indonesia) volcano, 270, 277
Laccoliths, 233, 234fLahar, 259f, 278–9Laki (Iceland) volcano, 84, 245, 252, 354Lamproite, 399
global occurrence of, 401ftrace elements in, 306–8mineralogical comparison of, 400t
Lamprophyre, 395, 398Lapilli, 27, 166
accretionary, 168, 264devitrified glassy, 173ftuff, 27f
Large igneous province, 364–9Large-ion lithophile (LIL) elements, 39f, 303–4
in MORB, 354La Soufrière (St Vincent), 270Lassen Peak (California) volcano, 257f, 279,
383fLatite, 32fLava, 245–57
domes, 246f, 255–8fields, monogenetic, 244, 245fflows, mostly basaltic
aa, 248, 250fblock, 248pahoehoe, 245, 247f, 248
fountain, 145, 247f, 267–8lake, 98, 268levée, 193, 244f, 248pillow, 151f, 249f, 349f, 376silicic flows, 254–7, 258fsubaerial, 250–2tubes, 245, 247f
Laws of thermodynamics, 53–5Layered mafic intrusions, 331t, 331–7Layering and layered fabric, 174
comb, 180f, 181compositional, 174f, 175, 177–80cryptic, 334, 335fdifferentiated, 560–1gneissic, 449f, 450grain-size-graded, 177–8, 179finch-scale, 179fmodal, 179fphase, 334, 335f
LeChatelier’s principle, 57, 479Lepidoblastic texture, 449, 454Leucite, 658t
Hills (Wyoming), 400fLeucocratic rocks, 28
Index 723
Leucosome, 457, 459fLever rule, 92Lherzolite
abyssal, 351–2chemical composition, 21t, 290tclassification, 30fmantle-derived inclusions, 290, Plates V and
VIpartial melting of, 295–8metasomatism of, 291–3, 307–8
LIL, see Large-ion lithophileLineation and lineated fabric, 174, 450, 451,
453fLine defects, see DislocationsLiquid(s)
advection, 4, 199–201distribution and migration in granular
aggregates, 294–5line of descent in fractionating magma, 96,
97f, 109fimmiscibility, 97–8, 322–4See also Melt(s) and Fluid(s)
Liquidus, 90–3, 105pressure dependence and relation to
geotherm, 203Liquidus phase, 93Lithic clasts, 167Lithophysae and lithophysal fabric, 166Lithosphere, 8f, 285f
ductile strength, 189, 190fheat transfer in, 4–5metasomatized, 295, 306–7, 403oceanic, 349f, 350f, 363f, 376–7
See also Crust, oceanicP–T path in subducting, 301–3
Long Valley (California) caldera, 265fLoss on ignition (LOI), 19
Maar over diatreme, 232, 233f, 270Mackenzie (Canada) dike swarm, 217f
flood basalt, 367tMafic rocks and minerals, 28, 30f
inclusions in granitoids, 181Magma
ascent in lithosphere, 210–36basalt, 90–100, 295–8, 300buoyancy, 194–7, 210chambers
border zones, 238fbottle-shaped, 203–4convection in, 201–5
convective melt fractionation in, 203–4, 322,343
flat-slab, 204–5flow in, 192–3ocean-ridge, 337–8replenishment in, 205–6sidewall crystallization in, 203–4, 343
contaminated, 328, 643crystal-melt equilibria in, 87–119definition, 72–3deformation, 191–4density, 194–7, 210diapirs, 222–4differentiation, 316–44
closed-system, 318–25open-system, 325–44
effusions, 245–58explosive, 80–3, 242–3, 259–75extrusion, 241–2
flow of viscous, 190–4fragmentation, 142–5, 259–61generation, 283–313
by decompression of mantle peridotite,295–300
in continental crust, 308–13from source rock, see Source rockin subarc mantle wedge, 300–6in subducted oceanic crust, 305–6under Hawaii, 360–2
granitic, 108–12, 311–12hybridized, 325–8intrusion, 210–39mantle connection in origin, 288, 313mid-ocean ridge basalt (MORB), 337–8,
351–3mingled, 178f, 325mixed, 325–8nature of phases in, 72–5Newtonian, 123–5, 191fNon-Newtonian, 190–4“ocean” in infant Earth and Moon, 652, 653overpressure causing
diking, 212–16, 221fdoming, 232–5
parent, 316primary, 299primitive, 300production in tectonic settings, 1–2rheology, 186–94stoping, 228–31types, 72–3volatiles dissolved in, 75–80water (external) interactions with, 260–2
Magmaticanalysis, 17–19arc, 300, 370, 377–86chemical composition, 12–13, 20–1, 23–5classification, 25–37contrast of fabric between metamorphic and,
413fabric, see Fabric, magmaticmineralogical composition, 22, 26, 29f, 30f,
33fsubsolidus reactions, 118–19suites and trends, 35–7, 337–43, 358f,
374ftypes, 20t, 21t, 28–31, 32f, 33f
“sedimentation,” 177–9, 197, 332, 336underplating, 211, 284, 584, 648
Magnesium (Mg) number, 300Magnetite, 658t
stability dependent on oxygen fugacity,64–6, 508
trace elements in, 23t, 41tMajor elements, 19Makaopuhi basalt, Plate III
crystal-melt equilibria of, 98–9Mantle
bedding in ash-fall layers, 266convection, 6–9, 285f, 301f, 350f, 353f, 355f,
362f, 363f, 370f, 649decompression melting of, 286–7, 649depleted versus enriched, 48fD layer, 6–8ductile strength, 190fas heat engine, 2–10magma generation in, 283–307, 355f, 629fmetasomatized, 291–5, 306–8MORB magmas from, 351–3
peridotite, 288–95plumes, 7–8, 217f, 301f, 350f, 353f, 362f,
363f, 370f, 649beneath basalt flood plateaus, 364–70beneath Iceland, 355fbeneath oceanic islands, 354–64
Precambrian, 612, 629primitive island arc magmas from, 303–5
trace elements in, 43t, 352freservoirs, isotopic, 354seismic tomography (image) of, 7fsource rock for mafic magma, 288–95
depleted, 43, 48fenriched, 43, 48f, 291, 306–8, 353–4
viscosity, 124wedge (subarc), 285f, 287, 301–3, 371, 375,
427fMantle-derived inclusions, 289–93, Plates V, VIMantled gneiss dome, 572, 573fMarble, 411f, 462Mariana arc, 373t, 374f, 597Martinique, 270–1Mass-balance equation, 101, 327–8Massifs, 289, 377, 603Mauna Loa (Hawaii) volcano, 246f, 250f, 251f,
357f, 359Mayon (Philippines) volcano, 279Medicine Lake (California) volcano, 341, 342fMegacrysts, 454, 632f
and mantle xenoliths, 291Melange, 593f, 594–6Melanocractic rocks, 28Melanosome, 457, 459fMelilite, 658tMelilitite, 32f, 358Melt(s), 59, 72
atomic structure, 73–5density, 194, 195fdiffusivities, 129f, 130fenthalpy, 54fluid separation and pegmatites, 324–5fraction, 190–2, 297–9, 309–13, 320fragmentation (explosive), 145immiscible, 73
in basaltic and carbonated silicate systems,322–4
in model binary system, 95f, 97inclusions in crystals, 76, 137, 140f, 158relaxation “time” during deformation, 125residual, 92, 96, 101–2, 318–22, 330, 334–43segregation from source rock, 313thermal convection in, 201–3, 202fviscosity, 74, 122–5, 126t, 191f, 625volatile
exsolution from, 79–84solubility in, 75–80
MeltingClapeyron equation for, 58crystalline residue from, 297–300, 310,
312–13curve, 57–8decompression, 286–7dehydration, 309–11incongruent, 97partial, 295–9
of continental source rocks, 309–11degree of, 298of granite, 311fof peridotite, 295–307, 355fof shale, 310f
724 Index
Melting (continued)of tonalite, 311ftrace element concentration resulting
from, 298–9, 300fperturbations in P–T–X of rock systems
causing, 283–8vein-plus-wall-rock, 307
MELTS software, 118Merensky Reef (South Africa), 331–2Mesosome, 457, 459fMetabasite, 412f, 460, 587–9, 599, 600Metaconglomerate, 417fMetacryst, 454Metagabbro, 481–2Metaluminous rocks, 34–5Metamorphic
classification of rocks, 447, 455–66convergence, 424core complex, 572, 574differentiation, 413, 421fabric, see Fabric, metamorphicfacies, 437, 438, 440t
See also specific types, e.g. granulitefield gradient, 438, 442ffluids, see Fluids, volatilegrade, 430, 431isograd, 435, 511–13mineral assemblage
in pelites in Barrovian zones, 577freactions, see Reaction(s), metamorphic
mineralstable, 436
sole beneath ophiolite sheet, 592–3terranes, 426zones, 431, 436
Barrovian, 434, 435, 467f, 570, 576–83Buchan, 435, 583–4, 586in carbonate contact aureole, 499–501inverted, 592mineralogical, 431in Onawa pelitic contact aureole, 429f,
432in skarns at Crestmore, California 433, 434
Metamorphismburial, 428contact, 426f, 428, 429f, 432, 499, 500controlling factors, 426fat convergent plate margins, 427fdefinition of, 404dynamic, 426evaluation of intensive variables during,
513–16hydrothermal, 426, 428, 589–91impact (shock), 430, 652infiltration, 497–8isochemical, 422low grade, 407–10metasomatic, see Metasomatic and
Metasomatismnear trench, 594–601nonvolatile loss of mass during, 504, 559,
560ocean-ridge, 301, 302, 426f, 427, 589–91,
596orogenic, 428poly-, 416, 444, 549–51, 610prograde, 431P–T conditions of, 405f, 439fregional, 426f, 428retrograde, 431, 433f
thermal, 426types of, 426–30ultrahigh-P (UHP), 442, 601–6
Metasomaticmantle rock, 307–8
veins in, 291–3, 307rocks, classification of, 465
low variance mineral assemblages in, 506zoning, 433, 434, 506
Metasomatism, 291–5, 422, 426, 504–8assessed by isocon diagram, 507–8constant volume replacement, 423, 464at Crestmore, California, 433–4cryptic, 291of lithosphere, 295, 306–7of mantle peridotite, 292–3modal, 291at oceanic ridges, 423, 427, 428, 589–91in Precambrian rocks, 617, 625
Metastableequilibrium, 11, 56, 66–9persistence beyond stability
conditions, 68–9, 405, 436phases in metamorphic rocks, 407
Meteorites, chondritic, 40, 43t, 288Mexican volcanic belt, 381f, 395Mg number, 300Mg–Fe partitioning in metamorphic minerals,
485–8Miarolitic cavities, 166Mica
chemical composition, 658t, 659tcrystal-melt equilibria, 76, 114–15formula, 406twhite, 408
Microcrystalline texture, 153–5Microlites, 155Microlithons, 449Microstructure, 14, 148
See also Texture and FabricMid-Atlantic Ridge, 254f
Iceland along, 353–4Mid-ocean ridge basalt (MORB), 337–8, 350–3
density, 196f, 211fisotope ratios in, 356ftrace element pattern, 43, 352f
Migmatite, 311–12, 427f, 458, 458fdomes, 572, 573f
Mineral(s)abbreviations, 406taccessory, 22, 23tassemblage, metamorphic, 436
assessing state of stable equilibrium in,117, 474
associations and compatibilities, 22, 474chemical analysis of, 12–13, 18–19chemical composition, 657t–660tdensity, 195–6formula, 406tgraphical representation of compatible
466–71melting of, 58f, 91–115normative, 32–3, 661tparagenesis, 473polymorphism, 88–9rock-forming, 22, 23t, 406tthermobarometers, see Thermobarometersvolatile-bearing, 111–17
Mineralization, see Ore depositsMineralogical
phase rule, 467, 506zones, see Metamorphic zones
Minette, 398Miscibility gap, 104Mixed volatile fluids, 493–500, 502f, 513Miyashiro, A., 377, 438Mobile components, 493Modal
analysis, 17–18composition (mode), 12f, 13metasomatism, 291
Molarheat capacity, 4volume
melting curve governed by, 57partial, 59–60
Mole fraction, 59Monogenetic lava field, 244, 245fMonomineralic layers, 320Monzonite, 29fMoon, 2, 131, 652, 653fMORB, see Mid-ocean ridge basaltMount Ascutney (Vermont), 229–30, 231f, 238Mount Everest, 386fMount Mazama (Oregon), 274fMount Pelée (Martinique), 270–1Mount Ranier (Washington), 383f
dike-sill swarm of, 215flahars of, 278f
Mount Saint Helens (Washington), 383fadakitic magmas of, 382 climate after 1980 eruption, 84crystal-melt equilibria in magma, 116–17explosion of, 242, 243f, 270
volcaniclastic deposits from, 259–60, 279lava dome, 258f
Mount Shasta (California), 244f, 279, 383fMudrock, see ShaleMugearite, 32f, 358tMuscovite
chemical composition, 659tformula, 406tmelting of, 309–10, 582stability, 435f, 577f–580ftrace elements in, 23t
Muskox (Canada) intrusion, 331t, 333fMylonite, 416, 419f, 458, 459f, 533f, 544f, 556,
571fMyrmekite, 105f, 163
Nappe, 572, 573fNegative Nb–Ta–Ti anomaly, 304–5Nematoblastic texture, 450, 453fNeodymium isotopes, 47, 48fNepheline, 26f, 658t
silica saturation and, 33–4, 64Nephelinite, 32f, 33f, 358
associated carbonatite, 324t, 395–7chemical composition, 21t, 324t
Network-forming cations, 73–4Neutron activation analysis, 19Newfoundland, 376–7, 378f, 552, 553fNewtonian viscosity, 123–5, 186fNew Zealand
magmatic arc, 339, 340fcalc–alkaline rock suites, 36f, 37fTaupo volcanic zone, 270–1, 378, 379f
metamorphic zones, 597–8Nigeria, 390, 391f
Ningi-Burra ring complex, 392f
Index 725
Nonhydrostatic state of stress, 184recrystallization under, 414–21
Non-Newtonian rheology of magma, 190–1,193f
Nonvolatile loss of mass during metamorphism,504, 559, 560
Norite, 30f, 648Normative composition and minerals, 33,
661–5Nucleation
of grains in metamorphic rocks, 522in melts
of crystals, 133–5of volatile bubbles, 142–5
Nuclei density, 137Nuées ardentes, 271
Obduction, 593Obsidian, 150f, 151Oceanic
crust, see Crustisland rocks, 354–64plateau, 254, 364–6, 369tspreading ridge, 349–54
magma chamber, 327f, 349f, 337–9Ocelli (varioles), 625Oddo–Harkins effect, 40Oikocrysts, 158Oldoinyo Lengai (Tanzania) volcano, 323–4Olivine
chemical composition, 657tcrystal-melt equilibria involving, 93–100, 112density, 195fductile strength, 189f, 190fformula, 406tfractionation in magmas
Kilauea basalts, 319fkomatiite, 627f, 629f
hydrogen diffusion in, 128fin magmatic rocks, 22fin metamorphic rocks (forsterite), 500–2as oxygen buffer (fayalite, QFM), 64–5segregation layer in Palisade sill, 330–1silica saturation (activity) and, 33, 63–4in Skaergaard intrusion, 335ftholeiite, 37, 99ttrace elements in, 23t, 41ttransition to spinel phase in mantle, 6f
Oman (Semail) ophiolite, 592–4Ontong Java Plateau, 364, 366f, 369tOpen system, 52
magma differentiation in, 325–9Ophiolite, 376–7, 378f, 592–4
possible Archean, 622Ophitic texture, 158, 159f, 163–4Orangeite, 306f, 398–401Order of magnitude, 7Ore deposits
in carbonatites, 395in greenstone belts, 617, 622in layered mafic intrusions, 337in pegmatites, 325, 388on seafloor, 302in skarns, 430volcanoes and, 81f, 85
Orogenic belts (orogens), see specific, such asAppalachian
metamorphism in, 428Ortho- (prefix on metamorphic rock names),
455
Orthopyroxenechemical composition, 657tdensity, 195fhigh-Al megacrysts in Proterozoic
anorthosite massifs, 640silica saturation (activity) and, 33, 63–4trace elements, 23t
Oscillatory zoning, 160in plagioclase, 139f, 155f
Ostwald ripening, 141, 145, 411, 525Ostwald’s step rule, 69Overpressure, see Magma overpressure
in volcanic system, 82Overprinting processes
in polymetamorphism, 416, 421, 442, 610subsolidus textural modification, 139–42
Oversteppingmetastability and, 68–9nucleation and, 134–5
Oxygendiffusion of, in crystals and melts, 128f, 130fin melt polymers, 73–4fugacity buffers, 64–6isotopes, 44–5, 84
in andesites, 329fin continental arc magmatic rocks, 380fprovide evidence for advection, 45, 85f,
499
Pahoehoe lava flows, 245, 247f, 248Paired metamorphic belts, 427f, 569, 570Palagonite, 153Paleosome, 457, 459fPalisades (New Jersey) sill, 329–30, 331f, 337fPantellerite, 35, 388tPara- (prefix on metamorphic rock names), 455Paraná (South America) flood plateau, 371fPartial melting, see MeltingPartial resorption of grains, 116f, 140f, 141f,
Plate IIPartition coefficients, 38–41, 43fP-domains, 450, 558, 560–1Pegmatite, 29, 324–5, 326fPegmatitic fabric, 156f, 157Peléan dome, 255Pelite and pelitic rock, 408, 426
in Barrovian metamorphic zones, 577–82Pendant (roof), 230fPeperite, 262Peralkaline rocks, 34–5, 388tPeraluminous rocks, 34–5Peridotite
abyssal, 349, 352falpine, 377chemical composition, 21t, 290tclassification, 30fCr-diopside, 289crystal-melt equilibria, 288fdensity, 195fmagma generation in, 295–300mantle
density, 211finclusions (xenoliths), 288–93, Plates V
and VImetasomatically enriched, 306–8partial melting of, 355f, 295–300
poikilitic, 158ftrace elements, 293f, 308t
Peritectic, 95Perlite, 152
Permeability, 501, 503advection and, 201in granular aggregates, 294, 295reaction-enhanced, 501
Perthite, 104, 105fPetrogenesis, 14Petrogenetic grid, 437
conceived by N. L. Bowen, 593for high-P and ultrahigh-P rocks, 604ffor pelitic rocks, 435f, 586ffor siliceous dolomites (calc-silicate rocks),
502fPetrogeny’s residua system, 110–11Petrography, 14Petrology, 14Petrotectonic associations, 9, 36–7, 222,
348–403state of stress and, 221–2See also Plate tectonics
PGE, see Platinum group elementsPhaneritic texture, 27, 155–7Phase
definition, 56diagram, 61, 87–8incompatibility, 93–5layering, 334, 335frelations
Gibb’s, 87–9Goldschmidt’s mineralogical, 467, 506See also Crystal-melt equilibria and
Reactions, metamorphic mineral rulePhenoclasts, 169, 170fPhenocrysts, 27, 157Phlogopite
chemical composition, 658tdensity, 195fin magmatic rocks, 26f, 115, 291, 307t, 308t,
399, 400tPhonolite, 20t, 32f, 33fPhreatic eruption, 269Phreatoplinian eruption, 270Phyllite, 457Phyllonite, 459Picrite, 31, 297, 319f, 320t, 357, 363, 365f, 366Pilbara (Australia) Craton, 223fPillow lava, 151f, 249f, 349f, 376
metamorphosed Archean, 424f, 616f, 618,622
Pipe, breccia, 231–2Pipe vesicles, 151f, 165Pitchstone, 152Plagioclase
in anorthositeArchean megacrystic, 630–2lunar, 652–3Proterozoic massifs, 637–43
in Barrovian pelite zones, 577fchemical composition, 658tcontrasting texture between magmatic and
metamorphic rocks, 413crystal growth in melts and shapes of, 135–8crystal-melt equilibria, 90–3, 98–114density, 195fductile strength, 189fequilibria and reactions in metamorphic
rocks, 479–85in Skaergaard intrusion, 335ftrace elements, 23t, 41tzoning, 103f, 139f, 155f, 160
Plagiogranite, 376, 377t
726 Index
Plagiogranite (continued)See also Granophyre and Trondhjemite
Plastic strain (deformation), 186, 529, 532–43Plate tectonics, 1, 2f, 8, Plate I
See also Petrotectonic associationsPlatinum group elements, 23t, 39fPlinian
deposits, 272feruptions, 263f, 268f, 270plumes, 262–4, 268f
Plug, 231Plume, see Mantle plumes and Volcanic plumesPluton, 27–8, 155–7, 224
associated features, 230fbatholith, 226chronology of emplacement relative to
tectonism, 231f, 238–9, 430composite, 225processes of emplacement, 226–36stock, 226syntectonic, 239zoned, 225–7See also Intrusions
Plutonic arcs, 382–6Poikilitic texture, 158fPoikiloblasts and poikiloblastic texture, 413,
414, 429f, 454, 523f, 524, 551f, 552,553f
Point defects, 129f, 538Polyhedral minimal surface area, 142fPolymerization, 73–4
viscosity and, 74, 124Polymetamorphism, 416, 421, 442, 444, 549–51Polymorphs and transitions among them
Al2SiO5, 476–9, 510CaCO3, 476carbon, 476silica, 88–9, 476
Porosity, 201, 501, 503Porphyritic rocks and texture, 27, 153f, 154f,
157–8, 160f, 161fPorphyroblasts and porphyroblastic texture,
413, 414f, 454, 524Porphyroclasts and porphyroclastic texture,
419f, 454, 460fmantled, 553f
Porphyry, 29–30, 157Potential energy, see EnergyPower law in ductile flow, 543Precision, accuracy versus, 17Preferred grain-shape and lattice orientation,
see Fabric, metamorphic, tectonitePrehnite-pumpellyite facies, 439f, 440, 569–71,
594–601Pressure
confining, 10, 76fdefinition of, 3, 184fluid, 75geobaric gradient and, 10melting temperature dependent on, 57–8,
89–90ridges in lava flow, 248, 256fshadow, 454, 530solution, 530, 531f, 556stress and, 184, 221f
Prism, accretionary, see Accreted terraneProduct phase, 473Prograde metamorphism and reactions, 431Progress variable, 496–7Propylitically altered rocks, 85
Protolith, 405, 424–6, 455, 617Psammitic, 426Pseudotachylite, 286P–T simulating devices in laboratory, 5–6P–T path in subducting lithosphere, 303fP–T–t path, 439, 441
Barrovian terranes, 582–3Buchan terranes, 584, 586granulite facies terranes, 646–8high P/T terranes, 600–1rocks associated with ophiolite, 594Tauern Window (Alps), 575ultrahigh-P (UHP) terranes, 604–5
P–T–X phase diagram, 61, 87–8Pumice, 143–4, 165
devitrified, 173ffall deposits of, 265f, 266fflows of, 272
Pumping, dilatancy, 191P–V work, 3, 82Pyroclastic
deposits and processesfall (ash), 260f, 262–6flow (ignimbrite), 167, 262, 263f, 270–7surge, 261f, 266–7
fabric, 82, 83f, 167, 170fPyroclasts, 82, 83f, 145, 167–8, 243, 259–70
in volcanic plumes, 262–4Pyroxene
chemical composition, 657tcrystal-melt equilibria, 112–13exsolution texture in, 103fhornfels facies, 439f, 440
Pyroxenite, 30f, 291
Q-domains, 450, 558, 560, 561Quartz
and buffer curves, 65fcrystal-melt equilibria, 93–8, 108–14density, 195fductile
deformation, 531f, 533f, 544fstrength, 190f
dynamically recrystallized, 544fmelt inclusions in, 140fpartially resorbed, 141fP–T stability, 88frelation to silica saturation (activity), 34, 64subgrains, 543f
Quartzite, 462Quartzo-feldspathic, 426
Radiation (heat transfer), 4Radioactive decay, 45
heat production by, 9, 285, 565, 567fRadiogenic isotopes, 45–7, 48f
A-type granites, 389andesites, 329farc basalts, 344fbulk silicate Earth, 48fcontinental arc rocks, 377, 384f, 385, 386flood plateau basalts, 366fhighly alkaline rocks, 400fHimalayan granites, 387mantle rocks, 48fmetasomatized mantle peridotite, 293fmid-ocean ridge basalt (MORB), 48f, 354,
356f, 361f, 366foceanic island rocks, 48f, 356f, 361f, 366f
Rapakivi
granite, 644–5texture, 160f, 161, 644
Rare earth element (REE), 23t, 39f, 40–3behavior during partial melting, 300f
Rayleigh law, 320Rayleigh number, 203Rayleigh–Taylor instabilities, 222, 326Reactant phase, 473Reaction
affinity, 509, 523relations in magmas, 95, 101–2replacement in cumulates, 332frim in magmatic crystals, 96, 116, 160–1,
Plate IIseries in magmatic rocks, 97, 102
Reactions, metamorphic mineral, 473–516continuous, 475, 484–8coupled, 492decarbonation, 492–8
influence on atmosphere, 499dehydration, 301–3, 431, 494–8devolatilization, 431discontinuous, 475, 479–84exchange, 475, 487heterogeneous, 475ion exchange, 504, 505internally buffered, 495at isograds, 511–13kinetic factors, 476, 477, 509, 520, 521mixed volatile fluid, 493–8, 502f, 513, 598,
645net transfer, 475overstepping conditions for, 509prograde, 431progress variable, 496redox, involving phases containing O, S, C,
Fe, 64–6, 475, 508retrograde, 431role of fluids, 509–11solid–fluid, 115, 475, 488–98solid–solid, 475texture, 433f, 473, 482fterminal disappearance, 483tie-line switching, 481
Reactive surface area, 509Recovery during dislocation creep, 541, 542f,
543fRecrystallization
defined, 410interaction with deformation, 521, 543–5,
556mimetic, 556nucleation and growth, 522–8
REE, see Rare earth elementRelaxation “time,” of melts, 125Replenishment in magma chambers, 326, 327f,
330, 332, 338Reservoir
geothermal, 81f, 85isotopic and chemical in mantle, 354
Residual melt, see Melt(s)Restite, 135, 181f, 312–13Resurgent uplift of caldera floor, 277Reticulite, scoria, 143fReversible thermodynamic process, 53Reworked volcanic deposits, 278Reynolds number, 192–3Rheology (non-Newtonian), 186, 190–3Rheomorphic
flow, 171, 275
Index 727
ignimbrite, 275Rhyolite, 232f, 339–42
A-type, 388–90composition
chemical, 20t, 388tmineralogical, 22f
domes, 220, 246f, 255–7, 276f, 277fflow layered, 178fignimbrite (ash-flow tuff), 265f, 271, 274f,
378–82, 392IUGS classification, 32f, 33f, 37fmelt density, 195fmelt diffusivities, 129–30mingled with basalt, 327fperalkaline, 388t, 392topaz, 388tviscosity of melts, 124–6
Riecke’s principle, 530Rift zone, 218f, 392–4Ring
complex, 232f, 390–2dike, 220, 230–1, 232f, 392f
Ring-fracture stoping, 230–1Rodingite, 465Room problem of magma intrusion, 111, 224,
235–6Rubidium-strontium isotopes, 46–7
See also Radiogenic isotopesRum (Scotland) intrusion, 331t, 372f
S-surface, 448, 552f, 554Salton Sea geothermal field, 498, 568, 584, 585fSamarium-neodymium isotopes, 47
See also Radiogenic isotopesSampling, 16–17Sanidinite facies, 439f, 440Saturation
alumina, 34–5silica, 33–4, 35, 37, 38fvolatile, 77–81
S–C fabric, 553f, 554Schist, 420f, 457Schistosity, 420f, 449f, 450, 558–61Schlieren, 174f, 175, 176fScoria and scoriaceous fabric, 165
basaltic thread-lace, 143Scotland, metamorphism in, 434–6, 576Scrope, George P., 72, 287Seamounts, 246f, 252–3
mantle plumes related to, 356“Second phase” effect on metamorphic grain
size, 525Segregation
layers, 420fof melt from residual crystals, 294–5,
312–13, 321–2, 332Semihornfels, 429fSeparation
fluid-melt, 324–5of immiscible melts, 322–4
Seriate texture, 155f, 156Serpentinite, 463–4, 596–7Shale, 408, 471tShear
sense indicators in metamorphic fabric, 551,553f, 554
simple 552f–555fversus pure, 534, 536f, 537, 538f, 547f
stress, 183, 184fproducing heat, 284
and viscous flow, 123–4, 190–4Sheet intrusions, 213–22
See also Dikes and SillsSheeted dike complex, 216, 349f, 376Shield volcanoes, 246f, 250–2, 357f, 359Shoshonite, 32f, 37f, 373t, 374fSHRIMP analyses, 604, 611Sialic rocks, 28Siberian flood basalt, 364f, 366f, 367tSidewall crystallization, 203–4, 343Sierra Madre Occidental (Mexico) ignimbrite
province, 381f, 382fSierra Nevada (California) batholith, 225–7,
236, 382–6modal composition, 26fvariation diagram of rocks, 343f
Sieve texture, 578fSilica (SiO2)
absolute concentration in rocks, 25, 25f, 324,396t
activity, 63–4basis of rock classification, 24, 25f, 31, 32fbuffers, 63–4crystalline, atomic structure of, 74fliquid (melt), atomic structure, 74fsaturation, 33–4
basaltic rocks and, 37, 38frelation to silica activity, 64
Silicate melts (liquids), 59, 72–5See also Melt(s)
Silicicdome, 220f, 243f, 244f, 246f, 255f, 257f,
276f, 277flava, 254–8pyroclastic deposits, 246f, 255f, 259–77rocks, 28See also Rhyolite
Sill, 213, 214fPalisades, 329–31, 337f
Sill-dike swarm, 214f, 215f, 368fSkaergaard (Greenland) intrusion 331t, 334–7
layering in, 179forigin of, 205, 208
photomicrograph of gabbro, 103fpyroxenes, 112tholeiitic differentiation trend, 337f
Skarn, 430, 433, 434, 465Skeletal crystals, 136–8, 151, 158, 626fSlate, 408, 429f, 456
belt, 570, 572fspotted, 429f, 432, 457
Slaty cleavage, see Cleavage in metamorphicrocks
Slave Province (Canada), 613, 637Slip (gliding), plastic, 532–43Snake River Plain (Idaho), 245f, 267f, 381f, 389Snowball fabric in tectonite, 548–9Solidus, 93, 101, 107f
basalt, 98f, 100f, 303f, 405fbounding realm of metamorphism, 405fgranite, 405f, 435fMount Saint Helens dacite, 117fperidotite, 288fP–T–X perturbations causing melting, 283–7See also Subsolidus
Solubilityof minerals and components in fluids, 498,
499f, 504of volatiles in melts, 76–81
Solutions, liquid, 59–66
Solvus, 97, 102, 107f, 112fSource rock, 283
depleted versus enriched, 43fertility, 297, 309–11partial melting of
continental crust, 308–13mantle, 288–308, 353–4; see also Mantle,
source rock for mafic magmasubducted basaltic oceanic crust, 305
Spanish Peaks (Colorado), 216fSpatter, welded (agglutinate), 268Specific volume of water, 75, 76fSpectrometry, 18–19Spherulites and spherulitic fabric, 136–8, 152f,
153, 158, 173fSpilite, 428, 465Spine (of viscous lava), 255Spinifex fabric, 625, 626f, 629Springs, hot, 81f, 302fStability
diagrams, 56energy and, 10–11, 52–8fields in P–T–X space, 88, 480, 493
Standard state, 61State properties (variables), 53Steam-blast explosions, 269Stillwater (Montana) layered mafic intrusion,
178, 331t, 332Stock, 226, 230fStokes–Einstein equation, 128Stokes’s Law, 178, 197, 264Stoping, 228–3l
ring-fracture, 230–1Strain, 184–5
elastic, 185, 186f, 531fellipsoid, 416, 537, 538f, 555geometric relation to responsible stress, 555hardening, 186f, 541intracrystalline plastic, 532–43markers of, 233, 537, 538fpartitioning, 418f, 537, 538fplane, 537, 538fshadow, 454time rate of, 186
Stratovolcano, 279, 280fStrength, 185–90Stress, 183–8
deformation and, 184–94difference, 187, 188f, 189f
See also Strengthmagma pressure and, 221fpetrotectonic association and state of, 221–2
Strombolian volcanic eruptions, 268Strontium isotopes, 46–8
A-type felsic rocks, 389andesite, 329fbasaltic oceanic rocks, 356f, 361fcarbonatite, 397continental arc magmatic rocks, 341, 344,
380f, 384f, 385, 386highly alkaline mafic/ultramafic rocks, 400fHimalayan granites, 387metasomatized mantle peridotite, 293fplateau flood basalts, 366f
Subalkaline rocks, 35–7Subgrains, 541, 543fSubhedral grains, 155fSubsolidus
decomposition, 161–2realm of metamorphism, 404, 405
728 Index
Subsolidus (continued)metasomatism, 291reactions in magmatic rocks, 118–19See also Solidus
Subsolvus granite, 104, 105fSudbury (Ontario), 286f, 331tSulfides, stability in metamorphic systems, 508Sulfur, in magma, 78Superior Province (Canada), 615, 619f, 620f,
622–3, 637f, 639f, 647fSupracrustal rock sequences, 613, 615, 617,
622Surface diffusion, 126Surface free energy
crystallization and, 131–2, 134intergrain and textural modification, 141,
142fSurface tension, 132Surges, pyroclastic, 261f, 264f, 266–7Surroundings of a system, 11Surtseyan eruption, 261f, 269Syenite, 20t, 29f, 206f, 390Symplectite texture, 454, 455f, 484f, 528System, 11
Tambora (Indonesia) volcano, 84Tauern Window, 574–6Taupo (New Zealand) volcanic zone, 270, 271,
339, 340f, 341f, 378, 379fTectonic settings
of magmatism, 8f, 285f, 643of metamorphism, 426–30, 564–606, 643,
648problematic for Precambrian terranes,
649–51and state of stress, 220–1See also Plate tectonics and Petrotectonic
associationsTectonic thickening and heating, 285Tectonite, 416, 528–61
fabric, see Fabric, metamorphicL-, L–S-, S-, 448–50
Tectonothermal factors in metamorphism, 431,439, 441, 564–606
Temperaturein Earth and geothermal gradient, 5–8as intensive variable, 53perturbations of causing partial melting,
384–6See also Heat
Tension, surface, 132Tephra, see Pyroclasts
chronology, 266Tephrite, 32f, 33fTernary feldspar equilibria, 100, 104–9Texture, 14
See also Fabric and specific types of, e.g.amygdaloidal
Thermalconduction (diffusion), 4–6, 123f, 130–1,
197–200conductivity, 130convection, 6–8, 201–5energy, 3expansion, 195gradient, 5relaxation in orogens, 565, 566fupper stability limit for minerals, 115transfer time, 131See also Heat
Thermobarometer (geo-, mineral)crystal-melt equilibria and, 117–18isotope, 45metamorphic mineral assemblage, 437, 485,
513–17, 566, 602oxygen buffers, 66and P–T–t paths, 566
Thermochemical convection, 203–5Thermodynamics, 51–66Thermomechanical feedback, 191, 284Tholeiite
abyssal, 350basalt, 37
chemical composition, 99t, 358t, 360t,369t, 373t
crystal-melt equilibria in, 98f, 100fdensity of melt, 195fimmiscible melts in, 322–3trace elements, normalized, 304f
Tholeiiticarc rocks, 35–6, 37f, 372–5differentiation trend, 35–6, 337f
See also Skaergaard trendThompson, James B. Jr, 14, 470, 505–6Thread-lace scoria, 143fTides in solid Earth, thermal energy from, 9Tonalite, 29f, 30f
dehydration melting of, 310tpartial melts of, 311f
Tonga arc, 36f, 37f, 339, 340f, 378Topaz rhyolite, 388Total alkalies-silica (TAS) diagram, 25f, 26f,
32f, 36fTrace elements, 19, 23t, 37–40
adakite, 43farc signature of, 303–5, 375A-type felsic rocks, 388t, 389fbehavior during fractional crystallization,
320–2behavior during partial melting, 299–300bulk partition coefficient, 39chondrite, 43tflood plateau basalts, 366f, 369tHawaiian rocks, 360, 361fhighly alkaline rocks, 306f, 396tHimalayan granite, 387timmiscible melts, 323tisland arc volcanic rocks, 303–4, 373tlunar basalt, 43fmantle peridotite, 293fmetasomatized mantle peridotite, 293fmid-ocean ridge basalt (MORB), 350–1normalized diagrams, 42–3partition coefficients, 38–43petrogenetic modeling, 37–44, 299, 320,
321fprimitive mantle, 43tSierra Nevada batholith, 385t
Trachyandesite, 21t, 32fTrachybasalt, 21t, 32fTrachyte, 20t, 32f, 33fTrachytic fabric, 155, 175Translation gliding (slip), 532–43Transport phenomena, 122, 123fTransposition, 421, 423f, 451f, 552fTrench, ocean, 285f, 301f, 340f, 372, 380fTriple point, 88, 478fTristan da Cunha, 36f, 346, 356, 364fTroctolite, 30f, 232fTrondhjemite, 30f, 306
partial melts, 311fTschermak end member pyroxene, 482TTG (tonalite, trondhjemite, granodiorite),
613, 618, 619f, 633–6, 650fmagma generation, 311, 621f, 634, 635
Tubes, lava, 245, 247fTuff, 27f
ash-flow, 270f, 271, 274f, 275ffused, 171lapilli, 170f, 172f, 173fwelded, 271
Tuff cone, 245f, 246f, 269Tuff ring, 232f, 269Turner, Francis J., 287, 438Twin
deformation, 460f, 531f, 532fgliding, 533–5
Ultramafic rocks, 28, 30fUndercooling, see Crystallization of magmaUnderplating, see Magmatic, underplatingUndulatory optical extinction, 460f, 532, 541,
544fUnivariant
boundary line, 478f, 479fequilibrium, 88
Unzen (Japan) volcano, 271Upheaved plug, 255Uplift, resurgent, 277
Valles (New Mexico) caldera, 276f, 277fVapor-phase crystals, 166, 173f, 275Variance, phase rule and, 87–8Variation diagrams, 23–4
to model magmatic differentiation, 317f,318f, 625–7
Varioles, 625Vein(s), 431, 432f, 466, 498
crack–seal, 466, 503, 545, 546fmetasomatic in mantle rock, 291–3, 307
Vein-plus-wall-rock melting, 307Velocity, terminal and Stokes’s law, 197Vesicles and vesicular fabric, 82, 165Vesiculation, 80f, 142–6, 165Vesuvius (Italy) volcano, 262, 270, 279Viscosity, 7, 74, 123f, 124
apparent (non-Newtonian), 190–4calculation of, 125coefficient of, 124crystallinity and, 191fdegree of polymerization and, 74, 124diffusion in melts controlled by, 128melt, 124Newtonian, 186
Viscous flow, 186Vitroclasts and vitroclastic fabric, 166–9Vitrophyre and vitrophyric texture, 27, 151f,
152f, 156f, 157Volatiles, 19, 75
critical point for, 75exsolution from melts, 79–80, 142–6,
165–70, 259chemical interaction between species, 80
in melts, 75–82, 89–90, 115pressure, 75–6role of in extrusion of lava, 242role in partial melting, 283, 287solubilities in melts, 76–9specific volume of, 76fSee also Fluid
Index 729
Volcanicplumes, 260f, 262–4
explosive style and, 267–70rock, 27sandstone, 278
Volcanic breccia, 27fVolcanic debris flow, 167f, 278–9Volcanic eruption
acid aerosols after, 84central, 242, 244f, 280fclimate and, 81f, 82–4explosive, 80–4, 145, 242–3, 259–77“explosiveness”, 267, 268ffissure, 242, 245fforecasting of, 83Hawaiian, 250–1, 267–8hydromagmatic, 260–1, 269–70phreatic, 269phreatoplinian, 270plinian, 263f, 268f, 270steam-blast, 269strombolian, 268vulcanian, 268
Volcaniclasts (volcaniclastic fabric), 166–7classification of, 27fconsolidation of, 171
Volcanoescomposite, 279, 280ffumaroles related to, 81f
island chains of, 356shield, 246f, 250–2, 356, 357f
evolution of, 359–60See also specific volcanoes, e.g. Laki
volcanoVolume diffusion, 126–7Vugs and vuggy fabric, 166
Waterdepression of melting T (solidus) by
dissolved, 89f, 100f, 104f, 110f, 284f,287, 303f
magma interactions with external, 260–2role in evolution of continents, 652–3solubility in silicate melts, 77–9as solvent, 491
Wehrlite, 30fWelded
spatter (agglutinate), 171, 268tuff, 271
Welding, 171, 273–5Whole-rock (bulk) chemical composition,
12–13classification of magmatic rocks by, 30–5See also Chemical composition
Wopmay Orogen (Canada), thermobarometry,515, 516f, 582, 583f
Work, 2–3, 83Wüstite, 6, 65f
Xenocrysts, 166as contaminant, 328nucleation on, 135
Xenoliths, 166, 181, 602breccia pipes and, 231as contaminant, 328eclogite, 290, 621as evidence for stoping, 229mantle-derived (peridotite), 289metasomatized, 307t, 308t
Xenomorphic grains, 159X-ray
fluorescence (XRF) spectrometry, 18–19tomography of metamorphic fabric, 525f
Yield strength (plastic), 186, 190, 197
Zeolite facies, 569f, 571, 594, 597–8Zimbabwe, 331t, 332Zircon, 22, 23t, 41t
dating of, 611, 621restite grains, 312–13
Zonedcrystals, 160, 527
oscillatory, 139f, 155f, 160: normal, 103f;reverse, 160
ignimbrite deposits, 273–5intrusions, 225, 227f
Zones, metamorphic, see Metamorphic zones
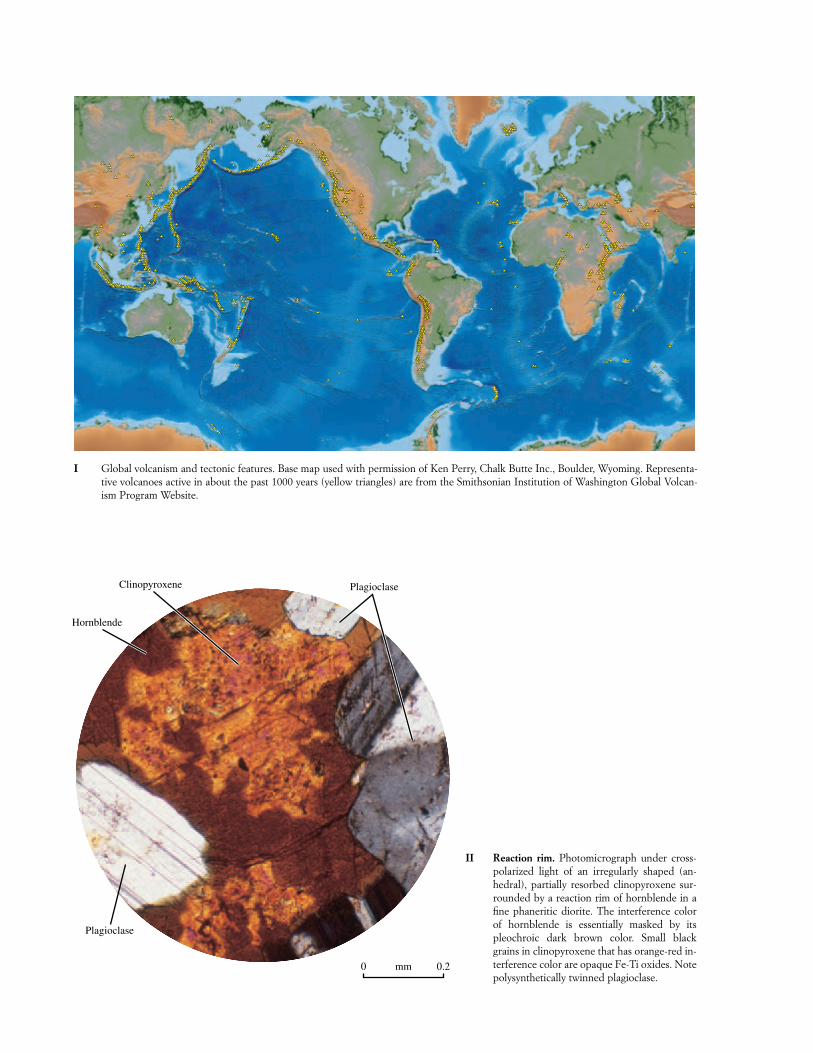
II Reaction rim. Photomicrograph under cross-polarized light of an irregularly shaped (an-hedral), partially resorbed clinopyroxene sur-rounded by a reaction rim of hornblende in afine phaneritic diorite. The interference colorof hornblende is essentially masked by itspleochroic dark brown color. Small blackgrains in clinopyroxene that has orange-red in-terference color are opaque Fe-Ti oxides. Notepolysynthetically twinned plagioclase.
I Global volcanism and tectonic features. Base map used with permission of Ken Perry, Chalk Butte Inc., Boulder, Wyoming. Representa-tive volcanoes active in about the past 1000 years (yellow triangles) are from the Smithsonian Institution of Washington Global Volcan-ism Program Website.
Plagioclase
Plagioclase
Hornblende
Clinopyroxene
0 0.2mm
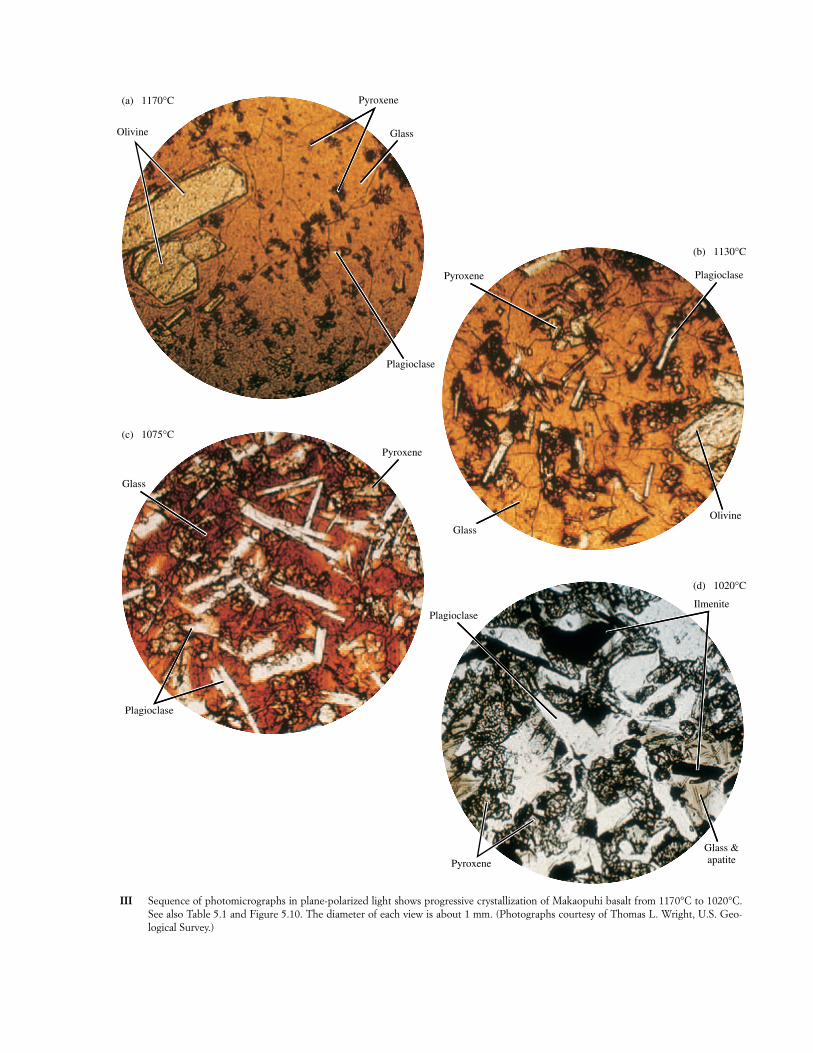
(a) 1170°C
(c) 1075°C
(b) 1130°C
(d) 1020°C
Olivine
Pyroxene
Pyroxene
Pyroxene
Pyroxene
Glass
Plagioclase
Plagioclase
Plagioclase
Glass
Glass &apatite
Glass
Plagioclase
Olivine
Ilmenite
III Sequence of photomicrographs in plane-polarized light shows progressive crystallization of Makaopuhi basalt from 1170°C to 1020°C.See also Table 5.1 and Figure 5.10. The diameter of each view is about 1 mm. (Photographs courtesy of Thomas L. Wright, U.S. Geo-logical Survey.)
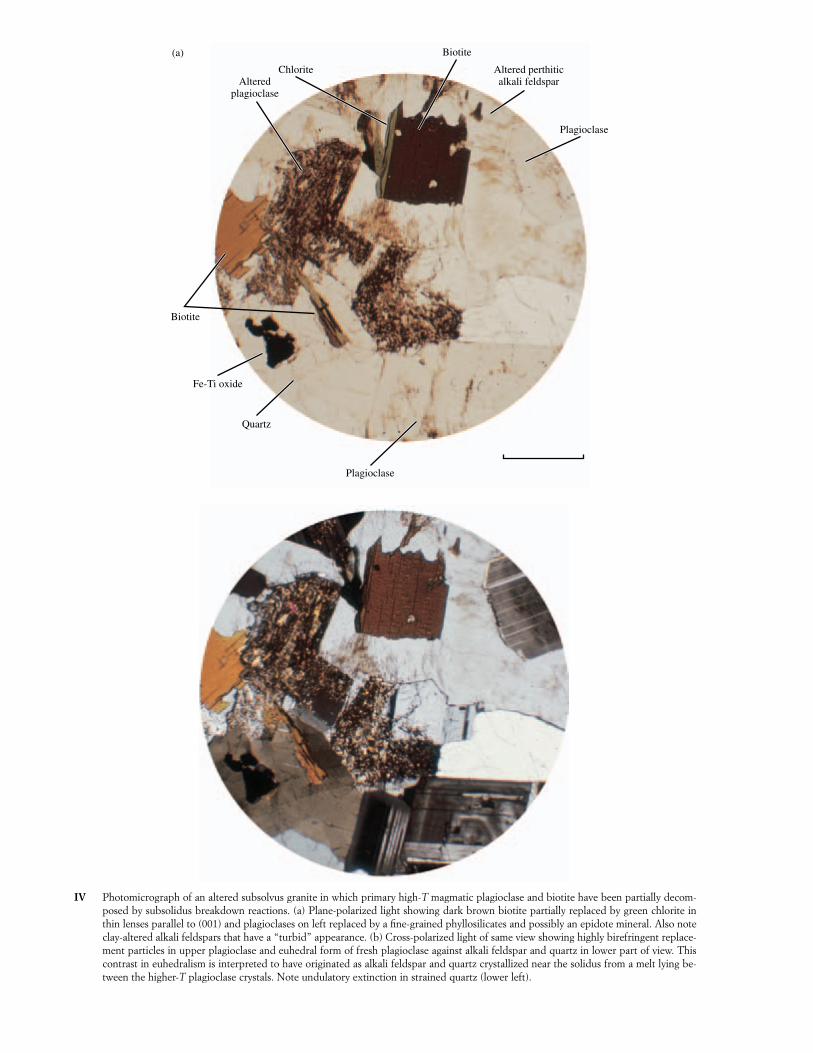
ChloriteAltered
plagioclase
Biotite
Biotite
Fe-Ti oxide
Quartz
Plagioclase
Altered perthiticalkali feldspar
Plagioclase
(a)
IV Photomicrograph of an altered subsolvus granite in which primary high-T magmatic plagioclase and biotite have been partially decom-posed by subsolidus breakdown reactions. (a) Plane-polarized light showing dark brown biotite partially replaced by green chlorite inthin lenses parallel to (001) and plagioclases on left replaced by a fine-grained phyllosilicates and possibly an epidote mineral. Also noteclay-altered alkali feldspars that have a “turbid” appearance. (b) Cross-polarized light of same view showing highly birefringent replace-ment particles in upper plagioclase and euhedral form of fresh plagioclase against alkali feldspar and quartz in lower part of view. Thiscontrast in euhedralism is interpreted to have originated as alkali feldspar and quartz crystallized near the solidus from a melt lying be-tween the higher-T plagioclase crystals. Note undulatory extinction in strained quartz (lower left).
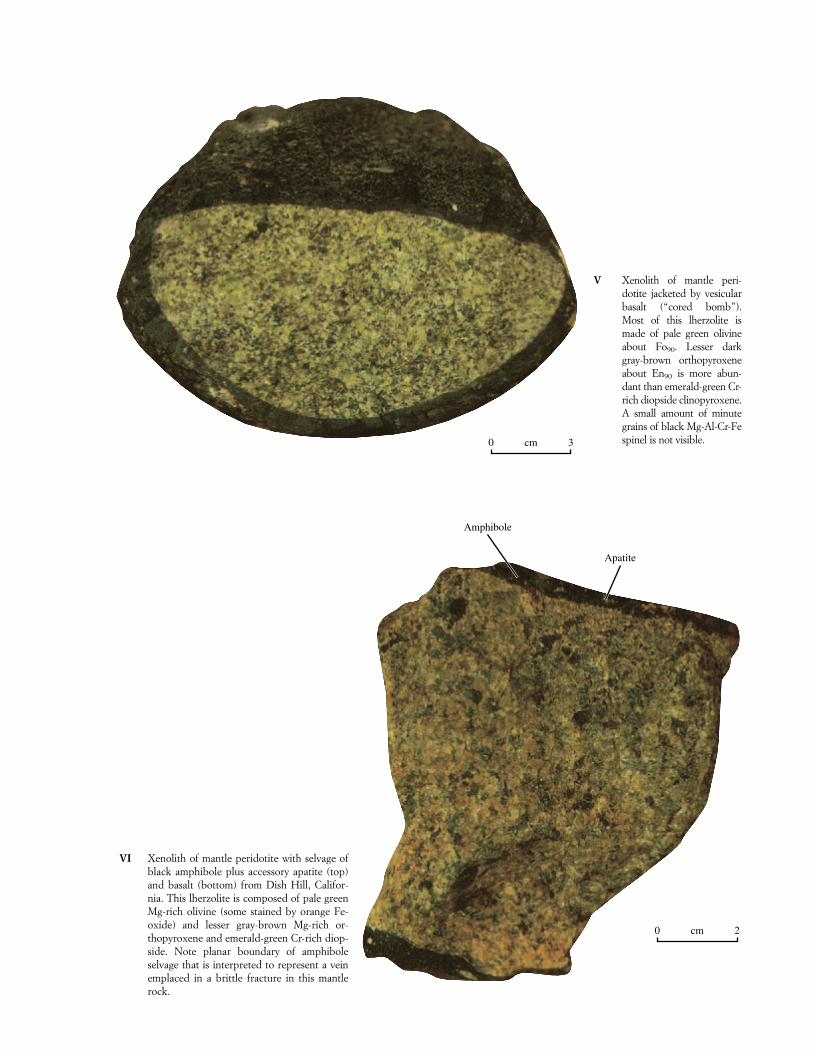
0 3cm
0 2cm
Amphibole
Apatite
V Xenolith of mantle peri-dotite jacketed by vesicularbasalt (“cored bomb”).Most of this lherzolite ismade of pale green olivineabout Fo90. Lesser darkgray-brown orthopyroxeneabout En90 is more abun-dant than emerald-green Cr-rich diopside clinopyroxene.A small amount of minutegrains of black Mg-Al-Cr-Fespinel is not visible.
VI Xenolith of mantle peridotite with selvage ofblack amphibole plus accessory apatite (top)and basalt (bottom) from Dish Hill, Califor-nia. This lherzolite is composed of pale greenMg-rich olivine (some stained by orange Fe-oxide) and lesser gray-brown Mg-rich or-thopyroxene and emerald-green Cr-rich diop-side. Note planar boundary of amphiboleselvage that is interpreted to represent a veinemplaced in a brittle fracture in this mantlerock.