evidence of slippage breakdown for a superhydrophobic microchannel
TRANSCRIPT
Evidence of slippage breakdown for a superhydrophobic microchannelG. Bolognesi,1, a) C. Cottin-Bizonne,1 and C. Pirat1
ILM, Universite de Lyon, Universite de Lyon 1 and CNRS, UMR5306, F-69622 Villeurbanne,France
(Dated: 6 August 2014)
A full characterization of the water flow past a silicon superhydrophobic surface with longitudinal micro-grooves enclosed in a microfluidic device is presented. Fluorescence microscopy images of the flow seeded withfluorescent passive tracers were digitally processed to measure both the velocity field and the position andshape of the liquid-air interfaces at the superhydrophobic surface. The simultaneous access to the meniscusand velocity profiles allows us to put under a strict test the no-shear boundary condition at the liquid-airinterface. Surprisingly, our measurements show that air pockets in the surface cavities can sustain non-zerointerfacial shear stresses, thereby hampering the friction reduction capabilities of the surface. The effects ofthe meniscus position and shape as well as of the liquid-air interfacial friction on the surface performancesare separately assessed and quantified.
I. INTRODUCTION
In lab-on-a-chip technology, the high hydrodynamicresistance the liquid experiences as it flows in a net-work of micrometric channels often imposes the microflu-idic device to be connected to pumping systems thou-sands of times bigger than the chip itself, thereby eras-ing many advantages of a millimeter-sized device. In thisrespect, superhydrophobic surfaces (SHS) have demon-strated to be an effective tool to relax the constraint ofno-moving liquid at the channel walls1, due to air pock-ets trapped in surface cavities (the so-called Cassie orFakir state). Air bubbles durably reside in the surfaceroughness only under specific conditions of pressure andsurface wettability2. When the Cassie state is no longerstable, the meniscus collapses within the cavities3–5 andthe liquid is in contact with the entire exposed surface ofthe solid (the so-called Wenzel state).In literature, the experimental measurements of water
slippage past SHS, usually characterized in terms of ef-fective slip length6, spread over a quite broad data rangewhich spans from hundreds of nanometers7 to few hun-dreds of micrometers8. Slight discrepancies between mea-surements and theoretical predictions are also reportedand mainly ascribed to experimental factors which can-not always be easily controlled or quantified. One ofthose is certainly the meniscus deformation9,10 resultingfrom the balance of liquid pressure and surface tension.Theoretical11–15 studies have demonstrated the negativeimpact of the meniscus curvature and position on the ef-fective slip length. Such a detrimental effect has beenconfirmed by experimental investigations of SHS charac-terized via several techniques like confocal microscopy16,micro particle image velocimetry (µ-PIV)17, pressureversus flow rate measurements18 and dynamic surfaceforce apparatus19. Similar results were also reported
a)[email protected]; Present address: Dept. of Chem-istry, Imperial College London, South Kensington Campus, SW72AZ, London UK
by numerical analysis via continuum models20, moleculardynamics21 and Lattice-Boltzmann simulations22. Veryrecently, a superhydrophobic microfluidic device with ac-tive control of the meniscus shape has been presented23.Through numerical and experimental investigations, theauthors showed how the resulting effective slip lengthcould be tuned and optimized by controlling the protru-sion depth of the meniscus into the flow.
Another phenomenon which might be responsible fora dramatic increase in the apparent surface friction, buthas not yet received adequate attention in the study ofSHS, is the fact that a water-air interface cannot al-ways be treated as a stress free boundary. In that re-spect, there are quite few experimental evidences18,24–28
showing that at the micrometer scale partial-slip or evenno-slip assumptions can be more appropriate, in somecircumstances, for modelling water-air interface underexperimental conditions. Lazouskaya et al.24 were thefirst to report a reduced mobility at the liquid-air inter-face in an open capillary channel, questioning the valid-ity of the no-shear boundary condition at the meniscusinterface. More recently, the same research group per-formed new experiments with a very similar geometry29
and highlighted the dependence of an effective interfacialshear stress on the channel dimensions. Particularly, forchannel width below the water capillary length (i.e. 2.7mm), the interfacial shear stress increases as the channelsize decreases. Investigating the speed of the advancingmeniscus flooding an open hydrophilic channel, Yang etal.30 found a good agreement between experimental dataand theoretical predictions when a no-slip boundary con-dition was assumed at the liquid-air interface.
Since the benefits of SHS in terms of friction reduc-tion rely on the presence of stress-free boundaries, it isessential to probe whether or not the liquid-air interfacescan always be considered as a perfect slip interface. Inthis paper, we fully characterize the flow past a siliconmicro-grooved surface and we specifically focus our atten-tion on the interfacial friction behaviour of the liquid-airinterfaces. However, discriminating between the effectsof a deformed meniscus, on one side, and the interfa-

2
cial friction at the liquid-air interface, on the other side,is not an easy task as this requires measuring the flownearby the meniscus while simultaneously determiningits shape and position. Experimental configurations toprobe both the liquid flow and the meniscus deformationhas been recently introduced18,23,31. For all those stud-ies, the direction normal to the SHS has to be co-planarto the microscope focal plane. This necessarily limits theexperimental investigation to one single surface geome-try, that is the one with micro-grooves perpendicular tothe flow direction. Micro-structured surfaces with micro-grooves parallel to the flow direction or with pillars andholes would be much more difficult to be studied in thatexperimental configuration. In this respect, we recentlydeveloped a novel technique32 to perform simultaneousvelocity and interface profile measurements on SHS. Thattechnique has no restriction on the SHS orientation andit has been successfully used to study even very compli-cated surface pattern like ellipse-shaped pillars. We nowadopt such a technique to characterize the interfacial fric-tion of a water flow past a silicon surface with longitudi-nal micro-grooves (see FIG. 1). We first investigate theslippage of the SHS globally by measuring the effectiveslip length of the velocity profile averaged over a sur-face pitch. We then focus on the local interfacial frictionand we evaluate the friction contributions of the liquid-solid and liquid-air interfaces, separately. By correlatingthe flow with the actual meniscus profile, we eventuallydetermine what boundary condition best describes theliquid-air interface behaviour. To best of our knowledge,such a strict test of the local boundary conditions at theliquid-air interfaces for micro-structured SHS has neverbeen performed so far.
II. METHODS AND MATERIALS
In this section, we provide a brief description of the ex-perimental set-up and procedures, the microfluidic deviceand the velocity and interface profile measurement tech-niques we used for characterizing the slippage at the su-perhydrophobic surface. A detailed presentation of thosemethods are reported elsewhere32.
A. Experimental set-up
A Nikon Eclipse TE 2000-U inverted microscope,equipped with a water immersion ×60 (NA 1.2) objec-tive, is used to capture fluorescence images of the flowinside the microfluidic chip fed by a flow control sys-tem (Fluigent MFCS-Flex). A DPSS laser (Cni MLL532,400mW at 532nm) excites red fluorescent 0.3µm diameterpolystyrene microspheres, dispersed in a ultrapure Milli-Q water flow (0.02% solid concentration). The fluores-cent particles act as passive tracers for tracking both thevelocity and the liquid-air and liquid-solid interface pro-files. A CCD camera (Allied Vision Technologies) records
water
airSi-SHS
colloidx
y
z
~30µm
50µm
FIG. 1. Three dimensional schematic view of the microchan-nel together with a SEM image of the Si-SHS (inset). Theultrapure water and the fluorescent colloids flow in the di-rection parallel to the microgrooves, wherein air pockets aretrapped.
the light emitted by the tracers at a frame rate of 200Hz.An acousto-optic-modulator (AA Optoelectronics MT80)periodically deflects the laser beam so that the camerasensor is exposed to the beam light for 10 µs only.
B. Microfluidic chip
We used a silicon superhydrophobic surface (Si-SHS),patterned with longitudinal microgrooves, 16µm in widthand 50µm in depth, evenly spaced by 16µm (see FIG. 1).To prevent in case of a Wenzel transition the cavi-ties being flooded along the whole channel length, thegrooves are sectioned in smaller grooves 1 mm in length,separated each other by transverse 1 µm thick walls,as highlighted in the inset of FIG. 1. The Si-SHSis first oxidized by oxygen plasma treatment and thensilanized via standard vapor deposition of 1H,1H,2H,2H-Perfluorooctyltrichlorosilane; 97% (ABCR) to promote astable Cassie state. The channel is finally assembled byclamping together the Si-SHS with a microscope coverslip covered with a PDMS film about 30 µm in thick-ness. A 2 mm×40 mm area was previously engraved onthe PDMS film. The resulting channel is then 40 mmlong, 2 mm wide and 30 µm deep33. Because of the highaspect-ratio of the cross-section, the confinement effectson the fluid flow are negligible.
C. Velocity measurements
Using µ-PIV cross-correlation analysis of sets of im-ages recorded at different focal planes17, we determinedthe velocity profile throughout the channel depth. Thenumber N of images per plane is chosen so that at theminimum detectable speed (about 30 µm/s) the Brown-ian motion component of tracer velocity is negligible (lessthan 1%) with respect to the average component. As aconsequence of that32, we recorded N = 4000 frames atfocal planes nearby the silicon surface and N = 3200anywhere else.

3
A reference coordinate system as the one shown inFIG. 1 is adopted. The z coordinate axis is parallel tothe optical axis and positively oriented from the surfaceto the cover slip. Its origin is at the liquid-solid interface.The y and x axes are parallel and transverse to the flowdirection, respectively. The axial step of the objectiveposition is 0.3 µm in the bulk and 0.1 µm close to theplane z = 0. Processing algorithms are implemented viacustom Matlab codes.
D. Interface detection
We recently introduced a novel technique32 to mea-sure the liquid-air and liquid-solid interface relative posi-tions and shapes with a resolution of tens of nanometers.Such a measurement is performed by post-processing thesame fluorescent microscopy images used for the µ-PIVvelocity analysis. Consequently, the velocity and inter-face profiles can be simultaneously determined with a sin-gle channel scan. The method is based on the detectionof the excluded volume, namely the region next to theinterface which is not accessible to the moving colloids.This volume is determined by splitting the fluorescentimages in overlapping rectangular interrogation windowsand, then, measuring for each window the intensity of thefluorescent light emitted by the flowing tracers as a func-tion of axial position. Nearby the interfaces, the intensityversus axial position plot can be fitted to a shifted errorfunction. The inflection point of the best-fit functioncan be reasonably assumed as the center of those colloidswhich flowed closest to the interfaces, namely the bound-ary of the excluded volume. By assembling data from allinterrogation windows, a 3D reconstruction of the ex-cluded volume boundary can be performed in the wholefield of view of the microscope objective. That bound-ary provides the relative position and the shape of bothliquid-air and liquid-solid interfaces. By considering thethickness of the depletion layer, the absolute position ofboth interfaces can be retrieved with the diameter of thepassive tracers being a good estimate for the accuracy ofsuch a measurement.We have also introduced32 an additional liquid-solid in-
terface detection algorithm, which is in good agreementwith the previous one. Such a method is capable of mea-suring the absolute axial position of a solid wall withnanometer accuracy, provided the wall reflects the lightemitted by the tracers. This is the case for a silicon flatsurface which, acting as mirror, lets us track both thereal and virtual (reflected) images of the tracers. The re-sulting velocity profiles are then symmetric with respectto the position where flow velocity vanishes to zero. Thesolid wall is then detected by locating the axes of sym-metry of those profiles. A fine localization of the solidwalls is necessary for high quality characterization of theslippage. For such a task, we adopt the reflection-basedinterface detection scheme since it can locate the abso-lute position of the liquid-solid interfaces more accurately
than the excluded-volume based one.
E. Cleaning and safety procedures
Standard microfluidic cleaning procedures wereadopted for manufacturing the chip and preparingthe solution. Microfluidic chip fabrication and oxygenplasma treatment were performed in ISO class 8 clean-room (NanoLyon). Silane vapor deposition was doneinside a desiccator placed under a chemical fume hoodwhereas the chip was assembled on a laboratory worktop.The solution of milli-Q water and colloids was preparedand stored using clean plastic disposable vials, plasticsyringes and needles. To prevent the accumulation offluorescent colloids on the Si-SHS, the silicon surface wascleaned via acetone ultrasonic bath and rinsed with DIwater before reusing it. Microfluidic tubings and fittingswere frequently cleaned with a mixture of DI water andethanol first and then washed with DI water only. Forcleaning and safety reasons, gloves were worn at all thetime during sample preparation and experiments.
III. RESULTS AND DISCUSSION
Slippage occurs at liquid-gas and liquid-solid interfaceswhenever the tangential component of the liquid velocityat the interface appears to be different from the one of theother phase (either solid or gas). That velocity gap be-tween the two phases is called slip velocity. A well knownquantity which has been used to characterize the slippageis the slip length b defined as the ratio between the slipvelocity and the shear rate at the interface6. When theslip length is experimentally estimated by averaging anappropriate measurement over a length scale much largerthan the molecular scale, we rather refer to it as effectiveslip length. For structured surfaces consisting of a peri-odic array of liquid-air and liquid-solid interfaces, if themeasurement is averaged over one array pitch, we referto it as global effective slip length. Conversely, if the sliplength is measured just on a pitch fraction, like the liquid-air or the liquid-solid interface only, we denote it as localeffective slip length. In the next sections, we character-ize the slippage of the examined Si-SHS by determiningboth the global and the local effective slip lengths.
A. Global effective slip length
We first assess the overall performance of our device bymeasuring the global effective slip length at the Si-SHS.Fluorescent images are acquired with a scan along thechannel depth from z = −6µm to z = 30µm. For sake ofsimplicity, we recall that the origin of the z axis is fixed atthe liquid-solid interface of the Si-SHS. The streamwisevelocity profile is averaged over the microscope field ofview in the flow (y) direction and over a surface pitch,
4
b)
0 5 1510 20 25 30
z[µm]
0
100
400
300
200
a)
0 5 1510 20 25 30
z[µm]
0
100
400
300
200
V [
µm
/s]
V [
µm
/s]
M1 M2
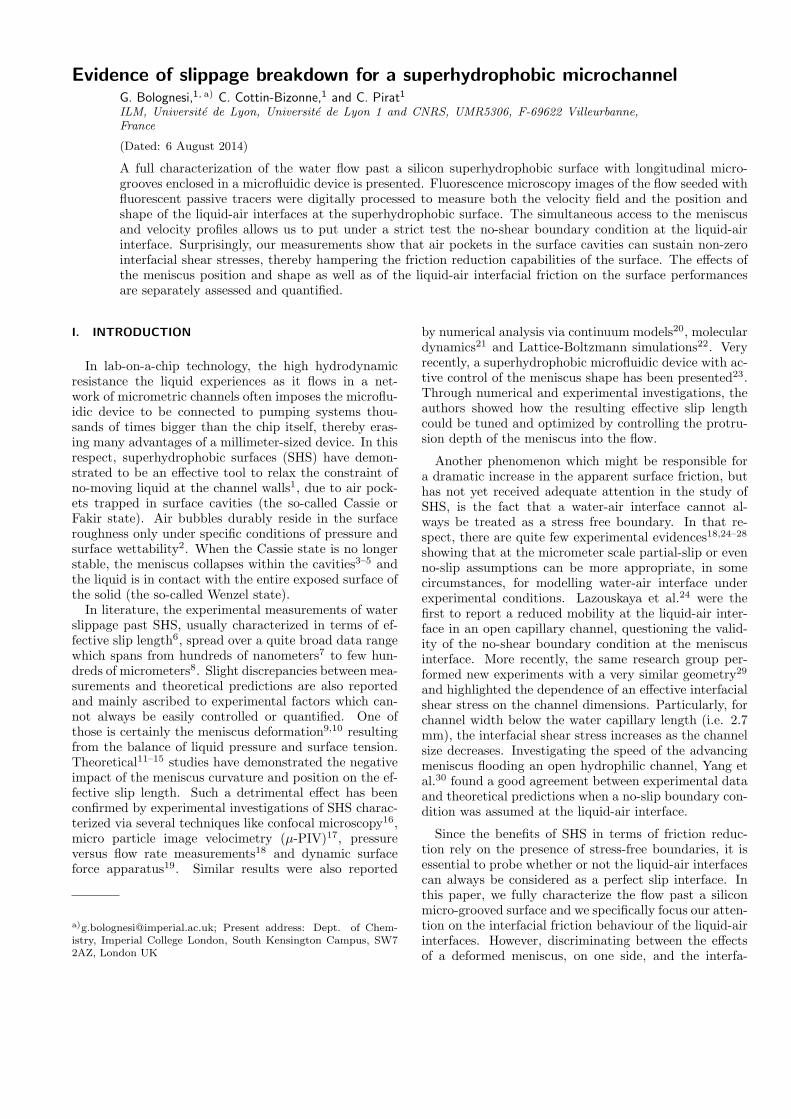
FIG. 2. Streamwise velocity profiles (solid circles) averagedover the roughness pitch for measurement M1 (left panel)and measurement M2 (right panel), together with the best-fitfunctions (solid lines).
consisting of one liquid-solid and one liquid-air area, inthe transverse (x) direction. The resulting profile is fittedto that one V (z) predicted by the one-dimensional (1D)model of a pressure driven flow with a sticky wall atz = H (i.e. the cover slip) and a partially slippery wallat z = 0 (i.e. the Si-SHS) with global effective slip lengthbgl. The parameter H stands for the channel depth. The
analytical expression for V (z) reads
V (z) = 4Vp(bgl +H)(H − z) [bgl(z +H) + zH]
H2(2bgl +H)2(1)
where Vp is the peak velocity. The fit parameters arebgl, H and Vp. It is worth noting that the channel depthparameter H has to be fitted because we could not ap-ply the reflection-based liquid-solid detection techniqueat the cover slip wall z=H. Indeed the reflection coef-ficient of glass is too low to accurately track the virtualimages of the colloids flowing next to the glass wall. Ad-ditionally, due to the elasticity of PDMS, the channeldepth might change between experiments as it dependson the clamping force which keeps together the PDMS-coated cover slip and the Si-SHS. The measurements wereperformed in two different spots of the device. We refersto those measurements with the labels M1 and M2. Be-tween M1 and M2, the microchannel was disassembled,cleaned and reassembled. FIG. 2 shows the experimentalprofiles V (z) and the corresponding best-fit curves. Thebest-fit parameters are reported in TABLE I togetherwith the fit uncertainties. It is worth recalling that inour system we do not control the geometry of the liquid-air interface and thus the meniscus can freely adapt itsshape and position according to the local experimentalconditions. As a consequence of that, there is no reasonfor the menisci to share the same shapes and positionsbetween measurements M1 and M2.To better assess the effectiveness of the friction reduc-
tion at the Si-SHS, we compare the experimental resultsto the theoretical model of a surface with a periodic pat-tern of no-slip and no-shear stripes parallel to the flow34.The predicted value for the global effective slip length is
bth = −L
πlog
[cos
(π2(1− Φs)
)](2)
where L is the pattern pitch and Φs the solid fraction,the latter being defined as the ratio between the no-slip
M1 M2
Vp 399.3± 0.5 µm/s 341.4± 0.5 µm/s
H 28.31± 0.04 µm 28.24± 0.04 µm
bgl 0.49± 0.05 µm 0.33± 0.04 µm
TABLE I. Best-fit parameters and corresponding uncertain-ties for the 1D model, see Eq.(1), for measurements M1 andM2: peak velocity Vp, channel depth H, global effective sliplength bgl.
stripe width and the pattern pitch. For the examinedSi-SHS whose solid fraction is Φs = 0.5 and surface pitchL = 32 µm, the expected global effective slip length isbth = 3.53 µm, namely ten times larger than what weactually measured. Moreover, we remark that the Si-SHS sample shows highly inhomogeneous slippage as theglobal effective slip length varies up to 40% between M1and M2.
B. Local effective slip length
In order to clarify this apparent contradiction betweenexperimental and theoretical results, a local investiga-tion of the surface friction at the liquid-air interfaces isrequired. Indeed the meniscus curvature at the surfacecavity depends on the pressure difference between the airand liquid phases as well as the surface tension accord-ing to the Laplace law. These elements together withthe meniscus position, dictated by the complex dynam-ics of the contact line, can be significantly affected byoften uncontrolled parameters (e.g. surface defects, im-purities) and thus highly varies along different regionsof the Si-SHS samples. That could in principle justifythe measured inhomogeneity of surface slippage as wellas the strong increase of the surface friction. Nonethe-less, a reduced mobility on a flat liquid-air interface couldalso produce the same effects. In order to discriminatebetween those two scenarios, we rely on our excluded-volume based interface detection technique to measurethe local interfacial friction at both the liquid-solid andliquid-air interfaces. We first determine the interface pro-files and then we correlate them to the correspondingflows.
FIG. 3 shows the transverse profiles of the boundariesof the excluded volumes for both M1 and M2. As re-ported elsewhere32, the absolute position of the mea-sured boundaries are accurate within a tracer diameter(namely, 0.3 µm), whose size is also shown in figure forcomparison. The distance between the actual interfacesand the excluded volume boundary depends on the thick-ness of the tracer depletion layer. At the solid surface, thedepletion layer is manly due to the impenetrability of themoving colloids with either the surface or possible trac-ers stuck to it. Thus the depletion layer thickness mayvary approximately between 0.5 to 1.5 particle diameter(namely, between 0.15µm to 0.45µm). Other phenomena

5
FIG. 3. Excluded volume boundary profiles along the trans-verse direction x for M1 (top panel) and M2 (bottom panel).The passive tracer size along the axial direction z is repre-sented by the largest solid circles.
which might affect the depletion layer, as the hydrody-namic Saffman lift or electrostatic interactions, can be ne-glected in our experiments32. At the liquid-air interface,the depletion layer thickness depends on the tracer wet-tability. Since polystyrene is an hydrophobic material,particles tend to stuck at the liquid-air interface35 witha contact angle of about 90◦. As a consequence of that,the depletion layer vanishes and the measured excluded-volume boundary well approximate the meniscus profile.FIG. 3 shows how both menisci are almost flat and pen-etrates with different depths inside the cavities. Whenthe meniscus is modelled as a no-shear interface, par-tial flooding of the surface cavities reduces the surfaceeffective slippage and higher filling levels corresponds tosmaller effective slip length19,21 . Our experiments showopposite behaviour with higher filling level (that is M1)corresponding to higher slippage. That is already an in-direct evidence that perfect-slip condition may not applyto the examined liquid-air interfaces.To probe what is the actual boundary condition needed
to effectively model the flow past the measured liquid-airinterface, we first average the streamwise velocity fieldalong the flow direction y. The resulting experimentaldiscrete function V (x, z) is fitted to the two-dimensional(2D) model Vth(x, z) which is solution of the Poissonequation:
∇2Vth(x, z) = ∇p/µ (3)
with the following boundary conditions
Vth(−L/2, z) = Vth(L/2, z)∂Vth
∂x |x=±L/2 = 0
Vth(x, z) = bs∂Vth
∂z for (x, z) ∈ liquid-solid interface
Vth(x, z) = ba∂Vth
∂z for (x, z) ∈ liquid-air interface
Vth(x,H) = 0
(4)
d/2 L/2x
z
0
Hno slip
peri
odic
B.C
. perio
dic
B.C
.
-d/2
partial
slip bs
partial
slip bs
partial
slip ba
-L/2
FIG. 4. 2D domain and boundary conditions where the best-fit function Vth(x, y) is solved for. The dashed line repre-sents the meniscus transverse profile measured through theexcluded volume based method (cf. FIG. 3). The parameterd = L/2 stands for the liquid-air interface width.
where p is the liquid pressure and µ the fluid dynamicviscosity. The domain where Eq.(3) is solved for isshown in FIG. 4 together with the boundary conditions.In such a model, the meniscus is shaped according tothe liquid-air interface profile measurements reported inFIG. 3, whereas the liquid-solid interfaces, located atz = 0, are assumed to be flat. Since we cannot findan analytical closed-form for Vth(x, z), we used ComsolMultiphysicsTM to perform the fit between the experi-mental 2D profile V (x, z) and the numerical solution ofthe 2D theoretical model Vth(x, z). The fit parametersare the ratio α = ∇p/µ between the pressure gradientand the dynamic viscosity, the channel depth H and thelocal effective slip lengths bs and ba. The latter param-eter is a direct measurement of the interfacial frictionat the actual liquid-air interface. The experimental andbest-fit velocity profiles are shown in FIG. 5. The solidand empty circles represent the experimental profiles atthe middle point of the liquid-solid and liquid-air inter-faces, respectively. Similarly, the solid and the dashedlines are given by the best-fit function Vth(x, z) evaluatedat the middle points of the liquid-solid and liquid-air in-terfaces, respectively. The best-fit parameters are shownin TABLE II. A good estimate for the accuracy of thelocal effective slip length measurements is given by thepassive tracer diameter. We can use the best-fit func-tion Vth(x, z) to calculate the interfacial shear stresses atthe middle point of both the liquid-solid and liquid-airinterfaces as follows
τ = µ∇Vth · n (5)
where n is the unit vector normal to the interface. Theresults are shown in TABLE III, where τs and τa referto the liquid-solid and liquid-air interfaces, respectively.For both M1 and M2, non-zero interfacial shear stressesappear at the menisci, which turn out to be, within theaccuracy of the measurements, closer to no-slip interfacesrather than no-shear ones.

6
b)
0 5 1510 20 25 30
z[µm]
0
100
400
300
200
a)
0 5 1510 20 25 30
z[µm]
0
100
400
300
200
V [
µm
/s]
V [
µm
/s]
FIG. 5. Streamwise velocity profiles at the middle point of theliquid-air (empty circles) and liquid-solid (solid circles) inter-faces for M1 (left panel) and M2 (right panel). The dashedand the solid lines are the corresponding best-fit profiles.
M1 M2
α 3.86± 0.01 (µm·s)−1 3.33± 0.01 (µm·s)−1
H 28.31± 0.05 µm 28.24± 0.05 µm
bs −0.02± 0.15 µm 0.00± 0.15 µm
ba −0.10± 0.15 µm 0.09± 0.15 µm
TABLE II. Best-fit parameters for the 2D model, see Eq.(3),for M1 and M2: pressure gradient and dynamic viscosity ratioα, channel depth H, local effective slip lengths bs and ba.
M1 M2
τs 60± 2 mPa 48± 2 mPa
τa 50± 5 mPa 45± 5 mPa
TABLE III. Interfacial shear stresses at the middle point ofthe liquid-solid and liquid-air interfaces for M1 and M2, cal-culated according to Eq.(5).
C. Discussion
Performing simultaneous interface and velocity profilemeasurements with our technique reveals that the as-sumption of a no-shear boundary condition at the liquid-air interface is not valid for the examined SHS. Thatis the reason why the predicted global effective slip-page of Eq.(2) is much higher than the measured val-ues. If instead we consider a model where the stress-freeboundary condition is replaced with a low partial-slip(namely, ba ≪ L), the corresponding global effective sliplength can be estimated through the following heuristicformula36
bth = (1− Φs)ba (6)
According to this model, for Φs = 0.5 the expected globalslip length is ba/2 whereas we measured values of bgllarger than ba (cf. TABLE I and TABLE II). In or-der to explain the observed behaviour, we must take intoaccount the actual profile of the menisci. FIG. 3 showsthat the menisci are essentially flat. Consequently, inour experiments any detrimental effect induced by themeniscus curvature19,23 on the global slippage is negligi-ble. On the other hand, the menisci are not co-planarwith the liquid-solid interfaces as it is assumed in the
model, but they partially penetrate the surface cavities.Since the liquid-air interfaces are almost immobilised (i.e.ba ≃ 0), the partial flooding of the cavities is responsiblefor an apparent positive global effective slippage, namelybgl > 0. Had been the meniscus directed towards theflow, we would have measured a negative global effectiveslip length. Additionally, the fact that the position ofthe menisci can vary along the surface sample accountsfor the observation of an apparent inhomogeneity of thesurface slippage. The difference between global effectiveslippages in M1 and M2 is about 40% and so is the dif-ference between the corresponding penetration depths ofthe menisci.
The possible causes behind the onset of an interfacialfriction at the liquid-air interface for the examined sam-ple are several. The presence of contaminant particleswithin the flow is one of those. Indeed, surface-active par-ticles or molecules can significantly affect the hydrody-namic behaviour of the interface they are adsorbed to. Asound example is given by the simple experiment of a ris-ing air bubble in a protein solution37. Even at a low sur-face coverage, the bubble motion induced a non-uniformprotein concentration at the interface which resulted ina surface tension gradient. Such a gradient generatedthe so-called Marangoni stresses which balanced the vis-cous stresses of the external flow. The Marangoni effectwas also observed by Manor et al.26 who used an atomicforce microscope to squeeze an air bubble against a micawall across a surfactant solution film. Interestingly, thebubble interface showed partial slippage even in the ab-sence of added surfactant. The authors explained sucha behaviour by assuming the presence of some surface-active impurity, which contaminated the liquid-air inter-face. A recent experimental study on nanobubble-likeobject generation38 reported the unexpected presence ofPDMS contaminant in sterile disposable needles, whichmade clear how difficult is to control the presence of im-purity within a sample even when working with standardmicrofluidic cleaning procedures.
As regards our system, the liquid-air interface is con-fined in a 1 mm×16 µm rectangular region, consisting oftwo adjacent grooves and two consecutive transverse 1µmthick walls (see FIG. 1). Consequently, contaminant par-ticles could be adsorbed onto the liquid-air interface andpushed by the liquid flow against the downstream trans-verse wall. That would result in a particle concentrationgradient and, hence, Marangoni stresses which opposethe water flow nearby the meniscus, causing higher fric-tion at the interface37. Possible agents acting as surfacecontaminants could be either PDMS molecules or un-known surfactant molecules used by the supplier in thepreparation of the fluorescent polystyrene colloids or eventhe colloids themselves. In that respect, it is worth not-ing that experiments involving the use of SHS are usuallyperformed following standard microfluidic cleaning pro-cedures. As detailed in the section II, we followed thoseprocedures and we did not implement any other special-ized cleaning protocol to control the level of contamina-

7
tion of the liquid-air interfaces. Alternative to the sur-face contamination scenario, we remind that Marangonistresses could also raise from µ-PIV laser-induced ther-mal effects. A detailed investigation about the actualcauses behind the measured interfacial friction at themeniscus are beyond the scope of this research.
IV. CONCLUSIONS
In the present paper, we applied our novel velocityand interface detection technique to thoroughly charac-terize the slippage behaviour of a silicon micro-groovedsuperhydrophobic surface. We first investigated theglobal slippage capability by averaging the velocity pro-files along a periodic array consisting of one liquid-air andone liquid-solid interface. The surface performances weremuch lower than expected when modelling the surface asa periodic pattern of co-planar no-shear and no-slip par-allel stripes. In addition, the surface shows an inhomo-geneous behaviour when slippage is probed in differentspots of the samples. To better clarify the discrepancywith the theory, we evaluated the interfacial friction atthe liquid-solid and liquid-air interfaces by measuring themeniscus profiles and relating them to the flow nearby.In doing so, we were able to probe the actual bound-ary condition at the deformed meniscus and we find outthat the liquid-air interface is not behaving like a no-shear boundary, as it is usually assumed in the studies ofSHS. Unexpectedly, the global slippage of the examinedSi-SHS is a mere consequence of almost no-slip menisciprotruding within the surface cavities. Due to the im-possibility to control the meniscus geometry, the globalslippage varies along the sample according to the localshape and position of the menisci.
We reported for the first time the violation under spe-cific circumstances of the widely common assumption ofstress-free boundary at the liquid-air interfaces in micro-structured SHS. We showed that even in presence of astable Cassie state, the friction reduction capabilitiesof SHS can be seriously compromised when interfacialstresses appears at the liquid-air interfaces. We provedthat those potential detrimental effects in terms of lowslippage can be as worse as those deriving from a de-formed meniscus protruding into the flow19,23. The ac-tual causes behind the onset of those stresses are still un-clear and further investigations are required. Controlledsample contamination via added surfactant could helpto understand the possible role played by surface-activemolecules within the flow. On the other hand, the inten-sity of laser-induced thermal effects at the liquid-air in-terface has to be assessed as well. To conclude, our studydemonstrated that when working with standard microflu-idic cleaning procedures the presence of non-deformed(i.e. flat) liquid-air interfaces in the cavities of a SHS canno longer be considered a sufficient condition to guaran-tee significant surface friction reduction.
V. ACKNOWLEDGEMENTS
We are pleased to thank L. Bocquet for interestingdiscussion and C. Ybert for both interesting discussionsand help with the development of the experimental set-up. We also thank the Universita Italo Francese andthe French embassy in Italy for their financial supportand the Lyon Institute of Nanotechnology (INL) for theuse of their cleanroom NanoLyon. This work was partlysupported by the French RENATECH network.
1J. Rothstein, “Slip on superhydrophobic surfaces,” Annual Re-view of Fluid Mechanics 42, 89–109 (2010).
2C. Cottin-Bizonne, J.-L. Barrat, L. Bocquet, and E. Charlaix,“Low-friction flows of liquid at nanopatterned interfaces,” Naturematerials 2, 237–240 (2003).
3A. Peters, C. Pirat, M. Sbragaglia, B. Borkent, M. Wessling,D. Lohse, and R. Lammertink, “Cassie-baxter to wenzel statewetting transition: Scaling of the front velocity,” The EuropeanPhysical Journal E 29, 391–397 (2009).
4A. Giacomello, S. Meloni, M. Chinappi, and C. M. Casciola,“Cassie–baxter and wenzel states on a nanostructured surface:Phase diagram, metastabilities, and transition mechanism byatomistic free energy calculations,” Langmuir 28, 10764–10772(2012).
5A. Giacomello, M. Chinappi, S. Meloni, and C. M. Casci-ola, “Metastable wetting on superhydrophobic surfaces: Contin-uum and atomistic views of the cassie-baxter–wenzel transition,”Physical review letters 109, 226102 (2012).
6E. Lauga, M. Brenner, and H. Stone, “Microfluidics: The no-slipboundary condition,” Springer handbook of experimental fluidmechanics , 1219–1240 (2007).
7P. Joseph, C. Cottin-Bizonne, J. Benoit, C. Ybert, C. Journet,P. Tabeling, and L. Bocquet, “Slippage of water past superhy-drophobic carbon nanotube forests in microchannels,” Physicalreview letters 97, 156104 (2006).
8C. Lee, C. Choi, and C. Kim, “Structured surfaces for a giantliquid slip,” Physical review letters 101, 64501 (2008).
9S. Richardson, “On the no-slip boundary condition,” Journal ofFluid Mechanics 59, 707–719 (1973).
10K. Jansons, “Determination of the macroscopic (partial) slipboundary condition for a viscous flow over a randomly rough sur-face with a perfect slip microscopic boundary condition,” Physicsof Fluids 31, 15 (1988).
11M. Sbragaglia and A. Prosperetti, “A note on the effective slipproperties for microchannel flows with ultrahydrophobic sur-faces,” Physics of Fluids 19, 043603 (2007).
12A. Davis and E. Lauga, “Geometric transition in friction for flowover a bubble mattress,” Physics of Fluids 21, 011701 (2009).
13D. Crowdy, “Slip length for longitudinal shear flow over a diluteperiodic mattress of protruding bubbles,” Physics of Fluids 22,121703 (2010).
14C. Ng and C. Wang, “Stokes shear flow over a grating: Impli-cations for superhydrophobic slip,” Physics of Fluids 21, 013602(2009).
15L. Wang, C. Teo, and B. Khoo, “Effects of interface deforma-tion on flow through microtubes containing superhydrophobicsurfaces with longitudinal ribs and grooves,” Microfluidics andNanofluidics 16, 225–236 (2014).
16J. Ou, B. Perot, and J. Rothstein, “Laminar drag reduction inmicrochannels using ultrahydrophobic surfaces,” Physics of fluids16, 4635 (2004).
17P. Tsai, A. Peters, C. Pirat, M. Wessling, R. Lammertink, andD. Lohse, “Quantifying effective slip length over micropatternedhydrophobic surfaces,” Physics of Fluids 21, 112002 (2009).
18T. Kim and C. Hidrovo, “Pressure and partial wetting effectson superhydrophobic friction reduction in microchannel flow,”Physics of Fluids 24, 112003–112003 (2012).
8
19A. Steinberger, C. Cottin-Bizonne, P. Kleimann, and E. Char-laix, “High friction on a bubble mattress,” Nature Materials 6,665–668 (2007).
20C. Teo and B. Khoo, “Flow past superhydrophobic surfaces con-taining longitudinal grooves: effects of interface curvature,” Mi-crofluidics and Nanofluidics 9, 499–511 (2010).
21D. Gentili, G. Bolognesi, A. Giacomello, M. Chinappi, andC. Casciola, “Pressure effects on water slippage over silane-coatedrough surfaces: pillars and holes,” Microfluidics and Nanofluidics, 1–10 (2014).
22J. Hyvaluoma, C. Kunert, and J. Harting, “Simulations of slipflow on nanobubble-laden surfaces,” Journal of Physics: Con-densed Matter 23, 184106 (2011).
23E. Karatay, A. S. Haase, C. W. Visser, C. Sun, D. Lohse, P. A.Tsai, and R. G. Lammertink, “Control of slippage with tun-able bubble mattresses,” Proceedings of the National Academyof Sciences 110, 8422–8426 (2013).
24V. Lazouskaya, Y. Jin, and D. Or, “Interfacial interactions andcolloid retention under steady flows in a capillary channel,” Jour-nal of colloid and interface science 303, 171–184 (2006).
25L. Parkinson, R. Sedev, D. Fornasiero, and J. Ralston, “Theterminal rise velocity of 10–100 µm diameter bubbles in water,”Journal of colloid and interface science 322, 168–172 (2008).
26O. Manor, I. U. Vakarelski, G. W. Stevens, F. Grieser, R. R.Dagastine, and D. Y. Chan, “Dynamic forces between bubblesand surfaces and hydrodynamic boundary conditions,” Langmuir24, 11533–11543 (2008).
27O. Manor, I. U. Vakarelski, X. Tang, S. J. OShea, G. W. Stevens,F. Grieser, R. R. Dagastine, and D. Y. Chan, “Hydrodynamicboundary conditions and dynamic forces between bubbles andsurfaces,” Physical review letters 101, 024501 (2008).
28R. Manica, L. Parkinson, J. Ralston, and D. Y. Chan, “Inter-preting the dynamic interaction between a very small rising bub-ble and a hydrophilic titania surface,” The Journal of Physical
Chemistry C 114, 1942–1946 (2009).29W. Zheng, L. Wang, D. Or, V. Lazouskaya, and Y. Jin, “Therole of mixed boundaries on flow in open capillary channels withcurved air-water interfaces,” Langmuir (2012).
30D. Yang, M. Krasowska, C. Priest, M. N. Popescu, and J. Ral-ston, “Dynamics of capillary-driven flow in open microchannels,”The Journal of Physical Chemistry C 115, 18761–18769 (2011).
31D. Byun, J. Kim, H. Ko, and H. Park, “Direct measurementof slip flows in superhydrophobic microchannels with transversegrooves,” Physics of Fluids 20, 113601 (2008).
32G. Bolognesi, C. Cottin-Bizonne, E. Guene, J. Teisseire, andC. Pirat, “A novel technique for simultaneous velocity and in-terface profile measurements on micro-structured surfaces,” SoftMatter 9, 2239–2244 (2013).
33G. Bolognesi, “Optical studies of micron-scale flows,” Lap Lam-bert Academic Publishing, Saarbrucken, Germany (2012).
34J. Philip, “Flows satisfying mixed no-slip and no-shear con-ditions,” Zeitschrift fur Angewandte Mathematik und Physik(ZAMP) 23, 353–372 (1972).
35V. N. Paunov, “Novel method for determining the three-phasecontact angle of colloid particles adsorbed at air-water and oil-water interfaces,” Langmuir 19, 7970–7976 (2003).
36C. Ybert, C. Barentin, C. Cottin-Bizonne, P. Joseph, and L. Boc-quet, “Achieving large slip with superhydrophobic surfaces: Scal-ing laws for generic geometries,” Physics of fluids 19, 123601(2007).
37C. Ybert and J. Di Meglio, “Ascending air bubbles in proteinsolutions,” The European Physical Journal B-Condensed Matterand Complex Systems 4, 313–319 (1998).
38R. P. Berkelaar, E. Dietrich, G. A. Kip, E. S. Kooij, H. J. Zand-vliet, and D. Lohse, “Exposing nanobubble-like objects to adegassed environment,” Soft Matter (2014).