evaluation of carbon and nitrogen mineralization rates in meadow soils from dairy farms under...
TRANSCRIPT

Evaluation of carbon and nitrogen mineralization ratesin meadow soils from dairy farms under transit to
biological cropping Systems
M. Sbih1, A. N'Dayegamiye2'3, and A. Karam1
1 Département des sols et de génie agroalimentaire, Université Laval, Sainte-Foy, Québec. Canada G1K 7P4;and2Institut de Recherche et Développement en Agroenvironnement, 2700 Einstein, Sainte-Foy, Québec.
Canada G1P 3W8. Received 1 February 2002, accepted 18 October2002.
Sbih, M., N'Dayegamiye, A. and Karam, A. 2003. Evaluation of carbon and nitrogen mineralization rates in meadow soils fromdairy farms under transit to biological cropping Systems. Can. J. Soil Sci. 83: 25-33. Mineralized soil N from meadow soils willbecome an important source of N to following crops in low-input biological cropping Systems. The C and N mineralization rates ofsoils from 34 sites situated on dairy farms recently converted to biological cropping Systems were evaluated in a 56-wk incubation at25°C. Data on C and N mineralization were fitted to first-order kinetic models. Carbon and N generally presented similar patterns ofmineralization. Total mineralized N (Nm) ranged between 88 and 235 mg N kg"1 soil, which represented 6.6 to 22% of total N.Carbon mineralization (Cm) rate was between 11 and 17 times greater than N mineralization (1523-2638 mg C kg"1 soil ) and Cmineralized represented 9 to 19% of soil organic C. The rate constant was between 0.05 and 0.123 wk~' for C (kç) and ranged from0.032 to 0.088 wk~' for N (kN). The half-life for C (1^0) and for N (TN0) varied, respectively, between 5.6 and 133 wk and between15 and 28 wk. Results show that about 80% of total mineralized C and N were mineralized during thé first 25 wk of incubation, cor-responding to thé mineralizable fraction of soil organic matter (OM). Data on C and N mineralization hâve been adjusted using abicompartmental model (active and récalcitrant pools), which corresponded, respectively, to first-order and exponential équations.Total mineralizable C and N (Cm and Nm), and thé C and N rate constants (kç, and kN) were strongly related, whereas thé rate con-stants of thé récalcitrant pools (hc and hN) were negatively related to thèse parameters. This suggests that C and N mineralizable poolswere independent of thé humified stable OM (récalcitrant pool). Carbon and N mineralization parameters were positively related tothé soil clay and silt contents, but inversely to thé sand levels. This study indicates that when ploughed, meadow soils contain largemineralizable N pools, which could sustain following crops with N nutrition in low-input biological cropping Systems.
Key words: Meadow soils, C and N mineralization rates, low-input Systems, dairy farms, soil particles sizes
Sbih, M., N'Dayegamiye, A. et Karam, A. 2003. Taux de minéralisation du C et de N des sols de prairie situés dans des fer-mes biologiques d'élevage de bovins laitiers. Can. J. Soil Sci. 83: 25-33. L'azote minéralisable des sols de prairie peut constituerune importante source d'azote pour les cultures subséquentes en systèmes biologiques. Cette étude avait comme objectif de déter-miner les taux de minéralisation du C et de N par une incubation de sols à 25°C pendant 56 semaines. Les sols étudiés provenaientde 34 sites repartis sur des fermes d'élevage en transition biologique. Les données obtenues ont été soumises à des équations de pre-mier ordre. De façon générale, le carbone et l'azote des sols ont présenté des patrons de minéralisation similaires. Les quantitéstotales d'azote minéralisé (Nm) ont varié de 88 à 235 mg N kg"1 sol, représentant 6,6 à 22% de l'azote total. Les quantités de Cminéralisé (Cm) étaient de 11 à 17 fois plus élevées que le N minéralisé (1523 à 2638 mg C kg"1 sol) et représentaient 9 à 19% duC organique. Les taux de minéralisation allaient de 0,05 à 0,123 seirr1 pour le C (kc) et de 0,032 à 0,088 sem~' pour N (kN). Lademi-vie du C (TC0) a varié entre 5,6 à 13,3 semaines et celle de N (TN0) entre 15 à 28 semaines, selon les sols. Ces résultats ontindiqué qu'environ 80% des quantités totales du C et de N ont été minéralisées pendant les premières 25 semaines d'incubation etdonc correspondaient à la fraction facilement minéralisable de la MO. Les données du C et de N ont été ajustées selon un modèleconstitué de deux compartiments (formes active et récalcitrante), correspondant respectivement à des équations de premier ordre etexponentielle. Les quantités totales de C et de N minéralisés (Cm et Nm) ainsi que leurs taux respectifs de minéralisation (kc et kN)ont été étroitement reliés, mais les taux de minéralisation du C et de N de la fraction récalcitrante (hc et hN) ne l'étaient pas. Cesrésultats suggèrent que les formes de C et de N minéralisables sont indépendantes de la fraction stable de la MO (forme récalci-trante). Les paramètres de minéralisation du C et de N étaient reliés positivement aux teneurs des sols en limon et en argile etinversement avec les contenus en sable. Cette étude a indiqué que lorsqu'ils sont labourés, les sols de prairie contiennent des quan-tités élevées de N minéralisable qui pourraint combler en partie la nutrition azotée des cultures suivantes sous systèmes biologiques.
Mots Clés: Prairie, taux de minéralisation du C et de N, systèmes d'agriculture biologique,fermes d'élevage de bovins laitiers, particules texturales du sol
Alternative agricultural practices (biological or organic) and detrimental to soil productivity, fertility and thé environ-low-input Systems hâve been adopted in récent years ment (Nguyen et al. 1995). Soils under low-input biologicalbecause conventional agricultural Systems are alledged to be cropping Systems are increasing in Eastern Québec, Canada.
Such Systems entail no minéral fertilizer input, which is3To whom correspondence should be addressed (e-mail: replaced by nutrients from applied dairy manure and [email protected]). inhérent soil N mineralization. When ploughed, meadow
25
26 CANADIAN JOURNAL OF SOIL SCIENCE
soils could présent high mineralized soil N, which will be animportant source of N for following crops in low-input bio-logical cropping Systems.
Depending on thé soil and environmental conditions, totalsoil N has been estimated to range from 1 to 10 t ha~' inarable soils (Patra et al. 1999).
Greater increases in total N were measured in biologicalSystems compared with Systems using conventional practices(Murata and Goh 1997). Murata and Goh (1997) hypothetizedthat thèse total N increases were due to N inputs from biolog-ical NT fixation in legume-based pastures.
On dairy faims, N is also added to thé soil through manureapplication and thé décomposition of grass residues or nativesoil organic N. Soil mineralizable N pools are high in pastureor meadow soils (Haynes and Francis 1990; Simard andN'Dayegamiye 1993). When meadows are ploughed, largeamounts of minéral N are released and made available to théfollowing crops. Furthermore, thé quantity of mineralizable Nfrom meadow soils could be in thé range of 100 to 200 kg ha~'.Soil N mineralization rates dépend on factors such as âge andcomposition of pastures, fertilizer application, température andsoil moisture (Balesdent et al. 1990). In soils with thé samecropping Systems, N mineralization parameters may also bedifférent depending on soil texture (Chaussod et al. 1986;Simard and N'Dayegamiye 1993; Hassink 1994). Hassink(1994) observed that mineralized N was greater in sandy soilsthan in clay soils. However, Simard and N'Dayegamiye(1993) observed faster N mineralization in sandy soils, butlower total quantities of mineralized N than in clay soils.
The capacity of a soil to supply mineralized N to plants isalso primarily related to OM content, but also to OM quali-ty. In a 10-yr farming System trial, Wander et al. (1994)found that soils under forage and grain-based rotations thatwere biologically managed accumulated more total and bio-logically active C compared to conventional Systems.Organic matter quality was defined in terms of mineraliz-able C and N and light fraction C and N contents (Wanderet al. 1994; N'Dayegamiye et al. 1997). Soil N mineraliza-tion is also related to microbial biomass (Bonde andRosswall 1987) and light-fraction of OM (Sierra 1996).
Soil incubation techniques are used to quantify thé min-eralizable pool of soil organic N. The potentially mineraliz-able N (NQ) concept and a related mineralization rate (k)were first promoted by Stanford and Smith (1972) for use incharacterizing soil available N. Since then, this concept hasbeen used for différent cropping Systems (Campbell et al.1981; Campbell et al. 1991; Simard and N'Dayegamiye1993; Benedetti and Sebastiani 1996). Thèse authors foundthat N mineralization potential is variable depending of soiltypes, weather conditions and cropping Systems.
The amount of mineralized N (Nm) is defined as thé dif-férence between thé amount of mineralized organic N attime 0 and time t. N mineralization parameters (N0 and k)are then estimated on thé assumption that there is only oneactive fraction of soil OM, and that organic N mineralizationfollows first-order kinetics. However, Campbell et al.(1993) indicated that there ARE two or more N mineraliz-able pools and, therefore, a double exponential modelshould better represent N mineralization patterns.
Mineralized N from ploughed meadow soils could be animportant N source for following crops. The objectives ofthis study were to détermine thé amounts of mineralized Cand N (Cm, Nm), and to calculate C and N mineralizationparameters (C0, NQ) and their rate constants (kc, kn) in low-input meadow soils of différent texture. Data obtained willbe useful in predicting C turnover in meadow soils and théamounts and rates of release of N under pasture in order toevaluate their relative capacity to supply crops with N.
MATERIALS AND METHODS
Soil AnalysisThe soils used in this study were taken from dairy farms thatchanged from conventional management to low-input biolog-ical cropping Systems 4 or 5 yr before sampling. The farmswere situated at Sainte-Croix de Lotbiniere, in eastern Québec,Canada. The 34 sites studied covered 380 ha and were culti-vated in meadow crops. Soil séries (Gleyed humo-ferric pod-zols) were: Tilly (7 sites), Bedford (12 sites), Orignaux Levard(10 sites), St-Jude (3 sites), Jolly (1 site), and Ranmbault(1 site). The C and N contents of thèse soils ranged from 1.09to 4.13% and from 0.065 to 0.32%, respectively. Their claycontents ranged from 8 to 33% (Table 1). Soil pH variedbetween 5.8 and 7.5. The forage crops were a red clover(Trifolium pratense L.) bromegrass (Bromus inermis Leyss)mix. Low-input Systems entail no minéral fertilizer input,which is replaced by solid dairy cattle manure applied eachspring at a rate of 20 Mg ha~' on a wet basis (on average 132kg N ha~'). Soils were tilled every 4 or 5 yr.
Soil samples were collected from 4- to 5-yr-old foragecrops, in thé 0-15 cm soil layer. Composite samples for eachsite were formed from nine field-moist subsamples, sievedthrough a 6 mm screen. Half of each sample was kept at 4°Cuntil thé beginning of thé incubation study. A second portionwas air-dried at room température for 72 h, passed through a2-mm sieve, and stored in thé laboratory. A subsample of théair-dried portion was ground to pass a 0.15-mm screen sieveand was used for thé C and N analysis.
Particle size analysis was performed on air-dried soils bymechanical dispersion of thé samples after OM décomposi-tion with H0O0. Sand, silt and clay contents were then deter-mined by thé hydrometer method (Gee and Bauder 1986).Soil pH was measured in water (soil-water ratio of 1:1 ). Theorganic carbon content was determined by thé Walkley-Black procédure (Allison 1965) and total N was measuredby Kjeldahl digestion (Bremner 1965). Minéral N (NOrNand NH4- N) was extracted with a 2 M KC1 solution (soil-solution ratio of 1:4). Total N and minéral N were then mea-sured using a Technicon Autoanalyzer.
Incubation MethodsThirty four sites were sampled in thé study and there were12 incubation periods; therefore, 408 50-g (oven dry basis)soil samples were incubated in duplicate in 1-L polyethyl-ene flasks. Demineralized water was added to adjust soilmoisture content to 85% of thé field capacity. Vials con-taining 10 mL 1 M NaOH were introduced to trap evolvedCO-, during incubation. The samples were incubated at 25°C

SB/H ET AL. — CARBON AND NITROGEN MINERALIZA TION RA TES 27
Table 1
Site
12345.6789101 11213141516171819202122232425262728293031323334
MeanStd.dcv
for 56
. Physical and chemical properties of meadow soils
Séries
TillyTillyTillyTillyTillyBedibrdBedfordBcdfordBcdfordBedfordBcdfordTillyTillyJollyBedfordBcdfordBcdfordBedfordBedfordBedfordSt-JudeOrignauxOrignauxOrignauxOrignauxOrignauxRaimbaultOrignauxOrignauxOrignauxOrignauxOrignauxSl-JudeSt-Jude
Soil
Texture
Sandy loamSandy loamLoamSandy loamClay loamLoamClay loamClay loamLoamFine sandy loamFine sandy loamClay loamLoamClay loamLoamFine sandy loamFine sandy loamFine sandy loamLoamLoamSandy loamSandy loamSandy loamSandy loamSandy loamSandy loamClay loamFine sandy loamSandy loamSandy loamFine sandy loamFine sandy loamFine sandy loamSandy loam
wk and thé incubation period
Particle size (g kg'1)
Sand(50-2000 mm)
6906004605202403902802605005207302404603404706306606504704508106907207806406704807907807707306806407.30
564172
s were 1,2,3,4,6,;
Silt(2-50 mm)
230250350310430440430430350300180470310.3803502602002403.30280100190160140270210240100120140180210250180
268105
* 12,
Clay(< 2 mm)
8015019017033017029031015018090
29023028018014014011020027090
1201208090
1202801101009090
12011090
16876
alizable soil N (N,
C(g kg'1)
23.125.529.461.340.829.633.333.833.123.422.625.028.830.126.325.518.629.438.740.016.732.218.610.317.720.625.510.916.219.313.113.916.224.0
26.410.0
Chemical properties
N(g kg'1)
1.882.012.923.23.212.54
2542.492.432.191.891.622.162.222.341.702.021.262.102.641.091.372.311.260.661.221.601.020.651.081.220.871.171.20
1.880.69
,) and humified organ
C/N
12121018121 11313131012151313I I159
231815152388
2717161116181 1161420
154
ic N are
PH
7.37.47.25.85.67.06.86.26.56.86.95.97.06.76.06.36.06.46.76.15.96.16.76.36.66.36.56.16.47.07.06.16.66.6
6.50.4
simultané-24, 32, 40, 48 and 56 wk. At thé end of each period, vialscontaining NaOH were sampled to measure thé CCX, con-tent. Soils for thé corresponding incubation period were thensampled (20 g) to measure mineralized N, and thé remain-ing soil in thé flask was discarded. Soil moisture lost duringincubation was replaced by adding deionized water on aweight basis at thé end of each incubation period.
The amount of accumulated CO, was determined by titra-tion of excess NaOH after précipitation of carbonates bybarium chloride (BaCl2). The titration was made by auto-matic titrimeter with hydrochloric acid (HC10.25N) (Ross etal. 1995). Mineralized N was extracted with a 2 M KCI solu-tion (soil-solution ratio of 1:4) and measured using aTechnicon Autoanalyzer. Mineralized C and N wereexpressed in mg kg'1 and represented thé average of tworeplicates (Table 2).
Data AnalysisA computer model based on first-order kinetics (Stanfordand Smith 1972) was used to analyze thé data on C and Nmineralization. The équation was based on thé followingassumptions: (i) thé mineralization of thé potentially miner-
ous and their amounts are independent of each other, and (ii)thé amount of mineralizable N (N0) must be lower than totalN mineralized (Nm) during a long-term incubation period(56 wk), because thé mineralization rate continuouslydecreases as incubation time increases. Thèse assumptionswere expressed in thé following équation:
N = N, e~kNt + Nn (1 - e~kNt) + eJiNt(1)
where Nm is cumulated mineralized N at time t, N; is théamount of minéral N initially présent in soil (before incuba-tion), N0 is thé amount of organic N initially présent aslabile fraction (more mineralizable), kN is thé first-order rateconstant and hN is thé rate constant of mineralization of thérécalcitrant fraction of OM.
The C-mineralization data were fitted to thé followingéquation, thé assumption being as previously described for N:
Cm, C0, kc and hc were kinetic parameters for C, as previ-ously defined for N.

28 CANADIAN JOURNAL OF SOIL SCIENCE
Table 2. Nitrogen and C mineralization paramcters' in meadow soils determined by mixed first-order models
Sites
123456789101 11213141516171819202122232425262728293031323334
N™.
210200218235211228200221209153148204214205170183156213201189137138153881101731801381441 1 8103102146155
N(),„-!vë
1641631772391812381581741781491551771681451511311582011701591281141046511519316596
1 14937674109128
Nm = Ni e
kN
-kt + N0 (1 -
hN
W1'"'
0.0640.0620.0620.0580.0840.0410.0830.0640.0540.0320.070.0580.0860.0880.0460.0730.0340.0540.0730.0730.0480.0530.0790.0650.0340.0270.0480.0840.0610.0820.0830.0830.0800.069
0.0570.0600.056-0.0160.051-0.0110.0640.0670.0480.0530.0170.0550.0630.0640.0460.065-0.0150.0560.0540.0480.040.0530.0600.050-0.0090.0430.0430.0600.0490.0490.0530.0530.0590.052
- e-kt) + ehl
R-
0.9950.9890.9980.9950.9920.9990.9930.9940.9970.9950.9890.9960.9800.9970.9980.9960.9900.9950.9940.9960.9980.9990.9930.9930.9960.9980.9990.9940.9990.9970.9930.9930.9980.998
Cm = C0(l-e-k') + eht
RMS
(mg kg"12.25.90.71.61.90.43.43.33.32.12.20.46.81.82.21.31.82.52.91.60.12.21.72.11.20.70.90.20.10.10.42.30.40.2
TN0
) (wk)10.811.1l l . l11.78.216.98.310.812.821.59.911.98.17.8
17,39.5
20.312.89.59.514.4138.710.820.325.614.48.211.38.48.38.38.610.0
cm C0(ma Vrr-ll
2097225326382118225123672249239222401941215221252078182421012184177024022342203618181959203015231748187822402080200221231826177418112170
"& i2070189022201720175023232070187019301642206016301900147016202085170520802180176016701660174013051750143018601660166020401470159016101990
\çwk~'
0.0570.0880.0910.0740.0710.050.0610.0950.0860.0880.0540.0710.0730.0950.1230.0520.0550.0930.080.0830.0660.0910.0960.0730.0520.1100.0990.1090.0890.0710.0890.0990.0880.084
0.0680.0660.0680.0680.0720.0920.0570.0710.0620.0970.05 10.0710.0530.0640.0710.0960.0890.0620.050.0590.050.0610.060.0980.0130.0690.0650.0680.0640.0710.0650.0540.0550.053
fC-
0.9970.9950.9950.9950.9970.9990.9980.9970.9940.9880.9920.9950.9970.9980.9880.9980.9970.9970.9990.9970.9970.9930.9980.9970.9990.9830.9970.9830.9950.9880.9980.9930.9970.996
(mg kg '1.32.83.82.61.413.81.31.63.66.04.32.61.20.45.03.21.71.30.41. 10.93.10.60.90.95.71.27.32.26.80.52.50.92.0
•Fo) (wk)
12.17.87.69.39.7ND11.37.28.07.812.89.79.47.25.613.312.67.48.68.310.57.67.29.413.36.37.06.36.67.79.77.77.07.8
zNm and Cm, mineralizcd N and C at 56 wk of incubation; N() and Cn, potentially mineralizable N and C; NS; kN and kc, rate constants l'or labile component ofOM; hN and hc are rate constants of récalcitrant component of OM; Nj, initial mineral-N at time = 0; TNO and T^O are half-lives; RMS, root mean square error.
The nonlinear least squares (NLLS) régression model(Smith et al. 1980) was used to solve Eqs. 1 and 2, based onminimizing thé sum of squares of thé derivative between théexpérimental data and corresponding mathematical models.Then thé error in prédiction was based on root mean square(RMS) error (Smith et al. 1980). Modeling data were ana-lyzed using SYSTAT® statistical software and thé relation-ships between C and N mineralization parameters and soilparticle sizes were determined by multiple corrélationanalysis (SYSTAT statistics inc. 1992).
RESULTS AND DISCUSSION
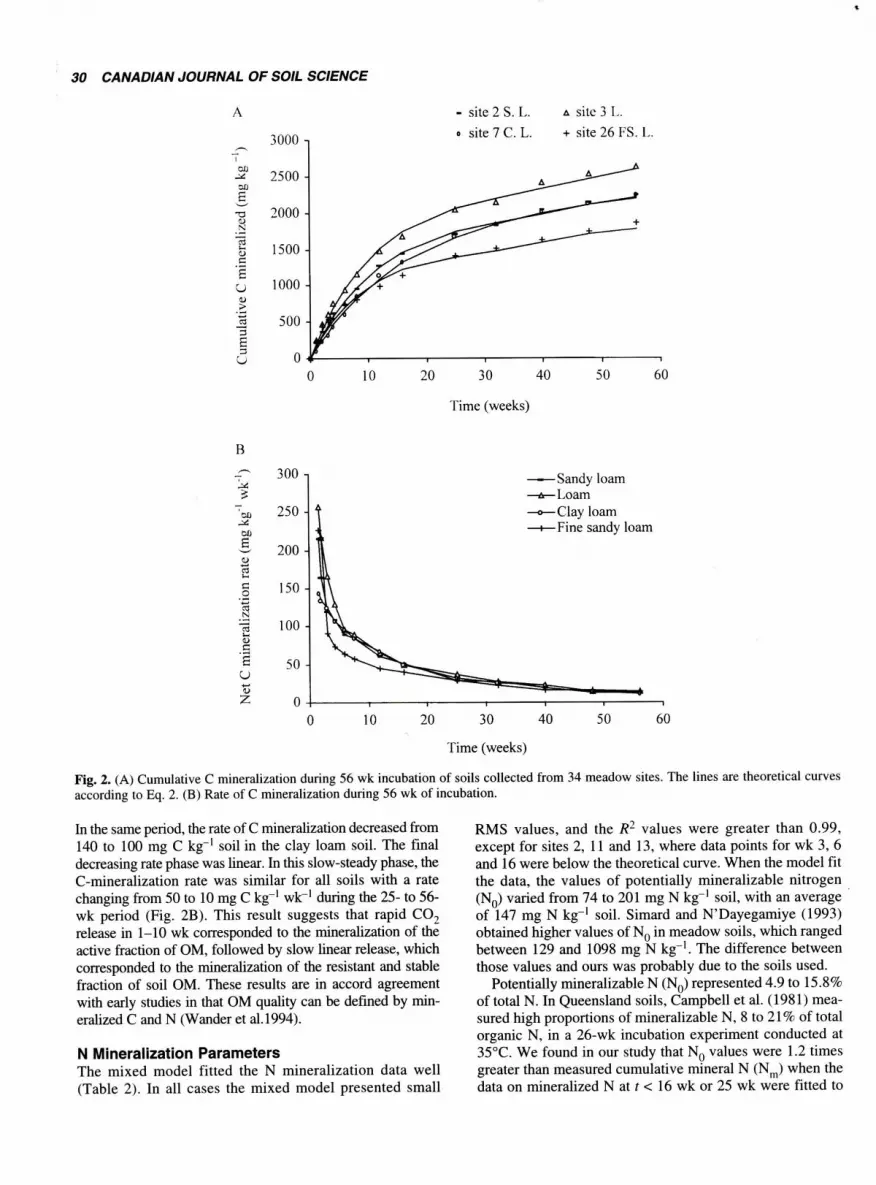
N MineralizationThe 56-wk incubation cumulative N mineralization curvesfrom thé 34 sites studied presented similar patterns; conse-quently, only représentative soils for différent textures areshown in Fig. 1. For ail soils, N mineralization was general-ly high and up to one-third of thé N was mineralized initial-ly within thé first 1 to 5 wk of incubation (Fig. 1). Nitrogenmineralization pattern presented a curvilinear phase denot-ing a rapid increase in N mineralization until weeks 25 or 32
in some cases. The final phase of N mineralization was gen-erally similar with a low constant rate resulting in an appar-ent linear growth curve (Fig. 1A).
For ail soils, two phases of N mineralization were observed.For example, in thé sandy loam, two maximum rates wereobserved in thé first phase: 12.5 mg N kg ' wk"1 in thé firstweek and 14 mg N kg"' wk~' during week 8. The data indicatethat N immobilization occurred, and that 11.3 mg N kg"1 wk"1
were immobilized (Fig. 1B). The same tendency was observedin thé loam. In thé clay loam, N mineralization rate betweenweeks 1 and 4 increased from 2 to 16 mg N kg"1 wk~'. Finally,in thé fine sandy loam, net N-immobilization was 6 mg N kg"1
wk"1 in thé first week followed by a period of intensive N min-eralization, which peaked in week 3 (Fig. 1B). Simard andN'Dayegamiye (1993) observed a similar lag in Podzolic soilsin thé early part of thé incubation due to microbial immobi-lization of N. In thé second phase, thé mineralization ratecurves were characterized by a rapid décline in N mineraliza-tion rates until weeks 25 to 32, after which N mineralizationrates remained nearly constant at about 1.3 mg kg"1 wk"1.
Thèse two observed N mineralization patterns suggest théoccurrence of two distinct OM pools mineralizing simulta-

SB/H ET AL. — CARBON AND NITROGEN MINERALIZA TION RA TES 29
Sf
Sy.
- site 1 S. L.o site 7 L.C.
A site 3 L+ site 26 f. S. L.
10 20 30 40
Time (weeks)
50 60
B
su
I-a
sIËZoz
20 -,
15 -
10 -
Site 2 S. L.
Site 3 L.
Site 7 C. L.
Site 26 FS. !..
-10 - Time (wceks)
Fig. 1. (A) Cumulative N mineralization during 56 wk incubation of soils collected from 34 meadow sites. The lines are theoretical curvesaccording to Eq. 1. Symbols are expérimental data. (B) Rate of N mineralization during 56 wk of incubation.
neously. The first phase corresponds to thé labile N pool inwhich mineralization predominated, and thé second phase isrelated to thé récalcitrant N pool. In thé last phase, when thélabile N pool seemed to be exhausted, a near-linear releasewas apparent (slow steady) after 25 wk of incubation.
The amount of N mineralized (Nm) after 56 wk of incu-bation ranged between 88 and 235 mg N kg"1, depending ofthé soils. This represented 6.6 to 22.1% of thé total soil N(Table 2). Thèse amounts of mineralized N are in thé rangeobtained for meadow soils from thé Lac St Jean région, inNorth Québec (Simard and N'Dayegamiye 1993).
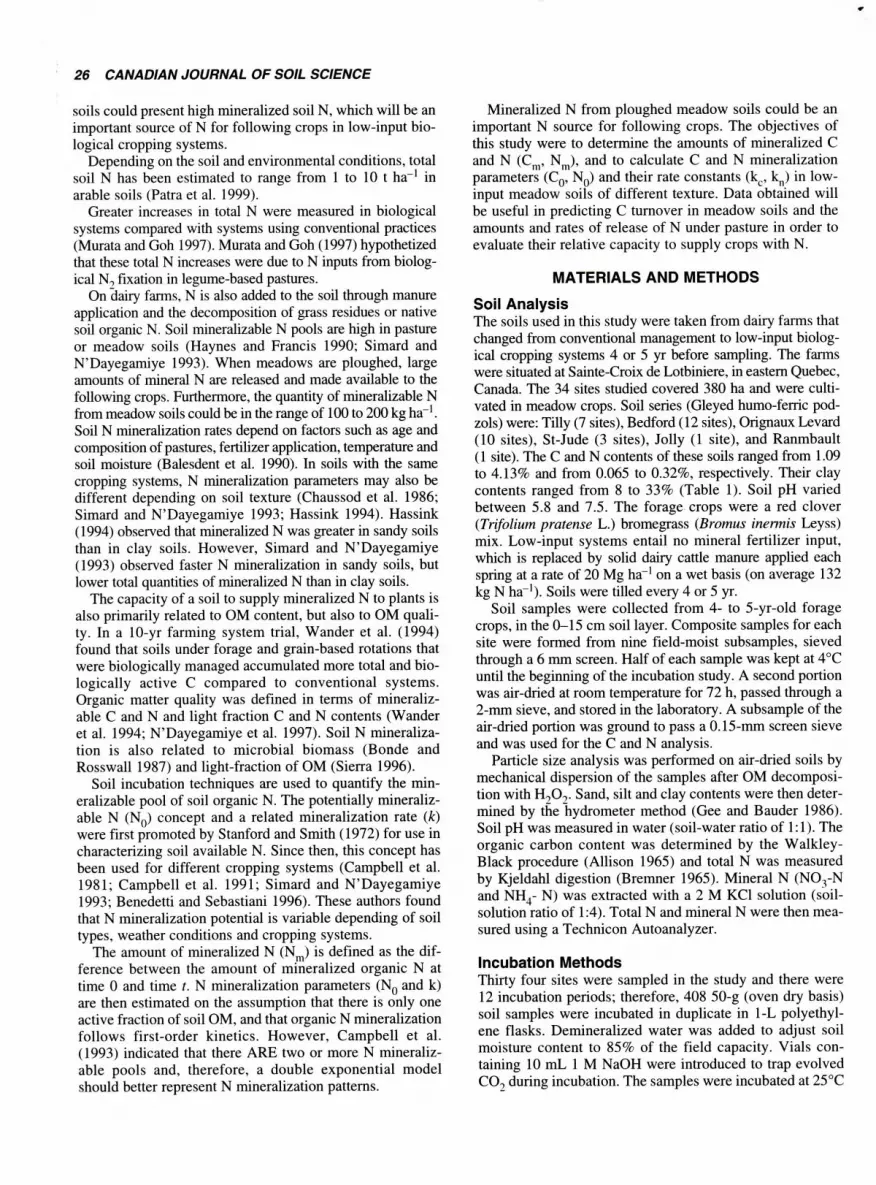
Carbon MineralizationThe amount of CO0-C evolved during 56 wk of incubationranged from 1523 mg C kg"1 soil in fine sandy loam soil to2638 mg C kg"1 soil in clay loam soil, representing 9 to 19%
of organic C (Table 2). In 449 d of soil incubation, similarmineralized C levels were reported in différent croppingSystems of eastern Norway (1305 to 1453 mg C kg"1 soil),being higher for forage than for conventional arable soils(Breland and Eltun 1999).
The cumulative amounts of CCX,-C during thé 56-wk peri-od of incubation are presented in Fig. 2. The data show twodistinct phases: an initial rapid mineralization rate, whichindicates an initial high rate of C décomposition during théfirst 16 wk, and a slow-steady phase in which mineralizationdeclined to a fairly constant rate after 16 wk, depending ofthé soils. Thus, C mineralization patterns resulted in anapparent curvilinear increase of CO7-C.
The curves of thé C-mineralization rate (Fig. 2B) indicatethat thé rate of C-mineralization decreased from 250 to 100 mgC kg"1 soil in thé first 6 wk in thé sandy loam and loam soils.
30 CANADIAN JOURNAL OF SOIL SCIENCE
A
M
T3OX
"H
3
u
3000 -,
2500-
2000-
1500 -
1000 -
500-
0
- site 2 S. L.o site 7 C. L.
A site 3 1,.+ site 26 FS. L.
0 10 20 30 40
Time (weeks)
50 60
B
CD
co
g'£uz
300-,
250-
200-
1 5 0 -
100 -
50 -
0 -
Sandy loamLoamClay loamFine sandy loam
0 10 20 30
Time (weeks)
40 50 60
Fig. 2. (A) Cumulative C mineralization during 56 wk incubation of soils collected from 34 meadow sites. The lines are theoretical curvesaccording to Eq. 2. (B) Rate of C mineralization during 56 wk of incubation.
In thé saine period, thé rate of C mineralization decreased from140 to 100 mg C kg"1 soil in thé clay loam soil. The finaldecreasing rate phase was linear. In this slow-steady phase, théC-mineralization rate was similar for ail soils with a ratechanging from 50 to 10 mg C kg~' wk"1 during thé 25- to 56-wk period (Fig. 2B). This resuit suggests that rapid CO7
release in 1-10 wk corresponded to thé mineralization of théactive fraction of OM, followed by slow linear release, whichcorresponded to thé mineralization of thé résistant and stablefraction of soil OM. Thèse results are in accord agreementwith early studies in that OM quality can be defmed by min-eralized C and N (Wander et al. 1994).
N Mineralization ParametersThe mixed model fitted thé N mineralization data well(Table 2). In ail cases thé mixed model presented small
RMS values, and thé R- values were greater than 0.99,except for sites 2, 11 and 13, where data points for wk 3, 6and 16 were below thé theoretical curve. When thé model fitthé data, thé values of potentially mineralizable nitrogen(NQ) varied from 74 to 201 mg N kg"' soil, with an averageof 147 mg N kg"1 soil. Simard and N'Dayegamiye (1993)obtained higher values of NQ in meadow soils, which rangedbetween 129 and 1098 mg N kg"1. The différence betweenthose values and ours was probably due to thé soils used.
Potentially mineralizable N (N0) represented 4.9 to 15.8%of total N. In Queensland soils, Campbell et al. (1981) mea-sured high proportions of mineralizable N, 8 to 21% of totalorganic N, in a 26-wk incubation experiment conducted at35°C. We found in our study that NQ values were 1.2 timesgreater than measured cumulative minéral N (Nm) when thédata on mineralized N at t < 16 wk or 25 wk were fitted to
SB/H ET AL. — CARBON AND NITROGEN MINERALIZA TION RA TES 29
_§
-a
oc
Sx
u
250
200
150
100
50 -
0
site 1 S. L.site 7 L.C.
A site 3 L+ site 26 f. S. L.
0 10 20 30 40
Time (weeks)
50 60
B 20 -,
15 -
10 -
-ag
1
Ezju
Site 2 S. L.
Site 3 L.
Site 7 C. L.
Site 26 FS. L.
5 -
-10- Time (weeks)
Fig. 1. (A) Cumulative N mineralization during 56 wk incubation of soils collected from 34 meadow sites. The lines are theoretical curvesaccording to Eq. 1. Symbols are expérimental data. (B) Rate of N mineralization during 56 wk of incubation.
neously. The first phase corresponds to thé labile N pool inwhich mineralization predominated, and thé second phase isrelated to thé récalcitrant N pool. In thé last phase, when thélabile N pool seemed to be exhausted, a near-linear releasewas apparent (slow steady) after 25 wk of incubation.
The amount of N mineralized (Nm) after 56 wk of incu-bation ranged between 88 and 235 mg N kg"1, depending ofthé soils. This represented 6.6 to 22.1 % of thé total soil N(Table 2). Thèse amounts of mineralized N are in thé rangeobtained for meadow soils from thé Lac St Jean région, inNorth Québec (Simard and N'Dayegamiye 1993).
Carbon MineralizationThe amount of CO2-C evolved during 56 wk of incubationranged from 1523 mg C kg"1 soil in fine sandy loam soil to2638 mg C kg"1 soil in clay loam soil, representing 9 to 19%
of organic C (Table 2). In 449 d of soil incubation, similarmineralized C levels were reported in différent croppingSystems of eastern Norway (1305 to 1453 mg C kg^1 soil),being higher for forage than for conventional arable soils(Breland and Eltun 1999).
The cumulative amounts of CO0-C during thé 56-wk peri-od of incubation are presented in Fig. 2. The data show twodistinct phases: an initial rapid mineralization rate, whichindicates an initial high rate of C décomposition during théfirst 16 wk, and a slow-steady phase in which mineralizationdeclined to a fairly constant rate after 16 wk, depending ofthé soils. Thus, C mineralization patterns resulted in anapparent curvilinear increase of CO?-C.
The curves of thé C-mineralization rate (Fig. 2B) indicatethat thé rate of C-mineralization decreased from 250 to 100 mgC kg"' soil in thé first 6 wk in thé sandy loam and loam soils.
SBIH ET AL. — CARBON AND NITROGEN MINERALIZATION RATES 31
Table 3. I incai corrélation coefficients between différent soil size-particles and kinetic parameters of N and C mineralization
SandSiltClayCtNiNm
C,nNQ
k
"Ncnkc
h(
Sand Silt Clay Ct* Ni
l.OOO -0.96*** -0.93*** -0.61"" -0.76"*l.OOO 0.79*" 0.59*" 0.73"*
l.OOO 0.58*" 0.71"*1 .000 0.92***
1.000
NB-0.71"*
0.72***0.63"*0.77***0.74*""1.000
Cm
-0.51"0.54*"0.42**0.55***0.71*"0.79*"l.OOO
N(i-0.63***0.68"*0.50***0.73*"0.64***0.90*"0.62***1 .000
kN
-0.37*0.31*0.41"NSNS
0.42"NS
-0.60***1.000
hN
NSNS
-0.36*NSNS
-0,44**-0.41"-0.47"-0.71*"
l.OOO
Çg
NSNSNS
0.34*NSNS
0.80***NSNS
-0.48**1 .000
kf.
NSNSNSNSNSNSNSNSNS
-0.56***0.71"'1 .000
hç
NSNS
-0.31*NSNSNSNSNSNS
0.43**-0.80***-0.89***
l.OOO
C,, organic C: Np Total N; Nm, minerali/ed N at 56 wk; Cm. mineralized C at 56 wk: N(), potentially mineralizable N; kN and hN, rate constants of labile andrécalcitrant OM, respectively; C0, potentially mineralizable C; kc and hc, rate constants of labile and récalcitrant OM.*. **, ***. Significant at P < 0.05. P < 0.01. P < 0.001, respectively; NS, nol significant.
ed and where potentially mineralizable N was relatively highthé rate constant hN tended to be low. Paustian and Bonde(1987) also observed thé same relationship. Assuming thatail organic N was potentially mineralizable, Mary et al.(1996) hâve found slightly lower rate constant.
C Mineralization ParametersThe C-mineralization data were fitted on thé mixed model(Table 2). This model described thé data very well. High coef-ficients of détermination were obtained which varied between0.983 and 0.999, and small RMS values measured rangingbetween 0.1 and 6.4 mg C kg"1. The potentially mineralizablecarbon (C()) varied between 1390 to 2220 mg C kg"1 of soil,which represented 4.2 and 15.2% of total organic C. Thèsevalues are in thé same order of magnitude as those reported byDelphin (1988) for soils cultivated to cereals, when a doubleexponential model was used. Nevertheless, CQ values found byNicolardot (1988) were lower and varied from 71 to 716 mg Ckg"' under corn-wheat cropping Systems.
Half-lives (TC0) of C0 ranged between 5.6 and 13.8 wk(Table 2), suggesting that thé C0 was mineralized between 11and 27 wk. We noted that 85% of thé C0 obtained was min-eralized during 24 wk. The rate constant of C mineralization(kc), varied between 0.05 and 0.123 wk~' (mean 0.08 ± 0.02wk~'). Only thé constant rates of sites 15, 26 and 28 wereabove 0.1 wk~'. Considering thé low variability of thé rateconstant k^, this suggests thé mineralizable C (C0) emanatedfrom similar organic matter components in meadow soils. Wealso noted that 59% of obtained kç were above thé average,suggesting that thé half-life (TH)) of this component was, onaverage, 7 wk. For thé remaining 41 % of thé sites, thé T^Oranged between 11 and 14 wk (mean 9 wk) (Table 2).
The rate constants of récalcitrant organic C (hc) variedfrom 0.013 to 0.098 wk"1. This suggests that only 109 mg Ckg"1 mineralized during 56 wk of incubation originatedfrom humified stable fractions. The mineralization rates ofpotentially mineralizable C (C0) were about 16 times greaterthan that of thé humified stable fraction. This weakest min-eralization of thé humified C indicated that thé récalcitrantfraction of OM is less decomposed by soil microorganismsthan labile OM fractions (Oades 1989). Hassink (1994) sug-
thé model (data not shown). However, with thé data on min-eralized N at / > 32 wk, thé model gave smaller NQ than Nm.Thèse results suggest that when thé time of incubation isless than 25 wk, thé model gave a better approximation ofN0 values. From week 25 to week 56, N mineralization rateremained low and nearly constant (on average 1.28 mg Nkg"1 wk'1). This resuit suggests that this mineralized N orig-inales from stable OM, and consequently it could not beincluded as potentially mineralizable N (N0). Potentiallymineralizable N (N()) is then related to labile organic frac-tions of soil OM, which could mineralize inside a long-termperiod of incubation. Our results agrée with those ofCampbell et al. (1993) who indicated that two or more min-eralizable N pools exist and release N at différent rates.
Single exponential models may estimate lesser amountsof N0 than measured cumulative mineral-N (Campbell et al.1993; Dou et al. 1996). A low incubation température mayalso lead to lesser levels of NQ than cumulative mineral-N(Campbell et al. 1993). In contrast, Paustian and Bonde( 1987) observed that a one-component model overestimatedN0 by 15-20 mg N kg"1. Campbell et al (1993) indicatedthat thé availability of N is better represented by measure-ments of cumulative mineralization than estimated N (N0),which varies with température, models used and thé dura-tion of thé incubation. Thèse authors recommend reportingthé cumulative amounts of N, which are analytical data,whereas N0 and KN are parameters estimated.
The rate constant (kN) ranged from 0.032 to 0.088 wk-1,with an average of 0.064 wk"1. Thèse data are in a similarrange to those measured by Campbell et al. (1981) inSaskatchewan soils. The half-life (TN0) ranged between 8and 20 wk (Table 2). According to thèse TN0, it appears thatpotentially mineralizable N was mineralized during 15 to 28wk except for sites 10, 18, 25 and 26 for which thé time ofmineralization exceeded 40 wk.
The rate constant of mineralization for thé résistant organ-ic N (hN) ranged from 0.04 to 0.067 wk"' with an average of0.057 wk"1 (Table 2). When NO was higher than Nm, a néga-tive hN was found. On thé other hand thé rate constants (kN)in thèse cases were relatively low (Table 2). It appears thatpotential mineralizable nitrogen and rate constant were relat-
32 CANADIAN JOURNAL OF SOIL SCIENCE
- site 2 S. L.A site 3 I...o site 7 C. L.+ site26FS. L.
12Ty = 1.319x-2.735
R2 = 0.984
= 0.809x-0.651R2 = 0.995
= 0.558x-0.902R2 = 0.989
C-mineralized (%
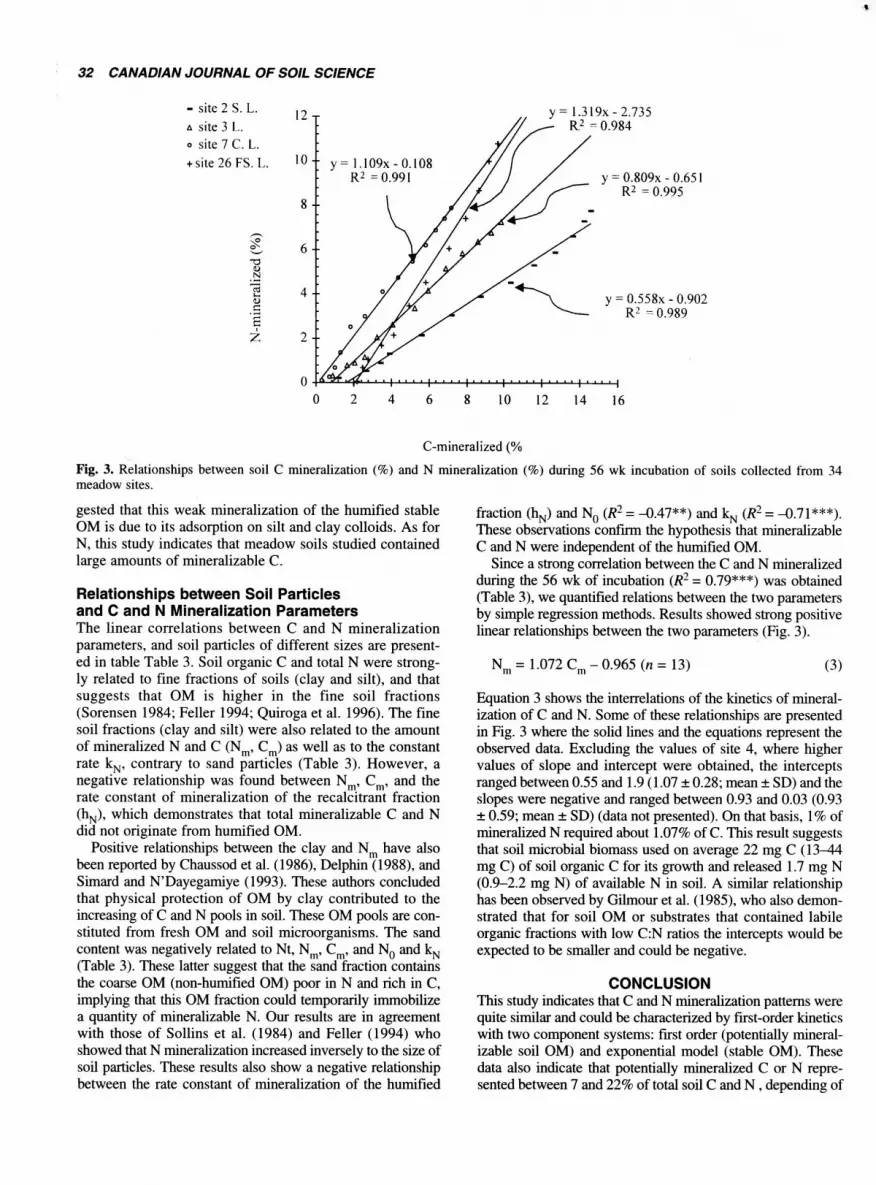
Fig. 3. Relationships between soil C mineralization (%) and N mineralization (%) during 56 wk incubation of soils collected from 34meadow sites.
gested that this weak mineralization of thé humified stableOM is due to its adsorption on silt and clay colloids. As forN, this study indicates that meadow soils studied containedlarge amounts of mineralizable C.
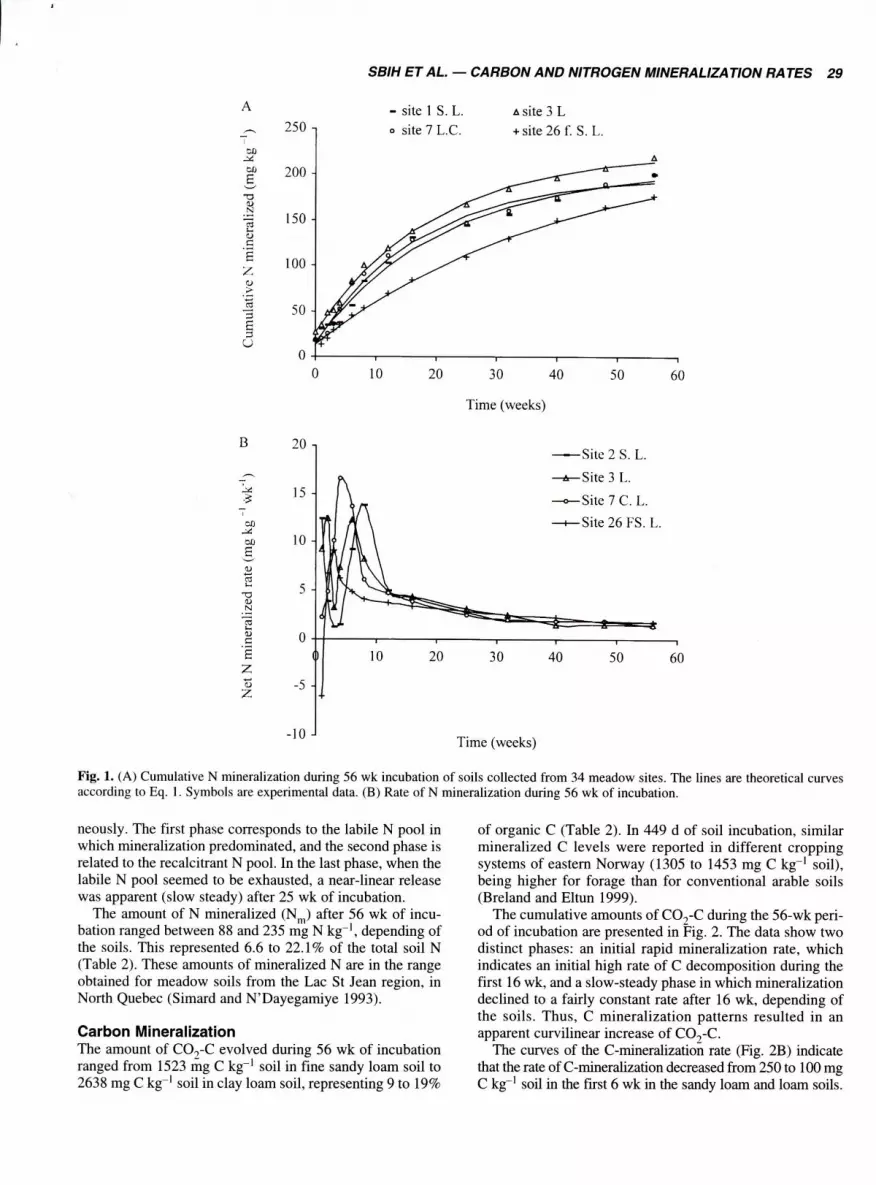
Relationships between Soil Partialesand C and N Mineralization ParametersThe linear corrélations between C and N mineralizationparameters, and soil particles of différent sizes are present-ed in table Table 3. Soil organic C and total N were strong-ly related to fine fractions of soils (clay and silt), and thatsuggests that OM is higher in thé fine soil fractions(Sorensen 1984; Feller 1994; Quiroga et al. 1996). The finesoil fractions (clay and silt) were also related to thé amountof mineralized N and C (Nm, Cm) as well as to thé constantrate kN, contrary to sand particles (Table 3). However, anégative relationship was found between Nm, Cm, and thérate constant of mineralization of thé récalcitrant fraction(hN), which demonstrates that total mineralizable C and Ndid not originale from humified OM.
Positive relationships between thé clay and Nm hâve alsobeen reported by Chaussod et al. (1986), Delphin (1988), andSimard and N'Dayegamiye (1993). Thèse authors concludedthat physical protection of OM by clay contributed to théincreasing of C and N pools in soil. Thèse OM pools are con-stituted from fresh OM and soil microorganisms. The sandcontent was negatively related to Nt, Nm, Cm, and N0 and kN
(Table 3). Thèse latter suggest that thé sand fraction containsthé coarse OM (non-humified OM) poor in N and rich in C,implying that this OM fraction could temporarily immobilizea quantity of mineralizable N. Our results are in agreementwith those of Sollins et al. (1984) and Feller (1994) whoshowed that N mineralization increased inversely to thé size ofsoil particles. Thèse results also show a négative relationshipbetween thé rate constant of mineralization of thé humified
fraction (hN) and N0 (R2 = -0.47**) and kN (R2 = -0.71***).Thèse observations confirm thé hypothesis that mineralizableC and N were independent of thé humified OM.
Since a strong corrélation between thé C and N mineralizedduring thé 56 wk of incubation (R2 - 0.79***) was obtained(Table 3), we quantified relations between thé two parametersby simple régression methods. Results showed strong positivelinear relationships between thé two parameters (Fig. 3).
N =1.072 C - 0.965 (n = 13) (3)
Equation 3 shows thé interrelations of thé kinetics of mineral-ization of C and N. Some of thèse relationships are presentedin Fig. 3 where thé solid lines and thé équations represent théobserved data. Excluding thé values of site 4, where highervalues of slope and intercept were obtained, thé interceptsranged between 0.55 and 1.9 ( 1.07 ± 0.28; mean ± SD) and théslopes were négative and ranged between 0.93 and 0.03 (0.93± 0.59; mean ± SD) (data not presented). On that basis, 1% ofmineralized N required about 1.07% of C. This resuit suggeststhat soil microbial biomass used on average 22 mg C (13-44mg C) of soil organic C for its growth and released 1.7 mg N(0.9-2.2 mg N) of available N in soil. A similar relationshiphas been observed by Gilmour et al. (1985), who also demon-strated that for soil OM or substrates that contained labileorganic fractions with low C:N ratios thé intercepts would beexpected to be smaller and could be négative.
CONCLUSIONThis study indicates that C and N mineralization patterns werequite similar and could be characterized by first-order kineticswith two component Systems: first order (potentially mineral-izable soil OM) and exponential model (stable OM). Thèsedata also indicate that potentially mineralized C or N repre-sented between 7 and 22% of total soil C and N , depending of

SB/H ET AL. — CARBON AND NITROGEN MINERALIZATION RATES 33
soil texture. Data obtained in this study suggest that meadowsoils under dairy faims hâve a high proportion of potentiallymineralizable C and N, and when tilled they could therebyprovide high amounts of available N for following crops.
ACKNOWLEDGMENTSThis study was supported by CORPAQ, Québec Ministry ofAgriculture. The authors gratefully acknowledge thé com-ments and suggestions of Dr. C. A. Campbell on earlier ver-sions of thé manuscript.
Allison, L. E. 1965. Total carbon. Pages 1367-1378 in C. A. Blacket al. eds. Methods of soil analysis. 2nd éd. Agronomy Monogr. 9,Part 1, ASA, SSSA, Madison, WI.Balesdent, J., Marriotti, A. and Boisgontier, D. 1990. Effect oftillage on soil organic carbon mineralization estimated from |:!Cabondance in maize fields. J. Soil Sci 41: 587-596.Benedetti, A. and Sébastian!, G. 1996. Détermination of poten-tially mineralizable nitrogen in agricultural soil. Biol. Fertil. Soils.21:114-120.Bonde, T. A and Rosswall, T. 1987. Seasonal variation in poten-tially mineralizable nitrogen in four cropping Systems. Soil Sci.Soc. Am. J. 51: 1508-1515.Breland, T. A. and Eltun, R. 1999. Soil microbial biomass andmineralization of carbon and nitrogen in ecological, integrated andconventional forage and arable cropping Systems. Biol Fertil Soils30: 193-201.Bremner, J. M. 1965. Total nitrogen, inorganic forms of nitrogen.Pages 1149-1255 in C. A. Black et al., eds. Methods of soil analy-sis. 2nd éd. ASA, SSSA, Madison, WI.Campbell, C. A., Ellert, B. H. and Jame, Y.W. 1993. Nitrogenmineralization potential in soils. Pages 341-349 in M.R. Carter, éd.Soil sampling and methods of analysis. Canadian Society of SoilScience, Ottawa, ON.Campbell, C. A., Lafond, G. P., Leyshon, A. J., Zentner, R. P.and Janzen, H. H. 1991. Effect of cropping practices on thé initialpotential rate of N mineralization in a thin Black Chernozem. Can.J. Soil Sci. 71: 43-53.Campbell, C. D., Myers, R. J. K. and Weier, K. L. 1981.Potentially mineralizable nitrogen, décomposition rates and theirrelationship to température for five Queensland soils. Aust. J. SoilRes. 19: 323-332.Chaussod, R., Nicolardot, B., Catroux, G. and Chrétien, J.1986. Relation entre les caractéristiques physico-chimiques etmicrobiologiques de quelques sols cultivés. Sci. Sol. 2: 213-226.Delphin, J. E. 1988. Évaluation du pouvoir minéralisateur de solsagricoles en fonction de leurs caractéristiques physico-chimiques.Agronomie 6: 453^56.Dou, Z., Toth, J. D., Jabro, J. D., Fox, R. H. and Fritton, D. D.1996. Soil nitrogen mineralization during laboratory incubation:dynamics and model fitting. Soil Biol. Biochem. 28: 625-632.Feller, C. 1994. La matière organique dans les sols tropicaux àargile 1:1. Recherche de compartiments fonctionnels. Uneapproche granulométrique. Thèse de doctorat es sciencesnaturelles, U.E.R. des sciences de la vie et de la terre, Institut degéologie Stassbourg. Ed. OROSTOM. no 144.Gee, G. W. and Bander, J. W. 1986. Particle size analysis. Pages383^11 in A. Klute, éd. Methods of soil analysis. 2nd éd.Agronomy Monogr. 9, Part 1, ASA and SSSA, Madison, WI.Gilmour, J. T., Clark, M. D. and Sigua, G. C. 1985. Estimatingnet nitrogen mineralization from carbon dioxide évolution. SoilSci. Soc. Am. J. 49: 1398-1402.
Haynes, R. J. and Francis, G. S. 1990. Effects of mixed croppingfarming Systems on changes in soil properties on thé CanterburryPlains. N. Z. J. Ecol 14: 78-82.Hassink, J. 1994. Effect of soil texture and grassland managementon soil organic C and N and rates of C and N mineralization. SoilBiol. Biochem. 26: 1221-1231.Mary, B., Recous, S., Darwis, D. and Robin, D. 1996.Interactions between décomposition of plant residues and nitrogencycling in soil. Plant Soil 181: 71-82.Murata, T. and Goh, K. M. 1997. Effects of cropping Systems onsoil organic matter in a pair of conventional and biodynamic mixedcropping farms in Canterbury, New Zealand. Biol Fertil Soils. 25:372-381.N'Dayegamiye, A., Goulet, M. and Laverdière, M. R. 1997.Effet à long terme d'apports d'engrais minéraux et de fumier surles teneurs en C et en N des fractions densimétriques et des agré-gats du loam limoneux Le bras. Can. J. Soil Sci. 77: 351-358.Nicolardot, B. 1988. Évolution du niveau de la biomasse microbi-enne des sols au cours d'une incubation de long durée. Relationavec la minéralisation du carbone et de l'azote organique. Rev.Écol. Biol. Sol. 25 (3): 287-304.Nguyen, M. L., Haynes, R. J. and Goh, K. M. 1995. Nutrientbudgets and status in three pairs of conventional and alternativemixed cropping farms in Canterbury, New Zealand. Agric Ecosyst.Environ. 52: 149-162.Oades, J. M. 1989. An introduction to organic matter in minéralsoils. Pages 89-159 in ). B. Dixon and S. B. Weed, eds. Mineraisin soil environments. SSSA, Madison, WI.Paustian, K. and Bonde, T. B. 1987. Interpreting incubation dataon nitrogen mineralization from soil organic matter. 1NTECOLBulletin 15: 101-112.Patra, A. K., Jarvis, S. C. and Hatch, D. J. 1999. Nitrogen min-eralization in soil layers, soil particles and macro-organic matterunder grassland. Biol Fertil Soils 29: 38^15.Quiroga, A. R., Buschiazzo, D. E. and Peinemann, N. 1996. Soilorganic matter particle size fractions in soils of thé semi arid argen-tinian pampas. Soil Sci.161: 104-108.Ross, D. J., Speir, T. W., Ketteles, H. A. and MacKay, A. D.1995. Soil microbial biomass, C and N mineralization and enzymeactivities in a hill pasture : influence of season and slow-release Pand S fertilizer. Soil Biol. Biochem. 27: 1431-1443.Sierra, J. 1996. Nitrogen mineralization and ils error of estimationunder field conditions related to thé light-fraction soil organic mat-ter. Aust. J. Soil Res. 34: 755-767.Simard, R. R. and N'Dayegamiye, A. 1993. Nitrogen mineral-ization potential of meadow soils. Can. J. Soil Sci. 73: 27-38.Smith, J. L., Schnabel, R. R., McNeal, B. L. and Campbell, G.S. 1980. Potential error in thé first-order model for estimatingnitrogen mineralization potential. Soil Sci. Soc. Am. J. 44:996-1000.Sollins, P., Spycher, G. and Glassman, C. A. 1984. Net nitrogenmineralization from light- and heavy-fraction forest soil organicmatter. Soil Biol. Biochem. 16: 13-37.Sorensen, L. H. 1984. Carbon-nitrogen relationship during théhumification of thé cellulose in soils containing différent amountsof clay. Soil Biol. Biochem. 13: 313-321.Stanford, G. and Smith, S. J. 1972. Nitrogen mineralizationpotentials of soils. Soil Sci. Soc. Am. 36: 465-472.SYSTAT, 1992. Intelligent software for statistics and graphies,version 5.2 Edition. Evasion, IL.Wander, M. M., Traîna, S. J., Stinner, B. R. and Peters, S. E.1994. Organic and conventional management effects on biologi-cally-active soil organic matter pools. Soil Sci Soc Am J. 58:1130-1139.