evaluating protein fouling on membranes patterned ... - mdpi
TRANSCRIPT
membranes
Article
Evaluating Protein Fouling on Membranes Patterned by WovenMesh Fabrics
Anna Malakian and Scott M. Husson *
�����������������
Citation: Malakian, A.; Husson, S.M.
Evaluating Protein Fouling on
Membranes Patterned by Woven
Mesh Fabrics. Membranes 2021, 11,
730. https://doi.org/10.3390/
membranes11100730
Academic Editor: Gaetano Di Bella
Received: 26 August 2021
Accepted: 22 September 2021
Published: 25 September 2021
Publisher’s Note: MDPI stays neutral
with regard to jurisdictional claims in
published maps and institutional affil-
iations.
Copyright: © 2021 by the authors.
Licensee MDPI, Basel, Switzerland.
This article is an open access article
distributed under the terms and
conditions of the Creative Commons
Attribution (CC BY) license (https://
creativecommons.org/licenses/by/
4.0/).
Department of Chemical and Biomolecular Engineering, Clemson University, Clemson, SC 29634, USA;[email protected]* Correspondence: [email protected]; Tel.: +1-(864)-656-4502; Fax: +1-(864)-656-0784
Abstract: Membrane surface patterning is one approach used to mitigate fouling. This study used acombination of flux decline measurements and visualization experiments to evaluate the effectivenessof a microscale herringbone pattern for reducing protein fouling on polyvinylidene fluoride (PVDF)ultrafiltration membranes. Thermal embossing with woven mesh stamps was used for the firsttime to pattern membranes. Embossing process parameters were studied to identify conditionsreplicating the mesh patterns with high fidelity and to determine their effect on membrane perme-ability. Permeability increased or remained constant when patterning at low pressure (≤4.4 MPa) asa result of increased effective surface area; whereas permeability decreased at higher pressures dueto surface pore-sealing of the membrane active layer upon compression. Flux decline measurementswith dilute protein solutions showed monotonic decreases over time, with lower rates for patternedmembranes than as-received membranes. These data were analyzed by the Hermia model to followthe transient nature of fouling. Confocal laser scanning microscopy (CLSM) provided complementary,quantitative, spatiotemporal information about protein deposition on as-received and patternedmembrane surfaces. CLSM provided a greater level of detail for the early (pre-monolayer) stageof fouling than could be deduced from flux decline measurements. Images show that the proteinimmediately started to accumulate rapidly on the membranes, likely due to favorable hydrophobicinteractions between the PVDF and protein, followed by decreasing rates of fouling with time asprotein accumulated on the membrane surface. The knowledge generated in this study can be usedto design membranes that inhibit fouling or otherwise direct foulants to deposit selectively in regionsthat minimize loss of flux.
Keywords: membrane fouling; membrane patterning; Hermia model; ultrafiltration; waterpurification
1. Introduction
Membrane biofouling occurs when biomass deposits form on a membrane surface orwithin its pores [1]. Biofouling impairs membrane performance by increasing the mass-transfer resistance for fluid transport through the membrane, which increases operatingcosts [2–4]. Preventing it is the main objective of this and numerous other studies.
A number of factors play important roles in the fouling process and influence thefouling mechanism; for proteins, these include Coulombic and other electrostatic forcesand hydrophobic interactions between protein molecules and membrane surfaces [5,6],which themselves change as fouling progresses. Correspondingly, a number of strategiescan be taken to combat membrane biofouling. These include feed pretreatment steps,the adjustment of operating conditions (e.g., crossflow velocity, pH) [7], the develop-ment of new membranes [8,9], and chemical or physical modification of the membranesurfaces [10–14]. Modifying membrane surfaces with ordered patterns of micro- andnanoscale features can alter shear-stress profiles in ways that mitigate fouling [15–17]. Theeffects of such microscale features as shark skin mimics [18], pyramids [2,19] and line and
Membranes 2021, 11, 730. https://doi.org/10.3390/membranes11100730 https://www.mdpi.com/journal/membranes
Membranes 2021, 11, 730 2 of 17
groove patterns [20,21] on protein fouling have been studied, and results show the positiveinfluence of patterning on decreasing the rate of fouling. Realizing these benefits throughthe commercial adoption of patterning will depend in part on the development of efficient,cost-effective manufacturing approaches.
Patterns can be introduced during phase inversion or post-membrane fabrication byembossing. Introducing patterns during phase inversion is normally performed by castingonto a mold. Upon solvent evaporation, the pattern features appear on the membranesurface [22]. This method avoids the added complexity of post-fabrication modification;however, a number of factors related to solution and solvent properties, wetting, andmembrane-mold adhesion may cause difficulties [22,23]. Post-fabrication embossing ap-plies a stamp under pressure to form surface patterns [24,25]. The replication of featureswith high fidelity can be achieved through the proper choice of embossing conditions [22].Although patterning by micromolding is complicated, post-fabrication thermal emboss-ing can be straightforward, using a roll-to-roll process [26]. Hutfles et al. [27] patternedultrafiltration membranes using a roll-to-roll process at room temperature. While ground-breaking for its introduction of a roll-to-roll process for membrane patterning, the stampwas produced using a nickel master mold that required specialized equipment and wasexpensive to process. Thus, there is a need to develop novel patterning methods to improvemanufacturability. The important innovation from our study was the identification anddemonstration of woven mesh fabrics as inexpensive and widely available stamps thatcould be used for the commercial application of roll-to-roll patterning.
Understanding how patterned membranes become fouled is expected to informimproved designs. Oftentimes, flux decline measurements are reported to quantify theimpact of fouling on membrane performance and fit to models that provide some insightson the fouling of mechanisms. Some have used atomic force microscopy (AFM) [16],electron microscopy (EM) [28,29], and confocal scanning laser microscopy (CLSM) [30]to observe, and sometimes quantify, foulant accumulation. CLSM is especially useful,as it provides information about membrane morphology and fouling over a relativelylarge visualization area, in the wet state, and without artifacts introduced by samplesectioning [31]. It also is capable of distinguishing multiple foulant species on the surfaceor co-locating the foulant and surface features. Zator et al. [32] used CLSM to characterizemembrane fouling and determine cleaning efficiencies. Marroquin et al. [33] studiedinternal fouling of microfiltration membranes by multicomponent foulant mixtures. Ofparticular relevance to our study, Choi et al. [34] visualized fouling on micropatternedmembranes and evaluated the role played by pattern geometry on membrane biofouling.Lee et al. [35] used CLSM to observe microbial attachment on patterned membranes. Inthese pioneering studies, the patterned membranes and biofilms were stained after thefiltration process. In this study, we stained the membranes before filtration and used adifferent stain for the protein foulant to locate and quantify protein deposition on thesurfaces of patterned membranes.
The aims of this study were to evaluate the efficacy of using woven mesh fabricfor patterning ultrafiltration membranes and to combine flux decline measurements andvisualization experiments to elucidate the mechanism(s) of protein fouling on the resultingmicroscale herringbone patterned membranes. Polyvinylidene fluoride (PVDF) ultrafiltra-tion membranes were patterned by thermal embossing with polyester woven mesh for thefirst time. Embossing process parameters were studied to identify conditions replicatingthe mesh pattern with high fidelity. Flux decline data using dilute protein were collectedand analyzed to uncover transient fouling mechanisms on as-received and patternedmembranes. CLSM provided complementary, quantitative, spatiotemporal informationabout protein deposition on as-received and patterned membrane surfaces. This studycontributes knowledge that is needed to inform the design of patterned membranes withfeatures that better mitigate fouling. Additionally, demonstration of patterning usingan inexpensive, widely available stamp is innovative and may be useful for commercialpractice of membrane patterning in a roll-to-roll process.
Membranes 2021, 11, 730 3 of 17
2. Materials and Methods2.1. Materials
Polyester woven mesh with 20 µm opening size (PM-E #635 polyester cloth) waspurchased from Gilson Company, Inc. (Lewis Center, OH, USA). High-strength, high-temperature silicone rubber sheets were purchased from McMaster-Carr (Robbinsville,NJ, USA). PVDF ultrafiltration membranes (Synder BN; 50 kDa MWCO) and polyamidenanofiltration membranes (GE HL) were from Sterlitech (Kent, WA, USA). Bovine serumalbumin (BSA, 66.4 kDa, 9048-46-8), sodium chloride (NaCl, 7647-14-5) and ethyl alcohol(anhydrous, 200 proof) were from MilliporeSigma (St. Louis, MO, USA). BSA-Alexa Fluor™647 conjugate, 5-(4,6-dichlorotriazinyl) aminofluorescein (5-DTAF), phosphate-bufferedsaline (1× PBS buffer), and sodium carbonate powder (Na2CO3, 497-19-8) were fromThermoFisher Scientific (Waltham, MA, USA).
2.2. Membrane Preparation
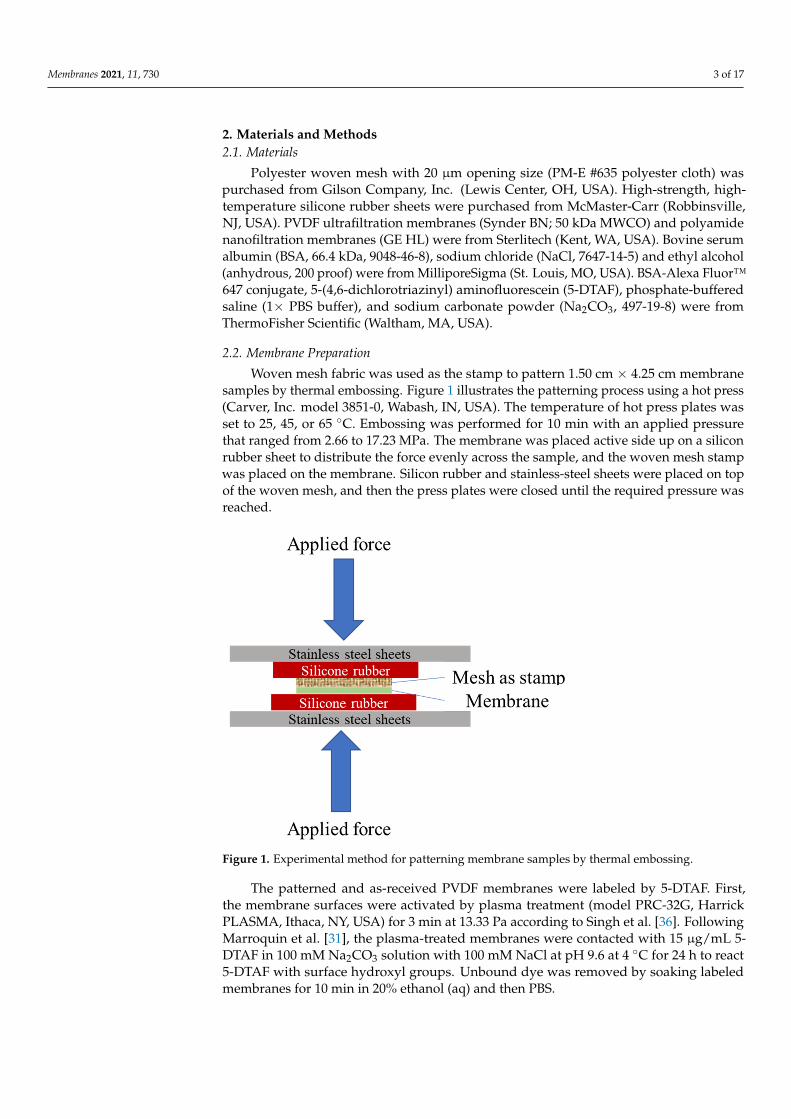
Woven mesh fabric was used as the stamp to pattern 1.50 cm × 4.25 cm membranesamples by thermal embossing. Figure 1 illustrates the patterning process using a hot press(Carver, Inc. model 3851-0, Wabash, IN, USA). The temperature of hot press plates wasset to 25, 45, or 65 ◦C. Embossing was performed for 10 min with an applied pressurethat ranged from 2.66 to 17.23 MPa. The membrane was placed active side up on a siliconrubber sheet to distribute the force evenly across the sample, and the woven mesh stampwas placed on the membrane. Silicon rubber and stainless-steel sheets were placed on topof the woven mesh, and then the press plates were closed until the required pressure wasreached.
Membranes 2021, 11, 730 3 of 17
an inexpensive, widely available stamp is innovative and may be useful for commercial practice of membrane patterning in a roll-to-roll process.
2. Materials and Methods 2.1. Materials
Polyester woven mesh with 20 μm opening size (PM-E #635 polyester cloth) was pur-chased from Gilson Company, Inc. (Lewis Center, OH, USA). High-strength, high-tem-perature silicone rubber sheets were purchased from McMaster-Carr (Robbinsville, NJ, USA). PVDF ultrafiltration membranes (Synder BN; 50 kDa MWCO) and polyamide nan-ofiltration membranes (GE HL) were from Sterlitech (Kent, WA, USA). Bovine serum al-bumin (BSA, 66.4 kDa, 9048-46-8), sodium chloride (NaCl, 7647-14-5) and ethyl alcohol (anhydrous, 200 proof) were from MilliporeSigma (St. Louis, MO, USA). BSA-Alexa Fluor™ 647 conjugate, 5-(4,6-dichlorotriazinyl) aminofluorescein (5-DTAF), phosphate-buffered saline (1× PBS buffer), and sodium carbonate powder (Na2CO3, 497-19-8) were from ThermoFisher Scientific (Waltham, MA, USA).
2.2. Membrane Preparation Woven mesh fabric was used as the stamp to pattern 1.50 cm × 4.25 cm membrane
samples by thermal embossing. Figure 1 illustrates the patterning process using a hot press (Carver, Inc. model 3851-0, Wabash, IN, USA). The temperature of hot press plates was set to 25, 45, or 65 °C. Embossing was performed for 10 min with an applied pressure that ranged from 2.66 to 17.23 MPa. The membrane was placed active side up on a silicon rubber sheet to distribute the force evenly across the sample, and the woven mesh stamp was placed on the membrane. Silicon rubber and stainless-steel sheets were placed on top of the woven mesh, and then the press plates were closed unptil the required pressure was reached.
Figure 1. Experimental method for patterning membrane samples by thermal embossing.
The patterned and as-received PVDF membranes were labeled by 5-DTAF. First, the membrane surfaces were activated by plasma treatment (model PRC-32G, Harrick PLASMA, Ithaca, NY, USA) for 3 min at 13.33 Pa according to Singh et al. [36]. Following Marroquin et al. [31], the plasma-treated membranes were contacted with 15 μg/mL 5-DTAF in 100 mM Na2CO3 solution with 100 mM NaCl at pH 9.6 at 4 °C for 24 h to react 5-DTAF with surface hydroxyl groups. Unbound dye was removed by soaking labeled membranes for 10 min in 20% ethanol (aq) and then PBS.
Figure 1. Experimental method for patterning membrane samples by thermal embossing.
The patterned and as-received PVDF membranes were labeled by 5-DTAF. First,the membrane surfaces were activated by plasma treatment (model PRC-32G, HarrickPLASMA, Ithaca, NY, USA) for 3 min at 13.33 Pa according to Singh et al. [36]. FollowingMarroquin et al. [31], the plasma-treated membranes were contacted with 15 µg/mL 5-DTAF in 100 mM Na2CO3 solution with 100 mM NaCl at pH 9.6 at 4 ◦C for 24 h to react5-DTAF with surface hydroxyl groups. Unbound dye was removed by soaking labeledmembranes for 10 min in 20% ethanol (aq) and then PBS.
Membranes 2021, 11, 730 4 of 17
2.3. Filtration Experiments
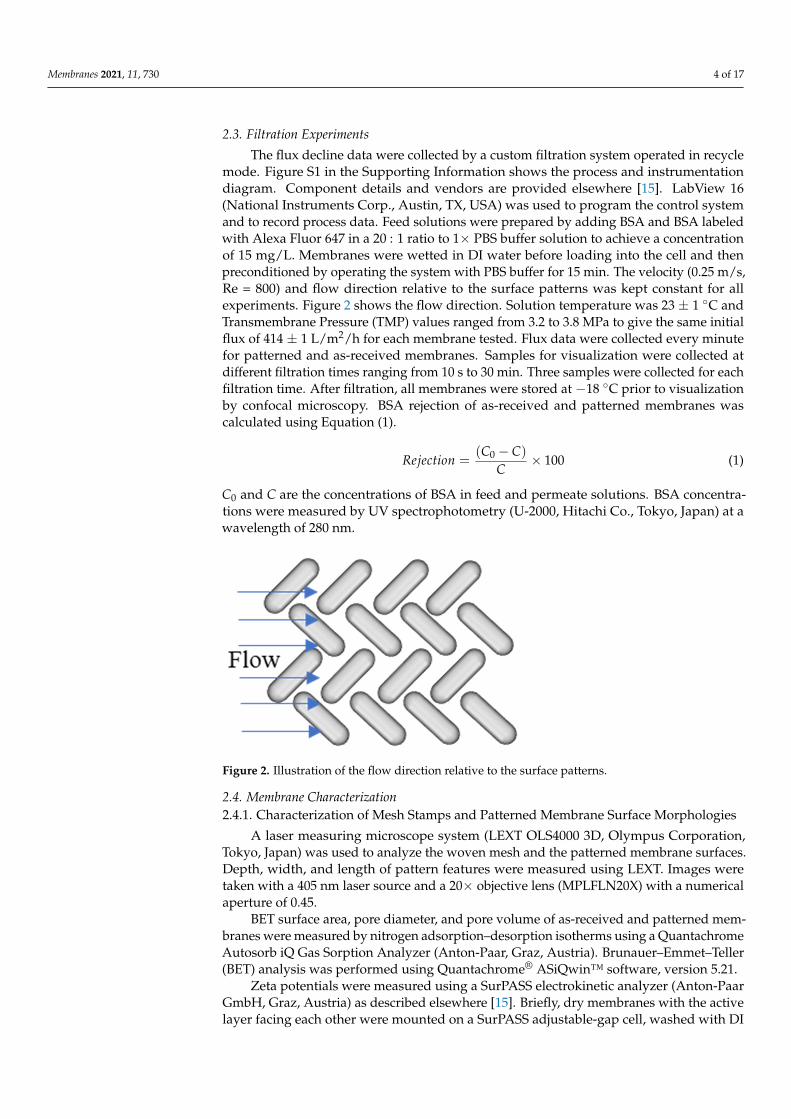
The flux decline data were collected by a custom filtration system operated in recyclemode. Figure S1 in the Supporting Information shows the process and instrumentationdiagram. Component details and vendors are provided elsewhere [15]. LabView 16(National Instruments Corp., Austin, TX, USA) was used to program the control systemand to record process data. Feed solutions were prepared by adding BSA and BSA labeledwith Alexa Fluor 647 in a 20 : 1 ratio to 1× PBS buffer solution to achieve a concentrationof 15 mg/L. Membranes were wetted in DI water before loading into the cell and thenpreconditioned by operating the system with PBS buffer for 15 min. The velocity (0.25 m/s,Re = 800) and flow direction relative to the surface patterns was kept constant for allexperiments. Figure 2 shows the flow direction. Solution temperature was 23 ± 1 ◦C andTransmembrane Pressure (TMP) values ranged from 3.2 to 3.8 MPa to give the same initialflux of 414 ± 1 L/m2/h for each membrane tested. Flux data were collected every minutefor patterned and as-received membranes. Samples for visualization were collected atdifferent filtration times ranging from 10 s to 30 min. Three samples were collected for eachfiltration time. After filtration, all membranes were stored at −18 ◦C prior to visualizationby confocal microscopy. BSA rejection of as-received and patterned membranes wascalculated using Equation (1).
Rejection =(C0 − C)
C× 100 (1)
C0 and C are the concentrations of BSA in feed and permeate solutions. BSA concentra-tions were measured by UV spectrophotometry (U-2000, Hitachi Co., Tokyo, Japan) at awavelength of 280 nm.
Membranes 2021, 11, 730 4 of 17
2.3. Filtration Experiments The flux decline data were collected by a custom filtration system operated in recycle
mode. Figure S1 in the Supporting Information shows the process and instrumentation diagram. Component details and vendors are provided elsewhere [15]. LabView 16 (Na-tional Instruments Corp., Austin, TX, USA) was used to program the control system and to record process data. Feed solutions were prepared by adding BSA and BSA labeled with Alexa Fluor 647 in a 20:1 ratio to 1× PBS buffer solution to achieve a concentration of 15 mg/L. Membranes were wetted in DI water before loading into the cell and then pre-conditioned by operating the system with PBS buffer for 15 min. The velocity (0.25 m/s, Re = 800) and flow direction relative to the surface patterns was kept constant for all ex-periments. Figure 2 shows the flow direction. Solution temperature was 23 ± 1 °C and Transmembrane Pressure (TMP) values ranged from 3.2 to 3.8 MPa to give the same initial flux of 414 ± 1 L/m2/h for each membrane tested. Flux data were collected every minute for patterned and as-received membranes. Samples for visualization were collected at dif-ferent filtration times ranging from 10 s to 30 min. Three samples were collected for each filtration time. After filtration, all membranes were stored at −18 °C prior to visualization by confocal microscopy. BSA rejection of as-received and patterned membranes was cal-culated using Equation (1). 𝑅𝑒𝑗𝑒𝑐𝑡𝑖𝑜𝑛 = 𝐶 𝐶𝐶 100 (1)
C0 and C are the concentrations of BSA in feed and permeate solutions. BSA concentrations were measured by UV spectrophotometry (U-2000, Hitachi Co., Tokyo, Japan) at a wave-length of 280 nm.
Figure 2. Illustration of the flow direction relative to the surface patterns.
2.4. Membrane Characterization 2.4.1. Characterization of Mesh Stamps and Patterned Membrane Surface Morphologies
A laser measuring microscope system (LEXT OLS4000 3D, Olympus Corporation, Tokyo, Japan) was used to analyze the woven mesh and the patterned membrane surfaces. Depth, width, and length of pattern features were measured using LEXT. Images were taken with a 405 nm laser source and a 20× objective lens (MPLFLN20X) with a numerical aperture of 0.45.
BET surface area, pore diameter, and pore volume of as-received and patterned mem-branes were measured by nitrogen adsorption–desorption isotherms using a Quantachrome Autosorb iQ Gas Sorption Analyzer (Anton-Paar, Graz, Austria). Brunauer–Emmet–Teller (BET) analysis was performed using Quantachrome® ASiQwin™ software, version 5.21.
Zeta potentials were measured using a SurPASS electrokinetic analyzer (Anton-Paar GmbH, Graz, Austria) as described elsewhere [15]. Briefly, dry membranes with the active
Figure 2. Illustration of the flow direction relative to the surface patterns.
2.4. Membrane Characterization2.4.1. Characterization of Mesh Stamps and Patterned Membrane Surface Morphologies
A laser measuring microscope system (LEXT OLS4000 3D, Olympus Corporation,Tokyo, Japan) was used to analyze the woven mesh and the patterned membrane surfaces.Depth, width, and length of pattern features were measured using LEXT. Images weretaken with a 405 nm laser source and a 20× objective lens (MPLFLN20X) with a numericalaperture of 0.45.
BET surface area, pore diameter, and pore volume of as-received and patterned mem-branes were measured by nitrogen adsorption–desorption isotherms using a QuantachromeAutosorb iQ Gas Sorption Analyzer (Anton-Paar, Graz, Austria). Brunauer–Emmet–Teller(BET) analysis was performed using Quantachrome® ASiQwin™ software, version 5.21.
Zeta potentials were measured using a SurPASS electrokinetic analyzer (Anton-PaarGmbH, Graz, Austria) as described elsewhere [15]. Briefly, dry membranes with the activelayer facing each other were mounted on a SurPASS adjustable-gap cell, washed with DI
Membranes 2021, 11, 730 5 of 17
water for 1 min and then with 0.1 M potassium chloride at pH 3. The pH was increased byadding 0.1 M sodium hydroxide solution.
Water contact angles were measured using a Krüss DSA 10-Mk2 contact angle go-niometer (Krüss, Humburg, Germany). Measurements were taken 30 s after a water drop(~3 µL) was placed on the surface. They were taken at three locations on each membrane.To determine contact angle, the sessile drop model was used in DSA version 1.80.0.2 DropShape Analysis software.
2.4.2. Visualization of Membrane Fouling by Confocal Microscopy
A Leica Microsystems (Buffalo Grove, IL, USA) SPE CLSM with an ACS Apo IMM 20×objective (numerical aperture = 0.6) was used in fluorescent mode for all fouling studies.A He-Ne laser (647 nm) and an Ar laser (488 nm) were used for excitation. The detectionconditions were held constant (laser intensity of 14.99% for the He-Ne laser and 14.05% forthe Ar laser, detection gain: 800, pin hole size: 94.3 µm, pixel dwell time: 1.44 µs) to allowdirect comparisons among CLSM images. No digital zoom was used while taking images.CLSM was used to collect a series of lateral x–y images at different focal depths. Dependingon the well depth of the patterns, a series of 10–15 images were produced by taking imagesfrom the surface of the membrane (Z = 0) to the well depth of the patterns (Z = 11 ± 3 µm).This z-series stack of images was used to create a 3-dimensional reconstruction of themembrane and to measure the mass of accumulated foulant using a calibration betweenfluorescence intensity and mass per unit area (vide infra).
Images were analyzed with NIH ImageJ software. Foulant was assigned a pixelintensity of zero (black), and membrane material was assigned an intensity of 255 (white).From black and white images, relative intensities of foulant on membrane surfaces werecalculated.
2.4.3. Calibration Curve Preparation
A calibration curve was created to measure labeled BSA surface concentrations. Solu-tions containing BSA Alexa Fluor 647 (in a 1:20 ratio with non-labeled BSA) were filteredthrough a GE HL nanofiltration membrane. Knowing the mass of protein per unit areaexactly is necessary to build the calibration curve; therefore, nanofiltration membraneswere used to ensure 100% protein rejection. Post-filtration, three samples from each mem-brane were visualized by CLSM. The average fluorescence intensity of the sample surfaceswas determined by lateral x–y scans. A calibration plot was prepared relating the aver-age fluorescence intensity to the known mass of BSA Alexa Fluor 647 per unit area ofmembrane.
3. Results and Discussion3.1. Membrane Patterning
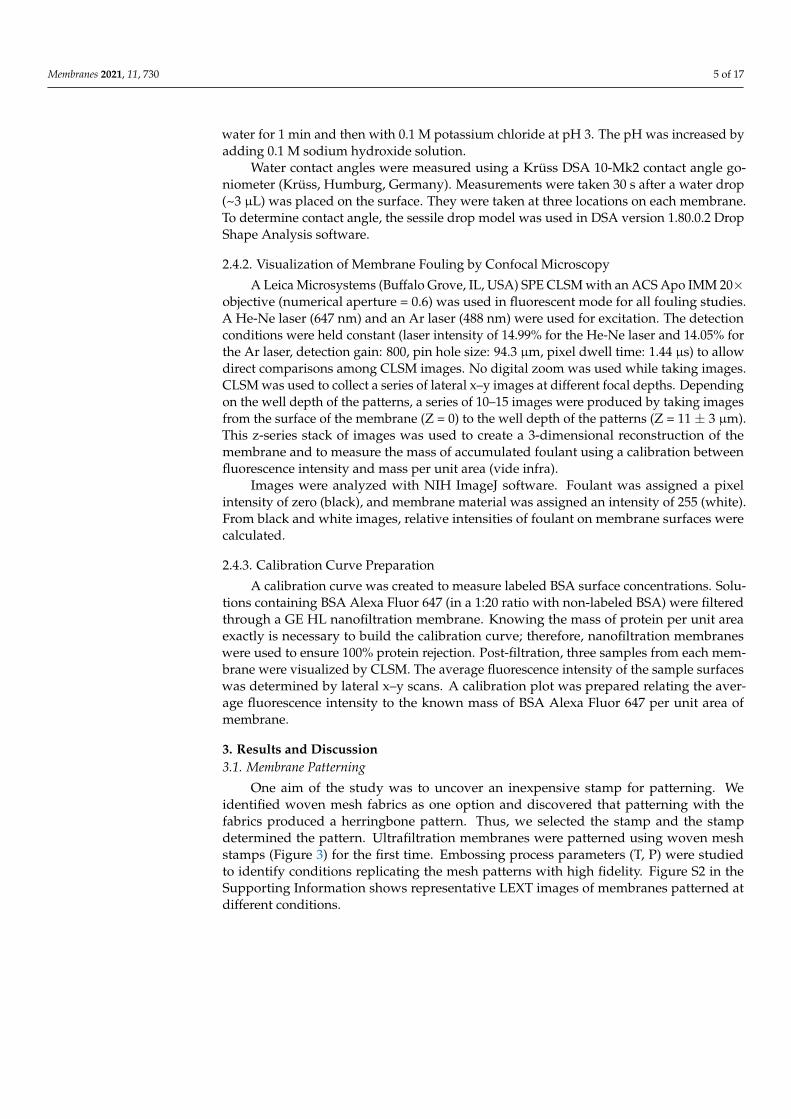
One aim of the study was to uncover an inexpensive stamp for patterning. Weidentified woven mesh fabrics as one option and discovered that patterning with thefabrics produced a herringbone pattern. Thus, we selected the stamp and the stampdetermined the pattern. Ultrafiltration membranes were patterned using woven meshstamps (Figure 3) for the first time. Embossing process parameters (T, P) were studiedto identify conditions replicating the mesh patterns with high fidelity. Figure S2 in theSupporting Information shows representative LEXT images of membranes patterned atdifferent conditions.
Membranes 2021, 11, 730 6 of 17Membranes 2021, 11, 730 6 of 17
Figure 3. (a) Woven mesh and (b) patterned membrane images produced by LEXT using the 20× objective. The average dimensions of the mesh features are 130 ± 2 (s.d.) μm by 52 ± 3 μm with average fiber height of 30 ± 2 μm. The average end-to-end feature dimensions on the membrane are 100 ± 6 μm by 34 ± 3 μm, with average depth of 19 ± 2 μm. The common scale bar for images is 100 μm.
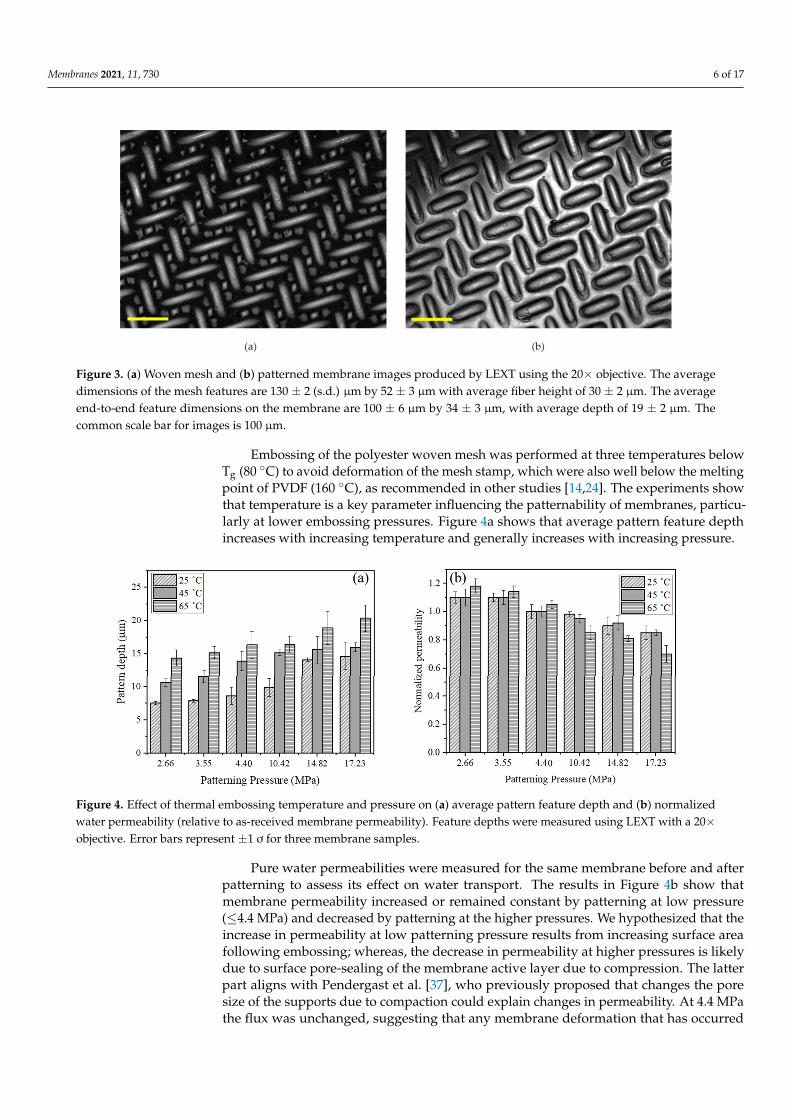
Embossing of the polyester woven mesh was performed at three temperatures below Tg (80 °C) to avoid deformation of the mesh stamp, which were also well below the melt-ing point of PVDF (160 °C), as recommended in other studies [14,24]. The experiments show that temperature is a key parameter influencing the patternability of membranes, particularly at lower embossing pressures. Figure 4a shows that average pattern feature depth increases with increasing temperature and generally increases with increasing pres-sure.
Figure 4. Effect of thermal embossing temperature and pressure on (a) average pattern feature depth and (b) normalized water permeability (relative to as-received membrane permeability). Feature depths were measured using LEXT with a 20× objective. Error bars represent ±1 ơ for three membrane samples.
Pure water permeabilities were measured for the same membrane before and after patterning to assess its effect on water transport. The results in Figure 4b show that mem-brane permeability increased or remained constant by patterning at low pressure (≤4.4 MPa) and decreased by patterning at the higher pressures. We hypothesized that the in-crease in permeability at low patterning pressure results from increasing surface area fol-lowing embossing; whereas, the decrease in permeability at higher pressures is likely due to surface pore-sealing of the membrane active layer due to compression. The latter part aligns with Pendergast et al. [37], who previously proposed that changes the pore size of the supports due to compaction could explain changes in permeability. At 4.4 MPa the flux was unchanged, suggesting that any membrane deformation that has occurred was
Figure 3. (a) Woven mesh and (b) patterned membrane images produced by LEXT using the 20× objective. The averagedimensions of the mesh features are 130 ± 2 (s.d.) µm by 52 ± 3 µm with average fiber height of 30 ± 2 µm. The averageend-to-end feature dimensions on the membrane are 100 ± 6 µm by 34 ± 3 µm, with average depth of 19 ± 2 µm. Thecommon scale bar for images is 100 µm.
Embossing of the polyester woven mesh was performed at three temperatures belowTg (80 ◦C) to avoid deformation of the mesh stamp, which were also well below the meltingpoint of PVDF (160 ◦C), as recommended in other studies [14,24]. The experiments showthat temperature is a key parameter influencing the patternability of membranes, particu-larly at lower embossing pressures. Figure 4a shows that average pattern feature depthincreases with increasing temperature and generally increases with increasing pressure.
Membranes 2021, 11, 730 6 of 17
Figure 3. (a) Woven mesh and (b) patterned membrane images produced by LEXT using the 20× objective. The average dimensions of the mesh features are 130 ± 2 (s.d.) μm by 52 ± 3 μm with average fiber height of 30 ± 2 μm. The average end-to-end feature dimensions on the membrane are 100 ± 6 μm by 34 ± 3 μm, with average depth of 19 ± 2 μm. The common scale bar for images is 100 μm.
Embossing of the polyester woven mesh was performed at three temperatures below Tg (80 °C) to avoid deformation of the mesh stamp, which were also well below the melt-ing point of PVDF (160 °C), as recommended in other studies [14,24]. The experiments show that temperature is a key parameter influencing the patternability of membranes, particularly at lower embossing pressures. Figure 4a shows that average pattern feature depth increases with increasing temperature and generally increases with increasing pres-sure.
Figure 4. Effect of thermal embossing temperature and pressure on (a) average pattern feature depth and (b) normalized water permeability (relative to as-received membrane permeability). Feature depths were measured using LEXT with a 20× objective. Error bars represent ±1 ơ for three membrane samples.
Pure water permeabilities were measured for the same membrane before and after patterning to assess its effect on water transport. The results in Figure 4b show that mem-brane permeability increased or remained constant by patterning at low pressure (≤4.4 MPa) and decreased by patterning at the higher pressures. We hypothesized that the in-crease in permeability at low patterning pressure results from increasing surface area fol-lowing embossing; whereas, the decrease in permeability at higher pressures is likely due to surface pore-sealing of the membrane active layer due to compression. The latter part aligns with Pendergast et al. [37], who previously proposed that changes the pore size of the supports due to compaction could explain changes in permeability. At 4.4 MPa the flux was unchanged, suggesting that any membrane deformation that has occurred was
Figure 4. Effect of thermal embossing temperature and pressure on (a) average pattern feature depth and (b) normalizedwater permeability (relative to as-received membrane permeability). Feature depths were measured using LEXT with a 20×objective. Error bars represent ±1 ơ for three membrane samples.
Pure water permeabilities were measured for the same membrane before and afterpatterning to assess its effect on water transport. The results in Figure 4b show thatmembrane permeability increased or remained constant by patterning at low pressure(≤4.4 MPa) and decreased by patterning at the higher pressures. We hypothesized that theincrease in permeability at low patterning pressure results from increasing surface areafollowing embossing; whereas, the decrease in permeability at higher pressures is likelydue to surface pore-sealing of the membrane active layer due to compression. The latterpart aligns with Pendergast et al. [37], who previously proposed that changes the poresize of the supports due to compaction could explain changes in permeability. At 4.4 MPathe flux was unchanged, suggesting that any membrane deformation that has occurred
Membranes 2021, 11, 730 7 of 17
was compensated for by the increased surface area for transport. To test this hypothesis,we performed BET nitrogen adsorption experiments to measure the specific surface areaand porosity for as-received and patterned PVDF membranes. Table 1 presents the resultsshowing values for membranes patterned at 65 ◦C and 3.55 MPa, which experienced a 17%increase in permeability, and patterned at 65 ◦C and 17.23 MPa with a 30% permeabilitydecrease. The results show that the nominal surface area increased by 11% after patterning,pore diameter increased 5%, and pore volume decreased 7% for low pressure patterning(3.55 MPa). These results support the first part of the hypothesis that the 17% increase inpermeability for membranes patterned at low pressure (3.55 MPa) is likely attributable toincreased surface area based on Darcy’s law [38] and also the increase in the membranesurface pore sizes. They also illustrate the competing effects of increased surface areaand decreased pore volume. On the other hand, the 75% increase in surface area afterpatterning, 24% decrease in pore diameter and 65% decrease in pore volume for highpressure patterning (17.23 MPa) support the second part of hypothesis, i.e., that the 30%decrease in permeability is due to surface pore-sealing of the membrane active layer.
Table 1. Brunauer–Emmet–Teller (BET) analysis data.
Membranes BET Surface Area(m2/g)
Pore Diameter(nm)
Pore Volume(cc/g)
As-receivedMembrane 5.76 20.1 7.79 × 10⁻³
Patterned Membrane65 ◦C, 3.55 MPa 6.43 21.2 7.21 × 10⁻³
Patterned Membrane65 ◦C, 17.23 MPa 10.13 15.1 2.75 × 10⁻³
Maruf et al. [24] reported that using a pressure higher than the yield strength ofporous PVDF membranes produced optimum patterning on the membrane surface. Totest whether this principle applies to patterning by polymeric mesh stamps, we measuredthe yield strength of the PVDF membranes from stress–strain curves [24] collected at a0.01 s−1 strain rate. Table 2 summarizes the yield strength values. Figure 4a shows no clearevidence of improved patternability by changing the pressure from just below the yieldstrength to just above it. However, Figure 4b shows that membrane permeability begins todecrease significantly as the patterning pressure approaches and exceeds the yield strength.This finding provides additional evidence that surface pore sealing contributes to the lossof membrane permeability at higher embossing pressures.
Table 2. Offset yield strength of the polyvinylidene fluoride (PVDF) membranes. Each valuerepresents the mean calculated from measurements on three samples, and the errors represent ±1 ơ.
Temperature (◦C) Yield Strength (MPa)
25 5.11 ± 0.1245 5.01 ± 0.2465 4.39 ± 0.44
The stability of patterns was studied by LEXT imaging of membrane surfaces beforeand after 2 h of pure water filtration. Feature stability depends on irreversible deformation.Figure S3c shows that the average pattern feature depth decreased by 20–30%. This findingis consistent with the results from Idarraga-Mora et al. [39], who studied the deformationof nanocomposite membrane supports upon compression. They observed that only ~20%of the initial deformation was reversible for Matrimid supports that were subjected to acompressive stress of 1.2 MPa. We attribute the 20–30% decrease in feature depth to thisreversible contribution to deformation.

Membranes 2021, 11, 730 8 of 17
Finally, measurements were performed to assess the robustness and reusability ofwoven mesh stamps, as reuse would be required for roll-to-roll processing [27]. Figure 5shows average pattern feature dimensions for membranes that were patterned up to10 times at 65 ◦C and 3.55 MPa with the same mesh stamp. The average values werecalculated from LEXT images of the patterned membranes (Figure S4) and paired t-testswere conducted to compare the feature dimensions of the patterned membranes after thefirst and tenth use. The results of the statistical tests are given in Table S1. The averagevalues for depth, width, and length of pattern features were statistically the same at 95%confidence, which suggests that the polyester woven mesh can be reused as a stamp.
Membranes 2021, 11, 730 8 of 17
subjected to a compressive stress of 1.2 MPa. We attribute the 20–30% decrease in feature depth to this reversible contribution to deformation.
Finally, measurements were performed to assess the robustness and reusability of woven mesh stamps, as reuse would be required for roll-to-roll processing [27]. Figure 5 shows average pattern feature dimensions for membranes that were patterned up to 10 times at 65 °C and 3.55 MPa with the same mesh stamp. The average values were calcu-lated from LEXT images of the patterned membranes (Figure S4) and paired t-tests were conducted to compare the feature dimensions of the patterned membranes after the first and tenth use. The results of the statistical tests are given in Table S1. The average values for depth, width, and length of pattern features were statistically the same at 95% confi-dence, which suggests that the polyester woven mesh can be reused as a stamp.
Figure 5. Average pattern feature dimensions for membranes that were patterned with the same mesh stamp up to 10 times at 65 °C and 3.55 MPa. Measurements were made using LEXT with a 20× objective. Error bars represent ±1 ơ from measurements on five pattern features.
3.2. Flux Decline Measurements Membranes for BSA filtration studies were patterned at 65 °C and 3.55 MPa, which
produced membranes with high pattern fidelity and enhanced permeability. The BSA re-jection increased from 96.2 ± 0.8 (s.d.) to 98.2 ± 1.0%; however, this increase is not statisti-cally significant at 95% confidence. Figure 6 shows flux versus time data collected for fil-tration of 15 mg/L BSA solution by as-received and patterned membranes. The starting pressures were adjusted to produce the same initial permeate flux for all experiments. This procedure allows direct comparison of results because it ensures that the initial rate of foulant transport to the surface is the same. The flux declined monotonically, with a lower rate for patterned membranes. We performed a model-based analysis of the data to postulate the most likely fouling mechanism(s). We theorize that such an analysis of the flux decline data combined with CLSM visualization data can improve our understanding of how membrane patterning influences fouling.
Figure 5. Average pattern feature dimensions for membranes that were patterned with the samemesh stamp up to 10 times at 65 ◦C and 3.55 MPa. Measurements were made using LEXT with a 20×objective. Error bars represent ±1 ơ from measurements on five pattern features.
3.2. Flux Decline Measurements
Membranes for BSA filtration studies were patterned at 65 ◦C and 3.55 MPa, whichproduced membranes with high pattern fidelity and enhanced permeability. The BSArejection increased from 96.2 ± 0.8 (s.d.) to 98.2 ± 1.0%; however, this increase is notstatistically significant at 95% confidence. Figure 6 shows flux versus time data collected forfiltration of 15 mg/L BSA solution by as-received and patterned membranes. The startingpressures were adjusted to produce the same initial permeate flux for all experiments.This procedure allows direct comparison of results because it ensures that the initial rateof foulant transport to the surface is the same. The flux declined monotonically, with alower rate for patterned membranes. We performed a model-based analysis of the data topostulate the most likely fouling mechanism(s). We theorize that such an analysis of theflux decline data combined with CLSM visualization data can improve our understandingof how membrane patterning influences fouling.
One approach is to analyze these data is to replot them on a logarithmic scale ofd2t/dV2 versus dt/dV, where V is the cumulative permeate volume. Field et al. [40] revisedthis Hermia model approach for crossflow filtration by including a term that considersfoulant removal.
d2tdV2 = k
(dtdV
)n(2)

Membranes 2021, 11, 730 9 of 17Membranes 2021, 11, 730 9 of 17
Figure 6. Bovine serum albumin (BSA) fouling tests. The initial flux was 414 ± 1 LMH for both sam-ples. Error bars represent ± 1 ơ among three samples.
One approach is to analyze these data is to replot them on a logarithmic scale of d2t/dV2 versus dt/dV, where V is the cumulative permeate volume. Field et al. [40] revised this Hermia model approach for crossflow filtration by including a term that considers foulant removal. 𝑑 𝑡𝑑𝑉 = 𝑘 𝑑𝑡𝑑𝑉 (2)
In Equation (2), parameter n depends on the fouling mechanism. Figure S5a in Sup-porting Information was used to determine that n = 1.0 (intermediate pore blocking) for the patterned membrane over the entire 2 h filtration run. In Figure S5b for as-received membranes, we observed a linear relationship with n > 2.0 in the early stage of filtration (first 20 min), suggesting that initial protein deposition did not block or seal pores [33]. Thereafter, the slope reached n = 2.0, suggesting a complete pore blocking mechanism. After 35 min of filtration, the slope changed to n = 1.1 for a short duration, indicating an intermediate pore blocking mechanism. At later times, d2t/dV2 reached a maximum. Ho and Zydney [41] indicate that the maximum occurs when more than 90% of the membrane surface is covered by protein aggregates, after which cake filtration becomes the dominate mechanism and the d2t/dV2 value decays to a constant value (n = 0). Before reaching the constant value, the negative slope on the plot reflects the transition between pore blocking and cake filtration where a large reduction occurs in the flux decline rate [41]. The results of the flux decline measurements and data analysis are consistent with numerous other studies that have shown how patterning with micron-scale features can reduce fouling [17,42,43]. Some of the reasons for the decreased fouling propensity include increased shear stress on the apex regions of patterned membranes, vortex formation in regions of the pattern valleys, and selective particle accumulation in the valleys during the initial stage of fouling [15,35,43,44].
3.3. Visualization of Membrane Fouling by CLSM CLSM was applied to visualize and characterize fouling, especially early stage foul-
ing where interactions between the foulant and membrane can be studied. Qualitative and quantitative spatiotemporal data on foulant accumulation were obtained by CLSM. For quantitative data, the intensity of images was measured by ImageJ software. Figure S6 presents the calibration curve. The areal mass of BSA on the membrane surfaces at differ-ent filtration times was determined by applying the calibration curve to the intensity pro-file. Previous studies have combined flux decline measurements with quantitative visual
0 50 100 150
200
300
400
As-received membrane Patterned membrane
Flux
(LM
H)
Time (min)
Figure 6. Bovine serum albumin (BSA) fouling tests. The initial flux was 414 ± 1 LMH for bothsamples. Error bars represent ±1 ơ among three samples.
In Equation (2), parameter n depends on the fouling mechanism. Figure S5a inSupporting Information was used to determine that n = 1.0 (intermediate pore blocking)for the patterned membrane over the entire 2 h filtration run. In Figure S5b for as-receivedmembranes, we observed a linear relationship with n > 2.0 in the early stage of filtration(first 20 min), suggesting that initial protein deposition did not block or seal pores [33].Thereafter, the slope reached n = 2.0, suggesting a complete pore blocking mechanism.After 35 min of filtration, the slope changed to n = 1.1 for a short duration, indicating anintermediate pore blocking mechanism. At later times, d2t/dV2 reached a maximum. Hoand Zydney [41] indicate that the maximum occurs when more than 90% of the membranesurface is covered by protein aggregates, after which cake filtration becomes the dominatemechanism and the d2t/dV2 value decays to a constant value (n = 0). Before reachingthe constant value, the negative slope on the plot reflects the transition between poreblocking and cake filtration where a large reduction occurs in the flux decline rate [41]. Theresults of the flux decline measurements and data analysis are consistent with numerousother studies that have shown how patterning with micron-scale features can reducefouling [17,42,43]. Some of the reasons for the decreased fouling propensity includeincreased shear stress on the apex regions of patterned membranes, vortex formation inregions of the pattern valleys, and selective particle accumulation in the valleys during theinitial stage of fouling [15,35,43,44].
3.3. Visualization of Membrane Fouling by CLSM
CLSM was applied to visualize and characterize fouling, especially early stage foulingwhere interactions between the foulant and membrane can be studied. Qualitative andquantitative spatiotemporal data on foulant accumulation were obtained by CLSM. Forquantitative data, the intensity of images was measured by ImageJ software. FigureS6 presents the calibration curve. The areal mass of BSA on the membrane surfaces atdifferent filtration times was determined by applying the calibration curve to the intensityprofile. Previous studies have combined flux decline measurements with quantitative visualanalysis of CLSM images to better understand protein fouling [45]. Here, we used thiscombined method to study the location and extent of BSA fouling on membranes patternedwith a herringbone geometry. Such knowledge can be used to design membranes thatinhibit fouling or otherwise direct foulants to deposit selectively in regions that minimizeloss of flux.
Membranes 2021, 11, 730 10 of 17
3.3.1. CLSM Analysis of Early-Stage Fouling
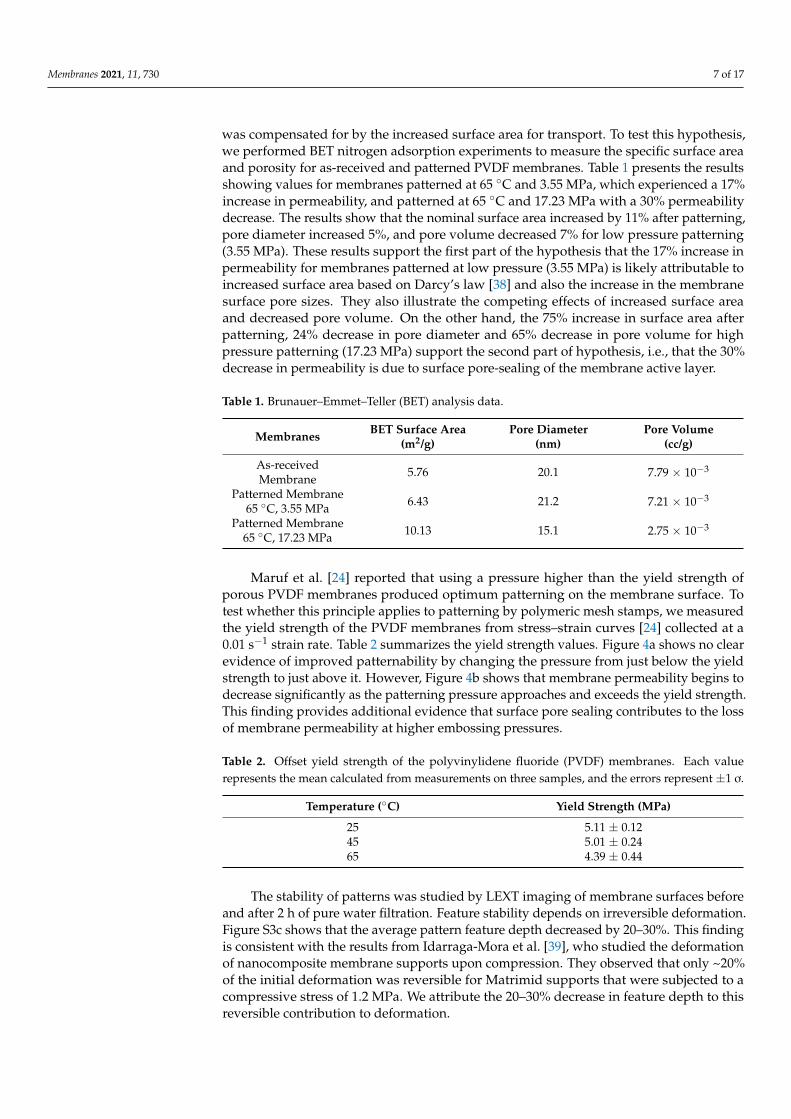
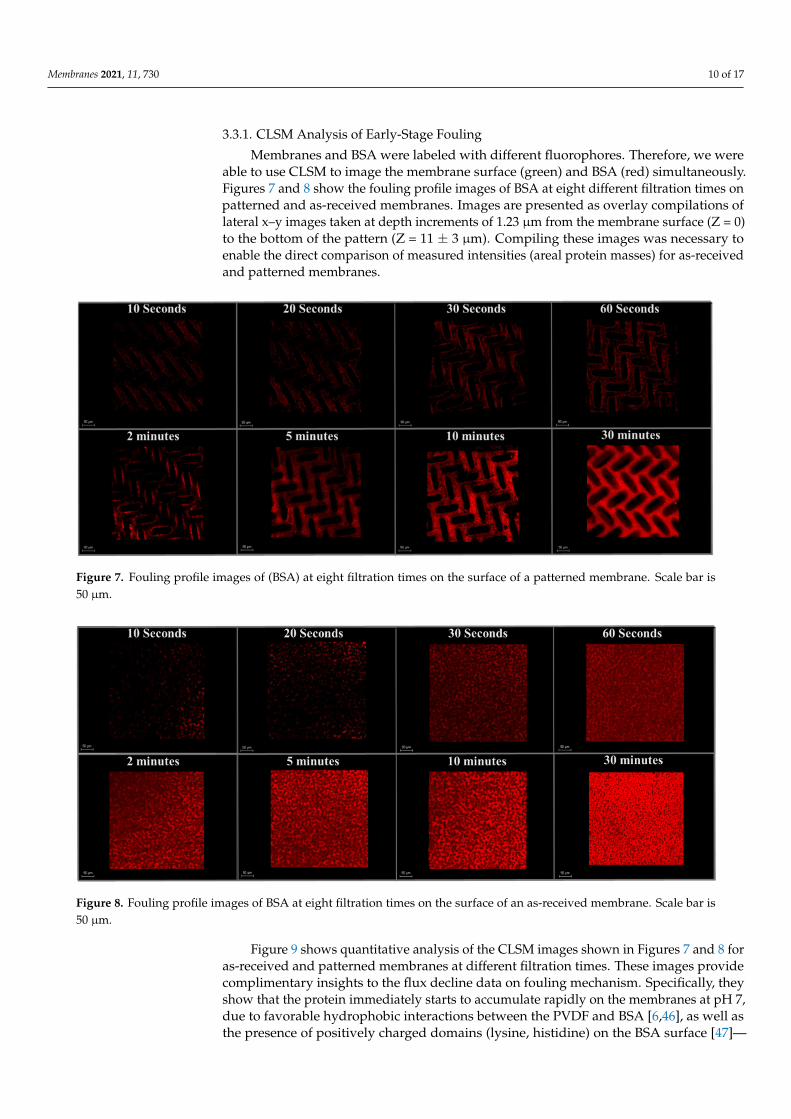
Membranes and BSA were labeled with different fluorophores. Therefore, we wereable to use CLSM to image the membrane surface (green) and BSA (red) simultaneously.Figures 7 and 8 show the fouling profile images of BSA at eight different filtration times onpatterned and as-received membranes. Images are presented as overlay compilations oflateral x–y images taken at depth increments of 1.23 µm from the membrane surface (Z = 0)to the bottom of the pattern (Z = 11 ± 3 µm). Compiling these images was necessary toenable the direct comparison of measured intensities (areal protein masses) for as-receivedand patterned membranes.
Membranes 2021, 11, 730 10 of 17
analysis of CLSM images to better understand protein fouling [45]. Here, we used this combined method to study the location and extent of BSA fouling on membranes pat-terned with a herringbone geometry. Such knowledge can be used to design membranes that inhibit fouling or otherwise direct foulants to deposit selectively in regions that min-imize loss of flux.
3.3.1. CLSM Analysis of Early-Stage Fouling Membranes and BSA were labeled with different fluorophores. Therefore, we were
able to use CLSM to image the membrane surface (green) and BSA (red) simultaneously. Figures 7 and 8 show the fouling profile images of BSA at eight different filtration times on patterned and as-received membranes. Images are presented as overlay compilations of lateral x–y images taken at depth increments of 1.23 μm from the membrane surface (Z = 0) to the bottom of the pattern (Z = 11 ± 3 μm). Compiling these images was necessary to enable the direct comparison of measured intensities (areal protein masses) for as-re-ceived and patterned membranes.
Figure 7. Fouling profile images of (BSA) at eight filtration times on the surface of a patterned membrane. Scale bar is 50 μm.
Figure 8. Fouling profile images of BSA at eight filtration times on the surface of an as-received membrane. Scale bar is 50 μm.
Figure 7. Fouling profile images of (BSA) at eight filtration times on the surface of a patterned membrane. Scale bar is50 µm.
Membranes 2021, 11, 730 10 of 17
analysis of CLSM images to better understand protein fouling [45]. Here, we used this combined method to study the location and extent of BSA fouling on membranes pat-terned with a herringbone geometry. Such knowledge can be used to design membranes that inhibit fouling or otherwise direct foulants to deposit selectively in regions that min-imize loss of flux.
3.3.1. CLSM Analysis of Early-Stage Fouling Membranes and BSA were labeled with different fluorophores. Therefore, we were
able to use CLSM to image the membrane surface (green) and BSA (red) simultaneously. Figures 7 and 8 show the fouling profile images of BSA at eight different filtration times on patterned and as-received membranes. Images are presented as overlay compilations of lateral x–y images taken at depth increments of 1.23 μm from the membrane surface (Z = 0) to the bottom of the pattern (Z = 11 ± 3 μm). Compiling these images was necessary to enable the direct comparison of measured intensities (areal protein masses) for as-re-ceived and patterned membranes.
Figure 7. Fouling profile images of (BSA) at eight filtration times on the surface of a patterned membrane. Scale bar is 50 μm.
Figure 8. Fouling profile images of BSA at eight filtration times on the surface of an as-received membrane. Scale bar is 50 μm. Figure 8. Fouling profile images of BSA at eight filtration times on the surface of an as-received membrane. Scale bar is50 µm.
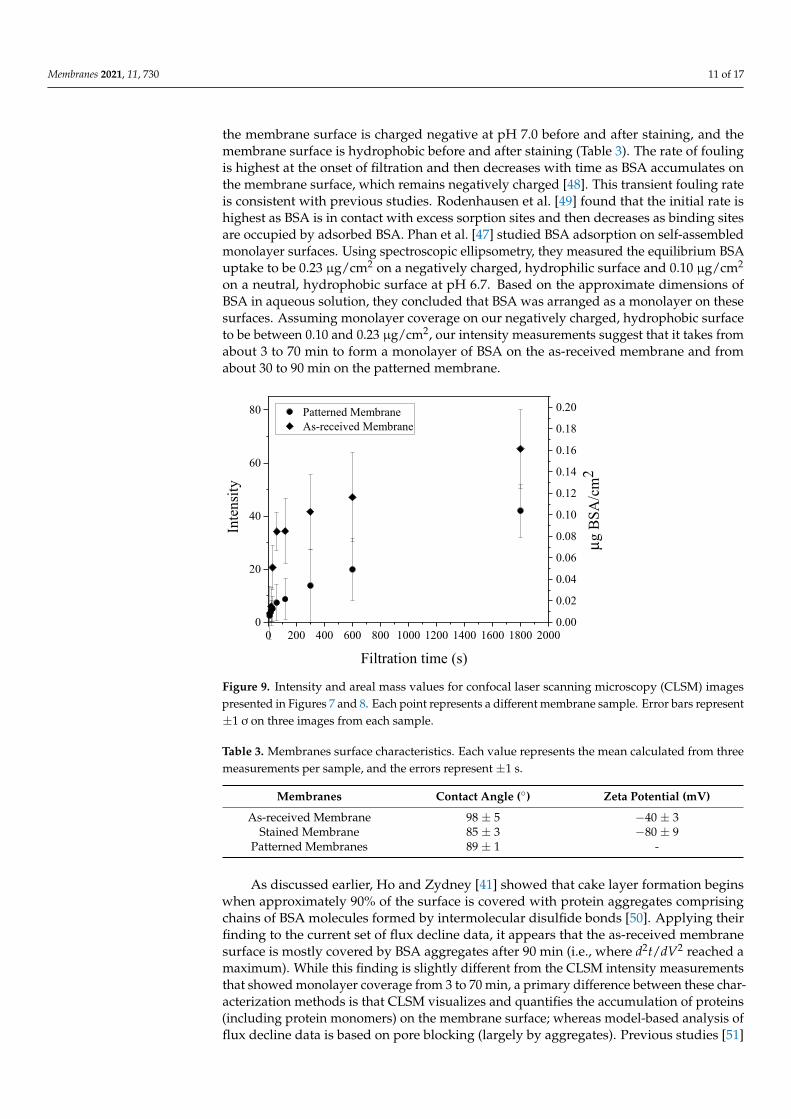
Figure 9 shows quantitative analysis of the CLSM images shown in Figures 7 and 8 foras-received and patterned membranes at different filtration times. These images providecomplimentary insights to the flux decline data on fouling mechanism. Specifically, theyshow that the protein immediately starts to accumulate rapidly on the membranes at pH 7,due to favorable hydrophobic interactions between the PVDF and BSA [6,46], as well asthe presence of positively charged domains (lysine, histidine) on the BSA surface [47]—
Membranes 2021, 11, 730 11 of 17
the membrane surface is charged negative at pH 7.0 before and after staining, and themembrane surface is hydrophobic before and after staining (Table 3). The rate of foulingis highest at the onset of filtration and then decreases with time as BSA accumulates onthe membrane surface, which remains negatively charged [48]. This transient fouling rateis consistent with previous studies. Rodenhausen et al. [49] found that the initial rate ishighest as BSA is in contact with excess sorption sites and then decreases as binding sitesare occupied by adsorbed BSA. Phan et al. [47] studied BSA adsorption on self-assembledmonolayer surfaces. Using spectroscopic ellipsometry, they measured the equilibrium BSAuptake to be 0.23 µg/cm2 on a negatively charged, hydrophilic surface and 0.10 µg/cm2
on a neutral, hydrophobic surface at pH 6.7. Based on the approximate dimensions ofBSA in aqueous solution, they concluded that BSA was arranged as a monolayer on thesesurfaces. Assuming monolayer coverage on our negatively charged, hydrophobic surfaceto be between 0.10 and 0.23 µg/cm2, our intensity measurements suggest that it takes fromabout 3 to 70 min to form a monolayer of BSA on the as-received membrane and fromabout 30 to 90 min on the patterned membrane.
Membranes 2021, 11, 730 11 of 17
Figure 9 shows quantitative analysis of the CLSM images shown in Figures 7 and 8 for as-received and patterned membranes at different filtration times. These images pro-vide complimentary insights to the flux decline data on fouling mechanism. Specifically, they show that the protein immediately starts to accumulate rapidly on the membranes at pH 7, due to favorable hydrophobic interactions between the PVDF and BSA [6,46], as well as the presence of positively charged domains (lysine, histidine) on the BSA surface [47]—the membrane surface is charged negative at pH 7.0 before and after staining, and the membrane surface is hydrophobic before and after staining (Table 3). The rate of foul-ing is highest at the onset of filtration and then decreases with time as BSA accumulates on the membrane surface, which remains negatively charged [48]. This transient fouling rate is consistent with previous studies. Rodenhausen et al. [49] found that the initial rate is highest as BSA is in contact with excess sorption sites and then decreases as binding sites are occupied by adsorbed BSA. Phan et al. [47] studied BSA adsorption on self-as-sembled monolayer surfaces. Using spectroscopic ellipsometry, they measured the equi-librium BSA uptake to be 0.23 μg/cm2 on a negatively charged, hydrophilic surface and 0.10 μg/cm2 on a neutral, hydrophobic surface at pH 6.7. Based on the approximate di-mensions of BSA in aqueous solution, they concluded that BSA was arranged as a mono-layer on these surfaces. Assuming monolayer coverage on our negatively charged, hydro-phobic surface to be between 0.10 and 0.23 μg/cm2, our intensity measurements suggest that it takes from about 3 to 70 min to form a monolayer of BSA on the as-received mem-brane and from about 30 to 90 min on the patterned membrane.
Figure 9. Intensity and areal mass values for confocal laser scanning microscopy (CLSM) images presented in Figures 7 and 8. Each point represents a different membrane sample. Error bars repre-sent ±1 ơ on three images from each sample.
Table 3. Membranes surface characteristics. Each value represents the mean calculated from three measurements per sample, and the errors represent ±1 s.
Membranes Contact Angle (°) Zeta Potential (mV) As-received Membrane 98 ± 5 −40 ± 3
Stained Membrane 85 ± 3 −80 ± 9 Patterned Membranes 89 ± 1 -
As discussed earlier, Ho and Zydney [41] showed that cake layer formation begins when approximately 90% of the surface is covered with protein aggregates comprising chains of BSA molecules formed by intermolecular disulfide bonds [50]. Applying their finding to the current set of flux decline data, it appears that the as-received membrane
0 200 400 600 800 1000 1200 1400 1600 1800 20000
20
40
60
80 Patterned MembraneAs-received Membrane
Filtration time (s)
Inte
nsity
0.00
0.02
0.04
0.06
0.08
0.10
0.12
0.14
0.16
0.18
0.20
μg B
SA/c
m2
Figure 9. Intensity and areal mass values for confocal laser scanning microscopy (CLSM) imagespresented in Figures 7 and 8. Each point represents a different membrane sample. Error bars represent±1 ơ on three images from each sample.
Table 3. Membranes surface characteristics. Each value represents the mean calculated from threemeasurements per sample, and the errors represent ±1 s.
Membranes Contact Angle (◦) Zeta Potential (mV)
As-received Membrane 98 ± 5 −40 ± 3Stained Membrane 85 ± 3 −80 ± 9
Patterned Membranes 89 ± 1 -
As discussed earlier, Ho and Zydney [41] showed that cake layer formation beginswhen approximately 90% of the surface is covered with protein aggregates comprisingchains of BSA molecules formed by intermolecular disulfide bonds [50]. Applying theirfinding to the current set of flux decline data, it appears that the as-received membranesurface is mostly covered by BSA aggregates after 90 min (i.e., where d2t/dV2 reached amaximum). While this finding is slightly different from the CLSM intensity measurementsthat showed monolayer coverage from 3 to 70 min, a primary difference between these char-acterization methods is that CLSM visualizes and quantifies the accumulation of proteins(including protein monomers) on the membrane surface; whereas model-based analysis offlux decline data is based on pore blocking (largely by aggregates). Previous studies [51]
Membranes 2021, 11, 730 12 of 17
have shown that the fouling occurs on more than just the membrane pores. Thus, whilethe Hermia model can provide some information about the fouling mechanism(s) usingsimple mathematical expressions [52], it does not give details about the onset of foulingwhen pore blocking is insignificant.
Models that describe fouling often assume that a single mechanism prevails through-out the entire duration of filtration [53] or fail to describe early stages of fouling. Forexample, as discussed above, the Hermia model provides no mechanistic insights into theearly stages of filtration [33], for example where steep slopes (n > 2) are observed, such asthose depicted in Figure S5. Such models serve as a useful tool to assess flux decline datafor further mechanistic studies; however, complementary tools are needed to understandthe early stages of fouling. Using CLSM imaging in this study provided a greater levelof detail for the early stage (pre-monolayer) fouling than could be deduced from fluxdecline measurements; it revealed high rates of initial fouling due to protein adsorptionand demonstrated that this rate was different for as-received and patterned membranes.Given that the test conditions were the same, it appears that differences in hydrodynamicsat the two membrane surfaces influenced the rate of attainment of BSA monolayer coverageand delayed the onset of pore blocking.
3.3.2. Visualizing Spatial Deposition of Foulant
CLSM also provided qualitative information on the location of BSA deposition duringearly stages of fouling. Figure 10 shows lateral x–y stacks for 2 min filtration at differentdepths from the membrane surface. (Figures S7–S13 show the fouling profiles for otherfiltration times.) The accumulation of BSA is greatest at the membrane surface for allfiltration times. By embossing the membrane surface with recessive features, shear stresscan be expected to increase within the recessions by creation of local vortices [28,34,54].On such a surface, bulk and vortex streamlines develop, and the velocity profile in therecessions will depend strongly on the crossflow velocity [35]. Choi et al. [28] observed intheir CFD study that for small particles such as BSA (dimension: 140 × 40 × 40 Å), movingfrom bulk to vortex streams is difficult, resulting in a reduction of deposited particlesinside the recessions. We believe this is the cause for the low degree of BSA foulingobserved within the pattern recessions. Won et al. [2] studied the fouling of membraneswith prism patterns and observed that the vortex streams that developed in the valleybetween pattern features enabled particles to escape from the valley back to the bulk stream.In the absence of a vortex stream or where it was diminished, the particles deposited in thevalley due to permeation drag. For mitigating particle deposition in the valley regions, theydeveloped new patterns by introducing flat interval regions (400 and 800 µm) betweenprism features. These regions enhanced the vortex stream and reduced particle deposition.Based on their study, we theorize that the long (100 µm) valley regions of our hemi-ellipsoidpattern structure further limit the amount of protein fouling within these regions. Workis underway to understand how the herringbone pattern of the hemi-ellipsoid recessionsinfluences vortex development and shear stress profiles inside the recessions and at thesurface.

Membranes 2021, 11, 730 13 of 17Membranes 2021, 11, 730 13 of 17
Figure 10. Confocal images after 2 min filtration of BSA solution. Images are shown for patterned membrane (green) and BSA foulant (red) at different depths from the surface (Z = 0). For better observation by the reader, light corrections (Bright-ness: +40% and Contrast: −40%) were applied to the images. The common scale bar is 50 μm.
4. Conclusions This study introduced a new membrane surface patterning strategy using woven
mesh fabric stamps that is capable of patterning large membrane areas while retaining or even increasing membrane permeability. Increased permeability at low patterning pres-sures was found to correlate with increased surface area. This study also validated the reusability of the woven mesh stamps, which is important for their use in continuous roll-to-roll patterning. Flux decline measurements and visualization experiments using confo-cal laser scanning microscopy provided the spatiotemporal information that was needed to understand the fouling behavior of the protein solutions on the as-received and pat-
Figure 10. Confocal images after 2 min filtration of BSA solution. Images are shown for patterned membrane (green)and BSA foulant (red) at different depths from the surface (Z = 0). For better observation by the reader, light corrections(Brightness: +40% and Contrast: −40%) were applied to the images. The common scale bar is 50 µm.
4. Conclusions
This study introduced a new membrane surface patterning strategy using wovenmesh fabric stamps that is capable of patterning large membrane areas while retainingor even increasing membrane permeability. Increased permeability at low patterningpressures was found to correlate with increased surface area. This study also validatedthe reusability of the woven mesh stamps, which is important for their use in continuousroll-to-roll patterning. Flux decline measurements and visualization experiments usingconfocal laser scanning microscopy provided the spatiotemporal information that wasneeded to understand the fouling behavior of the protein solutions on the as-received
Membranes 2021, 11, 730 14 of 17
and patterned membranes. This combined approach provided insights into the foulingmechanisms from the earliest stages of fouling, dominated by protein adsorption, tolater stages, dominated by cake layer formation; and revealed differences between themembranes. Details of the early (pre-monolayer) stage of fouling provided by microscopyshow that the protein immediately started to accumulate rapidly on the membranes due tofavorable hydrophobic interactions between the PVDF and protein, while the flux declinemeasurements show the decreasing rates of fouling with time as proteins accumulatedon the membrane surface. The results demonstrate that introduction of a herringbonepattern on the surface of PVDF ultrafiltration membranes significantly reduces proteinfouling relative to as-received membranes. Extending the approach to other patterns andmulticomponent solutions is expected to inform surface modification strategies used forthe control of biofouling.
Supplementary Materials: The following are available online at https://www.mdpi.com/article/10.3390/membranes11100730/s1, Figure S1: Apparatus for flux measurements; Figure S2: LEXT imagesof membranes patterned at different conditions; Figure S3: LEXT images of membranes before andafter 2 h filtration; Figure S4: LEXT images of membranes repeatedly patterned with same meshstamp; Figure S5: Flux decline analysis for BSA filtration with patterned and as-received membranes,Figure S6: Calibration data relating fluorescence intensity to areal mass for BSA-Alexa Fluor™ 647conjugate; Figure S7: 3D orthogonal reconstruction of CLSM images for patterned membrane after10 s filtration of BSA solution; Figure S8: 3D orthogonal reconstruction of CLSM images for patternedmembrane after 20 s filtration of BSA solution; Figure S9: 3D orthogonal reconstruction of CLSMimages for patterned membrane after 30 s filtration of BSA solution; Figure S10: 3D orthogonalreconstruction of CLSM images for patterned membrane after 60 s filtration of BSA solution; FigureS11: 3D orthogonal reconstruction of CLSM images for patterned membrane after 5 min filtration ofBSA solution; Figure S12: 3D orthogonal reconstruction of CLSM images for patterned membraneafter 10 min filtration of BSA solution; Figure S13: 3D orthogonal reconstruction of CLSM imagesfor patterned membrane after 30 min filtration of BSA solution; Table S1: Results of paired t-tests onmembrane pattern feature sizes.
Author Contributions: Conceptualization, A.M. and S.M.H.; methodology, A.M. and S.M.H.; valida-tion, A.M.; formal analysis, A.M. and S.M.H.; investigation, A.M. and S.M.H.; resources, S.M.H.; datacuration, A.M. and S.M.H.; writing—original draft preparation, A.M.; writing—review and editing,S.M.H.; visualization, A.M.; supervision, S.M.H.; project administration, S.M.H.; funding acquisition,S.M.H. All authors have read and agreed to the published version of the manuscript.
Funding: This work was supported by funding from the National Science Foundation (NSF) underAward CBET-1534304 and the Stimulus Research Program of the South Carolina EPSCoR Programunder Award 18-SR02. AM has been supported by a GAANN Fellowship (P200A180076) from theDepartment of Education. Any opinions expressed are those of the authors and do not necessarilyreflect the views of the NSF, SC EPSCoR, or DoED.
Institutional Review Board Statement: Not Applicable.
Informed Consent Statement: Not Applicable.
Data Availability Statement: The data presented in this study are available on request from thecorresponding author.
Acknowledgments: We thank Terri Bruce and Rhonda Powell from the Clemson Light ImagingFacility for assistance with LEXT and CLSM measurements. We thank Stephen Creager and MansourSaberi for assistance with thermal embossing and David Ladner and Lingyun Peng for assistancewith zeta potential measurements. S.M.H. acknowledges support from the William B. “Bill” Sturgis,‘57 and Martha Elizabeth “Martha Beth” Blackmon Sturgis Distinguished Professorship in Chemicaland Biomolecular Engineering.
Conflicts of Interest: The authors declare no conflict of interest.
Membranes 2021, 11, 730 15 of 17
References1. Firouzjaei, M.D.; Seyedpour, S.F.; Aktij, S.A.; Giagnorio, M.; Bazrafshan, N.; Mollahosseini, A.; Samadi, F.; Ahmadalipour, S.;
Firouzjaei, F.D.; Esfahani, M.R.; et al. Recent advances in functionalized polymer membranes for biofouling control and mitigationin forward osmosis. J. Membr. Sci. 2020, 596, 117604. [CrossRef]
2. Won, Y.J.; Jung, S.Y.; Jang, J.H.; Lee, J.W.; Chae, H.R.; Choi, D.C.; Hyun Ahn, K.; Lee, C.H.; Park, P.K. Correlation of membranefouling with topography of patterned membranes for water treatment. J. Membr. Sci. 2016, 498, 14–19. [CrossRef]
3. Mahlangu, T.O.; Thwala, J.M.; Mamba, B.B.; D’Haese, A.; Verliefde, A.R.D. Factors governing combined fouling by organic andcolloidal foulants in cross-flow nanofiltration. J. Membr. Sci. 2015, 491, 53–62. [CrossRef]
4. Chan, R.; Chen, V. Characterization of protein fouling on membranes: Opportunities and challenges. J. Membr. Sci. 2004, 242,169–188. [CrossRef]
5. Zhou, Y.; Wang, Z.; Zhang, Q.; Xi, X.; Zhang, J.; Yang, W. Equilibrium and thermodynamic studies on adsorption of BSA usingPVDF microfiltration membrane. Desalination 2012, 307, 61–67. [CrossRef]
6. Boributh, S.; Chanachai, A.; Jiraratananon, R. Modification of PVDF membrane by chitosan solution for reducing protein fouling.J. Membr. Sci. 2009, 342, 97–104. [CrossRef]
7. Wang, X.; Zhou, M.; Meng, X.; Wang, L.; Huang, D. Effect of protein on PVDF ultrafiltration membrane fouling behavior underdifferent pH conditions: Interface adhesion force and XDLVO theory analysis. Front. Environ. Sci. Eng. 2016, 10, 12. [CrossRef]
8. Wang, T.; Wang, Y.Q.; Su, Y.L.; Jiang, Z.Y. Antifouling ultrafiltration membrane composed of polyethersulfone and sulfobetainecopolymer. J. Membr. Sci. 2006, 280, 343–350. [CrossRef]
9. Malakian, A.; Zhou, M.; Zowada, R.T.; Foudazi, R. Synthesis and in situ functionalization of microfiltration membranes via highinternal phase emulsion templating. Polym. Int. 2019, 68, 1378–1386. [CrossRef]
10. Zhao, J.; Shi, Q.; Luan, S.; Song, L.; Yang, H.; Shi, H.; Jin, J.; Li, X.; Yin, J.; Stagnaro, P. Improved biocompatibility and antifoulingproperty of polypropylene non-woven fabric membrane by surface grafting zwitterionic polymer. J. Membr. Sci. 2011, 369, 5–12.[CrossRef]
11. Asatekin, A.; Kang, S.; Elimelech, M.; Mayes, A.M. Anti-fouling ultrafiltration membranes containing polyacrylonitrile-graft-poly(ethylene oxide) comb copolymer additives. J. Membr. Sci. 2007, 298, 136–146. [CrossRef]
12. Kang, S.; Asatekin, A.; Mayes, A.M.; Elimelech, M. Protein antifouling mechanisms of PAN UF membranes incorporatingPAN-g-PEO additive. J. Membr. Sci. 2007, 296, 42–50. [CrossRef]
13. Weinman, S.T.; Bass, M.; Pandit, S.; Herzberg, M.; Freger, V.; Husson, S.M. A switchable zwitterionic membrane surface chemistryfor biofouling control. J. Membr. Sci. 2018, 548, 490–501. [CrossRef]
14. Ding, Y.; Maruf, S.; Aghajani, M.; Greenberg, A.R. Surface patterning of polymeric membranes and its effect on antifoulingcharacteristics. Sep. Sci. Technol. 2017, 52, 240–257. [CrossRef]
15. Malakian, A.; Husson, S.M. Understanding the roles of patterning and foulant chemistry on nanofiltration threshold flux. J.Membr. Sci. 2020, 597, 117746. [CrossRef]
16. Kim, I.; Choi, D.-C.; Lee, J.; Chae, H.-R.; Hee Jang, J.; Lee, C.-H.; Park, P.-K.; Won, Y.-J. Preparation and application of patternedhollow-fiber membranes to membrane bioreactor for wastewater treatment. J. Membr. Sci. 2015, 490, 190–196. [CrossRef]
17. Maruf, S.H.; Rickman, M.; Wang, L.; Mersch IV, J.; Greenberg, A.R.; Pellegrino, J.; Ding, Y. Influence of sub-micron surfacepatterns on the deposition of model proteins during active filtration. J. Membr. Sci. 2013, 444, 420–428. [CrossRef]
18. Vasudevan, R.; Kennedy, A.J.; Merritt, M.; Crocker, F.H.; Baney, R.H. Microscale patterned surfaces reduce bacterial fouling-microscopic and theoretical analysis. Colloids Surf. B Biointerfaces 2014, 117, 225–232. [CrossRef] [PubMed]
19. Won, Y.J.; Choi, D.C.; Jang, J.H.; Lee, J.W.; Chae, H.R.; Kim, I.; Ahn, K.H.; Lee, C.H.; Kim, I.C. Factors affecting pattern fidelity andperformance of a patterned membrane. J. Membr. Sci. 2014, 462, 1–8. [CrossRef]
20. Maruf, S.H.; Greenberg, A.R.; Ding, Y. Influence of substrate processing and interfacial polymerization conditions on the surfacetopography and permselective properties of surface-patterned thin-film composite membranes. J. Membr. Sci. 2016, 512, 50–60.[CrossRef]
21. Gençal, Y.; Durmaz, E.N.; Çulfaz-Emecen, P.Z. Preparation of patterned microfiltration membranes and their performance incrossflow yeast filtration. J. Membr. Sci. 2015, 476, 224–233. [CrossRef]
22. Heinz, O.; Aghajani, M.; Greenberg, A.R.; Ding, Y. Surface-patterning of polymeric membranes: Fabrication and performance.Curr. Opin. Chem. Eng. 2018, 20, 1–12. [CrossRef]
23. Won, Y.J.; Lee, J.; Choi, D.C.; Chae, H.R.; Kim, I.; Lee, C.H.; Kim, I.C. Preparation and application of patterned membranes forwastewater treatment. Environ. Sci. Technol. 2012, 46, 11021–11027. [CrossRef]
24. Maruf, S.H.; Li, Z.; Yoshimura, J.A.; Xiao, J.; Greenberg, A.R.; Ding, Y. Influence of nanoimprint lithography on membranestructure and performance. Polymer 2015, 69, 129–137. [CrossRef]
25. Guo, L.J. Nanoimprint lithography: Methods and material requirements. Adv. Mater. 2007, 19, 495–513. [CrossRef]26. Nunes, S.P.; Culfaz-Emecen, P.Z.; Ramon, G.Z.; Visser, T.; Koops, G.H.; Jin, W.; Ulbricht, M. Thinking the future of membranes:
Perspectives for advanced and new membrane materials and manufacturing processes. J. Membr. Sci. 2020, 598, 117761. [CrossRef]27. Hutfles, J.; Chapman, W.; Pellegrino, J. Roll-to-roll nanoimprint lithography of ultrafiltration membrane. J. Appl. Polym. Sci. 2018,
135, 1–12. [CrossRef]
Membranes 2021, 11, 730 16 of 17
28. Choi, D.C.; Jung, S.Y.; Won, Y.J.; Jang, J.H.; Lee, J.; Chae, H.R.; Ahn, K.H.; Lee, S.; Park, P.K.; Lee, C.H. Three-dimensionalhydraulic modeling of particle deposition on the patterned isopore membrane in crossflow microfiltration. J. Membr. Sci. 2015,492, 156–163. [CrossRef]
29. Tang, C.Y.; Kwon, Y.N.; Leckie, J.O. Characterization of humic acid fouled reverse osmosis and nanofiltration membranes bytransmission electron microscopy and streaming potential measurements. Environ. Sci. Technol. 2007, 41, 942–949. [CrossRef][PubMed]
30. Marroquin, M.; Zhou, L.; Bruce, T.; Husson, S.M. Confocal microscopy: An Emerging Tool for Membrane Characterization. InAdvances in Membrane Characterization; Wiley: Hoboken, NJ, USA, 2016; ISBN 978-0-470-71154-5.
31. Marroquin, M.; Bruce, T.; Pellegrino, J.; Wickramasinghe, S.R.; Husson, S.M. Characterization of asymmetry in microporousmembranes by cross-sectional confocal laser scanning microscopy. J. Membr. Sci. 2011, 379, 504–515. [CrossRef]
32. Zator, M.; Ferrando, M.; López, F.; Güell, C. Microfiltration of protein/dextran/polyphenol solutions: Characterization of foulingand chemical cleaning efficiency using confocal microscopy. J. Membr. Sci. 2009, 344, 82–91. [CrossRef]
33. Marroquin, M.; Vu, A.; Bruce, T.; Powell, R.; Wickramasinghe, S.R.; Husson, S.M. Location and quantification of biologicalfoulants in a wet membrane structure by cross-sectional confocal laser scanning microscopy. J. Membr. Sci. 2014, 453, 282–291.[CrossRef]
34. Choi, W.; Lee, C.; Yoo, C.H.; Shin, M.G.; Lee, G.W.; Kim, T.S.; Jung, H.W.; Lee, J.S.; Lee, J.H. Structural tailoring of sharkskin-mimetic patterned reverse osmosis membranes for optimizing biofouling resistance. J. Membr. Sci. 2020, 595, 117602. [CrossRef]
35. Lee, Y.K.; Won, Y.J.; Yoo, J.H.; Ahn, K.H.; Lee, C.H. Flow analysis and fouling on the patterned membrane surface. J. Membr. Sci.2013, 427, 320–325. [CrossRef]
36. Singh, N.; Husson, S.M.; Zdyrko, B.; Luzinov, I. Surface modification of microporous PVDF membranes by ATRP. J. Membr. Sci.2005, 262, 81–90. [CrossRef]
37. Pendergast, M.T.M.; Nygaard, J.M.; Ghosh, A.K.; Hoek, E.M.V. Using nanocomposite materials technology to understand andcontrol reverse osmosis membrane compaction. Desalination 2010, 261, 255–263. [CrossRef]
38. Maruf, S.H.; Wang, L.; Greenberg, A.R.; Pellegrino, J.; Ding, Y. Use of nanoimprinted surface patterns to mitigate colloidaldeposition on ultrafiltration membranes. J. Membr. Sci. 2013, 428, 598–607. [CrossRef]
39. Idarraga-Mora, J.A.; Childress, A.S.; Friedel, P.S.; Ladner, D.A.; Rao, A.M.; Husson, S.M. Role of nanocomposite support stiffnesson TFC membrane water permeance. Membranes 2018, 8, 111. [CrossRef]
40. Field, R.W.; Wu, D.; Howell, J.A.; Gupta, B.B. Critical flux concept for microfiltration fouling. J. Membr. Sci. 1995, 100, 259–272.[CrossRef]
41. Ho, C.C.; Zydney, A.L. A combined pore blockage and cake filtration model for protein fouling during microfiltration. J. ColloidInterface Sci. 2000, 232, 389–399. [CrossRef]
42. Jang, J.H.; Lee, J.; Jung, S.Y.; Choi, D.C.; Won, Y.J.; Ahn, K.H.; Park, P.K.; Lee, C.H. Correlation between particle deposition andthe size ratio of particles to patterns in nano- and micro-patterned membrane filtration systems. Sep. Purif. Technol. 2015, 156,608–616. [CrossRef]
43. Kharraz, J.A.; An, A.K. Patterned superhydrophobic polyvinylidene fluoride (PVDF) membranes for membrane distillation:Enhanced flux with improved fouling and wetting resistance. J. Membr. Sci. 2020, 595, 117596. [CrossRef]
44. Elsherbiny, I.M.A.; Khalil, A.S.G.; Ulbricht, M. Surface micro-patterning as a promising platform towards novel polyamide thin-fi lm composite membranes of superior performance. J. Membr. Sci. 2017, 529, 11–22. [CrossRef]
45. Marroquin, M.; Vu, A.; Bruce, T.; Ranil Wickramasinghe, S.; Zhao, L.; Husson, S.M. Evaluation of fouling mechanisms inasymmetric microfiltration membranes using advanced imaging. J. Membr. Sci. 2014, 465, 1–13. [CrossRef]
46. Hashino, M.; Hirami, K.; Ishigami, T.; Ohmukai, Y.; Maruyama, T.; Kubota, N.; Matsuyama, H. Effect of kinds of membranematerials on membrane fouling with BSA. J. Membr. Sci. 2011, 384, 157–165. [CrossRef]
47. Phan, H.T.M.; Bartelt-Hunt, S.; Rodenhausen, K.B.; Schubert, M.; Bartz, J.C. Investigation of bovine serum albumin (BSA)attachment onto self-assembled monolayers (SAMs) using combinatorial quartz crystal microbalance with dissipation (QCM-D)and spectroscopic ellipsometry (SE). PLoS ONE 2015, 10, e0141282. [CrossRef]
48. Salis, A.; Boström, M.; Medda, L.; Cugia, F.; Barse, B.; Parsons, D.F.; Ninham, B.W.; Monduzzi, M. Measurements and theoreticalinterpretation of points of zero charge/potential of BSA protein. Langmuir 2011, 27, 11597–11604. [CrossRef]
49. Rodenhausen, K.B.; Duensing, B.A.; Kasputis, T.; Pannier, A.K.; Hofmann, T.; Schubert, M.; Tiwald, T.E.; Solinsky, M.; Wagner, M.In-situ monitoring of alkanethiol self-assembled monolayer chemisorption with combined spectroscopic ellipsometry and quartzcrystal microbalance techniques. Thin Solid Films 2011, 519, 2817–2820. [CrossRef]
50. Kelly, S.T.; Zydney, A.L. Effects of intermolecular thiol-disulfide interchange reactions on bsa fouling during microfiltration.Biotechnol. Bioeng. 1994, 44, 972–982. [CrossRef]
51. Huang, H.; Young, T.A.; Jacangelo, J.G. Unified membrane fouling index for low pressure membrane filtration of natural waters:Principles and methodology. Environ. Sci. Technol. 2008, 42, 714–720. [CrossRef]
52. Kirschner, A.Y.; Cheng, Y.H.; Paul, D.R.; Field, R.W.; Freeman, B.D. Fouling mechanisms in constant flux crossflow ultrafiltration.J. Membr. Sci. 2019, 574, 65–75. [CrossRef]

Membranes 2021, 11, 730 17 of 17
53. Mondal, S.; De, S. A fouling model for steady state crossflow membrane filtration considering sequential intermediate poreblocking and cake formation. Sep. Purif. Technol. 2010, 75, 222–228. [CrossRef]
54. Mazinani, S.; Al-Shimmery, A.; John Chew, Y.M.; Mattia, D. 3D Printed Fouling-Resistant Composite Membranes. ACS Appl.Mater. Interfaces 2019, 11, 26373–26383. [CrossRef] [PubMed]