evaluating causes of death and morbidity in iran, global burden of diseases, injuries, and risk...
TRANSCRIPT
Archives of Iranian Medicine, Volume 17, Number 5, May 2014304
Introduction
While there is no doubt about the burden of common dis-eases and risk factors, especially in developed countries, the Global Burden of Diseases, Injuries, and Risk Fac-
tors Study 2010 estimated the burden of a wide range of diseases, health disorders, and risk factors for 187 countries for 1990, 2005
--
ment in life expectancy, decrease in childhood infectious diseases
and maternal death, an increase in chronic diseases, especially cardiovascular, and nonfatal health burden caused by mental dis-orders and musculoskeletal diseases.1–5
Globally, 52.8 million (95% UI: 51.6 – 54.1 million) deaths oc-curred in 2010 compared to 46.5 million (95% UI: 45.7 – 47.4 million) deaths in 1990. The pattern of diseases has changed in de-veloping countries from communicable diseases to non-commu-nicable diseases and injuries. In 1990, infectious diseases caused 15.9 million deaths (15,065.8 – 16,842.5), and cardiovascular dis-eases accounted for 25.6% of total morbidity. In 2010, 24.9% of deaths were due to communicable diseases. Non-communicable diseases caused 75.1% of all deaths.5 There is a great deal of inter-est in how these changes can be detected and addressed by health systems for policymaking.
Iran’s health system restructuring, which started in 1980, suc-ceeded in expanding the health system’s coverage of primary ser-vices, including family planning, vaccination, maternal and peri-natal care, and children’s health and growth monitoring. Fertility rate,6 under-5 mortality,7 and maternal mortality8,9 have decreased
AbstractBackground: we aimed to recap and highlight the major results of the Global Burden of Diseases, Injuries, and Risk Factors Study 2010
by mortality and morbidity to clarify the current health priorities and challenges in Iran.Methods: We estimated Iran’s mortality and burden of 289 diseases with 67 risk factors and 1160 sequelae, which were used to clinically
present each disease and its disability or cause of death. We produced several measures to report health loss and status: all-cause mortal-
Results: -
-
Conclusion: -eases for health system is not over yet. Diet and physiological risk factors appear to be the most important targets for public health policy in
current programs. Keywords:
Cite this article as: Forouzanfar MH, Sepanlou SG, Shahraz S, Dicker D, Naghavi P, Pourmalek F, et al. Evaluating causes of death and morbidity in Iran, global burden of diseases, injuries, and risk factors study 2010. Arch Iran Med. 2014; 17(5): 304 – 320.
Original Article
Evaluating Causes of Death and Morbidity in Iran, Global Burden of Diseases, Injuries, and Risk Factors Study 2010
1, Sadaf G. Sepanlou MD2, Saeid Shahraz MD3, Daniel Dicker BSc1, Paria Naghavi BESc1, Farshad Pourmalek MD4, Ali Mokdad PhD1, Rafael Lozano MD1, Theo Vos PhD1, Mohsen Asadi-Lari MD5, Ali-Akbar Sayyari MD6, Christopher J.L. Murray Dphi1, Mohsen Naghavi MD1
1Institute for Health Metric and Evolution, Seattle, WA, USA, 2Digestive Diseases Research Institute, Tehran University of Medical Sci-ences, Tehran, Iran, 3Heller School of Social Policy and Management, Brandeis University, Waltham, MA, USA, 4School of Population and Public Health, Uni-versity of British Columbia, BC, Canada, 5Oncopathology Research Centre, Ministry of Health and Medical Education, Tehran, Iran,6Health deputy, Ministry of Health and Medical Education, Iran.
Mohammad Hossein Forouzanfar MD, Institute for Health Metric and Evolution, Seattle, WA, USA. E-mail: [email protected] for publication: 20 February 2014
See the pages: 302 – 303, 321 – 335, 336 – 342
Archives of Iranian Medicine, Volume 17, Number 5, May 2014 305
10 The Iranian population is much largest and older now, and life
11,12 The change in distri-
necessitating revision of health targets for health system planning and resource allocation.
time highlighted the great mortality and burden caused by road 13 It gained a great deal of attention in different sec-
than 33,000 in 2005 to 19,000 in 2012. The case of air pollution is an opposite example.14 Air pollution has been discussed in Iran for years and has increased and extended to almost all cities. Howev-
by air pollution in Iran may be one reason for lack of serious in-tervention and attention from different sectors.14 These examples highlight the necessity of estimating the burden of diseases and risk factors for monitoring the health status of the community and effective policymaking. There are multiple effective interventions to improve health on national and subnational levels; however, as resources are limited, determining priorities is the key. In this
for guiding policymaking.Overall, the burden of 291 diseases and 67 risk factors was es-
timated for 1990, 2005, and 2010. In this paper, we attempt to
diseases and risk factors by death and morbidity to clarify the cur-rent situation of health priorities and challenges in Iran.
Methods
Methods of estimating mortality and burden of diseases have been discussed extensively in capstone papers published by The Lancet.15 The burden of 289 diseases with 1160 sequelae and 67 risk factors was assessed for three time periods: 1990, 2005, and 2010. A sequela is a clinical presentation of a disease that pro-duces disability or causes death. One disease can have several se-quelae, e.g., ischemic heart disease has three sequelae: myocardial infarction, angina pectoris, and heart failure. Several diseases may have common sequelae (impairment sequelae), e.g., heart failure is a sequela of both ischemic heart disease and cardiomyopathy.4
The Global Burden of Disease (GBD) studies produce several measures to report health loss and status: all-cause death, cause-
of life lost due to disability (YLD), disability-adjusted life years (DALYs), life expectancy, and healthy life expectancy. All mea-sures were estimated for each estimation unit: 187 countries, two genders, three years (1990, 2005, and 2010), and 19 age groups
year intervals until age 80, and above 80.1–5,16,17
mortality rate. YLLs were calculated by multiplying the number of deaths due to each cause at each estimation block by a reference life expectancy, calculated by accounting the lowest observed mortality rate in each age group for each sex across all countries in 2010. So, the lowest mortality rate that may be observed in an age age group in a certain sex-country may be observed in another age group in a different sex-country. The reference life expectancy at birth was 86 years and similar for both genders.
For modeling death and morbidity, data from all countries were standardized by format and were aggregated. All available data of a disease or sequela were used for modeling to inform coun-try-level covariates and spatial analysis. The level of mortality or prevalence of a sequela in Iran is informed primarily by the data available from Iran, and then informed by country-level covari-ates such as income per capita, education, prevalence of smoking, or mean BMI. Moreover, a spatial analysis based on the random effects by super-region (regions are aggregated into seven super-regions), region, and country, as well as space-time smoothing of residuals helps to incorporate non-sampling variances and devia-tion from linear predictions. Finally, a combination of these tech-niques determines the level, which is different by cause and by the parameter of interest (mortality analysis or estimating prevalence of sequelae).
To estimate the number of deaths due to each GBD cause, data from vital registration systems, death registries, verbal autopsy studies, censuses, and demographic and health surveys were pro-
death based on the GBD cause list.
cause fraction (logit cf) measures for death. We tested and used more than 300 country-level covariates such as income per capita, access to health system, prevalence of smoking, and different metabolic and dietary risk factors. Each combination of covariates and outcome was modeled by three methods of linear, space-time
method evaluates performance of each model by the external va-lidity of each component model and pools all results to estimate posterior distribution of the death variable (mortality rate or cause fraction).
By a COD correct process, we took advantage of different amounts of data at different levels of sub-causes under a GBD cause. For example, we estimated the total number of deaths, car-diovascular deaths, stroke deaths, and deaths by ischemic stroke and hemorrhagic stroke separately. We rescaled the number of
deaths and parent causes (all CVD deaths and stroke deaths in this example) at each estimation unit.1,18
YLDs were calculated by multiplying the number of patients
estimated in a separate study. Prevalence of the majority of se-quelae was estimated by a Bayesian meta-regression tool called DisMod-MR.4
For each sequela, epidemiological data from published litera-ture, country reports, and analyzed available datasets (such as world health survey, MONICA study, and STEP) were fed to the software. Seven epidemiological parameters can be used in DisMod-MR, including incidence, prevalence, remission, case fa-tality (in terms of excess mortality, relative risk of mortality, with
MR has the capability of using country-level covariates in the analysis. DisMod-MR estimation includes two main steps. In the
compartmental model (including compartments of susceptible -
data were used in the model. The posterior distribution of preva-
Archives of Iranian Medicine, Volume 17, Number 5, May 2014306
lence was eventually estimated and used. Disability weights of different conditions were estimated by
population-based surveys including one telephone survey in the United States and household surveys in Bangladesh, Indonesia, Peru, and Tanzania.17
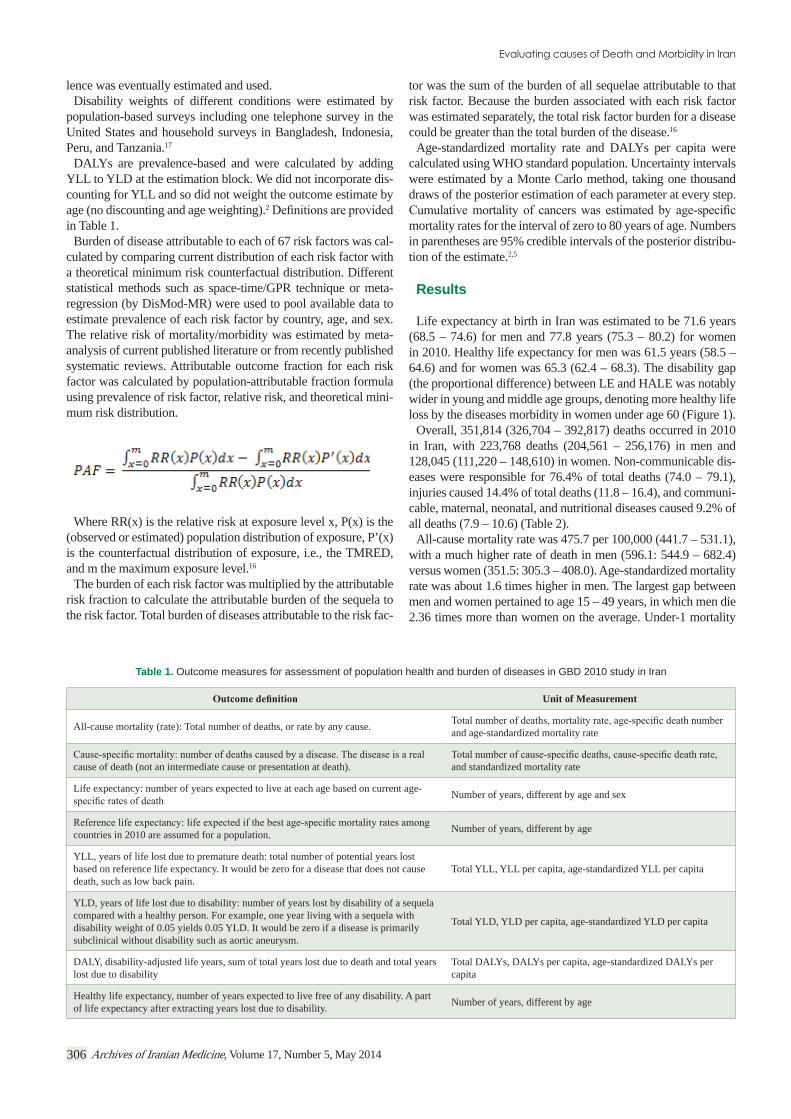
DALYs are prevalence-based and were calculated by adding YLL to YLD at the estimation block. We did not incorporate dis-counting for YLL and so did not weight the outcome estimate by age (no discounting and age weighting).2in Table 1.
Burden of disease attributable to each of 67 risk factors was cal-culated by comparing current distribution of each risk factor with a theoretical minimum risk counterfactual distribution. Different statistical methods such as space-time/GPR technique or meta-regression (by DisMod-MR) were used to pool available data to estimate prevalence of each risk factor by country, age, and sex. The relative risk of mortality/morbidity was estimated by meta-analysis of current published literature or from recently published systematic reviews. Attributable outcome fraction for each risk factor was calculated by population-attributable fraction formula using prevalence of risk factor, relative risk, and theoretical mini-mum risk distribution.
Where RR(x) is the relative risk at exposure level x, P(x) is the (observed or estimated) population distribution of exposure, P’(x) is the counterfactual distribution of exposure, i.e., the TMRED, and m the maximum exposure level.16
The burden of each risk factor was multiplied by the attributable risk fraction to calculate the attributable burden of the sequela to the risk factor. Total burden of diseases attributable to the risk fac-
tor was the sum of the burden of all sequelae attributable to that risk factor. Because the burden associated with each risk factor was estimated separately, the total risk factor burden for a disease could be greater than the total burden of the disease.16
Age-standardized mortality rate and DALYs per capita were calculated using WHO standard population. Uncertainty intervals were estimated by a Monte Carlo method, taking one thousand draws of the posterior estimation of each parameter at every step.
mortality rates for the interval of zero to 80 years of age. Numbers in parentheses are 95% credible intervals of the posterior distribu-tion of the estimate.2,5
Results
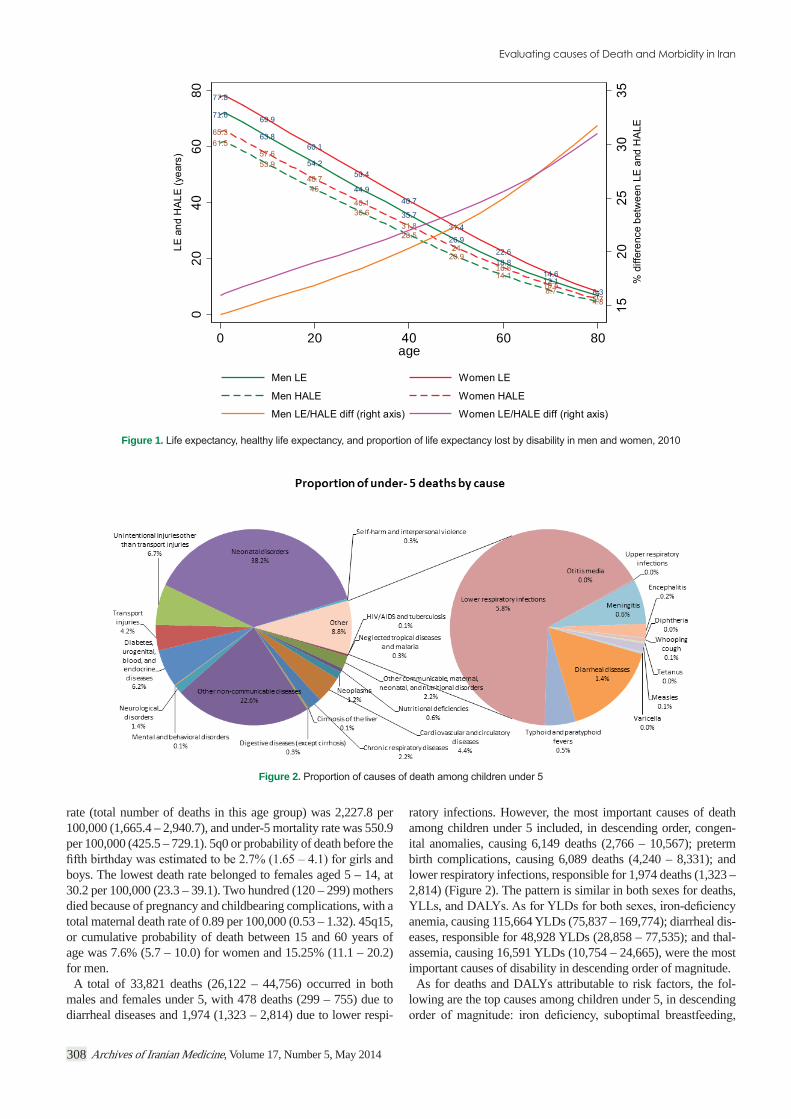
Life expectancy at birth in Iran was estimated to be 71.6 years (68.5 – 74.6) for men and 77.8 years (75.3 – 80.2) for women in 2010. Healthy life expectancy for men was 61.5 years (58.5 – 64.6) and for women was 65.3 (62.4 – 68.3). The disability gap (the proportional difference) between LE and HALE was notably wider in young and middle age groups, denoting more healthy life loss by the diseases morbidity in women under age 60 (Figure 1).
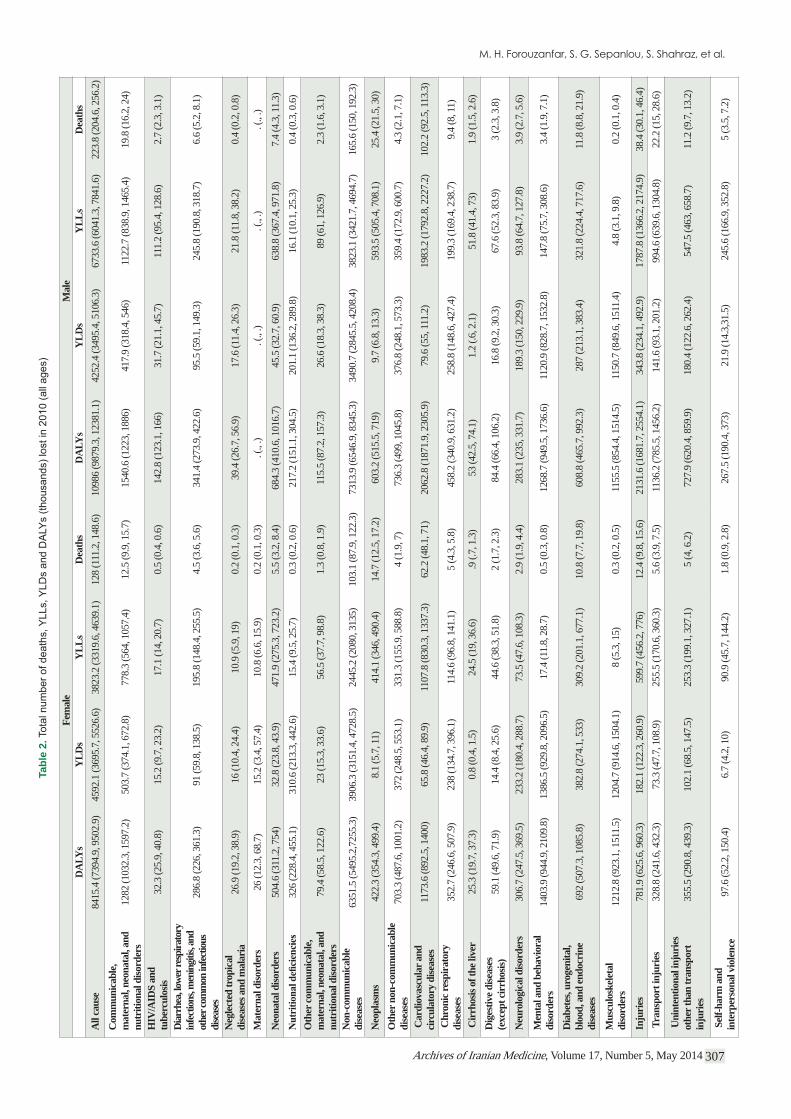
Overall, 351,814 (326,704 – 392,817) deaths occurred in 2010 in Iran, with 223,768 deaths (204,561 – 256,176) in men and 128,045 (111,220 – 148,610) in women. Non-communicable dis-eases were responsible for 76.4% of total deaths (74.0 – 79.1), injuries caused 14.4% of total deaths (11.8 – 16.4), and communi-cable, maternal, neonatal, and nutritional diseases caused 9.2% of all deaths (7.9 – 10.6) (Table 2).
All-cause mortality rate was 475.7 per 100,000 (441.7 – 531.1), with a much higher rate of death in men (596.1: 544.9 – 682.4) versus women (351.5: 305.3 – 408.0). Age-standardized mortality rate was about 1.6 times higher in men. The largest gap between men and women pertained to age 15 – 49 years, in which men die 2.36 times more than women on the average. Under-1 mortality
Unit of Measurement
All-cause mortality (rate): Total number of deaths, or rate by any cause. and age-standardized mortality rate
cause of death (not an intermediate cause or presentation at death). and standardized mortality rate
Life expectancy: number of years expected to live at each age based on current age- Number of years, different by age and sex
countries in 2010 are assumed for a population. Number of years, different by age
YLL, years of life lost due to premature death: total number of potential years lost based on reference life expectancy. It would be zero for a disease that does not cause death, such as low back pain.
Total YLL, YLL per capita, age-standardized YLL per capita
YLD, years of life lost due to disability: number of years lost by disability of a sequela compared with a healthy person. For example, one year living with a sequela with disability weight of 0.05 yields 0.05 YLD. It would be zero if a disease is primarily subclinical without disability such as aortic aneurysm.
Total YLD, YLD per capita, age-standardized YLD per capita
DALY, disability-adjusted life years, sum of total years lost due to death and total years lost due to disability
Total DALYs, DALYs per capita, age-standardized DALYs per capita
Healthy life expectancy, number of years expected to live free of any disability. A part of life expectancy after extracting years lost due to disability. Number of years, different by age
Table 1. Outcome measures for assessment of population health and burden of diseases in GBD 2010 study in Iran
Archives of Iranian Medicine, Volume 17, Number 5, May 2014 307
Fem
ale
Mal
eD
ALY
sY
LDs
YLL
sD
eath
sD
ALY
sY
LDs
YLL
sD
eath
sA
ll ca
use
8415
.4 (7
394.
9, 9
502.
9)45
92.1
(369
5.7,
552
6.6)
3823
.2 (3
319.
6, 4
639.
1)12
8 (1
11.2
, 148
.6)
1098
6 (9
879.
3, 1
2381
.1)
4252
.4 (3
495.
4, 5
106.
3)67
33.6
(604
1.3,
784
1.6)
223.
8 (2
04.6
, 256
.2)
Com
mun
icab
le,
mat
erna
l, ne
onat
al, a
nd
nutr
ition
al d
isord
ers
1282
(103
2.3,
159
7.2)
503.
7 (3
74.1
, 672
.8)
778.
3 (5
64, 1
057.
4)12
.5 (9
.9, 1
5.7)
1540
.6 (1
223,
188
6)41
7.9
(318
.4, 5
46)
1122
.7 (8
38.9
, 146
5.4)
19.8
(16.
2, 2
4)
HIV
/AID
S an
d tu
berc
ulos
is32
.3 (2
5.9,
40.
8)15
.2 (9
.7, 2
3.2)
17.1
(14,
20.
7)0.
5 (0
.4, 0
.6)
142.
8 (1
23.1
, 166
)31
.7 (2
1.1,
45.
7)11
1.2
(95.
4, 1
28.6
)2.
7 (2
.3, 3
.1)
Diar
rhea
, low
er re
spira
tory
in
fectio
ns, m
enin
gitis,
and
othe
r com
mon
infec
tious
di
seas
es
286.
8 (2
26, 3
61.3
)91
(59.
8, 1
38.5
)19
5.8
(148
.4, 2
55.5
)4.
5 (3
.6, 5
.6)
341.
4 (2
73.9
, 422
.6)
95.5
(59.
1, 1
49.3
)24
5.8
(190
.8, 3
18.7
)6.
6 (5
.2, 8
.1)
Neg
lect
ed tr
opic
al
dise
ases
and
mal
aria
26.9
(19.
2, 3
8.9)
16 (1
0.4,
24.
4)10
.9 (5
.9, 1
9)0.
2 (0
.1, 0
.3)
39.4
(26.
7, 5
6.9)
17.6
(11.
4, 2
6.3)
21.8
(11.
8, 3
8.2)
0.4
(0.2
, 0.8
)
Mat
erna
l diso
rder
s26
(12.
3, 6
8.7)
15.2
(3.4
, 57.
4)10
.8 (6
.6, 1
5.9)
0.2
(0.1
, 0.3
). (
., .)
. (.,
.). (
., .)
. (.,
.)
Neo
nata
l diso
rder
s50
4.6
(311
.2, 7
54)
32.8
(23.
8, 4
3.9)
471.
9 (2
75.3
, 723
.2)
5.5
(3.2
, 8.4
)68
4.3
(410
.6, 1
016.
7)45
.5 (3
2.7,
60.
9)63
8.8
(367
.4, 9
71.8
)7.
4 (4
.3, 1
1.3)
326
(228
.4, 4
55.1
)31
0.6
(213
.3, 4
42.6
)15
.4 (9
.5, 2
5.7)
0.3
(0.2
, 0.6
)21
7.2
(151
.1, 3
04.5
)20
1.1
(136
.2, 2
89.8
)16
.1 (1
0.1,
25.
3)0.
4 (0
.3, 0
.6)
Oth
er co
mm
unic
able
, m
ater
nal,
neon
atal
, and
nu
triti
onal
diso
rder
s79
.4 (5
8.5,
122
.6)
23 (1
5.3,
33.
6)56
.5 (3
7.7,
98.
8)1.
3 (0
.8, 1
.9)
115.
5 (8
7.2,
157
.3)
26.6
(18.
3, 3
8.3)
89 (6
1, 1
26.9
)2.
3 (1
.6, 3
.1)
Non
-com
mun
icab
le
dise
ases
6351
.5 (5
495.
2,72
55.3
)39
06.3
(315
1.4,
472
8.5)
2445
.2 (2
080,
313
5)10
3.1
(87.
9, 1
22.3
)73
13.9
(654
6.9,
834
5.3)
3490
.7 (2
845.
5, 4
208.
4)38
23.1
(342
1.7,
469
4.7)
165.
6 (1
50, 1
92.3
)
Neo
plas
ms
422.
3 (3
54.3
, 499
.4)
8.1
(5.7
, 11)
414.
1 (3
46, 4
90.4
)14
.7 (1
2.5,
17.
2)60
3.2
(515
.5, 7
19)
9.7
(6.8
, 13.
3)59
3.5
(505
.4, 7
08.1
)25
.4 (2
1.5,
30)
Oth
er n
on-c
omm
unic
able
di
seas
es70
3.3
(487
.6, 1
001.
2)37
2 (2
48.5
, 553
.1)
331.
3 (1
55.9
, 588
.8)
4 (1
.9, 7
)73
6.3
(499
, 104
5.8)
376.
8 (2
48.1
, 573
.3)
359.
4 (1
72.9
, 600
.7)
4.3
(2.1
, 7.1
)
Car
diov
ascu
lar a
nd
circ
ulat
ory
dise
ases
1173
.6 (8
92.5
, 140
0)65
.8 (4
6.4,
89.
9)11
07.8
(830
.3, 1
337.
3)62
.2 (4
8.1,
71)
2062
.8 (1
871.
9, 2
305.
9)79
.6 (5
5, 11
1.2)
1983
.2 (1
792.
8, 2
227.
2)10
2.2
(92.
5, 11
3.3)
Chr
onic
resp
irat
ory
dise
ases
352.
7 (2
46.6
, 507
.9)
238
(134
.7, 3
96.1
)11
4.6
(96.
8, 1
41.1
)5
(4.3
, 5.8
)45
8.2
(340
.9, 6
31.2
)25
8.8
(148
.6, 4
27.4
)19
9.3
(169
.4, 2
38.7
)9.
4 (8
, 11)
Cir
rhos
is of
the l
iver
25.3
(19.
7, 3
7.3)
0.8
(0.4
, 1.5
)24
.5 (1
9, 3
6.6)
.9 (.
7, 1
.3)
53 (4
2.5,
74.
1)1.
2 (.6
, 2.1
)51
.8 (4
1.4,
73)
1.9
(1.5
, 2.6
)D
iges
tive d
iseas
es
(exc
ept c
irrh
osis)
59.1
(49.
6, 7
1.9)
14.4
(8.4
, 25.
6)44
.6 (3
8.3,
51.
8)2
(1.7
, 2.3
)84
.4 (6
6.4,
106
.2)
16.8
(9.2
, 30.
3)67
.6 (5
2.3,
83.
9)3
(2.3
, 3.8
)
Neu
rolo
gica
l diso
rder
s30
6.7
(247
.5, 3
69.5
)23
3.2
(180
.4, 2
88.7
)73
.5 (4
7.6,
108
.3)
2.9
(1.9
, 4.4
)28
3.1
(235
, 331
.7)
189.
3 (1
50, 2
29.9
)93
.8 (6
4.7,
127
.8)
3.9
(2.7
, 5.6
)
Men
tal a
nd b
ehav
iora
l di
sord
ers
1403
.9 (9
44.9
, 210
9.8)
1386
.5 (9
29.8
, 209
6.5)
17.4
(11.
8, 2
8.7)
0.5
(0.3
, 0.8
)12
68.7
(949
.5, 1
736.
6)11
20.9
(828
.7, 1
532.
8)14
7.8
(75.
7, 3
08.6
)3.
4 (1
.9, 7
.1)
Dia
bete
s, ur
ogen
ital,
bloo
d, a
nd en
docr
ine
dise
ases
692
(507
.3, 1
085.
8)38
2.8
(274
.1, 5
33)
309.
2 (2
01.1
, 677
.1)
10.8
(7.7
, 19.
8)60
8.8
(465
.7, 9
92.3
)28
7 (2
13.1
, 383
.4)
321.
8 (2
24.4
, 717
.6)
11.8
(8.8
, 21.
9)
Mus
culo
skel
etal
di
sord
ers
1212
.8 (9
23.1
, 151
1.5)
1204
.7 (9
14.6
, 150
4.1)
8 (5
.3, 1
5)0.
3 (0
.2, 0
.5)
1155
.5 (8
54.4
, 151
4.5)
1150
.7 (8
49.6
, 151
1.4)
4.8
(3.1
, 9.8
)0.
2 (0
.1, 0
.4)
Inju
ries
781.
9 (6
25.6
, 960
.3)
182.
1 (1
22.3
, 260
.9)
599.
7 (4
56.2
, 776
)12
.4 (9
.8, 1
5.6)
2131
.6 (1
681.
7, 2
554.
1)34
3.8
(234
.1, 4
92.9
)17
87.8
(136
6.2,
217
4.9)
38.4
(30.
1, 4
6.4)
Tra
nspo
rt in
juri
es32
8.8
(241
.6, 4
32.3
)73
.3 (4
7.7,
108
.9)
255.
5 (1
70.6
, 360
.3)
5.6
(3.9
, 7.5
)11
36.2
(785
.5, 1
456.
2)14
1.6
(93.
1, 2
01.2
)99
4.6
(639
.6, 1
304.
8)22
.2 (1
5, 2
8.6)
Uni
nten
tiona
l inj
urie
s ot
her t
han
tran
spor
t in
juri
es35
5.5
(290
.8, 4
39.3
)10
2.1
(68.
5, 1
47.5
)25
3.3
(199
.1, 3
27.1
)5
(4, 6
.2)
727.
9 (6
20.4
, 859
.9)
180.
4 (1
22.6
, 262
.4)
547.
5 (4
63, 6
58.7
)11
.2 (9
.7, 1
3.2)
Sel
f-har
m a
nd
inte
rper
sona
l vio
lenc
e97
.6 (5
2.2,
150
.4)
6.7
(4.2
, 10)
90.9
(45.
7, 1
44.2
)1.
8 (0
.9, 2
.8)
267.
5 (1
90.4
, 373
)21
.9 (1
4.3,
31.5
)24
5.6
(166
.9, 3
52.8
)5
(3.5
, 7.2
)
Tabl
e 2.
Archives of Iranian Medicine, Volume 17, Number 5, May 2014308
rate (total number of deaths in this age group) was 2,227.8 per 100,000 (1,665.4 – 2,940.7), and under-5 mortality rate was 550.9 per 100,000 (425.5 – 729.1). 5q0 or probability of death before the
boys. The lowest death rate belonged to females aged 5 – 14, at 30.2 per 100,000 (23.3 – 39.1). Two hundred (120 – 299) mothers died because of pregnancy and childbearing complications, with a total maternal death rate of 0.89 per 100,000 (0.53 – 1.32). 45q15, or cumulative probability of death between 15 and 60 years of age was 7.6% (5.7 – 10.0) for women and 15.25% (11.1 – 20.2) for men.
A total of 33,821 deaths (26,122 – 44,756) occurred in both males and females under 5, with 478 deaths (299 – 755) due to diarrheal diseases and 1,974 (1,323 – 2,814) due to lower respi-
ratory infections. However, the most important causes of death among children under 5 included, in descending order, congen-ital anomalies, causing 6,149 deaths (2,766 – 10,567); preterm birth complications, causing 6,089 deaths (4,240 – 8,331); and lower respiratory infections, responsible for 1,974 deaths (1,323 – 2,814) (Figure 2). The pattern is similar in both sexes for deaths,
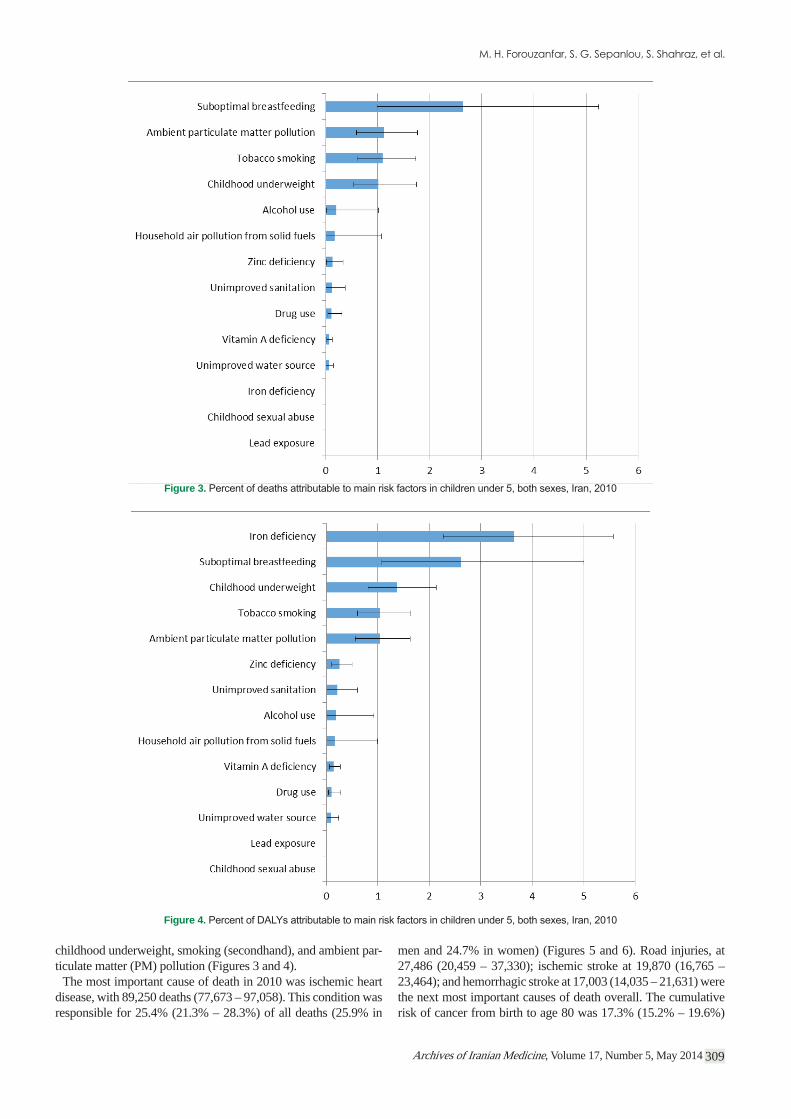
anemia, causing 115,664 YLDs (75,837 – 169,774); diarrheal dis-eases, responsible for 48,928 YLDs (28,858 – 77,535); and thal-assemia, causing 16,591 YLDs (10,754 – 24,665), were the most important causes of disability in descending order of magnitude.
As for deaths and DALYs attributable to risk factors, the fol-lowing are the top causes among children under 5, in descending
71.6
77.8
69.9
60.1
26.9
18.822.6
12.1
7
20.916.8
8.7
20
020
6080
0 20 60 80age
Figure 1.
Figure 2.
Archives of Iranian Medicine, Volume 17, Number 5, May 2014 309
childhood underweight, smoking (secondhand), and ambient par-ticulate matter (PM) pollution (Figures 3 and 4).
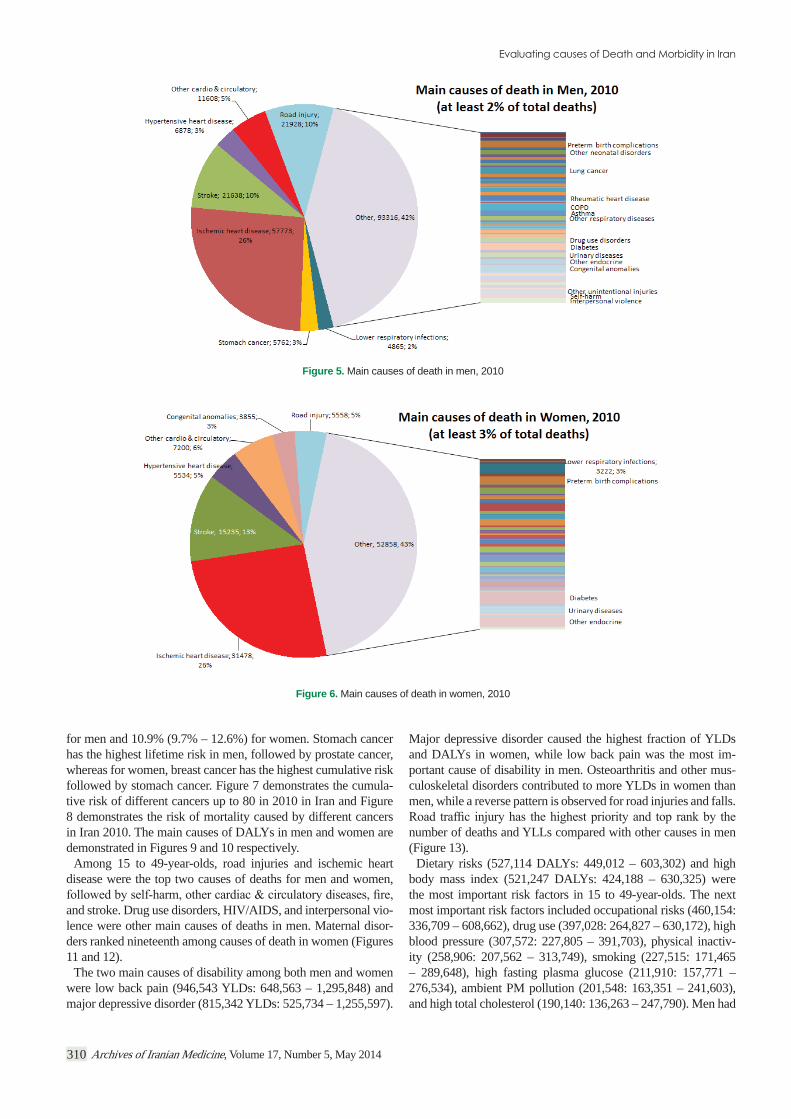
The most important cause of death in 2010 was ischemic heart disease, with 89,250 deaths (77,673 – 97,058). This condition was responsible for 25.4% (21.3% – 28.3%) of all deaths (25.9% in
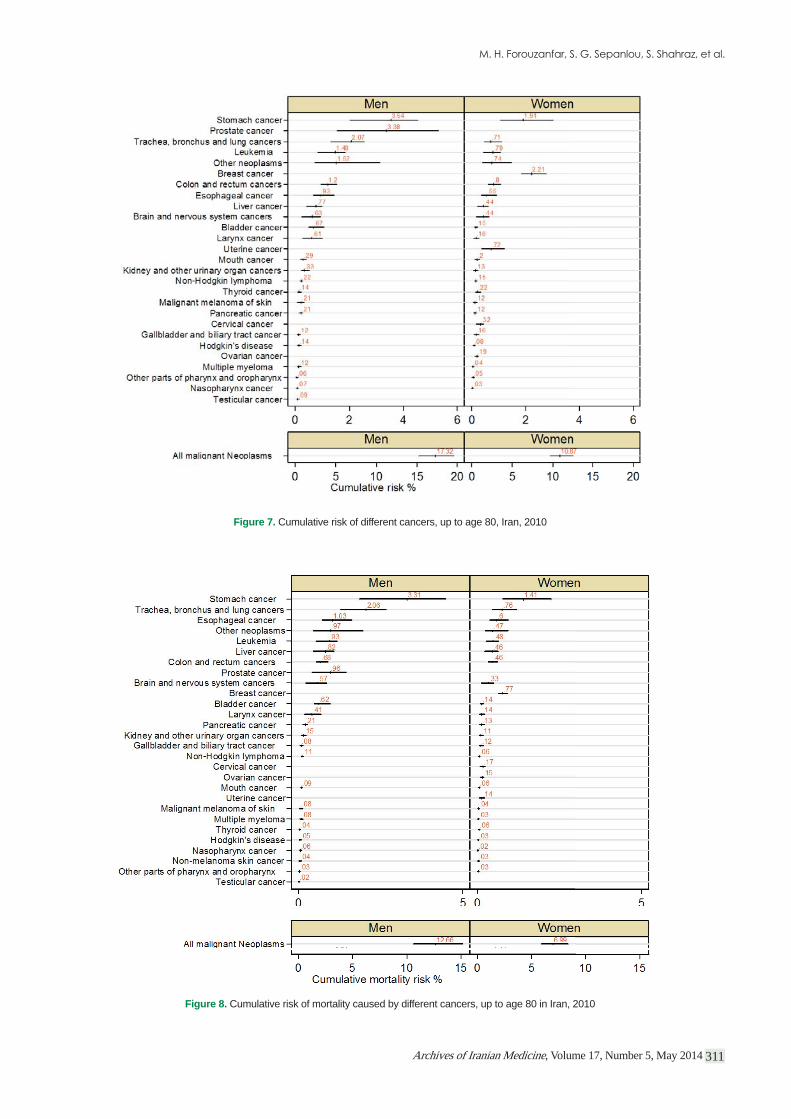
men and 24.7% in women) (Figures 5 and 6). Road injuries, at 27,486 (20,459 – 37,330); ischemic stroke at 19,870 (16,765 – 23,464); and hemorrhagic stroke at 17,003 (14,035 – 21,631) were the next most important causes of death overall. The cumulative risk of cancer from birth to age 80 was 17.3% (15.2% – 19.6%)
Figure 3.
Figure 4.
Archives of Iranian Medicine, Volume 17, Number 5, May 2014310
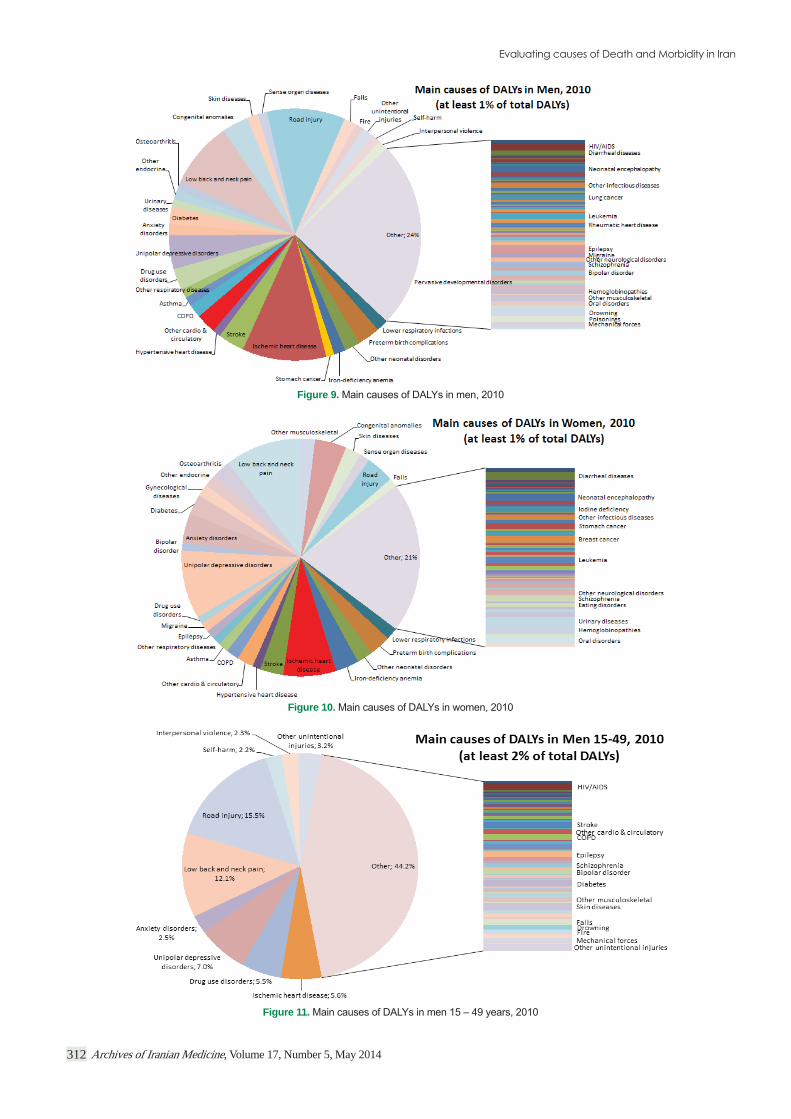
for men and 10.9% (9.7% – 12.6%) for women. Stomach cancer has the highest lifetime risk in men, followed by prostate cancer, whereas for women, breast cancer has the highest cumulative risk followed by stomach cancer. Figure 7 demonstrates the cumula-tive risk of different cancers up to 80 in 2010 in Iran and Figure 8 demonstrates the risk of mortality caused by different cancers in Iran 2010. The main causes of DALYs in men and women are demonstrated in Figures 9 and 10 respectively.
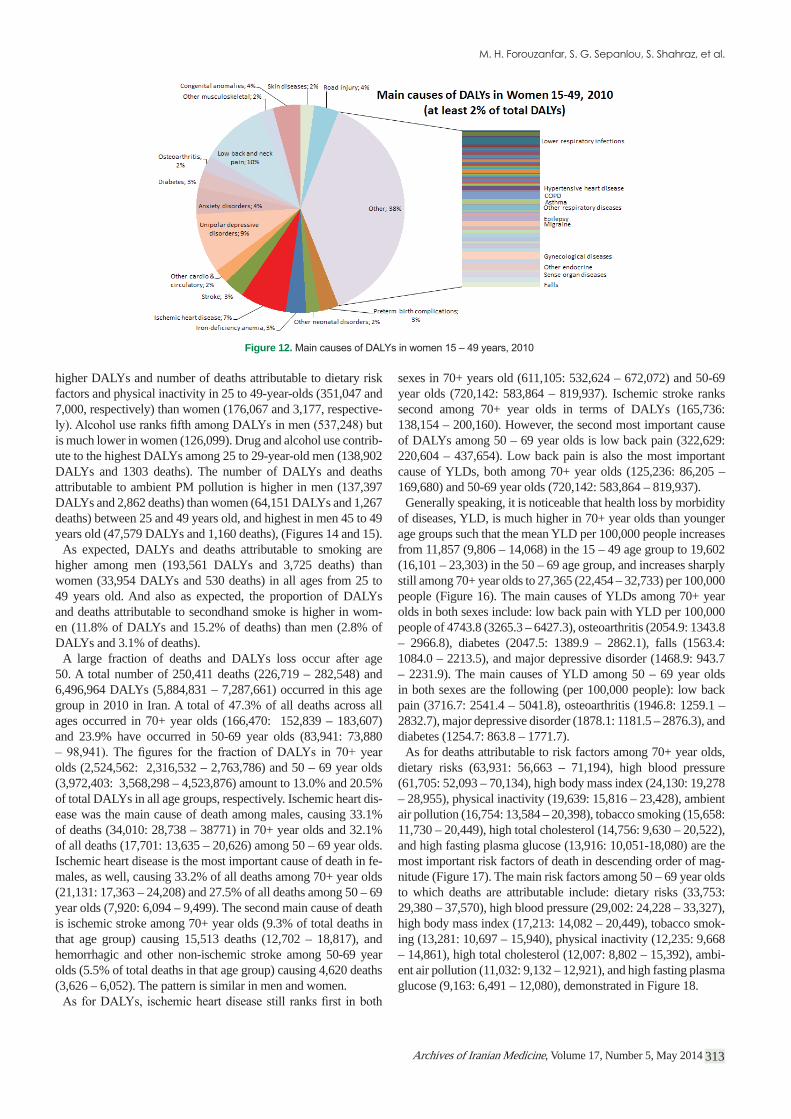
Among 15 to 49-year-olds, road injuries and ischemic heart disease were the top two causes of deaths for men and women,
and stroke. Drug use disorders, HIV/AIDS, and interpersonal vio-lence were other main causes of deaths in men. Maternal disor-ders ranked nineteenth among causes of death in women (Figures 11 and 12).
The two main causes of disability among both men and women were low back pain (946,543 YLDs: 648,563 – 1,295,848) and major depressive disorder (815,342 YLDs: 525,734 – 1,255,597).
Major depressive disorder caused the highest fraction of YLDs and DALYs in women, while low back pain was the most im-portant cause of disability in men. Osteoarthritis and other mus-culoskeletal disorders contributed to more YLDs in women than men, while a reverse pattern is observed for road injuries and falls.
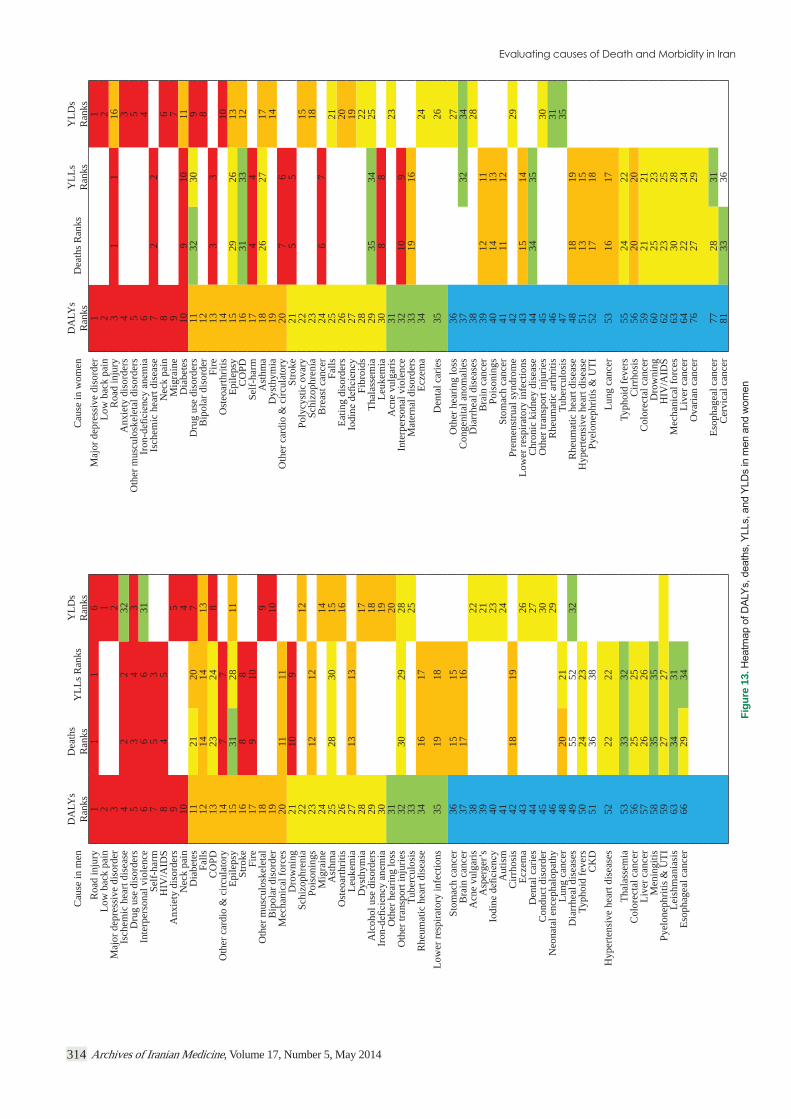
number of deaths and YLLs compared with other causes in men (Figure 13).
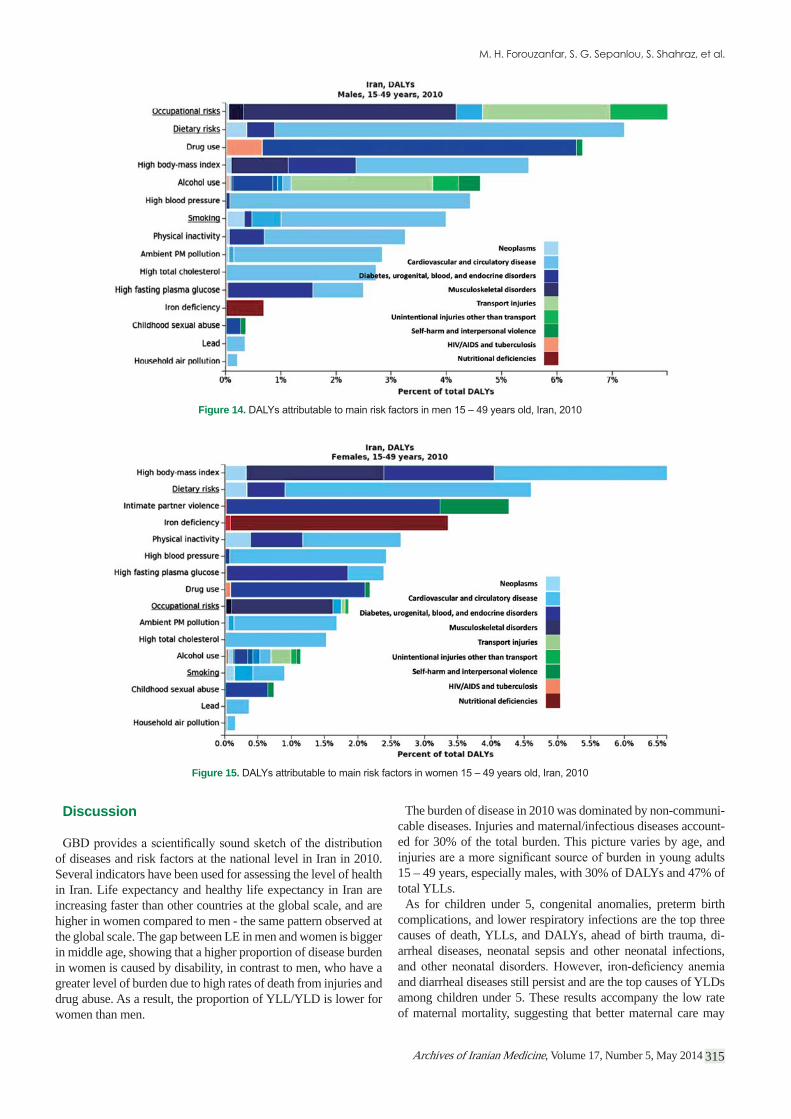
Dietary risks (527,114 DALYs: 449,012 – 603,302) and high body mass index (521,247 DALYs: 424,188 – 630,325) were the most important risk factors in 15 to 49-year-olds. The next most important risk factors included occupational risks (460,154: 336,709 – 608,662), drug use (397,028: 264,827 – 630,172), high blood pressure (307,572: 227,805 – 391,703), physical inactiv-ity (258,906: 207,562 – 313,749), smoking (227,515: 171,465 – 289,648), high fasting plasma glucose (211,910: 157,771 – 276,534), ambient PM pollution (201,548: 163,351 – 241,603), and high total cholesterol (190,140: 136,263 – 247,790). Men had
Figure 5. Main causes of death in men, 2010
Figure 6. Main causes of death in women, 2010
Archives of Iranian Medicine, Volume 17, Number 5, May 2014 311
Figure 7. Cumulative risk of different cancers, up to age 80, Iran, 2010
Figure 8. Cumulative risk of mortality caused by different cancers, up to age 80 in Iran, 2010
Archives of Iranian Medicine, Volume 17, Number 5, May 2014312
Figure 9.
Figure 10.
Figure 11.
Archives of Iranian Medicine, Volume 17, Number 5, May 2014 313
higher DALYs and number of deaths attributable to dietary risk factors and physical inactivity in 25 to 49-year-olds (351,047 and 7,000, respectively) than women (176,067 and 3,177, respective-
is much lower in women (126,099). Drug and alcohol use contrib-ute to the highest DALYs among 25 to 29-year-old men (138,902 DALYs and 1303 deaths). The number of DALYs and deaths attributable to ambient PM pollution is higher in men (137,397 DALYs and 2,862 deaths) than women (64,151 DALYs and 1,267 deaths) between 25 and 49 years old, and highest in men 45 to 49 years old (47,579 DALYs and 1,160 deaths), (Figures 14 and 15).
As expected, DALYs and deaths attributable to smoking are higher among men (193,561 DALYs and 3,725 deaths) than women (33,954 DALYs and 530 deaths) in all ages from 25 to 49 years old. And also as expected, the proportion of DALYs and deaths attributable to secondhand smoke is higher in wom-en (11.8% of DALYs and 15.2% of deaths) than men (2.8% of DALYs and 3.1% of deaths).
A large fraction of deaths and DALYs loss occur after age 50. A total number of 250,411 deaths (226,719 – 282,548) and 6,496,964 DALYs (5,884,831 – 7,287,661) occurred in this age group in 2010 in Iran. A total of 47.3% of all deaths across all ages occurred in 70+ year olds (166,470: 152,839 – 183,607) and 23.9% have occurred in 50-69 year olds (83,941: 73,880
olds (2,524,562: 2,316,532 – 2,763,786) and 50 – 69 year olds (3,972,403: 3,568,298 – 4,523,876) amount to 13.0% and 20.5% of total DALYs in all age groups, respectively. Ischemic heart dis-ease was the main cause of death among males, causing 33.1% of deaths (34,010: 28,738 – 38771) in 70+ year olds and 32.1% of all deaths (17,701: 13,635 – 20,626) among 50 – 69 year olds. Ischemic heart disease is the most important cause of death in fe-males, as well, causing 33.2% of all deaths among 70+ year olds (21,131: 17,363 – 24,208) and 27.5% of all deaths among 50 – 69 year olds (7,920: 6,094 – 9,499). The second main cause of death is ischemic stroke among 70+ year olds (9.3% of total deaths in that age group) causing 15,513 deaths (12,702 – 18,817), and hemorrhagic and other non-ischemic stroke among 50-69 year olds (5.5% of total deaths in that age group) causing 4,620 deaths (3,626 – 6,052). The pattern is similar in men and women.
sexes in 70+ years old (611,105: 532,624 – 672,072) and 50-69 year olds (720,142: 583,864 – 819,937). Ischemic stroke ranks second among 70+ year olds in terms of DALYs (165,736: 138,154 – 200,160). However, the second most important cause of DALYs among 50 – 69 year olds is low back pain (322,629: 220,604 – 437,654). Low back pain is also the most important cause of YLDs, both among 70+ year olds (125,236: 86,205 – 169,680) and 50-69 year olds (720,142: 583,864 – 819,937).
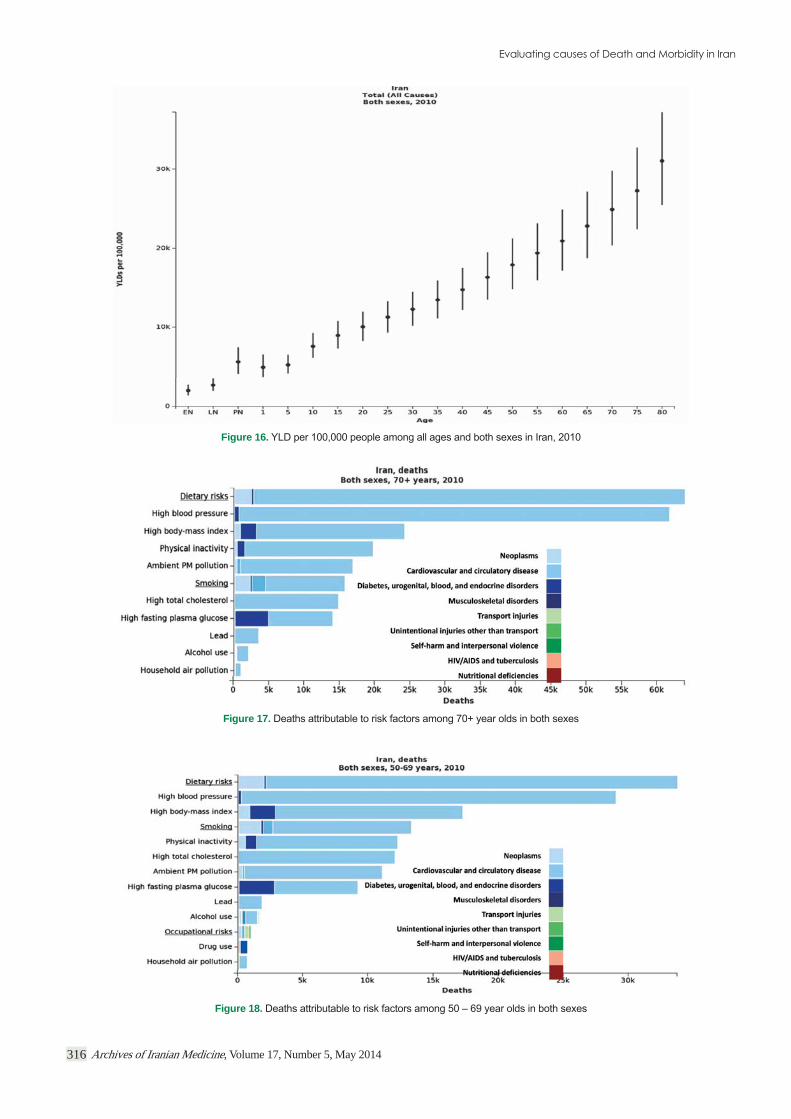
Generally speaking, it is noticeable that health loss by morbidity of diseases, YLD, is much higher in 70+ year olds than younger age groups such that the mean YLD per 100,000 people increases from 11,857 (9,806 – 14,068) in the 15 – 49 age group to 19,602 (16,101 – 23,303) in the 50 – 69 age group, and increases sharply still among 70+ year olds to 27,365 (22,454 – 32,733) per 100,000 people (Figure 16). The main causes of YLDs among 70+ year olds in both sexes include: low back pain with YLD per 100,000 people of 4743.8 (3265.3 – 6427.3), osteoarthritis (2054.9: 1343.8 – 2966.8), diabetes (2047.5: 1389.9 – 2862.1), falls (1563.4: 1084.0 – 2213.5), and major depressive disorder (1468.9: 943.7 – 2231.9). The main causes of YLD among 50 – 69 year olds in both sexes are the following (per 100,000 people): low back pain (3716.7: 2541.4 – 5041.8), osteoarthritis (1946.8: 1259.1 – 2832.7), major depressive disorder (1878.1: 1181.5 – 2876.3), and diabetes (1254.7: 863.8 – 1771.7).
As for deaths attributable to risk factors among 70+ year olds, dietary risks (63,931: 56,663 – 71,194), high blood pressure (61,705: 52,093 – 70,134), high body mass index (24,130: 19,278 – 28,955), physical inactivity (19,639: 15,816 – 23,428), ambient air pollution (16,754: 13,584 – 20,398), tobacco smoking (15,658: 11,730 – 20,449), high total cholesterol (14,756: 9,630 – 20,522), and high fasting plasma glucose (13,916: 10,051-18,080) are the most important risk factors of death in descending order of mag-nitude (Figure 17). The main risk factors among 50 – 69 year olds to which deaths are attributable include: dietary risks (33,753: 29,380 – 37,570), high blood pressure (29,002: 24,228 – 33,327), high body mass index (17,213: 14,082 – 20,449), tobacco smok-ing (13,281: 10,697 – 15,940), physical inactivity (12,235: 9,668 – 14,861), high total cholesterol (12,007: 8,802 – 15,392), ambi-ent air pollution (11,032: 9,132 – 12,921), and high fasting plasma glucose (9,163: 6,491 – 12,080), demonstrated in Figure 18.
Figure 12.
Archives of Iranian Medicine, Volume 17, Number 5, May 2014314
Cau
se in
men
DA
LYs
Ran
ks D
eath
sR
anks
YLL
s Ran
ks Y
LDs
Ran
ksC
ause
in w
omen
DA
LYs
Ran
ksD
eath
s Ran
ks Y
LLs
Ran
ks Y
LDs
Ran
ksR
oad
inju
ry1
11
6M
ajor
dep
ress
ive
diso
rder
11
Low
bac
k pa
in2
1Lo
w b
ack
pain
22
Maj
or d
epre
ssiv
e di
sord
er3
2R
oad
inju
ry3
11
16Is
chem
ic h
eart
dise
ase
42
232
Anx
iety
dis
orde
rs4
3D
rug
use
diso
rder
s5
34
3O
ther
mus
culo
skel
etal
dis
orde
rs5
5In
terp
erso
nal v
iole
nce
66
631
64
Self-
harm
75
3Is
chem
ic h
eart
dise
ase
72
2H
IV/A
IDS
84
5N
eck
pain
86
Anx
iety
dis
orde
rs9
5M
igra
ine
97
Nec
k pa
in10
4D
iabe
tes
109
1011
Dia
bete
s11
2120
7D
rug
use
diso
rder
s11
3230
9Fa
lls12
1414
13B
ipol
ar d
isor
der
128
CO
PD13
2324
8Fi
re13
33
Oth
er c
ardi
o &
circ
ulat
ory
147
7O
steo
arth
ritis
1410
Epile
psy
1531
2811
Epile
psy
1529
2613
Stro
ke16
88
CO
PD16
3133
12Fi
re17
910
Self-
harm
174
4O
ther
mus
culo
skel
etal
189
Ast
hma
1826
2717
Bip
olar
dis
orde
r19
10D
ysth
ymia
1914
Mec
hani
cal f
orce
s20
1111
Oth
er c
ardi
o &
circ
ulat
ory
207
6D
row
ning
2110
9St
roke
215
5Sc
hizo
phre
nia
2212
Poly
cyst
ic o
vary
2215
Pois
onin
gs23
1212
Schi
zoph
reni
a23
18M
igra
ine
2414
Bre
ast c
ance
r24
67
Ast
hma
2528
3015
Falls
2521
Ost
eoar
thrit
is26
16Ea
ting
diso
rder
s26
20Le
ukem
ia27
1313
2719
Dys
thym
ia28
17Fi
broi
ds28
22A
lcoh
ol u
se d
isor
ders
2918
Thal
asse
mia
2935
3425
3019
Leuk
emia
308
8O
ther
hea
ring
loss
3120
Acn
e vu
lgar
is31
23O
ther
tran
spor
t inj
urie
s32
3029
28In
terp
erso
nal v
iole
nce
3210
9Tu
berc
ulos
is33
25M
ater
nal d
isor
ders
3319
16R
heum
atic
hea
rt di
seas
e34
1617
Ecze
ma
3424
Low
er re
spira
tory
infe
ctio
ns35
1918
Den
tal c
arie
s35
26St
omac
h ca
ncer
3615
15O
ther
hea
ring
loss
3627
Bra
in c
ance
r37
1716
Con
geni
tal a
nom
alie
s37
3234
Acn
e vu
lgar
is38
22D
iarr
heal
dis
ease
s38
28A
sper
ger’s
3921
Bra
in c
ance
r39
1211
4023
Pois
onin
gs40
1413
Aut
ism
4124
Stom
ach
canc
er41
1112
Cirr
hosi
s42
1819
Prem
enst
rual
synd
rom
e42
29Ec
zem
a43
26Lo
wer
resp
irato
ry in
fect
ions
4315
14D
enta
l car
ies
4427
Chr
onic
kid
ney
dise
ase
4434
35C
ondu
ct d
isor
der
4530
Oth
er tr
ansp
ort i
njur
ies
4530
Neo
nata
l enc
epha
lopa
thy
4629
Rhe
umat
ic a
rthrit
is46
31Lu
ng c
ance
r48
2021
Tube
rcul
osis
4735
Dia
rrhe
al d
isea
ses
4955
5232
Rhe
umat
ic h
eart
dise
ase
4818
19Ty
phoi
d fe
vers
5024
23H
yper
tens
ive
hear
t dis
ease
5113
15C
KD
5136
38Py
elon
ephr
itis &
UTI
5217
18H
yper
tens
ive
hear
t dis
ease
s52
2222
Lung
can
cer
5316
17Th
alas
sem
ia53
3332
Typh
oid
feve
rs55
2422
Col
orec
tal c
ance
r56
2525
Cirr
hosi
s56
2020
Live
r can
cer
5726
26C
olor
ecta
l can
cer
5921
21M
enin
gitis
5835
35D
row
ning
6025
23Py
elon
ephr
itis &
UTI
5927
27H
IV/A
IDS
6223
25Le
ishm
ania
sis
6334
31M
echa
nica
l for
ces
6330
28Es
opha
geal
can
cer
6629
34Li
ver c
ance
r64
2224
Ova
rian
canc
er76
2729
Esop
hage
al c
ance
r77
2831
Cer
vica
l can
cer
8133
36
Figu
re 1
3.
Archives of Iranian Medicine, Volume 17, Number 5, May 2014 315
Discussion
of diseases and risk factors at the national level in Iran in 2010. Several indicators have been used for assessing the level of health in Iran. Life expectancy and healthy life expectancy in Iran are increasing faster than other countries at the global scale, and are higher in women compared to men - the same pattern observed at the global scale. The gap between LE in men and women is bigger in middle age, showing that a higher proportion of disease burden in women is caused by disability, in contrast to men, who have a greater level of burden due to high rates of death from injuries and drug abuse. As a result, the proportion of YLL/YLD is lower for women than men.
The burden of disease in 2010 was dominated by non-communi-cable diseases. Injuries and maternal/infectious diseases account-ed for 30% of the total burden. This picture varies by age, and
15 – 49 years, especially males, with 30% of DALYs and 47% of total YLLs.
As for children under 5, congenital anomalies, preterm birth complications, and lower respiratory infections are the top three causes of death, YLLs, and DALYs, ahead of birth trauma, di-arrheal diseases, neonatal sepsis and other neonatal infections,
and diarrheal diseases still persist and are the top causes of YLDs among children under 5. These results accompany the low rate of maternal mortality, suggesting that better maternal care may
Figure 14.
Figure 15.
Archives of Iranian Medicine, Volume 17, Number 5, May 2014316
Figure 16.
Figure 17.
Figure 18.
Archives of Iranian Medicine, Volume 17, Number 5, May 2014 317
have changed the disease pattern among children under 5. The risk factors responsible for the majority of DALYs include iron-
-derweight, which implies that improvement of maternal and child care is a necessity.
The burden of disease in all ages is dominated by cardiovascular diseases (especially ischemic heart disease (IHD)), low back pain
burden of IHD and injury results primarily from death,19, 20 muscu-loskeletal and mental diseases are debilitating and are responsible for a large number of YLDs.4 With increasing life expectancy and population aging, these diseases will be the main source of burden and a challenge for the Iranian health system for years.
The highest fraction of deaths occur after 50 years; the most im-portant causes of death in these groups are ischemic heart disease, and ischemic and hemorrhagic strokes. Apart from deaths, the quality of life decreases in older ages as YLDs per capita sharply increase in 50+ age groups. The main sources of disability among the elderly consist of chronic diseases such as low back pain, os-teoarthritis, major depressive disorder, and diabetes, all of which require appropriate primary and secondary prevention methods that have not been foreseen in the current health care system in Iran. It can be predicted that following the increase in mean age in Iran over coming years, the fraction of deaths and burden of different disabilities in the elderly will increase as well. There should be policies to envision the growing need for special care that should be provided to the elderly and their families in Iran in order to deal with deaths and disabling conditions and maintain the quality of their life.
Iran’s remarkable success in maternal and child health has de-creased communicable and maternal burden, although diarrhea
health system should push this effort to access remote places and improve patient care and prevention, since children still die from diarrhea and pneumonia. Improving vaccination against diarrhea and pneumonia pathogens, such as rotavirus and RSV, can be a good strategy. Although there is good access to improved sources of water and sanitation in Iran, maintaining the system’s quality
suboptimal breastfeeding still cause the largest burden in children, with the current focus of primary health care system in Iran on maternal and child health. Protecting children from exposure to tobacco smoke and air pollution should be a priority of the gov-ernment and community by implementing necessary laws to re-duce smoking, limit smoking in public areas, reduce air pollution, and educate families.
More than 57% of deaths in 2010 were caused by cardiovascu-lar diseases and cancers. The burden of IHD was twice as high as that of stroke, although both have common physiological and behavioral risk factors. The most important risk factor groups are dietary risks and physiological risk factors, including high body mass index, high blood pressure, high fasting plasma glucose, high blood cholesterol, physical inactivity, and smoking.21 Sev-eral interventions and preventive methods can reduce exposure to these risk factors. Training programs on balanced nutrition, limit-ing daily caloric intake, and increasing physical activity can re-duce obesity and its consequences. Controlling obesity decreases blood pressure and glucose intolerance and increases cholesterol
-lar disease. Successful prevention of diabetes by medications such
pressure-lowering medicines, and aspirin (called Polypill) suggest
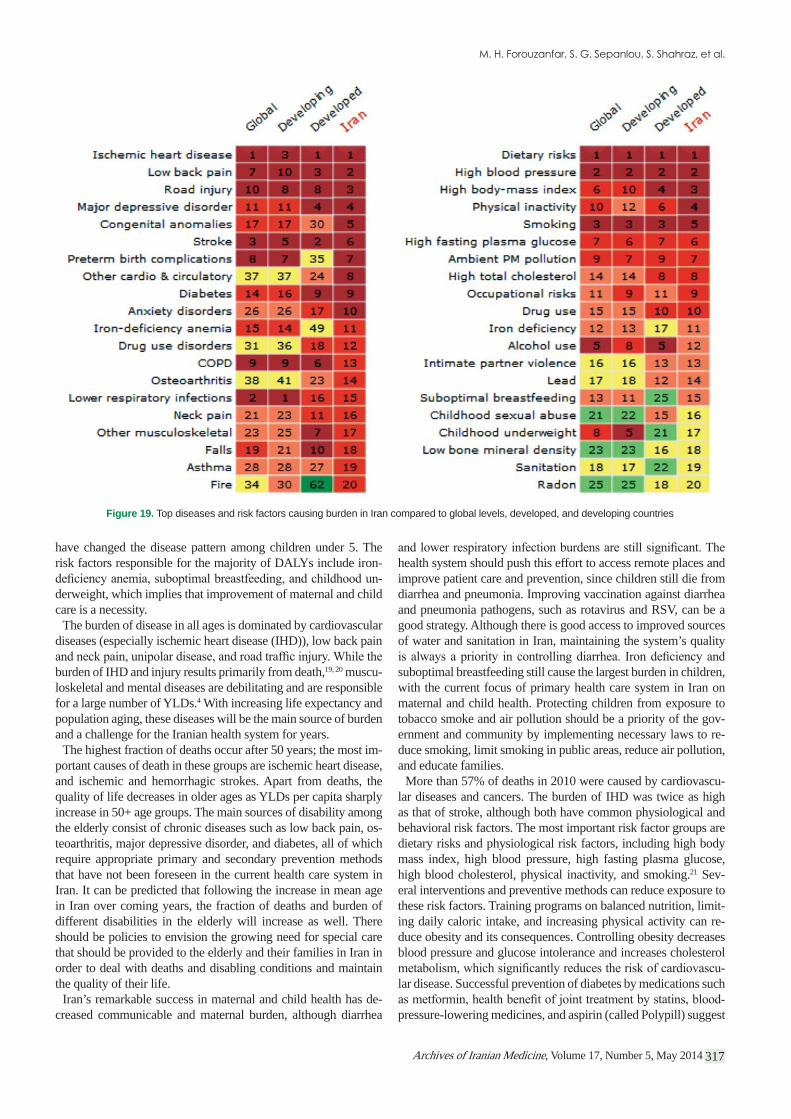
Figure 19. Top diseases and risk factors causing burden in Iran compared to global levels, developed, and developing countries
Archives of Iranian Medicine, Volume 17, Number 5, May 2014318
effective programs that can be implemented in the current health system structure.22–24 Preventive drug treatment can be a quick in-tervention for controlling the burden of cardiovascular diseases and can be delivered with the reliable coverage of the current Ira-nian health system.
After smoking, dietary risk factors are the most important be-havioral risk factors. More than 8.5% of total DALYs can be at-tributed to dietary risks, which strike primarily through cardio-vascular disease, diabetes and endocrine diseases, and to a lesser extent through cancer. Diets low in fruits and vegetables, high in sodium, low in whole grains, low in omega-3 fatty acids and high
the population to eat a healthy diet and limit salt and trans fat intake requires contributions from different sectors such as ag-
complimentary fruit and milk distribution in the schools and train-ing families to replace calories from other sources with fruit, veg-etables, and milk.
Road injury is the second-leading cause of death in Iran, with 27,000 deaths in 2010. The age-standardized death rate is more than twice the global average. One out of 200 men aged 15 to
13,25–27 Im-proving road safety, enforcing safe driving laws, requiring use of seatbelts, and improving quality and safety of cars should be a pri-ority of the health system in cooperation with other departments such as the police, policymakers, and industries. Iran’s govern-ment should take responsibility for implementing a coordinated
28–32
Cancer is the second most frequent cause of death and the sec-ond highest burden by YLLs. The most important cancers in Iran are gastric cancer (sixth-leading death rate) and lung cancer (elev-enth), followed by breast cancer (twelfth).33 Tobacco use is the most important risk factor for lung cancer which, along with diet, also increases the risk of gastric cancer. Aggressive tobacco con-trol is important to reduce the risk of these two cancers as well as the burden of cardiovascular disease. Increasing free access to mammography as a cost-effective preventive intervention for
High body mass index is a risk factor for breast cancer as well.In terms of total DALYs and disability, the burden of muscu-
loskeletal diseases and mental health is prominent in Iran. Low back and neck pain cause 11.4% of total DALYs, and unipolar
main strategy should focus on increasing disease care and reha-bilitation. Osteoarthritis and back pain limit physical activity, and decreased physical activity increases the risk of cardiovascular disease and reduces cognitive health in older people. One percent of DALYs is attributable to drug abuse. This contributes to the largest proportion of DALY between 20 and 30 years of age.
important risk factor in terms of DALYs (4.6% of total DALYs). Encouraging physical activity for all ages should be considered as part of any program aiming to reduce the burden of cardiovascu-lar diseases, diabetes and endocrine disorders, and cancer. A large burden of cardiovascular disease can be attributed to ambient air pollution (PM2.5).14 Air pollution has been proven as an impor-tant cause of lower respiratory infection and it predisposes chil-dren to other infectious diseases. A main source of air pollution
is the dust in the air which has become a major challenge in Iran over recent years. This problem needs long-term planning and in-ternational cooperation to reduce the PM2.5 concentration and its health effects. In Tehran and other large cities and some industrial cities, the main source of air pollution is manmade, disseminated from cars and factories, that can be addressed locally by a strong commitment of national and local authorities.
Comparing the leading diseases in Iran to those in other coun-tries, ischemic heart disease, low back pain, road injuries, and ma-jor depressive disorder are the top four causes of burden in Iran, similar to other developing and developed countries. However, certain diseases such as congenital anomalies and preterm birth complications are more common in Iran, highlighting the impor-tance of maternal care. Regarding risk factors, Iran’s pattern is very similar to that of developed countries. The top risks causing burden in Iran are dietary and physiological risk factors that are more similar to those in developed, rather than developing, coun-tries (Figure 19).
Iran’s health system restructuring was a successful move toward expanding health services and care over most parts of the country. It was designed to provide access to preventive health interven-tions, vaccinations, improve water and sanitation, and control environmental risks. GBD 2010 showed that the main source of burden is non-communicable diseases and metabolic plus dietary risk factors. The rapid health and epidemiological transition in Iran has imposed new challenges on the health system as well as the national and subnational policies. Addressing these chal-
infrastructure and necessary human resources. Universal and ru-ral insurance and family medicine are necessary to improve ac-cess to and quality of health care. Some preventive interventions such as monitoring blood pressure and follow-up of diabetics or free access to cholesterol-lowering and antihypertensive drugs for eligible people, can be incorporated into health system services through improvements to the current structure. For many risk factors, such as dietary risks, physical inactivity, smoking, and more importantly, mental health and musculoskeletal health, the current health system needs improved infrastructure and empow-erment through recruiting more skilled health professionals and
decentralization of public health management if it is supported by reliable health data at the local level, followed over time. Restruc-turing the health system to deal with non-communicable diseases is the most important topic. The Iranian health system was de-signed for controlling communicable diseases and reducing ma-ternal and child death. Recently, there have been incentives for integrating interventions for prevention of or screening for certain non-communicable diseases, but this is not an effective method under current circumstances. We have to restructure our health system to have a core of NCD prevention and control and imple-ment a number of programs to improve maternal and child health and prevent communicable diseases.
The GBD 2010 study has certain limitations, as well. Some of the limitations are inherent in the nature of the study. First, the
Second, relative risks are taken from large international meta-analyses, and there may be cross-country differences. However, there are studies demonstrating that despite other lifestyle and en-vironmental risk factors for infectious diseases, the relative risks
Archives of Iranian Medicine, Volume 17, Number 5, May 2014 319
for metabolic risk factors are somehow similar between countries. Third, relative risks differ for mortality and incidence of the dis-
for the country under study and are taken from global studies.
challenge was the lack of nationally representative and accurate
-34–36 Data on morbidity are too scarce and of low
quality. The scarcity of data makes it impossible to estimate bur-den at the subnational level in order to measure inequalities across provinces in Iran. Another challenge is the poor cooperation of research bodies in sharing the data. The Ministry of Health should take the lead and supervise the health information system, gather and clean available data systematically, and take on the respon-sibility of data warehousing at the national level. Also, it is the responsibility of the Ministry of Health to create a network of research entities in Iran to improve collaborations for studies that can be more representative of the Iranian population.
It is also necessary to recognize that health policies are not re-stricted to the health sector. There are several sectors outside the health system that can affect the health status of people, are relat-ed to the health sector, and should be involved in policy planning. It is the duty of the Ministry of Health to improve inter-sectoral collaborations in policymaking.
Conclusion
Iran has been successful in controlling infectious and mater-nal diseases overall. However, GBD 2010 shows evidence of an epidemiological transition from infectious to non-communicable disease burden, a fact that poses serious challenges to policymak-ers in the health sector and brings about new implications for the management of the health care system in Iran. Dealing with new challenges requires new thoughts, designs, and innovations to in-
-lated sectors in Iran. The rise of non-communicable diseases and chronic risk factors is too complex and thus need to be addressed by extensive inter-sectoral collaborations and cost-effective poli-cies at the national and subnational levels.
The most important function of a responsive health system is to systematically collect, analyze, and utilize data for decision-
credible reference for measuring the prevailing diseases and risk factors and the overall health status of a nation. In this regard,
estimation at the level of provinces or districts is required to dis-cover local health challenges and burdensome conditions as well as inequality in health status and access to health care. Second, the measurements have to be performed annually in order to de-tect trends of diseases and effectiveness of programs. Develop-ment of a comprehensive national health data system, including vital registration (recording of births and deaths), and a system
-istries, such as cancer registries, should be launched with enough coverage across the whole country to provide subnationally and nationally representative estimates. Another useful source of data is hospital records. Standardizing methods of coding and the sys-tem of reporting diseases among hospitalized patients can provide unique data for certain diseases that are not routinely captured in
demographic study sites and disease registries and can provide
The GBD 2010 project may convey several messages, but the most important to health policy-makers in Iran, as well as all other countries across the world, is that rigorous measurement of health
aimed at disease prevention, health promotion, and health sys-tem performance assessment at both the national and subnational scales.
Acknowledgments
We thank the countless individuals who have contributed to the Global Burden of Diseases Study 2010 in various capacities. We are especially grateful to Majid Ezzati PhD, Michael MacIntyre, Summer Ohno, Diego Gonzalez-Medina, David Phillips, Charles Atkinson, Adrienne Chew, Kate Muller and many other persons whose names do not appear here due to shortage of space.
References
1. Lozano R, Naghavi M, Foreman K, Lim S, Shibuya K, Aboyans V, et al. Global and regional mortality from 235 causes of death for 20 age groups in 1990 and 2010: a systematic analysis for the Global Burden of Disease Study 2010. Lancet. 2012; 380(9859): 2095 – 2128.
2. Murray CJ, Vos T, Lozano R, Naghavi M, Flaxman AD, Michaud C, et al. Disability-adjusted life years (DALYs) for 291 diseases and in-juries in 21 regions, 1990-2010: a systematic analysis for the Global Burden of Disease Study 2010. Lancet. 2012; 380(9859): 2197 – 2223.
3. Salomon JA, Wang H, Freeman MK, Vos T, Flaxman AD, Lopez AD, et al. Healthy life expectancy for 187 countries, 1990–2010: a system-atic analysis for the Global Burden Disease Study 2010. Lancet. 2012; 380(9859): 2144 – 2162.
4. Vos T, Flaxman AD, Naghavi M, Lozano R, Michaud C, Ezzati M, et al. Years lived with disability (YLDs) for 1160 sequelae of 289 diseas-es and injuries 1990-2010: a systematic analysis for the Global Bur-den of Disease Study 2010. Lancet. 2012; 380(9859): 2163 – 2196.
5. Wang H, Dwyer-Lindgren L, Lofgren KT, Rajaratnam JK, Marcus JR,
countries, 1970-2010: a systematic analysis for the Global Burden of Disease Study 2010. Lancet. 2012; 380(9859): 2071 – 2094.
6. Abbasi-Shavazi M, McDonald P, Hosseini-Chavoshi M. The Fertil-ity Transition in Iran: Revolution and Reproduction. 2009. Springer. Dordrecht
7. nutritional intervention for reducing malnutrition among children under 5 years of age in the Islamic Republic of Iran. East Mediterr Health J. 2000; 6(2-3): 238 – 245.
8. Lozano R, Wang H, Foreman KJ, Rajaratnam JK, Naghavi M, Marcus JR, et al. Progress towards Millennium Development Goals 4 and 5 on maternal and child mortality: an updated systematic analysis. Lancet. 2011; 378(9797): 1139 – 1165.
9. Hogan MC, Foreman KJ, Naghavi M, Ahn SY, Wang M, Makela SM, et al. Maternal mortality for 181 countries, 1980–2008: a systematic analysis of progress towards Millennium Development Goal 5. Lan-cet. 2010; 375(9726): 1609 – 1623.
10. Moradi-Lakeh M, Ramezani M, Naghavi M. Equality in safe delivery and its determinants in Iran. Arch Iran Med. 2007; 10(4): 446 – 451.
11. Statistics Center of Iran. Available from: URL: http://www.amar.org.ir/Default.aspx?tabid=96&agentType=ViewType&PropertyTypeID=4.
12. Pourmalek F, Abolhassani F, Naghavi M, Mohammad K, Majdzadeh R, Holakouie Naeini K, et al. Direct estimation of life expectancy in the Islamic Republic of Iran in 2003. East Mediterr Health J. 2009; 15(1): 76 – 84.
13. Naghavi M, Abolhassani F, Pourmalek F, Moradi-Lakeh M, Jafari N, Vaseghi S, et al. The burden of disease and injury in Iran 2003. Pop Health Met. 2009; 7(9): doi:10.1186/1478-7954-7-9.
14. Hosseinpoor AR, Forouzanfar MH, Yunesian M, Asghari F, Naieni
Archives of Iranian Medicine, Volume 17, Number 5, May 2014320
KH, Farhood D. Air pollution and hospitalization due to angina pec-toris in Tehran, Iran: a time-series study. Environ Res. 2005; 99(1): 126 – 131.
15. Murray CJ, Ezzati M, Flaxman AD, Lim S, Lozano R, Michaud , and metrics. Lancet. 2012;
380(9859): 2063 – 2066.16. Lim SS, Vos T, Flaxman AD, Danaei G, Shibuya K, Adair-Rohani H,
et al. A comparative risk assessment of burden of disease and injury attributable to 67 risk factors and risk factor clusters in 21 regions, 1990-2010: a systematic analysis for the Global Burden of Disease Study 2010. Lancet. 2012; 380(9859): 2224 – 2260.
17. Salomon JA, Vos T, Hogan DR, Gagnon M, Naghavi M, Mokdad A, et al. Common values in assessing health outcomes from disease and injury: disability weights measurement study for the Global Burden of Disease Study 2010. Lancet. 2012; 380(9859): 2129 – 2143.
18. Foreman KJ, Lozano R, Lopez AD, Murray CJ. Modeling causes of death: an integrated approach using CODEm. Popul Health Metr. 2012; 10: 1.
19. Forouzanfar MH, Moran AE, Flaxman AD, Roth G, Mensah GA, Ez-zati M, et al. Assessing the global burden of ischemic heart disease, part 2: analytic methods and estimates of the global epidemiology of ischemic heart disease in 2010. Glob Heart. 2012; 7(4): 331 – 342.
20. Moran AE, Oliver JT, Mirzaie M, Forouzanfar MH, Chilov M, Ander-son L, et al. Assessing the Global Burden of Ischemic Heart Disease: Part 1: Methods for a Systematic Review of the Global Epidemiology of Ischemic Heart Disease in 1990 and 2010. Glob Heart. 2012; 7(4): 315 – 329.
21. Gakidou E, Mallinger L, Abbott-Klafter J, Guerrero R, Villalpando S, Ridaura RL, et al. Management of diabetes and associated cardio-vascular risk factors in seven countries: a comparison of data from national health examination surveys. Bull World Health Organ. 2011; 89(3): 172 – 183.
22. Majed M, Moradmand Badie S. A pilot double-blind randomised placebo-controlled trial of the effects of -apy (‘polypill’) on cardiovascular risk factors. Arch Iran Med. 2011; 14(1): 78 – 80.
23. Malekzadeh F, Marshall T, Pourshams A, Gharravi M, Aslani A, Nat-eghi A, et al. A pilot double-blind randomised placebo-controlled trial
car-diovascular risk factors. Int J Clin Pract. 2010; 64(9): 1220 – 1227.
24. Rastegarpanah M, Malekzadeh F, Thomas GN, Mohagheghi A, Cheng KK, Marshall T. A new horizon in primary prevention of cardiovascu-
lar disease, can we prevent heart attack by “heart polypill”? Arch Iran Med. 2008; 11(3): 306 – 313.
25. Akbari ME, Naghavi M, Soori H. Epidemiology of deaths from in-juries in the Islamic Republic of Iran. East Mediterr Health J. 2006; 12(3-4): 382 – 390.
26. Naghavi M, Pourmalek F, Shahraz S, Jafari N, Delavar B, Motlagh ME. The burden of injuries in Iranian children in 2005. Popul Health Metr. 2010; 8: 5.
27. Naghavi M, Shahraz S, Bhalla K, Jafari N, Pourmalek F, Bartels D, et after rapid
motorization. Arch Iran Med. 2009; 12(3): 284 – 294.28. Bhalla K, Naghavi M, Shahraz S, Bartels D, Murray CJ. Building na-
tional estimates of the burden of road countries from all available data sources: Iran. Inj Prev. 2009; 15(3): 150 – 156.
29. Bhalla K, Shahraz S, Naghavi M, Lozano R, Murray C. Estimating the distribution of external causes in hospital data from injury diagnosis. Accid Anal Prev. 2008; 40(6): 1822 – 1829.
30. -rei use of the capture-recapture method in the West Azarbaijan province of Iran. Int J Inj Contr Saf Promot. 2008; 15(1): 9 – 17.
31. Khorasani-Zavareh D, Haglund BJ, Mohammadi R, Naghavi M, Azarbaijan province of Iran:
a cross-sectional interview-based study on victims’ characteristics and pre-hospital care. Int J Inj Contr Saf Promot. 2009; 16(3): 119 – 126.
32. Karkhaneh M, Naghavi M, Rowe BH, Hagel BE, Jafari N, Saunders LD. Epidemiology of bicycle injuries in 13 health divisions, Islamic Republic of Iran 2003. Accid Anal Prev. 2008; 40(1): 192 – 199.
33. Forouzanfar MH, Foreman KJ, Delossantos AM, Lozano R, Lopez AD, Murray CJ, et al. Breast and cervical cancer in 187 countries be-tween 1980 and 2010: a systematic analysis. Lancet. 2011; 378(9801): 1461 – 1484.
34. Khosravi A, Rao C, Naghavi M, Taylor R, Jafari N, Lopez AD. Impact
in the Islamic Republic of Iran: a cross-sectional study. Bull World Health Organ. 2008; 86(9): 688 – 696.
35. Khosravi A, Taylor R, Naghavi M, Lopez AD. Mortality in the Islamic Republic of Iran, 1964–2004. Bull World Health Organ. 2007; 85(8): 607 – 614.
36. Khosravi A, Taylor R, Naghavi M, Lopez AD. Differential mortality in Iran. Popul Health Metr. 2007; 5: 7.